UNITED STATES
SECURITIES AND EXCHANGE COMMISSION
Washington, D.C. 20549
FORM 8-K
CURRENT REPORT
Pursuant to Section 13 or 15(d)
of the Securities Exchange Act of 1934
Date of Report (Date of earliest event reported): August 5, 2025
FLYWIRE CORPORATION
(Exact name of Registrant as specified in its charter)
| Delaware | 001-40430 | 27-0690799 | ||
| (State or other jurisdiction of incorporation) |
(Commission File No.) |
(IRS Employer Identification No.) |
| 141 Tremont St #10 |
| Boston, MA 02111 |
| (Address of principal executive offices and zip code) |
Registrant’s telephone number, including area code: (617) 329-4524
Not Applicable
(Former Name or Former Address, if Changed Since Last Report)
Check the appropriate box below if the Form 8-K filing is intended to simultaneously satisfy the filing obligation of the registrant under any of the following provisions:
| ☐ | Written communications pursuant to Rule 425 under the Securities Act (17 CFR 230.425) |
| ☐ | Soliciting material pursuant to Rule 14a-12 under the Exchange Act (17 CFR 240.14a-12) |
| ☐ | Pre-commencement communications pursuant to Rule 14d-2(b) under the Exchange Act (17 CFR 240.14d-2(b)) |
| ☐ | Pre-commencement communications pursuant to Rule 13e-4(c) under the Exchange Act (17 CFR 240.13e-4(c)) |
Securities registered pursuant to Section 12(b) of the Act:
| Title of each class |
Trading |
Name of each exchange on which registered |
||
| Voting Common Stock, $0.0001 par value per share | FLYW | The Nasdaq Stock Market LLC (Nasdaq Global Select Market) |
Indicate by check mark whether the registrant is an emerging growth company as defined in Rule 405 of the Securities Act of 1933 (§230.405 of this chapter) or Rule 12b-2 of the Securities Exchange Act of 1934 (§240.12b-2 of this chapter).
Emerging growth company ☐
If an emerging growth company, indicate by check mark if the registrant has elected not to use the extended transition period for complying with any new or revised financial accounting standards provided pursuant to Section 13(a) of the Exchange Act. ☐
| Item 2.02. | Results of Operations and Financial Condition. |
On August 5, 2025, Flywire Corporation (“Flywire” or the “Company”) issued a press release (the “Press Release”) and is holding a conference call regarding its preliminary and unaudited financial results for the quarter ended June 30, 2025. The Press Release is furnished as Exhibit 99.1 to this Current Report on Form 8-K and is incorporated by reference herein.
Various statements to be made during the conference call are “forward-looking statements” within the meaning of the Private Securities Litigation Reform Act of 1995, including, but not limited to, statements regarding Flywire’s future operating results and financial position, Flywire’s business strategy and plans, market growth, and Flywire’s objectives for future operations. Flywire intends such forward-looking statements to be covered by the safe harbor provisions for forward-looking statements contained in Section 21E of the Securities Exchange Act of 1934 and the Private Securities Litigation Reform Act of 1995. In some cases, you can identify forward-looking statements by terms such as, but not limited to, “believe,” “may,” “will,” “potentially,” “estimate,” “continue,” “anticipate,” “intend,” “could,” “would,” “project,” “target,” “plan,” “expect,” or the negative of these terms, and similar expressions intended to identify forward-looking statements. Such forward-looking statements are based upon current expectations that involve risks, changes in circumstances, assumptions, and uncertainties. Important factors that could cause actual results to differ materially from those reflected in Flywire’s forward-looking statements include, among others, Flywire’s future financial performance, including its expectations regarding FX Neutral Revenue Less Ancillary Services growth, and Adjusted EBITDA margin growth and foreign exchange rates. Risks that may cause actual results to differ materially from these forward looking statements include, but are not limited to: Flywire’s ability to execute its business plan and effectively manage its growth; Flywire’s cross-border expansion plans and ability to expand internationally; anticipated trends, growth rates, and challenges in Flywire’s business and in the markets in which Flywire operates; the sufficiency of Flywire’s cash and cash equivalents to meet its liquidity needs; political, economic, foreign currency exchange rate, inflation, legal, social and health risks, that may affect Flywire’s business or the global economy; Flywire’s beliefs and objectives for future operations; Flywire’s ability to develop and protect its brand; Flywire’s ability to maintain and grow the payment volume that it processes; Flywire’s ability to further attract, retain, and expand its client base; Flywire’s ability to develop new solutions and services and bring them to market in a timely manner; Flywire’s expectations concerning relationships with third parties, including financial institutions and strategic partners; the effects of increased competition in Flywire’s markets and its ability to compete effectively; recent and future acquisitions or investments in complementary companies, products, services, or technologies; Flywire’s ability to enter new client verticals, including its relatively new business-to-business sector; Flywire’s expectations regarding anticipated technology needs and developments and its ability to address those needs and developments with its solutions; Flywire’s expectations regarding its ability to meet existing performance obligations and maintain the operability of its solutions; Flywire’s expectations regarding the effects of existing and developing laws and regulations, including with respect to payments and financial services, taxation, privacy and data protection; Flywire’s ability to adapt its business to changes in government policy regarding tariffs and immigration; economic and industry trends, including the risk of a global recession, projected growth, or trend analysis; the effects of global events and geopolitical conflicts, including without limitation the continuing hostilities in Ukraine and involving Israel, Hamas and Iran; Flywire’s ability to adapt to recommended or implemented U.S. policy changes, in particular those that impact higher education, the desire for foreign students to study in the U.S., immigration and visa policy, and changes to regulatory agencies and depth of enforcement of regulations; Flywire’s ability to adapt to changes in U.S. federal income or other tax laws or the interpretation of tax laws, including the Inflation Reduction Act of 2022; and The One Big Beautiful Bill Act of 2025; Flywire’s ability to attract and retain qualified employees; Flywire’s ability to maintain, protect, and enhance its intellectual property; Flywire’s ability to maintain the security and availability of its solutions; the increased expenses associated with being a public company; the future market price of Flywire’s common stock; and other factors that are described in the “Risk Factors” and “Management’s Discussion and Analysis of Financial Condition and Results of Operations” sections of Flywire’s Annual Report on Form 10-K for the year ended December 31, 2024 and Quarterly Report on Form 10-Q for the quarter ended March 31, 2025 which are on file with the Securities and Exchange Commission (SEC) and available on the SEC’s website at https://www.sec.gov/. Additional factors may be described in those sections of Flywire’s Quarterly Report on Form 10-Q for the quarter ended June 30, 2025, expected to be filed in the third quarter of 2025. The information conveyed on the conference call is provided only as of the date of the conference call, and Flywire undertakes no obligation to update any forward-looking statements presented during the conference call on account of new information, future events, or otherwise, except as required by law.
| Item 7.01. | Regulation FD Disclosure. |
On August 5, 2025, the Company provided an investor presentation that will be made available on the investor relations section of the Company’s website at https://ir.flywire.com/. The investor presentation is furnished as Exhibit 99.2 to this Current Report on Form 8-K and is incorporated by reference herein.
This information in this Item 7.01 of this Current Report on Form 8-K shall not be deemed “filed” for purposes of Section 18 of the Securities Exchange Act of 1934, as amended (the “Exchange Act”), or otherwise subject to the liabilities of that Section, or incorporated by reference in any filing under the Securities Act of 1933, as amended, or the Exchange Act, except as shall be expressly set forth by specific reference in any such filing.
| Item 9.01. | Financial Statements and Exhibits. |
(d) Exhibits
| Exhibit No. |
Description | |
| 99.1 | Flywire Corporation Press Release dated August 5, 2025. | |
| 99.2 | Flywire Corporation Investor Presentation dated August 5, 2025. | |
| 104 | Cover Page Interactive Data File (embedded within the Inline XBRL document) | |
SIGNATURE
Pursuant to the requirements of the Securities Exchange Act of 1934, the registrant has duly caused this report to be signed on its behalf by the undersigned hereunto duly authorized.
| FLYWIRE CORPORATION | ||
| By: | /s/ Cosmin Pitigoi |
|
| Name: | Cosmin Pitigoi | |
| Title: | Chief Financial Officer | |
Dated August 5, 2025
Exhibit 99.1
Flywire Reports Second Quarter 2025 Financial Results
Second Quarter Revenue Increased 27.2% Year-over-Year
Second Quarter Revenue Less Ancillary Services Increased 27.7% Year-over-Year
Previous Fiscal Year 2025 revenue guidance reaffirmed, aEBITDA margin guidance raised by 75 bps at midpoint
Boston, MA – August 5, 2025: Flywire Corporation (Nasdaq: FLYW) (“Flywire” or the “Company”), a global payments enablement and software company, today reported financial results for its second quarter ended June 30, 2025.
“Our strong Q2 results and double-digit FX-Neutral revenue growth are a testament to the high-performance culture we’ve built at Flywire and the value we provide our clients,” said Mike Massaro, CEO of Flywire. “I’m incredibly proud of our team for their skill, creativity, and unwavering commitment to client success, which has enabled us to win new business and increase our market share. We have proven that our solutions are the right fit for the verticals we serve, and we continue to expand our engagement with clients through our ‘land and expand’ strategy. This success, even amidst global uncertainty and headwinds our clients face, reflects the true character of our FlyMates. Looking ahead, I am excited about the strength of our competitive moat and the pace of innovation in our product roadmap. This can be seen clearly in our results, and the momentum is just beginning.”
Second Quarter 2025 Financial Highlights:
GAAP Results
| • | Revenue increased 27.2% to $131.9 million in the Second quarter of 2025, compared to $103.7 million in the Second quarter of 2024. Sertifi positively impacted revenue by $12.3 million in the Second quarter of 2025 adding 12 points of revenue growth year over year. |
| • | Gross Profit increased to $75.1 million, resulting in Gross Margin of 57.0%, for the Second quarter of 2025, compared to Gross Profit of $61.9 million and Gross Margin of 59.7% in the Second quarter of 2024. |
| • | Net loss was ($12.0) million in the Second quarter of 2025, compared to net loss of ($13.9) million in the Second quarter of 2024. |
Key Business Performance highlights:
| • | Signed nearly 200 new clients across all verticals, excluding the added Sertifi properties and Invoiced software accounts signed |
| • | Recognized by luxury travel network Virtuoso as a Technology Partner, gaining access to 2,300 preferred suppliers across 100 countries and $35 billion in annual luxury travel sales. |
| • | Scaled the fast-growing Travel vertical, expanding Flywire’s client roster globally and growing Sertifi’s revenue by +35% year-over-year on a pro-forma basis. |
| • | Deepened award-winning education partnership with Ellucian, deploying new integrations into Banner via Ellucian Ethos to streamline implementations for institutions in the U.S., U.K., and globally. |
| • | Collected more than $320 million in past-due tuition at U.S. institutions, preserving enrollment for 161,000+ students through its Student Financial Software (SFS). |
| • | Named to the PCI Security Standards Council 2025-2027 Board of Advisors to help shape global payment security standards. |
| • | Continued product and payment innovation in the UK Higher Education market, unveiling an enhanced solution for financial aid disbursements. |
| • | Named one of the Best Companies to Work for 2025-2026 by US News & World Report. |
| • | Signed a partnership with a leading provider of stablecoin-native payment infrastructure, to integrate stablecoin payment capabilities into Flywire’s global payment network. |
Key Operating Metrics and Non-GAAP Results
| • | Total Payment Volume increased 22% to $5.9 billion in the Second quarter of 2025, compared to $4.9 billion in the Second quarter of 2024. Excluding Sertifi, Total Payment Volume increased 17% to $5.7 billion in the Second quarter of 2025, compared to $4.9 billion in the Second quarter of 2024. |
| • | Revenue Less Ancillary Services increased 27.7% to $127.5 million in the Second quarter of 2025, compared to $99.9 million in the Second quarter of 2024. On an FX-neutral basis, Revenue Less Ancillary Services increased 25% year-over-year. Excluding Sertifi, Revenue Less Ancillary Services increased 15.4% year over year to $115.2 million or 12.7% year over year on an FX-Neutral basis in the Second quarter of 2025. |
| • | Adjusted Gross Profit increased to $77.9 million, up 22.7% compared to $63.4 million in the Second quarter of 2024. Adjusted Gross Margin was 61.1% in the Second quarter of 2025 compared to 63.5% in the Second quarter of 2024. |
| • | Adjusted EBITDA increased to $16.6 million in the Second quarter of 2025, compared to $5.8 million in the Second quarter of 2024. Our adjusted EBITDA margins increased over 700 bps year-over-year to 13% in the Second quarter of 2025. |
| • | Repurchased 0.6 million shares of our common stock for approximately $5.0 million (including commissions), with approximately $52 million remaining in the share repurchase program as of the end of the Second quarter 2025. |
| • | Increased Revolving Credit Facility from $125 million to $300 million with improved terms, expanded banking partnerships. |
| • | Share repurchase program has been increased by $150 million from the approximately $50 million that was remaining as of the end of the Second quarter 2025, bringing total authorization for future share repurchases to approximately $200 million. |
Guidance
”Second quarter 2025 performance significantly exceeded expectations for both FX Neutral Revenue and Adjusted EBITDA, as we delivered on go-to-market execution, strategic investments and operational efficiency,” said Flywire’s CFO, Cosmin Pitigoi. “Acknowledging student visa headwinds in the US, we are maintaining our revenue guidance and raising our adjusted EBITDA margin outlook for the full-year 2025. With ample liquidity supported by an expanded credit line and an increased buyback authorization, we are well-positioned to remain agile in our capital allocation — focusing on disciplined investments that drive long-term shareholder value.”
Based on information available as of August 5, 2025, Flywire anticipates the following results for the third quarter and fiscal year 2025*.
| Fiscal Year 2025 | ||
| FX-Neutral Revenue Less Ancillary Services Growth |
17-23% YoY | |
| FX-Neutral Revenue Less Ancillary Services Growth (excluding Sertifi) |
10-14% YoY | |
| Sertifi Revenue contribution1 of |
$35-40M | |
| Adjusted EBITDA Margin Growth |
+200-350 bps YoY |
| 1 | Since the acquisition closed on 02/24/2025. |
| Third Quarter 2025 | ||||
| FX-Neutral Revenue Less Ancillary Services Growth |
13-21% YoY | |||
| FX-Neutral Revenue Less Ancillary Services Growth (excluding Sertifi) |
7-13% YoY | |||
| Sertifi Revenue contribution |
$9-12M | |||
| Adjusted EBITDA Margin Growth |
+50-150 bps YoY | |||
| * | Flywire has not provided a quantitative reconciliation of forecasted FX-Neutral Revenue Less Ancillary Services Growth to forecasted GAAP Revenue Growth or forecasted Adjusted EBITDA Margin Growth to forecasted GAAP Net Income Margin Growth or to forecasted GAAP net income (loss) before income taxes within this earnings release because Flywire is unable, without making unreasonable efforts, to calculate certain reconciling items with confidence. These items include, but are not limited to, income taxes, which are directly impacted by unpredictable fluctuations in the market price of Flywire’s stock and foreign currency exchange rates. |
These statements are forward-looking, and actual results may differ materially. Refer to the “Safe Harbor Statement” below for information on the factors that could cause Flywire’s actual results to differ materially from these forward-looking statements.
Conference Call
The Company will host a conference call to discuss Second quarter financial results today at 5:00 pm ET. Hosting the call will be Mike Massaro, CEO, Rob Orgel, President and COO, and Cosmin Pitigoi, CFO. The conference call can be accessed live via webcast from the Company’s investor relations website at https://ir.flywire.com/. A replay will be available on the investor relations website following the call.
Note Regarding Share Repurchase Program
Repurchases under the Company’s share repurchase program (the Repurchase Program) may be made from time to time through open market purchases, in privately negotiated transactions or by other means, including through the use of trading plans intended to qualify under Rule 10b5-1 under the Securities Exchange Act of 1934, as amended, in accordance with applicable securities laws and other restrictions, including Rule 10b-18. The timing, value and number of shares repurchased will be determined by the Company in its discretion and will be based on various factors, including an evaluation of current and future capital needs, current and forecasted cash flows, the Company’s capital structure, cost of capital and prevailing stock prices, general market and economic conditions, applicable legal requirements, and compliance with covenants in the Company’s credit facility that may limit share repurchases based on defined leverage ratios. The Repurchase Program does not obligate the Company to purchase a specific number of, or any, shares. The Repurchase Program does not expire and may be modified, suspended, or terminated at any time without notice at the Company’s discretion.
Key Operating Metrics and Non-GAAP Financial Measures
Flywire uses non-GAAP financial measures to supplement financial information presented on a GAAP basis. The Company believes that excluding certain items from its GAAP results allows management to better understand its consolidated financial performance from period to period and better project its future consolidated financial performance as forecasts are developed at a level of detail different from that used to prepare GAAP-based financial measures. Moreover, Flywire believes these non-GAAP financial measures provide its stakeholders with useful information to help them evaluate the Company’s operating results by facilitating an enhanced understanding of the Company’s operating performance and enabling them to make more meaningful period-to-period comparisons. There are limitations to the use of the non-GAAP financial measures presented here. Flywire’s non-GAAP financial measures may not be comparable to similarly titled measures of other companies. Other companies, including companies in Flywire’s industry, may calculate non-GAAP financial measures differently, limiting the usefulness of those measures for comparative purposes.
Flywire uses supplemental measures of its performance, which are derived from its consolidated financial information, but which are not presented in its consolidated financial statements prepared in accordance with GAAP. These non-GAAP financial measures include the following:
| • | Revenue Less Ancillary Services. Revenue Less Ancillary Services represents the Company’s consolidated revenue in accordance with GAAP less (i) pass-through cost for printing and mailing services and (ii) marketing fees. The Company excludes these amounts to arrive at this supplemental non-GAAP financial measure as it views these services as ancillary to the primary services it provides to its clients. |
| • | Adjusted Gross Profit and Adjusted Gross Margin. Adjusted gross profit represents Revenue Less Ancillary Services less cost of revenue adjusted to (i) exclude pass-through cost for printing services, (ii) offset marketing fees against costs incurred and (iii) exclude depreciation and amortization, including accelerated amortization on the impairment of customer set-up costs tied to technology integration, if applicable. Adjusted Gross Margin represents Adjusted Gross Profit divided by Revenue Less Ancillary Services. Management believes this presentation supplements the GAAP presentation of Gross Profit and Gross Margin with a useful measure of the gross profit and gross margin of the Company’s payment-related services, which are the primary services it provides to its clients. |
| • | Adjusted EBITDA. EBITDA represents our consolidated net income (loss) in accordance with GAAP adjusted to include (i) interest expense, (ii) interest income, (iii) (benefit from) provision for income taxes and (iv) depreciation and amortization. Adjusted EBITDA represents EBITDA further adjusted by excluding (a) stock-based compensation expense and related payroll taxes, (b) the impact from the change in fair value measurement for contingent consideration associated with acquisitions,(c) gain (loss) from the remeasurement of foreign currency, (d) indirect taxes related to intercompany activity, (e) acquisition related transaction costs, (f) employee retention costs, such as incentive compensation, associated with acquisition activities and (g) restructuring costs. Management believes that the exclusion of these amounts to calculate Adjusted EBITDA provides useful measures for period-to-period comparisons of the Company’s business. |
| • | Adjusted EBITDA Margin - Adjusted EBITDA Margin represents Adjusted EBITDA divided by Revenue Less Ancillary Services. Management believes this presentation supplements the GAAP presentation of gross margin with a useful measure of the gross margin of the Company’s payment-related services, which are the primary services it provides to its clients. |
| • | FX Neutral Revenue Less Ancillary Services. FX Neutral Revenue Less Ancillary Services represents Revenue Less Ancillary Services adjusted to show presentation on a FX Neutral basis. The FX Neutral information presented is calculated by translating current-period results using prior-period weighted average foreign currency exchange rates. Flywire analyzes Revenue Less Ancillary Services on an FX Neutral basis to provide a comparable framework for assessing how the business performed, excluding the effect of foreign currency fluctuations. |
| • | Non-GAAP Operating Expenses - Non-GAAP Operating Expenses represents GAAP Operating Expenses adjusted by excluding (i) stock-based compensation expense and related payroll taxes, (ii) depreciation and amortization, (iii) acquisition related transaction costs, if applicable, (iv) employee retention costs, such as incentive compensation, associated with acquisition activities, (v) the impact from the change in fair value measurement for contingent consideration associated with acquisitions and (vi) restructuring costs. |
| • | FX Neutral Revenue Less Ancillary Services and Adjusted EBITDA, excluding Sertifi - FX Neutral Revenue Less Ancillary Services and Adjusted EBITDA, excluding Sertifi, represents FX Neutral Revenue Less Ancillary Services and Adjusted EBITDA, respectively, adjusted by excluding the contributions from Sertifi. Flywire believes these measures are useful in understanding the ongoing results of our operations. |
These non-GAAP financial measures are not meant to be considered as indicators of performance in isolation from or as a substitute for the Company’s revenue, gross profit, gross margin or net income (loss), or operating expenses prepared in accordance with GAAP and should be read only in conjunction with financial information presented on a GAAP basis. Reconciliations of these non-GAAP financial measures to the most directly comparable GAAP financial measure are presented below. Flywire encourages you to review these reconciliations in conjunction with the presentation of the non-GAAP financial measures for each of the periods presented. In future fiscal periods, Flywire may exclude such items and may incur income and expenses similar to these excluded items.
Flywire has not provided a quantitative reconciliation of forecasted FX-Neutral Revenue Less Ancillary Services Growth to forecasted GAAP Revenue Growth or forecasted Adjusted EBITDA Margin Growth to forecasted GAAP Net Income Margin Growth or to forecasted GAAP net income (loss) before income taxes within this earnings release because it is unable, without making unreasonable efforts, to calculate certain reconciling items with confidence. These items include, but are not limited to, income taxes, which are directly impacted by unpredictable fluctuations in the market price of Flywire’s stock and foreign currency exchange rates. For figures in this press release reported on an “FX-Neutral basis,” Flywire calculates the year-over-year impact of foreign currency movements using prior period weighted average foreign currency exchange rates.
About Flywire
Flywire is a global payments enablement and software company. We combine our proprietary global payments network, next-gen payments platform and vertical-specific software to deliver the most important and complex payments for our clients and their customers.
Flywire leverages its vertical-specific software and payments technology to deeply embed within the existing A/R workflows for its clients across the education, healthcare, and travel vertical markets, as well as in key B2B industries. Flywire also integrates with leading ERP systems, such as NetSuite, so organizations can optimize the payment experience for their customers while eliminating operational challenges.
Flywire supports over 4,800** clients with diverse payment methods in more than 140 currencies across more than 240 countries and territories around the world. Flywire is headquartered in Boston, MA, USA, with global offices. For more information, visit www.flywire.com. Follow Flywire on X (formerly known as Twitter), LinkedIn and Facebook.
**Excludes clients from Flywire’s Invoiced and Sertifi acquisitions
Safe Harbor Statement
This release contains forward-looking statements within the meaning of the Private Securities Litigation Reform Act of 1995, including, but not limited to, statements regarding Flywire’s future operating results and financial position, Flywire’s business strategy and plans, market growth, and Flywire’s objectives for future operations. Flywire intends such forward-looking statements to be covered by the safe harbor provisions for forward-looking statements contained in Section 21E of the Securities Exchange Act of 1934 and the Private Securities Litigation Reform Act of 1995. In some cases, you can identify forward-looking statements by terms such as, but not limited to, “believe,” “may,” “will,” “potentially,” “estimate,” “continue,” “anticipate,” “intend,” “could,” “would,” “project,” “target,” “plan,” “expect,” or the negative of these terms, and similar expressions intended to identify forward-looking statements. Such forward-looking statements are based upon current expectations that involve risks, changes in circumstances, assumptions, and uncertainties. Important factors that could cause actual results to differ materially from those reflected in Flywire’s forward-looking statements include, among others, Flywire’s future financial performance, including its expectations regarding FX Neutral Revenue Less Ancillary Services growth, and Adjusted EBITDA margin growth and foreign exchange rates.
Risks that may cause actual results to differ materially from these forward looking statements include, but are not limited to: Flywire’s ability to execute its business plan and effectively manage its growth; Flywire’s cross-border expansion plans and ability to expand internationally; anticipated trends, growth rates, and challenges in Flywire’s business and in the markets in which Flywire operates; the sufficiency of Flywire’s cash and cash equivalents to meet its liquidity needs; political, economic, foreign currency exchange rate, inflation, legal, social and health risks, that may affect Flywire’s business or the global economy; Flywire’s beliefs and objectives for future operations; Flywire’s ability to develop and protect its brand; Flywire’s ability to maintain and grow the payment volume that it processes; Flywire’s ability to further attract, retain, and expand its client base; Flywire’s ability to develop new solutions and services and bring them to market in a timely manner; Flywire’s expectations concerning relationships with third parties, including financial institutions and strategic partners; the effects of increased competition in Flywire’s markets and its ability to compete effectively; recent and future acquisitions or investments in complementary companies, products, services, or technologies; Flywire’s ability to enter new client verticals, including its relatively new business-to-business sector; Flywire’s expectations regarding anticipated technology needs and developments and its ability to address those needs and developments with its solutions; Flywire’s expectations regarding its ability to meet existing performance obligations and maintain the operability of its solutions; Flywire’s expectations regarding the effects of existing and developing laws and regulations, including with respect to payments and financial services, taxation, privacy and data protection; Flywire’s ability to adapt its business to changes in government policy regarding tariffs and immigration; economic and industry trends, including the risk of a global recession, projected growth, or trend analysis; the effects of global events and geopolitical conflicts, including without limitation the continuing hostilities in Ukraine and involving Israel, Hamas and Iran; Flywire’s ability to adapt to recommended or implemented U.S. policy changes, in particular those that impact higher education, the desire for foreign students to study in the U.S., immigration and visa policy, and changes to regulatory agencies and depth of enforcement of regulations; Flywire’s ability to adapt to changes in U.S. federal income or other tax laws or the interpretation of tax laws, including the Inflation Reduction Act of 2022; and The One Big Beautiful Bill Act of 2025; Flywire’s ability to attract and retain qualified employees; Flywire’s ability to maintain, protect, and enhance its intellectual property; Flywire’s ability to maintain the security and availability of its solutions; the increased expenses associated with being a public company; the future market price of Flywire’s common stock; and other factors that are described in the “Risk Factors” and “Management’s Discussion and Analysis of Financial Condition and Results of Operations” sections of Flywire’s Annual Report on Form 10-K for the year ended December 31, 2024 and Quarterly Report on Form 10-Q for the quarter ended March 31, 2025 which are on file with the Securities and Exchange Commission (SEC) and available on the SEC’s website at https://www.sec.gov/. Additional factors may be described in those sections of Flywire’s Quarterly Report on Form 10-Q for the quarter ended June 30, 2025, expected to be filed in the third quarter of 2025. The information in this release is provided only as of the date of this release, and Flywire undertakes no obligation to update any forward-looking statements contained in this release on account of new information, future events, or otherwise, except as required by law.
Contacts
Investor Relations:
Masha Kahn
ir@Flywire.com
Media:
Sarah King
Media@Flywire.com
Condensed Consolidated Statements of Operations and Comprehensive Loss
(Unaudited) (Amounts in thousands, except share and per share amounts)
| Three Months Ended June 30, | Six Months Ended June 30, | |||||||||||||||
| 2025 | 2024 | 2025 | 2024 | |||||||||||||
| Revenue |
$ | 131,891 | $ | 103,676 | $ | 265,343 | $ | 217,779 | ||||||||
| Costs and operating expenses: |
||||||||||||||||
| Payment processing services costs |
53,887 | 39,899 | 104,450 | 81,549 | ||||||||||||
| Technology and development |
17,106 | 15,834 | 34,017 | 32,571 | ||||||||||||
| Selling and marketing |
38,377 | 31,771 | 74,946 | 61,854 | ||||||||||||
| General and administrative |
30,175 | 31,959 | 63,233 | 63,555 | ||||||||||||
| Restructuring |
1,351 | — | 8,690 | — | ||||||||||||
|
|
|
|
|
|
|
|
|
|||||||||
| Total costs and operating expenses |
140,896 | 119,463 | 285,336 | 239,529 | ||||||||||||
|
|
|
|
|
|
|
|
|
|||||||||
| Loss from operations |
$ | (9,005 | ) | $ | (15,787 | ) | $ | (19,993 | ) | $ | (21,750 | ) | ||||
|
|
|
|
|
|
|
|
|
|||||||||
| Other income (expense): |
||||||||||||||||
| Interest expense |
(1,065 | ) | (133 | ) | (1,789 | ) | (275 | ) | ||||||||
| Interest income |
1,089 | 5,719 | 4,023 | 11,598 | ||||||||||||
| Gain (loss) from remeasurement of foreign currency |
3,947 | 998 | 7,523 | (3,378 | ) | |||||||||||
| Gain on available-for-sale debt securities |
8 | — | 166 | — | ||||||||||||
|
|
|
|
|
|
|
|
|
|||||||||
| Total other income, net |
3,979 | 6,584 | 9,923 | 7,945 | ||||||||||||
|
|
|
|
|
|
|
|
|
|||||||||
| Loss before provision for income taxes |
(5,026 | ) | (9,203 | ) | (10,070 | ) | (13,805 | ) | ||||||||
| Provision for income taxes |
6,981 | 4,677 | 6,097 | 6,292 | ||||||||||||
|
|
|
|
|
|
|
|
|
|||||||||
| Net Loss |
$ | (12,007 | ) | $ | (13,880 | ) | $ | (16,167 | ) | $ | (20,097 | ) | ||||
| Foreign currency translation adjustment |
6,655 | 193 | 9,332 | (1,168 | ) | |||||||||||
| Unrealized losses on available-for-sale debt securities, net |
$ | (36 | ) | $ | (53 | ) | $ | (165 | ) | $ | (53 | ) | ||||
|
|
|
|
|
|
|
|
|
|||||||||
| Total other comprehensive income (loss) |
$ | 6,619 | $ | 140 | $ | 9,167 | $ | (1,221 | ) | |||||||
|
|
|
|
|
|
|
|
|
|||||||||
| Comprehensive loss |
$ | (5,388 | ) | $ | (13,740 | ) | $ | (7,000 | ) | $ | (21,318 | ) | ||||
|
|
|
|
|
|
|
|
|
|||||||||
| Net loss attributable to common stockholders - basic and diluted |
$ | (12,007 | ) | $ | (13,880 | ) | $ | (16,167 | ) | $ | (20,097 | ) | ||||
|
|
|
|
|
|
|
|
|
|||||||||
| Net loss per share attributable to common stockholders - basic and diluted |
$ | (0.10 | ) | $ | (0.11 | ) | $ | (0.13 | ) | $ | (0.16 | ) | ||||
|
|
|
|
|
|
|
|
|
|||||||||
| Weighted average common shares outstanding - basic and diluted |
121,812,062 | 124,562,015 | 122,519,731 | 123,859,762 | ||||||||||||
|
|
|
|
|
|
|
|
|
|||||||||
Condensed Consolidated Balance Sheets
(Unaudited) (Amounts in thousands, except par value per share and share amounts)
| June 30, | December 31, | |||||||
| 2025 | 2024 | |||||||
| Assets |
||||||||
| Current assets: |
||||||||
| Cash and cash equivalents |
$ | 249,686 | $ | 495,242 | ||||
| Short-term investments |
24,545 | 115,848 | ||||||
| Accounts receivable, net |
29,700 | 23,703 | ||||||
| Unbilled receivables, net |
17,732 | 15,453 | ||||||
| Funds receivable from payment partners |
88,236 | 90,110 | ||||||
| Prepaid expenses and other current assets |
38,857 | 22,528 | ||||||
|
|
|
|
|
|||||
| Total current assets |
448,756 | 762,884 | ||||||
| Long-term investments |
14,885 | 50,125 | ||||||
| Property and equipment, net |
18,884 | 17,160 | ||||||
| Intangible assets, net |
199,587 | 118,684 | ||||||
| Goodwill |
406,439 | 149,558 | ||||||
| Other assets |
25,796 | 24,035 | ||||||
|
|
|
|
|
|||||
| Total assets |
$ | 1,114,347 | $ | 1,122,446 | ||||
|
|
|
|
|
|||||
| Liabilities and Stockholders’ Equity |
||||||||
| Current liabilities: |
||||||||
| Accounts payable |
$ | 17,484 | $ | 15,353 | ||||
| Funds payable to clients |
154,029 | 217,788 | ||||||
| Accrued expenses and other current liabilities |
49,507 | 49,297 | ||||||
| Deferred revenue |
19,220 | 7,337 | ||||||
|
|
|
|
|
|||||
| Total current liabilities |
240,240 | 289,775 | ||||||
| Deferred tax liabilities |
14,504 | 12,643 | ||||||
| Long-term debt |
60,000 | — | ||||||
| Other liabilities |
7,180 | 5,261 | ||||||
|
|
|
|
|
|||||
| Total liabilities |
321,924 | 307,679 | ||||||
|
|
|
|
|
|||||
| Commitments and contingencies Stockholders’ equity: |
||||||||
| Preferred stock, $0.0001 par value; 10,000,000 shares authorized as of June 30, 2025 and December 31, 2024; and no shares issued and outstanding as of June 30, 2025 and December 31 , 2024 |
— | — | ||||||
| Voting common stock, $0.0001 par value; 2,000,000,000 shares authorized as of June 30, 2025 and December 31, 2024; 129,076,628 shares issued and 120,307,481 shares outstanding as of June 30, 2025; 126,853,852 shares issued and 122,182,878 shares outstanding as of December 31, 2024 |
13 | 13 | ||||||
| Non-voting common stock, $0.0001 par value; 10,000,000 shares authorized as of June 30, 2025 and December 31, 2024; 1,873,320 shares issued and outstanding as of June 30, 2025 and December 31, 2024 |
— | — | ||||||
| Treasury voting common stock, 8,769,147 and 4,670,974 shares as of June 30, 2025 and December 31, 2024, respectively, held at cost |
(98,739 | ) | (46,268 | ) | ||||
| Additional paid-in capital |
1,071,085 | 1,033,958 | ||||||
| Accumulated other comprehensive income (loss) |
7,101 | (2,066 | ) | |||||
| Accumulated deficit |
(187,037 | ) | (170,870 | ) | ||||
|
|
|
|
|
|||||
| Total stockholders’ equity |
792,423 | 814,767 | ||||||
|
|
|
|
|
|||||
| Total liabilities and stockholders’ equity |
$ | 1,114,347 | $ | 1,122,446 | ||||
|
|
|
|
|
|||||
Reconciliation of Non-GAAP Financial Measures
(Unaudited) (Amounts in millions, except percentages)
| Three Months Ended June 30, |
Six Months Ended June 30, |
|||||||||||||||
| 2025 | 2024 | 2025 | 2024 | |||||||||||||
| Revenue |
$ | 131.9 | $ | 103.7 | $ | 265.3 | $ | 217.8 | ||||||||
| Adjusted to exclude gross up for: |
||||||||||||||||
| Pass-through cost for printing and mailing |
(4.2 | ) | (3.6 | ) | (8.7 | ) | (7.2 | ) | ||||||||
| Marketing fees |
(0.1 | ) | (0.2 | ) | (0.5 | ) | (0.5 | ) | ||||||||
|
|
|
|
|
|
|
|
|
|||||||||
| Revenue Less Ancillary Services |
$ | 127.5 | $ | 99.9 | $ | 256.2 | $ | 210.1 | ||||||||
|
|
|
|
|
|
|
|
|
|||||||||
| Payment processing services costs |
53.9 | 39.9 | 104.5 | 81.5 | ||||||||||||
| Hosting and amortization costs within technology and development |
2.9 | 1.9 | 5.3 | 3.9 | ||||||||||||
|
|
|
|
|
|
|
|
|
|||||||||
| Cost of Revenue |
$ | 56.7 | $ | 41.8 | $ | 109.8 | $ | 85.4 | ||||||||
|
|
|
|
|
|
|
|
|
|||||||||
| Adjusted to: |
||||||||||||||||
| Exclude printing and mailing costs |
(4.2 | ) | (3.6 | ) | (8.7 | ) | (7.2 | ) | ||||||||
| Offset marketing fees against related costs |
(0.1 | ) | (0.2 | ) | (0.5 | ) | (0.5 | ) | ||||||||
| Exclude depreciation and amortization |
(2.7 | ) | (1.5 | ) | (4.8 | ) | (3.0 | ) | ||||||||
|
|
|
|
|
|
|
|
|
|||||||||
| Adjusted Cost of Revenue |
$ | 49.7 | $ | 36.5 | $ | 95.8 | $ | 74.7 | ||||||||
| Gross Profit |
$ | 75.1 | $ | 61.9 | $ | 155.6 | $ | 132.4 | ||||||||
| Gross Margin |
57.0 | % | 59.7 | % | 58.7 | % | 60.8 | % | ||||||||
|
|
|
|
|
|
|
|
|
|||||||||
| Adjusted Gross Profit |
$ | 77.9 | $ | 63.4 | $ | 160.4 | $ | 135.4 | ||||||||
| Adjusted Gross Margin |
61.1 | % | 63.5 | % | 62.6 | % | 64.4 | % | ||||||||
|
|
|
|
|
|
|
|
|
|||||||||
| Three Months Ended June 30, 2025 |
Three Months Ended June 30, 2024 |
|||||||||||||||||||||||
| Transaction | Platform and Other Revenues |
Revenue | Transaction | Platform and Other Revenues |
Revenue | |||||||||||||||||||
| Revenue |
$ | 100.6 | $ | 31.3 | $ | 131.9 | $ | 85.3 | $ | 18.4 | $ | 103.7 | ||||||||||||
| Adjusted to exclude gross up for: |
||||||||||||||||||||||||
| Pass-through cost for printing and mailing |
— | (4.2 | ) | (4.2 | ) | — | (3.6 | ) | (3.6 | ) | ||||||||||||||
| Marketing fees |
(0.1 | ) | — | (0.1 | ) | (0.2 | ) | — | (0.2 | ) | ||||||||||||||
|
|
|
|
|
|
|
|
|
|
|
|
|
|||||||||||||
| Revenue Less Ancillary Services |
$ | 100.5 | $ | 27.1 | $ | 127.5 | $ | 85.1 | $ | 14.8 | $ | 99.9 | ||||||||||||
|
|
|
|
|
|
|
|
|
|
|
|
|
|||||||||||||
| Percentage of Revenue |
76.3 | % | 23.7 | % | 100.0 | % | 82.3 | % | 17.7 | % | 100.0 | % | ||||||||||||
| Percentage of Revenue Less Ancillary Services |
78.8 | % | 21.2 | % | 100.0 | % | 85.2 | % | 14.8 | % | 100.0 | % | ||||||||||||
| Six Months Ended June 30, 2025 |
Six Months Ended June 30, 2024 |
|||||||||||||||||||||||
| Transaction | Platform and Other Revenues |
Revenue | Transaction | Platform and Other Revenues |
Revenue | |||||||||||||||||||
| Revenue |
$ | 209.1 | $ | 56.3 | $ | 265.3 | $ | 180.5 | $ | 37.3 | $ | 217.8 | ||||||||||||
| Adjusted to exclude gross up for: |
||||||||||||||||||||||||
| Pass-through cost for printing and mailing |
— | (8.7 | ) | (8.7 | ) | — | (7.2 | ) | (7.2 | ) | ||||||||||||||
| Marketing fees |
(0.5 | ) | — | (0.5 | ) | (0.5 | ) | — | (0.5 | ) | ||||||||||||||
|
|
|
|
|
|
|
|
|
|
|
|
|
|||||||||||||
| Revenue Less Ancillary Services |
$ | 208.6 | $ | 47.6 | $ | 256.2 | $ | 180.0 | $ | 30.1 | $ | 210.1 | ||||||||||||
|
|
|
|
|
|
|
|
|
|
|
|
|
|||||||||||||
| Percentage of Revenue |
78.8 | % | 21.2 | % | 100.0 | % | 82.9 | % | 17.1 | % | 100.0 | % | ||||||||||||
| Percentage of Revenue Less Ancillary Services |
81.4 | % | 18.6 | % | 100.0 | % | 85.7 | % | 14.3 | % | 100.0 | % | ||||||||||||
FX Neutral Revenue Less Ancillary Services
(unaudited) (in millions)
| Three Months Ended June 30, |
Six Months Ended June 30, |
|||||||||||||||||||||||
| 2025 | 2024 | Growth Rate | 2025 | 2024 | Growth Rate | |||||||||||||||||||
| Revenue |
$ | 131.9 | $ | 103.7 | 27 | % | $ | 265.3 | $ | 217.8 | 22 | % | ||||||||||||
| Ancillary services |
(4.3 | ) | (3.8 | ) | (9.2 | ) | (7.7 | ) | ||||||||||||||||
|
|
|
|
|
|
|
|
|
|
|
|
|
|||||||||||||
| Revenue Less Ancillary Services |
127.5 | 99.9 | 28 | % | 256.2 | 210.1 | 22 | % | ||||||||||||||||
|
|
|
|
|
|
|
|
|
|
|
|
|
|||||||||||||
| Effects of foreign currency rate fluctuations |
(2.6 | ) | — | (0.6 | ) | — | ||||||||||||||||||
|
|
|
|
|
|
|
|
|
|
|
|
|
|||||||||||||
| FX Neutral Revenue Less Ancillary Services |
$ | 124.9 | $ | 99.9 | 25 | % | $ | 255.6 | $ | 210.1 | 22 | % | ||||||||||||
|
|
|
|
|
|
|
|
|
|
|
|
|
|||||||||||||
| Revenue Less Ancillary Services |
$ | 127.5 | $ | 99.9 | 28 | % | $ | 256.2 | $ | 210.1 | 22 | % | ||||||||||||
| Sertifi Revenue |
(12.3 | ) | — | (17.0 | ) | — | ||||||||||||||||||
|
|
|
|
|
|
|
|
|
|
|
|
|
|||||||||||||
| Revenue Less Ancillary Services excluding Sertifi |
$ | 115.2 | $ | 99.9 | 15 | % | $ | 239.2 | $ | 210.1 | 14 | % | ||||||||||||
|
|
|
|
|
|
|
|
|
|
|
|
|
|||||||||||||
Reconciliation of Non-GAAP Operating Expenses
(Unaudited) (in millions)
| June 30, | June 30, | |||||||||||||||
|
|
2025 | 2024 | 2025 | 2024 | ||||||||||||
| GAAP Technology and development |
$ | 17.1 | $ | 15.8 | $ | 34.0 | $ | 32.6 | ||||||||
| (-) Stock-based compensation expense and related taxes |
(3.2 | ) | (2.9 | ) | (6.4 | ) | (5.5 | ) | ||||||||
| (-) Depreciation and amortization |
(1.6 | ) | (1.7 | ) | (3.3 | ) | (3.6 | ) | ||||||||
|
|
|
|
|
|
|
|
|
|||||||||
| Non-GAAP Technology and development |
$ | 12.3 | $ | 11.2 | $ | 24.3 | $ | 23.5 | ||||||||
|
|
|
|
|
|
|
|
|
|||||||||
| GAAP Selling and marketing |
$ | 38.4 | $ | 31.8 | $ | 74.9 | $ | 61.9 | ||||||||
| (-) Stock-based compensation expense and related taxes |
(4.9 | ) | (4.9 | ) | (9.2 | ) | (9.0 | ) | ||||||||
| (-) Depreciation and amortization |
(4.3 | ) | (2.0 | ) | (7.3 | ) | (3.9 | ) | ||||||||
|
|
|
|
|
|
|
|
|
|||||||||
| Non-GAAP Selling and marketing |
$ | 29.2 | $ | 24.9 | $ | 58.4 | $ | 49.0 | ||||||||
|
|
|
|
|
|
|
|
|
|||||||||
| GAAP General and administrative |
$ | 30.2 | $ | 32.0 | $ | 63.2 | $ | 63.6 | ||||||||
| (-) Stock-based compensation expense and related taxes |
(9.3 | ) | (9.7 | ) | (17.7 | ) | (18.1 | ) | ||||||||
| (-) Depreciation and amortization |
(0.8 | ) | (0.8 | ) | (1.6 | ) | (1.5 | ) | ||||||||
| (-) Change in fair value of contingent consideration |
0.7 | 0.4 | 0.5 | 0.9 | ||||||||||||
| (-) Acquisition related transaction costs |
(0.1 | ) | — | (2.5 | ) | 0.0 | ||||||||||
|
|
|
|
|
|
|
|
|
|||||||||
| Non-GAAP General and administrative |
$ | 20.7 | $ | 21.9 | $ | 41.9 | $ | 44.9 | ||||||||
|
|
|
|
|
|
|
|
|
|||||||||
EBITDA and Adjusted EBITDA
(Unaudited) (in millions)
| Three Months Ended June 30, |
Six Months Ended June 30, |
|||||||||||||||
| 2025 | 2024 | 2025 | 2024 | |||||||||||||
| Net loss |
$ | (12.0 | ) | $ | (13.9 | ) | $ | (16.2 | ) | $ | (20.1 | ) | ||||
| Interest expense |
1.0 | 0.1 | 1.8 | 0.3 | ||||||||||||
| Interest income |
(1.1 | ) | (5.7 | ) | (4.0 | ) | (11.6 | ) | ||||||||
| Provision for income taxes |
7.0 | 4.7 | 6.1 | 6.3 | ||||||||||||
| Depreciation and amortization |
7.2 | 4.5 | 13.0 | 9.0 | ||||||||||||
|
|
|
|
|
|
|
|
|
|||||||||
| EBITDA |
2.1 | (10.3 | ) | 0.7 | (16.1 | ) | ||||||||||
| Stock-based compensation expense and related taxes |
17.3 | 17.5 | 33.3 | 32.6 | ||||||||||||
| Change in fair value of contingent consideration |
(0.7 | ) | (0.4 | ) | (0.5 | ) | (0.9 | ) | ||||||||
| (Gain) loss from remeasurement of foreign currency |
(3.9 | ) | (1.0 | ) | (7.5 | ) | 3.4 | |||||||||
| Gain on available for sale debt securities |
— | — | (0.2 | ) | — | |||||||||||
| Indirect taxes related to intercompany activity |
0.4 | — | 1.0 | 0.1 | ||||||||||||
| Acquisition related transaction costs |
0.1 | — | 2.5 | — | ||||||||||||
| Acquisition related employee retention costs |
— | 0.0 | — | 0.0 | ||||||||||||
| Restructuring |
1.4 | 0.0 | 8.7 | 0.0 | ||||||||||||
|
|
|
|
|
|
|
|
|
|||||||||
| Adjusted EBITDA |
$ | 16.6 | $ | 5.8 | $ | 38.0 | $ | 19.1 | ||||||||
|
|
|
|
|
|
|
|
|
|||||||||

Exhibit 99.2 2Q 2025 Earnings Supplement August 5, 2025

Disclosures This presentation includes forward-looking statements within the meaning of the Private Securities Litigation Reform Act of 1995 and Section 21E of the Securities Exchange Act of 1934, as amended. All statements other than statements of historical facts contained in this presentation, including statements regarding the outcome of the operational and portfolio reviews, the costs, cash outlays, benefits, timing and financial impacts of the actions that may be taken or transactions entered into in connection with the operational and portfolio reviews, expected benefits and synergies of the acquisition of Sertifi LLC, the benefits of Sertifi's platform, financial results and margins, Flywire’s ability to successfully implement Flywire’s business plan, future results of operations and financial position, business strategy and plans and Flywire’s objectives for future operations, are forward -looking statements. The words “believe,” “may,” “will,” “estimate,” “continue,” “anticipate,” “intend,” “expect,” “plans,” “potential,” “seeks,” “projects,” “should,” “could” and “would” and similar expressions are intended to identify forward -looking statements, although not all forward-looking statements contain these identifying words. Flywire has based these forward-looking statements largely on Flywire’s current expectations and projections about future events and financial trends that Flywire believes may affect Flywire’s financial condition, results of operations, business strategy, short-term and long-term business operations and objectives, and financial needs. These forward-looking statements are subject to a number of risks, uncertainties and assumptions that are described in the Risk Factors and Management's Discussion and Analysis of Financial Condition and Results of Operations sections of Flywire's Annual Report on Form 10-K for the year ended December 31, 2024 and Quarterly Report on Form 10-Q for the quarter ended March 31, 2025, which are on file with the Securities and Exchange Commission (SEC) and available on the SEC’s website at www.sec.gov. Additional factors may be described in those sections of Flywire’s Quarterly Report on Form 10-Q for the quarter ended June 30, 2025, expected to be filed with the SEC in the third quarter of 2025. In light of these risks, uncertainties and assumptions, the forward -looking events and circumstances discussed in this presentation may not occur and actual results could dier ma ff terially and adversely from those anticipated or implied in the forward-looking statements. You should not rely upon forward-looking statements as predictions of future events or performance. In addition, projections, assumptions and estimates of the future performance of the industries in which Flywire operates and the markets it serves are inherently imprecise and subject to a high degree of uncertainty and risk. All financial projections contained in this presentation are forward -looking statements and are based on Flywire’s management’s assessment of such matters. It is unlikely, however, that the assumptions on which Flywire has based its projections will prove to be fully correct or that the projected figures will be attained. Flywire’s actual future results may dier ma ff terially from Flywire’s projections, and it makes no express or implied representation or warranty as to attainability of the results reflected in these projections. Investments in Flywire’s securities involve a high degree of risk and should be regarded as speculative. The information in this presentation is provided only as of August 5, 2025, and Flywire undertakes no obligation to update any forward-looking statements contained in this presentation on account of new information, future events, or otherwise, except as required by law. This presentation contains certain non-GAAP financial measures as defined by SEC rules. Flywire has provided a reconciliation of those measures to the most directly comparable GAAP measures, which is available in the Appendix. The company has not provided a quantitative reconciliation of forecasted FX-Neutral Revenue Less Ancillary Services Growth to forecasted GAAP Revenue Growth or forecasted Adjusted EBITDA Margin Growth to forecasted GAAP Net Income Margin Growth or to forecasted GAAP net income (loss) before income taxes within this presentation because Flywire is unable, without making unreasonable eorts, to calcula ff te certain reconciling items with confidence. These items include but are not limited to income taxes which are directly impacted by unpredictable fluctuations in the market price of the company's stock and in foreign exchange rates.

Our Strategy to Date Vertical Expertise Strong “North Star” Thesis Dieren ff tiated Core Assets 123 in Big Markets Software drives The Flywire Deep vertical value in payments Advantage expertise ++

Q2 2025 Performance
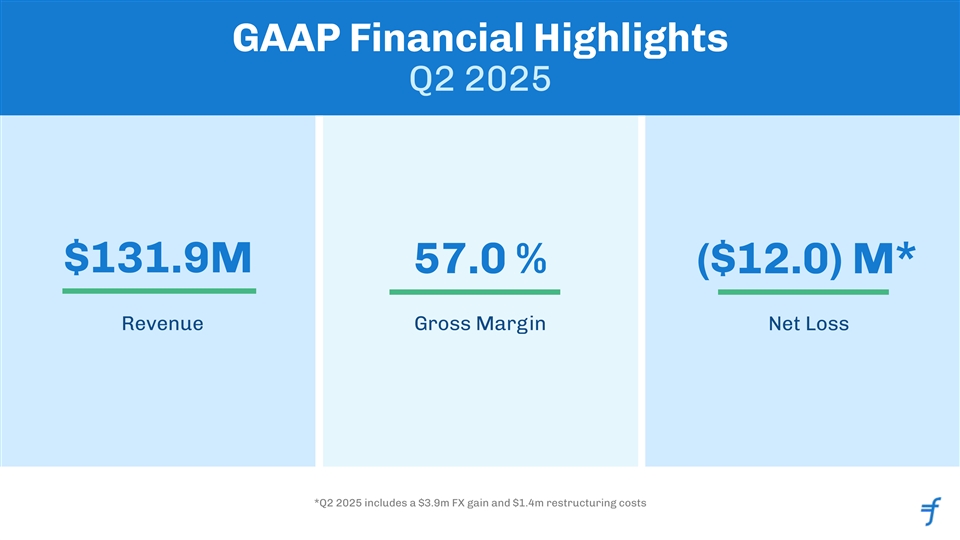
GAAP Financial Highlights Q2 2025 $131.9M 57.0 % ($12.0) M* Revenue Gross Margin Net Loss *Q2 2025 includes a $3.9m FX gain and $1.4m restructuring costs

Key Operating Metrics (Non-GAAP) Q2 2025 $5.9B $127.5M $77.9M $16.6M 2 2 1 1 +22.0% +27.7% 61.1% 13.0% Total Revenue Less Adjusted Adjusted EBITDA payment Ancillary Gross Profit volume Services 1. Represents Y-o-Y Growth as compared to Q224 2. Represents Margins as % of RLAS (Revenue Less Ancillary Services) See Appendix for reconciliation to GAAP amounts

Q2 Actual Performance vs Guidance: Strong Beat Across the Board Actual Guide* Beat RLAS variance to Guide Mid-Point: 2Q 2025 2Q 2025 ✔ Beat FXN Revenue by ~500 bps driven primarily by Travel strength and $127.5 $119.8 +$7.7M Total RLAS, $ Ms lower impact from AU risk 27.7% 20.0% +770 bps Y/Y RLAS Spot Growth (%) ✔ Sertifi Revenue of $12.3M, stronger performance by ~$1.3M 25.0% 20.0% +504 bps Y/Y RLAS FxN Growth (%) ✔ Reported $ Spot revenue beat by $12.3 $11.0 +$1.3M Sertifi, $ Ms $7.7M with $1M coming from Sertifi revenue beat, $2.6M from FX tailwind $115.2 $108.8 +$6.4M RLAS - ex Sertifi, $ Ms and $3.8M from operational outperformance including pull 12.7% 9.0% +368 bps Y/Y RLAS FxN Growth ex Sertifi (%) forward Adjusted EBITDA variance $16.6 $9.9 +$6.7M aEBITDA, $ Ms Mid-Point: ✔ Adjusted EBITDA margin was well +723 bps +250 bps +473 bps aEBITDA Margin expansion - YoY ahead of the guide (by 473bps / US$6.7M) * Refers to mid-point of guidance ranges, where applicable

“Operational Review” - Interim Update Areas of Focus Actions Taken 1H 2025 ● Completed restructuring removing 10% of headcount Streamlined ● Consolidated Payments & Product under Chief Payments Officer’s leadership organizational structure ● Removed layers of management in administrative areas ● IT/Systems, Data/Analytics and Digital Transformation now under CFO org ● Established centralized procurement function and savings roadmap ● Consolidating IT systems and software, foundational capability investments Cost analysis, ● Drove self service for customer support using AI broadly Automation & AI ● Leveraged ML to improve payment partner / transaction reconciliations ● New structure and team to handle our real estate ● Enhanced alignment of compensation to performance Alignment of hiring and ● Further prioritized 2H hiring plan to reduce new hiring across multiple functions compensation strategies ● Increasing investments in Data, Systems, payment infrastructure and platform ● Geographic Expansion, Product, and Sales alignment ● Deep analysis of R&D resource allocation at product level (ongoing) Product and GTM ● Rigorous review of sales rep productivity leading to personnel changes and process improvements Investments ● Focus on student payer retention by enhancing the account creation user experience to 8 increase the number of accounts and bolster repeat utilization.

Driving productivity/ leverage across all opex lines 1 1 1 Sales & Marketing Technology & Development General & Admin 9.1% 9.3% 1. Measures non-GAAP operating expenses as % of revenue less ancillary services (RLAS) Opportunities to scale ● Coding with AI… Increase feature ● Data architecture investments to drive insights ● Automating/Optimizing digital marketing for Travel velocity and engineering productivity and predictive/ML/AI capabilities ● Efficient upsells through customer education tools ● Continue to scale and streamline the ● Automation of customer service functions ● Faster Relationship Managers (RM) ramp up/ shared platform and vertical software ● Procurement - vendor consolidation of systems knowledge assistants/chatbots for internal use

EDU Strategy & New Products

Powerful Education Flywheel Investment in geo expansion & local payment options Expansive footprint of education clients & agents Network of bank, loan & fintech partners Network effects High volume of students / payers Product innovation & expanding product suite

Significant Global Investment in Integrations & Partnerships Global Integrations Preferred Partnerships FY 25’ New Partners Recently Added Global Strategic Relationship ~ 70+ Real Time Integrations across the Edtech Landscape Embedded in partner GTM Integrations & Partnerships

Spotlight: US Collection Management

Example 1 End term with a balance 2 Receive paper letter 3 Call Business Office to make arrangements 4 Manually calculate payment term The old way 5 Manually track in SIS and Excel Very manual process 6 Manually send and apply payment each month Automation with Flywire: Collection Management Modules PreCollect Internal Collections Agency Management • Offers payment terms • Daily work queue • Automatic placement school defines • Analytics to guide eorts ff • Payment file feeds back into ERP • Automation drives student self-service • Negotiate and enroll • Increases collectability • School-branded comms and experience • Collector and manager dashboard

Proven impact for U.S. institutions past-due debt collected $328M+ ↑ ↑ 50%40%20% 2 pre-collection savings $65M+ Increase in payment Improvement students saved Reduction 1 1 161K+ from collections plan enrollment in collections 1 in inquiries Flywire was the easiest We are delighted with our Flywire enables us to oer ff The ability to be flexible on implementation. We save time implementation and have students low-cost payment an individual level has really by using digital automation seen a remarkable decrease plans tailored to fit specific made a lot of our students to contact and help more in student and parent financial situations, and very, very happy and also students on a daily basis. contact with our office as a facilitate payment plans that made them able to continue We can now easily pull up a result. Our service staff now allow our students to easily school, and not have to dashboard and set up have more time to spend re-enroll and remain in worry about how they’re payment plans to fit specific assisting families who really school. going to pay tuition. financial circumstances. need our help! 1. Refers to all US institutions that have Collections Management with Flywire 2. Refers to amount that went to pre collections before debt became overdue ↑

Purdue pain point Flywire solution ● Handled past-due account ● Went live in March 2024 to digitize and management manually automate past-due collections ● Staff mailed demand letters ● Purdue liked that solution is “native”; to students with past-due comms are customizable CASE STUDY accounts for tuition 3x/year ● Key features: Collection ○ Receive alerts about students ● Payment plans manually set soon-to-default up in Word and emailed to Management ○ Notify students with past-due $’s students to physically ○ Collect payments and feed return transaction data into Banner ○ Assign students to collectors ● Significant issues engaging Automated alerts, ○ Send relevant accounts to collection students through this analog process agencies online payment plans, and Banner integration help 300+ Key results post implementation students get back on ● Payment plan usage skyrocketed from 29 plans to 327 in the first year ● Default rate on payment plans declined from 30% to 6.7% track and Purdue ● Reduction in collection agency debt placement, cutting expenses to recover $1M+ in agencies and protecting revenue that would otherwise be discounted; number of final demands issued down 48% revenue ● Annual savings of more than $1M in revenue otherwise written off ● 80% reduction in staff time managing past-due accounts

Spotlight: Early Sertifi Synergies

Sertifi Showing Early Signs of Success Net-New Enterprise Logo: International Sales in EMEA: Rapid Growth in Sertifi Pay: Caesars Entertainment 33% more ARR vs. Q1’25 2X+ Properties & Volume YTD Secured this net-new Sales have begun accelerating Team closed twice as many hospitality logo leveraging our in EMEA with ~100 net-new Sertifi Pay clients in H1 2025 leading Authorizations solution property wins; early progress vs. H1 2024 and Sertifi Pay laying the groundwork for volume doubled during that APAC expansion in H2 2025 same time period (YoY)

e-Signatures Payments Quickly send, collaborate on and Avoid payment delays and Sertifi send fully branded agreements - follow-ups by letting customers and receive notifications every pay at the time of signing step of the way Product Suite Overview Digital Authorizations Travel Authorizations Securely exchange authorizations Electronically send and receive and detect fraud early booking details and virtual/corporate cards

2025 & Q3 Financial Outlook

Guidance Context and Assumptions FY 2025 Guidance Context: Revenue and Margins ● Canada and Australia. Have experienced better performance of Australia in H1 but soft visa caps and higher visa fees expected to impact H2 revenues. Canada demand weakness continues. Overall expect revenues from Canada and Australia to decline approximately 20% YoY on a combined basis for FY 2025. ● US Edu: Expected approximately flat revenues as we watch F-1 visa and other incoming data. This assumes F-1 visas down approximately 20% YoY in FY 2025, predominantly impacting first year students, subject to other dynamics such as student and school mix. This is offset by new wins and market share gains, with strength in Domestic business.. ● As a result, expecting a mid-to-high single digit % headwind to total organic revenue growth from visa declines in our Big 4 Education markets (primarily from CA, AU and US, less impactful in UK) ● The Healthcare business: High single digit expected growth YoY, mostly H2 from key client ramp ● Travel & B2B + UK and EMEA EDU: continued strong expected growth above company average, though decelerating from prior year. ● Tougher YoY revenue comps in Q3, easier in 4Q, which are factored into our full year guide ● Adjusted EBITDA margin expansion higher in H1 vs H2 given timing of restructuring and investments, while managing opex and hiring in a data dependent manner.

Q3 2025 Outlook FX-Neutral Revenue 1 Adjusted EBITDA Less Ancillary Services margin expansion (YoY) Growth Total 13-21% YoY FXN 50-150 bps (including Sertifi) Flywire 7-13% $9-12M FXN Sertifi ex Sertifi revenue RLAS contribution 1. Flywire has not provided a quantitative reconciliation of forecasted FX Neutral revenue to GAAP revenue and Adjusted EBITDA margin to forecasted GAAP Net Income margin within this presentation because Flywire is unable, without making unreasonable eorts, to calcula ff te certain reconciling items with confidence. These items include, but are not limited to income taxes which are directly impacted by unpredictable fluctuations in the market price of Flywire's stock and in foreign exchange rates. 22

FY 2025 Outlook 1 FX-Neutral Revenue Less Adjusted EBITDA Ancillary Services Growth margin expansion (YoY) Total 17-23% YoY FXN 200-350 bps 2 (including Sertifi ) (including Sertifi) Flywire Excluding Previous guidance unchanged +75 bps increase at midpoint vs Sertifi previous guidance 2 10-14% YoY $35-40M FXN Sertifi ex Sertifi revenue RLAS contribution 1. Flywire has not provided a quantitative reconciliation of forecasted Adjusted EBITDA margin to forecasted GAAP Net Income margin within this presentation because Flywire is unable, without making unreasonable eorts, to calcula ff te certain reconciling items with confidence. These items include, but are not limited to income taxes which are directly impacted by unpredictable fluctuations in the market price of Flywire's stock and in foreign exchange rates. 2. Sertifi acquisition closed on 02.24.2025 23

Capital Allocation and Structure

Capital Allocation Strategy Overview 13 2 Organic growth Strategic Share investments acquisitions buybacks Geographic Expansion Accelerate within existing Share Repurchase Program industry and / or geographies enables purchasing when GTM Enhancement projected return exceeds our New product capability for cost of equity Deeper Software Integrations cross-sells & upsells Prudent approach in Ecosystem expansions with Enter new geographies or maintaining operational Strategic Payables & International regions liquidity and financial flexibility Agent solutions for organic investments & strategic M&A

1H25 YTD Cash Walk (US$M) 1 ● Cash represents corporate cash, cash equivalents, and investments (i.e. excludes client cash) ● Cash decrease primarily driven by $320M Sertifi acquisition, net of cash acquired ● Other includes proceeds from option exercises, issuance of ESPP stock, and FX 1. SBB - Share Buyback

Credit Facility Upsize (US$M) 1 ● Credit Facility upsized to $300M from $125M, increasing Flywire’s liquidity and financial flexibility ● Net $60M of Credit Facility used to fund the Sertifi acquisition in 1Q25, $65M that remained unfunded and available is now $240M, improving Flywire’s overall liquidity by 60%

Total Buyback Capacity Now at ~$200M (US$M) Share repurchases over the last 4 quarters Authorized $300M (-) Purchases through $(98M) 06/30/25 Remaining $202M ● Flywire began its share repurchase program in Q3’24 ● Approximately $54M of total cash was spent on share repurchases in 1H 2025 ● $150M increase to share repurchase program, bringing total repurchase capacity to approximately $200M

Appendix

FX Neutral Revenue Less Ancillary Services* *FX Neutral Revenue Less Ancillary Services: FX neutral revenue less ancillary services is adjusted for the impact of foreign currency rate fluctuations. This measure helps provide insight on comparable revenue growth by removing the eect o ff f changes in foreign currency exchange rates year-over-year. Foreign currency exchange impact in the current period is calculated using prior period monthly average exchange rates applied to the current period foreign currency amounts. $USD in Millions (unaudited)

Revenue Less Ancillary Services & Adjusted Gross Margin Reconciliations $USD in Millions (unaudited)

Revenue Disaggregation by Revenue Type $USD in Millions (unaudited)

Net Loss to Adjusted EBITDA Reconciliation $USD in Millions (unaudited)

Net Margin, EBITDA Margin, and Adjusted EBITDA Margin $USD in Millions (unaudited)