UNITED STATES
SECURITIES AND EXCHANGE COMMISSION
Washington, D.C. 20549
Form 8-K
CURRENT REPORT
Pursuant to Section 13 OR 15(d)
of the Securities Exchange Act of 1934
Date of Report (Date of earliest event reported): July 23, 2025
POPULAR, INC.
(Exact name of registrant as specified in its charter)
| Puerto Rico | 001-34084 | 66-0667416 | ||
| (State or other jurisdiction of incorporation or organization) |
(Commission File Number) |
(IRS Employer Identification Number) |
| 209 Muñoz Rivera Avenue | ||
| Hato Rey, Puerto Rico | 00918 | |
| (Address of principal executive offices) | (Zip code) |
(787) 765-9800
(Registrant’s telephone number, including area code)
NOT APPLICABLE
(Former name, former address and former fiscal year, if changed since last report)
Check the appropriate box below if the Form 8-K filing is intended to simultaneously satisfy the filing obligation of the registrant under any of the following provisions (see General Instruction A.2. below):
| ☐ | Written communication pursuant to Rule 425 under the Securities Act (17 CFR 230.425) |
| ☐ | Soliciting material pursuant to Rule 14a-12 under the Exchange Act (17 CFR 240.14a-12) |
| ☐ | Pre-commencement communication pursuant to Rule 14d-2(b) under the Exchange Act (17 CFR 240.14d-2(b)) |
| ☐ | Pre-commencement communication pursuant to Rule 13e-4(c) under the Exchange Act (17 CFR 240.13e-4(c)) |
Securities registered pursuant to Section 12(b) of the Act:
| Title of each class |
Trading Symbol(s) |
Name of each exchange on which registered |
||
| Common Stock ($0.01 par value) | BPOP | The NASDAQ Stock Market | ||
| 6.125% Cumulative Monthly Income Trust Preferred Securities | BPOPM | The NASDAQ Stock Market |
Indicate by check mark whether the registrant is an emerging growth company as defined in Rule 405 of the Securities Act of 1933 (§230.405 of this chapter) or Rule 12b-2 of the Securities Exchange Act of 1934 (§240.12b-2 of this chapter).
Emerging growth company ☐
If an emerging growth company, indicate by check mark if the registrant has elected not to use the extended transition period for complying with any new or revised financial accounting standards provided pursuant to Section 13(a) of the Exchange Act. ☐
| Item 2.02. | Results of Operations and Financial Condition. |
On July 23, 2025, Popular, Inc. (the “Corporation”) issued a press release announcing its unaudited financial results for the quarter ended June 30, 2025, a copy of which is attached as Exhibit 99.1 to this Current Report on Form 8-K.
The information furnished pursuant to this Item 2.02 of this Current Report on Form 8-K, including Exhibit 99.1, shall not be deemed “filed” for purposes of the Securities Exchange Act of 1934, as amended, nor shall it be incorporated by reference into any of the Corporation’s filings under the Securities Act of 1933, as amended, unless otherwise expressly stated in such filing.
| Item 7.01. | Regulation FD Disclosure. |
The Corporation is furnishing information regarding its conference call to discuss its financial results for the quarter ended June 30, 2025. A copy of the presentation to be used by the Corporation on the conference call is attached hereto as Exhibit 99.2.
The information furnished pursuant to this Item 7.01 of this Current Report on Form 8-K, including Exhibit 99.2, shall not be deemed “filed” for purposes of the Securities Exchange Act of 1934, as amended, nor shall it be incorporated by reference into any of the Corporation’s filings under the Securities Act of 1933, as amended, unless otherwise expressly stated in such filing.
| Item 9.01. | Financial Statements and Exhibits. |
Exhibits 99.1 and 99.2 shall not be deemed to be “filed” for purposes of the Securities Exchange Act of 1934, as amended.
| 99.1 | Press Release dated July 23, 2025 – Second Quarter 2025 Financial Results. | |
| 99.2 | Popular, Inc. Conference Call Presentation – Second Quarter 2025 Financial Results. | |
| 101 | Pursuant to Rule 406 of Regulation S-T, the cover page is formatted in Inline XBRL (Inline eXtensible Business Reporting Language). | |
| 104 | Cover Page Interactive Data File (embedded within the Inline XBRL document and included in Exhibit 101). | |
2
SIGNATURE
Pursuant to the requirements of the Securities Exchange Act of 1934, as amended, the registrant has duly caused this report to be signed on its behalf by the undersigned hereunto duly authorized.
| POPULAR, INC. (Registrant) |
||||||
| Date: July 23, 2025 | By: | /s/ Denissa M. Rodríguez |
||||
| Denissa M. Rodríguez | ||||||
| Senior Vice President and Corporate Comptroller | ||||||
3
Exhibit 99.1

Popular, Inc. Announces Second Quarter 2025 Financial Results
| • | Net income of $210.4 million in Q2 2025, compared to net income of $177.5 million in Q1 2025. |
| • | Earnings per share (“EPS”) of $3.09 in Q2 2025 vs. $2.56 in Q1 2025. |
| • | Net interest income of $631.5 million in Q2 2025, an increase of $25.9 million when compared to Q1 2025. |
| • | Net interest margin of 3.49% in Q2 2025, compared to 3.40% in Q1 2025; net interest margin on a taxable equivalent basis of 3.85% in Q2 2025, compared to 3.73% in Q1 2025. |
| • | Non-interest income of $168.5 million in Q2 2025, compared to $152.1 million in Q1 2025. |
| • | Operating expenses amounted to $492.8 million, compared to $471.0 million in Q1 2025. |
| • | Credit quality metrics improved: |
| • | Non-performing loans held-in-portfolio (“NPLs”) decreased by $2.4 million from Q1 2025; NPLs to loans ratio decreased two basis points to 0.82%; |
| • | Net charge-offs (“NCOs”) decreased by $6.9 million from Q1 2025; annualized NCOs to average loans held-in-portfolio at 0.45% vs. 0.53% in Q1 2025. |
| • | Allowance for credit losses (“ACL”) to loans held-in-portfolio at 2.02% vs. 2.05% in Q1 2025; and |
| • | ACL to NPLs at 246.9% vs. 242.7% in Q1 2025. |
| • | Money market and investment securities increased by $1.1 billion from Q1 2025; average quarterly balances increased by $261.9 million. |
| • | Loans held in portfolio, excluding loans held-for-sale, amounted to $38.2 billion, up $931.1 million from Q1 2025; average quarterly loan balances higher by $579.0 million. |
| • | Deposit balances amounted to $67.2 billion, an increase of $1.4 billion from Q1 2025; average quarterly deposits higher by $498.6 million. |
| • | Common Equity Tier 1 ratio of 15.91%, Common Equity per share of $87.31 and Tangible Book Value per share increase of $3.39 to $75.41 at June 30, 2025. |
| • | Capital actions during the quarter ended June 30, 2025 included the repurchase of 1,136,390 shares of common stock for $112.0 million at an average price of $98.54 per share. As of June 30, 2025, a total of $451.5 million had been repurchased under a common stock repurchase authorization of up to $500 million announced in Q3 2024. |
SAN JUAN, Puerto Rico – (BUSINESS WIRE) – Popular, Inc. (the “Corporation,” “Popular,” “we,” “us,” “our”) (NASDAQ:BPOP) reported net income of $210.4 million for the quarter ended June 30, 2025, compared to net income of $177.5 million for the quarter ended March 31, 2025.
“We delivered strong performance in the second quarter, highlighted by higher net interest income, an expanding net interest margin, healthy loan and deposit growth, and improved credit quality,” said Javier D. Ferrer, President and Chief Executive Officer of Popular, Inc. “I would like to recognize our colleagues, whose hard work made these achievements possible. I assume the role of CEO with a deep sense of responsibility and genuinely honored by the privilege of leading such a talented and dedicated team.
We recently announced an increase in our quarterly common stock dividend, from $0.70 to $0.75 per share, and a new common stock repurchase program of up to $500 million — actions that reflect the strength of our capital position and our continued commitment to delivering value to shareholders.
Our focus continues to be on executing our Transformation, ensuring we are the #1 bank for our customers while simplifying our operations to improve efficiency. With the progress we are making, we are optimistic about our future and confident in our ability to drive sustained performance.”
4
Significant Events
Capital actions
On July 16, 2025, the Corporation announced the following capital actions:
| • | an increase in the Corporation’s quarterly common stock dividend from $0.70 to $0.75 per share, commencing with the dividend payable in the fourth quarter of 2025, subject to the approval by the Corporation’s Board of Directors; and |
| • | a new common stock repurchase program of up to $500 million. |
This new common stock repurchase program is in addition to the $500 million common stock repurchase program announced by the Corporation on July 24, 2024 (the “2024 Repurchase Program”). As of July 15, 2025, approximately $32.8 million remained available for common stock repurchases under the 2024 Repurchase Program.
The Corporation’s planned common stock repurchases may be executed in open market transactions, privately negotiated transactions, block trades or any other manner determined by the Corporation. The timing, quantity and price of such repurchases will be subject to various factors, including market conditions, the Corporation’s capital position and financial performance, the capital impact of strategic initiatives and regulatory and tax considerations. The common stock repurchase program does not require the Corporation to acquire a specific dollar amount or number of shares and may be modified, suspended or terminated at any time without prior notice.
Earnings Highlights
| (Unaudited) |
Quarters ended | Six months ended | ||||||||||||||||||
| (Dollars in thousands, except per share information) |
30-Jun-25 | 31-Mar-25 | 30-Jun-24 | 30-Jun-25 | 30-Jun-24 | |||||||||||||||
| Net interest income |
$ | 631,549 | $ | 605,597 | $ | 568,312 | $ | 1,237,146 | $ | 1,119,056 | ||||||||||
| Provision for credit losses |
48,941 | 64,081 | 46,794 | 113,022 | 119,392 | |||||||||||||||
|
|
|
|
|
|
|
|
|
|
|
|||||||||||
| Net interest income after provision for credit losses |
582,608 | 541,516 | 521,518 | 1,124,124 | 999,664 | |||||||||||||||
| Other non-interest income |
168,477 | 152,061 | 166,306 | 320,538 | 330,124 | |||||||||||||||
| Operating expenses |
492,761 | 471,012 | 469,576 | 963,773 | 952,689 | |||||||||||||||
|
|
|
|
|
|
|
|
|
|
|
|||||||||||
| Income before income tax |
258,324 | 222,565 | 218,248 | 480,889 | 377,099 | |||||||||||||||
| Income tax expense |
47,884 | 45,063 | 40,459 | 92,947 | 96,027 | |||||||||||||||
|
|
|
|
|
|
|
|
|
|
|
|||||||||||
| Net income |
$ | 210,440 | $ | 177,502 | $ | 177,789 | $ | 387,942 | $ | 281,072 | ||||||||||
|
|
|
|
|
|
|
|
|
|
|
|||||||||||
| Net income applicable to common stock |
$ | 210,087 | $ | 177,149 | $ | 177,436 | $ | 387,236 | $ | 280,366 | ||||||||||
|
|
|
|
|
|
|
|
|
|
|
|||||||||||
| Net income per common share-basic |
$ | 3.09 | $ | 2.56 | $ | 2.47 | $ | 5.64 | $ | 3.90 | ||||||||||
|
|
|
|
|
|
|
|
|
|
|
|||||||||||
| Net income per common share-diluted |
$ | 3.09 | $ | 2.56 | $ | 2.46 | $ | 5.64 | $ | 3.90 | ||||||||||
|
|
|
|
|
|
|
|
|
|
|
|||||||||||
5
Non-GAAP Financial Measures
This press release contains financial information prepared under accounting principles generally accepted in the United States (“U.S. GAAP”) and non-GAAP financial measures. Management uses non-GAAP financial measures when it has determined that these measures provide more meaningful information about the underlying performance of the Corporation’s ongoing operations. Non-GAAP financial measures used by the Corporation may not be comparable to similarly named non-GAAP financial measures used by other companies.
Net interest income on a taxable equivalent basis
Net interest income, on a taxable equivalent basis, is presented with its different components in Tables D, E and F for the quarter ended June 30, 2025. Net interest income on a taxable equivalent basis is a non-GAAP financial measure. Management believes that this presentation provides meaningful information since it facilitates the comparison of revenues arising from taxable and tax-exempt sources.
Tangible Common Equity
Tangible common equity, the tangible common equity ratio, tangible assets and tangible book value per common share are non-GAAP financial measures. The tangible common equity ratio and tangible book value per common share are commonly used by banks and analysts in conjunction with more traditional bank capital ratios to compare the capital adequacy of banking organizations with significant amounts of goodwill or other intangible assets, typically stemming from the use of the purchase accounting method for mergers and acquisitions. Neither tangible common equity nor tangible assets or related measures should be used in isolation or as a substitute for stockholders’ equity, total assets or any other measure calculated in accordance with GAAP.
Refer to Table R for a reconciliation of total stockholders’ equity to tangible common equity and total assets to tangible assets.
6
Net Interest Income and Net Interest Margin
The Corporation’s net interest income for the second quarter of 2025 was $631.5 million, an increase of $25.9 million compared to $605.6 million in the previous quarter. The net interest margin (“NIM”) for the quarter was 3.49%, compared to 3.40% in the first quarter of 2025, an increase of nine basis points. Net interest income was positively impacted by one additional day when compared to the previous quarter, resulting in higher net interest income by $4.9 million.
During the period, average deposits increased by $498.6 million, including $143.2 million in average non-interest bearing deposits, compared to the first quarter of 2025, which enabled NIM expansion as a result of the increase in U.S. Treasuries at higher rates. NIM expansion was also driven by loan growth in the commercial, construction, mortgage and auto portfolios, as well as a favorable repricing of P.R. public deposits in Banco Popular de Puerto Rico (“BPPR”) and Popular Bank (“PB”, or “Popular U.S.”) deposits.
Net Interest Income and Net Interest Margin Taxable Equivalent (Non-GAAP)
Net interest income on a taxable equivalent basis for the second quarter of 2025 was $697.2 million, an increase of $33.3 million. Net interest margin on a taxable equivalent basis for the second quarter of 2025 was 3.85%, an increase of 12 basis points.
The main drivers of net interest income on a taxable equivalent basis were:
| • | higher income from investment securities by $15.9 million or 15 basis points due to investment activity of U.S. Treasuries at higher yields, largely attributed to higher average deposits as described above; |
| • | higher interest income from loans by $19.0 million, or two basis points, attributable to higher average loan balances and robust growth across most portfolios. Higher yields were noted across the majority of the loan portfolios which contributed to the increase during the period when compared to the first quarter of 2025, most notably in commercial by two basis points, in mortgage by seven basis points and in auto by two basis points; and |
| • | lower interest expense on interest-bearing deposits by $2.8 million, or seven basis points, driven primarily by a reduction in the cost of market-linked P.R. public deposits by 10 basis points and the cost of deposits in PB by 14 basis points, partially offset by an increase in the cost of interest-bearing deposits, excluding P.R. public deposits in BPPR. Total deposit costs decreased by five basis points to 1.78% quarter-over-quarter; excluding P.R. public deposits, total deposit costs were lower by two basis points to 1.15%; |
partially offset by:
| • | higher interest expense in other short-term borrowings by $3.8 million driven by FHLB advances in Popular Bank. |
Net Interest Income and Net Interest Margin (Banco Popular de Puerto Rico Segment)
For the BPPR segment, net interest income for the second quarter of 2025 was $538.5 million, representing an increase of $16.6 million over the previous quarter. Net interest margin increased by five basis points to 3.68%. Higher interest income was primarily attributed to:
| • | $9.5 million, or eight basis points increase in investment securities, mainly U.S. Treasuries, driven by higher average deposits, which increased by $485.3 million, including $93.4 million in average non-interest bearing deposits; and |
7
| • | $8.5 million increase in income from loans due to higher average balances, mainly in the mortgage portfolio with an increase in average portfolio balance of $154.6 million, higher yields in the auto portfolio, and one additional day in the period compared to the previous quarter. |
While the cost of P.R public deposits went down by 10 basis points, total deposit costs in BPPR decreased by three basis points to 1.52% quarter-over-quarter. The cost of new or renewed retail time deposits and commercial interest-bearing deposits at BPPR partially offset the positive impact from the repricing of P.R. public deposits.
Net Interest Income and Net Interest Margin (Popular Bank Segment)
In the PB segment, net interest income was $102.2 million, $9.3 million higher when compared to the previous quarter. Net interest margin in the PB segment expanded by 19 basis points to 2.93%.
| • | During the period, interest income from loan portfolios increased by $9.4 million, or 14 basis points, compared to the previous quarter, primarily due to higher average balances and higher yields in the commercial and construction loan portfolios. |
| • | The total cost of deposits decreased by $3.7 million, or 13 basis points, largely as a result of repricing across all deposit products and lower average balances, except for the higher average balances of time deposits captured through PB’s online channel. The average balance of short-term borrowings at Popular Bank increased by $339.2 million during the period, resulting in an increase in interest expense of $3.8 million and partially offsetting the benefit of reduced deposit costs on total interest expense. Nevertheless, PB’s NIM benefited from a seven-basis point reduction in the total cost of funds, driven by the decrease in deposit costs. |
Refer to tables D and E for more details on the components of net interest income and net interest margin on a taxable equivalent basis.
Non-interest income
Non-interest income amounted to $168.5 million for the quarter ended June 30, 2025, an increase of $16.4 million when compared to $152.1 million for the previous quarter. Non-interest income for the period was positively impacted by market-driven adjustments and certain other transactions including tax-related reimbursements and distributions from legacy investments. The service fee income for the quarter also reflects increased seasonal activity.
Refer below to a detailed breakdown of the main variances affecting non-interest income.
| • | higher other operating income by $7.2 million, mainly due to higher income from investments accounted under the equity investment method by $2.6 million, a positive variance of $2.3 million for the reimbursement of interest paid in excess to the U.S. Internal Revenue Service for late payment penalties related to tax withholdings on intercompany distributions for the years 2014-2024 previously disclosed in 2024, and a $1.2 million cash distribution from the exit of a legacy equity investment; |
| • | higher other service fees by $6.0 million mainly due to higher credit card and debit card fees by $2.4 million and $1.5 million, respectively, due to an increase in purchase volume, and higher insurance fees by $1.4 million; and |
| • | favorable fair value adjustments for an aggregate of $3.9 million, including $2.3 million for the valuation of equity securities held for deferred benefit plans, which have an offsetting effect in personnel costs, and a variance of $1.6 million in the fair value adjustment of mortgage servicing rights (“MSRs”). |
Refer to Table B for further details.
8
Operating expenses
Operating expenses for the second quarter of 2025 totaled $492.8 million, an increase of $21.7 million when compared to the first quarter of 2025. Total operating expenses are driven by personnel costs, professional fees and investment in technology and compliance.
The variance in operating expenses was driven primarily by:
| • | higher personnel costs by $16.6 million mainly due to higher incentives, including $13.0 million related to the profit-sharing plan which is tied to the Corporation’s financial performance and $4.7 million in other performance-based incentives, an increase in health insurance costs by $4.1 million, and a $2.3 million increase in the expense related to the valuation of equity securities held for deferred compensation plans, which have an offsetting effect in equity securities income; partially offset by lower other compensation by $3.7 million, and lower savings plan and payroll tax expense by $2.3 million and $1.9 million, respectively, both which are generally higher during the first quarter of the year; |
| • | higher business promotion expenses by $2.7 million, mainly due to higher volume of transactions tied to a customer reward program in our credit card business; and |
| • | higher net occupancy expenses by $1.9 million mainly due to lower rental income driven by reduced lease space, higher cleaning expenses and higher depreciation from new office remodeling. |
Full-time equivalent employees were 9,303 as of June 30, 2025, compared to 9,274 as of March 31, 2025.
For a breakdown of operating expenses by category refer to Table B.
Income taxes
For the second quarter of 2025, the Corporation recorded an income tax expense of $47.9 million, compared to an income tax expense of $45.1 million for the previous quarter. Higher income tax expense of $2.8 million is mainly driven by higher income before tax, offset in part by higher exempt income.
The effective tax rate (“ETR”) for the second quarter of 2025 was 18.5%, compared to 20.2% for the previous quarter. The ETR of the Corporation is impacted by the composition and source of its taxable income.
9
Credit Quality
The Corporation’s credit quality metrics demonstrated favorable trends in the second quarter of 2025 compared to the previous quarter, with improvements in NPLs and NCOs. The Corporation continues to closely monitor the economic landscape and borrower performance, as economic uncertainty remains a key consideration. Management believes that the improvements in risk management practices over recent years and the overall credit risk profile of the loan portfolio position the Corporation to continue to operate successfully in the current environment.
The following presents credit quality results for the second quarter of 2025:
Non-Performing Loans and Net Charge Offs
Total NPLs decreased by $2.4 million to $311.6 million compared to the previous quarter. Excluding consumer loans, inflows of NPLs held-in-the-portfolio decreased by $4.1 million in the second quarter of 2025. The ratio of NPLs to total loans held in the portfolio was 0.82% for the second quarter of 2025, compared to 0.84% for the previous quarter. NPLs variances per reporting segment include:
| • | In the BPPR segment, NPLs decreased by $4.4 million, reflected across all loan segments. Excluding consumer loans, inflows to NPLs in the BPPR segment decreased by $4.8 million compared to the previous quarter, mostly related to lower commercial NPLs inflows. |
| • | In the PB segment, NPLs increased by $1.9 million driven by higher commercial NPLs by $4.2 million. Inflows to NPLs, excluding consumer loans, remained flat quarter-over-quarter. |
Total NCOs of $42.2 million decreased by $6.9 million when compared to the first quarter of 2025. The Corporation’s ratio of annualized NCOs to average loans held-in-portfolio for the second quarter was 0.45%, compared to 0.53% in the first quarter of 2025.
NCOs variances per reporting segment include:
| • | In the BPPR segment, NCOs decreased by $6.9 million, mainly driven by lower auto and personal loans NCOs by $6.9 million and $2.6 million, respectively, partially offset by higher commercial NCOs by $2.5 million, mainly driven by a $3.8 million recovery recognized in the previous quarter. |
| • | In the PB segment, NCOs remained flat quarter-over-quarter at $2 million. |
Including OREO assets of $46.1 million, Non-performing Assets (“NPAs”) for the Corporation amounted to $357.8 million, a decrease of $8.4 million during the period driven by the sale of residential OREO properties, at a net gain, in the BPPR segment.
Refer to Table N for further information on NCOs and related ratios.
Refer to Table L for additional information on NPAs and related ratios.
Allowance for Credit Losses and Provision for Credit Losses
The ACL as of June 30, 2025 amounted to $769.5 million, an increase of $7.3 million when compared to the first quarter of 2025. The increase in ACL was driven by reserve build up associated with portfolio growth and unfavorable changes in the economic assumptions used in the ACL model. This increase was offset in part by the update to probability weights assigned to the economic scenarios, as further described below, and the net effect of changes in credit quality, and NCOs during the quarter.
10
The Corporation uses multiple economic scenarios to estimate its ACL. In the first quarter of 2025, management assigned equal probability weights to the baseline and pessimistic scenarios in response to economic uncertainty. In the second quarter of 2025, the probability weight for the pessimistic scenario was moderately decreased based on changes in the economic outlook and a reassessment of uncertainty compared to the previous quarter. This change resulted in a $4.5 million reduction in ACL reserve levels. The probability weight for the pessimistic scenario remains above the levels observed in 2024, given the ongoing economic uncertainty.
In the BPPR segment, the ACL increased by $3.0 million when compared to the previous quarter. This higher ACL was driven by an increase in the reserves for auto loans due to migrations between FICO score categories and changes in the economic scenarios. This increase was partially offset by lower reserves for commercial loans due to improvements in credit quality and changes in the probability weights, partially offset by ACL reserve build up due to portfolio growth.
In the PB segment, the ACL increased by $4.4 million from the previous quarter. This increase was influenced by changes in the forecast of the U.S. unemployment rate as well as higher qualitative reserves for the Commercial Real Estate (“CRE”) portfolio.
The Corporation’s ratio of the ACL to loans held-in-portfolio was 2.02% in the second quarter of 2025, compared to 2.05% in the previous quarter. The ratio of the ACL to NPLs held-in-portfolio was 246.9%, compared to 242.7% in the previous quarter.
The provision for loan losses for the loan and lease portfolios for the second quarter of 2025 was $49.5 million, a decrease of $15.7 million when compared to $65.2 million in the previous quarter. The provision for loan losses for the BPPR segment amounted to $43.2 million, compared to $52.7 million in the previous quarter. This reduction was mainly driven by lower provision expense for commercial loans and leases. The provision for loan losses for the PB segment amounted to $6.4 million, compared to $12.5 million in the prior quarter. The reduction in provision expense occurred mainly within the commercial loan portfolio.
The provision for credit losses for the second quarter of $48.9 million, includes the provision for loan and lease losses, along with the $1.1 million reserve release related to unfunded loan commitments and the $0.5 million provision for the Corporation’s investment portfolio.
Refer to Table L for break-out of non-performing assets and related ratios and to Table N for allowance for credit losses, net charge-offs and related ratios.
11
Non-Performing Assets
| (Unaudited) |
||||||||||||
| (In thousands) |
30-Jun-25 | 31-Mar-25 | 30-Jun-24 | |||||||||
| Non-performing loans held-in-portfolio |
$ | 311,625 | $ | 314,069 | $ | 341,835 | ||||||
| Other real estate owned |
46,126 | 52,114 | 70,225 | |||||||||
|
|
|
|
|
|
|
|||||||
| Total non-performing assets |
$ | 357,751 | $ | 366,183 | $ | 412,060 | ||||||
|
|
|
|
|
|
|
|||||||
| Net charge-offs for the quarter |
$ | 42,202 | $ | 49,103 | $ | 53,630 | ||||||
|
|
|
|
|
|
|
|||||||
| Ratios: |
||||||||||||
| Loans held-in-portfolio |
$ | 38,185,178 | $ | 37,254,032 | $ | 35,591,620 | ||||||
| Non-performing loans held-in-portfolio to loans held-in-portfolio |
0.82 | % | 0.84 | % | 0.96 | % | ||||||
| Allowance for credit losses to loans held-in-portfolio |
2.02 | 2.05 | 2.05 | |||||||||
| Allowance for credit losses to non-performing loans, excluding loans held-for-sale |
246.93 | 242.67 | 213.58 | |||||||||
Refer to Table L for additional information.
Provision for Credit Losses (Benefit)- Loan Portfolios
| (Unaudited) |
Quarters ended | Six months ended | ||||||||||||||||||
| (In thousands) |
30-Jun-25 | 31-Mar-25 | 30-Jun-24 | 30-Jun-25 | 30-Jun-24 | |||||||||||||||
| Provision for credit losses (benefit) - loan portfolios: |
||||||||||||||||||||
| BPPR |
$ | 43,150 | $ | 52,690 | $ | 48,585 | $ | 95,840 | $ | 109,593 | ||||||||||
| Popular U.S. |
6,389 | 12,528 | (4,428 | ) | 18,917 | 6,950 | ||||||||||||||
|
|
|
|
|
|
|
|
|
|
|
|||||||||||
| Total provision for credit losses (benefit) - loan portfolios |
$ | 49,539 | $ | 65,218 | $ | 44,157 | $ | 114,757 | $ | 116,543 | ||||||||||
|
|
|
|
|
|
|
|
|
|
|
|||||||||||
Credit Quality by Segment
| (Unaudited) | ||||||||||||
| (Dollars in thousands) |
Quarters ended | |||||||||||
| BPPR |
30-Jun-25 | 31-Mar-25 | 30-Jun-24 | |||||||||
| Provision for credit losses - loan portfolios |
$ | 43,150 | $ | 52,690 | $ | 48,585 | ||||||
| Net charge-offs |
40,164 | 47,102 | 49,308 | |||||||||
| Total non-performing loans held-in-portfolio |
257,648 | 262,006 | 286,887 | |||||||||
| Annualized net charge-offs to average loans held-in-portfolio |
0.61 | % | 0.72 | % | 0.79 | % | ||||||
| Allowance / loans held-in-portfolio |
2.53 | % | 2.59 | % | 2.56 | % | ||||||
| Allowance / non-performing loans held-in-portfolio |
263.63 | % | 258.11 | % | 224.34 | % | ||||||
|
|
|
|
|
|
|
|||||||
| Quarters ended | ||||||||||||
| Popular U.S. |
30-Jun-25 | 31-Mar-25 | 30-Jun-24 | |||||||||
| Provision for credit losses (benefit) - loan portfolios |
$ | 6,389 | $ | 12,528 | $ | (4,428 | ) | |||||
| Net charge-offs |
2,038 | 2,001 | 4,322 | |||||||||
| Total non-performing loans held-in-portfolio |
53,977 | 52,063 | 54,948 | |||||||||
| Annualized net charge-offs to average loans held-in-portfolio |
0.07 | % | 0.07 | % | 0.16 | % | ||||||
| Allowance / loans held-in-portfolio |
0.79 | % | 0.77 | % | 0.83 | % | ||||||
| Allowance / non-performing loans held-in-portfolio |
167.17 | % | 164.96 | % | 157.37 | % | ||||||
|
|
|
|
|
|
|
|||||||
12
Financial Condition Highlights
| (Unaudited) |
||||||||||||
| (In thousands) |
30-Jun-25 | 31-Mar-25 | 30-Jun-24 | |||||||||
| Cash and money market investments |
$ | 6,741,417 | $ | 6,575,193 | $ | 7,211,367 | ||||||
| Investment securities |
28,283,970 | 27,375,396 | 26,742,639 | |||||||||
| Loans |
38,185,178 | 37,254,032 | 35,591,620 | |||||||||
| Total assets |
76,065,090 | 74,038,606 | 72,845,072 | |||||||||
| Deposits |
67,217,491 | 65,819,255 | 65,530,862 | |||||||||
| Borrowings |
1,414,494 | 1,090,417 | 1,047,264 | |||||||||
| Total liabilities |
70,111,072 | 68,238,911 | 67,472,394 | |||||||||
| Stockholders’ equity |
5,954,018 | 5,799,695 | 5,372,678 | |||||||||
|
|
|
|
|
|
|
|||||||
13
Total assets amounted to $76.1 billion at June 30, 2025, an increase of $2.0 billion from the first quarter of 2025, driven by:
| • | an increase in securities available-for-sale (“AFS”) of $997.0 million, mainly due to an increase in investments in U.S. Treasury securities and a decrease in the unrealized losses of AFS securities of $63.7 million, partially offset by maturities and principal paydowns; |
| • | an increase in loans held-in-portfolio by $931.1 million, driven by an increase of $680.4 million in the BPPR segment across most portfolios, particularly commercial, including the origination of a $265.0 million commercial loan which represents the Corporation’s portion of a $425.0 million issuance in which BPPR acted as the lead bank and administrative agent, and mortgage loans, coupled with an increase of $250.7 million in the PB segment, particularly commercial and construction loans; and |
| • | an increase in money market investments of $145.8 million, mainly driven by higher deposits, partially offset by the purchase of investments in U.S. Treasury securities and loan originations; |
partially offset by:
| • | a decrease in securities held-to-maturity (“HTM”) of $107.0 million driven by maturities and principal paydowns, partially offset by the amortization of $46.2 million of the discount related to U.S. Treasury securities previously reclassified from AFS to HTM. |
Total liabilities increased by $1.9 billion from the first quarter of 2025, driven by:
| • | an increase of $1.4 billion in deposits, primarily driven by an increase in P.R. public deposits of approximately $1.3 billion, mainly due to tax collections, net of reimbursements. At quarter-end, P.R. public deposits totaled $20.9 billion and represented 31% of the Corporation’s total deposit portfolio; and |
| • | an increase in other short-term borrowings of $350 million due to FHLB advances in PB. |
Stockholders’ equity increased by $154.3 million from the first quarter of 2025 mainly due to the quarter’s net income of $210.4 million, a decrease in net unrealized losses in the portfolio of AFS securities of $48.4 million and the amortization of unrealized losses from securities previously reclassified to HTM of $37.0 million, net of tax, and other changes, mainly in accumulated other comprehensive income, for $16.0 million, partially offset by an increase in Treasury Stock of $109.3 million mainly due to common stock repurchases during the quarter and common and preferred dividends declared during the quarter of $48.2 million.
During the quarter and six months ended June 30, 2025, Popular repurchased 1,136,390 shares of common stock for $112.0 million at an average price of $98.54 per share and 2,406,959 shares of common stock for $234.2 million at an average price of $97.32 per share, respectively. As of June 30, 2025, Popular had repurchased a total of approximately 4.7 million shares of common stock for $451.5 million as part of the common stock repurchase authorization of up to $500 million announced in Q3 2024.
Common Equity Tier 1 ratio (“CET1”), common equity per share and tangible book value per share were 15.91%, $87.31 and $75.41 respectively, at June 30, 2025, compared to 16.11%, $83.75 and $72.02, respectively, at March 31, 2025.
Refer to Table A for capital ratios.
14
Cautionary Note Regarding Forward-Looking Statements
This press release contains “forward-looking statements” within the meaning of the U.S. Private Securities Litigation Reform Act of 1995, including without limitation those regarding Popular’s business, financial condition, results of operations, plans, objectives and future performance. These statements are not guarantees of future performance, are based on management’s current expectations and, by their nature, involve risks, uncertainties, estimates and assumptions. Potential factors, some of which are beyond the Corporation’s control, could cause actual results to differ materially from those expressed in, or implied by, such forward-looking statements. Risks and uncertainties include, without limitation, the effect of competitive and economic factors, and our reaction to those factors, the adequacy of the allowance for loan losses, delinquency trends, market risk and the impact of interest rate changes (including on our cost of deposits), our ability to attract deposits and grow our loan portfolio, capital market conditions, capital adequacy and liquidity, the effect of legal and regulatory proceedings, new regulatory requirements or accounting standards on the Corporation’s financial condition and results of operations, the occurrence of unforeseen or catastrophic events, such as extreme weather events, pandemics, man-made disasters or acts of violence or war, as well as actions taken by governmental authorities in response thereto, and the direct and indirect impact of such events on Popular, our customers, service providers and third parties. Other potential factors include Popular’s ability to successfully execute its transformation initiative, including, but not limited to, achieving projected earnings, efficiencies and return on tangible common equity and accurately anticipating costs and expenses associated therewith, imposition of additional or special FDIC assessments, or increases thereto, changes to regulatory capital, liquidity and resolution-related requirements applicable to financial institutions in response to recent developments affecting the banking sector, the impact of bank failures or adverse developments at other banks and related negative media coverage of the banking industry in general on investor and depositor sentiment regarding the stability and liquidity of banks, and changes in and uncertainty regarding federal funding, tax and trade policies, and rulemaking, supervision, examination and enforcement priorities of the federal administration. All statements contained herein that are not clearly historical in nature, are forward-looking, and the words “anticipate,” “believe,” “continues,” “expect,” “estimate,” “intend,” “project” and similar expressions, and future or conditional verbs such as “will,” “would,” “should,” “could,” “might,” “can,” “may” or similar expressions, are generally intended to identify forward-looking statements.
More information on the risks and important factors that could affect the Corporation’s future results and financial condition is included in our Form 10-K for the year ended December 31, 2024, our Form 10-Q for the quarter ended March 31, 2025, and the Form 10-Q for the quarter ended June 30, 2025 to be filed with the Securities and Exchange Commission. Our filings are available on the Corporation’s website (www.popular.com) and on the Securities and Exchange Commission website (www.sec.gov). The Corporation assumes no obligation to update or revise any forward-looking statements or information which speak as of their respective dates.
About Popular, Inc.
Popular, Inc. (NASDAQ: BPOP) is the leading financial institution in Puerto Rico, by both assets and deposits, and ranks among the top 50 U.S. bank holding companies by assets. Founded in 1893, Banco Popular de Puerto Rico, Popular’s principal subsidiary, provides retail, mortgage and commercial banking services in Puerto Rico and the U.S. and British Virgin Islands, as well as auto and equipment leasing and financing in Puerto Rico. Popular also offers broker-dealer and insurance services in Puerto Rico through specialized subsidiaries. In the mainland United States, Popular provides retail, mortgage and commercial banking services through its New York-chartered banking subsidiary, Popular Bank, which has branches located in New York, New Jersey and Florida.
Conference Call
Popular will hold a conference call to discuss its financial results today, Wednesday, July 23, 2025 at 11:00 a.m. Eastern Time. The call will be broadcast live over the Internet and can be accessed through the Investor Relations section of the Corporation’s website: www.popular.com.
Listeners are recommended to go to the website at least 15 minutes prior to the call to download and install any necessary audio software. The call may also be accessed through a dial-in telephone number 1-833-470-1428 (Toll Free) or 1-404-975-4839 (Local). The dial-in access code is 297124.
15
A replay of the webcast will be archived in Popular’s website. A telephone replay will be available one hour after the end of the conference call through Friday, August 22, 2025. The replay dial in is: 1-866-813-9403 or 1-929-458-6194. The replay passcode is 734694.
An electronic version of this press release can be found at the Corporation’s website: www.popular.com.
16
| Popular, Inc. |
| Financial Supplement to Second Quarter 2025 Earnings Release |
| Table A - Selected Ratios and Other Information |
| Table B - Consolidated Statement of Operations |
| Table C - Consolidated Statement of Financial Condition |
| Table D - Analysis of Levels and Yields on a Taxable Equivalent Basis (Non-GAAP) - QUARTER |
| Table E - Analysis of Levels and Yields on a Taxable Equivalent Basis (Non-GAAP) - QUARTER |
| Table F - Analysis of Levels and Yields on a Taxable Equivalent Basis (Non-GAAP) - YEAR-TO-DATE |
| Table G - Mortgage Banking Activities and Other Service Fees |
| Table H - Consolidated Loans and Deposits |
| Table I - Loan Delinquency - BPPR Operations |
| Table J - Loan Delinquency - Popular U.S. Operations |
| Table K - Loan Delinquency - Consolidated |
| Table L - Non-Performing Assets |
| Table M - Activity in Non-Performing Loans |
| Table N - Allowance for Credit Losses, Net Charge-offs and Related Ratios |
| Table O - Allowance for Credit Losses ‘‘ACL’’ - Loan Portfolios - BPPR Operations |
| Table P - Allowance for Credit Losses ‘‘ACL’’ - Loan Portfolios - Popular U.S. Operations |
| Table Q - Allowance for Credit Losses ‘‘ACL’’ - Loan Portfolios - Consolidated |
| Table R - Reconciliation to GAAP Financial Measures |
17
POPULAR, INC.
Financial Supplement to Second Quarter 2025 Earnings Release
Table A - Selected Ratios and Other Information
(Unaudited)
| Quarters ended | Six months ended | |||||||||||||||||||
| 30-Jun-25 | 31-Mar-25 | 30-Jun-24 | 30-Jun-25 | 30-Jun-24 | ||||||||||||||||
| Basic EPS |
$ | 3.09 | $ | 2.56 | $ | 2.47 | $ | 5.64 | $ | 3.90 | ||||||||||
| Diluted EPS |
$ | 3.09 | $ | 2.56 | $ | 2.46 | $ | 5.64 | $ | 3.90 | ||||||||||
| Average common shares outstanding |
68,050,361 | 69,280,137 | 71,970,773 | 68,661,851 | 71,920,254 | |||||||||||||||
| Average common shares outstanding - assuming dilution |
68,079,649 | 69,307,681 | 71,991,911 | 68,687,659 | 71,937,434 | |||||||||||||||
| Common shares outstanding at end of period |
67,937,468 | 68,984,148 | 72,365,926 | 67,937,468 | 72,365,926 | |||||||||||||||
| Market value per common share |
$ | 110.21 | $ | 92.37 | $ | 88.43 | $ | 110.21 | $ | 88.43 | ||||||||||
| Market capitalization - (In millions) |
$ | 7,487 | $ | 6,372 | $ | 6,399 | $ | 7,487 | $ | 6,399 | ||||||||||
| Return on average assets |
1.11 | % | 0.96 | % | 0.97 | % | 1.04 | % | 0.77 | % | ||||||||||
| Return on average common equity |
11.77 | % | 10.07 | % | 10.38 | % | 10.93 | % | 8.24 | % | ||||||||||
| Net interest margin (non-taxable equivalent basis) |
3.49 | % | 3.40 | % | 3.22 | % | 3.45 | % | 3.20 | % | ||||||||||
| Net interest margin (taxable equivalent basis) -non-GAAP |
3.85 | % | 3.73 | % | 3.48 | % | 3.80 | % | 3.44 | % | ||||||||||
| Common equity per share |
$ | 87.31 | $ | 83.75 | $ | 73.94 | $ | 87.31 | $ | 73.94 | ||||||||||
| Tangible common book value per common share (non-GAAP) [1] |
$ | 75.41 | $ | 72.02 | $ | 62.71 | $ | 75.41 | $ | 62.71 | ||||||||||
| Tangible common equity to tangible assets (non-GAAP) [1] |
6.81 | % | 6.78 | % | 6.30 | % | 6.81 | % | 6.30 | % | ||||||||||
| Return on average tangible common equity [1] |
13.26 | % | 11.36 | % | 11.77 | % | 12.32 | % | 9.35 | % | ||||||||||
| Tier 1 capital |
15.96 | % | 16.17 | % | 16.54 | % | 15.96 | % | 16.54 | % | ||||||||||
| Total capital |
17.70 | % | 17.92 | % | 18.30 | % | 17.70 | % | 18.30 | % | ||||||||||
| Tier 1 leverage |
8.51 | % | 8.50 | % | 8.53 | % | 8.51 | % | 8.53 | % | ||||||||||
| Common Equity Tier 1 capital |
15.91 | % | 16.11 | % | 16.48 | % | 15.91 | % | 16.48 | % | ||||||||||
|
|
|
|
|
|
|
|
|
|
|
|||||||||||
| [1] | Refer to Table R for reconciliation to GAAP financial measures. |
18
POPULAR, INC.
Financial Supplement to Second Quarter 2025 Earnings Release
Table B - Consolidated Statement of Operations
(Unaudited)
| Quarters ended |
Variance Quarter ended | Variance | Six months ended | |||||||||||||||||||||||||
| Q2 2025 | Q2 2025 | |||||||||||||||||||||||||||
| (In thousands, except per share information) |
30-Jun-25 | 31-Mar-25 | vs. Q1 2025 | 30-Jun-24 | vs. Q2 2024 | 30-Jun-25 | 30-Jun-24 | |||||||||||||||||||||
| Interest income: |
||||||||||||||||||||||||||||
| Loans |
$ | 684,587 | $ | 666,673 | $ | 17,914 | $ | 648,739 | $ | 35,848 | $ | 1,351,260 | $ | 1,287,469 | ||||||||||||||
| Money market investments |
69,532 | 70,166 | (634 | ) | 88,316 | (18,784 | ) | 139,698 | 176,832 | |||||||||||||||||||
| Investment securities |
189,753 | 180,159 | 9,594 | 184,852 | 4,901 | 369,912 | 351,747 | |||||||||||||||||||||
|
|
|
|
|
|
|
|
|
|
|
|
|
|
|
|||||||||||||||
| Total interest income |
943,872 | 916,998 | 26,874 | 921,907 | 21,965 | 1,860,870 | 1,816,048 | |||||||||||||||||||||
|
|
|
|
|
|
|
|
|
|
|
|
|
|
|
|||||||||||||||
| Interest expense: |
||||||||||||||||||||||||||||
| Deposits |
295,058 | 297,863 | (2,805 | ) | 339,939 | (44,881 | ) | 592,921 | 669,435 | |||||||||||||||||||
| Short-term borrowings |
5,300 | 1,426 | 3,874 | 1,126 | 4,174 | 6,726 | 2,318 | |||||||||||||||||||||
| Long-term debt |
11,965 | 12,112 | (147 | ) | 12,530 | (565 | ) | 24,077 | 25,239 | |||||||||||||||||||
|
|
|
|
|
|
|
|
|
|
|
|
|
|
|
|||||||||||||||
| Total interest expense |
312,323 | 311,401 | 922 | 353,595 | (41,272 | ) | 623,724 | 696,992 | ||||||||||||||||||||
|
|
|
|
|
|
|
|
|
|
|
|
|
|
|
|||||||||||||||
| Net interest income |
631,549 | 605,597 | 25,952 | 568,312 | 63,237 | 1,237,146 | 1,119,056 | |||||||||||||||||||||
| Provision for credit losses |
48,941 | 64,081 | (15,140 | ) | 46,794 | 2,147 | 113,022 | 119,392 | ||||||||||||||||||||
|
|
|
|
|
|
|
|
|
|
|
|
|
|
|
|||||||||||||||
| Net interest income after provision for credit losses |
582,608 | 541,516 | 41,092 | 521,518 | 61,090 | 1,124,124 | 999,664 | |||||||||||||||||||||
|
|
|
|
|
|
|
|
|
|
|
|
|
|
|
|||||||||||||||
| Service charges on deposit accounts |
38,826 | 39,054 | (228 | ) | 37,526 | 1,300 | 77,880 | 74,968 | ||||||||||||||||||||
| Other service fees |
100,522 | 94,508 | 6,014 | 96,863 | 3,659 | 195,030 | 191,135 | |||||||||||||||||||||
| Mortgage banking activities |
4,872 | 3,689 | 1,183 | 5,723 | (851 | ) | 8,561 | 10,083 | ||||||||||||||||||||
| Net gain (loss), including impairment, on equity securities |
1,862 | (414 | ) | 2,276 | 319 | 1,543 | 1,448 | 1,422 | ||||||||||||||||||||
| Net gain on trading account debt securities |
538 | 520 | 18 | 277 | 261 | 1,058 | 638 | |||||||||||||||||||||
| Adjustments to indemnity reserves on loans sold |
120 | 173 | (53 | ) | 212 | (92 | ) | 293 | (25 | ) | ||||||||||||||||||
| Other operating income |
21,737 | 14,531 | 7,206 | 25,386 | (3,649 | ) | 36,268 | 51,903 | ||||||||||||||||||||
|
|
|
|
|
|
|
|
|
|
|
|
|
|
|
|||||||||||||||
| Total non-interest income |
168,477 | 152,061 | 16,416 | 166,306 | 2,171 | 320,538 | 330,124 | |||||||||||||||||||||
|
|
|
|
|
|
|
|
|
|
|
|
|
|
|
|||||||||||||||
| Operating expenses: |
||||||||||||||||||||||||||||
| Personnel costs |
||||||||||||||||||||||||||||
| Salaries |
132,752 | 130,950 | 1,802 | 128,634 | 4,118 | 263,702 | 258,018 | |||||||||||||||||||||
| Commissions, incentives and other bonuses |
40,551 | 37,986 | 2,565 | 30,626 | 9,925 | 78,537 | 69,237 | |||||||||||||||||||||
| Profit sharing |
13,000 | — | 13,000 | — | 13,000 | 13,000 | — | |||||||||||||||||||||
| Pension, postretirement and medical insurance |
18,458 | 14,566 | 3,892 | 16,619 | 1,839 | 33,024 | 34,004 | |||||||||||||||||||||
| Other personnel costs, including payroll taxes |
24,594 | 29,211 | (4,617 | ) | 21,545 | 3,049 | 53,805 | 51,542 | ||||||||||||||||||||
|
|
|
|
|
|
|
|
|
|
|
|
|
|
|
|||||||||||||||
| Total personnel costs |
229,355 | 212,713 | 16,642 | 197,424 | 31,931 | 442,068 | 412,801 | |||||||||||||||||||||
| Net occupancy expenses |
29,140 | 27,218 | 1,922 | 27,692 | 1,448 | 56,358 | 55,733 | |||||||||||||||||||||
| Equipment expenses |
5,789 | 5,302 | 487 | 9,662 | (3,873 | ) | 11,091 | 19,229 | ||||||||||||||||||||
| Other taxes |
18,632 | 18,725 | (93 | ) | 15,333 | 3,299 | 37,357 | 29,708 | ||||||||||||||||||||
| Professional fees |
28,108 | 26,825 | 1,283 | 37,744 | (9,636 | ) | 54,933 | 66,662 | ||||||||||||||||||||
| Technology and software expenses |
84,696 | 83,668 | 1,028 | 79,752 | 4,944 | 168,364 | 159,214 | |||||||||||||||||||||
| Processing and transactional services |
||||||||||||||||||||||||||||
| Credit and debit cards |
13,044 | 12,926 | 118 | 13,739 | (695 | ) | 25,970 | 25,883 | ||||||||||||||||||||
| Other processing and transactional services |
24,817 | 24,855 | (38 | ) | 25,357 | (540 | ) | 49,672 | 47,407 | |||||||||||||||||||
|
|
|
|
|
|
|
|
|
|
|
|
|
|
|
|||||||||||||||
| Total processing and transactional services |
37,861 | 37,781 | 80 | 39,096 | (1,235 | ) | 75,642 | 73,290 | ||||||||||||||||||||
| Communications |
5,010 | 4,904 | 106 | 4,357 | 653 | 9,914 | 8,914 | |||||||||||||||||||||
| Business promotion |
||||||||||||||||||||||||||||
| Rewards and customer loyalty programs |
18,047 | 16,365 | 1,682 | 16,406 | 1,641 | 34,412 | 30,462 | |||||||||||||||||||||
| Other business promotion |
8,338 | 7,310 | 1,028 | 9,043 | (705 | ) | 15,648 | 15,976 | ||||||||||||||||||||
|
|
|
|
|
|
|
|
|
|
|
|
|
|
|
|||||||||||||||
| Total business promotion |
26,385 | 23,675 | 2,710 | 25,449 | 936 | 50,060 | 46,438 | |||||||||||||||||||||
| Deposit insurance |
9,407 | 10,035 | (628 | ) | 10,581 | (1,174 | ) | 19,442 | 34,468 | |||||||||||||||||||
| Other real estate owned (OREO) expense (income) |
(4,124 | ) | (3,330 | ) | (794 | ) | (5,750 | ) | 1,626 | (7,454 | ) | (11,071 | ) | |||||||||||||||
| Other operating expenses |
||||||||||||||||||||||||||||
| Operational losses |
6,185 | 6,138 | 47 | 11,823 | (5,638 | ) | 12,323 | 15,384 | ||||||||||||||||||||
| All other |
15,932 | 16,761 | (829 | ) | 15,679 | 253 | 32,693 | 40,390 | ||||||||||||||||||||
|
|
|
|
|
|
|
|
|
|
|
|
|
|
|
|||||||||||||||
| Total other operating expenses |
22,117 | 22,899 | (782 | ) | 27,502 | (5,385 | ) | 45,016 | 55,774 | |||||||||||||||||||
| Amortization of intangibles |
385 | 597 | (212 | ) | 734 | (349 | ) | 982 | 1,529 | |||||||||||||||||||
|
|
|
|
|
|
|
|
|
|
|
|
|
|
|
|||||||||||||||
| Total operating expenses |
492,761 | 471,012 | 21,749 | 469,576 | 23,185 | 963,773 | 952,689 | |||||||||||||||||||||
|
|
|
|
|
|
|
|
|
|
|
|
|
|
|
|||||||||||||||
| Income before income tax |
258,324 | 222,565 | 35,759 | 218,248 | 40,076 | 480,889 | 377,099 | |||||||||||||||||||||
| Income tax expense |
47,884 | 45,063 | 2,821 | 40,459 | 7,425 | 92,947 | 96,027 | |||||||||||||||||||||
|
|
|
|
|
|
|
|
|
|
|
|
|
|
|
|||||||||||||||
| Net income |
$ | 210,440 | $ | 177,502 | $ | 32,938 | $ | 177,789 | $ | 32,651 | $ | 387,942 | $ | 281,072 | ||||||||||||||
|
|
|
|
|
|
|
|
|
|
|
|
|
|
|
|||||||||||||||
| Net income applicable to common stock |
$ | 210,087 | $ | 177,149 | $ | 32,938 | $ | 177,436 | $ | 32,651 | $ | 387,236 | $ | 280,366 | ||||||||||||||
|
|
|
|
|
|
|
|
|
|
|
|
|
|
|
|||||||||||||||
| Net income per common share - basic |
$ | 3.09 | $ | 2.56 | $ | 0.53 | $ | 2.47 | $ | 0.62 | $ | 5.64 | $ | 3.90 | ||||||||||||||
|
|
|
|
|
|
|
|
|
|
|
|
|
|
|
|||||||||||||||
| Net income per common share - diluted |
$ | 3.09 | $ | 2.56 | $ | 0.53 | $ | 2.46 | $ | 0.63 | $ | 5.64 | $ | 3.90 | ||||||||||||||
|
|
|
|
|
|
|
|
|
|
|
|
|
|
|
|||||||||||||||
| Dividends Declared per Common Share |
$ | 0.70 | $ | 0.70 | $ | — | $ | 0.62 | $ | 0.08 | $ | 1.40 | $ | 1.24 | ||||||||||||||
|
|
|
|
|
|
|
|
|
|
|
|
|
|
|
|||||||||||||||
19
Popular, Inc.
Financial Supplement to Second Quarter 2025 Earnings Release
Table C - Consolidated Statement of Financial Condition
(Unaudited)
| Variance | ||||||||||||||||
| Q2 2025 vs. | ||||||||||||||||
| (In thousands) |
30-Jun-25 | 31-Mar-25 | 30-Jun-24 | Q1 2025 | ||||||||||||
| Assets: |
||||||||||||||||
| Cash and due from banks |
$ | 400,631 | $ | 380,165 | $ | 359,973 | $ | 20,466 | ||||||||
| Money market investments |
6,340,786 | 6,195,028 | 6,851,394 | 145,758 | ||||||||||||
| Trading account debt securities, at fair value |
29,643 | 28,477 | 28,045 | 1,166 | ||||||||||||
| Debt securities available-for-sale, at fair value |
20,490,212 | 19,493,180 | 18,543,279 | 997,032 | ||||||||||||
| Less: Allowance for credit losses |
— | — | 500 | — | ||||||||||||
|
|
|
|
|
|
|
|
|
|||||||||
| Debt securities available-for-sale, net |
20,490,212 | 19,493,180 | 18,542,779 | 997,032 | ||||||||||||
| Debt securities held-to-maturity, at amortized cost |
7,541,724 | 7,648,718 | 7,975,524 | (106,994 | ) | |||||||||||
| Less: Allowance for credit losses |
5,999 | 5,481 | 6,251 | 518 | ||||||||||||
|
|
|
|
|
|
|
|
|
|||||||||
| Debt securities held-to-maturity, net |
7,535,725 | 7,643,237 | 7,969,273 | (107,512 | ) | |||||||||||
|
|
|
|
|
|
|
|
|
|||||||||
| Equity securities |
222,391 | 205,021 | 195,791 | 17,370 | ||||||||||||
| Loans held-for-sale, at lower of cost or fair value |
2,898 | 5,077 | 8,225 | (2,179 | ) | |||||||||||
| Loans held-in-portfolio |
38,611,834 | 37,675,070 | 35,978,602 | 936,764 | ||||||||||||
| Less: Unearned income |
426,656 | 421,038 | 386,982 | 5,618 | ||||||||||||
| Allowance for credit losses |
769,485 | 762,148 | 730,077 | 7,337 | ||||||||||||
|
|
|
|
|
|
|
|
|
|||||||||
| Total loans held-in-portfolio, net |
37,415,693 | 36,491,884 | 34,861,543 | 923,809 | ||||||||||||
|
|
|
|
|
|
|
|
|
|||||||||
| Premises and equipment, net |
649,191 | 625,237 | 599,058 | 23,954 | ||||||||||||
| Other real estate |
46,126 | 52,114 | 70,225 | (5,988 | ) | |||||||||||
| Accrued income receivable |
274,867 | 262,720 | 260,162 | 12,147 | ||||||||||||
| Mortgage servicing rights, at fair value |
103,077 | 104,743 | 113,386 | (1,666 | ) | |||||||||||
| Other assets |
1,745,052 | 1,742,540 | 2,172,555 | 2,512 | ||||||||||||
| Goodwill |
802,954 | 802,954 | 804,428 | — | ||||||||||||
| Other intangible assets |
5,844 | 6,229 | 8,235 | (385 | ) | |||||||||||
|
|
|
|
|
|
|
|
|
|||||||||
| Total assets |
$ | 76,065,090 | $ | 74,038,606 | $ | 72,845,072 | $ | 2,026,484 | ||||||||
|
|
|
|
|
|
|
|
|
|||||||||
| Liabilities and Stockholders’ Equity: |
||||||||||||||||
| Liabilities: |
||||||||||||||||
| Deposits: |
||||||||||||||||
| Non-interest bearing |
$ | 15,114,614 | $ | 15,160,801 | $ | 15,470,082 | $ | (46,187 | ) | |||||||
| Interest bearing |
52,102,877 | 50,658,454 | 50,060,780 | 1,444,423 | ||||||||||||
|
|
|
|
|
|
|
|
|
|||||||||
| Total deposits |
67,217,491 | 65,819,255 | 65,530,862 | 1,398,236 | ||||||||||||
|
|
|
|
|
|
|
|
|
|||||||||
| Assets sold under agreements to repurchase |
56,043 | 57,268 | 105,684 | (1,225 | ) | |||||||||||
| Other short-term borrowings |
550,000 | 200,000 | — | 350,000 | ||||||||||||
| Notes payable |
808,451 | 833,149 | 941,580 | (24,698 | ) | |||||||||||
| Other liabilities |
1,479,087 | 1,329,239 | 894,268 | 149,848 | ||||||||||||
|
|
|
|
|
|
|
|
|
|||||||||
| Total liabilities |
70,111,072 | 68,238,911 | 67,472,394 | 1,872,161 | ||||||||||||
|
|
|
|
|
|
|
|
|
|||||||||
| Stockholders’ equity: |
||||||||||||||||
| Preferred stock |
22,143 | 22,143 | 22,143 | — | ||||||||||||
| Common stock |
1,049 | 1,049 | 1,048 | — | ||||||||||||
| Surplus |
4,919,950 | 4,912,886 | 4,852,747 | 7,064 | ||||||||||||
| Retained earnings |
4,861,958 | 4,699,697 | 4,385,522 | 162,261 | ||||||||||||
| Treasury stock |
(2,455,425 | ) | (2,346,093 | ) | (2,010,500 | ) | (109,332 | ) | ||||||||
| Accumulated other comprehensive loss, net of tax |
(1,395,657 | ) | (1,489,987 | ) | (1,878,282 | ) | 94,330 | |||||||||
|
|
|
|
|
|
|
|
|
|||||||||
| Total stockholders’ equity |
5,954,018 | 5,799,695 | 5,372,678 | 154,323 | ||||||||||||
|
|
|
|
|
|
|
|
|
|||||||||
| Total liabilities and stockholders’ equity |
$ | 76,065,090 | $ | 74,038,606 | $ | 72,845,072 | $ | 2,026,484 | ||||||||
|
|
|
|
|
|
|
|
|
|||||||||
20
Popular, Inc.
Financial Supplement to Second Quarter 2025 Earnings Release
Table D - Analysis of Levels and Yields on a Taxable Equivalent Basis (Non-GAAP)
For the quarters ended June 30, 2025 and March 31, 2025
(Unaudited)
| Variance |
||||||||||||||||||||||||||||||||||||||||||||
| Average Volume | Average Yields / Costs | Interest | Attributable to | |||||||||||||||||||||||||||||||||||||||||
| 30-Jun-25 |
31-Mar-25 | Variance | 30-Jun-25 | 31-Mar-25 | Variance | 30-Jun-25 | 31-Mar-25 | Variance | Rate | Volume | ||||||||||||||||||||||||||||||||||
| (In millions) | (In thousands) | |||||||||||||||||||||||||||||||||||||||||||
| $ 6,251 | $ | 6,379 | $ | (128 | ) | 4.46 | % | 4.46 | % | - | % | Money market investments |
$ | 69,532 | $ | 70,166 | $ | (634 | ) | $ | 789 | $ | (1,423 | ) | ||||||||||||||||||||
| 28,809 | 28,415 | 394 | 3.29 | 3.14 | 0.15 | Investment securities [1] |
236,372 | 220,435 | 15,937 | 12,117 | 3,820 | |||||||||||||||||||||||||||||||||
| 27 | 31 | (4 | ) | 5.99 | 5.82 | 0.17 | Trading securities |
407 | 440 | (33 | ) | 17 | (50 | ) | ||||||||||||||||||||||||||||||
|
|
|
|
|
|
|
|
|
|
|
|
|
|
|
|
|
|
|
|
|
|
|
|||||||||||||||||||||||
| 35,087 | 34,825 | 262 | 3.50 | 3.38 | 0.12 | Total money market, investment and trading securities |
306,311 | 291,041 | 15,270 | 12,923 | 2,347 | |||||||||||||||||||||||||||||||||
|
|
|
|
|
|
|
|
|
|
|
|
|
|
|
|
|
|
|
|
|
|
|
|||||||||||||||||||||||
| Loans: |
||||||||||||||||||||||||||||||||||||||||||||
| 18,676 | 18,489 | 187 | 6.73 | 6.71 | 0.02 | Commercial |
313,493 | 305,968 | 7,525 | 4,414 | 3,111 | |||||||||||||||||||||||||||||||||
| 1,459 | 1,309 | 150 | 8.19 | 8.11 | 0.08 | Construction |
29,806 | 26,190 | 3,616 | 567 | 3,049 | |||||||||||||||||||||||||||||||||
| 1,963 | 1,930 | 33 | 7.18 | 7.14 | 0.04 | Leasing |
35,249 | 34,444 | 805 | 208 | 597 | |||||||||||||||||||||||||||||||||
| 8,339 | 8,168 | 171 | 5.89 | 5.82 | 0.07 | Mortgage |
122,873 | 118,917 | 3,956 | 1,452 | 2,504 | |||||||||||||||||||||||||||||||||
| 3,211 | 3,203 | 8 | 14.00 | 14.04 | (0.04 | ) | Consumer |
112,083 | 110,859 | 1,224 | 1,034 | 190 | ||||||||||||||||||||||||||||||||
| 3,937 | 3,907 | 30 | 9.14 | 9.12 | 0.02 | Auto |
89,706 | 87,850 | 1,856 | 1,170 | 686 | |||||||||||||||||||||||||||||||||
|
|
|
|
|
|
|
|
|
|
|
|
|
|
|
|
|
|
|
|
|
|
|
|||||||||||||||||||||||
| 37,585 | 37,006 | 579 | 7.50 | 7.48 | 0.02 | Total loans |
703,210 | 684,228 | 18,982 | 8,845 | 10,137 | |||||||||||||||||||||||||||||||||
|
|
|
|
|
|
|
|
|
|
|
|
|
|
|
|
|
|
|
|
|
|
|
|||||||||||||||||||||||
| $ 72,672 | $ | 71,831 | $ | 841 | 5.57 | % | 5.49 | % | 0.08 | % | Total earning assets |
$ | 1,009,521 | $ | 975,269 | $ | 34,252 | $ | 21,768 | $ | 12,484 | |||||||||||||||||||||||
|
|
|
|
|
|
|
|
|
|
|
|
|
|
|
|
|
|
|
|
|
|
|
|||||||||||||||||||||||
| Interest bearing deposits: |
||||||||||||||||||||||||||||||||||||||||||||
| $8,062 | $ | 7,964 | $ | 98 | 1.71 | % | 1.72 | % | (0.01 | )% | NOW and money market |
$ | 34,288 | $ | 33,784 | $ | 504 | $ | (567 | ) | $ | 1,071 | ||||||||||||||||||||||
| 14,605 | 14,507 | 98 | 0.83 | 0.87 | (0.04 | ) | Savings |
30,378 | 31,280 | (902 | ) | (889 | ) | (13 | ) | |||||||||||||||||||||||||||||
| 8,532 | 8,400 | 132 | 3.15 | 3.22 | (0.07 | ) | Time deposits |
67,032 | 66,681 | 351 | (393 | ) | 744 | |||||||||||||||||||||||||||||||
| 20,333 | 20,305 | 28 | 3.22 | 3.32 | (0.10 | ) | P.R. public deposits |
163,360 | 166,118 | (2,758 | ) | (2,866 | ) | 108 | ||||||||||||||||||||||||||||||
|
|
|
|
|
|
|
|
|
|
|
|
|
|
|
|
|
|
|
|
|
|
|
|||||||||||||||||||||||
| 51,532 | 51,176 | 356 | 2.29 | 2.36 | (0.07 | ) | Total interest bearing deposits |
295,058 | 297,863 | (2,805 | ) | (4,715 | ) | 1,910 | ||||||||||||||||||||||||||||||
|
|
|
|
|
|
|
|
|
|
|
|
|
|
|
|
|
|
|
|
|
|||||||||||||||||||||||||
| 14,825 | 14,682 | 143 | Non-interest bearing demand deposits |
|||||||||||||||||||||||||||||||||||||||||
|
|
|
|
|
|
|
|
|
|
|
|
|
|||||||||||||||||||||||||||||||||
| 66,357 | 65,858 | 499 | 1.78 | 1.83 | (0.05 | ) | Total deposits |
295,058 | 297,863 | (2,805 | ) | (4,715 | ) | 1,910 | ||||||||||||||||||||||||||||||
|
|
|
|
|
|
|
|
|
|
|
|
|
|
|
|
|
|
|
|
|
|
|
|||||||||||||||||||||||
| 470 | 121 | 349 | 4.52 | 4.77 | (0.25 | ) | Short-term borrowings |
5,300 | 1,426 | 3,874 | (54 | ) | 3,928 | |||||||||||||||||||||||||||||||
| 832 | 862 | (30 | ) | 5.79 | 5.66 | 0.13 | Other medium and long-term debt |
11,965 | 12,112 | (147 | ) | (6 | ) | (141 | ) | |||||||||||||||||||||||||||||
|
|
|
|
|
|
|
|
|
|
|
|
|
|
|
|
|
|
|
|
|
|
|
|||||||||||||||||||||||
| 52,834 | 52,159 | 675 | 2.36 | 2.42 | (0.06 | ) | Total interest bearing liabilities (excluding demand deposits) |
312,323 | 311,401 | 922 | (4,775 | ) | 5,697 | |||||||||||||||||||||||||||||||
|
|
|
|
|
|
|
|
|
|
|
|
|
|
|
|
|
|
|
|
|
|
|
|||||||||||||||||||||||
| 5,013 | 4,990 | 23 | Other sources of funds |
|||||||||||||||||||||||||||||||||||||||||
|
|
|
|
|
|
|
|
|
|
|
|
|
|
|
|
|
|
|
|
|
|
|
|||||||||||||||||||||||
| $ 72,672 | $ | 71,831 | $ | 841 | 1.72 | % | 1.76 | % | (0.04 | )% | Total source of funds |
312,323 | 311,401 | 922 | (4,775 | ) | 5,697 | |||||||||||||||||||||||||||
|
|
|
|
|
|
|
|
|
|
|
|
|
|
|
|
|
|
|
|
|
|
|
|||||||||||||||||||||||
| 3.85 | % | 3.73 | % | 0.12 | % | Net interest margin/ income on a taxable equivalent basis (Non-GAAP) |
697,198 | 663,868 | 33,330 | $ | 26,543 | $ | 6,787 | |||||||||||||||||||||||||||||||
|
|
|
|
|
|
|
|
|
|
|
|
|
|
|
|
|
|||||||||||||||||||||||||||||
| 3.21 | % | 3.07 | % | 0.14 | % | Net interest spread Taxable equivalent adjustment |
65,649 | 58,271 | 7,378 | |||||||||||||||||||||||||||||||||||
|
|
|
|
|
|
|
|
|
|
|
|
|
|||||||||||||||||||||||||||||||||
| 3.49 | % | 3.40 | % | 0.09 | % | Net interest margin/ income non-taxable equivalent basis (GAAP) |
$ | 631,549 | $ | 605,597 | $ | 25,952 | ||||||||||||||||||||||||||||||||
|
|
|
|
|
|
|
|
|
|
|
|
|
|||||||||||||||||||||||||||||||||
Note: The changes that are not due solely to volume or rate are allocated to volume and rate based on the proportion of the change in each category.
| [1] | Average balances exclude unrealized gains or losses on debt securities available-for-sale and the unrealized loss related to certain securities transferred from available-for-sale to held-to-maturity. |
21
Popular, Inc.
Financial Supplement to Second Quarter 2025 Earnings Release
Table E - Analysis of Levels and Yields on a Taxable Equivalent Basis (Non-GAAP)
For the quarters ended June 30, 2025 and June 30, 2024
(Unaudited)
| Variance | ||||||||||||||||||||||||||||||||||||||||||||
| Average Volume | Average Yields / Costs | Interest | Attributable to | |||||||||||||||||||||||||||||||||||||||||
| 30-Jun-25 |
30-Jun-24 | Variance | 30-Jun-25 | 30-Jun-24 | Variance | 30-Jun-25 | 30-Jun-24 | Variance | Rate | Volume | ||||||||||||||||||||||||||||||||||
| (In millions) | (In thousands) | |||||||||||||||||||||||||||||||||||||||||||
| $ | 6,251 | $ | 6,471 | $ | (220 | ) | 4.46 | % | 5.49 | % | (1.03 | )% | Money market investments |
$ | 69,532 | $ | 88,316 | $ | (18,784 | ) | $ | (15,866 | ) | $ | (2,918 | ) | ||||||||||||||||||
| 28,809 | 28,943 | (134 | ) | 3.29 | 3.01 | 0.28 | Investment securities [1] |
236,372 | 216,922 | 19,450 | 18,673 | 777 | ||||||||||||||||||||||||||||||||
| 27 | 26 | 1 | 5.99 | 5.69 | 0.30 | Trading securities |
407 | 367 | 40 | 21 | 19 | |||||||||||||||||||||||||||||||||
|
|
|
|
|
|
|
|
|
|
|
|
|
|
|
|
|
|
|
|
|
|
|
|||||||||||||||||||||||
| 35,087 | 35,440 | (353 | ) | 3.50 | 3.47 | 0.03 | Total money market, investment and trading securities |
306,311 | 305,605 | 706 | 2,828 | (2,122 | ) | |||||||||||||||||||||||||||||||
|
|
|
|
|
|
|
|
|
|
|
|
|
|
|
|
|
|
|
|
|
|
|
|||||||||||||||||||||||
| Loans: |
||||||||||||||||||||||||||||||||||||||||||||
| 18,676 | 17,707 | 969 | 6.73 | 6.86 | (0.13 | ) | Commercial |
313,493 | 302,003 | 11,490 | (4,831 | ) | 16,321 | |||||||||||||||||||||||||||||||
| 1,459 | 1,070 | 389 | 8.19 | 9.11 | (0.92 | ) | Construction |
29,806 | 24,224 | 5,582 | (2,558 | ) | 8,140 | |||||||||||||||||||||||||||||||
| 1,963 | 1,789 | 174 | 7.18 | 6.86 | 0.32 | Leasing |
35,249 | 30,697 | 4,552 | 1,467 | 3,085 | |||||||||||||||||||||||||||||||||
| 8,339 | 7,817 | 522 | 5.89 | 5.66 | 0.23 | Mortgage |
122,873 | 110,673 | 12,200 | 4,632 | 7,568 | |||||||||||||||||||||||||||||||||
| 3,211 | 3,192 | 19 | 14.00 | 13.97 | 0.03 | Consumer |
112,083 | 110,906 | 1,177 | 374 | 803 | |||||||||||||||||||||||||||||||||
| 3,937 | 3,819 | 118 | 9.14 | 8.88 | 0.26 | Auto |
89,706 | 84,268 | 5,438 | 2,780 | 2,658 | |||||||||||||||||||||||||||||||||
|
|
|
|
|
|
|
|
|
|
|
|
|
|
|
|
|
|
|
|
|
|
|
|||||||||||||||||||||||
| 37,585 | 35,394 | 2,191 | 7.50 | 7.52 | (0.02 | ) | Total loans |
703,210 | 662,771 | 40,439 | 1,864 | 38,575 | ||||||||||||||||||||||||||||||||
|
|
|
|
|
|
|
|
|
|
|
|
|
|
|
|
|
|
|
|
|
|
|
|||||||||||||||||||||||
| $ 72,672 | $ | 70,834 | $ | 1,838 | 5.57 | % | 5.49 | % | 0.08 | % | Total earning assets |
$ | 1,009,521 | $ | 968,376 | $ | 41,145 | $ | 4,692 | $ | 36,453 | |||||||||||||||||||||||
|
|
|
|
|
|
|
|
|
|
|
|
|
|
|
|
|
|
|
|
|
|
|
|||||||||||||||||||||||
| Interest bearing deposits: |
||||||||||||||||||||||||||||||||||||||||||||
| $8,062 | $ | 7,522 | $ | 540 | 1.71 | % | 1.97 | % | (0.26 | )% | NOW and money market |
$ | 34,288 | $ | 36,783 | $ | (2,495 | ) | $ | (4,611 | ) | $ | 2,116 | |||||||||||||||||||||
| 14,605 | 14,728 | (123 | ) | 0.83 | 0.92 | (0.09 | ) | Savings |
30,378 | 33,749 | (3,371 | ) | (2,862 | ) | (509 | ) | ||||||||||||||||||||||||||||
| 8,532 | 8,237 | 295 | 3.15 | 3.39 | (0.24 | ) | Time deposits |
67,032 | 69,494 | (2,462 | ) | (4,857 | ) | 2,395 | ||||||||||||||||||||||||||||||
| 20,333 | 19,364 | 969 | 3.22 | 4.15 | (0.93 | ) | P.R. public deposits |
163,360 | 199,913 | (36,553 | ) | (45,918 | ) | 9,365 | ||||||||||||||||||||||||||||||
|
|
|
|
|
|
|
|
|
|
|
|
|
|
|
|
|
|
|
|
|
|
|
|||||||||||||||||||||||
| 51,532 | 49,851 | 1,681 | 2.29 | 2.74 | (0.45 | ) | Total interest bearing deposits |
295,058 | 339,939 | (44,881 | ) | (58,248 | ) | 13,367 | ||||||||||||||||||||||||||||||
|
|
|
|
|
|
|
|
|
|
|
|
|
|
|
|
|
|
|
|
|
|
|
|||||||||||||||||||||||
| 14,825 | 15,176 | (351 | ) | Non-interest bearing demand deposits |
||||||||||||||||||||||||||||||||||||||||
|
|
|
|
|
|
|
|
|
|
|
|
|
|
|
|
|
|
|
|
|
|
|
|||||||||||||||||||||||
| 66,357 | 65,027 | 1,330 | 1.78 | 2.10 | (0.32 | ) | Total deposits |
295,058 | 339,939 | (44,881 | ) | (58,248 | ) | 13,367 | ||||||||||||||||||||||||||||||
|
|
|
|
|
|
|
|
|
|
|
|
|
|
|
|
|
|
|
|
|
|
|
|||||||||||||||||||||||
| 470 | 80 | 390 | 4.52 | 5.64 | (1.12 | ) | Short-term borrowings |
5,300 | 1,126 | 4,174 | (213 | ) | 4,387 | |||||||||||||||||||||||||||||||
| 832 | 978 | (146 | ) | 5.79 | 5.16 | 0.63 | Other medium and long-term debt |
11,965 | 12,530 | (565 | ) | 181 | (746 | ) | ||||||||||||||||||||||||||||||
|
|
|
|
|
|
|
|
|
|
|
|
|
|
|
|
|
|
|
|
|
|
|
|||||||||||||||||||||||
| 52,834 | 50,909 | 1,925 | 2.36 | 2.79 | (0.43 | ) | Total interest bearing liabilities (excluding demand deposits) |
312,323 | 353,595 | (41,272 | ) | (58,280 | ) | 17,008 | ||||||||||||||||||||||||||||||
|
|
|
|
|
|
|
|
|
|
|
|
|
|
|
|
|
|
|
|
|
|
|
|||||||||||||||||||||||
| 5,013 | 4,749 | 264 | Other sources of funds |
|||||||||||||||||||||||||||||||||||||||||
|
|
|
|
|
|
|
|
|
|
|
|
|
|
|
|
|
|
|
|
|
|
|
|||||||||||||||||||||||
| $ 72,672 | $ | 70,834 | $ | 1,838 | 1.72 | % | 2.01 | % | (0.29 | )% | Total source of funds |
312,323 | 353,595 | (41,272 | ) | (58,280 | ) | 17,008 | ||||||||||||||||||||||||||
|
|
|
|
|
|
|
|
|
|
|
|
|
|
|
|
|
|
|
|
|
|
|
|||||||||||||||||||||||
| 3.85 | % | 3.48 | % | 0.37 | % | Net interest margin/ income on a taxable equivalent basis (Non-GAAP) |
697,198 | 614,781 | 82,417 | $ | 62,972 | $ | 19,445 | |||||||||||||||||||||||||||||||
|
|
|
|
|
|
|
|
|
|
|
|
|
|
|
|
|
|||||||||||||||||||||||||||||
| 3.21 | % | 2.70 | % | 0.51 | % | Net interest spread |
||||||||||||||||||||||||||||||||||||||
|
|
|
|
|
|
|
|||||||||||||||||||||||||||||||||||||||
| Taxable equivalent adjustment |
65,649 | 46,469 | 19,180 | |||||||||||||||||||||||||||||||||||||||||
|
|
|
|
|
|
|
|||||||||||||||||||||||||||||||||||||||
| 3.49 | % | 3.22 | % | 0.27 | % | Net interest margin/ income non-taxable equivalent basis (GAAP) |
$ | 631,549 | $ | 568,312 | $ | 63,237 | ||||||||||||||||||||||||||||||||
|
|
|
|
|
|
|
|
|
|
|
|
|
|||||||||||||||||||||||||||||||||
Note: The changes that are not due solely to volume or rate are allocated to volume and rate based on the proportion of the change in each category.
| [1] | Average balances exclude unrealized gains or losses on debt securities available-for-sale and the unrealized loss related to certain securities transferred from available-for-sale to held-to-maturity. |
22
Popular, Inc.
Financial Supplement to Second Quarter 2025 Earnings Release
Table F - Analysis of Levels and Yields on a Taxable Equivalent Basis (Non-GAAP) - YEAR-TO-DATE
(Unaudited)
| Variance | ||||||||||||||||||||||||||||||||||||||||||||
| Average Volume | Average Yields / Costs | Interest | Attributable to | |||||||||||||||||||||||||||||||||||||||||
| 30-Jun-25 |
30-Jun-24 | Variance | 30-Jun-25 | 30-Jun-24 | Variance | 30-Jun-25 | 30-Jun-24 | Variance | Rate | Volume | ||||||||||||||||||||||||||||||||||
| (In millions) | (In thousands) | |||||||||||||||||||||||||||||||||||||||||||
| $ | 6,314 | $ | 6,477 | $ | (163 | ) | 4.46 | % | 5.49 | % | (1.03 | )% | Money market investments |
$ | 139,698 | $ | 176,832 | $ | (37,134 | ) | $ | (32,791 | ) | $ | (4,343 | ) | ||||||||||||||||||
| 28,613 | 28,626 | (13 | ) | 3.22 | 2.86 | 0.36 | Investment securities [1] |
456,807 | 408,024 | 48,783 | 45,804 | 2,979 | ||||||||||||||||||||||||||||||||
| 29 | 30 | (1 | ) | 5.90 | 4.60 | 1.30 | Trading securities |
847 | 678 | 169 | 186 | (17 | ) | |||||||||||||||||||||||||||||||
|
|
|
|
|
|
|
|
|
|
|
|
|
|
|
|
|
|
|
|
|
|
|
|||||||||||||||||||||||
| 34,956 | 35,133 | (177 | ) | 3.45 | 3.35 | 0.10 | Total money market, investment and trading securities |
597,352 | 585,534 | 11,818 | 13,199 | (1,381 | ) | |||||||||||||||||||||||||||||||
|
|
|
|
|
|
|
|
|
|
|
|
|
|
|
|
|
|
|
|
|
|
|
|||||||||||||||||||||||
| Loans: |
||||||||||||||||||||||||||||||||||||||||||||
| 18,585 | 17,660 | 925 | 6.72 | 6.85 | (0.13 | ) | Commercial |
619,461 | 601,507 | 17,954 | (13,059 | ) | 31,013 | |||||||||||||||||||||||||||||||
| 1,385 | 1,031 | 354 | 8.15 | 9.04 | (0.89 | ) | Construction |
55,995 | 46,324 | 9,671 | (4,994 | ) | 14,665 | |||||||||||||||||||||||||||||||
| 1,951 | 1,766 | 185 | 7.14 | 6.80 | 0.34 | Leasing |
69,693 | 60,051 | 9,642 | 3,129 | 6,513 | |||||||||||||||||||||||||||||||||
| 8,254 | 7,770 | 484 | 5.86 | 5.64 | 0.22 | Mortgage |
241,789 | 219,216 | 22,573 | 8,609 | 13,964 | |||||||||||||||||||||||||||||||||
| 3,207 | 3,208 | (1 | ) | 14.02 | 13.94 | 0.08 | Consumer |
222,989 | 222,396 | 593 | 230 | 363 | ||||||||||||||||||||||||||||||||
| 3,929 | 3,791 | 138 | 9.11 | 8.82 | 0.29 | Auto |
177,511 | 166,322 | 11,189 | 5,010 | 6,179 | |||||||||||||||||||||||||||||||||
|
|
|
|
|
|
|
|
|
|
|
|
|
|
|
|
|
|
|
|
|
|
|
|||||||||||||||||||||||
| 37,311 | 35,226 | 2,085 | 7.49 | 7.50 | (0.01 | ) | Total loans |
1,387,438 | 1,315,816 | 71,622 | (1,075 | ) | 72,697 | |||||||||||||||||||||||||||||||
|
|
|
|
|
|
|
|
|
|
|
|
|
|
|
|
|
|
|
|
|
|
|
|||||||||||||||||||||||
| $ 72,267 | $ | 70,359 | $ | 1,908 | 5.54 | % | 5.43 | % | 0.11 | % | Total earning assets |
$ | 1,984,790 | $ | 1,901,350 | $ | 83,440 | $ | 12,124 | $ | 71,316 | |||||||||||||||||||||||
|
|
|
|
|
|
|
|
|
|
|
|
|
|
|
|
|
|
|
|
|
|
|
|||||||||||||||||||||||
| Interest bearing deposits: |
||||||||||||||||||||||||||||||||||||||||||||
| $8,022 | $ | 7,643 | $ | 379 | 1.72 | % | 1.99 | % | (0.27 | )% | NOW and money market |
$ | 68,290 | $ | 75,548 | $ | (7,258 | ) | $ | (9,978 | ) | $ | 2,720 | |||||||||||||||||||||
| 14,556 | 14,711 | (155 | ) | 0.85 | 0.93 | (0.08 | ) | Savings |
61,658 | 67,873 | (6,215 | ) | (5,274 | ) | (941 | ) | ||||||||||||||||||||||||||||
| 8,466 | 8,029 | 437 | 3.18 | 3.29 | (0.11 | ) | Time deposits |
133,713 | 131,511 | 2,202 | (5,555 | ) | 7,757 | |||||||||||||||||||||||||||||||
| 20,310 | 19,017 | 1,293 | 3.27 | 4.17 | (0.90 | ) | P.R public deposits |
329,260 | 394,503 | (65,243 | ) | (90,446 | ) | 25,203 | ||||||||||||||||||||||||||||||
|
|
|
|
|
|
|
|
|
|
|
|
|
|
|
|
|
|
|
|
|
|
|
|||||||||||||||||||||||
| 51,354 | 49,400 | 1,954 | 2.33 | 2.73 | (0.40 | ) | Total interest bearing deposits |
592,921 | 669,435 | (76,514 | ) | (111,253 | ) | 34,739 | ||||||||||||||||||||||||||||||
|
|
|
|
|
|
|
|
|
|
|
|
|
|
|
|
|
|
|
|
|
|
|
|||||||||||||||||||||||
| 14,758 | 15,129 | (371 | ) | Non-interest bearing demand deposits |
||||||||||||||||||||||||||||||||||||||||
|
|
|
|
|
|
|
|
|
|
|
|
|
|
|
|
|
|
|
|
|
|
|
|||||||||||||||||||||||
| 66,112 | 64,529 | 1,583 | 1.81 | 2.09 | (0.28 | ) | Total deposits |
592,921 | 669,435 | (76,514 | ) | (111,253 | ) | 34,739 | ||||||||||||||||||||||||||||||
|
|
|
|
|
|
|
|
|
|
|
|
|
|
|
|
|
|
|
|
|
|
|
|||||||||||||||||||||||
| 297 | 82 | 215 | 4.57 | 5.67 | (1.10 | ) | Short-term borrowings |
6,726 | 2,318 | 4,408 | (404 | ) | 4,812 | |||||||||||||||||||||||||||||||
| 847 | 988 | (141 | ) | 5.72 | 5.13 | 0.59 | Other medium and long-term debt |
24,077 | 25,239 | (1,162 | ) | 250 | (1,412 | ) | ||||||||||||||||||||||||||||||
|
|
|
|
|
|
|
|
|
|
|
|
|
|
|
|
|
|
|
|
|
|
|
|||||||||||||||||||||||
| 52,498 | 50,470 | 2,028 | 2.40 | 2.78 | (0.38 | ) | Total interest bearing liabilities (excluding demand deposits) |
623,724 | 696,992 | (73,268 | ) | (111,407 | ) | 38,139 | ||||||||||||||||||||||||||||||
|
|
|
|
|
|
|
|
|
|
|
|
|
|
|
|
|
|
|
|
|
|
|
|||||||||||||||||||||||
| 5,011 | 4,760 | 251 | Other sources of funds |
|||||||||||||||||||||||||||||||||||||||||
|
|
|
|
|
|
|
|
|
|
|
|
|
|
|
|
|
|
|
|
|
|
|
|||||||||||||||||||||||
| $ 72,267 | $ | 70,359 | $ | 1,908 | 1.74 | % | 1.99 | % | (0.25 | )% | Total source of funds |
623,724 | 696,992 | (73,268 | ) | (111,407 | ) | 38,139 | ||||||||||||||||||||||||||
| 3.80 | % | 3.44 | % | 0.36 | % | Net interest margin/ income on a taxable equivalent basis (Non-GAAP) |
1,361,066 | 1,204,358 | 156,708 | 123,531 | $ | 33,177 | ||||||||||||||||||||||||||||||||
|
|
|
|
|
|
|
|
|
|
|
|
|
|
|
|
|
|||||||||||||||||||||||||||||
| 3.14 | % | 2.65 | % | 0.49 | % | Net interest spread |
||||||||||||||||||||||||||||||||||||||
|
|
|
|
|
|
|
|||||||||||||||||||||||||||||||||||||||
| Taxable equivalent adjustment |
123,920 | 85,302 | 38,618 | |||||||||||||||||||||||||||||||||||||||||
|
|
|
|
|
|
|
|||||||||||||||||||||||||||||||||||||||
| 3.45 | % | 3.20 | % | 0.25 | % | Net interest margin/ income non-taxable equivalent basis (GAAP) |
$ | 1,237,146 | $ | 1,119,056 | $ | 118,090 | ||||||||||||||||||||||||||||||||
|
|
|
|
|
|
|
|
|
|
|
|
|
|||||||||||||||||||||||||||||||||
Note: The changes that are not due solely to volume or rate are allocated to volume and rate based on the proportion of the change in each category.
| [1] | Average balances exclude unrealized gains or losses on debt securities available-for-sale and the unrealized loss related to certain securities transferred from available-for-sale to held-to-maturity. |
23
Popular, Inc.
Financial Supplement to Second Quarter 2025 Earnings Release
Table G - Mortgage Banking Activities and Other Service Fees
(Unaudited)
Mortgage Banking Activities
| Quarters ended | Variance | Six months ended | Variance | |||||||||||||||||||||||||||||
| (In thousands) |
30-Jun-25 | 31-Mar-25 | 30-Jun-24 | Q2 2025 vs.Q1 2025 |
Q2 2025 vs.Q2 2024 |
30-Jun-25 | 30-Jun-24 | 2025 vs. 2024 |
||||||||||||||||||||||||
| Mortgage servicing fees, net of fair value adjustments: |
||||||||||||||||||||||||||||||||
| Mortgage servicing fees |
$ | 6,912 | $ | 7,168 | $ | 7,602 | $ | (256 | ) | $ | (690 | ) | $ | 14,080 | $ | 15,353 | $ | (1,273 | ) | |||||||||||||
| Mortgage servicing rights fair value adjustments |
(1,954 | ) | (3,570 | ) | (1,945 | ) | 1,616 | (9 | ) | (5,524 | ) | (5,384 | ) | (140 | ) | |||||||||||||||||
|
|
|
|
|
|
|
|
|
|
|
|
|
|
|
|
|
|||||||||||||||||
| Total mortgage servicing fees, net of fair value adjustments |
4,958 | 3,598 | 5,657 | 1,360 | (699 | ) | 8,556 | 9,969 | (1,413 | ) | ||||||||||||||||||||||
|
|
|
|
|
|
|
|
|
|
|
|
|
|
|
|
|
|||||||||||||||||
| Net (loss) gain on sale of loans, including valuation on loans held-for-sale |
(37 | ) | 193 | 2 | (230 | ) | (39 | ) | 156 | 76 | 80 | |||||||||||||||||||||
|
|
|
|
|
|
|
|
|
|
|
|
|
|
|
|
|
|||||||||||||||||
| Trading account (loss) profit: |
||||||||||||||||||||||||||||||||
| Unrealized (losses) gains on outstanding derivative positions |
(8 | ) | (87 | ) | 56 | 79 | (64 | ) | (95 | ) | 157 | (252 | ) | |||||||||||||||||||
| Realized (losses) gains on closed derivative positions |
(10 | ) | 1 | 9 | (11 | ) | (19 | ) | (9 | ) | 12 | (21 | ) | |||||||||||||||||||
|
|
|
|
|
|
|
|
|
|
|
|
|
|
|
|
|
|||||||||||||||||
| Total trading account (loss) profit |
(18 | ) | (86 | ) | 65 | 68 | (83 | ) | (104 | ) | 169 | (273 | ) | |||||||||||||||||||
|
|
|
|
|
|
|
|
|
|
|
|
|
|
|
|
|
|||||||||||||||||
| Losses on repurchased loans, including interest advances |
(31 | ) | (16 | ) | (1 | ) | (15 | ) | (30 | ) | (47 | ) | (131 | ) | 84 | |||||||||||||||||
|
|
|
|
|
|
|
|
|
|
|
|
|
|
|
|
|
|||||||||||||||||
| Total mortgage banking activities |
$ | 4,872 | $ | 3,689 | $ | 5,723 | $ | 1,183 | $ | (851 | ) | $ | 8,561 | $ | 10,083 | $ | (1,522 | ) | ||||||||||||||
|
|
|
|
|
|
|
|
|
|
|
|
|
|
|
|
|
|||||||||||||||||
Other Service Fees
| Quarters ended | Variance | Six months ended | Variance | |||||||||||||||||||||||||||||
| (In thousands) |
30-Jun-25 | 31-Mar-25 | 30-Jun-24 | Q2 2025 vs.Q1 2025 |
Q2 2025 vs.Q2 2024 |
30-Jun-25 | 30-Jun-24 | 2025 vs. 2024 |
||||||||||||||||||||||||
| Other service fees: |
||||||||||||||||||||||||||||||||
| Debit card fees [1] |
$ | 27,918 | $ | 26,432 | $ | 27,176 | $ | 1,486 | $ | 742 | $ | 54,350 | $ | 52,710 | $ | 1,640 | ||||||||||||||||
| Insurance fees |
12,695 | 11,309 | 13,368 | 1,386 | (673 | ) | 24,004 | 28,057 | (4,053 | ) | ||||||||||||||||||||||
| Credit card fees [1] |
32,502 | 30,130 | 30,748 | 2,372 | 1,754 | 62,632 | 60,315 | 2,317 | ||||||||||||||||||||||||
| Sale and administration of investment products |
9,058 | 8,973 | 7,850 | 85 | 1,208 | 18,031 | 15,277 | 2,754 | ||||||||||||||||||||||||
| Trust fees |
6,626 | 6,300 | 6,622 | 326 | 4 | 12,926 | 13,329 | (403 | ) | |||||||||||||||||||||||
| Other fees |
11,723 | 11,364 | 11,099 | 359 | 624 | 23,087 | 21,447 | 1,640 | ||||||||||||||||||||||||
|
|
|
|
|
|
|
|
|
|
|
|
|
|
|
|
|
|||||||||||||||||
| Total other service fees |
$ | 100,522 | $ | 94,508 | $ | 96,863 | $ | 6,014 | $ | 3,659 | $ | 195,030 | $ | 191,135 | $ | 3,895 | ||||||||||||||||
|
|
|
|
|
|
|
|
|
|
|
|
|
|
|
|
|
|||||||||||||||||
| [1] | Effective in the third quarter of 2024, the Corporation is reclassifying certain interchange fees, which were previously included jointly with credit card fees from common network activity, as debit card fees. For the quarter and six-month period ended June 30, 2024, interchange fees of approximately $10.9 million and $22.2 million were reclassified. |
24
Popular, Inc.
Financial Supplement to Second Quarter 2025 Earnings Release
Table H - Consolidated Loans and Deposits
(Unaudited)
Loans - Ending Balances
| Variance | ||||||||||||||||||||||||||||
| (Dollars in thousands) |
30-Jun-25 | 31-Mar-25 | 30-Jun-24 | Q2 2025 vs.Q1 2025 | % of Change | Q2 2025 vs.Q2 2024 | % of Change | |||||||||||||||||||||
| Loans held-in-portfolio: |
|
|||||||||||||||||||||||||||
| Commercial |
||||||||||||||||||||||||||||
| Commercial multi-family |
$ | 2,520,789 | $ | 2,374,915 | $ | 2,384,480 | $ | 145,874 | 6.14 | % | $ | 136,309 | 5.72 | % | ||||||||||||||
| Commercial real estate non-owner occupied |
5,521,374 | 5,540,603 | 5,004,472 | (19,229 | ) | (0.35 | %) | 516,902 | 10.33 | % | ||||||||||||||||||
| Commercial real estate owner occupied |
3,003,855 | 2,956,559 | 3,143,817 | 47,296 | 1.60 | % | (139,962 | ) | (4.45 | %) | ||||||||||||||||||
| Commercial and industrial |
8,043,752 | 7,693,523 | 7,195,357 | 350,229 | 4.55 | % | 848,395 | 11.79 | % | |||||||||||||||||||
| Total Commercial |
19,089,770 | 18,565,600 | 17,728,126 | 524,170 | 2.82 | % | 1,361,644 | 7.68 | % | |||||||||||||||||||
| Construction |
1,468,201 | 1,358,979 | 1,105,759 | 109,222 | 8.04 | % | 362,442 | 32.78 | % | |||||||||||||||||||
| Leasing |
1,983,068 | 1,949,705 | 1,828,048 | 33,363 | 1.71 | % | 155,020 | 8.48 | % | |||||||||||||||||||
| Mortgage |
8,444,427 | 8,273,753 | 7,883,726 | 170,674 | 2.06 | % | 560,701 | 7.11 | % | |||||||||||||||||||
| Consumer |
||||||||||||||||||||||||||||
| Credit cards |
1,215,293 | 1,187,777 | 1,162,557 | 27,516 | 2.32 | % | 52,736 | 4.54 | % | |||||||||||||||||||
| Home equity lines of credit |
77,479 | 77,109 | 68,992 | 370 | 0.48 | % | 8,487 | 12.30 | % | |||||||||||||||||||
| Personal |
1,876,463 | 1,850,023 | 1,879,619 | 26,440 | 1.43 | % | (3,156 | ) | (0.17 | %) | ||||||||||||||||||
| Auto |
3,861,702 | 3,820,242 | 3,773,292 | 41,460 | 1.09 | % | 88,410 | 2.34 | % | |||||||||||||||||||
| Other |
168,775 | 170,844 | 161,501 | (2,069 | ) | (1.21 | %) | 7,274 | 4.50 | % | ||||||||||||||||||
| Total Consumer |
7,199,712 | 7,105,995 | 7,045,961 | 93,717 | 1.32 | % | 153,751 | 2.18 | % | |||||||||||||||||||
|
|
|
|
|
|
|
|
|
|
|
|
|
|
|
|||||||||||||||
| Total loans held-in-portfolio |
$ | 38,185,178 | $ | 37,254,032 | $ | 35,591,620 | $ | 931,146 | 2.50 | % | $ | 2,593,558 | 7.29 | % | ||||||||||||||
| Loans held-for-sale: |
||||||||||||||||||||||||||||
| Mortgage |
$ | 2,898 | $ | 5,077 | $ | 8,225 | $ | (2,179 | ) | (42.92 | %) | $ | (5,327 | ) | (64.77 | %) | ||||||||||||
|
|
|
|
|
|
|
|
|
|
|
|
|
|
|
|||||||||||||||
| Total loans held-for-sale |
$ | 2,898 | $ | 5,077 | $ | 8,225 | $ | (2,179 | ) | (42.92 | %) | $ | (5,327 | ) | (64.77 | %) | ||||||||||||
|
|
|
|
|
|
|
|
|
|
|
|
|
|
|
|||||||||||||||
| Total loans |
$ | 38,188,076 | $ | 37,259,109 | $ | 35,599,845 | $ | 928,967 | 2.49 | % | $ | 2,588,231 | 7.27 | % | ||||||||||||||
|
|
|
|
|
|
|
|
|
|
|
|
|
|
|
|||||||||||||||
Deposits - Ending Balances
| Variance | ||||||||||||||||||||||||||||
| (In thousands) |
30-Jun-25 | 31-Mar-25 | 30-Jun-24 | Q2 2025 vs. Q1 2025 |
% of Change | Q2 2025 vs.Q2 2024 |
% of Change | |||||||||||||||||||||
| Deposits excluding P.R. public deposits: |
||||||||||||||||||||||||||||
| Demand deposits |
$ | 15,114,614 | $ | 15,160,801 | $ | 15,470,082 | $ | (46,187 | ) | (0.30 | %) | $ | (355,468 | ) | (2.30 | %) | ||||||||||||
| Savings, NOW and money market deposits (non-brokered) |
21,554,606 | 21,855,151 | 21,210,000 | (300,545 | ) | (1.38 | %) | 344,606 | 1.62 | % | ||||||||||||||||||
| Savings, NOW and money market deposits (brokered) |
829,506 | 822,065 | 729,326 | 7,441 | 0.91 | % | 100,180 | 13.74 | % | |||||||||||||||||||
| Time deposits (non-brokered) |
7,938,858 | 7,545,252 | 7,427,613 | 393,606 | 5.22 | % | 511,245 | 6.88 | % | |||||||||||||||||||
| Time deposits (brokered CDs) |
861,947 | 813,326 | 971,907 | 48,621 | 5.98 | % | (109,960 | ) | (11.31 | %) | ||||||||||||||||||
|
|
|
|
|
|
|
|
|
|
|
|
|
|
|
|||||||||||||||
| Sub-total deposits excluding P.R. public deposits |
46,299,531 | 46,196,595 | 45,808,928 | 102,936 | 0.22 | % | 490,603 | 1.07 | % | |||||||||||||||||||
|
|
|
|
|
|
|
|
|
|
|
|
|
|
|
|||||||||||||||
| P.R. public deposits: | ||||||||||||||||||||||||||||
| Demand deposits [1] |
12,376,316 | 11,157,254 | 10,409,323 | 1,219,062 | 10.93 | % | 1,966,993 | 18.90 | % | |||||||||||||||||||
| Savings, NOW and money market deposits (non-brokered) |
7,743,663 | 7,655,847 | 8,514,473 | 87,816 | 1.15 | % | (770,810 | ) | (9.05 | %) | ||||||||||||||||||
| Time deposits (non-brokered) |
797,981 | 809,559 | 798,138 | (11,578 | ) | (1.43 | %) | (157 | ) | (0.02 | %) | |||||||||||||||||
|
|
|
|
|
|
|
|
|
|
|
|
|
|
|
|||||||||||||||
| Sub-total P.R. public deposits |
20,917,960 | 19,622,660 | 19,721,934 | 1,295,300 | 6.60 | % | 1,196,026 | 6.06 | % | |||||||||||||||||||
|
|
|
|
|
|
|
|
|
|
|
|
|
|
|
|||||||||||||||
| Total deposits |
$ | 67,217,491 | $ | 65,819,255 | $ | 65,530,862 | $ | 1,398,236 | 2.12 | % | $ | 1,686,629 | 2.57 | % | ||||||||||||||
|
|
|
|
|
|
|
|
|
|
|
|
|
|
|
|||||||||||||||
| [1] | Includes interest bearing demand deposits. |
25
Popular, Inc.
Financial Supplement to Second Quarter 2025 Earnings Release
Table I - Loan Delinquency -BPPR Operations
(Unaudited)
| 30-Jun-25 |
||||||||||||||||||||||||||||||||
| BPPR |
||||||||||||||||||||||||||||||||
| Past due | Past due 90 days or more | |||||||||||||||||||||||||||||||
| (In thousands) |
30-59 days |
60-89 days |
90 days or more |
Total past due |
Current | Loans HIP | Non-accrual loans |
Accruing loans |
||||||||||||||||||||||||
| Commercial multi-family |
$ | 6,337 | $ | — | $ | 174 | $ | 6,511 | $ | 299,852 | $ | 306,363 | $ | 174 | $ | — | ||||||||||||||||
| Commercial real estate: |
||||||||||||||||||||||||||||||||
| Non-owner occupied |
113 | 1,679 | 6,084 | 7,876 | 3,322,108 | 3,329,984 | 6,084 | — | ||||||||||||||||||||||||
| Owner occupied |
1,087 | 2,098 | 27,320 | 30,505 | 1,171,601 | 1,202,106 | 27,320 | — | ||||||||||||||||||||||||
| Commercial and industrial |
4,657 | 2,449 | 12,652 | 19,758 | 5,574,966 | 5,594,724 | 8,588 | 4,064 | ||||||||||||||||||||||||
| Construction |
3,720 | — | — | 3,720 | 249,579 | 253,299 | — | — | ||||||||||||||||||||||||
| Mortgage |
262,525 | 109,530 | 324,140 | 696,195 | 6,407,811 | 7,104,006 | 147,464 | 176,676 | ||||||||||||||||||||||||
| Leasing |
23,109 | 5,629 | 7,976 | 36,714 | 1,946,354 | 1,983,068 | 7,976 | — | ||||||||||||||||||||||||
| Consumer: |
||||||||||||||||||||||||||||||||
| Credit cards |
14,184 | 9,360 | 25,201 | 48,745 | 1,166,545 | 1,215,290 | — | 25,201 | ||||||||||||||||||||||||
| Home equity lines of credit |
— | — | — | — | 1,809 | 1,809 | — | — | ||||||||||||||||||||||||
| Personal |
19,022 | 11,917 | 17,499 | 48,438 | 1,743,772 | 1,792,210 | 17,499 | — | ||||||||||||||||||||||||
| Auto |
102,643 | 22,404 | 40,595 | 165,642 | 3,696,060 | 3,861,702 | 40,595 | — | ||||||||||||||||||||||||
| Other |
2,500 | 160 | 2,212 | 4,872 | 155,550 | 160,422 | 1,948 | 264 | ||||||||||||||||||||||||
|
|
|
|
|
|
|
|
|
|
|
|
|
|
|
|
|
|||||||||||||||||
| Total |
$ | 439,897 | $ | 165,226 | $ | 463,853 | $ | 1,068,976 | $ | 25,736,007 | $ | 26,804,983 | $ | 257,648 | $ | 206,205 | ||||||||||||||||
|
|
|
|
|
|
|
|
|
|
|
|
|
|
|
|
|
|||||||||||||||||
| 31-Mar-25 |
||||||||||||||||||||||||||||||||
| BPPR |
||||||||||||||||||||||||||||||||
| Past due | Past due 90 days or more | |||||||||||||||||||||||||||||||
| (In thousands) |
30-59 days |
60-89 days |
90 days or more |
Total past due |
Current | Loans HIP | Non-accrual loans |
Accruing loans |
||||||||||||||||||||||||
| Commercial multi-family |
$ | 3,387 | $ | 112 | $ | 73 | $ | 3,572 | $ | 304,739 | $ | 308,311 | $ | 73 | $ | — | ||||||||||||||||
| Commercial real estate: |
||||||||||||||||||||||||||||||||
| Non-owner occupied |
3,045 | 74 | 6,306 | 9,425 | 3,304,377 | 3,313,802 | 6,306 | — | ||||||||||||||||||||||||
| Owner occupied |
7,512 | 141 | 26,891 | 34,544 | 1,168,868 | 1,203,412 | 26,891 | — | ||||||||||||||||||||||||
| Commercial and industrial |
4,637 | 2,871 | 13,089 | 20,597 | 5,227,961 | 5,248,558 | 9,327 | 3,762 | ||||||||||||||||||||||||
| Construction |
6,498 | — | — | 6,498 | 223,705 | 230,203 | — | — | ||||||||||||||||||||||||
| Mortgage |
249,712 | 105,166 | 333,557 | 688,435 | 6,257,507 | 6,945,942 | 148,506 | 185,051 | ||||||||||||||||||||||||
| Leasing |
19,178 | 5,192 | 8,895 | 33,265 | 1,916,440 | 1,949,705 | 8,895 | — | ||||||||||||||||||||||||
| Consumer: |
||||||||||||||||||||||||||||||||
| Credit cards |
13,365 | 10,555 | 30,506 | 54,426 | 1,133,352 | 1,187,778 | — | 30,506 | ||||||||||||||||||||||||
| Home equity lines of credit |
— | — | 18 | 18 | 2,039 | 2,057 | — | 18 | ||||||||||||||||||||||||
| Personal |
19,246 | 11,174 | 18,251 | 48,671 | 1,707,204 | 1,755,875 | 18,251 | — | ||||||||||||||||||||||||
| Auto |
78,743 | 15,893 | 41,784 | 136,420 | 3,683,822 | 3,820,242 | 41,784 | — | ||||||||||||||||||||||||
| Other |
2,686 | 144 | 2,307 | 5,137 | 153,586 | 158,723 | 1,973 | 334 | ||||||||||||||||||||||||
|
|
|
|
|
|
|
|
|
|
|
|
|
|
|
|
|
|||||||||||||||||
| Total |
$ | 408,009 | $ | 151,322 | $ | 481,677 | $ | 1,041,008 | $ | 25,083,600 | $ | 26,124,608 | $ | 262,006 | $ | 219,671 | ||||||||||||||||
|
|
|
|
|
|
|
|
|
|
|
|
|
|
|
|
|
|||||||||||||||||
26
| Variance |
||||||||||||||||||||||||||||||||
| Past due | Past due 90 days or more | |||||||||||||||||||||||||||||||
| (In thousands) |
30-59 days |
60-89 days |
90 days or more |
Total past due |
Current | Loans HIP | Non-accrual loans |
Accruing loans |
||||||||||||||||||||||||
| Commercial multi-family |
$ | 2,950 | $ | (112 | ) | $ | 101 | $ | 2,939 | $ | (4,887 | ) | $ | (1,948 | ) | $ | 101 | $ | — | |||||||||||||
| Commercial real estate: |
||||||||||||||||||||||||||||||||
| Non-owner occupied |
(2,932 | ) | 1,605 | (222 | ) | (1,549 | ) | 17,731 | 16,182 | (222 | ) | — | ||||||||||||||||||||
| Owner occupied |
(6,425 | ) | 1,957 | 429 | (4,039 | ) | 2,733 | (1,306 | ) | 429 | — | |||||||||||||||||||||
| Commercial and industrial |
20 | (422 | ) | (437 | ) | (839 | ) | 347,005 | 346,166 | (739 | ) | 302 | ||||||||||||||||||||
| Construction |
(2,778 | ) | — | — | (2,778 | ) | 25,874 | 23,096 | — | — | ||||||||||||||||||||||
| Mortgage |
12,813 | 4,364 | (9,417 | ) | 7,760 | 150,304 | 158,064 | (1,042 | ) | (8,375 | ) | |||||||||||||||||||||
| Leasing |
3,931 | 437 | (919 | ) | 3,449 | 29,914 | 33,363 | (919 | ) | — | ||||||||||||||||||||||
| Consumer: |
||||||||||||||||||||||||||||||||
| Credit cards |
819 | (1,195 | ) | (5,305 | ) | (5,681 | ) | 33,193 | 27,512 | — | (5,305 | ) | ||||||||||||||||||||
| Home equity lines of credit |
— | — | (18 | ) | (18 | ) | (230 | ) | (248 | ) | — | (18 | ) | |||||||||||||||||||
| Personal |
(224 | ) | 743 | (752 | ) | (233 | ) | 36,568 | 36,335 | (752 | ) | — | ||||||||||||||||||||
| Auto |
23,900 | 6,511 | (1,189 | ) | 29,222 | 12,238 | 41,460 | (1,189 | ) | — | ||||||||||||||||||||||
| Other |
(186 | ) | 16 | (95 | ) | (265 | ) | 1,964 | 1,699 | (25 | ) | (70 | ) | |||||||||||||||||||
|
|
|
|
|
|
|
|
|
|
|
|
|
|
|
|
|
|||||||||||||||||
| Total |
$ | 31,888 | $ | 13,904 | $ | (17,824 | ) | $ | 27,968 | $ | 652,407 | $ | 680,375 | $ | (4,358 | ) | $ | (13,466 | ) | |||||||||||||
|
|
|
|
|
|
|
|
|
|
|
|
|
|
|
|
|
|||||||||||||||||
27
Popular, Inc.
Financial Supplement to Second Quarter 2025 Earnings Release
Table J - Loan Delinquency - Popular U.S. Operations
(Unaudited)
| 30-Jun-25 |
||||||||||||||||||||||||||||||||
| Popular U.S. |
||||||||||||||||||||||||||||||||
| Past due | Past due 90 days or more |
|||||||||||||||||||||||||||||||
| (In thousands) |
30-59 days |
60-89 days |
90 days or more |
Total past due |
Current | Loans HIP | Non-accrual loans |
Accruing loans |
||||||||||||||||||||||||
| Commercial multi-family |
$ | — | $ | 4,675 | $ | 10,751 | $ | 15,426 | $ | 2,199,000 | $ | 2,214,426 | $ | 10,751 | $ | — | ||||||||||||||||
| Commercial real estate: |
||||||||||||||||||||||||||||||||
| Non-owner occupied |
1,503 | — | 7,893 | 9,396 | 2,181,994 | 2,191,390 | 7,893 | — | ||||||||||||||||||||||||
| Owner occupied |
10,677 | — | 231 | 10,908 | 1,790,841 | 1,801,749 | 231 | — | ||||||||||||||||||||||||
| Commercial and industrial |
9,235 | 5,195 | 3,025 | 17,455 | 2,431,573 | 2,449,028 | 2,836 | 189 | ||||||||||||||||||||||||
| Construction |
— | — | — | — | 1,214,902 | 1,214,902 | — | — | ||||||||||||||||||||||||
| Mortgage |
677 | 3,329 | 28,052 | 32,058 | 1,308,363 | 1,340,421 | 28,052 | — | ||||||||||||||||||||||||
| Consumer: |
||||||||||||||||||||||||||||||||
| Credit cards |
— | — | — | — | 3 | 3 | — | — | ||||||||||||||||||||||||
| Home equity lines of credit |
845 | 717 | 3,120 | 4,682 | 70,988 | 75,670 | 3,120 | — | ||||||||||||||||||||||||
| Personal |
1,045 | 532 | 1,094 | 2,671 | 81,582 | 84,253 | 1,094 | — | ||||||||||||||||||||||||
| Other |
694 | 1 | — | 695 | 7,658 | 8,353 | — | — | ||||||||||||||||||||||||
|
|
|
|
|
|
|
|
|
|
|
|
|
|
|
|
|
|||||||||||||||||
| Total |
$ | 24,676 | $ | 14,449 | $ | 54,166 | $ | 93,291 | $ | 11,286,904 | $ | 11,380,195 | $ | 53,977 | $ | 189 | ||||||||||||||||
|
|
|
|
|
|
|
|
|
|
|
|
|
|
|
|
|
|||||||||||||||||
|
31-Mar-25 |
||||||||||||||||||||||||||||||||
| Popular U.S. |
||||||||||||||||||||||||||||||||
| Past due | Past due 90 days or more |
|||||||||||||||||||||||||||||||
| (In thousands) |
30-59 days |
60-89 days |
90 days or more |
Total past due |
Current | Loans HIP | Non-accrual loans |
Accruing loans |
||||||||||||||||||||||||
| Commercial multi-family |
$ | 1,858 | $ | — | $ | 8,700 | $ | 10,558 | $ | 2,056,046 | $ | 2,066,604 | $ | 8,700 | $ | — | ||||||||||||||||
| Commercial real estate: |
||||||||||||||||||||||||||||||||
| Non-owner occupied |
768 | — | 7,886 | 8,654 | 2,218,147 | 2,226,801 | 7,886 | — | ||||||||||||||||||||||||
| Owner occupied |
— | — | 231 | 231 | 1,752,916 | 1,753,147 | 231 | — | ||||||||||||||||||||||||
| Commercial and industrial |
7,724 | 733 | 879 | 9,336 | 2,435,629 | 2,444,965 | 690 | 189 | ||||||||||||||||||||||||
| Construction |
— | — | — | — | 1,128,776 | 1,128,776 | — | — | ||||||||||||||||||||||||
| Mortgage |
29,944 | 1,604 | 29,087 | 60,635 | 1,267,176 | 1,327,811 | 29,087 | — | ||||||||||||||||||||||||
| Consumer: |
||||||||||||||||||||||||||||||||
| Credit cards |
— | — | — | — | (1 | ) | (1 | ) | — | — | ||||||||||||||||||||||
| Home equity lines of credit |
1,851 | 973 | 3,430 | 6,254 | 68,798 | 75,052 | 3,430 | — | ||||||||||||||||||||||||
| Personal |
1,381 | 781 | 2,034 | 4,196 | 89,952 | 94,148 | 2,034 | — | ||||||||||||||||||||||||
| Other |
1 | — | 5 | 6 | 12,115 | 12,121 | 5 | — | ||||||||||||||||||||||||
|
|
|
|
|
|
|
|
|
|
|
|
|
|
|
|
|
|||||||||||||||||
| Total |
$ | 43,527 | $ | 4,091 | $ | 52,252 | $ | 99,870 | $ | 11,029,554 | $ | 11,129,424 | $ | 52,063 | $ | 189 | ||||||||||||||||
|
|
|
|
|
|
|
|
|
|
|
|
|
|
|
|
|
|||||||||||||||||
28
| Variance |
||||||||||||||||||||||||||||||||
| Past due | Past due 90 days or more |
|||||||||||||||||||||||||||||||
| (In thousands) |
30-59 days |
60-89 days |
90 days or more |
Total past due |
Current | Loans HIP | Non-accrual loans |
Accruing loans |
||||||||||||||||||||||||
| Commercial multi-family |
$ | (1,858 | ) | $ | 4,675 | $ | 2,051 | $ | 4,868 | $ | 142,954 | $ | 147,822 | $ | 2,051 | $ | — | |||||||||||||||
| Commercial real estate: |
||||||||||||||||||||||||||||||||
| Non-owner occupied |
735 | — | 7 | 742 | (36,153 | ) | (35,411 | ) | 7 | — | ||||||||||||||||||||||
| Owner occupied |
10,677 | — | — | 10,677 | 37,925 | 48,602 | — | — | ||||||||||||||||||||||||
| Commercial and industrial |
1,511 | 4,462 | 2,146 | 8,119 | (4,056 | ) | 4,063 | 2,146 | — | |||||||||||||||||||||||
| Construction |
— | — | — | — | 86,126 | 86,126 | — | — | ||||||||||||||||||||||||
| Mortgage |
(29,267 | ) | 1,725 | (1,035 | ) | (28,577 | ) | 41,187 | 12,610 | (1,035 | ) | — | ||||||||||||||||||||
| Consumer: |
||||||||||||||||||||||||||||||||
| Credit cards |
— | — | — | — | 4 | 4 | — | — | ||||||||||||||||||||||||
| Home equity lines of credit |
(1,006 | ) | (256 | ) | (310 | ) | (1,572 | ) | 2,190 | 618 | (310 | ) | — | |||||||||||||||||||
| Personal |
(336 | ) | (249 | ) | (940 | ) | (1,525 | ) | (8,370 | ) | (9,895 | ) | (940 | ) | — | |||||||||||||||||
| Other |
693 | 1 | (5 | ) | 689 | (4,457 | ) | (3,768 | ) | (5 | ) | — | ||||||||||||||||||||
|
|
|
|
|
|
|
|
|
|
|
|
|
|
|
|
|
|||||||||||||||||
| Total |
$ | (18,851 | ) | $ | 10,358 | $ | 1,914 | $ | (6,579 | ) | $ | 257,350 | $ | 250,771 | $ | 1,914 | $ | — | ||||||||||||||
|
|
|
|
|
|
|
|
|
|
|
|
|
|
|
|
|
|||||||||||||||||
29
Popular, Inc.
Financial Supplement to Second Quarter 2025 Earnings Release
Table K - Loan Delinquency - Consolidated
(Unaudited)
| 30-Jun-25 |
||||||||||||||||||||||||||||||||
| Popular, Inc. |
||||||||||||||||||||||||||||||||
| Past due | Past due 90 days or more | |||||||||||||||||||||||||||||||
| (In thousands) |
30-59 days | 60-89 days | 90 days or more |
Total past due |
Current | Loans HIP | Non-accrual loans |
Accruing loans |
||||||||||||||||||||||||
| Commercial multi-family |
$ | 6,337 | $ | 4,675 | $ | 10,925 | $ | 21,937 | $ | 2,498,852 | $ | 2,520,789 | $ | 10,925 | $ | — | ||||||||||||||||
| Commercial real estate: |
||||||||||||||||||||||||||||||||
| Non-owner occupied |
1,616 | 1,679 | 13,977 | 17,272 | 5,504,102 | 5,521,374 | 13,977 | — | ||||||||||||||||||||||||
| Owner occupied |
11,764 | 2,098 | 27,551 | 41,413 | 2,962,442 | 3,003,855 | 27,551 | — | ||||||||||||||||||||||||
| Commercial and industrial |
13,892 | 7,644 | 15,677 | 37,213 | 8,006,539 | 8,043,752 | 11,424 | 4,253 | ||||||||||||||||||||||||
| Construction |
3,720 | — | — | 3,720 | 1,464,481 | 1,468,201 | — | — | ||||||||||||||||||||||||
| Mortgage |
263,202 | 112,859 | 352,192 | 728,253 | 7,716,174 | 8,444,427 | 175,516 | 176,676 | ||||||||||||||||||||||||
| Leasing |
23,109 | 5,629 | 7,976 | 36,714 | 1,946,354 | 1,983,068 | 7,976 | — | ||||||||||||||||||||||||
| Consumer: |
||||||||||||||||||||||||||||||||
| Credit cards |
14,184 | 9,360 | 25,201 | 48,745 | 1,166,548 | 1,215,293 | — | 25,201 | ||||||||||||||||||||||||
| Home equity lines of credit |
845 | 717 | 3,120 | 4,682 | 72,797 | 77,479 | 3,120 | — | ||||||||||||||||||||||||
| Personal |
20,067 | 12,449 | 18,593 | 51,109 | 1,825,354 | 1,876,463 | 18,593 | — | ||||||||||||||||||||||||
| Auto |
102,643 | 22,404 | 40,595 | 165,642 | 3,696,060 | 3,861,702 | 40,595 | — | ||||||||||||||||||||||||
| Other |
3,194 | 161 | 2,212 | 5,567 | 163,208 | 168,775 | 1,948 | 264 | ||||||||||||||||||||||||
|
|
|
|
|
|
|
|
|
|
|
|
|
|
|
|
|
|||||||||||||||||
| Total |
$ | 464,573 | $ | 179,675 | $ | 518,019 | $ | 1,162,267 | $ | 37,022,911 | $ | 38,185,178 | $ | 311,625 | $ | 206,394 | ||||||||||||||||
|
|
|
|
|
|
|
|
|
|
|
|
|
|
|
|
|
|||||||||||||||||
|
31-Mar-25 |
||||||||||||||||||||||||||||||||
| Popular, Inc. |
||||||||||||||||||||||||||||||||
| Past due | Past due 90 days or more | |||||||||||||||||||||||||||||||
| (In thousands) |
30-59 days | 60-89 days | 90 days or more |
Total past due |
Current | Loans HIP | Non-accrual loans |
Accruing loans |
||||||||||||||||||||||||
| Commercial multi-family |
$ | 5,245 | $ | 112 | $ | 8,773 | $ | 14,130 | $ | 2,360,785 | $ | 2,374,915 | $ | 8,773 | $ | — | ||||||||||||||||
| Commercial real estate: |
||||||||||||||||||||||||||||||||
| Non-owner occupied |
3,813 | 74 | 14,192 | 18,079 | 5,522,524 | 5,540,603 | 14,192 | — | ||||||||||||||||||||||||
| Owner occupied |
7,512 | 141 | 27,122 | 34,775 | 2,921,784 | 2,956,559 | 27,122 | — | ||||||||||||||||||||||||
| Commercial and industrial |
12,361 | 3,604 | 13,968 | 29,933 | 7,663,590 | 7,693,523 | 10,017 | 3,951 | ||||||||||||||||||||||||
| Construction |
6,498 | — | — | 6,498 | 1,352,481 | 1,358,979 | — | — | ||||||||||||||||||||||||
| Mortgage |
279,656 | 106,770 | 362,644 | 749,070 | 7,524,683 | 8,273,753 | 177,593 | 185,051 | ||||||||||||||||||||||||
| Leasing |
19,178 | 5,192 | 8,895 | 33,265 | 1,916,440 | 1,949,705 | 8,895 | — | ||||||||||||||||||||||||
| Consumer: |
||||||||||||||||||||||||||||||||
| Credit cards |
13,365 | 10,555 | 30,506 | 54,426 | 1,133,351 | 1,187,777 | — | 30,506 | ||||||||||||||||||||||||
| Home equity lines of credit |
1,851 | 973 | 3,448 | 6,272 | 70,837 | 77,109 | 3,430 | 18 | ||||||||||||||||||||||||
| Personal |
20,627 | 11,955 | 20,285 | 52,867 | 1,797,156 | 1,850,023 | 20,285 | — | ||||||||||||||||||||||||
| Auto |
78,743 | 15,893 | 41,784 | 136,420 | 3,683,822 | 3,820,242 | 41,784 | — | ||||||||||||||||||||||||
| Other |
2,687 | 144 | 2,312 | 5,143 | 165,701 | 170,844 | 1,978 | 334 | ||||||||||||||||||||||||
|
|
|
|
|
|
|
|
|
|
|
|
|
|
|
|
|
|||||||||||||||||
| Total |
$ | 451,536 | $ | 155,413 | $ | 533,929 | $ | 1,140,878 | $ | 36,113,154 | $ | 37,254,032 | $ | 314,069 | $ | 219,860 | ||||||||||||||||
|
|
|
|
|
|
|
|
|
|
|
|
|
|
|
|
|
|||||||||||||||||
30
| Variance |
||||||||||||||||||||||||||||||||
| Past due | Past due 90 days or more | |||||||||||||||||||||||||||||||
| (In thousands) |
30-59 days |
60-89 days |
90 days or more |
Total past due |
Current | Loans HIP | Non-accrual loans |
Accruing loans |
||||||||||||||||||||||||
| Commercial multi-family |
$ | 1,092 | $ | 4,563 | $ | 2,152 | $ | 7,807 | $ | 138,067 | $ | 145,874 | $ | 2,152 | $ | — | ||||||||||||||||
| Commercial real estate: |
||||||||||||||||||||||||||||||||
| Non-owner occupied |
(2,197 | ) | 1,605 | (215 | ) | (807 | ) | (18,422 | ) | (19,229 | ) | (215 | ) | — | ||||||||||||||||||
| Owner occupied |
4,252 | 1,957 | 429 | 6,638 | 40,658 | 47,296 | 429 | — | ||||||||||||||||||||||||
| Commercial and industrial |
1,531 | 4,040 | 1,709 | 7,280 | 342,949 | 350,229 | 1,407 | 302 | ||||||||||||||||||||||||
| Construction |
(2,778 | ) | — | — | (2,778 | ) | 112,000 | 109,222 | — | — | ||||||||||||||||||||||
| Mortgage |
(16,454 | ) | 6,089 | (10,452 | ) | (20,817 | ) | 191,491 | 170,674 | (2,077 | ) | (8,375 | ) | |||||||||||||||||||
| Leasing |
3,931 | 437 | (919 | ) | 3,449 | 29,914 | 33,363 | (919 | ) | — | ||||||||||||||||||||||
| Consumer: |
||||||||||||||||||||||||||||||||
| Credit cards |
819 | (1,195 | ) | (5,305 | ) | (5,681 | ) | 33,197 | 27,516 | — | (5,305 | ) | ||||||||||||||||||||
| Home equity lines of credit |
(1,006 | ) | (256 | ) | (328 | ) | (1,590 | ) | 1,960 | 370 | (310 | ) | (18 | ) | ||||||||||||||||||
| Personal |
(560 | ) | 494 | (1,692 | ) | (1,758 | ) | 28,198 | 26,440 | (1,692 | ) | — | ||||||||||||||||||||
| Auto |
23,900 | 6,511 | (1,189 | ) | 29,222 | 12,238 | 41,460 | (1,189 | ) | — | ||||||||||||||||||||||
| Other |
507 | 17 | (100 | ) | 424 | (2,493 | ) | (2,069 | ) | (30 | ) | (70 | ) | |||||||||||||||||||
|
|
|
|
|
|
|
|
|
|
|
|
|
|
|
|
|
|||||||||||||||||
| Total |
$ | 13,037 | $ | 24,262 | $ | (15,910 | ) | $ | 21,389 | $ | 909,757 | $ | 931,146 | $ | (2,444 | ) | $ | (13,466 | ) | |||||||||||||
|
|
|
|
|
|
|
|
|
|
|
|
|
|
|
|
|
|||||||||||||||||
31
Popular, Inc.
Financial Supplement to Second Quarter 2025 Earnings Release
Table L - Non-Performing Assets
(Unaudited)
| Variance | ||||||||||||||||||||||||||||||||
| (Dollars in thousands) |
30-Jun-25 | As a % of loans HIP by category |
31-Mar-25 | As a % of loans HIP by category |
30-Jun-24 | As a % of loans HIP by category |
Q2 2025 vs. Q1 2025 |
Q2 2025 vs. Q2 2024 |
||||||||||||||||||||||||
| Non-accrual loans: |
||||||||||||||||||||||||||||||||
| Commercial |
||||||||||||||||||||||||||||||||
| Commercial multi-family |
$ | 10,925 | 0.4 | % | $ | 8,773 | 0.4 | % | $ | 9,143 | 0.4 | % | $ | 2,152 | $ | 1,782 | ||||||||||||||||
| Commercial real estate non-owner occupied |
13,977 | 0.3 | 14,192 | 0.3 | 8,509 | 0.2 | (215 | ) | 5,468 | |||||||||||||||||||||||
| Commercial real estate owner occupied |
27,551 | 0.9 | 27,122 | 0.9 | 47,541 | 1.5 | 429 | (19,990 | ) | |||||||||||||||||||||||
| Commercial and industrial |
11,424 | 0.1 | 10,017 | 0.1 | 28,740 | 0.4 | 1,407 | (17,316 | ) | |||||||||||||||||||||||
| Total Commercial |
63,877 | 0.3 | 60,104 | 0.3 | 93,933 | 0.5 | 3,773 | (30,056 | ) | |||||||||||||||||||||||
| Leasing |
7,976 | 0.4 | 8,895 | 0.5 | 7,059 | 0.4 | (919 | ) | 917 | |||||||||||||||||||||||
| Mortgage |
175,516 | 2.1 | 177,593 | 2.1 | 175,344 | 2.2 | (2,077 | ) | 172 | |||||||||||||||||||||||
| Consumer |
||||||||||||||||||||||||||||||||
| Home equity lines of credit |
3,120 | 4.0 | 3,430 | 4.4 | 3,780 | 5.5 | (310 | ) | (660 | ) | ||||||||||||||||||||||
| Personal |
18,593 | 1.0 | 20,285 | 1.1 | 21,501 | 1.1 | (1,692 | ) | (2,908 | ) | ||||||||||||||||||||||
| Auto |
40,595 | 1.1 | 41,784 | 1.1 | 39,333 | 1.0 | (1,189 | ) | 1,262 | |||||||||||||||||||||||
| Other |
1,948 | 1.2 | 1,978 | 1.2 | 885 | 0.5 | (30 | ) | 1,063 | |||||||||||||||||||||||
| Total Consumer |
64,256 | 0.9 | 67,477 | 0.9 | 65,499 | 0.9 | (3,221 | ) | (1,243 | ) | ||||||||||||||||||||||
|
|
|
|
|
|
|
|
|
|
|
|
|
|
|
|
|
|||||||||||||||||
| Total non-performing loans held-in-portfolio |
311,625 | 0.8 | % | 314,069 | 0.8 | % | 341,835 | 1.0 | % | (2,444 | ) | (30,210 | ) | |||||||||||||||||||
| Other real estate owned (“OREO”) |
46,126 | 52,114 | 70,225 | (5,988 | ) | (24,099 | ) | |||||||||||||||||||||||||
|
|
|
|
|
|
|
|
|
|
|
|||||||||||||||||||||||
| Total non-performing assets [1] |
357,751 | 366,183 | 412,060 | (8,432 | ) | (54,309 | ) | |||||||||||||||||||||||||
|
|
|
|
|
|
|
|
|
|
|
|
|
|
|
|
|
|||||||||||||||||
| Accruing loans past due 90 days or more [2] |
$ | 206,394 | $ | 219,860 | $ | 237,581 | $ | (13,466 | ) | $ | (31,187 | ) | ||||||||||||||||||||
|
|
|
|
|
|
|
|
|
|
|
|||||||||||||||||||||||
| Ratios: |
||||||||||||||||||||||||||||||||
| Non-performing assets to total assets |
0.47 | % | 0.49 | % | 0.57 | % | ||||||||||||||||||||||||||
| Non-performing loans held-in-portfolio to loans held-in-portfolio |
0.82 | 0.84 | 0.96 | |||||||||||||||||||||||||||||
| Allowance for credit losses to loans held-in-portfolio |
2.02 | 2.05 | 2.05 | |||||||||||||||||||||||||||||
| Allowance for credit losses to non-performing loans, excluding loans held-for-sale |
246.93 | 242.67 | 213.58 | |||||||||||||||||||||||||||||
|
|
|
|
|
|
|
|
|
|
|
|
|
|
|
|
|
|||||||||||||||||
| [1] | There were no non-performing loans held-for-sale as of June 30, 2025, March 31, 2025 and June 30, 2024. |
| [2] | It is the Corporation’s policy to report delinquent residential mortgage loans insured by FHA or guaranteed by the VA as accruing loans past due 90 days or more as opposed to non-performing since the principal repayment is insured. The balance of these loans includes $8 million at June 30, 2025, related to the rebooking of loans previously pooled into GNMA securities, in which the Corporation had a buy-back option as further described below (March 31, 2025 - $7 million; June 30, 2024 - $10 million). Under the GNMA program, issuers such as BPPR have the option but not the obligation to repurchase loans that are 90 days or more past due. For accounting purposes, these loans subject to the repurchase option are required to be reflected (rebooked) on the financial statements of BPPR with an offsetting liability. These balances include $52 million of residential mortgage loans insured by FHA or guaranteed by the VA that are no longer accruing interest as of June 30, 2025 (March 31, 2025 - $57 million; June 30, 2024 - $81 million). Furthermore, the Corporation has approximately $29 million reverse mortgage loans which are guaranteed by FHA, as of June 30, 2025. Due to the guaranteed nature of the loans, it is the Corporation’s policy to exclude these balances from non-performing assets (March 31, 2025 - $30 million; June 30, 2024 - $34 million). |
32
Popular, Inc.
Financial Supplement to Second Quarter 2025 Earnings Release
Table M - Activity in Non-Performing Loans
(Unaudited)
Commercial loans held-in-portfolio:
| Quarter ended | Quarter ended | |||||||||||||||||||||||
| 30-Jun-25 | 31-Mar-25 | |||||||||||||||||||||||
| (In thousands) |
BPPR | Popular U.S. | Popular, Inc. | BPPR | Popular U.S. | Popular, Inc. | ||||||||||||||||||
| Beginning balance NPLs | $ | 42,597 | $ | 17,507 | $ | 60,104 | $ | 51,101 | $ | 23,654 | $ | 74,755 | ||||||||||||
| Plus: |
||||||||||||||||||||||||
| New non-performing loans |
1,768 | 5,632 | 7,400 | 5,781 | 5,413 | 11,194 | ||||||||||||||||||
| Advances on existing non-performing loans |
— | 20 | 20 | — | 17 | 17 | ||||||||||||||||||
| Less: |
||||||||||||||||||||||||
| Non-performing loans transferred to OREO |
(140 | ) | — | (140 | ) | (120 | ) | — | (120 | ) | ||||||||||||||
| Non-performing loans charged-off |
(403 | ) | (583 | ) | (986 | ) | (739 | ) | (1,130 | ) | (1,869 | ) | ||||||||||||
| Loans returned to accrual status / loan collections |
(1,656 | ) | (865 | ) | (2,521 | ) | (13,426 | ) | (10,447 | ) | (23,873 | ) | ||||||||||||
|
|
|
|
|
|
|
|
|
|
|
|
|
|||||||||||||
| Ending balance NPLs | $ | 42,166 | $ | 21,711 | $ | 63,877 | $ | 42,597 | $ | 17,507 | $ | 60,104 | ||||||||||||
|
|
|
|
|
|
|
|
|
|
|
|
|
|||||||||||||
| Mortgage loans held-in-portfolio:
|
|
|||||||||||||||||||||||
| Quarter ended | Quarter ended | |||||||||||||||||||||||
| 30-Jun-25 | 31-Mar-25 | |||||||||||||||||||||||
| (In thousands) |
BPPR | Popular U.S. | Popular, Inc. | BPPR | Popular U.S. | Popular, Inc. | ||||||||||||||||||
| Beginning balance NPLs | $ | 148,506 | $ | 29,087 | $ | 177,593 | $ | 158,442 | $ | 29,890 | $ | 188,332 | ||||||||||||
| Plus: | ||||||||||||||||||||||||
| New non-performing loans |
30,437 | 3,277 | 33,714 | 31,242 | 2,745 | 33,987 | ||||||||||||||||||
| Advances on existing non-performing loans |
— | — | — | — | 1 | 1 | ||||||||||||||||||
| Less: |
||||||||||||||||||||||||
| Non-performing loans transferred to OREO |
(2,245 | ) | (433 | ) | (2,678 | ) | (2,435 | ) | — | (2,435 | ) | |||||||||||||
| Non-performing loans charged-off |
(387 | ) | — | (387 | ) | (188 | ) | — | (188 | ) | ||||||||||||||
| Loans returned to accrual status / loan collections |
(28,847 | ) | (3,879 | ) | (32,726 | ) | (38,555 | ) | (3,549 | ) | (42,104 | ) | ||||||||||||
|
|
|
|
|
|
|
|
|
|
|
|
|
|||||||||||||
| Ending balance NPLs | $ | 147,464 | $ | 28,052 | $ | 175,516 | $ | 148,506 | $ | 29,087 | $ | 177,593 | ||||||||||||
|
|
|
|
|
|
|
|
|
|
|
|
|
|||||||||||||
| Total non-performing loans held-in-portfolio (excluding consumer):
|
|
|||||||||||||||||||||||
| Quarter ended | Quarter ended | |||||||||||||||||||||||
| 30-Jun-25 | 31-Mar-25 | |||||||||||||||||||||||
| (In thousands) |
BPPR | Popular U.S. | Popular, Inc. | BPPR | Popular U.S. | Popular, Inc. | ||||||||||||||||||
| Beginning balance NPLs | $ | 191,103 | $ | 46,594 | $ | 237,697 | $ | 209,543 | $ | 53,544 | $ | 263,087 | ||||||||||||
| Plus: | ||||||||||||||||||||||||
| New non-performing loans |
32,205 | 8,909 | 41,114 | 37,023 | 8,158 | 45,181 | ||||||||||||||||||
| Advances on existing non-performing loans |
— | 20 | 20 | — | 18 | 18 | ||||||||||||||||||
| Less: |
||||||||||||||||||||||||
| Non-performing loans transferred to OREO |
(2,385 | ) | (433 | ) | (2,818 | ) | (2,555 | ) | — | (2,555 | ) | |||||||||||||
| Non-performing loans charged-off |
(790 | ) | (583 | ) | (1,373 | ) | (927 | ) | (1,130 | ) | (2,057 | ) | ||||||||||||
| Loans returned to accrual status / loan collections |
(30,503 | ) | (4,744 | ) | (35,247 | ) | (51,981 | ) | (13,996 | ) | (65,977 | ) | ||||||||||||
|
|
|
|
|
|
|
|
|
|
|
|
|
|||||||||||||
| Ending balance NPLs |
$ | 189,630 | $ | 49,763 | $ | 239,393 | $ | 191,103 | $ | 46,594 | $ | 237,697 | ||||||||||||
|
|
|
|
|
|
|
|
|
|
|
|
|
|||||||||||||
33
Popular, Inc.
Financial Supplement to Second Quarter 2025 Earnings Release
Table N - Allowance for Credit Losses, Net Charge-offs and Related Ratios
(Unaudited)
| Quarters ended | ||||||||||||
| (In thousands) | 30-Jun-25 | 31-Mar-25 | 30-Jun-24 | |||||||||
|
|
|
|
|
|
|
|||||||
| Balance at beginning of period - loans held-in-portfolio | $ | 762,148 | $ | 746,024 | $ | 739,544 | ||||||
| Provision for credit losses | 49,539 | 65,218 | 44,157 | |||||||||
| Initial allowance for credit losses - PCD Loans | — | 9 | 6 | |||||||||
|
|
|
|
|
|
|
|||||||
| 811,687 | 811,251 | 783,707 | ||||||||||
|
|
|
|
|
|
|
|||||||
| Net loans charge-off (recovered)- BPPR | ||||||||||||
| Commercial: | ||||||||||||
| Commercial multi-family |
(6 | ) | (2 | ) | — | |||||||
| Commercial real estate non-owner occupied |
(451 | ) | (595 | ) | (44 | ) | ||||||
| Commercial real estate owner occupied |
(1,005 | ) | (406 | ) | (1,134 | ) | ||||||
| Commercial and industrial |
1,436 | (1,528 | ) | 6,021 | ||||||||
| Total Commercial | (26 | ) | (2,531 | ) | 4,843 | |||||||
| Leasing | 2,736 | 3,272 | 2,700 | |||||||||
| Mortgage | (2,429 | ) | (2,497 | ) | (3,749 | ) | ||||||
| Consumer: | ||||||||||||
| Credit cards |
17,311 | 16,429 | 13,712 | |||||||||
| Home equity lines of credit |
(307 | ) | (114 | ) | 41 | |||||||
| Personal |
15,776 | 18,338 | 20,975 | |||||||||
| Auto |
6,557 | 13,487 | 10,257 | |||||||||
| Other Consumer |
546 | 718 | 529 | |||||||||
| Total Consumer | 39,883 | 48,858 | 45,514 | |||||||||
|
|
|
|
|
|
|
|||||||
| Total net charged-off BPPR | $ | 40,164 | $ | 47,102 | $ | 49,308 | ||||||
|
|
|
|
|
|
|
|||||||
| Net loans charge-off (recovered) - Popular U.S. | ||||||||||||
| Commercial: | ||||||||||||
| Commercial multi-family |
563 | (1 | ) | (4 | ) | |||||||
| Commercial real estate non-owner occupied |
— | — | (42 | ) | ||||||||
| Commercial real estate owner occupied |
(26 | ) | (511 | ) | (59 | ) | ||||||
| Commercial and industrial |
(205 | ) | 925 | 988 | ||||||||
| Total Commercial | 332 | 413 | 883 | |||||||||
| Construction | — | — | (100 | ) | ||||||||
| Mortgage | (32 | ) | (185 | ) | (17 | ) | ||||||
| Consumer: | ||||||||||||
| Home equity lines of credit |
(579 | ) | (237 | ) | (383 | ) | ||||||
| Personal |
2,305 | 1,989 | 3,941 | |||||||||
| Other Consumer |
12 | 21 | (2 | ) | ||||||||
| Total Consumer | 1,738 | 1,773 | 3,556 | |||||||||
|
|
|
|
|
|
|
|||||||
| Total net charged-off Popular U.S. | $ | 2,038 | $ | 2,001 | $ | 4,322 | ||||||
|
|
|
|
|
|
|
|||||||
| Total loans net charged-off - Popular, Inc. | $ | 42,202 | $ | 49,103 | $ | 53,630 | ||||||
|
|
|
|
|
|
|
|||||||
| Balance at end of period - loans held-in-portfolio | $ | 769,485 | $ | 762,148 | $ | 730,077 | ||||||
|
|
|
|
|
|
|
|||||||
| Balance at beginning of period - unfunded commitments | $ | 14,169 | $ | 15,470 | $ | 16,767 | ||||||
| Provision for credit losses (benefit) | (1,116 | ) | (1,301 | ) | 2,117 | |||||||
|
|
|
|
|
|
|
|||||||
| Balance at end of period - unfunded commitments [1] |
$ | 13,053 | $ | 14,169 | $ | 18,884 | ||||||
|
|
|
|
|
|
|
|||||||
| POPULAR, INC. | ||||||||||||
| Annualized net charge-offs (recoveries) to average loans held-in-portfolio | 0.45 | % | 0.53 | % | 0.61 | % | ||||||
| Provision for credit losses (benefit) - loan portfolios to net charge-offs | 117.39 | % | 132.82 | % | 82.34 | % | ||||||
| BPPR | ||||||||||||
| Annualized net charge-offs (recoveries) to average loans held-in-portfolio | 0.61 | % | 0.72 | % | 0.79 | % | ||||||
| Provision for credit losses (benefit) - loan portfolios to net charge-offs | 107.43 | % | 111.86 | % | 98.53 | % | ||||||
| Popular U.S. | ||||||||||||
| Annualized net charge-offs (recoveries) to average loans held-in-portfolio | 0.07 | % | 0.07 | % | 0.16 | % | ||||||
| Provision for credit losses (benefit) - loan portfolios to net charge-offs | 313.49 | % | 626.09 | % | (102.45 | )% | ||||||
|
|
|
|
|
|
|
|||||||
| [1] Allowance for credit losses of unfunded commitments is presented as part of Other Liabilities in the Consolidated Statements of Financial Condition. |
|
|||||||||||
34
Popular, Inc.
Financial Supplement to Second Quarter 2025 Earnings Release
Table O - Allowance for Credit Losses “ACL”- Loan Portfolios - BPPR Operations
(Unaudited)
| 30-Jun-25 |
||||||||||||
| BPPR |
||||||||||||
| (Dollars in thousands) |
Total ACL | Total loans held-in-portfolio | ACL to loans held-in-portfolio | |||||||||
| Commercial: | ||||||||||||
| Commercial multi-family |
$ | 3,696 | $ | 306,363 | 1.21 | % | ||||||
| Commercial real estate - non-owner occupied |
43,139 | 3,329,984 | 1.30 | % | ||||||||
| Commercial real estate - owner occupied |
35,848 | 1,202,106 | 2.98 | % | ||||||||
| Commercial and industrial |
123,202 | 5,594,724 | 2.20 | % | ||||||||
|
|
|
|
|
|
|
|||||||
| Total commercial | $ | 205,885 | $ | 10,433,177 | 1.97 | % | ||||||
|
|
|
|
|
|
|
|||||||
| Construction | 3,075 | 253,299 | 1.21 | % | ||||||||
| Mortgage | 74,966 | 7,104,006 | 1.06 | % | ||||||||
| Leasing | 20,040 | 1,983,068 | 1.01 | % | ||||||||
| Consumer: | ||||||||||||
| Credit cards |
92,306 | 1,215,290 | 7.60 | % | ||||||||
| Home equity lines of credit |
54 | 1,809 | 2.99 | % | ||||||||
| Personal |
92,891 | 1,792,210 | 5.18 | % | ||||||||
| Auto |
182,274 | 3,861,702 | 4.72 | % | ||||||||
| Other |
7,758 | 160,422 | 4.84 | % | ||||||||
|
|
|
|
|
|
|
|||||||
| Total consumer | $ | 375,283 | $ | 7,031,433 | 5.34 | % | ||||||
|
|
|
|
|
|
|
|||||||
| Total | $ | 679,249 | $ | 26,804,983 | 2.53 | % | ||||||
|
|
|
|
|
|
|
|||||||
| 31-Mar-25 |
||||||||||||
| BPPR |
||||||||||||
| (Dollars in thousands) |
Total ACL | Total loans held-in-portfolio | ACL to loans held-in-portfolio | |||||||||
| Commercial: | ||||||||||||
| Commercial multi-family |
$ | 3,420 | $ | 308,311 | 1.11 | % | ||||||
| Commercial real estate - non-owner occupied |
42,848 | 3,313,802 | 1.29 | % | ||||||||
| Commercial real estate - owner occupied |
36,019 | 1,203,412 | 2.99 | % | ||||||||
| Commercial and industrial |
131,407 | 5,248,558 | 2.50 | % | ||||||||
|
|
|
|
|
|
|
|||||||
| Total commercial | $ | 213,694 | $ | 10,074,083 | 2.12 | % | ||||||
|
|
|
|
|
|
|
|||||||
| Construction | 2,719 | 230,203 | 1.18 | % | ||||||||
| Mortgage | 74,289 | 6,945,942 | 1.07 | % | ||||||||
| Leasing | 20,206 | 1,949,705 | 1.04 | % | ||||||||
| Consumer: | ||||||||||||
| Credit cards |
96,523 | 1,187,778 | 8.13 | % | ||||||||
| Home equity lines of credit |
60 | 2,057 | 2.92 | % | ||||||||
| Personal |
89,786 | 1,755,875 | 5.11 | % | ||||||||
| Auto |
171,979 | 3,820,242 | 4.50 | % | ||||||||
| Other |
7,007 | 158,723 | 4.41 | % | ||||||||
|
|
|
|
|
|
|
|||||||
| Total consumer | $ | 365,355 | $ | 6,924,675 | 5.28 | % | ||||||
|
|
|
|
|
|
|
|||||||
| Total | $ | 676,263 | $ | 26,124,608 | 2.59 | % | ||||||
|
|
|
|
|
|
|
|||||||
35
| Variance |
||||||||||||
| (Dollars in thousands) |
Total ACL | Total loans held-in-portfolio | ACL to loans held-in-portfolio | |||||||||
| Commercial: | ||||||||||||
| Commercial multi-family |
$ | 276 | $ | (1,948 | ) | 0.10 | % | |||||
| Commercial real estate - non-owner occupied |
291 | 16,182 | 0.01 | % | ||||||||
| Commercial real estate - owner occupied |
(171 | ) | (1,306 | ) | (0.01 | )% | ||||||
| Commercial and industrial |
(8,205 | ) | 346,166 | (0.30 | )% | |||||||
|
|
|
|
|
|
|
|||||||
| Total commercial | $ | (7,809 | ) | $ | 359,094 | (0.15 | )% | |||||
|
|
|
|
|
|
|
|||||||
| Construction | 356 | 23,096 | 0.03 | % | ||||||||
| Mortgage | 677 | 158,064 | (0.01 | )% | ||||||||
| Leasing | (166 | ) | 33,363 | (0.03 | )% | |||||||
| Consumer: | ||||||||||||
| Credit cards |
(4,217 | ) | 27,512 | (0.53 | )% | |||||||
| Home equity lines of credit |
(6 | ) | (248 | ) | 0.07 | % | ||||||
| Personal |
3,105 | 36,335 | 0.07 | % | ||||||||
| Auto |
10,295 | 41,460 | 0.22 | % | ||||||||
| Other |
751 | 1,699 | 0.43 | % | ||||||||
|
|
|
|
|
|
|
|||||||
| Total consumer | $ | 9,928 | $ | 106,758 | 0.06 | % | ||||||
|
|
|
|
|
|
|
|||||||
| Total | $ | 2,986 | $ | 680,375 | (0.06 | )% | ||||||
|
|
|
|
|
|
|
|||||||
36
Popular, Inc.
Financial Supplement to Second Quarter 2025 Earnings Release
Table P - Allowance for Credit Losses “ACL”- Loan Portfolios - POPULAR U.S. Operations
(Unaudited)
| 30-Jun-25 |
||||||||||||
| Popular U.S. |
||||||||||||
| (Dollars in thousands) |
Total ACL | Total loans held-in-portfolio | ACL to loans held-in-portfolio | |||||||||
| Commercial: | ||||||||||||
| Commercial multi-family |
$ | 13,085 | $ | 2,214,426 | 0.59 | % | ||||||
| Commercial real estate - non-owner occupied |
15,978 | 2,191,390 | 0.73 | % | ||||||||
| Commercial real estate - owner occupied |
13,203 | 1,801,749 | 0.73 | % | ||||||||
| Commercial and industrial |
18,160 | 2,449,028 | 0.74 | % | ||||||||
|
|
|
|
|
|
|
|||||||
| Total commercial | $ | 60,426 | $ | 8,656,593 | 0.70 | % | ||||||
|
|
|
|
|
|
|
|||||||
| Construction | 7,504 | 1,214,902 | 0.62 | % | ||||||||
| Mortgage | 10,209 | 1,340,421 | 0.76 | % | ||||||||
| Consumer: | ||||||||||||
| Credit cards |
— | 3 | - | % | ||||||||
| Home equity lines of credit |
1,330 | 75,670 | 1.76 | % | ||||||||
| Personal |
10,763 | 84,253 | 12.77 | % | ||||||||
| Other |
4 | 8,353 | 0.05 | % | ||||||||
|
|
|
|
|
|
|
|||||||
| Total consumer | $ | 12,097 | $ | 168,279 | 7.19 | % | ||||||
|
|
|
|
|
|
|
|||||||
| Total | $ | 90,236 | $ | 11,380,195 | 0.79 | % | ||||||
|
|
|
|
|
|
|
|||||||
| 31-Mar-25 |
||||||||||||
| Popular U.S. |
||||||||||||
| (Dollars in thousands) |
Total ACL | Total loans held-in-portfolio | ACL to loans held-in-portfolio | |||||||||
| Commercial: | ||||||||||||
| Commercial multi-family |
$ | 10,081 | $ | 2,066,604 | 0.49 | % | ||||||
| Commercial real estate - non-owner occupied |
15,453 | 2,226,801 | 0.69 | % | ||||||||
| Commercial real estate - owner occupied |
14,193 | 1,753,147 | 0.81 | % | ||||||||
| Commercial and industrial |
16,422 | 2,444,965 | 0.67 | % | ||||||||
|
|
|
|
|
|
|
|||||||
| Total commercial | $ | 56,149 | $ | 8,491,517 | 0.66 | % | ||||||
|
|
|
|
|
|
|
|||||||
| Construction | 6,793 | 1,128,776 | 0.60 | % | ||||||||
| Mortgage | 9,740 | 1,327,811 | 0.73 | % | ||||||||
| Consumer: | ||||||||||||
| Credit cards |
— | (1 | ) | — | % | |||||||
| Home equity lines of credit |
1,550 | 75,052 | 2.07 | % | ||||||||
| Personal |
11,651 | 94,148 | 12.38 | % | ||||||||
| Other |
2 | 12,121 | 0.02 | % | ||||||||
|
|
|
|
|
|
|
|||||||
| Total consumer | $ | 13,203 | $ | 181,320 | 7.28 | % | ||||||
|
|
|
|
|
|
|
|||||||
| Total |
$ | 85,885 | $ | 11,129,424 | 0.77 | % | ||||||
|
|
|
|
|
|
|
|||||||
37
| Variance |
||||||||||||
| (Dollars in thousands) |
Total ACL | Total loans held-in-portfolio | ACL to loans held-in-portfolio | |||||||||
| Commercial: | ||||||||||||
| Commercial multi-family |
$ | 3,004 | $ | 147,822 | 0.10 | % | ||||||
| Commercial real estate - non-owner occupied |
525 | (35,411 | ) | 0.04 | % | |||||||
| Commercial real estate - owner occupied |
(990 | ) | 48,602 | (0.08 | )% | |||||||
| Commercial and industrial |
1,738 | 4,063 | 0.07 | % | ||||||||
|
|
|
|
|
|
|
|||||||
| Total commercial | $ | 4,277 | $ | 165,076 | 0.04 | % | ||||||
|
|
|
|
|
|
|
|||||||
| Construction | 711 | 86,126 | 0.02 | % | ||||||||
| Mortgage | 469 | 12,610 | 0.03 | % | ||||||||
| Consumer: | ||||||||||||
| Credit cards |
— | 4 | — | % | ||||||||
| Home equity lines of credit |
(220 | ) | 618 | (0.31 | )% | |||||||
| Personal |
(888 | ) | (9,895 | ) | 0.39 | % | ||||||
| Other |
2 | (3,768 | ) | 0.03 | % | |||||||
|
|
|
|
|
|
|
|||||||
| Total consumer | $ | (1,106 | ) | $ | (13,041 | ) | (0.09 | )% | ||||
|
|
|
|
|
|
|
|||||||
| Total |
$ | 4,351 | $ | 250,771 | 0.02 | % | ||||||
|
|
|
|
|
|
|
|||||||
38
Popular, Inc.
Financial Supplement to Second Quarter 2025 Earnings Release
Table Q - Allowance for Credit Losses “ACL”- Loan Portfolios - Consolidated
(Unaudited)
| 30-Jun-25 |
||||||||||||
| (Dollars in thousands) |
Total ACL | Total loans held-in-portfolio | ACL to loans held-in-portfolio | |||||||||
| Commercial: |
||||||||||||
| Commercial multi-family |
$ | 16,781 | $ | 2,520,789 | 0.67 | % | ||||||
| Commercial real estate - non-owner occupied |
59,117 | 5,521,374 | 1.07 | % | ||||||||
| Commercial real estate - owner occupied |
49,051 | 3,003,855 | 1.63 | % | ||||||||
| Commercial and industrial |
141,362 | 8,043,752 | 1.76 | % | ||||||||
|
|
|
|
|
|
|
|||||||
| Total commercial | $ | 266,311 | $ | 19,089,770 | 1.40 | % | ||||||
|
|
|
|
|
|
|
|||||||
| Construction |
10,579 | 1,468,201 | 0.72 | % | ||||||||
| Mortgage |
85,175 | 8,444,427 | 1.01 | % | ||||||||
| Leasing |
20,040 | 1,983,068 | 1.01 | % | ||||||||
| Consumer: |
||||||||||||
| Credit cards |
92,306 | 1,215,293 | 7.60 | % | ||||||||
| Home equity lines of credit |
1,384 | 77,479 | 1.79 | % | ||||||||
| Personal |
103,654 | 1,876,463 | 5.52 | % | ||||||||
| Auto |
182,274 | 3,861,702 | 4.72 | % | ||||||||
| Other |
7,762 | 168,775 | 4.60 | % | ||||||||
|
|
|
|
|
|
|
|||||||
| Total consumer | $ | 387,380 | $ | 7,199,712 | 5.38 | % | ||||||
|
|
|
|
|
|
|
|||||||
| Total | $ | 769,485 | $ | 38,185,178 | 2.02 | % | ||||||
|
|
|
|
|
|
|
|||||||
| 31-Mar-25 |
||||||||||||
| (Dollars in thousands) |
Total ACL | Total loans held-in-portfolio | ACL to loans held-in-portfolio | |||||||||
| Commercial: |
||||||||||||
| Commercial multi-family |
$ | 13,501 | $ | 2,374,915 | 0.57 | % | ||||||
| Commercial real estate - non-owner occupied |
58,301 | 5,540,603 | 1.05 | % | ||||||||
| Commercial real estate - owner occupied |
50,212 | 2,956,559 | 1.70 | % | ||||||||
| Commercial and industrial |
147,829 | 7,693,523 | 1.92 | % | ||||||||
|
|
|
|
|
|
|
|||||||
| Total commercial | $ | 269,843 | $ | 18,565,600 | 1.45 | % | ||||||
|
|
|
|
|
|
|
|||||||
| Construction |
9,512 | 1,358,979 | 0.70 | % | ||||||||
| Mortgage |
84,029 | 8,273,753 | 1.02 | % | ||||||||
| Leasing |
20,206 | 1,949,705 | 1.04 | % | ||||||||
| Consumer: |
||||||||||||
| Credit cards |
96,523 | 1,187,777 | 8.13 | % | ||||||||
| Home equity lines of credit |
1,610 | 77,109 | 2.09 | % | ||||||||
| Personal |
101,437 | 1,850,023 | 5.48 | % | ||||||||
| Auto |
171,979 | 3,820,242 | 4.50 | % | ||||||||
| Other |
7,009 | 170,844 | 4.10 | % | ||||||||
|
|
|
|
|
|
|
|||||||
| Total consumer | $ | 378,558 | $ | 7,105,995 | 5.33 | % | ||||||
|
|
|
|
|
|
|
|||||||
| Total | $ | 762,148 | $ | 37,254,032 | 2.05 | % | ||||||
|
|
|
|
|
|
|
|||||||
39
| Variance |
||||||||||||
| (Dollars in thousands) |
Total ACL | Total loans held-in-portfolio | ACL to loans held-in-portfolio | |||||||||
| Commercial: | ||||||||||||
| Commercial multi-family |
$ | 3,280 | $ | 145,874 | 0.10 | % | ||||||
| Commercial real estate - non-owner occupied |
816 | (19,229 | ) | 0.02 | % | |||||||
| Commercial real estate - owner occupied |
(1,161 | ) | 47,296 | (0.07 | )% | |||||||
| Commercial and industrial |
(6,467 | ) | 350,229 | (0.16 | )% | |||||||
|
|
|
|
|
|
|
|||||||
| Total commercial | $ | (3,532 | ) | $ | 524,170 | (0.05 | )% | |||||
|
|
|
|
|
|
|
|||||||
| Construction | 1,067 | 109,222 | 0.02 | % | ||||||||
| Mortgage | 1,146 | 170,674 | (0.01 | )% | ||||||||
| Leasing | (166 | ) | 33,363 | (0.03 | )% | |||||||
| Consumer: | ||||||||||||
| Credit cards |
(4,217 | ) | 27,516 | (0.53 | )% | |||||||
| Home equity lines of credit |
(226 | ) | 370 | (0.30 | )% | |||||||
| Personal |
2,217 | 26,440 | 0.04 | % | ||||||||
| Auto |
10,295 | 41,460 | 0.22 | % | ||||||||
| Other |
753 | (2,069 | ) | 0.50 | % | |||||||
|
|
|
|
|
|
|
|||||||
| Total consumer | $ | 8,822 | $ | 93,717 | 0.05 | % | ||||||
|
|
|
|
|
|
|
|||||||
| Total |
$ | 7,337 | $ | 931,146 | (0.03 | )% | ||||||
|
|
|
|
|
|
|
|||||||
40
Popular, Inc.
Financial Supplement to Second Quarter 2025 Earnings Release
Table R - Reconciliation to GAAP Financial Measures
(Unaudited)
| (In thousands, except share or per share information) |
30-Jun-25 | 31-Mar-25 | 30-Jun-24 | |||||||||
| Total stockholders’ equity | $ | 5,954,018 | $ | 5,799,695 | $ | 5,372,678 | ||||||
| Less: Preferred stock | (22,143 | ) | (22,143 | ) | (22,143 | ) | ||||||
| Less: Goodwill | (802,954 | ) | (802,954 | ) | (804,428 | ) | ||||||
| Less: Other intangibles | (5,844 | ) | (6,229 | ) | (8,235 | ) | ||||||
|
|
|
|
|
|
|
|||||||
| Total tangible common equity | $ | 5,123,077 | $ | 4,968,369 | $ | 4,537,872 | ||||||
|
|
|
|
|
|
|
|||||||
| Total assets | $ | 76,065,090 | $ | 74,038,606 | $ | 72,845,072 | ||||||
| Less: Goodwill | (802,954 | ) | (802,954 | ) | (804,428 | ) | ||||||
| Less: Other intangibles | (5,844 | ) | (6,229 | ) | (8,235 | ) | ||||||
|
|
|
|
|
|
|
|||||||
| Total tangible assets | $ | 75,256,292 | $ | 73,229,423 | $ | 72,032,409 | ||||||
|
|
|
|
|
|
|
|||||||
| Tangible common equity to tangible assets | 6.81 | % | 6.78 | % | 6.30 | % | ||||||
| Common shares outstanding at end of period | 67,937,468 | 68,984,148 | 72,365,926 | |||||||||
| Tangible book value per common share | $ | 75.41 | $ | 72.02 | $ | 62.71 | ||||||
|
|
|
|
|
|
|
|||||||
| Quarterly average | ||||||||||||
| Total stockholders’ equity [1] | $ | 6,849,789 | $ | 6,785,208 | $ | 6,303,672 | ||||||
| Average unrealized (gains) losses on AFS securities transferred to HTM | 334,183 | 370,695 | 595,362 | |||||||||
|
|
|
|
|
|
|
|||||||
| Adjusted total stockholder’s equity | 7,183,972 | 7,155,903 | 6,899,034 | |||||||||
|
|
|
|
|
|
|
|||||||
| Less: Preferred Stock | (22,143 | ) | (22,143 | ) | (22,143 | ) | ||||||
| Less: Goodwill | (802,953 | ) | (802,953 | ) | (804,427 | ) | ||||||
| Less: Other intangibles | (6,096 | ) | (6,585 | ) | (8,706 | ) | ||||||
|
|
|
|
|
|
|
|||||||
| Total tangible equity | $ | 6,352,780 | $ | 6,324,222 | $ | 6,063,758 | ||||||
| Return on average tangible common equity | 13.26 | % | 11.36 | % | 11.77 | % | ||||||
|
|
|
|
|
|
|
|||||||
| [1] | Average balances exclude unrealized gains or losses on debt securities available-for-sale. |
CONTACTS:
Popular, Inc.
Investor Relations:
Paul J. Cardillo, 212-417-6721
Senior Vice President and Investor Relations Officer
pcardillo@popular.com
or
Media Relations:
MC González Noguera, 917-804-5253
Executive Vice President and Chief Communications & Public Affairs Officer
mc.gonzalez@popular.com
41

Exhibit 99.2 Investor Presentation Second Quarter 2025

Cautionary Note Regarding Forward-Looking Statements This presentation contains “forward-looking statements” within the meaning of the U.S. Private Securities Litigation Reform Act of 1995, including without limitation those regarding Popular’s business, financial condition, results of operations and objectives, performance, earnings and expenses. These statements are not guarantees of future performance, are based on the current expectations of Popular, Inc.’s management and, by their nature, involve risks, uncertainties, estimates and assumptions. Potential factors, some of which are beyond our control, could cause actual results to differ materially from those expressed in, or implied by, such forward-looking statements. More information on the risks and important factors that could affect our future results and financial condition is included in our Form 10-K for the year ended December 31, 2024, our Form 10-Q for the quarter ended March 31, 2025 and the Form 10-Q for the quarter ended June 30, 2025, to be filed with the Securities and Exchange Commission. Our filings are available on our website (www.popular.com) and on the Securities and Exchange Commission website (www.sec.gov). We assume no obligation to update or revise any forward-looking statements which speak as of their respective dates. 2
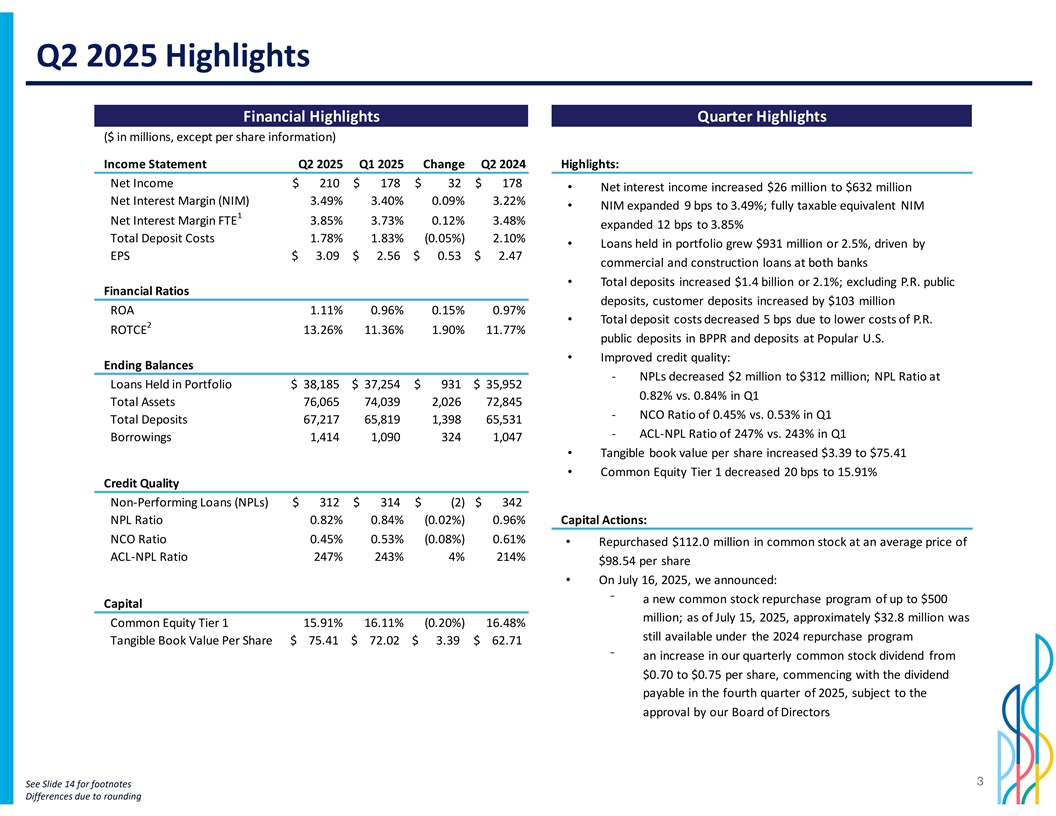
Q2 2025 Highlights Financial Highlights Quarter Highlights ($ in millions, except per share information) Income Statement Q2 2025 Q1 2025 Change Q2 2024 Highlights: Net Income $ 2 10 $ 1 78 $ 3 2 $ 1 78 • Net interest income increased $26 million to $632 million Net Interest Margin (NIM) 3.49% 3.40% 0.09% 3.22% • NIM expanded 9 bps to 3.49%; fully taxable equivalent NIM 1 Net Interest Margin FTE 3.85% 3.73% 0.12% 3.48% expanded 12 bps to 3.85% Total Deposit Costs 1.78% 1.83% (0.05%) 2.10% • Loans held in portfolio grew $931 million or 2.5%, driven by EPS $ 3 .09 $ 2 .56 $ 0 .53 $ 2 .47 commercial and construction loans at both banks • Total deposits increased $1.4 billion or 2.1%; excluding P.R. public Financial Ratios deposits, customer deposits increased by $103 million ROA 1.11% 0.96% 0.15% 0.97% • Total deposit costs decreased 5 bps due to lower costs of P.R. 2 ROTCE 13.26% 11.36% 1.90% 11.77% public deposits in BPPR and deposits at Popular U.S. • Improved credit quality: Ending Balances - NPLs decreased $2 million to $312 million; NPL Ratio at Loans Held in Portfolio $ 38,185 $ 3 7,254 $ 9 31 $ 35,952 0.82% vs. 0.84% in Q1 Total Assets 76,065 74,039 2,026 72,845 - NCO Ratio of 0.45% vs. 0.53% in Q1 Total Deposits 67,217 65,819 1,398 65,531 - ACL-NPL Ratio of 247% vs. 243% in Q1 Borrowings 1,414 1,090 3 24 1,047 • Tangible book value per share increased $3.39 to $75.41 • Common Equity Tier 1 decreased 20 bps to 15.91% Credit Quality Non-Performing Loans (NPLs) $ 3 12 $ 3 14 $ ( 2) $ 3 42 NPL Ratio 0.82% 0.84% (0.02%) 0.96% Capital Actions: NCO Ratio 0.45% 0.53% (0.08%) 0.61% • Repurchased $112.0 million in common stock at an average price of ACL-NPL Ratio 247% 243% 4% 214% $98.54 per share • On July 16, 2025, we announced: ⁻ a new common stock repurchase program of up to $500 Capital million; as of July 15, 2025, approximately $32.8 million was Common Equity Tier 1 15.91% 16.11% (0.20%) 16.48% still available under the 2024 repurchase program Tangible Book Value Per Share $ 75.41 $ 72.02 $ 3.39 $ 62.71 ⁻ an increase in our quarterly common stock dividend from $0.70 to $0.75 per share, commencing with the dividend payable in the fourth quarter of 2025, subject to the approval by our Board of Directors 3 See Slide 14 for footnotes Differences due to rounding

Business Highlights BPPR Popular U.S. ($ in millions) Q2 2025 Q1 2025 Change Q2 2024 ($ in millions) Q2 2025 Q1 2025 Change Q2 2024 Loans Held in Portfolio $ 26,774 $ 26,093 $ 681 $ 25,111 Loans Held in Portfolio $ 11,380 $ 11,129 $ 251 $ 9,911 P.R. Public Deposits 20,918 19,622 1,296 19,722 Total Deposits 11,946 11,953 (7) 10,018 Total Deposits 55,882 54,647 1,235 54,548 Borrowings 7 54 431 323 428 Borrowings 67 66 1 1 27 Net Interest Margin 2.93% 2.74% 0.19% 3.01% Net Interest Margin 3.68% 3.63% 0.05% 3.40% Total Deposit Costs 2.95% 3.09% (0.14%) 2.55% Total Deposit Costs 1.52% 1.55% (0.03%) 1.83% Highlights: Highlights: • Loans held in portfolio increased $251 million: • Loans held in portfolio increased $681 million: - commercial and construction loans increased $251 million ⁻ commercial and construction loans increased $383 million - mortgage loans increased $13 million ⁻ mortgage loans increased $158 million - consumer loans decreased $13 million ⁻ auto loans and leases increased $76 million ⁻ personal loans increased $36 million • NIM increased 19 bps to 2.93%: ⁻ credit card balances increased $28 million ⁻ loan yields increased 14 bps to 6.00% - total deposit costs decreased 14 bps to 2.95% • NIM increased 5 bps to 3.68%: ⁻ investment securities yields increased 8 bps to 2.60% • Borrowings increased $323 million due to short-term FHLB advances ⁻ loan yields decreased 3 bps to 7.86% ⁻ total deposit costs decreased 3 bps to 1.52%: ⁻ interest-bearing deposit costs decreased 4 bps ⁻ P.R. public deposit costs decreased 10 bps 4 Differences due to rounding
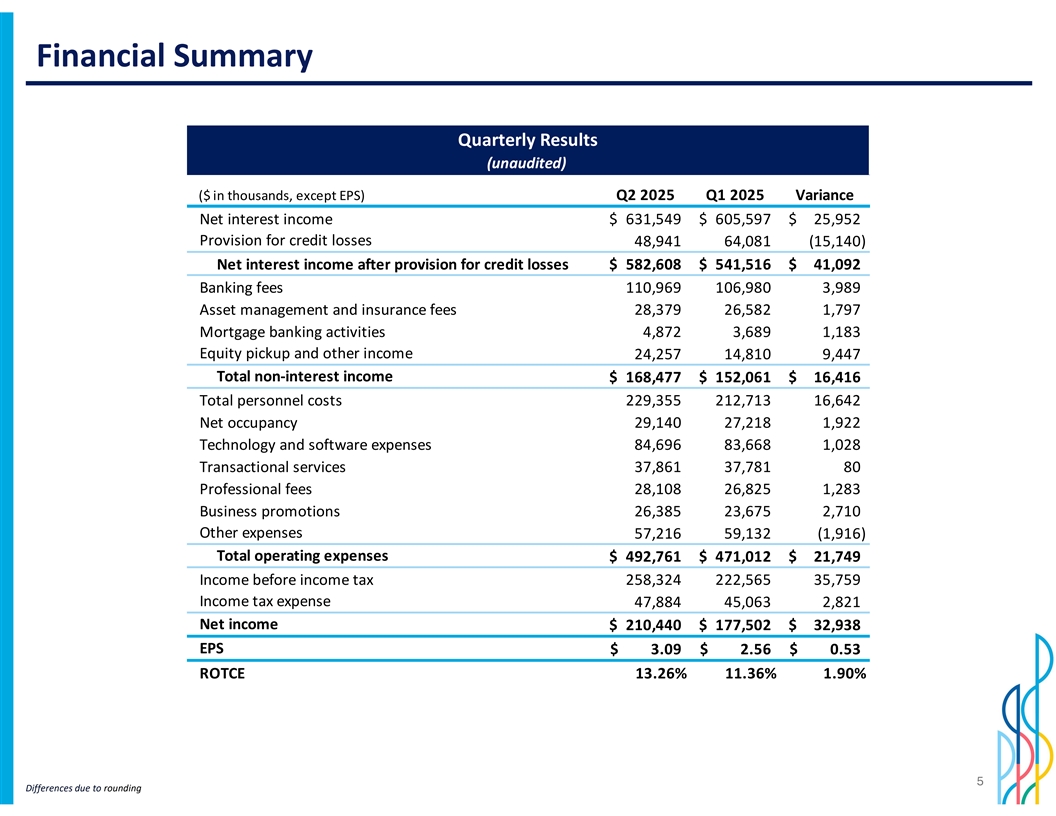
Financial Summary Quarterly Results (unaudited) ($ in thousands, except EPS) Q2 2025 Q1 2025 Variance Net interest income $ 6 31,549 $ 6 05,597 $ 25,952 Provision for credit losses 48,941 64,081 (15,140) Net interest income after provision for credit losses $ 5 82,608 $ 5 41,516 $ 41,092 Banking fees 110,969 106,980 3 ,989 Asset management and insurance fees 28,379 26,582 1,797 Mortgage banking activities 4 ,872 3 ,689 1 ,183 Equity pickup and other income 24,257 14,810 9,447 Total non-interest income $ 1 68,477 $ 1 52,061 $ 16,416 Total personnel costs 229,355 212,713 16,642 Net occupancy 29,140 27,218 1,922 Technology and software expenses 84,696 83,668 1,028 Transactional services 37,861 37,781 80 Professional fees 28,108 26,825 1,283 Business promotions 26,385 23,675 2,710 Other expenses 57,216 59,132 (1,916) Total operating expenses $ 4 92,761 $ 4 71,012 $ 21,749 Income before income tax 258,324 222,565 35,759 Income tax expense 47,884 45,063 2,821 Net income $ 2 10,440 $ 1 77,502 $ 32,938 EPS $ 3.09 $ 2.56 $ 0.53 ROTCE 13.26% 11.36% 1.90% 5 Differences due to rounding

Net Interest Income and NIM Dynamics Quarter Highlights: Earning Assets 1 (ending balances, $ in billions) • Net interest income increased $26 million to $632 million $72.8 $70.8 $69.7 $69.2 $68.0 • Net interest margin increased 9 bps to 3.49% 0.14 70.00 $38.2 $37.3 • Net interest margin FTE of 3.85% increased 12 bps: $37.1 0.12 $35.6 $36.2 60.00 0.1 - Earning assets yield FTE increased 8 bps to 5.57% 50.00 7.52% 7.56% 7.51% 7.48% 7.50% 0.08 - Loan yield FTE increased 2 bps to 7.50% 40.00 0.06 30.00 - Total deposit costs decreased 5 bps to 1.78% $34.6 $33.6 $33.6 $32.6 $31.8 0.04 20.00 • Money market and investment securities increased $1.0 billion; 0.02 10.00 represent 48% of earning assets 3.47% 3.43% 3.50% 3.38% 3.29% - 0 • Loans held in portfolio increased $931 million Q2 2024 Q3 2024 Q4 2024 Q1 2025 Q2 2025 • Deposits increased $1.4 billion. Excluding P.R. public deposits, Money market and investment securities Loan balances customer deposits increased $103 million Loan yield (FTE) Money market and investment securities yield Net Interest Income and NIM Sources of Funds ($ in millions) 1 (ending balances, $ in billions) $632 $68.6 $66.9 $66.6 $606 $66.1 $64.7 $591 0.0600 $572 $568 0.07 600 $20.9 60.00 $19.6 $19.7 0.06 $19.5 0.0500 $18.7 500 50.00 0.05 5.57% 0.0400 5.53% 5.49% 5.49% 5.49% 400 4.24% 40.00 4.15% 0.04 3.70% 0.0300 300 30.00 3.32% 3.85% 0.03 3.22% 3.73% 3.62% 3.48% 3.47% 0.0200 $46.3 200 $45.8 $45.4 $46.2 $45.0 20.00 0.02 2.06% 2.01% 0.0100 100 1.87% 0.01 10.00 1.76% 1.72% 1.27% 1.23% 1.21% 1.17% 1.15% - 0 - - Q2 2024 Q3 2024 Q4 2024 Q1 2025 Q2 2025 Q2 2024 Q3 2024 Q4 2024 Q1 2025 Q2 2025 Net interest income NIM (FTE) Earning assets yield (FTE) Cost of funds Deposits, excl P.R. public deposits P.R. public deposits Borrowings P.R. public deposit costs Deposit Costs, excl P.R. public deposit costs See Slide 14 for footnotes 6 Differences due to rounding
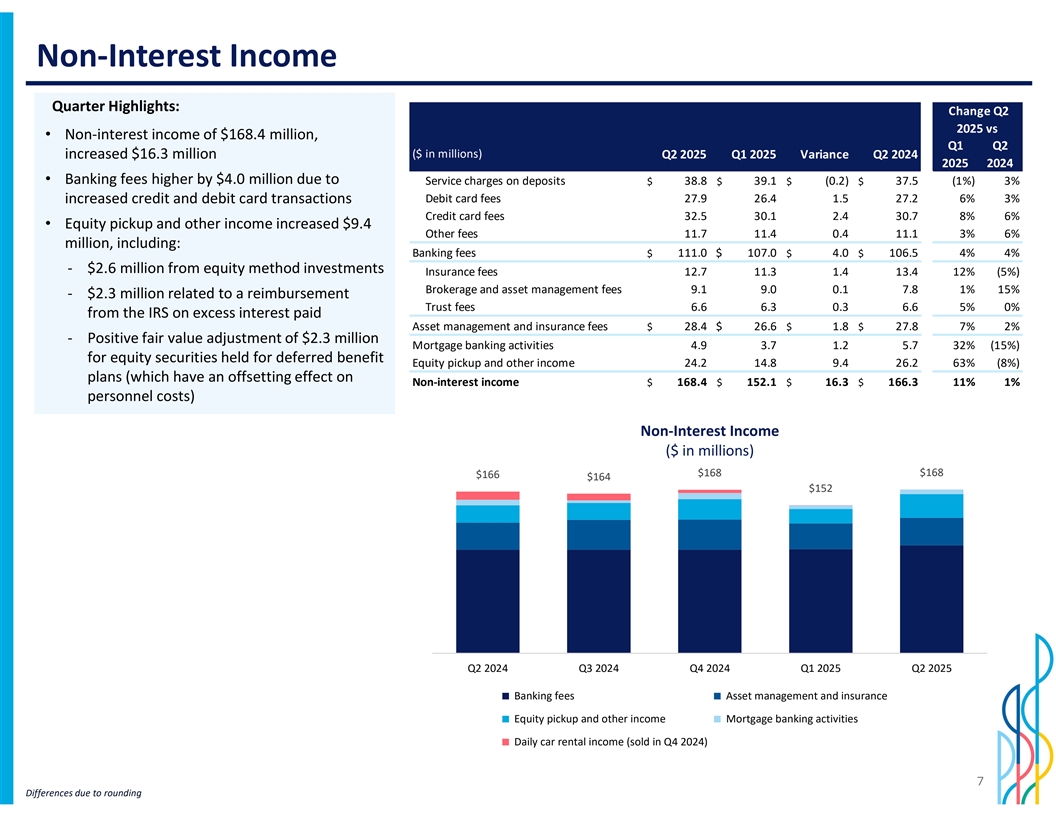
Non-Interest Income Quarter Highlights: Change Q2 2025 vs • Non-interest income of $168.4 million, Q1 Q2 ($ in millions) increased $16.3 million Q2 2025 Q1 2025 Variance Q2 2024 2025 2024 • Banking fees higher by $4.0 million due to Service charges on deposits $ 38.8 $ 39.1 $ (0.2) $ 37.5 (1%) 3% Debit card fees 27.9 26.4 1.5 27.2 6% 3% increased credit and debit card transactions Credit card fees 32.5 30.1 2.4 30.7 8% 6% • Equity pickup and other income increased $9.4 Other fees 11.7 11.4 0.4 11.1 3% 6% million, including: Banking fees $ 111.0 $ 107.0 $ 4.0 $ 106.5 4% 4% - $2.6 million from equity method investments Insurance fees 12.7 11.3 1.4 13.4 12% (5%) Brokerage and asset management fees 9.1 9.0 0.1 7.8 1% 15% - $2.3 million related to a reimbursement Trust fees 6.6 6.3 0.3 6.6 5% 0% from the IRS on excess interest paid Asset management and insurance fees $ 28.4 $ 26.6 $ 1.8 $ 27.8 7% 2% - Positive fair value adjustment of $2.3 million Mortgage banking activities 4.9 3.7 1.2 5.7 32% (15%) for equity securities held for deferred benefit Equity pickup and other income 24.2 14.8 9.4 26.2 63% (8%) plans (which have an offsetting effect on Non-interest income $ 168.4 $ 152.1 $ 16.3 $ 166.3 11% 1% personnel costs) Non-Interest Income ($ in millions) $168 $168 180.00 $166 180.00 $164 $152 160.00 160.00 140.00 140.00 120.00 120.00 100.00 100.00 80.00 80.00 60.00 60.00 40.00 40.00 20.00 20.00 - - Q2 2024 Q3 2024 Q4 2024 Q1 2025 Q2 2025 Banking fees Asset management and insurance Equity pickup and other income Mortgage banking activities Daily car rental income (sold in Q4 2024) 7 Differences due to rounding
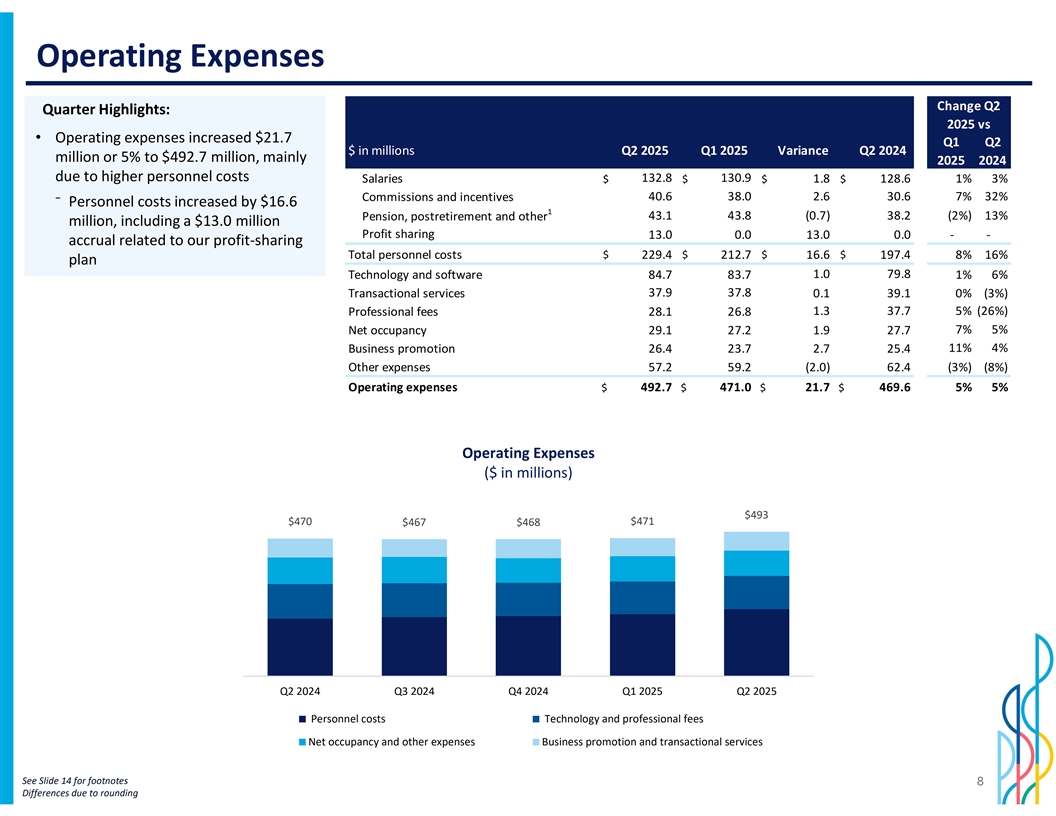
Operating Expenses Change Q2 Quarter Highlights: 2025 vs • Operating expenses increased $21.7 Q1 Q2 $ in millions Q2 2025 Q1 2025 Variance Q2 2024 million or 5% to $492.7 million, mainly 2025 2024 due to higher personnel costs Salaries $ 132.8 $ 130.9 $ 1.8 $ 128.6 1% 3% 40.6 38.0 2.6 30.6 7% 32% Commissions and incentives ⁻ Personnel costs increased by $16.6 1 Pension, postretirement and other 43.1 43.8 (0.7) 38.2 (2%) 13% million, including a $13.0 million Profit sharing 13.0 0.0 13.0 0.0 - - accrual related to our profit-sharing Total personnel costs $ 229.4 $ 212.7 $ 16.6 $ 197.4 8% 16% plan Technology and software 84.7 83.7 1.0 79.8 1% 6% Transactional services 37.9 37.8 0.1 39.1 0% (3%) 1.3 37.7 5% (26%) Professional fees 28.1 26.8 7% 5% Net occupancy 29.1 27.2 1.9 27.7 11% 4% Business promotion 26.4 23.7 2.7 25.4 Other expenses 57.2 59.2 (2.0) 62.4 (3%) (8%) Operating expenses $ 492.7 $ 471.0 $ 21.7 $ 469.6 5% 5% Operating Expenses ($ in millions) 600.00 600.00 $493 $470 $471 $467 $468 500.00 500.00 400.00 400.00 300.00 300.00 200.00 200.00 100.00 100.00 - - Q2 2024 Q3 2024 Q4 2024 Q1 2025 Q2 2025 Personnel costs Technology and professional fees Net occupancy and other expenses Business promotion and transactional services See Slide 14 for footnotes 8 Differences due to rounding
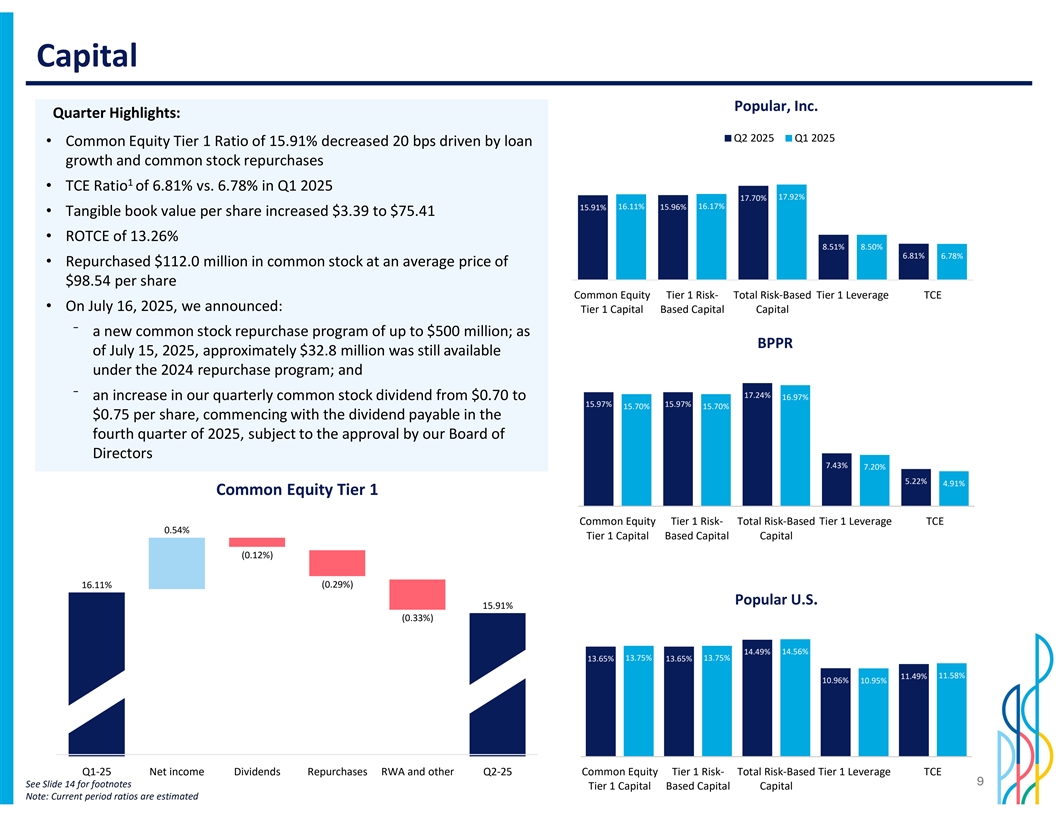
Capital Popular, Inc. Quarter Highlights: Q2 2025 Q1 2025 • Common Equity Tier 1 Ratio of 15.91% decreased 20 bps driven by loan growth and common stock repurchases 0.2 0.18 1 • TCE Ratio of 6.81% vs. 6.78% in Q1 2025 0.16 17.92% 17.70% 0.14 16.11% 16.17% 15.91% 15.96% • Tangible book value per share increased $3.39 to $75.41 0.12 0.1 0.08 • ROTCE of 13.26% 0.06 8.51% 8.50% 6.81% 6.78% 0.04 • Repurchased $112.0 million in common stock at an average price of 0.02 0 $98.54 per share Common Equity Tier 1 Risk- Total Risk-Based Tier 1 Leverage TCE • On July 16, 2025, we announced: Tier 1 Capital Based Capital Capital ⁻ a new common stock repurchase program of up to $500 million; as BPPR of July 15, 2025, approximately $32.8 million was still available 0.2 under the 2024 repurchase program; and 0.18 0.16 17.24% ⁻ an increase in our quarterly common stock dividend from $0.70 to 16.97% 0.14 15.97% 15.97% 15.70% 15.70% $0.75 per share, commencing with the dividend payable in the 0.12 0.1 fourth quarter of 2025, subject to the approval by our Board of 0.08 Directors 0.06 7.43% 7.20% 0.04 5.22% 4.91% 0.02 Common Equity Tier 1 0 Common Equity Tier 1 Risk- Total Risk-Based Tier 1 Leverage TCE 0.54% Tier 1 Capital Based Capital Capital (0.12%) 16.11% (0.29%) Popular U.S. 15.91% (0.33%) 0.16 0.14 14.49% 14.56% 0.12 13.65% 13.75% 13.65% 13.75% 0.1 11.49% 11.58% 10.96% 10.95% 0.08 0.06 0.04 0.02 0 Q1-25 Net income Dividends Repurchases RWA and other Q2-25 Common Equity Tier 1 Risk- Total Risk-Based Tier 1 Leverage TCE 9 See Slide 14 for footnotes Tier 1 Capital Based Capital Capital Note: Current period ratios are estimated
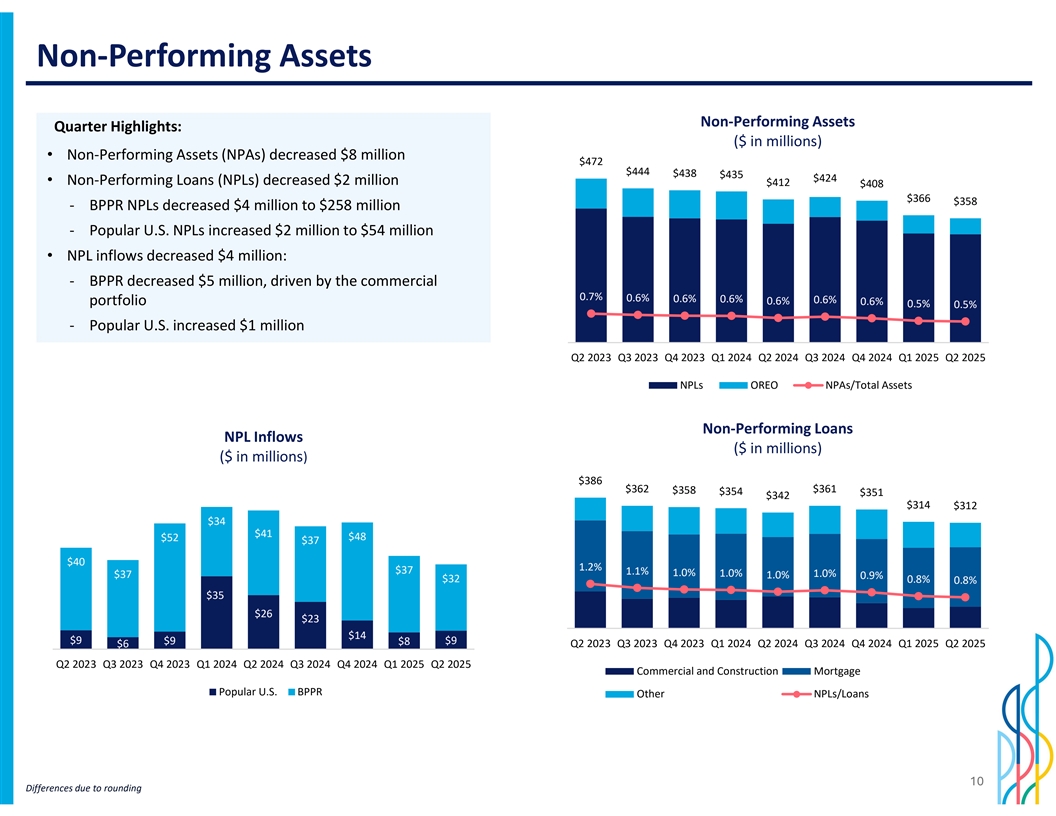
Non-Performing Assets Non-Performing Assets Quarter Highlights: ($ in millions) • Non-Performing Assets (NPAs) decreased $8 million $472 500 0.04 $444 $438 $435 $424 • Non-Performing Loans (NPLs) decreased $2 million 450 $412 $408 0.035 $366 400 $358 - BPPR NPLs decreased $4 million to $258 million 0.03 350 0.025 - Popular U.S. NPLs increased $2 million to $54 million 300 250 0.02 • NPL inflows decreased $4 million: 200 0.015 - BPPR decreased $5 million, driven by the commercial 150 0.7% 0.01 0.6% 0.6% 0.6% 0.6% portfolio 0.6% 0.6% 0.5% 0.5% 100 0.005 50 - Popular U.S. increased $1 million 0 0 Q2 2023 Q3 2023 Q4 2023 Q1 2024 Q2 2024 Q3 2024 Q4 2024 Q1 2025 Q2 2025 NPLs OREO NPAs/Total Assets Non-Performing Loans NPL Inflows ($ in millions) ($ in millions) 450 0.04 $386 80 400 $362 $358 $361 $354 $351 0.035 $342 70 $314 $312 350 0.03 $34 60 300 0.025 $41 $48 $52 $37 250 50 0.02 200 $40 40 1.2% 0.015 $37 1.1% 1.0% 1.0% 1.0% $37 150 1.0% 0.9% $32 0.8% 0.8% 30 0.01 100 $35 20 0.005 50 $26 $23 10 0 0 $14 $9 $9 $9 $8 $6 Q2 2023 Q3 2023 Q4 2023 Q1 2024 Q2 2024 Q3 2024 Q4 2024 Q1 2025 Q2 2025 0 Q2 2023 Q3 2023 Q4 2023 Q1 2024 Q2 2024 Q3 2024 Q4 2024 Q1 2025 Q2 2025 Commercial and Construction Mortgage Popular U.S. BPPR Other NPLs/Loans 10 Differences due to rounding

NCOs and Allowance for Credit Losses Quarter Highlights: • NCOs at $42 million and NCO Ratio of 0.45%, decreased by $7 million and 8 bps, respectively; led by lower consumer NCOs at BPPR • ACL-to-Loans Ratio at 2.02% vs. 2.05% in Q1 2025 Allowance for Credit Losses ACL Movement ($ in millions) ($ in millions) Reserve Reserve $45 $769 $762 Build Balance Balance Build Balance ACL/Loan Portfolios Q4 2024 (Release) Q1 2025 (Release) Q2 2025 Q2 2025 Commercial $ 271 $ 9 $ 279 $ ( 2) $ 277 1.35% $3 $3 Mortgage 82 2 84 1 85 1.01% $(2) $(42) Leases 16 4 20 (0) 20 1.01% Consumer: 376 2 379 9 387 5.38% Credit Cards 99 (3) 97 (4) 92 7.56% Personal Loans 104 (1) 103 2 105 5.38% Auto 166 6 172 10 182 4.72% Commercial Consumer Q1 Qualitative Q1 2025 ACL N NC CO O s s Ec Ec o on no o mm ic i Sc ce narios Qualitative Reserves Commercial Changes Consumer Changes Q2 2Q 022 5 ACL Other 7 0 7 1 8 4.60% portfolio portfolios 2025 scenarios reserves 2025 Total ACL $ 746 $ 16 $ 762 $ 7 $ 769 2.02% changes ACL changes ACL NCOs and NCO-to-Loans Ratio Consumer NCOs by Loan Portfolio ($ in millions) ($ in millions) 70 $67 $63 70 $62 $58 4.00% 5.00% $59 60 $55 $57 $54 $52 60 $51 $49 $49 50 50 $42 $42 3.00% $41 4.00% 3.56% $33 40 3.26% 3.16% 40 3.01% 2.85% 2.80% $24 2.003 % 0 $25 30 3.00% 2.41% 2.33% 20 20 0.71% 0.74% 0.66% 0.65% 0.61% 1.00% 0.53% 0.45% 2.00% 0.39% 1.52% 10 0.29% 10 - 0.00 % - 1.00% (10) (10) (20) -1.00% Q2 2023 Q3 2023 Q4 2023 Q1 2024 Q2 2024 Q3 2024 Q4 2024 Q1 2025 Q2 2025 Q2 2023 Q3 2023 Q4 2023 Q1 2024 Q2 2024 Q3 2024 Q4 2024 Q1 2025 Q2 2025 0.00% (20) Commercial and Construction Mortgage Leases Consumer NCO% Credit Card Personal Auto Other NCO% 11 Differences due to rounding
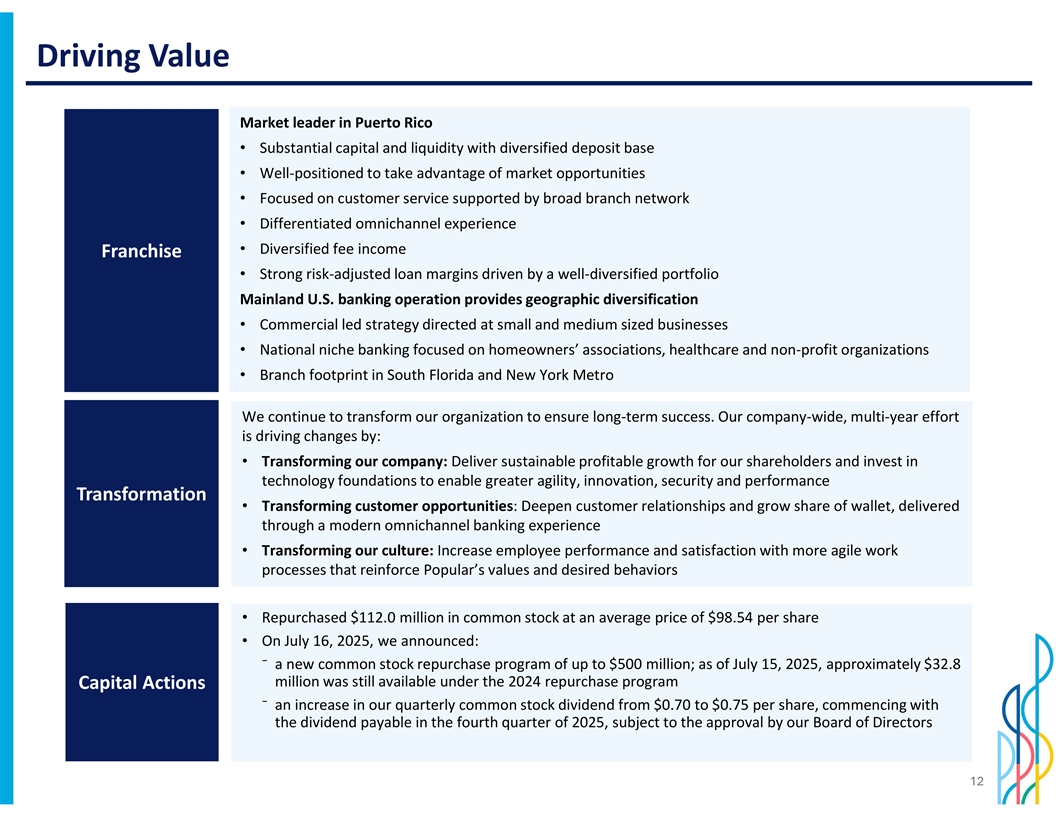
Driving Value Market leader in Puerto Rico • Substantial capital and liquidity with diversified deposit base • Well-positioned to take advantage of market opportunities • Focused on customer service supported by broad branch network • Differentiated omnichannel experience • Diversified fee income Franchise • Strong risk-adjusted loan margins driven by a well-diversified portfolio Mainland U.S. banking operation provides geographic diversification • Commercial led strategy directed at small and medium sized businesses • National niche banking focused on homeowners’ associations, healthcare and non-profit organizations • Branch footprint in South Florida and New York Metro We continue to transform our organization to ensure long-term success. Our company-wide, multi-year effort is driving changes by: • Transforming our company: Deliver sustainable profitable growth for our shareholders and invest in technology foundations to enable greater agility, innovation, security and performance Transformation • Transforming customer opportunities: Deepen customer relationships and grow share of wallet, delivered through a modern omnichannel banking experience • Transforming our culture: Increase employee performance and satisfaction with more agile work processes that reinforce Popular’s values and desired behaviors • Repurchased $112.0 million in common stock at an average price of $98.54 per share • On July 16, 2025, we announced: ⁻ a new common stock repurchase program of up to $500 million; as of July 15, 2025, approximately $32.8 million was still available under the 2024 repurchase program Capital Actions ⁻ an increase in our quarterly common stock dividend from $0.70 to $0.75 per share, commencing with the dividend payable in the fourth quarter of 2025, subject to the approval by our Board of Directors 12
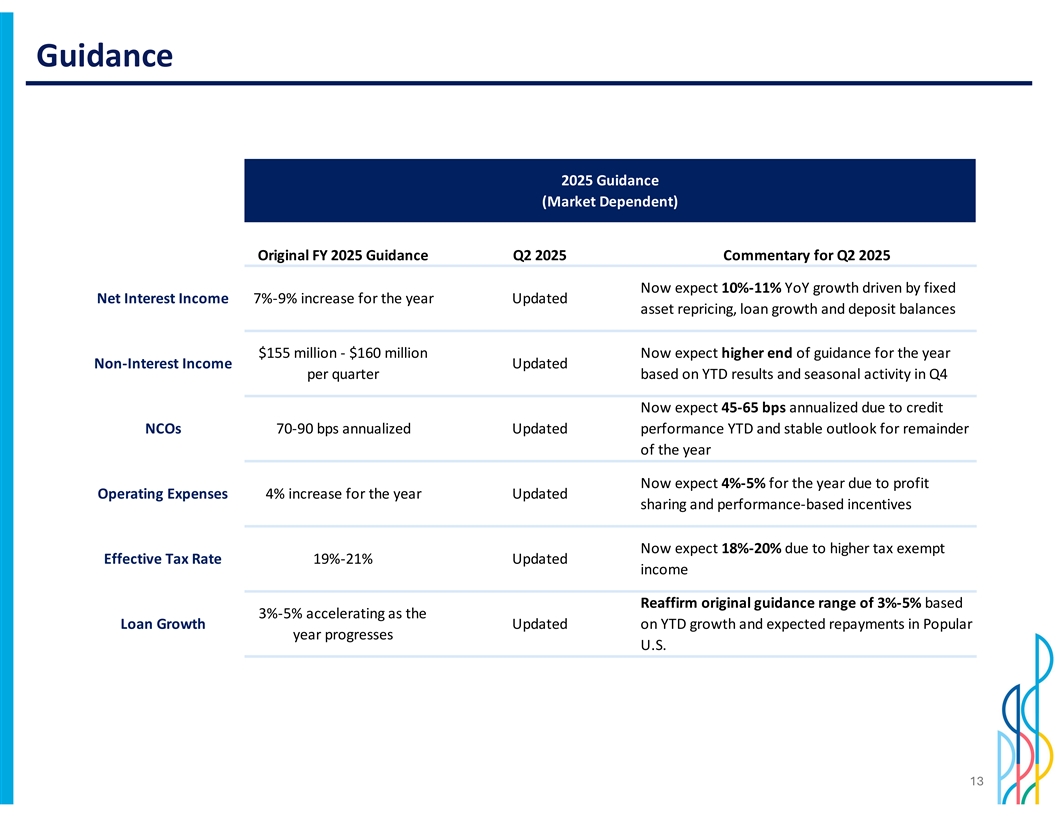
Guidance 2025 Guidance (Market Dependent) Original FY 2025 Guidance Q2 2025 Commentary for Q2 2025 Now expect 10%-11% YoY growth driven by fixed Net Interest Income 7%-9% increase for the year Updated asset repricing, loan growth and deposit balances $155 million - $160 million Now expect higher end of guidance for the year Non-Interest Income Updated per quarter based on YTD results and seasonal activity in Q4 Now expect 45-65 bps annualized due to credit NCOs 70-90 bps annualized Updated performance YTD and stable outlook for remainder of the year Now expect 4%-5% for the year due to profit Operating Expenses 4% increase for the year Updated sharing and performance-based incentives Now expect 18%-20% due to higher tax exempt Effective Tax Rate 19%-21% Updated income Reaffirm original guidance range of 3%-5% based 3%-5% accelerating as the Loan Growth Updated on YTD growth and expected repayments in Popular year progresses U.S. 13
Footnotes Slide 3: 1- Fully taxable equivalent (“FTE”) net interest margin represents a non-GAAP financial measure. See the Corporation's earnings press release, Form 10-Q and Form 10-K filed with the U.S. Securities and Exchange Commission for the applicable periods for the GAAP to non- GAAP reconciliation. 2- Return on average tangible common equity (“ROTCE”) represents a non-GAAP financial measure. See table R in the Corporation's earnings press release for the reconciliation of GAAP to non-GAAP financial measures. Slide 6: 1- Balances are as of end of period. Slide 8: 1- Pension, postretirement and other combines “pension, postretirement and medical insurance” and “other personnel costs, including payroll taxes” as presented in the Consolidated Statement of Operations. Slide 9: 1- TCE ratio is defined as the ratio of tangible common equity to tangible assets. 14

Investor Presentation Second Quarter 2025 Appendix
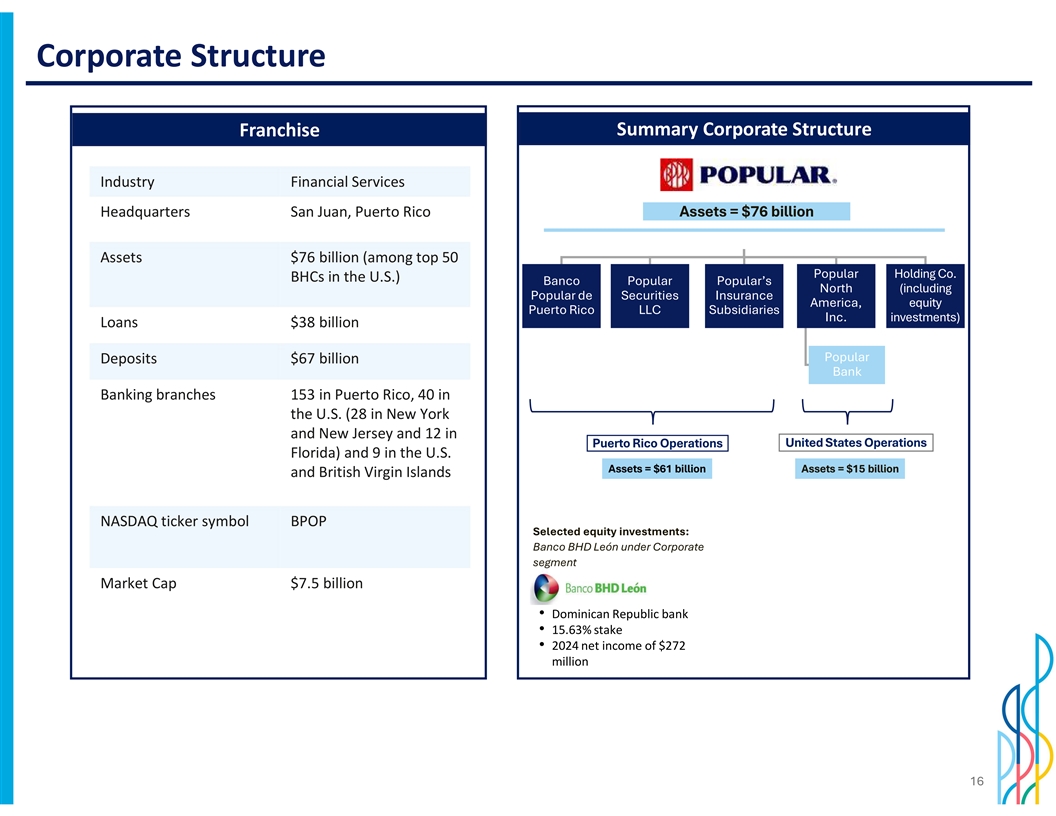
Corporate Structure Franchise Summary Corporate Structure Industry Financial Services Headquarters San Juan, Puerto Rico Assets = $76 billion Assets $76 billion (among top 50 Popular Holding Co. BHCs in the U.S.) Banco Popular Popular’s North (including Popular de Securities Insurance America, equity Puerto Rico LLC Subsidiaries Inc. investments) Loans $38 billion Popular Deposits $67 billion Bank Banking branches Earnin 1g 5s 3 in Puerto Rico, 40 in Earnings the U.S. (28 in New York and New Jersey and 12 in United States Operations Puerto Rico Operations Florida) and 9 in the U.S. Assets = $61 billion Assets = $15 billion and British Virgin Islands NASDAQ ticker symbol BPOP Selected equity investments: Banco BHD León under Corporate segment Market Cap $7.5 billion • Dominican Republic bank • 15.63% stake • 2024 net income of $272 million 16

Q2 2025 vs. Q1 2025 Financial Results BPPR Popular U.S. (Unaudited) ($ in millions) Q2 2025 Q1 2025 Variance Q2 2025 Q1 2025 Variance Net interest income $ 538 $ 522 $ 16 $ 1 02 $ 93 $ 9 Provision for credit losses 42 54 (12) 6 11 ( 5) Net interest income after provision for credit losses 496 468 28 9 6 82 14 Non-interest income 1 46 1 38 8 7 6 1 Operating expenses $ 422 $ 405 $ 17 $ 7 1 $ 66 $ 5 Income before income tax 2 20 2 01 1 9 3 2 22 1 0 Income tax expense 35 35 - 9 7 2 Net income $ 185 $ 166 $ 19 $ 2 3 $ 15 $ 8 Balance Sheet Highlights BPPR Popular U.S. (Unaudited) ($ in millions) Q2 2025 Q1 2025 Variance Q2 2025 Q1 2025 Variance Total assets $ 60,929 $ 59,289 $ 1,640 $ 1 4,865 $ 14,530 $ 335 Total loans HIP 26,774 26,093 681 1 1,380 11,129 251 Total deposits 55,882 54,647 1,235 1 1,946 11,953 ( 7) Asset Quality BPPR Popular U.S. Q2 2025 Q1 2025 Variance Q2 2025 Q1 2025 Variance Non-performing loans held-in-portfolio (HIP) / Total loans (HIP) 0.96% 1.00% (0.04%) 0.47% 0.47% 0.00% Non-performing assets / Total assets 0.50% 0.53% (0.03%) 0.37% 0.36% 0.01% Allowance for credit losses / Total loans (HIP) 2.53% 2.59% (0.06%) 0.79% 0.77% 0.02% 17 Differences due to rounding

Loan Composition and Yields Highlights: Loans Held-in-Portfolio Average Yield • Loans held-in-portfolio increased $931 (ending balances, million or 2.5%, compared to Q1 2025 $ in millions) Q2 2025 Q1 2025 Variance Q2 2025 (FTE) $ $ $ $ Commercial 19,090 18,566 524 18,676 6.73% ⁻ The increase was primarily driven by the commercial and construction Construction 1,468 1,359 109 1,459 8.19% portfolios in BPPR and Popular U.S., Mortgage 8,444 8,274 171 8,339 5.89% and the mortgage portfolio in BPPR 5,854 5,778 76 8.49% Auto loans and leases 5,901 • Average loan yield FTE of 7.50% Consumer 3,329 3,278 51 3,210 14.00% Total Loans $ 38,185 $ 37,254 $ 931 $ 37,585 7.50% Loan Composition (ending balances, $ in billions) 45.00 $38.2 40.00 $37.3 $37.1 $37.1 $36.2 $35.1 $3.3 35.00 $3.3 $3.3 $3.3 $32.1 $3.3 $3.3 $29.3 30.00 $3.1 $8.4 $8.1 $8.1 $8.3 $8.0 $2.6 $7.7 25.00 $7.4 $5.9 $7.5 $5.8 $5.8 $5.8 $5.7 $5.4 20.00 $1.5 $1.3 $1.3 $1.4 $5.1 $1.1 $1.0 $4.8 $0.8 15.00 $0.7 10.00 $19.1 $18.7 $18.7 $18.6 $18.1 $17.7 $15.7 $13.7 5.00 - 2021 2022 2023 2024 Q3 2024 Q4 2024 Q1 2025 Q2 2025 Commercial Construction Auto loans and Leases Mortgage Consumer 18 Differences due to rounding
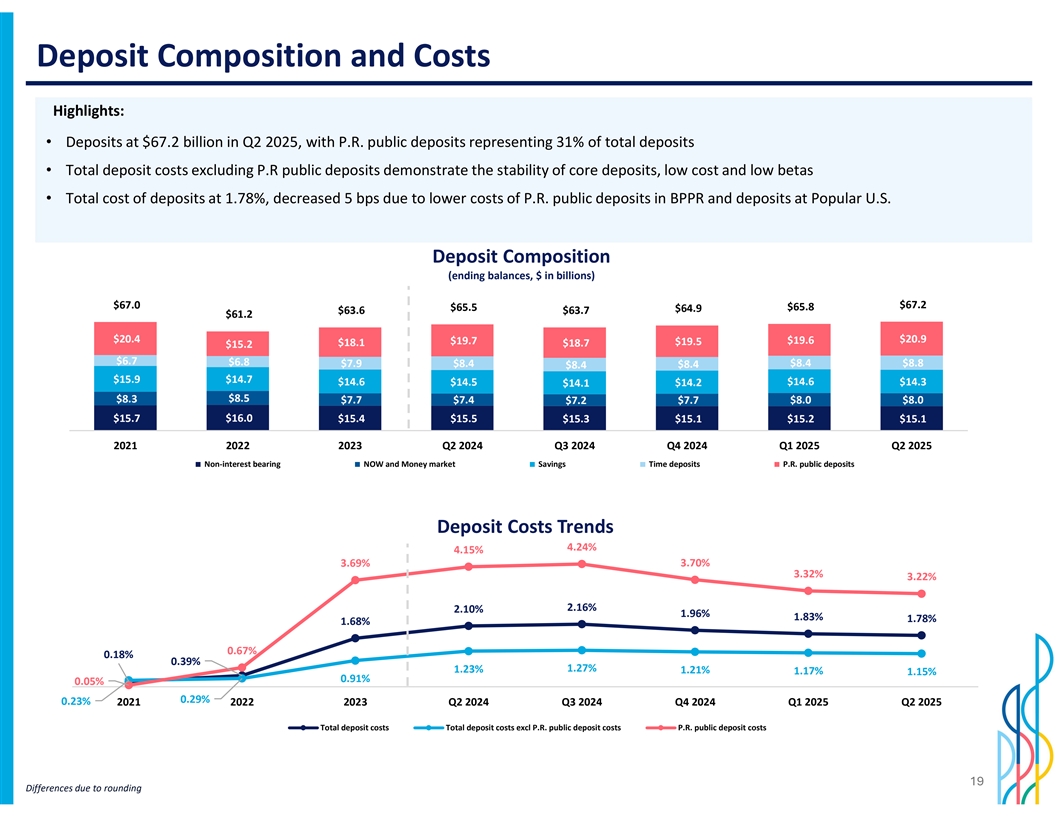
Deposit Composition and Costs Highlights: • Deposits at $67.2 billion in Q2 2025, with P.R. public deposits representing 31% of total deposits • Total deposit costs excluding P.R public deposits demonstrate the stability of core deposits, low cost and low betas • Total cost of deposits at 1.78%, decreased 5 bps due to lower costs of P.R. public deposits in BPPR and deposits at Popular U.S. Deposit Composition (ending balances, $ in billions) 80.00 $67.2 $67.0 $65.5 $65.8 $64.9 $63.6 $63.7 70.00 $61.2 60.00 $20.4 $20.9 $19.6 $19.7 $19.5 $18.1 $18.7 $15.2 50.00 $6.7 $6.8 40.00 $8.4 $8.8 $7.9 $8.4 $8.4 $8.4 30.00 $15.9 $14.7 $14.6 $14.5 $14.6 $14.3 $14.1 $14.2 20.00 $8.3 $8.5 $7.7 $7.4 $7.2 $7.7 $8.0 $8.0 10.00 $16.0 $15.7 $15.4 $15.5 $15.3 $15.1 $15.2 $15.1 - 2021 2022 2023 Q2 2024 Q3 2024 Q4 2024 Q1 2025 Q2 2025 Non-interest bearing NOW and Money market Savings Time deposits P.R. public deposits Deposit Costs Trends 4.24% 4.15% 0.045 3.69% 3.70% 0.04 3.32% 3.22% 0.035 0.03 2.16% 2.10% 0.025 1.96% 1.83% 1.78% 1.68% 0.02 0.015 0.67% 0.01 0.18% 0.39% 1.27% 0.005 1.23% 1.21% 1.17% 1.15% 0.91% 0.05% 0 0.29% 0.23% 2021 2022 2023 Q2 2024 Q3 2024 Q4 2024 Q1 2025 Q2 2025 Total deposit costs Total deposit costs excl P.R. public deposit costs P.R. public deposit costs 19 Differences due to rounding
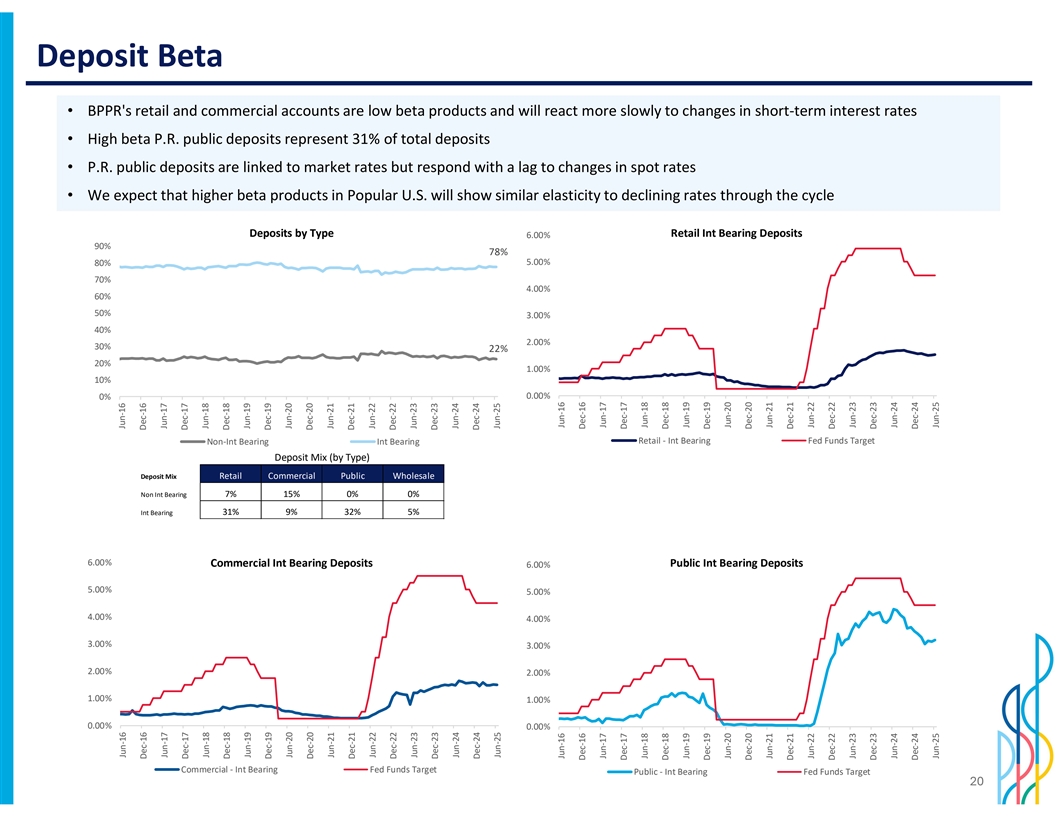
Deposit Beta • BPPR's retail and commercial accounts are low beta products and will react more slowly to changes in short-term interest rates • High beta P.R. public deposits represent 31% of total deposits • P.R. public deposits are linked to market rates but respond with a lag to changes in spot rates • We expect that higher beta products in Popular U.S. will show similar elasticity to declining rates through the cycle Deposits by Type Retail Int Bearing Deposits 6.00% 90% 78% 5.00% 80% 70% 4.00% 60% 50% 3.00% 40% 2.00% 30% 22% 20% 1.00% 10% 0.00% 0% Retail - Int Bearing Fed Funds Target Non-Int Bearing Int Bearing Deposit Mix (by Type) Deposit Mix Retail Commercial Public Wholesale Non Int Bearing 7% 15% 0% 0% 31% 9% 32% 5% Int Bearing 6.00% Commercial Int Bearing Deposits Public Int Bearing Deposits 6.00% 5.00% 5.00% 4.00% 4.00% 3.00% 3.00% 2.00% 2.00% 1.00% 1.00% 0.00% 0.00% Commercial - Int Bearing Fed Funds Target Public - Int Bearing Fed Funds Target 20 Jun-16 Jun-16 Dec-16 Dec-16 Jun-17 Jun-17 Dec-17 Dec-17 Jun-18 Jun-18 Dec-18 Dec-18 Jun-19 Jun-19 Dec-19 Dec-19 Jun-20 Jun-20 Dec-20 Dec-20 Jun-21 Jun-21 Dec-21 Dec-21 Jun-22 Jun-22 Dec-22 Dec-22 Jun-23 Jun-23 Dec-23 Dec-23 Jun-24 Jun-24 Dec-24 Dec-24 Jun-25 Jun-25 Jun-16 Jun-16 Dec-16 Dec-16 Jun-17 Jun-17 Dec-17 Dec-17 Jun-18 Jun-18 Dec-18 Dec-18 Jun-19 Jun-19 Dec-19 Dec-19 Jun-20 Jun-20 Dec-20 Dec-20 Jun-21 Jun-21 Dec-21 Dec-21 Jun-22 Jun-22 Dec-22 Dec-22 Jun-23 Jun-23 Dec-23 Dec-23 Jun-24 Jun-24 Dec-24 Dec-24 Jun-25 Jun-25
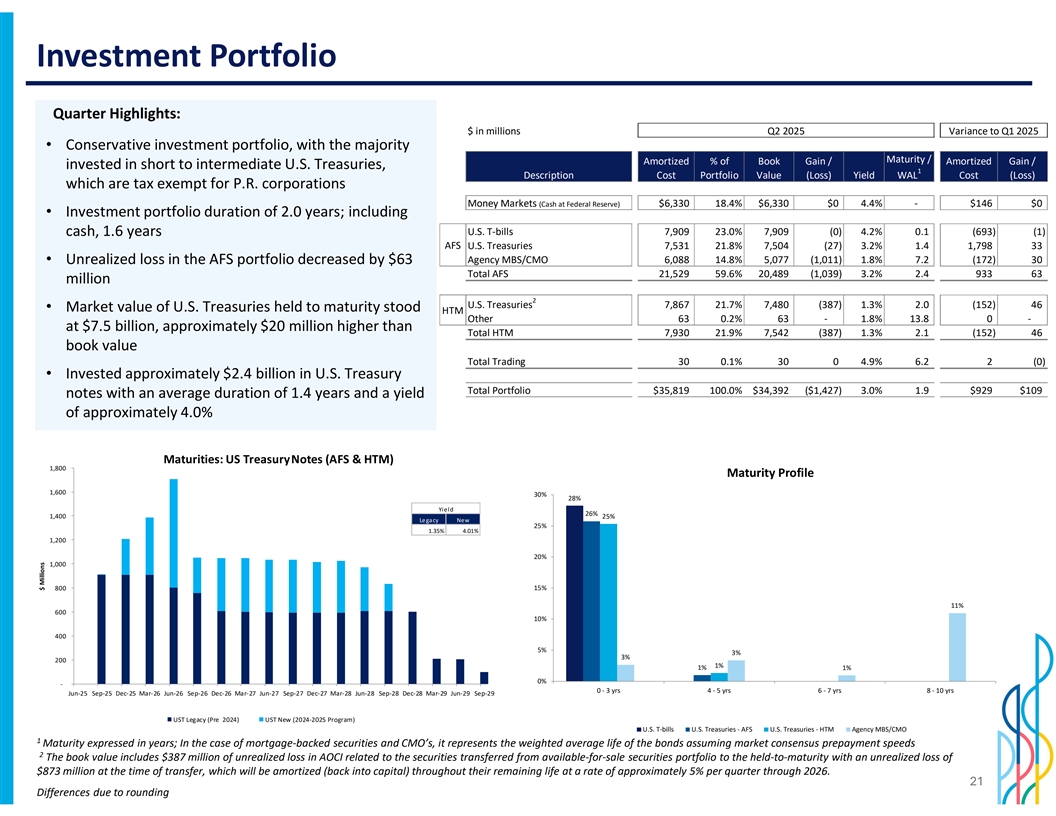
Investment Portfolio Quarter Highlights: $ in millions Q2 2025 Variance to Q1 2025 • Conservative investment portfolio, with the majority Maturity / Amortized % of Book Gain / Amortized Gain / invested in short to intermediate U.S. Treasuries, 1 Description Cost Portfolio Value (Loss) Yield WAL Cost (Loss) which are tax exempt for P.R. corporations Money Markets (Cash at Federal Reserve) $6,330 18.4% $6,330 $0 4.4% - $146 $0 • Investment portfolio duration of 2.0 years; including U.S. T-bills 7,909 23.0% 7,909 (0) 4.2% 0.1 (693) (1) cash, 1.6 years AFS U.S. Treasuries 7,531 21.8% 7,504 (27) 3.2% 1.4 1,798 33 • Unrealized loss in the AFS portfolio decreased by $63 Agency MBS/CMO 6,088 14.8% 5,077 ( 1,011) 1.8% 7.2 (172) 30 Total AFS 21,529 59.6% 20,489 ( 1,039) 3.2% 2.4 933 63 million 2 U.S. Treasuries 7,867 21.7% 7,480 (387) 1.3% 2.0 (152) 46 • Market value of U.S. Treasuries held to maturity stood HTM Other 63 0.2% 63 - 1.8% 13.8 0 - at $7.5 billion, approximately $20 million higher than Total HTM 7,930 21.9% 7,542 (387) 1.3% 2.1 (152) 46 book value Total Trading 30 0.1% 30 0 4.9% 6.2 2 (0) • Invested approximately $2.4 billion in U.S. Treasury Total Portfolio $35,819 100.0% $34,392 ($1,427) 3.0% 1.9 $929 $109 notes with an average duration of 1.4 years and a yield of approximately 4.0% Maturities: US Treasury Notes (AFS & HTM) 1,800 Maturity Profile 1,600 30% 28% Yield 26% 1,400 25% Legacy New 25% 1.35% 4.01% 1,200 20% 1,000 800 15% 11% 600 10% 400 5% 3% 3% 200 1% 1% 1% 0% 0% 0% 0% 0% 0% 0% 0% 0% 0% 0% 0% - 0 - 3 yrs 4 - 5 yrs 6 - 7 yrs 8 - 10 yrs Jun-25 Sep-25 Dec-25 Mar-26 Jun-26 Sep-26 Dec-26 Mar-27 Jun-27 Sep-27 Dec-27 Mar-28 Jun-28 Sep-28 Dec-28 Mar-29 Jun-29 Sep-29 UST Legacy (Pre 2024) UST New (2024-2025 Program) U.S. T-bills U.S. Treasuries - AFS U.S. Treasuries - HTM Agency MBS/CMO 1 Maturity expressed in years; In the case of mortgage-backed securities and CMO’s, it represents the weighted average life of the bonds assuming market consensus prepayment speeds 2 The book value includes $387 million of unrealized loss in AOCI related to the securities transferred from available-for-sale securities portfolio to the held-to-maturity with an unrealized loss of $873 million at the time of transfer, which will be amortized (back into capital) throughout their remaining life at a rate of approximately 5% per quarter through 2026. 21 Differences due to rounding $ Millions
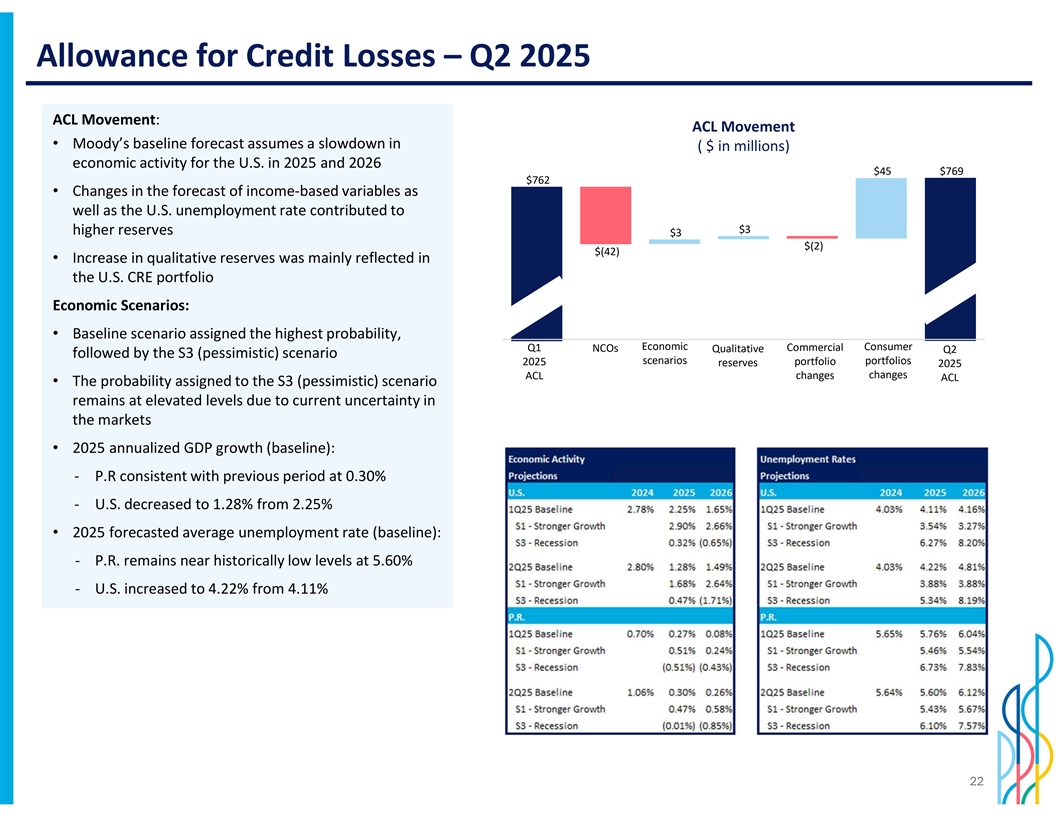
Allowance for Credit Losses – Q2 2025 ACL Movement: ACL Movement • Moody’s baseline forecast assumes a slowdown in ( $ in millions) economic activity for the U.S. in 2025 and 2026 $45 $769 $762 • Changes in the forecast of income-based variables as well as the U.S. unemployment rate contributed to $3 higher reserves $3 $(2) $(42) • Increase in qualitative reserves was mainly reflected in the U.S. CRE portfolio Economic Scenarios: • Baseline scenario assigned the highest probability, Economic Commercial Consumer Q1 NCOs Qualitative Q2 Q1 2025 ACL NCOs Economic Scenarios Qualitative Reserves Commercial Changes Consumer Changes Q2 2025 ACL followed by the S3 (pessimistic) scenario scenarios portfolios 2025 portfolio reserves 2025 changes ACL changes ACL • The probability assigned to the S3 (pessimistic) scenario remains at elevated levels due to current uncertainty in the markets • 2025 annualized GDP growth (baseline): - P.R consistent with previous period at 0.30% - U.S. decreased to 1.28% from 2.25% • 2025 forecasted average unemployment rate (baseline): - P.R. remains near historically low levels at 5.60% - U.S. increased to 4.22% from 4.11% 22
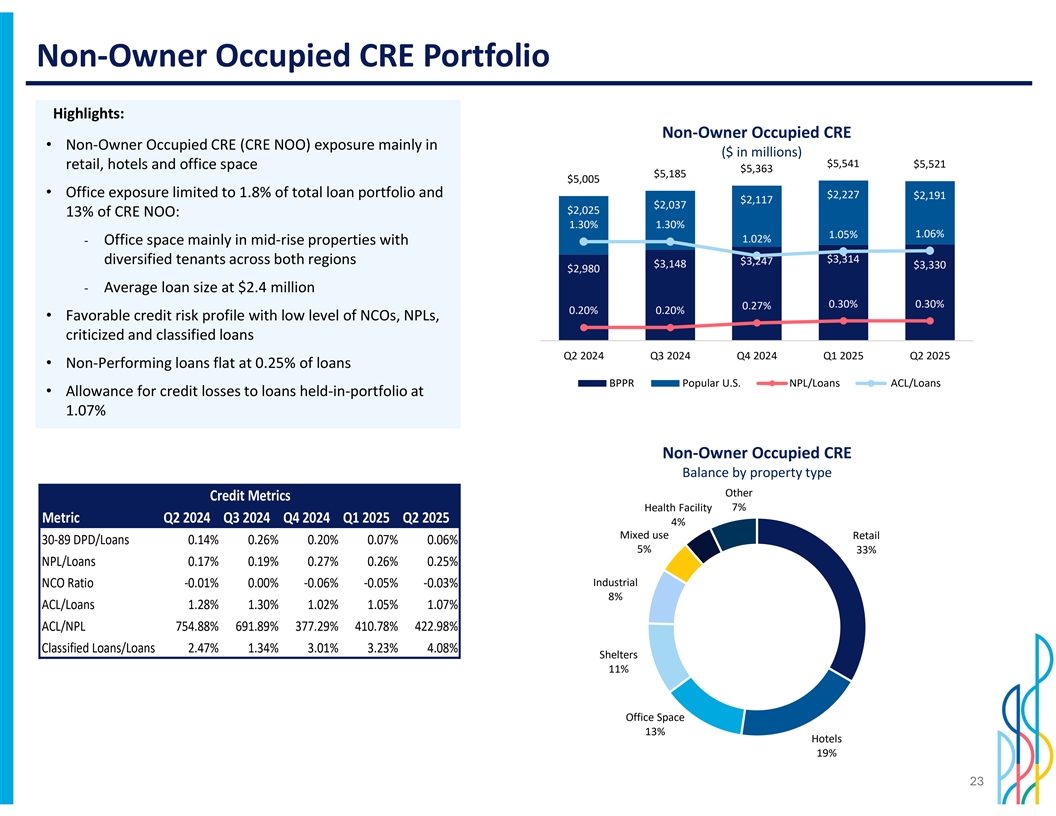
Non-Owner Occupied CRE Portfolio Highlights: Non-Owner Occupied CRE • Non-Owner Occupied CRE (CRE NOO) exposure mainly in ($ in millions) $5,541 $5,521 retail, hotels and office space $5,363 $5,185 $5,005 • Office exposure limited to 1.8% of total loan portfolio and 5,000 $2,227 $2,191 $2,117 $2,037 2.0% $2,025 13% of CRE NOO: 4,000 1.30% 1.30% 1.06% 1.05% 1.02% 1.5% - Office space mainly in mid-rise properties with 3,000 $3,314 diversified tenants across both regions $3,247 $3,148 $3,330 $2,980 1.0% 2,000 - Average loan size at $2.4 million 0.30% 0.30% 0.5% 0.27% 1,000 0.20% 0.20% • Favorable credit risk profile with low level of NCOs, NPLs, criticized and classified loans 0 0.0% Q2 2024 Q3 2024 Q4 2024 Q1 2025 Q2 2025 • Non-Performing loans flat at 0.25% of loans BPPR Popular U.S. NPL/Loans ACL/Loans • Allowance for credit losses to loans held-in-portfolio at 1.07% Non-Owner Occupied CRE Balance by property type Other Credit Metrics 7% Health Facility Metric Q2 2024 Q3 2024 Q4 2024 Q1 2025 Q2 2025 4% Mixed use Retail 30-89 DPD/Loans 0.14% 0.26% 0.20% 0.07% 0.06% 5% 33% NPL/Loans 0.17% 0.19% 0.27% 0.26% 0.25% Industrial NCO Ratio -0.01% 0.00% -0.06% -0.05% -0.03% 8% ACL/Loans 1.28% 1.30% 1.02% 1.05% 1.07% ACL/NPL 754.88% 691.89% 377.29% 410.78% 422.98% Classified Loans/Loans 2.47% 1.34% 3.01% 3.23% 4.08% Shelters 11% Office Space 13% Hotels 19% 23
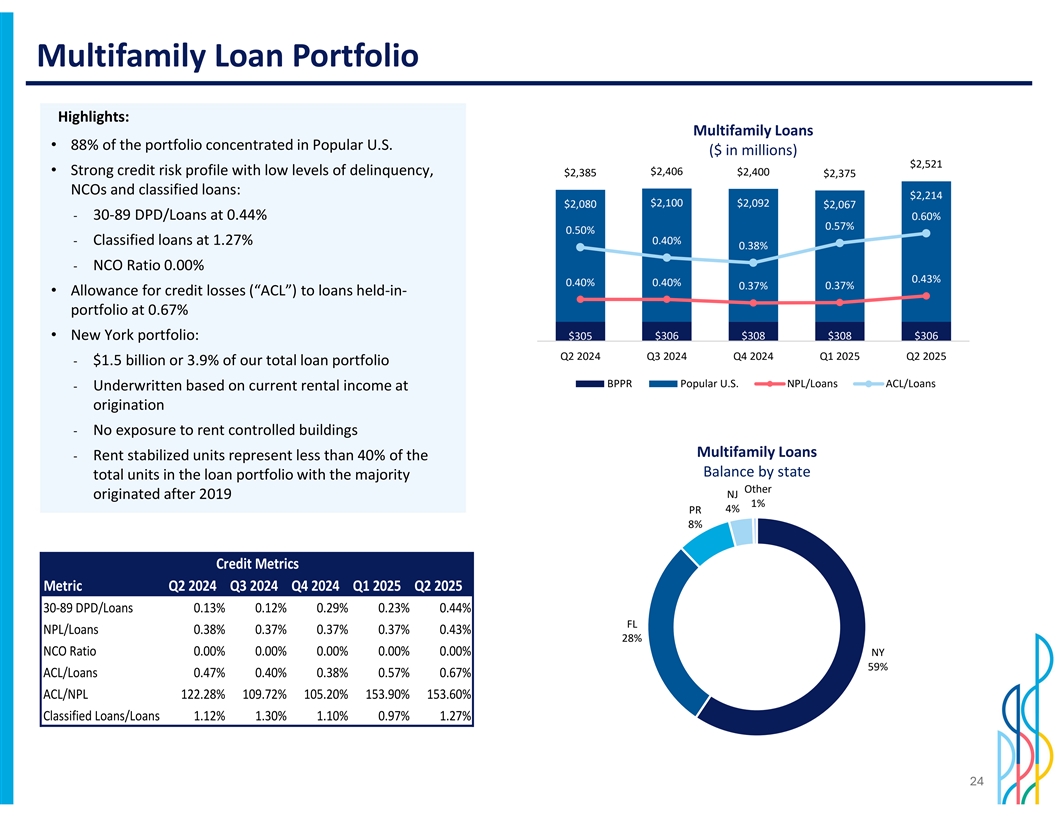
Multifamily Loan Portfolio Highlights: Multifamily Loans • 88% of the portfolio concentrated in Popular U.S. ($ in millions) $2,521 • Strong credit risk profile with low levels of delinquency, $2,406 $2,400 $2,385 $2,375 2,500 NCOs and classified loans: 1.4% $2,214 $2,100 $2,092 $2,080 $2,067 2,000 1.2% - 30-89 DPD/Loans at 0.44% 0.60% 0.57% 0.50% 1.0% 0.40% - Classified loans at 1.27% 1,500 0.38% 0.8% - NCO Ratio 0.00% 1,000 0.6% 0.43% 0.40% 0.40% 0.37% 0.37% • Allowance for credit losses (“ACL”) to loans held-in- 0.4% 500 portfolio at 0.67% 0.2% • New York portfolio: $305 $306 $308 $308 $306 0 0.0% Q2 2024 Q3 2024 Q4 2024 Q1 2025 Q2 2025 - $1.5 billion or 3.9% of our total loan portfolio BPPR Popular U.S. NPL/Loans ACL/Loans - Underwritten based on current rental income at origination - No exposure to rent controlled buildings Multifamily Loans - Rent stabilized units represent less than 40% of the Balance by state total units in the loan portfolio with the majority Other originated after 2019 NJ 1% 4% PR 8% Credit Metrics Metric Q2 2024 Q3 2024 Q4 2024 Q1 2025 Q2 2025 30-89 DPD/Loans 0.13% 0.12% 0.29% 0.23% 0.44% FL NPL/Loans 0.38% 0.37% 0.37% 0.37% 0.43% 28% NCO Ratio 0.00% 0.00% 0.00% 0.00% 0.00% NY 59% ACL/Loans 0.47% 0.40% 0.38% 0.57% 0.67% ACL/NPL 122.28% 109.72% 105.20% 153.90% 153.60% Classified Loans/Loans 1.12% 1.30% 1.10% 0.97% 1.27% 24
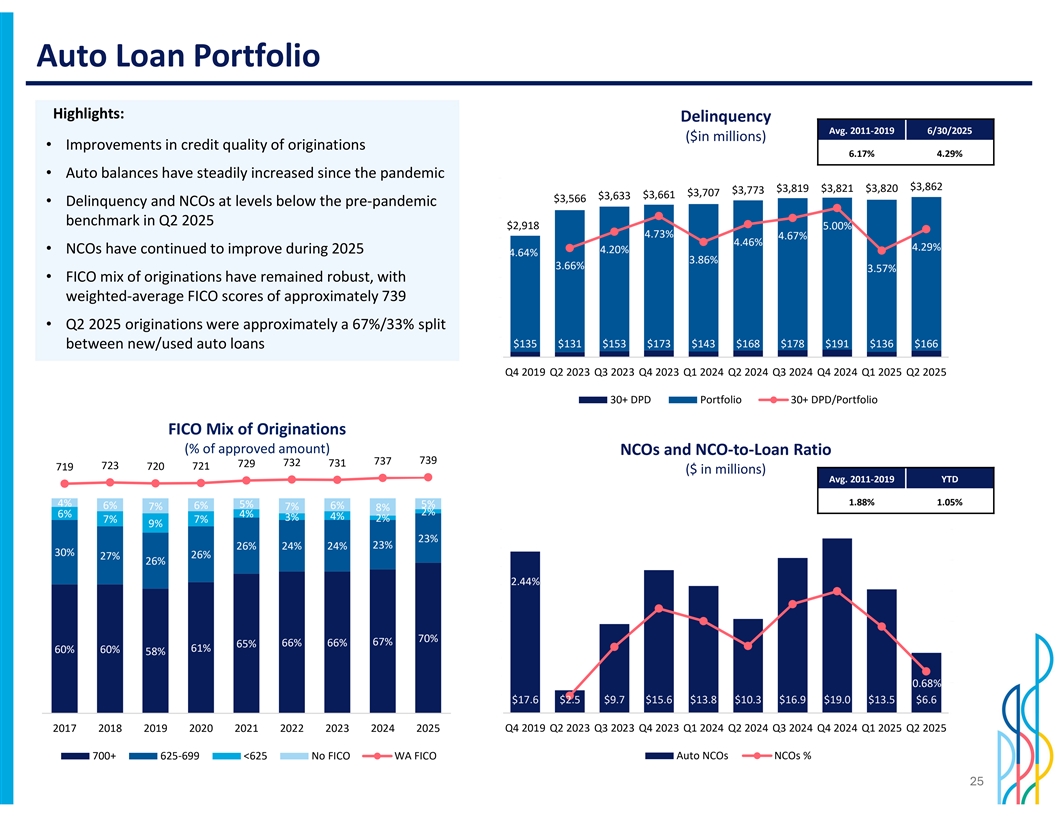
Auto Loan Portfolio Highlights: Delinquency Avg. 2011-2019 6/30/2025 ($in millions) • Improvements in credit quality of originations 6.17% 4.29% • Auto balances have steadily increased since the pandemic 4500 0.06 $3,862 $3,819 $3,821 $3,820 $3,773 $3,707 4000 $3,661 $3,633 $3,566 • Delinquency and NCOs at levels below the pre-pandemic 0.05 3500 benchmark in Q2 2025 $2,918 5.00% 4.73% 3000 0.04 4.67% 4.46% 4.29% • NCOs have continued to improve during 2025 4.20% 4.64% 2500 3.86% 0.03 3.66% 3.57% 2000 • FICO mix of originations have remained robust, with 1500 0.02 weighted-average FICO scores of approximately 739 1000 0.01 • Q2 2025 originations were approximately a 67%/33% split 500 $135 $131 $153 $173 $143 $168 $178 $191 $136 $166 between new/used auto loans 0 0 Q4 2019 Q2 2023 Q3 2023 Q4 2023 Q1 2024 Q2 2024 Q3 2024 Q4 2024 Q1 2025 Q2 2025 30+ DPD Portfolio 30+ DPD/Portfolio FICO Mix of Originations (% of approved amount) NCOs and NCO-to-Loan Ratio 739 737 732 731 729 723 721 719 720 ($ in millions) Avg. 2011-2019 YTD 700 100% 1.88% 1.05% 4% 5% 5% 6% 6% 6% 7% 7% 8% 2% 6% 4% 4% 3% 7% 7% 2% 600 9% 20 0.03 80% 23% 26% 24% 24% 23% 18 500 30% 26% 27% 0.025 26% 16 60% 14 2.44% 400 0.02 12 300 10 0.015 40% 8 70% 67% 66% 66% 65% 200 61% 60% 60% 0.01 58% 6 20% 4 100 0.005 0.68% 2 $17.6 $2.5 $9.7 $15.6 $13.8 $10.3 $16.9 $19.0 $13.5 $6.6 0 0 0% 0 2017 2018 2019 2020 2021 2022 2023 2024 2025 Q4 2019 Q2 2023 Q3 2023 Q4 2023 Q1 2024 Q2 2024 Q3 2024 Q4 2024 Q1 2025 Q2 2025 700+ 625-699 <625 No FICO WA FICO Auto NCOs NCOs % 25
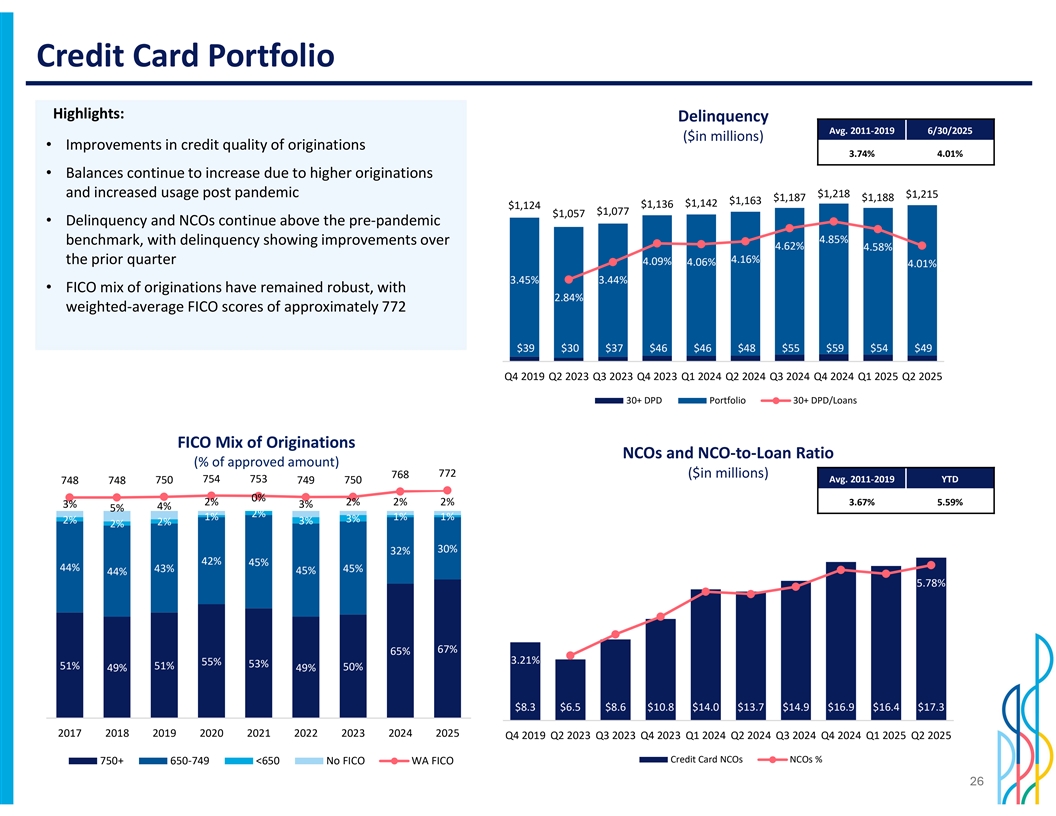
Credit Card Portfolio Highlights: Delinquency Avg. 2011-2019 6/30/2025 ($in millions) • Improvements in credit quality of originations 3.74% 4.01% • Balances continue to increase due to higher originations 1400 0.06 and increased usage post pandemic $1,218 $1,215 $1,187 $1,188 $1,163 0.055 $1,142 $1,136 $1,124 1200 $1,077 $1,057 0.05 • Delinquency and NCOs continue above the pre-pandemic 0.045 1000 4.85% benchmark, with delinquency showing improvements over 0.04 4.62% 4.58% 0.035 800 4.16% the prior quarter 4.09% 4.06% 4.01% 0.03 3.45% 3.44% 600 0.025 • FICO mix of originations have remained robust, with 2.84% 0.02 weighted-average FICO scores of approximately 772 400 0.015 0.01 200 0.005 $39 $30 $37 $46 $46 $48 $55 $59 $54 $49 0 0 Q4 2019 Q2 2023 Q3 2023 Q4 2023 Q1 2024 Q2 2024 Q3 2024 Q4 2024 Q1 2025 Q2 2025 30+ DPD Portfolio 30+ DPD/Loans FICO Mix of Originations NCOs and NCO-to-Loan Ratio (% of approved amount) 772 ($in millions) 768 754 753 Avg. 2011-2019 YTD 748 748 750 749 750 0% 2% 2% 2% 2% 3.67% 5.59% 3% 3% 4% 100% 5% 700 2% 1% 1% 1% 3% 2% 2% 3% 2% 20 0.07 600 18 80% 30% 32% 0.06 42% 45% 44% 16 43% 45% 500 45% 44% 5.78% 0.05 14 60% 400 12 0.04 10 300 40% 0.03 8 67% 65% 200 3.21% 55% 6 53% 0.02 51% 51% 50% 49% 49% 20% 4 100 0.01 2 $8.3 $6.5 $8.6 $10.8 $14.0 $13.7 $14.9 $16.9 $16.4 $17.3 0% 0 0 0 2017 2018 2019 2020 2021 2022 2023 2024 2025 Q4 2019 Q2 2023 Q3 2023 Q4 2023 Q1 2024 Q2 2024 Q3 2024 Q4 2024 Q1 2025 Q2 2025 Credit Card NCOs NCOs % 750+ 650-749 <650 No FICO WA FICO 26
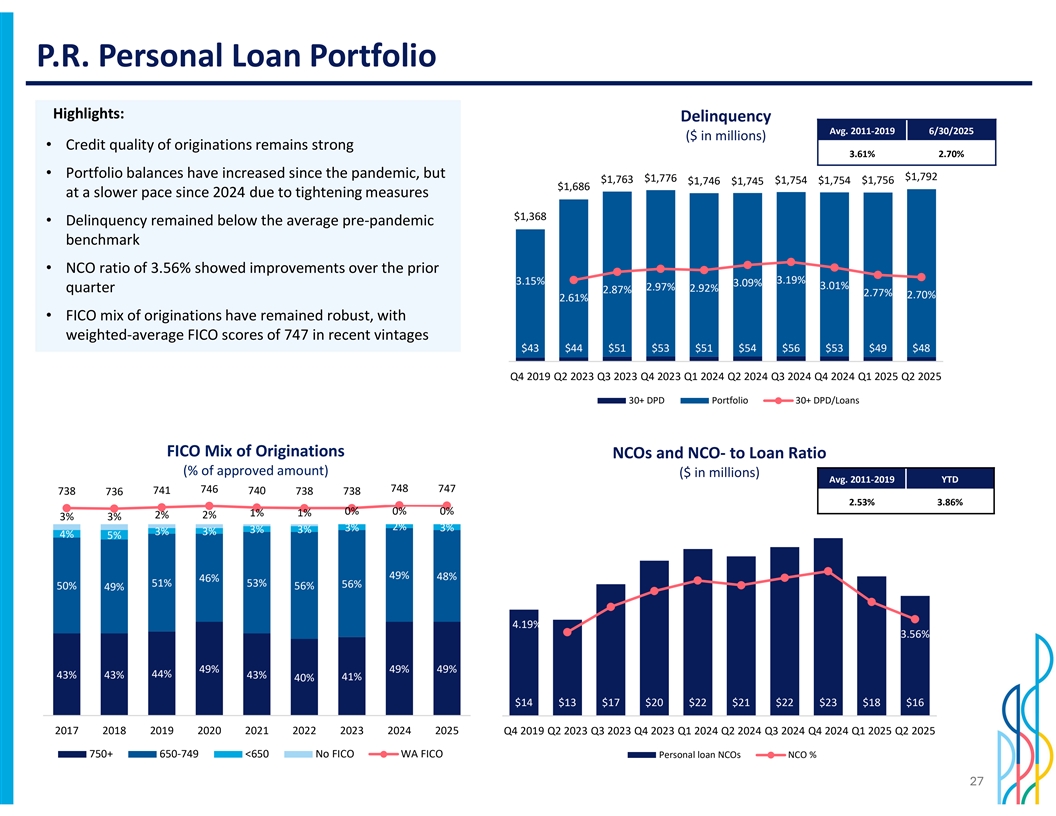
P.R. Personal Loan Portfolio Highlights: Delinquency Avg. 2011-2019 6/30/2025 ($ in millions) • Credit quality of originations remains strong 3.61% 2.70% 2000 0.06 • Portfolio balances have increased since the pandemic, but $1,792 $1,776 $1,763 $1,754 $1,754 $1,756 $1,746 $1,745 $1,686 1800 at a slower pace since 2024 due to tightening measures 0.05 1600 $1,368 • Delinquency remained below the average pre-pandemic 1400 0.04 benchmark 1200 1000 0.03 • NCO ratio of 3.56% showed improvements over the prior 3.19% 3.15% 800 3.09% 3.01% 2.97% quarter 2.92% 2.87% 2.77% 2.70% 0.02 2.61% 600 • FICO mix of originations have remained robust, with 400 0.01 weighted-average FICO scores of 747 in recent vintages 200 $43 $44 $51 $53 $51 $54 $56 $53 $49 $48 0 0 Q4 2019 Q2 2023 Q3 2023 Q4 2023 Q1 2024 Q2 2024 Q3 2024 Q4 2024 Q1 2025 Q2 2025 30+ DPD Portfolio 30+ DPD/Loans FICO Mix of Originations NCOs and NCO- to Loan Ratio (% of approved amount) ($ in millions) Avg. 2011-2019 YTD 748 747 746 738 741 740 738 738 736 2.53% 3.86% 0% 0% 0% 1% 1% 2% 2% 3% 3% 700 100% 25 0.07 2% 3% 3% 3% 3% 3% 3% 4% 5% 600 0.06 80% 20 500 49% 48% 0.05 46% 51% 53% 56% 50% 56% 49% 60% 15 400 0.04 4.19% 300 0.03 3.56% 40% 10 200 0.02 49% 49% 49% 44% 20% 43% 43% 43% 5 40% 41% 100 0.01 $14 $13 $17 $20 $22 $21 $22 $23 $18 $16 0% 0 0 0 2017 2018 2019 2020 2021 2022 2023 2024 2025 Q4 2019 Q2 2023 Q3 2023 Q4 2023 Q1 2024 Q2 2024 Q3 2024 Q4 2024 Q1 2025 Q2 2025 750+ 650-749 <650 No FICO WA FICO Personal loan NCOs NCO % 27

P.R. Public Sector Exposure The Corporation does not own any loans issued by the P.R. central government or its public corporations. As of June 30, 2025, our direct exposure to P.R. municipalities amounted to $362 million, flat when compared to the prior quarter Municipalities Outstanding P.R. Sector Exposure Obligations of municipalities are backed by real and ($ in millions) Loans Securities Total personal property taxes, municipal excise taxes, and/or a percentage of the sales and use tax Municipalities $ 351 $ 1 1 $ 362 Indirect exposure Indirect exposure $ 168 $ 4 4 $ 212 Indirect exposure includes loans or securities that are payable by non-governmental entities, but which carry a government guarantee to cover any shortfall in collateral in the event of borrower default. Majority are single-family mortgage related 28
Popular’s Credit Ratings Senio Sr en U ior n U s ne sec cu u re rd e R d a tR ing a stings Fitch BBB- Stable Outlook S&P BB+ Stable Outlook Moody’s Ba1 Stable Outlook 2018 2019 2020 2021 2022 April April June Moody’s Moody's September April Fitch upgrades upgrades to upgrades to B1 Moody’s upgrades S&P upgrades to to BBB- from Ba3 from B1 from B2 May March to Ba1 from Ba3, BB+ from BB-, BB, revised Fitch Moody’s revised outlook to Fitch and S&P revised outlook May S&P revised outlook to upgrades to revised outlook Stable revised outlook to Stable Fitch revised outlook to Stable BB from BB- to Positive to Positive Positive outlook to Positive March S&P lowers outlook to Stable 29

Investor Presentation Second Quarter 2025