UNITED STATES
SECURITIES AND EXCHANGE COMMISSION
Washington, D.C. 20549
FORM 8-K
CURRENT REPORT
Pursuant to Section 13 or 15(d)
of the Securities Exchange Act of 1934
July 18, 2025
(Date of report; date of
earliest event reported)
Commission file number: 1-3754
ALLY FINANCIAL INC.
(Exact name of registrant as specified in its charter)
| Delaware | 38-0572512 | |
|
(State or other jurisdiction of incorporation or organization) |
(I.R.S. Employer Identification No.) |
Ally Detroit Center
500 Woodward Ave.
Floor 10, Detroit, Michigan
48226
(Address of principal executive offices)
(Zip Code)
(866) 710-4623
(Registrant’s telephone number, including area code)
Check the appropriate box below if the Form 8-K filing is intended to simultaneously satisfy the filing obligation of the registrant under any of the following provisions (see General Instruction A.2. below):
| ☐ | Written communications pursuant to Rule 425 under the Securities Act (17 CFR 230.425) |
| ☐ | Soliciting material pursuant to Rule 14a-12 under the Exchange Act (17 CFR 240.14a-12) |
| ☐ | Pre-commencement communications pursuant to Rule 14d-2(b) under the Exchange Act (17 CFR 240.14d-2(b)) |
| ☐ | Pre-commencement communications pursuant to Rule 13e-4(c) under the Exchange Act (17 CFR 240.13e-4(c)) |
Securities registered pursuant to Section 12(b) of the Act (listed on the New York Stock Exchange):
Title of each class |
Trading symbols |
|
| Common Stock, par value $0.01 per share | ALLY |
Indicate by check mark whether the registrant is an emerging growth company as defined in Rule 405 of the Securities Act of 1933 (§230.405 of this chapter) or Rule 12b-2 of the Securities Exchange Act of 1934 (§240.12b-2 of this chapter).
Emerging growth company ☐
If an emerging growth company, indicate by check mark if the registrant has elected not to use the extended transition period for complying with any new or revised financial accounting standards provided pursuant to Section 13(a) of the Exchange Act. ☐
| Item 2.02 | Results of Operation and Financial Condition. |
On July 18, 2025, Ally Financial Inc. issued a press release announcing preliminary operating results for the second quarter ended June 30, 2025. The press release is attached hereto and incorporated by reference as Exhibit 99.1. Charts furnished to securities analysts are attached hereto and incorporated by reference as Exhibit 99.2. In addition, supplemental financial data furnished to securities analysts is attached hereto and incorporated by reference as Exhibit 99.3.
| Item 9.01 | Financial Statements and Exhibits. |
Exhibit |
Description |
|
| 99.1 | Press Release, Dated July 18, 2025 | |
| 99.2 | Charts Furnished to Securities Analysts | |
| 99.3 | Supplemental Financial Data Furnished to Securities Analysts | |
| 104 | The cover page from this Current Report on Form 8-K, formatted in Inline XBRL | |
SIGNATURES
Pursuant to the requirements of the Securities Exchange Act of 1934, the registrant has duly caused this report to be signed on its behalf by the undersigned hereunto duly authorized.
| ALLY FINANCIAL INC. | ||||||
| (Registrant) | ||||||
| Dated: July 18, 2025 | /s/ David J. DeBrunner |
|||||
| David J. DeBrunner | ||||||
| Vice President, Controller, and Chief Accounting Officer | ||||||
Exhibit 99.1
News release: IMMEDIATE RELEASE

Ally Financial Reports Second Quarter 2025 Financial Results
| $1.04 |
10.7% | $436 million | $2.1 billion | |||
| GAAP EPS |
RETURN ON COMMON EQUITY | PRE-TAX INCOME | GAAP TOTAL NET REVENUE | |||
| $0.99 |
13.6% | $418 million | $2.1 billion | |||
|
ADJUSTED EPS1 |
CORE ROTCE1 | CORE PRE-TAX INCOME1 | ADJUSTED TOTAL NET REVENUE1 | |||
FINANCIAL HIGHLIGHTS
| • | GAAP EPS of $1.04 and Adjusted EPS of $0.99, up 68% and 36% year over year, respectively |
| • | Pre-tax income of $436 million, up $157 million year over year. Core pre-tax income of $418 million, up $96 million year over year |
| • | NIM ex. OID1 of 3.45% is up 10 bps quarter over quarter |
| • | Common equity tier 1 ratio of 9.9% increased 38 bps quarter over quarter | Fully phased-in AOCI CET1 of 7.6% |
| • | Closed the sale of Credit Card on April 1 | Generated 40 bps of CET1, 20 bps recognized in 1Q, 20 bps recognized at closing |
OPERATIONAL HIGHLIGHTS
| • | $11.0 billion of consumer auto originations sourced from a record 3.9 million consumer auto applications |
| • | Retail auto originated yield1 of 9.82% with 42% of volume within the highest credit quality tier |
| • | 175 bps retail auto net charge-offs, down 6 bps year over year |
| • | Insurance written premiums of $349 million, up 2% year over year & up 6% year over year excl. impacts of excess of loss reinsurance |
| • | $143 billion of retail deposits | 92% FDIC insured | 88% core deposit funded |
| • | 65 consecutive quarters of retail deposit customer growth, up 30 thousand in 2Q | Now serving 3.4 million customers |
| • | Corporate Finance HFI portfolio of $11.0 billion | Continued strong returns with 2Q ROE of 31% |
CEO COMMENTS
“I am encouraged and energized by the progress we have made as an organization over the first half of the year. Our results demonstrate sound strategic positioning and disciplined execution, contributing to an improving financial trajectory. These results reflect the power of focus from our 10,000+ colleagues and our ongoing commitment to unlocking the full potential of our core franchises," said Chief Executive Officer, Michael Rhodes. "This unified focus strengthens my conviction in the path toward improved returns and long-term shareholder value creation.
Our Dealer Financial Services business continued its strong trajectory, with a record 3.9 million decisioned consumer applications, driving $11.0 billion in originations. In Insurance, average dealer inventory exposure rose by 23% year over year to $48 billion as we continue to expand new relationships and leverage synergies with our Auto Finance business.
Corporate Finance once again stood out, generating a strong 31% ROE and ending the quarter with zero net charge-offs and no new loans moving to non-accrual - underscoring the team's disciplined approach to growth and risk management.
At Ally Bank, we serve an all-time high of 3.4 million customers, marking 65 consecutive quarters of growth in our customer base. We ended the quarter with deposit balances of $143 billion - 92% of which are FDIC insured - reinforcing our position as the nation's largest all-digital bank.
Looking ahead, I am confident in the momentum across each of our businesses. With market-leading franchises, a powerful brand, and a culture that sets us apart, Ally is operating from a position of strength. While we remain mindful of the macro environment, our focus remains squarely on disciplined execution to consistently deliver strong results and generate more compelling returns over time."
Second Quarter 2025 Financial Results
| Increase / (Decrease) vs. | ||||||||||||||||||||
| ($ millions except per share data) | 2Q 25 | 1Q 25 | 2Q 24 | 1Q 25 | 2Q 24 | |||||||||||||||
| GAAP Net Income (Loss) Attributable to Common Shareholders |
$ | 324 | $ | (253 | ) | $ | 191 | 228 | % | 70 | % | |||||||||
| Core Net Income Attributable to Common Shareholders1 |
$ | 309 | $ | 179 | $ | 224 | 73 | % | 38 | % | ||||||||||
|
|
|
|
|
|
|
|
|
|
|
|||||||||||
| GAAP Earnings per Common Share (basic or diluted as applicable) |
$ | 1.04 | $ | (0.82 | ) | $ | 0.62 | 227 | % | 68 | % | |||||||||
| Adjusted EPS1 |
$ | 0.99 | $ | 0.58 | $ | 0.73 | 71 | % | 36 | % | ||||||||||
|
|
|
|
|
|
|
|
|
|
|
|||||||||||
| Return on GAAP Shareholder’s Equity |
10.7 | % | (8.6 | )% | 6.8 | % | 225 | % | 59 | % | ||||||||||
| Core ROTCE1 |
13.6 | % | 8.3 | % | 10.7 | % | 64 | % | 27 | % | ||||||||||
|
|
|
|
|
|
|
|
|
|
|
|||||||||||
| GAAP Common Shareholder’s Equity per Share |
$ | 39.71 | $ | 38.77 | $ | 37.34 | 2 | % | 6 | % | ||||||||||
| Adjusted Tangible Book Value per Share1 |
$ | 37.30 | $ | 35.95 | $ | 33.01 | 4 | % | 13 | % | ||||||||||
|
|
|
|
|
|
|
|
|
|
|
|||||||||||
| GAAP Total Net Revenue |
$ | 2,082 | $ | 1,541 | $ | 2,022 | 35 | % | 3 | % | ||||||||||
| Adjusted Total Net Revenue1 |
$ | 2,064 | $ | 2,065 | $ | 2,064 | 0 | % | 0 | % | ||||||||||
| 1 | The following are non-GAAP financial measures which Ally believes are important to the reader of the Consolidated Financial Statements, but which are supplemental to and not a substitute for GAAP measures: Adjusted Earnings per Share (Adjusted EPS), Adjusted Total Net Revenue, Core Pre-Tax Income, Core Net Income Attributable to Common Shareholders, Core OID, Core Return on Tangible Common Equity (Core ROTCE), Estimated Retail Auto Originated Yield, Tangible Common Equity, Net Financing Revenue (excluding Core OID) and Adjusted Tangible Book Value per Share (Adjusted TBVPS). These measures are used by management and we believe are useful to investors in assessing the company’s operating performance and capital. Refer to the Definitions of Non-GAAP Financial Measures and Other Key Terms, and Reconciliation to GAAP later in this release. |

Discussion of Second Quarter 2025 Results
Net income attributable to common shareholders was $324 million in the quarter, compared to $191 million in the second quarter of 2024.
Net financing revenue was $1.5 billion, down $1 million year over year. Net interest margin (“NIM”) of 3.41% and net interest margin excluding core OIDA of 3.45% were both up 9 bps year over year.
Other revenue increased $61 million year over year to $566 million due to a $35 million increase in fair value of equity securities in the quarter compared to a $28 million decrease in the second quarter of 2024. Adjusted other revenueA of $531 million decreased $2 million year over year as the removal of fee-related income from the sale of Credit Card and the wind-down of the consumer mortgage portfolio was mostly offset by momentum across diversified revenue streams including Insurance, SmartAuction, and Passthrough programs.
Provision for credit losses decreased $73 million year over year to $384 million, primarily driven by the sale of Credit Card and lower retail auto net charge-offs.
Noninterest expense decreased $24 million year over year, primarily driven by the sale of Credit Card and our ongoing commitment to prudent expense management, as evidenced by the seventh consecutive quarter with a year over year decline of controllable expenses.
| A | Represents a non-GAAP financial measure. Refer to the Definitions of Non-GAAP Financial Measures and Other Key Terms and Reconciliation to GAAP later in this press release. |
Second Quarter 2025 Financial Results
| Increase/(Decrease) vs. | ||||||||||||||||||||
| ($ millions except per share data) | 2Q 25 | 1Q 25 | 2Q 24 | 1Q 25 | 2Q 24 | |||||||||||||||
| (a) Net Financing Revenue |
$ | 1,516 | $ | 1,478 | $ | 1,517 | $ | 38 | $ | (1 | ) | |||||||||
| Core OID1 |
16 | 16 | 14 | 1 | 2 | |||||||||||||||
|
|
|
|
|
|
|
|
|
|
|
|||||||||||
| Net Financing Revenue (excluding Core OID)1 |
1,532 | 1,494 | 1,531 | 39 | 1 | |||||||||||||||
| (b) Other Revenue |
566 | 63 | 505 | 503 | 61 | |||||||||||||||
| Repositioning3 |
— | 495 | — | (495 | ) | — | ||||||||||||||
| Change in Fair Value of Equity Securities2 |
(35 | ) | 13 | 28 | (47 | ) | (63 | ) | ||||||||||||
|
|
|
|
|
|
|
|
|
|
|
|||||||||||
| Adjusted Other Revenue1 |
531 | 571 | 533 | (40 | ) | (2 | ) | |||||||||||||
| (c) Provision for Credit Losses |
384 | 191 | 457 | 193 | (73 | ) | ||||||||||||||
| Repositioning3 |
— | 306 | — | (306 | ) | — | ||||||||||||||
| Adjusted Provision for Credit Losses1 |
384 | 497 | 457 | (113 | ) | (73 | ) | |||||||||||||
|
|
|
|
|
|
|
|
|
|
|
|||||||||||
| (d) Noninterest Expense |
1,262 | 1,634 | 1,286 | (372 | ) | (24 | ) | |||||||||||||
| Repositioning3 |
— | (314 | ) | — | 314 | — | ||||||||||||||
|
|
|
|
|
|
|
|
|
|
|
|||||||||||
| Adjusted Noninterest Expense1 |
1,262 | 1,320 | 1,286 | (58 | ) | (24 | ) | |||||||||||||
|
|
|
|
|
|
|
|
|
|
|
|||||||||||
| Pre-Tax Income (loss) (a+b-c-d) |
$ | 436 | $ | (284 | ) | $ | 279 | $ | 720 | $ | 157 | |||||||||
| Income Tax Expense (Benefit) |
84 | (59 | ) | 60 | 143 | 24 | ||||||||||||||
| Net Income (Loss) from Discontinued Operations |
— | — | — | — | — | |||||||||||||||
|
|
|
|
|
|
|
|
|
|
|
|||||||||||
| Net Income (Loss) |
$ | 352 | $ | (225 | ) | $ | 219 | $ | 577 | $ | 133 | |||||||||
| Preferred Dividends |
28 | 28 | 28 | — | — | |||||||||||||||
|
|
|
|
|
|
|
|
|
|
|
|||||||||||
| Net Income (Loss) Attributable to Common Shareholders |
$ | 324 | $ | (253 | ) | $ | 191 | $ | 577 | $ | 133 | |||||||||
|
|
|
|
|
|
|
|
|
|
|
|||||||||||
| GAAP EPS (basic or diluted, as applicable) |
$ | 1.04 | $ | (0.82 | ) | $ | 0.62 | $ | 1.85 | $ | 0.42 | |||||||||
| Core OID, Net of Tax1 |
0.04 | 0.04 | 0.04 | 0.00 | 0.01 | |||||||||||||||
| Change in Fair Value of Equity Securities, Net of Tax2 |
(0.09 | ) | 0.03 | 0.07 | (0.12 | ) | (0.16 | ) | ||||||||||||
| Repositioning, Discontinued Ops., and Other, Net of Tax3 |
0.00 | 1.33 | — | (1.33 | ) | 0.00 | ||||||||||||||
|
|
|
|
|
|
|
|
|
|
|
|||||||||||
| Adjusted EPS1 |
$ | 0.99 | $ | 0.58 | $ | 0.73 | $ | 0.41 | $ | 0.26 | ||||||||||
| (1) | Represents a non-GAAP financial measure. Refer to the Definitions of Non-GAAP Financial Measures and Other Key Terms and Reconciliation to GAAP later in this press release. |
| (2) | Impacts the Insurance, Corporate Finance and Corporate and Other segments. The change reflects fair value adjustments to equity securities that are reported at fair value. Management believes the change in fair value of equity securities should be removed from select financial measures because it enables the reader to better understand the business’s ongoing ability to generate revenue and income. |
| (3) | Contains non-GAAP financial measures and other financial measures. See pages 5 and 6 for definitions. |
2
Pre-Tax Income by Segment
| Increase/(Decrease) vs. | ||||||||||||||||||||
| ($ millions) | 2Q 25 | 1Q 25 | 2Q 24 | 1Q 25 | 2Q 24 | |||||||||||||||
| Automotive Finance |
$ | 472 | $ | 375 | $ | 584 | $ | 97 | $ | (112 | ) | |||||||||
| Insurance |
28 | 2 | (40 | ) | 26 | 68 | ||||||||||||||
|
|
|
|
|
|
|
|
|
|
|
|||||||||||
| Dealer Financial Services |
$ | 500 | $ | 377 | $ | 544 | $ | 123 | $ | (44 | ) | |||||||||
| Corporate Finance |
96 | 76 | 109 | 20 | (13 | ) | ||||||||||||||
| Corporate and Other |
(160 | ) | (737 | ) | (374 | ) | 577 | 214 | ||||||||||||
|
|
|
|
|
|
|
|
|
|
|
|||||||||||
| Pre-Tax Income (Loss) from Continuing Operations |
$ | 436 | $ | (284 | ) | $ | 279 | $ | 720 | $ | 157 | |||||||||
|
|
|
|
|
|
|
|
|
|
|
|||||||||||
| Core OID1 |
16 | 16 | 14 | 1 | 2 | |||||||||||||||
| Change in Fair Value of Equity Securities2,3 |
(35 | ) | 13 | 28 | (47 | ) | (63 | ) | ||||||||||||
| Repositioning and Other3 |
— | 503 | — | (503 | ) | — | ||||||||||||||
|
|
|
|
|
|
|
|
|
|
|
|||||||||||
| Core Pre-Tax Income1 |
$ | 418 | $ | 247 | $ | 321 | $ | 170 | $ | 96 | ||||||||||
|
|
|
|
|
|
|
|
|
|
|
|||||||||||
| (1) | Represents a non-GAAP financial measure. Refer to the Definitions of Non-GAAP Financial Measures and Other Key Terms and Reconciliation to GAAP later in this press release. |
| (2) | Change in fair value of equity securities primarily impacts the Insurance, Corporate Finance, and Corporate and Other segments. Reflects equity fair value adjustments which requires change in the fair value of equity securities to be recognized in current period net income. |
| (3) | Contains non-GAAP financial measures and other financial measures. See pages 5 and 6 for definitions. |
Discussion of Segment Results
Auto Finance
Pre-tax income of $472 million was down $112 million year over year, driven by lower net financing revenue.
Net financing revenue of $1.3 billion was down $92 million year over year, primarily driven by lower lease gains and lower commercial assets. Ally’s retail auto portfolio yield, excluding the impact from hedges, increased 33 bps year over year to 9.19% as the portfolio continues to turn over and benefit from higher yielding vintages.
Provision for credit losses of $387 million was up $4 million year over year, driven by CECL reserve build on portfolio growth, partially offset by lower retail auto credit losses. The retail auto net charge-off rate was 1.75%, down 6 bps year over year. Retail auto delinquencies 30+ days past due, inclusive of non-accrual loans, decreased 24 bps year over year to 4.88%, representing the first year over year improvement since 2021.
Noninterest expense of $532 million was up $20 million year over year primarily driven by servicing-related expenses.
Consumer auto originations of $11.0 billion included $6.7 billion of used retail volume, or 61% of total originations, $3.2 billion of new retail volume, and $1.1 billion of lease. Estimated retail auto originated yieldB was 9.82% in the quarter with 42% of originations in our highest credit quality tier, representing 9 consecutive quarters of more than 40% of volume in our highest credit quality tier.
End-of-period auto earning assets of $113.4 billion decreased $3.6 billion year over year. End-of-period consumer auto earning assets of $92.4 billion increased $0.6 billion year over year driven by higher retail assets. End-of-period commercial earning assets of $21.1 billion were down $4.2 billion year over year, driven by lower new vehicle inventory.
Insurance
Pre-tax income of $28 million was up $68 million year over year. Results reflect a $58 million increase in the change in fair value of equity securities year over year. Core pre-tax lossC of $2 million increased $10 million year over year, driven by higher investment income.
Insurance losses of $203 million, up $22 million year over year, are reflective of higher weather losses associated with increased P&C inventory exposure.
Written premiums of $349 million, up 2% year over year, were driven by growth in P&C premiums partially offset by an increase in excess of loss reinsurance costs.
Total investment income, excluding the change in fair value of equity securitiesD, was $59 million, up $10 million year over year driven by higher realized investment gains.
| B | Estimated Retail Auto Originated Yield is a forward-looking non-GAAP financial measure determined by calculating the estimated average annualized yield for loans originated during the period. Refer to the Definitions of Non-GAAP Financial Measures and Other Key Terms and Reconciliation to GAAP later in this press release. |
| C | Represents a non-GAAP financial measure. Refer to the Definitions of Non-GAAP Financial Measures and Other Key Terms and Reconciliation to GAAP later in this press release. |
| D | Change in the fair value of equity securities to be recognized in current period net income. Refer to the Definitions of Non-GAAP Financial Measures and Other Key Terms and Reconciliation to GAAP later in this press release. |
3
Discussion of Segment Results
Corporate Finance
Pre-tax income of $96 million was down $13 million year over year driven by lower other revenue and net financing revenue.
Net financing revenue of $108 million was down $4 million year over year driven by lower amortized fee income. Other revenue of $19 million was down $11 million year over year driven by higher syndication and fee income in prior periods.
Provision benefit of $2 million was $5 million favorable year over year primarily due to lower specific reserve activity.
Return on equity (ROE) for the quarter was 31%.
The held-for-investment loan portfolio of $11.0 billion is 100% first lien. Criticized assets and non-accrual loan percentages remain near historically low levels at 10% and 1%, respectively.
Capital, Liquidity & Deposits
Capital
Ally paid a $0.30 per share quarterly common dividend, which was unchanged year over year. Ally’s Board of Directors approved a $0.30 per share common dividend for the third quarter of 2025. Ally did not repurchase any shares on the open market during the quarter.
Ally’s common equity tier 1 (CET1) capital ratio was 9.9%. The sale of Credit Card closed on April 1, generating 40 bps of CET1 in total, 20 bps recognized in 1Q with an additional 20 bps recognized at closing on April 1.
Risk weighted assets (RWA) of $151.4 billion were down $2.3 billion quarter over quarter due to the sale of Credit Card.
Liquidity & Funding
Cash and cash equivalentsE totaled $10.0 billion. Highly liquid securities were $19.2 billion and unused pledged borrowing capacity at the FHLB and FRB was $10.7 billion and $26.9 billion, respectively. Total current available liquidityF was $66.8 billion, 5.9x uninsured deposit balances.
Deposits represented 88% of Ally’s funding portfolio.
Deposits
Retail deposits of $143.2 billion were up $1.1 billion year over year, and down $2.9 billion quarter over quarter driven by seasonal tax outflows. Total deposits were $147.9 billion and Ally maintained an industry-leading customer retention rateG.
The average retail portfolio deposit rate was 3.58%, down 60 bps year over year and down 17 bps quarter over quarter.
Ally Bank added 30 thousand net new deposit customers, totaling 3.4 million, up 5% year over year. Millennials and younger customers continue to comprise the largest generation segment of new customers, accounting for 75% of new customers in the quarter.
| E | Cash & cash equivalents may include the restricted cash accumulation for retained notes maturing within the following 30 days and returned to Ally on the distribution date. See page 17 of the Financial Supplement for more details. |
| F | Total liquidity includes cash & cash equivalents, highly liquid securities and current unused borrowing capacity at the FHLB, and FRB Discount Window. See page 17 of the Financial Supplement for more details. |
| G | See definitions of non-GAAP financial measures and other key terms later in this document for more details. |
4
Definitions of Non-GAAP Financial Measures and Other Key Terms
Ally believes the non-GAAP financial measures defined here are important to the reader of the Consolidated Financial Statements, but these are supplemental to and not a substitute for GAAP measures. See Reconciliation to GAAP below for calculation methodology and details regarding each measure.
Adjusted earnings per share (Adjusted EPS) is a non-GAAP financial measure that adjusts GAAP EPS for revenue and expense items that are typically strategic in nature or that management otherwise does not view as reflecting the operating performance of the company. Management believes Adjusted EPS can help the reader better understand the operating performance of the core businesses and their ability to generate earnings. In the numerator of Adjusted EPS, GAAP net income attributable to common shareholders is adjusted for the following items: (1) excludes discontinued operations, net of tax, as Ally is primarily a domestic company and sales of international businesses and other discontinued operations in the past have significantly impacted GAAP EPS, (2) adds back the tax-effected non-cash Core OID, (3) adjusts for tax-effected repositioning and other which are primarily related to the extinguishment of high-cost legacy debt, strategic activities and significant other one-time items, (4) change in fair value of equity securities, (5) excludes significant discrete tax items that do not relate to the operating performance of the core businesses, and adjusts for preferred stock capital actions that have been taken by the company to normalize its capital structure, as applicable for respective periods. See page 6 for calculation methodology and details.
Core Return on Tangible Common Equity (Core ROTCE) is a non-GAAP financial measure that management believes is helpful for readers to better understand the ongoing ability of the company to generate returns on its equity base that supports core operations. For purposes of this calculation, tangible common equity is adjusted for Core OID balance and net DTA. Ally’s Core net income attributable to common shareholders for purposes of calculating Core ROTCE is based on the actual effective tax rate for the period adjusted for significant discrete tax items including tax reserve releases, which aligns with the methodology used in calculating adjusted earnings per share.
| (1) | In the numerator of Core ROTCE, GAAP net income attributable to common shareholders is adjusted for discontinued operations net of tax, tax-effected Core OID, tax-effected repositioning and other which are primarily related to the extinguishment of high-cost legacy debt, strategic activities and significant other one-time items, change in fair value of equity securities, significant discrete tax items, and preferred stock capital actions, as applicable for respective periods. |
| (2) | In the denominator, GAAP shareholder’s equity is adjusted for goodwill and identifiable intangibles net of DTL, Core OID balance, and net DTA. |
Adjusted Efficiency Ratio is a non-GAAP financial measure that management believes is helpful to readers in comparing the efficiency of its core banking and lending businesses with those of its peers. In the numerator of Adjusted Efficiency Ratio, total noninterest expense is adjusted for Rep and warrant expense, Insurance segment expense, and repositioning and other which are primarily related to the extinguishment of high-cost legacy debt, strategic activities and significant other one-time items, as applicable for respective periods. In the denominator, total net revenue is adjusted for Core OID and Insurance segment revenue. See Reconciliation to GAAP on page 7 for calculation methodology and details.
Adjusted Tangible Book Value per Share (Adjusted TBVPS) is a non-GAAP financial measure that reflects the book value of equity attributable to shareholders even if Core OID balance were accelerated immediately through the financial statements. As a result, management believes Adjusted TBVPS provides the reader with an assessment of value that is more conservative than GAAP common shareholder’s equity per share. Adjusted TBVPS generally adjusts common equity for: (1) goodwill and identifiable intangibles, net of DTLs, and (2) tax-effected Core OID balance to reduce tangible common equity in the event the corresponding discounted bonds are redeemed/tendered, as applicable for respective periods.
Core Net Income Attributable to Common Shareholders is a non-GAAP financial measure that serves as the numerator in the calculations of Adjusted EPS and Core ROTCE and that, like those measures, is believed by management to help the reader better understand the operating performance of the core businesses and their ability to generate earnings. Core Net Income Attributable to Common Shareholders adjusts GAAP net income attributable to common shareholders for discontinued operations net of tax, tax-effected Core OID expense, tax-effected repositioning and other primarily related to the extinguishment of high-cost legacy debt and strategic activities and significant other, preferred stock capital actions, significant discrete tax items and tax-effected changes in equity investments measured at fair value, as applicable for respective periods. See Reconciliation to GAAP on page 6 for calculation methodology and details.
Core Original Issue Discount (Core OID) Amortization Expense is a non-GAAP financial measure for OID, and is believed by management to help the reader better understand the activity removed from: Core pre-tax income (loss), Core net income (loss) attributable to common shareholders, Adjusted EPS, Core ROTCE, Adjusted efficiency ratio, Adjusted total net revenue, and Net financing revenue (excluding Core OID). Core OID is primarily related to bond exchange OID which excludes international operations and future issuances. See page 7 for calculation methodology and details.
Core Outstanding Original Issue Discount Balance (Core OID balance) is a non-GAAP financial measure for outstanding OID and is believed by management to help the reader better understand the balance removed from Core ROTCE and Adjusted TBVPS. Core OID balance is primarily related to bond exchange OID which excludes international operations and future issuances. See page 7 for calculation methodology and details.
Core Pre-Tax Income is a non-GAAP financial measure that adjusts pre-tax income from continuing operations by excluding (1) Core OID, and (2) change in fair value of equity securities (change in fair value of equity securities impacts the Insurance and Corporate Finance segments), and (3) Repositioning and other which are primarily related to the extinguishment of high-cost legacy debt, strategic activities and significant other one-time items, as applicable for respective periods or businesses. Management believes core pre-tax income can help the reader better understand the operating performance of the core businesses and their ability to generate earnings. See the Pre-Tax Income by Segment Table on page 3 for calculation methodology and details.
Tangible Common Equity is a non-GAAP financial measure that is defined as common stockholders’ equity less goodwill and identifiable intangible assets, net of deferred tax liabilities. Ally considers various measures when evaluating capital adequacy, including Tangible Common Equity. Ally believes that Tangible Common Equity is important because we believe readers may assess our capital adequacy using this measure. Additionally, presentation of this measure allows readers to compare certain aspects of our capital adequacy on the same basis to other companies in the industry. For purposes of calculating Core Return on Tangible Common Equity (Core ROTCE), Tangible Common Equity is further adjusted for Core OID balance and net deferred tax asset. See page 6 for calculation methodology & details.
Net Interest Margin (excluding Core OID) is calculated using a non-GAAP measure that adjusts net interest margin by excluding Core OID. The Core OID balance is primarily related to bond exchange OID which excludes international operations and future issuances. Management believes net interest margin ex. Core OID is a helpful financial metric because it enables the reader to better understand the business’ profitability and margins.
Net Financing Revenue (excluding Core OID) is calculated using a non-GAAP measure that adjusts net financing revenue by excluding Core OID. The Core OID balance is primarily related to bond exchange OID which excludes international operations and future issuances. Management believes net financing revenue ex. Core OID is a helpful financial metric because it enables the reader to better understand the business’ ability to generate revenue.
Adjusted Other Revenue is a non-GAAP financial measure that adjusts GAAP other revenue for OID expenses, repositioning, and change in fair value of equity securities. Management believes adjusted other revenue is a helpful financial metric because it enables the reader better understand the business’ ability to generate other revenue.
Adjusted Total Net Revenue is a non-GAAP financial measure that management believes is helpful for readers to understand the ongoing ability of the company to generate revenue. For purposes of this calculation, GAAP net financing revenue is adjusted by excluding Core OID to calculate net financing revenue ex. core OID. GAAP other revenue is adjusted for OID expenses, repositioning, and change in fair value of equity securities to calculate adjusted other revenue. Adjusted total net revenue is calculated by adding net financing revenue ex. core OID to adjusted other revenue.
Adjusted Noninterest Expense is a non-GAAP financial measure that adjusts GAAP noninterest expense for repositioning items. Management believes adjusted noninterest expense is a helpful financial metric because it enables the reader to better understand the business’ expenses excluding nonrecurring items.
Adjusted Provision for Credit Losses is a non-GAAP financial measure that adjusts GAAP provision for credit losses for repositioning items. Management believes adjusted provision for credit losses is a helpful financial metric because it enables the reader to better understand the business’s expenses excluding nonrecurring items.
Estimated Retail Auto Originated Yield is a financial measure determined by calculating the estimated average annualized yield for loans originated during the period. At this time there currently is no comparable GAAP financial measure for Estimated Retail Auto Originated Yield and therefore this forecasted estimate of yield at the time of origination cannot be quantitatively reconciled to comparable GAAP information.
Net Charge-Off Ratios are annualized net charge-offs divided by average outstanding finance receivables and loans excluding loans measured at fair value and loans held-for-sale.
Accelerated issuance expense (Accelerated OID) is the recognition of issuance expenses related to calls of redeemable debt.
Customer retention rate is the annualized 3-month rolling average of 1 minus the monthly attrition rate; excludes escheatment.
Repositioning is primarily related to the extinguishment of high-cost legacy debt, strategic activities, restructuring, and significant other one-time items.
Corporate and Other primarily consists of activity related to centralized corporate treasury activities such as management of the cash and corporate investment securities and loan portfolios, short- and long-term debt, retail and brokered deposit liabilities, derivative instruments, the amortization of the discount associated with new debt issuances and bond exchanges, and the residual impacts of our corporate FTP and treasury ALM activities. Corporate and Other also includes certain equity investments, the management of our consumer mortgage portfolio, and reclassifications and eliminations between the reportable operating segments. Subsequent to June 1, 2016, the revenue and expense activity associated with Ally Invest was included within the Corporate and Other segment. Subsequent to October 1, 2019, the revenue and expense activity associated with Ally Lending was included within the Corporate and Other segment. Ally Lending was moved to Assets of Operations Held for Sale on December 31, 2023. The sale of Ally Lending closed on March 1, 2024. Subsequent to December 1, 2021, the revenue and expense activity associated with Ally Credit Card was included within the Corporate and Other segment. Ally Credit Card was moved to Assets of Operations Held for Sale on March 31, 2025. The sale of Ally Credit Card closed on April 1, 2025.
5
Change in fair value of equity securities impacts the Insurance, Corporate Finance and Corporate and Other segments. The change reflects fair value adjustments to equity securities that are reported at fair value. Management believes the change in fair value of equity securities should be removed from select financial measures because it enables the reader to better understand the business’ ongoing ability to generate revenue and income.
Estimated impact of CECL on regulatory capital per final rule issued by U.S. banking agencies – In December 2018, the FRB and other U.S. banking agencies approved a final rule to address the impact of CECL on regulatory capital by allowing BHCs and banks, including Ally, the option to phase in the day-one impact of CECL over a three-year period. In March 2020, the FRB and other U.S. banking agencies issued an interim final rule that became effective on March 31, 2020 and provided an alternative option for banks to temporarily delay the impacts of CECL, relative to the incurred loss methodology for estimating the allowance for loan losses, on regulatory capital. A final rule that was largely unchanged from the March 2020 interim final rule was issued by the FRB and other U.S. banking agencies in August 2020, and became effective in September 2020. For regulatory capital purposes, these rules permitted us to delay recognizing the estimated impact of CECL on regulatory capital until after a two-year deferral period, which for us extended through December 31, 2021. Beginning on January 1, 2022, we are required to phase in 25% of the previously deferred estimated capital impact of CECL, with an additional 25% to be phased in at the beginning of each subsequent year until fully phased in by the first quarter of 2025. Under these rules, firms that adopt CECL and elect the five-year transition will calculate the estimated impact of CECL on regulatory capital as the day-one impact of adoption plus 25% of the subsequent change in allowance during the two-year deferral period, which according to the final rule approximates the impact of CECL relative to an incurred loss model. We adopted this transition option during the first quarter of 2020, and phased in the regulatory capital impacts of CECL from January 1, 2022, to January 1, 2025, based on this five-year transition period.
Reconciliation to GAAP
Adjusted Earnings per Share
| Numerator ($ millions) |
2Q 25 | 1Q 25 | 2Q 24 | |||||||||||||
| GAAP Net Income (Loss) Attributable to Common Shareholders |
$ | 324 | $ | (253 | ) | $ | 191 | |||||||||
| Discontinued Operations, Net of Tax |
— | — | — | |||||||||||||
| Core OID |
16 | 16 | 14 | |||||||||||||
| Repositioning and Other |
— | 503 | — | |||||||||||||
| Change in the Fair Value of Equity Securities |
(35 | ) | 13 | 28 | ||||||||||||
| Tax on: Core OID, Repo, & Change in Fair Value of Equity Securities (21% tax rate) |
4 | (99 | ) | (9 | ) | |||||||||||
| Significant Discrete Tax Items |
— | — | — | |||||||||||||
|
|
|
|
|
|
|
|||||||||||
| Core Net Income Attributable to Common Shareholders |
[a] | $ | 309 | $ | 179 | $ | 224 | |||||||||
| Denominator |
||||||||||||||||
| Weighted-Average Common Shares Outstanding (basic or diluted as applicable, thousands) |
[b] | 312,434 | 309,006 | 309,886 | ||||||||||||
|
|
|
|
|
|
|
|||||||||||
| Adjusted EPS |
[a] ÷ [b] | $ | 0.99 | $ | 0.58 | $ | 0.73 | |||||||||
Core Return on Tangible Common Equity (ROTCE)
| Numerator ($ millions) |
2Q 25 | 1Q 25 | 2Q 24 | |||||||||||||
| GAAP Net Income (Loss) Attributable to Common Shareholders |
$ | 324 | $ | (253 | ) | $ | 191 | |||||||||
| Discontinued Operations, Net of Tax |
— | — | — | |||||||||||||
| Core OID |
16 | 16 | 14 | |||||||||||||
| Repositioning and Other |
— | 503 | — | |||||||||||||
| Change in Fair Value of Equity Securities |
(35 | ) | 13 | 28 | ||||||||||||
| Tax on: Core OID, Repo, & Change in Fair Value of Equity Securities (21% tax rate) |
4 | (99 | ) | (9 | ) | |||||||||||
| Significant Discrete Tax Items |
— | — | — | |||||||||||||
|
|
|
|
|
|
|
|||||||||||
| Core Net Income Attributable to Common Shareholders |
[a] | $ | 309 | $ | 179 | $ | 224 | |||||||||
| Denominator (Average, $ millions) |
||||||||||||||||
| GAAP Shareholder’s Equity |
$ | 14,390 | $ | 14,068 | $ | 13,640 | ||||||||||
| Preferred Equity |
(2,324 | ) | (2,324 | ) | (2,324 | ) | ||||||||||
|
|
|
|
|
|
|
|||||||||||
| GAAP Common Shareholder’s Equity |
$ | 12,066 | 11,744 | $ | 11,316 | |||||||||||
| Goodwill & Identifiable Intangibles, Net of Deferred Tax Liabilities (DTLs) |
(241 | ) | (449 | ) | (717 | ) | ||||||||||
|
|
|
|
|
|
|
|||||||||||
| Tangible Common Equity |
$ | 11,824 | $ | 11,295 | $ | 10,599 | ||||||||||
| Core OID Balance |
(713 | ) | (729 | ) | (773 | ) | ||||||||||
| Net Deferred Tax Asset (DTA) |
(2,004 | ) | (1,923 | ) | (1,472 | ) | ||||||||||
|
|
|
|
|
|
|
|||||||||||
| Normalized Common Equity |
[b] | $ | 9,107 | $ | 8,644 | $ | 8,354 | |||||||||
|
|
|
|
|
|
|
|||||||||||
| Core Return on Tangible Common Equity |
[a] ÷ [b] | 13.6 | % | 8.3 | % | 10.7 | % | |||||||||
6
Adjusted Tangible Book Value per Share
| Numerator ($ millions) |
2Q 25 | 1Q 25 | 2Q 24 | |||||||||||||
| GAAP Shareholder’s Equity |
$ | 14,547 | $ | 14,232 | $ | 13,699 | ||||||||||
| Preferred Equity |
(2,324 | ) | (2,324 | ) | (2,324 | ) | ||||||||||
|
|
|
|
|
|
|
|||||||||||
| GAAP Common Shareholder’s Equity |
$ | 12,223 | $ | 11,908 | $ | 11,375 | ||||||||||
| Goodwill and Identifiable Intangible Assets, Net of DTLs |
(187 | ) | (295 | ) | (713 | ) | ||||||||||
|
|
|
|
|
|
|
|||||||||||
| Tangible Common Equity |
12,036 | 11,613 | 10,662 | |||||||||||||
| Tax-effected Core OID Balance (21% tax rate) |
(557 | ) | (570 | ) | (605 | ) | ||||||||||
|
|
|
|
|
|
|
|||||||||||
| Adjusted Tangible Book Value |
[a] | $ | 11,479 | $ | 11,044 | $ | 10,057 | |||||||||
| Denominator | ||||||||||||||||
| Issued Shares Outstanding (period-end, thousands) |
[b] | 307,787 | 307,152 | 304,656 | ||||||||||||
| Metric | ||||||||||||||||
| GAAP Common Shareholder’s Equity per Share |
$ | 39.71 | $ | 38.77 | $ | 37.34 | ||||||||||
| Goodwill and Identifiable Intangible Assets, Net of DTLs per Share |
(0.61 | ) | (0.96 | ) | (2.34 | ) | ||||||||||
|
|
|
|
|
|
|
|||||||||||
| Tangible Common Equity per Share |
$ | 39.10 | $ | 37.81 | $ | 35.00 | ||||||||||
| Tax-effected Core OID Balance (21% tax rate) per Share |
(1.81 | ) | (1.85 | ) | (1.99 | ) | ||||||||||
|
|
|
|
|
|
|
|||||||||||
| Adjusted Tangible Book Value per Share |
[a] ÷ [b] | $ | 37.30 | $ | 35.95 | $ | 33.01 | |||||||||
Adjusted Efficiency Ratio
| Numerator ($ millions) |
2Q 25 | 1Q 25 | 2Q 24 | |||||||||||||
| GAAP Noninterest Expense |
$ | 1,262 | $ | 1,634 | $ | 1,286 | ||||||||||
| Insurance Expense |
(424 | ) | (392 | ) | (405 | ) | ||||||||||
| Repositioning and Other |
— | (314 | ) | — | ||||||||||||
|
|
|
|
|
|
|
|||||||||||
| Adjusted Noninterest Expense for Adjusted Efficiency Ratio |
[a] | $ | 838 | $ | 928 | $ | 881 | |||||||||
| Denominator ($ millions) | ||||||||||||||||
| Total Net Revenue |
$ | 2,082 | $ | 1,541 | $ | 2,022 | ||||||||||
| Core OID |
16 | 16 | 14 | |||||||||||||
| Repositioning Items |
— | 495 | — | |||||||||||||
| Insurance Revenue |
(452 | ) | (394 | ) | (365 | ) | ||||||||||
|
|
|
|
|
|
|
|||||||||||
| Adjusted Net Revenue for Adjusted Efficiency Ratio |
[b] | $ | 1,646 | $ | 1,658 | $ | 1,671 | |||||||||
| Adjusted Efficiency Ratio |
[a] ÷ [b] | 50.9 | % | 56.0 | % | 52.7 | % | |||||||||
Original Issue Discount Amortization Expense ($ millions)
| 2Q 25 | 1Q 25 | 2Q 24 | ||||||||||
| GAAP Original Issue Discount Amortization Expense |
$ | 18 | $ | 18 | $ | 17 | ||||||
| Other OID |
(2 | ) | (3 | ) | (3 | ) | ||||||
|
|
|
|
|
|
|
|||||||
| Core Original Issue Discount (Core OID) Amortization Expense |
$ | 16 | $ | 16 | $ | 14 | ||||||
Outstanding Original Issue Discount Balance ($ millions)
| 2Q 25 | 1Q 25 | 2Q 24 | ||||||||||
| GAAP Outstanding Original Issue Discount Balance |
$ | (727 | ) | $ | (745 | ) | $ | (797 | ) | |||
| Other Outstanding OID Balance |
22 | 24 | 31 | |||||||||
|
|
|
|
|
|
|
|||||||
| Core Outstanding Original Issue Discount Balance (Core OID Balance) |
$ | (705 | ) | $ | (721 | ) | $ | (766 | ) | |||
7
| ($ millions) | ||||||||||||||
| Net Financing Revenue (Excluding Core OID) |
2Q 25 | 1Q 25 | 2Q 24 | |||||||||||
| GAAP Net Financing Revenue |
[w] | $ | 1,516 | $ | 1,478 | $ | 1,517 | |||||||
| Core OID |
16 | 16 | 14 | |||||||||||
|
|
|
|
|
|
|
|||||||||
| Net Financing Revenue (Excluding Core OID) |
[a] | $ | 1,532 | $ | 1,494 | $ | 1,531 | |||||||
| Adjusted Other Revenue |
2Q 25 | 1Q 25 | 2Q 24 | |||||||||||
| GAAP Other Revenue |
[x] | $ | 566 | $ | 63 | $ | 505 | |||||||
| Accelerated OID & Repositioning Items |
— | 495 | — | |||||||||||
| Change in Fair Value of Equity Securities |
(35 | ) | 13 | 28 | ||||||||||
|
|
|
|
|
|
|
|||||||||
| Adjusted Other Revenue |
[b] | $ | 531 | $ | 571 | $ | 533 | |||||||
| Adjusted Total Net Revenue |
2Q 25 | 1Q 25 | 2Q 24 | |||||||||||
| Adjusted Total Net Revenue |
[a]+[b] | $ | 2,064 | $ | 2,065 | $ | 2,064 | |||||||
| Adjusted Provision for Credit Losses |
2Q 25 | 1Q 25 | 2Q 24 | |||||||||||
| GAAP Provision for Credit Losses |
[y] | $ | 384 | $ | 191 | $ | 457 | |||||||
| Repositioning |
— | 306 | — | |||||||||||
|
|
|
|
|
|
|
|||||||||
| Adjusted Provision for Credit Losses |
[c] | $ | 384 | $ | 497 | $ | 457 | |||||||
| Adjusted Noninterest Expense |
2Q 25 | 1Q 25 | 2Q 24 | |||||||||||
| GAAP Noninterest Expense |
[z] | $ | 1,262 | $ | 1,634 | $ | 1,286 | |||||||
| Repositioning |
— | (314 | ) | — | ||||||||||
|
|
|
|
|
|
|
|||||||||
| Adjusted Noninterest Expense |
[d] | $ | 1,262 | $ | 1,320 | $ | 1,286 | |||||||
| Core Pre-Tax Income |
2Q 25 | 1Q 25 | 2Q 24 | |||||||||||
| Pre-Tax Income (Loss) |
[w]+[x]-[y]-[z] | $ | 436 | $ | (284 | ) | $ | 279 | ||||||
|
|
|
|
|
|
|
|||||||||
| Core Pre-Tax Income |
[a]+[b]-[c]-[d] | $ | 418 | $ | 247 | $ | 321 | |||||||
Insurance Non-GAAP Walk to Core Pre-Tax Income
| ($ millions) | 2Q 2025 | 2Q 2024 | ||||||||||||||||||||||
| GAAP | Change in the fair value of equity securities |
Non-GAAP1 | GAAP | Change in the fair value of equity securities |
Non-GAAP1 | |||||||||||||||||||
| Insurance |
||||||||||||||||||||||||
| Premiums, Service Revenue Earned and Other |
$ | 363 | $ | — | $ | 363 | $ | 344 | $ | — | $ | 344 | ||||||||||||
| Losses and Loss Adjustment Expenses |
203 | — | 203 | 181 | — | 181 | ||||||||||||||||||
| Acquisition and Underwriting Expenses |
221 | — | 221 | 224 | — | 224 | ||||||||||||||||||
| Investment Income and Other |
89 | (30 | ) | 59 | 21 | 28 | 49 | |||||||||||||||||
|
|
|
|
|
|
|
|
|
|
|
|
|
|||||||||||||
| Pre-Tax Income from Continuing Operations |
$ | 28 | $ | (30 | ) | $ | (2 | ) | $ | (40 | ) | $ | 28 | $ | (12 | ) | ||||||||
| 1 | Non-GAAP line items walk to Core Pre-Tax Income, a non-GAAP financial measure that adjusts Pre-Tax Income. |
8
Additional Financial Information
For additional financial information, the second quarter 2025 earnings presentation and financial supplement are available in the Events & Presentations section of Ally’s Investor Relations Website at http://www.ally.com/about/investor/events-presentations/.
About Ally Financial Inc.
Ally Financial Inc. (NYSE: ALLY) is a financial services company with the nation’s largest all-digital bank and an industry-leading auto financing business, driven by a mission to “Do It Right” and be a relentless ally for customers and communities. The company serves customers with deposits and securities brokerage and investment advisory services as well as auto financing and insurance offerings. The company also includes a seasoned corporate finance business that offers capital for equity sponsors and middle-market companies. For more information, please visit www.ally.com.
For more information and disclosures about Ally, visit https://www.ally.com/#disclosures.
For further images and news on Ally, please visit http://media.ally.com.
Forward-Looking Statements
This earnings release and related communications should be read in conjunction with the financial statements, notes, and other information contained in our Annual Reports on Form 10-K, Quarterly Reports on Form 10-Q, and Current Reports on Form 8-K. This information is preliminary and based on company and third-party data available at the time of the release or related communication.
This earnings release and related communications contain forward-looking statements within the meaning of the Private Securities Litigation Reform Act of 1995. These statements can be identified by the fact that they do not relate strictly to historical or current facts—such as statements about the outlook for financial and operating metrics and performance and future capital allocation and actions. Forward-looking statements often use words such as “believe,” “expect,” “anticipate,” “intend,” “pursue,” “seek,” “continue,” “estimate,” “project,” “outlook,” “forecast,” “potential,” “target,” “objective,” “trend,” “plan,” “goal,” “initiative,” “priorities,” or other words of comparable meaning or future-tense or conditional verbs such as “may,” “will,” “should,” “would,” or “could.” Forward-looking statements convey our expectations, intentions, or forecasts about future events, circumstances, or results. All forward-looking statements, by their nature, are subject to assumptions, risks, and uncertainties, which may change over time and many of which are beyond our control. In particular, forward-looking statements about Ally’s outlook, including expectations regarding net interest margin, adjusted other revenue, net-charge offs, non-interest expenses and average earning assets, and other forward-looking statements are based on our current expectations and are subject to various important factors that could cause actual results to differ materially, including general economic conditions, expectations regarding interest rates and inflation, monetary and fiscal policies in the United States and other jurisdictions, the composition of our balance sheet, including with respect to our loan and securities portfolios, the impact of our strategic initiatives, including recent initiatives involving our Credit Card and Mortgage operations, demand for new and used vehicles, demand for auto loans and leases and the impact of escalating tariffs and other trade policies on us, our customers and our strategic partners, and the economic impacts, volatility and uncertainty resulting therefrom.
You should not rely on any forward-looking statement as a prediction or guarantee about the future. Actual future objectives, strategies, plans, prospects, performance, conditions, or results may differ materially from those set forth in any forward-looking statement. Some of the factors that may cause actual results or other future events or circumstances to differ from those in forward-looking statements are described above and in our Annual Report on Form 10-K for the year ended December 31, 2024, our subsequent Quarterly Reports on Form 10-Q or Current Reports on Form 8-K, or other applicable documents that are filed or furnished with the U.S. Securities and Exchange Commission (collectively, our “SEC filings”).
Any forward-looking statement made by us or on our behalf speaks only as of the date that it was made. We do not undertake to update any forward-looking statement to reflect the impact of events, circumstances, or results that arise after the date that the statement was made, except as required by applicable securities laws. You, however, should consult further disclosures (including disclosures of a forward-looking nature) that we may make in any subsequent SEC filings.
This earnings release and related communications contain specifically identified non-GAAP financial measures, which supplement the results that are reported according to U.S. generally accepted accounting principles (“GAAP”). These non-GAAP financial measures may be useful to investors but should not be viewed in isolation from, or as a substitute for, GAAP results. Differences between non-GAAP financial measures and comparable GAAP financial measures are reconciled in the release.
Unless the context otherwise requires, the following definitions apply. The term “loans” means the following consumer and commercial products associated with our direct and indirect financing activities: loans, retail installment sales contracts, lines of credit, and other financing products excluding operating leases. The term “operating leases” means consumer- and commercial-vehicle lease agreements where Ally is the lessor and the lessee is generally not obligated to acquire ownership of the vehicle at lease-end or compensate Ally for the vehicle’s residual value. The terms “lend,” “finance,” and “originate” mean our direct extension or origination of loans, our purchase or acquisition of loans, or our purchase of operating leases, as applicable. The term “consumer” means all consumer products associated with our loan and operating-lease activities and all commercial retail installment sales contracts. The term “commercial” means all commercial products associated with our loan activities, other than commercial retail installment sales contracts. The term “partnerships” means business arrangements rather than partnerships as defined by law.
| Contacts: | ||
| Sean Leary | Peter Gilchrist | |
| Ally Investor Relations | Ally Communications (Media) | |
| 704-444-4830 | 704-644-6299 | |
| sean.leary@ally.com | peter.gilchrist@ally.com |
9

Exhibit 99.2 Ally Financial Inc. 2Q 2025 Earnings Review July 18, 2025 Contact Ally Investor Relations at (866) 710-4623 or investor.relations@ally.com
2Q 2025 Preliminary Results Forward-Looking Statements and Additional Information This presentation and related communications should be read in conjunction with the financial statements, notes, and other information contained in our Annual Reports on Form 10-K, Quarterly Reports on Form 10-Q, and Current Reports on Form 8-K. This information is preliminary and based on company and third-party data available at the time of the presentation or related communication. This presentation and related communications contain forward-looking statements within the meaning of the Private Securities Litigation Reform Act of 1995. These statements can be identified by the fact that they do not relate strictly to historical or current facts—such as statements about the outlook for financial and operating metrics and performance and future capital allocation and actions. Forward-looking statements often use words such as “believe,” “expect,” “anticipate,” “intend,” “pursue,” “seek,” “continue,” “estimate,” “project,” “outlook,” “forecast,” “potential,” “target,” “objective,” “trend,” “plan,” “goal,” “initiative,” “priorities,” or other words of comparable meaning or future-tense or conditional verbs such as “may,” “will,” “should,” “would,” or “could.” Forward-looking statements convey our expectations, intentions, or forecasts about future events, circumstances, or results. All forward-looking statements, by their nature, are subject to assumptions, risks, and uncertainties, which may change over time and many of which are beyond our control. In particular, forward-looking statements about Ally’s outlook, including expectations regarding net interest margin, adjusted other revenue, net-charge offs, non-interest expenses and average earning assets, and other forward-looking statements are based on our current expectations and are subject to various important factors that could cause actual results to differ materially, including general economic conditions, expectations regarding interest rates and inflation, monetary and fiscal policies in the United States and other jurisdictions, the composition of our balance sheet, including with respect to our loan and securities portfolios, the impact of our strategic initiatives, including recent initiatives involving our Credit Card and Mortgage operations, demand for new and used vehicles, demand for auto loans and leases and the impact of escalating tariffs and other trade policies on us, our customers and our strategic partners, and the economic impacts, volatility and uncertainty resulting therefrom. You should not rely on any forward-looking statement as a prediction or guarantee about the future. Actual future objectives, strategies, plans, prospects, performance, conditions, or results may differ materially from those set forth in any forward-looking statement. Some of the factors that may cause actual results or other future events or circumstances to differ from those in forward-looking statements are described above and in our Annual Report on Form 10-K for the year ended December 31, 2024, our subsequent Quarterly Reports on Form 10-Q or Current Reports on Form 8-K, or other applicable documents that are filed or furnished with the U.S. Securities and Exchange Commission (collectively, our “SEC filings”). Any forward-looking statement made by us or on our behalf speaks only as of the date that it was made. We do not undertake to update any forward-looking statement to reflect the impact of events, circumstances, or results that arise after the date that the statement was made, except as required by applicable securities laws. You, however, should consult further disclosures (including disclosures of a forward-looking nature) that we may make in any subsequent SEC filings. This presentation and related communications contain specifically identified non-GAAP financial measures, which supplement the results that are reported according to U.S. generally accepted accounting principles (“GAAP”). These non-GAAP financial measures may be useful to investors but should not be viewed in isolation from, or as a substitute for, GAAP results. Differences between non-GAAP financial measures and comparable GAAP financial measures are reconciled in the presentation. Unless the context otherwise requires, the following definitions apply. The term “loans” means the following consumer and commercial products associated with our direct and indirect financing activities: loans, retail installment sales contracts, lines of credit, and other financing products excluding operating leases. The term “operating leases” means consumer- and commercial-vehicle lease agreements where Ally is the lessor and the lessee is generally not obligated to acquire ownership of the vehicle at lease-end or compensate Ally for the vehicle’s residual value. The terms “lend,” “finance,” and “originate” mean our direct extension or origination of loans, our purchase or acquisition of loans, or our purchase of operating leases, as applicable. The term “consumer” means all consumer products associated with our loan and operating-lease activities and all commercial retail installment sales contracts. The term “commercial” means all commercial products associated with our loan activities, other than commercial retail installment sales contracts. The term “partnerships” means business arrangements rather than partnerships as defined by law. 2
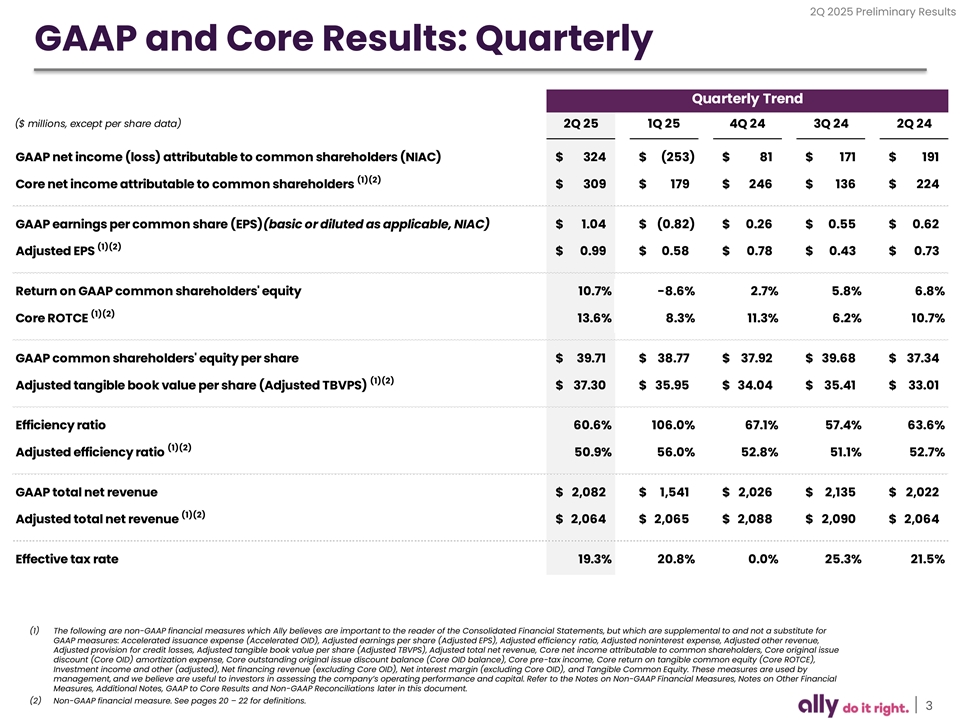
2Q 2025 Preliminary Results GAAP and Core Results: Quarterly Quarterly Trend ($ millions, except per share data) 2Q 25 1Q 25 4Q 24 3Q 24 2Q 24 GAAP net income (loss) attributable to common shareholders (NIAC) $ 324 $ (253) $ 81 $ 171 $ 191 (1)(2) Core net income attributable to common shareholders $ 3 09 $ 179 $ 246 $ 1 36 $ 224 GAAP earnings per common share (EPS)(basic or diluted as applicable, NIAC) $ 1.04 $ ( 0.82) $ 0.26 $ 0 .55 $ 0.62 (1)(2) Adjusted EPS $ 0.99 $ 0 .58 $ 0.78 $ 0.43 $ 0.73 Return on GAAP common shareholders' equity 10.7% -8.6% 2.7% 5.8% 6.8% (1)(2) Core ROTCE 13.6% 8.3% 11.3% 6.2% 10.7% GAAP common shareholders' equity per share $ 39.71 $ 38.77 $ 37.92 $ 39.68 $ 3 7.34 (1)(2) Adjusted tangible book value per share (Adjusted TBVPS) $ 37.30 $ 35.95 $ 3 4.04 $ 35.41 $ 33.01 Efficiency ratio 60.6% 106.0% 67.1% 57.4% 63.6% (1)(2) Adjusted efficiency ratio 50.9% 56.0% 52.8% 51.1% 52.7% GAAP total net revenue $ 2,082 $ 1,541 $ 2,026 $ 2,135 $ 2,022 (1)(2) Adjusted total net revenue $ 2,064 $ 2 ,065 $ 2,088 $ 2,090 $ 2 ,064 Effective tax rate 19.3% 20.8% 0.0% 25.3% 21.5% (1) The following are non-GAAP financial measures which Ally believes are important to the reader of the Consolidated Financial Statements, but which are supplemental to and not a substitute for GAAP measures: Accelerated issuance expense (Accelerated OID), Adjusted earnings per share (Adjusted EPS), Adjusted efficiency ratio, Adjusted noninterest expense, Adjusted other revenue, Adjusted provision for credit losses, Adjusted tangible book value per share (Adjusted TBVPS), Adjusted total net revenue, Core net income attributable to common shareholders, Core original issue discount (Core OID) amortization expense, Core outstanding original issue discount balance (Core OID balance), Core pre-tax income, Core return on tangible common equity (Core ROTCE), Investment income and other (adjusted), Net financing revenue (excluding Core OID), Net interest margin (excluding Core OID), and Tangible Common Equity. These measures are used by management, and we believe are useful to investors in assessing the company’s operating performance and capital. Refer to the Notes on Non-GAAP Financial Measures, Notes on Other Financial Measures, Additional Notes, GAAP to Core Results and Non-GAAP Reconciliations later in this document. (2) Non-GAAP financial measure. See pages 20 – 22 for definitions. 3
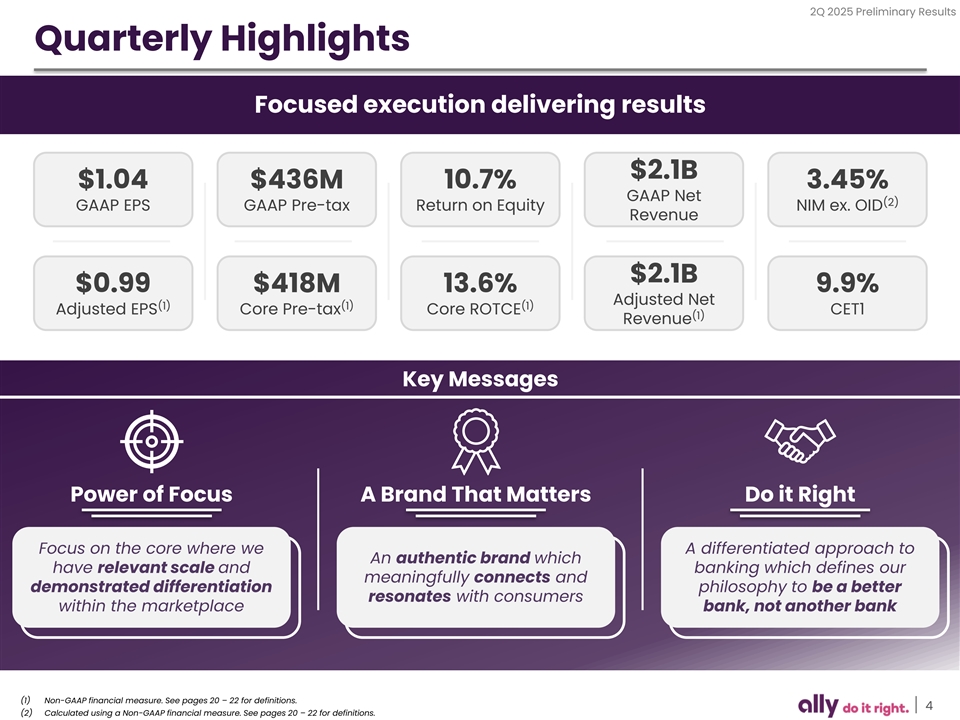
2Q 2025 Preliminary Results Quarterly Highlights Focused execution delivering results $2.1B $1.04 $436M 10.7% 3.45% GAAP Net (2) GAAP EPS GAAP Pre-tax Return on Equity NIM ex. OID Revenue $2.1B $0.99 $418M 13.6% 9.9% Adjusted Net (1) (1) (1) Adjusted EPS Core Pre-tax Core ROTCE CET1 (1) Revenue Key Messages Power of Focus A Brand That Matters Do it Right Focus on the core where we A differentiated approach to An authentic brand which have relevant scale and banking which defines our meaningfully connects and demonstrated differentiation philosophy to be a better resonates with consumers within the marketplace bank, not another bank (1) Non-GAAP financial measure. See pages 20 – 22 for definitions. 4 (2) Calculated using a Non-GAAP financial measure. See pages 20 – 22 for definitions.
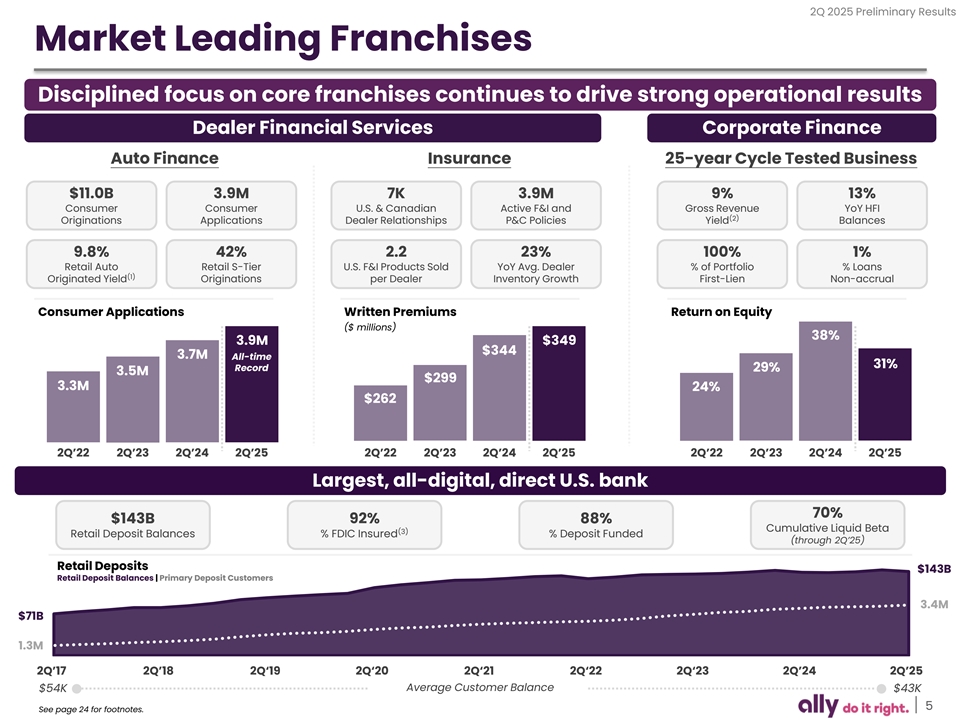
2Q 2025 Preliminary Results Market Leading Franchises Disciplined focus on core franchises continues to drive strong operational results Dealer Financial Services Corporate Finance Auto Finance Insurance 25-year Cycle Tested Business $11.0B 3.9M 7K 3.9M 9% 13% Consumer Consumer U.S. & Canadian Active F&I and Gross Revenue YoY HFI (2) Originations Applications Dealer Relationships P&C Policies Yield Balances 9.8% 42% 2.2 23% 100% 1% Retail Auto Retail S-Tier U.S. F&I Products Sold YoY Avg. Dealer % of Portfolio % Loans (1) Originated Yield Originations per Dealer Inventory Growth First-Lien Non-accrual Consumer Applications Written Premiums Return on Equity ($ millions) 38% 3.9M $349 $344 3.7M All-time 31% Record 29% 3.5M $299 3.3M 24% $262 2Q’22 2Q’23 2Q’24 2Q’25 2Q’22 2Q’23 2Q’24 2Q’25 2Q’22 2Q’23 2Q’24 2Q’25 Largest, all-digital, direct U.S. bank 70% $143B 92% 88% Cumulative Liquid Beta (3) Retail Deposit Balances % FDIC Insured % Deposit Funded (through 2Q’25) Retail Deposits $143B Retail Deposit Balances | Primary Deposit Customers 3.4M $71B 1.3M 2Q’17 2Q’18 2Q‘19 2Q‘20 2Q‘21 2Q‘22 2Q‘23 2Q’24 2Q’25 Average Customer Balance $54K $43K 5 See page 24 for footnotes.
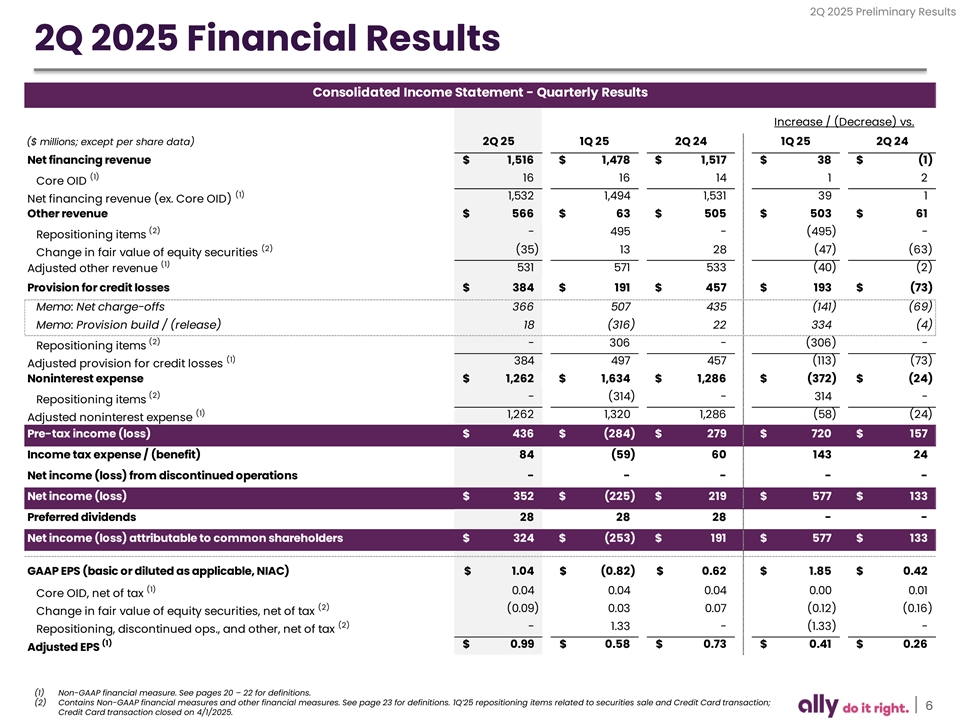
2Q 2025 Preliminary Results 2Q 2025 Financial Results Consolidated Income Statement - Quarterly Results Increase / (Decrease) vs. ($ millions; except per share data) 2Q 25 1Q 25 2Q 24 1Q 25 2Q 24 Net financing revenue $ 1,516 $ 1,478 $ 1,517 $ 38 $ (1) (1) 16 16 14 1 2 Core OID (1) 1,532 1,494 1,531 39 1 Net financing revenue (ex. Core OID) Other revenue $ 566 $ 63 $ 505 $ 503 $ 61 (2) - 4 95 - (495) - Repositioning items (2) (35) 13 28 ( 47) (63) Change in fair value of equity securities (1) Adjusted other revenue 531 571 5 33 (40) (2) Provision for credit losses $ 3 84 $ 191 $ 457 $ 193 $ (73) Memo: Net charge-offs 366 507 435 (141) (69) Memo: Provision build / (release) 18 (316) 22 334 (4) (2) - 3 06 - (306) - Repositioning items (1) 3 84 497 457 (113) (73) Adjusted provision for credit losses Noninterest expense $ 1,262 $ 1,634 $ 1,286 $ (372) $ (24) (2) - (314) - 314 - Repositioning items (1) 1 ,262 1 ,320 1 ,286 (58) (24) Adjusted noninterest expense Pre-tax income (loss) $ 4 36 $ (284) $ 279 $ 720 $ 157 Income tax expense / (benefit) 84 (59) 60 143 24 Net income (loss) from discontinued operations - - - - - Net income (loss) $ 352 $ ( 225) $ 219 $ 5 77 $ 133 Preferred dividends 28 28 28 - - Net income (loss) attributable to common shareholders $ 324 $ ( 253) $ 191 $ 5 77 $ 133 GAAP EPS (basic or diluted as applicable, NIAC) $ 1.04 $ ( 0.82) $ 0 .62 $ 1.85 $ 0.42 (1) 0.04 0.04 0.04 0 .00 0.01 Core OID, net of tax (2) (0.09) 0.03 0.07 ( 0.12) (0.16) Change in fair value of equity securities, net of tax (2) - 1.33 - (1.33) - Repositioning, discontinued ops., and other, net of tax (1) $ 0.99 $ 0.58 $ 0 .73 $ 0.41 $ 0.26 Adjusted EPS (1) Non-GAAP financial measure. See pages 20 – 22 for definitions. (2) Contains Non-GAAP financial measures and other financial measures. See page 23 for definitions. 1Q’25 repositioning items related to securities sale and Credit Card transaction; 6 Credit Card transaction closed on 4/1/2025.
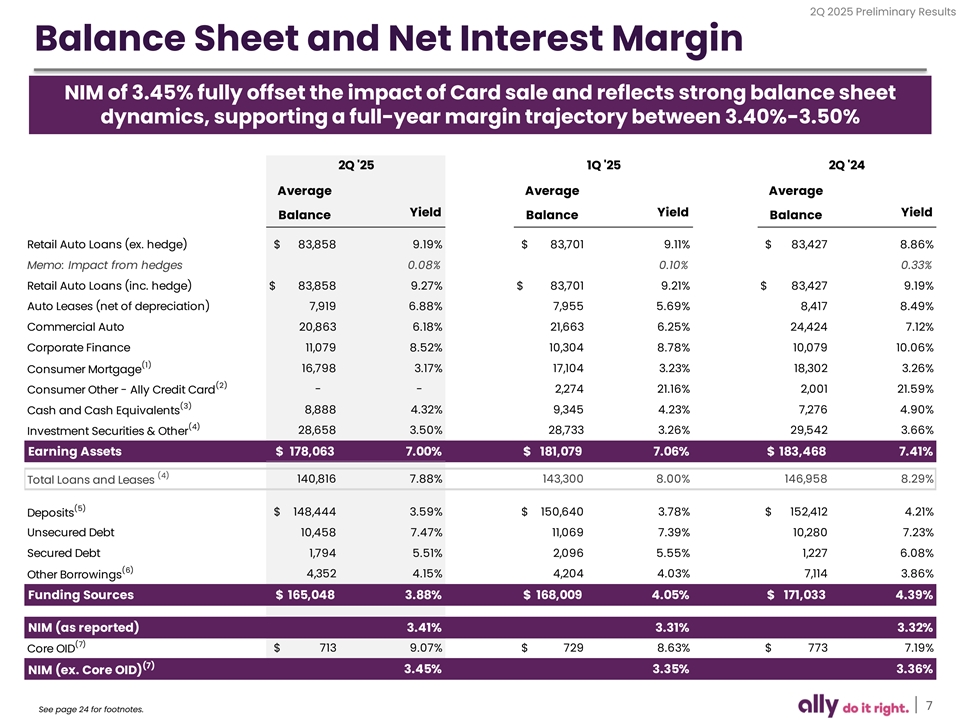
2Q 2025 Preliminary Results Balance Sheet and Net Interest Margin NIM of 3.45% fully offset the impact of Card sale and reflects strong balance sheet dynamics, supporting a full-year margin trajectory between 3.40%-3.50% 2Q '25 1Q '25 2Q '24 Average Average Average Yield Yield Yield Balance Balance Balance Retail Auto Loans (ex. hedge) $ 83,858 9.19% $ 8 3,701 9.11% $ 83,427 8.86% Memo: Impact from hedges 0.08% 0.10% 0.33% Retail Auto Loans (inc. hedge) $ 83,858 9.27% $ 8 3,701 9.21% $ 83,427 9.19% Auto Leases (net of depreciation) 7,919 6.88% 7,955 5.69% 8,417 8.49% Commercial Auto 2 0,863 6.18% 21,663 6.25% 24,424 7.12% Corporate Finance 11,079 8.52% 10,304 8.78% 1 0,079 10.06% (1) 1 6,798 3.17% 17,104 3.23% 18,302 3.26% Consumer Mortgage (2) Consumer Other - Ally Credit Card - - 2,274 21.16% 2,001 21.59% (3) 8 ,888 4.32% 9,345 4.23% 7,276 4.90% Cash and Cash Equivalents (4) Investment Securities & Other 28,658 3.50% 28,733 3.26% 29,542 3.66% Earning Assets $ 178,063 7.00% $ 1 81,079 7.06% $ 183,468 7.41% (4) 140,816 7.88% 143,300 8.00% 1 46,958 8.29% Total Loans and Leases (5) $ 148,444 3.59% $ 150,640 3.78% $ 152,412 4.21% Deposits Unsecured Debt 10,458 7.47% 1 1,069 7.39% 10,280 7.23% Secured Debt 1,794 5.51% 2,096 5.55% 1,227 6.08% (6) 4,352 4.15% 4,204 4.03% 7,114 3.86% Other Borrowings Funding Sources $ 165,048 3.88% $ 168,009 4.05% $ 1 71,033 4.39% NIM (as reported) 3.41% 3.31% 3.32% (7) $ 713 9.07% $ 729 8.63% $ 773 7.19% Core OID (7) 3.45% 3.35% 3.36% NIM (ex. Core OID) 7 See page 24 for footnotes.
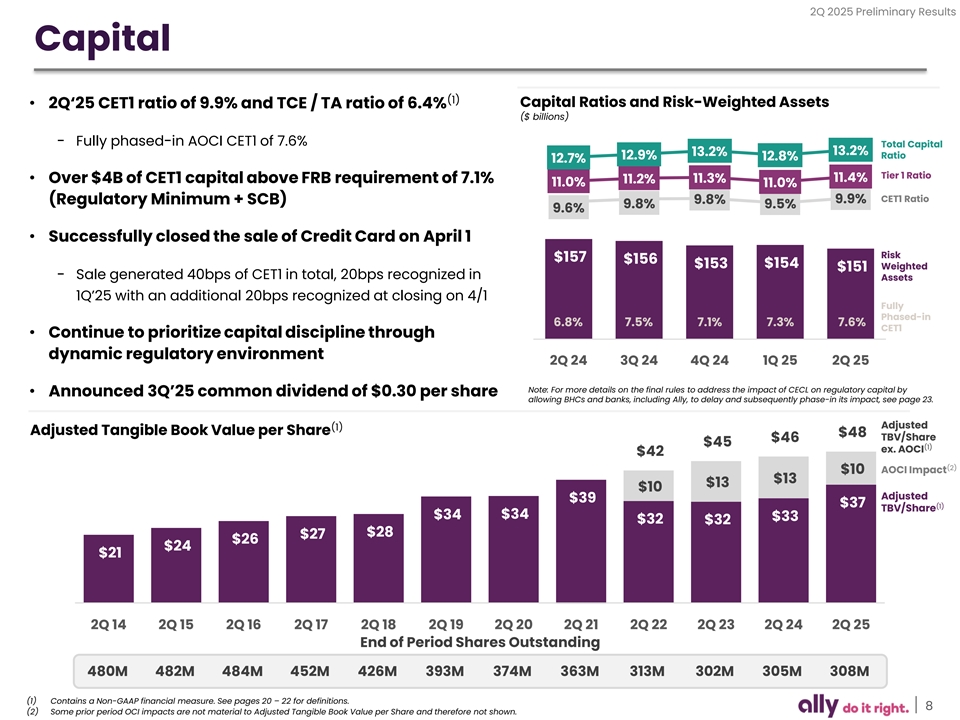
2Q 2025 Preliminary Results Capital (1) Capital Ratios and Risk-Weighted Assets • 2Q‘25 CET1 ratio of 9.9% and TCE / TA ratio of 6.4% ($ billions) − Fully phased-in AOCI CET1 of 7.6% Total Capital 13.2% 13.2% Ratio 12.9% 12.8% 12.7% Tier 1 Ratio 11.3% 11.4% • Over $4B of CET1 capital above FRB requirement of 7.1% 11.2% 11.0% 11.0% CET1 Ratio 9.8% 9.9% (Regulatory Minimum + SCB) 9.8% 9.5% 9.6% • Successfully closed the sale of Credit Card on April 1 Risk $157 $156 $153 $154 Weighted $151 − Sale generated 40bps of CET1 in total, 20bps recognized in Assets 1Q’25 with an additional 20bps recognized at closing on 4/1 Fully Phased-in 6.8% 7.5% 7.1% 7.3% 7.6% CET1 • Continue to prioritize capital discipline through dynamic regulatory environment 2Q 24 3Q 24 4Q 24 1Q 25 2Q 25 Note: For more details on the final rules to address the impact of CECL on regulatory capital by • Announced 3Q’25 common dividend of $0.30 per share allowing BHCs and banks, including Ally, to delay and subsequently phase-in its impact, see page 23. Adjusted (1) Adjusted Tangible Book Value per Share $48 TBV/Share $46 $45 (1) ex. AOCI $42 (2) AOCI Impact $10 $13 $13 $10 Adjusted $39 $37 (1) TBV/Share $34 $34 $33 $32 $32 $28 $27 $26 $24 $21 2Q 14 2Q 15 2Q 16 2Q 17 2Q 18 2Q 19 2Q 20 2Q 21 2Q 22 2Q 23 2Q 24 2Q 25 End of Period Shares Outstanding 480M 482M 484M 452M 426M 393M 374M 363M 313M 302M 305M 308M (1) Contains a Non-GAAP financial measure. See pages 20 – 22 for definitions. 8 (2) Some prior period OCI impacts are not material to Adjusted Tangible Book Value per Share and therefore not shown.
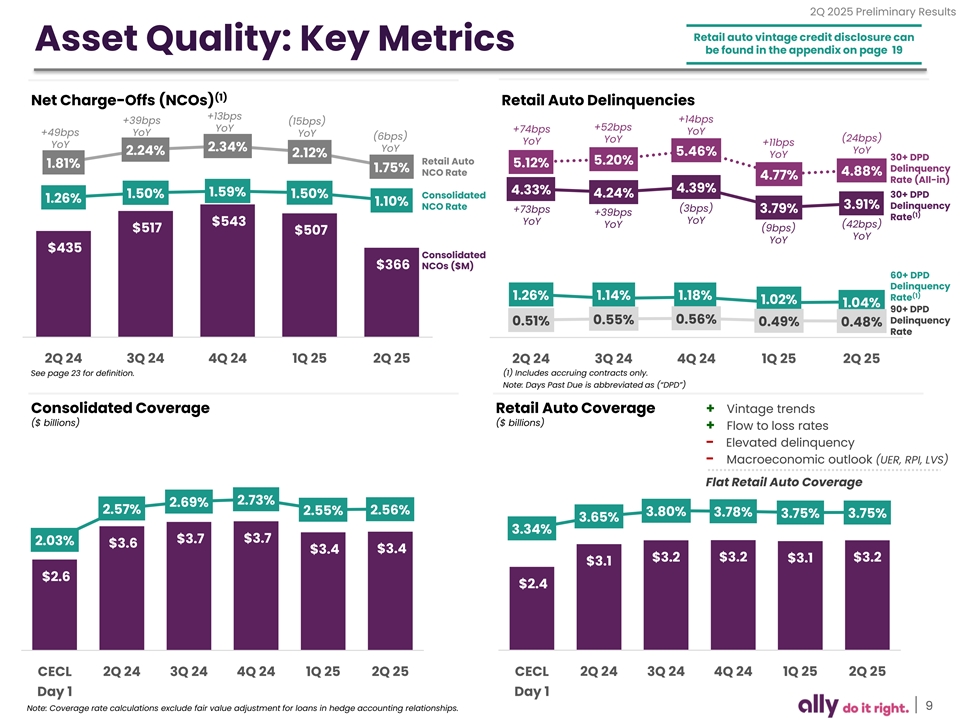
2Q 2025 Preliminary Results Retail auto vintage credit disclosure can Asset Quality: Key Metrics be found in the appendix on page 19 (1) Net Charge-Offs (NCOs) Retail Auto Delinquencies +13bps +14bps +39bps (15bps) +52bps YoY +74bps YoY +49bps YoY YoY (6bps) (24bps) YoY YoY +11bps YoY 2.34% YoY YoY 2.24% 5.46% 2.12% YoY 30+ DPD Retail Auto 5.20% 1.81% 5.12% 1.75% Delinquency NCO Rate 4.88% 4.77% Rate (All-in) 4.39% 4.33% 1.59% 4.24% 1.50% 1.50% Consolidated 30+ DPD 1.26% 1.10% 3.91% Delinquency NCO Rate (3bps) +73bps 3.79% +39bps (1) Rate YoY YoY $543 YoY (42bps) $517 (9bps) $507 YoY YoY $435 Consolidated $366 NCOs ($M) 60+ DPD Delinquency (1) 1.26% 1.14% 1.18% Rate 1.02% 1.04% 90+ DPD 0.55% 0.56% Delinquency 0.51% 0.49% 0.48% Rate 2Q 24 3Q 24 4Q 24 1Q 25 2Q 25 2Q 24 3Q 24 4Q 24 1Q 25 2Q 25 See page 23 for definition. (1) Includes accruing contracts only. Note: Days Past Due is abbreviated as (“DPD”) Consolidated Coverage Retail Auto Coverage + Vintage trends ($ billions) ($ billions) + Flow to loss rates - Elevated delinquency - Macroeconomic outlook (UER, RPI, LVS) Flat Retail Auto Coverage 2.73% 2.69% 2.57% 2.56% 2.55% 3.80% 3.78% 3.75% 3.75% 3.65% 3.34% $3.7 $3.7 2.03% $3.6 $3.4 $3.4 $3.2 $3.2 $3.2 $3.1 $3.1 $2.6 $2.4 CECL 2Q 24 3Q 24 4Q 24 1Q 25 2Q 25 CECL 2Q 24 3Q 24 4Q 24 1Q 25 2Q 25 Day 1 Day 1 Note: Coverage rate calculations exclude fair value adjustment for loans in hedge accounting relationships. 9
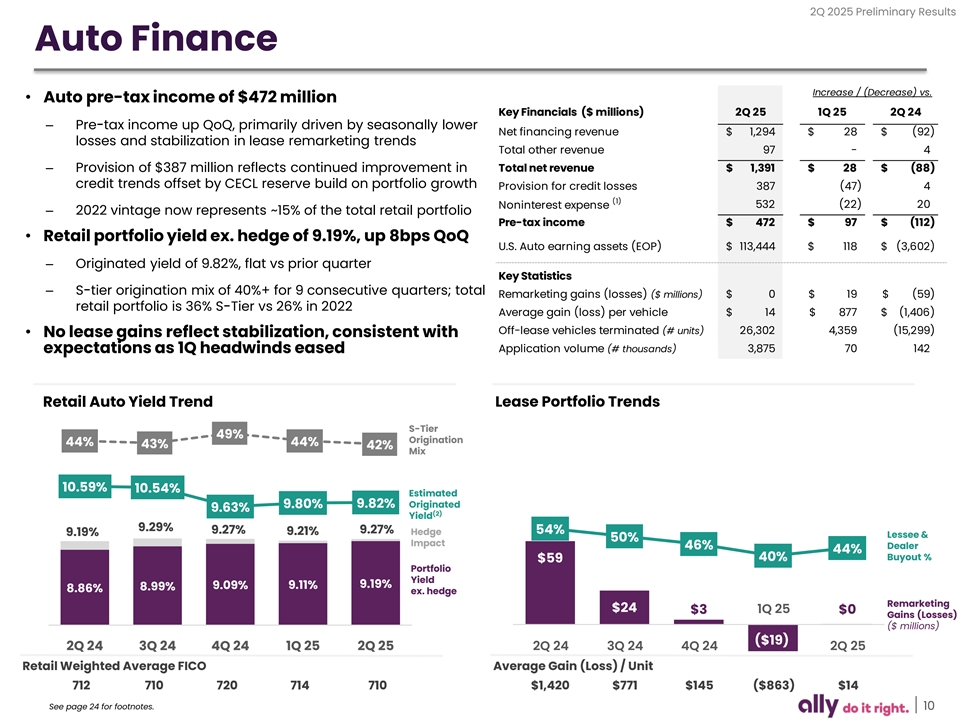
2Q 2025 Preliminary Results Auto Finance Increase / (Decrease) vs. • Auto pre-tax income of $472 million Key Financials ($ millions) 2Q 25 1Q 25 2Q 24 – Pre-tax income up QoQ, primarily driven by seasonally lower Net financing revenue $ 1 ,294 $ 28 $ (92) losses and stabilization in lease remarketing trends Total other revenue 97 - 4 – Provision of $387 million reflects continued improvement in Total net revenue $ 1,391 $ 28 $ (88) credit trends offset by CECL reserve build on portfolio growth Provision for credit losses 3 87 ( 47) 4 (1) 532 (22) 20 Noninterest expense – 2022 vintage now represents ~15% of the total retail portfolio Pre-tax income $ 472 $ 97 $ ( 112) • Retail portfolio yield ex. hedge of 9.19%, up 8bps QoQ U.S. Auto earning assets (EOP) $ 113,444 $ 118 $ ( 3,602) – Originated yield of 9.82%, flat vs prior quarter Key Statistics – S-tier origination mix of 40%+ for 9 consecutive quarters; total Remarketing gains (losses) ($ millions) $ 0 $ 19 $ (59) retail portfolio is 36% S-Tier vs 26% in 2022 Average gain (loss) per vehicle $ 14 $ 8 77 $ (1,406) Off-lease vehicles terminated (# units) 26,302 4,359 (15,299) • No lease gains reflect stabilization, consistent with Application volume (# thousands) 3,875 70 1 42 expectations as 1Q headwinds eased Retail Auto Yield Trend Lease Portfolio Trends S-Tier 49% Origination 44% 44% 43% 42% Mix 10.59% 10.54% Estimated 9.80% 9.82% Originated 9.63% (2) Yield 9.29% 9.27% 9.27% 9.21% Hedge 54% 9.19% Lessee & 50% Impact 46% Dealer 44% Buyout % 40% $59 Portfolio Yield 9.19% 9.09% 9.11% 8.99% 8.86% ex. hedge Remarketing $24 1Q 25 $3 $0 Gains (Losses) ($ millions) ($19) 2Q 24 3Q 24 4Q 24 1Q 25 2Q 25 2Q 24 3Q 24 4Q 24 2Q 25 Retail Weighted Average FICO Average Gain (Loss) / Unit 712 710 720 714 710 $1,420 $771 $145 ($863) $14 See page 24 for footnotes. 10
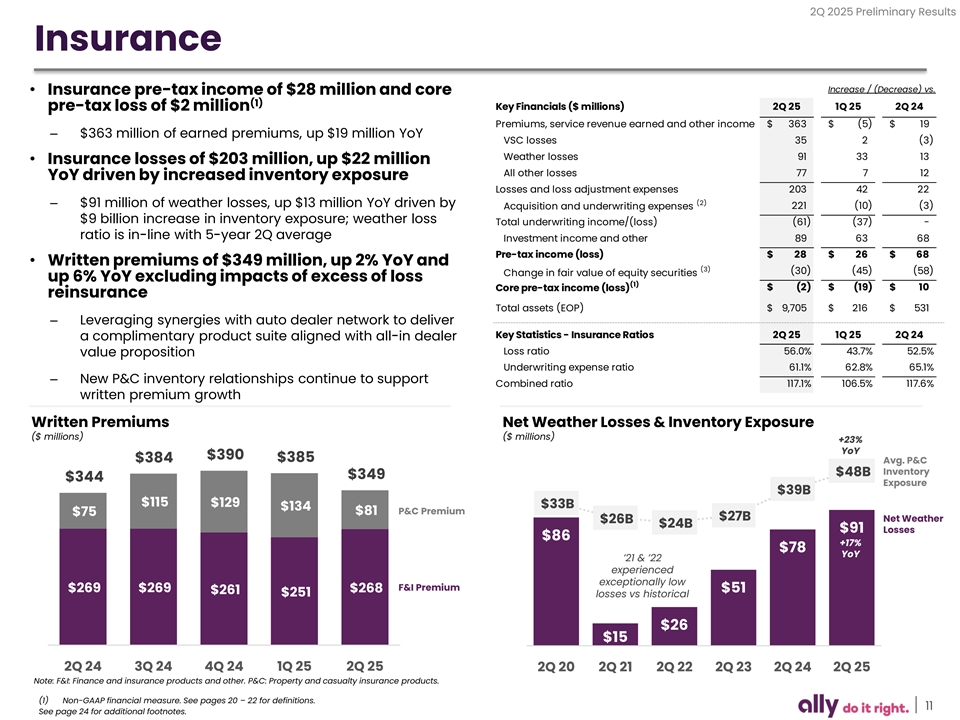
2Q 2025 Preliminary Results Insurance Increase / (Decrease) vs. • Insurance pre-tax income of $28 million and core (1) pre-tax loss of $2 million Key Financials ($ millions) 2Q 25 1Q 25 2Q 24 Premiums, service revenue earned and other income $ 3 63 $ ( 5) $ 19 – $363 million of earned premiums, up $19 million YoY VSC losses 35 2 (3) Weather losses 91 33 13 • Insurance losses of $203 million, up $22 million All other losses 77 7 12 YoY driven by increased inventory exposure Losses and loss adjustment expenses 203 42 22 (2) – $91 million of weather losses, up $13 million YoY driven by Acquisition and underwriting expenses 221 ( 10) (3) $9 billion increase in inventory exposure; weather loss Total underwriting income/(loss) (61) (37) - ratio is in-line with 5-year 2Q average Investment income and other 89 63 68 Pre-tax income (loss) $ 28 $ 26 $ 68 • Written premiums of $349 million, up 2% YoY and (3) ( 30) (45) ( 58) Change in fair value of equity securities up 6% YoY excluding impacts of excess of loss (1) $ (2) $ (19) $ 10 Core pre-tax income (loss) reinsurance Total assets (EOP) $ 9,705 $ 2 16 $ 531 – Leveraging synergies with auto dealer network to deliver Key Statistics - Insurance Ratios 2Q 25 1Q 25 2Q 24 a complimentary product suite aligned with all-in dealer Loss ratio 56.0% 43.7% 52.5% value proposition Underwriting expense ratio 61.1% 62.8% 65.1% – New P&C inventory relationships continue to support Combined ratio 117.1% 106.5% 117.6% written premium growth Written Premiums Net Weather Losses & Inventory Exposure ($ millions) ($ millions) +23% YoY $390 $384 $385 Avg. P&C Inventory $48B $349 $344 Exposure $39B $115 $129 $33B $134 $81 P&C Premium $75 $27B Net Weather $26B $24B $91 Losses $86 +17% $78 YoY ’21 & ’22 experienced exceptionally low F&I Premium $269 $269 $268 $51 $261 $251 losses vs historical $26 $15 2Q 24 3Q 24 4Q 24 1Q 25 2Q 25 2Q 20 2Q 21 2Q 22 2Q 23 2Q 24 2Q 25 Note: F&I: Finance and insurance products and other. P&C: Property and casualty insurance products. (1) Non-GAAP financial measure. See pages 20 – 22 for definitions. 11 See page 24 for additional footnotes.
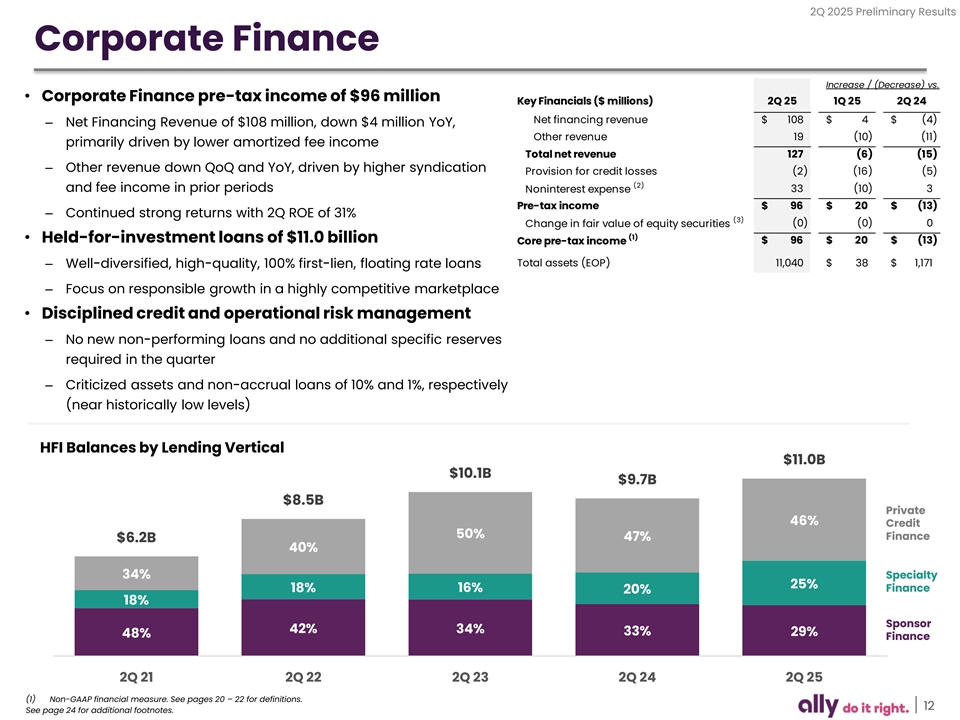
2Q 2025 Preliminary Results Corporate Finance Increase / (Decrease) vs. • Corporate Finance pre-tax income of $96 million Key Financials ($ millions) 2Q 25 1Q 25 2Q 24 Net financing revenue $ 108 $ 4 $ ( 4) – Net Financing Revenue of $108 million, down $4 million YoY, Other revenue 19 ( 10) ( 11) primarily driven by lower amortized fee income Total net revenue 127 (6) (15) – Other revenue down QoQ and YoY, driven by higher syndication Provision for credit losses (2) (16) (5) (2) and fee income in prior periods 33 ( 10) 3 Noninterest expense Pre-tax income $ 96 $ 20 $ (13) – Continued strong returns with 2Q ROE of 31% (3) (0) (0) 0 Change in fair value of equity securities (1) • Held-for-investment loans of $11.0 billion $ 96 $ 20 $ (13) Core pre-tax income Total assets (EOP) 11,040 $ 38 $ 1,171 – Well-diversified, high-quality, 100% first-lien, floating rate loans – Focus on responsible growth in a highly competitive marketplace • Disciplined credit and operational risk management – No new non-performing loans and no additional specific reserves required in the quarter – Criticized assets and non-accrual loans of 10% and 1%, respectively (near historically low levels) HFI Balances by Lending Vertical $11.0B $10.1B $9.7B $8.5B Private 46% Credit 50% Finance 47% $6.2B 40% 34% Specialty 25% 18% 16% Finance 20% 18% Sponsor 42% 34% 33% 29% 48% Finance 2Q 21 2Q 22 2Q 23 2Q 24 2Q 25 (1) Non-GAAP financial measure. See pages 20 – 22 for definitions. 12 See page 24 for additional footnotes.
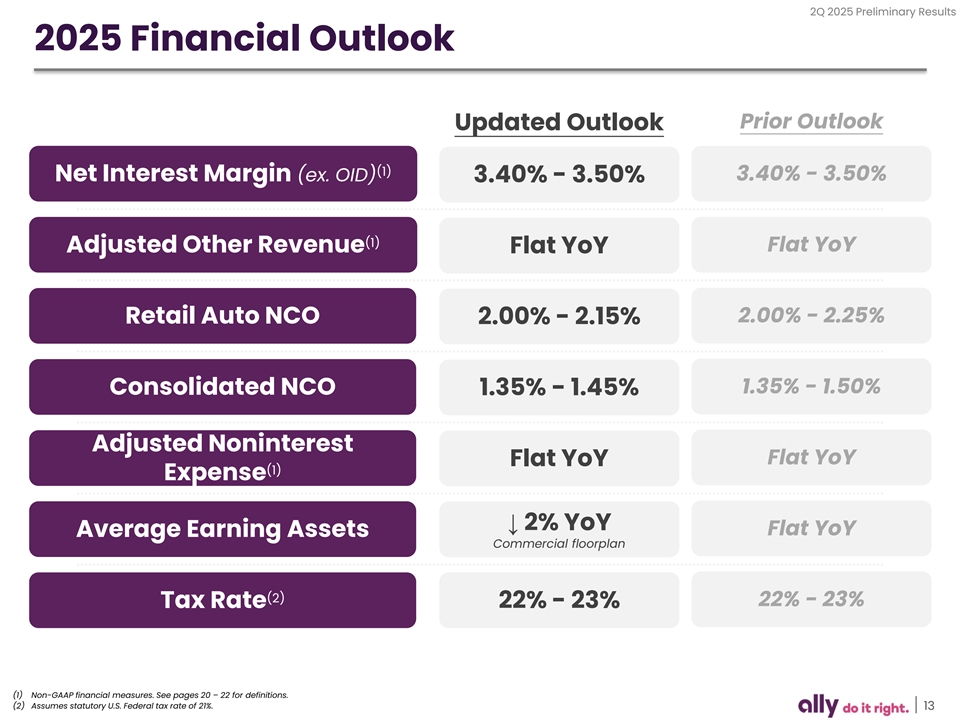
2Q 2025 Preliminary Results 2025 Financial Outlook Prior Outlook Updated Outlook (1) Net Interest Margin (ex. OID) 3.40% - 3.50% 3.40% - 3.50% (1) Flat YoY Adjusted Other Revenue Flat YoY 2.00% - 2.25% Retail Auto NCO 2.00% - 2.15% 1.35% - 1.50% Consolidated NCO 1.35% - 1.45% Adjusted Noninterest Flat YoY Flat YoY (1) Expense ↓ 2% YoY Flat YoY Average Earning Assets Commercial floorplan (2) 22% - 23% Tax Rate 22% - 23% (1) Non-GAAP financial measures. See pages 20 – 22 for definitions. (2) Assumes statutory U.S. Federal tax rate of 21%. 13

Supplemental
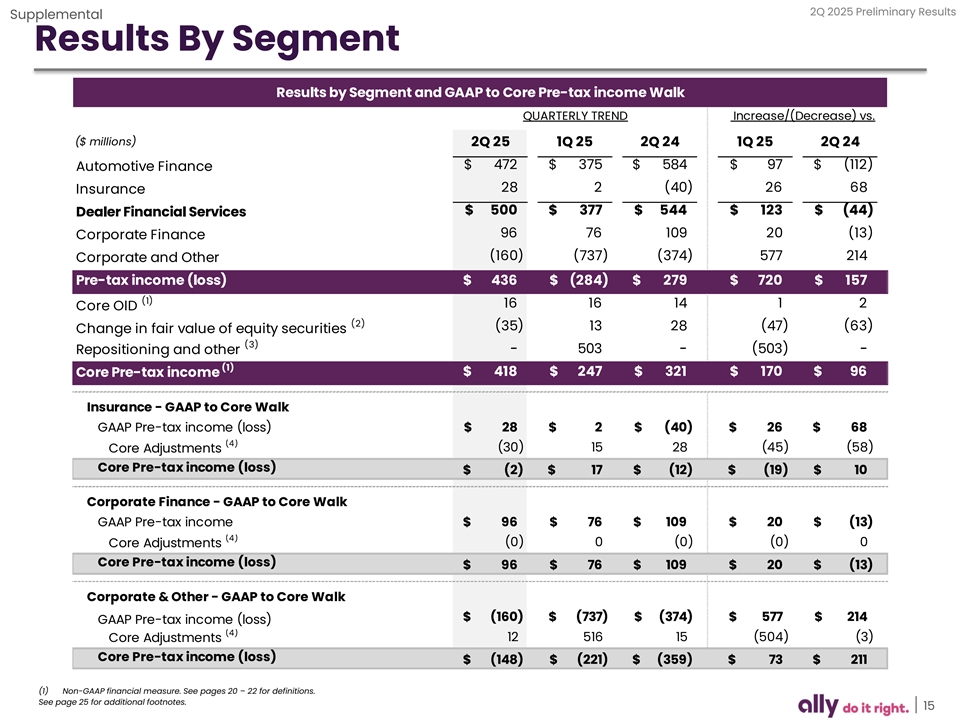
2Q 2025 Preliminary Results Supplemental Results By Segment Results by Segment and GAAP to Core Pre-tax income Walk QUARTERLY TREND Increase/(Decrease) vs. ($ millions) 2Q 25 1Q 25 2Q 24 1Q 25 2Q 24 $ 472 $ 3 75 $ 584 $ 97 $ (112) Automotive Finance 28 2 ( 40) 26 68 Insurance $ 500 $ 3 77 $ 544 $ 123 $ (44) Dealer Financial Services 96 76 109 20 (13) Corporate Finance (160) ( 737) (374) 5 77 2 14 Corporate and Other Pre-tax income (loss) $ 4 36 $ ( 284) $ 279 $ 72 0 $ 157 (1) 16 16 14 1 2 Core OID (2) (35) 13 28 (47) (63) Change in fair value of equity securities (3) - 503 - (503) - Repositioning and other (1) $ 4 18 $ 2 47 $ 321 $ 1 70 $ 96 Core Pre-tax income Insurance - GAAP to Core Walk GAAP Pre-tax income (loss) $ 28 $ 2 $ ( 40) $ 26 $ 68 (4) (30) 15 28 (45) (58) Core Adjustments Core Pre-tax income (loss) $ ( 2) $ 17 $ ( 12) $ (19) $ 10 Corporate Finance - GAAP to Core Walk GAAP Pre-tax income $ 96 $ 76 $ 109 $ 20 $ (13) (4) (0) 0 (0) (0) 0 Core Adjustments Core Pre-tax income (loss) $ 96 $ 76 $ 109 $ 20 $ (13) Corporate & Other - GAAP to Core Walk $ ( 160) $ ( 737) $ ( 374) $ 5 77 $ 21 4 GAAP Pre-tax income (loss) (4) 12 516 15 (504) ( 3) Core Adjustments Core Pre-tax income (loss) $ ( 148) $ ( 221) $ ( 359) $ 73 $ 21 1 (1) Non-GAAP financial measure. See pages 20 – 22 for definitions. See page 25 for additional footnotes. 15
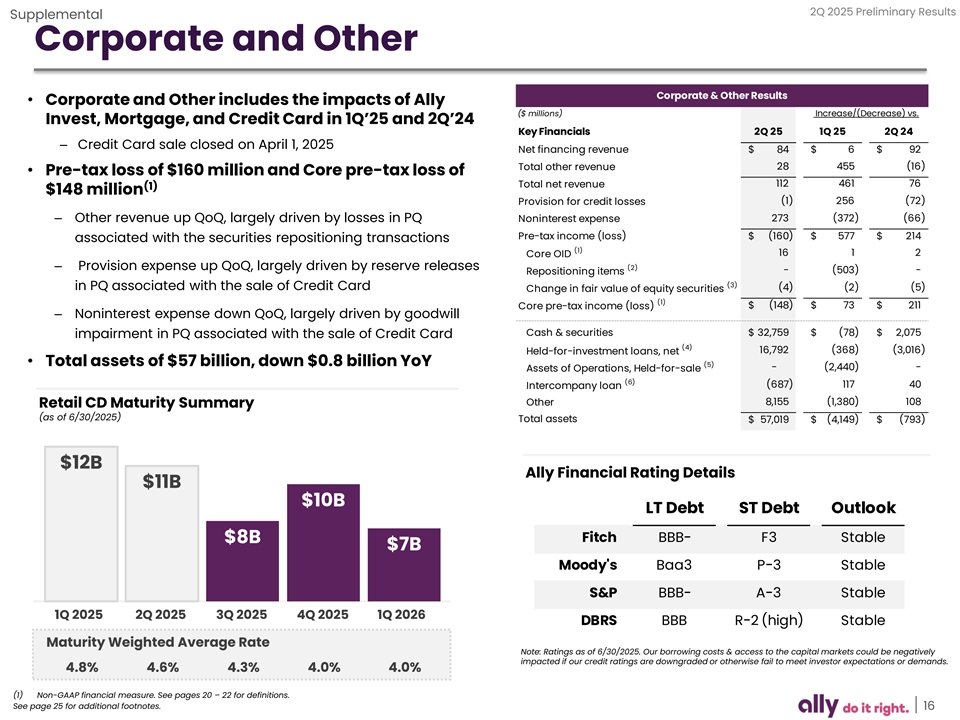
2Q 2025 Preliminary Results Supplemental Corporate and Other Corporate & Other Results • Corporate and Other includes the impacts of Ally ($ millions) Increase/(Decrease) vs. Invest, Mortgage, and Credit Card in 1Q’25 and 2Q’24 Key Financials 2Q 25 1Q 25 2Q 24 – Credit Card sale closed on April 1, 2025 Net financing revenue $ 84 $ 6 $ 92 28 455 (16) Total other revenue • Pre-tax loss of $160 million and Core pre-tax loss of 112 461 76 Total net revenue (1) $148 million (1) 256 (72) Provision for credit losses 273 (372) ( 66) – Other revenue up QoQ, largely driven by losses in PQ Noninterest expense Pre-tax income (loss) $ (160) $ 5 77 $ 214 associated with the securities repositioning transactions (1) 16 1 2 Core OID – Provision expense up QoQ, largely driven by reserve releases (2) - (503) - Repositioning items (3) in PQ associated with the sale of Credit Card (4) (2) (5) Change in fair value of equity securities (1) Core pre-tax income (loss) $ (148) $ 73 $ 211 – Noninterest expense down QoQ, largely driven by goodwill Cash & securities $ 32,759 $ (78) $ 2,075 impairment in PQ associated with the sale of Credit Card (4) 16,792 (368) ( 3,016) Held-for-investment loans, net • Total assets of $57 billion, down $0.8 billion YoY (5) - ( 2,440) - Assets of Operations, Held-for-sale (6) (687) 117 40 Intercompany loan Other 8,155 (1,380) 108 Retail CD Maturity Summary (as of 6/30/2025) Total assets $ 57,019 $ (4,149) $ (793) $12B Ally Financial Rating Details $11B $10B LT Debt ST Debt Outlook Fitch BBB- F3 Stable $8B $7B Moody's Baa3 P-3 Stable S&P BBB- A-3 Stable 1Q 2025 2Q 2025 3Q 2025 4Q 2025 1Q 2026 DBRS BBB R-2 (high) Stable Maturity Weighted Average Rate Note: Ratings as of 6/30/2025. Our borrowing costs & access to the capital markets could be negatively impacted if our credit ratings are downgraded or otherwise fail to meet investor expectations or demands. 4.8% 4.6% 4.3% 4.0% 4.0% (1) Non-GAAP financial measure. See pages 20 – 22 for definitions. See page 25 for additional footnotes. 16
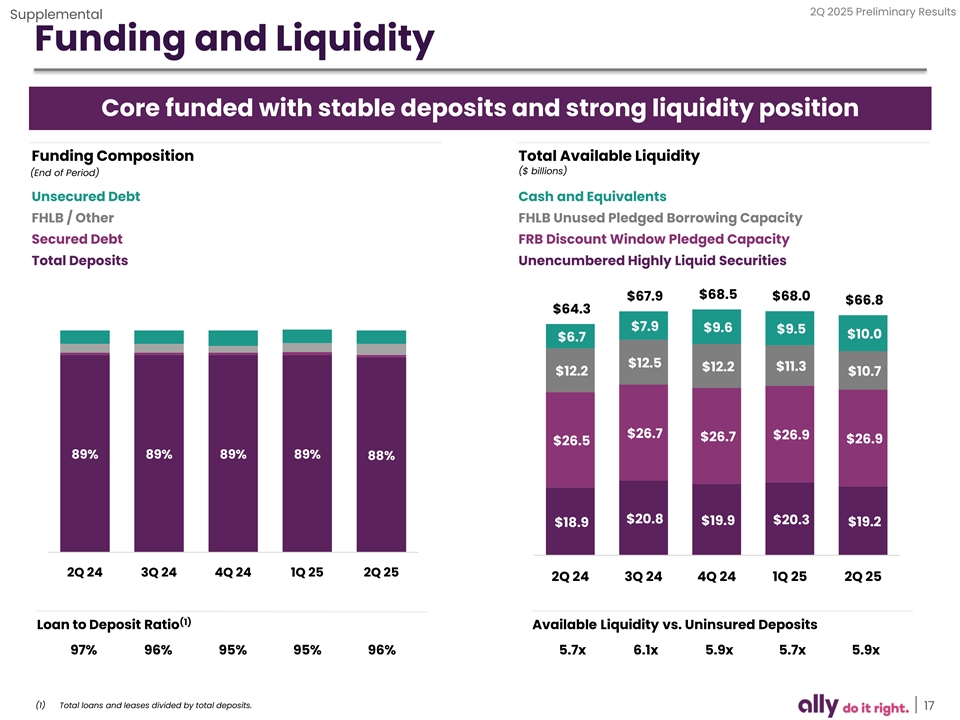
2Q 2025 Preliminary Results Supplemental Funding and Liquidity Core funded with stable deposits and strong liquidity position Funding Composition Total Available Liquidity ($ billions) (End of Period) Unsecured Debt Cash and Equivalents FHLB / Other FHLB Unused Pledged Borrowing Capacity Secured Debt FRB Discount Window Pledged Capacity Total Deposits Unencumbered Highly Liquid Securities $68.5 $67.9 $68.0 $66.8 $64.3 $7.9 $9.6 $9.5 $10.0 $6.7 $12.5 $11.3 $12.2 $12.2 $10.7 $26.7 $26.9 $26.7 $26.9 $26.5 89% 89% 89% 89% 88% $20.8 $20.3 $19.9 $18.9 $19.2 2Q 24 3Q 24 4Q 24 1Q 25 2Q 25 2Q 24 3Q 24 4Q 24 1Q 25 2Q 25 (1) Loan to Deposit Ratio Available Liquidity vs. Uninsured Deposits 97% 96% 95% 95% 96% 5.7x 6.1x 5.9x 5.7x 5.9x (1) Total loans and leases divided by total deposits. 17
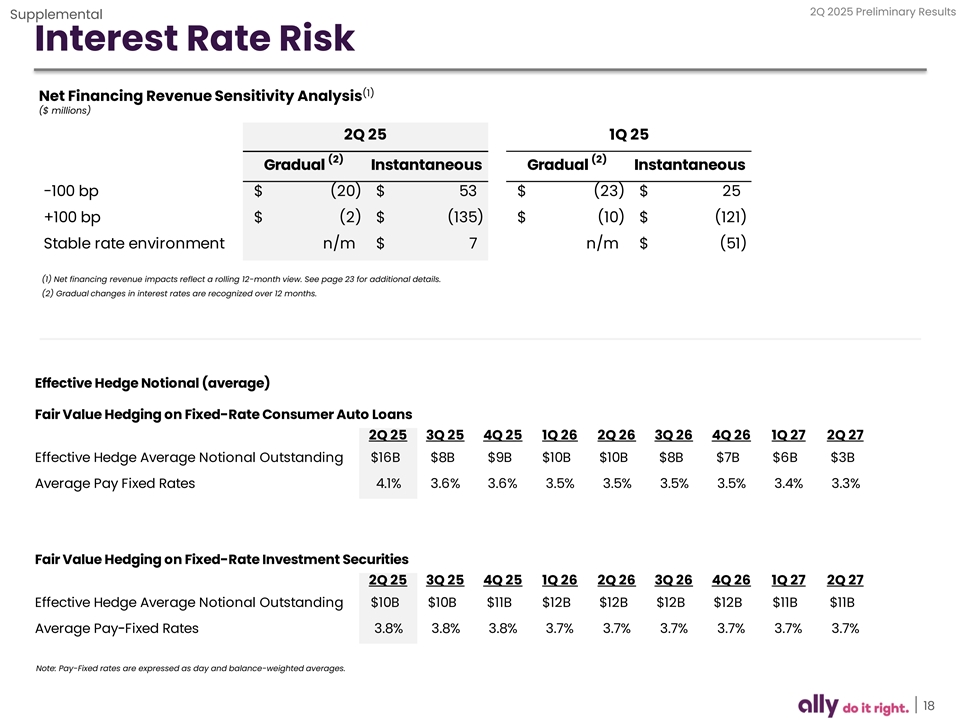
2Q 2025 Preliminary Results Supplemental Interest Rate Risk (1) Net Financing Revenue Sensitivity Analysis ($ millions) 2Q 25 1Q 25 (2) (2) Gradual Instantaneous Gradual Instantaneous -100 bp $ (20) $ 53 $ (23) $ 25 +100 bp $ (2) $ (135) $ (10) $ (121) Stable rate environment n/m $ 7 n/m $ (51) (1) Net financing revenue impacts reflect a rolling 12-month view. See page 23 for additional details. (2) Gradual changes in interest rates are recognized over 12 months. Effective Hedge Notional (average) Fair Value Hedging on Fixed-Rate Consumer Auto Loans 2Q 25 3Q 25 4Q 25 1Q 26 2Q 26 3Q 26 4Q 26 1Q 27 2Q 27 Effective Hedge Average Notional Outstanding $16B $8B $9B $10B $10B $8B $7B $6B $3B Average Pay Fixed Rates 4.1% 3.6% 3.6% 3.5% 3.5% 3.5% 3.5% 3.4% 3.3% Fair Value Hedging on Fixed-Rate Investment Securities 2Q 25 3Q 25 4Q 25 1Q 26 2Q 26 3Q 26 4Q 26 1Q 27 2Q 27 Effective Hedge Average Notional Outstanding $10B $10B $11B $12B $12B $12B $12B $11B $11B Average Pay-Fixed Rates 3.8% 3.8% 3.8% 3.7% 3.7% 3.7% 3.7% 3.7% 3.7% Note: Pay-Fixed rates are expressed as day and balance-weighted averages. 18
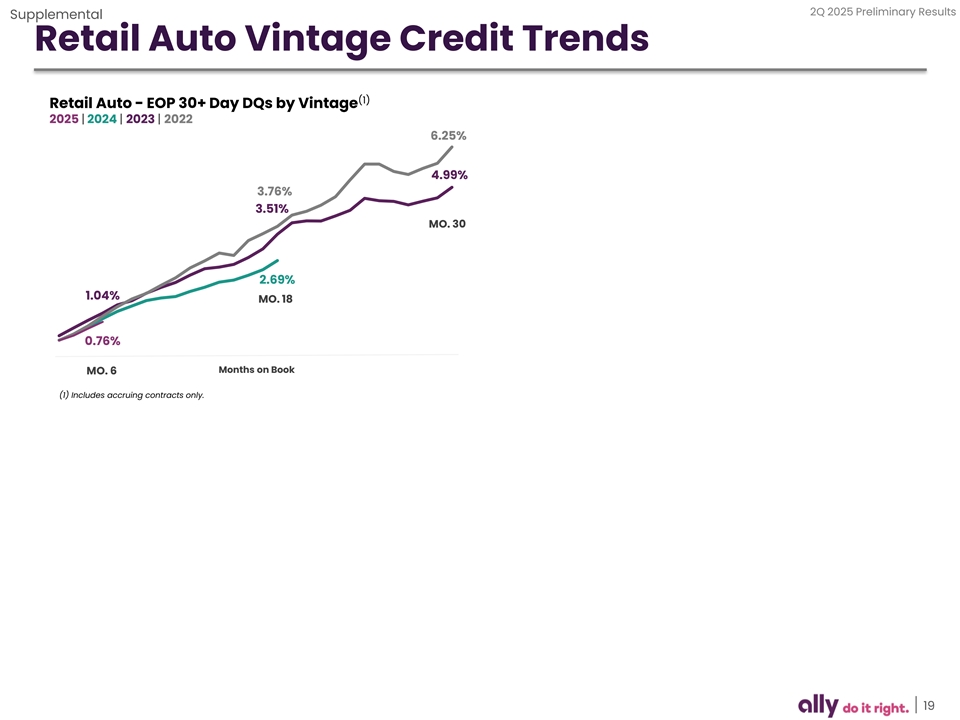
2Q 2025 Preliminary Results Supplemental Retail Auto Vintage Credit Trends (1) Retail Auto - EOP 30+ Day DQs by Vintage 2025 | 2024 | 2023 | 2022 6.25% 4.99% 3.76% 3.51% MO. 30 2.69% 1.04% MO. 18 0.76% Months on Book MO. 6 (1) Includes accruing contracts only. 19
2Q 2025 Preliminary Results Supplemental Notes on Non-GAAP Financial Measures The following are non-GAAP financial measures which Ally believes are important to the reader of the Consolidated Financial Statements, but which are supplemental to and not a substitute for GAAP measures: Accelerated issuance expense (Accelerated OID), Adjusted earnings per share (Adjusted EPS), Adjusted efficiency ratio, Adjusted noninterest expense, Adjusted other revenue, Adjusted provision for Credit Losses, Adjusted tangible book value per share (Adjusted TBVPS), Adjusted total net revenue, Core net income attributable to common shareholders, Core original issue discount (Core OID) amortization expense, Core outstanding original issue discount balance (Core OID balance), Core pre-tax income, Core return on tangible common equity (Core ROTCE), Investment income and other (adjusted), Net financing revenue (excluding Core OID), Net interest margin (excluding Core OID), and Tangible Common Equity. These measures are used by management, and we believe are useful to investors in assessing the company’s operating performance and capital. For calculation methodology, refer to the Reconciliation to GAAP later in this document. 1) Accelerated issuance expense (Accelerated OID) is the recognition of issuance expenses related to calls of redeemable debt. 2) Adjusted earnings per share (Adjusted EPS) is a non-GAAP financial measure that adjusts GAAP EPS for revenue and expense items that are typically strategic in nature or that management otherwise does not view as reflecting the operating performance of the company. Management believes Adjusted EPS can help the reader better understand the operating performance of the core businesses and their ability to generate earnings. In the numerator of Adjusted EPS, GAAP net income attributable to common shareholders is adjusted for the following items: (1) excludes discontinued operations, net of tax, as Ally is primarily a domestic company and sales of international businesses and other discontinued operations in the past have significantly impacted GAAP EPS, (2) adds back the tax-effected non-cash Core OID, (3) adjusts for tax- effected repositioning and other which are primarily related to the extinguishment of high-cost legacy debt, strategic activities and significant other one-time items, (4) change in fair value of equity securities, (5) excludes significant discrete tax items that do not relate to the operating performance of the core businesses, and adjusts for preferred stock capital actions that have been taken by the company to normalize its capital structure, as applicable for respective periods. See page 26 for calculation methodology and details. 3) Adjusted efficiency ratio is a non-GAAP financial measure that management believes is helpful to readers in comparing the efficiency of its core banking and lending businesses with those of its peers. See page 29 for calculation details. (1) In the numerator of Adjusted efficiency ratio, total noninterest expense is adjusted for Rep and warrant expense, Insurance segment expense, and repositioning and other which are primarily related to the extinguishment of high-cost legacy debt, strategic activities, restructuring and significant other one-time items, as applicable for respective periods. (2) In the denominator, total net revenue is adjusted for Core OID, Insurance segment revenue, and repositioning and other which are primarily related to the extinguishment of high-cost legacy debt, strategic activities, restructuring and significant other one-time items, as applicable for respective periods. See page 11 for the combined ratio for the Insurance segment which management uses as a primary measure of underwriting profitability for the Insurance segment. 4) Adjusted noninterest expense is a non-GAAP financial measure that adjusts GAAP noninterest expense for repositioning items. Management believes adjusted noninterest expense is a helpful financial metric because it enables the reader to better understand the business' expenses excluding nonrecurring items. See page 30 for calculation methodology and details. 5) Adjusted other revenue is a non-GAAP financial measure that adjusts GAAP other revenue for OID expenses, repositioning, and change in fair value of equity securities. Management believes adjusted other revenue is a helpful financial metric because it enables the reader to better understand the business' ability to generate other revenue. See page 30 for calculation methodology and details. 6) Adjusted provision for credit losses is a non-GAAP financial measure that adjusts GAAP provision for credit losses for repositioning items. Management believes adjusted provision for credit losses is a helpful financial metric because it enables the reader to better understand the business’ expenses excluding nonrecurring items. See page 30 for calculation methodology and details. 20
2Q 2025 Preliminary Results Supplemental Notes on Non-GAAP Financial Measures 7) Adjusted tangible book value per share (Adjusted TBVPS) is a non-GAAP financial measure that reflects the book value of equity attributable to shareholders even if Core OID balance were accelerated immediately through the financial statements. As a result, management believes Adjusted TBVPS provides the reader with an assessment of value that is more conservative than GAAP common shareholder’s equity per share. Adjusted TBVPS generally adjusts common equity for: (1) goodwill and identifiable intangibles, net of DTLs and (2) tax-effected Core OID balance to reduce tangible common equity in the event the corresponding discounted bonds are redeemed/tendered. Note: In December 2017, tax-effected Core OID balance was adjusted from a statutory U.S. Federal tax rate of 35% to 21% (“rate”) as a result of changes to U.S. tax law. The adjustment conservatively increased the tax-effected Core OID balance and consequently reduced Adjusted TBVPS as any acceleration of the non-cash charge in future periods would flow through the financial statements at a 21% rate versus a previously modeled 35% rate. See page 28 for calculation methodology and details. 8) Adjusted total net revenue is a non-GAAP financial measure that management believes is helpful for readers to understand the ongoing ability of the company to generate revenue. For purposes of this calculation, GAAP net financing revenue is adjusted by excluding Core OID to calculate net financing revenue ex. core OID. GAAP other revenue is adjusted for OID expenses, repositioning, and change in fair value of equity securities to calculate adjusted other revenue. Adjusted total net revenue is calculated by adding net financing revenue ex. core OID to adjusted other revenue. See page 30 for calculation methodology and details. 9) Core net income attributable to common shareholders is a non-GAAP financial measure that serves as the numerator in the calculations of Adjusted EPS and Core ROTCE and that, like those measures, is believed by management to help the reader better understand the operating performance of the core businesses and their ability to generate earnings. Core net income attributable to common shareholders adjusts GAAP net income attributable to common shareholders for discontinued operations net of tax, tax-effected Core OID expense, tax-effected repositioning and other primarily related to the extinguishment of high-cost legacy debt and strategic activities and significant other one-time items, preferred stock capital actions, significant discrete tax items and tax-effected changes in equity investments measured at fair value, as applicable for respective periods. See pages 26 – 27 for calculation methodology and details. 10) Core original issue discount (Core OID) amortization expense is a non-GAAP financial measure for OID and is believed by management to help the reader better understand the activity removed from: Core pre-tax income (loss), Core net income (loss) attributable to common shareholders, Adjusted EPS, Core ROTCE, Adjusted efficiency ratio, Adjusted total net revenue, and Net financing revenue (excluding Core OID). Core OID is primarily related to bond exchange OID which excludes international operations and future issuances. Core OID for all periods shown is applied to the pre-tax income of the Corporate and Other segment. See page 30 for calculation methodology and details. 11) Core outstanding original issue discount balance (Core OID balance) is a non-GAAP financial measure for outstanding OID and is believed by management to help the reader better understand the balance removed from Core ROTCE and Adjusted TBVPS. Core OID balance is primarily related to bond exchange OID which excludes international operations and future issuances. See page 30 for calculation methodology and details. 12) Core pre-tax income is a non-GAAP financial measure that adjusts pre-tax income from continuing operations by excluding (1) Core OID, and (2) change in fair value of equity securities (change in fair value of equity securities impacts the Insurance and Corporate Finance segments), and (3) Repositioning and other which are primarily related to the extinguishment of high-cost legacy debt, strategic activities and significant other one-time items, as applicable for respective periods or businesses. Management believes core pre-tax income can help the reader better understand the operating performance of the core businesses and their ability to generate earnings. See page 15 for calculation methodology and details. 21
2Q 2025 Preliminary Results Supplemental Notes on Non-GAAP Financial Measures 13) Core return on tangible common equity (Core ROTCE) is a non-GAAP financial measure that management believes is helpful for readers to better understand the ongoing ability of the company to generate returns on its equity base that supports core operations. For purposes of this calculation, tangible common equity is adjusted for Core OID balance and net DTA. Ally’s Core net income attributable to common shareholders for purposes of calculating Core ROTCE is based on the actual effective tax rate for the period adjusted for significant discrete tax items including tax reserve releases, which aligns with the methodology used in calculating adjusted earnings per share. See page 27 or calculation details. (1) In the numerator of Core ROTCE, GAAP net income attributable to common shareholders is adjusted for discontinued operations net of tax, tax-effected Core OID, tax-effected repositioning and other which are primarily related to the extinguishment of high-cost legacy debt, strategic activities and significant other one- time items, change in fair value of equity securities, significant discrete tax items, and preferred stock capital actions, as applicable for respective periods. (2) In the denominator, GAAP shareholder’s equity is adjusted for goodwill and identifiable intangibles net of DTL, Core OID balance, and net DTA. 14) Investment income and other (adjusted) is a non-GAAP financial measure that adjusts GAAP investment income and other for repositioning, and the change in fair value of equity securities. Management believes investment income and other (adjusted) is a helpful financial metric because it enables the reader to better understand the business' ability to generate investment income. 15) Net financing revenue excluding core OID is calculated using a non-GAAP measure that adjusts net financing revenue by excluding Core OID. The Core OID balance is primarily related to bond exchange OID which excludes international operations and future issuances. Management believes net financing revenue ex. Core OID is a helpful financial metric because it enables the reader to better understand the business' ability to generate revenue. See page 30 for calculation methodology and details. 16) Net interest margin excluding core OID is calculated using a non-GAAP measure that adjusts net interest margin by excluding Core OID. The Core OID balance is primarily related to bond exchange OID which excludes international operations and future issuances. Management believes net interest margin ex. Core OID is a helpful financial metric because it enables the reader to better understand the business' profitability and margins. See page 7 for calculation methodology and details. 17) Tangible Common Equity is a non-GAAP financial measure that is defined as common stockholders’ equity less goodwill and identifiable intangible assets, net of deferred tax liabilities. Ally considers various measures when evaluating capital adequacy, including tangible common equity. Ally believes that tangible common equity is important because we believe readers may assess our capital adequacy using this measure. Additionally, presentation of this measure allows readers to compare certain aspects of our capital adequacy on the same basis to other companies in the industry. For purposes of calculating Core return on tangible common equity (Core ROTCE), tangible common equity is further adjusted for Core OID balance and net deferred tax asset. See page 28 for calculation methodology and details. 22
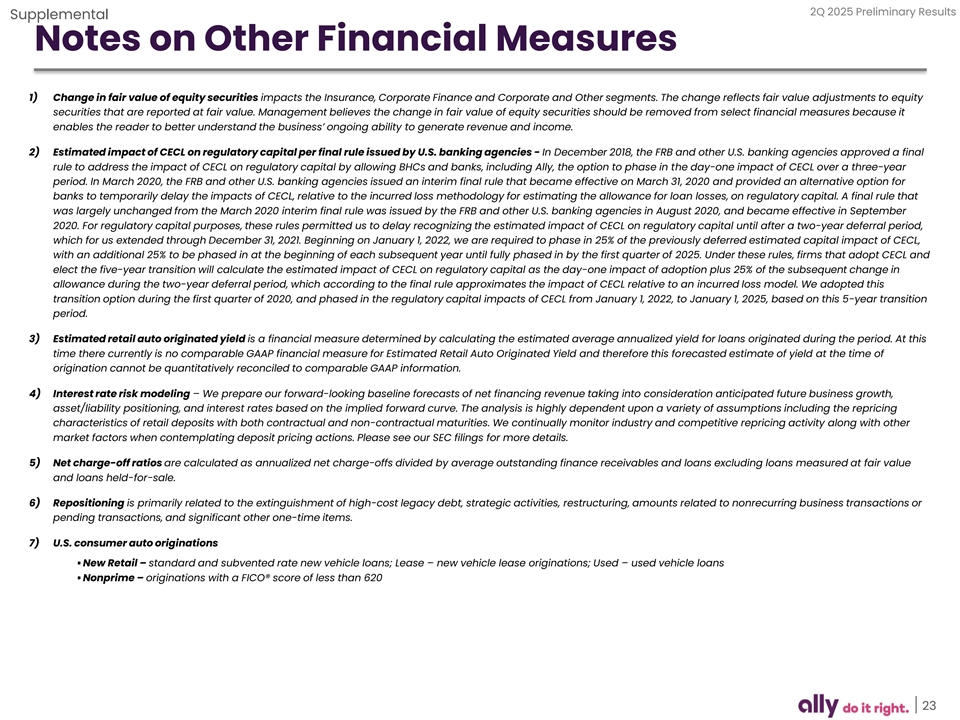
2Q 2025 Preliminary Results Supplemental Notes on Other Financial Measures 1) Change in fair value of equity securities impacts the Insurance, Corporate Finance and Corporate and Other segments. The change reflects fair value adjustments to equity securities that are reported at fair value. Management believes the change in fair value of equity securities should be removed from select financial measures because it enables the reader to better understand the business’ ongoing ability to generate revenue and income. 2) Estimated impact of CECL on regulatory capital per final rule issued by U.S. banking agencies - In December 2018, the FRB and other U.S. banking agencies approved a final rule to address the impact of CECL on regulatory capital by allowing BHCs and banks, including Ally, the option to phase in the day-one impact of CECL over a three-year period. In March 2020, the FRB and other U.S. banking agencies issued an interim final rule that became effective on March 31, 2020 and provided an alternative option for banks to temporarily delay the impacts of CECL, relative to the incurred loss methodology for estimating the allowance for loan losses, on regulatory capital. A final rule that was largely unchanged from the March 2020 interim final rule was issued by the FRB and other U.S. banking agencies in August 2020, and became effective in September 2020. For regulatory capital purposes, these rules permitted us to delay recognizing the estimated impact of CECL on regulatory capital until after a two-year deferral period, which for us extended through December 31, 2021. Beginning on January 1, 2022, we are required to phase in 25% of the previously deferred estimated capital impact of CECL, with an additional 25% to be phased in at the beginning of each subsequent year until fully phased in by the first quarter of 2025. Under these rules, firms that adopt CECL and elect the five-year transition will calculate the estimated impact of CECL on regulatory capital as the day-one impact of adoption plus 25% of the subsequent change in allowance during the two-year deferral period, which according to the final rule approximates the impact of CECL relative to an incurred loss model. We adopted this transition option during the first quarter of 2020, and phased in the regulatory capital impacts of CECL from January 1, 2022, to January 1, 2025, based on this 5-year transition period. 3) Estimated retail auto originated yield is a financial measure determined by calculating the estimated average annualized yield for loans originated during the period. At this time there currently is no comparable GAAP financial measure for Estimated Retail Auto Originated Yield and therefore this forecasted estimate of yield at the time of origination cannot be quantitatively reconciled to comparable GAAP information. 4) Interest rate risk modeling – We prepare our forward-looking baseline forecasts of net financing revenue taking into consideration anticipated future business growth, asset/liability positioning, and interest rates based on the implied forward curve. The analysis is highly dependent upon a variety of assumptions including the repricing characteristics of retail deposits with both contractual and non-contractual maturities. We continually monitor industry and competitive repricing activity along with other market factors when contemplating deposit pricing actions. Please see our SEC filings for more details. 5) Net charge-off ratios are calculated as annualized net charge-offs divided by average outstanding finance receivables and loans excluding loans measured at fair value and loans held-for-sale. 6) Repositioning is primarily related to the extinguishment of high-cost legacy debt, strategic activities, restructuring, amounts related to nonrecurring business transactions or pending transactions, and significant other one-time items. 7) U.S. consumer auto originations New Retail – standard and subvented rate new vehicle loans; Lease – new vehicle lease originations; Used – used vehicle loans Nonprime – originations with a FICO® score of less than 620 23
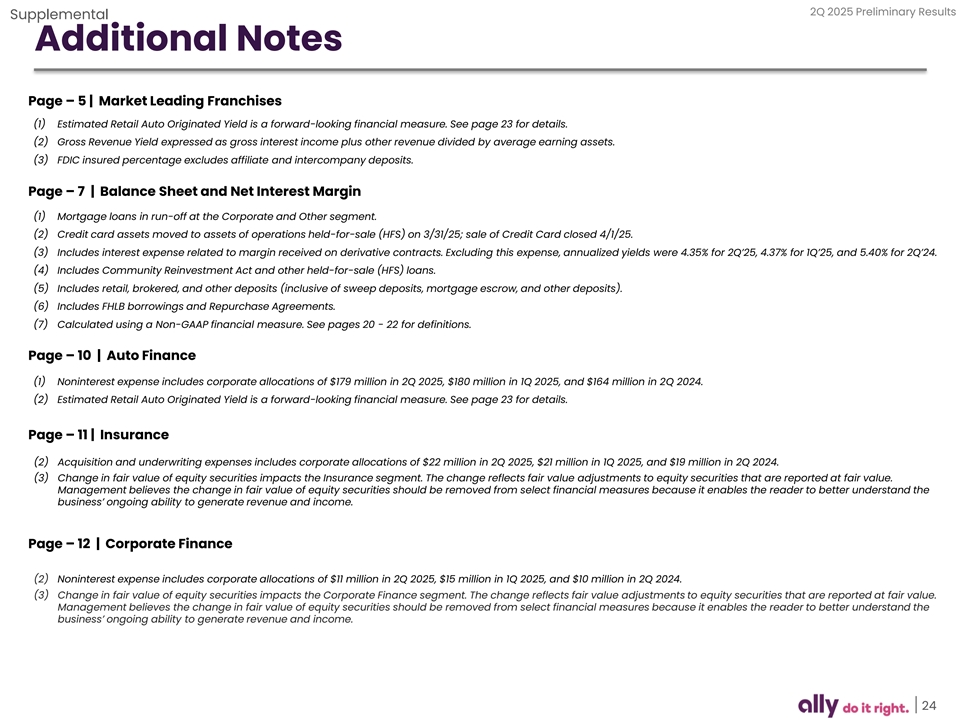
2Q 2025 Preliminary Results Supplemental Additional Notes Page – 5 | Market Leading Franchises (1) Estimated Retail Auto Originated Yield is a forward-looking financial measure. See page 23 for details. (2) Gross Revenue Yield expressed as gross interest income plus other revenue divided by average earning assets. (3) FDIC insured percentage excludes affiliate and intercompany deposits. Page – 7 | Balance Sheet and Net Interest Margin (1) Mortgage loans in run-off at the Corporate and Other segment. (2) Credit card assets moved to assets of operations held-for-sale (HFS) on 3/31/25; sale of Credit Card closed 4/1/25. (3) Includes interest expense related to margin received on derivative contracts. Excluding this expense, annualized yields were 4.35% for 2Q’25, 4.37% for 1Q’25, and 5.40% for 2Q’24. (4) Includes Community Reinvestment Act and other held-for-sale (HFS) loans. (5) Includes retail, brokered, and other deposits (inclusive of sweep deposits, mortgage escrow, and other deposits). (6) Includes FHLB borrowings and Repurchase Agreements. (7) Calculated using a Non-GAAP financial measure. See pages 20 - 22 for definitions. Page – 10 | Auto Finance (1) Noninterest expense includes corporate allocations of $179 million in 2Q 2025, $180 million in 1Q 2025, and $164 million in 2Q 2024. (2) Estimated Retail Auto Originated Yield is a forward-looking financial measure. See page 23 for details. Page – 11 | Insurance (2) Acquisition and underwriting expenses includes corporate allocations of $22 million in 2Q 2025, $21 million in 1Q 2025, and $19 million in 2Q 2024. (3) Change in fair value of equity securities impacts the Insurance segment. The change reflects fair value adjustments to equity securities that are reported at fair value. Management believes the change in fair value of equity securities should be removed from select financial measures because it enables the reader to better understand the business’ ongoing ability to generate revenue and income. Page – 12 | Corporate Finance (2) Noninterest expense includes corporate allocations of $11 million in 2Q 2025, $15 million in 1Q 2025, and $10 million in 2Q 2024. (3) Change in fair value of equity securities impacts the Corporate Finance segment. The change reflects fair value adjustments to equity securities that are reported at fair value. Management believes the change in fair value of equity securities should be removed from select financial measures because it enables the reader to better understand the business’ ongoing ability to generate revenue and income. 24

2Q 2025 Preliminary Results Supplemental Additional Notes Page – 15 | Results by Segment (2) Change in fair value of equity securities impacts the Insurance, Corporate Finance and Corporate and Other segments. The change reflects fair value adjustments to equity securities that are reported at fair value. Management believes the change in fair value of equity securities should be removed from select financial measures because it enables the reader to better understand the business’ ongoing ability to generate revenue and income. (3) Repositioning and other are primarily related to the extinguishment of high-cost legacy debt, strategic activities, restructuring, and significant other one-time items, as applicable for respective periods or businesses. (4) Includes adjustments for non-GAAP measures Core OID expense, change in fair value of equity securities, and repositioning. Page – 16 | Corporate and Other (2) Repositioning and other are primarily related to the extinguishment of high-cost legacy debt, strategic activities, restructuring, and significant other one-time items, as applicable for respective periods or businesses. (3) Change in fair value of equity securities impacts the Corporate and Other segments. The change reflects fair value adjustments to equity securities that are reported at fair value. Management believes the change in fair value of equity securities should be removed from select financial measures because it enables the reader to better understand the business’ ongoing ability to generate revenue and income. (4) HFI consumer mortgage portfolio and Ally credit card portfolio in 1Q 2025 and 2Q 2024. (5) Amounts related to Credit Card; sale of Credit Card closed on 4/1/2025. (6) Intercompany loan related to activity between Insurance and Corporate. 25
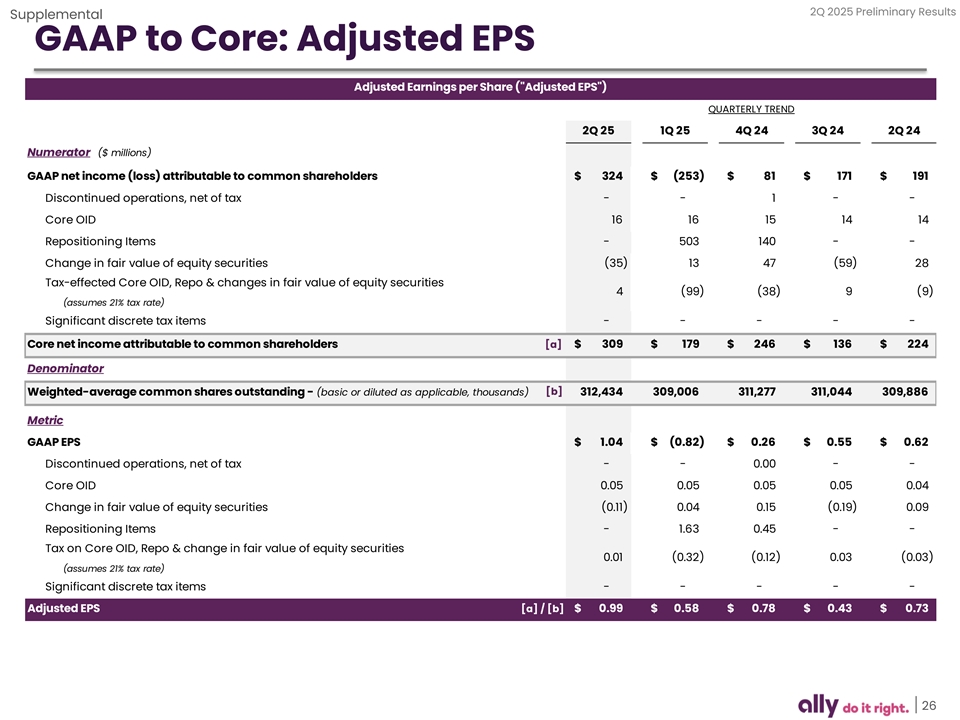
2Q 2025 Preliminary Results Supplemental GAAP to Core: Adjusted EPS Adjusted Earnings per Share ( Adjusted EPS ) QUARTERLY TREND 2Q 25 1Q 25 4Q 24 3Q 24 2Q 24 Numerator ($ millions) GAAP net income (loss) attributable to common shareholders $ 3 24 $ (253) $ 81 $ 171 $ 191 Discontinued operations, net of tax - - 1 - - Core OID 16 16 15 14 14 Repositioning Items - 503 140 - - Change in fair value of equity securities (35) 13 47 ( 59) 28 Tax-effected Core OID, Repo & changes in fair value of equity securities 4 ( 99) ( 38) 9 (9) (assumes 21% tax rate) Significant discrete tax items - - - - - Core net income attributable to common shareholders [a] $ 309 $ 179 $ 246 $ 1 36 $ 224 Denominator [b] Weighted-average common shares outstanding - (basic or diluted as applicable, thousands) 312,434 309,006 3 11,277 311,044 309,886 Metric GAAP EPS $ 1.04 $ (0.82) $ 0.26 $ 0.55 $ 0.62 Discontinued operations, net of tax - - 0.00 - - Core OID 0.05 0.05 0.05 0.05 0.04 Change in fair value of equity securities (0.11) 0.04 0.15 ( 0.19) 0.09 Repositioning Items - 1.63 0.45 - - Tax on Core OID, Repo & change in fair value of equity securities 0.01 (0.32) ( 0.12) 0.03 (0.03) (assumes 21% tax rate) Significant discrete tax items - - - - - Adjusted EPS [a] / [b] $ 0.99 $ 0.58 $ 0.78 $ 0.43 $ 0 .73 26
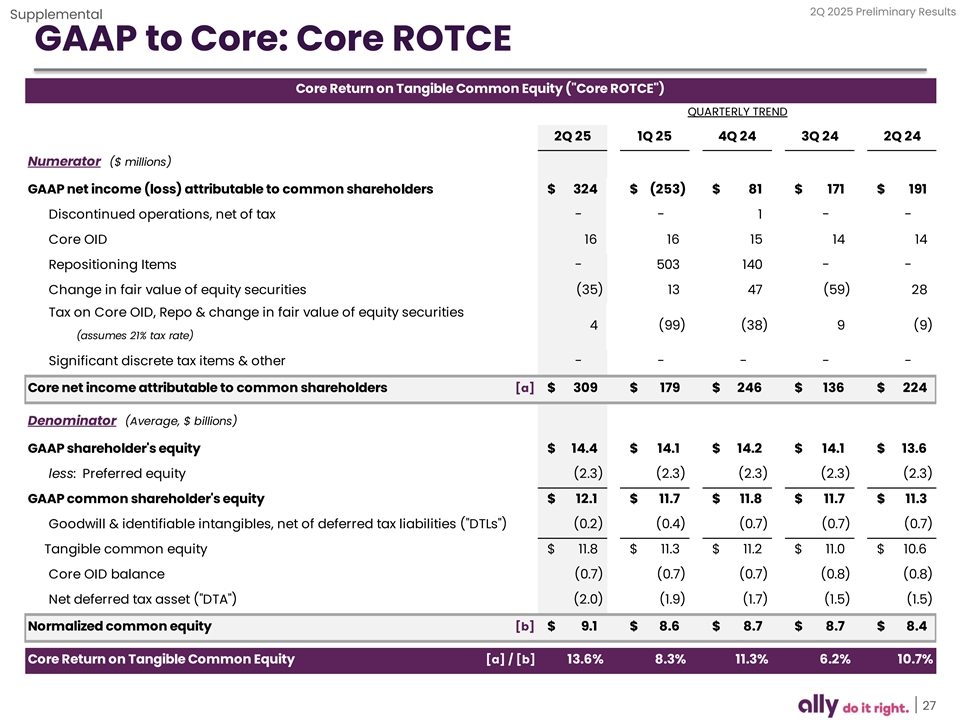
2Q 2025 Preliminary Results Supplemental GAAP to Core: Core ROTCE Core Return on Tangible Common Equity ( Core ROTCE ) QUARTERLY TREND 2Q 25 1Q 25 4Q 24 3Q 24 2Q 24 Numerator ($ millions) GAAP net income (loss) attributable to common shareholders $ 324 $ (253) $ 81 $ 171 $ 191 Discontinued operations, net of tax - - 1 - - Core OID 16 16 15 14 14 Repositioning Items - 503 140 - - Change in fair value of equity securities (35) 13 47 (59) 28 Tax on Core OID, Repo & change in fair value of equity securities 4 (99) (38) 9 (9) (assumes 21% tax rate) Significant discrete tax items & other - - - - - Core net income attributable to common shareholders [a] $ 309 $ 179 $ 246 $ 136 $ 224 Denominator (Average, $ billions) GAAP shareholder's equity $ 1 4.4 $ 14.1 $ 14.2 $ 14.1 $ 13.6 less: Preferred equity (2.3) (2.3) (2.3) (2.3) (2.3) GAAP common shareholder's equity $ 12.1 $ 11.7 $ 11.8 $ 11.7 $ 11.3 Goodwill & identifiable intangibles, net of deferred tax liabilities ( DTLs ) (0.2) (0.4) (0.7) (0.7) (0.7) Tangible common equity $ 11.8 $ 11.3 $ 11.2 $ 11.0 $ 10.6 Core OID balance (0.7) (0.7) (0.7) (0.8) (0.8) Net deferred tax asset ( DTA ) (2.0) (1.9) (1.7) (1.5) (1.5) Normalized common equity [b] $ 9.1 $ 8.6 $ 8.7 $ 8.7 $ 8 .4 Core Return on Tangible Common Equity [a] / [b] 13.6% 8.3% 11.3% 6.2% 10.7% 27
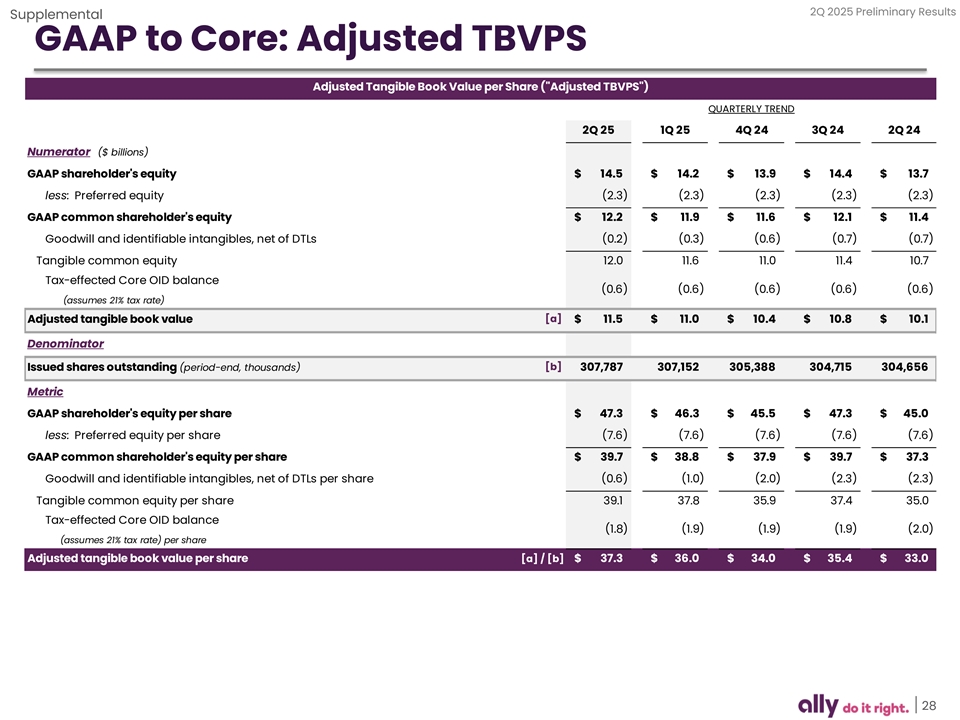
2Q 2025 Preliminary Results Supplemental GAAP to Core: Adjusted TBVPS Adjusted Tangible Book Value per Share ( Adjusted TBVPS ) QUARTERLY TREND 2Q 25 1Q 25 4Q 24 3Q 24 2Q 24 Numerator ($ billions) GAAP shareholder's equity $ 14.5 $ 14.2 $ 13.9 $ 14.4 $ 13.7 less: Preferred equity (2.3) (2.3) (2.3) (2.3) (2.3) GAAP common shareholder's equity $ 1 2.2 $ 11.9 $ 11.6 $ 12.1 $ 11.4 Goodwill and identifiable intangibles, net of DTLs (0.2) (0.3) (0.6) (0.7) (0.7) Tangible common equity 12.0 11.6 11.0 11.4 1 0.7 Tax-effected Core OID balance ( 0.6) (0.6) (0.6) ( 0.6) ( 0.6) (assumes 21% tax rate) Adjusted tangible book value [a] $ 11.5 $ 11.0 $ 10.4 $ 10.8 $ 10.1 Denominator Issued shares outstanding (period-end, thousands) [b] 307,787 3 07,152 3 05,388 304,715 304,656 Metric GAAP shareholder's equity per share $ 47.3 $ 46.3 $ 45.5 $ 47.3 $ 45.0 less: Preferred equity per share (7.6) (7.6) (7.6) (7.6) (7.6) GAAP common shareholder's equity per share $ 39.7 $ 38.8 $ 37.9 $ 39.7 $ 37.3 Goodwill and identifiable intangibles, net of DTLs per share ( 0.6) (1.0) (2.0) (2.3) (2.3) Tangible common equity per share 39.1 3 7.8 35.9 3 7.4 35.0 Tax-effected Core OID balance (1.8) (1.9) (1.9) (1.9) (2.0) (assumes 21% tax rate) per share Adjusted tangible book value per share [a] / [b] $ 37.3 $ 36.0 $ 34.0 $ 35.4 $ 33.0 28
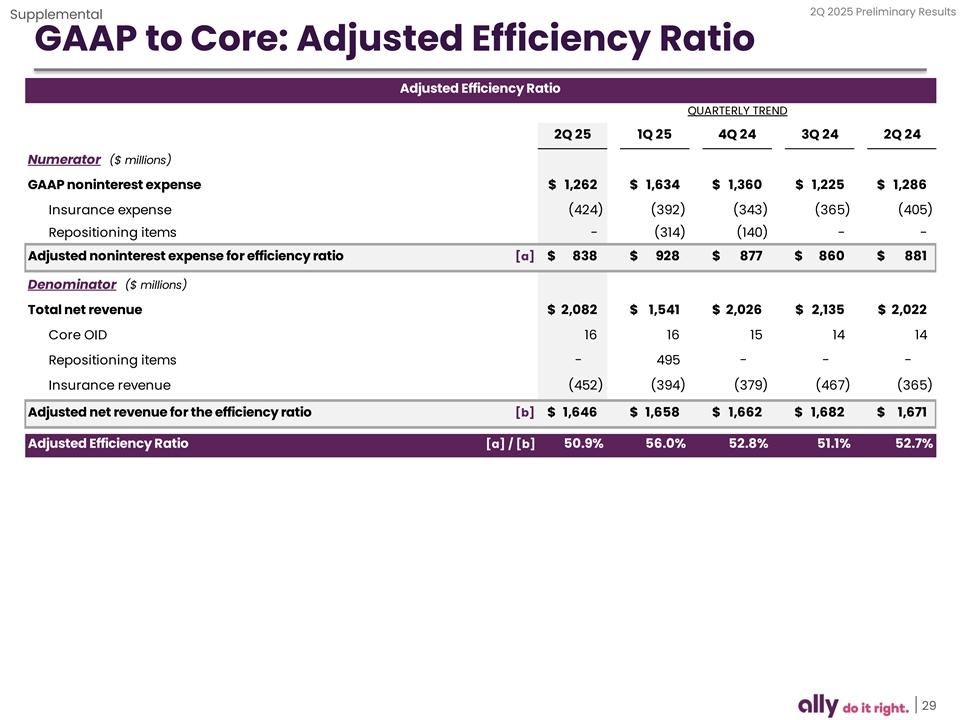
2Q 2025 Preliminary Results Supplemental GAAP to Core: Adjusted Efficiency Ratio Adjusted Efficiency Ratio QUARTERLY TREND 2Q 25 1Q 25 4Q 24 3Q 24 2Q 24 Numerator ($ millions) GAAP noninterest expense $ 1 ,262 $ 1,634 $ 1 ,360 $ 1 ,225 $ 1,286 Insurance expense ( 424) ( 392) (343) (365) ( 405) Repositioning items - ( 314) ( 140) - - Adjusted noninterest expense for efficiency ratio [a] $ 838 $ 928 $ 877 $ 8 60 $ 881 Denominator ($ millions) Total net revenue $ 2,082 $ 1,541 $ 2,026 $ 2 ,135 $ 2,022 Core OID 16 16 15 14 14 Repositioning items - 495 - - - Insurance revenue (452) ( 394) (379) ( 467) ( 365) Adjusted net revenue for the efficiency ratio [b] $ 1,646 $ 1,658 $ 1,662 $ 1,682 $ 1,671 Adjusted Efficiency Ratio [a] / [b] 50.9% 56.0% 52.8% 51.1% 52.7% 29
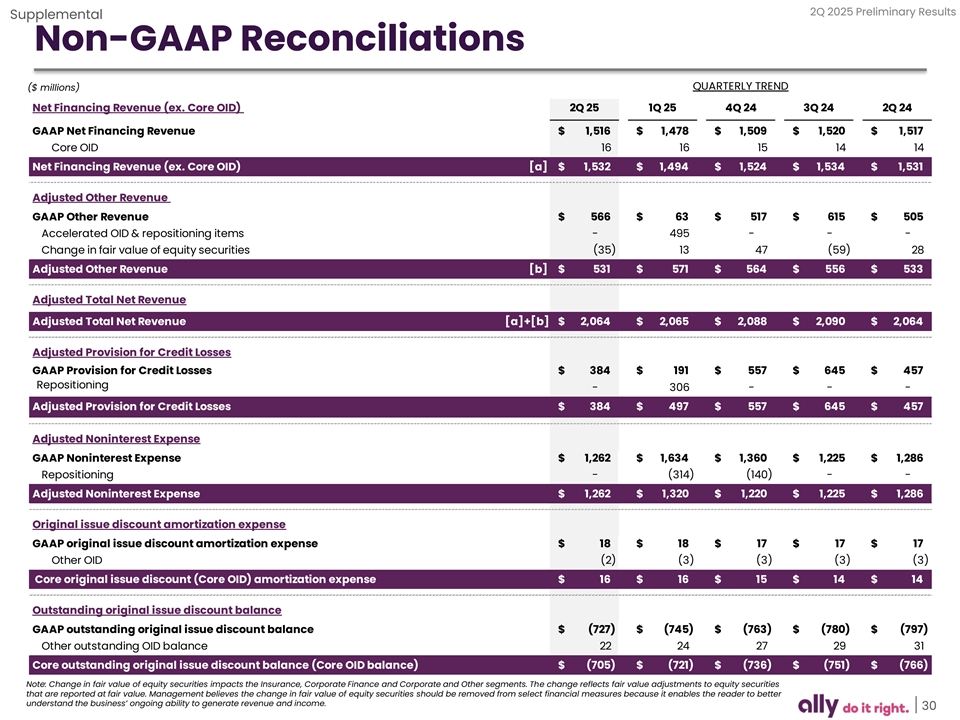
2Q 2025 Preliminary Results Supplemental Non-GAAP Reconciliations ($ millions) QUARTERLY TREND Net Financing Revenue (ex. Core OID) 2Q 25 1Q 25 4Q 24 3Q 24 2Q 24 GAAP Net Financing Revenue $ 1 ,516 $ 1,478 $ 1,509 $ 1,520 $ 1,517 Core OID 16 16 15 14 14 Net Financing Revenue (ex. Core OID) [a] $ 1,532 $ 1,494 $ 1 ,524 $ 1,534 $ 1 ,531 Adjusted Other Revenue GAAP Other Revenue $ 566 $ 63 $ 517 $ 6 15 $ 505 Accelerated OID & repositioning items - 495 - - - Change in fair value of equity securities (35) 13 47 (59) 28 Adjusted Other Revenue [b] $ 5 31 $ 571 $ 564 $ 556 $ 5 33 Adjusted Total Net Revenue Adjusted Total Net Revenue [a]+[b] $ 2 ,064 $ 2,065 $ 2,088 $ 2,090 $ 2 ,064 Adjusted Provision for Credit Losses GAAP Provision for Credit Losses $ 384 $ 191 $ 557 $ 645 $ 457 Repositioning - 306 - - - Adjusted Provision for Credit Losses $ 384 $ 497 $ 557 $ 645 $ 4 57 Adjusted Noninterest Expense GAAP Noninterest Expense $ 1,262 $ 1,634 $ 1,360 $ 1,225 $ 1,286 Repositioning - ( 314) ( 140) - - Adjusted Noninterest Expense $ 1,262 $ 1,320 $ 1,220 $ 1,225 $ 1,286 Original issue discount amortization expense GAAP original issue discount amortization expense $ 18 $ 18 $ 17 $ 17 $ 17 Other OID (2) ( 3) ( 3) ( 3) (3) Core original issue discount (Core OID) amortization expense $ 16 $ 16 $ 15 $ 14 $ 14 Outstanding original issue discount balance GAAP outstanding original issue discount balance $ ( 727) $ (745) $ (763) $ (780) $ (797) Other outstanding OID balance 22 24 27 29 31 Core outstanding original issue discount balance (Core OID balance) $ (705) $ (721) $ (736) $ (751) $ (766) Note: Change in fair value of equity securities impacts the Insurance, Corporate Finance and Corporate and Other segments. The change reflects fair value adjustments to equity securities that are reported at fair value. Management believes the change in fair value of equity securities should be removed from select financial measures because it enables the reader to better understand the business’ ongoing ability to generate revenue and income. 30

Exhibit 99.3 SECOND QUARTER 2025 FINANCIAL SUPPLEMENT
ALLY FINANCIAL INC. FORWARD-LOOKING STATEMENTS AND ADDITIONAL INFORMATION This document and related communications should be read in conjunction with the financial statements, notes, and other information contained in our Annual Reports on Form 10-K, Quarterly Reports on Form 10-Q, and Current Reports on Form 8-K. This information is preliminary and based on company and third-party data available at the time of the presentation or related communication. This document and related communications contain forward-looking statements within the meaning of the Private Securities Litigation Reform Act of 1995. These statements can be identified by the fact that they do not relate strictly to historical or current facts—such as statements about the outlook for financial and operating metrics and performance and future capital allocation and actions. Forward- looking statements often use words such as “believe,” “expect,” “anticipate,” “intend,” “pursue,” “seek,” “continue,” “estimate,” “project,” “outlook,” “forecast,” “potential,” “target,” “objective,” “trend,” “plan,” “goal,” “initiative,” “priorities,” or other words of comparable meaning or future-tense or conditional verbs such as “may,” “will,” “should,” “would,” or “could.” Forward-looking statements convey our expectations, intentions, or forecasts about future events, circumstances, or results. All forward-looking statements, by their nature, are subject to assumptions, risks, and uncertainties, which may change over time and many of which are beyond our control. In particular, forward-looking statements about Ally’s outlook, including expectations regarding net interest margin, adjusted other revenue, net-charge offs, non-interest expenses and average earning assets, and other forward-looking statements are based on our current expectations and are subject to various important factors that could cause actual results to differ materially, including general economic conditions, expectations regarding interest rates and inflation, monetary and fiscal policies in the United States and other jurisdictions, the composition of our balance sheet, including with respect to our loan and securities portfolios, the impact of our strategic initiatives, including recent initiatives involving our Credit Card and Mortgage operations, demand for new and used vehicles, demand for auto loans and leases and the impact of escalating tariffs and other trade policies on us, our customers and our strategic partners, and the economic impacts, volatility and uncertainty resulting therefrom. You should not rely on any forward-looking statement as a prediction or guarantee about the future. Actual future objectives, strategies, plans, prospects, performance, conditions, or results may differ materially from those set forth in any forward-looking statement. Some of the factors that may cause actual results or other future events or circumstances to differ from those in forward-looking statements are described above and in our Annual Report on Form 10-K for the year ended December 31, 2024, our subsequent Quarterly Reports on Form 10- Q or Current Reports on Form 8-K, or other applicable documents that are filed or furnished with the U.S. Securities and Exchange Commission (collectively, our “SEC filings”). Any forward-looking statement made by us or on our behalf speaks only as of the date that it was made. We do not undertake to update any forward-looking statement to reflect the impact of events, circumstances, or results that arise after the date that the statement was made, except as required by applicable securities laws. You, however, should consult further disclosures (including disclosures of a forward-looking nature) that we may make in any subsequent SEC filings. This document and related communications contain specifically identified non-GAAP financial measures, which supplement the results that are reported according to U.S. generally accepted accounting principles (“GAAP”). These non-GAAP financial measures may be useful to investors but should not be viewed in isolation from, or as a substitute for, GAAP results. Differences between non-GAAP financial measures and comparable GAAP financial measures are reconciled in the document. Unless the context otherwise requires, the following definitions apply. The term “loans” means the following consumer and commercial products associated with our direct and indirect financing activities: loans, retail installment sales contracts, lines of credit, and other financing products excluding operating leases. The term “operating leases” means consumer- and commercial-vehicle lease agreements where Ally is the lessor and the lessee is generally not obligated to acquire ownership of the vehicle at lease-end or compensate Ally for the vehicle’s residual value. The terms “lend,” “finance,” and “originate” mean our direct extension or origination of loans, our purchase or acquisition of loans, or our purchase of operating leases, as applicable. The term “consumer” means all consumer products associated with our loan and operating-lease activities and all commercial retail installment sales contracts. The term “commercial” means all commercial products associated with our loan activities, other than commercial retail installment sales contracts. The term “partnerships” means business arrangements rather than partnerships as defined by law. 2

ALLY FINANCIAL INC. TABLE OF CONTENTS Page(s) Consolidated Results Consolidated Financial Highlights 4 Consolidated Income Statement 5 Consolidated Period-End Balance Sheet 6 Consolidated Average Balance Sheet 7 Segment Detail Segment Highlights 8 Automotive Finance 9-10 Insurance 11 Corporate Finance 12 Corporate and Other 13 Credit Related Information 14-15 Supplemental Detail Capital 16 Liquidity and Deposits 17 Net Interest Margin 18 Earnings Per Share Related Information 19 Adjusted Tangible Book Per Share Related Information 20 Core ROTCE Related Information 21 Adjusted Efficiency Ratio Related Information 22 3
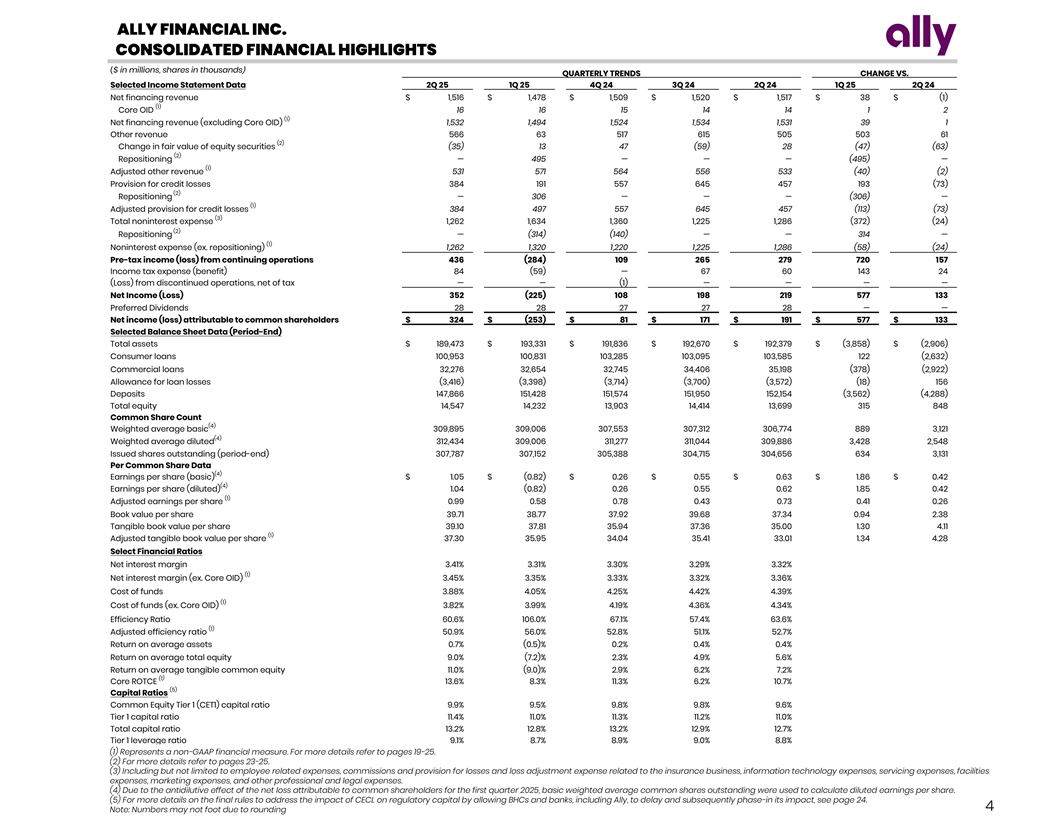
ALLY FINANCIAL INC. CONSOLIDATED FINANCIAL HIGHLIGHTS ($ in millions, shares in thousands) QUARTERLY TRENDS CHANGE VS. Selected Income Statement Data 2Q 25 1Q 25 4Q 24 3Q 24 2Q 24 1Q 25 2Q 24 Net financing revenue $ 1,516 $ 1,478 $ 1,509 $ 1,520 $ 1,517 $ 38 $ (1) (1) Core OID 16 16 15 14 14 1 2 (1) Net financing revenue (excluding Core OID) 1,532 1,494 1,524 1,534 1,531 39 1 Other revenue 566 63 517 615 505 503 61 (2) Change in fair value of equity securities (35) 13 47 (59) 28 (47) (63) (2) Repositioning — 495 — — — (495) — (1) Adjusted other revenue 531 571 564 556 533 (40) (2) Provision for credit losses 384 191 557 645 457 193 (73) (2) Repositioning — 306 — — — (306) — (1) Adjusted provision for credit losses 384 497 557 645 457 (113) (73) (3) Total noninterest expense 1,262 1,634 1,360 1,225 1,286 (372) (24) (2) Repositioning — (314) (140) — — 314 — (1) Noninterest expense (ex. repositioning) 1,262 1,320 1,220 1,225 1,286 (58) (24) Pre-tax income (loss) from continuing operations 436 (284) 109 265 279 720 157 Income tax expense (benefit) 84 (59) — 67 60 143 24 (Loss) from discontinued operations, net of tax — — (1) — — — — Net Income (Loss) 352 (225) 108 198 219 577 133 Preferred Dividends 28 28 27 27 28 — — Net income (loss) attributable to common shareholders $ 324 $ (253) $ 81 $ 171 $ 191 $ 577 $ 133 Selected Balance Sheet Data (Period-End) Total assets $ 189,473 $ 193,331 $ 191,836 $ 192,670 $ 192,379 $ (3,858) $ (2,906) Consumer loans 100,953 100,831 103,285 103,095 103,585 122 (2,632) Commercial loans 32,276 32,654 32,745 34,406 35,198 (378) (2,922) Allowance for loan losses (3,416) (3,398) (3,714) (3,700) (3,572) (18) 156 Deposits 147,866 151,428 151,574 151,950 152,154 (3,562) (4,288) Total equity 14,547 14,232 13,903 14,414 13,699 315 848 Common Share Count (4) Weighted average basic 309,895 309,006 307,553 307,312 306,774 889 3,121 (4) Weighted average diluted 312,434 309,006 311,277 311,044 309,886 3,428 2,548 Issued shares outstanding (period-end) 307,787 307,152 305,388 304,715 304,656 634 3,131 Per Common Share Data (4) Earnings per share (basic) $ 1.05 $ (0.82) $ 0.26 $ 0.55 $ 0.63 $ 1.86 $ 0.42 (4) Earnings per share (diluted) 1.04 (0.82) 0.26 0.55 0.62 1.85 0.42 (1) Adjusted earnings per share 0.99 0.58 0.78 0.43 0.73 0.41 0.26 Book value per share 39.71 38.77 37.92 39.68 37.34 0.94 2.38 Tangible book value per share 39.10 37.81 35.94 37.36 35.00 1.30 4.11 (1) Adjusted tangible book value per share 37.30 35.95 34.04 35.41 33.01 1.34 4.28 Select Financial Ratios Net interest margin 3.41% 3.31 % 3.30% 3.29% 3.32% (1) Net interest margin (ex. Core OID) 3.45% 3 .35 % 3 .33 % 3 .32 % 3.36% Cost of funds 3 .88% 4.05% 4.25 % 4.42 % 4 .39% (1) Cost of funds (ex. Core OID) 3.82% 3.99% 4.19% 4.36% 4.34 % Efficiency Ratio 6 0.6 % 1 06.0% 67.1% 57.4% 63.6 % (1) Adjusted efficiency ratio 50.9% 56.0% 52.8% 51.1 % 5 2.7 % Return on average assets 0 .7% ( 0.5)% 0.2 % 0.4 % 0.4% Return on average total equity 9.0% ( 7.2)% 2 .3% 4.9 % 5.6 % Return on average tangible common equity 1 1.0% (9.0)% 2 .9 % 6.2 % 7 .2 % (1) Core ROTCE 1 3.6% 8 .3% 11.3% 6.2% 10.7% (5) Capital Ratios Common Equity Tier 1 (CET1) capital ratio 9 .9% 9.5% 9.8% 9.8 % 9.6 % Tier 1 capital ratio 11.4% 1 1.0 % 1 1.3 % 11.2 % 11.0 % Total capital ratio 1 3.2% 12.8% 1 3.2% 1 2.9% 1 2.7% Tier 1 leverage ratio 9.1 % 8 .7 % 8 .9% 9.0% 8.8 % (1) Represents a non-GAAP financial measure. For more details refer to pages 19-25. (2) For more details refer to pages 23-25. (3) Including but not limited to employee related expenses, commissions and provision for losses and loss adjustment expense related to the insurance business, information technology expenses, servicing expenses, facilities expenses, marketing expenses, and other professional and legal expenses. (4) Due to the antidilutive effect of the net loss attributable to common shareholders for the first quarter 2025, basic weighted average common shares outstanding were used to calculate diluted earnings per share. (5) For more details on the final rules to address the impact of CECL on regulatory capital by allowing BHCs and banks, including Ally, to delay and subsequently phase-in its impact, see page 24. 4 Note: Numbers may not foot due to rounding
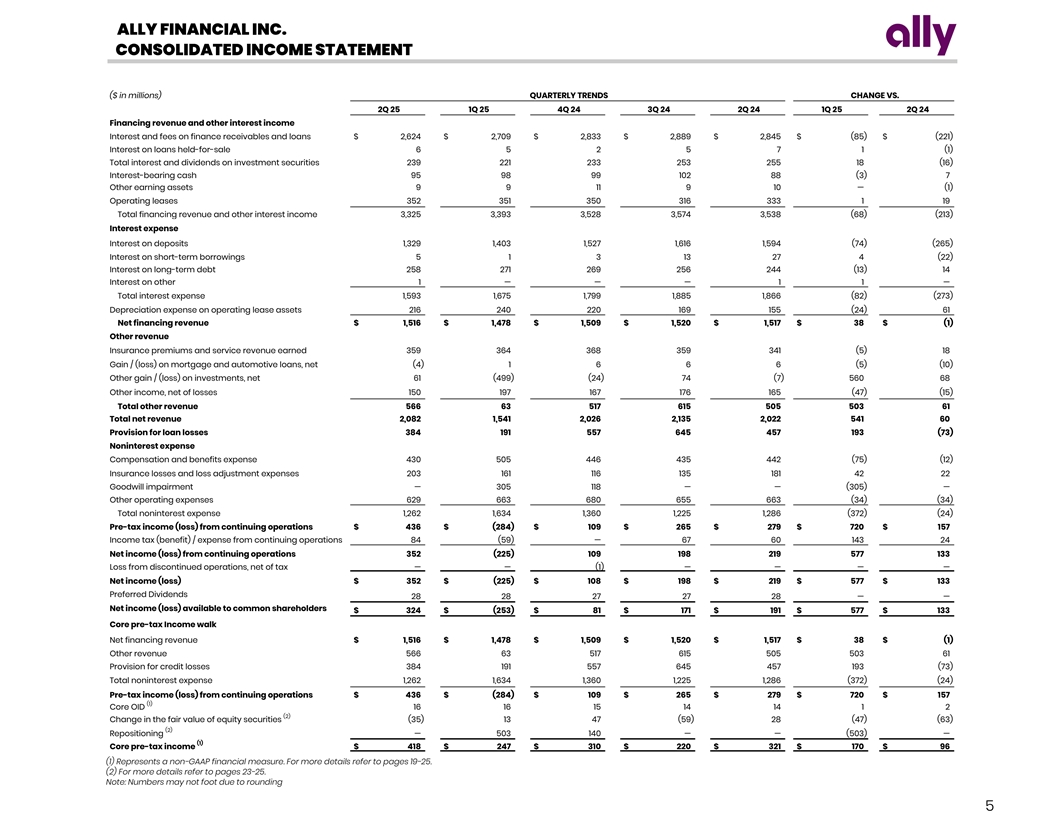
ALLY FINANCIAL INC. CONSOLIDATED INCOME STATEMENT ($ in millions) QUARTERLY TRENDS CHANGE VS. 2Q 25 1Q 25 4Q 24 3Q 24 2Q 24 1Q 25 2Q 24 Financing revenue and other interest income Interest and fees on finance receivables and loans $ 2,624 $ 2,709 $ 2,833 $ 2,889 $ 2,845 $ (85) $ (221) Interest on loans held-for-sale 6 5 2 5 7 1 (1) Total interest and dividends on investment securities 239 221 233 253 255 18 (16) Interest-bearing cash 95 98 99 102 88 (3) 7 Other earning assets 9 9 11 9 10 — (1) Operating leases 352 351 350 316 333 1 19 Total financing revenue and other interest income 3,325 3,393 3,528 3,574 3,538 (68) (213) Interest expense Interest on deposits 1,329 1,403 1,527 1,616 1,594 (74) (265) Interest on short-term borrowings 5 1 3 13 27 4 (22) Interest on long-term debt 258 271 269 256 244 (13) 14 Interest on other 1 — — — 1 1 — Total interest expense 1,593 1,675 1,799 1,885 1,866 (82) (273) Depreciation expense on operating lease assets 216 240 220 169 155 (24) 61 Net financing revenue $ 1,516 $ 1,478 $ 1,509 $ 1,520 $ 1,517 $ 38 $ (1) Other revenue Insurance premiums and service revenue earned 359 364 368 359 341 (5) 18 Gain / (loss) on mortgage and automotive loans, net (4) 1 6 6 6 (5) (10) Other gain / (loss) on investments, net 61 (499) (24) 74 (7) 560 68 Other income, net of losses 150 197 167 176 165 (47) (15) Total other revenue 566 63 517 615 505 503 61 Total net revenue 2,082 1,541 2,026 2,135 2,022 541 60 Provision for loan losses 384 191 557 645 457 193 (73) Noninterest expense Compensation and benefits expense 430 505 446 435 442 (75) (12) Insurance losses and loss adjustment expenses 203 161 116 135 181 42 22 Goodwill impairment — 305 118 — — (305) — Other operating expenses 629 663 680 655 663 (34) (34) Total noninterest expense 1,262 1,634 1,360 1,225 1,286 (372) (24) Pre-tax income (loss) from continuing operations $ 436 $ (284) $ 109 $ 265 $ 279 $ 720 $ 157 Income tax (benefit) / expense from continuing operations 84 (59) — 67 60 143 24 Net income (loss) from continuing operations 352 (225) 109 198 219 577 133 Loss from discontinued operations, net of tax — — (1) — — — — Net income (loss) $ 352 $ (225) $ 108 $ 198 $ 219 $ 577 $ 133 Preferred Dividends 28 28 27 27 28 — — Net income (loss) available to common shareholders $ 324 $ (253) $ 81 $ 171 $ 191 $ 577 $ 133 Core pre-tax Income walk Net financing revenue $ 1,516 $ 1,478 $ 1,509 $ 1,520 $ 1,517 $ 38 $ (1) Other revenue 566 63 517 615 505 503 61 Provision for credit losses 384 191 557 645 457 193 (73) Total noninterest expense 1,262 1,634 1,360 1,225 1,286 (372) (24) Pre-tax income (loss) from continuing operations $ 436 $ (284) $ 109 $ 265 $ 279 $ 720 $ 157 (1) Core OID 16 16 15 14 14 1 2 (2) Change in the fair value of equity securities (35) 13 47 (59) 28 (47) (63) (2) Repositioning — 503 140 — — (503) — (1) Core pre-tax income $ 418 $ 247 $ 310 $ 220 $ 321 $ 170 $ 96 (1) Represents a non-GAAP financial measure. For more details refer to pages 19-25. (2) For more details refer to pages 23-25. Note: Numbers may not foot due to rounding 5
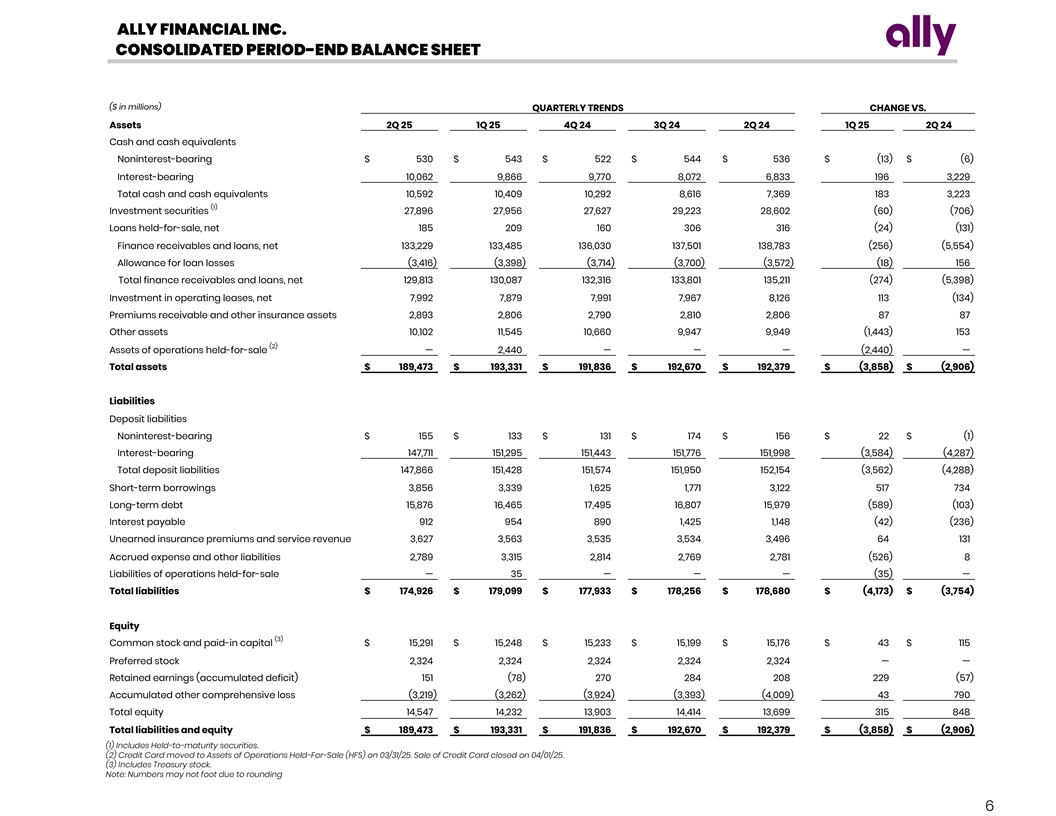
ALLY FINANCIAL INC. CONSOLIDATED PERIOD-END BALANCE SHEET ($ in millions) QUARTERLY TRENDS CHANGE VS. Assets 2Q 25 1Q 25 4Q 24 3Q 24 2Q 24 1Q 25 2Q 24 Cash and cash equivalents Noninterest-bearing $ 530 $ 543 $ 522 $ 544 $ 536 $ (13) $ (6) Interest-bearing 10,062 9,866 9,770 8,072 6,833 196 3,229 Total cash and cash equivalents 10,592 10,409 10,292 8,616 7,369 183 3,223 (1) Investment securities 27,896 27,956 27,627 29,223 28,602 (60) (706) Loans held-for-sale, net 185 209 160 306 316 (24) (131) Finance receivables and loans, net 133,229 133,485 136,030 137,501 138,783 (256) (5,554) Allowance for loan losses (3,416) (3,398) (3,714) (3,700) (3,572) (18) 156 Total finance receivables and loans, net 129,813 130,087 132,316 133,801 135,211 (274) (5,398) Investment in operating leases, net 7,992 7,879 7,991 7,967 8,126 113 (134) Premiums receivable and other insurance assets 2,893 2,806 2,790 2,810 2,806 87 87 Other assets 10,102 11,545 10,660 9,947 9,949 (1,443) 153 (2) Assets of operations held-for-sale — 2,440 — — — (2,440) — Total assets $ 189,473 $ 193,331 $ 191,836 $ 192,670 $ 192,379 $ (3,858) $ (2,906) Liabilities Deposit liabilities Noninterest-bearing $ 155 $ 133 $ 131 $ 174 $ 156 $ 22 $ (1) Interest-bearing 147,711 151,295 151,443 151,776 151,998 (3,584) (4,287) Total deposit liabilities 147,866 151,428 151,574 151,950 152,154 (3,562) (4,288) Short-term borrowings 3,856 3,339 1,625 1,771 3,122 517 734 Long-term debt 15,876 16,465 17,495 16,807 15,979 (589) (103) Interest payable 912 954 890 1,425 1,148 (42) (236) Unearned insurance premiums and service revenue 3,627 3,563 3,535 3,534 3,496 64 131 Accrued expense and other liabilities 2,789 3,315 2,814 2,769 2,781 (526) 8 Liabilities of operations held-for-sale — 35 — — — (35) — Total liabilities $ 174,926 $ 179,099 $ 177,933 $ 178,256 $ 178,680 $ (4,173) $ (3,754) Equity (3) Common stock and paid-in capital $ 15,291 $ 15,248 $ 15,233 $ 15,199 $ 15,176 $ 43 $ 115 Preferred stock 2,324 2,324 2,324 2,324 2,324 — — Retained earnings (accumulated deficit) 151 (78) 270 284 208 229 (57) Accumulated other comprehensive loss (3,219) (3,262) (3,924) (3,393) (4,009) 43 790 Total equity 14,547 14,232 13,903 14,414 13,699 315 848 Total liabilities and equity $ 189,473 $ 193,331 $ 191,836 $ 192,670 $ 192,379 $ (3,858) $ (2,906) (1) Includes Held-to-maturity securities. (2) Credit Card moved to Assets of Operations Held-For-Sale (HFS) on 03/31/25. Sale of Credit Card closed on 04/01/25. (3) Includes Treasury stock. Note: Numbers may not foot due to rounding 6
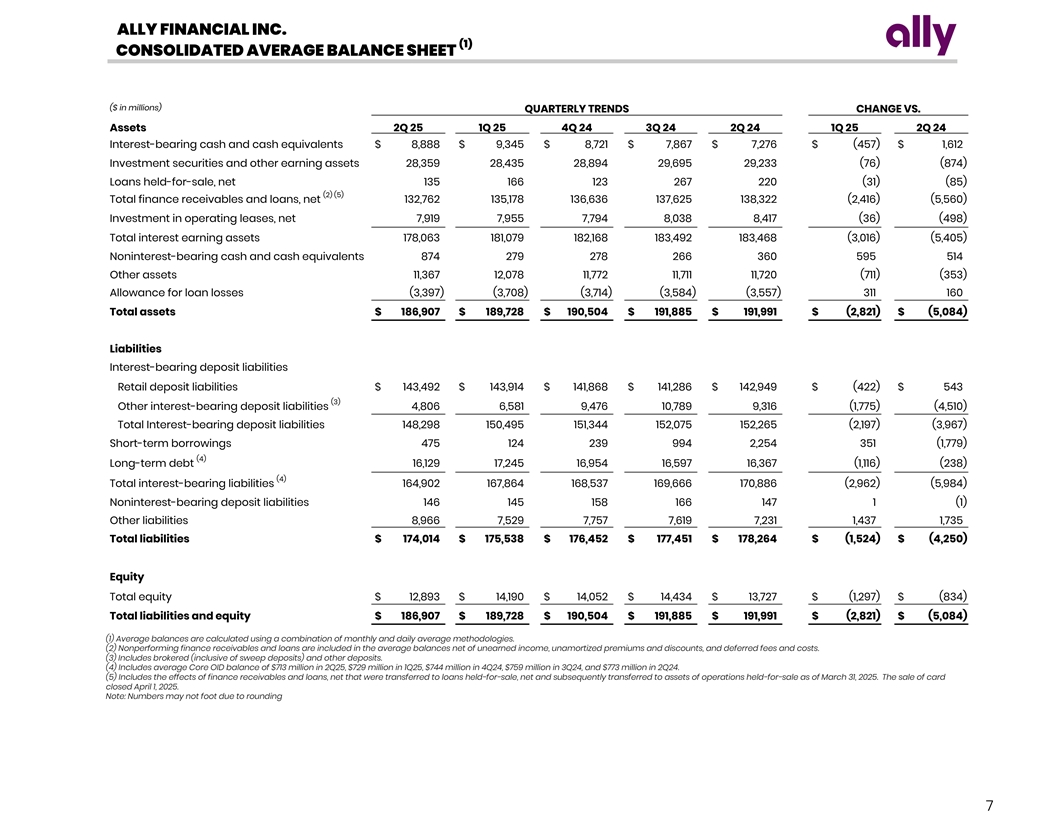
ALLY FINANCIAL INC. (1) CONSOLIDATED AVERAGE BALANCE SHEET ($ in millions) QUARTERLY TRENDS CHANGE VS. Assets 2Q 25 1Q 25 4Q 24 3Q 24 2Q 24 1Q 25 2Q 24 Interest-bearing cash and cash equivalents $ 8,888 $ 9,345 $ 8,721 $ 7,867 $ 7,276 $ (457) $ 1,612 Investment securities and other earning assets 28,359 28,435 28,894 29,695 29,233 (76) (874) Loans held-for-sale, net 135 166 123 267 220 (31) (85) (2) (5) Total finance receivables and loans, net 132,762 135,178 136,636 137,625 138,322 (2,416) (5,560) Investment in operating leases, net 7,919 7,955 7,794 8,038 8,417 (36) (498) Total interest earning assets 178,063 181,079 182,168 183,492 183,468 (3,016) (5,405) Noninterest-bearing cash and cash equivalents 874 279 278 266 360 595 514 Other assets 11,367 12,078 11,772 11,711 11,720 (711) (353) Allowance for loan losses (3,397) (3,708) (3,714) (3,584) (3,557) 311 160 Total assets $ 186,907 $ 189,728 $ 190,504 $ 191,885 $ 191,991 $ (2,821) $ (5,084) Liabilities Interest-bearing deposit liabilities Retail deposit liabilities $ 143,492 $ 143,914 $ 141,868 $ 141,286 $ 142,949 $ (422) $ 543 (3) Other interest-bearing deposit liabilities 4,806 6,581 9,476 10,789 9,316 (1,775) (4,510) Total Interest-bearing deposit liabilities 148,298 150,495 151,344 152,075 152,265 (2,197) (3,967) Short-term borrowings 475 124 239 994 2,254 351 (1,779) (4) Long-term debt 16,129 17,245 16,954 16,597 16,367 (1,116) (238) (4) Total interest-bearing liabilities 164,902 167,864 168,537 169,666 170,886 (2,962) (5,984) Noninterest-bearing deposit liabilities 146 145 158 166 147 1 (1) Other liabilities 8,966 7,529 7,757 7,619 7,231 1,437 1,735 Total liabilities $ 174,014 $ 175,538 $ 176,452 $ 177,451 $ 178,264 $ (1,524) $ (4,250) Equity Total equity $ 12,893 $ 14,190 $ 14,052 $ 14,434 $ 13,727 $ (1,297) $ (834) Total liabilities and equity $ 186,907 $ 189,728 $ 190,504 $ 191,885 $ 191,991 $ (2,821) $ (5,084) (1) Average balances are calculated using a combination of monthly and daily average methodologies. (2) Nonperforming finance receivables and loans are included in the average balances net of unearned income, unamortized premiums and discounts, and deferred fees and costs. (3) Includes brokered (inclusive of sweep deposits) and other deposits. (4) Includes average Core OID balance of $713 million in 2Q25, $729 million in 1Q25, $744 million in 4Q24, $759 million in 3Q24, and $773 million in 2Q24. (5) Includes the effects of finance receivables and loans, net that were transferred to loans held-for-sale, net and subsequently transferred to assets of operations held-for-sale as of March 31, 2025. The sale of card closed April 1, 2025. Note: Numbers may not foot due to rounding 7
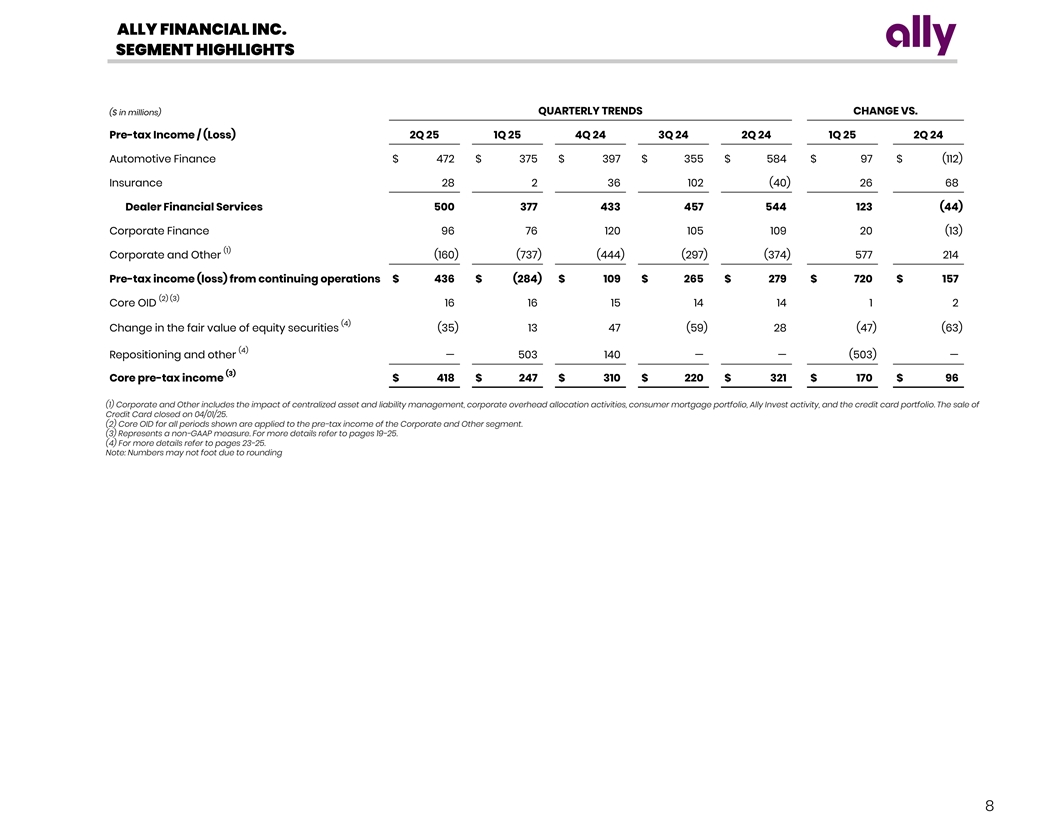
ALLY FINANCIAL INC. SEGMENT HIGHLIGHTS QUARTERLY TRENDS CHANGE VS. ($ in millions) Pre-tax Income / (Loss) 2Q 25 1Q 25 4Q 24 3Q 24 2Q 24 1Q 25 2Q 24 Automotive Finance $ 472 $ 375 $ 397 $ 355 $ 584 $ 97 $ (112) Insurance 28 2 36 102 (40) 26 68 Dealer Financial Services 500 377 433 457 544 123 (44) Corporate Finance 96 76 120 105 109 20 (13) (1) Corporate and Other (160) (737) (444) (297) (374) 577 214 Pre-tax income (loss) from continuing operations $ 436 $ (284) $ 109 $ 265 $ 279 $ 720 $ 157 (2) (3) Core OID 16 16 15 14 14 1 2 (4) Change in the fair value of equity securities (35) 13 47 (59) 28 (47) (63) (4) Repositioning and other — 503 140 — — (503) — (3) Core pre-tax income $ 418 $ 247 $ 310 $ 220 $ 321 $ 170 $ 96 (1) Corporate and Other includes the impact of centralized asset and liability management, corporate overhead allocation activities, consumer mortgage portfolio, Ally Invest activity, and the credit card portfolio. The sale of Credit Card closed on 04/01/25. (2) Core OID for all periods shown are applied to the pre-tax income of the Corporate and Other segment. (3) Represents a non-GAAP measure. For more details refer to pages 19-25. (4) For more details refer to pages 23-25. Note: Numbers may not foot due to rounding 8
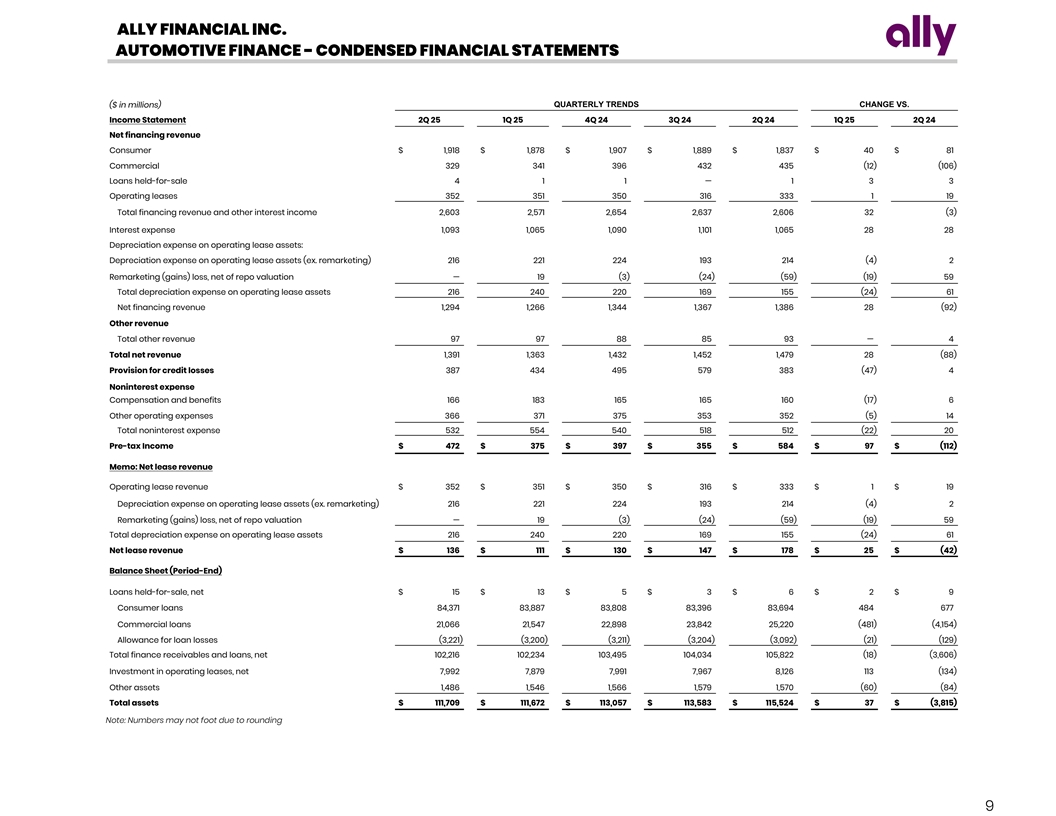
ALLY FINANCIAL INC. AUTOMOTIVE FINANCE - CONDENSED FINANCIAL STATEMENTS ($ in millions) QUARTERLY TRENDS CHANGE VS. Income Statement 2Q 25 1Q 25 4Q 24 3Q 24 2Q 24 1Q 25 2Q 24 Net financing revenue Consumer $ 1,918 $ 1,878 $ 1,907 $ 1,889 $ 1,837 $ 40 $ 81 Commercial 329 341 396 432 435 (12) (106) Loans held-for-sale 4 1 1 — 1 3 3 Operating leases 352 351 350 316 333 1 19 Total financing revenue and other interest income 2,603 2,571 2,654 2,637 2,606 32 (3) Interest expense 1,093 1,065 1,090 1,101 1,065 28 28 Depreciation expense on operating lease assets: Depreciation expense on operating lease assets (ex. remarketing) 216 221 224 193 214 (4) 2 Remarketing (gains) loss, net of repo valuation — 19 (3) (24) (59) (19) 59 Total depreciation expense on operating lease assets 216 240 220 169 155 (24) 61 Net financing revenue 1,294 1,266 1,344 1,367 1,386 28 (92) Other revenue Total other revenue 97 97 88 85 93 — 4 Total net revenue 1,391 1,363 1,432 1,452 1,479 28 (88) Provision for credit losses 387 434 495 579 383 (47) 4 Noninterest expense Compensation and benefits 166 183 165 165 160 (17) 6 Other operating expenses 366 371 375 353 352 (5) 14 Total noninterest expense 532 554 540 518 512 (22) 20 Pre-tax Income $ 472 $ 375 $ 397 $ 355 $ 584 $ 97 $ (112) Memo: Net lease revenue Operating lease revenue $ 352 $ 351 $ 350 $ 316 $ 333 $ 1 $ 19 Depreciation expense on operating lease assets (ex. remarketing) 216 221 224 193 214 (4) 2 Remarketing (gains) loss, net of repo valuation — 19 (3) (24) (59) (19) 59 Total depreciation expense on operating lease assets 216 240 220 169 155 (24) 61 Net lease revenue $ 136 $ 111 $ 130 $ 147 $ 178 $ 25 $ (42) Balance Sheet (Period-End) Loans held-for-sale, net $ 15 $ 13 $ 5 $ 3 $ 6 $ 2 $ 9 Consumer loans 84,371 83,887 83,808 83,396 83,694 484 677 Commercial loans 21,066 21,547 22,898 23,842 25,220 (481) (4,154) Allowance for loan losses (3,221) (3,200) (3,211) (3,204) (3,092) (21) (129) Total finance receivables and loans, net 102,216 102,234 103,495 104,034 105,822 (18) (3,606) Investment in operating leases, net 7,992 7,879 7,991 7,967 8,126 113 (134) Other assets 1,486 1,546 1,566 1,579 1,570 (60) (84) Total assets $ 111,709 $ 111,672 $ 113,057 $ 113,583 $ 115,524 $ 37 $ (3,815) Note: Numbers may not foot due to rounding 9
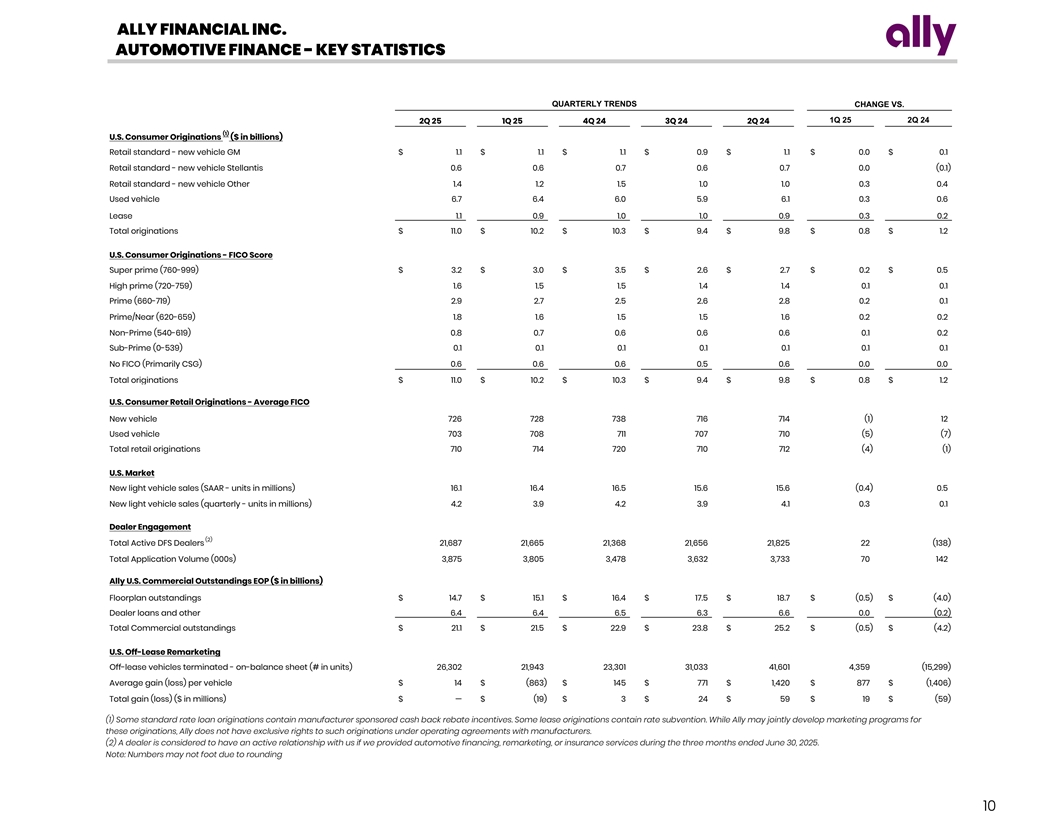
ALLY FINANCIAL INC. AUTOMOTIVE FINANCE - KEY STATISTICS QUARTERLY TRENDS CHANGE VS. 1Q 25 2Q 24 2Q 25 1Q 25 4Q 24 3Q 24 2Q 24 (1) U.S. Consumer Originations ($ in billions) Retail standard - new vehicle GM $ 1.1 $ 1.1 $ 1.1 $ 0.9 $ 1.1 $ 0.0 $ 0.1 Retail standard - new vehicle Stellantis 0.6 0.6 0.7 0.6 0.7 0.0 (0.1) Retail standard - new vehicle Other 1.4 1.2 1.5 1.0 1.0 0.3 0.4 Used vehicle 6.7 6.4 6.0 5.9 6.1 0.3 0.6 Lease 1.1 0.9 1.0 1.0 0.9 0.3 0.2 Total originations $ 11.0 $ 10.2 $ 10.3 $ 9.4 $ 9.8 $ 0.8 $ 1.2 U.S. Consumer Originations - FICO Score Super prime (760-999) $ 3.2 $ 3.0 $ 3.5 $ 2.6 $ 2.7 $ 0.2 $ 0.5 High prime (720-759) 1.6 1.5 1.5 1.4 1.4 0.1 0.1 Prime (660-719) 2.9 2.7 2.5 2.6 2.8 0.2 0.1 Prime/Near (620-659) 1.8 1.6 1.5 1.5 1.6 0.2 0.2 Non-Prime (540-619) 0.8 0.7 0.6 0.6 0.6 0.1 0.2 Sub-Prime (0-539) 0.1 0.1 0.1 0.1 0.1 0.1 0.1 No FICO (Primarily CSG) 0.6 0.6 0.6 0.5 0.6 0.0 0.0 Total originations $ 11.0 $ 10.2 $ 10.3 $ 9.4 $ 9.8 $ 0.8 $ 1.2 U.S. Consumer Retail Originations - Average FICO New vehicle 726 728 738 716 714 (1) 12 Used vehicle 703 708 711 707 710 (5) (7) Total retail originations 710 714 720 710 712 (4) (1) U.S. Market New light vehicle sales (SAAR - units in millions) 16.1 16.4 16.5 15.6 15.6 (0.4) 0.5 New light vehicle sales (quarterly - units in millions) 4.2 3.9 4.2 3.9 4.1 0.3 0.1 Dealer Engagement (2) Total Active DFS Dealers 21,687 21,665 21,368 21,656 21,825 22 (138) Total Application Volume (000s) 3,875 3,805 3,478 3,632 3,733 70 142 Ally U.S. Commercial Outstandings EOP ($ in billions) Floorplan outstandings $ 14.7 $ 15.1 $ 16.4 $ 17.5 $ 18.7 $ (0.5) $ (4.0) Dealer loans and other 6.4 6.4 6.5 6.3 6.6 0.0 (0.2) Total Commercial outstandings $ 21.1 $ 21.5 $ 22.9 $ 23.8 $ 25.2 $ (0.5) $ (4.2) U.S. Off-Lease Remarketing Off-lease vehicles terminated - on-balance sheet (# in units) 26,302 21,943 23,301 31,033 41,601 4,359 (15,299) Average gain (loss) per vehicle $ 14 $ (863) $ 145 $ 771 $ 1,420 $ 877 $ (1,406) Total gain (loss) ($ in millions) $ — $ (19) $ 3 $ 24 $ 59 $ 19 $ (59) (1) Some standard rate loan originations contain manufacturer sponsored cash back rebate incentives. Some lease originations contain rate subvention. While Ally may jointly develop marketing programs for these originations, Ally does not have exclusive rights to such originations under operating agreements with manufacturers. (2) A dealer is considered to have an active relationship with us if we provided automotive financing, remarketing, or insurance services during the three months ended June 30, 2025. Note: Numbers may not foot due to rounding 10
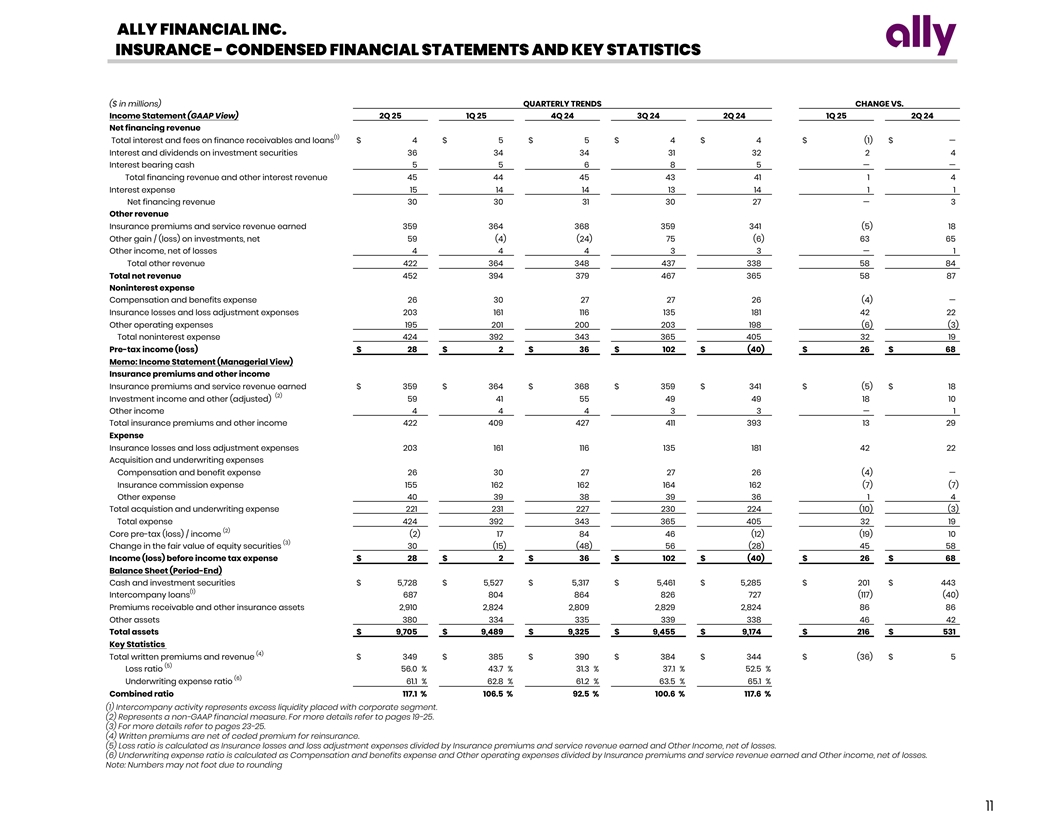
ALLY FINANCIAL INC. INSURANCE - CONDENSED FINANCIAL STATEMENTS AND KEY STATISTICS ($ in millions) QUARTERLY TRENDS CHANGE VS. Income Statement (GAAP View) 2Q 25 1Q 25 4Q 24 3Q 24 2Q 24 1Q 25 2Q 24 Net financing revenue (1) Total interest and fees on finance receivables and loans $ 4 $ 5 $ 5 $ 4 $ 4 $ (1) $ — Interest and dividends on investment securities 36 34 34 31 32 2 4 Interest bearing cash 5 5 6 8 5 — — Total financing revenue and other interest revenue 45 44 45 43 41 1 4 Interest expense 15 14 14 13 14 1 1 Net financing revenue 30 30 31 30 27 — 3 Other revenue Insurance premiums and service revenue earned 359 364 368 359 341 (5) 18 Other gain / (loss) on investments, net 59 (4) (24) 75 (6) 63 65 Other income, net of losses 4 4 4 3 3 — 1 Total other revenue 422 364 348 437 338 58 84 Total net revenue 452 394 379 467 365 58 87 Noninterest expense Compensation and benefits expense 26 30 27 27 26 (4) — Insurance losses and loss adjustment expenses 203 161 116 135 181 42 22 Other operating expenses 195 201 200 203 198 (6) (3) Total noninterest expense 424 392 343 365 405 32 19 Pre-tax income (loss) $ 28 $ 2 $ 36 $ 102 $ (40) $ 26 $ 68 Memo: Income Statement (Managerial View) Insurance premiums and other income Insurance premiums and service revenue earned $ 359 $ 364 $ 368 $ 359 $ 341 $ (5) $ 18 (2) Investment income and other (adjusted) 59 41 55 49 49 18 10 Other income 4 4 4 3 3 — 1 Total insurance premiums and other income 422 409 427 411 393 13 29 Expense Insurance losses and loss adjustment expenses 203 161 116 135 181 42 22 Acquisition and underwriting expenses Compensation and benefit expense 26 30 27 27 26 (4) — Insurance commission expense 155 162 162 164 162 (7) (7) Other expense 40 39 38 39 36 1 4 Total acquistion and underwriting expense 221 231 227 230 224 (10) (3) Total expense 424 392 343 365 405 32 19 (2) Core pre-tax (loss) / income (2) 17 84 46 (12) (19) 10 (3) Change in the fair value of equity securities 30 (15) (48) 56 (28) 45 58 Income (loss) before income tax expense $ 28 $ 2 $ 36 $ 102 $ (40) $ 26 $ 68 Balance Sheet (Period-End) Cash and investment securities $ 5,728 $ 5,527 $ 5,317 $ 5,461 $ 5,285 $ 201 $ 443 (1) Intercompany loans 687 804 864 826 727 (117) (40) Premiums receivable and other insurance assets 2,910 2,824 2,809 2,829 2,824 86 86 Other assets 380 334 335 339 338 46 42 Total assets $ 9,705 $ 9,489 $ 9,325 $ 9,455 $ 9,174 $ 216 $ 531 Key Statistics (4) Total written premiums and revenue $ 349 $ 385 $ 390 $ 384 $ 344 $ (36) $ 5 (5) Loss ratio 5 6.0 % 43.7 % 31.3 % 3 7.1 % 52.5 % (6) Underwriting expense ratio 6 1.1 % 62.8 % 61.2 % 6 3.5 % 65.1 % Combined ratio 1 17.1 % 1 06.5 % 92.5 % 100.6 % 1 17.6 % (1) Intercompany activity represents excess liquidity placed with corporate segment. (2) Represents a non-GAAP financial measure. For more details refer to pages 19-25. (3) For more details refer to pages 23-25. (4) Written premiums are net of ceded premium for reinsurance. (5) Loss ratio is calculated as Insurance losses and loss adjustment expenses divided by Insurance premiums and service revenue earned and Other Income, net of losses. (6) Underwriting expense ratio is calculated as Compensation and benefits expense and Other operating expenses divided by Insurance premiums and service revenue earned and Other income, net of losses. Note: Numbers may not foot due to rounding 11
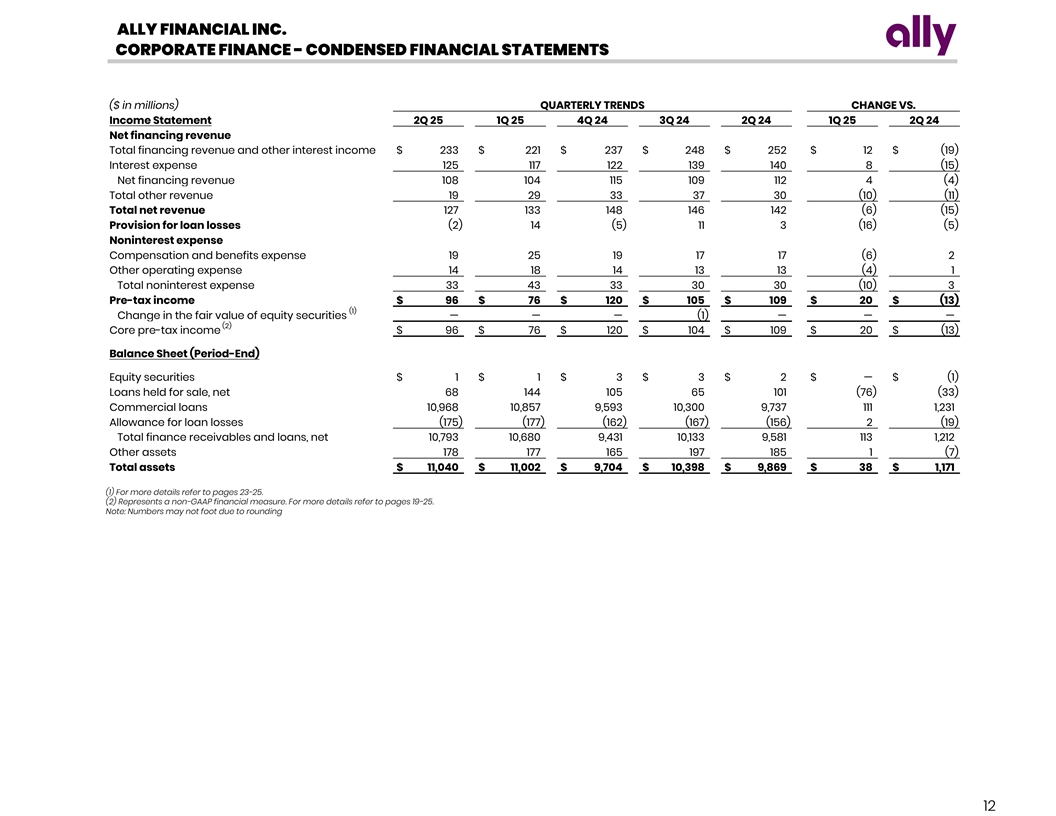
ALLY FINANCIAL INC. CORPORATE FINANCE - CONDENSED FINANCIAL STATEMENTS ($ in millions) QUARTERLY TRENDS CHANGE VS. Income Statement 2Q 25 1Q 25 4Q 24 3Q 24 2Q 24 1Q 25 2Q 24 Net financing revenue Total financing revenue and other interest income $ 233 $ 221 $ 237 $ 248 $ 252 $ 12 $ (19) Interest expense 125 117 122 139 140 8 (15) Net financing revenue 108 104 115 109 112 4 (4) Total other revenue 19 29 33 37 30 (10) (11) Total net revenue 127 133 148 146 142 (6) (15) Provision for loan losses (2) 14 (5) 11 3 (16) (5) Noninterest expense Compensation and benefits expense 19 25 19 17 17 (6) 2 Other operating expense 14 18 14 13 13 (4) 1 Total noninterest expense 33 43 33 30 30 (10) 3 Pre-tax income $ 96 $ 76 $ 120 $ 105 $ 109 $ 20 $ (13) (1) Change in the fair value of equity securities — — — (1) — — — (2) Core pre-tax income $ 96 $ 76 $ 120 $ 104 $ 109 $ 20 $ (13) Balance Sheet (Period-End) Equity securities $ 1 $ 1 $ 3 $ 3 $ 2 $ — $ (1) Loans held for sale, net 68 144 105 65 101 (76) (33) Commercial loans 10,968 10,857 9,593 10,300 9,737 111 1,231 Allowance for loan losses (175) (177) (162) (167) (156) 2 (19) Total finance receivables and loans, net 10,793 10,680 9,431 10,133 9,581 113 1,212 Other assets 178 177 165 197 185 1 (7) Total assets $ 11,040 $ 11,002 $ 9,704 $ 10,398 $ 9,869 $ 38 $ 1,171 (1) For more details refer to pages 23-25. (2) Represents a non-GAAP financial measure. For more details refer to pages 19-25. Note: Numbers may not foot due to rounding 12
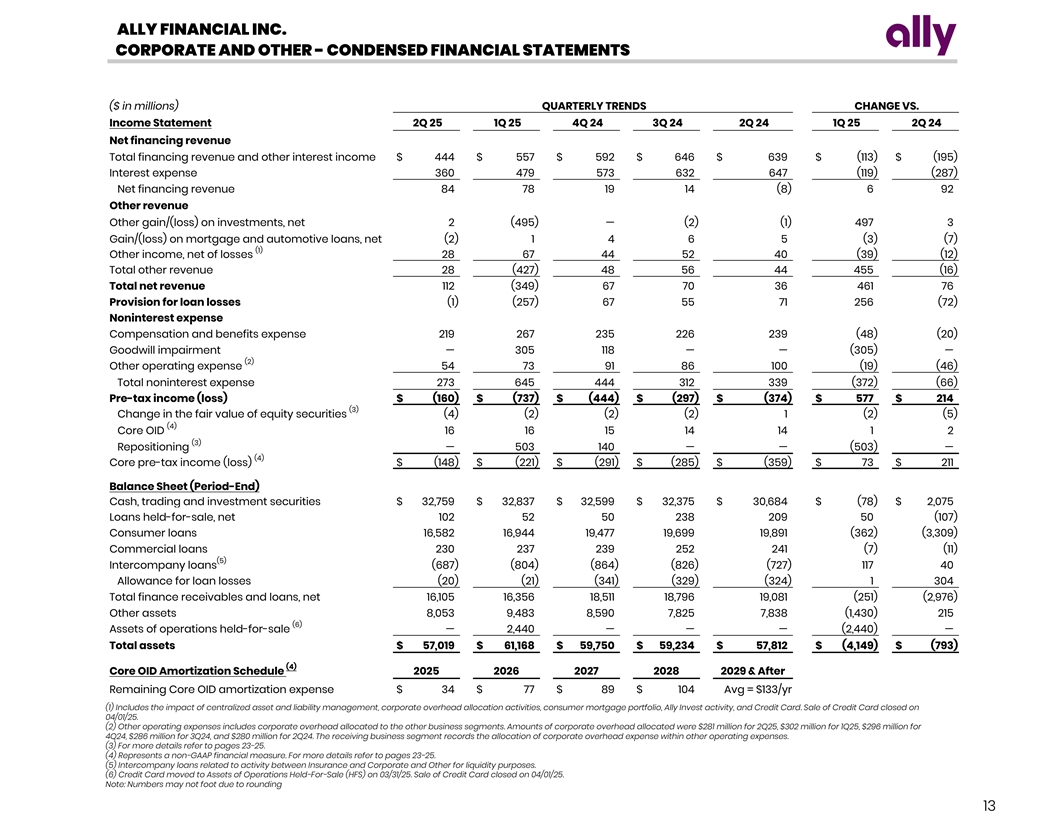
ALLY FINANCIAL INC. CORPORATE AND OTHER - CONDENSED FINANCIAL STATEMENTS ($ in millions) QUARTERLY TRENDS CHANGE VS. Income Statement 2Q 25 1Q 25 4Q 24 3Q 24 2Q 24 1Q 25 2Q 24 Net financing revenue Total financing revenue and other interest income $ 444 $ 557 $ 592 $ 646 $ 639 $ (113) $ (195) Interest expense 360 479 573 632 647 (119) (287) Net financing revenue 84 78 19 14 (8) 6 92 Other revenue Other gain/(loss) on investments, net 2 (495) — (2) (1) 497 3 Gain/(loss) on mortgage and automotive loans, net (2) 1 4 6 5 (3) (7) (1) Other income, net of losses 28 67 44 52 40 (39) (12) Total other revenue 28 (427) 48 56 44 455 (16) Total net revenue 112 (349) 67 70 36 461 76 Provision for loan losses (1) (257) 67 55 71 256 (72) Noninterest expense Compensation and benefits expense 219 267 235 226 239 (48) (20) Goodwill impairment — 305 118 — — (305) — (2) Other operating expense 54 73 91 86 100 (19) (46) Total noninterest expense 273 645 444 312 339 (372) (66) Pre-tax income (loss) $ (160) $ (737) $ (444) $ (297) $ (374) $ 577 $ 214 (3) Change in the fair value of equity securities (4) (2) (2) (2) 1 (2) (5) (4) Core OID 16 16 15 14 14 1 2 (3) Repositioning — 503 140 — — (503) — (4) Core pre-tax income (loss) $ (148) $ (221) $ (291) $ (285) $ (359) $ 73 $ 211 Balance Sheet (Period-End) Cash, trading and investment securities $ 32,759 $ 32,837 $ 32,599 $ 32,375 $ 30,684 $ (78) $ 2,075 Loans held-for-sale, net 102 52 50 238 209 50 (107) Consumer loans 16,582 16,944 19,477 19,699 19,891 (362) (3,309) Commercial loans 230 237 239 252 241 (7) (11) (5) Intercompany loans (687) (804) (864) (826) (727) 117 40 Allowance for loan losses (20) (21) (341) (329) (324) 1 304 Total finance receivables and loans, net 16,105 16,356 18,511 18,796 19,081 (251) (2,976) Other assets 8,053 9,483 8,590 7,825 7,838 (1,430) 215 (6) Assets of operations held-for-sale — 2,440 — — — (2,440) — Total assets $ 57,019 $ 61,168 $ 59,750 $ 59,234 $ 57,812 $ (4,149) $ (793) (4) Core OID Amortization Schedule 2025 2026 2027 2028 2029 & After Remaining Core OID amortization expense $ 34 $ 77 $ 89 $ 104 Avg = $133/yr (1) Includes the impact of centralized asset and liability management, corporate overhead allocation activities, consumer mortgage portfolio, Ally Invest activity, and Credit Card. Sale of Credit Card closed on 04/01/25. (2) Other operating expenses includes corporate overhead allocated to the other business segments. Amounts of corporate overhead allocated were $281 million for 2Q25, $302 million for 1Q25, $296 million for 4Q24, $286 million for 3Q24, and $280 million for 2Q24. The receiving business segment records the allocation of corporate overhead expense within other operating expenses. (3) For more details refer to pages 23-25. (4) Represents a non-GAAP financial measure. For more details refer to pages 23-25. (5) Intercompany loans related to activity between Insurance and Corporate and Other for liquidity purposes. (6) Credit Card moved to Assets of Operations Held-For-Sale (HFS) on 03/31/25. Sale of Credit Card closed on 04/01/25. Note: Numbers may not foot due to rounding 13
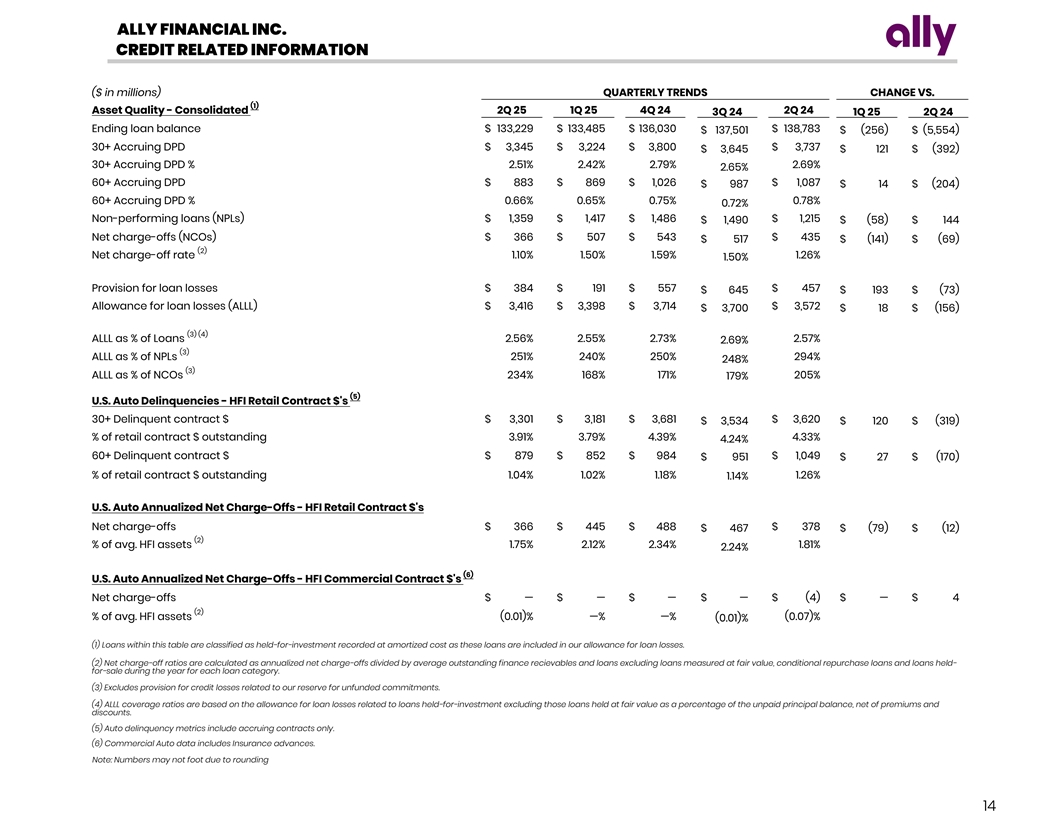
ALLY FINANCIAL INC. CREDIT RELATED INFORMATION ($ in millions) QUARTERLY TRENDS CHANGE VS. (1) Asset Quality - Consolidated 2Q 25 1Q 25 4Q 24 2Q 24 3Q 24 1Q 25 2Q 24 Ending loan balance $ 133,229 $ 133,485 $ 136,030 $ 138,783 $ 137,501 $ (256) $ (5,554) 30+ Accruing DPD $ 3,345 $ 3,224 $ 3,800 $ 3,737 $ 3,645 $ 121 $ (392) 30+ Accruing DPD % 2.51% 2 .42% 2 .79% 2 .69% 2.65% 60+ Accruing DPD $ 883 $ 869 $ 1,026 $ 1,087 $ 987 $ 14 $ (204) 60+ Accruing DPD % 0 .66% 0 .65 % 0.75% 0 .78% 0 .72% Non-performing loans (NPLs) $ 1,359 $ 1,417 $ 1,486 $ 1,215 $ 1,490 $ (58) $ 144 Net charge-offs (NCOs) $ 366 $ 507 $ 543 $ 435 $ 517 $ (141) $ (69) (2) Net charge-off rate 1 .10 % 1 .50% 1.59% 1 .26% 1 .50% Provision for loan losses $ 384 $ 191 $ 557 $ 457 $ 645 $ 193 $ (73) Allowance for loan losses (ALLL) $ 3,416 $ 3,398 $ 3,714 $ 3,572 $ 3,700 $ 18 $ (156) (3) (4) ALLL as % of Loans 2 .56 % 2.55% 2.73% 2 .57% 2 .69 % (3) ALLL as % of NPLs 251 % 2 40 % 250% 2 94% 248 % (3) ALLL as % of NCOs 234 % 1 68 % 1 71 % 2 05 % 179% (5) U.S. Auto Delinquencies - HFI Retail Contract $'s 30+ Delinquent contract $ $ 3,301 $ 3,181 $ 3,681 $ 3,620 $ 3,534 $ 120 $ (319) % of retail contract $ outstanding 3.91% 3 .79% 4 .39 % 4 .33% 4 .24 % 60+ Delinquent contract $ $ 879 $ 852 $ 984 $ 1,049 $ 951 $ 27 $ (170) % of retail contract $ outstanding 1 .04% 1.02% 1.18% 1 .26 % 1.14% U.S. Auto Annualized Net Charge-Offs - HFI Retail Contract $'s Net charge-offs $ 366 $ 445 $ 488 $ 378 $ 467 $ (79) $ (12) (2) % of avg. HFI assets 1.75 % 2.12% 2 .34 % 1 .81 % 2 .24% (6) U.S. Auto Annualized Net Charge-Offs - HFI Commercial Contract $'s Net charge-offs $ — $ — $ — $ — $ (4) $ — $ 4 (2) % of avg. HFI assets ( 0.01)% — % — % ( 0.07) % ( 0.01)% (1) Loans within this table are classified as held-for-investment recorded at amortized cost as these loans are included in our allowance for loan losses. (2) Net charge-off ratios are calculated as annualized net charge-offs divided by average outstanding finance recievables and loans excluding loans measured at fair value, conditional repurchase loans and loans held- for-sale during the year for each loan category. (3) Excludes provision for credit losses related to our reserve for unfunded commitments. (4) ALLL coverage ratios are based on the allowance for loan losses related to loans held-for-investment excluding those loans held at fair value as a percentage of the unpaid principal balance, net of premiums and discounts. (5) Auto delinquency metrics include accruing contracts only. (6) Commercial Auto data includes Insurance advances. Note: Numbers may not foot due to rounding 14
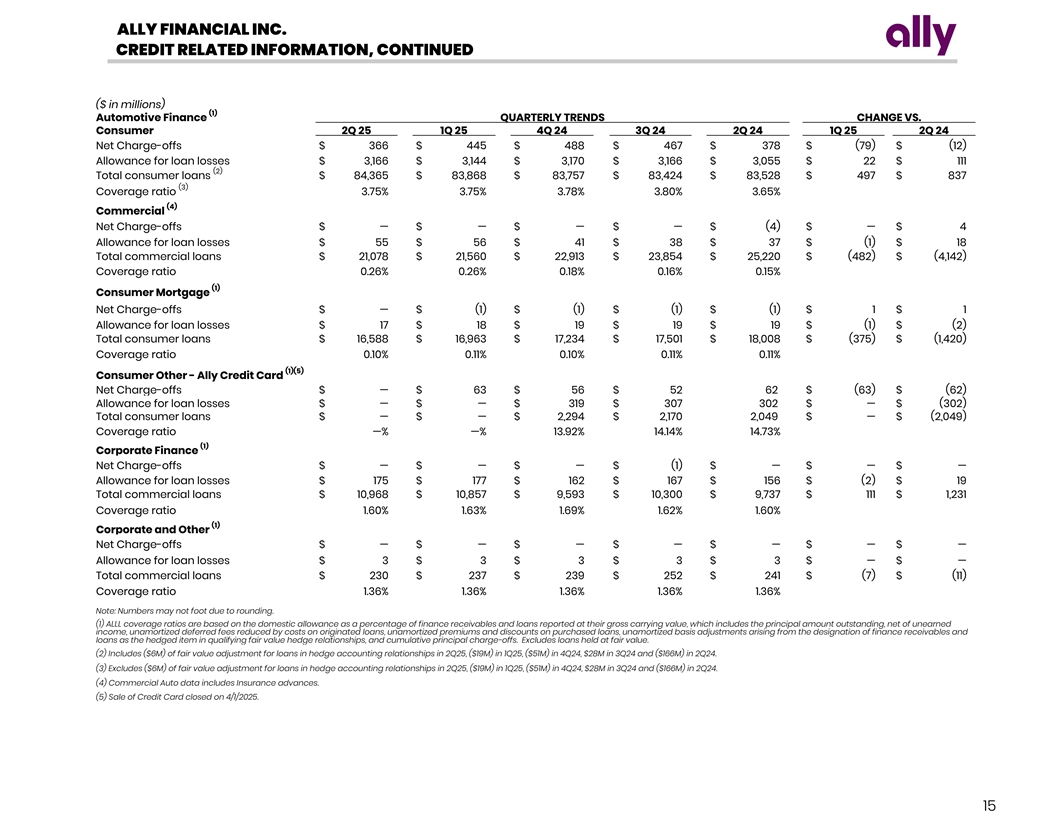
ALLY FINANCIAL INC. CREDIT RELATED INFORMATION, CONTINUED ($ in millions) (1) Automotive Finance QUARTERLY TRENDS CHANGE VS. Consumer 2Q 25 1Q 25 4Q 24 3Q 24 2Q 24 1Q 25 2Q 24 Net Charge-offs $ 366 $ 445 $ 488 $ 467 $ 378 $ (79) $ (12) Allowance for loan losses $ 3,166 $ 3,144 $ 3,170 $ 3,166 $ 3,055 $ 22 $ 111 (2) Total consumer loans $ 84,365 $ 83,868 $ 83,757 $ 83,424 $ 83,528 $ 497 $ 837 (3) Coverage ratio 3 .75 % 3.75 % 3 .78% 3 .80% 3 .65 % (4) Commercial Net Charge-offs $ — $ — $ — $ — $ (4) $ — $ 4 Allowance for loan losses $ 55 $ 56 $ 41 $ 38 $ 37 $ (1) $ 18 Total commercial loans $ 21,078 $ 21,560 $ 22,913 $ 23,854 $ 25,220 $ (482) $ (4,142) Coverage ratio 0 .26 % 0 .26% 0.18% 0 .16% 0.15 % (1) Consumer Mortgage Net Charge-offs $ — $ (1) $ (1) $ (1) $ (1) $ 1 $ 1 Allowance for loan losses $ 17 $ 18 $ 19 $ 19 $ 19 $ (1) $ (2) Total consumer loans $ 16,588 $ 16,963 $ 17,234 $ 17,501 $ 18,008 $ (375) $ (1,420) Coverage ratio 0 .10 % 0 .11% 0 .10% 0.11% 0 .11 % (1)(5) Consumer Other - Ally Credit Card Net Charge-offs $ — $ 63 $ 56 $ 52 62 $ (63) $ (62) Allowance for loan losses $ — $ — $ 319 $ 307 302 $ — $ (302) Total consumer loans $ — $ — $ 2,294 $ 2,170 2,049 $ — $ (2,049) Coverage ratio — % — % 1 3.92% 14.14% 14.73% (1) Corporate Finance Net Charge-offs $ — $ — $ — $ (1) $ — $ — $ — Allowance for loan losses $ 175 $ 177 $ 162 $ 167 $ 156 $ (2) $ 19 Total commercial loans $ 10,968 $ 10,857 $ 9,593 $ 10,300 $ 9,737 $ 111 $ 1,231 Coverage ratio 1.60% 1 .63% 1 .69 % 1 .62% 1.60% (1) Corporate and Other Net Charge-offs $ — $ — $ — $ — $ — $ — $ — Allowance for loan losses $ 3 $ 3 $ 3 $ 3 $ 3 $ — $ — Total commercial loans $ 230 $ 237 $ 239 $ 252 $ 241 $ (7) $ (11) Coverage ratio 1.36 % 1 .36 % 1 .36% 1.36% 1 .36 % Note: Numbers may not foot due to rounding. (1) ALLL coverage ratios are based on the domestic allowance as a percentage of finance receivables and loans reported at their gross carrying value, which includes the principal amount outstanding, net of unearned income, unamortized deferred fees reduced by costs on originated loans, unamortized premiums and discounts on purchased loans, unamortized basis adjustments arising from the designation of finance receivables and loans as the hedged item in qualifying fair value hedge relationships, and cumulative principal charge-offs. Excludes loans held at fair value. (2) Includes ($6M) of fair value adjustment for loans in hedge accounting relationships in 2Q25, ($19M) in 1Q25, ($51M) in 4Q24, $28M in 3Q24 and ($166M) in 2Q24. (3) Excludes ($6M) of fair value adjustment for loans in hedge accounting relationships in 2Q25, ($19M) in 1Q25, ($51M) in 4Q24, $28M in 3Q24 and ($166M) in 2Q24. (4) Commercial Auto data includes Insurance advances. (5) Sale of Credit Card closed on 4/1/2025. 15
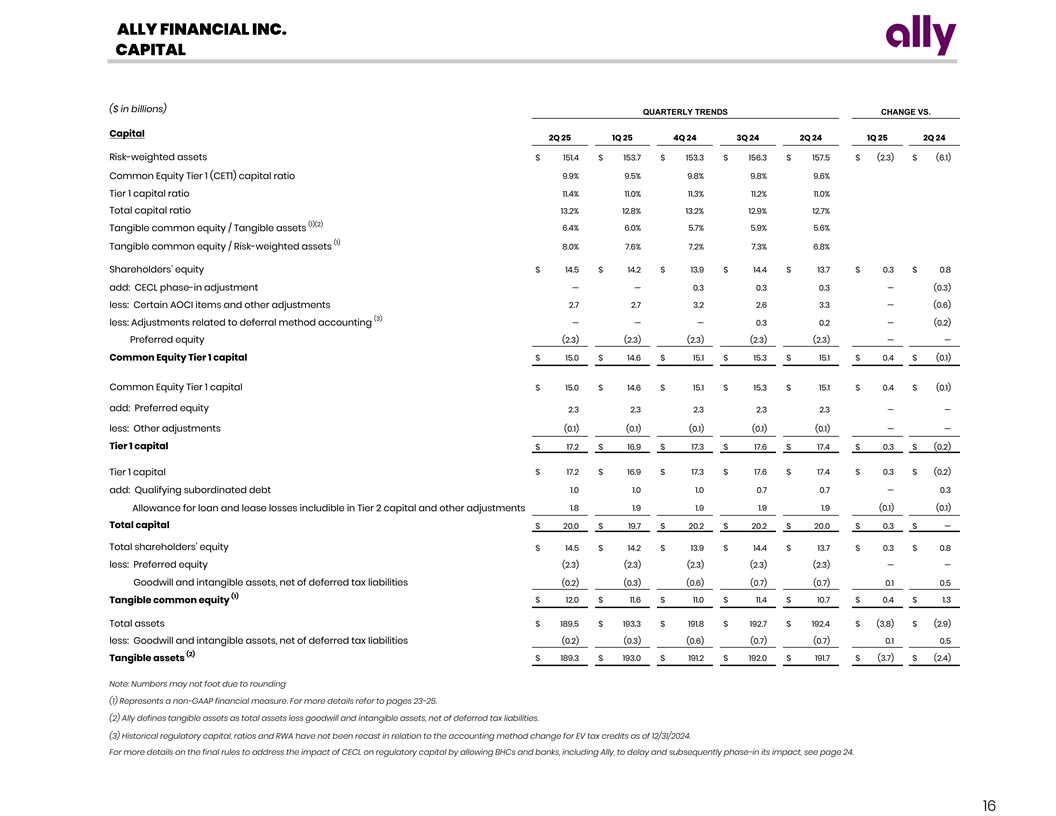
ALLY FINANCIAL INC. CAPITAL ($ in billions) QUARTERLY TRENDS CHANGE VS. Capital 2Q 25 1Q 25 4Q 24 3Q 24 2Q 24 1Q 25 2Q 24 Risk-weighted assets $ 151.4 $ 153.7 $ 153.3 $ 156.3 $ 157.5 $ (2.3) $ (6.1) 9 .9% 9 .5 % 9 .8% 9.8% 9 .6% Common Equity Tier 1 (CET1) capital ratio Tier 1 capital ratio 1 1.4% 1 1.0 % 1 1.3% 1 1.2 % 1 1.0 % Total capital ratio 13.2% 1 2.8 % 1 3.2 % 1 2.9 % 12.7% (1)(2) 6.4% 6.0 % 5.7 % 5.9 % 5 .6 % Tangible common equity / Tangible assets (1) Tangible common equity / Risk-weighted assets 8 .0 % 7 .6 % 7 .2 % 7 .3 % 6 .8% Shareholders’ equity $ 14.5 $ 14.2 $ 13.9 $ 14.4 $ 13.7 $ 0.3 $ 0.8 add: CECL phase-in adjustment — — 0.3 0.3 0.3 — (0.3) less: Certain AOCI items and other adjustments 2.7 2.7 3.2 2.6 3.3 — (0.6) (3) less: Adjustments related to deferral method accounting — — — 0.3 0.2 — (0.2) Preferred equity (2.3) (2.3) (2.3) (2.3) (2.3) — — Common Equity Tier 1 capital $ 15.0 $ 14.6 $ 15.1 $ 15.3 $ 15.1 $ 0.4 $ (0.1) Common Equity Tier 1 capital $ 15.0 $ 14.6 $ 15.1 $ 15.3 $ 15.1 $ 0.4 $ (0.1) add: Preferred equity 2.3 2.3 2.3 2.3 2.3 — — less: Other adjustments (0.1) (0.1) (0.1) (0.1) (0.1) — — Tier 1 capital $ 17.2 $ 16.9 $ 17.3 $ 17.6 $ 17.4 $ 0.3 $ (0.2) $ 17.2 $ 16.9 $ 17.3 $ 17.6 $ 17.4 $ 0.3 $ (0.2) Tier 1 capital add: Qualifying subordinated debt 1.0 1.0 1.0 0.7 0.7 — 0.3 1.8 1.9 1.9 1.9 1.9 (0.1) (0.1) Allowance for loan and lease losses includible in Tier 2 capital and other adjustments Total capital $ 20.0 $ 19.7 $ 20.2 $ 20.2 $ 20.0 $ 0.3 $ — Total shareholders' equity $ 14.5 $ 14.2 $ 13.9 $ 14.4 $ 13.7 $ 0.3 $ 0.8 less: Preferred equity (2.3) (2.3) (2.3) (2.3) (2.3) — — Goodwill and intangible assets, net of deferred tax liabilities (0.2) (0.3) (0.6) (0.7) (0.7) 0.1 0.5 (1) $ 12.0 $ 11.6 $ 11.0 $ 11.4 $ 10.7 $ 0.4 $ 1.3 Tangible common equity Total assets $ 189.5 $ 193.3 $ 191.8 $ 192.7 $ 192.4 $ (3.8) $ (2.9) less: Goodwill and intangible assets, net of deferred tax liabilities (0.2) (0.3) (0.6) (0.7) (0.7) 0.1 0.5 (2) Tangible assets $ 189.3 $ 193.0 $ 191.2 $ 192.0 $ 191.7 $ (3.7) $ (2.4) Note: Numbers may not foot due to rounding (1) Represents a non-GAAP financial measure. For more details refer to pages 23-25. (2) Ally defines tangible assets as total assets less goodwill and intangible assets, net of deferred tax liabilities. (3) Historical regulatory capital, ratios and RWA have not been recast in relation to the accounting method change for EV tax credits as of 12/31/2024. For more details on the final rules to address the impact of CECL on regulatory capital by allowing BHCs and banks, including Ally, to delay and subsequently phase-in its impact, see page 24. 16
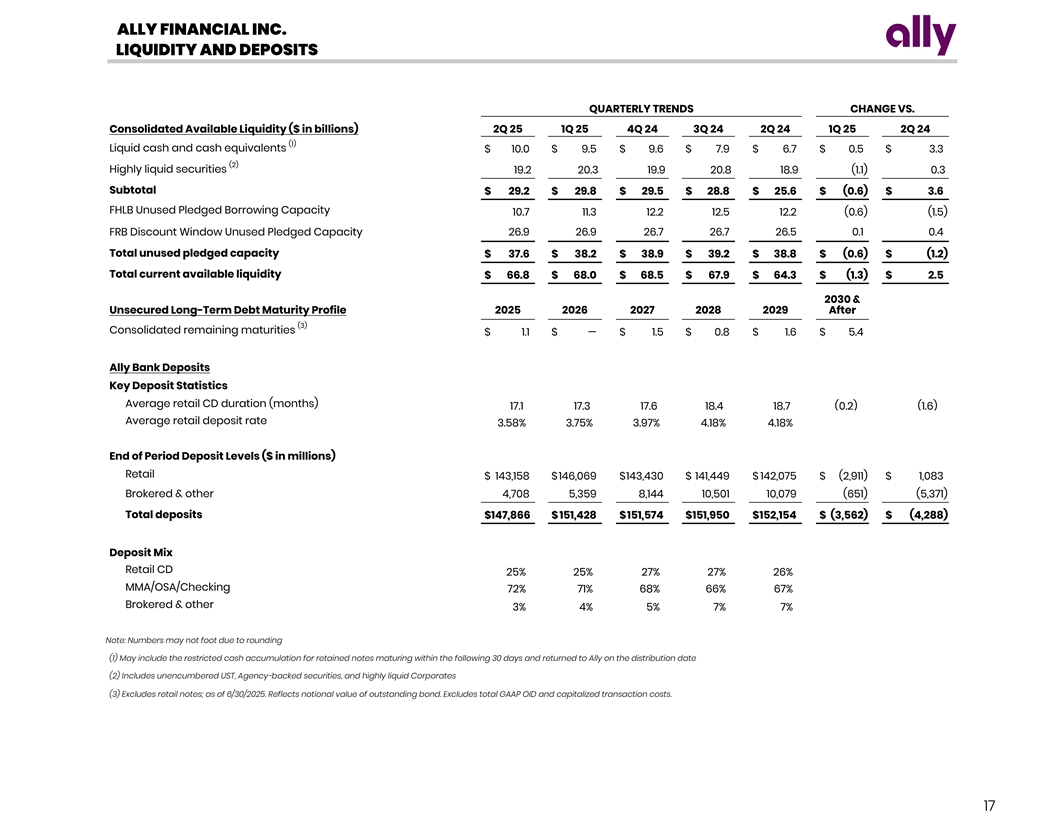
ALLY FINANCIAL INC. LIQUIDITY AND DEPOSITS QUARTERLY TRENDS CHANGE VS. Consolidated Available Liquidity ($ in billions) 2Q 25 1Q 25 4Q 24 3Q 24 2Q 24 1Q 25 2Q 24 (1) Liquid cash and cash equivalents $ 10.0 $ 9.5 $ 9.6 $ 7.9 $ 6.7 $ 0.5 $ 3.3 (2) Highly liquid securities 19.2 20.3 19.9 20.8 18.9 (1.1) 0.3 Subtotal $ 29.2 $ 29.8 $ 29.5 $ 28.8 $ 25.6 $ (0.6) $ 3.6 FHLB Unused Pledged Borrowing Capacity 10.7 11.3 12.2 12.5 12.2 (0.6) (1.5) FRB Discount Window Unused Pledged Capacity 26.9 26.9 26.7 26.7 26.5 0.1 0.4 Total unused pledged capacity $ 37.6 $ 38.2 $ 38.9 $ 39.2 $ 38.8 $ (0.6) $ (1.2) Total current available liquidity $ 66.8 $ 68.0 $ 68.5 $ 67.9 $ 64.3 $ (1.3) $ 2.5 2030 & Unsecured Long-Term Debt Maturity Profile 2025 2026 2027 2028 2029 After (3) Consolidated remaining maturities $ 1.1 $ — $ 1.5 $ 0.8 $ 1.6 $ 5.4 Ally Bank Deposits Key Deposit Statistics Average retail CD duration (months) 17.1 17.3 17.6 18.4 18.7 (0.2) (1.6) Average retail deposit rate 3 .58% 3 .75% 3 .97 % 4 .18% 4.18% End of Period Deposit Levels ($ in millions) Retail $ 143,158 $ 146,069 $ 143,430 $ 141,449 $ 142,075 $ (2,911) $ 1,083 Brokered & other 4,708 5,359 8,144 10,501 10,079 (651) (5,371) Total deposits $1 47,866 $ 151,428 $ 151,574 $ 151,950 $ 152,154 $ (3,562) $ (4,288) Deposit Mix Retail CD 25 % 2 5 % 27 % 27% 26% MMA/OSA/Checking 72 % 7 1% 6 8 % 66 % 6 7% Brokered & other 3 % 4 % 5% 7 % 7 % Note: Numbers may not foot due to rounding (1) May include the restricted cash accumulation for retained notes maturing within the following 30 days and returned to Ally on the distribution date (2) Includes unencumbered UST, Agency-backed securities, and highly liquid Corporates (3) Excludes retail notes; as of 6/30/2025. Reflects notional value of outstanding bond. Excludes total GAAP OID and capitalized transaction costs. 17
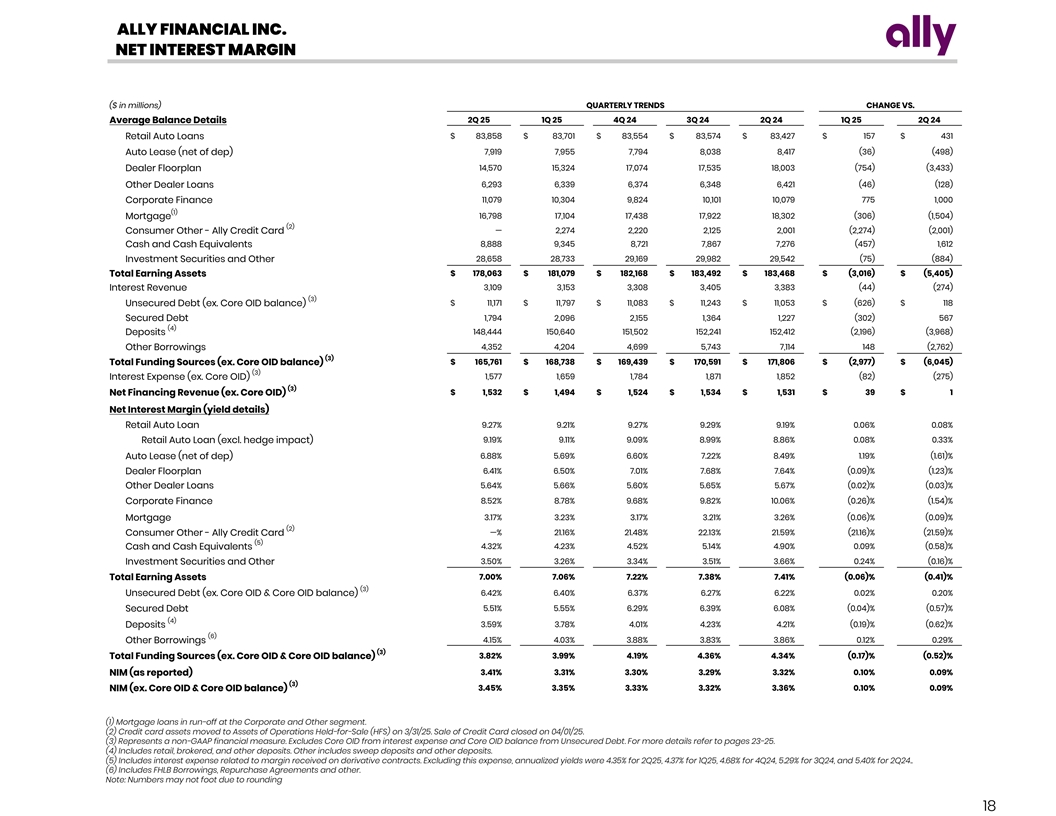
ALLY FINANCIAL INC. NET INTEREST MARGIN ($ in millions) QUARTERLY TRENDS CHANGE VS. 2Q 25 1Q 25 4Q 24 3Q 24 2Q 24 1Q 25 2Q 24 Average Balance Details $ 83,858 $ 83,701 $ 83,554 $ 83,574 $ 83,427 $ 157 $ 431 Retail Auto Loans 7,919 7,955 7,794 8,038 8,417 (36) (498) Auto Lease (net of dep) 14,570 15,324 17,074 17,535 18,003 (754) (3,433) Dealer Floorplan Other Dealer Loans 6,293 6,339 6,374 6,348 6,421 (46) (128) 11,079 10,304 9,824 10,101 10,079 775 1,000 Corporate Finance (1) 16,798 17,104 17,438 17,922 18,302 (306) (1,504) Mortgage (2) Consumer Other - Ally Credit Card — 2,274 2,220 2,125 2,001 (2,274) (2,001) 8,888 9,345 8,721 7,867 7,276 (457) 1,612 Cash and Cash Equivalents 28,658 28,733 29,169 29,982 29,542 (75) (884) Investment Securities and Other $ 178,063 $ 181,079 $ 182,168 $ 183,492 $ 183,468 $ (3,016) $ (5,405) Total Earning Assets Interest Revenue 3,109 3,153 3,308 3,405 3,383 (44) (274) (3) $ 11,171 $ 11,797 $ 11,083 $ 11,243 $ 11,053 $ (626) $ 118 Unsecured Debt (ex. Core OID balance) Secured Debt 1,794 2,096 2,155 1,364 1,227 (302) 567 (4) 148,444 150,640 151,502 152,241 152,412 (2,196) (3,968) Deposits 4,352 4,204 4,699 5,743 7,114 148 (2,762) Other Borrowings (3) Total Funding Sources (ex. Core OID balance) $ 165,761 $ 168,738 $ 169,439 $ 170,591 $ 171,806 $ (2,977) $ (6,045) (3) Interest Expense (ex. Core OID) 1,577 1,659 1,784 1,871 1,852 (82) (275) (3) Net Financing Revenue (ex. Core OID) $ 1,532 $ 1,494 $ 1,524 $ 1,534 $ 1,531 $ 39 $ 1 Net Interest Margin (yield details) Retail Auto Loan 9.27% 9 .21% 9.27 % 9.29 % 9.19% 0.06 % 0.08% 9.19% 9.11 % 9.09% 8 .99% 8.86 % 0 .08% 0 .33% Retail Auto Loan (excl. hedge impact) 6 .88% 5.69 % 6.60 % 7.22% 8 .49 % 1 .19% (1.61) % Auto Lease (net of dep) 6.41 % 6.50% 7.01 % 7 .68% 7.64 % ( 0.09) % ( 1.23) % Dealer Floorplan 5 .64% 5.66% 5 .60 % 5 .65 % 5 .67% ( 0.02)% (0.03) % Other Dealer Loans Corporate Finance 8 .52% 8 .78 % 9 .68% 9.82 % 10.06% ( 0.26)% ( 1.54)% 3 .17% 3.23% 3.17% 3 .21 % 3.26% (0.06) % (0.09)% Mortgage (2) Consumer Other - Ally Credit Card — % 2 1.16% 2 1.48 % 22.13 % 2 1.59% (21.16) % (21.59)% (5) Cash and Cash Equivalents 4.32% 4 .23 % 4 .52 % 5.14% 4 .90 % 0.09 % ( 0.58)% 3 .50% 3 .26% 3 .34 % 3.51 % 3 .66 % 0.24% (0.16) % Investment Securities and Other Total Earning Assets 7.00% 7 .06 % 7 .22% 7 .38% 7.41% ( 0.06)% ( 0.41)% (3) Unsecured Debt (ex. Core OID & Core OID balance) 6 .42 % 6 .40 % 6 .37 % 6 .27% 6 .22 % 0 .02% 0.20% Secured Debt 5 .51% 5.55% 6 .29 % 6 .39% 6 .08 % ( 0.04)% ( 0.57)% (4) Deposits 3 .59% 3 .78% 4 .01 % 4 .23 % 4.21 % ( 0.19)% ( 0.62) % (6) 4.15 % 4 .03% 3.88 % 3 .83% 3 .86% 0 .12 % 0.29 % Other Borrowings (3) 3.82 % 3 .99% 4 .19% 4 .36% 4 .34 % ( 0.17)% (0.52)% Total Funding Sources (ex. Core OID & Core OID balance) NIM (as reported) 3 .41 % 3 .31% 3 .30 % 3 .29% 3.32 % 0.10 % 0 .09 % (3) 3.45% 3.35% 3.33% 3.32 % 3 .36 % 0.10 % 0.09 % NIM (ex. Core OID & Core OID balance) (1) Mortgage loans in run-off at the Corporate and Other segment. (2) Credit card assets moved to Assets of Operations Held-for-Sale (HFS) on 3/31/25. Sale of Credit Card closed on 04/01/25. (3) Represents a non-GAAP financial measure. Excludes Core OID from interest expense and Core OID balance from Unsecured Debt. For more details refer to pages 23-25. (4) Includes retail, brokered, and other deposits. Other includes sweep deposits and other deposits. (5) Includes interest expense related to margin received on derivative contracts. Excluding this expense, annualized yields were 4.35% for 2Q25, 4.37% for 1Q25, 4.68% for 4Q24, 5.29% for 3Q24, and 5.40% for 2Q24.. (6) Includes FHLB Borrowings, Repurchase Agreements and other. Note: Numbers may not foot due to rounding 18
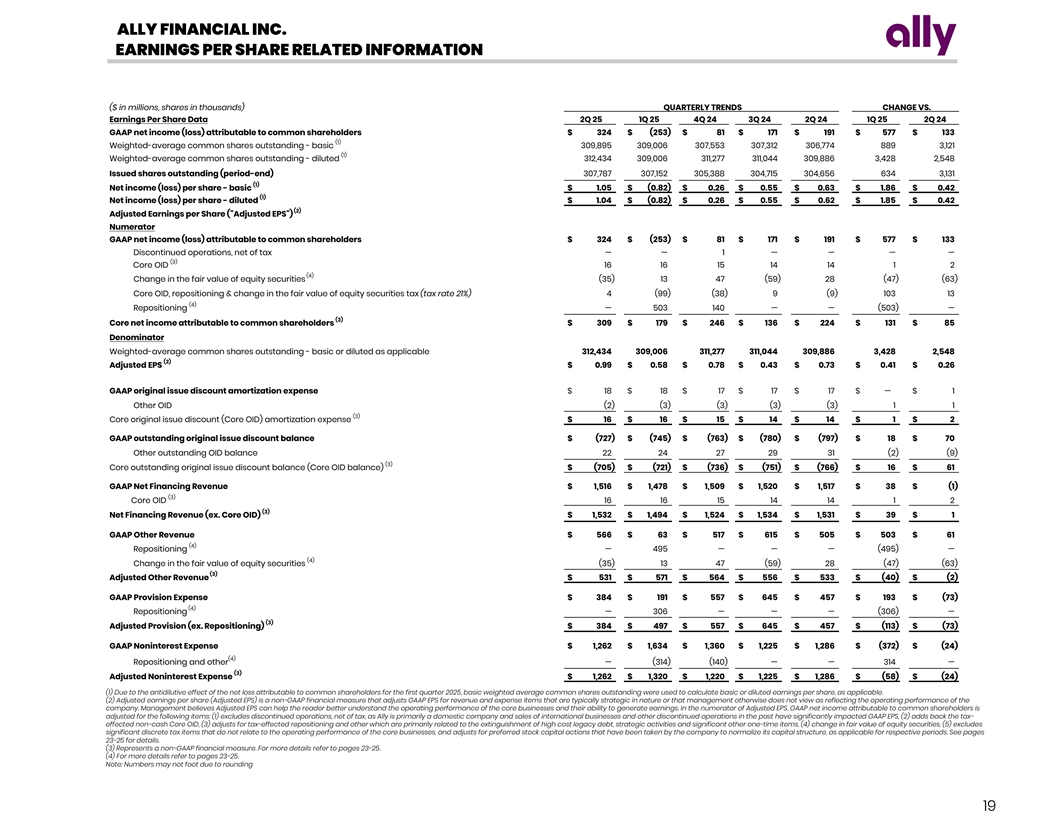
ALLY FINANCIAL INC. EARNINGS PER SHARE RELATED INFORMATION ($ in millions, shares in thousands) QUARTERLY TRENDS CHANGE VS. Earnings Per Share Data 2Q 25 1Q 25 4Q 24 3Q 24 2Q 24 1Q 25 2Q 24 GAAP net income (loss) attributable to common shareholders $ 324 $ (253) $ 81 $ 171 $ 191 $ 577 $ 133 (1) Weighted-average common shares outstanding - basic 309,895 309,006 307,553 307,312 306,774 889 3,121 (1) Weighted-average common shares outstanding - diluted 312,434 309,006 311,277 311,044 309,886 3,428 2,548 Issued shares outstanding (period-end) 307,787 307,152 305,388 304,715 304,656 634 3,131 (1) Net income (loss) per share - basic $ 1.05 $ (0.82) $ 0.26 $ 0.55 $ 0.63 $ 1.86 $ 0.42 (1) Net income (loss) per share - diluted $ 1.04 $ (0.82) $ 0.26 $ 0.55 $ 0.62 $ 1.85 $ 0.42 (2) Adjusted Earnings per Share ( Adjusted EPS ) Numerator GAAP net income (loss) attributable to common shareholders $ 324 $ (253) $ 81 $ 171 $ 191 $ 577 $ 133 Discontinued operations, net of tax — — 1 — — — — (3) Core OID 16 16 15 14 14 1 2 (4) Change in the fair value of equity securities (35) 13 47 (59) 28 (47) (63) Core OID, repositioning & change in the fair value of equity securities tax (tax rate 21%) 4 (99) (38) 9 (9) 103 13 (4) Repositioning — 503 140 — — (503) — (3) Core net income attributable to common shareholders $ 309 $ 179 $ 246 $ 136 $ 224 $ 131 $ 85 Denominator Weighted-average common shares outstanding - basic or diluted as applicable 312,434 309,006 311,277 311,044 309,886 3,428 2,548 (2) Adjusted EPS $ 0.99 $ 0.58 $ 0.78 $ 0.43 $ 0.73 $ 0.41 $ 0.26 GAAP original issue discount amortization expense $ 18 $ 18 $ 17 $ 17 $ 17 $ — $ 1 Other OID (2) (3) (3) (3) (3) 1 1 (3) Core original issue discount (Core OID) amortization expense $ 16 $ 16 $ 15 $ 14 $ 14 $ 1 $ 2 GAAP outstanding original issue discount balance $ (727) $ (745) $ (763) $ (780) $ (797) $ 18 $ 70 Other outstanding OID balance 22 24 27 29 31 (2) (9) (3) Core outstanding original issue discount balance (Core OID balance) $ (705) $ (721) $ (736) $ (751) $ (766) $ 16 $ 61 GAAP Net Financing Revenue $ 1,516 $ 1,478 $ 1,509 $ 1,520 $ 1,517 $ 38 $ (1) (3) Core OID 16 16 15 14 14 1 2 (3) Net Financing Revenue (ex. Core OID) $ 1,532 $ 1,494 $ 1,524 $ 1,534 $ 1,531 $ 39 $ 1 GAAP Other Revenue $ 566 $ 63 $ 517 $ 615 $ 505 $ 503 $ 61 (4) Repositioning — 495 — — — (495) — (4) Change in the fair value of equity securities (35) 13 47 (59) 28 (47) (63) (3) Adjusted Other Revenue $ 531 $ 571 $ 564 $ 556 $ 533 $ (40) $ (2) GAAP Provision Expense $ 384 $ 191 $ 557 $ 645 $ 457 $ 193 $ (73) (4) Repositioning — 306 — — — (306) — (3) Adjusted Provision (ex. Repositioning) $ 384 $ 497 $ 557 $ 645 $ 457 $ (113) $ (73) GAAP Noninterest Expense $ 1,262 $ 1,634 $ 1,360 $ 1,225 $ 1,286 $ (372) $ (24) (4) Repositioning and other — (314) (140) — — 314 — (3) Adjusted Noninterest Expense $ 1,262 $ 1,320 $ 1,220 $ 1,225 $ 1,286 $ (58) $ (24) (1) Due to the antidilutive effect of the net loss attributable to common shareholders for the first quarter 2025, basic weighted average common shares outstanding were used to calculate basic or diluted earnings per share, as applicable. (2) Adjusted earnings per share (Adjusted EPS) is a non-GAAP financial measure that adjusts GAAP EPS for revenue and expense items that are typically strategic in nature or that management otherwise does not view as reflecting the operating performance of the company. Management believes Adjusted EPS can help the reader better understand the operating performance of the core businesses and their ability to generate earnings. In the numerator of Adjusted EPS, GAAP net income attributable to common shareholders is adjusted for the following items: (1) excludes discontinued operations, net of tax, as Ally is primarily a domestic company and sales of international businesses and other discontinued operations in the past have significantly impacted GAAP EPS, (2) adds back the tax- effected non-cash Core OID, (3) adjusts for tax-effected repositioning and other which are primarily related to the extinguishment of high cost legacy debt, strategic activities and significant other one-time items, (4) change in fair value of equity securities, (5) excludes significant discrete tax items that do not relate to the operating performance of the core businesses, and adjusts for preferred stock capital actions that have been taken by the company to normalize its capital structure, as applicable for respective periods. See pages 23-25 for details. (3) Represents a non-GAAP financial measure. For more details refer to pages 23-25. (4) For more details refer to pages 23-25. Note: Numbers may not foot due to rounding 19
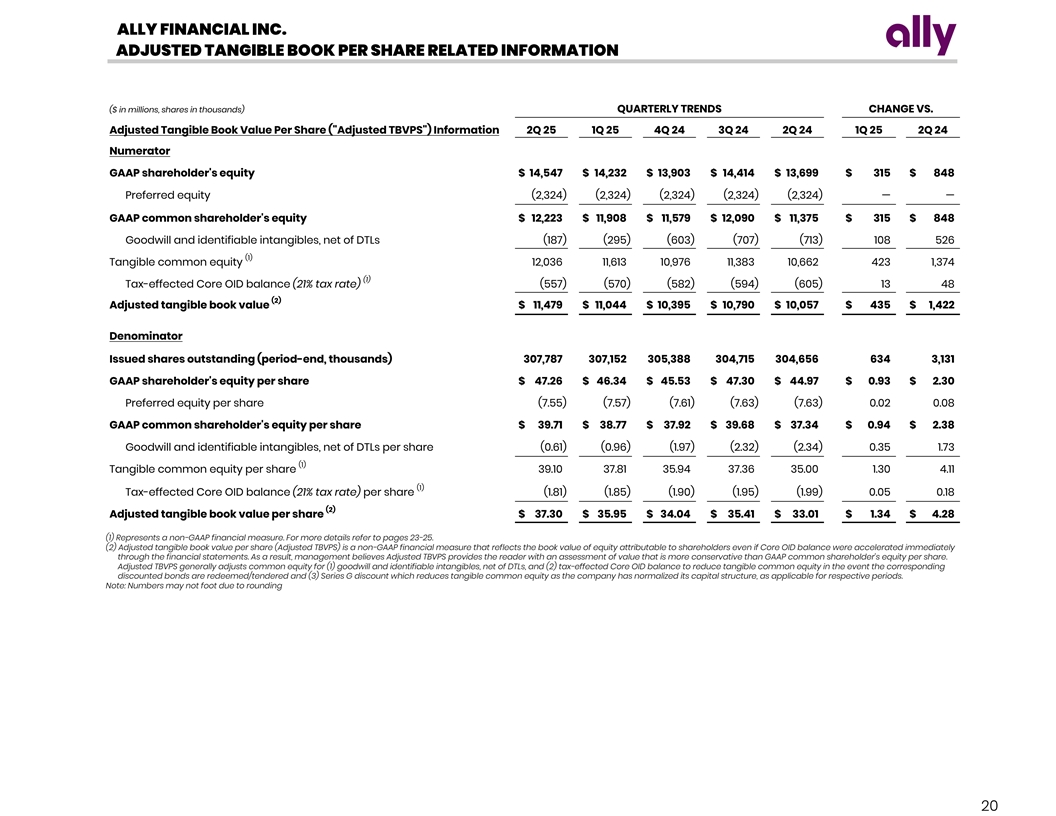
ALLY FINANCIAL INC. ADJUSTED TANGIBLE BOOK PER SHARE RELATED INFORMATION ($ in millions, shares in thousands) QUARTERLY TRENDS CHANGE VS. Adjusted Tangible Book Value Per Share ( Adjusted TBVPS ) Information 2Q 25 1Q 25 4Q 24 3Q 24 2Q 24 1Q 25 2Q 24 Numerator GAAP shareholder's equity $ 14,547 $ 14,232 $ 13,903 $ 14,414 $ 13,699 $ 315 $ 848 Preferred equity (2,324) (2,324) (2,324) (2,324) (2,324) — — GAAP common shareholder's equity $ 12,223 $ 11,908 $ 11,579 $ 12,090 $ 11,375 $ 315 $ 848 Goodwill and identifiable intangibles, net of DTLs (187) (295) (603) (707) (713) 108 526 (1) Tangible common equity 12,036 11,613 10,976 11,383 10,662 423 1,374 (1) Tax-effected Core OID balance (21% tax rate) (557) (570) (582) (594) (605) 13 48 (2) Adjusted tangible book value $ 11,479 $ 11,044 $ 10,395 $ 10,790 $ 10,057 $ 435 $ 1,422 Denominator Issued shares outstanding (period-end, thousands) 307,787 307,152 305,388 304,715 304,656 634 3,131 GAAP shareholder's equity per share $ 47.26 $ 46.34 $ 45.53 $ 47.30 $ 44.97 $ 0.93 $ 2.30 Preferred equity per share (7.55) (7.57) (7.61) (7.63) (7.63) 0.02 0.08 GAAP common shareholder's equity per share $ 39.71 $ 38.77 $ 37.92 $ 39.68 $ 37.34 $ 0.94 $ 2.38 Goodwill and identifiable intangibles, net of DTLs per share (0.61) (0.96) (1.97) (2.32) (2.34) 0.35 1.73 (1) Tangible common equity per share 39.10 37.81 35.94 37.36 35.00 1.30 4.11 (1) Tax-effected Core OID balance (21% tax rate) per share (1.81) (1.85) (1.90) (1.95) (1.99) 0.05 0.18 (2) Adjusted tangible book value per share $ 37.30 $ 35.95 $ 34.04 $ 35.41 $ 33.01 $ 1.34 $ 4.28 (1) Represents a non-GAAP financial measure. For more details refer to pages 23-25. (2) Adjusted tangible book value per share (Adjusted TBVPS) is a non-GAAP financial measure that reflects the book value of equity attributable to shareholders even if Core OID balance were accelerated immediately through the financial statements. As a result, management believes Adjusted TBVPS provides the reader with an assessment of value that is more conservative than GAAP common shareholder’s equity per share. Adjusted TBVPS generally adjusts common equity for (1) goodwill and identifiable intangibles, net of DTLs, and (2) tax-effected Core OID balance to reduce tangible common equity in the event the corresponding discounted bonds are redeemed/tendered and (3) Series G discount which reduces tangible common equity as the company has normalized its capital structure, as applicable for respective periods. Note: Numbers may not foot due to rounding 20
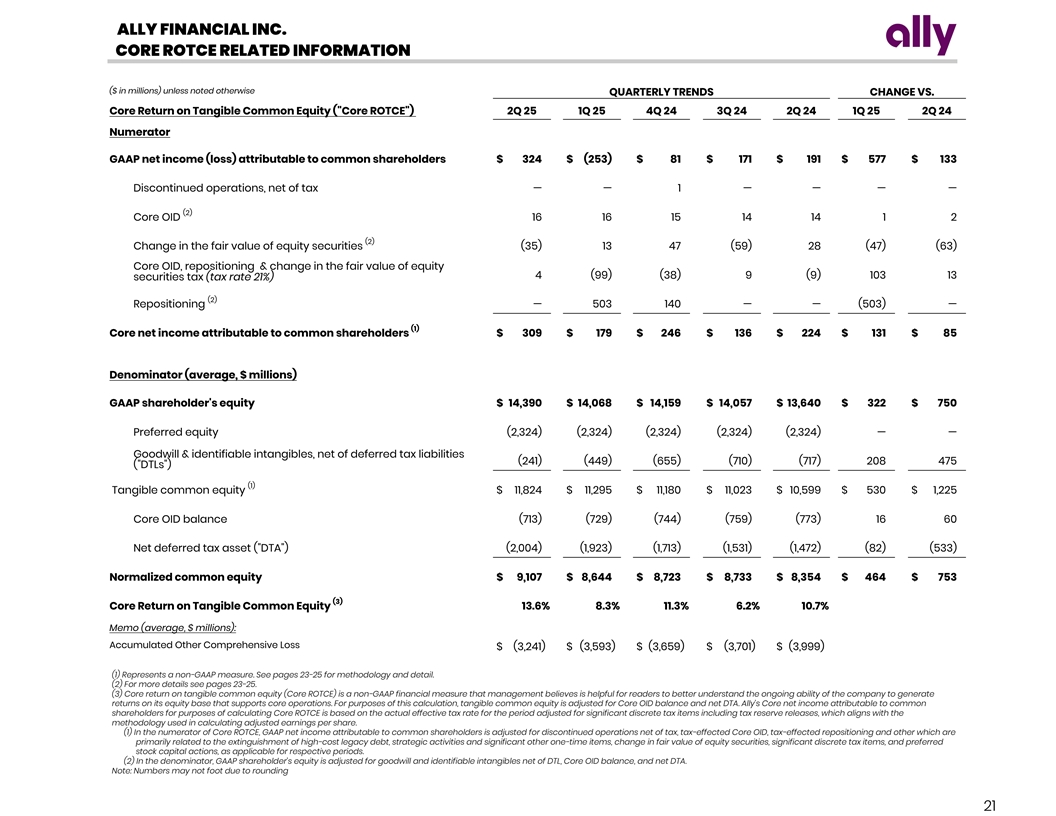
ALLY FINANCIAL INC. CORE ROTCE RELATED INFORMATION ($ in millions) unless noted otherwise QUARTERLY TRENDS CHANGE VS. Core Return on Tangible Common Equity ( Core ROTCE ) 2Q 25 1Q 25 4Q 24 3Q 24 2Q 24 1Q 25 2Q 24 Numerator GAAP net income (loss) attributable to common shareholders $ 324 $ (253) $ 81 $ 171 $ 191 $ 577 $ 133 Discontinued operations, net of tax — — 1 — — — — (2) Core OID 16 16 15 14 14 1 2 (2) Change in the fair value of equity securities (35) 13 47 (59) 28 (47) (63) Core OID, repositioning & change in the fair value of equity 4 (99) (38) 9 (9) 103 13 securities tax (tax rate 21%) (2) Repositioning — 503 140 — — (503) — (1) Core net income attributable to common shareholders $ 309 $ 179 $ 246 $ 136 $ 224 $ 131 $ 85 Denominator (average, $ millions) GAAP shareholder's equity $ 14,390 $ 14,068 $ 14,159 $ 14,057 $ 13,640 $ 322 $ 750 Preferred equity (2,324) (2,324) (2,324) (2,324) (2,324) — — Goodwill & identifiable intangibles, net of deferred tax liabilities (241) (449) (655) (710) (717) 208 475 ( DTLs ) (1) Tangible common equity $ 11,824 $ 11,295 $ 11,180 $ 11,023 $ 10,599 $ 530 $ 1,225 Core OID balance (713) (729) (744) (759) (773) 16 60 Net deferred tax asset ( DTA ) (2,004) (1,923) (1,713) (1,531) (1,472) (82) (533) Normalized common equity $ 9,107 $ 8,644 $ 8,723 $ 8,733 $ 8,354 $ 464 $ 753 (3) Core Return on Tangible Common Equity 1 3.6 % 8 .3 % 1 1.3 % 6 .2% 10.7% Memo (average, $ millions): Accumulated Other Comprehensive Loss $ (3,241) $ (3,593) $ (3,659) $ (3,701) $ (3,999) (1) Represents a non-GAAP measure. See pages 23-25 for methodology and detail. (2) For more details see pages 23-25. (3) Core return on tangible common equity (Core ROTCE) is a non-GAAP financial measure that management believes is helpful for readers to better understand the ongoing ability of the company to generate returns on its equity base that supports core operations. For purposes of this calculation, tangible common equity is adjusted for Core OID balance and net DTA. Ally’s Core net income attributable to common shareholders for purposes of calculating Core ROTCE is based on the actual effective tax rate for the period adjusted for significant discrete tax items including tax reserve releases, which aligns with the methodology used in calculating adjusted earnings per share. (1) In the numerator of Core ROTCE, GAAP net income attributable to common shareholders is adjusted for discontinued operations net of tax, tax-effected Core OID, tax-effected repositioning and other which are primarily related to the extinguishment of high-cost legacy debt, strategic activities and significant other one-time items, change in fair value of equity securities, significant discrete tax items, and preferred stock capital actions, as applicable for respective periods. (2) In the denominator, GAAP shareholder’s equity is adjusted for goodwill and identifiable intangibles net of DTL, Core OID balance, and net DTA. Note: Numbers may not foot due to rounding 21
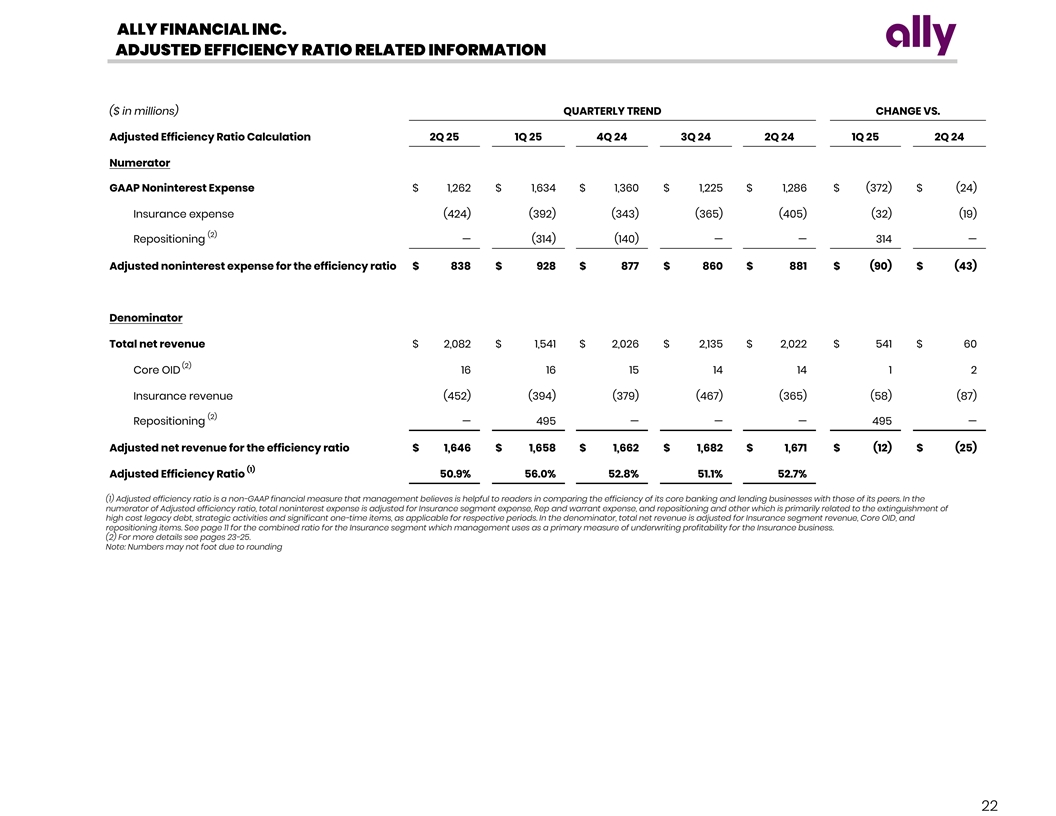
ALLY FINANCIAL INC. ADJUSTED EFFICIENCY RATIO RELATED INFORMATION ($ in millions) QUARTERLY TREND CHANGE VS. Adjusted Efficiency Ratio Calculation 2Q 25 1Q 25 4Q 24 3Q 24 2Q 24 1Q 25 2Q 24 Numerator GAAP Noninterest Expense $ 1,262 $ 1,634 $ 1,360 $ 1,225 $ 1,286 $ (372) $ (24) Insurance expense (424) (392) (343) (365) (405) (32) (19) (2) Repositioning — (314) (140) — — 314 — Adjusted noninterest expense for the efficiency ratio $ 838 $ 928 $ 877 $ 860 $ 881 $ (90) $ (43) Denominator Total net revenue $ 2,082 $ 1,541 $ 2,026 $ 2,135 $ 2,022 $ 541 $ 60 (2) Core OID 16 16 15 14 14 1 2 Insurance revenue (452) (394) (379) (467) (365) (58) (87) (2) Repositioning — 495 — — — 495 — Adjusted net revenue for the efficiency ratio $ 1,646 $ 1,658 $ 1,662 $ 1,682 $ 1,671 $ (12) $ (25) (1) Adjusted Efficiency Ratio 5 0.9% 5 6.0 % 52.8 % 51.1% 5 2.7 % (1) Adjusted efficiency ratio is a non-GAAP financial measure that management believes is helpful to readers in comparing the efficiency of its core banking and lending businesses with those of its peers. In the numerator of Adjusted efficiency ratio, total noninterest expense is adjusted for Insurance segment expense, Rep and warrant expense, and repositioning and other which is primarily related to the extinguishment of high cost legacy debt, strategic activities and significant one-time items, as applicable for respective periods. In the denominator, total net revenue is adjusted for Insurance segment revenue, Core OID, and repositioning items. See page 11 for the combined ratio for the Insurance segment which management uses as a primary measure of underwriting profitability for the Insurance business. (2) For more details see pages 23-25. Note: Numbers may not foot due to rounding 22
ALLY FINANCIAL INC. The following are non-GAAP financial measures which Ally believes are important to the reader of the Consolidated Financial Statements, but which are supplemental to and not a substitute for GAAP measures: Accelerated issuance expense (Accelerated OID), Adjusted earnings per share (Adjusted EPS), Adjusted efficiency ratio, Adjusted noninterest expense, Adjusted other revenue, Adjusted tangible book value per share (Adjusted TBVPS), Adjusted total net revenue, Core net income attributable to common shareholders, Core original issue discount (Core OID) amortization expense, Core outstanding original issue discount balance (Core OID balance), Core pre-tax income, Core return on tangible common equity (Core ROTCE), Investment income and other (adjusted), Net financing revenue (excluding Core OID), Net interest margin (excluding Core OID), and Tangible Common Equity. These measures are used by management and we believe are useful to investors in assessing the company’s operating performance and capital. 1) Accelerated issuance expense (Accelerated OID) is the recognition of issuance expenses related to calls of redeemable debt. 2) Adjusted earnings per share (Adjusted EPS) is a non-GAAP financial measure that adjusts GAAP EPS for revenue and expense items that are typically strategic in nature or that management otherwise does not view as reflecting the operating performance of the company. Management believes Adjusted EPS can help the reader better understand the operating performance of the core businesses and their ability to generate earnings. In the numerator of Adjusted EPS, GAAP net income attributable to common shareholders is adjusted for the following items: (1) excludes discontinued operations, net of tax, as Ally is primarily a domestic company and sales of international businesses and other discontinued operations in the past have significantly impacted GAAP EPS, (2) adds back the tax-effected non-cash Core OID, (3) adjusts for tax-effected repositioning and other which are primarily related to the extinguishment of high cost legacy debt, strategic activities and significant other one-time items, (4) excludes change in fair value of equity securities, (5) excludes significant discrete tax items that do not relate to the operating performance of the core businesses, and adjusts for preferred stock capital actions that have been taken by the company to normalize its capital structure, as applicable for respective periods. 3) Adjusted efficiency ratio is a non-GAAP financial measure that management believes is helpful to readers in comparing the efficiency of its core banking and lending businesses with those of its peers. (1) In the numerator of Adjusted efficiency ratio, total noninterest expense is adjusted for Rep and warrant expense, Insurance segment expense, and repositioning and other which are primarily related to the extinguishment of high-cost legacy debt, strategic activities and significant other one-time items, as applicable for respective periods. (2) In the denominator, total net revenue is adjusted for Core OID and Insurance segment revenue. 4) Adjusted noninterest expense is a non-GAAP financial measure that adjusts GAAP noninterest expense for repositioning items. Management believes adjusted noninterest expense is a helpful financial metric because it enables the reader better understand the business' expenses excluding nonrecurring items. 5) Adjusted other revenue is a non-GAAP financial measure that adjusts GAAP other revenue for OID expenses, repositioning, and change in fair value of equity securities. Management believes adjusted other revenue is a helpful financial metric because it enables the reader to better understand the business' ability to generate other revenue. 6) Adjusted Provision for Credit Losses is a non-GAAP financial measure that adjusts GAAP provision for credit losses for repositioning items. Management believes adjusted provision for credit losses is a helpful financial metric because it enables the reader better understand the business’s expenses excluding nonrecurring items. 7) Adjusted tangible book value per share (Adjusted TBVPS) is a non-GAAP financial measure that reflects the book value of equity attributable to shareholders even if Core OID balance were accelerated immediately through the financial statements. As a result, management believes Adjusted TBVPS provides the reader with an assessment of value that is more conservative than GAAP common shareholder’s equity per share. Adjusted TBVPS generally adjusts common equity for: (1) goodwill and identifiable intangibles, net of DTLs, (2) tax-effected Core OID balance to reduce tangible common equity in the event the corresponding discounted bonds are redeemed/tendered, and (3) Series G discount which reduces tangible common equity as the company has normalized its capital structure, as applicable for respective periods. Note: In December 2017, tax-effected Core OID balance was adjusted from a statutory U.S. Federal tax rate of 35% to 21% (“rate”) as a result of changes to U.S. tax law. The adjustment conservatively increased the tax-effected Core OID balance and consequently reduced Adjusted TBVPS as any acceleration of the non-cash charge in future periods would flow through the financial statements at a 21% rate versus a previously modeled 35% rate. 8) Adjusted total net revenue is a non-GAAP financial measure that management believes is helpful for readers to understand the ongoing ability of the company to generate revenue. For purposes of this calculation, GAAP net financing revenue is adjusted by excluding Core OID to calculate net financing revenue ex. core OID. GAAP other revenue is adjusted for OID expenses, repositioning, and change in fair value of equity securities to calculate adjusted other revenue. Adjusted total net revenue is calculated by adding net financing revenue ex. core OID to adjusted other revenue. 9) Change in fair value of equity securities impacts the Insurance, Corporate Finance and Corporate and Other segments. The change reflects fair value adjustments to equity securities that are reported at fair value. Management believes the change in fair value of equity securities should be removed from select financial measures because it enables the reader to better understand the business’ ongoing ability to generate revenue and income. 23
ALLY FINANCIAL INC. The following are non-GAAP financial measures which Ally believes are important to the reader of the Consolidated Financial Statements, but which are supplemental to and not a substitute for GAAP measures: Accelerated issuance expense (Accelerated OID), Adjusted earnings per share (Adjusted EPS), Adjusted efficiency ratio, Adjusted noninterest expense, Adjusted other revenue, Adjusted tangible book value per share (Adjusted TBVPS), Adjusted total net revenue, Core net income attributable to common shareholders, Core original issue discount (Core OID) amortization expense, Core outstanding original issue discount balance (Core OID balance), Core pre-tax income, Core return on tangible common equity (Core ROTCE), Investment income and other (adjusted), Net financing revenue (excluding Core OID), Net interest margin (excluding Core OID), and Tangible Common Equity. These measures are used by management and we believe are useful to investors in assessing the company’s operating performance and capital. 10) Core net income attributable to common shareholders is a non-GAAP financial measure that serves as the numerator in the calculations of Adjusted EPS and Core ROTCE and that, like those measures, is believed by management to help the reader better understand the operating performance of the core businesses and their ability to generate earnings. Core net income attributable to common shareholders adjusts GAAP net income attributable to common shareholders for discontinued operations net of tax, tax-effected Core OID expense, tax-effected repositioning and other primarily related to the extinguishment of high-cost legacy debt and strategic activities and significant other, preferred stock capital actions, significant discrete tax items and tax-effected changes in equity investments measured at fair value, as applicable for respective periods. 11) Core original issue discount (Core OID) amortization expense is a non-GAAP financial measure for OID and is believed by management to help the reader better understand the activity removed from: Core pre-tax income (loss), Core net income (loss) attributable to common shareholders, Adjusted EPS, Core ROTCE, Adjusted efficiency ratio, Adjusted total net revenue, and Net financing revenue (excluding Core OID). Core OID is primarily related to bond exchange OID which excludes international operations and future issuances. Core OID for all periods shown is applied to the pre-tax income of the Corporate and Other segment. 12) Core outstanding original issue discount balance (Core OID balance) is a non-GAAP financial measure for outstanding OID and is believed by management to help the reader better understand the balance removed from Core ROTCE and Adjusted TBVPS. Core OID balance is primarily related to bond exchange OID which excludes international operations and future issuances. 13) Core pre-tax income is a non-GAAP financial measure that adjusts pre-tax income from continuing operations by excluding (1) Core OID, and (2) change in fair value of equity securities (change in fair value of equity securities impacts the Insurance and Corporate Finance segments), and (3) Repositioning and other which are primarily related to the extinguishment of high cost legacy debt, strategic activities and significant other one-time items, as applicable for respective periods or businesses. Management believes core pre- tax income can help the reader better understand the operating performance of the core businesses and their ability to generate earnings. 14) Core return on tangible common equity (Core ROTCE) is a non-GAAP financial measure that management believes is helpful for readers to better understand the ongoing ability of the company to generate returns on its equity base that supports core operations. For purposes of this calculation, tangible common equity is adjusted for Core OID balance and net DTA. Ally’s Core net income attributable to common shareholders for purposes of calculating Core ROTCE is based on the actual effective tax rate for the period adjusted for significant discrete tax items including tax reserve releases, which aligns with the methodology used in calculating adjusted earnings per share. (1) In the numerator of Core ROTCE, GAAP net income attributable to common shareholders is adjusted for discontinued operations net of tax, tax-effected Core OID, tax-effected repositioning and other which are primarily related to the extinguishment of high-cost legacy debt, strategic activities and significant other one- time items, change in fair value of equity securities, significant discrete tax items, and preferred stock capital actions, as applicable for respective periods. (2) In the denominator, GAAP shareholder’s equity is adjusted for goodwill and identifiable intangibles net of DTL, Core OID balance, and net DTA. 15) Estimated impact of CECL on regulatory capital per final rule issued by U.S. banking agencies - In December 2018, the FRB and other U.S. banking agencies approved a final rule to address the impact of CECL on regulatory capital by allowing BHCs and banks, including Ally, the option to phase in the day-one impact of CECL over a three-year period. In March 2020, the FRB and other U.S. banking agencies issued an interim final rule that became effective on March 31, 2020 and provided an alternative option for banks to temporarily delay the impacts of CECL, relative to the incurred loss methodology for estimating the allowance for loan losses, on regulatory capital. A final rule that was largely unchanged from the March 2020 interim final rule was issued by the FRB and other U.S. banking agencies in August 2020, and became effective in September 2020. For regulatory capital purposes, these rules permitted us to delay recognizing the estimated impact of CECL on regulatory capital until after a two-year deferral period, which for us extended through December 31, 2021. Beginning on January 1, 2022, we are required to phase in 25% of the previously deferred estimated capital impact of CECL, with an additional 25% to be phased in at the beginning of each subsequent year until fully phased in by the first quarter of 2025. Under these rules, firms that adopt CECL and elect the five-year transition will calculate the estimated impact of CECL on regulatory capital as the day-one impact of adoption plus 25% of the subsequent change in allowance during the two-year deferral period, which according to the final rule approximates the impact of CECL relative to an incurred loss model. We adopted this transition option during the first quarter of 2020, and phased in the regulatory capital impacts of CECL from January 1, 2022, to January 1, 2025, in accordance with the five-year transition period. 16) Investment income and other (adjusted) is a non-GAAP financial measure that adjusts GAAP investment income and other for repositioning, and the change in fair value of equity securities. Management believes investment income and other (adjusted) is a helpful financial metric because it enables the reader to better understand the business' ability to generate investment income. 24
ALLY FINANCIAL INC. The following are non-GAAP financial measures which Ally believes are important to the reader of the Consolidated Financial Statements, but which are supplemental to and not a substitute for GAAP measures: Accelerated issuance expense (Accelerated OID), Adjusted earnings per share (Adjusted EPS), Adjusted efficiency ratio, Adjusted noninterest expense, Adjusted other revenue, Adjusted tangible book value per share (Adjusted TBVPS), Adjusted total net revenue, Core net income attributable to common shareholders, Core original issue discount (Core OID) amortization expense, Core outstanding original issue discount balance (Core OID balance), Core pre-tax income, Core return on tangible common equity (Core ROTCE), Investment income and other (adjusted), Net financing revenue (excluding Core OID), Net interest margin (excluding Core OID), and Tangible Common Equity. These measures are used by management and we believe are useful to investors in assessing the company’s operating performance and capital. 17) Net financing revenue excluding core OID is calculated using a non-GAAP measure that adjusts net financing revenue by excluding Core OID. The Core OID balance is primarily related to bond exchange OID which excludes international operations and future issuances. Management believes net financing revenue ex. Core OID is a helpful financial metric because it enables the reader to better understand the business' ability to generate revenue. 18) Net interest margin excluding core OID is calculated using a non-GAAP measure that adjusts net interest margin by excluding Core OID. The Core OID balance is primarily related to bond exchange OID which excludes international operations and future issuances. Management believes net interest margin ex. Core OID is a helpful financial metric because it enables the reader to better understand the business' profitability and margins. 19) Repositioning is primarily related to the extinguishment of high-cost legacy debt, strategic activities, restructuring, amounts related to nonrecurring business transactions or pending transactions, and significant other one-time items. 20) Tangible Common Equity is a non-GAAP financial measure that is defined as common stockholders’ equity less goodwill and identifiable intangible assets, net of deferred tax liabilities. Ally considers various measures when evaluating capital adequacy, including tangible common equity. Ally believes that tangible common equity is important because we believe readers may assess our capital adequacy using this measure. Additionally, presentation of this measure allows readers to compare certain aspects of our capital adequacy on the same basis to other companies in the industry. For purposes of calculating Core return on tangible common equity (Core ROTCE), tangible common equity is further adjusted for Core OID balance and net deferred tax asset. 25