UNITED STATES
SECURITIES AND EXCHANGE COMMISSION
Washington, D.C. 20549
FORM 6-K
REPORT OF FOREIGN PRIVATE ISSUER
PURSUANT TO SECTION 13A-16 OR 15D-16
UNDER THE SECURITIES EXCHANGE ACT OF 1934
For the month of May 2025
Commission File Number: 001-40865
Wallbox N.V.
(Translation of registrant’s name into English)
Carrer del Foc, 68
Barcelona, Spain 08038
Tel: +34 930 181 668
(Address of principal executive office)
Indicate by check mark whether the registrant files or will file annual reports under cover of Form 20-F or Form 40-F.
Form 20-F ☒ Form 40-F ☐
EXPLANATORY NOTE
On May 7, 2025, Wallbox N.V. (the “Company” or “Wallbox”) released information regarding its results of operations for the three months ended March 31, 2025. A copy of the Company’s press release and presentation materials are furnished hereto as Exhibits 99.1 and 99.2, respectively.
WALLBOX N.V. FIRST QUARTER 2025 RESULTS
| • | For the quarter ended March 31, 2025, the Company had revenue of €37.6 million, gross margin of 38.1% and operating loss of €19.6 million. |
| • | For the quarter ended March 31, 2025, labor costs and other operating expenses were €25 million and capital expenses were €0.7 million, of which €0.3 million was invested in property, plant and equipment. |
| • | During the three-month ended March 31, 2025, revenues by product and as a percentage of total revenues were as follows: |
| • | AC chargers – €25.6 million / 68% |
| • | DC chargers – €4 million / 11% |
| • | Software and other services – €8 million / 21% |
| • | During the three months ended March 31, 2025, revenues by geography and as a percentage of total revenues were as follows: |
| • | Europe – €25.5 million / 68% |
| • | North America – €11.4 million / 30% |
| • | Asia Pacific – €0.3 million / 1% |
| • | Latin America – €0.5 million / 1% |
| • | During the three months ended March 31, 2025, the Company sold approximately 36,000 AC units and 100 DC units. |
| • | As of March 31, 2025, the Company had inventory of €63.6 million. |
| • | As of March 31, 2025, the Company had approximately €40.6 million in cash, cash equivalents and financial investments and approximately €199 million of outstanding loans and borrowings. |
| • | Obtained CTEP and NTEP certifications for the Supernova DC fast charger. |
| • | Finalized debt framework agreement with primary lenders Santander, BBVA, Caixa and syndicated loan (EBN, ICO, ICF, MoraBanc and COFIDES) to defer the Company’s debt payments until May 2026. |
Consolidated Statements of Profit or Loss
(In thousand Euros)
| Year End | Quarter End | |||||||||||||||||||
| 2024 | 2023 | Q1 2025 | Q4 2024 | Q1 2024 | ||||||||||||||||
| Revenue |
163,943 | 143,769 | 37,642 | 37,394 | 43,050 | |||||||||||||||
| Changes in inventories and raw materials and consumables used |
(107,920 | ) | (95,503 | ) | (23,284 | ) | (25,500 | ) | (25,989 | ) | ||||||||||
|
|
|
|
|
|
|
|
|
|
|
|||||||||||
| Gross Profit |
56,023 | 48,266 | 14,358 | 11,894 | 17,061 | |||||||||||||||
| Employee benefits |
(71,488 | ) | (81,236 | ) | (14,975 | ) | (16,824 | ) | (19,823 | ) | ||||||||||
| Other operating expenses |
(54,089 | ) | (59,788 | ) | (10,011 | ) | (11,940 | ) | (12,788 | ) | ||||||||||
| Amortization and depreciation |
(37,873 | ) | (28,443 | ) | (10,204 | ) | (10,191 | ) | (8,750 | ) | ||||||||||
| Impairment of assets |
(26,415 | ) | — | 1,194 | (24,066 | ) | — | |||||||||||||
| Net other income |
25 | 14,260 | 22 | 57 | 519 | |||||||||||||||
|
|
|
|
|
|
|
|
|
|
|
|||||||||||
| Operating Loss |
(133,817 | ) | (106,941 | ) | (19,616 | ) | (51,070 | ) | (23,781 | ) | ||||||||||
| Financial income |
1,945 | 1,472 | 207 | 704 | 383 | |||||||||||||||
| Financial expense |
(23,680 | ) | (15,247 | ) | (3,489 | ) | (6,484 | ) | (5,878 | ) | ||||||||||
| Change in fair value of derivative warrant liabilities |
1,081 | 6,476 | 681 | 5,525 | (344 | ) | ||||||||||||||
| Foreign exchange gains / (losses) |
(4,044 | ) | 1,466 | 3,876 | (4,656 | ) | (1,291 | ) | ||||||||||||
|
|
|
|
|
|
|
|
|
|
|
|||||||||||
| Financial Results |
(24,698 | ) | (5,833 | ) | 1,275 | (4,911 | ) | (7,130 | ) | |||||||||||
| Loss Before Tax |
(158,515 | ) | (112,774 | ) | (18,341 | ) | (55,981 | ) | (30,911 | ) | ||||||||||
| Income tax credit |
6,723 | 703 | (73 | ) | 5,097 | 486 | ||||||||||||||
| Loss for the Period |
(151,792 | ) | (112,071 | ) | (18,414 | ) | (50,884 | ) | (30,425 | ) | ||||||||||
Cash and Cash Equivalents
(In thousand Euros)
| Quarter Ended March 31 | Year Ended December 31 | |||||||||||||||
| 2025 | 2024 | 2024 | 2023 | |||||||||||||
| Cash and cash equivalents |
35,582 | 77,932 | 20,036 | 101,158 | ||||||||||||
| Financial Investments (1) |
5,053 | 5,395 | 25,578 | 5,426 | ||||||||||||
|
|
|
|
|
|
|
|
|
|||||||||
| Cash, cash equivalents and Financial Investments |
40,635 | 83,327 | 45,614 | 106,584 | ||||||||||||
| (1) | Financial Investments are included in Other current financial assets |
Investments and Loans & Borrowings
(In thousand Euros)
| Quarter Ended March 31 | Year Ended December 31 | |||||||||||||||
| 2025 | 2024 | 2024 | 2023 | |||||||||||||
| Investments in Property, plant and equipment and Intangible Assets |
||||||||||||||||
| Property, plant and equipment |
335 | 845 | 3,114 | 9,106 | ||||||||||||
| Intangible assets - excluding R&D (salaries capitalized) |
378 | 927 | 6,790 | 7,103 | ||||||||||||
|
|
|
|
|
|
|
|
|
|||||||||
| Total Investments in Property, plant and equipment and Intangible Assets |
713 | 1,772 | 9,904 | 16,209 | ||||||||||||
| Non-Current Liabilities – Loans and Borrowings |
66,762 | 95,787 | 66,659 | 80,861 | ||||||||||||
| Current Liabilities – Loans and Borrowings |
132,636 | 115,845 | 131,810 | 126,496 | ||||||||||||
|
|
|
|
|
|
|
|
|
|||||||||
| Total Loans and Borrowings |
199,398 | 211,632 | 198,469 | 207,357 | ||||||||||||
Definitions and Basis of Presentation
| • | Gross Margin is defined as revenue less changes in inventory, raw materials and other consumables used divided by revenue. |
| • | Operating loss consists of the Company’s revenue and other income, less changes in inventories and raw materials and consumables used, employee benefits, other operating expenses, impairment of assets, and amortization and depreciation. |
| • | Other operating expenses primarily consist of professional services, marketing expenses, external temporary workers expense, delivery expense, insurance premiums and other expenses, including leases of machinery with lease terms of 12 months or less and leases of office equipment with low value, including IT equipment. |
| • | Revenue consists of retail sales, sales from distributors, resellers and installer customers of charging solutions for EVs, which includes electronic chargers and other services. |
INCORPORATION BY REFERENCE
The information included in this Report on Form 6-K under the heading “Wallbox N.V. First Quarter 2025 Results” is hereby incorporated by reference into the Company’s Registration Statement on Form S-8 (File No. 333-263795) and Registration Statements on Form F-3, as amended (File Nos. 333-268347, 333-268792, 333-271116, 333-273323, 333-276491 and 333-281952) and to be a part thereof from the date on which this report is filed, to the extent not superseded by documents or reports subsequently filed or furnished. Exhibit 99.1 and Exhibit 99.2 hereto shall not be deemed incorporated by reference into such registration statements.
EXHIBIT INDEX
| Exhibit No. |
Description |
|
| 99.1 | Wallbox N.V. Press Release, dated May 7, 2025 | |
| 99.2 | Wallbox N.V. Presentation, dated May 7, 2025 | |
SIGNATURES
Pursuant to the requirements of the Securities Exchange Act of 1934, as amended, the registrant has duly caused this report to be signed on its behalf by the undersigned hereunto duly authorized.
| Wallbox N.V. | ||||||
| Date: May 7, 2025 | By: | /s/ Enric Asunción Escorsa | ||||
| Enric Asunción Escorsa | ||||||
| Chief Executive Officer | ||||||
Exhibit 99.1

Wallbox Announces First Quarter 2025 Financial Results
BARCELONA, SPAIN - May 7, 2025 - Wallbox N.V. (NYSE:WBX), a leading provider of electric vehicle (“EV”) charging and energy management solutions worldwide, today announced its financial results for the first quarter ended March 31, 2025 and provided a business update.
First Quarter 2025 Highlights and Business Update:
| • | Generated revenue of €37.6 million in the quarter exceeding the guidance provided last quarter |
| • | Improved Gross Margin by 634 basis points quarter over quarter, now landing at 38.1% for the first quarter of 2025, within our target range |
| • | Adjusted EBITDA was €(7.8) million representing a 42% improvement quarter-over-quarter |
| • | North American sales maintained strong momentum, growing by 142% compared to the same period last year |
| • | Strong recovery of DC sales, growing 41% compared to last quarter |
| • | Continued operational optimization resulted in a 13% quarter-over-quarter reduction in labor costs and OPEX |
| • | Opened pre-orders for Wallbox’s Quasar 2 bi-birectional charger, in partnership with KIA, with a target to expand energy capabilities for Kia EV9 Drivers |
| • | Successfully obtained CTEP and NTEP certifications for the Supernova DC fast charger to boost sales in California, currently, the largest EV market in the USA |
| • | Finalized debt framework agreement with primary lenders Santander, BBVA, Caixa and the syndicated loan (EBN, ICO, ICF, MoraBanc and COFIDES) to defer debt payments until May 2026 |
| • | Surpassed the milestone of 100,000 EV chargers produced in the U.S. facility in Arlington, Texas. |
Executive Commentary
Enric Asunción, CEO of Wallbox, said, “We’ve kicked off 2025 with a solid first quarter, delivering revenue, Gross Margin, and Adjusted EBITDA in line or better than the guidance provided last quarter. Our growth with strategic partners and the creation of a healthy backlog for the upcoming quarter reinforce our confidence that we’re building real momentum. At the same time, we believe the Adjusted EBITDA break-even point is getting closer, thanks to continued gains in operational efficiency and another quarter of cost reductions, all while maintaining revenue. We’re also executing on strategic priorities, including opening pre-orders for Quasar 2 and restructuring banking agreements.”
Mr. Asunción continued, “The EV market delivered encouraging growth in the first quarter of 2025, a signal of renewed momentum for the industry. While we remain cautious in our outlook for the remainder of the year given ongoing economic uncertainty, our focus remains unchanged: to deliver best-in-class charging solutions that allow us to continue capturing growth from both existing and new customers, all while maintaining strict cost discipline. We are making meaningful progress across all these fronts. As Wallbox evolves into a more agile and efficient platform for growth, we are confident in our ability to unlock long-term value for our shareholders.”
Financial Outlook - Second Quarter 2025
The following reflects the company’s expectations for select key financial metrics for the second quarter 2025.
| • | Expects second quarter 2025 revenue to be in the range of €37 million and €39 million |
| • | Expects Gross Margin1 between 37% and 39% |
| • | Expects a negative Adjusted EBITDA1 between €(5) million and €(8) million |
| 1 | See Non-IFRS Financial Measures section below |
Conference Call Information
Wallbox NV will host a conference call to discuss the results and provide a business update at 8:00 AM Eastern Time today, May 7, 2025. The live audio webcast and accompanying presentation, will be accessible on Wallbox’s Investor Relations website at https://investors.wallbox.com/overview/default.aspx. A recording of the webcast will also be available following the conference call.
First Quarter 2025 Unaudited Financial Results
Wallbox N.V.
Consolidated Statements of Profit or Loss
(In thousand Euros)
| Year End | Quarter End | |||||||||||||||||||
| 2024 | 2023 | Q1 2025 | Q4 2024 | Q1 2024 | ||||||||||||||||
| Revenue |
163,943 | 143,769 | 37,642 | 37,394 | 43,050 | |||||||||||||||
| Changes in inventories and raw materials and consumables used |
(107,920 | ) | (95,503 | ) | (23,284 | ) | (25,500 | ) | (25,989 | ) | ||||||||||
|
|
|
|
|
|
|
|
|
|
|
|||||||||||
| Gross Profit |
56,023 | 48,266 | 14,358 | 11,894 | 17,061 | |||||||||||||||
| Employee benefits |
(71,488 | ) | (81,236 | ) | (14,975 | ) | (16,824 | ) | (19,823 | ) | ||||||||||
| Other operating expenses |
(54,089 | ) | (59,788 | ) | (10,011 | ) | (11,940 | ) | (12,788 | ) | ||||||||||
| Amortization and depreciation |
(37,873 | ) | (28,443 | ) | (10,204 | ) | (10,191 | ) | (8,750 | ) | ||||||||||
| Impairment of assets |
(26,415 | ) | — | 1,194 | (24,066 | ) | — | |||||||||||||
| Net other income |
25 | 14,260 | 22 | 57 | 519 | |||||||||||||||
|
|
|
|
|
|
|
|
|
|
|
|||||||||||
| Operating Loss |
(133,817 | ) | (106,941 | ) | (19,616 | ) | (51,070 | ) | (23,781 | ) | ||||||||||
| Financial income |
1,945 | 1,472 | 207 | 704 | 383 | |||||||||||||||
| Financial expense |
(23,680 | ) | (15,247 | ) | (3,489 | ) | (6,484 | ) | (5,878 | ) | ||||||||||
| Change in fair value of derivative warrant liabilities |
1,081 | 6,476 | 681 | 5,525 | (344 | ) | ||||||||||||||
| Foreign exchange gains / (losses) |
(4,044 | ) | 1,466 | 3,876 | (4,656 | ) | (1,291 | ) | ||||||||||||
|
|
|
|
|
|
|
|
|
|
|
|||||||||||
| Financial Results |
(24,698 | ) | (5,833 | ) | 1,275 | (4,911 | ) | (7,130 | ) | |||||||||||
| Loss Before Tax |
(158,515 | ) | (112,774 | ) | (18,341 | ) | (55,981 | ) | (30,911 | ) | ||||||||||
| Income tax credit |
6,723 | 703 | (73 | ) | 5,097 | 486 | ||||||||||||||
| Loss for the Period |
(151,792 | ) | (112,071 | ) | (18,414 | ) | (50,884 | ) | (30,425 | ) | ||||||||||
Reconciliation
(In thousand Euros)
| Year End | Quarter End | |||||||||||||||||||
| 2024 | 2023 | Q1 2025 | Q4 2024 | Q1 2024 | ||||||||||||||||
| Loss for the Period |
(151,792 | ) | (112,071 | ) | (18,414 | ) | (50,884 | ) | (30,425 | ) | ||||||||||
| Income tax credit |
(6,723 | ) | (703 | ) | 73 | (5,097 | ) | (486 | ) | |||||||||||
| Amortization and depreciation |
37,873 | 28,443 | 10,204 | 10,191 | 8,750 | |||||||||||||||
| Financial income |
(1,945 | ) | (1,472 | ) | (207 | ) | (704 | ) | (383 | ) | ||||||||||
| Financial expenses |
23,680 | 15,247 | 3,489 | 6,484 | 5,878 | |||||||||||||||
| Change in fair value of derivative warrant liabilities |
(1,081 | ) | (6,476 | ) | (681 | ) | (5,525 | ) | 344 | |||||||||||
| Foreign exchange gains/(losses) |
4,044 | (1,466 | ) | (3,876 | ) | 4,656 | 1,291 | |||||||||||||
|
|
|
|
|
|
|
|
|
|
|
|||||||||||
| EBITDA |
(95,944 | ) | (78,498 | ) | (9,412 | ) | (40,879 | ) | (15,031 | ) | ||||||||||
| Share based payment plan expenses |
2,837 | 14,191 | 557 | 586 | 652 | |||||||||||||||
| Other items |
(25 | ) | (3,094 | ) | (22 | ) | (57 | ) | (519 | ) | ||||||||||
| Negative goodwill |
— | (11,166 | ) | — | — | — | ||||||||||||||
| One-time expenses |
6,123 | 3,031 | 2,289 | 2,761 | 1,194 | |||||||||||||||
| Other non-cash expenses |
712 | 1,360 | 26 | 138 | 220 | |||||||||||||||
| Impairment of assets |
26,415 | — | (1,194 | ) | 24,066 | — | ||||||||||||||
|
|
|
|
|
|
|
|
|
|
|
|||||||||||
| Adjusted EBITDA |
(59,882 | ) | (74,176 | ) | (7,756 | ) | (13,385 | ) | (13,484 | ) | ||||||||||
Wallbox N.V.
Cash & Cash Equivalents
Cash and Cash Equivalents
(In thousand Euros)
| Quarter Ended March 31 | Year Ended December 31 | |||||||||||||||
| 2025 | 2024 | 2024 | 2023 | |||||||||||||
| Cash and cash equivalents |
35,582 | 77,932 | 20,036 | 101,158 | ||||||||||||
| Financial Investments (1) |
5,053 | 5,395 | 25,578 | 5,426 | ||||||||||||
|
|
|
|
|
|
|
|
|
|||||||||
| Cash, cash equivalents and Financial Investments |
40,635 | 83,327 | 45,614 | 106,584 | ||||||||||||
| (1) | Financial Investments are included in Other current financial assets |
Wallbox N.V.
Investments and Loans & Borrowings
Investments and Loans & Borrowings
(In thousand Euros)
| Quarter Ended March 31 | Year Ended December 31 | |||||||||||||||
| 2025 | 2024 | 2024 | 2023 | |||||||||||||
| Investments in Property, plant and equipment and Intangible Assets |
||||||||||||||||
| Property, plant and equipment |
335 | 845 | 3,114 | 9,106 | ||||||||||||
| Intangible assets - excluding R&D (salaries capitalized) |
378 | 927 | 6,790 | 7,103 | ||||||||||||
|
|
|
|
|
|
|
|
|
|||||||||
| Total Investments in Property, plant and equipment and Intangible Assets |
713 | 1,772 | 9,904 | 16,209 | ||||||||||||
| Non-Current Liabilities – Loans and Borrowings |
66,762 | 95,787 | 66,659 | 80,861 | ||||||||||||
| Current Liabilities – Loans and Borrowings |
132,636 | 115,845 | 131,810 | 126,496 | ||||||||||||
|
|
|
|
|
|
|
|
|
|||||||||
| Total Loans and Borrowings |
199,398 | 211,632 | 198,469 | 207,357 | ||||||||||||
Forward Looking Statements
This press release contains forward-looking statements within the meaning of the Private Securities Litigation Reform Act of 1995. We intend such forward-looking statements to be covered by the safe harbor provisions for forward-looking statements contained in Section 27A of the Securities Act of 1933, as amended (the “Securities Act”) and Section 21E of the Securities Exchange Act of 1934, as amended (the “Exchange Act”). All statements contained in this press release other than statements of historical fact should be considered forward-looking statements, including, without limitation, statements regarding Wallbox’s expected future operating results and financial position, long term profitability and cost optimization, industry and company growth, business strategy and plans and market opportunity, including in the California market. The words “anticipate,” “believe,” “can,” “continue,” “could,” “estimate,” “expect,” “focus,” “forecast,” “intend,” “likely,” “may,” “might,” “plan,” “possible,” “potential,” “predict,” “project,” “should,” “”target,” will,” “would” and similar expressions are intended to identify forward-looking statements, though not all forward-looking statements use these words or expressions. These statements are neither promises nor guarantees, but involve known and unknown risks, uncertainties and other important factors that may cause our actual results, performance or achievements to be materially different from any future results, performance or achievements expressed or implied by the forward-looking statements, including, but not limited to: Wallbox’s history of operating losses as an early stage company; the adoption and demand for electric vehicles including the success of alternative fuels, changes to rebates, tax credits and the impact of government incentives;political and economic uncertainty and macroeconomic factors, such as impacts from tariffs and trade barriers, consumer spending, inflation and foreign exchange rates; the accuracy of Wallbox’s forecasts and projections including those regarding its market opportunity; competition; risks related to losses or disruptions in Wallbox’s supply or manufacturing partners; impacts resulting from geopolitical conflicts; risks related to macro-economic conditions and inflation; Wallbox’s reliance on the third-parties outside of its control; risks related to Wallbox’s technology, intellectual property and infrastructure; executive orders and regulatory changes under the U.S. political administration and uncertainty therefrom, as well as the other important factors discussed under the caption “Risk Factors” in Wallbox’s Annual Report on Form 20-F for the fiscal year ended December 31, 2024, as such factors may be updated from time to time in its other filings with the Securities and Exchange Commission (the “SEC”), accessible on the SEC’s website at www.sec.gov and the Investors Relations section of Wallbox’s website at investors.wallbox.com. Any such forward-looking statements represent management’s estimates as of the date of this press release. Any forward-looking statement that Wallbox makes in this press release speaks only as of the date of such statement. Except as required by law, Wallbox disclaims any obligation to update or revise, or to publicly announce any update or revision to, any of the forward-looking statements, whether as a result of new information, future events or otherwise.
Non-IFRS Financial Measures
Wallbox reports its financial information required in accordance with the International Financial Reporting Standards (“IFRS”). This release includes financial measures not based on IFRS, including Adjusted EBITDA and Gross Margin (the “Non-IFRS Measure”). See the definitions set forth below for a further explanation of these terms.
Wallbox defines “Gross Margin” as revenue less changes in inventory, raw materials and other consumables used divided by revenue.
Wallbox defines EBITDA as loss for the period before income tax credit, financial income, financial expenses, amortization and depreciation, change in fair value of derivative warrants and foreign exchange gains/(losses). We define Adjusted EBITDA as EBITDA for the period further adjusted to take into account the impact of certain non-cash and other items that we do not consider in our evaluation of our ongoing operating performance. These non-cash and other items include, but not are limited to: share based payment plan expenses, certain one-time expenses related to a reduction in workforce initiated in January 2023, certain non-cash expenses related to the ESPP plan launched in January 2023, any negative goodwill arising from business combinations and other items outside the scope of our ordinary activities.
Management uses these Non-IFRS Measures as measurements of operating performance because they assist management in comparing the Company’s operating performance on a consistent basis, as they remove the impact of items not directly resulting from the Company’s core operations; for planning purposes, including the preparation of management’s internal annual operating budget and financial projections; to evaluate the performance and effectiveness of our strategic initiatives; and to evaluate the Company’s capacity to fund capital expenditures and expand its business.
The Non-IFRS Measures may not be comparable to similar measures disclosed by other companies, because not all companies and analysts calculate these measures in the same manner. We present the Non-IFRS Measures because we consider them to be important supplemental measures of our performance, and we believe they are frequently used by securities analysts, investors and other interested parties in the evaluation of companies. Management believes that investors’ understanding of our performance is enhanced by including the Non-IFRS Measures as a reasonable basis for comparing our ongoing results of operations. By providing the Non-IFRS Measures, together with reconciliations to IFRS, we believe we are enhancing investors’ understanding of our business and our results of operations, as well as assisting investors in evaluating how well we are executing our strategic initiatives.
Items excluded from the Non-IFRS Measures are significant components in understanding and assessing financial performance. The Non-IFRS Measures have limitations as analytical tools and should not be considered in isolation, or as an alternative to, or a substitute for loss for the period, revenue or other financial statement data presented in our consolidated financial statements as indicators of financial performance. Some of the limitations are: such measures do not reflect revenue related to fulfillment, which is necessary to the operation of our business; such measures do not reflect our expenditures, or future requirements for capital expenditures or contractual commitments; such measures do not reflect changes in our working capital needs; such measures do not reflect our share based payments, income tax benefit/(expense) or the amounts necessary to pay our taxes; although depreciation and amortization are not included in the calculation of Adjusted EBITDA, the assets being depreciated and amortized will often have to be replaced in the future and such measures do not reflect any costs for such replacements; and other companies may calculate such measures differently than we do, limiting their usefulness as comparative measures.
Due to these limitations, Adjusted EBITDA should not be considered as a measure of discretionary cash available to us to invest in the growth of our business and are in addition to, not a substitute for or superior to, measures of financial performance prepared in accordance with IFRS. In addition, the Non-IFRS Measures we use may differ from the non-IFRS financial measures used by other companies and are not intended to be considered in isolation or as a substitute for the financial information prepared and presented in accordance with IFRS. Furthermore, not all companies or analysts may calculate similarly titled measures in the same manner. We compensate for these limitations by relying primarily on our IFRS results and using the Non-IFRS Measures only as supplemental measures.
Reconciliations of the forward-looking non-IFRS measures to the most directly comparable IFRS measures cannot be provided without unreasonable efforts and are not provided herein because of the inherent difficulty in forecasting and quantifying certain amounts that are necessary for such reconciliations and certain other items reflected in our reconciliation of historical non-IFRS measures, the amounts of which could be material.
About Wallbox
Wallbox is a global technology company, dedicated to changing the way the world uses energy. Wallbox creates advanced electric vehicle charging and energy management systems that redefine the relationship between users and the network. Wallbox goes beyond charging electric vehicles to give users the power to control their consumption, save money and live more sustainably. Wallbox offers a complete portfolio of charging and energy management solutions for residential, semi-public, and public use in more than 100 countries around the world. Founded in 2015 in Barcelona, where the company’s headquarters are located, Wallbox currently has offices across Europe, Asia, and America. For more information, visit www.wallbox.com
| Wallbox Public Relations Contact: | Wallbox Investor Contact: | |
| Albert Cabanes | Michael Wilhelm | |
| Public Relations | Corporate Development & IR | |
| Press@wallbox.com | Investors@wallbox.com |
Source: Wallbox N.V.
Exhibit 99.2


2025 EARNINGS REPORT Enric Asunción Co-Founder & Chief Executive Officer Luis Boada Chief Financial Officer Michael Wilhelm Investor Relations

Disclaimer This presentation contains forward-looking statements within the meaning of the Private Securities Litigation Reform Act of 1995. We intend such forward-looking statements to be covered by the safe harbor provisions for forward-looking statements contained in Section 27A of the Securities Act of 1933, as amended (the “Securities Act”) and Section 21E of the Securities Exchange Act of 1934, as amended (the “Exchange Act”). All statements contained in this presentation other than statements of historical fact should be considered forward-looking statements, including, without limitation, statements regarding Wallbox’s future operating results and financial position, expected growth and profitability, expectations regarding partnerships and product features. The words “anticipate,” “believe,” “can,” “continue,” “could,” “estimate,” “expect,” “focus,” “forecast,” “intend,” “likely,” “may,” “might,” “plan,” “possible,” “potential,” “predict,” “project,” “should,” “”target,” will,” “would” and similar expressions are intended to identify forward-looking statements, though not all forward-looking statements use these words or expressions. These statements are neither promises nor guarantees, but involve known and unknown risks, uncertainties and other important factors that may cause our actual results, performance or achievements to be materially different from any future results, performance or achievements expressed or implied by the forward-looking statements, including, but not limited to: Wallbox’s history of operating losses as an early stage company; the adoption and demand for electric vehicles including the success of alternative fuels, changes to rebates, tax credits and the impact of government incentives;political and economic uncertainty and macroeconomic factors, such as impacts from tariffs and trade barriers, consumer spending, inflation and foreign exchange rates; the accuracy of Wallbox’s forecasts and projections including those regarding its market opportunity; competition; risks related to losses or disruptions in Wallbox’s supply or manufacturing partners; impacts resulting from geopolitical conflicts; risks related to macro-economic conditions and inflation; Wallbox’s reliance on the third-parties outside of its control; risks related to Wallbox’s technology, intellectual property and infrastructure; executive orders and regulatory changes under the U.S. political administration and uncertainty therefrom, as well as the other important factors discussed under the caption “Risk Factors” in Wallbox’s Annual Report on Form 20-F for the fiscal year ended December 31, 2024, as such factors may be updated from time to time in its other filings with the Securities and Exchange Commission (the “SEC”), accessible on the SEC’s website at www.sec.gov and the Investors Relations section of Wallbox’s website at investors.wallbox.com. Any such forward-looking statements represent management’s estimates as of the date of this press release. Any forward-looking statement that Wallbox makes in this press release speaks only as of the date of such statement. Except as required by law, Wallbox disclaims any obligation to update or revise, or to publicly announce any update or revision to, any of the forward-looking statements, whether as a result of new information, future events or otherwise. This presentation includes measures not calculated in accordance with the International Financial Reporting Standards (“IFRS”). See the slides at the end of this presentation for additional information and a reconciliation of these non-IFRS measures. Reconciliations of the forward-looking non-IFRS measures to the most directly comparable IFRS measures cannot be provided without unreasonable efforts and are not provided herein because of the inherent difficulty in forecasting and quantifying certain amounts that are necessary for such reconciliations and certain other items reflected in our reconciliation of historical non-IFRS measures, the amounts of which could be material. Unless otherwise indicated, information contained in this presentation concerning Wallbox’s industry and the markets in which it operates, including its general expectations, market position and market opportunity, is based on its management’s estimates and research, as well as industry and general publications and research, surveys and studies conducted by third parties. While Wallbox believes the information from these third-party publications, research, surveys and studies is reliable, it does not guarantee the accuracy or completeness of such information, and Wallbox has not independently verified this information. Management’s estimates are derived from publicly available information, their knowledge of the company’s industry and their assumptions based on such information and knowledge, which they believe to be reasonable. This data involves a number of assumptions and limitations which are necessarily subject to a high degree of uncertainty and risk due to a variety of factors, including those described in Wallbox’s periodic reports filed with the SEC under the caption “Risk Factors.” These and other factors could cause Wallbox’s future performance and market expectations to differ materially from its assumptions and estimates. Q1 2025 EARNINGS REPORT
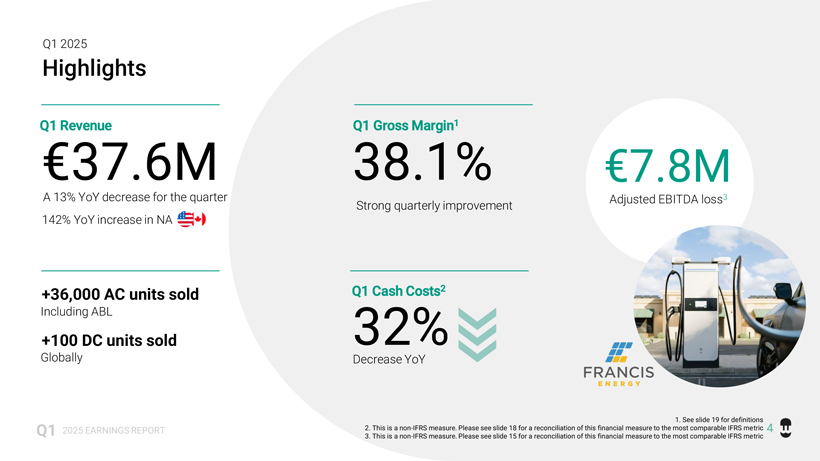
€7.8M Adjusted EBITDA loss3 Highlights Q1 2025 EARNINGS REPORT Q1 2025 €37.6M +36,000 AC units sold Including ABL +100 DC units sold Globally A 13% YoY decrease for the quarter Decrease YoY Strong quarterly improvement Q1 Revenue 1. See slide 19 for definitions 2. This is a non-IFRS measure. Please see slide 18 for a reconciliation of this financial measure to the most comparable IFRS metric 3. This is a non-IFRS measure. Please see slide 15 for a reconciliation of this financial measure to the most comparable IFRS metric 4 142% YoY increase in NA 38.1% Q1 Gross Margin1 32% Q1 Cash Costs2

Q1 2025 Revenues by Geography Q1 2025 EARNINGS REPORT 1. As percentage of revenue 2. Rho Motion EV Charging Database - April 2025 North America €11.4M / 30%1 Europe €25.5M / 68%1 LATAM €480k / 1%1 APAC €300k / 1%1 5

Q1 2025 Revenues by Product EARNINGS REPORT Q1 2025 DC Sales €4M / 11%1 AC Sales €25.6M / 68%1 Software, Services & Others €8M / 21%1 68% 11% 21% 1. As percentage of revenue 6

Q1 2025 Supernova PUBLIC SUPERNOVA • A next-generation fast public charger that offers greater efficiency and higher performance • Currently focused on speed, safety, transparency and compliance with applicable certifications • We achieved the California Type Evaluation Program (CTEP Certification) & National Type Wallbox x Pramac Turning Complexity Into Simplicity Evaluation Program (NTEP Certification) New Partnership • Strategic battery storage system initiative, a fully integrated charging solutions combining DC Fast charging, battery • Recently announced partnership energy storage and intelligent power distribution with Francis Energy • Includes Supernova 240 kW, scalable battery storage up to • Roll-out of newly CTEP 21 MWh from Pramac certified Supernova • To provide reduced grid dependency, accelerated site deployment and optimized energy usage Q1 2025 EARNINGS REPORT 7

Q1 2025 Quasar 2 Q1 2025 EARNINGS REPORT 8 PIONEERING TECH One of the first CCS bidirectional chargers in the world for residential use Initial launch of Quasar 2 with our partner KIA to enable bidirectional capabilities for the EV9 EASY INSTALLATION Installation service provided by COIL or another certified thirdparty installer BI-DIRECTIONAL Changes the flow of energy to enable V2H & V2G, and Back Up Power during blackouts HEMS1 Unleashes the EV’s full potential to power the home, enabling users to maximize savings while contributing to stabilize the grid 1. Home Energy Management System
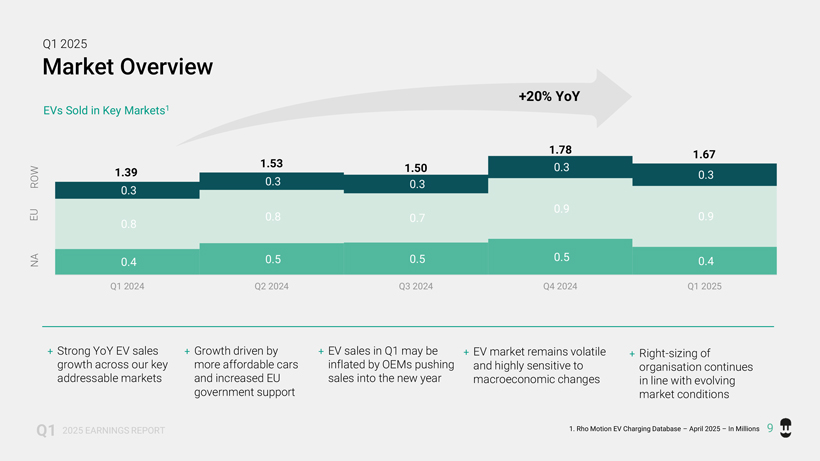
Q1 2025 Market Overview +20% YoY EVs Sold in Key Markets1 1.78 1.67 1.53 1.50 0.3 1.39 0.3 ROW 0.3 0.3 0.3 0.9 EU 0.8 0.7 0.9 0.8 NA 0.4 0.5 0.5 0.5 0.4 Q1 2024 Q2 2024 Q3 2024 Q4 2024 Q1 2025 + Strong YoY EV sales + Growth driven by + EV sales in Q1 may be + EV market remains volatile + Right-sizing of growth across our key more affordable cars inflated by OEMs pushing and highly sensitive to organisation continues addressable markets and increased EU sales into the new year macroeconomic changes in line with evolving government support market conditions Q1 2025 EARNINGS REPORT 1. Rho Motion EV Charging Database – April 2025 – In Millions 9

Q1 2025 Q1 2025 EARNINGS REPORT 1. See slide 19 for definitions 2. This is a non-IFRS measure. Please see slide 15 for a reconciliation of this financial measure to the most comparable IFRS metric Q1 Labor Costs & OPEX Q1 Revenue €37.6M Europe remained soft, but was offset by strong performance in North America Q1 Gross Margin1 38.1% Positively impacted by product mix and ABL’s cross-selling €25.0M 23% YoY improvement, reflecting increased operational efficiency Q1 Adjusted EBITDA Loss2 €7.8M Driven by the reduction in costs 10
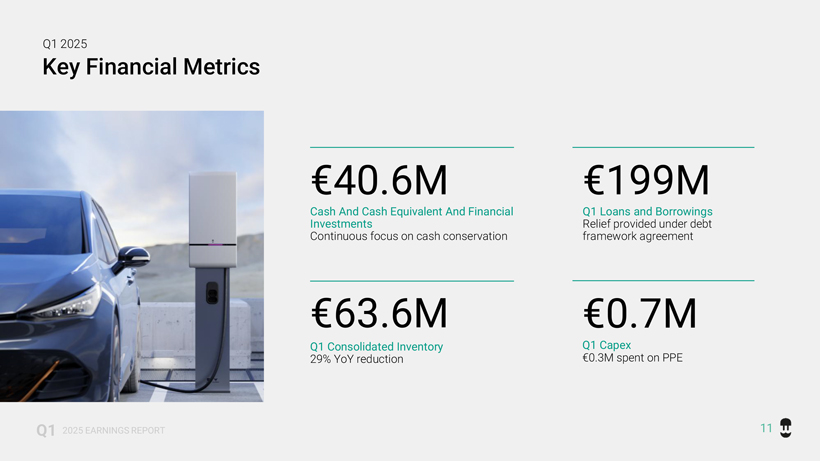
Q1 2025 Key Financial Metrics €40.6M €199M Cash And Cash Equivalent And Financial Q1 Loans and Borrowings Investments Relief provided under debt Continuous focus on cash conservation framework agreement €63.6M €0.7M Q1 Consolidated Inventory Q1 Capex 29% YoY reduction €0.3M spent on PPE Q1 2025 EARNINGS REPORT 11
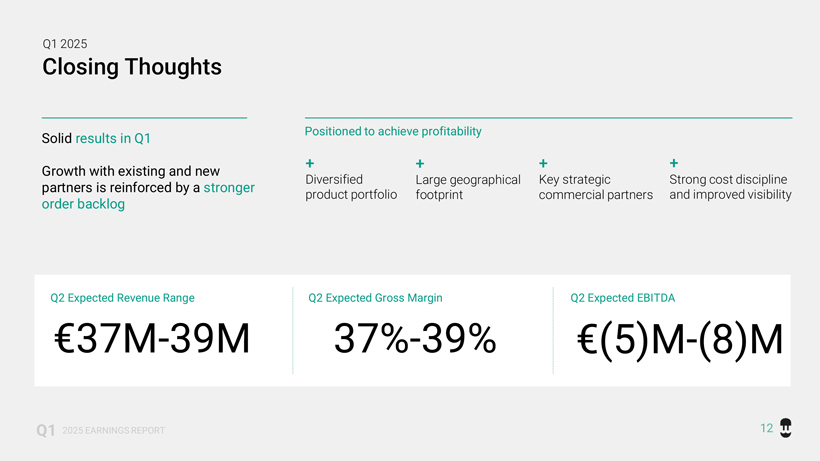
Q1 2025 Closing Thoughts Positioned to achieve profitability Solid results in Q1 + + + + Growth with existing and new Diversified Large geographical Key strategic Strong cost discipline partners is reinforced by a stronger product portfolio footprint commercial partners and improved visibility order backlog Q2 Expected Revenue Range Q2 Expected Gross Margin Q2 Expected EBITDA €37M-39M 37%-39% €(5)M-(8)M Q1 2025 EARNINGS REPORT 12

Q&A

Financial Overview Consolidated Statement of Profit or Loss1 Y E A R E N D E D Q UA R T E R E N D E D Unaudited, in € 000’s 3 1 D E C E MBER 3 1 D E C E MBER 20242 2023 Q1 2025 Q4 20242 Q1 2024 Revenue 163,943 143,769 37,642 37,394 43,050 Change in inventories and raw materials and consumables used (107,920) (95,503) (23,284) (25,500) (25,989) Gross Profit 56,023 48,266 14,358 11,894 17,061 Employee benefits (71,488) (81,236) (14,975) (16,824) (19,823) Other operating expenses (54,089) (59,788) (10,011) (11,940) (12,788) Amortization and depreciation (37,873) (28,443) (10,204) (10,191) (8,750) Impairment of assets (26,415) - 1,194 (24,066) - <<< Net other income 25 14,260 22 57 519 Operating Loss (133,817) (106,941) (19,616) (51,070) (23,781) Financial income 1,945 1,472 207 704 383 Financial expense (23,680) (15,247) (3,489) (6,484) (5,878) Change in fair value derivative warrant liabilities 1,081 6,476 681 5,525 (344) Foreign exchange gains/(losses) (4,044) 1,466 3,876 (4,656) (1,291) Financial Results (24,698) (5,833) 1,275 (4,911) (7,130) Loss before Tax (158,515) (112,774) (18,341) (55,981) (30,911) Income tax credit 6,723 703 (73) 5,097 486 Loss for the Period (151,792) (112,071) (18,414) (50,884) (30,425) Q1 2025 EARNINGS REPORT 1. See slide 19 for definitions 14 2. Includes updated financials after completion of the 2024 audit
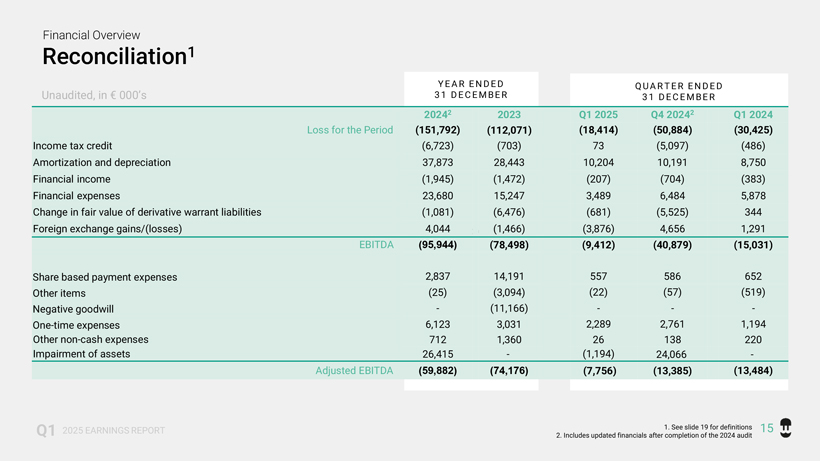
Financial Overview Reconciliation1 Y E A R E N D E D Q UA R T E R E N D E D Unaudited, in € 000’s 3 1 D E C E MBER 3 1 D E C E MBER 20242 2023 Q1 2025 Q4 20242 Q1 2024 Loss for the Period (151,792) (112,071) (18,414) (50,884) (30,425) Income tax credit (6,723) (703) 73 (5,097) (486) Amortization and depreciation 37,873 28,443 10,204 10,191 8,750 Financial income (1,945) (1,472) (207) (704) (383) Financial expenses 23,680 15,247 3,489 6,484 5,878 Change in fair value of derivative warrant liabilities (1,081) (6,476) (681) (5,525) 344 Foreign exchange gains/(losses) 4,044 (1,466) (3,876) 4,656 1,291 EBITDA (95,944) (78,498) (9,412) (40,879) (15,031) Share based payment expenses 2,837 14,191 557 586 652 Other items (25) (3,094) (22) (57) (519) Negative goodwill - (11,166) - - -One-time expenses 6,123 3,031 2,289 2,761 1,194 Other non-cash expenses 712 1,360 26 138 220 Impairment of assets 26,415 - (1,194) 24,066 -Adjusted EBITDA (59,882) (74,176) (7,756) (13,385) (13,484) Q1 2025 EARNINGS REPORT 1. See slide 19 for definitions 15 2. Includes updated financials after completion of the 2024 audit

Financial Overview Cash & Cash Equivalents Unaudited, in € 000’s Q UA RT E R E N D ED Y E A R E N D E D 3 1 M A R C H 3 1 DECEMBER 2025 2024 2024 2023 Cash and cash equivalents 35,582 77,932 20,036 101,158 Financial Investments (1) 5,053 5,395 25,578 5,426 Cash, cash equivalents and Financial Investments 40,635 83,327 45,614 106,584 Q1 2025 EARNINGS REPORT 1. Financial Investments are included in Other Current Financial Assets 16
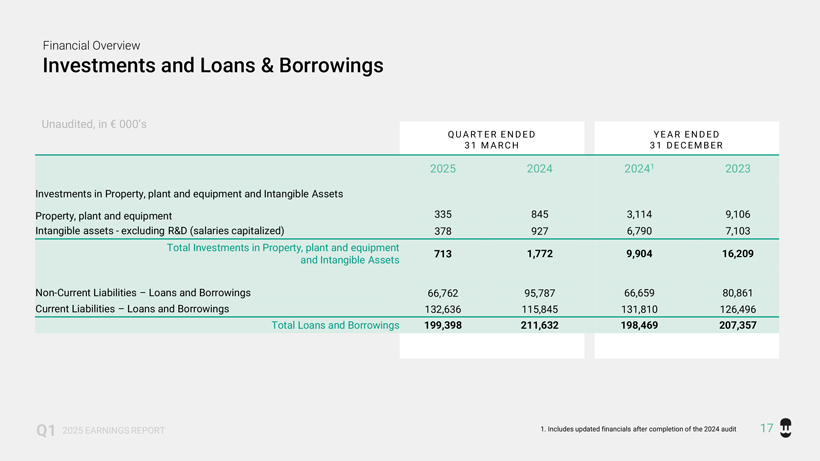
Financial Overview Investments and Loans & Borrowings Unaudited, in € 000’s Q U A R T E R E N D ED Y E A R E N D E D 3 1 M A R C H 3 1 D E C E MBER 2025 2024 20241 2023 Investments in Property, plant and equipment and Intangible Assets Property, plant and equipment 335 845 3,114 9,106 Intangible assets - excluding R&D (salaries capitalized) 378 927 6,790 7,103 Total Investments in Property, plant and equipment 713 1,772 9,904 16,209 and Intangible Assets Non-Current Liabilities – Loans and Borrowings 66,762 95,787 66,659 80,861 Current Liabilities – Loans and Borrowings 132,636 115,845 131,810 126,496 Total Loans and Borrowings 199,398 211,632 198,469 207,357 Q1 2025 EARNINGS REPORT 1. Includes updated financials after completion of the 2024 audit 17

Financial Overview Reconciliation Cash Costs1 Unaudited, in € 000’s Y E A R 2 0 2 5 Y E A R 2 0 2 4 Q1 Q4 Q1 Employee benefits (14,975) (16,824) (19,823) Other operating expenses (10,011) (11,940) (12,788) Labor Costs & OPEX (24,986) (28,764) (32,611) R&D activation (2,672) (3,091) (5,811) Share based payment expenses 557 586 652 One-time expenses 2,289 2,761 1,194 Other non-cash expenses 26 138 220Cash Costs (24,786) (28,370) (36,356) Q1 2025 EARNINGS REPORT 1. See slide 19 for definitions 18

Definitions and Disclosures 1 “EBITDA” is defined as loss for the period before income tax credit, financial income, financial expenses, amortization and depreciation, change in fair value of derivative warrants, and foreign exchange gains/(losses). 2 “Adjusted EBITDA” is defined as EBITDA EBITDA for the period further adjusted to take into account the impact of certain non-cash and other items that we do not in our evaluation of our ongoing operating performance. These non-cash and other items include, but not are limited to: share based payment plan expenses, certain one time expenses related to a reduction in workforce initiated in January 2023, certain non-cash expenses related to the ESPP plan launched in January 2023, any negative goodwill arising from business combinations and other items outside the scope of our ordinary activities. 3 Operating loss consists of Wallbox’s revenue and other income less changes in inventories and raw materials and consumables used, employee benefits, other operating expenses, impairment of assets, and amortization and depreciation.4 Wallbox’s revenue consists of retail sales, sales from distributors, resellers and installer customers of charging solutions for EVs, which includes electronic chargers and other services. 5 Gross Margin is defined as revenue less changes in inventory, raw materials and other consumables used divided by revenue.6 Other operating expenses primarily consist of professional services, marketing expenses, external temporary workers expense, delivery expense, insurance premiums other expenses, including leases of machinery with lease terms of 12 months or less and leases of office equipment with low value, including IT equipment. 7 Cash costs is defined as labor costs & opex excluding R&D activation, share based payment expenses, one-time expenses and other non-cash expenses. Q1 2025 x EARNINGS REPORT

Thank you Gracias Danke Web Contact Twitter @wallboxchargers www.investors.wallbox.com investors@wallbox.com Facebook Wallbox LinkedIn Wallbox Instagram @wallboxcharger