UNITED STATES
SECURITIES AND EXCHANGE COMMISSION
Washington, D.C. 20549
FORM 8-K
CURRENT REPORT
Pursuant to Section 13 or 15(d)
of the Securities Exchange Act of 1934
Date of Report (Date of earliest event reported): April 22, 2025
PennyMac Mortgage Investment Trust
(Exact name of registrant as specified in its charter)
| Maryland | 001-34416 | 27-0186273 | ||
| (State or other jurisdiction of incorporation) |
(Commission File Number) |
(IRS Employer Identification No.) |
| 3043 Townsgate Road, Westlake Village, California | 91361 | |
| (Address of principal executive offices) | (Zip Code) |
(818) 224-7442
(Registrant’s telephone number, including area code)
Not Applicable
(Former name or former address, if changed since last report)
Check the appropriate box below if the Form 8-K filing is intended to simultaneously satisfy the filing obligation of the registrant under any of the following provisions:
| ☐ | Written communications pursuant to Rule 425 under the Securities Act (17 CFR 230.425) |
| ☐ | Soliciting material pursuant to Rule 14a-12 under the Exchange Act (17 CFR 240.14a-12) |
| ☐ | Pre-commencement communications pursuant to Rule 14d-2(b) under the Exchange Act (17 CFR 240.14d-2(b)) |
| ☐ | Pre-commencement communications pursuant to Rule 13e-4(c) under the Exchange Act (17 CFR 240.13e-4(c)) |
Securities registered pursuant to Section 12(b) of the Act:
| Title of each class |
Trading |
Name of each exchange |
||
| Common Shares of Beneficial Interest, $0.01 par value | PMT | New York Stock Exchange | ||
| 8.125% Series A Cumulative Redeemable Preferred Shares of Beneficial Interest, $0.01 par value | PMT/PA | New York Stock Exchange | ||
| 8.00% Series B Cumulative Redeemable Preferred Shares of Beneficial Interest, $0.01 par value | PMT/PB | New York Stock Exchange | ||
| 6.75% Series C Cumulative Redeemable Preferred Shares of Beneficial Interest, $0.01 par value | PMT/PC | New York Stock Exchange | ||
| 8.50% Senior Note Due 2028 | PMTU | New York Stock Exchange | ||
| 9.00% Senior Note Due 2030 | PMTV | New York Stock Exchange |
Indicate by check mark whether the registrant is an emerging growth company as defined in Rule 405 of the Securities Act of 1933 (§230.405 of this chapter) or Rule 12b-2 of the Securities Exchange Act of 1934 (§240.12b-2 of this chapter).
Emerging growth company ☐
If an emerging growth company, indicate by check mark if the registrant has elected not to use the extended transition period for complying with any new or revised financial accounting standards provided pursuant to Section 13(a) of the Exchange Act. ☐
| Item 2.02 | Results of Operations and Financial Condition. |
On April 22, 2025, PennyMac Mortgage Investment Trust (the “Company”) issued a press release and a slide presentation announcing its financial results for the fiscal quarter ended March 31, 2025. A copy of the press release and the slide presentation used in connection with the Company’s presentation of financial results were made available on April 22, 2025 and are furnished as Exhibits 99.1 and Exhibit 99.2, respectively. In addition, the Company has made available other supplemental financial information for the fiscal quarter ended March 31, 2025 on its website at pmt.pennymac.com.
The information in Item 2.02 of this report, including the exhibits hereto, shall not be deemed “filed” for purposes of Section 18 of the Securities Exchange Act of 1934, or otherwise subject to the liabilities of Section 18, nor shall it be deemed incorporated by reference into any disclosure document relating to the Company, except to the extent, if any, expressly set forth by specific reference in such filing.
| Item 9.01 | Financial Statements and Exhibits. |
(d) Exhibits.
| Exhibit No. |
Description |
|
| 99.1 | Press Release, dated April 22, 2025, issued by PennyMac Mortgage Investment Trust pertaining to its financial results for the fiscal quarter ended March 31, 2025. | |
| 99.2 | Slide Presentation for use beginning on April 22, 2025 in connection with a presentation of financial results for the fiscal quarter ended March 31, 2025. | |
| 104 | Cover Page Interactive Data File (embedded within the Inline XBRL document). | |
SIGNATURE
Pursuant to the requirements of the Securities Exchange Act of 1934, the registrant has duly caused this report to be signed on its behalf by the undersigned hereunto duly authorized.
| PENNYMAC MORTGAGE INVESTMENT TRUST | ||||||
| Dated: April 22, 2025 | /s/ Daniel S. Perotti |
|||||
| Daniel S. Perotti | ||||||
| Senior Managing Director and Chief Financial Officer | ||||||
Exhibit 99.1

PennyMac Mortgage Investment Trust
Reports First Quarter 2025 Results
WESTLAKE VILLAGE, Calif. – April 22, 2025 – PennyMac Mortgage Investment Trust (NYSE: PMT) today reported net loss attributable to common shareholders of $0.8 million, or $(0.01) per common share on a diluted basis for the first quarter of 2025, on net investment income of $44.5 million. PMT previously announced a cash dividend for the first quarter of 2025 of $0.40 per common share of beneficial interest, which was declared on March 6, 2025, and will be paid on April 25, 2025, to common shareholders of record as of April 11, 2025.
First Quarter 2025 Highlights
Financial results:
| • | Net loss attributable to common shareholders of $0.8 million; annualized return on average common equity of 0%1 |
| • | Strong levels of income excluding market driven value changes offset by fair value declines |
| • | Book value per common share decreased to $15.43 at March 31, 2025, from $15.87 at December 31, 2024 |
Other investment highlights:
| • | Investment activity driven by correspondent production volumes |
| • | Correspondent loan production volumes for PMT’s account totaled $2.8 billion in unpaid principal balance (UPB), down 20 percent from the prior quarter; PMT also acquired $637 million in UPB of loans acquired or originated by PennyMac Financial Services, Inc. (NYSE: PFSI) |
| • | Resulted in the creation of $47 million in new mortgage servicing rights (MSRs) |
| 1 | Return on average common equity is calculated based on net income attributable to common shareholders as a percentage of monthly average common equity during the quarter |
1
| • | Closed three Agency-eligible investor loan securitizations with a combined UPB of $1.0 billion |
| • | Generated $66 million of net new investments in non-Agency subordinate bonds2 |
| • | Generated $29 million of net new investments in senior bonds2 |
Other highlights:
| • | Issued $173 million of senior unsecured notes due to mature in 2030 |
| • | Retired $45 million in credit risk transfer (CRT) term notes |
Notable activity after quarter end
| • | Closed an additional Agency-eligible investor loan securitization with a UPB of $354 million |
| • | Generated $23 million of net new investments in non-Agency subordinate bonds2 |
“PMT produced strong levels of income excluding market-driven value changes in the first quarter,” said Chairman and CEO David Spector. “This strong core performance was offset by net fair value declines due to interest rate volatility and credit spread widening. During the quarter, we opportunistically issued $173 million in unsecured senior notes, not only demonstrating our strong access to the capital markets, but also further strengthening our balance sheet and extending our debt maturity profile. Additionally, we successfully executed three securitizations of investor loans totaling $1 billion in UPB, with retained investments of $94 million at attractive returns, and firmly established PMT as a leading issuer of private label securitizations.”
Mr. Spector continued, “Despite tremendous interest rate volatility, PMT’s long-standing expertise in risk management, including interest rate hedging and the establishment of unique financing arrangements without margin call provisions for our credit risk transfer investments, enables us to effectively manage through these challenging market conditions. Moreover, the synergistic relationship with our manager and services provider PFSI, which provides unique access to a consistent, high-quality pipeline of loans, positions us to adapt to changes in the regulatory environment. These strategic advantages collectively distinguish us from other mortgage REITs and enhance our ability to manage through market uncertainty. As a result, I remain confident in the ability of our seasoned and experienced management team to navigate successfully through this rapidly changing environment.”
| 2 | We consolidate the assets and liabilities in the trust that issued the subordinate bonds; accordingly, this investment is shown as Loans at fair value and Asset-backed financing of variable interest entities on our consolidated balance sheet |
2
The following table presents the contributions of PMT’s operating segments, consisting of Credit Sensitive Strategies, Interest Rate Sensitive Strategies, and Correspondent Production, as well as non-segment activities in our corporate operations:
| Quarter ended March 31, 2025 |
Credit sensitive strategies |
Interest rate sensitive strategies |
Correspondent production |
Reportable segment total |
Corporate | Total | ||||||||||||||||||
| (in thousands) | ||||||||||||||||||||||||
| Net investment income: |
||||||||||||||||||||||||
| Net gains on investments and financings |
||||||||||||||||||||||||
| Mortgage-backed securities |
$ | (1,010 | ) | $ | 65,865 | $ | — | $ | 64,855 | $ | — | $ | 64,855 | |||||||||||
| Loans at fair value |
2,767 | (3,509 | ) | — | (742 | ) | — | (742 | ) | |||||||||||||||
| CRT investments |
(1,800 | ) | — | — | (1,800 | ) | — | (1,800 | ) | |||||||||||||||
|
|
|
|
|
|
|
|
|
|
|
|
|
|||||||||||||
| (43 | ) | 62,356 | — | 62,313 | — | 62,313 | ||||||||||||||||||
| Net gains on loans acquired for sale |
— | — | 12,344 | 12,344 | — | 12,344 | ||||||||||||||||||
| Net loan servicing fees |
— | (27,210 | ) | — | (27,210 | ) | — | (27,210 | ) | |||||||||||||||
| Net interest expense: |
||||||||||||||||||||||||
| Interest income |
19,549 | 119,896 | 33,198 | 172,643 | 3,448 | 176,091 | ||||||||||||||||||
| Interest expense |
18,117 | 135,332 | 27,522 | 180,971 | 1,166 | 182,137 | ||||||||||||||||||
|
|
|
|
|
|
|
|
|
|
|
|
|
|||||||||||||
| 1,432 | (15,436 | ) | 5,676 | (8,328 | ) | 2,282 | (6,046 | ) | ||||||||||||||||
| Other |
(141 | ) | — | 3,205 | 3,064 | — | 3,064 | |||||||||||||||||
|
|
|
|
|
|
|
|
|
|
|
|
|
|||||||||||||
| 1,248 | 19,710 | 21,225 | 42,183 | 2,282 | 44,465 | |||||||||||||||||||
|
|
|
|
|
|
|
|
|
|
|
|
|
|||||||||||||
| Expenses: |
||||||||||||||||||||||||
| Earned by PennyMac Financial Services, Inc.: |
||||||||||||||||||||||||
| Loan servicing fees |
2 | 21,727 | — | 21,729 | — | 21,729 | ||||||||||||||||||
| Management fees |
— | — | — | — | 7,012 | 7,012 | ||||||||||||||||||
| Loan fulfillment fees |
— | — | 5,290 | 5,290 | — | 5,290 | ||||||||||||||||||
| Professional services |
— | — | 4,880 | 4,880 | 2,102 | 6,982 | ||||||||||||||||||
| Compensation |
— | — | — | — | 2,970 | 2,970 | ||||||||||||||||||
| Loan collection and liquidation |
42 | 1,927 | — | 1,969 | — | 1,969 | ||||||||||||||||||
| Safekeeping |
— | 1,034 | 76 | 1,110 | — | 1,110 | ||||||||||||||||||
| Mortgage loan origination fees |
— | — | 686 | 686 | — | 686 | ||||||||||||||||||
| Other expenses |
94 | 496 | 166 | 756 | 2,260 | 3,016 | ||||||||||||||||||
|
|
|
|
|
|
|
|
|
|
|
|
|
|||||||||||||
| $ | 138 | $ | 25,184 | $ | 11,098 | $ | 36,420 | $ | 14,344 | $ | 50,764 | |||||||||||||
|
|
|
|
|
|
|
|
|
|
|
|
|
|||||||||||||
| Pretax (loss) income |
$ | 1,110 | $ | (5,474 | ) | $ | 10,127 | $ | 5,763 | $ | (12,062 | ) | $ | (6,299 | ) | |||||||||
|
|
|
|
|
|
|
|
|
|
|
|
|
|||||||||||||
Credit Sensitive Strategies Segment
The Credit Sensitive Strategies segment primarily includes results from PMT’s organically-created GSE CRT investments, opportunistic investments in other GSE CRT, investments in non-Agency subordinate bonds from private-label securitizations of PMT’s production and legacy investments. Pretax income for the segment was $1.1 million on net investment income of $1.2 million, compared to pretax income of $20.1 million on net investment income of $20.4 million in the prior quarter.
Net losses on investments in the segment were $43 thousand, compared to net gains on investments of $20.2 million in the prior quarter. These net losses include $1.8 million of losses on PMT’s organically-created GSE CRT investments and $1.0 million in losses on other acquired subordinate CRT mortgage-backed securities (MBS), largely offset by $2.8 million of gains on investments from non-Agency subordinate bonds from PMT’s production.
3
Net losses on PMT’s organically-created CRT investments for the quarter were $1.8 million, compared to net gains of $24.6 million in the prior quarter. These net losses include $14.5 million in valuation-related losses, which reflected the impact of credit spread widening in the first quarter. The prior quarter included $10.2 million of gains due to credit spread tightening. Net losses on PMT’s organically-created CRT investments also included $14.0 million in realized gains and carry, compared to $14.8 million in the prior quarter. Realized losses during the quarter were $1.2 million, similar to levels realized in prior quarters.
Net interest income for the segment totaled $1.4 million, compared to $0.4 million in the prior quarter. Interest income totaled $19.5 million, down from $21.1 million in the prior quarter. Interest expense totaled $18.1 million, down from $20.7 million in the prior quarter.
Interest Rate Sensitive Strategies Segment
The Interest Rate Sensitive Strategies segment includes results from investments in MSRs, Agency MBS, non-Agency senior MBS and interest rate hedges. Pretax loss for the segment was $5.5 million on net investment income of $19.7 million, compared to pretax income of $25.5 million on net investment income of $51.9 million in the prior quarter. The segment includes investments that typically have offsetting fair value exposures to changes in interest rates. For example, in a period with decreasing interest rates, MSRs are expected to decrease in fair value, whereas Agency pass-through and non-Agency senior MBS are expected to increase in fair value.
The results in the Interest Rate Sensitive Strategies segment consist of net gains and losses on investments, net interest income and net loan servicing fees, as well as associated expenses.
Losses from net loan servicing fees was $27.2 million, compared to net loan servicing fee income of $207.4 million in the prior quarter. Net loan servicing fees included contractually specified servicing fees of $152.2 million and $3.9 million in other fees, reduced by $88.8 million in realization of MSR cash flows, which was down slightly from $90.6 million in the prior quarter. Net loan servicing fees also included $55.8 million in fair value declines on MSRs due to lower interest rates, $39.9 million in hedging losses, and $1.2 million of MSR recapture income. Net gains on investments for the segment were $62.4 million, which primarily consisted of gains on MBS due to lower interest rates. PMT’s hedging activities are intended to manage its net exposure across all interest rate sensitive strategies, which include MSRs, MBS and related tax impacts.
4
The following schedule details net loan servicing fees:
| March 31, 2025 | Quarter ended December 31, 2024 |
March 31, 2024 | ||||||||||
| (in thousands) | ||||||||||||
| From non-affiliates: |
||||||||||||
| Contractually specified |
$ | 152,199 | $ | 159,553 | $ | 160,357 | ||||||
| Other fees |
3,917 | 4,884 | 3,011 | |||||||||
| Effect of MSRs: |
||||||||||||
| Change in fair value |
||||||||||||
| Realization of cashflows |
(88,759 | ) | (90,612 | ) | (99,772 | ) | ||||||
| Market changes |
(55,831 | ) | 183,879 | 71,570 | ||||||||
|
|
|
|
|
|
|
|||||||
| (144,590 | ) | 93,267 | (28,202 | ) | ||||||||
| Hedging results |
(39,944 | ) | (51,209 | ) | (89,814 | ) | ||||||
|
|
|
|
|
|
|
|||||||
| (184,534 | ) | 42,058 | (118,016 | ) | ||||||||
|
|
|
|
|
|
|
|||||||
| Net servicing fees from non-affiliates |
(28,418 | ) | 206,495 | 45,352 | ||||||||
| From PFSI—MSR recapture income |
1,208 | 926 | 353 | |||||||||
|
|
|
|
|
|
|
|||||||
| Net loan servicing fees |
$ | (27,210 | ) | $ | 207,421 | $ | 45,705 | |||||
|
|
|
|
|
|
|
|||||||
Net interest expense for the segment was $15.4 million versus $29.6 million in the prior quarter. Interest income totaled $119.9 million, up from $106.1 million in the prior quarter primarily due to a higher amount of retained investments from Agency-eligible investor loan securitizations. Interest expense totaled $135.3 million, essentially unchanged from the prior quarter.
Segment expenses were $25.2 million, down from $26.4 million in the prior quarter.
Correspondent Production Segment
PMT acquires newly originated loans from correspondent sellers and typically sells or securitizes the loans, resulting in current-period income and additions to its investments in MSRs related to a portion of its production. PMT’s Correspondent Production segment generated pretax income of $10.1 million in the first quarter, down from $22.5 million in the prior quarter.
5
Through its correspondent production activities in the first quarter, PMT acquired a total of $2.8 billion in UPB of loans, down 20 percent from the prior quarter and up 57 percent from the first quarter of 2024. Of total correspondent acquisitions from non-affiliates, government-insured or guaranteed acquisitions totaled $11.3 billion, up 2 percent from the prior quarter, and conventional conforming and jumbo acquisitions totaled $11.7 billion, down 31 percent from the prior quarter. $2.8 billion of conventional conforming and jumbo volume was for PMT’s account, down 20 percent from the prior quarter. PMT is expected to retain all jumbo production and 15 to 25 percent of total conventional conforming correspondent production in the second quarter of 2025, compared to 21 percent in the first quarter of 2025. PMT also acquired $637 million in UPB of loans acquired or originated by PFSI for inclusion in private label securitizations, up from $437 million in the prior quarter. Interest rate lock commitments on conventional conforming and jumbo loans for PMT’s account totaled $2.7 billion, down 14 percent from the prior quarter.
Segment revenues were $21.2 million and included net gains on loans acquired for sale of $12.3 million, net interest income of $5.7 million, and other income of $3.2 million, which primarily consists of volume-based origination fees. Net gains on loans acquired for sale decreased $14.0 million from the prior quarter, which included gains from increased demand for private label securitization and whole loan execution for non-owner occupied loans. Interest income was $33.2 million, up slightly from the prior quarter, and interest expense was $27.5 million, down slightly from the prior quarter.
Segment expenses were $11.1 million, up slightly from $10.9 million in the prior quarter. The weighted average fulfillment fee rate in the first quarter was 19 basis points, up from 18 basis points in the prior quarter.
Under a renewed mortgage banking services agreement with PFSI, effective July 1, 2025, correspondent production volumes will initially be acquired by PFSI. However, PMT will retain the right to purchase up to 100 percent of non-government correspondent loan production.
Corporate
Corporate includes interest income from cash and short-term investments, management fees, and corporate expenses.
Corporate revenues were $2.3 million, up slightly from the prior quarter. Management fees were $7.0 million, and other expenses were $7.3 million.
6
Taxes
PMT recorded a tax benefit of $16.0 million, driven by declines on MSRs held in PMT’s taxable REIT subsidiary.
***
Management’s slide presentation and accompanying materials will be available in the Investor Relations section of the Company’s website at pmt.pennymac.com after the market closes on Tuesday, April 22, 2025. Management will also host a conference call and live audio webcast at 6:00 p.m. Eastern Time to review the Company’s financial results. The webcast can be accessed at pmt.pennymac.com, and a replay will be available shortly after its conclusion.
Individuals who are unable to access the website but would like to receive a copy of the materials should contact the Company’s Investor Relations department at 818.224.7028.
7
About PennyMac Mortgage Investment Trust
PennyMac Mortgage Investment Trust is a mortgage real estate investment trust (REIT) that invests primarily in residential mortgage loans and mortgage-related assets. PMT is externally managed by PNMAC Capital Management, LLC, a wholly-owned subsidiary of PennyMac Financial Services, Inc. (NYSE: PFSI). Additional information about PennyMac Mortgage Investment Trust is available at pmt.pennymac.com.
| Media Kristyn Clark mediarelations@pennymac.com 805.225.8224 |
Investors Kevin Chamberlain Isaac Garden investorrelations@pennymac.com 818.224.7028 |
8
Forward-Looking Statements
This press release contains forward-looking statements within the meaning of Section 21E of the Securities Exchange Act of 1934, as amended, regarding management’s beliefs, estimates, projections and assumptions with respect to, among other things, the Company’s financial results, future operations, business plans and investment strategies, as well as industry and market conditions, all of which are subject to change. Words like “believe,” “expect,” “anticipate,” “promise,” “plan,” and other expressions or words of similar meanings, as well as future or conditional verbs such as “will,” “would,” “should,” “could,” or “may” are generally intended to identify forward-looking statements. Actual results and operations for any future period may vary materially from those projected herein and from past results discussed herein. Factors which could cause actual results to differ materially from historical results or those anticipated include, but are not limited to: changes in interest rates; the Company’s ability to comply with various federal, state and local laws and regulations that govern its business; volatility in the Company’s industry, the debt or equity markets, the general economy or the real estate finance and real estate markets; events or circumstances which undermine confidence in the financial and housing markets or otherwise have a broad impact on financial and housing markets; changes in real estate values, housing prices and housing sales; changes in macroeconomic, consumer and real estate market conditions; the degree and nature of the Company’s competition; the availability of, and level of competition for, attractive risk-adjusted investment opportunities in mortgage loans and mortgage-related assets that satisfy the Company’s investment objectives; the inherent difficulty in winning bids to acquire mortgage loans, and the Company’s success in doing so; the concentration of credit risks to which the Company is exposed; the Company’s dependence on and potential conflicts with its manager, servicer and their affiliates; the Company’s ability to mitigate cybersecurity risks, cybersecurity incidents and technology disruptions; the development of artificial intelligence; the availability, terms and deployment of short term and long term capital; the adequacy of the Company’s cash reserves and working capital; the Company’s ability to maintain the desired relationship between its financing and the interest rates and maturities of its assets; the timing and amount of cash flows, if any, from the Company’s investments; the Company’s substantial amount of indebtedness; the performance, financial condition and liquidity of borrowers; the Company’s exposure to risks of loss and disruptions in operations resulting from severe weather events, man-made or other natural conditions, including climate change and pandemics; the ability of the Company’s servicer, which also provides the Company with fulfillment services, to approve and monitor correspondent sellers and underwrite loans to investor standards; incomplete or inaccurate information or documentation provided by customers or counterparties, or adverse changes in the financial condition of the Company’s customers and counterparties; the Company’s indemnification and repurchase obligations in connection with mortgage loans it purchases and later sells or securitizes; the quality and enforceability of the collateral documentation evidencing the Company’s ownership and rights in the assets in which it invests; increased rates of delinquency, defaults and forbearances and/or decreased recovery rates on the Company’s investments; the performance of mortgage loans underlying mortgage-backed securities in which the Company retains credit risk; the Company’s ability to foreclose on its investments in a timely manner or at all; increased prepayments of the mortgages and other loans underlying the Company’s mortgage-backed securities or relating to the Company’s mortgage servicing rights and other investments; risks associated with the discontinuation of LIBOR; the degree to which the Company’s hedging strategies may or may not protect it from interest rate volatility; the effect of the accuracy of or changes in the estimates the Company makes about uncertainties, contingencies and asset and liability valuations when measuring and reporting upon the Company’s financial condition and results of operations; the Company’s ability to maintain appropriate internal control over financial reporting; the Company’s ability to detect misconduct and fraud; 9 developments in the secondary markets for the Company’s mortgage loan products; legislative and regulatory changes that impact the mortgage loan industry or housing market; regulatory or other changes that impact government agencies or government-sponsored entities, or such changes that increase the cost of doing business with such agencies or entities; federal and state mortgage regulations and enforcement; changes in government support of homeownership; changes in government or government-sponsored home affordability programs; changes in the Company’s investment objectives or investment or operational strategies, including any new lines of business or new products and services that may subject it to additional risks; limitations imposed on the Company’s business and its ability to satisfy complex rules for it to qualify as a REIT for U.S. federal income tax purposes and qualify for an exclusion from the Investment Company Act of 1940 and the ability of certain of the Company’s subsidiaries to qualify as REITs or as taxable REIT subsidiaries for U.S. federal income tax purposes; changes in governmental regulations, accounting treatment, tax rates and similar matters; the Company’s ability to make distributions to its shareholders in the future; the Company’s failure to deal appropriately with issues that may give rise to reputational risk; and the Company’s organizational structure and certain requirements in its charter documents. You should not place undue reliance on any forward-looking statement and should consider all of the uncertainties and risks described above, as well as those more fully discussed in reports and other documents filed by the Company with the Securities and Exchange Commission from time to time. The Company undertakes no obligation to publicly update or revise any forward-looking statements or any other information contained herein, and the statements made in this press release are current as of the date of this release only.
9
10
PENNYMAC MORTGAGE INVESTMENT TRUST AND SUBSIDIARIES
CONSOLIDATED BALANCE SHEETS (UNAUDITED)
| March 31, 2025 | December 31, 2024 | March 31, 2024 | ||||||||||
| (in thousands except share amounts) | ||||||||||||
| ASSETS |
||||||||||||
| Cash |
$ | 247,941 | $ | 337,694 | $ | 126,578 | ||||||
| Short-term investments at fair value |
204,158 | 103,198 | 343,343 | |||||||||
| Mortgage-backed securities at fair value |
4,035,862 | 4,063,706 | 3,949,678 | |||||||||
| Loans acquired for sale at fair value |
2,002,207 | 2,116,318 | 911,602 | |||||||||
| Loans at fair value |
3,228,991 | 2,193,575 | 1,408,610 | |||||||||
| Derivative assets |
45,162 | 56,840 | 62,734 | |||||||||
| Deposits securing credit risk transfer arrangements |
1,087,949 | 1,110,708 | 1,187,100 | |||||||||
| Mortgage servicing rights at fair value |
3,770,034 | 3,867,394 | 3,951,737 | |||||||||
| Servicing advances |
84,733 | 105,037 | 125,971 | |||||||||
| Due from PennyMac Financial Services, Inc. |
15,155 | 16,015 | 1 | |||||||||
| Other |
154,034 | 438,221 | 226,346 | |||||||||
|
|
|
|
|
|
|
|||||||
| Total assets |
$ | 14,876,226 | $ | 14,408,706 | $ | 12,293,700 | ||||||
|
|
|
|
|
|
|
|||||||
| LIABILITIES |
||||||||||||
| Assets sold under agreements to repurchase |
$ | 6,202,539 | $ | 6,500,938 | $ | 5,118,377 | ||||||
| Mortgage loan participation and sale agreements |
4,576 | 11,593 | 25,216 | |||||||||
| Notes payable secured by credit risk transfer and mortgage servicing assets |
2,683,368 | 2,929,790 | 2,880,025 | |||||||||
| Unsecured senior notes |
773,122 | 605,860 | 601,373 | |||||||||
| Asset-backed financing of variable interest entities at fair value |
2,967,631 | 2,040,375 | 1,308,680 | |||||||||
| Interest-only security payable at fair value |
35,954 | 34,222 | 32,227 | |||||||||
| Derivative and credit risk transfer strip liabilities at fair value |
17,941 | 7,351 | 18,750 | |||||||||
| Accounts payable and accrued liabilities |
105,451 | 139,124 | 125,055 | |||||||||
| Due to PennyMac Financial Services, Inc. |
29,198 | 30,206 | 30,835 | |||||||||
| Income taxes payable |
147,773 | 163,861 | 174,730 | |||||||||
| Liability for losses under representations and warranties |
5,955 | 6,886 | 19,519 | |||||||||
|
|
|
|
|
|
|
|||||||
| Total liabilities |
12,973,508 | 12,470,206 | 10,334,787 | |||||||||
|
|
|
|
|
|
|
|||||||
| SHAREHOLDERS’ EQUITY |
||||||||||||
| Preferred shares of beneficial interest |
541,482 | 541,482 | 541,482 | |||||||||
| Common shares of beneficial interest—authorized, 500,000,000 common shares of $0.01 par value; issued and outstanding 87,010,608, 86,860,960 and 86,760,408 common shares, respectively |
870 | 869 | 868 | |||||||||
| Additional paid-in capital |
1,924,902 | 1,925,067 | 1,922,954 | |||||||||
| Accumulated deficit |
(564,536 | ) | (528,918 | ) | (506,391 | ) | ||||||
|
|
|
|
|
|
|
|||||||
| Total shareholders’ equity |
1,902,718 | 1,938,500 | 1,958,913 | |||||||||
|
|
|
|
|
|
|
|||||||
| Total liabilities and shareholders’ equity |
$ | 14,876,226 | $ | 14,408,706 | $ | 12,293,700 | ||||||
|
|
|
|
|
|
|
|||||||
11
PENNYMAC MORTGAGE INVESTMENT TRUST AND SUBSIDIARIES
CONSOLIDATED STATEMENTS OF OPERATIONS (UNAUDITED)
| For the Quarterly Periods Ended | ||||||||||||
| March 31, 2025 | December 31, 2024 | March 31, 2024 | ||||||||||
| Investment Income |
||||||||||||
| Net gains on investments and financings |
$ | 62,313 | $ | (105,655 | ) | $ | 39,753 | |||||
| Net gains on loans acquired for sale |
12,344 | 26,387 | 14,518 | |||||||||
| Loan origination fees |
3,152 | 3,986 | 2,008 | |||||||||
| Net loan servicing fees: |
||||||||||||
| From nonaffiliates |
||||||||||||
| Servicing fees |
156,116 | 164,437 | 163,368 | |||||||||
| Change in fair value of mortgage servicing rights |
(144,590 | ) | 93,267 | (28,202 | ) | |||||||
| Hedging results |
(39,944 | ) | (51,209 | ) | (89,814 | ) | ||||||
|
|
|
|
|
|
|
|||||||
| (28,418 | ) | 206,495 | 45,352 | |||||||||
| From PennyMac Financial Services, Inc. |
1,208 | 926 | 353 | |||||||||
|
|
|
|
|
|
|
|||||||
| (27,210 | ) | 207,421 | 45,705 | |||||||||
| Interest income |
176,091 | 163,135 | 143,559 | |||||||||
| Interest expense |
182,137 | 187,120 | 171,527 | |||||||||
|
|
|
|
|
|
|
|||||||
| Net interest expense |
(6,046 | ) | (23,985 | ) | (27,968 | ) | ||||||
| Other |
(88 | ) | (227 | ) | 189 | |||||||
|
|
|
|
|
|
|
|||||||
| Net investment income |
44,465 | 107,927 | 74,205 | |||||||||
|
|
|
|
|
|
|
|||||||
| Expenses |
||||||||||||
| Earned by PennyMac Financial Services, Inc.: |
||||||||||||
| Loan servicing fees |
21,729 | 20,486 | 20,262 | |||||||||
| Management fees |
7,012 | 7,149 | 7,188 | |||||||||
| Loan fulfillment fees |
5,290 | 6,356 | 4,016 | |||||||||
| Professional services |
6,982 | 6,041 | 1,758 | |||||||||
| Compensation |
2,970 | 997 | 1,916 | |||||||||
| Loan collection and liquidation |
1,969 | 2,537 | 1,369 | |||||||||
| Safekeeping |
1,110 | 1,336 | 932 | |||||||||
| Loan origination |
686 | 914 | 473 | |||||||||
| Other |
3,016 | 6,987 | 3,910 | |||||||||
|
|
|
|
|
|
|
|||||||
| Total expenses |
50,764 | 52,803 | 41,824 | |||||||||
|
|
|
|
|
|
|
|||||||
| (Loss) income before (benefit from) provision for income taxes |
(6,299 | ) | 55,124 | 32,381 | ||||||||
| (Benefit from) provision for income taxes |
(15,979 | ) | 8,589 | (15,227 | ) | |||||||
|
|
|
|
|
|
|
|||||||
| Net income |
9,680 | 46,535 | 47,608 | |||||||||
| Dividends on preferred shares |
10,455 | 10,455 | 10,455 | |||||||||
|
|
|
|
|
|
|
|||||||
| Net (loss) income attributable to common shareholders |
$ | (775 | ) | $ | 36,080 | $ | 37,153 | |||||
|
|
|
|
|
|
|
|||||||
| (Loss) earnings per common share |
||||||||||||
| Basic |
$ | (0.01 | ) | $ | 0.41 | $ | 0.43 | |||||
| Diluted |
$ | (0.01 | ) | $ | 0.41 | $ | 0.39 | |||||
| Weighted average shares outstanding |
||||||||||||
| Basic |
86,907 | 86,861 | 86,689 | |||||||||
| Diluted |
86,907 | 86,861 | 111,017 | |||||||||
12

Exhibit 99.2 1Q25 EARNINGS REPORT PennyMac Mortgage Investment Trust April 2025
FORWARD LOOKING STATEMENTS This presentation contains forward-looking statements within the meaning of Section 21E of the Securities Exchange Act of 1934, as amended, regarding management’s beliefs, estimates, projections and assumptions with respect to, among other things, the Company’s financial results, future operations, business plans and investment strategies, as well as industry and market conditions, all of which are subject to change. Words like “believe,” “expect,” “anticipate,” “promise,” “plan,” and other expressions or words of similar meanings, as well as future or conditional verbs such as “will,” “would,” “should,” “could,” or “may” are generally intended to identify forward-looking statements. Actual results and operations for any future period may vary materially from those projected herein and from past results discussed herein. These forward-looking statements include, but are not limited to, statements regarding future changes in interest rates, housing, and prepayment rates; future loan originations and production; future loan delinquencies, defaults and forbearances; future investment and hedge expenses; future investment strategies, future earnings and return on equity as well as other business and financial expectations. Factors which could cause actual results to differ materially from historical results or those anticipated include, but are not limited to: changes in interest rates; the Company’s ability to comply with various federal, state and local laws and regulations that govern its business; the general economy or the real estate finance and real estate markets; events or circumstances which undermine confidence in the financial and housing markets or otherwise have a broad impact on financial and housing markets; changes in real estate values, housing prices and housing sales; changes in macroeconomic, consumer and real estate market conditions; the degree and nature of the Company’s competition; the availability of, and level of competition for, attractive risk adjusted investment opportunities in mortgage loans and mortgage related assets that satisfy the Company’s investment objectives; the inherent difficulty in winning bids to acquire mortgage loans, and the Company’s success in doing so; the concentration of credit risks to which the Company is exposed; the Company’s dependence on and potential conflicts with its manager, servicer and their affiliates; the Company’s ability to mitigate cybersecurity risks, cybersecurity incidents and technology disruptions; the development of artificial intelligence; the availability, terms and deployment of short term and long term capital; the adequacy of the Company’s cash reserves and working capital; the Company’s ability to maintain the desired relationship between its financing and the interest rates and maturities of its assets; the timing and amount of cash flows, if any, from the Company’ s investments; the Company’s substantial amount of indebtedness; the performance, financial condition and liquidity of borrowers; the Company’s exposure to risks of loss and disruptions in operations resulting from severe weather events, man-made or other natural conditions, including climate change and pandemics; the ability of the Company’s servicer, which also provides the Company with fulfillment services, to approve and monitor correspondent sellers and underwrite loans to investor standards; incomplete or inaccurate information or documentation provided by customers or counterparties, or adverse changes in the financial condition of the Company’s customers and counterparties; the Company’s indemnification and repurchase obligations in connection with mortgage loans it purchases and later sells or securitizes; the quality and enforceability of the collateral documentation evidencing the Company’ s ownership and rights in the assets in which it invests; increased rates of delinquency, defaults and forbearances and/or decreased recovery rates on the Company’s investments; the performance of mortgage loans underlying mortgage backed securities in which the Company retains credit risk; the Company’s ability to foreclose on its investments in a timely manner or at all; increased prepayments of the mortgages and other loans underlying the Company’s mortgage backed securities or relating to the Company’s mortgage servicing rights and other investments; risks associated with the discontinuation of LIBOR; the degree to which the Company’s hedging strategies may or may not protect it from interest rate volatility; the effect of the accuracy of or changes in the estimates the Company makes about uncertainties, contingencies and asset and liability valuations when measuring and reporting upon the Company’s financial condition and results of operations; the Company’s ability to maintain appropriate internal control over financial reporting; the Company’s ability to detect misconduct and fraud; developments in the secondary markets for the Company’s mortgage loan products; legislative and regulatory changes that impact the mortgage loan industry or housing market regulatory or other changes that impact government agencies or government sponsored entities, or such changes that increase the cost of doing business with such agencies or entities; federal and state mortgage regulations and enforcement; changes in government support of homeownership; changes in government or government sponsored home affordability programs; changes in the Company’s investment objectives or investment or operational strategies, including any new lines of business or new products and services that may subject it to additional risks volatility in the Company’s industry, the debt or equity markets; limitations imposed on the Company’s business and its ability to satisfy complex rules for it to qualify as a REIT for U.S. federal income tax purposes and qualify for an exclusion from the Investment Company Act of 1940 and the ability of certain of the Company’s subsidiaries to qualify as REITs or as taxable REIT subsidiaries for U.S. federal income tax purposes; changes in governmental regulations, accounting treatment, tax rates and similar matters; the Company’s ability to make distributions to its shareholders in the future; the Company’s failure to deal appropriately with issues that may give rise to reputational risk; and the Company’s organizational structure and certain requirements in its charter documents. You should not place undue reliance on any forward-looking statement and should consider all of the uncertainties and risks described above, as well as those more fully discussed in reports and other documents filed by the Company with the Securities and Exchange Commission from time to time. The Company undertakes no obligation to publicly update or revise any forward-looking statements or any other information contained herein, and the statements made in this presentation are current as of the date of this presentation only. This presentation contains financial information calculated other than in accordance with U.S. generally accepted accounting principles (“GAAP”), such as income excluding market driven value changes that provide a meaningful perspective on the Company’s business results since the Company utilizes this information to evaluate and manage the business. Non-GAAP disclosures have limitations as an analytical tool and should not be viewed as a substitute for financial information determined in accordance with GAAP. 2
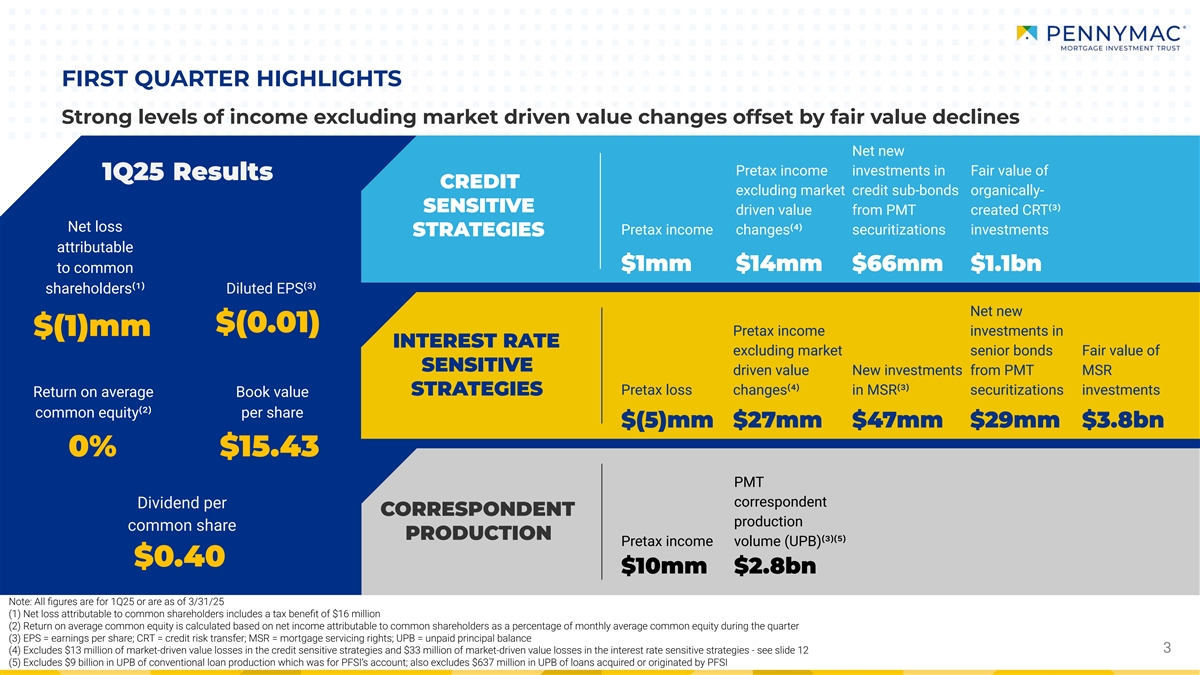
FIRST QUARTER HIGHLIGHTS Strong levels of income excluding market driven value changes offset by fair value declines Net new Pretax income investments in Fair value of 1Q25 Results CREDIT excluding market credit sub-bonds organically- SENSITIVE driven value from PMT created CRT⁽³⁾ Net loss Pretax income changes⁽⁴⁾ securitizations investments STRATEGIES attributable $1mm $14mm $66mm $1.1bn to common shareholders⁽¹⁾ Diluted EPS⁽³⁾ Net new $(0.01) $(1)mm Pretax income investments in INTEREST RATE excluding market senior bonds Fair value of SENSITIVE driven value New investments from PMT MSR Pretax loss changes⁽⁴⁾ in MSR⁽³⁾ securitizations investments STRATEGIES Return on average Book value common equity⁽²⁾ per share $(5)mm $27mm $47mm $29mm $3.8bn 0% $15.43 PMT correspondent Dividend per CORRESPONDENT production common share PRODUCTION Pretax income volume (UPB)⁽³⁾⁽⁵⁾ $0.40 $10mm $2.8bn Note: All figures are for 1Q25 or are as of 3/31/25 (1) Net loss attributable to common shareholders includes a tax benefit of $16 million (2) Return on average common equity is calculated based on net income attributable to common shareholders as a percentage of monthly average common equity during the quarter (3) EPS = earnings per share; CRT = credit risk transfer; MSR = mortgage servicing rights; UPB = unpaid principal balance 3 3 (4) Excludes $13 million of market-driven value losses in the credit sensitive strategies and $33 million of market-driven value losses in the interest rate sensitive strategies - see slide 12 (5) Excludes $9 billion in UPB of conventional loan production which was for PFSI’s account; also excludes $637 million in UPB of loans acquired or originated by PFSI
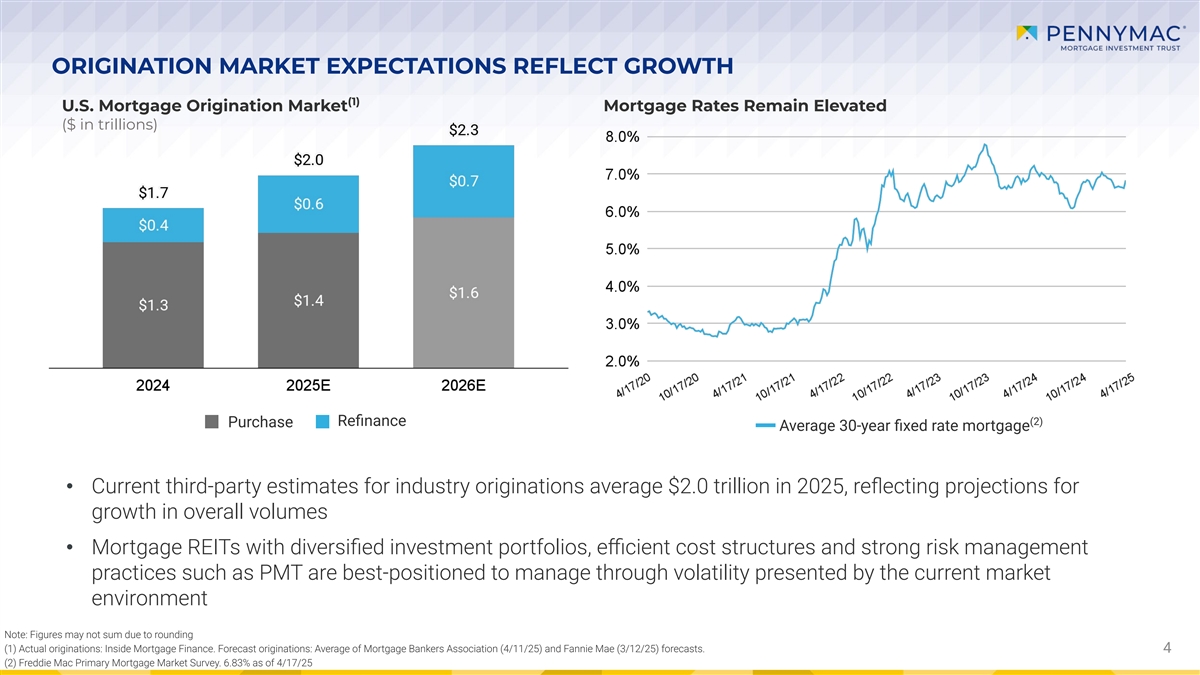
ORIGINATION MARKET EXPECTATIONS REFLECT GROWTH (1) U.S. Mortgage Origination Market Mortgage Rates Remain Elevated ($ in trillions) (2) Refinance Purchase Average 30-year fixed rate mortgage • Current third-party estimates for industry originations average $2.0 trillion in 2025, reflecting projections for growth in overall volumes • Mortgage REITs with diversified investment portfolios, efficient cost structures and strong risk management practices such as PMT are best-positioned to manage through volatility presented by the current market environment Note: Figures may not sum due to rounding (1) Actual originations: Inside Mortgage Finance. Forecast originations: Average of Mortgage Bankers Association (4/11/25) and Fannie Mae (3/12/25) forecasts. 4 (2) Freddie Mac Primary Mortgage Market Survey. 6.83% as of 4/17/25
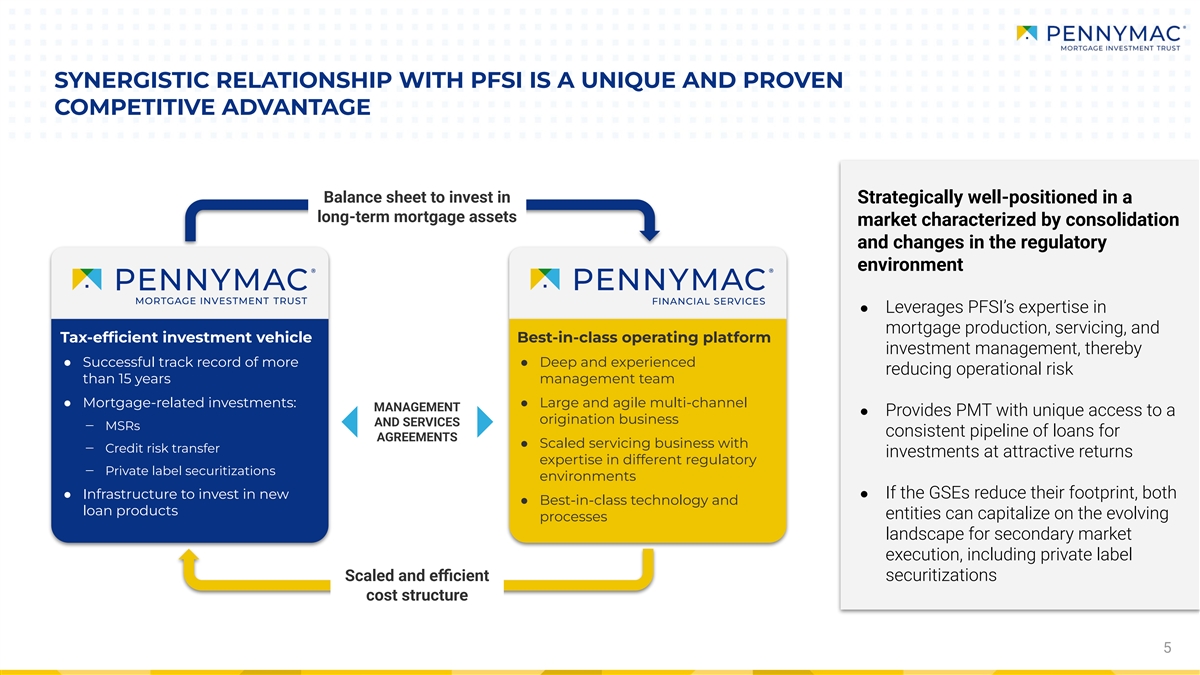
SYNERGISTIC RELATIONSHIP WITH PFSI IS A UNIQUE AND PROVEN COMPETITIVE ADVANTAGE Balance sheet to invest in Strategically well-positioned in a long-term mortgage assets market characterized by consolidation and changes in the regulatory environment ● Leverages PFSI’s expertise in mortgage production, servicing, and Tax-efficient investment vehicle Best-in-class operating platform investment management, thereby ● Successful track record of more ● Deep and experienced reducing operational risk than 15 years management team ● Mortgage-related investments: ● Large and agile multi-channel MANAGEMENT ● Provides PMT with unique access to a origination business AND SERVICES ‒ MSRs consistent pipeline of loans for AGREEMENTS ● Scaled servicing business with ‒ Credit risk transfer investments at attractive returns expertise in different regulatory ‒ Private label securitizations environments ● Infrastructure to invest in new ● If the GSEs reduce their footprint, both ● Best-in-class technology and loan products entities can capitalize on the evolving processes landscape for secondary market execution, including private label Scaled and efficient securitizations cost structure 5
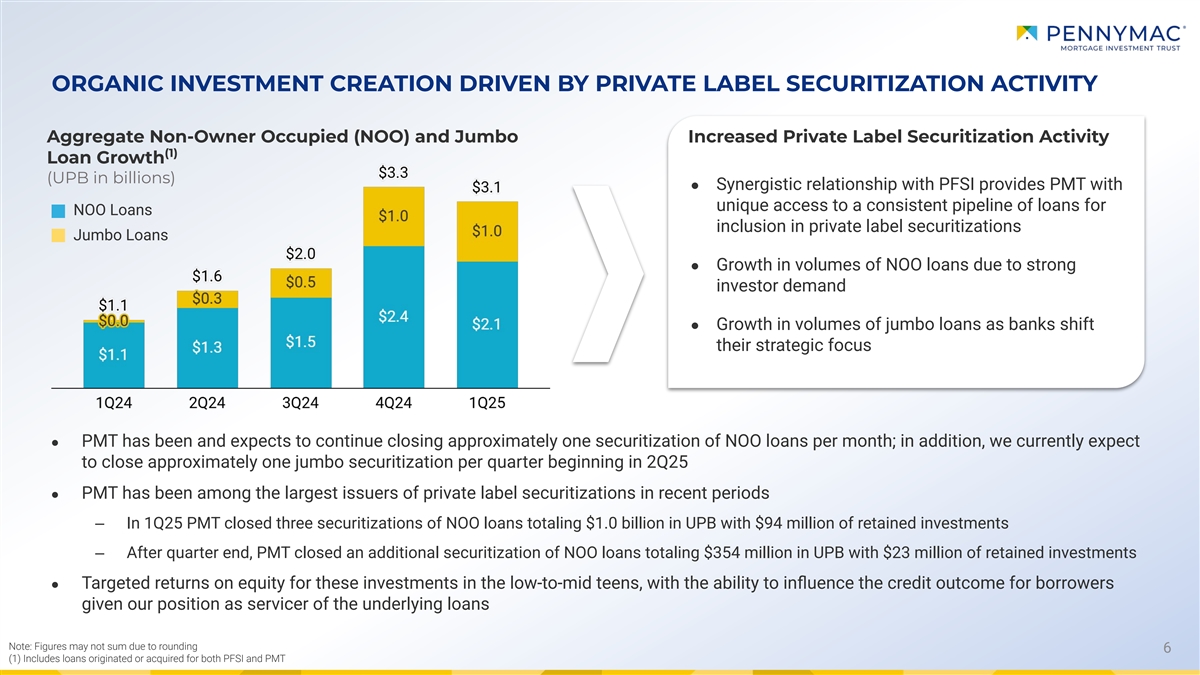
Note: Figures may not sum due to rounding (1) Includes loans originated or acquired for both PFSI and PMT ORGANIC INVESTMENT CREATION DRIVEN BY PRIVATE LABEL SECURITIZATION ACTIVITY Aggregate Non-Owner Occupied (NOO) and Jumbo Increased Private Label Securitization Activity (1) Loan Growth (UPB in billions) ● Synergistic relationship with PFSI provides PMT with unique access to a consistent pipeline of loans for NOO Loans inclusion in private label securitizations Jumbo Loans ● Growth in volumes of NOO loans due to strong investor demand ● Growth in volumes of jumbo loans as banks shift their strategic focus ● PMT has been and expects to continue closing approximately one securitization of NOO loans per month; in addition, we currently expect to close approximately one jumbo securitization per quarter beginning in 2Q25 ● PMT has been among the largest issuers of private label securitizations in recent periods ‒ In 1Q25 PMT closed three securitizations of NOO loans totaling $1.0 billion in UPB with $94 million of retained investments ‒ After quarter end, PMT closed an additional securitization of NOO loans totaling $354 million in UPB with $23 million of retained investments ● Targeted returns on equity for these investments in the low-to-mid teens, with the ability to influence the credit outcome for borrowers given our position as servicer of the underlying loans 6
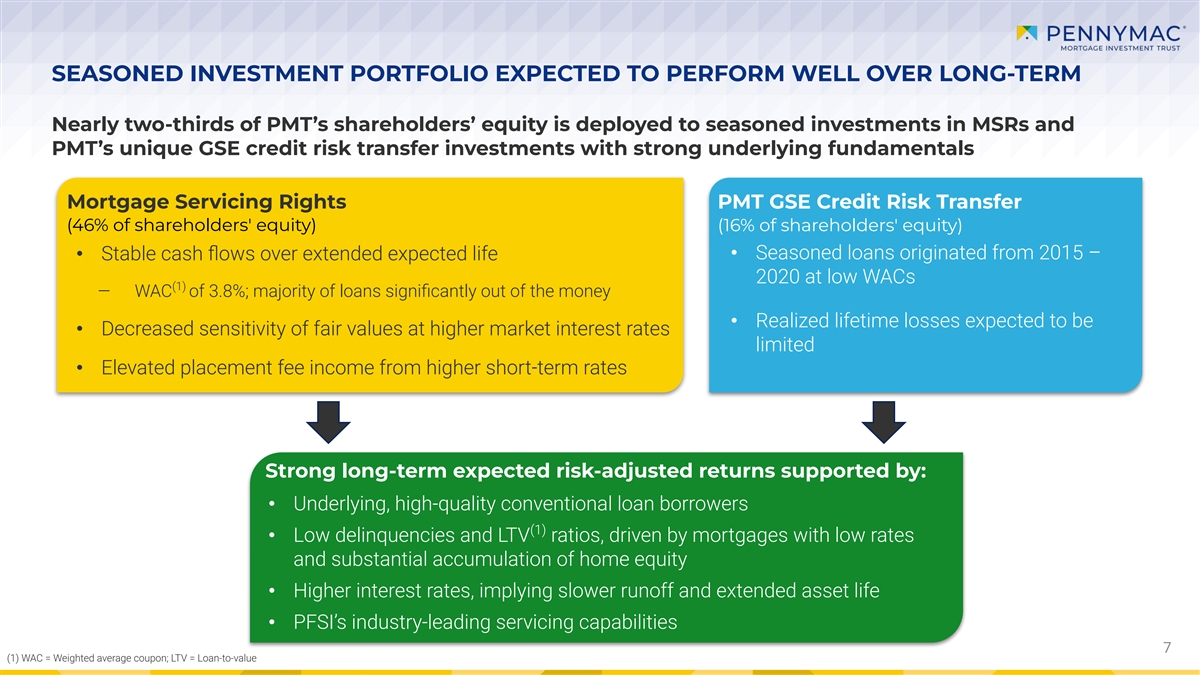
SEASONED INVESTMENT PORTFOLIO EXPECTED TO PERFORM WELL OVER LONG-TERM Nearly two-thirds of PMT’s shareholders’ equity is deployed to seasoned investments in MSRs and PMT’s unique GSE credit risk transfer investments with strong underlying fundamentals Mortgage Servicing Rights PMT GSE Credit Risk Transfer (46% of shareholders' equity) (16% of shareholders' equity) • Stable cash flows over extended expected life • Seasoned loans originated from 2015 – 2020 at low WACs (1) ‒ WAC of 3.8%; majority of loans significantly out of the money • Realized lifetime losses expected to be • Decreased sensitivity of fair values at higher market interest rates limited • Elevated placement fee income from higher short-term rates Strong long-term expected risk-adjusted returns supported by: • Underlying, high-quality conventional loan borrowers (1) • Low delinquencies and LTV ratios, driven by mortgages with low rates and substantial accumulation of home equity • Higher interest rates, implying slower runoff and extended asset life • PFSI’s industry-leading servicing capabilities 7 (1) WAC = Weighted average coupon; LTV = Loan-to-value
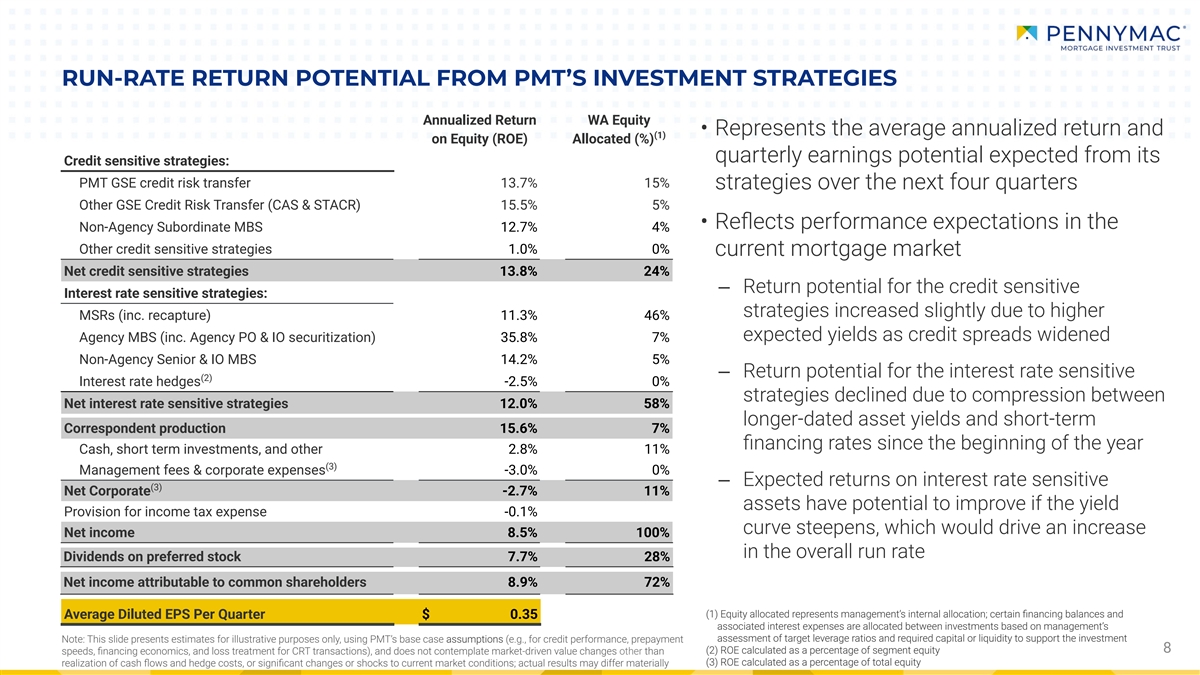
RUN-RATE RETURN POTENTIAL FROM PMT’S INVESTMENT STRATEGIES Annualized Return WA Equity • Represents the average annualized return and (1) on Equity (ROE) Allocated (%) quarterly earnings potential expected from its Credit sensitive strategies: PMT GSE credit risk transfer 13.7% 15% strategies over the next four quarters Other GSE Credit Risk Transfer (CAS & STACR) 15.5% 5% • Reflects performance expectations in the Non-Agency Subordinate MBS 12.7% 4% Other credit sensitive strategies 1.0% 0% current mortgage market Net credit sensitive strategies 13.8% 24% ‒ Return potential for the credit sensitive Interest rate sensitive strategies: strategies increased slightly due to higher MSRs (inc. recapture) 11.3% 46% expected yields as credit spreads widened Agency MBS (inc. Agency PO & IO securitization) 35.8% 7% Non-Agency Senior & IO MBS 14.2% 5% ‒ Return potential for the interest rate sensitive (2) Interest rate hedges -2.5% 0% strategies declined due to compression between Net interest rate sensitive strategies 12.0% 58% longer-dated asset yields and short-term Correspondent production 15.6% 7% financing rates since the beginning of the year Cash, short term investments, and other 2.8% 11% (3) Management fees & corporate expenses -3.0% 0% ‒ Expected returns on interest rate sensitive (3) Net Corporate -2.7% 11% assets have potential to improve if the yield Provision for income tax expense -0.1% curve steepens, which would drive an increase Net income 8.5% 100% in the overall run rate Dividends on preferred stock 7.7% 28% Net income attributable to common shareholders 8.9% 72% (1) Equity allocated represents management’s internal allocation; certain financing balances and Average Diluted EPS Per Quarter $ 0.35 associated interest expenses are allocated between investments based on management’s assessment of target leverage ratios and required capital or liquidity to support the investment Note: This slide presents estimates for illustrative purposes only, using PMT’s base case assumptions (e.g., for credit performance, prepayment 8 (2) ROE calculated as a percentage of segment equity speeds, financing economics, and loss treatment for CRT transactions), and does not contemplate market-driven value changes other than (3) ROE calculated as a percentage of total equity realization of cash flows and hedge costs, or significant changes or shocks to current market conditions; actual results may differ materially
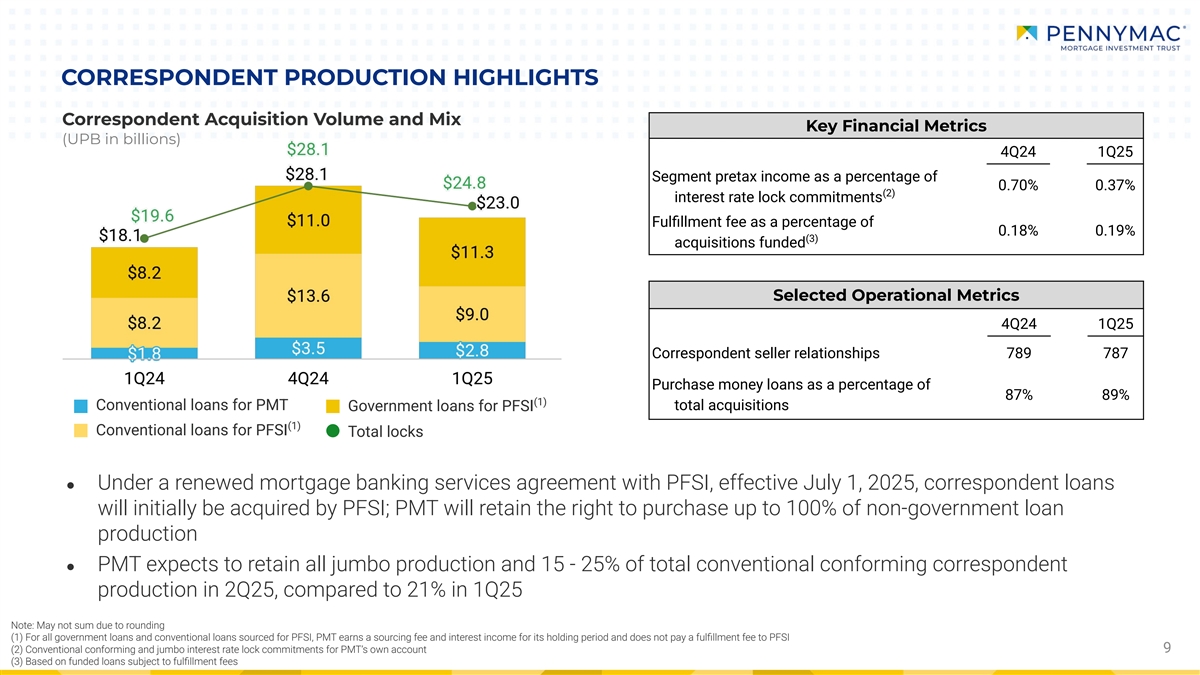
CORRESPONDENT PRODUCTION HIGHLIGHTS Correspondent Acquisition Volume and Mix Key Financial Metrics (UPB in billions) 4Q24 1Q25 Segment pretax income as a percentage of 0.70% 0.37% (2) interest rate lock commitments Fulfillment fee as a percentage of 0.18% 0.19% (3) acquisitions funded Selected Operational Metrics 4Q24 1Q25 Correspondent seller relationships 789 787 Purchase money loans as a percentage of 87% 89% (1) Conventional loans for PMT total acquisitions Government loans for PFSI (1) Conventional loans for PFSI Total locks ● Under a renewed mortgage banking services agreement with PFSI, effective July 1, 2025, correspondent loans will initially be acquired by PFSI; PMT will retain the right to purchase up to 100% of non-government loan production ● PMT expects to retain all jumbo production and 15 - 25% of total conventional conforming correspondent production in 2Q25, compared to 21% in 1Q25 Note: May not sum due to rounding (1) For all government loans and conventional loans sourced for PFSI, PMT earns a sourcing fee and interest income for its holding period and does not pay a fulfillment fee to PFSI (2) Conventional conforming and jumbo interest rate lock commitments for PMT’s own account 9 (3) Based on funded loans subject to fulfillment fees
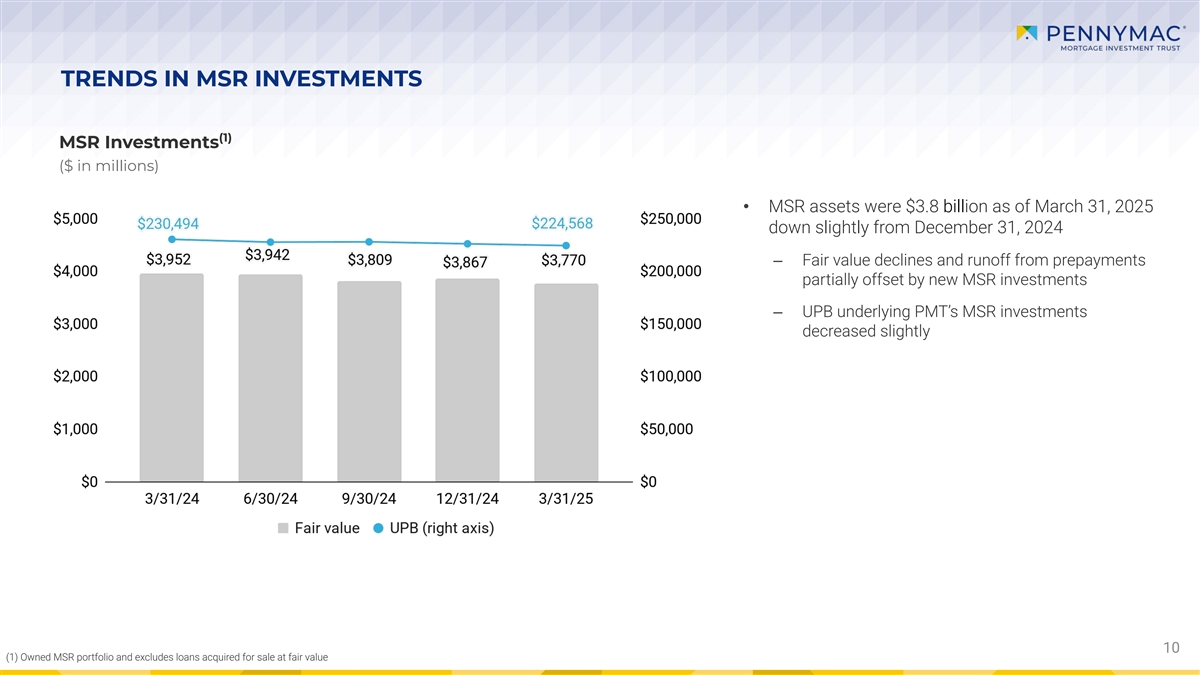
TRENDS IN MSR INVESTMENTS (1) MSR Investments ($ in millions) • MSR assets were $3.8 billion as of March 31, 2025 down slightly from December 31, 2024 ‒ Fair value declines and runoff from prepayments partially offset by new MSR investments ‒ UPB underlying PMT’s MSR investments decreased slightly 10 (1) Owned MSR portfolio and excludes loans acquired for sale at fair value
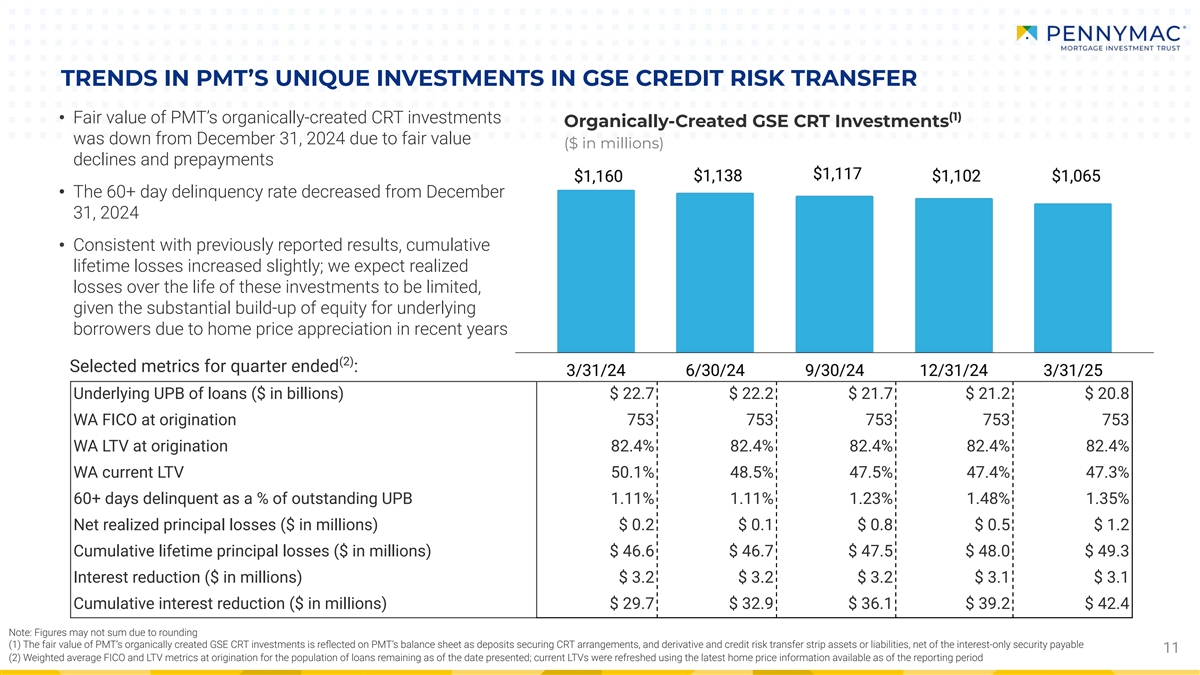
TRENDS IN PMT’S UNIQUE INVESTMENTS IN GSE CREDIT RISK TRANSFER (1) • Fair value of PMT’s organically-created CRT investments Organically-Created GSE CRT Investments was down from December 31, 2024 due to fair value ($ in millions) declines and prepayments • The 60+ day delinquency rate decreased from December 31, 2024 • Consistent with previously reported results, cumulative lifetime losses increased slightly; we expect realized losses over the life of these investments to be limited, given the substantial build-up of equity for underlying borrowers due to home price appreciation in recent years (2) Selected metrics for quarter ended : Underlying UPB of loans ($ in billions) $ 22.7 $ 22.2 $ 21.7 $ 21.2 $ 20.8 WA FICO at origination 753 753 753 753 753 WA LTV at origination 82.4% 82.4% 82.4% 82.4% 82.4% WA current LTV 50.1% 48.5% 47.5% 47.4% 47.3% 60+ days delinquent as a % of outstanding UPB 1.11% 1.11% 1.23% 1.48% 1.35% Net realized principal losses ($ in millions) $ 0.2 $ 0.1 $ 0.8 $ 0.5 $ 1.2 Cumulative lifetime principal losses ($ in millions) $ 46.6 $ 46.7 $ 47.5 $ 48.0 $ 49.3 Interest reduction ($ in millions) $ 3.2 $ 3.2 $ 3.2 $ 3.1 $ 3.1 Cumulative interest reduction ($ in millions) $ 29.7 $ 32.9 $ 36.1 $ 39.2 $ 42.4 Note: Figures may not sum due to rounding (1) The fair value of PMT’s organically created GSE CRT investments is reflected on PMT’s balance sheet as deposits securing CRT arrangements, and derivative and credit risk transfer strip assets or liabilities, net of the interest-only security payable 11 (2) Weighted average FICO and LTV metrics at origination for the population of loans remaining as of the date presented; current LTVs were refreshed using the latest home price information available as of the reporting period
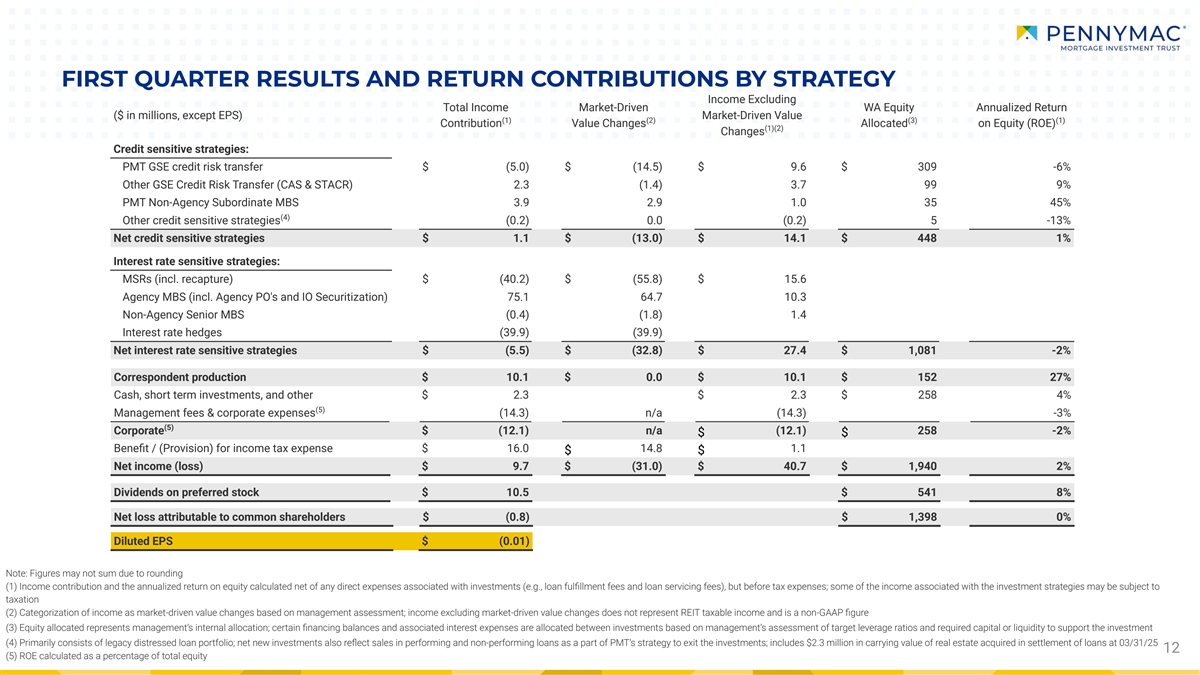
FIRST QUARTER RESULTS AND RETURN CONTRIBUTIONS BY STRATEGY Income Excluding Total Income Market-Driven WA Equity Annualized Return ($ in millions, except EPS) Market-Driven Value (1) (2) (3) (1) Contribution Value Changes Allocated on Equity (ROE) (1)(2) Changes Credit sensitive strategies: PMT GSE credit risk transfer $ (5.0) $ (14.5) $ 9.6 $ 309 -6% Other GSE Credit Risk Transfer (CAS & STACR) 2.3 (1.4) 3.7 99 9% PMT Non-Agency Subordinate MBS 3.9 2.9 1.0 35 45% (4) Other credit sensitive strategies (0.2) 0.0 (0.2) 5 -13% Net credit sensitive strategies $ 1.1 $ (13.0) $ 14.1 $ 448 1% Interest rate sensitive strategies: MSRs (incl. recapture) $ (40.2) $ (55.8) $ 15.6 Agency MBS (incl. Agency PO's and IO Securitization) 75.1 64.7 10.3 Non-Agency Senior MBS (0.4) (1.8) 1.4 Interest rate hedges (39.9) (39.9) Net interest rate sensitive strategies $ (5.5) $ (32.8) $ 27.4 $ 1,081 -2% Correspondent production $ 10.1 $ 0.0 $ 10.1 $ 152 27% Cash, short term investments, and other $ 2.3 $ 2.3 $ 258 4% (5) Management fees & corporate expenses (14.3) n/a (14.3) -3% (5) Corporate $ (12.1) n/a (12.1) 258 -2% $ $ Benefit / (Provision) for income tax expense $ 16.0 14.8 1.1 $ $ Net income (loss) $ 9.7 $ (31.0) $ 40.7 $ 1,940 2% Dividends on preferred stock $ 10.5 $ 541 8% Net loss attributable to common shareholders $ (0.8) $ 1,398 0% Diluted EPS $ (0.01) Note: Figures may not sum due to rounding (1) Income contribution and the annualized return on equity calculated net of any direct expenses associated with investments (e.g., loan fulfillment fees and loan servicing fees), but before tax expenses; some of the income associated with the investment strategies may be subject to taxation (2) Categorization of income as market-driven value changes based on management assessment; income excluding market-driven value changes does not represent REIT taxable income and is a non-GAAP figure (3) Equity allocated represents management’s internal allocation; certain financing balances and associated interest expenses are allocated between investments based on management’s assessment of target leverage ratios and required capital or liquidity to support the investment (4) Primarily consists of legacy distressed loan portfolio; net new investments also reflect sales in performing and non-performing loans as a part of PMT’s strategy to exit the investments; includes $2.3 million in carrying value of real estate acquired in settlement of loans at 03/31/25 12 (5) ROE calculated as a percentage of total equity
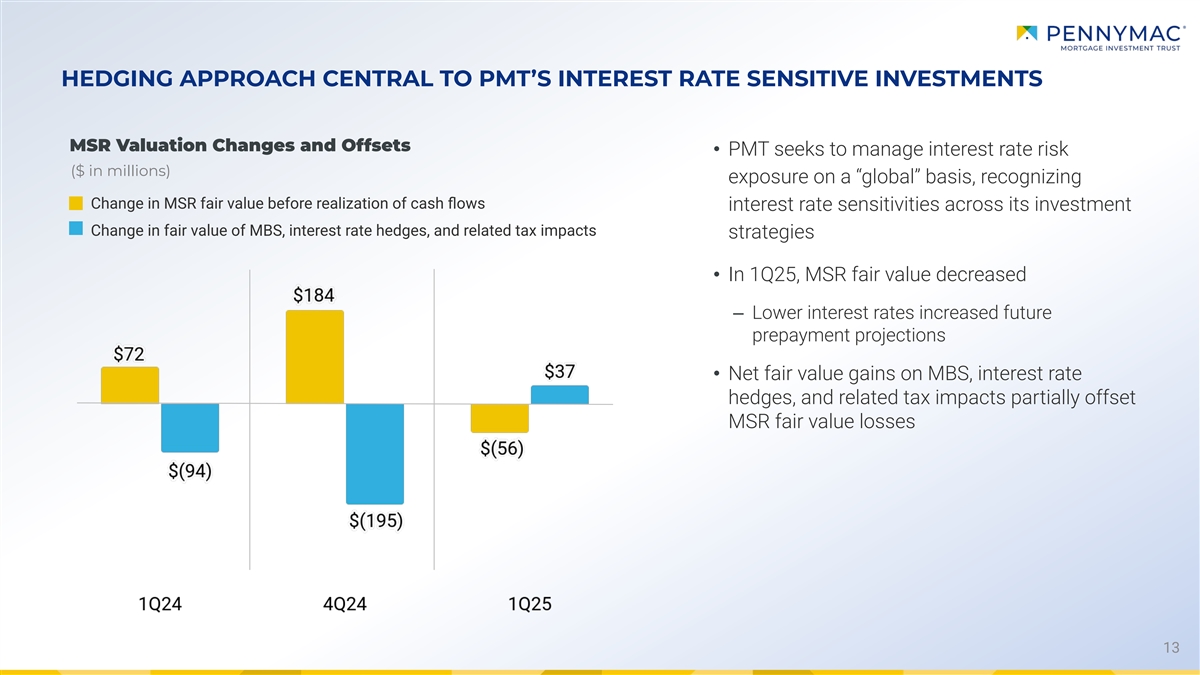
HEDGING APPROACH CENTRAL TO PMT’S INTEREST RATE SENSITIVE INVESTMENTS MSR Valuation Changes and Offsets • PMT seeks to manage interest rate risk ($ in millions) exposure on a “global” basis, recognizing Change in MSR fair value before realization of cash flows interest rate sensitivities across its investment Change in fair value of MBS, interest rate hedges, and related tax impacts strategies • In 1Q25, MSR fair value decreased ‒ Lower interest rates increased future prepayment projections • Net fair value gains on MBS, interest rate hedges, and related tax impacts partially offset MSR fair value losses 13
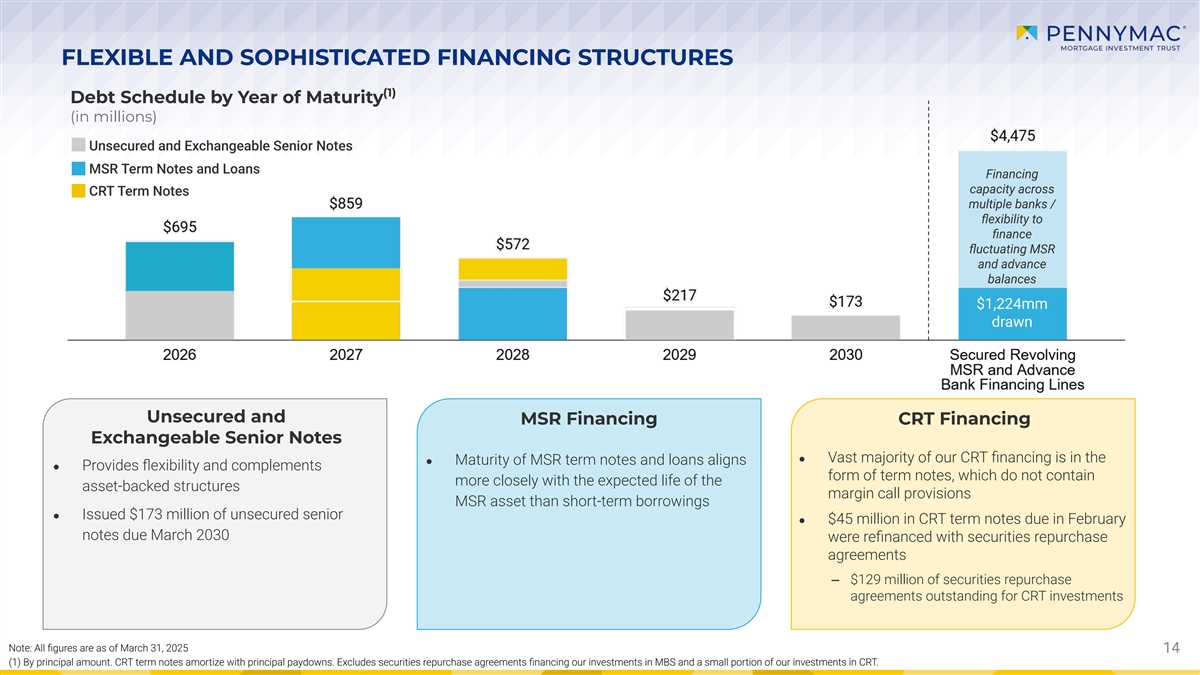
FLEXIBLE AND SOPHISTICATED FINANCING STRUCTURES (1) Debt Schedule by Year of Maturity (in millions) Unsecured and Exchangeable Senior Notes Financing MSR Term Notes and Loans Financing capacity across capacity across CRT Term Notes multiple banks / multiple banks / flexibility to flexibility to finance finance fluctuating MSR fluctuating MSR and advance and advance balances balances $1,224mm drawn Unsecured and MSR Financing CRT Financing Exchangeable Senior Notes ● Vast majority of our CRT financing is in the ● Maturity of MSR term notes and loans aligns ● Provides flexibility and complements form of term notes, which do not contain more closely with the expected life of the asset-backed structures margin call provisions MSR asset than short-term borrowings ● Issued $173 million of unsecured senior ● $45 million in CRT term notes due in February notes due March 2030 were refinanced with securities repurchase agreements ‒ $129 million of securities repurchase agreements outstanding for CRT investments Note: All figures are as of March 31, 2025 14 14 (1) By principal amount. CRT term notes amortize with principal paydowns. Excludes securities repurchase agreements financing our investments in MBS and a small portion of our investments in CRT.

APPENDIX
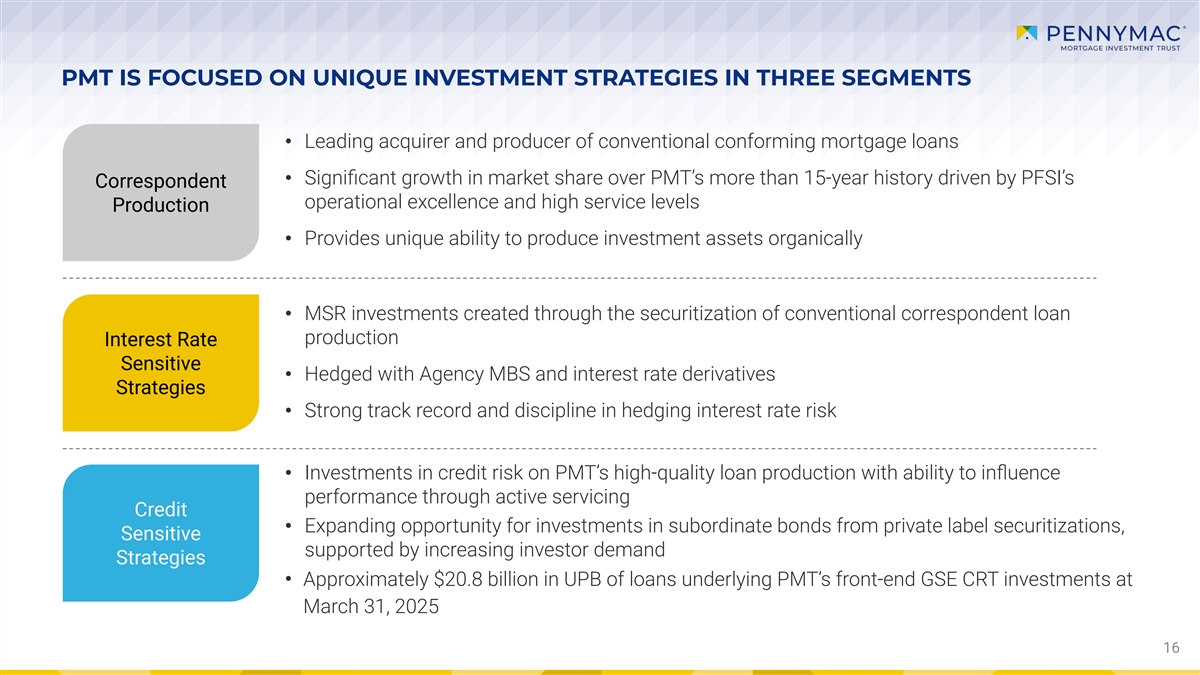
PMT IS FOCUSED ON UNIQUE INVESTMENT STRATEGIES IN THREE SEGMENTS • Leading acquirer and producer of conventional conforming mortgage loans • Significant growth in market share over PMT’s more than 15-year history driven by PFSI’s Correspondent operational excellence and high service levels Production • Provides unique ability to produce investment assets organically • MSR investments created through the securitization of conventional correspondent loan production Interest Rate Sensitive • Hedged with Agency MBS and interest rate derivatives Strategies • Strong track record and discipline in hedging interest rate risk • Investments in credit risk on PMT’s high-quality loan production with ability to influence performance through active servicing Credit • Expanding opportunity for investments in subordinate bonds from private label securitizations, Sensitive supported by increasing investor demand Strategies • Appr oximately $20.8 billion in UPB of loans underlying PMT’s front-end GSE CRT investments at March 31, 2025 16
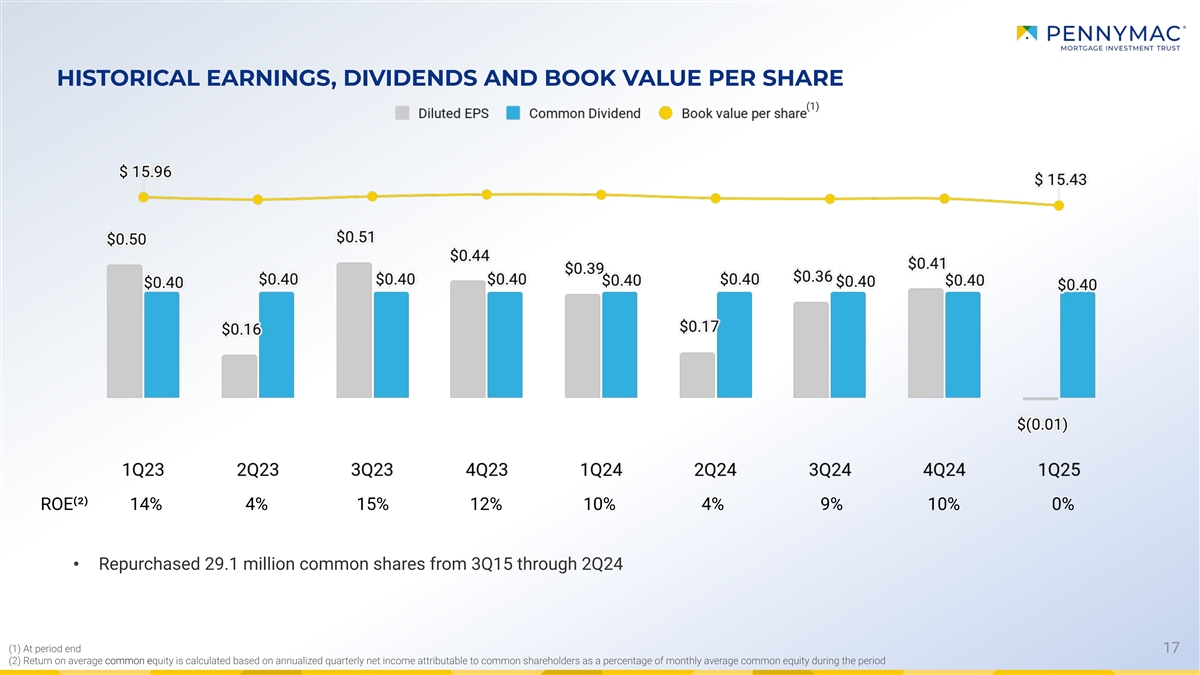
(1) At period end (2) Return on average common equity is calculated based on annualized quarterly net income attributable to common shareholders as a percentage of monthly average common equity during the period HISTORICAL EARNINGS, DIVIDENDS AND BOOK VALUE PER SHARE (1) ROE⁽²⁾ 14% 4% 15% 12% 10% 4% 9% 10% 0% • Repurchased 29.1 million common shares from 3Q15 through 2Q24 17
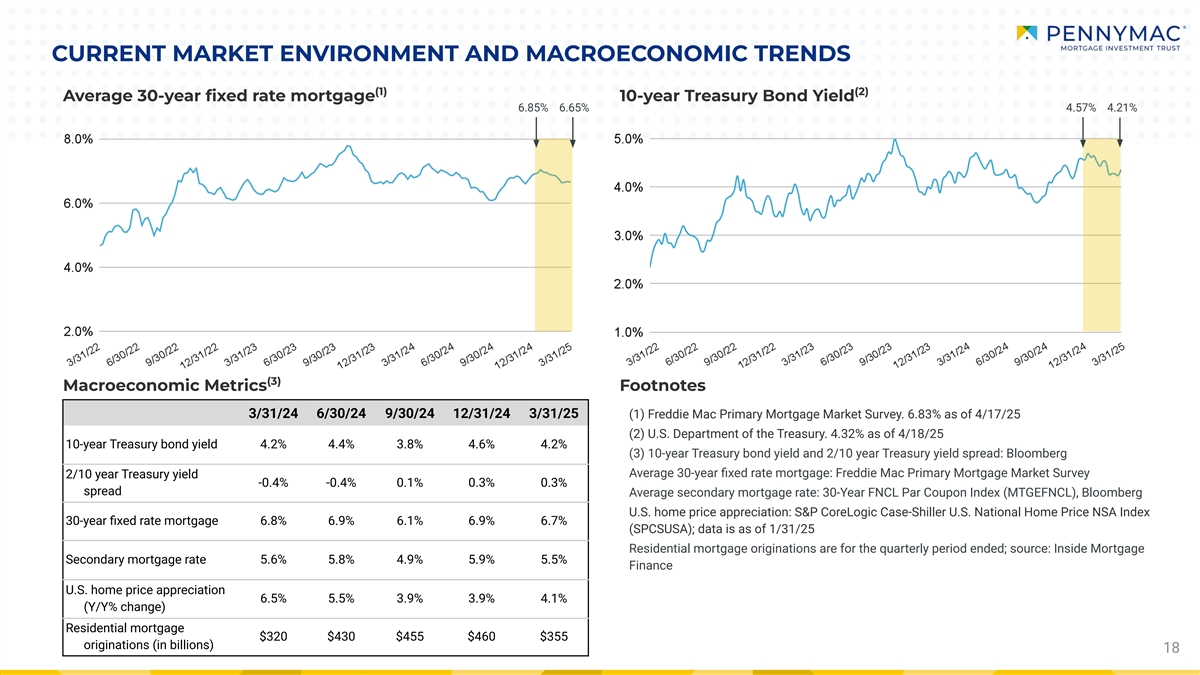
CURRENT MARKET ENVIRONMENT AND MACROECONOMIC TRENDS (1) (2) Average 30-year fixed rate mortgage 10-year Treasury Bond Yield 6.85% 6.65% 4.57% 4.21% (3) Macroeconomic Metrics Footnotes 3/31/24 6/30/24 9/30/24 12/31/24 3/31/25 (1) Freddie Mac Primary Mortgage Market Survey. 6.83% as of 4/17/25 (2) U.S. Department of the Treasury. 4.32% as of 4/18/25 10-year Treasury bond yield 4.2% 4.4% 3.8% 4.6% 4.2% (3) 10-year Treasury bond yield and 2/10 year Treasury yield spread: Bloomberg Average 30-year fixed rate mortgage: Freddie Mac Primary Mortgage Market Survey 2/10 year Treasury yield -0.4% -0.4% 0.1% 0.3% 0.3% spread Average secondary mortgage rate: 30-Year FNCL Par Coupon Index (MTGEFNCL), Bloomberg U.S. home price appreciation: S&P CoreLogic Case-Shiller U.S. National Home Price NSA Index 30-year fixed rate mortgage 6.8% 6.9% 6.1% 6.9% 6.7% (SPCSUSA); data is as of 1/31/25 Residential mortgage originations are for the quarterly period ended; source: Inside Mortgage Secondary mortgage rate 5.6% 5.8% 4.9% 5.9% 5.5% Finance U.S. home price appreciation 6.5% 5.5% 3.9% 3.9% 4.1% (Y/Y% change) Residential mortgage $320 $430 $455 $460 $355 originations (in billions) 18
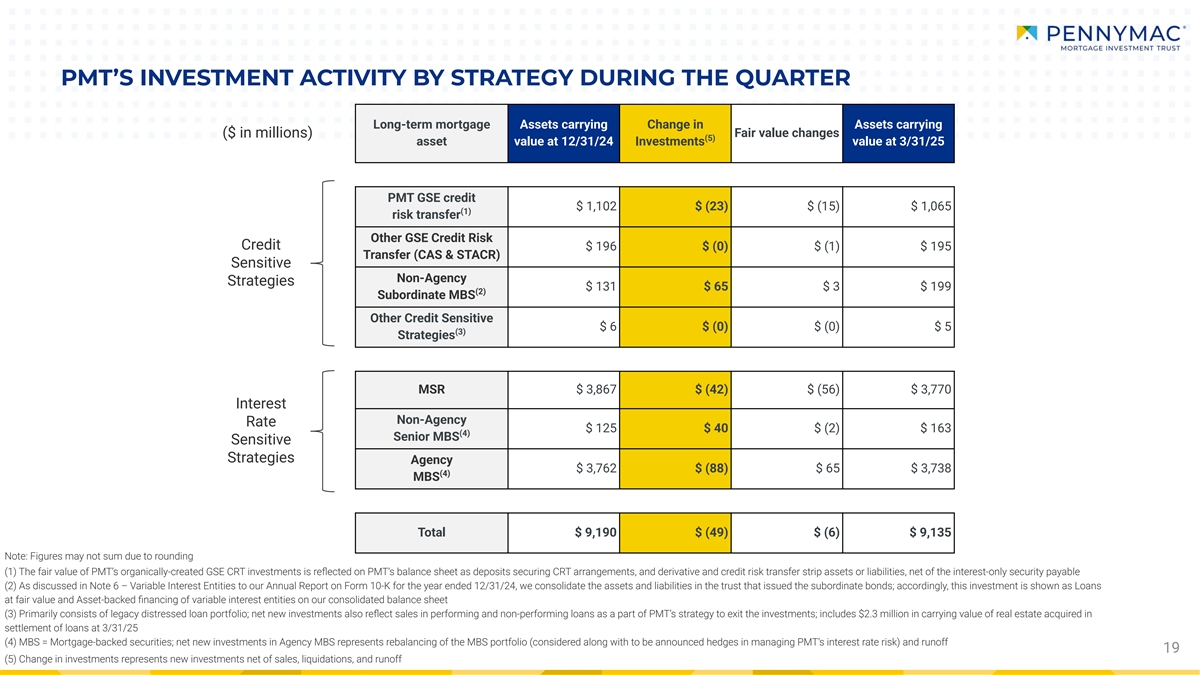
PMT’S INVESTMENT ACTIVITY BY STRATEGY DURING THE QUARTER Long-term mortgage Assets carrying Change in Assets carrying ($ in millions) Fair value changes (5) asset value at 12/31/24 Investments value at 3/31/25 PMT GSE credit $ 1,102 $ (23) $ (15) $ 1,065 (1) risk transfer Other GSE Credit Risk Credit $ 196 $ (0) $ (1) $ 195 Transfer (CAS & STACR) Sensitive Non-Agency Strategies $ 131 $ 65 $ 3 $ 199 (2) Subordinate MBS Other Credit Sensitive $ 6 $ (0) $ (0) $ 5 (3) Strategies MSR $ 3,867 $ (42) $ (56) $ 3,770 Interest Non-Agency Rate $ 125 $ 40 $ (2) $ 163 (4) Senior MBS Sensitive Strategies Agency $ 3,762 $ (88) $ 65 $ 3,738 (4) MBS Total $ 9,190 $ (49) $ (6) $ 9,135 Note: Figures may not sum due to rounding (1) The fair value of PMT’s organically-created GSE CRT investments is reflected on PMT’s balance sheet as deposits securing CRT arrangements, and derivative and credit risk transfer strip assets or liabilities, net of the interest-only security payable (2) As discussed in Note 6 – Variable Interest Entities to our Annual Report on Form 10-K for the year ended 12/31/24, we consolidate the assets and liabilities in the trust that issued the subordinate bonds; accordingly, this investment is shown as Loans at fair value and Asset-backed financing of variable interest entities on our consolidated balance sheet (3) Primarily consists of legacy distressed loan portfolio; net new investments also reflect sales in performing and non-performing loans as a part of PMT’s strategy to exit the investments; includes $2.3 million in carrying value of real estate acquired in settlement of loans at 3/31/25 (4) MBS = Mortgage-backed securities; net new investments in Agency MBS represents rebalancing of the MBS portfolio (considered along with to be announced hedges in managing PMT’s interest rate risk) and runoff 19 (5) Change in investments represents new investments net of sales, liquidations, and runoff
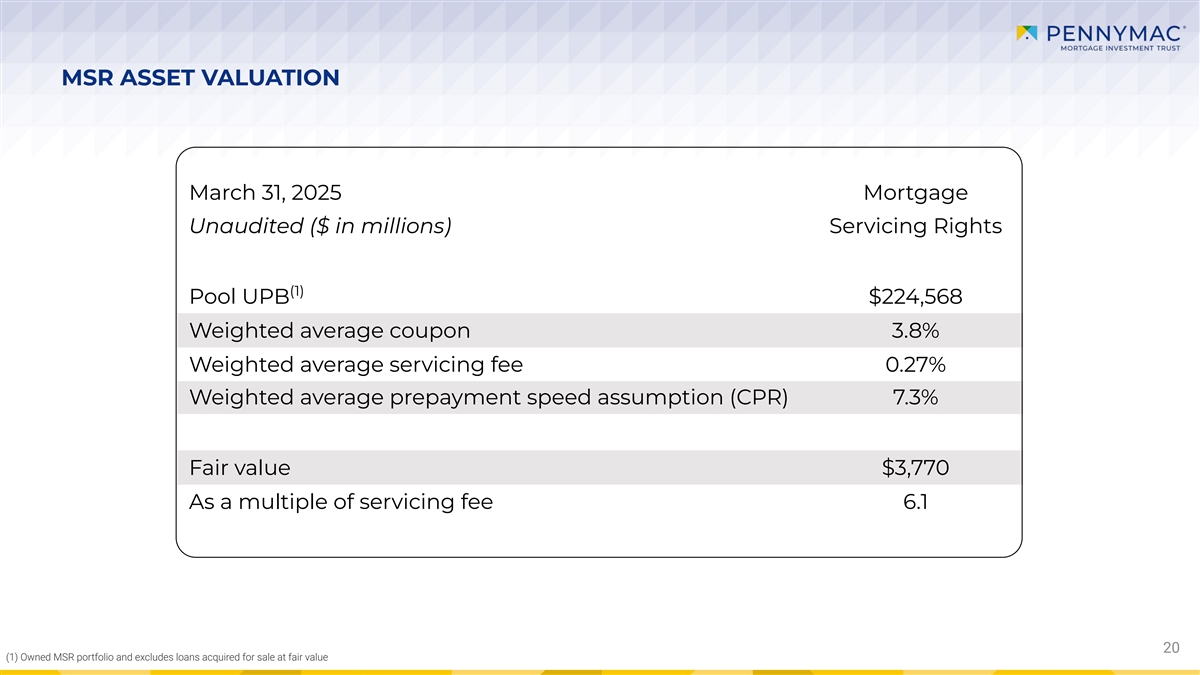
MSR ASSET VALUATION March 31, 2025 Mortgage Unaudited ($ in millions) Servicing Rights (1) Pool UPB $224,568 Weighted average coupon 3.8% Weighted average servicing fee 0.27% Weighted average prepayment speed assumption (CPR) 7.3% Fair value $3,770 As a multiple of servicing fee 6.1 20 (1) Owned MSR portfolio and excludes loans acquired for sale at fair value
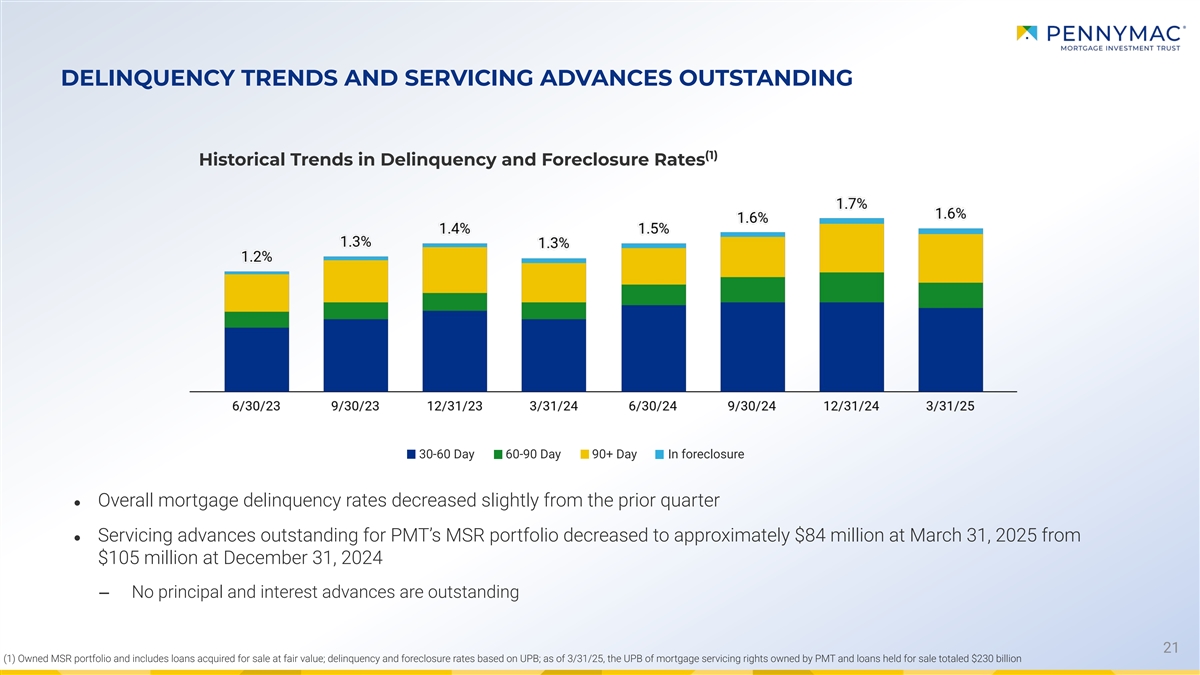
DELINQUENCY TRENDS AND SERVICING ADVANCES OUTSTANDING (1) Historical Trends in Delinquency and Foreclosure Rates 30-60 Day 60-90 Day 90+ Day In foreclosure ● Overall mortgage delinquency rates decreased slightly from the prior quarter ● Servicing advances outstanding for PMT’s MSR portfolio decreased to approximately $84 million at March 31, 2025 from $105 million at December 31, 2024 ‒ No principal and interest advances are outstanding 21 (1) Owned MSR portfolio and includes loans acquired for sale at fair value; delinquency and foreclosure rates based on UPB; as of 3/31/25, the UPB of mortgage servicing rights owned by PMT and loans held for sale totaled $230 billion
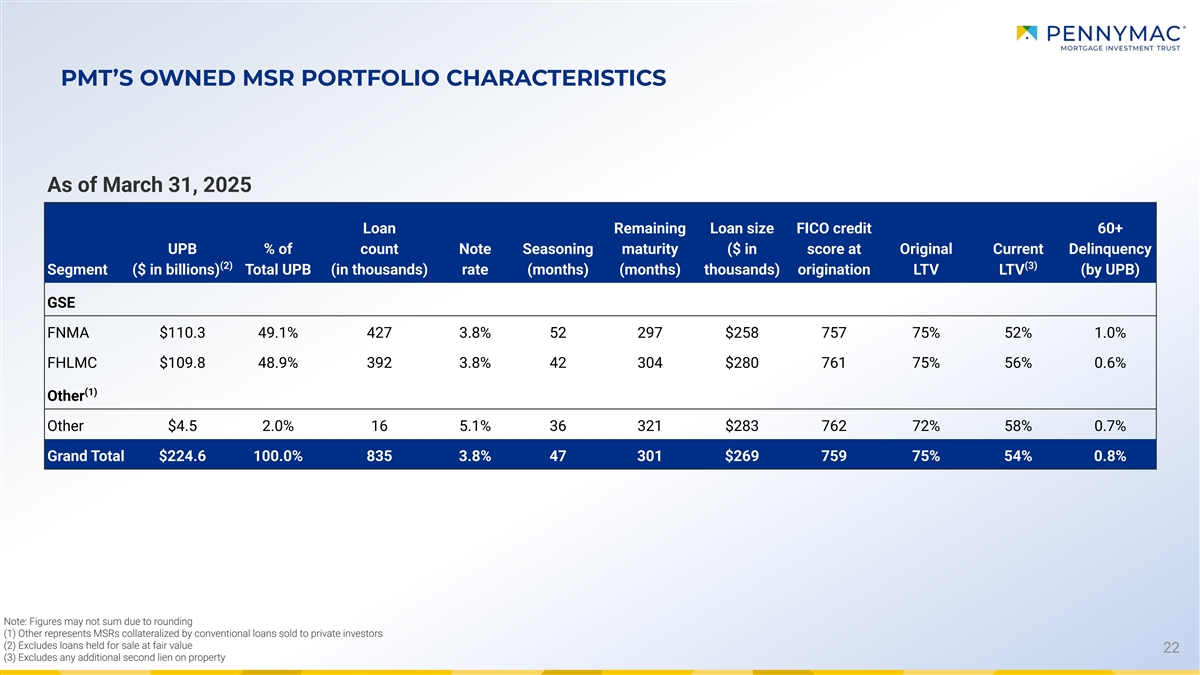
PMT’S OWNED MSR PORTFOLIO CHARACTERISTICS As of March 31, 2025 Loan Remaining Loan size FICO credit 60+ UPB % of count Note Seasoning maturity ($ in score at Original Current Delinquency (2) (3) Segment ($ in billions) Total UPB (in thousands) rate (months) (months) thousands) origination LTV LTV (by UPB) GSE FNMA $110.3 49.1% 427 3.8% 52 297 $258 757 75% 52% 1.0% FHLMC $109.8 48.9% 392 3.8% 42 304 $280 761 75% 56% 0.6% (1) Other Other $4.5 2.0% 16 5.1% 36 321 $283 762 72% 58% 0.7% Grand Total $224.6 100.0% 835 3.8% 47 301 $269 759 75% 54% 0.8% Note: Figures may not sum due to rounding (1) Other represents MSRs collateralized by conventional loans sold to private investors (2) Excludes loans held for sale at fair value 22 (3) Excludes any additional second lien on property
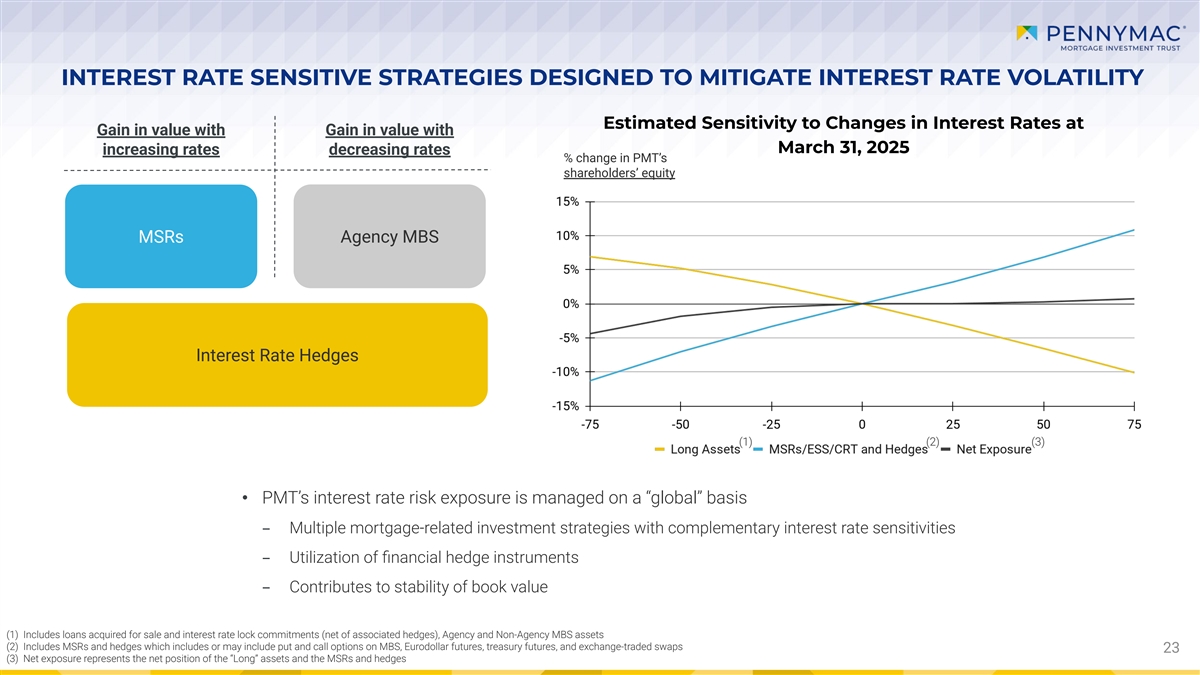
INTEREST RATE SENSITIVE STRATEGIES DESIGNED TO MITIGATE INTEREST RATE VOLATILITY Estimated Sensitivity to Changes in Interest Rates at Gain in value with Gain in value with March 31, 2025 increasing rates decreasing rates % change in PMT’s shareholders’ equity MSRs Agency MBS Interest Rate Hedges (1) (2) (3) • PMT’s interest rate risk exposure is managed on a “global” basis – Multiple mortgage-related investment strategies with complementary interest rate sensitivities – Utilization of financial hedge instruments – Contributes to stability of book value (1) Includes loans acquired for sale and interest rate lock commitments (net of associated hedges), Agency and Non-Agency MBS assets (2) Includes MSRs and hedges which includes or may include put and call options on MBS, Eurodollar futures, treasury futures, and exchange-traded swaps 23 (3) Net exposure represents the net position of the “Long” assets and the MSRs and hedges
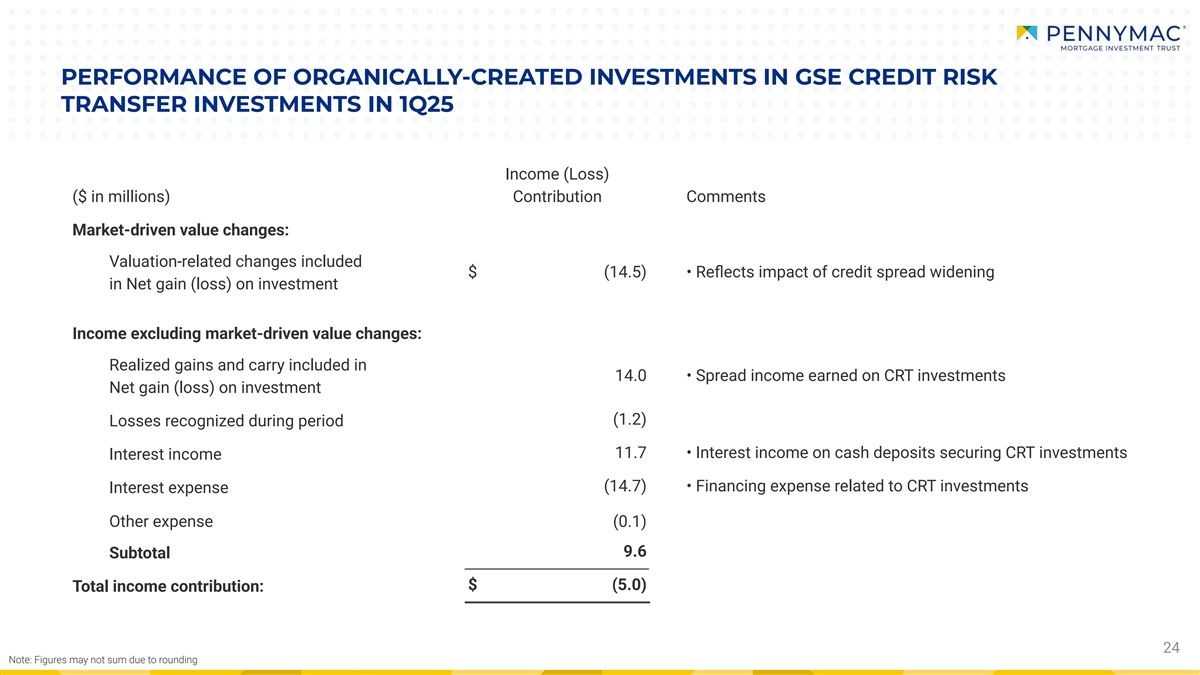
PERFORMANCE OF ORGANICALLY-CREATED INVESTMENTS IN GSE CREDIT RISK TRANSFER INVESTMENTS IN 1Q25 Income (Loss) ($ in millions) Contribution Comments Market-driven value changes: Valuation-related changes included $ (14.5) • Reflects impact of credit spread widening in Net gain (loss) on investment Income excluding market-driven value changes: Realized gains and carry included in 14.0 • Spread income earned on CRT investments Net gain (loss) on investment (1.2) Losses recognized during period 11.7 • Interest income on cash deposits securing CRT investments Interest income (14.7) • Financing expense related to CRT investments Interest expense Other expense (0.1) 9.6 Subtotal $ (5.0) Total income contribution: 24 Note: Figures may not sum due to rounding
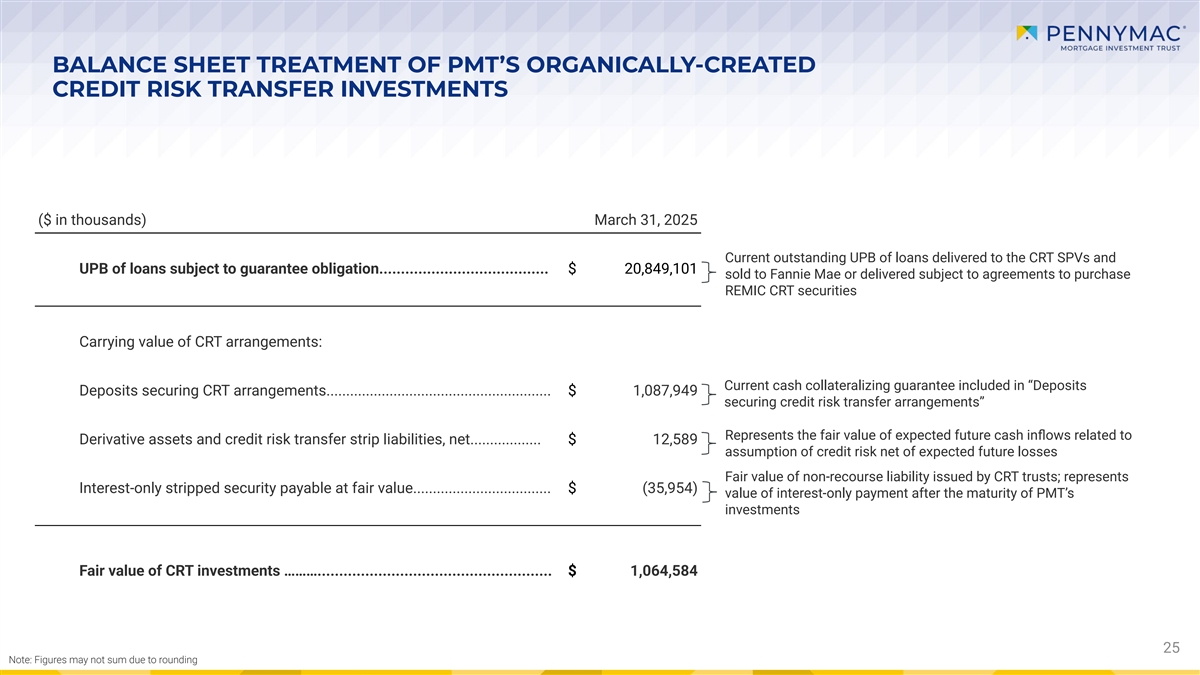
BALANCE SHEET TREATMENT OF PMT’S ORGANICALLY-CREATED CREDIT RISK TRANSFER INVESTMENTS ($ in thousands) March 31, 2025 Current outstanding UPB of loans delivered to the CRT SPVs and UPB of loans subject to guarantee obligation....................................... $ 20,849,101 sold to Fannie Mae or delivered subject to agreements to purchase REMIC CRT securities Carrying value of CRT arrangements: Current cash collateralizing guarantee included in “Deposits Deposits securing CRT arrangements......................................................... $ 1,087,949 securing credit risk transfer arrangements” Represents the fair value of expected future cash inflows related to Derivative assets and credit risk transfer strip liabilities, net.................. $ 12,589 assumption of credit risk net of expected future losses Fair value of non-recourse liability issued by CRT trusts; represents Interest-only stripped security payable at fair value................................... $ (35,954) value of interest-only payment after the maturity of PMT’s investments Fair value of CRT investments ………...................................................... $ 1,064,584 25 Note: Figures may not sum due to rounding
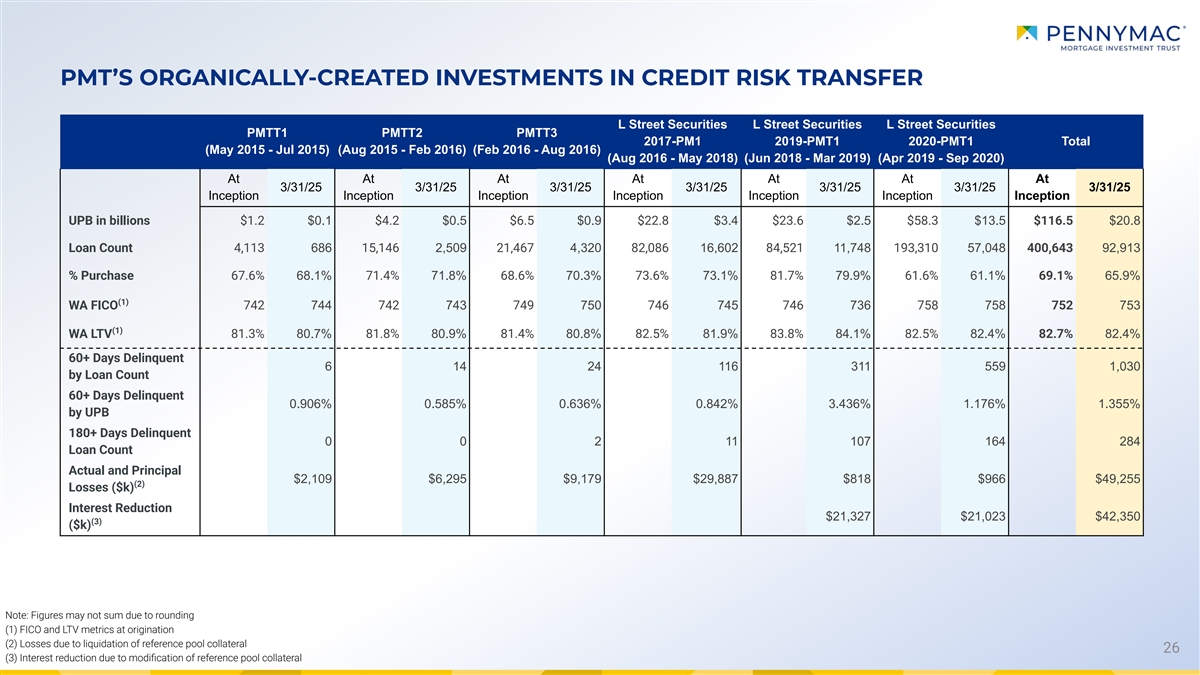
PMT’S ORGANICALLY-CREATED INVESTMENTS IN CREDIT RISK TRANSFER L Street Securities L Street Securities L Street Securities PMTT1 PMTT2 PMTT3 2017-PM1 2019-PMT1 2020-PMT1 Total (May 2015 - Jul 2015) (Aug 2015 - Feb 2016) (Feb 2016 - Aug 2016) (Aug 2016 - May 2018) (Jun 2018 - Mar 2019) (Apr 2019 - Sep 2020) At At At At At At At 3/31/25 3/31/25 3/31/25 3/31/25 3/31/25 3/31/25 3/31/25 Inception Inception Inception Inception Inception Inception Inception UPB in billions $1.2 $0.1 $4.2 $0.5 $6.5 $0.9 $22.8 $3.4 $23.6 $2.5 $58.3 $13.5 $116.5 $20.8 Loan Count 4,113 686 15,146 2,509 21,467 4,320 82,086 16,602 84,521 11,748 193,310 57,048 400,643 92,913 % Purchase 67.6% 68.1% 71.4% 71.8% 68.6% 70.3% 73.6% 73.1% 81.7% 79.9% 61.6% 61.1% 69.1% 65.9% (1) WA FICO 742 744 742 743 749 750 746 745 746 736 758 758 752 753 (1) WA LTV 81.3% 80.7% 81.8% 80.9% 81.4% 80.8% 82.5% 81.9% 83.8% 84.1% 82.5% 82.4% 82.7% 82.4% 60+ Days Delinquent 6 14 24 116 311 559 1,030 by Loan Count 60+ Days Delinquent 0.906% 0.585% 0.636% 0.842% 3.436% 1.176% 1.355% by UPB 180+ Days Delinquent 0 0 2 11 107 164 284 Loan Count Actual and Principal $2,109 $6,295 $9,179 $29,887 $818 $966 $49,255 (2) Losses ($k) Interest Reduction $21,327 $21,023 $42,350 (3) ($k) Note: Figures may not sum due to rounding (1) FICO and LTV metrics at origination (2) Losses due to liquidation of reference pool collateral 26 (3) Interest reduction due to modification of reference pool collateral
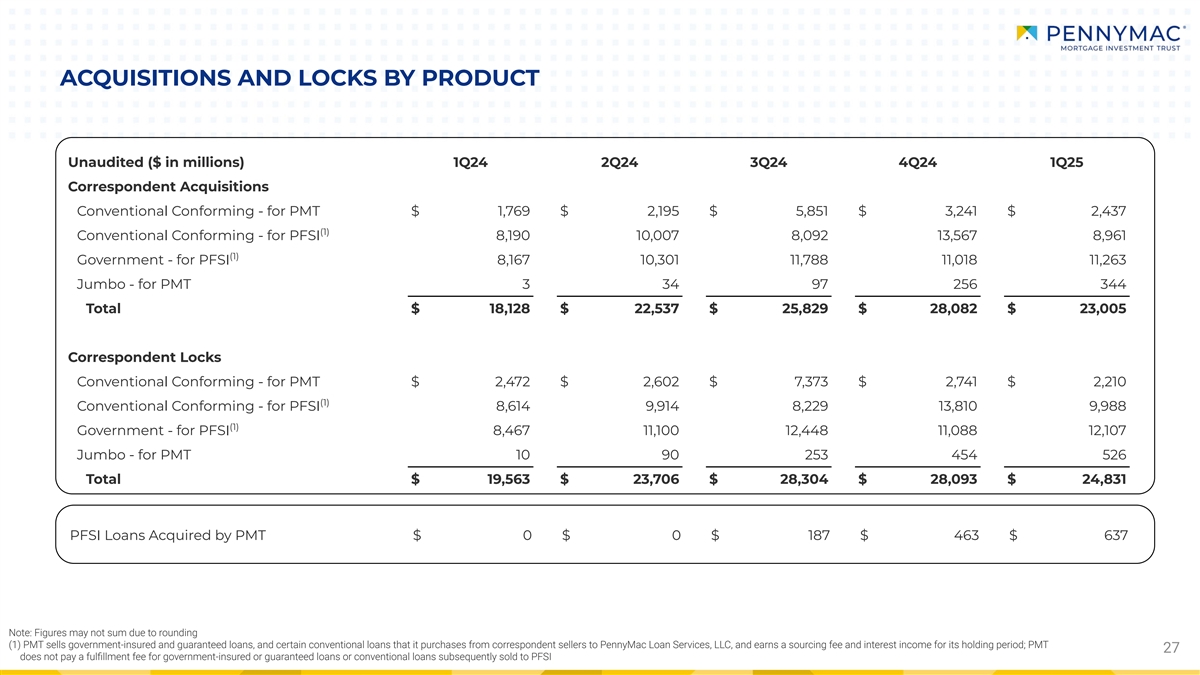
ACQUISITIONS AND LOCKS BY PRODUCT Unaudited ($ in millions) 1Q24 2Q24 3Q24 4Q24 1Q25 Correspondent Acquisitions Conventional Conforming - for PMT $ 1,769 $ 2,195 $ 5,851 $ 3,241 $ 2,437 (1) Conventional Conforming - for PFSI 8,190 10,007 8,092 13,567 8,961 (1) Government - for PFSI 8,167 10,301 11,788 11,018 11,263 Jumbo - for PMT 3 34 97 256 344 Total $ 18,128 $ 22,537 $ 25,829 $ 28,082 $ 23,005 Correspondent Locks Conventional Conforming - for PMT $ 2,472 $ 2,602 $ 7,373 $ 2,741 $ 2,210 (1) Conventional Conforming - for PFSI 8,614 9,914 8,229 13,810 9,988 (1) Government - for PFSI 8,467 11,100 12,448 11,088 12,107 Jumbo - for PMT 10 90 253 454 526 Total $ 19,563 $ 23,706 $ 28,304 $ 28,093 $ 24,831 PFSI Loans Acquired by PMT $ 0 $ 0 $ 187 $ 463 $ 637 Note: Figures may not sum due to rounding (1) PMT sells government-insured and guaranteed loans, and certain conventional loans that it purchases from correspondent sellers to PennyMac Loan Services, LLC, and earns a sourcing fee and interest income for its holding period; PMT 27 does not pay a fulfillment fee for government-insured or guaranteed loans or conventional loans subsequently sold to PFSI

28