UNITED STATES
SECURITIES AND EXCHANGE COMMISSION
Washington, D.C. 20549
Form 6-K
Report of Foreign Private Issuer
Pursuant to Rule 13a-16 or 15d-16
under the Securities Exchange Act of 1934
For the month of March 2025
Commission File Number 001-16139
Wipro Limited
(Exact name of Registrant as specified in its charter)
Not Applicable
(Translation of Registrant’s name into English)
Karnataka, India
(Jurisdiction of incorporation or organization)
Doddakannelli
Sarjapur Road
Bangalore, Karnataka 560035, India +91-80-2844-0011
(Address of principal executive offices)
Indicate by check mark whether the registrant files or will file annual reports under cover Form 20-F or Form 40-F: Form 20-F ☒ Form 40-F ☐
Indicate by check mark if the registrant is submitting the Form 6-K in paper as permitted by Regulation S-T Rule 101(b)(1): Yes ☐ No ☒
Note: Regulation S-T Rule 101(b)(1) only permits the submission in paper of a Form 6-K if submitted solely to provide an attached annual report to security holders.
Indicate by check mark if the registrant is submitting the Form 6-K in paper as permitted by Regulation S-T Rule 101(b)(7): Yes ☐ No ☒
Note: Regulation S-T Rule 101(b)(7) only permits the submission in paper of a Form 6-K if submitted to furnish a report or other document that the registrant foreign private issuer must furnish and make public under the laws of the jurisdiction in which the registrant is incorporated, domiciled or legally organized (the registrant’s “home country”), or under the rules of the home country exchange on which the registrant’s securities are traded, as long as the report or other document is not a press release, is not required to be and has not been distributed to the registrant’s security holders, and, if discussing a material event, has already been the subject of a Form 6-K submission or other Commission filing on EDGAR.
DISCLOSURE OF RESULTS OF OPERATIONS AND FINANCIAL CONDITION
Wipro Limited, a company organized under the laws of the Republic of India (the “Company”), hereby furnishes the Commission with the following information concerning its public disclosures regarding its results of operations for the quarter and year ended March 31, 2025. The following information shall not be deemed “filed” for purposes of Section 18 of the Securities Exchange Act of 1934, as amended, or incorporated by reference in any filing under the Securities Act of 1933, as amended, except as shall be expressly set forth by specific reference in such a filing.
On April 16, 2025, the Company announced its results of operations for the quarter and year ended March 31, 2025. The Company issued a press release announcing its results under International Financial Reporting Standards (“IFRS”), a copy of which is attached to this Form 6-K as Item 99.1.
The Company placed advertisements in certain Indian newspapers concerning its results of operations for the quarter and year ended March 31, 2025, under IFRS. A copy of the form of this advertisement is attached to this Form 6-K as Item 99.2.
The Company made available on its website the Condensed Consolidated Interim Financial Statements for the quarter and year ended March 31, 2025, under IFRS. A copy of such financial statements is attached to this Form 6-K as Item 99.3.
The Company filed with stock exchanges in India a statement of statutorily audited consolidated financial results for the quarter and year ended March 31, 2025, under IFRS. A copy of such financial statements is attached to this Form 6-K as Item 99.4.
The Company filed with stock exchanges in India a data sheet containing operating metrics for the quarter and year ended March 31, 2025. A copy of such data sheet is attached to this Form 6-K as Item 99.5.
SIGNATURES
Pursuant to the requirements of the Securities Exchange Act of 1934, the registrant has duly caused this report to be signed on its behalf by the undersigned, thereunto duly organized.
| WIPRO LIMITED |
| By: /s/ Aparna Chandrashekar Iyer |
| Aparna Chandrashekar Iyer |
| Chief Financial Officer |
| Dated: April 21, 2025 |
INDEX TO EXHIBITS
Exhibit 99.1
| FOR IMMEDIATE RELEASE |

|
Wipro announces results for the Quarter and Year ended March 31, 2025
Net income grew 6.4% QoQ in Q4’25 and grew 18.9% YoY for FY’25
FY’25 margin at 17.1%, expands 0.9%, Q4 margin at 17.5%, expands 1.1% YoY
Large deal booking grew 48.5% YoY in Q4’25 and grew 17.5% YoY for FY’25
Operating cash flow at 104.4% of net income for Q4’25 and 128.2% for FY’25
EAST BRUNSWICK, N.J. | BANGALORE, India – Apr 16, 2025: Wipro Limited (NYSE: WIT, BSE: 507685, NSE: WIPRO), a leading technology services and consulting company, announced financial results under International Financial Reporting Standards (IFRS) for the quarter and year ended March 31, 2025.
Highlights of the Results
Results for the Quarter ended March 31, 2025:
| 1. | Gross revenue at ₹225.0 billion ($2,634.2 million1), an increase of 0.8% QoQ and 1.3% YoY. |
| 2. | IT services segment revenue was at $2,596.5 million, decrease of 1.2% QoQ and 2.3% YoY. |
| 3. | Non-GAAP2 constant currency IT Services segment revenue decreased 0.8% QoQ and 1.2% YoY. |
| 4. | Total bookings3 was at $3,955 million, up by 13.4% QoQ in constant currency2. Large deal bookings4 was at $1,763 million, an increase of 48.5% YoY in constant currency2. |
| 5. | IT services operating margin5 for Q4’25 was at 17.5%, flat QoQ and expansion of 1.1% YoY. |
| 6. | Net income for the quarter was at ₹35.7 billion ($417.8 million1), an increase of 6.4% QoQ and 25.9% YoY. |
| 7. | Earnings per share for the quarter at ₹3.4 ($0.041), an increase of 6.2% QoQ and 25.8% YoY. |
| 8. | Operating cash flows of ₹37.5 billion ($438.5 million1), decrease of 28.2% YoY and at 104.4% of Net Income for the quarter. |
| 9. | Voluntary attrition was at 15.0% on a trailing 12-month basis. |
Results for the Year ended March 31, 2025:
| 1. | Gross revenue reached ₹890.9 billion ($10.4 billion1), a decrease of 0.7% YoY. |
| 2. | IT services segment revenue was at $10,511.5 million, a decrease of 2.7% YoY. |
| 3. | Non-GAAP2 constant currency IT Services segment revenue decreased 2.3% YoY. |
| 4. | Large deal bookings4 was at $5.4 billion, up by 17.5% YoY. Total bookings3 was at $14.3 billion, decrease of 3.8% YoY. |
| 5. | IT services operating margin5 for the year was at 17.1%, up by 0.9% YoY. |
| 6. | Net income for the year was at ₹131.4 billion ($1,537.0 million1), an increase of 18.9% YoY. |
| 7. | Earnings per share for the year was at ₹12.6 ($0.151), an increase of 20.3% YoY. |
| 8. | Operating cash flows of ₹169.4 billion ($1,983.0 million1), decrease of 3.9% YoY and at 128.2% of Net Income for the year. |
1
Outlook for the Quarter ending June 30, 2025
We expect revenue from our IT Services business segment to be in the range of $2,505 million to $2,557 million*. This translates to sequential guidance of (-)3.5% to (-)1.5% in constant currency terms.
*Outlook for the Quarter ending June 30, 2025, is based on the following exchange rates: GBP/USD at 1.26, Euro/USD at 1.05, AUD/USD at 0.63, USD/INR at 86.60 and CAD/USD at 0.70
Performance for the Quarter and Year ended March 31, 2025
Srini Pallia, CEO and Managing Director, said “We closed FY25 with two mega deal wins, an increase in large deal bookings, and growth in our top accounts. Client satisfaction scores improved, reflecting strong execution and engagement. We also continued to invest in our global talent and in strengthening our consulting and AI capabilities. As clients remain cautious in the face of macroeconomic uncertainty, we’re focused on partnering closely with them while staying committed to consistent and profitable growth.”
Aparna Iyer, Chief Financial Officer, said “For Q4 operating margins expanded 110 basis points year on year and for the full financial year margin expanded by 90 basis points. Our focus on execution rigour has ensured that our margins have steadily expanded even in a softening revenue environment. Our endeavor will be to maintain the margin in a narrow band in the coming quarters. Our net income grew 6.4% sequentially in Q4 and 18.9% for the full financial year. Cash flow continued to be robust in Q4 resulting in net operating cash flow generation of almost $ 2 Bn for FY’25, which is 128.2% of our net income.”
Capital Allocation:
The interim dividend of ₹ 6 declared by the Board at its meeting held on January 17th, 2025, shall be considered as final dividend for the financial year 2024-25.
| 1. | For the convenience of the readers, the amounts in Indian Rupees in this release have been translated into United States Dollars at the certified foreign exchange rate of US$1 = ₹85.43, as published by the Federal Reserve Board of Governors on March 31, 2025. However, the realized exchange rate in our IT Services business segment for the quarter ended March 31, 2025, was US$1= ₹86.44 |
| 2. | Constant currency for a period is the product of volumes in that period times the average actual exchange rate of the corresponding comparative period. |
| 3. | Total Bookings refers to the total contract value of all orders that were booked during the period including new orders, renewals, and increases to existing contracts. Bookings do not reflect subsequent terminations or reductions related to bookings originally recorded in prior fiscal periods. Bookings are recorded using then-existing foreign currency exchange rates and are not subsequently adjusted for foreign currency exchange rate fluctuations. The revenues from these contracts accrue over the tenure of the contract. For constant currency growth rates, refer note 2. |
| 4. | Large deal bookings consist of deals greater than or equal to $30 million in total contract value. |
| 5. | IT Services Operating Margin refers to Segment Results Total as reflected in IFRS financials. |
2
Highlights of Strategic Deal Wins
In the fourth quarter, Wipro continued to win large and strategic deals across industries. Key highlights include:
| 1. | Phoenix Group, the UK’s largest long-term savings and retirement business, has selected Wipro to deliver life and pension business administration for their ReAssure business and accelerate the Group’s operational transformation. Under the terms of the 10-year deal, Wipro’s FCA-regulated entity, Wipro Financial Services Outsourcing Limited (WFOSL), will deliver comprehensive life and pension administration services that will encompass Policy Administration, Claims Processing, Customer Service Support, Data Management and Reporting, and Compliance and Regulatory Support. As part of the engagement, Wipro will also assume management of the client’s core policy administration ALPHA platform, modernizing it with AI, Automation, Cloud, and digital transformation technologies. This engagement aligns with our strategic big bet of setting up an Insurance Third Party Administration (TPA) business that will open doors for us to target large, multi-year platform, deals encompassing operations and technology. |
| 2. | A prominent North America-based financial institution has selected Wipro to enhance its technology infrastructure, delivery and operations. The Wipro team will consolidate the client’s existing technology vendors, thereby providing improved visibility into their technological delivery. Wipro will implement a global delivery model across the client’s entire business to streamline processes, optimize resource allocation, and significantly boost efficiency. This comprehensive approach will enable the client to achieve substantial cost savings, heightened productivity, and superior service delivery. |
| 3. | A manufacturer of premium household appliances headquartered in Europe has selected Wipro to manage and transform its IT landscape. The Wipro team will future-proof the client’s IT infrastructure by harnessing its AI-driven Smart-Operations Solution that includes conversational virtual service desk AI agents providing seamless support in multiple languages. Wipro will consolidate all business applications, infrastructure, and cyber security tracks onto a unified monitoring platform to provide better visibility into the client’s technology ecosystem. From this project, the client can expect to see enhanced operational efficiency and robust cyber-risk management. |
| 4. | One of the largest health insurers in the U.S has extended its engagement with Wipro to automate and streamline its financial and membership reconciliation. Wipro will deploy its industry leading Medicare platform, “Payer-in-a-box”, to support the client’s growing business. The SaaS based solution will provide the client with increased flexibility to handle membership growth, optimized financial control, and assured compliance with Centre for Medicare & Medicaid Services regulations. Additionally, the solution will also ensure data security, platform stability, and seamless business continuity for the client. |
| 5. | A Fortune 100 global healthcare payer, experiencing significant business growth, has entrusted Wipro to manage its increased operational demands. Wipro will leverage its deep expertise and AI tools to scale the client’s Medicare, Medicaid, and ACA operations. This will enable the client to focus on their core strategic priorities, optimize operational costs, and significantly improve efficiency in member services. Wipro will support the client in improving user experience and driving exceptional business outcomes. |
3
| 6. | A US-based payment card services company has expanded its relationship with Wipro to modernize and maintain its business applications portfolio. The Wipro team will undertake a transformation and optimization program across the client’s payment ecosystem. From this project, the client will see significantly improved transaction security for their end-customers, as well as enhanced scalability and cost efficiency. |
| 7. | A leading American multinational energy corporation has extended their relationship with Wipro to provide Application Management Services across their entire Oil & Gas value chain. Leveraging Wipro’s AI-powered NextGen AMS solution, the team will modernize and manage an expanded scope of business applications that power critical functions across the client’s end-to-end business value chain. Through this engagement, the client will see a significant increase in AI-enabled operational efficiency, improved resilience in automation, enhanced service levels, as well as stronger alignment with their competitive performance goals. |
| 8. | A North American parcel delivery company has extended its relationship with Wipro to provide private Cloud solutions, which comprise Cloud Server, Storage, Network, Security, and Scheduling services. Leveraging AI-Ops tools, the Wipro team will help the client achieve improved ticket resolution and reduction in planned outages. Further, the client will realize enhanced business agility and scalability, as well as cost predictability, data sovereignty, and resiliency. |
| 9. | A Europe-based international food wholesaler has extended its partnership with Wipro to provide comprehensive business application management, cloud, and IT support services. In the initial phase of the partnership, Wipro assisted the customer in accelerating their cloud strategy by migrating 80% of their on-premises infrastructure to the cloud and contributing to the modernization of their store infrastructure. The second phase will focus on enhancing cloud security through modernization and optimization of the client’s cloud environment. The Wipro team will also continue to manage and modernize the client’s business applications, utilizing GenAI-powered solutions to swiftly detect and resolve incidents, ensuring uninterrupted operations. Additionally, Wipro will leverage data-driven business insights to improve strategic decision-making, leading to enhanced operational efficiency and greater visibility into the client’s business segments. |
| 10. | A large Australian engineering and construction company has strengthened its strategic, long-standing partnership with Wipro by expanding into a Managed Services contract. Wipro will leverage automation and AI ops to improve user experience, deliver faster and higher quality issue resolution, as well as to optimize IT costs, and streamline operations. Wipro will also transform the client’s IT service delivery across multiple business units to create a modern, secure, and sustainable environment. |
| 11. | A multinational engineering corporation has selected Wipro to implement AI-powered comprehensive managed infosec services solution to enhance their network, endpoint, cloud, and identity security. Integrating AI solutions from the WeGA studio, Wipro will automate processes, efficiently resolve alerts, and provide contextual resolutions for the client. Wipro will enhance agent productivity by 15-20%, resulting in significant efficiency gains and improved overall performance. |
4
| 12. | Wipro has partnered with a US-based utility company to set up a GenAI Center of Excellence to spearhead AI innovation. Through the CoE, Wipro will create a comprehensive GenAI strategy for the client’s AI and data lifecycle. Wipro is developing an end-to-end resource planning platform for logistics, power management, and asset health monitoring, to streamline operations. The AI & data CoE will facilitate better risk governance, accelerated adoption and measurable ROI. The client will also see enhanced decision-making, regulatory alignment, as well as reusable and faster deployment of AI models. |
Analyst Recognition
| 1. | Wipro was positioned as a Horizon 3 – Market Leader in the HFS Horizons: Generative Enterprise Services, 2025 report |
| 2. | Wipro was ranked as a Leader in Avasant’s Life Sciences Digital Services 2025 RadarView™ |
| 3. | Wipro was positioned as a Leader in Everest Group’s Managed Detection and Response (MDR) Services PEAK Matrix® Assessment 2025 |
| 4. | Wipro was positioned as a Leader in ISG Provider Lens™ - Power & Utilities Industry Services and Solutions 2024 – North America & Europe (multiple quadrants) |
| 5. | Wipro was rated as a Leader in ISG Provider Lens™ - Oil and Gas Industry Services and Solutions 2024 - North America (all quadrants) |
| 6. | Wipro was recognized as a Leader in ISG Provider Lens™ - Telecom, Media and Entertainment Industry Services 2024 – North America (multiple quadrants) |
| 7. | Wipro was featured as a Leader in ISG Provider Lens™ - Advanced Analytics and AI Services 2024 - US (all quadrants) |
| 8. | Wipro was recognized as a Leader in ISG Provider Lens™ - Healthcare Digital Services 2024 - US (all quadrants) |
| 9. | Wipro was recognized as a Leader and Star Performer in Everest Group’s SAP Business Application Services PEAK Matrix® Assessment 2025 |
| 10. | Wipro was positioned as a Leader in ISG Provider Lens™ - Oracle Cloud and Technology Ecosystem 2024 - US & Europe (all quadrants) |
| 11. | Wipro was rated as a Leader in ISG Provider Lens™ - Sustainability and ESG 2024 - US & Europe (all quadrants) |
| 12. | Wipro was positioned as a Leader in the 2025 Gartner® Magic Quadrant™ for Outsourced Digital Workplace Services |
| 13. | Wipro was recognized as a Leader in Everest Group’s Application Management Services PEAK Matrix® Assessment 2025 |
Source & Disclaimer: *Gartner, “Magic Quadrant for Outsourced Digital Workplace Services”, Karl Rosander, et al, 24 March 2025.
GARTNER is a registered trademark and service mark of Gartner, Inc. and/or its affiliates in the U.S. and internationally, and MAGIC QUADRANT is a registered trademark of Gartner, Inc. and/or its affiliates and are used herein with permission. All rights reserved.
Gartner does not endorse any vendor, product, or service depicted in its research publications, and does not advise technology users to select only those vendors with the highest ratings or other designation. Gartner’s research publications consist of the opinions of Gartner’s research organization and should not be construed as statements of fact. Gartner disclaims all warranties, expressed or implied, with respect to this research, including any warranties of merchantability or fitness for a particular purpose.
The Gartner content described herein (the “Gartner Content”) represents research opinion or viewpoints published, as part of a syndicated subscription service, by Gartner, Inc. (“Gartner”), and is not a representation of fact. Gartner Content speaks as of its original publication date (and not as of the date of this press release, and the opinions expressed in the Gartner Content are subject to change without notice.
5
IT Products
1. IT Products segment revenue for the quarter was ₹0.8 billion ($9.5 million1)
2. IT Products segment results for the quarter were ₹0.03 billion ($0.3million1)
3. IT Products segment revenue for the year was ₹2.7 billion ($31.5 million1)
4. IT Products segment results for the year were (₹(-)0.2 billion) ($(-)2.0 million1)
Please refer to the table on page 12 for reconciliation between IFRS IT Services Revenue and IT Services Revenue on a non-GAAP constant currency basis.
About Key Metrics and Non-GAAP Financial Measures
This press release contains key metrics and non-GAAP financial measures within the meaning of Regulation G and Item 10(e) of Regulation S-K. Such non-GAAP financial measures are measures of our historical or future performance, financial position or cash flows that are adjusted to exclude or include amounts that are excluded or included, as the case may be, from the most directly comparable financial measure calculated and presented in accordance with IFRS.
The table on page 12 provides IT Services Revenue on a constant currency basis, which is a non-GAAP financial measure that is calculated by translating IT Services Revenue from the current reporting period into U.S. dollars based on the currency conversion rate in effect for the prior reporting period. We refer to growth rates in constant currency so that business results may be viewed without the impact of fluctuations in foreign currency exchange rates, thereby facilitating period-to-period comparisons of our business performance. Further, in the normal course of business, we may divest a portion of our business which may not be strategic. We refer to the growth rates in both reported and constant currency adjusting for such divestments in order to represent the comparable growth rates.
Our key metrics and non-GAAP financial measures are not based on any comprehensive set of accounting rules or principles and should not be considered a substitute for, or superior to, the most directly comparable financial measure calculated in accordance with IFRS and may be different from non-GAAP measures used by other companies. Our key metrics and non-GAAP financial measures are not comparable to, nor should be substituted for, an analysis of our revenue over time and involve estimates and judgments. In addition to our non-GAAP measures, the financial statements prepared in accordance with IFRS and the reconciliation of these non-GAAP financial measures with the most directly comparable IFRS financial measure should be carefully evaluated.
Results for the Quarter and Year ended March 31, 2025, prepared under IFRS, along with individual business segment reports, are available in the Investors section of our website www.wipro.com/investors/
Quarterly Conference Call
We will hold an earnings conference call today at 07:00 p.m. Indian Standard Time (8:30 a.m. U.S. Eastern Time) to discuss our performance for the quarter. The audio from the conference call will be available online through a webcast and can be accessed at the following link- https://links.ccwebcast.com/?EventId=WIP160425 An audio recording of the management discussions and the question-and-answer session will be available online and will be accessible in the Investor Relations section of our website at www.wipro.com
6
About Wipro Limited
Wipro Limited (NYSE: WIT, BSE: 507685, NSE: WIPRO) is a leading technology services and consulting company focused on building innovative solutions that address clients’ most complex digital transformation needs. Leveraging our holistic portfolio of capabilities in consulting, design, engineering, and operations, we help clients realize their boldest ambitions and build future-ready, sustainable businesses. With over 230,000 employees and business partners across 65 countries, we deliver on the promise of helping our clients, colleagues, and communities thrive in an ever-changing world. For additional information, visit us at www.wipro.com
| Contact for Investor Relations |
Contact for Media & Press |
|||
| Dipak Kumar Bohra |
Abhishek Jain |
Dinesh Joshi |
||
| Phone: +91-80-6142 7201 |
Phone: +91-80-6142 6143 |
Phone: +91 92052-64001 |
||
|
dipak.bohra@wipro.com |
abhishek.jain2@wipro.com |
media-relations@wipro.com |
||
Forward-Looking Statements
The forward-looking statements contained herein represent Wipro’s beliefs regarding future events, many of which are by their nature, inherently uncertain and outside Wipro’s control. Such statements include, but are not limited to, statements regarding Wipro’s growth prospects, its future financial operating results, the benefits its customers experience and its plans, expectations and intentions. Wipro cautions readers that the forward-looking statements contained herein are subject to risks and uncertainties that could cause actual results to differ materially from the results anticipated by such statements. Such risks and uncertainties include, but are not limited to, risks and uncertainties regarding fluctuations in our earnings, revenue and profits, our ability to generate and manage growth, complete proposed corporate actions, intense competition in IT services, our ability to maintain our cost advantage, wage increases in India, our ability to attract and retain highly skilled professionals, time and cost overruns on fixed-price, fixed-time frame contracts, client concentration, restrictions on immigration, our ability to manage our international operations, reduced demand for technology in our key focus areas, disruptions in telecommunication networks, our ability to successfully complete and integrate potential acquisitions, liability for damages on our service contracts, the success of the companies in which we make strategic investments, withdrawal of fiscal governmental incentives, political instability, war, legal restrictions on raising capital or acquiring companies outside India, unauthorized use of our intellectual property and general economic conditions affecting our business and industry.
Additional risks that could affect our future operating results are more fully described in our filings with the United States Securities and Exchange Commission, including, but not limited to, Annual Reports on Form 20-F. These filings are available at www.sec.gov. We may, from time to time, make additional written and oral forward-looking statements, including statements contained in the company’s filings with the Securities and Exchange Commission and our reports to shareholders. We do not undertake to update any forward-looking statement that may be made from time to time by us or on our behalf.
# # #
(Tables to follow)
7
WIPRO LIMITED AND SUBSIDIARIES
INTERIM CONDENSED CONSOLIDATED STATEMENT OF FINANCIAL POSITION
(₹ in millions, except share and per share data, unless otherwise stated)
| As at March 31, 2024 | As at March 31, 2025 | |||||||||||
|
|
Convenience translation into US dollar in millions (unaudited) |
|||||||||||
| ASSETS |
||||||||||||
| Goodwill |
316,002 | 325,014 | 3,804 | |||||||||
| Intangible assets |
32,748 | 27,450 | 321 | |||||||||
| Property, plant and equipment |
81,608 | 80,684 | 944 | |||||||||
| Right-of-Use assets |
17,955 | 25,598 | 300 | |||||||||
| Financial assets |
||||||||||||
| Derivative assets |
25 | ^ | ^ | |||||||||
| Investments |
21,629 | 26,458 | 310 | |||||||||
| Trade receivables |
4,045 | 299 | 3 | |||||||||
| Other financial assets |
5,550 | 4,664 | 54 | |||||||||
| Investments accounted for using the equity method |
1,044 | 1,327 | 16 | |||||||||
| Deferred tax assets |
1,817 | 2,561 | 30 | |||||||||
| Non-current tax assets |
9,043 | 7,230 | 85 | |||||||||
| Other non-current assets |
10,331 | 7,460 | 87 | |||||||||
|
|
|
|
|
|
|
|||||||
| Total non-current assets |
501,797 | 508,745 | 5,954 | |||||||||
|
|
|
|
|
|
|
|||||||
| Inventories |
907 | 694 | 8 | |||||||||
| Financial assets |
||||||||||||
| Derivative assets |
1,333 | 1,820 | 21 | |||||||||
| Investments |
311,171 | 411,474 | 4,817 | |||||||||
| Cash and cash equivalents |
96,953 | 121,974 | 1,428 | |||||||||
| Trade receivables |
115,477 | 117,745 | 1,378 | |||||||||
| Unbilled receivables |
58,345 | 64,280 | 753 | |||||||||
| Other financial assets |
10,536 | 8,448 | 99 | |||||||||
| Contract assets |
19,854 | 15,795 | 185 | |||||||||
| Current tax assets |
6,484 | 6,417 | 75 | |||||||||
| Other current assets |
29,602 | 29,128 | 341 | |||||||||
|
|
|
|
|
|
|
|||||||
| Total current assets |
650,662 | 777,775 | 9,105 | |||||||||
|
|
|
|
|
|
|
|||||||
|
|
|
|
|
|
|
|||||||
| TOTAL ASSETS |
1,152,459 | 1,286,520 | 15,059 | |||||||||
|
|
|
|
|
|
|
|||||||
| EQUITY |
||||||||||||
| Share capital |
10,450 | 20,944 | 245 | |||||||||
| Share premium |
3,291 | 2,628 | 31 | |||||||||
| Retained earnings |
630,936 | 716,477 | 8,387 | |||||||||
| Share-based payment reserve |
6,384 | 6,985 | 82 | |||||||||
| Special Economic Zone re-investment reserve |
42,129 | 27,778 | 325 | |||||||||
| Other components of equity |
56,693 | 53,497 | 626 | |||||||||
|
|
|
|
|
|
|
|||||||
| Equity attributable to the equity holders of the Company |
749,883 | 828,309 | 9,696 | |||||||||
| Non-controlling interests |
1,340 | 2,138 | 25 | |||||||||
|
|
|
|
|
|
|
|||||||
| TOTAL EQUITY |
751,223 | 830,447 | 9,721 | |||||||||
|
|
|
|
|
|
|
|||||||
| LIABILITIES |
||||||||||||
| Financial liabilities |
||||||||||||
| Loans and borrowings |
62,300 | 63,954 | 749 | |||||||||
| Lease liabilities |
13,962 | 22,193 | 260 | |||||||||
| Derivative liabilities |
4 | - | - | |||||||||
| Other financial liabilities |
4,985 | 7,793 | 91 | |||||||||
| Deferred tax liabilities |
17,467 | 16,443 | 192 | |||||||||
| Non-current tax liabilities |
37,090 | 42,024 | 492 | |||||||||
| Other non-current liabilities |
12,970 | 17,119 | 200 | |||||||||
| Provisions |
- | 294 | 3 | |||||||||
|
|
|
|
|
|
|
|||||||
| Total non-current liabilities |
148,778 | 169,820 | 1,987 | |||||||||
|
|
|
|
|
|
|
|||||||
| Financial liabilities |
||||||||||||
| Loans, borrowings and bank overdrafts |
79,166 | 97,863 | 1,146 | |||||||||
| Lease liabilities |
9,221 | 8,025 | 94 | |||||||||
| Derivative liabilities |
558 | 968 | 11 | |||||||||
| Trade payables and accrued expenses |
88,566 | 88,252 | 1,033 | |||||||||
| Other financial liabilities |
2,272 | 3,878 | 45 | |||||||||
| Contract liabilities |
17,653 | 20,063 | 235 | |||||||||
| Current tax liabilities |
21,756 | 34,481 | 404 | |||||||||
| Other current liabilities |
31,295 | 31,086 | 364 | |||||||||
| Provisions |
1,971 | 1,637 | 19 | |||||||||
|
|
|
|
|
|
|
|||||||
| Total current liabilities |
252,458 | 286,253 | 3,351 | |||||||||
|
|
|
|
|
|
|
|||||||
| TOTAL LIABILITIES |
401,236 | 456,073 | 5,338 | |||||||||
|
|
|
|
|
|
|
|||||||
| TOTAL EQUITY AND LIABILITIES |
1,152,459 | 1,286,520 | 15,059 | |||||||||
|
|
|
|
|
|
|
|||||||
^ Value is less than 0.5
8
WIPRO LIMITED AND SUBSIDIARIES
INTERIM CONDENSED CONSOLIDATED STATEMENT OF INCOME
(₹ in millions, except share and per share data, unless otherwise stated)
| Three months ended March 31, | Year ended March 31, | |||||||||||||||||||||||
| 2024 | 2025 | 2025 | 2024 | 2025 | 2025 | |||||||||||||||||||
|
|
|
Convenience translation into US dollar in millions (unaudited) |
|
|
Convenience translation into US dollar in millions (unaudited) |
|||||||||||||||||||
| Revenues |
222,083 | 225,042 | 2,634 | 897,603 | 890,884 | 10,428 | ||||||||||||||||||
| Cost of revenues |
(157,219 | ) | (155,525 | ) | (1,820 | ) | (631,497 | ) | (617,802 | ) | (7,231 | ) | ||||||||||||
|
|
|
|
|
|
|
|
|
|
|
|
|
|||||||||||||
| Gross profit |
64,864 | 69,517 | 814 | 266,106 | 273,082 | 3,197 | ||||||||||||||||||
| Selling and marketing expenses |
(15,443 | ) | (15,065 | ) | (176 | ) | (69,972 | ) | (64,378 | ) | (753 | ) | ||||||||||||
| General and administrative expenses |
(13,920 | ) | (15,589 | ) | (183 | ) | (60,375 | ) | (57,465 | ) | (673 | ) | ||||||||||||
| Foreign exchange gains/(losses), net |
(128 | ) | 224 | 3 | 340 | 32 | ^ | |||||||||||||||||
|
|
|
|
|
|
|
|
|
|
|
|
|
|||||||||||||
| Results from operating activities |
35,373 | 39,087 | 458 | 136,099 | 151,271 | 1,771 | ||||||||||||||||||
| Finance expenses |
(3,308 | ) | (3,767 | ) | (44 | ) | (12,552 | ) | (14,770 | ) | (173 | ) | ||||||||||||
| Finance and other income |
6,759 | 11,819 | 138 | 23,896 | 38,202 | 447 | ||||||||||||||||||
| Share of net profit/ (loss) of associate and joint venture accounted for using the equity method |
(202 | ) | 291 | 3 | (233 | ) | 254 | 3 | ||||||||||||||||
|
|
|
|
|
|
|
|
|
|
|
|
|
|||||||||||||
| Profit before tax |
38,622 | 47,430 | 555 | 147,210 | 174,957 | 2,048 | ||||||||||||||||||
| Income tax expense |
(10,040 | ) | (11,549 | ) | (135 | ) | (36,089 | ) | (42,777 | ) | (501 | ) | ||||||||||||
|
|
|
|
|
|
|
|
|
|
|
|
|
|||||||||||||
| Profit for the period |
28,582 | 35,881 | 420 | 111,121 | 132,180 | 1,547 | ||||||||||||||||||
|
|
|
|
|
|
|
|
|
|
|
|
|
|||||||||||||
| Profit attributable to: |
||||||||||||||||||||||||
| Equity holders of the Company |
28,346 | 35,696 | 418 | 110,452 | 131,354 | 1,537 | ||||||||||||||||||
| Non-controlling interests |
236 | 185 | 2 | 669 | 826 | 10 | ||||||||||||||||||
|
|
|
|
|
|
|
|
|
|
|
|
|
|||||||||||||
| Profit for the period |
28,582 | 35,881 | 420 | 111,121 | 132,180 | 1,547 | ||||||||||||||||||
|
|
|
|
|
|
|
|
|
|
|
|
|
|||||||||||||
| Earnings per equity share: |
||||||||||||||||||||||||
| Attributable to equity holders of the Company |
||||||||||||||||||||||||
| Basic |
2.71 | 3.41 | 0.04 | 10.44 | 12.56 | 0.15 | ||||||||||||||||||
| Diluted |
2.70 | 3.39 | 0.04 | 10.41 | 12.52 | 0.14 | ||||||||||||||||||
| Weighted average number of equity shares used in computing earnings per equity share | ||||||||||||||||||||||||
| Basic |
10,444,700,646 | 10,462,328,534 | 10,462,328,534 | 10,576,571,110 | 10,456,741,552 | 10,456,741,552 | ||||||||||||||||||
| Diluted |
10,470,351,422 | 10,490,716,219 | 10,490,716,219 | 10,611,424,628 | 10,488,939,392 | 10,488,939,392 | ||||||||||||||||||
^ Value is less than 0.5
9
Information on reportable segments for the three months ended March 31, 2025, December 31, 2024, March 31, 2024, and year ended March 31, 2025 and March 31, 2024 are as follows:
| Particulars | Three months ended | Year ended | ||||||||||||||||||
| March 31, 2025 |
December 31, 2024 |
March 31, 2024 |
March 31, 2025 |
March 31, 2024 |
||||||||||||||||
| Audited | Audited | Audited | Audited | Audited | ||||||||||||||||
| Segment revenue | ||||||||||||||||||||
| IT Services | ||||||||||||||||||||
| Americas 1 |
73,721 | 72,010 | 67,229 | 281,824 | 268,230 | |||||||||||||||
| Americas 2 |
68,582 | 68,120 | 67,724 | 271,972 | 269,482 | |||||||||||||||
| Europe |
58,552 | 59,282 | 61,344 | 240,077 | 253,927 | |||||||||||||||
| APMEA |
23,598 | 23,439 | 24,499 | 94,351 | 102,177 | |||||||||||||||
| Total of IT Services | 224,453 | 222,851 | 220,796 | 888,224 | 893,816 | |||||||||||||||
| IT Products |
813 | 747 | 1,159 | 2,692 | 4,127 | |||||||||||||||
|
Total segment revenue |
225,266 | 223,598 | 221,955 | 890,916 | 897,943 | |||||||||||||||
| Segment result |
||||||||||||||||||||
| IT Services |
||||||||||||||||||||
| Americas 1 |
16,195 | 14,966 | 14,081 | 58,186 | 59,364 | |||||||||||||||
| Americas 2 |
15,513 | 15,275 | 15,791 | 61,326 | 59,163 | |||||||||||||||
| Europe |
8,140 | 7,600 | 7,933 | 29,434 | 33,354 | |||||||||||||||
| APMEA |
3,672 | 3,667 | 3,401 | 12,850 | 12,619 | |||||||||||||||
| Unallocated |
(4,250 | ) | (2,518 | ) | (5,011 | ) | (10,157 | ) | (20,304 | ) | ||||||||||
| Total of IT Services |
39,270 | 38,990 | 36,195 | 151,639 | 144,196 | |||||||||||||||
| IT Products |
28 | 29 | 143 | (173 | ) | (371 | ) | |||||||||||||
|
Reconciling Items |
(211 | ) | (53 | ) | (965 | ) | (195 | ) | (7,726 | ) | ||||||||||
|
Total segment result |
39,087 | 38,966 | 35,373 | 151,271 | 136,099 | |||||||||||||||
| Finance expenses |
(3,767 | ) | (4,146 | ) | (3,308 | ) | (14,770 | ) | (12,552 | ) | ||||||||||
| Finance and other income |
11,819 | 9,708 | 6,759 | 38,202 | 23,896 | |||||||||||||||
| Share of net profit/ (loss) of associate and joint venture accounted for using the equity method | 291 | 5 | (202 | ) | 254 | (233 | ) | |||||||||||||
|
Profit before tax |
47,430 | 44,533 | 38,622 | 174,957 | 147,210 | |||||||||||||||
10
Additional Information:
The Company is organized into the following operating segments: IT Services and IT Products.
IT Services: The IT Services segment primarily consists of IT services offerings to customers organized by four Strategic Market Units (“SMUs”) - Americas 1, Americas 2, Europe and Asia Pacific Middle East and Africa (“APMEA”). Americas 1 and Americas 2 are primarily organized by industry sector, while Europe and APMEA are organized by countries.
Americas 1 includes the entire business of Latin America (“LATAM”) and the following industry sectors in the United States of America: Communications, media and information services, Software and gaming, New age technology, Consumer goods, medical devices and life sciences, Healthcare, and Technology products and services. Americas 2 includes the entire business in Canada and the following industry sectors in the United States of America: Banking and financial services, Energy, Manufacturing and resources, Capital markets and insurance, and Hi-tech.
Europe consists of the United Kingdom and Ireland, Switzerland, Germany, Northern Europe and Southern Europe.
APMEA consists of Australia and New Zealand, India, Middle East, South-East Asia, Japan and Africa.
Revenue from each customer is attributed to the respective SMUs based on the location of the customer’s primary buying center of such services. With respect to certain strategic global customers, revenue may be generated from multiple countries based on such customer’s buying centers, but the total revenue related to these strategic global customers are attributed to a single SMU based on the geographical location of key decision makers.
IT Products: The Company is a value-added reseller of security, packaged and SaaS software for leading international brands. In certain total outsourcing contracts of the IT Services segment, the Company delivers hardware, software products and other related deliverables. Revenue relating to these items is reported as revenue from the sale of IT Products.
11
Reconciliation of selected GAAP measures to Non-GAAP measures
| 1. | Reconciliation of Non-GAAP Constant Currency IT Services Revenue to IT Services Revenue as per IFRS ($Mn) |
| Three Months ended March 31, 2025 | ||
| IT Services Revenue as per IFRS |
$2,596.5 | |
| Effect of Foreign currency exchange movement |
$11.4 | |
|
Non-GAAP Constant Currency IT Services Revenue based on previous quarter exchange rates |
$2,607.9 | |
|
|
||
| Three Months ended March 31, 2025 | ||
| IT Services Revenue as per IFRS |
$2,596.5 | |
| Effect of Foreign currency exchange movement |
$29.8 | |
|
Non-GAAP Constant Currency IT Services Revenue based on exchange rates of comparable period in previous year |
$2,626.3 | |
|
|
||
| Year ended March 31, 2025 | ||
| IT Services Revenue as per IFRS |
$10,511.5 | |
| Effect of Foreign currency exchange movement |
$45.0 | |
|
Non-GAAP Constant Currency IT Services Revenue based on previous year exchange rates |
$10,556.6 | |
12
| 2. | Reconciliation of Free Cash Flow for three months and twelve months ended March 31, 2025 |
| Amount in INR Mn | ||||
| Three months ended March 31, 2025 |
Twelve months ended March 31, 2025 |
|||
|
Net Income for the period [A] |
35,881 | 132,180 | ||
|
Computation of Free Cash Flow |
||||
| Net cash generated from operating activities [B] |
37,465 | 169,426 | ||
| Add/ (deduct) cash inflow/ (outflow)on: |
||||
| Purchase of property, plant and equipment |
(6,875) | (14,737) | ||
| Proceeds from sale of property, plant and equipment |
306 | 1,822 | ||
|
Free Cash Flow [C] |
30,896 | 156,511 | ||
|
Operating Cash Flow as percentage of Net Income [B/A] |
104.4% | 128.2% | ||
| Free Cash Flow as percentage of Net Income [C/A] |
86.1% | 118.4% | ||
-------------------------------
13
Exhibit 99.2


Exhibit 99.3
WIPRO LIMITED AND SUBSIDIARIES
INTERIM CONDENSED CONSOLIDATED FINANCIAL STATEMENTS UNDER IFRS
AS AT AND FOR THE THREE MONTHS AND YEAR ENDED MARCH 31, 2025
WIPRO LIMITED AND SUBSIDIARIES
INTERIM CONDENSED CONSOLIDATED STATEMENT OF FINANCIAL POSITION
(₹ in millions, except share and per share data, unless otherwise stated)
| Notes | As at March 31, 2024 | As at March 31, 2025 | ||||||||||||
|
|
|
Convenience translation into US dollar in millions (unaudited) Refer to Note 2(iii) |
||||||||||||
| ASSETS |
||||||||||||||
| Goodwill |
6 | 316,002 | 325,014 | 3,804 | ||||||||||
| Intangible assets |
6 | 32,748 | 27,450 | 321 | ||||||||||
| Property, plant and equipment |
4 | 81,608 | 80,684 | 944 | ||||||||||
| Right-of-Use assets |
5 | 17,955 | 25,598 | 300 | ||||||||||
| Financial assets |
||||||||||||||
| Derivative assets |
18 | 25 | ^ | ^ | ||||||||||
| Investments |
8 | 21,629 | 26,458 | 310 | ||||||||||
| Trade receivables |
4,045 | 299 | 3 | |||||||||||
| Other financial assets |
11 | 5,550 | 4,664 | 54 | ||||||||||
| Investments accounted for using the equity method |
1,044 | 1,327 | 16 | |||||||||||
| Deferred tax assets |
1,817 | 2,561 | 30 | |||||||||||
| Non-current tax assets |
9,043 | 7,230 | 85 | |||||||||||
| Other non-current assets |
12 | 10,331 | 7,460 | 87 | ||||||||||
|
|
|
|
|
|
|
|
|
|
||||||
| Total non-current assets |
501,797 | 508,745 | 5,954 | |||||||||||
|
|
|
|
|
|
|
|
|
|
||||||
| Inventories |
9 | 907 | 694 | 8 | ||||||||||
| Financial assets |
||||||||||||||
| Derivative assets |
18 | 1,333 | 1,820 | 21 | ||||||||||
| Investments |
8 | 311,171 | 411,474 | 4,817 | ||||||||||
| Cash and cash equivalents |
10 | 96,953 | 121,974 | 1,428 | ||||||||||
| Trade receivables |
115,477 | 117,745 | 1,378 | |||||||||||
| Unbilled receivables |
58,345 | 64,280 | 753 | |||||||||||
| Other financial assets |
11 | 10,536 | 8,448 | 99 | ||||||||||
| Contract assets |
19,854 | 15,795 | 185 | |||||||||||
| Current tax assets |
6,484 | 6,417 | 75 | |||||||||||
| Other current assets |
12 | 29,602 | 29,128 | 341 | ||||||||||
|
|
|
|
|
|
|
|
|
|
||||||
| Total current assets |
650,662 | 777,775 | 9,105 | |||||||||||
|
|
|
|
|
|
|
|
|
|
||||||
| TOTAL ASSETS |
1,152,459 | 1,286,520 | 15,059 | |||||||||||
|
|
|
|
|
|
|
|
|
|
||||||
| EQUITY |
||||||||||||||
| Share capital |
10,450 | 20,944 | 245 | |||||||||||
| Share premium |
3,291 | 2,628 | 31 | |||||||||||
| Retained earnings |
630,936 | 716,477 | 8,387 | |||||||||||
| Share-based payment reserve |
6,384 | 6,985 | 82 | |||||||||||
| Special Economic Zone re-investment reserve |
42,129 | 27,778 | 325 | |||||||||||
| Other components of equity |
56,693 | 53,497 | 626 | |||||||||||
|
|
|
|
|
|
|
|
|
|
||||||
| Equity attributable to the equity holders of the Company |
749,883 | 828,309 | 9,696 | |||||||||||
| Non-controlling interests |
1,340 | 2,138 | 25 | |||||||||||
|
|
|
|
|
|
|
|
|
|
||||||
| TOTAL EQUITY |
751,223 | 830,447 | 9,721 | |||||||||||
|
|
|
|
|
|
|
|
|
|
||||||
| LIABILITIES |
||||||||||||||
| Financial liabilities |
||||||||||||||
| Loans and borrowings |
13 | 62,300 | 63,954 | 749 | ||||||||||
| Lease liabilities |
13,962 | 22,193 | 260 | |||||||||||
| Derivative liabilities |
18 | 4 | - | - | ||||||||||
| Other financial liabilities |
15 | 4,985 | 7,793 | 91 | ||||||||||
| Deferred tax liabilities |
17,467 | 16,443 | 192 | |||||||||||
| Non-current tax liabilities |
37,090 | 42,024 | 492 | |||||||||||
| Other non-current liabilities |
16 | 12,970 | 17,119 | 200 | ||||||||||
| Provisions |
17 | - | 294 | 3 | ||||||||||
|
|
|
|
|
|
|
|
|
|
||||||
| Total non-current liabilities |
148,778 | 169,820 | 1,987 | |||||||||||
|
|
|
|
|
|
|
|
|
|
||||||
| Financial liabilities |
||||||||||||||
| Loans, borrowings and bank overdrafts |
13 | 79,166 | 97,863 | 1,146 | ||||||||||
| Lease liabilities |
9,221 | 8,025 | 94 | |||||||||||
| Derivative liabilities |
18 | 558 | 968 | 11 | ||||||||||
| Trade payables and accrued expenses |
14 | 88,566 | 88,252 | 1,033 | ||||||||||
| Other financial liabilities |
15 | 2,272 | 3,878 | 45 | ||||||||||
| Contract liabilities |
17,653 | 20,063 | 235 | |||||||||||
| Current tax liabilities |
21,756 | 34,481 | 404 | |||||||||||
| Other current liabilities |
16 | 31,295 | 31,086 | 364 | ||||||||||
| Provisions |
17 | 1,971 | 1,637 | 19 | ||||||||||
|
|
|
|
|
|
|
|
|
|
||||||
| Total current liabilities |
252,458 | 286,253 | 3,351 | |||||||||||
|
|
|
|
|
|
|
|
|
|
||||||
| TOTAL LIABILITIES |
401,236 | 456,073 | 5,338 | |||||||||||
|
|
|
|
|
|
|
|
|
|
||||||
| TOTAL EQUITY AND LIABILITIES |
1,152,459 | 1,286,520 | 15,059 | |||||||||||
|
|
|
|
|
|
|
|
|
|
||||||
| ^ Value is less than 0.5 |
|
|||||||||||||
The accompanying notes form an integral part of these interim condensed consolidated financial statements
| As per our report of even date attached | For and on behalf of the Board of Directors | |||||
| for Deloitte Haskins & Sells LLP | Rishad A. Premji | Deepak M. Satwalekar | Srinivas Pallia | |||
| Chartered Accountants | Chairman | Director | Chief Executive Officer and | |||
| Firm’s Registration No: 117366W/W - 100018 | (DIN: 02983899) | (DIN: 00009627) | Managing Director |
|||
| (DIN: 10574442)
|
||||||
| Anand Subramanian | Aparna C. Iyer | M. Sanaulla Khan | ||||
| Partner | Chief Financial Officer | Company Secretary | ||||
| Membership No.: 110815 | Membership No.: F4129 | |||||
|
Bengaluru |
||||||
| April 16, 2025 | ||||||
1
WIPRO LIMITED AND SUBSIDIARIES
INTERIM CONDENSED CONSOLIDATED STATEMENT OF INCOME
(₹ in millions, except share and per share data, unless otherwise stated)
| Three months ended March 31, | Year ended March 31, | |||||||||||||||||||||||||||
| Notes | 2024 | 2025 | 2025 | 2024 | 2025 | 2025 | ||||||||||||||||||||||
|
|
|
Convenience translation into US dollar in millions (unaudited) Refer to Note 2(iii) |
|
|
Convenience translation into US dollar in millions (unaudited) Refer to Note 2(iii) |
|||||||||||||||||||||||
| Revenues |
21 | 222,083 | 225,042 | 2,634 | 897,603 | 890,884 | 10,428 | |||||||||||||||||||||
| Cost of revenues |
22 | (157,219 | ) | (155,525 | ) | (1,820 | ) | (631,497 | ) | (617,802 | ) | (7,231 | ) | |||||||||||||||
|
|
|
|
|
|
|
|
|
|
|
|
|
|
|
|
|
|
|
|||||||||||
| Gross profit |
64,864 | 69,517 | 814 | 266,106 | 273,082 | 3,197 | ||||||||||||||||||||||
| Selling and marketing expenses |
22 | (15,443 | ) | (15,065 | ) | (176 | ) | (69,972 | ) | (64,378 | ) | (753 | ) | |||||||||||||||
| General and administrative expenses |
22 | (13,920 | ) | (15,589 | ) | (183 | ) | (60,375 | ) | (57,465 | ) | (673 | ) | |||||||||||||||
| Foreign exchange gains/(losses), net |
24 | (128 | ) | 224 | 3 | 340 | 32 | ^ | ||||||||||||||||||||
|
|
|
|
|
|
|
|
|
|
|
|
|
|
|
|
|
|
|
|||||||||||
| Results from operating activities | 35,373 | 39,087 | 458 | 136,099 | 151,271 | 1,771 | ||||||||||||||||||||||
| Finance expenses |
23 | (3,308 | ) | (3,767 | ) | (44 | ) | (12,552 | ) | (14,770 | ) | (173 | ) | |||||||||||||||
| Finance and other income |
24 | 6,759 | 11,819 | 138 | 23,896 | 38,202 | 447 | |||||||||||||||||||||
| Share of net profit/ (loss) of associate and joint venture accounted for using the equity method |
(202 | ) | 291 | 3 | (233 | ) | 254 | 3 | ||||||||||||||||||||
|
|
|
|
|
|
|
|
|
|
|
|
|
|
|
|
|
|
|
|||||||||||
| Profit before tax |
38,622 | 47,430 | 555 | 147,210 | 174,957 | 2,048 | ||||||||||||||||||||||
| Income tax expense |
20 | (10,040 | ) | (11,549 | ) | (135 | ) | (36,089 | ) | (42,777 | ) | (501 | ) | |||||||||||||||
|
|
|
|
|
|
|
|
|
|
|
|
|
|
|
|
|
|
|
|||||||||||
| Profit for the period |
28,582 | 35,881 | 420 | 111,121 | 132,180 | 1,547 | ||||||||||||||||||||||
|
|
|
|
|
|
|
|
|
|
|
|
|
|
|
|
|
|
|
|||||||||||
| Profit attributable to: |
||||||||||||||||||||||||||||
| Equity holders of the Company |
28,346 | 35,696 | 418 | 110,452 | 131,354 | 1,537 | ||||||||||||||||||||||
| Non-controlling interests |
236 | 185 | 2 | 669 | 826 | 10 | ||||||||||||||||||||||
|
|
|
|
|
|
|
|
|
|
|
|
|
|
|
|
|
|
|
|||||||||||
| Profit for the period |
28,582 | 35,881 | 420 | 111,121 | 132,180 | 1,547 | ||||||||||||||||||||||
|
|
|
|
|
|
|
|
|
|
|
|
|
|
|
|
|
|
|
|||||||||||
| Earnings per equity share: |
25 | |||||||||||||||||||||||||||
| Attributable to equity holders of the Company |
||||||||||||||||||||||||||||
| Basic |
2.71 | 3.41 | 0.04 | 10.44 | 12.56 | 0.15 | ||||||||||||||||||||||
| Diluted |
2.70 | 3.39 | 0.04 | 10.41 | 12.52 | 0.14 | ||||||||||||||||||||||
| Weighted average number of equity shares used in computing earnings per equity share | ||||||||||||||||||||||||||||
| Basic |
10,444,700,646 | 10,462,328,534 | 10,462,328,534 | 10,576,571,110 | 10,456,741,552 | 10,456,741,552 | ||||||||||||||||||||||
| Diluted |
10,470,351,422 | 10,490,716,219 | 10,490,716,219 | 10,611,424,628 | 10,488,939,392 | 10,488,939,392 | ||||||||||||||||||||||
| ^ Value is less than 0.5 |
|
|||||||||||||||||||||||||||
The accompanying notes form an integral part of these interim condensed consolidated financial statements
| As per our report of even date attached | For and on behalf of the Board of Directors | |||||
| for Deloitte Haskins & Sells LLP | Rishad A. Premji | Deepak M. Satwalekar | Srinivas Pallia | |||
| Chartered Accountants | Chairman | Director | Chief Executive Officer and | |||
| Firm’s Registration No: 117366W/W - 100018 | (DIN: 02983899) | (DIN: 00009627) | Managing Director | |||
| (DIN: 10574442)
|
||||||
| Anand Subramanian | Aparna C. Iyer | M. Sanaulla Khan | ||||
| Partner | Chief Financial Officer |
Company Secretary | ||||
| Membership No.: 110815 | Membership No.: F4129 | |||||
|
Bengaluru |
||||||
| April 16, 2025 | ||||||
2
WIPRO LIMITED AND SUBSIDIARIES
INTERIM CONDENSED CONSOLIDATED STATEMENT OF COMPREHENSIVE INCOME
(₹ in millions, except share and per share data, unless otherwise stated)
| Three months ended March 31, | Year ended March 31, | |||||||||||||||||||||||
| 2024 | 2025 | 2025 | 2024 | 2025 | 2025 | |||||||||||||||||||
|
|
|
Convenience translation into US dollar in millions (unaudited) Refer to Note 2(iii) |
|
|
Convenience translation into US dollar in millions (unaudited) Refer to Note 2(iii) |
|||||||||||||||||||
| Profit for the period | 28,582 | 35,881 | 420 | 111,121 | 132,180 | 1,547 | ||||||||||||||||||
| Other comprehensive income (OCI) | ||||||||||||||||||||||||
| Items that will not be reclassified to profit or loss in subsequent periods | ||||||||||||||||||||||||
| Remeasurements of the defined benefit plans, net |
(177 | ) | 124 | 1 | 82 | 274 | 3 | |||||||||||||||||
| Net change in fair value of investment in equity instruments measured at fair value through OCI |
(506 | ) | (2,943 | ) | (34 | ) | (473 | ) | (3,476 | ) | (41 | ) | ||||||||||||
|
|
|
|
|
|
|
|
|
|
|
|
|
|
|
|
|
|
|
|||||||
| (683 | ) | (2,819 | ) | (33 | ) | (391 | ) | (3,202 | ) | (38 | ) | |||||||||||||
|
|
|
|
|
|
|
|
|
|
|
|
|
|
|
|
|
|
|
|||||||
| Items that will be reclassified to profit or loss in subsequent periods | ||||||||||||||||||||||||
| Foreign currency translation differences |
(844 | ) | 1,762 | 21 | 4,219 | 7,331 | 86 | |||||||||||||||||
| Reclassification of foreign currency translation differences on liquidation of subsidiaries to statement of income |
(2 | ) | (55 | ) | (1 | ) | (198 | ) | (41 | ) | ^ | |||||||||||||
| Net change in time value of option contracts designated as cash flow hedges, net of taxes |
271 | (94 | ) | (1 | ) | 198 | (189 | ) | (2 | ) | ||||||||||||||
| Net change in intrinsic value of option contracts designated as cash flow hedges, net of taxes |
15 | 335 | 4 | 128 | 146 | 2 | ||||||||||||||||||
| Net change in fair value of forward contracts designated as cash flow hedges, net of taxes |
355 | 810 | 9 | 1,655 | (745 | ) | (9 | ) | ||||||||||||||||
| Net change in fair value of investment in debt instruments measured at fair value through OCI, net of taxes |
261 | 352 | 4 | 1,516 | 963 | 11 | ||||||||||||||||||
|
|
|
|
|
|
|
|
|
|
|
|
|
|
|
|
|
|
|
|||||||
| 56 | 3,110 | 36 | 7,518 | 7,465 | 88 | |||||||||||||||||||
|
|
|
|
|
|
|
|
|
|
|
|
|
|
|
|
|
|
|
|||||||
| Total other comprehensive income, net of taxes |
(627 | ) | 291 | 3 | 7,127 | 4,263 | 50 | |||||||||||||||||
|
|
|
|
|
|
|
|
|
|
|
|
|
|
|
|
|
|
|
|||||||
| Total comprehensive income for the period |
27,955 | 36,172 | 423 | 118,248 | 136,443 | 1,597 | ||||||||||||||||||
|
|
|
|
|
|
|
|
|
|
|
|
|
|
|
|
|
|
|
|||||||
| Total comprehensive income attributable to: |
||||||||||||||||||||||||
| Equity holders of the Company |
27,781 | 36,005 | 421 | 117,744 | 135,595 | 1,587 | ||||||||||||||||||
| Non-controlling interests |
174 | 167 | 2 | 504 | 848 | 10 | ||||||||||||||||||
|
|
|
|
|
|
|
|
|
|
|
|
|
|
|
|
|
|
|
|||||||
| 27,955 | 36,172 | 423 | 118,248 | 136,443 | 1,597 | |||||||||||||||||||
|
|
|
|
|
|
|
|
|
|
|
|
|
|
|
|
|
|
|
|||||||
| ^ Value is less than 0.5 |
|
|||||||||||||||||||||||
The accompanying notes form an integral part of these interim condensed consolidated financial statements
| As per our report of even date attached | For and on behalf of the Board of Directors | |||||
| for Deloitte Haskins & Sells LLP | Rishad A. Premji | Deepak M. Satwalekar | Srinivas Pallia | |||
| Chartered Accountants | Chairman | Director | Chief Executive Officer and | |||
| Firm’s Registration No: 117366W/W - 100018 | (DIN: 02983899) | (DIN: 00009627) | Managing Director | |||
| (DIN: 10574442)
|
||||||
| Anand Subramanian | Aparna C. Iyer | M. Sanaulla Khan | ||||
| Partner | Chief Financial Officer |
Company Secretary | ||||
| Membership No.: 110815 | Membership No.: F4129 | |||||
|
Bengaluru |
||||||
| April 16, 2025 | ||||||
3
WIPRO LIMITED AND SUBSIDIARIES
INTERIM CONDENSED CONSOLIDATED STATEMENT OF CHANGES IN EQUITY
(₹ in millions, except share and per share data, unless otherwise stated)
|
Special Economic Zone re- investment reserve |
Other components of equity |
Equity attributable to the equity holders of the Company |
Non- controlling interests |
Total equity | ||||||||||||||||||||||||||||||||||||||||||||
| Particulars | Number of shares (1) |
Share capital, fully paid-up |
Share premium |
Retained earnings |
Share- based payment reserve |
Foreign currency translation reserve (2) |
Cash flow hedging reserve (3) |
Other reserves (2) |
||||||||||||||||||||||||||||||||||||||||
| As at April 1, 2023 | 5,487,917,741 | 10,976 | 3,689 | 660,964 | 5,632 | 46,803 | 43,255 | (1,403 | ) | 11,248 | 781,164 | 589 | 781,753 | |||||||||||||||||||||||||||||||||||
| Comprehensive income for the year | ||||||||||||||||||||||||||||||||||||||||||||||||
| Profit for the year |
- | - | - | 110,452 | - | - | - | - | - | 110,452 | 669 | 111,121 | ||||||||||||||||||||||||||||||||||||
| Other comprehensive income |
- | - | - | - | - | - | 4,006 | 1,981 | 1,305 | 7,292 | (165 | ) | 7,127 | |||||||||||||||||||||||||||||||||||
|
|
|
|
|
|
|
|
|
|
|
|
|
|
|
|
|
|
|
|
|
|
|
|
|
|
|
|
|
|
|
|
|
|
|
|
|
|||||||||||||
| Total comprehensive income for the year | - | - | - | 110,452 | - | - | 4,006 | 1,981 | 1,305 | 117,744 | 504 | 118,248 | ||||||||||||||||||||||||||||||||||||
|
|
|
|
|
|
|
|
|
|
|
|
|
|
|
|
|
|
|
|
|
|
|
|
|
|
|
|
|
|
|
|
|
|
|
|
|
|||||||||||||
| Issue of equity shares on exercise of options | 6,883,426 | 13 | 3,370 | - | (3,370 | ) | - | - | - | - | 13 | - | 13 | |||||||||||||||||||||||||||||||||||
| Issue of shares by controlled trust on exercise of options (1) | - | - | - | 1,462 | (1,462 | ) | - | - | - | - | - | - | - | |||||||||||||||||||||||||||||||||||
| Compensation cost related to employee share-based payment | - | - | - | 7 | 5,584 | - | - | - | - | 5,591 | - | 5,591 | ||||||||||||||||||||||||||||||||||||
| Transferred from Special Economic Zone re-investment reserve | - | - | - | 4,674 | - | (4,674 | ) | - | - | - | - | - | - | |||||||||||||||||||||||||||||||||||
| Buyback of equity shares, including tax thereon (4) | (269,662,921 | ) | (539 | ) | (3,768 | ) | (141,015 | ) | - | - | - | - | 539 | (144,783 | ) | - | (144,783 | ) | ||||||||||||||||||||||||||||||
| Transaction cost related to buyback of equity shares (4) | - | - | - | (390 | ) | - | - | - | - | - | (390 | ) | - | (390 | ) | |||||||||||||||||||||||||||||||||
| Financial liability on written put options (5) | - | - | - | - | - | - | - | - | (4,238 | ) | (4,238 | ) | - | (4,238 | ) | |||||||||||||||||||||||||||||||||
| Non-controlling interests on acquisition of subsidiary (5) | - | - | - | - | - | - | - | - | - | - | 472 | 472 | ||||||||||||||||||||||||||||||||||||
| Dividend | - | - | - | (5,218 | ) | - | - | - | - | - | (5,218 | ) | (322 | ) | (5,540 | ) | ||||||||||||||||||||||||||||||||
| Others | - | - | - | - | - | - | - | - | - | - | 97 | 97 | ||||||||||||||||||||||||||||||||||||
|
|
|
|
|
|
|
|
|
|
|
|
|
|
|
|
|
|
|
|
|
|
|
|
|
|
|
|
|
|
|
|
|
|
|
|
|
|||||||||||||
| Other transactions for the year | (262,779,495 | ) | (526 | ) | (398 | ) | (140,480 | ) | 752 | (4,674 | ) | - | - | (3,699 | ) | (149,025 | ) | 247 | (148,778 | ) | ||||||||||||||||||||||||||||
|
|
|
|
|
|
|
|
|
|
|
|
|
|
|
|
|
|
|
|
|
|
|
|
|
|
|
|
|
|
|
|
|
|
|
|
|
|||||||||||||
|
|
|
|
|
|
|
|
|
|
|
|
|
|
|
|
|
|
|
|
|
|
|
|
|
|
|
|
|
|
|
|
|
|
|
|
|
|||||||||||||
| As at March 31, 2024 | 5,225,138,246 | 10,450 | 3,291 | 630,936 | 6,384 | 42,129 | 47,261 | 578 | 8,854 | 749,883 | 1,340 | 751,223 | ||||||||||||||||||||||||||||||||||||
|
|
|
|
|
|
|
|
|
|
|
|
|
|
|
|
|
|
|
|
|
|
|
|
|
|
|
|
|
|
|
|
|
|
|
|
|
|||||||||||||
|
|
||||||||||||||||||||||||||||||||||||||||||||||||
| (1) Includes 5,952,740 treasury shares held as at March 31, 2024 by a controlled trust. 3,943,096 shares have been transferred by the controlled trust to eligible employees on exercise of options during the year ended March 31, 2024. (2) Refer to Note 19 (3) Refer to Note 18 (4) Refer to Note 30 (5) Refer to Note 7 |
|
|||||||||||||||||||||||||||||||||||||||||||||||
4
WIPRO LIMITED AND SUBSIDIARIES
INTERIM CONDENSED CONSOLIDATED STATEMENT OF CHANGES IN EQUITY
(₹ in millions, except share and per share data, unless otherwise stated)
| Special Economic Zone re- investment |
Other components of equity |
Equity attributable to the equity holders of the Company |
Non- controlling interests |
Total equity | ||||||||||||||||||||||||||||||||||||||||||||
| Particulars | Number of shares (1) |
Share capital, fully paid-up |
Share premium |
Retained earnings |
Share- based payment reserve |
Foreign currency translation reserve (2) |
Cash flow hedging reserve (3) |
Other reserves (2) |
||||||||||||||||||||||||||||||||||||||||
| As at April 1, 2024 | 5,225,138,246 | 10,450 | 3,291 | 630,936 | 6,384 | 42,129 | 47,261 | 578 | 8,854 | 749,883 | 1,340 | 751,223 | ||||||||||||||||||||||||||||||||||||
| Comprehensive income for the year | ||||||||||||||||||||||||||||||||||||||||||||||||
| Profit for the year |
- | - | - | 131,354 | - | - | - | - | - | 131,354 | 826 | 132,180 | ||||||||||||||||||||||||||||||||||||
| Other comprehensive income |
- | - | - | - | - | - | 7,253 | (788 | ) | (2,224 | ) | 4,241 | 22 | 4,263 | ||||||||||||||||||||||||||||||||||
|
|
|
|
|
|
|
|
|
|
|
|
|
|
|
|
|
|
|
|
|
|
|
|
|
|
|
|
|
|
|
|
|
|
|
|
|
|||||||||||||
| Total comprehensive income for the year | - | - | - | 131,354 | - | - | 7,253 | (788 | ) | (2,224 | ) | 135,595 | 848 | 136,443 | ||||||||||||||||||||||||||||||||||
|
|
|
|
|
|
|
|
|
|
|
|
|
|
|
|
|
|
|
|
|
|
|
|
|
|
|
|
|
|
|
|
|
|
|
|
|
|||||||||||||
| Issue of equity shares on exercise of options | 13,628,596 | 27 | 4,950 | - | (4,950 | ) | - | - | - | - | 27 | - | 27 | |||||||||||||||||||||||||||||||||||
| Bonus issue of equity shares (4) | 5,233,369,207 | 10,467 | (5,613 | ) | (3,193 | ) | - | - | - | - | (1,661 | ) | - | - | - | |||||||||||||||||||||||||||||||||
| Dividend (5) | - | - | - | (62,750 | ) | - | - | - | - | - | (62,750 | ) | - | (62,750 | ) | |||||||||||||||||||||||||||||||||
| Transfer from Other components of equity (2) | - | - | - | 5,754 | - | - | - | - | (5,754 | ) | - | - | - | |||||||||||||||||||||||||||||||||||
| Transfer of shares pertaining to Non-controlling interests of subsidiary | - | - | - | 25 | - | - | (14 | ) | - | (8 | ) | 3 | (3 | ) | - | |||||||||||||||||||||||||||||||||
| Compensation cost related to employee share-based payment | - | - | - | - | 5,551 | - | - | - | - | 5,551 | - | 5,551 | ||||||||||||||||||||||||||||||||||||
| Transferred from Special Economic Zone re-investment reserve | - | - | - | 14,351 | - | (14,351 | ) | - | - | - | - | - | - | |||||||||||||||||||||||||||||||||||
| Others | - | - | - | - | - | - | - | - | - | - | (47 | ) | (47 | ) | ||||||||||||||||||||||||||||||||||
|
|
|
|
|
|
|
|
|
|
|
|
|
|
|
|
|
|
|
|
|
|
|
|
|
|
|
|
|
|
|
|
|
|
|
|
|
|||||||||||||
| Other transactions for the year | 5,246,997,803 | 10,494 | (663 | ) | (45,813 | ) | 601 | (14,351 | ) | (14 | ) | - | (7,423 | ) | (57,169 | ) | (50 | ) | (57,219 | ) | ||||||||||||||||||||||||||||
|
|
|
|
|
|
|
|
|
|
|
|
|
|
|
|
|
|
|
|
|
|
|
|
|
|
|
|
|
|
|
|
|
|
|
|
|
|||||||||||||
|
|
||||||||||||||||||||||||||||||||||||||||||||||||
|
|
|
|
|
|
|
|
|
|
|
|
|
|
|
|
|
|
|
|
|
|
|
|
|
|
|
|
|
|
|
|
|
|
|
|
|
|||||||||||||
| As at March 31, 2025 | 10,472,136,049 | 20,944 | 2,628 | 716,477 | 6,985 | 27,778 | 54,500 | (210 | ) | (793 | ) | 828,309 | 2,138 | 830,447 | ||||||||||||||||||||||||||||||||||
|
|
|
|
|
|
|
|
|
|
|
|
|
|
|
|
|
|
|
|
|
|
|
|
|
|
|
|
|
|
|
|
|
|
|
|||||||||||||||
| Convenience translation into US dollar in millions (unaudited) Refer to Note 2(iii) | 245 | 31 | 8,387 | 82 | 325 | 638 | (3 | ) | (9 | ) | 9,696 | 25 | 9,721 | |||||||||||||||||||||||||||||||||||
| (1) Includes 11,905,480 treasury shares held as at March 31, 2025 by a controlled trust. (2) Refer to Note 19 (3) Refer to Note 18 (4) Refer to Note 31 (5) Refer to Note 32 |
|
|||||||||||||||||||||||||||||||||||||||||||||||
The accompanying notes form an integral part of these interim condensed consolidated financial statements
| As per our report of even date attached | For and on behalf of the Board of Directors | |||||
| for Deloitte Haskins & Sells LLP | Rishad A. Premji | Deepak M. Satwalekar | Srinivas Pallia | |||
| Chartered Accountants | Chairman | Director | Chief Executive Officer and | |||
| Firm’s Registration No: 117366W/W -100018 | (DIN: 02983899) | (DIN: 00009627) | Managing Director | |||
| (DIN: 10574442)
|
||||||
| Anand Subramanian | Aparna C. Iyer | M. Sanaulla Khan | ||||
| Partner | Chief Financial Officer |
Company Secretary | ||||
| Membership No.: 110815 | Membership No.: F4129 | |||||
|
Bengaluru |
||||||
| April 16, 2025 | ||||||
5
WIPRO LIMITED AND SUBSIDIARIES
INTERIM CONDENSED CONSOLIDATED STATEMENT OF CASH FLOWS
(₹ in millions, except share and per share data, unless otherwise stated)
| Year ended March 31, | ||||||||||||
| 2024 | 2025 | 2025 | ||||||||||
| Convenience translation into US dollar in millions (unaudited) Refer to Note 2(iii) |
||||||||||||
|
|
|
|
|
|
|
|
|
|
||||
| Cash flows from operating activities |
||||||||||||
| Profit for the year |
111,121 | 132,180 | 1,547 | |||||||||
| Adjustments to reconcile profit for the year to net cash generated from operating activities: |
||||||||||||
| Gain on sale of property, plant and equipment, net |
(2,072 | ) | (606 | ) | (7 | ) | ||||||
| Depreciation, amortization and impairment expense |
34,071 | 29,579 | 346 | |||||||||
| Unrealized exchange (gain)/loss, net |
655 | (623 | ) | (7 | ) | |||||||
| Share-based compensation expense |
5,584 | 5,551 | 65 | |||||||||
| Share of net (profit)/loss of associate and joint venture accounted for using equity method |
233 | (254 | ) | (3 | ) | |||||||
| Income tax expense |
36,089 | 42,777 | 501 | |||||||||
| Finance and other income, net of finance expenses |
(11,344 | ) | (23,432 | ) | (274 | ) | ||||||
| Change in fair value of contingent consideration |
(1,300 | ) | (169 | ) | (2 | ) | ||||||
| Lifetime expected credit loss |
640 | 324 | 4 | |||||||||
| Other non-cash items |
488 | - | - | |||||||||
| Changes in operating assets and liabilities, net of effects from acquisitions |
||||||||||||
| (Increase)/Decrease in trade receivables |
7,824 | 1,894 | 23 | |||||||||
| (Increase)/Decrease in unbilled receivables and contract assets |
5,919 | (1,331 | ) | (16 | ) | |||||||
| (Increase)/Decrease in Inventories |
287 | 213 | 2 | |||||||||
| (Increase)/Decrease in other financial assets and other assets |
8,869 | 6,609 | 78 | |||||||||
| Increase/(Decrease) in trade payables, accrued expenses, other financial liabilities, other liabilities and provisions |
(435 | ) | 548 | 6 | ||||||||
| Increase/(Decrease) in contract liabilities |
(5,053 | ) | 2,341 | 27 | ||||||||
|
|
|
|
|
|
|
|
|
|
||||
| Cash generated from operating activities before taxes |
191,576 | 195,601 | 2,290 | |||||||||
| Income taxes paid, net |
(15,360 | ) | (26,175 | ) | (307 | ) | ||||||
|
|
|
|
|
|
|
|
|
|
||||
| Net cash generated from operating activities |
176,216 | 169,426 | 1,983 | |||||||||
|
|
|
|
|
|
|
|
|
|
||||
| Cash flows from investing activities: |
||||||||||||
| Payment for purchase of property, plant and equipment |
(10,510 | ) | (14,737 | ) | (173 | ) | ||||||
| Proceeds from disposal of property, plant and equipment |
4,022 | 1,822 | 21 | |||||||||
| Payment for purchase of investments |
(975,069 | ) | (801,582 | ) | (9,383 | ) | ||||||
| Proceeds from sale of investments |
978,598 | 706,520 | 8,270 | |||||||||
| Payment for business acquisitions including deposits and escrow, net of cash acquired |
(5,291 | ) | (964 | ) | (11 | ) | ||||||
| Payment for investment in joint venture |
(484 | ) | - | - | ||||||||
| Repayment of security deposit for property, plant and equipment |
300 | (300 | ) | (3 | ) | |||||||
| Interest received |
20,111 | 26,212 | 307 | |||||||||
| Dividend received |
3 | 2,299 | 27 | |||||||||
|
|
|
|
|
|
|
|
|
|
||||
| Net cash generated from/(used in) investing activities |
11,680 | (80,730 | ) | (945 | ) | |||||||
|
|
|
|
|
|
|
|
|
|
||||
| Cash flows from financing activities: |
||||||||||||
| Proceeds from issuance of equity shares and shares pending allotment |
13 | 27 | ^ | |||||||||
| Repayment of loans and borrowings |
(130,557 | ) | (177,672 | ) | (2,080 | ) | ||||||
| Proceeds from loans and borrowings |
120,500 | 195,595 | 2,290 | |||||||||
| Payment of lease liabilities |
(10,060 | ) | (10,474 | ) | (123 | ) | ||||||
| Payment for contingent consideration |
(1,294 | ) | - | - | ||||||||
| Interest and finance expenses paid |
(10,456 | ) | (8,689 | ) | (102 | ) | ||||||
| Payment of dividend |
(5,218 | ) | (62,750 | ) | (734 | ) | ||||||
| Payment of dividend to Non-controlling interest holders |
(322 | ) | - | - | ||||||||
| Payment for buyback of equity shares, including tax and transaction cost |
(145,173 | ) | - | - | ||||||||
|
|
|
|
|
|
|
|
|
|
||||
| Net cash used in financing activities |
(182,567 | ) | (63,963 | ) | (749 | ) | ||||||
|
|
|
|
|
|
|
|
|
|
||||
| Net increase/(decrease) in cash and cash equivalents during the year |
5,329 | 24,733 | 290 | |||||||||
| Effect of exchange rate changes on cash and cash equivalents |
(239 | ) | 290 | 3 | ||||||||
| Cash and cash equivalents at the beginning of the year |
91,861 | 96,951 | 1,135 | |||||||||
|
|
|
|
|
|
|
|
|
|
||||
| Cash and cash equivalents at the end of the year (Note 10) |
96,951 | 121,974 | 1,428 | |||||||||
|
|
|
|
|
|
|
|
|
|
||||
^ Value is less than 0.5
The accompanying notes form an integral part of these interim condensed consolidated financial statements
| As per our report of even date attached | For and on behalf of the Board of Directors | |||||
| for Deloitte Haskins & Sells LLP | Rishad A. Premji | Deepak M. Satwalekar | Srinivas Pallia | |||
| Chartered Accountants | Chairman | Director | Chief Executive Officer and | |||
| Firm’s Registration No: 117366W/W - 100018 | (DIN: 02983899) | (DIN: 00009627) | Managing Director | |||
| (DIN: 10574442)
|
||||||
| Anand Subramanian | Aparna C. Iyer | M. Sanaulla Khan | ||||
| Partner | Chief Financial Officer | Company Secretary | ||||
| Membership No.: 110815 | Membership No.: F4129 | |||||
|
Bengaluru |
||||||
| April 16, 2025 | ||||||
6
WIPRO LIMITED AND SUBSIDIARIES
NOTES TO THE INTERIM CONDENSED CONSOLIDATED FINANCIAL STATEMENTS
(₹ in millions, except share and per share data, unless otherwise stated)
1. The Company overview
Wipro Limited (“Wipro” or the “Parent Company”), together with its subsidiaries and controlled trusts (collectively, “we”, “us”, “our”, “the Company” or the “Group”) is a global information technology (“IT”), consulting and business process services (“BPS”) company.
Wipro is a public limited company incorporated and domiciled in India. The address of its registered office is Wipro Limited, Doddakannelli, Sarjapur Road, Bengaluru – 560 035, Karnataka, India. The Company has its primary listing with BSE Ltd. and National Stock Exchange of India Limited. The Company’s American Depository Shares (“ADS”) representing equity shares are also listed on the New York Stock Exchange.
The Company’s Board of Directors authorized these interim condensed consolidated financial statements for issue on April 16, 2025.
2. Basis of preparation of interim condensed consolidated financial statements
(i) Statement of compliance and basis of preparation
These interim condensed consolidated financial statements have been prepared in compliance with IAS 34, “Interim Financial Reporting”, as issued by the International Accounting Standards Board (“IASB”). Selected explanatory notes are included to explain events and transactions that are significant to understand the changes in financial position and performance of the Company since the last annual consolidated financial statements as at and for the year ended March 31, 2024. These interim condensed consolidated financial statements do not include all the information required for full annual financial statements prepared in accordance with International Financial Reporting Standards and its interpretations (“IFRS”).
The interim condensed consolidated financial statements correspond to the classification provisions contained in IAS 1 (revised), “Presentation of Financial Statements”. For clarity, various items are aggregated in the interim condensed consolidated statements of income, interim condensed consolidated statements of comprehensive income and interim condensed consolidated statements of financial position. These items are disaggregated separately in the notes to the interim condensed consolidated financial statements, where applicable. The accounting policies have been consistently applied to all periods presented in these interim condensed consolidated financial statements except for new accounting standards, amendments and interpretations adopted by the Company effective from April 1, 2024.
All amounts included in the interim condensed consolidated financial statements are reported in millions of Indian rupees (₹ in millions) except share and per share data, unless otherwise stated. Due to rounding off, the numbers presented throughout the document may not add up precisely to the totals and percentages may not precisely reflect the absolute figures. Previous period figures have been regrouped/rearranged, wherever necessary.
(ii) Basis of measurement
These interim condensed consolidated financial statements have been prepared on a historical cost convention and on an accrual basis, except for the following material items which have been measured at fair value as required by relevant IFRS:
| a. | Derivative financial instruments; |
| b. | Financial instruments classified as fair value through other comprehensive income or fair value through profit or loss; |
| c. | The defined benefit liability/(asset) is recognized as the present value of defined benefit obligation less fair value of plan assets; and |
| d. | Contingent consideration and liability on written put options. |
(iii) Convenience translation (unaudited)
The accompanying interim condensed consolidated financial statements have been prepared and reported in Indian rupees, the functional currency of the Parent Company. Solely for the convenience of the readers, the interim condensed consolidated financial statements as at and for the three months and year ended March 31, 2025, have been translated into United States dollars at the certified foreign exchange rate of US$1 = ₹ 85.43 as published by Federal Reserve Board of Governors on March 31, 2025. No representation is made that the Indian rupee amounts have been, could have been or could be converted into United States dollars at such a rate or any other rate. Due to rounding off, the translated numbers presented throughout the document may not add up precisely to the totals.
(iv) Use of estimates and judgment
The preparation of the interim condensed consolidated financial statements in conformity with IFRS requires the management to make judgments, accounting estimates and assumptions that affect the application of accounting policies and the reported amounts of assets, liabilities, income and expenses. Accounting estimates are monetary amounts in the interim condensed consolidated financial statements that are subject to measurement uncertainty. An accounting policy may require items in the interim condensed consolidated financial statements to be measured at monetary amounts that cannot be observed directly and must instead be estimated. In such a case, management develops an accounting estimate to achieve the objective set out by the accounting policy. Developing accounting estimates involves the use of judgements or assumptions based on the latest available and reliable information. Actual results may differ from those accounting estimates.
Accounting estimates and underlying assumptions are reviewed on an ongoing basis. Changes to accounting estimates are recognized in the period in which the estimates are changed and in any future periods affected. In particular, information about material areas of estimation, uncertainty and critical judgments in applying accounting policies that have material effect on the amounts recognized in the interim condensed consolidated financial statements are included in the following notes:
7
| a) | Revenue recognition: The Company applies judgement to determine whether each product or service promised to a customer is capable of being distinct, and is distinct in the context of the contract, if not, the promised product or service is combined and accounted as a single performance obligation. Revenue is recognized upon transfer of control of promised products or services to customers in an amount that reflects the consideration the Company expects to receive (the “Transaction Price”). The Company allocates the Transaction Price to separately identifiable performance obligation deliverables based on their relative stand-alone selling price. In cases where the Company is unable to determine the stand-alone selling price, the Company uses expected cost-plus margin approach in estimating the stand-alone selling price. The Company uses the percentage of completion method using the input (cost expended) method to measure progress towards completion in respect of fixed price contracts. Percentage of completion method accounting relies on estimates of total expected contract revenue and costs. This method is followed when reasonably dependable estimates of the revenues and costs applicable to various elements of the contract can be made. Key factors that are reviewed in estimating the future costs to complete include estimates of future labor costs and productivity efficiencies. Because the financial reporting of these contracts depends on estimates that are assessed continually during the term of these contracts, revenue recognized, profit and timing of revenue for remaining performance obligations are subject to revisions as the contract progresses to completion. When estimates indicate that a loss will be incurred, the loss is provided for in the period in which the loss becomes probable. Volume discounts are recorded as a reduction of revenue. When the amount of discount varies with the levels of revenue, volume discount is recorded based on estimate of future revenue from the customer. |
| b) | Impairment testing: Goodwill recognized on business combination is tested for impairment at least annually and when events occur or changes in circumstances indicate that the recoverable amount of goodwill or a cash generating unit to which goodwill pertains, is less than the carrying value. The Company assesses acquired intangible assets with finite useful life for impairment whenever events or changes in circumstances indicate that the carrying amount may not be recoverable. The recoverable amount of an asset or a cash generating unit is higher of value-in-use and fair value less cost of disposal. The calculation of value in use of an asset or a cash generating unit involves use of significant estimates and assumptions which include turnover, growth rates and net margins used to calculate projected future cash flows, risk-adjusted discount rate, future economic and market conditions. |
| c) | Income taxes: The major tax jurisdictions for the Company are India and the United States of America. |
Significant judgments are involved in determining the provision for income taxes including judgment on whether tax positions are probable of being sustained in tax assessments. A tax assessment can involve complex issues, which can only be resolved over extended time periods.
Deferred tax is recorded on temporary differences between the tax bases of assets and liabilities and their carrying amounts, at the rates that have been enacted or substantively enacted at the reporting date. The ultimate realization of deferred tax assets is dependent upon the generation of future taxable profits during the periods in which those temporary differences and tax loss carry-forwards become deductible. The Company considers expected reversal of deferred tax liabilities and projected future taxable income in making this assessment. The amount of deferred tax assets considered realizable, however, could reduce in the near term if estimates of future taxable income during the carry-forward period are reduced.
| d) | Business combinations: In accounting for business combinations, judgment is required to assess whether an identifiable intangible asset is to be recorded separately from goodwill. Additionally, estimating the acquisition date fair value of the identifiable assets acquired (including useful life estimates), liabilities assumed, and contingent consideration assumed involves management judgment. These measurements are based on information available at the acquisition date and are based on expectations and assumptions that have been deemed reasonable by management. Changes in these judgments, estimates, and assumptions can materially affect the results of operations. |
| e) | Defined benefit plans and compensated absences: The cost of the defined benefit plans, compensated absences and the present value of the defined benefit obligations are based on actuarial valuation using the projected unit credit method. An actuarial valuation involves making various assumptions that may differ from actual developments in the future. These include the determination of the discount rate, future salary increases and mortality rates. Due to the complexities involved in the valuation and its long-term nature, a defined benefit obligation is highly sensitive to changes in these assumptions. All assumptions are reviewed at each reporting date. |
| f) | Expected credit losses on financial assets: The impairment provisions of financial assets are based on assumptions about risk of default and expected timing of collection. The Company uses judgment in making these assumptions and selecting the inputs to the expected credit loss calculation based on the Company’s history of collections, customer’s creditworthiness, existing market conditions as well as forward looking estimates at the end of each reporting period. |
| g) | Useful lives of property, plant and equipment: The Company depreciates property, plant and equipment on a straight-line basis over estimated useful lives of the assets. The charge in respect of periodic depreciation is derived based on an estimate of an asset’s expected useful life and the expected residual value at the end of its life. The lives are based on historical experience with similar assets as well as anticipation of future events, which may impact their life, such as changes in technology. The estimated useful life is reviewed at least annually. |
| h) | Useful lives of intangible assets: The Company amortizes intangible assets on a straight-line basis over estimated useful lives of the assets. The useful life is estimated based on a number of factors including the effects of obsolescence, demand, competition and other economic factors such as the stability of the industry and known technological advances and the level of maintenance expenditures required to obtain the expected future cash flows from the assets. The estimated useful life is reviewed at least annually. |
8
| i) | Provisions and contingent liabilities: The Company estimates the provisions that have present obligations as a result of past events and it is probable that outflow of resources will be required to settle the obligations. These provisions are reviewed at the end of each reporting date and are adjusted to reflect the current best estimates. |
The Company uses significant judgement to disclose contingent liabilities. Contingent liabilities are disclosed when there is a possible obligation arising from past events, the existence of which will be confirmed only by the occurrence or non-occurrence of one or more uncertain future events not wholly within the control of the Company or a present obligation that arises from past events where it is either not probable that an outflow of resources will be required to settle the obligation or a reliable estimate of the amount cannot be made. Contingent assets are neither recognized nor disclosed in the financial statements.
3. Material accounting policy information
Please refer to the Company’s Annual report for the year ended March 31, 2024, for a discussion of the Company’s other material accounting policy information except for new accounting standards, amendments and interpretations adopted by the Company effective on or after April 1, 2024.
| i. | New amendments not yet adopted: |
Certain new standards, amendments to standards and interpretations are not yet effective for annual periods beginning after April 1, 2024 and have not been applied in preparing these interim condensed consolidated financial statements. New standards, amendments to standards and interpretations that could have potential impact on the interim condensed consolidated financial statements of the Company are:
Amendments to IAS 21 – The Effects of Changes in Foreign Exchange Rates
On August 15, 2023, IASB issued ‘Lack of Exchangeability (Amendments to IAS 21)’ that clarifies how an entity should assess whether a currency is exchangeable and how it should determine a spot exchange rate when exchangeability is lacking, as well as require the disclosure of information that enables users of financial statements to understand the impact of a currency not being exchangeable. These amendments are effective for annual reporting periods beginning on or after January 1, 2025, with earlier application permitted. The adoption of amendments to IAS 21 is not expected to have any material impact on the interim condensed consolidated financial statements.
IFRS 18 – Presentation and Disclosure in Financial Statements
On April 9, 2024, IASB issued IFRS 18 ‘Presentation and Disclosure in Financial Statements’ which supersedes IAS 1 ‘Presentation of Financial Statements’, aimed at improving comparability and transparency of communication in financial statements. IFRS 18 requires an entity to classify all income and expenses within its statement of profit or loss into one of five categories: operating, investing, financing, income taxes and discontinued operations. These categories are complemented by the requirement to present specified totals and subtotals for ‘operating profit or loss’, ‘profit or loss before financing and income taxes’ and ‘profit or loss’. It also requires disclosure of management-defined performance measures and includes new requirements for aggregation and disaggregation of financials information based on the identified ‘roles’ of the primary financial statements and the notes.
Consequent to above, a narrow-scope amendments have been made to IAS 7 ‘Statement of Cash Flows’, which include changing the starting point for determining cash flows from operations under the indirect method from ‘profit or loss’ to ‘operating profit or loss’. Further, some requirements previously included within IAS 1 have been moved to IAS 8 ‘Accounting Policies, Changes in Accounting Estimates and Errors’ which has also been renamed IAS 8 ‘Basis of Preparation of Financial Statements’. IAS 34 ‘ Interim Financial Reporting’ was amended to require disclosure of management defined performance measures. Minor consequential amendments to other standards were also made.
An entity that prepares condensed interim financial statements in accordance with IAS 34 in the first year of adoption of IFRS 18, must present the heading and mandatory subtotals it expects to use in its annual financial statement. Comparative period in both the interim and annual financial statements will need to be restated and a reconciliation of the statement of profit or loss previously published will be required for the immediately preceding comparative period. IFRS 18 and the amendments to the other standards, is effective for reporting period beginning on or after January 1, 2027 and are to be applied retrospectively, with earlier application permitted.
The Company is currently assessing the impact of adopting IFRS 18 and the amendments to other standards, on the interim condensed consolidated financial statements.
IFRS 19 – Subsidiaries without Public Accountability: Disclosures
On May 9, 2024, IASB issued IFRS 19 ‘Subsidiaries without Public accountability: Disclosures’ which specifies the disclosure requirements an entity is permitted to apply instead of the disclosure requirements in other IFRS Accounting Standards. The standard allows a subsidiary which does not have public accountability and has an ultimate or intermediate parent that produces consolidated financial statements available for public use that comply with IFRS Accounting Standards, to elect IFRS 19. IFRS 19 and the amendments to the other standards, is effective for reporting period beginning on or after January 1, 2027, with earlier application permitted.
9
The Company is currently assessing the impact of adopting IFRS 19 on the interim condensed consolidated financial statements.
Amendments to IFRS 9 and IFRS 7 – Classification and Measurement of Financial Instruments
On May 30, 2024, IASB issued ‘Classification and Measurement of Financial Instruments (Amendments to IFRS 9 and IFRS 7)’ to address matters identified during the post-implementation review of IFRS 9. The amendments clarify that a financial liability is derecognized on the ‘settlement date’ and introduce an accounting policy choice to derecognize financial liabilities settled using an electronic payment system before settlement date. The classification of financial asset with ESG linked features has been clarified through additional guidance on the assessment of contingent features. Additional disclosures are introduced for financial instruments with contingent features and equity instruments classified as fair value through OCI. These amendments are effective for annual reporting periods beginning on or after January 1, 2026, with earlier application permitted. The Company is currently assessing the impact of adopting these amendments on the interim condensed consolidated financial statements.
Amendments to IFRS 9 and IFRS 7 - Contracts referencing Nature-dependent electricity
The International Accounting Standards Board (IASB) has published amendments to IFRS 9 and IFRS 7 titled Contracts Referencing Nature-dependent Electricity. The IASB has added application guidance to IFRS 9 to address specifically whether a contract to buy electricity generated from a source dependent on natural conditions is held for the entity’s own-use expectations. The amendments also address specifically how an entity applies the hedge accounting requirements in IFRS 9 when a contract referencing nature-dependent electricity with a variable nominal amount is designated as the hedging instrument. The IASB decided to add complementary disclosure requirements to IFRS 7. The amendments are effective for annual periods beginning on or after 1 January 2026, with earlier application permitted. The Company is currently assessing the impact of adopting these amendments on the interim condensed consolidated financial statements.
4. Property, plant and equipment
|
|
|
|
|
|
|
|
||||||||||||||||||||||
| Land | Buildings | Plant and equipment (1) |
Furniture and fixtures |
Office equipment |
Vehicles | Total | ||||||||||||||||||||||
| Gross carrying value: |
||||||||||||||||||||||||||||
| As at April 1, 2023 |
₹ 4,860 | ₹ 47,700 | ₹ 117,732 | ₹ 18,086 | ₹ 7,818 | ₹ 161 | ₹ 196,357 | |||||||||||||||||||||
| Additions |
- | 428 | 6,975 | 1,716 | 354 | 3 | 9,476 | |||||||||||||||||||||
| Additions through Business combinations |
- | - | 373 | - | 1 | - | 374 | |||||||||||||||||||||
| Disposals |
(486) | (1,174) | (22,815) | (1,586) | (663) | (131) | (26,855) | |||||||||||||||||||||
| Translation adjustment |
1 | 70 | 248 | 17 | 4 | 1 | 341 | |||||||||||||||||||||
|
|
|
|
|
|
|
|
|
|
|
|
|
|
|
|||||||||||||||
| As at March 31, 2024 |
₹ 4,375 | ₹ 47,024 | ₹ 102,513 | ₹ 18,233 | ₹ 7,514 | ₹ 34 | ₹ 179,693 | |||||||||||||||||||||
|
|
|
|
|
|
|
|
|
|
|
|
|
|
|
|||||||||||||||
| Accumulated depreciation/ impairment: |
||||||||||||||||||||||||||||
| As at April 1, 2023 |
₹ - | ₹ 10,927 | ₹ 85,501 | ₹ 11,520 | ₹ 5,928 | ₹ 145 | ₹ 114,021 | |||||||||||||||||||||
| Depreciation and impairment |
- | 1,490 | 11,856 | 2,193 | 638 | 7 | 16,184 | |||||||||||||||||||||
| Disposals |
- | (683) | (22,019) | (1,444) | (639) | (130) | (24,915) | |||||||||||||||||||||
| Translation adjustment |
- | 41 | 211 | 18 | 5 | ^ | 275 | |||||||||||||||||||||
|
|
|
|
|
|
|
|
|
|
|
|
|
|
|
|||||||||||||||
| As at March 31, 2024 |
₹ - | ₹ 11,775 | ₹ 75,549 | ₹ 12,287 | ₹ 5,932 | ₹ 22 | ₹ 105,565 | |||||||||||||||||||||
|
|
|
|
|
|
|
|
|
|
|
|
|
|
|
|||||||||||||||
| Net carrying value as at March 31, 2024 |
₹ 4,375 | ₹ 35,249 | ₹ 26,964 | ₹ 5,946 | ₹ 1,582 | ₹ 12 | ₹ 74,128 | |||||||||||||||||||||
|
|
|
|
|
|
|
|
|
|
|
|
|
|
|
|||||||||||||||
| Capital work-in-progress |
₹ 7,480 | |||||||||||||||||||||||||||
|
|
|
|||||||||||||||||||||||||||
| Net carrying value including Capital work-in-progress as at March 31, 2024 |
|
₹ 81,608 | ||||||||||||||||||||||||||
|
|
|
|||||||||||||||||||||||||||
| Gross carrying value: |
||||||||||||||||||||||||||||
| As at April 1, 2024 |
₹ 4,375 | ₹ 47,024 | ₹ 102,513 | ₹ 18,233 | ₹ 7,514 | ₹ 34 | ₹ 179,693 | |||||||||||||||||||||
| Additions |
- | 6,215 | 10,623 | 3,143 | 943 | 10 | 20,934 | |||||||||||||||||||||
| Additions through Business combination (Refer to Note 7) | - | - | 9 | - | - | - | 9 | |||||||||||||||||||||
| Disposals |
(6) | (680) | (13,668) | (1,803) | (793) | (9) | (16,959) | |||||||||||||||||||||
| Translation adjustment |
4 | (3) | 77 | 3 | (1) | (1) | 79 | |||||||||||||||||||||
|
|
|
|
|
|
|
|
|
|
|
|
|
|
|
|||||||||||||||
| As at March 31, 2025 |
₹ 4,373 | ₹ 52,556 | ₹ 99,554 | ₹ 19,576 | ₹ 7,663 | ₹ 34 | ₹ 183,756 | |||||||||||||||||||||
|
|
|
|
|
|
|
|
|
|
|
|
|
|
|
|||||||||||||||
| Accumulated depreciation/ impairment: |
||||||||||||||||||||||||||||
| As at April 1, 2024 |
₹ - | ₹ 11,775 | ₹ 75,549 | ₹ 12,287 | ₹ 5,932 | ₹ 22 | ₹ 105,565 | |||||||||||||||||||||
| Depreciation and impairment |
- | 1,662 | 11,050 | 2,229 | 623 | 4 | 15,568 | |||||||||||||||||||||
| Disposals |
- | (410) | (13,189) | (1,526) | (730) | (8) | (15,863) | |||||||||||||||||||||
| Translation adjustment |
- | (30) | 49 | (1) | (4) | (1) | 13 | |||||||||||||||||||||
|
|
|
|
|
|
|
|
|
|
|
|
|
|
|
|||||||||||||||
| As at March 31, 2025 |
₹ - | ₹ 12,997 | ₹ 73,459 | ₹ 12,989 | ₹ 5,821 | ₹ 17 | ₹ 105,283 | |||||||||||||||||||||
|
|
|
|
|
|
|
|
|
|
|
|
|
|
|
|||||||||||||||
| Net carrying value as at March 31, 2025 |
₹ 4,373 | ₹ 39,559 | ₹ 26,095 | ₹ 6,587 | ₹ 1,842 | ₹ 17 | ₹ 78,473 | |||||||||||||||||||||
|
|
|
|
|
|
|
|
|
|
|
|
|
|
|
|||||||||||||||
| Capital work-in-progress |
₹ 2,211 | |||||||||||||||||||||||||||
|
|
|
|||||||||||||||||||||||||||
| Net carrying value including Capital work-in-progress as at March 31, 2025 |
|
₹ 80,684 | ||||||||||||||||||||||||||
|
|
|
|||||||||||||||||||||||||||
^ Value is less than 0.5
(1) Including net carrying value of computer equipment and software amounting to ₹ 17,553 and ₹ 16,003, as at March 31, 2024 and March 31, 2025, respectively.
10
5. Right-of-Use assets
| Category of Right-of-Use asset |
|
|||||||||||||||||||
| Land | Buildings | Plant and equipment (1) |
Vehicles | Total | ||||||||||||||||
| Gross carrying value: |
||||||||||||||||||||
| As at April 1, 2023 |
₹ 1,278 | ₹ 27,946 | ₹ 2,580 | ₹ 865 | ₹ 32,669 | |||||||||||||||
| Additions |
65 | 6,505 | 264 | 251 | 7,085 | |||||||||||||||
| Additions through Business combination |
- | 33 | - | - | 33 | |||||||||||||||
| Disposals |
- | (6,203) | (636) | (271) | (7,110) | |||||||||||||||
| Translation adjustment |
- | 172 | 34 | 4 | 210 | |||||||||||||||
|
|
|
|
|
|
|
|
|
|
|
|||||||||||
| As at March 31, 2024 |
₹ 1,343 | ₹ 28,453 | ₹ 2,242 | ₹ 849 | ₹ 32,887 | |||||||||||||||
|
|
|
|
|
|
|
|
|
|
|
|||||||||||
| Accumulated depreciation: |
||||||||||||||||||||
| As at April 1, 2023 |
₹ 77 | ₹ 12,127 | ₹ 1,192 | ₹ 571 | ₹ 13,967 | |||||||||||||||
| Depreciation |
21 | 5,485 | 444 | 181 | 6,131 | |||||||||||||||
| Disposals |
- | (4,439) | (561) | (244) | (5,244) | |||||||||||||||
| Translation adjustment |
- | 64 | 11 | 3 | 78 | |||||||||||||||
|
|
|
|
|
|
|
|
|
|
|
|||||||||||
| As at March 31, 2024 |
₹ 98 | ₹ 13,237 | ₹ 1,086 | ₹ 511 | ₹ 14,932 | |||||||||||||||
|
|
|
|
|
|
|
|
|
|
|
|||||||||||
| Net carrying value as at March 31, 2024 |
₹ 1,245 | ₹ 15,216 | ₹ 1,156 | ₹ 338 | ₹ 17,955 | |||||||||||||||
|
|
|
|
|
|
|
|
|
|
|
|||||||||||
| Gross carrying value: |
||||||||||||||||||||
| As at April 1, 2024 |
₹ 1,343 | ₹ 28,453 | ₹ 2,242 | ₹ 849 | ₹ 32,887 | |||||||||||||||
| Additions |
- | 10,822 | 3,735 | 228 | 14,785 | |||||||||||||||
| Disposals |
(221) | (4,389) | (632) | (354) | (5,596) | |||||||||||||||
| Translation adjustment |
- | 152 | 100 | 17 | 269 | |||||||||||||||
|
|
|
|
|
|
|
|
|
|
|
|||||||||||
| As at March 31, 2025 |
₹ 1,122 | ₹ 35,038 | ₹ 5,445 | ₹ 740 | ₹ 42,345 | |||||||||||||||
|
|
|
|
|
|
|
|
|
|
|
|||||||||||
| Accumulated depreciation: |
||||||||||||||||||||
| As at April 1, 2024 |
₹ 98 | ₹ 13,237 | ₹ 1,086 | ₹ 511 | ₹ 14,932 | |||||||||||||||
| Depreciation |
21 | 5,362 | 539 | 180 | 6,102 | |||||||||||||||
| Disposals |
(13) | (3,776) | (303) | (319) | (4,411) | |||||||||||||||
| Translation adjustment |
- | 81 | 34 | 9 | 124 | |||||||||||||||
|
|
|
|
|
|
|
|
|
|
|
|||||||||||
| As at March 31, 2025 |
₹ 106 | ₹ 14,904 | ₹ 1,356 | ₹ 381 | ₹ 16,747 | |||||||||||||||
|
|
|
|
|
|
|
|
|
|
|
|||||||||||
| Net carrying value as at March 31, 2025 |
₹ 1,016 | ₹ 20,134 | ₹ 4,089 | ₹ 359 | ₹ 25,598 | |||||||||||||||
|
|
|
|
|
|
|
|
|
|
|
|||||||||||
(1) Including net carrying value of computer equipment amounting to ₹ 2 and ₹ 1 as at March 31, 2024 and March 31, 2025, respectively.
6. Goodwill and intangible assets
The movement in goodwill balance is given below:
| As at | ||||||||
| March 31, 2024 | March 31, 2025 | |||||||
| Balance at the beginning of the year |
₹ 307,970 | ₹ 316,002 | ||||||
| Translation adjustment |
4,206 | 7,688 | ||||||
| Acquisition through Business combinations(1) |
4,314 | 1,324 | ||||||
| Disposals |
(488) | - | ||||||
|
|
|
|
|
|||||
| Balance at the end of the year |
₹ 316,002 | ₹ 325,014 | ||||||
|
|
|
|
|
|||||
(1) Acquisition through business combination for the year ended March 31, 2024 is after considering the impact of ₹ (503) towards measurement period changes in purchase price allocation of acquisitions made during the year ended March 31, 2023.
The movement in intangible assets is given below:
| Intangible assets |
||||||
|
Customer-related |
Marketing-related |
Total |
||||
| Gross carrying value: |
||||||
| As at April 1, 2023 |
₹ 49,813 | ₹ 11,924 | ₹ 61,737 | |||
| Acquisition through Business combination |
556 | 390 | 946 | |||
| Deductions/adjustments |
(7,306) | (505) | (7,811) | |||
| Translation adjustment |
609 | 163 | 772 | |||
|
|
|
|
||||
| As at March 31, 2024 |
₹ 43,672 | ₹ 11,972 | ₹ 55,644 | |||
|
|
|
|
||||
| Accumulated amortization/ impairment: |
||||||
| As at April 1, 2023 |
₹ 15,417 | ₹ 3,275 | ₹ 18,692 | |||
| Amortization and impairment (1) (2) |
9,961 | 1,795 | 11,756 | |||
| Deductions/adjustments |
(7,306) | (505) | (7,811) | |||
| Translation adjustment |
209 | 50 | 259 | |||
|
|
|
|
||||
| As at March 31, 2024 |
₹ 18,281 | ₹ 4,615 | ₹ 22,896 | |||
|
|
|
|
||||
| Net carrying value as at March 31, 2024 |
₹ 25,391 | ₹ 7,357 | ₹ 32,748 | |||
|
|
|
|
||||
11
| Gross carrying value: |
||||||
| As at April 1, 2024 |
₹ 43,672 | ₹ 11,972 | ₹ 55,644 | |||
| Acquisition through Business combination (Refer to Note 7) |
1,896 | - | 1,896 | |||
| Deductions/adjustments |
(4,101) | (2,518) | (6,619) | |||
| Translation adjustment |
994 | 268 | 1,262 | |||
|
|
|
|
||||
| As at March 31, 2025 |
₹ 42,461 | ₹ 9,722 | ₹ 52,183 | |||
|
|
|
|
||||
| Accumulated amortization/ impairment: |
||||||
| As at April 1, 2024 |
₹ 18,281 | ₹ 4,615 | ₹ 22,896 | |||
| Amortization and impairment (1) |
6,327 | 1,582 | 7,909 | |||
| Deductions/adjustments |
(4,101) | (2,518) | (6,619) | |||
| Translation adjustment |
443 | 104 | 547 | |||
|
|
|
|
||||
| As at March 31, 2025 |
₹ 20,950 | ₹ 3,783 | ₹ 24,733 | |||
|
|
|
|
||||
| Net carrying value as at March 31, 2025 |
₹ 21,511 | ₹ 5,939 | ₹ 27,450 | |||
|
|
|
|
(1) During the year ended March 31, 2024 and 2025, decline in the revenue and earnings estimates led to revision of recoverable value of customer-relationship intangible assets and marketing related intangible assets recognized on business combinations. Consequently, the Company has recognized impairment charge of ₹ 808 and ₹ Nil for the three months ended March 31, 2024 and 2025, respectively and ₹ 1,701 and ₹ 1,155 for the year ended March 31, 2024 and 2025 respectively, as part of amortization and impairment.
(2) Due to change in our estimate of useful life of customer-related intangibles in an earlier business combination, the Company has recognized additional amortization charge of ₹ Nil and ₹ 2,807 for the three months and year ended March 31, 2024 respectively, as part of amortization and impairment.
Amortization expense on intangible assets is included in selling and marketing expenses in the interim condensed consolidated statement of income.
7. Business combinations
During the year ended March 31, 2025, the Company has completed a business combination by acquiring 100% equity interest in Applied Value Technologies, Inc. and Applied Value Technologies B.V., which was consummated on December 16, 2024. The Company has also acquired 100% equity interest in Applied Value Technologies Pte Limited (“AVT”), which was consummated on January 3, 2025. AVT helps enterprises transform IT operations through a highly customized and data-driven approach. AVT will augment Wipro’s existing application services capabilities, helping drive new growth opportunities. The total consideration (upfront cash to acquire control, deferred consideration and contingent consideration) for the acquisition is ₹ 2,836.
| Description |
||||
| Net assets |
₹ 173 | |||
| Fair value of property, plant and equipment |
9 | |||
| Fair value of customer-related intangibles |
1,896 | |||
| Deferred tax liabilities on intangible assets |
(566) | |||
|
|
|
|||
| Total identifiable assets |
₹ 1,512 | |||
| Goodwill |
1,324 | |||
|
|
|
|||
| Total purchase price |
₹ 2,836 | |||
|
|
|
|||
| Net Assets include: |
||||
| Cash and cash equivalents |
₹ 113 | |||
| Fair value of acquired trade receivables included in net assets |
215 | |||
| Gross contractual amount of acquired trade receivables |
215 | |||
| Less: Allowance for lifetime expected credit loss |
- | |||
| Transaction costs included in general and administrative expenses |
₹ 45 | |||
The above purchase price allocation for AVT is provisional and will be finalized as soon as practicable within the measurement period, but in no event later than one year following the date of acquisition.
The goodwill of ₹ 1,324 comprises value of acquired workforce and expected synergies arising from the business combinations. Goodwill is allocated to IT Services segment and is not deductible for income tax purposes.
The total consideration of AVT includes a deferred consideration of ₹ 264 payable within six months from consummation date.
The total consideration of AVT includes a contingent consideration linked to achievement of revenues and earnings over a period of 3 years ending December 31, 2027, and range of contingent consideration payable is between ₹ Nil and ₹ 2,122. The fair value of the contingent consideration is estimated by applying the discounted cash-flow approach considering probability adjusted revenue and earnings estimates. The undiscounted fair value of contingent consideration is ₹ 2,122 as at the date of acquisition. The discounted fair value of contingent consideration of ₹ 1,537 is recorded as part of provisional purchase price allocation.
The pro-forma effects of acquisition of AVT for the three months and year ended March 31, 2025, on the Company’s results were not material.
12
8. Investments
| As at | ||||||||
| March 31, 2024 | March 31, 2025 | |||||||
| Non-current |
||||||||
| Financial instruments at FVTPL |
||||||||
| Equity instruments (1) |
₹ 4,404 | ₹ 4,955 | ||||||
| Fixed maturity plan mutual funds |
1,395 | 1,203 | ||||||
| Financial instruments at FVTOCI |
||||||||
| Equity instruments (1) |
15,830 | 12,493 | ||||||
| Financial instruments at amortized cost |
||||||||
| Inter corporate and term deposits (3) |
^ | 7,807 | ||||||
|
|
|
|
|
|||||
| ₹ 21,629 | ₹ 26,458 | |||||||
|
|
|
|
|
|||||
| Current |
||||||||
| Financial instruments at FVTPL |
||||||||
| Short-term mutual funds (2) |
₹ 71,686 | ₹ 88,776 | ||||||
| Fixed maturity plan mutual funds |
- | 300 | ||||||
| Financial instruments at FVTOCI |
||||||||
| Non-convertible debentures |
154,407 | 219,389 | ||||||
| Government securities |
7,030 | 10,651 | ||||||
| Commercial papers |
11,845 | 2,858 | ||||||
| Bonds |
28,195 | 21,138 | ||||||
| Financial instruments at amortized cost |
||||||||
| Inter corporate and term deposits (3) |
38,008 | 68,362 | ||||||
|
|
|
|
|
|||||
| ₹ 311,171 | ₹ 411,474 | |||||||
|
|
|
|
|
|||||
| ₹ 332,800 | ₹ 437,932 | |||||||
|
|
|
|
|
|||||
| Financial instruments at FVTPL |
₹ 77,485 | ₹ 95,234 | ||||||
| Financial instruments at FVTOCI |
217,307 | 266,529 | ||||||
| Financial instruments at amortized cost |
38,008 | 76,169 | ||||||
^ Value is less than 0.5
(1) Uncalled capital commitments outstanding as at March 31, 2024 and 2025, was ₹ 1,450 and ₹ 1,576, respectively.
(2) As at March 31, 2024 and 2025, short-term mutual funds include units lien with bank on account of margin money for currency derivatives amounting to ₹ 218 and ₹ 233, respectively.
(3) These deposits earn a fixed rate of interest. As at March 31, 2024 and 2025, term deposits include current deposits in lien with banks, held as margin money deposits against guarantees amounting to ₹ 117 and ₹ 953, respectively.
9. Inventories
| As at | ||||||||
| March 31, 2024 | March 31, 2025 | |||||||
| Stores and spare parts |
₹ 27 | ₹ 9 | ||||||
| Traded goods |
880 | 685 | ||||||
|
|
|
|
|
|||||
| ₹ 907 | ₹ 694 | |||||||
|
|
|
|
|
|||||
10. Cash and cash equivalents
| As at | ||||||||
| March 31, 2024 | March 31, 2025 | |||||||
| Cash and bank balances |
₹ 60,648 | ₹ 74,456 | ||||||
| Demand deposits with banks (1) |
36,305 | 47,518 | ||||||
|
|
|
|
|
|||||
| ₹ 96,953 | ₹ 121,974 | |||||||
|
|
|
|
|
|||||
(1) These deposits can be withdrawn by the Company at any time without prior notice and without any penalty on the principal.
Cash and cash equivalents consist of the following for the purpose of the statement of cash flows:
| As at | ||||||||
| March 31, 2024 | March 31, 2025 | |||||||
| Cash and cash equivalents |
₹ 96,953 | ₹ 121,974 | ||||||
| Bank overdrafts |
(2) | ^ | ||||||
|
|
|
|
|
|||||
| ₹ 96,951 | ₹ 121,974 | |||||||
|
|
|
|
|
|||||
^ Value is less than 0.5
11. Other financial assets
13
11. Other financial assets
| As at | ||||||||
| March 31, 2024 | March 31, 2025 | |||||||
| Non-current |
||||||||
| Security deposits |
₹ | 1,221 | ₹ | 1,318 | ||||
| Finance lease receivables |
4,270 | 3,090 | ||||||
| Dues from officers and employees |
59 | 30 | ||||||
| Others |
||||||||
| Advance to customer |
- | 225 | ||||||
| Other receivables |
- | 1 | ||||||
|
|
|
|
|
|||||
| ₹ | 5,550 | ₹ | 4,664 | |||||
|
|
|
|
|
|||||
| Current |
||||||||
| Security deposits |
₹ | 2,035 | ₹ | 1,827 | ||||
| Dues from officers and employees |
596 | 505 | ||||||
| Interest receivables |
230 | 596 | ||||||
| Finance lease receivables |
5,307 | 5,144 | ||||||
| Others |
||||||||
| Claims Receivables |
145 | 195 | ||||||
| Advance to customer |
- | 70 | ||||||
| Other receivables |
2,223 | 111 | ||||||
|
|
|
|
|
|||||
| ₹ | 10,536 | ₹ | 8,448 | |||||
|
|
|
|
|
|||||
| ₹ | 16,086 | ₹ | 13,112 | |||||
|
|
|
|
|
|||||
12. Other assets
| As at | ||||||||
| March 31, 2024 | March 31, 2025 | |||||||
| Non-current |
||||||||
| Prepaid expenses |
₹ | 3,424 | ₹ | 2,657 | ||||
| Costs to obtain contract (1) |
2,324 | 3,277 | ||||||
| Costs to fulfil contract (2) |
205 | 378 | ||||||
| Others - Interest receivable from statutory authorities |
4,378 | 1,148 | ||||||
|
|
|
|
|
|||||
| ₹ | 10,331 | ₹ | 7,460 | |||||
|
|
|
|
|
|||||
| Current |
||||||||
| Prepaid expenses |
₹ | 17,574 | ₹ | 16,917 | ||||
| Dues from officers and employees |
343 | 453 | ||||||
| Advance to suppliers |
3,267 | 2,323 | ||||||
| Balance with GST and other authorities |
6,029 | 6,760 | ||||||
| Costs to obtain contract (1) |
867 | 1,407 | ||||||
| Costs to fulfil contract (2) |
60 | 131 | ||||||
| Others |
||||||||
| Defined benefit plan asset, net |
1,010 | 472 | ||||||
| Withholding taxes |
329 | 542 | ||||||
| Other receivables |
123 | 123 | ||||||
|
|
|
|
|
|||||
| ₹ | 29,602 | ₹ | 29,128 | |||||
|
|
|
|
|
|||||
| ₹ | 39,933 | ₹ | 36,588 | |||||
|
|
|
|
|
|||||
(1) Costs to obtain contract amortization of ₹ 275 and ₹ 356 during the three months ended March 31, 2024 and 2025 respectively, ₹ 1,083 and ₹ 1,333 during the year ended March 31, 2024 and 2025 respectively.
(2) Costs to fulfil contract amortization of ₹ 15 and ₹ 31 during the three months ended March 31, 2024 and 2025 respectively, ₹ 60 and ₹ 83 during the year ended March 31, 2024 and 2025 respectively.
13. Loans, borrowings and bank overdrafts
| As at | ||||||||
| March 31, 2024 | March 31, 2025 | |||||||
| Non-current |
||||||||
| Unsecured Notes 2026 (1) |
₹ | 62,300 | ₹ | 63,954 | ||||
|
|
|
|
|
|||||
| ₹ | 62,300 | ₹ | 63,954 | |||||
|
|
|
|
|
|||||
| Current |
||||||||
| Borrowings from banks |
₹ | 79,164 | ₹ | 97,863 | ||||
| Bank overdrafts |
2 | ^ | ||||||
|
|
|
|
|
|||||
| ₹ | 79,166 | ₹ | 97,863 | |||||
|
|
|
|
|
|||||
| ₹ | 141,466 | ₹ | 161,817 | |||||
|
|
|
|
|
|||||
^ Value is less than 0.5
(1) On June 23, 2021, Wipro IT Services LLC, a wholly owned step-down subsidiary of Wipro Limited, issued US$ 750 million in unsecured notes 2026 (the “Notes”). The Notes bear interest at a rate of 1.50% per annum and will mature on June 23, 2026. Interest on the Notes is payable semi-annually on June 23 and December 23 of each year, commencing from December 23, 2021.
14
The Notes are listed on Singapore Exchange Securities Trading Limited (SGX-ST).
14. Trade payables and accrued expenses
| As at | ||||||||
| March 31, 2024 | March 31, 2025 | |||||||
| Trade payables |
₹ | 23,275 | ₹ | 21,985 | ||||
| Accrued expenses |
65,291 | 66,267 | ||||||
|
|
|
|
|
|||||
| ₹ | 88,566 | ₹ | 88,252 | |||||
|
|
|
|
|
|||||
15. Other financial liabilities
| As at | ||||||||
| March 31, 2024 | March 31, 2025 | |||||||
| Non-current |
||||||||
| Contingent consideration (Refer to Note 18) |
₹ | 429 | ₹ | 1,307 | ||||
| Liability on written put options to non-controlling interests (Refer to Note 18) |
4,303 | 4,945 | ||||||
| Rent deposit |
- | 26 | ||||||
| Liabilities towards customer contracts |
- | 1,026 | ||||||
| Others |
||||||||
| Deferred consideration for Business combination |
57 | 61 | ||||||
| Long-term incentive payable |
196 | 387 | ||||||
| Other liabilities |
- | 41 | ||||||
|
|
|
|
|
|||||
| ₹ | 4,985 | ₹ | 7,793 | |||||
|
|
|
|
|
|||||
| Current |
||||||||
| Contingent consideration (Refer to Note 18) |
₹ | - | ₹ | 557 | ||||
| Advance from customers |
598 | 167 | ||||||
| Cash settled ADS RSUs |
3 | - | ||||||
| Capital creditors |
333 | 1,255 | ||||||
| Rent deposit |
788 | 475 | ||||||
| Liabilities towards customer contracts |
78 | 342 | ||||||
| Others |
||||||||
| Interest accrued on loans and borrowings |
347 | 489 | ||||||
| Deferred consideration for Business combination |
91 | 295 | ||||||
| Unclaimed dividend |
34 | 64 | ||||||
| Other liabilities |
- | 234 | ||||||
|
|
|
|
|
|||||
| ₹ | 2,272 | ₹ | 3,878 | |||||
|
|
|
|
|
|||||
| ₹ | 7,257 | ₹ | 11,671 | |||||
|
|
|
|
|
|||||
16. Other liabilities
| As at | ||||||||
| March 31, 2024 | March 31, 2025 | |||||||
| Non-current |
||||||||
| Employee benefits obligations |
₹ | 4,219 | ₹ | 4,362 | ||||
| Statutory and other liabilities |
8,751 | 12,757 | ||||||
|
|
|
|
|
|||||
| ₹ | 12,970 | ₹ | 17,119 | |||||
|
|
|
|
|
|||||
| Current |
||||||||
| Employee benefits obligations |
₹ | 16,057 | ₹ | 16,001 | ||||
| Statutory and other liabilities (1) |
14,019 | 14,295 | ||||||
| Advance from customers |
1,192 | 790 | ||||||
| Others (1) |
27 | - | ||||||
|
|
|
|
|
|||||
| ₹ | 31,295 | ₹ | 31,086 | |||||
|
|
|
|
|
|||||
| ₹ | 44,265 | ₹ | 48,205 | |||||
|
|
|
|
|
|||||
(1) ₹ 744 has been reclassified from Others to Statutory and other liabilities for the year ended March 31, 2024.
17. Provisions
| As at | ||||||||
| March 31, 2024 | March 31, 2025 | |||||||
| Non-current |
||||||||
| Provision for onerous contracts |
₹ | - | ₹ | 294 | ||||
| ₹ | - | ₹ | 294 | |||||
| Current |
||||||||
| Provision for onerous contracts |
₹ | 1,599 | ₹ | 1,288 | ||||
| Provision for warranty |
217 | 207 | ||||||
| Others |
155 | 142 | ||||||
|
|
|
|
|
|||||
| ₹ | 1,971 | ₹ | 1,637 | |||||
|
|
|
|
|
|||||
| ₹ | 1,971 | ₹ | 1,931 | |||||
|
|
|
|
|
|||||
15
18. Financial instruments
The carrying value of financial instruments by categories as at March 31, 2024 is as follows:
| Fair value through profit or loss |
Fair value through other comprehensive income |
Amortized cost |
Total | |||||||||||||||||
| Mandatory | Designated upon initial recognition |
|||||||||||||||||||
| Financial Assets: |
||||||||||||||||||||
| Cash and cash equivalents (Refer to Note 10) |
₹ | - | ₹ | - | ₹ | - | ₹ | 96,953 | ₹ | 96,953 | ||||||||||
| Investments (Refer to Note 8) |
||||||||||||||||||||
| Equity Instruments |
4,404 | - | 15,830 | - | 20,234 | |||||||||||||||
| Fixed maturity plan mutual funds |
1,395 | - | - | - | 1,395 | |||||||||||||||
| Short-term mutual funds |
71,686 | - | - | - | 71,686 | |||||||||||||||
| Non-convertible debentures |
- | 154,407 | - | - | 154,407 | |||||||||||||||
| Government securities |
- | 7,030 | - | - | 7,030 | |||||||||||||||
| Commercial papers |
- | 11,845 | - | - | 11,845 | |||||||||||||||
| Bonds |
- | 28,195 | - | - | 28,195 | |||||||||||||||
| Inter corporate and term deposits |
- | - | - | 38,008 | 38,008 | |||||||||||||||
| Other financial assets |
||||||||||||||||||||
| Trade receivables |
- | - | - | 119,522 | 119,522 | |||||||||||||||
| Unbilled receivables |
- | - | - | 58,345 | 58,345 | |||||||||||||||
| Other financial assets (Refer to Note 11) |
- | - | - | 16,086 | 16,086 | |||||||||||||||
| Derivative assets (Refer to Note 18) |
390 | - | 968 | - | 1,358 | |||||||||||||||
|
|
|
|
|
|
|
|
|
|
|
|||||||||||
| ₹ | 77,875 | ₹ | 201,477 | ₹ | 16,798 | ₹ | 328,914 | ₹ | 625,064 | |||||||||||
|
|
|
|
|
|
|
|
|
|
|
|||||||||||
| Financial Liabilities: |
||||||||||||||||||||
| Trade payables and other liabilities |
||||||||||||||||||||
| Trade payables and accrued expenses (Refer to Note 14) |
₹ | - | ₹ | - | ₹ | - | ₹ | 88,566 | ₹ | 88,566 | ||||||||||
| Other financial liabilities (Refer to Note 15) |
- | - | - | 7,257 | 7,257 | |||||||||||||||
| Loans, borrowings and bank overdrafts (Refer to Note 13) |
- | - | - | 141,466 | 141,466 | |||||||||||||||
| Lease liabilities |
- | - | - | 23,183 | 23,183 | |||||||||||||||
| Derivative liabilities (Refer to Note 18) |
329 | - | 233 | - | 562 | |||||||||||||||
|
|
|
|
|
|
|
|
|
|
|
|||||||||||
| ₹ | 329 | ₹ | - | ₹ | 233 | ₹ | 260,472 | ₹ | 261,034 | |||||||||||
|
|
|
|
|
|
|
|
|
|
|
|||||||||||
The carrying value of financial instruments by categories as at March 31, 2025 is as follows:
| Fair value through profit or loss |
Fair value through other comprehensive income |
Amortized cost |
Total | |||||||||||||||||
| Mandatory | Designated upon initial recognition |
|||||||||||||||||||
| Financial Assets: |
||||||||||||||||||||
| Cash and cash equivalents (Refer to Note 10) |
₹ | - | ₹ | - | ₹ | - | ₹ | 121,974 | ₹ | 121,974 | ||||||||||
| Investments (Refer to Note 8) |
||||||||||||||||||||
| Equity Instruments |
4,955 | - | 12,493 | - | 17,448 | |||||||||||||||
| Fixed maturity plan mutual funds |
1,503 | - | - | - | 1,503 | |||||||||||||||
| Short-term mutual funds |
88,776 | - | - | - | 88,776 | |||||||||||||||
| Non-convertible debentures |
- | 219,389 | - | - | 219,389 | |||||||||||||||
| Government securities |
- | 10,651 | - | - | 10,651 | |||||||||||||||
| Commercial papers |
- | 2,858 | - | - | 2,858 | |||||||||||||||
| Bonds |
- | 21,138 | - | - | 21,138 | |||||||||||||||
| Inter corporate and term deposits |
- | - | - | 76,169 | 76,169 | |||||||||||||||
| Other financial assets |
||||||||||||||||||||
| Trade receivables |
- | - | - | 118,044 | 118,044 | |||||||||||||||
| Unbilled receivables |
- | - | - | 64,280 | 64,280 | |||||||||||||||
| Other financial assets (Refer to Note 11) |
- | - | - | 13,112 | 13,112 | |||||||||||||||
| Derivative assets (Refer to Note 18) |
1,105 | - | 715 | - | 1,820 | |||||||||||||||
|
|
|
|
|
|
|
|
|
|
|
|||||||||||
| ₹ | 96,339 | ₹ | 254,036 | ₹ | 13,208 | ₹ | 393,579 | ₹ | 757,162 | |||||||||||
|
|
|
|
|
|
|
|
|
|
|
|||||||||||
| Financial Liabilities: |
||||||||||||||||||||
| Trade payables and other liabilities |
||||||||||||||||||||
| Trade payables and accrued expenses (Refer to Note 14) |
₹ | - | ₹ | - | ₹ | - | ₹ | 88,252 | ₹ | 88,252 | ||||||||||
| Other financial liabilities (Refer to Note 15) |
- | - | - | 11,671 | 11,671 | |||||||||||||||
| Loans, borrowings and bank overdrafts (Refer to Note 13) |
- | - | - | 161,817 | 161,817 | |||||||||||||||
| Lease liabilities |
- | - | - | 30,218 | 30,218 | |||||||||||||||
16
| Derivative liabilities (Refer to Note 18) |
75 | - | 893 | - | 968 | |||||||||||||||
|
|
|
|
|
|
|
|
|
|
|
|||||||||||
| ₹ | 75 | ₹ | - | ₹ | 893 | ₹ | 291,958 | ₹ | 292,926 | |||||||||||
|
|
|
|
|
|
|
|
|
|
|
Fair value
Financial assets and liabilities include cash and cash equivalents, trade receivables, unbilled receivables, finance lease receivables, employee and other advances, eligible current and non-current assets, loans, borrowings and bank overdrafts, lease liabilities, trade payables and accrued expenses, and eligible current liabilities and non-current liabilities.
The fair value of cash and cash equivalents, trade receivables, unbilled receivables, short-term loans, borrowings and bank overdrafts, lease liabilities, trade payables and accrued expenses, other current financial assets and liabilities approximate their carrying amount largely due to the short-term nature of these instruments. Finance lease receivables are periodically evaluated based on individual credit worthiness of customers. Based on this evaluation, the Company records allowance for estimated credit losses on these receivables. As at March 31, 2024 and March 31, 2025, the carrying value of such financial assets, net of allowances, and liabilities, approximates the fair value.
The Company’s Unsecured Notes 2026 are contracted at fixed coupon rate of 1.50% and market yield of Unsecured Notes 2026 as of March 31, 2025 is 4.69%
Investments in short-term mutual funds and fixed maturity plan mutual funds, which are classified as FVTPL are measured using net asset values at the reporting date multiplied by the quantity held. Fair value of investments in non-convertible debentures, government securities, commercial papers and bonds classified as FVTOCI is determined based on the indicative quotes of price and yields prevailing in the market at the reporting date. Fair value of investments in equity instruments classified as FVTOCI or FVTPL is determined using market approach primarily based on market multiples method.
The fair value of derivative financial instruments is determined based on observable market inputs including currency spot and forward rates, yield curves and currency volatility.
Fair value hierarchy
The table below analyses financial instruments carried at fair value, by valuation method. The different levels have been defined as follows:
Level 1 – Quoted prices (unadjusted) in active markets for identical assets or liabilities.
Level 2 – Inputs other than quoted prices included within Level 1 that are observable for the asset or liability, either directly (i.e. as prices) or indirectly (i.e. derived from prices).
Level 3 – Inputs for the assets or liabilities that are not based on observable market data (unobservable inputs).
There were no transfer between Level 1, 2 and 3 during the year ended March 31, 2024 and 2025.
The following table presents fair value hierarchy of assets and liabilities measured at fair value on a recurring basis:
| As at | ||||||||||||||||||||||||||||||||
| March 31, 2024 | March 31, 2025 | |||||||||||||||||||||||||||||||
| Fair value measurements at reporting date | Fair value measurements at reporting date | |||||||||||||||||||||||||||||||
| Total | Level 1 | Level 2 | Level 3 | Total | Level 1 | Level 2 | Level 3 | |||||||||||||||||||||||||
| Assets |
||||||||||||||||||||||||||||||||
| Derivative instruments: |
||||||||||||||||||||||||||||||||
| Cash flow hedges |
₹ | 968 | ₹ | - | ₹ | 968 | ₹ | - | ₹ | 715 | ₹ | - | ₹ | 715 | ₹ | - | ||||||||||||||||
| Others |
390 | - | 390 | - | 1,105 | - | 1,105 | - | ||||||||||||||||||||||||
| Investments: |
||||||||||||||||||||||||||||||||
| Short-term mutual funds |
71,686 | 71,686 | - | - | 88,776 | 88,776 | - | - | ||||||||||||||||||||||||
| Fixed maturity plan mutual funds |
1,395 | - | 1,395 | - | 1,503 | - | 1,503 | - | ||||||||||||||||||||||||
| Equity instruments |
20,234 | 108 | - | 20,126 | 17,448 | 57 | - | 17,391 | ||||||||||||||||||||||||
| Non-convertible debentures, government securities, commercial papers and bonds |
201,477 | 1,282 | 200,195 | - | 254,036 | 10,550 | 243,486 | - | ||||||||||||||||||||||||
| Liabilities |
||||||||||||||||||||||||||||||||
| Derivative instruments: |
||||||||||||||||||||||||||||||||
17
| Cash flow hedges |
₹ | (233 | ) | ₹ | - | ₹ | (233 | ) | ₹ | - | ₹ | (893 | ) | ₹ | - | ₹ | (893 | ) | ₹ | - | ||||||||||||
| Others |
(329 | ) | - | (329 | ) | - | (75 | ) | - | (75 | ) | - | ||||||||||||||||||||
| Liability on written put options to non-controlling interests |
(4,303 | ) | - | - | (4,303 | ) | (4,945 | ) | - | - | (4,945 | ) | ||||||||||||||||||||
| Contingent consideration |
(429 | ) | - | - | (429 | ) | (1,864 | ) | - | - | (1,864 | ) | ||||||||||||||||||||
The following methods and assumptions were used to estimate the fair value of the level 2 financial instruments included in the above table.
| Financial instrument
|
Method and assumptions
|
|
| Derivative instruments (assets and liabilities) | The Company enters into derivative financial instruments with various counterparties, primarily banks with investment grade credit ratings. Derivatives valued using valuation techniques with market observable inputs are mainly interest rate swaps, foreign exchange forward contracts and foreign exchange option contracts. The most frequently applied valuation techniques include forward pricing, swap models and Black Scholes models (for option valuation), using present value calculations. The models incorporate various inputs including the credit quality of counterparties, foreign exchange spot and forward rates, interest rate curves and forward rate curves of the underlying. As at March 31, 2025, the changes in counterparty credit risk had no material effect on the hedge effectiveness assessment for derivatives designated in hedge relationships and other financial instruments recognized at fair value.
|
|
| Investment in non-convertible debentures, government securities, commercial papers, certificate of deposits and bonds
|
Fair value of these instruments is derived based on the indicative quotes of price and yields prevailing in the market as at reporting date.
|
|
| Investment in fixed maturity plan mutual funds | Fair value of these instruments is derived based on the indicative quotes of price prevailing in the market as at reporting date.
|
The following methods and assumptions were used to estimate the fair value of the level 3 financial instruments included in the above table.
| Financial instrument
|
Method and assumptions
|
|
| Investment in equity instruments | Fair value of these instruments is determined using market approach primarily based on market multiples method.
|
|
| Contingent consideration and liability on written put options to non-controlling interests | Fair value of these instruments is determined using valuation techniques which includes inputs relating to risk-adjusted revenue and operating profit forecast.
|
The following table presents changes in Level 3 assets and liabilities for the year ended March 31, 2024 and March 31, 2025:
| As at | ||||||||
| Investment in equity instruments | March 31, 2024 | March 31, 2025 | ||||||
| Balance at the beginning of the year |
₹ | 19,321 | ₹ | 20,126 | ||||
| Additions |
1,277 | 1,925 | ||||||
| Disposals (1) (2) |
(416 | ) | (1,828 | ) | ||||
| Gain/(loss) recognized in consolidated statement of income |
(136 | ) | 321 | |||||
| Gain/(loss) recognized in other comprehensive income |
(485 | ) | (3,609 | ) | ||||
| Translation adjustment |
565 | 456 | ||||||
|
|
|
|
|
|||||
| Balance at the end of the year |
₹ | 20,126 | ₹ | 17,391 | ||||
|
|
|
|
|
|||||
(1) During the year ended March 31, 2024, the Company sold its shares in Moogsoft (Herd) Inc. at a fair value of ₹ 179 and recognized a cumulative loss of ₹ 91 in other comprehensive income.
(2) During the year ended March 31, 2025, as a result of an acquisition by another investors, the Company sold its shares of equity instruments in six companies at a fair value of ₹ 1,281 and recognized a cumulative loss of ₹ 175 in other comprehensive income and cumulative gain of ₹ 152 in consolidated statement of income.
| As at | ||||||||
| Contingent consideration | March 31, 2024 | March 31, 2025 | ||||||
| Balance at the beginning of the year |
₹ | (3,053 | ) | ₹ | (429 | ) | ||
| Addition through Business combination |
- | (1,537 | ) | |||||
| Reversals (1) |
1,300 | 169 | ||||||
| Payouts |
1,294 | - | ||||||
| Finance expense (recognized)/reversed in consolidated statement of income |
55 | (47 | ) | |||||
| Translation adjustment |
(25 | ) | (20 | ) | ||||
|
|
|
|
|
|||||
| Balance at the end of the year |
₹ | (429 | ) | ₹ | (1,864 | ) | ||
|
|
|
|
|
|||||
(1) Towards change in fair value of earn-out liability as a result of changes in estimates of revenue and earnings over the earn-out period.
18
| As at | ||||||||
| Liability on written put options to non-controlling interests | March 31, 2024 | March 31, 2025 | ||||||
| Balance at the beginning of the year |
₹ | - | ₹ | (4,303 | ) | |||
| Addition through Business combination |
(4,238 | ) | - | |||||
| Finance expense recognized in consolidated statement of income |
(33 | ) | (530 | ) | ||||
| Translation adjustment |
(32 | ) | (112 | ) | ||||
|
|
|
|
|
|||||
| Balance at the end of the year |
₹ | (4,303 | ) | ₹ | (4,945 | ) | ||
|
|
|
|
|
|||||
Derivative assets and liabilities
The Company is exposed to currency fluctuations on foreign currency assets / liabilities, forecasted cash flows denominated in foreign currency and net investment in foreign operations. The Company is also exposed to interest rate fluctuations on investments in floating rate financial assets and floating rate borrowings. The Company follows established risk management policies, including the use of derivatives to hedge foreign currency assets / liabilities, interest rates, foreign currency forecasted cash flows and net investment in foreign operations. The counter parties in these derivative instruments are primarily banks and the Company considers the risks of non-performance by the counterparty as immaterial.
The Company determines the existence of an economic relationship between the hedging instrument and the hedged item based on the currency, amount and timing of its forecasted cash flows. Hedge effectiveness is determined at the inception of the hedge relationship, and through periodic prospective effectiveness assessments to ensure that an economic relationship exists between the hedged item and hedging instrument, including whether the hedging instrument is expected to offset changes in cash flows of hedged items.
If the hedge ratio for risk management purposes is no longer optimal but the risk management objective remains unchanged and the hedge continues to qualify for hedge accounting, the hedge relationship will be rebalanced by adjusting either the volume of the hedging instrument or the volume of the hedged item so that the hedge ratio aligns with the ratio used for risk management purposes. Any hedge ineffectiveness is calculated and accounted for in consolidated statement of income at the time of the hedge relationship rebalancing.
The following table summarizes activity in the cash flow hedging reserve within equity related to all derivative instruments classified as cash flow hedges:
| Year ended March 31, | ||||||||
| 2024 | 2025 | |||||||
| Balance as at the beginning of the year |
₹ | (1,762 | ) | ₹ | 773 | |||
| Changes in fair value of effective portion of derivatives |
1,461 | (1,185 | ) | |||||
| Deferred cancellation gain/(loss), net |
40 | (91 | ) | |||||
| Net (gain)/loss reclassified to consolidated statement of income on occurrence of hedged transactions (1) |
1,016 | 203 | ||||||
| Net (gain)/loss on ineffective portion of derivative instruments classified to consolidated statement of income |
18 | 25 | ||||||
|
|
|
|
|
|||||
| Gain/(loss) on cash flow hedging derivatives, net |
₹ | 2,535 | ₹ | (1,048 | ) | |||
|
|
|
|
|
|||||
| Balance as at the end of the year |
₹ | 773 | ₹ | (275 | ) | |||
| Deferred tax asset/(liability) thereon |
(195 | ) | 65 | |||||
|
|
|
|
|
|||||
| Balance as at the end of the year, net of deferred taxes |
₹ | 578 | ₹ | (210 | ) | |||
|
|
|
|
|
|||||
(1) Includes net (gain)/loss reclassified to revenue of ₹ 898 and ₹ 394 for the year ended March 31, 2024, and 2025, respectively; net (gain)/loss reclassified to cost of revenues of ₹ 221 and ₹ (51) for the year ended March 31, 2024, and 2025, respectively; net (gain)/loss reclassified to finance expenses of ₹ (167) and ₹ (213) for the year ended March 31, 2024, and 2025, respectively and net (gain)/loss reclassified to finance and other income of ₹ 64 and ₹ 73 for the year ended March 31, 2024, and 2025, respectively.
The related hedge transactions for balance in cash flow hedging reserves as at March 31, 2025 are expected to occur and be reclassified to the statement of income over a period of 17 months.
As at March 31, 2024 and 2025, there were no material gains or losses on derivative transactions or portions thereof that have become ineffective as hedges or associated with an underlying exposure that did not occur.
19. Foreign currency translation reserve and Other reserves
The movement in foreign currency translation reserve attributable to equity holders of the Company is summarized below:
19
| Year ended March 31, | ||||||||
| 2024 | 2025 | |||||||
| Balance at the beginning of the year |
₹ | 43,255 | ₹ | 47,261 | ||||
| Translation difference related to foreign operations, net |
4,204 | 7,294 | ||||||
| Transfer of shares pertaining to Non-controlling interests of subsidiary |
- | (14 | ) | |||||
| Reclassification of foreign currency translation differences on liquidation of subsidiaries to statement of income |
(198 | ) | (41 | ) | ||||
|
|
|
|
|
|||||
| Balance at the end of the year |
₹ | 47,261 | ₹ | 54,500 | ||||
|
|
|
|
|
|||||
The movement in other reserves is summarized below:
| Other Reserves | ||||||||||||||||||||
| Particulars | Remeasurements of the defined benefit plans |
Investment in debt instruments measured at fair value through OCI |
Investment in equity instruments measured at fair value through OCI |
Capital Redemption Reserve |
Gross obligation to non-controlling interests under put options |
|||||||||||||||
| As at April 1, 2023 |
₹ | (548 | ) | ₹ | (119 | ) | ₹ | 10,793 | ₹ | 1,122 | ₹ | - | ||||||||
| Additions due to acquisition (Refer to Note 7) |
- | - | - | - | (4,238 | ) | ||||||||||||||
| Other comprehensive income |
262 | 1,516 | (473 | ) | - | - | ||||||||||||||
| Buyback of equity shares (Refer to Note 30) |
- | - | - | 539 | - | |||||||||||||||
| As at March 31, 2024 |
₹ | (286 | ) | ₹ | 1,397 | ₹ | 10,320 | ₹ | 1,661 | ₹ | (4,238 | ) | ||||||||
| As at April 1, 2024 |
₹ | (286 | ) | ₹ | 1,397 | ₹ | 10,320 | ₹ | 1,661 | ₹ | (4,238 | ) | ||||||||
| Other comprehensive income |
289 | 963 | (3,476 | ) | - | - | ||||||||||||||
| Bonus issue of equity shares (Refer to Note 31) |
- | - | - | (1,661 | ) | - | ||||||||||||||
| Transfer of shares pertaining to Non-controlling interests of subsidiary |
(8 | ) | - | - | - | - | ||||||||||||||
| Transfer to Retained earnings (1) |
(130 | ) | - | (5,624 | ) | - | - | |||||||||||||
| As at March 31, 2025 |
₹ | (135 | ) | ₹ | 2,360 | ₹ | 1,220 | ₹ | - | ₹ | (4,238 | ) | ||||||||
(1) Towards transfer of cumulative realized (gain)/loss on disposal of investments in equity instruments designated as FVTOCI and towards transfer of cumulative (gain)/loss on remeasurement of defined benefit plans to retained earnings.
20. Income taxes
| Three months ended March 31, | Year ended March 31, | |||||||||||||||
| 2024 | 2025 | 2024 | 2025 | |||||||||||||
| Income tax expense as per the consolidated statement of income |
₹ | 10,040 | ₹ | 11,549 | ₹ | 36,089 | ₹ | 42,777 | ||||||||
| Income tax included in other comprehensive income on: |
||||||||||||||||
| Gains/(losses) on investment securities |
69 | 80 | 259 | 83 | ||||||||||||
| Gains/(losses) on cash flow hedging derivatives |
211 | 372 | 554 | (260 | ) | |||||||||||
| Remeasurements of the defined benefit plans |
(22 | ) | (26 | ) | 111 | 49 | ||||||||||
|
|
|
|
|
|
|
|
|
|||||||||
| ₹ | 10,298 | ₹ | 11,975 | ₹ | 37,013 | ₹ | 42,649 | |||||||||
|
|
|
|
|
|
|
|
|
|||||||||
Income tax expense consists of the following:
| Three months ended March 31, | Year ended March 31, | |||||||||||||||
| 2024 | 2025 | 2024 | 2025 | |||||||||||||
| Current tax expense |
₹ | 7,594 | ₹ | 13,056 | ₹ | 34,973 | ₹ | 45,405 | ||||||||
| Deferred tax expense/(reversal) |
2,446 | (1,507 | ) | 1,116 | (2,628 | ) | ||||||||||
|
|
|
|
|
|
|
|
|
|||||||||
| ₹ | 10,040 | ₹ | 11,549 | ₹ | 36,089 | ₹ | 42,777 | |||||||||
|
|
|
|
|
|
|
|
|
|||||||||
Income tax expenses are net of provision recorded/(reversal) of taxes pertaining to earlier periods, amounting to ₹ 598 and ₹ (689) for the three months ended March 31, 2024 and 2025, and ₹ (690) and ₹ (2,306) for the year ended March 31, 2024 and 2025, respectively.
The Pillar Two legislations are neither enacted nor substantively enacted by Government of India, where the Parent company is incorporated. Pillar Two legislation has been enacted, or substantively enacted, in certain other jurisdictions where the Company operates. However, the Company does not expect any material financial impact for the three months and year ended March 31, 2025. The Company is continuing to assess the impact, if any, of Pillar Two income taxes legislation on future financial performance.
21. Revenues
The tables below present disaggregated revenue from contracts with customers by business segment (Refer to Note 28 “Segment Information”), sector and nature of contract. The Company believes that the below disaggregation best depicts the nature, amount, timing and uncertainty of revenue and cash flows from economic factors.
20
Information on disaggregation of revenues for the three months ended March 31, 2024 is as follows:
| IT Services | IT Products | Total | ||||||||||||||||||||||||||
| Americas 1 | Americas 2 | Europe | APMEA | Total | ||||||||||||||||||||||||
| A. Revenue |
||||||||||||||||||||||||||||
| Rendering of services |
₹ | 67,267 | ₹ | 67,761 | ₹ | 61,381 | ₹ | 24,515 | ₹ | 220,924 | ₹ | - | ₹ | 220,924 | ||||||||||||||
| Sale of products |
- | - | - | - | - | 1,159 | 1,159 | |||||||||||||||||||||
| ₹ | 67,267 | ₹ | 67,761 | ₹ | 61,381 | ₹ | 24,515 | ₹ | 220,924 | ₹ | 1,159 | ₹ | 222,083 | |||||||||||||||
| B. Revenue by sector |
||||||||||||||||||||||||||||
| Banking, Financial Services and Insurance |
₹ | 496 | ₹ | 41,217 | ₹ | 23,167 | ₹ | 8,964 | ₹ | 73,844 | ||||||||||||||||||
| Health |
25,860 | 21 | 4,111 | 1,179 | 31,171 | |||||||||||||||||||||||
| Consumer |
25,401 | 1,609 | 10,557 | 3,812 | 41,379 | |||||||||||||||||||||||
| Technology and Communications (1) |
14,826 | 6,419 | 7,682 | 4,768 | 33,695 | |||||||||||||||||||||||
| Energy, Manufacturing and Resources (1) |
684 | 18,495 | 15,864 | 5,792 | 40,835 | |||||||||||||||||||||||
| ₹ | 67,267 | ₹ | 67,761 | ₹ | 61,381 | ₹ | 24,515 | ₹ | 220,924 | ₹ | 1,159 | ₹ | 222,083 | |||||||||||||||
| C. Revenue by nature of contract |
||||||||||||||||||||||||||||
| Fixed price and volume based |
₹ | 35,670 | ₹ | 35,611 | ₹ | 35,891 | ₹ | 15,219 | ₹ | 122,391 | ₹ | - | ₹ | 122,391 | ||||||||||||||
| Time and materials |
31,597 | 32,150 | 25,490 | 9,296 | 98,533 | - | 98,533 | |||||||||||||||||||||
|
Products |
- | - | - | - | - | 1,159 | 1,159 | |||||||||||||||||||||
| ₹ | 67,267 | ₹ | 67,761 | ₹ | 61,381 | ₹ | 24,515 | ₹ | 220,924 | ₹ | 1,159 | ₹ | 222,083 | |||||||||||||||
|
Information on disaggregation of revenues for the three months ended March 31, 2025 is as follows: |
|
|||||||||||||||||||||||||||
| IT Services | IT Products | Total | ||||||||||||||||||||||||||
| Americas 1 | Americas 2 | Europe | APMEA | Total | ||||||||||||||||||||||||
| A. Revenue |
||||||||||||||||||||||||||||
| Rendering of services |
₹ | 73,648 | ₹ | 68,517 | ₹ | 58,492 | ₹ | 23,572 | ₹ | 224,229 | ₹ | - | ₹ | 224,229 | ||||||||||||||
| Sale of products |
- | - | - | - | - | 813 | 813 | |||||||||||||||||||||
| ₹ | 73,648 | ₹ | 68,517 | ₹ | 58,492 | ₹ | 23,572 | ₹ | 224,229 | ₹ | 813 | ₹ | 225,042 | |||||||||||||||
| B. Revenue by sector |
||||||||||||||||||||||||||||
| Banking, Financial Services and Insurance |
₹ | 264 | ₹ | 44,173 | ₹ | 22,338 | ₹ | 9,840 | ₹ | 76,615 | ||||||||||||||||||
| Health |
28,291 | 129 | 3,124 | 807 | 32,351 | |||||||||||||||||||||||
| Consumer |
26,398 | 1,079 | 11,151 | 3,803 | 42,431 | |||||||||||||||||||||||
| Technology and Communications (1) |
17,585 | 5,740 | 7,662 | 3,164 | 34,151 | |||||||||||||||||||||||
| Energy, Manufacturing and Resources (1) |
1,110 | 17,396 | 14,217 | 5,958 | 38,681 | |||||||||||||||||||||||
| ₹ | 73,648 | ₹ | 68,517 | ₹ | 58,492 | ₹ | 23,572 | ₹ | 224,229 | ₹ | 813 | ₹ | 225,042 | |||||||||||||||
| C. Revenue by nature of contract |
||||||||||||||||||||||||||||
| Fixed price and volume based |
₹ | 37,012 | ₹ | 34,002 | ₹ | 34,244 | ₹ | 14,667 | ₹ | 119,925 | ₹ | - | ₹ | 119,925 | ||||||||||||||
| Time and materials |
36,636 | 34,515 | 24,248 | 8,905 | 104,304 | - | 104,304 | |||||||||||||||||||||
|
Products |
- | - | - | - | - | 813 | 813 | |||||||||||||||||||||
| ₹ | 73,648 | ₹ | 68,517 | ₹ | 58,492 | ₹ | 23,572 | ₹ | 224,229 | ₹ | 813 | ₹ | 225,042 | |||||||||||||||
21
Information on disaggregation of revenues for the year ended March 31, 2024 is as follows:
| IT Services | IT Products | Total | ||||||||||||||||||||||||||
| Americas 1 | Americas 2 | Europe | APMEA | Total | ||||||||||||||||||||||||
| A. Revenue |
||||||||||||||||||||||||||||
| Rendering of services |
₹ | 268,131 | ₹ | 269,387 | ₹ | 253,817 | ₹ | 102,141 | ₹ | 893,476 | ₹ | - | ₹ | 893,476 | ||||||||||||||
| Sale of products |
- | - | - | - | - | 4,127 | 4,127 | |||||||||||||||||||||
| ₹ | 268,131 | ₹ | 269,387 | ₹ | 253,817 | ₹ | 102,141 | ₹ | 893,476 | ₹ | 4,127 | ₹ | 897,603 | |||||||||||||||
| B. Revenue by sector |
||||||||||||||||||||||||||||
| Banking, Financial Services and Insurance |
₹ | 2,462 | ₹ | 165,002 | ₹ | 95,475 | ₹ | 35,762 | ₹ | 298,701 | ||||||||||||||||||
| Health |
95,496 | 162 | 17,699 | 4,954 | 118,311 | |||||||||||||||||||||||
| Consumer |
102,439 | 5,351 | 43,035 | 16,387 | 167,212 | |||||||||||||||||||||||
| Technology and Communications (1) |
66,326 | 25,220 | 30,961 | 19,651 | 142,158 | |||||||||||||||||||||||
| Energy, Manufacturing and Resources (1) |
1,408 | 73,652 | 66,647 | 25,387 | 167,094 | |||||||||||||||||||||||
| ₹ | 268,131 | ₹ | 269,387 | ₹ | 253,817 | ₹ | 102,141 | ₹ | 893,476 | ₹ | 4,127 | ₹ | 897,603 | |||||||||||||||
| C. Revenue by nature of contract |
||||||||||||||||||||||||||||
| Fixed price and volume based |
₹ | 150,253 | ₹ | 140,676 | ₹ | 149,007 | ₹ | 62,011 | ₹ | 501,947 | ₹ | - | ₹ | 501,947 | ||||||||||||||
| Time and material |
117,878 | 128,711 | 104,810 | 40,130 | 391,529 | - | 391,529 | |||||||||||||||||||||
|
Products |
- | - | - | - | - | 4,127 | 4,127 | |||||||||||||||||||||
| ₹ | 268,131 | ₹ | 269,387 | ₹ | 253,817 | ₹ | 102,141 | ₹ | 893,476 | ₹ | 4,127 | ₹ | 897,603 | |||||||||||||||
|
Information on disaggregation of revenues for the year ended March 31, 2025 is as follows: |
|
|||||||||||||||||||||||||||
| IT Services | IT Products | Total | ||||||||||||||||||||||||||
| Americas 1 | Americas 2 | Europe | APMEA | Total | ||||||||||||||||||||||||
| A. Revenue |
||||||||||||||||||||||||||||
| Rendering of services |
₹ | 281,806 | ₹ | 271,965 | ₹ | 240,187 | ₹ | 94,234 | ₹ | 888,192 | ₹ | - | ₹ | 888,192 | ||||||||||||||
| Sale of products |
- | - | - | - | - | 2,692 | 2,692 | |||||||||||||||||||||
| ₹ | 281,806 | ₹ | 271,965 | ₹ | 240,187 | ₹ | 94,234 | ₹ | 888,192 | ₹ | 2,692 | ₹ | 890,884 | |||||||||||||||
| B. Revenue by sector |
||||||||||||||||||||||||||||
| Banking, Financial Services and Insurance |
₹ | 1,240 | ₹ | 172,817 | ₹ | 91,965 | ₹ | 38,231 | ₹ | 304,253 | ||||||||||||||||||
| Health |
108,305 | 236 | 13,982 | 3,272 | 125,795 | |||||||||||||||||||||||
| Consumer |
103,875 | 6,659 | 43,435 | 15,344 | 169,313 | |||||||||||||||||||||||
| Technology and Communications (1) |
64,907 | 24,255 | 31,804 | 14,933 | 135,899 | |||||||||||||||||||||||
| Energy, Manufacturing and Resources (1) |
3,479 | 67,998 | 59,001 | 22,454 | 152,932 | |||||||||||||||||||||||
| ₹ | 281,806 | ₹ | 271,965 | ₹ | 240,187 | ₹ | 94,234 | ₹ | 888,192 | ₹ | 2,692 | ₹ | 890,884 | |||||||||||||||
| C. Revenue by nature of contract |
||||||||||||||||||||||||||||
| Fixed price and volume based |
₹ | 144,904 | ₹ | 137,385 | ₹ | 142,241 | ₹ | 56,390 | ₹ | 480,920 | ₹ | - | ₹ | 480,920 | ||||||||||||||
| Time and materials |
136,902 | 134,580 | 97,946 | 37,844 | 407,272 | - | 407,272 | |||||||||||||||||||||
|
Products |
- | - | - | - | - | 2,692 | 2,692 | |||||||||||||||||||||
| ₹ | 281,806 | ₹ | 271,965 | ₹ | 240,187 | ₹ | 94,234 | ₹ | 888,192 | ₹ | 2,692 | ₹ | 890,884 | |||||||||||||||
(1) Effective October 1, 2024, the Company has reorganized its sectors by merging “Technology” and “Communications” into “Technology and Communications” sector, and by merging “Energy, Natural Resources and Utilities” and “Manufacturing” into “Energy, Manufacturing and Resources” sector. Comparative period disaggregation of revenue has been restated to give effect to this change.
22
22. Expenses by nature
| Three months ended March 31, | Year ended March 31, | |||||||||||||||
| 2024 | 2025 | 2024 | 2025 | |||||||||||||
| Employee compensation |
₹ 136,255 | ₹ 133,454 | ₹ 549,301 | ₹ 533,477 | ||||||||||||
| Sub-contracting and technical fees |
24,318 | 24,896 | 103,030 | 100,148 | ||||||||||||
| Cost of hardware and software |
978 | 841 | 4,116 | 3,170 | ||||||||||||
| Travel |
3,349 | 3,158 | 15,102 | 14,095 | ||||||||||||
| Facility expenses |
3,727 | 4,113 | 14,556 | 16,067 | ||||||||||||
| Software license expense for internal use |
4,395 | 4,951 | 18,378 | 19,338 | ||||||||||||
| Depreciation, amortization and impairment (1) |
8,405 | 7,217 | 34,071 | 29,579 | ||||||||||||
| Communication |
956 | 899 | 4,878 | 3,842 | ||||||||||||
| Legal and professional fees |
2,324 | 3,133 | 9,559 | 11,270 | ||||||||||||
| Rates, taxes and insurance |
1,414 | 1,690 | 5,993 | 5,804 | ||||||||||||
| Marketing and brand building |
667 | 917 | 3,555 | 3,591 | ||||||||||||
| Lifetime expected credit loss |
367 | 365 | 640 | 324 | ||||||||||||
| (Gain)/loss on sale of property, plant and equipment, net (2) | 102 | 160 | (2,072) | (606) | ||||||||||||
| Miscellaneous expenses (3) |
(675) | 385 | 737 | (454) | ||||||||||||
|
|
|
|
|
|
|
|
|
|||||||||
| Total cost of revenues, selling and marketing expenses and general and administrative expenses | ₹ 186,582 | ₹ 186,179 | ₹ 761,844 | ₹ 739,645 | ||||||||||||
|
|
|
|
|
|
|
|
|
|||||||||
(1) Depreciation, amortization and impairment includes an impairment charge on intangible assets amounting to ₹ 808 and ₹ Nil for the three months ended March 31, 2024 and 2025, respectively and ₹ 1,701 and ₹ 1,155 for the year ended March 31, 2024 and 2025, respectively (Refer to Note 6).
(2) (Gain)/loss on sale of property, plant and equipment for the year ended March 31, 2024 and 2025, includes gain on sale of immovable properties of ₹ (2,357) and gain on relinquishment of the lease hold rights of land, and transfer of building along with other assets of ₹ (885), respectively.
(3) Miscellaneous expenses are net of reversals of contingent consideration of ₹ 1,300 and ₹ 169 for the year ended March 31, 2024 and 2025 (Refer to Note 18). Miscellaneous expenses are net of insurance claim received of ₹ 1,805 during the year ended March 31, 2025.
23. Finance expenses
| Three months ended March 31, | Year ended March 31, | |||||||||||||||
| 2024 | 2025 | 2024 | 2025 | |||||||||||||
| Interest on loans and borrowings |
₹ 1,773 | ₹ 1,790 | ₹ 6,893 | ₹ 7,124 | ||||||||||||
| Interest on lease liabilities |
374 | 442 | 1,334 | 1,593 | ||||||||||||
| Interest on liability on written put options to non-controlling interests | 33 | 134 | 33 | 530 | ||||||||||||
| Other finance expenses |
1,128 | 1,401 | 4,292 | 5,523 | ||||||||||||
|
|
|
|
|
|
|
|
|
|||||||||
| ₹ 3,308 | ₹ 3,767 | ₹ 12,552 | ₹ 14,770 | |||||||||||||
|
|
|
|
|
|
|
|
|
|||||||||
|
24. Finance and other income and Foreign exchange gains/(losses), net |
|
|||||||||||||||
| Three months ended March 31, | Year ended March 31, | |||||||||||||||
| 2024 | 2025 | 2024 | 2025 | |||||||||||||
| Interest income |
₹ 5,341 | ₹ 7,529 | ₹ 19,478 | ₹ 27,210 | ||||||||||||
| Dividend income from equity investments designated as FVTOCI | 1 | 2,298 | 3 | 2,299 | ||||||||||||
| Net gain from investments classified as FVTPL |
1,431 | 1,992 | 4,558 | 8,765 | ||||||||||||
| Net loss from investments classified as FVTOCI |
(14) | - | (143) | (72) | ||||||||||||
|
|
|
|
|
|
|
|
|
|||||||||
| Finance and other income |
₹ 6,759 | ₹ 11,819 | ₹ 23,896 | ₹ 38,202 | ||||||||||||
|
|
|
|
|
|
|
|
|
|||||||||
| Foreign exchange gains/(losses), net, on financial instruments measured at FVTPL | ₹ 751 | ₹ 505 | ₹ 650 | ₹ (398) | ||||||||||||
| Other foreign exchange gains/(losses), net |
(879) | (281) | (310) | 430 | ||||||||||||
|
|
|
|
|
|
|
|
|
|||||||||
| Foreign exchange gains/(losses), net |
₹ (128) | ₹ 224 | ₹ 340 | ₹ 32 | ||||||||||||
|
|
|
|
|
|
|
|
|
|||||||||
25. Earnings per equity share
A reconciliation of profit for the period and equity shares used in the computation of basic and diluted earnings per equity share is set out below:
Basic: Basic earnings per equity share is calculated by dividing the profit attributable to equity shareholders of the Company by the weighted average number of equity shares outstanding during the period, excluding equity shares purchased by the Company and held as treasury shares.
| Three months ended March 31, | Year ended March 31, | |||||||||||||||
| 2024 | 2025 | 2024 | 2025 | |||||||||||||
| Profit attributable to equity holders of the Company | ₹ 28,346 | ₹ 35,696 | ₹ 110,452 | ₹ 131,354 | ||||||||||||
| Weighted average number of equity shares outstanding | 10,444,700,646 | 10,462,328,534 | 10,576,571,110 | 10,456,741,552 | ||||||||||||
|
|
|
|
|
|
|
|
|
|||||||||
| Basic earnings per equity share |
₹ 2.71 | ₹ 3.41 | ₹ 10.44 | ₹ 12.56 | ||||||||||||
|
|
|
|
|
|
|
|
|
|||||||||
23
Diluted: Diluted earnings per equity share is calculated by adjusting the weighted average number of equity shares outstanding during the period for assumed conversion of all dilutive potential equity shares. Employee share options are dilutive potential equity shares for the Company.
The calculation is performed in respect of share options to determine the number of equity shares that could have been acquired at fair value (determined as the average market price of the Company’s equity shares during the period). The number of equity shares calculated as above is compared with the number of equity shares that would have been issued assuming the exercise of the share options.
| Three months ended March 31, | Year ended March 31, | |||||||||||||||
| 2024 | 2025 | 2024 | 2025 | |||||||||||||
| Profit attributable to equity holders of the Company |
₹ 28,346 | ₹ 35,696 | ₹ 110,452 | ₹ 131,354 | ||||||||||||
| Weighted average number of equity shares outstanding |
10,444,700,646 | 10,462,328,534 | 10,576,571,110 | 10,456,741,552 | ||||||||||||
| Effect of dilutive equivalent share options |
25,650,776 | 28,387,685 | 34,853,518 | 32,197,840 | ||||||||||||
|
|
|
|
|
|
|
|
|
|||||||||
| Weighted average number of equity shares for diluted earnings per equity share |
10,470,351,422 | 10,490,716,219 | 10,611,424,628 | 10,488,939,392 | ||||||||||||
|
|
|
|
|
|
|
|
|
|||||||||
| Diluted earnings per equity share |
₹ 2.70 | ₹ 3.39 | ₹ 10.41 | ₹ 12.52 | ||||||||||||
|
|
|
|
|
|
|
|
|
|||||||||
Earnings per share and number of shares outstanding for the three months and year ended March 31, 2024, have been proportionately adjusted for the bonus issue in the ratio of 1:1 i.e. 1 (one) bonus equity share of ₹ 2 each for every 1 (one) fully paid-up equity shares held (including ADS holders). Refer to Note 31.
Earnings per share for each of the three months ended June 30, 2023, September 30, 2023, December 31, 2023 and March 31, 2024 will not add up to earnings per share for the year ended March 31, 2024, on account of buyback of equity shares.
26. Employee compensation
| Three months ended March 31, | Year ended March 31, | |||||||||||||||
| 2024 | 2025 | 2024 | 2025 | |||||||||||||
| Salaries and bonus |
₹ 130,176 | ₹ 126,715 | ₹ 524,484 | ₹ 507,629 | ||||||||||||
| Employee benefits plans |
4,786 | 5,544 | 19,227 | 20,306 | ||||||||||||
| Share-based compensation (1) |
1,293 | 1,195 | 5,590 | 5,542 | ||||||||||||
|
|
|
|
|
|
|
|
|
|||||||||
| ₹ 136,255 | ₹ 133,454 | ₹ 549,301 | ₹ 533,477 | |||||||||||||
|
|
|
|
|
|
|
|
|
|||||||||
(1) Includes ₹ 1 and ₹ (1) for the three months ended March 31, 2024 and 2025, respectively and ₹ 6 and ₹ (9) for the year ended March 31, 2024 and 2025 respectively, towards cash settled ADS RSUs.
The employee benefit cost is recognized in the following line items in the interim condensed consolidated statement of income:
| Three months ended March 31, | Year ended March 31, | |||||||||||||||
| 2024 | 2025 | 2024 | 2025 | |||||||||||||
| Cost of revenues |
₹ 116,112 | ₹ 114,271 | ₹ 459,466 | ₹ 452,800 | ||||||||||||
| Selling and marketing expenses |
12,808 | 11,226 | 51,224 | 47,788 | ||||||||||||
| General and administrative expenses |
7,335 | 7,957 | 38,611 | 32,889 | ||||||||||||
|
|
|
|
|
|
|
|
|
|||||||||
| ₹ 136,255 | ₹ 133,454 | ₹ 549,301 | ₹ 533,477 | |||||||||||||
|
|
|
|
|
|
|
|
|
|||||||||
The Company has granted below options under RSU and ADS option plan:
| Three months ended March 31, | Year ended March 31, | |||||||||||||||
| 2024 | 2025 | 2024 | 2025 | |||||||||||||
| Restricted Stock Units (RSU) |
70,768 | 67,433 | 3,344,668 | 3,498,476 | ||||||||||||
| ADS RSU |
111,703 | 1,237,058 | 8,886,979 | 9,707,235 | ||||||||||||
| Performance based stock options (RSUs) |
- | - | 1,892,498 | 2,014,993 | ||||||||||||
| Performance based stock options (ADS) |
- | - | 5,659,164 | 5,323,067 | ||||||||||||
Numbers in above table are not given effect of bonus shares issued during the year ended March 31, 2025.
During the year ended March 31, 2025, RSU and ADS grants were issued under the Wipro Employee Restricted Stock Unit plan 2007 (WSRUP 2007 plan) and Wipro ADS Restricted Stock Unit Plan (WARSUP 2004 plan), respectively. The Company has also made RSU and ADS grants under the Wipro Limited Employee Stock Options, Performance Stock Unit and/or Restricted Stock Unit Scheme 2024, which was approved by the shareholders at the AGM dated July 18, 2024. Performance based stock options will vest based on the performance parameters of the Company.
27. Commitments and contingencies
Capital commitments: As at March 31, 2024 and 2025 the Company had committed to spend approximately ₹ 10,322 and ₹ 8,719 respectively, under agreements to purchase/ construct property and equipment. These amounts are net of capital advances paid in respect of these purchases. Refer to Note 8 for uncalled capital commitments on investment in equity instruments.
Guarantees: As at March 31, 2024 and 2025, guarantees provided by banks on behalf of the Company to the Indian Government, customers and certain other agencies aggregate to ₹ 13,455 and ₹ 13,110 respectively, as part of the bank line of credit.
24
Contingencies and lawsuits: The Company is subject to legal proceedings and claims resulting from tax assessment orders/ penalty notices issued under the Income Tax Act, 1961, which have arisen in the ordinary course of its business. Some of the claims involve complex issues and it is not possible to make a reasonable estimate of the expected financial effect, if any, that will result from ultimate resolution of such proceedings. However, the resolution of these legal proceedings is not likely to have a material and adverse effect on the results of operations or the financial position of the Company.
The Company’s assessments are completed for the years up to March 31, 2019. The Company has received demands on multiple tax issues. These claims are primarily arising out of denial of deduction under section 10A of the Income Tax Act, 1961 in respect of profit earned by the Company’s undertaking in Software Technology Park at Bengaluru, the appeals filed against the said demand before the Appellate authorities have been allowed in favor of the Company by the second appellate authority for the years up to March 31, 2008 which either has been or may be contested by the Income tax authorities before the Hon’ble Supreme Court of India. Other claims relate to disallowance of tax benefits on profits earned from Software Technology Park and Special Economic Zone units, capitalization of research and development expenses, transfer pricing adjustments on intercompany / inter unit transactions and other issues.
Income tax claims against the Company amounting to ₹ 95,520 and ₹ 99,431 are not acknowledged as debt as at March 31, 2024 and 2025, respectively. These matters are pending before various Appellate Authorities and the management expects its position will likely be upheld on ultimate resolution and will not have a material adverse effect on the Company’s financial position and results of operations.
The contingent liability in respect of disputed demands for excise duty, custom duty, sales tax and other matters amounting to ₹ 18,799 and ₹ 19,292 as of March 31, 2024, and 2025, respectively. However, the resolution of these disputed demands is not likely to have a material and adverse effect on the results of operations or the financial position of the Company.
28. Segment information
The Company is organized into the following operating segments: IT Services and IT Products.
IT Services: The IT Services segment primarily consists of IT services offerings to customers organized by four Strategic Market Units (“SMUs”) - Americas 1, Americas 2, Europe and Asia Pacific Middle East and Africa (“APMEA”). Americas 1 and Americas 2 are primarily organized by industry sector, while Europe and APMEA are organized by countries.
Americas 1 includes the entire business of Latin America (“LATAM”) and the following industry sectors in the United States of America: communications, media and information services, software and gaming, new age technology, consumer goods, medical devices and life sciences, healthcare, and technology products and services. Americas 2 includes the entire business in Canada and the following industry sectors in the United States of America: banking and financial services, energy, manufacturing and resources, capital markets and insurance, and hi-tech. Europe consists of the United Kingdom and Ireland, Switzerland, Germany, Northern Europe and Southern Europe. APMEA consists of Australia and New Zealand, India, Middle East, South East Asia, Japan and Africa.
Revenue from each customer is attributed to the respective SMUs based on the location of the customer’s primary buying center of such services. With respect to certain strategic global customers, revenue may be generated from multiple countries based on such customer’s buying centers, but the total revenue related to these strategic global customers are attributed to a single SMU based on the geographical location of key decision makers.
Our IT Services segment provides a range of IT and IT enabled services which include digital strategy advisory, customer centric design, technology consulting, IT consulting, custom application design, development, re-engineering and maintenance, systems integration, package implementation, cloud and infrastructure services, business process services, cloud, mobility and analytics services, research and development and hardware and software design.
IT Products: The Company is a value-added reseller of security, packaged and SaaS software for leading international brands. In certain total outsourcing contracts of the IT Services segment, the Company delivers hardware, software products and other related deliverables. Revenue relating to these items is reported as revenue from the sale of IT Products.
The Chief Executive Officer (“CEO”) and Managing Director of the Company has been identified as the Chief Operating Decision Maker as defined by IFRS 8, “Operating Segments”. The CEO of the Company evaluates the segments based on their revenue growth and operating income.
Assets and liabilities used in the Company’s business are not identified to any of the operating segments, as these are used interchangeably between segments. Management believes that it is currently not practicable to provide segment disclosures relating to total assets and liabilities since a meaningful segregation of the available data is onerous.
25
Information on reportable segments for the three months ended March 31, 2024, is as follows:
| IT Services | IT Products |
Reconciling Items |
Total | |||||||||||||||||||||||||||||
| Americas 1 | Americas 2 | Europe | APMEA | Total | ||||||||||||||||||||||||||||
| Revenue |
₹ | 67,229 | ₹ | 67,724 | ₹ | 61,344 | ₹ | 24,499 | ₹ | 220,796 | ₹ | 1,159 | ₹ | - | ₹ | 221,955 | ||||||||||||||||
| Segment result |
14,081 | 15,791 | 7,933 | 3,401 | 41,206 | 143 | (965 | ) | 40,384 | |||||||||||||||||||||||
| Unallocated |
(5,011 | ) | - | - | (5,011 | ) | ||||||||||||||||||||||||||
| Segment result total |
₹ | 36,195 | ₹ | 143 | ₹ | (965 | ) | ₹ | 35,373 | |||||||||||||||||||||||
| Finance expenses |
(3,308 | ) | ||||||||||||||||||||||||||||||
| Finance and other income |
6,759 | |||||||||||||||||||||||||||||||
| Share of net profit/(loss) of associate and joint venture accounted for using the equity method |
|
(202
|
)
|
|||||||||||||||||||||||||||||
| Profit before tax |
₹ | 38,622 | ||||||||||||||||||||||||||||||
| Income tax expense |
(10,040 | ) | ||||||||||||||||||||||||||||||
| Profit for the period |
₹ | 28,582 | ||||||||||||||||||||||||||||||
|
Depreciation, amortization and impairment |
₹ | 8,405 | ||||||||||||||||||||||||||||||
Information on reportable segments for the three months ended March 31, 2025, is as follows:
| IT Services | IT Products |
Reconciling Items |
Total | |||||||||||||||||||||||||||||
| Americas 1 | Americas 2 | Europe | APMEA | Total | ||||||||||||||||||||||||||||
| Revenue |
₹ | 73,721 | ₹ | 68,582 | ₹ | 58,552 | ₹ | 23,598 | ₹ | 224,453 | ₹ | 813 | ₹ | - | ₹ | 225,266 | ||||||||||||||||
| Segment result |
16,195 | 15,513 | 8,140 | 3,672 | 43,520 | 28 | (211 | ) | 43,337 | |||||||||||||||||||||||
| Unallocated |
(4,250 | ) | (4,250 | ) | ||||||||||||||||||||||||||||
| Segment result total |
₹ | 39,270 | ₹ | 28 | ₹ | (211 | ) | ₹ | 39,087 | |||||||||||||||||||||||
| Finance expenses |
(3,767 | ) | ||||||||||||||||||||||||||||||
| Finance and other income |
11,819 | |||||||||||||||||||||||||||||||
| Share of net profit/(loss) of associate and joint venture accounted for using the equity method |
|
291
|
|
|||||||||||||||||||||||||||||
| Profit before tax |
₹ | 47,430 | ||||||||||||||||||||||||||||||
| Income tax expense |
(11,549 | ) | ||||||||||||||||||||||||||||||
| Profit for the period |
₹ | 35,881 | ||||||||||||||||||||||||||||||
|
Depreciation, amortization and impairment |
₹ | 7,217 | ||||||||||||||||||||||||||||||
26
Information on reportable segments for the year ended March 31, 2024, is as follows:
| IT Services | IT Products |
Reconciling Items |
Total | |||||||||||||||||||||||||||||
| Americas 1 | Americas 2 | Europe | APMEA | Total | ||||||||||||||||||||||||||||
| Revenue |
₹ | 268,230 | ₹ | 269,482 | ₹ | 253,927 | ₹ | 102,177 | ₹ | 893,816 | ₹ | 4,127 | ₹ | - | ₹ | 897,943 | ||||||||||||||||
| Segment result |
59,364 | 59,163 | 33,354 | 12,619 | 164,500 | (371 | ) | (7,726 | ) | 156,403 | ||||||||||||||||||||||
| Unallocated |
(20,304 | ) | - | - | (20,304 | ) | ||||||||||||||||||||||||||
| Segment result total |
₹ | 144,196 | ₹ | (371 | ) | ₹ | (7,726 | ) | ₹ | 136,099 | ||||||||||||||||||||||
| Finance expense |
(12,552 | ) | ||||||||||||||||||||||||||||||
| Finance and other income |
23,896 | |||||||||||||||||||||||||||||||
| Share of net profit/(loss) of associate and joint venture accounted for using the equity method |
|
(233
|
)
|
|||||||||||||||||||||||||||||
| Profit before tax |
₹ | 147,210 | ||||||||||||||||||||||||||||||
| Income tax expense |
(36,089 | ) | ||||||||||||||||||||||||||||||
| Profit for the year |
₹ | 111,121 | ||||||||||||||||||||||||||||||
|
Depreciation, amortization and impairment |
₹ | 34,071 | ||||||||||||||||||||||||||||||
Information on reportable segments for the year ended March 31, 2025, is as follows:
| IT Services | IT Products |
Reconciling Items |
Total | |||||||||||||||||||||||||||||
| Americas 1 | Americas 2 | Europe | APMEA | Total | ||||||||||||||||||||||||||||
| Revenue |
₹ | 281,824 | ₹ | 271,972 | ₹ | 240,077 | ₹ | 94,351 | ₹ | 888,224 | ₹ | 2,692 | ₹ | - | ₹ | 890,916 | ||||||||||||||||
| Segment result |
58,186 | 61,326 | 29,434 | 12,850 | 161,796 | (173 | ) | (195 | ) | 161,428 | ||||||||||||||||||||||
| Unallocated |
(10,157 | ) | - | - | (10,157 | ) | ||||||||||||||||||||||||||
| Segment result total |
₹ | 151,639 | ₹ | (173 | ) | ₹ | (195 | ) | ₹ | 151,271 | ||||||||||||||||||||||
| Finance expense |
(14,770 | ) | ||||||||||||||||||||||||||||||
| Finance and other income |
38,202 | |||||||||||||||||||||||||||||||
| Share of net profit/(loss) of associate and joint venture accounted for using the equity method |
|
254
|
|
|||||||||||||||||||||||||||||
| Profit before tax |
₹ | 174,957 | ||||||||||||||||||||||||||||||
| Income tax expense |
(42,777 | ) | ||||||||||||||||||||||||||||||
| Profit for the year |
₹ | 132,180 | ||||||||||||||||||||||||||||||
|
Depreciation, amortization and impairment |
₹ | 29,579 | ||||||||||||||||||||||||||||||
27
Revenues from India, being Company’s country of domicile, is ₹ 5,575 and ₹ 5,271 for the three months ended March 31, 2024, and 2025, respectively and ₹ 23,484 and ₹ 20,699 for the year ended March 31, 2024, and 2025, respectively.
Revenues from United States of America and United Kingdom contributed more than 10% of Company’s total revenues as per table below:
| Three months ended March 31, | Year ended March 31, | |||||||||||||||
| 2024 | 2025 | 2024 | 2025 | |||||||||||||
| United States of America |
₹ | 128,934 | ₹ | 136,385 | ₹ | 512,740 | ₹ | 529,943 | ||||||||
| United Kingdom |
25,392 | 22,954 | 108,613 | 95,241 | ||||||||||||
|
|
|
|
|
|
|
|
|
|||||||||
| ₹ | 154,326 | ₹ | 159,339 | ₹ | 621,353 | ₹ | 625,184 | |||||||||
|
|
|
|
|
|
|
|
|
|||||||||
No customer individually accounted for more than 10% of the revenues during the three months and year ended March 31, 2024 and 2025.
Management believes that it is currently not practicable to provide disclosure of geographical location wise assets, since the meaningful segregation of the available information is onerous.
Notes:
| a) | “Reconciling Items” includes elimination of inter-segment transactions and other corporate activities. |
| b) | Revenue from sale of Company owned intellectual properties is reported as part of IT Services revenues. |
| c) | For the purpose of segment reporting, the Company has included the impact of “foreign exchange gains/(losses), net” in revenues, which is reported as a part of operating profit in the interim condensed consolidated statement of income. |
| d) | Restructuring cost of ₹ Nil and ₹ 6,814 for the three months and year ended March 31, 2024, respectively is included under Reconciling items. |
| e) | Reconciling Items for the three months and year ended March 31, 2024 includes employee costs of ₹ 921 towards outgoing CEO and Managing Director. |
| f) | “Unallocated” within IT Services segment results is after recognition of the below: |
| Three months ended March 31, | Year ended March 31, | |||||||||||||||
| 2024 | 2025 | 2024 | 2025 | |||||||||||||
| Amortization and impairment expenses on intangible assets (Refer to Note 6) |
₹ | 2,569 | ₹ | 1,631 | ₹ | 11,756 | ₹ | 7,909 | ||||||||
| Change in fair value of contingent consideration (Refer to Note 18) |
(792 | ) | (2 | ) | (1,300 | ) | (169 | ) | ||||||||
Segment results of IT Services segment for the three and year ended March 31, 2024 are after considering additional amortization due to change in estimate of useful life of the customer-related intangibles in an earlier Business combination. (Refer to Note 6)
| g) | Segment results of IT Services segment are after recognition of share-based compensation expense of ₹ 1,293 and ₹ 1,195 for the three months ended March 31, 2024 and 2025, respectively and ₹ 5,590 and ₹ 5,542 for the year ended March 31, 2024 and 2025 respectively. |
| h) | Segment results of IT Services segment are after recognition of (gain)/loss on sale of property, plant and equipment of ₹ 102 and ₹ 160 for the three months ended March 31, 2024 and 2025, respectively and ₹ (2,072) and ₹ (606) for the year ended March 31, 2024 and 2025 respectively. |
| 29. | List of subsidiaries, associate and joint venture as at March 31, 2025 is provided below: |
| Subsidiaries | Subsidiaries | Subsidiaries |
Country of Incorporation |
|||
|
Attune Consulting India Private Limited |
India | |||||
|
Capco Technologies Private Limited |
India | |||||
|
Wipro Technology Product Services Private Limited |
India | |||||
|
Wipro Chengdu Limited |
China | |||||
|
Wipro Holdings (UK) Limited |
U.K. | |||||
|
Wipro HR Services India Private Limited |
India | |||||
|
Wipro IT Services Bangladesh Limited |
Bangladesh | |||||
| Wipro IT Services UK Societas |
U.K. | |||||
| Designit A/S | Denmark | |||||
| Designit Denmark A/S | Denmark | |||||
| Designit Germany GmbH | Germany | |||||
| Designit Oslo A/S | Norway | |||||
| Designit Spain Digital, S.L.U | Spain | |||||
| Designit T.L.V Ltd. | Israel | |||||
| Wipro Bahrain Limited Co. W.L.L | Bahrain |
28
| Wipro Czech Republic IT Services s.r.o. | Czech Republic | |||||
| Wipro CRM Services (formerly known as Wipro 4C NV) | Belgium | |||||
| Wipro 4C Consulting France SAS | France | |||||
| Wipro CRM Services B.V. (formerly known as Wipro 4C Nederland B.V) | Netherlands | |||||
| Wipro CRM Services ApS | Denmark | |||||
| Wipro CRM Services UK Limited | U.K. | |||||
| Grove Holdings 2 S.á.r.l | Luxembourg | |||||
| Capco Solution Services GmbH | Germany | |||||
| The Capital Markets Company Italy Srl | Italy | |||||
| Capco Brasil Serviços E Consultoria Ltda | Brazil | |||||
| The Capital Markets Company BV (1) | Belgium | |||||
| Capco Consulting Middle East FZE (4) | UAE | |||||
| PT. WT Indonesia | Indonesia | |||||
| Rainbow Software LLC | Iraq | |||||
| Wipro Arabia Limited (2) | Saudi Arabia | |||||
| Women’s Business Park Technologies Limited (2) | Saudi Arabia | |||||
| Wipro Doha LLC | Qatar | |||||
| Wipro Financial Outsourcing Services Limited | U.K. | |||||
| Wipro UK Limited | U.K. | |||||
| Wipro Gulf LLC | Sultanate of Oman | |||||
| Wipro Holdings Hungary Korlátolt Felelősségű Társaság | Hungary | |||||
| Wipro Information Technology Netherlands BV. | Netherlands | |||||
| Wipro do Brasil Technologia Ltda (1) | Brazil | |||||
| Wipro Information Technology Kazakhstan LLP | Kazakhstan | |||||
| Wipro Outsourcing Services (Ireland) Limited | Ireland | |||||
| Wipro Portugal S.A. (1) | Portugal | |||||
| Wipro Solutions Canada Limited | Canada | |||||
| Wipro Technologies Limited | Russia | |||||
| Wipro Technologies Peru SAC | Peru | |||||
| Wipro Technologies W.T. Sociedad Anonima | Costa Rica | |||||
| Wipro Technology Chile SPA | Chile | |||||
| Applied Value Technologies B.V. (5) | Netherlands | |||||
| Wipro IT Service Ukraine, LLC | Ukraine | |||||
| Wipro IT Services Poland SP Z.O.O | Poland | |||||
| Wipro IT Services S.R.L. | Romania | |||||
| Wipro Regional Headquarter | Saudi Arabia | |||||
| Wipro Technologies Australia Pty Ltd | Australia | |||||
| Wipro Ampion Holdings Pty Ltd (1) | Australia | |||||
| Wipro Technologies SA | Argentina | |||||
| Wipro Technologies SA DE CV | Mexico | |||||
| Wipro Technologies South Africa (Proprietary) Limited | South Africa | |||||
| Wipro Technologies Nigeria Limited | Nigeria | |||||
| Wipro Technologies SRL | Romania | |||||
| Wipro (Thailand) Co. Limited | Thailand | |||||
| Wipro Japan KK |
Japan | |||||
| Wipro Networks Pte Limited |
Singapore | |||||
| Wipro (Dalian) Limited | China | |||||
| Wipro Technologies SDN BHD | Malaysia | |||||
| Applied Value Technologies Pte Limited (6) | Singapore | |||||
|
Wipro Overseas IT Services Private Limited |
India | |||||
|
Wipro Philippines, Inc. |
Philippines | |||||
|
Wipro Shanghai Limited |
China |
29
| Wipro Trademarks Holding Limited |
India | |||||
|
Wipro Travel Services Limited |
India | |||||
|
Wipro VLSI Design Services India Private Limited |
India | |||||
| Wipro, LLC |
USA | |||||
| Wipro Gallagher Solutions, LLC | USA | |||||
| Wipro Insurance Solutions, LLC | USA | |||||
| Wipro IT Services, LLC | USA | |||||
| Aggne Global Inc. (3) | USA | |||||
| Cardinal US Holdings, Inc.(1) | USA | |||||
| Edgile, LLC | USA | |||||
| HealthPlan Services, Inc. (1) | USA | |||||
| Infocrossing, LLC | USA | |||||
| International TechneGroup Incorporated (1) | USA | |||||
| Wipro NextGen Enterprise Inc. (1) | USA | |||||
| Rizing Intermediate Holdings, Inc. (1) | USA | |||||
| Wipro Appirio, Inc. (1) | USA | |||||
| Wipro Designit Services, Inc. (1) | USA | |||||
| Wipro Telecom Consulting LLC | USA | |||||
| Wipro VLSI Design Services, LLC | USA | |||||
| Applied Value Technologies, Inc. (7) | USA | |||||
|
Aggne Global IT Services Private Limited (3) |
India | |||||
| Wipro, Inc. (8) |
USA | |||||
| Wipro Life Science Solutions, LLC (9) | USA |
The Company controls ‘The Wipro SA Broad Based Ownership Scheme Trust’, ‘Wipro SA Broad Based Ownership Scheme SPV (RF) (PTY) LTD’ incorporated in South Africa and Wipro Foundation in India. All the above direct subsidiaries are 100% held by the Company except as mentioned in footnote (2) and (3) below.
(2) Wipro IT Services UK Societas holds 66.67% of the equity securities of Wipro Arabia Limited. Wipro Arabia Limited has acquired 45% of the equity securities of Women’s Business Park Technologies Limited on March 24, 2025 in addition to 55% of the equity securities held.
(3) The Company holds 60% of the equity securities of Aggne Global IT Services Private Limited and Wipro IT Services, LLC holds 60% of the equity securities of Aggne Global Inc.
(4) Capco Consulting Middle East FZE has been incorporated with effect from December 17, 2024 which is 100% held by Grove Holdings 2 S.á.r.l.
(5) Wipro Information Technology Netherlands BV. has acquired 100% of the equity securities of Applied Value Technologies B.V.
(6) Wipro Networks Pte Limited has acquired 100% of the equity securities of Applied Value Technologies Pte Limited
(7) Wipro IT Services, LLC has acquired 100% of the equity securities of Applied Value Technologies, Inc.
(8) Wipro, Inc. has been incorporated as a wholly-owned subsidiary of the Company with the effect from September 30, 2024.
(9) Wipro Life Science Solutions, LLC has been incorporated as a wholly-owned subsidiary of Wipro, Inc. with effect from October 10, 2024.
(1) Step Subsidiary details of Cardinal US Holdings, Inc., HealthPlan Services, Inc., International TechneGroup Incorporated, Wipro NextGen Enterprise Inc., Rizing Intermediate Holdings, Inc., The Capital Markets Company BV, Wipro Ampion Holdings Pty Ltd, Wipro Appirio, Inc., Wipro Designit Services, Inc., Wipro do Brasil Technologia Ltda and Wipro Portugal S.A. are as follows:
| Subsidiaries | Subsidiaries | Subsidiaries | Country of Incorporation |
|||
| Cardinal US Holdings, Inc. |
USA | |||||
| Capco Consulting Services LLC | USA | |||||
| Capco RISC Consulting LLC | USA | |||||
| The Capital Markets Company LLC | USA | |||||
|
HealthPlan Services, Inc. |
USA |
30
| HealthPlan Services Insurance Agency, LLC | USA | |||||
| International TechneGroup Incorporated |
USA | |||||
| International TechneGroup Ltd. | U.K. | |||||
| ITI Proficiency Ltd | Israel | |||||
| MechWorks S.R.L. | Italy | |||||
| Wipro NextGen Enterprise Inc. |
USA | |||||
| LeanSwift AB | Sweden | |||||
| Rizing Intermediate Holdings, Inc. |
USA | |||||
| Rizing Lanka (Private) Ltd | Sri Lanka | |||||
| Attune Netherlands B.V. (11) | Netherlands | |||||
| Rizing Solutions Canada Inc. | Canada | |||||
| Rizing LLC | USA | |||||
| Aasonn Philippines Inc. | Philippines | |||||
| Rizing B.V. | Netherlands | |||||
| Rizing Consulting Ireland Limited | Ireland | |||||
| Rizing Consulting Pty Ltd. | Australia | |||||
| Rizing Geospatial LLC | USA | |||||
| Rizing GmbH | Germany | |||||
| Rizing Limited | U.K. | |||||
| Rizing Consulting USA, Inc. (10) | USA | |||||
| Rizing Pte Ltd. (11) | Singapore | |||||
| The Capital Markets Company BV |
Belgium | |||||
| CapAfric Consulting (Pty) Ltd | South Africa | |||||
| Capco Belgium BV | Belgium | |||||
| Capco Consultancy (Malaysia) Sdn. Bhd | Malaysia | |||||
| Capco Consultancy (Thailand) Ltd | Thailand | |||||
| Capco Consulting Singapore Pte. Ltd | Singapore | |||||
| Capco Greece Single Member P.C | Greece | |||||
| Capco Poland sp. z.o.o | Poland | |||||
| The Capital Markets Company (UK) Ltd | U.K. | |||||
| The Capital Markets Company GmbH | Germany | |||||
| Capco Austria GmbH | Austria | |||||
| The Capital Markets Company Limited | Hong Kong | |||||
| The Capital Markets Company Limited | Canada | |||||
| The Capital Markets Company S.á.r.l | Switzerland | |||||
| Andrion AG | Switzerland | |||||
| The Capital Markets Company S.A.S | France | |||||
| The Capital Markets Company s.r.o | Slovakia | |||||
| Wipro Ampion Holdings Pty Ltd |
Australia | |||||
| Wipro Revolution IT Pty Ltd | Australia | |||||
| Wipro Shelde Australia Pty Ltd | Australia | |||||
| Wipro Appirio, Inc. |
USA | |||||
| Wipro Appirio (Ireland) Limited | Ireland | |||||
| Wipro Appirio UK Limited | U.K. | |||||
| Topcoder, LLC. | USA | |||||
| Wipro Designit Services, Inc. |
USA | |||||
| Wipro Designit Services Limited | Ireland | |||||
| Wipro do Brasil Technologia Ltda |
Brazil | |||||
| Wipro do Brasil Servicos Ltda | Brazil | |||||
| Wipro Do Brasil Sistemas De Informatica Ltda | Brazil | |||||
| Wipro Portugal S.A. |
Portugal | |||||
| Wipro Technologies GmbH | Germany | |||||
| Wipro Business Solutions GmbH (11) | Germany | |||||
| Wipro IT Services Austria GmbH | Austria |
(10) Attune Netherlands B.V transferred its entire shareholding in Rizing Consulting USA, Inc. to Rizing LLC, effective March 31, 2025.
(11) Step Subsidiary details of Attune Netherlands B.V., Rizing Pte Ltd., Wipro Business Solutions GmbH are as follows:
31
| Subsidiaries | Subsidiaries | Subsidiaries | Country of Incorporation |
|||
| Attune Netherlands B.V. |
Netherlands | |||||
| Rizing Germany GmbH | Germany | |||||
| Attune Italia S.R.L | Italy | |||||
| Attune UK Ltd. | U.K. | |||||
| Rizing Pte Ltd. |
Singapore | |||||
| Rizing New Zealand Ltd. | New Zealand | |||||
| Rizing Philippines Inc. | Philippines | |||||
| Rizing SDN BHD | Malaysia | |||||
| Rizing Solutions Pty Ltd | Australia | |||||
| Wipro Business Solutions GmbH |
Germany | |||||
| Wipro Technology Solutions S.R.L | Romania |
As at March 31, 2025, the Company held 43.7% interest in Drivestream Inc. and 27% interest in SDVerse LLC, accounted for using the equity method.
The list of controlled trusts are:
| Name of the entity | Country of incorporation | |
| Wipro Equity Reward Trust | India | |
| Wipro Foundation | India |
| 30. | Buyback of equity shares |
During the year ended March 31, 2024, the Company concluded the buyback of 269,662,921 equity shares (at a price of ₹ 445 per equity share) as approved by the Board of Directors on April 27, 2023. This has resulted in a total cash outflow of ₹ 145,173 (including tax on buyback of ₹ 24,783 and transaction costs related to buyback of ₹ 390). In line with the requirement of the Companies Act, 2013, an amount of ₹ 3,768 and ₹ 141,405 has been utilized from share premium and retained earnings respectively. Further, capital redemption reserve (included in other reserves) of ₹ 539 (representing the nominal value of the shares bought back) has been created as an apportionment from retained earnings. Consequent to such buyback, the paid-up equity share capital has reduced by ₹ 539.
| 31. | Issue of bonus shares |
During the year ended March 31, 2025, the Company concluded bonus issue in the ratio of 1:1 i.e.1 (one) bonus equity share of ₹ 2 each for every 1 (one) fully paid-up equity shares held (including ADS holders) as approved by the shareholders of the Company on November 21, 2024. Subsequently, on December 4, 2024, the Company allotted 5,232,094,402 equity shares (including ADS) to shareholders who held equity shares as on the record date of December 3, 2024. The Company also allotted 1:1 bonus equity share on 1,274,805 equity shares (including ADS) under allotment as on the record date. Consequently, ₹ 10,467 (representing par value of ₹ 2 per share) was transferred from capital redemption reserves, share premium and retained earnings to the share capital.
| 32. | During the year ended March 31, 2025, the Company paid an interim dividend of ₹ 6 per equity share (declared on January 17, 2025). |
| As per our report of even date attached | For and on behalf of the Board of Directors | |||||
| for Deloitte Haskins & Sells LLP |
Rishad A. Premji | Deepak M. Satwalekar | Srinivas Pallia | |||
| Chartered Accountants | Chairman | Director | Chief Executive Officer and | |||
| Firm Registration No: 117366W/W - 100018 | (DIN: 02983899) | (DIN:00009627) | Managing Director | |||
| (DIN: 10574442) | ||||||
| Anand Subramanian | Aparna C. Iyer | M. Sanaulla Khan | ||||
| Partner | Chief Financial Officer | Company Secretary | ||||
| Membership No. 110815 | Membership No.: F4129 | |||||
| Bengaluru | ||||||
| April 16, 2025 | ||||||
32
Exhibit 99.4
|
WIPRO LIMITED CIN: L32102KA1945PLC020800 ; Registered Office : Wipro Limited, Doddakannelli, Sarjapur Road, Bengaluru - 560035, India Website: www.wipro.com ; Email id – info@wipro.com ; Tel: +91-80-2844 0011 ; Fax: +91-80-2844 0054 STATUTORILY AUDITED CONSOLIDATED FINANCIAL RESULTS FOR THE THREE MONTHS AND YEAR ENDED MARCH 31, 2025 UNDER IFRS (IASB) (₹ in millions, except share and per share data, unless otherwise stated)
|
|
|||||||||||||||||||||
| Particulars | Three months ended | Year ended | ||||||||||||||||||||
| March 31, 2025 |
December 31, 2024 |
March 31, 2024 |
March 31, 2025 |
March 31, 2024 |
||||||||||||||||||
| Income | ||||||||||||||||||||||
| a) Revenue from operations |
225,042 | 223,188 | 222,083 | 890,884 | 897,603 | |||||||||||||||||
| b) Foreign exchange gains/(losses), net |
224 | 410 | (128 | ) | 32 | 340 | ||||||||||||||||
| I |
Total income | 225,266 | 223,598 | 221,955 | 890,916 | 897,943 | ||||||||||||||||
| Expenses | ||||||||||||||||||||||
| a) Purchases of stock-in-trade |
810 | 459 | 825 | 2,967 | 3,832 | |||||||||||||||||
| b) Changes in inventories of stock-in-trade |
31 | 318 | 156 | 195 | 278 | |||||||||||||||||
| c) Employee benefits expense |
133,454 | 133,035 | 136,255 | 533,477 | 549,301 | |||||||||||||||||
| d) Depreciation, amortization and impairment expense |
7,217 | 6,765 | 8,405 | 29,579 | 34,071 | |||||||||||||||||
| e) Sub-contracting and technical fees |
24,896 | 25,903 | 24,318 | 100,148 | 103,030 | |||||||||||||||||
| f) Facility expenses |
4,113 | 3,884 | 3,727 | 16,067 | 14,556 | |||||||||||||||||
| g) Travel |
3,158 | 3,164 | 3,349 | 14,095 | 15,102 | |||||||||||||||||
| h) Communication |
899 | 871 | 956 | 3,842 | 4,878 | |||||||||||||||||
| i) Legal and professional fees |
3,133 | 2,842 | 2,324 | 11,270 | 9,559 | |||||||||||||||||
| j) Software license expense for internal use |
4,951 | 5,080 | 4,395 | 19,338 | 18,378 | |||||||||||||||||
| k) Marketing and brand building |
917 | 1,032 | 667 | 3,591 | 3,555 | |||||||||||||||||
| l) Lifetime expected credit loss/ (write-back) |
365 | (608 | ) | 367 | 324 | 640 | ||||||||||||||||
| m) (Gain)/loss on sale of property, plant and equipment, net |
160 | 77 | 102 | (606 | ) | (2,072 | ) | |||||||||||||||
| n) Other expenses |
2,075 | 1,810 | 736 | 5,358 | 6,736 | |||||||||||||||||
| II |
Total expenses | 186,179 | 184,632 | 186,582 | 739,645 | 761,844 | ||||||||||||||||
|
III |
Finance expenses | 3,767 | 4,146 | 3,308 | 14,770 | 12,552 | ||||||||||||||||
|
IV |
Finance and other income | 11,819 | 9,708 | 6,759 | 38,202 | 23,896 | ||||||||||||||||
|
V |
Share of net profit/ (loss) of associate and joint venture accounted for using the equity method | 291 | 5 | (202 | ) | 254 | (233 | ) | ||||||||||||||
|
VI |
Profit before tax [I-II-III+IV+V] | 47,430 | 44,533 | 38,622 | 174,957 | 147,210 | ||||||||||||||||
| VII |
Tax expense | 11,549 | 10,866 | 10,040 | 42,777 | 36,089 | ||||||||||||||||
|
VIII |
Profit for the period [VI-VII] | 35,881 | 33,667 | 28,582 | 132,180 | 111,121 | ||||||||||||||||
| Other comprehensive income (OCI) | ||||||||||||||||||||||
| Items that will not be reclassified to profit or loss in subsequent periods |
||||||||||||||||||||||
| Remeasurements of the defined benefit plans, net |
124 | (231 | ) | (177 | ) | 274 | 82 | |||||||||||||||
| Net change in fair value of investment in equity instruments measured at fair value through OCI |
(2,943 | ) | (367 | ) | (506 | ) | (3,476 | ) | (473 | ) | ||||||||||||
| Items that will be reclassified to profit or loss in subsequent periods |
||||||||||||||||||||||
| Foreign currency translation differences |
1,762 | 1,853 | (844 | ) | 7,331 | 4,219 | ||||||||||||||||
| Reclassification of foreign currency translation differences on liquidation of subsidiaries to statement of income |
(55 | ) | 1 | (2 | ) | (41 | ) | (198 | ) | |||||||||||||
| Net change in time value of option contracts designated as cash flow hedges, net of taxes |
(94 | ) | 269 | 271 | (189 | ) | 198 | |||||||||||||||
| Net change in intrinsic value of option contracts designated as cash flow hedges, net of taxes |
335 | (171 | ) | 15 | 146 | 128 | ||||||||||||||||
| Net change in fair value of forward contracts designated as cash flow hedges, net of taxes |
810 | (1,100 | ) | 355 | (745 | ) | 1,655 | |||||||||||||||
| Net change in fair value of investment in debt instruments measured at fair value through OCI, net of taxes |
352 | 37 | 261 | 963 | 1,516 | |||||||||||||||||
|
IX |
Total other comprehensive income for the period, net of taxes | 291 | 291 | (627 | ) | 4,263 | 7,127 | |||||||||||||||
1
| Total comprehensive income for the period [VIII+IX] | 36,172 | 33,958 | 27,955 | 136,443 | 118,248 | |||||||||||||||||
| X |
Profit for the period attributable to: | |||||||||||||||||||||
| Equity holders of the Company | 35,696 | 33,538 | 28,346 | 131,354 | 110,452 | |||||||||||||||||
| Non-controlling interests | 185 | 129 | 236 | 826 | 669 | |||||||||||||||||
| 35,881 | 33,667 | 28,582 | 132,180 | 111,121 | ||||||||||||||||||
| Total comprehensive income for the period attributable to: | ||||||||||||||||||||||
| Equity holders of the Company | 36,005 | 33,783 | 27,781 | 135,595 | 117,744 | |||||||||||||||||
| Non-controlling interests | 167 | 175 | 174 | 848 | 504 | |||||||||||||||||
| 36,172 | 33,958 | 27,955 | 136,443 | 118,248 | ||||||||||||||||||
|
XI |
Paid up equity share capital (Par value ₹ 2 per share) | 20,944 | 20,938 | 10,450 | 20,944 | 10,450 | ||||||||||||||||
|
XII |
Reserves excluding revaluation reserves and Non-controlling interests as per balance sheet | 807,365 | 739,433 | |||||||||||||||||||
| XIII |
Earnings per share (EPS) | |||||||||||||||||||||
| (Equity shares of par value of ₹ 2/- each) | ||||||||||||||||||||||
| (EPS for the three months ended periods are not annualized) | ||||||||||||||||||||||
| Basic (in ₹) | 3.41 | 3.21 | 2.71 | 12.56 | 10.44 | |||||||||||||||||
| Diluted (in ₹) | 3.39 | 3.20 | 2.70 | 12.52 | 10.41 |
| 1. | The audited consolidated financial results of the Company for the three months and year ended March 31, 2025, have been approved by the Board of Directors of the Company at its meeting held on April 16, 2025. The Company confirms that its statutory auditors, Deloitte Haskins & Sells LLP have issued an audit report with unmodified opinion on the consolidated financial results. |
| 2. | The above consolidated financial results have been prepared on the basis of the audited interim condensed consolidated financial statements for the year ended March 31, 2025 and the audited interim condensed consolidated financial statements for the nine months ended December 31, 2024, which are prepared in accordance with International Financial Reporting Standards and its interpretations (“IFRS”), as issued by the International Accounting Standards Board (“IASB”). The figures of last quarter are the balancing figures between audited figures in respect of the full financial year and the published year-to-date figures up to the third quarter of the current financial year. All amounts included in the consolidated financial results (including notes) are reported in millions of Indian rupees (₹ in millions) except share and per share data, unless otherwise stated. |
| 3. | (Gain)/loss on sale of property, plant and equipment for the year ended March 31, 2025, includes gain on relinquishment of the lease hold rights of land, and transfer of building along with other assets of ₹ (885), and for the year ended March 31, 2024 includes gain on sale of immovable properties of ₹ (2,357). |
| 4. | Other expenses are net of reversals of contingent consideration of ₹ 2, ₹ Nil, ₹ 792 for the three months ended March 31, 2025, December 31, 2024 and March 31, 2024, respectively, and ₹ 169 and ₹ 1,300 for the year ended March 31, 2025 and 2024, respectively. Other expenses are net of insurance claim received of ₹ Nil for the three months ended March 31, 2025, December 31, 2024 and March 31, 2024, respectively, and ₹ 1,805 and ₹ Nil for the year ended March 31, 2025 and 2024, respectively. |
| 5. | List of subsidiaries, associate and joint venture as at March 31, 2025 are provided in the table below: |
| Subsidiaries | Subsidiaries | Subsidiaries |
Country of Incorporation |
|||
| Attune Consulting India Private Limited | India | |||||
| Capco Technologies Private Limited | India | |||||
| Wipro Technology Product Services Private Limited | India | |||||
| Wipro Chengdu Limited | China | |||||
| Wipro Holdings (UK) Limited | U.K. | |||||
| Wipro HR Services India Private Limited | India | |||||
| Wipro IT Services Bangladesh Limited | Bangladesh | |||||
| Wipro IT Services UK Societas | U.K. | |||||
| Designit A/S | Denmark | |||||
| Designit Denmark A/S | Denmark | |||||
| Designit Germany GmbH | Germany | |||||
| Designit Oslo A/S | Norway |
2
| Designit Spain Digital, S.L.U | Spain | |||||
| Designit T.L.V Ltd. | Israel | |||||
| Wipro Bahrain Limited Co. W.L.L | Bahrain | |||||
| Wipro Czech Republic IT Services s.r.o. | Czech Republic | |||||
| Wipro CRM Services (formerly known as Wipro 4C NV) | Belgium | |||||
| Wipro 4C Consulting France SAS | France | |||||
| Wipro CRM Services B.V. (formerly known as Wipro 4C Nederland B.V) | Netherlands | |||||
| Wipro CRM Services ApS | Denmark | |||||
| Wipro CRM Services UK Limited | U.K. | |||||
| Grove Holdings 2 S.á.r.l | Luxembourg | |||||
| Capco Solution Services GmbH | Germany | |||||
| The Capital Markets Company Italy Srl | Italy | |||||
| Capco Brasil Serviços E Consultoria Ltda | Brazil | |||||
| The Capital Markets Company BV (1) | Belgium | |||||
| Capco Consulting Middle East FZE (4) | UAE | |||||
| PT. WT Indonesia | Indonesia | |||||
| Rainbow Software LLC | Iraq | |||||
| Wipro Arabia Limited (2) | Saudi Arabia | |||||
| Women’s Business Park Technologies Limited (2) | Saudi Arabia | |||||
| Wipro Doha LLC | Qatar | |||||
| Wipro Financial Outsourcing Services Limited | U.K. | |||||
| Wipro UK Limited | U.K. | |||||
| Wipro Gulf LLC | Sultanate of Oman | |||||
| Wipro Holdings Hungary Korlátolt Felelősségű Társaság | Hungary | |||||
| Wipro Information Technology Netherlands BV. | Netherlands | |||||
| Wipro do Brasil Technologia Ltda (1) | Brazil | |||||
| Wipro Information Technology Kazakhstan LLP | Kazakhstan | |||||
| Wipro Outsourcing Services (Ireland) Limited | Ireland | |||||
| Wipro Portugal S.A. (1) | Portugal | |||||
| Wipro Solutions Canada Limited | Canada | |||||
| Wipro Technologies Limited | Russia | |||||
| Wipro Technologies Peru SAC | Peru | |||||
| Wipro Technologies W.T. Sociedad Anonima | Costa Rica | |||||
| Wipro Technology Chile SPA | Chile | |||||
| Applied Value Technologies B.V. (5) | Netherlands | |||||
| Wipro IT Service Ukraine, LLC | Ukraine | |||||
| Wipro IT Services Poland SP Z.O.O | Poland | |||||
| Wipro IT Services S.R.L. | Romania | |||||
| Wipro Regional Headquarter | Saudi Arabia | |||||
| Wipro Technologies Australia Pty Ltd | Australia | |||||
| Wipro Ampion Holdings Pty Ltd (1) | Australia | |||||
| Wipro Technologies SA | Argentina | |||||
| Wipro Technologies SA DE CV | Mexico | |||||
| Wipro Technologies South Africa (Proprietary) Limited | South Africa | |||||
| Wipro Technologies Nigeria Limited | Nigeria | |||||
| Wipro Technologies SRL | Romania | |||||
| Wipro (Thailand) Co. Limited | Thailand | |||||
| Wipro Japan KK | Japan | |||||
| Wipro Networks Pte Limited | Singapore | |||||
| Wipro (Dalian) Limited | China | |||||
| Wipro Technologies SDN BHD | Malaysia | |||||
| Applied Value Technologies Pte Limited (6) | Singapore | |||||
| Wipro Overseas IT Services Private Limited | India |
3
| Wipro Philippines, Inc. | Philippines | |||||
| Wipro Shanghai Limited | China | |||||
| Wipro Trademarks Holding Limited | India | |||||
| Wipro Travel Services Limited | India | |||||
| Wipro VLSI Design Services India Private Limited | India | |||||
| Wipro, LLC | USA | |||||
| Wipro Gallagher Solutions, LLC | USA | |||||
| Wipro Insurance Solutions, LLC | USA | |||||
| Wipro IT Services, LLC | USA | |||||
| Aggne Global Inc. (3) | USA | |||||
| Cardinal US Holdings, Inc.(1) | USA | |||||
| Edgile, LLC | USA | |||||
| HealthPlan Services, Inc. (1) | USA | |||||
| Infocrossing, LLC | USA | |||||
| International TechneGroup Incorporated (1) | USA | |||||
| Wipro NextGen Enterprise Inc. (1) | USA | |||||
| Rizing Intermediate Holdings, Inc. (1) | USA | |||||
| Wipro Appirio, Inc. (1) | USA | |||||
| Wipro Designit Services, Inc. (1) | USA | |||||
| Wipro Telecom Consulting LLC | USA | |||||
| Wipro VLSI Design Services, LLC | USA | |||||
| Applied Value Technologies, Inc. (7) | USA | |||||
| Aggne Global IT Services Private Limited (3) |
India | |||||
| Wipro, Inc. (8) | USA | |||||
| Wipro Life Science Solutions, LLC (9) | USA |
The Company controls ‘The Wipro SA Broad Based Ownership Scheme Trust’, ‘Wipro SA Broad Based Ownership Scheme SPV (RF) (PTY) LTD’ incorporated in South Africa and Wipro Foundation in India. All the above direct subsidiaries are 100% held by the Company except as mentioned in footnote (2) and (3) below.
(2) Wipro IT Services UK Societas holds 66.67% of the equity securities of Wipro Arabia Limited. Wipro Arabia Limited has acquired 45% of the equity securities of Women’s Business Park Technologies Limited on March 24, 2025 in addition to 55% of the equity securities held.
(3) The Company holds 60% of the equity securities of Aggne Global IT Services Private Limited and Wipro IT Services, LLC holds 60% of the equity securities of Aggne Global Inc.
(4) Capco Consulting Middle East FZE has been incorporated with effect from December 17, 2024 which is 100% held by Grove Holdings 2 S.á.r.l.
(5) Wipro Information Technology Netherlands BV. has acquired 100% of the equity securities of Applied Value Technologies B.V.
(6) Wipro Networks Pte Limited has acquired 100% of the equity securities of Applied Value Technologies Pte Limited
(7) Wipro IT Services, LLC has acquired 100% of the equity securities of Applied Value Technologies, Inc.
(8) Wipro, Inc. has been incorporated as a wholly-owned subsidiary of the Company with the effect from September 30, 2024.
(9) Wipro Life Science Solutions, LLC has been incorporated as a wholly-owned subsidiary of Wipro, Inc. with effect from October 10, 2024.
(1) Step Subsidiary details of Cardinal US Holdings, Inc., HealthPlan Services, Inc., International TechneGroup Incorporated, Wipro NextGen Enterprise Inc., Rizing Intermediate Holdings, Inc., The Capital Markets Company BV, Wipro Ampion Holdings Pty Ltd, Wipro Appirio, Inc., Wipro Designit Services, Inc., Wipro do Brasil Technologia Ltda and Wipro Portugal S.A. are as follows:
| Subsidiaries | Subsidiaries | Subsidiaries | Country of Incorporation | |||
| Cardinal US Holdings, Inc. |
USA | |||||
| Capco Consulting Services LLC |
USA | |||||
| Capco RISC Consulting LLC |
USA | |||||
| The Capital Markets Company LLC |
USA |
4
| HealthPlan Services, Inc. | USA | |||||
| HealthPlan Services Insurance Agency, LLC | USA | |||||
| International TechneGroup Incorporated | USA | |||||
| International TechneGroup Ltd. | U.K. | |||||
| ITI Proficiency Ltd | Israel | |||||
| MechWorks S.R.L. | Italy | |||||
| Wipro NextGen Enterprise Inc. | USA | |||||
| LeanSwift AB | Sweden | |||||
| Rizing Intermediate Holdings, Inc. | USA | |||||
| Rizing Lanka (Private) Ltd | Sri Lanka | |||||
| Attune Netherlands B.V. (11) | Netherlands | |||||
| Rizing Solutions Canada Inc. | Canada | |||||
| Rizing LLC | USA | |||||
| Aasonn Philippines Inc. | Philippines | |||||
| Rizing B.V. | Netherlands | |||||
| Rizing Consulting Ireland Limited | Ireland | |||||
| Rizing Consulting Pty Ltd. | Australia | |||||
| Rizing Geospatial LLC | USA | |||||
| Rizing GmbH | Germany | |||||
| Rizing Limited | U.K. | |||||
| Rizing Consulting USA, Inc. (10) | USA | |||||
| Rizing Pte Ltd. (11) | Singapore | |||||
| The Capital Markets Company BV | Belgium | |||||
| CapAfric Consulting (Pty) Ltd | South Africa | |||||
| Capco Belgium BV | Belgium | |||||
| Capco Consultancy (Malaysia) Sdn. Bhd | Malaysia | |||||
| Capco Consultancy (Thailand) Ltd | Thailand | |||||
| Capco Consulting Singapore Pte. Ltd | Singapore | |||||
| Capco Greece Single Member P.C | Greece | |||||
| Capco Poland sp. z.o.o | Poland | |||||
| The Capital Markets Company (UK) Ltd | U.K. | |||||
| The Capital Markets Company GmbH | Germany | |||||
| Capco Austria GmbH | Austria | |||||
| The Capital Markets Company Limited | Hong Kong | |||||
| The Capital Markets Company Limited | Canada | |||||
| The Capital Markets Company S.á.r.l | Switzerland | |||||
| Andrion AG | Switzerland | |||||
| The Capital Markets Company S.A.S | France | |||||
| The Capital Markets Company s.r.o | Slovakia | |||||
| Wipro Ampion Holdings Pty Ltd | Australia | |||||
| Wipro Revolution IT Pty Ltd | Australia | |||||
| Wipro Shelde Australia Pty Ltd | Australia | |||||
| Wipro Appirio, Inc. | USA | |||||
| Wipro Appirio (Ireland) Limited | Ireland | |||||
| Wipro Appirio UK Limited | U.K. | |||||
| Topcoder, LLC. | USA | |||||
| Wipro Designit Services, Inc. | USA | |||||
| Wipro Designit Services Limited | Ireland | |||||
| Wipro do Brasil Technologia Ltda | Brazil | |||||
| Wipro do Brasil Servicos Ltda | Brazil | |||||
| Wipro Do Brasil Sistemas De Informatica Ltda | Brazil | |||||
| Wipro Portugal S.A. | Portugal | |||||
| Wipro Technologies GmbH | Germany | |||||
| Wipro Business Solutions GmbH (11) | Germany | |||||
| Wipro IT Services Austria GmbH | Austria |
(10) Attune Netherlands B.V transferred its entire shareholding in Rizing Consulting USA, Inc. to Rizing LLC, effective March 31, 2025.
5
(11) Step Subsidiary details of Attune Netherlands B.V., Rizing Pte Ltd., Wipro Business Solutions GmbH are as follows:
| Subsidiaries | Subsidiaries | Subsidiaries | Country of Incorporation | |||
| Attune Netherlands B.V. |
Netherlands | |||||
| Rizing Germany GmbH |
Germany | |||||
| Attune Italia S.R.L |
Italy | |||||
| Attune UK Ltd. |
U.K. | |||||
| Rizing Pte Ltd. |
Singapore | |||||
| Rizing New Zealand Ltd. |
New Zealand | |||||
| Rizing Philippines Inc. |
Philippines | |||||
| Rizing SDN BHD |
Malaysia | |||||
| Rizing Solutions Pty Ltd |
Australia | |||||
| Wipro Business Solutions GmbH |
Germany | |||||
| Wipro Technology Solutions S.R.L |
Romania |
As at March 31, 2025, the Company held 43.7% interest in Drivestream Inc. and 27% interest in SDVerse LLC, accounted for using the equity method.
The list of controlled trusts are:
| Name of the entity | Country of incorporation | |
| Wipro Equity Reward Trust |
India | |
| Wipro Foundation |
India |
| 6. | Segment Information |
The Company is organized into the following operating segments: IT Services and IT Products.
IT Services: The IT services segment primarily consists of IT services offerings to customers organized by four Strategic Market Units (“SMUs”) - Americas 1, Americas 2, Europe and Asia Pacific Middle East and Africa (“APMEA”). Americas 1 and Americas 2 are primarily organized by industry sector, while Europe and APMEA are organized by countries.
Americas 1 includes the entire business of Latin America (“LATAM”) and the following industry sectors in the United States of America: communications, media and information services, software and gaming, new age technology, consumer goods, medical devices and life sciences, healthcare, and technology products and services. Americas 2 includes the entire business in Canada and the following industry sectors in the United States of America: banking and financial services, energy, manufacturing and resources, capital markets and insurance, and hi-tech. Europe consists of the United Kingdom and Ireland, Switzerland, Germany, Northern Europe and Southern Europe. APMEA consists of Australia and New Zealand, India, Middle East, South East Asia, Japan and Africa.
Revenue from each customer is attributed to the respective SMUs based on the location of the customer’s primary buying center of such services. With respect to certain strategic global customers, revenue may be generated from multiple countries based on such customer’s buying centers, but the total revenue related to these strategic global customers are attributed to a single SMU based on the geographical location of key decision makers.
Our IT Services segment provides a range of IT and IT enabled services which include digital strategy advisory, customer centric design, technology consulting, IT consulting, custom application design, development, re-engineering and maintenance, systems integration, package implementation, cloud and infrastructure services, business process services, cloud, mobility and analytics services, research and development and hardware and software design.
IT Products: The Company is a value-added reseller of security, packaged and SaaS software for leading international brands. In certain total outsourcing contracts of the IT Services segment, the Company delivers hardware, software products and other related deliverables. Revenue relating to these items is reported as revenue from the sale of IT Products.
The Chief Executive Officer (“CEO”) and Managing Director of the Company has been identified as the Chief Operating Decision Maker as defined by IFRS 8, “Operating Segments”. The CEO of the Company evaluates the segments based on their revenue growth and operating income.
Assets and liabilities used in the Company’s business are not identified to any of the operating segments, as these are used interchangeably between segments. Management believes that it is currently not practicable to provide segment disclosures relating to total assets and liabilities since a meaningful segregation of the available data is onerous.
6
Information on reportable segments for the three months ended March 31, 2025, December 31, 2024, March 31, 2024, and year ended March 31, 2025 and March 31, 2024 are as follows:
| Particulars | Three months ended | Year ended | ||||||||||||||||||
| March 31, 2025 |
December 31, 2024 |
March 31, 2024 |
March 31, 2025 |
March 31, 2024 |
||||||||||||||||
| Audited | Audited | Audited | Audited | Audited | ||||||||||||||||
| Segment revenue |
||||||||||||||||||||
| IT Services |
||||||||||||||||||||
| Americas 1 |
73,721 | 72,010 | 67,229 | 281,824 | 268,230 | |||||||||||||||
| Americas 2 |
68,582 | 68,120 | 67,724 | 271,972 | 269,482 | |||||||||||||||
| Europe |
58,552 | 59,282 | 61,344 | 240,077 | 253,927 | |||||||||||||||
| APMEA |
23,598 | 23,439 | 24,499 | 94,351 | 102,177 | |||||||||||||||
| Total of IT Services |
224,453 | 222,851 | 220,796 | 888,224 | 893,816 | |||||||||||||||
| IT Products |
813 | 747 | 1,159 | 2,692 | 4,127 | |||||||||||||||
|
Total segment revenue |
225,266 | 223,598 | 221,955 | 890,916 | 897,943 | |||||||||||||||
| Segment result |
||||||||||||||||||||
| IT Services |
||||||||||||||||||||
| Americas 1 |
16,195 | 14,966 | 14,081 | 58,186 | 59,364 | |||||||||||||||
| Americas 2 |
15,513 | 15,275 | 15,791 | 61,326 | 59,163 | |||||||||||||||
| Europe |
8,140 | 7,600 | 7,933 | 29,434 | 33,354 | |||||||||||||||
| APMEA |
3,672 | 3,667 | 3,401 | 12,850 | 12,619 | |||||||||||||||
| Unallocated |
(4,250 | ) | (2,518 | ) | (5,011 | ) | (10,157 | ) | (20,304 | ) | ||||||||||
| Total of IT Services |
39,270 | 38,990 | 36,195 | 151,639 | 144,196 | |||||||||||||||
| IT Products |
28 | 29 | 143 | (173 | ) | (371 | ) | |||||||||||||
|
Reconciling Items |
(211 | ) | (53 | ) | (965 | ) | (195 | ) | (7,726 | ) | ||||||||||
|
Total segment result |
39,087 | 38,966 | 35,373 | 151,271 | 136,099 | |||||||||||||||
| Finance expenses |
(3,767 | ) | (4,146 | ) | (3,308 | ) | (14,770 | ) | (12,552 | ) | ||||||||||
| Finance and other income |
11,819 | 9,708 | 6,759 | 38,202 | 23,896 | |||||||||||||||
| Share of net profit/ (loss) of associate and joint venture accounted for using the equity method |
291 | 5 | (202 | ) | 254 | (233 | ) | |||||||||||||
|
Profit before tax |
47,430 | 44,533 | 38,622 | 174,957 | 147,210 | |||||||||||||||
Notes:
| a) | “Reconciling Items” includes elimination of inter-segment transactions and other corporate activities. |
| b) | Revenue from sale of Company owned intellectual properties is reported as part of IT Services revenues. |
| c) | For the purpose of segment reporting, the Company has included the net impact of foreign exchange gains/(losses), net in revenues amounting to ₹ 224, ₹ 410, and ₹ (128) for the three months ended March 31, 2025, December 31, 2024 and March 31, 2024 respectively, ₹ 32 and ₹ 340 for the year ended March 31, 2025 and March 31, 2024, respectively, which is reported under foreign exchange gains/(losses), net in the consolidated financial results. |
| d) | Restructuring cost of ₹ Nil and ₹ 6,814 for the three months and year ended March 31, 2024, respectively, is included under Reconciling Items. |
| e) | Reconciling Items for the three months and year ended March 31, 2024 includes employee costs of ₹ 921 towards outgoing CEO and Managing Director. |
| f) | “Unallocated” within IT Services segment results is after recognition of the below: |
| Three months ended | Year ended | |||||||||||||||||||
| March 31, 2025 |
December 31, 2024 |
March 31, 2024 |
March 31, 2025 |
March 31, 2024 |
||||||||||||||||
| Amortization and impairment expenses on intangible assets | 1,631 | 1,577 | 2,569 | 7,909 | 11,756 | |||||||||||||||
| Change in fair value of contingent consideration |
(2 | ) | - | (792 | ) | (169 | ) | (1,300 | ) | |||||||||||
Segment results of IT Services segment for the three months and year ended March 31, 2024 are after considering additional amortization due to change in estimate of useful life of the customer-related intangibles in an earlier Business combination.
| g) | Segment results of IT Services segment are after recognition of share-based compensation expense ₹ 1,195, ₹ 1,712 and ₹ 1,293 for the three months ended March 31, 2025, December 31, 2024 and March 31, 2024, respectively and ₹ 5,542 and ₹ 5,590 for the year ended March 31, 2025 and March 31, 2024 respectively. |
| h) | Segment results of IT Services segment are after recognition of (gain)/loss on sale of property, plant and equipment of ₹ 160, ₹ 77 and ₹ 102 for the three months ended March 31, 2025, December 31, 2024 and March 31, 2024, respectively, and ₹ (606) and ₹ (2,072) for the year ended March 31, 2025 and March 31, 2024 respectively. |
7
| 7. | During the year ended March 31, 2025 and 2024, decline in revenue and earnings estimates led to revision of recoverable value of customer-relationship intangible assets and marketing related intangible assets recognized on business combinations. Consequently, the Company has recognized impairment charge of ₹ Nil, ₹ Nil and ₹ 808 for the three months ended March 31, 2025, December 31, 2024 and March 31, 2024, ₹ 1,155 and ₹ 1,701 for the year ended March 31, 2025 and 2024, as part of amortization and impairment. |
| 8. | Buyback of equity shares |
During the year ended March 31, 2024, the Company concluded the buyback of 269,662,921 equity shares (at a price of ₹ 445 per equity share) as approved by the Board of Directors on April 27, 2023. This has resulted in a total cash outflow of ₹ 145,173 (including tax on buyback of ₹ 24,783 and transaction costs related to buyback of ₹ 390). In line with the requirement of the Companies Act, 2013, an amount of ₹ 3,768 and ₹ 141,405 has been utilized from share premium and retained earnings respectively. Further, capital redemption reserve (included in other reserves) of ₹ 539 (representing the nominal value of the shares bought back) has been created as an apportionment from retained earnings. Consequent to such buyback, the paid-up equity share capital has reduced by ₹ 539.
Earnings per share for each of the three months ended June 30, 2023, September 30, 2023, December 31, 2023 and March 31, 2024 will not add up to earnings per share for the year ended March 31, 2024, on account of buyback of equity shares.
| 9. | Issue of bonus shares |
During the year ended March 31, 2025, the Company concluded bonus issue in the ratio of 1:1 i.e.1 (one) bonus equity share of ₹ 2 each for every 1 (one) fully paid-up equity shares held (including ADS holders) was approved by the shareholders of the Company on November 21, 2024. Subsequently, on December 4, 2024, the Company allotted 5,232,094,402 equity shares (including ADS) to shareholders who held equity shares as on the record date of December 3, 2024. The Company also allotted 1:1 bonus equity share on 1,274,805 equity shares (including ADS) under allotment as on the record date. Consequently, ₹ 10,467 (representing par value of ₹ 2 per share) was transferred from capital redemption reserves, share premium and retained earnings to the share capital.
Earnings per share for all prior periods have been proportionately adjusted for the bonus issue in the ratio of 1:1 i.e. 1 (one) bonus equity share of ₹ 2 each for every 1 (one) fully paid-up equity shares held (including ADS holders).
| 10. | Consolidated Balance Sheet: |
| As at March 31, 2024 | As at March 31, 2025 | |||||||
| ASSETS |
||||||||
| Goodwill |
316,002 | 325,014 | ||||||
| Intangible assets |
32,748 | 27,450 | ||||||
| Property, plant and equipment |
81,608 | 80,684 | ||||||
| Right-of-Use assets |
17,955 | 25,598 | ||||||
| Financial assets |
||||||||
| Derivative assets |
25 | ^ | ||||||
| Investments |
21,629 | 26,458 | ||||||
| Trade receivables |
4,045 | 299 | ||||||
| Other financial assets |
5,550 | 4,664 | ||||||
| Investments accounted for using the equity method |
1,044 | 1,327 | ||||||
| Deferred tax assets |
1,817 | 2,561 | ||||||
| Non-current tax assets |
9,043 | 7,230 | ||||||
| Other non-current assets |
10,331 | 7,460 | ||||||
|
|
|
|
|
|||||
| Total non-current assets |
501,797 | 508,745 | ||||||
|
|
|
|
|
|||||
| Inventories |
907 | 694 | ||||||
| Financial assets |
||||||||
| Derivative assets |
1,333 | 1,820 | ||||||
| Investments |
311,171 | 411,474 | ||||||
| Cash and cash equivalents |
96,953 | 121,974 | ||||||
| Trade receivables |
115,477 | 117,745 | ||||||
| Unbilled receivables |
58,345 | 64,280 | ||||||
| Other financial assets |
10,536 | 8,448 | ||||||
| Contract assets |
19,854 | 15,795 | ||||||
| Current tax assets |
6,484 | 6,417 | ||||||
| Other current assets |
29,602 | 29,128 | ||||||
|
|
|
|
|
|||||
| Total current assets |
650,662 | 777,775 | ||||||
|
|
|
|
|
|||||
|
|
||||||||
|
|
|
|
|
|||||
| TOTAL ASSETS |
1,152,459 | 1,286,520 | ||||||
|
|
|
|
|
|||||
8
| EQUITY |
||||||||
| Share capital |
10,450 | 20,944 | ||||||
| Share premium |
3,291 | 2,628 | ||||||
| Retained earnings |
630,936 | 716,477 | ||||||
| Share-based payment reserve |
6,384 | 6,985 | ||||||
| Special Economic Zone Re-investment reserve |
42,129 | 27,778 | ||||||
| Other components of equity |
56,693 | 53,497 | ||||||
|
|
|
|
|
|||||
| Equity attributable to the equity holders of the Company |
749,883 | 828,309 | ||||||
| Non-controlling interests |
1,340 | 2,138 | ||||||
|
|
|
|
|
|||||
| TOTAL EQUITY |
751,223 | 830,447 | ||||||
|
|
|
|
|
|||||
| LIABILITIES |
||||||||
| Financial liabilities |
||||||||
| Loans and borrowings |
62,300 | 63,954 | ||||||
| Lease liabilities |
13,962 | 22,193 | ||||||
| Derivative liabilities |
4 | - | ||||||
| Other financial liabilities |
4,985 | 7,793 | ||||||
| Deferred tax liabilities |
17,467 | 16,443 | ||||||
| Non-current tax liabilities |
37,090 | 42,024 | ||||||
| Other non-current liabilities |
12,970 | 17,119 | ||||||
| Provisions |
- | 294 | ||||||
|
|
|
|
|
|||||
| Total non-current liabilities |
148,778 | 169,820 | ||||||
|
|
|
|
|
|||||
| Financial liabilities |
||||||||
| Loans, borrowings and bank overdrafts |
79,166 | 97,863 | ||||||
| Lease liabilities |
9,221 | 8,025 | ||||||
| Derivative liabilities |
558 | 968 | ||||||
| Trade payables and accrued expenses |
88,566 | 88,252 | ||||||
| Other financial liabilities |
2,272 | 3,878 | ||||||
| Contract liabilities |
17,653 | 20,063 | ||||||
| Current tax liabilities |
21,756 | 34,481 | ||||||
| Other current liabilities |
31,295 | 31,086 | ||||||
| Provisions |
1,971 | 1,637 | ||||||
|
|
|
|
|
|||||
| Total current liabilities |
252,458 | 286,253 | ||||||
|
|
|
|
|
|||||
| TOTAL LIABILITIES |
401,236 | 456,073 | ||||||
|
|
|
|
|
|||||
|
|
||||||||
|
|
|
|
|
|||||
| TOTAL EQUITY AND LIABILITIES |
1,152,459 | 1,286,520 | ||||||
|
|
|
|
|
^ Value is less than 0.5
| 11. | Consolidated statement of cash flows: |
|
Year ended March 31, |
||||||||
| 2024 | 2025 | |||||||
| Cash flows from operating activities |
||||||||
| Profit for the year |
111,121 | 132,180 | ||||||
| Adjustments to reconcile profit for the year to net cash generated from operating activities: |
||||||||
| Gain on sale of property, plant and equipment, net |
(2,072 | ) | (606 | ) | ||||
| Depreciation, amortization and impairment expense |
34,071 | 29,579 | ||||||
| Unrealized exchange (gain)/loss, net |
655 | (623 | ) | |||||
| Share-based compensation expense |
5,584 | 5,551 | ||||||
| Share of net (profit)/loss of associate and joint venture accounted for using equity method |
233 | (254 | ) | |||||
| Income tax expense |
36,089 | 42,777 | ||||||
| Finance and other income, net of finance expenses |
(11,344 | ) | (23,432 | ) | ||||
| Change in fair value of contingent consideration |
(1,300 | ) | (169 | ) | ||||
| Lifetime expected credit loss |
640 | 324 | ||||||
| Other non-cash items |
488 | — | ||||||
| Changes in operating assets and liabilities, net of effects from acquisitions |
||||||||
| (Increase)/Decrease in trade receivables |
7,824 | 1,894 | ||||||
| (Increase)/Decrease in unbilled receivables and contract assets |
5,919 | (1,331 | ) | |||||
| (Increase)/Decrease in Inventories |
287 | 213 | ||||||
| (Increase)/Decrease in other financial assets and other assets |
8,869 | 6,609 | ||||||
| Increase/(Decrease) in trade payables, accrued expenses, other financial liabilities, other liabilities and provisions |
(435 | ) | 548 | |||||
| Increase/(Decrease) in contract liabilities |
(5,053 | ) | 2,341 | |||||
|
|
|
|
|
|||||
| Cash generated from operating activities before taxes |
191,576 | 195,601 | ||||||
9
| Income taxes paid, net |
(15,360 | ) | (26,175 | ) | ||||
|
|
|
|
|
|||||
| Net cash generated from operating activities |
176,216 | 169,426 | ||||||
|
|
|
|
|
|||||
| Cash flows from investing activities: |
||||||||
| Payment for purchase of property, plant and equipment |
(10,510 | ) | (14,737 | ) | ||||
| Proceeds from disposal of property, plant and equipment |
4,022 | 1,822 | ||||||
| Payment for purchase of investments |
(975,069 | ) | (801,582 | ) | ||||
| Proceeds from sale of investments |
978,598 | 706,520 | ||||||
| Payment for business acquisitions including deposits and escrow, net of cash acquired |
(5,291 | ) | (964 | ) | ||||
| Payment for investment in joint venture |
(484 | ) | - | |||||
| Repayment of security deposit for property, plant and equipment |
300 | (300 | ) | |||||
| Interest received |
20,111 | 26,212 | ||||||
| Dividend received |
3 | 2,299 | ||||||
|
|
|
|
|
|||||
| Net cash generated from/(used in) investing activities |
11,680 | (80,730 | ) | |||||
|
|
|
|
|
|||||
| Cash flows from financing activities: |
||||||||
| Proceeds from issuance of equity shares and shares pending allotment |
13 | 27 | ||||||
| Repayment of loans and borrowings |
(130,557 | ) | (177,672 | ) | ||||
| Proceeds from loans and borrowings |
120,500 | 195,595 | ||||||
| Payment of lease liabilities |
(10,060 | ) | (10,474 | ) | ||||
| Payment for contingent consideration |
(1,294 | ) | - | |||||
| Interest and finance expenses paid |
(10,456 | ) | (8,689 | ) | ||||
| Payment of dividend |
(5,218 | ) | (62,750 | ) | ||||
| Payment of dividend to Non-controlling interest holders |
(322 | ) | - | |||||
| Payment for buyback of equity shares, including tax and transaction cost |
(145,173 | ) | - | |||||
|
|
|
|
|
|||||
| Net cash used in financing activities |
(182,567 | ) | (63,963 | ) | ||||
|
|
|
|
|
|||||
| Net increase/(decrease) in cash and cash equivalents during the year |
5,329 | 24,733 | ||||||
| Effect of exchange rate changes on cash and cash equivalents |
(239 | ) | 290 | |||||
| Cash and cash equivalents at the beginning of the year |
91,861 | 96,951 | ||||||
|
|
|
|
|
|||||
| Cash and cash equivalents at the end of the year |
96,951 | 121,974 | ||||||
|
|
|
|
|
| By order of the Board, |
For, Wipro Limited |
|
| Place: Bengaluru Date: April 16, 2025 |
Rishad A. Premji Chairman |
|
10
Exhibit 99.5

Wipro Limited Highlights for the Quarter ended March 31, 2025 REVENUE QoQ Constant YoY Constant Operating $2.60 Bn Currency Currency Margin 0.8% 1.2% 17.5% STRATEGIC MARKET UNITS MIX 32.8% AMERICAS 1 30.6% AMERICAS 2 26.1% EUROPE 10.5% APMEA SECTOR MIX 34.2% 18.9% 17.3% 15.2% 14.4% Banking, Consumer Technology & Energy, Health Financial Communications Manufacturing Services & Resources & Insurance TOTAL $4.0 Bn Operating EPS ₹ 3.4 Cash Flow $439 Mn BOOKINGS 10.5% YoY CC 6.2% QoQ Operating LARGE DEAL $1.8 Bn cash 104.4% TCV 25.8% YoY Flow/Net 48.5% YoY CC Income Revenue from our IT Services business segment to be in the range of OUTLOOK $2,505 million to $2,557 million*. This translates to sequential guidance of for the Quarter ending (-)3.5% to (-)1.5% in constant currency terms. June 30, 2025 *Outlook for the Quarter ending June 30, 2025, is based on the following exchange rates: GBP/USD at 1.26, Euro/USD at 1.05, AUD/USD at 0.63, USD/INR at 86.60 and CAD/USD at 0.70 CUSTOMER CONCENTRATION TOP1 4.4% 14.5% TOP 10 24.2% TOP 5 TOTAL HEADCOUNT 233,346 ATTRITION VOL – TTM 15.0% NET UTILIZATION 84.6% OFFSHORE REVENUE 62.1% EXCLUDING TRAINEES PERCENTAGE OF SERVICES P a g e 1

Wipro Limited Highlights for the Year ended March 31, 2025 REVENUE YoY Reported YoY Constant Operating $10.5 Bn Currency Currency Margin 2.7% 2.3% 17.1% STRATEGIC MARKET UNITS MIX 31.7% AMERICAS 1 30.6% AMERICAS 2 27.1% EUROPE 10.6% APMEA SECTOR MIX 34.3% 19.1% 17.2% 15.3% 14.1% Banking, Consumer Technology & Energy, Health Financial Communications Manufacturing Services & Resources & Insurance TOTAL $14.3 Bn Operating EPS ₹ 12.6 Cash Flow $1,983 Mn BOOKINGS 3.8% YoY CC 20.3% YoY Operating LARGE DEAL $5.4 Bn cash 128.2% TCV Flow/Net 17.5% YoY CC Income The interim dividend of ₹ 6 declared by the Board at its meeting CAPITAL ALLOCATION held on January 17th, 2025 shall be considered as final dividend for the financial year 2024-25. CUSTOMER CONCENTRATION TOP1 4.3% 14.0% TOP 10 23.3% TOP 5 TOTAL HEADCOUNT 233,346 ATTRITION VOL – TTM 15.0% OFFSHORE REVENUE NET UTILIZATION 85.6% 60.1% PERCENTAGE OF SERVICES EXCLUDING TRAINEES P a g e 2

Wipro Limited Results for the Quarter and Year ended March 31, 2025 FY 24 – 25 FY 23 – 24 A IT Services FY Q4 Q3 Q2 Q1 FY Q4 IT Services Revenues ($Mn) 10,511.5 2,596.5 2,629.1 2,660.1 2,625.9 10,805.3 2,657.4 Sequential Growth -2.7% -1.2% -1.2% 1.3% -1.2% -3.8% 0.1% Sequential Growth in Constant Currency Note 1 -2.3% -0.8% 0.1% 0.6% -1.0% -4.4% -0.3% Operating Margin % Note 2 17.1% 17.5% 17.5% 16.8% 16.5% 16.1% 16.4% Strategic Market Units Mix Americas 1 31.7% 32.8% 32.3% 30.8% 30.9% 30.0% 30.4% Americas 2 30.6% 30.6% 30.6% 30.6% 30.8% 30.1% 30.7% Europe 27.1% 26.1% 26.7% 27.9% 27.6% 28.4% 27.8% APMEA 10.6% 10.5% 10.4% 10.7% 10.7% 11.5% 11.1% Sectors Mix Banking, Financial Services and Insurance 34.3% 34.2% 34.1% 34.8% 34.0% 33.4% 33.5% Consumer 19.1% 18.9% 19.0% 19.2% 19.2% 18.8% 18.7% Energy, Manufacturing & Resources 17.2% 17.3% 16.9% 17.0% 17.6% 18.7% 18.5% Technology and Communications 15.3% 15.2% 15.3% 15.4% 15.3% 15.9% 15.2% Health 14.1% 14.4% 14.7% 13.6% 13.9% 13.2% 14.1% Total Bookings Total Bookings TCV ($Mn) Note 3 14,315 3,955 3,514 3,561 3,284 14,907 3,607 Large deal TCV ($Mn) Note 4 5,368 1,763 961 1,489 1,154 4,573 1,191 Guidance ($Mn) — 2,602—2,655 2,607—2,660 2,600—2,652 2,617-2,670 - 2,615–2,669 Guidance restated based on — 2,591 – 2,644 2,575 – 2,628 2,618 – 2,670 2,612-2,665 - 2,624–2,678 actual currency realized ($Mn) Revenues performance against guidance — 2,597 2,629 2,660 2,626 - 2,657 P a g e 3
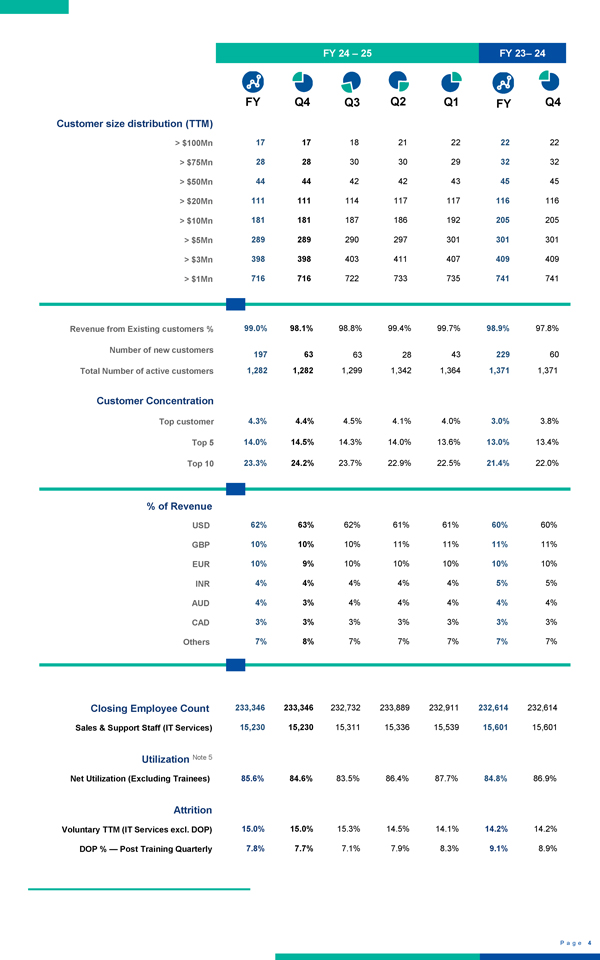
($Mn) FY 24 – 25 FY 23– 24 FY Q4 Q3 Q2 Q1 FY Q4 Customer size distribution (TTM) > $100Mn 17 17 18 21 22 22 22 > $75Mn 28 28 30 30 29 32 32 > $50Mn 44 44 42 42 43 45 45 > $20Mn 111 111 114 117 117 116 116 > $10Mn 181 181 187 186 192 205 205 > $5Mn 289 289 290 297 301 301 301 > $3Mn 398 398 403 411 407 409 409 > $1Mn 716 716 722 733 735 741 741 Revenue from Existing customers % 99.0% 98.1% 98.8% 99.4% 99.7% 98.9% 97.8% Number of new customers 197 63 63 28 43 229 60 Total Number of active customers 1,282 1,282 1,299 1,342 1,364 1,371 1,371 Customer Concentration Top customer 4.3% 4.4% 4.5% 4.1% 4.0% 3.0% 3.8% Top 5 14.0% 14.5% 14.3% 14.0% 13.6% 13.0% 13.4% Top 10 23.3% 24.2% 23.7% 22.9% 22.5% 21.4% 22.0% % of Revenue USD 62% 63% 62% 61% 61% 60% 60% GBP 10% 10% 10% 11% 11% 11% 11% EUR 10% 9% 10% 10% 10% 10% 10% INR 4% 4% 4% 4% 4% 5% 5% AUD 4% 3% 4% 4% 4% 4% 4% CAD 3% 3% 3% 3% 3% 3% 3% Others 7% 8% 7% 7% 7% 7% 7% Closing Employee Count 233,346 233,346 232,732 233,889 232,911 232,614 232,614 Sales & Support Staff (IT Services) 15,230 15,230 15,311 15,336 15,539 15,601 15,601 Utilization Note 5 Net Utilization (Excluding Trainees) 85.6% 84.6% 83.5% 86.4% 87.7% 84.8% 86.9% Attrition Voluntary TTM (IT Services excl. DOP) 15.0% 15.0% 15.3% 14.5% 14.1% 14.2% 14.2% DOP % — Post Training Quarterly 7.8% 7.7% 7.1% 7.9% 8.3% 9.1% 8.9% P a g e 4

FY 24 – 25 FY 23– 24 B Revenue Mix Note 5 FY Q4 Q3 Q2 Q1 FY Q4 Revenue from FPP 56.6% 55.5% 56.7% 56.7% 57.6% 59.2% 58.9% Offshore Revenue — % of Services 60.1% 62.1% 60.8% 59.8% 57.9% 59.9% 60.4% Growth Metrics C Note 1 for the Quarter and Year ended March 31, 2025 Q4’25 Q4’25 Q4’25 Q4’25 FY’25 FY’25 Reported Reported CC CC Reported CC QoQ% YoY% QoQ% YoY% YoY% YoY% IT Services -1.2% -2.3% -0.8% -1.2% -2.7% -2.3% Strategic Market Units Americas 1 0.3% 5.4% 0.2% 6.0% 2.8% 3.2% Americas 2 -1.2% -2.7% -1.0% -1.8% -1.1% -0.7% Europe -3.3% -8.3% -2.5% -6.9% -7.4% -7.1% APMEA -0.7% -7.3% 1.0% -4.9% -9.8% -8.9% Sectors Banking, Financial Services and Insurance -1.0% -0.2% -0.5% 0.8% -0.3% -0.1% Consumer -1.6% -1.2% -1.3% 0.0% -0.9% -0.4% Energy, Manufacturing & Resources 0.6% -8.7% 1.1% -7.0% -10.5% -9.6% Tech and Comms -1.5% -2.4% -0.9% -1.1% -6.5% -5.9% Health -3.1% -0.2% -3.1% 0.1% 4.0% 4.1% Annexure to Datasheet Segment-wise breakup of D Q4 FY24-25 (INR Mn) Cost of Revenues, S&M and G&A Reconciling Particulars IT Services IT Products Total Items Cost of revenues 154,463 856 206 155,525 Selling and marketing expenses 15,096 -33 2 15,065 General and administrative expenses 15,624 -38 3 15,589 Total 185,183 785 211 186,179 Note 1: Constant currency (CC) for a period is the product of volumes in that period times the average actual exchange rate of the corresponding comparative period Note 2: IT Services Operating Margin refers to Segment Results Total as reflected in IFRS financials Note 3: Total Bookings refers to the total contract value of all orders that were booked during the period including new orders, renewals, and changes to existing contracts. Bookings do not reflect subsequent terminations or reductions related to bookings originally recorded in prior fiscal periods. Bookings are recorded using then-existing foreign currency exchange rates and are not subsequently adjusted for foreign currency exchange rate fluctuations. The revenues from these contracts accrue over the tenure of the contract. For constant currency growth rates, refer note 1 Note 4: Large deal bookings constitute of deals greater than or equal to $30 million in total contract value terms Note 5: IT Services excluding DOP (Digital Operations and Platforms) and entities which are not integrated in Wipro limited systems at the beginning of current fiscal year. P a g e 5