UNITED STATES
SECURITIES AND EXCHANGE COMMISSION
WASHINGTON, D.C. 20549
FORM 8-K
CURRENT REPORT
PURSUANT TO SECTION 13 OR 15(d)
OF THE SECURITIES EXCHANGE ACT OF 1934
Date of Report (Date of earliest event reported): April 16, 2025
Farmers National Banc Corp.
(Exact name of registrant as specified in its charter)
| Ohio | 001-35296 | 34-1371693 | ||
| (State or other jurisdiction of incorporation) |
(Commission File Number) |
(IRS Employer Identification No.) |
||
| 20 South Broad Street, P.O. Box 555, Canfield, Ohio | 44406-0555 | |||
| (Address of principal executive offices) | (Zip Code) | |||
(330) 533-3341
(Registrant’s telephone number, including area code)
(Former name or former address, if changed since last report)
Check the appropriate box below if the Form 8-K filing is intended to simultaneously satisfy the filing obligation of the registrant under any of the following provisions:
| ☐ | Written communication pursuant to Rule 425 under the Securities Act (17 CFR 230.425) |
| ☐ | Soliciting material pursuant to Rule 14a-12 under the Exchange Act (17 CFR 240.14a-12) |
| ☐ | Pre-commencement communication pursuant to Rule 14d-2(b) under the Exchange Act (17 CFR 240.14d-2(b)) |
| ☐ | Pre-commencement communication pursuant to Rule 13e-4(c) under the Exchange Act (17 CFR 240.13e-4(c)) |
Securities registered pursuant to Section 12(b) of the Act:
| Title of each class |
Trading |
Name of each exchange |
||
| Common Stock, No Par Value | FMNB | The NASDAQ Stock Market |
Indicate by check mark whether the registrant is an emerging growth company as defined in Rule 405 of the Securities Act of 1933 (§230.405 of this chapter) or Rule 12b-2 of the Securities Exchange Act of 1934 (§240.12b-2 of this chapter).
Emerging growth company ☐
If an emerging growth company, indicate by check mark if the registrant has elected not to use the extended transition period for complying with any new or revised financial accounting standards provided pursuant to Section 13(a) of the Exchange Act. ☐
| Item 2.02 | Results of Operations and Financial Condition. |
On April 16, 2025, Farmers National Banc Corp. (the “Company”) announced earnings for the quarter ended March 31, 2025. A copy of the press release and certain financial information for that period is attached as Exhibit 99.1 hereto and incorporated by reference herein.
Also on April 16, 2025, the Company first provided investors with a supplemental presentation regarding first quarter earnings and other current financial information, attached as Exhibit 99.2 hereto and incorporated by reference herein.
Pursuant to General Instruction B.2 of Current Report on Form 8-K, the information in this Item 2.02 and Exhibits 99.1 and 99.2 are being furnished and shall not be deemed to be “filed” for purposes of Section 18 of the Securities Exchange Act of 1934, as amended (the “Exchange Act”), or otherwise subject to the liability of that section. Furthermore, the information in this Item 2.02 and Exhibits 99.1 and 99.2 shall not be deemed to be incorporated by reference into the filings of the Company under the Securities Act of 1933, as amended (the “Securities Act”) except as may be expressly set forth by specific reference in such filing.
| Item 7.01 | Regulation FD Disclosure. |
As described in “Item 2.02 Results of Operations and Financial Condition” above, on April 16, 2025, the Company issued a press release announcing earnings results for the quarter ended March 31, 2025. The full text of the press release issued in connection with the announcement is attached as Exhibit 99.1 hereto and incorporated by reference herein. In addition, on April 16, 2025, the Company first provided investors with a supplemental presentation regarding first quarter earnings and other current financial information, a copy of which is attached as Exhibit 99.2 hereto and incorporated by reference herein.
The press release and presentation is furnished herein, as part of this Item 7.01, as Exhibits 99.1 and 99.2. Pursuant to General Instruction B.2 of Current Report on Form 8-K, the information in this Item 7.01 and Exhibits 99.1 and 99.2 shall not be deemed to be “filed” for purposes of Section 18 of the Exchange Act, or otherwise subject to the liability of that section. Furthermore, the information in this Item 7.01 and Exhibits 99.1 and 99.2 shall not be deemed to be incorporated by reference into the filings of the Company under the Securities Act, except as may be expressly set forth by specific reference in such filing.
| Item 9.01 | Financial Statements and Exhibits. |
| (d) | Exhibits. |
| Exhibit |
Description |
|
| 99.1 | Press Release, dated April 16, 2025 | |
| 99.2 | Investor Presentation, dated April 16, 2025 | |
| 104 | Cover Page Interactive Data File (embedded within the Inline XBRL document) | |
SIGNATURES
Pursuant to the requirements of the Securities Exchange Act of 1934, the registrant has duly caused this report to be signed on its behalf by the undersigned hereunto duly authorized.
| Farmers National Banc Corp. | ||
| By: | /s/ Kevin J. Helmick |
|
| Kevin J. Helmick | ||
| President and Chief Executive Officer | ||
Date: April 16, 2025
Exhibit 99.1
April 16, 2025
Press Release
| Source: | Farmers National Banc Corp. |
Kevin J. Helmick, President and CEO
20 South Broad Street, P.O. Box 555
Canfield, OH 44406
330.533.3341
Email: exec@farmersbankgroup.com
FARMERS NATIONAL BANC CORP. REPORTS EARNINGS FOR FIRST QUARTER OF 2025
| • | 169 consecutive quarters of profitability |
| • | Opened a commercial loan production office in Columbus at the end of the first quarter |
| • | Net interest margin increased from 2.70% in the first quarter of 2024 to 2.85% in the first quarter of 2025 |
| • | Efficiency ratio improved to 59.6% in the first quarter of 2025 compared to the first quarter of 2024 |
| • | Restructured $23.8 million of available for sale securities in March with a 260 basis point pickup in reinvestment yield |
| • | Credit metrics remain solid with non-performing loans to loans ratio falling to 0.64% at March 31, 2025 |
| • | Annualized net charge-offs as a percentage of average loans were only 4 basis points in the first quarter of 2025 |
CANFIELD, Ohio (April 16, 2025) – Farmers National Banc Corp. (“Farmers” or the “Company”) (NASDAQ: FMNB) today reported net income of $13.6 million, or $0.36 per diluted share, for the first quarter of 2025 compared to $11.2 million, or $0.30 per diluted share, for the first quarter of 2024. Net income for the first quarter of 2025 included pretax losses on the sale of investments securities and other assets totaling $1.3 million. Excluding these items (non-GAAP), net income for the first quarter of 2025 was $14.6 million, or $0.39 per diluted share.
Kevin J. Helmick, President and CEO, stated “We entered 2025 from a position of strength with a legacy of profitability, strong asset quality and robust liquidity levels. As near-term economic uncertainty has picked up recently, we are well positioned to support our Ohio and Pennsylvania communities, while making strategic investments across our business and adding proven bankers to our team. The most recent of those strategic investments is the Company’s exciting entrance into the growth market of greater Columbus.”
Balance Sheet
Total assets increased by $38.1 million in the first quarter of 2025 to $5.16 billion from $5.12 billion at December 31, 2024. Loans declined slightly to $3.25 billion at March 31, 2025 from $3.27 billion at December 31, 2024. The decrease from the prior quarter was primarily due to declines in C&I and CRE lending as rising business uncertainty has reduced origination activity. The pipeline for the second quarter currently shows improvement but the introduction of tariffs adds more uncertainty to the decision making of borrowers.
The Company had securities available for sale totaling $1.28 billion as of March 31, 2025, compared to $1.27 billion at December 31, 2024. Net unrealized losses on the portfolio totaled $223.7 million at March 31, 2025, compared to $244.1 million at December 31, 2024. The Company also restructured $23.8 million of available for sale securities and reinvested the proceeds into securities with yields approximately 260 basis points higher than those sold. The earn back on the $1.3 million loss that was incurred on the sale is approximately 2.2 years. The Company anticipates continued volatility in the bond market in 2025.
Total deposits increased to $4.48 billion at March 31, 2025, from $4.27 billion at December 31, 2024. This $214.5 million increase was driven by an increase of $85.0 million in brokered CDs along with an increase in customer deposits of $129.5 million. The majority of the increase in customer deposits was driven by seasonal growth in public funds which totaled $106.3 million for the quarter.
Total stockholders’ equity increased to $429.1 million at March 31, 2025, from $406.0 million at December 31, 2024. The increase was due to a reduction in the unrealized losses on investments securities of $16.0 million along with an increase in retained earnings of $7.2 million due to $13.6 million of net income recognized during the quarter offset by dividends paid on outstanding common shares.
Credit Quality
Non-performing loans declined to $20.7 million at March 31, 2025, compared to $22.8 million at December 31, 2024. The Company continues to actively manage its level of non-performing loans and designated a single non-performing loan relationship totaling $1.8 million to “loans held for sale” during the first quarter of 2025. The Company expects a sale of the relationship to close in the second quarter of 2025. Non-performing loans to total loans were 0.64% at March 31, 2025, compared to 0.70% at December 31, 2024. The Company’s loans which were 30-89 days delinquent were $11.2 million at March 31, 2025, compared to $13.0 million at December 31, 2024, or 0.34% of total loans at March 31, 2025.
The Company’s provision for credit losses and unfunded commitments was a recovery of $204,000 for the first quarter of 2025 compared to a recovery of $449,000 for the first quarter of 2024. The recovery in the first quarter of 2025 was driven primarily by a recovery related to the provision for unfunded commitments. Annualized net charge-offs as a percentage of average loans were 0.04% for the first quarter of 2025, compared to 0.13% for the first quarter of 2024. The allowance for credit losses to total loans was 1.09% at March 31, 2025, compared to 1.10% at December 31, 2024.
Net Interest Income
The Company recorded $34.2 million in net interest income in the first quarter of 2025 compared to $31.7 million in the first quarter of 2024. Average interest earning assets increased to $4.89 billion in the first quarter of 2025 compared to $4.80 billion in the first quarter of 2024. The increase was primarily driven by an increase in average loan balances of $80.6 million. The net interest margin improved to 2.85% in the first quarter of 2025 from 2.70% in the first quarter of 2024. The year-over-year increase in net interest margin was due to higher yields on earning assets and lower funding costs on interest bearing liabilities. The current rate cutting cycle by the Federal Reserve that began in September of 2024 has had a significant impact on funding costs while the lag effects of assets repricing continue to drive earning asset yields higher. The yield on interest earning assets increased from 4.65% in the first quarter of 2024 to 4.74% in the first quarter of 2025 with both loans and securities showing increased yields. Interest bearing liabilities declined from 2.61% in the first quarter of 2024 to 2.52% in the first quarter of 2025. The Company expects its net interest margin will continue to expand in 2025 but the degree of expansion will depend on future Federal Reserve cuts to the fed funds rate. Excluding acquisition marks and PPP interest, non-GAAP, the Company’s net interest margin was 2.67% in the first quarter of 2025 compared to 2.50% in the first quarter of 2024.
Noninterest Income
Noninterest income increased from $8.4 million in the first quarter of 2024 to $10.5 million in the first quarter of 2025 due to improved profitability across all fee based lines of business and a lower level of losses on the sale of available for sale securities. Service charge income on deposit accounts increased $175,000 to $1.8 million in the first quarter of 2025 compared to $1.6 million for the first quarter in 2024. The Company undertook a review of all service charges in late 2023 and early 2024 and implemented fee increases across deposit product lines in the second quarter of 2024. Bank owned life insurance income increased $103,000 during the first quarter of 2025 to $810,000 compared to $707,000 in the first quarter of 2024. The Company purchased an additional $15.0 million in policies during the first quarter of 2025 and policy crediting rates have increased over the last twelve months. Trust fees increased to $2.6 million in the first quarter of 2025 compared to $2.5 million in the first quarter of 2024. The increase was due to continued growth in the business unit. Insurance agency commissions increased to $1.7 million in the first quarter of 2025 from $1.5 million in the first quarter of 2024. Annuity sales continue to drive growth. Losses on the sale of available for sale securities declined to $1.3 million in the first quarter of 2025 from a loss of $2.1 million in the first quarter of 2024. The bank restructured $23.8 million at the end of the first quarter of 2025 resulting in the loss realized on the sale. Retirement plan consulting fees increased to $798,000 in the first quarter of 2025 from $617,000 in the first quarter of 2024 primarily due to the acquisition of Crest Retirement Advisors LLC in late December of 2024. Debit card income grew from $1.6 million in the first quarter of 2024 to $1.9 million in the first quarter of 2025 as better volumes were realized in the current period.
Noninterest Expense
Noninterest expense increased to $28.5 million in the first quarter of 2025 compared to $27.0 million in the first quarter of 2024. Salaries and employee benefits increased to $16.2 million in the first quarter of 2025, from $15.1 million for the first quarter of 2024. The increase was primarily driven by annual raises, the acquisition of Crest Retirement in the fourth quarter of 2024 and higher commission expense from increased revenue in the fee-based businesses. Occupancy and equipment expense increased to $4.1 million in the first quarter of 2025 from $3.7 million in the first quarter of 2024 due to increased maintenance costs in 2025, the result of more severe winter weather along with timing differences. Core processing expense increased $262,000 from the first quarter of 2024 to $1.4 million in the first quarter of 2025. The increase was due to annual increases and timing differences. Other noninterest expense declined to $3.2 million in the first quarter of 2025 from $3.4 million in the first quarter of 2024. Several categories of expense showed declines as the Company continues to implement various cost saving initiatives.
Liquidity
The Company had access to an additional $749.3 million in FHLB borrowing capacity at March 31, 2025, along with $319.8 million in available for sale securities that are available for pledging. The Company’s loan to deposit ratio was 72.6% at March 31, 2025 while the Company’s average deposit balance per account (excluding collateralized deposits) was $25,741 for the same period.
About Farmers National Banc Corp.
Founded in 1887, Farmers National Banc Corp. is a diversified financial services company headquartered in Canfield, Ohio, with $5.2 billion in banking assets. Farmers National Banc Corp.’s wholly-owned subsidiaries are comprised of The Farmers National Bank of Canfield, a full-service national bank engaged in commercial and retail banking with 62 banking locations in Mahoning, Trumbull, Columbiana, Portage, Stark, Wayne, Medina, Geauga and Cuyahoga Counties in Ohio and Beaver, Butler, Allegheny, Jefferson, Clarion, Venango, Clearfield, Mercer, Elk and Crawford Counties in Pennsylvania, and Farmers Trust Company, which operates trust offices and offers services in the same geographic markets. Total wealth management assets under care at March 31, 2025 are $4.3 billion. Farmers National Insurance, LLC, a wholly-owned subsidiary of The Farmers National Bank of Canfield, offers a variety of insurance products.
Non-GAAP Disclosure
This press release includes disclosures of Farmers’ tangible common equity ratio, return on average tangible assets, return on average tangible equity, net income excluding costs related to acquisition activities and certain items, return on average assets excluding merger costs and certain items, return on average equity excluding merger costs and certain items, net interest margin excluding acquisition marks and related accretion and PPP interest and fees and efficiency ratio less certain items, which are financial measures not prepared in accordance with generally accepted accounting principles in the United States (GAAP). A non-GAAP financial measure is a numerical measure of historical or future financial performance, financial position or cash flows that excludes or includes amounts that are required to be disclosed by GAAP. Farmers believes that these non-GAAP financial measures provide both management and investors a more complete understanding of the underlying operational results and trends and Farmers’ marketplace performance. The presentation of this additional information is not meant to be considered in isolation or as a substitute for the numbers prepared in accordance with GAAP. The reconciliations of non-GAAP financial measures to their GAAP equivalents are included in the tables following Consolidated Financial Highlights below.
Cautionary Statements Regarding Forward-Looking Statements
We make statements in this news release and our related investor conference call, and we may from time to time make other statements, that are forward-looking statements within the meaning of the Private Securities Litigation Reform Act of 1995, including statements about Farmers’ financial condition, results of operations, asset quality trends and profitability. Forward-looking statements are not historical facts but instead represent only management’s current expectations and forecasts regarding future events, many of which, by their nature, are inherently uncertain and outside of Farmers’ control. Forward-looking statements are preceded by terms such as “expects,” “believes,” “anticipates,” “intends” and similar expressions, as well as any statements related to future expectations of performance or conditional verbs, such as “will,” “would,” “should,” “could” or “may.” Farmers’ actual results and financial condition may differ, possibly materially, from the anticipated results and financial condition indicated in these forward-looking statements. Factors that could cause Farmers’ actual results to differ materially from those described in certain forward-looking statements include significant changes in near-term local, regional, and U.S. economic conditions including those resulting from continued high rates of inflation, tightening monetary policy of the Board of Governors of the Federal Reserve, U.S. and foreign country tariff policies, and possibility of a recession; and the other factors contained in Farmers’ Annual Report on Form 10-K for the year ended December 31, 2024 and subsequent Quarterly Reports on Form 10-Q filed with the Securities and Exchange Commission (SEC) and available on Farmers’ website (www.farmersbankgroup.com) and on the SEC’s website (www.sec.gov). Forward-looking statements are not guarantees of future performance and should not be relied upon as representing management’s views as of any subsequent date. Farmers does not undertake any obligation to update the forward-looking statements to reflect the impact of circumstances or events that may arise after the date of the forward-looking statements.
Farmers National Banc Corp. and Subsidiaries
Consolidated Financial Highlights
(Amounts in thousands, except per share results) Unaudited
Consolidated Statements of Income
| For the Three Months Ended | ||||||||||||||||||||
| March 31, 2025 |
Dec. 31, 2024 |
Sept. 30, 2024 |
June 30, 2024 |
March 31, 2024 |
||||||||||||||||
| Total interest income |
$ | 57,305 | $ | 57,909 | $ | 57,923 | $ | 56,846 | $ | 55,054 | ||||||||||
| Total interest expense |
23,110 | 25,170 | 26,047 | 24,780 | 23,367 | |||||||||||||||
|
|
|
|
|
|
|
|
|
|
|
|||||||||||
| Net interest income |
34,195 | 32,739 | 31,876 | 32,066 | 31,687 | |||||||||||||||
| Provision (credit) for credit losses |
(204 | ) | 295 | 7,008 | 1,112 | (449 | ) | |||||||||||||
| Noninterest income |
10,481 | 11,413 | 12,340 | 9,606 | 8,357 | |||||||||||||||
| Acquisition related costs |
0 | 92 | 0 | 0 | 0 | |||||||||||||||
| Other expense |
28,526 | 26,082 | 27,075 | 26,403 | 27,039 | |||||||||||||||
|
|
|
|
|
|
|
|
|
|
|
|||||||||||
| Income before income taxes |
16,354 | 17,683 | 10,133 | 14,157 | 13,454 | |||||||||||||||
| Income taxes |
2,776 | 3,292 | 1,598 | 2,374 | 2,214 | |||||||||||||||
|
|
|
|
|
|
|
|
|
|
|
|||||||||||
| Net income |
$ | 13,578 | $ | 14,391 | $ | 8,535 | $ | 11,783 | $ | 11,240 | ||||||||||
|
|
|
|
|
|
|
|
|
|
|
|||||||||||
| Average diluted shares outstanding |
37,381 | 37,616 | 37,567 | 37,487 | 37,479 | |||||||||||||||
| Basic earnings per share |
0.36 | 0.38 | 0.23 | 0.32 | 0.30 | |||||||||||||||
| Diluted earnings per share |
0.36 | 0.38 | 0.23 | 0.31 | 0.30 | |||||||||||||||
| Cash dividends per share |
0.17 | 0.17 | 0.17 | 0.17 | 0.17 | |||||||||||||||
| Performance Ratios |
||||||||||||||||||||
| Net Interest Margin (Annualized) |
2.85 | % | 2.72 | % | 2.66 | % | 2.71 | % | 2.70 | % | ||||||||||
| Efficiency Ratio (Tax equivalent basis) |
59.60 | % | 56.42 | % | 58.47 | % | 60.80 | % | 61.54 | % | ||||||||||
| Return on Average Assets (Annualized) |
1.06 | % | 1.12 | % | 0.66 | % | 0.93 | % | 0.90 | % | ||||||||||
| Return on Average Equity (Annualized) |
13.12 | % | 13.43 | % | 8.18 | % | 12.15 | % | 11.47 | % | ||||||||||
| Other Performance Ratios (Non-GAAP) |
||||||||||||||||||||
| Return on Average Tangible Assets |
1.10 | % | 1.16 | % | 0.69 | % | 0.97 | % | 0.93 | % | ||||||||||
| Return on Average Tangible Equity |
24.02 | % | 23.95 | % | 14.94 | % | 23.74 | % | 21.88 | % | ||||||||||
| Consolidated Statements of Financial Condition |
||||||||||||||||||||
| March 31, 2025 |
Dec. 31, 2024 |
Sept. 30, 2024 |
June 30, 2024 |
March 31, 2024 |
||||||||||||||||
| Assets |
||||||||||||||||||||
| Cash and cash equivalents |
$ | 113,256 | $ | 85,738 | $ | 189,136 | $ | 180,987 | $ | 148,630 | ||||||||||
| Debt securities available for sale |
1,281,413 | 1,266,553 | 1,293,350 | 1,246,730 | 1,270,149 | |||||||||||||||
| Other investments |
40,334 | 45,405 | 33,617 | 37,594 | 34,619 | |||||||||||||||
| Loans held for sale |
2,973 | 5,005 | 2,852 | 2,577 | 1,854 | |||||||||||||||
| Loans |
3,251,391 | 3,268,346 | 3,280,517 | 3,237,369 | 3,181,318 | |||||||||||||||
| Less allowance for credit losses |
35,549 | 35,863 | 36,186 | 33,991 | 33,159 | |||||||||||||||
|
|
|
|
|
|
|
|
|
|
|
|||||||||||
| Net Loans |
3,215,842 | 3,232,483 | 3,244,331 | 3,203,378 | 3,148,159 | |||||||||||||||
|
|
|
|
|
|
|
|
|
|
|
|||||||||||
| Other assets |
503,222 | 483,740 | 473,217 | 485,587 | 476,599 | |||||||||||||||
|
|
|
|
|
|
|
|
|
|
|
|||||||||||
| Total Assets |
$ | 5,157,040 | $ | 5,118,924 | $ | 5,236,503 | $ | 5,156,853 | $ | 5,080,010 | ||||||||||
|
|
|
|
|
|
|
|
|
|
|
|||||||||||
| Liabilities and Stockholders’ Equity |
||||||||||||||||||||
| Deposits |
||||||||||||||||||||
| Noninterest-bearing |
$ | 979,142 | $ | 965,507 | $ | 969,682 | $ | 968,693 | $ | 977,475 | ||||||||||
| Interest-bearing |
3,342,182 | 3,226,321 | 3,317,223 | 3,237,142 | 3,220,650 | |||||||||||||||
| Brokered time deposits |
159,964 | 74,951 | 74,932 | 0 | 0 | |||||||||||||||
|
|
|
|
|
|
|
|
|
|
|
|||||||||||
| Total deposits |
4,481,288 | 4,266,779 | 4,361,837 | 4,205,835 | 4,198,125 | |||||||||||||||
| Other interest-bearing liabilities |
188,275 | 391,150 | 371,038 | 494,890 | 433,777 | |||||||||||||||
| Other liabilities |
58,343 | 54,967 | 63,950 | 59,434 | 51,082 | |||||||||||||||
|
|
|
|
|
|
|
|
|
|
|
|||||||||||
| Total liabilities |
4,727,906 | 4,712,896 | 4,796,825 | 4,760,159 | 4,682,984 | |||||||||||||||
| Stockholders’ Equity |
429,134 | 406,028 | 439,678 | 396,694 | 397,026 | |||||||||||||||
|
|
|
|
|
|
|
|
|
|
|
|||||||||||
| Total Liabilities and Stockholders’ Equity |
$ | 5,157,040 | $ | 5,118,924 | $ | 5,236,503 | $ | 5,156,853 | $ | 5,080,010 | ||||||||||
|
|
|
|
|
|
|
|
|
|
|
|||||||||||
| Period-end shares outstanding |
37,615 | 37,586 | 37,574 | 37,575 | 37,546 | |||||||||||||||
| Book value per share |
$ | 11.41 | $ | 10.80 | $ | 11.70 | $ | 10.56 | $ | 10.57 | ||||||||||
| Tangible book value per share (Non-GAAP)* |
6.42 | 5.80 | 6.69 | 5.53 | 5.52 | |||||||||||||||
| * | Tangible book value per share is calculated by dividing tangible common equity by outstanding shares |
| For the Three Months Ended | ||||||||||||||||||||
| Capital and Liquidity | March 31, 2025 |
Dec. 31, 2024 |
Sept. 30, 2024 |
June 30, 2024 |
March 31, 2024 |
|||||||||||||||
| Common Equity Tier 1 Capital Ratio (a) |
11.48 | % | 11.14 | % | 10.91 | % | 10.94 | % | 10.88 | % | ||||||||||
| Total Risk Based Capital Ratio (a) |
14.88 | % | 14.55 | % | 14.34 | % | 14.42 | % | 14.38 | % | ||||||||||
| Tier 1 Risk Based Capital Ratio (a) |
11.97 | % | 11.62 | % | 11.39 | % | 11.43 | % | 11.37 | % | ||||||||||
| Tier 1 Leverage Ratio (a) |
8.54 | % | 8.36 | % | 8.20 | % | 8.26 | % | 8.19 | % | ||||||||||
| Equity to Asset Ratio |
8.32 | % | 7.93 | % | 8.40 | % | 7.69 | % | 7.82 | % | ||||||||||
| Tangible Common Equity Ratio (b) |
4.86 | % | 4.42 | % | 4.98 | % | 4.18 | % | 4.24 | % | ||||||||||
| Net Loans to Assets |
62.36 | % | 63.15 | % | 61.96 | % | 62.12 | % | 61.97 | % | ||||||||||
| Loans to Deposits |
72.55 | % | 76.60 | % | 75.21 | % | 76.97 | % | 75.78 | % | ||||||||||
| Asset Quality |
||||||||||||||||||||
| Non-performing loans |
$ | 20,724 | $ | 22,818 | $ | 19,076 | $ | 12,870 | $ | 11,951 | ||||||||||
| Non-performing assets |
20,902 | 22,903 | 19,137 | 12,975 | 12,215 | |||||||||||||||
| Loans 30 - 89 days delinquent |
11,192 | 13,032 | 15,562 | 18,546 | 14,069 | |||||||||||||||
| Charged-off loans |
698 | 928 | 5,116 | 661 | 1,282 | |||||||||||||||
| Recoveries |
362 | 293 | 504 | 98 | 271 | |||||||||||||||
| Net Charge-offs |
336 | 635 | 4,612 | 563 | 1,011 | |||||||||||||||
| Annualized Net Charge-offs to Average Net Loans |
0.04 | % | 0.08 | % | 0.58 | % | 0.07 | % | 0.13 | % | ||||||||||
| Allowance for Credit Losses to Total Loans |
1.09 | % | 1.10 | % | 1.10 | % | 1.05 | % | 1.04 | % | ||||||||||
| Non-performing Loans to Total Loans |
0.64 | % | 0.70 | % | 0.58 | % | 0.40 | % | 0.38 | % | ||||||||||
| Loans 30 - 89 Days Delinquent to Total Loans |
0.34 | % | 0.40 | % | 0.47 | % | 0.57 | % | 0.44 | % | ||||||||||
| Allowance to Non-performing Loans |
171.54 | % | 157.17 | % | 189.69 | % | 264.11 | % | 277.46 | % | ||||||||||
| Non-performing Assets to Total Assets |
0.41 | % | 0.45 | % | 0.37 | % | 0.25 | % | 0.24 | % | ||||||||||
|
|
|
|
|
|
|
|
|
|
|
|||||||||||
| (a) | March 31, 2025 ratio is estimated |
| (b) | This is a non-GAAP financial measure. A reconciliation to GAAP is shown below |
| For the Three Months Ended | ||||||||||||||||||||
| End of Period Loan Balances | March 31, 2025 |
Dec. 31, 2024 |
Sept. 30, 2024 |
June 30, 2024 |
March 31, 2024 |
|||||||||||||||
| Commercial real estate |
$ | 1,370,661 | $ | 1,382,714 | $ | 1,372,374 | $ | 1,348,675 | $ | 1,339,372 | ||||||||||
| Commercial |
336,600 | 349,966 | 358,247 | 343,694 | 335,747 | |||||||||||||||
| Residential real estate |
846,639 | 845,081 | 852,444 | 849,561 | 836,252 | |||||||||||||||
| HELOC |
161,991 | 158,014 | 155,967 | 151,511 | 143,696 | |||||||||||||||
| Consumer |
257,310 | 259,954 | 269,231 | 268,606 | 256,846 | |||||||||||||||
| Agricultural loans |
267,737 | 262,392 | 261,773 | 265,035 | 260,425 | |||||||||||||||
|
|
|
|
|
|
|
|
|
|
|
|||||||||||
| Total, excluding net deferred loan costs |
$ | 3,240,938 | $ | 3,258,121 | $ | 3,270,036 | $ | 3,227,082 | $ | 3,172,338 | ||||||||||
|
|
|
|
|
|
|
|
|
|
|
|||||||||||
| For the Three Months Ended | ||||||||||||||||||||
| End of Period Customer Deposit Balances | March 31, 2025 |
Dec. 31, 2024 |
Sept. 30, 2024 |
June 30, 2024 |
March 31, 2024 |
|||||||||||||||
| Noninterest-bearing demand |
$ | 979,142 | $ | 965,507 | $ | 969,682 | $ | 968,693 | $ | 977,474 | ||||||||||
| Interest-bearing demand |
1,468,424 | 1,366,255 | 1,453,288 | 1,380,266 | 1,381,383 | |||||||||||||||
| Money market |
718,083 | 682,558 | 676,664 | 677,058 | 646,308 | |||||||||||||||
| Savings |
416,162 | 414,796 | 418,771 | 433,166 | 452,949 | |||||||||||||||
| Certificate of deposit |
739,512 | 762,712 | 768,500 | 746,652 | 740,011 | |||||||||||||||
|
|
|
|
|
|
|
|
|
|
|
|||||||||||
| Total customer deposits |
$ | 4,321,323 | $ | 4,191,828 | $ | 4,286,905 | $ | 4,205,835 | $ | 4,198,125 | ||||||||||
|
|
|
|
|
|
|
|
|
|
|
|||||||||||
| For the Three Months Ended | ||||||||||||||||||||
| Noninterest Income | March 31, 2025 |
Dec. 31, 2024 |
Sept. 30, 2024 |
June 30, 2024 |
March 31, 2024 |
|||||||||||||||
| Service charges on deposit accounts |
$ | 1,758 | $ | 1,890 | $ | 1,992 | $ | 1,846 | $ | 1,583 | ||||||||||
| Bank owned life insurance income, including death benefits |
810 | 613 | 688 | 652 | 707 | |||||||||||||||
| Trust fees |
2,641 | 2,700 | 2,544 | 2,345 | 2,510 | |||||||||||||||
| Insurance agency commissions |
1,741 | 1,273 | 1,416 | 1,255 | 1,528 | |||||||||||||||
| Security gains (losses), including fair value changes for equity securities |
(1,313 | ) | 10 | (403 | ) | (124 | ) | (2,120 | ) | |||||||||||
| Retirement plan consulting fees |
798 | 719 | 677 | 623 | 617 | |||||||||||||||
| Investment commissions |
529 | 621 | 476 | 478 | 432 | |||||||||||||||
| Net gains on sale of loans |
326 | 282 | 506 | 417 | 297 | |||||||||||||||
| Other mortgage banking fee income (loss), net |
147 | 285 | (168 | ) | 192 | 125 | ||||||||||||||
| Debit card and EFT fees |
1,866 | 2,164 | 1,993 | 1,760 | 1,567 | |||||||||||||||
| Other noninterest income |
1,178 | 856 | 2,619 | 162 | 1,111 | |||||||||||||||
|
|
|
|
|
|
|
|
|
|
|
|||||||||||
| Total Noninterest Income |
$ | 10,481 | $ | 11,413 | $ | 12,340 | $ | 9,606 | $ | 8,357 | ||||||||||
|
|
|
|
|
|
|
|
|
|
|
|||||||||||
| For the Three Months Ended | ||||||||||||||||||||
| Noninterest Expense | March 31, 2025 |
Dec. 31, 2024 |
Sept. 30, 2024 |
June 30, 2024 |
March 31, 2024 |
|||||||||||||||
| Salaries and employee benefits |
$ | 16,166 | $ | 14,424 | $ | 14,874 | $ | 14,558 | $ | 15,069 | ||||||||||
| Occupancy and equipment |
4,138 | 4,075 | 3,968 | 3,815 | 3,730 | |||||||||||||||
| FDIC insurance and state and local taxes |
1,262 | 1,019 | 1,480 | 1,185 | 1,345 | |||||||||||||||
| Professional fees |
1,196 | 785 | 1,084 | 1,194 | 1,254 | |||||||||||||||
| Merger related costs |
0 | 92 | 0 | 0 | 0 | |||||||||||||||
| Advertising |
456 | 192 | 435 | 445 | 431 | |||||||||||||||
| Intangible amortization |
735 | 914 | 629 | 630 | 688 | |||||||||||||||
| Core processing charges |
1,397 | 1,202 | 1,186 | 1,099 | 1,135 | |||||||||||||||
| Other noninterest expenses |
3,176 | 3,471 | 3,419 | 3,477 | 3,387 | |||||||||||||||
|
|
|
|
|
|
|
|
|
|
|
|||||||||||
| Total Noninterest Expense |
$ | 28,526 | $ | 26,174 | $ | 27,075 | $ | 26,403 | $ | 27,039 | ||||||||||
|
|
|
|
|
|
|
|
|
|
|
|||||||||||
Average Balance Sheets and Related Yields and Rates
(Dollar Amounts in Thousands)
| Three Months Ended March 31, 2025 |
Three Months Ended March 31, 2024 |
|||||||||||||||||||||||
| AVERAGE BALANCE |
INTEREST (1) | YIELD/ RATE (1) |
AVERAGE BALANCE |
INTEREST (1) | YIELD/ RATE (1) |
|||||||||||||||||||
| EARNING ASSETS |
||||||||||||||||||||||||
| Loans (2) |
$ | 3,261,908 | $ | 46,810 | 5.74 | % | $ | 3,181,337 | $ | 45,096 | 5.67 | % | ||||||||||||
| Taxable securities |
1,135,580 | 7,096 | 2.50 | 1,101,347 | 6,415 | 2.33 | ||||||||||||||||||
| Tax-exempt securities (2) |
377,078 | 2,990 | 3.17 | 408,075 | 3,208 | 3.14 | ||||||||||||||||||
| Other investments |
44,170 | 541 | 4.90 | 34,406 | 362 | 4.21 | ||||||||||||||||||
| Federal funds sold and other |
73,575 | 510 | 2.77 | 71,757 | 626 | 3.49 | ||||||||||||||||||
|
|
|
|
|
|
|
|
|
|||||||||||||||||
| Total earning assets |
4,892,311 | 57,947 | 4.74 | 4,796,922 | 55,707 | 4.65 | ||||||||||||||||||
| Nonearning assets |
226,456 | 227,044 | ||||||||||||||||||||||
|
|
|
|
|
|||||||||||||||||||||
| Total assets |
$ | 5,118,767 | $ | 5,023,966 | ||||||||||||||||||||
|
|
|
|
|
|||||||||||||||||||||
| INTEREST-BEARING LIABILITIES |
||||||||||||||||||||||||
| Time deposits |
$ | 733,406 | $ | 6,632 | 3.62 | % | $ | 736,932 | $ | 7,048 | 3.83 | % | ||||||||||||
| Brokered time deposits |
143,393 | 1,538 | 4.29 | 0 | 0 | 0.00 | ||||||||||||||||||
| Savings deposits |
1,115,259 | 4,012 | 1.44 | 1,084,579 | 3,598 | 1.33 | ||||||||||||||||||
| Demand deposits - interest bearing |
1,377,522 | 7,535 | 2.19 | 1,345,311 | 7,743 | 2.30 | ||||||||||||||||||
|
|
|
|
|
|
|
|
|
|||||||||||||||||
| Total interest-bearing deposits |
3,369,580 | 19,717 | 2.34 | 3,166,822 | 18,389 | 2.32 | ||||||||||||||||||
| Short term borrowings |
218,444 | 2,417 | 4.43 | 324,791 | 3,939 | 4.85 | ||||||||||||||||||
| Long term borrowings |
86,209 | 976 | 4.53 | 88,721 | 1,038 | 4.68 | ||||||||||||||||||
|
|
|
|
|
|
|
|
|
|||||||||||||||||
| Total borrowed funds |
304,653 | 3,393 | 4.45 | 413,512 | 4,977 | 4.81 | ||||||||||||||||||
|
|
|
|
|
|
|
|
|
|||||||||||||||||
| Total interest-bearing liabilities |
3,674,233 | 23,110 | 2.52 | 3,580,334 | 23,366 | 2.61 | ||||||||||||||||||
| NONINTEREST-BEARING LIABILITIES AND STOCKHOLDERS’ EQUITY |
||||||||||||||||||||||||
| Demand deposits - noninterest bearing |
977,619 | 995,168 | ||||||||||||||||||||||
| Other liabilities |
52,894 | 52,915 | ||||||||||||||||||||||
| Stockholders’ equity |
414,021 | 395,549 | ||||||||||||||||||||||
|
|
|
|
|
|||||||||||||||||||||
| TOTAL LIABILITIES AND |
||||||||||||||||||||||||
| STOCKHOLDERS’ EQUITY |
$ | 5,118,767 | $ | 5,023,966 | ||||||||||||||||||||
|
|
|
|
|
|||||||||||||||||||||
|
|
|
|
|
|||||||||||||||||||||
| Net interest income and interest rate spread |
$ | 34,837 | 2.22 | % | $ | 32,341 | 2.04 | % | ||||||||||||||||
|
|
|
|
|
|
|
|
|
|||||||||||||||||
| Net interest margin |
2.85 | % | 2.70 | % | ||||||||||||||||||||
|
|
|
|
|
|||||||||||||||||||||
| (1) | Interest and yields are calculated on a tax-equivalent basis where applicable. |
| (2) | For 2025, adjustments of $103 thousand and $539 thousand, respectively, were made to tax equate income on tax exempt loans and tax exempt securities. For 2024, adjustments of $80 thousand and $573 thousand, respectively, were made to tax equate income on tax exempt loans and tax exempt securities. These adjustments were based on a marginal federal income tax rate of 21%, less disallowances. |
| Reconciliation of Total Assets to Tangible Assets | For the Three Months Ended | |||||||||||||||||||
| March 31, 2025 |
Dec. 31, 2024 |
Sept. 30, 2024 |
June 30, 2024 |
March 31, 2024 |
||||||||||||||||
| Total Assets |
$ | 5,157,040 | $ | 5,118,924 | $ | 5,236,503 | $ | 5,156,853 | $ | 5,080,010 | ||||||||||
| Less Goodwill and other intangibles |
187,466 | 188,200 | 188,340 | 188,970 | 189,599 | |||||||||||||||
|
|
|
|
|
|
|
|
|
|
|
|||||||||||
| Tangible Assets |
$ | 4,969,574 | $ | 4,930,724 | $ | 5,048,163 | $ | 4,967,883 | $ | 4,890,411 | ||||||||||
|
|
|
|
|
|
|
|
|
|
|
|||||||||||
| Average Assets |
5,118,767 | 5,159,901 | 5,134,062 | 5,044,516 | 5,023,966 | |||||||||||||||
| Less average Goodwill and other intangibles |
187,947 | 188,256 | 188,755 | 189,382 | 190,040 | |||||||||||||||
|
|
|
|
|
|
|
|
|
|
|
|||||||||||
| Average Tangible Assets |
$ | 4,930,820 | $ | 4,971,645 | $ | 4,945,307 | $ | 4,855,134 | $ | 4,833,926 | ||||||||||
|
|
|
|
|
|
|
|
|
|
|
|||||||||||
| Reconciliation of Common Stockholders’ Equity to Tangible Common Equity | For the Three Months Ended | |||||||||||||||||||
| March 31, 2025 |
Dec. 31, 2024 |
Sept. 30, 2024 |
June 30, 2024 |
March 31, 2024 |
||||||||||||||||
| Stockholders’ Equity |
$ | 429,134 | $ | 406,028 | $ | 439,678 | $ | 396,694 | $ | 397,026 | ||||||||||
| Less Goodwill and other intangibles |
187,466 | 188,200 | 188,340 | 188,970 | 189,599 | |||||||||||||||
|
|
|
|
|
|
|
|
|
|
|
|||||||||||
| Tangible Common Equity |
$ | 241,668 | $ | 217,828 | $ | 251,338 | $ | 207,724 | $ | 207,427 | ||||||||||
|
|
|
|
|
|
|
|
|
|
|
|||||||||||
| Average Stockholders’ Equity |
414,021 | 428,646 | 417,327 | 387,881 | 395,549 | |||||||||||||||
| Less average Goodwill and other intangibles |
187,947 | 188,256 | 188,755 | 189,382 | 190,040 | |||||||||||||||
|
|
|
|
|
|
|
|
|
|
|
|||||||||||
| Average Tangible Common Equity |
$ | 226,074 | $ | 240,390 | $ | 228,572 | $ | 198,499 | $ | 205,509 | ||||||||||
|
|
|
|
|
|
|
|
|
|
|
|||||||||||
| Reconciliation of Net Income, Less Merger and Certain Items | For the Three Months Ended | |||||||||||||||||||
| March 31, 2025 |
Dec. 31, 2024 |
Sept. 30, 2024 |
June 30, 2024 |
March 31, 2024 |
||||||||||||||||
| Net income |
$ | 13,578 | $ | 14,391 | $ | 8,535 | $ | 11,783 | $ | 11,240 | ||||||||||
| Acquisition related costs - after tax |
0 | 82 | 0 | 0 | 0 | |||||||||||||||
| Net loss (gain) on asset/security sales - after tax |
1,056 | 70 | (32 | ) | 407 | 1,675 | ||||||||||||||
|
|
|
|
|
|
|
|
|
|
|
|||||||||||
| Net income - Adjusted |
$ | 14,634 | $ | 14,543 | $ | 8,503 | $ | 12,190 | $ | 12,915 | ||||||||||
|
|
|
|
|
|
|
|
|
|
|
|||||||||||
| Diluted EPS excluding merger and certain items |
$ | 0.39 | $ | 0.39 | $ | 0.23 | $ | 0.33 | $ | 0.34 | ||||||||||
|
|
|
|
|
|
|
|
|
|
|
|||||||||||
| Return on Average Assets excluding merger and certain items (Annualized) |
1.14 | % | 1.13 | % | 0.66 | % | 0.97 | % | 1.03 | % | ||||||||||
| Return on Average Equity excluding merger and certain items (Annualized) |
14.14 | % | 13.57 | % | 8.15 | % | 12.57 | % | 13.06 | % | ||||||||||
| Return on Average Tangible Equity excluding acquisition costs and certain items (Annualized) |
25.89 | % | 24.20 | % | 14.88 | % | 24.56 | % | 25.14 | % | ||||||||||
| Efficiency ratio excluding certain items | For the Three Months Ended | |||||||||||||||||||
| March 31, 2025 |
Dec. 31, 2024 |
Sept. 30, 2024 |
June 30, 2024 |
March 31, 2024 |
||||||||||||||||
| Net interest income, tax equated |
$ | 34,837 | $ | 33,364 | $ | 32,483 | $ | 32,661 | $ | 32,341 | ||||||||||
| Noninterest income |
10,481 | 11,413 | 12,340 | 9,606 | 8,357 | |||||||||||||||
| Net (gain) on loan sale |
0 | 0 | 0 | 0 | 0 | |||||||||||||||
| Net loss (gain) on asset/security sales |
1,337 | 89 | (41 | ) | 515 | 2,120 | ||||||||||||||
|
|
|
|
|
|
|
|
|
|
|
|||||||||||
| Net interest income and noninterest income adjusted |
46,655 | 44,866 | 44,782 | 42,782 | 42,818 | |||||||||||||||
| Noninterest expense less intangible amortization |
27,791 | 25,260 | 26,446 | 25,773 | 26,351 | |||||||||||||||
| Acquisition related costs |
0 | 92 | 0 | 0 | 0 | |||||||||||||||
|
|
|
|
|
|
|
|
|
|
|
|||||||||||
| Noninterest expense adjusted |
27,791 | 25,168 | 26,446 | 25,773 | 26,351 | |||||||||||||||
|
|
|
|
|
|
|
|
|
|
|
|||||||||||
| Efficiency ratio excluding certain items |
59.57 | % | 56.10 | % | 59.05 | % | 60.24 | % | 61.54 | % | ||||||||||
|
|
|
|
|
|
|
|
|
|
|
|||||||||||
| Net interest margin excluding acquisition marks and PPP interest and fees | For the Three Months Ended | |||||||||||||||||||
| March 31, 2025 |
Dec. 31, 2024 |
Sept. 30, 2024 |
June 30, 2024 |
March 31, 2024 |
||||||||||||||||
| Net interest income, tax equated |
$ | 34,837 | $ | 33,364 | $ | 32,483 | $ | 32,661 | $ | 32,341 | ||||||||||
| Acquisition marks |
2,151 | 1,953 | 2,123 | 2,391 | 2,370 | |||||||||||||||
| PPP interest and fees |
0 | 0 | 0 | 1 | 1 | |||||||||||||||
|
|
|
|
|
|
|
|
|
|
|
|||||||||||
| Adjusted and annualized net interest income |
130,744 | 125,644 | 121,440 | 121,076 | 119,880 | |||||||||||||||
|
|
|
|
|
|
|
|
|
|
|
|||||||||||
| Average earning assets |
4,892,311 | 4,912,702 | 4,890,344 | 4,825,532 | 4,796,922 | |||||||||||||||
|
|
|
|
|
|
|
|
|
|
|
|||||||||||
| Less PPP average balances |
105 | 112 | 118 | 171 | 213 | |||||||||||||||
|
|
|
|
|
|
|
|
|
|
|
|||||||||||
| Adjusted average earning assets |
4,892,206 | 4,912,590 | 4,890,226 | 4,825,361 | 4,796,709 | |||||||||||||||
|
|
|
|
|
|
|
|
|
|
|
|||||||||||
| Net interest margin excluding marks and PPP interest and fees |
2.67 | % | 2.56 | % | 2.48 | % | 2.51 | % | 2.50 | % | ||||||||||
|
|
|
|
|
|
|
|
|
|
|
|||||||||||

Exhibit 99.2 Q1 2025 Investor Presentation NASDAQ: FMNB
Disclosure Statement Forward-Looking Statements This presentation contains forward-looking statements within the meaning of the Private Securities Litigation Reform Act of 1995, including statements about the financial condition, results of operations, asset quality trends and profitability of Farmers National Banc Corp. (“Farmers”). Forward-looking statements are not historical facts but instead express only management’s current expectations and forecasts of future events or long-term-goals, many of which, by their nature, are inherently uncertain and outside of Farmers’ control. Forward-looking statements are preceded by terms such as “expects,” “believes,” “anticipates,” “intends” and similar expressions, as well as any statements related to future expectations of performance or conditional verbs, such as “will,” “would,” “should,” “could” or “may.” Farmers’ actual results and financial condition may differ, possibly materially, from those indicated in these forward-looking statements. Factors that could cause Farmers’ actual results to differ materially from those described in the forward-looking statements include significant changes in near-term local, regional, and U.S. economic conditions including those resulting from continued high rates of inflation, tightening monetary policy of the Board of Governors of the Federal Reserve, U.S. and foreign country tariff policies, and possibility of a recession; and the other factors contained in Farmers’ periodic reports and registration statements filed with the Securities and Exchange Commission, including its Annual Report on Form 10-K for the year ended December 31, 2024, and Quarterly Reports on Form 10-Q, which have been filed with the Securities and Exchange Commission and are available on Farmers’ website (www.farmersbankgroup.com) and on the Securities and Exchange Commission’s website (www.sec.gov). Forward-looking statements are not guarantees of future performance and should not be relied upon as representing management’s views as of any subsequent date. Farmers undertakes no obligation to update forward-looking statements, whether as a result of new information, future events or otherwise. Use of Non-GAAP Financial Measures This presentation contains certain financial information determined by methods other than in accordance with accounting principles generally accepted in the United States (“GAAP”). These non-GAAP financial measures include “Core Deposits” and “Tangible Common Equity ratio.” Farmers believes that these non-GAAP financial measures provide both management and investors a more complete understanding of Farmers’ deposit profile and capital. These non-GAAP financial measures are supplemental and are not a substitute for any analysis based on GAAP financial measures. Because not all companies use the same calculation of “Core Deposits” and “Tangible Common Equity ratio,” this presentation may not be comparable to other similarly titled measures as calculated by other companies. 2
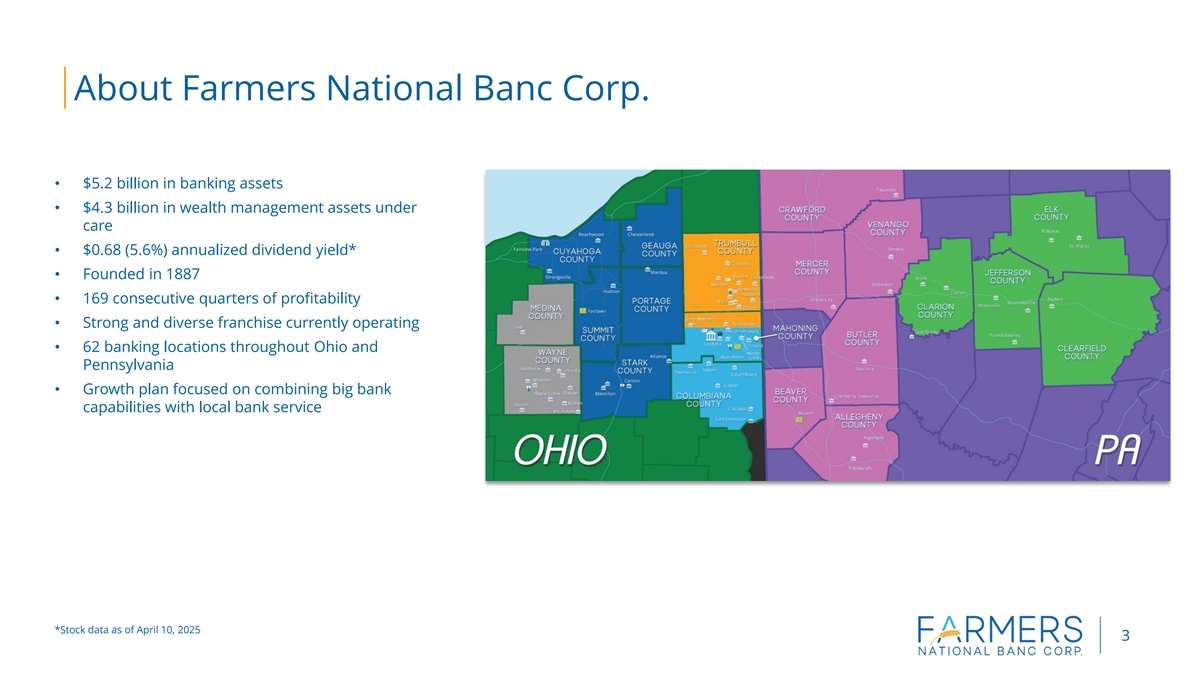
About Farmers National Banc Corp. • $5.2 billion in banking assets • $4.3 billion in wealth management assets under care • $0.68 (5.6%) annualized dividend yield* • Founded in 1887 • 169 consecutive quarters of profitability • Strong and diverse franchise currently operating • 62 banking locations throughout Ohio and Pennsylvania • Growth plan focused on combining big bank capabilities with local bank service *Stock data as of April 10, 2025 3
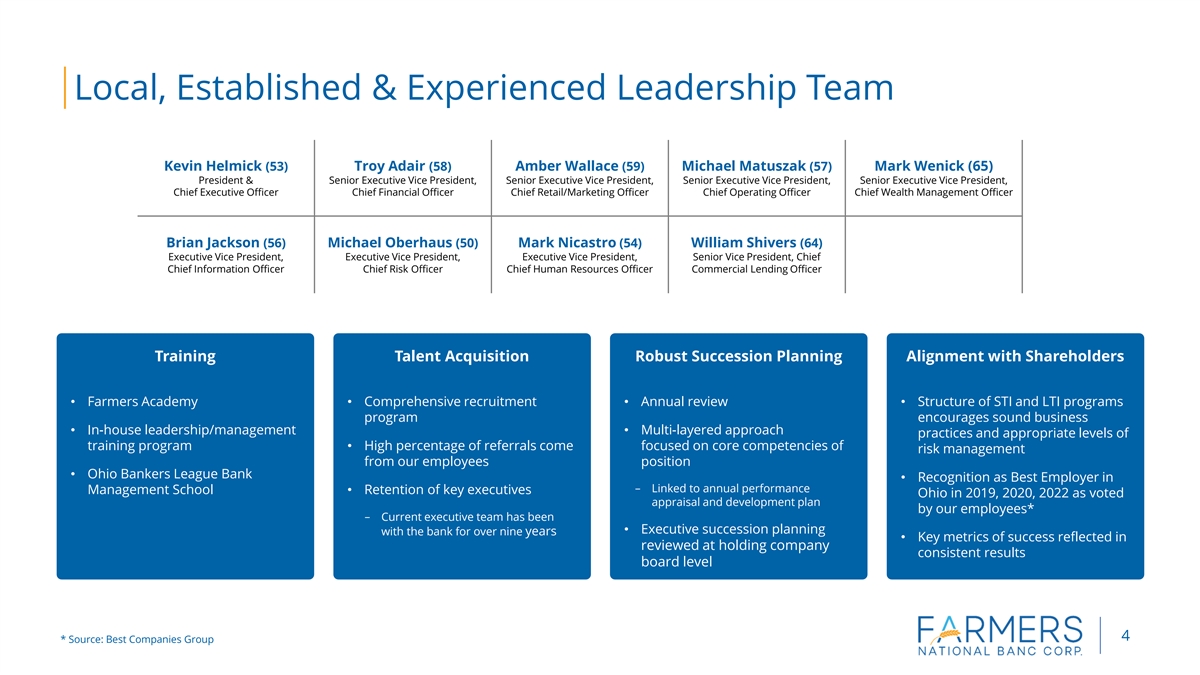
Local, Established & Experienced Leadership Team Kevin Helmick (53) Troy Adair (58) Amber Wallace (59) Michael Matuszak (57) Mark Wenick (65) President & Senior Executive Vice President, Senior Executive Vice President, Senior Executive Vice President, Senior Executive Vice President, Chief Executive Officer Chief Financial Officer Chief Retail/Marketing Officer Chief Operating Officer Chief Wealth Management Officer Brian Jackson (56) Michael Oberhaus (50) Mark Nicastro (54) William Shivers (64) Executive Vice President, Executive Vice President, Executive Vice President, Senior Vice President, Chief Chief Information Officer Chief Risk Officer Chief Human Resources Officer Commercial Lending Officer Training Talent Acquisition Robust Succession Planning Alignment with Shareholders • Farmers Academy• Comprehensive recruitment • Annual review• Structure of STI and LTI programs program encourages sound business • In-house leadership/management • Multi-layered approach practices and appropriate levels of training program• High percentage of referrals come focused on core competencies of risk management from our employees position • Ohio Bankers League Bank • Recognition as Best Employer in − Linked to annual performance Management School • Retention of key executives Ohio in 2019, 2020, 2022 as voted appraisal and development plan by our employees* − Current executive team has been • Executive succession planning with the bank for over nine years • Key metrics of success reflected in reviewed at holding company consistent results board level 4 * Source: Best Companies Group

Farmers Strategic Vision Leveraging our History with Modern Banking Technologies to Support our Future Invest in our Franchise Drive Financial Excellence • Leverage technology• Strive for performance metrics in top quartile ranking vs. peer group • Drive efficiencies through Six Sigma operating framework• Focus on growing noninterest income • Strive to be customer centric and provide exceptional experiences • Proactive capital management • Assure Farmers is the best place to work • Maintain financial strength • Continued pursuit of organic and M&A opportunities • Prudent risk management and focus on asset quality 5
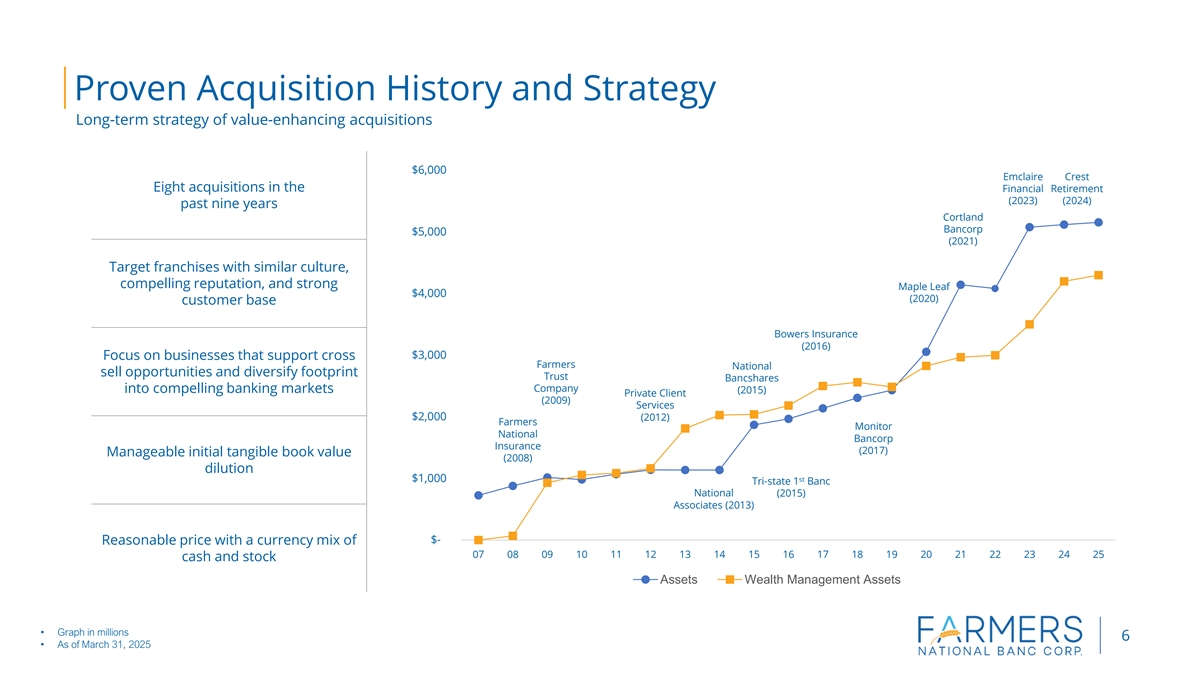
Proven Acquisition History and Strategy Long-term strategy of value-enhancing acquisitions $6,000 Emclaire Crest Eight acquisitions in the Financial Retirement (2023) (2024) past nine years Cortland Bancorp $5,000 (2021) Target franchises with similar culture, compelling reputation, and strong Maple Leaf $4,000 (2020) customer base Bowers Insurance (2016) $3,000 Focus on businesses that support cross Farmers National sell opportunities and diversify footprint Trust Bancshares Company into compelling banking markets (2015) Private Client (2009) Services $2,000 (2012) Farmers Monitor National Bancorp Insurance (2017) Manageable initial tangible book value (2008) dilution $1,000 st Tri-state 1 Banc National (2015) Associates (2013) $- Reasonable price with a currency mix of 07 08 09 10 11 12 13 14 15 16 17 18 19 20 21 22 23 24 25 cash and stock Assets Wealth Management Assets • Graph in millions 6 • As of March 31, 2025

Financial Performance NASDAQ: FMNB
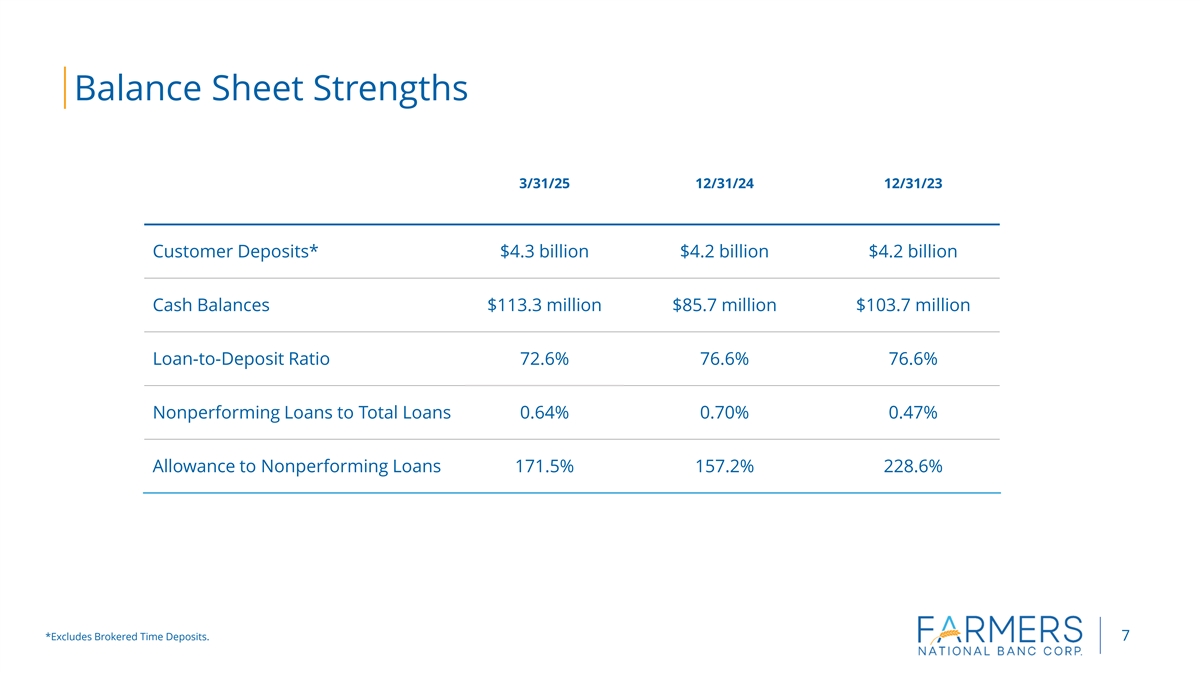
Balance Sheet Strengths (1) 3/31/25 12/31/24 12/31/23 Customer Deposits* $4.3 billion $4.2 billion $4.2 billion Cash Balances $113.3 million $85.7 million $103.7 million (1) Loan-to-Deposit Ratio 72.6% 76.6% 76.6% Nonperforming Loans to Total Loans 0.64% 0.70% 0.47% Allowance to Nonperforming Loans 171.5% 157.2% 228.6% *Excludes Brokered Time Deposits. 7
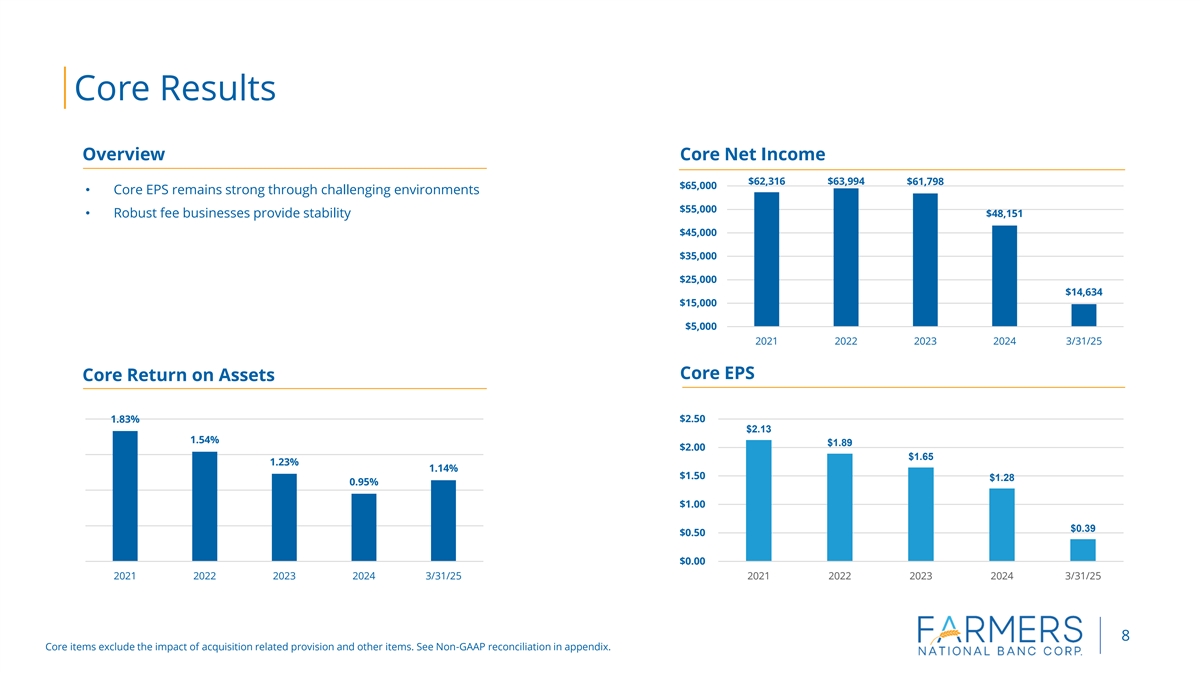
Core Results Overview Core Net Income $62,316 $63,994 $61,798 $65,000 • Core EPS remains strong through challenging environments $55,000 • Robust fee businesses provide stability $48,151 $45,000 $35,000 $25,000 $14,634 $15,000 $5,000 2021 2022 2023 2024 3/31/25 Core EPS Core Return on Assets 1.83% $2.50 $2.13 1.54% $1.89 $2.00 $1.65 1.23% 1.14% $1.50 $1.28 0.95% $1.00 $0.39 $0.50 $0.00 2021 2022 2023 2024 3/31/25 2021 2022 2023 2024 3/31/25 8 Core items exclude the impact of acquisition related provision and other items. See Non-GAAP reconciliation in appendix.
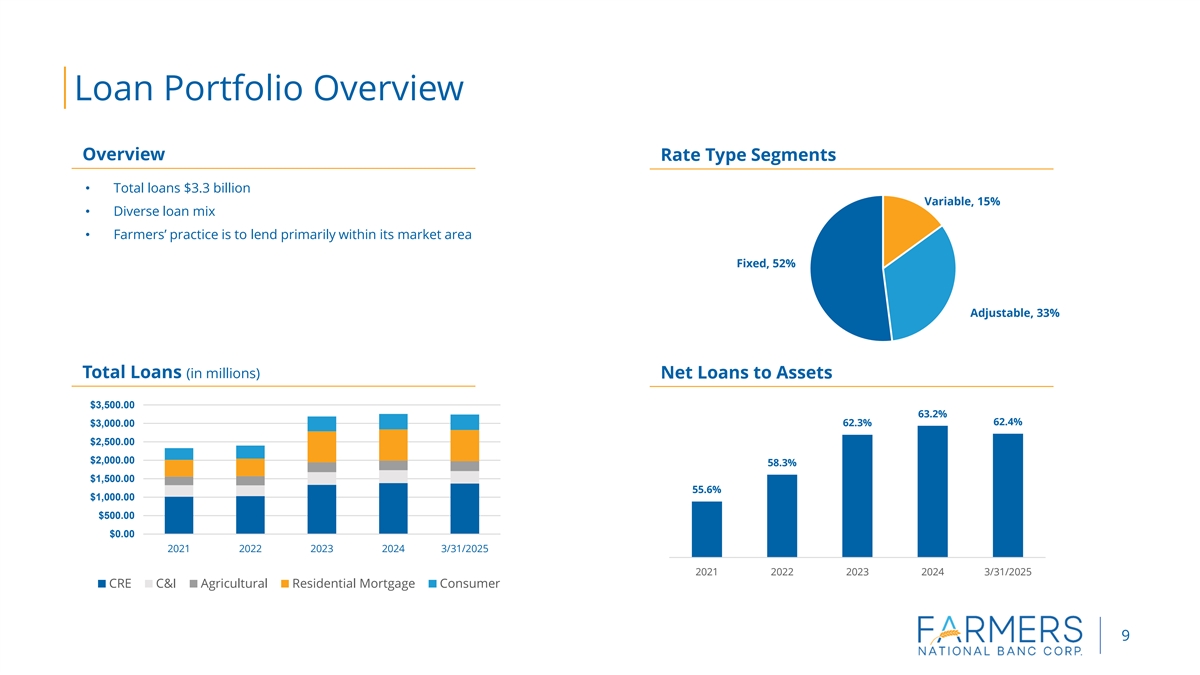
Loan Portfolio Overview Overview Rate Type Segments • Total loans $3.3 billion Variable, 15% • Diverse loan mix • Farmers’ practice is to lend primarily within its market area Fixed, 52% Adjustable, 33% Total Loans (in millions) Net Loans to Assets $3,500.00 63.2% 62.4% 62.3% $3,000.00 $2,500.00 $2,000.00 58.3% $1,500.00 55.6% $1,000.00 $500.00 $0.00 2021 2022 2023 2024 3/31/2025 2021 2022 2023 2024 3/31/2025 CRE C&I Agricultural Residential Mortgage Consumer 9
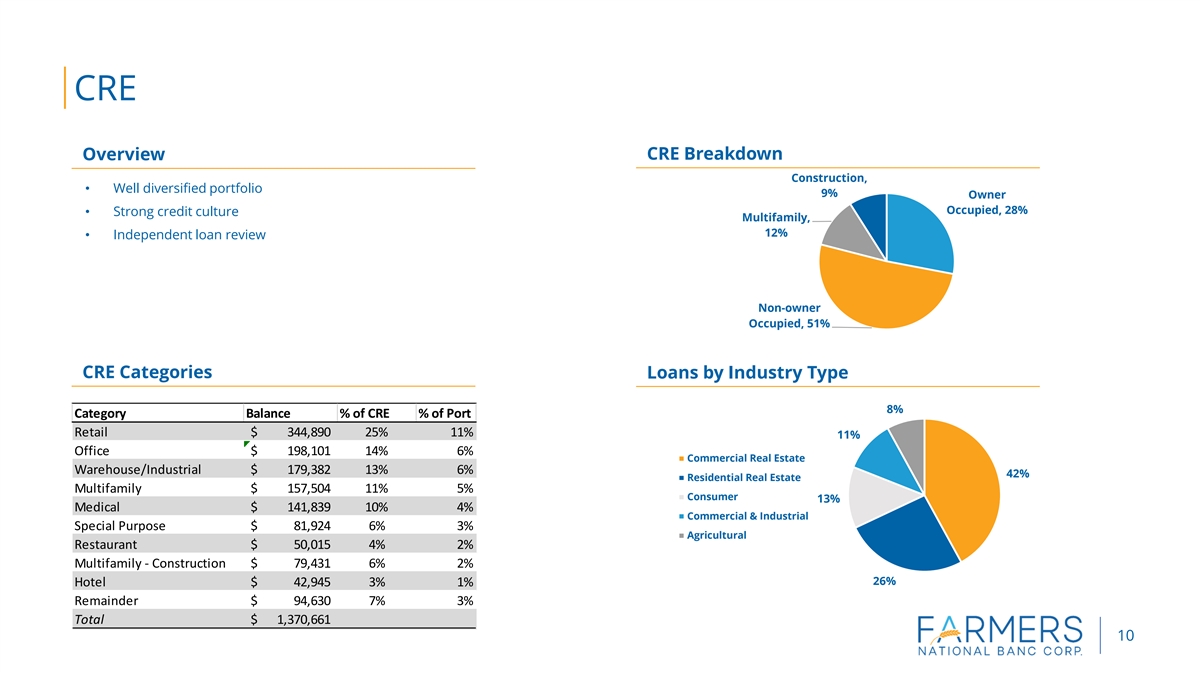
CRE Overview CRE Breakdown Construction, • Well diversified portfolio 9% Owner Occupied, 28% • Strong credit culture Multifamily, 12% • Independent loan review Non-owner Occupied, 51% CRE Categories Loans by Industry Type 8% Category Balance % of CRE % of Port Retail $ 344,890 25% 11% 11% Office $ 198,101 14% 6% Commercial Real Estate Warehouse/Industrial $ 179,382 13% 6% 42% Residential Real Estate Multifamily $ 157,504 11% 5% Consumer 13% Medical $ 141,839 10% 4% Commercial & Industrial Special Purpose $ 8 1,924 6% 3% Agricultural Restaurant $ 5 0,015 4% 2% Multifamily - Construction $ 7 9,431 6% 2% 26% Hotel $ 42,945 3% 1% Remainder $ 94,630 7% 3% Total $ 1 ,370,661 10
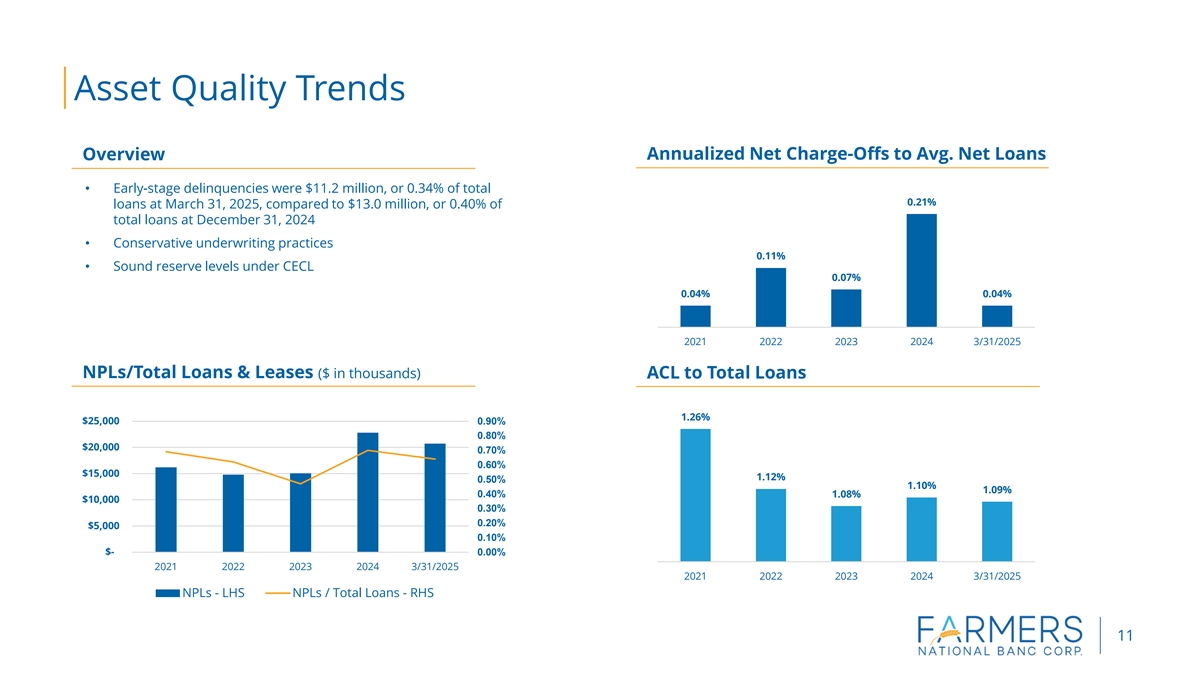
Asset Quality Trends Overview Annualized Net Charge-Offs to Avg. Net Loans • Early-stage delinquencies were $11.2 million, or 0.34% of total 0.21% loans at March 31, 2025, compared to $13.0 million, or 0.40% of total loans at December 31, 2024 • Conservative underwriting practices 0.11% • Sound reserve levels under CECL 0.07% 0.04% 0.04% 2021 2022 2023 2024 3/31/2025 NPLs/Total Loans & Leases ($ in thousands) ACL to Total Loans 1.26% $25,000 0.90% 0.80% $20,000 0.70% 0.60% $15,000 1.12% 0.50% 1.10% 1.09% 0.40% 1.08% $10,000 0.30% 0.20% $5,000 0.10% $- 0.00% 2021 2022 2023 2024 3/31/2025 2021 2022 2023 2024 3/31/2025 NPLs - LHS NPLs / Total Loans - RHS 11
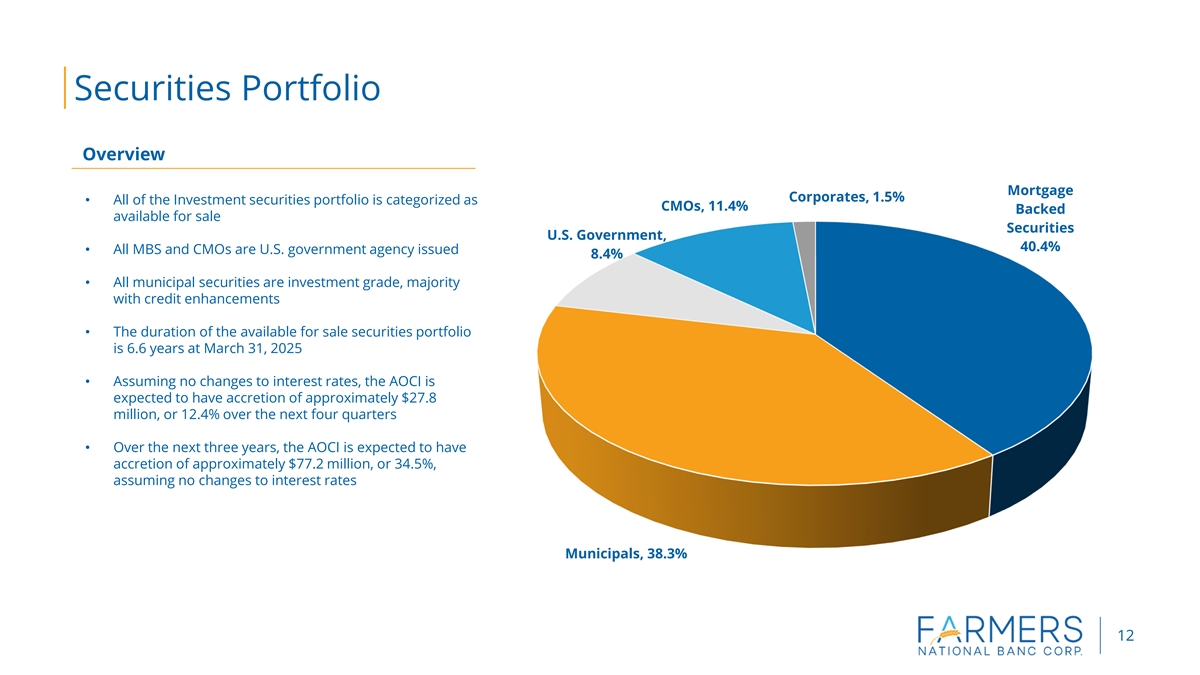
Securities Portfolio Overview Mortgage Corporates, 1.5% • All of the Investment securities portfolio is categorized as CMOs, 11.4% Backed available for sale Securities U.S. Government, 40.4% • All MBS and CMOs are U.S. government agency issued 8.4% • All municipal securities are investment grade, majority with credit enhancements • The duration of the available for sale securities portfolio is 6.6 years at March 31, 2025 • Assuming no changes to interest rates, the AOCI is expected to have accretion of approximately $27.8 million, or 12.4% over the next four quarters • Over the next three years, the AOCI is expected to have accretion of approximately $77.2 million, or 34.5%, assuming no changes to interest rates Municipals, 38.3% 12
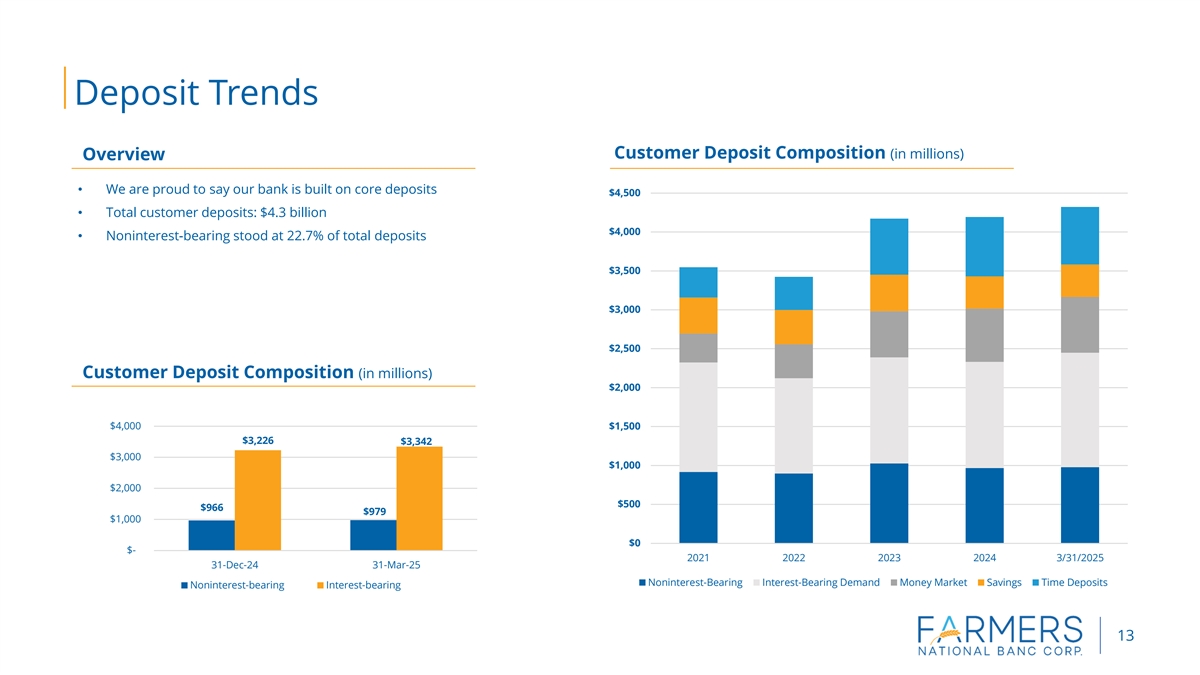
Deposit Trends Customer Deposit Composition (in millions) Overview • We are proud to say our bank is built on core deposits $4,500 • Total customer deposits: $4.3 billion $4,000 • Noninterest-bearing stood at 22.7% of total deposits $3,500 $3,000 $2,500 Customer Deposit Composition (in millions) $2,000 $4,000 $1,500 $3,226 $3,342 $3,000 $1,000 $2,000 $500 $966 $979 $1,000 $0 $- 2021 2022 2023 2024 3/31/2025 31-Dec-24 31-Mar-25 Noninterest-Bearing Interest-Bearing Demand Money Market Savings Time Deposits Noninterest-bearing Interest-bearing 13
Liquidity Farmers National Banc Corp. has the following sources of liquidity at the holding company as of March 31, 2025 : • $39.9 million of cash and equivalents • $5.0 million in unsecured lines of credit with a zero balance Farmers National Bank has the following sources of liquidity as of March 31, 2025: • $110.5 million of cash and equivalents • $749.3 million of additional borrowing capacity at the FHLB • $25.0 million of unsecured lines of credit with a zero balance • $319.8 million of available for sale securities that are not pledged • Brokered CDs • Securities roll-off of approximately $86.4 million in next 12 months 14
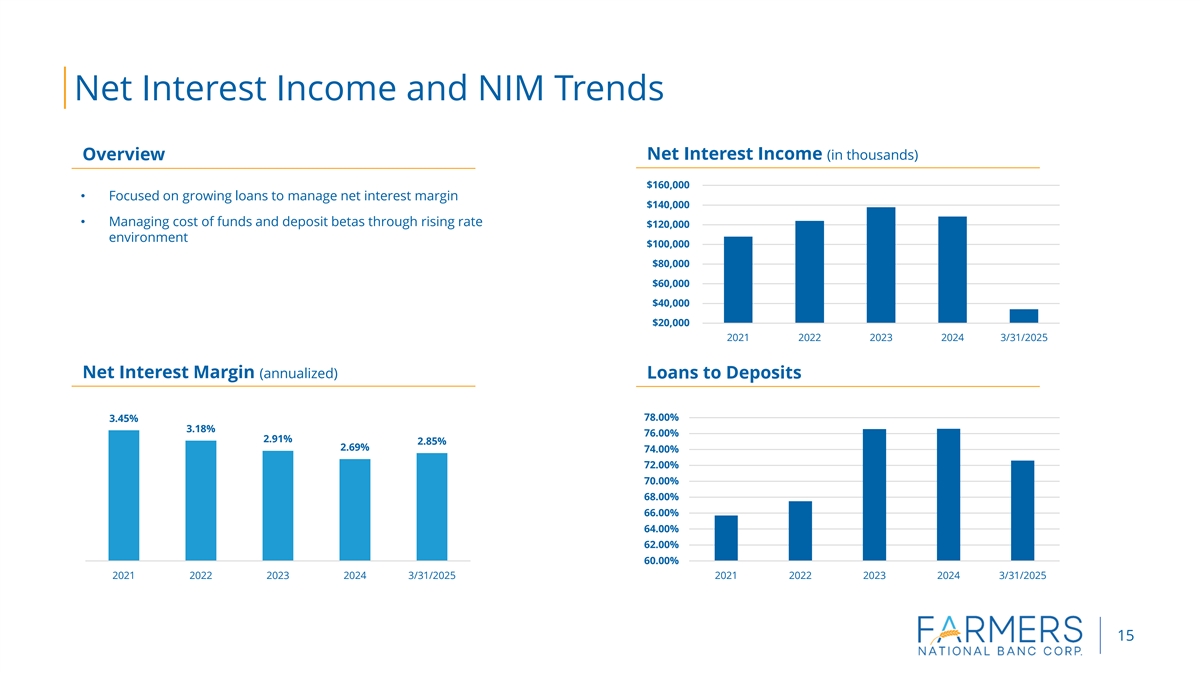
Net Interest Income and NIM Trends Overview Net Interest Income (in thousands) $160,000 • Focused on growing loans to manage net interest margin $140,000 • Managing cost of funds and deposit betas through rising rate $120,000 environment $100,000 $80,000 $60,000 $40,000 $20,000 2021 2022 2023 2024 3/31/2025 Net Interest Margin (annualized) Loans to Deposits 78.00% 3.45% 3.18% 76.00% 2.91% 2.85% 2.69% 74.00% 72.00% 70.00% 68.00% 66.00% 64.00% 62.00% 60.00% 2021 2022 2023 2024 3/31/2025 2021 2022 2023 2024 3/31/2025 15
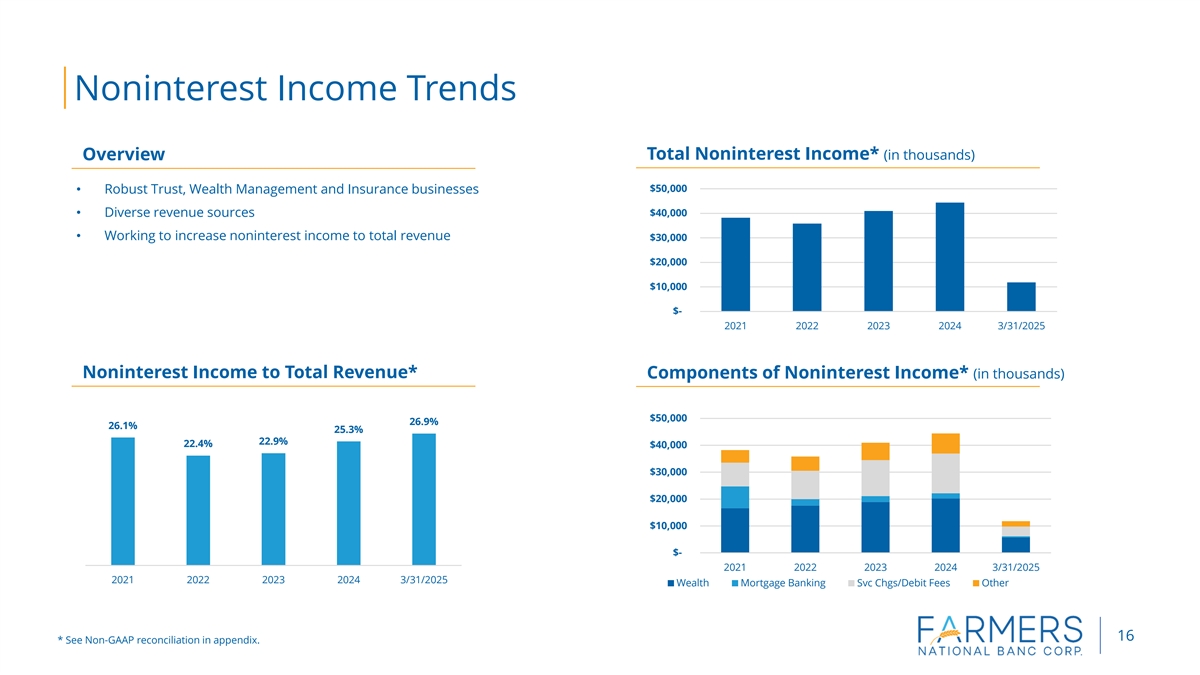
Noninterest Income Trends Overview Total Noninterest Income* (in thousands) $50,000 • Robust Trust, Wealth Management and Insurance businesses $40,000 • Diverse revenue sources • Working to increase noninterest income to total revenue $30,000 $20,000 $10,000 $- 2021 2022 2023 2024 3/31/2025 Noninterest Income to Total Revenue* Components of Noninterest Income* (in thousands) $50,000 26.9% 26.1% 25.3% 22.9% 22.4% $40,000 $30,000 $20,000 $10,000 $- 2021 2022 2023 2024 3/31/2025 2021 2022 2023 2024 3/31/2025 Wealth Mortgage Banking Svc Chgs/Debit Fees Other 16 * See Non-GAAP reconciliation in appendix.
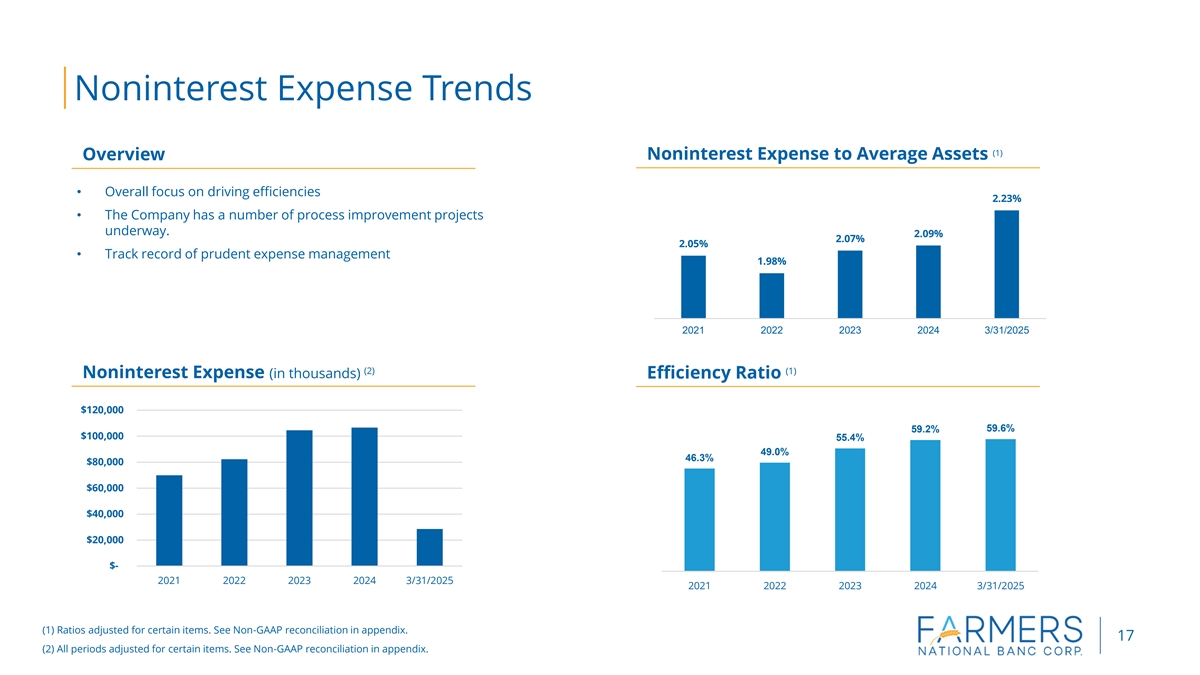
Noninterest Expense Trends 1) (1) Overview Noninterest Expense to Average Assets • Overall focus on driving efficiencies 2.23% • The Company has a number of process improvement projects underway. 2.09% 2.07% 2.05% • Track record of prudent expense management 1.98% 2021 2022 2023 2024 3/31/2025 (2) (1) Noninterest Expense (in thousands) Efficiency Ratio $120,000 59.6% 59.2% $100,000 55.4% 49.0% 46.3% $80,000 $60,000 $40,000 $20,000 $- 2021 2022 2023 2024 3/31/2025 2021 2022 2023 2024 3/31/2025 (1) Ratios adjusted for certain items. See Non-GAAP reconciliation in appendix. 17 (2) All periods adjusted for certain items. See Non-GAAP reconciliation in appendix.
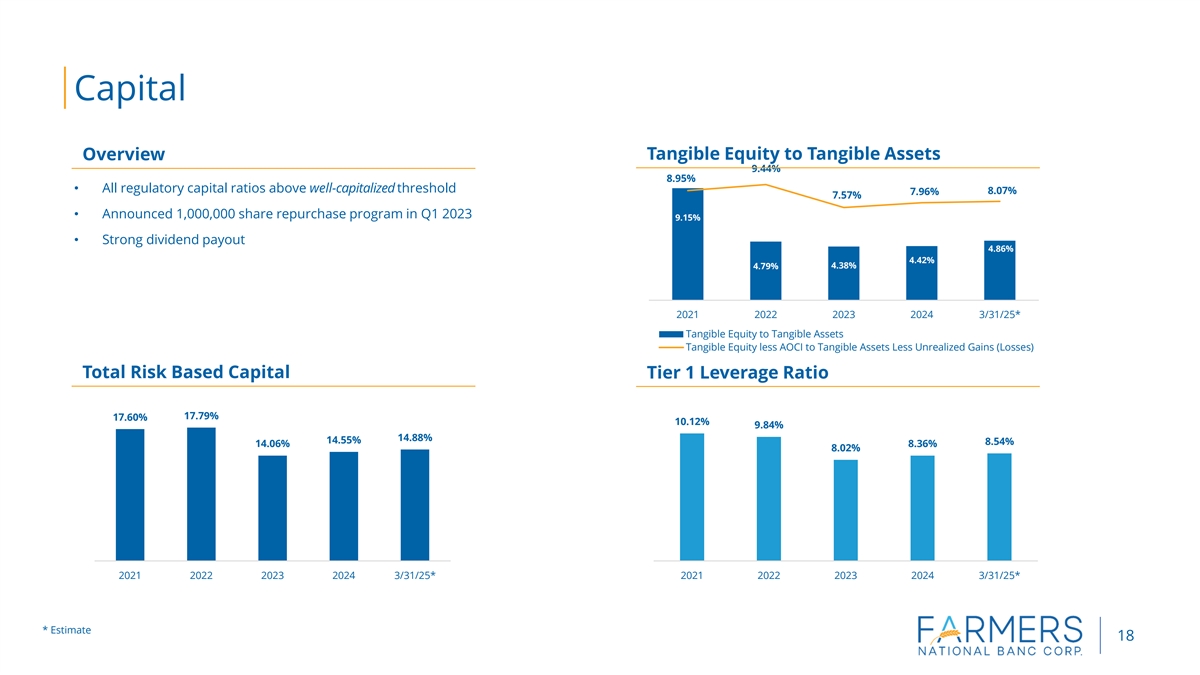
Capital Overview Tangible Equity to Tangible Assets 9.44% 8.95% • All regulatory capital ratios above well-capitalized threshold 8.07% 7.96% 7.57% • Announced 1,000,000 share repurchase program in Q1 2023 9.15% • Strong dividend payout 4.86% 4.42% 4.79% 4.38% 2021 2022 2023 2024 3/31/25* Tangible Equity to Tangible Assets Tangible Equity less AOCI to Tangible Assets Less Unrealized Gains (Losses) Total Risk Based Capital Tier 1 Leverage Ratio 17.79% 17.60% 10.12% 9.84% 14.88% 14.55% 8.54% 14.06% 8.36% 8.02% 2021 2022 2023 2024 3/31/25* 2021 2022 2023 2024 3/31/25* * Estimate 18
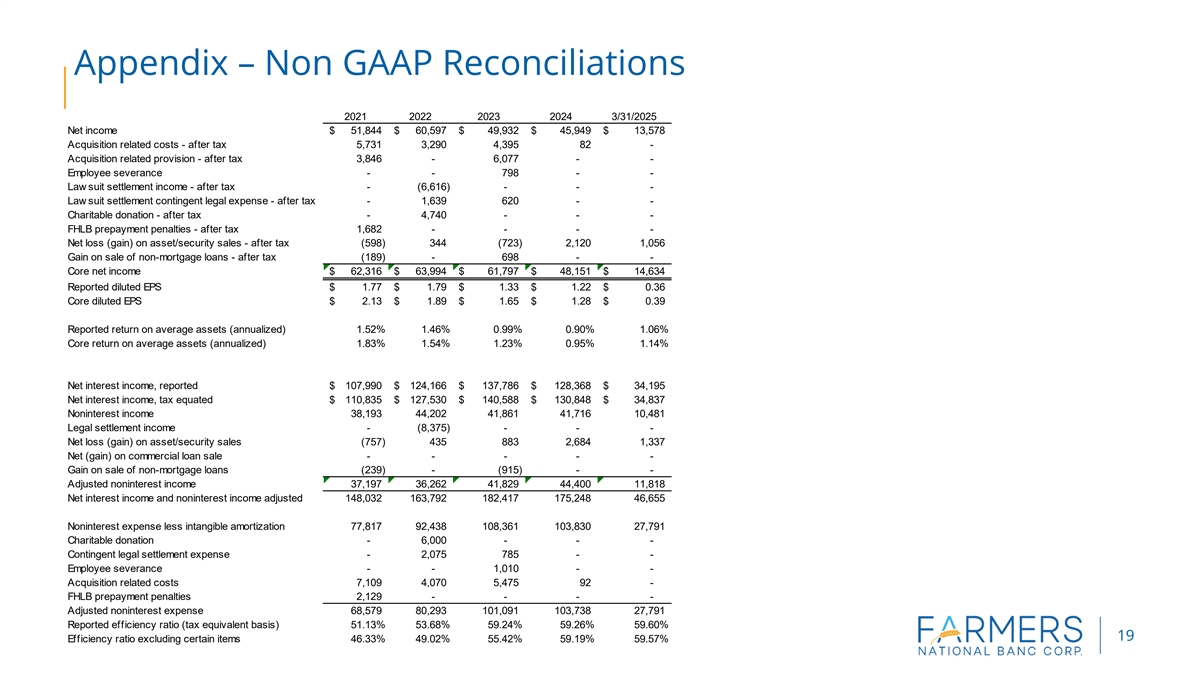
Appendix – Non GAAP Reconciliations 2021 2022 2023 2024 3/31/2025 Net income $ 51,844 $ 60,597 $ 49,932 $ 45,949 $ 13,578 Acquisition related costs - after tax 5,731 3,290 4,395 82 - Acquisition related provision - after tax 3,846 - 6,077 - - Employee severance - - 798 - - Law suit settlement income - after tax - (6,616) - - - Law suit settlement contingent legal expense - after tax - 1,639 620 - - Charitable donation - after tax - 4,740 - - - FHLB prepayment penalties - after tax 1,682 - - - - Net loss (gain) on asset/security sales - after tax (598) 344 ( 723) 2,120 1,056 Gain on sale of non-mortgage loans - after tax (189) - 698 - - Core net income $ 62,316 $ 63,994 $ 61,797 $ 48,151 $ 14,634 Reported diluted EPS $ 1.77 $ 1.79 $ 1.33 $ 1.22 $ 0 .36 Core diluted EPS $ 2.13 $ 1.89 $ 1.65 $ 1.28 $ 0 .39 Reported return on average assets (annualized) 1.52% 1.46% 0.99% 0.90% 1.06% Core return on average assets (annualized) 1.83% 1.54% 1.23% 0.95% 1.14% Net interest income, reported $ 107,990 $ 124,166 $ 137,786 $ 128,368 $ 3 4,195 Net interest income, tax equated $ 110,835 $ 127,530 $ 140,588 $ 130,848 $ 3 4,837 Noninterest income 38,193 44,202 41,861 41,716 10,481 Legal settlement income - (8,375) - - - Net loss (gain) on asset/security sales (757) 435 883 2,684 1 ,337 Net (gain) on commercial loan sale - - - - - Gain on sale of non-mortgage loans (239) - ( 915) - - Adjusted noninterest income 37,197 36,262 41,829 44,400 11,818 Net interest income and noninterest income adjusted 148,032 163,792 182,417 175,248 4 6,655 Noninterest expense less intangible amortization 77,817 92,438 108,361 103,830 2 7,791 Charitable donation - 6,000 - - - Contingent legal settlement expense - 2,075 785 - - Employee severance - - 1,010 - - Acquisition related costs 7,109 4,070 5,475 92 - FHLB prepayment penalties 2,129 - - - - Adjusted noninterest expense 68,579 80,293 101,091 103,738 2 7,791 Reported efficiency ratio (tax equivalent basis) 51.13% 53.68% 59.24% 59.26% 59.60% 19 Efficiency ratio excluding certain items 46.33% 49.02% 55.42% 59.19% 59.57%
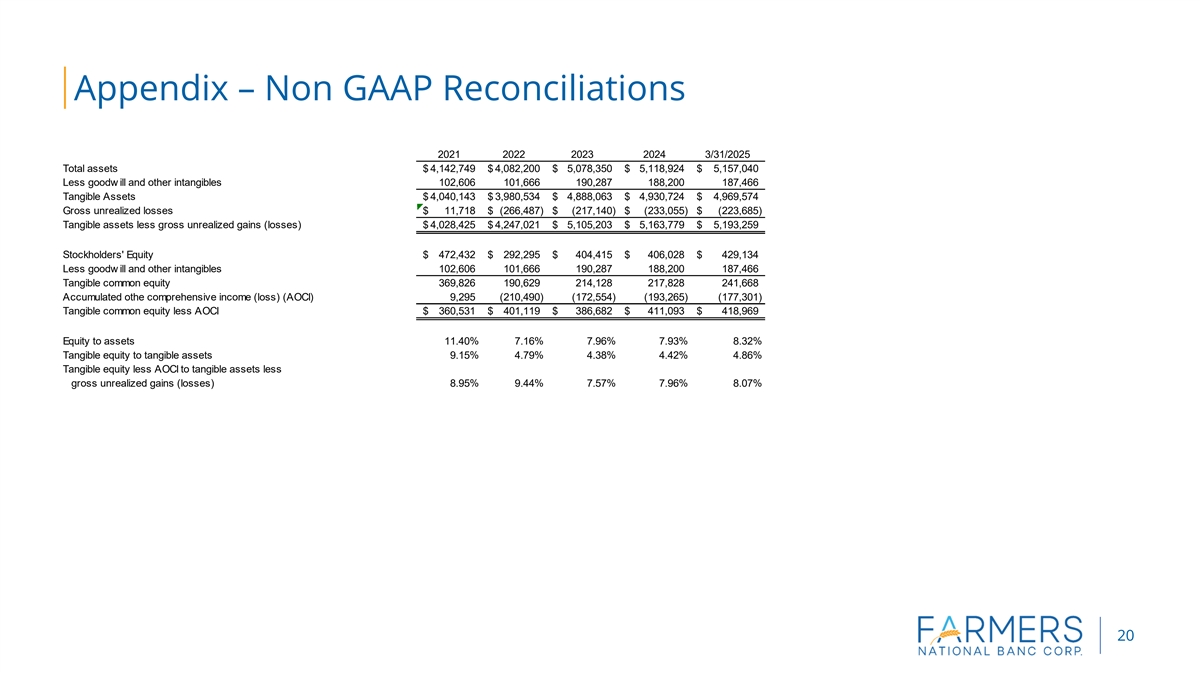
Appendix – Non GAAP Reconciliations 2021 2022 2023 2024 3/31/2025 Total assets $ 4,142,749 $ 4,082,200 $ 5,078,350 $ 5,118,924 $ 5,157,040 Less goodw ill and other intangibles 102,606 101,666 190,287 188,200 1 87,466 Tangible Assets $ 4,040,143 $ 3,980,534 $ 4,888,063 $ 4,930,724 $ 4 ,969,574 Gross unrealized losses $ 11,718 $ (266,487) $ (217,140) $ (233,055) $ (223,685) Tangible assets less gross unrealized gains (losses) $ 4,028,425 $ 4,247,021 $ 5,105,203 $ 5,163,779 $ 5 ,193,259 Stockholders' Equity $ 472,432 $ 292,295 $ 404,415 $ 406,028 $ 429,134 Less goodw ill and other intangibles 102,606 101,666 190,287 188,200 1 87,466 Tangible common equity 369,826 190,629 214,128 217,828 2 41,668 Accumulated othe comprehensive income (loss) (AOCI) 9,295 (210,490) (172,554) ( 193,265) (177,301) Tangible common equity less AOCI $ 360,531 $ 401,119 $ 386,682 $ 411,093 $ 418,969 Equity to assets 11.40% 7.16% 7.96% 7.93% 8.32% Tangible equity to tangible assets 9.15% 4.79% 4.38% 4.42% 4.86% Tangible equity less AOCI to tangible assets less gross unrealized gains (losses) 8.95% 9.44% 7.57% 7.96% 8.07% 20