UNITED STATES
SECURITIES AND EXCHANGE COMMISSION
WASHINGTON, D.C. 20549
FORM 8-K
CURRENT REPORT
Pursuant to Section 13 or 15(d)
of the Securities Exchange Act of 1934
Date of Report (Date of earliest event reported): April 15, 2025
CNB FINANCIAL CORPORATION
(Exact name of registrant as specified in its charter)
| Pennsylvania | 001-39472 | 25-1450605 | ||
| (State or other jurisdiction of incorporation or organization) |
(Commission File Number) |
(I.R.S. Employer Identification No.) |
1 South Second Street
PO Box 42
Clearfield, Pennsylvania 16830
(Address of principal executive offices, zip code)
Registrant’s telephone number, including area code: (814) 765-9621
Not Applicable
(Former name or former address, if changed since last report)
Check the appropriate box below if the Form 8-K filing is intended to simultaneously satisfy the filing obligation of the registrant under any of the following provisions:
| ☒ | Written communications pursuant to Rule 425 under the Securities Act (17 CFR 230.425) |
| ☐ | Soliciting material pursuant to Rule 14a-12 under the Exchange Act (17 CFR 240.14a-12) |
| ☐ | Pre-commencement communications pursuant to Rule 14d-2(b) under the Exchange Act (17 CFR 240.14d-2(b)) |
| ☐ | Pre-commencement communications pursuant to Rule 13e-4(c) under the Exchange Act (17 CFR 240.13e-4(c)) |
Securities registered pursuant to Section 12(b) of the Act:
| Title of each class |
Trading Symbol |
Name of each exchange on which registered |
||
| Common Stock, no par value | CCNE | The NASDAQ Stock Market LLC | ||
| Depositary Shares (each representing a 1/40th interest in a share of 7.125% Series A Non-Cumulative, perpetual preferred stock) | CCNEP | The NASDAQ Stock Market LLC |
Indicate by check mark whether the registrant is an emerging growth company as defined in Rule 405 of the Securities Act of 1933 (§230.405 of this chapter) or Rule 12b-2 of the Securities Exchange Act of 1934 (§240.12b-2 of this chapter).
Emerging growth company ☐
If an emerging growth company, indicate by check mark if the registrant has elected not to use the extended transition period for complying with any new or revised financial accounting standards provided pursuant to Section 13(a) of the Exchange Act. ☐
| Item 7.01. | Regulation FD Disclosure. |
CNB Financial Corporation (the “Corporation”) (NASDAQ: CCNE), the parent company of CNB Bank, will conduct a presentation on April 15, 2025 at its 2025 Annual Meeting of Shareholders. The presentation will also be posted on the Corporation’s website at https://cnbbank.q4ir.com/events-and-presentations/default.aspx. A copy of the presentation is furnished hereto as Exhibit 99.1 and is hereby incorporated by reference herein.
The information contained in this Item 7.01, including Exhibit 99.1 attached hereto, shall not be deemed to be “filed” for the purposes of Section 18 of the Securities Exchange Act of 1934, as amended (the “Exchange Act”), or otherwise subject to the liabilities of such section, nor shall such information or exhibit be deemed incorporated by reference into any filing under the Securities Act of 1933, as amended, or the Exchange Act, except as may be expressly set forth by specific reference in such filing.
| Item 9.01. | Financial Statements and Exhibits |
| (d) | Exhibits |
| Exhibit Number |
Description |
|
| 99.1 | Investor Presentation, dated April 15, 2025 | |
| 104 | Cover Page Interactive Data File (embedded within the Inline XBRL document) | |
SIGNATURE
Pursuant to the requirements of the Securities Exchange Act of 1934, the Registrant has duly caused this report to be signed on its behalf by the undersigned hereunto duly authorized.
| CNB FINANCIAL CORPORATION | ||||||
| Date: April 15, 2025 | By: | /s/ Tito L. Lima |
||||
| Tito L. Lima | ||||||
| Treasurer | ||||||

Exhibit 99.1 April 15, 2025 INVESTOR PRESENTATION O U R F AM I LY O F B AN K S

CERTAIN IMPORTANT INFORMATION CAUTION REGARDING FORWARD LOOKING STATEMENTS This presentation includes forward-looking statements within the meaning of Section 27A of the Securities Act of 1933, as amended, and Section 21E of the Securities Exchange Act of 1934, as amended, with respect to the Corporation’s financial condition, liquidity, results of operations, future performance and business. These forward-looking statements are intended to be covered by the safe harbor for “forward-looking statements” provided by the Private Securities Litigation Reform Act of 1995. Forward-looking statements are those that are not historical facts. Forward-looking statements include statements with respect to beliefs, plans, objectives, goals, expectations, anticipations, estimates and intentions that are subject to significant risks and uncertainties and are subject to change based on various factors (some of which are beyond the Corporation’s control). Forward-looking statements often include the words “believes,” “expects,” “anticipates,” “estimates,” “forecasts,” “intends,” “plans,” “targets,” “potentially,” “probably,” “projects,” “outlook” or similar expressions or future conditional verbs such as “may,” “will,” “should,” “would” and “could.” The Corporation’s actual results may differ materially from those contemplated by the forward-looking statements, which are neither statements of historical fact nor guarantees or assurances of future performance. Such known and unknown risks, uncertainties and other factors that could cause the actual results to differ materially from the statements, include, but are not limited to, (i) adverse changes or conditions in capital and financial markets, including actual or potential stresses in the banking industry; (ii) changes in interest rates; (iii) the credit risks of lending activities, including our ability to estimate credit losses and the allowance for credit losses, as well as the effects of changes in the level of, and trends in, loan delinquencies and write-offs; (iv) effectiveness of our data security controls in the face of cyber attacks and any reputational risks following a cybersecurity incident; (v) changes in general business, industry or economic conditions or competition; (vi) changes in any applicable law, rule, regulation, policy, guideline or practice governing or affecting financial holding companies and their subsidiaries or with respect to tax or accounting principles or otherwise; (vii) governmental approvals of the Corporation's pending merger with ESSA may not be obtained, or adverse regulatory conditions may be imposed in connection with governmental approvals of the merger; (viii) the Corporation's shareholders and/or the shareholders of ESSA may fail to approve the merger; (ix) higher than expected costs or other difficulties related to integration of combined or merged businesses; (x) the effects of business combinations and other acquisition transactions, including the inability to realize our loan and investment portfolios; (xi) changes in the quality or composition of our loan and investment portfolios; (xii) adequacy of loan loss reserves; (xiii) increased competition; (xiv) loss of certain key officers; (xv) deposit attrition; (xvi) rapidly changing technology; (xvii) unanticipated regulatory or judicial proceedings and liabilities and other costs; (xviii) changes in the cost of funds, demand for loan products or demand for financial services; and (xix) other economic, competitive, governmental or technological factors affecting our operations, markets, products, services and prices. Such developments could have an adverse impact on the Corporation's financial position and results of operations. For more information about factors that could cause actual results to differ from those discussed in the forward-looking statements, please refer to the “Risk Factors” and “Management’s Discussion and Analysis of Financial Condition and Results of Operations” sections of and the forward-looking statement disclaimers in the Corporation’s annual and quarterly reports filed with the Securities and Exchange Commission. The forward-looking statements are based upon management’s beliefs and assumptions and are made as of the date of this presentation. Factors or events that could cause the Corporation’s actual results to differ may emerge from time to time, and it is not possible for the Corporation to predict all of them. The Corporation undertakes no obligation to publicly update or revise any forward-looking statements included in this presentation or to update the reasons why actual results could differ from those contained in such statements, whether as a result of new information, future events or otherwise, except to the extent required by law. In light of these risks, uncertainties and assumptions, the forward-looking events discussed in this presentation might not occur and you should not put undue reliance on any forward-looking statements. NON-GAAP FINANCIAL MEASURES This report contains references to financial measures that are not defined in GAAP. Management uses non-GAAP financial information in its analysis of the Corporation’s performance. Management believes that these non-GAAP measures provide a greater understanding of ongoing operations, enhance comparability of results of operations with prior periods and show the effects of significant gains and charges in the periods presented. The Corporation’s management believes that investors may use these non- GAAP measures to analyze the Corporation’s financial performance without the impact of unusual items or events that may obscure trends in the Corporation’s underlying performance. This non-GAAP data should be considered in addition to results prepared in accordance with GAAP, and is not a substitute for, or superior to, GAAP results. Limitations associated with non-GAAP financial measures include the risks that persons might disagree as to the appropriateness of items included in these measures and that different companies might calculate these measures differently. Non-GAAP measures reflected within the presentation include: Tangible common equity/tangible assets, Adjusted Net Income Available to Common Stockholders, Adjusted Diluted Earnings per Common Share, Net Interest Margin (fully tax equivalent basis), Adjusted Return on Average Assets, Adjusted Return on Average Equity, Efficiency Ratio (fully tax equivalent basis), and Adjusted Efficiency Ratio (fully tax equivalent basis). 2

2024 HIGHLIGHTS AT A GLANCE § Net income available to common shareholders (“earnings”) was $50.3 million, or $2.39 per diluted share, for the twelve months ended December 31, 2024, compared to earnings of $53.7 million, or $2.55 per diluted share, for the twelve months ended December 31, 2023. § The decrease in earnings and diluted earnings per share comparing the twelve months ended December 31, 2024 to the twelve months ended December 31, 2023 was primarily due to the rise in deposit costs year over year. § The Corporation continued to focus on executing our core growth strategies: § At December 31, 2024, loans totaled $4.6 billion, with an increase of $140.5 million, or 3.14%, compared to the balance as of December 31, 2023. § At December 31, 2024, total deposits were $5.4 billion, reflecting an increase of $372.6 million, or 7.45%, compared to total deposits measured as of December 31, 2023. § The Corporation's Return on Average Assets and Return on Average Equity of 0.93% and 9.21%, respectively, were lower for the twelve months ended December 31, 2024, compared to the same measures of 1.04% and 10.54%, respectively, for the twelve months ended December 31, 2023. § Book value per common share was $26.34 at December 31, 2024, reflecting an increase of $1.77 or 7.20% from $24.57 at December 31, 2023. 3

FINANCIAL TRENDS TOTAL GROSS LOANS ($M) TOTAL DEPOSITS ($M) CAGR = 6.5% CAGR = 8.1% $5,000 $6,000 $4,609 $5,371 $4,468 $4,275 $4,999 $4,716 $4,622 $5,000 $4,000 $3,635 $4,182 $3,372 $4,000 $3,000 $3,000 $2,000 $2,000 $1,000 $1,000 $0 $0 2020 2021 2022 2023 2024 2020 2021 2022 2023 2024 TOTAL ASSETS ($M) CAGR = 7.0% $7,000 $6,192 $5,753 $6,000 $5,475 $5,329 $4,729 $5,000 $4,000 $3,000 $2,000 $1,000 $0 2020 2021 2022 2023 2024 4 (1) Compound Annual Growth Rate, (“CAGR”) based on the period from December 31, 2020, to December 31, 2024.

EARNINGS TRENDS (1) (1) RETURN ON AVERAGE ASSETS RETURN ON AVERAGE EQUITY 15.00% 1.40% 13.9% 13.4% 1.20% 1.14% 1.20% 1.04% 12.00% 10.5% 0.93% 1.00% 9.1% 9.2% 0.75% 9.00% 0.80% 0.60% 6.00% 0.40% 3.00% 0.20% 0.00% 0.00% 2020 2021 2022 2023 2024 2020 2021 2022 2023 2024 (1) DILUTED EARNINGS PER SHARE $3.50 $3.26 $3.16 $3.00 $2.55 $2.39 $2.50 $1.97 $2.00 $1.50 $1.00 $0.50 $- 2020 2021 2022 2023 2024 (1) Return on average assets, return on average equity, and diluted earnings per share include merger costs, Federal Home Loan Bank (“FHLB”) prepayment penalties and 5 branch closure costs in 2020.
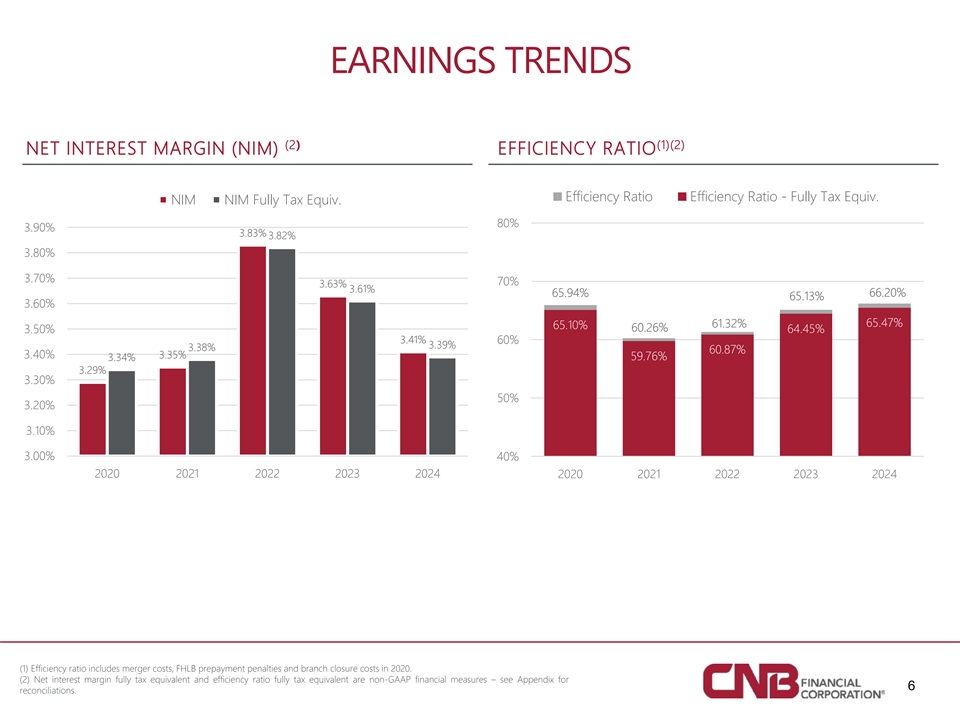
EARNINGS TRENDS (2) (1)(2) NET INTEREST MARGIN (NIM) EFFICIENCY RATIO Efficiency Ratio Efficiency Ratio - Fully Tax Equiv. NIM NIM Fully Tax Equiv. 80% 3.90% 3.83% 3.82% 3.80% 3.70% 70% 3.63% 3.61% 65.94% 66.20% 65.13% 3.60% 65.47% 61.32% 65.10% 60.26% 3.50% 64.45% 3.41% 60% 3.39% 3.38% 60.87% 3.40% 3.35% 59.76% 3.34% 3.29% 3.30% 50% 3.20% 3.10% 3.00% 40% 2020 2021 2022 2023 2024 2020 2021 2022 2023 2024 (1) Efficiency ratio includes merger costs, FHLB prepayment penalties and branch closure costs in 2020. (2) Net interest margin fully tax equivalent and efficiency ratio fully tax equivalent are non-GAAP financial measures – see Appendix for 6 reconciliations.
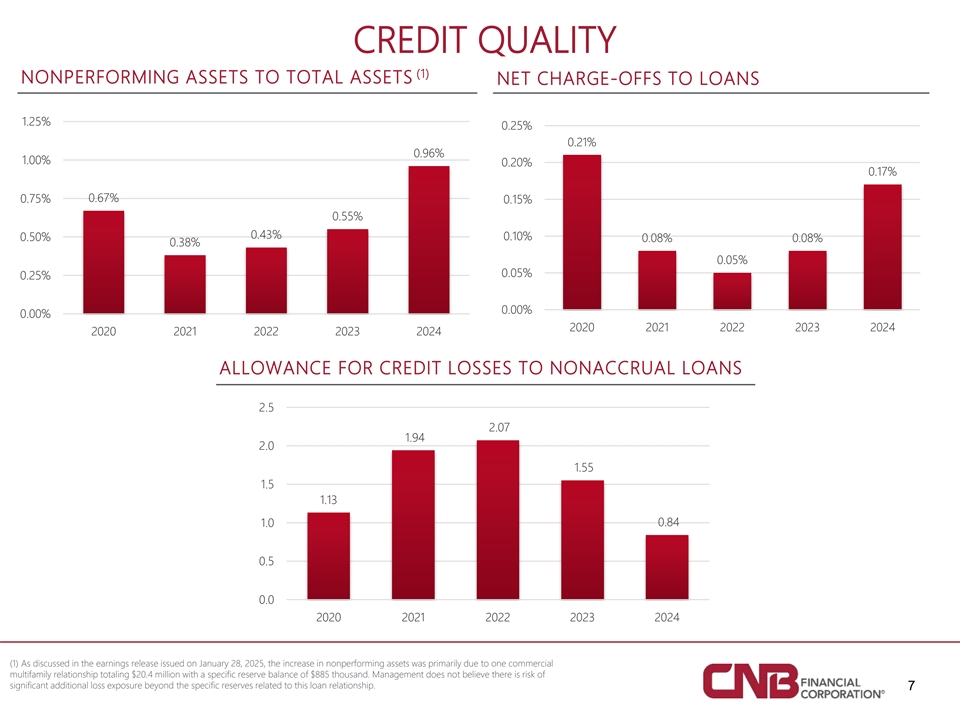
CREDIT QUALITY (1) NONPERFORMING ASSETS TO TOTAL ASSETS NET CHARGE-OFFS TO LOANS 1.25% 0.25% 0.21% 0.96% 1.00% 0.20% 0.17% 0.75% 0.67% 0.15% 0.55% 0.43% 0.10% 0.50% 0.08% 0.08% 0.38% 0.05% 0.05% 0.25% 0.00% 0.00% 2020 2021 2022 2023 2024 2020 2021 2022 2023 2024 ALLOWANCE FOR CREDIT LOSSES TO NONACCRUAL LOANS 2.5 2.07 1.94 2.0 1.55 1.5 1.13 1.0 0.84 0.5 0.0 2020 2021 2022 2023 2024 (1) As discussed in the earnings release issued on January 28, 2025, the increase in nonperforming assets was primarily due to one commercial multifamily relationship totaling $20.4 million with a specific reserve balance of $885 thousand. Management does not believe there is risk of significant additional loss exposure beyond the specific reserves related to this loan relationship. 7
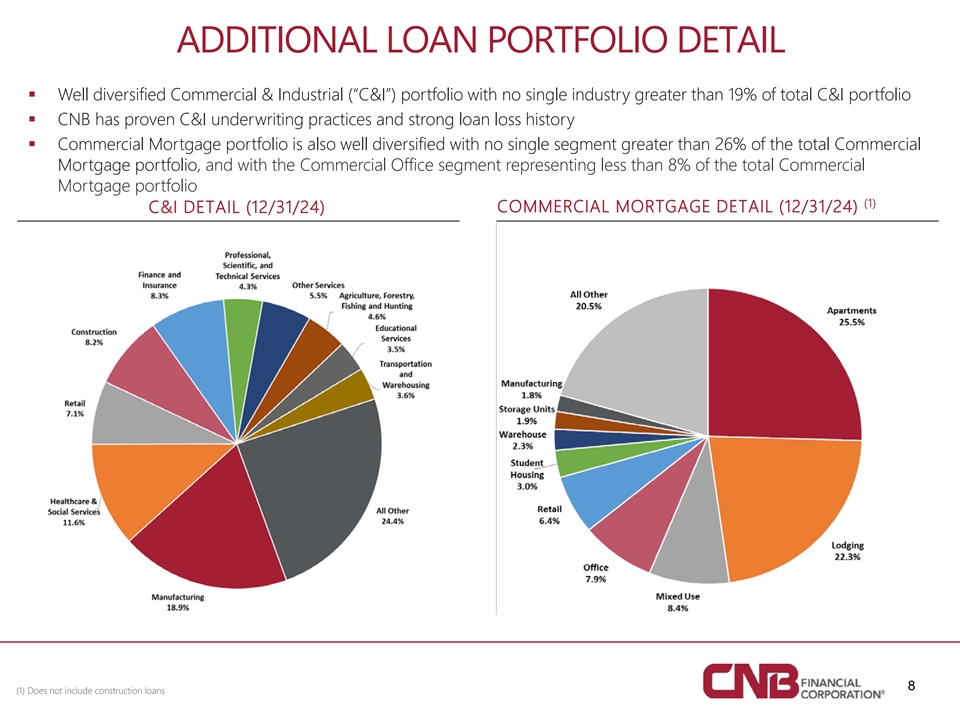
ADDITIONAL LOAN PORTFOLIO DETAIL § Well diversified Commercial & Industrial (“C&I”) portfolio with no single industry greater than 19% of total C&I portfolio § CNB has proven C&I underwriting practices and strong loan loss history § Commercial Mortgage portfolio is also well diversified with no single segment greater than 26% of the total Commercial Mortgage portfolio, and with the Commercial Office segment representing less than 8% of the total Commercial Mortgage portfolio (1) COMMERCIAL MORTGAGE DETAIL (12/31/24) C&I DETAIL (12/31/24) 8 (1) Does not include construction loans

ADDITIONAL COMMERCIAL MORTGAGE DETAIL (1) (1) (1) LODGING (12/31/24) OFFICE (12/31/24) MULTI-FAMILY (12/31/24) • Consists of 225 loans, totaling $367.6 • Consists of 170 loans, totaling $321.6 • Consists of 112 loans, totaling $113.7 million, or 7.98% of total loans million, or 6.98% of total loans million, or 2.47% of total loans outstanding. outstanding. outstanding. • Nonaccrual multi-family loans totaled • There were no nonaccrual commercial • There were no nonaccrual commercial $20.7 million, or 5.62% of total multi-family lodging loans. office loans. (2) loans outstanding. • The average outstanding balance per loan • The average outstanding balance per loan • The average outstanding balance per loan was $1.9 million. was $1.0 million. was $1.6 million. (1) Markets are based upon metropolitan statistical areas. (2) As discussed in the earnings release issued on January 28, 2025, the increase in nonperforming assets was primarily due to one commercial multifamily relationship totaling 9 $20.4 million with a specific reserve balance of $885 thousand. Management does not believe there is risk of significant additional loss exposure beyond the specific reserves related to this loan relationship.

CAPITAL DIVIDEND PER COMMON SHARE PREFERRED STOCK DIVIDEND – FIXED RATE $0.75 10.0% $0.71 $0.70 $0.70 $0.69 $0.70 9.0% $0.68 $0.65 8.0% 7.125% 7.125% 7.125% 7.125% 7.125% $0.60 7.0% $0.55 6.0% $0.50 5.0% 2020 2021 2022 2023 2024 2020 2021 2022 2023 2024 (1) TANGIBLE COMMON EQUITY/TANGIBLE ASSETS BOOK VALUE PER COMMON SHARE 10% Common equity / Total assets CAGR = 5.5% Tangible common equity / Tangible assets $30.00 $26.34 9% $24.57 $22.85 $25.00 $22.39 8.93% 8.93% $21.29 8.64% 8% 8.28% 8.22% $20.00 7.90% 7.58% 7% $15.00 7.23% 6.70% $10.00 6% 6.45% $5.00 5% 2020 2021 2022 2023 2024 $- 2020 2021 2022 2023 2024 10 (1) Tangible common equity/tangible assets is a non-GAAP financial measure – see Appendix for reconciliation.

REGULATORY CAPITAL RATIOS 16.2% 16.1% 16.0% 11.8% 11.5% 11.4% 10.7% 10.5% 10.4% Common Equity Tier 1 Ratio Tier 1 Leverage Ratio Total Risk Based Ratio 12/31/2022 12/31/2023 12/31/2024 11
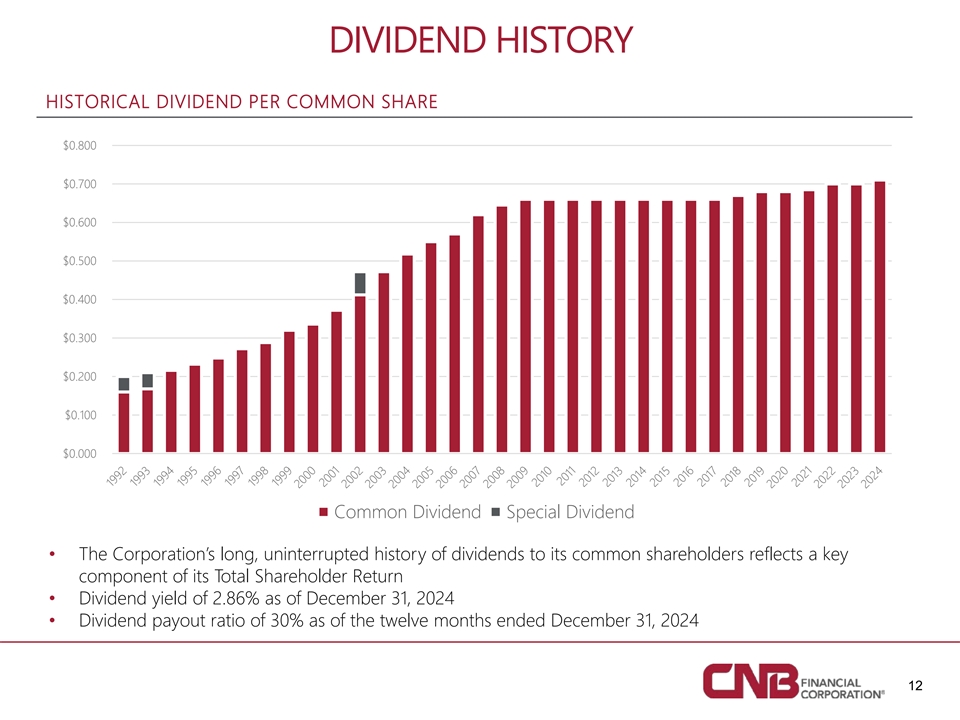
DIVIDEND HISTORY HISTORICAL DIVIDEND PER COMMON SHARE $0.800 $0.700 $0.600 $0.500 $0.400 $0.300 $0.200 $0.100 $0.000 Common Dividend Special Dividend • The Corporation’s long, uninterrupted history of dividends to its common shareholders reflects a key component of its Total Shareholder Return • Dividend yield of 2.86% as of December 31, 2024 • Dividend payout ratio of 30% as of the twelve months ended December 31, 2024 12

FINANCIAL PERFORMANCE SUMMARY Q1 2025 Three Months Ended QoQ % YoY % Dollars in thousands, except per share data 3/31/25 12/31/24 3/31/24 Change Change Total Assets $ 6, 295,508 $ 6, 192,010 $ 5, 801,412 1.7 % 8.5 % Loans 4,610,009 4, 608,956 4, 431,398 0.0 % 4.0 % Deposits 5,460,078 5,371,364 5, 037,553 1.7 % 8.4 % Net Income Available to Common Stockholders 10,406 13, 988 11, 525 -25.6 % -9.7 % (1) Adjusted Net Income Available to Common Stockholders 11,893 13,988 11,525 -15.0 % 3.2 % Diluted Earnings per Common Share 0. 50 0. 66 0. 55 -24.2 % -9.1 % (1) Adjusted Diluted Earnings per Common Share 0. 57 0. 66 0. 55 -13.6 % 3.6 % Net Interest Margin 3.38 % 3. 44 % 3.40 % -1.7 % -0.6 % (1) Net Interest Margin (fully tax equivalent basis) 3.37 % 3. 43 % 3.38 % -1.7 % -0.3 % Return on Average Assets 0. 75 % 0.98 % 0. 88 % -23.5 % -14.8 % (1) Adjusted Return on Average Assets 0.85 % 0.98 % 0.88 % -13.3 % -3.4 % Return on Average Equity 7. 52 % 9. 79 % 8. 79 % -23.2 % -14.4 % (1) Adjusted Return on Average Equity 8.49 % 9. 79 % 8. 79 % -13.3 % -3.4 % Efficiency Ratio 72. 07 % 63.68 % 69. 08 % 13.2 % 4.3 % (1) Efficiency Ratio (fully tax equivalent basis) 71.28 % 63. 02 % 68. 29 % 13.1 % 4.4 % (1) Adjusted Efficiency Ratio (fully tax equivalent basis) 68. 62 % 63. 02 % 68.29 % 8.9 % 0.5 % (1) Adjusted Net Income Available to Common Stockholders, Adjusted Diluted Earnings per Common Share, Net Interest Margin (fully tax equivalent basis), Adjusted Return on Average Assets, Adjusted Return on Average Equity, Efficiency Ratio (fully tax equivalent basis), and Adjusted Efficiency Ratio 13 (fully tax equivalent basis) are non-GAAP financial measures – see Appendix for reconciliations. Performance ratios are annualized
LIQUIDITY PROFILE § At March 31, 2025, the total estimated uninsured deposits for CNB Bank were approximately $1.6 billion, or approximately 27.94% of total CNB Bank deposits. However, when excluding $101.9 million of affiliate company deposits and $481.2 million of pledged-investment collateralized deposits, the adjusted amount and percentage of total estimated uninsured deposits was approximately $971.1 million, or approximately 17.46% of total CNB Bank deposits as of March 31, 2025. § At March 31, 2025, the Corporation had $447.1 million of cash equivalents held in CNB Bank’s interest- bearing deposit account at the Federal Reserve. These excess funds, when combined with $4.7 billion in (i) available borrowing capacity from the FHLB and the Federal Reserve, and (ii) available unused commitments from brokered deposit sources and other third-party funding channels, including previously established lines of credit from correspondent banks, resulted in the total available liquidity sources for the Corporation as of March 31, 2025 to be approximately 5.3 times the estimated amount of adjusted uninsured deposit balances discussed above. § At March 31, 2025, the Corporation had no outstanding short-term borrowings from the FHLB or the Federal Reserve's Discount Window. 14

LOOKING INTO 2025 § In November 2024, Ridge View Bank celebrated the grand opening of its regional headquarters in Roanoke, VA which is positioned to help grow the Corporation’s regional presence in 2025 and beyond. § In February 2025, CNB Bank and its predecessor organization, County National Bank, celebrated 160 years in business. § In February 2025, Impressia Bank opened their headquarters, located in the iconic Electric Tower in Buffalo, NY. § In February 2025, Erie Bank opened a full-service Branch and Financial Education Center on Parade Street in Erie, Pennsylvania. § In August 2025, Erie Bank will celebrate 20 years in business. th § BankOnBuffalo plans to open a full-service branch in Lancaster, NY in 2025. This will be the 13 location, in addition to the BankOnWheels, in this region. 15

STRATEGIC MERGER WITH ESSA BANCORP, INC § On January 9, 2025, the Corporation and CNB Bank entered into a definitive merger agreement with ESSA Bancorp, Inc. (“ESSA”) and its subsidiary bank, ESSA Bank & Trust Company, pursuant to which the Corporation will acquire ESSA in an all-stock transaction. § Expands the Corporation’s reach into eastern Pennsylvania and the greater Lehigh Valley. “We are excited to partner with ESSA which shares such a strong banking tradition with CNB. This combination aligns two high performing banks with an exceptional commitment to client-focused services for its customers and financial support to sustain the economic vitality of the communities in which they operate,” said Michael D. Peduzzi, President and CEO of CNB Financial Corporation. 16 (1) Excludes the administrative branch

PARADE STREET § On February 24, 2025, ERIEBank held the grand opening of its Financial Education Center on Parade Street in Erie, Pennsylvania. § The Financial Education Center is more than just a banking office — it is a local hub designed to empower the community with financial literacy resources, personalized banking solutions, and educational workshops tailored to the needs of individuals and businesses in the Erie region. In February 2024, construction began on a new community banking office and financial education center. “We are incredibly excited to open this new office on Parade Street. This location represents a significant investment in the Erie community. We’re not just bringing banking services to the area; we’re bringing opportunities for financial education and growth. It’s our mission to be a true partner in the success of this neighborhood, and we’re proud to take this important step forward,” said Katie Jones, ERIEBank Regional President. 17

THANK YOU FOR ATTENDING OUR 2025 ANNUAL SHAREHOLDER MEETING. 18

APPENDIX
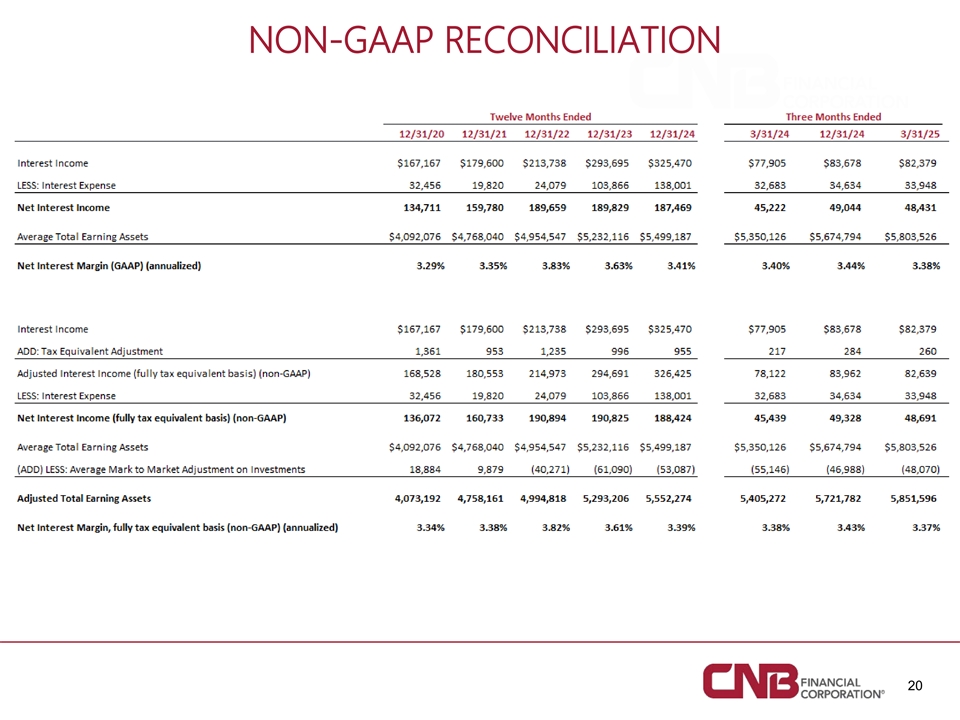
NON-GAAP RECONCILIATION 20
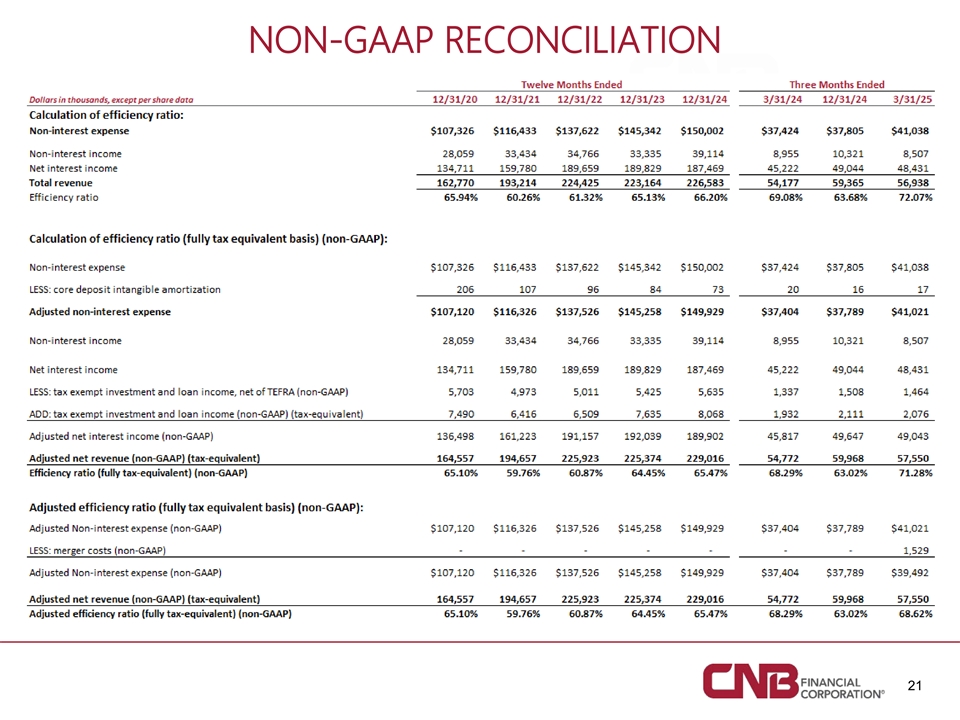
NON-GAAP RECONCILIATION 21

NON-GAAP RECONCILIATION 22
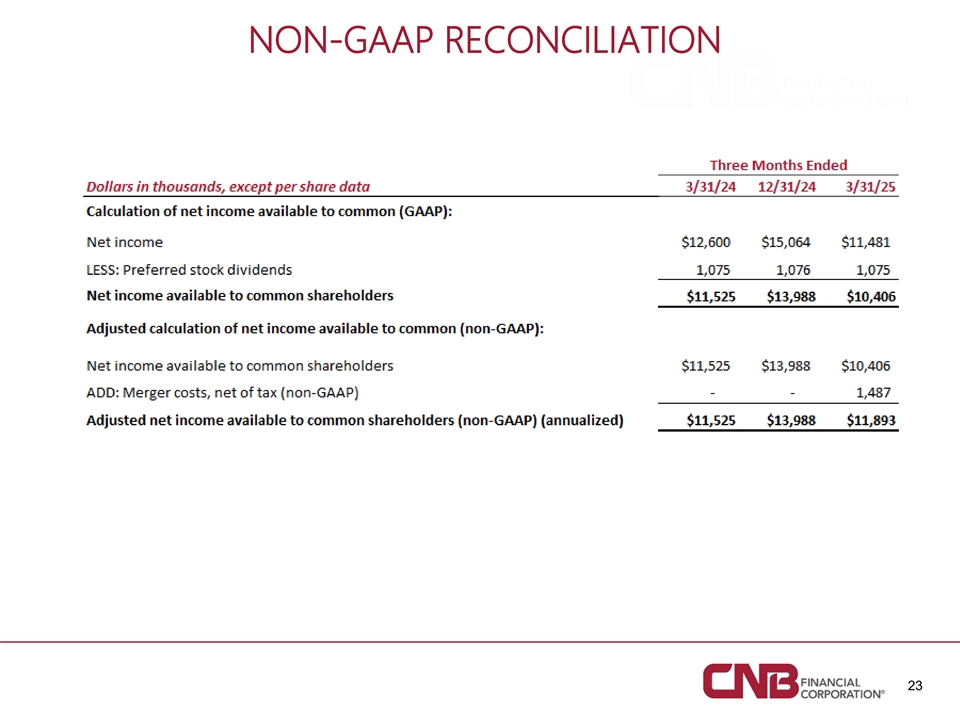
NON-GAAP RECONCILIATION 23

NON-GAAP RECONCILIATION Three Months Ended Dollars in thousands, except per share data 3/31/24 12/31/24 3/31/25 Diluted earnings per common share computation: Net income available to common shareholders $ 11,525 $ 13,988 $ 10,406 LESS: net income available to common shareholders allocated to participating securities 92 98 57 Net income available to common shareholders allocated to common stock $ 11,433 $ 13,890 $ 10,349 Weighted average common shares outstanding for basic earnings per common share 20,824 20,857 20,867 ADD: Dilutive effect of stock compensation 63 73 58 Weighted average shares and dilutive potential common shares 20,887 20,930 20,925 Diluted earnings per common share $ 0.55 $ 0.66 $ 0.50 Adjusted diluted earnings per common share computation (non-GAAP): Adjusted net income available to common shareholders allocated to common stock (non-GAAP) $ 11,433 $ 13,890 $ 11,828 Weighted average common shares outstanding for basic earnings per common share 20,824 20,857 20,867 ADD: Dilutive effect of stock compensation 63 73 58 Weighted average shares and dilutive potential common shares 20,887 20,930 20,925 Adjusted diluted earnings per common share (non-GAAP) $ 0.55 $ 0.66 $ 0.57 24
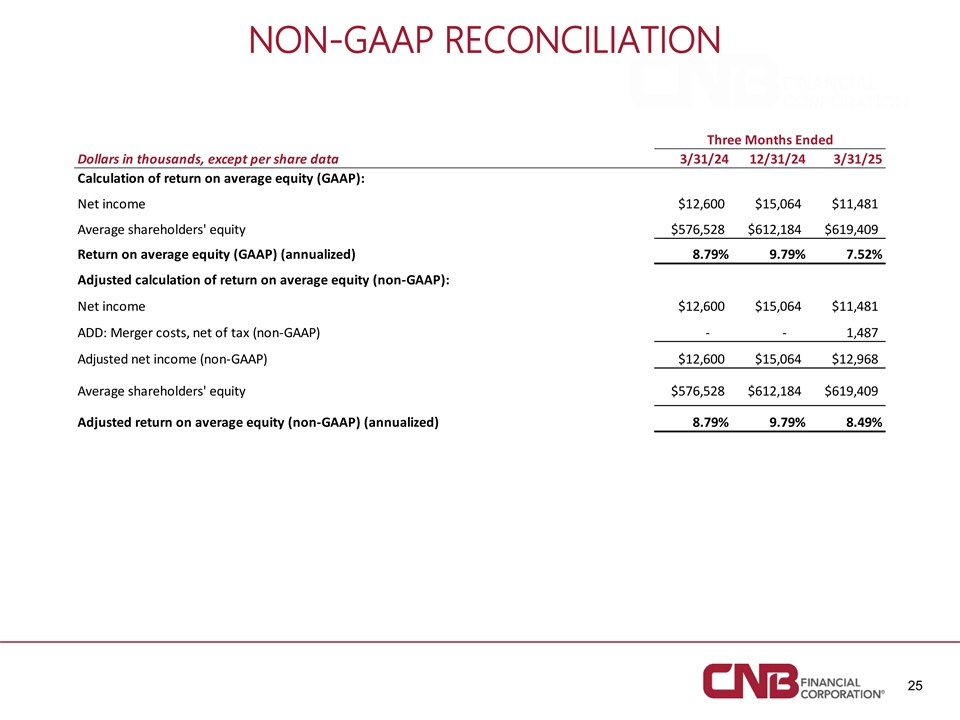
NON-GAAP RECONCILIATION Three Months Ended Dollars in thousands, except per share data 3/31/24 12/31/24 3/31/25 Calculation of return on average equity (GAAP): Net income $12,600 $15,064 $11,481 Average shareholders' equity $576,528 $612,184 $619,409 Return on average equity (GAAP) (annualized) 8.79% 9.79% 7.52% Adjusted calculation of return on average equity (non-GAAP): Net income $12,600 $15,064 $11,481 ADD: Merger costs, net of tax (non-GAAP) - - 1,487 Adjusted net income (non-GAAP) $12,600 $15,064 $12,968 Average shareholders' equity $576,528 $612,184 $619,409 Adjusted return on average equity (non-GAAP) (annualized) 8.79% 9.79% 8.49% 25
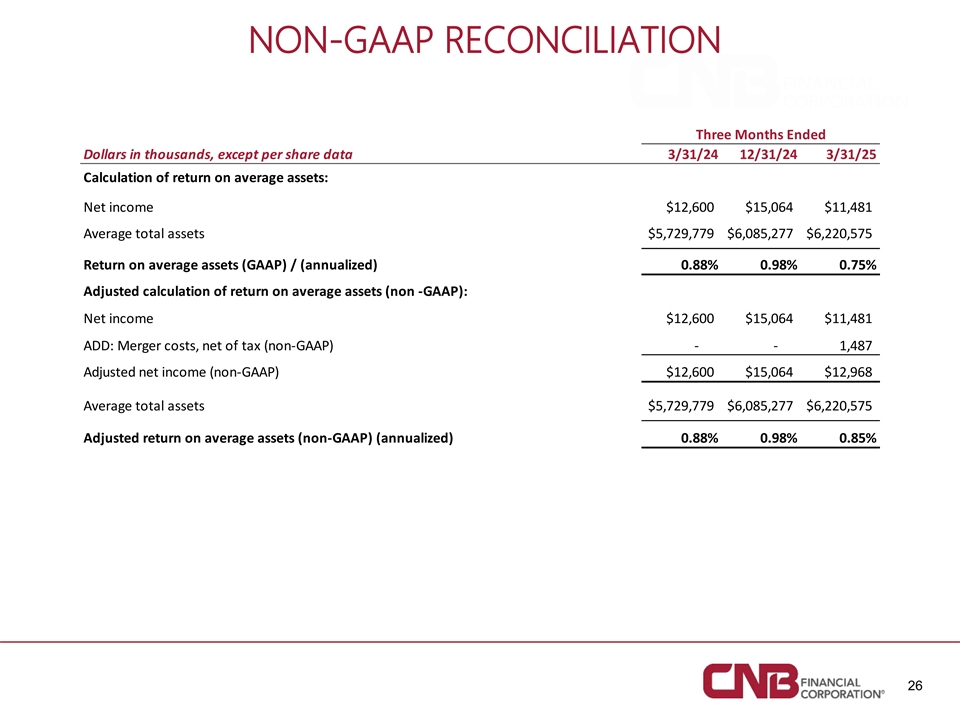
NON-GAAP RECONCILIATION Three Months Ended Dollars in thousands, except per share data 3/31/24 12/31/24 3/31/25 Calculation of return on average assets: Net income $12,600 $15,064 $11,481 Average total assets $5,729,779 $6,085,277 $6,220,575 Return on average assets (GAAP) / (annualized) 0.88% 0.98% 0.75% Adjusted calculation of return on average assets (non -GAAP): Net income $12,600 $15,064 $11,481 ADD: Merger costs, net of tax (non-GAAP) - - 1,487 Adjusted net income (non-GAAP) $12,600 $15,064 $12,968 Average total assets $5,729,779 $6,085,277 $6,220,575 Adjusted return on average assets (non-GAAP) (annualized) 0.88% 0.98% 0.85% 26