UNITED STATES SECURITIES AND EXCHANGE COMMISSION
Washington, D.C. 20549
Form 8-K
| CURRENT REPORT PURSUANT TO SECTION 13 or 15(d) OF THE SECURITIES EXCHANGE ACT OF 1934 | ||
| Date of Report (Date of earliest event reported): April 14, 2025 | ||
The Goldman Sachs Group, Inc.
(Exact name of registrant as specified in its charter)
Commission File Number: 001-14965
| Delaware | 13-4019460 | |
| (State or other jurisdiction of incorporation) |
(IRS Employer Identification No.) |
|
| 200 West Street, New York, N.Y. | 10282 | |
| (Address of principal executive offices) | (Zip Code) | |
(212) 902-1000
(Registrant’s telephone number, including area code)
Check the appropriate box below if the Form 8-K filing is intended to simultaneously satisfy the filing obligation of the registrant under any of the following provisions:
☐ Written communications pursuant to Rule 425 under the Securities Act (17 CFR 230.425)
☐ Soliciting material pursuant to Rule 14a-12 under the Exchange Act (17 CFR 240.14a-12)
☐ Pre-commencement communications pursuant to Rule 14d-2(b) under the Exchange Act (17 CFR 240.14d-2(b))
☐ Pre-commencement communications pursuant to Rule 13e-4(c) under the Exchange Act (17 CFR 240.13e-4(c))
Securities registered pursuant to Section 12(b) of the Act:
| Title of each class | Trading Symbol |
Exchange on which registered |
||
| Common stock, par value $.01 per share | GS | NYSE | ||
| Depositary Shares, Each Representing 1/1,000th Interest in a Share of Floating Rate Non-Cumulative Preferred Stock, Series A | GS PrA | NYSE | ||
| Depositary Shares, Each Representing 1/1,000th Interest in a Share of Floating Rate Non-Cumulative Preferred Stock, Series C | GS PrC | NYSE | ||
| Depositary Shares, Each Representing 1/1,000th Interest in a Share of Floating Rate Non-Cumulative Preferred Stock, Series D | GS PrD | NYSE | ||
| 5.793% Fixed-to-Floating Rate Normal Automatic Preferred Enhanced Capital Securities of Goldman Sachs Capital II | GS/43PE | NYSE | ||
| Floating Rate Normal Automatic Preferred Enhanced Capital Securities of Goldman Sachs Capital III | GS/43PF | NYSE | ||
| Medium-Term Notes, Series F, Callable Fixed and Floating Rate Notes due March 2031 of GS Finance Corp. | GS/31B | NYSE | ||
| Medium-Term Notes, Series F, Callable Fixed and Floating Rate Notes due May 2031 of GS Finance Corp. | GS/31X | NYSE | ||
Indicate by check mark whether the registrant is an emerging growth company as defined in Rule 405 of the Securities Act of 1933 (17 CFR 230.405) or Rule 12b-2 of the Securities Exchange Act of 1934 (17 CFR 240.12b-2).
Emerging growth company ☐
If an emerging growth company, indicate by check mark if the registrant has elected not to use the extended transition period for complying with any new or revised financial accounting standards provided pursuant to Section 13(a) of the Exchange Act. ☐
Item 2.02 Results of Operations and Financial Condition.
On April 14, 2025, The Goldman Sachs Group, Inc. (Group Inc. and, together with its consolidated subsidiaries, the firm) reported its earnings for the first quarter ended March 31, 2025. A copy of Group Inc.’s press release containing this information is attached as Exhibit 99.1 to this Report on Form 8-K and is incorporated herein by reference.
Item 7.01 Regulation FD Disclosure.
On April 14, 2025, at 9:30 a.m. (ET), the firm will hold a conference call to discuss the firm’s financial results, outlook and related matters. A copy of the presentation for the conference call is attached as Exhibit 99.2 to this Report on Form 8-K.
Item 9.01 Financial Statements and Exhibits.
(d) Exhibits.
| 99.1 |
The quotation on page 1 of Exhibit 99.1 and the information under the caption “Quarterly Highlights” on the following page (Excluded Sections) shall not be deemed “filed” for purposes of Section 18 of the Securities Exchange Act of 1934 (Exchange Act) or otherwise subject to the liabilities under that Section and shall not be deemed to be incorporated by reference into any filing of Group Inc. under the Securities Act of 1933 or the Exchange Act. The information included in Exhibit 99.1, other than in the Excluded Sections, shall be deemed “filed” for purposes of the Exchange Act.
| 99.2 | Presentation of Group Inc. dated April 14, 2025, for the conference call on April 14, 2025. |
Exhibit 99.2 is being furnished pursuant to Item 7.01 of Form 8-K and the information included therein shall not be deemed “filed” for purposes of Section 18 of the Exchange Act or otherwise subject to the liabilities under that Section and shall not be deemed to be incorporated by reference into any filing of Group Inc. under the Securities Act of 1933 or the Exchange Act.
| 101 | Pursuant to Rule 406 of Regulation S-T, the cover page information is formatted in iXBRL (Inline eXtensible Business Reporting Language). |
| 104 | Cover Page Interactive Data File (formatted in iXBRL in Exhibit 101). |
SIGNATURE
Pursuant to the requirements of the Securities Exchange Act of 1934, the Registrant has duly caused this report to be signed on its behalf by the undersigned hereunto duly authorized.
| THE GOLDMAN SACHS GROUP, INC. |
||||||
| (Registrant) | ||||||
| Date: April 14, 2025 | By: | /s/ Denis P. Coleman III |
||||
| Name: Denis P. Coleman III | ||||||
| Title: Chief Financial Officer | ||||||
Exhibit 99.1

|
First Quarter 2025
Earnings Results
Media Relations: Tony Fratto 212-902-5400 Investor Relations: Jehan Ilahi 212-902-0300
|
||
|
The Goldman Sachs Group, Inc. 200 West Street | New York, NY 10282
|
First Quarter 2025 Earnings Results
Goldman Sachs Reports First Quarter Earnings Per Common Share of $14.12
|
“Our strong results this quarter have demonstrated that in times of great uncertainty, clients turn to Goldman Sachs for execution and insight. While we are entering the second quarter with a markedly different operating environment than earlier this year, we remain confident in our ability to continue to support our clients.” |
|
- David Solomon, Chairman and Chief Executive Officer
|
Financial Summary
|
|
|
|||||||
|
Net Revenues
|
Net Earnings
|
EPS
|
||||||
|
1Q25 $15.06 billion
|
1Q25 $4.74 billion
|
1Q25 $14.12
|
||||||
|
Annualized ROE1
|
Annualized ROTE1
|
Book Value Per Share
|
||||||
|
1Q25 16.9%
|
1Q25 18.0%
|
1Q25 $344.20
|
||||||
NEW YORK, April 14, 2025 – The Goldman Sachs Group, Inc. (NYSE: GS) today reported net revenues of $15.06 billion and net earnings of $4.74 billion for the first quarter ended March 31, 2025.
Diluted earnings per common share (EPS) was $14.12 for the first quarter of 2025 compared with $11.58 for the first quarter of 2024 and $11.95 for the fourth quarter of 2024.
Annualized return on average common shareholders’ equity (ROE)1 was 16.9% and annualized return on average tangible common shareholders’ equity (ROTE)1 was 18.0% for the first quarter of 2025.
1
Goldman Sachs Reports
First Quarter 2025 Earnings Results
Quarterly Highlights
| ◾ | During the quarter, the firm supported clients and continued to execute on strategic priorities, which contributed to the firm’s third highest quarterly net revenues of $15.06 billion, as well as strong net earnings of $4.74 billion and diluted EPS of $14.12. |
| ◾ | Global Banking & Markets generated net revenues of $10.71 billion, driven by record net revenues in Equities (including record net revenues in financing) and strong performances in Fixed Income, Currency and Commodities (including record net revenues in financing) and Debt underwriting. |
| ◾ | The firm ranked #1 in worldwide announced and completed mergers and acquisitions, equity and equity-related offerings and common stock offerings, and ranked #2 in high-yield debt offerings and leveraged loan offerings, for the year-to-date.2 |
| ◾ | Asset & Wealth Management generated net revenues of $3.68 billion. Assets under supervision3 increased $36 billion during the quarter to a record $3.17 trillion. |
| ◾ | Book value per common share increased by 2.2% during the quarter to $344.20. |
Net Revenues
| Net revenues were $15.06 billion for the first quarter of 2025, 6% higher than the first quarter of 2024 and 9% higher than the fourth quarter of 2024. The increase compared with the first quarter of 2024 reflected higher net revenues in Global Banking & Markets, partially offset by slightly lower net revenues in Asset & Wealth Management. |
|
Net Revenues
|
||
|
$15.06 billion
|
||||
2
Goldman Sachs Reports
First Quarter 2025 Earnings Results
| Global Banking & Markets |
|
Net revenues in Global Banking & Markets were $10.71 billion for the first quarter of 2025, 10% higher than the first quarter of 2024 and 26% higher than the fourth quarter of 2024.
Investment banking fees were $1.91 billion, 8% lower than the first quarter of 2024, primarily due to significantly lower net revenues in Advisory compared with a strong prior year period, partially offset by higher net revenues in Debt underwriting, primarily driven by asset-backed and investment-grade activity. Net revenues in Equity underwriting were unchanged. The firm’s Investment banking fees backlog3 increased compared with the end of 2024.
Net revenues in Fixed Income, Currency and Commodities (FICC) were $4.40 billion, 2% higher than the first quarter of 2024, reflecting higher net revenues in FICC financing, driven by significantly higher net revenues from mortgages and structured lending. Net revenues in FICC intermediation were slightly lower, reflecting lower net revenues in credit products, interest rate products and commodities, largely offset by higher net revenues in currencies and slightly higher net revenues in mortgages.
Net revenues in Equities were $4.19 billion, 27% higher than the first quarter of 2024, due to significantly higher net revenues in Equities intermediation (primarily reflecting significantly higher net revenues in derivatives) and in Equities financing (primarily reflecting significantly higher net revenues in portfolio financing).
Net revenues in Other were $197 million, compared with $12 million for the first quarter of 2024, primarily reflecting significantly lower net losses on hedges. |
Global Banking & Markets
|
|||||
|
$10.71 billion
|
||||||
|
Advisory |
$ 792 million |
|||||
|
Equity underwriting |
$ 370 million |
|||||
|
Debt underwriting |
$ 752 million |
|||||
|
Investment banking fees |
$ 1.91 billion |
|||||
|
FICC intermediation |
$ 3.39 billion |
|||||
|
FICC financing |
$ 1.01 billion |
|||||
|
FICC |
$ 4.40 billion |
|||||
|
Equities intermediation |
$ 2.55 billion |
|||||
|
Equities financing |
$ 1.65 billion |
|||||
|
Equities |
$ 4.19 billion |
|||||
|
Other
|
$ 197 million
|
|||||
| Asset & Wealth Management |
| Net revenues in Asset & Wealth Management were $3.68 billion for the first quarter of 2025, 3% lower than the first quarter of 2024 and 22% lower than the fourth quarter of 2024. The decrease compared with the first quarter of 2024 reflected significantly lower net revenues in Equity investments and Debt investments, partially offset by higher Management and other fees. Net revenues in Private banking and lending and Incentive fees were also higher.
The decrease in Equity investments net revenues reflected significantly lower net gains from investments in private equities and higher net losses from investments in public equities. The decrease in Debt investments net revenues reflected significantly lower net interest income due to a reduction in the debt investments balance sheet and net losses compared with net gains in the prior year period. The increase in Management and other fees primarily reflected the impact of higher average assets under supervision. The increase in Private banking and lending net revenues primarily reflected higher net interest income from lending. The increase in Incentive fees was driven by harvesting.
|
Asset & Wealth Management
|
|||||
|
$3.68 billion
|
||||||
|
Management and other fees
|
$ 2.70 billion |
|||||
| Incentive fees
|
$ 129 million |
|||||
| Private banking and lending
|
$ 725 million |
|||||
| Equity investments
|
$ (5) million |
|||||
|
|
Debt investments
|
$ 127 million
|
||||
3
Goldman Sachs Reports
First Quarter 2025 Earnings Results
| Platform Solutions |
|
|
||||||
| Net revenues in Platform Solutions were $676 million for the first quarter of 2025, 3% lower than the first quarter of 2024 and essentially unchanged compared with the fourth quarter of 2024.
Transaction banking and other net revenues were lower compared with the first quarter of 2024, primarily reflecting lower average deposit balances. Consumer platforms net revenues were essentially unchanged compared with the first quarter of 2024.
|
Platform Solutions
|
|||||
|
$676 million
|
||||||
|
Consumer platforms |
$ 611 million | |||||
| Transaction banking and other
|
$ 65 million
|
|||||
Provision for Credit Losses
|
|
||||||
| Provision for credit losses was $287 million for the first quarter of 2025, compared with $318 million for the first quarter of 2024 and $351 million for the fourth quarter of 2024. Provisions for the first quarter of 2025 primarily reflected net provisions related to the credit card portfolio. Provisions for the first quarter of 2024 reflected net provisions related to both the credit card portfolio (driven by net charge-offs) and wholesale loans (driven by impairments).
|
Provision for Credit Losses
|
|||||
|
$287 million
|
||||||
Operating Expenses
|
|
||||
| Operating expenses were $9.13 billion for the first quarter of 2025, 5% higher than the first quarter of 2024 and 10% higher than the fourth quarter of 2024. The firm’s efficiency ratio3 was 60.6% for the first quarter of 2025, compared with 60.9% for the first quarter of 2024.
The increase in operating expenses compared with the first quarter of 2024 primarily reflected significantly higher transaction based expenses and higher compensation and benefits expenses (reflecting improved operating performance), partially offset by significantly lower consolidated investment entities expenses, including impairments (largely in depreciation and amortization) and a decrease from the FDIC special assessment fee recognized in the first quarter of 2024 (in other expenses).
Net provisions for litigation and regulatory proceedings were $(11) million for the first quarter of 2025, compared with $23 million for the first quarter of 2024.
Headcount was essentially unchanged compared with the end of 2024. |
|
Operating Expenses
|
||
|
$9.13 billion
|
||||
|
Efficiency Ratio
|
||||
|
60.6%
|
||||
4
Goldman Sachs Reports
First Quarter 2025 Earnings Results
Provision for Taxes
| The effective income tax rate for the first quarter of 2025 was 16.1%, down from the full year rate of 22.4% for 2024, primarily reflecting an increase in tax benefits on the settlement of employee share-based awards4, partially offset by a decrease in other permanent tax benefits, for the first quarter of 2025 compared with the full year of 2024.
|
Effective Tax Rate
|
|||
|
16.1%
|
||||
Other Matters
| ◾ On April 11, 2025, the Board of Directors of The Goldman Sachs Group, Inc. (Board) declared a dividend of $3.00 per common share to be paid on June 27, 2025 to common shareholders of record on May 30, 2025.
◾ In the first quarter of 2025, the firm returned $5.34 billion of capital to common shareholders, including $4.36 billion of common share repurchases (7.1 million shares at an average cost of $610.57) and $976 million of common stock dividends. During the quarter, the Board approved a share repurchase program authorizing repurchases of up to $40 billion of common stock.3
◾ Global core liquid assets3 averaged $441 billion for the first quarter of 2025, compared with an average of $422 billion for the fourth quarter of 2024. |
Declared Quarterly Dividend Per Common Share
|
|||
|
$3.00
|
||||
|
Common Share Repurchases
|
||||
|
7.1 million shares for $4.36 billion
|
||||
|
Average GCLA
|
||||
|
$441 billion
|
||||
5
Goldman Sachs Reports
First Quarter 2025 Earnings Results
The Goldman Sachs Group, Inc. is a leading global financial institution that delivers a broad range of financial services to a large and diversified client base that includes corporations, financial institutions, governments and individuals. Founded in 1869, the firm is headquartered in New York and maintains offices in all major financial centers around the world.
| Cautionary Note Regarding Forward-Looking Statements |
This press release contains “forward-looking statements” within the meaning of the safe harbor provisions of the U.S. Private Securities Litigation Reform Act of 1995. Forward-looking statements are not historical facts or statements of current conditions, but instead represent only the firm’s beliefs regarding future events, many of which, by their nature, are inherently uncertain and outside of the firm’s control. It is possible that the firm’s actual results, financial condition and liquidity may differ, possibly materially, from the anticipated results, financial condition and liquidity in these forward-looking statements. For information about some of the risks and important factors that could affect the firm’s future results, financial condition and liquidity, see “Risk Factors” in Part I, Item 1A of the firm’s Annual Report on Form 10-K for the year ended December 31, 2024.
Information regarding the firm’s assets under supervision, capital ratios, risk-weighted assets, supplementary leverage ratio, balance sheet data, global core liquid assets and VaR consists of preliminary estimates. These estimates are forward-looking statements and are subject to change, possibly materially, as the firm completes its financial statements.
Statements about the firm’s Investment banking fees backlog and future results also may constitute forward-looking statements. Such statements are subject to the risk that transactions may be modified or may not be completed at all, and related net revenues may not be realized or may be materially less than expected. Important factors that could have such a result include, for underwriting transactions, a decline or weakness in general economic conditions, changes in international trade policies, including the imposition of tariffs, an outbreak or worsening of hostilities, volatility in the securities markets or an adverse development with respect to the issuer of the securities and, for financial advisory transactions, a decline in the securities markets, an inability to obtain adequate financing, an adverse development with respect to a party to the transaction or a failure to obtain a required regulatory approval. For information about other important factors that could adversely affect the firm’s Investment banking fees, see “Risk Factors” in Part I, Item 1A of the firm’s Annual Report on Form 10-K for the year ended December 31, 2024.
| Conference Call |
A conference call to discuss the firm’s financial results, outlook and related matters will be held at 9:30 am (ET). The call will be open to the public. Members of the public who would like to listen to the conference call should dial 1-800-289-0459 (in the U.S.) or 1-323-794-2095 (outside the U.S.) passcode number 7042022. The number should be dialed at least 10 minutes prior to the start of the conference call. The conference call will also be accessible as an audio webcast through the Investor Relations section of the firm’s website, www.goldmansachs.com/investor-relations. There is no charge to access the call. For those unable to listen to the live broadcast, a replay will be available on the firm’s website beginning approximately three hours after the event. Please direct any questions regarding obtaining access to the conference call to Goldman Sachs Investor Relations, via e-mail, at gs-investor-relations@gs.com.
6
Goldman Sachs Reports
First Quarter 2025 Earnings Results
The Goldman Sachs Group, Inc. and Subsidiaries
Segment Net Revenues (unaudited)
$ in millions
| THREE MONTHS ENDED | % CHANGE FROM | |||||||||||||||||||||||
| MARCH 31, 2025 |
DECEMBER 31, 2024 |
MARCH 31, 2024 |
DECEMBER 31, 2024 |
MARCH 31, 2024 |
||||||||||||||||||||
|
GLOBAL BANKING & MARKETS
|
||||||||||||||||||||||||
| Advisory
|
$ 792 | $ 960 | $ 1,011 | (18) % | (22) % | |||||||||||||||||||
| Equity underwriting
|
|
370
|
|
|
499
|
|
|
370
|
|
|
(26)
|
|
|
–
|
|
|||||||||
| Debt underwriting
|
|
752
|
|
|
595
|
|
|
699
|
|
|
26
|
|
|
8
|
|
|||||||||
| Investment banking fees |
1,914 | 2,054 | 2,080 | (7) | (8) | |||||||||||||||||||
| FICC intermediation
|
|
3,390
|
|
|
1,750
|
|
|
3,471
|
|
|
94
|
|
|
(2)
|
|
|||||||||
| FICC financing
|
|
1,014
|
|
|
989
|
|
|
852
|
|
|
3
|
|
|
19
|
|
|||||||||
| FICC |
4,404 | 2,739 | 4,323 | 61 | 2 | |||||||||||||||||||
| Equities intermediation |
|
2,547
|
|
|
1,953
|
|
|
1,989
|
|
|
30
|
|
|
28
|
|
|||||||||
| Equities financing
|
|
1,645
|
|
|
1,498
|
|
|
1,322
|
|
|
10
|
|
|
24
|
|
|||||||||
| Equities
|
|
4,192
|
|
|
3,451
|
|
|
3,311
|
|
|
21
|
|
|
27
|
|
|||||||||
| Other
|
|
197
|
|
|
235
|
|
|
12
|
|
|
(16)
|
|
|
N.M.
|
|
|||||||||
|
Net revenues
|
|
10,707
|
|
|
8,479
|
|
|
9,726
|
|
|
26
|
|
|
10
|
|
|||||||||
|
ASSET & WEALTH MANAGEMENT
|
||||||||||||||||||||||||
|
Management and other fees
|
|
2,703
|
|
|
2,818
|
|
|
2,452
|
|
|
(4)
|
|
|
10
|
|
|||||||||
| Incentive fees
|
|
129
|
|
|
174
|
|
|
88
|
|
|
(26)
|
|
|
47
|
|
|||||||||
| Private banking and lending
|
|
725
|
|
|
736
|
|
|
682
|
|
|
(1)
|
|
|
6
|
|
|||||||||
| Equity investments
|
|
(5)
|
|
|
729
|
|
|
222
|
|
|
N.M.
|
|
|
N.M.
|
|
|||||||||
| Debt investments
|
|
127
|
|
|
264
|
|
|
345
|
|
|
(52)
|
|
|
(63)
|
|
|||||||||
|
Net revenues
|
|
3,679
|
|
|
4,721
|
|
|
3,789
|
|
|
(22)
|
|
|
(3)
|
|
|||||||||
|
PLATFORM SOLUTIONS
|
||||||||||||||||||||||||
| Consumer platforms |
611 | 597 | 618 | 2 | (1) | |||||||||||||||||||
|
Transaction banking and other
|
|
65
|
|
|
72
|
|
|
80
|
|
|
(10)
|
|
|
(19)
|
|
|||||||||
|
Net revenues
|
|
676
|
|
|
669
|
|
|
698
|
|
|
1
|
|
|
(3)
|
|
|||||||||
|
Total net revenues
|
|
$ 15,062
|
|
|
$ 13,869
|
|
|
$ 14,213
|
|
|
9
|
|
|
6
|
|
|||||||||
|
Geographic Net Revenues (unaudited)3 |
|
|||||||||||||||||||||||
| $ in millions | ||||||||||||||||||||||||
| THREE MONTHS ENDED | ||||||||||||||||||||||||
| MARCH 31, 2025 |
DECEMBER 31, 2024 |
MARCH 31, 2024 |
||||||||||||||||||||||
|
Americas
|
$ 9,866 | $ 9,097 | $ 9,181 | |||||||||||||||||||||
| EMEA
|
3,491 | 2,773 | 3,470 | |||||||||||||||||||||
| Asia
|
|
1,705
|
|
|
1,999
|
|
|
1,562
|
|
|||||||||||||||
|
Total net revenues
|
|
$ 15,062
|
|
|
$ 13,869
|
|
|
$ 14,213
|
|
|||||||||||||||
| Americas
|
66% | 66% | 65% | |||||||||||||||||||||
| EMEA
|
23% | 20% | 24% | |||||||||||||||||||||
| Asia
|
|
11%
|
|
|
14%
|
|
|
11%
|
|
|||||||||||||||
|
Total
|
|
100%
|
|
|
100%
|
|
|
100%
|
|
|||||||||||||||
7
Goldman Sachs Reports
First Quarter 2025 Earnings Results
The Goldman Sachs Group, Inc. and Subsidiaries
Consolidated Statements of Earnings (unaudited)3
In millions, except per share amounts and headcount
| THREE MONTHS ENDED | % CHANGE FROM | |||||||||||||||||||||||
| MARCH 31, 2025 |
DECEMBER 31, 2024 |
MARCH 31, 2024 |
DECEMBER 31, 2024 |
MARCH 31, 2024 |
||||||||||||||||||||
|
REVENUES
|
||||||||||||||||||||||||
| Investment banking
|
|
$ 1,916
|
|
|
$ 2,056
|
|
|
$ 2,085
|
|
|
(7) %
|
|
|
(8) %
|
|
|||||||||
| Investment management
|
|
2,759
|
|
|
2,923
|
|
|
2,491
|
|
|
(6)
|
|
|
11
|
|
|||||||||
| Commissions and fees
|
|
1,226
|
|
|
1,085
|
|
|
1,077
|
|
|
13
|
|
|
14
|
|
|||||||||
| Market making
|
|
5,723
|
|
|
3,833
|
|
|
6,094
|
|
|
49
|
|
|
(6)
|
|
|||||||||
| Other principal transactions
|
|
543
|
|
|
1,627
|
|
|
1,092
|
|
|
(67)
|
|
|
(50)
|
|
|||||||||
|
Total non-interest revenues |
12,167 | 11,524 | 12,839 | 6 | (5) | |||||||||||||||||||
| Interest income
|
|
19,383
|
|
|
19,954
|
|
|
19,555
|
|
|
(3)
|
|
|
(1)
|
|
|||||||||
| Interest expense |
16,488 | 17,609 | 18,181 | (6) | (9) | |||||||||||||||||||
|
Net interest income |
2,895 | 2,345 | 1,374 | 23 | 111 | |||||||||||||||||||
|
Total net revenues |
15,062 | 13,869 | 14,213 | 9 | 6 | |||||||||||||||||||
|
Provision for credit losses |
287 | 351 | 318 | (18) | (10) | |||||||||||||||||||
|
OPERATING EXPENSES |
||||||||||||||||||||||||
| Compensation and benefits
|
|
4,876
|
|
|
3,759
|
|
|
4,585
|
|
|
30
|
|
|
6
|
|
|||||||||
| Transaction based
|
|
1,850
|
|
|
1,872
|
|
|
1,497
|
|
|
(1)
|
|
|
24
|
|
|||||||||
| Market development
|
|
156
|
|
|
181
|
|
|
153
|
|
|
(14)
|
|
|
2
|
|
|||||||||
| Communications and technology
|
|
506
|
|
|
523
|
|
|
470
|
|
|
(3)
|
|
|
8
|
|
|||||||||
| Depreciation and amortization
|
|
506
|
|
|
498
|
|
|
627
|
|
|
2
|
|
|
(19)
|
|
|||||||||
| Occupancy
|
|
233
|
|
|
240
|
|
|
247
|
|
|
(3)
|
|
|
(6)
|
|
|||||||||
| Professional fees
|
|
424
|
|
|
475
|
|
|
384
|
|
|
(11)
|
|
|
10
|
|
|||||||||
| Other expenses
|
|
577
|
|
|
713
|
|
|
695
|
|
|
(19)
|
|
|
(17)
|
|
|||||||||
|
Total operating expenses |
9,128 | 8,261 | 8,658 | 10 | 5 | |||||||||||||||||||
| Pre-tax earnings
|
|
5,647
|
|
|
5,257
|
|
|
5,237
|
|
|
7
|
|
|
8
|
|
|||||||||
| Provision for taxes |
909 | 1,146 | 1,105 | (21) | (18) | |||||||||||||||||||
|
Net earnings |
4,738 | 4,111 | 4,132 | 15 | 15 | |||||||||||||||||||
| Preferred stock dividends |
155 | 188 | 201 | (18) | (23) | |||||||||||||||||||
|
Net earnings applicable to common shareholders |
$ 4,583 | $ 3,923 | $ 3,931 | 17 | 17 | |||||||||||||||||||
|
EARNINGS PER COMMON SHARE |
||||||||||||||||||||||||
|
Basic3
|
|
$ 14.25
|
|
|
$ 12.13
|
|
|
$ 11.67
|
|
|
17 %
|
|
|
22 %
|
|
|||||||||
| Diluted |
$ 14.12 | $ 11.95 | $ 11.58 | 18 | 22 | |||||||||||||||||||
|
AVERAGE COMMON SHARES |
||||||||||||||||||||||||
| Basic
|
|
320.8
|
|
|
322.4
|
|
|
335.6
|
|
|
–
|
|
|
(4)
|
|
|||||||||
| Diluted |
324.5 | 328.4 | 339.5 | (1) | (4) | |||||||||||||||||||
|
SELECTED DATA AT PERIOD-END |
||||||||||||||||||||||||
| Common shareholders’ equity
|
|
$ 109,147
|
|
|
$ 108,743
|
|
|
$ 107,343
|
|
|
–
|
|
|
2
|
|
|||||||||
| Basic shares3
|
|
317.1
|
|
|
322.9
|
|
|
334.3
|
|
|
(2)
|
|
|
(5)
|
|
|||||||||
| Book value per common share
|
|
$ 344.20
|
|
|
$ 336.77
|
|
|
$ 321.10
|
|
|
2
|
|
|
7
|
|
|||||||||
| Headcount
|
|
46,600
|
|
|
46,500
|
|
|
44,400
|
|
|
–
|
|
|
5
|
|
|||||||||
8
Goldman Sachs Reports
First Quarter 2025 Earnings Results
The Goldman Sachs Group, Inc. and Subsidiaries
Condensed Consolidated Balance Sheets (unaudited)3
$ in billions
| AS OF | ||||||||||||||||||||
| MARCH 31, 2025 |
DECEMBER 31, 2024 |
|||||||||||||||||||
|
ASSETS
|
||||||||||||||||||||
| Cash and cash equivalents |
$ 167 | $ 182 | ||||||||||||||||||
| Collateralized agreements |
398 | 375 | ||||||||||||||||||
| Customer and other receivables |
165 | 134 | ||||||||||||||||||
| Trading assets |
596 | 571 | ||||||||||||||||||
| Investments |
196 | 184 | ||||||||||||||||||
| Loans |
210 | 196 | ||||||||||||||||||
| Other assets
|
|
34
|
|
|
34
|
|
||||||||||||||
|
Total assets
|
|
$ 1,766
|
|
|
$ 1,676
|
|
||||||||||||||
|
LIABILITIES AND SHAREHOLDERS’ EQUITY
|
||||||||||||||||||||
| Deposits |
$ 471 | $ 433 | ||||||||||||||||||
| Collateralized financings |
330 | 359 | ||||||||||||||||||
| Customer and other payables |
254 | 223 | ||||||||||||||||||
| Trading liabilities |
233 | 202 | ||||||||||||||||||
| Unsecured short-term borrowings |
71 | 70 | ||||||||||||||||||
| Unsecured long-term borrowings |
263 | 243 | ||||||||||||||||||
| Other liabilities
|
|
20
|
|
|
24
|
|
||||||||||||||
|
Total liabilities
|
|
1,642
|
|
|
1,554
|
|
||||||||||||||
| Shareholders’ equity
|
|
124
|
|
|
122
|
|
||||||||||||||
|
Total liabilities and shareholders’ equity
|
|
$ 1,766
|
|
|
$ 1,676
|
|
||||||||||||||
|
Capital Ratios and Supplementary Leverage Ratio (unaudited)3 $ in billions
|
|
|||||||||||||||||||
| AS OF | ||||||||||||||||||||
| MARCH 31, 2025 |
DECEMBER 31, 2024 |
|||||||||||||||||||
| Common equity tier 1 capital |
$ 102.7 | $ 103.1 | ||||||||||||||||||
|
STANDARDIZED CAPITAL RULES
|
||||||||||||||||||||
| Risk-weighted assets |
$ 696 | $ 689 | ||||||||||||||||||
| Common equity tier 1 capital ratio |
14.8% | 15.0% | ||||||||||||||||||
|
ADVANCED CAPITAL RULES
|
||||||||||||||||||||
| Risk-weighted assets |
$ 663 | $ 675 | ||||||||||||||||||
| Common equity tier 1 capital ratio |
15.5% | 15.3% | ||||||||||||||||||
|
SUPPLEMENTARY LEVERAGE RATIO
|
||||||||||||||||||||
| Supplementary leverage ratio
|
|
5.5%
|
|
|
5.5%
|
|
||||||||||||||
|
Average Daily VaR (unaudited)3 $ in millions
|
|
|||||||||||||||||||
| THREE MONTHS ENDED | ||||||||||||||||||||
| MARCH 31, 2025 |
DECEMBER 31, 2024 |
|||||||||||||||||||
| RISK CATEGORIES
|
||||||||||||||||||||
| Interest rates |
$ 70 | $ 83 | ||||||||||||||||||
| Equity prices |
42 | 49 | ||||||||||||||||||
| Currency rates |
36 | 31 | ||||||||||||||||||
| Commodity prices |
15 | 19 | ||||||||||||||||||
| Diversification effect
|
|
(72)
|
|
|
(86)
|
|
||||||||||||||
|
Total
|
|
$ 91
|
|
|
$ 96
|
|
||||||||||||||
9
Goldman Sachs Reports
First Quarter 2025 Earnings Results
The Goldman Sachs Group, Inc. and Subsidiaries
Assets Under Supervision (unaudited)3
$ in billions
| AS OF | ||||||||||||||||||||||||||||
| MARCH 31, 2025 |
DECEMBER 31, 2024 |
MARCH 31, 2024 |
||||||||||||||||||||||||||
|
ASSET CLASS
|
||||||||||||||||||||||||||||
| Alternative investments
|
$
|
341
|
|
$
|
336
|
|
$
|
296
|
|
|||||||||||||||||||
| Equity
|
|
771
|
|
|
772
|
|
|
713
|
|
|||||||||||||||||||
| Fixed income
|
|
1,221
|
|
|
1,184
|
|
|
1,141
|
|
|||||||||||||||||||
|
Total long-term AUS
|
|
2,333
|
|
|
2,292
|
|
|
2,150
|
|
|||||||||||||||||||
| Liquidity products
|
|
840
|
|
|
845
|
|
|
698
|
|
|||||||||||||||||||
|
Total AUS
|
$
|
3,173
|
|
$
|
3,137
|
|
$
|
2,848
|
|
|||||||||||||||||||
| THREE MONTHS ENDED | ||||||||||||||||||||||||||||
| MARCH 31, 2025 |
DECEMBER 31, 2024 |
MARCH 31, 2024 |
||||||||||||||||||||||||||
| Beginning balance |
$
|
3,137
|
|
$
|
3,103
|
|
$
|
2,812
|
|
|||||||||||||||||||
| Net inflows / (outflows):
|
||||||||||||||||||||||||||||
| Alternative investments
|
|
4
|
|
|
11
|
|
|
–
|
|
|||||||||||||||||||
| Equity
|
|
11
|
|
|
4
|
|
|
1
|
|
|||||||||||||||||||
| Fixed income
|
|
14
|
|
|
7
|
|
|
23
|
|
|||||||||||||||||||
|
Total long-term AUS net inflows / (outflows)
|
|
29
|
|
|
22
|
|
24 | |||||||||||||||||||||
| Liquidity products
|
|
(5)
|
|
|
70
|
|
(39) | |||||||||||||||||||||
|
Total AUS net inflows / (outflows)
|
|
24
|
|
|
92
|
|
(15) | |||||||||||||||||||||
| Net market appreciation / (depreciation)
|
|
12
|
|
|
(58)
|
|
51 | |||||||||||||||||||||
|
Ending balance
|
$ | 3,173 | $ | 3,137 | $ | 2,848 | ||||||||||||||||||||||
10
Goldman Sachs Reports
First Quarter 2025 Earnings Results
|
Footnotes |
|
|
| 1. | Annualized ROE is calculated by dividing annualized net earnings applicable to common shareholders by average monthly common shareholders’ equity. Annualized ROTE is calculated by dividing annualized net earnings applicable to common shareholders by average monthly tangible common shareholders’ equity (tangible common shareholders’ equity is calculated as total shareholders’ equity less preferred stock, goodwill and identifiable intangible assets). Management believes that ROTE is meaningful because it measures the performance of businesses consistently, whether they were acquired or developed internally, and that tangible common shareholders’ equity is meaningful because it is a measure that the firm and investors use to assess capital adequacy. ROTE and tangible common shareholders’ equity are non-GAAP measures and may not be comparable to similar non-GAAP measures used by other companies. |
The table below presents a reconciliation of average common shareholders’ equity to average tangible common shareholders’ equity:
| AVERAGE FOR THE | ||||||||||
| Unaudited, $ in millions
|
THREE MONTHS ENDED MARCH 31, 2025 |
|
||||||||
| Total shareholders’ equity
|
|
$ 123,354
|
|
|||||||
| Preferred stock
|
|
(14,678)
|
|
|||||||
|
Common shareholders’ equity
|
|
108,676
|
|
|||||||
|
Goodwill |
|
(5,862)
|
|
|||||||
| Identifiable intangible assets
|
|
(845)
|
|
|||||||
|
Tangible common shareholders’ equity
|
|
$ 101,969
|
|
|||||||
| 2. | Dealogic – January 1, 2025 through March 31, 2025. |
| 3. | For information about the following items, see the referenced sections in Part II, Item 7 “Management’s Discussion and Analysis of Financial Condition and Results of Operations” in the firm’s Annual Report on Form 10-K for the year ended December 31, 2024: (i) Investment banking fees backlog – see “Results of Operations – Global Banking & Markets,” (ii) assets under supervision – see “Results of Operations – Asset & Wealth Management – Assets Under Supervision,” (iii) efficiency ratio – see “Results of Operations – Operating Expenses,” (iv) share repurchase program – see “Capital Management and Regulatory Capital – Capital Management,” (v) global core liquid assets – see “Risk Management – Liquidity Risk Management,” (vi) basic shares – see “Balance Sheet and Funding Sources – Balance Sheet Analysis and Metrics” and (vii) VaR – see “Risk Management – Market Risk Management.” |
| For information about the following items, see the referenced sections in Part II, Item 8 “Financial Statements and Supplementary Data” in the firm’s Annual Report on Form 10-K for the year ended December 31, 2024: (i) risk-based capital ratios and the supplementary leverage ratio – see Note 20 “Regulation and Capital Adequacy,” (ii) geographic net revenues – see Note 25 “Business Segments” and (iii) unvested share-based awards that have non-forfeitable rights to dividends or dividend equivalents in calculating basic EPS – see Note 21 “Earnings Per Common Share.” |
| For information about net interest income and total non-interest revenues, see the firm’s Form 8-K dated January 15, 2025. |
| Represents a preliminary estimate for the first quarter of 2025 for the firm’s assets under supervision, capital ratios, risk-weighted assets, supplementary leverage ratio, balance sheet data, global core liquid assets and VaR. These may be revised in the firm’s Quarterly Report on Form 10-Q for the period ended March 31, 2025. |
| 4. | The impact of the tax benefits related to employee share-based awards was a reduction to provision for taxes for the first quarter of 2025 of approximately $525 million, which increased diluted EPS by $1.63 and annualized ROE by 2.0 percentage points. |
11
Exhibit 99.2

First Quarter 2025 Earnings Results Presentation April 14, 2025 Goldman Sachs
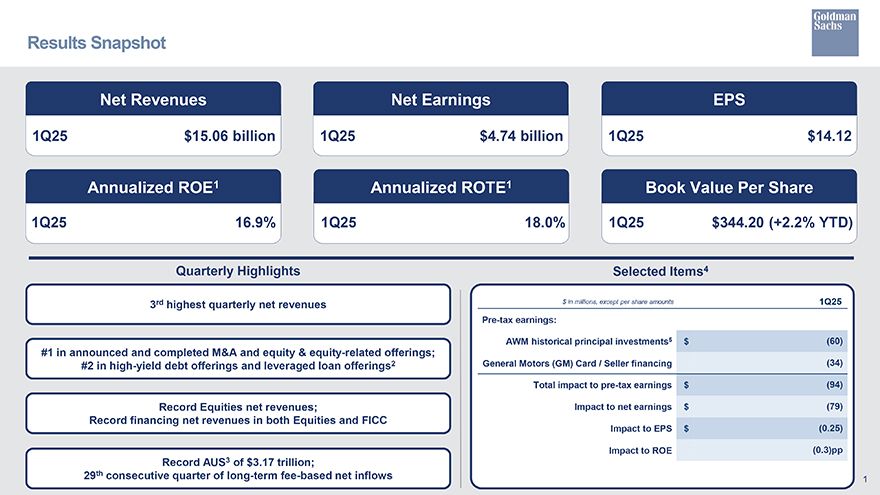
Results Snapshot Goldman Sachs Net Revenues Net Earnings EPS 1Q25 $15.06 billion 1Q25 $4.74 billion 1Q25 $14.12 Annualized ROE¹ Annualized ROTE¹ Book Value Per Share 1Q25 16.9% 1Q25 18.0% 1Q25 $344.20 (+2.2% YTD) Quarterly Highlights 3rd highest quarterly net revenues Selected Items4 $ in millions, except per share amounts Pre-tax earnings: 1Q25 #1 in announced and completed M&A and equity & equity-related offerings; #2 in high-yield debt offerings and leveraged loan offerings? Record Equities net revenues; Record financing net revenues in both Equities and FICC Record AUS³ of $3.17 trillion; 29th consecutive quarter of long-term fee-based net inflows AWM historical principal investments5 $ General Motors (GM) Card / Seller financing (60) (34) Total impact to pre-tax earnings $ Impact to net earnings $ (94) (79) Impact to EPS $ (0.25) Impact to ROE (0.3)pp
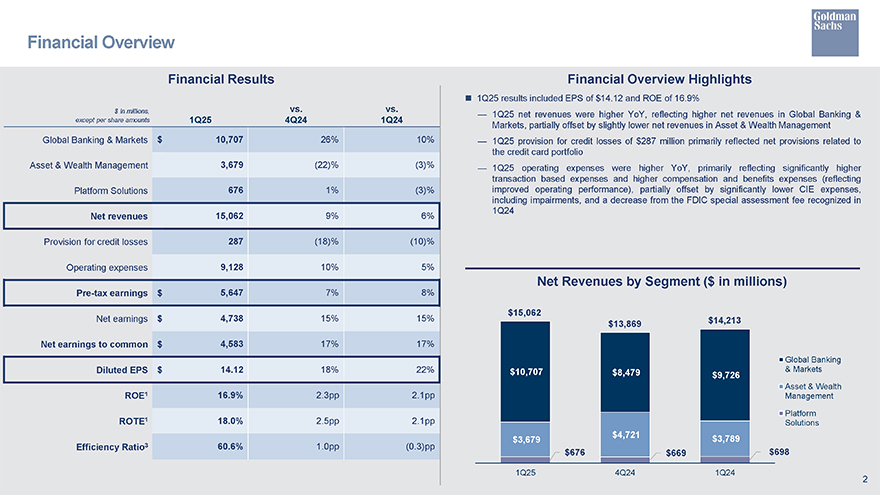
Goldman Sachs Financial Overview Financial Results Financial Overview Highlights1Q25 results included EPS of $14.12 and ROE of 16.9%— 1Q25 net revenues were higher YoY, reflecting higher net revenues in Global Banking &Markets, partially offset by slightly lower net revenues in Asset & Wealth Management— 1Q25 provision for credit losses of $287 million primarily reflected net provisions related to the credit card portfolio — 1Q25 operating expenses were higher YoY, primarily reflecting significantly higher transaction based expenses and higher compensation and benefits expenses (reflecting improved operating performance), partially offset by significantly lower CIE expenses, including impairments, and a decrease from the FDIC special assessment fee recognized in 1Q242 $ in millions, except per share amounts 1Q25 vs. 4Q24 vs. 1Q24 Global Banking & Markets $ 10,707 26% 10% Asset & Wealth Management 3,679 (22)% (3)% Platform Solutions 676 1% (3)% Net revenues 15,062 9% 6% Provision for credit losses 287 (18)% (10)% Operating expenses 9,128 10% 5% Pre-tax earnings $ 5,647 7% 8% Net earnings $ 4,738 15% 15% Net earnings to common $ 4,583 17% 17% Diluted EPS $ 14.12 18% 22%ROE1 16.9% 2.3pp 2.1pp ROTE1 18.0% 2.5pp 2.1pp Efficiency Ratio3 60.6% 1.0pp (0.3)pp Net Revenues by Segment ($ in millions) $676 $669 $698 1Q25 4Q24 1Q24 Global Banking & Markets Asset & Wealth Management Platform Solutions
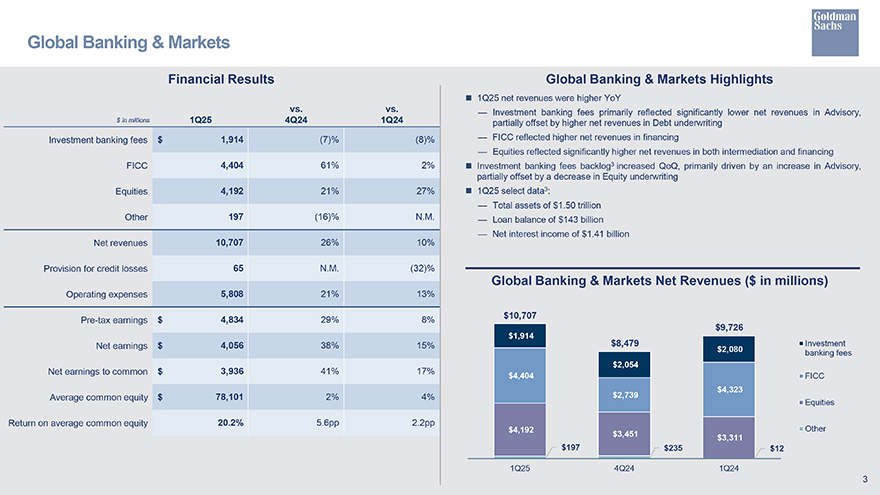
Goldman Sachs Global Banking & Markets Financial Results VS. VS. $ in millions 1Q25 4Q24 1Q24 Investment banking fees $ 1,914 (7)% (8)% FICC 4,404 61% 26 2% Equities 4,192 21% 27% Other 197 (16)% N.M. Global Banking & Markets Highlights 1Q25 net revenues were higher YoY Investment banking fees primarily reflected significantly lower net revenues in Advisory, partially offset by higher net revenues in Debt underwriting—FICC reflected higher net revenues in financing—Equities reflected significantly higher net revenues in both intermediation and financing Investment banking fees backlog³ increased QoQ, primarily driven by an increase in Advisory, partially offset by a decrease in Equity underwriting â– 1Q25 select data³: Total assets of $1.50 trillion Loan balance of $143 billion Net interest income of $1.41 billion Net revenues 10,707 26% 10% Provision for credit losses 65 N.M. (32)% Global Banking & Markets Net Revenues ($ in millions) Operating expenses 5,808 21% 13% $10,707 Pre-tax earnings $ 4,834 29% 8% $9,726 $1,914 Net earnings $ 4,056 38% 15% $8,479 $2,080 â– Investment banking fees $2,054 Net earnings to common $ Average common equity $ 3,936 41% 17% $4,404 â– FICC $4,323 78,101 2% 4% $2,739 â– Equities Return on average common equity 20.2% 5.6pp 2.2pp $4,192 â– Other $3,451 $3,311 $197 $235 $12 1Q25 4Q24 1Q24 3
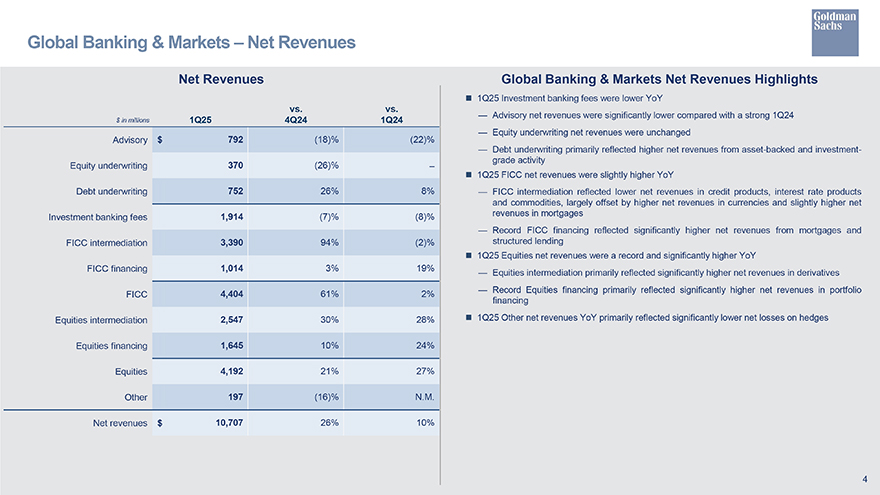
Global Banking & Markets—Net Revenues Net Revenues VS. $ in millions 1Q25 4Q24 VS. 1Q24 Advisory $ 792 (18)% (22)% Equity underwriting 370 (26)% Debt underwriting 752 26% 8% Investment banking fees 1,914 (7)% (8)% FICC intermediation 3,390 94% (2)% FICC financing 1,014 3% 19% FICC 4,404 61% 2% Equities intermediation 2,547 30% 28% Equities financing 1,645 10% 24% Equities 4,192 21% 27% Other 197 (16)% N.M. Net revenues $ 10,707 26% 10% Goldman Sachs Global Banking & Markets Net Revenues Highlights â–1Q25 Investment banking fees were lower YoY—Advisory net revenues were significantly lower compared with a strong 1Q24 Equity underwriting net revenues were unchanged Debt underwriting primarily reflected higher net revenues from asset-backed and investment- grade activity 1Q25 FICC net revenues were slightly higher YoY—FICC intermediation reflected lower net revenues in credit products, interest rate products and commodities, largely offset by higher net revenues in currencies and slightly higher net revenues in mortgages Record FICC financing reflected significantly higher net revenues from mortgages and structured lending 1Q25 Equities net revenues were a record and significantly higher YoY—Equities intermediation primarily reflected significantly higher net revenues in derivatives Record Equities financing primarily reflected significantly higher net revenues in portfolio financing â– 1Q25 Other net revenues YoY primarily reflected significantly lower net losses on hedges 4
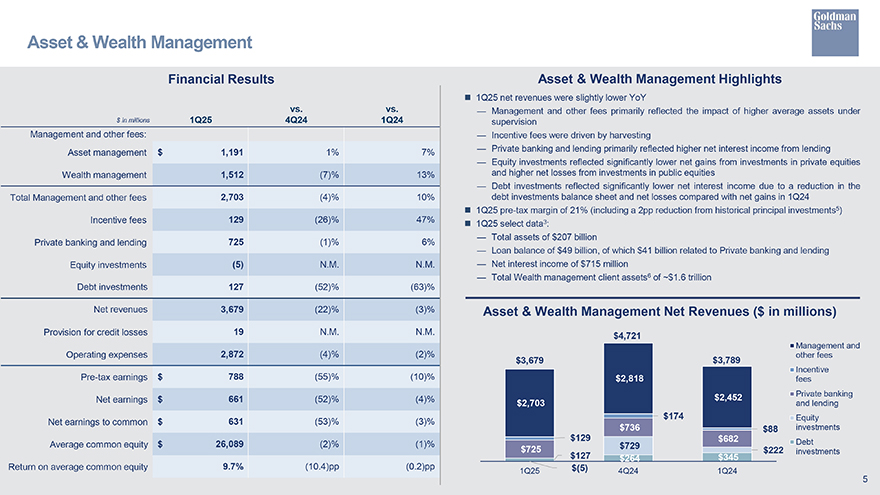
Goldman Sachs Asset & Wealth Management Financial Results $ in millions 1Q25 VS. 4Q24 VS. 1Q24 Management and other fees: Asset management $ 1,191 1% 7% Wealth management 1,512 (7)% 13% Total Management and other fees 2,703 (4)% 10% Incentive fees 129 (26)% 47% Private banking and lending 725 (1)% 6% Equity investments (5) N.M. N.M. Debt investments 127 (52)% (63)% Net revenues 3,679 (22)% (3)% Asset & Wealth Management Highlights â– 1Q25 net revenues were slightly lower YoY Management and other fees primarily reflected the impact of higher average assets under supervision Incentive fees were driven by harvesting Private banking and lending primarily reflected higher net interest income from lending Equity investments reflected significantly lower net gains from investments in private equities and higher net losses from investments in public equities Debt investments reflected significantly lower net interest income due to a reduction in the debt investments balance sheet and net losses compared with net gains in 1Q24 1Q25 pre-tax margin of 21% (including a 2pp reduction from historical principal investments) â– 1Q25 select data³: Total assets of $207 billion Loan balance of $49 billion, of which $41 billion related to Private banking and lending Net interest income of $715 million Total Wealth management client assets of ~$1.6 trillion Asset & Wealth Management Net Revenues ($ in millions) Provision for credit losses 19 N.M. N.M. $4,721 Operating expenses 2,872 (4)% (2)% â– Management and other fees Pre-tax earnings $ 788 (55)% (10)% $3,679 $2,818 $3,789 â–Incentive fees Net earnings $ 661 (52)% (4)% $2,452 â– Private banking $2,703 and lending $174 Net earnings to common $ 631 (53)% (3)% $736 $88 Equity investments $129 $682 Average common equity 26,089 (2)% (1)%—Debt $729 $725 $222 investments $127 $264 $345 Return on average common equity 9.7% (10.4)pp (0.2)pp 1Q25 $(5) 4Q24 1Q24 5
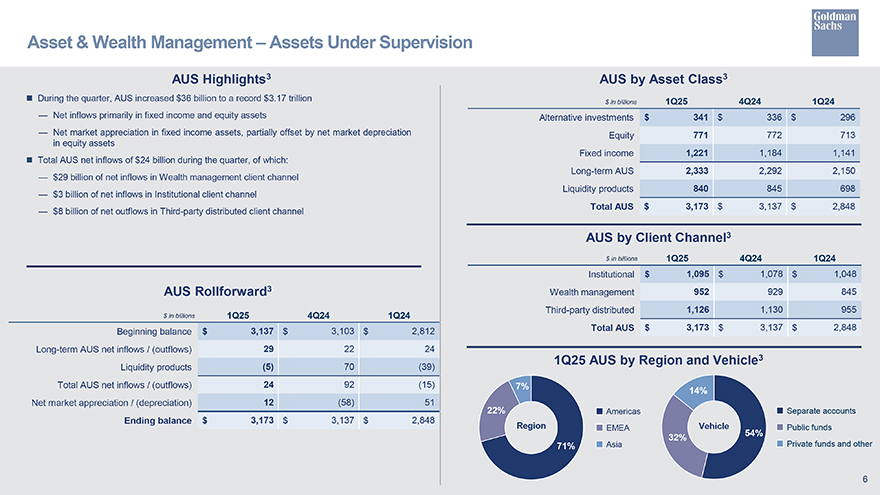
Goldman Sachs Asset & Wealth Management—Assets Under Supervision AUS Highlights³ During the quarter, AUS increased $36 billion to a record $3.17 trillion—Net inflows primarily in fixed income and equity assets Net market appreciation in fixed income assets, partially offset by net market depreciation in equity assets Total AUS net inflows of $24 billion during the quarter, of which: $29 billion of net inflows in Wealth management client channel $3 billion of net inflows in Institutional client channel $8 billion of net outflows in Third-party distributed client channel AUS by Asset Class³ $ in billions Alternative investments $ 1Q25 4Q24 1Q24 341 $ 336 $ 296 Equity 771 772 713 Fixed income 1,221 1,184 1,141 Long-term AUS 2,333 2,292 2,150 Liquidity products 840 845 698 Total AUS $ 3,173 $ 3,137 $ 2,848 AUS by Client Channel AUS Rollforward³ $ in billions 1Q25 4Q24 1Q24 Beginning balance $ Long-term AUS net inflows / (outflows) Liquidity products Total AUS net inflows / (outflows) 3,137 $ 3,103 $ 2,812 $ in billions 1Q25 4Q24 1Q24 Institutional $ 1,095 $ 1,078 $ 1,048 Wealth management 952 929 845 Third-party distributed 1,126 1,130 955 Total AUS $ 3,173 $ 3,137 $ 2,848 29 22 24 (5) 70 (39) 1Q25 AUS by Region and Vehicle³ 24 92 (15) 7% 14% Net market appreciation / (depreciation) 12 (58) 51 22% Americas Separate accounts Ending balance $ 3,173 $ 3,137 $ 2,848 Region EMEA Vehicle Public funds 54% 32% 71% Asia Private funds and other 6
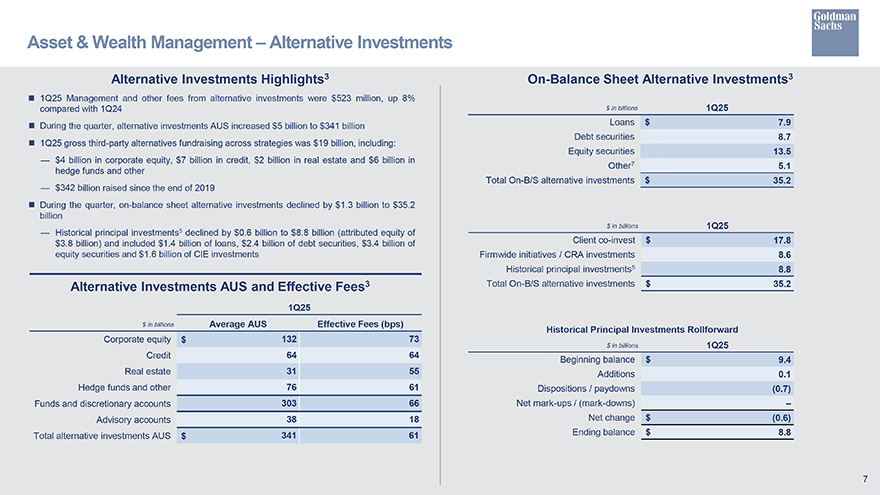
Asset & Wealth Management—Alternative Investments Alternative Investments Highlights³ 1Q25 Management and other fees from alternative investments were $523 million, up 8% compared with 1Q24 â– During the quarter, alternative investments AUS increased $5 billion to $341 billion â– 1Q25 gross third-party alternatives fundraising across strategies was $19 billion, including:—$4 billion in corporate equity, $7 billion in credit, $2 billion in real estate and $6 billion in hedge funds and other—$342 billion raised since the end of 2019 â–During the quarter, on-balance sheet alterative investments declined by $1.3 billion to $35.2 billion Historical principal investments5 declined by $0.6 billion to $8.8 billion (attributed equity of $3.8 billion) and included $1.4 billion of loans, $2.4 billion of debt securities, $3.4 billion of equity securities and $1.6 billion of CIE investments Alternative Investments AUS and Effective Fees³ On-Balance Sheet Alternative Investments³ $ in billions 1Q25 Loans $ 7.9 Debt securities Equity securities Other? 8.7 13.5 5.1 35.2 Total On-B/S alternative investments $ $ in billions 1Q25 Client co-invest $ 17.8 8.6 8.8 35.2 Firmwide initiatives / CRA investments Historical principal investments5 Total On-B/S alternative investments $ 1Q25 $ in billions Average AUS Effective Fees (bps) Corporate equity $ 132 Credit 64 31 Real estate Hedge funds and other Funds and discretionary accounts Advisory accounts 76 303 38 Total alternative investments AUS $ 341 Historical Principal Investments Rollforward 61 61 73 ༢ ཆེ à½,ྲྠà½, à½,ྲཱ པ 64 66 18 $ in billions Beginning balance $ Additions 1Q25 9.4 0.1 (0.7) Net change $ (0.6) Ending balance $ 8.8 Dispositions/paydowns Net mark-ups/(mark-downs) Goldman Sachs 7
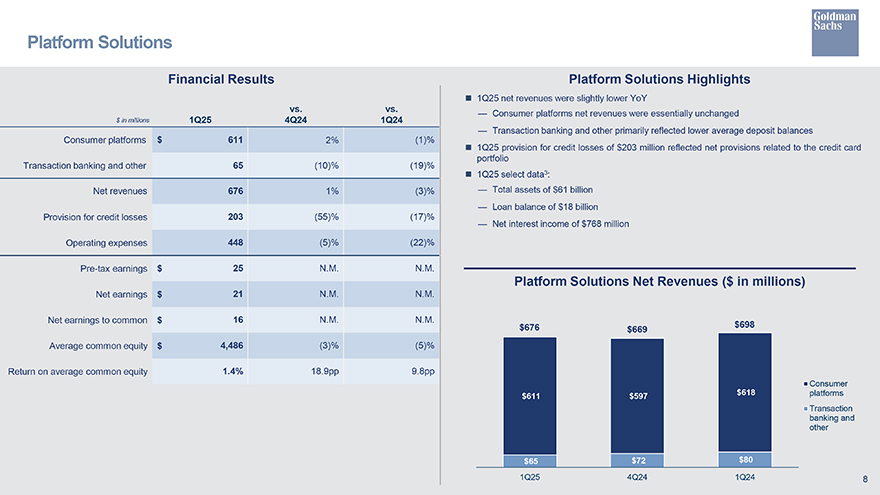
Platform Solutions Financial Results Goldman Sachs $ in millions Consumer platforms $ 1Q25 VS. 4Q24 VS. 1Q24 611 2% (1)% Transaction banking and other 65 (10)% (19)% Net revenues 676 1% (3)% Platform Solutions Highlights â– 1Q25 net revenues were slightly lower YoY—Consumer platforms net revenues were essentially unchanged Transaction banking and other primarily reflected lower average deposit balances â– 1Q25 provision for credit losses of $203 million reflected net provisions related to the credit card portfolio â– 1Q25 select data³: Total assets of $61 billion Loan balance of $18 billion Provision for credit losses 203 (55)% (17)% Net interest income of $768 million Operating expenses 448 (5)% (22)% Pre-tax earnings $ 25 N.M. N.M. Platform Solutions Net Revenues ($ in millions) Net earnings $ 21 N.M. N.M. Net earnings to common $ Average common equity $ Return on average common equity 16 N.M. N.M. $676 $669 $698 4,486 (3)% (5)% 1.4% 18.9pp 9.8pp $611 $597 $618 â– Consumer platforms â–Transaction $65 $72 $80 1Q25 4Q24 1Q24 banking and other 8
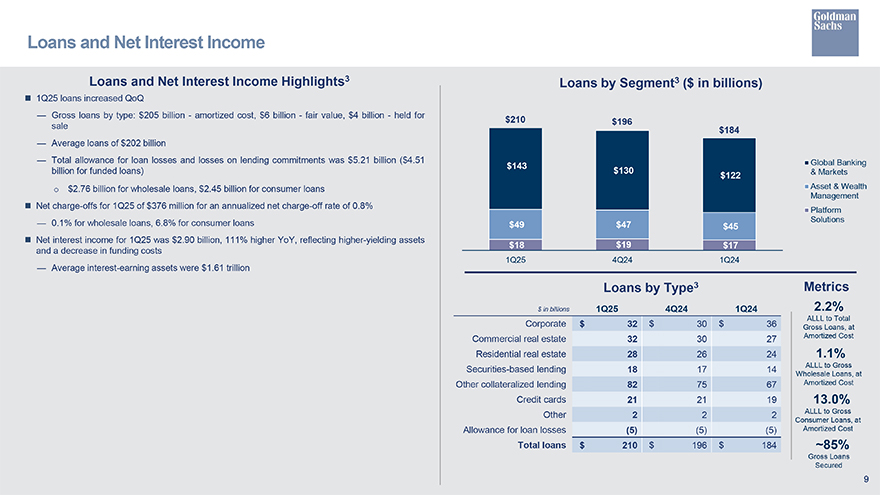
Loans and Net Interest Income Loans and Net Interest Income Highlights³ â– 1Q25 loans increased QoQ Gross loans by type: $205 billion—amortized cost, $6 billion—fair value, $4 billion—held for sale $210—Average loans of $202 billion Loans by Segment³ ($ in billions) $196 $184 Total allowance for loan losses and losses on lending commitments was $5.21 billion ($4.51 billion for funded loans) $143 $130 $122 $2.76 billion for wholesale loans, $2.45 billion for consumer loans â– Net charge-offs for 1Q25 of $376 million for an annualized net charge-off rate of 0.8%—0.1% for wholesale loans, 6.8% for consumer loans $49 $47 $45 â– Net interest income for 1Q25 was $2.90 billion, 111% higher YoY, reflecting higher-yielding assets and a decrease in funding costs $18 1Q25 $19 $17 4Q24 1Q24—Average interest-earning assets were $1.61 trillion Goldman Sachs â– Global Banking & Markets ☐ Asset & Wealth Management â– Platform Solutions Loans by Type³ $ in billions Corporate $ 1Q25 4Q24 1Q24 Metrics 2.2% ALLL to Total 32 $ 30 $ 36 Gross Loans, at Commercial real estate 32 30 27 Amortized Cost Residential real estate 28 26 24 1.1% Securities-based lending 18 ALLL to Gross 17 14 Wholesale Loans, at Other collateralized lending 82 75 67 Amortized Cost Credit cards 21 21 19 Other 2 2 2 Allowance for loan losses (5) (5) (5) Total loans $ 210 $ 196 $ 184 13.0% ALLL to Gross Consumer Loans, at Amortized Cost -85% Gross Loans Secured 9

Expenses Financial Results Goldman Sachs Expense Highlights â– 1Q25 total operating expenses were higher YoY Compensation and benefits expenses were higher (reflecting improved operating performance)—Non-compensation expenses were slightly higher, reflecting: Significantly higher transaction based expenses Partially offset by significantly lower CIE expenses, including impairments (largely in depreciation and amortization) and a decrease from the FDIC special assessment fee recognized in 1Q24 (in other expenses) The effective income tax rate for 1Q25 was 16.1%, down from the full year rate of 22.4% for 2024, primarily reflecting an increase in tax benefits on the settlement of employee share- based awards, partially offset by a decrease in other permanent tax benefits, for 1Q25 compared with 2024 VS. vs. $ in millions 1Q25 4Q24 1Q24 Compensation and benefits $ Transaction based Market development 4,876 30% 6% 1,850 (1)% 24% 156 (14)% 2% Communications and technology 506 (3)% 8% Depreciation and amortization 506 2% (19)% Occupancy 233 (3)% (6)% Professional fees 424 (11)% 10% 60.6% Other expenses 577 (19)% (17)% Total operating expenses $ 9,128 10% 5% Provision for taxes $ 909 (21)% (18)% Effective Tax Rate 16.1% Efficiency Ratio” 60.9% 1Q25 1Q24 1224 10
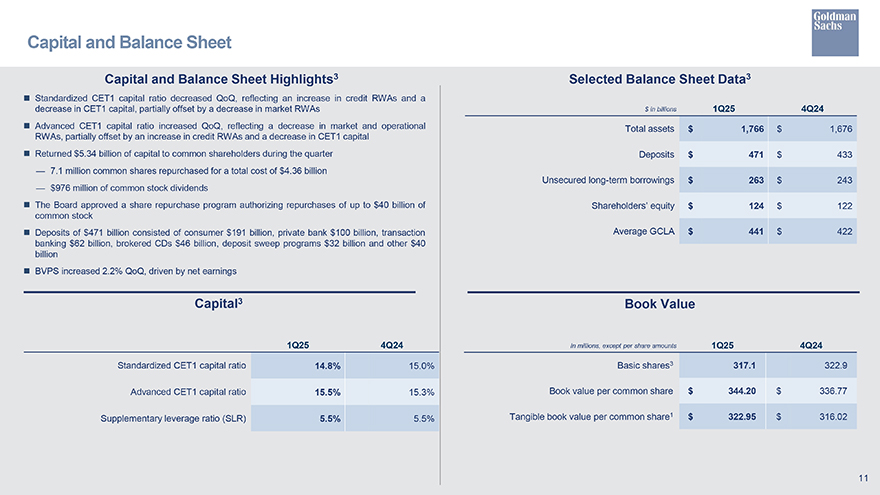
Goldman Sachs Capital and Balance Sheet Capital and Balance Sheet Highlights â– Standardized CET1 capital ratio decreased QoQ, reflecting an increase in credit RWAS and a decrease in CET1 capital, partially offset by a decrease in market RWAS â– Advanced CET1 capital ratio increased QoQ, reflecting a decrease in market and operational RWAS, partially offset by an increase in credit RWAS and a decrease in CET1 capital â– Retumed $5.34 billion of capital to common shareholders during the quarter—7.1 million common shares repurchased for a total cost of $4.36 billion—$976 million of common stock dividends â– The Board approved a share repurchase program authorizing repurchases of up to $40 billion of common stock â– Deposits of $471 billion consisted of consumer $191 billion, private bank $100 billion, transaction banking $62 billion, brokered CDs $46 billion, deposit sweep programs $32 billion and other $40 billion â– BVPS increased 2.2% QoQ, driven by net earnings Selected Balance Sheet Data³ $ in billions 1Q25 4Q24 Total assets $ 1,766 $ 1,676 Deposits $ 471 $ 433 Unsecured long-term borrowings $ 263 $ 243 Shareholders’ equity $ 124 $ 122 Average GCLA $ 441 $ 422 Capital3 Book Value 1Q25 4Q24 Standardized CET1 capital ratio 14.8% 15.0% Advanced CET1 capital ratio Supplementary leverage ratio (SLR) 15.5% 15.3% Book value per common share 5.5% 5.5% Tangible book value per common share¹ In millions, except per share amounts Basic shares³ 1Q25 4Q24 317.1 322.9 $ 344.20 $ 336.77 322.95 $ 316.02 11 =
Goldman Sachs Cautionary Note Regarding Forward-Looking Statements This presentation contains “forward-looking statements” within the meaning of the safe harbor provisions of the U.S. Private Securities Litigation Reform Act of 1995. Forward-looking statements are not historical facts or statements of current conditions, but instead represent only the firm’s beliefs regarding future events, many of which, by their nature, are inherently uncertain and outside of the firm’s control. It is possible that the firm’s actual results, financial condition and liquidity may differ, possibly materially, from the anticipated results, financial condition and liquidity in these forward-looking statements. For information about some of the risks and important factors that could affect the firm’s future results, financial condition and liquidity and the forward-looking statements below, see “Risk Factors” in Part I, Item 1A of the firm’s Annual Report on Form 10-K for the year ended December 31, 2024. Information regarding the firm’s assets under supervision, capital ratios, risk-weighted assets, supplementary leverage ratio, balance sheet data and global core liquid assets (GCLA) consists of preliminary estimates. These estimates are forward-looking statements and are subject to change, possibly materially, as the firm completes its financial statements. Statements regarding (i) forward catalysts, estimated GDP growth or contraction, interest rate and inflation trends and volatility, (ii) the timing, profitability, benefits and other prospective aspects of business initiatives and the achievability of targets and goals, (iii) the firm’s expense savings, productivity and strategic location initiatives, (iv) the future state of the firm’s liquidity and regulatory capital ratios (including the firm’s stress capital buffer and G-SIB buffer, and the potential impact of changes to U.S. regulatory capital rules), (v) the firm’s prospective capital distributions (including dividends and repurchases), (vi) the firm’s future effective income tax rate, (vii) the firm’s Investment banking fees backlog and future results, (viii) the firm’s planned 2025 benchmark debt issuances, and (ix) the firm’s ability to sell, and the terms of any proposed or pending sale of, Asset & Wealth Management historical principal investments, and the firm’s ability to transition the GM credit card program are forward-looking statements. Statements regarding forward catalysts are subject to the risk that the actual operating environment may differ, possibly materially, due to, among other things, changes or the absence of changes in general economic and market conditions, CEO confidence, sponsor activity, productivity gains, and the regulatory backdrop. Statements regarding estimated GDP growth or contraction, interest rate and inflation trends and volatility are subject to the risk that actual GDP growth or contraction, interest rate and inflation trends and volatility may differ, possibly materially, due to, among other things, changes in general economic conditions and monetary, fiscal and trade policy, including tariffs. Statements about the timing, profitability, benefits and other prospective aspects of business and expense savings initiatives and the achievability of targets and goals are based on the firm’s current expectations regarding the firm’s ability to effectively implement these initiatives and achieve these targets and goals and may change, possibly materially, from what is currently expected. Statements about the future state of the firm’s liquidity and regulatory capital ratios (including the firm’s stress capital buffer and G-SIB buffer), as well as its prospective capital distributions (including dividends and repurchases), are subject to the risk that the firm’s actual liquidity, regulatory capital ratios and capital distributions may differ, possibly materially, from what is currently expected, including due to, among other things, the results of supervisory stress tests and potential future changes to regulatory capital rules, which may not be what the firm expects. Statements about the firm’s future effective income tax rate are subject to the risk that the firm’s future effective income tax rate may differ from the anticipated rate indicated, possibly materially, due to, among other things, changes in the tax rates applicable to the firm, the firm’s earnings mix or profitability, the entities in which the firm generates profits and the assumptions made in forecasting the firm’s expected tax rate, and potential future guidance from tax authorities. Statements about the firm’s Investment banking fees backlog and future advisory and capital market results are subject to the risk that advisory and capital market activity may not increase as the firm expects or that transactions may be modified or may not be completed at all, and related net revenues may not be realized or may be materially less than expected. Important factors that could have such a result include, for underwriting transactions, a decline or weakness in general economic conditions, changes in international trade policies, including the imposition of tariffs, an outbreak or worsening of hostilities, volatility in the securities markets or an adverse development with respect to the issuer of the securities and, for financial advisory transactions, a decline in the securities markets, an inability to obtain adequate financing, an adverse development with respect to a party to the transaction or a failure to obtain a required regulatory approval. Statements regarding the firm’s planned 2025 benchmark debt issuances are subject to the risk that actual issuances may differ, possibly materially, due to changes in market conditions, business opportunities or the firm’s funding needs. Statements about the proposed or pending sales of Asset & Wealth Management historical principal investments are subject to the risks that buyers may not bid on these assets or bid at levels, or with terms, that are unacceptable to the firm, and that the performance of these activities may deteriorate as a result of the proposed and pending sales, and statements about the process to transition the GM credit card program are subject to the risk that a transaction may not close on the anticipated timeline or at all. 12
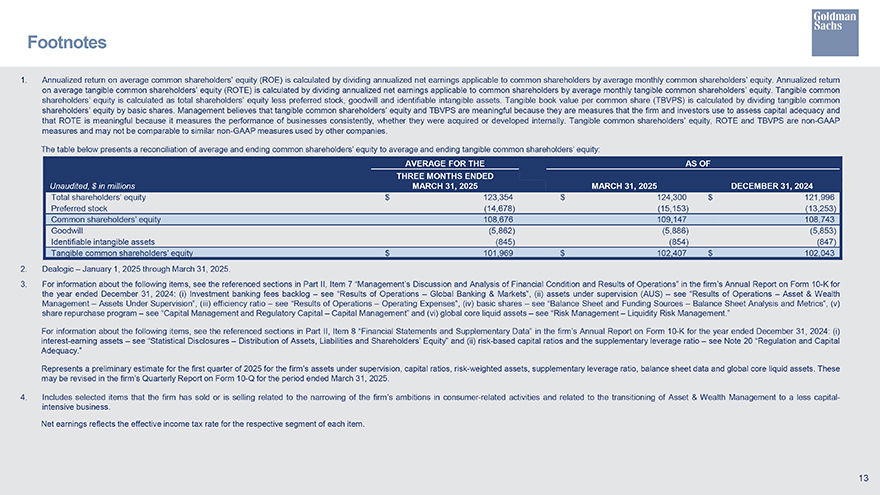
Goldman Sachs 1. Footnotes Annualized return on average common shareholders’ equity (ROE) is calculated by dividing annualized net eamings applicable to common shareholders by average monthly common shareholders’ equity. Annualized return on average tangible common shareholders’ equity (ROTE) is calculated by dividing annualized net earnings applicable to common shareholders by average monthly tangible common shareholders’ equity. Tangible common shareholders’ equity is calculated as total shareholders’ equity less preferred stock, goodwill and identifiable intangible assets. Tangible book value per common share (TBVPS) is calculated by dividing tangible common shareholders’ equity by basic shares. Management believes that tangible common shareholders’ equity and TBVPS are meaningful because they are measures that the firm and investors use to assess capital adequacy and that ROTE is meaningful because it measures the performance of businesses consistently, whether they were acquired or developed internally. Tangible common shareholders’ equity, ROTE and TBVPS are non-GAAP measures and may not be comparable to similar non-GAAP measures used by other companies. The table below presents a reconciliation of average and ending common shareholders’ equity to average and ending tangible common shareholders’ equity: Unaudited, $in millions Total shareholders’ equity Preferred stock Common shareholders’ equity Goodwill Identifiable intangible assets Tangible common shareholders’ equity 2. Dealogic—January 1, 2025 through March 31, 2025. AVERAGE FOR THE THREE MONTHS ENDED MARCH 31, 2025 123,354 (14,678) 108,676 (5,862) (845) 101,969 AS OF MARCH 31, 2025 DECEMBER 31, 2024 124,300 (15,153) $ 121,996 (13,253) 109,147 108,743 (5,886) (5,853) (854) (847) 102,407 102,043 3. 4. For information about the following items, see the referenced sections in Part II, Item 7 “Management’s Discussion and Analysis of Financial Condition and Results of Operations” in the firm’s Annual Report on Form 10-K for the year ended December 31, 2024: (i) Investment banking fees backlog—see “Results of Operations—Global Banking & Markets”, (ii) assets under supervision (AUS)—see “Results of Operations—Asset & Wealth Management—Assets Under Supervision”, (iii) efficiency ratio—see “Results of Operations—Operating Expenses”, (iv) basic shares—see “Balance Sheet and Funding Sources—Balance Sheet Analysis and Metrics”, (v) share repurchase program—see “Capital Management and Regulatory Capital—Capital Management” and (vi) global core liquid assets—see “Risk Management—Liquidity Risk Management.” For information about the following items, see the referenced sections in Part II, Item 8 “Financial Statements and Supplementary Data” in the firm’s Annual Report on Form 10-K for the year ended December 31, 2024: (i) interest-earning assets—see “Statistical Disclosures—Distribution of Assets, Liabilities and Shareholders’ Equity” and (ii) risk-based capital ratios and the supplementary leverage ratio—see Note 20 “Regulation and Capital Adequacy.” Represents a preliminary estimate for the first quarter of 2025 for the firm’s assets under supervision, capital ratios, risk-weighted assets, supplementary leverage ratio, balance sheet data and global core liquid assets. These may be revised in the firm’s Quarterly Report on Form 10-Q for the period ended March 31, 2025. Includes selected items that the firm has sold or is selling related to the narrowing of the firm’s ambitions in consumer-related activities and related to the transitioning of Asset & Wealth Management to a less capital- intensive business. Net eamings reflects the effective income tax rate for the respective segment of each item. 13
Footnotes—Continued 5. 6. Includes consolidated investment entities (CIES) and other legacy investments the firm intends to exit over the medium term (medium term refers to a 3-5 year time horizon from year-end 2022). Consists of AUS, brokerage assets and Marcus deposits. Goldman Sachs 7. Other on-balance sheet alternative investments include tax credit investments (accounted for under the proportional amortization method of accounting) of $3.2 billion and CIEs, which held assets (generally accounted for at historical cost less depreciation) of $1.9 billion, both as of March 31, 2025. The assets held by CIEs were funded with liabilities of $0.8 billion as of March 31, 2025, which are substantially all nonrecourse, thereby reducing the firm’s equity at risk. Substantially all of the firm’s CIEs are engaged in commercial real estate investment activities. 14