☐ |
REGISTRATION STATEMENT PURSUANT TO SECTION 12 OF THE SECURITIES EXCHANGE ACT OF 1934 |
☒ |
ANNUAL REPORT PURSUANT TO SECTION 13(a) or 15(d) of THE SECURITIES EXCHANGE ACT OF 1934 |
For the fiscal year ended December 31 , 2024
|
Commission File Number 001-11444 |
Title of each class |
Trading Symbol(s) |
Name of each exchange on which registered |
||
Common Shares |
MGA |
New York Stock Exchange |
||
|
☒ Annual Information Form |
☒ Audited Annual Financial Statements |
Auditor Name: Deloitte LLP
|
Auditor Location: Toronto, Canada
|
Auditor Firm ID: 1208 |
| 1. | ANNUAL INFORMATION FORM |
The Registrant’s Annual Information Form for the year ended December 31, 2024 is attached as Exhibit 1 (the “Annual Information Form”) to this annual report on Form 40-F and is incorporated by reference herein.
| 2. | AUDITED ANNUAL FINANCIAL STATEMENTS |
The Registrant’s consolidated audited financial statements as at and for the fiscal years ended December 31, 2024 and December 31, 2023, including the reports of independent registered public accounting firm, prepared by Deloitte LLP (“Deloitte”) with respect thereto, are included in Exhibit 2 attached to this annual report on Form 40-F and are incorporated by reference herein.
| 3. | MANAGEMENT’S DISCUSSION AND ANALYSIS |
The Registrant’s Management’s Discussion and Analysis of Operations and Financial Position for the year ended December 31, 2024 is included in Exhibit 3 attached to this annual report on Form 40-F and is incorporated by reference herein.
| 4. | WEBSITE INFORMATION |
Notwithstanding any reference to the Registrant’s website in the Annual Information Form or in the documents attached or incorporated as exhibits hereto, the information contained on the Registrant’s website, or any other website referred to on the Registrant’s website, is not a part of this annual report on Form 40-F and, therefore, is not filed with the Commission.
| 5. | FORWARD-LOOKING STATEMENTS |
The Registrant has made in the documents filed as part of this annual report on Form 40-F, and from time to time may otherwise make “forward-looking statements”, within the meaning of Section 21E under the Securities Exchange Act of 1934, as amended (the “Exchange Act”) and Section 27A of the U.S. Securities Act of 1933, and related assumptions concerning its operations, economic performance and financial matters. Actual results or events could differ materially from those set forth in, or implied by, the forward-looking statements and the related assumptions due to a variety of factors. Reference is made to the section titled “Forward-Looking Statements” on page 2 of the Annual Information Form for a discussion of such factors.
| 6. | CONTROLS AND PROCEDURES |
The Registrant’s Chief Executive Officer and its Executive Vice-President and Chief Financial Officer are responsible for establishing and maintaining the Registrant’s disclosure controls and procedures (as such term is defined in Rules 13a-15(e) and 15d-15(e) under the Exchange Act) and internal control over financial reporting (as such term is defined in Rules 13a-15(f) and 15d-15(f) under the Exchange Act).
Disclosure Controls and Procedures
The disclosure provided under the heading Controls and Procedures – Disclosure Controls and Procedures included in Exhibit 3: Management’s Discussion and Analysis is incorporated by reference herein.
Internal Control Over Financial Reporting
The disclosure provided under the heading Controls and Procedures – Management’s Annual Report on Internal Control Over Financial Reporting included in Exhibit 3: Management’s Discussion and Analysis is incorporated by reference herein.
Changes in Internal Controls Over Financial Reporting
The disclosure provided under the heading Controls and Procedures – Changes in Internal Controls Over Financial Reporting included in Exhibit 3: Management’s Discussion and Analysis is incorporated by reference herein.
| 7. | AUDIT COMMITTEE MEMBERS AND AUDIT COMMITTEE FINANCIAL EXPERT |
The Registrant has a separately designated standing audit committee of its Board of Directors (the “Audit Committee”), which is currently comprised of the following members of the Registrant’s Board of Directors: Mary Lou Maher (Chair), Jan R. Hauser, Jay K. Kunkel and Peter Sklar.
The Registrant’s Board of Directors has determined that each of Ms. Maher, Ms. Hauser, Mr. Kunkel and Mr. Sklar, is an “audit committee financial expert” and that each member of the Audit Committee is “independent” and “financially literate”, as such terms are defined in the listing standards of the New York Stock Exchange and Exchange Act Rule 10A-3.
| 8. | CODE OF ETHICS |
The Registrant has adopted a code of ethics that applies to all of its employees, including its Chief Executive Officer, its Chief Financial Officer, its Controller and other persons performing similar functions. The full text of such code of ethics is available on the Registrant’s website at www.magna.com under the Leadership & Governance section.
| 9. | CORPORATE GOVERNANCE |
As a “foreign private issuer” listed on The New York Stock Exchange (the “NYSE”), the Registrant is required to disclose the significant ways in which its corporate governance practices differ from those to be followed by U.S. domestic issuers under the NYSE listing standards. There is only one significant difference between the Registrant’s corporate governance practices and those required of U.S. domestic companies under NYSE listing standards. NYSE listing standards require shareholder approval of all “equity compensation plans” and material revisions to these types of plans (with limited exceptions). The rules of the Toronto Stock Exchange (the “TSX”) require shareholder approval of “security-based compensation arrangements,” which are plans that involve newly issued shares, or specified amendments to such plans. The Registrant follows the TSX rules and has previously obtained shareholder approval for the following security-based compensation arrangements:
| • | Treasury PSU Plan approved by shareholders on May 3, 2022; and |
| • | Amended and Restated 2009 Stock Option Plan approved by shareholders on May 6, 2010. |
The Registrant will seek shareholder approval for the following security-based compensation arrangement at its upcoming annual and special meeting of shareholders to be held on May 8, 2025:
| • | 2025 Incentive Stock Option Plan approved by the Registrant’s Board of Directors on March 27, 2025. |
The Registrant also has two equity compensation arrangements which involve the purchase of its common shares in the secondary trading market at market prices:
| • | Performance Stock Unit Plan approved by the Registrant’s Board of Directors on August 7, 2018; and |
| • | Restricted Stock Unit arrangements. |
The rules of the TSX do not require shareholder approval for these equity compensation arrangements and accordingly the Registrant has not sought shareholder approval of either.
| 10. | PRINCIPAL ACCOUNTANT FEES AND SERVICES |
The table below shows the fees for professional services rendered by our principal accountant, Deloitte, for the fiscal years ended December 31, 2024 and December 31, 2023.
| Fiscal 2024 | Fiscal 2023 | |||||||
| Type of Services | Fees($) | % of Total | Fees($) | % of Total | ||||
| Audit Fees |
10,265,000 | 57% | 10,199,000 | 52% | ||||
| Audit-Related Fees |
6,786,000 | 37% | 8,198,000 | 42% | ||||
| Tax Fees |
1,114,000 | 6% | 1,069,000 | 6% | ||||
| All Other Fees |
10,000 | <1% | 7,000 | <1% | ||||
| Total |
18,175,000 | 100% | 19,473,000 | 100.00% | ||||
The services comprising the “Audit Fees” category for each of the last two fiscal years were performed by Deloitte to comply with the standards of the Public Company Accounting Oversight Board (United States) (“PCAOB”), including integrated audit of the consolidated financial statements and quarterly reviews. In some cases, fees in this category may include an appropriate allocation of fees for tax services or accounting consultations, to the extent such services were necessary to comply with the standards of the PCAOB.
This category includes fees incurred in connection with the audit of our internal control over financial reporting for purposes of Section 404 of the Sarbanes-Oxley Act of 2002.
The services comprising the “Audit-Related Fees” category consists of fees paid in respect of assurance and related services, including such things as due diligence relating to mergers and acquisitions, accounting consultations and audits in connection with acquisitions, services related to statutory audits of certain foreign subsidiaries, attest services that are not required by statute or regulation and consultation concerning financial accounting and reporting standards. Audit-related services actually provided by Deloitte in each of fiscal 2024 and fiscal 2023 consisted of: services related to statutory audits of certain foreign subsidiaries, assurance services and procedures related to attest engagements not required by statute or regulation, due diligence relating to mergers and acquisitions and other assurance services.
The services comprising the “Tax Fees” category consists of all fees paid in respect of tax compliance, planning and advisory services performed by Deloitte’s tax professionals, except those services required in order to comply with the standards of the PCAOB which are included under “Audit Services”. The tax services actually provided by Deloitte in each of fiscal 2024 and fiscal 2023 consisted of: domestic and international tax advisory, compliance and research services, as well as transfer pricing advisory services.
The category “All Other Fees” captures fees in respect of all permitted services not falling under any of the previous categories.
In order to protect Deloitte’s independence, the Audit Committee has a process for pre-approving all services provided by, and related fees to be paid to, Deloitte. This process includes reviewing, on a quarterly basis, the details and associated costs of the services expected to be provided by Deloitte. Audit Committee approval is required for any services that have not previously been approved by the Audit Committee. In assessing the impact of any proposed services on auditor independence, the Audit Committee considers whether:
| • | the services are consistent with applicable auditor independence rules; |
| • | the independent auditor is best positioned to provide the most effective and efficient service, for reasons such as its familiarity with the Registrant’s business, people, culture, accounting systems and risk profile; and |
| • | the services enhance the Registrant’s ability to manage or control risks and improve audit quality. |
None of the services provided by Deloitte in 2024 were treated as exempt from pre-approval pursuant to the de minimis provision of paragraph (c)(7)(i)(C) of Rule 2-01 of Regulation S-X.
| 11. | TABULAR DISCLOSURE OF CONTRACTUAL OBLIGATIONS |
The tabular disclosure regarding the Registrant’s known contractual obligations provided under the heading Financial Condition, Liquidity and Capital Resources – Contractual Obligations included in Exhibit 3: Management’s Discussion and Analysis is incorporated by reference herein.
UNDERTAKING AND CONSENT TO SERVICE OF PROCESS
| A. | Undertaking |
Registrant undertakes to make available, in person or by telephone, representatives to respond to inquiries made by the Commission staff, and to furnish promptly, when requested to do so by the Commission staff, information relating to: the securities registered pursuant to Form 40-F; the securities in relation to which the obligation to file an annual report on Form 40-F arises; or transactions in said securities.
| B. | Consent to Service of Process |
A Form F-X signed by the Registrant and its agent for service of process was previously filed with the Commission.
SIGNATURES
Pursuant to the requirements of the Exchange Act, the Registrant certifies that it meets all of the requirements for filing on Form 40-F and has duly caused this annual report to be signed on its behalf by the undersigned, thereunto duly authorized.
| Registrant: |
MAGNA INTERNATIONAL INC. | |||
| By (Signature and Title): |
/s/ “Bassem Shakeel” |
|||
| Bassem A. Shakeel, | ||||
| Vice-President, Associate General Counsel and Corporate Secretary | ||||
| Date: |
March 28, 2025. | |||
EXHIBIT INDEX
| Exhibit 1 |
Annual Information Form of the Registrant dated March 27, 2025. |
|
| Exhibit 2 |
Registrant’s audited financial statements as at and for the years ended December 31, 2024 and 2023. |
|
| Exhibit 3 |
||
| Exhibit 4 |
||
| Exhibit 97 |
||
| Exhibit 99.1 |
||
| Exhibit 99.2 |
||
| Exhibit 99.3 |
||
| Exhibit 99.4 |
||
| Exhibit 101 |
Interactive Data File. |
|
| Exhibit 104 |
Cover Page Interactive Data File – the cover page interactive data file does not appear in the Interactive Data File because its XBRL tags are embedded within the Inline XBRL document. |
|
Exhibit 1
2025 Annual Information Form March 27, 2025 | Magna International Inc.
Contents
Annual Information Form
| 2 | Forward-Looking Statements | |||
| 4 | Corporate Structure | |||
| 4 | About Magna | |||
| 6 | Our Industry | |||
| 9 | Our Business & Strategy | |||
| 16 | Risk Factors | |||
| 24 | Description of the Business | |||
| 37 | Innovation and Research & Development | |||
| 40 | Capital Structure, Financings & Credit Ratings | |||
| 44 | Directors & Executive Officers | |||
| 47 | Legal Proceedings | |||
| 48 | Other Information | |||
| 49 | Schedules | |||
| A-1 | Appendix 1 – Sustainability Report FY 2024 | |||
Important Information About this Document
This Annual Information Form (“AIF”) provides information about Magna International Inc. (“Magna”), including its industry, corporate structure, strategy, risk factors relating to its business and operations, products and services, sustainability activities, and other information related to its business activities.
Readers should note that in this AIF:
| ∎ | we use the terms “you” and “your” to refer to the shareholder, potential investor, or reader while “we”, “us”, “our”, “company” and “Magna” refer to Magna International Inc. and, where applicable, its subsidiaries; |
| ∎ | we use the term “Executive Management” to refer to our Chief Executive Officer, together with our corporate Executive Vice-Presidents; |
| ∎ | we use the term “Operating Group management” to refer to the senior management within each of our product-based business units corresponding to the capabilities described in “Section 6 – Description of the Business – Products & Services” in this AIF; |
| ∎ | dollar amounts in this AIF are stated in U.S. dollars, unless otherwise indicated; |
| ∎ | a reference to “fiscal year” is a reference to the fiscal or financial year from January 1 to December 31 of the year stated; |
| ∎ | sales figures disclosed have been prepared in accordance with United States Generally Accepted Accounting Principles (“U.S. GAAP”); |
| ∎ | where we have referred to specific customers or competitors, the reference includes the customers’ or competitors’ operating divisions and subsidiaries, unless otherwise stated; |
| ∎ | facility and employee figures include certain equity-accounted operations, unless otherwise indicated; |
| ∎ | references to our “Circular” refer to our Management Information Circular/Proxy Statement dated March 27, 2025 for our virtual-only 2025 Annual Meeting of Shareholders to be held on May 8, 2025 (the “Meeting”); and |
| ∎ | information is current as of March 27, 2025, unless otherwise indicated. |
Forward-Looking Statements
We disclose “forward-looking information” or “forward-looking statements” (collectively, “forward-looking statements”) to provide information about management’s current expectations and plans. Such forward-looking statements may not be appropriate for other purposes.
Forward-looking statements may include financial and other projections, as well as statements regarding our future plans, strategic objectives or economic performance, or the assumptions underlying any of the foregoing, and other statements that are not recitations of historical fact. We use words such as “may”, “would”, “could”, “should”, “will”, “likely”, “expect”, “anticipate”, “assume”, “believe”, “intend”, “plan”, “aim”, “forecast”, “outlook”, “project”, “potential”, “estimate”, “future”, “target” and similar expressions suggesting future outcomes or events to identify forward-looking statements.
Forward-looking statements in this AIF include, but are not limited to, statements relating to:
| ∎ | implementation of our business strategy; |
| ∎ | implementation of our segment-specific strategic initiatives; |
| ∎ | implementation of our sustainability strategy and initiatives, and achievement of sustainability targets/commitments; |
| ∎ | our approach to capital structure, including; maintenance of a strong balance sheet; preservation of strong investment grade ratings; |
| delivering strong Return on Invested Capital; investing for growth; achieving our target leverage ratio; future returns of capital to our shareholders through dividends; and repurchasing shares with excess liquidity; |
| ∎ | implementation of our supply chain initiatives; and |
| ∎ | estimates of future environmental clean-up and remediation costs. |
Forward-looking statements are based on information currently available to us and are based on assumptions and analyses made by us in light of our experience and our perception of historical trends, current conditions and expected future developments, as well as other factors we believe are appropriate in the circumstances.
While we believe we have a reasonable basis for making such forward-looking statements, they are not a guarantee of future performance or outcomes. Whether actual results and developments conform to our expectations and predictions is subject to a number of risks, assumptions, and uncertainties, many of which are beyond our control, and the effects of which can be difficult to predict, including, without limitation:
2 Annual Information Form
Macroeconomic, Geopolitical and Other Risks
| ∎ | threats to free trade agreements; |
| ∎ | international trade disputes; |
| ∎ | interest rate levels; |
| ∎ | geopolitical risks; |
Risks Related to the Automotive Industry
| ∎ | North American EV program deferrals, cancellations and volume reductions; |
| ∎ | economic cyclicality; |
| ∎ | regional production volume declines; |
| ∎ | deteriorating vehicle affordability; |
| ∎ | uncertain pace of EV adoption; |
| ∎ | intense competition; |
Strategic Risks
| ∎ | evolution of the vehicle; |
| ∎ | evolving business risk profile; |
| ∎ | technology and innovation; |
| ∎ | investments in mobility and technology companies; |
Customer-Related Risks
| ∎ | customer concentration; |
| ∎ | market shifts; |
| ∎ | growth of EV-focused original equipment manufacturers (“OEMs”); |
| ∎ | risks of conducting business with newer EV-focused OEMs; |
| ∎ | dependence on outsourcing; |
| ∎ | customer cooperation and consolidation; |
| ∎ | consumer take rates shifts; |
| ∎ | customer purchase orders; |
| ∎ | potential OEM production-related disruptions; |
Supply Chain Risks
| ∎ | supply base; |
| ∎ | supplier claims; |
| ∎ | supply chain disruptions; |
| ∎ | regional energy supply and pricing; |
Manufacturing/Operational Risks
| ∎ | product launch; |
| ∎ | operational underperformance; |
| ∎ | restructuring costs; |
| ∎ | impairments; |
| ∎ | skilled labour attraction/retention; |
| ∎ | leadership expertise and succession; |
Pricing Risks
| ∎ | quote/pricing assumptions; |
| ∎ | customer pricing pressure/contractual arrangements; |
| ∎ | commodity price volatility; |
| ∎ | scrap steel/aluminum price volatility; |
Warranty/Recall Risks
| ∎ | repair/replacement costs; |
| ∎ | warranty provisions; |
| ∎ | product liability; |
Climate Change Risks
| ∎ | transition risks and physical risks; |
| ∎ | strategic and other risks; |
IT Security/Cybersecurity Risks
| ∎ | IT/cybersecurity breach; |
| ∎ | product cybersecurity breach; |
Acquisition Risks
| ∎ | inherent merger and acquisition risks; |
| ∎ | acquisition integration and synergies; |
Other Business Risks
| ∎ | joint ventures; |
| ∎ | intellectual property; |
| ∎ | risks of doing business in foreign markets; |
| ∎ | relative foreign exchange rates; |
| ∎ | currency devaluation in Argentina; |
| ∎ | pension risks; |
| ∎ | tax risks; |
| ∎ | returns on capital investments; |
| ∎ | financial flexibility; |
| ∎ | credit ratings changes; |
| ∎ | stock price fluctuation; |
| ∎ | dividends; |
Legal, Regulatory and Other Risks
| ∎ | legal and regulatory proceedings; |
| ∎ | changes in laws; and |
| ∎ | environmental compliance. |
In evaluating forward-looking statements or forward-looking information, we caution readers not to place undue reliance on any forward-looking statement, and readers should specifically consider the various factors which could cause actual events or results to differ materially from those indicated by such forward-looking statements, including the risks, assumptions, and uncertainties above that are discussed in greater detail in this AIF under “Section 5 – Risk Factors”.
Magna International Inc. 3
1. Corporate Structure
Issuer
Magna was originally incorporated under the laws of the Province of Ontario, Canada on November 16, 1961. Our charter documents currently consist of amended and restated articles of incorporation dated December 31, 2017, which were issued pursuant to the Business Corporations Act (Ontario).
Our registered and head office is located at 337 Magna Drive, Aurora, Ontario, Canada L4G 7K1. Our Common Shares trade on the Toronto Stock Exchange (“TSX”) under the trading symbol “MG”, and the New York Stock Exchange (“NYSE”) under the trading symbol “MGA”. For a list of our principal subsidiaries and investments, please refer to Schedule A.
2. About Magna
Overview
Magna is more than one of the world’s largest suppliers in the automotive space. We are a mobility technology company built to innovate, with a global, entrepreneurial-minded team of over 170,000 employees(1) across 341 manufacturing operations and 106 product development, engineering, and sales (“PDE&S”) centres spanning 28 countries(2), as follows:

With over 65 years of expertise, our ecosystem of interconnected products combined with our complete vehicle expertise uniquely positions us to advance mobility in an expanded transportation landscape.
Our business is managed under four operating segments which have been determined on the basis of technological opportunities, product similarities, as well as market and operating factors, as follows:
| ◾ | Body Exteriors & Structures |
| ◾ | Power & Vision |
| ◾ | Seating Systems |
| ◾ | Complete Vehicles |
Our internal financial reporting is aligned with the way our business is managed. Accordingly, we present key internal operating performance measures for the reporting segments described above to our chief operating decision maker to use in the assessment of operating performance, allocation of resources, and to help plan our long-term strategic direction and future global growth.
| (1) | Number of employees includes over 158,000 employees at our wholly owned or controlled entities and over 12,000 employees at certain operations accounted for under the equity method. |
| (2) | Manufacturing operations and PDES centres include certain operations accounted for under the equity method. |
4 Annual Information Form
Our Corporate Culture
Magna is a champion for safer and better mobility, envisioning future-forward technologies and delivering innovative solutions that are positively impacting mobility and society by enhancing the way people move. At Magna’s foundation is an entrepreneurial, decentralized, fair enterprise organization that is driven by a culture, the key elements of which are as follows:
Entrepreneurialism and Decentralization
We follow a corporate policy of functional and operational decentralization, which we believe increases flexibility, customer responsiveness and productivity.
| ∎ | Our manufacturing and assembly operations are conducted through “Divisions”, each of which is an autonomous business unit operating within pre-determined guidelines. Each Division is a separate profit centre under the authority of a general manager who has the discretion to determine rates of pay, hours of work and sources of supply, within the framework of our Employee’s Charter, our Global Labour Standards Policy and our Operational Principles (each as described below), as well as our corporate policies. |
| ∎ | Divisions are aligned globally by product area in Operating Groups. Operating Group management is responsible for overseeing the Divisions within its product area(s), including approval of Divisional business plans and preparation of Operating Group business plans for presentation to Executive Management. Our Operating Groups are aligned under four reporting segments overseen by members of Executive Management to ensure that the Operating Groups are: taking advantage of cross-Group synergies; sharing research and development and best practices; and consistently approaching technology trends that impact their business and our customers. |
| ∎ | Our Executive Management team, led by our CEO, interfaces with the investment community and is responsible for our long-term strategic planning and future growth, as well as monitoring the performance of Operating Group management. In addition, our Executive Management: allocates capital; oversees mergers, acquisitions, dispositions and strategic alliances; manages global marketing and customer strategies; develops employee policies and programs; manages leadership training, development and succession planning; oversees and supports our sustainability and environmental, social and governance (“ESG”) strategy, targets and global initiatives; and develops common finance, internal controls, compliance, IT, quality, labour and employment, environmental, health & safety, ergonomics and other policies, programs or global standards. |
Employee’s Charter & Global Labour Standards Policy
Magna’s Employee’s Charter provides direction for the company in shaping how we honour our commitments to our employees. We are dedicated to fostering a culture rooted in fairness and care for our employees. This commitment is central to Magna’s philosophy, where employees and management work together to ensure the company’s success. Our Global Labour Standards Policy further articulates our Fair Enterprise Culture and provides a framework for our commitment to fundamental human rights and international labour relations. See “Appendix 1 – Sustainability Report – Section 4.2 Fairness and Concern for Employees” for a description of our human resource principles, including our Employee’s Charter, as well as the details of our Global Labour Standards Policy and the key commitments that it sets out.
Core Values
Magna’s unique culture starts with our core values, a reflection of who we are as individuals and as a company. Our core values are the cornerstone of our organization, driving our commitment to our employees and enabling us to deliver exceptional value to all our stakeholders. Our values of “Think Big”, “Never Settle”, “Be Collaborative” and “Take Responsibility” guide our actions, decisions and interactions, fostering a culture of integrity and excellence.
Operational Excellence
Magna’s operational excellence mindset fosters a culture of relentless execution, continuous improvement and accountability. We take an innovative team-driven approach to refining processes and systems, delivering value to our customers and stakeholders. Our people-first approach drives innovation and craftsmanship, creating a safe, respectful and rewarding workplace. Linked to our MAFACT assessment system, (detailed in “Section 6 – Description of the Business – Manufacturing & Engineering” and “Factory of the Future (FoF) Initiatives” in this AIF) these principles enable consistent measurement and improvement, resulting in reduced waste, enhanced efficiency and superior product quality. By integrating advanced manufacturing technologies and Factory of the Future initiatives, we are shaping a smarter, more sustainable future for mobility.
Incentive-Based Management Compensation
We maintain an incentive-based compensation system for management, which directly links short-term incentive compensation to the operational performance of an applicable business unit, as measured by profitability. In the case of our Divisions and Operating Groups, the short-term incentive formula is based on Divisional or Operating Group EBIT, after taking into account a funds employed charge. For our Executive Management, the short-term incentive is linked to Magna’s Pre-Tax Profit and Free Cash Flow. Members of our Operating Group management and Executive Management also receive equity-based incentives tied to metrics such as return on invested capital (ROIC), stock price performance, and relative total shareholder return. Our approach to executive compensation is described in further detail in the sections of our Circular titled “Compensation and Performance Report” and “Compensation Discussion & Analysis”.
Magna International Inc. 5
3. Our Industry
General
The global automotive sector is one of the most dynamic industries in the world. The industry is rapidly evolving in response to societal, mobility-related, and economic trends, including the transition to a lower carbon economy, which is accelerating the shift from internal combustion to electric propulsion. These trends are detailed in “Section 4 – Our Business & Strategy – Industry Trends”. Tier 1 automotive suppliers (“Tier 1 Suppliers”) design, engineer and manufacture components, assemblies, systems, subsystems, and modules for original equipment manufacturers (“OEMs” or “automobile manufacturers”) of vehicles and light trucks. Tier 1 Suppliers source subcomponents from Tier 2 and other sub-suppliers, which are integrated into the products sold by Tier 1 Suppliers directly to OEMs.
The global automotive industry is cyclical and is sensitive to a broad range of macroeconomic, political, and other trends as discussed in “Section 4 – Our Business & Strategy” in this AIF. Throughout 2024, the automotive industry continued to experience a number of macroeconomic and industry challenges:
| ∎ | reduced vehicle production volumes, including in certain key markets; |
| ∎ | increasing trade protectionism which can disrupt existing automotive supply chains and force automotive suppliers and OEMs to make inefficient long-term investment decisions; and |
| ∎ | uncertain pace of electric vehicle (“EV”) adoption which can result in EV program delays, deferrals and cancellations. |
See “Section 4 – Our Business & Strategy – Macroeconomic, Political and Other Trends” and “Industry Trends” for details of how these trends affect Magna and the automotive industry. See also “Industry Trends” in our Management’s Discussion & Analysis of Results of Operations and Financial Position for the year ended December 31, 2024 (“MD&A”).
Automotive Production Markets
OEMs have historically built their vehicles in the regions where those vehicles are primarily sold and, as a result, many OEMs have established manufacturing facilities in multiple countries. While we believe this historical practice will continue long term; currently, in light of the imposition or threat of new or higher tariffs on imported goods, some of the China-based, EV-focused OEMs, such as BYD and Chery have announced manufacturing plants in Europe, and we see the trend towards localization of manufacturing to meet changing and volatile demand continuing on a global basis. See “Section 6 – Description of the Business – Manufacturing & Engineering” of this AIF for details of Magna’s global manufacturing footprint.
China, Europe, North America, Japan, India, and South Korea represent the largest automotive production markets in the world, accounting for approximately 89% of vehicles produced globally.(1) China’s approximate 33% share of global production led all countries in 2024, followed by the United States and Japan, with 11% and 9% shares, respectively.(1) The local demand for vehicles in China, India, and certain markets outside of North America and Western Europe has increased over time. This increasing local demand has helped boost the local automotive industry in these countries and attracted investments in manufacturing from North American, European, and Asian-based automobile manufacturers, through stand-alone investments and/or joint ventures with local partners. In the case of China, the increasing migration of component system and vehicle design, development, and engineering, especially for EVs, is expected to further benefit the automotive industry in that market.
Customers
OEMs produced over 89 million light vehicles in 2024.(1) The top 15 OEMs, representing approximately 76% or approximately 68 million vehicles based on 2024 light vehicle production, were:(1)
| 1. Toyota Motor Corporation |
9. Suzuki Motor Corporation |
|
| 2. Volkswagen Group |
10. Zhejiang Geely Holding Group |
|
| 3. Hyundai Motor Group |
11. Nissan Motor Corporation |
|
| 4. Stellantis N.V. |
12. BMW AG |
|
| 5. General Motors Company |
13. Mercedes-Benz Group AG |
|
| 6. BYD Auto |
14. Renault S.A. |
|
| 7. Ford Motor Company |
15. Chery Automobile |
|
| 8. Honda Motor Company |
The considerable growth of the Chinese automotive market over the past decade has led to the significant growth of several Chinese OEMs, including BYD Auto, Geely and Chery, as listed above. In addition, the growing trend toward vehicle electrification has led to the emergence of newer EV-focused OEMs, particularly in China. See “Section 5 – Risk Factors – Growth of EV-Focused OEMs; Risks of Conducting Business with Newer EV-Focused OEMs” in this AIF.
For a list of our top customers on a consolidated basis and within each reporting segment, see “Section 6 – Description of the Business – Products & Services” in this AIF.
| (1) | S&P Global |
6 Annual Information Form
Competition
In spite of high barriers to entry in many product areas, as well as the highly capital intensive nature of the global Tier 1 automotive supply industry, competition is fierce and intensifying from many different sources. For most of our Operating Groups, competition comes primarily from automobile manufacturers and from other “traditional” Tier 1 Suppliers, including ones in which one or more automobile manufacturers may have direct or indirect investments. However, with the growing importance of electrification and electronics in the automotive value chain, a number of established electronics and semiconductor chip and manufacturing companies have entered or expanded their presence in the automotive industry, becoming direct competitors to Tier 1 Suppliers, including us. Additionally, disruptive technology innovators are changing the competitive landscape of the automotive industry through the development of high-value product and service offerings, particularly in areas related to vehicle electrification, vehicle autonomy, new mobility, and connectivity, which traditional automotive suppliers may not be able to match. As a result of these trends, some suppliers seek to enhance their competitive positioning by entering into strategic partnerships, joint ventures or collaborations with technology and software companies. Lastly, competition has also intensified as automobile manufacturers have reduced the number of their Tier 1 Suppliers in connection with their strategy to increase the number and range of vehicles built from high-volume global platforms.
The basis on which automobile manufacturers select automotive suppliers for particular programs is determined by a number of factors, which may include, among other factors: price; overall relationship, including historical performance with respect to innovation, quality/ warranty, launch execution and timeliness of delivery; manufacturing footprint; proprietary technologies; financial strength; ability to test and validate new technologies for application in the automotive industry; scope of in-house engineering and tooling capabilities; carbon footprint and alignment with the customer’s sustainability/ESG goals and targets; and existing agreements.
The number of competitors that are asked by automobile manufacturers to bid on any individual product has been reduced in many cases. We expect further reductions as a result of the increasing preference of automobile manufacturers to deal with fewer suppliers and reward those suppliers with earlier and deeper involvement.
Based on 2023 global automotive parts sales to OEMs, the top 10 Tier 1 Suppliers globally were:(1)
| Supplier | Key Automotive Products(2) | Supplier | Key Automotive Products(2) | |||
| 1. Robert Bosch |
Powertrain solutions, chassis systems control, electrical drives, car multimedia, electronics, aftermarket products, steering | 6. Hyundai Mobis(3) | In-vehicle infotainment systems, braking, steering, lamps, safety, suspension, autonomous driving, electrification systems, advanced driver assistance systems | |||
| 2. ZF Friedrichshafen AG |
Electrified powertrain, chassis, driveline, braking systems, steering wheel, autonomous transport systems, electronics & advanced driver assistance systems, active & passive safety systems | 7. Aisin Corporation(3) | Powertrain, chassis and vehicle safety systems, body electronics, vehicle navigation systems | |||
| 3. Magna International Inc. |
Body and chassis, exteriors, powertrain, active driver assistance, electronics, mirrors and lighting, mechatronics, seating systems, vehicle engineering and manufacturing, roof systems | 8. Continental Corporation | Autonomous mobility, passive safety, brake, chassis, motion and motion-controlled systems, tires, rubber, electric mobility, connected mobility | |||
| 4. Contemporary Amperex Technology Co., Ltd. |
Electric vehicle battery modules, cells and management systems, battery materials. | 9. Forvia Group | Seating, interiors, clean mobility (exhaust systems), lighting, hydrogen mobility, electrification and energy management, cockpit, electronics & software integration | |||
| 5. Denso Corporation(3) |
Thermal systems, powertrain systems, electrification systems, mobility electronics, sensor system & semiconductors | 10. Lear Corporation | Seating, electrical distribution and connection systems, battery disconnect systems, electronic systems, software and connected services, electronic control modules, electrification products, connectivity products | |||
Magna International Inc. 7
Notes:
(1) Automotive News (supplement) (June 24, 2024).
(2) Key automotive product descriptions are based on information from each Tier 1 Supplier’s website.
(3) OEM subsidiary or OEM investee.
While no single Tier 1 Supplier currently supplies a full range of products which compete with ours, a number of Tier 1 Suppliers can produce some or many of the same types of components, assemblies, modules, and systems that we currently produce. Some of our competitors may have greater technical or other resources than we do and some of them may be stronger in markets in which we operate. A list of our key competitors within each product capability in our reporting segments can be found in “Section 6 – Description of the Business – Products & Services” in this AIF. See also the risk factors related to “Intense Competition” and “Technology and Innovation” in “Section 5 – Risk Factors” in this AIF.
8 Annual Information Form
4. Our Business & Strategy
Business Drivers
Our business and operating results are dependent on light vehicle production by our customers in three key regions — North America, Europe, and China. Ordinarily, OEM vehicle production levels are aligned with vehicle sales levels and thus affected by changes in such levels. More recently, the automotive industry has faced headwinds, including lower vehicle production volumes in some of our key markets, along with macroeconomic, geopolitical, trade/tariff and other risks. While we supply systems and components to many OEMs globally, we do not supply systems and components for every vehicle, nor is the value of our content consistent from one vehicle to the next. As a result, customer and program mix relative to market trends, as well as the value of our content on specific vehicle production programs, are important drivers of our performance. Key factors impacting production volumes, product/customer mix and content, as well as legislative/ regulatory trends are listed below.
| Growth Driver | Factors Potentially Impacting Growth Driver | |
| Vehicle Production Volumes |
◾ Vehicle sales levels, which are affected by: ◾ General macroeconomic and political conditions ◾ Vehicle affordability ◾ Uncertain pace of EV adoption ◾ Consumer confidence levels, which may be affected by consumer perceptions and general trends related to the job, housing, and stock markets, as well other macroeconomic and political factors ◾ Interest rates and/or availability of credit ◾ Fuel and energy prices ◾ Relative currency values ◾ OEM, supplier or sub-supplier production disruptions ◾ Supply chains and infrastructure ◾ Free trade arrangements ◾ The imposition of tariffs on vehicles or components or materials incorporated therein ◾ Availability and relative cost of skilled labour ◾ Labour disruptions ◾ Commodities prices ◾ Regulatory considerations, including environmental, emissions, and safety standards |
|
|
Customer Mix |
◾ OEM outsourcing as well as their supplier preferences and relationships ◾ Alignment between our portfolio and OEMs’ requirements ◾ Business relations between us and each of our OEM customers ◾ Our ability to supply products and systems from multiple production locations for global vehicle platforms ◾ Competitiveness of our products ◾ Exclusivity of our products and systems due to certain intellectual property rights ◾ OEM cooperation and consolidation ◾ Our ability to grow sales to growing OEMs |
|
| Program Mix |
◾ OEM outsourcing strategies, as well as their supplier preferences and relationships ◾ Our ability to supply products and systems from multiple production locations for global vehicle platforms ◾ Alignment between our portfolio and OEMs’ requirements ◾ Our capital allocation decisions ◾ The competitive position of our products and systems compared to competing products and the overall cost of such products and systems to the end consumer ◾ Pricing of our products and systems relative to competing products ◾ Our customers’ perception of our reputation for product quality, as well as timeliness of delivery ◾ Our product engineering capabilities ◾ Our ability to finance pre-production engineering costs ◾ The scope of our authority relative to the OEM, regarding sourcing of sub-components or products which are incorporated into the systems which we supply ◾ Consumer “take rates” for products and systems we sell ◾ Collaboration among our Operating Groups |
|
|
Legislative/regulatory trends promoting sustainability and safety |
◾ Regulatory actions mandating higher fuel efficiency, lower carbon emissions and/or enhanced safety features ◾ Timeline of regulations related to the phase-out of vehicles with internal combustion engines |
|
Magna International Inc. 9
Macroeconomic, Political and Other Trends
The global automotive industry is cyclical and, as noted above, vehicle production and/or sales may be affected by a broad range of macroeconomic, political, and other factors. Some such factors which are currently affecting the industry are discussed below.
| Macroeconomic, Political & Other Trends | Description | Potential Impact on Magna | ||
| Increasing Trade Protectionism |
◾ Threats to free trade agreements, particularly in North America pursuant to the United States-Mexico-Canada Agreement (“USMCA”) have spurred concerns regarding the development or escalation of international trade disputes ◾ The imposition or threat of new or higher tariffs on goods imported into the United States from Canada, Mexico, Europe and China, together with retaliatory countermeasures that may be enacted by these countries, will significantly interfere with existing automotive supply chains ◾ Government pressure on OEMs to localize production of vehicles in markets in which they are sold ◾ Tier 1 Suppliers may also increase localization to meet changing and volatile demand |
◾ Inability of automotive suppliers and vehicle manufacturers to make efficient long-term investment decisions ◾ Production inefficiencies ◾ Unrecoverable costs impacting profitability ◾ Decreased vehicle affordability leading to reduced demand for and production of vehicles ◾ Distortion of commodity pricing ◾ Increased volatility in relative foreign exchange rates and the stock market ◾ Loss of future business ◾ Suboptimal inventory levels ◾ Pricing pressures from sub-suppliers ◾ Challenges in retaining employees due to production volatility ◾ Financial stress on supply base |
||
| Elevated Interest Rates |
◾ Key lending rates in North America and Europe remain elevated compared to levels experienced prior to 2020. Although rates have eased in all regions, the risk remains that rates could increase if inflation rises or fails to decrease. ◾ Availability and cost of credit are both factors affecting consumer confidence, which is a critical driver of vehicle sales and thus automotive production |
◾ Higher borrowing costs if interest rates remain elevated for a prolonged period of time ◾ Lower sales as a result of a decrease in consumer demand for vehicles, and in turn, lower production |
||
| Supply Chain Disruptions |
◾ Supply chain inefficiencies caused by trade disputes ◾ Supply chain disruptions caused by geopolitical conflict or uncertainty ◾ Supply chain disruptions caused by extreme weather events growing in frequency |
◾ Lower sales ◾ Unrecoverable costs impacting profitability ◾ Production inefficiencies from our production lines being stopped/ restarted ◾ Penalties or business interruption claims from customers ◾ Loss of future business ◾ Reputational damage ◾ Suboptimal inventory levels ◾ Pricing pressures from sub-suppliers ◾ Financial stress on supply base ◾ Challenges in retaining employees due to production volatility |
||
10 Annual Information Form
| Macroeconomic, Political & Other Trends | Description | Potential Impact on Magna | ||
| Geopolitical Conflicts |
◾ Deteriorating U.S. relations with its largest trading partners including China, Mexico, and Canada ◾ On-going military conflicts in Ukraine and the Middle East ◾ Political pressure to manufacture and source from countries that are geopolitical allies |
◾ Weakening of economic growth and consumer confidence ◾ Increasing trade protectionism ◾ Disruption of steel, aluminum and energy supplies (particularly natural gas and oil), shipping/transportation and logistics, vehicle production and/or supply chains ◾ Increased export control and sanctions restrictions ◾ Planning and investment uncertainty ◾ Elevated interest rates ◾ Commodities prices ◾ Relative foreign exchange rates ◾ Increased physical and cybersecurity threats |
||
| Economic/political uncertainty |
◾ Deterioration of consumer confidence, including as a result of the direct/ indirect impacts of geopolitical events, such as trade disputes and military conflicts |
◾ Lower vehicle sales, and production volumes ◾ Planning and investment uncertainty ◾ Pricing pressure from OEMs and increasing financial stress on supply base |
||
| Regulatory focus on climate impact |
◾ Government regulation limiting the sale of new vehicles with ICE engines by certain future dates ◾ Governmental authorities, customers, equity investors, lenders, rating agencies, employees and other stakeholders increasing scrutiny of companies’ impact on and resilience to climate change ◾ Focus on energy reduction and transition to renewable / carbon neutral energy sources ◾ Increasing expectations regarding disclosures of ESG metrics ◾ Growth in investment demand for companies demonstrating sustainable strategy and operations ◾ Heightened focus and concern on risk of supply chain disruptions from climate-related events |
◾ Increased capital expenditures associated with certain long-term product portfolio changes ◾ Focus on energy reduction opportunities to reduce energy costs ◾ Decarbonization strategies / commitments could require increased capital spending and/or involve higher operating costs, including higher costs to purchase renewable energy ◾ Potential for increased / decreased demand for Magna’s Common Shares, based on market views as to sustainability of the company ◾ Risk of disruption to automotive supply chains, transportation routes and electricity grids from climate-related events |
||
Magna International Inc. 11
Industry Trends
The automotive industry is being defined by a number of trends, which are discussed below together with their potential impact on Magna.
| Automotive Industry Trends | Description | Potential Impact on Magna | ||
| Uncertain transition to EVs |
◾ Pace of transition varies by region, vehicle segment and OEM ◾ Certain OEMs, primarily in North America, have been deferring or cancelling planned EV programs and/or reducing production volumes ◾ Number of EVs sold globally growing, but rate of growth has moderated in some markets with a misalignment between EV production/supply and consumer demand for certain models |
◾ Increased management attention to pursue commercial recoveries related to investments made ◾ Incurrence of potentially unrecoverable pre-production, tooling, engineering, and other costs incurred in advance of production ◾ Production inefficiencies, including as a result of unutilized or underutilized production capacity and/or disruptions to our workforce plans at affected facilities. ◾ Significant development and engineering costs for OEMs may increase collaboration among OEMs and outsourcing to suppliers |
||
| Regulatory focus on reducing CO2 emissions |
◾ Sustainability considerations have driven regulatory action for reduced vehicle emissions in recent years ◾ Regulatory action has been a major factor in driving transition to EVs to date ◾ Despite trend in recent years, regulatory context may shift based on political and other changes in North America and Europe |
◾ Continuing opportunities to support OEM customers’ efforts through lightweighting, more efficient drivetrains, electrification, and active aerodynamics ◾ Magna’s diversified portfolio is largely agnostic to powertrain choice |
||
| Growth of Chinese EV OEMs |
◾ Rapid growth and development of Chinese OEMs’ EV technologies and vehicles provides advantages as they seek to expand into global markets ◾ Certain Chinese OEMs have announced entry into Mexico and European markets |
◾ Potential loss of sales to the extent Chinese OEMs adversely impact traditional OEMs in China and Europe ◾ Potential for new business opportunities with Chinese OEMs |
||
| Chinese policies aimed at growing high-value domestic development/production |
◾ Continuing Chinese government focus on increasing engineering, development and manufacturing of high-value, high-tech products in China |
◾ Continued localization of engineering, development, and manufacturing ◾ Uncertainty regarding whether Chinese domestic companies will be preferred over foreign-owned companies operating in China ◾ Potential for increased export control restrictions in the U.S. and Western Europe relating to strategically important and/or technologically advanced products and technology |
||
| Continued growth in demand for ADAS features and systems |
◾ Increased regulatory requirements related to vehicle safety in recent years have spurred growth of ADAS features and systems ◾ Enhancing ADAS capabilities requires significant investment, with uncertain returns on investment due to intense competition, including from established technology companies |
◾ Opportunities to grow Magna high-value content, particularly in our Power & Vision segment ◾ Potential challenges in attracting and retaining highly skilled engineers and software personnel ◾ Potential inability to achieve desired scale and competitive positioning |
||
12 Annual Information Form
| Automotive Industry Trends | Description | Potential Impact on Magna | ||
| Continuing elevated product warranty expectations and product recall levels |
◾ Over the last decade, OEMs have become more inclined to recall vehicles with potentially faulty products ◾ Increased frequency and severity of recalls, together with other factors, have impacted coverage and pricing for recall insurance |
◾ Increased OEM pricing pressure, including pressure to assume greater warranty responsibility ◾ Elevated product recall and related product replacement cost risk, even where root cause is not agreed with OEM or cannot be determined ◾ Higher self-insured retentions and, reduced coverage limits on recall insurance, as well as increased reluctance by certain sub-suppliers to absorb the full cost of warranty/ recall expenses relating to the failure of their components, create greater net exposure |
||
| OEM cooperative alliances / consolidation |
◾ Joint platform development, powertrain sharing, and/or purchasing ◾ Regional joint ventures ◾ Partnerships expanding to new areas of vehicle ecosystem (raw materials/batteries; components/software; infrastructure/aftersales) ◾ OEM consolidation from time to time |
◾ Increased OEM pricing pressure ◾ Increase in sales, where Magna has strong relationship with lead OEM ◾ Decrease in sales, where Magna has weaker relationship with lead OEM |
||
Magna International Inc. 13
Our Corporate Strategy
Magna operates in a rapidly evolving, highly competitive, cyclical, lean, global manufacturing industry. To drive long-term success, we are focused on the following key areas:
| Product Portfolio |
Magna’s approach to product involves viewing our portfolio through the lens of a long-term owner. As a starting point for this approach, each of our businesses must meet the following requirements:
◾ operating in meaningful or growing markets with significant profit opportunities;
◾ having strong market positioning and profitable growth, or a path toward both; and
◾ possessing sustainable competitive advantages.
These requirements for our product portfolio have already delivered scale and market leading positioning across a number of different businesses and markets. For example, our portfolio reflects:
◾ global leadership in body and chassis, all-wheel drive/front wheel-drive, transmissions, latches, mirrors and contract vehicle assembly;
◾ top five global positioning in ADAS;
◾ North American leadership in exteriors and top three market positioning in seating; and
◾ top five European market positioning in both exteriors and seating.
Employing strategic portfolio management, we seek to achieve strong performance in leading markets. Practically, this involves managing all our businesses for continuous improvement, while deploying capital investments to areas that are most aligned with our long-term portfolio priorities.
One such priority has been to focus on businesses that can deliver profitable growth while remaining agnostic to the vehicle’s method of propulsion — this is currently the case for a large majority of our product portfolio.
However, we believe that electrification provides growth opportunities, even though the pace of adoption may not be linear. As the proportion of vehicles on our roads transitions from ICE to EV, Magna is strategically positioned to increase the content and value we can deliver to our customers. |
|
|
Customer Strategy |
Although we supply products and systems to every major vehicle manufacturer, the majority of our sales are currently to six customers. While continuing to support these customers, we have increased focus and strengthened relationships with a number of growing North American, European and Chinese OEMs to diversify sales. In the case of OEMs which do not traditionally outsource business outside their established supplier networks, we seek opportunistic growth opportunities, while new entrant OEMs are carefully assessed for overall product and business viability.
Given the rapid evolution of the automotive industry, we continue to regularly assess the alignment between our strategy and our OEM customers, leveraging our cross-group activity both to identify and pursue strategic business awards, as well as to assess and strengthen risk mitigation. |
|
| Operational Excellence |
As a manufacturer of highly engineered automotive products, we are committed to continuous improvement and operational excellence. Our approach to operational excellence is based on three elements:
◾ Executing on the Fundamentals — reinforcing solid execution with respect to program launches, product quality and warranty management;
◾ Improving our Most Impactful Divisions — focusing attention on long-term margin transformation for operating divisions with the highest impact to Magna overall; and |
|
| ◾ Leveraging our Smart Factory initiatives — new manufacturing processes developed from our Factory of the Future initiatives and our MAFACT operating system are distilled into use cases which |
||
14 Annual Information Form
| are scaled across Groups to leverage common opportunities. |
||
| Capital Allocation |
A disciplined, profitable approach to growth is a foundational principle. This broad principle is distilled down to three fundamental components:
◾ Maintaining a Strong Balance Sheet — a strong balance sheet is critical to preserving our liquidity and high investment grade credit ratings. Accordingly, our target Adjusted Debt / Adjusted EBITDA leverage ratio range is currently between 1.0x and 1.5x.
◾ Invest and Manage for Growth — we are focused on accretive investments to support long-term Free Cash Flow generation. This consists of organic (investments in our business) and inorganic (M&A) opportunities that provide advantageous product capabilities, customer diversification or geographic footprint in areas where we require additional capacity. We are willing to exit businesses that are not aligned with our requirements and product portfolio strategy and have done so in recent years, including through the sale of our former interiors business (2015), fluid pressure and controls group (2019), as well as certain exteriors business units in Germany (2021), seating operations in Brazil, a powertrain business in France (2023), our former divisions in Russia (2023) and a body and chassis business in India (2024). Overall, we aim to maintain a sustainable competitive advantage through innovation, cutting edge technology and manufacturing, and use our investments to support achievement of this objective.
◾ Return Capital to Shareholders — we believe in providing shareholders a stable dividend. Dividends are supplemented by additional returns of capital through share repurchases, which we fund with excess liquidity. |
|
| People and Talent |
We are committed to an operating philosophy based on fairness and concern for people. This philosophy is part of a culture in which employees and management share the responsibility to help ensure our success. Our Employee’s Charter sets out this philosophy through the following fundamental principles:
◾ job security;
◾ safe and healthful workplace;
◾ fair treatment;
◾ competitive wages and benefits;
◾ employee equity and profit participation;
◾ communication and information; and
◾ an employee hotline. |
|
Magna International Inc. 15
5. Risk Factors
The industry in which we compete and the business we conduct are subject to a number of risks and uncertainties. Our short and medium-term operational success, as well as our ability to create long-term value through our corporate strategy, are subject to a number of risks and uncertainties. These risks and uncertainties, together with a number of assumptions, underlie the forward-looking statements made in this AIF. In order to fully understand these risks, uncertainties, and assumptions, you should carefully consider the following risk factors in addition to other information included in this AIF:
Macroeconomic, Geopolitical and Other Risks
| ∎ | Threats to Free Trade Agreements: Historical growth in the automotive industry has been aided by the free movement of goods, services, people and capital through bilateral and regional trade agreements, particularly in North America pursuant to the North American Free Trade Agreement (1994 – 2020) and the United States-Mexico-Canada Agreement (2020 – Present). The current U.S. administration has indicated its intent to renegotiate the USMCA and is proceeding with new or higher tariffs on goods imported into the United States from Canada, Mexico, Europe and China. Taken together with any retaliatory measures that may be enacted by these countries, such measures will increase our input costs, the prices customers pay for our products, and could increase borrowing costs for consumers. In turn, this further decreases vehicle affordability for consumers which could have a material adverse effect on the demand for our products, our sales, profitability and competitive position. |
| ∎ | International Trade Disputes: International trade disputes could, among other things, reduce demand for and production of vehicles, disrupt global supply chains, distort commodity pricing, impair the ability of automotive suppliers and vehicle manufacturers to make efficient long-term investment decisions, create volatility in relative foreign exchange rates, and contribute to stock market volatility. The imposition of sanctions, tariffs and/or the escalation of trade disputes which interfere with automotive supply chains could have an adverse effect on our operations, profitability and ability to effectively execute our corporate strategy. |
| ∎ | Interest Rates: Key lending rates in North America and Europe remain elevated compared to levels experienced prior to 2020. Although rates have eased in all regions, the risk remains that rates could increase if inflation rises or fails to decrease. The availability and cost of credit are both factors affecting consumer confidence, which is a critical driver of vehicle sales and thus automotive production. A material, sustained decrease in consumer demand for vehicles could result in further reductions to vehicle production from levels assumed in our business plan, which could have a material adverse effect on our profitability and financial condition. Higher interest rates will also have an adverse effect on our borrowing costs and, if prolonged, could have an adverse effect on our profitability. |
| ∎ | Geopolitical Risks: The occurrence of geopolitical crises could create a number of risks, including: disruption of energy supplies (particularly natural gas and oil), shipping/transportation and logistics, vehicle production and/or supply chains; weakening economic growth and consumer confidence; increasing physical or cybersecurity threats; and/or worsening other risks described elsewhere in these Risk Factors, such as commodity prices, relative foreign exchange rates and risks of doing business in foreign markets. An expansion or worsening of existing geopolitical crises, or the occurrence of significant new geopolitical risks, could have a material adverse effect on our business and operations. |
Risks Related to the Automotive Industry
| ∎ | North American Electric Vehicle Program Deferrals, Cancellations and Volume Reductions: Certain OEMs, primarily in North America, have been updating their EV strategies by deferring or cancelling planned EV programs and/or reducing production volumes below the levels at which we previously quoted. We are pursuing commercial recoveries from our customers as a result of these actions, but we may be unable to fully recover various pre-production, tooling, engineering, and other costs incurred in advance of production, or unable to recover them within the timeframe originally contemplated in our business plan. We may also experience production inefficiencies, including as a result of unutilized or underutilized production capacity and/or disruptions to our workforce plans at affected facilities. The deferral or cancellation of EV programs, or reduction in planned production volumes, combined with the failure to secure commercial recoveries from our customers to offset associated costs and inefficiencies, may have a material adverse effect on our profitability. |
| ∎ | Economic Cyclicality: Ordinarily, the global automotive industry is cyclical, with potential for regional differences in the timing of expansion and contraction of economic cycles. In normal industry cycles, lower consumer confidence typically translates to lower vehicle sales and production volumes. Examples of factors which often reduce consumer confidence include: worsening economic, political, and other conditions; consumer perceptions and general trends related to the job, housing, and stock markets; military conflict; increasing inflation (particularly fuel and energy prices); and rising interest rates. A significant decline in vehicle production volumes from levels assumed in our business plan could have a material adverse effect on our profitability and financial condition. |
| ∎ | Regional Production Volume Declines: North America, Europe and China are key automotive producing regions for us, and our operating results are primarily dependent on car and light truck production by our customers in these regions. A significant or sustained decline in vehicle production volumes in any or all these geographic regions could have a material adverse effect on our operations, sales, and profitability. |
16 Annual Information Form
| ∎ | Deteriorating Vehicle Affordability: Vehicle affordability to consumers is becoming more challenged due to a combination of factors, including: higher prices for vehicles; costs related to advanced electronic systems; elevated vehicle finance costs; and changes in relative foreign exchange rates. A material, sustained decrease in consumer demand for vehicles due to deteriorating vehicle affordability could result in reductions to vehicle production from levels assumed in our business plan, which could have a material adverse effect on our profitability and financial condition. |
| ∎ | Uncertain Pace of EV Adoption: Although the number of electric vehicles sold globally continues to grow, the rate of growth has moderated in some markets due to consumer uncertainty related to issues such as: vehicle affordability; reduced availability of government subsidies for the purchase of EVs; concerns regarding evolving battery technologies; anxiety regarding driving range; inadequacy of charging infrastructure; the growth of new, EV-focused OEMs and/or new EV models with little or no operating and warranty history; and rapid depreciation and deterioration in residual values for EVs. If planned production volumes for EV programs do not materialize, we may not be able to recover our capital investments related to such programs, or to recover such investments within the timeframes contemplated, which could have a material adverse effect on our profitability and financial condition. |
| ∎ | Intense Competition: The automotive supply industry is highly competitive and becoming more so. Some of our competitors have higher or more rapidly growing market share than we do in certain product or geographic markets. Additionally, a number of established electronics, semiconductor chip and contract manufacturing companies have entered or expanded their presence in the automotive industry. At the same time, disruptive technology innovators have been introducing novel product and service solutions which traditional automotive suppliers may not be able to match. Failure to successfully compete with existing or new competitors could affect our ability to fully implement our corporate strategy. |
Strategic Risks
| ∎ | Evolution of the Vehicle: The success of our corporate strategy is correlated to our ability to grow our business and capabilities in product areas which demonstrate long-term growth. Some systems in our product portfolio are expected to decline over the long-term, including manual transmissions, mechanical all-wheel drive/four-wheel drive systems and fuel tank systems. The failure to grow our sales of higher growth products at or above the industry rates of growth for such products could have a material adverse effect on our profitability and financial condition. |
| ∎ | Evolving Business Risk Profile: The risk profile of our business continues to evolve due to our exposure to product areas such as battery enclosures, electrified powertrains, and ADAS and electronics. As a result, we may face new or heightened risks, including: forecasting, planning and capital allocation risks due to uncertainties regarding the shift from ICE to EV production volumes, take-rates for ADAS systems and/or features offered to consumers as optional items; reduction in demand for certain products which are unique to ICE vehicles; challenges in quoting for profitable returns on products with leading-edge technologies; rigorous testing and validation requirements from OEM customers for complex new products; increased warranty and recall risks on new products and leading-edge technologies; increased product liability risks; increased counterparty risk; heightened risk of technological obsolescence of some of our products, processes and/or assets; and difficulties in attracting or retaining employees with critical skills in high-demand areas. Realization of one or more such risks could have a material adverse effect on our operations, profitability, or financial condition. |
| ∎ | Technology and Innovation: While we continue to invest in technology and innovation which we believe will be critical to our long-term growth, the automotive industry is experiencing significant electrical, electronic, and software-driven change and disruption. Our ability to anticipate changes in technology and to successfully develop and introduce new and enhanced products and/or manufacturing processes on a timely basis will be significant factors in our ability to remain competitive. Additionally, our success is dependent on our ability to attract, develop and retain employees with the required technical and/or software skills. If we are unsuccessful or are less successful than our competitors in consistently developing innovative products and/or processes, we may be placed at a competitive disadvantage in bidding for new business and may not be able to recover some or all our engineering, research and development costs, which could have a material adverse effect on our profitability and financial condition and ability to fully implement our corporate strategy. |
| ∎ | Investments in Mobility and Technology Companies: In addition to our development activities, we have invested in various mobility and technology companies, as well as funds that invest in such companies, and may continue to do so in the future. However, investing in such companies involves a high degree of risk, including the potential loss of some or all our investment value and/or supply continuity risks to the extent we have supply relations with them. There is currently no public market for the shares or units of some of these investments and, as a result, we may be unable to monetize such investments in the future. In some cases, we may have shares or share purchase warrants with technology-driven suppliers with which we have commercial supply relations; while the value of such equity may be affected by the commercial prospects of such programs, our ability to exit our investments may be impaired by the existence of our commercial supply relationship. Investments in companies or funds which are currently or subsequently become publicly traded are “marked-to-market” quarterly, which may result in us recording unrealized gains or losses in any given quarter. The realization of any of the foregoing investment-related risks could have an adverse effect on our profitability and financial condition. |
Customer-Related Risks
| ∎ | Customer Concentration: Although we supply parts to all major OEMs, a significant majority of our sales are to six customers: General Motors, Daimler, Ford, BMW, Volkswagen and Stellantis. Additionally, growth rates of OEMs differ by region and segment, with significant |
Magna International Inc. 17
| growth by some EV-focused OEMs in certain markets, such as China. Shifts in market share away from our top customers could have a material adverse effect on our profitability to the extent we are unable to offset such lost sales with sufficient sales growth with alternative OEMs. |
| ∎ | Market Shifts: While we supply parts for a wide variety of vehicles produced globally, we do not supply parts for all vehicles produced, nor is the number or value of parts evenly distributed among the vehicles for which we do supply parts. Additionally, in recent years, we have experienced a concentration in content on certain EV models. Shifts in market shares away from vehicles on which we have significant content, as well as vehicle segments in which our sales may be more heavily concentrated, could have a material adverse effect on our sales and profitability. |
| ∎ | Growth of EV-Focused OEMs: A number of EV-focused OEMs, including Tesla, BYD, Geely, Nio, SAIC, XPeng, and Rivian, have emerged in recent years. Despite significant tariffs and other protectionist headwinds, some China-based, EV-focused OEMs, such as BYD and Geely, have entered the European market with vehicles exported from China, while both BYD and Chery have announced plans to manufacture EVs in European countries. While we are growing and targeting further growth with some of the newer EV-focused OEMs, we do not have relations with all, nor are such relationships as well established as those with our traditional customers. The failure to sufficiently grow our sales to those EV-focused OEMs which achieve significant commercial success could adversely impact our long-term strategy. At the same time, the failure of newer EV-focused OEMs to which we supply systems could adversely impact the success of our customer diversification strategy, as well as create counterparty risks described below. |
| ∎ | Risks of Conducting Business with Newer EV-Focused OEMs: Conducting business with newer EV-focused OEMs poses incremental risks and challenges compared to our traditional customers, including as a result of: their relatively short operating histories; limited financial, liquidity/capital or other resources; less mature product development and validation processes; uncertain market acceptance of their products/services; and untested business models. These factors may elevate our counterparty risks in dealing with such OEMs, particularly with respect to recovery of: pre-production (including tooling, engineering, and launch) and production receivables; inventory; fixed assets and capitalized pre-production expenditures; as well as other statutory warranty, recall and third-party claims related to our role as contract manufacturer or supplier of components on new vehicles in instances where the OEM is no longer able to assume such costs, such as on the Fisker Ocean SUV. The inability of newer EV-focused OEMs to achieve commercial success, or the bankruptcy or insolvency of any such OEM with which we conduct business, could have a material adverse effect on our profitability and financial condition. |
| ∎ | Dependence on Outsourcing: We depend on outsourcing by OEMs, including the outsourcing of complete vehicle assembly to our contract vehicle manufacturing business. The extent of such outsourcing is dependent on a number of factors, including: the cost, quality, and timeliness of outsourced production relative to in-house production by an OEM; the degree of unutilized capacity at an OEM’s facilities; tariffs; and collective bargaining agreements and labour relations between OEMs and labour unions. Currently, many OEMs have excess vehicle assembly capacity. Additionally, since EVs have fewer components than vehicles with internal combustion engines, some OEMs may insource production of certain components or systems to maintain employment levels committed to in collective bargaining agreements and/or in connection with government incentives. A reduction in outsourcing by OEMs, or the loss of any material production or assembly programs combined with the failure to secure alternative programs with sufficient volumes and margins, could have a material adverse effect on our profitability. |
| ∎ | Customer Cooperation and Consolidation: Competing OEMs have cooperated and collaborated in different ways to save costs, including through: joint purchasing activities; platform sharing; powertrain sharing; joint R&D; and regional joint ventures. Additionally, the automotive industry has previously experienced OEM consolidation. While OEM cooperation and consolidation may present opportunities, they also present a risk that we could lose future business or experience even greater pricing pressure on certain production programs, either of which could have an adverse effect on our profitability. |
| ∎ | Consumer Take Rate Shifts: Shifts in consumer preferences may impact “take rates” for certain types of products we sell. Examples of such products include: all-wheel drive systems; power liftgates; active aerodynamics systems; ADAS; and complete vehicles with certain option packages or option choices. Where shifts in consumer preferences result in higher “take rates” for products that we do not sell or for products we sell at a lower margin, our profitability may be adversely affected. |
| ∎ | Customer Purchase Orders: Contracts from our customers consist of blanket purchase orders which generally provide for the supply of a customer’s annual requirements rather than a specific quantity of products and can be terminated by a customer at any time. We may have various pre-production, tooling, engineering, dedicated program capital, and other costs incurred in advance of production which cannot be easily recovered from our customers if a purchase order is terminated and/or if forecast production volumes fail to materialize within the timeframe contemplated in our business plan. We may also experience production inefficiencies, including as a result of unutilized or underutilized production capacity and/or disruptions to our workforce plans at facilities affected by the cancellation or reduction of production volumes. The failure to secure commercial recoveries from customers to offset such costs and other operating inefficiencies, as well as higher costs due to tariffs, may have a material adverse effect on our profitability. |
| ∎ | Potential OEM Production-Related Disruptions: Any significant OEM production disruptions, including as a result of labour unrest at customer or sub-supplier facilities, parts shortages or natural disasters, would lead to disruptions to our production, which could have a material adverse effect on our sales and profitability. |
18 Annual Information Form
Supply Chain Risks
| ∎ | Supply Base: We rely on a number of suppliers to supply us with a wide range of components required in connection with our business. The financial health of automotive suppliers is impacted by a number of factors, including economic conditions and production volumes. A significant worsening of economic conditions or reduction in production volumes could deteriorate the financial condition of our supply base, which could lead to, among other things: disruptions in the supply of critical components to us or our customers; and/or temporary shutdowns of our production lines or the production lines of our customers; all of which could have a material adverse effect on our profitability. |
| ∎ | Supplier Claims: Input cost increases, shortfalls in vehicle production volumes, program deferrals or cancellations, intellectual property concerns, tariffs, and other factors could give rise to commercial or legal cost recovery claims against us by our suppliers, which could have an adverse effect on our profitability. |
| ∎ | Supply Chain Disruptions: OEMs and Tier 1 automotive suppliers may experience supply disruptions or constraints on other critical manufacturing inputs, for a number of different reasons, including: government regulation or intervention; trade and tariff disputes; geopolitical and/or military conflict; interruption of shipping or other transportation routes; natural catastrophes; labour disruptions; part shortages; intellectual property claims; and pandemics. Supply chain disruptions which prevent us from timely supplying products to our customers could result in a range of potential adverse consequences, including: unrecoverable price increases; elevated, unrecoverable costs such as those for premium freight or re-sourcing of supply; penalties, business interruption claims, or other commercial claims by our customers and suppliers; loss of future business; and reputational damage. The impacts of prolonged supply chain disruptions or constraints could have a material adverse effect on our operations and profitability. |
| ∎ | Regional Energy Supply and Pricing: Regional energy supplies have from time to time been disrupted due to geopolitical and military conflict, supply/demand imbalances, government regulation, severe weather events, and challenges related to the transition to renewable energy generation. Unforeseen supply disruptions, demand spikes, prolonged energy disruptions and/or significant energy price increases could have a material adverse effect on our operations and profitability. |
Manufacturing/Operational Risks
| ∎ | Product Launch: The launch of production is a complex process, the success of which depends on a wide range of factors, including: the timing and frequency of design changes by our customers relative to the start of production; product maturity and complexity; production readiness of our own, as well as our customers’ and suppliers’ manufacturing facilities; robustness of manufacturing and validation processes; launch volumes; quality and production readiness of tooling and equipment; sufficiency of skilled employees; and initial product quality. Failure by us to successfully launch a new product or complete vehicle could result in commercial or litigation claims against us which could have a material adverse effect on our profitability. Additionally, a significant product or program launch failure could adversely affect our reputation, future business prospectus with one or more customers, and/or ability to execute our strategy. |
| ∎ | Operational Underperformance: From time to time, we may have operating divisions which are not performing at expected levels of profitability. The size and complexity of automotive manufacturing operations often makes it difficult to achieve a quick turnaround of underperforming divisions. Significant or prolonged underperformance at any of our operating divisions could have a material adverse effect on our profitability and operations. |
| ∎ | Restructuring Costs: We may sell some product lines and/or downsize, close, or sell some of our operating divisions. By taking such actions, we will incur restructuring, downsizing and/or other significant non-recurring costs. These costs may be higher in some countries than others and could have a material adverse effect on our profitability. |
| ∎ | Impairments: We have recorded significant impairment charges related to equity interests in joint ventures, goodwill, and long-lived assets in the past and may do so again in the future. The occurrence of any of a number of potential scenarios could result in indicators of impairment, including: the early termination, loss, renegotiation of the terms of, or delay in the implementation of, any significant production contract; the technological obsolescence of any of our products or production assets; production volumes that are lower than expected; and the insolvency of a customer. In conducting our impairment analysis, we make forward-looking assumptions regarding: the impact of turnaround plans on underperforming operations; new business opportunities; program price and cost assumptions on current and future business; the timing and success of new program launches; and forecast production volumes. To the extent such forward-looking assumptions are not met, any resulting impairment loss could have a material adverse effect on our profitability. |
| ∎ | Skilled Labour Attraction/Retention: Our business is based on successfully attracting, developing, and retaining employees at all levels of the company from “shop-floor” to Executive Management. The markets for highly skilled workers, as well as talented professionals and leaders in our industry are extremely competitive, particularly in the major global automotive and technology centres in which many of our operations are located. The inability to meet our needs for skilled workers and talented professionals and leaders, whether through recruitment or internal training and development activities could impact our ability to profitably conduct business and/or effectively implement our strategy. |
| ∎ | Leadership Expertise and Succession: Effective succession planning programs and practices are critical elements of our overall talent management strategy. While we believe that our leadership development and succession programs have been effective in facilitating leadership transitions to date, our ability to profitably conduct business and/or successfully implement our strategy could be impacted by |
Magna International Inc. 19
| the failure to: identify, train, develop and support high-performing leaders; ensure effective knowledge transfers from transitioning leaders to successors; and/or otherwise promote organizational robustness and resilience through leadership transitions in critical roles. |
Pricing Risks
| ∎ | Quote/Pricing Assumptions: The time between award of new production business and start of production typically ranges between two and four years. Since product pricing is typically determined at the time of award, we are subject to significant pricing risk due to changes in input costs, production volumes, and other quote assumptions from the time of award through the start of production. The inability to quote effectively, or the occurrence of a material change in input cost, production volume or other quote assumptions between program award and production, could have a material adverse effect on our profitability. |
| ∎ | Customer Pricing Pressure/Contractual Arrangements: We face ongoing pricing pressure from OEMs, including through: quoting pre-requirements; long-term supply agreements with mutually agreed price reductions over the life of the agreement; non-contractual annual price concession demands; pressure to absorb costs related to product design, engineering and tooling, and/or amortize such costs through the piece price for the product; pressure to assume incremental warranty costs; and OEM refusal to fully offset inflationary price increases. OEMs possess significant leverage over their suppliers due to their purchasing power and the highly competitive nature of the automotive supply industry. As a result of the broad portfolio of parts we supply to our six largest OEM customers, such customers may be able to exert greater leverage over us as compared to our competitors. We attempt to offset price concessions and costs in a number of ways, including through commercial negotiations with our customers, improved operating efficiencies and cost reduction efforts. Our inability to fully offset price concessions, absorb design, engineering, and tooling costs, and/or fully recover such costs over the life of production, could have a material adverse effect on our profitability. Moreover, while we attempt to negotiate contractual terms with our suppliers that align with the contractual terms between us and our OEM customers, we may not always be successful in doing so. Any such gaps between our customer and supplier contract terms could, in certain circumstances, have an adverse effect on our profitability. |
| ∎ | Commodity Price Volatility: Prices for certain key raw materials and commodities used in our parts, including steel, aluminum, resin, and energy can be volatile. In some cases, our risk is mitigated because we purchase steel, aluminum, and to a more limited extent, resin under customer resale programs. Where such commodity purchases are not made under customer resale programs, we seek to offset commodity price increases by: passing such increases to our customers; engineering products with reduced commodity content; implementing hedging strategies; or otherwise. To the extent we are unable to offset commodity price increases, such additional commodity costs could have an adverse effect on our profitability. |
| ∎ | Scrap Steel/Aluminum Price Volatility: Some of our manufacturing facilities generate a significant amount of engineered scrap steel and/or aluminum in their manufacturing processes but recover some of the value through the sale of such scrap. Scrap steel and scrap aluminum prices can also be volatile and do not necessarily move in the same direction as steel or aluminum prices. Declines in scrap steel/aluminum prices from time to time could have an adverse effect on our profitability. |
Warranty/Recall Risks
| ∎ | Repair/Replacement Costs: We are responsible for the repair and replacement costs associated with defective products we supply to our customers. Certain of our products, such as transmissions and battery enclosures, typically have a higher unit and labour service cost in the event of replacement. Other products, such as cameras, radars, and side door latches, are supplied in multiples of two or four for a single vehicle, which could result in significant cost in the event all need to be replaced. OEMs and/or government regulators can initiate recalls of safety or regulated products, which could place us at risk for the administrative costs of the recall, in addition to the repair/replacement costs of defective products, even in situations where we dispute the need for a recall or the responsibility for any alleged defect. See the claim disclosed in “Section 10 — Legal Proceedings” in this AIF. The obligation to repair or replace defective products could have a material adverse effect on our operations and profitability. To the extent such obligation arises as a result of a product recall, we may face reputational damage, and the combination of administrative and repair/replacement costs could have a material adverse effect on our profitability. |
| ∎ | Warranty Provisions: In certain circumstances, we are at risk for warranty, product liability and recall costs. We are currently experiencing increased customer pressure to assume greater warranty responsibility. Certain customers seek to impose partial responsibility for warranty costs where the underlying root cause of a product or system failure cannot be determined, or where the root cause is disputed, as in the case of a warranty claim disclosed in “Section 10 — Legal Proceedings” in this AIF. Warranty provisions for our products are based on our best estimate of the amounts necessary to settle existing or probable claims related to product defects. Warranty claims which exceed warranty provisions could have a material adverse effect on our profitability. In addition, warranty provisions for our powertrain systems, electronics and complete vehicle programs are also established based on our or our customers’ warranty experience with the applicable type of product and, in some cases, the terms in the applicable customer agreements. Actual warranty experience which results in costs that exceed our warranty provisions, could have a material adverse effect on our profitability. |
| ∎ | Product Liability: We cannot guarantee that the design, engineering, testing, validation, and manufacturing measures we employ to ensure high-quality products will be completely effective, particularly as electronic content and product complexity increases and/or as we enter newer product areas such as eDrives or ADAS. If our products fail to perform as expected or as required by governmental |
20 Annual Information Form
| regulations, and/or to the extent any such failure results in, or is alleged to result in, bodily injury and/or property damage or other losses, our customers or government regulators may initiate a product recall of such products and/or third party product liability claims may be brought against us. The defense of product liability claims, particularly class action claims in North America, may be costly and judgements against us could impair our reputation and have a material adverse effect on our profitability. |
Climate Change Risks
| ∎ | Transition Risks and Physical Risks: Our Sustainability Report, which is appended to this AIF, contains a detailed discussion of transitional and physical climate change risks, along with our efforts to mitigate them. Readers are encouraged to review such climate risk disclosures. |
| ∎ | Strategic and Other Risks: A number of the risk factors discussed in this section contain detailed discussions of strategic and other risks related to the automotive industry and our business within the context of the transition to electromobility, including: North American EV Program Deferrals, Cancellations and Volume Reductions; Uncertain Pace of EV Adoption; Evolution of the Vehicle; Evolving Business Risk Profile; Customer Concentration; Market Shifts; Growth of EV-focused OEMs; and Dependence on Outsourcing. Readers are encouraged to review this entire Risk Factors section in its entirety. |
IT Security/Cybersecurity Risks
| ∎ | IT/Cybersecurity Breach: Although we have established and continue to enhance security controls intended to protect our IT systems and infrastructure, there is no guarantee that such security measures will be effective in preventing unauthorized physical access or cyber-attacks. A significant breach of our IT systems could: result in theft of funds; cause disruptions in our manufacturing operations; lead to the loss, destruction, or inappropriate use of sensitive data, including employees’ personal data; or result in theft of our, our customers’ or our suppliers’ intellectual property or confidential information. The occurrence of any of the foregoing could adversely affect our operations and/or reputation and could lead to claims against us that could have a material adverse effect on our profitability. |
| ∎ | Product Cybersecurity: The risk of vehicle cyber-attacks has risen with the proliferation of technology designed to connect vehicles to external networks. Although vehicle and systems-level cybersecurity controls and protections are typically managed and/or specified by our OEM customers, we cannot provide assurance that such controls and protections will be effective in preventing cyber intrusion through one of our products. Furthermore, an OEM customer may still seek to hold us financially responsible, even where the OEM specified the cybersecurity controls and protections. Any such cyber intrusion could cause reputational damage and lead to claims against us that have an adverse effect on our profitability. |
Acquisition Risks
| ∎ | Inherent Merger and Acquisition Risks: Acquisitions are subject to a range of inherent risks, including the assumption of incremental regulatory/compliance, pricing, supply chain, commodities, labour relations, litigation, environmental, pensions, warranty, recall, IT, tax, or other risks. While due diligence on an acquisition target is intended to mitigate such risks, these efforts may not always prove to be sufficient in identifying all risks and liabilities related to the acquisition, including as a result of: limited access to information; time constraints for conducting due diligence; inability to access target company facilities and/or personnel; or other limitations in the due diligence process. Additionally, we may identify risks and liabilities that we are not able to sufficiently mitigate through appropriate contractual indemnities or other protections. The realization of any such risks could have a material adverse effect on our profitability. |
| ∎ | Acquisition Integration and Synergies: We may not be able to successfully integrate or achieve anticipated synergies from our acquisitions and/or such acquisitions may be dilutive in the short to medium term. Either of these outcomes could have a material adverse effect on our profitability. |
Other Business Risks
| ∎ | Joint Ventures: We conduct certain of our operations through joint ventures with contractual arrangements under which we share management responsibilities with our joint venture partner(s). Joint venture operations carry a range of risks, including those relating to: failure of our joint venture partner(s) to satisfy contractual obligations; potential conflicts between us and our joint venture partner(s); strategic objectives of joint venture partners that may differ from our own; potential delays in decision-making; a limited ability to implement some or all of our policies, practices and controls, or to control legal and regulatory compliance, within the joint venture(s); and other risks inherent to non-wholly owned operations. The likelihood of such occurrences and their potential effect on us vary depending on the joint venture arrangement, however, the occurrence of any such risks could have an adverse effect on our operations, profitability, and reputation. |
| ∎ | Intellectual Property: We own intellectual property that is important to our business and product portfolio. Our intellectual property is an important factor in protecting our innovation activities and maintaining our competitive advantage. From time to time, our intellectual property rights may be challenged, including through the assertion of intellectual property infringement claims which could result in us: being prevented from producing and selling certain products; having to license the infringed product/technology; and/or incurring monetary damages. The foregoing consequences could have an adverse effect on our sales, profitability, and ability to fully implement our corporate strategy. |
Magna International Inc. 21
| ∎ | Risks of Doing Business in Foreign Markets: Conducting business in markets outside our traditional markets of North America and Europe carries a number of potential risks, including those relating to: political, civil and economic instability and uncertainty; military conflict; corruption risks; high inflation and our ability to recover inflation-related cost increases; trade, customs and tax risks; potential sanctions and export control risk; expropriation risks; currency exchange rates; currency controls; limitations on the repatriation of funds; insufficient infrastructure; competition to attract and retain qualified employees; and other risks associated with conducting business internationally. The likelihood of such occurrences and their potential effect on us vary from country to country and are unpredictable, however, the occurrence of any such risks could have an adverse effect on our operations, profitability, and financial condition. |
| ∎ | Relative Foreign Exchange Rates: Our profitability is affected by movements of our U.S. dollar reporting currency against the Canadian dollar, the euro, the Chinese renminbi, and other currencies in which we generate revenues and incur expenses. Significant long-term fluctuations in relative currency values, in particular a significant change in the relative values of the U.S. dollar, Canadian dollar, euro, or Chinese renminbi, could have an adverse effect on our profitability and financial condition and any sustained change in such relative currency values could adversely impact our competitiveness in certain geographic regions. |
| ∎ | Pension Risks: Some of our current and former employees in Canada, the United States and Germany participate in defined benefit pension plans. Although such plans in North America have been closed to new participants, existing participants in Canada continue to accrue benefits. Our defined benefit pension plans in Germany are not funded and plans in Canada and the United States may not be fully funded. Our pension funding obligations in North America could increase significantly due to a reduction in plan funding status caused by a variety of factors, including: weak performance of capital markets; declining interest rates; failure to achieve sufficient investment returns; investment risks inherent in the investment portfolios of the plans; and other factors. A significant increase in our pension funding obligations could have an adverse effect on our profitability and financial condition. |
| ∎ | Tax Risks: At any given time, we may face tax exposures arising out of changes in tax or transfer pricing laws, adverse court rulings, tax reassessments or otherwise. To the extent we cannot implement measures to offset these exposures, they may have an adverse effect on our profitability. We have incurred losses in some countries which we may not be able to fully or partially offset against income we have earned in those countries. In some cases, we may not be able to utilize these losses at all if we cannot generate profits in those countries and/or if we have ceased conducting business in those countries altogether. Our inability to utilize tax losses could adversely affect our profitability. |
| ∎ | Returns on Capital Investments: In recent years, we have invested significant amounts of money in our business through capital expenditures to support new facilities, expansion of existing facilities, purchases of production equipment and acquisitions. Returns achieved on such investments in the past are not necessarily indicative of the returns we may achieve on future investments and our inability to achieve returns on future investments which equal or exceed returns on past investments could have a material adverse effect on our level of profitability. |
| ∎ | Financial Flexibility: The occurrence of an economic shock not contemplated in our business plan, a rapid deterioration of conditions or a prolonged recession could result in the depletion of our cash resources, which could have a material adverse effect on our operations and financial condition. |
| ∎ | Credit Ratings Changes: There is no assurance that any credit rating currently assigned to us will remain in effect for any period of time or that any rating will not be revised or withdrawn entirely by a rating agency in the future. A downgrade in the credit ratings assigned to us by one or more agencies could increase our cost of borrowing or impact our ability to negotiate loans, which could have an adverse effect on our profitability, financial condition, and the trading price of our Common Shares. |
| ∎ | Stock Price Fluctuation: Trading prices of our Common Shares cannot be predicted and may fluctuate significantly due to a variety of factors, many of which are outside our control. |
| ∎ | Dividends: Our Board of Directors (“Board”) may in certain circumstances determine that it is in the best interests of the company to reduce or suspend our dividend. In such event, the trading price of our Common Shares may be materially affected. |
Legal, Regulatory and Other Risks
| ∎ | Legal and Regulatory Proceedings: From time to time, we may become involved in regulatory proceedings, or become liable for legal, contractual, and other claims by various parties, including customers, suppliers, former employees, class action plaintiffs and others. Depending on the nature or duration of any potential proceedings or claims, we may incur substantial costs and expenses, be required to devote significant management time and resources to the matters and suffer reputational damage as a result of regulatory proceedings. On an ongoing basis, we attempt to assess the likelihood of any adverse judgements or outcomes to these proceedings or claims, although it is difficult to predict final outcomes with any degree of certainty. Except as disclosed in this AIF, and from time to time in our consolidated financial statements and/or our MD&A, we do not believe that any of the proceedings or claims to which we are currently a party will have a material adverse effect on our profitability; however, we cannot provide any assurance to this effect. |
| ∎ | Changes in Laws: A significant change in the current regulatory environment in our principal markets, including changes in tax laws, the imposition of tariffs and trade barriers, stricter regulatory approaches to CO2 emissions, software and data privacy, sourcing of electrical components, and access to rare earth minerals, and other laws which impose additional costs on automotive manufacturers or consumers, could have an adverse effect on our profitability. |
22 Annual Information Form
| ∎ | Environmental Compliance: While we regularly attempt to estimate environmental clean-up liabilities, such an exercise is complex. In addition, environmental laws and regulations are complex, change frequently and have tended to become more stringent and expensive over time. In certain circumstances, we could be named as a Potentially Responsible Party (“PRP”) with respect to a contaminated site. Costs associated with being a PRP could be material depending on site conditions and the number of participating PRPs. As a result, we may incur material costs or liabilities significantly in excess of amounts we have reserved, which could have an adverse effect on our operations, profitability, financial condition, or reputation. |
Magna International Inc. 23
6. Description of the Business
Geographic Markets & Customers
Major Customers
While we supply products and services to a large number of customers worldwide, sales to our six largest customers represented the following proportions of our consolidated sales in 2024 and 2023:
| Magna Sales Ranking |
OEM Ranking(1) |
Customer | Proportion of Magna Sales |
|||||
| 2024 | 2023 | |||||||
| 1 |
5 |
General Motors |
15% | 15% | ||||
| 2 |
7 | Ford |
13% | 12% | ||||
| 3 |
13 |
Mercedes-Benz |
13% | 14% | ||||
| 4 |
12 | BMW |
11% | 12% | ||||
| 5 |
4 | Stellantis |
11% | 12% | ||||
| 6 |
2 | Volkswagen |
11% | 11% | ||||
| Other |
26% | 24% | ||||||
| TOTAL |
100% | 100% | ||||||
Note:
(1) Based on 2024 global light vehicle production.
Customer Management Offices
We have a globally structured sales, engineering and marketing team spread across multiple global locations where our customers maintain engineering, commercial and/or manufacturing facilities. The various internal operating divisions and subsidiaries of the automobile manufacturers normally initiate many of their own purchasing decisions. As a result, an automobile manufacturer may effectively constitute multiple customers.
Purchase Orders
Our sales are generated through customer requests to quote on particular products, as well as the tools and dies required to produce parts. Purchase orders for our products are typically for one or more models, and typically extend over the life of each model, which is generally four to seven years. However, purchase orders issued by our automobile manufacturer customers typically do not require them to purchase any minimum number of our products. Releases under such purchase orders, which authorize us to supply specific quantities of products, are issued for planning, raw material, and production purposes, which is typically over a one to four month period in advance of anticipated delivery dates. The actual number of products that we supply under purchase orders in any given year is dependent upon the number of vehicles produced by the automobile manufacturers of the specific models in which those products are incorporated.
It has been our experience that once we receive purchase orders for products for a particular vehicle model or program, we will usually continue to supply those products until the end of that model or program, although most of our customers’ purchase orders allow them to terminate the purchase order for convenience. In addition, as part of our purchase contracts, we are generally required to supply service parts for up to 15 years after the end of production of any model, provided that we are the contracted supplier at the time production ceases. Automobile manufacturers could cease sourcing their production requirements from us for a number of reasons, including if we refuse to accept demands for price reductions or other concessions and if the vehicle is not meeting their sales targets. Should the latter occur, we are still required to provide service parts for up to 15 years, although we may be able to negotiate that this be supplied as a one-time up front purchase.
Manufacturing, Sustainability & Engineering
Operational Excellence
Magna embodies a mindset of doing things better, faster and more efficiently while maintaining high quality and delivering value to our stakeholders. To measure and enhance performance, we utilize the Magna Factory Concept or “MAFACT” assessment process that focuses on critical elements of operational excellence in accordance with our Operational Principles. This system enables us to track progress, identify opportunities and implement consistent improvements across our operations.
Sustainability
We are committed to being a responsible corporate citizen that conducts business in a manner that balances profits, people and planet. Magna accepts the reality of climate change and the importance of addressing sustainability in our operations. To this end, we are committed to decarbonization of our operations and have committed to near-term (by 2030) and net-zero (by 2050) science-based targets with respect to Scopes 1, 2 and 3 GHG emissions.
24 Annual Information Form
In support of these targets, we have committed to achieving 100% renewable electricity usage by 2025 in our European operations, by 2028 in our Canadian operations, and by 2030 globally. For a full description of our sustainability strategy, initiatives, targets, and achievements to date, see “Appendix 1 – Sustainability Report”.
Factory of the Future (FoF) Initiatives
We continue to look at ways to integrate leading edge manufacturing trends into our operations, including data analytics, as well as artificial intelligence (AI) capabilities designed to, among other things: increase information available to human operators to enhance decision making; automate certain processes to increase efficiency and safety; optimize material and process flows; and perform predictive maintenance on equipment. Specifically, a number of our global facilities have implemented a combination of new technological applications, software, and processes in order to benefit from more efficient and effective factory solutions, which is known as our “Factory of the Future (FoF)” approach. Supporting these initiatives are investments in underlying foundational Industry 4.0 connectivity infrastructure. Magna has made significant progress in establishing common data collection, pipeline, governance structure and analytics building blocks that support efficient adoption of FoF solutions at scale. Through 2024, our Smart Factory Solutions Marketplace enables Divisions globally to identify and plan to implement proven solutions. More than 100 solutions have been implemented, and even more have been identified for future implementation. A few examples of our FoF activities are set out below.
|
Advanced Robots & Digital Twin
∎ Our Corporate R&D team has developed a core Advanced Robotics System for high volume production using state-of-the-art 2D/3D vision systems and advanced robotics trajectory planning with AI supporting simplified, rapid implementation ∎ The system has been launched in more than ten Magna facilities with over 90 systems in high volume production. As part of our planned “scaled implementation” approach, the system continues to scale in other facilities across all Magna Operating Groups for cost optimization ∎ The advanced robotics platform allows continuous upgrades in performance and continues to introduce lower cost hardware enabled by software functionality |
Collaborative and Fenceless Robot System
∎ Our Corporate R&D team is working with several robotics companies, startups, research labs and universities to develop enabling technologies that can be scaled across Magna. Key focus areas include part to part assembly operations not presently possible with robots ∎ Collaborative robots enable automation alongside people, while fenceless enables industrial robots to be slowed/stopped when people approach ∎ Elimination of fencing and guarding of robot cells takes up less floor space and allows freedom of movement and access for human workers ∎ The insight gained from the fenceless robot system is allowing Magna to co-develop, test, and validate the next generation of fenceless robotics for high volume automotive production in a safe, collaborative, and efficient way
|
Predictive Maintenance
∎ Divisions across all our Operating Groups have actively implemented predictive maintenance of injection moulding machines, presses, weld, machining cellas among others. Data from a machine controller, as well as additional sensors, is collected and processed in real time allowing emerging maintenance issues to be pinpointed and addressed before they develop into larger issues ∎ These activities allow for production and efficiency improvements, including reduced equipment downtime, as well as avoidance of unexpected equipment failures ∎ This flexible hardware and software platform works within Magna’s standard I40 infrastructure, enabling rapid scaling and reuse of key building blocks |
||||||
|
Vision Inspection and Augmented Reality
∎ Our Corporate R&D team, working with vendor partners, is implementing multiple use cases of AI-enabled vision systems using low cost cameras to identify defects, track quality and process conditions to allow real-time process monitoring and feedback ∎ Magna works with multiple vendors, but also develops in-house capabilities to support future scaling of use cases and improving technology ∎ In-house capability and standard infrastructure enables rapid scaling and solution development across multiple use cases |
Data Analytics & Digital Infrastructure
∎ Our Corporate IT team, Operating Groups, Divisions, and Corporate R&D teams are implementing standards and data connectivity across the enterprise ∎ Standardized digital infrastructure enables faster, more intelligent analytics solutions, ultimately aiding decision making ∎ Standardized digital infrastructure also enables lower cost, faster implementation of shop floor solutions responsive to Industry 4.0 – which defines the rapid change to technology, industries, and society due to increasing interconnectivity and smart automation
|
Autonomous Mobile Robots
∎ Our New Mobility, R&D and Divisions/Operating Group teams are developing and implementing mobile robots for material handling in multiple Divisions ∎ A combination of in-house and vendor partner hardware and software solutions support planning simulation, route optimization, and robot hardware and software ∎ These solutions enable improved labour efficiency, better utilization of floor and rack space as well as optimization of material inventory and tracking |
Magna International Inc. 25
Facilities
As at December 31, 2024, we had the following manufacturing and PDE&S facilities in each designated geographic region:

Our manufacturing and PDE&S facilities occupied approximately 81.2 million and 4.1 million square feet, respectively. These facilities were broken down between third party leases, and those owned by us as set out below. At this time, the largest percentage of properties leased (by square footage) from any single landlord is approximately 14%.

Our facility leases typically have terms of at least five years with one or more options to renew. Among other terms, our leases typically require us to return the facilities to the condition in which we received them at start of the lease (reasonable wear and tear excepted). From time to time, the cost of doing so may be significant due to such factors as the length of the lease period, the nature of the manufacturing operations, the extent of modifications made to the leased properties over the term of the lease and other factors.
We are also subject to environmental laws and regulations both as tenant and owner of our properties. Our leases with third party landlords generally provide that we must maintain the leased properties in accordance with all applicable laws, including environmental laws. Magna routinely conducts Phase 1 Environmental Assessments, and if necessary Phase 2 Site Investigations, at manufacturing, assembly, and warehousing locations prior to or at the start of occupancy to identify any actual and potential pre-existing environmental concerns at leased or owned sites. Magna is responsible for addressing certain environmental impacts arising at our properties, including exacerbations of existing impacts as defined by lease terms or regulatory requirements. Our leases with third party landlords generally also contain indemnities in favour of the landlord with respect to environmental matters and those indemnities may survive the termination of the leases.
Key Components and Raw Materials
Our key purchased components include: stampings, electronics, semiconductor chips, molded parts, die casting, forging, coverstock, and wire harnesses. Our key purchased raw materials are steel, resin and aluminum. While we endeavour to purchase the majority of these components and raw materials from regional suppliers where we do business, factors such as price, quality, transportation costs, warehousing costs, duties, tariffs, availability of supply, timeliness of delivery, and customer requirements have an impact on the decision to source from certain suppliers.
Magna International Inc. 27
In some cases, we are directed by our OEM customers to source components or commodities from specific suppliers, as is largely the case for leather we purchase for use in automotive seats we produce. We also purchase some key components and raw materials offshore when shortages occur or when we choose to source one supplier for a global program. Prices for our raw materials used in our production of parts, like steel, resin, aluminum, natural gas and electricity continue to be volatile.
Approximately two-thirds of our combined steel and aluminum is acquired through resale programs operated by automobile manufacturers and the balance is generally acquired through annual or six month contracts that fluctuate with market indices. Under customer steel resale programs we are not exposed to steel and aluminum price volatility, thus helping to manage our production costs. Certain of our operations generate steel and aluminum scrap, which we typically sell at prices that fluctuate with published market indices. Most of our resin purchases fluctuate directly with market indices, although we do participate in some customer resale programs on approximately one quarter of our resin purchases. In some cases, our customers direct us to buy certain other raw materials from specified suppliers, at specified prices. Consistent with lean manufacturing principles, we do not typically carry inventories of key raw materials or finished products significantly in excess of those reasonably required to meet production and shipping schedules.
Products & Services
Top Programs
Our top fifteen programs/platforms based on 2024 production and vehicle assembly sales were:
| Customer | Vehicle | Capabilities | ||||||||||||||||||
| Body Exteriors & Structures |
Power & Vision | Seating Systems |
Complete Vehicles |
|||||||||||||||||

|

|

|

|

|

|

|

|
|
||||||||||||
|
General Motors |
Full-Size SUVs & Pick-up Trucks |
∎ | ∎ | ∎ | ∎ | ∎ | ∎ | ∎ | ||||||||||||
|
Mercedes- Benz |
Mercedes-Benz G-Class |
∎ | ∎ | ∎ | ∎ | ∎ | ∎ | ∎ | ∎ | |||||||||||
| Stellantis | Jeep Grand Cherokee | ∎ | ∎ | ∎ | ∎ | ∎ | ∎ | ∎ | ||||||||||||
| Ford | Ford Transit | ∎ | ∎ | ∎ | ∎ | ∎ | ∎ | ∎ | ||||||||||||
| General Motors | GMC Acadia, Buick Enclave, Cadillac XT6, Chevrolet Blazer, Chevrolet Traverse |
∎ | ∎ | ∎ | ∎ | ∎ | ∎ | ∎ | ∎ | |||||||||||
| Ford | Ford F-Series Super Duty | ∎ | ∎ | ∎ | ∎ | ∎ | ∎ | |||||||||||||
| BMW | BMW X1 | ∎ | ∎ | ∎ | ∎ | ∎ | ∎ | ∎ | ||||||||||||
| BMW | BMW X5 | ∎ | ∎ | ∎ | ∎ | ∎ | ∎ | ∎ | ∎ | |||||||||||
|
Mercedes- Benz |
Mercedes-Benz GLE/GLE Coupe, Mercedes-Benz GLS |
∎ | ∎ | ∎ | ∎ | ∎ | ∎ | ∎ | ||||||||||||
| Ford |
Ford Escape, Ford Kuga, Lincoln Corsair |
∎ | ∎ | ∎ | ∎ | ∎ | ∎ | ∎ | ||||||||||||
| Stellantis | Chrysler Minivans | ∎ | ∎ | ∎ | ∎ | ∎ | ∎ | |||||||||||||
| Stellantis | RAM Pick-up Trucks | ∎ | ∎ | ∎ | ∎ | ∎ | ∎ | ∎ | ∎ | |||||||||||
| BMW | BMW X3 | ∎ | ∎ | ∎ | ∎ | ∎ | ∎ | |||||||||||||
| Ford | Ford Expedition, Lincoln Navigator | ∎ | ∎ | ∎ | ∎ | ∎ | ∎ | |||||||||||||
| Jaguar | I-Pace | ∎ | ∎ | |||||||||||||||||
Note: Capabilities represented may not be on each vehicle or each trim level of each vehicle. Additionally, our capabilities in each product area range from components to full systems, only some of which may be represented on any particular program. Our Roof Systems capabilities are not present on the programs/platforms listed.
Product Portfolio
We continue to evolve our product portfolio consistent with the strategy described under Section 4 “Our Business & Strategy – Corporate Strategy” in this AIF. The development of innovative technologies and solutions which are responsive to the global megatrends defining the “Car of the Future” requires research and development (“R&D”) spending, as well as capital investments and the acquisition of engineering talent with the necessary software and other expertise.
28 Annual Information Form
We believe that in typical years, the relatively stable profitability and cash generation from our “traditional” businesses provide us with the ability to fund the R&D and capital investment required to realize opportunities related to product areas such as electrification, ADAS and others aligned with the Car of the Future.
Some of our recent innovations can be found in “Section 7 – Innovation and Research & Development – Innovations and Innovation Awards”.
Product Segments
A description of our product and service capabilities, processes, top customers, and key competitors by reporting segment follow. Manufacturing facility and PDE&S Centres counts below include joint venture facilities.
Body Exteriors & Structures
Our Body Exteriors & Structures segment includes our body and chassis systems, and exterior systems operations.
| 155* Manufacturing Facilities |
22* PDE&S Centres |
20 Countries |
64,050 Employees |
$17.0B 2024 Sales |
||||
| * | Figure includes certain manufacturing facilities and PDE&S centres shared with other reporting segments. |
Top Segment Programs
| Customer |
Vehicle | |
| 1. General Motors |
Full-Size SUVs & Pick-up Trucks | |
| 2. Ford |
Ford F-Series Super Duty | |
| 3. Mercedes-Benz |
Mercedes-Benz GLE/GLE Coupe, GLS | |
| 4. Stellantis |
Jeep Grand Cherokee | |
| 5. Ford |
Ford Bronco Sport | |
Segment Trends and Strategic Focus
Within our Body Exteriors & Structures segment, we aim to support our customers’ efforts to deliver vehicles which consume less fuel and produce lower CO2 emissions, particularly through reduced vehicle weight, aerodynamic enhancements, and use of multi-materials. We currently offer our customers a broad range of lightweight product solutions, such as thermoplastic liftgates, as well as reduced-weight products formed through advanced manufacturing processes, such as hot stamping, high-pressure aluminum casting and multi-material joinery.
Magna International Inc. 29
Product Capabilities
Body and Chassis
| Products
∎ body systems ∎ chassis systems ∎ battery enclosures ∎ engineering and testing |
Key Processes
Forming technologies: ∎ hydroforming ∎ cold stamping, including high-strength steel & aluminum ∎ hot stamping ∎ roll forming ∎ high pressure aluminum casting ∎ advanced welding & joining ∎ sealing and adhesive bonding ∎ stretch bending of aluminum extrusions
Finishing technologies: ∎ e-coating ∎ high temperature wax coating ∎ heat treatment ∎ machining ∎ powder coating ∎ conversion coating for aluminum castings |
Top Customers
∎ BMW ∎ Ford ∎ General Motors ∎ Mercedes-Benz ∎ Stellantis ∎ Volkswagen |
Key Competitors
∎ Benteler International AG ∎ Flex-N-Gate Corporation ∎ F-Tech Inc. ∎ Georg Fischer Ltd. ∎ Gestamp Automoción S.L. ∎ Martinrea International Inc. ∎ Metalsa, S.A. de C.V. ∎ Minth Group Ltd. ∎ Nemak, S.A.B. de C.V. ∎ Autokiniton US Holdings, Inc. |
30 Annual Information Form
Exteriors
| Products
∎ fascia ∎ exterior trim ∎ front end modules ∎ body panels & liftgates ∎ engineered glass ∎ step assists ∎ sealing ∎ integrated systems |
Key Processes
Molding technologies:
∎ LARGE TONNAGE MOLDING ● Up to 4,000-ton capability ● Structural & insert molding ● Robotic sequencing ● Flaming
∎ COMPRESSION MOLDING ● 1,500 to 2,500 ton compression capability ● Thermoplastic, thermoset, carbon fiber & glass-reinforced materials
∎ SPECIALTY MOLDING ● MulitShot ● Overmolding ● Insert Molding ● EPDM Molding ● PUR
Painting ∎ 1K & 2K solvent or water technology ∎ High & low bake capability ∎ Electrostatic rotary bell application
Assembly, Joining, & Sequencing processes: ∎ Just-in-time assembly & sequencing ∎ Flexible assembly line implementation ∎ Joining technologies ● Resistive implant welding & bonding ● Ultrasonic & vibration welding ● Laser cutting & welding
∎ Co-extruded Moldings ● Co-extruded PVC, TPO, PP, TPV and EPDM ● Dual extrusion ● Combined processes: Co-extrusion and extrusion with injection molding
∎ Glass Encapsulation ● Molding with Glass Encapsulation PVC, TPV/TPE/TPS ● IMM 600 ton 1,500-ton ● Plastic and metal hardware bonding
∎ Complimentary Metal Forming ● Stamping – up to 800T Progressive and Mechanical Transfer ● Roll forming – including in line welding ● Welding – Robotic MIG, Spot, and Projection |
Top Customers
∎ BMW ∎ Ford ∎ General Motors ∎ Nissan ∎ Stellantis ∎ Volkswagen |
Key Competitors
∎ ABC Group ∎ Flex-N-Gate Corporation ∎ Plastic Omnium S.A. ∎ Röchling Group ∎ Samvardhana Motherson Peguform ∎ SRG Global Inc. |
Magna International Inc. 31
Power & Vision
Our Power and Vision segment comprises our global powertrain systems, electronics systems, and mechatronics, mirrors & lighting, and roof systems operations.
| 109* Manufacturing Facilities |
62* PDE&S Centres |
25 Countries |
57,650 Employees |
$15.4B 2024 Sales |
||||
| * | Figure includes certain manufacturing facilities and PDE&S centres shared with other reporting segments. |
Top Segment Programs
| Customer |
Vehicle | |
| 1. General Motors |
Full-Size SUVs & Pick-up Trucks | |
| 2. BMW |
BMW X1 | |
| 3. Chery |
Chery Tiggo 8 Series | |
| 4. Chery |
Jetour Traveller | |
| 5. Stellantis |
RAM Pick-up Trucks | |
Segment Trends and Strategic Focus
In our Power and Vision segment, we seek to realize opportunities presented by trends toward electrification, advanced driver assistance systems and autonomous driving. We believe that our powertrain business is well-positioned to benefit from the shift toward electrification by leveraging the investments we have made in high-voltage technologies, including highly integrated primary and secondary electric drive systems, as well as individual components such as electric traction motors and inverters through our joint venture with LG Electronics Inc. While investing in electrified technologies we continue to optimize operations in our market-leading traditional products such as 4WD/AWD systems and transmissions. Our Vision Systems business is currently a leading supplier of camera-based driver assistance systems, and we continue to invest in advanced driver assistance technologies to expand the assisted driving systems expertise we can offer customers. We continue to leverage our expertise in supplying and integrating the sensor suite to create seamless functionality of features, software, and middleware. Vehicle connectivity is also a crucial aspect of our business, and we develop advanced systems that enable seamless communication between vehicles, infrastructure, and other devices. These investments include both in-house research and development, as well as venture capital investments in and strategic relationships with mobility and technology companies.
32 Annual Information Form
Product Capabilities
Powertrain
| Products
∎ high-voltage electric drive systems and components (eMotors*; inverters, onboard chargers*, gearboxes, e-clutches and mechatronic modules for hybrid and BEVs)
∎ transmission systems (dedicated hybrid drives, dual clutch/hybrid dual clutch and manual transmissions) ∎ driveline systems (AWD/4WD products, including transfer cases and rear drive modules) ∎ metal-forming products (transmission, ICE, and driveline components)
* Through our joint venture with LG Electronics Inc. |
Key Processes
∎ powertrain systems assembly and final testing ∎ flow-forming, ∎ stamping and spinning ∎ grob, roller & cam die spline forming ∎ precision heavy stamping ∎ profilator processing ∎ in-die fine cutting ∎ soft and hard processing of gears and shafts ∎ CNC machining & broaching ∎ rotary swaging ∎ heat treating ∎ welding, including laser, electron beam (EB), capacitor discharge (CD), inertia, resistance & metal inert gas (MIG)/tungsten inert gas (TIG) ∎ assembly & final test of eMotors*, inverters, and on-board chargers*
* Through our joint venture with LG Electronics Inc. |
Top Customers
∎ BMW ∎ Chery ∎ Ford ∎ General Motors ∎ Mercedes-Benz ∎ Nissan ∎ Renault ∎ Renault-Nissan-Mitsubishi ∎ Stellantis ∎ Volkswagen |
Key Competitors
∎ Aisin Group ∎ Blue Nexus ∎ BorgWarner Inc. ∎ Dana Inc. ∎ EnPower Electronics ∎ GKN plc ∎ JATCO Ltd. ∎ Linamar Corporation ∎ Nidec Corporation ∎ Robert Bosch GmbH ∎ Schaeffler AG ∎ Valeo S.A. ∎ ZF Group |
Magna International Inc. 33
Electronics
| Products
∎ far camera modules (mono and stereo cameras) ∎ remote camera heads ∎ interior sensing cameras ∎ radars ∎ thermal sensing ∎ domain controllers |
Key Processes
∎ printed circuit board assembly ∎ high volume flash programming ∎ automated image & machine vision camera assembly capability ∎ in-circuit and functional testing ∎ complete ADAS engineering services; systems, electrical design, software design, cybersecurity, functional safety, mechanical design and validation |
Top Customers
∎ General Motors ∎ Mercedes-Benz ∎ Stellantis ∎ Subaru ∎ Volkswagen ∎ Volvo ∎ BMW |
Key Competitors
∎ Aptiv PLC ∎ Continental AG ∎ Denso Corporation ∎ Forvia Group ∎ Robert Bosch GmbH ∎ Valeo S.A. ∎ ZF Group |
Mirrors
| Products
∎ interior mirrors ∎ exterior mirrors ∎ camera monitoring systems ∎ driver/occupant monitoring systems ∎ smart actuators |
Key Processes
∎ electronics integration ∎ injection molding ∎ painting ∎ manual and automated assembly |
Top Customers
∎ BMW ∎ Ford ∎ General Motors ∎ Mercedes-Benz ∎ Stellantis ∎ Volkswagen |
Key Competitors
∎ Ficosa International S.A. ∎ Gentex Corporation ∎ SMR Automotive |
Lighting
| Products
∎ forward lighting ∎ rear lighting ∎ lit grilles/panels/displays |
Key Processes
∎ electronics integration ∎ injection molding ∎ hardcoating/anti-fog treatment ∎ metallizing ∎ manual and automated assembly |
Top Customers
∎ General Motors ∎ Stellantis ∎ Volkswagen ∎ Geely |
Key Competitors
∎ Changzhou Xingyu Automotive Lighting System Co, Ltd. ∎ Hella KGaA Hueck & Co. (now part of Forvia Group) ∎ Koito Manufacturing Co. ∎ Marelli Automotive Lighting ∎ Valeo S.A. |
Mechatronics
| Products
∎ latching systems ∎ door modules ∎ charge port doors ∎ power systems ∎ hinges ∎ door handles |
Key Processes
∎ electronics integration ∎ light stamping ∎ injection molding ∎ manual and automated assembly |
Top Customers
∎ BMW ∎ Ford ∎ General Motors ∎ Renault-Nissan-Mitsubishi ∎ Stellantis |
Key Competitors
∎ ADAC Automotive ∎ Aisin Corporation ∎ Brose Fahrzeugteile GmbH & Co. KG ∎ Inteva Products, LLC ∎ Kiekert AG |
Roof Systems
| Products
∎ modular roofs ∎ hard tops and soft tops ∎ textile folding roofs |
Key Processes
∎ “cut and sew” of complete fabric covers ∎ backlight gluing ∎ manual and automated complete retractable roof assembly |
Top Customers
∎ BMW ∎ Mercedes-Benz ∎ Renault-Nissan-Mitsubishi ∎ Stellantis ∎ Toyota |
Key Competitors
∎ Valmet Automotive Inc. ∎ Webasto Group |
34 Annual Information Form
Seating Systems
Our Seating Systems segment comprises our global seating systems operations.
| 69* Manufacturing Facilities |
9* PDE&S Centres |
16 Countries |
33,550 Employees |
$5.8B 2024 Sales |
||||
| * | Figure includes certain manufacturing facilities and PDE&S centres shared with other reporting segments. |
Top Segment Programs
| Customer |
Vehicle | |
| 1. Stellantis |
Jeep Grand Cherokee | |
| 2. Ford |
Ford Escape | |
| 3. BMW |
BMW X5 | |
| 4. Stellantis |
Chrysler Minivans | |
| 5. Ford |
Ford Transit | |
Segment Trends and Strategic Focus
Our Seating Systems group continues to retain and win new business due to our expertise in seat complete integration based on disciplined design standards and delivering innovative seating solutions. Capitalizing on our Seating Systems group strength in seat mechanisms and vertical integration, we are developing and supplying reconfigurable seating solutions that enable consumers to use their vehicle cabin more efficiently. With an enhanced focus on sustainability, we are growing a strong portfolio of disruptive seating solutions, using the circular economy as our framework.
Product Capabilities
Seating Systems
| Products
∎ complete seating systems ∎ seat structures, mechanism & hardware solutions ∎ foam & trim products, including sustainable seating solutions |
Key Processes
∎ traditional “cut and sew” technology ∎ manual and automated assembly |
Top Customers
∎ BMW ∎ Chang’an ∎ BYD ∎ Ford ∎ Geely ∎ General Motors ∎ Stellantis ∎ Volkswagen |
Key Competitors
∎ Adient plc ∎ Forvia Group ∎ Lear Corporation |
Magna International Inc. 35
Complete Vehicles
Our Complete Vehicles segment comprises our global complete vehicle engineering and manufacturing operations.
| 11* Manufacturing Facilities |
28* PDE&S Centres |
10 Countries |
12,425 Employees |
$5.2B 2024 Sales |
||||
| * | Figure includes certain manufacturing facilities and PDE&S centres shared with other reporting segments. |
Segment Programs
| Customer |
Vehicle | |
| 1. Mercedes-Benz |
Mercedes-Benz G-Class | |
| 2. Tata Motors |
Jaguar I-Pace | |
| 3. BMW |
BMW Z4 Coupe | |
| 4. Tata Motors |
Jaguar E-Pace | |
| 5. Toyota |
Toyota Supra | |
Segment Trends and Strategic Focus
Our Complete Vehicles business continues to provide OEM-level expertise to traditional customers seeking a trusted vehicle complete vehicle outsource partner, as well as new market entrants seeking expertise for their traditional, electrified, autonomous and/or new mobility / MaaS concepts. Traditional OEMs currently represent the substantial majority of our Complete Vehicles group business customers. However, engineering sales with non-traditional customers, including Asian OEMs and new OEM entrants, continue to grow. MaaS providers represent an important source of new opportunities since they typically do not have the vehicle development, engineering, integration, and assembly capabilities of traditional OEMs and thus require outsource partners to commercialize their concepts. In this segment, we also focus on leveraging our expertise in alternative energy storage and propulsion systems by further strengthening and capitalizing on our know-how in different propulsion systems. In addition, we continue to focus on integration and testing of autonomous driving systems, and we support our customers with one of the most versatile test environments for highly automated vehicles.
Product Capabilities
Vehicle Engineering & Manufacturing
| Products
∎ complete vehicle manufacturing ∎ engineering services |
Key Processes
∎ body-in-white ∎ paint ∎ assembly |
Top Customers
∎ Mercedes-Benz ∎ BMW ∎ Tata Motors |
Key Competitors
Traditional and New OEMs
Contract Manufacturers ∎ NEVS AB ∎ Valmet Automotive ∎ VDL Nedcar B.V.
Engineering Services ∎ Bertrandt Group ∎ EDAG Engineering GmbH ∎ IAV GmbH |
Tooling & Engineering
As part of our production programs, we design, engineer and manufacture tooling for our own use, as well as for sale to our customers. Tooling used in our production programs is often purchased by us from third parties and sold to our customers on a pass-through basis. In addition, we manufacture tooling for our customers on a standalone basis, which is tooling sold separately and not part of a production arrangement. We also provide engineering services independent of our production programs, as well as for programs for which we have production sales.
Acquisitions and Divestitures
For further details of our acquisitions and divestitures in the last three fiscal years, refer to “Schedule B – Acquisitions and Divestitures”.
36 Annual Information Form
7. Innovation and Research & Development
Focus on Innovation and Technology
We have historically emphasized technology development and product and process innovation as a key element of our corporate strategy. See “Section 4 – Our Business & Strategy – Our Corporate Strategy” for further details. We continue to invest significant resources to develop and commercialize innovative technologies, which will provide additional value to our customers. In addition, we aim to advance our sustainability goals through innovations in electrification, AI, driver assistance, lightweighting, adjacent mobility markets such as micromobility, materials, fuel efficiency, and energy efficiency for both end-use products and our manufacturing processes.
We expect that our involvement with automobile manufacturers and new mobility partners in the development of innovative product and process technologies will increase as such manufacturers and partners further involve suppliers like us in the overall vehicle concept, development, and manufacturing process.
Our Research and Development Process
Our R&D activities take place at our Division/Operating Group level and at the corporate level. Our Divisional/Operating Groups work with our customers to identify product and technology gaps. Magna’s Corporate R&D team, under the global direction of our Senior Vice President, Corporate R&D, analyzes the key megatrends that are expected to drive future mobility and automotive development. As part of these efforts, our Corporate R&D team engages with the advanced engineering and product development teams of our current and potential OEM customers to understand their product strategies and better align our own product strategy and technology development with customer needs.
All of our R&D projects follow an Innovation Development Process (IDP) – a multi-stage process aimed at turning ideas into innovations that can ultimately be commercialized and scaled. The initial phase of the process is designed to foster the generation of ideas and includes, among other things: identification of key customer (internal or external) needs; identification of potential technologies and industrial or academic partners; understanding of and analysis of societal, digital, demographic, regulatory, industry and other trends which may create demand for and thus drive development of new automotive and mobility technologies; review of academic research; collecting and screening ideas submitted through innovation programs; review of emerging technologies in non-automotive industries; and automotive customer input.
Concepts that progress past this initial stage are further evaluated, including with respect to: fit with our strategy regarding electrification, autonomy, new mobility, vehicle connectivity and advanced manufacturing; commercialization potential; and risks and challenges to further development. Selected innovations then progress through subsequent stages towards product or process realization, validation and eventually, product launch.
Our R&D initiatives are supported by and involve close collaboration with our Corporate R&D group. Our Division/Operating Group R&D teams work together with our Corporate R&D group on technology development, and where necessary specific working groups are established to discuss and develop technological solutions.
As a result of our innovation activities, we have developed a number of product, process and materials innovations, some of which are described in this Section 7 under “Innovations and Innovation Awards”.
As a key part of our own innovation efforts and to gain further access to innovative thinking outside of our company, we partner with start-ups and early stage companies, inventors, entrepreneurs, universities, technical institutions, and the venture capital community to help bring innovative ideas to market. We also look for the best ideas from other industries and apply them to mobility – a process we call “auto-qualifying”. As part of our continuing efforts to develop innovative solutions to the technology challenges of new mobility and the automotive industry, in the last year we have considered thousands of potential innovations, which has led to several active projects. Such projects include: novel sensor and software technologies supporting ADAS features; efficiency and performance technologies related to electric drives and power electronics; Artificial Intelligence solutions enabling Generative Engineering tools, advanced human-like robotics, inspection systems, Digital Twin/simulation and data analytics technologies supporting our strategic focus on operational excellence.
As an example of our collaborative process in action, Magna partnered with General Motors and Wipro to develop SDVerse, a groundbreaking B2B marketplace for automotive software. SDVerse revolutionizes the software sourcing and procurement process by connecting buyers and sellers through a transparent digital platform. This industry-first initiative aims to enable participants to reduce costs, streamline operations, and accelerate the development of software-defined vehicles (SDVs). By leveraging SDVerse, Magna fosters a more interconnected ecosystem, encouraging collaboration and co-creation among OEMs, suppliers, and software developers. This platform not only expands access to new innovations but also improves efficiency and enhances customer vehicle quality through competition. Another example of our collaborative product innovation process in action – in 2024 we accelerated R&D collaboration with vendors and academia to develop human-like robotics capabilities. Starting with the University of Toronto, but also including research agreements with multiple universities such as MIT, Arizona, Michigan, Waterloo and others, Magna is working to test and develop emerging robotics capability. Improvements in robotics hardware, but more importantly the rapid development of AI based solutions is creating opportunity for robots to be far more capable. Leveraging AI in vision systems, task and path planning and control systems may greatly increase the robotics applications in manufacturing, supporting our overall Factory of the Future Operational Excellence.
Magna International Inc. 37
Intellectual Property
We own and use numerous patents, trademarks, and other intellectual property in connection with our operations. In addition, certain of our Operating Groups license their technology to third parties on a limited basis. We also license and use patents owned by others. From time to time, claims of intellectual property infringement are made by us or against us. At present, we believe that the outcome of any pending claim, whether positive or negative, will not have a material adverse effect upon us. While in the aggregate our intellectual property and licenses are considered important in the operation of our business, we do not consider them of such importance that the expiry of any one patent or license would materially affect our business. See “Section 5 – Risk Factors – “Intellectual Property” in this AIF for a discussion of risks related to our intellectual property.
Innovations & Innovation Awards
We believe that innovation has been the foundation of Magna’s success and an important factor in our competitiveness, a key operational priority, and a critical element of our corporate strategy. Our current strategic focus is aimed at responding to key industry trends, as discussed in “Section 4 – Our Business & Strategy – Our Corporate Strategy”. Some examples of recent innovations are as follows:
Innovations
|
|
NEXT GENERATION 800V EDRIVE
|
|
| Magna’s next generation 800v eDrive solution is a drop-in solution that incorporates several advanced technologies, resulting in significant reductions in weight and size, enhanced performance, extended driving range and greater sustainability. The innovation offers enhanced flexibility due to its lightweight (75 kg) design and 20% reduction in height from Magna’s prior generation eDrive. A key technology and a supplier industry-first advancement is the ability to rotate the eDrive 90 degrees around the drive axis, which allows improved system integration in the front and rear vehicle space. Delivering peak power of 250 kW and a peak axle torque of 5,000 Nm, the system also achieves up to 93% efficiency in real-world driving (including Worldwide harmonized Light vehicles Test Cycles (WLTC) and highway driving), which significantly improves efficiency across a wide range of vehicle speeds. The eDrive system requires less aluminum and heavy rare earth materials, resulting in a significant reduction of CO2 emissions during production by approximately 20% compared to previous generation eDrives. | ||
|
|
SPECIALIZED EDRIVE SYSTEM
|
|
| Magna has secured a specialized eDrive system business award with a North American-based OEM, showcasing its ability to deliver tailored solutions for diverse market needs. This system is engineered to enhance performance and efficiency in EVs, featuring state-of-the-art motor technology and integrated software controls. The specialized eDrive system is compact, lightweight, and scalable, enabling automakers to optimize vehicle dynamics and energy efficiency. This innovation underscores Magna’s commitment to advancing electrification and enhancing the performance of next-generation EVs. | ||
|
|
DEDICATED HYBRID DRIVE SYSTEM
|
|
| Magna continues to accelerate hybrid innovation with its first dedicated hybrid drive system award, designed to meet the evolving needs of global automakers. This innovative system combines electric motor technology with internal combustion engine efficiency, delivering a seamless transition between electric and hybrid modes The system, which includes Magna’s DHD Duo System (a longitudinal front drive solution featuring an advanced dual e-motor and multi-speed design), offers enhanced performance, improved fuel efficiency, and reduced emissions, making it an adaptable solution for multiple vehicle platforms without the need for structural modifications. By leveraging advanced engineering and design, the dedicated drive system underscores Magna’s commitment to providing scalable, flexible powertrain solutions for the hybrid market. | ||
|
|
RECONFIGURABLE SEATING SYSTEM
|
|
| Magna has been awarded a significant business contract with a Chinese OEM to supply reconfigurable seating systems that redefine interior vehicle flexibility. These seating systems incorporate advanced mechanisms allowing for multiple seating arrangements, optimized for both comfort and space utilization. The integration of power swivel seats with nearly two meters of power long rails, shared by front and rear rows and the center console, creates a 270-degree rotation of both the driver and front passenger seats. This configuration increases the seat track articulation distance of both the front and rear seats. By blending cutting-edge materials and intuitive designs, the reconfigurable seating systems cater to growing consumer demand for personalized and versatile vehicle interiors and highlighting Magna’s expertise in enhancing in-cabin experience offerings for global automakers. | ||
38 Annual Information Form

|
IMPAIRED DRIVING DETECTION TECHNOLOGY
Magna has demonstrated a breath and camera-based pre-development technology designed to combat impaired driving. Our new impaired driving detection technology determines if drivers are “fit to drive” in a fast, reliable and affordable way. The integrated solution combines key elements of the interior sensing system, which utilizes camera technology to detect driver distraction, drowsiness and intoxication through pupillary signals, with infrared sensor technology developed by Senseair, a leader in air and gas sensing. Cockpit embedded sensors, place in proximity to the driver, measure and quantify the alcohol and carbon dioxide levels in diluted exhalations from the driver to passively detect elevated blood alcohol concentration ad or above legal limits. |
|

|
eDS DUO BRINGS ELECTRIC POWER TO MERCEDES-BENZ
Magna’s long-standing partnership with Mercedes-Benz reaches a new milestone with the eDS Duo electric drive system, now powering the first all-electric model of the iconic off-roader. This 2-speed, dual e-motor system delivers exceptional traction, enabling advanced features like the “G-Turn.” With silicon carbide and decoupling technology, it maximizes efficiency and performance. Having supplied three generations of transfer cases for this legendary vehicle, Magna now drives its electrified future. This innovation underscores Magna’s ability to evolve with the industry, reinforcing its role as a trusted partner in advancing cutting-edge mobility solutions. |
|
Innovation Awards
A number of our product and process innovations have received accolades and awards in recent years. Recently, Magna was:
|
|
∎ A 2024 Automotive News PACE Award winner for our Integrated Driver & Occupant Monitoring System, an industry-first solution that reduces packaging complexities by fully integrating Magna’s high-resolution camera, infrared emitters, and electronic control unit into the vehicle’s interior mirror. The system actively monitors driver head, eye, and body movement and sends customizable audible or visual alerts if signs of distracted behavior, drowsiness, or fatigue are detected. |
|
|
|
∎ Recognized with two 2024 Automotive News PACEpilot Innovation to Watch awards for post-pilot, pre-commercial innovations, including:
|
|
|
∎ EcoSphere TM 100% Melt-Recyclable Foam and Trim, a simple, smart, and sustainable seating solution that eliminates the disposal of seating foam pads and trim covers in landfills by utilizing polyester-based mono-materials with Magna’s innovative 100% Melt Recyclable Foam and Trim system. EcoSphere will be production-ready in 2025 to boost sustainability by reducing the number of seats that end up in landfills.
|
||
|
∎ Modular & Scalable Active Grille Shutter Assembly, an innovative and cost-effective solution that can be easily adapted to many vehicles using only about seven common parts to create up to 90 grille shutter variations. Magna produces nearly 3 million Active Grille Shutters annually, and the aero product suite has already contributed to a significant CO2 reduction since 2015.
|
||
|
|
∎ A recipient of five 2023 General Motors Supplier of the Year Awards, recognizing Magna’s excellence in quality, innovation, and performance across multiple product lines. |
|
Magna International Inc. 39
8. Capital Structure, Financings & Credit Ratings
Capital Structure Approach
We aim to maintain the company’s financial flexibility in order to remain in a position to pursue opportunities and withstand an industry downturn, including by:
| ∎ | maintaining sufficient liquidity, including committed lines of credit, to run our operations and continue investing in our business through organic growth, innovation spending, and acquisitions that fit our product strategy; |
| ∎ | preserving a strong investment grade credit rating of BBB+ or better, and an Adjusted Debt to Adjusted EBITDA ratio that meets or exceeds the Moody’s Investors Service criteria for a strong investment grade credit rating; |
| ∎ | growing dividends over time as earnings grow; and |
| ∎ | repurchasing shares with excess liquidity. |
Other core elements of our approach to capital structure and strategy include:
| ∎ | lowering our capital spending as a percentage of sales, thereby increasing free cash flow generation; |
| ∎ | utilizing share repurchases to deploy excess cash not needed for organic growth and acquisitions; and |
| ∎ | delivering strong Return on Invested Capital. |
In light of the above strategy, we have made significant levels of investment in our business in recent years and have also returned significant amounts of capital to our shareholders in the form of dividends and share repurchases. We had an Adjusted Debt(1) ratio of 1.75 times Adjusted EBITDA(1) at the end of 2024 and our capital structure strategy remains with a long-term target range of 1.0 – 1.5 times Adjusted EBITDA. Our Adjusted Debt ratio currently exceeds our target range as a result of our Notes issuances to fund the acquisition of the Veoneer Active Safety business in 2023 and investments to support new business awards. However, we are committed to getting into our target range.
Authorized Share Capital
Our authorized share capital consists of an unlimited number of Common Shares and 99,760,000 Preference Shares, issuable in series, all with no par value. As of March 19, 2025, the Record Date for our Meeting, a total of 281,735,503 Common Shares were issued and outstanding. No Preference Shares have been issued or are outstanding.
The following is a brief description of the significant attributes of our authorized share capital and is qualified in its entirety by reference to the detailed provisions in our charter documents, that set out the attributes of our Common Shares and our Preference Shares.
Common Shares
The holders of our Common Shares are entitled to:
| ∎ | one vote for each Common Share held at all meetings of our shareholders, other than meetings of the holders of another class or series of shares; |
| ∎ | receive any dividends that may be declared by our Board, subject to the preferential rights attaching to any shares ranking in priority to our Common Shares; and |
| ∎ | receive, after the payment of our liabilities and subject to the rights of the holders of any shares ranking in priority to our Common Shares, all our property and assets available for distribution in the event of our liquidation, dissolution or winding-up, whether voluntary or involuntary, or any other distribution of assets among our shareholders for the purpose of winding-up our affairs. |
For further details of the market for our securities, refer to “Schedule C – Market for Securities”.
Preference Shares
Our Board may, without the approval of any of our shareholders, fix the number of shares in, and determine the attributes of, an individual series of Preference Shares and issue shares of such series from time to time. The shares of each such series will be entitled to a preference over our Common Shares, but will rank equally with the Preference Shares of every other series with respect to the payment of dividends and in the distribution of all our property and assets available for distribution in the event of our liquidation, dissolution or winding-up, whether voluntary or involuntary, or any other distribution of assets among our shareholders for the purpose of winding-up our affairs. No Preference Shares have been issued or are outstanding and we do not currently anticipate issuing any such shares. In the event we do issue Preference Shares in the future, we would expect to issue them solely for legitimate financing purposes and not to block a change of control transaction.
| (1) | Adjusted Debt is calculated by taking our long- and short-term debt and operating lease liabilities and adding pension obligations and certain other Moody’s adjustments. Adjusted EBITDA is calculated by taking our Adjusted Earnings before Interest and Taxes and adding back Depreciation, operating lease expense, and interest income, and adding adjustments relating to the cash portion of Other Expense, net and pension obligation expenses. In each case, such adjustments reflect a methodology for calculating such ratios used by Moody’s. |
40 Annual Information Form
Amendments to Share Provisions and Other Matters
The provisions attaching to our Preference Shares, to a series of our Preference Shares and to our Common Shares may not be deleted or varied without the approval of the holders of the class or series concerned. In addition, no shares of a class ranking prior to or on a parity with our Preference Shares, or our Common Shares, may be created without the approval of the holders of the class or each series of the class concerned. Any approval required to be given must be given by two-thirds of the votes cast by those present or voting at a meeting of the holders of the class or series concerned duly called for that purpose in addition to any other consent or approval required by law.
Dividends
The following table sets forth the cash dividends paid and payable on our Common Shares in respect of each quarter for the last three years.

We intend to continue paying a quarterly dividend from our cash flow from operations, with the aim of regularly increasing the dividend consistent with our practice since 2010. Magna’s quarterly dividend has increased for fifteen consecutive years. The declaration and payment of dividends, including the dividend rate, is reviewed quarterly by our Board and is subject to the Board’s discretion taking into account our cash flow, capital requirements, our financial condition, and other factors they consider relevant. See “Section 5 – Risk Factors”.
Dividend Reinvestment Plan (DRIP)
Since 1994, we have maintained a dividend reinvestment plan in which registered shareholders have the option to purchase additional Common Shares by investing the cash dividends paid on their shares.
Financings and Securities/Corporate Transactions
Senior Unsecured Notes
We currently have the following senior unsecured notes outstanding:
| Issuance Date | Amount Issued | Interest Rate | Maturity Date | |||
| September 23, 2015 |
$650,000,000 | 4.150% | October 1, 2025 | |||
| September 25, 2017 |
€600,000,000 | 1.500% | September 25, 2027 | |||
| June 15, 2020 |
$750,000,000 | 2.450% | June 15, 2030 | |||
| March 10, 2023 |
C$350,000,000 | 4.95% | January 31, 2031 | |||
| March 17, 2023 |
€550,000,000 | 4.375% | March 17, 2032 | |||
| March 21, 2023 |
$300,000,000 | 5.980% | March 21, 2026 | |||
| March 21, 2023 |
$500,000,000 | 5.500% | March 21, 2033 | |||
| March 14, 2024 |
$400,000,000 | 5.050% | March 14, 2029 | |||
| May 30, 2024 |
C$450,000,000 | 4.800% | May 30, 2029 | |||
The prospectus supplements (or in the case of the 4.95% and 4.80% Canadian dollar-denominated notes, the offering memorandums) which describe each of the notes above have been filed and are available on SEDAR+ (www.sedarplus.ca).
On June 17, 2024, we repaid at maturity our U.S. dollar-denominated 3.625% senior unsecured notes originally issued in June 2014.
Credit Facilities
We maintain a $2.7 billion syndicated revolving credit facility (the “Global Credit Facility”), which we amended in March 2024 to extend the maturity date from June 24, 2028, to June 25, 2029. The facility includes a $150 million Mexican tranche and a tranche for Canada, U.S.,
Magna International Inc. 41
and Europe, which is fully transferable between jurisdictions and can be drawn in U.S. dollars, Canadian dollars, or euros. As at December 31, 2024, no amounts were outstanding under this facility.
We also maintain an $800 million, 364-day syndicated revolving credit facility that expires on June 24, 2025, and can be drawn in U.S. dollars or Canadian dollars. As at December 31, 2024, no amounts were outstanding under the 364-day facility.
On March 6, 2023, we entered into a syndicated credit agreement with several financial institutions providing for an unsecured term loan (the “Term Loan”) with a 3-year tranche of US$800 million and 5-year tranche of US$600 million. During 2023, the Company drew $100 million from the 3-year tranche and $300 million from the 5-year tranche of the Term Loan. The remaining loan commitment amounts under Term Loan were subsequently cancelled. We continue to maintain the $400 million term loan in 2024. As at December 31, 2024, $400 million in aggregate was outstanding under the Term Loan.
Commercial Paper Programs
We maintain a euro-commercial paper program (the “ECP Program”) and a U.S. commercial paper program (the “USCP Program”), each backstopped by our Global Credit Facility. Under the ECP Program, one of our indirect wholly owned subsidiaries may, from time to time, issue euro-commercial paper notes, subject to an aggregate maximum of €1 billion or its equivalent in alternative currencies (increased from €500 million in September 2024). Under the USCP Program, we may, from time to time, issue commercial paper notes, subject to an aggregate maximum of $2 billion or its equivalent in alternative currencies (increased from $1 billion in March 2023). As at December 31, 2024, we had $0 outstanding issues under the ECP Program and $271 million under the USCP Program.
Normal Course Issuer Bid
On February 13, 2024, the TSX accepted our Notice of Intention to Make a Normal Course Issuer Bid relating to the purchase of up to 300,000 Magna Common Shares (the “Prior NCIB”), representing approximately 0.1% of our “public float” of Common Shares. On November 5, 2024, the TSX accepted our Notice of Intention to terminate the Prior NCIB and establish a new Normal Course Issuer Bid relating to the purchase of up to 28,500,000 Magna Common Shares (the “New NCIB”), representing approximately 10% of our “public float” of Common Shares. The primary purposes of the Prior NCIB and New NCIB were and are purchases for cancellation, as well as purchases to fund our stock-based compensation awards or programs and/or our obligations to our deferred profit-sharing plans. The Prior NCIB commenced on February 15, 2024 and was terminated on November 6, 2024. The New NCIB commenced on November 7, 2024 and will terminate no later than November 6, 2025.
Purchases of Common Shares under the Prior NCIB and the New NCIB as of the date of this AIF have been made on the TSX or the NYSE at the prevailing market price at the time of purchase and in accordance with the rules and policies of the TSX or in compliance with Rule 10b-18 under the U.S. Securities Exchange Act of 1934, respectively, or through other published markets, or by such other means permitted by the TSX.
We have purchased the following Common Shares pursuant to the New NCIB as at March 19, 2025, and under our Prior NCIB which commenced on February 15, 2024 and terminated on November 6, 2024 for the purposes described below:
| New NCIB | Prior NCIB | |||||||
| Shares purchased and cancelled |
5,699,444 | 0 | ||||||
| Shares purchased and retained for stock-based compensation awards or programs and/or deferred profit sharing plans |
135,270 | 98,636 | ||||||
| Total |
5,834,714 | 98,636 | ||||||
Ratings
As of the date of this AIF, we have been assigned the ratings in the table below:
| Credit Rating Agency |
Issuer Rating |
Senior Debt Rating |
Short-Term Debt Rating |
Outlook/ Trend |
||||
| Dominion Bond Rating Service (DBRS)(1) |
A (low) | A (low) | R-1 (low) | Stable | ||||
| Moody’s Investor Services (Moody’s)(2) |
A3 | A3 | P-2 | Stable | ||||
| Standard & Poor’s (S&P)(3) |
A- | A- | A-2 | Negative | ||||
Notes:
| (1) | DBRS’s issuer and senior debt ratings are based on its long-term rating scale that ranges from “AAA” to “D” which represents the range from an issuer with the highest credit quality to one that has filed under bankruptcy, insolvency or winding up legislation or failed to satisfy an obligation after exhausting grace periods. A rating in the “A” rating category is in the third highest category of the relevant scale of eight major categories and is considered by DBRS to be of good credit quality, with substantial capacity for payment of financial obligations. “High” and “low” grades are used to indicate the relative standing of credit within a particular rating category. The absence of one of these designations indicates a rating which is in the middle of the category, excluding the AAA and D categories for which the “high”, “middle” or “low” designations are not used. The DBRS rating trends provide guidance in respect of DBRS’ opinion regarding the outlook for the rating in question, with rating trends falling into one of three categories – “Positive”, “Stable” or “Negative”. The rating trend indicates the direction in which DBRS considers the rating is headed should present tendencies continue, or in some cases, unless challenges are addressed. A “Positive” or “Negative” does not necessarily indicate a rating change is imminent, but rather the trend represents an indication that there is a greater likelihood that the rating could change in the future versus if a “Stable” trend was assigned. |
42 Annual Information Form
| DBRS’s short-term debt rating is based on its commercial paper and short-term debt rating scale that ranges from “R-1 (high)” to “D” which represents the range from an issuer with the highest credit quality to one that has filed under bankruptcy, insolvency or winding up legislation or failed to satisfy an obligation after exhausting grace periods. A rating in the “R-1 (low)” category represents the third highest category of the relevant scale of ten major categories and is considered by DBRS to be of good credit quality, with substantial capacity for payment of financial obligations. |
| (2) | Moody’s senior unsecured issuer rating is an opinion as to our future relative creditworthiness. The credit rating is based on a rating scale that, for global automotive suppliers, ranges from “Aaa” to “C”, which represents the range from those obligations with minimal credit risk to those obligations that are in default with little prospect of recovery. Issuers in the “A” rating category are in the third highest category of the relevant scale of nine major categories and are considered by Moody’s to be subject to low credit risk. The determination of the overall rating assigned to a global automotive supplier is based on an assessment of an issuer’s performance in five broad weighted categories, some of which are further broken down into a number of weighted sub-factors each of which maps to a specific letter rating in the range above. The indicated rating category for each sub-factor (i.e., Aaa, Aa, etc.) is then converted into a numeric value, which is then multiplied by the weight for that sub-factor with the results then totaled to produce a composite weighted-factor score, that is itself then mapped back to an alphanumeric rating based on the ratings range from Aaa to C. Moody’s appends the numerical modifiers 1, 2, or 3 to each generic rating classification from Aa through Caa. The modifiers 1, 2 and 3 indicate that the obligation ranks in the higher end, mid-range, or lower end of its generic rating category, respectively. The Moody’s rating outlook is an opinion regarding the likely direction of an issuer’s rating over the medium term, and fall into one of four categories: Positive, Negative, Stable or Developing. |
| (3) | S&P’s issuer credit rating is a current opinion of our overall financial capacity (i.e. credit worthiness) to pay our financial obligations in full and on time. This credit rating is based on a rating scale that ranges from “AAA” to “D”, which represents the range from extremely strong capacity to meet financial obligations to a failure to pay one or more financial obligations when it came due. An issuer with a long-term issuer rating in the “A” rating category is in the third highest category of the relevant scale of ten major categories and is considered by S&P to have a strong capacity to meet its financial commitments but is somewhat more susceptible to the adverse effects of changes in circumstances and economic conditions than issuers in higher-rated categories. The ratings from “AA” to “CCC” may be modified by the addition of a plus (+) or minus (-) sign to show relative standing within the major rating categories. The lack of one of these designations indicates a rating that is in the middle of the category. The S&P rating outlook assesses the potential direction of a credit rating over the intermediate term (typically six months to two years) but is not necessarily a precursor to a rating change. |
Credit ratings are intended to provide investors with an independent measure of the credit quality of debt and securities. The credit ratings assigned to us or our senior debt by the rating agencies are not recommendations to purchase, hold or sell our debt or securities, since such ratings do not address market price or suitability for a particular investor. There is no assurance that any rating will remain in effect for any given period of time or that any rating will not be revised or withdrawn entirely by a rating agency in the future, if in its judgement, circumstances warrant. See “Section 5 – Risk Factors – “Credit Ratings Changes” in this AIF. We have made payments in the ordinary course to the rating agencies listed above in connection with the assignment of ratings on our securities. In addition, we made payments to Moody’s and S&P in connection with the confirmation of our ratings in respect of the issuance of our Senior Notes and continued issuances under our ECP Program and USCP Program.
Magna International Inc. 43
9. Directors & Executive Officers
Directors
Our Board currently consists of the following members:
| Name & Municipality of Residence | Director Since | Principal Occupation | ||
| Mary S. Chan(1) Arizona, U.S.A. |
August 10, 2017 | Chief Operating Officer, Nikola Corporation and Corporate Director |
||
| Hon. V. Peter Harder Ontario, Canada |
January 10, 2020 | Senator and Corporate Director | ||
| Jan R. Hauser(2) Massachusetts, U.S.A. |
August 1, 2022 | Corporate Director | ||
| Seetarama (Swamy) Kotagiri Michigan, U.S.A. |
January 1, 2021 | President & Chief Executive Officer of Magna | ||
| Jay K. Kunkel Tokyo, Japan |
May 11, 2023 | Corporate Director | ||
| Robert F. MacLellan(3) Ontario, Canada |
May 10, 2018 | Chairman, Northleaf Capital Partners, and Corporate Director | ||
| Mary Lou Maher Ontario, Canada |
May 6, 2021 | Corporate Director | ||
| William A. Ruh Montana, U.S.A. |
May 11, 2017 | Chief Executive Officer, Lifestyle Solutions Real Estate and Corporate Director |
||
| Dr. Indira V. Samarasekera British Columbia, Canada |
May 8, 2014 | Corporate Director | ||
| Peter Sklar Ontario, Canada |
February 14, 2025 | Corporate Director | ||
| Matthew Tsien Washington, U.S.A. |
May 11, 2023 | Corporate Director | ||
| Dr. Thomas Weber Baden-Württemberg, Germany |
January 1, 2022 | Corporate Director | ||
| Lisa S. Westlake Florida, U.S.A. |
May 9, 2019 | Corporate Director | ||
Notes:
| (1) | Ms. Chan was Chief Operating Officer of Nikola Corporation (“Nikola”) when it filed a voluntary petition for bankruptcy protection under Chapter 11 of the U.S. Bankruptcy Code on February 19, 2025. Ms. Chan will retain her position as Chief Operating Officer until Nikola emerges from bankruptcy protection. |
| (2) | Ms. Hauser was a director of Proterra Inc. (“Proterra”) when it filed a voluntary petition for bankruptcy protection under Chapter 11 of the U.S. Bankruptcy Code on August 7, 2023. Proterra’s shares were suspended from trading on August 17, 2023. Ms. Hauser’s term as a director of Proterra ended effective March 13, 2024, when it emerged from bankruptcy. |
| (3) | Chairman of the Board. |
All of our directors, except Peter Sklar (who was appointed to our Board on February 14, 2025), were elected to their present terms of office by our shareholders at our Annual Meeting of Shareholders held on May 9, 2024. The term of office for each director expires at the conclusion of the next annual meeting of our shareholders. Each of our current directors is being nominated for election at the Meeting.
All of the directors have held the principal occupations identified above (or another position with the same employer) for not less than five years, except as follows:
| ∎ | Ms. Chan was Managing Partner of VectoIQ LLP from January 2016 to October 2023; |
| ∎ | Mr. Harder served as the Representative of the Government of Canada in the Senate from March 2016 to January 2020; |
| ∎ | Mr. Kunkel was Executive Vice President for Tenneco Federal Mogul Corporation and President of Tenneco’s Asia operations from November 2018 to September 2020; |
| ∎ | Ms. Maher was concurrently the Canadian Managing Partner, Quality and Risk, KPMG Canada and Global Head of Inclusion and Diversity, KPMG International from October 2017 to February 2021; |
| ∎ | Mr. Ruh was Chief Executive Officer, Digital of Lendlease Group from January 2019 to December 2023; |
| ∎ | Mr. Sklar was an Equity Research Analyst for BMO Capital Markets from January 1993 to May 2023; and |
| ∎ | Mr. Tsien held various roles with General Motors and its group of companies, including Executive Vice President, Chief Technology Officer, and President, General Motors Ventures from June 2020 to October 2021, as well as Executive Vice President and President, GM China from January 2014 to June 2020. |
With the exception of Mr. Kotagiri, our CEO, all other directors have been determined by our Board to be “independent directors” within the meaning of such term under applicable law.
44 Annual Information Form
Board Committees
Our Board has four standing committees: Audit Committee; Governance, Nominating and Sustainability Committee (“GNSC”); Talent Oversight and Compensation Committee (“TOCC”); and Technology Committee.
A copy of our Board Charter, Audit Committee Charter, as well as the charters of our other Board Committees are available on our website (www.magna.com), have been filed on SEDAR+ (www.sedarplus.ca) and EDGAR (www.sec.gov/edgar) and are incorporated by reference into this AIF. Additional information about our Audit Committee is contained under “Corporate Governance – Report of the Audit Committee” in our Circular for our Meeting, which is incorporated by reference into this AIF.
Membership of these Committees as of the date of this AIF are as follows:
| Name | Audit Committee |
Governance, Nominating & Sustainability Committee |
Talent Oversight & Compensation Committee |
Technology Committee |
||||
| Mary S. Chan |
∎ | ∎ | ||||||
| Hon. V. Peter Harder |

|
∎ | ||||||
| Jan R. Hauser |
∎ | ∎ | ||||||
| Jay K. Kunkel |
∎ | ∎ | ||||||
| Robert F. MacLellan(1) |
∎ | |||||||
| Mary Lou Maher |
|
∎ | ||||||
| William A. Ruh |
∎ |

|
||||||
| Dr. Indira V. Samarasekera |
|
∎ | ||||||
| Peter Sklar |
∎ | ∎ | ||||||
| Matthew Tsien |
∎ | ∎ | ||||||
| Dr. Thomas Weber |
∎ | ∎ | ||||||
| Lisa S. Westlake |
∎ | ∎ | ||||||
∎ Committee
Member
Committee Chair
Notes:
| (1) | Chairman of the Board |
Additional details regarding our Committee structure can be found in the “Corporate Governance” section of our Circular.
Magna International Inc. 45
Executive Officers
Our executive officers currently consist of the following persons:
| Name & Municipality of Residence | Principal Occupation | |
| Seetarama (Swamy) Kotagiri Michigan, U.S.A. |
President and Chief Executive Officer (since January 2021) |
|
| Patrick W.D. McCann Ontario, Canada |
Executive Vice-President and Chief Financial Officer (since January 2022) |
|
| John H. Farrell Ontario, Canada |
Executive Vice-President and Chief Operating Officer (since December 2024) |
|
| Tom J. Rucker Birmingham, Michigan |
Executive Vice-President and Chief People and Business Transformation Officer (since December 2024) |
|
| Bruce R. Cluney Ontario, Canada |
Executive Vice-President and Chief Legal Officer (since July 2020) |
|
| Matteo Del Sorbo Ontario, Canada |
Executive Vice-President, Magna New Mobility (since January 2022) |
|
| Uwe Geissinger Hesse, Germany |
Executive Vice-President (since February 2021) and President of Magna Europe (since May 2023) |
|
| Boris Shulkin Michigan, U.S.A. |
Executive Vice-President (since February 2021) and Chief Digital & Information Officer (since April 2022) |
|
| Eric J. Wilds Michigan, U.S.A. |
Executive Vice-President and Chief Strategy & Commercial Officer (since November 2024) |
|
To the extent that our executive officers have not held the offices identified above for the last five years, they have held the following offices or positions with us and/or have had the following principal occupations during the last five years:
| ∎ | Prior to becoming our CEO, Mr. Kotagiri was President, Magna International from January 2020 to December 2020 and Executive Vice-President and Chief Technology Officer from January 2014 to January 2020. He also served as President, Power and Vision from May 2018 to December 2020; |
| ∎ | Mr. McCann was Senior Vice-President, Finance from May 2019 to December 2021, and Vice-President, Cosma Group from January 2016 to April 2019; |
| ∎ | Mr. Farrell was President of Cosma International from January 2013 to December 2022, and President (Cosma, Exteriors and Seating) from January 2023 to November 2024; |
| ∎ | Mr. Rucker was President of Magna Powertrain from October 2019 to December 2022, President (MPT, MML, Electronics and Complete Vehicles) from January 2023 to November 2024; |
| ∎ | Mr. Cluney was Executive Vice-President and General Counsel, Power and Vision from July 2018 to July 2020; |
| ∎ | Mr. Del Sorbo was Vice-President, Business Development from January 2020 to January 2022 and Vice-President, Business Development – Exteriors, Seating, Mirrors, Closures and Cosma Groups from January 2017 to January 2020; |
| ∎ | Mr. Geissinger was Executive Vice President, Operational Efficiency from February 2021 to May 2023, President, Magna Electronics and Senior Vice-President Operations, Power & Vision Group from April 2019 to February 2021, and Senior Vice-President, Fluid Pressure & Controls Group from January 2017 to March 2019; |
| ∎ | Mr. Shulkin was Executive Vice President, Technology & Investments from February 2021 to March 2022, Senior Vice-President, Technology and Development from July 2020 to February 2021, and Vice-President, Research and Development from May 2011 to July 2020; and |
| ∎ | Mr. Wilds was Executive Vice President, Business Development & Strategy, Magna Power and Vision from January 2018 to January 2020, and Chief Sales & Marketing Officer from January 2020 to October 2024. |
46 Annual Information Form
Beneficial Ownership of Securities
As at March 19, 2025, we had 281,735,503 Common Shares issued and outstanding. All our directors and executive officers (as a group 21 persons) owned beneficially or exercised control or direction over 442,794 Common Shares representing approximately 0.2% of the class, as at March 19, 2025. Our issued and outstanding Common Shares are held as follows:

10. Legal Proceedings
Regulatory Proceedings
From time to time, the Company may become involved in regulatory proceedings. Magna’s policy is to comply with all applicable laws, including antitrust and competition laws. Based on a previously completed global review of legacy antitrust risks which led to a September 2020 settlement with the European Commission and a June 2022 settlement with Brazil’s federal competition authority involving in both cases the supply of closure systems, Magna does not currently anticipate any material liabilities. However, we could be subject to restitution settlements, civil proceedings, reputational damage, and other consequences, including as a result of the matters specifically referred to above.
Other
In the ordinary course of business activities, we may become contingently liable for litigation and claims with customers, suppliers, former employees, and other parties. In addition, we may be, or could become, liable to incur environmental remediation costs to bring environmental contamination levels back within acceptable legal limits. On an ongoing basis, we assess the potential of any adverse judgments or outcomes to these matters, as well as any associated probable costs and losses.
A determination of the provision required, if any, for these contingencies is made after analysis of each individual issue. The required provision may change in the future due to new developments in each matter or changes in approach, such as a change in settlement strategy in dealing with these matters.
Warranty, Product Liability and Recall Costs
In certain circumstances, we are at risk for warranty, product liability and recall costs, and are currently experiencing increased customer pressure to assume greater warranty responsibility. Certain customers seek to impose, partial responsibility for the warranty costs where the underlying root cause of product or system failure cannot be determined. Due to the nature of the costs, we make our best estimate of the expected future costs, however, the ultimate amount of such costs could be materially different. For most types of products, we only account for existing or probable claims on product defect issues when amounts related to such issues are probable and reasonably estimable. However, for certain complete vehicle assembly, powertrain systems, and electronics contracts, we record an estimate of future warranty-related costs based on the terms of the specific customer agreements and/or our warranty experience.
Product liability and recall provisions are established based on our best estimate of the amounts necessary to settle existing claims, which typically take into account: the number of units that may be returned; the cost of the product being replaced; labour to remove and replace the defective part; and the customer’s administrative costs relating to the recall. In making this estimate, judgement is also required as to the ultimate negotiated sharing of the cost between us, the customer and, in some cases a supplier. Where applicable, insurance recoveries related to such provisions are also recorded.
In December 2023, we received a notification (the “Notification Letter”) from a customer informing us as to the customer’s initial determination that one of Magna’s Operating Groups bears responsibility for costs totaling $352 million related to two product recalls. The Notification Letter has triggered a 90-day negotiation period regarding financial allocation of the total costs for the two recalls. In the event such negotiations are not concluded successfully during this period, the customer has discretion under its Terms and Conditions to debit Magna up to 50% of the parts and labour costs actually incurred related to the recalls. We believe that the product in question met the customer’s specifications, and accordingly, we are vigorously contesting the customer’s determination. Magna does not currently anticipate any material liabilities.
Magna International Inc. 47
11. Other Information
Additional Information
Our Circular contains the following additional information:
| ∎ | our directors’ and named executive officers’ remuneration and indebtedness; |
| ∎ | our voting securities and their principal holders; and |
| ∎ | securities authorized for issuance under our equity-based compensation plans. |
Additional financial information about us is provided in our consolidated financial statement as at and for the year ended December 31, 2024, and in our MD&A. These documents and additional information about us may be found on SEDAR+, at www.sedarplus.ca, on EDGAR at www.sec.gov/edgar and on our website, at www.magna.com.
Interests of Management & Others in Material Transactions
Reference is made to “Interests of Management and Other Insiders in Certain Transactions” in our Circular for our Meeting, which is incorporated by reference into this AIF.
Transfer Agent & Registrar
The transfer agent and registrar for our Common Shares is TSX Trust Company, at its principal offices in Toronto, Ontario set out below. The co-transfer agent and co-registrar for our Common Shares in the United States is Continental Stock Transfer & Trust Co., at its offices in New York, NY set out below.
| TSX Trust Company | Continental Stock Transfer & Trust Co. | |||
| 301 – 100 Adelaide St. West | 1 State Street, 30th Floor | |||
| Toronto, ON M5H 4H1 | New York, NY 10004 | |||
| Telephone: 1-800-387-0825 or 416-682-3860 | ||||
| Fax: 1-888-249-6189 or 1-514-985-8843 | ||||
| Email: shareholderinquiries@tmx.com | ||||
Interests of Experts
Our independent auditor for the 2024 fiscal year is Deloitte LLP. Deloitte LLP is independent within the meaning of the Rules of Professional Conduct of the Chartered Professional Accountants of Ontario, and the applicable rules and regulations adopted by the Securities and Exchange Commission (SEC) and the Public Company Accounting Oversight Board (United States) (PCAOB). Additional information regarding the fees paid to our independent auditors is contained under “Business of the Meeting – Reappointment of Deloitte LLP as Magna’s Independent Auditors” in our Circular, which is incorporated by reference into this AIF.
48 Annual Information Form
Schedules
Schedule A
Principal Subsidiaries and Investments
Subsidiaries
A list of our principal subsidiaries and each of their jurisdictions of incorporation as of December 31, 2024, is set out below. Our legal structure (including that of our subsidiaries) is not necessarily indicative of our operational structure.
|
Subsidiary(1)(2) |
Voting Securities |
Jurisdiction of Incorporation |
||
| 1305290 Ontario Inc. |
100% | Ontario | ||
| Magna International Investments S.A. |
100% | Luxembourg | ||
| Magna International Europe GmbH |
100% | Austria | ||
| Magna Automotive Europe GmbH |
100% | Austria | ||
| Magna Automotive Holding GmbH |
100% | Austria | ||
| Magna Metalforming GmbH |
100% | Austria | ||
| Magna Steyr GmbH & Co. KG |
100% | Austria | ||
| Magna Steyr Fahrzeugtechnik GmbH & Co. KG |
100% | Austria | ||
| Engineering Center Steyr GmbH |
100% | Austria | ||
| Magna Powertrain GmbH |
100% | Austria | ||
| Magna PT Beteilgungs GmbH |
100% | Austria | ||
| Magna Electronics Foreign HoldCo AB |
100% | Sweden | ||
| Magna Electronics AB |
100% | Sweden | ||
| Magna Automotive Holding (Germany) GmbH |
100% | Germany | ||
| Magna PT Holding GmbH |
100% | Germany | ||
| Magna PT B.V. & Co. KG |
100% | Germany | ||
| Magna Financing Luxembourg Canada ULC |
100% | Alberta | ||
| Magna US Holding, Inc. |
100% | Delaware | ||
| Cosma International of America, Inc. |
100% | Michigan | ||
| Intier Automotive of America, Inc. |
100% | Delaware | ||
| Intier Automotive of America Holdings, Inc. |
100% | Delaware | ||
| Magna Seating of America, Inc. |
100% | Delaware | ||
| Magna Exteriors Holdings, Inc. |
100% | Delaware | ||
| Magna Exteriors of America, Inc. |
100% | Delaware | ||
| Magna Mirrors of America, Inc. |
100% | Michigan | ||
| Magna International (Hong Kong) Limited |
100% | Hong Kong | ||
| Magna Exteriors Inc. |
100% | Ontario | ||
| Magna Powertrain de Mexico, S.A. de C.V. |
100% | Mexico | ||
| Magna Seating Inc. |
100% | Ontario | ||
| Magna Internacional de Mexico, S.A. de C.V. |
100% | Mexico | ||
| Magna Powertrain Inc. |
100% | Ontario | ||
| Formex Mexico S.A. de C.V. |
100% | Mexico | ||
Notes:
| (1) | The table shows the percentages of the votes attached to all voting securities and of each class of non-voting securities, owned by us or over which control or direction is exercised by us. Parent/subsidiary relationships are identified by indentations. Percentages represent the total equity interest in a subsidiary, which is not necessarily indicative of percentage voting control. |
| (2) | Subsidiaries not shown each represent less than 10% of our total consolidated revenues and total consolidated assets (although not all subsidiaries shown necessarily each represent more than 10% of our total consolidated assets and total consolidated sales) and, if considered in aggregate as a single subsidiary, represent less than 20% of our total consolidated revenues and total consolidated assets. |
Magna International Inc. 49
Investments
Our principal equity method investments are the following:
| Joint Venture | Magna Equity Ownership % |
Partner(s) | Reporting Segment | |||
| Litens Automotive Partnership |
76.7% (non-controlling 50% voting interest) |
Current and retired members of senior Litens management | Power & Vision | |||
| Hubei HAPM MAGNA Seating Systems Co., Ltd. |
49.9% | Hubei Aviation Precision Machinery Co., Ltd. | Seating Systems | |||
| LG Magna e-Powertrain Co., Ltd. |
49.0% | LG Electronics Inc. | Power & Vision | |||
| BAIC Bluepark Magna Automobile Co., Ltd. |
49.0% | Blue Sky New Energy Industry Investment Co., Ltd. | Complete Vehicles | |||
50 Annual Information Form
Schedule B
Acquisitions and Divestitures
We have completed a number of acquisitions, divestitures, financings, and securities/corporate transactions in the last three fiscal years, including those listed below. None of these acquisitions constitutes a “significant acquisition” within the meaning of such term in National Instrument 51-102 – Continuous Disclosure Obligations of the Canadian Securities Administrators. Additional information about the acquisitions and/or divestitures listed below can be found in Note 7 of our consolidated financial statement as at and for the year ended December 31, 2024, Note 7 of our consolidated financial statement as at and for the year ended December 31, 2023, and Note 21 of our consolidated financial statement as at and for the year ended December 31, 2022.
Acquisitions
| Year | Acquisition | |
| 2024 | 100% of the common shares and voting interests of HE System Electronic. HES develops and produces micro-electronic assemblies and electronic systems. |
|
| 2023 | 100% of the common shares and voting interests of the entities holding the Veoneer Active Safety Business. Veoneer AS supplies active safety products globally including active safety integration systems, radar, camera systems, internal cabin sensing, thermal sensing, and light detection. |
|
| 2022 | Investment in Yulu Mobility, an electrified mobility provider in India and together with Yulu Mobility, establishment of 51% controlling interest in a new battery swapping entity (“Magna Yuma”) to support electrification of mobility and required infrastructure. |
|
Divestitures
| Year | Divestiture | |
| 2024 | Divestiture of the Company’s Body Exteriors & Structures operations in India(1) |
|
| 2023 | Sale of the Company’s divisions in Russia |
|
| 2022 | None |
|
| Note: |
| 1. Additional information can be found in Note 4 of our unaudited financial statements for the three months ended September 30, 2024. |
Magna International Inc. 51
Schedule C
Market for Securities
Our Common Shares are listed and posted for trading on the TSX under the trading symbol “MG”, and on the NYSE under the trading symbol “MGA”.
The high and low sale prices and volume of shares traded for our Common Shares, as reported by the TSX and NYSE, respectively, for the months during the year ended December 31, 2024 were as follows:
| Month | TSX High (C$) |
TSX Low (C$) |
TSX Volume |
NYSE High ($) |
NYSE Low ($) |
NYSE Volume |
||||||
| January |
79.2 | 71.61 | 12,771,258 | 59.53 | 52.91 | 21,141,308 | ||||||
| February |
79.98 | 71.67 | 38,598,456 | 59.37 | 53.01 | 33,664,348 | ||||||
| March |
75.93 | 70.27 | 18,381,333 | 56.12 | 51.90 | 23,808,672 | ||||||
| April |
73.48 | 65.31 | 16,343,776 | 54.36 | 47.42 | 35,035,752 | ||||||
| May |
66.66 | 60.27 | 42,140,511 | 48.64 | 43.96 | 60,905,162 | ||||||
| June |
62.1 | 55.93 | 23,399,898 | 45.52 | 40.83 | 24,916,419 | ||||||
| July |
63.6 | 56.93 | 24,100,485 | 46.44 | 41.43 | 30,267,038 | ||||||
| August |
61.27 | 52.25 | 38,706,765 | 44.39 | 38.01 | 44,182,723 | ||||||
| September |
58.73 | 51.79 | 22,725,760 | 43.54 | 38.05 | 30,485,796 | ||||||
| October |
61.06 | 53.95 | 21,000,462 | 44.30 | 39.40 | 29,435,968 | ||||||
| November |
65.78 | 57.47 | 34,309,226 | 47.00 | 41.31 | 37,251,091 | ||||||
| December |
66.42 | 59.00 | 23,128,432 | 47.22 | 41.00 | 29,281,312 | ||||||
52 Annual Information Form
Appendix 1
Sustainability
Report
FY 2024

A-1 Annual Information Form
Contents
|
Sustainability Report |
| A-5 | Our Commitment to a Sustainable Future | |
| A-6 | Summary Sustainability Metrics | |
| A-8 | Introduction | |
| A-11 | Sustainability Governance | |
| A-19 | Climate-Related Opportunities | |
| A-24 | Climate-Related Risks and Risk Mitigation | |
| A-32 | Non-Climate Elements of Sustainability | |
| A-52 | Sustainability Metrics | |
Magna International Inc. A-2

Integrating Sustainability and Operational Excellence
Sustainability and operational excellence are intertwined at Magna, driving efficiency, innovation and long-term profitability.
Our sustainability initiatives continue to create competitive advantage by optimizing resources, streamlining processes and advancing innovation. We foster a culture of creativity and accountability that fuels environmental stewardship and superior performance across the organization.
Embedding sustainability into our daily operations and strategy reduces our environmental impact while enhancing business performance. This integration allows us to minimize waste and make more informed decisions, while staying ahead of industry trends.
Ultimately, we are positioned for lasting success while delivering value to our stakeholders and society.

A-3 Annual Information Form

Building a Firm Foundation
In the past year, I’ve had the privilege of visiting many of Magna’s manufacturing regions. The common thread everywhere is a commitment to efficiency, sustainability, and doing what’s best for the community.
In 2024, we set ambitious goals to reduce our environmental impact, enhance responsible sourcing and strengthen our social commitments. We made strides in increasing supply chain transparency, launching innovative pilot programs, and refining our approach to energy efficiency. We continue to build a firm foundation to hit our 2025 100% renewable electricity goal in our European operations and our 2030 science-based targets.
Some of our targets proved more challenging than anticipated, but have provided us with critical insights we are sharing with our partners and supply chain to fine-tune our approach.
We remain committed to operational excellence and embedding sustainability deeper into our business, innovating with purpose, and partnering with stakeholders to accelerate our progress.

Magna International Inc. A-4
Our Commitment to a Sustainable Future
Magna’s decarbonization targets are built on principles of operational excellence and innovation. As a global leader in the automotive industry, Magna has set ambitious net-zero targets. Magna has approved near-and long-term science-based emission reduction targets with the Science Based Targets Initiative (SBTi), and the SBTi has verified Magna’s net-zero science-based target by 2050.
Magna’s Decarbonization and Energy Targets
| Target |
Target Year | Status | ||
| 1-year
5% energy savings in implemented energy projects |
2023 | Achieved | ||
| 1-year 5% energy intensity reduction (Compared to 2022)
|
2023 | Exceeded | ||
| 1-Year 10% energy intensity reduction (Stretch goal) (Compared to 2022)
|
2023 | Exceeded | ||
| 1-year
5% energy savings in implemented energy projects |
2024 | Achieved | ||
| 2-Year 10% energy intensity reduction (Compared to 2022)
|
2024 | Achieved | ||
| Environmental, Social and Governance (ESG) scoring for 90% of supplier spend
|
2025 | On Track | ||
| 100% renewable electricity in European operations
|
2025 | On Track | ||
| 5-year 20% energy intensity reduction (Compared to 2022)
|
2027 | On Track | ||
| 100% renewable electricity in Canadian operations
|
2028 | On Track | ||
| 100% renewable electricity in global operations
|
2030 | On Track | ||
| 25% reduction in value chain (Scope 3)
emissions from 2021 baseline |
2030 | On Track | ||
| 42% reduction in global operational (Scope 1
& 2) emissions from 2021 baseline |
2030 | On Track | ||
|
Net-zero emissions reduction (90% absolute reduction in Scopes 1, 2 &
3) |
2050 | On Track | ||
Our Renewable Electricity Progress
| Where We Are |
Year Over Year Progress |
Where We Are Going |
||||
| % of global electricity used that is renewable electricity |
23% | +100bps | ~37% Expected by end of 2025 |
|||
| Divisions using renewable electricity |
140 (~41%) |
+37 | >200 (~59%) Expected by end of 2025 |
|||
| Divisions with 100% renewable electricity |
90 (~26%) |
+15 | >165 (~48%) Expected by end of 2025 |
|||
| Divisions with on-site solar generation |
36 (~11%) |
+18 | ~20 In progress or currently investigating |
|||
A-5 Annual Information Form
Summary Sustainability Metrics
Magna GHG Emissions (Scopes 1,2 & 3)
| Topic |
ISSB Code | Metric (Metric Tons (t) CO2e) |
2024 | 2023 | 2022 | 2021 Baseline |
CHANGE FROM 2021 BASELINE(3) |
|||||||
| Emissions |
ISSB S2, 29(a)(i)(1) | Scope 1 Emissions | 418,963 | 424,561 | 433,636 | 436,267 | i 4.0% | |||||||
| ISSB S2, 29(a)(i)(2) | Scope 2 (Market-Based) Emissions | 1,158,866 | 1,150,656 | 1,168,803 | 1,089,730 | h 6.3% | ||||||||
| ISSB S2, 29(a)(i)(3) | Scope 3 Emissions | Not available(1) | 57,842,606(2) | 56,561,629 | 58,655,441 | i 1.4%(4) | ||||||||
Magna GHG Emissions (Scope 3, by Category)
| Topic |
Category | 2023 | 2022 | 2021 Baseline |
||||
|
Scope 3 Emissions by Category (Metric Tons (t) CO2e)(5) |
Category 1 Purchased Goods & Services
|
30,165,695 |
25,281,422 |
22,762,020 |
||||
|
Category 2 Capital Goods
|
533,363 |
374,450 |
372,331 |
|||||
|
Category 3 Fuel- and Energy-Related Activities
|
319.890 |
321,287 |
318,366 |
|||||
|
Category 4 Upstream Transportation & Distribution
|
959,848 |
839,782 |
791,049 |
|||||
|
Category 5 Waste Generated in Operations
|
318,272 |
371,767 |
306,063 |
|||||
|
Category 6 Business Travel
|
43,955 |
36,055 |
26,924 |
|||||
|
Category 7 Employee Commuting
|
136,815 |
132,106 |
132,015 |
|||||
|
Category 8 Upstream Leased Assets
|
Not relevant to Magna |
|||||||
|
Category 9 Downstream Transportation & Distribution
|
771,287 |
685,877 |
910,907 |
|||||
|
Category 10 Processing of Sold Products
|
759,782 |
879,317 |
1,047,424 |
|||||
|
Category 11 Use of Sold Products
|
23,160,992 |
26,973,570 |
31,362,035 |
|||||
|
Category 12 End-of-Life Treatment of Sold Products
|
585,007 |
591,251 |
529,872 |
|||||
|
Category 13 Downstream Leased Assets
|
Not relevant to Magna |
|||||||
|
Category 14 Franchises
|
Not relevant to Magna |
|||||||
|
Category 15 Investments
|
87,700 |
74,745 |
96,435 |
|||||
| Total | 57,842,606 | 56,561,629 | 58,655,441 | |||||
Notes:
| (1) | 2024 Scope 3 emissions inventory not available at time of preparation of this Sustainability Report. These emissions will be reported in our annual CDP submission. |
| (2) | Our Scope 3 data is based on completed inventories for the applicable year. Our Scope 3 emissions data includes eleven relevant categories. Scope 3 categories 8, 13 and 15 are not relevant to Magna. |
| (3) | We have used a 2021 baseline for our emissions reporting in the tables above, in line with our science-based near-term and net-zero targets. |
| (4) | 2023 Scope 3 emissions compared to 2021 baseline. |
| (5) | Improvements in data collection or changes in methodology used to calculate Scope 3 emissions (e.g., availability of primary data to replace secondary data such as industry averages) can result in fluctuations in Scope 3 inventory. |
Magna International Inc. A-6
Non-Climate Metrics
| TOPIC |
SASB CODE | METRIC | UNIT OF MEASURE | 2024(1) | CHANGE FROM 2019 BASELINE(2) |
|||||
|
Energy Management |
TR-AP-130a.1 |
Aggregate amount of energy consumed
|
Gigajoules (GJ)
|
20,243,182 GJ / 5,623,106 MWh
|
i 12.1% |
|||||
|
% of energy consumed supplied from electrical grid
|
Percentage (%) |
58.8% |
h 380 bps |
|||||||
|
% of energy consumed that is renewable energy
|
Percentage (%) |
14.0% |
— |
|||||||
| — |
Energy intensity |
MegaWatt hours (MWh) /
|
131 MWh / USDm |
i 19.1% |
||||||
|
Energy intensity reduction |
MegaWatt hours (MWh) /
|
Target: ≥5% p.a. Actual: -0. 8% (2024)
|
— |
|||||||
|
Waste Management |
TR-AP-150a.1 |
Aggregate amount of waste generated from manufacturing operations
|
Metric Tons (t) |
1,520,274 t |
— |
|||||
|
% of waste generated that is hazardous
|
Percentage (%) |
4.0% |
— |
|||||||
|
% of waste generated that was recycled
|
Percentage (%) |
89.2% |
— |
|||||||
| — |
% hazardous waste diverted from landfill
|
Percentage (%) |
93.7% |
— |
||||||
|
Waste diversion from landfill |
Percentage (%) |
Target: ≥95% p.a. Actual: 96.1% (2024)
|
— |
|||||||
|
Water Management |
— |
Annual water withdrawals |
Megalitres (ML) |
6,409 ML |
i 17.2% |
|||||
|
Water reduction |
Percentage (%) |
Target: 1.5% p.a. 15% by 2030 (vs. 2019) Actual: 17% (2024)
|
— |
|||||||
|
Environmental Management |
— |
Annual remediation expenses |
Reporting Currency (USD) |
<$1.5m |
No material change |
|||||
|
Aggregate remediation balance for known events
|
Reporting Currency (USD) |
$20.0m |
No material change |
|||||||
|
Environmental violations > $10,000 USD
|
Number |
0 |
— |
|||||||
|
Amount paid as a result of such environmental violations
|
Reporting Currency (USD) |
0 |
— |
|||||||
|
Health and Safety |
— |
Accident frequency rate |
1.0 = 1 lost time injury / illness per 100 employees working 40 hours/week, 50 weeks/year
|
0.47 |
i 54.8% |
|||||
|
Accident severity rate |
10.0 = 10 lost work days / 100 employees working 40 hours/week, 50 weeks/year
|
9.15 |
i 25.9% |
|||||||
|
Environmental & Health and Safety Certifications
|
— |
ISO 14001 Certified Divisions
|
Number
|
281(3)
|
—
|
|||||
|
ISO 50001 Certified Divisions
|
Number
|
26(3)
|
—
|
|||||||
|
ISO 45001 Certified Divisions
|
Number
|
200(3)
|
—
|
|||||||
|
Competitive Behaviour |
TR-AP-520a.1 |
Total amount of monetary losses incurred as a result of legal proceedings associated with anti-competitive behaviour regulations
|
Reporting Currency (USD) |
NIL |
— |
|||||
|
Gender Diversity |
— |
% of employees who are women(4)
|
Percentage (%) |
29% |
— |
|||||
|
% Women in Critical Positions
|
Percentage (%) |
19% |
— |
|||||||
|
% Women on the Board of Magna
|
Percentage (%) |
42%(4) |
h 600 bps |
|||||||
Notes:
| (1) | 2024 data with respect to emissions, and water withdrawals have been verified by an independent third-party verification firm. Energy management, waste management, and health and safety data is preliminary. |
| (2) | Items indicated by a dash were not tracked in baseline year. We have used a 2019 baseline for other metrics consistent with our previous sustainability reports. |
| (3) | Percentage of Magna facilities with the applicable certification is: ISO 14001 (~72%), ISO 50001 (~7%), and ISO 45001 (~51%). |
| (4) | Wholly owned operations only. |
| (5) | As of February 14, 2025, the percentage of women on the Board is 38%, following the appointment of Mr. Peter Sklar to our Board on that date. |
A-7 Annual Information Form
Introduction
At Magna we are committed to making a difference through our products and processes, as well as continuing to demonstrate care and concern for our people and the communities in which they live.
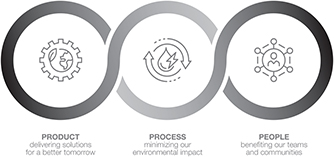
Magna was recognized as one of Canada’s Most Responsible Companies for 2025. The Newsweek/Statista award, in its first year, recognized select companies from among Canada’s 700 largest private and public companies across 13 industries for their commitment to the climate, social welfare and responsible governance.

Magna’s Climate Change Commitment
We recognize the reality of climate change and its impact on the planet. As a result, we are focused on doing the right things today so that our corporate interests do not come at the expense of the viability of life for the generations that follow. Although combating climate change requires a collective global response, Magna is determined to play its part in addressing this existential threat to our planet. In 2024, we received approval by the SBTi of Magna’s near-term and net-zero emission reduction targets and the verification by SBTi of Magna’s net-zero science-based target by 2050.
The details of Magna’s net-zero commitment are outlined in Section 1.4 of this Sustainability Report.
Approach to Sustainable Value Creation
Overall, our approach to sustainable value creation involves:
| ∎ | designing, engineering, manufacturing and delivering innovative product solutions for our customers, which achieve shared goals of reduced weight, lower fuel consumption and reduced carbon emissions; |
| ∎ | optimizing and innovating our manufacturing processes for resource and input efficiency, as well as product quality; |
| ∎ | enhancing the energy efficiency of our plants and transitioning our operations to 100% renewable energy by 2030 to achieve our SBT requirement to reduce scope 1 and 2 emissions by 42% from a 2021 baseline; |
| ∎ | engaging our supply chain to reduce Scope 3 emissions 25% by 2030 from a 2021 baseline; |
| ∎ | staying focused on our net-zero commitment to reduce Scope 1, 2 and 3 emissions 90% by 2050 from a 2021 baseline; |
| ∎ | treating our employees fairly and looking out for their health, safety and general well-being; |
| ∎ | serving as a good community partner, particularly in the communities in which our employees live and work; and |
| ∎ | enhancing the sustainability of our supply chain with respect to human rights and working conditions through communication, monitoring, and where necessary, corrective action. |
Magna International Inc. A-8
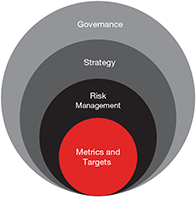
This Sustainability Report aims to provide our stakeholders with a better understanding of how we approach the creation of sustainable, long-term value and our management of sustainability-related risks. The report has been structured to align with the International Sustainability Standards Board (ISSB) IFRS S1 and S2 Climate Related Disclosures Standards, the Sustainability Accounting Standards Board’s (SASB) Auto Parts accounting standard, where possible; and also includes key disclosures completed in 2024 that are aligned with the European Sustainability Reporting Standard (ESRS). This includes, for the first time, an outline of the results of our ESRS-aligned double materiality assessment, and disclosure of the scenarios utilized to complete qualitative and quantitative climate scenario analysis. While this report may not currently provide stakeholders with all the information sought through the ISSB, SASB, and ESRS frameworks; we continue to evolve and enhance our disclosure as our collection and validation of the applicable data improves. While the ISSB and SASB Auto Parts frameworks primarily address climate-related factors, this Sustainability Report aims to go beyond such items to give stakeholders a better understanding of the broad range of environmental, social and governance initiatives that define our approach to sustainable value creation.
Double Materiality Assessment
In 2024, Magna conducted a comprehensive Double Materiality Assessment (DMA) as part of our commitment to enhancing our sustainability reporting. A DMA evaluates how a company’s operations and value chain could impact people and the environment (impact materiality) and identifies sustainability issues with potentially significant financial implications for the Company (financial materiality). This process helps identify impacts, risks, and opportunities, and assess their materiality. This assessment goes beyond a climate lens to understand our impact and risks for communities and ecosystems.
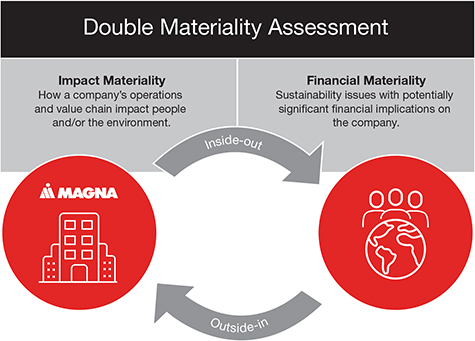
Our DMA was led by an internal team in collaboration with a third-party consulting firm. We began by establishing a list of sustainability-related topics to identify impacts, risks, and opportunities. This universe of topics was derived from sustainability matters in the ESRS and other relevant sources including: sustainability frameworks such as the SASB Auto-Parts and SASB Automobile Sustainability Accounting standards, our previous sustainability reports, other Magna disclosure documents, ESG rating frameworks, and industry peer reports. Based on this universe of topics, a comprehensive list of Impact, Risk, and Opportunity (IRO) statements was identified.
These IROs were assessed through a detailed stakeholder engagement process using the following criteria:
| ∎ | Impact Assessment: Positive and negative impacts were evaluated based on severity (scale, scope, and irremediability) and likelihood. |
| ∎ | Financial Assessment: Risks and opportunities were assessed based on financial size and likelihood. |
The DMA identified a list of material topics for the Company.
A-9 Annual Information Form
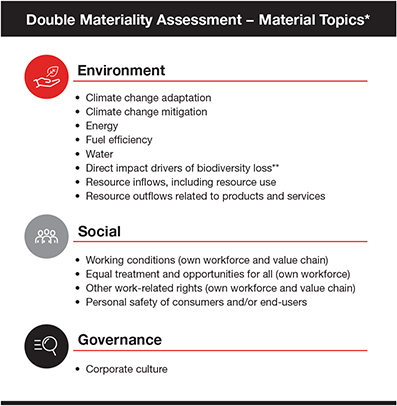
| * | Certain topics, such as cybersecurity and anti-competitive practices, did not meet applicable threshholds under our DMA methodology. Nonetheless, they remain significant priorities for Magna and our activities in these areas are disclosed in this Sustainability Report. |
| ** | This category addresses deforestation and phytosanitation. |
Magna’s DMA aligns with the E.U.’s Corporate Sustainability Reporting Directive (CSRD) and enhances transparency and accountability in our sustainability reporting. The DMA will also help further focus our sustainability risk management activities and inform relevant strategic priority areas.
We plan to review Magna’s material topic listing annually, and formally update our DMA, as needed, with support from key internal and external stakeholders.
Magna International Inc. A-10
| 1. | Sustainability Governance |
| 1.1 | Board Oversight |
Magna’s Board of Directors is the company’s highest decision-making body, except to the extent certain rights have been reserved for shareholders under applicable law or Magna’s articles of incorporation or by-laws. As such, the Board is responsible for the overall stewardship of the company by: supervising the management of the business and affairs of Magna in accordance with the legal requirements set out in applicable company law (Business Corporations Act (Ontario)), as well as other applicable law; and, jointly with Management, seeking to create long-term shareholder value. The Board operates under a written Board Charter, in addition to applicable law, our articles of incorporation and by-laws. The Board Charter, which has been filed with securities regulatory authorities on SEDAR+ (www.sedarplus.ca), and is available in the Leadership & Governance section of Magna’s website (www.magna.com), delineates Board oversight responsibilities including with respect to a number of areas relevant to sustainability such as: corporate culture; corporate governance; strategy; risk; shareholder engagement; and fundamental corporate actions.
The Board takes an integrated and coordinated approach to oversight (including climate-related issues). This includes oversight of:
| ∎ | the Company’s corporate culture, including its commitment to innovation/R&D, as well as its overall approach to corporate governance; |
| ∎ | long-term strategy, including sustainability strategy and near-term business plans; |
| ∎ | fundamental corporate actions, including acquisitions/divestitures and capital allocation; |
| ∎ | major corporate policies; |
| ∎ | enterprise risk management, including sustainability risks; |
| ∎ | our overall system of compensation of Executive Management, rooted in profitability and which drives desired management behaviours that are central to our climate strategy, including operational efficiency. |
| ∎ | material public disclosures (including this Sustainability Report); |
| ∎ | preparedness of the Company to comply with emerging sustainability/ESG related legislation; and |
| ∎ | shareholder engagement, including on sustainability/ESG topics. |
Climate-related and other sustainability issues are typically considered by the Board at least annually through the Board’s strategic planning process. Typically, Magna’s most senior corporate R&D executive identifies and analyses material trends impacting the automotive industry, including automotive and mobility trends arising from climate-related issues. Significant opportunities and risks are then addressed at the annual Board strategy meeting. Guidance, feedback and other outputs from the strategy meeting are incorporated and integrated into Operating Group business plans for the next business planning meeting. Climate and other sustainability issues may also arise before the Board in connection with its oversight of fundamental corporate actions such as review/approval of material acquisitions/divestitures, three-year business plans and capital expenditures. Additionally, the Board annually monitors our progress in reducing our carbon footprint and reviews/approves the company’s material public disclosures, such as our Annual Information Form / Annual Report on Form 40-F incorporating this Sustainability Report. The Board also reviews/approves other public disclosures such as our Fighting Against Forced Labour and Child Labour in Supply Chains Report, and reviews the Corporation’s progress in preparing for emerging sustainability reporting, most notably the CSRD.
| 1.1.1 | GNSC and TOCC Roles |
The Board carries out its duties in part through standing committees composed solely of independent directors. One such committee, the GNSC, supports the Board’s oversight of the company’s approach to sustainability and climate change issues, including alignment with Magna’s overall strategy, stakeholder expectations, regulatory and voluntary frameworks, market norms and best practices. The GNSC assesses Magna’s overall approach to reducing its carbon footprint, the effectiveness of our environmental compliance program, the Company’s approach to human rights and supply chain due diligence, the continued effectiveness of the climate elements of the Company’s ESG program, as well as Magna’s actions to identify, monitor and mitigate any material risk exposures relating to such areas. The Board’s TOCC also supports the Board’s sustainability oversight activities by assessing Magna’s approach to certain non-climate elements of sustainability, including its approach to advancing diversity and inclusion in our workplace, and occupational health and safety compliance, as well as Magna’s actions to identify, monitor and mitigate any material risk exposures relating to such areas.
Like the Board, each of the GNSC and TOCC maintains a written charter which outlines its specific roles and responsibilities. The GNSC and TOCC Charters have been filed on SEDAR+ and are available in the Leadership & Governance section of Magna’s website (www.magna.com). Matters under the GNSC’s responsibility include: corporate governance, sustainability, and other matters. The scope of the GNSC’s oversight role with respect to sustainability includes climate-related issues generally, as well as related elements such as environmental management and compliance. As Magna defines “sustainability” in a broad and inclusive manner to include areas that go beyond climate-related issues, the GNSC’s role also extends to matters such as supply chain sustainability. The GNSC periodically reviews Magna’s policies, practices and public disclosures relating to sustainability topics, and makes recommendations to the Board regarding such items. During 2024, the GNSC received updates, among other things, on Magna’s enterprise risk management program, its evolving sustainability strategy, progress towards achieving its operational decarbonization commitments, Scope 3 decarbonization strategy and activities, ESG regulatory and reporting developments, and its activities in relation to supply chain monitoring, including supplier ESG requirements. The GNSC also reviewed, provided input into, and approved the organization’s Sustainability Report and presented its recommendations to the Board regarding the Board’s approval of the Sustainability Report.
A-11 Annual Information Form
Additionally, the GNSC received reporting relating to the performance of Magna’s environmental compliance and management program. The TOCC’s responsibilities include: talent management and succession planning, executive and incentive compensation, employee health and safety, and other matters. During 2024, the TOCC received updates on, among other things, Magna’s occupational health and safety management program, leadership development and succession planning, its human resources/talent management strategy, and culture and employee engagement.
| 1.1.2 | Other Board Committees |
In addition to the GNSC and TOCC, the Board maintains two other standing committees – the Audit Committee and the Technology Committee. While neither of these committees have specific sustainability responsibilities, each may have a role with respect to sustainability risks and opportunities that arise indirectly out of the committee’s primary role and responsibilities.
Magna’s Audit Committee supports the Board through its oversight of financial and audit-related matters, including financial risks and disclosures. To the extent that climate-related or other sustainability risks are or could be financially material, the Audit Committee would be involved through its consideration of the financial statement or other disclosure of the nature and scale of the risk. During 2024, the Audit Committee received updates on, among other things, and Magna’s Ethics and Legal Compliance Program, including administration of our Code of Conduct and Ethics, compliance training initiatives, and activities of the Company’s Compliance Council.
The Technology Committee supports the Board’s oversight duties by advising it on technology trends, related opportunities and risks, R&D and innovation, and technology-focused acquisitions, as well as the alignment between the company’s technology and its strategic priorities. As such, the scope of the Technology Committee’s role includes products and processes that seek to realize opportunities created by climate-related challenges. In this regard, the Technology Committee engaged in “deep dive” reviews of technology trends, opportunities and risks, including large castings technology landscape, integrated systems, powertrain electrification trends, and autonomous mobile robot technology and market. In addition, the Technology Committee reviewed Magna’s R&D/innovation initiatives in relation to Magna’s overall strategy.
| 1.2 | Management |
Climate-related issues are part of the CEO’s responsibility. As Magna’s highest-ranking member of management, the CEO guides and directs Executive Management and Operating Group Presidents with respect to product portfolio and strategic planning, business planning, capital expenditures, innovation/R&D, manufacturing productivity and efficiency, as well as other critical areas, including the setting of, and progress in meeting, Magna’s near-term and net-zero commitments. The CEO is also the highest executive responsible for customer management, shareholder engagement/investor relations, as well as talent management. The criticality of climate sustainability to the future of the automotive industry generally means that climate-related issues are interwoven through all of the foregoing areas of the CEO’s responsibilities. At the same time, the importance of making demonstrable progress with climate sustainability goals requires CEO-level engagement and direction to ensure organizational alignment.
To assist our CEO, Magna’s Chief Operating Officer functions as an executive “champion” for climate-related and other sustainability matters (the “Sustainability Champion”). The Sustainability Champion reports directly to Magna’s CEO on sustainability matters and helps coordinate and align sustainability priorities across the company’s Operating Groups. Operating Group management is responsible for development of product strategies to address, industry and other trends, and business opportunities and risks, including those which arise due to climate-related challenges.
We also have a bottom-up sustainability structure (See Magna’s Decarbonization Organizational Structure below) with representatives at each of our three main management levels (Divisional, Operating Group and Corporate). Approximately 99% of our manufacturing Divisions have an energy management champion who works with members of our Global Energy Team to identify and implement high-priority energy management projects. The Global Energy Team functions across all of our Divisions and Operating Groups to share energy efficiency/ management case studies and best practices. Each Operating Group’s day-to-day sustainability activities are coordinated through a Group sustainability “lead”. Operating Group sustainability leads routinely interact with our Global Director, Sustainability & Energy who oversees and tracks key sustainability metrics and KPIs, such as the energy reduction goals, as well as progress towards our near-term and net-zero commitments. The Global Director, who reports to the Sustainability Champion, collaborates with Operating Group sustainability leads and cross-functional corporate leaders, including operational improvement, research and development, environmental, purchasing, legal, finance, and real estate, to develop Magna’s long-term sustainability and decarbonization strategy and near-term goals. In connection with our evolving sustainability strategy and our commitment to reaching our near-term and net-zero targets, our energy reduction progress and initiatives are reported to our Sustainability Champion, helping to increase the visibility of these initiatives across our Operating Groups through the Sustainability Champion’s regular interaction with Operating Group Presidents.
A number of initiatives intended to help us achieve our near-term and net-zero targets are underway, including energy optimization initiatives at most of our operating Divisions and a phased in transition to renewable electricity globally. We previously launched new initiatives within our Operating Groups focused on Life Cycle Assessments (LCA), Sustainable Materials and Supply Chain Decarbonization. Each initiative is led by an Operating Group-level champion in their respective subject matter that directly supports the execution of our decarbonization strategy. LCA Champions oversee Operating Group LCA processes and requirements, including understanding frameworks governing LCAs and customer requirements.
Magna International Inc. A-12
Sustainable Materials Champions assist in the development of sustainable materials sourcing plans, identify potential sustainable materials relevant to current and future products, identify and oversee participation in sustainable materials certification schemes, and support our purchasing team in communicating with OEM customers and suppliers on relevant sustainable materials topics. Supply Chain Sustainability Champions assist on all ESG related supply chain topics for their Operating Groups and support supplier ESG monitoring and corrective action. They will also oversee Operating Group compliance with our ESG nomination criteria (discussed in Section 4.9.3.3).
Magna’s decarbonization organizational structure is as follows:

Aspects of sustainability beyond climate change concerns are typically managed through a matrix structure in which corporate-wide functions support initiatives implemented or managed by Operating Groups and Divisions. Examples of functional areas managed in this manner include: environmental management and compliance; occupational health and safety; quality and operational improvement; talent management, including diversity and inclusion; ethics and legal compliance; lobbying and political engagement; cybersecurity; data privacy; supply chain management; and materials compliance.
| 1.3 | Key Updates to Our Sustainability Program |
In 2024 and to date in 2025, our Sustainability program evolved in a number of ways, including:
Energy Efficiency and Decarbonization
| ∎ | Achieved approximately $36m in annual energy cost avoidance through our ECO50 energy reduction projects initiative (discussed in Section 2.3.1). |
| ∎ | Launched a new Global Energy Efficiency Tracker, which enables us to better track targeted initiatives to increase energy efficiency and monitor the implementation of energy efficiency initiatives and technologies at all our facilities. |
| ∎ | Improved our Energy Savings Case Study communication process to more effectively spread our successful energy saving strategies and technologies and drive additional energy saving projects. |
| ∎ | Revised our MAFACT 6.10 Energy Efficiency module to strengthen energy efficiency and energy reduction requirements, as well as promote the use of renewable energy on site, where feasible. We also reworked our MAFACT 6.11 Sustainability module to reinforce newly introduced supply chain sustainability topics, as well as providing tools to support Magna Divisions in developing long term sustainability strategies to reduce Scope 3 emissions. MAFACT is discussed in greater detail in Section 6 of our AIF. |
| ∎ | Launched a pilot project to integrate Artificial Intelligence into infrastructure equipment to increase energy efficiency through intelligent control and optimization. |
| ∎ | Enrolled Magna in a long-term renewables procurement program in Ontario, guaranteeing Magna a supply of renewable electricity and price security for the next 10 years. This arrangement will allow Magna Divisions to achieve 100% renewable electricity in Canada by 2028, two years ahead of Magna’s global target. |
A-13 Annual Information Form
| ∎ | Increased engagement with Magna’s R&D teams to examine development of more sustainable products and more sustainable processes for Magna Divisions. |
Training and Capacity Building
| ∎ | Rolled out mandatory enhanced compliance training for key functional employees on responsible sourcing and global supply chain laws, covering such issues as child labour, human trafficking, forced labour, and the responsible use of third party labour brokers. |
| ∎ | Developed a carbon literacy webinar series to help educate Magna employees regardless of location or background on carbon emissions. Topics include introduction to carbon emissions and emissions accounting, Scopes 1 and 3 emissions, Scope 1 emission reduction methods, deep dives into Scope 3 categories 1 and 11, and renewable electricity. The webinar series also includes an introduction to the UN SDGs, water usage and risks, and biodiversity. |
| ∎ | Implemented a new training and certification program to train our energy champions in five different modules covering different aspects of energy management. |
| ∎ | Conducted dedicated Scope 3 emissions accounting training for Magna Divisions globally to better understand how Scope 3 emissions are quantified and calculated and strategies for reducing such emissions. |
| ∎ | Developed new tools to track sustainability events, biodiversity projects, circularity & recycling projects and other UN SDG-relevant sustainability projects completed at Magna Divisions to highlight Divisional efforts that extend beyond energy reduction and renewable electricity. |
Responsible Supply Chain Initiatives
| ∎ | Expanded supply chain activities, including launching a new Supplier ESG (S-ESG) pillar in our supplier scorecard process and mandatory Magna Minimum Requirements (MMR) for our suppliers (discussed in Section 4.9.3.3). |
| ∎ | Introduced a Supplier Environmental Performance (S-EP) disclosure program for suppliers using the third party M2030 platform to support our science-based targets. This S-EP program will contribute to our decarbonization activities and enhance our transparency into our supply chain’s Scope 3 emissions, as discussed in Section 1.4.5. |
| ∎ | Worked with Suppliers Partnership for the Environment (SP) to launch Transform Auto, a program to support the automotive supply chain procure renewable energy across North America. The program is positioned so it is scalable to additional regions. |
Sustainability Reporting
| ∎ | Completed Magna’s first double materiality assessment and climate scenario analysis, as well as currently developing a climate transition plan. |
| ∎ | Published Magna’s first annual Report on Fighting Against Forced Labour and Child Labour In Supply Chains. |
| 1.4 | Magna’s Net-Zero Commitment |
| 1.4.1 | Science-Based Targets |
The fight against climate change is leading to major transformation in the mobility sector. As a global leader within the industry, Magna has set ambitious targets as discussed under Magna’s Climate Change Commitment on page A-8.
Magna prides itself on continuous improvement and innovation. For almost 70 years, we have showcased our commitment to design by delivering some of the most sophisticated mobility solutions; and we continue to leverage this ingenuity and entrepreneurial spirit to tackle one of our world’s most pressing challenges: climate change. Focus is needed on true decarbonization and elimination of carbon to keep global warming below 1.5 degrees according to the latest Intergovernmental Panel on Climate Change (IPCC) 2023 Climate Change Report. To meet our communities’, customers’, and stakeholder expectations, Magna has made science-based near-term and 2050 net-zero commitments.
Magna’s pursuit of net-zero begins with our near-term commitment of 42% reduction in Scopes 1 and 2 emissions, and 25% reduction in Scope 3 emissions by 2030, each from a 2021 baseline. Our near-term commitments are the launch point towards our net-zero by 2050 commitment which requires 90% reduction in Scope 1, 2 and 3 emissions from a 2021 baseline, as required by the SBTi Net-Zero Standard.
| 1.4.2 | Roadmap for Fulfilling Our Commitment |
Achieving net-zero is an ambitious and complex challenge. We have taken the first step to indicate our commitment and outline our net-zero emissions strategy. We have also developed a framework through collaboration with internal and external stakeholders. By leveraging experts across all Operating Groups and Divisions to identify the most appropriate technical solutions, while monitoring for emerging technologies, we will continue to progress towards our net-zero goal. Our strategy and roadmap will continue to evolve, including through our climate scenario analysis, development of a formal climate transition plan, and our growing LCA activities, as discussed in Section 1.4.3 below.
Magna International Inc. A-14

We are focused on the following four pillars as we continue to evolve our net-zero roadmap:

As Magna carries out activities within each pillar, with support from Operating Groups and Divisions, our focus will continue to be on energy conservation and reduction. In the near-term, our net-zero commitment is supported by our goal of achieving 100% renewable electricity in Europe by 2025, in Canada by 2028, and globally by 2030. To support this effort, Magna’s Global Energy Leads have been integrated directly into our global sustainability organization. Each Division’s Energy Champion is critical to achieving our net-zero commitments working to deliver emission reductions, as well as cost savings and risk minimization. Progress is already being made in our manufacturing operations which implemented approximately 261,000 MWh of energy saving projects in 2024.
2024 Emissions and Energy Performance
In 2024, our absolute Scope 1 emissions decreased 1.3% compared to 2023 (to 418,963 metric tons). Our Scope 2 (market based) emissions increased slightly 0.7% compared to 2023 (to 1,158,866 metric tons). The increase in our Scope 2 emissions is attributable to an increase in Magna’s energy consumption compared to 2023. The rise in energy consumption is due primarily to:
| ∎ | the production ramp-up of several EV-related facilities in 2024; |
| ∎ | the vertical integration of a supplier’s painting operation; and |
| ∎ | colder winter weather in certain regions. |
Despite the increase in Magna’s absolute energy consumption, we have achieved an approximately 19% reduction in energy intensity from our 2021 baseline, in large part due to the successful achievement of our 5% energy-saving project targets in each of 2023 and 2024. We also made significant efforts in 2024 with respect to renewable electricity, including:
| ∎ | expanding on-site renewables – double the number of Divisions using on-site renewables in 2024 compared to 2021; and |
| ∎ | increasing renewable electricity procurement – a 60% increase in 2024 compared to 2021. |
These efforts have led to a 3% reduction in non-renewable absolute energy consumption, and an 18% decrease in non-renewable energy intensity, each compared to 2021. We believe the anticipated achievement of our first regional renewable energy target (100% renewable electricity usage in our European Operations by the end of 2025), will significantly reduce our absolute Scope 2 emissions level compared to 2024 compared to our 2021 baseline.
| 1.4.3 | Climate Scenario Analysis |
In 2024, we conducted a detailed Climate Scenario Analysis to identify of our risks & opportunities to help manage uncertainty, test business resilience, and inform our strategy. This analysis aligns with the CSRD, and ISSB’s IFRS S2 climate-related disclosure standards. The Climate Scenario Analysis identified key climate risks and opportunities that could impact Magna’s operations and value chain and will help Magna align its climate initiatives to relevant risks and opportunities to drive sustainable growth.
A-15 Annual Information Form
The Climate Scenario Analysis involved evaluating two storylines or scenarios comprising both physical and transition risks:
| 1) | Net-Zero (NZE) Storyline: This represents a low emissions scenario consistent with a 1.5°C rise in temperature above pre-industrial levels in 2100. In this scenario, the world has massively transformed to limit climate change. The storyline derives transition scenarios from the International Energy Agency (IEA) and World Energy Outlook’s (WEO) Net-Zero by 2050 Scenario, and uses physical scenarios based on the IPCC SSP1-RCP 2.6 scenario from their 6th Assessment Report. |
| 2) | STEPS Storyline: This represents a moderate emissions scenario where current measures continue but fall short of limiting warming, and the global temperature rise is on track for 2.4°C above pre-industrial levels in 2100. In this scenario, the world makes only a moderate effort to limit climate change. The storyline is based on the IEA and WEO’s IEA Stated Policies Scenario (STEPS) for transition scenarios, and on the IPCC SSP2-RCP 4.5 scenario from their 6th Assessment Report for physical scenarios. |
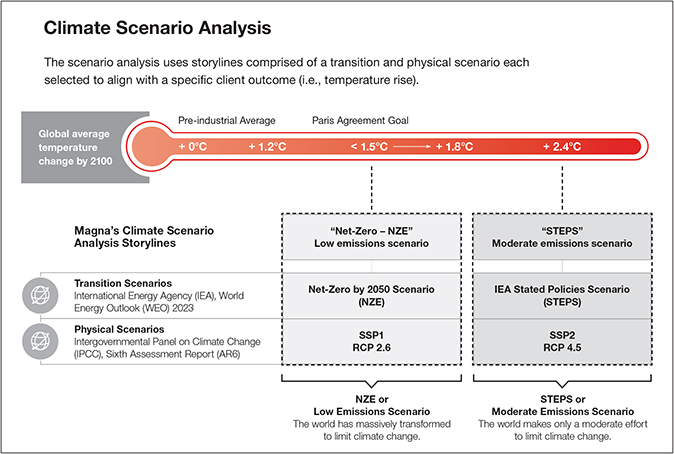
These storylines were selected for the following reasons:

Going forward, we will work with key internal stakeholders to identify opportunities to integrate our climate scenario analysis into our existing risk management framework.
1.4.4 Sustainable Materials and Life Cycle Assessments
We are committed to advancing sustainability through the strategic use of sustainable materials and comprehensive LCAs. During 2024 and to date in 2025, we completed a number of LCAs and LCA Data Sheets for our products at the request of our OEM customers. Our approach is designed to support our engineering and other departments in processing sustainable materials, setting internal targets, and meeting OEM customer requirements.
Magna International Inc. A-16
LCAs are integral to our sustainability efforts, providing a comprehensive evaluation of the environmental impacts associated with all stages of a product’s life. This includes raw material extraction, manufacturing, distribution, use, and end-of-life disposal. By conducting thorough LCAs, we can identify opportunities for improvement, reduce our carbon footprint, and enhance the overall sustainability of our products.
Our sustainable materials strategy is a cornerstone of our commitment to reducing our environmental impact and achieving our net-zero target. This strategy encompasses the development and implementation of a roadmap that guides our organization in making informed decisions about sustainable materials. By leveraging our collective expertise, knowledge, and innovation, we aim to accelerate the transition to a low-carbon economy and position Magna as a global sustainability leader.
Internally, our roadmap and guidelines serve as valuable resources for all departments, helping them understand what can and must be discussed with customers and suppliers. These documents are regularly updated to reflect the latest developments in the field of sustainable materials. We are also currently developing a sustainable materials standard that will be shared with our suppliers to support a consistent and standardized approach.
1.4.5 Addressing Scope 3 Emissions
Magna has established near-term energy saving goals (details in Section 2.3.1) and renewable electricity goals (details in Sections 1.4.2 and 2.3.1) to tackle our Scope 1 and 2 emissions. For Scope 3 emissions, our near-term and net-zero targets are reductions of 25% by 2030 and reductions of 90% by 2050, respectively, taking into account all 15 emissions categories (12 of which are relevant to Magna). While Magna intends to work on reducing the impact in all relevant categories; there will be a significant focus on category 1 (Purchased Goods and Services) and category 11 (Use of Sold Product) which account for approximately 90% of our Scope 3 emissions based on our current Scope 3 emissions inventory.

A-17 Annual Information Form
We maintain two working groups (discussed above): Sustainable Materials, and Supply Chain Sustainability that focus on supply chain decarbonization. In 2024 these cross-functional groups contributed in-depth knowledge on commodities and technologies that will be instrumental in executing our net-zero strategy.
In 2024, we also took concrete actions to assist our suppliers in their decarbonization efforts, including:
Manufacture 2030 Rollout
The roll out of Manufacture 2030 (M2030) platform to suppliers, which aims to improve the environmental performance of our supply chain. We are committed to reducing carbon emissions and improving the impact of our products for the benefit of our customers, partners, investors, and regulators. We know we cannot achieve this ambition alone. For this reason we are evolving our Carbon Reduction Program into an Environmental Performance Disclosure via M2030. The program is designed to help our suppliers reduce emissions and improve environmental performance in their facilities. We expect all our valued suppliers to submit an Environmental Performance Disclosure via M2030. In 2024 we hosted virtual events to engage with our supply chain on the benefits of M2030. The events focused on:
| ∎ | The future of the industry: why carbon reduction is a strategic priority for the Automotive sector |
| ∎ | The program: how our partnership with M2030 will align supplier targets and reduction plans to industry expectations |
| ∎ | The benefits that M2030 can offer to suppliers of all sizes |
Transform Auto Initiative
Magna has collaborated with OEMs across the automotive industry to support decarbonization through the creation, and launch, of the Transform Auto initiative. This initiative is designed to support the automotive sector in its transition to renewable energy and it supports Magna’s decarbonization initiatives because our supplier’s Scope 2 emissions make up a portion of Magna’s Scope 3 emissions.
The Transform Auto initiative is a comprehensive program aimed at promoting renewable energy adoption and sustainability practices among automotive suppliers. The initiative focuses on several key areas, including community solar projects, green tariff programs, and utility-scale renewable energy procurement. By engaging with suppliers and stakeholders, Magna aims to create a collaborative environment that fosters innovation and sustainable development. Key components of the Initiative are:
| ∎ | Community Solar Projects: Transform Auto is actively supporting suppliers in contracting for community solar projects in Illinois and New York. These projects provide an opportunity for suppliers to access renewable energy without the need for on-site installations. The initiative includes educational webinars and feasibility assessments to help suppliers evaluate the potential benefits of community solar. |
| ∎ | Green Tariff Programs: Magna has evaluated various green tariff programs to identify those that offer the best fit for their sustainability goals. The focus is on programs that provide cost savings, flexible contract terms, and minimal penalties for termination. Magna’s participation in programs like DTE’s MyGreenPower has been highly successful, and the company is encouraging other suppliers to explore similar opportunities. |
| ∎ | Utility-Scale Renewable Energy Procurement: The initiative also explores options for utility-scale renewable energy procurement, such as offsite power purchase agreements (PPAs). |
Magna International Inc. A-18
2. Climate-Related Opportunities
2.1 Corporate Strategy
To drive long-term success, Magna is focused on a number of key areas as part of its corporate strategy. Once strategic area critical to climate-related opportunities is Magna’s product portfolio.
Magna’s approach to product involves viewing our portfolio through the lens of a long-term owner. As a starting point for this approach, each of our businesses must meet the following requirements:
| ∎ | operating in meaningful or growing markets with significant profit opportunities; |
| ∎ | having strong market positioning and profitable growth, or a path toward both; |
| ∎ | possessing sustainable competitive advantages. |
These requirements for our product portfolio have already delivered scale and market leading positioning across a number of different businesses and markets. For example, our portfolio reflects:
| ∎ | global leadership in body and chassis, all-wheel drive/front wheel-drive, transmissions, latches, mirrors and contract vehicle assembly; |
| ∎ | top five global positioning in ADAS; |
| ∎ | North American leadership in exteriors and top three market positioning in seating; and |
| ∎ | top five European market positioning in both exteriors and seating. |
Employing strategic portfolio management, we seek to achieve strong performance in leading markets. Practically, this involves managing all our businesses for continuous improvement, while deploying capital investments to areas that are most aligned with our long-term portfolio priorities.
One such priority has been to focus on businesses that can deliver profitable growth while remaining agnostic to the vehicle’s method of propulsion — this is currently the case for ~90% of our product portfolio.

However, we believe that electrification provides growth opportunities, even though the pace of adoption may not be linear. As the proportion of vehicles on our roads transitions from ICE to EV, Magna is strategically positioned to increase the content and value we can deliver to our customers.
For a detailed description of Magna’s corporate strategy, see Magna’s current Annual Information Form on Magna’s website www.magna.com The transition to a lower-carbon economy has provided, and is expected to continue to provide, opportunities to enter new product and service markets.
A-19 Annual Information Form
2.2 Markets & Products
Some recent new products developed to take advantage of opportunities from such transition include:

|
NEXT GENERATION 800V EDRIVE
|
|
| Magna’s next generation 800v eDrive solution is a drop-in solution that incorporates several advanced technologies, resulting in significant reductions in weight and size, enhanced performance, extended driving range and greater sustainability. The innovation offers enhanced flexibility due to its lightweight (75 kg) design and 20% reduction in height from Magna’s prior generation eDrive. A key technology and a supplier industry-first advancement is the ability to rotate the eDrive 90 degrees around the drive axis, which allows improved system integration in the front and rear vehicle space. Delivering peak power of 250 kW and a peak axle torque of 5,000 Nm, the system also achieves up to 93% efficiency in real-world driving (including Worldwide harmonized Light vehicles Test Cycles (WLTC) and highway driving), which significantly improves efficiency across a wide range of vehicle speeds. The eDrive system requires less aluminum and heavy rare earth materials, resulting in a significant reduction of CO2 emissions during production by approximately 20% compared to previous generation eDrives. | ||

|
SPECIALIZED EDRIVE SYSTEM | |
| Magna has secured a specialized eDrive system business award with a North American-based OEM, showcasing its ability to deliver tailored solutions for diverse market needs. This system is engineered to enhance performance and efficiency in electric vehicles (EVs), featuring state-of-the-art motor technology and integrated software controls. The specialized eDrive system is compact, lightweight, and scalable, enabling automakers to optimize vehicle dynamics and energy efficiency. This innovation underscores Magna’s commitment to advancing electrification and enhancing the performance of next-generation EVs. | ||

|
DEDICATED HYBRID DRIVE SYSTEM
|
|
| Magna continues to accelerate hybrid innovation with its first dedicated hybrid drive system award, designed to meet the evolving needs of global automakers. This innovative system combines electric motor technology with internal combustion engine efficiency, delivering a seamless transition between electric and hybrid modes. The system, which includes Magna’s DHD Duo System (a longitudinal front drive solution featuring an advanced dual e-motor and multi-speed design), offers enhanced performance, improved fuel efficiency, and reduced emissions, making it an adaptable solution for multiple vehicle platforms without the need for structural modifications. By leveraging advanced engineering and design, the dedicated drive system underscores Magna’s commitment to providing scalable and flexible powertrain solutions for the hybrid market. | ||
2.3 Resource Efficiency
2.3.1 Energy
Our aggregate global energy spend in 2024 amounted to approximately $494 million broken down by type as follows:
| ∎ | Electricity – approximately $411 million |
| ∎ | Natural Gas – approximately $62 million |
| ∎ | Other (Propane; Liquid Petrol; Diesel; District Heat; Steam; Coal Gas) – $21 million |
As part of our sustainability and operational efficiency efforts, we are focused on optimizing energy use, which may result in savings in overall energy costs. However, as we continue to forecast growth in Sales and number of facilities over the medium-term, we anticipate that our aggregate energy consumption may increase. Accordingly, we are focused on becoming more energy efficient (measured by energy consumption relative to Sales) so that, at minimum, our rate of increase in energy consumption slows.
In connection with our efforts to promote energy efficiency, we established energy reduction targets for each of our Operating Groups, as illustrated below. In 2023 we achieved our 1 year target, completing energy projects that amounted to a 5% reduction of each Operating Group’s 2022 absolute energy usage and we exceeded our 1-year stretch target aimed at reducing energy cost intensity by 10% (achieving approximately 11%). In 2024, we mirrored our 2023 achievement by reaching another 5% reduction in absolute energy use through the completion of energy saving projects. We also achieved a 10% reduction in energy intensity compared to 2022.
Magna International Inc. A-20

We have also developed a phased-in renewable energy strategy focused on Europe and the U.S. first, followed by Canada, and then the other markets in which we operate. In 2024, 23% of our global electricity consumed was from renewable energy sources evidenced by renewable Energy Attribute Certificates (EACs) or from on-site generation from photovoltaic (solar panel) or solar thermal systems, where feasible. At the end of 2024, 140 of our facilities use renewable electricity in some form, a sixfold increase in Divisions since 2020, with 90 such Divisions using 100% renewable electricity.
Renewable Electricity Purchases
In 2024, we purchased approximately 736,000 MWh of renewable electricity, an approximately 60 percent increase since 2021. In the near – and medium terms, adoption of renewable energy may increase our energy costs, but we are working to offset the impact of such increases through energy use reductions. Our renewable electricity efforts are bolstered by strategic partnerships, such as our agreement with Ontario Power Generation to have 100% renewable electricity in our Canadian facilities by 2028 – two years ahead of schedule.
On-Site Renewable Electricity
We generated 51,283 MWh of on-site solar electricity in 2024 – five times more than in 2023. 36 of Magna’s facilities have on-site solar panel installations, three times the amount we had in 2023. Our renewable energy self-generation has grown over time, however, self-generation represents a more limited opportunity for us compared to the purchase of EACs, since the vast majority of our facilities are leased, as well as other factors such as, footprint constraints for solar panels at certain owned facilities, and/or facilities in locations with relatively clean electrical grids that make self-generation economically unfeasible.
To support the acceleration of our renewable energy transition, Magna is actively integrating renewable electricity solutions across its global Divisions, reinforcing our commitment to sustainability and operational excellence. In addition to cutting carbon emissions and air pollution, we view renewable electricity as a smart investment – lowering operational costs and leading to long-term cost savings. Looking ahead, we are committed to achieving our 100% renewable electricity targets in Europe in 2025, Canada by 2028, and globally by 2030.
Energy Efficiency Activities
Approximately 99% of our Divisions have active energy teams pursuing energy efficiency measures in their respective Divisions. These teams are supported at the corporate level by a Global Energy Team which helps identify and promote energy reduction initiatives, including through: training courses designed to promote strategies for reduced energy use; regional benchmarking sessions; regular communication through newsletters; an internal energy savings collaboration site; and best practice sharing.
Some of the incremental changes made by our Divisions to their facilities and processes to reduce our energy consumption and improve energy efficiency include:
| ∎ | Installation of LED lighting and installation of lighting controls into the building management system (BMS); |
| ∎ | Equipment start-up/shut-down/idling procedures to achieve energy-savings during production downtimes; |
| ∎ | Compressed air leak identification and repair initiatives; |
| ∎ | Use of ceiling fans to blend air temperatures evenly within our operations; |
| ∎ | Computer-controlled utility and HVAC systems to allow for improved performance and energy reduction; |
| ∎ | Installation of energy metering and monitoring systems, a requirement for all our manufacturing facilities; |
| ∎ | Door and dock seal repairs to reduce heat loss; |
| ∎ | High efficiency chiller and compressor upgrades; |
| ∎ | Integration of air economizers and heat recovery units into HVAC systems; |
| ∎ | Software-managed and occupancy-sensor-controlled lighting and energy efficient lighting retrofits; |
| ∎ | Use of solar panels at certain facilities; |
| ∎ | Installation of insulation mattresses on equipment and heating units; |
| ∎ | Recovery of waste heat from certain high heat processes for use in other areas; |
A-21 Annual Information Form
| ∎ | Installation of variable frequency drives on motors and pumps; and |
| ∎ | Participation in energy savings and incentives programs offered by utilities providers in some jurisdictions in which we operate. |
In 2024, the energy team launched a new global energy efficiency tracker, which provides an overview of energy efficiency improvement activities at all sites and has introduced a scoring system that we expect will drive further continuous improvement and positively impact energy savings in the coming years.
Our efforts to reduce energy consumption and operate facilities on a more energy efficient basis forms part of our formal MAFACT system – the primary operational assessment audit tool used to support our operational excellence. The MAFACT system establishes standards for achieving operational efficiencies, identifies benchmarks and promotes best practice sharing among Divisions in Magna. The integration of energy management elements into a core operational assessment tool such as MAFACT is intended to reinforce the importance of energy management throughout the organization and help realize potential cost savings. In 2024, we implemented over 1500 energy projects across all of our Operating Groups which resulted in approximately 76,000 tons of CO2 equivalent in annual savings using the location-based method. Given the importance of energy optimization in meeting our net-zero targets and to further incentivize our Divisions, we have established a separate approval category for energy efficiency and sustainability-related capital improvements.
In 2024, we initiated The Energy Cost Optimization (ECO50) initiative, a campaign aimed at achieving $50 million in annual savings through energy reduction projects and on-site renewable energy generation implemented in 2024 and 2025. The focus of the initiative has been operational efficiency, downtime energy usage, and onsite renewables. Completed project examples include:
| ∎ | minimizing equipment working in passive mode in one of our Mexican Divisions; |
| ∎ | eliminating leaks in paint-shop spray booths in one of our Chinese Divisions; |
| ∎ | replacing a gas heating system with a heat pump in one of our Divisions in France; |
| ∎ | installing a 11,200 KWp on-site solar project at our Magna Steyr facility in Graz, Austria. |
Twelve months into this twenty-four month campaign, the initiative had realized approximately $36 million in annual energy costs avoidance. The initiative underscores Magna’s commitment to integrating energy efficiency and sustainability into our operations.
2.3.2 Water
We have implemented a 1.5% per year water reduction target, with the aim of reducing water use 15% by 2030, in each case referencing 2019 as the baseline year. To date, we have met this target, having achieved a reduction of 17% at the end of 2024. While we are not a significant water user, achievement of water reductions would be expected to result in cost savings, potentially by offsetting (in whole or in part) any increase in the rates charged by applicable water utilities. Overall, we do not anticipate that any savings will be material. We have established a working group to drive the development of a new water strategy that we intend to roll out before the end of 2025.
2.3.3 Waste
We have also implemented a zero waste to landfill (“ZWTL”) target. Waste sent to landfill bears both an economic cost borne by Magna, and an environmental cost borne by society as a whole. Although achievement of our ZWTL target will help reduce or eliminate the economic cost, we do not anticipate any such savings will be material. In 2024 we diverted 96.1% of waste generated away from landfill.
2.3.4 Biodiversity
In 2024, Magna established a working group which is developing a strategy in 2025 aimed at assessing our potential impact on biodiversity.
We maintain a phytosanitation program aimed at preventing the introduction and spread of plant diseases (i.e., pests and mold) through the cross-border import/export process. Our phytosanitation policy which applies to suppliers and shippers aligns with the International Plant Protection Convention (IPPC) standard for treatment of wood packaging material (e.g., wooden pallets), and includes the requirements of ISPM-15 (International Standards for Phytosanitary Measures). Our phytosanitation program includes training sessions for internal employees and suppliers, as well as reviews aimed at confirming compliance with our policy.
2.3.5 Packaging and Shipping
Magna’s Global Packaging and Shipping Guidelines are designed to promote safe and efficient packaging and shipping of materials to Magna facilities worldwide. These guidelines emphasize part quality, ergonomic considerations, and the use of sustainable materials to minimize environmental impact. Our suppliers are responsible for complying with these standards and ensuring material quality throughout the shipping process. The guidelines detail the development and approval process for packaging, outlining the responsibilities of both Magna and its suppliers. This includes defining preferred packaging systems, approving packaging plans, and ensuring compliance with local regulations. Specific requirements cover pricing, design, container selection, ergonomic considerations, and testing. Sustainability is a key focus, with guidelines promoting the use of recyclable materials and reducing waste. Magna encourages the use of resin identification codes for plastic packaging to facilitate recycling and discourages wasteful, excessive, or non-recyclable packaging. The guidelines follow a hierarchy of waste elimination: reduce, reuse, and recycle. Suppliers are expected to continuously identify and correct wasteful packaging practices, ensuring that all materials used are recyclable and contribute to a circular economy.
Magna International Inc. A-22
2.4 Resilience
The automotive industry as a whole is investing in innovations aimed at adapting mobility products and service solutions to a lower carbon economy. The risk mitigation factors below in “Section 3 – Climate-Related Risks and Risk Mitigation” and initiatives to realize opportunities discussed in this Section of the Sustainability Report, together with factors addressed in “Section 4 – Our Business & Strategy” of our AIF, are expected to promote our ability to adapt and succeed in a lower carbon economy.
A-23 Annual Information Form
3. Climate-Related Risks and Risk Mitigation
Magna maintains both top-down and bottom-up processes for identifying and assessing sustainability-related risks within the governance structure described in “Section 1 – Sustainability Governance” of this Sustainability Report. In order to fully understand the risks set out below, you should also carefully consider the risk factors set out in “Section 5 – Risk Factors” in our AIF.
3.1 Transition Risks and Risk Mitigation
3.1.1 Regulatory Policy Actions
Applicable near-term policy actions related to climate change generally fall into one of the following categories, each of which may have an indirect effect on Magna:
| ∎ | Average Fleet Emissions or Fuel Efficiency Regulations: Governments in key auto producing regions have set challenging average vehicle fleet emissions or fuel efficiency targets which OEMs must meet, including the European Union (“E.U.”), China, and the U.S., as detailed below. We regularly monitor changes in regulation relating to emissions and fuel efficiency as part of our strategic planning processes: |
European Union: E.U. regulations generally require OEMs to achieve E.U. fleet-wide average emissions of 93.6 g CO2/km for cars from 2025 to 2029 (153.9 g CO2/km for vans), and 49.5 g CO2/km (90.6 for g CO2/km vans) from 2030-2034, each based on the Worldwide Harmonized Light Vehicles Test Procedure (WLTP). As part of the E.U.’s approved “Fit for 55” legislation, the target is a 100% reduction from 2035 onwards, meaning 0g CO2/km for both cars and vans. Vehicle manufacturers with an average fleet economy in excess of the target must pay an excess emissions penalty for each vehicle registered within the E.U. Penalties levied on non-compliant OEMs may be passed on to vehicle-buying consumers, which could impact demand for such vehicles and thus demand for Magna products supplied for such programs. Additionally, E.U. regulations contain incentives aimed at promoting the development of Zero- and low-emission vehicles (“ZLEVs”). The CO2 emissions targets applying to any particular OEM will be relaxed if its share of ZLEVs registered within the E.U. in any year exceeds 25% from 2025 to 2029; however, such incentives will be eliminated under the Fit for 55 legislation from 2030 onwards.
China: China has maintained stringent (China VI) emissions regulations addressing particulate emissions since 2021. In 2023, a new phase of China’s emission standards, known as China VI-B, was implemented whereby non-compliant vehicles are no longer allowed to be produced, imported, or sold in China (subject to a 6-month grace period that ended December 31, 2023). China is accelerating the development of the China VII vehicle emission standards, which are expected to be officially released in 2025. These standards are expected to drastically reduce NOx, particulate matter, and CO2 emissions.
United States: The US EPA new vehicle emissions standards for passenger cars and light-duty trucks with model years 2023-2026 increase in stringency through that period, and would result in a fleetwide average fuel economy of approximately 40 mpg in 2026. In March 2024, the EPA issued its new emissions standards that would increase in stringency each year from model year 2027 to model year 2032. If maintained, the new standards would result in an industry-wide average target of:
| ∎ | 85 grams/mile of CO2 for light-duty vehicles by 2032, representing a 50% reduction in projected fleet average GHG emissions compared to 2026 model year standards, and |
| ∎ | 274 grams/mile of CO2 for medium-duty vehicles by 2032, representing a 44% reduction in projected fleet average GHG emissions compared to 2026 model year standards. |
In addition, in June 2024, the U.S. National Highway Traffic Safety Administration (NHTSA) announced the final corporate Average Fuel Economy (CAFE) standards - regulating how far vehicles must travel on a gallon of fuel for 2027 to 2031 model year vehicles. The standards would effectively bring the average light-duty vehicle fuel economy up to approximately 50.4 miles per gallon by model year 2031. In 2022, the U.S. also announced stricter standards on smog-forming emissions from trucks, vans and buses starting in the 2027 model year. The new EPA rules are more than 80% stronger than current rules and represent the first update to clean air standards for heavy-duty vehicles in over 20 years.
However, the new US administration has taken steps to roll back policies supporting electric vehicles (EVs), including eliminating EV purchase incentives, revoking the prior administration’s executive order targeting 50% of new vehicle sales to be zero-emission by 2030, and halting funding for EV infrastructure that had been earmarked in the US Inflation Reduction Act of 2022 and the Infrastructure Investments and Jobs Act. Additionally, the current administration has signaled plans to roll back some or all of the vehicle tailpipe emissions standards discussed above.
Globally, the EV market continues to grow, with nearly one in five cars sold in 2024 being electric. Countries like China and those in Europe are leading the charge with strong government support and incentives. At a global level, tightening emissions standards are intended to promote the transition to ZEVs. OEMs have been spending significant sums in R&D in order to meet the higher regulatory standards. Although production of ZLEVs/ZEVs is accelerating due to regulatory requirements, to the extent that ZLEVs/ZEVs do not sell at the levels expected, including as a result of governmental policy reversals, production volumes may need to be reduced. Lower than forecast production may impact our ability to recover various pre-production, tooling, engineering, and other costs incurred in advance of production, or to recover them within the timeframe initially contemplated in our business plan.
Magna International Inc. A-24
Additionally, we may experience production inefficiencies, including as a result of unutilized or underutilized production capacity and/or disruptions to our workforce plans at affected facilities.
| ∎ | Phase-Out of New ICE Vehicles: In addition to more stringent fleet emissions and fuel efficiency standards, the number of national and subnational jurisdictions committing to, or accelerating existing commitments to, phase-out of the sale or registration of new ICE engines is growing. As part of its Fit for 55 legislation, the E.U. will require 100% reduction in CO2 emissions by 2035 effectively banning the sale of new gasoline and diesel fueled vehicles in E.U. member countries by that date, with an interim reduction of 55% by 2030. |
The United Kingdom introduced new regulations (the Zero Emission Vehicle (ZEV) Mandate) in January 2024 requiring 22% of all new cars and vans sold by OEMs in the UK to be zero emission, with the percentage rising to 80% by 2030, and culminating in the complete ban on the sale of new ICE vehicles by 2035.
In North America, Canada has accelerated its mandatory phase out of ICE and diesel powered vehicles through the Electric Vehicle Availability Standard that requires all new sales of light-duty vehicles to be ZEVs by 2035; with interim targets requiring 20% ZEVs from 2026, and at least 60% by 2030. Companies offering vehicles for sale in Canada will be required to offer a growing percentage of their fleet as ZEVs starting in 2026 and increasing to 100 per cent by 2035. The Canadian government is also investing in charging infrastructure to support the increased adoption of ZEVs.
In the US, the State of California’s, California Air Resources Board (CARB) has adopted the Advanced Clean Cars II regulations. The regulations ban ICE-powered vehicles in California by 2035, and include progressive targets for ZLEVs in the intervening years. Several US States and the District of Columbia have existing laws that require state emissions policies to mirror those of California. Currently 17 US states have adopted all or part of California’s low-emissions or zero-emission vehicle regulations. In addition, the following US states have adopted California’s Advanced Clean Cars II regulations: Colorado; Delaware; Maryland; Massachusetts; New Jersey; New Mexico; New York; Oregon; Rhode Island; Vermont; Washington and the District of Columbia.
Given the long lead times for vehicle development such regulation and proposed regulation are expected to increasingly impact OEM and automotive supplier product planning and development this decade, and have led to several OEM establishing EV targets for specific brands or their complete vehicle offerings. Although the number of EVs sold globally continues to grow, the rate of sales growth began to slow in 2024. As a result, certain OEMs (primarily in North America) have been updating their EV strategies by deferring or cancelling planned EV programs and/or reducing production volumes for current programs. As a result of these actions, we may be unable to recover various pre-production, tooling, engineering, and other costs incurred in advance of production, or to recover them within the timeframe initially contemplated in our business plan. Additionally, we may experience production inefficiencies, including as a result of unutilized or underutilized production capacity and/or disruptions to our workforce plans at affected facilities. Despite the program deferrals discussed above, each of our top six customers maintains ambitious targets for greater EV production by the 2030-2035 period. EVs accounted for approximately 13% of total of global light vehicle production in 2024, and are projected to reach 32% by 2030 (45% by 2035) based on current S&P Global (Autobase) light vehicle production forecasts.
| ∎ | Vehicle Restrictions in Congested Urban Centres: municipal governments in a number of cities around the world have introduced restrictions on personal-use vehicles in congested urban centres, in an effort to reduce CO2 emissions and improve urban air quality. Examples of the types of restrictions include: car-free zones; toll charges; and use restrictions by license plate. Continued expansion of such initiatives could reduce the demand for personal-use vehicles, which could affect our profitability. |
We attempt to mitigate applicable policy risks relating to climate change-related regulation in a number of ways, including:
| ∎ | monitoring and evaluating global regulatory developments; |
| ∎ | early-stage interaction with our OEM customers to understand their product priorities and regulatory compliance requirements; |
| ∎ | in-house R&D, including our ongoing analysis of industry and other trends, combined with investment strategies in mobility and technology start-ups; and |
| ∎ | strategic planning processes at both Operating Group and Corporate levels, including Board oversight of strategic plans. |
In terms of direct policy actions affecting our operations, we anticipate continued strengthening of environmental regulations related to industrial emissions and discharge of pollutants to air, water and ground. We currently face strict environmental regulations in the countries where we operate and have developed a global environmental management program in order to comply with or exceed regulatory standards. Our environmental management program is regularly updated to address changing environmental laws and regulations. Refer to “Section 4.1 – Environmental Stewardship” in this Sustainability Report for a description of the program.
A-25 Annual Information Form
In considering the potential impact of the above or other climate-related policy actions, readers are encouraged to review the following risk factors in “Section 5 – Risk Factors” in our AIF:
|
∎ Threats to Free Trade Agreements |
∎ Growth of EV-focused OEMs |
|
|
∎ International Trade Disputes |
∎ Risks of Conducting Business with Newer |
|
|
∎ Geopolitical Risks North American Electric Vehicle Program |
EV-Focused OEMs |
|
| Deferrals, Cancellations and Volume Reductions |
∎ Impairments |
|
|
∎ Regional Volume Declines |
∎ Changes in Laws |
|
|
∎ Deteriorating Vehicle Affordability |
∎ Market Shifts |
|
|
∎ Consumer Take Rate Shifts |
∎ Customer Purchase Orders |
|
|
∎ Uncertain Pace of EV Adoption |
∎ Customer Pricing Pressure/Contractual Arrangements |
|
|
∎ Evolution of the Vehicle |
∎ Environmental Compliance |
Over the medium-to long-term, carbon pricing initiatives may present a risk to our profitability. According to the World Bank, in 2024 there were 110 carbon pricing initiatives implemented or scheduled for implementation in 53 countries and 40 sub-national jurisdictions, which would cover emissions representing 24% of global GHG emissions.
Currently, some of our operations are impacted by two emissions trading schemes:
| ∎ | E.U. Emissions Trading Scheme (ETS): Our Magna Steyr complete vehicle assembly operations participate in the E.U. Emissions Trading Scheme which works on the ‘cap and trade’ principle. A cap is set on the total amount of certain GHG that can be emitted by the operators covered by the system. The cap is reduced over time so that total emissions fall. Within the cap, operators purchase or receive emissions allowances, which they can trade with one another as needed. The limit on the total number of allowances available ensures that they have a value. The price signal incentivizes emission reductions and promotes investment in innovative, low-carbon technologies, while trading brings flexibility so that emissions are cut where it costs least to do so. After each year, an operator must surrender enough allowances to cover fully its emissions, otherwise heavy fines are imposed. If an installation reduces its emissions, it can keep the spare allowances to cover its future needs or else sell them to another operator that is short of allowances. |
| ∎ | Ontario Emission Performance Standards (EPS) Program: While none of our facilities are currently mandated to join the EPS Program, two of our facilities in Ontario voluntarily participate in the Program, and several other of our Ontario facilities may also voluntarily opt in. The Province of Ontario Emissions Performance Standards Regulation is used to determine an emissions limit that industrial facilities must meet each year, with the intent of, among other things, encouraging Ontario’s industrial sector to reduce greenhouse gas emissions. Facilities registered under the Ontario EPS must quantify and report their GHG emissions data to the authorities, have such emissions data verified and must comply with their emissions limits. The compliance obligation for a facility under the Ontario EPS program is the difference between its verified total emissions and its verified total annual emissions limit imposed by the Ontario EPS program. A facility can satisfy its compliance obligation either by reducing its GHG emissions or submitting a compliance instrument. The two compliance instruments available are (i) excess emissions units (EEUs) where the facility pays a carbon price per tons of CO2e for exceeding the annual emissions limit; and (ii) emissions performance units (EPUs), which are credits earned by a facility for emitting less GHG that its annual emissions limit under the Program. The Program aligns carbon prices for future years with Canada’s federal benchmark, which will result in the price of EEUs to increase annually. |
The carbon pricing schemes discussed above have not significantly impacted our profitability to date. We are pursuing energy reduction measures and developing decarbonization strategies for our manufacturing facilities as detailed in this Sustainability Report. However, over the medium- to long-term, carbon pricing initiatives could affect our profitability to the extent we are unable to implement cost-saving or energy reduction measures within a timeframe and/or at a cost which enables us to offset or avoid the cost of carbon pricing initiatives.
3.1.2 Customer-Driven Policy Actions
A number of our OEM customers have set carbon reduction targets and are challenging Tier 1 Suppliers to support such targets. Some such OEM targets and expectations are more aggressive than our own decarbonization targets. In some cases, we are being asked to quote the supply of future programs based on 100% renewable energy use for production. Although we expect to meet or exceed our customers’ expectations, the inability to do so within the timeframes expected could result in the loss of some future business.
3.1.3 Climate-Related Litigation
We do not currently believe that climate-change related litigation represents a significant legal risk for us. However, if OEMs are adversely impacted by climate-change litigation, there is a possibility that Tier 1 Suppliers like Magna could face additional pricing pressure. Readers are encouraged to review the “Customer Pricing Pressure/Contractual Arrangements” risk factor in “Section 5 – Risk Factors” in our AIF.
3.1.4 Technology
Investments in automotive technologies that support the transition to ZLEVs can be significant, particularly in product areas such as battery systems for hybrid and EVs. While our product strategy does not currently include battery systems or other components which generate or store energy for ZLEVs, we have been awarded several battery enclosure programs and currently offer a range of electrified drivetrain products, hybrid dual-clutch transmissions (“HDTs”), dedicated hybrid transmissions (“DHTs”), as well as complete electric-drive (“e-Drive”)
Magna International Inc. A-26
systems. We have also expanded our product offering into other areas relevant to ZLEVs – for example, in conjunction with a joint venture partner, we can offer customers a complete EV platform. Our R&D spending for electrification solutions has been significant over the last few years and is expected to continue to be in coming years as electrification-related technologies continue to evolve. Additionally, our OEM customers are making significant investments in the development of ZLEVs, which is impacting their profitability and could lead to increased pricing pressure on us.
As ZLEVs increase their proportion of the overall vehicle market over the medium-to-long-term, we expect our sales of manual transmissions and traditional DCTs to decline, and sales of HDTs, DHTs and e-Drive systems to increase. The increasing adoption of electrified drivetrain solutions adversely impacts our AWD and 4WD businesses over the long term, since it is possible to achieve AWD through the use of electric motors in hybrid or fully-electrified drivetrains. However, OEM product plans show mechanical AWD and 4WD programs extending out for approximately the next decade. We seek to offset displacement of mechanical AWD and 4WD systems through increased sales of electrified product offerings such as e-Drive systems.
Overall, we believe that the range of products we offer our OEM customers provides us with a competitive advantage and an effective hedge against the market uncertainties associated with the transition to ZLEVs. As illustrated below, a substantial majority of our products are “agnostic” with respect to the type of vehicle propulsion system used, and therefore remain relevant to ZLEVs.
In the case of drivetrain products, we view the know-how gained from our mechanical drivetrain expertise as being critical to our ability to deliver innovative electrified solutions that meet our customers’ needs. In addition to continuing to offer a range of mechanical and electrified drivetrain products, we aim to mitigate technology transition risks through:
| ∎ | early-stage interaction with our OEM customers to understand their product priorities and regulatory compliance requirements; |
| ∎ | in-house R&D including our ongoing analysis of industry and other trends, combined with investment strategies in mobility and technology start-ups; and |
| ∎ | strategic planning processes at both Operating Group and Corporate levels, including Board oversight of strategic plans. |
In considering the potential impact of the above or other climate-related policy actions, readers are encouraged to review the following risk factors in “Section 5 – Risk Factors” in our AIF:
|
∎ Intense Competition |
∎ Restructuring Costs |
|
|
∎ Consumer Take Rate Shifts |
∎ Technology and Innovation |
|
|
∎ Growth of EV-Focused OEMs |
∎ Changes in Laws |
|
|
∎ Risks of Conducting Business with Newer |
∎ Market Shifts |
|
| EV-Focused OEMs |
∎ Dependence on Outsourcing |
|
|
∎ Deteriorating Vehicle Affordability |
∎ Impairments |
|
|
∎ Uncertain Pace of EV Adoption |
∎ Customer Pricing Pressure/Contractual Arrangements |
|
|
∎ Evolution of the Vehicle |
∎ Investments in Mobility and Technology Companies |
|
|
∎ Customer Purchase Orders |
∎ Intellectual Property |
3.1.5 Market
Some of the risks impacting the market for our products in the transition to a lower carbon economy are described above under “Section 3.1.1 – Regulatory Policy Actions” and “Section 3.1.4 – Technology”. Additionally, there are potential risks to the demand for personal mobility vehicles, and thus for our products, from technology-driven shared mobility solutions such as ride hailing and ride sharing. To date, such shared mobility solutions have not had a material impact on the demand for new vehicles and no such adverse effect is expected in the near- to medium-term. In any event, our own strategy related to new mobility seeks to mitigate risks to our business and realize opportunities based on the breadth of capabilities we can offer new mobility customers.
Additionally, in order to enhance our understanding of potential shifts in consumer behavior, we conduct our own analysis of various factors that are expected to drive future personal and shared mobility trends, including through:
| ∎ | monitoring and analysis of social, digital, demographic, regulatory, industry, geopolitical and other trends which may create demand for and drive development of new automotive and mobility technologies; |
| ∎ | review of academic research; |
| ∎ | collection and screening of ideas submitted through innovation programs; and |
| ∎ | early-stage interaction with our OEM customers and new mobility market entrants to understand their product priorities. |
We do not currently anticipate long-term supply constraints on key commodities required by us in our business, including steel, aluminum or resin. However, production processes for steel and aluminum are carbon intensive, with relatively scarce supply of low-carbon alternatives. As the entire industry’s decarbonization and net-zero efforts increase, the price of low-carbon steel and aluminum may increase in the near- and medium-terms until the supply of low-carbon product is sufficient to meet growing demand. In the near- and medium-term, the increasing production of ZLEVs may also strain supplies of the rare earth minerals and other metals required for vehicle battery systems, which we do not supply, including nickel, cobalt and lithium used in EV batteries, copper for EV charging infrastructure and rare earth metals for EV motor magnets. Geopolitical events and trade disputes, can also significantly impact the supply of rare earth minerals by creating uncertainties and volatility in global markets. Such disputes often result in tariffs, export restrictions, or other measures that can strain supplies of critical materials. However, such supply constraints could help spur the development of alternative battery technologies or low carbon fuels and/or promote technological breakthroughs that could facilitate market penetration of hydrogen fuel cell or other technologies.
A-27 Annual Information Form
We intend to continue developing and offering solutions such as e-Drive systems which are neutral as to electric power source (battery or hydrogen fuel cell stack) in order to mitigate potential risks related to supply constraints of rare earth minerals or other commodities needed for current ZLEV power source technologies.
In considering the potential impact of market risks, readers are encouraged to review the following risk factors in “Section 5 – Risk Factors” in our AIF:
|
∎ North American Electric Vehicle Program Deferrals, |
∎ Supply Chain Disruptions |
|
| Cancellations and Volume Reductions |
∎ Quote/Pricing Assumptions |
|
|
∎ Interest Rates |
∎ Commodity Price Volatility |
|
|
∎ Intense Competition |
∎ Technology and Innovation |
|
|
∎ Consumer Take Rate Shifts |
∎ Market Shifts |
|
|
∎ Uncertain Pace of EV Adoption |
∎ Dependence on Outsourcing |
|
|
∎ Evolution of the Vehicle |
∎ Customer Pricing Pressure/Contractual Arrangements |
|
|
∎ Deteriorating Vehicle Affordability |
∎ Investments in Mobility and Technology Companies |
|
|
∎ Growth of EV-Focused OEMs |
||
|
∎ Risks of Conducting Business with Newer |
||
| EV-Focused OEMs |
3.1.6 Reputation
Since light vehicles are contributors to global GHG emissions, Tier 1 suppliers like Magna may face reputational risks from participation in the automotive industry. Examples of such risk types include potential loss of business from sustainability-focused customers, reduced investor demand for our shares, and challenges attracting talent. A number of our OEM customers are embedding sustainability criteria in their sourcing decisions and could reduce purchases from us if they perceive Magna to lag other suppliers with respect to sustainability. Stakeholders, including investors and employees, as well as prospective employees are increasingly focused on companies’ sustainability efforts. Investors may sell shares of investee companies perceived to be less sustainable. In addition, younger workforce demographics want to work in companies they perceive as sustainable, making it difficult for companies to attract such talent if the company is perceived as lagging. However, OEMs and Tier 1 Suppliers have been proactively adapting to climate change and transitioning to a lower carbon economy, as evidenced by the significant spending on R&D and technological innovation to reduce CO2 emissions, particularly through electrification and powertrain efficiency, as well as the setting of decarbonization targets in their own operations. At the same time, particular OEMs may be viewed as more or less sustainable based on their sustainability strategies and commitment to transitioning to a lower-carbon economy. Equally, particular vehicle models or even entire vehicle segments may be perceived to be more or less sustainable. As a supplier of a broad range of systems to all major OEMs, we do not anticipate any consequences to our reputation by virtue of the fact that we may supply to any particular OEM, vehicle or vehicle segment. In any event, we believe that our R&D and technological innovation, which is focused on lightweighting, improved fuel economy and lower emissions, together with our sustainability strategy, including our net-zero commitments, and respectable ESG ratings, serve to mitigate potential reputational risks.
3.2 Physical Risks and Risk Mitigation
3.2.1 Acute
With the increased frequency and severity of extreme weather events associated with Climate change, including floods, windstorms, wildfires, tornados, tsunamis, hailstorms and other natural weather hazards, we face the risk that such an event could cause significant damage to one or more of our facilities or those of our customers and/or sub-suppliers. While our primary concern in an acute climate event affecting one of our facilities would be the safety and well-being of our employees, property damage and business interruption would represent the primary financial risk.
An acute climate event that significantly damages one of our facilities, could disrupt our production and/or prevent us from supplying products to our customers. Such an event could lead to us incurring a number of costs, many of which may be unrecoverable, including: costs related to the physical repair of any damage to our facility; costs related to premium freight or re-sourcing of supply; penalties or business interruption claims by our customers; loss of future business and reputational damage; and higher insurance costs going forward.
Extreme climate events could also disrupt supply chains for the entire industry over the near-, medium- and long-term. The National Centers for Environmental Information, a U.S. federal agency, estimates that the number of billion-dollar weather and climate disasters in the United States has risen significantly to an annual average of 23 in the last five years, from an annual average of three per year in the 1980s. In recent years, a number of supply disruptions resulting from extreme weather have occurred around the world, including:
| ∎ | A hurricane in the U.S. Gulf Coast that caused delays in automotive component deliveries and production halts. |
| ∎ | Typhoons in Southeast Asia that damaged infrastructure and logistics networks in Vietnam and Thailand, impacting the supply of automotive components. |
| ∎ | Flooding in India and Bangladesh that disrupted production and delivery of raw materials needed for automotive manufacturing. |
Magna International Inc. A-28
Such events can cause shortages of critical materials, which in turn drives prices higher. Efforts to mitigate the impact of such events often result in higher near-term costs until disruption of the affected material has been resolved, due to factors such as premium freight costs for substitute materials. As the frequency of such events increases, we may be forced to maintain higher inventories of various materials and components required for production, to minimize potential disruptions.
We maintain a global property risk control (PRC) program to support our efforts to mitigate risks to our employees’ safety, physical property risks and potential for business interruption due to extreme weather events. The program, which includes risk engineering with support from a third party property risk engineering consulting firm, includes the following elements to promote the physical resiliency of our facilities and minimize the risk of disruption to our operations: pre-screening of facility site selection; acquisition risk assessments; periodic facility inspections; facility construction design review and recommendations; and training and education. Our third party risk engineering consultant typically engages in over 200 physical on-site assessments annually to evaluate various risks, including those relating to natural hazards and also conducts targeted analysis of areas of concern. Using the Swiss Re CatNet and Munich Re natural catastrophe databases, the advisor has analyzed over 400 unique Magna locations to assess climate related exposures, including: flood, wind, storm surge, wildfire, tornado. tsunami, hailstorm, lightning, temperature change, precipitation, sea level rise risk and water security. The results of the analysis form the basis of discussions with our PRC group regarding potential risk control recommendations to be implemented in our facilities.
In certain circumstances, the program extends the risk assessment to our direct suppliers by identifying and evaluating potential exposures to our direct supply chain (including natural hazards) which could potentially disrupt business operations. To augment our monitoring capabilities, we use a third party software platform that, among other things, includes live monitoring of supply chain risks, including weather events such as drought, floods, earthquakes, landslides, and tropical storms. Where such supply chain exposures are identified, a more detailed assessment may be performed to better understand the supply chain risk, including further on-site assessment, where practicable.
In considering the potential impact of acute physical risks, readers are encouraged to review the following risk factors in “Section 5 – Risk Factors” in our AIF:
|
∎ Supply Chain Disruptions |
∎ Legal and Regulatory Proceedings |
|
|
∎ Semiconductor chip supply |
∎ Climate Change Risks – Transition and Physical Risks |
|
| disruptions and price increases |
||
|
∎ Regional Energy Supply and Pricing |
An extreme weather event that damages any of our manufacturing Divisions and results in injuries or fatalities among employees at such Division could have a material adverse effect on our reputation and could result in legal claims being brought against us.
Climate change considerations may impact the availability of and premiums for insurance coverage in general, and in particular, for properties in high-risk locations. Additionally, we may need to self-insure a higher level of risk, which could result in a material adverse effect on profitability in the event of an extreme weather event which causes damage to one or more of our facilities.
3.2.2 Chronic
As part of our PRC program, we have retained an advisor to map our global footprint against identified earthquake, wind exposed/ hurricane, flood exposed and wildfire zones, as well as areas with low water security, in order to assist us with footprint planning, as well as our understanding of, and efforts to address, potential risks associated with such types of natural catastrophes. This footprint mapping exercise provided the following conclusions:
| ∎ | Property Risk Concentrations: The top ten geographic regions in which we have large concentrations of property/asset risk, meaning multiple locations within a 35 km radius, comprise approximately 46% of the total insured value (“TIV”) under the property risk program. These geographic regions are located in Austria, Canada, Germany, Mexico and the U.S.A. All of the regions of concentrated property/asset value are considered to be “Low” seismic hazard zones and are not exposed to tropical cyclones. |
| ∎ | Seismic Zones: Scientific research is increasingly linking the effects of climate change on seismic activity. More specifically, it is believed that changes in climate that alter ice and water loads could lead to more more frequent fault movements and earthquakes due to rapidly changing stress conditions. We have operations in Austria, Germany, Slovenia, Slovak Republic, Morocco, Portugal, India, Turkey, Japan, Italy, Romania, North Macedonia, Serbia, China, the U.S., and Mexico comprising approximately 5% of the TIV under our property risk program, which are located in regions of “moderately high” or greater seismic hazard. There are no Magna operations in regions where the seismic hazard is considered “Very High” or “Extreme”. |
| ∎ | Tropical Cyclone Zones: Operations in certain parts of Mexico, Japan, China, India, and the U.S. comprising approximately 4% of the TIV under our property risk program are located in hurricane risk Zone 1 to Zone 5, with 2 locations in Mexico, 1 location in China, |
A-29 Annual Information Form
| 1 location in India and 1 in the USA falling in Zone 3, as per Munich Re’s Natural Hazards Assessment Network (NATHAN) categorization. TIV by Tropical Cyclone Zones are as follows: |
| Munich Re (NATHAN) Tropical Cyclone Zone |
Proportion of TIV | |||
| Zone 5: > 300 km/h |
NIL | |||
| Zone 4: 252-300 km/h |
NIL | |||
| Zone 3: 213-251 km/h |
0.7 | % | ||
| Zone 2: 185-212 km/h |
2.2 | % | ||
| Zone 1: 142-184 km/h |
6.9 | % | ||
| Zone 0: 76-141 km/h |
19.1 | % | ||
| No hazard: < 76 km/h |
71.1 | % | ||
| ∎ | Flood Zones: Flood risk is typically categorized as 50-year, 100-year, 200-year and 500-year flood risks. Definitions of these categories based on Swiss Re’s CatNet Global Flood Zone (GFZ) categorization showing the number of our locations and the proportion by TIV for each category are as follows. The information provides insights into possible flood hazards across the property portfolio. Site specific flood hazard determination requires highly precise geocoding, site finished floor elevation and other related construction details. In many cases, site-level review and validation were completed to confirm the exposure: |
| Category |
Flood Probability | Number of Locations |
Proportion of TIV within 5 km Radius |
|||||||
| 50 year |
1 in 50 (2%) chance of occurring in a year | 22 | 1.3% | |||||||
| 100 year |
1 in 100 (1%) chance of occurring in a year | 70 | 10.1% | |||||||
| 200 year |
1 in 200 (0.5%) chance of occurring in a year | 104 | 12.1% | |||||||
| 500 year |
1 in 500 (0.2%) chance of occurring in a year | 38 | 2.7% | |||||||
| Outside |
Outside recognized flood zones | 532 | 73.9% | |||||||
Climate change is associated with a rise in sea levels as well as an increase in the frequency and severity of flooding, which places properties located within a five kilometres radius of the current coastline at greater risk of coastal flooding. A total of thirteen (13) of our Divisions are located five kilometres or closer to a coastline or body of water and thus may be at higher risk from the effects of climate-change related sea rise or flooding:
| No. of Divisions |
Location(s) | Body of Water | ||
| 2 |
Michigan, U.S. | Lake Michigan | ||
| 1 |
Ohio, U.S. | Lake Erie | ||
| 1 |
California, U.S. | San Pedro Creek | ||
| 1 |
Ontario, Canada | Lake Ontario | ||
| 1 |
Liverpool, U.K. | River Mersey | ||
| 1 |
Bari, Italy | Adriatic Sea | ||
| 1 |
Kocaeli, Turkey | Lake Sapanca | ||
| 1 |
Tangier, Morocco | Atlantic Ocean | ||
| 1 |
Santa Catarina, Brazil | Rio Piral | ||
| 1 |
Hangzhou, China | East China Sea | ||
| 1 |
Taizhou, China | East China Sea | ||
| 1 |
Kanagawa, Japan | Onda River | ||
Two of such Divisions (Kocaeli, Turkey and Taizhou, China) representing less than 0.1% of TIV are located within one kilometre of a coastline.
| ∎ | Wildfires: One of our Divisions located in Brazil, representing less than 1% of TIV, is considered as being exposed to significant wildfire risk. All other wildfire risk is considered moderate to negligible. Wildfire risk is reviewed based on proximity to forests and grasslands with consideration of topography and climate conditions. |
Magna International Inc. A-30
| ∎ | Tornados: The review of tornado hazard is based on the historical occurrence and the intensity of F2 to F5 (see F-Scale below) events based on meteorological data. Approximately 85% of property values fall within the moderate to “no tornado observed” categories, based on Swiss Re’s hazard data. The other 15% fall within the significant, high and very high categories, represent various locations in the U.S. |
| Fujita Scale (F-Scale) |
||
| F0 |
< 73 MPH | |
| F1 |
73 to 112 MPH | |
| F2 |
113 to 157 MPH | |
| F3 |
158 to 206 MPH | |
| F4 |
207 to 260 MPH | |
| F5 |
261+ MPH | |
| Category |
F2 – F5 Tornados per year (per 2,500 sq km) |
Number of Locations |
Proportion of TIV |
|||||||
| Very High |
> 0.75 Tornados per year | 4 | 1.9 | % | ||||||
| High |
> 0.5 to < 0.75 Tornados per year | 18 | 5.8 | % | ||||||
| Significant |
> 0.35 to < 0.5 Tornados per year | 51 | 7.3 | % | ||||||
| Moderate |
> 0.2 to < 0.35 Tornados per year | 46 | 7.3 | % | ||||||
| Low |
> 0.1 to < 0.2 Tornados per year | 179 | 17.3 | % | ||||||
| Very Low |
< 0.1 Tornados per year | 332 | 41.1 | % | ||||||
|
No Observation |
Not in tornado zones | 136 | 19.4 | % | ||||||
| ∎ | Water Security: Water scarcity is a chronic condition in a number of regions of the world, and it is expected to be amplified due to the effects of climate change. |
As part of our Property Risk Management program we conducted an assessment of water security risk in 2022. Water security suggests the reliability/ security of an acceptable quantity and quality of water, since water is a critical input in many production processes as well as the lifeblood of sprinkler protection systems. A reduction or failure of water supply could cause a significant impact on operations in the affected region. The methodology for determining water security exposure was based on the “Baseline Water Stress” 4 of the World Resources Institute (WRI) Aqueduct Global Maps 3.0, that measures the ratio of water withdrawals to available renewable surface and groundwater at the catchment scale. Water withdrawals include domestic, industrial, irrigation, and livestock consumptive and non-consumptive uses. Available renewable water supplies include the impact of upstream consumptive water users and large dams on downstream water availability. The indicator used is calculated by inverting the “Baseline Water Stress” scores and converted to a 0-100 scale to represent “Water Availability” as a percentage. Low values represent water stressed areas, due to either high water withdrawals or low water supplies.
The 2022 assessment showed that there were 61 locations in regions deemed to have “low” water security, comprising approximately 14% of 2022 TIV. The assessment indicated exposure locations in China, Germany, India, Italy, Mexico, Spain and the United States. However, Mexico represented the most significant region in terms of exposure to water security risks, as approximately 50% of the affected locations were in Mexico. While we currently attempt to mitigate the impact of water scarcity risks through water reduction and re-use activities, including the use of treated waste water for irrigation of green areas on a site, the water security analysis is used for additional discussions with our risk engineering consultant, including potential additional recommendations for action plans to mitigate water security risks in the affected regions.
In considering the potential impact of chronic physical risks, readers are encouraged to review the following risk factors in “Section 5 – Risk Factors” in our AIF:
|
∎ Supply Chain Disruptions |
∎ Regional Energy Shortages and Pricing |
|
|
∎ Climate Change Risks – Transition and Physical Risks |
A-31 Annual Information Form
4. Non-Climate Elements of Sustainability
4.1 Environmental Stewardship
| 270+
FACILITIES ISO 14001 CERTIFIED
25+
FACILITIES ISO 50001 CERTIFIED
|
Magna strives to be an industry leader in health, safety and environmental practices in all operations through technological innovation and process efficiencies to minimize the impact of our operations on the environment and to provide safe and healthful working conditions. In furtherance of this objective, Magna’s Health, Safety and Environmental Policy (“HSE Policy”) commits Magna to, among other things:
∎ complying with, and exceeding where reasonably possible, all applicable health, safety and environmental laws and regulations and conforming with our internal standards based on generally accepted environmental practices and industry codes of practice; ∎ regularly evaluating and monitoring past and present business activities impacting on health, safety and environmental matters; ∎ improving the efficient use of natural resources, including energy and water; ∎ minimizing waste streams and emissions, including CO2e; ∎ implementing environmental sustainability targets as defined in the Magna Environmental Principles which are available on our wesbite; ∎ utilizing innovative design and engineering to reduce the environmental impact of our products during vehicle operation and at end of life; ∎ ensuring that a systematic review program is implemented and monitored at all times for each of |
|||
| our operations, with a goal of continuous improvement in health, safety and environmental matters and zero accidents or environmental incidents; and |
||||
| ∎ reporting to the Board at least annually. |
||||
The full text of the HSE Policy is located on Magna’s website (www.magna.com).
Magna International Inc. A-32
4.1.1 Environmental Compliance
Magna is subject to a wide range of environmental laws and regulations relating to emissions, soil and ground water quality, wastewater discharge, waste management and storage of hazardous substances. Magna maintains a global environmental program which consists of both internal and third party audits and inspections of our facilities for compliance with local regulations, internal corporate environmental requirements and industry best practices as detailed below:

General environmental awareness training is provided to employees by Division management as well as Magna’s Environmental Department as part of ISO 14001 certification compliance. In addition, Magna’s Environmental Department holds regular conferences for representatives of our manufacturing facilities in order to:
| ∎ | reinforce Magna’s commitment to environmental responsibility; |
| ∎ | communicate changes in local and regional regulations; and |
| ∎ | share best practices with respect to environmental protection, compliance and sustainability initiatives. |
4.1.2 Hazardous Waste and Industrial Emissions
We operate a number of manufacturing facilities that use environmentally-sensitive processes and hazardous materials. We believe that all of these operations meet, in all material respects, applicable governmental standards for management of hazardous waste and industrial emissions. Occasionally our operations may receive a notice of violation or similar communication from local regulators during routine reviews. We have in the past and will continue in the future to address any such notices promptly. Based on our preliminary data, approximately four percent of the aggregate waste generated by Magna in 2024 was hazardous, similar to 2023. We attempt to reduce the amount of hazardous waste that ends up in secure landfills through: recycling, reuse or energy recovery initiatives. Approximately 94% of the hazardous waste generated by Magna in 2024 was diverted from secure landfills through such initiatives.
A-33 Annual Information Form
4.2 Fairness and Concern for Employees
|
|
4.2.1 Our Commitment to Magna Employees
|
|
| We are committed to an operating philosophy based on fairness and concern for people. This philosophy is one in which employees and management share in the responsibility of ensuring our company’s success. Our Employee’s Charter, a foundational document in our business, sets out this philosophy through the following principles: |
||
|
∎ Job Security – Being competitive by making a better product for a better price is the best way to enhance job security. Magna is committed to working together with employees to help protect their job security. To assist employees Magna will provide job counselling and training, as well as employee and family assistance programs. |
||
|
∎ A Safe & Healthful Workplace – Magna is committed to providing employees with a working environment which is safe and healthful. |
||
|
∎ Fair Treatment – Magna offers equal opportunities based on an individual’s qualifications and performance, free from discrimination or favouritism. |
||
|
∎ Competitive Wages & Benefits – Magna provides employees with information which enables them to compare their total compensation, including wages and benefits, with those earned by employees of their direct competitors and local companies their Division competes with for people. If total compensation is found not to be competitive, it will be adjusted. |
||
|
∎ Employee Equity & Profit Participation – Magna believes that every employee should share in the financial success of the company. |
||
|
∎ Communication & Information – Through regular monthly meetings between management and employees, continuous improvement meetings and through various publications and videos, we keep our employees informed about company and industry developments. We also conduct regular employee opinion surveys to help facilitate employee engagement and to receive valuable feedback from employees to help drive continuous improvement. |
||
|
∎ The Hotline – Should an employee have a problem, or feel the above principles are not being met, we encourage them to contact the Hotline to register their complaint(s). Those using the Hotline do not have to give their name, but if they choose to do so, it will be held in strict confidence. Hotline Investigators will respond to those using the Hotline. The Hotline is committed to investigating and resolving all concerns or complaints and must report the outcome to Magna’s Global Human Resources Department. We also maintain a confidential and anonymous whistle-blower hotline for employees and other stakeholders that is overseen by our Audit Committee. See Section 4.5 – “Corporate Ethics and Compliance” below for further details. |
||
|
We also maintain a Global Labour Standards Policy, which codifies our existing practices consistent with our Fair Enterprise culture. This Policy provides a framework for our commitment to fundamental human rights and international standards that help support positive employee relations, including: |
||
|
∎ promoting the importance of diversity, inclusion, and respect for one another, regardless of personal differences; |
||
|
∎ not tolerating harassment of any kind, including physical, sexual, psychological or verbal abuse; |
||
|
∎ ensuring employees do not face discrimination in accordance with the protections afforded by applicable law, including discrimination based on race, nationality or social origin, colour, sex, religion, gender identity, disability or sexual orientation; |
||
|
∎ condemning child labour; |
||
|
∎ rejecting forced or compulsory labour; |
||
|
∎ maintaining safe and healthy workplaces; and |
||
|
∎ providing employees with appropriate rest and leisure time. |
||
|
We publish a Slavery and Human Trafficking Statement setting out the steps Magna has taken to address the risk of slavery and human trafficking in our operations and supply chain. The statement can be found in the “Financial Reports & Public Filings” section of our website, at www.magna.com. |
||
|
Our commitment to our employees continued to garner recognition, including: |
||
|
∎ Forbes: America’s Best Large Employers (2025) |
||
|
∎ Forbes: Canada’s Best Employers (2023 and 2024) |
||
|
∎ Fortune: World’s Most Admired Companies (2023 & 2024) |
||
|
∎ Built in: Best Places to Work (2023 and 2024) |
||
|
∎ “Open Company” Certification from Glassdoor |
||
|
∎ Mercer China: Healthiest Workplace Awards (2024-2025) |
||
|
∎ Zhaopin: China Best Employer Award (2024) |
||
|
∎ Universum: Most Attractive Employer Award – Austria, Canada & Mexico (2024) |
||
|
∎ 51job: 100 Excellence Employer of China of 2024; Excellence in Diversity and Inclusion (2024); Top Graduate Employer Brands (2024) |
Magna International Inc. A-34
4.2.2 Collective Rights
We are committed to providing workplace environments that promote the dignified, ethical, and respectful treatment of our employees, as reflected in the standards contained in our Global Labour Standards Policy and our Code of Conduct and Ethics (“Code”).
Our Global Labour Standards Policy articulates our respect for employees’ right to associate freely and to choose for themselves whether or not they wish to be represented by a third party in accordance with local laws. We operate both unionized and non-unionized facilities across multiple regions, as well as having facilities where other forms of representative structures exist, such as works councils, and/or where industry-wide tariff agreements apply. In our core regions such as the Americas, Europe and Asia, we have a number of locations formally represented by trade unions, where local collective bargaining agreements are in place. Where such arrangements exist, we strive to maintain positive and productive business relationships with these organizations, resulting in competitive industry agreements.
Employees in our unrepresented facilities benefit from a system of progressive and people-focused human resources policies, coupled with consultative concern resolution programs which include our Fairness Committee, Employee Advocates, Employee Opinion Survey, Open- Door Process and our Hotline, all designed to proactively address individual and workplace issues in a constructive and respectful manner.
4.2.3 Magna’s Open-Door Process
Magna maintains a comprehensive Open-Door Process, whereby employees are empowered to bring issues and concerns forward to leadership at all levels of the organization, without fear of retaliation. This process enables management and employees to collaborate on resolving workplace issues together. This process includes regular use of Employee Opinion Surveys, focus groups, and local continuous improvement action plans, focused on maintaining a positive workplace environment.
As a part of our Open-Door Process, we maintain Fairness Committees in many of our North American and European manufacturing facilities, as well as at various manufacturing facilities in India and China. These Fairness Committees enable employees to have many of their concerns resolved by a peer review committee comprised of both management and fellow employees. Most of our North American manufacturing facilities also have an Employee Advocate who works with our employees and management to help address any concerns that arise in the workplace quickly and in accordance with our Employee’s Charter, Global Labour Standards Policy and Operational Principles.
4.2.4 Leadership Development / Talent Management
Our talent management strategy is closely aligned with our current business objectives and the ongoing transformation in the automotive industry. Recognizing the increasing need for a lean and digitally adept workforce, we focus on building such an employee base through targeted attraction and recruitment, professional development and succession planning.
Central to our talent management strategy is our continuously evolving Leadership Development System designed to identify, train and develop future leaders with the skills and expertise needed to manage a rapidly transforming, complex, global business. This development framework is built on best practices in the business and manufacturing environment that includes multiple levels of programs, including our flagship Operations Management Accelerator (OMA) program.
The OMA program is designed to cultivate a talent pool of future General Managers and Assistant General Managers for our Divisions. The year-long program integrates instruction from university faculty with practical learning opportunities led by Magna’s leadership team. Participants, who must meet stringent acceptance criteria, engage in comprehensive modules covering finance, manufacturing, and supply chain management, each consisting of virtual, in-person, and self-directed study components. The program also includes immersive in-plant learning sessions, providing hands-on experience in real-world settings. A key feature of the OMA program is the capstone project, where participants address a realistic problem or opportunity within their Division, ensuring that their learning is applied to tangible business challenges.
4.2.5 Employee Training & Learning Ecosystem
The training modules in the table below represent required baseline, Corporate-led training completed in 2024 by designated categories of employees – generally white collar employees with computer/email access – representing approximately 25% of our total workforce:
A-35 Annual Information Form
| Course |
Course Objective |
Trainees (2024) |
||
| Ethics & Legal Compliance: Code of Conduct & Ethics |
Reinforce the importance of Magna’s Code of Conduct and Ethics and related policies, including scenarios based on working with customers, vendors and colleagues. |
~47,400 |
||
| Ethics & Legal Compliance: Conflicts of Interest |
Work through scenario-based training regarding personal workplace relationships, sourcing business, and how to deal with gifts and entertainment. |
~42,500 |
||
| Labour, Human Rights and Environmental Compliance in the Global Supply Chain: Introduction to Global Supply Chain Laws |
Provide overview of global supply chain laws and the implications for managing operations and global supply chains, as well as responsible sourcing related risk management practices and legal and regulatory risks associated with doing business with non-compliant suppliers. |
~24,000 |
||
| Labour, Human Rights and Environmental Compliance in the Global Supply Chain: Third Party Service Providers, Staffing Agencies & Labour Brokers — Reducing Forced Labour Risks |
Review potential risks associated with in-sourcing contingent workers from third-party service providers, staffing agencies and labour brokers, as well as understanding of non-compliant labour practices, how to structure such arrangements in a lawful manner, and recognizing the warning signs of forced labour scenarios. |
~23,500 |
||
| Labour, Human Rights and Environmental Compliance in the Global Supply Chain: The Ethical Employment of Young Workers & Preventing Child Labour |
Understanding international treaty and regulatory requirements surrounding the lawful employment of young workers, including the legal framework and obligations associated with employing young workers, ensuring compliance with appropriate terms of employment and conditions for training, apprenticeship, and educational programs. |
~23,700 |
||
| Information Security Risk: Mid-Year Training |
Reinforces employees’ role in securing Magna’s information, including handling, classification and sharing of sensitive information and data privacy and protection |
~43,600 |
||
| Information Security Risk: Secure the Intelligent Future |
Reviews risks, policies and best practices relating to cybersecurity and social engineering and artificial intelligence security and data risks. |
~42,500 |
||
| Regulatory and Safety Training: Risk Mitigation |
Reviews the Corporation’s and employees’ risks management responsibilities with respect to product quality and safety regulatory requirements |
~24,700 |
||
| Regulatory and Safety Training: Risk Mitigation |
Reinforces Magna’s ‘Culture of Quality’ and the importance of regulatory compliance, Magna’s “Speak Up” culture and the need to keep risk mitigation at the forefront of decision making. |
~39,000 |
||
In addition to the foregoing training, we continue to promote a culture of sustainability through dedicated training that focused on our sustainability objectives and priorities. The Sustainability training was completed by ~5650 employees in 2024. We have also developed a carbon literacy webinar series to help educate Magna employees on carbon emissions as detailed in Section 1.3. In addition, we conducted dedicated Scope 3 emissions accounting training to help Magna Divisions globally better understand how Scope 3 emissions are quantified and calculated so that they can better understand strategies for reducing such emissions.
All new employees are required to receive compliance on-boarding training on Code and related topics as part of their on-boarding process when joining the company and all new people managers receive advanced ethics training. All customer-facing employees receive advanced antitrust training upon hiring.
Magna International Inc. A-36
Based on the training modules currently tracked in our Learning Management System, Magna employees completed over 520,000 hours of training in 2024 (an average of 7.5 hours per tracked employee). However, the vast majority of training provided to Magna employees occurs at the plant level through Operating Group/Divisional personnel or members of Magna’s departmental subject matter experts. Although this plant-level training is not currently tracked globally, we aim to improve such tracking going forward as more of our training activities are centrally recorded in our Learning Management System. This plant-level training generally consists of, among other topics:
| ∎ | Industrial hygiene; |
| ∎ | Use of equipment and compliance with safety protocols; |
| ∎ | General safety and awareness; |
| ∎ | Quality and product safety; |
| ∎ | Current and emerging legal requirements; |
| ∎ | Sustainability; |
| ∎ | Energy efficiency; and |
| ∎ | Employee health and wellness. |
We also:
| ∎ | Maintain continuous learning opportunities supported by a global team, with localized resources in our major footprint locations in the following areas for employees on the shop floor to senior management: |
| ∎ | Manufacturing operations, technical skills, and apprenticeships; |
| ∎ | Business and functional knowledge and skills; |
| ∎ | Leadership skills, interpersonal skills, mentoring, and coaching. |
| ∎ | provide a Leadership Excellence Program (LE) targeted to each level of leadership, built on best practices in the business and manufacturing environment |
In addition to the structured training described above, Magna’s training and development ecosystem makes available a vast range of on-demand training and development resources for employees to enhance and future proof their technical and other skills through self-customized learning. Employees have access to a centralized learner dashboard which gives them access to different types of learning content, including mobile access for flexible learning; and provides personalized learning recommendations based on the employee job profiles. Over 83,000 items of learning content, in multiple languages, are available in Magna’s Learning Hub catalogue covering: Culture and Engagement, Diversity & Inclusion, Engineering & R&D, Environment and Sustainability, Ethics, Legal and Compliance, Finance, Healthy & Safety, Human Resources, IT & Software, Leadership, MAFACT, Manufacturing, Professional Skills, Quality, Sales & Business Development and Supply Chain & Purchasing.
4.3 Diversity and Inclusion in our Workplaces
Magna is committed to attracting, retaining and developing under-represented talent across the globe. In order to pursue this commitment, Magna’s identified strategic pillars for Diversity and Inclusion (“D&I”) initiatives are reviewed and approved by our Executive Management through the Chairs of our Diversity and Inclusion Council. Periodic updates are provided to the Board of Directors about how the company is progressing the D&I strategy.
Our key D&I priorities in 2024 shifted to accelerating diversity, cultivating an inclusive culture, ensuring talent fairness, and being a company of choice as discussed below:
4.3.1 Accelerating Diversity
Our Executive Management continues to reinforce the importance of an inclusive and diverse organization. We continue to roll out facilitated workshops to all leadership levels to better equip leaders with tools and resources to drive inclusive behaviour. We have provided D&I training for employees and have made various D&I tools and resources available for all employees. To further advance our D&I progress, we have implemented three employee-led, volunteer resource communities: Race & Ethnicity (EDGE); LGTBQ+ and Allies (PRIDE); and the Women’s eXchange. These communities support the execution of Magna’s D&I strategy, raise awareness and help foster a more inclusive environment. The employee resource communities provide, among other things, opportunities for mentoring and career development.
4.3.2 Cultivating an Inclusive Culture
All of our employees are critical stakeholders in our business. We also recognize that the diversity of our employees helps us drive operational excellence. The principle of Fair Treatment, outlined in our Employee’s Charter – one which we reinforce through employee meetings, training and communications – has been a key element in fostering an inclusive workplace at Magna. Any employee who feels that we are not living up to the principles of the Charter can seek redress through the Magna Hotline.
We seek to abide by all applicable labour and employment laws, including those prohibiting discrimination and harassment and those providing for the reasonable accommodation of differences. We are committed to providing equal employment and career advancement opportunities, without discrimination based on sex, race, ethnic background, religion, disability or any other personal characteristic protected by law. This is addressed in our Code of Conduct documentation and training, which all Magna employees must complete. Building on the foundation of awareness, education, and constructive dialogue established at Magna, we continue to prioritize inclusion programs to support our employees along additional dimensions of diversity.
A-37 Annual Information Form
4.3.3 Talent Fairness
We strive to ensure that all employees have equal opportunities to join and grow in the organization, as promised in our Employee’s Charter. To drive progress, we seek to embed relevant inclusion practices through our talent attraction and management processes. As part of our succession planning program, we continue to identify high-potential candidates and equip them with development plans to support their progression to advanced roles. We have put in place guidance for talent and succession discussions with the goal of providing succession-eligible candidates receive proper focus. We also provide relevant D&I training for employees and have made various D&I tools and resources available.
4.3.4 Company of Choice
We are focused on being a company of choice and key contributor to society, communities and the planet. We are advancing our initiatives in this area through strategic partnerships, and by working with D&I thought leaders, associations and non-profit organizations dedicated to the advancement of women, racial minorities, and employees of diverse backgrounds; promotion of inclusive work cultures; as well as strategies and actions to address the needs of a diverse workforce. These partnerships help us to benchmark our activities and progress, as well as provide insight into best practices and emerging topics for our D&I agenda. Recognizing the importance of improving gender diversity within key technical career streams and to support the development of the next generation of the talent in science, technology, engineering, and mathematics (STEM), we have formed strategic partnerships with a number of organizations that promote gender diversity in technical career streams. Our current strategic partnerships include: Automotive Women’s Alliance; Build a Dream; Centre for Automotive Diversity, Inclusion & Advancement (CADIA); Catalyst; FIRST Robotics – Girls in STEM; her Career; Institute of Electrical and Electronic Engineers (IEEE); Indspire; Inforum; KnowledgeStart; National Society of Black Engineers (NSBE); Queen’s University Engineering Society; Society of Hispanic Professional Engineers; Society of Women Engineers (SWE); WISE (Women in Science and Engineering); and Women in Manufacturing. We also participate in various automotive advisory groups to help keep the focus on Diversity and Inclusion in the industry strong. We are leveraging the experience of organizations focused on inclusion to ensure Magna continues to be positioned as a company of choice.
4.3.5 Gender Diversity
We are continuing to progress our agenda to increase the number of women in Magna. On a global basis, approximately 29% of the employees in our wholly owned operations are women. A total of approximately 5,579 employees in our wholly owned operations occupy critical roles with 1,037 of such employees, or 19%, being women. Both the percentage of women in our wholly owned operations, and the percentage of women in critical roles remained flat compared to the previous year. Underrepresentation of women in our workforce is most pronounced in IT, operations, and product engineering career streams, which is a consistent trend throughout the automotive industry. We recognize that there are improvements to be made and we are pursuing strategies to accelerate the progression of women, in director and managerial level roles, and in our most critical operational and technical roles, where there is the greatest level of underrepresentation.
In addition, the Board as a whole continues to advocate for improved gender representation and other diversity in leadership and other critical roles, as well as STEM career streams. In addition to their strong advocacy, the female directors of the Board, currently representing 38% of our Board of Directors, have also sought opportunities to mentor and share their experiences with the company’s high-performing female employees. Recognizing the important example set by the Board with respect to its own composition, the Board maintains a Board Diversity Policy (located in the Board Charter). Consistent with the recommendations of the Canadian Coalition for Good Governance, gender parity is achieved if the balance between male and female directors ranges between 40% and 60% over a rolling three-year time frame. Assuming election of all Board nominees at Magna’s annual and special meetings of shareholders on May 8, 2025, the percentage of women on the Board will be 38%. In addition to the Board gender representation discussed above, 38% of nominees for election at Magna’s annual meeting of shareholders are diverse nominees (based on LGBTQ+ or being an underrepresented minority in their home country).
Magna International Inc. A-38
4.4 Occupational Health and Safety
4.4.1 Health and Safety Standards and Compliance
| 190+
FACILITIES ISO 45001 CERTIFIED
|
|
Our health and safety program at our Divisions must include specific areas of risk assessment and evaluation that at a minimum includes: machinery and equipment safety; incident and accident management; personal protective equipment; emergency preparedness policies and action plans; fire protection; ergonomics; mental health/stress; industrial hygiene and handling of chemical/biological substances; and working at heights and confined space.
Our commitment to providing a safe and healthful work environment is fulfilled through a regular program of health and safety audits and inspections of our global facilities. These audits and inspections cover the specific minimum topics listed above. Audits are designed to address documentation requirements, while inspections assess physical hazards. Audits and inspections are conducted on-site and followed with a report |
||
| requiring the facility to develop an action plan to address deficiencies or best practices. The action plans are reviewed quarterly by senior Operating Group management. |
||||
The compliance program incorporates international and regional standards, including: ISO 45001, Canadian Standards Association (CSA), American National Standards Institute (ANSI), Conformité Européenne (CE), as well as country-specific standards. Audits and inspections are conducted by specialists with knowledge of Magna’s standards and country-specific requirements. Legislative changes, accident trends and changes to industry standards are incorporated into the program as part of the annual review of the program and updates of audit requirements are conducted every three years. The key elements of the program are detailed below:

Our Health and Safety Department holds regular conferences with representatives of our Divisions to reinforce our commitment to providing a safe and healthful work environment, as well as to share best practices with respect to occupational health and safety. An employee who believes we have not fulfilled our promise to provide a safe and healthful working environment can seek redress through the Magna Hotline.
4.4.2 Ergonomics Program
Magna is committed to minimizing and eliminating ergonomics risk factors. A key program for supporting employee well-being is our ergonomics program which aims to reduce the risk of musculoskeletal injuries. Managed by each Division’s ergonomic committee and with the support and guidance of corporate ergonomists, the program regularly evaluates Division ergonomics against a set of established criteria.
A-39 Annual Information Form
4.5 Corporate Ethics and Compliance
4.5.1 Code of Conduct and Ethics
We are committed to conducting business in a legal and ethical manner globally. Our Code, which applies equally to all our directors, executive officers and employees, articulates our compliance-oriented values and expectations. The principles of the Code have been and continue to be reinforced by our Chief Executive Officer, Executive Management, Operating Group management and the Board.
The Code addresses standards of conduct in a number of specific areas, including:
| ∎ | how to report suspected violations of the Code, and prohibiting retaliation against persons who report such violations in good faith; |
| ∎ | respect for human rights, diversity and inclusion; |
| ∎ | conducting business with integrity, fairness and respect; |
| ∎ | complying with all laws and regulations, including anti-corruption/bribery and antitrust/competition laws; |
| ∎ | lobbying and political contributions; |
| ∎ | full, accurate and timely public disclosures, including financial reporting; |
| ∎ | prohibiting insider trading; |
| ∎ | compliance with environmental, and occupational health and safety laws; |
| ∎ | protecting personal data; |
| ∎ | respect for human rights, diversity and inclusion; |
| ∎ | careful communication, and protecting confidential and personal information; |
| ∎ | managing conflicts of interest; |
| ∎ | giving and receiving gifts and entertainment; and |
| ∎ | compliance with related corporate policies. |
The Code, which is disclosed on the “For Employees” section of our website (www.magna.com) and posted on our employee intranet in 28 different languages, is reviewed regularly with all amendments approved by the Board. We have also supplemented the requirements of the Code through the adoption of policies covering specific topics, including: bribery and improper payments, tooling practices, gifts and entertainment, anti-retaliation, careful communication, conflicts of interest, sanctions and trade embargoes, antitrust and competition, data privacy, and the conduct of internal ethics investigations (all of which are also available on our website (www.magna.com)).
4.5.2 Global Compliance Program
|
|
In order to help our employees understand the values, standards and principles underlying our Code, we have implemented a global compliance program (the “Program”) overseen by the Audit Committee, which includes training of employees through different modalities (e-learning live in-person, and virtual instructor-led) on various topics relating to compliance and ethics. We also provide specialized compliance training modules which target specific functional audiences and high-risk regions. In addition to providing training on compliance and ethics topics generally, these specialized modules are designed to be interactive and incorporate real-life scenarios and exercises, which we believe amplify our Program expectations and resonate more powerfully with participants.
The Program is supervised by the Magna Compliance Council (“Compliance Council”), a body that includes key corporate officers representing our finance, legal, human resources, operations, internal audit, sales and marketing, technology, information, research and development, and compliance functions. The Compliance Council is tasked with, among other things, providing overall direction for our Program, approving key initiatives and ensuring that the required elements of our Program are being carried out globally by our cross-functional Operating Group Compliance Committees. |
In 2025, for the fourth year in a row, Magna was selected as a World’s Most Ethical Companies Honoree® by Ethisphere, a global leader in defining and advancing standards of ethical business practice.

Magna International Inc. A-40
4.5.3 Magna Hotline
The Magna Hotline is a whistle-blower hotline. The Hotline is confidential and reporters can remain anonymous (except where local law requires disclosure of a reporter’s identity), and is available for employees and other stakeholders such as customers and suppliers at all levels of our supply chain to make reports by phone or online at any time in 29+ languages. Reports are received and tracked by an independent third party service provider. Reports to the Magna Hotline (other than reports of an HR nature) are reviewed by our Internal Audit Department and, when appropriate, an investigation is conducted in accordance with our Policy on Internal Ethics Investigations. Investigations are conducted by Magna’s Internal Audit Department, Corporate Security team, In-House lawyers and/or external counsel (where applicable). We maintain an Investigations Oversight Committee, a sub-committee of the Compliance Council, which meets quarterly (and on an ad hoc basis, as needed) to review such investigations to maintain consistency of discipline and promote early awareness and oversight. The Audit Committee receives quarterly presentations from the Vice-President, Internal Audit regarding Magna Hotline activity and details of compliance, fraud, financial reporting, and other investigations (other than HR-related investigations).
4.6 Product Quality and End User Safety
4.6.1 Our Ambition
At Magna, our ambition is to lead the automotive industry in product quality and end user safety. We are committed to delivering innovative, reliable and safe products that exceed customer expectations and contribute to a sustainable future. Our integrated management system aims to embed quality and safety in every stage of our product lifecycle, from design and development to manufacturing and delivery.
Our overarching goal is to achieve zero recalls. We aim to eliminate product defects and enhance the reliability of our products through continuous improvement, rigorous testing, and proactive risk management. By focusing on quality and safety, we strive to protect the end user and maintain our customer’s trust in our brand.
4.6.2 Product Compliance
Our product design and development processes incorporate all relevant local, national, and international regulations and standards. Our commitment to compliance is reflected in our continuous monitoring and improvement efforts, where we regularly evaluate and update our compliance measures to incorporate the latest technological advancements and industry best practices.
Maintaining certifications such as IATF 16949, ISO 9001, and ISO 45001 is part of our commitment to high-quality standards. At the end of 2024, all Divisions that supply products to OEMs were IATF certified. We also work closely with our suppliers to support their adherence to our stringent compliance requirements.
4.6.3 Integrated Product Management System
Ensuring the safety of our products is paramount at Magna. Our comprehensive approach to product safety includes:
| ∎ | Safety Management Systems: Implementing proactive and robust systems that include risk assessment, hazard identification through error proofing, and mitigation strategies to prevent accidents and promote product safety throughout its lifecycle. In support of our ambition we use the following systems: |
| ∎ | Error proofing technology to proactively identify issues; |
| ∎ | Crisis management systems are in place and supported by appropriate senior management oversight; |
| ∎ | Our Global Warranty Management System (GWMS) identifies customer claims data to monitor trends, anomalies, and potential field escapes. We work collaboratively with our customers on end user safety. |
| ∎ | Incident and Recall Management: Establishing efficient incident and recall management processes to swiftly address any safety concerns, minimize risk to end users, and prevent recurrence via benchmarking, read across and lessons learned activities. |
| ∎ | Annual Employee Training: Providing ongoing training for employees and suppliers on safety standards to support a thorough understanding and consistent application of best practices. Every year we train over 100,000 employees on risk mitigation and safety compliance. |
| ∎ | Customer Engagement: Actively engaging with customers on product safety and performance, and then using this information to drive continuous improvement and innovation. We continuously track our performance against customer-specific requirements. The strength of our engagement program is demonstrated by the 109 customer awards focused on delivery quality that we received last year. |
4.7 Lobbying & Political Engagement
Magna is committed to upholding the highest standards of integrity in our lobbying activities and political engagement. Our approach to conducting such activities in accordance with applicable law and ethical norms, and in alignment with our sustainability commitments, is as follows:
A-41 Annual Information Form
4.7.1 Core Commitments
Our core commitments in this area are:
| ∎ | Lobbying: Magna pledges to comply with applicable law and uphold the highest levels of integrity in all lobbying efforts. Our lobbying strategies and practices are designed with the best interests of our stakeholders in mind. We are committed to honest and ethical engagement with policymakers. |
| ∎ | Political Engagement: Magna is committed to being a responsible corporate citizen, which includes ensuring compliance with applicable law regarding political contributions and expenditures. |
| ∎ | Comprehensiveness of Commitment: Our commitment to integrity in lobbying is holistic, encompassing all areas of our business and supported by senior management. A dedicated governance structure supports adherence to this strategy, with accountability assigned at the corporate level. |
Our strategy supports Magna’s interest in promoting public policies relevant to Magna and educating policymakers about our business, while complying with all relevant laws and regulations governing lobbying and political contributions, and expenditures involving government officials, including the reporting and disclosure of such amounts.
4.7.2 Implementation Measures
In order to give effect to our commitments we undertake a number of measures:
| ∎ | Disclosure: Detailed information about our lobbying activities as required by law. |
| ∎ | Approval Procedures: Magna has established a pre-approval procedure (“Disclose It” reporting system) for expenditures involving government officials. |
| ∎ | Stakeholder Engagement: While our strategy is comprehensive and supported by senior management, we recognize the importance of involving stakeholders in the implementation of our lobbying strategies at the corporate level. Efforts to enhance stakeholder involvement are ongoing. |
Magna will comply with all applicable laws and regulations governing campaign finance, political contributions, and other related expenditures, including reporting and disclosure requirements. Magna regularly consults internal and external legal counsel regarding compliance of its political expenditures and other political and lobbying activities with applicable law. Magna’s lobbying strategy is subject to regular review and updates to reflect changes in legal requirements, and industry best practices.
4.8 Data Security, Cybersecurity and Privacy
4.8.1 Enterprise Cybersecurity
Our enterprise cybersecurity strategy was developed by our Information Security, Risk and Compliance Department (“ISRC”) which ultimately reports to our EVP and Chief Digital and Information Officer. The strategy has been designed using guiding principles from our Code as well as enterprise risk considerations and aligns with industry standards including the National Institute of Standards and Technology, relevant ISO standards, and applicable customer requirements. Our Board has risk oversight responsibility for Magna’s enterprise IT/information security systems and cybersecurity program and receives reports regarding the program at periodic meetings.
Our cybersecurity initiatives are based on five key considerations:
| ∎ | Identify – develop an organizational understanding of cybersecurity risk to systems, people, assets, data, and capabilities; |
| ∎ | Protect – develop and implement appropriate safeguards against cybersecurity risk and continue to deliver critical services; |
| ∎ | Detect – internal and external 24 × 7 monitoring of all information traffic for cyber-attacks, including ransomware and other malware; |
| ∎ | Respond – our Security Operations Centre has appropriate incident response plans/processes and the necessary resources and expertise to respond to detected threats; and |
| ∎ | Recover – our Security Operations Centre works with IT operations to recover as quickly as possible by rebuilding affected systems and restoring data back-ups. |
We are committed to working with our customers and other stakeholders so that appropriate cybersecurity standards and requirements are continually monitored and implemented as required. In addition, we ensure that we comply with all governmental rules and regulations regarding cybersecurity or privacy regulations (such as GDPR as defined and detailed below), which directly affect cybersecurity requirements. Our selection process for third party (e.g. Cloud-based) services includes a due diligence approach that ensures that such services are evaluated using industry standard security assurance approaches to assess and address the risks associated with third party technology services and aligns with our overall approach to cybersecurity.
We regularly evaluate and adjust our information security management strategy based on a variety of considerations including risk assessments, continuous monitoring and periodic independent cybersecurity maturity evaluations. This enables the ISRC to identify and prioritize responses to residual risk arising from changes to our business or the ever-changing threat landscape. Magna has developed and implemented centralized enterprise cybersecurity policies, compliance measures, as well as training and awareness programs designed to support execution of our cybersecurity strategy to minimize our exposure.
Magna International Inc. A-42
Governance of cybersecurity over our shared global telecommunications and computer infrastructure is centralized under the ISRC. The ISRC facilitates identification of our risk exposures and mandates the implementation of appropriate security controls. We have processes in place for upgrading our IT systems, including patching and other protective measures, in a timely manner.
4.8.2 Product-Embedded and Solution Software Cybersecurity
In addition to the above centralized initiatives, our decentralized operating model assigns cybersecurity accountability to our Operating Groups with respect to risk/security issues inherent in products. However, the ISRC provides various standards-based approaches to assist our Operating Groups in assessing their respective product cybersecurity risk and maturity. From this assessment, our Divisions and Operating Groups are then able to determine appropriate cyber solutions that may be required. Our Technology Committee supports the Board through the committee’s risk oversight responsibility for Magna’s product-embedded or solution software cybersecurity.
4.8.3 Privacy
Magna is committed to preserving the privacy of our stakeholders in accordance with applicable laws. Our Code articulates our approach to the privacy of our employees and protection of their personal information. We only collect, use and disclose personal information for legitimate business or employment purposes, as required by law, or with an individual’s consent. In addition, like any other asset, confidential information which includes trade secrets and proprietary information is a valuable part of our business and we aim to safeguard it.
Magna has established a data privacy organization and program in our divisions in the E.U., Morocco, Brazil, Thailand, China, and India. The program includes the issuance of policies and procedures, employee training, gap assessments and the implementation of a data privacy management system.
In addition to our general privacy and confidentiality commitments, our Global Data Privacy Policy (the “Privacy Policy”) has been established. The Privacy Policy is designed to guide our compliance with, among others, the E.U. General Data Protection Regulation (“GDPR”), China’s Personal Information Protection Law, the Brazilian General Data Protection Law, Thailand’s Personal Data Protection Act and India’s Digital Personal Data Protection Act.
The Privacy Policy sets out general data protection principles, responsibilities of data controllers and processors, circumstances under which personal data can be transferred, rights of data subjects and actions that must be taken in case of data breach, as well as addressing data retention periods. The Privacy Policy is accompanied by a variety of formal and comprehensive procedures, developed and overseen by our Compliance Council.
A training program has been implemented to address general data privacy awareness for all employees and provide more specific rules for those employees who are handling personal data as part of their daily work. Finally, those employees across our organization responsible for handling privacy requests by data subjects or for addressing data breaches have been provided with the tailored training and resources to carry out such responsibilities.
Furthermore, Magna continues to monitor legislative and regulatory developments in the fast-changing data privacy landscape in other regions with Magna operations.
4.9 Supply Chain Responsibility
Requirements for transparent, sustainable, and responsible supply chains are rapidly evolving. More rigorous laws and regulations have been, and continue to be, introduced in jurisdictions around the world. The evolving regulatory landscape includes more extensive obligations regarding due diligence, supply chain mapping, commodities/product tracing, and reporting.
Magna is committed to responsible and ethical sourcing in its supply chain, and aims to implement sustainable, long term sourcing strategies. Magna’s commitment is supported by its governance structure, comprehensive policy/contractual framework, supplier engagement activities, and supplier risk monitoring and analysis through live monitoring, supplier self-assessment questionnaires (SAQs), and where necessary, supplier audits.
4.9.1 Policy and Contractual Framework
4.9.1.1 Supplier Code of Conduct
We hold ourselves and our suppliers to high ethical standards. Our Supplier Code of Conduct and Ethics (“Supplier Code”) is a foundational document in our business relationships with suppliers. It outlines the principles we apply internally at Magna through our Code, as well as expectations we have for every company that supplies goods or services to Magna, relating to, among other things:
| ∎ | ethical business conduct, such as compliance with antitrust/competition, anti-corruption/bribery and export controls laws; conflict minerals reporting; avoidance and reporting of conflicts of interest; and protection of Magna intellectual property and confidential information; |
| ∎ | employee rights, including those rights set out in our Employee’s Charter, Global Working Conditions and Global Labour Standards Policy; and |
| ∎ | environmental responsibility and compliance. |
A-43 Annual Information Form
4.9.1.2 Global Labour Standards
All Magna employees and suppliers are required to abide by our Global Labour Standards, which articulate our commitment to various internationally recognized frameworks that govern workers’ rights, including the UN Universal Declaration of Human Rights, ILO Fundamental Conventions (which include conventions prohibiting forced and child labour-related practices), and ILO Declaration on Fundamental Principles and Rights at Work. The Global Labour Standards have been incorporated into our Supplier Code.
4.9.1.3 Human Rights & Environmental Standards
Our Human Rights & Environmental Statement (the “Human Rights Statement”) is a comprehensive summary of Magna’s values and commitment regarding human rights and environmental standards, and internal and supply chain requirements. The Human Rights Statement outlines our human rights and environmental risks identification and assessment processes, as well as the manner in which we control, prevent, and if necessary, remediate issues.
This policy framework forms an integral part of our overall contractual relationship with our suppliers. It articulates our fair enterprise culture and serves as a general endorsement of the human rights and international labour standards reflected in the United Nations Universal Declaration of Human Rights, International Labour Organization (“ILO”) Fundamental Conventions, and ILO Declaration on Fundamental Principles and Rights at Work. The framework also reflects an express and unequivocal prohibition on the use of forced or child labour – both internally and by suppliers. Pursuant to these policies, as well as applicable Purchasing Terms and Conditions, our suppliers are required to cooperate with audit and investigation activities to validate their adherence to these standards. In accordance with the Supplier Code, suppliers should also require their own suppliers and sub-suppliers to establish similar policies to facilitate a consistent commitment.
We expect the standards set out in the Supplier Code, Global Labour Standards, and Human Rights Statement to be met by our suppliers, even in jurisdictions where meeting such standards may not be considered part of the usual business culture and a failure to do so can result in the termination by Magna of the supply relationship. The full texts of these policies are available on our website (www.magna.com).
We also continue to support and participate in industry efforts to develop common standards relating to business ethics, environmental standards, working conditions and employee rights. We will continue to engage with our suppliers to raise awareness of the importance of sustainability and compliance with regulatory standards and compliance with regulatory standards and compliance with regulatory standards and Magna’s core values. For example, we are a member company of the German automotive industry dialogue (“Branchendialog Automobilindustrie”), a multi-stakeholder forum consisting of relevant participants from the automotive industry as well as civil society with expertise on human rights risks in automotive supply and value chains.
4.9.2 Human Rights and Global Working Conditions in our Supply Chain
Respect for human rights is a part of our core company values and we recognize our responsibility with respect to preventing forced/child labour and promoting socially responsible business practices. is committed to conducting business in a legal and ethical manner globally and we seek to fully comply with all applicable labour and other laws in all jurisdictions in which we operate. While such jurisdictions have a range of different laws, Magna’s policy framework applies equally to all our operations across the globe to establish a common and consistent baseline for the fair treatment of our own employees, as well as those in our supply chain. We hold our own employees to high ethical standards and expect the same commitment of our suppliers, vendors, consultants, independent contractors, agents, or any third party engaged on our behalf.
We expect that our supply chain will adhere to our Global Labour Standards, our Supplier Code, and our Human Rights Statement, which have a strong focus on protection of human rights and working conditions, including strict prohibitions on the use of child, underage, slave or forced labour. Our Global Working Conditions are an integral part of our supplier package that emphasize the importance of maintaining global working conditions and standards that result in dignified and respectful treatment of all employees within all our global operating locations, as well as those of our supply chain. A failure by any of our suppliers to comply with its terms can result in the termination by Magna of the supply relationship.
With respect to third party service providers and staffing agencies, we maintain a number of oversight and due diligence practices, including:
| ∎ | a global policy on “Doing Business with Staffing Agencies and 3rd Party Service Providers” that sets out best practices when doing business with 3rd party vendors supplying labour-related services to Magna, including: due diligence requirements; prohibition on the use of fees or worker debt arrangements that might result in conditions leading to debt bondage; requirements for transparent employment terms; and conducting checks on contract workers for the purposes of verifying ethical and legally compliant employment conditions; |
| ∎ | service agreement templates for use with 3rd party labour suppliers to ensure that contingent workers are subject to the same ethical standards applicable to Magna’s regular full-time employees. The service agreement templates include, among other things, robust audit and investigation provisions; |
| ∎ | a system for reporting non-compliant suppliers designed to help prevent business with prohibited suppliers; |
| ∎ | conducting over 2,600 ‘manpower’ audits of labour related suppliers; and |
Magna International Inc. A-44
| ∎ | a global Labour and Employment Audit program designed to assess HR compliance-related issues, policies, and practices at the local Divisional level and adherence to both Magna policy and local laws, in a variety of areas, including fair working conditions and prevention of forced and child labour. |
4.9.2.1 Governance
In addition to setting the “tone from the top” regarding our commitment to human rights and working conditions, Executive Management approves the implementation of the policies, procedures, systems, and tools described in this Sustainability Report, including through the Magna Compliance Council, which provides regular and ad-hoc updates on measures implemented to comply with relevant laws and regulations covering social risks.
Several of Magna’s Corporate functions centrally manage policies and, in some cases, implementation of activities aimed at social risks generally, and forced/child labour risk in particular. These include:
| ∎ | Magna’s global Human Resources function (including Magna’s Health, Safety and Environmental department), is responsible for ensuring respect for working conditions and employment standards compliance, human rights, safety and employee wellness, as well as environmental standards, within our own business, as well as managing various due diligence and audit processes; |
| ∎ | a Human Rights Officer (HRO) oversees our compliance with the German Supply Chain Due Diligence (Lieferkettensorgfaltspflichtengesetz (LkSG)) (the “German Act”). We also have a global advisory board comprised of senior Magna leadership that provides guidance and receives periodic reports on the activities of the HRO and the German Act compliance team. |
| ∎ | Magna’s global Procurement and Supplier Management function is responsible for directing due diligence processes within the supplier base as described in subsection 4.9.3; |
| ∎ | our Ethics and Compliance function oversees our ethics and compliance program, updates to key policies such as our Code of Conduct, and Supplier Code, and Ethics and Compliance training, as well as related investigations and remedial action; |
| ∎ | other specialist functions provide regular and ad-hoc reports to their function leadership; and |
| ∎ | overall support for ESG policy, practices and initiatives is also provided by our global Sustainability team. |
Magna’s Compliance Council supervises our ethics and compliance program, including whether the required elements of our compliance Program are being carried out globally by our cross-functional Operating Group Compliance Committees.
Day-to-day responsibility for effective implementation and execution of compliance activities relating to human rights are managed by each of Magna’s Operating Groups and their respective business divisions and partners within our overall policy framework and with the support of the Magna Corporate functions referred to above.
Board-level oversight is provided by the Governance, Nominating and Sustainability Committee of Magna’s Board of Directors (with respect to supply chain risks) and the Talent Oversight and Compensation Committee (with respect to health and safety risks and social risks related to our own workforce). Our Audit Committee oversees our global compliance program.
We annually report our activities with respect forced labour/child labour pursuant to Canada’s Fighting Against Forced Labour and Child Labour in Supply Chains Act (the “Canadian Forced Labour Act”). The report is available on our website (www.magna.com).
We maintain cross-functional working groups to coordinate implementation of activities to meet obligations under laws and regulations addressing human rights and social risks, including the German Act, Canadian Forced Labour Act, the U.S. Uyghur Forced Labor Prevention Act, the E.U. Corporate Sustainability Due Diligence Directive (CSDDD); and E.U. Regulation on Prohibiting Products Made with Forced Labour on the Union Market.
4.9.2.2 Training and Capacity Building
Given the importance of human rights, we implemented mandatory enhanced compliance training for designated categories of employees on responsible sourcing and global supply chain laws, covering such issues such as child labour, human trafficking, forced labour, and the responsible use of third party labour brokers. The training is mandatory for employees across various functional areas with responsibility for hiring and supplier/vendor selection and oversight, such as Human Resources, Purchasing, Legal, and Quality, as well as other functional leadership. Additional detail regarding each training module, as well as number of trainees who completed the training in 2024, can be found in Section 4.2.5.
Magna communicates the standards expected of its suppliers through a variety of mechanisms, including: supplier conferences/roundtables; direct buyer interactions; correspondence with suppliers; our Corporate website and Supplier information portal; and corrective action plans generated from self-assessment questionnaires or audits we request suppliers to complete (as discussed in Section 4.9.3.4).
Our Supplier Roundtables engage key suppliers on topics including energy reduction, decarbonization, sustainable materials and products, supply chain resiliency, and human rights and working conditions. We are currently developing a roadmap to enhance training opportunities for our suppliers and further build supplier awareness of sustainability and supply chain responsibility.
4.9.3 Supply Chain Management
Our supply chain management system is designed to to improve the supply chain resilience; enhance transparency into our supply chain; improve supplier sustainability performance; and meet regulatory requirements.
A-45 Annual Information Form
4.9.3.1 General
Magna’s supply chain management group focuses on a number of elements that we believe are integral to world class supply chain management, such as: standardized supplier quality and delivery performance ratings; specific roles and responsibilities; processes and standards; global training; and risk management. The supplier quality and delivery performance ratings have been established to help optimize business award decisions. We use cross-functional sourcing teams, in the majority of our sourcing decisions, to help support compliance with our internal standards when we place new business within our supply base. In order to promote awareness of the key elements of our supply chain risk management program, including the requirements in our Supplier Code, we provide global on-line training on an ongoing basis to internal purchasing employees.
We continue to increase digitization of our supply chain management, including focusing on spend analytics and online transportation risk tracking, as well as electronic tagging and tracing of certain assets.
As part of our strategy to improve sustainability performance across our supply chain, we are developing an ESG component for our program award criteria, as discussed under “Supplier Reviews” below.
Our governance framework and key activities with respect to supply chain ESG risk management is set forth below:
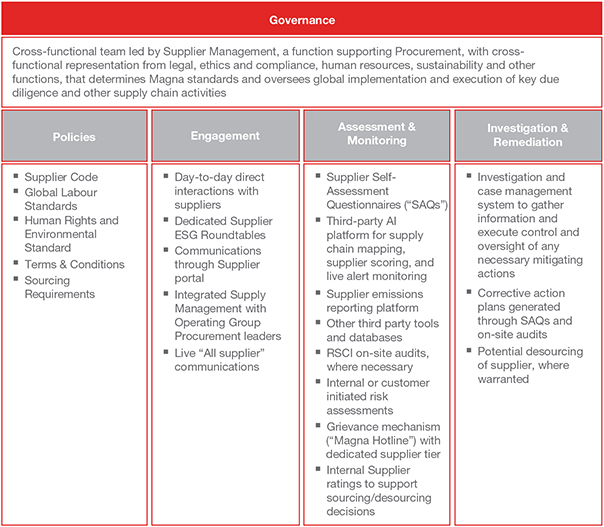
4.9.3.2 Risk Assessment, Monitoring and Supply Chain Mapping
We identify, evaluate and prioritize risks based on the likelihood of the risk occurring, severity of the impact should a risk materialize, and the extent of our contribution to the risk, if any. Within our supply chain, prioritization of certain risks may also include considerations relating to our proximity to the risk and our ability to influence mitigation of the risk by a supplier. Our analysis and prioritization of supply chain risk incorporates a number of inputs, including: expertise from internal function experts; information and trends derived from due diligence tools we utilize, such as our third-party live alert risk monitoring platform; regulatory areas of focus, including regulations/enforcement activity aimed at specific entities, geographies and/or commodities; supplier-specific information from SAQs and audits, and public sources, such as independent reports or databases (i.e., human rights indices).
Our risk analysis and due diligence activities are informed by global or industry standards and frameworks, including: the UN Guiding Principles for Business and Human Rights, the UN Universal Declaration of Human Rights, the OECD Due Diligence Guidelines for Multinational Enterprises, the ILO conventions/declarations referenced in our Global Labour Standards; and the AIAG/Drive Sustainability’s Automotive Industry Guiding Principles to Enhance Sustainability Performance in the Supply Chain (its Automotive Sustainability Practical Guidance).
Magna International Inc. A-46
We have implemented a third party supply chain risk monitoring and mapping tool (Prewave), which monitors and provides real-time alerts affecting supply chains covering 34 categories, including: human rights risks (i.e. forced/child labour), operational issues, financial or legal issues, CSR incidents (i.e., environmental incidents, poor working conditions), industrial accidents, product incidents (i.e., recalls), cyber risks, natural disasters, governance risks (i.e., corporate wrongdoing), labour unrest, and political unrest. Through the tool’s supply chain mapping capabilities, Magna is able to conduct a periodic analysis of specific risk areas through bottom-up mapping over and above the day-to-day live supply chain risk monitoring conducted through the platform. In 2024, we performed targeted supply chain mapping on a periodic basis relating to key commodities (e.g., semiconductors and aluminium), as well as entities identified on the UFLPA Entity List from time to time. We are currently conducting a pilot project in conjunction with Prewave to further enhance our Tier n mapping capabilities through the tool.
4.9.3.3 Supplier Reviews
Magna’s review process for production suppliers is designed to assess their overall operational, performance and financial health. We use a scorecard to provide ongoing monitoring and assessment of suppliers, which tracks (among other things) whether suppliers have certain industry-recognized environmental and health and safety certifications, such as ISO 14001 and ISO 18001. In 2025 the supplier review scorecard was enhanced to include a mandatory supplier ESG (“S-ESG”) rating. This fourth rating pillar establishes key ESG elements as a minimum requirement for future business with Magna. The S-ESG rating is based on supplier scores received in the industry-aligned third party self-assessment questionnaire (discussed in detail below) and Magna Minimum Requirements (MMR) for human rights and working conditions. The S-ESG assesses our suppliers’ environmental impact and commitment to sustainability, including evaluating suppliers’ labour practices, human rights, and occupational health and safety standards, as well as corporate governance structures, compliance with global regulations, and responsible supply chain management. The S-ESG score is mandatory for all existing and potential new direct material suppliers.
Additionally, in 2025, disclosure of environmental performance (such as emissions, waste and water consumption) through the M2030 platform (discussed in Section 1.4.5) will become an essential prerequisite for participation in RFQ processes and awarding of future business. This represents a critical step to enhancing our Scope 3 emissions inventory and facilitating Magna’s activities for reducing Scope 3 emissions in order to meet our near-term and net-zero science-based targets.
Suppliers that do not achieve a sufficient S-ESG rating, or with deviations or violations may be required to undertake a number of steps, including, among other things: providing additional information to Magna to verify findings; participation in an onsite audit; and/or implementing corrective action plan/timeline for improvement. A deviation from the Magna Minimum Requirements could result in termination of the supply relationship. No production suppliers were terminated in 2024 as a result of a violation of working conditions or human rights. We have terminated business relationships with a number of temporary staffing/labour agencies that did not meet the requirements of our global staffing agency policy discussed in Section 4.9.2 above.
4.9.3.4 Assessing and Auditing Suppliers
In support of our new S-ESG rating, we invited approximately 4,800 suppliers (representing approximately 75% procurement spend) to complete the NQC SAQ, a third party supply chain management and auditing organization that collects and analyzes supplier responses and grades their overall performance via their SupplierAssurance platform. The number of in-scope suppliers required to complete an SAQ is expected to expand in 2025 to over 90% of procurement spend. The self-assessment questionnaires (currently SAQ 5.0) is a standard automotive industry sustainability questionnaire developed by global OEMs. The SAQ which Magna Divisions also complete for requesting OEM customers annually, requires information, including documentation, relating to several topics, including, among other things: sustainability management; working conditions and human rights; health and safety; business ethics; environmental compliance; supplier management; and responsible sourcing of raw materials, as well as questions specifically addressed to compliance with specific legislative requirements, such as the German Act (as defined below). In addition to requiring supplier completion of the SAQ, each of Magna’s own operating Divisions complete the self-assessment.
In addition to the SAQ scoring process, all of Magna’s production suppliers are included in our Prewave third party risk monitoring and mapping tool. Each supplier has a risk scorecard that includes an overall rating and ratings for each of the 34 categories monitored in the platform.
With respect to audits, Magna is a founding member of the Responsible Supply Chain Initiative (RSCI), an association of automotive OEMs, Tier 1 Suppliers and industry associations, which has established a standardized assessment program for due diligence in the automotive supply chain relating to social compliance, occupational safety and environmental protection. Magna initiated RSCI audits of six (6) suppliers in 2024 following our risk assessment process. Four (4) suppliers completed the full RSCI audit in 2024 and one supplier completed an initial audit, with a follow-up audit expected in Q1 2025, and one supplier is not proceeding to a follow-up audit as they are no longer a strategic supplier of Magna. The four auditee suppliers with completed audits were awarded a full or interim RSCI label demonstrating compliance with the RSCI Assessment Standard.
A-47 Annual Information Form
Audited suppliers that do not receive an RSCI label undergo remediation activities. Magna expects that it will continue to grow its audit program in 2025, with a focus on key commodities and critical geographies.
4.9.3.5 Supplier Grievance Mechanism
We maintain a whistleblower mechanism, the Magna Hotline (discussed in detail in section 4.5.3). The Hotline includes a separate submission tier for our supply chain. Following investigation, corrective measures to eliminate and remediate would be initiated if a violation is confirmed.
4.9.4 Responsible Materials
Magna is focused on responsible raw materials sourcing, and management of substances of concern to comply with applicable regulations, meet customer and industry specifications, and reduce environmental and social risks associated with raw materials extraction/processing. To this end, we have implemented due diligence and reporting practices aimed at meeting obligations relating to responsible sourcing of raw materials, as well as responsible management of chemical substances in our products.
4.9.4.1 Raw Materials Compliance
Conflict Minerals / Extended Minerals
Pursuant to U.S. Securities and Exchange Commission (SEC) rules, we are required to report annually regarding our due diligence activities relating to “conflict minerals” (tin, tantalum, tungsten and gold, also known as 3TG) that originated in the Democratic Republic of Congo or an adjoining country. Consistent with the approach taken by our customers, suppliers and other industries, we are engaged in an annual process of determining whether any products which we make or buy contain such “conflict minerals”. We request all relevant suppliers to report to us using a standardized Conflict Minerals Reporting Template, including identifying smelters and refiners of 3TG in our supply chain. Our suppliers are requested to cascade the same requirement throughout their supply chain.
We have designed our conflict minerals activities in accordance with the OECD Due Diligence Guidance for Responsible Supply Chains of Minerals from Conflict-Affected and High-Risk Areas. Planned enhancements to our Conflict Minerals Program in 2025 are expected to improve supplier response rates and further enhance our red flag analysis and remediation capabilities. Our activities with respect to extended minerals currently include collecting information regarding Cobalt and Mica. Our extended minerals diligence program will be extended in 2025 to include collecting information regarding copper, natural graphite, lithium and nickel.
The full details of our Conflict Minerals Program can be found in our latest conflict minerals report, available on our website www.magna.com and on the SEC’s EDGAR website (www.sec.gov/edgar). We continue to engage with our suppliers to increase awareness, and accuracy, of “conflict minerals” reporting requirements and, through our membership in the Responsible Minerals Initiative (RMI), support continuing cross-industry efforts to identify and validate conflict-free smelters and refiners.
European Union Deforestation Regulation (“EUDR”)
The EUDR aims to prevent products consumed within the E.U. from contributing to deforestation or forest degradation globally. The Regulation prohibits the placing on the E.U. market, the supply and export of certain raw materials and related products unless such commodities/products are “deforestation-free”, and comply with the relevant legislation of the production country. For Magna, the most relevant commodities/products covered by the EUDR are leather and natural rubber, as well as, potentially timber.
Magna is currently working on implementation of systems and processes aimed at compliance with the EUDR’s stringent risk assessment, due diligence, traceability and reporting requirements which are effective December 2025.
4.9.4.2 Responsible Management of Substances in Products
REACH and Other Chemicals Legislation
Magna has implemented a comprehensive program aimed at compliance with the E.U.’s REACH (Registration, Evaluation, Authorization, and Restriction of Chemicals) regulation and other global chemicals regulation, including the E.U. End-of-Life Vehicle Directive, the Stockholm Convention on Persistent Organic Pollutants, US Toxic Substances Control Act (TOSCA), the Canadian Chemicals Management Plan, Japan Chemical Substances Control Law, US Proposition 65). This program focuses on identifying and managing the use of chemicals in products and processes, and ensuring that they meet the stringent requirements set forth by chemicals management regulations. Magna’s approach to chemicals management, includes risk assessments, continuous monitoring, and collaboration with suppliers and OEM customers for the safe use of chemicals in automotive products.
PFAS
Per- and polyfluoroalkyl substances (PFAS) (also known as “forever chemicals”) are a group of approximately 10,000 synthetic chemicals with unique properties (low friction, heat resistance, chemical/fuel stability, low permeation and durability). Such chemicals do not break down easily, and stay in the environment for long periods of time. As a result, they can pose significant risks to human health and ecosystems. PFAS regulations vary significantly across different countries, reflecting diverse approaches to managing the risks associated with these persistent chemicals. Some jurisdictions, such as Canada has imposed stringent reporting requirements for PFAS with a view to establishing baseline data to support future regulatory actions. Other jurisdictions such as the US and Europe have, or have proposed, regulations banning or phasing-out PFAS in certain products.
Magna International Inc. A-48
In addition to compliance with existing reporting obligations, Magna currently monitors current and emerging PFAS regulations, and is developing tools and processes to allow our Operating Groups to assess and address the potential impact of PFAS regulations on its product portfolio and to commence substitution activities in cooperation with our supply chain, where alternatives are available.
4.9.5 Supplier Diversity
To support the supplier diversity efforts which form part of our supply chain management program, we participate as a corporate member of several industry-recognized suppler diversity organizations, including:
|
∎ the National Minority Supplier Development Council (NMSDC) |
∎ National Veteran Business Development Council (NVBDC) |
∎ Women’s Business Enterprise National Council (WBENC) |
||
|
∎ the Canadian Aboriginal and Minority Supplier Council (CAMSC) |
∎ the National LGBT Chamber of Commerce (NGLCC) |
∎ Disability: IN |
||
|
∎ Women Business Enterprises Canada Council (WBE Canada) |
∎ Great Lakes Women’s Business Council (GL-WBC) |
∎ WEConnect International |
||
|
∎ Michigan Minority Supplier Development Council (MMSDC) |
||||
In addition, we are supporters of the Michigan Hispanic Chamber of Commerce (MHCC), the US Hispanic Chamber of Commerce (USHCC), the Asian Pacific American Chamber of Commerce (APACC), the Detroit LGBT Chamber of Commerce, the Upstate SC LGBT+ Chamber of Commerce, the Veteran Owned Business Roundtable (VOBRT), the Council of Supplier Diversity Professionals (CSDP), the Memphis Minority Business Council (MMBC), and the National Business League. We are also involved with a number of supplier diversity advocacy events, conferences, and procurement fairs, including many organized by our OEM customers, such as GM Supplier Inclusion Board, Stellantis MatchMaker, BMW Supplier Diversity Conference, Toyota Opportunity Exchange and Honda Network Partnership.
4.10 Contributing to Communities in Which we Operate
4.10.1 Commitment to Communities and Society
Magna recognizes the importance of giving back to society. We have a long history of supporting many global social and charitable causes, primarily in the communities around the world in which our employees live and work.
While much of our corporate giving is to general philanthropic causes, we have identified seven United Nations Sustainable Development Goals that most directly relate to our business. Examples of Magna’s activities and accomplishments with respect to each relevant Development Goal is as follows:

|
∎ Since 2017, more than $2M has been raised from employee donations and Magna’s Matching program through annual participation in the World Vision Global 6K for Water, which aims to bring life-changing clean water to communities in need. The Suppliers Partnership for the Environment (SP) – an association of global automakers and their suppliers working together to advance environmental sustainability through the automotive supply chain – previously awarded Magna SP’s Community Impact Award for our support of the Global 6K for Water challenge.
|
|
|
∎ Magna’s corporate wellness initiatives help support the ongoing physical and mental health of employees globally.
|
||
|
∎ Magna has contributed over $25M toward medical infrastructure and over $1M to the Red Cross and other organizations to aid with global disaster relief efforts. Magna’s Employee Disaster Relief Fund provides financial assistance to eligible employees and their families in the event they are victims of a disaster. In 2024, the program helped 133 employees in Austria, Brazil, Canada, China, Germany, Hungary, India, Italy, Mexico, Morocco, Poland, Serbia, Spain, Thailand, and the United States.
|
||
|
∎ In addition, thousands of employees in Spain and the United States were supported with humanitarian aid relief funding and supplies after Hurricane Helene (South Carolina) and the Spanish Floods (Valencia) destroyed local Magna communities.
|
||
|
∎ Magna locations around the globe organize food drives and fundraisers to support local foodbanks and to address food security. |
||
|
|
||
A-49 Annual Information Form

|
∎ Magna sponsors and actively participates in FIRST Robotics globally to encourage students to consider careers in science, technology and engineering. FIRST organizes mentor-based programs that help participants build science, engineering and technology skills while also fostering self-confidence, communication skills and leadership
∎ Magna embraces a culture of learning, including a program that pays for employees to pursue job-related certificate programs and university degrees
∎ Employees can access Magna-sponsored scholarships for their children to pursue university degrees
∎ We have partnerships in several countries with universities and technical institutions to develop a talent pipeline and help promote skilled trades development
∎ Magna sponsors several regional and international skills competitions through WorldSkills to enhance technical trades development and growth opportunities for students
∎ We support the Canadian Institute for Advanced Research a Canadian-based global research organization that brings together teams of top researchers from around the world to address important and complex questions
∎ We support Skills USA and Ontario, organizations that champion and stimulate the development of world-class technological and employability skills for youth
∎ We support Relay Education’s Renewable Energy STEM (Science, Technology, Engineering, and Math) workshops which provide support for over 7000 children across 7 countries Magna operates in. These workshops bring interactive STEM experiences to students who otherwise may not have access to such programming. |
|

|
∎ Magna’s Women’s eXchange Employee Resource Community strives to empower, develop and recognize its female employees and encourage students to pursue STEM careers. In 2024, members of Wx were more likely to be promoted and more likely stay with Magna than their peers.
∎ Magna’s Board maintains a Board Diversity Policy targeting gender parity (achieved if the balance between male and female directors ranges between 40% and 60%, assessed over a three-year timeframe). Currently, 38% of our Board members are women.
∎ Since 2016, Magna has spent more than $2.38 billion with women-owned businesses/suppliers as part of its overall supplier diversity program
∎ Magna celebrates and honours the many contributions of women around the world, including annually celebrating International Women’s Day through live global events for employees to connect with and honour outstanding women in the company |
|
|
Magna:
∎ completed thousands of energy/sustainability projects in recent years, resulting in significant and ongoing energy, emission, and costs savings throughout its global operations. In 2024, we implemented approximately 261,000 MWh of energy saving projects.
∎ created a Global Bold Perspective Award to showcase student vehicle designs of the future. The automotive design competition annually selects a winner from entries from students in North America, Europe and China
∎ sponsored the development of The Scanlon Creek Nature Centre in Ontario. Based on universal design and net-zero carbon principles, construction of this new building will create a community hub where people of all ages and abilities can access award-winning, innovative programming that connects them to nature while building environmental knowledge and awareness.
∎ continued to grow our annual Commitment to Sustainability Awards, which are open to Magna’s Divisions globally and focus on three categories: (i) product excellence and innovation; (ii) process improvements that advance lean and sustainability efforts; and (iii) people – programs that overcome employee and community challenges in the areas of education and training, health and safety, diversity and inclusion, and other areas of social impact.
|
|
Magna International Inc. A-50

|
∎ Magna’s race and ethnicity-focused (EDGE), LGTBQ+ and Allies (PRIDE) Employee, and Women’s eXchange Resource Communities, support employee-led learning opportunities to foster open dialogue and understanding, as well as opportunities for mentoring and career development
∎ 38% of Board nominees for election at Magna’s annual meeting of shareholders are diverse nominees (based on LGBTQ+ or being an underrepresented minority in their home country)
∎ Since 2016, Magna has spent more than $3.7 billion with Minority-owned businesses/suppliers as part of its overall supplier diversity program
∎ Unconscious bias training is required for all managers and available to any Magna employee
∎ Magna partners with various United Way agencies in North America to support a broad number of organizations that are delivering community-based solutions to address poverty and inequalities
∎ Magna has partnered with other industry leaders to support a variety of poverty-reduction efforts in the Greater Detroit and Greater Toronto Areas, including support for Pope Francis Center and Inn from the Cold, organizations that provide vital services to people experiencing homelessness |
|

|
Magna:
∎ has implemented a zero waste to landfill target. Approximately 94% of total waste outputs from operations in 2024 were recycled or diverted from landfills, rising to approximately 96% if energy recovery is included
∎ consumed 23% of its global electricity from renewable electricity sources (approximately 14% of our global energy purchase was renewable)
∎ reduced its energy intensity by approximately 10%, (compared to 2022), meeting the 2-year 10% goal set for 2024
∎ met its long-term (2030) water use reduction target, having achieved a 17% reduction in water withdrawals in 2024 against our 2019 baseline
∎ has received Performance Standard certification from the Aluminum Stewardship Initiative (ASI) for five of its Divisions in Europe. ASI is the only voluntary sustainability standard for the aluminum value chain. ASI’s independent third-party certification focuses on material stewardship, including as it relates to product design, life cycle assessments, management of process scrap, and recycling of products at end-of-life
∎ recognized one of our US Exteriors Divisions with a Commitment to Sustainability Award for its innovative process enhancement that resulted in the reduction of paint line operational air flow leading to significant energy savings.
∎ recognized Divisions from our MML and Exteriors groups with a Commitment to Sustainability Award for developing an innovative recycling process that reduces waste and promotes the reuse of materials in the manufacturing process. This work was also recognized externally, winning a 2024 Sustainability Award from Business Intelligence Group.
∎ is pursuing several packaging and logistics initiatives and aligning with industry partners to limit the overall use of materials and to increase transportation efficiency across the supply chain, including publication of automotive packaging guidelines through a committee of the Suppliers’ Partnership for the Environment which Magna Co-Chairs |
|
|
|
Magna:
∎ has approved near- and long-term science-based emission reduction targets with the SBTi, and the SBTi has verified our net-zero science-based target by 2050
∎ is committed to achieving 100% renewable electricity usage by 2025 in its European operations, by 2028 in its Canadian operations, and by 2030 in its global operations. 140 Divisions currently use renewable electricity, with 90 Divisions at 100% renewable electricity.
∎ is a financial sponsor of the Technical Office of the International Sustainability Standards Board (ISSB) that is establishing a comprehensive global baseline of climate change-related disclosure standards |
|
A-51 Annual Information Form
5. Sustainability Metrics
In this Sustainability Report we report according to the SASB framework, and the ISSB IFRS S2 Climate Related Disclosures Standard in relation to Scope 1, 2 and 3 emissions. SASB establishes and maintains industry-specific standards that assist companies in disclosing sustainability information to investors. SASB metrics indicated below are identified by the relevant SASB Auto Parts Sustainability Accounting Standard code. We currently obtain independent, third party validation of our Scope 1 and 2 emissions data, as well as our water withdrawal data. We are committed to continuing to enhance both the data collection/validation processes and thus the quality of the data, in the coming years.
5.1 Energy Management and Emissions
5.1.1 Energy
Energy management data is set out below.
| SASB Accounting Metric (TR-AP-130a.1) |
2024(1) | 2023 | 2022 | |||||||||
| Aggregate amount of energy consumed by Magna |
|
20,243,182 GJ / 5,623,106 MWh |
|
|
20,077,657 GJ 5,577,127 MWh |
|
|
19,859,666 GJ 5,516,574 MWh |
|
|||
| Percentage of energy consumed by Magna that was supplied from grid electricity |
58.8% | 59.0% | 58.0% | |||||||||
| Percentage of energy consumed by Magna that is renewable energy |
14.0%(2) | 12.9%(2) | 8.8%(2) | |||||||||
Notes:
(1) Preliminary data.
(2) The percentage of renewable electricity used in 2024 was 23% (22% in 2023;17% in 2022).
Energy intensity relative to Sales is as follows:
| 2024 | 2023 | 2022 | ||||
| Energy Intensity (MWh/Sales (USDm)) |
131 MWh/USDm | 130 MWh/USDm | 146 MWh/USDm | |||
In connection with our efforts to promote energy efficiency, we developed the energy reduction targets as detailed in Section 2.3.1 above.
5.1.2 Emissions
Energy consumed can be converted to CO2 emissions based on regional conversion factors. In order to help us and our stakeholders better assess trends related to the emissions we generate, we track emissions “intensity” on the basis of total sales, employee headcount and aggregate square footage of our facilities and offices. These intensity metrics assist us in determining whether we are becoming more efficient by normalizing emissions on a per dollar of sales, per employee and per square footage basis. The raw data for Scope 1 & 2 emissions, together with intensity metrics are set out below. Magna adheres to the GHG Protocol Corporate Accounting and Reporting Standard (“GHG Protocol”) for its Scope 1 and 2 reporting. Magna adheres to the GHG Protocol Corporate Value Chain (Scope 3) Standard and guidance from the SBTi for its Scope 3 reporting. We use commonly accepted emission factors such as those available from the GHG Protocol, International Energy Association (IEA), United States EPA, including its eGrid database, United Kingdom Department for Energy Security and Net-Zero, ecoinvent and CEDA (Comprehensive Environmental Data Archive), as well as other local or regional references. Our Scope 1 and 2 emissions data is verified annually by an independent third party verification firm.
| ISSB S2, 29(a)(i) |
2024 | 2023 | 2022 | |||||||||
| Scope 1 Emissions (metric tons) |
418,963 | 424,561 | 433,636 | |||||||||
| Scope 2 Emissions (metric tons)(1) |
1,158,907 | 1,150,656 | 1,168,803 | |||||||||
| Scope 1 & 2 Emissions (metric tons)(2) |
1,577,870 | 1,575,217 | 1,602,439 | |||||||||
| Sales (USD, millions) |
42,836 | 42,797 | 37,840 | |||||||||
| Sales Intensity (CO2 metric tons/$ Sales) |
0.0000368 | 0.0000368 | 0.0000424 | |||||||||
| Employees |
170,000 | 179,000 | 168,000 | |||||||||
| Employee Intensity (metric tons/employee) |
9.3 | 8.8 | 9.5 | |||||||||
| Square Footage (million sq. ft) |
85.3 | 83.8 | 84.4 | |||||||||
| Square Footage Intensity (metric tons/sq. ft.) |
0.0185 | 0.0188 | 0.0189 | |||||||||
| Scope 3 Emissions (metric tons) |
— | (3) | 57,842,606 | 56,561,629 | ||||||||
Notes:
(1) Market-based emissions calculation method.
Magna International Inc. A-52
(2) Sales Intensity, Employee Intensity and Square Footage Intensity are calculated based on combined Scope 1 and 2 Emissions.
(3) 2024 Scope 3 emissions inventory not availabe at time of preparation of this Sustainability Report. These emissions will be reported in our annual CDP submission.
In connection with our net-zero commitment and submission of near-term and net-zero targets to SBTi for validation, we submitted our scope 1, 2 and 3 baseline emissions for 2021 as per the table below:
| Emission Type |
2021 Baseline Year | |||
| Scope 1 (tCO2e) |
436,267 | |||
| Scope 2 (tCO2e) |
1,089,730 | |||
| Scope 3 (tCO2e) |
58,655,441 | |||
| Total |
60,181,438 | |||
5.2 Water and Waste Management
5.2.1 Water
We have implemented a 1.5% per year water reduction target, with the aim of reducing water use 15% by 2030, in each case referencing 2019 as the baseline year in which we withdrew 7,740 ML of water. Our water withdrawals in 2024 represent a 17% reduction from our 2019 baseline, exceeding our overall 2030 target. Water withdrawal data is verified annually by an independent third party verification firm.
Water withdrawal data is set out below:
| Description |
2024 | 2023 | 2022 | |||
| Water withdrawals (ML) |
6,409 | 6,571 | 6,292 | |||
5.2.2 Waste Management
Waste reduction and scrap elimination are important considerations in our manufacturing activities, including as part of our efforts to achieve operational excellence in our facilities globally. We have implemented a zero waste to landfill target, with the aim of eliminating landfill-bound waste.
Waste data is set out below:
| SASB Accounting Metric (TR-AP-150a.1) |
2024(1) | 2023 | 2022 | |||||||||
| Aggregate amount of waste generated from manufacturing by Magna |
1,520,274 t | 1,365,712 t | 1,476,282 t | |||||||||
| Percentage of waste generated by Magna that is hazardous |
4.0%(2) | 3.9%(2) | 4.3%(2) | |||||||||
| Percentage of waste generated by Magna that was recycled |
89.2%(3) | 91.8%(3) | 87.2%(3) | |||||||||
Notes:
(1) Preliminary data.
(2) Approximately 94% of such hazardous waste was diverted from secure landfills through recycling, reuse, or energy recovery initiatives in 2024 (92% in 2023; 90% in 2022).
(3) For 2024, this figure would be 96.1% if energy recovery was also included as a category of recycled waste (96.2 in 2023; 90.9% in 2022).
5.3 Environmental Remediation
The aggregate costs incurred in complying with environmental laws and regulations, including the costs of clean-up and remediation, have not had a material adverse effect on Magna to date and are set out below.
| Description |
2024 | 2023 | 2022 | |||
| Annual remediation expenses |
<1.5m | <$1.0m | <$1.0m | |||
| Aggregate remediation balance for known events |
$20.0m | $18.8m | $16.3m | |||
| Environmental Violations > $10,000 USD |
0 | 1 | 0 | |||
| Amount paid (in USD) as a result of such Environmental Violations |
N/A | $30,000 | N/A | |||
5.4 Product Safety
Magna is at risk for product warranty, product liability and recall costs, and is currently experiencing increased customer pressure to assume greater warranty responsibility. Certain customers seek to impose partial responsibility for warranty costs where the underlying root cause of a product or system failure cannot be determined. For most types of products, we only account for existing or probable product warranty claims. However, for certain complete vehicle assembly, powertrain systems and electronics contracts, Magna also records an estimate of future warranty-related costs based on the terms of the specific customer agreements and/or Magna’s warranty experience.
A-53 Annual Information Form
Product liability and recall provisions are established based on Magna’s best estimate of the amounts necessary to settle existing claims, which typically take into account: the number of units that may be returned; the cost of the product being replaced; labour to remove and replace the defective part; and the customer’s administrative costs relating to the recall. Where applicable, such provisions are booked net of recoveries from sub-suppliers and along with related insurance recoveries. Due to the uncertain nature of the net costs, actual product liability costs could be materially different from our best estimates of future costs. In 2024, our warranty expense (net) increased by $64 million compared to 2023. See Note 15 of our consolidated financial statements for the year ended December 31, 2024, which have been filed on SEDAR+ www.sedarplus.ca and are on Magna’s website (www.magna.com).
For a description of our activities relating to quality and end user safety, see Section 4.6.
5.5 Fuel Efficiency
Our product strategy, which is discussed in “Section 4 – Our Business & Strategy – Our Corporate Strategy” of this AIF, includes as a core element the supply of product solutions which support our customers’ objectives of increased fuel efficiency and reduced vehicle CO2 emissions.
We are currently examining the requirements using the E.U. Taxonomy for environmentally sustainable economic activities, in connection with upcoming reporting obligations under the E.U. CSRD reporting regime. Our preliminary analysis indicates that the potentially relevant categories under the E.U. Taxonomy are: (i) 3.18: “Manufacture, repair, maintenance, retrofit, reuse and upgrade of mobility components for zero-emission personal mobility aids”. This would include components we produce that are “essential for providing and improving the environmental performance of the vehicle”, namely our electrified powertrains produced by our Magna Powertrain operating Group. Our high voltage portfolio covers the entire range for pure electric vehicles, from single components to complete systems – from eAxles and eDrive transmissions up to highly integrated eDrives; (ii) 3.3: “Production of low-carbon technologies for transport”, which could include complete Electric Vehicle assembly by our Magna Steyr operating Group; and (iii) 3.4: “Manufacture of batteries”, which could include manufacture of respective components such as battery casings/enclosures via our body and chassis group.
5.6 Materials Sourcing
The SASB Auto Parts Standard identifies critical materials as defined by the U.S. National Research Council (NRC) of which cobalt, magnesium, tantalum and tungsten are most relevant to our products. We do not purchase such materials in their raw form, however, they may be present in components and sub-assemblies that we purchase. Our key purchased raw materials are steel, resin and aluminum, and our key purchased components include: stampings, electronics, chips, molded parts, die casting, forging, coverstock, and wire harnesses. See the discussion in “Section 6 – Description of the Business – Manufacturing & Engineering – Key Components and Raw Materials” of our AIF.
We address strategic risks regarding critical materials with more limited supply and key commodities/raw materials in a number of ways, including: diversification of suppliers; carrying excess inventory, where appropriate; and, designing and engineering our products to minimize the use of scarce/limited materials, where not constrained by customer specifications.
We are a member of the Aluminum Stewardship Initiative (ASI), and five of our Powertrain Divisions have received certification under ASI’s Performance Standard, which supports responsible aluminium supply chains by among other things: providing a common standard for assessing ESG performance in the aluminium value chain, and establishing requirements that can be independently audited to provide objective evidence for meeting the criteria for certification, including product design, life cycle assessments, management of process scrap, and recycling of products at end-of-life. Additionally we are exploring certification against the ASI Chain of Custody standard, which represents a higher level of commitment, and we are part of Catena-X, a collaborative initiative aimed at implementing standardized processes for sustainable materials across our supply chain.
With respect to reputational risk related to critical materials, we maintain a conflict minerals program, including an annual process of determining whether any of our products contain conflict minerals, and through our membership in the responsible mineral initiative (RMI) supporting continuing cross-industry efforts to identify conflict-free smelters and refiners. We also report to requesting OEM customers with respect to Cobalt and Mica.
5.7 Competitive Behaviour
Magna’s policy is to comply with all applicable laws, including antitrust and competition laws and we have implemented a robust compliance training program to mitigate against the risk of an antitrust violation. Our Global Compliance Program is described in Section 4.5 - “Corporate Ethics and Compliance” of this Sustainability Report.
We previously completed a global review focused on antitrust risk and do not currently anticipate any material liabilities in connection with the review. See “Section 10 – Legal Proceedings” of our AIF.
| SASB Accounting Metric (TR-AP-520a.1) |
2024 | 2023 | 2022 | |||
| Total amount of monetary losses incurred as a result of legal proceedings associated with anti-competitive behaviour regulations |
NIL | NIL | $1.2m(1) | |||
Magna International Inc. A-54
Note:
| (1) | June 2022 settlement with the Conselho Administrativo de Defesa Economica (CADE), Brazil’s Federal competition authority, in connection with an administrative proceeding commenced in 2019 into alleged anticompetitive behaviour regarding the supply of automotive door latches and related products. |
5.8 Health & Safety
We are committed to providing a safe and healthful workplace for our employees. This commitment is fulfilled through a regular program of health and safety audits and inspections of our global facilities. In connection with our health and safety program we track the frequency and severity of workplace accidents and conduct post-accident reviews to develop action plans to reduce/eliminate similar accidents in the future.
| Description |
2024(1) | 2023 | 2022 | |||
| Accident Frequency Rate(2)(4) |
0.47 | 0.55 | 0.64 | |||
| Accident Severity Rate(3)(4) |
9.15 | 13.48 | 15.75 | |||
Notes:
| (1) | Preliminary data. |
| (2) | Frequency 1.0 translates to 1 injury or illness per 100 employees working 40 hours/week, 50 weeks/year. |
| (3) | Severity 10.0 translates to 10 lost work days per 100 employees working 40 hours/week, 50 weeks/year. Severity Rate is reported as of February 13, 2025, but could change, including as a result of employees who continue to accrue lost work days in relation to an accident. |
| (4) | Global production facilities and certain engineering locations. |
The occurrence of injuries and fatalities is a matter of significant concern for both management and the Board. The TOCC reviews the circumstances related to significant injuries and all fatalities of employees or third parties on Magna properties and reports same to the Board. There were no employee fatalities at Magna facilities in 2024.
5.9 Diversity
Diversity within our employee population is important to us and we strive to create an inclusive work environment throughout our company. As part of our efforts to promote an inclusive workplace, we track metrics relating to gender diversity in our workforce.
| Description |
2024 | 2023 | 2022 | |||||||||
| Percentage of global employees who are women (wholly owned operations) |
29.0% | 28.0% | 28.0% | |||||||||
| Women in critical roles |
19.0% | 18.0%(1) | 18.0% | |||||||||
| Women on the Board of Magna |
42.0% | 38.0%(2) | 42.0% | |||||||||
Notes:
| (1) | 1037 women in critical roles out of 5579 such roles. |
| (2) | As of February 14, 2025, the percentage of women on the Board is 38%, following the appointment of Mr. Peter Sklar to our Board on that date. |
5.10 Other Sustainability Reporting
In addition to this Sustainability Report, other key sustainability-related public reports, include an:
| ∎ | Annual CDP report which provides investors and customers with information relating to corporate GHG emissions, water use, deforestation risk and perceived corporate risk due to climate change. |
| ∎ | Annual conflict minerals report, in accordance with SEC requirements, |
| ∎ | Annual report on fighting against slave labour and child labour in supply chains. |
Each of these reports is available on our website, at www.magna.com.
Magna also provides ESG information directly to our customers. These assessments are supplier requirements and typically follow common reporting templates approved by automotive industry associations in North America (Automotive Industry Action Group) and Europe (CSR Europe/Drive Sustainability) or third party platforms such as Ecovadis.
We also continue to prepare for the ESRS and CSRD which will include extensive ESG reporting requirements for relevant Magna entities based on our DMA.
A-55 Annual Information Form

Magna International Inc. 337 Magna Drive Aurora, Ontario Canada L4G 7K1 Telephone: 905 726 2462
 |
Magna International Inc. 337 Magna Drive
Aurora, Ontario L4G 7K1
Tel (905)
726-2462
Fax (905)
726-7164
|
· |
Evaluated the reasonableness of management’s forecasted sale volumes through consideration of the following: |
○ |
Historical sales volumes; |
○ |
Analyst and industry reports; |
○ |
Pipeline of contracts in the proposal stage; |
○ |
Underlying management analyses detailing growth plans; |
○ |
Known changes in the Company’s operations, which are expected to impact future operating performance; and |
○ |
Internal communications to management and the Board of Directors. |
· |
With the assistance of fair value specialists, evaluated the reasonableness of the discount rates by testing the source information underlying the determination of the discount rates and developing a range of independent estimates and comparing those to the discount rates selected by management. |
· |
With the assistance of fair value specialists, evaluated the reasonableness of the terminal growth rates by developing a range of independent estimates and comparing those to the terminal growth rates selected by management. |
· |
Evaluated the effectiveness of controls over the determination of forecasted sales volumes, discount rates and terminal growth rates. |
Note |
2024 |
2023 | ||||||||||||
| Sales |
$ |
42,836 |
$ | 42,797 | ||||||||||
| Costs and expenses |
||||||||||||||
| Cost of goods sold |
37,037 |
37,185 | ||||||||||||
| Selling, general and administrative |
2,061 |
2,050 | ||||||||||||
| Depreciation |
1,510 |
1,436 | ||||||||||||
| Amortization of acquired intangible assets |
112 |
88 | ||||||||||||
| Interest expense, net |
16 | 211 |
156 | |||||||||||
| Equity income |
(101 |
) |
(112 | ) | ||||||||||
| Other expense, net |
4 | 464 |
388 | |||||||||||
| Income from operations before income taxes |
1,542 |
1,606 | ||||||||||||
| Income taxes |
12 | 446 |
320 | |||||||||||
| Net income |
1,096 |
1,286 | ||||||||||||
| Income attributable to non-controlling interests |
(87 |
) |
(73 | ) | ||||||||||
| Net income attributable to Magna International Inc. |
$ |
1,009 |
$ | 1,213 | ||||||||||
| Earnings per Common Share: |
5 | |||||||||||||
| Basic |
$ |
3.52 |
$ | 4.24 | ||||||||||
| Diluted |
$ |
3.52 |
$ | 4.23 | ||||||||||
| Weighted average number of Common Shares outstanding during the year [in millions]: |
5 | |||||||||||||
| Basic |
286.8 |
286.2 | ||||||||||||
| Diluted |
286.9 |
286.6 | ||||||||||||
Note |
2024 |
2023 | ||||||||||||
| Net income |
$ |
1,096 |
$ | 1,286 | ||||||||||
| Other comprehensive income (loss), net of tax: |
21 | |||||||||||||
| Net unrealized (loss) gain on translation of net investment in foreign operations |
(555 |
) |
166 | |||||||||||
| Net unrealized (loss) gain on cash flow hedges |
(102 |
) |
94 | |||||||||||
| Reclassification of net gain on cash flow hedges to net income |
(54 |
) |
(56 | ) | ||||||||||
| Reclassification of net loss on pensions to net income |
1 |
1 | ||||||||||||
| Pension and post-retirement benefits |
1 |
(5 | ) | |||||||||||
| Other comprehensive (loss) income |
(709 |
) |
200 | |||||||||||
| Comprehensive income |
387 |
1,486 | ||||||||||||
| Comprehensive income attributable to non-controlling interests |
(71 |
) |
(56 | ) | ||||||||||
| Comprehensive income attributable to Magna International Inc. |
$ |
316 |
$ | 1,430 | ||||||||||
Note |
2024 |
2023 | ||||||||||||
ASSETS |
||||||||||||||
Current assets |
||||||||||||||
Cash and cash equivalents |
6 | $ |
1,247 |
$ | 1,198 | |||||||||
Accounts receivable |
7,376 |
7,881 | ||||||||||||
Inventories |
8 | 4,151 |
4,606 | |||||||||||
Prepaid expenses and other |
344 |
352 | ||||||||||||
13,118 |
14,037 | |||||||||||||
Investments |
9 | 1,045 |
1,273 | |||||||||||
Fixed assets, net |
10 | 9,584 |
9,618 | |||||||||||
Operating lease right-of-use |
17 | 1,941 |
1,744 | |||||||||||
Intangible assets, net |
13 | 738 |
876 | |||||||||||
Goodwill |
11 | 2,674 |
2,767 | |||||||||||
Other assets |
14, 18 | 1,120 |
1,319 | |||||||||||
Deferred tax assets |
12 | 819 |
621 | |||||||||||
$ |
31,039 |
$ | 32,255 | |||||||||||
LIABILITIES AND SHAREHOLDERS’ EQUITY |
||||||||||||||
Current liabilities |
||||||||||||||
Short-term borrowing |
$ |
271 |
$ | 511 | ||||||||||
Accounts payable |
7,194 |
7,842 | ||||||||||||
Other accrued liabilities |
15 | 2,572 |
2,626 | |||||||||||
Accrued salaries and wages |
867 |
912 | ||||||||||||
Income taxes payable |
192 |
125 | ||||||||||||
Long-term debt due within one year |
16 | 708 |
819 | |||||||||||
Current portion of operating lease liabilities |
17 | 293 |
399 | |||||||||||
12,097 |
13,234 | |||||||||||||
Long-term debt |
16 | 4,134 |
4,175 | |||||||||||
Operating lease liabilities |
17 | 1,662 |
1,319 | |||||||||||
Long-term employee benefit liabilities |
18 | 533 |
591 | |||||||||||
Other long-term liabilities |
19 | 396 |
475 | |||||||||||
Deferred tax liabilities |
12 | 277 |
184 | |||||||||||
19,099 |
19,978 | |||||||||||||
Shareholders’ equity |
||||||||||||||
Common Shares [issued: 2024 – 282,875,928; 2023 – 286,552,908] |
20 | 3,359 |
3,354 | |||||||||||
Contributed surplus |
149 |
125 | ||||||||||||
Retained earnings |
9,598 |
9,303 | ||||||||||||
Accumulated other comprehensive loss |
21 | (1,584 |
) |
(898 | ) | |||||||||
11,522 |
11,884 | |||||||||||||
Non-controlling interests |
418 |
393 | ||||||||||||
11,940 |
12,277 | |||||||||||||
$ |
31,039 |
$ | 32,255 | |||||||||||
On behalf of the Board: |
||||
/s/ “Mary Lou Maher” |
/s/ “Robert F. MacLellan” |
|||
Director |
Chairman of the Board |
|||
Note |
2024 |
2023 | ||||||||||||
OPERATING ACTIVITIES |
||||||||||||||
Net income |
$ |
1,096 |
$ | 1,286 | ||||||||||
Items not involving current cash flows |
6 | 1,857 |
1,642 | |||||||||||
2,953 |
2,928 | |||||||||||||
Changes in operating assets and liabilities |
6 | 681 |
221 | |||||||||||
Cash provided from operating activities |
3,634 |
3,149 | ||||||||||||
INVESTMENT ACTIVITIES |
||||||||||||||
Fixed asset additions |
(2,178 |
) |
(2,500 | ) | ||||||||||
Increase in investments, other assets and intangible assets |
(617 |
) |
(562 | ) | ||||||||||
Acquisitions |
7 | (86 |
) |
(1,504 | ) | |||||||||
Increase in public and private equity investments |
(12 |
) |
(11 | ) | ||||||||||
Net cash inflow (outflow) from disposal of facilities |
4 | 82 |
(48 | ) | ||||||||||
Proceeds from dispositions |
219 |
122 | ||||||||||||
Cash used for investing activities |
(2,592 |
) |
(4,503 | ) | ||||||||||
FINANCING ACTIVITIES |
||||||||||||||
Issues of debt |
16 | 778 |
2,083 | |||||||||||
Issue of Common Shares on exercise of stock options |
30 |
20 | ||||||||||||
Contributions to subsidiaries by non-controlling interests |
— |
11 | ||||||||||||
Tax withholdings on vesting of equity awards |
(8 |
) |
(11 | ) | ||||||||||
Dividends paid to non-controlling interests |
(46 |
) |
(74 | ) | ||||||||||
(Decrease) increase in short-term borrowings |
(182 |
) |
487 | |||||||||||
Repurchase of Common Shares |
20 | (207 |
) |
(13 | ) | |||||||||
Dividends |
(539 |
) |
(522 | ) | ||||||||||
Repayments of debt |
16 | (815 |
) |
(644 | ) | |||||||||
Cash (used for) provided from financing activities |
(989 |
) |
1,337 | |||||||||||
Effect of exchange rate changes on cash and cash equivalents |
(4 |
) |
(19 | ) | ||||||||||
Net increase (decrease) in cash and cash equivalents during the year |
49 |
(36 | ) | |||||||||||
Cash and cash equivalents, beginning of year |
1,198 |
1,234 | ||||||||||||
Cash and cash equivalents, end of year |
6 | $ |
1,247 |
$ | 1,198 | |||||||||
Common Shares |
Contri- buted Surplus |
Retained Earnings |
AOCL [i]
|
Non- controlling Interests |
Total Equity |
|||||||||||||||||||||||
Number |
Stated Value |
|||||||||||||||||||||||||||
[in millions] |
||||||||||||||||||||||||||||
Balance, December 31, 2022 |
285.9 |
$ |
3,299 |
$ |
111 |
$ |
8,639 |
$ |
(1,114 |
) |
$ |
400 |
$ |
11,335 |
||||||||||||||
Net income |
1,213 | 73 | 1,286 | |||||||||||||||||||||||||
Other comprehensive income |
217 | (17 | ) | 200 | ||||||||||||||||||||||||
Contribution by non-controlling interests |
11 | 11 | ||||||||||||||||||||||||||
Shares issued on exercise of stock options |
0.5 | 25 | (5 | ) | 20 | |||||||||||||||||||||||
Release of stock and stock units |
0.4 | 26 | (26 | ) | — | |||||||||||||||||||||||
Tax withholdings on vesting of equity awards |
(0.2 | ) | (2 | ) | (9 | ) | (11 | ) | ||||||||||||||||||||
Repurchase and cancellation under normal course issuer bids [note 20] |
(0.2 | ) | (2 | ) | (10 | ) | (1 | ) | (13 | ) | ||||||||||||||||||
Stock-based compensation expense |
45 | 45 | ||||||||||||||||||||||||||
Dividends paid to non-controlling interests |
(74 | ) | (74 | ) | ||||||||||||||||||||||||
Dividends paid [$1.84 per share] |
0.2 | 8 | (530 | ) | (522 | ) | ||||||||||||||||||||||
Balance, December 31, 2023 |
286.6 |
$ |
3,354 |
$ |
125 |
$ |
9,303 |
$ |
(898 |
) |
$ |
393 |
$ |
12,277 |
||||||||||||||
Net income |
1,009 | 87 | 1,096 | |||||||||||||||||||||||||
Other comprehensive loss |
(693 | ) | (16 | ) | (709 | ) | ||||||||||||||||||||||
Shares issued on exercise of stock options |
0.7 | 36 | (6 | ) | 30 | |||||||||||||||||||||||
Release of stock and stock units |
0.3 | 19 | (19 | ) | — | |||||||||||||||||||||||
Tax withholdings on vesting of equity awards |
(0.2 | ) | (2 | ) | (6 | ) | (8 | ) | ||||||||||||||||||||
Repurchase and cancellation under normal course issuer bids [note 20] |
(4.7 | ) | (55 | ) | (162 | ) | 7 | (210 | ) | |||||||||||||||||||
Stock-based compensation expense |
49 | 49 | ||||||||||||||||||||||||||
Dividends paid to non-controlling interests |
(46 | ) | (46 | ) | ||||||||||||||||||||||||
Dividends paid [$1.90 per share] |
0.2 | 7 | (546 | ) | (539 | ) | ||||||||||||||||||||||
Balance, December 31, 2024 |
282.9 |
$ |
3,359 |
$ |
149 |
$ |
9,598 |
$ |
(1,584 |
) |
$ |
418 |
$ |
11,940 |
||||||||||||||
(i) |
AOCL is Accumulated Other Comprehensive Loss. |
2024 |
2023 | |||||||||
Impacts related to Fisker Inc. [“Fisker”] [a] |
$ |
198 |
$ | 110 | ||||||
Restructuring activities [b] |
187 |
148 | ||||||||
Long-lived asset impairments [c] |
79 |
— | ||||||||
Investments [d] |
9 |
91 | ||||||||
Gain on business combination [e] |
(9 |
) |
— | |||||||
Veoneer Active Safety Business transaction costs [f] |
— |
23 | ||||||||
Operations in Russia [g] |
— |
16 | ||||||||
Other expense, net |
$ |
464 |
$ | 388 | ||||||
[a] |
Impacts related to Fisker |
2024 |
2023 | |||||||||
Impairment and supplier related settlements |
$ |
330 |
$ | — | ||||||
Fisker warrants |
33 |
110 | ||||||||
Recognition of deferred revenue |
(196 |
) |
— | |||||||
Restructuring |
31 |
— | ||||||||
$ |
198 |
$ | 110 | |||||||
| Body Exteriors & Structures |
Power & Vision |
Seating Systems |
Complete Vehicles |
Total | ||||||||||||||||
Accounts receivable |
$ | 3 | $ | 4 | $ | 2 | $ | 14 | $ | 23 | ||||||||||
Inventories |
5 | 52 | 8 | 2 | 67 | |||||||||||||||
Other assets, net |
— | 54 | — | 90 | 144 | |||||||||||||||
Fixed assets, net |
1 | 49 | 5 | 3 | 58 | |||||||||||||||
Other accrued liabilities |
(5 | ) | — | — | (10 | ) | (15 | ) | ||||||||||||
Operating lease right-of-use |
1 | — | 1 | — | 2 | |||||||||||||||
5 |
159 |
16 |
99 |
279 |
||||||||||||||||
Supplier settlements |
4 | 41 | 6 | — | 51 | |||||||||||||||
$ |
9 |
$ |
200 |
$ |
22 |
$ |
99 |
$ |
330 |
|||||||||||
[b] |
Restructuring activities |
2024 |
2023 | |||||||
Power & Vision |
$ |
104 |
$ | 117 | ||||
Complete Vehicles |
55 |
— | ||||||
Body Exteriors & Structures |
28 |
31 | ||||||
Other expense, net |
187 |
148 | ||||||
Tax effect |
(28 |
) |
(24 | ) | ||||
Net loss attributable to Magna |
$ |
159 |
$ | 124 | ||||
[c] |
Long-lived asset impairments |
[d] |
Investments |
2024 |
2023 | |||||||
Non-cash impairment charge [i]
|
$ |
13 |
$ | 90 | ||||
Revaluation of public and private equity investments |
13 |
1 | ||||||
Revaluation of public company warrants [ii]
|
(17 |
) |
— | |||||
Other expense, net |
9 |
91 | ||||||
Tax effect |
3 |
(1 | ) | |||||
Net loss attributable to Magna |
$ |
12 |
$ | 90 | ||||
| [i] | The non-cash impairment charge relates to the impairment of a private equity investment. |
| [ii] | The revaluation of Fisker warrants previously presented within Revaluation of public company warrants has been reclassified to Impacts related to Fisker. |
[e] |
Gain on business combination |
[f] |
Veoneer Active Safety Business transaction costs |
[g] |
Operations in Russia |
5. |
EARNINGS PER SHARE |
2024 |
2023 | |||||||
Basic earnings per Common Share: |
||||||||
Net income attributable to Magna International Inc. |
$ |
1,009 |
$ | 1,213 | ||||
Weighted average number of Common Shares outstanding during the year |
286.8 |
286.2 | ||||||
Basic earnings per Common Share |
$ |
3.52 |
$ | 4.24 | ||||
Diluted earnings per Common Share [a]: |
||||||||
Net income attributable to Magna International Inc. |
$ |
1,009 |
$ | 1,213 | ||||
Weighted average number of Common Shares outstanding during the year |
286.8 |
286.2 | ||||||
Stock options and restricted stock |
0.1 |
0.4 | ||||||
286.9 |
286.6 | |||||||
Diluted earnings per Common Share |
$ |
3.52 |
$ | 4.23 | ||||
| [a] | Diluted earnings per Common Share exclude 5.2 million [2023 – 2.8 million] Common Shares issuable under the Company’s Incentive Stock Option Plan because these options were not “in-the-money”. two-class method was excluded from the calculation of earnings per share because the effect would be immaterial. |
| [a] | Cash and cash equivalents consist of: |
2024 |
2023 | |||||||||||
Bank term deposits and bankers’ acceptances |
$ |
497 |
$ | 502 | ||||||||
Cash |
750 |
696 | ||||||||||
$ |
1,247 |
$ | 1,198 | |||||||||
| [b] | Items not involving current cash flows: |
2024 |
2023 | |||||||||||
Depreciation |
$ |
1,510 |
$ | 1,436 | ||||||||
Amortization of acquired intangible assets |
112 |
88 | ||||||||||
Amortization of other assets and intangible assets included in cost of goods sold |
306 |
224 | ||||||||||
Deferred revenue amortization |
(294 |
) |
(159 | ) | ||||||||
Other non-cash charges |
10 |
41 | ||||||||||
Deferred tax recovery |
(110 |
) |
(261 | ) | ||||||||
Dividends received in excess of equity income |
78 |
37 | ||||||||||
Non-cash portion of Other expense, net [note 4] |
245 |
236 | ||||||||||
$ |
1,857 |
$ | 1,642 | |||||||||
| [c] | Changes in operating assets and liabilities: |
2024 |
2023 | |||||||||||
Accounts receivable |
$ |
454 |
$ | (819 | ) | |||||||
Inventories |
153 |
(196 | ) | |||||||||
Prepaid expenses and other |
(35 |
) |
15 | |||||||||
Accounts payable |
(357 |
) |
609 | |||||||||
Accrued salaries and wages |
1 |
(23 | ) | |||||||||
Other accrued liabilities |
369 |
636 | ||||||||||
Income taxes payable (receivable) |
96 |
(1 | ) | |||||||||
$ |
681 |
$ | 221 | |||||||||
[a] |
HE System Electronic Acquisition |
[b] |
Veoneer Acquisition |
2024 |
2023 | |||||||||||
Raw materials and supplies |
$ |
1,672 |
$ | 1,861 | ||||||||
Work-in-process |
446 |
450 | ||||||||||
Finished goods |
664 |
569 | ||||||||||
Tooling and engineering |
1,369 |
1,726 | ||||||||||
$ |
4,151 |
$ | 4,606 | |||||||||
2024 |
2023 | |||||||||||
Equity method investments [a]
|
$ |
794 |
$ | 987 | ||||||||
Public and private equity investments [b]
|
206 |
230 | ||||||||||
Warrants |
14 |
34 | ||||||||||
Debt investments |
31 |
22 | ||||||||||
$ |
1,045 |
$ | 1,273 | |||||||||
| [a] | The ownership percentages and carrying values of the Company’s principal equity method investments at December 31 were as follows [in millions, except percentages]: |
2024 |
2023 |
|||||||||||||||||
LG Magna e-Powertrain Co., Ltd. [i]
|
49.0 |
% |
$ |
298 |
$ | 405 | ||||||||||||
Litens Automotive Partnership [ii]
|
76.7 |
% |
$ |
262 |
$ | 332 | ||||||||||||
Hubei HAPM Magna Seating Systems Co., Ltd. |
49.9 |
% |
$ |
140 |
$ | 129 | ||||||||||||
BAIC BluePark Magna Automobile Co., Ltd. |
49.0 |
% |
$ |
99 |
$ | 95 | ||||||||||||
| [i] | LG Magna e-Powertrain [“LGM”] is a variable interest entity [‘‘VIE’’] and depends on the Company and LG Electronics for any additional cash needs. The Company cannot make key operating decisions considered the most significant to the VIE, and is therefore not the primary beneficiary. The Company’s known maximum exposure to loss approximated the carrying value of its investment balance as at December 31, 2024. |
| [ii] | The Company accounts for its investments under the equity method of accounting as a result of significant participating rights that prevent control. |
| [b] | Cumulative unrealized gains and losses on equity securities held as at December 31, 2024 were $29 million and $18 million [$28 million and $323 million as at December 31, 2023], respectively. |
2024 |
2023 | |||||||||||
Current assets |
$ |
2,543 |
$ | 2,516 | ||||||||
Non-current assets |
$ |
1,561 |
$ | 1,884 | ||||||||
Current liabilities |
$ |
1,870 |
$ | 1,702 | ||||||||
Long-term liabilities |
$ |
682 |
$ | 876 | ||||||||
2024 |
2023 | |||||||||||
Sales |
$ |
5,300 |
$ | 5,008 | ||||||||
Cost of goods sold & expenses |
5,184 |
4,863 | ||||||||||
Net income |
$ |
116 |
$ | 145 | ||||||||
2024 |
2023 | |||||||||||
Cost |
||||||||||||
Land |
$ |
177 |
$ | 188 | ||||||||
Buildings |
3,119 |
3,014 | ||||||||||
Machinery and equipment |
19,356 |
19,226 | ||||||||||
22,652 |
22,428 | |||||||||||
Accumulated depreciation |
||||||||||||
Buildings |
(1,470 |
) |
(1,394 | ) | ||||||||
Machinery and equipment |
(11,598 |
) |
(11,416 | ) | ||||||||
$ |
9,584 |
$ | 9,618 | |||||||||
Body Exteriors & Structures |
Power & Vision |
Seating Systems |
Complete Vehicles |
Corporate |
Total |
|||||||||||||||||||
Balance, December 31, 2022 |
448 | 1,198 | 260 | 105 | 20 | 2,031 | ||||||||||||||||||
Acquisitions [note 7b] |
— | 670 | — | — | — | 670 | ||||||||||||||||||
Foreign exchange and other |
4 | 60 | (2 | ) | 4 | — | 66 | |||||||||||||||||
Balance, December 31, 2023 |
452 | 1,928 | 258 | 109 | 20 | 2,767 | ||||||||||||||||||
Acquisitions [note 7a] |
— |
34 |
— |
— |
— |
34 |
||||||||||||||||||
Foreign exchange and other |
(17 |
) |
(94 |
) |
(8 |
) |
(7 |
) |
(1 |
) |
(127 |
) |
||||||||||||
Balance, December 31, 2024 |
$ 435 |
$ |
1,868 |
$ |
250 |
$ |
102 |
$ 19 |
$ |
2,674 |
||||||||||||||
| ● | Increasing the discount rate by 50 basis points results in the fair value to be below the carrying amount by approximately 5%, or $300 million; |
| ● | Decreasing the terminal growth rate by 50 basis points results in the fair value to be below carrying amount by approximately 3%, or $170 million; or |
| ● | Decreasing planned production volumes would impact forecasted sales and could lead to a reduction in the reporting unit’s estimated fair value below its carrying amount. |
| ● | Increasing the discount rate by 50 basis points results in the fair value to be below the carrying amount by approximately 6%, or $120 million; |
| ● | Decreasing the terminal growth rate by 50 basis points results in the fair value to be below the carrying amount by approximately 1%, or $40 million; or |
| ● | Decreasing forecasted sales due to increased competition, lower planned production volumes, or lower take-rates for ADAS systems could lead to a reduction in the reporting unit’s estimated fair value below its carrying amount. |
| [a] | The provision for income taxes differs from the expense that would be obtained by applying the Canadian statutory income tax rate as a result of the following: |
2024 |
2023 | |||||||||
Canadian statutory income tax rate |
26.5 |
% |
26.5 | % | ||||||
Tax on repatriation of foreign earnings |
4.1 |
3.6 | ||||||||
Valuation allowance on deferred tax assets |
3.1 |
(3.0 | ) | |||||||
Net effect of losses not benefited |
2.8 |
1.2 | ||||||||
Foreign exchange re-measurement
|
1.7 |
(1.7 | ) | |||||||
Reserve for uncertain tax positions |
(0.4 |
) |
0.6 | |||||||
Non-taxable capital (gains) losses |
(1.1 |
) |
1.2 | |||||||
Earnings of equity accounted investees |
(1.3 |
) |
(1.4 | ) | ||||||
Deductible inflationary adjustments |
(1.8 |
) |
(1.7 | ) | ||||||
Foreign rate differentials |
(2.3 |
) |
(3.2 | ) | ||||||
Research and development tax credits |
(4.5 |
) |
(4.1 | ) | ||||||
Others |
2.1 |
1.9 | ||||||||
Effective income tax rate |
28.9 |
% |
19.9 | % | ||||||
[b] The details of income (loss) before income taxes by jurisdiction are as follows: |
2024 |
2023 | |||||||||
Canadian |
$ |
56 |
$ | (184 | ) | |||||
Foreign |
1,486 |
1,790 | ||||||||
$ |
1,542 |
$ | 1,606 | |||||||
|
[c] The details of the income tax provision are as follows:
|
||||||||||
2024 |
2023 | |||||||||
Current |
||||||||||
Canadian |
$ |
46 |
$ | 24 | ||||||
Foreign |
510 |
557 | ||||||||
556 |
581 | |||||||||
Deferred |
||||||||||
Canadian |
(12 |
) |
(26 | ) | ||||||
Foreign |
(98 |
) |
(235 | ) | ||||||
(110 |
) |
(261 | ) | |||||||
$ |
446 |
$ | 320 | |||||||
| [d] | Deferred income taxes have been provided on temporary differences, which consist of the following: |
2024 |
2023 | |||||||
Unrealized remeasurement of investments |
$ |
63 |
$ | (26 | ) | |||
Change in valuation allowance on deferred tax assets |
47 |
(47 | ) | |||||
Tax on undistributed foreign earnings |
19 |
4 | ||||||
Tax depreciation in excess of book depreciation |
29 |
33 | ||||||
Net tax losses benefit |
(67 |
) |
(25 | ) | ||||
Net increase in non-deductible liabilities |
(96 |
) |
(63 | ) | ||||
Book amortization in excess of tax amortization |
(112 |
) |
(112 | ) | ||||
Others |
7 |
(25 | ) | |||||
$ |
(110 |
) |
$ | (261 | ) | |||
| [e] | Deferred tax assets and liabilities consist of the following temporary differences: |
2024 |
2023 | |||||||||
Assets |
||||||||||
| Tax benefit of loss carryforwards | $ |
1,187 |
$ | 892 | ||||||
| Liabilities currently not deductible for tax | 451 |
400 | ||||||||
| Operating lease liabilities | 449 |
399 | ||||||||
| Other assets tax value in excess of book value | 263 |
150 | ||||||||
| Unrealized losses on foreign exchange hedges and retirement liabilities | 100 |
44 | ||||||||
| Tax credit carryforwards | 89 |
90 | ||||||||
| Unrealized losses on remeasurement of investments | 12 |
79 | ||||||||
| Others | 9 |
29 | ||||||||
2,560 |
2,083 | |||||||||
Valuation allowance against tax benefit of loss carryforwards |
(841 |
) |
(597 | ) | ||||||
Other valuation allowance |
(241 |
) |
(221 | ) | ||||||
$ |
1,478 |
$ | 1,265 | |||||||
Liabilities |
||||||||||
Operating lease right-of-use |
446 |
403 | ||||||||
Tax depreciation in excess of book depreciation |
294 |
232 | ||||||||
Tax on undistributed foreign earnings |
188 |
171 | ||||||||
Unrealized gain on foreign exchange hedges and retirement liabilities |
8 |
22 | ||||||||
936 |
828 |
|||||||||
Net deferred tax assets |
$ |
542 |
$ | 437 | ||||||
2024 |
2023 | |||||||
Long-term deferred tax assets |
$ |
819 |
$ | 621 | ||||
Long-term deferred tax liabilities |
(277 |
) |
(184 | ) | ||||
$ |
542 |
$ | 437 | |||||
| [f] | Deferred income taxes have not been provided on $5 billion of undistributed earnings of certain foreign subsidiaries, as the Company has concluded that such earnings should not give rise to additional tax liabilities upon repatriation or are indefinitely reinvested. A determination of the amount of the unrecognized tax liability relating to the remittance of such undistributed earnings is not practicable. |
| [g] | Income taxes paid in cash [net of refunds] for the year ended December 31, 2024 were $ 499 million [2023 - $546 million]. |
| [h] | As at December 31, 2024, the Company had domestic and foreign operating loss carryforwards of $ 4.7 billion and tax credit carryforwards of $89 million. Approximately $2.4 billion of the operating losses can be carried forward indefinitely. The remaining operating losses and tax credit carryforwards expire between 2025 and 2044 . |
| [i] | As at December 31, 2024 and 2023, the Company’s gross unrecognized tax benefits were $ 204 million and $220 million, respectively [excluding interest and penalties], of which $135 million and $188 million, respectively, if recognized, would affect the Company’s effective tax rate. The gross unrecognized tax benefits differ from the amount that would affect the Company’s effective tax rate due primarily to the impact of the valuation allowance on deferred tax assets. A summary of the changes in gross unrecognized tax benefits is as follows: |
2024 |
2023 | |||||||
Balance, beginning of year |
$ |
220 |
$ | 142 | ||||
Increase based on tax positions related to current year |
11 |
28 | ||||||
Increase based on tax positions of prior years |
2 |
— | ||||||
Settlements |
(6 |
) |
1 | |||||
Foreign currency translation |
(15 |
) |
5 | |||||
Statute expirations |
(8 |
) |
(14 | ) | ||||
Acquisitions [note 7] |
— |
58 | ||||||
$ |
204 |
$ | 220 | |||||
|
Remaining
weighted average
useful life in years
|
2024 |
2023 | ||||||||||
Cost |
||||||||||||
Customer relationship intangibles |
3 |
$ |
473 |
$ | 514 | |||||||
Patents and Technology |
6 |
572 |
613 | |||||||||
Computer software and other licenses |
4 |
593 |
621 | |||||||||
1,638 |
1,748 | |||||||||||
Accumulated depreciation |
||||||||||||
Customer relationship intangibles |
(249 |
) |
(236 | ) | ||||||||
Patents and Technology |
(215 |
) |
(163 | ) | ||||||||
Computer software and other licenses |
(436 |
) |
(473 | ) | ||||||||
$ |
738 |
$ | 876 | |||||||||
2024 |
2023 | |||||||
Preproduction costs related to long-term supply agreements |
$ |
697 |
$ | 835 | ||||
Long-term receivables |
239 |
321 | ||||||
Pension overfunded status [note 18[a]] |
57 |
41 | ||||||
Unrealized gain on cash flow hedges [note 22] |
11 |
4 | ||||||
Other |
116 |
118 | ||||||
$ |
1,120 |
$ | 1,319 | |||||
2024 |
2023 | |||||||
Balance, beginning of year |
$ |
270 |
$ | 257 | ||||
Expense, net |
149 |
85 | ||||||
Settlements |
(100 |
) |
(91 | ) | ||||
Business combination |
— |
12 | ||||||
Foreign exchange and other |
(10 |
) |
7 | |||||
$ |
309 |
$ | 270 | |||||
| [a] | Commercial Paper Program |
| [b] | Credit Facilities |
| [a] | The Company’s long-term debt, net of unamortized issuance costs, is substantially uncollateralized and consists of the following: |
2024 |
2023 | |||||||
Senior Notes [i]
|
||||||||
$650 million due October 2025 at 4.150% |
$ |
649 |
$ | 648 | ||||
$300 million due March 2026 at 5.980% |
299 |
298 | ||||||
€600 million due September 2027 at 1.500% |
620 |
662 | ||||||
$400 million due March 2029 at 5.050% |
397 |
— | ||||||
Cdn$450 million due May 2029 at 4.800% |
311 |
— | ||||||
$750 million due June 2030 at 2.450% |
746 |
745 | ||||||
Cdn$350 million due January 2031 at 4.950% |
242 |
263 | ||||||
€550 million due March 2032 at 4.375% |
566 |
604 | ||||||
$500 million due March 2033 at 5.500% |
496 |
495 | ||||||
$750 million due June 2024 at 3.625% |
— |
750 | ||||||
Bank term debt at a weighted average interest rate of 5.06% [2023 – 5.99%], denominated primarily in USD and Chinese Renminbi |
506 |
510 | ||||||
Government loans at a weighted average interest rate of 0.00% [2023 – 0.12%], denominated primarily in Canadian dollar |
6 |
8 | ||||||
Other |
4 |
11 | ||||||
4,842 |
4,994 | |||||||
Less due within one year |
708 |
819 | ||||||
$ |
4,134 |
$ | 4,175 | |||||
| [b] | Future principal repayments on long-term debt are estimated to be as follows: |
2025 |
$ |
709 |
||
2026 |
408 |
|||
2027 |
652 |
|||
2028 |
305 |
|||
2029 |
716 |
|||
Thereafter |
2,072 |
|||
$ |
4,862 |
|||
| [c] | During 2024, the Company issued the following Senior Notes: |
Settlement Date |
Maturity Date |
|||||
Cdn$450 million at 4.800% |
May 30, 2024 | May 30, 2029 | ||||
$400 million at 5.050% |
March 14, 2024 | March 14, 2029 | ||||
| [d] | On March 28, 2024, the Company extended the maturity date of its $2.7 billion syndicated revolving credit facility from June 24, 2028, to June 25, 2029. No amounts are outstanding under this credit facility. |
| [e] | Interest expense, net includes: |
2024 |
2023 | |||||||||
Interest expense |
||||||||||
Current |
$ |
127 |
$ | 80 | ||||||
Long-term |
182 |
162 | ||||||||
309 |
242 |
|||||||||
Interest income |
(98 |
) |
(86 | ) | ||||||
Interest expense, net |
$ |
211 |
$ | 156 | ||||||
| [f] | Interest paid in cash was $309 million |
| [a] | The Company has entered into leases primarily for real estate, manufacturing equipment, and vehicles with terms that typically range from 1 to 15 years, excluding land use rights which generally extend over 90 years. These leases often include options to extend the term of the lease , most often for a period of 5 years. When it is reasonably certain that the option will be exercised, the impact of the option is included in the lease term for purposes of determining total future lease payments. |
2024 |
2023 | |||||||
| Operating lease expense |
$ |
410 |
$ | 353 | ||||
| Short-term lease expense |
21 |
18 | ||||||
| Variable lease expense |
30 |
27 | ||||||
| Total lease expense |
$ |
461 |
$ | 398 | ||||
2024 |
2023 | |||||||
| Operating cash flows – cash paid |
$ |
438 |
$ | 366 | ||||
| New right-of-use |
$ |
748 |
$ | 320 | ||||
| Weighted-average remaining lease term |
9 years |
8 years | ||||||
| Weighted-average discount rate |
6.3% |
5.4% | ||||||
| [b] | Operating lease liabilities consist of: |
| Current operating liabilities |
$ |
293 |
$ | 399 | ||||
| Non-current operating lease liabilities |
1,662 |
1,319 | ||||||
| Total lease liabilities |
$ |
1,955 |
$ | 1,718 |
| [c] | Future annual payments for operating leases are as follows [i] : |
| 2025 |
$ |
379 |
||
| 2026 |
333 |
|||
| 2027 |
298 |
|||
| 2028 |
264 |
|||
| 2029 |
230 |
|||
| Thereafter |
1,006 |
|||
2,510 |
||||
| Less: amount representing interest |
555 |
|||
| Total lease liabilities |
$ |
1,955 |
||
| [i] | Excludes $11 million of future payments for leases, primarily for manufacturing facilities, commencing during 2025 . |
| [d] | The Company’s finance leases were not material for any of the periods presented. |
2024 |
2023 | |||||||
| Defined benefit pension plans and other [a] |
$ |
126 |
$ | 124 | ||||
| Termination and long-term service arrangements [b] |
375 |
428 | ||||||
| Retirement medical benefits plans |
17 |
20 | ||||||
| Other long-term employee benefits |
15 |
19 | ||||||
| Long-term employee benefit obligations |
$ |
533 |
$ | 591 | ||||
[a] |
Defined benefit pension plans |
2024 |
2023 | |||||||
| Projected benefit obligation |
||||||||
| Discount rate |
4.6 |
% |
4.7% | |||||
| Rate of compensation increase |
3.2 |
% |
3.7% | |||||
| Net periodic benefit cost |
||||||||
| Discount rate |
4.1 |
% |
4.5% | |||||
| Rate of compensation increase |
3.2 |
% |
3.7% | |||||
| Expected return on plan assets |
5.9 |
% |
5.7% | |||||
2024 |
2023 | |||||||
Projected benefit obligation |
||||||||
Beginning of year |
$ |
511 |
$ | 498 | ||||
Current service cost |
7 |
6 | ||||||
Interest cost |
22 |
22 | ||||||
Actuarial gains and changes in actuarial assumptions |
(17 |
) |
5 | |||||
Benefits paid |
(22 |
) |
(24 | ) | ||||
Acquisition [note 7] |
— |
4 | ||||||
Divestiture |
— |
(10 | ) | |||||
Foreign exchange |
(26 |
) |
10 | |||||
End of year |
475 |
511 | ||||||
Plan assets at fair value [i] |
||||||||
Beginning of year |
427 |
391 | ||||||
Return on plan assets |
17 |
41 | ||||||
Employer contributions |
5 |
7 | ||||||
Benefits paid |
(22 |
) |
(19 | ) | ||||
Foreign exchange |
(22 |
) |
7 | |||||
End of year |
405 |
427 | ||||||
Ending funded status – Plan deficit |
$ |
70 |
$ | 84 | ||||
Amounts recorded in the consolidated balance sheet |
||||||||
Non-current asset [note 14] |
$ |
57 |
$ | 41 | ||||
Current liability |
1 |
1 | ||||||
Non-current liability |
126 |
124 | ||||||
Net liability |
$ |
70 |
$ | 84 | ||||
Unrecognized actuarial losses recorded in accumulated other comprehensive income |
$ |
(72 |
) |
$ | (75 | ) | ||
Net periodic benefit cost |
||||||||
Current service cost |
$ |
7 |
$ | 6 | ||||
Interest cost |
22 |
22 | ||||||
Return on plan assets |
(24 |
) |
(21 | ) | ||||
Actuarial (gains) losses |
(18 |
) |
3 | |||||
Net periodic benefit cost |
$ |
(13 |
) |
$ | 10 | |||
| [i] | The asset allocation of the Company’s defined benefit pension plans at December 31, 2024 and the target allocation range for 2025 are as follows: |
2025 |
2024 | |||||||
Fixed income securities |
60-86% |
64% | ||||||
Equity securities |
14-44% |
27% | ||||||
Cash and cash equivalents |
0-10% |
9% | ||||||
100% |
100% | |||||||
[b] |
Termination and long-term service arrangements |
2024 |
2023 | |||||||
Discount rate |
5.2% |
5.3% | ||||||
Rate of compensation increase |
3.5% |
3.7% | ||||||
2024 |
2023 | |||||||
Projected benefit obligation |
||||||||
Beginning of year |
$ |
445 |
$ | 387 | ||||
Current service cost |
16 |
16 | ||||||
Interest cost |
20 |
20 | ||||||
Actuarial (gains) losses and changes in actuarial assumptions |
(4 |
) |
21 | |||||
Benefits paid |
(46 |
) |
(24 | ) | ||||
Foreign exchange |
(40 |
) |
25 | |||||
Ending funded status – Plan deficit |
$ |
391 |
$ | 445 | ||||
Amounts recorded in the consolidated balance sheet |
||||||||
Current liability |
$ |
16 |
$ | 17 | ||||
Non-current liability |
375 |
428 | ||||||
Net liability |
$ |
391 |
$ | 445 | ||||
Unrecognized actuarial losses recorded in accumulated other comprehensive income |
$ |
(51 |
) |
$ | (59 | ) | ||
Net periodic benefit cost |
||||||||
Current service cost |
$ |
16 |
$ | 16 | ||||
Interest cost |
20 |
20 | ||||||
Actuarial losses |
3 |
7 | ||||||
Net periodic benefit cost |
$ |
39 |
$ | 43 | ||||
[c] |
Future benefit payments |
|
Defined
benefit
pension plans
|
Termination
and long-term service
arrangements
|
Retirement
medical
benefits plans
|
Total | |||||||||||||
Expected employer contributions - 2025 |
$ | 6 | $ | 16 | $ | 1 | $ | 23 | ||||||||
Expected benefit payments: |
||||||||||||||||
2025 |
$ | 26 | $ | 16 | $ | 1 | $ | 43 | ||||||||
2026 |
26 | 17 | 1 | 44 | ||||||||||||
2027 |
27 | 18 | 1 | 46 | ||||||||||||
2028 |
27 | 24 | 1 | 52 | ||||||||||||
2029 |
28 | 26 | 2 | 56 | ||||||||||||
Thereafter |
150 | 174 | 6 | 330 | ||||||||||||
| $ | 284 | $ | 275 | $ | 12 | $ | 571 | |||||||||
2024 |
2023 | |||||||
Long-term portion of income taxes payable |
$ |
143 |
$ | 167 | ||||
Long-term portion of deferred revenue |
97 |
223 | ||||||
Asset retirement obligation |
32 |
37 | ||||||
Long-term portion of fair value of hedges [note 21] |
83 |
8 | ||||||
Other |
41 |
40 | ||||||
$ |
396 |
$ | 475 | |||||
| [a] | At December 31, 2024, the Company’s authorized, issued and outstanding capital stock are as follows: |
| [i] | Each share is entitled to one vote per share at all meetings of shareholders. |
| [ii] | Each share shall participate equally as to dividends. |
| [b] | The Company had a Normal Course Issuer Bid in place for the 12-month period ending November 2023 [“2023 Bid”]. Subsequently, the Company entered into a new Normal Course Issuer Bid for the 12-month period ending February 2025 [“Prior 2024 Bid”], which was terminated on November 6, 2024. |
2024 |
2023 | |||||||||||||||||||
|
Shares purchased |
Cash amount |
Shares
purchased
|
Cash
amount
|
|||||||||||||||||
2022 Bid |
— | $ | — | 239,296 | $ | 13 | ||||||||||||||
Prior 2024 Bid |
98,636 | 5 | — | — | ||||||||||||||||
2024 Bid |
4,551,327 | 202 | — | — | ||||||||||||||||
4,649,963 |
$ |
207 |
239,296 | $ | 13 | |||||||||||||||
| [c] | The following table presents the maximum number of shares that would be outstanding if all the dilutive instruments outstanding at February 26, 2025 were exercised or converted: |
Common Shares |
281,688,546 | |||
Stock options [i]
|
5,905,458 | |||
| 287,594,004 |
| [i] | Options to purchase Common Shares are exercisable by the holder in accordance with the vesting provisions and upon payment of the exercise price as may be determined from time to time pursuant to the Company’s stock option plans. |
2024 |
2023 | |||||||
Accumulated net unrealized loss on translation of net investment in foreign operations |
||||||||
Balance, beginning of year |
$ |
(836 |
) |
$ | (1,018 | ) | ||
Net unrealized (loss) gain |
(539 |
) |
183 | |||||
Repurchase of shares under Normal Course Issuer Bids [note 20] |
7 |
(1 | ) | |||||
Balance, end of year |
(1,368 |
) |
(836 | ) | ||||
Accumulated net unrealized gain on cash flow hedges [b] |
||||||||
Balance, beginning of year |
43 |
5 | ||||||
Net unrealized (loss) gain |
(102 |
) |
94 | |||||
Reclassifications to net income [a] |
(54 |
) |
(56 | ) | ||||
Balance, end of year |
(113 |
) |
43 | |||||
Accumulated net unrealized loss on other long-term employee benefit liabilities [b] |
||||||||
Balance, beginning of year |
(105 |
) |
(101 | ) | ||||
Revaluation |
1 |
— | ||||||
Net unrealized loss |
— |
(5 | ) | |||||
Reclassifications to net income [a] |
1 |
1 | ||||||
Balance, end of year |
(103 |
) |
(105 | ) | ||||
Total accumulated other comprehensive loss [c] |
$ |
(1,584 |
) |
$ | (898 | ) | ||
| [a] | The effects on net income of amounts reclassified from AOCL were as follows: |
2024 |
2023 | |||||||
Cash flow hedges |
||||||||
Sales |
$ |
(7 |
) |
$ | (32 | ) | ||
Cost of sales |
76 |
107 | ||||||
Income tax |
(15 |
) |
(19 | ) | ||||
Net of tax |
54 |
56 | ||||||
Other long-term employee benefit liabilities |
||||||||
Cost of sales |
(1 |
) |
(1 | ) | ||||
Income tax |
— |
— | ||||||
Net of tax |
(1 |
) |
(1 | ) | ||||
Total reclassification to net income |
$ |
53 |
$ | 55 | ||||
| [b] | The amount of income tax benefit (loss) that has been allocated to each component of other comprehensive loss is as follows: |
2024 |
2023 | |||||||
Accumulated net unrealized loss on translation of net investment in foreign operations |
$ |
5 |
$ | 6 | ||||
Accumulated net unrealized gain on cash flow hedges |
||||||||
Balance, beginning of year |
(16 |
) |
— | |||||
Net unrealized gain (loss) |
46 |
(35 | ) | |||||
Reclassifications to net income |
15 |
19 | ||||||
Balance, end of year |
45 |
(16 | ) | |||||
Accumulated net unrealized loss on other long-term liabilities |
||||||||
Balance, beginning of year |
9 |
6 | ||||||
Net unrealized (loss) gain |
(3 |
) |
3 | |||||
Reclassifications to net income |
(2 |
) |
— | |||||
Balance, end of year |
4 |
9 | ||||||
Total income tax benefit (loss) |
$ |
54 |
$ | (1 | ) | |||
| [c] | The amount of other comprehensive loss that is expected to be reclassified to net income during 2025 is $78 million. |
[a] |
Foreign exchange contracts |
| For U.S dollars | For Canadian dollars | For euros | ||||||||||||||||||||||||||||||||||||||
|
Buy
(sell)
|
Peso
amount
|
Weighted
average
rate
|
Canadian
amount
|
Weighted
average
rate
|
euro
amount
|
Weighted
average
rate
|
US
dollar
amount
|
Weighted
average
rate
|
US
dollar
amount
|
Weighted
average
rate
|
||||||||||||||||||||||||||||||
2025 |
12,117 | 0.050 | 1,237 | 0.747 | 197 | 1.083 | 180 | 1.364 | 160 | 0.911 | ||||||||||||||||||||||||||||||
2025 |
(60 | ) | 18.703 | (245 | ) | 1.364 | (146 | ) | 0.911 | (924 | ) | 0.747 | (214 | ) | 1.083 | |||||||||||||||||||||||||
2026 |
6,803 | 0.049 | 602 | 0.751 | 146 | 1.109 | 58 | 1.346 | 73 | 0.896 | ||||||||||||||||||||||||||||||
2026 |
— | — | (77 | ) | 1.346 | (66 | ) | 0.896 | (453 | ) | 0.751 | (162 | ) | 1.109 | ||||||||||||||||||||||||||
2027 |
3,521 | 0.046 | 313 | 0.749 | 98 | 1.119 | 28 | 1.341 | 51 | 0.890 | ||||||||||||||||||||||||||||||
2027 |
(34 | ) | 22.566 | (37 | ) | 1.341 | (45 | ) | 0.890 | (234 | ) | 0.749 | (110 | ) | 1.119 | |||||||||||||||||||||||||
2028 |
— | — | 114 | 0.756 | 10 | 1.145 | 10 | 1.323 | 31 | 0.887 | ||||||||||||||||||||||||||||||
2028 |
— | — | (13 | ) | 1.323 | (27 | ) | 0.887 | (86 | ) | 0.756 | (12 | ) | 1.145 | ||||||||||||||||||||||||||
2029 |
— | — | — | — | (7 | ) | 0.884 | — | — | 8 | 0.884 | |||||||||||||||||||||||||||||
| 22,347 | 1,894 | 160 | (1,421 | ) | (175 | ) | ||||||||||||||||||||||||||||||||||
[b] |
Financial assets and liabilities |
2024 |
2023 | |||||||
Financial assets |
||||||||
Cash and cash equivalents |
$ |
1,247 |
$ | 1,198 | ||||
Accounts receivable |
7,376 |
7,881 | ||||||
Warrants and public and private equity investments |
220 |
264 | ||||||
Debt investments |
31 |
22 | ||||||
Long-term receivables included in other assets [note 14] |
260 |
321 | ||||||
$ |
9,134 |
$ | 9,686 | |||||
Financial liabilities |
||||||||
Short-term borrowing |
$ |
271 |
$ | 511 | ||||
Long-term debt (including portion due within one year) |
4,842 |
4,994 | ||||||
Operating lease liability |
1,955 |
1,718 | ||||||
Accounts payable |
7,194 |
7,842 | ||||||
$ |
14,262 |
$ | 15,065 | |||||
Foreign currency contracts designated as effective hedges, measured at fair value |
||||||||
Prepaid expenses |
$ |
33 |
$ | 78 | ||||
Other assets |
10 |
4 | ||||||
Other accrued liabilities |
(107 |
) |
(13 | ) | ||||
Other long-term liabilities |
(83 |
) |
(8 | ) | ||||
$ |
(147 |
) |
$ | 61 | ||||
[c] |
Derivatives designated as effective hedges, measured at fair value |
|
Gross amounts presented in consolidated balance sheets |
Gross amounts not offset in consolidated balance sheets |
Net amounts |
||||||||||
December 31, 2024 |
||||||||||||
Assets |
$ 43 |
$ 37 |
$ |
6 |
||||||||
Liabilities |
$ (190 |
) |
$ (37 |
) |
$ |
(153 |
) |
|||||
December 31, 2023 |
||||||||||||
Assets |
$ 82 | $ 7 | $ | 75 | ||||||||
Liabilities |
$ (20 | ) | $ (7 | ) | $ | (13 | ) | |||||
[d] |
Supplier financing programs |
2024 |
2023 |
|||||||
Balance, beginning of year |
$ |
132 |
$ | 135 | ||||
Amounts settled |
(172 |
) |
(106 | ) | ||||
Amounts added to the program |
126 |
103 | ||||||
Balance, end of year |
$ |
86 |
$ | 132 | ||||
[e] |
Fair value |
[f] |
Credit risk |
[g] |
Currency risk |
[h] |
Interest rate risk |
[i] |
Equity price risk |
| [a] | The following tables show segment information for the Company’s reporting segments and a reconciliation of Adjusted EBIT to the Company’s consolidated income before income taxes: |
2024 |
||||||||||||||||||||||
|
Total sales |
External sales |
Adjusted EBIT |
Depreciation |
Equity (income) loss |
||||||||||||||||||
Body Exteriors & Structures |
$ 16,999 |
$ 16,745 |
$ 1,283 |
$ 731 |
$ (4 |
) |
||||||||||||||||
Power & Vision |
15,391 |
15,132 |
810 |
572 |
(70 |
) |
||||||||||||||||
Seating Systems |
5,800 |
5,787 |
223 |
98 |
(24 |
) |
||||||||||||||||
Complete Vehicles |
5,186 |
5,155 |
130 |
83 |
(7 |
) |
||||||||||||||||
Corporate & Other [i] |
(540 |
) |
17 |
(117 |
) |
26 |
4 |
|||||||||||||||
Total Reportable Segments |
$ 42,836 |
$ 42,836 |
$ 2,329 |
$ 1,510 |
$ (101 |
) |
||||||||||||||||
2023 |
||||||||||||||||||||||
|
Total
sales
|
External sales |
Adjusted EBIT |
Depreciation | Equity loss (income) |
||||||||||||||||||
Body Exteriors & Structures |
$ 17,511 | $ 17,199 | $ 1,304 | $ 716 | $ 4 | |||||||||||||||||
Power & Vision |
14,305 | 14,052 | 668 | 510 | (107 | ) | ||||||||||||||||
Seating Systems |
6,047 | 6,027 | 218 | 89 | (3 | ) | ||||||||||||||||
Complete Vehicles |
5,538 | 5,502 | 124 | 100 | (8 | ) | ||||||||||||||||
Corporate & Other [i] |
(604 | ) | 17 | (76 | ) | 21 | 2 | |||||||||||||||
Total Reportable Segments |
$ 42,797 | $ 42,797 | $ 2,238 | $ 1,436 | $ (112 | ) | ||||||||||||||||
2024 |
||||||||||||||||||||||
|
Net assets |
Investments |
Goodwill |
Fixed assets, net |
Fixed asset additions |
||||||||||||||||||
Body Exteriors & Structures |
$ 8,727 |
$ 24 |
$ 435 |
$ 5,805 |
$ 1,338 |
|||||||||||||||||
Power & Vision |
6,982 |
525 |
1,868 |
2,828 |
644 |
|||||||||||||||||
Seating Systems |
1,401 |
193 |
250 |
476 |
112 |
|||||||||||||||||
Complete Vehicles |
439 |
105 |
102 |
375 |
59 |
|||||||||||||||||
Corporate & Other |
724 |
198 |
19 |
100 |
25 |
|||||||||||||||||
Total Reportable Segments |
$ 18,273 |
$ 1,045 |
$ 2,674 |
$ 9,584 |
$ 2,178 |
|||||||||||||||||
2023 |
||||||||||||||||||||||
|
Net
assets
|
Investments | Goodwill |
Fixed
assets,
net
|
Fixed
asset
additions
|
||||||||||||||||||
Body Exteriors & Structures |
$ 8,147 | $ 2 | $ 452 | $ 5,569 | $ 1,638 | |||||||||||||||||
Power & Vision |
7,880 | 696 | 1,929 | 2,991 | 664 | |||||||||||||||||
Seating Systems |
1,340 | 172 | 257 | 506 | 108 | |||||||||||||||||
Complete Vehicles |
574 | 100 | 109 | 453 | 65 | |||||||||||||||||
Corporate & Other |
1,066 | 303 | 20 | 100 | 25 | |||||||||||||||||
Total Reportable Segments |
$ 19,007 | $ 1,273 | $ 2,767 | $ 9,619 | $ 2,500 | |||||||||||||||||
| [i] | Included in Corporate and Other Adjusted EBIT are intercompany fees charged to the automotive segments. |
| [b] | The following table reconciles Net income from operations to Adjusted EBIT: |
2024 |
2023 |
|||||||
Net Income |
$ |
1,096 |
$ |
1,286 |
||||
Add: |
||||||||
Amortization of acquired intangible assets |
112 |
88 |
||||||
Interest expense, net |
211 |
156 |
||||||
Other expense, net |
464 |
388 |
||||||
Income taxes |
446 |
320 |
||||||
Adjusted EBIT |
$ |
2,329 |
$ |
2,238 |
||||
| [c] | The following table reconciles Total Assets to Net Assets: |
2024 |
2023 |
|||||||
Total Assets |
$ |
31,039 |
$ |
32,255 |
||||
Deduct assets not included in segment net assets: |
||||||||
Cash and cash equivalents |
(1,247 |
) |
(1,198 |
) |
||||
Deferred tax assets |
(819 |
) |
(621 |
) |
||||
Long-term receivables from joint venture partners |
(67 |
) |
(49 |
) |
||||
Deduct liabilities included in segment net assets: |
||||||||
Accounts payable |
(7,194 |
) |
(7,842 |
) |
||||
Accrued salaries and wages |
(867 |
) |
(912 |
) |
||||
Other accrued liabilities |
(2,572 |
) |
(2,626 |
) |
||||
Segment Net Assets |
$ |
18,273 |
$ |
19,007 |
||||
| [d] | The following table aggregates external revenues by customer as follows: |
2024 |
2023 |
|||||||
General Motors |
$ |
6,588 |
$ |
6,162 |
||||
Daimler AG |
5,563 |
5,785 |
||||||
Ford Motor Company |
5,296 |
5,317 |
||||||
BMW |
5,042 |
5,334 |
||||||
Volkswagen |
4,388 |
4,684 |
||||||
Stellantis |
4,330 |
5,246 |
||||||
Other |
11,629 |
10,269 |
||||||
$ |
42,836 |
$ |
42,797 |
|||||
| [e] | The following table summarizes external revenues and long-lived assets by geographic region: |
External Sales |
Fixed Assets, Net |
|||||||||||||||
2024 |
2023 | 2024 |
2023 | |||||||||||||
North America |
||||||||||||||||
United States |
$ |
10,927 |
$ | 10,855 | $ |
2,624 |
$ | 2,297 | ||||||||
Mexico |
5,366 |
4,958 | 1,635 |
1,509 | ||||||||||||
Canada |
4,322 |
4,909 | 1,109 |
1,211 | ||||||||||||
20,615 |
20,722 | 5,368 |
5,017 | |||||||||||||
Europe |
||||||||||||||||
Austria |
6,381 |
6,926 | 679 |
787 | ||||||||||||
Germany |
4,199 |
4,403 | 769 |
831 | ||||||||||||
Czech Republic |
1,553 |
1,330 | 314 |
342 | ||||||||||||
Poland |
797 |
798 | 174 |
238 | ||||||||||||
Sweden |
432 |
322 | 125 |
150 | ||||||||||||
Italy |
419 |
464 | 218 |
240 | ||||||||||||
United Kingdom |
401 |
442 | 152 |
162 | ||||||||||||
Spain |
399 |
390 | 73 |
81 | ||||||||||||
Slovakia |
296 |
273 | 329 |
329 | ||||||||||||
Turkey |
255 |
325 | 13 |
9 | ||||||||||||
France |
245 |
337 | 75 |
77 | ||||||||||||
Other Europe |
239 |
207 | 223 |
214 | ||||||||||||
15,616 |
16,217 | 3,144 |
3,460 | |||||||||||||
Asia Pacific |
||||||||||||||||
China |
5,564 |
4,843 | 945 |
958 | ||||||||||||
India |
180 |
242 | 47 |
100 | ||||||||||||
Other Asia Pacific |
338 |
231 | 10 |
12 | ||||||||||||
6,082 |
5,316 | 1,002 |
1,070 | |||||||||||||
Rest of World |
523 |
542 | 70 |
72 | ||||||||||||
$ |
42,836 |
$ | 42,797 | $ |
9,584 |
$ | 9,619 | |||||||||
Exhibit 3
MAGNA INTERNATIONAL INC.
Management’s Discussion and Analysis of Results of Operations and Financial Position
Unless otherwise noted, all amounts in this Management’s Discussion and Analysis of Results of Operations and Financial Position [“MD&A”] are in U.S. dollars and all tabular amounts are in millions of U.S. dollars, except per share figures, which are in U.S. dollars. When we use the terms “we”, “us”, “our” or “Magna”, we are referring to Magna International Inc. and its subsidiaries and jointly controlled entities, unless the context otherwise requires.
This MD&A should be read in conjunction with the audited consolidated financial statements for the year ended December 31, 2024 included in our 2024 Annual Report to Shareholders.
This MD&A may contain statements that are forward looking. Refer to the “Forward-Looking Statements” section in this MD&A for a more detailed discussion of our use of forward-looking statements.
This MD&A has been prepared as at February 26, 2025.
HIGHLIGHTS
INDUSTRY PRODUCTION ENVIRONMENT
| • | Global light vehicle production in 2024 was largely unchanged from 2023, with North America and Europe declining 1% and 4%, respectively, while China increased 5%. |
SALES & EARNINGS
| • | Total sales were essentially unchanged at $42.8 billion in 2024 compared to 2023. Factors positively impacting sales included the launch of new programs, the acquisition of Veoneer Active Safety [“Veoneer AS”], the negative impact of the UAW labour strikes during 2023, higher engineering revenue, and the net favourable impact of commercial items. These were largely offset by lower production on certain programs, the end of production on certain programs, lower complete vehicle assembly volumes and the net weakening of foreign currencies against the U.S. dollar. |
| • | Diluted earnings per share were $3.52 and Adjusted diluted earnings per share(1) were $5.41 in 2024. |
| • | Adjusted diluted earnings per share declined modestly compared to 2023, primarily reflecting higher interest costs and a higher income tax rate, partially offset by higher Adjusted EBIT. |
| • | Adjusted EBIT was higher, reflecting net favourable commercial items negotiated largely as a result of lower than anticipated volumes on certain new electric vehicle programs, the impact of operational excellence activities and productivity and efficiency improvements, and lower net engineering costs. These factors were partially offset by reduced earnings on lower assembly volumes, and higher production input costs net of customer recoveries. |
CASH & INVESTMENTS
| • | Cash generated from operating activities was $3.6 billion, compared to $3.1 billion in 2023, largely reflecting an increase in cash generated from operating assets and liabilities. |
| • | We continued to invest in our business, including $2.2 billion for fixed assets and $617 million in investment and other asset spending. |
| • | We returned $746 million to shareholders in 2024 through $539 million in dividends and $207 million in share repurchases. |
| • | During the fourth quarter, our Board of Directors increased our quarterly dividend to $0.485 per share, our 15th consecutive year of dividend increases. |
| • | We raised $725 million in the form of Senior Notes to refinance $750 million in Senior Notes that came due in 2024. |
STRATEGIC UPDATES
| • | Utilizing our strong innovation pipeline, we won substantial additional business across our portfolio, including: |
| • | an 800-volt dedicated hybrid drive system for a China-based OEM; |
| • | reconfigurable seating business for a China-based OEM; |
| • | hot-stamping business using advanced materials for a Japan-based OEM; |
| • | advanced interior cabin sensing systems for three OEMs; and |
| • | high-performance eDrive system business for a North America-based OEM. |
| • | We were awarded: |
| • | a 2024 Automotive News PACE award for our integrated driver and occupant monitoring system; and |
| • | two 2024 Automotive New PACEpilot Innovations to Watch, an award which acknowledges post-pilot, pre-commercial innovations in the automotive and future mobility space, for our EcoSphere™ 100% Melt-Recyclable Foam and Trim and Modular & Scalable Active Grille Shutter Assembly. |
1 Adjusted diluted earnings per share is a Non-GAAP financial measure. Refer to the section “Use of Non-GAAP Measures”.
Magna International Inc. Annual Report 2024 1
OVERVIEW
OUR BUSINESS(2)
Magna is more than one of the world’s largest suppliers in the automotive space. We are a mobility technology company built to innovate, with a global, entrepreneurial-minded team of over 170,000(3) employees across 341 manufacturing operations and 106 product development, engineering and sales centres spanning 28 countries. With 65+ years of expertise, our ecosystem of interconnected products combined with our complete vehicle expertise uniquely positions us to advance mobility in an expanded transportation landscape. For further information about Magna (NYSE:MGA; TSX:MG), please visit www.magna.com or follow us on social.
FORWARD-LOOKING STATEMENTS
Certain statements in this MD&A may constitute “forward-looking information” or “forward-looking statements” (collectively, “forward-looking statements”). Any such forward-looking statements are intended to provide information about management’s current expectations and plans and may not be appropriate for other purposes. Forward-looking statements may include financial and other projections, as well as statements regarding our future plans, strategic objectives or economic performance, or the assumptions underlying any of the foregoing, and other statements that are not recitations of historical fact. We use words such as “may”, “would”, “could”, “should”, “will”, “likely”, “expect”, “anticipate”, “assume”, “believe”, “intend”, “plan”, “aim”, “forecast”, “outlook”, “project”, “potential”, “estimate”, “target” and similar expressions suggesting future outcomes or events to identify forward-looking statements.
Forward-looking statements are based on information currently available to us and are based on assumptions and analyses made by us in light of our experience and our perception of historical trends, current conditions and expected future developments, as well as other factors we believe are appropriate in the circumstances. While we believe we have a reasonable basis for making any such forward-looking statements, they are not a guarantee of future performance or outcomes. Whether actual results and developments conform to our expectations and predictions is subject to a number of risks, assumptions, and uncertainties, many of which are beyond our control, and the effects of which can be difficult to predict, including the risk factors which are described later in this MD&A.
INDUSTRY TRENDS
Our operating results are primarily dependent on the levels of North American, European, and Chinese car and light truck production by our customers. While we supply systems and components to every major original equipment manufacturer [“OEM”], we do not supply systems and components for every vehicle, nor is the value of our content consistent from one vehicle to the next. As a result, customer and program mix relative to market trends, as well as the value of our content on specific vehicle production programs, are also important drivers of our results.
Ordinarily, OEM production volumes are aligned with vehicle sales levels and are affected by changes in such levels. Aside from vehicle sales levels, production volumes are typically impacted by a range of factors, including: general economic and political conditions; labour disruptions; free trade arrangements; tariffs; relative currency values; commodities prices; supply chains and infrastructure; availability and relative cost of skilled labour; regulatory considerations, including those related to environmental emissions and safety standards; and other factors.
Overall vehicle sales levels are significantly affected by changes in consumer confidence levels, which may in turn be impacted by consumer perceptions and general trends related to the job, housing, and stock markets, as well as other macroeconomic and political factors. Other factors which typically impact vehicle sales levels and thus production volumes include: vehicle affordability; interest rates and/or availability of credit; fuel and energy prices; relative currency values; considerations related to vehicle propulsion, safety, and other technologies or features; government subsidies to consumers for the purchase of low- and zero-emission vehicles; and other factors.
During 2024, the primary industry trends impacting us were program cancellations, deferrals and reductions in production volumes, related mainly to North American EV programs in 2024. We continue to implement a business strategy which is rooted in our best assessment as to the rate and direction of change in the automotive industry. Our short and medium-term operational success, as well as our ability to create long-term value through our business strategy, are subject to a number of risks and uncertainties which are discussed later in this MD&A.
2 Manufacturing operations, product development, engineering and sales centres include certain operations accounted for under the equity method.
3 Number of employees includes over 158,000 employees at our wholly owned or controlled entities and over 12,000 employees at operations accounted for under the equity method.
2 Magna International Inc. Annual Report 2024
USE OF NON-GAAP FINANCIAL MEASURES
In addition to results presented in accordance with accounting principles generally accepted in the United States of America [”U.S. GAAP”], this report includes the use of Adjusted earnings before interest and taxes [“Adjusted EBIT”], Adjusted EBIT as a percentage of sales, Adjusted diluted earnings per share, and Adjusted Return on Invested Capital [collectively, the “Non-GAAP Measures”]. We believe these Non-GAAP financial measures provide additional information that is useful to investors in understanding our underlying performance and trends through the same financial measures employed by our management. Readers should be aware that Non-GAAP Measures have no standardized meaning under U.S. GAAP and accordingly may not be comparable to the calculation of similar measures by other companies. We believe that Adjusted EBIT, Adjusted EBIT as a percentage of sales, Adjusted diluted earnings per share and Adjusted Return on Invested Capital provide useful information to our investors for measuring our operational performance as they exclude certain items that are not reflective of ongoing operating profit and facilitate a comparison with prior periods. The presentation of any Non-GAAP Measures should not be considered in isolation or as a substitute for our related financial results prepared in accordance with U.S. GAAP. Non-GAAP financial measures are presented together with the most directly comparable U.S. GAAP financial measure, and a reconciliation to the most directly comparable U.S. GAAP financial measure, can be found in the “Non-GAAP Financial Measures Reconciliation” section of this MD&A.
RESULTS OF OPERATIONS
AVERAGE FOREIGN EXCHANGE
| 2024 | 2023 | Change | ||||||||||
| 1 Canadian dollar equals U.S. dollars |
0.730 | 0.742 | - 2% | |||||||||
| 1 euro equals U.S. dollars |
1.082 | 1.082 | — | |||||||||
| 1 Chinese renminbi equals U.S. dollars |
0.139 | 0.141 | - 2% | |||||||||
The preceding table reflects the average foreign exchange rates between the most common currencies in which we conduct business and our U.S. dollar reporting currency.
The results of operations for which the functional currency is not the U.S. dollar are translated into U.S. dollars using the average exchange rates for the relevant period. Throughout this MD&A, reference is made to the impact of translation of foreign operations on reported U.S. dollar amounts where relevant.
Our results can also be affected by the impact of movements in exchange rates on foreign currency transactions (such as raw material purchases or sales denominated in foreign currencies). However, as a result of hedging programs employed by us, foreign currency transactions in the current period have not been fully impacted by movements in exchange rates. We record foreign currency transactions at the hedged rate where applicable.
Finally, foreign exchange gains and losses on revaluation and/or settlement of monetary items denominated in a currency other than an operation’s functional currency impact reported results. These gains and losses are recorded in selling, general and administrative expense.
LIGHT VEHICLE PRODUCTION VOLUMES
Our operating results are mostly dependent on light vehicle production in the regions reflected in the table below:
Light Vehicle Production Volumes (thousands of units)
| 2024 | 2023 | Change | ||||||||||
| North America |
15,518 | 15,614 | - 1% | |||||||||
| Europe |
16,878 | 17,637 | - 4% | |||||||||
| China |
30,702 | 29,227 | + 5% | |||||||||
| Other |
26,885 | 27,715 | - 3% | |||||||||
| Global |
89,983 | 90,193 | — | |||||||||
Magna International Inc. Annual Report 2024 3
RESULTS OF OPERATIONS – FOR THE YEAR ENDED DECEMBER 31, 2024
SALES
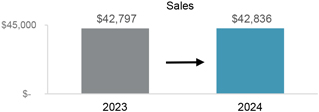
Sales were substantially unchanged at $42.84 billion for 2024 compared to $42.80 billion for 2023. Factors positively impacting sales include:
| • | the launch of new programs during or subsequent to 2023; |
| • | the net impact of acquisitions and divestitures, during 2023 and 2024, which increased sales by $468 million; |
| • | the negative impact of the UAW labour strikes, which negatively impacted 2023 sales by approximately $325 million; |
| • | higher engineering revenue; |
| • | commercial items in 2024 and 2023, which had a net favourable impact on a year-over-year basis; and |
| • | customer price increases to partially recover certain higher production input costs. |
These factors were partially offset by:
| • | lower production on certain programs; |
| • | the end of production of certain programs; |
| • | lower complete vehicle assembly volumes, including the end of production of the BMW 5-Series and Jaguar E-Pace; |
| • | the net weakening of foreign currencies against the U.S. dollar, which decreased reported U.S. dollar sales by $151 million; and |
| • | customer price concessions. |
COST OF GOODS SOLD
| 2024 | 2023 | Change | ||||||||||
| Material |
$ | 25,991 | $ | 26,309 | $ | (318) | ||||||
| Direct labour |
3,127 | 3,164 | (37) | |||||||||
| Overhead |
7,919 | 7,712 | 207 | |||||||||
| Cost of goods sold |
$ | 37,037 | $ | 37,185 | $ | (148) | ||||||
Cost of goods sold decreased $148 million to $37.04 billion for 2024 compared to $37.19 billion for 2023, primarily due to:
| • | a decrease in material, direct labour and overhead costs associated with lower sales in our Complete Vehicles segment, which has a higher material content compared to our consolidated average; |
| • | lower material, direct labour and overhead associated with lower production sales on certain programs; |
| • | productivity and efficiency improvements, including lower costs at certain underperforming facilities; |
| • | the net weakening of foreign currencies against the U.S. dollar, which decreased reported U.S. dollar costs of goods sold by $123 million; |
| • | lower net engineering costs, including spending related to our electrification and active safety business; and |
| • | commercial items in 2024 and 2023, which had a net favourable impact on a year-over-year basis, including the negative impact of a settlement with a supplier during the fourth quarter of 2024. |
These factors were partially offset by:
| • | acquisitions, net of divestitures, during or subsequent to 2023; |
| • | higher production input costs net of customer recoveries, including labour, partially offset by lower prices for certain commodities; |
| • | an increase in material, direct labour and overhead costs associated with higher engineering sales; |
| • | the negative impact of the UAW labour strikes during 2023; |
| • | an increase in net warranty costs of $61 million; and |
| • | higher restructuring costs. |
4 Magna International Inc. Annual Report 2024
SELLING, GENERAL AND ADMINISTRATIVE [“SG&A”]
SG&A expense increased $11 million to $2.06 billion for 2024 compared to $2.05 billion for 2023, primarily as a result of:
| • | higher labour and benefit costs; |
| • | higher pre-operating costs incurred at new facilities; |
| • | higher restructuring costs; and |
| • | acquisitions, net of divestitures, during or subsequent to 2023. |
These factors were partially offset by:
| • | lower provisions against certain accounts receivable and other balances; |
| • | lower legal fees, including costs incurred during 2023 due to the acquisition of Veoneer AS and financing activities; |
| • | the net weakening of foreign currencies against the U.S. dollar, which decreased SG&A by $12 million; |
| • | a gain on the sale of an equity method investment during the first quarter of 2024; |
| • | higher net transactional foreign exchange gains in 2024 compared to 2023; and |
| • | lower incentive compensation. |
DEPRECIATION
Depreciation increased $74 million to $1.51 billion for 2024 compared to $1.44 billion for 2023, primarily due to increased capital deployed at new and existing facilities including to support the launch of programs, and acquisitions, net of divestitures, during or subsequent to 2023, partially offset by the end of production of certain programs and the net weakening of foreign currencies against the U.S. dollar, which decreased depreciation by $5 million.
AMORTIZATION OF ACQUIRED INTANGIBLE ASSETS
Amortization of acquired intangible assets increased $24 million to $112 million for 2024 compared to $88 million for 2023 primarily due to the acquisition of Veoneer AS during the second quarter of 2023.
INTEREST EXPENSE, NET
During 2024, we recorded net interest expense of $211 million compared to $156 million for 2023. The $55 million increase was primarily a result of interest expense on higher short-term borrowings, Senior Notes issued during 2023 and 2024 at higher interest rates than the Senior Notes repaid during 2023 and 2024, and the Term Loan entered into during 2023. These factors were partially offset by higher interest income earned on cash and investments due to higher interest rates.
EQUITY INCOME
Equity income decreased $11 million to $101 million for 2024 compared to $112 million for 2023, primarily as a result of reduced earnings due to unfavourable product mix and lower sales at certain equity-accounted entities. These factors were partially offset by commercial items in 2024 and 2023, which had a favourable impact on a year-over-year basis.
OTHER EXPENSE, NET
| 2024 | 2023 | |||||||
| Impacts related to Fisker (1) |
$ | 198 | $ | 110 | ||||
| Restructuring activities (2) |
187 | 148 | ||||||
| Long-lived asset impairments (3) |
79 | — | ||||||
| Investments (4) |
9 | 91 | ||||||
| Gain on business combination (5) |
(9 | ) | — | |||||
| Veoneer Active Safety Business transaction costs (6) |
— | 23 | ||||||
| Operations in Russia (7) |
— | 16 | ||||||
| Other expense, net |
$ | 464 | $ | 388 | ||||
| (1) | Impacts related to Fisker |
| 2024 | 2023 | |||||||
| Impairment and supplier related settlements |
$ | 330 | $ | — | ||||
| Fisker warrants |
33 | 110 | ||||||
| Recognition of deferred revenue |
(196 | ) | — | |||||
| Restructuring |
31 | — | ||||||
| $ | 198 | $ | 110 | |||||
Magna International Inc. Annual Report 2024 5
During 2024, Fisker filed for Chapter 11 bankruptcy protection in the United States and for similar protection in Austria. As a result during 2024, we recorded impairment charges on our Fisker related assets, as well as charges for supplier settlements and restructurings. In the course of such bankruptcy proceedings, during the third quarter of 2024 our manufacturing agreement for the Fisker Ocean SUV was terminated and as a result, we recognized $196 million of previously deferred revenue related to our Fisker warrants.
Impairment and supplier related settlements
During 2024, we recorded a $279 million [$219 million after tax] impairment charge on our Fisker related assets including production receivables, inventory, fixed assets and other capitalized expenditures. We recorded an additional $51 million [$38 million after tax] of charges in connection with impairments and supplier settlements. For 2024, charges related to impairments, purchase obligations and supplier settlements totaled $330 million [$257 million after tax]. The following table summarizes the net asset impairments and supplier settlements for the year ended December 31, 2024 by segment:
| Body Exteriors & Structures |
Power & Vision |
Seating Systems |
Complete Vehicles |
Total | ||||||||||||||||||||||||||||||||
| Accounts receivable |
$ | 3 | $ | 4 | $ | 2 | $ | 14 | $ | 23 | ||||||||||||||||||||||||||
| Inventories |
5 | 52 | 8 | 2 | 67 | |||||||||||||||||||||||||||||||
| Other assets, net |
— | 54 | — | 90 | 144 | |||||||||||||||||||||||||||||||
| Fixed assets, net |
1 | 49 | 5 | 3 | 58 | |||||||||||||||||||||||||||||||
| Other accrued liabilities |
(5 | ) | — | — | (10 | ) | (15) | |||||||||||||||||||||||||||||
| Operating lease right-of-use assets |
1 | — | 1 | — | 2 | |||||||||||||||||||||||||||||||
| 5 | 159 | 16 | 99 | 279 | ||||||||||||||||||||||||||||||||
| Supplier settlements |
4 | 41 | 6 | — | 51 | |||||||||||||||||||||||||||||||
| $ | 9 | $ | 200 | $ | 22 | $ | 99 | $ | 330 | |||||||||||||||||||||||||||
Fisker warrants
In 2020, Fisker issued 19.5 million penny warrants to us to purchase common stock in connection with our agreements with Fisker for platform sharing, engineering and manufacturing of the Fisker Ocean SUV. These warrants vested during 2021 and 2022 based on specified milestones and were marked to market each quarter.
During 2024, we recorded a $33 million [$25 million after tax] impairment charge on these warrants reducing the value of the warrants to nil. During 2023, we had revaluation losses of $110 million [$83 million after tax] on these warrants.
Recognition of deferred revenue
When the warrants were issued and the vesting provisions realized, we recorded offsetting amounts to deferred revenue within other accrued liabilities and other long-term liabilities and a portion of this deferred revenue was previously recognized in income in prior years as performance obligations were satisfied. During the third quarter of 2024, the agreement for manufacturing of the Fisker Ocean SUV was terminated, and we recognized the remaining $196 million of deferred revenue in income.
Restructuring
During 2024, we recorded restructuring charges of $31 million [$24 million after tax] in our Complete Vehicles segment in connection with our Fisker related assembly operations.
| (2) | Restructuring activities |
We recorded restructuring charges related to significant plant closures and consolidations primarily in Europe and to a lesser extent in North America.
| 2024 | 2023 | |||||||||||
| Power & Vision |
$ | 104 | $ | 117 | ||||||||
| Complete Vehicles |
55 | — | ||||||||||
| Body Exteriors & Structures |
28 | 31 | ||||||||||
| Other expense, net |
187 | 148 | ||||||||||
| Tax effect |
(28 | ) | (24) | |||||||||
| Net loss attributable to Magna |
$ | 159 | $ | 124 | ||||||||
6 Magna International Inc. Annual Report 2024
| (3) | Long-lived asset impairments |
During 2024, we recorded impairment charges of $79 million [$79 million after tax] on fixed assets, right of use assets and intangible assets at two European lighting facilities in our Power & Vision segment.
| (4) | Investments |
| 2024 | 2023 | |||||||||||
| Non-cash impairment charge (i) |
$ | 13 | $ | 90 | ||||||||
| Revaluation of public and private equity investments |
13 | 1 | ||||||||||
| Revaluation of public company warrants (ii) |
(17 | ) | — | |||||||||
| Other expense, net |
9 | 91 | ||||||||||
| Tax effect |
3 | (1) | ||||||||||
| Net loss attributable to Magna |
$ | 12 | $ | 90 | ||||||||
| (i) | The non-cash impairment charge relates to the impairment of a private equity investment. |
| (ii) | The revaluation of Fisker warrants previously presented within Revaluation of public company warrants has been reclassified to Impacts related to Fisker. |
| (5) | Gain on business combination |
During 2024, we acquired a business in our Body Exteriors & Structures segment for $5 million, resulting in a bargain purchase gain of $9 million [$9 million after tax].
| (6) | Veoneer Active Safety Business transaction costs |
During 2023, we incurred $23 million [$22 million after tax] of transaction costs relating to our acquisition of the Veoneer Active Safety Business [“Veoneer AS”]. Refer to Note 7, “Business Combinations”, to the consolidated financial statements included in this Report.
| (7) | Operations in Russia |
During 2023, we completed the sale of all of our investments in Russia which resulted in a loss of $16 million [$16 million after tax] including a net cash outflow of $23 million.
INCOME FROM OPERATIONS BEFORE INCOME TAXES
Income from operations before income taxes was $1.54 billion for 2024 compared to $1.61 billion for 2023. The $64 million decrease was a result of the following changes, each as discussed above:
| 2024 | 2023 | Change | ||||||||||||||||||
| Sales |
$ | 42,836 | $ | 42,797 | $ | 39 | ||||||||||||||
| Costs and expenses |
||||||||||||||||||||
| Cost of goods sold |
37,037 | 37,185 | (148) | |||||||||||||||||
| Depreciation |
1,510 | 1,436 | 74 | |||||||||||||||||
| Amortization of acquired intangible assets |
112 | 88 | 24 | |||||||||||||||||
| Selling, general & administrative |
2,061 | 2,050 | 11 | |||||||||||||||||
| Interest expense, net |
211 | 156 | 55 | |||||||||||||||||
| Equity income |
(101 | ) | (112 | ) | 11 | |||||||||||||||
| Other expense, net |
464 | 388 | 76 | |||||||||||||||||
| Income from operations before income taxes |
$ | 1,542 | $ | 1,606 | $ | (64) | ||||||||||||||
Magna International Inc. Annual Report 2024 7
INCOME TAXES
| 2024 | 2023 | |||||||||||||||||||||||||||
| Income taxes as reported |
$ | 446 | 28.9 | % | $ | 320 | 19.9 | % | ||||||||||||||||||||
| Tax effect on Other expense, net and Amortization of acquired intangible assets |
85 | (3.8 | ) | 70 | (1.2 | ) | ||||||||||||||||||||||
| Adjustments to Deferred Tax Valuation Allowances |
(51 | ) | (2.4 | ) | 47 | 2.3 | ||||||||||||||||||||||
| $ | 480 | 22.7 | % | $ | 437 | 21.0 | % | |||||||||||||||||||||
During 2024 we increased the valuation allowance against certain deferred tax assets in Austria, which was partially offset by the release of certain valuation allowances in Spain, Czechia and Brazil. In 2023, we released valuation allowances against certain deferred tax assets in Brazil and the United States [“Adjustments to Deferred Tax Valuation Allowances”].
Excluding the tax effect on Other expense, net and Amortization of acquired intangible assets, as well as the Adjustments to Deferred Tax Valuation Allowances our effective income tax rate increased to 22.7% for 2024 compared to 21.0% for 2023 primarily due to unfavourable foreign exchange adjustments recognized for U.S. GAAP purposes. This was partially offset by favourable changes in our reserves for uncertain tax positions.
INCOME ATTRIBUTABLE TO NON-CONTROLLING INTERESTS
Income attributable to non-controlling interests was $87 million for 2024 compared to $73 million for 2023. This $14 million increase was primarily due to higher net income at our non-wholly owned operations in China.
NET INCOME ATTRIBUTABLE TO MAGNA INTERNATIONAL INC.
Net income attributable to Magna International Inc. was $1.01 billion for 2024 compared to $1.21 billion for 2023. This $204 million decrease was as a result of an increase in income taxes of $126 million, a decrease in income from operations before income taxes of $64 million and an increase in income attributable to non-controlling interests of $14 million.
EARNINGS PER SHARE
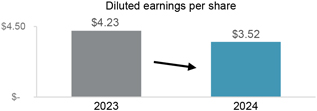
|

|
| 2024 | 2023 | % Change | ||||||||||||||||||
| Earnings per Common Share |
||||||||||||||||||||
| Basic |
$ | 3.52 | $ | 4.24 | - 17% | |||||||||||||||
| Diluted |
$ | 3.52 | $ | 4.23 | - 17% | |||||||||||||||
| Weighted average number of Common Shares outstanding (millions) |
||||||||||||||||||||
| Basic |
286.8 | 286.2 | — | |||||||||||||||||
| Diluted |
286.9 | 286.6 | — | |||||||||||||||||
| Adjusted diluted earnings per share |
$ | 5.41 | $ | 5.49 | - 1% | |||||||||||||||
Diluted earnings per share was $3.52 for 2024 compared to $4.23 for 2023. The $0.71 decrease was as a result of lower net income attributable to Magna International Inc., as discussed above.
Other expense, net, and the Amortization of acquired intangible assets, each after tax, and Adjustments to Deferred Tax Valuation Allowances negatively impacted diluted earnings per share by $1.89 in 2024 and $1.26 in 2023, respectively. Adjusted diluted earnings per share, as reconciled in the “Non-GAAP Financial Measures Reconciliation” section, was $5.41 for 2024 compared to $5.49 for 2023, a decrease of $0.08.
8 Magna International Inc. Annual Report 2024
NON-GAAP PERFORMANCE MEASURES - FOR THE YEAR ENDED DECEMBER 31, 2024
ADJUSTED EBIT AS A PERCENTAGE OF SALES
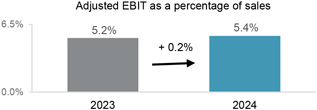
The table below shows the change in Magna’s Sales and Adjusted EBIT by segment and the impact each segment’s changes have on Magna’s Adjusted EBIT as a percentage of sales for 2024 compared to 2023:
| Sales | Adjusted EBIT |
Adjusted EBIT as a percentage of sales |
||||||||||||||
| 2023 |
$ | 42,797 | $ | 2,238 | 5.2% | |||||||||||
| Increase (decrease) related to: |
||||||||||||||||
| Body Exteriors & Structures |
(512 | ) | (21 | ) | — | |||||||||||
| Power & Vision |
1,086 | 142 | + 0.2% | |||||||||||||
| Seating Systems |
(247 | ) | 5 | — | ||||||||||||
| Complete Vehicles |
(352 | ) | 6 | + 0.1% | ||||||||||||
| Corporate and Other |
64 | (41 | ) | - 0.1% | ||||||||||||
| 2024 |
$ | 42,836 | $ | 2,329 | 5.4% | |||||||||||
Adjusted EBIT as a percentage of sales increased to 5.4% for 2024 compared to 5.2% for 2023 primarily due to:
| • | commercial items in 2024 and 2023, which had a net favourable impact on a year-over-year basis, including the negative impact of a settlement with a supplier during the fourth quarter of 2024; |
| • | productivity and efficiency improvements, including lower costs at certain underperforming facilities; |
| • | the negative impact of the UAW labour strikes during 2023; and |
| • | lower net engineering costs, including spending related to our electrification and active safety business. |
These factors were offset by:
| • | higher production input costs net of customer recoveries, including labour, partially offset by lower prices for certain commodities; |
| • | reduced earnings on lower assembly volumes; |
| • | reduced earnings on lower sales; |
| • | higher net warranty costs; |
| • | acquisitions, net of divestitures, during and subsequent to 2023; and |
| • | higher restructuring costs. |
Magna International Inc. Annual Report 2024 9
ADJUSTED RETURN ON INVESTED CAPITAL

Adjusted Return on Invested Capital decreased to 9.5% for 2024 compared to 10.0% for 2023 as a result of higher Average Invested Capital partially offset by an increase in Adjusted After-tax operating profits.
Average Invested Capital increased $1.11 billion to $18.88 billion for 2024 compared to $17.77 billion for 2023, primarily due to:
| • | average investment in fixed assets in excess of average depreciation expense on fixed assets; and |
| • | acquisitions, net of divestitures, during or subsequent to 2023. |
These factors were partially offset by:
| • | impairments and restructuring related to Fisker during 2024; |
| • | a decrease in average operating assets and liabilities; |
| • | the net weakening of foreign currencies against the U.S. dollar; and |
| • | lower net investments in public and private equity companies and public company warrants. |
10 Magna International Inc. Annual Report 2024
SEGMENT ANALYSIS
We are a global automotive supplier that has complete vehicle engineering and contract manufacturing expertise, as well as product capabilities which include body, chassis, exterior, seating, powertrain, active driver assistance, electronics, mechatronics, mirrors, lighting and roof systems.
Our reporting segments are: Body Exteriors & Structures; Power & Vision; Seating Systems; and Complete Vehicles.
| Sales | Adjusted EBIT | |||||||||||||||||||||||||||||||||||
| 2024 | 2023 | Change | 2024 | 2023 | Change | |||||||||||||||||||||||||||||||
| Body Exteriors & Structures |
$ | 16,999 | $ | 17,511 | $ | (512) | $ | 1,283 | $ | 1,304 | $ | (21) | ||||||||||||||||||||||||
| Power & Vision |
15,391 | 14,305 | 1,086 | 810 | 668 | 142 | ||||||||||||||||||||||||||||||
| Seating Systems |
5,800 | 6,047 | (247) | 223 | 218 | 5 | ||||||||||||||||||||||||||||||
| Complete Vehicles |
5,186 | 5,538 | (352) | 130 | 124 | 6 | ||||||||||||||||||||||||||||||
| Corporate and Other |
(540 | ) | (604 | ) | 64 | (117 | ) | (76 | ) | (41) | ||||||||||||||||||||||||||
| Total reportable segments |
$ | 42,836 | $ | 42,797 | $ | 39 | $ | 2,329 | $ | 2,238 | $ | 91 | ||||||||||||||||||||||||
BODY EXTERIORS & STRUCTURES
| 2024 | 2023 | Change | ||||||||||||||
| Sales |
$ | 16,999 | $ | 17,511 | $ | (512 | ) | - 3% | ||||||||
| Adjusted EBIT |
$ | 1,283 | $ | 1,304 | $ | (21 | ) | - 2% | ||||||||
| Adjusted EBIT as a percentage of sales |
7.5% | 7.4% | + 0.1% | |||||||||||||
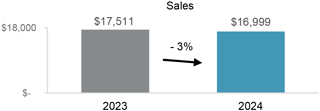
Sales – Body Exteriors & Structures
Sales decreased 3% or $512 million to $17.00 billion for 2024 compared to $17.51 billion for 2023, primarily due to:
| • | the end of production of certain programs, including the: |
| • | Dodge Charger; |
| • | Chevrolet Bolt EV; |
| • | Ford Edge; and |
| • | Chevrolet Camaro; |
| • | lower production on certain programs; |
| • | divestitures during 2024, which decreased sales by $146 million; |
| • | the net weakening of foreign currencies against the U.S. dollar, which decreased reported U.S. dollar sales by $58 million; and |
| • | net customer price concessions. |
These factors were partially offset by:
| • | the launch of programs during or subsequent to 2023, including the: |
| • | Ford F-Series Super Duty; |
| • | Chevrolet Silverado EV and GMC Sierra EVs; |
| • | GMC Hummer EV SUV; and |
| • | Chevrolet Equinox & Blazer EVs; |
| • | the negative impact of the UAW labour strikes, which negatively impacted 2023 sales by approximately $200 million; and |
| • | commercial items in 2024 and 2023, which had a net favourable impact on a year-over-year basis. |
Magna International Inc. Annual Report 2024 11
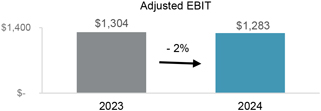
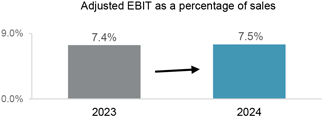
Adjusted EBIT and Adjusted EBIT as a percentage of sales – Body Exteriors & Structures
Adjusted EBIT decreased $21 million to $1,283 million for 2024 compared to $1,304 million for 2023 while Adjusted EBIT as a percentage of sales increased to 7.5% from 7.4%. Adjusted EBIT was lower primarily as a result of reduced earnings on lower sales. Excluding the impact of lower sales, Adjusted EBIT and Adjusted EBIT as a percentage of sales were higher primarily due to:
| • | commercial items in 2024 and 2023, which had a net favourable impact on a year-over-year basis; |
| • | productivity and efficiency improvements, including lower costs at certain underperforming facilities; |
| • | the negative impact of the UAW labour strikes during 2023; and |
| • | higher net transactional foreign exchange gains in 2024 compared to 2023. |
These factors were partially offset by:
| • | higher production input costs net of customer recoveries, primarily for labour; |
| • | supply chain premiums, partially as a result of a supplier bankruptcy; |
| • | higher restructuring costs; |
| • | higher net warranty costs of $12 million; and |
| • | provisions related to the insolvency of two Chinese OEMs during 2024. |
POWER & VISION
| 2024 | 2023 | Change | ||||||||||||||
| Sales |
$ | 15,391 | $ | 14,305 | $ | 1,086 | + 8% | |||||||||
| Adjusted EBIT |
$ | 810 | $ | 668 | $ | 142 | + 21% | |||||||||
| Adjusted EBIT as a percentage of sales |
5.3% | 4.7% | + 0.6% | |||||||||||||
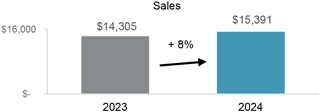
Sales – Power & Vision
Sales increased 8% or $1.09 billion to $15.39 billion for 2024 compared to $14.31 billion for 2023, primarily due to:
| • | the launch of programs during or subsequent to 2023, including the: |
| • | Chery Jetour Traveller; |
| • | Chery Tiggo 8; |
| • | Chevrolet Equinox & Blazer EVs; and |
| • | BMW X2; |
| • | acquisitions, net of divestitures, during or subsequent to 2023, which increased sales by $614 million; |
| • | the negative impact of the UAW labour strikes, which negatively impacted 2023 sales by approximately $80 million; and |
| • | customer price increases to partially recover certain higher production input costs. |
12 Magna International Inc. Annual Report 2024
These factors were partially offset by:
| • | lower production on certain programs; |
| • | the end of production of particular programs, including the: |
| • | Dodge Charger; |
| • | Fisker Ocean; |
| • | Chevrolet Camaro; and |
| • | Mini Clubman; |
| • | the net weakening of foreign currencies against the U.S. dollar, which decreased reported U.S. dollar sales by $84 million; and |
| • | net customer price concessions. |
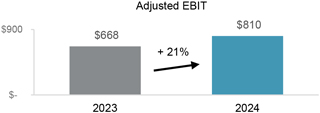
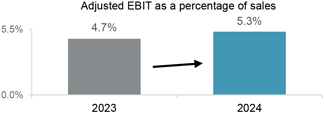
Adjusted EBIT and Adjusted EBIT as a percentage of sales – Power & Vision
Adjusted EBIT increased $142 million to $810 million for 2024 compared to $668 million for 2023 and Adjusted EBIT as a percentage of sales increased to 5.3% from 4.7%. These increases were primarily as a result of:
| • | increased earnings on higher sales, including improved margins from operational excellence and cost initiatives; |
| • | commercial items in 2024 and 2023, which had a net favourable impact on a year-over-year basis, including the negative impact of a settlement with a supplier during the fourth quarter of 2024; |
| • | lower net engineering costs, including spending related to our electrification and active safety businesses; and |
| • | the negative impact of the UAW labour strikes during 2023. |
These factors were partially offset by:
| • | higher net warranty costs of $46 million; |
| • | higher launch costs; |
| • | lower equity income; |
| • | lower tooling contribution; |
| • | higher production input costs net of customer recoveries, primarily for labour; and |
| • | acquisitions, net of divestitures, during or subsequent to 2023. |
SEATING SYSTEMS
| 2024 | 2023 | Change | ||||||||||||||
| Sales |
$ | 5,800 | $ | 6,047 | $ | (247 | ) | - 4% | ||||||||
| Adjusted EBIT |
$ | 223 | $ | 218 | $ | 5 | + 2% | |||||||||
| Adjusted EBIT as a percentage of sales |
3.8% | 3.6% | + 0.2% | |||||||||||||
Magna International Inc. Annual Report 2024 13
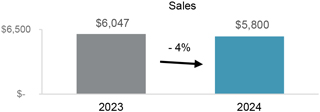
Sales – Seating Systems
Sales decreased 4% or $247 million to $5.80 billion for 2024 compared to $6.05 billion for 2023, primarily due to:
| • | the end of production of certain programs, including the: |
| • | Chevrolet Bolt EV; |
| • | Ford Edge; |
| • | Skoda Superb; and |
| • | Lincoln Nautilus; |
| • | lower production on certain programs, including the Jeep Grand Cherokee; |
| • | the net weakening of foreign currencies against the U.S. dollar, which decreased reported U.S. dollar sales by $18 million; and |
| • | net customer price concessions. |
These factors were partially offset by:
| • | the launch of programs during or subsequent to 2023, including the: |
| • | BYD Qin L; |
| • | Mini Countryman; |
| • | Skoda Kodiaq; and |
| • | BYD Seal U DM-i; |
| • | customer price increases to partially recover certain higher production input costs; and |
| • | the negative impact of the UAW labour strikes, which negatively impacted 2023 sales by approximately $45 million. |
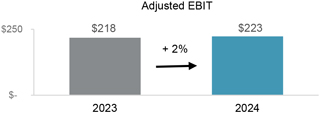
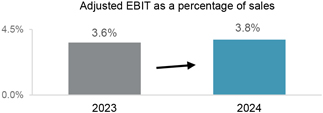
Adjusted EBIT and Adjusted EBIT as a percentage of sales – Seating Systems
Adjusted EBIT increased $5 million to $223 million for 2024 compared to $218 million for 2023 and Adjusted EBIT as a percentage of sales increased to 3.8% from 3.6%. These increases were primarily due to:
| • | commercial items in 2024 and 2023, which had a net favourable impact on a year-over-year basis; |
| • | lower launch costs; |
| • | lower net foreign exchange losses, primarily due to the weakening in 2023 of the Argentine peso against the U.S. dollar; and |
| • | the negative impact of the UAW labour strikes during 2023. |
These factors were partially offset by:
| • | reduced earnings on lower sales; |
| • | provisions related to the insolvency of a Chinese OEM during 2024; and |
| • | higher restructuring costs. |
14 Magna International Inc. Annual Report 2024
COMPLETE VEHICLES
| 2024 | 2023 | Change | ||||||||||||||
| Complete Vehicle Assembly Volumes (thousands of units)(i) |
71.9 | 105.1 | (33.2 | ) | - 32% | |||||||||||
| Sales |
$ | 5,186 | $ | 5,538 | $ | (352 | ) | - 6% | ||||||||
| Adjusted EBIT |
$ | 130 | $ | 124 | $ | 6 | + 5% | |||||||||
| Adjusted EBIT as a percentage of sales |
2.5% | 2.2% | + 0.3% | |||||||||||||
| (i) | Vehicles produced at our Complete Vehicle operations are included in Europe Light Vehicle Production volumes. |
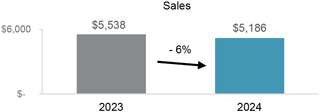
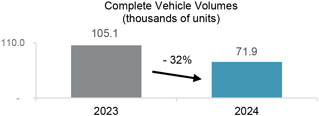
Sales – Complete Vehicles
Sales decreased 6% or $352 million to $5.19 billion for 2024 compared to $5.54 billion for 2023 and assembly volumes decreased 32%. The decrease in sales is substantially a result of lower assembly volumes, including the end of production of the BMW 5-Series and Jaguar E-Pace. The impact of lower assembly volumes was partially offset by:
| • | higher engineering revenue; |
| • | commercial items during 2024 and 2023, which had a net favourable impact on a year-over-year basis; |
| • | customer price increases to partially recover certain higher production input costs; and |
| • | a $9 million increase in reported U.S. dollar sales as a result of the strengthening of the euro against the U.S. dollar. |
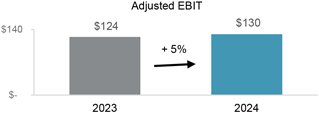
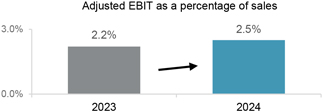
Adjusted EBIT and Adjusted EBIT as a percentage of sales – Complete Vehicles
Adjusted EBIT increased $6 million to $130 million for 2024 compared to $124 million for 2023 while Adjusted EBIT as a percentage of sales increased to 2.5% from 2.2%. These increases were primarily due to:
| • | commercial items in 2024 and 2023, which had a net favourable impact on a year-over-year basis; |
| • | higher engineering margins on higher engineering sales; |
| • | lower restructuring costs; and |
| • | lower launch, engineering and other costs. |
These factors were partially offset by:
| • | reduced earnings on lower assembly volumes; and |
| • | higher production input costs net of customer recoveries, primarily for labour. |
Magna International Inc. Annual Report 2024 15
CORPORATE AND OTHER
Adjusted EBIT was a loss of $117 million for 2024 compared to a loss of $76 million for 2023. The $41 million decrease was primarily the result of:
| • | net transactional foreign exchange losses in 2024 compared to net transactional foreign exchange gains in 2023; |
| • | increased investments in research, development and new mobility; |
| • | a decrease in fees received from our divisions; and |
| • | higher costs to accelerate operational excellence activities. |
These factors were partially offset by:
| • | lower incentive compensation; and |
| • | a gain on the sale of an equity-method investment during 2024. |
16 Magna International Inc. Annual Report 2024
FINANCIAL CONDITION, LIQUIDITY AND CAPITAL RESOURCES
OPERATING ACTIVITIES
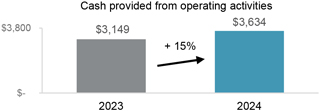
| 2024 | 2023 | Change | ||||||||||
| Net income |
$ | 1,096 | $ | 1,286 | ||||||||
| Items not involving current cash flows |
1,857 | 1,642 | ||||||||||
| 2,953 | 2,928 | $ | 25 | |||||||||
| Changes in operating assets and liabilities |
681 | 221 | 460 | |||||||||
| Cash provided from operating activities |
$ | 3,634 | $ | 3,149 | $ | 485 | ||||||
Cash provided from operating activities
Comparing 2024 to 2023, cash provided from operating activities increased $485 million primarily as a result of:
| • | a $1.18 billion increase in cash received from customers; |
| • | a $122 million decrease in cash taxes; and |
| • | higher dividends received from equity investments of $30 million. |
These factors were partially offset by:
| • | a $588 million increase in cash paid for materials and overhead; |
| • | a $202 million increase in cash paid for labour; and |
| • | a $53 million increase in cash interest paid. |
Changes in operating assets and liabilities
During 2024, we generated $681 million from operating assets and liabilities primarily consisting of:
| • | a $478 million decrease in tooling investment for current and upcoming program launches; |
| • | a $369 million increase in other accrued liabilities; |
| • | a $186 million decrease in production and other receivables; and |
| • | a $96 million increase in taxes payable. |
These factors were partially offset by:
| • | a $271 million decrease in accounts payable; |
| • | a $143 million increase in production inventory; and |
| • | a $35 million increase in prepaids and other. |
Magna International Inc. Annual Report 2024 17
INVESTING ACTIVITIES
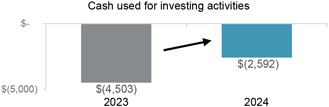
| 2024 | 2023 | Change | ||||||||||
| Fixed asset additions |
$ | (2,178 | ) | $ | (2,500 | ) | ||||||
| Increase in investments, other assets and intangible assets |
(617 | ) | (562 | ) | ||||||||
| Increase in public and private equity investments | (12) | (11) | ||||||||||
| Fixed assets, investments, other assets and intangible assets additions |
(2,807 | ) | (3,073 | ) | ||||||||
| Proceeds from dispositions |
219 | 122 | ||||||||||
| Net cash inflow (outflow) from disposal of facilities |
82 | (48 | ) | |||||||||
| Acquisitions |
(86 | ) | (1,504 | ) | ||||||||
| Cash used for investing activities |
$ | (2,592 | ) | $ | (4,503 | ) | $ | 1,911 | ||||
|
Cash used for investing activities in 2024 was $1.91 billion lower compared to 2023. The change between 2024 and 2023 was primarily due to the acquisition of Veoneer AS during the second quarter of 2023, a $322 million decrease in cash used for fixed assets, higher proceeds from dispositions during 2024, primarily related to the sale of an equity method investment during the first quarter of 2024, and the net cash inflow from the disposal of our Body Exteriors & Structures operations in India during the third quarter of 2024. These factors were partially offset by a $55 million increase in cash used for investments, other assets and intangible assets.
FINANCING ACTIVITIES
|
|
|||||||||||
| 2024 | 2023 | Change | ||||||||||
| Issues of debt |
$ | 778 | $ | 2,083 | ||||||||
| Issue of Common Shares on exercise of stock options |
30 | 20 | ||||||||||
| Contributions to subsidiaries by non-controlling interests |
— | 11 | ||||||||||
| Tax withholdings on vesting of equity awards |
(8 | ) | (11 | ) | ||||||||
| Dividends paid to non-controlling interest |
(46 | ) | (74 | ) | ||||||||
| (Decrease) increase in short-term borrowings |
(182 | ) | 487 | |||||||||
| Repurchase of Common Shares |
(207 | ) | (13 | ) | ||||||||
| Dividends paid |
(539 | ) | (522 | ) | ||||||||
| Repayments of debt |
(815 | ) | (644 | ) | ||||||||
| Cash (used for) provided from financing activities |
$ | (989 | ) | $ | 1,337 | $ | (2,326 | ) | ||||
During 2024, we issued the following Senior Notes [the “Senior Notes”]:
| Settlement Date | Amount in USD at Issuance Date |
Maturity Date | ||||||||||
| $400 million Senior Notes at 5.05% |
March 14, 2024 | $ | 397 million | March 14, 2029 | ||||||||
| Cdn$450 million Senior Notes at 4.800% |
May 30, 2024 | $ | 328 million | May 30, 2029 | ||||||||
Net cash proceeds received from the Senior Notes issuances was $725 million, which were issued for general corporate purposes, including the repayment of debt that matured in June 2024.
The Senior Notes are unsecured obligations and do not include any financial covenants. We may redeem the Senior Notes in whole or in part at any time, and from time to time, at specified redemption prices determined in accordance with the terms of the indenture governing the Senior Notes. Refer to Note 16, “Debt” of our audited consolidated financial statements for the year ended December 31, 2024.
18 Magna International Inc. Annual Report 2024
Short-term borrowings decreased $182 million in 2024 primarily due to our increase in cash from operating activities enabling us to repay notes under the euro-commercial paper program and U.S. commercial paper program.
During 2024, we repurchased 4.7 million Common Shares under normal course issuer bids for aggregate cash consideration of $207 million.
Cash dividends paid per Common Share were $1.90 for 2024 compared to $1.84 for 2023.
FINANCING RESOURCES
| 2024 | 2023 | Change | ||||||||||
| Liabilities |
||||||||||||
| Short-term borrowings |
$ | 271 | $ | 511 | ||||||||
| Long-term debt due within one year |
708 | 819 | ||||||||||
| Current portion of operating lease liabilities |
293 | 399 | ||||||||||
| Long-term debt |
4,134 | 4,175 | ||||||||||
| Operating lease liabilities |
1,662 | 1,319 | ||||||||||
| $ | 7,068 | $ | 7,223 | $ | (155 | ) | ||||||
Financial liabilities decreased $155 million to $7.07 billion as at December 31, 2024 primarily as a result of the repayment of $750 million in Senior Notes during the second quarter of 2024, and the repayment of notes under the euro-commercial paper program and U.S. commercial paper program. These decreases were partially offset by the issuance of $400 million of Senior Notes during the first quarter of 2024, and the issuance of Cdn$450 million of Senior Notes during the second quarter of 2024.
CASH RESOURCES
In 2024, our cash resources remain substantially unchanged at $1.2 billion, primarily as a result of cash provided from operating activities being substantially offset by cash used for investing and financing activities, as discussed above. In addition to our cash resources at December 31, 2024, we had term and operating lines of credit totaling $4.1 billion, of which $3.3 billion was unused and available.
On March 28, 2024, we amended our $2.7 billion syndicated revolving credit facility, including to extend the maturity date from June 24, 2028 to June 25, 2029. As of December 31, 2024, we have no amounts outstanding under this credit facility.
On May 10, 2024, we amended our $800 million 364-day syndicated revolving credit facility, including to extend the maturity date from June 24, 2024 to June 24, 2025. As of December 31, 2024, we have not borrowed any funds under this credit facility.
MAXIMUM NUMBER OF SHARES ISSUABLE
The following table presents the maximum number of shares that would be outstanding if all of the outstanding options at February 26, 2025 were exercised:
| Common Shares |
281,688,546 | |||
| Stock options (i) |
5,905,458 | |||
| 287,594,004 |
| (i) | Options to purchase Common Shares are exercisable by the holder in accordance with the vesting provisions and upon payment of the exercise price as may be determined from time to time pursuant to our stock option plans. |
Magna International Inc. Annual Report 2024 19
CONTRACTUAL OBLIGATIONS
A purchase obligation is defined as an agreement to purchase goods or services that is enforceable and legally binding on us and that specifies all significant terms, including: fixed or minimum quantities to be purchased; fixed, minimum or variable price provisions; and the approximate timing of the transaction. Consistent with our customer obligations, substantially all of our purchases are made under purchase orders with our suppliers which are requirements based and accordingly do not specify minimum quantities. Other long-term liabilities are defined as long-term liabilities that are recorded on our consolidated balance sheet. Based on this definition, the following table includes only those contracts which include fixed or minimum obligations.
At December 31, 2024, we had contractual obligations requiring annual payments as follows:
| 2026- | 2028- | |||||||||||||||||||
| 2025 | 2027 | 2029 | Thereafter | Total | ||||||||||||||||
| Operating leases |
$ | 379 | $ | 631 | $ | 494 | $ | 1,006 | $ | 2,510 | ||||||||||
| Long-term debt |
709 | 1,060 | 1,021 | 2,072 | 4,862 | |||||||||||||||
| Unconditional purchase obligations: |
||||||||||||||||||||
| Materials and services |
3,064 | 1,042 | 903 | 830 | 5,839 | |||||||||||||||
| Capital |
956 | 192 | 33 | 18 | 1,199 | |||||||||||||||
| Total contractual obligations |
$ | 5,108 | $ | 2,925 | $ | 2,451 | $ | 3,926 | $ | 14,410 | ||||||||||
Our unfunded obligation with respect to employee future benefit plans, which have been actuarially determined, was $478 million at December 31, 2024. These obligations are as follows:
| Pension Liability |
Retirement Medical Liability |
Termination and Long-term Service Arrangements |
Total | |||||||||||
| Projected benefit obligation |
$ | 475 | $ 17 | $ 391 | $ | 883 | ||||||||
| Less plan assets at fair value |
(405 | ) | — | — | (405 | ) | ||||||||
| Ending funded status – Plan deficit |
$ | 70 | $ 17 | $ 391 | $ | 478 | ||||||||
Foreign Currency Activities
Our North American operations negotiate sales contracts with OEMs for payment in U.S. dollars, Canadian dollars and Mexican pesos. Materials and equipment are purchased in various currencies depending upon competitive factors, including relative currency values. Our North American operations use labour and materials which are paid for in U.S. dollars, Canadian dollars and Mexican pesos. Our Mexican operations generally use the U.S. dollar as the functional currency.
Our European operations negotiate sales contracts with OEMs for payment principally in euros. Our European operations’ material, equipment and labour are principally paid for in euros and U.S. dollars.
Our Asian operations negotiate sales contracts with OEMs for payment principally in Chinese renminbi. Our Asian operations’ material, equipment and labour are paid for principally in Chinese renminbi.
We employ hedging programs, primarily through the use of foreign exchange forward contracts, in an effort to manage our foreign exchange exposure, which arises when manufacturing facilities have committed to the delivery of products for which the selling price or material purchases have been quoted in foreign currencies and for labour in countries where the local currency is not the divisions’ functional currency. These commitments represent our contractual obligations to deliver products over the duration of the product programs, which can last a number of years. The amount and timing of the forward contracts will be dependent upon a number of factors, including anticipated production delivery schedules and anticipated production costs, which may be paid in the foreign currency. Despite these measures, significant long-term fluctuations in relative currency values, in particular a significant change in the relative values of the U.S. dollar, Canadian dollar, euro, Chinese renminbi or Mexican peso, could have an adverse effect on our profitability and financial condition (as discussed throughout this MD&A).
20 Magna International Inc. Annual Report 2024
NON-GAAP FINANCIAL MEASURES RECONCILIATION
The reconciliation of Non-GAAP financial measures is as follows:
ADJUSTED EBIT
| 2024 | 2023 | |||||||
| Net income |
$ | 1,096 | $ | 1,286 | ||||
| Add : |
||||||||
| Amortization of acquired intangible assets |
112 | 88 | ||||||
| Interest expense, net |
211 | 156 | ||||||
| Other expense, net |
464 | 388 | ||||||
| Income taxes |
446 | 320 | ||||||
| Adjusted EBIT |
$ | 2,329 | $ | 2,238 | ||||
ADJUSTED EBIT AS A PERCENTAGE OF SALES
| 2024 | 2023 | |||||||
| Sales |
$ | 42,836 | $ | 42,797 | ||||
| Adjusted EBIT |
$ | 2,329 | $ | 2,238 | ||||
| Adjusted EBIT as a percentage of sales |
5.4% | 5.2% | ||||||
ADJUSTED DILUTED EARNINGS PER SHARE
| 2024 | 2023 | |||||||
| Net income attributable to Magna International Inc. |
$ | 1,009 | $ | 1,213 | ||||
| Add (deduct): |
||||||||
| Amortization of acquired intangible assets |
112 | 88 | ||||||
| Other expense, net |
464 | 388 | ||||||
| Tax effect on Amortization of acquired intangible assets and Other expense, net |
(85 | ) | (70) | |||||
| Adjustments to Deferred Tax Valuation Allowances |
51 | (47) | ||||||
| Adjusted net income attributable to Magna International Inc. |
$ | 1,551 | $ | 1,572 | ||||
| Diluted weighted average number of Common Shares outstanding during the period (millions) |
286.9 | 286.6 | ||||||
| Adjusted diluted earnings per share |
$ | 5.41 | $ | 5.49 | ||||
Magna International Inc. Annual Report 2024 21
ADJUSTED RETURN ON INVESTED CAPITAL
Adjusted Return on Invested Capital is calculated as Adjusted After-tax operating profits divided by Average Invested Capital for the period. Average Invested Capital for the twelve month period is averaged on a five-fiscal quarter basis.
| 2024 | 2023 | |||||||
| Net Income |
$ | 1,096 | $ | 1,286 | ||||
| Add (deduct): |
||||||||
| Interest expense, net |
211 | 156 | ||||||
| Amortization of acquired intangible assets |
112 | 88 | ||||||
| Other expense, net |
464 | 388 | ||||||
| Tax effect on Interest expense, net, Amortization of acquired intangible assets and Other expense, net |
(133) | (102) | ||||||
| Adjustments to Deferred Tax Valuation Allowances |
51 | (47) | ||||||
| Adjusted After-tax operating profits |
$ | 1,801 | $ | 1,769 | ||||
| 2024 | 2023 | |||||||
| Total Assets |
$ | 31,039 | $ | 32,255 | ||||
| Excluding: |
||||||||
| Cash and cash equivalents |
(1,247 | ) | (1,198) | |||||
| Deferred tax assets |
(819 | ) | (621) | |||||
| Less Current Liabilities |
(12,097 | ) | (13,234) | |||||
| Excluding: |
||||||||
| Short-term borrowing |
271 | 511 | ||||||
| Long-term debt due within one year |
708 | 819 | ||||||
| Current portion of operating lease liabilities |
293 | 399 | ||||||
| Invested Capital |
$ | 18,148 | $ | 18,931 | ||||
| 2024 | 2023 | |||||||
| Adjusted After-tax operating profits |
$ | 1,801 | $ | 1,769 | ||||
| Average Invested Capital |
$ | 18,875 | $ | 17,771 | ||||
| Adjusted Return on Invested Capital |
9.5% | 10.0% | ||||||
| SUBSEQUENT EVENT |
||||||||
NORMAL COURSE ISSUER BID
Subsequent to December 31, 2024, we purchased 1,187,382 Common Shares for cancellation and 92,928 Common Shares to satisfy stock-based compensation awards each under our existing normal course issuer bid for cash consideration of $51 million.
22 Magna International Inc. Annual Report 2024
SIGNIFICANT ACCOUNTING POLICIES AND CRITICAL ACCOUNTING ESTIMATES
Our significant accounting policies are more fully described in Note 2, “Significant Accounting Policies”, to the consolidated financial statements included in this Report. The preparation of the audited consolidated financial statements requires management to make estimates and assumptions that affect the reported amounts of assets, liabilities, revenues and expenses and the related disclosure of contingent assets and liabilities, as of the date of the consolidated financial statements. These estimates and assumptions are based on our historical experience, and various other assumptions we believe to be reasonable in the circumstances. Since these estimates and assumptions are subject to an inherent degree of uncertainty, actual results in these areas may differ significantly from our estimates.
We believe the following critical accounting policies and estimates affect the more subjective or complex judgements and estimates used in the preparation of our consolidated financial statements and accompanying notes. Management has discussed the development and selection of the following critical accounting policies with the Audit Committee of the Board of Directors, and the Audit Committee has reviewed our disclosure relating to critical accounting policies in this MD&A.
REVENUE RECOGNITION - COMPLETE VEHICLE ASSEMBLY ARRANGEMENTS
Our complete vehicle assembly contracts with customers are complex and often include promises to transfer multiple products and services, some of which may be implicitly contracted. Each good or service is evaluated to determine whether it represents a distinct performance obligation, and whether it should be characterized as revenue or as a reimbursement of costs incurred. The total transaction price is then allocated to the distinct performance obligations based on the expected cost plus a margin approach and recognized as revenue.
Additionally, as the terms of our complete vehicle assembly contracts with customers differ with respect to the ownership of components related to the assembly process, we must determine whether we are acting as principal in these arrangements, or acting as an agent in which case the revenue recognized would principally reflect the assembly fee.
Significant interpretation and judgment is sometimes required to determine the appropriate accounting for these contracts including: (i) combining contracts that may impact the allocation of the transaction price between products and services; (ii) determining whether performance obligations are considered distinct and are required to be accounted for separately or combined; and (iii) the allocation of the transaction price to each distinct performance obligation and determining when to recognize revenue.
IMPAIRMENT ASSESSMENTS – GOODWILL, LONG-LIVED ASSETS, AND EQUITY METHOD INVESTMENTS
We review goodwill at the reporting unit level for impairment in the fourth quarter of each year or more frequently if events or changes in circumstances indicate that goodwill might be impaired. Goodwill impairment is assessed by comparing the fair value of a reporting unit to the underlying carrying value of the reporting unit’s net assets, including goodwill. If a reporting unit’s carrying amount exceeds its fair value, an impairment is recognized based on that difference. The fair value of a reporting unit is determined using the estimated discounted future cash flows of the reporting unit.
In addition to our review of goodwill, we evaluate fixed assets and other long-lived assets for impairment whenever indicators of impairment exist. Indicators of impairment include the bankruptcy of a significant customer, or the early termination, loss, renegotiation of the terms of, significant volume decrease in, or delay in the implementation of, any significant production contract. If the sum of the undiscounted future cash flows expected to result from the assets, without interest charges, is less than the carrying amount of the assets, an asset impairment may be recognized in the consolidated financial statements. The amount of impairment to be recognized is calculated as the difference between the fair value and carrying amount of the asset.
As of December 31, 2024, we had equity method investments of $794 million. We monitor our investments for indicators of other-than-temporary declines in value on an ongoing basis in accordance with U.S. GAAP. If we determine that an other-than-temporary decline in value has occurred, we recognize an impairment loss, which is measured as the difference between the book value and the fair value of the investment. Fair value is generally determined using an income approach based on discounted cash flows.
We believe that the impairment assessments for goodwill, long-lived assets, and equity method investments contain “critical accounting estimates” because: (i) they are subject to significant measurement uncertainty and are susceptible to change, which could materially impact our assessment for fair value, as management is required to make forward-looking assumptions regarding the impact of improvement plans on current operations, in-sourcing and other new business opportunities, program pricing and cost assumptions on current and future business, the timing of new program launches and future forecasted production volumes, the appropriate discount rates (based on a weighted average cost of capital ranging from 11% to 16% at December 31, 2024); and (ii) any resulting impairment loss could have a material impact on our consolidated net income and on the amount of assets reported in our consolidated balance sheet.
Magna International Inc. Annual Report 2024 23
WARRANTY
We record product warranty costs, which include product liability and recall costs. Under most customer agreements, we only account for existing or probable claims on product default issues when amounts related to such issues are probable and reasonably estimable. For certain products, we record an estimate of future warranty-related costs based on the terms of the specific customer agreements and/or the Company’s warranty experience.
Product liability and recall provisions are established based on our best estimate of the amounts necessary to settle existing claims. These estimates typically require assumptions from management regarding: the number of units that may be returned; the cost of the product being replaced; labour to remove and replace the defective part; and the customer’s administrative costs relating to the recall. In making this estimate, judgement is also required as to the ultimate negotiated sharing of the cost between us, the customer and, in some cases a supplier. Where applicable, insurance recoveries related to such provisions are also recorded.
We monitor warranty activity on an ongoing basis and revise our best estimate as necessary. Due to the uncertainty and potential volatility of the factors contributing to developing estimates of the amounts necessary to settle existing claims, actual product liability costs could be materially different from our best estimate.
INCOME TAXES
The determination of tax liabilities involves dealing with uncertainties in the application of complex tax laws. Significant judgement and estimates are required in determining our provision for income taxes, deferred tax assets and liabilities, and liabilities for unrecognized tax benefits. We recognize tax benefits from uncertain tax positions only if it is more likely than not that the tax position will be sustained on examination by the taxing authorities, based on the technical merits of the position. The tax benefits recognized in the financial statements from such positions are then measured based on the largest benefit that has a greater than 50% likelihood of being realized upon ultimate settlement.
At December 31, 2024, we had gross unrecognized tax benefits of $204 million excluding interest and penalties, of which $135 million, if recognized, would affect our effective tax rate. The gross unrecognized tax benefits differ from the amount that would affect our effective tax rate due primarily to the impact of the valuation allowances on deferred tax assets.
Deferred tax assets and liabilities are recognized for the estimated future tax effects attributable to temporary differences between financial statement carrying value of existing assets and liabilities and their respective tax bases and tax loss and credit carryforwards. Deferred tax assets and liabilities are measured using the enacted tax rates and laws that will be in effect when the differences are expected to reverse. Accounting standards require that we assess whether valuation allowances should be established or maintained against our deferred income tax assets, based on consideration of all available evidence, using a “more-likely-than-not” standard. The factors used to assess the likelihood of realization are: history of losses, forecasts of future pre-tax income and tax planning strategies that could be implemented to realize the deferred tax assets. On a quarterly basis, we evaluate the realizability of deferred tax assets by assessing our valuation allowances and by adjusting the amount of such allowances as necessary. We use tax planning strategies to realize deferred tax assets in order to avoid the potential loss of these tax benefits. Changes in our estimates, due to unforeseen events or otherwise, could have a material impact on our financial condition and results of operations. Refer to Note 12, “Income Taxes” of the notes to the consolidated financial statements for additional information.
EMPLOYEE FUTURE BENEFIT PLANS
The determination of the obligation and expense for defined benefit pension, termination and long service arrangements and other post-retirement benefits, such as retiree healthcare and medical benefits, is dependent on the selection of certain assumptions used by actuaries in calculating such amounts. Those assumptions include, among others, the discount rate, expected long-term rate of return on plan assets and rates of increase in compensation costs. Actual results that differ from the assumptions used are accumulated and amortized over future periods and therefore impact the recognized expense in future periods. Significant changes in assumptions or significant plan amendments could materially affect our future employee benefit obligations and future expense.
At December 31, 2024, we had past service costs and actuarial experience losses of $156 million included in accumulated other comprehensive income that will be amortized to future employee benefit expense over the expected average remaining service life of employees or over the expected average life expectancy of retired employees, depending on the status of the plan.
24 Magna International Inc. Annual Report 2024
COMMITMENTS AND CONTINGENCIES
From time to time, we may be contingently liable for litigation, legal and/or regulatory actions and proceedings and other claims. Refer to Note 23, “Contingencies” of our audited consolidated financial statements for the year ended December 31, 2024.
For a discussion of risk factors relating to legal and other claims/actions against us, refer to “Item 5. Risk Factors” in our Annual Information Form, filed with the securities commissions in Canada, our Annual Report on Form 40-F, filed with the United States Securities and Exchange Commission, and subsequent filings.
CONTROLS AND PROCEDURES
DISCLOSURE CONTROLS AND PROCEDURES
Disclosure controls and procedures (as defined in Rules 13a-15(e) and 15d-15(e) under the Securities Exchange Act of 1934, as amended [the “Exchange Act”]), are designed to ensure that material information required to be disclosed in reports filed or submitted under the Exchange Act is recorded, processed, summarized and reported on a timely basis, and that such information is accumulated and communicated to senior management, including the Company’s Chief Executive Officer and Chief Financial Officer, as appropriate, to enable them to make timely decisions regarding required disclosure of such information. We have conducted an evaluation of our disclosure controls and procedures as of December 31, 2024, under the supervision, and with the participation of our Chief Executive Officer and our Chief Financial Officer. Based on this evaluation, our Chief Executive Officer and our Chief Financial Officer have concluded that our disclosure controls and procedures (as this term is defined in the rules adopted by Canadian securities regulatory authorities and the United States Securities and Exchange Commission [“SEC”]) are effective as of December 31, 2024.
MANAGEMENT’S ANNUAL REPORT ON INTERNAL CONTROL OVER FINANCIAL REPORTING
Internal control over financial reporting is a process designed to provide reasonable, but not absolute, assurance regarding the reliability of financial reporting and preparation of financial statements for external purposes in accordance with U.S. GAAP. Our management is responsible for establishing and maintaining adequate internal control over financial reporting. Due to its inherent limitations, internal control over financial reporting may not prevent or detect misstatements on a timely basis. Additionally, projections of any evaluation of the effectiveness of internal control over financial reporting to future periods are subject to the risk that the controls may become inadequate because of changes in conditions, or that the degree of compliance with the policies or procedures may deteriorate. Our management used the Committee of Sponsoring Organizations of the Treadway Commission [“COSO”] Internal Control-Integrated Framework (2013) to evaluate the effectiveness of internal control over financial reporting.
Based on this evaluation, our Chief Executive Officer and our Chief Financial Officer have assessed the effectiveness of our internal control over financial reporting and concluded that, as at December 31, 2024, such internal control over financial reporting is effective. The Company’s internal control over financial reporting as of December 31, 2024, has been audited by Deloitte LLP, an Independent Registered Public Accounting Firm, who also audited the Company’s consolidated financial statements for the year ended December 31, 2024. Deloitte LLP expressed an unqualified opinion on the effectiveness of the Company’s internal control over financial reporting. This report precedes our audited consolidated financial statements for the year ended December 31, 2024.
CHANGES IN INTERNAL CONTROLS OVER FINANCIAL REPORTING
There have been no changes in our internal controls over financial reporting that occurred during 2024 that have materially affected or are reasonably likely to materially affect, our internal control over financial reporting.
RISK FACTORS
Our short and medium-term operational success, as well as our ability to create long-term value through our business strategy, are subject to risks and uncertainties. The following are the more significant risks:
MACROECONOMIC, GEOPOLITICAL AND OTHER RISKS
| • | Threats to Free Trade Agreements: Historical growth in the automotive industry has been aided by the free movement of goods, services, people and capital through bilateral and regional trade agreements, particularly in North America pursuant to the North American Free Trade Agreement (1994 – 2020) and the United States-Mexico-Canada Agreement [“USMCA”] (2020 – Present). The current U.S. administration has indicated its intent to renegotiate the USMCA and may proceed with tariffs on goods imported into the United States from Canada, Mexico, Europe and China. Taken together with any retaliatory measures that may be enacted by these countries, such measures will increase our input costs, the prices our U.S. customers pay for our products, and borrowing costs for consumers. In turn, this further decreases vehicle affordability for consumers which could have a material adverse effect on the demand for our products, our sales, profitability and competitive position. |
Magna International Inc. Annual Report 2024 25
| • | International Trade Disputes: International trade disputes could, among other things, reduce demand for and production of vehicles, disrupt global supply chains, distort commodity pricing, impair the ability of automotive suppliers and vehicle manufacturers to make efficient long-term investment decisions, create volatility in relative foreign exchange rates, and contribute to stock market volatility. The imposition of sanctions, tariffs and/or the escalation of trade disputes which interfere with automotive supply chains could have an adverse effect on our operations, profitability and ability to effectively execute our corporate strategy. |
| • | Interest Rates: Key lending rates in North America and Europe remain elevated compared to levels experienced prior to 2020. Although rates have eased in all regions, the risk remains that rates could increase in the U.S. if inflation fails to decrease. The availability and cost of credit are both factors affecting consumer confidence, which is a critical driver of vehicle sales and thus automotive production. A material, sustained decrease in consumer demand for vehicles could result in further reductions to vehicle production from levels assumed in our business plan, which could have a material adverse effect on our profitability and financial condition. Higher interest rates will also have an adverse effect on our borrowing costs and, if prolonged, could have an adverse effect on our profitability. |
| • | Geopolitical Risks: The occurrence of geopolitical crises could create a number of risks, including: disruption of energy supplies (particularly natural gas and oil), shipping/transportation and logistics, vehicle production and/or supply chains; weakening economic growth and consumer confidence; increasing physical or cybersecurity threats; and/or worsening other risks described elsewhere in these Risk Factors, such as commodity prices, relative foreign exchange rates and risks of doing business in foreign markets. An expansion or worsening of existing geopolitical crises, or the occurrence of significant new geopolitical risks, could have a material adverse effect on our business and operations. |
RISKS RELATED TO THE AUTOMOTIVE INDUSTRY
| • | North American Electric Vehicle Program Deferrals, Cancellations and Volume Reductions. Certain OEMs, primarily in North America, have been updating their Electric Vehicle [“EV”] strategies by deferring or cancelling planned EV programs and/or reducing production volumes below the levels to which we previously quoted. We are pursuing commercial recoveries from our customers as a result of these actions, but we may be unable to fully recover various pre-production, tooling, engineering, and other costs incurred in advance of production, or unable to recover them within the timeframe originally contemplated in our business plan. We may also experience production inefficiencies, including as a result of unutilized or underutilized production capacity and/or disruptions to our workforce plans at affected facilities. The deferral or cancellation of EV programs, or reduction in planned production volumes, combined with the failure to secure commercial recoveries from our customers to offset associated costs and inefficiencies, may have a material adverse effect on our profitability. |
| • | Economic Cyclicality: Ordinarily, the global automotive industry is cyclical, with potential for regional differences in the timing of expansion and contraction of economic cycles. In normal industry cycles, lower consumer confidence typically translates to lower vehicle sales and production volumes. Examples of factors which often reduce consumer confidence include: worsening economic, political, and other conditions; consumer perceptions and general trends related to the job, housing, and stock markets; military conflicts; increasing inflation (particularly fuel and energy prices); and rising interest rates. A significant decline in vehicle production volumes from levels assumed in our business plan could have a material adverse effect on our profitability and financial condition. |
| • | Regional Production Volume Declines: North America, Europe and China are key automotive producing regions for us, and our operating results are primarily dependent on car and light truck production by our customers in these regions. A significant or sustained decline in vehicle production volumes in any or all these geographic regions could have a material adverse effect on our operations, sales, and profitability. |
| • | Deteriorating Vehicle Affordability: Vehicle affordability to consumers is becoming more challenged due to a combination of factors, including: higher prices for vehicles; costs related to advanced electronic systems; elevated vehicle finance costs; and changes in relative foreign exchange rates. A material, sustained decrease in consumer demand for vehicles due to deteriorating vehicle affordability could result in reductions to vehicle production from levels assumed in our business plan, which could have a material adverse effect on our profitability and financial condition. |
| • | Uncertain Pace of EV Adoption: Although the number of electric vehicles sold globally continues to grow, the rate of growth has moderated in some markets due to consumer uncertainty related to issues such as: vehicle affordability; reduced availability of government subsidies for the purchase of EVs; concerns regarding evolving battery technologies; anxiety regarding driving range; inadequacy of charging infrastructure; the growth of new, EV-focused OEMs and/or new EV models with little or no operating and warranty history; and rapid depreciation and deterioration in residual values for EVs. If planned production volumes for EV programs do not materialize, we may not be able to recover our capital investments related to such programs, or to recover such investments within the timeframes contemplated, which could have a material adverse effect on our profitability and financial condition. |
26 Magna International Inc. Annual Report 2024
| • | Intense Competition: The automotive supply industry is highly competitive and becoming more so. Some of our competitors have higher or more rapidly growing market share than we do in certain product or geographic markets. Additionally, a number of established electronics, semiconductor chip and contract manufacturing companies have entered or expanded their presence in the automotive industry. At the same time, disruptive technology innovators have been introducing novel product and service solutions which traditional automotive suppliers may not be able to match. Failure to successfully compete with existing or new competitors could affect our ability to fully implement our corporate strategy. |
STRATEGIC RISKS
| • | Evolution of the Vehicle: The success of our corporate strategy is correlated to our ability to grow our business and capabilities in product areas which demonstrate long-term growth. Some systems in our product portfolio are expected to decline over the long-term, including manual transmissions, mechanical all-wheel drive/four-wheel drive systems and fuel tank systems. The failure to grow our sales of higher growth products at or above the industry rates of growth for such products could have a material adverse effect on our profitability and financial condition. |
| • | Evolving Business Risk Profile: The risk profile of our business continues to evolve due to our exposure to product areas such as battery enclosures, electrified powertrains, and ADAS and electronics. As a result, we may face new or heightened risks, including: forecasting, planning and capital allocation risks due to uncertainties regarding the shift from ICE to EV production volumes, take-rates for ADAS systems and/or features offered to consumers as optional items; reduction in demand for certain products which are unique to ICE vehicles; challenges in quoting for profitable returns on products with leading-edge technologies; rigorous testing and validation requirements from OEM customers for complex new products; increased warranty and recall risks on new products and leading-edge technologies; increased product liability risks; increased counterparty risk; heightened risk of technological obsolescence of some of our products, processes and/or assets; and difficulties in attracting or retaining employees with critical skills in high-demand areas. Realization of one or more such risks could have a material adverse effect on our operations, profitability, or financial condition. |
| • | Technology and Innovation: While we continue to invest in technology and innovation which we believe will be critical to our long-term growth, the automotive industry is experiencing significant electrical, electronic, and software-driven change and disruption. Our ability to anticipate changes in technology and to successfully develop and introduce new and enhanced products and/or manufacturing processes on a timely basis will be significant factors in our ability to remain competitive. Additionally, our success is dependent on our ability to attract, develop and retain employees with the required technical and/or software skills. If we are unsuccessful or are less successful than our competitors in consistently developing innovative products and/or processes, we may be placed at a competitive disadvantage in bidding for new business and may not be able to recover some or all our engineering, research, and development costs, which could have a material adverse effect on our profitability and financial condition and ability to fully implement our corporate strategy. |
| • | Investments in Mobility and Technology Companies: In addition to our development activities, we have invested in various mobility and technology companies, as well as funds that invest in such companies, and may continue to do so in the future. However, investing in such companies involves a high degree of risk, including the potential loss of some or all our investment value. There is currently no public market for the shares or units of some of these investments and, as a result, we may be unable to monetize such investments in the future. In some cases, we may have shares or share purchase warrants with technology-driven suppliers with which we have commercial supply relations; while the value of such equity may be affected by the commercial prospects of such programs, our ability to exit our investments may be impaired by the existence of our commercial supply relationship. Investments in companies or funds which are currently or subsequently become publicly traded are “marked-to-market” quarterly, which may result in us recording unrealized gains or losses in any given quarter. The realization of any of the foregoing investment-related risks could have an adverse effect on our profitability and financial condition. |
CUSTOMER-RELATED RISKS
| • | Customer Concentration: Although we supply parts to all major OEMs, a significant majority of our sales are to six customers: General Motors, Daimler, Ford, BMW, Volkswagen and Stellantis. Additionally, growth rates of OEMs differ by region and segment, with significant growth by some EV-focused OEMs in certain markets, such as China. Shifts in market share away from our top customers could have a material adverse effect on our profitability to the extent we are unable to offset such lost sales with sufficient sales growth with alternative OEMs. |
| • | Market Shifts: While we supply parts for a wide variety of vehicles produced globally, we do not supply parts for all vehicles produced, nor is the number or value of parts evenly distributed among the vehicles for which we do supply parts. Additionally, in recent years, we have experienced a concentration in content on certain EV models. Shifts in market shares away from vehicles on which we have significant content, as well as vehicle segments in which our sales may be more heavily concentrated, could have a material adverse effect on our sales and profitability. |
Magna International Inc. Annual Report 2024 27
| • | Growth of EV-Focused OEMs: A number of EV-focused OEMs, including Tesla, BYD, Geely, Nio, SAIC, XPeng, and Rivian, have emerged in recent years. Despite significant tariffs and other protectionist headwinds, some China-based, EV-focused OEMs, such as BYD and Geely, have entered the European market with vehicles exported from China, while both BYD and Chery have announced plans to manufacture EVs in European countries. While we are targeting growth with some of the newer EV-focused OEMs, we do not have relations with all, nor are such relationships as well established as those with our traditional customers. The failure to sufficiently grow our sales to those EV-focused OEMs which achieve significant commercial success could adversely impact our long-term strategy. At the same time, the failure of newer EV-focused OEMs to which we supply systems could adversely impact the success of our customer diversification strategy, as well as create counterparty risks described below. |
| • | Risks of Conducting Business with Newer EV-Focused OEMs: Conducting business with newer EV-focused OEMs poses incremental risks and challenges compared to our traditional customers, including as a result of: their relatively short operating histories; limited financial, liquidity/capital or other resources; less mature product development and validation processes; uncertain market acceptance of their products/services; and untested business models. These factors may elevate our counterparty risks in dealing with such OEMs, particularly with respect to recovery of: pre-production (including tooling, engineering, and launch) and production receivables; inventory; fixed assets and capitalized pre-production expenditures; as well as other statutory warranty, recall and third-party claims related to our role as contract manufacturer or supplier of components on new vehicles in instances where the OEM is no longer able to assume such costs, such as on the Fisker Ocean SUV. The inability of newer EV-focused OEMs to achieve commercial success, or the bankruptcy or insolvency of any such OEM with which we conduct business, could have a material adverse effect on our profitability and financial condition. |
| • | Dependence on Outsourcing: We depend on outsourcing by OEMs, including the outsourcing of complete vehicle assembly to our contract vehicle manufacturing business. The extent of such outsourcing is dependent on a number of factors, including: the cost, quality, and timeliness of outsourced production relative to in-house production by an OEM; the degree of unutilized capacity at an OEM’s facilities; and collective bargaining agreements and labour relations between OEMs and labour unions. Currently, many OEMs have excess vehicle assembly capacity. Additionally, since EVs have fewer components than vehicles with internal combustion engines, some OEMs may insource production of certain components or systems to maintain employment levels committed to in collective bargaining agreements and/or in connection with government incentives. A reduction in outsourcing by OEMs, or the loss of any material production or assembly programs combined with the failure to secure alternative programs with sufficient volumes and margins, could have a material adverse effect on our profitability. |
| • | Customer Cooperation and Consolidation: Competing OEMs have cooperated and collaborated in different ways to save costs, including through: joint purchasing activities; platform sharing; powertrain sharing; joint R&D; and regional joint ventures. Additionally, the automotive industry has previously experienced OEM consolidation. While OEM cooperation and consolidation may present opportunities, they also present a risk that we could lose future business or experience even greater pricing pressure on certain production programs, either of which could have an adverse effect on our profitability. |
| • | Consumer Take Rate Shifts: Shifts in consumer preferences may impact “take rates” for certain types of products we sell. Examples of such products include: all-wheel drive systems; power liftgates; active aerodynamics systems; ADAS; and complete vehicles with certain option packages or option choices. Where shifts in consumer preferences result in higher “take rates” for products that we do not sell or for products we sell at a lower margin, our profitability may be adversely affected. |
| • | Customer Purchase Orders: Contracts from our customers consist of blanket purchase orders which generally provide for the supply of a customer’s annual requirements rather than a specific quantity of products and can be terminated by a customer at any time. We may have various pre-production, tooling, engineering, dedicated program capital, and other costs incurred in advance of production which cannot easily be recovered from our customers if a purchase order is terminated and/or if forecast production volumes fail to materialize within the timeframe contemplated in our business plan. We may also experience production inefficiencies, including as a result of unutilized or underutilized production capacity and/or disruptions to our workforce plans at facilities affected by the cancellation or reduction of production volumes. The failure to secure commercial recoveries from customers to offset such costs and other operating inefficiencies may have a material adverse effect on our profitability. |
| • | Potential OEM Production-Related Disruptions: Any significant OEM production disruptions, including as a result of labour unrest at customer or sub-supplier facilities, would lead to disruptions to our production, which could have a material adverse effect on our sales, and profitability. |
SUPPLY CHAIN RISKS
| • | Supply Base: We rely on a number of suppliers to supply us with a wide range of components required in connection with our business. The financial health of automotive suppliers is impacted by a number of factors, including economic conditions and production volumes. A significant worsening of economic conditions or reduction in production volumes could deteriorate the financial condition of our supply base, which could lead to, among other things: disruptions in the supply of critical components to us or our customers; and/or temporary shutdowns of one of our production lines or the production lines of one of our customers; all of which could have a material adverse effect on our profitability. |
28 Magna International Inc. Annual Report 2024
| • | Supplier Claims: Input cost increases, shortfalls in vehicle production volumes, program deferrals or cancellations, and other circumstances could give rise to commercial or legal cost recovery claims against us by our suppliers, which could have an adverse effect on our profitability. |
| • | Supply Chain Disruptions: OEMs and Tier 1 automotive suppliers may experience supply disruptions or constraints on other critical manufacturing inputs, for a number of different reasons, including: government regulation or intervention; geopolitical and/or military conflict; interruption of shipping or other transportation routes; natural catastrophes; labour disruptions; and pandemics. Supply chain disruptions which prevent us from timely supplying products to our customers could result in a range of potential adverse consequences, including: unrecoverable price increases; elevated, unrecoverable costs such as those for premium freight or re-sourcing of supply; penalties, business interruption claims, or other commercial claims by our customers and suppliers; loss of future business; and reputational damage. The impacts of prolonged supply chain disruptions or constraints could have a material adverse effect on our operations and profitability. |
| • | Regional Energy Supply and Pricing: Regional energy supplies have from time to time been disrupted due to geopolitical and military conflict, supply/demand imbalances, government regulation, severe weather events, and challenges related to the transition to renewable energy generation. Unforeseen supply disruptions, demand spikes, prolonged energy disruptions and/or significant energy price increases could have a material adverse effect on our operations and profitability. |
MANUFACTURING / OPERATIONAL RISKS
| • | Product Launch: The launch of production is a complex process, the success of which depends on a wide range of factors, including: the timing and frequency of design changes by our customers relative to the start of production; product maturity and complexity; production readiness of our own, as well as our customers’ and suppliers’ manufacturing facilities; robustness of manufacturing and validation processes; launch volumes; quality and production readiness of tooling and equipment; sufficiency of skilled employees; and initial product quality. Failure by us to successfully launch a new product or complete vehicle could result in commercial or litigation claims against us which could have a material adverse effect on our profitability. Additionally, a significant product or program launch failure could adversely affect our reputation and/or ability to execute our strategy. |
| • | Operational Underperformance: From time to time, we may have operating divisions which are not performing at expected levels of profitability. The size and complexity of automotive manufacturing operations often makes it difficult to achieve a quick turnaround of underperforming divisions. Significant or prolonged underperformance at any of our operating divisions could have a material adverse effect on our profitability and operations. |
| • | Restructuring Costs: We may sell some product lines and/or downsize, close, or sell some of our operating divisions. By taking such actions, we will incur restructuring, downsizing and/or other significant non-recurring costs. These costs may be higher in some countries than others and could have a material adverse effect on our profitability. |
| • | Impairments: We have recorded significant impairment charges related to equity interests in joint ventures, goodwill, and long-lived assets in the past and may do so again in the future. The occurrence of any of a number of potential scenarios could result in indicators of impairment, including: the early termination, loss, renegotiation of the terms of, or delay in the implementation of, any significant production contract; the technological obsolescence of any of our products or production assets; production volumes that are lower than expected; and the insolvency of a customer. In conducting our impairment analysis, we make forward-looking assumptions regarding: the impact of turnaround plans on underperforming operations; new business opportunities; program price and cost assumptions on current and future business; the timing and success of new program launches; and forecast production volumes. To the extent such forward-looking assumptions are not met, any resulting impairment loss could have a material adverse effect on our profitability. |
| • | Skilled Labour Attraction/Retention: Our business is based on successfully attracting, developing, and retaining employees at all levels of the company from “shopfloor” to Executive Management. The markets for highly skilled workers, as well as talented professionals and leaders in our industry are extremely competitive, particularly in the major global automotive and technology centres in which many of our operations are located. The inability to meet our needs for skilled workers and talented professionals and leaders, whether through recruitment or internal training and development activities could impact our ability to profitably conduct business and/or effectively implement our strategy. |
| • | Leadership Expertise and Succession: Effective succession planning programs and practices are critical elements of our overall talent management strategy. While we believe that our leadership development and succession programs have been effective in facilitating leadership transitions to date, our ability to profitably conduct business and/or successfully implement our strategy could be impacted by the failure to: identify, train, develop and support high-performing leaders; ensure effective knowledge transfers from transitioning leaders to successors; and/or otherwise promote organizational robustness and resilience through leadership transitions in critical roles. |
Magna International Inc. Annual Report 2024 29
PRICING RISKS
| • | Quote/Pricing Assumptions: The time between award of new production business and start of production typically ranges between two and four years. Since product pricing is typically determined at the time of award, we are subject to significant pricing risk due to changes in input costs and quote assumptions from the time of award through the start of production. The inability to quote effectively, or the occurrence of a material change in input cost or other quote assumptions between program award and production, could have a material adverse effect on our profitability. |
| • | Customer Pricing Pressure/Contractual Arrangements: We face ongoing pricing pressure from OEMs, including through: quoting pre-requirements; long-term supply agreements with mutually agreed price reductions over the life of the agreement; non-contractual annual price concession demands; pressure to absorb costs related to product design, engineering and tooling, and/or amortize such costs through the piece price for the product; pressure to assume incremental warranty costs; and OEM refusal to fully offset inflationary price increases. OEMs possess significant leverage over their suppliers due to their purchasing power and the highly competitive nature of the automotive supply industry. As a result of the broad portfolio of parts we supply to our six largest OEM customers, such customers may be able to exert greater leverage over us as compared to our competitors. We attempt to offset price concessions and costs in a number of ways, including through commercial negotiations with our customers, improved operating efficiencies and cost reduction efforts. Our inability to fully offset price concessions, absorb design, engineering, and tooling costs, and/or fully recover such costs over the life of production, could have a material adverse effect on our profitability. Moreover, while we attempt to negotiate contractual terms with our suppliers that align with the contractual terms between us and our OEM customers, we may not always be successful in doing so. Any such gaps between our customer and supplier contract terms could, in certain circumstances, have an adverse effect on our profitability. |
| • | Commodity Price Volatility: Prices for certain key raw materials and commodities used in our parts, including steel, aluminum, resin, and energy can be volatile. In some cases, our risk is mitigated because we purchase steel, aluminum, and to a more limited extent, resin under customer resale programs. Where such commodity purchases are not made under customer resale programs, we seek to offset commodity price increases by: passing such increases to our customers; engineering products with reduced commodity content; implementing hedging strategies; or otherwise. To the extent we are unable to offset commodity price increases, such additional commodity costs could have an adverse effect on our profitability. |
| • | Scrap Steel/Aluminum Price Volatility: Some of our manufacturing facilities generate a significant amount of engineered scrap steel and/or aluminum in their manufacturing processes but recover some of the value through the sale of such scrap. Scrap steel and scrap aluminum prices can also be volatile and do not necessarily move in the same direction as steel or aluminum prices. Declines in scrap steel/aluminum prices from time to time could have an adverse effect on our profitability. |
WARRANTY / RECALL RISKS
| • | Repair/Replacement Costs: We are responsible for the repair and replacement costs associated with defective products we supply to our customers. Certain of our products, such as transmissions and battery enclosures, typically have a higher unit and labour service cost in the event of replacement. Other products, such as cameras, radars and side door latches, are supplied in multiples of two or four for a single vehicle, which could result in significant cost in the event all need to be replaced. OEMs and/or government regulators can initiate recalls of safety or regulated products, which could place us at risk for the administrative costs of the recall in addition to the repair/replacement costs of defective products, even in situations where we dispute the need for a recall or the responsibility for any alleged defect. The obligation to repair or replace defective products could have a material adverse effect on our operations and profitability. To the extent such obligation arises as a result of a product recall, we may face reputational damage, and the combination of administrative and repair/replacement costs could have a material adverse effect on our profitability. |
| • | Warranty Provisions: In certain circumstances, we are at risk for warranty, product liability and recall costs. We are currently experiencing increased customer pressure to assume greater warranty responsibility. Certain customers seek to impose partial responsibility for warranty costs where the underlying root cause of a product or system failure cannot be determined, or where the root cause is disputed, as in the case of a warranty claim disclosed in the Contingencies note of our consolidated financial statements. Warranty provisions for our products are based on our best estimate of the amounts necessary to settle existing or probable claims related to product defects. Warranty claims which exceed warranty provisions could have a material adverse effect on our profitability. In addition, warranty provisions for our powertrain systems, electronics and complete vehicle programs are also established based on our or our customers’ warranty experience with the applicable type of product and, in some cases, the terms in the applicable customer agreements. Actual warranty experience which results in costs that exceed our warranty provisions, could have a material adverse effect on our profitability. |
30 Magna International Inc. Annual Report 2024
| • | Product Liability: We cannot guarantee that the design, engineering, testing, validation, and manufacturing measures we employ to ensure high-quality products will be completely effective, particularly as electronic content and product complexity increases and/or as we enter newer product areas such as e-Drives or ADAS. If our products fail to perform as expected or as required by governmental regulations, and/or to the extent any such failure results in, or is alleged to result in, bodily injury and/or property damage or other losses, our customers or government regulators may initiate a product recall of such products and/or third party product liability claims may be brought against us. The defense of product liability claims, particularly class action claims in North America, may be costly and judgements against us could impair our reputation and have a material adverse effect on our profitability. |
IT SECURITY / CYBERSECURITY RISKS
| • | IT/Cybersecurity Breach: Although we have established and continue to enhance security controls intended to protect our IT systems and infrastructure, there is no guarantee that such security measures will be effective in preventing unauthorized physical access or cyber-attacks. A significant breach of our IT systems could: result in theft of funds; cause disruptions in our manufacturing operations; lead to the loss, destruction, or inappropriate use of sensitive data, including employees’ personal data; or result in theft of our, our customers’ or our suppliers’ intellectual property or confidential information. The occurrence of any of the foregoing could adversely affect our operations and/or reputation and could lead to claims against us that could have a material adverse effect on our profitability. |
| • | Product Cybersecurity: The risk of vehicle cyber-attacks has risen with the proliferation of technology designed to connect vehicles to external networks. Although vehicle and systems-level cybersecurity controls and protections are typically managed and/or specified by our OEM customers, we cannot provide assurance that such controls and protections will be effective in preventing cyber intrusion through one of our products. Furthermore, an OEM customer may still seek to hold us financially responsible, even where the OEM specified the cybersecurity controls and protections. Any such cyber intrusion could cause reputational damage and lead to claims against us that have an adverse effect on our profitability. |
ACQUISITION RISKS
| • | Inherent Merger and Acquisition Risks: Acquisitions are subject to a range of inherent risks, including the assumption of incremental regulatory/compliance, pricing, supply chain, commodities, labour relations, litigation, environmental, pensions, warranty, recall, IT, tax, or other risks. While due diligence on an acquisition target is intended to mitigate such risks, these efforts may not always prove to be sufficient in identifying all risks and liabilities related to the acquisition, including as a result of: limited access to information; time constraints for conducting due diligence; inability to access target company facilities and/or personnel; or other limitations in the due diligence process. Additionally, we may identify risks and liabilities that we are not able to sufficiently mitigate through appropriate contractual indemnities or other protections. The realization of any such risks could have a material adverse effect on our profitability. |
| • | Acquisition Integration and Synergies: We may not be able to successfully integrate or achieve anticipated synergies from our acquisitions and/or such acquisitions may be dilutive in the short to medium term. Either of these outcomes could have a material adverse effect on our profitability. |
OTHER BUSINESS RISKS
| • | Joint Ventures: We conduct certain of our operations through joint ventures with contractual arrangements under which we share management responsibilities with our joint venture partner(s). Joint venture operations carry a range of risks, including those relating to: failure of our joint venture partner(s) to satisfy contractual obligations; potential conflicts between us and our joint venture partner(s); strategic objectives of joint venture partners that may differ from our own; potential delays in decision-making; a limited ability to implement some or all of our policies, practices and controls, or to control legal and regulatory compliance, within the joint venture(s); and other risks inherent to non-wholly-owned operations. The likelihood of such occurrences and their potential effect on us varies depending on the joint venture arrangement, however, the occurrence of any such risks could have an adverse effect on our operations, profitability, and reputation. |
| • | Intellectual Property: We own intellectual property that is important to our business and product portfolio. Our intellectual property is an important factor in protecting our innovation activities and maintaining our competitive advantage. From time to time, our intellectual property rights may be challenged, including through the assertion of intellectual property infringement claims which could result in us: being prevented from producing and selling certain products; having to license the infringed product/technology; and/or incurring monetary damages. The foregoing consequences could have an adverse effect on our sales, profitability, and ability to fully implement our corporate strategy. |
| • | Risks of Doing Business in Foreign Markets: Conducting business in markets outside our traditional markets of North America and Europe carries a number of potential risks, including those relating to: political, civil and economic instability and uncertainty; military conflict; corruption risks; high inflation and our ability to recover inflation-related cost increases; trade, customs and tax risks; potential sanctions and export control risk; expropriation risks; currency exchange rates; currency controls; limitations on the repatriation of funds; insufficient infrastructure; competition to attract and retain qualified employees; and other risks associated with conducting business internationally. The likelihood of such occurrences and their potential effect on us vary from country to country and are unpredictable, however, the occurrence of any such risks could have an adverse effect on our operations, profitability, and financial condition. |
Magna International Inc. Annual Report 2024 31
| • | Relative Foreign Exchange Rates: Our profitability is affected by movements of our U.S. dollar reporting currency against the Canadian dollar, the euro, the Chinese renminbi, and other currencies in which we generate revenues and incur expenses. Significant long-term fluctuations in relative currency values, in particular a significant change in the relative values of the U.S. dollar, Canadian dollar, euro, or Chinese renminbi, could have an adverse effect on our profitability and financial condition and any sustained change in such relative currency values could adversely impact our competitiveness in certain geographic regions. |
| • | Returns on Capital Investments: In recent years, we have invested significant amounts of money in our business through capital expenditures to support new facilities, expansion of existing facilities, purchases of production equipment and acquisitions. Returns achieved on such investments in the past are not necessarily indicative of the returns we may achieve on future investments and our inability to achieve returns on future investments which equal or exceed returns on past investments could have a material adverse effect on our level of profitability. |
| • | Financial Flexibility: The occurrence of an economic shock not contemplated in our business plan, a rapid deterioration of conditions or a prolonged recession could result in the depletion of our cash resources, which could have a material adverse effect on our operations and financial condition. |
| • | Credit Rating Changes: There is no assurance that any credit rating currently assigned to us will remain in effect for any period of time or that any rating will not be revised or withdrawn entirely by a rating agency in the future. A downgrade in the credit ratings assigned to us or our industry by one or more agencies could increase our cost of borrowing or impact our ability to negotiate loans, which could have an adverse effect on our profitability, financial condition, and the trading price of our Common Shares. |
| • | Stock Price Fluctuation: Trading prices of our Common Shares cannot be predicted and may fluctuate significantly due to a variety of factors, many of which are outside our control. |
LEGAL, REGULATORY AND OTHER RISKS
| • | Legal and Regulatory Proceedings: From time to time, we may become involved in regulatory proceedings, or become liable for legal, contractual, and other claims by various parties, including customers, suppliers, former employees, class action plaintiffs and others. Depending on the nature or duration of any potential proceedings or claims, we may incur substantial costs and expenses, be required to devote significant management time and resources to the matters and suffer reputational damage as a result of regulatory proceedings. On an ongoing basis, we attempt to assess the likelihood of any adverse judgements or outcomes to these proceedings or claims, although it is difficult to predict final outcomes with any degree of certainty. Except as disclosed from time to time in our consolidated financial statements and/or our MD&A, we do not believe that any of the proceedings or claims to which we are currently a party will have a material adverse effect on our profitability; however, we cannot provide any assurance to this effect. |
| • | Changes in Laws: A significant change in the current regulatory environment in our principal markets, including: changes in tax laws; the imposition of tariffs and trade barriers; stricter regulatory approaches to CO2 emissions, software and data privacy, sourcing of electronics components, and access to rare earth minerals; and other laws which impose additional costs on automotive manufacturers or consumers, could have an adverse effect on our profitability. |
32 Magna International Inc. Annual Report 2024
Exhibit 4
Consent of Independent Registered Public Accounting Firm
We consent to the incorporation by reference in Registration Statement Nos. 333-270086 and 333-277377 on Form F-10 and 333-271114, 333-210449 and 333-128257 on Form S-8 and to the use of our reports dated February 26, 2025, relating to the consolidated financial statements of Magna International Inc. (the “Company”), and the effectiveness of the Company’s internal control over financial reporting, appearing in this Annual Report on Form 40-F for the year ended December 31, 2024.
/s/ Deloitte LLP
Chartered Professional Accountants
Licensed Public Accountants
Toronto, Canada
March 28, 2025
Exhibit 99.1
CERTIFICATION
I, Seetarama (Swamy) Kotagiri, President and Chief Executive Officer, certify that:
| 1. | I have reviewed this annual report on Form 40-F of Magna International Inc. (the “issuer”); |
| 2. | Based on my knowledge, this report does not contain any untrue statement of a material fact or omit to state a material fact necessary to make the statements made, in light of the circumstances under which such statements were made, not misleading with respect to the period covered by this report; |
| 3. | Based on my knowledge, the financial statements, and other financial information included in this report, fairly present in all material respects the financial condition, results of operations and cash flows of the issuer as of, and for, the periods presented in this report; |
| 4. | The issuer’s other certifying officer(s) and I are responsible for establishing and maintaining disclosure controls and procedures (as defined in Exchange Act Rules 13a-15(e) and 15d-15(e)) and internal control over financial reporting (as defined in Exchange Act Rules 13a-15(f) and 15d-15(f)) for the issuer and have: |
| a) | Designed such disclosure controls and procedures, or caused such disclosure controls and procedures to be designed under our supervision, to ensure that material information relating to the issuer, including its consolidated subsidiaries, is made known to us by others within those entities, particularly during the period in which this report is being prepared; |
| b) | Designed such internal control over financial reporting, or caused such internal control over financial reporting to be designed under our supervision, to provide reasonable assurance regarding the reliability of financial reporting and the preparation of financial statements for external purposes in accordance with generally accepted accounting principles; |
| c) | Evaluated the effectiveness of the issuer’s disclosure controls and procedures and presented in this report our conclusions about the effectiveness of the disclosure controls and procedures, as of the end of the period covered by this report based on such evaluation; and |
| d) | Disclosed in this report any change in the issuer’s internal control over financial reporting that occurred during the period covered by the annual report that has materially affected, or is reasonably likely to materially affect, the issuer’s internal control over financial reporting; and |
| 5. | The issuer’s other certifying officer(s) and I have disclosed, based on our most recent evaluation of internal control over financial reporting, to the issuer’s auditors and the audit committee of the issuer’s board of directors (or persons performing the equivalent functions): |
| a) | All significant deficiencies and material weaknesses in the design or operation of internal controls over financial reporting which are reasonably likely to adversely affect the issuer’s ability to record, process, summarize and report financial information; and |
| b) | Any fraud, whether or not material, that involves management or other employees who have a significant role in the issuer’s internal control over financial reporting. |
Date as of the 28th day of March, 2025.
| /s/ “Swamy Kotagiri” |
| Seetarama (Swamy) Kotagiri |
| President and Chief Executive Officer |
Exhibit 99.2
CERTIFICATION
I, Patrick W.D. McCann, Executive Vice-President and Chief Financial Officer, certify that:
| 1. | I have reviewed this annual report on Form 40-F of Magna International Inc. (the “issuer”); |
| 2. | Based on my knowledge, this report does not contain any untrue statement of a material fact or omit to state a material fact necessary to make the statements made, in light of the circumstances under which such statements were made, not misleading with respect to the period covered by this report; |
| 3. | Based on my knowledge, the financial statements, and other financial information included in this report, fairly present in all material respects the financial condition, results of operations and cash flows of the issuer as of, and for, the periods presented in this report; |
| 4. | The issuer’s other certifying officer(s) and I are responsible for establishing and maintaining disclosure controls and procedures (as defined in Exchange Act Rules 13a-15(e) and 15d-15(e)) and internal control over financial reporting (as defined in Exchange Act Rules 13a-15(f) and 15d-15(f)) for the issuer and have: |
| a) | Designed such disclosure controls and procedures, or caused such disclosure controls and procedures to be designed under our supervision, to ensure that material information relating to the issuer, including its consolidated subsidiaries, is made known to us by others within those entities, particularly during the period in which this report is being prepared; |
| b) | Designed such internal control over financial reporting, or caused such internal control over financial reporting to be designed under our supervision, to provide reasonable assurance regarding the reliability of financial reporting and the preparation of financial statements for external purposes in accordance with generally accepted accounting principles; |
| c) | Evaluated the effectiveness of the issuer’s disclosure controls and procedures and presented in this report our conclusions about the effectiveness of the disclosure controls and procedures, as of the end of the period covered by this report based on such evaluation; and |
| d) | Disclosed in this report any change in the issuer’s internal control over financial reporting that occurred during the period covered by the annual report that has materially affected, or is reasonably likely to materially affect, the issuer’s internal control over financial reporting; and |
| 5. | The issuer’s other certifying officer(s) and I have disclosed, based on our most recent evaluation of internal control over financial reporting, to the issuer’s auditors and the audit committee of the issuer’s board of directors (or persons performing the equivalent functions): |
| a) | All significant deficiencies and material weaknesses in the design or operation of internal controls over financial reporting which are reasonably likely to adversely affect the issuer’s ability to record, process, summarize and report financial information; and |
| b) | Any fraud, whether or not material, that involves management or other employees who have a significant role in the issuer’s internal control over financial reporting. |
Date as of the 28th day of March, 2025.
| /s/ “Patrick McCann” |
| Patrick W.D. McCann |
| Executive Vice-President and Chief Financial Officer |
Exhibit 99.3
CERTIFICATE OF PRINCIPAL EXECUTIVE OFFICER
PURSUANT TO
18 U.S.C. SECTION 1350
AS ADOPTED PURSUANT TO SECTION 906 OF
THE SARBANES-OXLEY ACT OF 2002
I, Seetarama (Swamy) Kotagiri, President and Chief Executive Officer of Magna International Inc. (the “Company”), certify that:
| 1. | the Annual Report on Form 40-F of the Company dated the 28th day of March, 2025 for the fiscal year ending December 31, 2024 (the “Report”) fully complies with the requirements of Sections 13(a) and 15(d) of the Securities Exchange Act of 1934; and |
| 2. | the information contained in the Report fairly presents, in all material respects, the financial condition and results of operations of the Company. |
Dated as of the 28th day of March, 2025.
| /s/ “Swamy Kotagiri” |
| Seetarama (Swamy) Kotagiri |
| President and Chief Executive Officer |
A signed original of this written statement required by Section 906 has been provided to the Company and will be retained by the Company and furnished to the Securities and Exchange Commission or its staff upon request.
Exhibit 99.4
CERTIFICATE OF PRINCIPAL FINANCIAL OFFICER
PURSUANT TO
18 U.S.C. SECTION 1350
AS ADOPTED PURSUANT TO SECTION 906 OF
THE SARBANES-OXLEY ACT OF 2002
I, Patrick W.D. McCann, the Executive Vice-President and Chief Financial Officer of Magna International Inc. (the “Company”), certify that:
| 1. | the Annual Report on Form 40-F of the Company dated the 28th day of March, 2025 for the fiscal year ending December 31, 2024 (the “Report”) fully complies with the requirements of Sections 13(a) and 15(d) of the Securities Exchange Act of 1934; and |
| 2. | the information contained in the Report fairly presents, in all material respects, the financial condition and results of operations of the Company. |
Dated as of the 28th day of March, 2025.
| /s/ “Patrick McCann” |
| Patrick W.D. McCann |
| Executive Vice-President and Chief Financial Officer |
A signed original of this written statement required by Section 906 has been provided to the Company and will be retained by the Company and furnished to the Securities and Exchange Commission or its staff upon request.