UNITED STATES
SECURITIES AND EXCHANGE COMMISSION
Washington, D.C. 20549
FORM 8-K
CURRENT REPORT
Pursuant to Section 13 OR 15(d)
of The Securities Exchange Act of 1934
Date of Report (Date of earliest event reported): March 20, 2025

NN, Inc.
(Exact name of registrant as specified in its charter)
| Delaware | 001-39268 | 62-1096725 | ||
| (State or other jurisdiction of incorporation) |
(Commission File Number) |
(I.R.S. Employer Identification No.) |
| 6210 Ardrey Kell Road, Suite 120 | ||
| Charlotte, North Carolina | 28277 | |
| (Address of principal executive offices) | (Zip Code) |
(980) 264-4300
(Registrant’s telephone number, including area code)
(Former name or former address, if changed since last report)
Check the appropriate box if the Form 8-K filing is intended to simultaneously satisfy the filing obligation of the registrant under any of the following provisions (see General Instruction A.2. below):
| ☐ | Written communications pursuant to Rule 425 under the Securities Act (17 CFR 230.425) |
| ☐ | Soliciting material pursuant to Rule 14a-12 under the Exchange Act (17 CFR 240.14a-12) |
| ☐ | Pre-commencement communications pursuant to Rule 14d-2(b) under the Exchange Act (17 CFR 240.14d- 2(b)) |
| ☐ | Pre-commencement communications pursuant to Rule 13e-4(c) under the Exchange Act (17 CFR 240.13e- 4(c)) |
Securities registered pursuant to Section 12(b) of the Act:
| Title of each class |
Trading symbol |
Name of each exchange |
||
| Common Stock, par value $0.01 | NNBR | The Nasdaq Stock Market LLC |
Indicate by check mark whether the registrant is an emerging growth company as defined in Rule 405 of the Securities Act of 1933 (§230.405 of this chapter) or Rule 12b-2 of the Securities Exchange Act of 1934 (§240.12b-2 of this chapter).
Emerging growth company. ☐
If an emerging growth company, indicate by check mark if the registrant has elected not to use the extended transition period for complying with any new or revised financial accounting standards provided pursuant to Section 13(a) of the Exchange Act. ☐
| ITEM 7.01 | REGULATION FD DISCLOSURE |
NN, Inc., a Delaware corporation (the “Company”), presented virtually at the Sidoti Small-Cap Virtual Conference (the “Conference”) on March 20, 2025, which featured an investor presentation (the “Investor Presentation”). A copy of the Investor Presentation is furnished as Exhibit 99.1 to this Current Report on Form 8-K and is available on the Company’s website at https://ir.vertexinc.com/.
Pursuant to the rules and regulations of the U.S. Securities and Exchange Commission the information furnished pursuant to this Item 7.01 of this Current Report (including Exhibit 99.1) is deemed to have been furnished and shall not be deemed “filed” for purposes of Section 18 of the Securities Exchange Act of 1934, as amended (the “Exchange Act”), or otherwise subject to the liabilities of that section. Such information shall not be incorporated by reference into any other filing of the Company under the Securities Act of 1933, as amended, or the Exchange Act, whether made before or after the date hereof, regardless of any general incorporation language in such filing.
| ITEM 9.01 | FINANCIAL STATEMENTS AND EXHIBITS |
(d) Exhibits.
| Exhibit No. |
Description of Exhibit |
|
| 99.1 | Investor Presentation, dated March 2025 | |
| 104 | Cover Page Interactive Data File (embedded within the Inline XBRL document) | |
SIGNATURES
Pursuant to the requirements of the Securities Exchange Act of 1934, the registrant has duly caused this report to be signed on its behalf by the undersigned hereunto duly authorized.
Date: March 21, 2025
| NN, INC. | ||
| By: | /s/ Christopher H. Bohnert |
|
| Name: | Christopher H. Bohnert | |
| Title: | Senior Vice President and Chief Financial Officer | |

Exhibit 99.1 Sidoti March Small Cap Conference Presentation March 2025
Forward Looking Statement & Disclosures Except for specific historical information, many of the matters discussed in this presentation may express or imply projections of revenues or expenditures, statements of plans and objectives or future operations or statements of future economic performance. These statements may discuss goals, intentions and expectations as to future trends, plans, events, results of operations or financial condition, or state other information relating to NN, Inc. (the “Company”) based on current beliefs of management as well as assumptions made by, and information currently available to, management. Forward-looking statements generally will be accompanied by words such as “anticipate,” “believe,” “could,” “estimate,” “expect,” “forecast,” “guidance,” “intend,” “may,” “possible,” “potential,” “predict,” “project” or other similar words, phrases or expressions. Forward-looking statements involve a number of risks and uncertainties that are outside of management’s control and that may cause actual results to be materially different from such forward-looking statements. Such factors include, among others, general economic conditions and economic conditions in the industrial sector; the impacts of pandemics, epidemics, disease outbreaks and other public health crises on our financial condition, business operations and liquidity; competitive influences; risks that current customers will commence or increase captive production; risks of capacity underutilization; quality issues; material changes in the costs and availability of raw materials; economic, social, political and geopolitical instability, military conflict, currency fluctuation, and other risks of doing business outside of the United States; inflationary pressures and changes in the cost or availability of materials, supply chain shortages and disruptions, the availability of labor and labor disruptions along the supply chain; our dependence on certain major customers, some of whom are not parties to long-term agreements (and/or are terminable on short notice); the impact of acquisitions and divestitures, as well as expansion of end markets and product offerings; our ability to hire or retain key personnel; the level of our indebtedness; the restrictions contained in our debt agreements; our ability to obtain financing at favorable rates, if at all, and to refinance existing debt as it matures; our ability to secure, maintain or enforce patents or other appropriate protections for our intellectual property; new laws and governmental regulations; the impact of climate change on our operations; and cyber liability or potential liability for breaches of our or our service providers’ information technology systems or business operations disruptions. The foregoing factors should not be construed as exhaustive and should be read in conjunction with the sections entitled “Risk Factors” and “Management’s Discussion and Analysis of Financial Condition and Results of Operations” included in the Company’s filings made with the Securities and Exchange Commission. Any forward-looking statement speaks only as of the date of this press release, and the Company undertakes no obligation to publicly update or review any forward-looking statement, whether as a result of new information, future developments or otherwise, except as required by law. New risks and uncertainties may emerge from time to time, and it is not possible for the Company to predict their occurrence or how they will affect the Company. The Company qualifies all forward-looking statements by these cautionary statements. With respect to any non-GAAP financial measures included in the following presentation, the accompanying information required by SEC Regulation G can be found in the back of this document or in the “Investors” section of the Company’s web site, www.nninc.com, under the heading “News & Events” and subheading “Presentations.” 2
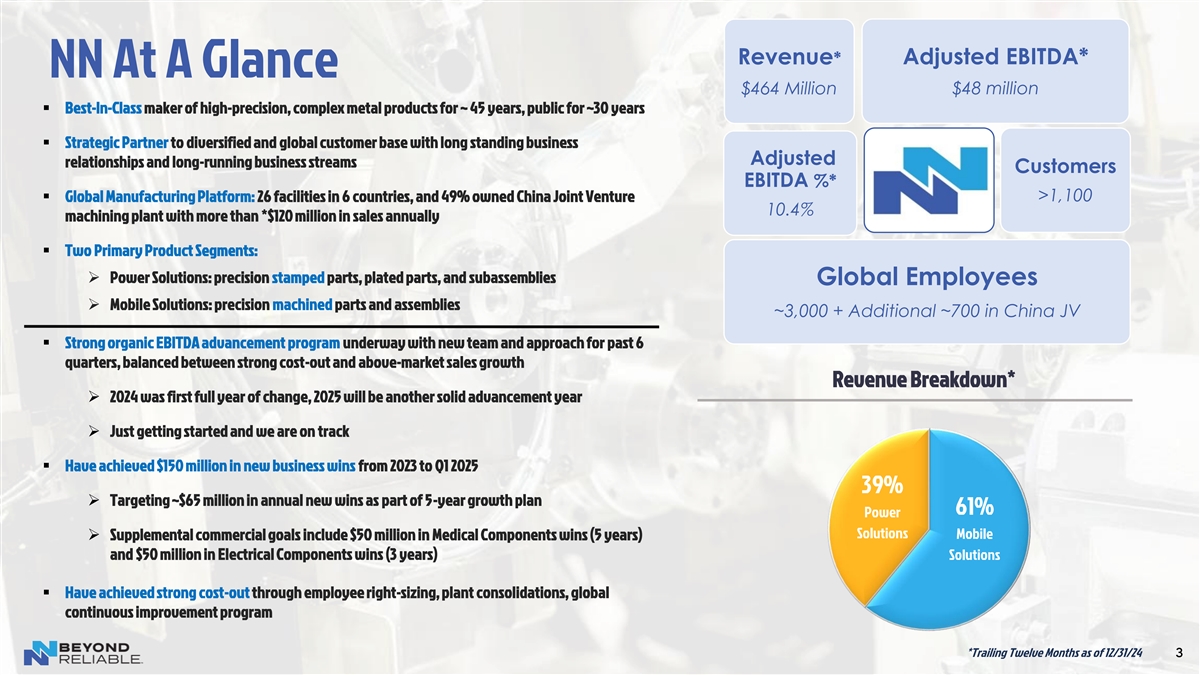
Revenue* Adjusted EBITDA* NN At A Glance $464 Million $48 million ▪ Best-In-Class maker of high-precision, complex metal products for ~ 45 years, public for ~30 years ▪ Strategic Partner to diversified and global customer base with long standing business Adjusted relationships and long-running business streams Customers EBITDA %* >1,100 ▪ Global Manufacturing Platform: 26 facilities in 6 countries, and 49% owned China Joint Venture 10.4% machining plant with more than *$120 million in sales annually ▪ Two Primary Product Segments: ➢ Power Solutions: precision stamped parts, plated parts, and subassemblies Global Employees ➢ Mobile Solutions: precision machined parts and assemblies ~3,000 + Additional ~700 in China JV ▪ Strong organic EBITDA advancement program underway with new team and approach for past 6 quarters, balanced between strong cost-out and above-market sales growth Revenue Breakdown* ➢ 2024 was first full year of change, 2025 will be another solid advancement year ➢ Just getting started and we are on track ▪ Have achieved $150 million in new business wins from 2023 to Q1 2025 39% ➢ Targeting ~$65 million in annual new wins as part of 5-year growth plan 61% Power Solutions Mobile ➢ Supplemental commercial goals include $50 million in Medical Components wins (5 years) and $50 million in Electrical Components wins (3 years) Solutions ▪ Have achieved strong cost-out through employee right-sizing, plant consolidations, global continuous improvement program *Trailing Twelve Months as of 12/31/24 3
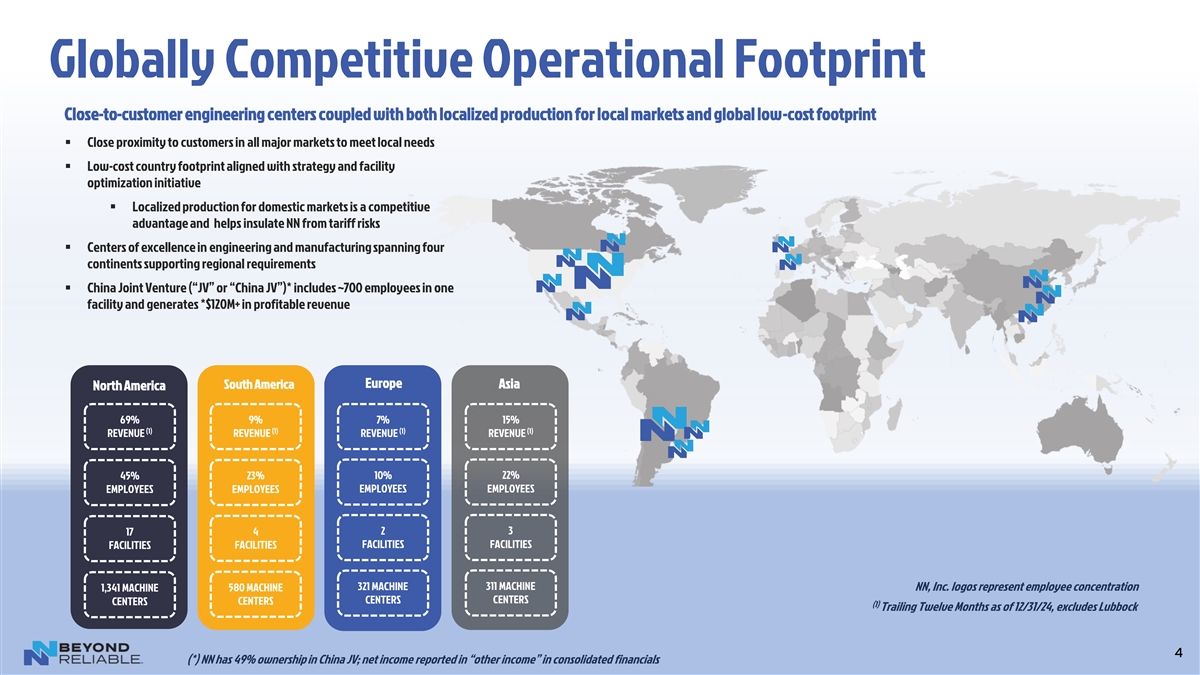
Globally Competitive Operational Footprint Close-to-customer engineering centers coupled with both localized production for local markets and global low-cost footprint ▪ Close proximity to customers in all major markets to meet local needs ▪ Low-cost country footprint aligned with strategy and facility optimization initiative ▪ Localized production for domestic markets is a competitive advantage and helps insulate NN from tariff risks ▪ Centers of excellence in engineering and manufacturing spanning four continents supporting regional requirements ▪ China Joint Venture (“JV” or “China JV”)* includes ~700 employees in one facility and generates *$120M+ in profitable revenue Europe South America Asia North America 69% 9% 7% 15% (1) (1) (1) (1) REVENUE REVENUE REVENUE REVENUE 10% 22% 45% 23% EMPLOYEES EMPLOYEES EMPLOYEES EMPLOYEES 4 2 3 17 FACILITIES FACILITIES FACILITIES FACILITIES 321 MACHINE 311 MACHINE 580 MACHINE NN, Inc. logos represent employee concentration 1,341 MACHINE CENTERS CENTERS CENTERS CENTERS (1) Trailing Twelve Months as of 12/31/24, excludes Lubbock 4 (*) NN has 49% ownership in China JV; net income reported in “other income” in consolidated financials
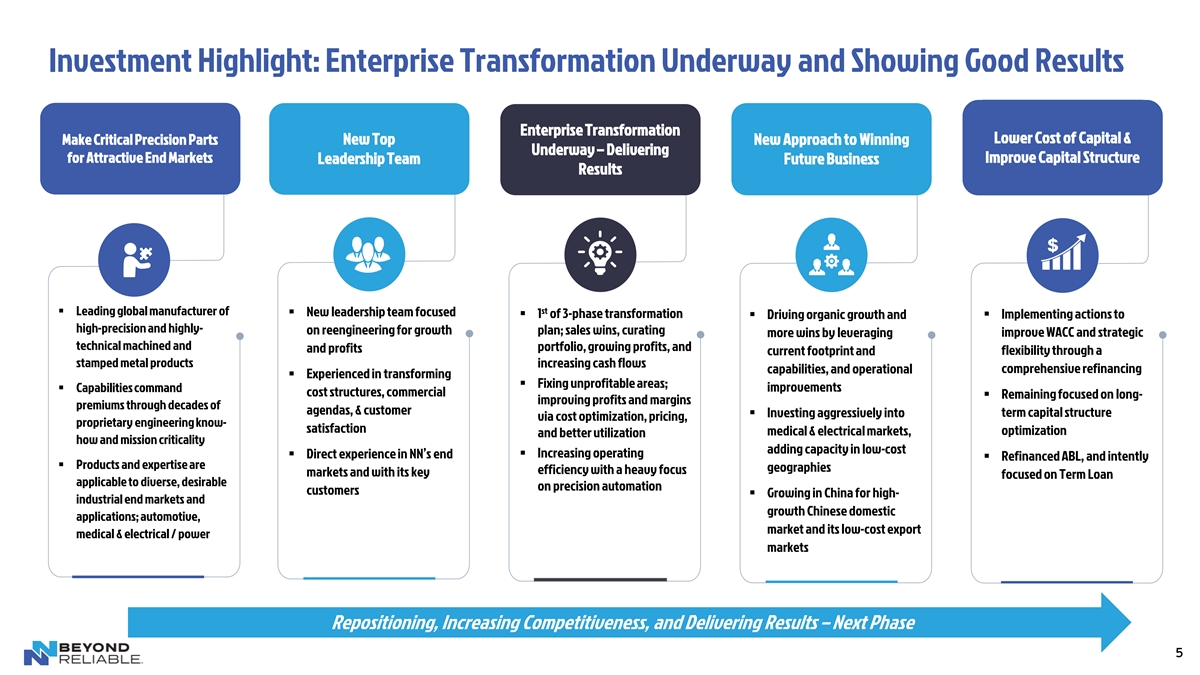
Investment Highlight: Enterprise Transformation Underway and Showing Good Results Enterprise Transformation Lower Cost of Capital & Make Critical Precision Parts New Top New Approach to Winning Underway – Delivering for Attractive End Markets Improve Capital Structure Leadership Team Future Business Results st ▪ Leading global manufacturer of ▪ New leadership team focused ▪ 1 of 3-phase transformation ▪ Driving organic growth and ▪ Implementing actions to high-precision and highly- on reengineering for growth plan; sales wins, curating more wins by leveraging improve WACC and strategic technical machined and portfolio, growing profits, and and profits current footprint and flexibility through a stamped metal products increasing cash flows capabilities, and operational comprehensive refinancing ▪ Experienced in transforming ▪ Fixing unprofitable areas; ▪ Capabilities command improvements cost structures, commercial ▪ Remaining focused on long- improving profits and margins premiums through decades of agendas, & customer ▪ Investing aggressively into term capital structure via cost optimization, pricing, proprietary engineering know- satisfaction optimization medical & electrical markets, and better utilization how and mission criticality adding capacity in low-cost ▪ Increasing operating ▪ Direct experience in NN’s end ▪ Refinanced ABL, and intently ▪ Products and expertise are geographies efficiency with a heavy focus markets and with its key focused on Term Loan applicable to diverse, desirable on precision automation customers ▪ Growing in China for high- industrial end markets and growth Chinese domestic applications; automotive, market and its low-cost export medical & electrical / power markets Repositioning, Increasing Competitiveness, and Delivering Results – Next Phase 5
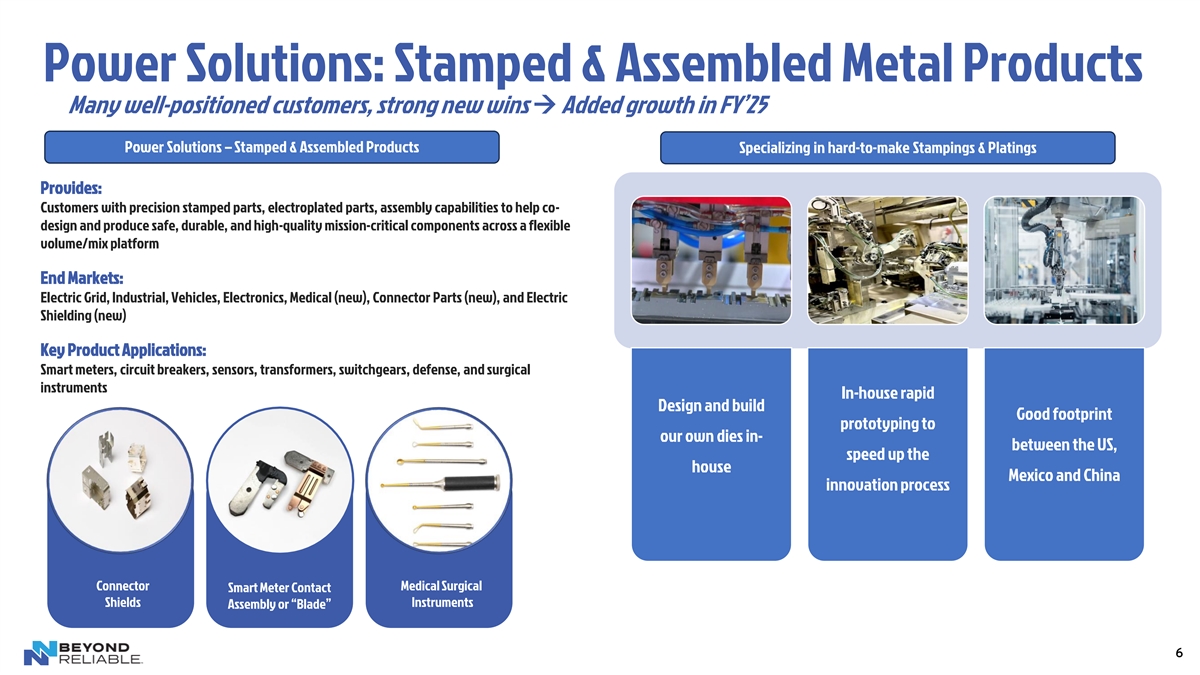
Power Solutions: Stamped & Assembled Metal Products Many well-positioned customers, strong new wins → Added growth in FY’25 Power Solutions – Stamped & Assembled Products Specializing in hard-to-make Stampings & Platings Provides: Customers with precision stamped parts, electroplated parts, assembly capabilities to help co- design and produce safe, durable, and high-quality mission-critical components across a flexible volume/mix platform End Markets: Electric Grid, Industrial, Vehicles, Electronics, Medical (new), Connector Parts (new), and Electric Shielding (new) Key Product Applications: Smart meters, circuit breakers, sensors, transformers, switchgears, defense, and surgical instruments In-house rapid Design and build Good footprint prototyping to our own dies in- between the US, speed up the house Mexico and China innovation process Connector Medical Surgical Smart Meter Contact Shields Instruments Assembly or “Blade” 6
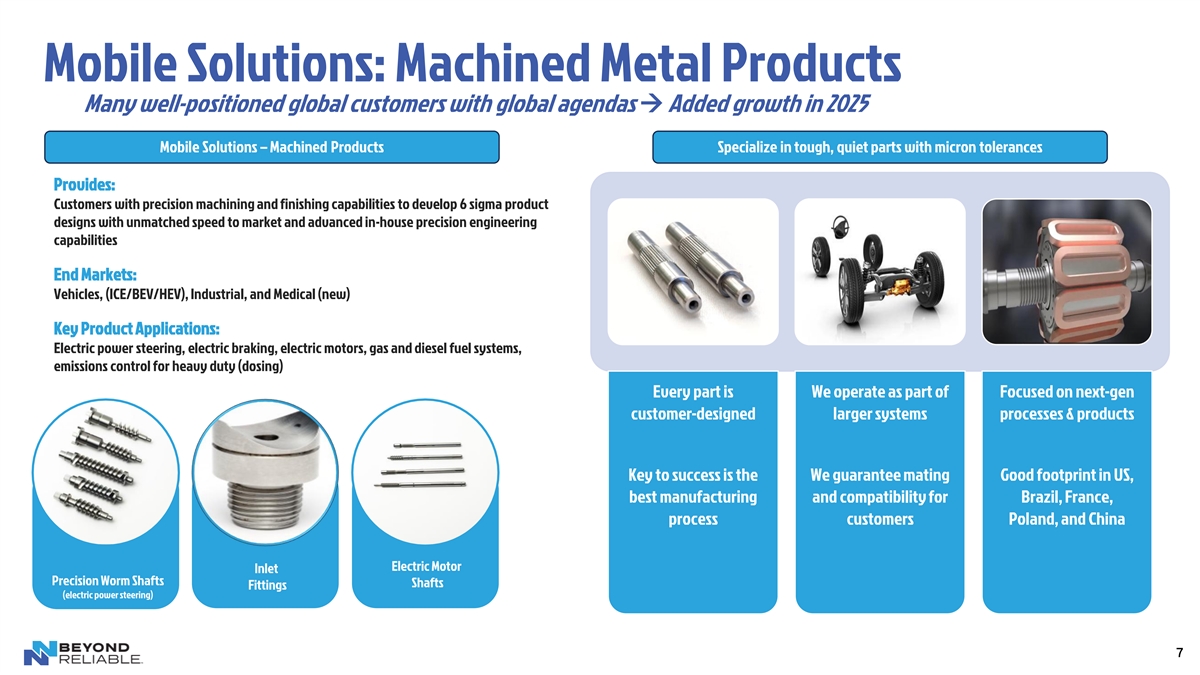
Mobile Solutions: Machined Metal Products Many well-positioned global customers with global agendas → Added growth in 2025 Mobile Solutions – Machined Products Specialize in tough, quiet parts with micron tolerances Provides: Customers with precision machining and finishing capabilities to develop 6 sigma product designs with unmatched speed to market and advanced in-house precision engineering capabilities End Markets: Vehicles, (ICE/BEV/HEV), Industrial, and Medical (new) Key Product Applications: Electric power steering, electric braking, electric motors, gas and diesel fuel systems, emissions control for heavy duty (dosing) Every part is We operate as part of Focused on next-gen customer-designed larger systems processes & products Key to success is the We guarantee mating Good footprint in US, best manufacturing and compatibility for Brazil, France, process customers Poland, and China Electric Motor Inlet Precision Worm Shafts Shafts Fittings (electric power steering) 7
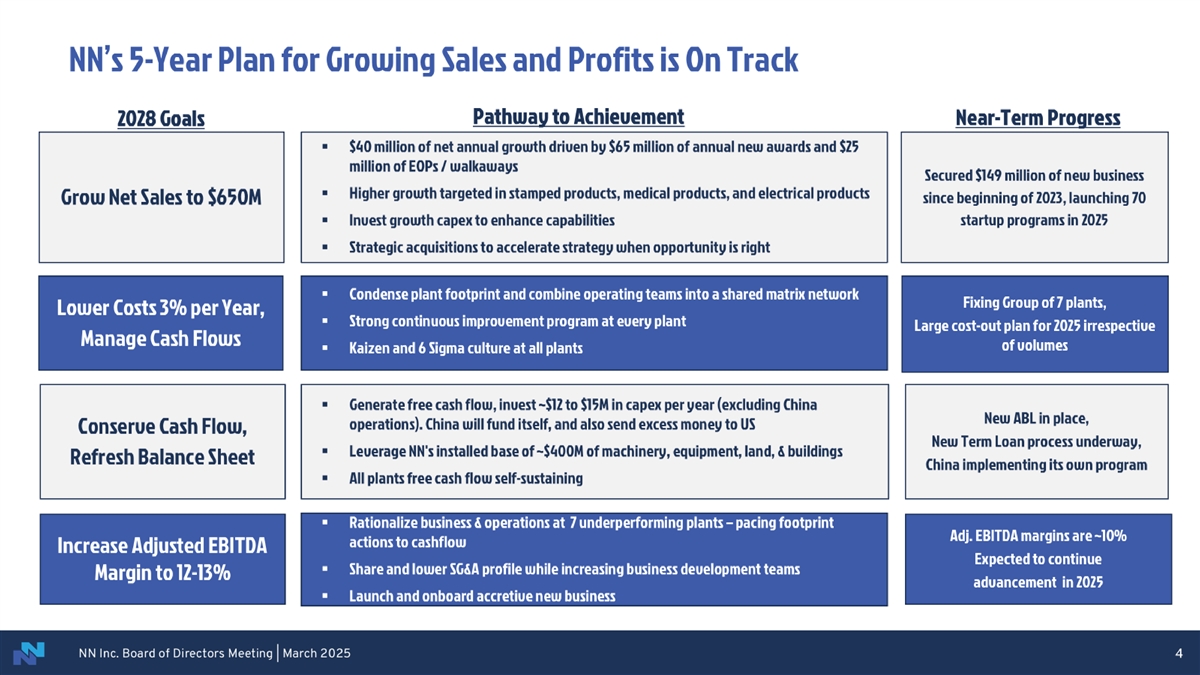
NN’s 5-Year Plan for Growing Sales and Profits Pathway to Achievement Near-Term Progress 2028 Goals ▪ $40 million of net annual growth driven by $65 million of annual new awards and $25 million of EOPs / walkaways Secured $149 million of new business ▪ Higher growth targeted in stamped products, medical products, and electrical products since beginning of 2023, launching 70 Grow Net Sales to $650M ▪ Invest growth capex to enhance capabilities startup programs in 2025 ▪ Strategic acquisitions to accelerate strategy when opportunity is right ▪ Condense plant footprint and combine operating teams into a shared matrix network Lower Costs 3% per Year, Fixed Group of 7 plants, ▪ Strong continuous improvement program at every plant $15 million cost-out plan for 2025 Manage Cash Flows ▪ Kaizan and 6 Sigma culture at all plants ▪ Generate free cash flow, invest ~$12 to $15M in capex per year (excl. China operations) New ABL in place, Conserve Cash Flow,▪ China funds itself, and sends money to US New Term Loan process underway, ▪ Leverage NN's installed base of ~$400M of machinery, equipment, land, & buildings Refresh Balance Sheet China implementing its own program ▪ All plants free cash flow self-sustaining ▪ Rationalize business & operations at 7 underperforming plants – two closures underway Adj. EBITDA margins are ~10% Increase Adjusted EBITDA ▪ Share and lower SG&A profile while increasing business development teams Expected to continue Margin to 12-13% advancement in 2025 ▪ Launch and onboard accretive new business 8
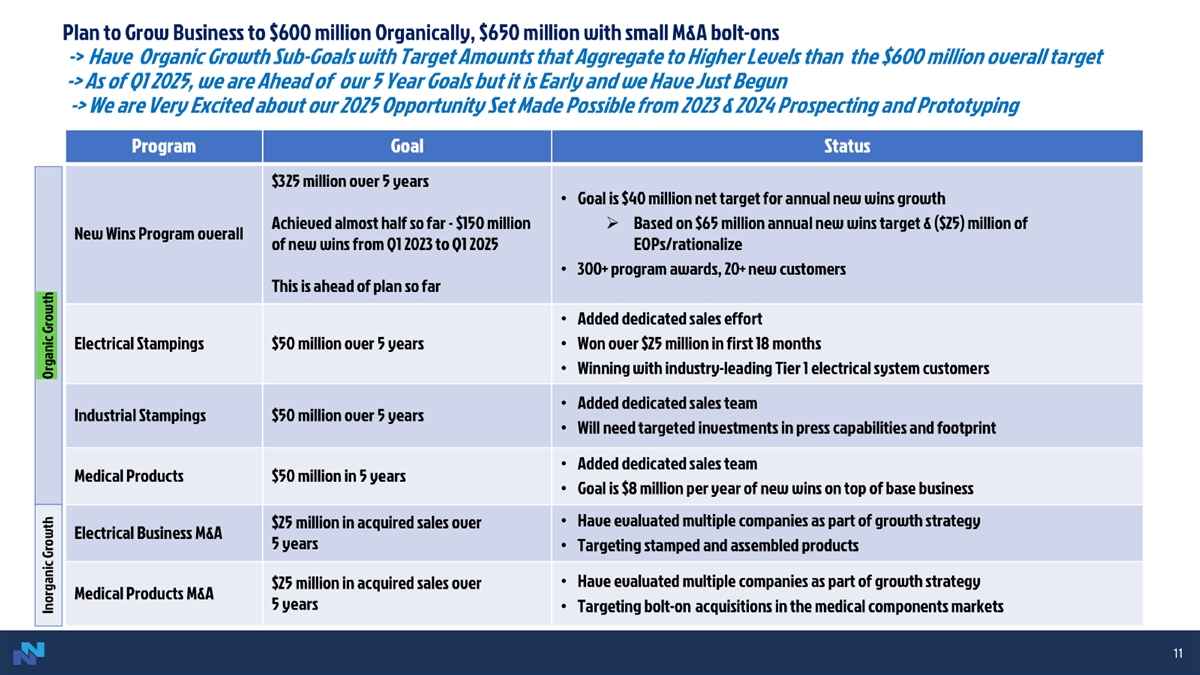
5-Year Plan to Grow and Diversify Revenue Profile to $650 million → $600 million Organic + $50 million of Growth via Acquisition Program Goal Status • Performing in-line with $40 million annual new wins growth (net) goal • Based on $65 million annual new wins target & ($25) million of EOPs New Wins Program $325 million over 5 years • $60 million of new wins achieved in ’23 & ’24 are not yet in run-rate • First 2 years = $136 million of new awards, ~300+ programs, ~20+ new customers • Added dedicated sales team Electrical “Connect and $50 million over 3 years• On track to win ~$29 million in first 18 months of this initiative Protect” New Wins • Winning with new blue chip, industry leading customers: Aptiv, Yazaki, Sumitomo • Added dedicated sales team -‘Team for Grid Solutions’ Electrical “Power Up” New $50 million over 5 years Wins • On track to win ~$12 million in first 12 months • Added dedicated sales team Medical Products $50 million over 5 years New Wins • Won ~$5 million in first 12 months • Have evaluated a few companies Electrical Business M&A $25 million in acquired sales over 5 years • Will be selective • Have evaluated a few companies Medical Products M&A $25 million in acquired sales over 5 years • Targeting bolt-on acquisitions in orthopedics 9 M&A Growth Organic Growth
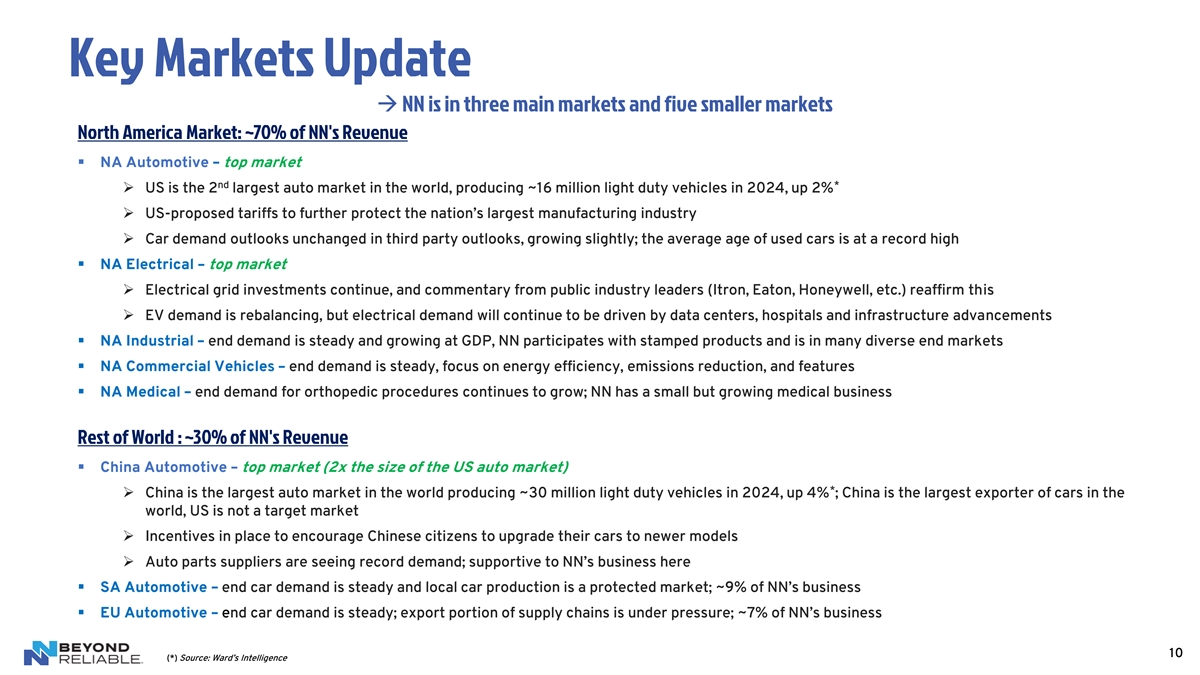
Key Markets Update → NN is in three main markets and five smaller markets North America Market: ~70% of NN's Revenue ▪ NA Automotive – top market nd * ➢ US is the 2 largest auto market in the world, producing ~16 million light duty vehicles in 2024, up 2% ➢ US-proposed tariffs to further protect the nation’s largest manufacturing industry ➢ Car demand outlooks unchanged in third party outlooks, growing slightly; the average age of used cars is at a record high ▪ NA Electrical – top market ➢ Electrical grid investments continue, and commentary from public industry leaders (Itron, Eaton, Honeywell, etc.) reaffirm this ➢ EV demand is rebalancing, but electrical demand will continue to be driven by data centers, hospitals and infrastructure advancements ▪ NA Industrial – end demand is steady and growing at GDP, NN participates with stamped products and is in many diverse end markets ▪ NA Commercial Vehicles – end demand is steady, focus on energy efficiency, emissions reduction, and features ▪ NA Medical – end demand for orthopedic procedures continues to grow; NN has a small but growing medical business Rest of World : ~30% of NN's Revenue ▪ China Automotive – top market (2x the size of the US auto market) * ➢ China is the largest auto market in the world producing ~30 million light duty vehicles in 2024, up 4% ; China is the largest exporter of cars in the world, US is not a target market ➢ Incentives in place to encourage Chinese citizens to upgrade their cars to newer models ➢ Auto parts suppliers are seeing record demand; supportive to NN’s business here ▪ SA Automotive – end car demand is steady and local car production is a protected market; ~9% of NN’s business ▪ EU Automotive – end car demand is steady; export portion of supply chains is under pressure; ~7% of NN’s business 10 (*) Source: Ward’s Intelligence
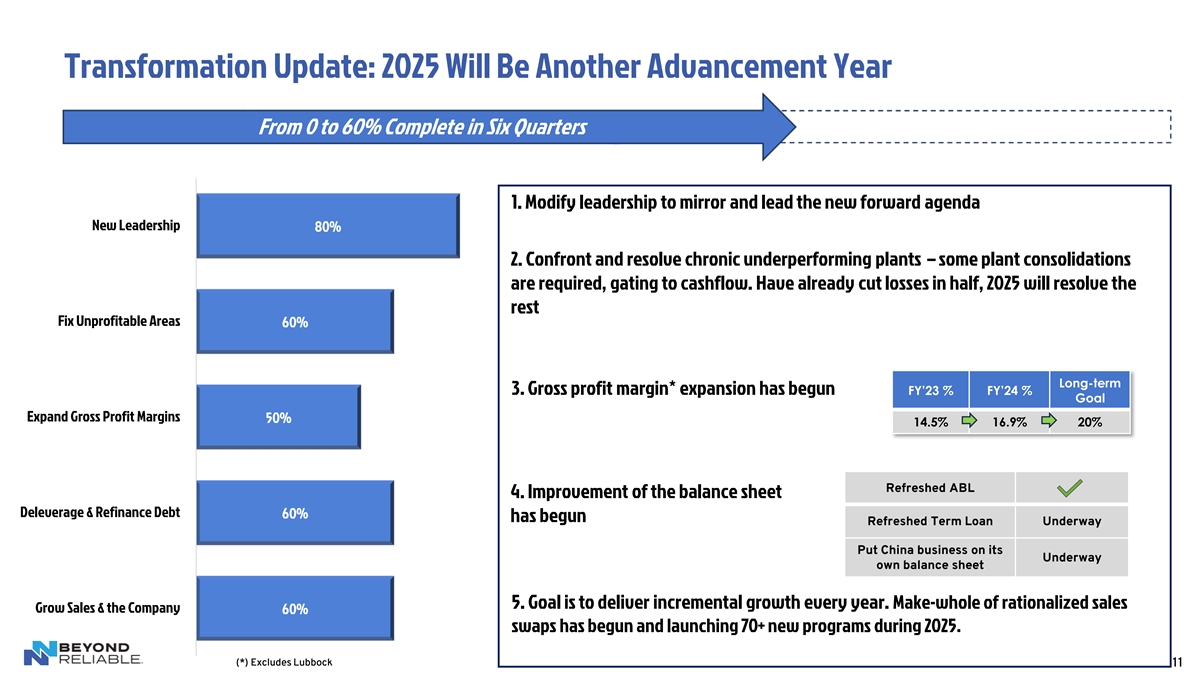
Transformation Update: 2025 Will Be Another Advancement Year From 0 to 60% Complete in Six Quarters 1. Modify leadership to mirror and lead the new forward agenda New Leadership 80% 2. Confront and resolve chronic underperforming plants – some plant consolidations are required, gating to cashflow. Have already cut losses in half, 2025 will resolve the rest Fix Unprofitable Areas 60% Long-term 3. Gross profit margin* expansion has begun FY’23 % FY’24 % Goal Expand Gross Profit Margins 50% 14.5% 16.9% 20% Refreshed ABL 4. Improvement of the balance sheet Deleverage & Refinance Debt 60% has begun Refreshed Term Loan Underway Put China business on its Underway own balance sheet 5. Goal is to deliver incremental growth every year. Make-whole of rationalized sales Grow Sales & the Company 60% swaps has begun and launching 70+ new programs during 2025. (*) Excludes Lubbock 11
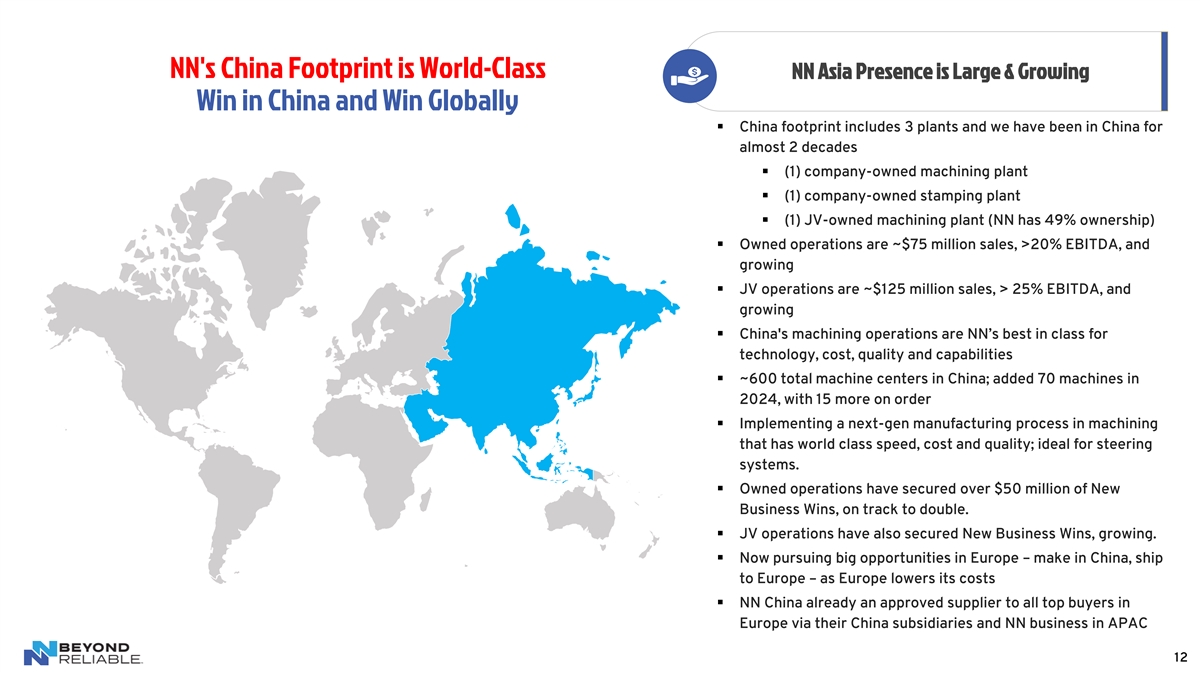
NN's China Footprint is World-Class NN Asia Presence is Large & Growing Win in China and Win Globally ▪ China footprint includes 3 plants and we have been in China for almost 2 decades ▪ (1) company-owned machining plant ▪ (1) company-owned stamping plant ▪ (1) JV-owned machining plant (NN has 49% ownership) ▪ Owned operations are ~$75 million sales, >20% EBITDA, and growing ▪ JV operations are ~$125 million sales, > 25% EBITDA, and growing ▪ China's machining operations are NN’s best in class for technology, cost, quality and capabilities ▪ ~600 total machine centers in China; added 70 machines in 2024, with 15 more on order ▪ Implementing a next-gen manufacturing process in machining that has world class speed, cost and quality; ideal for steering systems. ▪ Owned operations have secured over $50 million of New Business Wins, on track to double. ▪ JV operations have also secured New Business Wins, growing. ▪ Now pursuing big opportunities in Europe – make in China, ship to Europe – as Europe lowers its costs ▪ NN China already an approved supplier to all top buyers in Europe via their China subsidiaries and NN business in APAC 12
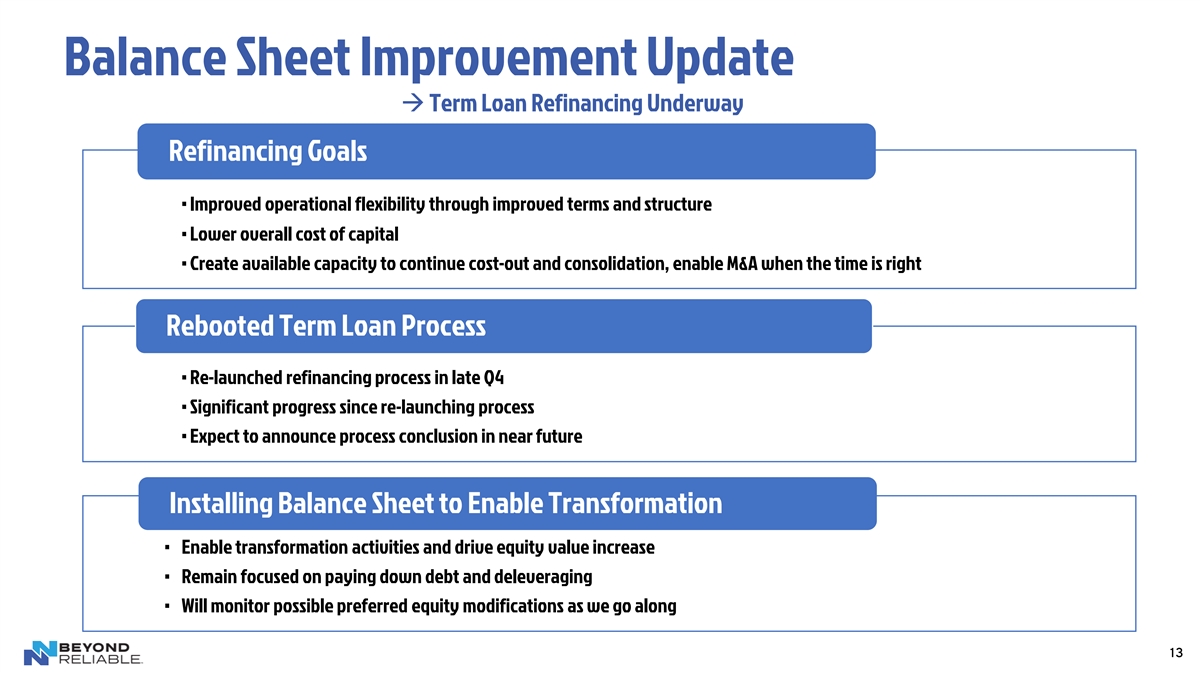
Balance Sheet Improvement Update → Term Loan Refinancing Underway Refinancing Goals • Improved operational flexibility through improved terms and structure • Lower overall cost of capital • Create available capacity to continue cost-out and consolidation, enable M&A when the time is right Rebooted Term Loan Process • Re-launched refinancing process in late Q4 • Significant progress since re-launching process • Expect to announce process conclusion in near future Installing Balance Sheet to Enable Transformation • Enable transformation activities and drive equity value increase • Remain focused on paying down debt and deleveraging • Will monitor possible preferred equity modifications as we go along 13
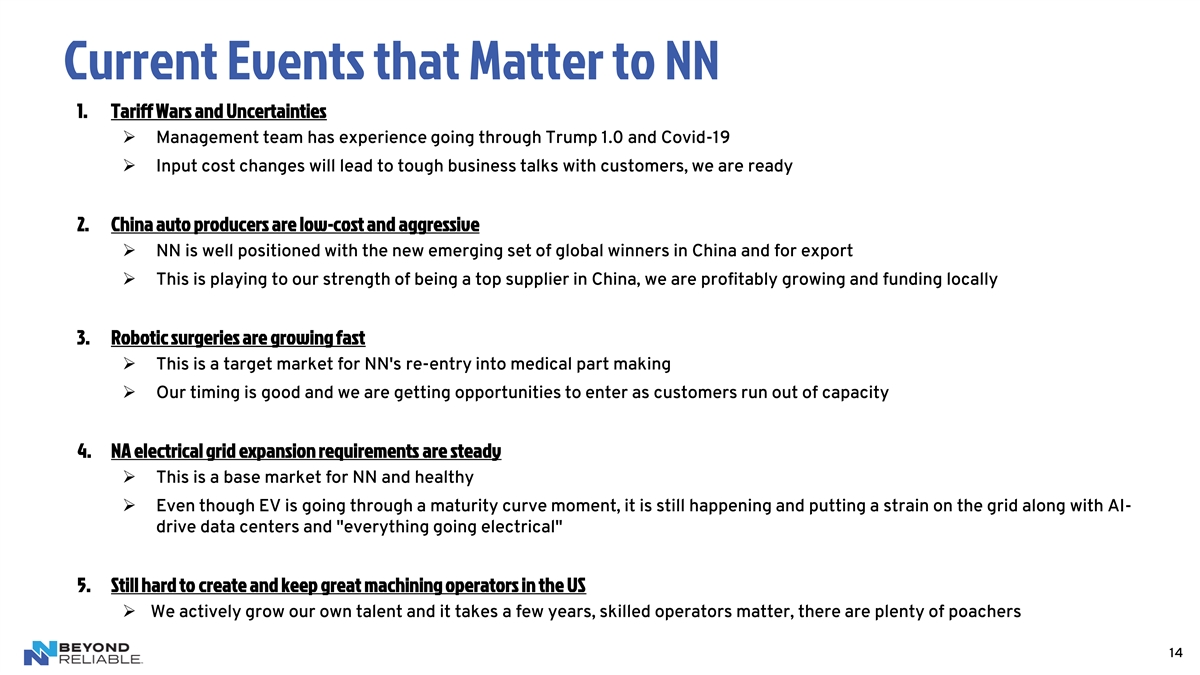
Current Events that Matter to NN 1. Tariff Wars and Uncertainties ➢ Management team has experience going through Trump 1.0 and Covid-19 ➢ Input cost changes will lead to tough business talks with customers, we are ready 2. China auto producers are low-cost and aggressive ➢ NN is well positioned with the new emerging set of global winners in China and for export ➢ This is playing to our strength of being a top supplier in China, we are profitably growing and funding locally 3. Robotic surgeries are growing fast ➢ This is a target market for NN's re-entry into medical part making ➢ Our timing is good and we are getting opportunities to enter as customers run out of capacity 4. NA electrical grid expansion requirements are steady ➢ This is a base market for NN and healthy ➢ Even though EV is going through a maturity curve moment, it is still happening and putting a strain on the grid along with AI- drive data centers and everything going electrical 5. Still hard to create and keep great machining operators in the US ➢ We actively grow our own talent and it takes a few years, skilled operators matter, there are plenty of poachers 14
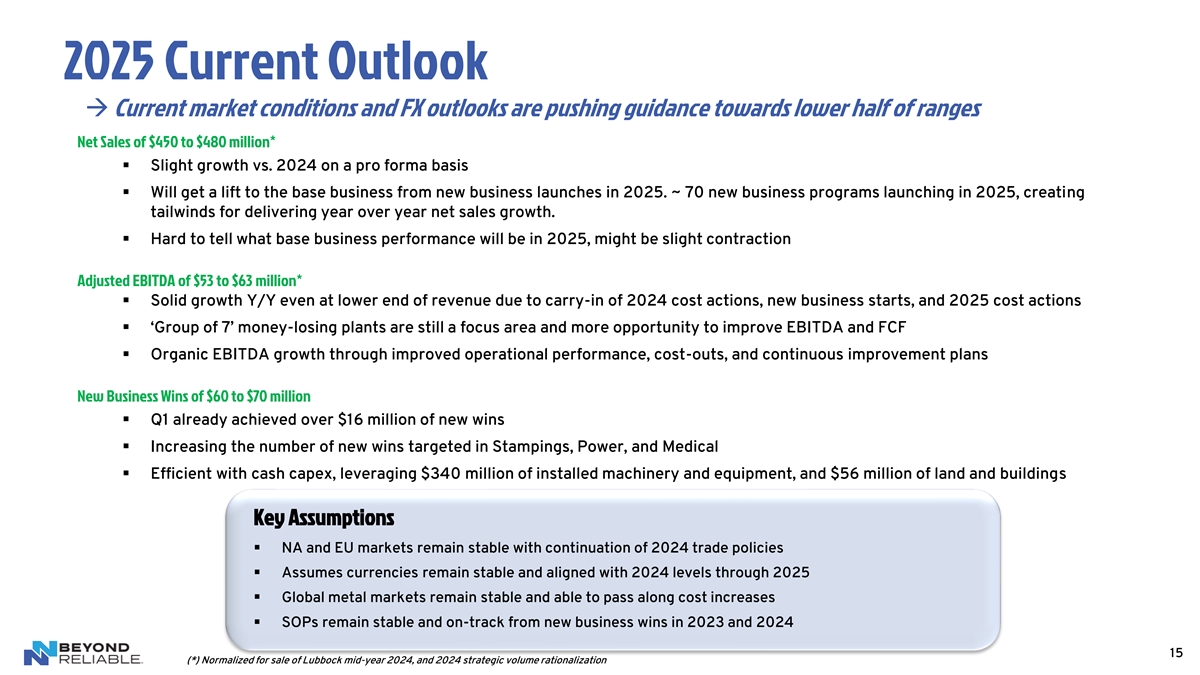
2025 Current Outlook → Current market conditions and FX outlooks are pushing guidance towards lower half of ranges Net Sales of $450 to $480 million* ▪ Slight growth vs. 2024 on a pro forma basis ▪ Will get a lift to the base business from new business launches in 2025. ~ 70 new business programs launching in 2025, creating tailwinds for delivering year over year net sales growth. ▪ Hard to tell what base business performance will be in 2025, might be slight contraction Adjusted EBITDA of $53 to $63 million* ▪ Solid growth Y/Y even at lower end of revenue due to carry-in of 2024 cost actions, new business starts, and 2025 cost actions ▪ ‘Group of 7’ money-losing plants are still a focus area and more opportunity to improve EBITDA and FCF ▪ Organic EBITDA growth through improved operational performance, cost-outs, and continuous improvement plans New Business Wins of $60 to $70 million ▪ Q1 already achieved over $16 million of new wins ▪ Increasing the number of new wins targeted in Stampings, Power, and Medical ▪ Efficient with cash capex, leveraging $340 million of installed machinery and equipment, and $56 million of land and buildings Key Assumptions ▪ NA and EU markets remain stable with continuation of 2024 trade policies ▪ Assumes currencies remain stable and aligned with 2024 levels through 2025 ▪ Global metal markets remain stable and able to pass along cost increases ▪ SOPs remain stable and on-track from new business wins in 2023 and 2024 15 (*) Normalized for sale of Lubbock mid-year 2024, and 2024 strategic volume rationalization
Investor Contacts Joe Caminiti or Stephen Poe, Investors NNBR@alpha-ir.com 312-445-2870 Thank You 16
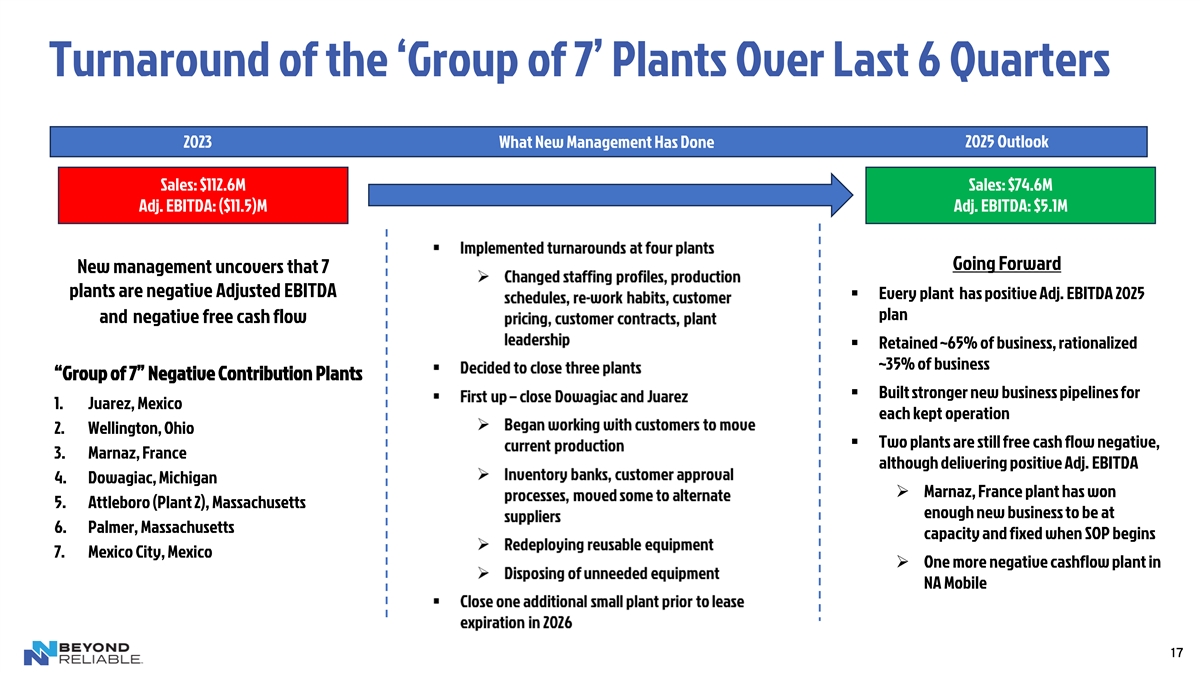
Turnaround of the ‘Group of 7’ Plants Over Last 6 Quarters 2023 2025 Outlook What New Management Has Done Sales: $112.6M Sales: $74.6M Adj. EBITDA: ($11.5)M Adj. EBITDA: $5.1M Going Forward New management uncovers that 7 plants are negative Adjusted EBITDA ▪ Every plant has positive Adj. EBITDA 2025 plan and negative free cash flow ▪ Retained ~65% of business, rationalized ~35% of business “Group of 7” Negative Contribution Plants ▪ Built stronger new business pipelines for 1. Juarez, Mexico each kept operation 2. Wellington, Ohio ▪ Two plants are still free cash flow negative, 3. Marnaz, France although delivering positive Adj. EBITDA 4. Dowagiac, Michigan ➢ Marnaz, France plant has won 5. Attleboro (Plant 2), Massachusetts enough new business to be at 6. Palmer, Massachusetts capacity and fixed when SOP begins 7. Mexico City, Mexico ➢ One more negative cashflow plant in NA Mobile 17
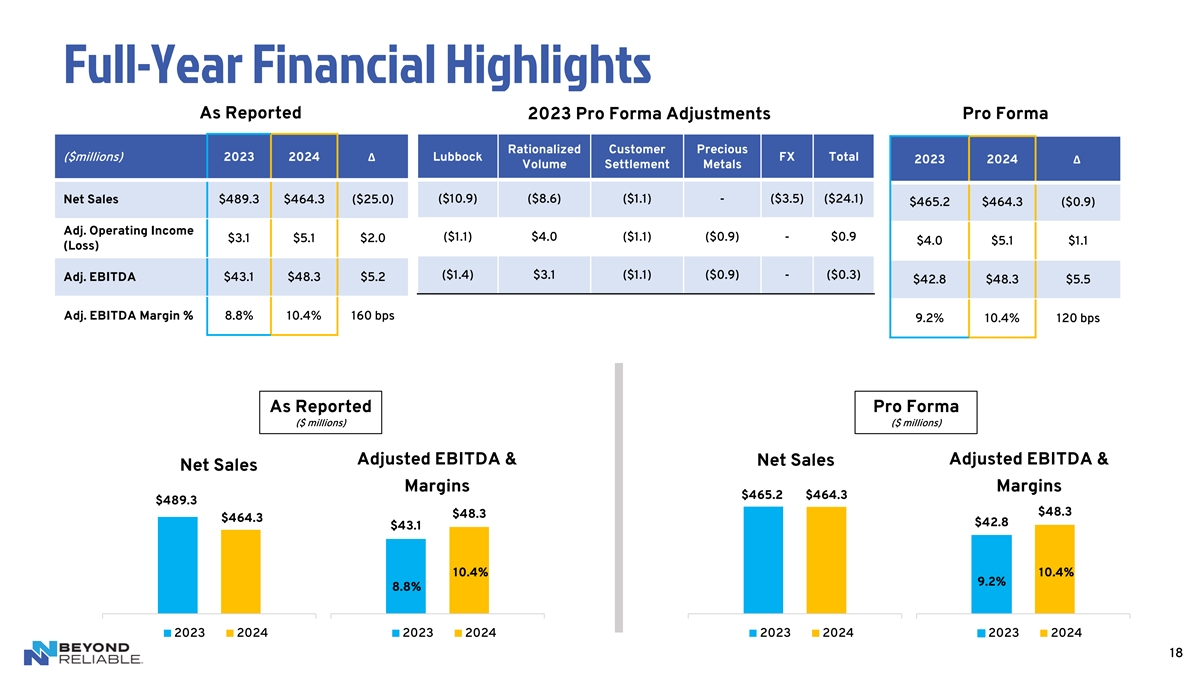
Full-Year Financial Highlights As Reported Pro Forma 2023 Pro Forma Adjustments Rationalized Customer Precious ($millions) 2023 2024Δ Lubbock FX Total 2023 2024Δ Volume Settlement Metals ($10.9) ($8.6) ($1.1) - ($3.5) ($24.1) Net Sales $489.3 $464.3 ($25.0) $465.2 $464.3 ($0.9) Adj. Operating Income ($1.1) $4.0 ($1.1) ($0.9) - $0.9 $3.1 $5.1 $2.0 $4.0 $5.1 $1.1 (Loss) ($1.4) $3.1 ($1.1) ($0.9) - ($0.3) Adj. EBITDA $43.1 $48.3 $5.2 $42.8 $48.3 $5.5 Adj. EBITDA Margin % 8.8% 10.4% 160 bps 9.2% 10.4% 120 bps As Reported Pro Forma ($ millions) ($ millions) Adjusted EBITDA & Adjusted EBITDA & Net Sales Net Sales Margins Margins $465.2 $464.3 $489.3 $48.3 $48.3 $464.3 $42.8 $43.1 10.4% 10.4% 9.2% 8.8% 2023 2024 2023 2024 2023 2024 2023 2024 18
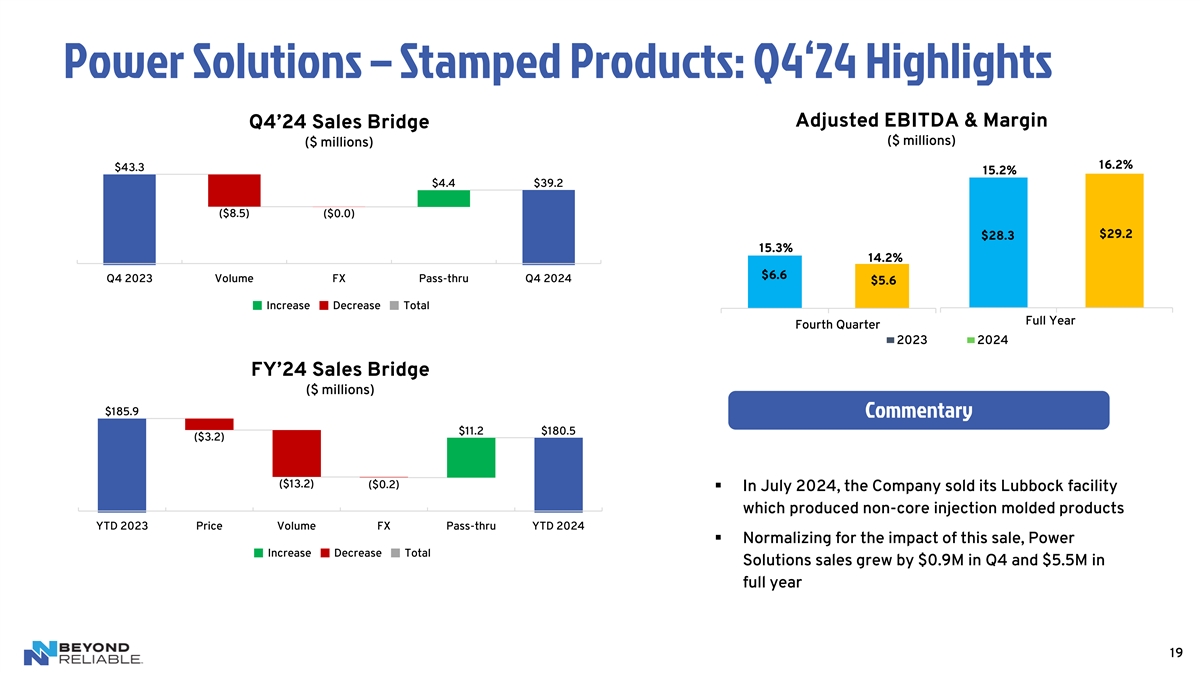
Power Solutions – Stamped Products: Q4‘24 Highlights Adjusted EBITDA & Margin Q4’24 Sales Bridge ($ millions) ($ millions) 16.2% $43.3 15.2% $4.4 $39.2 ($8.5) ($0.0) $29.2 $28.3 15.3% 14.2% $6.6 Q4 2023 Volume FX Pass-thru Q4 2024 $5.6 Increase Decrease Total Full Year Fourth Quarter 2023 2024 2023 2024 2023 2024 FY’24 Sales Bridge ($ millions) $185.9 Commentary $11.2 $180.5 ($3.2) ($13.2) ($0.2) ▪ In July 2024, the Company sold its Lubbock facility which produced non-core injection molded products YTD 2023 Price Volume FX Pass-thru YTD 2024 ▪ Normalizing for the impact of this sale, Power Increase Decrease Total Solutions sales grew by $0.9M in Q4 and $5.5M in full year 19
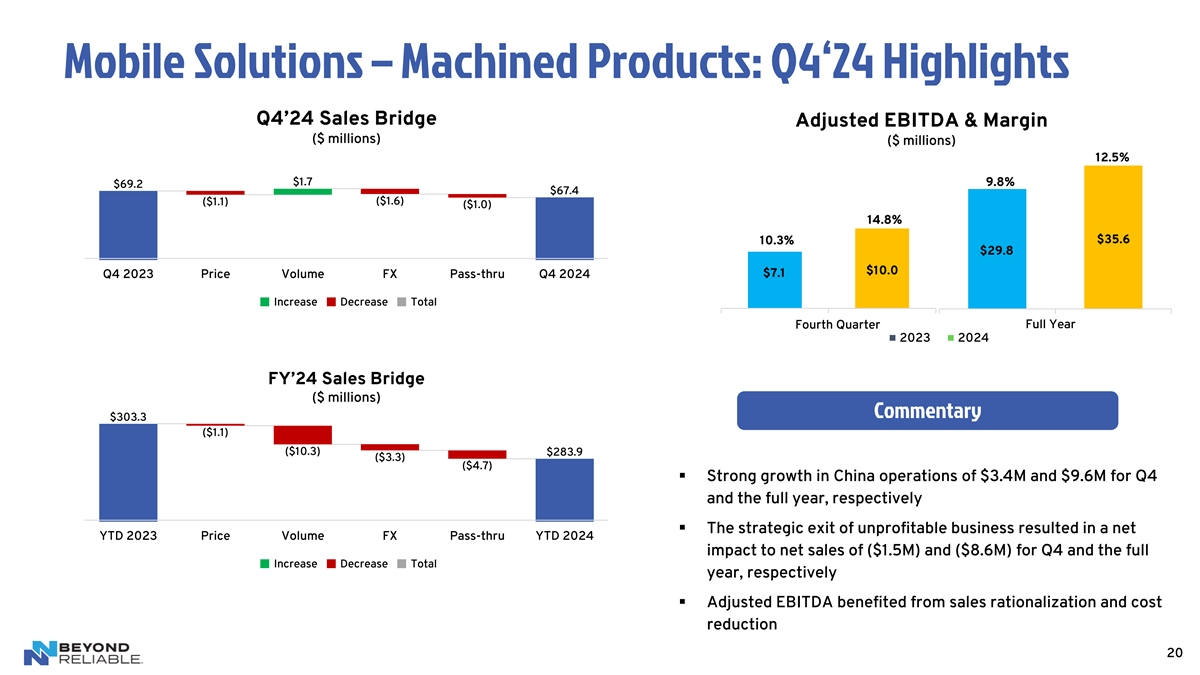
Mobile Solutions – Machined Products: Q4‘24 Highlights Q4’24 Sales Bridge Adjusted EBITDA & Margin ($ millions) ($ millions) 12.5% $1.7 9.8% $69.2 $67.4 ($1.1) ($1.6) ($1.0) 14.8% $35.6 10.3% $29.8 $10.0 $7.1 Q4 2023 Price Volume FX Pass-thru Q4 2024 Increase Decrease Total Fourth Quarter Full Year 2023 2024 2023 2024 2023 2024 FY’24 Sales Bridge ($ millions) Commentary $303.3 ($1.1) ($10.3) $283.9 ($3.3) ($4.7) ▪ Strong growth in China operations of $3.4M and $9.6M for Q4 and the full year, respectively ▪ The strategic exit of unprofitable business resulted in a net YTD 2023 Price Volume FX Pass-thru YTD 2024 impact to net sales of ($1.5M) and ($8.6M) for Q4 and the full Increase Decrease Total year, respectively ▪ Adjusted EBITDA benefited from sales rationalization and cost reduction 20
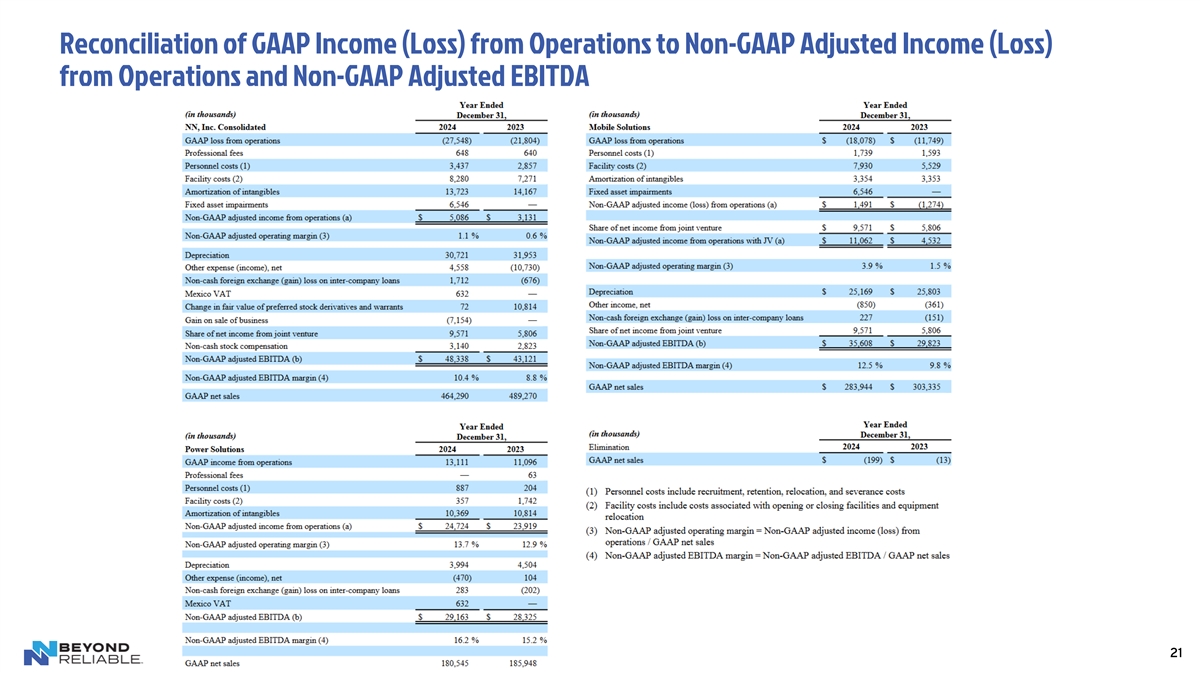
Reconciliation of GAAP Income (Loss) from Operations to Non-GAAP Adjusted Income (Loss) from Operations and Non-GAAP Adjusted EBITDA 21
Non-GAAP Financial Measures Footnotes The Company discloses in this presentation the non-GAAP financial measures of adjusted income (loss) from operations, adjusted EBITDA, adjusted net income (loss), adjusted net income (loss) per diluted share, free cash flow and net debt. Each of these non-GAAP financial measures provides supplementary information about the impacts of acquisition, divestiture and integration related expenses, foreign-exchange impacts on inter-company loans, reorganizational and impairment charges. The costs we incur in completing acquisitions, including the amortization of intangibles and deferred financing costs, and divestitures are excluded from these measures because their size and inconsistent frequency are unrelated to our commercial performance during the period, and we believe are not indicative of our ongoing operating costs. We exclude the impact of currency translation from these measures because foreign exchange rates are not under management’s control and are subject to volatility. Other non-operating charges are excluded, as the charges are not indicative of our ongoing operating cost. We believe the presentation of adjusted income (loss) from operations, adjusted EBITDA, adjusted net income (loss), adjusted net income (loss) per diluted share, free cash flow and net debt provides useful information in assessing our underlying business trends and facilitates comparison of our long-term performance over given periods. The non-GAAP financial measures provided herein may not provide information that is directly comparable to that provided by other companies in the Company's industry, as other companies may calculate such financial results differently. The Company's non-GAAP financial measures are not measurements of financial performance under GAAP and should not be considered as alternatives to actual income growth derived from income amounts presented in accordance with GAAP. The Company does not consider these non-GAAP financial measures to be a substitute for, or superior to, the information provided by GAAP financial results. (a) Non-GAAP adjusted EBITDA represents GAAP income (loss) from operations, adjusted to include income taxes, interest expense, write-off of unamortized debt issuance costs, interest rate swap payments and change in fair value, change in fair value of preferred stock derivatives and warrants, depreciation and amortization, charges related to acquisition and transition costs, non-cash stock compensation expense, foreign exchange gain (loss) on inter-company loans, restructuring and integration expense, costs related to divested businesses and litigation settlements, income from discontinued operations, and non-cash impairment charges, to the extent applicable. We believe this presentation is commonly used by investors and professional research analysts in the valuation, comparison, rating, and investment recommendations of companies in the industrial industry. We use this information for comparative purposes within the industry. Non-GAAP adjusted EBITDA is not a measure of financial performance under GAAP and should not be considered as a measure of liquidity or as an alternative to GAAP income (loss) from continuing operations. 22