EXHIBIT 99.1
Cameco Corporation
2024 Annual Information Form
March 21, 2025

Cameco Corporation
2024 Annual information form
March 21, 2025
Contents
| Important information about this document |
3 | |||
| Our business |
7 | |||
| Our values and strategy |
13 | |||
| Operations, projects and investments |
28 | |||
| Uranium – Tier-one operations |
29 | |||
| Uranium – Tier-two operations |
79 | |||
| Uranium – Advanced projects |
81 | |||
| Uranium – Exploration |
83 | |||
| Fuel services |
84 | |||
| Westinghouse Electric Company |
87 | |||
| Other nuclear fuel cycle investments |
95 | |||
| Mineral reserves and resources |
96 | |||
| Our sustainability principles and practices |
102 | |||
| The regulatory environment |
105 | |||
| Risks that can affect our business |
115 | |||
| 1 – Operational risks |
116 | |||
| 2 – Financial risks |
123 | |||
| 3 – Governance and compliance risks |
130 | |||
| 4 – Social risks |
132 | |||
| 5 – Environmental risks |
133 | |||
| 6 – Strategic risks |
134 | |||
| Legal proceedings |
144 | |||
| Investor information |
144 | |||
| Governance |
149 | |||
| Appendix A |
154 | |||
Important information about this document
This annual information form (AIF) for the year ended December 31, 2024 provides important information about Cameco Corporation. It describes our history, our markets, our operations and projects, our mineral reserves and resources, our approach to sustainability matters, our regulatory environment, the risks we face in our business and the market for our shares, among other things.
It also incorporates by reference:
| • our management’s discussion and analysis for the year ended December 31, 2024 (2024 MD&A), which is available on SEDAR+ (www.sedarplus.ca) and on EDGAR (www.sec.gov) as an exhibit to our Annual Report on Form 40-F; and |
Throughout this document, the terms we, us, our, the company and Cameco mean Cameco Corporation and its subsidiaries. |
|
|
• our audited consolidated financial statements for the year ended December 31, 2024 (2024 financial statements), which are also available on SEDAR+ and on EDGAR as an exhibit to our Annual Report on Form 40-F. |
We have prepared this document to meet the requirements of Canadian securities laws, which are different from what United States (US) securities laws require.
The information contained in this AIF is presented as at December 31, 2024, the last day of our most recently completed financial year, and is based on what we knew as of March 17, 2025, except as otherwise stated.
Reporting currency and financial information
Unless we have specified otherwise, all dollar amounts are in Canadian dollars. Any references to $(US) mean US dollars.
The financial information in this AIF has been presented in accordance with International Financial Reporting Standards (IFRS).
Caution about forward-looking information
Our AIF and the documents incorporated by reference include statements and information about our expectations for the future. When we discuss our strategy, plans and future financial and operating performance, or other things that have not yet taken place, we are making statements considered to be forward-looking information or forward-looking statements under Canadian and US securities laws. We refer to them in this AIF as forward-looking information. In particular, the discussions under the headings Market overview and developments, Building a balanced portfolio, and Westinghouse Electric Company in this AIF contain forward-looking information.
Key things to understand about the forward-looking information in this AIF:
| • | It typically includes words and phrases about the future, such as anticipate, believe, estimate, expect, plan, will, intend, goal, target, forecast, project, strategy and outlook (see examples on page 4). |
| • | It represents our current views and can change significantly. |
| • | It is based on a number of material assumptions, including those we have listed below on pages 6 and 7, which may prove to be incorrect. |
| • | Actual results and events may be significantly different from what we currently expect, due to the risks associated with our business. We list a number of these material risks below. We recommend you also review other parts of this document, including Risks that can affect our business starting on page 115, and our 2024 MD&A, which includes a discussion of other material risks that could cause actual results to differ significantly from our current expectations. |
Forward-looking information is designed to help you understand management’s current views of our near- and longer-term prospects, and it may not be appropriate for other purposes. We will not necessarily update this information unless we are required to by Canadian or US securities laws.
2024 ANNUAL INFORMATION FORM Page 3
Examples of forward-looking information in this AIF
| • | our expectations about 2025 and future global uranium supply, consumption, contracting, demand, geopolitical issues and the market, including the discussion under the headings Market overview and developments and Building a balanced portfolio |
| • | the discussion under the heading Our strategy, including the role of nuclear energy in the world’s shift to a low-carbon, climate-resilient economy, our expectation that our strategy will allow us to increase long-term value, our intention to execute our strategy with an emphasis on safety, people and the environment, our ability to address risks and opportunities that we believe may have a significant impact on our ability to add long-term value for our stakeholders, and our expected financial capacity to execute our strategy, invest in new opportunities and self-manage risk |
| • | the discussion of our expectations relating to our 49% interest in Westinghouse, including our investment expanding our participation in the nuclear fuel value chain and providing a platform for further growth and various factors and drivers for Westinghouse’s business segments |
| • | our expectations relating to our Canada Revenue Agency (CRA) transfer pricing dispute, including our confidence that the courts would reject any attempt by CRA to utilize the same or similar positions for other tax years currently in dispute, and our belief that CRA should return the full amount of cash and security that has been paid or otherwise secured by us |
| • | our view that we have the strengths to take advantage of the world’s rising demand for safe, clean, secure, reliable, affordable, and carbon-free energy |
| • | that we will continue to focus on delivering our products responsibly and addressing the sustainability risks and opportunities that we believe will make our business sustainable and will build long-term value |
| • | our expectations about 2025 and future consumption of conversion services |
| • | our expectations for the future of the nuclear industry and the potential for new enrichment technology, including that nuclear power must be a central part of the solution to the world’s shift to a low-carbon climate-resilient economy while helping provide energy security and that our investment in enrichment technology, if successful, will allow us to participate in the entire nuclear fuel value chain |
| • | our expectations relating to care and maintenance costs |
| • | our expectations of executing major supply contracts |
| • | our expectations regarding the amount of security we will need to provide to CRA in connection with the tax debts CRA considers us owing for 2018 |
| • | our ability to capitalize on the current backlog of long-term contracting as a proven and reliable supplier with tier-one productive capacity and a record of honouring supply commitments, and to increase value throughout these price cycles |
| • | future plans and expectations for our uranium properties, advanced projects, and fuel services operating sites, including production levels and the suspension of production at certain properties, pace of advancement and expansion capacity, and carbon reduction targets |
| • | estimates of operating and capital costs and mine life for our tier-one uranium operations |
| • | our expectations regarding our licences for McArthur River, Key Lake and Crow Butte |
| • | our ability to successfully negotiate a new collective agreement for the unionized employees at McArthur River |
| • | estimated decommissioning and reclamation costs for uranium properties and fuel services operating sites |
| • | Kazatomprom’s planned production levels and timing for JV Inkai |
| • | our mineral reserve and resource estimates |
| • | our expectations that the price of uranium, production costs, and recovery rates will allow us to operate or develop a particular site or sites |
| • | estimates of metallurgical recovery and other production parameters for each uranium property |
| • | production estimates at the McArthur River/Key Lake, Cigar Lake and Inkai operations, and fuel services |
| • | our discussion of the ongoing conflict between Russia and Ukraine |
| • | our views on our ability to align our production with market opportunities and our contract portfolio |
| • | our expectation regarding opportunities to improve operational effectiveness and to reduce our impact on the environment, including through the use of digital and automation technologies |
| • | our expectations about when future reactors will come online |
| • | our efforts to participate in the commercialization and deployment of small modular reactors (SMRs) and contribute to the mitigation of global climate change and help to provide energy security and affordability by exploring SMRs and other emerging opportunities within the fuel cycle |
| • | our expectations about future demand for SMRs |
| • | our expectation that the US Department of Energy (DOE) will make available a portion of its excess uranium inventory over the next two decades |
2024 ANNUAL INFORMATION FORM Page 4
| • | the discussion under the heading Our Sustainability principles and practices, including our belief there is a significant opportunity for us to be part of the solution to combat climate change while helping provide energy security and that we are well positioned to deliver significant long-term business value |
Material risks
| • | actual sales volumes or market prices for any of our products or services are lower than we expect, or cost of sales is higher than we expect, for any reason, including changes in market prices, loss of market share to a competitor, tariffs, trade restrictions or geopolitical issues |
| • | we are adversely affected by changes in currency exchange rates, interest rates, royalty rates, tax rates, tariffs, or inflation |
| • | our production costs are higher than planned, or necessary supplies are not available or not available on commercially reasonable terms |
| • | our strategies may change, be unsuccessful or have unanticipated consequences, or we may not be able to achieve anticipated operational flexibility and efficiency |
| • | changing views of governments regarding the pursuit of carbon reduction strategies or that our view on the role of nuclear power in pursuit of those strategies may prove to be inaccurate |
| • | risks relating to the development and use of new technology or lack of appropriate technology needed to achieve our 30% GHG emissions reduction target or advance our ambition to reach net-zero GHG emissions |
| • | our estimates and forecasts prove to be inaccurate, including production, purchases, deliveries, cash flow, revenue, costs, decommissioning, reclamation expenses, or timing or receipt of future dividends from JV Inkai |
| • | that we may not realize expected benefits from our interest in Westinghouse or any of our other joint venture investments |
| • | that Westinghouse fails to generate sufficient cash flow to fund its approved annual operating budget or make distributions to the partners |
| • | the risk that we and Westinghouse may not be able to meet sales commitments for any reason |
| • | the risk that Westinghouse may not achieve the expected growth in its business |
| • | the risk to Westinghouse’s business associated with potential production disruptions, including those related to global supply chain disruptions, global economic uncertainty, political volatility, labour relations issues, and operating risks |
| • | the possibility of a materially different outcome in disputes with CRA for other tax years |
| • | our ability to implement and execute our overarching low carbon transition strategy |
| • | our investments allowing us to participate in the entire nuclear fuel value chain; fuel fabrication; reactor maintenance; development of new reactors; and nuclear sustainability services |
| • | the risk that Westinghouse may not be able to implement its business objectives in a manner consistent with its or our sustainability principles and practices and other values |
| • | the risk that Westinghouse’s strategies may change, be unsuccessful, or have unanticipated consequences |
| • | the risk that Westinghouse may be unsuccessful in respect of its new business |
| • | the risk that Westinghouse may fail to comply with nuclear licence and quality assurance requirements at its facilities |
| • | the risk that Westinghouse may lose protections against liability for nuclear damage, including discontinuation of global nuclear liability regimes and indemnities |
| • | the risk that increased trade barriers may adversely impact our business, or the business of any of the joint ventures in which we have invested |
| • | the risk that Westinghouse may default under its credit facilities, impacting adversely Westinghouse’s ability to fund its ongoing operations and to make distributions |
| • | the risk that liabilities at Westinghouse may exceed our estimates and the discovery of unknown or undisclosed liabilities |
| • | the risk that occupational health and safety issues may arise at Westinghouse’s operations |
| • | the risk that there may be disputes between us and Brookfield (as defined below) regarding our strategic partnership, or disputes between us and any of our other joint venture partners |
| • | the risk that we may default under the governance agreement with Brookfield, including us losing some or all of our interest in Westinghouse |
| • | the risk that we are unable to enforce our legal rights under our agreements, permits or licences |
| • | disruption or delay in the transportation of our products |
| • | that we are subject to litigation or arbitration that has an adverse outcome |
| • | that the courts may accept the same, similar or different positions and arguments advanced by CRA to reach decisions that are adverse to us for other tax years currently in dispute |
| • | a major accident at a nuclear power plant |
2024 ANNUAL INFORMATION FORM Page 5
| • | that CRA does not agree that the court rulings for the years that have been resolved in Cameco’s favour should apply to subsequent tax years |
| • | that CRA will not return all or substantially all of the cash and security that has been paid or otherwise secured in a timely manner, or at all |
| • | there are defects in, or challenges to, title to our properties |
| • | our mineral reserve and resource estimates are not reliable, or there are unexpected or challenging geological, hydrological or mining conditions |
| • | we are affected by environmental, safety and regulatory risks, including workforce health and safety or increased regulatory burdens or delays |
| • | necessary permits or approvals from government authorities cannot be obtained or maintained |
| • | we are affected by political risks, including developments in US foreign policy, global conflicts, sanctions, or any potential future unrest in Kazakhstan |
| • | we may be affected by crime, corruption, making improper payments or providing benefits that may violate Canadian or US laws relating to foreign corrupt practices or sanctions |
| • | we are affected by war, terrorism, cyber-attacks, sabotage, blockades, civil unrest, social or political activism, outbreak of illness (such as a pandemic like COVID-19), accident or a deterioration in political support for, or demand for, nuclear energy |
| • | operations are disrupted due to problems with our own or our joint venture partners’, suppliers’ or customers’ facilities, the unavailability of reagents, equipment, operating parts and supplies critical to production, equipment failure, lack of tailings capacity, labour shortages, labour relations issues, strikes or lockouts, fires, underground floods, cave-ins, ground movements, tailings dam failures, transportation disruptions or accidents, aging infrastructure, or other development and operating risks |
Material assumptions
| • | our expectations regarding sales and purchase volumes and prices for uranium and fuel services, cost of sales, trade restrictions, inflation, and that counterparties to our sales and purchase agreements will honour their commitments |
| • | our expectations for the nuclear industry, including its growth profile, market conditions, geopolitical issues, and the demand for and supply of uranium |
| • | the continuing pursuit of carbon reduction and energy security strategies by governments and the role of nuclear in the pursuit of those strategies |
| • | we are impacted by changes in the regulation or public perception of the safety of nuclear power plants, which adversely affect the construction of new plants, the relicensing of existing plants and the demand for uranium |
| • | government laws, regulations, policies or decisions that adversely affect us, including tax and trade laws, tariffs and sanctions, including changes in mining laws or regulations |
| • | our uranium suppliers or purchasers fail to fulfil their commitments |
| • | our McArthur River development, mining or production plans are delayed or do not succeed for any reason |
| • | our Key Lake mill production plan is delayed or does not succeed for any reason |
| • | our Cigar Lake development, mining or production plans are delayed or do not succeed for any reason |
| • | JV Inkai’s development, mining or production plans are delayed or do not succeed for any reason or JV Inkai is unable to transport and deliver its production |
| • | our production plan for our fuel services division is delayed or does not succeed for any reason, including due to the availability of production supplies |
| • | our expectations relating to care and maintenance costs prove to be inaccurate |
| • | we are affected by natural phenomena, such as forest fires, floods or earthquakes as well as shifts in temperature, precipitation, and the impact of more frequent severe weather conditions on our operations as a result of climate change |
| • | the risks that generally apply to all our operations and advanced uranium projects that are discussed under the heading Risks that can affect our business in this AIF and under the heading Managing the risks in our 2024 MD&A |
| • | that the construction of new nuclear power plants and the relicensing of existing nuclear power plants will not be adversely affected by changes in regulation or in the public perception of the safety of nuclear power plants |
| • | our ability to continue to supply our products and services in the expected quantities and at the expected times |
| • | our expected production levels for Cigar Lake, McArthur River/Key Lake, JV Inkai and our fuel services operating sites |
| • | plans to transport our products succeed, including the shipment of our share of JV Inkai production to our Blind River refinery |
2024 ANNUAL INFORMATION FORM Page 6
| • | the availability or development of technologies needed to achieve our 30% GHG emissions reduction target or advance our net-zero GHG emission ambition |
| • | the success of our plans and strategies relating to Westinghouse |
| • | our cost expectations, including production costs, operating costs, and capital costs |
| • | our expectations regarding tax payments, tax rates, tariffs, royalty rates, currency exchange rates, interest rates and inflation |
| • | in our dispute with CRA, that courts will reach consistent decisions for other tax years that are based upon similar positions and arguments |
| • | that CRA will not successfully advance different positions and arguments that may lead to different outcomes for other tax years |
| • | our expectation that we will recover all or substantially all of the amounts paid or secured in respect of the CRA dispute to date |
| • | our expectations regarding spot prices and realized prices for uranium |
| • | our decommissioning and reclamation estimates, including the assumptions upon which they are based, are reliable |
| • | our mineral reserve and resource estimates, and the assumptions upon which they are based, are reliable |
| • | our understanding of the geological, hydrological and other conditions at our uranium properties |
| • | Westinghouse’s ability to generate cash flow and fund its approved annual operating budget and make distributions to the partners |
| • | our Key Lake mill production plans succeed |
| • | our ability to mitigate adverse consequences of production shortfalls or delays in the shipment of our share of JV Inkai production to our Blind River refinery |
| • | our ability to compete for additional business opportunities so as to generate additional revenue for us as a result of our interest in Westinghouse |
| • | market conditions and other factors upon which we based our forecasts for Westinghouse will be as expected |
| • | Westinghouse’s production, purchases, sales, deliveries, and costs |
| • | Westinghouse’s ability to mitigate adverse consequences of delays in production and construction |
| • | the absence of new and adverse laws, government regulations, policies or decisions, including with respect to changes in mining laws or regulations |
| • | that there will not be any significant adverse consequences to Westinghouse’s business resulting from business disruptions, including those relating to supply disruptions, economic or political uncertainty and volatility, labour relation issues, and operating risks |
| • | Westinghouse will comply with the covenants in its credit agreement |
| • | Westinghouse will comply with nuclear licence and quality assurance requirements at its facilities |
| • | Westinghouse maintaining protections against liability for nuclear damage, including continuation of global nuclear liability regimes and indemnities |
| • | our McArthur River and Cigar Lake development, mining and production plans succeed |
| • | JV Inkai’s development, mining and production plans succeed, and that JV Inkai will be able to deliver its production |
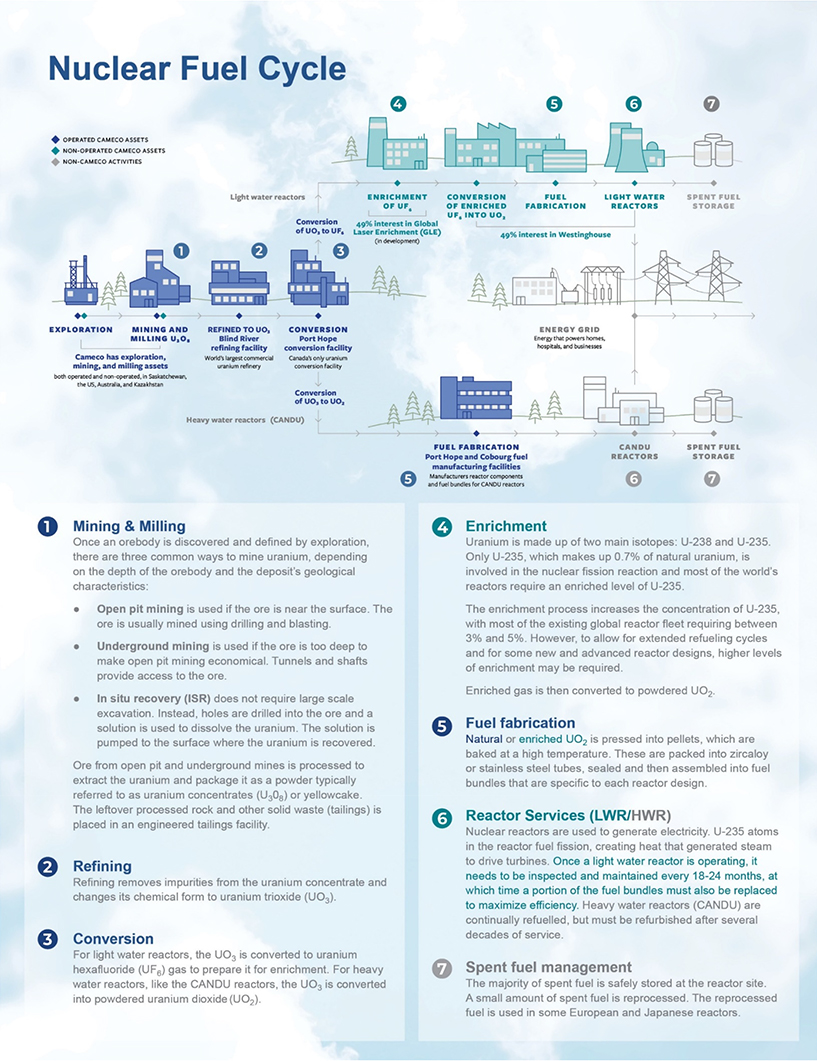
Our business
| Our operations span the nuclear fuel cycle from exploration to fuel services, which include uranium production, refining, uranium dioxide (UO2) and uranium hexafluoride (UF6) conversion services and CANDU fuel manufacturing for heavy water reactors. We have also further enhanced our ability to meet our customers’ growing demand for reliable and secure nuclear fuel supplies, services and technologies by investing in Westinghouse. Westinghouse’s assets augment the core of our business, providing operating plant services to the installed global base of reactors, the design fabrication and supply of fuel assemblies and the design, development, engineering and procurement of equipment for new reactors. We also have made an investment in a third-generation enrichment technology, that if successful we expect will allow us to participate in the entire nuclear fuel value chain. | Cameco Corporation 2121 – 11th Street West Saskatoon, Saskatchewan Canada S7M 1J3 Telephone: 306.956.6200
This is our head office, registered office and principal place of business.
We are publicly listed on the Toronto and New York stock exchanges, and had a total of 2,884 employees at December 31, 2024. |
With extraordinary assets, a proven operating track record, long-term contract portfolio, strong sustainability commitment, employee expertise, comprehensive industry knowledge, and a strong balance sheet, the company is making investments that it expects will create a platform for strategic growth. We are confident in our ability to increase long-term value by positioning the company as an industry leader at a time when the world’s prioritization of energy security, national security and increasing
2024 ANNUAL INFORMATION FORM Page 7
electrification is driving growth in demand and when geopolitics are creating concerns about the origin and security of supplies across the nuclear fuel cycle.
Business segments
| URANIUM | ||
| Our uranium production capacity is among the world’s largest. In 2024, our tier-one production accounted for 18% of world production. We have controlling ownership of the world’s largest high-grade mineral reserves.
Product
• uranium concentrates (U3O8)
Mineral reserves and resources
Mineral reserves
• approximately 457 million pounds proven and probable
Mineral resources
• approximately 408 million pounds measured and indicated
• approximately 153 million pounds inferred |
Tier-one operations
• McArthur River and Key Lake, Saskatchewan
• Cigar Lake, Saskatchewan
• Inkai, Kazakhstan
Tier-two operations
• Rabbit Lake, Saskatchewan
• Smith Ranch-Highland, Wyoming
• Crow Butte, Nebraska
Advanced projects
• Millennium, Saskatchewan
• Yeelirrie, Australia
• Kintyre, Australia
Exploration
• focused on North America
• approximately 0.75 million hectares of land |
|
| FUEL SERVICES | ||
| We are an integrated uranium fuel supplier, offering refining, conversion, and fuel manufacturing services.
Products
• uranium trioxide (UO3)
• UF6 for light-water reactors (we have about 20% of world primary conversion capacity)
• UO2 for CANDU heavy-water reactors
• fuel bundles, reactor components and monitoring equipment used by CANDU heavy-water reactors |
Operations
• Blind River refinery, Ontario
• Port Hope conversion facility, Ontario
• Cameco Fuel Manufacturing Inc. (CFM), Ontario (manufactures fuel bundles and reactor components for CANDU heavy-water reactors) |
|
| WESTINGHOUSE ELECTRIC COMPANY (Westinghouse) | ||
| We own a 49% interest in Westinghouse in a strategic partnership with Brookfield.
Products
• Operating plant services (core business) – Provides outage and maintenance services, engineering support, instrumentation and controls equipment, plant modifications, and components and parts to nuclear reactors
• Nuclear fuel (core business) – designs and manufactures nuclear fuel supplies and services for light water reactors
• New build – designs, develops and procures equipment for new nuclear plant projects |
Operations
• Columbia, South Carolina (fuel fabrication)
• Springfields, United Kingdom (fuel fabrication)
• Västerås, Sweden (fuel fabrication) |
|
2024 ANNUAL INFORMATION FORM Page 8
For information about the financial performance of our segments for the years ended December 31, 2024 and 2023, see our 2024 MD&A as follows:
| • | uranium – page 57 |
| • | fuel services – page 59 |
| • | Westinghouse – page 59 |
OTHER NUCLEAR FUEL CYCLE INVESTMENTS
Enrichment
We have a 49% interest in Global Laser Enrichment LLC (GLE) which is testing third-generation enrichment technology that, if successful, will use lasers to commercially enrich uranium. GLE is the exclusive licensee of the proprietary SILEX laser enrichment technology, that is in the development phase.
2024 ANNUAL INFORMATION FORM Page 9
2024 ANNUAL INFORMATION FORM Page 10
Major developments
| 2022 | 2023 | 2024 | ||
| January
• We announce plans to transition McArthur River and Key Lake from care and maintenance to planned production of 15 million pounds per year (100% basis) by 2024, 40% below its annual licensed capacity, and to reduce production at Cigar Lake in 2024 to 13.5 million pounds per year (100% basis), 25% below its annual licensed capacity starting in 2024.
May
• We acquire an additional 4.522% interest in Cigar Lake increasing our interest to 54.547%.
October
• We announce our plans to form a strategic partnership with Brookfield Renewable Partners L.P., together with its institutional partners (Brookfield), to acquire Westinghouse, a global provider of nuclear services, from Brookfield Business Partners. Brookfield will own a 51% interest and we will own a 49% interest in Westinghouse. We are responsible to contribute approximately $2.2 billion (US) in respect of the acquisition.
• We issue 34,057,250 common shares at a price of $21.95 (US) per share for gross proceeds to us of approximately $747.6 million (US) pursuant to a bought deal. The net offering proceeds are intended to partially fund our share of the acquisition of Westinghouse.
November
• We announce that the first pounds of uranium ore from the McArthur River mine have now been milled and packaged at the Key Lake mill, marking the achievement of initial production as these facilities transition back to normal operations. |
March
• We sign a major supply contract to provide sufficient volumes of natural uranium hexafluoride, or UF6 (consisting of uranium and conversion services), to meet Ukraine’s full nuclear fuel needs through 2035.
• CRA issues revised assessments for the 2007 through 2013 tax years, which result in a refund of $297 million, consisting of $86 million in cash and $211 million in letters of credit, which are returned in the second quarter. CRA continued to hold $483 million that we had remitted or secured based on prior reassessments CRA had issued in our longstanding tax dispute.
November
• We announce that the acquisition of Westinghouse in a strategic partnership with Brookfield closed on November 7, 2023. |
May
• We issue $500 million of debentures, bearing interest at 4.94%, maturing in 2031.
June
• We redeem $500 million of debentures, bearing interest at 4.19%, maturing in June 2024.
December
• 2024 packaged production of
|
||
2024 ANNUAL INFORMATION FORM Page 11
Updates for 2025
Production at Inkai was suspended in January 2025 for approximately three weeks. Cameco and Kazatomprom (KAP) continue to work with JV Inkai to determine the impact of the production suspension on the operation’s 2025 production plans. Any estimates of Inkai’s 2025 and subsequent production will be tentative and uncertain. JV Inkai is experiencing procurement and supply chain issues, most notably related to the stability of sulfuric acid deliveries, as well as challenges related to construction delays and acidification of new wellfields.
Additionally, on January 13, 2025, we repaid in full the remaining principal of $200 million (US) on the term loan debt incurred in connection with the Westinghouse acquisition.
How Cameco was formed
Cameco was incorporated under the Canada Business Corporations Act on June 19, 1987.
We were formed when two crown corporations were privatized and their assets merged:
| • | Saskatchewan Mining Development Corporation (SMDC) (uranium mining and milling operations); and |
| • | Eldorado Nuclear Limited (uranium mining, refining and conversion operations) (now Canada Eldor Inc.) |
There are constraints and restrictions on ownership of shares in the capital of Cameco (common shares) set out in our company articles, and a related requirement to maintain offices in Saskatchewan. These are requirements of the Eldorado Nuclear Limited Reorganization and Divestiture Act (Canada), as amended, and The Saskatchewan Mining Development Corporation Reorganization Act, as amended, and are described on pages 145 and 146.
We have made the following amendments to our articles:
| 2002 | • increased the maximum share ownership for individual non-residents to 15% from 5%
• increased the limit on voting rights of non-residents to 25% from 20% |
|
| 2003 | • allowed the board to appoint new directors between shareholder meetings as permitted by the Canada Business Corporations Act, subject to certain limitations
• eliminated the requirement for the chair of the board to be ordinarily resident in the province of Saskatchewan |
|
| We have two main subsidiaries:
• Cameco Europe Ltd., a company incorporated under the laws of Switzerland, which we have 100% ownership of through subsidiaries.
• Cameco U.S. Holdings, Inc., a company incorporated under the laws of the state of Nevada, in which we have 100% direct ownership.
At January 1, 2025, we do not have any other subsidiaries that are material, either individually or collectively. |
For more information
You can find more information about Cameco on SEDAR+ (sedarplus.ca), EDGAR (sec.gov) and on our website (cameco.com).
See our most recent management proxy circular for additional information, including how our directors and officers are compensated and any loans to them, principal holders of our securities, and securities authorized for issue under our equity compensation plans. We expect the circular for our May 9, 2025 annual meeting of shareholders to be available on April 3, 2025.
See our 2024 financial statements and 2024 MD&A for additional financial information. |
2024 ANNUAL INFORMATION FORM Page 12
Our values and strategy
We believe we have the right strategy to add long-term value and we will do so in a manner that reflects our values. For over 35 years, we have been delivering our products responsibly. Building on that strong foundation, we remain committed to our efforts to operate in a responsible and sustainable manner, identifying and addressing the risks and opportunities that we believe may have a significant impact on our ability to add long-term value for our stakeholders.
Committed to our values
Our values are discussed below. They define who we are as a company, are at the core of everything we do and help to embed sustainability principles and practices as we execute on our strategy. They are:
| • | safety and environment |
| • | people |
| • | integrity |
| • | excellence |
Safety and Environment
The safety of people and protection of the environment are the foundations of our work. All of us share in the responsibility of continually improving the safety of our workplace and the quality of our environment.
We are committed to keeping people safe and conducting our business with respect and care for both the local and global environment.
People
We value the contribution of every employee and we treat people fairly by demonstrating our respect for individual dignity, creativity and cultural diversity. By being open and honest, we achieve the strong relationships we seek.
We are committed to developing and supporting a flexible, skilled, stable and diverse workforce, in an environment that:
| • | attracts and retains talented people and inspires them to be fully productive and engaged |
| • | encourages relationships that build the trust, credibility and support we need to grow our business |
Integrity
Through personal and professional integrity, we lead by example, earn trust, honour our commitments and conduct our business ethically.
We are committed to acting with integrity in every area of our business, wherever we operate.
Excellence
We pursue excellence in all that we do. Through leadership, collaboration and innovation, we strive to achieve our full potential and inspire others to reach theirs.
Our strategy
We are a pure-play investment in the growing demand for nuclear energy, focused on taking advantage of the near-, medium-, and long-term growth occurring in our industry. We provide nuclear fuel and nuclear power products, services, and technologies across the fuel cycle, complemented by our investment in Westinghouse, that support the generation of carbon-free, reliable, secure, and affordable energy. Our strategy is set within the context of what we believe is a transitioning market environment. Increasing populations, a growing focus on electrification and decarbonization, and concerns about energy security and affordability are driving a global focus on tripling nuclear power capacity by 2050, which is expected to durably strengthen the long-term fundamentals for our industry. Nuclear energy must be a central part of the solution to the world’s shift to a low-carbon, secure energy economy. It is an option that can provide the power needed, not only reliably, but also safely and affordably, and in a way that will help achieve climate, energy and national security objectives.
Our strategy is to capture full-cycle value by:
| • | remaining disciplined in our contracting activity, building a balanced portfolio in accordance with our contracting framework |
2024 ANNUAL INFORMATION FORM Page 13
| • | profitably producing from our tier-one assets and aligning our production decisions in all segments of the fuel cycle with contracted demand and customer needs |
| • | being financially disciplined to allow us to: |
| • | execute our strategy |
| • | invest in new opportunities that are expected to add long-term value |
| • | self-manage risk |
| • | exploring other emerging opportunities within the nuclear power value chain, which align with our commitment to manage our business responsibly and sustainably, contribute to decarbonization, and help to provide secure and affordable energy |
We continually evaluate investment opportunities within the nuclear fuel value chain, which align well with our commitment to manage our business responsibly and sustainably, and allow us to contribute to energy security solutions. Expanding our participation in the fuel cycle is expected to complement our tier-one uranium and fuel services assets, creating new revenue opportunities, and enhancing our ability to meet the increasing needs of existing and new customers for secure, reliable nuclear fuel supplies, services and technologies.
We have signed a number of non-binding arrangements to explore several areas of cooperation to advance the commercialization and deployment of SMRs in Canada and around the world.
We will make an investment decision when an opportunity is available at the right time and the right price. We strive to pursue corporate development initiatives that will leave us and our stakeholders in a fundamentally stronger position. As such, an investment opportunity is never assessed in isolation. Investments must compete for investment capital with our own internal growth opportunities. They are subject to our capital allocation process described in our 2024 MD&A under Capital Allocation – Disciplined Financial Management, starting on page 29.
We expect our strategy will allow us to increase long-term value, and we will execute it with an emphasis on safety, people and the environment.
For more information on our strategy, see our 2024 MD&A under Our values and strategy, starting on page 22.
Market overview and developments
A market in transition
In 2024, geopolitical uncertainty and heightened concerns about energy security, national security, and climate change continued to improve the demand and supply fundamentals for the nuclear power industry and the fuel cycle that is required to support it. Increasingly, countries and companies around the globe are recognizing the critical role nuclear power must play in providing carbon-free and secure baseload power. This was evidenced at the 29th Conference of Parties (COP29), where a total of 31 countries have now signed the declaration to triple nuclear energy capacity by 2050. This growing support has led to a rise in demand as closed reactors are returning to service, reactors are being saved from retirement, life extensions are being sought and approved for existing reactor fleets, and numerous commitments and plans are advancing for the construction of new nuclear generating capacity. In addition, there is increasing interest in SMRs, including smaller versions of existing technology and advanced technology designs, with companies in energy intensive sectors looking to nuclear to help achieve their decarbonization plans. The potential expansion of the markets and use cases for nuclear energy could add significant demand in the decades to come, with a growing number of agreements being signed and several projects already underway.
While demand for uranium and nuclear fuel continues to increase, future supply is not keeping pace. Heightened supply risk caused by growing geopolitical uncertainty, shrinking secondary supplies and a lack of investment in new capacity over the past decade has motivated utilities to evaluate their near-, mid- and long-term nuclear fuel supply chains. The uncertainty about where nuclear fuel supplies will come from to satisfy growing demand has led to significant long-term contracting activity in recent years. In 2024, about 119 million pounds of uranium was placed under long-term contracts by utilities. While the volume remains below replacement rate, this potentially increases the cumulative level of uncovered requirements in the future, when primary supply is expected to be limited, and secondary supply stocks have been drawn down. Prices across the nuclear fuel cycle continued to trend higher in 2024, reaching historic highs in conversion, where spot price increased 111% and term price rose 46% compared to 2023, and in enrichment, where spot and term prices rose over 23% and 10% respectively compared to 2023. At the front end of the cycle, uranium spot prices experienced volatility and averaged $85 (US) per pound for 2024, while the long-term uranium price increased 19% over the prior year, ending 2024 above $80 (US) per
2024 ANNUAL INFORMATION FORM Page 14
pound. We expect continued competition to secure uranium, conversion services and enrichment services under long-term contracts with proven sustainable producers and suppliers who have a diversified portfolio of assets in geopolitically attractive jurisdictions, and on terms that help ensure a reliable supply is available to satisfy demand.
Durable demand growth
The benefits of nuclear energy have come clearly into focus, supporting a level of durability that we believe has not been previously seen. The durability is being driven not only by the geopolitical realignment in energy markets but also by a global focus on achieving the net-zero carbon targets set by countries and companies around the world. Geopolitical uncertainty has deepened concerns about energy security and national security, highlighting the role of energy policy in balancing three main objectives: providing a reliable and secure baseload profile; providing an affordable, levelized cost profile; and providing a clean emissions profile. Net-zero carbon targets are also turning global attention to a broader triple challenge: about one-third of the global population must be lifted out of energy poverty by improving access to clean and reliable baseload electricity; approximately 80% of the current global electricity grids that run on carbon-emitting sources of thermal power must be replaced with a carbon-free, reliable alternative; and global power grids must grow by electrifying industries, such as private and commercial transportation, and home and industrial heating, which today are largely powered with carbon-emitting sources of thermal energy. There is increasing recognition that nuclear power meets these objectives and has a key role to play in achieving energy security and decarbonization goals. The growth in demand is not just long-term and in the form of new builds, but medium-term in the form of reactor restarts and life extensions, and near-term with early reactor retirement plans being deferred or cancelled and new markets continuing to emerge. Long-term momentum remains very supportive with the installed base of nuclear capacity and an increasing focus on large-scale new build and the development of SMRs.
Demand and energy policy highlights
| • | The inaugural Nuclear Energy Summit was held in Brussels in March, jointly organized by Belgium and the International Atomic Energy Agency (IAEA) with representatives from 32 countries in attendance. The leaders backed supportive measures in areas including financing, regulatory cooperation, technological innovation and workforce training to enable the expansion of nuclear power to help address climate change and boost energy security. |
| • | At COP29, the 2024 United Nations Climate Change Conference held in Baku, Azerbaijan, six new countries were added to the declaration to triple nuclear energy capacity by 2050, bringing the total to 31. It was recognized that financing mechanisms will play a key role in meeting targets, and the increased interest and investment from some of the world’s largest and advanced technology companies could help support future nuclear deployment. |
| • | The International Energy Agency’s (IEA) 2024 World Energy Outlook report was released in October. The projections for global electricity demand in the Stated Policies Scenario (SPS) increased 6%, or 2,200 terawatt-hours (TWh) higher in 2035, driven primarily by light industrial consumption, cooling, mobility, and data centers and AI. Nuclear generation showed a modest increase in the SPS while the Net Zero Scenario (NZE) shows a 16% increase to 7,000 TWh by 2050, compared to 6,000 TWh in the previous report. |
| • | In China, China National Nuclear Corporation (CNNC) started construction at Zhangzhou unit 3 in early 2024, a domestically designed Hualong One (HPR1000), with plans for six more units at the site. CNNC also commenced construction at the Jinqimen nuclear project where it has plans for six HPR1000s. Additionally, China General Nuclear announced that Fangchenggang unit 4, an HPR1000, began loading fuel in February and began operating on April 1. Finally, in August, four new CAP1400 reactors that use Westinghouse technology were approved, bringing the total number of approved reactors in China to 16. |
| • | In Japan, Onagawa unit 2 restarted in October, becoming the first boiling water reactor (BWR) to return to operation under the post-2011 Japanese Nuclear Regulatory Authority (NRA) safety regime. Additionally, Chugoku Electric Power Company successfully restarted Shimane unit 2 in December, bringing the total number of restarted reactors to 14. Finally, the NRA approved a 10-year life extension for two of Kansai’s reactors, Ohi units 3 and 4, from 30 years to 40 years, allowing them to operate until 2061 and 2063, respectively. |
| • | In South Korea, Korea Hydro & Nuclear Power (KHNP) announced that Shin Hanul unit 2 entered commercial operation, while units 3 and 4 are proceeding toward construction. In addition, Saeul units 3 and 4 are progressing through construction, which upon completion will mark 30 units operating in the country. KHNP also initiated the process to extend the lives of Wolsong units 2, 3 and 4. |
| • | In India, the Atomic Energy Commission reaffirmed the country’s plan to triple nuclear power generation by 2030 from current output of 7.5 gigawatt-electric (GWe), with an additional nine reactors currently under construction and additional units planned at various sites, which could potentially include SMRs. The most recent activity has been at Rajasthan unit 7, which is expected to be fully operational in early 2025, and Rajasthan unit 8 which is expected to come online in early 2026. |
2024 ANNUAL INFORMATION FORM Page 15
| • | In the Czech Republic, the government announced KHNP as the preferred bid for the construction of two additional units at the existing Dukovany nuclear site and two at the Temelin site. |
| • | Energoatom saw first concrete poured in the construction of Khmelnitski units 5 and 6. The new reactors will be the first built in Ukraine using Westinghouse’s AP1000® technology. |
| • | Italy is moving towards a reversal of the country’s current ban on nuclear power production with plans to finalize a nuclear reintroduction strategy by the end of 2027. |
| • | In Poland, the government approved a plan to build an SMR based on designs from Rolls-Royce. Additionally, Polskie Elektrownie Jądrowe announced it has received a Letter of Interest for $1.5 billion (US) in potential financing from Export Development Canada to support Poland’s AP1000 project, which aims to be the country’s first nuclear power plant. |
| • | In Romania, the US Exim Bank approved a $98 million (US) loan commitment for the financing of an SMR project utilizing NuScale technology, with additional funding announcements at the G7 leaders’ summit, totaling up to $275 million (US). The project aims for 462 MWe of capacity at a retired coal plant in the country, with a total of six 77 MWe modules to be constructed. |
| • | In Egypt, the fourth and final VVER-1200 unit at El Dabba began construction. Unit 1 is expected to begin commercial operation in 2029 with the remaining three to follow in the early to mid-2030s. |
| • | Following a lengthy legal battle, Brazilian utility Electronuclear was successful in appealing the government ordered suspension of activity at Angra unit 3, a 1,350 MWe reactor, allowing it to continue construction. |
| • | In the US, Southern Company announced that Vogtle unit 4, a Westinghouse AP1000, moved into commercial operation, making it the second new reactor to come online in the US in over 28 years. |
| • | The US Nuclear Regulatory Commission (NRC) approved Dominion’s North Anna units 1 and 2 for an extension of their operating licences from 60 to 80 years, keeping the reactors online until the 2050s, while Vistra received approval to operate Comanche Peak units 1 and 2 for up to 60 years. Additionally, approval was received to extend Pacific Gas & Electric’s two-unit Diablo Canyon plant operation until 2030, while filings have already been made to extend the operating lives of the units a further 20 years, until the mid-2040s. |
| • | The DOE released its Advanced Nuclear Commercial Liftoff report, outlining the need to add 200 GWe of new generating capacity in order to triple US nuclear capacity by 2050, as part of their net-zero emissions target. Starting in 2030, the report calls for a 13 GWe annual increase in output for 15 years to reach 300 GWe by 2050. This increase is expected to come from extending reactor operating licences, uprating of capacity, and restarting shutdown reactors, along with new large scale and advanced reactors. The report also calls for a significant increase in capacity across the nuclear fuel supply chain and notably, a secure supply of uranium from the US, allies, and partners. |
| • | The US DOE announced plans to finance $900 million (US) for deployment of light-water SMRs, with $800 million (US) of the funding for two of the “first-mover teams” which can include utilities, SMR producers, vendors, and other end-users. In addition, former President Biden signed the Accelerating Deployment of Versatile, Advanced Nuclear for Clean Energy (ADVANCE) Act into law, which builds on prior legislation to modernize licensing, speed up the licensing process and reduce fees, while simplifying the environmental review process. |
| • | Numerous utilities made positive progress towards restarting shutdown nuclear plants in 2024. Holtec International announced their intention to restart the Palisades 800 MWe pressurized water reactor in Michigan, with both state and federal governments backing the effort, which would mark the first US reactor to restart after being shut down for decommissioning. Additionally, NextEra Energy announced they have initiated the regulatory process to restart the Duane Arnold plant, which could see the reactor returning to operation as early as 2028. Finally, Constellation Energy announced their $1.6 billion (US) plan to restart the 835 MWe Crane Clean Energy Center (formerly Three Mile Island Unit 1) in Pennsylvania. The restart is planned for 2028 with Microsoft agreeing to a 20-year power purchase agreement to support the investments in restarting the plant. |
| • | With the rapid expansion of artificial intelligence and data center demand, numerous other technology companies also made commitments to nuclear for both large scale and SMR projects. Notably, Google announced a deal with Kairos Power to buy the output from at least six first-of-a-kind fluoride salt-cooled, high-temperature reactors. Additionally, Amazon and Energy Northwest announced an agreement for Amazon to fund the development of SMRs, with the right to purchase power from the first four Xe-100 units (320 MWe) and an option for Energy Northwest to build up to eight additional units (640 MWe). Finally, Sabey, a US data center developer, is working with TerraPower to explore the deployment of Natrium SMRs at current and future data center sites. |
2024 ANNUAL INFORMATION FORM Page 16
| • | In Canada, Bruce Power submitted plans for its Bruce C Project, planning to add 4.8 GWe of new generation to complement 6.5 GWe of existing generation. In early 2025, the Ontario government announced plans for Ontario Power Group (OPG) to construct a 10 GWe nuclear plant near Port Hope. In addition, OPG is proceeding with refurbishments of Pickering B’s four units, expected to be completed by the mid-2030s and extending the plants’ operating lives by 30 years. OPG also successfully completed initial site preparation at the Darlington plant for the first of four GE-Hitachi BWRX-300 SMRs, with the nuclear portion of construction for the first unit set to start in early 2025, with planned commercial operation in 2029. |
| • | Westinghouse opened a new nuclear engineering hub in Kitchener, Ontario, where 50 engineers will be stationed. In addition, SaskPower, Westinghouse, and Cameco signed a Memorandum of Understanding to evaluate Saskatchewan’s carbon-free energy needs involving discussions on the AP1000, AP300™ and eVinci™ reactors. The province will be evaluating the suitability of its infrastructure for a nuclear fuel supply chain through SaskNuclear, a newly formed subsidiary of SaskPower. |
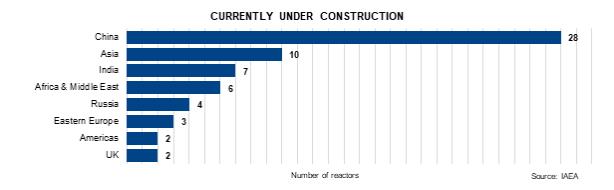
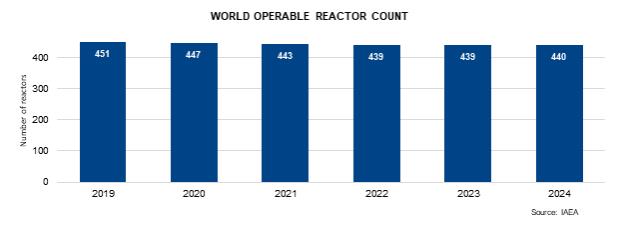
According to the IAEA, globally there are currently 440 operable reactors and 62 reactors under construction. Several nations are appreciating the energy security and carbon-free energy benefits of nuclear power and have reaffirmed their commitment with plans underway to support existing reactor units and review policies to encourage more nuclear generation. Several other non-nuclear countries have emerged as candidates for new nuclear capacity. In some countries where phase-out policies have been in place, policy reversals and decisions have been made to keep reactors running, with public opinion polls showing increasing support. With a number of reactor construction projects recently approved and many more planned, demand for uranium continues to improve. There is growing recognition of the role nuclear must play in providing safe, affordable, carbon-free baseload electricity to achieve a low-carbon economy, with geopolitical uncertainty causing some utilities to move away from Russian energy supplies and seek nuclear fuel suppliers whose values are aligned with their own, or whose origin of supply better protects them from potential interruptions.
2024 ANNUAL INFORMATION FORM Page 17
Supply uncertainty
Geopolitical uncertainty, energy security, and national security remained the most notable factors impacting security of supply in 2024. Driven by the Russian invasion of Ukraine, the mine suspension in Niger, and supply chain challenges, particularly in Kazakhstan, many governments and utilities are re-examining procurement strategies that rely on nuclear fuel supplies from these jurisdictions. In addition, sanctions on Russia and import/export restrictions added to the delivery risks for nuclear fuel supplies coming out of Central Asia. Several uranium projects restarted in 2024 in support of increased demand, though delays and higher-than-expected production costs were a common theme. Despite the positive price trend in 2024, the deepening geopolitical uncertainty, sanctions and trade policy restrictions, and years of underinvestment in new uranium and fuel cycle service capacities has shifted risk from producers to utilities.
Supply and trade policy highlights
| • | The Prohibiting Russian Uranium Imports Act (H.R. 1042) went into effect in August with the intent to prohibit the imports of Russian low-enriched uranium (LEU) into the US until 2040. It contains a US DOE waiver process available until 2028, where utilities can apply through a public process for an exception to the import ban in situations concerning energy and national security. In November, the Russian government issued a decree to immediately limit the export of LEU to the US, which was meant to be symmetrical to the trade actions taken by the US earlier in the year. This resulted in two ships departing from St. Petersburg to Baltimore without any of their intended enriched uranium product cargo onboard. |
| • | The DOE approved funding of up to $2.7 billion (US) to support domestic production of LEU and high-assay low-enriched uranium (HALEU) by creating a guaranteed buyer of US produced nuclear fuel to restore US nuclear fuel production capabilities. Initial awards were granted for HALEU in October and LEU in December. |
| • | In January 2025, KAP announced that 2024 production increased 10% from the prior year to 60.5 million pounds U3O8. No update was provided on 2025 production guidance beyond its previous announcement from August 2024, where it lowered its 2025 guidance range to 65 million to 68.9 million pounds U3O8 (previously 79.3 million to 81.9 million pounds U3O8), citing project delays and continued sulfuric acid shortages. A significant portion of the reduced 2025 guidance resulted from production delays at Appak LLP, as well as JV Budenovskoye LLP. Additionally, KAP reduced production guidance for JV KATCO LLP below annual production capacity until at least 2026. |
| • | In July, the government of Kazakhstan introduced amendments to the Tax Code of the Republic of Kazakhstan which involved changes to the Mineral Extraction Tax (MET) rate for uranium. The MET rate will increase from 6% in 2024, to 9% in 2025, with the introduction of a progressive system based on actual annual production volumes under each subsoil use agreement, starting in 2026, where the highest rate is 18% for operations producing over 10.4 million pounds. An additional MET of up to 2.5% based on the spot market price of uranium, will also be added in 2026. The MET is incurred and paid by the mining entities, impacting both KAP and different JVs and subsidiaries. |
| • | In October, Orano Canada Inc. (Orano) announced plans to temporarily suspend operations at their SOMAIR mine in Niger due to growing financial difficulties resulting from the coup d’état in July 2023 and the subsequent closure of the main supply and export route in Niger. Orano confirmed in December that the Nigerien authorities have taken operational control of the project, resulting from escalating conflicts between the company and the country’s ruling military junta. Earlier in the year, Orano also reported that the Nigerien government revoked their operating permit for their undeveloped Imouraren deposit. Further in the region, GoviEx Uranium Inc. (GoviEx) was informed by the Nigerien government that they no longer have rights over the perimeter of the Madaouela mining permit. In December, both Orano and GoviEx initiated arbitration proceedings against the Republic of Niger for the Imouraren and Madaouela projects respectively. |
| • | In March, Paladin Energy Ltd. (Paladin) announced the restart of its Langer Heinrich mine in Namibia which has an annual production capacity of 5.2 million pounds U3O8 and had been in care and maintenance since 2018. In November, Paladin updated their 2025 production guidance from 4.0-4.5 million pounds U3O8 to 3.0-3.6 million pounds U3O8 due to ongoing challenges and operational variability in ramping up production. |
| • | In 2024, several other uranium projects also restarted production including Boss Energy’s Honeymoon ISR project in Australia, Uranium Energy Corp.’s Christensen Ranch ISR operations in Wyoming, enCore Energy’s Alta Mesa Uranium Central Processing Plant and Wellfield in Texas, and Peninsula Energy Ltd.’s Lance ISR project in Wyoming. In June, Terrafame also reported it officially started recovering natural uranium at its industrial site in Sotkamo, Finland. |
| • | Sprott Physical Uranium Trust (SPUT) purchased about three million pounds U3O8 in 2024, bringing total purchases since inception to nearly 48 million pounds U3O8, and a total physical position of 66.2 million pounds U3O8. Volatility in the equity market impacts SPUT’s ability to raise funds to purchase uranium based on its share price trading at a discount or a premium to the net asset value (NAV) of the uranium it holds; in 2024 SPUT was at a discount to NAV for most of the year, negatively impacting its ability to buy uranium. |
2024 ANNUAL INFORMATION FORM Page 18
| • | Following 2023 announcements from both Urenco and Orano to proceed with enrichment capacity expansion projects, 2024 saw advancements with the first new centrifuges being installed at Urenco USA and Orano starting construction at its Georges Besse II (GBII) expansion in France. A total capacity expansion of 1.8 million separative work units (SWU) is planned across three Urenco facilities including in Germany and the Netherlands, which represents a 10% capacity increase, whereas Orano seeks to grow GBII’s enrichment capacity, by approximately 2.5 million SWU annually, a 30% increase. |
Long-term contracting creates full-cycle value for proven productive assets
Like other commodities, the demand for uranium is cyclical. However, unlike other commodities, uranium is not traded in meaningful quantities on a commodity exchange. The uranium market is principally based on bilaterally negotiated long-term contracts covering the annual run-rate requirements of nuclear power plants, with a small spot market to serve discretionary demand. History demonstrates that in general, when prices are rising and high, uranium is perceived as scarce, and more contracting activity takes place with proven and reliable suppliers. The higher demand discovered during this contracting cycle drives investment in higher-cost sources of production, which due to lengthy development timelines, tend to miss the contracting cycle and ramp up after demand has already been won by proven producers. When prices are declining and low, there is no perceived urgency to contract, and contracting activity and investment in new supply dramatically decreases. After years of low prices, and a lack of investment in supply, and as the uncommitted material available in the spot market begins to thin, security-of-supply tends to overtake price concerns. Utilities typically re-enter the long-term contracting market to ensure they have a reliable future supply of uranium to run their reactors.
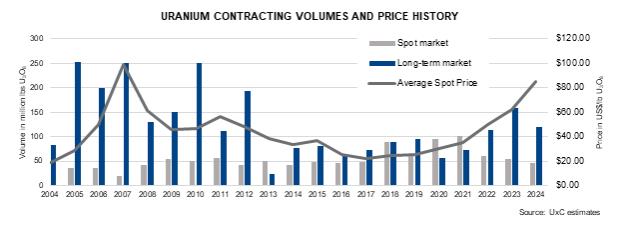
UxC reports that over the last five years approximately 534 million pounds U3O8 equivalent have been locked-up in the long-term market, while approximately 798 million pounds U3O8 equivalent have been consumed in reactors. We remain confident that utilities have a growing gap to fill.
We believe the current backlog of long-term contracting presents a substantial opportunity for proven and reliable suppliers with tier-one productive capacity and a record of honouring supply commitments. As a low-cost producer, we manage our operations to increase value throughout these price cycles.
2024 ANNUAL INFORMATION FORM Page 19
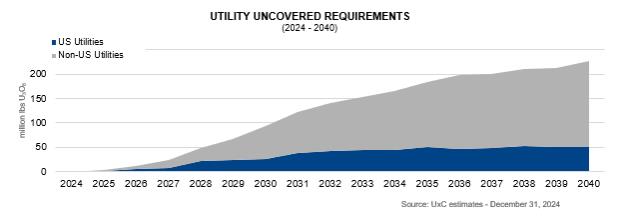
In our industry, customers do not come to the market right before they need to load nuclear fuel into their reactors. To operate a reactor that could run for more than 60 years, natural uranium and the downstream services have to be purchased years in advance, allowing time for a number of processing steps before a finished fuel bundle arrives at the power plant. At present, we believe there is a significant amount of uranium that needs to be contracted to keep reactors running into the next decade.
UxC estimates that cumulative uncovered requirements are about 2.1 billion pounds to the end of 2040. With the lack of investment over the past decade, there is growing uncertainty about where uranium will come from to satisfy growing demand, and utilities are becoming increasingly concerned about the availability of material to meet their long-term needs. In addition, secondary supplies have diminished, and the material available in the spot market has thinned as producers and financial funds continue to purchase material. Furthermore, geopolitical uncertainty is causing some utilities to seek nuclear fuel suppliers whose values are aligned with their own or whose origin of supply better protects them from potential interruptions, including from transportation challenges or the possible imposition of formal sanctions.
We will continue to take the actions we believe are necessary to position the company for long-term success. Therefore, we will continue to align our production decisions with our customers’ needs under our contract portfolio. We will undertake contracting activity which is intended to ensure we have adequate protection while maintaining exposure to the benefits that come from having uncommitted, low-cost supply to place into a strengthening market.
Building a balanced portfolio
The purpose of our contracting framework is to deliver value. Our approach is to secure a solid base of earnings and cash flow by maintaining a balanced contract portfolio that optimizes our realized price.
Contracting decisions in all segments of our business need to consider the nuclear fuel market structure, the nature of our competitors, and the current market environment. The vast majority of run-rate fuel requirements are procured under long-term contracts. The spot market is thinly-traded, where certain utilities may buy small, discretionary volumes. This market structure is reflective of the baseload nature of nuclear power and the relatively small proportion of the overall operating costs the fuel represents compared to other sources of baseload electricity. Additionally, about half of the fuel supply typically comes from state-owned entities with production volume strategies or ambitions to serve state nuclear power ambitions with low-cost fuel supplies, or from diversified mining companies that produce uranium as a by-product. We evaluate our strategy in the context of our market environment and continue to adjust our actions in accordance with our contracting framework:
| • | First, we build a long-term contract portfolio by layering in volumes over time. In addition to our committed sales, we will compete for customer demand in the market where we think we can obtain value and, in general, as part of longer-term contracts. We will take advantage of opportunities the market provides, where it makes sense from an economic, logistical, diversification and strategic point of view. Those opportunities may come in the form of spot, mid-term or long-term demand, and will be additive to our current committed sales. |
| • | Based on our portfolio of long-term contracts, we decide how to best source material to satisfy that demand, planning our production in accordance with our contract portfolio and other available sources of supply. We will not produce from our tier-one assets to sell into an oversupplied spot market. |
| • | We do not intend to build an inventory of excess uranium. Excess inventory serves to contribute to the sense that uranium is abundant and creates an overhang on the market, and it ties up working capital on our balance sheet. |
2024 ANNUAL INFORMATION FORM Page 20
| • | Depending on the timing and volume of our production, purchase commitments, and our inventory volumes, we may be active buyers in the market in order to meet our annual delivery commitments. Historically, we have generally planned our annual delivery commitments to slightly exceed the annual supply we expect to come from our annual production and our long-term purchase commitments and have therefore relied on the spot market to meet a small portion of our delivery commitments. During the time that our tier-one assets were in care and maintenance from 2018-2022, we relied more heavily on market purchases to meet our delivery obligations. In general, if we choose to purchase material to meet demand, we expect the cost of that material will be more than offset by the volume of commitments in our sales portfolio that are exposed to market prices at the time of delivery over the long-term. |
In addition to this framework, our contracting decisions always factor in who the customer is, our desire for regional diversification, the product form, and logistical factors.
Ultimately, our goal is to protect and extend the value of our contract portfolio on terms that recognize the value of our assets, including future development projects, and pricing mechanisms that provide adequate protection when prices go down and exposure to rising prices. We believe using this framework will allow us to create long-term value. Our focus will continue to be on ensuring we have the financial capacity to execute on our strategy and self-manage risk.
Long-term contracting
Uranium is not traded in meaningful quantities on a commodity exchange. Utilities have historically bought the majority of their uranium and fuel services products under long-term contracts that are bilaterally negotiated with suppliers. The spot market is discretionary and typically used for one-time volumes, not to satisfy annual demand. We sell uranium and fuel products and services directly to nuclear utilities around the world as uranium concentrates, UO2 and UF6, conversion services, or fuel fabrication and reactor components for CANDU heavy water reactors. We have a solid portfolio of long-term sales contracts that reflect our reputation as a proven, reliable supplier of geographically stable supply, and the long-term relationships we have built with our customers.
In general, we are active in the market when it is beneficial for us and in support of our long-term contract portfolio. We undertake activity in the spot and term markets prudently, looking at the prices and other business factors to decide whether it is appropriate to purchase or sell into the spot or term market. Not only is this activity a source of profit, but it also gives us insight into underlying market fundamentals.
We deliver the majority of our uranium under long-term contracts each year, some of which are tied to market-related pricing mechanisms quoted at time of delivery. Therefore, our net earnings and operating cash flows are generally affected by changes in the uranium price. Market prices are influenced by the fundamentals of supply and demand, market access and trade policy issues, geopolitical events, disruptions in planned supply and demand, and other market factors.
The objectives of our contracting strategy are to:
| • | optimize realized price by balancing exposure to future market prices while providing some certainty for our future earnings and cash flow |
| • | focus on meeting the nuclear industry’s growing annual uncovered requirements with our tier-one production |
| • | establish and grow market share with strategic and regionally diverse customers |
We have a portfolio of long-term contracts, each bilaterally negotiated with customers, that have a mix of base-escalated pricing and market-related pricing mechanisms, including provisions that provide exposure to rising market prices and also protect us when the market price is declining. This is a balanced and flexible approach that allows us to adapt to market conditions, put a floor on our average realized price and deliver the best value over the long term.
This approach has allowed our realized price to outperform the market during periods of weak uranium demand, and we expect it will enable us to realize increases linked to higher market prices in the future.
Base-escalated contracts for uranium: use a pricing mechanism based on a term-price indicator at the time the contract is accepted and escalated to the time of each delivery over the term of the contract.
Market-related contracts for uranium: are different from base-escalated contracts in that the pricing mechanism may be based on either the spot price or the long-term price, and that price is generally set a month or more prior to delivery rather than at the time the contract is accepted. These contracts may provide for discounts and typically include floor prices and/or ceiling prices, which are established at time of contract acceptance and usually escalate over the term of the contract.
2024 ANNUAL INFORMATION FORM Page 21
Fuel services contracts: the majority of our fuel services contracts use a base-escalated mechanism per kilogram of uranium (KgU) and reflect the market at the time the contract is accepted.
Optimizing our contract portfolio
We work with our customers to optimize the value of our contract portfolio. With respect to new contracting activity, there is often a lag from when contracting discussions begin and when contracts are executed. With our large pipeline of business under negotiation in our uranium segment, and a value driven strategy, we continue to be strategically patient in considering the commercial terms we are willing to accept. We layer in contracts over time, with higher commitments in the near term and declining over time in accordance with utilities growing uncovered requirements. Demand may come in the form of off-market negotiations or through on-market requests for proposals. We remain confident that we can add acceptable new sales commitments to our portfolio of long-term contracts to underpin the ongoing operation of our productive capacity and capture long-term value.
Given our view that additional long-term supply will need to be incented to meet the growing demand for safe, reliable, carbon-free nuclear energy, our preference today is to sign long-term contracts with market-related pricing mechanisms. However, we believe our customers expect prices to rise and prefer to lock-in today’s prices, with a fixed-price mechanism. Our goal is to balance all these factors, along with our desire for customer and regional diversification, with product form, and logistical factors to ensure we have adequate protection and will have exposure to rising market prices under our contract portfolio, while maintaining the benefits that come from having low-cost supply to deliver into a strengthening market.
At times, we may also look for opportunities to optimize the value of our portfolio. In cases where there is a changing policy, operating, or economic environment, including the introduction of new taxes or tariffs in certain jurisdictions, we manage risk accordingly. We have taken actions such as positioning material ahead of expected deliveries, revising our contract terms to protect us from unexpected future implementation of taxes or tariffs, and adjusting our contracts to minimize potential negative impacts while maintaining strong customer relationships, and we will continue to consider additional mitigation in the future.
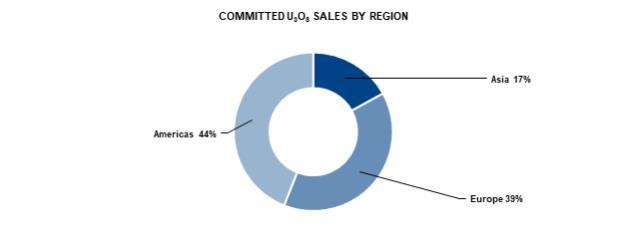
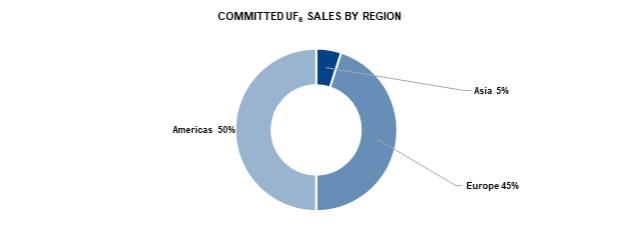
Contract portfolio status
We have executed contracts to sell about 220 million pounds of U3O8 with 41 customers worldwide in our uranium segment, and about 85 million kilograms as UF6 conversion with 34 customers worldwide in our fuel services segment. We sell uranium and fuel services products to nuclear utilities in 16 countries.
Economic dependence
Customers – U3O8:
Our five largest customers account for 58% of commitments
2024 ANNUAL INFORMATION FORM Page 22
Customers – UF6 conversion:
Our five largest customers account for 59% of commitments
Managing our contract commitments
We allow sales volumes to vary year-to-year depending on:
| • | the level of sales commitments in our long-term contract portfolio |
| • | market opportunities |
| • | our sources of supply |
To meet our delivery commitments and to mitigate risk, we have access to a number of sources of supply, which includes uranium obtained from:
| • | our productive capacity |
| • | purchases under our JV Inkai agreement, under long-term agreements and in the spot market |
| • | our inventory in excess of our working requirements |
| • | product loans |
Our supply discipline
As spot is not the fundamental market, true value is built under a long-term contract portfolio and is measured over the full commodity cycle. Therefore, we align our uranium production decisions with our contract commitments and market opportunities to avoid carrying excess inventory or having to sell into an oversupplied spot market. In accordance with market conditions, and to mitigate risk, we evaluate the optimal mix of our production, inventory and purchases in order to satisfy our contractual commitments and in order to realize the best return over the entire commodity cycle. During a prolonged period of uncertainty, this could mean leaving our uranium in the ground. For the years 2016 through 2022, we left more than 130 million pounds of uranium in the ground (100% basis) by curtailing our production. We purchased more than 60 million pounds including spot and long-term purchases and in 2018 we drew down our inventory by almost 20 million pounds. That totals over 210 million pounds (100% basis) of uranium that were not available to the market.
However, today we believe the uranium market is in transition, driven by the growing demand for nuclear energy and the increasing recognition that it is essential for energy security, national security, and the clean-energy transition. As the market continues to transition, we expect to continue placing our uranium under long-term contracts and meet rising demand with production from our best margin operations.
With the improvements in the market, the new long-term contracts we have put in place, and a pipeline of contracting discussions, we plan to produce 18 million pounds (100% basis) at McArthur River/Key Lake and 18 million pounds (100% basis) at Cigar Lake in 2025. We are still in discussions with JV Inkai and KAP to determine our production target for 2025.
Our production decisions will continue to be aligned with market opportunities and our ability to secure the appropriate long-term contract homes for our unencumbered, in-ground inventory, demonstrating that we continue to responsibly manage our assets in accordance with our customers’ needs.
2024 ANNUAL INFORMATION FORM Page 23
Our production plans for McArthur River/Key Lake and Cigar Lake are expected to generate strong financial performance by allowing us to source the majority of our committed sales from the lower cost produced pounds. We are investing in capital projects to help ensure the reliability and sustainability of our existing operations, and to replace aging infrastructure in order to maintain capacity at current production levels and to position us for future production flexibility, although no decision on future production levels has been made. In addition, with conversion demand elevated, we have been successful in securing long-term sales commitments that will support increased production at Port Hope, which is expected to further improve its contribution to our financial results. However, this is not an end to our supply discipline. Our Rabbit Lake and US ISR assets remain in a safe state of care and maintenance, and we expect to continue to adjust our production in accordance with our contract portfolio. This will remain our production plan until we see further improvements in the uranium market and contracting progress, once again demonstrating that we are a responsible fuel supplier.
Managing our costs
Production costs
In order to operate efficiently and cost-effectively, we manage operating costs and improve plant reliability by prudently investing in production infrastructure, new technology, and business process improvements. Like all mining companies, our uranium segment is affected by the cost of inputs such as labour and fuel.
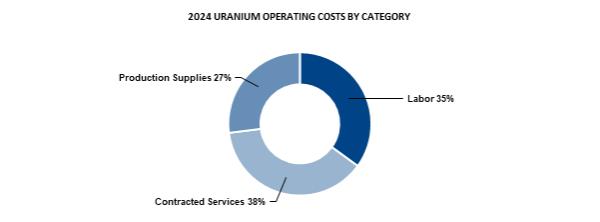
| * | Production supplies include reagents, fuel and other items. Contracted services include utilities and camp costs, air charters, mining and maintenance contractors and security and ground freight. |
The annual cash cost of production reflects the operating cost of mining and milling our share of the Cigar Lake, McArthur River, and Key Lake operations. The annual cost of production will reflect a combined cost of all our operating uranium assets. See 2024 financial results by segment – Uranium starting on page 57 of our 2024 MD&A for more information. In 2025, our cash production costs may continue to be affected by inflation, the availability of personnel with the necessary skills and experience, supply chain challenges impacting the availability of materials and reagents, and continued work to maintain the long-term reliability of our assets.
Operating costs in our fuel services segment are mainly fixed. In 2024, labour and contracted services accounted for about 53% of the total. The largest variable operating cost is for anhydrous hydrogen fluoride, followed by zirconium, and energy (natural gas and electricity).
We continue to look to adopt innovative and advanced digital and automation technologies to improve efficiency and operational flexibility and to further reduce costs.
Care and maintenance costs
In 2025, we expect to incur between $62 million and $67 million in care and maintenance costs related to the suspension of production at our Rabbit Lake mine and mill, and our US operations. Production at these operations is higher-cost and the timing of a restart is uncertain. We continue to evaluate our options in order to minimize these costs.
2024 ANNUAL INFORMATION FORM Page 24
Purchases and inventory costs
Our costs are also affected by the purchases of uranium and conversion services we make under long-term contracts and on the spot market.
To meet our delivery commitments, we make use of our mined production, inventories, purchases of our share of material from Inkai, purchases under long-term contracts, purchases we make on the spot market and product loans. In 2025, we expect the price for the majority of our purchases will be quoted at the time of delivery.
The cost of purchased material may be higher or lower than our other sources of supply, depending on market conditions. The cost of purchased material affects our cost of sales, which is determined by calculating the average of all of our sources of supply, including opening inventory, production, and purchases, and adding royalties, selling costs, and care and maintenance costs. Our cost of sales could be impacted if we do not achieve our annual production plan, or if we are unable to source uranium as planned, and we are required to purchase uranium at prices that differ from our cost of inventory.
Potential tariff impact
The US has threatened the imposition of a 10% tariff on Canadian energy products, which is currently contemplated to include uranium. We have proactively taken steps to minimize the potential impact of imposed tariffs, and while we currently do not anticipate the direct impact of a 10% tariff to be material on our 2025 financial results, there continues to be uncertainty around the exact details of how these tariffs may be applied or if they will be applied to uranium products, if they are applied at all.
Financial impact
The growing demand for nuclear power due to its safety, carbon-free energy, reliability, security and affordability attributes has contributed to increased demand for nuclear fuel products and services. As a result, we have seen significant price increases across the nuclear fuel value chain, which reflect the need for capacity increases to satisfy the projected growth.
The deliberate and disciplined actions we took to curtail production and streamline operations over the past decade came with near-term costs like care and maintenance costs, operational readiness costs, and purchase costs higher than our production costs. However, we considered these costs as investments in our future.
Today, thanks to our investments, and with our continued ability to secure new long-term sales commitments, we believe we are well-positioned for growth. Our core growth is expected to come from our existing mining and fuel services assets. We do not have to build new capacity to pursue new opportunities. We believe we have sufficient productive capacity to expand, a position we have not enjoyed in previous price cycles.
And, with the acquisition of a 49% interest in Westinghouse, we expect to be able to expand our growth profile by extending our reach in the nuclear fuel cycle at a time when there are tremendous tailwinds for the nuclear power industry. We are extending our reach with an investment in assets, that like ours, are strategic, proven, licensed and permitted, that are located in geopolitically favourable jurisdictions, and that we expect will be able to grow from their existing footprint. These assets are also expected to provide new opportunities for our existing suite of uranium and fuel services assets.
We believe our actions and investments have helped position the company to self-manage risk, generate strong financial performance, and allow us to execute on our strategy while rewarding our stakeholders for their continued patience and support of our strategy to build long-term value.
Supply sources
Uranium supply sources include primary production (production from mines that are currently in commercial operation) and secondary supply sources (excess inventories, uranium made available from defense stockpiles and the decommissioning of nuclear weapons, re-enriched depleted uranium tails, and used reactor fuel that has been reprocessed).
Primary production
While the uranium production industry is international in scope, there are only a small number of companies operating in relatively few countries. In addition, there are barriers to entry and bringing on and ramping up production can take a significant number of years. During the low-price environment that persisted for about a decade following 2011, a number of projects were cancelled or delayed, and some production was discontinued. Current prices and contracting activity are supporting the restart of some assets, however, the market has yet to incentivise the investment in new supply necessary to meet the anticipated growth in uranium requirements.
2024 ANNUAL INFORMATION FORM Page 25
We estimate world mine production in 2024 was about 154 million pounds U3O8, up from 143 million pounds in 2023:
| • | Over 82% of estimated world production was sourced from four countries: Kazakhstan (38%), Canada (24%), Namibia (12%) and Australia (8%). |
| • | About 72% of estimated world production was attributable to five producers. Cameco accounted for approximately 18% (27 million pounds) of estimated world production. |
Secondary sources
There are a number of secondary sources, but most of these sources are finite and will not meet long-term needs:
| • | The US government has historically made some of its inventories available to the market, although in smaller and predictable quantities. |
| • | The Russian government also holds substantial volumes of nuclear fuel inventory largely in the form of depleted uranium, but overall, their contribution to secondary supplies has reduced significantly since the end of the Highly Enriched Uranium (HEU) Agreement between the Russian and United States governments. |
| • | Utilities, mostly in Europe and some in Japan and Russia, use reprocessed uranium and plutonium from used reactor fuel. |
| • | Re-enriched depleted uranium tails and uranium from underfeeding are also generated when there is excess enrichment capacity. |
Uranium from US inventories
Historically, the DOE was one of the primary sources of secondary supplies in the uranium market. This role has been significantly reduced since the suspension of the barter program of its natural UF6 inventory. DOE’s current primary contribution to secondary supplies is HEU downblending. The vast majority of the DOE’s inventory is large volumes of depleted uranium (DU).
In 2018, the DOE announced it was suspending its practice of bartering its excess uranium through the end of 2019. This barter suspension has since been extended on an annual basis. The DOE has indicated a commitment to continue the suspension of the UF6 barter program. There is currently no available timetable to dispose of the remaining natural UF6 in DOE’s excess inventory, estimated at less than 9 million pounds.
The DOE’s DU inventory may become available to the market over the next two decades, although a significant portion of the inventory requires either further processing or the development of commercial arrangements before it can be brought to market.
Trade restraints and policies
The importation of Russian uranium into the US market is regulated by the amended USEC Privatization Act and by the Agreement Suspending the Antidumping Action against Russian Uranium Products (RSA), which together impose annual quotas on imports of Russian uranium. These quotas were set at the equivalent of 20% of annual US reactor demand and expired at the end of 2020. An amendment to the RSA was signed that extends the agreement from January 1, 2021 through December 31, 2040 and provides a clear set of rules around access to the US nuclear energy sector by Russian nuclear fuel suppliers. Since 1992, the importation of Russian uranium products in the US has been subject to a quota under the RSA. The amendment reduces the average overall quota and introduces caps, which will reduce the amount of Russian uranium, conversion and enrichment supplied to the US over the long-term. The amendment also includes important new provisions to ensure that all Russian origin uranium must be counted against the quota even if it is imported after further processing in other countries.
The US restrictions do not affect the sale of Russian uranium to other countries. A significant portion of world uranium demand is from utilities in countries that are not affected by the US restrictions. Utilities in some countries, however, adopt policies that limit the amount of Russian uranium they will buy. The Euratom Supply Agency in Europe must approve all uranium related contracts for members of the European Union (EU) and limits the use of certain nuclear fuel supplies from any one source to maintain security of supply, although these limits do not apply to uranium sold separately from enriched uranium product.
Since the Russian invasion of Ukraine on February 24, 2022, many jurisdictions have imposed strict economic sanctions against Russia, including Canada, the United States, the European Union, the United Kingdom, and others. The Canadian government has cancelled existing export permits to Russia and will not grant new export permits to Russia. The US government enacted the Prohibiting Russian Uranium Imports Act on May 13, 2024, which banned imports of uranium from
2024 ANNUAL INFORMATION FORM Page 26
Russia as of August 11, 2024, unless the Secretary of Energy grants a waiver to allow such imports. These waivers expire on January 1, 2028, and no new Russian imports would be permitted thereafter. The recent change in administration in the US may result in additional changes to or removal of these restrictions in the US. In any case, trade sanctions and Russian export restraints of LEU to the US will impact the flow of nuclear fuel supplies coming in and out of Russia, including supplies shipped through Russian ports. The global nuclear industry currently relies on Russia for approximately 13% of its supply of uranium concentrates, 23% of conversion supply, and 43% of enrichment capacity.
In 2024, the DOE approved funding of up to $2.7 billion (US) to support domestic production of LEU and HALEU by creating a guaranteed buyer of US produced nuclear fuel to restore US nuclear fuel production capabilities and guard against potential commercial and national security risks as a result of the country’s near-total reliance on foreign imports. In 2024, six LEU companies and four HALEU companies were selected by the US government to compete for future supply contracts. Contracts entered into by these companies with the US government will last for up to 10 years and have a minimum purchase amount of $2 million (US).
The recent change in administration in the US adds uncertainty to the global economic outlook, including with respect to the timing, scope and magnitude of potential US import tariffs.
President Trump signed executive orders (the Executive Orders) imposing a 25% tariff on all goods originating in Canada and imported into the United States and a 10% tariff on “energy and energy resources” from Canada (which is currently contemplated to include uranium), with originally planned implementation dates of February 4, 2025 and March 4, 2025. The Executive Orders also state that if Canada introduces retaliatory measures, such as through the imposition of import duties on U.S. exports to Canada (or other similar measures), the U.S. tariffs may be increased or expanded. In response, the Government of Canada imposed 25% tariffs on $155 billion in goods imported from the U.S., coming into effect in two phases. Provincial governments across Canada have also responded to the U.S. tariffs, in some cases introducing their own retaliatory measures. To date, Canada and the U.S. agreed to delay the imposition of certain tariffs on imported goods but the situation remains temporary and uncertain. President Trump has also suggested that a new economic deal may be structured with Canada, though the scope and terms of such a deal, if any, are unknown.
Although discussions continue regarding a potential economic arrangement between the two countries, there remains significant uncertainty over whether tariffs or other restrictive trade measures or countermeasures will be implemented and, if so, the scope, impact, and duration of any such measures and their application to uranium or conversion sales. Potential measures could include, among others, increased tariffs on Canadian energy exports, export restrictions on certain commodities including Canadian energy exports, restrictions on cross-border supply chains, or additional regulatory barriers to trade.
Conversion services
We have about 20% of world UF6 primary conversion capacity and supply UO2 for Canadian-made CANDU reactors. For conversion services, we compete with a small number of primary commercial suppliers to meet global demand. In addition, at times we compete with secondary supplies that come to market as UF6 and are described above.
Changes to contracts
A description of the aspects of our business that we reasonably expect to be affected in the current financial year by renegotiation or termination of contracts or sub-contracts, and the likely effect, is included in Operations, projects and investments beginning on page 28 and Risks that can affect our business beginning on page 115.
Environmental Protection
A description of the financial and operational effects of environmental protection requirements on our capital expenditures, profit or loss and competitive position of Cameco in the current financial year and the expected effect in future years is contained in Decommissioning and financial assurances on pages 39 and 52 in respect of McArthur River, Key Lake and Cigar Lake, Decommissioning on page 69 in respect of Inkai, Estimating decommissioning and environmental remediation costs on page 94 in respect of Westinghouse, Nuclear waste management and decommissioning on page 113 relating to Cameco generally, and Risks that can affect our business on page 115.
2024 ANNUAL INFORMATION FORM Page 27
Operations, projects and investments
Uranium
| Tier-one operations |
||||
| McArthur River mine/Key Lake mill |
29 | |||
| Cigar Lake |
44 | |||
| Inkai |
58 | |||
| Tier-two operations |
||||
| Rabbit Lake |
79 | |||
| US ISR Operations |
80 | |||
| Advanced projects |
||||
| Millennium |
81 | |||
| Yeelirrie |
82 | |||
| Kintyre |
82 | |||
| Exploration |
83 |
Fuel services
| Refining, conversion and fuel manufacturing |
||||
| Blind River Refinery |
85 | |||
| Port Hope Conversion Services |
85 | |||
| Cameco Fuel Manufacturing Inc. |
86 |
Westinghouse
| Core business |
90 | |||
| New build |
92 |
Other nuclear fuel cycle investments
| Global Laser Enrichment (GLE) |
95 |
Uranium production
| Cameco’s share |
2023 | 2024 | 2025 Plan | |||||||||
| McArthur River/Key Lake |
9.4 | 1 | 14.2 | 1 | 12.6 | |||||||
| Cigar Lake |
8.2 | 2 | 9.2 | 2 | 9.8 | |||||||
| Rabbit Lake |
— | 3 | — | 3 | — | 3 | ||||||
| US ISR Operations |
— | 3 | — | 3 | — | 3 | ||||||
| Total |
17.6 | 23.4 | 22.4 | |||||||||
| 1 | The McArthur River/Key Lake operations restarted production in November 2022. In 2023, production continued to ramp up and all remaining operational activities, including mine development and underground exploration were restarted. In 2024, record production was achieved due to improved performance of the Key Lake mill. |
| 2 | At Cigar Lake, productivity in 2023 was impacted as we completed development and commissioning activities in the first quarter and achieved first production from a new mining area. We had expected to recover from these delays in the second half of the year. However, in the third quarter, we determined maintenance work was required on one of the underground circuits, which had not been planned. The additional time required to complete this work did not allow for the delayed production volumes to be recovered prior to year-end. In 2024, production did not meet expectations due to challenges at Orano’s McClean Lake mill caused by ore quality variances and unplanned maintenance issues. |
| 3 | The Rabbit Lake operation remains in a state of care and maintenance, and we are no longer developing new wellfields at US ISR operations. |
2024 ANNUAL INFORMATION FORM Page 28
Due to equity accounting, our share of production from Inkai is shown as a purchase. Production at Inkai was suspended for approximately three weeks in January 2025. Based on KAP’s announcement on January 27, 2025, the impact of this suspension on Inkai’s 2025 production, and our corresponding purchase entitlements, are currently being assessed. Any estimates of Inkai’s 2025 and subsequent production will be tentative and uncertain. JV Inkai is experiencing procurement and supply chain issues, most notably related to the stability of sulfuric acid deliveries, as well as challenges related to construction delays and acidification of new wellfields.
Uranium – Tier-one operations
McArthur River mine / Key Lake mill
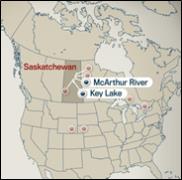
|
2024 Production (our share)
14.2M lb
2025 Production Outlook (our share)
12.6M lb
Estimated Reserves (our share)
251.0M lb
Estimated Mine Life
2044 |
McArthur River is the world’s largest, high-grade uranium mine, and Key Lake is the world’s largest uranium mill. We are the operator of both the mine and mill.
McArthur River is considered a material uranium property for us. There is a technical report dated March 29, 2019 (effective December 31, 2018) that can be downloaded from SEDAR+ (www.sedarplus.ca) or from EDGAR (www.sec.gov).
| Location | Saskatchewan, Canada | |||
| Ownership | McArthur River – 69.805% | |||
| Key Lake – 83.33% | ||||
| Mine type | Underground | |||
| Mining methods | Blasthole stoping and raiseboring | |||
| End product | Uranium concentrate | |||
| Certification | ISO 14001 certified | |||
| Estimated reserves | 251.0 million pounds (proven and probable), average grade U3O8: 6.55% | |||
| Estimated resources | 4.7 million pounds (measured and indicated), average grade U3O8: 2.29% | |||
| 1.7 million pounds (inferred), average grade U3O8: 2.95% | ||||
| Licensed capacity | Mine and mill: 25.0 million pounds per year | |||
| Licence term | Through October 2043 | |||
| Total packaged production: | 2000 to 2024 | 358.1 million pounds (McArthur River/Key Lake) (100% basis) | ||
| 1983 to 2002 | 209.8 million pounds (Key Lake) (100% basis) | |||
| 2024 production | 14.2 million pounds (20.3 million pounds on 100% basis) | |||
| 2025 production outlook | 12.6 million pounds (18.0 million pounds on 100% basis) | |||
| Estimated decommissioning cost | $51.4 million – McArthur River (100% basis) | |||
| $276.7 million – Key Lake (100% basis) | ||||
| All values shown, including reserves and resources, represent our share only, unless indicated. | ||||
2024 ANNUAL INFORMATION FORM Page 29
Business structure
| McArthur River is owned by a joint venture (MRJV) between two companies: |
Key Lake is owned by a joint venture between the same two companies: |
|
| • Cameco – 69.805% (operator) |
• Cameco – 83.333% (operator) |
|
| • Orano – 30.195% |
• Orano – 16.667% |
|
History
| 1976 | • Canadian Kelvin Resources Ltd. and Asamera Oil Corporation Ltd. form an exploration joint venture, which includes the lands that the McArthur River mine is situated on |
|
| 1977 | • SMDC, one of our predecessor companies, acquires a 50% interest |
|
| 1980 | • McArthur River joint venture is formed
• SMDC becomes the operator
• Active surface exploration begins
• Between 1980 and 1988 SMDC reduces its interest to 43.991% |
|
| 1988 | • Eldorado Resources Limited merges with SMDC to form Cameco
• We become the operator
• Deposit discovered by surface drilling |
|
| 1988-1992 | • Surface drilling reveals significant mineralization of potentially economic uranium grades, in a 1,700 metre zone at depths of between 500 to 640 metres |
|
| 1992 | • We increase our interest to 53.991% |
|
| 1993 | • Underground exploration program receives government approval – program consists of shaft sinking (completed in 1994) and underground development and drilling |
|
| 1995 | • We increase our interest to 55.844% |
|
| 1997-1998 | • Federal authorities issue construction licences for McArthur River after reviewing the environmental impact statement, holding public hearings, and receiving approvals from the governments of Canada and Saskatchewan |
|
| 1998 | • We acquire all of the shares of Uranerz Exploration and Mining Ltd. (UEM), increasing our interest to 83.766%
• We sell half of the shares of UEM to Orano, reducing our interest to 69.805%, and increasing Orano’s to 30.195% |
|
| 1999 | • Federal authorities issue the operating licence and provincial authorities give operating approval, and mining begins in December |
|
| 2003 | • Production is temporarily suspended in April because of a water inflow
• Mining resumes in July |
|
| 2009 | • UEM distributes equally to its shareholders:
• its 27.922% interest in the McArthur River joint venture, giving us a 69.805% direct interest, and Orano a 30.195% direct interest
• its 33.333% interest in the Key Lake joint venture, giving us an 83.33% direct interest, and Orano a 16.667% direct interest |
|
| 2013 | • Federal authorities granted a 10-year renewal of the McArthur River and Key Lake operating licences |
|
| 2014 | • After a two-week labour disruption, we enter into a four-year collective agreement with unionized employees at McArthur River and Key Lake operations |
|
| 2017 | • We announce our plan to temporarily suspend production at McArthur River and Key Lake in 2018 |
|
| 2018 | • We announce the suspension of production at McArthur River and Key Lake for an indeterminate duration |
|
| 2022 | • We announce plans to transition McArthur River and Key Lake from care and maintenance to planned production of 15 million pounds per year (100% basis) by 2024 |
|
2024 ANNUAL INFORMATION FORM Page 30
| 2023 | • We updated our production plans for McArthur River and Key Lake to achieve
production of
• In October 2023, the Canadian Nuclear Safety Commission (CNSC) granted 20-year renewals to the licences for both McArthur River and Key Lake |
|
| 2024 | • Production from the mine was impacted by availability of mobile equipment, certain workforce skills and an unplanned shutdown to accommodate ventilation repairs in shaft 2; however, total packaged production set a new record due to improvements and optimization of the Key Lake mill and the availability of sufficient ore feed supplemented by broken ore inventory |
|
Technical report
| This description is based on the project’s technical report: McArthur River Operation, Northern Saskatchewan, Canada, dated March 29, 2019 (effective December 31, 2018). The report was prepared for us in accordance with Canadian National Instrument 43-101 – Standards of Disclosure for Mineral Projects (NI 43-101), by or under the supervision of Linda Bray, P. Eng., Gregory M. Murdock, P. Eng., and Alain D. Renaud, P. Geo. The following description has been prepared under the supervision of Biman Bharadwaj, P. Eng., Daley McIntyre, P. Eng., Gregory M. Murdock, P. Eng., and Alain D. Renaud, P. Geo. They are all qualified persons within the meaning of NI 43-101 but are not independent of us.
The conclusions, projections and estimates included in this description are subject to the qualifications, assumptions and exclusions set out in the technical report. We recommend you read the technical report in its entirety to fully understand the project. You can download a copy from SEDAR+ (www.sedarplus.ca) or from EDGAR (www.sec.gov). |
For information about uranium sales see pages 21 to 24, environmental matters see Our sustainability principles and practices and The regulatory environment starting on pages 102 and 105, and taxes see page 110.
For a description of royalties payable to the province of Saskatchewan on the sale of uranium extracted from orebodies within the province, see page 112.
For a description of risks that might affect access, title or the right or ability to perform work on the property, see Governance and compliance risks starting at page 130, Social risks starting at page 132 and Environmental risks starting at page 133. |
About the McArthur River property
Location
The McArthur River mine site is located near Toby Lake, approximately 620 kilometres north of Saskatoon. The mine site is in close proximity to other uranium production operations: the Key Lake mill is 80 kilometres southwest by road and the Cigar Lake mine is 46 kilometres northeast by air.
Access
Access to the property is by an all-weather gravel road and by air. Supplies are transported by truck from Saskatoon and elsewhere. There is a 1.6-kilometre unpaved airstrip and an air terminal one kilometre east of the mine site, on the surface lease.
Saskatoon, a major population centre south of the McArthur River property, has highway, rail and air links to the rest of North America.
Leases
Surface lease
The MRJV acquired the right to use and occupy the lands necessary to mine the deposit under a surface lease agreement with the province of Saskatchewan. The lease covers 1,425 hectares and expires in May 2043.
We are required to report annually on the status of the environment, land development and progress on northern employment and business development.
Mineral lease
We have the right to mine the deposit under ML 5516, granted to us by the province of Saskatchewan. The lease covers 1,380 hectares and expires in March 2034. We have the right to renew the lease for further 10-year terms.
2024 ANNUAL INFORMATION FORM Page 31
Mineral claims
A mineral claim gives us the right to explore for minerals and to apply for a mineral lease. There are 28 mineral claims, totaling 87,747 hectares, adjoining the mineral lease and surrounding the deposit. The mineral claims are in good standing until 2028, or later.
Environment, social and community factors
The climate is typical of the continental sub-arctic region of northern Saskatchewan. Summers are short and cool even though daily temperatures can sometimes reach above 30°C. The mean daily temperature for the coldest month is below -20°C, and winter daily temperatures can reach below -40°C.
The deposit is 40 kilometres inside the eastern margin of the Athabasca Basin in northern Saskatchewan. The topography and environment are typical of the taiga forested lands in the Athabasca Basin.
We are committed to building long-lasting and trusting relationships with the communities in which we operate. For more information, see Our Sustainability principles and practices at page 102.
No communities are in the immediate vicinity of McArthur River. The community of Wollaston Lake is approximately 120 kilometres by air to the east of the mine site. The community of Pinehouse is approximately 300 kilometres south of the mine by road.
Athabasca Basin community resident employees and contractors fly to the mine site from designated pick-up points. Other employees and contractors fly to the mine from Saskatoon with pick-up points in Prince Albert and La Ronge.
Geological setting
The deposit is in the southeastern portion of the Athabasca Basin in northern Saskatchewan, within the southwest part of the Churchill structural province of the Canadian Shield. The deposit is located at or near the unconformity contact between the Athabasca Group sandstones and underlying metasedimentary rocks of the Wollaston Domain.
The deposit is similar to other Athabasca Basin deposits but is distinguished by its very high grade and overall size. Unlike Cigar Lake, there is no development of extensive hydrothermal clay alteration in the sandstone above the uranium mineralization and the deposit is relatively simple geochemically with negligible amounts of other metals.
McArthur River’s geological setting is similar to the Cigar Lake deposit in that the sandstone that overlies the deposit and basement rocks contains large volumes of water at significant pressure.
Mineralization
McArthur River’s mineralization is structurally controlled by a northeast-southwest trending reverse fault (the P2 fault), which dips 40-65 degrees to the southeast and has thrust a wedge of basement rock into the overlying sandstone with a vertical displacement ranging between 60 and 80 metres.
The deposit consists of nine mineralized zones with delineated mineral resources and/or reserves: Zones 1, 2, 3, 4, 4 South, A, B, McA North 1 and McA North 2. These and three under-explored mineralized showings, known as McA North 3, McA North 4 and McA South 1, as well as other mineralized occurrences have been identified over a strike length of 2,700 metres.
The main part of the mineralization, generally at the upper part of the basement wedge, averages 12.7 metres in width and has a vertical extent ranging between 50 metres and 120 metres.
The deposit has two distinct styles of mineralization:
| • | high-grade mineralization at the unconformity near the P2 reverse fault and within both sandstone and basement rocks |
| • | fracture controlled and vein like mineralization that occurs in the sandstone away from the unconformity and within the basement quartzite |
The high-grade mineralization along the unconformity constitutes most of the mineralization within the McArthur River deposit. Mineralization occurs across a zone of strongly altered basement rocks and sandstone across both the unconformity and the P2 structure. Mineralization is generally within 15 metres of the basement/sandstone contact with the exception of Zone 2.
Uranium oxide in the form of uraninite and pitchblende (+/- coffinite) occurs as disseminated grains in aggregates ranging in size from millimetres to decimetres, and as massive mineralization up to several metres thick.
2024 ANNUAL INFORMATION FORM Page 32
Geochemically, the deposit does not contain any significant quantities of the elements nickel, copper, cobalt, lead, zinc, molybdenum, and arsenic that are present in other unconformity related Athabasca uranium deposits although locally elevated quantities of these elements have been observed in Zone B.
Deposit type
McArthur River is an unconformity-associated uranium deposit. Deposits of this type are believed to have formed through an oxidation-reduction reaction at a contact where oxygenated fluids met with reducing fluids. The geological model was confirmed by surface drilling, underground drilling, development, and production activities.
About the McArthur River operation
McArthur River is a fully developed property with sufficient surface rights to meet current mining operation needs. In February 2018, we began a planned 10-month production suspension. In response to market conditions, in July 2018 we extended the suspension for an indefinite duration. In February 2022, we announced and began the transition from care and maintenance back into production.
We began construction and development of the McArthur River mine in 1997 and completed it on schedule. Mining began in December 1999 and commercial production on November 1, 2000. We have successfully packaged approximately 358.1 million pounds (100% basis) since we began mining in 1999.
The mineral reserves at McArthur River are contained within seven zones: Zones 1, 2, 3, 4, 4 South, A and B. There are currently two active mining zones (Zone 2 and 4), one with development significantly advanced (Zone 1), and one in the early-to-mid stages of development (Zone 4 South).
Zone 2 has been actively mined since production began in 1999. The ore zone was initially divided into three freeze panels. As the freeze wall was expanded, the inner connecting freeze walls were decommissioned to recover the inaccessible uranium around the active freeze pipes. Mining of Zone 2 is almost complete. About 3.1 million pounds of mineral reserves remain secured behind a freeze wall, and we expect to recover them using a combination of raisebore and blasthole stope mining.
Zone 4 has been actively mined since 2010. The zone was divided into four freeze panels, and like in Zone 2, as the freeze wall was expanded, the inner connecting freeze walls were decommissioned. Zone 4 has 87.5 million pounds of mineral reserves secured behind freeze walls, and it will be the main source of production for the next several years. Raisebore and blasthole stope mining will be used to recover the mineral reserves.
Zone 1 is the next planned mine area to be brought into production. Freeze hole drilling was completed in 2023 and brine distribution construction and commissioning was completed in 2024. All freeze walls are actively freezing and it is predicted that an active freeze wall will be in place in the second quarter of 2025. Once an active freeze wall has been established, drill and extraction chamber development will need to be completed prior to the start of production (first production expected late 2025). Once complete, an additional 48.0 million pounds of mineral reserves will be secured behind freeze walls. Blasthole stope mining is currently planned as the main extraction method in Zone 1.
Zone 4 South remains in the early development stages. Development for the freeze drifts is in progress on the lower levels and freeze drilling continues on the completed upper freeze drifts. Brine distribution work is scheduled to begin on the upper levels in 2025.
We plan to expand both underground and surface exploration activities in 2025.
Permits
We need three key permits to operate the McArthur River mine:
| • | Uranium Mine Operating Licence – renewed in 2023 and expires in October 2043 (from the CNSC); |
| • | Approval to Operate Pollutant Control Facilities – renewed in 2022 and expires on June 30, 2028 (from the Saskatchewan Ministry of Environment (SMOE)); and |
| • | Water Rights Licence and Approval to Operate Works – amended in 2011 and valid for an undefined term (from the Saskatchewan Watershed Authority) |
The CNSC licence conditions handbook allows McArthur River to produce up to 25.0 million pounds (100% basis) per year.
2024 ANNUAL INFORMATION FORM Page 33
Infrastructure
Surface facilities are 550 metres above sea level. The site includes:
| • an underground mine with three shafts: one full service shaft and two ventilation shafts
• 1.6-kilometre gravel airstrip and air terminal
• waste rock stockpiles
• water containment ponds and treatment plant
• a freshwater pump house
• a powerhouse
• electrical substations |
• backup electrical generators
• a warehouse
• freeze plants
• a concrete batch plant
• an administration and maintenance shop building
• a permanent residence and recreation facilities
• an ore slurry load out facility |
Water, power and heat
Toby Lake, which is nearby and easy to access, has enough water to satisfy all surface water requirements. Collection of groundwater that naturally enters our shafts is sufficient to meet all underground process water requirements and supplements the surface industrial water supply. The site is connected to the provincial power grid, and it has backup generators in case there is an interruption in grid power.
McArthur River operates throughout the year despite cold winter conditions. During the winter, we heat the fresh air necessary to ventilate the underground workings using propane-fired burners.
Employees
Employees are recruited with preference given to residents of northern Saskatchewan.
The collective agreement with the United Steelworkers Local 8914 expired in December 2022 and a new three-year contract was approved by union membership in July 2024. The new collective agreement expires in December 2025.
Mining
The McArthur River deposit presents unique challenges that are not typical of traditional hard or soft rock mines. These challenges are the result of mining in or near high pressure ground water in challenging ground conditions with significant radiation concerns due to the high-grade uranium ore. We take significant steps and precautions to reduce the risks. Mine designs and mining methods are selected based on their ability to mitigate hydrological, radiological, and geotechnical risks. Operational experience gained since the start of production has resulted in a significant reduction in risk. However, there is no guarantee that our efforts to mitigate risk will be successful.
Mining methods and techniques
All the mineralized areas discovered to date at McArthur River are in, or partially in, water-bearing ground with significant pressure at mining depths.
There are three approved mining methods at McArthur River: raisebore mining, blasthole stope mining and boxhole mining. However, only raisebore and blasthole stope mining remain in use. Before we begin mining an area, we freeze the ground around it by circulating chilled brine through freeze holes to form an impermeable frozen barrier.
Blasthole stope mining
Blasthole stope mining began in 2011 and is the main extraction method planned for future production. It is planned in areas where blastholes can be accurately drilled and small stable stopes excavated without jeopardizing the freeze wall integrity. The use of this method has allowed the site to improve operating costs by increasing overall extraction efficiency by reducing underground development, concrete consumption, mineralized waste generation and improving extraction cycle time.
Raisebore mining
Raisebore mining is an innovative non-entry approach that we adapted to meet the unique challenges at McArthur River, and it has been used since mining began in 1999. This method is favourable for mining the weaker rock mass areas of the deposit and is suitable for massive high-grade zones where there is access both above and below the ore zone.
2024 ANNUAL INFORMATION FORM Page 34
Initial processing
McArthur River produces two product streams, high-grade slurry and low-grade mineralized rock. Both product streams are shipped to the Key Lake mill to produce uranium ore concentrate.
The high-grade material is ground with water and the resulting slurry is thickened underground and then pumped to surface. The material is then thickened again, blended for grade control and shipped to Key Lake in slurry totes using haul trucks.
The low-grade mineralized material is hoisted to surface and shipped as a dry product to Key Lake using covered haul trucks. Once at Key Lake, the material is ground with water, thickened and blended with the high-grade slurry to a nominal 5% U3O8 mill feed grade. It is then processed into uranium ore concentrate (UOC) and packaged in drums for further processing offsite.
Tailings
McArthur River does not have a tailings management facility (TMF) as it ships all mineralized material to Key Lake for milling and processing.
Waste rock
The waste rock piles are confined to a small footprint on the surface lease and managed in contained facilities. These are separated into three categories:
| • | clean waste (includes mine development waste, crushed waste, and various piles for concrete aggregate and backfill) |
| • | low-grade mineralized material which is temporarily stored on lined pads until trucked to Key Lake |
| • | waste with acid-generating potential – temporarily stored on lined pads – for concrete aggregate |
Water inflow incidents
There have been two notable water inflow incidents at the McArthur River mine. These two inflows have strongly influenced our mine design, inflow risk mitigation and inflow preparedness:
Bay 12 Inflow: Production was suspended on April 6, 2003, as increased water inflow due to a rock fall in a new development area (Bay 12 located just above the 530-metre level) began to flood the lower portions of the mine, including the underground grinding circuit area. Additional dewatering capacity was installed, and the flooded areas were dewatered and repaired. We resumed mining in July 2003 and sealed off the excess water inflow in July 2004.
590-7820N Inflow: In November 2008, there was a small water inflow in the lower Zone 4 development area on the 590-metre level. It did not impact production but did delay local development for approximately one year. In January 2010, the inflow was sealed off and local development was resumed.
Pumping capacity and treatment limits
Our standard for this mine is to secure pumping capacity of at least one and a half times the estimated maximum sustained inflow. We review our dewatering system and requirements at least once a year and before we begin work on any new zone. As our mine plan is advanced, our dewatering system will be expanded to handle water from the new mine areas. We believe we have sufficient pumping, water treatment and surface storage capacity to handle the estimated maximum sustained inflow.
Production
McArthur River Mine
No mining took place from February 2018 through October 2022. In 2022, we produced 0.64 million pounds (0.45 million pounds our share), in 2023, we produced 14.8 million pounds (10.3 million pounds our share) and in 2024, we produced 15.8 million pounds (11.0 million pounds our share). We plan to produce 18 million pounds (100% basis) in 2025.
The mine plan is designed to extract all current McArthur River mineral reserves. The following is a general summary of the mine plan production schedule parameters on a 100% basis for these mineral reserves:
2024 ANNUAL INFORMATION FORM Page 35
| Total mine production | • 2,086,000 tonnes of ore
• 357.7 million pounds of U3O8, based on current unmined mineral reserves
• Average grade of 7.78%
• 200 to 360 tonnes per day, varying with ore grade (18 million pound annual mine rate) |
Note: Broken and in-circuit ore inventory (previously mined material) is not included in the mine production plan total. Current broken inventory consists of 0.6 million pounds at McArthur River and 1.3 million pounds at Key Lake.
Key Lake Mill
No milling took place from February 2018 through October 2022. In 2022, we packaged 1.1 million pounds (0.8 million pounds our share), in 2023, we packaged 13.5 million pounds (9.4 million pounds our share) and in 2024, we packaged 20.3 million pounds (14.2 million pounds our share).
The mill plan is designed to process all current McArthur River mineral reserves plus Key Lake low-grade mineralization remaining from the Deilmann and Gaertner pits. In addition, a small amount of recycled product from Blind River and Port Hope facilities is planned to be processed. The following is a general summary of the mill plan production schedule parameters on a 100% basis for these mineral reserves, mineralized material, and product:
| Total mill production | • 3,283,000 tonnes of mill feed including blend and recycle material
• Average feed grade of 5.01%
• 360 million pounds of U3O8 packaged based on an average recovery of 99.2% |
Production Suspension
In 2018, we had a temporary planned production suspension and in July 2018 we extended the suspension for an indeterminate duration. There was nominal production in 2018, as mining was completed and as a result of in-circuit inventory reduction in preparation for the extended care and maintenance period, and no production from 2019 through 2021. A reduced workforce remained at McArthur River and Key Lake to keep the facilities in a state of safe care and maintenance. Care and maintenance activities included mine dewatering, water treatment, freeze wall maintenance, and environmental monitoring, as well as preservation maintenance and monitoring of critical facilities.
Production Resumption Plan
With our February 2022 announcement to transition McArthur River and Key Lake from care and maintenance to resuming production, through most of 2022 we undertook the necessary operational readiness activities prior to restarting production. Operational readiness activities consisted of recruitment, training, infrastructure upgrades and commissioning as well as reactivation of mobile equipment previously stored for care and maintenance.
In November 2022, we announced that the first pounds of uranium ore from the McArthur River mine had been milled and packaged at the Key Lake mill, marking the achievement of initial production as these facilities transition back into normal operations. Total packaged production from McArthur River and Key Lake in 2022 was 1.1 million pounds (0.8 million pounds our share).
In 2022, production forecasts were revised as we worked through normal commissioning issues to integrate the existing and new assets with upgraded operational technology which caused some delays to the schedule at the mill. During the year, we expensed operational readiness costs of approximately $169 million directly to cost of sales. With the restart of production in 2023, we no longer expensed monthly operational readiness costs.
Production ramp-up activities continued in 2023 and 2024. The McArthur River mine produced 15.8 million pounds in 2024, which was less than its plan to mine 18.3 million pounds. The production shortfall was due primarily to an unplanned shutdown at the mine to accommodate ventilation repairs in shaft 2. In addition, the mine’s performance was impacted by the availability of mobile equipment (mainly due to the time required to order, receive and commission new mining equipment) and skilled workforce. However, total packaged production from McArthur River and Key Lake in 2024 was 20.3 million pounds (14.2 million pounds our share), compared to 13.5 million pounds (9.4 million pounds our share) in 2023. Total packaged production in 2024 exceeded our annual expectation of 19 million pounds (13.3 million pounds our share) principally due to investments during care and maintenance focused to improve and optimize the Key Lake mill, and by having sufficient ore
2024 ANNUAL INFORMATION FORM Page 36
feed material available, which included the ore mined at McArthur River in 2024 (which was lower than plan), supplemented by broken ore inventory at McArthur River and Key Lake that was carried over from 2023.
All required mining and milling activities have now resumed at McArthur and Key Lake and we plan to produce 18 million pounds in 2025. Although the performance of the Key Lake mill in 2024 demonstrated production rates and capacities that, when annualized, exceeded 18 million pounds, the operation’s output is currently constrained by McArthur River’s limited ability to increase the production of mined ore to feed the mill, and because the majority of the previously mined excess broken ore inventory that allowed the mill to exceed production expectations in 2024 has been processed. There are several operational risks that could impact the 2025 production plan, including the availability of personnel with the necessary skills and experience, aging infrastructure, and the potential impact of supply chain challenges on the availability of materials, reagents and equipment that carry with them the risks of not achieving our production plans. A significant amount of new equipment is expected to be delivered to site in 2025. In addition, some of the equipment is customized for use specifically at McArthur River and it therefore requires extensive testing and commissioning time, resulting in notable operational risks related to mobile equipment availability in 2025.
Licensed annual production capacity
The McArthur River mine and Key Lake mill are both licensed to produce up to 25 million pounds (100% basis) per year. To achieve annual production at the licensed capacity, additional investment will be required.
We are addressing aging infrastructure and potential bottlenecks at Key Lake and the advancement of freezing at McArthur River to ensure reliability and sustainability. While these projects are required to support and maintain capacity at current production levels, they have been classified as growth because they also position us for future production flexibility, including to its licensed annual capacity of 25 million pounds, although no decision on future production levels has been made. We will plan our production in line with market opportunities and our contract portfolio, demonstrating that we continue to be a responsible, long-term supplier of uranium fuel.
Key Lake mill
Location and access
The Key Lake mill is located in northern Saskatchewan, 570 kilometres north of Saskatoon. The site is 9 kilometres long and 5 kilometres wide and is connected to McArthur River by an 80-kilometre all-weather road. There is a 1.6-kilometre unpaved airstrip and an air terminal on the east edge of the site.
Permits
We need two key permits to operate the Key Lake mill:
| • | Uranium Mill Operating Licence – renewed in October 2023 and expires in October 2043 (from the CNSC); and |
| • | Approval to Operate Pollutant Control Facilities – renewed in 2021 and expires on November 30, 2029 (from the SMOE) |
The CNSC licence conditions handbook allows the Key Lake mill to produce up to 25.0 million pounds (100% basis) per year.
Supply
All McArthur River ore, including our share, is milled at Key Lake. We do not have a formal toll milling agreement with the Key Lake joint venture.
In June 1999, the Key Lake joint venture (Cameco and UEM) entered a toll milling agreement with Orano to process their total share of McArthur River ore. The terms of the agreement (as amended in January 2001) include the following:
| • | processing is at cost, plus a toll milling fee; and |
| • | the Key Lake joint venture owners are responsible for decommissioning the Key Lake mill and for certain capital costs, including the cost of any tailings management associated with milling Orano’s share of McArthur River ore |
2024 ANNUAL INFORMATION FORM Page 37
With the UEM distribution in 2009 (see History on page 30 for more information), we made the following changes to the agreement:
| • | the fees and expenses related to Orano’s pro-rata share of ore produced just before the UEM distribution (16.234% – the first ore stream) have not changed. Orano is not responsible for any capital or decommissioning costs related to the first ore stream. |
| • | the fees and expenses related to Orano’s pro-rata share of ore produced as a result of the UEM distribution (an additional 13.961% – the second ore stream) have not changed. Orano’s responsibility for capital and decommissioning costs related to the second ore stream are, however, as a Key Lake joint venture owner under the original agreement. |
The agreement was amended again in 2011 and now requires:
| • | milling of the first ore stream at the Key Lake mill until May 31, 2028; and |
| • | milling of the second ore stream at the Key Lake mill for the entire life of the McArthur River project. |
Processing
McArthur River low-grade mineralization, including legacy low-grade mineralized waste rock stored at Key Lake, is ground and thickened at Key Lake and then blended with McArthur River high-grade slurry to a nominal 5% U3O8 mill feed grade. All remaining uranium processing (leaching through to calcined uranium ore concentrate packaging) and tailings disposal also occur at Key Lake.
The Key Lake mill comprises the following eight plants:
| • | ore slurry receiving plant |
| • | grinding/blending plant |
| • | reverse osmosis plant |
| • | leaching/counter current decantation plant |
| • | solvent extraction plant |
| • | yellowcake precipitation//calcining/packaging/ammonium sulfate plant |
| • | bulk neutralization/lime handling/tailings treatment and pumping |
| • | powerhouse/utilities/acid plant/oxygen plant complex |
Recovery and metallurgical testing
The McArthur River original flowsheet was largely based on the use of conventional mineral processing concepts and equipment. Where necessary, testwork was undertaken to prove design concepts or adapt conventional equipment for unique services. Simulated ore was utilized in much of the testwork because the off-site testing facilities were not licensed to receive radioactive materials. Testwork at the Key Lake metallurgical laboratory also confirmed the suitability of the Key Lake mill circuit for processing McArthur River ore with some Key Lake circuit modifications.
To date, numerous changes have been made to both the McArthur River and Key Lake processing and water treatment circuits to improve their operational reliability and efficiency. From a uranium recovery perspective, the most important was to change the McArthur River grinding circuit classification system from screens to cyclones. This was completed in late 2009 and provided a measurable recovery increase as well as reduced particle segregation issues. From 2012 to 2017, Key Lake achieved an annual mill recovery of approximately 99.2% and this is assumed to continue.
Testing at Key Lake has shown that use of a silica coagulant was able to alleviate the issues caused by the cement dilution in the ore from McArthur River. This has eliminated the need to operate the gravity concentrator circuit as well as increased the solvent extraction circuit operational reliability.
Waste rock
There are five rock stockpiles at the Key Lake site:
| • | three contain non-mineralized waste rock. These will be decommissioned when the site is closed. |
| • | two contain low-grade mineralized material. These are used to reduce the grade of McArthur River ore slurry before it enters the mill circuits to maintain a nominal 5% U3O8 ore feed grade. |
Treatment of effluent
We modified Key Lake’s effluent treatment process to satisfy our licence and permit requirements.
2024 ANNUAL INFORMATION FORM Page 38
Tailings capacity
There are two TMFs at the Key Lake site:
| • | an above-ground impoundment facility, where tailings are stored within compacted till embankments. We have not deposited tailings here since 1996, and are looking at several options for decommissioning this facility in the future; and |
| • | the Deilmann open pit, which was mined out in the 1990s. Tailings from processing McArthur River ore are deposited in the Deilmann in-pit TMF. |
Beginning in July 2001, periodic sloughing of the pit walls in the western portion of the Deilmann TMF was experienced. We implemented a long-term stabilization plan, with the final phase completed in 2019.
Based upon the current licence conditions, tailings capacity is sufficient to mill all the known McArthur River mineral reserves and resources, should they be converted to reserves, with additional capacity to toll mill ore from other regional deposits.
Decommissioning and financial assurances
Updated preliminary decommissioning plans for McArthur River and Key Lake were submitted in 2017 and 2018 as part of the regular five-year update schedule. Prior to revising the letters of credit, approval of the updated plans is required from the province of Saskatchewan and CNSC staff as well as formal approval from the CNSC through a Commission proceeding. The necessary approvals were received. The documents included our estimated cost for implementing the plans and addressing known environmental liabilities.
In 2022, as part of the required five-year update schedule, we submitted revised preliminary decommissioning estimates for McArthur River and Key Lake, which are currently being reviewed by the province of Saskatchewan and CNSC staff.
For more information, see Nuclear waste management and decommissioning.
Operating and capital costs
The following is a summary of the operating and capital cost estimates for the life of mine, stated in constant 2024 dollars and reflecting a forecast life-of-mine mill production of 360 million pounds U3O8 packaged.
| Operating Costs ($Cdn million) |
Total (2025 – 2044) |
|||
| McArthur River Mining |
||||
| Site administration |
$ | 1,192.9 | ||
| Mining costs |
2,115.8 | |||
| Process |
334.2 | |||
| Corporate overhead |
311.0 | |||
|
|
|
|||
| Total mining costs |
$ | 3,953.9 | ||
|
|
|
|||
| Key Lake Milling |
||||
| Administration |
$ | 1,014.9 | ||
| Milling costs |
2,033.9 | |||
| Corporate overhead |
307.6 | |||
|
|
|
|||
| Total milling costs |
$ | 3,356.4 | ||
|
|
|
|||
| Total operating costs |
$ | 7,310.3 | ||
|
|
|
|||
| Total operating cost per pound U3O8 |
$ | 20.31 | ||
|
|
|
|||
Note: Presented as total cost to the McArthur River Joint Venture.
Estimated operating costs to the MRJV consist of annual expenditures at McArthur River to mine the mineral reserves, process it underground, including grinding, thickening, pumping the resulting slurry to surface and transporting it to Key Lake, as well as the costs associated with the low-grade mineralized waste brought to surface and transported to Key Lake for ore blending purposes.
2024 ANNUAL INFORMATION FORM Page 39
Operating costs at Key Lake consist of costs for receipt of the slurry, grinding of mineralized waste for blending, processing of the ore up to and including precipitation, dewatering, calcining and packaging of the yellowcake into drums, including the cost of tailings placement for long-term storage in the Deilmann TMF.
We expect increased operating costs primarily related to maintaining the long-term reliability of our assets at both sites. Maintenance costs have increased substantially in the past year due to increases in the costs of materials and supplemental contractor labour.
| Capital Costs ($Cdn million) |
Total (2025 – 2044) |
|||
| McArthur River Mine Development |
$ | 458.6 | ||
| McArthur River Mine Capital |
||||
| Freeze infrastructure |
$ | 141.3 | ||
| Water management |
22.9 | |||
| Concrete batching and delivery |
34.7 | |||
| Other mine capital |
433.8 | |||
|
|
|
|||
| Total mine capital |
$ | 632.7 | ||
|
|
|
|||
| Key Lake Mill Sustaining |
||||
| Total mill capital |
$ | 621.6 | ||
|
|
|
|||
| Total capital costs |
$ | 1,712.9 | ||
|
|
|
|||
Notes:
| 1. | Presented as total cost to the MRJV. |
| 2. | Mine development includes delineation drilling, mine development, probe and grout drilling, freeze drilling, and minor support infrastructure. |
Estimated capital costs to the MRJV include sustaining costs for both McArthur River and Key Lake, as well as underground development at McArthur River to bring undeveloped mineral reserves into production. Overall, the largest segment of capital at McArthur River is mine development. Other significant capital includes freeze infrastructure costs.
Capital costs have increased due to investments required to refresh aging infrastructure to help ensure reliable and sustainable production, including work required to upgrade the calciner and crystallization circuit at Key Lake.
The economic analysis, effective as of December 31, 2018, being the effective date of the technical report for McArthur River and Key Lake operations, resulted in an estimated pre-tax net present value (NPV) (at a discount rate of 8%) to Cameco for net cash flows from January 1, 2019 forward of $2.97 billion for its share of the current McArthur River mineral reserves. Using the total capital invested to December 31, 2018, along with the operating and capital estimates for the remainder of the mineral reserves, the pre-tax internal rate of return (IRR) was estimated to be 11.6%.
The analysis was from the point of view of Cameco, which owns 69.805% of the MRJV, and incorporated a projection of Cameco’s sales revenue from its proportionate share of the related production, less its share of related operating and capital costs of the MRJV, as well as royalties and surcharges that will be payable on the sale of concentrates.
For the purpose of the economic analysis, the projected impact of income taxes was excluded due to the nature of the required calculations. McArthur River operates as an unincorporated joint venture and is, therefore, not subject to direct income taxation at the joint venture level. It is not practical to allocate a resulting income tax cost to Cameco’s portion of the McArthur River operation, as Cameco’s tax expense is a function of several variables, most of which are independent of its investment in McArthur River.
2024 ANNUAL INFORMATION FORM Page 40
| Economic |
Year 0 | Year 1 | Year 2 | Year 3 | Year 4 | Year 5 | Year 6 | Year 7 | Year 8 | Year 9 | Year 10 | Year 11 | Year 12 | |||||||||||||||||||||||||||||||||||||||
| Production volume (000’s lbs U308) |
— | 2,788 | 12,508 | 12,550 | 12,653 | 12,591 | 12,621 | 12,611 | 12,550 | 12,556 | 12,587 | 12,553 | 12,569 | |||||||||||||||||||||||||||||||||||||||
| Sales revenue |
$ | — | $ | 131.7 | $ | 572.2 | $ | 577.5 | $ | 602.8 | $ | 618.7 | $ | 635.0 | $ | 651.6 | $ | 662.9 | $ | 683.3 | $ | 698.0 | $ | 709.1 | $ | 719.4 | ||||||||||||||||||||||||||
| Operating costs |
68.2 | 137.5 | 171.1 | 169.5 | 169.0 | 168.9 | 170.1 | 172.9 | 177.5 | 177.9 | 179.3 | 179.9 | 180.0 | |||||||||||||||||||||||||||||||||||||||
| Capital costs |
3.7 | 31.1 | 36.7 | 31.9 | 31.0 | 42.9 | 36.8 | 34.7 | 35.0 | 42.6 | 43.6 | 74.4 | 32.0 | |||||||||||||||||||||||||||||||||||||||
| Basic royalty |
— | 5.6 | 24.3 | 24.5 | 25.6 | 26.3 | 27.0 | 27.7 | 28.2 | 29.0 | 29.7 | 30.1 | 30.6 | |||||||||||||||||||||||||||||||||||||||
| Resource surcharge |
— | 3.9 | 17.2 | 17.3 | 18.1 | 18.6 | 19.0 | 19.5 | 19.9 | 20.5 | 20.9 | 21.3 | 21.6 | |||||||||||||||||||||||||||||||||||||||
| Profit royalty |
— | — | 42.6 | 49.7 | 53.5 | 54.1 | 57.3 | 59.6 | 60.4 | 62.3 | 64.1 | 61.1 | 69.1 | |||||||||||||||||||||||||||||||||||||||
| Net pre-tax cash flow |
$ | (71.9 | ) | $ | (46.5 | ) | $ | 280.2 | $ | 284.6 | $ | 305.5 | $ | 307.9 | $ | 324.8 | $ | 337.2 | $ | 341.8 | $ | 351.0 | $ | 360.4 | $ | 342.3 | $ | 386.2 | ||||||||||||||||||||||||
| Economic Analysis |
Year 13 | Year 14 | Year 15 | Year 16 | Year 17 | Year 18 | Year 19 | Year 20 | Year 21 | Year 22 | Year 23 | Total | ||||||||||||||||||||||||||||||||||||
| Production volume (000’s lbs U308) |
12,567 | 12,630 | 12,618 | 12,602 | 12,591 | 12,603 | 12,611 | 12,649 | 12,779 | 11,705 | 6,060 | 272,553 | ||||||||||||||||||||||||||||||||||||
| Sales revenue |
$ | 748.7 | $ | 757.8 | $ | 772.9 | $ | 787.6 | $ | 780.6 | $ | 787.7 | $ | 794.5 | $ | 796.9 | $ | 805.1 | $ | 737.4 | $ | 381.8 | $ | 15,413.2 | ||||||||||||||||||||||||
| Operating costs |
182.1 | 184.7 | 185.3 | 184.5 | 184.0 | 182.1 | 181.8 | 178.8 | 175.4 | 171.0 | 148.6 | 4,080.3 | ||||||||||||||||||||||||||||||||||||
| Capital costs |
33.3 | 23.6 | 21.7 | 21.4 | 21.6 | 21 .9 | 17.7 | 11.9 | 6.4 | 1.4 | — | 657.5 | ||||||||||||||||||||||||||||||||||||
| Basic royalty |
31.8 | 32.2 | 32.8 | 33.5 | 33.2 | 33.5 | 33.8 | 33.9 | 34.2 | 31.3 | 16.2 | 655.1 | ||||||||||||||||||||||||||||||||||||
| Resource surcharge |
22.5 | 22.7 | 23.2 | 23.6 | 23.4 | 23.6 | 23.8 | 23.9 | 24.2 | 22.1 | 11.5 | 462.4 | ||||||||||||||||||||||||||||||||||||
| Profit royalty |
73.1 | 75.7 | 78.1 | 80.5 | 79.5 | 80.8 | 82.5 | 84.2 | 86.6 | 78.5 | 31.7 | 1,465.0 | ||||||||||||||||||||||||||||||||||||
| Net pre-tax cash flow |
$ | 405.9 | $ | 418.9 | $ | 431.7 | $ | 444.1 | $ | 438.9 | $ | 445.7 | $ | 454.9 | $ | 464.3 | $ | 478.2 | $ | 433.0 | $ | 173.8 | $ | 8,092.9 | ||||||||||||||||||||||||
| Pre-tax NPV (8%) to January 1, 2019 | $2,973.3 | |
| Pre-tax IRR(%) | 11.6% |
Notes:
| 1. | Production volume does not include recycled product received from the Blind River Refinery and the Port Hope Conversion Facility. |
Our expectations and plans regarding McArthur River/Key Lake, including forecasts of operating and capital costs, net cash flow, production and mine life are forward-looking information and are based specifically on the risks and assumptions discussed on pages 4, 5 and 6. We may change our operating or capital spending plans in 2025, depending upon uranium markets, our financial position, results of operation, or other factors. Estimates of expected future production, and capital and operating costs are inherently uncertain, particularly beyond one year, and may change materially over time.
Exploration, drilling, sampling, data quality and estimates
There are no historical mineral resource estimates within the meaning of NI 43-101 to report. The original McArthur River mineral resource estimates were derived from surface diamond drilling from 1980 to 1992. In 1988 and 1989, this drilling first revealed significant uranium mineralization and by 1992, we had delineated the mineralization over a strike length of 1,700 metres at depths of between 500 to 640 metres. Following the drillhole results, development of an underground exploration project was undertaken in 1993.
Exploration
Drilling has been carried out extensively from both surface and underground to locate and delineate mineralization. Surface exploration drilling is initially used in areas where underground access is not available. The results are used to guide future underground exploration activities.
Drilling
Surface drilling
We have carried out surface drilling since 2004, to test the extension of mineralization identified from the historical surface drillholes, to test new targets along the strike, and to evaluate the P2 trend northeast and southwest of the mine. Surface drilling since 2004 has extended the potential strike length to more than 2,700 metres.
We have completed preliminary drill tests of the P2 trend at 300 metre intervals or less over 11.5 kilometres (5.0 kilometres northeast and 6.4 kilometres southwest of the McArthur River deposit) of the total 13.75 kilometres strike length of the P2 trend. Surface exploration drilling in 2015 focused on additional evaluation in the southern part of the P2 trend south of the P2 main mineralization. Starting in 2016, exploration efforts mostly shifted away from the P2 trend to the north part of the property.
2024 ANNUAL INFORMATION FORM Page 41
Underground drilling
In 1993, regulators approved an underground exploration program, consisting of shaft sinking, lateral development and drilling. We completed the shaft in 1994.
We have drilled more than 1,350 underground drillholes since 1993 to get detailed information along 1,800 metres of strike length. The drilling was primarily completed from the 530 and 640 metre levels.
Other data
In addition to the exploration drilling, geological data has been collected from the underground probe and grout, service, drain, freeze, and geotechnical drill programs.
Recent activity
Underground exploration at McArthur River continued in 2024 with the main focus areas being infill drilling of Zones A and B.
Sampling, analysis and data verification
Surface samples
Surface holes were generally drilled on sections spaced between 50 and 200 metres with 12 to 25 metres between holes on a section when necessary. Drilled depths average 670 metres.
The orientation of mineralization is variable but, in general, vertical holes generally intersect mineralization at angles of 25 to 45 degrees, resulting in true widths being 40 to 70% of the intersected width. Angled holes usually intercept mineralization closer to perpendicular, giving intercepts that are closer to true width.
Any stratigraphy exhibiting noteworthy alteration, structures or radiometric anomalies is split and sampled.
Given that the vast majority of the deposit has been delineated from underground, few surface holes are used for mineral resource and reserve estimation purposes.
Underground samples
Underground drilling is generally planned to provide close to true thicknesses results. All underground exploration holes are core drilled and gamma probed whenever possible. McArthur River uses a high-flux gamma probe designed and constructed by alphaNUCLEAR, a member of the Cameco group of companies. This high-flux gamma probe utilizes two Geiger Műller tubes to detect the amount of gamma radiation emanating from the surroundings. The count rate obtained from the high-flux probe is compared against chemical assay results to establish a correlation to convert corrected probe count rates into equivalent % U3O8 grades for use when assay results are unavailable. The consistency between probe data and chemical assays demonstrates that secular equilibrium exists within the deposit. A small portion of the data used to estimate mineral resources is obtained from assays, and in these cases, the core depth is validated by comparing the downhole gamma survey results with a hand-held scintillometer on core before it is logged, photographed, and then sampled for uranium analysis. Attempts are made to avoid having samples cross geological boundaries.
When sampled, the entire core from each sample interval is taken for assay or other measurements to characterize the physical and geochemical properties of the deposit. This reduces the potential sample bias inherent when splitting core. Core recovery throughout the deposit has generally been very good. However, in areas of poor core recovery, uranium grade determination is generally based on radiometric probe results.
The typical sample collection process at our operations is performed by or under the supervision of a qualified geoscientist and includes the following procedures:
| • | marking the sample intervals on the core boxes at nominal 0.5 metre sample lengths |
| • | collection of the samples in plastic bags, taking the entire core |
| • | documentation of the sample location, assigning a sample number, and description of the sample, including radiometric values from a hand-held device |
| • | bagging and sealing, with sample tags inside bags and sample numbers on the bags |
| • | placement of samples in steel drums for shipping |
2024 ANNUAL INFORMATION FORM Page 42
Sample security
Current sampling protocols dictate that all samples are collected and prepared in a restricted core processing facility. The core samples are collected and transferred from the core boxes to high-strength plastic sample bags, then sealed. The sealed bags are then placed in steel drums and shipped in compliance with the Transport of Dangerous Goods regulations with tamper-resistant security seals. Chain of custody documentation is present from inserting samples into steel drums to the final delivery of results by the Saskatchewan Research Council Geoanalytical Laboratories (SRCGL).
All samples collected are prepared and analysed under the close supervision of qualified personnel at SRCGL, which is a restricted access laboratory licensed by the CNSC.
Analysis
Drill core assay sample preparation is performed at SRCGL’s main laboratory, which is independent of the participants of the MRJV. It involves jaw crushing to 80% passing at less than two millimetres and splitting out a 100- to 200-gram sub-sample using a riffle splitter. The sub-sample is pulverized to 90% at less than 106 microns using a puck and ring grinding mill. The pulp is then transferred to a bar coded plastic snap top vial. Assaying by SRCGL involves digesting an aliquot of pulp in concentrated 3:1 HCl:HNO3, on a hot plate for approximately one hour. The volume is then made up in a 100-millilitre volumetric flask using deionized water prior to analysis by ICP-OES. Instruments used in the analysis are calibrated using certified commercial solutions. This method is ISO/IEC 17025:2017 accredited by the Standards Council of Canada.
Quality control and data verification
The quality assurance and quality control procedures used during early drilling programs were typical for the time. Many of the original signed assay certificates from surface drilling are available and have been reviewed by Cameco geoscientists.
More recent sample preparation and assaying was completed under the supervision of qualified personnel at SRCGL and includes preparing and analysing standards, duplicates and blanks. At least two standards are analysed for each 40-sample batch. We also include a pulp repeat and one split sample repeat with every group. Samples that fail quality controls are re-analysed.
In 2013, McArthur River implemented a SQL server based centralized geological data management system to manage all drillhole and sample related data. All core logging, sample collection, downhole probing and sample dispatching activities are carried out and managed within this system. All assay, geochemical and physical analytical results obtained from the external laboratory are uploaded directly into the centralized database, thereby mitigating the potential for manual data transfer errors. The database used for the current mineral resource and mineral reserve estimates was validated by Cameco qualified geoscientists.
Additional data quality control measures include:
| • | surveyed drillhole collar coordinates and downhole deviations are entered into the database and visually validated and compared to the planned location of the holes |
| • | comparison of the information in the database against the original data, including paper logs, assay certificates and original probing data files as required. Approximately 15% of new holes drilled in Zone B were compared against the assay certificates with no discrepancies observed. |
| • | validation of core logging information in plan and section views, and review of logs against photographs of the core |
| • | checking for data entry errors such as overlapping intervals and out of range values |
| • | radiometric probes undergo annual servicing and re-calibration as well as additional checks including control probing to ensure precision and accuracy of the probes. Servicing and re-calibration of the probes were performed to support 2024 drilling activities. Control probing results in 2024 have been within acceptable tolerances. |
| • | validating uranium grades comparing radiometric probing, core radioactivity measurements and chemical assay results. New measurement data collected in 2024 was reviewed. No issues were observed. |
No mineral resource estimate updates were completed in 2024. Quality control and data verification activities described above will be finalized prior to the next resource estimate update.
2024 ANNUAL INFORMATION FORM Page 43
Since the start of commercial production, we have regularly compared information collected from production activities, such as freeze holes, raisebore pilot holes, radiometric scanning of scoop tram buckets and mill feed sampling, to the drillhole data informed models. We also compare the uranium block model with mine production results on a quarterly basis to ensure an acceptable level of accuracy is maintained. Results in 2024 were within acceptable tolerances.
Our geoscientists, including a qualified person as such term is defined in NI 43-101, have witnessed or reviewed drilling, core handling, radiometric probing, logging, sampling facilities, sampling and data verification procedures employed at the McArthur River operation and consider the methodologies to be satisfactory and the results representative and reliable. There has been no indication of significant inconsistencies in the data used or verified nor any failures to adequately verify the data.
Accuracy
We are satisfied with the quality of data and consider it valid for use in the estimation of mineral resources and reserves for McArthur River. Comparison of the actual mine production with the expected production supports this opinion.
Mineral reserve and resource estimates
Please see pages 98 and 99 for our mineral reserve and resource estimates for McArthur River.
Uranium – Tier-one operations
Cigar Lake
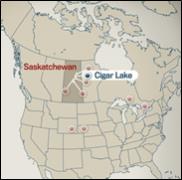
|
2024 Production (our share) 9.2M lb |
|
| 2025 Production Outlook (our share) 9.8M lb |
||
| Estimated Reserves (our share) 105.2M lb |
||
| Estimated Mine Life 2036 |
Cigar Lake is the world’s highest grade uranium mine. We are a 54.5% owner and the mine operator. Cigar Lake uranium ore is milled at Orano’s McClean Lake mill.
Cigar Lake is considered a material uranium property for us. There is a technical report dated March 22, 2024 (effective December 31, 2023) that can be downloaded from SEDAR+ (www.sedarplus.ca) or from EDGAR (www.sec.gov).
| Location | Saskatchewan, Canada | |
| Ownership | 54.547% | |
| Mine type | Underground | |
| Mining method | Jet boring system | |
| End product | Uranium concentrate | |
| Certification | ISO 14001 certified | |
| Estimated reserves | 105.2 million pounds (proven and probable), average grade U3O8: 15.87% | |
| Estimated resources | 12.9 million pounds (measured and indicated), average grade U3O8: 4.93%
|
|
| 10.9 million pounds (inferred), average grade U3O8: 5.55% | ||
| Licensed capacity | 18.0 million pounds per year (our share 9.8 million pounds per year) | |
| Licence term | Through June, 2031 | |
| Total packaged production: 2014 to 2024 | 155.4 million pounds (100% basis) | |
| 2024 production | 9.2 million pounds (16.9 million pounds on 100% basis) | |
| 2025 production outlook | 9.8 million pounds (18.0 million pounds on 100% basis) | |
| Estimated decommissioning cost | $76.5 million (100% basis) | |
|
All values shown, including reserves and resources, represent our share only, unless otherwise indicated. |
||
2024 ANNUAL INFORMATION FORM Page 44
Business structure
Cigar Lake is owned by a joint venture of three companies (CLJV):
| • | Cameco – 54.547% (operator) |
| • | Orano – 40.453% |
| • | TEPCO Resources Inc. – 5.000% |
History
| 1976 | • Canadian Kelvin Resources and Asamera Oil Corporation form an exploration joint venture, which includes the lands that the Cigar Lake mine was built on |
|
| 1977 | • SMDC, one of our predecessor companies, acquires a 50% interest |
|
| 1980 | • Waterbury Lake joint venture formed, includes lands now called Cigar Lake |
|
| 1981 | • Deposit discovered by surface drilling – it was delineated by a surface drilling program between 1982 and 1986 |
|
| 1985 | • Reorganization of the Waterbury Lake joint venture – Cigar Lake Mining Corporation becomes the operator of the Cigar Lake lands and a predecessor to Orano becomes the operator of the remaining Waterbury Lake lands
• SMDC has a 50.75% interest |
|
| 1987-1992 | • Test mining, including sinking shaft 1 to 500 metres and lateral development on 420 metre, 465 metre and 480 metre levels |
|
| 1988 | • Eldorado Resources Limited merges with SMDC to form Cameco |
|
| 1993-1997 | • Canadian and Saskatchewan governments authorize the project to proceed to regulatory licensing stage, based on recommendation of the joint federal-provincial panel after public hearings on the project’s environmental impact |
|
| 2000 | • JBS tested in waste and frozen ore |
|
| 2001 | • Joint venture approves a feasibility study and detailed engineering begins in June |
|
| 2002 | • Joint venture is reorganized, new joint venture agreement is signed, Rabbit Lake and JEB toll milling agreements are signed, and we replace Cigar Lake Mining Corporation as Cigar Lake mine operator |
|
| 2004 | • Environmental assessment process is complete
• CNSC issues a construction licence |
|
| 2005 | • Development begins in January |
|
| 2006 | • Two water inflow incidents delay development:
• in April, shaft 2 floods
• in October, underground development areas flood
• In November, we begin work to remediate the underground development areas |
|
| 2008 | • Remediation interrupted by another inflow in August, preventing the mine from being dewatered |
|
| 2009 | • Remediation of shaft 2 completed in May
• We seal the 2008 inflow in October |
|
| 2010 | • We finish dewatering the underground development areas in February, establish safe access to the 480 metre level, the main working level of the mine, and backfill the 465 metre level
• We substantially complete clean-up, inspection, assessment and securing of underground development and resume underground development in the south end of the mine |
|
| 2011 | • We begin to freeze the ground around shaft 2 and restart freezing the orebody from underground and from the surface
• We resume the sinking of shaft 2 and early in 2012 achieve breakthrough to the 480 metre level, establishing a second means of egress for the mine
• We receive regulatory approval of our mine plan and begin work on our Seru Bay project
• Agreements are signed by the Cigar Lake and McClean Lake joint venture participants to mill all Cigar Lake ore at the McClean Lake mill and the Rabbit Lake toll milling agreement is terminated |
|
2024 ANNUAL INFORMATION FORM Page 45
| 2012 | • We achieve breakthrough to the 500 metre level in shaft 2
• We assemble the first JBS unit underground and move it to a production tunnel where we commence preliminary commissioning |
|
| 2013 | • CNSC issues an eight-year operating licence
• We begin jet boring in ore |
|
| 2014 | • First Cigar Lake ore shipped to McClean Lake mill
• McClean Lake mill starts producing uranium concentrate from Cigar Lake ore |
|
| 2015 | • We declared commercial production in May |
|
| 2016 | • We updated the CNSC on our commissioning activities to satisfy a condition in our federal licence |
|
| 2020 | • In March, production is temporarily suspended as a precautionary measure due to the COVID-19 pandemic
• In September, production resumes
• In December, production is temporarily suspended as a precautionary measure due to the COVID-19 pandemic |
|
| 2021 | • In April, we announce plans to restart production
• In June, CNSC granted a 10-year renewal of Cigar Lake’s uranium operating licence |
|
| 2022 | • In February, we announce plans to reduce production at Cigar Lake in 2024 to 13.5 million pounds per year (100% basis), 25% below its annual licensed capacity
• In May, we acquire an additional 4.522 percentage interest in Cigar Lake, increasing our interest to 54.547% |
|
| 2023 | • We updated our production plans for Cigar Lake to maintain production of 18 million pounds per year (100% basis) in 2024 |
|
| 2024 | • We began work to extend the mine life to 2036, subject to receipt of all regulatory approvals, with estimated full annual production of 18 million pounds (100% basis) for 10 years followed by a two-year ramp-down until depletion |
|
Technical report
| This description is based on the project’s technical report: Cigar Lake Operation, Northern Saskatchewan, Canada, dated March 22, 2024 (effective December 31, 2023) except for some updates that reflect developments since the technical report was published. The report was prepared for us in accordance with NI 43-101, by or under the supervision of Biman Bharadwaj, P. Eng., Scott Bishop, P. Eng., Alain D. Renaud, P. Geo., and Lloyd Rowson, P. Eng. The following description has been prepared under the supervision of Kirk Lamont, P. Eng., Scott Bishop, P. Eng., Alain D. Renaud P. Geo., and Biman Bharadwaj, P. Eng. They are all qualified persons within the meaning of NI 43-101 but are not independent of us.
The conclusions, projections and estimates included in this description are subject to the qualifications, assumptions and exclusions set out in the technical report except as such qualifications, assumptions and exclusions may be modified in this AIF. We recommend you read the technical report in its entirety to fully understand the project. You can download a copy from SEDAR+ (www.sedarplus.ca) or from EDGAR (www.sec.gov). |
For information about uranium sales see pages 21 to 24, environmental matters see Our sustainability principles and practices and The regulatory environment starting on pages 102 and 105, and taxes see page 110.
For a description of royalties payable to the province of Saskatchewan on the sale of uranium extracted from orebodies within the province, see page 112.
For a description of risks that might affect access, title or the right or ability to perform work on the property, see Governance and compliance risks starting at page 130, Social risks starting at page 132 and Environmental risks starting at page 133. |
About the Cigar Lake property
We began developing the Cigar Lake underground mine in 2005, but development was delayed due to water inflows. In October 2014, the McClean Lake mill produced the first uranium concentrate from ore mined at the Cigar Lake operation. Commercial production was declared in May 2015. Since that time, mine operation has achieved full nameplate capacity.
2024 ANNUAL INFORMATION FORM Page 46
Location
The Cigar Lake mine site is located near Waterbury Lake, approximately 660 kilometres north of Saskatoon. The mine site is near other uranium production operations: McClean Lake mill is 69 kilometres northeast by road and McArthur River mine is 46 kilometres southwest by air from the mine site.
Access
Access to the property is by an all-weather road and by air. Site activities occur year-round, including supply deliveries. There is an unpaved airstrip and air terminal east of the mine site.
Saskatoon, a major population centre south of the Cigar Lake deposit, has highway, rail and air links to the rest of North America.
Leases
Surface lease
The CLJV acquired the right to use and occupy the lands necessary to mine the deposit under a surface lease agreement with the province of Saskatchewan. The lease covers approximately 715 hectares and expires in May 2044.
We are required to report annually on the status of the environment, land development and progress on northern employment and business development.
Mineral lease
We have the right to mine the deposit under ML 5521, granted to the CLJV by the province of Saskatchewan. The lease covers 308 hectares and expires in November 2031. The CLJV has the right to renew the lease for further 10-year terms.
Mineral claims
A mineral claim gives us the right to explore for minerals and to apply for a mineral lease. There are 39 mineral claims totaling 96,102 hectares, adjoining the mineral lease and surrounding the site. The mineral claims are in good standing until 2026 or later.
Environment, social and community factors
The climate is typical of the continental sub-arctic region of northern Saskatchewan. Summers are short and cool even though daily temperatures can sometimes reach above 30°C. The mean daily temperature for the coldest month is below -20°C, and winter daily temperatures can reach below -40°C.
The deposit is 40 kilometres west of the eastern margin of the Athabasca Basin in northern Saskatchewan. The topography and environment are typical of the taiga forested lands in the Athabasca Basin. This area is covered with 30 to 50 metres of overburden. Vegetation is dominated by black spruce and jack pine. There is a lake known as “Cigar Lake” which, in part, overlays the deposit.
We are committed to building long-lasting and trusting relationships with the communities in which we operate. For more information, see Our Sustainability principles and practices at page 102.
The closest inhabited site is Points North Landing, 56 kilometres northeast by road. The community of Wollaston Lake is approximately 80 kilometres by air to the east of the mine site.
Athabasca Basin community resident employees and contractors fly to the mine site from designed pick-up points. Other employees and contractors fly to site from Saskatoon with pickup points in Prince Albert and La Ronge.
Geological setting
The deposit is at the unconformity contact separating late Paleoproterozoic to Mesoproterozoic sandstone of the Athabasca Group from middle Paleoproterozoic metasedimentary gneiss and plutonic rocks of the Wollaston Group. The Key Lake, McClean Lake and Collins Bay deposits all have a similar structural setting. While Cigar Lake shares many similarities with these deposits, it is distinguished by its flat-lying geometry, size, the intensity of its alteration process, the high degree of associated hydrothermal clay alteration and the presence of massive, extremely rich, high-grade uranium mineralization.
2024 ANNUAL INFORMATION FORM Page 47
Cigar Lake’s geological setting is similar to McArthur River’s: the permeable sandstone, which overlays the deposit and basement rocks, contains large volumes of water at significant pressure. Unlike McArthur River, however, the deposit is flat-lying with the ore zone being overlain by variably developed clay alteration as opposed to silica enrichment.
Mineralization
The Cigar Lake deposit has the shape of a flat- to cigar-shaped lens and is approximately 1,950 metres in length, 25 to 100 metres in width, and ranges up to 15.7 metres thick, with an average thickness of about 5.4 metres. It occurs at depths ranging between 410 to 450 metres below the surface. The eastern part of Cigar Lake (CLMain) is approximately 670 metres long by 100 metres wide and the western part (CLExt) is approximately 1,280 metres long by 75 metres wide.
The deposit has two distinct styles of mineralization:
| • | high-grade mineralization at or proximal to the unconformity which includes all of the mineral resources and mineral reserves |
| • | low-grade, fracture controlled, vein-like mineralization which is located either higher up in the sandstone or in the basement rock mass |
The uranium oxide in the form of uraninite and pitchblende occurs as disseminated grains in aggregates ranging in size from millimetres to decimetres, and as massive metallic lenses of mineralization up to a few metres thick in a matrix of sandstone and clay. Coffinite (uranium silicate) is estimated to form less than 3% of the total uranium mineralization.
Geochemically, the deposit contains quantities of the elements nickel, copper, cobalt, lead, zinc, molybdenum, arsenic and rare earth elements, but in non-economic concentrations. Higher concentrations of these elements are associated with massive pitchblende or massive sections of arseno-sulfides.
Deposit type
Cigar Lake is an unconformity-related uranium deposit. Deposits of this type are believed to have formed through a redox reaction at a contact where oxygenated fluids met with reducing fluids. The geological model was confirmed by surface drilling, development, and production activities.
About the Cigar Lake operation
Cigar Lake is a developed property with sufficient surface rights to meet current mining operation needs. We are currently mining in the CLMain orebody. We have successfully packaged approximately 155.4 million pounds (100% basis) since we began mining in 2014.
Permits
Please see page 54 for more information about regulatory approvals for Cigar Lake.
Infrastructure
Surface facilities are 490 metres above sea level. The site includes:
| • an underground mine with two shafts
• access road joining the provincial highway and McClean Lake
• site roads and site grading
• airstrip and terminal
• employee residence and construction camp
• Shaft No. 1 and No. 2 surface facilities
• freeze plants and brine distribution equipment
• surface freeze pads
• water supply, storage and distribution for industrial water, potable water and fire suppression
• propane, diesel and gasoline storage and distribution
• electrical power substation and distribution |
• compressed air supply and distribution
• mine water storage ponds and water treatment
• sewage collection and treatment
• surface and underground pumping system installation
• surface runoff containment infrastructure
• waste rock stockpiles and aggregate processing infrastructure
• garbage disposal landfill
• administration, maintenance and warehousing facilities
• ore load out facility
• concrete batch plant
• Seru Bay treated water effluent pipeline
• emergency power generating facilities |
2024 ANNUAL INFORMATION FORM Page 48
The Cigar Lake mine site contains all the necessary services and facilities to operate a remote underground mine, including personnel accommodation, access to water, airport, site roads and other necessary buildings and infrastructure.
Water, power and heat
Waterbury Lake, which is nearby, provides water for the industrial activities and the camp. The site is connected to the provincial electricity grid, and it has standby generators in case there is an interruption in grid power.
Cigar Lake operates throughout the year despite cold winter conditions. During the winter, we use propane-fired burners to heat the fresh air necessary to ventilate the underground workings.
Employees
Employees are recruited with preference given to residents of northern Saskatchewan.
Mining
The Cigar Lake deposit presents unique challenges that are not typical of traditional hard or soft rock mines. These challenges are the result of mining in or near high-pressure ground water in challenging ground conditions with significant radiation concerns due to the high-grade uranium and elements of concern in the orebody with respect to water quality. We take significant steps and precautions to reduce the risks. Mine designs and the mining method are selected based on their ability to mitigate hydrological, radiological, and geotechnical risks. Operational experience gained since the start of production has resulted in a significant reduction in risk. However, there is no guarantee that our efforts to mitigate risk will be successful.
Mining methods
At Cigar Lake, the permeable sandstone which overlays the deposit and basement rocks, contains large volumes of water at significant pressure. Before we begin mining, we freeze the ore zone and surrounding ground. We use a jet boring system (JBS) to mine the ore.
Artificial ground freezing (AGF)
The current method of mining the Cigar Lake orebody uses progressive block freezing of portions of the mineralized zone and adjacent host rock. Freezing the orebody reduces the risk of potential inflow of groundwater and release of radon gas into the workplace, while increasing cavity stability and standup time during mining. The freezing strategy is to bulk freeze the ore zone and the surrounding area prior to start of mining in a given area. Frozen cavity criteria are applied to each cavity prior to mining to ensure it meets the minimum standard prior to excavation.
This AGF system freezes the deposit and surrounding rock to between -5°C and -25°C in two to four years, depending on freeze pipe geometry and ground properties such as water content and thermal conductivity.
JBS mining
As a result of the unique geological conditions at Cigar Lake, we are unable to utilize traditional mining methods that require access above the ore, which necessitated the development of a non-entry mining method specifically adapted for this deposit. After many years of test mining, we selected jet boring, a non-entry mining method, and it has been used since we began mining in 2014. This method involves:
| • | drilling a pilot hole into the frozen orebody, inserting a high-pressure water jet and cutting a cavity out of the frozen ore; |
| • | collecting the ore and water mixture (slurry) from the cavity and pumping it to a storage sump, allowing it to settle; |
| • | using a clamshell, transporting the ore from the storage sump to an underground crushing and grinding circuit; |
| • | once mining is complete, filling each cavity in the orebody with concrete; and |
| • | starting the process again with the next cavity |
2024 ANNUAL INFORMATION FORM Page 49
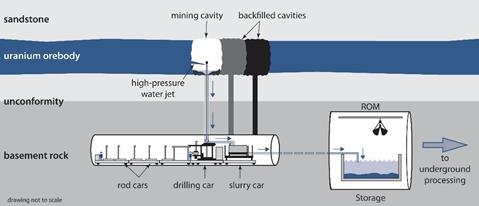
This is a non-entry method, which means mining is carried out from headings in the basement rock below the deposit, so employees are not exposed to the ore. This mining approach is highly effective at managing worker exposure to radiation levels. Combined with ground freezing and the cuttings collection and hydraulic conveyance system, jet boring reduces radiation exposure to acceptable levels that are below regulatory limits.
The mine equipment fleet is currently comprised of three JBS units plus other equipment to support mine development, drilling and other services. Additional scooptrams, plus some smaller ancillary equipment, will be added to the current equipment fleet to meet the production and development requirements for the remainder of the mine life.
We have divided the orebody into production panels. At least three production panels need to be frozen at one time to achieve the full annual production rate of 18 million pounds. One JBS machine will be located below each frozen panel and the three JBS machines required are currently in operation. Two machines can actively mine at any given time while the third is moving, setting up, backfilling or undergoing maintenance.
Mine development
Mine development for construction and operation uses two basic approaches: drill and blast and mechanical excavation with conventional ground support is applied in areas with a competent rock mass, and New Austrian Tunnelling Method (NATM) principles in areas of weak or poor quality rock mass. Most permanent areas of the mine, which contain the majority of the installed equipment and infrastructure, are hosted in competent rock mass and are excavated and supported conventionally. The production tunnels immediately below the orebody are primarily in poor, weak rock mass and are excavated and supported using NATM. NATM was adopted as the primary method of developing new production cross-cuts, replacing the former Mine Development System (MDS).
NATM, as applied at Cigar Lake, involves a multi-stage sequential mechanical excavation, extensive external ground support and a specialized shotcrete liner. The liner system incorporates yielding elements which permit controlled deformation required to accommodate additive pressure from mining and ground freezing activities. The production tunnels have an inside diameter of five metres and are approximately circular in profile.
We plan our mine development to take place away from known groundwater sources whenever possible. In addition, we assess all planned mine development for relative risk and apply extensive additional technical and operating controls for all higher risk development.
In order to successfully achieve the planned production schedule, we must continue to successfully transition into new mining areas, which includes mine development and investment in critical support infrastructure, and deployment of the jet boring method in new areas. If development or infrastructure construction work is delayed for any reason, including if the performance of our jet boring method is materially different in new areas than in previously mined areas, our ability to meet our future production plans may be impacted.
Mine access
There are two main levels in the mine: the 480 and 500 metre levels. Both levels are in the basement rocks below the unconformity. Mining is conducted from the 480-metre level which is located approximately 40 metres below the ore zone. The main underground processing and infrastructure facilities are located on this level. The 500-metre level is accessed via a ramp from the 480-metre level. The 500-metre level provides for the main ventilation exhaust drift for the mine, the mine dewatering sump and additional processing facilities. All construction required for production has been completed.
2024 ANNUAL INFORMATION FORM Page 50
Processing
Cigar Lake ore is processed at two locations:
Crushing and grinding of the ore is conducted underground at Cigar Lake, while leaching, purification and final yellowcake production and packaging occurs at the McClean Lake mill. The ore is trucked as a thickened finely ground slurry from Cigar Lake to the McLean Lake mill in purpose-built containers identical to those used to transport McArthur River ore slurry to the Key Lake mill.
Recovery and metallurgical testing
Extensive metallurgical test work was performed on core samples of Cigar Lake ore from 1992 to 1999. Samples used for the metallurgical test work during this period may not have been representative of the deposit as a whole. Additional test work completed by Orano in 2012 with drill core samples verified that a high uranium recovery rate could be achieved regardless of the variability of the ore. Test work also concluded that more hydrogen gas evolution took place than previously anticipated, which resulted in safety related modifications being implemented in the leaching circuit. Leaching modifications began in 2013 and were completed in 2014, with mill start-up in September 2014. Since 2014, the McClean Lake mill has processed on a daily basis a range of ore grades, at times in excess of 28% U (33% U3O8).
In 2018 and 2019, Orano completed test work on core samples from CLExt. The test work, combined with ongoing optimization and operating experience at the McClean Lake mill, confirmed that no modifications would be required to the mill circuits to process CLExt ore. Tailings neutralization and aging tests also completed during this period verified that the current operating practices at the McClean Lake mill will produce tailings that are stable over the long-term.
Based on the test results and past mill performance, an overall uranium recovery of 98.8% for CLMain and 98.5% for CLExt is expected for the remainder of the mine life.
Specific ore induced risks include:
| • | Elevated arsenic concentration in the mill feed may result in increased leaching circuit solution temperatures. This could result in a reduction in mill feed rates and additional capital and operating expense to modify the leaching process. |
| • | Hydrogen evolution rates in leaching may exceed the design capacity of the hydrogen gas control system resulting in reduced leach feed rates. Additional capital expense may be required to increase the capacity of the hydrogen gas control system. |
Tailings
Cigar Lake site does not have a TMF. The ore is processed at the McClean Lake mill. See Toll milling agreement below for a discussion of the McClean Lake TMF.
Waste rock
The waste rock piles are separated into three categories:
| • | clean waste – will remain on the mine site for use as aggregate for roads, concrete backfill and future site reclamation |
| • | mineralized waste (>0.03% U3O8) – will be disposed of underground at the Cigar Lake mine; and |
| • | waste with acid-generating potential – temporarily stored on lined pads and is used as aggregate for concrete backfill |
The latter two stockpiles are contained on lined pads; however, no significant mineralized waste has been identified during development to date.
2024 ANNUAL INFORMATION FORM Page 51
Production
The mine plan is designed to extract all current Cigar Lake mineral reserves. The following is a general summary of the mine plan production schedule parameters on a 100% basis for these mineral reserves:
| Total mill production | • 190.2 million pounds of U3O8, based on current mineral reserves and an overall milling recovery of 98.8% for CLMain and 98.5% for CLExt
• Full annual production of 18 million pounds of U3O8 |
|
| Total mine production | • 549,700 tonnes of ore |
|
| Average annual mine production | • 115 to 150 tonnes per day during peak production, depending on ore grade |
|
| Average mill feed grade | • 16% U3O8 |
|
Total packaged production from Cigar Lake in 2024 was 16.9 million pounds U3O8 (9.2 million pounds our share) compared to 15.1 million pounds U3O8 (8.2 million pounds our share) in 2023. In 2024, lower productivity from the mine was primarily the result of a lower production rate at the McClean Lake mill. At various times during the year, the mill was impacted by ore quality variances, like lower ore grades and/or higher arsenic levels, and by unplanned maintenance at the McClean Lake mill. The majority of downtime occurred in the first and third quarters of the year.
In 2025, we expect to produce at the licensed rate of 18 million pounds (100% basis) per year.
Inflation, the availability of personnel with the necessary skills and experience, and the impact of supply chain challenges on the availability of materials and reagents carry with them the risk of not achieving our production plans, production delays and increased costs in 2025 and future years.
Decommissioning and financial assurances
An updated preliminary decommissioning plan for Cigar Lake was submitted in 2017 and 2018 as part of the regular five-year update schedule. Prior to revising the letters of credit, approval of the updated plan is required from the province and CNSC staff as well as formal approval from the CNSC through a Commission proceeding. The necessary approvals were received. The document included our estimated cost for implementing the plan and addressing known environmental liabilities.
The reclamation and remediation activities associated with waste rock and tailings at the McClean Lake mill are covered by the plans and cost estimates for this facility.
In 2022, as part of the required five-year update schedule, we submitted a revised preliminary decommissioning estimate for Cigar Lake, which is currently awaiting CNSC review and approval.
For more information, see Nuclear waste management and decommissioning.
Water inflow and mine/mill development
Cigar Lake water inflow incidents
From 2006 through 2008, the Cigar Lake project suffered several setbacks because of three water inflow incidents. The first occurred in 2006, resulting in the flooding of the then partially completed Shaft No. 2. The two subsequent incidents involved inflows in the mine workings connected to Shaft No. 1 and resulted in flooding of the mine workings. We executed recovery and remediation plans for all three inflows. Re-entry into the main mine workings was achieved in 2010 and work to secure the mine was completed in 2011. The mine is fully remediated and entered commercial production in 2015.
Lessons learned from the inflows have been applied to the subsequent mine plan and development to reduce the risk of future inflows and improve our ability to manage them should they occur.
Increased pumping capacity
In 2012, we increased the installed mine dewatering capacity to 2,500 cubic metres per hour. Mine water treatment capacity has been increased to 2,550 cubic metres per hour, and regulatory approval to discharge routine and non-routine treated water to Seru Bay is in place. As a result, we believe we have sufficient pumping, water treatment and surface storage capacity to handle the estimated maximum inflow.
2024 ANNUAL INFORMATION FORM Page 52
Current status of development
Construction of all common major underground development and process facilities required for the duration of the mine life is complete. A number of underground access drifts and production crosscuts remain to be driven as part of ongoing mine development to sustain production rates.
On surface, construction of all infrastructure associated with CLMain required to achieve nameplate capacity has been completed, while infrastructure associated with CLExt remains to be installed.
Underground mine development continued in 2024. We completed development of two production crosscuts; one in the eastern portion and one in the western portion of CLMain. Development also continued for access to the CLExt orebody.
During 2024, we:
| • | produced from and continued development work in the CLMain orebody in alignment with our long-term production plan |
| • | successfully executed a planned 28-day annual maintenance outage |
| • | fully completed the ground freezing program for the CLMain orebody by finishing the outfitting of the final freeze holes |
| • | began physical surface work for development of the CLExt portion of the orebody |
| • | completed an expansion of the waste rock storage pads to support the remaining mine development, including development in both the CLMain and CLExt portions of the orebody |
In 2025, we plan to:
| • | continue production and development activities in CLMain as well as development drifts to access CLExt in alignment with our long-term mine plan |
| • | continue earthworks and construction of surface services to support the expansion of freeze activities required for future production from CLExt |
Toll milling agreement
The McClean Lake joint venture agreed to process Cigar Lake’s ore slurry at its McClean Lake mill, according to the terms in its agreement with the CLJV: JEB toll milling agreement (effective January 1, 2002 and amended and restated effective November 30, 2011), dedicating the necessary McClean Lake mill capacity to process and package 18 million pounds of Cigar Lake uranium concentrate annually.
The CLJV pays a toll milling fee and its share of milling expenses.
The McClean Lake mill started receiving Cigar Lake ore in March 2014 and produced its first drum of Cigar Lake yellowcake in October 2014. All of Cigar Lake’s ore slurry from current mineral reserves will be processed at the McClean Lake mill, operated by Orano. Orano does not expect any new major infrastructure is necessary at the McClean Lake mill to receive and process Cigar Lake’s mineral reserves. Minor mill upgrades, in the spirit of continual improvement, related to throughput optimisation and reagent efficiency continue to be implemented.
The McClean Lake joint venture commenced work in 2012 to optimize its TMF to accommodate all of Cigar Lake’s current mineral reserves. This optimization included periodic raising of a bentonite amended liner, the most recent of which was completed in 2023.
In 2022, Orano received regulatory approval for the expansion of the JEB TMF.
The expansion will be achieved by the continued construction of an engineered embankment and placement of a bentonite amended liner. Following the staged expansion, the TMF is expected to have capacity to receive tailings from processing all of Cigar Lake’s current mineral reserves.
The McClean Lake joint venture is responsible for all costs of decommissioning the McClean Lake mill. As well, the joint venture is responsible for the liabilities associated with tailings produced from processing Cigar Lake ore at the McClean Lake mill.
The collective agreement with unionized employees at the McClean Lake mill ends on May 31, 2025.
Regulatory approvals
There are three key permits that are required to operate the mine.
2024 ANNUAL INFORMATION FORM Page 53
Operating and processing licences
Federally, Cigar Lake holds a “Uranium Mine Licence” from the CNSC with a corresponding Licence Conditions Handbook (LCH). Provincially, Cigar Lake holds an “Approval to Operate Pollutant Control Facilities” from the SMOE and a “Water Rights Licence to Use Surface Water and Approval to Operate Works” from the Saskatchewan Watershed Authority.
The CNSC licence expires on June 30, 2031. The SMOE approval was extended to January 31, 2024 and then renewed in 2024 and the current approval now expires in 2030. The Saskatchewan Watershed Authority water rights licence was obtained in 1988 and was amended in 2023 and now expires in 2028.
The current Cigar Lake LCH authorizes an annual production rate up to 18 million pounds per year. The CNSC licence and LCH for the McClean Lake operation, issued by the CNSC in 2017, authorizes the production of up to 24 million pounds U3O8 annually. The licence and LCH were amended in 2022 to authorize the expansion of the JEB TMF.
Approvals, issued by the SMOE pursuant to the Saskatchewan Environmental Assessment Act, for Cigar Lake are based on estimated annual production rates of 18 million pounds U3O8 for CLMain and 6 million pounds U3O8 for CLExt. As such, it is anticipated that the planned annual production rate of 18 million pounds U3O8 for CLExt represents a change to the approved development that will require Ministerial Approval. Cameco plans to submit the information required to obtain this approval in 2025.
Water treatment/effluent discharge system
The mine dewatering system was designed and constructed to handle both routine and non-routine water treatment and effluent discharge, and it has been approved and licensed by the CNSC and the SMOE.
We began discharging treated water to Seru Bay in August 2013 following the receipt of regulatory approvals.
The Cigar Lake orebody contains elements of concern with respect to the water quality and the receiving environment. The distribution of elements such as arsenic, molybdenum, selenium and others is non-uniform throughout the orebody, and this can present challenges in meeting the required effluent concentrations.
There have been ongoing efforts to optimize the current water treatment process and water handling systems to ensure acceptable environmental performance.
Operating and capital costs
The following is a summary of the Cigar Lake operating and capital cost estimates for the remaining life of mine, stated in constant 2024 dollars and reflecting a forecast life-of-mine mill production of 190.2 million pounds.
| Operating Costs ($Cdn million) |
Total (2025 – 2036) |
|||
| Cigar Lake Mining |
||||
| Site administration |
$ | 648.6 | ||
| Mining costs |
965.8 | |||
| Process |
320.6 | |||
| Corporate overhead |
183.9 | |||
|
|
|
|||
| Total mining costs |
$ | 2,118.9 | ||
|
|
|
|||
| McClean Lake Milling |
||||
| Administration |
$ | 513.8 | ||
| Milling costs |
1,119.8 | |||
| Corporate overhead |
94.4 | |||
| Toll milling |
170.9 | |||
|
|
|
|||
| Total milling costs |
$ | 1898.9 | ||
|
|
|
|||
| Total operating costs |
$ | 4,017.8 | ||
|
|
|
|||
| Total operating cost per pound U3O8 |
$ | 21.12 | ||
|
|
|
|||
Note: presented as total cost to the CLJV (100% basis)
2024 ANNUAL INFORMATION FORM Page 54
Operating costs consist of annual expenditures at Cigar Lake to mine the ore, treat the ore underground, including crushing, grinding and density control, followed by pumping the resulting slurry to surface for transportation to McClean Lake.
Operating costs at McClean Lake consist of the cost of offloading and leaching the Cigar Lake ore slurry into uranium solution and further processing into calcined U3O8 product.
| Capital Costs ($Cdn million) |
Total (2025 – 2036) |
|||
| Cigar Lake Mine Development |
$ | 378.2 | ||
| Cigar Lake Mine Capital |
||||
| Underground infrastructure and production tunnel outfitting |
$ | 302.1 | ||
| Ground freezing system |
146.8 | |||
| Other mine capital |
214.0 | |||
|
|
|
|||
| Total mine capital |
$ | 662.9 | ||
|
|
|
|||
| McClean Lake Mill Capital |
||||
| Tailings expansion |
$ | 52.6 | ||
| Other mill capital |
230.8 | |||
|
|
|
|||
| Total mill capital |
$ | 283.4 | ||
|
|
|
|||
| Total capital costs |
$ | 1,324.5 | ||
|
|
|
|||
Note: presented as total cost to the CLJV (100% basis)
Estimated capital costs to the CLJV include sustaining capital for Cigar Lake and McClean Lake mill, as well as underground development at Cigar Lake to bring mineral reserves into production. Overall, the largest capital cost at Cigar Lake is surface freeze drilling and brine distribution infrastructure. Other significant capital includes tunnel outfitting and mine development costs.
Our expectations and plans regarding Cigar Lake, including forecasts of operating and capital costs, production and mine life are forward-looking information, and are based specifically on the risks and assumptions discussed on pages 5, 6 and 7. We may change operating or capital spending plans in 2025, depending upon uranium markets, our financial position, results of operation and other factors. Estimates of expected future production and capital and operating costs are inherently uncertain, particularly beyond one year, and may change materially over time.
Exploration, drilling, sampling, data quality and estimates
There are no historical estimates within the meaning of NI 43-101 to report. The Cigar Lake uranium deposit was discovered in 1981 by surface exploration drilling.
We focus most of our exploration activities on mineral lease ML 5521. Orano is responsible for exploration activity on the 38 surrounding mineral claims. The data from the exploration program on the 39 mineral claims is not part of the database used for the estimate of the mineral resources and mineral reserves at Cigar Lake.
Exploration
After the 2006 water inflow events, it was recognized that more detailed geophysical information in the immediate deposit area was required. Since 2006, a number of geophysical surveys over the Cigar Lake deposit provided additional knowledge on geological structures and fault zones. In the fall of 2007, a supplementary geophysical program was conducted over a portion of the CLMain area of the deposit to identify major structures within the sandstone column. In 2015, Cameco conducted a geotechnical drill program consisting of nine surface diamond holes (drilled to a vertical depth of 525 metres) over the western portion of the CLMain area of the deposit. Downhole cross-well seismic was done within these boreholes to image major fault structures and geotechnical characteristics of this portion of the deposit.
This information has since been incorporated into our geological models. These are regularly updated as additional information is collected, allowing for better mine planning and mitigation of potential risk.
2024 ANNUAL INFORMATION FORM Page 55
Drilling
Surface drilling – mineral lease
The last diamond drillhole of the 1981 program was located south of Cigar Lake and was the discovery hole for the Cigar Lake uranium deposit. The deposit was subsequently delineated by surface drilling between 1982 and 1986, followed by several small drilling campaigns to gather geotechnical and infill data between 1986 and 2007. Additional drilling campaigns were conducted by Cameco after 2007 which targeted a broad range of technical objectives, including geotechnical, geophysical, delineation and ground freezing. Since 2012, diamond drilling managed by Cameco has mainly focused on underground geotechnical and surface ground freezing programs on CLMain along with continued delineation drilling on CLExt. Drill depths for surface delineation holes range from approximately 460 to 550 metres.
Delineation drilling in the CLMain zone was originally completed at a nominal drillhole fence spacing of 25 to 50 metres (east-west), with holes at 20 to 25 metres (north-south) spacing on the fences. Since then, the entire portion of the CLMain deposit has had surface freeze holes installed at a nominal 7 x 7 metre pattern.
The CLExt zone was historically drilled at a nominal drillhole fence spacing of 200 metres, with holes at 20 metre spacing on the fences. Subsequent drill programs occurring between 2011 and 2023 have since reduced the drillhole spacing down to approximately 15 x 15 metres in local areas of the deposit.
Drilling results have been used to delineate and interpret the 3-dimensional geometry of the mineralized areas, the lithostructural settings, the geotechnical conditions, and to estimate the distribution and content of uranium and other elements.
Surface freeze hole drilling over the CLMain zone, ongoing since 2012, has been completed. Freeze hole drilling over the CLExt zone is planned to begin in 2026.
Underground drilling – mineral lease
Diamond drilling from underground is primarily to ascertain rock mass characteristics in advance of development and mining. Cigar Lake Mining Corporation, the previous operator, and Cameco have conducted underground geotechnical drilling since 1989. A total of 522 underground geotechnical holes have been completed on CLMain and 51 have been completed on CLExt.
At one time, freeze holes were drilled from underground into the deposit for the purpose of freezing the ground prior to mining. No underground freeze holes have been drilled since 2006. None of them are currently used for freezing or for mineral resource and reserve estimation purposes.
Sampling, analysis and data verification
Sampling
Vertical surface drilling generally represents the true thickness of the zone given the flat-lying mineralization. All holes are core drilled and gamma probed whenever possible. Cigar Lake uses a high-flux gamma probe designed and constructed by alphaNUCLEAR, a member of the Cameco group of companies. This high-flux gamma probe utilizes two Geiger Műller tubes to detect the amount of gamma radiation emanating from the surroundings. The count rate obtained from the high-flux probe is compared against chemical assay results to establish a correlation to convert corrected probe count rates into equivalent % U3O8 grades for use when assay results are unavailable.
The consistency between probe data and chemical assays demonstrates that secular equilibrium exists within the deposit. Approximately 25% of the data used to estimate mineral resources is obtained from assays in CLMain, while for CLExt, all core has been assayed. In these cases, the core depth is validated by comparing the downhole gamma survey results with a hand-held scintillometer on core before it is logged, photographed, and then sampled for uranium analysis. Attempts are made to avoid having samples cross geological boundaries.
When sampled, the entire core from each sample interval is taken for assay or other measurements to characterize the physical and geochemical properties of the deposit, except for some of the earliest sampling in 1981 and 1982 (which were validated or removed following subsequent delineation drilling and whole core assay measurements). This was done to reduce the potential for sampling bias, given the high-grade nature and variability of the grades of the mineralization, and to minimize human exposure to gamma radiation and radon gas during the sampling process.
2024 ANNUAL INFORMATION FORM Page 56
The typical sample collection process at our operations is performed by or under the supervision of a qualified geoscientist and includes the following procedures:
| • | marking the sample intervals on the core boxes at nominal 0.5 metre sample lengths |
| • | collection of the samples in plastic bags, taking the entire core |
| • | documentation of the sample location, assigning a sample number, and description of the sample, including radiometric values from a hand-held device |
| • | bagging and sealing, with sample tags inside bags and sample numbers on the bags |
| • | placement of samples in steel drums for shipping |
Sample security
Current sampling protocols dictate that all samples are collected and prepared in a restricted core processing facility. Core samples are collected and transferred from core boxes to high-strength plastic sample bags, then sealed. The sealed bags are then placed in steel drums and shipped in compliance with the Transport of Dangerous Goods regulations with tamper-resistant security seals. Chain of custody documentation is present from inserting samples into steel drums to final delivery of results by SRCGL.
All samples collected are prepared and analysed under close supervision of qualified personnel at SRCGL, which is a restricted access laboratory licensed by the CNSC.
Analysis
Since 2002, assay sample preparation has been done at SRCGL, which is independent of the participants of CLJV. It involves jaw crushing to 80% passing at less than two millimetres and splitting out a 100- to 200-gram sub-sample using a riffle splitter. The sub-sample is pulverized to 90% at less than 106 microns using a puck and ring grinding mill. The pulp is then transferred to a bar coded plastic snap top vial. Assaying by SRCGL involves digesting an aliquot of pulp in concentrated 3:1 HCl:HNO3 on a hot plate for approximately one hour. The volume is then made up in a 100-millilitre volumetric flask using deionized water prior to analysis by ICP-OES. Instruments used in the analysis are calibrated using certified commercial solutions. This method is ISO/IEC 17025:2017 accredited by the Standards Council of Canada.
Quality control and data verification
The quality assurance and quality control procedures used during the early drilling programs were typical for the time. The majority of uranium assays in the database from the early drilling programs were obtained from Loring Laboratories Ltd., which was independent of the participants of CLJV. For uranium assays up to 5% U3O8, 12 standards and two blanks were run with each batch of samples and for uranium assays over 5% U3O8, a minimum of four standards were run with each batch of samples.
More recent sample preparation and assaying is being completed under the close supervision of qualified personnel at SRCGL and includes preparing and analysing standards, duplicates, and blanks. At least two standards are analysed for each 40-sample batch. We also include a pulp repeat and one split sample repeat with every group. Samples that fail quality controls are re-analysed.
The original database, which forms part of the database used for the current mineral resource and mineral reserve estimates, was compiled by previous operators. Many of the original signed assay certificates are available and have been reviewed by Cameco geoscientists.
In 2013, Cigar Lake implemented a SQL server based centralized geological data management system to manage all drillhole and sample related data. All core logging, sample collection, downhole probing and sample dispatching activities are carried out and managed within this system. All assay, geochemical and physical analytical results obtained from the external laboratory are uploaded directly into the centralized database, thereby mitigating potential for manual data transfer errors. The database used for the current mineral resource and mineral reserve estimates was validated by Cameco qualified geoscientists.
Additional data verification measures taken on the data collected at Cigar Lake are as follows:
| • | surveyed drillhole collar coordinates and downhole deviations are entered into the database and visually validated and compared to the planned location of the holes |
2024 ANNUAL INFORMATION FORM Page 57
| • | all CLExt holes drilled in 2011 and 2012 were resurveyed between the summer of 2012 and summer of 2015 |
| • | comparison of the information in the database against the original data, including paper logs, assay certificates and original probing data files as required. Approximately 5% of holes in the current resource estimates were compared against the assay certificates with no discrepancies observed. |
| • | validation of core logging information in plan and section views, and review of logs against photographs of the core |
| • | checking for data entry errors such as overlapping intervals and out of range values |
| • | radiometric probes undergo annual servicing and re-calibration as well as additional checks including control probing to ensure precision and accuracy of the probes. All probes were serviced and re-calibrated. There were no control probing activities in 2024. |
| • | validating uranium grades comparing radiometric probing, core radioactivity measurements and chemical assay results. The current correlation to convert corrected probe count rates into equivalent % U3O8 grades was completed in 2023. |
No surface freeze drilling or mineral resource estimate updates occurred in 2024. Since the start of commercial production, we have compared the uranium block model with mine production results on a quarterly basis to ensure an acceptable level of accuracy is maintained. Results in 2024 were within acceptable tolerances.
Our geoscientists, including a qualified person as such term is defined in NI 43-101, have witnessed or reviewed drilling, core handling, radiometric probing, logging, sampling facilities, sampling and data verification procedures underpinning the current mineral resource and reserve estimates at the Cigar Lake operation and consider the methodologies to be satisfactory and the results representative and reliable. There has been no indication of significant inconsistencies in the data used or verified nor any failures to adequately verify the data.
Accuracy
We are satisfied with the quality of data and consider it valid for use in the estimation of mineral resources and reserves for Cigar Lake. Comparison of the actual mine production with the expected production supports this opinion.
Mineral reserve and resource estimates
Please see pages 98 and 99 for our mineral reserve and resource estimates for Cigar Lake.
Uranium – Tier-one operations
Inkai
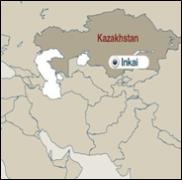
|
2024 Production (100% basis) 7.8M lb |
|
| 2025 Production Outlook (100% basis) See Production – 2025 Production on page 67
|
||
| Estimated Reserves (our share) 100.4M lb
|
||
| Estimated Mine Life | ||
| 2045 (based on licence term) |
Inkai is a very significant uranium deposit, located in Kazakhstan. The operator is JV Inkai limited liability partnership, which we jointly own (40%)1 with KAP (60%).
Inkai is considered a material uranium property for us. There is a technical report dated November 12, 2024 (effective September 30, 2024) that can be downloaded from SEDAR+ (www.sedarplus.ca) or from EDGAR (www.sec.gov).
2024 ANNUAL INFORMATION FORM Page 58
| Location | South Kazakhstan | |
| Ownership | 40%1 | |
| Mine type | In situ recovery (ISR) | |
| End product | Uranium concentrate | |
| Certifications | BSI OHSAS 18001 | |
| ISO 14001 certified | ||
| Estimated reserves | 100.4 million pounds (proven and probable), average grade U3O8: 0.03% | |
| Estimated resources | 37.1 million pounds (measured and indicated), average grade U3O8: 0.03% | |
| 8.9 million pounds (inferred), average grade U3O8: 0.03% | ||
| Licensed capacity (wellfields) | 10.4 million pounds per year (our share 4.2 million pounds per year)1 | |
| Licence term | Through July 2045 | |
| Total packaged production: 2009 to 2024 | 98.0 million pounds (100% basis) | |
| 2024 production | 7.8 million pounds (100% basis)1 | |
| 2025 production outlook | See Production – 2025 Production on page 67 | |
| Estimated decommissioning cost (100% basis) | $35.4 million (US) (100% basis) | |
| All values shown, including reserves and resources, represent our share only, unless indicated. | ||
| 1 Our ownership interest in the joint venture is 40% and we equity account for our investment. As such, our share of production is shown as a purchase. |
||
Business structure
JV Inkai is a Kazakhstan limited liability partnership between two companies:
| • | Cameco – 40% |
| • | Kazatomprom (KAP) – 60% |
History
| 1976-78 | • Deposit is discovered
• Exploration drilling continues until 1996 |
|
| 1979 | • Regional and local hydrogeology studies begin
• Borehole tests characterize the four aquifers within the Inkai deposit (Uvanas, Zhalpak, Inkuduk and Mynkuduk) |
|
| 1988 | • Pilot test in the northeast area of Block 1 begins, lasts 495 days and recovers 92,900 pounds of uranium |
|
| 1993 | • First Kazakhstan estimates of uranium resources for Block 1 |
|
| 1996 | • First Kazakhstan estimates of uranium resources for Block 2
• Kazakhstan regulators registers JV Inkai, a joint venture among us, Uranerzbergbau-GmbH and National Joint Stock Company Atomic Power Engineering and Industry (KATEP) |
|
| 1997 | • KAP is established |
|
| 1998 | • KATEP transfers all of its interest in JV Inkai to KAP
• We acquire all of Uranerzbergbau-GmbH’s interest in JV Inkai, increasing our interest to 66 2/3%
• We agree to transfer a 6 2/3% interest to KAP, reducing our holdings to a 60% interest |
|
| 1999 | • JV Inkai receives a mining licence for Block 1 and an exploration with subsequent mining licence for Blocks 2 and 3 from the government of Kazakhstan |
|
| 2000 | • JV Inkai and the government of Kazakhstan sign a subsoil use contract (called the resource use contract, abbreviated RUC), which covers the licences issued in 1999 (see above) |
|
| 2002 | • Pilot leach test in the north area of Block 2 begins |
|
| 2005 | • Construction of ISR commercial processing facility at Block 1 begins |
|
| 2006 | • Complete pilot leach test at Block 2
• Exploration-delineation drilling initiated at Block 3 |
|
2024 ANNUAL INFORMATION FORM Page 59
| 2007 | • Sign Amendment No.1 to the RUC, extending the exploration period at Blocks 2 and 3 |
|
| 2008 | • Commission front half of the main processing plant (MPP) in the fourth quarter, and begin processing solution from Block 1 |
|
| 2009 | • Sign Amendment No. 2 to the RUC, which approves the mining licence at Block 2, extends the exploration period for Block 3 to July 13, 2010, and requires JV Inkai to adopt the new tax code and meet the Kazakhstan content thresholds for human resources, goods, works and services
• Commission the MPP, and started commissioning the first satellite plant (Sat1) |
|
| 2010 | • Receive regulatory approval for commissioning of the MPP
• File a notice of potential commercial discovery at Block 3
• Receive approval in principle for the extension of Block 3 exploration for a five-year appraisal period that expires July 2015, and an increase in annual production from Blocks 1 and 2 to 3.9 million pounds (100% basis) |
|
| 2011 | • Receive regulatory approval for commissioning of the first satellite plant
• Sign Amendment No. 3 to the RUC, which extends the exploration period for Block 3 to July 2015 and provides government approval to increase annual production from Blocks 1 and 2 to 3.9 million pounds (100% basis)
• Sign a memorandum of agreement with KAP to increase annual production from Blocks 1 and 2 from 3.9 million pounds to 5.2 million pounds (100% basis) |
|
| 2012 | • Sign a memorandum of agreement with KAP setting out the framework to increase annual production from Blocks 1 and 2 to 10.4 million pounds (100% basis), to extend the term of JV Inkai’s RUC through 2045 and to cooperate on the development of uranium conversion capacity, with the primary focus on uranium refining rather than uranium conversion
• Start construction of a test leach facility at Block 3 |
|
| 2013 | • Sign Amendment No. 4 to the RUC, which provides government approval to increase annual production from Blocks 1 and 2 to 5.2 million pounds (100% basis) |
|
| 2015 | • Complete construction of the second satellite facility (Sat2) at Block 3
• Regulatory approval allowing processing of uranium eluate is received and the pilot leach test is initiated at Block 3
• The Subsoil Law (as defined below) in Kazakhstan is amended to allow producers to produce within 20% (above or below) of their licensed production rate in a year |
|
| 2016 | • Sign an agreement with KAP and JV Inkai to restructure and enhance JV Inkai, subject to closing, increasing KAP’s holdings to a 60% interest and reducing our holdings to a 40% interest
• Sign Amendment No. 5 to the RUC, which extends the exploration period for Block 3 to July 2018 |
|
| 2017 | • In December, close the agreement with KAP and JV Inkai to restructure and enhance JV Inkai. Under the agreement, effective January 1, 2018, our ownership interest drops to 40% and we will equity account for our investment.
• Sign Amendment No. 6 to the RUC, which grants JV Inkai the right to produce up to 10.4 million pounds per year and extends the term of the RUC until July 13, 2045 |
|
| 2018 | • Infill drilling program in the Sat1 Area begins and is completed in 2019. Sat2 commercial production starts along with expansion project, including the increase in pump station capacity, two additional ion exchange (IX) sorption columns, and required piping. |
|
| 2021 | • Updates to mineral reserve and mineral resource estimate based on the 2018/2019 infill drilling program. The State Reserve Commission of Kazakhstan approves new estimates. Sat2 expansion is completed. |
|
2024 ANNUAL INFORMATION FORM Page 60
Technical report
| This description is based on the project’s technical report: Inkai Operation, Turkestan Region, Republic of Kazakhstan, dated November 12, 2024 (effective September 30, 2024). The report was prepared for us in accordance with NI 43-101, by or under the supervision of C. Scott Bishop, P. Eng., Sergey Ivanov, P. Geo. and Alain D. Renaud, P. Geo. The following description has been prepared under the supervision of Biman Bharadwaj, P. Eng., C. Scott Bishop, P. Eng., Sergey Ivanov, P. Geo. and Alain D. Renaud, P. Geo. They are all qualified persons within the meaning of NI 43-101 but are not independent of us.
The conclusions, projections and estimates included in this description are subject to the qualifications, assumptions and exclusions set out in the technical report except as such qualifications, assumptions and exclusions may be modified in this AIF. We recommend you read the technical report in its entirety to fully understand the project. You can download a copy from SEDAR+ (www.sedarplus.ca) or from EDGAR (www.sec.gov). |
For information about environmental matters, see Our sustainability principles and practices and The regulatory environment starting on pages 102 and 105.
For a description of royalties payable to the government of Kazakhstan on the sale of uranium extracted from orebodies within the country and taxes, see page 112.
For a description of risks that might affect access, title or the right or ability to perform work on the property, see Strategic risks – Foreign investments and operations and Kazakhstan at page 139, Operational risks – Permitting and licensing at page 122, Governance and compliance risks starting at page 130, Social risks starting at page 132, and Environmental risks starting at page 133. |
About the Inkai property
Location
Inkai is in the Suzak District of Turkestan Region, Kazakhstan near the town of Taikonur, 350 kilometres northwest of the city of Shymkent and 155 kilometres east of the city of Kyzylorda. JV Inkai’s corporate office is in Shymkent. JV Inkai’s corporate office is located in Shymkent. Inkai is accessible by paved road from Shymkent (440 kilometres), from Turkistan (310 kilometres) and from Kyzylorda (290 kilometres).
Access
Taikonur can be reached from Astana or Almaty by flying to one of the regional cities of Shymkent or Kyzylorda, then driving on paved roads. The road to Taikonur is currently the primary access road for transportation of people, supplies and uranium product for JV Inkai. Major airline service is available to Astana and Almaty from Europe, Russia, China and other countries in the region.
Rail transportation is available from Almaty to Shymkent then northwest to Shieli, Kyzylorda and beyond. A rail line also runs from the town of Dzhambul to KAP’s Centralia facility to the south of Taikonur.
Property tenure – MA area and mining allotment
The RUC between the Republic of Kazakhstan and JV Inkai that was signed in July 2000 provides for JV Inkai’s mining rights, as amended by amendments numbered one to six. The RUC provides JV Inkai the right to explore for and to extract uranium from the subsoil contained in the Mining Allotment Area (the MA Area). The MA Area is the 139 square kilometres area in which JV Inkai currently has the right to mine, which includes the historical Block 1 and portions of Blocks 2 and 3; now referred to as the MPP Area, and the two satellite areas, Sat1 and Sat2, respectively. Amendment No. 6 to the RUC grants JV Inkai mining rights over the MA Area until mid-2045. See Resource use contract on page 68 for more information.
JV Inkai owns uranium extracted from this subsoil and has the right to use the surface of the MA Area. JV Inkai has obligations under the RUC which it must comply with in order to maintain these rights. In addition to complying with its obligations under the RUC, JV Inkai, like all subsoil users, is required to abide by the work program appended to its RUC, which relates to its mining operations.
Under Kazakhstan law, subsoil and mineral resources belong to the state. Currently, the state provides access to the subsoil and mineral resources under a resource use contract. Minerals extracted from the subsoil by a subsoil user under a resource use contract are the property of the subsoil user unless the applicable resource use contract or the Subsoil Code (as defined below) provides otherwise. The Subsoil Code defines the framework and the procedures connected with the granting of subsoil rights and the regulation of the activities of subsoil users. See Subsoil Law on page 69 below for more information.
2024 ANNUAL INFORMATION FORM Page 61
The RUC gives JV Inkai a right to use the surface of the property while exploring, mining and reclaiming the land. However, this right must be set forth in a land lease agreement with the applicable local administrative authorities.
On a regular basis, JV Inkai obtains from local authorities the necessary land lease agreements for new buildings and infrastructure. JV Inkai does not hold land leases for the entire MA Area. JV Inkai obtains land leases gradually only for surface area required for exploration, mining or construction of new infrastructure.
Environment, social and community factors
Inkai lies in the Betpak-Dala Desert. The ground consists of extensive sand deposits with vegetation limited to grasses and occasional low bushes. Major hydrographic systems in the area include the Shu, Sarysu and Boktykaryn rivers. These rivers typically exhibit surface water flow in May and June and revert to isolated reaches with salty water during the rest of the year.
The region is also characterized by strong winds. The prevailing direction of the wind is northeast, averaging 3.8 to 4.6 m/sec. Dust storms are common. The climate in south central Kazakhstan is semi-arid, with temperatures ranging from -35°C in the winter to +40°C in the summer.
JV Inkai operates in the Suzak district of the Turkestan region. The territory of the district is about 41,000 square kilometres and its population is over 60,000. The town of Taikonur, with a population of approximately 700, is in this district and the Inkai deposit is located nearby.
In accordance with JV Inkai’s corporate responsibility strategy and to comply with its obligations under the RUC, JV Inkai finances projects and provides goods and services to support the district’s social infrastructure.
Under the RUC, JV Inkai is required to finance the training and development of Kazakhstan personnel. The RUC imposes local content requirements on JV Inkai with respect to employees, goods, works and services. See Resource use contract on page 68 for more information.
Geological setting
The geology of south-central Kazakhstan is composed of a large relatively flat basin of Cretaceous to Quaternary age continental clastic sedimentary rocks. The Chu-Sarysu Basin extends for more than 1,000 kilometres from the foothills of the Tien Shan Mountains located on south and southeast sides of the basin, and merges into the flats of the Aral Sea depression to the northwest. The basin is up to 250 kilometres wide, bordered by the Karatau Mountains on the southwest and the Kazakh Uplands on the northeast. The basin is composed of gently-dipping to nearly flat-lying fluvial-derived unconsolidated sediments comprising inter-bedded sand, silt and local clay horizons.
The Cretaceous and Paleogene sediments contain several stacked and relatively continuous, sinuous roll-fronts or redox fronts hosted in the more porous and permeable sand and silt units. Several uranium deposits and active ISR uranium mines are located at these regional oxidation roll-fronts, developed along a regional system of superimposed mineralization fronts. The overall stratigraphic horizon of interest in the basin is approximately 200 to 250 metres in vertical section.
The Inkai deposit is a roll-front deposit hosted within the Middle and Lower Inkuduk and the Upper and Lower Mynkuduk horizons which are comprised of fine, medium and coarse-grain sands, gravels and clays. The redox boundary can be readily recognized in core by a distinct colour change from grey and greenish-grey on the reduced side to light-grey with yellowish stains on the oxidized side, stemming from the oxidation of pyrite to limonite and consumption of organic carbon.
Hydrogeological parameters of the deposit play a key role in ISR mining which have been demonstrated at Inkai through various studies, pilot leaching tests, and mining results since start of commercial production in 2009.
Mineralization
Uranium mineralization in the Sat1 and Sat2 Area mostly occurs in the middle and upper parts of the Inkuduk aquifer. In the MPP Area, uranium mineralization is generally associated with the Mynkuduk aquifer.
The roll front mineralization is hosted by four horizons: the Middle Inkuduk; the Lower Inkuduk; the Upper Mynkuduk, and the Lower Mynkuduk horizons.
2024 ANNUAL INFORMATION FORM Page 62
The extent and dimensions of Inkai’s mineralized horizons are shown in the table below.
| Horizon |
Strike Length (km) |
Width (m) |
Average Width (m) |
Depth (m) |
Average Depth (m) |
|||||||||||||||
| Middle Inkuduk |
35 | 40-1,600 | 350 | 262-380 | 314 | |||||||||||||||
| Lower Inkuduk |
40 | 40-600 | 250 | 317-447 | 382 | |||||||||||||||
| Upper and Lower Mynkuduk |
40 | 40-350 | 200 | 350-528 | 390 | |||||||||||||||
Mineralization comprises sooty pitchblende (85%) and coffinite (15%). The pitchblende occurs as micron-sized globules and spherical aggregates, while the coffinite forms microscopic crystals. Both uranium minerals occur in pores on interstitial materials such as clay minerals, as films around and in cracks within sand grains, and as pseudomorphic replacements of rare organic matter commonly associated with pyrite.
Deposit type
The Inkai uranium deposit is a roll-front type deposit. Roll-front deposits are a type of stratiform deposits that forms within permeable sandstones at the interface between oxidized and reduced lithologies. The Cretaceous and Paleogene sediments contain several stacked and relatively continuous, sinuous “roll-fronts”, or redox fronts hosted in the more porous and permeable sand and silt units. Microcrystalline uraninite and coffinite are deposited during diagenesis by uraniferous ground water, in a crescent-shaped lens that cuts across bedding and forms at the interface between oxidized and reduced lithologies. Sandstone host rocks are medium to coarse grained and were highly permeable at the time of mineralization. There are several uranium deposits and active ISR uranium mines at these regional oxidation roll-fronts, developed along a regional system of superimposed mineralization fronts.
About the Inkai operation
Inkai is a developed producing property with sufficient surface rights to meet future mining operation needs for the current mineral reserves. It has site facilities and infrastructure. Plans are progressing to expand the operation to give it the capability to produce at least 10.4 million pounds per year.
Licences
Having the rights to explore for and to extract uranium under the RUC, JV Inkai, as a nuclear facility, is also required to hold certain permits and licences to operate the mine. With regard to environmental protection requirements, JV Inkai has applied for and received:
| • | a permit for environmental emissions and discharges for the operation valid until December 31, 2034 |
| • | water use permits with various expiry dates |
JV Inkai currently holds the following additional material licences relating to its mining activities and has applied for prolongation of licences which expired in 2024:
| • | “Licence for nuclear materials handling” valid until December 20, 2029 |
| • | “Licence for operation of mining production and chemical productions” with an indefinite term |
| • | “Licence for transportation of radioactive substances within the territory of the Republic of Kazakhstan” valid until November 12, 2029 |
| • | “Licence for radioactive waste handling” valid until December 20, 2029 |
| • | “Licence for ionizing radiation equipment handling” with an indefinite term |
Renewal of environmental permits requires the submission of an annual report on pollution levels to Kazakhstan’s environmental authorities, compliance with the permits’ provisions and the remittance of any environmental payment obligations.
JV Inkai is qualified as a primary water user, and is entitled to extract water directly from water sources for its own use JV Inkai has obtained special water use permits, which have various expiry dates. Water usage under the permits is limited to the purposes defined in the permits.
As is typical with any mineral extraction site, construction, operation, and reclamation are subject to an ongoing process during which permits, licences, and approvals are requested, monitored and reported on, expire, and are amended or renewed.
2024 ANNUAL INFORMATION FORM Page 63
Infrastructure
There are three processing facilities on the MA Area: the MPP, Sat1 and Sat2.
The existing MPP, Sat1 and Sat2 circuit capacities were estimated using Inkai monthly process summaries. The MPP has demonstrated an IX capacity of 2.7 million pounds U3O8 per year and a product drying and packaging capacity of 8.3 million pounds U3O8 per year. Sat1 and Sat2 have demonstrated respective IX capacities of 6.3 and 4.5 million pounds U3O8 per year.
The following infrastructure currently exists on the MA Area: administrative, engineering and construction offices, a laboratory, shops, garages, holding ponds and reagent storage tanks, enclosures for low-level radioactive waste and domestic waste, an emergency response building, food services facilities, roads and power lines, wellfield pipelines and header houses.
At Taikonur, JV Inkai has an employee residence camp with catering and leisure facilities. The following upgrades are in progress:
| • | expansion of the camp in a phased approach with construction of two residential blocks for 165 people each and addition of a dining room for 150 people |
| • | construction of a 24-kilometre asphalt paved road connecting the camp to the three processing facilities |
Water, power and heat
Inkai has access to sufficient water from groundwater wells for all planned industrial activities. Potable water for use at the camp and at the site facilities is supplied from shallow wells on site. The electrical supply for Inkai is from the national power grid. Inkai is connected to the grid via a 35-kilovolt power line, which is a branch of the circuit that supplies the Stepnoye mine east of Inkai. In case of power outage, there are standby generators. Telephone communications utilize a satellite internet system and fibre optics. Site operations are carried out throughout the year, despite the cold winter and hot summer conditions.
Employees
Currently, Taikonur has a population of approximately 700 people who are mainly employed in uranium development and exploration. Whenever possible, JV Inkai hires personnel from Taikonur and surrounding villages.
Royalties
Effective January 1, 2023, JV Inkai is required to pay the MET of 6% on production of uranium. The MET is calculated as 6% of the monetary value of the extracted uranium. The monetary value is determined as the weighted average price of uranium from public price reporting sources for the corresponding period.
Effective January 1, 2025, the applicable MET rate was increased to 9%. Effective January 1, 2026, a progressive MET system will be introduced that will depend on the actual volume of annual mineral extraction under each subsoil use agreement. Under the progressive system that will take effect in 2026, the highest rate is 18% for operations producing over 10.4 million pounds. Additionally, a further MET tax of up to 2.5% based on the spot market price of uranium, will also be introduced in 2026. The MET is incurred and paid by the mining entities, which is expected to have a significant impact on JV Inkai’s cost structure.
For a description of other amounts payable to the government of Kazakhstan on the sale of uranium extracted from orebodies within the country and other taxes, see Kazakhstan taxes on page 112.
Mining
Mining at Inkai is based upon a conventional and well-established ISR process. ISR mining of uranium is defined by the IAEA as:
“The extraction of ore from a host sandstone by chemical solutions (lixiviants) and the recovery of uranium at the surface. ISL (ISR) extraction is conducted by injecting a suitable leach solution into the ore zone below the water table; oxidizing, complexing and mobilizing the uranium; recovering the pregnant (loaded) solutions through production wells (extraction wells or recovery wells); and finally, pumping the uranium bearing solution to the surface for further processing.”
2024 ANNUAL INFORMATION FORM Page 64
ISR mining at Inkai uses a sulfuric acid-based lixiviant. The mining process comprises the following components to produce uranium-bearing solution (UBS), which goes to the settling ponds and then to the respective IX plant before being directed to the MPP for production of uranium as yellowcake:
| • | Determination of the grade x thickness (GT) cut-off for the initial design and the operating period. The design cut-off sets the minimum amount of uranium per pattern required to justify wellfield installation before funds are committed, and the operating head grade in UBS cut-off for individual producer wells dictates the lower limit once a well has entered production. |
| • | Preparation of a production sequence, which will deliver the UBS to meet production requirements considering the rate of wellfield uranium recovery, UBS uranium head grades, and wellfield flow rates. |
| • | Wellfield development, using an optimal pattern design to distribute barren lixiviant to the wellfield injectors, and to collect UBS back to the MPP, Sat1 or Sat2, as the case may be. |
The above factors are used to estimate the number of operating wellfields, wellfield patterns and header houses over the production life. They also determine the unit cost of each of the mining components required to realize the production schedule, including drilling, wellfield installation and wellfield operation.
Significant experience since the start of commercial production in 2009 supports the current production plan. Currently, all wellfields utilize hexagonal or line-drive patterns and the UBS is captured on IX resins at their respective processing facilities.
Processing
As a result of extensive test work and operational experience, a very efficient process of uranium recovery has been established. The process consists of the following major steps:
| • | uranium in situ leaching with a sulfuric acid-based lixiviant |
| • | uranium adsorption from UBS with IX resin |
| • | elution of uranium from resin with ammonium nitrate |
| • | precipitation of uranium as yellowcake with hydrogen peroxide and anhydrous ammonia |
| • | yellowcake thickening, dewatering, and drying |
| • | packaging of dry yellowcake product in containers |
All plants load and elute uranium from resin while the resulting eluate is converted to yellowcake at the MPP. Inkai is designed to produce a dry uranium product that meets the quality specifications of uranium refining and conversion facilities.
Construction work for a process expansion of the Inkai circuit to at least 10.4 million pounds U3O8 per year is in progress. The expansion project includes an upgrade to the yellowcake filtration and packaging units and the addition of a pre-dryer and calciner.
Production
The annual production target of 10.4 million pounds U3O8 requires a combined flow of approximately 5,680 cubic metres per hour (m3/h) and an average head grade of approximately 100 parts per million of uranium delivered to the IX columns. Flow capacity within individual production wells generally vary between 8.0 m3/h and 10.5 m3/h on average resulting in approximately 550 patterns required to be in operation to achieve the required flow to the IX circuits. Wellfields are typically in production for two to five years.
In recent years, production from higher cost wellfields in the MPP Area have been reduced, largely due to sulfuric acid supply challenges. Production from each of the three areas is planned to increase as these challenges are resolved and Inkai can bring on additional wellfields.
The production plan, based on mineral reserves, forecasts an estimated 204.5 million pounds of packaged production from January 2025 until mid-2045 and is based on Cameco’s assumptions for production from JV Inkai. Discussions are ongoing between Cameco and KAP regarding plans for recovering production shortfalls to the ramp-up schedule in the implementation agreement among Cameco, KAP and JV Inkai dated May 27, 2016 (the Implementation Agreement), to restructure and enhance JV Inkai, as supplemented or amended from time to time. Apart from 2024, which is discussed below, Cameco expects that any changes made to this production schedule will conform to the +/-20% variance limit to the production plan in the RUC. See Implementation Agreement below for more information.
2024 ANNUAL INFORMATION FORM Page 65
The life of mine plan (LOM Plan) is partially based on inferred mineral resources. Annual production levels will be dependent on results of further delineation drilling and market conditions. There is no certainty that the LOM Plan production will be realized. With continued delineation drilling and wellfield development, Cameco expects that the majority of the inferred mineral resources within the LOM Plan production will be upgraded to indicated and/or measured mineral resources.
The reserves-based production profile and economic analysis supporting the reported mineral reserves do not include the inferred mineral resources. The production plan is based on mineral reserves and forecasts an estimated 204.5 million pounds U3O8 of packaged production from January 2025 through the projected mine life extending to mid-2045.
Production at Inkai was suspended for approximately three weeks in January 2025. Based on KAP’s announcement on January 27, 2025, the impact of this suspension on Inkai’s 2025 production, and our corresponding purchase entitlements, are currently being assessed. Any estimates of Inkai’s 2025 and subsequent production will be tentative and uncertain
JV Inkai has successfully packaged approximately 98.0 million pounds (100% basis) since it began mining in 2009.
The illustration below presents the reserves-based production plan and the LOM Plan over the mine life.
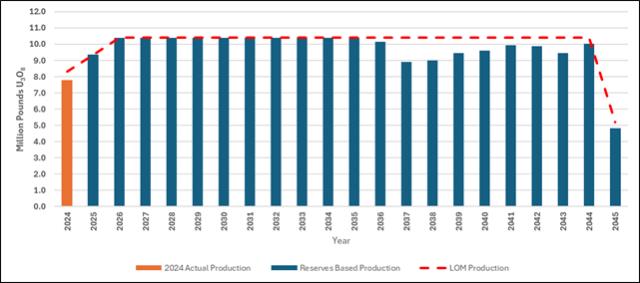
Note: The Inkai production estimate for 2025 is tentative.
Implementation Agreement
In May 2016, Cameco and KAP signed the Implementation Agreement to restructure JV Inkai. The restructuring closed on December 11, 2017, with an effective date of January 1, 2018, and consisted of the following:
| • | JV Inkai has the right to produce 10.4 million pounds of U3O8 per year (4.2 million pounds our share), an increase from the prior licensed annual production of 5.2 million pounds (3.0 million pounds our share) |
| • | JV Inkai has the right to produce from the MA Area until 2045 (previously, the licence terms were to 2024 for Block 1 and to 2030 for Blocks 2 and 3) |
| • | our ownership interest in JV Inkai is 40% (from 60%) and KAP’s ownership interest is 60% (from 40%). However, during the ramp-up, we are entitled to purchase 57.5% on the first 5.2 million pounds U3O8. As annual production increases above 5.2 million pounds, we are entitled to purchase 22.5% of any incremental production, to the maximum annual share of 4.2 million pounds U3O8. Once the ramp-up is complete, our share of all production will be 40%, matching our ownership interest |
| • | a governance framework that provides protection for us as a minority owner of JV Inkai |
| • | the boundaries of the MA Area match the agreed production profile for JV Inkai to 2045 |
| • | priority payment of the loan that our subsidiary made to JV Inkai to fund exploration and evaluation of Block 3 (the loan was repaid in 2019) |
Based on the production purchase entitlement under the Implementation Agreement, for 2024 we were entitled to purchase 3.6 million pounds, or 45.9% of JV Inkai’s 2024 production of 7.8 million pounds. Timing of our JV Inkai purchases will fluctuate during the quarters and may not match production, and similar to 2023, the 2024 timing was impacted by shipping delays. Total purchases in 2024 were 4.2 million pounds, of which 2.5 million pounds were related to our 2024 entitlement.
2024 ANNUAL INFORMATION FORM Page 66
With KAP, we also completed and reviewed a feasibility study for the purpose of evaluating the design, construction, and operation of a uranium refinery in Kazakhstan. In accordance with the Implementation Agreement, a decision was made not to proceed with construction of the uranium refinery as contemplated in the feasibility study. We subsequently signed an agreement to license our proprietary UF6 conversion technology to KAP, to allow KAP to examine the feasibility of constructing and operating its own UF6 conversion facility in Kazakhstan.
Supplemental agreements to the Implementation Agreement
JV Inkai has experienced a number of delays in achieving the production levels outlined in the Implementation Agreement. We agreed with KAP to revise the production ramp-up schedule via supplemental agreements to the Implementation Agreement while staying within the 20% deviation from the production levels specified in the RUC, as allowed under the Subsoil Code. There have been four supplements since the Implementation Agreement was first signed. The supplemental agreements also included specifics covering:
| • | production targets and increases to recover the shortfall to the original ramp-up schedule |
| • | production sharing framework for the production shortfall |
| • | dividend distribution sharing formula |
| • | continued support for the calciner project |
| • | toll processing of a portion of JV Inkai production in 2021 |
Discussions are ongoing with KAP regarding additional supplemental agreements to address continuing delays to the ramp-up schedule.
2024 Production
Total 2024 production from Inkai was 7.8 million pounds (100% basis). JV Inkai was not able to achieve its target production for 2024 of 8.3 million pounds of U3O8 (100% basis), as it was contingent upon receipt of sufficient volumes of sulfuric acid in accordance with a specific schedule.
The 2024 production volume represents more than a 20% reduction of the original RUC approved production amount of 10.4 million pounds. The Subsoil Code permits subsoil users to deviate by up to 20% from the approved production volumes without changing their project documents. Nevertheless, JV Inkai still met its financial obligations under the RUC for 2024. There is a risk that the Competent Authority (as defined below) may require JV Inkai to update its project documents and work program and/or catch up production to address underproduction in 2024. We do not expect that this underproduction will result in the RUC being suspended or terminated. However, there can be no certainty that future uranium production deficits will not cause the validity of JV Inkai’s RUC to be challenged.
2025 Production
Production plans for 2025 and subsequent years are uncertain and being reassessed. Presently, JV Inkai is experiencing procurement and supply chain issues, most notably, related to the stability of sulfuric acid deliveries. It is also experiencing challenges related to construction delays, acidification of new wellfields, and inflationary pressures on its production costs.
In addition, on December 31, 2024, we were unexpectedly informed that KAP, as majority owner and controlling partner of the joint venture, had directed JV Inkai to suspend production activity as of January 1, 2025. The suspension was implemented pending approval by Kazakhstan’s Ministry of Energy of an extension to submit an updated Project for Uranium Deposit Development (PUDD) documentation. When the extension had not yet been granted at 2024 year-end as expected, KAP made the decision to halt production in order to avoid potential violation of Kazakhstan legislation. The extension was approved and JV Inkai resumed production on January 23, 2025. Cameco and KAP continue to work with JV Inkai to determine the impact of the approximately three-week production suspension on the operation’s 2025 production plans.
Expansion Project
Engineering work for a process expansion of the Inkai circuit to support a nominal production of at least 10.4 million pounds U3O8 per year has been completed and construction is in progress. The expansion project includes an upgrade to the yellowcake filtration and packaging units, and the addition of a pre-dryer and calciner. Currently, Inkai estimates the completion of the expansion project in 2025, subject to it successfully managing the schedule risk related to contractor performance.
2024 ANNUAL INFORMATION FORM Page 67
Sales
100% of JV Inkai’s annual production is sold to Cameco and KAP. Annual uranium sales contracts between JV Inkai and a Cameco subsidiary to purchase Cameco’s share of JV Inkai’s production are concluded each year, as well as similar contracts between JV Inkai and KAP to purchase KAP’s share of JV Inkai’s production. JV Inkai currently has no other forward-sales commitments for its uranium production.
In accordance with the Kazakhstan government’s resolution on uranium concentrate pricing regulations (effective February 3, 2011), product is currently purchased from JV Inkai at a price equal to the uranium spot price, less a 5% discount (maximum allowable). The spot price represents an average of various third-party consultant views on the most competitive near-term offers available for natural uranium concentrates (U3O8).
Cash distribution
Excess cash, net of working capital requirements, will be distributed to the partners as dividends. In 2024, we received dividend payments from JV Inkai totaling $129 million (US), net of withholdings. Our share of dividends follows our production purchase entitlements as described above. Delays in deliveries of our share of production could reduce the dividend that JV Inkai is able to declare for the calendar year and/or the following year.
Resource use contract
The RUC was signed by the Republic of Kazakhstan and JV Inkai and then registered on July 13, 2000, based on the licence granted on April 20, 1999. The RUC provides for JV Inkai’s mining rights to the MA Area, as well as containing obligations with which JV Inkai must comply in order to maintain such rights. There have been six amendments to the RUC, as follows:
| • | In 2007, Amendment No. 1 to the RUC was signed, extending the exploration period of Blocks 2 and 3 for two years |
| • | In 2009, Amendment No. 2 to the RUC was signed, adopting the 2009 Tax Code, implementing local content and employment requirements, and extending the exploration period at Block 3 |
| • | In 2011, Amendment No. 3 to the RUC was signed, increasing production and giving JV Inkai government approval to carry out a five-year assessment program on Block 3 that included delineation drilling, uranium resource estimation, construction and operation of a processing plant at Block 3, and completion of a feasibility study |
| • | In 2013, Amendment No. 4 to the RUC was signed to increase annual production from Blocks 1 and 2 to 5.2 million pounds U3O8 |
| • | In 2016, Amendment No. 5 to the RUC was signed, extending the exploration period at Block 3 to July 13, 2018 |
| • | In 2017, Amendment No. 6 to the RUC was signed, which grants JV Inkai the right to produce up to 10.4 million pounds per year and extends the term of the RUC until July 13, 2045 |
Discussions are ongoing with respect to a further amendment to the RUC, which may address recent production shortfalls, incorporate updated wellfield design and sequencing and incorporate new decommissioning estimates. Inkai retained a local engineering firm to develop an updated PUDD, which, after going through a regulatory review and approval process, will form the basis for a work program. This updated work program is anticipated to support a further amendment to the RUC.
In addition to complying with its obligations under the RUC, JV Inkai, like all subsoil users, is required to abide by the work program appended to the RUC, which relates to its mining operations.
Environment
The Ecological Code, adopted in 2021, is the principal legislation in Kazakhstan dealing with the protection of the environment. The Ecological Code firmly established the “polluter pays” principle pursuant to which the person whose actions or activities cause environmental damage must remediate the components of the environment that were damaged in full and at its own expense. Administrative or criminal liability for environmental damage does not release such person from civil liability for such remediation of the environment.
Under the existing legislative regime, a subsoil user, such as JV Inkai, is obliged to comply with environmental requirements during all stages of a subsoil use operation. Kazakhstan environmental legislation requires that contemplated activities that may have an impact on the environment undergo the environmental assessment prior to making of any legal, organizational or economic decisions with respect to an operation that could impact the environment and public health. One of the types of such environmental assessment is an environmental impact assessment (EIA).
2024 ANNUAL INFORMATION FORM Page 68
Under the Ecological Code, an EIA is a mandatory requirement for business projects which may have direct or indirect impact on the environment and human health. Every EIA must be reviewed and approved by the appropriate state agency for environmental protection which results in an opinion confirming the conclusions on the possible significant impacts of the planned activity on the environment, the admissibility of the planned activity and the conditions under which the activity is recognized as admissible.
The baseline conditions and potential environmental impacts of the commercial mining facility at Inkai were assessed based on Republic of Kazakhstan and western U.S. standards. The baseline fieldwork was performed in 2001 - 2002. The EIA reports describe the biological, hydrogeological, hydrologic and other physical environmental baseline prior to exploration and the commencement of production operations and assess the potential impacts to environmental media and the human environment from the proposed operations. The environmental studies completed to date have not identified any potential impacts to human health or the environment that could not be mitigated through permit conditions or reclamation bond commitments.
JV Inkai may be subject to administrative penalties for waste exceedances and intends to mitigate against any potential waste exceedances through the construction of additional biological treatment plants (BTP) at MPP, Sat1 and Sat2. The BTP are anticipated to be completed by the end of Q1, 2025.
As required under Kazakhstan law, JV Inkai has a permit for environmental emissions and discharges for the operation that is valid until December 31, 2034. JV Inkai also holds certain water use permits which have various expiry dates.
JV Inkai carries environmental insurance, as required by the RUC and environmental law.
Decommissioning
JV Inkai’s decommissioning obligations are largely defined by the RUC and the Subsoil Code. JV Inkai is required to maintain a reclamation fund, which is capped at $500,000 (US), as security for meeting its decommissioning obligations; it is fully funded.
JV Inkai developed a preliminary decommissioning estimate reflecting current total decommissioning costs under a “decommission now” scenario and updates the plan every year. The preliminary decommissioning estimate prepared as of the end of 2024 was $35.4 million (US).
Under the Subsoil Code, the decommissioning cost estimate for the RUC timeframe must be included in the PUDD. Inkai retained the services of a local engineering firm licensed to prepare the PUDD. The PUDD preparation, including the decommissioning cost estimate, is currently in progress. Once completed, the PUDD undergoes regulatory review and approval. Any required amendments to the RUC to reflect the updated PUDD are then required to be prepared and signed by the Competent Authority and JV Inkai to become a part of the RUC. The decommissioning estimate contained in the PUDD is subject to review and update every three years. Updates account for changes in the volume of work based on the deposit’s development as well as any decommissioning activities carried out in the previous three-year period. The decommissioning costs in the PUDD are subject to review and approval by the government. The decommissioning cost estimates in the PUDD, once approved, will form the basis for determining the required contributions to the reclamation fund, subject to a corresponding amendment to the RUC.
Under the RUC, JV Inkai must submit a project for decommissioning the property to the government six months before mining activities are complete.
Groundwater is not actively restored post-mining in Kazakhstan. See pages 68 to 73 for additional details.
Decommissionng is also referred to below on page 73.
Kazakhstan government and legislation
Subsoil Law
The principal legislation governing subsoil exploration and mining activity in Kazakhstan is the Code of the Republic of Kazakhstan on Subsoil and Subsoil Use No. 125-VI dated December 27, 2017 (which became effective on June 28, 2018), as amended (the Subsoil Code). It replaced the Law on the Subsoil and Subsoil Use dated June 24, 2010, as amended (the
2024 ANNUAL INFORMATION FORM Page 69
Subsoil Law). In general, the rights held by JV Inkai are governed by the Subsoil Law that was in effect at the time of the RUC registration in July 2000. As follows from the stability provisions of the RUC, the Subsoil Code should apply insofar as it does not deteriorate JV Inkai’s position from the previous Subsoil Law that was in effect at the time the licences were issued in April 1999.
The Subsoil Code defines the framework and the procedures connected with the granting of subsoil rights and the regulation of the activities of subsoil users. The subsoil, including mineral resources, are Kazakhstan state property, while minerals brought to the surface belong to the subsoil user, unless otherwise provided by contract or the Subsoil Code.
In order to develop mineral resources, the appropriate state agency designated under the Subsoil Law as the Competent Authority for uranium resources (the Competent Authority) - currently, the Ministry of Energy of the Republic of Kazakhstan grants exploration and production rights to third parties. The Ministry of Energy will soon cease to be the Competent Authority in the sector of uranium mining with its respective powers and functions to be assumed by the new Nuclear Energy Agency (the Agency), created by the President’s decree on March 18, 2025. The decree states that it was adopted for the purpose of development of Kazakhstan’s nuclear sector and ensuring nuclear safety. The decree thus establishes that the Agency will be directly accountable to the President. It is expected that transfer of powers and functions from the Ministry of Energy to the Agency will take place once the Agency is formed, staffed, and its governance documents are drafted and approved. Subsoil rights are granted for a specific period but may be extended prior to the expiration of the applicable contract or licence.
Pursuant to the Subsoil Code, a subsoil user is accorded, among other things, the exclusive right to conduct mining operations, to erect production facilities, to freely dispose of its share of production and to conduct negotiations for extension of the contract, subject to restrictions and requirements set out in the Subsoil Code.
As of the date of this Annual Information Form, a bill introducing significant amendments to the Subsoil Code, including the uranium regulation (the Potential Amendments) has been submitted to Kazakhstan Parliament. It is uncertain whether, when, or in what form the bill will be adopted. A summary of the key Potential Amendments is set out in the relevant sections below.
Stabilization
Under the previous Subsoil Law, changes in legislation that worsened the position of the subsoil user did not apply to resource use contracts signed or licences granted before the changes were adopted. Additionally, the RUC contains its own stability provision that reflects this approach.
While the Subsoil Code still contains the above guarantees, there are a number of listed exceptions such as national defence or security, ecological safety, public health, taxation, customs, and protection of competition.
Some of the provisions of the current Subsoil Code are stated to be applicable retroactively. Given that some subsoil use contracts (including the RUC) contain the legislation stability guarantee and the latter is also provided for by both the stabilized Subsoil Law and the Subsoil Code, any retrospective provisions of the Subsoil Code should not generally override such stability guarantee unless an exception applies.
Overall, the Republic of Kazakhstan has gradually weakened the stabilization guarantee, particularly in relation to new projects, and the national security exception is applied broadly to encompass security over strategic national resources.
Transfer of subsoil rights and priority rights
Amendments to the previous Subsoil Law provide the Republic of Kazakhstan with a pre-emptive right to acquire subsurface use rights and equity interests in entities holding subsoil use rights and in any entity which may directly or indirectly determine or exert influence on decisions made by a subsoil user, if the main activity of such entity is related to subsoil use in Kazakhstan, when such entity wishes to transfer such rights or interests. This pre-emptive right was also provided by the Subsoil Law and it permitted the Republic of Kazakhstan to purchase any subsoil use rights or equity interests being offered for transfer on terms no less favourable than those offered by other purchasers.
The Subsoil Law provided that assignments and transfers of subsoil use rights may be made only with the prior consent of the Competent Authority. The Competent Authority had the right to terminate a subsoil contract if a transaction takes place without such consent.
The Subsoil Code continues to provide for the state’s pre-emptive right to deposits of strategic importance and the requirement to obtain the Competent Authority’s consent to transfer of subsurface use rights and equity interests in entities holding subsoil use rights or entities who may directly or indirectly control the subsoil user. Inkai is considered a deposit of strategic importance.
2024 ANNUAL INFORMATION FORM Page 70
That said, the Subsoil Code liberates to some extent the regime of regulatory approvals. For example, it provides for a longer list of cases where the pre-emptive right and the consent requirements do not apply (e.g., abolished the requirement to obtain consent in case of a charter capital increase without change in shareholding and a transaction with government, state body, national management holding or national company).
Dispute resolution
The dispute resolution procedure in the Subsoil Code does not specifically disallow international arbitration. Instead, it states that if a dispute relates to exercise, amendment or termination of subsoil use rights, the parties can resolve the dispute according to the laws of Kazakhstan and international treaties ratified by the Republic of Kazakhstan. Pursuant to amendments to the Subsoil Code that came into effect on January 10, 2023, disputes under contracts related to complex hydrocarbon projects are expressly allowed to be referred to international arbitration under the United Nations Commission on International Trade Law (UNCITRAL) rules. However, no express arbitration rights have been provided for uranium contracts.
The RUC allows for international arbitration. The Subsoil Code provides for resolution of disputes by court order (meaning state courts) on a number of specific issues such as termination of resource use contracts and some of these provisions were given retrospective effect. Generally, we believe those retrospective provisions should not override the stability guarantee and should not apply to the RUC.
Contract termination
Under the Subsoil Code, the Competent Authority can unilaterally terminate a contract before it expires on the following grounds:
| (a) | failure to provide or provision of knowingly false information in the reports required to be submitted to the Competent Authority; |
| (b) | less than 30% of the financial obligations under a contract are fulfilled during the reporting year; |
| (c) | conducting uranium production operations that involve violating the integrity of the earth surface without establishing the decommissioning security in accordance with the established schedule; |
| (d) | breach of the terms of the resource use contract; |
| (e) | entry into force of a court judgment prohibiting subsoil use operations; |
| (f) | conducting uranium production operations without the approved project documents; |
| (g) | violation of the requirements applicable to transfer of subsoil rights or an object connected with the subsoil use rights (direct and indirect ownership interests in a subsoil user) such as consent of the Competent Authority for the transfer if such consent was required; and |
| (h) | activities of a subsoil user exploring or developing a strategic deposit entails such changes in the economic interests of the state that it poses a threat to national security and the subsoil user does not satisfy the Competent Authority’s request to amend the resource use contract in this regard. |
The Competent Authority may terminate the resource use contract on grounds (a)-(d) only where it notifies the subsoil user of the alleged violations and the subsoil user fails to remedy one of the violations indicated in sub-sections (a)-(c) within three months from the date of receipt of notice from the Competent Authority or when the subsoil user fails to remedy more than two contractual violations under the resource use contract within the time specified in the notice from the Competent Authority. The Competent Authority may terminate the resource use contract immediately on grounds (e)-(g). In case of ground (h), the Competent Authority may terminate the resource use contract only upon the government’s decision.
March 2021 amendments to the Subsoil Code gave retrospective effect to the provisions on termination of resource use contracts.
We believe that the Subsoil Code’s retrospective provisions on termination should not override the stability guarantee and therefore terms of the RUC should continue to apply unless the state seeks to apply the national security, ecological safety or health care exception to the guarantee of legal stability. The termination provisions of the RUC are more favourable than those contained in the Subsoil Code, as the RUC may only be terminated by the Competent Authority with notice to JV Inkai in respect of any contractual breaches, with a period to cure any such breaches, other than with respect to breaches relating to a threat to human life or to the environment.
2024 ANNUAL INFORMATION FORM Page 71
The Potential Amendments provide for the additional grounds for contract termination by the Competent Authority which are proposed to have retroactive effect. Namely, the Competent Authority could unilaterally terminate a subsoil use contract in the event of full depletion of the uranium reserves to be extracted under a work program as of January 1, 2024, unless there is an increase in reserves and such increase is approved by the Competent Authority. However, the Competent Authority may approve the increase in the reserves only on the condition of acceptance by the subsoil user of one of the following obligations: (i) increase a national uranium company’s share in a subsoil user to 90% or (ii) a foreign participant in the subsoil user must transfer technology for converting and enriching uranium to the form of uranium hexafluoride enriched up to 5% to either a national uranium company or a joint venture between the foreign participant and a national uranium company. If the subsoil user accepts these obligations but subsequently violates them, the Competent Authority may terminate the contract.
Work Programs and Project Documentation
In addition to following its obligations under the RUC, JV Inkai, like all subsoil users, is required to abide by work programs, which is a mandatory part of the RUC, and which relate to its operations over the life of the mine.
Work programs must be developed in accordance with project documents. The Subsoil Code establishes three types of project documents for uranium production, depending on the type and stage of the work:
| • | pilot production project: none for JV Inkai |
| • | mining project: JV Inkai’s PUDD |
| • | decommissioning project |
The project documents are developed and undergo a review and approval process. All work must be in compliance with the project documents, and conducting any work without an approved project document, or in non-compliance with it, is not permitted. Since January 2015, subsoil users conducting production of hard materials, including uranium, are allowed to produce within 20% (above or below) of their approved project targets in a year without triggering a requirement to revise the approved project documents. Any changes to the project documents that affect investment project targets included in the work program require amendments to the work program. Thus, changes of types, methods, technologies, volumes and terms of uranium mining operations are only allowed after amendment of the relevant project documents. Any amendments to aspects of the work program that are an integral part of the RUC require an application to the Competent Authority for approval, signing and registering amendments to the RUC.
The Potential Amendments stipulate that an increase in production, an increase in the reserves, or an extension of the mining period are only allowed upon introduction to the contract of one of the following obligations of a foreign participant in a subsoil user:
| • | to increase a national uranium company’s participation interest in a subsoil user to 90%; or |
| • | to transfer technology for converting and enriching uranium to the form of uranium hexafluoride enriched up to 5% and (1) to ensure localization of the technology by building a plant together with a national uranium company, (2) guarantee a market for not less than 50% of the plant’s products by signing a long-term agreement on the purchase of the plant’s products, and (3) establish penalties for breach of these obligations. |
As currently contemplated, the above amendments would have retroactive effect.
Procurement Requirements
Under the Subsoil Code, all subsoil users, (with some exceptions) must procure goods, works and services for uranium mining operations under prescribed statutory procedures.
The Subsoil Code requires procurements from open tender, single source, open competition to control costs (digital procurement) to be conducted using the register of goods, works and services (the register of potential suppliers) or other digital procurement systems located on Kazakhstan’s internet sites. Uranium mining companies may also conduct procurement of certain limited goods, works and services by applying other methods or on commodity exchanges.
2024 ANNUAL INFORMATION FORM Page 72
Subsoil users are also required to develop annual and mid-term (for five financial years) procurement programs based on the work program and respective budget.
Prior to 2018, JV Inkai followed the statutory procedures prescribed by the Subsoil Code. After 2018, as an entity with more than 50% of voting shares directly or indirectly belonging to Samruk Kazyna National Wealth Fund, JV Inkai has been following Samruk Kazyna procurement procedures that generally are more prescriptive than the procedures in the Subsoil Code.
Local content
The Subsoil Code imposes local content requirements for works, services and employees.
The RUC imposes local content requirements on JV Inkai with respect to employees, goods, works and services. As such, at least 40% of the costs of the acquired goods and equipment, 90% of contract works and 100%, 70% and 60% of employees, depending on their qualifications (workers, engineers, and management, respectively), must be of local origin. Effective January 1, 2021, under Kazakhstan law this local content requirement ceased to apply to goods procured by JV Inkai.
Strategic Deposits
On August 13, 2009, a governmental resolution “On Determination of the List of Subsoil (Deposit) Blocks having Strategic Importance” No. 1213 came into force whereby 231 blocks, including all three of JV Inkai’s blocks, were prescribed as strategic deposits. The Kazakhstan government re-approved this list in 2011 by its decree No. 1137, and in 2018 by its decree No. 389, which still included Inkai.
Under the Subsoil Code, if a subsoil user’s actions in the performance of subsoil use operations with respect to strategic deposits result in a change to the economic interests of the Republic of Kazakhstan which create a threat to national security, the Competent Authority is entitled to require an amendment to the resource use contract for the purpose of restoring the economic interests of the Republic of Kazakhstan. The Subsoil Code prescribes strict deadlines for the parties to negotiate and execute any such required amendments and failure to comply with such deadlines entitles the Competent Authority to terminate the resource use contract unilaterally. The Subsoil Code also allows the Competent Authority, upon a decision of the government of the Republic of Kazakhstan, to unilaterally terminate a resource use contract if it determines that the subsoil use operations conducted thereunder will result in a change in the economic interests of Kazakhstan, which create a threat to national security. In such circumstances, the Competent Authority must provide not less than two months prior notice of such termination. The Competent Authority has the right to unilaterally terminate a resource use contract without having to apply to a court or arbitration panel for termination. The basis for exercise by the Competent Authority of any of these powers is a “change in the economic interests of the Republic of Kazakhstan which creates a threat to national security”, which might be interpreted broadly. Moreover, this right of unilateral termination applies retroactively to old resource use contracts.
Decommissioning
The decommissioning regulations have been changed by the Subsoil Code. The general provisions related to decommissioning have been modified and special provisions on decommissioning of uranium fields have been introduced. The transitional provisions of the Subsoil Code preserve the decommissioning fund mechanism applicable to the RUC and accordingly, JV Inkai continues to rely upon its existing decommissioning fund. At the same time, the preparation of an updated PUDD for Inkai, including the decommissioning cost estimate, is currently in progress. Once completed, the PUDD would undergo regulatory review and approval. Any required amendments to the RUC to reflect the updated PUDD will then be required to be prepared and signed by the Competent Authority and JV Inkai. See page 69 for additional details.
Uranium special regulations
In addition to the general provisions described above, the Subsoil Code differentiates uranium from the rest of solid minerals and provides an additional, distinct set of rules to govern uranium mining specifically. The Subsoil Code provides that a uranium deposit is granted for mining to a uranium national company (a joint stock company created by the government of Kazakhstan’s decree and controlling stock of which belongs to the state or national management fund and conducting activities in uranium sphere) on the basis of direct negotiations. Currently, the uranium national company is KAP. The Subsoil Code does not envisage that such direct negotiations can be initiated by persons other than national companies. It follows then that new subsoil use rights for uranium mining can only be granted to a national company.
2024 ANNUAL INFORMATION FORM Page 73
The Subsoil Code further stipulates that a subsoil use right for uranium mining (or a share in such subsoil use right) granted to a uranium national company on the basis of direct negotiations may only be further transferred to a legal entity in which more than 50% of the shares (participating interests) belong directly or indirectly to a uranium national company. Such a transferee, in turn, may only transfer the subsoil use right (or share in the subsoil use right) to a legal entity in which more than 50% of the shares (participating interests) belong directly or indirectly to a uranium national company.
The Potential Amendments envisage an increase in the required amount of direct or indirect participation of a national uranium company in a potential transferee from 50% to 75%.
The uranium special rules also regulate issues of termination of the uranium subsoil use right, provision of a uranium deposit and its extension/reduction, conditions, and periods of mining and project and design documents. The Subsoil Code does not generally establish a retroactive effect for these special uranium rules, subject to a few exceptions (for example, uranium contract termination provisions now apply retroactively).
Currency Control Regulations
Monitoring of currency operations
The National Bank of the Republic of Kazakhstan (the NBK) is the main state authority responsible for currency regulation and currency control. As part of currency regulation, the NBK monitors certain currency transactions. In particular, the NBK carries out record registration of currency contracts related to ‘capital movement transactions’, where the value exceeds US$500,000 (or the equivalent amount in any other currency). The concept of ‘capital movement transactions’ includes, inter alia, loan agreements, agreements providing for participation in the capital of a Kazakh legal entity), and sale and purchase agreements entered into between a resident and a non-resident of Kazakhstan.
Based on the above, a Kazakh resident, when entering into a transaction with a non-resident, is responsible for (i) registration of a contract if the value of the contract exceeds or may exceed US$500,000 (or the equivalent amount in any other currency), and (ii) ongoing currency control reporting associated with the transaction.
By way of example, the following transactions between residents and non-residents are subject to record registration with the NBK: foundation agreements, direct investment contracts, loan agreements, etc.
At the same time, payment of dividends by a Kazakh company to its non-resident participant (shareholder) is not currently subject to record registration with the NBK, despite the fact that such payment of dividends may be carried out in a foreign currency.
In general, the registration with the NBK needs to be accomplished before any payments are made under a relevant “capital movement transaction.”
For completeness, the registration and the ongoing reporting requirements must be observed by Kazakh residents, not by their foreign counterparties.
Export-import transactions
Contracts related to export and import of goods, works and services are also subject to the currency regulation. In particular, an export-import contract is subject to record registration with a Kazakh bank, which processes the payment under such contract (or, in some cases, with the NBK), if the amount of such contract exceeds an equivalent of US$50,000.
Purchase / sale of foreign currency
Pursuant to the current Law of the Republic of Kazakhstan on Currency Regulation and Currency Control (the Currency Control Law), Kazakh legal entities (other than Kazakh banks) undertake purchasing and/or selling of foreign currency (a) through their bank accounts opened with Kazakh banks, and (b) in accordance with the rules on carrying out currency operations in Kazakhstan.
Kazakh resident legal entities (except Kazakh banks) can buy non-cash foreign currency for the national currency for the purposes not related to the fulfillment of obligations in foreign currency in an amount not exceeding the equivalent of $50,000 (US) per each business day. Purposes not related to fulfilment of obligations in foreign currency include crediting or transfer of foreign currency to a resident’s own accounts, including the accounts of its separate subdivisions, as well as gratuitous transfers of money in foreign currency.
2024 ANNUAL INFORMATION FORM Page 74
A Kazakh resident (except Kazakh banks), when applying for the purchase of non-cash foreign currency for national currency to a Kazakh bank in an amount exceeding the equivalent of $50,000 (US), shall indicate the purpose of the purchase and provide a copy of the currency contract, as well as an invoice or other payment document.
Measures for the protection of payment balance
Pursuant to the Currency Control Law, the Kazakhstan Government, based on a joint recommendation with the NBK, is entitled to introduce “measures for protection of payment balance” (i.e., a special currency regime). These measures can be established when there is a serious threat to the stability of (i) the payment balance, (ii) the internal currency market, and (iii) the economic security of the Republic of Kazakhstan – provided that these events cannot be resolved by other economic policy measures.
The measures for protection of payment balance must comply with international treaties ratified by the Republic of Kazakhstan, if and when such treaties entered into within the framework of participation in international associations (organizations) (e.g., Eurasian Economic Community). Such measures must only have a temporary effect and be cancelled when the circumstances (events) that led to their introduction are eliminated.
While the measures for the protection of payment balance have not been imposed in practice yet, in theory, measures for protection of payment balance may potentially prevent Kazakhstan companies, like JV Inkai, from inter alia paying dividends to their participants abroad or repatriating any or all of its profits in foreign currency. JV Inkai can hold $US on its accounts as needed, and buy foreign currency to pay dividends in case of shortage.
The RUC grants JV Inkai a measure of protection from currency control regulations, granting it the right to freely transfer funds, in state and other currencies, inside and outside Kazakhstan.
Operating, capital costs and economic analysis
The cost estimates in this section are on a 100% basis with a currency exchange rate assumption of 365 Kazakhstan Tenge to $1.00 Cdn. All cost projections are stated in constant 2025 Canadian dollars and reflect a production forecast for the period from 2025 to mid-2045 of 204.5 million pounds U3O8.
Operating costs for Inkai are estimated to be $12.62 per pound of U3O8 over the remaining life of the current mineral reserves. The operating cost projections have incorporated the production sequence and pattern design of the wellfields along with past production experience to determine the estimated annual expenditures. Estimated operating expenditures, excluding taxes and royalties, for ISR mining, surface processing, site administration and corporate overhead for Inkai from 2025 to mid-2045 are shown in the table below.
| Operating Costs ($Cdn million) |
Total (2025 – 2045) |
|||
| Site administration |
$ | 657.6 | ||
| Mining costs |
949.9 | |||
| Processing costs |
376.9 | |||
| Corporate overhead |
596.1 | |||
|
|
|
|||
| Total operating costs |
$ | 2,580.5 | ||
|
|
|
|||
| Average cost per pound U3O8 |
$ | 12.62 | ||
|
|
|
|||
Note: presented as total cost to JV Inkai (100% basis).
Capital costs for Inkai are estimated to be $1,406 billion over the remaining life of the current mineral reserves. The remaining capital costs, as of January 1, 2025, includes $1,143 billion for wellfield development, $86 million for construction and expansion, and $177 million for sustaining capital. For the period from 2025 to mid-2045, capital cost estimates have decreased by 5% compared to the recent technical report for Inkai. The decrease relates to expenditures incurred in 2024.
Capital for construction and expansion is heavily weighted to 2025 to 2027 due to the capital required for the ramp-up and expansion projects, as well as upgrades planned for existing facilities.
2024 ANNUAL INFORMATION FORM Page 75
The table below shows the annual capital cost estimate for Inkai from 2025 to mid-2045.
| Capital Costs ($Cdn million) |
Total (2025 – 2045) |
|||
| Total wellfield development |
$ | 1,143.2 | ||
| Construction and maintenance capital |
85.6 | |||
| Sustaining capital |
177.1 | |||
|
|
|
|||
| Total capital costs |
$ | 1,405.9 | ||
|
|
|
|||
Note: presented as total cost to JV Inkai (100% basis).
The economic analysis shown in the table below effective as of September 30, 2024 being the effective date of the technical report for JV Inkai, is based upon Cameco’s assumption regarding the production plan, which contemplates mining and processing Inkai’s mineral reserve from January 1, 2024 to mid-2045. The financial projections do not contain any estimates involving the potential mining and processing of inferred mineral resources. Mineral resources that are not mineral reserves have no demonstrated economic viability.
The economic analysis is undertaken from the perspective of JV Inkai and is based on JV Inkai’s share (100%) of Inkai mineral reserves. The economic analysis assumes that 85% of these reserves are recoverable as saleable yellowcake. The net cash flow incorporates the projected sales revenue from the estimated saleable yellowcake, less the related operating and capital cost, MET (including the increased rate in 2025 and the tiered approach based on production and price assumptions for 2026 and onward), and corporate income tax.
The economic analysis results in an after tax NPV (at a discount rate of 12%), for the net cash flows from January 1, 2024 to mid-2045, of $4.3 billion for JV Inkai mineral reserves. Using the total capital invested, along with the operating and capital cost estimates for the remainder of the mineral reserves, the after-tax IRR is estimated to be 26.9%.
Annual Cash Flows – 100% JV Inkai basis
| Economic Analysis ($Cdn M) |
2024 | 2025 | 2026 | 2027 | 2028 | 2029 | 2030 | 2031 | 2032 | |||||||||||||||||||||||||||
| Production volume (000’s lbs U3O8)1 |
7,696 | 9,360 | 10,400 | 10,399 | 10,399 | 10,399 | 10,399 | 10,399 | 10,399 | |||||||||||||||||||||||||||
| Sales Revenue |
$ | 923.8 | $ | 1,170.8 | $ | 1,245.9 | $ | 1,148.5 | $ | 1,099.1 | $ | 1,074.4 | $ | 1,037.3 | $ | 1,037.3 | $ | 1,025.0 | ||||||||||||||||||
| Operating Costs |
107.0 | 125.1 | 131.0 | 127.6 | 127.6 | 128.1 | 127.6 | 126.2 | 127.7 | |||||||||||||||||||||||||||
| Capital Costs |
70.0 | 77.9 | 97.8 | 73.8 | 72.1 | 74.1 | 66.3 | 71.0 | 66.9 | |||||||||||||||||||||||||||
| Mineral Extraction Tax |
58.3 | 110.9 | 216.4 | 199.5 | 185.1 | 180.9 | 174.7 | 174.7 | 172.6 | |||||||||||||||||||||||||||
| Corporate Income Tax |
140.5 | 175.1 | 167.3 | 152.6 | 145.8 | 142.0 | 128.8 | 131.8 | 130.4 | |||||||||||||||||||||||||||
| Net cash flow |
$ | 547.9 | $ | 681.7 | $ | 633.2 | $ | 594.9 | $ | 568.4 | $ | 549.2 | $ | 540.0 | $ | 533.6 | $ | 527.3 | ||||||||||||||||||
| 2033 |
2034 |
2035 |
2036 |
2037 |
2038 |
2039 |
2040 |
2041 |
2042 |
2043 |
2044 |
2045 |
Total |
|||||||||||||
| 10,399 |
10,399 | 10,399 | 10,141 | 8,904 | 9,012 | 9,446 | 9,591 | 9,934 | 9,888 | 9,468 | 10,033 | 4,827 | 212,292 | |||||||||||||
| $1,049.7 |
$1,037.3 | $1,025.0 | $1,011.6 | $898.8 | $909.7 | $964.7 | $990.9 | $1,026.3 | $1,021.5 | $978.1 | $1,036.5 | $498.7 | $22,210.6 | |||||||||||||
| 126.9 |
128.2 | 127.0 | 128.9 | 120.4 | 121.6 | 122.0 | 123.7 | 123.6 | 125.0 | 123.2 | 127.5 | 61.9 | 2,687.9 | |||||||||||||
| 71.3 |
60.2 | 68.4 | 68.9 | 69.4 | 66.3 | 62.4 | 61.2 | 62.5 | 61.6 | 66.0 | 59.2 | 28.5 | 1,475.9 | |||||||||||||
| 176.8 |
174.7 | 172.6 | 170.4 | 151.4 | 153.2 | 162.5 | 166.9 | 172.8 | 172.0 | 164.7 | 174.6 | 84.0 | 3,569.8 | |||||||||||||
| 134.9 |
133.2 | 130.7 | 128.2 | 113.3 | 114.6 | 123.1 | 127.5 | 132.0 | 131.8 | 125.8 | 132.6 | 62.8 | 2,905.2 | |||||||||||||
| $539.8 |
$541.0 | $526.2 | $515.2 | $444.3 | $453.9 | $494.8 | $511.5 | $535.3 | $531.1 | $498.4 | $542.6 | $261.5 | $11,571.8 |
Note: numbers may not add due to rounding.
| 1 | Based on KAP’s announcement on January 27, 2025, production in Kazakhstan is expected to remain below the level stipulated in subsoil use agreements. With the halt of production for approximately 3 weeks in January 2025, we are still in discussions with JV Inkai and KAP to determine how this may impact production at Inkai in 2025 and thereafter and therefore our corresponding purchase obligation. |
2024 ANNUAL INFORMATION FORM Page 76
There is considerable uncertainty regarding the future political and economic landscape in Kazakhstan, which could impact capital and operating cost estimates (for additional information see a discussion of Financial risks starting on page 123 and Strategic risks – Foreign investments and operations and Kazakhstan on page 139).
Our expectations and plans regarding Inkai, including forecasts of operating and capital costs, net annual cash flow, production and mine life are forward-looking information, and are based specifically on the risks and assumptions discussed on pages 5, 6 and 7. Operating or capital spending plans may change in 2025, depending on uranium markets and other factors. Estimates of expected future production, net annual cash flows, and capital and operating costs are inherently uncertain, particularly beyond one year, and may change materially over time.
Exploration, drilling, sampling, data quality and estimates
Exploration
Exploration drilling
JV Inkai’s uranium exploration and delineation drilling programs in the MPP, Sat1 and Sat2 Areas were conducted by drilling vertical holes from surface. Delineation of the areas and their geological and geophysical features were carried out by drilling on a grid at a prescribed density of 3.2 to 1.6-kilometre line spacing and 200 to 50-metre hole spacing with coring. Additional information was obtained by further drilling at grids of 800 to 400 x 200 to 50 metres with coring and 200 to 100 x 50 to 25 metre grids, usually without core being recovered.
Vertical holes are drilled with a triangular drill bit for use in unconsolidated formations down to the target horizon, at which point the rest of the hole is cored. At the Inkai deposit, approximately 50% of all exploration holes are cored through the entire mineralized interval. Sampling, radiometric probing, hole deviation, geophysical and hole diameter surveys are done by site crews and experienced contractors.
The total number of holes drilled at Inkai is presented in the table below.
| Type |
Number of Holes | |||
| Historical exploration – delineation (non-JV Inkai) 1976-1996 |
3,017 | |||
| Block 3 delineation 2006-2016 |
1,003 | |||
| Block 2 delineation 2016-2019 |
1,207 | |||
| Pre-production drilling 2013-December 31, 2024 |
930 | |||
|
|
|
|||
| Total |
6,157 | |||
|
|
|
|||
Historical drilling information was relied upon to estimate Inkai’s original mineral resources and reserves for the MA Area.
Additional exploration and delineation work was completed in the Sat2 Area by JV Inkai from 2006 to 2016.
A delineation and infill drilling program was completed in the Sat1 Area, by JV Inkai from 2016 to 2018. The program was designed to refine the geological model to be used for resource estimation and classification of the area.
From 2013 to 2024, additional pre-production drilling was conducted within the MA Area to better establish the mineralization distribution and to support further development and wellfield design.
Sampling analysis and data verification
The sampling, sample preparation, analyses, and geophysical downhole logging during the exploration and delineation programs follow the procedures and manuals which adhere to the requirements set out in the State Reserves Commission (SRC) guidelines. In compliance with the requirements of the SRC, drilling conducted on grids of 400 x 50 metres or greater are cored. A minimum core recovery of 70% is required in at least 70% of the drillholes for further studies, including those used for gamma probing and radioactive disequilibrium correlation purposes.
Sampling and Analysis
Drill core is logged in log journals following the developed manuals and representative core samples are selected for the following analyses and tests: determination of the content of uranium, radium and associated elements; determination of bulk density, moisture content, porosity and acid-base balance of monolith rocks; determination of mineralization and host rock physical composition, grain size and carbonate content; and column leach tests for uranium leachability.
2024 ANNUAL INFORMATION FORM Page 77
Detailed sampling procedures guide the sampling interval within the mineralization. Where core recoveries are greater than 70% and radioactivity is greater than 40 micro-roentgens per hour, core samples are taken at irregular intervals of 0.2 to 1.2 metres. Sample intervals also are differentiated by barren or low-permeability material. The average core sample length is 0.4 metre. The sampling is conducted from half the core divided along its axis. Core diameter is 60, 70 or 100 millimetres depending on depth. The required sample weight is determined based on the length of the samples and the diameters of the core sampled.
Sample preparation and assaying are done by Volkovgeology following SRC guidelines. When core samples are being analysed for geochemistry, they are primarily analysed for grain size and assayed for uranium, radium, thorium, potassium and carbonate content. On selected fence lines, a more extensive study of geochemistry is undertaken.
The core samples for uranium and radium determination are taken from representative intervals. Samples are ground down to pass 1.0 millimetre mesh size and are subsequently subdivided until the final representative weight of samples and duplicates is reached (0.2 kilogram) at the final division stage.
The laboratory tests for uranium and radium were performed by the Central Analytical Laboratory (CAL) of JSC Volkovgeology, located in Almaty. The laboratory was certified and licensed by the National Centre for Accreditation of the Republic of Kazakhstan to comply with the STRK ISO/IEC 17025-2007 standard, Certificate number KZ.I.02.1029. Volkovgeology is a subsidiary of KAP, which is part owner of JV Inkai. The uranium content was determined by using X-ray fluorescence spectrum analysis while the radium content was determined through gamma-X-ray spectrum analysis. Assays from core sampling are only used for gamma probing correlation and radioactive disequilibrium determination purposes. Additional duplicate samples are collected by a different sampler from the second half of the core split for quality control purposes.
Sample Security
JV Inkai’s current sampling process follows the strict regulations imposed by the Kazakhstan government, and includes the highest level of security measures, quality assurance and quality control. With respect to historical Kazakhstan exploration on the MA Area, we have been unable to locate the documentation on sample security. However, based on the rigorous quality assurance and quality control used in other areas of sampling, the regulations imposed by the Kazakhstan government and comparisons against current data, we believe that the security measures taken to store and ship samples were of the highest quality.
Quality Control
In order to ensure the assay accuracy and reliability for the purposes of correlation with gamma probing and disequilibrium determination for resource estimation, the following quality controls were carried out:
| • | Source materials for logging calibration are used to test the probing equipment on a quarterly basis. The variation in gamma logging results cannot exceed +/- 5% grade-thickness, and the variation in recording electrical logging parameters does not exceed +/- 7%. Results falling outside acceptable tolerances are reviewed. |
| • | Further comparisons have been made between gamma logging data and neutron logging data to confirm the absence of systematic errors. Prompt fission neutron logging, a direct measurement method for determining uranium content, was performed for a number of drillholes as a check against gamma radioactivity-determined uranium grades, which provides an indirect measure of uranium content. |
| • | Resulting equivalent U3O8 grades are checked against the chemical assay results. |
| • | Internal laboratory control of the uranium and the radium grade determination is performed by comparing the results of the sample against its blind duplicate. The mean square error between sample and duplicate is calculated by measuring the deviation to ensure it stays within the prescribed limits. The number of control samples was approximately 9% of all samples for uranium and approximately 6% of all samples for radium. |
| • | Internal inter-method control of assays for uranium and radium were performed in the form of checks between the results of the X-ray fluorescence analysis for uranium against the results of wet chemical analyses conducted by CAL. The results of radium determination were checked against the results of radiochemical analyses also conducted by CAL. The number of control samples was approximately 12% of all samples for uranium and radium. |
2024 ANNUAL INFORMATION FORM Page 78
| • | External (inter-laboratory) controls for the uranium and radium assays were carried out at the VIMS laboratory in Moscow, Russia, Nevskoe PGO laboratory in Saint-Petersburg, Russia and Kyzyltepageologiya Laboratory in Navoi, Uzbekistan. The number of control samples was approximately 3% of all samples for uranium and radium. |
Data Verification
Sampling and analysis procedures used for the MPP Area resource estimate were examined by both our geoscientists and an independent consultant and found to be detailed and thorough. The relationship between radioactive readings and calculated radium grades obtained from the use of the method was studied in detail at that time, showing a good relationship between radioactivity and radium grade in most locations.
All of the drillhole information in use at Inkai is provided to us upon request. The current database has been validated a number of times by geoscientists with JV Inkai, JSC Volkovgeology, the SRC, Two Key LLP, and our geoscientists. Correlation on grade-thickness from radioactivity and from radium grade (and its subsequent conversion to uranium grade based on radium-uranium equilibrium) has been reviewed by our geoscientists and found to be accurate and reliable. Our geoscientists have witnessed or reviewed drilling, core handling, radiometric probing, logging, sampling processes and facilities used at the Inkai mine and consider the methodologies to be satisfactory and the results representative and reliable.
Mineral Processing and Metallurgical Testing
The ISR mining method at Inkai uses a sulfuric acid-based lixiviant. The resulting UBS is processed at the MPP, Sat1 and Sat2 to obtain eluate which is further processed at the MPP to currently produce uranium peroxide yellowcake.
Exploration at Inkai started in the late 1970’s involving sampling, assaying and mineralogical studies at Blocks 1, 2 and 3. Standardized column leach tests on composite samples were performed to measure average uranium UBS grades and levels of acid consumption. Uranium recoveries approaching 85% or greater were achieved with all samples.
A pilot test, using the ISR mining method, was performed in the northeast area of Block 1 starting in December 1988. The pilot leach test in Block 2 started in 2002 and was completed in 2006 while the pilot leach test in Block 3 was initiated in 2015 and completed in 2017.
Commercial production at MPP, Sat1 and Sat2 started in 2009, 2010 and 2018 respectively.
There are three processing facilities on the MA Area: the MPP, Sat1 and Sat2. Since the MPP, Sat1 and Sat2 processing plants have been in commercial production for a significant period, validating the test work results, we have determined that the metallurgical test results for these three operating process circuits are no longer significant or relevant in regard to forming the basis of future recovery assumptions and estimates.
Mineral reserve and resource estimates
Please see pages 98 and 99 for our mineral reserve and resource estimates for Inkai.
Uranium – Tier-two operations
Rabbit Lake
Located in Saskatchewan, Canada, our 100% owned Rabbit Lake operation opened in 1975, and has the second largest uranium mill in the world. Due to market conditions, we suspended production at Rabbit Lake during the second quarter of 2016.
2024 ANNUAL INFORMATION FORM Page 79
| Location | Saskatchewan, Canada | |
| Ownership | 100% | |
| End product | Uranium concentrates | |
| ISO certification | ISO 14001 certified | |
| Mine type | Underground | |
| Estimated reserves | — | |
| Estimated resources | 38.6 million pounds (indicated), average grade U3O8: 0.95% | |
| 33.7 million pounds (inferred), average grade U3O8: 0.62% | ||
| Mining methods | Vertical blasthole stoping | |
| Licensed capacity | Mill: maximum 16.9 million pounds per year; currently 11 million | |
| Licence term | Through October 2038 | |
| Total production: 1975 to 2024 | 202.2 million pounds | |
| 2024 production | 0 million pounds | |
| 2025 production outlook | 0 million pounds | |
| Estimated decommissioning cost | $294.8 million | |
Production suspension
The site remained in a safe state of care and maintenance throughout 2024.
While in standby, we continue to evaluate our options in order to minimize care and maintenance costs. We expect standby operating costs in care and maintenance to range between $43 million and $47 million in 2025, an increase from 2024 due to project work related to containment improvements.
Future production
We do not expect any production from Rabbit Lake in 2025.
US ISR Operations
Located in Nebraska and Wyoming in the US, the Crow Butte and Smith Ranch-Highland (including the North Butte satellite) operations began production in 1991 and 1975, respectively. Each operation has its own processing facility. Due to market conditions, we curtailed production and deferred all wellfield development at these operations during the second quarter of 2016.
2024 ANNUAL INFORMATION FORM Page 80
| Ownership | 100% | |||
| End product | Uranium concentrates | |||
| ISO certification | ISO 14001 certified | |||
| Estimated reserves | Smith Ranch-Highland: | — | ||
| North Butte-Brown Ranch: | — | |||
| Crow Butte: | — | |||
| Estimated resources | Smith Ranch-Highland: | 24.9 million pounds (measured and indicated), average grade U3O8: 0.06% | ||
| 7.7 million pounds (inferred), average grade U3O8: 0.05% | ||||
| North Butte-Brown Ranch: | 9.4 million pounds (measured and indicated), average grade U3O8: 0.07% | |||
| 0.4 million pounds (inferred), average grade U3O8: 0.06% | ||||
| Crow Butte: | 13.9 million pounds (measured and indicated), average grade U3O8: 0.25% | |||
| 1.8 million pounds (inferred), average grade U3O8: 0.16% | ||||
| Mining methods | In situ recovery (ISR) | |||
| Licensed capacity | Smith Ranch-Highland:1 | Wellfields: 3 million pounds per year; processing plants: 5.5 million pounds per year | ||
| Crow Butte: | Processing plants and wellfields: 2 million pounds per year | |||
| Licence term | Smith Ranch-Highland: | Through September 2028 | ||
| Crow Butte: | Through October 2024 (in timely renewal) | |||
| Total production: 2002 to 2024 | 33.0 million pounds | |||
| 2024 production | 0 million pounds | |||
| 2025 production outlook | 0 million pounds | |||
| Estimated decommissioning cost | Smith Ranch-Highland: $248.6 million (US), including North Butte | |||
| Crow Butte: $65.4 million (US) | ||||
| 1 | Including Highland mill. |
Production and curtailment
As a result of our 2016 decision, commercial production at the US operations ceased in 2018.
We expect ongoing cash and non-cash care and maintenance costs to range between $14 million (US) and $15 million (US) for 2025.
In September 2024, the operating licence renewal for Crow Butte was submitted and timely renewal is now in process by the NRC.
Future production
We do not expect any production in 2025.
Uranium – Advanced projects
Our advanced projects are part of our project pipeline and these resources are supportive of growth beyond our existing suite of tier-one and tier-two assets. We plan to advance them at a pace aligned with market opportunities.
| Millennium | ||
| Location | Saskatchewan, Canada | |
| Ownership | 69.9% | |
| End product | Uranium concentrates | |
| Potential mine type | Underground | |
| Estimated resources (our share) | 53.0 million pounds (indicated), average grade U3O8: 2.39% | |
| 20.2 million pounds (inferred), average grade U3O8: 3.19% | ||
Background
The Millennium deposit was discovered in 2000 and was delineated through geophysical surveys and surface drilling work between 2000 and 2013.
2024 ANNUAL INFORMATION FORM Page 81
Yeelirrie
| Location | Western Australia | |
| Ownership | 100% | |
| End product | Uranium concentrates | |
| Potential mine type | Open pit | |
| Estimated resources | 128.1 million pounds (measured and indicated), average grade U3O8: 0.15% | |
Background
The Yeelirrie deposit was discovered in 1972 and is a near-surface calcrete-style deposit that is amenable to open pit mining techniques. It is one of Australia’s largest undeveloped uranium deposits.
Kintyre
| Location | Western Australia | |
| Ownership | 100% | |
| End product | Uranium concentrates | |
| Potential mine type | Open pit | |
| Estimated resources (our share) | 53.5 million pounds (indicated), average grade U3O8: 0.62% | |
| 6.0 million pounds (inferred), average grade U3O8: 0.53% | ||
Background
The Kintyre deposit was discovered in 1985 and is amenable to open pit mining techniques.
2024 project updates
We believe that we have some of the best undeveloped uranium projects in the world. However, our primary focus is on producing from our tier-one uranium assets at a pace aligned with our contract portfolio and market opportunities.
Planning for the future
2025 Planned activity
No work is planned at Millennium, Yeelirrie or Kintyre in 2025.
Project approval
A project description for Millennium was submitted to the Saskatchewan Ministry of Environment and the CNSC in 2009, along with a draft Environmental Impact Statement (EIS) in 2012. The EIS received Ministerial Approval from Saskatchewan in December 2013. In May 2014, Cameco notified the CNSC that it did not wish to proceed with the CNSC’s licensing process due to economic conditions. The CNSC’s Environmental Assessment and licensing process remains on hold and can be reopened at Cameco’s request. The provincial approval remains valid, as it was renewed in 2018 and again in 2023.
The approval for the Yeelirrie project, received from the prior state government, required substantial commencement of the project by January 2022, and this was not achieved. The current government declined to grant us an extension to achieve it. In the future, we can again apply for an extension of time to achieve substantial commencement of the project. If granted by a future government we could commence the Yeelirrie project, provided we have all other required regulatory approvals. Approval for the Yeelirrie project at the federal level was granted in 2019 and extends until 2043.
Approval of the Kintyre project at the federal level was granted in 2015 and extends until 2045. The approval received for Kintyre from the prior state government required substantial commencement of the project by March 2020, being within five years of the grant of the approval, and this was not achieved. The current government declined to grant us an extension to achieve it. In the future, we can apply for an extension of time to achieve substantial commencement of the project. If granted by a future government, we could commence the Kintyre project, provided we have all other required regulatory approvals.
2024 ANNUAL INFORMATION FORM Page 82
Uranium – Exploration
Our exploration program is focused on replacing mineral reserves as they are depleted by our production, which is key to sustaining our business, meeting our commitments, and ensuring long-term growth. Our exploration activity is adjusted annually in line with market signals and at a pace aligned with Cameco’s mining plans and marketing requirements. In recent years, as we began to bring back our tier-one production, we also increased exploration spending, all in response to the positive momentum in the nuclear fuel market which has provided a clear signal that more uranium production will be required in the next decade, setting the stage for a renewed exploration cycle.
Our position as one of the world’s largest uranium producers and our continued growth across the nuclear fuel cycle has been driven by decades of experience and our history of exploration, discovery and mining successes. Our land position totals 754,000 hectares (1.8 million acres) that cover exploration and development prospects in Canada, Australia, Kazakhstan and the US that are among the best in the world. In northern Saskatchewan alone, we have direct interests in 660,000 hectares (1.6 million acres) that cover many of the most prospective areas of the Athabasca Basin.
In northern Saskatchewan, our well-established infrastructure includes licensed and fully permitted uranium mills and mines in the eastern Athabasca basin, supported by a network of roads, airstrips and electricity supply. This infrastructure provides us with an advantage that not only underpins the potential development of our advanced exploration projects, but also supports our ongoing work to both delineate existing prospects and deposits, and to identify undiscovered uranium potential. Additionally, our decades of work to establish a positive corporate reputation by prioritizing our relationships with northern Saskatchewan Indigenous communities, confirms our long-term commitment to continually engage and provide ongoing benefits to the people that call the region home.
The well-known uranium endowment of the Athabasca Basin, where we are involved in 45 projects (including partner-operated joint ventures, previously 39 projects in 2023), is the result of its unique geology, creating a remarkable mining jurisdiction that hosts the highest uranium grades and some of the largest uranium deposits in the world. On our projects, numerous uranium occurrences have been identified, along with several prospects and undeveloped deposits of variable grades and sizes which have progressed through multiple stages of evaluation. Depending on the potential deposit size, ground quality, evolving mining technologies and the uranium market environment, some of these prospects are expected to become viable, economic deposits in a uranium market and price environment that supports new primary production and provides an adequate risk-adjusted return.
The combination of our large land position and proven expertise in discovering and developing world class uranium deposits provides the foundation for future mill-supported exploration projects, ranging from early to advanced stages of greenfield exploration and for brownfield opportunities to extend the lives of our existing operations.
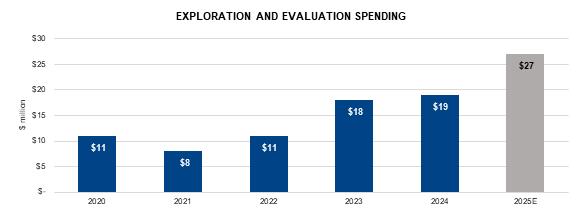
2024 ANNUAL INFORMATION FORM Page 83
2024 UPDATE
Brownfields and advanced exploration
Brownfields and advanced exploration activities include exploration near our existing operations and expenditures for maintaining advanced projects and delineation drilling where uranium mineralization is being defined. In 2024, we spent about $4 million in Saskatchewan, $2 million in Australia and $1 million in the US on brownfield and advanced exploration projects. The spending in Saskatchewan was primarily focused on advanced exploration on the Dawn Lake project.
On the LaRocque Lake corridor of the Dawn Lake project located approximately 45 km northwest of the Rabbit Lake operation, our 2024 exploration drilling continued to expand the footprint of known uranium mineralization with additional high-grade mineralized intercepts. Although the deposit remains at an early stage of exploration, the results to date are comparable to those of other mines and known deposits in the Athabasca Basin.
Regional exploration
Regional exploration is defined as projects that are considered greenfields. In 2024, we spent over $8 million on regional exploration programs that are comprised of target generation geophysical surveys and diamond drilling primarily in northern Saskatchewan.
PLANNING FOR THE FUTURE
We plan to continue to focus on our core projects in Saskatchewan under our long-term exploration framework. Our leadership position and industry expertise in both exploration and corporate social responsibility makes us a partner of choice. For properties and projects that meet our investment criteria, we may partner with other companies through strategic alliances, equity holdings and traditional joint venture arrangements to optimize our exploration activity and spending.
Brownfield exploration
In 2025, we plan to spend about $9 million on brownfields and advanced exploration, primarily to refine the footprint of the mineralization identified on the LaRocque Lake corridor of the Dawn Lake project, and to undertake a brownfield exploration program at McArthur River.
Regional exploration
We plan to spend approximately $12 million on diamond drilling and target generation geophysical surveys on our core regional projects in Saskatchewan, in 2025.
Fuel services
Refining, conversion and fuel manufacturing
We have about 20% of world UF6 primary conversion capacity and are a supplier of natural UO2. Our focus is on cost-competitiveness and operational efficiency, as well as increasing our production of UF6 in line with our contract portfolio and market opportunities.
Our fuel services segment is strategically important because it helps support the growth of the uranium segment. Offering a range of products and services to customers helps us broaden our business relationships and meet customer needs.
As in our uranium segment, we are focused on securing new long-term contracts and on aligning our production decisions with our contract portfolio that will allow us to continue to produce and consistently support the long-term needs of our customers.
In addition, we are pursuing non-traditional markets for our UO2 and fuel fabrication business and have been actively securing new contracts for reactor components to support refurbishment of Canadian reactors.
In 2024, fuel services produced 13.5 million kgU, similar to 2023. This included UF6 production of 10,781 tonnes, lower than our expectation of 11,000 to 11,500 tonnes of UF6 due to temporary operational issues in one of the processing circuits at the UF6 plant during the first half of the year.
We plan to produce between 13 million and 14 million kgU in our fuel services segment in 2025.
Inflation, the availability of personnel with the necessary skills and experience, aging infrastructure, and the potential impact of supply chain challenges on the availability of materials and reagents carry the risk of not achieving our production plans, production delays, and increased costs in 2025 and future years.
2024 ANNUAL INFORMATION FORM Page 84
Blind River Refinery
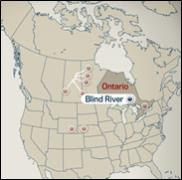
|
Licensed Capacity
24.0M kgU as UO3
Licence renewal in February 2032 |
Blind River is the world’s largest commercial uranium refinery, refining uranium concentrates from mines around the world into UO3.
| Location | Ontario, Canada | |
| Ownership | 100% | |
| End product | UO3 | |
| ISO certification | ISO 14001 certified | |
| Licensed capacity | 18.0 million kgU as UO3 per year, approved to 24.0 million subject to the completion of certain equipment upgrades (advancement depends on market conditions) | |
| Licence term | Through February 2032 | |
| Estimated decommissioning cost | $57.5 million | |
Markets
UO3 is shipped to Port Hope for conversion into either UF6 or UO2.
Capacity
In 2012, the CNSC granted an increase to our annual licensed production capacity from 18 million kgU per year as UO3 to 24 million kgU as UO3, subject to the completion of certain equipment upgrades. These upgrades will be advanced based on market conditions.
Licensing
In February 2022, the CNSC granted our Blind River refinery a 10-year operating licence, which will expire in February 2032.
Port Hope Conversion Services
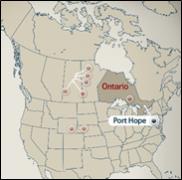
|
Licensed Capacity
12.5M kgU as UF6
2.8M kgU as UO2
Licence renewal in February 2027 |
Port Hope is the only uranium conversion facility in Canada and a supplier of UO2 for Canadian-made CANDU heavy-water reactors.
2024 ANNUAL INFORMATION FORM Page 85
| Location | Ontario, Canada | |
| Ownership | 100% | |
| End product | UF6, UO2 | |
| ISO certification | ISO 14001 certified | |
| Licensed capacity | 12.5 million kgU as UF6 per year | |
| 2.8 million kgU as UO2 per year | ||
| Licence term | Through February 2027 | |
| Estimated decommissioning cost | $138.2 million | |
Conversion services
At our UO2 plant, we convert UO3 to UO2 powder, used to make pellets for Canadian CANDU reactors and CANDU reactors in other countries and blanket fuel for light water nuclear reactors.
At our UF6 plant, we convert UO3 to UF6 and then ship it to enrichment plants primarily in the US and Europe. There, it is processed to become low enriched UF6, which is subsequently converted to enriched UO2 and used as reactor fuel for light water nuclear reactors.
Anhydrous hydrofluoric acid (AHF) is a primary feed material for the production of UF6. We have agreements with more than one supplier of AHF to provide us with diversity of supply.
Port Hope conversion facility clean-up and modernization (Vision in Motion)
Vision in Motion is a unique opportunity that demonstrates our continued commitment to a clean environment. It has been made possible by the opening of a long-term waste management facility by the Government of Canada’s Port Hope Area Initiative project. There is a limited opportunity during the life of this project to engage in clean-up and renewal activities that address legacy waste at the Port Hope Conversion facility inherited from historic operations. Progress continued over the past year with the removal of old buildings and structures on site, and the project will continue to be active in the year ahead, including the construction of a new warehouse building.
Licensing
In February 2017, the CNSC approved a ten-year operating licence for the Port Hope conversion facility.
Labour relations
The current collective bargaining agreement with the unionized employees at our Port Hope conversion facility ends on June 30, 2025. There is a risk to the production plan if we are unable to reach an agreement and there is a labour dispute.
Cameco Fuel Manufacturing Inc. (CFM)
|
|
Licensed Capacity
1.65M kgU as UO2 fuel pellets
Licence renewal in
February 2043 |
CFM produces fuel bundles and reactor components for CANDU heavy-water reactors.
2024 ANNUAL INFORMATION FORM Page 86
| Location | Ontario, Canada | |
| Ownership | 100% | |
| End product | CANDU fuel bundles and components | |
| ISO certification | ISO 9001 certified, ISO 14001 certified | |
| Licensed capacity | 1.65 million kgU as UO2 fuel pellets | |
| Licence term | Through February 2043 | |
| Estimated decommissioning cost | $10.8 million | |
Fuel manufacturing
CFM’s main business is making fuel bundles for CANDU reactors. CFM presses UO2 powder into pellets that are loaded into tubes, manufactured by CFM, and then assembled into fuel bundles. These bundles are ready to insert into a CANDU reactor core. CFM also produces many different zirconium-based reactor components for CANDU reactors.
Manufacturing services agreements
A substantial portion of CFM’s business is the supply of fuel bundles to the Bruce Power A and B nuclear units in Ontario. We supply the UO2 for these fuel bundles.
Licensing
In January 2023, the CNSC granted a 20-year renewal to the licence for CFM. The licence renewal also granted CFM’s request for a slight production increase to 1,650 tonnes as UO2 fuel pellets.
Labour relations
A new collective agreement with unionized employees at our CFM operations was reached in June 2024 for a three-year term, expiring in June 2027.
Westinghouse Electric Company
Westinghouse is a nuclear reactor technology original equipment manufacturer (OEM) and a leading provider of highly technical aftermarket products and services to its customer base which includes commercial nuclear power utilities and government agencies globally. Westinghouse’s history in the energy industry stretches back over a century, during which time the company became a pioneer in nuclear energy.
Like Cameco, Westinghouse enables carbon-free, baseload and dispatchable energy that is needed to strengthen energy security, reinforce national security, and support the energy transition, all of which, we believe, make the company well-positioned for long-term growth.
2024 ANNUAL INFORMATION FORM Page 87
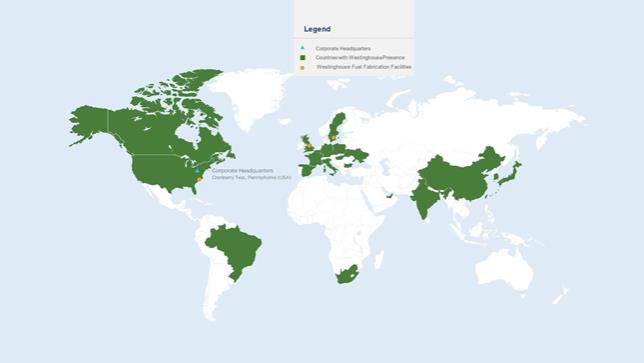
| Corporate headquarters | Cranberry Township, Pennsylvania (United States) | |
| Ownership | 49% - equity-accounted | |
| Locations | Three fuel fabrication facilities (US, Sweden, United Kingdom), approximately 90 facilities, engineering centers, and workshops, with over 10,000 employees in more than 21 countries, including major nuclear component fabrication facilities in the US and Italy. | |
| Business activities | Core business: Designs and manufactures nuclear fuel supplies and intermediate products and provides fuel cycle services for light water reactors. Westinghouse is the OEM or a technology provider to about 50% of the global nuclear reactor fleet, for which it provides outage and maintenance services, engineering support, instrumentation and controls equipment, plant modifications, and components and parts for the installed base of nuclear reactors and new reactors as they are brought on-line. | |
| New build: Designs, develops and procures equipment for new AP1000 nuclear reactors, with licensing agreements that allow Westinghouse to benefit from the construction of other reactor designs that incorporate AP1000 technology. This business line also includes the design of new small and micro reactors. | ||
| Certifications | ISO 14001 | |
| ISO 45001 | ||
| Estimated decommissioning cost | $299.9 million (US) (100% basis) | |
Background
On November 7, 2023, we announced the closing of the acquisition of Westinghouse in partnership with Brookfield. Our share of the purchase price was $2.1 billion (US). Brookfield beneficially owns a 51% interest in Westinghouse, and we beneficially own 49%. Bringing together Cameco’s expertise in the nuclear industry with Brookfield’s expertise in clean energy, positions nuclear power at the heart of the energy transition and creates a powerful platform for strategic growth across the nuclear sector.
2024 ANNUAL INFORMATION FORM Page 88
The acquisition of Westinghouse was completed in the form of a limited partnership with Brookfield. The board of directors governing the limited partnership consists of six directors, three appointed by Cameco and three appointed by Brookfield. Decision-making by the board corresponds to percentage ownership interests in the limited partnership (51% Brookfield and 49% Cameco). However, decisions with respect to certain reserved matters under the partnership agreement, such as the approval of the annual budget and business plan require the presence and support of both Cameco and Brookfield appointees to the board as long as certain ownership thresholds are met.
As of November 7, 2023, we receive the economic benefit of our ownership in Westinghouse. We account for our proportionate interest in Westinghouse on an equity basis.
We expect this strategic acquisition will be transformative and accretive to Cameco and like Cameco, Westinghouse has nuclear assets that are strategic, proven, licensed and permitted, and that are in geopolitically attractive jurisdictions. We expect these assets, like ours, will participate in the growing demand profile for nuclear energy.
Cash distributions
Annually, we and Brookfield (the partners) approve a budget and business plan, which outline Westinghouse’s financial projections and capital allocation priorities. The determination of whether to make cash distributions to us and Brookfield will be based on the approved budgeted expenditures and capital allocation priorities, including growth investment opportunities, as well as available cash balances. However, the timing of cash distributions is expected to be aligned with the timing of Westinghouse’s cash flows.
A distribution of $100 million (US) from Westinghouse was paid in February 2025, of which we received $49 million (US) representing our share of the distribution. This is the first distribution since the acquisition closed.
The financial information in the sections below is derived from the annual consolidated financial statements of Westinghouse, which are reported in US dollars and prepared in accordance with US GAAP. Such numbers have been updated to reflect IFRS differences to conform with Cameco’s accounting convention and are reflected on a 100% basis due to Cameco using equity accounting for its acquisition of a 49% interest in Westinghouse as of November 7, 2023.
Westinghouse debt
As at December 31, 2024, Westinghouse had the following outstanding debt:
| • | $3.5 billion (US) term loan with a maturity of January 2031 |
| • | credit facilities of $500 million (US), which were undrawn and mature in January 2029 |
| • | financial assurances including letters of credit of about $330 million (US) issued and surety bonds of $294 million (US) |
The credit agreements are non-recourse to Cameco, but come with certain covenants, which if breached, could result in all amounts outstanding thereunder to be immediately due and payable by Westinghouse. We expect Westinghouse to continue to comply with these covenants in 2025.
Business activities
Westinghouse’s main business activities span two key stages of the life cycle of a nuclear reactor:
| • | Core business, including the operations and maintenance of the installed base, and |
| • | New build, which designs, develops, and procures equipment for new nuclear reactors. |
2024 ANNUAL INFORMATION FORM Page 89
Westinghouse’s total 2024 revenue was $4.3 billion (US), broken down by region as follows:
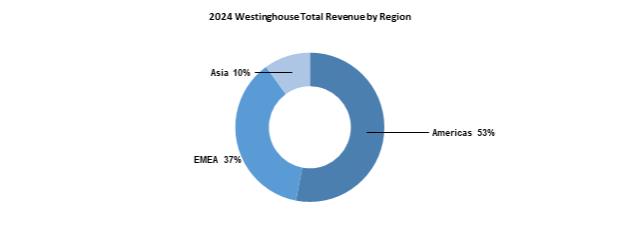
* EMEA means Europe, Middle East and Africa.
Core business
In 2024, Westinghouse’s core business covered two main business units: Operating Plant Services (OPS) and Nuclear Fuel. Effective January 1, 2025, the OPS business unit will be transformed into two new global business units: Long-Term Operations and Outage & Maintenance Services. Going forward, Westinghouse’s core business will therefore encompass Nuclear Fuel, Outage & Maintenance Services and Long-Term Operations.
Operating Plant Services (OPS)
The OPS business unit served the installed global base of reactors across two business lines:
| • | Outage and maintenance services generates revenue entirely from providing refueling, maintenance, inspection and repair services to the existing global installed reactor base and it is not reliant on new plant projects. These services are provided under long-term customer relationships and demand is driven by safety related maintenance, regulatory compliance, and asset performance. |
| • | Long term operations offer solutions to enhance the reliability, safety, lifespan, and cost-effectiveness of customer operations and supplies replacement parts and products as well as operational and technical support. The following services are provided within this business line: |
| • | Engineering services generates stable revenue by engineering bespoke replacement components or equipment, and delivering engineering studies to validate that changes to plant operation are within plant design safety margins, and through studies designed to establish the best course of action to improve plant performance (e.g. do nothing, repair, replace) for emergent issues. Demand for these services is driven by the long-term relationships Westinghouse has built with its customers through prompt response to emergent customer business needs, and through providing services to recently completed nuclear units. |
| • | Instrumentation and controls generates revenue by providing advanced digital systems that include core safety and non-safety instrumentation, automation, and control systems through product development, design, assembly and testing of advanced products. This business line also provides simulation services for multiple nuclear reactor technologies. |
| • | Parts generates revenue by providing specialized manufacturing and commercial dedication capabilities to support Westinghouse’s ability to make tailored parts that are challenging to replicate. Westinghouse can offer qualified replacement parts (e.g., control rod drives) and products (safety and non-safety), as well as operational and technical support. Demand is largely driven by the need for consumables used during and between outages to maintain safe and efficient operation of nuclear power plants. |
2024 ANNUAL INFORMATION FORM Page 90
The 2024 revenue for OPS was approximately $2.5 billion (US), representing about 58% of Westinghouse’s total 2024 revenue. Westinghouse’s 2024 revenue by region for OPS was as follows:
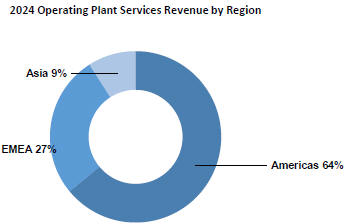
* EMEA means Europe, Middle East and Africa.
Nuclear Fuel
The Nuclear Fuel business unit designs and fabricates highly engineered, bespoke fuel assemblies that maximize power in a specific reactor. Westinghouse primarily supplies fuel assemblies for pressurized water reactors, although it has made advancements and can also provide certified fuel assemblies for a variety of reactor technologies, including boiling water reactors, advanced gas-cooled reactors and water-water energetic reactors (VVER).
The nuclear fuel business unit benefits from long-term customer relationships and has predictable demand for its products and services. To allow consistent power generation, these reactors require an outage to refuel every 18 to 24 months during which one-third of the fuel assemblies are replaced.
The 2024 revenue from the nuclear fuel business unit was approximately $1.5 billion (US), representing approximately 36% of Westinghouse’s total 2024 revenue. Westinghouse’s 2024 revenue by region for nuclear fuel was as follows:
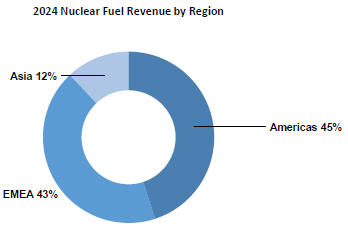
* EMEA means Europe, Middle East and Africa.
Planning for the future
The importance of nuclear power in providing carbon-free, secure and affordable baseload power as an essential part of the electricity grid in many countries, is creating opportunities to add significant long-term value for Westinghouse. The announcements of reactor life extensions and reactor restarts are creating new and extended opportunities for both the OPS and Nuclear Fuel business units to service, maintain and fuel existing reactors. Expanded fabrication services for different types of reactor technology, including those for which Westinghouse is not the OEM, as well as the introduction of fuel types that can reduce outage frequency and optimize fuel burnup (LEU+ fuels), creates opportunities in the core business as well.
2024 ANNUAL INFORMATION FORM Page 91
Of note, Westinghouse’s role in the design, development, engineering and procurement of equipment for new reactors, can create further opportunities for the core business through future reactor services and fuel supply contracts once a reactor begins commercial operation.
Springfields Fuels Limited
Westinghouse’s portfolio of global operations includes Springfields Fuels Limited (SFL) in the United Kingdom. Unique to SFL is a licence that is not limited to low-enriched uranium; the site can handle any U-235 enrichment level across a range of facilities that currently include capabilities related to fuel fabrication and nuclear materials management.
The potential for a conversion plant is among the most attractive emerging opportunities for SFL. Since the 1960s, the site has hosted several conversion lines, most recently operating under a toll-conversion agreement with Cameco, which ended in 2014. The conclusion of that contract and weak market conditions at the time resulted in the closure and partial decommissioning of the Line 4 conversion facility, which had been in operation since 1993. However, the current geopolitical environment has resulted in a potential opportunity for additional western-based conversion capacity, and has brought SFL’s historic conversion capabilities and unique licence into focus. Westinghouse is currently evaluating the cost, timeline and infrastructure required to bring back conversion capacity at SFL. The evaluation must also carefully consider other potential opportunities available to the site, including the optimization of shared infrastructure that could be required to expand to other nuclear fuel products, as well as potential external funding options in light of the site’s unique licence.
Similar to any segment of the nuclear fuel cycle, the decision to add conversion capacity at SFL must be underpinned by a portfolio of long-term contracts to support any investment.
New build
The importance of nuclear power in providing carbon-free, secure and affordable baseload power as an essential part of the electricity grid in many countries, is creating opportunities for the New Build business unit to add significant long-term value for Westinghouse. In addition to its role in the design, development, engineering and procurement of equipment for new reactors (it does not provide construction services or assume any construction risk), once a new reactor begins commercial operation, further opportunities can be added to the OPS and Nuclear Fuel business through future reactor services and fuel supply contracts. Its technology and experience provide a competitive advantage as the engineering and procurement aspects of new build programs are initiated.
The 2024 revenue from the New Build business unit was approximately $300 million (US) representing approximately 6% of Westinghouse’s total 2024 revenue. Westinghouse’s 2024 revenue by region for the new build business was as follows.
Westinghouse’s 2024 revenue by region for the new build business was as follows:
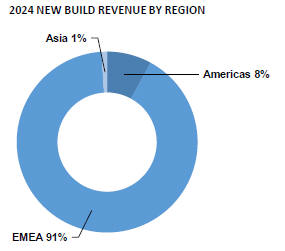
* EMEA means Europe, Middle East and Africa.
2024 ANNUAL INFORMATION FORM Page 92
Contracting framework
Following an announcement of a successful bid, there are a number of contracts that must be signed before work commences and revenue is realized. Once contracts are signed and work begins, new build projects are expected to generate multi-year revenue streams and EBITDA for Westinghouse.
Front end engineering and design (FEED) contracts often precede engineering services contracts, which are required before work can begin. The chart below is an illustrative framework and the assumptions used for the expected timing of revenue flows and profitability as these large, one-time decisions by utilities to construct new nuclear power plants using Westinghouse’s proven AP1000 reactor design are made.
See the section titled New build: Contracting framework starting on page 102 of Cameco’s 2024 MD&A for more information.
Planning for the future
In addition to the AP1000 reactors already deployed (US and China), Poland, Bulgaria and Ukraine have each chosen the AP1000 reactor for their new nuclear energy programs and signed contracts (FEED-1 or engineering services contracts), with several other nations evaluating technology options that include the AP1000:
| • | Poland does not currently have any nuclear capacity and is planning to build up to three reactors at the Lubiatowo-Kopalino nuclear power plant, and three more at a second site (to be determined). Westinghouse is working under engineering services contracts for the first three reactors and the Polish government continues to work towards a potential Final Investment Decision (FID). |
| • | Bulgaria has produced nuclear power since the 1970’s using Soviet-era VVER reactor technology at the Kozloduy nuclear power plant. The site hosts two operating VVER reactors and four retired VVER reactors that are being decommissioned. The country is planning to build two AP1000s at the Kozloduy facility and Westinghouse is working under a FEED-1 contract on the first of the two, and the Bulgarian government continues to work towards an FID. |
| • | Ukraine has a long history with nuclear power and currently operates 15 VVER reactors across four nuclear plants, as well as having four reactors that have been retired and are in different stages of decommissioning. Two additional VVER reactors were under construction until 1990 when work was suspended. The country is now planning/proposing to build up to nine AP1000 reactors across multiple new and existing plant sites, with Westinghouse working under a FEED-1 contract on the first of two AP1000 units planned at the Khmelnitski nuclear power plant. The timing of an FID for planned and proposed reactors in Ukraine is unknown. |
Westinghouse was also recently awarded a contract to evaluate the deployment of an AP1000 reactor in Slovenia.
Technology Export
On January 16, 2025, Westinghouse announced it had resolved its technology and export dispute with Korea Electric Power Corporation (KEPCO) and KHNP, which resolves the dispute and establishes a framework for additional deployments outside of South Korea, to the mutual and material benefit of Westinghouse, KEPCO and KHNP.
Competitive position
Demand for Westinghouse’s products and services is being driven by the increasing recognition by policy makers, industry, and general public of the critical role for nuclear energy in providing carbon-free, secure and affordable baseload electricity.
Westinghouse has several critical-to-business suppliers with unique capabilities that are key to delivering Westinghouse’s products to its operating plant and new plant customers. It has long-standing relationships with its key suppliers, and generally has secured long-term agreements with these suppliers to solidify Westinghouse’s business relationships and security of supply. Westinghouse works closely with these suppliers to ensure that pricing and lead times from these suppliers are in line with the market expectations.
Westinghouse’s core business relies heavily on a small number of customers in 46 countries, consisting primarily of utility companies that own nuclear reactors around the globe. Westinghouse’s five largest customers accounted for approximately 35% of Westinghouse’s contracted sales.
Westinghouse’s primary competitors vary based on business unit. For OPS, the market is fragmented with several competitors globally for each business line. For nuclear fuels, Westinghouse has two primary competitors serving the same global customer base. For new build, Westinghouse has two primary competitors that offer similar services.
2024 ANNUAL INFORMATION FORM Page 93
Business cycles
Westinghouse’s core business is characterized by recurring and predictable revenue and cash flow streams, the majority of which are secured in advance under long-term contracts with durations that can range from three to more than ten years, depending on the product or service being provided. The 18-to 24-month outage cycle for most reactors drives some variability in its annual cash flow.
Market opportunities
Amid the ongoing demand growth and global energy security concerns, we expect there will be new opportunities for Westinghouse to compete for and win new business. Westinghouse’s reputation as a global leader in the nuclear industry and its position as the only fully European supplier for certified VVER fuel assemblies are expected to benefit its Core business as Eastern European countries seek to develop a reliable fuel supply chain independent of Russia.
In terms of new construction, beyond the countries currently advancing plans to invest in nuclear energy and approaching an FID, several other countries are considering or reconsidering the deployment of new nuclear plants. Sweden, Finland, Slovenia, Netherlands, Slovakia, UK, US and Canada are all considering nuclear energy and each represents a potential opportunity for Westinghouse’s AP1000 technology.
In addition to its AP1000 reactor design, Westinghouse has submitted its pre-application Regulatory Engagement Plan with the NRC for the development of its 300 Mw AP300 SMR, which is based on the proven and licensed AP1000 reactor design, while its 5 Mw eVinci microreactor design was awarded additional US Department of Energy funding for the detailed engineering and experiment planning (DEEP) process for a test reactor at Idaho National Lab. The AP300 SMR and the eVinci microreactor are expected to offer the same carbon-free baseload benefits as larger nuclear reactor technologies, but are tailored for specific applications, including industrial, remote mining, off-grid communities, defense facilities and critical infrastructure. As with the AP1000 reactor, they are expected to have applications beyond electricity generation, including district and process heat, desalination and hydrogen production. We remain optimistic about the future competitiveness of these technologies and their potential to make a meaningful contribution to Westinghouse’s long-term financial performance. However, both are currently in the development phase with a market and business case for these new products continuing to evolve.
Intangible assets
Upon acquisition, the fair value of intangible assets was determined as part of the purchase price allocation. Intangible assets includes customer relationships and contracts, developed technology, the Westinghouse trade name, and product development costs.
Estimating decommissioning and environmental remediation costs
Westinghouse’s decommissioning provisions relate to the decommissioning of its fuel fabrication facilities, other licensed nuclear facilities and contaminated equipment at those locations.
Westinghouse develops conceptual decommissioning plans for its operating sites and uses them to estimate its decommissioning costs. The plans are submitted to regulators to determine the amount of financial assurance it must provide to secure its decommissioning obligations. Its plans include reclamation techniques that Westinghouse believes will generate reasonable environmental and radiological performance. Regulators give “conceptual approval” to a decommissioning plan if they believe the concept is reasonable.
The decommissioning plans are reviewed every one to five years. The cost estimates for both accounting purposes and licence applications are also reviewed. As properties approach or go into decommissioning, regulators review the detailed decommissioning plans. This can result in additional regulatory process, requirements, costs, and financial assurances.
At the end of 2024, Westinghouse had estimated total decommissioning and reclamation costs of $194 million (US). This is the discounted value of the obligation and is based on its current operations. Regulatory approval is required prior to beginning decommissioning. The expected timing for these costs is based on each facility’s expected operating life. The required costs for decommissioning and reclamation in each of the next five years are not expected to be material.
Westinghouse provides financial assurances using surety bonds for decommissioning liabilities to regulatory authorities, as required. It had a total of about $258 million (US) in surety bonds supporting decommissioning liabilities at the end of 2024. All of its fuel fabrication facilities have financial assurances in place in connection with the preliminary plans for decommissioning each of the sites.
2024 ANNUAL INFORMATION FORM Page 94
In addition to these decommissioning obligations, Westinghouse has environmental remediation obligations associated with the discharge of pollutants and the disposal of waste associated with ongoing operations at its sites. At the end of 2024, Westinghouse had estimated total environmental and waste liabilities of $41.5 million (US).
Complying with regulations
Nuclear safety regulators license Westinghouse site activities worldwide and oversee the work done with customers. Licencing requires compliance with stringent regulations, advanced training, and comprehensive programs.
Westinghouse’s US fabrication facilities are licensed by the NRC and are fully compliant with Federal Regulations. Westinghouse’s non-US fabrication facilities are compliant with regulators in their respective regions. In addition, Westinghouse voluntarily implements industry best practices and standards for safety established by the Institute for Nuclear Power Operations (INPO) and the World Association of Nuclear Operators (WANO).
Other nuclear fuel cycle investments
Global Laser Enrichment
GLE is the exclusive worldwide licensee of the proprietary Separation of Isotopes by Laser Excitation (SILEX) laser uranium enrichment technology (a third-generation enrichment technology). Following the restructure of GLE in early 2021, Cameco is the commercial lead for the GLE project with a 49% interest and an option to attain a majority interest of 75%. Silex Systems Ltd. (Silex Systems) is the licensor of the SILEX technology and is the technology lead for the project, currently holding the remaining 51% interest in GLE.
Subject to completion of the technology demonstration program and its progression through to commercialization, GLE has the potential to offer a variety of advantages to the global nuclear energy sector, including:
| • | re-enriching depleted uranium tails left over as a by-product of first-generation gaseous diffusion enrichment operations, repurposing the legacy material into a commercial source of uranium and conversion products to fuel nuclear reactors, and aiding in the responsible clean-up of legacy tails inventories as per GLE’s agreement with the DOE |
| • | producing commercial low-enriched uranium (LEU) to fuel the world’s existing and future fleet of large-scale light-water reactors (as well as for SMRs that require LEU-based fuel, if a commercial market develops) with greater efficiency and flexibility than current enrichment technologies |
| • | producing HALEU to serve the SMR and advanced reactor designs that, if commercially deployed, would require the development of a HALEU-based fuel cycle. |
Our view is that re-enriching US Government inventories of depleted uranium tails into a commercial source of uranium and conversion is GLE’s lowest-risk path to the market. This opportunity is underpinned by an agreement between GLE and the DOE, which gives GLE access to DOE tails and is expected to help address the growing supply gap for Western-origin nuclear fuel supplies and services. However, expansion of a potential tails re-enrichment facility to enable GLE to produce LEU or HALEU would require significant, additional capital expenditure and market support.
GLE continues to focus its efforts on technology demonstration and aims to commence Technology Readiness Level 6 (TRL-6) testing in the first quarter of 2025. The successful demonstration of TRL-6, the sixth step of a nine-step model under the DOE’s Technology Readiness Assessment Guide to assess the technical maturity, will include the completion of integrated testing and test results validation by way of a report prepared by an independent third-party. Successful demonstration of TRL-6 is expected to confirm reliable, large-scale system performance under relevant conditions (pilot-scale demonstration), representing a major step in a technology’s demonstrated readiness. Pending the commencement of TRL-6 enrichment testing in the first quarter of 2025, we anticipate GLE could successfully complete the TRL-6 demonstration, including receipt of the third-party validation report, by the end of Q3 2025, which supports a commercial online date for a tails re-enrichment facility in 2030.
2024 ANNUAL INFORMATION FORM Page 95
GLE’s 2025 operational budget will remain materially unchanged from its 2024 budget in order to prioritize the demonstration of TRL-6. GLE is continuing work to prepare and submit a NRC licence application and anticipates receipt of the third full-scale laser system module from Silex Systems in 2025. The third full-scale laser system represents an iterative design and will be used to better understand the operability and manufacturability of specific components as part of GLE’s technology maturation program.
We expect that GLE’s path to commercialization will depend on several factors, including but not limited to, the successful progression and completion of GLE’s technology demonstration and maturation program, a clear commercial use case for its technology, supportive market fundamentals, future Russian fuel imports to the US, the ability to secure substantial government support and funding (specifically, accelerated commercial pathways related to LEU and, potentially, HALEU, are reliant on government funding), and assured industry support by way of a long-term contract portfolio.
We remain supportive of and committed to the project and in potentially increasing our equity interest, but we have no plans to exercise our option to increase our ownership in GLE from 49% to 75% at this time.
Mineral reserves and resources
Our mineral reserves and resources are the foundation of our company and fundamental to our success.
We have interests in a number of uranium properties. The tables in this section show the estimates of the proven and probable mineral reserves, and measured, indicated, and inferred mineral resources at those properties. However, only three of the properties listed in those tables are material uranium properties for us: McArthur River/Key Lake, Cigar Lake and Inkai. Mineral reserves and resources are all reported as of December 31, 2024.
We estimate and disclose mineral reserves and resources in five categories, using the definition standards adopted by the Canadian Institute of Mining, Metallurgy and Petroleum Council, and in accordance with NI 43-101.
About mineral resources
Mineral resources do not have to demonstrate economic viability but have reasonable prospects for eventual economic extraction. They fall into three categories: measured, indicated and inferred. Our reported mineral resources are exclusive of mineral reserves.
| • | measured and indicated mineral resources can be estimated with sufficient confidence to allow the appropriate application of technical, economic, marketing, legal, and sustainability factors to support evaluation of the economic viability of the deposit. |
| • | measured resources: we can confirm both geological and grade continuity to support detailed mine planning |
| • | indicated resources: we can reasonably assume geological and grade continuity to support mine planning |
| • | inferred mineral resources are estimated using limited geological evidence and sampling information. We do not have enough confidence to evaluate their economic viability in a meaningful way. You should not assume that all or any part of an inferred mineral resource will be upgraded to an indicated or measured mineral resource, but it is reasonably expected that the majority of inferred mineral resources could be upgraded to indicated mineral resources with continued exploration. |
Our share of uranium in the following mineral resource tables is based on our respective ownership interests. Mineral resources that are not mineral reserves have no demonstrated economic viability.
About mineral reserves
Mineral reserves are the economically mineable part of measured and/or indicated mineral resources demonstrated by at least a preliminary feasibility study. The reference point at which mineral reserves are defined is the point where the ore is delivered to the processing plant, except for ISR operations where the reference point is where the mineralization occurs under the existing or planned wellfield patterns. Mineral reserves fall into two categories:
| • | proven mineral reserves: the economically mineable part of a measured resource for which at least a preliminary feasibility study demonstrates that, at the time of reporting, economic extraction could be reasonably justified with a high degree of confidence |
| • | probable mineral reserves: the economically mineable part of a measured and/or indicated resource for which at least a preliminary feasibility study demonstrates that, at the time of reporting, economic extraction could be reasonably justified with a degree of confidence lower than that applying to proven reserves |
2024 ANNUAL INFORMATION FORM Page 96
For properties where we are the operator, we use current geological models, an average uranium price of $63 (US) per pound U3O8, and current or projected operating costs and mine plans to estimate our mineral reserves, allowing for dilution and mining losses. We apply our standard data verification process for every estimate. For properties in which we have an interest but are not the operator, we will take reasonable steps to ensure that the reserve and resource estimates that we report are reliable.
Our share of uranium in the mineral reserves table below is based on our respective ownership interests.
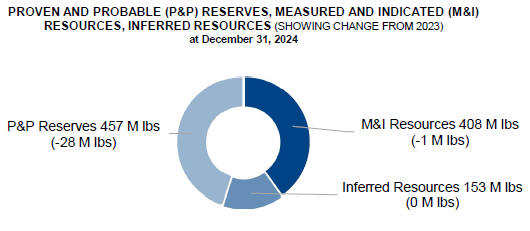
Qualified persons
The technical and scientific information discussed in this AIF, including mineral reserve and resource estimates, for our material properties (McArthur River/Key Lake, Cigar Lake and Inkai) was approved by the following individuals who are qualified persons for the purposes of NI 43-101:
| McArthur River/Key Lake | Cigar Lake | |
| • Greg Murdock, general manager, McArthur River, Cameco
• Daley McIntyre, general manager, Key Lake, Cameco
• Alain D. Renaud, principal resource geologist, technical services, Cameco
• Biman Bharadwaj, principal metallurgist, technical services, Cameco |
• Kirk Lamont, general manager, Cigar Lake, Cameco
• Scott Bishop, director, technical services, Cameco
• Alain D. Renaud, principal resource geologist, technical services, Cameco
• Biman Bharadwaj, principal metallurgist, technical services, Cameco |
|
| Inkai | ||
| • Sergey Ivanov, deputy general director, technical services, Cameco Kazakhstan LLP
• Alain D. Renaud, principal resource geologist, technical services, Cameco
• Biman Bharadwaj, principal metallurgist, technical services, Cameco
• Scott Bishop, director, technical services, Cameco |
||
Important information about mineral reserve and resource estimates
Although we have carefully prepared and verified the mineral reserve and resource figures in this document, the figures are estimates, based in part on forward-looking information.
Estimates are based on our knowledge, mining experience, analysis of drilling results, the quality of available data and management’s best judgment. They are, however, imprecise by nature, may change over time, and include many variables and assumptions, including:
| • | geological interpretation |
| • | extraction plans |
| • | commodity prices and currency exchange rates |
| • | recovery rates |
| • | operating and capital costs |
2024 ANNUAL INFORMATION FORM Page 97
There is no assurance that the indicated levels of uranium will be produced, and we may have to re-estimate our mineral reserves based on actual production experience. Changes in the price of uranium, production costs or recovery rates could make it unprofitable for us to operate or develop a particular site or sites for a period of time. See page 3 for information about forward-looking information, and page 115 for a discussion of the risks that can affect our business.
Please see pages 99 to 102 for the specific assumptions, parameters and methods used for the McArthur River, Cigar Lake and Inkai mineral reserve and resource estimates.
Our estimate of mineral resources and mineral reserves may be materially affected by the occurrence of one or more of the risks described under the heading Reserve and resource estimates are not precise on page 125. In addition to those risks, our estimates of mineral resources and mineral reserves for certain properties may be materially affected by the occurrence of one or more of the following risks or factors:
McArthur River and Cigar Lake mineral resource and reserve estimates
| • | Water inflows – see Flooding at McArthur River and Cigar Lake at page 117 |
| • | Technical challenges – see Technical challenges at Cigar Lake and McArthur River at page 118 |
Inkai mineral resource and reserve estimates
| • | Political risks – see Foreign investments and operations at page 139 and Kazakhstan at page 139 |
The extent to which our estimates of mineral resources and mineral reserves may be affected by the foregoing issues could vary from material gains to material losses.
Important information for US investors
We present information about mineralization, mineral reserves and resources as required by NI 43-101 of the Canadian Securities Administrators, in accordance with applicable Canadian securities laws. As a foreign private issuer filing reports with the US Securities and Exchange Commission (SEC) under the Multijurisdictional Disclosure System, we are not required to comply with the SEC’s disclosure requirements relating to mining properties. Investors in the US should be aware that the disclosure requirements of NI 43-101 are different from those under applicable SEC rules, and the information that we present concerning mineralization, mineral reserves and resources may not be comparable to information made public by companies that comply with the SEC’s reporting and disclosure requirements for mining companies.
Mineral reserves
As of December 31, 2024 (100% – only the shaded column shows our share).
Proven and probable
(tonnes in thousands; pounds in millions)
| OUR SHARE |
||||||||||||||||||||||||||||||||||||||||||||||||
| PROVEN | PROBABLE | TOTAL MINERAL RESERVES | RESERVES CONTENT (LBS U3O8) |
|||||||||||||||||||||||||||||||||||||||||||||
| MINING METHOD |
GRADE | CONTENT | GRADE | CONTENT | GRADE | CONTENT | METALLURGICAL | |||||||||||||||||||||||||||||||||||||||||
| PROPERTY | TONNES | % U3O8 | (LBS U3O8) | TONNES | % U3O8 | (LBS U3O8) | TONNES | % U3O8 | (LBS U3O8) | RECOVERY (%) | ||||||||||||||||||||||||||||||||||||||
| Cigar Lake |
UG | 322.0 | 16.68 | 118.4 | 229.4 | 14.73 | 74.5 | 551.4 | 15.87 | 192.9 | 105.2 | 98.7 | ||||||||||||||||||||||||||||||||||||
| Key Lake |
OP | 61.1 | 0.52 | 0.7 | — | — | — | 61.1 | 0.52 | 0.7 | 0.6 | 95.0 | ||||||||||||||||||||||||||||||||||||
| McArthur River |
UG | 1,970.3 | 6.81 | 295.8 | 520.4 | 5.56 | 63.7 | 2,490.7 | 6.55 | 359.6 | 251.0 | 99.2 | ||||||||||||||||||||||||||||||||||||
| Inkai |
ISR | 277,232.9 | 0.03 | 201.6 | 90,850.8 | 0.02 | 49.4 | 368,083.7 | 0.03 | 251.0 | 100.4 | 85.0 | ||||||||||||||||||||||||||||||||||||
| Total |
279,586.3 | — | 616.5 | 91,600.6 | — | 187.6 | 371,187.0 | — | 804.1 | 457.2 | — | |||||||||||||||||||||||||||||||||||||
(UG – underground, OP – open pit, ISR – in situ recovery)
Note that the estimates in the above table:
| • | use a constant dollar average uranium price of approximately $63 (US) per pound U3O8 |
| • | are based on exchange rates of $1.00 US=$1.28 Cdn and $1.00 US=475 Kazakhstan Tenge |
| • | may not add due to rounding |
Metallurgical recovery
We report mineral reserves as the quantity of contained ore supporting our mining plans and provide an estimate of the metallurgical recovery for each uranium property. The estimate of the amount of valuable product that can be physically recovered by the metallurgical extraction process is obtained by multiplying the quantity of contained metal (content) by the planned metallurgical recovery percentage. The content and our share of uranium in the table above are before accounting for estimated metallurgical recovery.
2024 ANNUAL INFORMATION FORM Page 98
Changes this year
Our share of proven and probable mineral reserves decreased from 485 million pounds U3O8 at the end of 2023, to 457 million pounds at the end of 2024. The change was primarily the result of:
| • | production at Cigar Lake, Inkai and McArthur River, which removed 27 million pounds of proven and probable reserves from our mineral inventory. |
The remaining changes are attributable to other adjustments based on the mineral resource and reserve estimate updates at Cigar Lake, McArthur River and Inkai.
Mineral resources
As of December 31, 2024 (100% – only the shaded columns show our share).
Measured, indicated and inferred
(tonnes in thousands; pounds in millions)
| OUR SHARE |
OUR SHARE |
|||||||||||||||||||||||||||||||||||||||||||||||
| MEASURED RESOURCES (M) | INDICATED RESOURCES (I) | INFERRED RESOURCES | ||||||||||||||||||||||||||||||||||||||||||||||
| TOTAL M+I |
TOTAL M+I | INFERRED | ||||||||||||||||||||||||||||||||||||||||||||||
| GRADE | CONTENT | GRADE | CONTENT | CONTENT | CONTENT | GRADE | CONTENT | CONTENT | ||||||||||||||||||||||||||||||||||||||||
| PROPERTY |
TONNES | % U3O8 | (LBS U3O8) |
TONNES | % U3O8 | (LBS U3O8) |
(LBS U3O8) |
(LBS U3O8) | TONNES | % U3O8 | (LBS U3O8) |
(LBS U3O8) | ||||||||||||||||||||||||||||||||||||
| Cigar Lake |
75.5 | 4.88 | 8.1 | 141.3 | 4.95 | 15.4 | 23.6 | 12.9 | 163.4 | 5.55 | 20.0 | 10.9 | ||||||||||||||||||||||||||||||||||||
| Fox Lake |
— | — | — | — | — | — | — | — | 386.7 | 7.99 | 68.1 | 53.3 | ||||||||||||||||||||||||||||||||||||
| Kintyre |
— | — | — | 3,897.7 | 0.62 | 53.5 | 53.5 | 53.5 | 517.1 | 0.53 | 6.0 | 6.0 | ||||||||||||||||||||||||||||||||||||
| McArthur River |
71.8 | 2.28 | 3.6 | 60.3 | 2.31 | 3.1 | 6.7 | 4.7 | 36.4 | 2.95 | 2.4 | 1.7 | ||||||||||||||||||||||||||||||||||||
| Millennium |
— | — | — | 1,442.6 | 2.39 | 75.9 | 75.9 | 53.0 | 412.4 | 3.19 | 29.0 | 20.2 | ||||||||||||||||||||||||||||||||||||
| Rabbit Lake |
— | — | — | 1,836.5 | 0.95 | 38.6 | 38.6 | 38.6 | 2,460.9 | 0.62 | 33.7 | 33.7 | ||||||||||||||||||||||||||||||||||||
| Tamarack |
— | — | — | 183.8 | 4.42 | 17.9 | 17.9 | 10.3 | 45.6 | 1.02 | 1.0 | 0.6 | ||||||||||||||||||||||||||||||||||||
| Yeelirrie |
27,172.9 | 0.16 | 95.9 | 12,178.3 | 0.12 | 32.2 | 128.1 | 128.1 | — | — | — | — | ||||||||||||||||||||||||||||||||||||
| Crow Butte |
1,558.1 | 0.19 | 6.6 | 939.3 | 0.35 | 7.3 | 13.9 | 13.9 | 531.4 | 0.16 | 1.8 | 1.8 | ||||||||||||||||||||||||||||||||||||
| Gas Hills - Peach |
687.2 | 0.11 | 1.7 | 3,626.1 | 0.15 | 11.6 | 13.3 | 13.3 | 3,307.5 | 0.08 | 6.0 | 6.0 | ||||||||||||||||||||||||||||||||||||
| Inkai |
75,923.1 | 0.03 | 58.2 | 63,488.4 | 0.02 | 34.5 | 92.7 | 37.1 | 33,742.2 | 0.03 | 22.3 | 8.9 | ||||||||||||||||||||||||||||||||||||
| North Butte - Brown Ranch |
604.2 | 0.08 | 1.1 | 5,530.3 | 0.07 | 8.4 | 9.4 | 9.4 | 294.5 | 0.06 | 0.4 | 0.4 | ||||||||||||||||||||||||||||||||||||
| Ruby Ranch |
— | — | — | 2,215.3 | 0.08 | 4.1 | 4.1 | 4.1 | 56.2 | 0.13 | 0.2 | 0.2 | ||||||||||||||||||||||||||||||||||||
| Shirley Basin |
89.2 | 0.15 | 0.3 | 1,638.2 | 0.11 | 4.1 | 4.4 | 4.4 | 508.0 | 0.10 | 1.1 | 1.1 | ||||||||||||||||||||||||||||||||||||
| Smith Ranch - Highland |
3,703.5 | 0.10 | 7.9 | 14,372.3 | 0.05 | 17.0 | 24.9 | 24.9 | 6,861.0 | 0.05 | 7.7 | 7.7 | ||||||||||||||||||||||||||||||||||||
| Total |
109,885.6 | — | 183.4 | 111,550.5 | — | 323.6 | 507.0 | 408.2 | 49,323.5 | — | 199.8 | 152.6 | ||||||||||||||||||||||||||||||||||||
Note that mineral resources:
| • | do not include amounts that have been identified as mineral reserves |
| • | do not have demonstrated economic viability |
| • | totals may not add due to rounding |
Changes this year
Our share of measured and indicated mineral resources decreased from 409 million pounds U3O8 at the end of 2023, to 408 million pounds U3O8 at the end of 2024. Our share of inferred mineral resources remained unchanged at 153 million pounds U3O8.
Key assumptions, parameters and methods
McArthur River
Key assumptions and parameters
The key assumptions and parameters to estimate the mineral resources and reserves are as follows:
2024 ANNUAL INFORMATION FORM Page 99
| • | mineral resources and mineral reserves have been estimated based on the use of raisebore and blasthole stoping methods |
| • | grades of U3O8 were obtained from chemical assaying of drill core or from equivalent % U3O8 grades obtained from radiometric probing results. In areas of poor core recovery (usually < 75%) or missing samples, the grade was determined from probing |
| • | when not measured, densities are determined using formulas based on the relation between density measurements of drill core and chemical assay grades |
| • | reasonable expectation for eventual economic extraction of the mineral resources is based on a uranium price of $64 (US) per pound U3O8, anticipated exchange rates, mining and process recoveries, production costs, royalties and mineralized area tonnage, grade, and spatial continuity considerations |
| • | mineral resources have been estimated at a minimum mineralized thickness of 1.0 metre and at a minimum grade of 0.50% U3O8 |
| • | the reference point at which mineral reserves are defined is when the ore is delivered to the Key Lake mill |
| • | mining rates and operating costs assume annual packaged production of at least 18 million pounds |
| • | operating costs used in the cut-off calculation are based on 2025 current or estimated costs |
| • | mineral reserves assume a 99.4% planned mine recovery and have allowances for expected waste (34.4% average) and backfill (5.7% average) dilution as part of the normal mining extraction process |
| • | reported mineral reserves are based on pounds U3O8 recovered per excavation, translating into an average cut-off grade of 0.88% U3O8 |
| • | an average uranium price of $63.00 (US) per pound with a $1.00 (US) = $1.28 (Cdn) fixed exchange rate was used to estimate the mineral reserves |
| • | reported mineral reserves are not adjusted for the estimated mill recovery of 99.2% |
Key methods
The key methods to estimate the mineral resources and reserves are as follows:
| • | the models were created from the geological interpretation in section views and in 3-dimensions from surface and underground drillhole information |
| • | mineral resources were estimated using 3-dimensional block models. Ordinary kriging and inverse distance squared methods were used to estimate the grade and density. |
| • | only measured and indicated mineral resources are considered for conversion to mineral reserves |
| • | mineral reserves have been estimated on the basis of designed raisebore and blasthole stopes in conjunction with freeze curtains with positive economics from the estimated recovered uranium |
| • | dilution and mining recovery parameters are assigned to each excavation to determine diluted and recovered ore tonnes and metal content |
| • | revenue from each excavation is based on recovered (packaged) uranium multiplied by the metal price less royalties |
| • | all planned mine zones have been assessed to ensure sufficient recoverable pounds are present to pay for capital and fixed operating costs |
| • | excavations that are not profitable based on the cut-off calculation are removed from the mineral reserves |
Maptek Vulcan and Leapfrog Geo software were used to generate the mineral resource and reserve estimates.
Cigar Lake
Key assumptions and parameters
The key assumptions and parameters to estimate the mineral resources and reserves are as follows:
| • | mineral resources and mineral reserves have been estimated based on the use of the JBS extraction method |
| • | grades of U3O8 were obtained from chemical assaying of drill core or from equivalent % U3O8 grades obtained from radiometric probing results. In areas of poor core recovery (usually < 75%) or missing samples, the grade was determined from probing. |
| • | when not measured, densities are determined using formulas based on the relation between density measurements of drill core and chemical assay grades |
2024 ANNUAL INFORMATION FORM Page 100
| • | reasonable expectation for eventual economic extraction of the mineral resources is based on a uranium price of $64 (US) per pound U3O8, anticipated exchange rates, mining and process recoveries, production costs, royalties and mineralized area tonnage, grade, and spatial continuity considerations |
| • | mineral resources have been estimated using a minimum mineralization thickness of 1.0 metre and a minimum grade of 1.0% U3O8 for CLMain and 0.8% U3O8 for CLExt |
| • | the reference point at which mineral reserves are defined is when the ore is delivered to the McClean Lake mill |
| • | the mining rate is assumed to vary between 115 and 150 tonnes per day and a full mill production rate of approximately 18 million pounds U3O8 per year |
| • | operating costs used in the cut-off calculation are based on mine and mill life of asset forecasts |
| • | an average allowance of 35% dilution at 0% U3O8 and an 86% mining recovery factor have been used to estimate the mineral reserves |
| • | mineral reserves have been estimated based on a mill recovery factor of 98.8% for CLMain and 98.5% for CLExt |
| • | an average uranium price of $63.00 (US) per pound less royalties with a $1.00 (US) = $1.28 (Cdn) fixed exchange rate was used |
| • | reported mineral reserves are not adjusted for the estimated mill recovery |
Key methods
The key methods to estimate the mineral resources and reserves are as follows:
| • | the geological interpretation of the orebody was done in section views and in 3-dimensions from surface drillhole information |
| • | mineral resources were estimated using 3-dimensional block models. Ordinary kriging and inverse distance squared methods were used to estimate the grade and density. |
| • | only measured and indicated mineral resources are considered for conversion to mineral reserves |
| • | JBS cavities are designed over the full extent of the indicated and measured mineral resources |
| • | dilution and mining recovery parameters are assigned to each cavity to determine diluted and recovered ore tonnes and metal content |
| • | revenue from each cavity is based on recovered (packaged) uranium multiplied by the metal price less royalties |
| • | costs of mining and processing each cavity (including toll milling fees) are subtracted from revenues |
| • | cavities with a positive profit are aggregated by production panel. Panels with insufficient operating profit to cover development and ground freezing capital costs are excluded from the mineral reserves. |
| • | cavities that are not profitable based on the cut-off calculation are removed from the mineral reserves |
Maptek Vulcan and Leapfrog Geo software were used to generate the mineral resource and reserve estimates.
Inkai
Key assumptions and parameters
Key assumptions and parameters to estimate the mineral resources and reserves are as follows:
| • | mineral resources and mineral reserves have been estimated based on the use of the ISR extraction method |
| • | do not include allowances for metallurgical recovery but include some allowances for dilutive material expected under leaching conditions |
| • | grades of U3O8 were obtained from equivalent % U3O8 grades based on gamma radiometric probing of drillholes, checked against assay results and prompt fission neutron logging results to account for disequilibrium |
| • | average density of 1.7 tonnes per cubic metre was used, based on historical and current sample measurements |
| • | a resource block must be confined to one aquifer taking into consideration the distribution of local aquitards |
| • | reasonable expectation for eventual economic extraction of the mineral resources is based on a uranium price of $64 (US) per pound U3O8, anticipated exchange rates, mining and process recoveries, production costs, royalties and mineralized area tonnage, grade, and spatial continuity considerations |
| • | are estimated using a minimum grade of 0.012% U3O8 per drillhole interval and minimum Grade x Thickness (GT) of 0.071 m% U3O8 for MPP Area and 0.047 m% U3O8 for Sat1 and Sat2 Areas |
| • | additional criteria to estimate mineral resources include a maximum allowable amount of barren material per resource block, particle sizes and hydraulic conductivity and carbonate content as stipulated in the SRC Guidelines |
| • | mineral reserves represent the in situ ore available for production within the term of the RUC |
2024 ANNUAL INFORMATION FORM Page 101
| • | the reference point at which mineral reserves are defined is the point where the mineralization occurs under existing or planned wellfield patterns |
| • | reserves-based annual production varies between 8.3 and 10.4 million pounds U3O8 |
| • | dilutive material in the mineral reserves, comprising approximately 40% of total diluted tonnage, is based on permeability and planned screen lengths and represents the rock volume contacted by the lixiviant. The diluted tonnage is used to generate the wellfield uranium recovery curves and production forecasts |
| • | reported mineral reserves are not adjusted for the estimated metallurgical recovery of 85%. For wellfields started close to the end of the RUC term, the target recoveries of 85% are not expected to be achieved |
| • | a constant dollar average uranium price of $63 (US) per pound U3O8, with a $1.00 (US) = $1.28 (Cdn) and 475 Kazakhstan Tenge to $1.00 (US) fixed exchange rate was used |
| • | a cut-off of 0.13 m% U3O8 is applied on the estimated GT value for each block of the mineral resources model. The cut-off is determined with consideration to: |
| • | uranium price |
| • | wellfield development and operating costs defined by depth, acid consumption, wellfield pattern layouts, and metallurgical recovery |
| • | UBS processing costs |
Key methods
The key methods used to estimate the mineral resources and reserves are as follows:
| • | geological interpretation of the orebody was done in section and plan views derived from surface drillhole information |
| • | were estimated with the GT area average method, where the estimated variable is the uranium grade multiplied by the thickness of the interval and using averages for the blocks |
| • | the metal content per block is estimated considering average grade, thicknesses and density and multiplying by an ore/waste factor |
| • | only measured and indicated mineral resources are considered for conversion to mineral reserves |
| • | cut-off criteria applied to identify areas for mining, including consideration of the rate of wellfield uranium recovery, lixiviant uranium head grades, wellfield flow rates and production requirements to define the production sequence |
| • | preparation of a feasible mining plan with required infrastructure, reclamation costs as well as other relevant factors |
| • | submittal of appropriate documentation for regulatory purposes |
Geological modelling and mining software used to generate the mineral resource and reserve estimates were AtomGeo, MapInfo and Micromine.
Our sustainability principles and practices
A key part of our strategy, reflecting our values
We are committed to delivering our products responsibly and profitably. We integrate sustainability principles and practices into every aspect of our business, from our corporate objectives and approach to compensation, to our overall corporate strategy, risk management, and day-to-day operations, and they align with our values. We seek to be transparent with our stakeholders, keeping them updated on the risks and opportunities that we believe may have a significant impact on our ability to achieve our strategic plan and add long-term value. We recognize the importance of integrating certain sustainability factors, such as safety performance, a clean environment and supportive communities, into our executive compensation strategy as we see success in these areas as critical to the long-term success of the company.
Our board of directors holds the highest level of oversight for our business strategy and strategic risks, including sustainability matters. Oversight of sustainability reporting and disclosure has been delegated by the board to the Safety, Health and Environment (SHE) committee of the board. We also have a multi-disciplinary sustainability steering committee, chaired by our senior vice-president and chief corporate officer that includes representatives from across the organization whose role is to review our sustainability governance and reporting, as well as our current approach to sustainability, against evolving trends. Additional information about the governance of our sustainability matters is included in our most recent Sustainability Report.
2024 ANNUAL INFORMATION FORM Page 102
In an effort to continually evolve the robustness of our sustainability commitments and communications, we aim to stay up to date with sustainability related reporting standards. In 2020, we began to work to report in alignment with Sustainability Accounting Standards Board (SASB). In 2022, we began to address the recommendations of the Task Force on Climate-Related Financial Disclosures (TCFD) in our Sustainability Report. We are now working to understand the requirements of the IFRS S1 sustainability disclosure standards, and S2 climate-related disclosure standard released in 2023, alongside the Canadian Sustainability Standards Board adapted versions, the Canadian Sustainability Disclosure Standards 1 and 2, which were published in 2024. It is still unclear when and to what extent the Canadian Securities Administrators may adopt these standards.
In July 2024, we published our 2023 Sustainability Report. The report sets out our strategy and the policies and programs we use to govern and manage sustainability issues that are important to our stakeholders. In addition to SASB and TCFD, the report provides key sustainability performance indicator data based on the Global Reporting Initiative’s Sustainability Framework as well as some unique corporate indicators, to measure and report our performance on environmental, social and economic impacts in the areas we believe have a significant impact on our sustainability in the long-term and are important to our stakeholders. This is our sustainability report card to our stakeholders. You can find our report at cameco.com/about/sustainability.
At Cameco, our approach to stewardship is guided by our corporate governance framework, which includes a strong and established Cameco Management System (CMS) which sets out our vision, values, and measures of success. The CMS describes the framework of policies, programs, and procedures we use to help us fulfill all the tasks required to achieve our objectives, strategy and practices, and are continuously evaluated and reviewed to improve their rigour.
There are ten policies identified in the CMS which provide high-level direction to Cameco across all sustainability topics, the specific policies include: Code of Conduct and Ethics; Corporate Disclosure; Delegation of Financial Authority; Electronic Information and Information Technology Security; Mineral Reserve and Resource; Our People; Procurement of Goods and Services; Risk Management; Safety, Health, Environment and Quality; and Sustainability. These policies help speak to our strategic planning process, leadership alignment and accountability, compliance and assessment, people and culture, process identification and work management, risk management, communications and stakeholder support, knowledge and information management, change management, problem identification and resolution, and continual improvement.
Environment
We acknowledge and embrace our responsibility to manage our activities with care for the protection of environmental resources. Our stewardship is guided by established policies and programs designed to minimize our impacts on air, land, and water, and to safeguard the biodiversity of surrounding ecosystems.
Within our CMS, we have an integrated Safety, Health, Environment and Quality Management System (SHEQ). Alignment with, and certification to, the ISO standards is important to us as it is one of the world’s most widely recognized set of standards. Due to the multi-disciplinary nature of this system, we maintain ISO 14001 certification of the environmental components of the management system at the corporate level and align the safety and health components of the management system with ISO 45001.
Climate Action
We recognize the critical nature of the fight against climate change, and want our employees, customers, investors, and community partners near our operations to know we are committed to being an active and constructive partner in addressing this challenge. The reduction of carbon and GHG emissions is important and necessary in Canada and around the world. Policy makers and major industries recognize that nuclear power must be a central part of the solution to the world’s shift to a low-carbon, climate-resilient economy. Several nations have reaffirmed their commitments to nuclear power and are developing plans to support existing reactors and are reviewing their policies to encourage more nuclear capacity. There are now 31 countries that have signed on to the Net Zero Nuclear declaration that was launched at the 28th Conference of Parties to triple nuclear energy capacity by 2050.
2024 ANNUAL INFORMATION FORM Page 103
As one of the world’s largest producers of the uranium needed to fuel nuclear reactors, we believe this represents a significant business opportunity for us. By delivering our products and services responsibly and profitably, we can be a part of the solution to enhance national, energy and climate security given 100% of our product is used to produce reliable carbon-free base-load electricity. We enable secure baseload power and emissions reductions globally through nuclear power and are committed to transforming our already low operational GHG emissions footprint to achieve our ambition of having net-zero emissions while delivering significant long-term business value.
Cameco has put its support behind Net Zero Nuclear, an initiative between government, industry leaders and civil society to triple global nuclear capacity to achieve carbon neutrality by 2050. As a strategic partner, we can assist with deepening industry support for this initiative, which was launched by the World Nuclear Association and the Emirates Nuclear Energy Corporation, with the support of the Atoms4NetZero initiative launched by the International Atomic Energy Agency at the 2023 World Nuclear Symposium in London. Since its launch, more than 120 companies have endorsed the Net Zero Nuclear Industry Pledge, along with 14 financial institutions and 31 countries that have signed the declaration.
Previously, we undertook a planning process to outline our overarching Low Carbon Transition Plan. Within this plan, we set a target to reduce our combined Scope 1 and 2 GHG emissions by 30% by 2030, from 2015 levels. We also identified the practical and achievable actions that we expect to take to decarbonize our operations and manage climate-related risks. In doing so, we are working to demonstrate our alignment with the ambitions of the Paris Agreement and Canadian legislative framework to, “limit global temperature rise to well below 2 degrees Celsius (°C), above pre-industrial levels, and to pursue efforts to limit global temperature rise even further to 1.5°C.”
We recognize that climate change, including shifts in temperature, precipitation and more frequent severe weather events could affect our operations in a range of possible ways. As part of our efforts, we have completed climate change scenario analyses to understand how projected long-term changing climate conditions could impact our employees, assets, and operations in Canada and the United States. We leveraged internal subject matter expertise with help from a third-party expert to complete the assessments.
The physical risk assessment studies were undertaken to deliver initial forward-looking physical climate risk assessments and identify possible risk management and adaptation options across our underground and in situ mining, milling and fuel services operations.
When it comes to climate change, we have tracked and reported our GHG emissions for more than two decades. A summary of our activities to understand and mitigate the risks associated with climate change scenarios is reported to the board of directors on a regular basis in accordance with our Risk Management program, including the mitigating controls and management actions taken to reduce these risks.
Social
Our relationships with our workforce, Indigenous Peoples, and local communities are fundamental to our success. The safety and protection of our workforce and the public is our top priority in our assessment of risk and planning for safe operations and product transport. To deliver on our strategy, we invest in programs to attract and retain a skilled workforce that has a broad range of complementary skills, abilities, and experience, that reflect the communities in which we operate and to help increase the participation of underrepresented groups in trades and technical positions. We want to build a workforce that is dedicated to continuous improvement and shares our values.
We have a five-pillar approach to develop and maintain long-term relationships and provide opportunities to those living in areas near our operations. The five-pillars include workforce development, business development, community investment, environmental stewardship, and community engagement. To strengthen relationships and shape them into mutually beneficial partnerships, we have established agreements with northern and Indigenous communities near our operations that allow us to determine focus areas based on the community’s unique needs, optimizing benefits to the community, providing certainty around community investment and local business opportunities.
Governance
We believe that sound governance is the foundation for strong corporate performance. Our diverse and independent board of directors’ primary role is to provide strategic direction and risk oversight in order to help the company achieve its objectives. The board guides the company to operate as a sustainable business, to optimize financial returns while effectively managing risk, and to conduct business in a way that is transparent, independent, and ethical.
2024 ANNUAL INFORMATION FORM Page 104
The board has formal governance guidelines that set out our approach to governance and the board’s governance role and practices. The guidelines are intended to ensure that we comply with all of the applicable governance rules and legislation in Canada and the US, conduct ourselves in the best interests of our stakeholders, and meet industry best practices. The guidelines are reviewed and updated regularly.
Risk and Risk Management
Our board of directors oversees management’s implementation of appropriate risk management processes and controls. We have a Risk Policy that is supported by our formal Risk Management Program.
Our Risk Management Program involves a broad, systematic approach to identifying, assessing, monitoring, reporting and managing the significant risks we face in our business and operations, including risks that could impact our four measures of success. The program is based on the ISO 31000 Risk Management guidelines. ISO 31000 provides guidance on risk management activities with internationally recognized practices and provides sound principles for effective management and governance of risks. Our program applies to all risks facing the company. The program establishes clear accountabilities for employees throughout the company to take ownership of risks specific to their area and to effectively manage those risks. The program is reviewed annually to ensure that it continues to meet our needs.
We use a common risk matrix throughout the company. Any risk that has the potential to significantly affect our ability to achieve our corporate objectives or strategic plan is considered an enterprise risk and is brought to the attention of senior management and the board. We continually update our risk profile by performing regular monitoring of risks across the organization. Regular monitoring helps us to properly manage risks and identify any new risks. Detailed risk reporting is provided on a quarterly basis to senior management and the board and its committees on the status of the mitigating and/or monitoring plans for each of the enterprise risks. Management also reviews monthly updates on the company’s progress in managing these risks.
See Managing the risks, starting on page 74 of our 2024 MD&A, for a discussion of the material risks, and the specific risks discussed under each operation, advanced project, and other fuel cycle investment update in our 2024 MD&A. In addition to carefully considering the other information in this AIF, we also recommend you review Risks that can affect our business starting at page 115 of this AIF which includes a discussion of other material risks that could have an impact on our business. These risks, however, are not a complete list of the potential risks our operations, advanced projects, or other investments face. There may be others we are not aware of or risks we feel are not material today that could become material in the future.
Measuring our results
Targets and Metrics: The Link to Executive Pay
Each year, we set corporate objectives that are aligned with our strategic plan. These objectives fall under our four measures of success: outstanding financial performance, safe, healthy and rewarding workplace, clean environment and supportive communities. Performance against specific targets under these objectives forms the foundation for a portion of annual employee and executive compensation. See our most recent management proxy circular for more information on how executive compensation is determined.
We saw a significant improvement in our financial performance (earnings and cash flow) as our tier-one production increased and our average realized price reflected the improving market. However, we did not meet all of our targets, including our safety performance, in 2024. We remain committed to improvement as reflected in our objectives for 2025. For more information on our compensation targets and our reported performance against those targets, see the Measuring our results section in our 2024 MD&A and our most recent management proxy circular.
The regulatory environment
This section discusses some of the more significant government controls and regulations that have a material effect on our business. A significant part of our economic value depends on our ability to comply with the extensive and complex laws and regulations that govern our activities. At this time, we do not expect any of the proposed legislation or changes to existing legislation will have a material effect on our business.
2024 ANNUAL INFORMATION FORM Page 105
International treaty on the non-proliferation of nuclear weapons
The Treaty on the Non-Proliferation of Nuclear Weapons (NPT) is an international treaty that was established in 1970. It has three objectives:
| • | to prevent the spread of nuclear weapons and weapons technology |
| • | to foster the peaceful uses of nuclear energy |
| • | to further the goal of achieving general and complete disarmament |
The NPT establishes a safeguards system under the responsibility of the IAEA. Almost all countries are signatories to the NPT, including Canada, the US, the United Kingdom and France. We are therefore subject to the NPT and comply with the IAEA’s requirements.
Industry regulation and permits
Canada
Our Canadian operations have regulatory obligations to both the federal and provincial governments. There are four main regulatory agencies that issue licences and approvals:
| • | CNSC (federal) |
| • | Fisheries and Oceans Canada (federal) |
| • | SMOE |
| • | Ontario Ministry of Environment |
Environment and Climate Change Canada (federal) is also a major regulatory agency that has a mandate involving specific pieces of federal regulations.
Uranium industry regulation
The government of Canada recognizes the special importance of the uranium industry to Canada’s national interest, and regulates the industry through legislation and regulations, and exerts additional control through government policy.
Federal legislation applies to any work or undertaking in Canada for the development, production, or use of nuclear energy or for the mining, production, refinement, conversion, enrichment, processing, reprocessing, possession, or use of a nuclear substance. Federal policy requires that any property or plant used for any of these purposes must be legally and beneficially owned by a company incorporated in Canada.
Mine ownership restrictions
The federal government has instituted a policy that restricts ownership of Canadian uranium mining properties to:
| • | a minimum of 51% ownership by residents |
| • | a basic maximum limit of 49% ownership by non-residents of uranium properties at the first stage of production |
The government may grant exceptions. For example, resident ownership may be less than 51% if the property is Canadian controlled. Exceptions will only be granted in cases where it is demonstrated that Canadian partners cannot be found, and it must receive Cabinet approval.
The government issued a letter to the Canadian uranium industry on December 23, 1987, outlining the details of this ownership policy. On March 3, 2010, the government announced its intention to liberalize the foreign investment restrictions on Canada’s uranium mining sector to “ensure that unnecessary regulation does not inhibit the growth of Canada’s uranium mining industry by unduly restricting foreign investment”. However, after striking an expert panel to study the issue and soliciting feedback from various stakeholders, the federal government stated in October 2011 that it would not be changing the policy.
The Canada-EU Trade Agreement (CETA) was provisionally implemented in September 2017. The Non-resident Ownership Policy provisions for CETA countries are now in effect, which removes the requirement to seek a Canadian partner to hold the majority interest in a Canadian uranium mining property before applying for an exemption. An EU company is still required to apply for an exemption to hold a majority interest in a Canadian uranium mining property and the proposal will be evaluated by the government on its merits.
2024 ANNUAL INFORMATION FORM Page 106
Cameco ownership restriction
We are subject to ownership restrictions under the Eldorado Nuclear Limited Reorganization and Divestiture Act, which restricts the issue, transfer, and ownership, including joint ownership, of common shares to prevent both residents and non-residents of Canada from owning or controlling more than a certain percentage of shares. See page 145 for more information.
Industry governance
The Nuclear Safety and Control Act (NSCA) is the primary federal legislation governing the control of the mining, extraction, processing, use and export of uranium in Canada. It authorizes the CNSC to make regulations governing all aspects of the development and application of nuclear energy, including uranium mining, milling, conversion, fuel fabrication and transportation. It grants the CNSC licensing authority. A person may only possess or dispose of nuclear substances and build, operate, and decommission its nuclear facilities according to the terms and conditions of a CNSC licence. Licensees must satisfy specific conditions of the licence to maintain the right to operate their nuclear facilities.
The NSCA emphasizes the importance of environmental as well as health and safety matters and requires licence applicants and licensees to make adequate provisions for protection of the environment and for the health and safety of workers and the public.
Regulations made under the NSCA include those dealing with the specific licence requirements of facilities, radiation protection, physical security for all nuclear facilities and the transport of radioactive materials. The CNSC has also issued regulatory documents and, in some cases, adopted national standards to assist licensees in complying with regulatory requirements, such as decommissioning, emergency planning, and optimizing radiation protection measures.
All of our Canadian operations are governed primarily by licences granted by the CNSC and are subject to all federal statutes and regulations that apply to us, and all the laws that generally apply in the province where the operation is located, unless there is a conflict with the terms and conditions of the licence or the federal laws that apply to us.
Uranium export
We must secure export licences and export permits from the CNSC and Global Affairs Canada to export our uranium. These arrangements are governed by the bi-lateral and multi-lateral agreements that are in place between governments.
Land tenure
Most of our uranium reserves and resources are in the province of Saskatchewan:
| • | a mineral claim from the province gives us the right to explore for minerals (other government approvals are required to carry out surface exploration) |
| • | a crown lease with the province gives us the right to mine the minerals on the property |
| • | a surface lease with the province gives us the right to use the land for surface facilities and mine shafts while mining and reclaiming the land |
A mineral claim has a one-year term, with the right to renew for successive one-year periods. Generally, the holder must spend a certain amount on exploration to keep the mineral claim in good standing. If we spend more than the amount required, then the extra amount can be applied to future years.
A holder of a mineral claim in good standing has the right to convert it into a crown lease. A crown lease is for 10 years, with a right to renew for additional 10-year terms. The lessee must spend a certain amount on work during each year of the crown lease. The lease cannot be terminated unless the lessee defaults on any terms of the lease, or under any provisions of The Crown Minerals Act (Saskatchewan) or regulations under it, including any prescribed environmental concerns. Crown leases can be amended unilaterally by the lessor by an amendment to The Crown Minerals Act (Saskatchewan) or The Mineral Tenure Registry Regulations (Saskatchewan).
A surface lease can be for up to 33 years in accordance with The Crown Resource Land Regulations, 2019 (Saskatchewan) made pursuant to The Provincial Lands Act, 2016 (Saskatchewan), as necessary for operating the mine and reclaiming the land. The province also uses surface leases to specify other requirements relating to environmental and radiation protection as well as socioeconomic objectives.
2024 ANNUAL INFORMATION FORM Page 107
United States
Uranium industry regulation
In the US, uranium recovery is regulated by the NRC according to the Atomic Energy Act of 1954, as amended. Its primary function is to:
| • | ensure employees, the public and the environment are protected from radioactive materials |
| • | regulate most aspects of the uranium recovery process |
The NRC’s regulations for uranium recovery facilities are codified in Title 10 of the Code of Federal Regulations (10 CFR). It issues Domestic Source Material Licences under 10 CFR, Part 40. The National Environmental Policy Act governs the review of licence applications, which is implemented through 10 CFR, Part 51.
At Smith Ranch-Highland and Crow Butte, safety is regulated by the federal Occupational Safety and Health Administration.
Other governmental agencies are also involved in the regulation of the uranium recovery industry.
The NRC also regulates the export of uranium from the US and the transport of nuclear materials within the US in conjunction with the Department of Transportation (DOT). It does not review or approve specific sales contracts. It also grants export licences to ship uranium outside the US.
Wyoming
The uranium recovery industry is also regulated by the Wyoming Department of Environmental Quality (WDEQ), the Land Quality Division (LQD) according to the Wyoming Environmental Quality Act (WEQA) and the Land Quality Division Non Coal Rules and Regulations under the WEQA. According to the state act, the WDEQ issues a permit to mine. The LQD administers the permit. As of September 30, 2018, the NRC has entered into an agreement with the state of Wyoming, transferring regulatory authority for licensing, rulemaking, inspection, and enforcement activities necessary to regulate uranium ISR mining. The WDEQ LQD Uranium Recovery Program (URP) has assumed this regulatory authority.
The state also administers a number of EPA programs under the Clean Air Act and the Clean Water Act. The WDEQ, Water Quality Division, through the agreement state program, administers the EPA’s Underground Injection Control Regulations (UIC). The LQD administers the regulation of the uranium mining UIC program with the LQD Non-Coal Rules and Regulations. Wyoming currently requires wellfield decommissioning to the standard of pre-mining use.
Nebraska
The uranium recovery industry is regulated by the NRC, and the Nebraska Department of Environment and Energy according to the Nebraska Environmental Protection Act. The Nebraska Department of Environment and Energy issues a permit to mine. The state requires wellfield groundwater be restored to the class of use water standard.
Land tenure
Our uranium resources in the US are held by subsidiaries located in Wyoming and Nebraska. The right to mine or develop minerals is acquired either by leases from the owners (private parties or the state) or mining claims located on property owned by the US federal government. Our subsidiaries acquire surface leases that allow them to conduct operations.
Kazakhstan
See Kazakhstan government and legislation starting on page 69.
Complying with environmental regulations
Our business is required to comply with laws and regulations that are designed to protect the environment and control the management of hazardous wastes and materials. Some laws and regulations focus on environmental issues in general, and others are specifically related to mining and the nuclear sector. They change often, with requirements increasing, and existing standards being applied more stringently. While this dynamic promotes continuous improvement, it can increase expenses and capital expenditures, or limit or delay our activities.
Government legislation and regulation in various jurisdictions establish standards for system performance, standards, objectives and guidelines for air and water quality emissions, and other design or operational requirements for the various SHEQ components of our operations and the mines that we plan to develop. In addition, we must complete an environmental assessment before we begin developing a new mine or make any significant change to our operations. Once we have permanently stopped mining and processing activities, we are required to decommission and reclaim the operating site to the satisfaction of the regulators, and we may be required to actively manage former mining properties for many years.
2024 ANNUAL INFORMATION FORM Page 108
Canada
Not only is there ongoing regulatory oversight by the CNSC, the SMOE, the Ontario Ministry of the Environment, and Environment and Climate Change Canada, but there is also public scrutiny of the impact our operations have on the environment.
The CNSC, an independent regulatory authority established by the federal government under the NSCA, is our main federal regulator in Canada. In 2019, the federal government introduced the Impact Assessment Act (IAA) along with changes to the Fisheries Act and introduced the Canadian Navigable Waters Act. The new assessment legislation broadens the scope of a federal assessment beyond strictly environment, and the Fisheries Act and the Canadian Navigable Waters Act introduced changes to the language that will take some time to fully understand as the government is still developing and issuing guidance and working out the impact of the revisions. In October 2023, the Supreme Court of Canada ruled that parts of the IAA were outside the federal government’s competence and thus unconstitutional. In response, the federal government is currently reviewing this legislative framework in order to bring it within constitutional bounds. Certain amendments to the IAA came into force on June 20, 2024, although further amendments may be coming in 2025 in order to fully address the Supreme Court’s ruling.
Plans to build new mines in Saskatchewan are subject to the provincial environmental assessment process. In certain cases, a review panel may be appointed, and public hearings held.
Over the past few years, CNSC audits of our operations have focused on the following SHEQ programs:
| • radiation protection
• environmental monitoring
• emergency preparedness and fire protection
• operational quality assurance
• organization and management systems effectiveness |
• transportation systems
• geotechnical monitoring
• training
• ventilation systems
• waste management |
Improving our environmental performance is challenging and we have focused on maintaining our excellent treated water quality while maintaining production at our facilities or while they are in care and maintenance.
Efforts like these often require additional environmental studies near the operations, and we will continue to undertake these as required.
It can take a significant amount of time for regulators to make requested changes to a licence or grant a requested approval because the activity may require an approval with an extensive review of supporting technical data, management programs and procedures. We are improving the quality of our proposals and submissions and have introduced a number of programs to ensure we continue to comply with regulatory requirements, but this has also increased our capital expenditures and our operating costs.
As our SHEQ management system matures, regulators continue to review our programs and recommend ways to improve our SHEQ performance. These recommendations are generally procedural and do not involve large capital costs, although systems applications can be significant and result in higher operating costs.
Federal requirements stemming from the Species at Risk Act are introducing significant uncertainty into the management of activities in northern Saskatchewan. One specific example includes the amended national recovery strategy for woodland caribou, which contains strategic directions that have the potential to impact economic and social development in northern Saskatchewan. As a requirement of this document, the province of Saskatchewan is responsible for developing range plans that outline population and habitat protection measures for activities conducted in northern Saskatchewan. Mitigation requirements, and other measures, could have an impact on our Saskatchewan operations and advanced projects in northern Saskatchewan.
2024 ANNUAL INFORMATION FORM Page 109
A number of government or governmental bodies have introduced or are contemplating regulatory changes in response to the potential impacts of climate change. While we have a relatively small carbon footprint, our Canadian facilities could experience higher annual operating costs due to changes in GHG pricing and regulations, such as carbon pricing, the Canadian Clean Fuel Standard, and/or other policy changes. As indicated above, we recognize that climate change, including shifts in temperature, precipitation and more frequent severe weather events could affect our operations in a range of possible ways. In 2024, we completed a physical climate risk assessment for each of our US sites. Through this project, and those completed in 2022 for our mining division and 2023 for our fuel services division, we successfully completed our target to invest annually in projects that continue to enhance our understanding of climate-related physical risks and complete climate scenario-based physical risk assessments at all our majority-owned and operated sites by year-end 2026. See Our Sustainability principles and practices – environment starting on page 102.
We believe that regulatory expectations of the CNSC and other federal and provincial regulators will continue to evolve, and lead to changes to both requirements and the regulatory framework. This will likely increase our costs.
United States
Our ISR operations in the US must meet federal, state, and local regulations governing air emissions, water discharges, handling and disposal of hazardous materials and site reclamation, among other things.
Mining activities must meet comprehensive environmental regulations from the NRC, Bureau of Land Management, Environmental Protection Agency (EPA) and state environmental agencies. The process of obtaining mine permits and licences generally takes several years, and involves environmental assessment reports, public hearings, and comments. We have the permits and licences required for our US ISR Operations for 2024. A renewal application for the Crow Butte Operation NRC Source Material Licence was submitted on September 24, 2024. Crow Butte is currently in timely renewal as the NRC conducts its completeness review of the application.
The ISR mining method at our US ISR Operations involves extracting uranium from underground non-potable aquifers by dissolving the uranium with a carbonate-based water solution and pumping it to a processing facility on the surface. After mining is complete, ISR wellfields must be restored according to regulatory requirements. This generally involves restoring the groundwater to its pre-mining state or equivalent class of use water standard. Restoration of Crow Butte wellfields is regulated by the Nebraska Department of Environment and Energy and the NRC. Restoration of Smith Ranch-Highland wellfields is regulated by the WDEQ.
See page 115 for the status of wellfield restoration and regulatory approvals.
Kazakhstan
Please see Resource use contract and Kazakhstan government and legislation on pages 68 to 75 for information on environmental regulations applicable to JV Inkai’s decommissioning obligations in Kazakhstan.
Taxes and Royalties
Transfer pricing dispute
Background
Since 2008, CRA has disputed our marketing and trading structure and the related transfer pricing methodology we used for certain intercompany uranium sale and purchase agreements.
For the years 2003 to 2014, CRA shifted Cameco Europe Limited’s income (as recalculated by CRA) back to Canada and applied statutory tax rates, interest and instalment penalties, and, from 2007 to 2011, transfer pricing penalties. In addition, for 2014 to 2017, CRA has advanced an alternate reassessing position, see Reassessments, remittances and next steps below for more information.
In September 2018, the Tax Court of Canada (Tax Court) ruled that our marketing and trading structure involving foreign subsidiaries, as well as the related transfer pricing methodology used for certain intercompany uranium sales and purchasing agreements, were in full compliance with Canadian law for the tax years in question (2003, 2005 and 2006). On June 26, 2020, the Federal Court of Appeal (Court of Appeal) upheld the Tax Court’s decision.
On February 18, 2021, the Supreme Court of Canada (Supreme Court) dismissed CRA’s application for leave to appeal the June 26, 2020 decision of the Court of Appeal. The dismissal means that the dispute for the 2003, 2005 and 2006 tax years is fully and finally resolved in our favour. Although not technically binding, there is nothing in the reasoning of the lower court decisions that should result in a different outcome for the 2007 through 2014 tax years, which were reassessed on the same basis.
2024 ANNUAL INFORMATION FORM Page 110
Refund and cost award
The Minister of National Revenue issued new reassessments for the 2003 through 2006 tax years in accordance with the decision and in July 2021, refunded the tax paid for those years. In October 2023, pursuant to a cost award from the courts, we received a payment of approximately $12 million for disbursements which is in addition to the $10 million we received from CRA in April 2021 as reimbursement for legal fees.
Reassessments, remittances and next steps
The Canadian income tax rules include provisions that generally require larger companies like us to remit or otherwise secure 50% of the cash tax plus related interest and penalties at the time of reassessment. Following the Supreme Court’s dismissal of CRA’s application for leave to appeal, we wrote to CRA requesting reversal of CRA’s transfer pricing adjustments for 2007 through 2013 and the return of the $780 million in cash and letters of credit we paid or provided for those years. Given the strength of the court decisions received, our request was made on the basis that the Tax Court would reject any attempt by CRA to defend its reassessments for the 2007 through 2013 tax years applying the same or similar positions already denied for previous years.
In March 2023, CRA issued revised reassessments for the 2007 through 2013 tax years, which resulted in a refund of $297 million of the $780 million in cash and letters of credit held by CRA at the time. The refund consisted of cash in the amount of $86 million and letters of credit in the amount of $211 million, which were returned in the second quarter.
The series of court decisions that were completely and unequivocally in our favour for the 2003, 2005 and 2006 tax years, determined that the income earned by our foreign subsidiary from the sale of non-Canadian produced uranium was not taxable in Canada. In accordance with these decisions, CRA issued reassessments reducing the proposed transfer pricing adjustment from $5.1 billion to $3.3 billion, resulting in a reduction of $1.8 billion in income taxable in Canada compared to the previous reassessments issued to us by CRA for the 2007 through 2013 tax years.
The remaining transfer pricing adjustment of $3.3 billion for the 2007 to 2013 tax years relates to the sale of Canadian-produced uranium by our foreign subsidiary. We maintain that the clear and decisive court decisions described above apply, and that CRA should fully reverse the remaining transfer pricing adjustments for these years and return all cash and security being held.
In October 2021, due to a lack of significant progress on our points of contention, we filed a notice of appeal with the Tax Court for the years 2007 through 2013. We have asked the Tax Court to order the complete reversal of CRA’s transfer pricing adjustment for those years and the return of all cash and letters of credit being held, with costs.
In 2020, CRA advanced an alternate reassessing position for the 2014 tax year in the event the basis for its original reassessment, noted above, is unsuccessful. Subsequent to this, we received reassessments for the 2015, 2016 and 2017 tax years, all reflecting this alternative reassessing position. CRA did not require additional security for the tax debts they considered owing for 2014 through 2016, while CRA did require additional letters of credit related to the tax debts they considered owing for 2017. CRA continues to hold $555 million ($209 million in cash and $346 million in letters of credit) that we have remitted or secured to date.
The new basis of reassessment is inconsistent with the methodology CRA has pursued for prior years and we are disputing it separately. Our view is that this alternate methodology will not result in a materially different outcome from our 2014 to 2017 filing positions. We filed appeals with the Tax Court for each year from 2014 to 2017. In late 2024, we received a reassessment for the 2018 tax year. The reassessment relates to contracts other than those discussed above. CRA has advanced another alternate reassessing position for the 2018 tax year. We filed a notice of objection for 2018 on March 17, 2025.
We will not be in a position to determine the definitive outcome of the dispute for any tax year other than 2003 through 2006 until such time as all reassessments have been issued advancing CRA’s arguments and final resolution is reached for that tax year. CRA may also advance alternative reassessment methodologies for years other than 2003 through 2006, such as the alternative reassessing position advanced for 2014 through 2017 or the new alternative reassessing position advanced for 2018.
2024 ANNUAL INFORMATION FORM Page 111
Caution about forward-looking information relating to our CRA tax dispute
This discussion of our expectations relating to our tax dispute with CRA and future tax reassessments by CRA is forward-looking information that is based upon the assumptions and subject to the material risks discussed under the heading Caution about forward-looking information beginning on page 3 and also on the more specific assumptions and risks listed below. Actual outcomes may vary significantly.
| Assumptions
• the courts will reach consistent decisions for subsequent tax years that are based on similar positions and arguments
• CRA will not successfully advance different positions and arguments that may lead to a different outcome for other tax years |
Material risks that could cause actual results to differ materially
• the possibility the courts may accept the same, similar or different positions and arguments advanced by CRA to reach decisions that are adverse to us for other tax years
• the possibility that we will not be successful in eliminating all double taxation
• the possibility that CRA does not agree that the court decisions for the years that have been resolved in Cameco’s favour should apply to subsequent tax years
• the possibility CRA will not return all or substantially all of the cash and security that has been paid or otherwise secured by Cameco in a timely manner, or at all
• the possibility of a materially different outcome in disputes for other tax years |
Canadian royalties
We pay royalties on the sale of all uranium extracted at our mines in the province of Saskatchewan.
Two types of royalties are paid:
| • | Basic royalty: This royalty is calculated as 5% of gross sales of uranium, less the Saskatchewan resource credit of 0.75%. |
| • | Profit royalty: A 10% royalty is charged on profit up to and including $28.732/kg U3O8 ($13.03/lb) and a 15% royalty is charged on profit in excess of $28.732/kg U3O8. Profit is determined as revenue less certain operating, exploration, reclamation and capital costs. Both exploration and capital costs are deductible at the discretion of the producer. |
As a resource corporation in Saskatchewan, we also pay a corporate resource surcharge of 3% of the value of resource sales.
Canadian income taxes
We are subject to federal income tax and provincial taxes in Saskatchewan and Ontario. Current income tax expense for 2024 was $24 million.
Our Ontario fuel services operations are eligible for a manufacturing and processing tax credit.
The Organization for Economic Co-operation and Development has proposed the introduction of rules that would impose a global minimum tax rate of 15%. Switzerland, Luxembourg, and Germany have all enacted or substantively enacted these rules.
US taxes
Our subsidiaries in Wyoming and Nebraska pay severance taxes, property taxes and Ad Valorem taxes in those states. They incurred $0.87 million (US) in taxes in 2024.
Our US subsidiaries are subject to US federal and state income tax.
Kazakhstan taxes
Stability of the tax regime envisaged the RUC was abolished with the entry into legal force of the 2009 Tax Code in 2009. Amendment No. 2 to the RUC, signed in 2009, by making applicable the 2009 Tax Code, eliminated the tax stabilization provision of the RUC.
2024 ANNUAL INFORMATION FORM Page 112
The tax code, effective January 1, 2018 (the 2018 Tax Code), provides that subsoil users pay all taxes and payments provided in the tax legislation effective as of the date of occurrence of tax obligations. There were several important changes introduced to the 2018 Tax Code with effect from January 1, 2025, as briefly described below:
| • | The MET rate on uranium (extracted using solution mining methods) was increased from 6% to 9% with the introduction of a progressive system based on actual annual production volumes under each subsoil use agreement, starting in 2026, where the highest rate is 18% for operations producing over 10.4 million pounds. An additional MET of up to 2.5% based on the spot market price of uranium, will also be added in 2026. The MET is incurred and paid by the mining entities, impacting both KAP and different JVs and subsidiaries, including JV Inkai. (Article 746 of the 2018 Tax Code). |
| • | Changes were introduced with respect to deductibility of costs incurred by subsoil users on research, scientific, technical and development work (R&D costs). In particular the 2018 Tax Code was amended to introduce additional requirements for documentary confirmation of incurred R&D costs. Such documentary confirmation includes notification of the authorized body, a report on scientific or scientific-technical activities and documents confirming the costs associated with such activities (for expenses on R&D work), and the actually executed technical assignment and acts of acceptance of the completed stages of works (for expenses on acquisition of R&D works). |
| • | The 2018 Tax Code was also amended to include deductible expenses financing of the establishment of scientific centers at research universities (provided there is a notification of the authorized body on establishment of a scientific center). |
| • | Further, the 2018 Tax Code was amended to allow a decrease in taxable income for 50% of costs incurred on (a) R&D works in connection with creation of an industrial property object, and (b) acquisition of exclusive rights to intellectual property from certain entities with the purpose of commercialization of the results of scientific or scientific-technical activity. |
| • | The possibility to pay import VAT via offset method was excluded (Articles 427 and 428 of the 2018 Tax Code). However, as we understand, the issue of exclusion of these articles from the 2018 Tax Code is being actively discussed. Thus, on January 30, 2025, a meeting of the State Commission on Modernization of the Economy of the Republic of Kazakhstan was held on the subject of extending the validity of these provisions of the 2018 Tax Code from January 1, 2025. It appears that, as a result of this meeting, it was decided to make amendments to the 2018 Tax Code to extend the validity of the provisions of the 2018 Tax Code, providing for the payment of VAT by offset method on imported goods from January 1, 2025, until the adoption of amendment to be guided by the norms of legislation in force as of December 31, 2024. |
| • | Rates of payment for emissions of pollutants from stationary sources, for discharges of pollutants, and for disposal of production and consumption waste were doubled (Articles 576 of the 2018 Tax Code). |
| • | The social tax rate was increased to 11%. |
JV Inkai’s costs could be impacted by potential changes to the 2018 Tax Code, the changes to the MET rate for uranium and by possible increased financial contributions to social and other state causes, although these risks cannot be quantified or estimated at this time.
We also note that currently a new tax code is being developed. The bill was submitted to the lower chamber of the Kazakhstan Parliament and is expected to come into force in 2026.
Nuclear waste management and decommissioning
Once we have permanently stopped mining and processing activities, we are required to reclaim and decommission the operating sites. This includes all waste rock, TMF and other areas of the site affected by our activities to the satisfaction of regulatory authorities.
Estimating decommissioning and reclamation costs
We develop conceptual decommissioning plans for our operating sites and use them to estimate our decommissioning costs, which is the basis used to determine the amount of financial assurance we must provide to secure our decommissioning obligations. Our plans include reclamation techniques that we believe generate reasonable environmental and radiological performance. The conceptual plans and estimated costs are submitted to our regulators for review and approval.
We started conducting reviews of our conceptual decommissioning plans for all Canadian sites in 1996. We typically review them every five years. We review our cost estimates for both accounting purposes and licence applications. For our US sites, they are reviewed annually. A preliminary decommissioning plan has been established for Inkai. The plan for Inkai is updated every three years or as significant changes take place, which would affect the decommissioning estimate. See Decommissioning on page 69 for further details on the plan for Inkai.
2024 ANNUAL INFORMATION FORM Page 113
As properties approach or go into decommissioning, a detailed decommissioning plan is prepared for regulators to review and accept. This can result in additional regulatory process, requirements, costs, and financial assurances.
At the end of 2024, our estimate of total decommissioning and reclamation costs was $1.38 billion. This is the undiscounted value of the obligation and is based on our current operations. We had accounting provisions of $1.03 billion at the end of 2024 (the present value of the $1.38 billion). Regulatory approval is required prior to beginning decommissioning. The expected timing for these costs is based on each mine or fuel service facility’s expected operating life. Our required costs for decommissioning and reclamation in each of the next five years are not expected to be material. However, we may choose to undertake progressive reclamation activities, for example, as we do at our US assets and through our Vision in Motion project at our Port Hope fuel services facilities.
Cameco and our joint venture partners provide financial assurances for decommissioning and reclamation such as letters of credit or surety bonds to regulatory authorities, as required. We had a total of about $1.13 billion in financial assurances supporting our reclamation liabilities at the end of 2024. This amount is based on the approved preliminary decommissioning estimates and will increase to reflect the updated preliminary decommissioning estimate amounts once they are approved. All of our North American operations have financial assurances in place in connection with our preliminary plans for decommissioning of the sites.
Please also see note 16 to our 2024 financial statements for our estimate of decommissioning and reclamation costs and related financial assurances.
Canada
Decommissioning estimates
| (100% basis) |
||||
| McArthur River |
$ | 51.4 million | ||
| Rabbit Lake |
$ | 294.8 million | ||
| Key Lake |
$ | 276.7 million | ||
| Cigar Lake |
$ | 76.5 million |
Preliminary decommissioning plans for all Saskatchewan mining operations were submitted in 2017 and 2018 as part of the regular five-year update schedule. Prior to revising the letters of credit, approval of the updated plans is required from the province and CNSC staff as well as formal approval from the CNSC through a Commission proceeding. All Saskatchewan mining operations have received the necessary approvals.
In 2022, as part of the required five-year update schedule, we submitted revised preliminary decommissioning estimates for all Saskatchewan mining operations, which are currently being reviewed by the province and CNSC staff. Updated estimates, based on revisions made to address regulatory comments, were submitted for McArthur River, Cigar Lake and Rabbit Lake in 2024.
The reclamation and remediation activities associated with waste rock and tailings from processing Cigar Lake ore and uranium solution are covered in the plans and cost estimates for the facility that will be processing it.
Decommissioning estimates
| (100% basis) |
||||
| Port Hope |
$ | 138.2 million | ||
| Blind River |
$ | 57.5 million | ||
| CFM |
$ | 10.8 million |
We renewed our licence for Port Hope in 2017. As part of that process, an update to the Port Hope Conversion Facility preliminary decommissioning plan was finalized and accepted in February 2017 and the letter of credit was updated in March 2017. In 2022, as part of the required five-year update schedule, we submitted a revised preliminary decommissioning estimate for Port Hope, which was approved by the CNSC in May 2024 and the financial assurance was updated in June 2024.
2024 ANNUAL INFORMATION FORM Page 114
We renewed our licence for Blind River in 2022. As part of the process, an update to the Blind River preliminary decommissioning plan was finalized and accepted in February 2022. An update to the CFM preliminary decommissioning plan was also finalized and accepted in February 2022.
Recycling uranium byproducts
We have arrangements with two facilities for processing certain uranium-bearing by-products from Blind River and Port Hope. An agreement has been in place with the White Mesa mill in Blanding, Utah for a number of years. Recycled by-product material was being processed at Key Lake until the decision was made in 2018 to suspend production and place the mill and the McArthur River mine in care and maintenance.
United States
After mining has been completed, an ISR wellfield has to be restored according to regulatory requirements. This generally involves restoring the groundwater to its pre-mining state or equivalent class of water standard.
For wellfield restoration to be complete, regulatory approval is required. It is difficult for us to estimate the timing for wellfield restoration due to the uncertainty in timing for receiving final regulatory approval.
Crow Butte
Restoration of Crow Butte wellfields is regulated by the Nebraska Department of Environment and Energy and the NRC. There are seven wellfields being restored at Crow Butte. The groundwater at mine unit #1 has been restored to pre-mining quality standards, all wells are plugged, and the piping removed.
Our estimated cost of decommissioning the property is $65.4 million (US). We have provided the state of Nebraska with $65.4 million (US) in financial assurances as security for decommissioning the property.
Smith Ranch-Highland
Restoration of Smith Ranch-Highland wellfields is regulated by the WDEQ. In 2018, the NRC transferred to the state of Wyoming its authority to regulate uranium ISR mining in the state. There are eleven wellfields being restored at Smith Ranch-Highland and North Butte, one wellfield in stability, one mine unit in long term monitoring, and two wellfields (mine unit A and mine unit B) that have been fully restored.
Restoration of mine unit B was approved by the WDEQ in 2008, while NRC approval has not yet been attained. An Alternate Concentration Limit (ACL) request was submitted to the NRC in May 2013. The NRC subsequently requested additional information, and that additional sampling be conducted. The URP program will be responsible for the final approval of Mine Unit B restoration.
Our estimated cost of decommissioning the property is $248.6 million (US), including North Butte. We have provided the state of Wyoming with $245.4 million (US) in financial assurances as security for decommissioning the property.
Westinghouse and JV Inkai
Please see Estimating decommissioning and environmental remediation costs on page 94 for information on Westinghouse’s decommissioning obligations.
Please see Decommissioning on page 69 for information on JV Inkai’s decommissioning obligations in Kazakhstan.
Risks that can affect our business
The nature of our business means we face many kinds of risks and hazards – some that relate to the nuclear energy industry in general, and others that apply to specific properties, operations, investments, or planned operations. These risks could have a significant impact on our business, earnings, cash flows, financial condition, results of operations or prospects, which may result in a significant decrease in the market price of our common shares. In addition to considering the other information in this AIF, you should consider carefully the risks discussed in this section in deciding whether to invest in securities of Cameco.
2024 ANNUAL INFORMATION FORM Page 115
The following section describes the risks that are most material to our business. Many of these risks, or similar risks, also apply to our JV Inkai partnership as well as our investment in Westinghouse. Such risks to JV Inkai or Westinghouse also could have a significant impact on our earnings, cash flows, or financial condition, which may result in a significant decrease in the market price of our common shares. This is not, however, a complete list of the potential risks we face – there may be others we are not aware of, or risks we feel are not material today that could become material in the future. Our risk policy and process involves a broad, systematic approach to identifying, assessing, reporting and managing the significant risks we face in our business and operations. However, there is no assurance that we will be successful in preventing the harm that any of these risks could cause.
Please also see the risk discussion in our 2024 MD&A.
Types of risk
| • Operational
• Financial
• Governance and compliance |
• Environmental
• Social
• Strategic |
1 – Operational risks
General operating risks and hazards
We are subject to a number of operational risks and hazards, many of which are beyond our control.
These risks and hazards include:
| • catastrophic accidents resulting in large-scale releases of hazardous chemicals (such as a release of UF6 or anhydrous hydrogen fluoride used in the UF6 conversion process or release of ammonia at our mining and milling operations), or a tailings facility failure
• environmental incidents (including hazardous emissions from our refinery and conversion facilities)
• subsurface contamination from current or legacy operations
• industrial safety accidents
• equipment failures or aging facilities
• fires
• transportation incidents, which may involve radioactive or other hazardous materials
• transportation and delivery disruptions
• labour shortages, disputes or strikes
• availability of personnel with the necessary skills and experience
• cost increases for labour, contracted or purchased materials, supplies and services
• shortages of, or interruptions in the supply of, required equipment, materials, services, and supplies (including anhydrous hydrofluoric acid at our conversion facilities)
• interruptions in the supply of electricity, water, and other utilities or other infrastructure
• inability of our innovation initiatives to achieve the expected cost saving and operational flexibility objectives |
• cyberattacks
• joint venture dispute or litigation
• non-compliance with legal requirements, including exceeding applicable air or water limits or requirements
• inability to obtain and renew the licences and other approvals needed to operate, restart, and to increase production at our mines, mills, and processing facilities, or to develop new mines, or for Westinghouse to operate its fuel fabrication or other facilities or undertake its other commercial activities
• workforce health and safety or increased regulatory burdens resulting from a pandemic or other causes
• uncertain impact of changing regulations or policy leading to higher annual operating costs, including GHG pricing and regulations (e.g., carbon pricing, the Canadian Clean Fuel Standard)
• blockades or other acts of social or political activism
• natural phenomena, such as forest fires, floods, and earthquakes as well as shifts in temperature, precipitation, and the impact of more frequent severe weather conditions on our operations as a result of climate change
• outbreak of illness (such as a pandemic)
• unusual, unexpected or adverse mining or geological conditions
• underground water inflows at our mining operations
• ground movement or cave-ins at our mining operations
• mineral reserve and resource estimates are not precise |
2024 ANNUAL INFORMATION FORM Page 116
There is no assurance that any of the above risks will not result in:
| • damage to or destruction of our properties and facilities located on these properties
• personal injury or death
• environmental damage
• delays in, or interruptions of, our exploration or development activities or transportation and delivery of our products |
• delays in, interruptions of, or decrease in production at our operations
• costs, expenses, or monetary losses
• legal liability
• adverse government or regulatory action |
Any of these events could result in one or more of our operations becoming unprofitable, cause us not to receive an adequate return on invested capital, or have a material and adverse effect on our earnings, cash flows, financial condition, results of operations or prospects.
JV Inkai and Westinghouse operate independently from Cameco, however, they may be subject to the same or similar operational risks.
Insurance coverage
We buy insurance to cover losses or liabilities arising from some of the operating risks and hazards listed above, as well as other business risks. We do not have dedicated cyber insurance coverage and we do not buy property insurance coverage for our suspended Rabbit Lake operation.
We believe we have a reasonable amount of coverage for the risks we choose to insure against. There is no assurance, however, that this coverage will be adequate, that it will continue to be available, that premiums will be economically feasible, or that we will maintain this coverage. Like other nuclear energy and mining companies, we do not have insurance coverage for certain environmental losses or liabilities and other risks, either because it is not available, or because it cannot be purchased at a reasonable cost. Insurance availability at any time is driven by several factors and availability may be impacted by the announced intention of certain providers to restrict underwriting of certain industries, assets or projects. We may also be required to increase the amount of our insurance coverage due to changes in the regulation of the nuclear industry.
We may suffer material losses from uninsurable or uninsured risks or insufficient insurance coverage, which could have a material and adverse effect on our earnings, cash flows, financial condition, results of operations or prospects.
JV Inkai and Westinghouse also buy insurance to cover losses or liabilities arising from some of the operating risks and hazards listed above, as well as other business risks. Similar risks would apply with respect to their insurance coverage as a result of uninsurable or uninsured risks or insufficient insurance coverage.
Flooding at McArthur River and Cigar Lake
The sandstone that overlays the McArthur River and Cigar Lake deposits and basement rock is water-bearing with significant pressure at mining depths. This high-pressure water source is isolated from active development and production areas in order to reduce the inherent risk of an inflow. McArthur River relies on pressure grouting and ground freezing, and sufficient pumping, water treatment and above ground storage capacity to mitigate the risks of the high-pressure ground water. Cigar Lake relies on these same controls except for pressure grouting. These steps reduce, but do not fully eliminate, the risk of water inflows.
A water inflow could have a material and adverse effect on us, including:
| • | significant delays or interruptions in production or lower production |
| • | significant delays or interruptions in mine development |
| • | loss of mineral reserves |
| • | a material increase in capital or operating costs |
| • | erosion of stakeholder support, including governments, communities and shareholders |
2024 ANNUAL INFORMATION FORM Page 117
It could also have a material and adverse effect on our earnings, cash flows, financial condition, results of operations or prospects. The degree of impact depends on the magnitude, location and timing of the flood or water inflow. Floods and water inflows are generally not insurable.
McArthur River and Cigar Lake have had water inflows. There is no guarantee that there will not be water inflows at McArthur River or Cigar Lake in the future.
McArthur River
Production was suspended for three months in 2003 due to a water inflow event that occurred as the result of a ground failure during tunnel development. This resulted in flooding of portions of the mine and caused a major setback in the development advancement of a new mining zone. In 2008, we also had a small water inflow event that did not impact production but caused significant development delay.
Cigar Lake
We have had three water inflows at Cigar Lake since 2006 (please see page 52 for details).
These water inflows caused:
| • | a significant delay in development and production at the property |
| • | a significant increase in capital costs |
| • | the need to notify many of our customers of the interruption in planned uranium supply |
Technical challenges at Cigar Lake and McArthur River
The unique nature of the deposits at Cigar Lake and McArthur River poses many technical challenges, including but not limited to: high-pressure ground water management, unplanned water inflows, weak and altered ground conditions, unplanned ground failures, schedule uncertainty of development and freeze times of new mine zones, radiation protection, ore-handling and transport controls, water treatment performance and other mining-related challenges such as variable dilution and recovery values.
The areas being mined at Cigar Lake must meet specific ground freezing requirements before we begin jet boring. We have encountered longer than anticipated freeze durations due to inherent variability of the underlying geology across the deposit.
The Cigar Lake orebody contains elements of concern with respect to the water quality and the receiving environment. The distribution of elements such as arsenic, molybdenum, selenium and others is non-uniform throughout the orebody, and this can present challenges in attaining and maintaining the required effluent concentrations. There have been ongoing efforts to optimize the current water treatment process and water handling systems to ensure acceptable environmental performance, which is expected to avoid the need for additional capital upgrades and potential deferral of production.
Metallurgical test work has been used to design the McClean Lake mill circuits and associated modifications relevant to Cigar Lake ore. Samples used for metallurgical test work may not be representative of the deposit as a whole. There is a risk that elevated arsenic concentration in the mill feed may result in increased leaching circuit solution temperatures, potentially causing an increase in costs and reducing production.
If any of these technical challenges are not managed, it could have a material and adverse effect on our earnings, cash flows, financial condition, results of operations or prospects.
Cigar Lake extension
In order to successfully achieve the planned production schedule, we must continue to successfully transition into new mining areas, which includes mine development and investment in critical support infrastructure, and deployment of the jet boring method in new areas. If development or infrastructure construction work is delayed for any reason, including if the performance of our jet boring method is materially different in new areas than in previously mined areas, our ability to meet our future production plans may be impacted.
Information technology systems
We have become increasingly dependent on the availability and integrity of our electronic information and the reliability of our information technology systems and infrastructure. We rely on our information technology to process, transmit and store
2024 ANNUAL INFORMATION FORM Page 118
electronic information, including information we use to safely operate our assets. Our information technology systems are subject to disruption, damage, or failure from a variety of sources, including without limitation, security breaches, cyber-attacks, computer viruses, malicious software, natural disasters or defects in hardware or software systems.
Cyber attackers may use a range of techniques, from manipulating people to using sophisticated malicious software and hardware on a single or distributed basis. Often, advanced cyber attackers use a combination of techniques in their attempt to evade safeguards and delay discovery of a cyber-attack. We take measures to secure our infrastructure against potential cyber-attacks that may damage our infrastructure, systems, and data. We have implemented a defense in depth security program to secure and protect our information and business operations including formalizing and implementing an information security policy, user awareness training, and introducing system security configuration standards and access control measures. As technologies evolve and cyber-attacks become more sophisticated, we may incur significant costs to upgrade or enhance our security measures to mitigate potential harm.
We do not have dedicated cyber insurance coverage. However, to reduce the risk of successful cyber-attacks and to reduce the impact of any successful cyber-attacks, we have implemented several layers of perimeter and endpoint security defense and response mechanisms, security event logging and monitoring of network activities, and developed a cyber incident response process.
Despite the measures put in place to protect our systems and data, there can be no assurance that these measures will be sufficient to protect against such cyber-attacks or mitigate against such risks, or if such cyber-attacks or risks occur, that they will be adequately addressed in a timely manner.
Such a breach could result in unauthorized access to proprietary, confidential or sensitive information, destruction or corruption of data, disruption or delay in our business activities, remediation costs that may include liability for stolen assets or information, repairing system damage or incentives offered to customers or suppliers in an effort to maintain business relationships after an attack, legal or regulatory consequences, and a negative effect on our reputation and customer confidence. Disruption of critical information technology services or breaches of information security could have a material and adverse effect on our earnings, cash flows, financial condition, or results of operations.
JV Inkai and Westinghouse operate independently from Cameco, but have similar risks related to information technology systems.
Tailings management
Managing tailings is integral to mining. Cameco has four tailings management facilities (TMFs), two at the Key Lake mill and two at the Rabbit Lake operation (where the site is in a state of safe care and maintenance). Key Lake and Rabbit Lake each have one active in pit TMF and one inactive above ground TMF.
Cameco manages these facilities in accordance with Mining Association of Canada’s Towards Sustainable Mining Tailings Management Protocol, which provides a comprehensive approach across the entire life cycle of a tailings facility, from the initial planning through to closure and post-closure. Our program includes requirements for an independent tailings review board, annual reviews, and emergency preparedness to complement the robust operating, maintenance and surveillance programs for each TMF. In addition, our active tailings management facilities are in pit with no risk of dam failure. If a TMF failure, regulatory, or other issues prevent us from maintaining the existing tailings management capacity at our Key Lake mill, or if these issues prevent Orano from maintaining or increasing tailing capacity at the McClean Lake mill, then uranium production could be constrained and this could have a material and adverse effect on our earnings, cash flows, financial condition, or results of operations.
A failure of the confining embankment for either of Cameco’s above ground TMFs (one at Key Lake, one at Rabbit Lake) may release stored water and tailings into the environment. This failure could result in environmental damage, increased costs, and regulatory action. Such an event could have a material and adverse effect on our earnings, cash flows, financial condition, or results of operations.
We have designed and operated our tailings management facilities with the intent to achieve a safe state both during operations and post-decommissioning. Our conceptual decommissioning plans for our Canadian properties address decommissioning of our tailing management facilities. Among other things, the plans are based upon a conceptual design model of the decommissioned facility that seeks to limit the environmental impact in accordance with regulatory requirements. Although we seek to ensure closure design of the facility accomplishes that objective, due to the inherent
2024 ANNUAL INFORMATION FORM Page 119
uncertainty with modeling outcomes, we cannot guarantee that we will. As the facilities approach or go into decommissioning, this can result in additional requirements and costs. In addition, as the facilities are decommissioned, there is a possibility of increased loadings to the environment, resulting in environmental damage, increased costs and regulatory action among other things. The occurrence of one or more of these events could have a material and adverse effect on our earnings, cash flows, financial condition, or results of operations.
Mining in the US and at JV Inkai is done using in situ recovery and does not have any associated tailings.
Equipment availability
We have been impacted by mobile equipment availability, mainly due to the time required to order, receive, and commission new mining equipment. In addition, some of the equipment is customized for use specifically at our operating sites and it therefore requires extensive testing and commissioning time. The risk of delay in receiving and commissioning new mining equipment could have an adverse effect on our earnings, cash flows, financial condition or results of operations.
Aging facilities
Our fuel services facilities and mining and milling facilities in northern Saskatchewan are aging. This exposes us to many risks, including the potential for higher maintenance and operating costs, the need for significant capital expenditures to upgrade and refurbish these facilities, the potential for decreases or delays in, or interruption of, production, and the potential for environmental damage.
These risks could have a material and adverse effect on our earnings, cash flows, financial condition, or results of operations.
Ability to attract and retain a skilled and diverse workforce
The company’s ability to manage its operations efficiently and effectively including maintaining strong safety and environmental performance, is dependent on the efforts of the company’s employees and contractors, including our executive, and senior technical and operating personnel. Having a workforce that has a broad range of complementary skills, abilities and that reflects the communities in which we operate is integral to the success of the company to bring new ideas, perspectives, experiences, and expertise to the company which can create a competitive advantage and enhance the support of the communities where we operate.
We, JV Inkai and Westinghouse compete with other companies in the mining and nuclear industry on a global basis to attract and retain workers at all levels with appropriate skills and experience necessary to operate our mines, processing and manufacturing facilities and work at our corporate offices. We, JV Inkai and Westinghouse may not always be able to fill positions on a timely basis. There is a limited pool of skilled people and competition is intense. We also experience employee turnover because of an aging workforce. From time to time, the mining or nuclear energy industry experiences a shortage of tradespeople and other skilled or experienced personnel globally, regionally, or locally. We have a comprehensive strategy to attract and retain high caliber people, including programs to help increase the participation of underrepresented groups in trades and technical positions in our workplace. Our goal is to create an inclusive work environment, with a workforce that has a broad range of skills, abilities, experiences and perspectives, and that reflects the demographics where we operate. Despite our efforts, there is no assurance the company will be able to attract and retain a workforce with the right mix of skills, abilities, experiences, and that is fully reflective of the communities closest to our operations. Failure to do so could adversely impact our measures of success, increase our recruiting and training costs and reduce the efficiency of our operations, and have an adverse effect on our earnings, cash flows, financial condition or results of operations.
Collective agreements
We have unionized employees and face the risk of strikes. On December 31, 2024, we had 2,884 employees (including employees of our subsidiaries). This includes 823 unionized employees at McArthur River, Key Lake, Port Hope, and at CFM’s facilities, who are members of four different locals of the United Steelworkers trade union.
| • | The collective agreement with the bargaining unit employees at our conversion facilities at Port Hope ends on June 30, 2025. |
| • | The collective agreement with the bargaining unit employees at the McArthur River and Key Lake operations ends In December 2025. |
| • | The collective agreement with the bargaining unit employees at CFM ends in June 2027. |
| • | Orano’s collective agreement with bargaining unit employees at the McClean Lake mill ends on May 31, 2025. |
2024 ANNUAL INFORMATION FORM Page 120
We cannot predict whether we or Orano will reach new collective agreements with these and other employees without a work stoppage or work interruptions while negotiations are underway.
A lengthy work interruption could have a material and adverse effect on our earnings, cash flows, financial condition or results of operations.
Westinghouse also has unionized employees and has similar risks related to work stoppage and work interruptions.
Occupational health and safety and accident risks
Some of the tasks undertaken by our employees and contractors are inherently dangerous and have the potential to result in serious injury or death. Accordingly, our operations are exposed to the risk of accidents that may give rise to personal injury, loss of life, disruption to service and economic loss, including, for example, resulting from related litigation.
We are subject to increasingly stringent laws and regulations governing health and safety matters. Any violation of these obligations, or serious accidents involving our employees, contractors or members of the public, could expose us to adverse regulatory consequences, including the forfeiture or suspension of its operating licences, potential litigation, claims for material financial compensation, reputational damage, fines or other legislative sanctions, which may materially and adversely impact our financial condition.
JV Inkai and Westinghouse operate independently from Cameco, but have similar risks related to occupational health and safety and accident risks at their operations.
Supplies and contractors
Supplies
We buy reagents and other production inputs and supplies from suppliers around the world. If there is a shortage of, or disruption in the delivery of, any of these supplies, including parts and equipment, or their costs rise significantly, it could limit or interrupt production or increase production costs. It could also have an adverse effect on our ability to carry out operations or have a material and adverse effect on our earnings, cash flows, financial condition, or results of operations. We examine our entire supply chain as necessary to identify areas to diversify or add inventory where we may be vulnerable, but there is no assurance that we will be able to mitigate the risk. Disruptions to the supply chain worldwide due to the COVID-19 pandemic and the February 2022 Russian invasion of Ukraine has increased the risk. In 2023, planned production from our fuel services operations was impacted by hydrogen supply issues.
Presently, JV Inkai is experiencing procurement and supply chain issues, most notably, related to the availability and delivery of sulfuric acid in accordance with a specific schedule. Cameco and KAP continue to work with JV Inkai to determine the impact of the approximately three-week production suspension in January 2025 on the operation’s 2025 production plans. However, any production target will be tentative and contingent upon receipt of sulfuric acid in sufficient quantities and when required. KAP has indicated that if limited availability of sulfuric acid continues through the year, its production plans for 2025 could be negatively impacted. While KAP will actively pursue alternative sources of sulfuric acid, its continued shortage in Kazakhstan could have a material and adverse effect on our earnings, cash flows, financial condition, or results of operations.
Westinghouse is exposed to similar risks related to production inputs and supplies. A shortage of, or disruption in the delivery, of any of these supplies could limit or interrupt their production or increase their production costs.
Contractors
In some cases, we rely on a single contractor or supplier to provide us with services and/or reagents or other production inputs and supplies. Relying on a single contractor or supplier is a security of supply risk because we may not receive quality service, timely service, or service that otherwise meets our needs. These risks could have a material and adverse effect on our earnings, cash flows, financial condition, or results of operations.
In the past, Inkai experienced shortages in supply of drilling services. In the last few years, Inkai has relied on a single drilling contractor. Since mine development and ore access at Inkai is dependent on the drilling and equipping of extractor and injector wells, interruptions in drilling may have a detrimental impact on production. While Inkai currently has access to a sufficient supply of drilling services, meeting the ramp-up production targets will require an increased amount of drilling. Procuring sufficient amounts of drilling services of the required quality and at the appropriate time may prove to be challenging.
2024 ANNUAL INFORMATION FORM Page 121
Completion of the expansion project described in Expansion Project on page 67 requires procurement of adequate construction services. Currently, Inkai continues to experience issues leading to delays with completion of the expansion projects due to challenges with procuring services of qualified construction contractors. If these issues are not resolved within a reasonable timeframe, Inkai runs the risk of not meeting the production targets set out in the ramp-up schedule or production cost increases due to reliance on toll milling.
Transportation
Due to the geographical location of many of our mines and operations, including Inkai, and our customers, we are highly dependent on third parties for the provision of transportation services, including road, air, and port services. We negotiate prices for the provision of these services in circumstances where we may not have viable alternatives to using specific providers. We require regulatory approvals to transport and export our products. Contractual disputes, demurrage charges and port capacity issues, regulatory issues, availability of transports and vessels, inclement weather or other factors can have a material adverse effect on our ability to transport materials and our products according to schedules and contractual commitments. These risks could have a material and adverse effect on our earnings, cash flows, financial condition, or results of operations.
The geopolitical situation continues to cause transportation risks. We could continue to experience delays in our expected 2025 Inkai deliveries. To mitigate this risk, we have inventory, long-term purchase agreements and loan arrangements in place we can draw on. Depending on when we receive shipments of our share of Inkai’s production, our share of earnings from this equity-accounted investee and the timing of the receipt of our share of dividends from the joint venture may be impacted.
Permitting and licensing
All mining projects and processing facilities around the world require government approvals, licences, or permits, and operations and development projects in Canada, the US, Kazakhstan, and Australia are no exception. Depending on the location of the project, this can be a complex and time-consuming process involving multiple government agencies. We also require governmental permits to export and transport our products.
Many approvals, licences and permits must be obtained from regulatory authorities and maintained, but there is no assurance that they will grant or renew them, approve any additional licences or permits for potential changes to operations in the future or in response to new legislation, or that they will process any of the applications on a timely basis. Stakeholders, like environmental groups, non-government organizations (NGOs) and Indigenous groups claiming rights to traditional lands, can raise legal challenges. A significant delay in obtaining or renewing the necessary approvals, licences or permits, or failure to receive the necessary approvals, licences or permits, could interrupt operations, or prevent them from operating, or disrupt the transportation and sale of our products, which could have a material and adverse effect on our earnings, cash flows, financial condition, results of operations, or prospects.
Intellectual property
Westinghouse has developed and owns various forms of proprietary nuclear intellectual property. To protect its intellectual property rights, Westinghouse may be required to spend significant resources to monitor and protect these rights, including through litigation. Such litigation could be costly and may result in the impairment or loss of portions of Westinghouse’s intellectual property. Furthermore, Westinghouse’s efforts to enforce its intellectual property rights may be met with defenses, counterclaims, and countersuits attacking the validity and enforceability of Westinghouse’s intellectual property rights and may result in invalidation or cancellation of such rights. The costs of protecting its intellectual property rights, as well as the impairment or cancellation of such rights, could have a material adverse effect on Westinghouse’s earnings, cash flows, financial condition, results of operations, or prospects.
In addition, companies have increasingly become subject to infringement threats from non-operating organizations (sometimes referred to as “patent trolls”) filing lawsuits for patent infringement in order to extract settlements. Westinghouse may become subject to claims for infringement and it may be required to defend itself from such claims. All of these types of matters, regardless of their merit, can be time consuming, costly to defend in litigation, divert Westinghouse’s attention and resources, damage Westinghouse’s reputation and cause Westinghouse to incur significant expenses. Westinghouse’s current exposure with respect to pending legal matters could change if determinations by judges and other finders of fact are not in accordance with Westinghouse’s evaluation of such claims. Should Westinghouse’s evaluations prove incorrect and such claims are successful, Westinghouse’s exposure could exceed expectations and have a material adverse effect on its business, financial results and financial condition.
2024 ANNUAL INFORMATION FORM Page 122
Fuel fabrication defects and product liability
We fabricate nuclear fuel bundles, other reactor components, and monitoring equipment. These products are complex and may have defects that can be detected at any point in their product life cycle. Flaws in the products could materially and adversely affect our reputation, which could result in a significant cost to us and have a negative effect on our ability to sell our products in the future. We could also incur substantial costs to correct any product errors, which could have an adverse effect on our operating margins. While we have introduced significant automation to limit the potential for quality issues, there is no guarantee that we will detect all defects or errors in our products.
It is possible that some customers may demand compensation if we deliver defective products. If there are a significant number of product defects, it could have a significant impact on our operating results.
Agreements with some customers may include specific terms limiting our liability to customers. Even if there are limited liability provisions in place, existing or future laws, or unfavourable judicial decisions may make them ineffective. We have not experienced any material product liability claims to date, however, they could occur in the future because of the nature of nuclear fuel products. A successful product liability claim could result in significant monetary liability and could seriously disrupt our fuel manufacturing business and the company overall.
Westinghouse operates independently from Cameco but could be exposed to similar risks related to defects and product liability.
Failure to comply with nuclear licence and quality assurance requirements at certain Westinghouse facilities could result in costs, additional regulatory oversight and reputational risk
Westinghouse is a supplier of nuclear reactors, components, fuel and fuel handling equipment, maintenance and operating support services, and dismantling and decontamination services to the global nuclear power sector. Westinghouse and its affiliates maintain licences from nuclear regulatory authorities in the United States, United Kingdom, and Sweden to operate fuel fabrication facilities. These facilities are subject to significant regulatory scrutiny and any failure to comply with safety, security and quality assurances requirements at those facilities could result in increased regulatory oversight and civil penalties, as well as costs in remedying noncompliance and reputational risk.
In addition, enhanced safety or security requirements promulgated by these regulatory bodies could necessitate capital expenditures by Westinghouse. Significant non-compliance could result in revocation of certain of Westinghouse’s licences.
Further, Westinghouse operates major nuclear component fabrication facilities in the United States. Components fabricated by Westinghouse at these facilities must comply with stringent quality requirements, including certifications under nuclear quality standards. Failure to adhere to these standards could result in liability under customer contracts, including replacement of supplied components and potential exposure to litigation over nuclear power plant shutdowns resulting from defective components. Quality control issues at these facilities could also result in additional regulatory oversight and costs arising out of implementation of corrective actions. Any such adverse effects would negatively impact our business, financial results, and financial condition.
2 – Financial risks
Volatility and sensitivity to prices
We are invested across the nuclear fuel and reactor cycles, with our largest segment being uranium mining. As such, our earnings and cash flow are closely related to, and sensitive to, fluctuations in the spot and long-term market prices for nuclear fuel products and services.
Many factors beyond our control affect these prices, including the following, among others:
| • | demand for nuclear power and the rate of construction of nuclear power plants |
| • | timing and volume of demand for nuclear fuel products and services |
| • | forward contracts of nuclear fuel supplies and services for nuclear power plants |
| • | accidents in any part of the world affecting the nuclear industry in a specific region or in general, such as the March 11, 2011 accident at Fukushima Dai-ichi Nuclear Power Plant in Japan |
| • | terrorist attacks on nuclear fuel production infrastructure, transport, or on nuclear power plants |
| • | war and civil disturbances (including the ongoing conflict between Russia and Ukraine) |
2024 ANNUAL INFORMATION FORM Page 123
| • | uncertain legal, political, and economic environments |
| • | political and economic conditions in countries producing and buying nuclear fuel products and services |
| • | government laws, policies, and decisions, including trade restrictions and sanctions |
| • | reprocessing of used reactor fuel and the re-enrichment of depleted uranium tails |
| • | uranium and conversion from underfeeding generated using excess enrichment capacity |
| • | sales of excess civilian and military inventories of uranium fuel products and services by governments and industry participants |
| • | levels of nuclear fuel production and production costs |
| • | significant production interruptions or delays in expansion plans or new mines or nuclear fuel services going into production |
| • | actions of investment and hedge funds in the uranium market |
| • | transactions by speculators and producers |
| • | prices of alternate sources to nuclear power, including oil, natural gas, coal, hydroelectric, solar and wind |
| • | import tariffs |
We cannot predict the effect that any one or all of these factors will have on the prices of nuclear fuel products and services.
Prices have fluctuated widely in the last several years, though have seen notable recovery since 2022 with long term prices across the fuel cycle now approaching levels seen before the March 11, 2011 accident at Fukushima. We have experienced difficult nuclear fuel markets, which have adversely impacted our financial condition and prospects, though the recent price trend has been positive.
The table below shows the range in spot prices over the last five years.
| Range of spot uranium prices $US/lb of U3O8 |
||||||||||||||||||||
| 2020 | 2021 | 2022 | 2023 | 2024 | ||||||||||||||||
| High |
$ | 33.93 | $ | 45.75 | $ | 58.20 | $ | 91.00 | $ | 100.25 | ||||||||||
| Low |
$ | 24.63 | $ | 27.98 | $ | 43.08 | $ | 50.48 | $ | 72.63 | ||||||||||
| Spot UF6 conversion values $US/kg U |
||||||||||||||||||||
| High |
$ | 22.50 | $ | 21.75 | $ | 40.00 | $ | 46.00 | $ | 96.00 | ||||||||||
| Low |
$ | 21.50 | $ | 16.10 | $ | 16.25 | $ | 39.75 | $ | 55.00 | ||||||||||
The next table shows the range in term prices over the last five years.
| Range of long-term uranium prices $US/lb of U3O8 |
||||||||||||||||||||
| 2020 | 2021 | 2022 | 2023 | 2024 | ||||||||||||||||
| High |
$ | 36.00 | $ | 43.00 | $ | 52.00 | $ | 68.00 | $ | 81.50 | ||||||||||
| Low |
$ | 32.50 | $ | 33.50 | $ | 42.88 | $ | 52.50 | $ | 72.00 | ||||||||||
| Term UF6 conversion values $US/kg U |
||||||||||||||||||||
| High |
$ | 19.00 | $ | 19.00 | $ | 27.25 | $ | 34.25 | $ | 50.00 | ||||||||||
| Low |
$ | 18.00 | $ | 18.00 | $ | 18.50 | $ | 27.50 | $ | 34.38 | ||||||||||
Notes:
| • | Spot and long-term uranium prices are the average of prices published monthly by UxC, LLC (UxC) and from The Nuexco Exchange Value, published by TradeTech. |
| • | Spot and term UF6 conversion values are the average of the North American prices published monthly by UxC and from The Nuexco Conversion Value, published by TradeTech. |
2024 ANNUAL INFORMATION FORM Page 124
If prices across the fuel cycle fall for a sustained period, we may change our operating plans. This would have a material and adverse effect on our earnings, cash flows, financial condition, results of operations or prospects. We have been impacted by low U3O8 and conversion prices in the past. In 2014, we cancelled our toll conversion agreement with Springfields Fuels Ltd. (SFL) which was not set to expire until 2016 and decreased production in response to weak market conditions. In 2016, we suspended production at Rabbit Lake and curtailed production at our US mines and in 2018, we suspended production at our McArthur River and Key Lake operations and reduced our dividend.
Declines in nuclear fuel prices could also delay or deter a decision to expand or build new capacity or begin commercial production once constructed, or adversely affect our ability to finance our operations, as well as necessitate a decision to reduce production volumes. Any of these events could have an adverse effect on our future earnings, cash flows, financial condition, results of operations, or prospects.
A sustained decline in nuclear fuel prices may require us to write down our mineral reserves and mineral resources, and material write downs of our fuel cycle investments, and an increase in charges for amortization, reclamation, and closures.
In our uranium and fuel services segments, we use a contracting strategy to reduce volatility in our future earnings and cash flow from exposure to fluctuations in prices. In the case of uranium, it involves building a portfolio that consists of base-escalated contracts and market-related contracts with terms of 5 to 10 years (on average). In our fuel services segment, the portfolio largely consists of base-escalated contracts. This strategy may mean that we do not fully realize the benefit immediately if there is a significant increase in prices across the nuclear fuel cycle. This strategy also creates currency risk since we receive payment under the majority of our sales contracts in US dollars. In addition, this strategy has provided us with a measure of protection for our business from the low uranium prices previously experienced. As of December 31, 2024, we had about 220 million pounds of uranium under long-term contract, with commitments requiring delivery of an average of about 28 million pounds per year from 2025 through 2029, with commitment levels in 2025 through 2027 higher than the average and in 2028 and 2029 lower than the average, reflecting our disciplined approach to contracting. In our fuel services segment, we had about 85 million KgU as UF6 under long-term contract. As the market improves, in our uranium segment we expect to continue to layer in volumes capturing greater upside using market-related pricing mechanisms that benefit from a constructive price environment, while also providing adequate downside protection. As a result, we may become more exposed to fluctuations in uranium prices and this could have an adverse effect on our future earnings, cash flows, financial condition, results of operations or prospects. There is no assurance that our contracting strategy will be successful.
We make purchases on the spot market and under long-term agreements to supplement our production and supply our contracts. There are, however, risks associated with these purchases, including the risk of losses, which could have an adverse effect on our earnings, cash flows, financial condition, or results of operations.
JV Inkai and Westinghouse operate independently from Cameco, but may be subject to the same or similar volatility and sensitivity to nuclear fuel prices.
Reserve, resource, production, capital and operating cost estimates
Reserve and resource estimates are not precise
Our mineral reserves and resources are the foundation of our uranium mining operations and are fundamental to our success.
The uranium mineral reserves and resources reported in this AIF are estimates and are therefore subjective and subject to numerous inherent uncertainties. There is no assurance that the indicated tonnages or grades of uranium will be mined or milled or that we will receive the uranium price we used in estimating these reserves.
While we believe that the mineral reserve and resource estimates included in this AIF are well established and reflect management’s best estimates, reserve and resource estimates, by their nature, are imprecise, do not reflect exact quantities and depend to a certain extent on statistical inferences that may ultimately prove unreliable. The tonnage and grade of reserves we actually recover, and rates of production from our current mineral reserves, may be less than our estimates. Fluctuations in the market price of uranium and changing exchange rates and operating and capital costs can make reserves uneconomic to mine in the future and ultimately cause us to reduce our reserves.
Short-term operating factors relating to mineral reserves, like the need for orderly development of orebodies or the processing of different ore grades, can also prompt us to modify reserve estimates or make reserves uneconomic to mine in the future, and can ultimately cause us to reduce our reserves. Reserves also may have to be re-estimated based on actual production experience.
2024 ANNUAL INFORMATION FORM Page 125
Mineral resources may be upgraded to proven or probable mineral reserves if they demonstrate profitable recovery. Estimating reserves or resources is always affected by economic and technological factors, which can change over time, and experience in using a particular mining method. There is no assurance that any resource estimate will ultimately be upgraded to proven or probable reserves. If we do not obtain or maintain the necessary permits or government approvals, or there are changes to applicable legislation, it could cause us to reduce our reserves or resources.
Mineral resource and reserve estimates can be uncertain because they are based on data from limited sampling and drilling and not from the entire orebody. As we gain more knowledge and understanding of an orebody, the resource and reserve estimate may change significantly, either positively or negatively.
The reliability of resource and reserve estimates is highly dependent upon the accuracy of the assumptions upon which they are based and the quality of information available. These assumptions may prove to be inaccurate.
If our mineral reserve or resource estimates for our uranium properties are inaccurate or are reduced in the future, it could:
| • | require us to write down the value of a property |
| • | result in lower uranium concentrate production than previously estimated |
| • | result in lower revenue than previously estimated |
| • | require us to incur increased capital or operating costs, or |
| • | require us to operate mines or facilities unprofitably |
This could have a material and adverse effect on our earnings, cash flows, financial condition, results of operations, or prospects.
Production, capital and operating cost estimates may be inaccurate
We, JV Inkai and Westinghouse establish our operating and capital plans based on the information available at the time, including expert opinions. There is no assurance, however, that these plans will not change as new information is available or there is a change in expert opinion.
Studies we use may contain estimated capital and operating costs, production and economic returns and other estimates that may be significantly different than actual results.
We, JV Inkai and Westinghouse prepare estimates of future production, capital costs and operating costs for particular operations, but there is no assurance we will achieve these estimates. Estimates of expected future production, capital costs and operating costs are inherently uncertain, particularly beyond one year, and could change materially over time.
Production, capital cost and operating cost estimates for:
| • | McArthur River/Key Lake assume that development, mining, milling, and production plans proceed as expected |
| • | Cigar Lake assume that development, mining, milling, and production plans proceed as expected |
| • | Inkai assume that development, mining, and production plans proceed as expected |
| • | Westinghouse assume that their operating and capital plans proceed as expected |
Production estimates for uranium refining, conversion and fuel manufacturing assume there is no disruption or reduction in supply from us or third-party sources, and that estimated rates and costs of processing are accurate, among other things.
2024 ANNUAL INFORMATION FORM Page 126
Our actual production and costs may vary from estimates for a variety of reasons, including, among others:
| • actual ore mined varying from estimated grade, tonnage, dilution, metallurgical and other characteristics
• mining and milling losses greater than planned
• short-term operating factors relating to the ore, such as the need for sequential development of orebodies and the processing of new or different ore grades
• risks and hazards associated with mining, milling, uranium refining, conversion and fuel manufacturing
• failure of mining methods and plans
• failure to obtain and maintain the necessary regulatory and participant approvals
• natural phenomena, such as forest fires, floods, or earthquakes as well as shifts in temperature, precipitation, and the impact of more frequent severe weather condition as the result of climate change
• labour shortages or strikes
• development, mining, or production plans for McArthur River are delayed or do not succeed for any reason
|
• difficulties in milling McArthur River ore at Key Lake
• development, mining, or production plans for Cigar Lake are delayed or do not succeed for any reason
• difficulties in milling Cigar Lake ore at McClean Lake
• development, mining, or production plans for Inkai are delayed or do not succeed for any reason
• procurement and supply chain issues at Inkai, including the stability of sulfuric acid deliveries, as well as challenges related to construction delays and acidification of new wellfields at Inkai
• interruptions in the supply of electricity, water, and other utilities or infrastructure
• delays, interruption or reduction in production or construction activities due to fires, failure or unavailability of critical equipment, shortage of supplies, underground floods, earthquakes, tailings dam failures, lack of tailings capacity, ground movements and cave-ins, outbreak of illness (such as a pandemic), cyber-attacks, or other difficulties |
Operating costs may also be affected by a variety of factors including changing waste to ore ratios, ore grades or metallurgy, mine and mill recoveries, labour costs, costs of supplies and services (for example, fuel and power), general inflationary pressures, and currency exchange rates, and increasing regulatory burdens.
Failure to achieve production or cost estimates or a material increase in costs could have a material and adverse effect on our earnings, cash flows, financial condition, or results of operations.
Market price volatility
The company’s common shares are listed on the TSX and the NYSE. The price of our common shares may be significantly affected by factors unrelated to our performance, including the following:
| • | market risk and sentiment |
| • | legal, political, and economic environments factors |
| • | energy prices |
| • | a reduction in analytical coverage of us by investment banks with research capabilities |
| • | a drop in trading volume and general market interest in our securities may adversely affect an investor’s ability to liquidate an investment and consequently an investor’s interest in acquiring a significant stake in us |
| • | our failure to meet the reporting and other obligations under Canadian and US securities laws or imposed by the exchanges could result in a delisting of our common shares from the TSX or NYSE |
As a result of any of these factors, the market price of our common shares may increase or decline even if our operating results, underlying asset values or prospects have not changed. This may cause decreases in asset values that are deemed to be non-temporary, which may result in impairment losses. There can be no assurance that continuing fluctuations in price and volume will not occur. If such increased levels of volatility and market turmoil continue, our operations could be adversely impacted, and the trading price of our common shares may be materially adversely affected.
Currency fluctuations
Our earnings and cash flow may also be affected by fluctuations in the exchange rate between the Canadian and US dollar. We sell the majority of our uranium and fuel services products under long-term sales contracts, which are routinely denominated in US dollars. Our product purchases are denominated in US dollars while our production costs are largely denominated in Canadian dollars. Our consolidated financial statements are expressed in Canadian dollars.
Any fluctuations in the exchange rate between the US dollar and Canadian dollar can result in favourable or unfavourable foreign currency exposure, which can have a material effect on our future earnings, cash flows, financial condition or results of operations, as has been the case in the past. While we use a hedging program to limit any adverse effects of fluctuations in foreign exchange rates, there is no assurance that these hedges will eliminate any potential material negative impact of fluctuating exchange rates and we do not hedge any of our balance sheet investments.
JV Inkai and Westinghouse may also be impacted by fluctuations in currency exchange rates.
Economic dependence on key customers
Our main business relates to the production and sale of uranium concentrates (our uranium segment) and providing uranium conversion services (our fuel services segment). We rely heavily on a small number of customers to purchase a significant portion of our uranium concentrates and conversion services. Westinghouse’s core business also relies heavily on a small number of customers, consisting primarily of utility companies that own nuclear reactors around the globe. There is overlap in customers across our uranium segment, our fuel services segment, and Westinghouse’s core business.
2024 ANNUAL INFORMATION FORM Page 127
At December 31, 2024:
| • | in our uranium segment, our five largest customers account for 58% of our contracted supply of U3O8 |
| • | in our fuel services segment, our five largest UF6 conversion customers account for 59% of our contracted supply of UF6 conversion services |
| • | Westinghouse’s five largest customers accounted for approximately 35% of its contracted sales |
We are a supplier of UO2 used by Canadian CANDU heavy water reactors. Our sales to our largest customer accounted for 52% of our UO2 sales in 2024. In addition, revenues in 2024 from our two largest customers of our uranium segment represented $713 million or approximately 27% of total segment revenues, while revenues from our two largest customers from our conversion segment represented $81 million or approximately 31% of total segment revenues.
Sales for the Bruce A and B reactors represent a substantial portion of our fuel manufacturing business.
If we or Westinghouse lose any of our largest customers, if any of them curtails their purchases, or if we are unable to transport our products to them, it could have a material and adverse effect on our earnings, cash flows, financial condition or results of operations.
Counterparty and credit risk
Our business operations expose us to the risk of counterparties not meeting their contractual obligations, including:
| • | customers |
| • | suppliers |
| • | financial institutions and other counterparties to our derivative financial instruments and hedging arrangements relating to foreign currency exchange rates and interest rates |
| • | financial institutions which hold our cash on deposit and through which we make short-term investments |
| • | insurance providers |
Credit risk is the risk that counterparties will not be able to pay for services provided under the terms of the contract. If a counterparty to any of our significant contracts defaults on a payment or other obligation or becomes insolvent, it could have a material and adverse effect on our cash flows, earnings, financial condition, or results of operations.
JV Inkai and Westinghouse operate independently of Cameco but have similar risks related to counterparty and credit risk.
Uranium products, conversion and fuel services
In our uranium and fuel services segments, we manage the credit risk of our customers for uranium products, conversion, and fuel services by:
| • | monitoring their creditworthiness |
| • | asking for pre-payment or another form of security if they pose an unacceptable level of credit risk |
As of December 31, 2024, 81% of our forecast revenue under contract for the period 2025 to 2027 is with customers whose creditworthiness meets our standards for unsecured payment terms.
Other
We manage the credit risk on our derivative and hedging arrangements, cash deposits and insurance policies by dealing with financial institutions and insurers that meet our credit rating standards and by limiting our exposure to individual counterparties.
We diversify or increase inventory in our supply chain to limit our reliance on a single contractor, or limited number of contractors. We also monitor the creditworthiness of our suppliers to manage the risk of suppliers defaulting on delivery commitments.
There is no assurance, however, that we will be successful in our efforts to manage the risk of default or credit risk.
Liquidity and financing
Liquidity, or access to funds, is essential to our business.
2024 ANNUAL INFORMATION FORM Page 128
Nuclear energy and mining are extremely capital-intensive businesses, and companies need significant ongoing capital to maintain and improve existing operations, invest in large scale capital projects with long lead times, and manage uncertain development and permitting timelines and the volatility associated with fluctuating commodity prices and input prices.
We believe our current financial resources are sufficient to support projects planned for 2025. We have a number of alternatives to fund future capital requirements, including using our operating cash flow, drawing on our cash balances, drawing on existing credit facilities, entering new credit facilities, and raising additional capital through debt or equity financings, including by offering securities using our base shelf prospectus or utilizing our at-the-market equity program.
There is no assurance that we will obtain the financing we need when needed. Volatile equity, nuclear fuel markets, a claim against us, an adverse court or arbitration decision, a significant event disrupting our business or operations, or other factors, may make it difficult or impossible for us to obtain debt or equity financing on favourable terms, or at all.
A lack of liquidity could result in a delay or postponement of any or all of our exploration, development or other growth initiatives, or could otherwise have a material adverse impact on our financial condition.
We also believe JV Inkai and Westinghouse each currently have financial resources and will generate operating cash flows sufficient to support their annual operating budget. Default by Westinghouse under its credit facilities would impact its ability to fund its ongoing operations.
Decommissioning and reclamation obligations
Environmental regulators are demanding more and more financial assurances so that the parties involved, and not the government, bear the cost of decommissioning and reclaiming sites. Our North American operations have financial assurances in place in connection with our preliminary plans for decommissioning of the sites.
We have filed conceptual decommissioning plans for our North American facilities with the regulators. We review these plans for Canadian facilities every five years. Plans for our US sites are reviewed every year. Regulators review our conceptual plans on a regular basis. As sites approach or go into decommissioning, a detailed decommissioning plan is prepared for regulators to review and accept. This can lead to additional requirements, costs, and financial assurances. It is not possible to predict what level of decommissioning, reclamation, and financial assurances regulators may require in the future.
If we must comply with additional regulations, or the actual cost of decommissioning and reclamation in the future is significantly higher than our current estimates, this could have a material and adverse effect on our earnings, cash flows, financial condition, or results of operations.
JV Inkai and Westinghouse also have decommissioning and reclamation obligations. If the actual cost or liabilities are significantly higher than current estimates, this could have a material and adverse effect on the financial condition of JV Inkai or Westinghouse.
The liabilities of Westinghouse may exceed our estimates, and there may also be unknown or undisclosed liabilities in connection with its acquisition
Westinghouse has various potential liabilities relating to the conduct of its business prior to the acquisition, including, but not limited to, potential liability for unfunded pension liabilities, liability for cleanup, decommissioning or remediation of environmental conditions, intellectual property disputes, and other potential liabilities that could adversely affect Westinghouse’s financial position. These potential liabilities could negatively impact the value of our investment in Westinghouse. Although we have conducted what we believe to be a sufficient level of investigation in connection with the acquisition, it is possible that the potential liabilities we have identified may exceed our expectations, and there may be liabilities that we failed to discover or were unable to quantify accurately or at all in our due diligence, which we conducted prior to the entry into the acquisition agreement. Only certain of these events may entitle the purchaser to recourse under the acquisition agreement for such liabilities and contingencies. The discovery of any material liabilities, or the inability to obtain full recourse for such liabilities, could have a material adverse effect on our investment in Westinghouse and our ability to realize the benefits thereof.
In connection with the acquisition, the strategic partnership and the general partner obtained representation and warranty coverage, with total limits of up to $800 million (US) above retention of 0.5% of the enterprise value. Nevertheless, this insurance policy is subject to certain exclusions and limitations. In addition, there may be circumstances for which the insurer may elect to limit such coverage or refuse to indemnify us or situations for which the coverage provided under the representation and warranty insurance policy may not be sufficient or applicable.
2024 ANNUAL INFORMATION FORM Page 129
3 – Governance and compliance risks
Litigation
We are currently subject to litigation or threats of litigation and may be involved in disputes with other parties in the future that result in litigation. This litigation may involve joint venture participants, suppliers, customers, governments, regulators, tax authorities, or other persons.
We cannot accurately predict the outcome of any litigation. The costs of defending or settling litigation can be significant. If a dispute cannot be resolved favourably, it may have a material and adverse effect on our earnings, cash flows, financial condition, results of operations, or prospects. See Legal proceedings on page 144 for more information.
We are currently involved in a tax dispute with CRA and in 2017 settled a dispute with the IRS. See Transfer pricing dispute at pages 110 and 111. In addition, we are subject to the risk that CRA, the IRS or other tax authorities in other countries may seek to challenge or reassess our income tax returns on the same or a different basis for the same periods or other previously reported periods. Substantial success for CRA in the tax dispute would be material, and other unfavourable outcomes of challenges or reassessments initiated by the IRS or tax authorities in other countries could be material to our cash flows, financial condition, results of operations or prospects.
JV Inkai and Westinghouse operate independently from Cameco, but may be subject to the same or similar litigation risks.
Joint ventures and Partnerships
We participate in McArthur River, Key Lake, Cigar Lake, Inkai, Millennium, GLE, and Westinghouse through joint ventures or partnerships with third parties. Some of these joint ventures are unincorporated and some are incorporated (like JV Inkai and GLE). We have other joint ventures and may enter more in the future.
There are risks associated with joint ventures and partnerships, including:
| • | disagreement with a joint venture participant or partner about how to develop, operate or finance a project |
| • | a joint venture participant or partner not complying with a joint venture or partnership agreement or law applicable to Cameco |
| • | possible litigation or arbitration between joint venture participants or partners about joint venture/partnership matters |
| • | the inability to exert control over decisions related to a joint venture/partnership we do not have a controlling interest in |
The other owner of JV Inkai is KAP, an entity majority owned by the government of Kazakhstan, so its actions and priorities could be dictated by government policies instead of commercial considerations or could be counter to laws applicable to us.
These risks could result in legal liability, affect our ability to develop or operate a project under a joint venture or partnership, and / or have a material and adverse effect on our earnings, cash flows, financial condition, results of operations or prospects.
We do not currently control Westinghouse
We do not currently control Westinghouse. We beneficially own 49% of Westinghouse and Brookfield beneficially owns 51%. Although we have certain rights pursuant to a shareholders’ agreement between us and Brookfield with regards to the governance of the general partner of the strategic partnership, including the right to designate directors of the boards of directors of the general partner and certain material subsidiaries of the general partner and the strategic partnership, our beneficial ownership in the strategic partnership entities is 49%, whereas Brookfield beneficially owns 51%, and the directors are entitled to weighted voting corresponding to the designating shareholder’s proportionate equity interest. Consequently, other than in the case of certain reserved matters expressly set out in the governance agreement, Brookfield has the power to control the strategic partnership entities. Accordingly, we cannot provide any assurance that Westinghouse will be operated in the same way we would operate Westinghouse if we were its sole owner.
We expect that the strategic partnership entities will, to the greatest extent possible, be funded by their own cash flows and third-party funding. Pursuant to the governance agreement, to the extent a strategic partnership entity requires additional capital to meet a funding shortfall for certain approved activities, if funding of such shortfall by an equity issuance is approved as a reserved matter, the strategic partnership may make equity funding requests to us and Brookfield, on a pro rata basis on
2024 ANNUAL INFORMATION FORM Page 130
the basis of our and Brookfield’s respective equity interests in the strategic partnership and general partner. Failure by us to meet such an equity funding request would not constitute a default under the governance agreement, but in the event that Brookfield elects to participate in the equity financing and we do not, our interest in the strategic partnership would be diluted, and Brookfield would be entitled to subscribe not only for its pro rata portion but also for any portion of the equity that we elect not to fund. There can be no assurance that we or Brookfield will have the necessary capital resources to meet an equity funding request if and when made by the strategic partnership. In the event that the strategic partnership cannot raise the necessary funds from us or Brookfield or otherwise obtain adequate required capital on favorable terms or at all, it may be required to scale back or entirely halt any operating or expansion plans and its business, financial condition and results of operations could be adversely affected.
Further, disputes may arise between us and Brookfield that may adversely affect the success of the strategic partnership entities and have a material adverse effect on our business, results of operations and financial performance. Our failure to otherwise comply with our obligations under the governance agreement may result in us being in default under the governance agreement and could result in us losing some or all of our interest in the strategic partnership.
Government laws and regulations
In addition to laws and regulations relating to the protection of the environment, employee health and safety, and waste management (see Environmental risks), our business activities are subject to extensive and complex laws and regulations in other areas.
There are laws and regulations for uranium exploration, development, mining, milling, refining, conversion, fuel manufacturing, transport, exports, imports, taxes and royalties, and labour standards.
Significant financial and management resources are required to comply with these laws and regulations, and this will likely continue as laws and government regulations become more and more strict. We are unable to predict the ultimate cost of compliance or its effect on our business because legal requirements change frequently, are subject to interpretation, and may be enforced to varying degrees.
Some of our operations are regulated by government agencies that exercise discretionary powers conferred by statute. If these agencies do not apply their discretionary authority consistently, then we may not be able to predict the ultimate cost of complying with these requirements or their effect on operations.
Existing, new, or changing laws, regulations and standards of regulatory enforcement could disrupt transportation of our products, increase costs, lower, delay or interrupt production, or affect decisions about whether to continue with existing operations or development projects. This could have a material and adverse effect on our earnings, cash flows, financial condition, results of operations, or prospects.
If we do not comply with the laws and regulations that apply to us or our business, or it is alleged we do not comply, then regulatory or judicial authorities could take any number of enforcement actions, including:
| • | corrective measures that require us to increase capital or operating expenditures or install additional equipment |
| • | remedial actions that result in temporary or permanent shut-down or reduction of our operations |
| • | requirements that we compensate communities that suffer loss or damage because of our or their activities |
| • | civil or criminal fines or penalties |
Legal and political circumstances are different outside North America, which can change the nature of regulatory risks in foreign jurisdictions when compared with regulatory risks associated with operations in North America.
JV Inkai and Westinghouse operate independently of Cameco, but are subject to regulatory risks that could impact their financial condition and their operations could be subject to enforcement actions. Furthermore, actions taken by such entities could subject us to potential legal liability that could restrict our ability to realize the benefit of such investments.
Internal controls over financial reporting
We use internal controls over financial reporting to provide reasonable assurance that we authorize transactions, safeguard assets against improper or unauthorized use, and record and report transactions properly. This gives us reasonable assurance that our financial reporting is reliable and prepared in accordance with IFRS.
2024 ANNUAL INFORMATION FORM Page 131
It is impossible for any system to provide absolute assurance or guarantee reliability, regardless of how well it is designed or operated. We continue to evaluate our internal controls to identify areas for improvement and provide as much assurance as reasonably possible. We conduct an annual assessment of our internal controls over financial reporting and produce an attestation report of their effectiveness by our independent auditors to meet the requirement of Section 404 of the Sarbanes-Oxley Act of 2002.
If we do not satisfy the requirements for internal controls on an ongoing, timely basis, it could negatively affect investor confidence in our financial reporting, which could have an impact on our business and the trading price of our common shares. If a deficiency is identified and we do not introduce new or better controls, or have difficulty implementing them, it could harm our financial results or our ability to meet reporting obligations.
Westinghouse operates independently of Cameco and provides their own financial reporting that is subject to similar risks.
Anti-bribery and anti-corruption laws
We are subject to anti-bribery and anti-corruption laws, including the Corruption of Foreign Public Officials Act (Canada) and the United States Foreign Corrupt Practices Act of 1977. Failure to comply with these laws could subject us to, among other things, reputational damage, civil or criminal penalties, other remedial measures and legal expenses which could adversely affect our business, results from operations, and financial condition. It may not be possible for us to ensure compliance with anti-bribery and anti-corruption laws in every jurisdiction in which our employees, agents, sub-contractors, investment operations or joint venture partners are located or may be located in the future.
JV Inkai and Westinghouse operate independently of Cameco but may be subject to the same or similar risks related to bribery and corruption and compliance with related laws (see Strategic Risks).
4 – Social risks
Defects in title
We have investigated our rights to explore and mine our material properties, and those rights are in good standing to our knowledge. There is no assurance, however, that these rights will not be revoked or significantly altered to our detriment, or that our rights will not be challenged by third parties, including local governments and by Indigenous groups, such as First Nations and Métis in Canada.
Relationships with Indigenous peoples and local communities
Our ability to foster and maintain the support of local communities and governments for our development projects and operations is critical to the conduct and growth of our business, and we do this by engaging in dialogue and consulting with them about our activities and the social and economic benefits they will generate. There is no assurance, however, that this support can be fostered or maintained. There is an increasing focus on ensuring that appropriate programs and policies, including for sustainability matters, are in place to manage nuclear energy and mining activities to protect the environment and communities affected by the activities. Some NGOs are vocal critics of the nuclear energy and mining industries, and oppose globalization, nuclear energy, and resource development. Adverse publicity generated by these NGOs or others, related to the nuclear energy industry or the extractive industry in general, or our operations in particular, could have an adverse effect on our reputation or financial condition and may affect our relationship with the communities we operate in. While we are committed to operating in a socially responsible way, there is no guarantee that our efforts will mitigate this risk.
Indigenous rights, title claims, engagement and consultation
Managing Indigenous rights, title claims, engagement and related consultation is an integral part of our exploration, development, and mining activities, and we are committed to managing them effectively. We have signed agreements with the communities closest to our Canadian mining operations to help mitigate the risks associated with potential Indigenous land or consultation claims that could impact our Canadian mining operations. These agreements provide substantial socioeconomic opportunities to these communities and are intended to provide us with support for these operations from those communities. There is no assurance, however, that we will not face material adverse consequences because of the legal and factual uncertainties inherent with Indigenous rights, title claims and consultation.
2024 ANNUAL INFORMATION FORM Page 132
Exploration, development, mining, milling and decommissioning activities at our various properties in Saskatchewan may be affected by claims by Indigenous groups, and related consultation issues. We also face similar issues with our activities in other provinces and countries.
It is generally acknowledged that under historical treaties, First Nations in northern Saskatchewan ceded title to most traditional lands in the region in exchange for treaty benefits and reserve lands. Some First Nations in Saskatchewan, however, assert that their treaties are not an accurate record of their agreement with the Canadian government and that they did not cede title to the minerals when they ceded title to their traditional lands. Further, the United Nations Declaration on the Rights of Indigenous Peoples Act (UNDRIP) came into force on June 21, 2021, and on June 21, 2023, the Government of Canada released the UN Declaration Act Action Plan, which includes 181 measures aimed at implementing the goals of UNDRIP from 2023 to 2028. These measures and recent litigation related to the implementation of UNDRIP in Canadian law create some additional risk for future activities, which we will continue to monitor in the coming years.
5 – Environmental risks
Complex legislation and environmental, health and safety risk
Our activities have an impact on the environment, so our operations are subject to extensive and complex laws and regulations relating to the protection of the environment, employee health and safety, and waste management. We also face risks that are unique to uranium mining, processing, and fuel manufacturing. Laws to protect the environment as well as employee health and safety are becoming more stringent for members of the nuclear energy industry.
Our facilities operate under various operating and environmental approvals, licences, and permits that have conditions that we must meet as part of our regular business activities. In a number of instances, our right to continue operating these facilities depends on our compliance with these conditions.
Our ability to obtain approvals, licences, and permits, maintain them, and successfully develop and operate facilities may be adversely affected by the real or perceived impact of our activities on the environment and human health and safety at development projects and operations and in surrounding communities. The real or perceived impact of activities of other nuclear energy or mining companies can also have an adverse effect on our ability to secure and maintain approvals, licences and permits.
Our compliance with laws and regulations relating to the protection of the environment, employee health and safety, and waste management requires significant expenditures, and can cause delays in production or project development. This has been the case in the past and may be so in the future. Failing to comply can lead to fines and penalties, temporary or permanent suspension of development and operational activities, clean-up costs, damages, and the loss of, or the inability to obtain, key approvals, permits, and licences. We are exposed to these potential liabilities for our development projects and operations as well as our closed operations. There is no assurance that we have been or will be in full compliance with all these laws and regulations, or with all the necessary approvals, permits, and licences.
These risks could delay or interrupt our operations or project development activities, delay, interrupt or lower our production, and could have a material and adverse effect on our earnings, cash flows, financial condition, results of operations or prospects.
JV Inkai and Westinghouse operate independently of Cameco, but have risks related to environment, health and safety, which could impact the operation of their facilities, their ability to secure and maintain approvals, licences and permits and could have a material and adverse effect on their earnings, cash flows, financial condition, results of operations or prospects.
Treated water releases
Responsible management of water is critical to our business success. At our Canadian operations, treated water releases are monitored and studies are conducted to monitor conditions in the downstream receiving environment. However, changes in ore chemistry, identification of new elements of concern, changes in regulatory requirements or other issues, may result in additional costs and regulatory action, and could also require installation of new water treatment facilities. The occurrence of one or more of these events could have a material and adverse effect on our earnings, cash flows, financial condition, or results of operations.
2024 ANNUAL INFORMATION FORM Page 133
Air emissions at Port Hope Conversion Facility
At the Port Hope Conversion Facility, the main stacks for UF6 and UO2 are continuously monitored and have discharge limits in place, which are monitored while the plants are operational. A large-scale process failure or catastrophic accident has potential to significantly impact the surrounding community and have other consequences, including constraining production, regulatory action, and environmental damage. The occurrence of one or more of such events could have a material and adverse effect on our earnings, cash flows, financial condition, or results of operations.
6 – Strategic risks
Major nuclear incident risk
Due to their inherent materiality, major accidents in the nuclear industry, and most notably at nuclear power plants, such as the Chernobyl nuclear power plant accident of 1986 in the Soviet Union and the accident in 2011 at the Fukushima-Daiichi nuclear power plant in Japan, garner significant worldwide attention and spawn global public sentiment favouring more significant regulation for nuclear power generation. For example, following the accident at Fukushima, certain countries, like Germany and Switzerland, announced their intention to phase out nuclear power. As of April 15, 2023, Germany had shut down all of its 17 nuclear reactors. Prior to the accident in 2011 at Fukushima, Japan had 54 nuclear reactors, which represented 12% of global nuclear generating capacity. As of January 2025, Japan has restarted 14 reactors. The effect of the 2011 accident at the Fukushima-Daiichi nuclear power plant on the uranium market has had a material and adverse effect on our earnings, cash flows, financial condition, results of operations, and prospects.
Westinghouse has various contracts in place with Energoatom, Ukraine’s national nuclear power company, and actively carries on business in the country. The military conflict between Russia and Ukraine has had and continues to have a negative impact on Westinghouse’s operations in Ukraine, resulting in loss of revenue and corresponding loss of earnings. Furthermore, certain nuclear power plants are located in the disputed territory.
Another major accident at a nuclear power plant, or a similar disaster related to the nuclear industry, including as the result of the military conflict between Russia and Ukraine, could lead to more countries adopting increasingly stringent safety regulations in the nuclear industry, cause the public sentiment to shift more in favour of phasing-out nuclear power, and reverse or halt the recent positive trend towards nuclear power. The reaction to any such major accident could be significantly more severe and may result in a rapid global abandonment of nuclear power generation. Any such event may result in, among other things, a significant reduction in the demand for uranium and the resulting decline in the price of uranium.
Another major accident at a nuclear power plant, or a similar disaster related to the nuclear industry, could have a material and adverse effect on our earnings, cash flows, financial condition, results of operations, and prospects.
JV Inkai and Westinghouse operate independently from Cameco, but may be subject to similar nuclear incident risks.
Public acceptance of nuclear energy is uncertain
Because of unique political, technological, and environmental factors affecting the nuclear industry, including public attention following the 2011 accident at Fukushima in Japan, the industry is subject to public opinion risks that could have a material adverse impact on the demand for nuclear power and increase the regulation of the nuclear power industry.
A major shift in public opinion, whether due to an accident at a nuclear power plant, changing views regarding the pursuit of carbon reduction strategies, or other causes, could impact the continuing acceptance of nuclear energy and the future prospects for nuclear power generation, which could have a material adverse effect on our earnings, cash flows, financial condition, results of operations, or prospects.
In addition, we may be impacted by changes in regulation and public perception of the safety of nuclear power plants, which could adversely affect the construction of new plants, the re-licensing of existing plants, the demand for our and Westinghouse’s products and services and the future prospects for nuclear generation. These events could have a material adverse effect on our earnings, cash flows, financial condition, results of operations or prospects.
2024 ANNUAL INFORMATION FORM Page 134
Industry concentration risk
Our business segments are concentrated in the nuclear fuel and reactor cycles, with our largest segment being uranium mining. As such, we are sensitive to changes in, and our performance and future prospects, will depend to a greater extent on, the overall condition of the nuclear energy industry and the public acceptance of nuclear energy. We may be susceptible to increased risks, compared to diversified metals trading companies or diversified mining companies, as a result of the fact that our operations are concentrated in the nuclear fuel business.
Because we derive the majority of our revenues from sales of nuclear fuel products and services, our results of operations and cash flows will fluctuate as the price of nuclear fuel products and services increases or decreases. A sustained period of declining prices across the nuclear fuel cycle would materially and adversely affect our results of operations and cash flows. Additionally, if the market price for nuclear fuel declines or remains at relatively low levels for a sustained period, we may have to revise our operating plans, including reducing operating costs and capital expenditures, terminating, or suspending mining operations at one or more of our properties, and discontinuing certain exploration and development plans. In the past, we have been impacted by the sustained period of low prices. In a sustained period of low prices, we may be unable to decrease our costs in an amount sufficient to offset reductions in revenues and may incur losses. See Financial risks – Volatility and sensitivity to prices on page 123.
Mine concentration risk
Our main sources of uranium production are mines at Cigar Lake and McArthur River and our interest in JV Inkai.
In 2025, our share of planned Cigar Lake production is 9.8 million pounds. Cigar Lake production is milled at the McClean Lake mill operated by Orano. There is a risk to our Cigar Lake production plan if the McClean Lake mill is unable to mill Cigar Lake production.
In 2025, our share of planned McArthur River production is 12.6 million pounds. McArthur River production is milled at the Key Lake mill we operate.
We own a 40% interest in JV Inkai and presently, JV Inkai is experiencing procurement and supply chain issues, most notably, related to the availability of sulfuric acid. It is also experiencing challenges related to construction delays and inflationary pressures on its production costs. Production plans for 2025 and subsequent years are uncertain and being reassessed (see 2025 Production on page 67).
Any disruption in or reduction in production from one or more of these mines could have a material and adverse effect on our earnings, cash flows, financial condition, results of operations or prospects.
Alternate sources of energy
Nuclear energy competes with other sources of energy like oil, natural gas, coal, hydroelectric, solar and wind. Some of these sources can be considered substitutes for nuclear energy, particularly over the longer term. Sustained lower costs for these energy sources may result in lower demand for nuclear energy and consequently a reduction in demand for uranium and lower uranium prices.
A major shift in the power generation industry towards non-nuclear power or non-uranium based sources of nuclear energy, whether due to lower cost of power generation associated with such sources, government policy decisions, or otherwise, could have a material adverse effect on our earnings, cash flows, financial condition, results of operations, or prospects.
JV Inkai and Westinghouse operate independently from Cameco but may be subject to similar risks related to a reduction in demand for uranium and lower uranium prices due to alternate sources of energy.
Industry competition and international trade restrictions
The international nuclear fuels industry, which includes supplying uranium concentrates and uranium conversion services, is highly competitive. We directly compete with a relatively small number of nuclear fuel suppliers in the world. The number of potential end customers for our products and services, being utility companies, is relatively small.
The supply of nuclear fuel products and services is affected by a number of international trade agreements and government legislation and policies. These and any similar future agreements, governmental legislation, policies, or trade restrictions are beyond our control and may affect the supply of nuclear fuel available in the US, Europe and Asia, the world’s largest markets for nuclear fuel.
2024 ANNUAL INFORMATION FORM Page 135
The nuclear energy industry is global and also susceptible to nuclear trade controls due to the sensitive nature of nuclear technologies, equipment and material and the importance of nuclear energy to national security. The ability of Westinghouse to conduct business globally is dependent on its ability to maintain and secure new licences for the export of nuclear technology, equipment, and materials. While licences are not always required, there are certain nuclear exports and destinations for those exports that are subject to stringent licensing requirements. For example, Westinghouse’s continued ability to sell services and equipment to reactors in China is dependent on its existing specific authorization under applicable law. In case of geopolitical circumstances that would result in sanctions on China, this specific authorization would be limited or terminated, negatively impacting the business.
Any political decisions about the supply of nuclear fuels can affect our future prospects. With the recent change in administration in the US, there is no assurance that the US (or other governments) will not enact legislation or take other actions that restricts who can buy or supply nuclear fuels or facilitates a new supply of uranium.
Tariffs on international trade
The recent change in administration in the US adds uncertainty to the global economic outlook, including with respect to the timing, scope and magnitude of potential US import tariffs.
President Trump has signed Executive Orders imposing a 25% tariff on all goods originating in Canada and imported into the United States and a 10% tariff on “energy and energy resources” from Canada (which is currently contemplated to include uranium) with originally planned implementation dates of February 4, 2025, and March 4, 2025. The Executive Orders also state that if Canada introduces retaliatory measures, such as through the imposition of import duties on U.S. exports to Canada (or other similar measures), the U.S. tariffs may be increased or expanded. In response, the Government of Canada imposed 25% tariffs on $155 billion in goods imported from the U.S., coming into effect in two phases. Provincial governments across Canada have also responded to the U.S. tariffs, in some cases introducing their own retaliatory measures. To date, Canada and the U.S. agreed to delay the imposition of certain tariffs on imported goods but the situation remains temporary and uncertain. President Trump has also suggested that a new economic deal may be structured with Canada, though the scope and terms of such a deal, if any, are unknown.
Although discussions continue regarding a potential economic arrangement between the two countries, there remains significant uncertainty over whether tariffs or other restrictive trade measures or countermeasures will be implemented and, if so, the scope, impact, and duration of any such measures and their application to uranium or conversion sales. Potential measures could include, among others, increased tariffs on Canadian energy exports, export restrictions on certain commodities including Canadian energy exports, restrictions on cross-border supply chains, or additional regulatory barriers to trade.
Technical innovation and obsolescence
Requirements for our products or those of Westinghouse may be affected by technological changes and innovation in nuclear reactors and other uses of uranium. These technological changes could reduce the demand for nuclear reactors and uranium, which could have a material adverse impact on our future earnings, cash flows, financial condition or results of operations.
Reputational risks
Damage to our reputation can occur from actual or perceived actions or inactions and a variety of events and circumstances, either for us, our joint ventures or the businesses we have invested in, many of which are out of our control. The growing use of social media to generate, publish and discuss community news and issues and to connect with others has made it significantly easier for individuals and groups to share their opinions of us and our activities, whether accurate or not. We do not control how we are perceived by others. Loss of reputation could result in, among other things, a decrease to the price of our common shares, decreased investor confidence, challenges in maintaining positive relationships with the communities in which we operate and other important stakeholders, and increased risks in obtaining permits or financing for our operations, any of which could have a material and adverse effect on our earnings, cash flows, financial condition, results of operations, or prospects.
Replacement of depleted reserves
Cigar Lake, Inkai and McArthur River mines are currently our main sources of mined uranium concentrates. We must replace mineral reserves depleted by production at these mines to maintain or increase our annual production levels over the long term. Reserves can be replaced by expanding known orebodies, locating new deposits, or making acquisitions. Substantial expenditures are required to establish new mineral reserves. We may not be able to sustain or increase production if:
| • | we do not identify, discover, or acquire other deposits |
2024 ANNUAL INFORMATION FORM Page 136
| • | we do not find extensions to existing ore bodies |
| • | we do not convert resources to reserves at our mines or other projects |
This could have a material and adverse effect on our ability to maintain production to or beyond currently contemplated mine lives, as well it could have a material and adverse effect on our earnings, cash flows, financial condition, results of operations or prospects.
Although we have successfully replenished reserves in the past through ongoing exploration, development and acquisition programs, there is no assurance that we will be successful in our current or future exploration, development, or acquisition efforts.
Development and expansion projects to sustain production and fuel growth
Our ability to sustain and increase our uranium production depends in part on successfully developing new mines and/or expanding existing operations.
Several factors affect the economics and success of these projects:
| • the attributes of the deposit, including its depth, size and grade
• capital and operating costs
• metallurgical recoveries
• the accuracy of mineral reserve estimates
• government regulations
• availability of appropriate infrastructure, particularly power and water |
• future uranium prices
• the accuracy of feasibility studies
• acquiring surface or other land rights
• receiving necessary government permits
• receiving necessary stakeholder support |
The effect of these factors, either alone or in combination, cannot be accurately predicted and their impact may result in our inability to extract uranium economically from any identified mineral resource.
Generally, development projects have no operating history that can be used to estimate future cash flows. We must invest a substantial amount of capital and time to develop a project and achieve commercial production. A change in costs or construction schedule can affect the economics of a project. Actual costs could increase significantly, and economic returns could be materially different from our estimates. We could fail to obtain the necessary governmental approvals for construction or operation. In any of these situations, a project might not proceed according to its original timing, or at all.
It is not unusual in the nuclear energy or mining industries for new or expanded operations to experience unexpected problems during start-up or ramp-up, resulting in delays, higher capital expenditures than anticipated and reductions in planned production. Production may be insufficient to recover exploration, development, and production costs. Delays, additional costs or reduced or insufficient production could have a material and adverse effect on our earnings, cash flows, financial condition, results of operations or prospects.
There is no assurance we will be able to complete development of new mines, or expand existing operations, economically or on a timely basis.
Uranium exploration is highly speculative
Uranium exploration is highly speculative and involves many risks, and few properties that are explored are ultimately developed into producing mines.
Even if mineralization is discovered, it can take several years in the initial phases of drilling until a production decision is possible, and the economic feasibility of developing an exploration property may change over time. We are required to make a substantial investment to establish proven and probable mineral reserves, to determine the optimal metallurgical process to extract minerals from the ore, to construct mining and processing facilities (in the case of new properties) and to extract and process the ore. We might abandon an exploration project because of poor results or because we feel that we cannot economically mine the mineralization.
2024 ANNUAL INFORMATION FORM Page 137
Given these uncertainties, there is no assurance that our exploration activities will be successful and result in new reserves to expand or replace our current mineral reserves to maintain or increase our production.
Competition for sources of uranium
There is competition for mineral acquisition opportunities throughout the world, so we may not be able to acquire rights to explore additional attractive uranium mining properties on terms that we consider acceptable.
There is no assurance that we will acquire any interest in additional uranium properties or access uranium from other sources, that will result in additional uranium concentrates we can sell. If we are not able to acquire these interests or rights, it could have a material and adverse effect on our future earnings, cash flows, financial condition, or results of operations. Even if we do acquire these interests or rights, the resulting business arrangements may ultimately prove not to be beneficial.
Changes in climate conditions and regulatory regime could adversely affect our business and operations
There is significant evidence of the effects of climate change on our planet and we recognize it is a global challenge. In 2024, connections between geopolitical uncertainty and concerns about energy security, national security, and climate change all impacted our business in a range of both favorable and adverse ways. Continued changes in climate conditions and related regulatory regimes could adversely affect our business and operations. For example, mining and uranium processing operations require energy and result in a carbon footprint either directly or through the purchase of fossil-fuel based electricity. As such, we are impacted by current and emerging policy and regulation relating to GHG emission levels and energy efficiency, as well as those reporting of climate change risks. While some of the costs associated with reducing emissions may be reduced by increased energy efficiency enabling operational cost savings, technological innovation, or the increased demand for our uranium and conversion services, the current regulatory trend may result in additional costs at some of our operations. A number of government or governmental bodies have introduced or are contemplating regulatory changes in response to the potential impacts of climate change. Where legislation already exists, regulations relating to emissions levels and energy efficiency are set to become more stringent. Where changes in legislation and regulation stringency further materialize, they are likely to require us to further invest in decarbonization projects, where possible, and could also increase our operating and compliance costs.
In addition, the physical risks of climate change may also have an adverse effect at our operations. These may include shifts in temperature and precipitation as well as extreme weather events such as floods, droughts, wildfires, and extreme storms. Such events may occur more frequently. These physical impacts could require us to suspend or reduce production or close operations and could prevent us from pursuing expansion opportunities. These effects may adversely impact the cost, production, and financial performance of our operations.
As noted in the Our Sustainability principles and practices section starting on page 102, to begin to understand and prepare to manage physical climate risks, Cameco completed physical risk assessment studies to deliver initial forward-looking information regarding projected changing climate conditions and identified how these changes could impact our employees, assets and operations across our majority owned and operated sites in northern Saskatchewan, Ontario, Wyoming and Nebraska over the last three years. Findings from the work outline possible risk management and adaptation options across our underground mining, in situ recovery, milling, and fuel services operations. We plan to continue to advance this work in 2025 by developing site-specific adaptation plans for each of our majority owned and operated sites, and where needed embedding key findings and potential actions into Cameco’s internal Risk Management Program processes and develop an adaptation action plan for each site in the study.
We will continue to explore climate change projections for the areas where we operate and those critical to moving supplies and products through our value chain. We will use this information to identify where our existing climate-related acute and chronic risk management practices are expected to remain sufficient in the years to come and where adaptation and other enhancements may be required.
However, we can provide no assurance that efforts to mitigate the risks of climate change will be effective and that physical risks of climate change will not have a material and adverse effect on our earnings, cash flows, financial condition, results of operations, or prospects.
JV Inkai and Westinghouse operate independently from Cameco, but may be subject to similar climate change risks.
2024 ANNUAL INFORMATION FORM Page 138
Foreign investments and operations
We, JV Inkai and Westinghouse do business in countries and jurisdictions outside of Canada and the US, including the developing world. Doing business in these countries poses risks because they have different economic, cultural, regulatory, and political environments. Future economic and political conditions could also cause governments of these countries to change their policies on foreign investments, development and ownership of resources, or impose other restrictions, limitations or requirements that we may not foresee today.
Risks related to doing business in a foreign country can include:
| • uncertain legal, political, and economic environments
• strong governmental control and regulation
• lack of an independent judiciary
• war, terrorism, and civil disturbances (including the ongoing conflict between Russia and Ukraine)
• crime, corruption, making improper payments or providing benefits that may violate Canadian or US law or laws relating to foreign corrupt practices or sanctions
• unexpected changes in governments and regulatory officials
• uncertainty or disputes as to the authority of regulatory officials
• changes in a country’s laws or policies, including those related to mineral tenure, mining, imports, exports, tax, duties, and currency
• cancellation or renegotiation of permits or contracts
• exposure to global public health issues (for example, an outbreak of illness)
• disruption in transportation between jurisdictions |
• royalty and tax increases or other claims by government entities, including retroactive claims
• expropriation and nationalization
• delays in obtaining necessary permits or inability to obtain or maintain them
• currency fluctuations
• high inflation
• joint venture participants falling out of political favour
• restrictions on local operating companies selling their production offshore
• exchange or capital controls, including restrictions on local operating companies holding US dollars or other foreign currencies in offshore bank accounts
• import and export regulations, including restrictions on the export of uranium
• limitations on the repatriation of earnings
• exposure to different employment practices and labour laws
• increased financing costs |
If one or more of these risks occur, it could have a material and adverse effect on our earnings, cash flows, financial condition, results of operations or prospects.
We and Westinghouse also risk being at a competitive disadvantage to companies from countries that are not subject to Canadian or US law or laws relating to foreign corrupt practices.
We enter joint venture arrangements with local participants from time to time to mitigate political risk. There is no assurance that these joint ventures will mitigate our political risk in a foreign jurisdiction.
We do not have political risk insurance for our foreign investments, including our investment in JV Inkai.
Kazakhstan
Kazakhstan declared itself independent in 1991 after the dissolution of the Soviet Union. Our investment in JV Inkai is subject to the greater risks associated with doing business in developing countries, which have significant potential for social, economic, political, legal, and fiscal instability. Kazakhstan laws and regulations, including those affecting the regulation of mining, are complex and still developing and their application can be difficult to predict. The other owner of JV Inkai is KAP, an entity majority owned by the government of Kazakhstan. We have entered into agreements with JV Inkai and KAP intended to mitigate political risk. Among other things, this risk includes the imposition of governmental laws or policies that could restrict or hinder JV Inkai paying us dividends, or selling us our share of JV Inkai production, or that impose discriminatory taxes or currency controls on these transactions. The restructuring of JV Inkai, which took effect January 1, 2018, was undertaken with the objective to better align the interests of Cameco and KAP and includes a governance framework that provides for protection for us as a minority owner of JV Inkai. There can be no assurance we will be successful in managing this risk.
2024 ANNUAL INFORMATION FORM Page 139
Complex legal regime
JV Inkai has a contract with the Kazakhstan government and was granted licences to conduct mining and exploration activities at Inkai. The licensing regime has long been abolished but licences issued before such abolishment remain valid. JV Inkai’s ability to conduct these activities, however, depends on the regulator’s view on whether its licences are still valid and other government approvals being granted.
To maintain and increase production at Inkai, JV Inkai needs ongoing support, agreement, and co-operation from KAP and from the Kazakhstan government. Kazakhstan foreign investment, environmental and mining laws and regulations are complex and still developing, so it can be difficult to predict how they will be applied. JV Inkai’s best efforts may therefore not always reflect full compliance with the law, and non-compliance can lead to an outcome that is disproportionate to the nature of the breach.
Subsoil Law
Amendments to the old Subsoil Law in 2007 allow the government to reopen resource use contracts in certain circumstances, and in 2009, the Kazakhstan government passed a resolution that classified 231 blocks, including Inkai’s blocks, as strategic deposits. The Kazakhstan government re-approved this list in 2011 and in 2018 and Inkai’s blocks remain on it. These actions may increase the government’s ability to expropriate JV Inkai’s properties in certain situations. In 2009, at the request of the Kazakhstan government, JV Inkai amended the RUC to adopt a new tax code, even though the government had agreed to tax stabilization provisions in the original contract.
The previous subsoil use law which went into effect in 2010 weakened the stabilization guarantee of the prior law and the current Subsoil Code contains a significant number of provisions which apply retrospectively. These developments reflect increased political risk in Kazakhstan.
Production variance to resource use contract
Production in Kazakhstan is expected to remain below the level stipulated in subsoil use agreements, due to the approximately three-week production halt in January 2025, the sulfuric acid shortage in the country and delays in development of new deposits.
JV Inkai’s target for production in 2024 was 8.3 million pounds of U3O8 (100% basis). However, this target was tentative and contingent upon receipt of sufficient quantities of sulfuric acid and on a specified schedule. The actual production volume for JV Inkai in 2024 was 7.8 million pounds, meaning that the annual production volume has decreased by more than 20% of the original RUC approved production volume of 10.4 million pounds.
The Subsoil Code permits subsoil users to deviate by up to 20% from the approved production volumes without changing their project documents. As noted, JV Inkai produced uranium below this allowance in 2024. However, JV Inkai still met its financial obligations under the RUC for 2024. There is a risk that the Competent Authority may require JV Inkai to update its project documents and work program and/or catch up production. Cameco does not expect that this underproduction in 2024 will result in the RUC being suspended or terminated. However, there can be no certainty that future uranium production deficits will not cause the validity of JV Inkai’s RUC to be challenged.
Nationalization
Industries like mineral production are regarded as nationally or strategically important, but there is no assurance they will not be expropriated or nationalized. Government policy can change to discourage foreign investment and nationalize mineral production, or the government can implement new limitations, restrictions, or requirements.
One of the most recent examples of the legislation that effectively poses a risk of property confiscation are the Potential Amendments to the Subsoil Code which, if adopted, would limit the subsoil user’s right to increase production, increase uranium reserves or extend the mining period unless the subsoil user accepts one of the following obligations: (i) increase the national uranium company’s share in the subsoil user to 90% or (ii) obligating a foreign participant in the subsoil user to transfer technology for converting and enriching uranium to the form of uranium hexafluoride enriched up to 5% to either a national uranium company or a joint venture between the foreign participant and a national uranium company.
Another example is the Law on Return of Illegally Diverted Assets to the State adopted after re-election of President Tokayev. This law is aimed at confiscation of assets deemed to have been illegally acquired by persons holding a responsible public position or a managerial position in state or quasi-state companies (target persons) or by
2024 ANNUAL INFORMATION FORM Page 140
individuals/legal entities affiliated with the target persons. As the law establishes extremely broad categories of affiliated persons such as, for example, individuals and legal entities related to target persons by common commercial interests, foreign investors are potentially at risk of being declared as affiliated to target persons and their assets deemed illegally diverted and confiscated. There is no assurance that our investment in Kazakhstan will not be nationalized, taken over or confiscated by any authority or body, whether the action is legitimate or not. While there are provisions for compensation and reimbursement of losses to investors under these circumstances, there is no assurance that these provisions would restore the value of our original investment or fully compensate us for the investment loss. This could have a material and adverse effect on our earnings, cash flows, financial condition, results of operations or prospects.
Government regulations
Our investment in Kazakhstan may be affected in varying degrees by government regulations restricting production, price controls, export controls, currency controls, taxes and royalties, expropriation of property, environmental, mining and safety legislation, and annual fees to maintain mineral properties in good standing. Kazakhstan regulatory authorities exercise considerable discretion in the interpretation and enforcement of local laws and regulations. At times, authorities use this discretion to enforce rights in a manner that is inconsistent with relevant legislation, particularly with respect to licence issuance, renewal, and compliance. Requirements imposed by regulatory authorities may be costly and time-consuming and may result in delays in the commencement, continuation, or expansion of production operations. Regulatory authorities may impose more onerous requirements and obligations than those currently in effect.
There is no assurance that the laws in Kazakhstan which provide protection to investments, including foreign investments, will not be amended, or abolished, or that these existing laws will be enforced or interpreted to provide adequate protection against any or all of the risks described above. There is also no assurance that the RUC can be enforced or will provide adequate protection against any or all the risks described above.
See pages 69 to 75 for a more detailed discussion of the regulatory and political environment in Kazakhstan.
Presidential succession and instability
The first President of Kazakhstan, Nursultan Nazarbayev, was in office since Kazakhstan became an independent republic in 1991 until he resigned on March 20, 2019. He was succeeded by Kassym-Jomart Tokayev. Subsequently Kazakhstan experienced some instability.
In early January 2022, Kazakhstan saw the most significant instability since it became independent in 1991. The events resulted in a state of emergency being declared across the country. With the assistance of the Collective Security Treaty Organization (CSTO), the government restored order and in the second half of January, the state of emergency was gradually lifted and withdrawal of CSTO forces from Kazakhstan was completed. In November 2022, President Tokayev was re-elected for a new seven-year term.
While the political regime has since stabilized, there remains considerable uncertainty regarding the future political and economic landscape in Kazakhstan once the seven-year presidential term of President Tokayev comes to an end, which could have a material and adverse effect on our earnings, cash flows, financial condition, results of operations or prospects.
Risk of Corruption
Based on Kazakhstan’s ranking as 93 out of 180 on the 2023 Transparency International Corruption Index, corruption remains an issue in the country. Having assessed Cameco’s and JV Inkai’s exposure to corruption in Kazakhstan, it was concluded that the risk of JV Inkai and Cameco violating applicable laws prohibiting corrupt activities (including Corruption of Foreign Public Officials Act (Canada) and the United States Foreign Corrupt Practices Act of 1977) are mitigated by JV Inkai’s controls relating to such risks, including JV Inkai’s Code of Conduct and Ethics, Business Conduct Policy, Anti-Bribery and Anti-Fraud Policy and Anti-corruption Compliance Manual and Cameco’s controls relating to such risks, including Cameco’s Code of Conduct and Ethics and Global Anti-corruption Program.
There can be no assurance, however, that corruption will not indirectly affect or otherwise impair JV Inkai’s or Cameco’s ability to operate in Kazakhstan and effectively pursue its business plan in that country. The failure of the government of Kazakhstan to continue to fight corruption or the perceived risk of corruption in Kazakhstan could have a material adverse effect on the local economy. Any allegations of corruption in Kazakhstan or evidence of money laundering could adversely affect the country’s ability to attract foreign investment and may have an adverse effect on its economy which in turn could have a material adverse effect on JV Inkai’s and Cameco’s business, results of operations, financial condition and prospects. Additionally, JV Inkai and Cameco are subject to competition with companies from countries that are not subject to or do not follow Canadian, United States or similar laws and regulation with respect to anti-corruption or bribery.
2024 ANNUAL INFORMATION FORM Page 141
Compliance with sanctions
It has been reported in the media that Kazakhstan’s official stance is that it will not comply with the sanctions against Russia to the detriment of its own industries, but at the same time, it will not become a place for circumventing these restrictions, and in particular, Kazakhstan will cooperate with Western countries to prevent resale of restricted dual-use goods to Russia.
European Union (EU) Sanctions Envoy David O’Sullivan during his visit to Kazakhstan stated that the EU “fully respects Kazakhstan’s decision not to align with the sanctions” and does not desire to interfere with legitimate trade between Kazakhstan and Russia. Still, the EU has concerns regarding resale of EU-sanctioned dual-use goods to Russia through Kazakhstan and has cooperated with Kazakhstan authorities to circumvent the resale of dual-use products.
However, U.S., EU, and Canadian sanctions allow for the imposition of sanctions on companies and individuals in third countries (i.e., outside of the U.S., the EU, Canada, and Russia) that are found to be engaged in certain Russia-related activities, such as aiding Russia’s military, providing material support to sanctioned Russian parties, and / or helping Russia to circumvent sanctions. Accordingly, there is a risk of persons, banks, and companies based in Kazakhstan being targeted for sanctions if they engage in certain Russia-related activities.
To the extent that JV Inkai’s suppliers or other relationships are subject to sanctions or secondary sanctions, under Canadian economic sanctions laws there is a risk that we may not be able to realize the benefit of our investment in JV Inkai which could have a material and adverse effect on our earnings, cash flows, financial condition, or results of operations.
Australia
Western Australian Government’s uranium policy
State governments in Australia have prohibited uranium mining or uranium exploration from time to time. From 2002 to 2008, uranium mining was banned in Western Australia, where our Kintyre and Yeelirrie projects are located. In 2017, the Western Australian state government announced a ban on the grant of future uranium mining leases and that it would not prevent the progress of four uranium projects that had received approval from the previous government, two of the approved projects being Kintyre and Yeelirrie.
The approval received for Kintyre from the prior state government required substantial commencement of the project by March 2020, and this was not achieved. The current government declined to grant us an extension to achieve it. In the future, we can apply for an extension of time to achieve substantial commencement of the project. If granted by a future government we could commence the Kintyre project, provided we have all other required regulatory approvals.
The approval received for Yeelirrie project from the prior state government required substantial commencement of the project by January 2022, and this was not achieved. The current government declined to grant us an extension to achieve it. In the future we can again apply for an extension of time to achieve substantial commencement of the project. If granted by a future government we could commence the Yeelirrie project, provided we have all other required regulatory approvals. Approval for the Yeelirrie project at the federal level was granted in 2019 and extends until 2043.
A prohibition or restriction on uranium exploration or mining in the future that interferes with the development of Kintyre or Yeelirrie could have a material and adverse effect on our future earnings, cash flows, financial condition, results of operations, or prospects.
Conflict in Ukraine
On February 24, 2022, Russia commenced a military invasion of Ukraine. In response, many jurisdictions have imposed strict economic sanctions against Russia, including Canada, the United States, the European Union, the United Kingdom, and others. Additionally, Russia has imposed export restraints of LEU to the United States. Currently, the global nuclear industry relies on Russia for approximately 13% of its supply of uranium concentrates, 23% of conversion supply and 43% of enrichment capacity. With continued conflict, there is ongoing uncertainty about the ability to continue to rely on nuclear fuel supplies coming out of Russia or that ship through Russian ports. The geopolitical situation continues to cause transportation risks in Central Asia, which impacted our shipments of finished product from JV Inkai in 2022, 2023 and 2024. We may continue to experience delays in our expected deliveries in 2025. See Uranium – Tier-one operations – Inkai and Operational risks – Transportation.
2024 ANNUAL INFORMATION FORM Page 142
Our business has been and may continue to be impacted by the ongoing conflict between Russia and Ukraine and the related economic sanctions.
In March 2023, we signed a major supply contract with Energoatom, Ukraine’s state-owned nuclear energy utility, to supply 100% of Energoatom’s UF6 requirements. The military conflict between Russia and Ukraine may have a negative impact on this supply contract, which could have a material and adverse effect on our earnings, cash flow, financial condition, result of operations, or prospects.
The military conflict between Russia and Ukraine has had and continues to have a negative impact on Westinghouse’s operations in Ukraine, resulting in the loss of revenue and the corresponding loss of earnings, See Strategic risks – Major nuclear incident risk.
Governments continue to develop and implement economic sanctions in response to the conflict. For instance, the Prohibiting Russian Uranium Imports Act was passed by the United States House of Representatives in December 2023, which was enacted and bans imports of enriched Russian uranium to the United States. This ban is subject to certain waivers until 2028 allowing the import of low-enriched uranium from Russia if the United States energy secretary determines there is no alternative source available or if the shipments are in the national interest. Sanctions such as these may lead to significant volatility in global uranium prices. In addition, with the recent change in administration in the US, there remains significant uncertainty regarding future economic sanctions in the United States and how they may be altered by such administration.
As we have from time to time purchased uranium enrichment services from a Russia-based entity in order to sell enriched uranium directly to customers, we may be required to purchase such enrichment services from other suppliers. Cameco infrequently purchases these services, as the majority of our customers work directly with their own enrichment services providers. In addition, our customer contracts may require deliveries of uranium to areas that are directly affected by the ongoing conflict and the related economic sanctions. These deliveries may need to be adjusted in consideration of the ongoing conflict and/or to comply with applicable sanctions.
The ongoing conflict and economic sanctions may also give rise to additional indirect impacts, including increased fuel prices, supply chain challenges, logistics and transport disruptions and heightened cybersecurity disruptions and threats. Increased fuel prices and ongoing volatility of such prices may have adverse impacts on our costs of doing business.
To date, we have not been materially affected by the current conflict and economic sanctions, but there remains significant uncertainty surrounding the outcome of the ongoing conflict, future economic sanctions, our contractual arrangements with Energoatom and shipments of our share of finished JV Inkai product. In particular, possible violations of applicable economic sanctions laws as a result of JV Inkai’s dealings with suppliers or other relationships could have an adverse effect on our ability to realize the benefit of our investment in JV Inkai. We will continue to monitor the potential impacts on our business as the situation develops.
Westinghouse’s comprehensive protections against liability for nuclear damage depend on the viability of global indemnities and continuation of nuclear liability regimes
Global nuclear liability regimes shield nuclear industry participants from unlimited exposure to nuclear accident risks and ensure compensation for victims of nuclear incidents. The US regime, based on the Price-Anderson Nuclear Industries Indemnity Act, as amended, provides for “economic channeling” of liability by establishing requirements for nuclear reactor operators to maintain two layers of insurance (totaling approximately $14 billion (US)), which cover anyone potentially liable, including suppliers, for nuclear damage. International global nuclear liability regimes under the 1963 Vienna Convention on Civil Liability, as amended by the 1997 Protocol; the Paris Convention on Third Party Liability in the Field of Nuclear Energy and the Brussels Supplementary Convention; and the 1997 Convention on Supplementary Compensation for Nuclear Damage provide for legal channeling of liability to the operator of a nuclear installation.
While these nuclear liability regimes shield nuclear suppliers and service providers from nuclear damage in the specific jurisdiction in which a nuclear incident occurs, radioactive releases can be transboundary, and there is no single global nuclear liability regime. Only approximately 70 countries are party to an existing liability regime, and not all the regimes are interconnected. This exposes suppliers to potential liability in jurisdictions not party to a nuclear liability regime. In addition, nuclear liability regimes cover only offsite nuclear damage and do not apply to property damage to the plant itself or any equipment onsite, which typically is covered by separate insurance maintained by nuclear operators.
2024 ANNUAL INFORMATION FORM Page 143
To address these gaps, Westinghouse obtains from its customers global indemnities against nuclear damage as well as waivers of any onsite property damage. However, should an existing nuclear liability regime be repealed in any country, should any such indemnity be insufficient or should a customer become unable to act on an indemnity due to a bankruptcy or other financial hardship, Westinghouse could be exposed to claims in the event of a nuclear incident.
Legal proceedings
We are currently involved in a dispute with CRA. See Transfer pricing dispute at page 110 for more details about this dispute.
Investor information
Share capital
Our authorized share capital consists of:
| • | first preferred shares |
| • | second preferred shares |
| • | common shares |
| • | one class B share |
Preferred shares
We do not currently have any preferred shares outstanding, but we can issue an unlimited number of first preferred or second preferred shares with no nominal or par value, in one or more series. The board must approve the number of shares, and the designation, rights, privileges, restrictions and conditions attached to each series of first or second preferred shares.
Preferred shares can carry voting rights, and they rank ahead of common shares and the class B share for receiving dividends and distributing assets if the company is liquidated, dissolved or wound up.
First preferred shares
Each series of first preferred shares ranks equally with the shares of other series of first preferred shares. First preferred shares rank ahead of second preferred shares, common shares and the class B share.
Second preferred shares
Each series of second preferred shares ranks equally with the shares of other series of second preferred shares. Second preferred shares rank after first preferred shares and ahead of common shares and the class B share.
Common shares
We can issue an unlimited number of common shares with no nominal or par value. Only holders of common shares have full voting rights in Cameco.
If you hold our common shares, you are entitled to vote on all matters that are to be voted on at any shareholder meeting, other than meetings that are only for holders of another class or series of shares. Each common share you own represents one vote, except where noted below. As a holder of common shares, you are also entitled to receive any dividends that are declared by our board of directors.
Common shares rank after preferred shares with respect to the payment of dividends and the distribution of assets if the company is liquidated, dissolved or wound up, or any other distribution of our assets among our shareholders if we were to wind up our affairs.
Holders of our common shares have no pre-emptive, redemption, purchase or conversion rights for these shares. Except as described under Ownership and voting restrictions, non-residents of Canada who hold common shares have the same rights as shareholders who are residents of Canada.
On December 31, 2024, we had 435,312,083 common shares outstanding. These were fully paid and non-assessable.
2024 ANNUAL INFORMATION FORM Page 144
On February 28, 2025, there were 259,958 stock options outstanding to acquire common shares of Cameco under the company’s stock option plan with exercise prices ranging from $11.32 to $15.27.
In 2024 and 2025, no stock options were granted.
Our articles of incorporation have provisions that restrict the issue, transfer, and ownership of voting securities of Cameco (see Ownership and voting restrictions below).
Class B shares
The province of Saskatchewan holds our one class B share outstanding. It is fully paid and non-assessable.
The one class B share entitles the province to receive notices of and attend all meetings of shareholders, for any class or series.
The class B shareholder can only vote at a meeting of class B shareholders, and only as a class if there is a proposal to:
| • | amend Part 1 of Schedule B of the articles, which states that: |
| • | Cameco’s registered office and head office operations must be in Saskatchewan |
| • | the vice-chair of the board, chief executive officer (CEO), president, chief financial officer (CFO) and generally all of the senior officers (vice-presidents and above) must live in Saskatchewan |
| • | all annual meetings of shareholders must be held in Saskatchewan |
| • | amalgamation, if it would require an amendment to Part 1 of Schedule B of the articles, or |
| • | an amendment to the articles in a way that would change the rights of class B shareholders |
The class B shareholder can request and receive information from us to determine whether or not we are complying with Part 1 of Schedule B of the articles.
The class B shareholder does not have the right to receive any dividends declared by Cameco. The class B share ranks after first and second preferred shares, but equally with common shareholders, with respect to the distribution of assets if the company is liquidated, dissolved or wound up. The class B shareholder has no pre-emptive, redemption, purchase or conversion rights with its class B share, and the share cannot be transferred.
Ownership and voting restrictions
The federal government established ownership restrictions when Cameco was formed so we would remain Canadian controlled. There are restrictions on issuing, transferring, and owning Cameco common shares whether you own the shares as a registered shareholder, hold them beneficially or control your investment interest in Cameco directly or indirectly. These are described in the Eldorado Nuclear Limited Reorganization and Divestiture Act (Canada) (ENL Reorganization Act) and our company articles.
The following is a summary of the restrictions listed in our company articles.
Residents
A Canadian resident, either individually or together with associates, cannot hold, beneficially own or control shares or other Cameco securities, directly or indirectly, representing more than 25% of the votes that can be cast to elect directors.
Non-residents
A non-resident of Canada, either individually or together with associates, cannot hold, beneficially own or control shares or other Cameco securities, directly or indirectly, representing more than 15% of the total votes that can be cast to elect directors.
Voting restrictions
All votes cast at the meeting by non-residents, either beneficially or controlled directly or indirectly, will be counted and pro-rated collectively to limit the proportion of votes cast by non-residents to no more than 25% of the total shareholder votes cast at the meeting.
We limit the counting of votes by non-residents of Canada at our annual meeting of shareholders to abide by this restriction. This has resulted in non-residents receiving less than one vote per share.
2024 ANNUAL INFORMATION FORM Page 145
Enforcement
The company articles allow us to enforce the ownership and voting restrictions by:
| • | suspending voting rights |
| • | forfeiting dividends and other distributions |
| • | prohibiting the issue and transfer of common shares |
| • | requiring the sale or disposition of common shares |
| • | suspending all other shareholder rights. |
To verify compliance with restrictions on ownership and voting of common shares, we require existing shareholders, proposed transferees or other subscribers for voting shares to declare their residency, ownership of common shares and other things relating to the restrictions. Nominees such as banks, trust companies, securities brokers or other financial institutions who hold the shares on behalf of beneficial shareholders need to make the declaration on their behalf.
We cannot issue or register a transfer of any voting shares if it would result in a contravention of the resident or non-resident ownership restrictions.
If we believe there is a contravention of our ownership restrictions based on any shareholder declarations filed with us, or our books and records or those of our registrar and transfer agent or otherwise, we can suspend all shareholder rights for the securities they hold, other than the right to transfer them. We can only do this after giving the shareholder 30 days’ notice, unless he or she has disposed of the holdings, and we have been advised of this.
Understanding the terms
Please see our articles for the exact definitions of associate, resident, non-resident, control, and beneficial ownership which are used for the restrictions described above.
Other restrictions
The ENL Reorganization Act imposes some additional restrictions on Cameco. We must maintain our registered office and our head office operations in Saskatchewan. We are also prohibited from:
| • | creating restricted shares (these are generally defined as a participating share with restrictive voting rights) |
| • | applying for continuance in another jurisdiction |
| • | enacting articles of incorporation or bylaws that have provisions that are inconsistent with the ENL Reorganization Act |
We must maintain our registered office and head office operations in Saskatchewan under the Saskatchewan Mining Development Corporation Reorganization Act. This generally includes all executive, corporate planning, senior management, administrative and general management functions.
Credit ratings
Credit ratings provide an independent, professional assessment of a corporation’s credit risk. They are not a comment on the market price of a security or suitability for an individual investor and are, therefore, not recommendations to buy, hold or sell our securities.
We provide rating agencies DBRS Limited (DBRS) and S&P Global Ratings (S&P) with confidential information to support the credit rating process.
The credit ratings assigned to our securities by external ratings agencies are important to our ability to raise capital at competitive pricing to support our business operations and execute our strategy.
We have three series of senior unsecured debentures outstanding:
| • | $100 million of debentures issued on November 14, 2012, that have an interest rate of 5.09% per year and mature on November 14, 2042 |
| • | $400 million of debentures issued on October 21, 2020, that have an interest rate of 2.95% per year and mature on October 21, 2027 |
| • | $500 million of debentures issued on May 24, 2024, that have an interest rate of 4.94% per year and mature on May 24, 2031 |
2024 ANNUAL INFORMATION FORM Page 146
We have a commercial paper program which is supported by a $1 billion unsecured revolving credit facility that matures October 1, 2028. As of December 31, 2024, there were no amounts outstanding under the commercial paper facility.
Additionally, after making partial prepayments of $400 million (US) in 2024, $200 million (US) remained outstanding at December 31, 2024 on the term loan debt incurred in connection with the Westinghouse acquisition. The remaining principal of $200 million (US) was repaid in full on January 13, 2025.
The table below shows the current DBRS and S&P ratings and the rating trends/outlooks of our commercial paper and senior unsecured debentures:
| Rating Agency |
Rating |
Rating Trend/Outlook |
||
| Commercial paper |
||||
| DBRS |
R-2 (middle) | Stable | ||
| S&P |
A-3 | Positive | ||
| Senior Unsecured Debentures |
||||
| DBRS |
BBB | Stable | ||
| S&P |
BBB- | Positive |
The rating agencies may revise or withdraw these ratings at any time if they believe circumstances warrant. The rating trend/outlook represents the ratings agency’s assessment of the likelihood and direction that the rating could change in the future.
A change in our credit ratings could affect our cost of funding and our access to capital through the capital markets.
On May 28, 2020, DBRS changed Cameco’s rating outlook to stable from negative. The change was based on the improving outlook for the uranium industry, including the uranium price increases in 2020. On May 26, 2021, May 27, 2022, October 12, 2023 and September 9, 2024, DBRS confirmed the rating and the outlook.
On December 19, 2024, S&P revised its outlook for Cameco to positive from stable and affirmed the BBB- rating. The outlook reflected the positive fundamentals for nuclear power.
Commercial paper
Rating scales for commercial paper are meant to indicate the risk that a borrower will not fulfill its near-term debt obligations in a timely manner.
The table below explains the credit ratings of our commercial paper in more detail:
| Rating |
Ranking |
|||
| DBRS rates commercial paper by
categories ranging |
R-2 (Middle) | • middle of the R-2 category
• represents “adequate credit quality”
• fifth highest of 10 available credit rating categories |
||
| S&P rates commercial paper by
categories ranging |
A-3 | • represents “adequate protection parameters”
• third highest of six available credit rating categories |
||
Senior unsecured debentures
Long-term debt rating scales are meant to indicate the risk that a borrower will not fulfill its full obligations, with respect to interest and principal, in a timely manner.
2024 ANNUAL INFORMATION FORM Page 147
The table below explains the credit ratings of our senior unsecured debentures in more detail:
| Rating |
Ranking |
|||
| DBRS
rates senior unsecured debentures by categories |
BBB | • middle of the BBB category
• represents “adequate credit quality”
• fourth highest of eight available credit rating categories
• capacity for the payment of financial obligations is considered acceptable
• may be vulnerable to future economic events |
||
| S&P
rates senior unsecured debentures by categories |
BBB- | • the lower end of the BBB category
• exhibits “adequate protection parameters”
• fourth highest of 10 available credit rating categories
• adverse economic conditions or changing circumstances are more likely to lead to a weakened capacity to meet financial commitments |
||
Payments to credit rating agencies
Over the last two years, we paid approximately $1,154,100 in connection with credit ratings related services.
Material contracts
Below is a list of material contracts entered into and still in effect, which have been filed on SEDAR+ in accordance with National Instrument 51-102 Continuous Disclosure Obligations:
Supplemental indentures
We entered into the Sixth supplemental indenture with CIBC Mellon on November 14, 2012, relating to the issue of $100 million in unsecured debentures at an interest rate of 5.09% per year and due in 2042.
We entered into the Eighth supplemental indenture with CIBC Mellon on October 21, 2020, relating to the issue of $400 million in unsecured debentures at an interest rate of 2.95% per year and due in 2027.
We entered into the Ninth supplemental indenture with BNY Trust Company of Canada on May 24, 2024, relating to the issue of $500 million in unsecured debentures at an interest rate of 4.94% per year and due in 2031.
We entered into the Resignation and Appointment Agreement with CIBC Mellon and BNY Trust Company of Canada on February 22, 2021, relating to resignation of CIBC Mellon as trustee and appointment of BNY as trustee under the above supplemental indentures.
See Senior unsecured debentures, above for more information about these debentures.
Resource use contract
See page 68 at Resource use contract for information about this contract.
Market for our securities
Our common shares are listed and traded on the Toronto Stock Exchange (TSX) (under the symbol CCO) and the New York Stock Exchange (under the symbol CCJ).
We have a registrar and transfer agent in Canada and the US for our common shares:
| Canada | TSX Trust Company 301 – 100 Adelaide Street West Toronto, ON M5H 4H1 |
US | Equiniti Trust Company, LLC 55 Challenger Road 2nd floor Ridgefield Park, New Jersey United States of America 07660 |
2024 ANNUAL INFORMATION FORM Page 148
Trading activity
The table below shows the high and low closing prices and trading volume for our common shares on the TSX in 2024.
| 2024 |
High ($) | Low ($) | Volume | |||||||||
| January |
69.05 | 54.94 | 28,731,605 | |||||||||
| February |
68.77 | 53.65 | 31,022,215 | |||||||||
| March |
59.89 | 52.57 | 31,615,344 | |||||||||
| April |
72.23 | 59.82 | 26,464,054 | |||||||||
| May |
76.51 | 64.05 | 23,075,195 | |||||||||
| June |
76.18 | 66.74 | 21,117,715 | |||||||||
| July |
73.62 | 60.13 | 24,972,593 | |||||||||
| August |
61.17 | 50.56 | 26,195,729 | |||||||||
| September |
66.26 | 48.62 | 28,098,864 | |||||||||
| October |
80.96 | 64.18 | 23,456,930 | |||||||||
| November |
85.02 | 69.58 | 26,344,676 | |||||||||
| December |
88.18 | 73.29 | 20,696,286 | |||||||||
Dividend
In 2024, our board of directors declared a dividend of $0.16 per common share which was paid on December 13, 2024. The decision to declare an annual dividend by our board is reviewed regularly and will be based on our cash flow, financial position, strategy and other relevant factors including appropriate alignment with the cyclical nature of our earnings.
The table below shows the dividends per common share for the last three fiscal years.
| 2024 | 2023 | 2022 | ||||||||||
| Cash dividends |
$ | 0.16 | $ | 0.12 | $ | 0.12 | ||||||
| Total dividends paid (millions) |
$ | 70 | $ | 52 | $ | 52 | ||||||
Governance
Directors
| Director |
Board committees |
Principal occupation or employment |
||
| Daniel Camus Westmount, Québec, Canada
Director since 2011 |
Audit and finance (Chair) Human resources and compensation |
Corporate director as of 2011 | ||
| Tammy Cook-Searson Lac La Ronge, Saskatchewan, Canada Director since 2023 |
Safety, health and environment Technical |
2005 to present – Chief of the Lac La Ronge Indian Band and President of Kitsaki Management Limited Partnership | ||
| Catherine Gignac Mississauga, Ontario, Canada Director since 2014 |
A member of all board committees | Corporate director as of 2011 | ||
| Tim Gitzel Saskatoon, Saskatchewan, Canada Director since 2011 |
None | July 2011 to present – President and Chief Executive Officer | ||
2024 ANNUAL INFORMATION FORM Page 149
| Director |
Board committees |
Principal occupation or employment |
||
| Kathryn Jackson Indialantic, Florida, USA
Director since 2017 |
Human resources and compensation Nominating, corporate governance and risk (Chair) Technical | Corporate director as of 2008 | ||
| Don Kayne Delta, British Columbia, Canada
Director since 2016 |
Human resources and compensation (Chair) Nominating, corporate governance and risk Safety, health and environment | January 1, 2025 to present – Special Advisor to the CEO of Canfor Corporation May 2011 to December 2024 – President and CEO of Canfor Corporation, an integrated forest products company September 2012 to April 2022 – Chief Executive Officer of Canfor Pulp Products Incorporated, an integrated forest products company |
||
| Dominique Minière Toronto, Ontario, Canada
Director since 2023 |
Human resources and compensation Safety, health and environment (Chair) Technical | Corporate director as of 2023 January 2022 to December 2022 – Executive Vice President of Ontario Power Generation September 2020 to December 2021 – Executive Vice President and Chief Strategy Officer of Ontario Power Generation March 2019 to September 2020 – Nuclear President of Ontario Power Generation |
||
| Leontine van Leeuwen-Atkins Calgary, Alberta, Canada
Director since 2020 |
Audit and finance Nominating, corporate governance and risk Technical (Chair) | Corporate director as of 2019 |
||
Each director is elected for a term of one year and holds office until the next annual meeting unless he or she steps down, as required by corporate law.
Officers
| Officer |
Principal occupation or employment for past five years |
|
| Catherine Gignac Chair Mississauga, Ontario, Canada |
Assumed current position November 2023 | |
| Tim Gitzel President and Chief Executive Officer Saskatoon, Saskatchewan, Canada |
Assumed current position July 2011 | |
| Grant Isaac Executive Vice-President and Chief Financial Officer Saskatoon, Saskatchewan, Canada |
Assumed current position February 2023 July 2011 to February 1, 2023 – Senior Vice-President and Chief Financial Officer |
|
| Sean Quinn Senior Vice-President, Chief Legal Officer and Corporate Secretary Saskatoon, Saskatchewan, Canada |
Assumed current position April 2014 | |
| Brian Reilly Senior Vice-President and Chief Operating Officer Saskatoon, Saskatchewan, Canada |
Assumed current position July 2017 | |
| Heidi Shockey Senior Vice-President and Deputy Chief Financial Officer Saskatoon, Saskatchewan, Canada |
Assumed current position February 2023 April 2020 to February 1, 2023 – Vice-President, Controller October 2017 to March 2020 – Vice-President, Controller and Treasurer March 2013 to September 2017 – Vice-President, Controller |
|
2024 ANNUAL INFORMATION FORM Page 150
| Officer |
Principal occupation or employment for past five years |
|
| Rachelle Girard Senior Vice-President and Chief Corporate Officer Saskatoon, Saskatchewan, Canada |
Assumed current position July 2024 February 2023 to June 2024 – Vice-President, Investor Relations April 2020 to February 2023 – Vice-President, Investor Relations, Tax & Treasury February 2018 to April 2020 – Vice-President, Investor Relations |
|
| David Doerksen Senior Vice-President and Chief Marketing Officer Corman Park, Saskatchewan, Canada |
Assumed current position October 2024 October 2017 to September 2024 – Vice-President, Marketing |
|
To our knowledge, the total number of common shares that the directors and executive officers as a group either: (i) beneficially owned; or (ii) exercised direction or control over, directly or indirectly, was 765,063 as at March 17, 2025. This represents less than 1% of our outstanding common shares.
To the best of our knowledge, none of the directors, executive officers or shareholders that either: (i) beneficially owned; or (ii) exercised direction or control of, directly or indirectly, over 10% of any class of our outstanding securities, nor their associates or affiliates, have or have had within the three most recently completed financial years, any material interests in material transactions which have affected, or will materially affect, the company.
Other information about our directors and officers
None of our directors or officers, or a shareholder with significant holdings that could materially affect control of us, is or was a director or executive officer of another company in the past 10 years that:
| • | was the subject of a cease trade or similar order, or an order denying that company any exemption under securities legislation, for more than 30 consecutive days while the director or executive officer held that role with the company |
| • | was involved in an event that resulted in the company being subject to one of the above orders after the director or executive officer no longer held that role with the company |
| • | while acting in that capacity, or within a year of acting in that capacity, became bankrupt, made a proposal under any legislation relating to bankruptcy or insolvency or was subject to or instituted any proceedings, arrangement or compromise with creditors or had a receiver, receiver manager or trustee appointed to hold the assets of that company |
None of them in the past 10 years:
| • | became bankrupt |
| • | made a proposal under any legislation relating to bankruptcy or insolvency |
| • | has been subject to or launched any proceedings, arrangement or compromise with any creditors, or |
| • | had a receiver, receiver manager or trustee appointed to hold any of their assets |
None of them has ever been subject to:
| • | penalties or sanctions imposed by a court relating to securities legislation or by a securities regulatory authority or has entered into a settlement agreement with a securities regulatory authority, or |
| • | any other penalties or sanctions imposed by a court or regulatory body that would likely be considered important to a reasonable investor in making an investment decision |
About the audit and finance committee
Audit and finance committee charter
See appendix A for a copy of the audit and finance committee charter. You can also find a copy on our website (cameco.com/about/governance/board committees).
2024 ANNUAL INFORMATION FORM Page 151
Composition of the audit and finance committee
The committee is made up of three members: Daniel Camus (chair), Catherine Gignac and Leontine van Leeuwen-Atkins. Each member is independent and financially literate using criteria that meet the standards of the Canadian Securities Administrators as set out in National Instrument 52-110 Audit Committees.
Relevant education and experience
Daniel Camus, a corporate director, is the former group chief financial officer and former head of strategy and international activities of Electricité de France SA (EDF), a France-based integrated energy operator active in the generation, distribution, transmission, supply and trading of electrical energy with international subsidiaries. He has chaired several audit committees of other public company boards. He was formerly the audit committee chair and a board member of the non-governmental organization, MedAccess plc, located in London, UK, from 2020 to 2024. He is the former audit committee chair and a board member of the non-governmental organization, FIND Diagnostics, located in Geneva, Switzerland. Mr. Camus received his PhD in Economics from Sorbonne University and an MBA in finance and economics from the Institute d’Études Politiques de Paris.
Catherine Gignac, a corporate director, is a former mining equity research analyst with leading global brokerage firms. She has served on the audit, compensation, nominating and sustainability committees of other public company boards and served on the board of the public company, Corvus Gold Inc., for six years and as chair of its board for five years. She has more than 30 years’ experience as a mining equity research analyst and geologist. She held senior positions with leading firms, including Merrill Lynch Canada, RBC Capital Markets, UBS Investment Bank and Dundee Capital Markets Inc. and Loewen Ondaatje McCutcheon Limited. Ms. Gignac holds the ICD.D designation from the Institute of Corporate Directors and received her bachelor of science degree in geology (honours) from McMaster University.
Leontine van Leeuwen-Atkins, a corporate director, is a former Partner with KPMG Canada, and served as a board member of KPMG Canada’s National Board of Directors until 2019. Ms. Atkins serves on the board of one other public company and as its audit committee chair. She serves on the board of one private company as well as audit committee member. She is a Fellow of the Chartered Professional Accountants (CPA) of Alberta and holds the ICD.D designation from the Institute of Corporate Directors. She has over 30 years of experience in the global mining, power, utility and oil and gas industries, with a focus on corporate strategy. Ms. Atkins received her bachelor of business administration degree in finance from Acadia University and a master of business administration degree from Dalhousie University.
2024 ANNUAL INFORMATION FORM Page 152
Auditors’ fees
The table below shows the fees billed by the external auditors for services in 2024 and 2023:
| 2024 ($) |
% of total fees |
2023 ($) |
% of total fees |
|||||||||||||||
| Audit fees |
||||||||||||||||||
| Cameco1 |
3,571,900 | 83.1 | 2,436,700 | 88.7 | ||||||||||||||
| Subsidiaries2 |
164,400 | 3.8 | 135,600 | 4.9 | ||||||||||||||
| Securities engagement3 |
217,900 | 5.1 | — | — | ||||||||||||||
|
|
|
|
|
|
|
|
|
|||||||||||
| Total audit fees |
3,954,200 | 92.0 | 2,572,300 | 93.6 | ||||||||||||||
|
|
|
|
|
|
|
|
|
|||||||||||
| Audit-related fees |
||||||||||||||||||
| Translation services4 |
82,500 | 1.9 | — | — | ||||||||||||||
| Pension and other audit-related services5 |
85,500 | 2.0 | 31,600 | 1.2 | ||||||||||||||
|
|
|
|
|
|
|
|
|
|||||||||||
| Total audit-related fees |
168,000 | 3.9 | 31,600 | 1.2 | ||||||||||||||
|
|
|
|
|
|
|
|
|
|||||||||||
| Tax fees |
||||||||||||||||||
| Compliance |
— | — | 5,600 | 0.2 | ||||||||||||||
| Planning and advice6 |
80,200 | 1.9 | 136,100 | 5.0 | ||||||||||||||
|
|
|
|
|
|
|
|
|
|||||||||||
| Total tax fees |
80,200 | 1.9 | 141,700 | 5.2 | ||||||||||||||
|
|
|
|
|
|
|
|
|
|||||||||||
| All other fees |
||||||||||||||||||
| Other non-audit fees7 |
95,600 | 2.2 | — | — | ||||||||||||||
|
|
|
|
|
|
|
|
|
|||||||||||
| Total other non-audit fees |
95,600 | 2.2 | — | — | ||||||||||||||
|
|
|
|
|
|
|
|
|
|||||||||||
| Total fees |
4,298,000 | 100 | 2,745,600 | 100 | ||||||||||||||
| 1 | Includes amounts billed for the audit of Cameco’s annual consolidated financial statements and the review of interim financial statements. |
| 2 | Includes amounts billed for the audit of Cameco’s subsidiary financial statements. |
| 3 | Includes amounts billed for auditor involvement in filing Cameco’s 2024 base shelf prospectus and Form S-8 with the SEC. |
| 4 | Translation services for 2024 relate to the French translation of the 2023 annual financial statements and MD&A. No invoices were issued in 2023 for translation services. |
| 5 | Includes amounts billed for the audit of Cameco’s pension plan financial statements and other audit-related services. |
| 6 | Includes amounts billed for tax compliance and tax advisory services. |
| 7 | Other non-audit fees for 2024 includes amounts billed for Cameco’s I-4 Membership. No invoices were issued in 2023. |
Approving services
The audit and finance committee must pre-approve all services the external auditors will provide to make sure they remain independent. This is according to our audit and finance committee charter and consistent with our corporate governance practices. The audit and finance committee pre-approves services up to a specific limit. If we expect the fees to exceed the limit, or the external auditors to provide new audit or non-audit services that have not been pre-approved in the past, then this must be pre-approved separately.
Any service that is not generally pre-approved must be approved by the audit and finance committee before the work is carried out, or by the committee chair, or board chair in their absence, as long as the proposed service is presented to the full audit and finance committee at its next meeting.
The committee has adopted a written policy that describes the procedures for implementing these principles.
Interest of experts
Our auditor is KPMG LLP, independent chartered accountants, who have audited our 2024 financial statements.
KPMG LLP are the auditors of Cameco and have confirmed with respect to Cameco that they are independent within the meaning of the relevant rules and related interpretations prescribed by the relevant professional bodies in Canada and any applicable legislation or regulations and that they are independent accountants with respect to Cameco under all relevant US professional and regulatory standards.
2024 ANNUAL INFORMATION FORM Page 153
The individuals who are qualified persons for the purposes of NI 43-101 are listed under Mineral reserves and resources on page 97 and under Technical report on pages 31, 46 and 61. As a group, they beneficially own, directly or indirectly, less than 1% of any class of the outstanding securities of Cameco and our associates and affiliates.
Appendix A
Audit and finance committee of the Board of Directors
Mandate
Purpose
The primary purpose of the audit and finance committee (the “committee”) is to assist the board of directors (the “board”) in fulfilling its oversight responsibilities for (a) the accounting and financial reporting processes, (b) the internal controls, (c) the external auditors, including performance, qualifications, independence, and their audit of the corporation’s financial statements, (d) the performance of the corporation’s internal audit function, (e) financial matters and risk management of financial risks, (f) the corporation’s process for monitoring compliance with laws and regulations (other than environmental and safety laws) and its code of conduct and ethics, and (g) prevention and detection of fraudulent activities. The committee shall also prepare such reports as required to be prepared by it by applicable securities laws.
In addition, the committee provides an avenue for communication between each of the internal auditor, the external auditors, management, and the board. The committee shall have a clear understanding with the external auditors that they must maintain an open and transparent relationship with the committee and that the ultimate accountability of the external auditors is to the board and the committee, as representatives of the shareholders. The committee, in its capacity as a committee of the board, subject to the requirements of applicable law, is directly responsible for the appointment, compensation, retention, and oversight of the external auditors.
The committee has the authority to communicate directly with the external auditors and internal auditor.
The committee shall make regular reports to the board concerning its activities and in particular shall review with the board any issues that arise with respect to the quality or integrity of the corporation’s financial statements, the performance and independence of the external auditors, the performance of the corporation’s internal audit function, or the corporation’s process for monitoring compliance with laws and regulations other than environmental and safety laws.
Composition
The board shall appoint annually, from among its members, a committee and its chair. The committee shall consist of at least three members and shall not include any director employed by the corporation.
Each committee member will be independent pursuant to the standards for independence adopted by the board.
Each committee member shall be financially literate with at least one member having accounting or related financial expertise, using the terms defined as follows:
“Financially literate” means the ability to read and understand a set of financial statements that present a breadth and level of complexity of accounting issues that are generally comparable to the breadth and complexity of issues that can reasonably be expected to be raised by the corporation’s financial statements; and
“Accounting or related financial expertise” means the ability to analyse and interpret a full set of financial statements, including the notes attached thereto, in accordance with Canadian generally accepted accounting principles.
In addition, where possible, at least one member of the committee shall qualify as an “audit committee financial expert” within the meaning of applicable securities law.
Members of the committee may not serve on the audit and finance committees of more than three public companies (including Cameco’s) without the approval of the board.
2024 ANNUAL INFORMATION FORM Page 154
Meetings
The committee will meet at least four times annually and as many additional times as the committee considers necessary to carry out its duties effectively. The committee will hold separate closed sessions with the external auditors, the internal auditor, the chief financial officer and other members of management at each regularly scheduled meeting.
A majority of the members of the committee shall constitute a quorum. No business may be transacted by the committee except at a meeting of its members at which a quorum of the committee is present.
The committee may invite such officers, directors and employees of the corporation as it may see fit from time to time to attend at meetings of the committee and assist thereat in the discussion and consideration of any matter.
A meeting of the committee may be convened by the chair of the committee, a member of the committee, the external auditors, the internal auditor, the chief executive officer or the chief financial officer. The secretary, who shall be appointed by the committee, shall, upon direction of any of the foregoing, arrange a meeting of the committee. The committee shall report to the board in a timely manner with respect to each of its meetings.
Duties and responsibilities
To carry out its oversight responsibilities, the committee shall:
Financial reporting process
| 1. | Review with management and the external auditors any items of concern, any proposed changes in the selection or application of major accounting policies and the reasons for the change, any identified risks and uncertainties, and any issues requiring management judgement, to the extent that the foregoing may be material to financial reporting. |
| 2. | Consider any matter required to be communicated to the committee by the external auditors under applicable generally accepted auditing standards, applicable law and listing standards, including the external auditors’ report to the committee (and management’s response thereto) on: (a) all critical accounting policies and practices used by the corporation; (b) all material alternative accounting treatments of financial information within generally accepted accounting principles that have been discussed with management, including the ramifications of the use of such alternative treatments and disclosures and the treatment preferred by the external auditors; and (c) any other material written communications between the external auditors and management. |
| 3. | Require the external auditors to present and discuss with the committee their views about the quality, not just the acceptability, of the implementation of generally accepted accounting principles with particular focus on accounting estimates and judgements made by management and their selection of accounting principles. |
| 4. | Discuss with management and the external auditors (a) any accounting adjustments that were noted or proposed (i.e. immaterial or otherwise) by the external auditors but were not reflected in the financial statements, (b) any material correcting adjustments that were identified by the external auditors in accordance with generally accepted accounting principles or applicable law, (c) any communication reflecting a difference of opinion between the audit team and the external auditors’ national office on material auditing or accounting issues raised by the engagement, and (d) any “management” or “internal control” letter issued, or proposed to be issued, by the external auditors to the corporation. |
| 5. | Discuss with management and the external auditors any significant financial reporting issues considered during the fiscal period and the method of resolution. Resolve disagreements between management and the external auditors regarding financial reporting. |
| 6. | Review with management and the external auditors (a) any off-balance sheet financing mechanisms being used by the corporation and their effect on the corporation’s financial statements and (b) the effect of regulatory and accounting initiatives on the corporation’s financial statements, including the potential impact of proposed initiatives. |
| 7. | Review with management and the external auditors and legal counsel, if necessary, any litigation, claim or other contingency, including tax assessments, that could have a material effect on the financial position or operating results of the corporation, and the manner in which these matters have been disclosed or reflected in the financial statements. |
| 8. | Review with the external auditors any audit problems or difficulties experienced by the external auditors in performing the audit, including any restrictions or limitations imposed by management, and management’s response. Resolve any disagreements between management and the external auditors regarding these matters. |
2024 ANNUAL INFORMATION FORM Page 155
| 9. | Review the results of the external auditors’ audit work including findings and recommendations, management’s response, and any resulting changes in accounting practices or policies and the impact such changes may have on the financial statements. |
| 10. | Review and discuss with management and the external auditors the audited annual financial statements and related management discussion and analysis, make recommendations to the board with respect to approval thereof, before being released to the public, and obtain an explanation from management of all significant variances between comparable reporting periods. |
| 11. | Review and discuss with management and the external auditors all interim unaudited financial statements and related interim management discussion and analysis and make recommendations to the board with respect to the approval thereof, before being released to the public. |
| 12. | Obtain confirmation from the chief executive officer and the chief financial officer (and considering the external auditors’ comments, if any, thereon) to their knowledge: |
| (a) | that the audited financial statements, together with any financial information included in the annual MD&A and annual information form, fairly present in all material respects the corporation’s financial condition, cash flow and results of operation, as of the date and for the periods presented in such filings; and |
| (b) | that the interim financial statements, together with any financial information included in the interim MD&A, fairly present in all material respects the corporation’s financial condition, cash flow and results of operation, as of the date and for the periods presented in such filings. |
| 13. | Review news releases to be issued in connection with the audited annual financial statements and related management discussion and analysis and the interim unaudited financial statements and related interim management discussion and analysis, before being released to the public. Discuss the type and presentation of information to be included in news releases (paying particular attention to any use of “pro-forma” or “adjusted” non-GAAP, information). |
| 14. | Review any news release, before being released to the public, containing earnings guidance or financial information based upon the corporation’s financial statements prior to the release of such statements. |
| 15. | Review the appointment of the chief financial officer and have the chief financial officer report to the committee on the qualifications of new key financial executives involved in the financial reporting process. |
| 16. | Consult with the human resources and compensation committee on the succession plan for the chief financial officer and controller. Review the succession plans in respect of the chief financial officer and controller. |
Internal controls
| 17. | Receive from management a statement of the corporation’s system of internal controls over accounting and financial reporting. |
| 18. | Consider and review with management, the internal auditor and the external auditors, the adequacy and effectiveness of internal controls over accounting and financial reporting within the corporation and any proposed significant changes in them. |
| 19. | Consider and discuss the scope of the internal auditors’ and external auditors’ review of the corporation’s internal controls, and obtain reports on significant findings and recommendations, together with management responses. |
| 20. | Discuss, as appropriate, with management, the external auditors and the internal auditor, any major issues as to the adequacy of the corporation’s internal controls and any special audit steps in light of material internal control deficiencies. |
| 21. | Review annually the disclosure controls and procedures, including (a) the certification timetable and related process and (b) the procedures that are in place for the review of the corporation’s disclosure of financial information extracted from the corporation’s financial statements and the adequacy of such procedures. Receive confirmation from the chief executive officer and the chief financial officer of the effectiveness of disclosure controls and procedures, and whether there are any significant deficiencies and material weaknesses in the design or operation of internal control over financial reporting which are reasonably likely to adversely affect the corporation’s ability to record, process, summarize and report financial information or any fraud, whether or not material, that involves management or other employees who have a significant role in the corporation’s internal control over financial reporting. In addition, receive confirmation from the chief executive officer and the chief financial officer that they are prepared to sign the annual and quarterly certificates required by applicable securities law. |
2024 ANNUAL INFORMATION FORM Page 156
| 22. | Review management’s annual report and the external auditors’ report on the assessment of the effectiveness of the corporation’s internal control over financial reporting. |
| 23. | Receive a report, at least annually, from the technical committee of the board on the corporation’s mineral reserves. |
External auditors
| (i) | External Auditors’ Qualifications and Selection |
| 24. | Subject to the requirements of applicable law, be solely responsible to select, retain, compensate, oversee, evaluate and, where appropriate, replace the external auditors, who must be registered with agencies mandated by applicable law. The committee shall be entitled to adequate funding from the corporation for the purpose of compensating the external auditors for completing an audit and audit report. |
| 25. | Instruct the external auditors that: |
| (a) | they are ultimately accountable to the board and the committee, as representatives of shareholders; and |
| (b) | they must report directly to the committee. |
| 26. | Ensure that the external auditors have direct and open communication with the committee and that the external auditors meet regularly with the committee without the presence of management to discuss any matters that the committee or the external auditors believe should be discussed privately. |
| 27. | Evaluate the external auditors’ qualifications, performance, and independence. As part of that evaluation: |
| (a) | at least annually, request and review a formal report by the external auditors describing: the firm’s internal quality-control procedures; any material issues raised by the most recent internal quality-control review, or peer review, of the firm, or by any inquiry or investigation by governmental or professional authorities, within the preceding five years, respecting one or more independent audits carried out by the firm, and any steps taken to deal with any such issues; and (to assess the auditors’ independence) all relationships between the external auditors and the corporation, including the amount of fees received by the external auditors for the audit services and for various types of non-audit services for the periods prescribed by applicable law; and |
| (b) | annually review and confirm with management and the external auditors the independence of the external auditors, including the extent of non-audit services and fees, the extent to which the compensation of the audit partners of the external auditors is based upon selling non-audit services, the timing and process for implementing the rotation of the lead audit partner, reviewing partner and other partners providing audit services for the corporation, whether there should be a regular rotation of the audit firm itself, and whether there has been a “cooling off” period of one year for any former employees of the external auditors who are now employees with a financial oversight role, in order to assure compliance with applicable law on such matters; and |
| (c) | annually review and evaluate senior members of the external audit team, including their expertise and qualifications. In making this evaluation, the audit and finance committee should consider the opinions of management and the internal auditor. |
Conclusions on the independence of the external auditors should be reported to the board.
| 28. | Review and approve the corporation’s policies for the corporation’s hiring of employees and former employees of the external auditors. Such policies shall include, at minimum, a one-year hiring “cooling off” period. |
| (ii) | Other Matters |
| 29. | Meet with the external auditors to review and approve the annual audit plan of the corporation’s financial statements prior to the annual audit being undertaken by the external auditors, including reviewing the year-to-year co-ordination of the audit plan and the planning, staffing and extent of the scope of the annual audit. This review should include an explanation from the external auditors of the factors considered by the external auditors in determining their audit scope, including major risk factors. The external auditors shall report to the committee all significant changes to the approved audit plan. |
2024 ANNUAL INFORMATION FORM Page 157
| 30. | Review and recommend to the board for approval the basis and amount of the external auditors’ fees with respect to the annual audit in light of all relevant matters. |
| 31. | Review and pre-approve all audit and non-audit service engagement fees and terms in accordance with applicable law, including those provided to the subsidiaries of the corporation by the external auditors or any other person in its capacity as external auditors of such subsidiary. Between scheduled committee meetings, the chair of the committee, on behalf of the committee, is authorised to pre-approve any audit or non-audit service engagement fees and terms. At the next committee meeting, the chair shall report to the committee any such pre-approval given. Establish and adopt procedures for such matters. |
Internal auditor
| 32. | Review and approve the appointment or removal of the internal auditor. |
| 33. | Review and discuss with the external auditors, management, and internal auditor the responsibilities, budget and staffing of the corporation’s internal audit function. |
| 34. | Review and approve the mandate for the internal auditor and the scope of annual work planned by the internal auditor, receive summary reports of internal audit findings, management’s response thereto, and reports on any subsequent follow-up to any identified weakness. |
| 35. | Ensure that the internal auditor has direct and open communication with the committee and that the internal auditor meets regularly with the committee without the presence of management to discuss any matters that the committee or the internal auditor believe should be discussed privately, such as problems or difficulties which were encountered in the course of internal audit work, including restrictions on the scope of activities or access to required information, and any disagreements with management. |
| 36. | Review and discuss with the internal auditor and management the internal auditor’s ongoing assessments of the corporation’s business processes and system of internal controls. |
| 37. | Review the effectiveness of the internal audit function, including staffing, organizational structure and qualifications of the internal auditor and staff. |
Compliance
| 38. | Monitor compliance by the corporation with all payments and remittances required to be made in accordance with applicable law, where the failure to make such payments could render the directors of the corporation personally liable. |
| 39. | The receipt of regular updates from management regarding compliance with laws and regulations and the process in place to monitor such compliance, excluding, however, legal compliance matters subject to the oversight of the safety, health and environment committee of the board. Review the findings of any examination by regulatory authorities and any external auditors’ observations relating to such matters. |
| 40. | Establish and oversee the procedures in the code of conduct and ethics policy to address: |
| (a) | the receipt, retention and treatment of complaints received by the corporation regarding accounting, internal accounting or auditing matters; and |
| (b) | confidential, anonymous submissions by employees of concerns regarding questionable accounting and auditing matters. |
Receive periodically a summary report on such matters as required by the code of conduct and ethics.
| 41. | Review and recommend to the board for approval a code of conduct and ethics for employees, officers and directors of the corporation. Monitor management’s implementation of the code of conduct and ethics and the global anti-corruption program and review compliance therewith by, among other things, obtaining an annual report summarizing statements of compliance by employees pursuant to such policies and reviewing the findings of any investigations of non-compliance. Periodically review the adequacy and appropriateness of such policies and programs and make recommendations to the board thereon. |
2024 ANNUAL INFORMATION FORM Page 158
| 42. | Monitor management’s implementation of the anti-fraud policy; and review compliance therewith by, among other things, receiving reports from management on: |
| (a) | any investigations of fraudulent activity; |
| (b) | monitoring activities in relation to fraud risks and controls; and |
| (c) | assessments of fraud risk. |
Periodically review the adequacy and appropriateness of the anti-fraud policy and make recommendations to the board thereon.
| 43. | Review all proposed related party transactions and situations involving a director’s, senior officer’s or an affiliate’s potential or actual conflict of interest that are not required to be dealt with by an “independent committee” pursuant to securities law rules, other than routine transactions and situations arising in the ordinary course of business, consistent with past practice. Between scheduled committee meetings, the chair of the committee, on behalf of the committee, is authorized to review all such transactions and situations. At the next committee meeting, the chair shall report the results of such review. |
| 44. | Monitor management of hedging, debt and credit, make recommendations to the board respecting policies for management of such risks, and review the corporation’s compliance therewith. |
| 45. | Approve the review and approval process for the expenses submitted for reimbursement by the chief executive officer. |
| 46. | Oversee management’s mitigation of material risks within the committee’s mandate and as otherwise assigned. |
Financial oversight
| 47. | Assist the board in its consideration and ongoing oversight of matters pertaining to: |
| (a) | capital structure and funding including finance and cash flow planning; |
| (b) | capital management planning and initiatives; |
| (c) | property and corporate acquisitions and divestitures including proposals which may have a material impact on the corporation’s capital position; |
| (d) | the corporation’s annual budget and business plan; |
| (e) | the corporation’s insurance program; |
| (f) | supply chain management; |
| (g) | directors’ and officers’ liability insurance and indemnity agreements; |
| (h) | the annual approval to elect the end-user exception under Dodd Frank; and |
| (i) | matters the board may refer to the committee from time to time in connection with the corporation’s capital position. |
General
| 48. | Conduct any actions to oversee management respecting all other matters relating to this mandate. |
| 49. | Undertake such other tasks as may be directed to it from time to time by the board. |
Organizational matters
| 50. | The procedures governing the committee shall, except as otherwise provided for herein, be those applicable to the board committees as set forth in Part 7 of the General Bylaws of the corporation. |
| 51. | The members and the chair of the committee shall be entitled to receive remuneration for acting in such capacity as the board may from time to time determine. |
| 52. | The committee shall have the resources and authority appropriate to discharge its duties and responsibilities, including the authority to: |
2024 ANNUAL INFORMATION FORM Page 159
| (a) | select, retain, terminate, set and approve the fees and other retention terms of special or independent counsel, accountants or other experts, as it considers appropriate; and |
| (b) | obtain appropriate funding to pay, or approve the payment of, such approved fees; |
without seeking approval of the board or management.
| 53. | Any member of the committee may be removed or replaced at any time by the board and shall cease to be a member of the committee upon ceasing to be a director. The board may fill vacancies on the committee by appointment from among its members. If and whenever a vacancy shall exist on the committee, the remaining members may exercise all its powers so long as a quorum remains in office. Subject to the foregoing, each member of the committee shall remain as such until the next annual meeting of shareholders after that member’s election. |
| 54. | The committee shall annually review and assess the adequacy of its mandate and recommend any proposed changes to the nominating, corporate governance and risk committee for recommendation to the board for approval. |
| 55. | The committee shall participate in an annual performance evaluation, the results of which will be reviewed by the board. |
| 56. | The committee shall perform any other activities consistent with this mandate, the corporation’s governing laws and the regulations of stock exchanges, as the committee or the board considers necessary or appropriate. |
| 57. | A standing invitation will be issued to all non-executive directors to attend the financial oversight portion of each committee meeting. |
2024 ANNUAL INFORMATION FORM Page 160

EXHIBIT 99.3
Cameco Corporation
2024 Management’s Discussion and Analysis
February 20, 2025
Exhibit 99.3

Management’s discussion and analysis
February 20, 2025
| 10 | MARKET OVERVIEW AND DEVELOPMENTS |
|
| 17 | 2024 PERFORMANCE HIGHLIGHTS |
|
| 22 | OUR VALUES AND STRATEGY |
|
| 32 | OUR SUSTAINABILITY PRINCIPLES AND PRACTICES |
|
| 35 | MEASURING OUR RESULTS |
|
| 37 | FINANCIAL RESULTS |
|
| 73 | OPERATIONS AND PROJECTS |
|
| 107 | MINERAL RESERVES AND RESOURCES |
|
| 112 | ADDITIONAL INFORMATION |
|
This management’s discussion and analysis (MD&A) includes information that will help you understand management’s perspective of our audited consolidated financial statements (financial statements) and notes for the year ended December 31, 2024. The information is based on what we knew as of February 19, 2025.
We encourage you to read our audited consolidated financial statements and notes as you review this MD&A. You can find more information about Cameco, including our financial statements and our most recent annual information form, on our website at cameco.com, on SEDAR+ at www.sedarplus.ca, or on EDGAR at www.sec.gov. You should also read our annual information form before making an investment decision about our securities.
The financial information in this MD&A and in our financial statements and notes is prepared according to International Financial Reporting Standards (IFRS), unless otherwise indicated.
Unless we have specified otherwise, all dollar amounts are in Canadian dollars.
Throughout this document, the terms we, us, our, the Company and Cameco mean Cameco Corporation and its subsidiaries, unless otherwise indicated.
Caution about forward-looking information
Our MD&A includes statements and information about our expectations for the future. When we discuss our strategy, plans, future financial and operating performance, or other things that have not yet taken place, we are making statements considered to be forward-looking information or forward-looking statements under Canadian and United States (US) securities laws. We refer to them in this MD&A as forward-looking information.
Key things to understand about the forward-looking information in this MD&A:
| • | It typically includes words and phrases about the future, such as: anticipate, believe, estimate, expect, forecast, goal, intend, outlook, plan, project, strategy, target, vision, and will (see examples below). |
| • | It represents our current views and can change significantly. |
| • | It is based on a number of material assumptions, including those we have listed on page 5, which may prove to be incorrect. |
| • | Actual results and events may be significantly different from what we currently expect, due to the risks associated with our business. We list a number of these material risks on page 4. We recommend you also review our most recent annual information form, which includes a discussion of other material risks that could cause actual results to differ significantly from our current expectations. |
| • | Forward-looking information is designed to help you understand management’s current views of our near- and longer-term prospects, and it may not be appropriate for other purposes. We will not necessarily update this information unless we are required to by securities laws. |
Examples of forward-looking information in this MD&A
| • | our view that we have the strengths to take advantage of the world’s rising demand for safe, secure, reliable, affordable and carbon-free energy |
| • | that we will continue to focus on delivering our products responsibly and addressing the risks and opportunities that we believe will make our business sustainable and will build long-term value |
| • | our expectations about when future reactors will come online |
| • | our expectations about 2025 and future global uranium supply, consumption, contracting, demand, geopolitical issues and the market including the discussion under the heading Market overview and developments |
| • | our expectations for the future of the nuclear industry and the potential for new enrichment technology, including that nuclear power must be a central part of the solution to the world’s shift to a low-carbon climate-resilient economy and that our investment in enrichment technology, if successful, will allow us to participate in the entire nuclear fuel value chain |
| • | our efforts to participate in the commercialization and deployment of small modular reactors (SMRs) and increase our contributions to decarbonization and help provide energy security by exploring SMRs and other emerging opportunities within the fuel cycle |
| • | our expectations about future demand for SMRs |
| • | our views on our ability to self-manage risk |
| • | the discussion under the heading Our business |
| • | the discussion under the heading Our strategy |
| • | our expectations regarding the effect of supply scarcity on our long-term contract portfolio |
| • | our expectations regarding the operation of, and production levels for, the Cigar Lake mine and McArthur River/Key Lake operation and fuel services, as well as our exploration activities at these and other sites |
| • | our expectations regarding the future average unit cost of production at McArthur River/Key Lake at Cigar Lake and at JV Inkai operations |
| • | our expectations regarding our licences for McArthur River, Key Lake and Crow Butte |
| • | Kazatomprom’s planned production levels for JV Inkai and the timing of deliveries, and our other expectations regarding JV Inkai |
| • | the discussion under the heading Our Sustainability principles and practices including our belief that we can be part of the solution to enhance national, energy and climate security, and our position to deliver significant long-term business value |
| • | our expectations for uranium purchases, sales and deliveries |
| • | our intentions regarding future dividend payments |
| • | the discussion of our expectations relating to our Canada Revenue Agency (CRA) transfer pricing dispute, including our confidence that the courts would reject any attempt by CRA to utilize the same or similar positions for other tax years currently in dispute, our plan to file a notice of objection for 2018 and our belief that CRA should return the full amount of cash and security that has been paid or otherwise secured by us |
| • | the discussion of our future plans for Cigar Lake and McArthur River/Key Lake under the heading 2024 performance highlights |
| • | our views on our ability to align our production with market opportunities and our contract portfolio |
| • | our expectation regarding opportunities to improve operational effectiveness and to reduce our impact on the environment, including through the use of digital and automation technologies |
| • | the discussion under the heading Outlook for 2025, including expected business resiliency, expectations for 2025 average unit cost of sales, average purchase price per pound, deliveries and production, 2025 financial outlook, our revenue, tax rates, adjusted net earnings and cash flow sensitivity, and our price sensitivity analysis for our uranium segment |
2 CAMECO CORPORATION
| • | the discussion under the heading Liquidity and capital resources, including expected liquidity to meet our 2025 obligations |
| • | our expectation that the uranium contract portfolio we have built will continue to provide a solid revenue stream, and our portfolio management strategy, including our inventory strategy and the extent of our spot market purchases |
| • | our expectation that our cash balances and operating cash flows will meet our anticipated 2025 capital requirements |
| • | our expectations for our and Westinghouse Electric Company’s (Westinghouse) future capital expenditures and sources of funds |
| • | our expectation that in 2025 we will be able to comply with all the covenants in our credit agreements |
| • | our expectation that Westinghouse will continue to comply with the covenants in its credit agreements |
| • | life of mine operating cost estimates for the Cigar Lake, McArthur River/Key Lake and JV Inkai operations |
| • | our future plans and expectations for uranium properties, advanced uranium projects, and fuel services operating sites, including production levels and suspension of production at certain properties, pace of advancement and expansion capacity, carbon reduction targets and mine life, and that our core growth is expected to come from our existing mining and fuel services assets |
| • | our expectations related to care and maintenance costs |
| • | our mineral reserve and resource estimates |
| • | our decommissioning estimates |
| • | the discussion of our expectations relating to our 49% interest in Westinghouse, including the investment in Westinghouse expanding our participation in the nuclear fuel value chain, Westinghouse providing a platform for further growth, and various factors and drivers for Westinghouse’s business segment |
| • | our expectation that our investment in Westinghouse will enhance our participation in the nuclear fuel cycle |
| • | our expectation that our investment in Westinghouse will be accretive to us and augment the core of our business |
| • | our expectation of Westinghouse being well positioned to participate in the growing demand profile for nuclear energy |
| • | our plans to update our physical climate risk assessments, incorporate these findings into our internal risk management review and developing an adaptation action plan template and our expectations regarding the timing for implementation of these plans |
| • | our expectations regarding our research and development expenses for 2025 |
| • | our expectations regarding the Canadian Nuclear Safety Commission’s review of our preliminary decommissioning cost estimate for the Port Hope conversion facility |
| • | our expectations regarding which extraction methods we will use in the future |
| • | our expectation that Westinghouse’s durable and growing business will allow Westinghouse to self-fund its approved annual operating budget, maintain its existing capacity to service its annual financial obligations from de-risked cash flows, and pay annual distributions to its owners |
| • | our 2025 outlook for Westinghouse, including Adjusted EBITDA, capital expenditures and revenue |
| • | our expectation that strategic initiatives, including the development of the AP300™ small modular reactor and the eVinci™ microreactor, will provide new business opportunities for Westinghouse that will make a meaningful contribution to Westinghouse’s long-term financial performance |
| • | our expectation for Westinghouse projects generating multi-year revenue streams and EBITDA for Westinghouse |
| • | our expectation that the timing of cash distributions from Westinghouse will be aligned with the timing of Westinghouse’s cash flows |
| • | our expectation that Westinghouse’s new opportunities will allow Westinghouse to compete for and win new business |
| • | our expectation that Westinghouse’s reputation and position will benefit its core business as Eastern European countries seek to develop a reliable fuel supply chain |
| • | our expectations regarding the growth of Westinghouse’s Adjusted EBITDA over the next five years |
| • | our estimates in respect of the framework for the timing of revenue flows and profitability of contracts under a new build project |
| • | our expectations with respect to the development of the AP300 small modular reactor and eVinci microreactor |
| • | our expectation on Westinghouse being well-positioned for future growth |
| • | our expectations regarding when Global Laser Enrichment’s technology will be deployed at a commercial scale |
MANAGEMENT’S DISCUSSION AND ANALYSIS 3
Material risks
| • | actual sales volumes or market prices for any of our products or services are lower than we expect, or cost of sales is higher than we expect, for any reason, including changes in market prices, loss of market share to a competitor, trade restrictions, geopolitical issues or the impact of a pandemic |
| • | we are adversely affected by changes in currency exchange rates, interest rates, royalty rates, tax rates, tariffs or inflation |
| • | our production costs are higher than planned, or necessary supplies are not available, or not available on commercially reasonable terms |
| • | our strategies may change, be unsuccessful or have unanticipated consequences, or we may not be able to achieve anticipated operational flexibility and efficiency |
| • | changing views of governments regarding the pursuit of carbon reduction strategies or our view may prove to be inaccurate on the role of nuclear power in pursuit of those strategies |
| • | our estimates and forecasts prove to be inaccurate, including production, purchases, deliveries, cash flow, revenue, costs, decommissioning, reclamation expenses, or timing or receipt of future dividends from JV Inkai |
| • | that we may not realize the expected benefits from our investment in Westinghouse or any of our other joint venture investments |
| • | Westinghouse fails to generate sufficient cash flow to fund its approved annual operating budget or make distributions to the partners |
| • | we are unable to enforce our legal rights under our existing agreements, permits or licences |
| • | we are subject to litigation or arbitration that has an adverse outcome |
| • | that the courts may accept the same, similar or different positions and arguments advanced by CRA to reach decisions that are adverse to us for other tax years |
| • | the possibility of a materially different outcome in disputes with CRA for other tax years |
| • | that CRA does not agree that the court rulings for the years that have been resolved in Cameco’s favour should apply to subsequent tax years |
| • | that CRA will not return all or substantially all of the cash and security that has been paid or otherwise secured in a timely manner, or at all |
| • | there are defects in, or challenges to, title to our properties |
| • | our mineral reserve and resource estimates are not reliable, or there are unexpected or challenging geological, hydrological or mining conditions |
| • | we are affected by environmental, safety and regulatory risks, including workforce health and safety or increased regulatory burdens or delays resulting from a pandemic or other causes |
| • | we are adversely affected by subsurface contamination from current or legacy operations |
| • | necessary permits or approvals from government authorities cannot be obtained or maintained |
| • | we are affected by political risks, including developments in US foreign policy, global conflicts, sanctions or any potential future unrest in Kazakhstan |
| • | we may be affected by crime, corruption, making improper payments or providing benefits that may violate Canadian or US law or laws relating to foreign corrupt practices or sanctions |
| • | operations are disrupted due to problems with our own or our suppliers’ or customers’ facilities, the unavailability of reagents, equipment, operating parts and supplies critical to production, equipment failure, lack of tailings capacity, labour shortages, labour relations issues, strikes or lockouts, underground floods, cave-ins, ground movements, tailings dam failures, transportation disruptions or accidents, aging infrastructure or other development and operating risks |
| • | we are affected by terrorism, sabotage, blockades, civil unrest, social or political activism, outbreak of illness (such as a pandemic), accident or a deterioration in political support for, or demand for, nuclear energy |
| • | a major accident at a nuclear power plant |
| • | we are impacted by changes in the regulation or public perception of the safety of nuclear power plants, which adversely affect the construction of new plants, the relicensing of existing plants and the demand for uranium |
| • | government laws, regulations, policies or decisions that adversely affect us, including tax and trade laws, tariffs and sanctions, including changes in mining laws or regulations |
| • | our uranium suppliers or purchasers fail to fulfil their commitments |
| • | our McArthur River development, mining or production plans are delayed or do not succeed for any reason |
| • | our Cigar Lake development, mining or production plans are delayed or do not succeed for any reason |
| • | our production plans for our fuel services segment do not succeed for any reason |
| • | the McClean Lake’s mill production plan is delayed or does not succeed for any reason |
| • | water quality and environmental concerns could result in a potential deferral of production and additional capital and operating expenses required for the Cigar Lake and McArthur River/Key Lake operations |
| • | JV Inkai’s development, mining or production plans are delayed or do not succeed for any reason, or JV Inkai is unable to transport and deliver its production |
| • | we may be unsuccessful in pursuing innovation or implementing advanced technologies, including the risk that the commercialization and deployment of SMRs or new enrichment technology may incur unanticipated delays or expenses, or ultimately prove to be unsuccessful |
| • | our expectations relating to care and maintenance costs prove to be inaccurate |
| • | the risk that we may not be able to realize our expected cash flow |
| • | the risk that we may become unable to pay future dividends at the expected rate |
4 CAMECO CORPORATION
| • | we are affected by natural phenomena, including inclement weather, fire, flood and earthquakes |
| • | the risks that generally apply to all our operations and advanced uranium projects that are discussed under the heading Managing the risks beginning on page 70 |
| • | the risks relating to our tier-one uranium operations discussed under the heading McArthur River mine/Key Lake mill – Managing Our Risks beginning on page 75, under the heading Cigar Lake – Managing Our Risks beginning on page 79, and under the heading Inkai – Managing Our Risks beginning on page 83 |
| • | unexpected changes in uranium supply, demand, long-term contracting, and prices |
| • | changes in consumer demand for nuclear power and uranium as a result of changing societal views and objectives regarding nuclear power, electrification and decarbonization |
| • | the risk that our views regarding nuclear power, its growth profile, and benefits may prove to be incorrect |
| • | the risk that we and Westinghouse may not be able to meet sales commitments for any reason |
| • | the risk that Westinghouse may not achieve the expected growth in its business |
| • | the risk to Westinghouse’s business associated with potential production disruptions, including those related to global supply chain disruptions, global economic uncertainty, political volatility, labour relations issues, and operating risks |
| • | the risk that Westinghouse may not be able to implement its business objectives in a manner consistent with its or our sustainability principles and other values |
| • | the risk that Westinghouse’s strategies may change, be unsuccessful, or have unanticipated consequences |
| • | the risk that Westinghouse may be unsuccessful in respect of its new business |
| • | the risk that Westinghouse may be delayed in announcing its future financial results |
| • | the risk that Westinghouse may fail to comply with nuclear licence and quality assurance requirements at its facilities |
| • | the risk that Westinghouse may lose protections against liability for nuclear damage, including discontinuation of global nuclear liability regimes and indemnities |
| • | the risk that increased trade barriers may adversely impact our business, or the business of any of the joint ventures in which we have invested |
| • | the risk that Westinghouse may default under its credit facilities, impacting adversely Westinghouse’s ability to fund its ongoing operations and to make distributions |
| • | the risk that liabilities at Westinghouse may exceed our estimates and the discovery of unknown or undisclosed liabilities |
| • | the risk that occupational health and safety issues may arise at Westinghouse’s operations |
| • | the risk that there may be disputes between us and Brookfield Renewable Partners (Brookfield) regarding our strategic partnership, or disputes between us and any of our other joint venture partners |
| • | the risk that we may default under the governance agreement with Brookfield, including us losing some or all of our interest in Westinghouse |
Material assumptions
| • | our expectations regarding sales and purchase volumes and prices for uranium and fuel services, cost of sales, trade restrictions, inflation and that counterparties to our sales and purchase agreements will honour their commitments |
| • | our expectations for the nuclear industry, including its growth profile, market conditions, geopolitical issues and the demand for and supply of uranium |
| • | the continuing pursuit of carbon reduction strategies by governments and the role of nuclear in the pursuit of those strategies |
| • | the assumptions discussed under the heading 2025 Financial Outlook |
| • | our expectations regarding spot prices and realized prices for uranium, and other factors discussed under the heading Price sensitivity analysis: uranium segment |
| • | Westinghouse’s ability to generate cash flow and fund its approved annual operating budget and make distributions to the partners |
| • | our ability to compete for additional business opportunities so as to generate additional revenue for us as a result of our investment in Westinghouse |
| • | market conditions and other factors upon which we based our investment in Westinghouse and our related forecasts will be as expected |
| • | the success of our plans and strategies relating to our investment in Westinghouse and our other joint venture investments |
| • | that the construction of new nuclear power plants and the relicensing of existing nuclear power plants will not be more adversely affected than expected by changes in regulation or in the public perception of the safety of nuclear power plants |
| • | our ability to continue to supply our products and services in the expected quantities and at the expected times |
| • | our expected production levels for Cigar Lake, McArthur River/Key Lake, JV Inkai and our fuel services operating sites |
| • | our cost expectations, including production costs, operating costs, and capital costs |
| • | our expectations regarding tax payments, tax rates, tariffs, royalty rates, currency exchange rates and interest rates |
| • | our entitlement to and ability to receive expected refunds and payments from CRA |
MANAGEMENT’S DISCUSSION AND ANALYSIS 5
| • | in our dispute with CRA, that courts will reach consistent decisions for other tax years that are based upon similar positions and arguments |
| • | that CRA will not successfully advance different positions and arguments that may lead to different outcomes for other tax years |
| • | our expectation that we will recover all or substantially all of the amounts paid or secured in respect of the CRA dispute to date |
| • | our decommissioning and reclamation estimates, including the assumptions upon which they are based, are reliable |
| • | our mineral reserve and resource estimates, and the assumptions upon which they are based, are reliable |
| • | our understanding of the geological, hydrological and other conditions at our uranium properties |
| • | our Cigar Lake and McArthur River development, mining and production plans succeed |
| • | our Key Lake mill production plan succeeds |
| • | the McClean Lake mill is able to process Cigar Lake ore as expected |
| • | our production plans for our fuel services segment succeed |
| • | JV Inkai’s development, mining and production plans succeed, and that JV Inkai will be able to transport and deliver its production |
| • | the ability of JV Inkai to pay dividends, or the timing of their payments |
| • | that care and maintenance costs will be as expected |
| • | our and our contractors’ ability to comply with current and future environmental, safety and other regulatory requirements, and to obtain and maintain required regulatory approvals |
| • | that we will be successful in our efforts to renew our operating licence for Crow Butte |
| • | assumptions regarding our expected cash flow |
| • | our operations and those of our joint venture investments are not significantly disrupted as a result of political instability, sanctions, nationalization, developments in US foreign policy, terrorism, sabotage, blockades, civil unrest, breakdown, natural disasters, outbreak of illness (such as a pandemic), governmental or political actions, litigation or arbitration proceedings, the unavailability of reagents, equipment, operating parts and supplies critical to production, labour shortages, labour relations issues, strikes or lockouts, underground floods, cave-ins, ground movements, tailings dam failure, lack of tailings capacity, transportation disruptions or accidents, aging infrastructure or other development or operating risks |
| • | that no major accident at a nuclear power plant will occur |
| • | nuclear power and uranium demand, supply, consumption, long-term contracting, growth in the demand for and global public acceptance of nuclear energy, and prices |
| • | Westinghouse’s production, purchases, sales, deliveries, and costs |
| • | the assumptions and discussion set out under the heading Westinghouse Electric Company – Future Prospects |
| • | the market conditions and other factors upon which we have based Westinghouse’s future plans and forecasts |
| • | Westinghouse’s ability to mitigate adverse consequences of delays in production and construction |
| • | the success of Westinghouse’s plans and strategies |
| • | the absence of new and adverse laws, government regulations, policies or decisions in any country where such developments would affect us, including with respect to changes in mining laws or regulations |
| • | that there will not be any significant adverse consequences to Westinghouse’s business resulting from business disruptions, including those relating to supply disruptions, economic or political uncertainty and volatility, labour relation issues, and operating risks |
| • | Westinghouse’s ability to announce future financial results when expected |
| • | Westinghouse will comply with the covenants in its credit agreements |
| • | Westinghouse will comply with nuclear licence and quality assurance requirements at its facilities |
| • | Westinghouse maintaining protections against liability for nuclear damage, including continuation of global nuclear liability regimes and indemnities |
| • | that known and unknown liabilities at Westinghouse will not materially exceed our estimates |
| • | the absence of disputes between us and Brookfield or any of our other joint venture partners regarding our strategic partnership or joint venture arrangements, and that we do not default under the governance agreement with Brookfield or any other joint venture agreement to which we are a party |
6 CAMECO CORPORATION
[This page is intentionally left blank.]
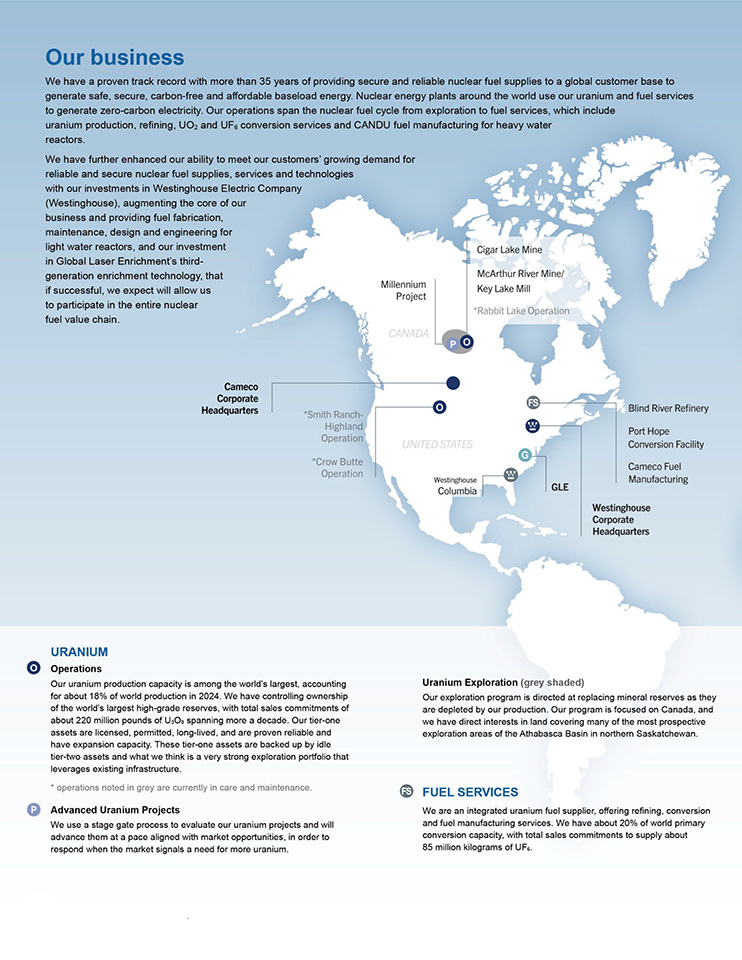
8 CAMECO CORPORATION
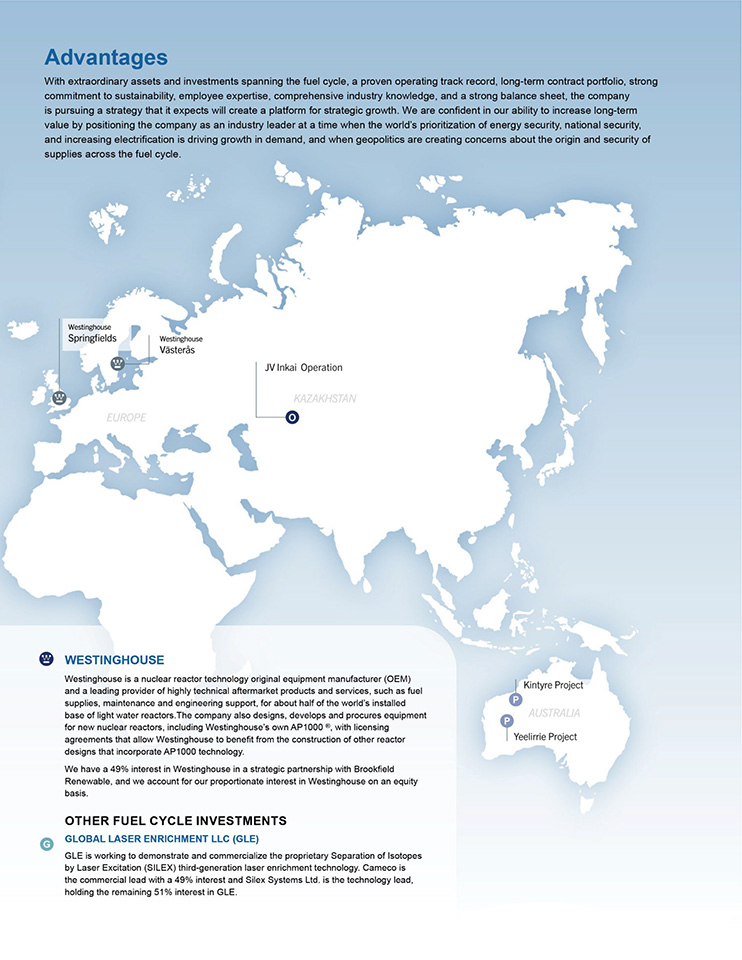
MANAGEMENT’S DISCUSSION AND ANALYSIS 9
Market overview and developments
A market in transition
In 2024, geopolitical uncertainty and heightened concerns about energy security, national security, and climate change continued to improve the demand and supply fundamentals for the nuclear power industry and the fuel cycle that is required to support it. Increasingly, countries and companies around the globe are recognizing the critical role nuclear power must play in providing carbon-free and secure baseload power which was evidenced at the 29th Conference of Parties (COP29), where a total of 31 countries have now signed the declaration to triple nuclear energy capacity by 2050. This growing support has led to a rise in demand as closed reactors are returning to service, reactors are being saved from retirement, life extensions are being sought and approved for existing reactor fleets, and numerous commitments and plans are advancing for the construction of new nuclear generating capacity. In addition, there is increasing interest in small modular reactors (SMR), including smaller versions of existing technology and advanced technology designs, with companies in energy intensive sectors looking to nuclear to help achieve their decarbonization plans. The potential expansion of the markets and use cases for nuclear energy could add significant demand in the decades to come, with a growing number of agreements being signed and several projects already underway.
While demand for uranium and nuclear fuel continues to increase, future supply is not keeping pace. Heightened supply risk caused by growing geopolitical uncertainty, shrinking secondary supplies and a lack of investment in new capacity over the past decade has motivated utilities to evaluate their near-, mid- and long-term nuclear fuel supply chains. The uncertainty about where nuclear fuel supplies will come from to satisfy growing demand has led to significant long-term contracting activity in recent years. In 2024, about 119 million pounds of uranium was placed under long-term contracts by utilities. While the volume remains below replacement rate, this potentially increases the cumulative level of uncovered requirements in the future, when primary supply is expected to be limited, and secondary supply stocks have been drawn down. Prices across the nuclear fuel cycle continued to trend higher in 2024, reaching historic highs in conversion, where spot price increased 111% and term price rose 46% compared to 2023, and in enrichment, where spot and term prices rose over 23% and 10% respectively compared to 2023. At the front end of the cycle, uranium spot prices experienced volatility and averaged $85 (US) per pound for 2024, while the long-term uranium price increased 19% over the prior year, ending 2024 above $80 (US) per pound. We expect continued competition to secure uranium, conversion services and enrichment services under long-term contracts with proven sustainable producers and suppliers who have a diversified portfolio of assets in geopolitically attractive jurisdictions, and on terms that help ensure a reliable supply is available to satisfy demand.
DURABLE DEMAND GROWTH
The benefits of nuclear energy have come clearly into focus, supporting a level of durability that, we believe, has not been previously seen. The durability is being driven not only by the geopolitical realignment in energy markets but also by a global focus on achieving the net-zero carbon targets set by countries and companies around the world. Geopolitical uncertainty has deepened concerns about energy security and national security, highlighting the role of energy policy in balancing three main objectives: providing a reliable and secure baseload profile; providing an affordable, levelized cost profile; and providing a clean emissions profile. Net-zero carbon targets are also turning global attention to a broader triple challenge: about one-third of the global population must be lifted out of energy poverty by improving access to clean and reliable baseload electricity; approximately 80% of the current global electricity grids that run on carbon-emitting sources of thermal power must be replaced with a carbon-free, reliable alternative; and global power grids must grow by electrifying industries, such as private and commercial transportation, and home and industrial heating, which today are largely powered with carbon-emitting sources of thermal energy. There is increasing recognition that nuclear power meets these objectives and has a key role to play in achieving energy security and decarbonization goals. The growth in demand is not just long-term and in the form of new builds, but medium-term in the form of reactor restarts and life extensions, and near-term with early reactor retirement plans being deferred or cancelled and new markets continuing to emerge. Long-term momentum remains very supportive with the installed base of nuclear capacity and an increasing focus on large-scale new build and the development of SMRs.
10 CAMECO CORPORATION
Demand and energy policy highlights
| • | The inaugural Nuclear Energy Summit was held in Brussels in March, jointly organized by Belgium and the International Atomic Energy Agency (IAEA) with representatives from 32 countries in attendance. The leaders backed supportive measures in areas including financing, regulatory cooperation, technological innovation and workforce training to enable the expansion of nuclear power to help address climate change and boost energy security. |
| • | At the 29th annual Conference of Parties (COP29), the 2024 United Nations Climate Change Conference held in Baku, Azerbaijan, six new countries were added to the declaration to triple nuclear energy capacity by 2050, bringing the total to 31. It was recognized that financing mechanisms will play a key role in meeting targets, and the increased interest and investment from some of the world’s largest and advanced technology companies could help support future nuclear deployment. |
| • | The International Energy Agency’s (IEA) 2024 World Energy Outlook report was released in October. The projections for global electricity demand in the Stated Policies Scenario (SPS) increased 6%, or 2,200 terawatt-hours (TWh) higher in 2035, driven primarily by light industrial consumption, cooling, mobility, and data centers and artificial intelligence (AI). Nuclear generation showed a modest increase in the SPS while the Net Zero Scenario (NZE) shows a 16% increase to 7,000 TWh by 2050, compared to 6,000 TWh in the previous report. |
| • | In China, China National Nuclear Corporation (CNNC) started construction at Zhangzhou unit 3 in early 2024, a domestically designed Hualong One (HPR1000), with plans for six more units at the site. CNNC also commenced construction at the Jinqimen nuclear project where it has plans for six HPR1000s. Additionally, China General Nuclear announced that Fangchenggang unit 4, an HPR1000, began loading fuel in February and began operating on April 1. Finally, in August, four new CAP1400 reactors that use Westinghouse technology were approved, bringing the total number of approved reactors in China to 16. |
| • | In Japan, Onagawa unit 2 restarted in October, becoming the first boiling water reactor (BWR) to return to operation under the post-2011 Japanese Nuclear Regulatory Authority (NRA) safety regime. Additionally, Chugoku Electric Power Company successfully restarted Shimane unit 2 in December, bringing the total number of restarted reactors to 14. Finally, the NRA approved a 10-year life extension for two of Kansai’s reactors, Ohi units 3 and 4, from 30 years to 40 years, allowing them to operate until 2061 and 2063, respectively. |
| • | In South Korea, Korea Hydro & Nuclear Power (KHNP) announced that Shin Hanul unit 2 entered commercial operation, while units 3 and 4 are proceeding toward construction. In addition, Saeul units 3 and 4 are progressing through construction, which upon completion will mark 30 units operating in the country. KHNP also initiated the process to extend the lives of Wolsong units 2, 3 and 4. |
| • | In India, the Atomic Energy Commission reaffirmed the country’s plan to triple nuclear power generation by 2030 from current output of 7.5 GWe, with an additional nine reactors currently under construction and additional units planned at various sites, which could potentially include SMRs. The most recent activity has been at Rajasthan unit 7, which is expected to be fully operational in early 2025, and Rajasthan unit 8 which is expected to come online in early 2026. |
| • | In the Czech Republic, the government announced KHNP as the preferred bid for the construction of two additional units at the existing Dukovany nuclear site and two at the Temelin site. |
| • | Energoatom saw first concrete poured in the construction of Khmelnitski units 5 and 6. The new reactors will be the first built in Ukraine using Westinghouse’s AP1000® technology. |
| • | Italy is moving towards a reversal of the country’s current ban on nuclear power production with plans to finalize a nuclear reintroduction strategy by the end of 2027. |
| • | In Poland, the government approved a plan to build an SMR based on designs from Rolls-Royce. Additionally, Polskie Elektrownie Jądrowe announced it has received a Letter of Interest for $1.5 billion (US) in potential financing from Export Development Canada to support Poland’s AP1000 project, which aims to be the country’s first nuclear power plant. |
| • | In Romania, the US Exim Bank approved a $98 million (US) loan commitment for the financing of an SMR project utilizing NuScale technology, with additional funding announcements at the G7 leaders’ summit, totaling up to $275 million (US). The project aims for 462 MWe of capacity at a retired coal plant in the country, with a total of six 77 MWe modules to be constructed. |
| • | In Egypt, the fourth and final VVER-1200 unit at El Dabba began construction. Unit 1 is expected to begin commercial operation in 2029 with the remaining three to follow in the early to mid-2030s. |
| • | Following a lengthy legal battle, Brazilian utility Electronuclear was successful in appealing the government ordered suspension of activity at Angra unit 3, a 1,350 MWe reactor, allowing it to continue construction. |
MANAGEMENT’S DISCUSSION AND ANALYSIS 11
| • | In the US, Southern Company announced that Vogtle unit 4, a Westinghouse AP1000, moved into commercial operation, making it the second new reactor to come online in the US in over 28 years. |
| • | The US Nuclear Regulatory Commission approved Dominion’s North Anna units 1 and 2 for an extension of their operating licences from 60 to 80 years, keeping the reactors online until the 2050s, while Vistra received approval to operate Comanche Peak units 1 and 2 for up to 60 years. Additionally, approval was received to extend Pacific Gas & Electric’s two-unit Diablo Canyon plant operation until 2030, while filings have already been made to extend the operating lives of the units a further 20 years, until the mid-2040s. |
| • | The US Department of Energy (DOE) released its Advanced Nuclear Commercial Liftoff report, outlining the need to add 200 GWe of new generating capacity in order to triple US nuclear capacity by 2050, as part of their net-zero emissions target. Starting in 2030, the report calls for a 13 GWe annual increase in output for 15 years to reach 300 GWe by 2050. This increase is expected to come from extending reactor operating licences, uprating of capacity, and restarting shutdown reactors, along with new large scale and advanced reactors. The report also calls for a significant increase in capacity across the nuclear fuel supply chain and notably, a secure supply of uranium from the US, allies, and partners. |
| • | The US DOE announced plans to finance $900 million (US) for deployment of light-water SMRs, with $800 million (US) of the funding for two of the “first-mover teams” which can include utilities, SMR producers, vendors, and other end-users. In addition, former President Biden signed the Accelerating Deployment of Versatile, Advanced Nuclear for Clean Energy (ADVANCE) Act into law, which builds on prior legislation to modernize licensing, speed up the licensing process and reduce fees, while simplifying the environmental review process. |
| • | Numerous utilities made positive progress towards restarting shutdown nuclear plants in 2024. Holtec International announced their intention to restart the Palisades 800 MWe pressurized water reactor in Michigan, with both state and federal governments backing the effort, which would mark the first US reactor to restart after being shut down for decommissioning. Additionally, NextEra Energy announced they have initiated the regulatory process to restart the Duane Arnold plant, which could see the reactor returning to operation as early as 2028. Finally, Constellation Energy announced their $1.6 billion (US) plan to restart the 835 MWe Crane Clean Energy Center (formerly Three Mile Island Unit 1) in Pennsylvania. The restart is planned for 2028 with Microsoft agreeing to a 20-year power purchase agreement to support the investments in restarting the plant. |
| • | With the rapid expansion of AI and data center demand, numerous other technology companies also made commitments to nuclear for both large scale and SMR projects. Notably, Google announced a deal with Kairos Power to buy the output from at least six first-of-a-kind fluoride salt-cooled, high-temperature reactors. Additionally, Amazon and Energy Northwest announced an agreement for Amazon to fund the development of SMRs, with the right to purchase power from the first four Xe-100 units (320 MWe) and an option for Energy Northwest to build up to eight additional units (640 MWe). Finally, Sabey, a US data center developer, is working with TerraPower to explore the deployment of Natrium SMRs at current and future data center sites. |
| • | In Canada, Bruce Power submitted plans for its Bruce C Project, planning to add 4.8 GWe of new generation to complement 6.5 GWe of existing generation. In early 2025, the Ontario government announced plans for Ontario Power Group (OPG) to construct a 10 GWe nuclear plant near Port Hope. In addition, OPG is proceeding with refurbishments of Pickering B’s four units, expected to be completed by the mid-2030s and extending the plants’ operating lives by 30 years. OPG also successfully completed initial site preparation at the Darlington plant for the first of four GE-Hitachi BWRX-300 SMRs, with the nuclear portion of construction for the first unit set to start in early 2025, with planned commercial operation in 2029. |
| • | Westinghouse opened a new nuclear engineering hub in Kitchener, Ontario, where 50 engineers will be stationed. In addition, SaskPower, Westinghouse, and Cameco signed a Memorandum of Understanding to evaluate Saskatchewan’s clean energy needs involving discussions on the AP1000, AP300 and eVinci reactors. The province will be evaluating the suitability of its infrastructure for a nuclear fuel supply chain through SaskNuclear, a newly formed subsidiary of SaskPower. |
12 CAMECO CORPORATION
According to the IAEA, globally there are currently 440 operable reactors and 62 reactors under construction. Several nations are appreciating the energy security and carbon-free energy benefits of nuclear power and have reaffirmed their commitment with plans underway to support existing reactor units and review policies to encourage more nuclear generation. Several other non-nuclear countries have emerged as candidates for new nuclear capacity. In some countries where phase-out policies have been in place, policy reversals and decisions have been made to keep reactors running, with public opinion polls showing increasing support. With a number of reactor construction projects recently approved and many more planned, demand for uranium continues to improve. There is growing recognition of the role nuclear must play in providing safe, affordable, carbon-free baseload electricity to achieve a low-carbon economy, with geopolitical uncertainty causing some utilities to move away from Russian energy supplies and seek nuclear fuel suppliers whose values are aligned with their own, or whose origin of supply better protects them from potential interruptions.
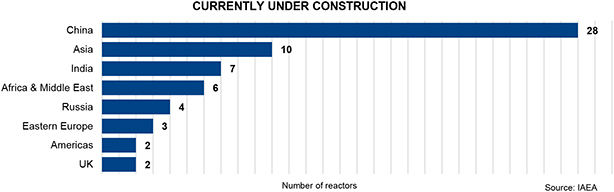
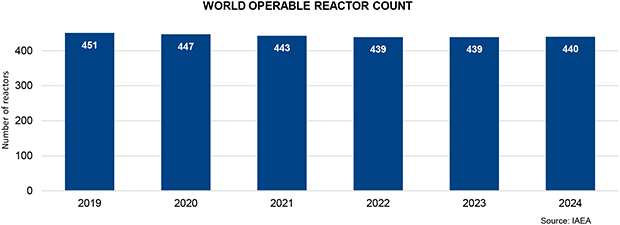
SUPPLY UNCERTAINTY
Geopolitical uncertainty, energy security, and national security remained the most notable factors impacting security of supply in 2024. Driven by the Russian invasion of Ukraine, the mine suspension in Niger, and supply chain challenges, particularly in Kazakhstan, many governments and utilities are re-examining procurement strategies that rely on nuclear fuel supplies from these jurisdictions. In addition, sanctions on Russia and import/export restrictions added to the delivery risks for nuclear fuel supplies coming out of Central Asia. Several uranium projects restarted in 2024 in support of increased demand, though delays and higher-than-expected production costs were a common theme. Despite the positive price trend in 2024, the deepening geopolitical uncertainty, sanctions and trade policy restrictions, and years of underinvestment in new uranium and fuel cycle service capacities has shifted risk from producers to utilities.
MANAGEMENT’S DISCUSSION AND ANALYSIS 13
Supply and trade policy highlights
| • | The Prohibiting Russian Uranium Imports Act (H.R. 1042) went into effect in August with the intent to prohibit the imports of Russian low-enriched uranium (LEU) into the US until 2040. It contains a US DOE waiver process available until 2028, where utilities can apply through a public process for an exception to the import ban in situations concerning energy and national security. In November, the Russian government issued a decree to immediately limit the export of LEU to the US, which was meant to be symmetrical to the trade actions taken by the US earlier in the year. This resulted in two ships departing from St. Petersburg to Baltimore without any of their intended enriched uranium product cargo onboard. |
| • | The DOE approved funding of up to $2.7 billion (US) to support domestic production of LEU and high-assay low-enriched uranium (HALEU) by creating a guaranteed buyer of US-produced nuclear fuel to restore US nuclear fuel production capabilities. Initial awards were granted for HALEU in October and LEU in December. |
| • | In January 2025, Kazatomprom (KAP) announced that 2024 production increased 10% from the prior year to 60.5 million pounds U3O8. No update was provided on 2025 production guidance beyond its previous announcement from August 2024, where it lowered its 2025 guidance range to 65 million to 68.9 million pounds U3O8 (previously 79.3 million to 81.9 million pounds U3O8), citing project delays and continued sulfuric acid shortages. A significant portion of the reduced 2025 guidance resulted from production delays at Appak LLP, as well as JV Budenovskoye LLP. Additionally, KAP reduced production guidance for JV KATCO LLP below annual production capacity until at least 2026. |
| • | In July, the government of Kazakhstan introduced amendments to the Tax Code of the Republic of Kazakhstan which involved changes to the Mineral Extraction Tax (MET) rate for uranium. The MET rate will increase from 6% in 2024, to 9% in 2025, with the introduction of a progressive system based on actual annual production volumes under each subsoil use agreement, starting in 2026, where the highest rate is 18% for operations producing over 10.4 million pounds. An additional MET of up to 2.5% based on the spot market price of uranium, will also be added in 2026. The MET is incurred and paid by the mining entities, impacting both KAP and different JVs and subsidiaries. |
| • | In October, Orano announced plans to temporarily suspend operations at their SOMAIR mine in Niger due to growing financial difficulties resulting from the coup d’état in July 2023 and the subsequent closure of the main supply and export route in Niger. Orano confirmed in December that the Nigerien authorities have taken operational control of the project, resulting from escalating conflicts between the company and the country’s ruling military junta. Earlier in the year, Orano also reported that the Nigerien government revoked their operating permit for their undeveloped Imouraren deposit. Further in the region, GoviEx Uranium Inc. (GoviEx) was informed by the Nigerien government that they no longer have rights over the perimeter of the Madaouela mining permit. In December, both Orano and GoviEx initiated arbitration proceedings against the Republic of Niger for the Imouraren and Madaouela projects respectively. |
| • | In March, Paladin Energy Ltd. (Paladin) announced the restart of its Langer Heinrich mine in Namibia which has an annual production capacity of 5.2 million pounds U3O8 and had been in care and maintenance since 2018. In November, Paladin updated their 2025 production guidance from 4.0-4.5 million pounds U3O8 to 3.0-3.6 million pounds U3O8 due to ongoing challenges and operational variability in ramping up production. |
| • | In 2024, several other uranium projects also restarted production including Boss Energy’s Honeymoon ISR project in Australia, Uranium Energy Corp.’s Christensen Ranch ISR operations in Wyoming, enCore Energy’s Alta Mesa Uranium Central Processing Plant and Wellfield in Texas, and Peninsula Energy Ltd.’s Lance ISR project in Wyoming. In June, Terrafame also reported it officially started recovering natural uranium at its industrial site in Sotkamo, Finland. |
| • | Sprott Physical Uranium Trust (SPUT) purchased about three million pounds U3O8 in 2024, bringing total purchases since inception to nearly 48 million pounds U3O8, and a total physical position of 66.2 million pounds U3O8. Volatility in the equity market impacts SPUT’s ability to raise funds to purchase uranium based on its share price trading at a discount or a premium to the net asset value (NAV) of the uranium it holds; in 2024 SPUT was at a discount to NAV for most of the year, negatively impacting its ability to buy uranium. |
| • | Following 2023 announcements from both Urenco and Orano to proceed with enrichment capacity expansion projects, 2024 saw advancements with the first new centrifuges being installed at Urenco USA and Orano starting construction at its Georges Besse II (GBII) expansion in France. A total capacity expansion of 1.8 million separative work units (SWU) is planned across three Urenco facilities including in Germany and the Netherlands, which represents a 10% capacity increase, whereas Orano seeks to grow GBII’s enrichment capacity by approximately 2.5 million SWU annually, a 30% increase. |
14 CAMECO CORPORATION
Long-term contracting creates full-cycle value for proven productive assets
Like other commodities, the demand for uranium is cyclical. However, unlike other commodities, uranium is not traded in meaningful quantities on a commodity exchange. The uranium market is principally based on bilaterally negotiated long-term contracts covering the annual run-rate requirements of nuclear power plants, with a small spot market to serve discretionary demand. History demonstrates that in general, when prices are rising and high, uranium is perceived as scarce, and more contracting activity takes place with proven and reliable suppliers. The higher demand discovered during this contracting cycle drives investment in higher-cost sources of production, which due to lengthy development timelines, tend to miss the contracting cycle and ramp up after demand has already been won by proven producers. When prices are declining and low, there is no perceived urgency to contract, and contracting activity and investment in new supply dramatically decreases. After years of low prices, and a lack of investment in supply, and as the uncommitted material available in the spot market begins to thin, security-of-supply tends to overtake price concerns. Utilities typically re-enter the long-term contracting market to ensure they have a reliable future supply of uranium to run their reactors.
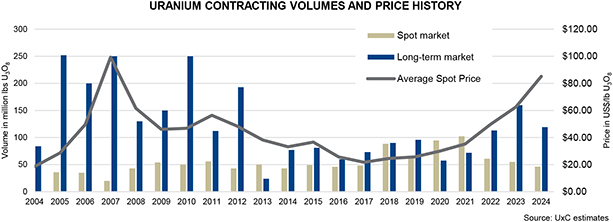
UxC reports that over the last five years approximately 534 million pounds U3O8 equivalent have been locked-up in the long-term market, while approximately 798 million pounds U3O8 equivalent have been consumed in reactors. We remain confident that utilities have a growing gap to fill.
We believe the current backlog of long-term contracting presents a substantial opportunity for proven and reliable suppliers with tier-one productive capacity and a record of honoring supply commitments. As a low-cost producer, we manage our operations to increase value throughout these price cycles.
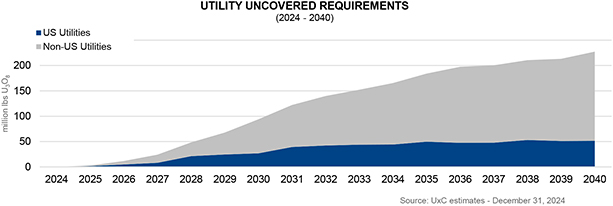
In our industry, customers do not come to the market right before they need to load nuclear fuel into their reactors. To operate a reactor that could run for more than 60 years, natural uranium and the downstream services have to be purchased years in advance, allowing time for a number of processing steps before a finished fuel bundle arrives at the power plant. At present, we believe there is a significant amount of uranium that needs to be contracted to keep reactors running into the next decade.
MANAGEMENT’S DISCUSSION AND ANALYSIS 15
UxC estimates that cumulative uncovered requirements are about 2.1 billion pounds to the end of 2040. With the lack of investment over the past decade, there is growing uncertainty about where uranium will come from to satisfy growing demand, and utilities are becoming increasingly concerned about the availability of material to meet their long-term needs. In addition, secondary supplies have diminished, and the material available in the spot market has thinned as producers and financial funds continue to purchase material. Furthermore, geopolitical uncertainty is causing some utilities to seek nuclear fuel suppliers whose values are aligned with their own or whose origin of supply better protects them from potential interruptions, including from transportation challenges or the possible imposition of formal sanctions.
We will continue to take the actions we believe are necessary to position the company for long-term success. Therefore, we will continue to align our production decisions with our customers’ needs under our contract portfolio. We will undertake contracting activity which is intended to ensure we have adequate protection while maintaining exposure to the benefits that come from having uncommitted, low-cost supply to place into a strengthening market.
16 CAMECO CORPORATION
2024 performance highlights
In 2024, we revised our calculation of adjusted net earnings to adjust for unrealized foreign exchange gains and losses as well as for share-based compensation because it better reflects how we assess our operational performance. We have restated comparative periods to reflect this change. See non-IFRS measures starting on page 65 for more information.
Financial performance
| HIGHLIGHTS DECEMBER 31 ($ MILLIONS EXCEPT WHERE INDICATED) |
2024 | 2023 | CHANGE | |||||||||
| Revenue |
3,136 | 2,588 | 21 | % | ||||||||
| Gross profit |
783 | 562 | 39 | % | ||||||||
| Net earnings attributable to equity holders |
172 | 361 | (52 | )% | ||||||||
| $ per common share (diluted) |
0.39 | 0.83 | (52 | )% | ||||||||
| Adjusted net earnings (non-IFRS, see page 65) |
292 | 383 | (24 | )% | ||||||||
| $ per common share (adjusted and diluted) |
0.67 | 0.88 | (24 | )% | ||||||||
| Adjusted EBITDA (non-IFRS, see page 65) |
1,531 | 884 | 73 | % | ||||||||
| Cash provided by operations |
905 | 688 | 32 | % | ||||||||
Net earnings attributable to equity holders (net earnings) and adjusted net earnings were lower in 2024 compared to 2023 primarily due to the impact of purchase accounting on the full year results of Westinghouse. As a result, we believe adjusted EBITDA is a better measure to assess our operating performance. See 2024 consolidated financial results beginning on page 38 for more information. Of note, we:
| • | increased adjusted EBITDA by 73% as a result of improving results in our uranium segment due to the return to our tier-one production levels, as well as full year results from Westinghouse, our share of its adjusted EBITDA being $483 million for 2024. See non-IFRS measures starting on page 65 for more information. |
| • | generated $905 million in cash from operations |
| • | received a cash dividend of $129 million (US), net of withholdings, from JV Inkai |
| • | received $49 million (US) in February 2025, which represents our share of a $100 million (US) distribution paid by Westinghouse |
| • | successfully refinanced $500 million in unsecured debentures that matured in 2024. The refinanced debt now matures in 2031 with credit spreads reflective of a higher credit rating than we currently have been assigned |
| • | prioritized repayment of $400 million (US) of the $600 million (US) term loan utilized to finance the acquisition of Westinghouse, reducing total debt to $1.3 billion. The remaining $200 million (US) was repaid in January 2025, extinguishing the term loan. See Liquidity starting on page 50 for more information. |
| • | increased our annual dividend to $0.16 per common share in 2024, with a plan to increase the dividend to at least $0.24 per common share over time. See Return for more details. |
Our segment updates and other fuel cycle investment updates
In our uranium segment, we continued to execute our strategy, further ramping up our tier-one assets which had a positive impact on our operations. Of note in 2024, we:
| • | delivered 33.6 million pounds of uranium in alignment with the commitments under our contract portfolio |
| • | produced 16.9 million pounds (100% basis) at Cigar Lake. Production did not meet our expectations due to a lower production rate at Orano’s McClean Lake mill. |
| • | produced 20.3 million pounds (100% basis) at McArthur River/Key Lake, setting a new production record for a uranium mining operation anywhere in the world, due in large part to off-cycle investments in automation, digitization and optimization projects at Key Lake. |
| • | purchased 11.0 million pounds of uranium, including our spot purchases and committed purchase volumes (including JV Inkai purchases) |
| • | received the final 1.2 million pounds of our share of JV Inkai’s 2023 production, as well as 2.7 million pounds of our total share of JV Inkai’s 2024 production. The remainder of our share of 2024 production, about 0.9 million pounds, is being |
MANAGEMENT’S DISCUSSION AND ANALYSIS 17
| stored at JV Inkai for future delivery in order to optimize transportation and delivery costs. The timing of future deliveries is uncertain. |
| • | maintained Rabbit Lake and US ISR operations in care and maintenance |
In 2024, in our fuel services segment, we:
| • | delivered 12.1 million kgU under contract |
| • | produced 13.5 million kgU, including 10.8 million kgU of UF6 |
See Operations and projects beginning on page 73 for more information.
| HIGHLIGHTS |
2024 | 2023 | CHANGE | |||||||||||||
| Uranium |
Production volume (million lbs) |
23.4 | 17.6 | 33 | % | |||||||||||
| Sales volume (million lbs) |
33.6 | 32.0 | 5 | % | ||||||||||||
| Average realized price1 |
($US/lb) |
58.34 | 49.76 | 17 | % | |||||||||||
| ($Cdn/lb) |
79.70 | 67.31 | 18 | % | ||||||||||||
| Revenue ($ millions) |
2,677 | 2,153 | 24 | % | ||||||||||||
| Gross profit ($ millions) |
681 | 445 | 53 | % | ||||||||||||
| Earnings before income taxes |
904 | 606 | 49 | % | ||||||||||||
| Adjusted EBITDA (non-IFRS, see page 65) |
1,179 | 835 | 41 | % | ||||||||||||
| Fuel services | Production volume (million kgU) |
13.5 | 13.3 | 2 | % | |||||||||||
| Sales volume (million kgU) |
12.1 | 12.0 | 1 | % | ||||||||||||
| Average realized price 2 |
($Cdn/kgU) | 37.87 | 35.61 | 6 | % | |||||||||||
| Revenue ($ millions) |
459 | 426 | 8 | % | ||||||||||||
| Earnings before income taxes |
108 | 129 | (16 | )% | ||||||||||||
| Adjusted EBITDA (non-IFRS, see page 65) |
145 | 164 | (12 | )% | ||||||||||||
| Westinghouse3 | Revenue ($ millions) |
2,892 | 521 | >100 | % | |||||||||||
| (our share) |
Net loss |
(218 | ) | (24 | ) | >100 | % | |||||||||
| Adjusted EBITDA (non-IFRS, see page 65) |
483 | 101 | >100 | % | ||||||||||||
| 1 | Uranium average realized price is calculated as the revenue from sales of uranium concentrate, transportation and storage fees divided by the volume of uranium concentrates sold. |
| 2 | Fuel services average realized price is calculated as revenue from the sale of conversion and fabrication services, including fuel bundles and reactor components, transportation and storage fees divided by the volumes sold. |
| 3 | This table includes comparative results for the period beginning on the date of acquisition until the end of 2023 |
It was another positive year for the nuclear energy industry. Demand for nuclear power, including support for existing reactors, continues to grow, with a focus on energy security and national security amid continued global geopolitical uncertainty. We believe nuclear energy is in durable growth mode, and as we see the growth translate into contracts, we too will be back in durable growth mode. This growth will be sought in the same manner as we approach all aspects of our business; strategic, deliberate, disciplined and responsible and with a focus on generating full-cycle value.
Strong fourth quarter results in the uranium and Westinghouse segments provided a boost to annual results, as expected. Net earnings were $135 million for the quarter and $172 million for the year compared to $80 million for the quarter and $361 for the year in 2023, while adjusted net earnings were $157 million for the quarter and $292 million for the year compared to $108 million for the quarter and $383 million for the year in 2023. The 2024 annual results were lower compared to 2023 primarily due to the impact of purchase accounting on the full year results of Westinghouse. We use adjusted EBITDA to assess our operational performance. Full year adjusted EBITDA increased by approximately $647 million to $1.5 billion compared to $884 million in 2023 mainly due to the contributions from the uranium segment, reflective of a return to our tier-one production levels and an improving price environment, as well as the benefit from a full year of our Westinghouse investment, which was acquired in November 2023.
In our uranium segment, despite muted contracting volumes for the industry as utilities focused first on securing enrichment and conversion, we continued to negotiate off-market contracts and add to our long-term portfolio.
18 CAMECO CORPORATION
After delivering our 2024 sales, the long-term portfolio now totals about 220 million pounds, representing about 25% of our current reserve and resource base and retaining exposure to the improving demand from our customers as they look to secure their long-term needs. We continue to have a large and growing pipeline of uranium business under discussion. Our focus remains on obtaining market-related pricing mechanisms that benefit from a constructive price environment, while also providing adequate downside protection. We are being strategically patient in our discussions to maximize value in our contract portfolio and to maintain exposure to higher prices with unencumbered future productive capacity. In addition, with strong demand and pricing at historic highs in the UF6 conversion market, we were successful in adding new long-term contracts that bring our total contracted volumes to about 85 million kgU of UF6 that will underpin our fuel services operations for years to come.
Cameco has more than 35 years of experience in this market, and we have designed our strategy of full-cycle value capture to be resilient. Given the nature of our contracts, we have good visibility into when and where we need to deliver material, and we have put in place a number of tools that allow us to self-manage risk.
We have built a strong reputation as a proven and reliable supplier, with a diversified production portfolio that provides us with the flexibility to work with our customers to ensure they maintain access to our reliable supplies to satisfy their ongoing fuel requirements. In addition to our production, we can source material from market purchases today, and while these purchases would be more expensive than our production, our strategy positions us to benefit from added demand for nuclear fuel supplies and services. We have exposure to higher prices under the market-related contracts in our long-term portfolio and a pipeline of contracting discussions underway, which we expect will also benefit from the increased focus on securing access to scarce supplies and generate long-term value for Cameco. Also, we do not have to buy every pound in the spot market. We can source from inventory, to be replaced by production or purchases later. Further, we have the ability to pull forward long-term purchase arrangements that we put in place in a much lower-price environment, and with licensed storage facilities, we have secured the ability to borrow product under the terms of some of our storage agreements. See Managing our Contract Commitments on page 27 for more information on our sourcing options.
The tailwinds that are expected to benefit our core uranium and fuel services businesses are also presenting significant future growth opportunities for Westinghouse, which we own with our partner Brookfield Renewable Partners (Brookfield) (Cameco’s share is 49%). In 2024, we saw the continued advancement of AP1000® new build opportunities in Poland, Bulgaria, Ukraine and Slovenia. In early 2025, Westinghouse also announced a settlement agreement in its technology and export dispute with Korea Electric Power Corporation and Korea Hydro & Nuclear Power Co., Ltd. (KEPCO and KHNP), which resolves the dispute and establishes a framework for additional deployments outside of South Korea, to the mutual and material benefit of Westinghouse, KEPCO and KHNP. See Westinghouse Electric Company starting on page 98 for more information.
Thanks to our disciplined strategy, our balance sheet is strong, and we expect it will enable us to continue executing our strategy while self-managing risk, including risks related to global macro-economic uncertainty and volatility, and uncertain trade policy decisions. As of December 31, 2024, we had $600 million in cash and cash equivalents with $1.3 billion in total debt. In addition, we have a $1.0 billion undrawn credit facility.
In the current environment, we believe the risk to uranium supply is greater than the risk to uranium demand and expect it will create a renewed focus on ensuring availability of long-term supply to fuel nuclear reactors.
We will continue to align our production with our contract portfolio and market opportunities, demonstrating that we continue to responsibly manage our supply in accordance with our customers’ needs.
We will continue to look for opportunities to improve operational effectiveness, to improve our safety performance and reduce our impact on the environment, including through the use of digital and automation technologies to allow us to operate our assets with more flexibility and efficiency. This is key to our ability to continue to align our production decisions with our contract portfolio commitments and opportunities. With a solid base of contracts to underpin our tier-one productive capacity, and a growing contracting pipeline we expect we will continue to generate strong financial performance.
As we execute on our strategy, we will continue to focus on protecting the health and safety of our employees, delivering our products safely and responsibly and addressing the risks and opportunities that we believe will make our business sustainable and will build long-term value.
MANAGEMENT’S DISCUSSION AND ANALYSIS 19
Industry prices
| 2024 | 2023 | CHANGE | ||||||||||
| Uranium ($US/lb U3O8)1 |
||||||||||||
| Average annual spot market price |
85.14 | 62.51 | 36 | % | ||||||||
| Average annual long-term price |
78.88 | 58.20 | 36 | % | ||||||||
| Fuel services ($US/kgU as UF6)1 |
||||||||||||
| Average annual spot market price |
||||||||||||
| North America |
68.29 | 41.23 | 66 | % | ||||||||
| Europe |
68.21 | 41.23 | 65 | % | ||||||||
| Average annual long-term price |
||||||||||||
| North America |
40.57 | 30.55 | 33 | % | ||||||||
| Europe |
40.47 | 30.55 | 32 | % | ||||||||
Note: the industry does not publish UO2 prices.
| 1 | Average of prices reported by TradeTech and UxC, LLC (UxC) |
On the spot market, where purchases call for delivery within one year, the volume reported by UxC for 2024 decreased to 46 million pounds U3O8 equivalent, compared to 57 million pounds U3O8 equivalent in 2023. In 2024, total spot purchases by producers, junior uranium companies, financial funds and intermediaries was approximately 40 million pounds U3O8 equivalent, compared to approximately 43 million pounds U3O8 equivalent in 2023; in 2024, these purchases represented over 85% of spot market purchases compared to over 76% in 2023. In 2024, the uranium spot price ranged from a month-end high of $100.25 (US) per pound to a month-end low of $72.63 (US), averaging $85.14 (US) for the year. This average was up $22.63 (US) per pound, or 36%, compared to the 2023 average.
Long-term contracts generally call for deliveries to begin more than two years after the contract is finalized, and use a number of pricing formulas, including base-escalated prices set at time of contracting and escalated over the term of the contract, and market referenced prices (spot and long-term indicators) determined near the time of delivery, which also often include floor prices and ceiling prices that are also escalated to time of delivery. The volume of long-term contracting reported by UxC for 2024 was about 119 million pounds U3O8 equivalent, down from about 161 million pounds U3O8 equivalent in 2023. The contracting volume in 2023 was higher due to significant non-US utilities diversifying away from Russian supply, including our contracts with Ukraine and Bulgaria, one of which totaled over 40 million pounds. The lower long-term uranium volumes reported in 2024 can be attributed in part to US utilities awaiting clarity on implementation of the Russian uranium import ban, the US waiver process, and Russian export restraints, although requests for proposals from utilities are continuing alongside requests for direct off-market negotiations.
The average reported long-term price at the end of the year was $80.50 (US) per pound, up $12.50 (US) from the end of 2023. During the year, the uranium long-term price steadily increased from a month-end low of $72.00 (US) per pound in January to a high of $81.50 (US) per pound in November, averaging $78.88 (US) for the year.
With increased demand for western conversion services, pricing in both North America and Europe continues to be strong. At the end of 2024, the average reported spot price for North American delivery reached a record high of $97.00 (US) per kilogram uranium as UF6 (US/kgU as UF6), up $51.00 (US) from the end of 2023. Long-term UF6 conversion prices for North American delivery also reached a record high and finished 2024 at $50.00 (US/kgU as UF6), up $15.75 (US) from the end of 2023.
20 CAMECO CORPORATION
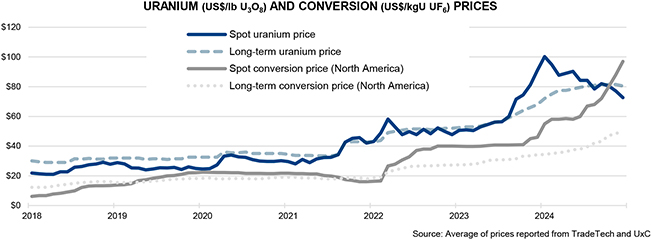
MANAGEMENT’S DISCUSSION AND ANALYSIS 21
Our values and strategy
We believe we have the right strategy to add long-term value and we will do so in a manner that reflects our values. For over 35 years, we have been delivering our products responsibly. Building on that strong foundation, we remain committed to our efforts to operate in a responsible and sustainable manner, identifying and addressing the risks and opportunities that we believe may have a significant impact on our ability to add long-term value for our stakeholders.
Committed to our values
Our values are discussed below. They define who we are as a company, are at the core of everything we do, and help to embed sustainability principles and practices as we execute on our strategy. They are:
| • | safety and environment |
| • | people |
| • | integrity |
| • | excellence |
SAFETY AND ENVIRONMENT
The safety of people and protection of the environment are the foundations of our work. All of us share in the responsibility of continually improving the safety of our workplace and the quality of our environment.
We are committed to keeping people safe and conducting our business with respect and care for both the local and global environment.
PEOPLE
We value the contribution of every employee, and we treat people fairly by demonstrating our respect for individual dignity, creativity and cultural diversity. By being open and honest, we achieve the strong relationships we seek.
We are committed to developing and supporting a flexible, skilled, stable and diverse workforce, in an environment that:
| • | attracts and retains talented people and inspires them to be fully productive and engaged |
| • | encourages relationships that build the trust, credibility and support we need to grow our business |
INTEGRITY
Through personal and professional integrity, we lead by example, earn trust, honour our commitments and conduct our business ethically.
We are committed to acting with integrity in every area of our business, wherever we operate.
EXCELLENCE
We pursue excellence in all that we do. Through leadership, collaboration and innovation, we strive to achieve our full potential and inspire others to reach theirs.
Our strategy
We are a pure-play investment in the growing demand for nuclear energy, focused on taking advantage of the near-, medium-, and long-term growth occurring in our industry. We provide nuclear fuel and nuclear power products, services, and technologies across the fuel cycle, complemented by our investment in Westinghouse, that support the generation of secure, carbon-free, reliable, and affordable energy. Our strategy is set within the context of what we believe is a transitioning market environment. Increasing populations, a growing focus on electrification and decarbonization, and concerns about energy security and affordability are driving a global focus on tripling nuclear power capacity by 2050, which is expected to durably strengthen the long-term fundamentals for our industry. Nuclear energy must be a central part of the solution to the world’s shift to a low-carbon, secure energy economy. It is an option that can provide the power needed, not only reliably, but also safely and affordably, and in a way that will help achieve climate, energy and national security objectives.
Our strategy is to capture full-cycle value by:
| • | remaining disciplined in our contracting activity, building a balanced portfolio in accordance with our contracting framework |
22 CAMECO CORPORATION
| • | profitably producing from our tier-one assets and aligning our production decisions in all segments of the fuel cycle with contracted demand and customer needs |
| • | being financially disciplined to allow us to: |
| • | execute our strategy |
| • | invest in new opportunities that are expected to add long-term value |
| • | to self-manage risk |
| • | exploring other emerging opportunities within the nuclear power value chain, which align with our commitment to manage our business responsibly and sustainably, contribute to decarbonization, and help to provide secure and affordable energy |
We expect our strategy will allow us to increase long-term value, and we will execute it with an emphasis on safety, people and the environment.
URANIUM
Uranium production is central to our strategy, as it is the biggest value driver of the nuclear fuel cycle and our business. We have tier-one assets that are licensed, permitted, long-lived, and are proven reliable with capacity to expand. These tier-one assets are backed up by idle tier-two assets and what we think is the best exploration portfolio of mineral reserves and resources that in some cases can leverage our existing infrastructure. Currently, we believe that we have ample productive capacity with the ability to expand as the demand for nuclear energy and nuclear fuel grows.
We are focused on protecting and extending the value of our contract portfolio, on aligning our production decisions with our contract portfolio and market opportunities thereby optimizing the value of our lowest cost assets. We also prioritize maintaining a strong balance sheet, and on efficiently managing the company. We have undertaken a number of deliberate and disciplined actions, including a focus on operational effectiveness to allow us to operate our assets more efficiently and with more flexibility.
FUEL SERVICES
Our fuel services segment supports our strategy to capture full-cycle value by providing our customers with access to refining and conversion services for both heavy-water and light-water reactors, and CANDU fuel and reactor component manufacturing for heavy-water reactors.
As in our uranium segment, we are focused on securing new long-term contracts and on aligning our production decisions with our contract portfolio that will allow us to continue to profitably produce and consistently support the long-term needs of our customers.
In addition, we are pursuing non-traditional markets for our UO2 and fuel fabrication business and have been actively securing new contracts for reactor components to support refurbishment of Canadian reactors.
WESTINGHOUSE
In 2023, we completed the acquisition of Westinghouse, a global provider of mission-critical and specialized technologies, products and services for light-water reactors across most phases of the nuclear power sector, in a strategic partnership with Brookfield. We own a 49% interest in Westinghouse.
We are enhancing our ability to compete for more business by investing in additional nuclear fuel cycle assets that we expect will augment the core of our business and offer more solutions to our customers across the nuclear fuel cycle. Like Cameco, Westinghouse has nuclear assets that are strategic, proven, licensed and permitted, and that are in geopolitically attractive jurisdictions. We expect these assets, like ours, will participate in the growing demand profile for nuclear energy.
Westinghouse has a stable and predictable core business generating durable cash flows. Like Cameco, Westinghouse has a long-term contract portfolio, which we believe positions it well to compete for growing demand for new nuclear reactors and reactor services, as well as the fuel supplies and services needed to keep the global reactor fleet operating safely and reliably. This strong base of business also helps protect Westinghouse from macro-economic headwinds as utility customers run their critical nuclear power plants. Its durable and growing business is expected to allow Westinghouse to self-fund its approved annual operating budget, to service its annual financial obligations from de-risked cash flows, and to pay annual distributions to its owners. See Westinghouse starting on page 98 for more information.
MANAGEMENT’S DISCUSSION AND ANALYSIS 23
OTHER NUCLEAR FUEL CYCLE INVESTMENTS
We continually evaluate investment opportunities within the nuclear fuel value chain that align well with our commitment to add long-term value by managing our business responsibly and sustainably, and allow us to contribute to energy security solutions. Expanding our participation in the fuel cycle is expected to complement our tier-one uranium and fuel services assets, creating new revenue opportunities, and it enhances our ability to meet the increasing needs of existing and new customers for secure, reliable nuclear fuel supplies, services and technologies.
In particular, we are interested in the second largest value driver of the fuel cycle, enrichment, and have a 49% interest in Global Laser Enrichment LLC (GLE). GLE is the exclusive licensee of the proprietary SILEX laser enrichment technology, a third-generation uranium enrichment technology. We are the commercial lead for the GLE project with an option to attain a majority interest of up to 75% ownership. See Global Laser Enrichment starting on page 106 for more information.
Additionally, we have signed a number of non-binding arrangements to explore several areas of cooperation to advance the commercialization and deployment of small modular reactors in Canada and around the world.
We will make an investment decision when an opportunity is available at the right time and the right price. We strive to pursue corporate development initiatives that will leave us and our stakeholders in a fundamentally stronger position. As such, an investment opportunity is never assessed in isolation. Investments must compete for investment capital with our own internal growth opportunities. They are subject to our capital allocation process described under Capital Allocation – Disciplined Financial Management, starting on page 29.
BUILDING A BALANCED PORTFOLIO
The purpose of our contracting framework is to deliver value. Our approach is to secure a solid base of earnings and cash flow by maintaining a balanced contract portfolio that optimizes our realized price.
Contracting decisions in all segments of our business need to consider the nuclear fuel market structure, the nature of our competitors, and the current market environment. The vast majority of run-rate fuel requirements are procured under long-term contracts. The spot market is thinly-traded, where certain utilities may buy small, discretionary volumes. This market structure is reflective of the baseload nature of nuclear power and the relatively small proportion of the overall operating costs the fuel represents compared to other sources of baseload electricity. Additionally, about half of the fuel supply typically comes from state-owned entities with production volume strategies or ambitions to serve state nuclear power ambitions with low-cost fuel supplies, or from diversified mining companies that produce uranium as a by-product. We evaluate our strategy in the context of our market environment and continue to adjust our actions in accordance with our contracting framework:
| • | First, we build a long-term contract portfolio by layering in volumes over time. In addition to our committed sales, we will compete for customer demand in the market where we think we can obtain value and, in general, as part of longer-term contracts. We will take advantage of opportunities the market provides, where it makes sense from an economic, logistical, diversification and strategic point of view. Those opportunities may come in the form of spot, mid-term or long-term demand, and will be additive to our current committed sales. |
| • | Based on our portfolio of long-term contracts, we decide how to best source material to satisfy that demand, planning our production in accordance with our contract portfolio and other available sources of supply. We will not produce from our tier-one assets to sell into an oversupplied spot market. |
| • | We do not intend to build an inventory of excess uranium. Excess inventory serves to contribute to the sense that uranium is abundant and creates an overhang on the market, and it ties up working capital on our balance sheet. |
| • | Depending on the timing and volume of our production, purchase commitments, and our inventory volumes, we may be active buyers in the market in order to meet our annual delivery commitments. Historically, prior to the tier one supply curtailments that we undertook from 2016-2022, we have generally planned our annual delivery commitments to slightly exceed the annual supply we expect to come from our annual production and our long-term purchase commitments and have therefore relied on the spot market to meet a small portion of our delivery commitments. In general, if we choose to purchase material to meet demand, we expect the cost of that material will be more than offset by the volume of commitments in our sales portfolio that are exposed to market prices at the time of delivery over the long-term. |
In addition to this framework, our contracting decisions always factor in who the customer is, our desire for regional diversification, the product form, and logistical factors.
24 CAMECO CORPORATION
Ultimately, our goal is to protect and extend the value of our contract portfolio on terms that recognize the value of our assets, including future development projects, and pricing mechanisms that provide adequate protection when prices go down and exposure to rising prices. We believe using this framework will allow us to create long-term value. Our focus will continue to be on ensuring we have the financial capacity to execute on our strategy and self-manage risk.
LONG-TERM CONTRACTING
Uranium is not traded in meaningful quantities on a commodity exchange. Utilities have historically bought the majority of their uranium and fuel services products under long-term contracts that are bilaterally negotiated with suppliers. The spot market is discretionary and typically used for one-time volumes, not to satisfy annual demand. We sell uranium and fuel products and services directly to nuclear utilities around the world as uranium concentrates, UO2 and UF6, conversion services, or fuel fabrication and reactor components for CANDU heavy water reactors. We have a solid portfolio of long-term sales contracts that reflect our reputation as a proven, reliable supplier of geographically stable supply, and the long-term relationships we have built with our customers.
In general, we are active in the market when it is beneficial for us and in support of our long-term contract portfolio. We undertake activity in the spot and term markets prudently, looking at the prices and other business factors to decide whether it is appropriate to purchase or sell into the spot or term market. Not only is this activity a source of profit, but it also gives us insight into underlying market fundamentals.
We deliver the majority of our uranium under long-term contracts each year, some of which are tied to market-related pricing mechanisms quoted at time of delivery. Therefore, our net earnings and operating cash flows are generally affected by changes in the uranium price. Market prices are influenced by the fundamentals of supply and demand, market access and trade policy issues, geopolitical events, disruptions in planned supply and demand, and other market factors.
The objectives of our contracting strategy are to:
| • | optimize realized price by balancing exposure to future market prices while providing some certainty for our future earnings and cash flow |
| • | focus on meeting the nuclear industry’s growing annual uncovered requirements with our tier-one production |
| • | establish and grow market share with strategic and regionally diverse customers |
We have a portfolio of long-term contracts, each bilaterally negotiated with customers, that have a mix of base-escalated pricing and market-related pricing mechanisms, including provisions that provide exposure to rising market prices and also protect us when the market price is declining. This is a balanced and flexible approach that allows us to adapt to market conditions, put a floor on our average realized price and deliver the best value over the long term.
This approach has allowed our realized price to outperform the market during periods of weak uranium demand, and we expect it will enable us to realize increases linked to higher market prices in the future.
Base-escalated contracts for uranium: use a pricing mechanism based on a term-price indicator at the time the contract is accepted and escalated to the time of each delivery over the term of the contract.
Market-related contracts for uranium: are different from base-escalated contracts in that the pricing mechanism may be based on either the spot price or the long-term price, and that price is generally set a month or more prior to delivery rather than at the time the contract is accepted. These contracts may provide for discounts and typically include floor prices and/or ceiling prices, which are established at time of contract acceptance and usually escalate over the term of the contract.
Fuel services contracts: the majority of our fuel services contracts use a base-escalated mechanism per kgU and reflect the market at the time the contract is accepted.
MANAGEMENT’S DISCUSSION AND ANALYSIS 25
OPTIMIZING OUR CONTRACT PORTFOLIO
We work with our customers to optimize the value of our contract portfolio. With respect to new contracting activity, there is often a lag from when contracting discussions begin and when contracts are executed. With our large pipeline of business under negotiation in our uranium segment, and a value driven strategy, we continue to be strategically patient in considering the commercial terms we are willing to accept. We layer in contracts over time, with higher commitments in the near term and declining over time in accordance with utilities growing uncovered requirements. Demand may come in the form of off-market negotiations or through on-market requests for proposals. We remain confident that we can add acceptable new sales commitments to our portfolio of long-term contracts to underpin the ongoing operation of our productive capacity and capture long-term value.
Given our view that additional long-term supply will need to be incented to meet the growing demand for safe, reliable, carbon-free nuclear energy, our preference today is to sign long-term contracts with market-related pricing mechanisms. However, we believe our customers expect prices to rise and prefer to lock-in today’s prices, with a fixed-price mechanism. Our goal is to balance all these factors, along with our desire for customer and regional diversification, with product form, and logistical factors to ensure we have adequate protection and will have exposure to rising market prices under our contract portfolio, while maintaining the benefits that come from having low-cost supply to deliver into a strengthening market.
At times, we may also look for opportunities to optimize the value of our portfolio. In cases where there is a changing policy, operating, or economic environment, including the introduction of new taxes or tariffs in certain jurisdictions, we manage risk accordingly. We have taken actions such as positioning material ahead of expected deliveries, revising our contract terms to protect us from unexpected future implementation of taxes or tariffs, and adjusting our contracts to minimize potential negative impacts while maintaining strong customer relationships, and we will continue to consider additional mitigation in the future.
CONTRACT PORTFOLIO STATUS
We have executed contracts to sell about 220 million pounds of U3O8 with 41 customers worldwide in our uranium segment, and about 85 million kilograms as UF6 conversion with 34 customers worldwide in our fuel services segment. We sell uranium and fuel services products to nuclear utilities in 16 countries.
Customers – U3O8:
Five largest customers account for 58% of commitments Five largest customers account for 59% of commitments
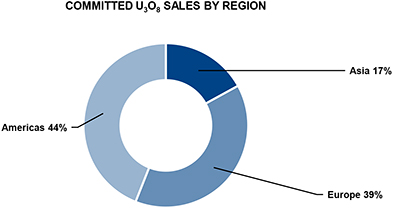
26 CAMECO CORPORATION
Customers – UF6 conversion:
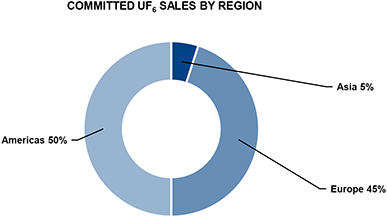
MANAGING OUR CONTRACT COMMITMENTS
We allow sales volumes to vary year-to-year depending on:
| • | the level of sales commitments in our long-term contract portfolio |
| • | market opportunities |
| • | our sources of supply |
To meet our delivery commitments and to mitigate risk, we have access to a number of sources of supply, which includes uranium obtained from:
| • | our productive capacity |
| • | purchases under our JV Inkai agreement, under long-term agreements and in the spot market |
| • | our inventory in excess of our working requirements |
| • | product loans |
OUR SUPPLY DISCIPLINE
As spot is not the fundamental market, true value is built under a long-term contract portfolio and is measured over the full commodity cycle. Therefore, we align our uranium production decisions with our contract commitments and market opportunities to avoid carrying excess inventory or having to sell into an oversupplied spot market. In accordance with market conditions, and to mitigate risk, we evaluate the optimal mix of our production, inventory and purchases in order to satisfy our contractual commitments and in order to realize the best return over the entire commodity cycle. During a prolonged period of uncertainty, this could mean leaving our uranium in the ground. For the years 2016 through 2022, we left more than 130 million pounds of uranium in the ground (100% basis) by curtailing our production. We purchased more than 60 million pounds including spot and long-term purchases and in 2018 we drew down our inventory by almost 20 million pounds. That totals over 210 million pounds (100% basis) of uranium that were not available to the market.
However, today we believe the uranium market is in transition, driven by the growing demand for nuclear energy and the increasing recognition that it is essential for energy security, national security, and the clean-energy transition. As the market continues to transition, we expect to continue placing our uranium under long-term contracts and meet rising demand with production from our best margin operations.
With the improvements in the market, the new long-term contracts we have put in place, and a pipeline of contracting discussions, we plan to produce 18 million pounds (100% basis) at McArthur River/Key Lake and 18 million pounds (100% basis) at Cigar Lake in 2025. We are still in discussions with JV Inkai and KAP to determine our purchase entitlement for 2025.
Our production decisions will continue to be aligned with market opportunities and our ability to secure the appropriate long-term contract homes for our unencumbered, in-ground inventory, demonstrating that we continue to responsibly manage our assets in accordance with our customers’ needs.
MANAGEMENT’S DISCUSSION AND ANALYSIS 27
Our production plans for McArthur River/Key Lake and Cigar Lake are expected to generate strong financial performance by allowing us to source the majority of our committed sales from the lower cost produced pounds. We are investing in capital projects to help ensure the reliability and sustainability of our existing operations, and to replace aging infrastructure in order to maintain capacity at current production levels and to position us for future production flexibility, although no decision on future production levels has been made. In addition, with conversion demand elevated, we have been successful in securing long-term sales commitments that will support increased production at Port Hope, which is expected to further improve its contribution to our financial results. However, this is not an end to our supply discipline. Our Rabbit Lake and US ISR assets remain in a safe state of care and maintenance, and we expect to continue to adjust our production in accordance with our contract portfolio. This will remain our production plan until we see further improvements in the uranium market and contracting progress, once again demonstrating that we are a responsible fuel supplier.
MANAGING OUR COSTS
Production costs
In order to operate efficiently and cost-effectively, we manage operating costs and improve plant reliability by prudently investing in production infrastructure, new technology, and business process improvements. Like all mining companies, our uranium segment is affected by the cost of inputs such as labour and fuel.
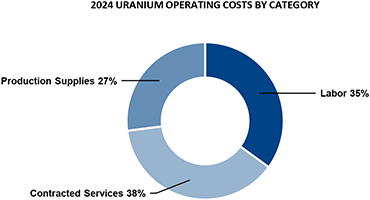
| * | Production supplies include reagents, fuel and other items. Contracted services include utilities and camp costs, air charters, mining and maintenance contractors and security and ground freight. |
The annual cash cost of production reflects the operating cost of mining and milling our share of the Cigar Lake, McArthur River, and Key Lake operations. The annual cost of production will reflect a combined cost of all our operating uranium assets. See 2024 financial results by segment – Uranium starting on page 57 for more information. In 2025, our cash production costs may continue to be affected by inflation, the availability of personnel with the necessary skills and experience, supply chain challenges impacting the availability of materials and reagents, and continued work to maintain the long-term reliability of our assets.
Operating costs in our fuel services segment are mainly fixed. In 2024, labour and contracted services accounted for about 53% of the total. The largest variable operating cost is for anhydrous hydrogen fluoride, followed by zirconium, and energy (natural gas and electricity).
We continue to look to adopt innovative and advanced digital and automation technologies to improve efficiency and operational flexibility and to further reduce costs.
Care and maintenance costs
In 2025, we expect to incur between $62 million and $67 million in care and maintenance costs related to the suspension of production at our Rabbit Lake mine and mill, and our US operations. Production at these operations is higher-cost and the timing of a restart is uncertain. We continue to evaluate our options in order to minimize these costs.
28 CAMECO CORPORATION
Purchases and inventory costs
Our costs are also affected by the purchases of uranium and conversion services we make under long-term contracts and on the spot market.
To meet our delivery commitments, we make use of our mined production, inventories, purchases of our share of material from Inkai, purchases under long-term contracts, purchases we make on the spot market and product loans. In 2025, we expect the price for the majority of our purchases will be quoted at the time of delivery.
The cost of purchased material may be higher or lower than our other sources of supply, depending on market conditions. The cost of purchased material affects our cost of sales, which is determined by calculating the average of all of our sources of supply, including opening inventory, production, and purchases, and adding royalties, selling costs, and care and maintenance costs. Our cost of sales could be impacted if we do not achieve our annual production plan, or if we are unable to source uranium as planned, and we are required to purchase uranium at prices that differ from our cost of inventory.
Potential tariff impact
Currently, the US has threatened the imposition of a 10% tariff on Canadian energy products. We have proactively taken steps to minimize the potential impact of imposed tariffs, and while we currently do not anticipate the direct impact of a 10% tariff to be material on our 2025 financial results, there continues to be uncertainty around the exact details of how these tariffs may be applied or if they will be applied to uranium products.
Financial impact
The growing demand for nuclear power due to its safety, carbon-free energy, reliability, security and affordability attributes has contributed to increased demand for nuclear fuel products and services. As a result, we have seen significant price increases across the nuclear fuel value chain, which reflect the need for capacity increases to satisfy the projected growth.
The deliberate and disciplined actions we took to curtail production and streamline operations over the past decade came with near-term costs like care and maintenance costs, operational readiness costs, and purchase costs higher than our production costs. However, we considered these costs as investments in our future.
Today, thanks to our investments, and with our continued ability to secure new long-term sales commitments, we believe we are well-positioned for growth. Our core growth is expected to come from our existing mining and fuel services assets. We do not have to build new capacity to pursue new opportunities. We believe we have sufficient productive capacity to expand, a position we have not enjoyed in previous price cycles.
And, with the acquisition of a 49% interest in Westinghouse, we expect to be able to expand our growth profile by extending our reach in the nuclear fuel cycle at a time when there are tremendous tailwinds for the nuclear power industry. We are extending our reach with an investment in assets that like ours, are strategic, proven, licensed and permitted, that are located in geopolitically favourable jurisdictions, and that we expect will be able to grow from their existing footprint. These assets are also expected to provide new opportunities for our existing suite of uranium and fuel services assets.
We believe our actions and investments have helped position the company to self-manage risk, generate strong financial performance, and allow us to execute on our strategy while rewarding our stakeholders for their continued patience and support of our strategy to build long-term value.
CAPITAL ALLOCATION – DISCIPLINED FINANCIAL MANAGEMENT
Delivering long-term value is a top priority. While we navigate by our investment-grade rating with a focus on reducing leverage, we continually evaluate our investment options to ensure we allocate our capital in a way that we believe will:
| • | sustain our assets and grow our core business in a manner that we expect will generate ongoing liquidity and create sustainable long-term value |
| • | maintain a strong balance sheet that will allow us to execute on our strategy, take advantage of strategic opportunities and self-manage risk |
| • | allow us to sustainably deliver a dividend while considering the cyclical nature of our earnings and cash flow |
MANAGEMENT’S DISCUSSION AND ANALYSIS 29
To generate value, free cash flow must be productively reinvested in the business. We start by determining how much cash we have to invest (investable capital). Investable capital takes into account our expected cash flow from operations, including the expected cash distributions from JV Inkai and our Westinghouse investment, minus the cash required to satisfy our financing costs, for working capital purposes, and the other uses of cash we consider to be higher priority, such as dividends. This investable capital can be reinvested in the core business of the company. We expect that we will generate free cash flow sufficient to support ongoing investment in the long-term sustainable production from our tier-one assets. Additional free cash flow can be used to take advantage of opportunities in line with our long-term strategy, to manage our balance sheet for the future, or it could be returned to shareholders.
Reinvestment / Investment
We have a multidisciplinary capital allocation committee that evaluates all sustaining, capacity replacement, or growth investment opportunities.
For our core business, opportunities are ranked using return criteria that includes both financial and non-financial metrics, with a current priority focus on five main value drivers:
| • | cost reduction |
| • | enabling digital technology |
| • | operational flexibility |
| • | improving safety performance |
| • | emission reduction |
Only those that meet the required risk-adjusted return criteria are considered for investment.
Growth opportunities across the fuel cycle and new and existing investments must also demonstrate a sufficient risk-adjusted return to support deployment of capital.
We also must identify, at the corporate level, the expected impact on cash flow, earnings, and the balance sheet. All project risks must be identified, including the risks of not investing. Allocation of capital only occurs once an investment has cleared these hurdles.
This may result in some opportunities being held back in favour of higher return investments and should allow us to generate the best return on investment decisions when faced with multiple prospects, while also controlling our costs and meeting sustainability objectives.
Supported by a similar capital allocation process, we expect Westinghouse to self-fund opportunities identified in its business plan and to provide us with a distribution to the extent the funds are not prioritized for reinvestment.
Return
We believe in returning cash to shareholders under appropriate circumstances and we plan our dividend to be sustainable. In 2024, the board of directors approved an increase of the annual dividend from $0.12 per common share in 2023, to $0.16 per common share in 2024. In addition, to recognize the return to our tier-one run rate, and in line with the principles of our capital allocation framework, we have recommended, to our board of directors, a dividend growth plan for consideration. Based on our plan, we expect an annual increase of at least $0.04 per common share in each of 2025 and 2026 to achieve a doubling of the 2023 dividend from $0.12 per common share, to $0.24 per common share.
If we have excess cash and determine the best use is to return it to shareholders, we can do that through a share repurchase or dividend—an annual dividend, one-time supplemental dividend or a progressive dividend. The decision to return capital and the type of return is evaluated regularly by our board of directors with careful consideration of our cash flow, liquidity, financial position, strategy, capital structure and other relevant factors including appropriate alignment with the cyclical nature of our earnings.
In Action
During 2024, as we continued the return to our tier-one cost structure, the focus was to ensure we had the financial capacity to execute on our 2024 production plan and to source material for our 2024 deliveries. In addition, we began work to extend the mine life at Cigar Lake and to evaluate the work and investment required to expand production at McArthur River/Key Lake up to its licensed capacity of 25 million pounds per year (100% basis).
30 CAMECO CORPORATION
We refinanced $500 million senior unsecured debentures in 2024, which effectively extended the maturity of the indebtedness to 2031. We also made repayments of $400 million (US) on the $600 million (US) floating-rate term loan that was used to finance the acquisition of Westinghouse. In January 2025, we made the final repayment of $200 million (US), so the term loan is now fully extinguished. See Liquidity and capital resources – Financing Activities starting on page 50 for more information about the term loan.
A distribution of $100 million (US) from Westinghouse was paid in February 2025, of which we received $49 million (US) representing our share of the distribution. This is the first distribution since the acquisition closed.
Our priorities in 2025 remain focused on delivering from our tier-one assets. We are investing to help ensure reliability and sustainability of existing operations, and to replace aging infrastructure to maintain capacity at current production levels, while positioning for future production flexibility, including to achieve licensed capacity at McArthur River/Key Lake of 25 million pounds per year (100% basis) in line with market demand, although no decision to increase production has been made. Additionally, we will maintain our focus on improving operational effectiveness across the company through, for example, the use of digital and automation technologies. The particular goals of this work are to reduce operating costs, increase operational flexibility, improve our safety performance and reduce our impact on the environment, including the reduction of our GHG emissions.
If the market transition continues as expected, our priorities might include consideration of:
| • | the opportunities available to add value with our licensed and permitted tier-two assets and brownfield infrastructure |
| • | further value-adding opportunities in the nuclear fuel value chain |
| • | the return of excess cash to shareholders |
Any opportunities will be rigorously assessed by our capital allocation committee and our board of directors before an investment decision is made.
Shares and stock options outstanding
At February 18, 2025, we had:
| • | 435,312,083 common shares and one Class B share outstanding |
| • | 259,958 stock options outstanding, with exercise prices ranging from $11.32 to $15.27 |
Dividend
In 2024, our board of directors declared a 2024 annual dividend of $0.16 per common share which was paid on December 13, 2024. See the section titled Return on page 30 for more information regarding the factors the board considers in deciding to declare an annual dividend.
MANAGEMENT’S DISCUSSION AND ANALYSIS 31
Our sustainability principles and practices
A key part of our strategy, reflecting our values
We are committed to delivering our products responsibly and profitably. We integrate sustainability principles and practices into every aspect of our business, from our corporate objectives and approach to compensation, to our overall corporate strategy, risk management, and day-to-day operations, and they align with our values. We seek to be transparent with our stakeholders, keeping them updated on the risks and opportunities that we believe may have a significant impact on our ability to achieve our strategic plan and add long-term value. We recognize the importance of integrating certain sustainability factors, such as safety performance, a clean environment and supportive communities, into our executive compensation strategy as we see success in these areas as critical to the long-term success of the company.
Our board of directors holds the highest level of oversight for our business strategy and strategic risks, including sustainability matters. Oversight of sustainability reporting and disclosure has been delegated by the board to the Safety, Health and Environment (SHE) committee of the board. We also have a multi-disciplinary sustainability steering committee, chaired by our senior vice-president and chief corporate officer that includes representatives from across the organization whose role is to review our sustainability governance and reporting, as well as our current approach to sustainability, against evolving trends. Additional information about the governance of our sustainability matters is included in our most recent Sustainability Report.
In an effort to continually evolve the robustness of our sustainability commitments and communications, we aim to stay up to date with sustainability related reporting standards. In 2020, we began to work to report in alignment with Sustainability Accounting Standards Board (SASB). In 2022, we began to address the recommendations of the Task Force on Climate-Related Financial Disclosures (TCFD) in our Sustainability Report. We are now working to understand the requirements of the IFRS S1 sustainability disclosure standards, and S2 climate-related disclosure standard released in 2023, alongside the Canadian Sustainability Standards Board adapted versions, the Canadian Sustainability Disclosure Standards 1 and 2, which were published in 2024. It is still unclear when and to what extent the Canadian Securities Administrators may adopt these standards.
In July 2024, we published our 2023 Sustainability Report. The report sets out our strategy and the policies and programs we use to govern and manage sustainability issues that are important to our stakeholders. In addition to SASB and TCFD, the report provides key sustainability performance indicator data based on the Global Reporting Initiative’s Sustainability Framework as well as some unique corporate indicators, to measure and report our performance on environmental, social and economic impacts in the areas we believe have a significant impact on our sustainability in the long-term and are important to our stakeholders. This is our sustainability report card to our stakeholders. You can find our report at cameco.com/about/sustainability.
At Cameco, our approach to stewardship is guided by our corporate governance framework, which includes a strong and established Cameco Management System (CMS) which sets out our vision, values, and measures of success. The CMS describes the framework of policies, programs, and procedures we use to help us fulfill all the tasks required to achieve our objectives, strategy and practices, and are continuously evaluated and reviewed to improve their rigour.
There are ten policies identified in the CMS which provide high-level direction to Cameco across all sustainability topics, the specific policies include: Code of Conduct and Ethics; Corporate Disclosure; Delegation of Financial Authority; Electronic Information and Information Technology Security; Mineral Reserve and Resource; Our People; Procurement of Goods and Services; Risk Management; Safety, Health, Environment and Quality; and Sustainability. These policies help speak to our strategic planning process, leadership alignment and accountability, compliance and assessment, people and culture, process identification and work management, risk management, communications and stakeholder support, knowledge and information management, change management, problem identification and resolution, and continual improvement.
ENVIRONMENT
We acknowledge and embrace our responsibility to manage our activities with care for the protection of environmental resources. Our stewardship is guided by established policies and programs designed to minimize our impacts on air, land, and water, and to safeguard the biodiversity of surrounding ecosystems.
32 CAMECO CORPORATION
Within our CMS, we have an integrated Safety, Health, Environment and Quality Management System. Alignment with, and certification to, the ISO standards is important to us as it is one of the world’s most widely recognized set of standards. Due to the multi-disciplinary nature of this system, we maintain ISO 14001 certification of the environmental components of the management system at the corporate level and align the safety and health components of the management system with ISO 45001.
Climate Action
We recognize the critical nature of the fight against climate change, and want our employees, customers, investors, and community partners near our operations to know we are committed to being an active and constructive partner in addressing this challenge. The reduction of carbon and greenhouse gas (GHG) emissions is important and necessary in Canada and around the world. Policy makers and major industries recognize that nuclear power must be a central part of the solution to the world’s shift to a low-carbon, climate-resilient economy. Several nations have reaffirmed their commitments to nuclear power and are developing plans to support existing reactors and are reviewing their policies to encourage more nuclear capacity. There are now 31 countries that have signed on to the Net Zero Nuclear declaration that was launched at COP28 to triple nuclear energy capacity by 2050.
As one of the world’s largest producers of the uranium needed to fuel nuclear reactors, we believe this represents a significant business opportunity for us. By delivering our products and services responsibly and profitably, we can be a part of the solution to enhance national, energy and climate security given 100% of our product is used to produce reliable carbon-free base-load electricity. We enable secure baseload power and emissions reductions globally through nuclear power and are committed to transforming our already low operational GHG emissions footprint to achieve our ambition of having net-zero emissions while delivering significant long-term business value.
Cameco has put its support behind Net Zero Nuclear, an initiative between government, industry leaders and civil society to triple global nuclear capacity to achieve carbon neutrality by 2050. As a strategic partner, we can assist with deepening industry support for this initiative, which was launched by the World Nuclear Association and the Emirates Nuclear Energy Corporation, with the support of the Atoms4NetZero initiative launched by the International Atomic Energy Agency at the 2023 World Nuclear Symposium in London. Since its launch, more than 120 companies have endorsed the Net Zero Nuclear Industry Pledge, along with 14 financial institutions and 31 countries that have signed the declaration.
Previously, we undertook a planning process to outline our overarching Low Carbon Transition Plan. Within this plan, we set a target to reduce our combined Scope 1 and 2 GHG emissions by 30% by 2030, from 2015 levels. We also identified the practical and achievable actions that we expect to take to decarbonize our operations and manage climate-related risks. In doing so, we are working to demonstrate our alignment with the ambitions of the Paris Agreement and Canadian legislative framework to, “limit global temperature rise to well below 2 degrees Celsius (°C), above pre-industrial levels, and to pursue efforts to limit global temperature rise even further to 1.5°C”.
We recognize that climate change, including shifts in temperature, precipitation and more frequent severe weather events could affect our operations in a range of possible ways. As part of our efforts, we have completed climate change scenario analyses to understand how projected long-term changing climate conditions could impact our employees, assets, and operations in Canada and the United States. We leveraged internal subject matter expertise with help from a third-party expert to complete the assessments.
The physical risk assessment studies were undertaken to deliver initial forward-looking physical climate risk assessments and identify possible risk management and adaptation options across our underground and in situ mining, milling and fuel services operations.
When it comes to climate change, we have tracked and reported our GHG emissions for more than two decades. A summary of our activities to understand and mitigate the risks associated with climate change scenarios is reported to the board of directors on a regular basis in accordance with our Risk Management program, including the mitigating controls and management actions taken to reduce these risks.
MANAGEMENT’S DISCUSSION AND ANALYSIS 33
SOCIAL
Our relationships with our workforce, Indigenous Peoples, and local communities are fundamental to our success. The safety and protection of our workforce and the public is our top priority in our assessment of risk and planning for safe operations and product transport. To deliver on our strategy, we invest in programs to attract and retain a skilled workforce that has a broad range of complementary skills, abilities and experience, that reflect the communities in which we operate and to help increase the participation of underrepresented groups in trades and technical positions. We want to build a workforce that is dedicated to continuous improvement and shares our values.
We have a five-pillar approach to develop and maintain long-term relationships and provide opportunities to those living in areas near our operations. The five-pillars include workforce development, business development, community investment, environmental stewardship, and community engagement. To strengthen relationships and shape them into mutually beneficial partnerships, we have established agreements with northern and Indigenous communities near our operations that allow us to determine focus areas based on the community’s unique needs, optimizing benefits to the community, providing certainty around community investment and local business opportunities.
GOVERNANCE
We believe that sound governance is the foundation for strong corporate performance. Our diverse and independent board of directors’ primary role is to provide strategic direction and risk oversight in order to help the company achieve its objectives. The board guides the company to operate as a sustainable business, to optimize financial returns while effectively managing risk, and to conduct business in a way that is transparent, independent, and ethical.
The board has formal governance guidelines that set out our approach to governance and the board’s governance role and practices. The guidelines are intended to ensure that we comply with all of the applicable governance rules and legislation in Canada and the US, conduct ourselves in the best interests of our stakeholders, and meet industry best practices. The guidelines are reviewed and updated regularly.
Risk and Risk Management
Our board of directors oversees management’s implementation of appropriate risk management processes and controls. We have a Risk Policy that is supported by our formal Risk Management Program.
Our Risk Management Program involves a broad, systematic approach to identifying, assessing, monitoring, reporting and managing the significant risks we face in our business and operations, including risks that could impact our four measures of success. The program is based on the ISO 31000 Risk Management guidelines. ISO 31000 provides guidance on risk management activities with internationally recognized practices and provides sound principles for effective management and governance of risks. Our program applies to all risks facing the company. The program establishes clear accountabilities for employees throughout the company to take ownership of risks specific to their area and to effectively manage those risks. The program is reviewed annually to ensure that it continues to meet our needs.
We use a common risk matrix throughout the company. Any risk that has the potential to significantly affect our ability to achieve our corporate objectives or strategic plan is considered an enterprise risk and is brought to the attention of senior management and the board. We continually update our risk profile by performing regular monitoring of risks across the organization. Regular monitoring helps us to properly manage risks and identify any new risks. Detailed risk reporting is provided on a quarterly basis to senior management and the board and its committees on the status of the mitigating and/or monitoring plans for each of the enterprise risks. Management also reviews monthly updates on the company’s progress in managing these risks.
In addition to considering the other information in this MD&A, you should carefully consider the material risks discussed starting on page 4, under the heading Managing the risks, starting on page 74, and the specific risks discussed under each operation, advanced project, and other fuel cycle investment update in this document. These risks, however, are not a complete list of the potential risks our operations, advanced projects, or other investments face. There may be others we are not aware of or risks we feel are not material today that could become material in the future.
We recommend you also review our annual information form, which includes a discussion of other material risks that could have an impact on our business.
34 CAMECO CORPORATION
Measuring our results
Targets and Metrics: The link to executive pay
Each year, we set corporate objectives that are aligned with our strategic plan. These objectives fall under our four measures of success: outstanding financial performance, safe, healthy and rewarding workplace, clean environment and supportive communities. Performance against specific targets under these objectives forms the foundation for a portion of annual employee and executive compensation. See our most recent management proxy circular for more information on how executive compensation is determined.
We saw a significant improvement in our financial performance (earnings and cash flow) as our tier-one production increased and our average realized price reflected the improving market. However, we did not meet all our targets, including our safety performance, in 2024. We remain committed to improvement as reflected in our objectives for 2025.
| 2024 OBJECTIVES1 |
TARGET |
RESULTS |
||
| OUTSTANDING FINANCIAL PERFORMANCE | ||||
| Earnings measure | Achieve targeted adjusted net earnings. | • adjusted net earnings was above the target |
||
| Cash flow measure | Achieve targeted cash flow from operations (before working capital changes). | • cash flow from operations was below the target |
||
| SAFE, HEALTHY AND REWARDING WORKPLACE | ||||
| Workplace safety measure | Strive for no injuries at all Cameco-operated sites. Maintain a long-term downward trend in combined employee and contractor total recordable injury rate while achieving targets on specified leading indicators. | • we did not achieve our target for TRIR and results remained similar to 2023
• performance of the leading indicators was within the target range |
||
| CLEAN ENVIRONMENT | ||||
| Environmental performance measures | Achieve corporate environmental targets.
Publish total Scope 3 emissions value and method of quantification. |
• performance on corporate environmental measures was within the target range
• performance on the Scope 3 emissions measure was above the target |
||
| SUPPORTIVE COMMUNITIES | ||||
| Stakeholder support measure | Enhance Residents of Saskatchewan’s North (RSN) skill development and progression focused on internal development for progression and external trades training | • performance on the RSN skill enhancement measure was above the target |
||
| 1 | Detailed results for our 2024 corporate objectives and the related targets will be provided in our 2025 management proxy circular prior to our Annual Meeting of Shareholders on May 9, 2025. |
MANAGEMENT’S DISCUSSION AND ANALYSIS 35
2025 objectives
OUTSTANDING FINANCIAL PERFORMANCE
| • | Achieve targeted financial measures. |
SAFE, HEALTHY AND REWARDING WORKPLACE
| • | Improve workplace safety performance at all sites. |
CLEAN ENVIRONMENT
| • | Improve environmental performance at all sites and continue to execute on our Low Carbon Transition Plan. |
SUPPORTIVE COMMUNITIES
| • | Build and sustain strong stakeholder support for our activities. |
36 CAMECO CORPORATION
Financial results
This section of our MD&A discusses our performance, financial condition and outlook for the future.
| 38 |
2024 CONSOLIDATED FINANCIAL RESULTS |
|
| 46 |
OUTLOOK FOR 2025 |
|
| 50 |
LIQUIDITY AND CAPITAL RESOURCES |
|
| 57 |
2024 FINANCIAL RESULTS BY SEGMENT |
|
| 57 |
URANIUM |
|
| 59 |
FUEL SERVICES |
|
| 59 |
WESTINGHOUSE |
|
| 60 |
FOURTH QUARTER FINANCIAL RESULTS |
|
| 60 |
CONSOLIDATED RESULTS |
|
| 62 |
URANIUM |
|
| 64 |
FUEL SERVICES |
|
| 64 |
WESTINGHOUSE |
|
| 65 |
NON-IFRS MEASURES |
MANAGEMENT’S DISCUSSION AND ANALYSIS 37
2024 consolidated financial results
In the fourth quarter of 2023, we announced the closing of the acquisition of a 49% interest in Westinghouse. Effective November 7, 2023, we began equity accounting for this investment. Our share of Westinghouse’s earnings has been reflected in our financial results from that date.
In the second quarter of 2022, we along with Orano acquired Idemitsu Canada Resources Ltd.’s 7.875% participating interest in the Cigar Lake Joint Venture. Our ownership stake in Cigar Lake now stands at 54.547%, 4.522 percentage points higher than it was prior to the transaction. Effective May 19, 2022, we have reflected our share of production and financial results based on this new ownership stake.
| HIGHLIGHTS | CHANGE FROM | |||||||||||||||
| DECEMBER 31 ($ MILLIONS EXCEPT WHERE INDICATED) |
2024 | 2023 | 2022 | 2023 TO 2024 | ||||||||||||
| Revenue |
3,136 | 2,588 | 1,868 | 21 | % | |||||||||||
| Gross profit |
783 | 562 | 233 | 39 | % | |||||||||||
| Net earnings attributable to equity holders |
172 | 361 | 89 | (52 | )% | |||||||||||
| $ per common share (basic) |
0.40 | 0.83 | 0.22 | (53 | )% | |||||||||||
| $ per common share (diluted) |
0.39 | 0.83 | 0.22 | (52 | )% | |||||||||||
| Adjusted net earnings (non-IFRS, see page 65)1 |
292 | 383 | 123 | (24 | )% | |||||||||||
| $ per common share (adjusted and diluted) |
0.67 | 0.88 | 0.30 | (24 | )% | |||||||||||
| Adjusted EBITDA (non-IFRS, see page 65) |
1,531 | 884 | 431 | 73 | % | |||||||||||
| Cash provided by operations |
905 | 688 | 305 | 32 | % | |||||||||||
| 1 | In 2024, we revised our calculation of adjusted net earnings to adjust for unrealized foreign exchange gains and losses as well as for share-based compensation because it better reflects how we assess our operational performance. We have restated comparative periods to reflect this change. |
38 CAMECO CORPORATION
Net earnings
The following table shows what contributed to the change in net earnings (loss) in 2024 compared to 2023 and 2022.
| ($ MILLIONS) |
2024 | 2023 | 2022 | |||||||||||
| Net earnings (losses) - previous year |
361 | 89 | (103 | ) | ||||||||||
|
|
|
|
|
|
|
|||||||||
| Change in gross profit by segment |
|
|||||||||||||
| (we calculate gross profit by deducting from revenue the cost of products and services sold, and depreciation and amortization (D&A), net of hedging benefits) |
|
|||||||||||||
| Uranium |
Impact from sales volume changes | 22 | 30 | (6 | ) | |||||||||
| Higher realized prices ($US) |
390 | 208 | 328 | |||||||||||
| Foreign exchange impact on realized prices |
26 | 95 | 44 | |||||||||||
| Higher costs | (203 | ) | (9 | ) | (137 | ) | ||||||||
|
|
|
|
|
|
|
|||||||||
| change – uranium | 235 | 324 | 229 | |||||||||||
|
|
|
|
|
|
|
|||||||||
| Fuel services | Impact from sales volume changes |
2 | 9 | (21 | ) | |||||||||
| Higher realized prices ($Cdn) |
27 | 32 | 33 | |||||||||||
| Higher costs | (47 | ) | (34 | ) | (13 | ) | ||||||||
|
|
|
|
|
|
|
|||||||||
| change – fuel services | (18 | ) | 7 | (1 | ) | |||||||||
|
|
|
|
|
|
|
|||||||||
| Other changes |
||||||||||||||
| Higher administration expenditures |
(7 | ) | (74 | ) | (44 | ) | ||||||||
| Higher exploration and research and development expenditures |
(17 | ) | (16 | ) | (8 | ) | ||||||||
| Change in reclamation provisions |
30 | 31 | (31 | ) | ||||||||||
| Change in gains or losses on derivatives |
(221 | ) | 111 | (86 | ) | |||||||||
| Change in foreign exchange gains or losses |
50 | (58 | ) | 74 | ||||||||||
| Change in earnings from equity-accounted investees |
(165 | ) | 60 | 26 | ||||||||||
| Canadian Emergency Wage Subsidy |
— | — | (21 | ) | ||||||||||
| Bargain purchase gain on CLJV ownership interest increase |
— | (23 | ) | 23 | ||||||||||
| Higher (lower) finance income |
(91 | ) | 75 | 30 | ||||||||||
| Higher finance costs |
(31 | ) | (30 | ) | (9 | ) | ||||||||
| Change in income tax recovery or expense |
41 | (130 | ) | 3 | ||||||||||
| Other |
5 | (5 | ) | 7 | ||||||||||
|
|
|
|
|
|
|
|||||||||
| Net earnings - current year |
172 | 361 | 89 | |||||||||||
|
|
|
|
|
|
|
|||||||||
Average realized prices
| CHANGE FROM | ||||||||||||||||||||
| 2024 | 2023 | 2022 | 2023 TO 2024 | |||||||||||||||||
| Uranium1 |
$ | US/lb | 58.34 | 49.76 | 44.73 | 17 | % | |||||||||||||
| $ | Cdn/lb | 79.70 | 67.31 | 57.85 | 18 | % | ||||||||||||||
|
|
|
|
|
|
|
|
|
|||||||||||||
| Fuel services |
$ | Cdn/kgU | 37.87 | 35.61 | 32.92 | 6 | % | |||||||||||||
|
|
|
|
|
|
|
|
|
|||||||||||||
| 1 | Average realized foreign exchange rate ($US/$Cdn): 2024 – 1.37, 2023 – 1.35 and 2022 – 1.29. |
Revenue
The following table shows what contributed to the change in revenue for 2024.
| ($ MILLIONS) |
||||
| Revenue – 2023 |
2,588 | |||
|
|
|
|||
| Uranium |
||||
| Higher sales volume |
107 | |||
| Higher realized prices ($Cdn) |
416 | |||
|
|
|
|||
| Fuel services |
||||
| Higher sales volume |
7 | |||
| Higher realized prices ($Cdn) |
27 | |||
|
|
|
|||
| Other |
(9 | ) | ||
|
|
|
|||
| Revenue – 2024 |
3,136 | |||
|
|
|
|||
See 2024 Financial results by segment on page 57 for more detailed discussion.
MANAGEMENT’S DISCUSSION AND ANALYSIS 39
THREE-YEAR TREND
In 2023, revenue increased by 39% compared to 2022 due to a 45% increase in the uranium segment and a 17% increase in our fuel services segment. Both segments saw increases in the average realized price and sales volume.
In 2024, revenue increased by 21% compared to 2023 due to a 24% increase in the uranium segment and an 8% increase in our fuel services segment. Both segments saw significant increases in the average realized price and while sales volume remained constant in fuel services, the uranium segment saw an increase in volume. See notes 18 and 28 in our annual financial statements for more information.
SALES DELIVERY OUTLOOK FOR 2025
For 2025 we have committed sales volumes in our uranium segment of between 31 and 34 million pounds.
In our uranium and fuel services segments, our customers choose when in the year to receive deliveries. As a result, our quarterly delivery patterns and, therefore, our sales volumes and revenue can vary significantly. We expect a greater share of uranium deliveries in 2025 to be in the second half of the year as shown below. However, not all delivery notices have been received to date and the expected delivery pattern could change. Typically, we receive notices six months in advance of the requested delivery date.
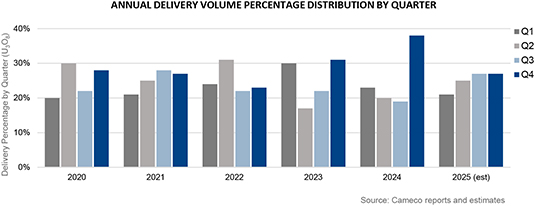
Corporate expenses
ADMINISTRATION
| ($ MILLIONS) |
2024 | 2023 | CHANGE | |||||||||
| Direct administration1 |
212 | 186 | 14 | % | ||||||||
| Stock-based compensation1 |
41 | 60 | (32 | )% | ||||||||
|
|
|
|
|
|
|
|||||||
| Total administration |
253 | 246 | 3 | % | ||||||||
|
|
|
|
|
|
|
|||||||
| 1 | Direct administration and stock-based compensation are supplementary financial measures. They are components of administration expense as shown on the statement of earnings and calculated according to IFRS. |
Direct administration costs in 2024 were $26 million higher than in 2023 largely due to the impacts of inflation and higher payments under Collaboration Agreements tied to increased production volumes.
We recorded $41 million in stock-based compensation expenses in 2024, $19 million lower compared to 2023 due to both the grant and vesting of a lower number of share-based awards compared to the same period last year. See note 24 to the financial statements.
Administration outlook for 2025
We expect direct administration costs to be between $220 million to $230 million.
40 CAMECO CORPORATION
EXPLORATION AND RESEARCH & DEVELOPMENT
Our 2024 exploration activities were focused primarily on Canada. As planned, our spending increased from $18 million in 2023 to $19 million in 2024.
We also had research and development expenditures in 2024 of $37 million compared to $21 million in 2023. These expenses are related to our investment in Global Laser Enrichment LLC (GLE). See Global Laser Enrichment on page 106.
Exploration and research & development outlook for 2025
We expect exploration expenses to be about $27 million in 2025. The focus for 2025 will be on our core projects in Saskatchewan. We expect research and development expenses to be about $47 million in 2025, primarily related to our investment in GLE. See Global Laser Enrichment on page 106.
FINANCE COSTS
Finance costs were $147 million, an increase from $116 million in 2023 primarily due to interest on the US term loan put in place to finance the acquisition of Westinghouse. See note 20 to the financial statements.
FINANCE INCOME
Finance income was $21 million compared to $112 million in 2023 mainly due to a lower short-term investment balance throughout 2024 due to the closing of the Westinghouse acquisition in November 2023 and $400 million (US) in debt repayments made in 2024.
GAINS AND LOSSES ON DERIVATIVES
In 2024, we recorded $183 million in losses on our derivatives compared to $38 million in gains in 2023. The losses reflect a weaker Canadian dollar compared to the US dollar in 2024 compared to 2023. See Foreign exchange on page 44 and note 26 to the financial statements.
INCOME TAXES
We recorded an income tax expense of $85 million in 2024 compared to an expense of $126 million in 2023 primarily as a result of lower earnings in Canada compared to 2023. Equity-accounted investees are included in both Canadian and foreign earnings net of tax paid in the jurisdictions in which they operate. Foreign earnings include losses in some jurisdictions for which no future tax benefit has been recognized.
In 2024, we recorded earnings of $401 million in Canada compared to earnings of $562 million in 2023, while in foreign jurisdictions, we recorded a loss of $144 million compared to a loss of $75 million in 2023.
| ($ MILLIONS) |
2024 | 2023 | ||||||
| Net earnings (loss) before income taxes |
||||||||
| Canada |
401 | 562 | ||||||
| Foreign |
(144 | ) | (75 | ) | ||||
|
|
|
|
|
|||||
| Total net earnings before income taxes |
257 | 487 | ||||||
|
|
|
|
|
|||||
| Income tax expense (recovery) |
||||||||
| Canada |
63 | 131 | ||||||
| Foreign |
22 | (5 | ) | |||||
|
|
|
|
|
|||||
| Total income tax expense |
85 | 126 | ||||||
|
|
|
|
|
|||||
| Effective tax rate |
33 | % | 26 | % | ||||
|
|
|
|
|
|||||
TRANSFER PRICING DISPUTE
Background
Since 2008, Canada Revenue Agency (CRA) has disputed our marketing and trading structure and the related transfer pricing methodology we used for certain intercompany uranium sale and purchase agreements.
MANAGEMENT’S DISCUSSION AND ANALYSIS 41
For the years 2003 to 2014, CRA shifted Cameco Europe Limited’s income (as recalculated by CRA) back to Canada and applied statutory tax rates, interest and instalment penalties, and, from 2007 to 2011, transfer pricing penalties. In addition, for 2014 to 2017, CRA has advanced an alternate reassessing position, see Reassessments, remittances and next steps below for more information.
In September 2018, the Tax Court of Canada (Tax Court) ruled that our marketing and trading structure involving foreign subsidiaries, as well as the related transfer pricing methodology used for certain intercompany uranium sales and purchasing agreements, were in full compliance with Canadian law for the tax years in question (2003, 2005 and 2006). On June 26, 2020, the Federal Court of Appeal (Court of Appeal) upheld the Tax Court’s decision.
On February 18, 2021, the Supreme Court of Canada (Supreme Court) dismissed CRA’s application for leave to appeal the June 26, 2020 decision of the Court of Appeal. The dismissal means that the dispute for the 2003, 2005 and 2006 tax years is fully and finally resolved in our favour. Although not technically binding, there is nothing in the reasoning of the lower court decisions that should result in a different outcome for the 2007 through 2014 tax years, which were reassessed on the same basis.
Refund and cost award
The Minister of National Revenue issued new reassessments for the 2003 through 2006 tax years in accordance with the decision and in July 2021, refunded the tax paid for those years. In October 2023, pursuant to a cost award from the courts, we received a payment of approximately $12 million for disbursements which is in addition to the $10 million we received from CRA in April 2021 as reimbursement for legal fees.
Reassessments, remittances and next steps
The Canadian income tax rules include provisions that generally require larger companies like us to remit or otherwise secure 50% of the cash tax plus related interest and penalties at the time of reassessment. Following the Supreme Court’s dismissal of CRA’s application for leave to appeal, we wrote to CRA requesting reversal of CRA’s transfer pricing adjustments for 2007 through 2013 and the return of the $780 million in cash and letters of credit we paid or provided for those years. Given the strength of the court decisions received, our request was made on the basis that the Tax Court would reject any attempt by CRA to defend its reassessments for the 2007 through 2013 tax years applying the same or similar positions already denied for previous years.
In March 2023, CRA issued revised reassessments for the 2007 through 2013 tax years, which resulted in a refund of $297 million of the $780 million in cash and letters of credit held by CRA at the time. The refund consisted of cash in the amount of $86 million and letters of credit in the amount of $211 million, which were returned in the second quarter.
The series of court decisions that were completely and unequivocally in our favour for the 2003, 2005 and 2006 tax years, determined that the income earned by our foreign subsidiary from the sale of non-Canadian produced uranium was not taxable in Canada. In accordance with these decisions, CRA issued reassessments reducing the proposed transfer pricing adjustment from $5.1 billion to $3.3 billion, resulting in a reduction of $1.8 billion in income taxable in Canada compared to the previous reassessments issued to us by CRA for the 2007 through 2013 tax years.
The remaining transfer pricing adjustment of $3.3 billion for the 2007 to 2013 tax years relates to the sale of Canadian-produced uranium by our foreign subsidiary. We maintain that the clear and decisive court decisions described above apply, and that CRA should fully reverse the remaining transfer pricing adjustments for these years and return all cash and security being held.
In October 2021, due to a lack of significant progress on our points of contention, we filed a notice of appeal with the Tax Court for the years 2007 through 2013. We have asked the Tax Court to order the complete reversal of CRA’s transfer pricing adjustment for those years and the return of all cash and letters of credit being held, with costs.
42 CAMECO CORPORATION
In 2020, CRA advanced an alternate reassessing position for the 2014 tax year in the event the basis for its original reassessment, noted above, is unsuccessful. Subsequent to this, we received a reassessment for the 2015, 2016 and 2017 tax years, all reflecting this alternative reassessing position. While CRA did not require additional security for the tax debts they considered owing for 2014 through 2016, CRA did require additional letters of credit related to the tax debts they considered owing for 2017. CRA continues to hold $555 million ($209 million in cash and $346 million in letters of credit) that we have remitted or secured to date. The new basis of reassessment is inconsistent with the methodology CRA has pursued for prior years and we are disputing it separately. Our view is that this alternate methodology will not result in a materially different outcome from our 2014 to 2017 filing positions. We filed appeals with the Tax Court for each year from 2014 through 2017.
In late 2024, we received a reassessment for the 2018 tax year. The reassessment relates to contracts other than those discussed above. CRA has advanced another alternate reassessing position for the 2018 tax year. We plan to file a notice of objection for 2018.
We will not be in a position to determine the definitive outcome of the dispute for any tax year other than 2003 through 2006 until such time as all reassessments have been issued advancing CRA’s arguments and final resolution is reached for that tax year. CRA may also advance alternative reassessment methodologies for years other than 2003 through 2006, such as the alternative reassessing position advanced for 2014 through 2017, or the new alternative reassessing position advanced for 2018.
Caution about forward-looking information relating to our CRA tax dispute
This discussion of our expectations relating to our tax dispute with CRA and future tax reassessments by CRA is forward-looking information that is based upon the assumptions and subject to the material risks discussed under the heading Caution about forward-looking information beginning on page 2 and also on the more specific assumptions and risks listed below. Actual outcomes may vary significantly.
Assumptions
| • | the courts will reach consistent decisions for subsequent tax years that are based on similar positions and arguments |
| • | CRA will not successfully advance different positions and arguments that may lead to a different outcome for other tax years |
Material risks that could cause actual results to differ materially
| • | the possibility the courts may accept the same, similar or different positions and arguments advanced by CRA to reach decisions that are adverse to us for other tax years |
| • | the possibility that we will not be successful in eliminating all double taxation |
| • | the possibility that CRA does not agree that the court decisions for the years that have been resolved in Cameco’s favour should apply to subsequent tax years |
| • | the possibility CRA will not return all or substantially all of the cash and security that has been paid or otherwise secured by Cameco in a timely manner, or at all |
| • | the possibility of a materially different outcome in disputes for other tax years |
Tax outlook for 2025
Our consolidated tax rate is a blend of the statutory rates applicable to taxable income earned or tax losses incurred in Canada and in our foreign subsidiaries. Since 2017, our global marketing organization has been mainly consolidated in Canada in order to achieve efficiencies, resulting in more income earned in Canada. In addition, equity-accounted investees are included in Canadian and foreign earnings net of tax paid in the jurisdiction in which they operate. We continue to expect our consolidated tax rate will trend toward the Canadian statutory rate in the longer term.
The actual effective tax rate will vary from year-to-year, primarily due to the actual distribution of earnings among jurisdictions and differences between accounting earnings and income for tax purposes. In addition, the Organization for Economic Co-operation and Development has proposed the introduction of rules that would impose a global minimum tax rate of 15% beginning in 2024. Switzerland, Luxembourg, and Germany have all enacted or substantively enacted these rules.
MANAGEMENT’S DISCUSSION AND ANALYSIS 43
FOREIGN EXCHANGE
The exchange rate between the Canadian dollar and US dollar affects the financial results of our uranium and fuel services segments.
We sell the majority of our uranium and fuel services products under long-term sales contracts, which are routinely denominated in US dollars. While our product purchases are denominated in US dollars, our production costs are largely denominated in Canadian dollars. To provide cash flow predictability, we hedge a portion of our net US/Cdn exposure (e.g. total US dollar sales less US dollar expenditures and product purchases) to manage shorter term exchange rate volatility. Our results are therefore affected by the movements in the exchange rate, and in particular on the unhedged portion of our net exposure.
Our risk management policy is based on a 60-month period and permits us to hedge 35% to 100% of our expected net exposure in the first 12-month period. Our normal practice is to layer in hedge contracts over a three- to four-year period with the hedge ratios being highest in the first 12 months and decreasing hedge ratios in subsequent years. The portion of our net exposure that remains unhedged is subject to prevailing market exchange rates for the period. A weakening Canadian dollar would have a positive effect on the unhedged exposure, and a strengthening Canadian dollar would have a negative effect.
Impact of hedging on IFRS earnings
We do not use hedge accounting under IFRS and, therefore, we are required to report gains and losses on all hedging activity, both for contracts that close in the period and those that remain outstanding at the end of the period. For the contracts that remain outstanding, we must treat them as though they were settled at the end of the reporting period (mark-to-market).
However, we do not believe the gains and losses that we are required to report under IFRS appropriately reflect the intent of our hedging activities, so we make adjustments in calculating our ANE to better reflect the impact of our hedging program in the applicable reporting period.
Impact of hedging on ANE
We designate contracts for use in particular periods, based on our expected net exposure in that period. Hedge contracts are layered in over time based on this expected net exposure. The result is that our current hedge portfolio is made up of a number of contracts which are currently designated to net exposures we expect in 2025 and future years and we will recognize the gains or losses in ANE in those periods.
For the purposes of ANE, gains and losses on derivatives are reported based on the difference between the effective hedge rate of the contracts designated for use in the particular period and the exchange rate at the time of settlement. This results in an adjustment to current period IFRS earnings to effectively remove reported gains or losses on derivatives that arise from contracts put in place for use in future periods. The effective hedge rate will lag the market in periods of rapid currency movement. See Non-IFRS measures on page 65.
The table below provides a summary of our hedge portfolio at December 31, 2024. You can use this information to estimate the expected gains or losses on derivatives for 2025 on an ANE basis. Additionally, if we add contracts to the portfolio that are designated for use in 2025 or if there are changes in the US/Cdn exchange rates in the year, those expected gains or losses could change.
44 CAMECO CORPORATION
Hedge portfolio summary
| DECEMBER 31, 2024 | AFTER | |||||||||||||||
| ($ MILLIONS) |
2025 | 2025 | TOTAL | |||||||||||||
| US dollar forward contracts |
($ millions | ) | 1,070 | 1,210 | 2,280 | |||||||||||
| Average contract rate1 |
(US/Cdn dollar | ) | 1.35 | 1.35 | 1.35 | |||||||||||
|
|
|
|
|
|
|
|||||||||||
| Total US dollar hedge contracts |
($ millions | ) | 1,070 | 1,210 | 2,280 | |||||||||||
| Average hedge rate |
(US/Cdn dollar | ) | 1.35 | 1.35 | 1.35 | |||||||||||
| Hedge ratio2 |
63 | % | 14 | % | 22 | % | ||||||||||
| 1 | The average contract rate is the weighted average of the rates stipulated in the outstanding contracts. |
| 2 | Hedge ratio is calculated by dividing the amount (in foreign currency) of outstanding derivative contracts by estimated future net exposures. |
At December 31, 2024:
| • | The value of the US dollar relative to the Canadian dollar was $1.00 (US) for $1.44 (Cdn), up from $1.00 (US) for $1.32 (Cdn) at December 31, 2023. The exchange rate averaged $1.00 (US) for $1.37 (Cdn) over the year. |
| • | The mark-to-market position on all foreign exchange contracts was a $140 million loss compared to a $12 million gain at December 31, 2023. The mark-to-market position is a component of gains/losses on derivatives as shown on the statement of earnings and calculated in accordance with IFRS. |
We manage counterparty risk associated with hedging by dealing with highly rated counterparties and diversifying our exposure. At December 31, 2024, all of our hedging counterparties had a S&P Global Ratings credit rating of A or better.
For information on the impact of foreign exchange on our intercompany balances, see note 26 to the financial statements.
MANAGEMENT’S DISCUSSION AND ANALYSIS 45
Outlook for 2025
Our outlook for 2025 reflects our plan to produce 18 million pounds (100% basis) at each of Cigar Lake and McArthur River/Key Lake, and 13 million to 14 million kgU in our fuel services segment, as well as continued work to extend the mine life at Cigar Lake.
In 2025, we expect strong financial performance, including cash flow generation. Our financial performance and the amount of cash generated will be dependent on sourcing the material required to meet our deliveries as planned, including achieving our production plans.
As in prior years, we will incur care and maintenance costs for the ongoing curtailment of our tier-two assets, which are expected to be between $62 million and $67 million.
2024 outlook compared to actual
Our actual results were largely in-line with the outlook provided in our third quarter MD&A. Average unit cost of sales in our fuel services segment was $29.14 per kgU compared to our outlook of $25.50 to $26.50 per kgU due to 2024 production being at the low end of the range provided in the third quarter MD&A combined with inflationary pressures.
See 2024 Financial results by segment on page 57 for details.
2025 Financial outlook
| CONSOLIDATED | URANIUM | FUEL SERVICES | WESTINGHOUSE | |||||||||||||
| Production (owned and operated properties) |
— | 22.4 million lbs | 13 to 14 million kgU | — | ||||||||||||
| Market purchases |
— | up to 3 million lbs | — | — | ||||||||||||
| Committed purchases (including Inkai purchase volumes) |
— | 9 million lbs | — | — | ||||||||||||
| Sales/delivery volume |
— | 31 to 34 million lbs | 13 to 14 million kgU | — | ||||||||||||
| Revenue |
$ | 3,300 to 3,550 million | $ | 2,800 to 3,000 million | $ | 500-550 million | — | |||||||||
| Average realized price |
— | $ | 84.00/lb | 1 | — | — | ||||||||||
| Average unit cost of sales (including D&A) |
— | $ | 59.50-63.00/lb | 2 | $ | 27.00-$28.75/kgU | 3 | — | ||||||||
| Direct administration costs |
$ | 220-230 million | — | — | — | |||||||||||
| Exploration costs |
— | $ | 27 million | — | — | |||||||||||
| Research and development |
$ | 47 million | — | — | — | |||||||||||
| Capital expenditures |
$ | 360-400 million | $ | 285-310 million | $ | 70-80 million | — | |||||||||
| Adjusted EBITDA (non-IFRS measure see page 65) (USD) |
— | — | — | $ | 355-405 million | |||||||||||
| 1 | Uranium average realized price is calculated as the revenue from sales of uranium concentrate, transportation and storage fees divided by the volume of uranium concentrates sold |
| 2 | Uranium average unit cost of sales is calculated as the cash and non-cash costs of the product sold, royalties, care and maintenance and selling costs, divided by the volume of uranium concentrates sold. |
| 3 | Fuel services average unit cost of sales is calculated as the cash and non-cash costs of the product sold, transportation and weighing and sampling costs, as well as care and maintenance costs, divided by the volume of products sold. |
We do not provide an outlook for the items in the table that are marked with a dash.
The following assumptions were used to prepare the outlook in the table above:
| • | Market purchases reflect the market purchases we have made to date or plan to make in 2025. Market purchases may vary if planned production varies. In addition, if we decide to increase our working inventory from current levels our market purchases could be higher. Our market purchases could also be lower if, instead of making market purchases, we choose to source the required volumes by temporarily reducing inventory levels, by pulling forward long-term purchase commitments, or by drawing on loan arrangements we have in place. |
46 CAMECO CORPORATION
| • | Committed purchases are based on the 4.8 million pounds we currently have commitments to acquire under contract in 2025 and our JV Inkai purchases, which we have assumed will be equivalent to our 2024 purchase volume of 4.2 million pounds. Following the halt of production in January 2025 at Inkai, we are in discussions with JV Inkai and KAP to determine how the halt will impact production at Inkai in 2025 and thereafter and our corresponding purchase entitlements. If Inkai production and/or deliveries vary, committed purchases will vary and we may have to rely on our other sources of supply described above. We equity account for our minority ownership interest in JV Inkai. We record our share of its production as a purchase. However, this does not reflect our share of the economic benefit. Our share of the economic benefit is based on the difference between our purchase price and JV Inkai’s lower production cost and is reflected in the line item on our statement of earnings called, “share of earnings from equity-accounted investees”. As a result, increases in the spot price increase our cost of purchases from JV Inkai and also our “share of earnings from equity-accounted investees”. The benefit is realized, through receipt of a cash dividend, when declared and paid by JV Inkai. |
| • | Our 2025 outlook for sales/delivery volume does not include sales between our uranium and fuel services segments. |
| • | Sales/delivery volume is based on the volumes we currently have commitments to deliver under contract in 2025. |
| • | Uranium revenue and average realized price are based on a uranium spot price of $71.75 (US) per pound (the UxC spot price on December 30, 2024), a long-term price indicator of $79.00 (US) per pound (the UxC long-term indicator on December 30, 2024) and an exchange rate of $1.00 (US) for $1.40 (Cdn). |
| • | Uranium average unit cost of sales (including D&A) is based on the expected unit cost of sales for produced material, the planned market purchases and committed purchases noted in the outlook at an anticipated average purchase price of about $100 (Cdn) per pound and includes care and maintenance costs of between $62 million and $67 million. We expect overall unit cost of sales could vary if there are changes in production and market or committed purchase volumes or the mix of supply sources used to meet our contract deliveries, uranium spot prices, and/or care and maintenance costs in 2025. In addition, unit cost of sales could be impacted by the imposition of tariffs in the US, see Managing our costs on page 28 for more information. |
| • | The adjusted EBITDA outlook for Westinghouse is based on the assumptions listed later in this section. |
| • | Westinghouse and JV Inkai are accounted for using the equity method for our share. Under equity accounting Westinghouse and JV Inkai capital expenditures are not presented within our consolidated financial statements and are therefore not included in our outlook for capital expenditures. |
For more information on how changes in the exchange rate or uranium prices can impact our outlook see Revenue, adjusted net earnings, and cash flow sensitivity analysis below, and Foreign exchange starting on page 44.
In 2025 we expect our share of adjusted EBITDA from our equity investment in Westinghouse to be between $355 million and $405 million in US dollars. Over the next five years, we expect its adjusted EBITDA will grow at a compound annual growth rate of 6% to 10%.
| $USD | ||||
| CAMECO SHARE (49%) |
MILLIONS | |||
| Net loss |
(20-70 | ) | ||
| Depreciation and amortization |
260-275 | |||
| Finance income |
(1-2 | ) | ||
| Finance costs |
120-135 | |||
| Income tax expense (recovery) |
5-(10 | ) | ||
|
|
|
|||
| EBITDA |
320-370 | |||
| Inventory purchase accounting |
1-5 | |||
| Restructuring costs |
15-30 | |||
| Other expenses |
10-25 | |||
|
|
|
|||
| Adjusted EBITDA (non-IFRS, see page 65) |
355-405 | |||
|
|
|
|||
Note: the ranges for 2025 outlook for EBITDA and adjusted EBITDA are not determined using the high and low estimates of the ranges provided for each of the detailed reconciling line items.
We expect that earnings and adjusted EBITDA will be weak in the first half of the year and weighted to the fourth quarter.
The outlook for adjusted EBITDA from Westinghouse for 2025 and its growth over the next five years are based on the following assumptions:
MANAGEMENT’S DISCUSSION AND ANALYSIS 47
| • | A compound annual growth rate in revenue from its core business of 6% to 8%, which is slightly higher than the anticipated average growth rate of the nuclear industry based on the World Nuclear Association’s Reference Case. In addition to orders for pressurized water reactor fuel and services, this includes orders for VVER, BWR fuel and services, and a phase out of AGR fuel. The outlook assumes that work is fulfilled on the timelines and scope expected based on current orders received, and additional work is secured based on past trends. The expected margins for the core business are aligned with the historic margins of 16% to 19%, with the variability expected to come from product mix compared to in previous years. |
| • | Growth in its new build business from new AP1000 reactor projects based on agreements that have been signed and announcements where AP1000 technology has been selected. This includes Poland, Bulgaria and Ukraine, as well as the expected benefit over this period for deployment of reactor designs using Westinghouse’s technology. It is assumed that work on announced agreements and announced selections to be done by Westinghouse would proceed on the timelines and revenue pattern noted under the New Build Framework. A delay in project timelines or cancellation of announced projects would result in a growth rate near the bottom of the range. The top of the growth range assumes the announced projects continue and two additional projects are secured within the timeframe from the group of planned and proposed projects. For all new build projects, the growth assumes Westinghouse undertakes only the engineering and procurement work required prior to a new reactor project breaking ground, which is a small component of the overall potential. |
| • | Estimates and assumptions, including growth capital timelines, new build development timelines for both announced and potential reactor builds which are subject to regulatory approval, as well as risks related to the current geopolitical and macro-economic environment, may differ significantly from those assumed. |
| • | Contributions from new technologies are outside the 5-year time frame. Timelines for investment in research and development for new technologies, including the eVinci microreactor and AP300 small modular reactor, may differ from that assumed. |
| • | The outlook for capital expenditures includes growth capex for expansion of fuel fabrication capabilities, as well as work to evaluate cost, timeline and infrastructure required to bring back conversion capacity and consider the potential future opportunities at the Springfields site in the UK. As with Cameco’s other investments, planning for this site will align with market opportunities. |
Westinghouse 2025 capital spending outlook
| CAMECO’S SHARE ($USD MILLIONS) |
2025 PLAN | |||
| Total |
120-150 | |||
|
|
|
|||
| Sustaining capital |
60-75 | |||
| Growth capital |
60-75 | |||
Westinghouse debt
At December 31, 2024, Westinghouse had the following outstanding debt:
| • | $3.5 billion (US) term loan with a maturity of January 2031 |
| • | credit facilities of $500 million (US), which were undrawn and mature in January 2029 |
| • | financial assurances including letters of credit of about $330 million (US) issued and surety bonds of $294 million (US) |
The credit agreements are non-recourse to Cameco, but come with certain covenants, which if breached, could result in all amounts outstanding thereunder to be immediately due and payable by Westinghouse. We expect Westinghouse to continue to comply with these covenants in 2025.
Caution about forward-looking information relating to our future earnings and adjusted EBITDA form Westinghouse
This discussion of our expectations for Westinghouse’s future earnings and adjusted EBITDA and our share thereof is forward-looking information that is based upon the assumptions and subject to the material risks discussed under the headings Caution about forward-looking information beginning on page 2. Actual results and events may be significantly different from what we currently expect.
REVENUE, ADJUSTED NET EARNINGS, AND CASH FLOW SENSITIVITY ANALYSIS
We have sensitivity to the uranium price through both our sales and purchase commitments. However, at the current price levels many of the market-related sales contracts we have delivered into or are delivering into this year are subject to ceiling prices and therefore are generally less sensitive than our purchase commitments.
48 CAMECO CORPORATION
As a result, if the uranium spot price increased by $5 (US) per pound, we expect revenue would increase by $64 million, while ANE would increase by $18 million and cash flow would decrease by $14 million. From a cash flow perspective, the sensitivity does not adequately capture the impact of JV Inkai purchases, which straddle two fiscal reporting periods due to when dividends are declared and paid by JV Inkai. The cash flow sensitivity includes the cash outflow for the 4.2 million pounds of uranium assumed to be purchased from JV Inkai in 2025 at a 5% discount to the spot price but does not account for an associated increase in the cash dividend expected, which will be tied to our agreed to 2025 production purchase entitlement and is expected to be received in 2026. JV Inkai distributes excess cash as dividends to its owners, net of working capital requirements. In the case of a $5 (US) per pound increase in uranium prices, the JV Inkai purchases are responsible for about a $28 million decrease in cash flow, and we expect the impact of these purchases on the 2025 cash flow will be partially offset by dividends once declared and paid in 2026.
If the uranium spot price decreased by $5 (US) per pound, we expect revenue to decrease by $65 million, ANE to decrease by $19 million, and cash flow to increase by $13 million. From a cash flow perspective, the impact of the noted decrease in uranium price on the assumed purchase of uranium from JV Inkai is expected to have the opposite impact from that described above for the noted uranium price increase.
In the case of a $5 (US) increase or decrease in the uranium spot price, the sensitivity for ANE compared to the sensitivity for cash flow is less due to the impact on our net earnings from the inclusion of our share of earnings from our equity-accounted investment in JV Inkai in the reporting period, the rate of inventory turnover, and income taxes.
The following assumptions were used to prepare the revenue, ANE and cash flow sensitivity analysis above:
| • | 4.8 million pounds of purchases are sourced from the market. |
| • | Total JV Inkai purchases for the year are equivalent to our 2024 purchase volume of 4.2 million pounds. |
| • | For market-related contracts not yet priced and for delivery in 2025, subject to any floors or ceilings, we used a uranium spot price of $71.75 (US) per pound (the UxC spot price as of December 30, 2024), a long-term price indicator of $79.00 (US) per pound (the UxC long-term indicator on December 30, 2024) and an exchange rate of $1.00 (US) for $1.40 (Cdn). |
To the extent that our market purchases or Inkai purchases vary, the sensitivity of our ANE and cash flow to changes in the spot and long-term prices may be impacted. In the case of decreased market or Inkai purchases, our sensitivity would be reduced. In the case of increased market or Inkai purchases, our sensitivity would be greater.
A one cent increase or decrease in the value of the US dollar compared to the Canadian dollar would respectively increase or decrease expected revenue by $22 million, ANE by $3 million and cash flow by $2 million. The majority of our sales are denominated in US dollars, resulting in sensitivity to foreign exchange rates. Revenue will be recognized at the prevailing foreign exchange rate at the time of the sale. ANE and cash flow are less sensitive to foreign exchange rates as we have layered in foreign exchange hedges to provide cash flow certainty. Currently, for 2025, we have $1,070 million (US) hedged at an average rate of 1.35, meaning for ANE and cash flow purposes that this portion of our net exposure to the US dollar will realize a rate of 1.35 USDCAD instead of prevailing rates. See Foreign Exchange starting on page 44 for more details.
PRICE SENSITIVITY ANALYSIS: URANIUM SEGMENT
As discussed under the Long-term contracting section on page 25, our average realized price is based on pricing terms established in our portfolio of long-term contracts, which includes a mix of base-escalated and market-related contracts that are layered in over time. Each confidential contract is bilaterally negotiated with the customer and delivery generally does not begin until two years or more after signing.
| • | Base-escalated contracts will reflect market conditions and pricing at the time each contract was finalized, with escalation factors applied based on when the material is delivered. |
| • | Market-related contracts reference a pricing mechanism that may be based on either the spot price or the long-term price, and that price is generally set a month or more prior to delivery, subject to specific terms unique to each contract, such as floors and ceilings set relative to market pricing at time of negotiation and typically escalated to time of delivery. |
As a result of these contracting dynamics, changes to our average realized price will generally lag changes in market prices in both rising and falling price conditions. The magnitude and direction of the deviation can vary based on the degree of market price volatility between the time the contract price is set, and the time the product is delivered.
MANAGEMENT’S DISCUSSION AND ANALYSIS 49
To help understand how the pricing under our current portfolio of commitments is expected to react at various spot prices at December 31, 2024, we have constructed the table that follows.
The table is based on the volumes and pricing terms under the long-term commitments in our contract portfolio that have been finalized as at December 31, 2024. The table does not include volumes and pricing terms in contracts under negotiation or those that have been accepted but are still subject to contract finalization. Based on the terms and volumes under contracts that have been finalized, the table is designed to indicate how our average realized price would react under various spot price assumptions at a point in time. In other words, the prices shown in the table would only be realized if the contract portfolio remained exactly as it was on December 31, 2024, using the following assumptions:
| • | The uranium price remains fixed at a given spot level for each annual period shown |
| • | Deliveries based on commitments under finalized contracts include best estimates of the expected deliveries and flexibility under contract terms |
| • | To reflect escalation mechanisms contained in existing contracts, the long-term US inflation rate target of 2% is used, for modeling purposes only |
It is important to note, that the table is not a forecast of prices we expect to receive. The prices we actually realize will be different from the prices shown in the table. We intend to update this table each quarter in our MD&A to reflect deliveries made and changes to our contract portfolio. As a result, we expect the table to change from quarter to quarter.
Expected realized uranium price sensitivity under various spot price assumptions at December 31, 2024
| (rounded to the nearest $1.00) | ||||||||||||||||||||||||||||
| SPOT PRICES | ||||||||||||||||||||||||||||
| ($US/lb U3O8) |
$20 | $40 | $60 | $80 | $100 | $120 | $140 | |||||||||||||||||||||
| 2025 |
43 | 47 | 55 | 61 | 64 | 65 | 65 | |||||||||||||||||||||
| 2026 |
42 | 45 | 56 | 66 | 69 | 70 | 72 | |||||||||||||||||||||
| 2027 |
42 | 45 | 57 | 69 | 73 | 75 | 77 | |||||||||||||||||||||
| 2028 |
48 | 50 | 59 | 71 | 76 | 78 | 80 | |||||||||||||||||||||
| 2029 |
50 | 52 | 61 | 73 | 81 | 84 | 86 | |||||||||||||||||||||
As of December 31, 2024, we had commitments requiring delivery of an average of about 28 million pounds per year from 2025 through 2029, with commitment levels in 2025 through 2027 higher than the average and in 2028 and 2029 lower than the average, reflecting our disciplined approach to contracting. As the market improves, we expect to continue to layer in volumes capturing greater upside using market-related pricing mechanisms.
Liquidity and capital resources
Our financial objective is to ensure we have the cash and access to capital to fund our operating activities, investments and other financial obligations in order to execute our strategy, take advantage of opportunities and to self-manage risk. We regularly consider our financing options so we can take advantage of favourable market conditions when they arise. We have a number of alternatives to fund future capital requirements, including using our operating cash flow, drawing on our existing credit facilities, entering new credit facilities, and raising additional capital through debt or equity financings, including by offering securities on our base shelf prospectus or utilizing our at-the-market equity program.
At the end of 2024, we had cash and cash equivalents of $600 million, while our total debt amounted to $1.3 billion. We have a risk management policy to manage our cash balances and investments, which are largely held in government securities or with banks that are party to our lending facilities. On January 13, 2025, we repaid the remaining $200 million (US) on our US term loan, extinguishing the term loan and further reducing our total debt outstanding. A distribution of $100 million (US) from Westinghouse was paid in February 2025, of which we received $49 million (US) representing our share of the distribution.
We expect to continue to see strong earnings and cash flow generation in 2025.
50 CAMECO CORPORATION
We have large, creditworthy customers that continue to need our nuclear fuel products and services irrespective of weak economic conditions or uncertain trade policies, therefore we expect the contract portfolio we have built to continue to provide a solid revenue stream. In our uranium segment, we have commitments to deliver an average of 28 million pounds per year from 2025 through 2029, with commitment levels in 2025 through 2027 higher than the average and in 2028 and 2029 lower than the average.
We expect the low-cost production from our tier one assets will continue to generate strong cash flows which we expect will meet our capital requirements during 2025. However, cash flow from operations for 2025 will be dependent on our ability to source the material required to meet our deliveries as planned, including achieving our production plans.
With the Supreme Court’s dismissal of CRA’s application for leave, the dispute of the 2003 through 2006 tax years are fully and finally resolved in our favour. Furthermore, we are confident the courts would reject any attempt by CRA to utilize the same position and arguments for tax years 2007 through 2014, or its alternate reassessing position for tax years 2014 through 2017, or its new alternative reassessing position for 2018 and believe CRA should return all cash and letters of credit (to date, $555 million) being held. However, timing of any further payments is uncertain, and there can be no assurance that the courts will take this position. See page 41 for more information.
Financial condition
| 2024 | 2023 | |||||||
| Cash position ($ millions) |
||||||||
| (cash and cash equivalents) |
600 | 567 | ||||||
|
|
|
|
|
|||||
| Cash provided by operations ($ millions) |
||||||||
| (net cash flow generated by our operating activities after changes in working capital) |
905 | 688 | ||||||
|
|
|
|
|
|||||
| Cash from operations/net debt |
||||||||
| (net debt is total consolidated debt, less cash position) |
133 | % | 57 | % | ||||
|
|
|
|
|
|||||
| Net debt/total capitalization |
||||||||
| (total capitalization is net debt and equity) |
10 | % | 17 | % | ||||
|
|
|
|
|
|||||
Credit ratings
The credit ratings assigned by external ratings agencies are important as they impact our ability to raise capital at competitive pricing to support our business operations and execute our strategy.
Third-party ratings for our commercial paper and senior debt as of February 19, 2025 are as follows:
| SECURITY |
DBRS | S&P | ||||||
| Commercial paper |
R-2 (middle) | A-3 | ||||||
| Senior unsecured debentures |
BBB | BBB- | ||||||
| Rating trend / rating outlook |
Stable | 1 | Positive | 2 | ||||
| 1 | On September 9, 2024, DBRS confirmed the rating and outlook. |
| 2 | On December 19, 2024, S&P revised Cameco’s rating outlook to positive and affirmed the rating. |
The rating agencies may revise or withdraw these ratings if they believe circumstances warrant. The rating trend/outlook represents the rating agency’s assessment of the likelihood and direction that the rating could change in the future.
A change in our credit ratings could affect our cost of funding and our access to capital through the capital markets.
MANAGEMENT’S DISCUSSION AND ANALYSIS 51
Liquidity
| ($ MILLIONS) |
2024 | 2023 | ||||||
| Cash and cash equivalents at beginning of year |
567 | 2,282 | ||||||
|
|
|
|
|
|||||
| Cash from operations |
905 | 688 | ||||||
|
|
|
|
|
|||||
| Investment activities |
||||||||
| Additions to property, plant and equipment and acquisitions |
(212 | ) | (3,183 | ) | ||||
| Other investing activities |
5 | — | ||||||
|
|
|
|
|
|||||
| Financing activities |
||||||||
| Change in debt |
(545 | ) | 817 | |||||
| Interest paid |
(89 | ) | (41 | ) | ||||
| Issue of shares |
17 | 28 | ||||||
| Dividends |
(70 | ) | (52 | ) | ||||
| Other financing activities |
(1 | ) | (3 | ) | ||||
|
|
|
|
|
|||||
| Exchange rate on changes on foreign currency cash balances |
23 | 31 | ||||||
|
|
|
|
|
|||||
| Cash and cash equivalents at end of year |
600 | 567 | ||||||
|
|
|
|
|
|||||
CASH FROM OPERATIONS
Cash from operations in 2024 was higher than in 2023 due to higher earnings and a higher dividend payment from JV Inkai in 2024, partially offset by the $86 million cash refund received from CRA in 2023 and higher interest received due to higher cash and investment balances in 2023. Not including working capital requirements, our operating cash flows in the year were up $203 million. See note 23 to the financial statements.
INVESTING ACTIVITIES
Cash used in investing includes acquisitions and capital spending.
Capital spending
We classify capital spending as sustaining, capacity replacement or growth. As a mining company, sustaining capital is the money we spend to keep our facilities running in their present state, which would follow a gradually decreasing production curve, while capacity replacement capital is spent to maintain current production levels at those operations. Growth capital is money we invest to generate incremental production, and for business development. We have a capital allocation process to approve our capital spend. See Capital Allocation beginning on page 29 for more information.
| CAMECO’S SHARE ($ MILLIONS) |
2024 ACTUAL | 2025 PLAN | ||||||
| Sustaining capital |
||||||||
| Uranium |
70 | 80-85 | ||||||
| Fuel services |
41 | 65-70 | ||||||
| Other |
9 | 5-10 | ||||||
|
|
|
|
|
|||||
| Total sustaining capital |
120 | 150-165 | ||||||
|
|
|
|
|
|||||
| Capacity replacement capital |
||||||||
| Uranium |
65 | 145-160 | ||||||
| Fuel services |
— | — | ||||||
|
|
|
|
|
|||||
| Total capacity replacement capital |
65 | 145-160 | ||||||
|
|
|
|
|
|||||
| Growth capital |
||||||||
| Uranium |
19 | 60-65 | ||||||
| Fuel services |
8 | 5-10 | ||||||
|
|
|
|
|
|||||
| Total growth capital |
27 | 65-75 | ||||||
|
|
|
|
|
|||||
| Total sustaining, capacity replacement and growth |
212 | 360-400 | ||||||
|
|
|
|
|
|||||
52 CAMECO CORPORATION
Outlook for investing activities
| CAMECO’S SHARE ($ MILLIONS) |
2025 PLAN | 2026 PLAN | 2027 PLAN | |||||||||
| Total uranium & fuel services |
360-400 | 375-425 | 280-330 | |||||||||
|
|
|
|
|
|
|
|||||||
| Sustaining capital |
150-165 | 135-150 | 130-145 | |||||||||
| Capacity replacement capital |
145-160 | 140-155 | 125-140 | |||||||||
| Growth capital |
65-75 | 100-120 | 25-45 | |||||||||
Our 2025, 2026 and 2027 capital spending estimates assume that we produce 18 million pounds (100% basis) per year at McArthur River/Key Lake and Cigar Lake and between 13 million and 14 million kgU in fuel services. If our production plans change, then our capital spending estimates may change.
Our estimate for capital spending in 2025 has been increased to between $360 million and $400 million (previously between $200 million and $250 million) and in 2026 has been increased to between $375 million and $425 million (previously between $200 million and $250 million) due mainly to capital projects to help ensure reliability and sustainability of existing operations. Projects include addressing aging infrastructure and potential bottlenecks at Key Lake and the advancement of freezing at McArthur River. While these projects are required to support and maintain capacity at current production levels, they have been classified as growth because they also position us for future production flexibility. No decision on changes to future production levels has been made.
Capital expenditures for JV Inkai are expected to be covered by JV Inkai cash flows and Westinghouse capital expenditures are expected to be covered by Westinghouse cash flows in 2025. Both are included in our overall equity investments.
Major capital expenditures expected in 2025 include:
| • | Investments required to refresh aging infrastructure and mobile equipment to help ensure reliable and sustainable production at all our operations as planned, including work required to upgrade the calciner and crystallization circuit at Key Lake. |
| • | Cigar Lake – continued work on the Cigar Lake extension. See Cigar Lake starting on page 81. |
| • | McArthur River – freeze plant expansion and freeze distribution to next mining zone. |
This information regarding currently expected capital expenditures for future periods is forward-looking information and is based upon the assumptions and subject to the material risks discussed on pages 4 to 6. Our actual capital expenditures for future periods may be significantly different.
FINANCING ACTIVITIES
Cash from financing includes borrowing and repaying debt, and other financial transactions including paying dividends and providing financial assurance.
Contractual obligations
| 2026 AND | 2028 AND | 2030 AND | ||||||||||||||||||
| DECEMBER 31 ($ MILLIONS) |
2025 | 2027 | 2029 | BEYOND | TOTAL | |||||||||||||||
| Debt1 |
288 | 400 | — | 600 | 1,288 | |||||||||||||||
| Interest on debt1 |
59 | 83 | 60 | 103 | 305 | |||||||||||||||
| Provision for reclamation |
35 | 96 | 108 | 1,144 | 1,383 | |||||||||||||||
| Provision for waste disposal |
4 | 5 | 1 | — | 10 | |||||||||||||||
| Other liabilities |
87 | 65 | 5 | 77 | 234 | |||||||||||||||
| Capital commitments |
148 | — | — | — | 148 | |||||||||||||||
| Unconditional product purchase obligations |
415 | 190 | 12 | — | 617 | |||||||||||||||
|
|
|
|
|
|
|
|
|
|
|
|||||||||||
| Total |
1,036 | 839 | 186 | 1,924 | 3,985 | |||||||||||||||
|
|
|
|
|
|
|
|
|
|
|
|||||||||||
| 1 | Debt and interest on debt are calculated as of December 31, 2024 and assume that all debt is held to maturity and as such do not incorporate the 2025 repayment of the term loan outstanding, or any other reductions, and the associated impact on interest payments. |
We have contractual capital commitments of approximately $148 million at December 31, 2024. Certain of the contractual commitments may contain cancellation clauses; however, we disclose the commitments based on management’s intent to fulfil the contracts.
MANAGEMENT’S DISCUSSION AND ANALYSIS 53
We have borrowing capacity including the following, which we expect to be sufficient to meet our needs in 2025:
| • | A $1.0 billion unsecured revolving credit facility that matures October 1, 2028. Each calendar year, upon mutual agreement, the facility can be extended for an additional year. We may increase the revolving credit facility above $1.0 billion, by increments of no less than $50 million, up to a total of $1.25 billion. The facility ranks equally with all of our other senior debt. At December 31, 2024, there were no amounts outstanding under this facility. |
| • | Financial assurance facilities with various financial institutions and insurers of approximately $1.9 billion. At December 31, 2024, we had approximately $1.5 billion outstanding on these facilities. For more information see Financial Assurances below. |
On May 24, 2024, we issued debentures in the amount of $500 million, at an interest rate of 4.94% per annum, the Series I senior unsecured debentures mature on May 24, 2031. The proceeds from the issuance were used to retire our outstanding $500 million Series G debentures bearing interest of 4.19% at maturity on June 24, 2024.
In total we have $1.0 billion in senior unsecured debentures outstanding:
| • | $400 million bearing interest at 2.95% per year, maturing on October 21, 2027 |
| • | $500 million bearing interest at 4.94% per year, maturing on May 24, 2031 |
| • | $100 million bearing interest at 5.09% per year, maturing on November 14, 2042 |
Additionally, after making partial prepayments of $400 million (US) in 2024, $200 million (US) remained outstanding at December 31, 2024 on the term loan debt incurred in connection with the Westinghouse acquisition. The remaining principal of $200 million (US) was repaid in full on January 13, 2025.
Debt covenants
Our credit agreements include the following financial covenants:
| • | our funded debt to tangible net worth ratio must be 1:1 or less |
| • | other customary covenants and events of default |
Funded debt is total consolidated debt less non-recourse debt, $100 million in letters of credit, cash and cash equivalents and short-term investments.
Not complying with any of these covenants could result in accelerated payment and termination of our credit agreements. At December 31, 2024, we complied with all covenants, and we expect to continue to comply in 2025.
OFF-BALANCE SHEET ARRANGEMENTS
We had three kinds of off-balance sheet arrangements at the end of 2024:
| • | purchase commitments |
| • | financial assurances |
| • | other arrangements |
Purchase commitments
We make purchases under long-term contracts where it is beneficial for us to do so and to support our long-term contract portfolio. The following table is based on our purchase commitments in our uranium and fuel services segments at December 31, 20242, but does not include purchases of our share of Inkai production. These commitments include a mix of fixed-price and market-related contracts. Actual payments will be different as a result of changes to our purchase commitments and, in the case of contracts with market-related pricing, the market prices in effect at the time of delivery. We will update this table as required in our MD&A to reflect material changes to our purchase commitments and changes in the prices used to estimate our commitments under market-related contracts.
| 2026 AND | 2028 AND | 2030 AND | ||||||||||||||||||
| DECEMBER 31, 2024 ($ MILLIONS) |
2025 | 2027 | 2029 | BEYOND | TOTAL | |||||||||||||||
| Purchase commitments1,2 |
415 | 190 | 12 | — | 617 | |||||||||||||||
|
|
|
|
|
|
|
|
|
|
|
|||||||||||
| 1 | Denominated in US dollars and Japanese yen, converted from US dollars to Canadian dollars at the rate of 1.40 and from Japanese yen to Canadian dollars at the rate of $0.01. |
| 2 | These amounts have been adjusted for any additional purchase commitments that we have entered into since December 31, 2024, but does not include deliveries taken under contract since December 31, 2024. |
54 CAMECO CORPORATION
We have commitments of $617 million (Cdn) for the following:
| • | approximately 7.8 million pounds of U3O8 equivalent from 2025 to 2028 |
| • | approximately 0.2 million kgU as UF6 in conversion services in 2025 |
| • | about 0.3 million SWU of enrichment services to meet existing forward sales commitments under agreements with a non-Western supplier |
The suppliers do not have the right to terminate agreements other than pursuant to customary events of default provisions.
Financial assurances
We use standby letters of credit and surety bonds mainly to provide financial assurance for the decommissioning and reclamation of our mining and fuel services facilities. We also use financial assurances to support obligations relating to the CRA dispute, for ordinary course of business and as overdraft protection. At December 31, 2024 our financial assurances totaled $1.5 billion, up from $1.4 billion at December 31, 2023. Our financial assurances were made up of $1.13 billion related to our decommissioning and reclamation obligations and $346 million in relation to the CRA tax dispute. Our financial assurances renew automatically on an annual basis, unless otherwise advised by the issuing institution.
Once we have permanently stopped mining and processing activities at an operating site, we are required to decommission the site to the satisfaction of the regulators. We have developed preliminary decommissioning plans for our operating sites and use them to estimate our decommissioning costs. Regulators review and accept our preliminary decommissioning plans on a regular basis. As the site approaches or goes into decommissioning, regulators review the detailed decommissioning plans. This can result in further regulatory process, as well as additional requirements, costs and financial assurances.
We have submitted updates to all Saskatchewan operations’ Preliminary Decommissioning Plan (PDP) and Preliminary Decommissioning Cost Estimate (PDCE) documents in accordance with the five-year timeline specified in the regulations. Upon acceptance of the PDP and PDCE documents by the Saskatchewan Ministry of Environment and Canadian Nuclear Safety Commission (CNSC) staff, a formal Commission proceeding will be required for final approval of the PDP and PDCE by the Commission. Existing financial assurances are in place and will be updated upon regulatory acceptance of the updated documents.
The PDP and PDCE for the Blind River refinery and Cameco Fuel Manufacturing were approved by the CNSC in 2022; for the Port Hope conversion facility, they were revised in 2022, approved by the Commission in May 2024 and the financial assurance was updated in June 2024.
For Smith Ranch-Highland, the 2024 surety was approved and is awaiting approval by the State of Wyoming. For Crow Butte, the 2024 annual update was submitted to the federal Nuclear Regulatory Commission and Nebraska Department of Environmental Quality in September 2024.
At the end of 2024, our estimate of total decommissioning and reclamation costs was $1.38 billion. This is the undiscounted value of the obligation and is based on our current operations. We had accounting provisions of $1.03 billion at the end of 2024 (the present value of the $1.38 billion). Regulatory approval is required prior to beginning decommissioning. The expected timing for these costs in based on each mine or fuel service facility’s expected operating life. Our required costs for decommissioning and reclamation in each of the next five years are not expected to be material. However, we may choose to undertake progressive reclamation activities, for example, as we do at our US assets and through our Vision in Motion project at our Port Hope fuel services facilities.
Other arrangements
We have arranged for standby product loan facilities with various counterparties. The arrangements allow us to borrow up to 1.8 million kgU of UF6 conversion services and 4.9 million pounds of U3O8 by September 30, 2027 with repayment in kind up to December 31, 2027. Under the loan facilities, standby fees of up to 1.5% are payable based on the market value of the facilities and interest is payable on the market value of any amounts drawn at rates ranging from 0.5% to 3.0%. At December 31, 2024, we have 1.6 million kgU of UF6 conversion services and 2.5 million pounds of U3O8 drawn on the loans.
MANAGEMENT’S DISCUSSION AND ANALYSIS 55
BALANCE SHEET
| DECEMBER 31, | CHANGE | |||||||||||||||
| ($ MILLIONS EXCEPT PER SHARE AMOUNTS) |
2024 | 2023 | 2022 | 2023 TO 2024 | ||||||||||||
| Inventory |
827 | 692 | 665 | 20 | % | |||||||||||
| Total assets |
9,907 | 9,934 | 8,633 | — | ||||||||||||
| Total non-current liabilities |
2,357 | 2,651 | 2,236 | (11 | )% | |||||||||||
| Dividends per common share |
0.16 | 0.12 | 0.12 | 33 | % | |||||||||||
Total product inventories increased by 20% to $827 million this year primarily due to the higher cost of purchased material and a higher inventory volume. At December 31, 2024, our average cost for uranium was $59.39 per pound, up from $49.62 per pound at December 31, 2023. As of December 31, 2024, we held an inventory of 11.0 million pounds of U3O8 equivalent (excluding broken ore), compared to 10.3 million pounds at the end of 2023.
At the end of 2024, our total assets amounted to $9.9 billion, no change compared to 2023. In 2023, the total asset balance increased by $1.3 billion compared to 2022, due mainly to the addition of Westinghouse as an equity-accounted investee, partially offset by the decrease in cash and cash equivalents and short-term investments used to fund the acquisition.
56 CAMECO CORPORATION
2024 financial results by segment
Uranium
| HIGHLIGHTS |
2024 | 2023 | CHANGE | |||||||||||||
| Production volume (million lbs) |
23.4 | 17.6 | 33 | % | ||||||||||||
|
|
|
|
|
|
|
|||||||||||
| Sales volume (million lbs) |
33.6 | 32.0 | 5 | % | ||||||||||||
|
|
|
|
|
|
|
|||||||||||
| Average spot price |
($US/lb | ) | 85.14 | 62.51 | 36 | % | ||||||||||
| Average long-term price |
($US/lb | ) | 78.88 | 58.20 | 36 | % | ||||||||||
| Average realized price |
($US/lb | ) | 58.34 | 49.76 | 17 | % | ||||||||||
| ($Cdn/lb | ) | 79.70 | 67.31 | 18 | % | |||||||||||
|
|
|
|
|
|
|
|||||||||||
| Average unit cost of sales (including D&A) |
($Cdn/lb | ) | 59.47 | 53.41 | 11 | % | ||||||||||
|
|
|
|
|
|
|
|||||||||||
| Revenue ($ millions) |
2,677 | 2,153 | 24 | % | ||||||||||||
|
|
|
|
|
|
|
|||||||||||
| Gross profit ($ millions) |
681 | 445 | 53 | % | ||||||||||||
|
|
|
|
|
|
|
|||||||||||
| Gross profit (%) |
25 | 21 | 19 | % | ||||||||||||
|
|
|
|
|
|
|
|||||||||||
| Earnings before income taxes |
904 | 606 | 49 | % | ||||||||||||
|
|
|
|
|
|
|
|||||||||||
| Adjusted EBITDA (non-IFRS, see page 65)1 |
1,179 | 835 | 41 | % | ||||||||||||
|
|
|
|
|
|
|
|||||||||||
| 1 | Includes JV Inkai adjusted EBITDA of $279 million in 2024 and $235 million in 2023. See JV Inkai contribution to uranium segment below. |
Production volumes in 2024 increased by 33% compared to 2023. See Uranium – production overview on page 76 for more information.
Uranium revenues this year were up 24% compared to 2023 due to an increase in sales volumes of 5% and an increase of 18% in the Canadian dollar average realized price due to the impact of the increase in average US dollar spot price on market-related contracts. For more information on the impact of spot price changes on average realized price, see Price sensitivity analysis: uranium segment on page 49.
Total cost of sales (including D&A) increased by 17% ($2.0 billion compared to $1.7 billion in 2023) due primarily to an increase in sales volume of 5% as well as an 11% increase in unit cost of sales. Unit cost of sales is higher than in the same period in 2023 due to the higher cost of purchased material in 2024 compared to the same period in 2023 partially offset by lower production costs.
The net effect was a $236 million increase in gross profit for the year.
The following table shows the costs of produced and purchased uranium incurred in the reporting periods (see Non-IFRS measures starting on page 65). These costs do not include care and maintenance costs and selling costs such as royalties, transportation and commissions, nor do they reflect the impact of opening inventories on our reported cost of sales.
| ($CDN/LB) |
2024 | 2023 | CHANGE | |||||||||
| Produced |
||||||||||||
| Cash cost |
21.60 | 24.12 | (10 | )% | ||||||||
| Non-cash cost |
9.75 | 11.60 | (16 | )% | ||||||||
|
|
|
|
|
|
|
|||||||
| Total production cost 1 |
31.35 | 35.72 | (12 | )% | ||||||||
|
|
|
|
|
|
|
|||||||
| Quantity produced (million lbs)1 |
23.4 | 17.6 | 33 | % | ||||||||
|
|
|
|
|
|
|
|||||||
| Purchased |
||||||||||||
| Cash cost1 |
102.04 | 81.02 | 26 | % | ||||||||
|
|
|
|
|
|
|
|||||||
| Quantity purchased (million lbs)1 |
11.0 | 11.3 | (3 | )% | ||||||||
|
|
|
|
|
|
|
|||||||
| Totals |
||||||||||||
| Produced and purchased costs |
53.95 | 53.43 | 1 | % | ||||||||
|
|
|
|
|
|
|
|||||||
| Quantities produced and purchased (million lbs) |
34.4 | 28.9 | 19 | % | ||||||||
|
|
|
|
|
|
|
|||||||
| 1 | Due to equity accounting for JV Inkai, our share of production is shown as a purchase at the time of delivery. JV Inkai purchases will fluctuate during the quarters and timing of purchases will not match production. In 2024 we purchased 4.2 million pounds at a purchase price per pound of $108.56 ($79.48 (US)) (2023 – 4.2 million pounds at a purchase price per pound of $92.72 ($67.69 (US))). |
MANAGEMENT’S DISCUSSION AND ANALYSIS 57
The average cash cost of production was 10% lower compared to 2023, due to higher production at Cigar Lake and McArthur River/Key Lake.
In 2025, we expect the average unit cost of production at McArthur River/Key Lake to continue to be higher than the average unit life of mine operating costs reflected in our most recent annual information form as we continue work to realize the benefits from the operational improvements that have been made. The average unit production cost at Cigar Lake is expected to trend down with higher planned production. The estimated average unit life of mine operating costs reflected in our most recent annual information form are $16.70 per pound at McArthur River/Key Lake and $20.58 per pound at Cigar Lake.
We equity account for our share of JV Inkai. As a result, we record our share of its production as a purchase, which under Kazakhstan’s pricing regulations, requires we purchase the material at a price equal to the uranium spot price, less a 5% discount. However, this does not reflect the economic benefit to Cameco. Our share of the economic benefit is based on the difference between our purchase price and JV Inkai’s lower production cost and is reflected in the line item on our statement of earnings called, “share of earnings from equity-accounted investees.” This benefit is realized through receipt of a cash dividend, when declared and paid by JV Inkai. Excess cash, net of working capital requirements is distributed to the partners as dividends. If there is a significant disruption to JV Inkai’s operations for any reason, it may not achieve its production plans, there may be a delay in production, and it may experience increased costs to produce uranium.
Our purchases in 2024, totaled about $1.12 billion, representing an average annual cost of $102.04 per pound, about $70.00 per pound higher than our total unit production cost for the year. Although purchased pounds are transacted in US dollars, we account for the purchases in Canadian dollars. The average cost of purchased material in Canadian dollar terms increased by 26% this year compared to 2023. The average cash cost of purchased material was $102.04 (Cdn), or $74.86 (US) per pound, compared to $81.02 (Cdn), or $59.42 (US) per pound in the same period in 2023.
JV Inkai contribution to uranium segment
Net earnings before income taxes includes $108 million from JV Inkai and $279 million is included in adjusted EBITDA from JV Inkai, compared to $129 million and $235 million respectively in 2023.
The increase in JV Inkai’s equity earnings and adjusted EBITDA was largely driven by the higher uranium prices in 2024 compared to 2023, partially offset by increased costs. In April, we received a cash dividend of $129 million (US), net of withholdings, based on JV Inkai’s 2023 financial performance. From a cash flow perspective, we expect to realize the benefit from JV Inkai’s 2024 financial performance in 2025, once the dividend for 2024 is declared and paid.
The following table reconciles our share of earnings from JV Inkai to adjusted EBITDA:
| ($ MILLIONS) |
2024 | 2023 | CHANGE | |||||||||
| Share of earnings from equity-accounted investee |
208 | 179 | 16 | % | ||||||||
| Depreciation and amortization |
23 | 14 | 64 | % | ||||||||
| Finance income |
(1 | ) | — | — | ||||||||
| Income tax expense |
58 | 42 | 38 | % | ||||||||
|
|
|
|
|
|
|
|||||||
| EBITDA |
288 | 235 | 23 | % | ||||||||
|
|
|
|
|
|
|
|||||||
| Unrealized foreign exchange gains |
(9 | ) | — | — | ||||||||
|
|
|
|
|
|
|
|||||||
| Adjusted EBITDA (non-IFRS, see page 65) attributable to JV Inkai |
279 | 235 | 19 | % | ||||||||
|
|
|
|
|
|
|
|||||||
ROYALTIES
We pay royalties on the sale of all uranium extracted at our mines in the province of Saskatchewan. Two types of royalties are paid:
| • | Basic royalty: calculated as 5% of gross sales of uranium, less the Saskatchewan resource credit of 0.75%. |
| • | Profit royalty: a 10% royalty is charged on profit up to and including $28.732/kg U3O8 ($13.03/lb) and a 15% royalty is charged on profit in excess of $28.732/kg U3O8. Profit is determined as revenue less certain operating, exploration, reclamation and capital costs. Both exploration and capital costs are deductible at the discretion of the producer. |
As a resource corporation in Saskatchewan, we also pay a corporate resource surcharge of 3% of the value of resource sales.
58 CAMECO CORPORATION
Fuel services
| (includes results for UF6, UO2, UO3 and fuel fabrication) HIGHLIGHTS |
2024 | 2023 | CHANGE | |||||||||||||
| Production volume (million kgU) |
13.5 | 13.3 | 2 | % | ||||||||||||
| Sales volume (million kgU) |
12.1 | 12.0 | 1 | % | ||||||||||||
| Average realized price |
($ | Cdn/kgU | ) | 37.87 | 35.61 | 6 | % | |||||||||
| Average unit cost of sales (including D&A) |
($ | Cdn/kgU | ) | 29.14 | 25.23 | 15 | % | |||||||||
| Revenue ($ millions) |
459 | 426 | 8 | % | ||||||||||||
| Earnings before income taxes |
108 | 129 | (16 | )% | ||||||||||||
| Adjusted EBITDA (non-IFRS, see page 65) |
145 | 164 | (12 | )% | ||||||||||||
| Adjusted EBITDA margin (non-IFRS, see page 65) |
32 | 38 | (16 | )% | ||||||||||||
Total revenue increased by 8% from 2023 due mainly to a 6% increase in the realized price. The increase in realized price was mainly the result of increased prices due to the impact of improving market conditions on our long-term contract portfolio.
Total cost of products and services sold (including D&A) increased 17% ($353 million compared to $301 million in 2023), due primarily to a 15% increase in average unit cost of sales compared to 2023 due to higher input costs.
The net effect was a $21 million decrease in earnings before income taxes.
Westinghouse
On November 7, 2023, we announced the closing of the acquisition of Westinghouse in a strategic partnership with Brookfield. Cameco now owns a 49% interest and Brookfield owns the remaining 51%. Under the equity method of accounting, beginning on November 7, 2023, we have included our share of Westinghouse’s earnings in our financial results.
| ($MILLIONS) (our share) |
2024 | 2023 | CHANGE | |||||||||
| Net loss1 |
(218 | ) | (24 | ) | >100 | % | ||||||
| Depreciation and amortization |
357 | 61 | >100 | % | ||||||||
| Finance income |
(4 | ) | (2 | ) | 100 | % | ||||||
| Finance costs |
225 | 30 | >100 | % | ||||||||
| Income tax recovery |
(61 | ) | (7 | ) | >100 | % | ||||||
|
|
|
|
|
|
|
|||||||
| EBITDA (non-IFRS, see page 65) |
299 | 58 | >100 | % | ||||||||
| Inventory purchase accounting2 |
71 | 27 | >100 | % | ||||||||
| Acquisition-related transition costs |
29 | — | — | |||||||||
| Other expenses |
78 | 8 | >100 | % | ||||||||
| Unrealized foreign exchange losses |
2 | 8 | (75 | )% | ||||||||
| Long-term incentive plan |
4 | — | — | |||||||||
|
|
|
|
|
|
|
|||||||
| Adjusted EBITDA (non-IFRS, see page 65) |
483 | 101 | >100 | % | ||||||||
|
|
|
|
|
|
|
|||||||
| Capital expenditures |
176 | 42 | >100 | % | ||||||||
|
|
|
|
|
|
|
|||||||
| Adjusted free cash flow (non-IFRS, see page 65) |
307 | 59 | >100 | % | ||||||||
|
|
|
|
|
|
|
|||||||
| Revenue |
2,892 | 521 | >100 | % | ||||||||
|
|
|
|
|
|
|
|||||||
| Adjusted EBITDA margin (non-IFRS, see page 65) |
17 | % | 19 | % | (14 | )% | ||||||
|
|
|
|
|
|
|
|||||||
| 1 | This table includes comparative results for the period beginning on the date of acquisition until the end of 2023. |
| 2 | Net earnings for 2023 and 2024 were impacted by purchase price accounting. Inventories acquired were assigned values based on the market price at the date of the acquisition. As these quantities are sold, cost of products and services sold reflects these market values, regardless of Westinghouse’s historic costs. |
The impact of purchase accounting, which required the revaluation of its inventories based on market prices at time of acquisition and the expensing of some other non-operating acquisition-related transition costs have resulted in a net loss of $218 million. The impact of these items was largely isolated to the first half of 2024 and are expected to have a smaller impact in future years. Increased depreciation and amortization charges will however continue to impact Westinghouse’s net earnings on an ongoing basis as a result of the revaluation of its assets upon our acquisition.
We use adjusted EBITDA as a performance measure as the impact of the revaluation of Westinghouse’s inventory and assets and the non-operating acquisition-related transition costs do not reflect the underlying performance for the reporting period. Adjusted EBITDA was $483 million in 2024.
MANAGEMENT’S DISCUSSION AND ANALYSIS 59
Fourth quarter financial results
Consolidated results
| THREE MONTHS ENDED | ||||||||||||
| HIGHLIGHTS | DECEMBER 31 | |||||||||||
| ($ MILLIONS EXCEPT WHERE INDICATED) |
2024 | 2023 | CHANGE | |||||||||
| Revenue |
1,183 | 844 | 40 | % | ||||||||
| Gross profit |
250 | 133 | 88 | % | ||||||||
| Net earnings attributable to equity holders |
135 | 80 | 69 | % | ||||||||
| $ per common share (basic) |
0.31 | 0.18 | 72 | % | ||||||||
| $ per common share (diluted) |
0.31 | 0.18 | 72 | % | ||||||||
| Adjusted net earnings (non-IFRS, see page 65) |
157 | 108 | 45 | % | ||||||||
| $ per common share (adjusted and diluted) |
0.36 | 0.25 | 44 | % | ||||||||
| Adjusted EBITDA (non-IFRS, see page 65) |
524 | 336 | 56 | % | ||||||||
| Cash provided by operations |
530 | 201 | >100 | % | ||||||||
Quarterly trends
| HIGHLIGHTS | 2024 | 2023 | ||||||||||||||||||||||||||||||
| ($ MILLIONS EXCEPT PER SHARE AMOUNTS) |
Q4 | Q3 | Q2 | Q1 | Q4 | Q3 | Q2 | Q1 | ||||||||||||||||||||||||
| Revenue |
1,183 | 721 | 598 | 634 | 844 | 575 | 482 | 687 | ||||||||||||||||||||||||
| Net earnings (loss) attributable to equity holders |
135 | 7 | 36 | (7 | ) | 80 | 148 | 14 | 119 | |||||||||||||||||||||||
| $ per common share (basic) |
0.31 | 0.02 | 0.08 | (0.02 | ) | 0.18 | 0.34 | 0.03 | 0.27 | |||||||||||||||||||||||
| $ per common share (diluted) |
0.31 | 0.02 | 0.08 | (0.02 | ) | 0.18 | 0.34 | 0.03 | 0.27 | |||||||||||||||||||||||
| Adjusted net earnings (non-IFRS, see page 65) |
157 | 24 | 65 | 46 | 108 | 96 | 46 | 133 | ||||||||||||||||||||||||
| $ per common share (adjusted and diluted) |
0.36 | 0.06 | 0.15 | 0.11 | 0.25 | 0.22 | 0.11 | 0.31 | ||||||||||||||||||||||||
| Cash from operations |
530 | 52 | 260 | 63 | 201 | 185 | 87 | 215 | ||||||||||||||||||||||||
Key things to note:
| • | The timing of customer requirements, which tends to vary from quarter to quarter, drives revenue in the uranium and fuel services segments, meaning quarterly results are not necessarily a good indication of annual results due to the variability in customer requirements. |
| • | Net earnings do not trend directly with revenue due to unusual items and transactions that occur from time to time. We use adjusted net earnings, a non-IFRS measure, as a more meaningful way to compare our results from period to period (see page 65 for more information). |
| • | Cash from operations tends to fluctuate as a result of the timing of deliveries and product purchases in our uranium and fuel services segments. |
| • | We acquired our share of Westinghouse on November 7, 2023. Our quarterly results are impacted by variability in the timing of Westinghouse’s customer requirements and delivery and outage schedules. The first quarter is typically weaker, with stronger expected performance in the second half of the year, and higher expected cash flows in the fourth quarter. In 2024, the revaluation of Westinghouse’s inventory had a significant impact on Westinghouse’s quarterly results in the first half of the year. Westinghouse’s results were and will continue to be impacted by the amortization of the intangible assets that arose as a result of the fair values assigned to Westinghouse’s net assets at the time of the acquisition. See Westinghouse, starting on page 64 for more information. |
60 CAMECO CORPORATION
The table that follows presents the differences between net earnings (losses) and adjusted net earnings (losses) for the previous seven quarters.
| HIGHLIGHTS | 2024 | 2023 | ||||||||||||||||||||||||||||||
| ($ MILLIONS EXCEPT PER SHARE AMOUNTS) |
Q4 | Q3 | Q2 | Q1 | Q4 | Q3 | Q2 | Q1 | ||||||||||||||||||||||||
| Net earnings (loss) attributable to equity holders |
135 | 7 | 36 | (7 | ) | 80 | 148 | 14 | 119 | |||||||||||||||||||||||
| Adjustments |
||||||||||||||||||||||||||||||||
| Adjustments on derivatives |
133 | (28 | ) | 14 | 33 | (59 | ) | 41 | (35 | ) | (6 | ) | ||||||||||||||||||||
| Unrealized foreign exchange losses (gains) |
(56 | ) | 15 | (7 | ) | (18 | ) | (1 | ) | (57 | ) | 43 | 5 | |||||||||||||||||||
| Share-based compensation |
17 | 4 | 15 | 8 | 12 | 22 | 11 | 18 | ||||||||||||||||||||||||
| Adjustments on other operating expense (income) |
(23 | ) | 5 | (2 | ) | (15 | ) | 40 | (48 | ) | 8 | (2 | ) | |||||||||||||||||||
| Income taxes on adjustments |
(37 | ) | 7 | (7 | ) | (9 | ) | 6 | (10 | ) | 7 | (1 | ) | |||||||||||||||||||
| Adjustments on equity investees (net of tax): |
||||||||||||||||||||||||||||||||
| Inventory purchase accounting |
3 | — | 12 | 38 | 20 | — | — | — | ||||||||||||||||||||||||
| Acquisition-related transition costs |
— | 4 | 5 | 14 | — | — | — | — | ||||||||||||||||||||||||
| Unrealized foreign exchange losses (gains) |
(16 | ) | 9 | (1 | ) | 1 | 10 | — | (2 | ) | — | |||||||||||||||||||||
| Long-term incentive plan |
1 | 1 | — | 1 | — | — | — | — | ||||||||||||||||||||||||
| Adjusted net earnings (non-IFRS, see page 65) |
157 | 24 | 65 | 46 | 108 | 96 | 46 | 133 | ||||||||||||||||||||||||
Corporate expenses
ADMINISTRATION
| THREE MONTHS ENDED | ||||||||||||
| DECEMBER 31 | ||||||||||||
| ($ MILLIONS) |
2024 | 2023 | CHANGE | |||||||||
| Direct administration |
62 | 48 | 29 | % | ||||||||
| Stock-based compensation |
15 | 11 | 36 | % | ||||||||
| Total administration |
77 | 59 | 31 | % | ||||||||
Direct administration costs were $62 million in the quarter, $14 million higher than the same period last year primarily due to higher labour costs and the impact of higher inflationary adjustments. We recorded $15 million in stock-based compensation expenses in the fourth quarter of 2024, $4 million higher compared to 2023 due to the increase in our share price compared to the same period last year.
MANAGEMENT’S DISCUSSION AND ANALYSIS 61
Fourth quarter financial results by segment
Uranium
| THREE MONTHS ENDED | ||||||||||||||||
| DECEMBER 31 | ||||||||||||||||
| HIGHLIGHTS |
2024 | 2023 | CHANGE | |||||||||||||
| Production volume (million lbs) |
6.1 | 5.7 | 7 | % | ||||||||||||
|
|
|
|
|
|
|
|||||||||||
| Sales volume (million lbs) |
12.8 | 9.8 | 30 | % | ||||||||||||
|
|
|
|
|
|
|
|||||||||||
| Average spot price |
($US/lb | ) | 76.75 | 82.21 | (7 | )% | ||||||||||
| Average long-term price |
($US/lb | ) | 81.17 | 66.00 | 23 | % | ||||||||||
| Average realized price |
($US/lb | ) | 58.45 | 52.35 | 12 | % | ||||||||||
| ($Cdn/lb | ) | 80.90 | 71.65 | 13 | % | |||||||||||
|
|
|
|
|
|
|
|||||||||||
| Average unit cost of sales (including D&A) |
($Cdn/lb | ) | 64.24 | 61.90 | 4 | % | ||||||||||
|
|
|
|
|
|
|
|||||||||||
| Revenue ($ millions) |
1,035 | 700 | 48 | % | ||||||||||||
|
|
|
|
|
|
|
|||||||||||
| Gross profit ($ millions) |
213 | 96 | >100 | % | ||||||||||||
|
|
|
|
|
|
|
|||||||||||
| Gross profit (%) |
21 | 14 | 50 | % | ||||||||||||
|
|
|
|
|
|
|
|||||||||||
| Earnings before income taxes |
289 | 122 | >100 | % | ||||||||||||
|
|
|
|
|
|
|
|||||||||||
| Adjusted EBITDA (non-IFRS, see page 65)1 |
391 | 231 | 70 | % | ||||||||||||
|
|
|
|
|
|
|
|||||||||||
| 1 | Includes JV Inkai adjusted EBITDA of $90 million in 2024 and $116 million in 2023. See JV Inkai contribution to uranium segment below. |
Production volumes this quarter increased by 7% compared to the fourth quarter of 2023. See Uranium – production overview on page 76 for more information.
Uranium revenues were up 48% due to a 30% increase in sales volume due to the timing of sales, which were in line with the delivery pattern disclosed in our 2023 annual MD&A, and a 13% increase in the Canadian dollar average realized price. While the average US dollar spot price for uranium decreased by 7% compared to the same period in 2023, the Canadian dollar average realized price increased by 13% due to the lagging effect of spot price impacts on market-related contracts in 2023 and 2024. For more information on the impact of spot price changes on average realized price, see Price sensitivity analysis: uranium segment on page 49.
Total cost of sales (including D&A) increased by 36% ($821 million compared to $605 million in 2023). This was primarily the result of the 30% increase in sales volume as well as an increase of 4% in the average unit cost of sales which was due to the higher cost of purchased material.
The net effect was a $117 million increase in gross profit.
The following table shows the costs of produced and purchased uranium incurred in the reporting periods (see Non-IFRS measures starting on page 65). These costs do not include care and maintenance costs, selling costs such as royalties, transportation and commissions, nor do they reflect the impact of opening inventories on our reported cost of sales.
62 CAMECO CORPORATION
| THREE MONTHS ENDED | ||||||||||||
| DECEMBER 31 | ||||||||||||
| ($/LB) |
2024 | 2023 | CHANGE | |||||||||
| Produced |
||||||||||||
| Cash cost |
23.57 | 21.07 | 12 | % | ||||||||
| Non-cash cost |
10.00 | 10.95 | (9 | )% | ||||||||
|
|
|
|
|
|
|
|||||||
| Total production cost 1 |
33.57 | 32.02 | 5 | % | ||||||||
|
|
|
|
|
|
|
|||||||
| Quantity produced (million lbs)1 |
6.1 | 5.7 | 7 | % | ||||||||
|
|
|
|
|
|
|
|||||||
| Purchased |
||||||||||||
| Cash cost1 |
104.49 | 89.89 | 16 | % | ||||||||
|
|
|
|
|
|
|
|||||||
| Quantity purchased (million lbs)1 |
4.8 | 6.3 | (24 | )% | ||||||||
|
|
|
|
|
|
|
|||||||
| Totals |
||||||||||||
| Produced and purchased costs |
64.80 | 62.40 | 4 | % | ||||||||
|
|
|
|
|
|
|
|||||||
| Quantities produced and purchased (million lbs) |
10.9 | 12.0 | (9 | )% | ||||||||
|
|
|
|
|
|
|
|||||||
| 1 | Due to equity accounting for JV Inkai, our share of production will be shown as a purchase at the time of delivery. JV Inkai purchases will fluctuate during the quarters and timing of purchases will not match production. During the quarter we purchased 3 million pounds at a purchase price per pound of $100.72 ($73.10 (US)) (Q4 2023 – 2.8 million pounds at a purchase price per pound of $105.74 ($77.13 (US))). |
The average cash cost of production for the fourth quarter was 12% higher compared to the same period in the prior year. Cash cost was higher due to the impact of inflationary pressures.
Although purchased pounds are transacted in US dollars, we account for the purchases in Canadian dollars. In the fourth quarter, the average cash cost of purchased material was $104.49 (Cdn) per pound, or $76.13 (US) per pound in US dollar terms, compared to $89.89 (Cdn) per pound, or $65.67 (US) per pound in the fourth quarter of 2023.
JV Inkai contribution to uranium segment
Net earnings before income taxes includes $56 million from Inkai and $90 million is included in adjusted EBITDA from JV Inkai, compared to $79 million and $116 million respectively in 2023.
The following table reconciles our share of earnings from JV Inkai to adjusted EBITDA:
| THREE MONTHS ENDED | ||||||||||||
| DECEMBER 31 | ||||||||||||
| ($ MILLIONS) |
2024 | 2023 | CHANGE | |||||||||
| Share of earnings from equity-accounted investee |
56 | 79 | (29)% | |||||||||
| Depreciation and amortization |
11 | 8 | 45% | |||||||||
| Income tax expense |
30 | 27 | 11% | |||||||||
|
|
|
|
|
|
|
|||||||
| EBITDA |
97 | 114 | (15)% | |||||||||
|
|
|
|
|
|
|
|||||||
| Unrealized foreign exchange losses (gains) |
(7 | ) | 2 | >(100%) | ||||||||
|
|
|
|
|
|
|
|||||||
| Adjusted EBITDA (non-IFRS, see page 65) attributable to JV Inkai |
90 | 116 | (22)% | |||||||||
|
|
|
|
|
|
|
|||||||
MANAGEMENT’S DISCUSSION AND ANALYSIS 63
Fuel services
| (includes results for UF6, UO2, UO3 and fuel fabrication) | ||||||||||||||||
| THREE MONTHS ENDED | ||||||||||||||||
| DECEMBER 31 | ||||||||||||||||
| HIGHLIGHTS |
2024 | 2023 | CHANGE | |||||||||||||
| Production volume (million kgU) |
3.6 | 3.7 | (3 | )% | ||||||||||||
|
|
|
|
|
|
|
|||||||||||
| Sales volume (million kgU) |
4.2 | 4.2 | — | |||||||||||||
|
|
|
|
|
|
|
|||||||||||
| Average realized price |
($ | Cdn/kgU | ) | 35.41 | 32.19 | 10 | % | |||||||||
|
|
|
|
|
|
|
|||||||||||
| Average unit cost of sales (including D&A) |
($ | Cdn/kgU | ) | 26.53 | 22.69 | 17 | % | |||||||||
|
|
|
|
|
|
|
|||||||||||
| Revenue ($ millions) |
148 | 134 | 10 | % | ||||||||||||
|
|
|
|
|
|
|
|||||||||||
| Earnings before income taxes |
37 | 40 | (8 | )% | ||||||||||||
|
|
|
|
|
|
|
|||||||||||
| Adjusted EBITDA (non-IFRS, see page 65) |
49 | 51 | (4 | )% | ||||||||||||
|
|
|
|
|
|
|
|||||||||||
| Adjusted EBITDA margin (non-IFRS, see page 65) |
33 | 38 | (13 | )% | ||||||||||||
|
|
|
|
|
|
|
|||||||||||
Total revenue increased by 10% due to a 10% increase in average realized price. The increase in average realized price was mainly the result of increased prices for UF6 due to the impact of improving market conditions on our long-term contract portfolio.
Total cost of sales (including D&A) increased by 17% to $111 million compared to the fourth quarter of 2023 due to an increase of 17% in the average unit cost of sales. Unit cost of sales increased mainly as a result of higher input costs.
The net effect was a $3 million decrease in earnings before income taxes.
Westinghouse
| THREE MONTHS ENDED | ||||||||||||
| DECEMBER 31 | ||||||||||||
| ($MILLIONS) (our share) |
2024 | 2023 | CHANGE | |||||||||
| Net earnings (loss)1 |
9 | (24 | ) | >(100%) | ||||||||
| Depreciation and amortization |
90 | 61 | 48% | |||||||||
| Finance income |
(2 | ) | (2 | ) | — | |||||||
| Finance costs |
53 | 30 | 77% | |||||||||
| Income tax recovery |
(11 | ) | (7 | ) | 57% | |||||||
|
|
|
|
|
|
|
|||||||
| EBITDA (non-IFRS, see page 65) |
139 | 58 | >100% | |||||||||
| Inventory purchase accounting2 |
5 | 27 | (81)% | |||||||||
| Other expenses |
26 | 8 | >100% | |||||||||
| Unrealized foreign exchange losses (gains) |
(9 | ) | 8 | >(100%) | ||||||||
| Long-term incentive plan |
1 | — | — | |||||||||
|
|
|
|
|
|
|
|||||||
| Adjusted EBITDA (non-IFRS, see page 65) |
162 | 101 | 60% | |||||||||
|
|
|
|
|
|
|
|||||||
| Capital expenditures |
78 | 42 | 86% | |||||||||
|
|
|
|
|
|
|
|||||||
| Adjusted free cash flow (non-IFRS, see page 65) |
84 | 59 | 42% | |||||||||
|
|
|
|
|
|
|
|||||||
| Revenue |
841 | 521 | 61% | |||||||||
|
|
|
|
|
|
|
|||||||
| Adjusted EBITDA margin (non-IFRS, see page 65) |
19 | % | 19 | % | (1)% | |||||||
|
|
|
|
|
|
|
|||||||
| 1 | This table includes comparative results for the period beginning on the date of acquisition until the end of 2023. |
| 2 | Net earnings for 2023 and 2024 were impacted by purchase price accounting. Inventories acquired were assigned values based on the market price at the date of the acquisition. As these quantities are sold, cost of products and services sold reflects these market values, regardless of Westinghouse’s historic costs. |
On November 7, 2023, we announced the closing of the acquisition of a 49% interest in Westinghouse and began to equity account for this investment. Our share of Westinghouse’s earnings has been reflected in our financial results from that date. In the fourth quarter, Westinghouse reported net earnings of $9 million (our share), compared to a $24 million loss (our share) in the same quarter last year.
Adjusted EBITDA was $162 million, compared to $101 million in the fourth quarter of 2023. We use adjusted EBITDA as a performance measure as the impact of the revaluation of Westinghouse’s inventory and assets and the non-operating acquisition-related transition costs do not reflect the underlying performance for the reporting period.
64 CAMECO CORPORATION
Westinghouse’s results were and will continue to be impacted by the amortization of the intangible assets that arose as a result of the fair values assigned to Westinghouse’s net assets at the time of acquisition.
Non-IFRS measures
The non-IFRS measures referenced in this document are supplemental measures, which are used as indicators of our financial performance. Management believes that these non-IFRS measures provide useful supplemental information to investors, securities analysts, lenders and other interested parties in assessing our operational performance and our ability to generate cash flows to meet our cash requirements. These measures are not recognized measures under IFRS, do not have standardized meanings, and are therefore unlikely to be comparable to similarly-titled measures presented by other companies. Accordingly, these measures should not be considered in isolation or as a substitute for the financial information reported under IFRS. We are not able to reconcile our forward-looking non-IFRS guidance because we cannot predict the timing and amounts of discrete items, which could significantly impact our IFRS results.
The following are the non-IFRS measures used in this document.
ADJUSTED NET EARNINGS
Adjusted net earnings (ANE) is our net earnings attributable to equity holders, adjusted for non-operating or non-cash items such as gains and losses on derivatives, unrealized foreign exchange gains and losses, share-based compensation, adjustments to reclamation provisions flowing through other operating expenses, and bargain purchase gains, that we believe do not reflect the underlying financial performance for the reporting period. In 2024, we revised our calculation of adjusted net earnings to adjust for unrealized foreign exchange gains and losses as well as for share-based compensation because it better reflects how we assess our operational performance. We have restated comparative periods to reflect this change. Other items may also be adjusted from time to time. We adjust this measure for certain of the items that our equity-accounted investees make in arriving at other non-IFRS measures. Adjusted net earnings is one of the targets that we measure to form the basis for a portion of annual employee and executive compensation (see Measuring our results starting on page 35).
In calculating ANE we adjust for derivatives. We do not use hedge accounting under IFRS and, therefore, we are required to report gains and losses on all hedging activity, both for contracts that close in the period and those that remain outstanding at the end of the period. For the contracts that remain outstanding, we must treat them as though they were settled at the end of the reporting period (mark-to-market). However, we do not believe the gains and losses that we are required to report under IFRS appropriately reflect the intent of our hedging activities, so we make adjustments in calculating our ANE to better reflect the impact of our hedging program in the applicable reporting period. See Foreign exchange starting on page 44 for more information.
We also adjust for changes to our reclamation provisions that flow directly through earnings. Every quarter we are required to update the reclamation provisions for all operations based on new cash flow estimates, discount and inflation rates. This normally results in an adjustment to our asset retirement obligation asset in addition to the provision balance. When the assets of an operation have been written off due to an impairment, as is the case with our Rabbit Lake and US ISR operations, the adjustment is recorded directly to the statement of earnings as “other operating expense (income)”. See note 16 of our annual financial statements for more information. This amount has been excluded from our ANE measure.
As a result of the change in ownership of Westinghouse when it was acquired by Cameco and Brookfield, Westinghouse’s inventories at the acquisition date were revalued based on the market price at that date. As these quantities are sold, Westinghouse’s cost of products and services sold reflect these market values, regardless of their historic costs. Our share of these costs is included in earnings from equity-accounted investees and recorded in cost of products and services sold in the investee information (see note 12 to the financial statements). Since this expense is non-cash, outside of the normal course of business and only occurred due to the change in ownership, we have excluded our share from our ANE measure.
Westinghouse has also expensed some non-operating acquisition-related transition costs that the acquiring parties agreed to pay for, which resulted in a reduction in the purchase price paid. Our share of these costs is included in earnings from equity accounted investees and recorded in other expenses in the investee information (see note 12 to the financial statements). Since this expense is outside of the normal course of business and only occurred due to the change in ownership, we have excluded our share from our ANE measure.
MANAGEMENT’S DISCUSSION AND ANALYSIS 65
To facilitate a better understanding of these measures, the table below reconciles adjusted net earnings with our net earnings for the fourth quarter and year ended 2024, and compares it to the same periods in 2023 as well as the year ended 2022.
| THREE MONTHS ENDED | YEAR ENDED | |||||||||||||||||||
| DECEMBER 31 | DECEMBER 31 | |||||||||||||||||||
| ($ MILLIONS) |
2024 | 2023 | 2024 | 2023 | 2022 | |||||||||||||||
| Net earnings attributable to equity holders |
135 | 80 | 172 | 361 | 89 | |||||||||||||||
|
|
|
|
|
|
|
|
|
|
|
|||||||||||
| Adjustments |
||||||||||||||||||||
| Adjustments on derivatives |
133 | (59 | ) | 152 | (59 | ) | 76 | |||||||||||||
| Unrealized foreign exchange gains |
(56 | ) | (1 | ) | (66 | ) | (10 | ) | (34 | ) | ||||||||||
| Share-based compensation |
17 | 12 | 44 | 63 | 28 | |||||||||||||||
| Adjustments on other operating expense (income) |
(23 | ) | 40 | (35 | ) | (2 | ) | 26 | ||||||||||||
| Adjustment to other income |
— | — | — | — | (23 | ) | ||||||||||||||
| Income taxes on adjustments |
(37 | ) | 6 | (46 | ) | 2 | (40 | ) | ||||||||||||
| Adjustments on equity investees (net of tax): |
||||||||||||||||||||
| Inventory purchase accounting |
3 | 20 | 53 | 20 | — | |||||||||||||||
| Acquisition-related transition costs |
— | — | 22 | — | — | |||||||||||||||
| Unrealized foreign exchange losses (gains) |
(16 | ) | 10 | (7 | ) | 8 | 1 | |||||||||||||
| Long-term incentive plan |
1 | — | 3 | — | — | |||||||||||||||
|
|
|
|
|
|
|
|
|
|
|
|||||||||||
| Adjusted net earnings |
157 | 108 | 292 | 383 | 123 | |||||||||||||||
|
|
|
|
|
|
|
|
|
|
|
|||||||||||
The following table shows what contributed to the change in adjusted net earnings (non-IFRS measure, see above) in 2024 compared to the same period in 2023 and 2022.
| ($ MILLIONS) |
2024 | 2023 | 2022 | |||||||||||
| Adjusted net earnings (losses) - previous year |
383 | 123 | (64 | ) | ||||||||||
|
|
|
|
|
|
|
|||||||||
| Change in gross profit by segment |
||||||||||||||
| (we calculate gross profit by deducting from revenue the cost of products and services sold, and depreciation and amortization (D&A), net of hedging benefits) |
|
|||||||||||||
| Uranium |
Impact from sales volume changes |
22 | 30 | (6 | ) | |||||||||
| Higher realized prices ($US) |
390 | 208 | 328 | |||||||||||
| Foreign exchange impact on realized prices |
26 | 95 | 44 | |||||||||||
| Higher costs |
(203 | ) | (9 | ) | (137 | ) | ||||||||
|
|
|
|
|
|
|
|||||||||
| change – uranium |
235 | 324 | 229 | |||||||||||
|
|
|
|
|
|
|
|||||||||
| Fuel services |
Impact from sales volume changes |
2 | 9 | (21 | ) | |||||||||
| Higher realized prices ($Cdn) |
27 | 32 | 33 | |||||||||||
| Higher costs |
(47 | ) | (34 | ) | (13 | ) | ||||||||
|
|
|
|
|
|
|
|||||||||
| change – fuel services |
(18 | ) | 7 | (1 | ) | |||||||||
|
|
|
|
|
|
|
|||||||||
| Other changes |
||||||||||||||
| Higher administration expenditures |
(7 | ) | (74 | ) | (44 | ) | ||||||||
| Higher exploration and research and development expenditures |
(17 | ) | (16 | ) | (8 | ) | ||||||||
| Change in reclamation provisions |
(3 | ) | 3 | 3 | ||||||||||
| Change in gains on derivatives |
(10 | ) | (24 | ) | (23 | ) | ||||||||
| Change in unrealized foreign exchange gains or losses |
(6 | ) | (34 | ) | 40 | |||||||||
| Change in earnings from equity-accounted investees |
(122 | ) | 87 | 27 | ||||||||||
| Canadian Emergency Wage Subsidy |
— | — | (21 | ) | ||||||||||
| Change in share-based compensation |
(19 | ) | 35 | (18 | ) | |||||||||
| Higher (lower) finance income |
(91 | ) | 75 | 30 | ||||||||||
| Higher finance costs |
(31 | ) | (30 | ) | (9 | ) | ||||||||
| Change in income tax recovery or expense |
(7 | ) | (88 | ) | (25 | ) | ||||||||
| Other |
5 | (5 | ) | 7 | ||||||||||
|
|
|
|
|
|
|
|||||||||
| Adjusted net earnings - current year |
292 | 383 | 123 | |||||||||||
|
|
|
|
|
|
|
|||||||||
The following table shows what contributed to the change in net earnings and adjusted net earnings (non-IFRS measure, see above) in the fourth quarter of 2024 compared to the same period in 2023.
66 CAMECO CORPORATION
| ($ MILLIONS) |
IFRS | Adjusted | ||||||||
| Net earnings - 2023 |
80 | 108 | ||||||||
|
|
|
|
|
|||||||
| Change in gross profit by segment |
||||||||||
| (we calculate gross profit by deducting from revenue the cost of products and services sold, and depreciation and amortization (D&A), net of hedging benefits) |
|
|||||||||
| Uranium |
Impact from sales volume changes |
29 | 29 | |||||||
| Higher realized prices ($US) |
107 | 107 | ||||||||
| Foreign exchange impact on realized prices |
11 | 11 | ||||||||
| Higher costs |
(30 | ) | (30 | ) | ||||||
|
|
|
|
|
|||||||
| change – uranium |
117 | 117 | ||||||||
|
|
|
|
|
|||||||
| Higher realized prices ($Cdn) |
13 | 13 | ||||||||
| Higher costs |
(16 | ) | (16 | ) | ||||||
|
|
|
|
|
|||||||
| change – fuel services |
(3 | ) | (3 | ) | ||||||
|
|
|
|
|
|||||||
| Other changes |
||||||||||
| Higher administration expenditures |
(18 | ) | (18 | ) | ||||||
| Higher exploration and research and development expenditures |
(7 | ) | (7 | ) | ||||||
| Change in reclamation provisions |
70 | 7 | ||||||||
| Change in gains on derivatives |
(198 | ) | (6 | ) | ||||||
| Change in unrealized foreign exchange gains or losses |
50 | (5 | ) | |||||||
| Change in earnings from equity-accounted investees |
10 | (32 | ) | |||||||
| Change in share-based compensation |
— | 5 | ||||||||
| Lower finance income |
(16 | ) | (16 | ) | ||||||
| Higher finance costs |
16 | 16 | ||||||||
| Change in income tax recovery or expense |
29 | (14 | ) | |||||||
| Other |
5 | 5 | ||||||||
|
|
|
|
|
|||||||
| Net earnings - 2024 |
135 | 157 | ||||||||
|
|
|
|
|
|||||||
EBITDA
EBITDA is defined as net earnings attributable to equity holders, adjusted for the costs related to the impact of the company’s capital and tax structure including depreciation and amortization, finance income, finance costs (including accretion) and income taxes.
ADJUSTED EBITDA
Adjusted EBITDA is defined as EBITDA, as further adjusted for the impact of certain costs or benefits incurred in the period which are either not indicative of the underlying business performance or that impact the ability to assess the operating performance of the business. These adjustments include the amounts noted in the adjusted net earnings definition.
In calculating adjusted EBITDA, we also adjust for items included in the results of our equity-accounted investees. These items are reported as part of marketing, administrative and general expenses within the investee financial information and are not representative of the underlying operations. These include gain/loss on undesignated hedges, transaction costs related to acquisitions and gain/loss on disposition of a business.
We also adjust for the unwinding of the effect of purchase accounting on the sale of inventories which is included in our share of earnings from equity-accounted investee and recorded in the cost of products and services sold in the investee information (see note 12 to the financial statements).
The company may realize similar gains or incur similar expenditures in the future.
ADJUSTED FREE CASH FLOW
Adjusted free cash flow is defined as adjusted EBITDA less capital expenditures for the period.
ADJUSTED EBITDA MARGIN
Adjusted EBITDA margin is defined as adjusted EBITDA divided by revenue for the appropriate period.
MANAGEMENT’S DISCUSSION AND ANALYSIS 67
EBITDA, adjusted EBITDA, adjusted free cash flow, and adjusted EBITDA margin are measures which allow us and other users to assess results of operations from a management perspective without regard for our capital structure. To facilitate a better understanding of these measures, the table below reconciles earnings before income taxes with EBITDA and adjusted EBITDA for the fourth quarters and years ended 2024 and 2023.
For the year ended December 31, 2024:
| FUEL | ||||||||||||||||||||
| ($ MILLIONS) |
URANIUM1 | SERVICES | WESTINGHOUSE | OTHER | TOTAL | |||||||||||||||
| Net earnings (loss) before income taxes2 |
904 | 108 | (218 | ) | (622 | ) | 172 | |||||||||||||
| Depreciation and amortization |
239 | 37 | — | 5 | 281 | |||||||||||||||
| Finance income |
— | — | — | (21 | ) | (21 | ) | |||||||||||||
| Finance costs |
— | — | — | 147 | 147 | |||||||||||||||
| Income taxes |
— | — | — | 85 | 85 | |||||||||||||||
|
|
|
|
|
|
|
|
|
|
|
|||||||||||
| 1,143 | 145 | (218 | ) | (406 | ) | 664 | ||||||||||||||
| Adjustments on equity investees |
||||||||||||||||||||
| Depreciation and amortization |
23 | — | 357 | — | 380 | |||||||||||||||
| Finance income |
(1 | ) | — | (4 | ) | — | (5 | ) | ||||||||||||
| Finance expense |
— | — | 225 | — | 225 | |||||||||||||||
| Income taxes |
58 | — | (61 | ) | — | (3 | ) | |||||||||||||
|
|
|
|
|
|
|
|
|
|
|
|||||||||||
| Net adjustments on equity investees |
80 | — | 517 | — | 597 | |||||||||||||||
|
|
|
|
|
|
|
|
|
|
|
|||||||||||
| EBITDA |
1,223 | 145 | 299 | (406 | ) | 1,261 | ||||||||||||||
| Gain on derivatives |
— | — | — | 152 | 152 | |||||||||||||||
| Other operating income |
(35 | ) | — | — | — | (35 | ) | |||||||||||||
| Share-based compensation |
— | — | — | 44 | 44 | |||||||||||||||
| Unrealized foreign exchange gains |
— | — | — | (66 | ) | (66 | ) | |||||||||||||
|
|
|
|
|
|
|
|
|
|
|
|||||||||||
| (35 | ) | — | — | 130 | 95 | |||||||||||||||
| Adjustments on equity investees |
||||||||||||||||||||
| Inventory purchase accounting |
— | — | 71 | — | 71 | |||||||||||||||
| Acquisition-related transition costs |
— | — | 29 | — | 29 | |||||||||||||||
| Other expenses |
— | — | 78 | — | 78 | |||||||||||||||
| Unrealized foreign exchange losses (gains) |
(9 | ) | — | 2 | — | (7 | ) | |||||||||||||
| Long-term incentive plan |
— | — | 4 | — | 4 | |||||||||||||||
|
|
|
|
|
|
|
|
|
|
|
|||||||||||
| Net adjustments on equity investees |
(9 | ) | — | 184 | — | 175 | ||||||||||||||
|
|
|
|
|
|
|
|
|
|
|
|||||||||||
| Adjusted EBITDA |
1,179 | 145 | 483 | (276 | ) | 1,531 | ||||||||||||||
|
|
|
|
|
|
|
|
|
|
|
|||||||||||
| 1 | JV Inkai EBITDA of $279 million is included in the uranium segment. See Financial results by segment – Uranium for reconciliation. |
| 2 | Westinghouse earnings are after income taxes |
68 CAMECO CORPORATION
For the year ended December 31, 2023:
| FUEL | ||||||||||||||||||||
| ($ MILLIONS) |
URANIUM1 | SERVICES | WESTINGHOUSE | OTHER | TOTAL | |||||||||||||||
| Net earnings (loss) before income taxes2 |
606 | 129 | (24 | ) | (350 | ) | 361 | |||||||||||||
| Depreciation and amortization |
175 | 35 | — | 10 | 220 | |||||||||||||||
| Finance income |
— | — | — | (112 | ) | (112 | ) | |||||||||||||
| Finance costs |
— | — | — | 116 | 116 | |||||||||||||||
| Income taxes |
— | — | — | 126 | 126 | |||||||||||||||
|
|
|
|
|
|
|
|
|
|
|
|||||||||||
| 781 | 164 | (24 | ) | (210 | ) | 711 | ||||||||||||||
| Adjustments on equity investees |
||||||||||||||||||||
| Depreciation and amortization |
14 | — | 61 | — | 75 | |||||||||||||||
| Finance income |
— | — | (2 | ) | — | (2 | ) | |||||||||||||
| Finance expenses |
— | — | 30 | — | 30 | |||||||||||||||
| Income taxes |
42 | — | (7 | ) | — | 35 | ||||||||||||||
|
|
|
|
|
|
|
|
|
|
|
|||||||||||
| Net adjustments on equity investees |
56 | — | 82 | — | 138 | |||||||||||||||
|
|
|
|
|
|
|
|
|
|
|
|||||||||||
| EBITDA |
837 | 164 | 58 | (210 | ) | 849 | ||||||||||||||
| Loss on derivatives |
— | — | — | (59 | ) | (59 | ) | |||||||||||||
| Other operating income |
(2 | ) | — | — | — | (2 | ) | |||||||||||||
| Share-based compensation |
— | — | — | 63 | 63 | |||||||||||||||
| Unrealized foreign exchange gains |
— | — | — | (10 | ) | (10 | ) | |||||||||||||
|
|
|
|
|
|
|
|
|
|
|
|||||||||||
| (2 | ) | — | — | (6 | ) | (8 | ) | |||||||||||||
| Adjustments on equity investees |
||||||||||||||||||||
| Inventory purchase accounting |
— | — | 27 | — | 27 | |||||||||||||||
| Other expenses |
— | — | 8 | — | 8 | |||||||||||||||
| Unrealized foreign exchange losses |
— | — | 8 | — | 8 | |||||||||||||||
|
|
|
|
|
|
|
|
|
|
|
|||||||||||
| Net adjustments on equity investees |
— | — | 43 | — | 43 | |||||||||||||||
|
|
|
|
|
|
|
|
|
|
|
|||||||||||
| Adjusted EBITDA |
835 | 164 | 101 | (216 | ) | 884 | ||||||||||||||
|
|
|
|
|
|
|
|
|
|
|
|||||||||||
| 1 | JV Inkai EBITDA of $235 million is included in the uranium segment. See Financial results by segment – Uranium for reconciliation. |
| 2 | Westinghouse earnings are after income taxes |
MANAGEMENT’S DISCUSSION AND ANALYSIS 69
For the quarter ended December 31, 2024:
| FUEL | ||||||||||||||||||||
| ($ MILLIONS) |
URANIUM1 | SERVICES | WESTINGHOUSE | OTHER | TOTAL | |||||||||||||||
| Net earnings (loss) before income taxes2 |
289 | 37 | 9 | (199 | ) | 136 | ||||||||||||||
| Depreciation and amortization |
91 | 12 | — | 1 | 104 | |||||||||||||||
| Finance income |
— | — | — | (3 | ) | (3 | ) | |||||||||||||
| Finance costs |
— | — | — | 31 | 31 | |||||||||||||||
| Income taxes |
— | — | — | (2 | ) | (2 | ) | |||||||||||||
|
|
|
|
|
|
|
|
|
|
|
|||||||||||
| 380 | 49 | 9 | (172 | ) | 266 | |||||||||||||||
| Adjustments on equity investees |
||||||||||||||||||||
| Depreciation and amortization |
11 | — | 90 | — | 101 | |||||||||||||||
| Finance income |
— | — | (2 | ) | — | (2 | ) | |||||||||||||
| Finance expense |
— | — | 53 | — | 53 | |||||||||||||||
| Income taxes |
30 | — | (11 | ) | — | 19 | ||||||||||||||
|
|
|
|
|
|
|
|
|
|
|
|||||||||||
| Net adjustments on equity investees |
41 | — | 130 | — | 171 | |||||||||||||||
|
|
|
|
|
|
|
|
|
|
|
|||||||||||
| EBITDA |
421 | 49 | 139 | (172 | ) | 437 | ||||||||||||||
| Gain on derivatives |
— | — | — | 133 | 133 | |||||||||||||||
| Other operating income |
(23 | ) | — | — | — | (23 | ) | |||||||||||||
| Share-based compensation |
— | — | — | 17 | 17 | |||||||||||||||
| Unrealized Foreign exchange gains |
— | — | — | (56 | ) | (56 | ) | |||||||||||||
|
|
|
|
|
|
|
|
|
|
|
|||||||||||
| (23 | ) | — | — | 94 | 71 | |||||||||||||||
| Adjustments on equity investees |
||||||||||||||||||||
| Inventory purchase accounting |
— | — | 5 | — | 5 | |||||||||||||||
| Other expenses |
— | — | 26 | — | 26 | |||||||||||||||
| Unrealized foreign exchange gains |
(7 | ) | — | (9 | ) | — | (16 | ) | ||||||||||||
| Long-term incentive plan |
— | — | 1 | — | 1 | |||||||||||||||
|
|
|
|
|
|
|
|
|
|
|
|||||||||||
| Net adjustments on equity investees |
(7 | ) | — | 23 | — | 16 | ||||||||||||||
|
|
|
|
|
|
|
|
|
|
|
|||||||||||
| Adjusted EBITDA |
391 | 49 | 162 | (78 | ) | 524 | ||||||||||||||
|
|
|
|
|
|
|
|
|
|
|
|||||||||||
| 1 | JV Inkai EBITDA of $90 million is included in the uranium segment. See Financial results by segment – Uranium for reconciliation. |
| 2 | Westinghouse earnings are after income taxes |
70 CAMECO CORPORATION
For the quarter ended December 31, 2023:
| FUEL | ||||||||||||||||||||
| ($ MILLIONS) |
URANIUM1 | SERVICES | WESTINGHOUSE | OTHER | TOTAL | |||||||||||||||
| Net earnings (loss) before income taxes2 |
122 | 40 | (24 | ) | (57 | ) | 81 | |||||||||||||
| Depreciation and amortization |
32 | 11 | — | 3 | 46 | |||||||||||||||
| Finance income |
— | — | — | (19 | ) | (19 | ) | |||||||||||||
| Finance costs |
— | — | — | 47 | 47 | |||||||||||||||
| Income taxes |
— | — | — | 27 | 27 | |||||||||||||||
|
|
|
|
|
|
|
|
|
|
|
|||||||||||
| 154 | 51 | (24 | ) | 1 | 182 | |||||||||||||||
| Adjustments on equity investees |
||||||||||||||||||||
| Depreciation and amortization |
8 | — | 61 | — | 69 | |||||||||||||||
| Finance income |
— | — | (2 | ) | — | (2 | ) | |||||||||||||
| Finance expenses |
— | — | 30 | — | 30 | |||||||||||||||
| Income taxes |
27 | — | (7 | ) | — | 20 | ||||||||||||||
|
|
|
|
|
|
|
|
|
|
|
|||||||||||
| Net adjustments on equity investees |
35 | — | 82 | — | 117 | |||||||||||||||
|
|
|
|
|
|
|
|
|
|
|
|||||||||||
| EBITDA |
189 | 51 | 58 | 1 | 299 | |||||||||||||||
| Loss on derivatives |
— | — | — | (59 | ) | (59 | ) | |||||||||||||
| Other operating expense |
40 | — | — | — | 40 | |||||||||||||||
| Share-based compensation |
— | — | — | 12 | 12 | |||||||||||||||
| Unrealized foreign exchange gains |
— | — | — | (1 | ) | (1 | ) | |||||||||||||
|
|
|
|
|
|
|
|
|
|
|
|||||||||||
| 40 | — | — | (48 | ) | (8 | ) | ||||||||||||||
| Adjustments on equity investees |
||||||||||||||||||||
| Inventory purchase accounting |
— | — | 27 | — | — | |||||||||||||||
| Other expenses |
— | — | 8 | — | — | |||||||||||||||
| Unrealized foreign exchange losses |
2 | — | 8 | — | 10 | |||||||||||||||
|
|
|
|
|
|
|
|
|
|
|
|||||||||||
| Net adjustments on equity investees |
2 | — | 43 | — | 45 | |||||||||||||||
|
|
|
|
|
|
|
|
|
|
|
|||||||||||
| Adjusted EBITDA |
231 | 51 | 101 | (47 | ) | 336 | ||||||||||||||
|
|
|
|
|
|
|
|
|
|
|
|||||||||||
| 1 | JV Inkai EBITDA of $116 million is included in the uranium segment. See Financial results by segment – Uranium for reconciliation. |
| 2 | Westinghouse earnings are after income taxes |
CASH COST PER POUND, NON-CASH COST PER POUND AND TOTAL COST PER POUND FOR PRODUCED AND PURCHASED URANIUM
Cash cost per pound, non-cash cost per pound and total cost per pound for produced and purchased uranium are non-IFRS measures. We use these measures in our assessment of the performance of our uranium business. These measures are not necessarily indicative of operating profit or cash flow from operations as determined under IFRS.
MANAGEMENT’S DISCUSSION AND ANALYSIS 71
To facilitate a better understanding of these measures, the table below reconciles these measures to cost of product sold and depreciation and amortization for the fourth quarters and years ended 2024 and 2023.
| THREE MONTHS | YEAR ENDED | |||||||||||||||
| ENDED DECEMBER 31 | DECEMBER 31 | |||||||||||||||
| ($ MILLIONS) |
2024 | 2023 | 2024 | 2023 | ||||||||||||
| Cost of product sold |
730.2 | 573.3 | 1,757.2 | 1,532.3 | ||||||||||||
| Royalties |
(51.5 | ) | (10.6 | ) | (139.9 | ) | (71.7 | ) | ||||||||
| Other selling costs |
(4.7 | ) | (3.8 | ) | (16.9 | ) | (10.9 | ) | ||||||||
| Care and maintenance |
(13.6 | ) | (11.6 | ) | (50.9 | ) | (46.7 | ) | ||||||||
| Change in inventories |
(15.0 | ) | 139.1 | 78.4 | (63.0 | ) | ||||||||||
|
|
|
|
|
|
|
|
|
|||||||||
| Cash operating costs (a) |
645.4 | 686.4 | 1,627.9 | 1,340.0 | ||||||||||||
| Depreciation and amortization |
91.2 | 31.6 | 238.7 | 175.5 | ||||||||||||
| Care and maintenance |
(0.2 | ) | (0.5 | ) | (0.8 | ) | (3.9 | ) | ||||||||
| Change in inventories |
(30.0 | ) | 31.3 | (9.8 | ) | 32.6 | ||||||||||
|
|
|
|
|
|
|
|
|
|||||||||
| Total operating costs (b) |
706.4 | 748.8 | 1,856.0 | 1,544.2 | ||||||||||||
|
|
|
|
|
|
|
|
|
|||||||||
| Uranium produced & purchased (million lbs) (c) |
10.9 | 12.0 | 34.4 | 28.9 | ||||||||||||
|
|
|
|
|
|
|
|
|
|||||||||
| Cash costs per pound (a ÷ c) |
59.21 | 57.20 | 47.32 | 46.37 | ||||||||||||
| Total costs per pound (b ÷ c) |
64.80 | 62.40 | 53.95 | 53.43 | ||||||||||||
|
|
|
|
|
|
|
|
|
|||||||||
72 CAMECO CORPORATION
Operations, projects and investments
This section of our MD&A is an overview of the mining, milling and processing facilities we operate or have an interest in, our curtailed operations, our advanced uranium projects and our exploration activities, what we accomplished this year, our plans for the future and how we manage risk. It also includes an overview of our investments in Westinghouse and GLE.
| 74 |
MANAGING THE RISKS |
|
| 76 |
URANIUM – PRODUCTION OVERVIEW |
|
| 76 |
PRODUCTION OUTLOOK |
|
| 77 |
URANIUM – TIER-ONE OPERATIONS |
|
| 77 |
MCARTHUR RIVER MINE / KEY LAKE MILL |
|
| 81 |
CIGAR LAKE |
|
| 85 |
INKAI |
|
| 89 |
URANIUM – TIER-TWO OPERATIONS |
|
| 89 |
RABBIT LAKE |
|
| 90 |
US ISR |
|
| 91 |
URANIUM – ADVANCED PROJECTS |
|
| 91 |
MILLENNIUM |
|
| 91 |
YEELIRRIE |
|
| 91 |
KINTYRE |
|
| 93 |
URANIUM – EXPLORATION |
|
| 95 |
FUEL SERVICES |
|
| 95 |
BLIND RIVER REFINERY |
|
| 96 |
PORT HOPE CONVERSION SERVICES |
|
| 96 |
CAMECO FUEL MANUFACTURING INC. (CFM) |
|
| 98 |
WESTINGHOUSE ELECTRIC COMPANY |
|
| 106 |
OTHER NUCLEAR FUEL CYCLE INVESTMENTS |
|
| 106 |
GLOBAL LASER ENRICHMENT (GLE) |
|
MANAGEMENT’S DISCUSSION AND ANALYSIS 73
Managing the risks
The nature of our business means we face many kinds of potential risks and hazards – some that relate to the nuclear energy industry in general, safety, health and environmental risks associated with any mining and chemical processing company and others that apply to specific properties, operations, planned operations, Westinghouse or other fuel cycle investments. Our uranium and fuel services and Westinghouse segments also face unique risks associated with radiation. These risks could have a significant impact on our business, earnings, cash flows, financial condition, results of operations or prospects, which may result in a significant decrease in the market price of our common shares.
Risks and hazards generally applicable to the mining, milling and processing facilities we operate, and advanced projects include:
| • | catastrophic accidents resulting in large-scale releases of hazardous chemicals, or a tailings facility failure |
| • | industrial safety accidents |
| • | environmental incidents or subsurface contamination from current or legacy operations |
| • | transportation incidents, which may involve the release of radioactive or other hazardous materials |
| • | labour shortages, disputes or strikes |
| • | availability of personnel with the necessary skills and experience |
| • | cost increases for labour, contracted or purchased materials, supplies and services |
| • | shortages of, or interruptions in the supply of, required materials, supplies, services and equipment |
| • | transportation and delivery disruptions |
| • | interruptions in the supply of electricity, water, and other utilities or infrastructure |
| • | inability of our innovation initiatives to achieve the expected cost saving and operational flexibility objectives |
| • | equipment failures or aging facilities |
| • | cyberattacks |
| • | joint venture disputes or litigation |
| • | non-compliance with legal requirements, including exceeding applicable air or water limits |
| • | inability to obtain and renew the licences and other approvals needed to restart, operate, and to increase production at our mines, mills, processing facilities, to develop new mines, or for Westinghouse to operate its fuel fabrication or other facilities or undertake its other commercial activities |
| • | increased workforce health and safety risks or increased regulatory burdens resulting from a pandemic or other causes |
| • | fires |
| • | blockades or other acts of social or political activism |
| • | uncertain impact of changing regulations or policy leading to higher annual operating costs, including GHG pricing and regulations (e.g., carbon pricing, the Canadian Clean Fuel Standard) |
| • | natural phenomena, such as forest fires, floods and earthquakes as well as shifts in temperature, precipitation, and the impact of more frequent severe weather conditions on our operations as a result of climate change |
| • | outbreak of communicable illness (such as a pandemic) |
| • | unusual, unexpected or adverse mining or geological conditions |
| • | underground water inflows at our mining operations |
| • | ground movement or cave-ins at our mining operations |
| • | reserve and resource estimates are not precise |
Risks and hazards generally applicable to Westinghouse and our ownership interest in Westinghouse include:
| • | failure to realize any or all of the anticipated benefits from the acquisition |
| • | Westinghouse’s failure to generate sufficient cash flow to fund its approved annual operating budget or make distributions to us and Brookfield |
| • | Westinghouse’s failure to comply with nuclear licence and quality assurance requirements at its facilities |
| • | Westinghouse’s loss of protections against liability for nuclear damage, including discontinuation of global nuclear liability regimes and indemnities |
| • | adverse public perception of nuclear energy |
| • | adverse public reaction to an unforeseen nuclear incident resulting in a lessening of demand for nuclear generators |
| • | threat of increased trade barriers adversely impacting Westinghouse’s business |
| • | our inability to control Westinghouse |
| • | liabilities at Westinghouse exceeding our estimates and the discovery of unknown or undisclosed liabilities |
| • | default by Westinghouse under its credit facilities impacting adversely Westinghouse’s ability to fund its ongoing operations |
| • | occupational health and safety issues arising at Westinghouse’s operations |
74 CAMECO CORPORATION
| • | disputes between us and Brookfield regarding our strategic partnership |
| • | Cameco defaulting under the governance agreement with Brookfield, including us losing some or all of our interest in Westinghouse |
We have a Risk Policy that is supported by our formal Risk Management Program.
Our Risk Management Program involves a broad, systematic approach to identifying, assessing, monitoring, reporting and managing the significant risks we face in our business and operations, including risks that could impact our four measures of success. For more information about our risk management program see the Risk and Risk Management section in this MD&A, as well as our most recent Sustainability Report at cameco.com.
We have insurance to cover some of these risks and hazards, but not all of them, and not to the full amount of losses or liabilities that could potentially arise.
In addition to considering the other information in this MD&A and the risks noted above, you should carefully consider the material risks discussed starting on page 4, and the specific risks discussed under the update for each operation, advanced project, Westinghouse, and GLE in this section. These risks, however, are not a complete list of the potential risks our operations, advanced projects, or other investments face. There may be others we are not aware of or risks we feel are not material today that could become material in the future.
We recommend you also review our most recent annual information form, which includes a discussion of other material risks that could have an impact on our business.
MANAGEMENT’S DISCUSSION AND ANALYSIS 75
Uranium – production overview
Our share of production in our uranium segment in the fourth quarter was 6.1 million pounds, 7% higher compared to the same period in 2023, while production for the year was 23.4 million pounds, 33% higher than in 2023. Total production in 2024 was 0.3 million pounds above the revised production plan we announced in the third quarter. See Uranium – Tier-one operations starting on page 77 for more information.
The Rabbit Lake operation remained in a safe and sustainable state of care and maintenance, and we are no longer developing new wellfields at Crow Butte and Smith Ranch-Highland. See Uranium – Tier-two operations beginning on page 89 for more information.
Uranium production
| CAMECO SHARE | THREE MONTHS ENDED DECEMBER 31 |
YEAR ENDED DECEMBER 31 |
||||||||||||||||||||||
| (MILLION LBS) |
2024 | 2023 | 2024 | 2023 | 2024 PLAN | 2025 PLAN | ||||||||||||||||||
| Cigar Lake |
2.5 | 2.6 | 9.2 | 8.2 | up to 9.8 | 9.8 | ||||||||||||||||||
| McArthur River/Key Lake |
3.6 | 3.1 | 14.2 | 9.4 | up to 13.3 | 1 | 12.6 | |||||||||||||||||
|
|
|
|
|
|
|
|
|
|
|
|
|
|||||||||||||
| Total |
6.1 | 5.7 | 23.4 | 17.6 | up to 23.1 | 22.4 | ||||||||||||||||||
|
|
|
|
|
|
|
|
|
|
|
|
|
|||||||||||||
| 1 | During the third quarter, we updated our McArthur River/Key Lake production forecast to 19 million pounds (100% basis) in 2024 (previously 18 million pounds). |
PRODUCTION OUTLOOK
We remain focused on taking advantage of the long-term growth we see coming in our industry, while maintaining the ability to respond to market conditions as they evolve. Our strategy includes a focus, in our uranium segment, on protecting and extending the value of our contract portfolio, on aligning our production decisions with our contract portfolio and market opportunities in order to increase long-term value, and to do that with an emphasis on safety, people and the environment.
In 2025, we are planning production of 22.4 million pounds (our share).
Due to equity accounting, our share of production from Inkai is shown as a purchase. Based on KAP’s announcement on January 27, 2025, production in Kazakhstan is expected to remain below the level stipulated in the subsoil use agreements. With the halt of production in January 2025, we are still in discussions with JV Inkai and KAP to determine how this may impact production at Inkai in 2025 and thereafter and therefore our corresponding purchase entitlements. See Uranium – Tier-one operations- Inkai beginning on page 85 for more information.
76 CAMECO CORPORATION
Uranium – Tier-one operations
McArthur River mine / Key Lake mill
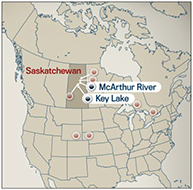
|
2024 Production (our share) | |
| 14.2M lb | ||
| 2025 Production Outlook (our share) | ||
| 12.6M lb | ||
| Estimated Reserves (our share) | ||
| 251.0M lb | ||
| Estimated Mine Life | ||
| 2044 |
McArthur River is the world’s largest, high-grade uranium mine, and Key Lake is the world’s largest uranium mill. We are the operator of both the mine and mill.
McArthur River is considered a material uranium property for us. There is a technical report dated March 29, 2019 (effective December 31, 2018) that can be downloaded from SEDAR+ (www.sedarplus.ca) or from EDGAR (www.sec.gov).
| Location | Saskatchewan, Canada | |||
| Ownership | McArthur River – 69.805% | |||
| Key Lake – 83.33% | ||||
| Mine type | Underground | |||
| Mining methods | Blasthole stoping and raiseboring | |||
| End product | Uranium concentrate | |||
| Certification | ISO 14001 certified | |||
| Estimated reserves | 251.0 million pounds (proven and probable), average grade U3O8: 6.55% | |||
| Estimated resources | 4.7 million pounds (measured and indicated), average grade U3O8: 2.29% | |||
| 1.7 million pounds (inferred), average grade U3O8: 2.95% | ||||
| Licensed capacity | Mine and mill: 25.0 million pounds per year | |||
| Licence term | Through October 2043 | |||
| Total packaged production: | 2000 to 2024 | 358.1 million pounds (McArthur River/Key Lake) (100% basis) | ||
| 1983 to 2002 | 209.8 million pounds (Key Lake) (100% basis) | |||
| 2024 production | 14.2 million pounds (20.3 million pounds on 100% basis) | |||
| 2025 production outlook | 12.6 million pounds (18.0 million pounds on 100% basis) | |||
| Estimated decommissioning cost | $51.4 million – McArthur River (100% basis) | |||
| $276.7 million – Key Lake (100% basis) | ||||
All values shown, including reserves and resources, represent our share only, unless indicated.
MANAGEMENT’S DISCUSSION AND ANALYSIS 77
BACKGROUND
Mine description
The mineral reserves at McArthur River are contained within seven zones: zones 1, 2, 3, 4, 4 South, A and B. There are currently two active mining zones (zone 2 and 4), one with development significantly advanced (zone 1), and one in the early-to mid-stages of development (zone 4 South).
Zone 2 has been actively mined since production began in 1999. The ore zone was initially divided into three freeze panels. As the freeze wall was expanded, the inner connecting freeze walls were decommissioned to recover the inaccessible uranium around the active freeze pipes. Mining of zone 2 is almost complete. About 3.1 million pounds of mineral reserves remain secured behind a freeze wall, and we expect to recover them using a combination of raisebore and blasthole stope mining.
Zone 4 has been actively mined since 2010. The zone was divided into four freeze panels, and like in zone 2, as the freeze wall was expanded, the inner connecting freeze walls were decommissioned. Zone 4 has 87.5 million pounds of mineral reserves secured behind freeze walls, and it will be the main source of production for the next several years. Raisebore and blasthole stope mining will be used to recover the mineral reserves.
Zone 1 is the next planned mine area to be brought into production. Freeze hole drilling was completed in 2023 and brine distribution construction and commissioning was completed in 2024. All freeze walls are actively freezing and it is predicted that an active freeze wall will be in place in the second quarter of 2025. Once an active freeze wall has been established, drill and extraction chamber development will need to be completed prior to the start of production (first production expected late 2025). Once complete, an additional 48.0 million pounds of mineral reserves will be secured behind freeze walls. Blasthole stope mining is currently planned as the main extraction method in zone 1.
Zone 4 South remains in the early development stages. Development for the freeze drifts is in progress on the lower levels and freeze drilling continues on the completed upper freeze drifts. Brine distribution work is scheduled to begin on the upper levels in 2025.
We have successfully packaged approximately 358.1 million pounds (100% basis) since we began mining in 1999.
Mining methods and techniques
All the mineralized areas discovered to date at McArthur River are in, or partially in, water-bearing ground with significant pressure at mining depths.
There are three approved mining methods at McArthur River: raisebore mining, blasthole stope mining and boxhole mining. However, only raisebore and blasthole stope mining remain in use. Before we begin mining an area, we freeze the ground around it by circulating chilled brine through freeze holes to form an impermeable frozen barrier.
Blasthole stope mining
Blasthole stope mining began in 2011 and is the main extraction method planned for future production. It is planned in areas where blastholes can be accurately drilled and small stable stopes excavated without jeopardizing the freeze wall integrity. The use of this method has allowed the site to improve operating costs by increasing overall extraction efficiency by reducing underground development, concrete consumption, mineralized waste generation and improving extraction cycle time.
Raisebore mining
Raisebore mining is an innovative non-entry approach that we adapted to meet the unique challenges at McArthur River, and it has been used since mining began in 1999. This method is favourable for mining the weaker rock mass areas of the deposit and is suitable for massive high-grade zones where there is access both above and below the ore zone.
Initial processing
McArthur River produces two product streams, high grade slurry and low-grade mineralized rock. Both product streams are shipped to Key Lake mill to produce uranium ore concentrate.
The high-grade material is ground and thickened into a slurry underground and then pumped to surface. The material is then thickened and blended for grade control and shipped to Key Lake in slurry totes using haul trucks.
78 CAMECO CORPORATION
The low-grade mineralized material is hoisted to surface and shipped as a dry product to Key Lake using covered haul trucks. Once at Key Lake, the material is ground, thickened and blended with the high-grade slurry to a nominal 5% U3O8 mill feed grade. It is then processed into uranium ore concentrate and packaged in drums for further processing offsite.
Tailings capacity
Based on the current licence conditions, tailings capacity at Key Lake is sufficient to mill all the known McArthur River mineral reserves and resources, should they be converted to reserves, with additional capacity to toll mill ore from other regional deposits.
Licensed annual production capacity
The McArthur River mine and Key Lake mill are both licensed to produce up to 25 million pounds (100% basis) per year. To achieve annual production at the licensed capacity, additional investment will be required.
2024 UPDATE
Production
The McArthur River and Key Lake operation continued with production rampup and optimization activities in 2024.
Total packaged production from McArthur River and Key Lake in 2024 was 20.3 million pounds (14.2 million pounds our share), compared to 13.5 million pounds (9.4 million pounds our share) in 2023. Production in 2024 exceeded our annual expectation of 19 million pounds (13.3 million pounds our share).
The McArthur River mine produced 15.8 million pounds, which was less than its plan to mine 18.3 million pounds, primarily due to an unplanned shutdown at the mine to accommodate ventilation repairs in Shaft 2. In addition, the mine’s performance was impacted by the availability of mobile equipment and certain workforce skills.
The Key Lake mill saw notable improvements in its operational performance in 2024, with the site becoming more familiar and experienced with new equipment and control system upgrades. In addition, the systematic understanding of process bottlenecks and efforts to remove or decrease their impacts allowed Key Lake to optimize the mill throughput rates.
Of note, our 2024 packaged production of 20.3 million pounds of U3O8 sets both a new annual production record for the Key Lake mill, as well as a new world record for annual production from any uranium mill. These significant achievements were made possible in part by our off-cycle investments during care and maintenance to improve and optimize the Key Lake mill, and by having sufficient ore feed material available, which included the ore mined at McArthur River in 2024 (which was lower than its plan), supplemented by broken ore inventory at McArthur River and Key Lake that was carried over from prior years.
Exploration
Underground exploration at McArthur River continued in 2024 with the main focus areas being infill drilling of zones A and B.
PLANNING FOR THE FUTURE
Production
We plan to produce 18 million pounds (100% basis) in 2025. Although the performance of the Key Lake mill in 2024 demonstrated production rates and capacities that, when annualized, exceeded 18 million pounds, the operation’s output is currently constrained by the McArthur River mine’s limited ability to increase the production of mined ore to feed the mill, and because the majority of the previously mined, excess broken ore inventory that allowed the mill to exceed production expectations in 2024, has been processed. In 2025, we expect to bring zone 1 into production and advance zone 4 south development while we continue adding to our workforce and replacing mobile equipment. We also plan to expand both underground and surface exploration activities in 2025.
MANAGEMENT’S DISCUSSION AND ANALYSIS 79
We are addressing aging infrastructure and potential bottlenecks at Key Lake and the advancement of freezing at McArthur River to ensure reliability and sustainability. While these projects are required to support and maintain capacity at current production levels, they have been classified as growth because they also position us for future production flexibility, including to its licensed annual capacity of 25 million pounds, although no decision on changes to future production levels has been made. We will plan our production in line with market opportunities and our contract portfolio, demonstrating that we continue to be a responsible, long-term supplier of uranium fuel.
MANAGING OUR RISKS
The McArthur River deposit presents unique challenges that are not typical of traditional hard or soft rock mines. These challenges are the result of mining in or near high pressure ground water in challenging ground conditions with significant radiation concerns due to the high-grade uranium. We take significant steps and precautions to reduce the risks. Mine designs and mining methods are selected based on their ability to mitigate hydrological, radiological and geotechnical risks. Operational experience gained since the start of production has resulted in a significant reduction in risk. However, there is no guarantee that our efforts to mitigate risk will be successful.
In addition to the risks listed on pages 74 to 75, in 2024 we are focused on the management of the following risks:
Equipment availability
In 2024, the McArthur River mine was impacted by mobile equipment availability, mainly due to the time required to order, receive and commission new mining equipment. A significant amount of new equipment is expected to be delivered to site in 2025. In addition, some of the equipment is customized for use specifically at McArthur River and it therefore requires extensive testing and commissioning time, resulting in notable operational risks related to mobile equipment availability in 2025.
Inflation, labour shortages and supply chain issues
Inflation, the availability of personnel with the necessary skills and experience, and the potential impact of supply chain challenges on the availability of materials and reagents, create additional risks to our production plans and could result in production delays and increased costs in 2025 and future years.
Labour relations
The collective agreement with the United Steelworkers Local 8914 expires in December 2025. As such, the risk of labour dispute impacts is expected to be minimal in 2025.
Water inflow risk
All the mineralized areas discovered to date at McArthur River are in, or partially in, water-bearing ground with significant pressure at mining depths. This high-pressure water source is isolated from active development and production areas to reduce the inherent risk of an inflow. McArthur River relies on pressure grouting and ground freezing, and sufficient pumping, water treatment and above ground storage capacity to mitigate the risks of the high-pressure ground water.
McArthur River has not experienced a significant disruption to its mining or development activities resulting from a water inflow since 2008. The consequences of another water inflow at McArthur River would depend on its magnitude, location and timing, but could include a significant interruption or reduction in production, a material increase in costs or a loss of mineral reserves.
Transition to new mine areas
In 2025, McArthur River is scheduled to transition into two new mine areas within zone 1 and the zone 4 clay area. The risk of unforeseen challenges during the development of these areas could impact our production schedule. The impact would depend on the magnitude of the delay and the mine’s ability to substitute with production from alternative mining areas.
80 CAMECO CORPORATION
Uranium – Tier-one operations
Cigar Lake
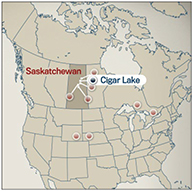
|
2024 Production (our share) | |
| 9.2M lb | ||
| 2025 Production Outlook (our share) | ||
| 9.8M lb | ||
| Estimated Reserves (our share) | ||
| 105.2M lb | ||
| Estimated Mine Life | ||
| 2036 |
Cigar Lake is the world’s highest-grade uranium mine. We are a 54.5% owner and the mine operator. Cigar Lake ore is milled at Orano’s McClean Lake mill.
Cigar Lake is considered a material uranium property for us. There is a technical report dated March 22, 2024 (effective December 31, 2023) that can be downloaded from SEDAR+ (www.sedarplus.ca) or from EDGAR (www.sec.gov).
| Location | Saskatchewan, Canada | |||
| Ownership | 54.547% | |||
| Mine type | Underground | |||
| Mining method | Jet boring system | |||
| End product | Uranium concentrate | |||
| Certification | ISO 14001 certified | |||
| Estimated reserves | 105.2 million pounds (proven and probable), average grade U3O8: 15.87% | |||
| Estimated resources | 12.9 million pounds (measured and indicated), average grade U3O8: 4.93% | |||
|
10.9 million pounds (inferred), average grade U3O8: 5.55% |
||||
| Licensed capacity | 18.0 million pounds per year (our share 9.8 million pounds per year) | |||
| Licence term | Through June 2031 | |||
| Total packaged production: 2014 to 2024 | 155.4 million pounds (100% basis) | |||
| 2024 production | 9.2 million pounds (16.9 million pounds on 100% basis) | |||
| 2025 production outlook | 9.8 million pounds (18.0 million pounds on 100% basis) | |||
| Estimated decommissioning cost | $76.5 million (100% basis) | |||
All values shown, including reserves and resources, represent our share only, unless otherwise indicated.
BACKGROUND
Mine description
Cigar Lake’s geological setting is similar to McArthur River’s. However, unlike McArthur River, the Cigar Lake deposit is horizontally oriented. The Cigar Lake deposit was historically divided into two parts. The eastern portion, previously referred to as Phase 1, is now the Cigar Lake Main (CLMain) portion of the deposit, whereas the western portion, previously referred to as Phase 2 and the area where we have begun development work, is now the Cigar Lake Extension (CLExt).
Mine development is carried out in the basement rocks below the ore horizon. New mine development is required throughout the mine life to gain access to the ore above.
MANAGEMENT’S DISCUSSION AND ANALYSIS 81
Mining method
At Cigar Lake, the permeable sandstone which overlays the deposit and basement rocks, contains large volumes of water at significant pressure. Before we begin mining, we freeze the ore zone and surrounding ground. We use a jet boring system to mine the ore.
Jet boring system (JBS) mining
As a result of the unique geological conditions at Cigar Lake, we are unable to utilize traditional mining methods that require access above the ore, which necessitated the development of a non-entry mining method specifically adapted for this deposit. After many years of test mining, we selected jet boring, and it has been used since mining began in 2014. This method involves:
| • | drilling a pilot hole into the frozen orebody, inserting a high-pressure water jet and cutting a cavity out of the frozen ore |
| • | collecting the ore and water mixture (slurry) from the cavity and pumping it to a storage sump, allowing it to settle |
| • | using a clamshell, transporting the ore from the storage sump to an underground grinding and processing circuit |
| • | once mining is complete, filling each cavity in the orebody with concrete |
| • | starting the process again with the next cavity. |
We have divided the orebody into production panels and at least three production panels need to be frozen at one time to achieve the annual production rate. A JBS machine is located below a frozen panel with three JBS machines available for operation. Two machines actively mine at any given time while the third is moving, setting up, or undergoing maintenance.
We have successfully packaged approximately 155.4 million pounds (100% basis) since we began mining in 2014.
Initial processing
We carry out initial processing of the extracted ore at Cigar Lake before shipping it to McClean Lake. To accomplish this, we:
| • | grind the ore and mix it with water to form a slurry in our underground circuit |
| • | pump the slurry 500 metres to the surface and store it in one of two ore slurry holding tanks, where it is blended and thickened to remove excess water |
| • | the final slurry, at an average grade of approximately 16% U3O8, is pumped into transport truck containers and shipped to McClean Lake mill on a 69-kilometre all-weather road |
Water from this process, including water from underground operations, is treated on the surface. Any excess treated water is released into the environment.
Milling
All of Cigar Lake’s ore slurry is being processed at the McClean Lake mill, operated by Orano. Given the McClean Lake mill’s capacity, it is able to:
| • | process up to 18 million pounds U3O8 per year |
| • | process and package all of Cigar Lake’s current mineral reserves |
Licensing annual production capacity
The Cigar Lake mine is licensed to produce up to 18 million pounds (100% basis) per year. Orano’s McClean Lake mill is licensed to produce 24 million pounds annually.
2024 UPDATE
Production
Total packaged production from Cigar Lake in 2024 was 16.9 million pounds U3O8 (9.2 million pounds our share) compared to 15.1 million pounds U3O8 (8.2 million pounds our share) in 2023.
Lower productivity from the mine was primarily the result of a lower production rate at the McClean Lake mill. At various times during the year, the mill was impacted by ore quality variances, like lower ore grades and/or higher arsenic levels, and by unplanned maintenance at the McClean Lake mill. The majority of downtime occurred in the first and fourth quarters of the year.
82 CAMECO CORPORATION
During the year, we:
| • | produced from and continued development work in the CLMain orebody in alignment with our long-term production plan |
| • | successfully executed a planned 28-day annual maintenance outage |
| • | fully completed the ground freezing program for CLMain orebody by finishing the outfitting of the final freeze holes |
| • | began physical surface work for development of the CLExt portion of the orebody |
| • | completed an expansion of the waste rock storage pads to support the remaining mine development, including development in both the CLMain and CLExt portions of the orebody |
Underground development
Underground mine development continued in 2024. We completed development of two production crosscuts; one in the eastern portion and one in the western portion of CLMain. Development also continued for access to the CLExt orebody.
PLANNING FOR THE FUTURE
Production
In 2025, we expect to produce 18 million pounds (100% basis) at Cigar Lake; our share is approximately 9.8 million pounds.
In 2025, we plan to continue production and development activities in CLMain, as well as development drifts to access CLExt in alignment with our long-term mine plan. We will also continue earthworks and construction of surface services to support the expansion of freeze activities required for future production from CLExt.
CIGAR LAKE EXTENSION
A new NI 43-101 technical report for Cigar Lake was filed March 22, 2024, replacing the previous Cigar Lake Operation technical report, filed in March 2016. Key highlights of the report include:
| • | extension of the mine life to 2036 subject to receipt of all regulatory approvals, with estimated full annual production of 18 million pounds (100% basis) (9.8 million pounds our share) U3O8 recovered from the mill for 10 years followed by a two-year ramp down until depletion |
| • | conversion of 73.4 million pounds (100% basis) (40 million pounds our share) of CLExt mineral resources into mineral reserves |
| • | mine development and capital expenditures for CLExt expected to be approximately $895 million (Cameco’s share – $487 million), including approximately $520 million (Cameco’s share – $284 million) required in advance of first ore from CLExt in 2030 |
| • | increase in estimated average cash operating costs per pound—from $18.75 to $20.58 |
More detailed descriptions of the scientific and technical information on which the mineral reserves and mine plan are based are included in the relevant sections of the technical report. A copy is available on SEDAR+ (www.sedarplus.ca), on EDGAR (www.sec.gov), and on Cameco’s website (www.cameco.com/media/media-library).
MANAGING OUR RISKS
The Cigar Lake deposit presents unique challenges that are not typical of traditional hard or soft rock mines. These challenges are the result of mining in or near high-pressure ground water in challenging ground conditions with significant radiation concerns due to the high-grade uranium and elements of concern in the orebody with respect to water quality. We take significant steps and precautions to reduce the risks. Mine designs and the mining method are selected based on their ability to mitigate hydrological, radiological, and geotechnical risks. Operational experience gained since the start of production has resulted in a significant reduction in risk. However, there is no guarantee that our efforts to mitigate risk will be successful.
In addition to the risks listed on pages 74 to 75, in 2025 we are focused on the management of the following risks:
Inflation, labour shortages, and supply chain challenges
Inflation, the availability of personnel with the necessary skills and experience, and the potential impact of supply chain challenges on the availability of materials and reagents, create additional risks to our production plans and could result in production delays and increased costs in 2025 and future years.
MANAGEMENT’S DISCUSSION AND ANALYSIS 83
Transition to new mining areas
In order to successfully achieve the planned production schedule, we must continue to successfully transition into new mining areas, which includes mine development and investment in critical support infrastructure, and deployment of the jet boring method in new areas. If development or infrastructure construction work is delayed for any reason, including if the performance of our jet boring method is materially different in new areas than in previously mined areas, our ability to meet our future production plans may be impacted.
Water inflow risk
The sandstone that overlays the Cigar Lake deposit and basement rocks is water-bearing with significant pressure at mining depths. This high-pressure water source is isolated from active development and production areas in order to reduce the inherent risk of an inflow. Cigar Lake relies on ground freezing and sufficient pumping, water treatment and above ground storage capacity to mitigate the risks of the high-pressure ground water.
Cigar Lake has not experienced a significant disruption resulting from a water inflow since 2008. The consequences of another water inflow at Cigar Lake would depend on its magnitude, location and timing, but could include a significant interruption or reduction in production, a material increase in costs or a loss of mineral reserves.
84 CAMECO CORPORATION
Uranium – Tier-one operations
Inkai
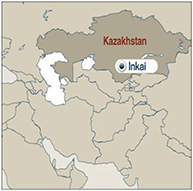
|
2024 Production (100% basis) | |
| 7.8M lb | ||
| 2025 Production Outlook (100% basis) | ||
| See Planning for the future – Production on page 87 | ||
| Estimated Reserves (our share) | ||
| 100.4M lb | ||
| Estimated Mine Life | ||
| 2045 (based on licence term) |
Inkai is a very significant uranium deposit, located in Kazakhstan. The operator is JV Inkai limited liability partnership, which we jointly own (40%)1 with Kazatomprom (KAP) (60%).
Inkai is considered a material uranium property for us. There is a technical report dated November 12, 2024 (effective September 30, 2024) that can be downloaded from SEDAR+ (www.sedarplus.ca) or from EDGAR (www.sec.gov).
| Location |
South Kazakhstan | |||
| Ownership |
40%1 | |||
| Mine type |
In situ recovery (ISR) | |||
| End product |
Uranium concentrate | |||
| Certifications |
BSI OHSAS 18001 | |||
| ISO 14001 certified | ||||
| Estimated reserves |
100.4 million pounds (proven and probable), average grade U3O8: 0.03% | |||
| Estimated resources |
37.1 million pounds (measured and indicated), average grade U3O8: 0.03% | |||
| 8.9 million pounds (inferred), average grade U3O8: 0.03% | ||||
| Licensed capacity (wellfields) |
10.4 million pounds per year (our share 4.2 million pounds per year)1 | |||
| Licence term |
Through July 2045 | |||
| Total packaged production: 2009 to 2024 |
98.0 million pounds (100% basis) | |||
| 2024 production |
7.8 million pounds (100% basis)1 | |||
| 2025 production outlook |
See Planning for the future – Production on page 871 | |||
| Estimated decommissioning cost (100% basis) |
$35.4 million (US) (100% basis) | |||
All values shown, including reserves and resources, represent our share only, unless indicated.
| 1 | Our ownership interest in the joint venture is 40% and we equity account for our investment. As such, our share of production is shown as a purchase. |
MANAGEMENT’S DISCUSSION AND ANALYSIS 85
BACKGROUND
Mine description
The Inkai uranium deposit is a roll-front type orebody within permeable sandstones. The more porous and permeable units host several stacked and relatively continuous, sinuous “roll-fronts” of low-grade uranium forming a regional system. Superimposed over this regional system are several uranium projects and active mines.
Inkai’s mineralization ranges in depths from about 260 metres to 530 metres. The deposit has a surface projection of about 40 kilometres in length, and the width ranges from 40 to 1,600 metres. The deposit has hydrogeological and mineralization conditions favourable for use of in situ recovery (ISR) technology.
Mining and milling method
JV Inkai uses conventional, well-established, and very efficient ISR technology, developed after extensive test work and operational experience. The process involves five major steps:
| • | leach the uranium in situ by circulating an acid-based solution through the host formation |
| • | recover it from solution with ion exchange resin (takes place at both main and satellite processing plants) |
| • | precipitate the uranium with hydrogen peroxide |
| • | thicken, dewater, and dry it |
| • | package the uranium peroxide product in drums |
JV Inkai has successfully packaged approximately 98.0 million pounds (100% basis) since it began mining in 2009.
2024 UPDATE
Production
Production was impacted by the continued procurement and supply chain issues in Kazakhstan, most notably, related to the stability of sulfuric acid deliveries. As a result, total 2024 production from JV Inkai on a 100% basis was 7.8 million pounds (3.6 million pounds our share), 0.6 million pounds lower than in 2023. Production was impacted by differences in the annual mine plan, a shift in the acidification schedule for new wellfields, and unstable acid supply throughout the year.
We received 2.7 million pounds of our total share of Inkai’s 2024 production. The remainder of our share of 2024 production, about 0.9 million pounds, is being stored at JV Inkai for future delivery in order to optimize transportation and delivery costs. The timing of future deliveries is uncertain.
Production purchase entitlements
Under the terms of a restructuring agreement signed with our partner KAP in 2016, our ownership interest in JV Inkai is 40% and KAP’s share is 60%. However, during production ramp-up to the licensed limit of 10.4 million pounds, we are entitled to purchase 57.5% of the first 5.2 million pounds of annual production, and as annual production increases over 5.2 million pounds, we are entitled to purchase 22.5% of such incremental production, to the maximum annual share of 4.2 million pounds. Once the ramp-up to 10.4 million pounds annually is complete, we will be entitled to purchase 40% of such annual production, matching our ownership interest.
Based on the production purchase entitlement under the 2016 JV Inkai restructuring agreement, for 2024 we were entitled to purchase 3.6 million pounds, or 45.9% of JV Inkai’s 2024 production of 7.8 million pounds. Timing of our JV Inkai purchases will fluctuate during the quarters and may not match production, and similar to 2023, the 2024 timing was impacted by shipping delays. Total purchases in 2024 were 4.2 million pounds, of which 2.5 million pounds were related to our 2024 entitlement.
Cash distribution
Excess cash, net of working capital requirements, will be distributed to the partners as dividends. In 2024, we received a cash dividend from JV Inkai of $129 million (US), net of withholdings. Our share of dividends follows our production purchase entitlements as described above. Delays in deliveries of our share of production could reduce the dividend that JV Inkai is able to declare for the calendar year.
86 CAMECO CORPORATION
UPDATED INKAI OPERATION TECHNICAL REPORT
A new NI 43-101 technical report for Inkai Operation was filed November 12, 2024, replacing the previous Inkai Operation technical report, filed in January of 2018. Key highlights of the report include:
| • | Increase in average price used in the economic analysis to $87.50 per pound U3O8 from $54.40 (US) |
| • | increase in estimated average cash operating costs per pound to $12.66 from $9.55 |
| • | expected total packed production of 213.3 million pounds U3O8 based on mineral reserves from 2024 through the projected mine life extending to mid-2045 |
| • | decrease in estimated after-tax internal rate of return of 26.9%, using the total capital investments, along with the operating and capital cost estimates, from 27.1% |
| • | total estimated Inkai capital to bring the remaining mineral reserves into production is approximately $1.5 billion, an increase of 106% when compared to the 2018 Technical Report’s 2024 to mid-2045 time frame. The change is mostly related to wellfield development activities with increased drilling tariffs and higher costs for sulfuric acid and other materials. |
PLANNING FOR THE FUTURE
Expansion project
Engineering work for a process expansion of the Inkai circuit to support a nominal production of at least 10.4 million pounds U3O8 per year has been completed and construction is in progress. The expansion project includes an upgrade to the yellowcake filtration and packaging units, and the addition of a pre-dryer and calciner. Please refer to Section 17.4 of the updated Technical Report for further details. Currently, Inkai estimates the completion of the expansion project in 2025, subject to it successfully managing the schedule risk related to contractor performance.
Production
On December 31, 2024, we were unexpectedly informed that Kazatomprom, as majority owner and controlling partner of the joint venture, had directed JV Inkai to suspend production activity as of January 1, 2025. The suspension was implemented pending approval by Kazakhstan’s Ministry of Energy of an extension to submit an updated Project for Uranium Deposit Development documentation. When the extension had not yet been granted at 2024 year-end as expected, Kazatomprom made the decision to halt production in order to avoid potential violation of Kazakhstan legislation. The extension was approved and JV Inkai resumed production on January 23, 2025. Cameco and Kazatomprom continue to work with JV Inkai to determine the impact of the approximately three-week production suspension on the operation’s 2025 production plans.
Our share of production is purchased at a discount to the spot price and included at this value in inventory. In addition, JV Inkai capital is not included in our outlook for capital expenditures.
Mineral extraction tax
In July 2024, the government of the Republic of Kazakhstan introduced amendments to the country’s Tax Code which involves changes to the Mineral Extraction Tax (MET) rate for uranium. The MET rate will increase from the current rate of 6%, to a rate of 9% in 2025, with a further change in 2026 that will see the introduction of a progressive MET system based on actual annual production volumes under each subsoil use agreement. Under the progressive system that will take effect in 2026, the highest rate is 18% for operations producing over 10.4 million pounds. Additionally, a further MET of up to 2.5% based on the spot market price of uranium, will also be introduced in 2026. The MET is incurred and paid by the mining entities, which is expected to have a significant impact on JV Inkai’s cost structure.
MANAGING OUR RISKS
In addition to the risks listed on pages 74 to 75, JV Inkai also manages the following risks:
Production forecast
Production plans for 2025 and subsequent years are uncertain and being reassessed. JV Inkai’s target for production in 2024 was 8.3 million pounds of U3O8 (100% basis). However, this target was tentative and contingent upon receipt of sufficient quantities of sulfuric acid on a specified schedule. Actual 2024 production volume of 7.8 million pounds is a decrease of more than 20% of the original approved production volume of 10.4 million pounds.
MANAGEMENT’S DISCUSSION AND ANALYSIS 87
Presently, JV Inkai is experiencing procurement and supply chain issues, most notably, related to the stability of sulfuric acid deliveries. It is also experiencing challenges related to construction delays and inflationary pressures on its production costs.
A significant disruption to JV Inkai’s previous production plans for 2025 and subsequent years could result in financial penalties and further escalation of production costs. In addition, JV Inkai’s costs could be impacted by potential changes to the tax code in Kazakhstan and by possible increased financial contributions to social and other state causes, although these risks cannot be quantified or estimated at this time.
Depending on production levels at Inkai and the outcome of our discussions related thereto with JV Inkai and KAP, our share of production and earnings from this equity-accounted investee and the amount and timing of our dividends from the joint venture may be impacted.
Transportation
The geopolitical situation continues to cause transportation risks in the region. We could continue to experience delays in our expected Inkai deliveries. To mitigate this risk, we have inventory, long-term purchase agreements and loan arrangements in place we can draw on. Depending on when we receive shipments of our share of Inkai’s production, our share of earnings from this equity-accounted investee and the timing of the receipt of our share of dividends from the joint venture may be impacted.
Political
Kazakhstan declared itself independent in 1991 after the dissolution of the Soviet Union. Our investment in JV Inkai is subject to the greater risks associated with doing business in developing countries, which have significant potential for social, economic, political, legal and fiscal instability. Kazakhstan laws and regulations, including those affecting the regulation of mining, are complex and still developing and their application can be difficult to predict. The other owner of JV Inkai is Kazatomprom, an entity majority owned by the government of Kazakhstan. We have entered into agreements with JV Inkai and Kazatomprom intended to mitigate political risk. This risk includes the imposition of governmental laws or policies that could restrict or hinder JV Inkai paying us dividends, or selling us our share of JV Inkai production, or that impose discriminatory taxes or currency controls on these transactions. The restructuring of JV Inkai, which took effect January 1, 2018, was undertaken with the objective to better align the interests of Cameco and Kazatomprom and includes a governance framework that provides for protection for us as a minority owner of JV Inkai.
For more details on this risk, please see our most recent annual information form under the heading political risks.
88 CAMECO CORPORATION
Uranium – Tier-two operations
Rabbit Lake
Located in Saskatchewan, Canada, our 100% owned Rabbit Lake operation opened in 1975, and has the second largest uranium mill in the world. Due to market conditions, we suspended production at Rabbit Lake during the second quarter of 2016.
| Location | Saskatchewan, Canada | |||
| Ownership | 100% | |||
| End product | Uranium concentrates | |||
| ISO certification | ISO 14001 certified | |||
| Mine type | Underground | |||
| Estimated reserves | — | |||
| Estimated resources | 38.6 million pounds (indicated), average grade U3O8: 0.95% | |||
| 33.7 million pounds (inferred), average grade U3O8: 0.62% | ||||
| Mining methods | Vertical blasthole stoping | |||
| Licensed capacity | Mill: maximum 16.9 million pounds per year; currently 11 million | |||
| Licence term | Through October 2038 | |||
| Total production: 1975 to 2024 | 202.2 million pounds | |||
| 2024 production | 0 million pounds | |||
| 2025 production outlook | 0 million pounds | |||
| Estimated decommissioning cost | $294.8 million | |||
OPERATING STATUS
The site remained in a safe state of care and maintenance throughout 2024.
While in standby, we continue to evaluate our options in order to minimize care and maintenance costs. We expect standby operating costs in care and maintenance to range between $43 million and $47 million in 2025, an increase from 2024 due to project work related to containment improvements.
FUTURE PRODUCTION
We do not expect any production from Rabbit Lake in 2025.
MANAGING OUR RISKS
We manage the risks listed on pages 74 to 75.
MANAGEMENT’S DISCUSSION AND ANALYSIS 89
US ISR Operations
Located in Nebraska and Wyoming in the US, the Crow Butte and Smith Ranch-Highland (including the North Butte satellite) operations began production in 1991 and 1975, respectively. Each operation has its own processing facility. Due to market conditions, we curtailed production and deferred all wellfield development at these operations during the second quarter of 2016.
| Ownership | 100% | |||
| End product | Uranium concentrates | |||
| ISO certification | ISO 14001 certified | |||
| Estimated reserves | Smith Ranch-Highland: | — | ||
| North Butte-Brown Ranch: | — | |||
| Crow Butte: | — | |||
| Estimated resources | Smith Ranch-Highland: | 24.9 million pounds (measured and indicated), average grade U3O8: 0.06% | ||
| 7.7 million pounds (inferred), average grade U3O8: 0.05% | ||||
| North Butte-Brown Ranch: | 9.4 million pounds (measured and indicated), average grade U3O8: 0.07% | |||
| 0.4 million pounds (inferred), average grade U3O8: 0.06% | ||||
| Crow Butte: | 13.9 million pounds (measured and indicated), average grade U3O8: 0.25% | |||
| 1.8 million pounds (inferred), average grade U3O8: 0.16% | ||||
| Mining methods | In situ recovery (ISR) | |||
| Licensed capacity | Smith Ranch-Highland:1 | Wellfields: 3 million pounds per year; processing plants: 5.5 million pounds per year | ||
| Crow Butte: | Processing plants and wellfields: 2 million pounds per year | |||
| Licence term | Smith Ranch-Highland: | Through September 2028 | ||
| Crow Butte: | Through October 2024 (in timely renewal) | |||
| Total production: 2002 to 2024 | 33.0 million pounds | |||
| 2024 production | 0 million pounds | |||
| 2025 production outlook | 0 million pounds | |||
| Estimated decommissioning cost | Smith Ranch-Highland: $248.6 million (US), including North Butte | |||
|
Crow Butte: $65.4 million (US) |
||||
| 1 | Including Highland mill |
PRODUCTION CURTAILMENT
As a result of our 2016 decision, commercial production at the US operations ceased in 2018. We expect ongoing cash and non-cash care and maintenance costs to range between $14 million (US) and $15 million (US) for 2025.
FUTURE PRODUCTION
We do not expect any production in 2025.
MANAGING OUR RISKS
In September 2024, the operating licence renewal for Crow Butte was submitted and timely renewal is now in process by the Nuclear Regulatory Commission.
We also manage the risks listed on pages 74 to 75.
90 CAMECO CORPORATION
Uranium – advanced projects
Our advanced projects are part of our project pipeline, and these resources are supportive of growth beyond our existing suite of tier-one and tier-two assets. We plan to advance these projects at a pace aligned with market opportunities.
Millennium
| Location | Saskatchewan, Canada | |||
| Ownership | 69.9% | |||
| End product | Uranium concentrates | |||
| Potential mine type | Underground | |||
| Estimated resources (our share) | 53.0 million pounds (indicated), average grade U3O8: 2.39% | |||
| 20.2 million pounds (inferred), average grade U3O8: 3.19% | ||||
BACKGROUND
The Millennium deposit was discovered in 2000 and was delineated through geophysical surveys and surface drilling work between 2000 and 2013.
Yeelirrie
| Location |
Western Australia | |||
| Ownership |
100% | |||
| End product |
Uranium concentrates | |||
| Potential mine type |
Open pit | |||
| Estimated resources |
128.1 million pounds (measured and indicated), average grade U3O8: 0.15% | |||
BACKGROUND
The Yeelirrie deposit was discovered in 1972 and is a near-surface calcrete-style deposit that is amenable to open pit mining techniques. It is one of Australia’s largest undeveloped uranium deposits.
Kintyre
| Location |
Western Australia | |||
| Ownership |
100% | |||
| End product |
Uranium concentrates | |||
| Potential mine type |
Open pit | |||
| Estimated resources |
53.5 million pounds (indicated), average grade U3O8: 0.62% | |||
| 6.0 million pounds (inferred), average grade U3O8: 0.53% | ||||
BACKGROUND
The Kintyre deposit was discovered in 1985 and is amenable to open pit mining techniques.
2024 PROJECT UPDATES
We believe that we have some of the best undeveloped uranium projects in the world. However, our current focus is on producing from our tier-one uranium assets at a pace aligned with our contract portfolio and market opportunities.
PLANNING FOR THE FUTURE
2025 Planned activity
No work is planned at Millennium, Yeelirrie or Kintyre in 2025.
MANAGEMENT’S DISCUSSION AND ANALYSIS 91
MANAGING THE RISKS
Project approval
A project description for Millennium was submitted to the Saskatchewan Ministry of Environment and the CNSC in 2009, along with a draft Environmental Impact Statement (EIS) in 2012. The EIS received Ministerial Approval from Saskatchewan in December 2013. In May 2014, Cameco notified the CNSC that it did wish to proceed with the CNSC’s licensing process due to economic conditions. The CNSC’s Environmental Assessment and licensing process remains on hold and can be reopened at Cameco’s request. The provincial approval remains valid, as it was renewed in 2018 and again in 2023.
The approval for the Yeelirrie project, received from the prior state government, required substantial commencement of the project by January 2022, and this was not achieved. The current government declined to grant us an extension to achieve it. In the future, we can again apply for an extension of time to achieve substantial commencement of the project. If granted by a future government we could commence the Yeelirrie project, provided we have all other required regulatory approvals. Approval for the Yeelirrie project at the federal level was granted in 2019 and extends until 2043. Approval of the Kintyre project at the federal level was granted in 2015 and extends until 2045.
The approval received for Kintyre from the prior state government required substantial commencement of the project by March 2020, being within five years of the grant of the approval, and this was not achieved. The current government declined to grant us an extension to achieve it. In the future, we can apply for an extension of time to achieve substantial commencement of the project. If granted by a future government we could commence the Kintyre project, provided we have all other required regulatory approvals.
For all of our advanced projects, we manage the risks listed on pages 74 to 75.
92 CAMECO CORPORATION
Uranium – exploration
Our exploration program is focused on replacing mineral reserves as they are depleted by our production, which is key to sustaining our business, meeting our commitments, and ensuring long-term growth. Our exploration activity is adjusted annually in line with market signals and at a pace aligned with Cameco’s mining plans and marketing requirements. In recent years, as we began to bring back our tier-one production, we also increased exploration spending, all in response to the positive momentum in the nuclear fuel market, which has provided a clear signal that more uranium production will be required in the next decade, setting the stage for a renewed exploration cycle.
Our position as one of the world’s largest uranium producers and our continued growth across the nuclear fuel cycle has been driven by decades of experience and our history of exploration, discovery and mining successes. Our land position totals 754,000 hectares (1.8 million acres) that cover exploration and development prospects in Canada, Australia, Kazakhstan and the US that are among the best in the world. In northern Saskatchewan alone, we have direct interests in 660,000 hectares (1.6 million acres) that cover many of the most prospective areas of the Athabasca Basin.
In northern Saskatchewan, our well-established infrastructure includes licensed and fully permitted uranium mills and mines in the eastern Athabasca basin, supported by a network of roads, airstrips and electricity supply. This infrastructure provides us with an advantage that not only underpins the potential development of our advanced exploration projects, but also supports our ongoing work to both delineate existing prospects and deposits, and to identify undiscovered uranium potential. Additionally, our decades of work to establish a positive corporate reputation by prioritizing our relationships with northern Saskatchewan Indigenous communities, confirms our long-term commitment to continually engage and provide ongoing benefits to the people that call the region home.
The well-known uranium endowment of the Athabasca Basin, where we are involved in 45 projects (including partner-operated joint ventures, previously 39 projects in 2023), is the result of its unique geology, creating a remarkable mining jurisdiction that hosts the highest uranium grades and some of the largest uranium deposits in the world. On our projects, numerous uranium occurrences have been identified, along with several prospects and undeveloped deposits of variable grades and sizes which have progressed through multiple stages of evaluation. Depending on the potential deposit size, ore and ground quality, evolving mining technologies and the uranium market environment, some of these prospects are expected to become viable, economic deposits in a uranium market and price environment that supports new primary production and provides an adequate risk-adjusted return.
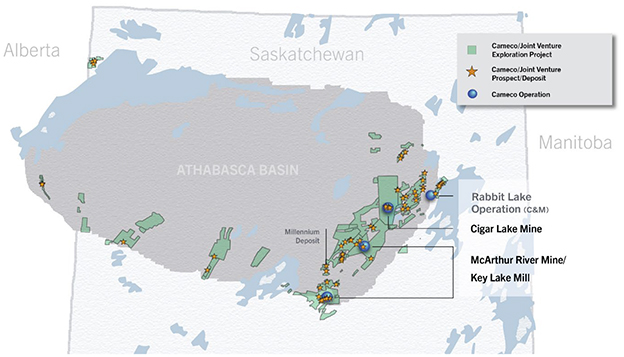
MANAGEMENT’S DISCUSSION AND ANALYSIS 93
The combination of our large land position and proven expertise in discovering and developing world class uranium deposits provides the foundation for future mill-supported exploration projects, ranging from early to advanced stages of greenfield exploration and for brownfield opportunities to extend the lives of our existing operations.
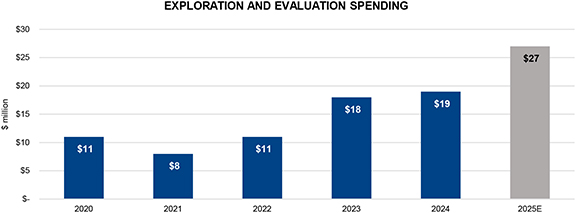
2024 UPDATE
Brownfields and advanced exploration
Brownfields and advanced exploration activities include exploration near our existing operations and expenditures for maintaining advanced projects and delineation drilling where uranium mineralization is being defined. In 2024, we spent about $4 million in Saskatchewan, $2 million in Australia and $1 million in the US on brownfield and advanced exploration projects. The spending in Saskatchewan was primarily focused on advanced exploration on the Dawn Lake project.
On the LaRocque Lake corridor of the Dawn Lake project located approximately 45 km northwest of the Rabbit Lake operation, our 2024 exploration drilling continued to expand the footprint of known uranium mineralization with additional high-grade mineralized intercepts. Although the deposit remains at an early stage of exploration, the results to date are comparable to those of other mines and known deposits in the Athabasca Basin.
Regional exploration
Regional exploration is defined as projects that are considered greenfields. In 2024, we spent over $8 million on regional exploration programs that are comprised of target generation geophysical surveys and diamond drilling primarily in northern Saskatchewan.
PLANNING FOR THE FUTURE
We plan to continue to focus on our core projects in Saskatchewan under our long-term exploration framework. Our leadership position and industry expertise in both exploration and corporate social responsibility makes us a partner of choice. For properties and projects that meet our investment criteria, we may partner with other companies through strategic alliances, equity holdings and traditional joint venture arrangements to optimize our exploration activity and spending.
Brownfields and Advanced Exploration
In 2025, we plan to spend about $9 million on brownfields and advanced exploration, primarily to refine the footprint of the mineralization identified on the LaRocque Lake corridor of the Dawn Lake project, and to undertake a brownfield exploration program at McArthur River.
Regional Exploration
We plan to spend approximately $12 million on diamond drilling and target generation geophysical surveys on our core regional projects in Saskatchewan, in 2025.
94 CAMECO CORPORATION
Fuel services
Refining, conversion and fuel manufacturing
We have about 20% of world UF6 primary conversion capacity and are a supplier of natural UO2. Our focus is on cost-competitiveness and operational efficiency, as well as increasing our production of UF6 in line with our contract portfolio and market opportunities.
Our fuel services segment is strategically important because it helps support the growth of the uranium segment. Offering a range of products and services to customers helps us broaden our business relationships and meet customer needs.
Blind River Refinery
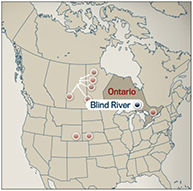
|
Licensed Capacity
24.0M kgU as UO3
Licence renewal in
February 2032 |
Blind River is the world’s largest commercial uranium refinery, refining uranium concentrates from mines around the world into UO3.
| Location | Ontario, Canada | |||
| Ownership | 100% | |||
| End product | UO3 | |||
| ISO certification | ISO 14001 certified | |||
| Licensed capacity | 18.0 million kgU as UO3 per year, approved to 24.0 million subject to the completion of certain equipment upgrades (advancement depends on market conditions) | |||
| Licence term | Through February 2032 | |||
| Estimated decommissioning cost | $58 million | |||
MANAGEMENT’S DISCUSSION AND ANALYSIS 95
Port Hope Conversion Services

|
Licensed Capacity
12.5M kgU as UF6
2.8M kgU as UO2
Licence renewal in
February 2027 |
Port Hope is the only uranium conversion facility in Canada and a supplier of UO2 for Canadian-made CANDU heavy-water reactors.
| Location | Ontario, Canada | |
| Ownership | 100% | |
| End product | UF6, UO2 | |
| ISO certification | ISO 14001 certified | |
| Licensed capacity | 12.5 million kgU as UF6 per year | |
| 2.8 million kgU as UO2 per year | ||
| Licence term | Through February 2027 | |
| Estimated decommissioning cost | $138.2 million | |
Cameco Fuel Manufacturing Inc. (CFM)
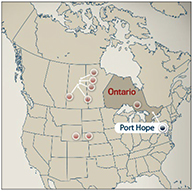
|
Licensed Capacity
1.65M kgU as UO2 fuel pellets
Licence renewal in
February 2043 |
CFM produces fuel bundles and reactor components for CANDU heavy-water reactors.
| Location | Ontario, Canada | |
| Ownership | 100% | |
| End product | CANDU fuel bundles and components | |
| ISO certification | ISO 9001 certified, ISO 14001 certified | |
| Licensed capacity | 1.65 million kgU as UO2 fuel pellets | |
| Licence term | Through February 2043 | |
| Estimated decommissioning cost | $10.8 million | |
96 CAMECO CORPORATION
2024 UPDATE
Production
Fuel services produced 13.5 million kgU in 2024, similar to 2023. This included UF6 production of 10,781 tonnes, lower than our expectation of 11,000 to 11,500 tonnes of UF6 due to temporary operational issues in one of the processing circuits at the UF6 plant during the first half of the year.
Port Hope conversion facility cleanup and modernization (Vision in Motion)
Vision in Motion is a unique opportunity that demonstrates our continued commitment to a clean environment. It has been made possible by the opening of a long-term waste management facility by the Government of Canada’s Port Hope Area Initiative project. There is a limited opportunity during the life of this project to engage in clean-up and renewal activities that address legacy waste at the Port Hope Conversion facility inherited from historic operations. Progress continued over the past year with the removal of old buildings and structures on site, and the project will continue to be active in the year ahead, including the construction of a new warehouse building.
PLANNING FOR THE FUTURE
Production
We plan to produce between 13 million and 14 million kgU in our fuel services segment in 2025.
MANAGING OUR RISKS
We take significant steps and precautions to reduce risk. However, there is no guarantee that our efforts to mitigate risk will be successful.
In addition to the risks listed on pages 74 to 75, in 2024 we are focused on the management of the following risks:
Production plans
Inflation, the availability of personnel with the necessary skills and experience, aging infrastructure, and the potential impact of supply chain challenges on the availability of materials and reagents carry the risk of not achieving our production plans, production delays, and increased costs in 2025 and future years.
Labour relations
The collective agreement with unionized employees at our Port Hope conversion facility expires in June 2025. There is a risk to the production plan if we are unable to reach an agreement and there is a labour dispute.
MANAGEMENT’S DISCUSSION AND ANALYSIS 97
Westinghouse Electric Company
Westinghouse is a nuclear reactor technology original equipment manufacturer (OEM) and a leading provider of highly technical aftermarket products and services to commercial nuclear power utilities and government agencies globally. Westinghouse’s history in the energy industry stretches back over a century, during which time the company became a pioneer in nuclear energy.
Like Cameco, Westinghouse enables carbon-free, baseload and dispatchable energy that is needed to strengthen energy security, reinforce national security, and support the energy transition, all of which, we believe, make the company well-positioned for long-term growth.
| Corporate headquarters | Cranberry Township, Pennsylvania (United States)
|
|
| Locations | Three fuel fabrication facilities (US, Sweden, United Kingdom), approximately 90 facilities, engineering centers, and workshops, with over 10,000 employees in more than 21 countries, including major nuclear component fabrication facilities in the US and Italy.
|
|
| Ownership | 49% - equity-accounted
|
|
| Business activities | Core business: Designs and manufactures nuclear fuel supplies and intermediate products and provides fuel cycle services for light water reactors. Westinghouse is the OEM or a technology provider to about 50% of the global nuclear reactor fleet, for which it provides outage and maintenance services, engineering support, instrumentation and controls equipment, plant modifications, and components and parts for the installed base of nuclear reactors and new reactors as they are brought on-line.
|
|
| New build: Designs, develops and procures equipment for new AP1000 nuclear reactors, with licensing agreements that allow Westinghouse to benefit from the construction of other reactor designs that incorporate AP1000 technology. This business line also includes the design of new small and micro reactors
|
||
| Certifications | ISO 14001
|
|
| ISO 45001
|
||
| Estimated decommissioning cost | $299.9 million (US) |
BACKGROUND
On November 7, 2023, we announced the closing of the acquisition of Westinghouse in partnership with Brookfield. Our share of the purchase price was $2.1 billion (US). Brookfield beneficially owns a 51% interest in Westinghouse, and we beneficially own 49%. Bringing together Cameco’s expertise in the nuclear industry with Brookfield’s expertise in clean energy, positions nuclear power at the heart of the energy transition and creates a powerful platform for strategic growth across the nuclear sector.
The acquisition of Westinghouse was completed in the form of a limited partnership with Brookfield. The board of directors governing the limited partnership consists of six directors, three appointed by Cameco and three appointed by Brookfield. Decision-making by the board corresponds to percentage ownership interests in the limited partnership (51% Brookfield and 49% Cameco). However, decisions with respect to certain reserved matters under the partnership agreement, such as the approval of the annual budget and business plan, require the presence and support of both Cameco and Brookfield appointees to the board as long as certain ownership thresholds are met.
As of November 7, 2023, we receive the economic benefit of our ownership in Westinghouse. We account for our proportionate interest in Westinghouse on an equity basis.
We expect this strategic acquisition will be transformative and accretive to Cameco and like Cameco, Westinghouse has nuclear assets that are strategic, proven, licensed and permitted, and that are in geopolitically attractive jurisdictions. We expect these assets, like ours, will participate in the growing demand profile for nuclear energy.
98 CAMECO CORPORATION
BUSINESS ACTIVITIES
Westinghouse’s main business activities span two key stages of the life cycle of a nuclear reactor:
| • | Core business, including the operations and maintenance of the installed base, and |
| • | New build, which designs, develops and procures equipment for new nuclear reactors. |
Westinghouse’s total 2024 revenue was $4.3 billion (US), broken down by region as follows:
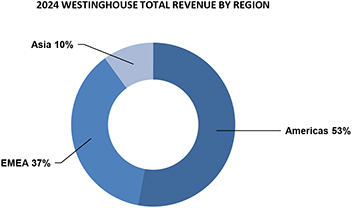
Core business
In 2024, Westinghouse’s core business covered two main business units: Operating Plant Services (OPS) and Nuclear Fuel. Effective January 1, 2025, the OPS business unit will be transformed into two new global business units: Long-Term Operations and Outage & Maintenance Services. Going forward, Westinghouse’s core business will therefore encompass Nuclear Fuel, Outage & Maintenance Services and Long-term Operations.
Core business: Operating Plant Services (OPS)
The OPS business unit served the installed global base of reactors across two business lines:
| • | Outage and maintenance services generates revenue entirely from providing refueling, maintenance, inspection and repair services to the existing global installed reactor base and it is not reliant on new plant projects. These services are provided under long-term customer relationships and demand is driven by safety-related maintenance, regulatory compliance, and asset performance. |
| • | Long term operations offer solutions to enhance the reliability, safety, lifespan, and cost-effectiveness of customer operations and supplies replacement parts and products as well as operational and technical support. The following services are provided within this business line: |
| • | Engineering services generates stable revenue by engineering bespoke replacement components or equipment, and delivering engineering studies to validate that changes to plant operation are within plant design safety margins, and through studies designed to establish the best course of action to improve plant performance (e.g. do nothing, repair, replace) for emergent issues. Demand for these services is driven by the long-term relationships Westinghouse has built with its customers through prompt response to emergent customer business needs, and through providing services to recently completed nuclear units. |
| • | Instrumentation and controls generates revenue by providing advanced digital systems that include core safety and non-safety instrumentation, automation, and control systems through product development, design, assembly and testing of advanced products. This business line also provides simulation services for multiple nuclear reactor technologies. |
MANAGEMENT’S DISCUSSION AND ANALYSIS 99
| • | Parts generates revenue by providing specialized manufacturing and commercial dedication capabilities to support Westinghouse’s ability to make tailored parts that are challenging to replicate. Westinghouse can offer qualified replacement parts (e.g., control rod drives) and products (safety and non-safety), as well as operational and technical support. Demand is largely driven by the need for consumables used during and between outages to maintain safe and efficient operation of nuclear power plants. |
The 2024 revenue for OPS was approximately $2.5 billion (US), representing about 58% of Westinghouse’s total 2024 revenue. Westinghouse’s 2024 revenue by region for OPS was as follows:
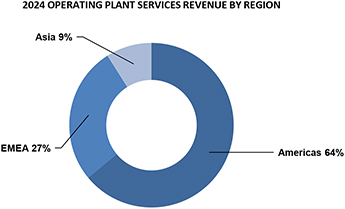
Core business: Nuclear Fuel
The Nuclear Fuel business unit designs and fabricates highly engineered, bespoke fuel assemblies that maximize power in a specific reactor. Westinghouse primarily supplies fuel assemblies for pressurized water reactors, although it has made advancements and can also provide certified fuel assemblies for a variety of reactor technologies, including boiling water reactors, advanced gas-cooled reactors and water-water energetic reactors (VVER).
The nuclear fuel business unit benefits from long-term customer relationships and has predictable demand for its products and services. To allow consistent power generation, these reactors require an outage to refuel every 18 to 24 months during which one-third of the fuel assemblies are replaced.
The 2024 revenue from the nuclear fuel business unit was approximately $1.5 billion (US), representing approximately 36% of Westinghouse’s total 2024 revenue. Westinghouse’s 2024 revenue by region for nuclear fuel was as follows:
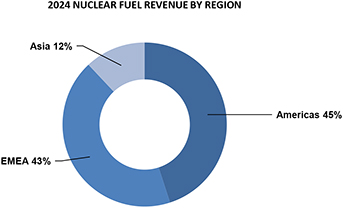
100 CAMECO CORPORATION
Core business: Planning for the future
The importance of nuclear power in providing carbon-free, secure and affordable baseload power as an essential part of the electricity grid in many countries, is creating opportunities to add significant long-term value for Westinghouse. The announcements of reactor life extensions and reactor restarts are creating new and extended opportunities for both the OPS and Nuclear Fuel business units to service, maintain and fuel existing reactors. Expanded fabrication services for different types of reactor technology, including those for which Westinghouse is not the OEM, as well as the introduction of fuel types that can reduce outage frequency and optimize fuel burnup (LEU+ fuels), creates opportunities in the core business as well.
Of note, Westinghouse’s role in the design, development, engineering and procurement of equipment for new reactors, can create further opportunities for the core business through future reactor services and fuel supply contracts once a reactor begins commercial operation.
Springfields Fuels Limited
Westinghouse’s portfolio of global operations includes Springfields Fuels Limited (SFL), in the United Kingdom. Unique to SFL is a licence that is not limited to low-enriched uranium; the site can handle any U-235 enrichment level across a range of facilities that currently include capabilities related to fuel fabrication and nuclear materials management.
The potential for a conversion plant is among the most attractive emerging opportunities for SFL. Since the 1960s, the site has hosted several conversion lines, most recently operating under a toll-conversion agreement with Cameco, which ended in 2014. The conclusion of that contract and weak market conditions at the time resulted in the closure and partial decommissioning of the Line 4 conversion facility, which had been in operation since 1993. However, the current geopolitical environment has resulted in a potential opportunity for additional western-based conversion capacity and has brought SFL’s historic conversion capabilities and unique licence into focus. Westinghouse is currently evaluating the cost, timeline and infrastructure required to bring back conversion capacity at SFL. The evaluation must also carefully consider other potential opportunities available to the site, including the optimization of shared infrastructure that could be required to expand to other nuclear fuel products, as well as potential external funding options in light of the site’s unique licence.
Similar to any segment of the nuclear fuel cycle, the decision to add conversion capacity at SFL must be underpinned by a portfolio of long-term contracts to support any investment.
New Build
The importance of nuclear power in providing carbon-free, secure and affordable baseload power as an essential part of the electricity grid in many countries, is creating opportunities for the New Build business unit to add significant long-term value for Westinghouse. In addition to its role in the design, development, engineering and procurement of equipment for new reactors (it does not provide construction services or assume any construction risk), once a new reactor begins commercial operation, further opportunities can be added to the OPS and Nuclear Fuel business through future reactor services and fuel supply contracts. Its technology and experience provide a competitive advantage as the engineering and procurement aspects of new build programs are initiated.
The 2024 revenue from the New Build business unit was approximately $300 million (US) representing approximately 6% of Westinghouse’s total 2024 revenue. Westinghouse’s 2024 revenue by region for the new build business was as follows:
MANAGEMENT’S DISCUSSION AND ANALYSIS 101
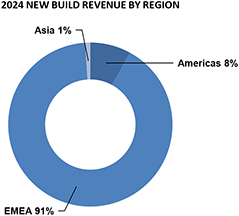
New Build: Contracting framework
Following an announcement of a successful bid, there are a number of contracts that must be signed before work commences and revenue is realized. Once contracts are signed and work begins, new build projects are expected to generate multi-year revenue streams and EBITDA for Westinghouse.
Front end engineering and design (FEED) contracts often precede engineering services contracts, which are required before work can begin. The chart below is an illustrative framework and the assumptions used for the expected timing of revenue flows and profitability as these large, one-time decisions by utilities to construct new nuclear power plants using Westinghouse’s proven AP1000 reactor design are made.
Assumptions and estimates:
| • | Cost to construct new AP1000 reactor in the US based on an MIT (Massachusetts Institute of Technology) study: $6 billion to $8 billion (US), although it can vary significantly depending on in-country labour and construction productivity rates. There is a measured and noticeable scale effect where multiple reactors have been built – for example, in China, where four AP1000 reactors are in operation and twelve more are under construction, compared to the US, where two are in operation and there are currently none under construction. |
| • | Engineering and procurement work: 25% to 40% of total plant cost, depending on the scope of the project – excluding China, where Westinghouse’s scope is typically less than 10% of the total project cost, and any benefits accruing from the settlement agreement with KEPCO and KHNP. |
| • | EBITDA margin for new build activity is expected to be aligned with the overall core business, although it can vary between 10% and 20%. |
102 CAMECO CORPORATION
Illustrative framework of Westinghouse revenue flow for reactor new build project
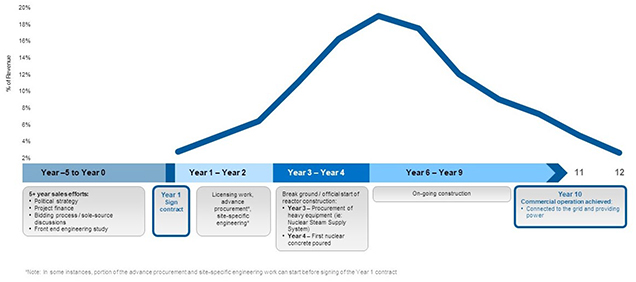
New Build: Planning for the future
In addition to the AP1000 reactors already deployed (US and China), Poland, Bulgaria and Ukraine have each chosen the AP1000 reactor for their new nuclear energy programs and signed contracts (FEED-1 or engineering services contracts), with several other nations evaluating technology options that include the AP1000:
| • | Poland does not currently have any nuclear capacity and is planning to build up to three reactors at the Lubiatowo-Kopalino nuclear power plant, and three more at a second site (to be determined). Westinghouse is working under engineering services contracts for the first three reactors and the Polish government continues to work towards a potential Final Investment Decision (FID). |
| • | Bulgaria has produced nuclear power since the 1970’s using Soviet-era water-water energetic (VVER) reactor technology at the Kozloduy nuclear power plant. The site hosts two operating VVER reactors and four retired VVER rectors that are being decommissioned. The country is planning to build two AP1000s at the Kozloduy facility and Westinghouse is working under a FEED-1 contract on the first of the two, and the Bulgarian government continues to work towards an FID. |
| • | Ukraine has a long history with nuclear power and currently operates 15 VVER reactors across four nuclear plants, as well as having four reactors that have been retired and are in different stages of decommissioning. Two additional VVER reactors were under construction until 1990 when work was suspended. The country is now planning/proposing to build up to nine AP1000 reactors across multiple new and existing plant sites, with Westinghouse working under a FEED-1 contract on the first of two AP1000 units planned at the Khmelnitski nuclear power plant. The timing of an FID for planned and proposed reactors in Ukraine is unknown. |
Westinghouse was also recently awarded a contract to evaluate the deployment of an AP1000 reactor in Slovenia.
Technology export
On January 16, 2025, Westinghouse announced it had resolved its technology and export dispute with KEPCO and KHNP, which resolves the dispute and establishes a framework for additional deployments outside of South Korea, to the mutual and material benefit of Westinghouse, KEPCO and KHNP.
Business cycles
Westinghouse’s core business is characterized by recurring and predictable revenue and cash flow streams, the majority of which are secured in advance under long-term contracts with durations that can range from three to more than ten years, depending on the product or service being provided. The 18-to 24-month outage cycle for most reactors drives some variability in annual cash flow.
MANAGEMENT’S DISCUSSION AND ANALYSIS 103
Cash distributions
Annually, we and Brookfield (the partners) approve a budget and business plan, which outline Westinghouse’s financial projections and capital allocation priorities. The determination of whether to make cash distributions to us and Brookfield will be based on the approved budgeted expenditures and capital allocation priorities, including growth investment opportunities, as well as available cash balances. However, the timing of cash distributions is expected to be aligned with the timing of Westinghouse’s cash flows.
A distribution of $100 million (US) from Westinghouse was paid in February 2025, of which we received $49 million (US) representing our share of the distribution. This is the first distribution since the acquisition closed.
FUTURE PROSPECTS
Amid the ongoing demand growth and global energy security concerns, we expect there will be new opportunities for Westinghouse to compete for and win new business. Westinghouse’s reputation as a global leader in the nuclear industry and its position as the only fully European supplier for certified VVER fuel assemblies are expected to benefit its Core business as Central and Eastern European countries seek to develop a reliable fuel supply chain independent of Russia.
In term of new construction, beyond the countries currently advancing plans to invest in nuclear energy and approaching an FID, several other countries are considering or reconsidering the deployment of new nuclear plants. Sweden, Finland, Slovenia, Netherlands, Slovakia, UK, US and Canada are all considering nuclear energy and each represents a potential opportunity for Westinghouse’s AP1000 technology.
In addition to its AP1000 reactor design, Westinghouse has submitted its pre-application Regulatory Engagement Plan with the US Nuclear Regulatory Commission for the development of its 300 Mw AP300 small modular reactor, which is based on the proven and licensed AP1000 reactor design, while its 5 Mw eVinci microreactor design was awarded additional US Department of Energy funding for the detailed engineering and experiment planning (DEEP) process for a test reactor at Idaho National Lab. The AP300 small modular reactor and the eVinci microreactor are expected to offer the same carbon-free baseload benefits as larger nuclear reactor technologies, but are tailored for specific applications, including industrial, remote mining, off-grid communities, defense facilities and critical infrastructure. As with the AP1000 reactor, they are expected to have applications beyond electricity generation, including district and process heat, desalination and hydrogen production. We remain optimistic about the future competitiveness of these technologies and their potential to make a meaningful contribution to Westinghouse’s long-term financial performance. However, both are currently in the development phase with a market and business case for these new products continuing to evolve.
Caution about forward-looking information relating to Westinghouse
This discussion of our expectations relating to the future prospects of Westinghouse is subject to the assumptions and risks that are discussed under the heading Caution about forward-looking information beginning on page 2 and may be subject to the risks listed under the heading Managing the risks, starting on page 74, which include:
Assumptions
| • | the market conditions and other factors upon which we have based Westinghouse’s future plans and forecasts |
| • | Westinghouse’s ability to mitigate adverse consequences of delays in production and construction, and the success of its plans and strategies |
| • | the absence of new and adverse government regulations, policies or decisions, and that Westinghouse will comply with nuclear licence and quality assurance requirements at its facilities |
| • | that there will not be any significant adverse consequences to Westinghouse’s business resulting from business disruptions, including those relating to supply disruptions, economic or political uncertainty and volatility, labour relation issues, and operating risks |
Material risks that could cause actual results to differ materially
| • | the risk that Westinghouse may not be able to meet sales commitments for any reason |
| • | the risk that Westinghouse may not achieve the expected growth or success in its business |
| • | the risk to Westinghouse’s business associated with potential production disruptions, including those related to global supply chain disruptions, global economic uncertainty, political volatility, labour relations issues, and operating risks |
| • | the risk that Westinghouse’s strategies may change, be unsuccessful, or have unanticipated consequences |
| • | the risk that Westinghouse may fail to comply with nuclear licence and quality assurance requirements at its facilities |
| • | the risk that Westinghouse’s new technologies may not work as anticipated |
104 CAMECO CORPORATION
We also recommend that you review our most recent AIF, which discusses other material risks that could have an impact on Westinghouse’s performance. Actual outcomes may vary significantly.
MANAGEMENT’S DISCUSSION AND ANALYSIS 105
Other Nuclear Fuel Cycle Investments
Global Laser Enrichment
Global Laser Enrichment LLC (GLE) is the exclusive worldwide licensee of the proprietary Separation of Isotopes by Laser Excitation (SILEX) laser uranium enrichment technology (a third-generation enrichment technology). Following the restructure of GLE in early 2021, Cameco is the commercial lead for the GLE project with a 49% interest and an option to attain a majority interest of 75%. Silex Systems Ltd. (Silex Systems) is the licensor of the SILEX technology and is the technology lead for the project, currently holding the remaining 51% interest in GLE.
Subject to completion of the technology demonstration program and its progression through to commercialization, GLE has the potential to offer a variety of advantages to the global nuclear energy sector, including:
| • | re-enriching depleted uranium tails left over as a by-product of first-generation gaseous diffusion enrichment operations, repurposing the legacy material into a commercial source of uranium and conversion products to fuel nuclear reactors, and aiding in the responsible clean-up of legacy tails inventories as per GLE’s agreement with the US Department of Energy (DOE) |
| • | producing commercial low-enriched uranium (LEU) to fuel the world’s existing and future fleet of large-scale light-water reactors (as well as for SMRs that require LEU-based fuel, if a commercial market develops) with greater efficiency and flexibility than current enrichment technologies |
| • | producing high-assay low-enriched uranium (HALEU) to serve the SMR and advanced reactor designs that, if commercially deployed, would require the development of a HALEU-based fuel cycle. |
Our view is that re-enriching US Government inventories of depleted uranium tails into a commercial source of uranium and conversion is GLE’s lowest-risk path to the market. This opportunity is underpinned by an agreement between GLE and the DOE, which gives GLE access to DOE tails and is expected to help address the growing supply gap for Western-origin nuclear fuel supplies and services. However, expansion of a potential tails re-enrichment facility to enable GLE to produce LEU or HALEU would require significant, additional capital expenditure and market support.
GLE continues to focus its efforts on technology demonstration and aims to commence Technology Readiness Level 6 (TRL-6) testing in the first quarter of 2025. The successful demonstration of TRL-6, the sixth step of a nine-step model under the DOE’s Technology Readiness Assessment Guide to assess the technical maturity, will include the completion of integrated testing and test results validation by way of a report prepared by an independent third-party. Successful demonstration of TRL-6 is expected to confirm reliable, full system performance under relevant conditions (pilot-scale demonstration), representing a major step in a technology’s demonstrated readiness. Pending the commencement of TRL-6 enrichment testing in the first quarter of 2025, we anticipate GLE could successfully complete the TRL-6 demonstration, including receipt of the third-party validation report, by the end of Q3 2025, which supports a commercial online date for a tails re-enrichment facility in 2030.
GLE’s 2025 operational budget will remain materially unchanged from its 2024 budget in order to prioritize the demonstration of TRL-6. GLE is continuing work to prepare and submit a US Nuclear Regulatory Commission licence application and anticipates receipt of the third full-scale laser system module from Silex Systems in 2025. The third full-scale laser system represents an iterative design and will be used to better understand the operability and manufacturability of specific components as part of GLE’s technology maturation program.
We expect that GLE’s path to commercialization will depend on several factors, including but not limited to, the successful progression and completion of GLE’s technology demonstration and maturation program, a clear commercial use case for its technology, supportive market fundamentals, future Russian fuel imports to the US, the ability to secure substantial government support and funding (specifically, accelerated commercial pathways related to LEU and, potentially, HALEU, are reliant on government funding), and assured industry support by way of a long-term contract portfolio.
We remain supportive of and committed to the project and in potentially increasing our equity interest, but we have no plans to exercise our option to increase our ownership in GLE from 49% to 75% at this time.
MANAGING OUR RISKS
GLE is subject to the risks relating to the nuclear industry discussed under the heading Caution about forward-looking information beginning on page 2.
106 CAMECO CORPORATION
Mineral reserves and resources
Our mineral reserves and resources are the foundation of our company and fundamental to our success.
We have interests in a number of uranium properties. The tables in this section show the estimates of the proven and probable mineral reserves, and measured, indicated, and inferred mineral resources at those properties. However, only three of the properties listed in those tables are material uranium properties for us: McArthur River/Key Lake, Cigar Lake and Inkai. Mineral reserves and resources are all reported as of December 31, 2024.
We estimate and disclose mineral reserves and resources in five categories, using the definition standards adopted by the Canadian Institute of Mining, Metallurgy and Petroleum Council, and in accordance with National Instrument 43-101 – Standards of Disclosure for Mineral Projects (NI 43-101), developed by the Canadian Securities Administrators.
About mineral resources
Mineral resources do not have to demonstrate economic viability but have reasonable prospects for eventual economic extraction. They fall into three categories: measured, indicated and inferred. Our reported mineral resources are exclusive of mineral reserves.
| • | measured and indicated mineral resources can be estimated with sufficient confidence to allow the appropriate application of technical, economic, marketing, legal, and sustainability factors to support evaluation of the economic viability of the deposit |
| • | measured resources: we can confirm both geological and grade continuity to support detailed mine planning |
| • | indicated resources: we can reasonably assume geological and grade continuity to support mine planning |
| • | inferred mineral resources are estimated using limited geological evidence and sampling information. We do not have enough confidence to evaluate their economic viability in a meaningful way. You should not assume that all or any part of an inferred mineral resource will be upgraded to an indicated or measured mineral resource, but it is reasonably expected that the majority of inferred mineral resources could be upgraded to indicated mineral resources with continued exploration. |
Our share of uranium in the following mineral resource tables is based on our respective ownership interests. Reported mineral resources have not demonstrated economic viability.
About mineral reserves
Mineral reserves are the economically mineable part of measured and/or indicated mineral resources demonstrated by at least a preliminary feasibility study. The reference point at which mineral reserves are defined is the point where the ore is delivered to the processing plant, except for ISR operations where the reference point is where the mineralization occurs under the existing or planned wellfield patterns. Mineral reserves fall into two categories:
| • | proven reserves: the economically mineable part of a measured resource for which at least a preliminary feasibility study demonstrates that, at the time of reporting, economic extraction could be reasonably justified with a high degree of confidence |
| • | probable reserves: the economically mineable part of a measured and/or indicated resource for which at least a preliminary feasibility study demonstrates that, at the time of reporting, economic extraction could be reasonably justified with a degree of confidence lower than that applying to proven reserves |
For properties where we are the operator, we use current geological models, an average uranium price of $63 (US) per pound U3O8, and current or projected operating costs and mine plans to report our mineral reserves, allowing for dilution and mining losses. We apply our standard data verification process for every estimate. For properties in which we have an interest but are not the operator, we will take reasonable steps to ensure that the reserve and resource estimates that we report are reliable.
Our share of uranium in the mineral reserves table below is based on our respective ownership interests.
MANAGEMENT’S DISCUSSION AND ANALYSIS 107
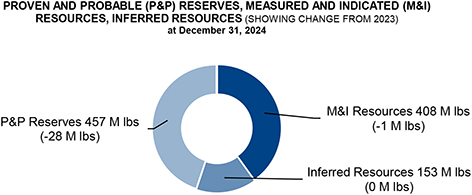
Changes this year
Our share of proven and probable mineral reserves decreased from 485 million pounds U3O8 at the end of 2023 to 457 million pounds at the end of 2024. The change was primarily the result of:
| • | production at Cigar Lake, Inkai and McArthur River, which removed 27 million pounds of proven and probable reserves from our mineral inventory. |
The remaining changes are attributable to other adjustments based on the mineral reserve estimate updates at Cigar Lake, McArthur River and Inkai.
Our share of measured and indicated mineral resources decreased from 409 million pounds U3O8 at the end of 2023 to 408 million pounds at the end of 2024. Our share of inferred mineral resources remained unchanged at 153 million pounds U3O8.
108 CAMECO CORPORATION
Qualified persons
The technical and scientific information discussed in this MD&A for our material properties (McArthur River/Key Lake, Cigar Lake and Inkai) was approved by the following individuals who are qualified persons for the purposes of NI 43-101:
MCARTHUR RIVER/KEY LAKE
| • | Greg Murdock, general manager, McArthur River, Cameco |
| • | Daley McIntyre, general manager, Key Lake, Cameco |
| • | Alain D. Renaud, principal resource geologist, technical services, Cameco |
| • | Biman Bharadwaj, principal metallurgist, technical services, Cameco |
CIGAR LAKE
| • | Kirk Lamont, general manager, Cigar Lake, Cameco |
| • | Scott Bishop, director, technical services, Cameco |
| • | Alain D. Renaud, principal resource geologist, technical services, Cameco |
| • | Biman Bharadwaj, principal metallurgist, technical services, Cameco |
INKAI
| • | Alain D. Renaud, principal resource geologist, technical services, Cameco |
| • | Scott Bishop, director, technical services, Cameco |
| • | Biman Bharadwaj, principal metallurgist, technical services, Cameco |
| • | Sergey Ivanov, deputy director general, technical services, Cameco Kazakhstan LLP |
Important information about mineral reserve and resource estimates
Although we have carefully prepared and verified the mineral reserve and resource figures in this document, the figures are estimates, based in part on forward-looking information.
Estimates are based on knowledge, mining experience, analysis of drilling results, the quality of available data and management’s best judgment. They are, however, imprecise by nature, may change over time, and include many variables and assumptions, including:
| • | geological interpretation |
| • | extraction plans |
| • | commodity prices and currency exchange rates |
| • | recovery rates |
| • | operating and capital costs |
There is no assurance that the indicated levels of uranium will be produced, and we may have to re-estimate our mineral reserves based on actual production experience. Changes in the price of uranium, production costs or recovery rates could make it unprofitable for us to operate or develop a particular site or sites for a period of time. See page 2 for information about forward-looking information.
Please see our mineral reserves and resources section of our most recent annual information form for the specific assumptions, parameters and methods used for McArthur River, Inkai and Cigar Lake mineral reserve and resource estimates.
Important information for US investors
We present information about mineralization, mineral reserves and resources as required by National Instrument 43-101 – Standards of Disclosure for Mineral Projects of the Canadian Securities Administrators (NI 43-101), in accordance with applicable Canadian securities laws. As a foreign private issuer filing reports with the US Securities and Exchange Commission (SEC) under the Multijurisdictional Disclosure System, we are not required to comply with the SEC’s disclosure requirements relating to mining properties. Investors in the United States should be aware that the disclosure requirements of NI 43-101 are different from those under applicable SEC rules, and the information that we present concerning mineralization, mineral reserves and resources may not be comparable to information made public by companies that comply with the SEC’s reporting and disclosure requirements for mining companies.
MANAGEMENT’S DISCUSSION AND ANALYSIS 109
Mineral reserves
As of December 31, 2024 (100% – only the shaded column shows our share)
PROVEN AND PROBABLE
(tonnes in thousands; pounds in millions)
| OUR | ||||||||||||||||||||||||||||||||||||||||||||||
| SHARE | ||||||||||||||||||||||||||||||||||||||||||||||
| PROVEN | PROBABLE | TOTAL MINERAL RESERVES | RESERVES | |||||||||||||||||||||||||||||||||||||||||||
| MINING | GRADE | CONTENT | GRADE | CONTENT | GRADE | CONTENT | CONTENT | METALLURGICAL | ||||||||||||||||||||||||||||||||||||||
| PROPERTY |
METHOD |
TONNES | % U3O8 | (LBS U3O8) | TONNES | % U3O8 | (LBS U3O8) | TONNES | % U3O8 | (LBS U3O8) | (LBS U3O8) | RECOVERY (%) | ||||||||||||||||||||||||||||||||||
| Cigar Lake |
UG | 322.0 | 16.68 | 118.4 | 229.4 | 14.73 | 74.5 | 551.4 | 15.87 | 192.9 | 105.2 | 98.7 | ||||||||||||||||||||||||||||||||||
| Key Lake |
OP | 61.1 | 0.52 | 0.7 | — | — | — | 61.1 | 0.52 | 0.7 | 0.6 | 95.0 | ||||||||||||||||||||||||||||||||||
| McArthur River |
UG | 1,970.3 | 6.81 | 295.8 | 520.4 | 5.56 | 63.7 | 2,490.7 | 6.55 | 359.6 | 251.0 | 99.2 | ||||||||||||||||||||||||||||||||||
| Inkai |
ISR | 277,232.9 | 0.03 | 201.6 | 90,850.8 | 0.02 | 49.4 | 368,083.7 | 0.03 | 251.0 | 100.4 | 85.0 | ||||||||||||||||||||||||||||||||||
|
|
|
|
|
|
|
|
|
|
|
|
|
|
|
|
|
|
|
|
|
|
|
|||||||||||||||||||||||||
| Total |
279,586.3 | — | 616.5 | 91,600.6 | — | 187.6 | 371,187.0 | — | 804.1 | 457.2 | — | |||||||||||||||||||||||||||||||||||
|
|
|
|
|
|
|
|
|
|
|
|
|
|
|
|
|
|
|
|
|
|
|
|||||||||||||||||||||||||
(UG – underground, OP – open pit, ISR – in situ recovery)
Note that the estimates in the above table:
| • | use a constant dollar average uranium price of approximately $63 (US) per pound U3O8 |
| • | are based on exchange rates of $1.00 US=$1.28 Cdn and $1.00 US=475 Kazakhstan Tenge |
| • | may not add due to rounding |
Our estimate of mineral reserves and mineral resources may be positively or negatively affected by the occurrence of one or more of the material risks discussed under the heading Caution about forward-looking information beginning on page 2, as well as certain property-specific risks. See Uranium – Tier-one operations starting on page 77.
Metallurgical recovery
We report mineral reserves as the quantity of contained ore supporting our mining plans and provide an estimate of the metallurgical recovery for each uranium property. The estimate of the amount of valuable product that can be physically recovered by the metallurgical extraction process is obtained by multiplying the quantity of contained metal (content) by the planned metallurgical recovery percentage. The content and our share of uranium in the table above are before accounting for estimated metallurgical recovery.
110 CAMECO CORPORATION
Mineral resources
As of December 31, 2024 (100% – only the shaded columns show our share)
MEASURED, INDICATED AND INFERRED
(tonnes in thousands; pounds in millions)
| OUR SHARE |
OUR SHARE |
|||||||||||||||||||||||||||||||||||||||||||||||
| MEASURED RESOURCES (M) | INDICATED RESOURCES (I) | INFERRED RESOURCES | ||||||||||||||||||||||||||||||||||||||||||||||
| TOTAL M+I | TOTAL M+I | INFERRED | ||||||||||||||||||||||||||||||||||||||||||||||
| GRADE | CONTENT | GRADE | CONTENT | CONTENT | CONTENT | GRADE | CONTENT | CONTENT | ||||||||||||||||||||||||||||||||||||||||
| PROPERTY |
TONNES | % U3O8 | (LBS U3O8) | TONNES | % U3O8 | (LBS U3O8) | (LBS U3O8) | (LBS U3O8) | TONNES | % U3O8 | (LBS U3O8) | (LBS U3O8) | ||||||||||||||||||||||||||||||||||||
| Cigar Lake |
75.5 | 4.88 | 8.1 | 141.3 | 4.95 | 15.4 | 23.6 | 12.9 | 163.4 | 5.55 | 20.0 | 10.9 | ||||||||||||||||||||||||||||||||||||
| Fox Lake |
— | — | — | — | — | — | — | — | 386.7 | 7.99 | 68.1 | 53.3 | ||||||||||||||||||||||||||||||||||||
| Kintyre |
— | — | — | 3,897.7 | 0.62 | 53.5 | 53.5 | 53.5 | 517.1 | 0.53 | 6.0 | 6.0 | ||||||||||||||||||||||||||||||||||||
| McArthur River |
71.8 | 2.28 | 3.6 | 60.3 | 2.31 | 3.1 | 6.7 | 4.7 | 36.4 | 2.95 | 2.4 | 1.7 | ||||||||||||||||||||||||||||||||||||
| Millennium |
— | — | — | 1,442.6 | 2.39 | 75.9 | 75.9 | 53.0 | 412.4 | 3.19 | 29.0 | 20.2 | ||||||||||||||||||||||||||||||||||||
| Rabbit Lake |
— | — | — | 1,836.5 | 0.95 | 38.6 | 38.6 | 38.6 | 2,460.9 | 0.62 | 33.7 | 33.7 | ||||||||||||||||||||||||||||||||||||
| Tamarack |
— | — | — | 183.8 | 4.42 | 17.9 | 17.9 | 10.3 | 45.6 | 1.02 | 1.0 | 0.6 | ||||||||||||||||||||||||||||||||||||
| Yeelirrie |
27,172.9 | 0.16 | 95.9 | 12,178.3 | 0.12 | 32.2 | 128.1 | 128.1 | — | — | — | — | ||||||||||||||||||||||||||||||||||||
| Crow Butte |
1,558.1 | 0.19 | 6.6 | 939.3 | 0.35 | 7.3 | 13.9 | 13.9 | 531.4 | 0.16 | 1.8 | 1.8 | ||||||||||||||||||||||||||||||||||||
| Gas Hills - Peach |
687.2 | 0.11 | 1.7 | 3,626.1 | 0.15 | 11.6 | 13.3 | 13.3 | 3,307.5 | 0.08 | 6.0 | 6.0 | ||||||||||||||||||||||||||||||||||||
| Inkai |
75,923.1 | 0.03 | 58.2 | 63,488.4 | 0.02 | 34.5 | 92.7 | 37.1 | 33,742.2 | 0.03 | 22.3 | 8.9 | ||||||||||||||||||||||||||||||||||||
| North Butte - Brown Ranch |
604.2 | 0.08 | 1.1 | 5,530.3 | 0.07 | 8.4 | 9.4 | 9.4 | 294.5 | 0.06 | 0.4 | 0.4 | ||||||||||||||||||||||||||||||||||||
| Ruby Ranch |
— | — | — | 2,215.3 | 0.08 | 4.1 | 4.1 | 4.1 | 56.2 | 0.13 | 0.2 | 0.2 | ||||||||||||||||||||||||||||||||||||
| Shirley Basin |
89.2 | 0.15 | 0.3 | 1,638.2 | 0.11 | 4.1 | 4.4 | 4.4 | 508.0 | 0.10 | 1.1 | 1.1 | ||||||||||||||||||||||||||||||||||||
| Smith Ranch - Highland |
3,703.5 | 0.10 | 7.9 | 14,372.3 | 0.05 | 17.0 | 24.9 | 24.9 | 6,861.0 | 0.05 | 7.7 | 7.7 | ||||||||||||||||||||||||||||||||||||
|
|
|
|
|
|
|
|
|
|
|
|
|
|
|
|
|
|
|
|
|
|
|
|
|
|||||||||||||||||||||||||
| Total |
109,885.6 | — | 183.4 | 111,550.5 | — | 323.6 | 507.0 | 408.2 | 49,323.5 | — | 199.8 | 152.6 | ||||||||||||||||||||||||||||||||||||
|
|
|
|
|
|
|
|
|
|
|
|
|
|
|
|
|
|
|
|
|
|
|
|
|
|||||||||||||||||||||||||
Note that mineral resources:
| • | do not include amounts that have been identified as mineral reserves |
| • | do not have demonstrated economic viability |
| • | totals may not add due to rounding |
MANAGEMENT’S DISCUSSION AND ANALYSIS 111
Additional information
Due to the nature of our business, we are required to make estimates that affect the amount of assets and liabilities, revenues and expenses, commitments and contingencies we report. We base our estimates on our experience, our best judgment, guidelines established by the Canadian Institute of Mining, Metallurgy and Petroleum and on assumptions we believe are reasonable.
We believe the following critical accounting estimates reflect the more significant judgments used in the preparation of our financial statements. These estimates affect all of our segments, unless otherwise noted.
Decommissioning and reclamation
In our uranium and fuel services segments, we are required to estimate the cost of decommissioning and reclamation for each operation, but we normally do not incur these costs until an asset is nearing the end of its useful life. Regulatory requirements and decommissioning methods could change during that time, making our actual costs different from our estimates. A significant change in these costs or in our mineral reserves could have a material impact on our net earnings and financial position. See note 16 to the financial statements.
Carrying value of assets
We depreciate property, plant and equipment primarily using the unit-of-production method, where the carrying value is reduced as resources are depleted. A change in our mineral reserves would change our depreciation expenses, and such a change could have a material impact on amounts charged to earnings.
We assess the carrying values of property, plant and equipment, intangibles and investments in associates and joint ventures every year, or more often if necessary. If we determine that we cannot recover the carrying value of an asset, we write off the unrecoverable amount against current earnings. We base our assessment of recoverability on assumptions and judgments we make about future prices, compound annual growth rates in Westinghouse’s core business, production costs, our requirements for sustaining capital, our ability to economically recover mineral reserves and the impact of geopolitical events. A material change in any of these assumptions could have a significant impact on the potential impairment of these assets.
In performing impairment assessments of long-lived assets, assets that cannot be assessed individually are grouped together into the smallest group of assets that generates cash inflows that are largely independent of the cash inflows from other assets or groups of assets. Management is required to exercise judgment in identifying these cash generating units.
Taxes
When we are preparing our financial statements, we estimate taxes in each jurisdiction we operate in, taking into consideration different tax rates, non-deductible expenses, valuation of deferred tax assets, changes in tax laws and our expectations for future results.
We base our estimates of deferred income taxes on temporary differences between the assets and liabilities we report in our financial statements, and the assets and liabilities determined by the tax laws in the various countries we operate in. We record deferred income taxes in our financial statements based on our estimated future cash flows, which includes estimates of non-deductible expenses, future market conditions, production levels and intercompany sales. If these estimates are not accurate, there could be a material impact on our net earnings and financial position.
Controls and procedures
We have evaluated the effectiveness of our disclosure controls and procedures and internal control over financial reporting as of December 31, 2024, as required by the rules of the US Securities and Exchange Commission and the Canadian Securities Administrators.
112 CAMECO CORPORATION
Management, including our Chief Executive Officer (CEO) and our Chief Financial Officer (CFO), supervised and participated in the evaluation, and concluded that our disclosure controls and procedures are effective to provide a reasonable level of assurance that the information we are required to disclose in reports we file or submit under securities laws is recorded, processed, summarized and reported accurately, and within the time periods specified. It should be noted that, while the CEO and CFO believe that our disclosure controls and procedures provide a reasonable level of assurance that they are effective, they do not expect the disclosure controls and procedures or internal control over financial reporting to be capable of preventing all errors and fraud. A control system, no matter how well conceived or operated, can provide only reasonable, not absolute, assurance that the objectives of the control system are met.
Management, including our CEO and our CFO, is responsible for establishing and maintaining internal control over financial reporting and conducted an evaluation of the effectiveness of our internal control over financial reporting based on the Internal Control — Integrated Framework (2013) issued by the Committee of Sponsoring Organizations of the Treadway Commission (COSO). Based on this evaluation, management concluded that our internal control over financial reporting was effective as of December 31, 2024.
In April 2024, we implemented SAP S/4 HANA, an enterprise resource planning (ERP) system across the entire organization. The implementation process included extensive involvement by key end users and required significant pre-implementation planning, design, and testing. As a result of this implementation, we modified certain existing internal controls and implemented new controls and procedures. We have taken actions to monitor and maintain appropriate internal controls over financial reporting during this period of change, including performing additional verifications and analysis to ensure data integrity. We also conducted extensive post-implementation monitoring and testing to ensure that internal controls over financial reporting are properly designed.
There have been no other changes in our internal control over financial reporting during the year that have materially affected, or are reasonably likely to materially affect, our internal control over financial reporting.
New standards adopted
A number of amendments to existing standards became effective January 1, 2024, but they did not have an effect on our financial statements.
A number of amendments to existing standards are not yet effective for the year ended December 31, 2024, and have not been applied in preparing these consolidated financial statements. We do not intend to early adopt any of the amendments and do not expect them to have a material impact on our financial statements.
MANAGEMENT’S DISCUSSION AND ANALYSIS 113
EXHIBIT 99.4
For fiscal years ended December 31, 2024 and December 31, 2023, KPMG LLP and its affiliates billed Cameco Corporation and its subsidiaries the following fees:
| 2024 ($) |
% of total fees |
2023 ($) |
% of total fees |
|||||||||||||
| Audit fees |
||||||||||||||||
| Cameco1 |
3,571,900 | 83.1 | 2,436,700 | 88.7 | ||||||||||||
| Subsidiaries2 |
164,400 | 3.8 | 135,600 | 4.9 | ||||||||||||
| Securities engagement3 |
217,900 | 5.1 | — | — | ||||||||||||
|
|
|
|
|
|
|
|
|
|||||||||
| Total audit fees |
3,954,200 | 92.0 | 2,572,300 | 93.6 | ||||||||||||
|
|
|
|
|
|
|
|
|
|||||||||
| Audit-related fees |
||||||||||||||||
| Translation services4 |
82,500 | 1.9 | — | — | ||||||||||||
| Pension and other audit-related services5 |
85,500 | 2.0 | 31,600 | 1.2 | ||||||||||||
|
|
|
|
|
|
|
|
|
|||||||||
| Total audit-related fees |
168,000 | 3.9 | 31,600 | 1.2 | ||||||||||||
|
|
|
|
|
|
|
|
|
|||||||||
| Tax fees |
||||||||||||||||
| Compliance |
— | — | 5,600 | 0.2 | ||||||||||||
| Planning and advice6 |
80,200 | 1.9 | 136,100 | 5.0 | ||||||||||||
|
|
|
|
|
|
|
|
|
|||||||||
| Total tax fees |
80,200 | 1.9 | 141,700 | 5.2 | ||||||||||||
|
|
|
|
|
|
|
|
|
|||||||||
| All other fees |
||||||||||||||||
| Other non-audit fees7 |
95,600 | 2.2 | — | — | ||||||||||||
| Total other non-audit fees |
95,600 | 2.2 | — | — | ||||||||||||
|
|
|
|
|
|
|
|
|
|||||||||
| Total fees |
4,298,000 | 100 | 2,745,600 | 100 | ||||||||||||
|
|
|
|
|
|
|
|
|
|||||||||
| 1 | Includes amounts billed for the audit of Cameco’s annual consolidated financial statements and the review of interim financial statements. |
| 2 | Includes amounts billed for the audit of Cameco’s subsidiary financial statements. |
| 3 | Includes amounts billed for auditor involvement in filing Cameco’s 2024 base shelf prospectus and Form S-8 filing with the SEC. |
| 4 | Translation services for 2024 relate to the French translation of the 2023 annual financial statements and management’s discussion and analysis. No invoices were issued in 2023 for translation services. |
| 5 | Includes amounts billed for the audit of Cameco’s pension plan financial statements and other audit-related services. |
| 6 | Includes amounts billed for tax compliance and tax advisory services. |
| 7 | Other non-audit fees for 2024 include amounts billed for Cameco’s I-4 Membership. No invoices were issued in 2023. |
Pre-Approval Policies and Procedures
As part of Cameco Corporation’s corporate governance practices, under its committee charter, the audit committee is required to pre-approve the audit and non-audit services performed by the external auditors. The audit committee pre-approves the audit and non-audit services up to a maximum specified level of fees. If fees relating to audit and non-audit services are expected to exceed this level or if a type of audit or non-audit service is to be performed that previously has not been pre-approved, then separate pre-approval by Cameco Corporation’s audit committee or audit committee chair, or in the absence of the audit committee chair, the chair of the board, is required. All pre-approvals granted pursuant to the delegated authority must be presented by the member(s) who granted the pre-approvals to the full audit committee at its next meeting. The audit committee has adopted a written policy to provide procedures to implement the foregoing principles. For each of the years ended December 31, 2024 and 2023, none of Cameco Corporation’s Audit Related Fees, Tax Fees or All Other Fees made use of the de minimis exception to pre-approval provisions contained in paragraph (c)(7)(i) of Rule 2-01 of Regulation S-X promulgated by the U.S. Securities and Exchange Commission.
EXHIBIT 99.5
CONSENT OF INDEPENDENT REGISTERED PUBLIC ACCOUNTING FIRM
The Board of Directors
Cameco Corporation
We consent to the use of:
| • | our report dated February 19, 2025 on the consolidated financial statements of Cameco Corporation (the “Entity”) which comprise the consolidated statements of financial position as of December 31, 2024 and 2023, the related consolidated statements of earnings, comprehensive income, changes in equity and cash flows for each of the years then ended, and the related notes (collectively the “consolidated financial statements”), and |
| • | our report dated February 19, 2025 on the effectiveness of the Entity’s internal control over financial reporting as of December 31, 2024 |
each of which is included in the Annual Report on Form 40-F of the Entity for the fiscal year ended December 31, 2024.
We also consent to the incorporation by reference of such reports in the Registration Statements on Form S-8 (File Nos. 333-11736, 333-06180, 333-139165, 333-196422, and 333-281406) and the Registration Statement on Form F-10 (File No. 333-283140) of the Entity.
| /s/ KPMG LLP |
| Chartered Professional Accountants |
| March 21, 2025 |
| Saskatoon, Canada |
EXHIBIT 99.6
CERTIFICATION PURSUANT TO RULE 13a-14(a) OR 15d-14(a)
OF THE U.S. SECURITIES EXCHANGE ACT OF 1934, AS AMENDED
I, Tim Gitzel, certify that:
| 1. | I have reviewed this Annual Report on Form 40-F of Cameco Corporation; |
| 2. | Based on my knowledge, this report does not contain any untrue statement of a material fact or omit to state a material fact necessary to make the statements made, in light of the circumstances under which such statements were made, not misleading with respect to the period covered by this report; |
| 3. | Based on my knowledge, the financial statements, and other financial information included in this report, fairly present in all material respects the financial condition, results of operations and cash flows of the issuer as of, and for, the periods presented in this report; |
| 4. | The issuer’s other certifying officer and I are responsible for establishing and maintaining disclosure controls and procedures (as defined in Exchange Act Rules 13a-15(e) and 15d-15(e)) and internal control over financial reporting (as defined in Exchange Act Rules 13a-15(f) and 15d-15(f)) for the issuer and have: |
| a) | designed such disclosure controls and procedures, or caused such disclosure controls and procedures to be designed under our supervision, to ensure that material information relating to the issuer, including its consolidated subsidiaries, is made known to us by others within those entities, particularly during the period in which this report is being prepared; |
| b) | designed such internal control over financial reporting, or caused such internal control over financial reporting to be designed under our supervision, to provide reasonable assurance regarding the reliability of financial reporting and the preparation of financial statements for external purposes in accordance with generally accepted accounting principles; |
| c) | evaluated the effectiveness of the issuer’s disclosure controls and procedures and presented in this report our conclusions about the effectiveness of the disclosure controls and procedures, as of the end of the period covered by this report based on such evaluation; and |
| d) | disclosed in this report any change in the issuer’s internal control over financial reporting that occurred during the period covered by the Annual Report that has materially affected, or is reasonably likely to materially affect, the issuer’s internal control over financial reporting; and |
| 5. | The issuer’s other certifying officer and I have disclosed, based on our most recent evaluation of internal control over financial reporting, to the issuer’s auditors and the audit committee of the issuer’s board of directors (or persons performing the equivalent functions): |
| a) | all significant deficiencies and material weaknesses in the design or operation of internal control over financial reporting which are reasonably likely to adversely affect the issuer’s ability to record, process, summarize and report financial information; and |
| b) | any fraud, whether or not material, that involves management or other employees who have a significant role in the issuer’s internal control over financial reporting. |
Date: March 21, 2025
| /s/ Tim Gitzel |
||
| Name: | Tim Gitzel | |
| Title: | President and Chief Executive Officer (Principal Executive Officer) |
|
EXHIBIT 99.7
CERTIFICATION PURSUANT TO RULE 13a-14(a) OR 15d-14(a)
OF THE U.S. SECURITIES EXCHANGE ACT OF 1934, AS AMENDED
I, Grant Isaac, certify that:
| 1. | I have reviewed this Annual Report on Form 40-F of Cameco Corporation; |
| 2. | Based on my knowledge, this report does not contain any untrue statement of a material fact or omit to state a material fact necessary to make the statements made, in light of the circumstances under which such statements were made, not misleading with respect to the period covered by this report; |
| 3. | Based on my knowledge, the financial statements, and other financial information included in this report, fairly present in all material respects the financial condition, results of operations and cash flows of the issuer as of, and for, the periods presented in this report; |
| 4. | The issuer’s other certifying officer and I are responsible for establishing and maintaining disclosure controls and procedures (as defined in Exchange Act Rules 13a-15(e) and 15d-15(e)) and internal control over financial reporting (as defined in Exchange Act Rules 13a-15(f) and 15d-15(f)) for the issuer and have: |
| a) | designed such disclosure controls and procedures, or caused such disclosure controls and procedures to be designed under our supervision, to ensure that material information relating to the issuer, including its consolidated subsidiaries, is made known to us by others within those entities, particularly during the period in which this report is being prepared; |
| b) | designed such internal control over financial reporting, or caused such internal control over financial reporting to be designed under our supervision, to provide reasonable assurance regarding the reliability of financial reporting and the preparation of financial statements for external purposes in accordance with generally accepted accounting principles; |
| c) | evaluated the effectiveness of the issuer’s disclosure controls and procedures and presented in this report our conclusions about the effectiveness of the disclosure controls and procedures, as of the end of the period covered by this report based on such evaluation; and |
| d) | disclosed in this report any change in the issuer’s internal control over financial reporting that occurred during the period covered by the Annual Report that has materially affected, or is reasonably likely to materially affect, the issuer’s internal control over financial reporting; and |
| 5. | The issuer’s other certifying officer and I have disclosed, based on our most recent evaluation of internal control over financial reporting, to the issuer’s auditors and the audit committee of the issuer’s board of directors (or persons performing the equivalent functions): |
| a) | all significant deficiencies and material weaknesses in the design or operation of internal control over financial reporting which are reasonably likely to adversely affect the issuer’s ability to record, process, summarize and report financial information; and |
| b) | any fraud, whether or not material, that involves management or other employees who have a significant role in the issuer’s internal control over financial reporting. |
Date: March 21, 2025
| /s/ Grant Isaac |
||
| Name: |
Grant Isaac |
|
| Title: |
Executive Vice-President and Chief Financial Officer (Principal Financial Officer) |
|
EXHIBIT 99.8
CERTIFICATION PURSUANT TO
18 U.S.C. SECTION 1350
AS ADOPTED PURSUANT TO
SECTION 906 OF THE SARBANES-OXLEY ACT OF 2002
In connection with the Annual Report of Cameco Corporation (the “Company”) on Form 40-F for the year ended December 31, 2024, as filed with the U.S. Securities and Exchange Commission on the date hereof (the “Report”), I, Tim Gitzel, President and Chief Executive Officer of the Company, certify, pursuant to 18 U.S.C. Section 1350, as adopted pursuant to Section 906 of the Sarbanes-Oxley Act of 2002, that to the best of my knowledge:
| 1. | The Report fully complies with the requirements of Section 13(a) or 15(d) of the Securities Exchange Act of 1934; and |
| 2. | The information contained in the Report fairly presents, in all material respects, the financial condition and results of operations of the Company. |
| By: | /s/ Tim Gitzel | |
| Name: Tim Gitzel | ||
| Title: President and Chief Executive Officer | ||
March 21, 2025
EXHIBIT 99.9
CERTIFICATION PURSUANT TO
18 U.S.C. SECTION 1350
AS ADOPTED PURSUANT TO
SECTION 906 OF THE SARBANES-OXLEY ACT OF 2002
In connection with the Annual Report of Cameco Corporation (the “Company”) on Form 40-F for the year ended December 31, 2024, as filed with the U.S. Securities and Exchange Commission on the date hereof (the “Report”), I, Grant Isaac, Executive Vice-President and Chief Financial Officer of the Company, certify, pursuant to 18 U.S.C. Section 1350, as adopted pursuant to Section 906 of the Sarbanes-Oxley Act of 2002, that to the best of my knowledge:
| 1. | The Report fully complies with the requirements of Section 13(a) or 15(d) of the Securities Exchange Act of 1934; and |
| 2. | The information contained in the Report fairly presents, in all material respects, the financial condition and results of operations of the Company. |
| By: | /s/ Grant Isaac | |
| Name: Grant Isaac | ||
| Title: Executive Vice-President and Chief Financial Officer | ||
March 21, 2025
EXHIBIT 99.10
CONSENT OF EXPERT
Reference is made to the Annual Report on Form 40-F (the “Form 40-F”) of Cameco Corporation filed with the United States Securities and Exchange Commission pursuant to the United States Securities Exchange Act of 1934, as amended, and any amendments thereto.
I hereby consent to reference to my name and my involvement in the preparation of, or supervision of the preparation of, scientific and technical information in the following instances:
| (a) | under the headings “Operations, projects and investments – Uranium – Tier-one operations – McArthur River mine/Key Lake mill”, “Operations, projects and investments – Cigar Lake”, “Operations, projects and investments – Uranium – Tier-one operations – Inkai”, “Mineral reserves and resources” and “Governance – Interest of experts” in the Corporation’s Annual Information Form for the year ended December 31, 2024 dated March 21, 2025 for the McArthur River mine/Key Lake mill, Cigar Lake and Inkai operations; and |
| (b) | under the headings “Operations, projects and investments – Uranium – Tier-one operations – McArthur River mine/Key Lake mill”, “Operations, projects and investments – Uranium – Tier-one operations – Cigar Lake”, “Operations, projects and investments – Uranium – Tier-one operations – Inkai”, and “Mineral reserves and resources” in Management’s Discussion and Analysis for the year ended December 31, 2024 dated February 20, 2025 for the McArthur River mine/Key Lake mill, Cigar Lake and Inkai operations, |
(collectively the “Technical Information”) in the Form 40-F, and to the inclusion and incorporation by reference of information derived from the Technical Information in the Form 40-F.
I also hereby consent to the incorporation by reference of such Technical Information in the Registration Statements on Form S-8 (File Nos. 333-11736, 333-06180, 333-139165, and 333-281406) for the Cameco Corporation Stock Option Plan, the Registration Statement on Form S-8 (File No. 333-196422) for the Cameco Corporation Employee Share Ownership Plan and the Registration Statement on Form F-10 (File No. 333-283140).
Sincerely,
| /s/ Alain D. Renaud |
| Name: Alain D. Renaud, P. Geo. |
| Title: Principal Resource Geologist, Technical Services, Cameco Corporation |
Date: March 21, 2025
EXHIBIT 99.11
CONSENT OF EXPERT
Reference is made to the Annual Report on Form 40-F (the “Form 40-F”) of Cameco Corporation filed with the United States Securities and Exchange Commission pursuant to the United States Securities Exchange Act of 1934, as amended, and any amendments thereto.
I hereby consent to reference to my name and my involvement in the preparation of, or supervision of the preparation of, scientific and technical information in the following instances:
| (a) | under the headings “Operations, projects and investments – Uranium – Tier-one operations – McArthur River mine/Key Lake mill”, “Operations, projects and investments – Uranium – Tier-one operations – Cigar Lake”, “Operations, projects and investments – Uranium – Tier-one operations – Inkai”, “Mineral reserves and resources” and “Governance – Interest of experts” in the Corporation’s Annual Information Form for the year ended December 31, 2024 dated March 21, 2025 for the McArthur River mine/Key Lake mill, Cigar Lake and Inkai operations; and |
| (b) | under the headings “Operations, projects and investments – Uranium – Tier-one operations – McArthur River mine/Key Lake mill”, “Operations, projects and investments – Uranium – Tier-one operations – Cigar Lake”, “Operations, projects and investments – Uranium – Tier-one operations – Inkai”, and “Mineral reserves and resources” in Management’s Discussion and Analysis for the year ended December 31, 2024 dated February 20, 2025 for the McArthur River mine/Key Lake mill, Cigar Lake and Inkai operations, |
(collectively the “Technical Information”) in the Form 40-F, and to the inclusion and incorporation by reference of information derived from the Technical Information in the Form 40-F.
I also hereby consent to the incorporation by reference of such Technical Information in the Registration Statements on Form S-8 (File Nos. 333-11736, 333-06180, 333-139165, and 333-281406) for the Cameco Corporation Stock Option Plan, the Registration Statement on Form S-8 (File No. 333-196422) for the Cameco Corporation Employee Share Ownership Plan and the Registration Statement on Form F-10 (File No. 333-283140).
Sincerely,
| /s/ Biman Bharadwaj | ||
| Name: Biman Bharadwaj, P. Eng. | ||
| Title: Principal Metallurgist, Technical Services, Cameco Corporation | ||
Date: March 21, 2025
EXHIBIT 99.12
CONSENT OF EXPERT
Reference is made to the Annual Report on Form 40-F (the “Form 40-F”) of Cameco Corporation filed with the United States Securities and Exchange Commission pursuant to the United States Securities Exchange Act of 1934, as amended, and any amendments thereto.
I hereby consent to reference to my name and my involvement in the preparation of, or supervision of the preparation of, scientific and technical information in the following instances:
| (a) | under the headings “Operations, projects and investments – Uranium – Tier-one operations – Cigar Lake”, “Operations, projects and investments – Uranium – Tier-one operations – Inkai”, “Mineral reserves and resources” and “Governance – Interest of experts” in the Corporation’s Annual Information Form for the year ended December 31, 2024 dated March 21, 2025 for the Cigar Lake and Inkai operations; and |
| (b) | under the headings “Operations, projects and investments – Uranium – Tier-one operations – Cigar Lake”, “Operations, projects and investments – Uranium – Tier-one operations – Inkai”, and “Mineral reserves and resources” in Management’s Discussion and Analysis for the year ended December 31, 2024 dated February 20, 2025 for the Cigar Lake and Inkai operations, |
(collectively the “Technical Information”) in the Form 40-F, and to the inclusion and incorporation by reference of information derived from the Technical Information in the Form 40-F.
I also hereby consent to the incorporation by reference of such Technical Information in the Registration Statements on Form S-8 (File Nos. 333-11736, 333-06180, 333-139165, and 333-281406) for the Cameco Corporation Stock Option Plan, the Registration Statement on Form S-8 (File No. 333-196422) for the Cameco Corporation Employee Share Ownership Plan and the Registration Statement on Form F-10 (File No. 333-283140).
Sincerely,
| /s/ Scott Bishop | ||
| Name: | Scott Bishop, P. Eng. | |
| Title: |
Director, Technical Assurance & Mineral Reserves, Technical Services, Cameco Corporation |
|
Date: March 21, 2025
EXHIBIT 99.13
CONSENT OF EXPERT
Reference is made to the Annual Report on Form 40-F (the “Form 40-F”) of Cameco Corporation filed with the United States Securities and Exchange Commission pursuant to the United States Securities Exchange Act of 1934, as amended, and any amendments thereto.
I hereby consent to reference to my name and my involvement in the preparation of, or supervision of the preparation of, scientific and technical information in the following instances:
| (a) | under the headings “Operations, projects and investments – Uranium – Tier-one operations – Cigar Lake”, “Mineral reserves and resources” and “Governance – Interest of experts” in the Corporation’s Annual Information Form for the year ended December 31, 2024 dated March 21, 2025 for the Cigar Lake operation; and |
| (b) | under the headings “Operations, projects and investments – Uranium – Tier-one operations – Cigar Lake” and “Mineral reserves and resources” in Management’s Discussion and Analysis for the year ended December 31, 2024 dated February 20, 2025 for the Cigar Lake operation, |
(collectively the “Technical Information”) in the Form 40-F, and to the inclusion and incorporation by reference of information derived from the Technical Information in the Form 40-F.
I also hereby consent to the incorporation by reference of such Technical Information in the Registration Statements on Form S-8 (File Nos. 333-11736, 333-06180, 333-139165, and 333-281406) for the Cameco Corporation Stock Option Plan, the Registration Statement on Form S-8 (File No. 333-196422) for the Cameco Corporation Employee Share Ownership Plan and the Registration Statement on Form F-10 (File No. 333-283140).
Sincerely,
| /s/ Kirk Lamont |
||
| Name: |
Kirk Lamont, P. Eng. |
|
| Title: |
General Manager, Cigar Lake, Cameco Corporation |
|
Date: March 21, 2025
EXHIBIT 99.14
CONSENT OF EXPERT
Reference is made to the Annual Report on Form 40-F (the “Form 40-F”) of Cameco Corporation filed with the United States Securities and Exchange Commission pursuant to the United States Securities Exchange Act of 1934, as amended, and any amendments thereto.
I hereby consent to reference to my name and my involvement in the preparation of, or supervision of the preparation of, scientific and technical information in the following instances:
| (a) | under the headings “Operations, projects and investments – Uranium – Tier-one operations – McArthur River mine/Key Lake mill”, “Mineral reserves and resources” and “Governance – Interest of experts” in the Corporation’s Annual Information Form for the year ended December 31, 2024 dated March 21, 2025 for the McArthur River mine; and |
| (b) | under the headings “Operations, projects and investments – Uranium – Tier-one operations – McArthur River mine/Key Lake mill” and “Mineral reserves and resources” in Management’s Discussion and Analysis for the year ended December 31, 2024 dated February 20, 2025 for the McArthur River mine, |
(collectively the “Technical Information”) in the Form 40-F, and to the inclusion and incorporation by reference of information derived from the Technical Information in the Form 40-F.
I also hereby consent to the incorporation by reference of such Technical Information in the Registration Statements on Form S-8 (File Nos. 333-11736, 333-06180, 333-139165, and 333-281406) for the Cameco Corporation Stock Option Plan, the Registration Statement on Form S-8 (File No. 333-196422) for the Cameco Corporation Employee Share Ownership Plan and the Registration Statement on Form F-10 (File No. 333-283140).
Sincerely,
| /s/ Gregory M. Murdock |
||
| Name: |
Gregory M. Murdock, P. Eng. |
|
| Title: |
General Manager, McArthur River, Cameco Corporation |
|
Date: March 21, 2025
EXHIBIT 99.15
CONSENT OF EXPERT
Reference is made to the Annual Report on Form 40-F (the “Form 40-F”) of Cameco Corporation filed with the United States Securities and Exchange Commission pursuant to the United States Securities Exchange Act of 1934, as amended, and any amendments thereto.
I hereby consent to reference to my name and my involvement in the preparation of, or supervision of the preparation of, scientific and technical information in the following instances:
| (a) | under the headings “Operations, projects and investments – Uranium – Tier-one operations – Inkai”, “Mineral reserves and resources” and “Governance – Interest of experts” in the Corporation’s Annual Information Form for the year ended December 31, 2024 dated March 21, 2025 for the Inkai operation; and |
| (b) | under the headings “Operations, projects and investments – Uranium – Tier-one operations – Inkai”, and “Mineral reserves and resources” in Management’s Discussion and Analysis for the year ended December 31, 2024 dated February 20, 2025 for the Inkai operation, |
(collectively the “Technical Information”) in the Form 40-F, and to the inclusion and incorporation by reference of information derived from the Technical Information in the Form 40-F.
I also hereby consent to the incorporation by reference of such Technical Information in the Registration Statements on Form S-8 (File Nos. 333-11736, 333-06180, 333-139165, and 333-281406) for the Cameco Corporation Stock Option Plan, the Registration Statement on Form S-8 (File No. 333-196422) for the Cameco Corporation Employee Share Ownership Plan and the Registration Statement on Form F-10 (File No. 333-283140).
Sincerely,
| /s/ Sergey Ivanov |
||
| Name: |
Sergey Ivanov, P. Geo. |
|
| Title: |
Deputy Director General, Technical Services, Cameco Kazakhstan LLP |
|
Date: March 21, 2025
EXHIBIT 99.16
CONSENT OF EXPERT
Reference is made to the Annual Report on Form 40-F (the “Form 40-F”) of Cameco Corporation filed with the United States Securities and Exchange Commission pursuant to the United States Securities Exchange Act of 1934, as amended, and any amendments thereto.
I hereby consent to reference to my name and my involvement in the preparation of, or supervision of the preparation of, scientific and technical information in the following instances:
| (a) | under the headings “Operations, projects and investments – Uranium – Tier-one operations – McArthur River mine/Key Lake mill”, “Mineral reserves and resources” and “Governance – Interest of experts” in the Corporation’s Annual Information Form for the year ended December 31, 2024 dated March 21, 2025 for the Key Lake mill; and |
| (b) | under the headings “Operations, projects and investments – Uranium – Tier-one operations – McArthur River mine/Key Lake mill” and “Mineral reserves and resources” in Management’s Discussion and Analysis for the year ended December 31, 2024 dated February 20, 2025 for the Key Lake mill, |
(collectively the “Technical Information”) in the Form 40-F, and to the inclusion and incorporation by reference of information derived from the Technical Information in the Form 40-F.
I also hereby consent to the incorporation by reference of such Technical Information in the Registration Statements on Form S-8 (File Nos. 333-11736, 333-06180, 333-139165, and 333-281406) for the Cameco Corporation Stock Option Plan, the Registration Statement on Form S-8 (File No. 333-196422) for the Cameco Corporation Employee Share Ownership Plan and the Registration Statement on Form F-10 (File No. 333-23140).
Sincerely,
| /s/ Daley McIntyre |
||
| Name: |
Daley McIntyre, P. Eng. |
|
| Title: |
General Manager, Key Lake, Cameco Corporation |
|
Date: March 21, 2025