UNITED STATES
SECURITIES AND EXCHANGE COMMISSION
Washington, D.C. 20549
Form 6-K
Report of Foreign Private Issuer
Pursuant to Rule 13a-16 or 15d-16
Under the Securities Exchange Act of 1934
For the month of February, 2025
Commission File Number: 001-38336
NUTRIEN LTD.
(Name of registrant)
Suite 1700, 211 19th Street East
Saskatoon, Saskatchewan, Canada
S7K 5R6
(Address of principal executive office)
Indicate by check mark whether the registrant files or will file annual reports under cover of Form 20-F or Form 40-F.
Form 20-F ☐ Form 40-F ☒
SIGNATURE
Pursuant to the requirements of the Securities Exchange Act of 1934, the registrant has duly caused this report to be signed on its behalf by the undersigned, thereunto duly authorized.
| NUTRIEN LTD. | ||||||
| Date: February 28, 2025 | By: | /s/ Noralee Bradley |
||||
| Name: | Noralee Bradley | |||||
| Title: | Executive Vice President, External Affairs and Chief Sustainability and Legal Officer | |||||
EXHIBIT INDEX
Exhibit 99.1
NUTRIEN LTD.
ALLAN
NATIONAL INSTRUMENT 43-101 TECHNICAL REPORT ON
ALLAN POTASH DEPOSIT (KL 112R C),
SASKATCHEWAN, CANADA
FEBRUARY 20, 2025

PREPARED BY: JODI DERKACH, P. GEO.
| CRAIG FUNK, P. ENG., P. GEO. |
NUTRIEN LTD.
GEOSERVICES & LAND—ENGINEERING, TECHNOLOGY & CAPITAL
SUITE 1700, 211 19TH STREET EAST
SASKATOON, SASKATCHEWAN, CANADA
S7K 5R6
QUALIFIED PERSONS: JODI DERKACH, P. GEO. AND CRAIG FUNK, P. ENG., P. GEO.
DATE AND SIGNATURE PAGE
The scientific and technical information included in this report has been prepared under the supervision of persons who are ‘‘qualified persons’’ under Canadian National Instrument 43-101. Jodi Derkach, P. Geo. and Craig Funk, P. Eng., P. Geo. are the qualified persons who supervised the preparation of the information presented in this report and who verified the data disclosed herein.
| /s/ “Jodi Derkach” | ||||||||
| Signature | Jodi Derkach P. Geo. | |||||||
| Senior Manager, Land & Resource Nutrien Ltd. |
||||||||
| Date | February 20, 2025 | |||||||
| /s/ “Craig Funk” | ||||||||
| Signature | Craig Funk, P. Eng., P. Geo. | |||||||
| Director, GeoServices & Land Nutrien Ltd. |
||||||||
| Date | February 20, 2025 | |||||||
2
AUTHOR PAGE
The scientific and technical information included in this report has been prepared by, or under the supervision of, persons who are ‘‘qualified persons’’ under Canadian National Instrument 43-101.
Jodi Derkach, B. Sc., Cert. GIS, P. Geo. (APEGS Member # 14897)
| • | Senior Manager, Land & Resource—Engineering, Technology & Capital |
| • | B. Sc. (Geology), University of Saskatchewan, Saskatoon, Saskatchewan, Canada, 2007 |
| • | Geographic Information Science for Resource Management Certificate, Saskatchewan Polytechnic, Prince Albert, Saskatchewan, Canada, 2010 |
| • | with Nutrien or its subsidiaries since 2010 |
Craig Funk, B. Sc., M. Sc., P. Eng., P. Geo. (APEGS Member # 16034)
| • | Director, GeoServices & Land—Engineering, Technology & Capital |
| • | B. Sc. (Geological Engineering – Geophysics), University of Saskatchewan, Saskatoon, Saskatchewan, Canada, 1989 |
| • | M. Sc. (Geophysics), University of Saskatchewan, Saskatoon, Saskatchewan, Canada, 1992 |
| • | with Nutrien or its subsidiaries since 2008 |
are the qualified persons who supervised the preparation of all information presented in this report and who verified the data disclosed herein.
The team of persons who conducted the work presented within this report consists of:
Lisa MacKenzie, Cert. GIS
| • | Senior Advisor, Land—Engineering, Technology & Capital |
| • | Geographic Information Science for Resource Management Certificate, Saskatchewan Polytechnic, Prince Albert, Saskatchewan, Canada, 2012 |
| • | with Nutrien or its subsidiaries since 2012 |
Jennifer Nicolay Lawlor, B. Sc., P. Geo. (APEGS Member # 16167)
| • | Senior Advisor, Land & Resource – Engineering, Technology & Capital |
| • | B. Sc. (Geology), University of Regina, Regina, Saskatchewan, Canada, 2008 |
| • | with Nutrien or its subsidiaries since 2013 |
The authors would like to acknowledge the many staff who provided information and expert reviews on portions of this report, as well as past contributions of former (retired) staff Terrance Danyluk and Arnfinn Prugger.
3
TABLE OF CONTENTS
| DATE AND SIGNATURE PAGE | 2 | |||||
| AUTHOR PAGE | 3 | |||||
| TABLE OF CONTENTS |
4 | |||||
| LIST OF FIGURES |
6 | |||||
| LIST OF TABLES |
7 | |||||
| 1.0 |
SUMMARY | 8 | ||||
| 2.0 |
INTRODUCTION | 10 | ||||
| 3.0 |
RELIANCE ON OTHER EXPERTS | 11 | ||||
| 4.0 |
PROPERTY DESCRIPTION AND LOCATION | 11 | ||||
| 4.1 |
GENERAL | 11 | ||||
| 4.2 |
MINERAL RIGHTS | 12 | ||||
| 5.0 |
ACCESSIBILITY, CLIMATE, LOCAL RESOURCES, INFRASTRUCTURE AND PHYSIOGRAPHY | 13 | ||||
| 6.0 |
HISTORY | 14 | ||||
| 7.0 |
GEOLOGICAL SETTING AND MINERALIZATION | 15 | ||||
| 8.0 |
DEPOSIT TYPE | 17 | ||||
| 9.0 |
EXPLORATION | 18 | ||||
| 10.0 |
DRILLING | 20 | ||||
| 11.0 |
SAMPLING PREPARATION, ANALYSES AND SECURITY | 22 | ||||
| 11.1 |
BASIC APPROACH | 22 | ||||
| 11.2 |
MEAN POTASH MINERAL GRADE FROM IN-MINE SAMPLES | 24 | ||||
| 11.3 |
POTASH ORE DENSITY FROM IN-MINE MINERAL GRADE MEASUREMENTS | 25 | ||||
| 12.0 |
DATA VERIFICATION | 26 | ||||
| 12.1 |
ASSAY DATA | 26 | ||||
| 12.2 |
EXPLORATION DATA | 26 | ||||
| 13.0 |
MINERAL PROCESSING AND METALLURGICAL TESTING | 27 | ||||
| 14.0 |
MINERAL RESOURCE ESTIMATES | 27 | ||||
| 14.1 |
DEFINITIONS OF MINERAL RESOURCE | 27 | ||||
4
| 14.2 |
ALLAN POTASH RESOURCE CALCULATIONS | 28 | ||||
| 15.0 |
MINERAL RESERVE ESTIMATES | 29 | ||||
| 15.1 |
DEFINITIONS OF MINERAL RESERVE | 29 | ||||
| 15.2 |
ALLAN POTASH RESERVE CALCULATIONS | 30 | ||||
| 16.0 |
MINING METHOD | 31 | ||||
| 16.1 |
MINING OPERATIONS | 31 | ||||
| 16.2 |
RISKS TO POTASH MINING OPERATIONS, WITH EMPHASIS ON WATER INFLOWS | 34 | ||||
| 17.0 |
RECOVERY METHODS | 34 | ||||
| 18.0 |
PROJECT INFRASTRUCTURE | 36 | ||||
| 19.0 |
MARKET STUDIES AND CONTRACTS | 36 | ||||
| 20.0 |
ENVIRONMENTAL STUDIES, PERMITTING, AND SOCIAL OR COMMUNITY IMPACT | 39 | ||||
| 21.0 |
CAPITAL AND OPERATING COSTS | 41 | ||||
| 22.0 |
ECONOMIC ANALYSIS | 41 | ||||
| 22.1 |
FUNDAMENTALS | 41 | ||||
| 22.2 |
TAXES | 42 | ||||
| 23.0 |
ADJACENT PROPERTIES | 42 | ||||
| 24.0 |
OTHER RELEVANT DATA AND INFORMATION | 42 | ||||
| 25.0 |
INTERPRETATION AND CONCLUSIONS | 42 | ||||
| 26.0 |
RECOMMENDATIONS | 42 | ||||
| 27.0 |
REFERENCES | 43 | ||||
5
LIST OF FIGURES
Unless otherwise noted, figures for which a source and / or date are not provided are current as of the effective date of this report and were prepared by the Company.
| Figure 1: Aerial photo of Allan surface operations, 2012 |
8 | |||
| Figure 2: Actual finished potash products production from the Allan mine over the past 10 years (in million tonnes per year) |
9 | |||
| Figure 3: Map showing location of Nutrien Operations, including Allan |
11 | |||
| Figure 4: Nutrien’s potash operations, including Allan, relative to potash mineralization (pink) in Saskatchewan |
12 | |||
| Figure 5: Map showing Allan Crown Lease KL 112R C (blue) |
13 | |||
| Figure 6: Map showing infrastructure near Allan. Allan surface operations shown as red dot |
14 | |||
| Figure 7: Vertical section showing basic layered-Earth stratigraphy in a typical Saskatchewan potash region |
16 | |||
| Figure 8: Geophysical wireline logs showing basic stratigraphy of the Prairie Evaporite Formation in the Saskatoon area |
17 | |||
| Figure 9: Cross-section of the Prairie Evaporite Formation across southern Saskatchewan showing relative position of potash members |
18 | |||
| Figure 10: Potash exploration at Allan including 3D seismic (purple), 2D seismic infill (orange lines), and potash drillholes (black dots) |
19 | |||
| Figure 11: A seismic section showing relative rock velocities and major geological units at Nutrien’s conventional potash operations |
20 | |||
| Figure 12: Stratigraphic section showing local nomenclature at, and adjacent to, the mining horizon |
21 | |||
| Figure 13: Potash assay plot for PCS Allan 09-27-034-01 W3 indicating the best 3.35 m (11’) mining interval |
23 | |||
| Figure 14: Histogram of potash ore grade from Allan in-mine grade samples (data from 1968 through to the end of 2024) |
24 | |||
| Figure 15: Map showing Allan Mineral Resource as of December 2024 |
29 | |||
| Figure 16: Map showing Allan Mineral Reserve to December 2024 |
31 | |||
| Figure 17: Schematic cross-section through the Prairie Evaporite Formation, illustrating mining horizons at each of Nutrien’s conventional potash operations |
32 | |||
| Figure 18: Mined tonnes, product tonnes, and concentration ratio for the Allan mine over the past 10 years |
34 | |||
| Figure 19: Simplified flow diagram for potash flotation and crystallization milling methods used at Allan |
35 | |||
| Figure 20: Allan mill recovery rate over the past 10 years |
35 | |||
| Figure 21: Historical Company potash sales 2015 to 2024 in million tonnes / year* |
37 | |||
| Figure 22: Historical Company potash net sales 2015 to 2024 in million USD $ / year* |
37 | |||
| Figure 23: World potash production and demand for 2024E |
38 | |||
| Figure 24: World potash shipments and consumption, 2019-2024E |
39 | |||
| Figure 25: Aerial photo showing the Allan surface operations, disposal wells, and Tailings Management Area |
40 | |||
| Figure 26: Historic annual average realized potash price in USD / tonne* |
41 |
6
LIST OF TABLES
| Table 1: Potash Mineral Resources and Reserves for Allan, as of December 31, 2024 |
10 | |||
| Table 2: Assay results for all potash test holes within Allan Lease KL 112R C |
22 | |||
| Table 3: Values for potash assay plot in Figure 13 |
23 | |||
| Table 4: Primary Potash Market Profile |
38 |
7
EFFECTIVE DATE OF REPORT
The effective date of this report is December 31, 2024, other than where otherwise noted.
| 1.0 | SUMMARY |
Effective January 1, 2018, Potash Corporation of Saskatchewan Inc. (“PotashCorp”) and Agrium Inc. (“Agrium”) completed a court-approved plan of arrangement (the “Arrangement”), involving, among others, PotashCorp, Agrium and Nutrien Ltd. (“Nutrien”) the new parent company of PotashCorp and Agrium. As a result of completing the Arrangement, PotashCorp and Agrium are wholly-owned subsidiaries of Nutrien. References to “the Company” means Nutrien, indirectly through PotashCorp, or, for references prior to the completion of the Arrangement, PotashCorp, as the context requires.
Nutrien is a leading global provider of crop inputs and services. We operate a world-class network of production, distribution and agriculture retail facilities that positions us to efficiently serve the needs of farmers.
Nutrien is a corporation organized under the Canada Business Corporations Act, the common shares of which are listed and publicly traded on the Toronto and New York stock exchanges (symbol NTR).
The Company owns and operates a potash mine at Allan, Saskatchewan, Canada (“Allan mine” or “Allan”). An aerial view of the Allan surface operations is shown in Figure 1. The Allan Crown Subsurface Mineral Lease is numbered KL 112R C (the “Allan Crown Lease”) and was last amended in January 2021. Production of potash from the Allan mine began in 1968.

Figure 1: Aerial photo of Allan surface operations, 2012.
In 2024, annual nameplate capacity for Allan was 4.0 million tonnes and annual operational capability was 2.4 million tonnes of finished potash products (concentrated KCl). Estimates of nameplate capacity are based on capacity as per design specifications or Canpotex entitlements once these have been determined. Operational capability is the estimated annual achievable production level at current staffing and operational readiness (estimated at beginning of year), not including any inventory-related shutdowns and unplanned downtime and may vary during the year and year-to-year including as between our potash operations. While the term potash refers to a wide variety of potassium bearing minerals, in the Allan region of Saskatchewan, the predominant potash mineralization is sylvinite, which is comprised mainly of the minerals sylvite (KCl / potassium-salt) and halite (NaCl / rock salt), with minor amounts water insolubles.
8
Carnallite (KMgCl3 · 6H2O) occurs only in trace amounts at Allan. Potash fertilizer is concentrated, nearly pure KCl (i.e. greater than 95% pure KCl), but ore grade is traditionally reported on a % K2O equivalent basis. The “% K2O equivalent” gives a standard measurement of the nutrient value of different potassium-bearing rocks and minerals. To convert from % K2O equivalent tonnes to actual KCl tonnes, multiply by 1.58.
The Allan mine is a conventional underground mining operation whereby continuous mining machines are used to excavate the potash ore by the stress-relief mining method, with continuous conveyor belt transport of ore from the mining face to the bottom of the production shaft. In addition to hoisting potash ore to surface, the production shaft also provides fresh air ventilation to the mine and serves as a secondary egress. The Service Shaft is used for service access, and exhaust ventilation from the mine. Raw potash ore is processed and concentrated on surface and concentrated finished potash products (near-pure KCl) are sold and shipped to markets in North America and offshore.
Virtually all Allan underground mining rooms are in the potash mineralized zone situated approximately 12 m below the top of the host evaporite salt, the Prairie Evaporite Formation. More specifically, the Allan mine is located within the Patience Lake Member of the Prairie Evaporite Formation. In this Member, there are two potash seams named A Zone (the upper seam) and B Zone (the lower seam); at present, only the A Zone is being mined at Allan. Mine elevations range from approximately 980 m to 1,120 m depth below surface. These depths to A Zone potash mineralization are anticipated over most of the Allan lease area. Mine workings are protected from aquifers in overlying formations by salt which overlies the mineralized zone. Conservative local extraction ratios (never exceeding 45% in any mining block) are employed at Allan to minimize potential detrimental effects of mining on overlying strata; this is common practice in flat-lying, tabular ore bodies overlain by water-bearing layers.
Part of the normal surface infrastructure associated with operating the potash mine in Saskatchewan includes waste disposal on the land and disposal of salt brine into deep subsurface aquifers. The Company stows salt tailings within an engineered and licensed Tailings Management Area (TMA) and operates two brine disposal wells near the surface plant of the Allan mine.
Since opening in 1968, 192.352 million tonnes of potash ore have been mined and hoisted at Allan to produce 67.990 million tonnes of finished potash products. The life-of-mine average concentration ratio (raw ore / finished potash products) is 2.83 and the overall extraction ratio over this period is 28%. Actual production of finished potash products at Allan for the last 10 years is shown in Figure 2.

Figure 2: Actual finished potash products production from the Allan mine over the past 10 years (in million tonnes per year).
Over the past three years (2022, 2023, 2024), actual potash production at Allan has totaled:
| • | 20.368 million tonnes of ore mined and hoisted (6.789 million tonnes per year, on average) |
| • | 7.290 million tonnes of finished potash products produced (2.430 million tonnes per year, on average) |
| • | Average mill feed ore grade was 25.0% K2O equivalent |
| • | Average concentration ratio (ore mined / potash produced) was 2.79 |
9
The Canadian Institute of Mining and Metallurgy and Petroleum (CIM) has defined Mineral Resources and Reserves in The CIM Definition Standards for Mineral Resources and Reserves (2014). Based on these guidelines, all mineral rights owned or leased by the Company at Allan can be assigned to Mineral Resource categories (Inferred, Indicated, and Measured) and Mineral Reserve categories (Probable and Proven). Mineral Resources (reported as in-place tonnes) and Mineral Reserves (reported as recoverable ore tonnes) for Allan as of December 31, 2024, are outlined in Table 1. Mineral Resources reported are exclusive of Mineral Reserves.
Table 1: Potash Mineral Resources and Reserves for Allan, as of December 31, 2024.
| Proven Mineral Reserve (millions of tonnes recoverable ore) |
99 | |||
| Probable Mineral Reserve (millions of tonnes recoverable ore) |
260 | |||
|
|
|
|||
| Total Mineral Reserve (millions of tonnes recoverable ore) |
359 | |||
| Measured Mineral Resource - A Zone (millions of tonnes in-place) |
1,625 | |||
| Measured Mineral Resource - B Zone (millions of tonnes in-place) |
2,168 | |||
| Indicated Mineral Resource - A Zone (millions of tonnes in-place) |
2,157 | |||
| Indicated Mineral Resource - B Zone (millions of tonnes in-place) |
2,157 | |||
| Inferred Mineral Resource - A Zone (millions of tonnes in-place) |
1,197 | |||
| Inferred Mineral Resource - B Zone (millions of tonnes in-place) |
1,197 | |||
|
|
|
|||
| Total Mineral Resource (millions of tonnes in-place) |
10,501 | |||
| Average % K2O Grade - A Zone (from Allan in-mine samples) |
24.5 | % | ||
| Average % K2O Grade - B Zone (from Lanigan in-mine samples) |
20.2 | % | ||
|
|
|
|||
| Years of Remaining Mine Life |
53 | |||
The average mineral grade of the Allan Mineral Resource and Mineral Reserve is estimated to be 24.5% K2O equivalent and was determined from thousands of in-mine samples at Allan to the end of December 2024 (discussed further in Section 11.2).
Potash production in any given year at the Allan potash mine is a function of many variables, so actual production in any given year can vary dramatically from tonnages produced in previous years. The Mineral Reserve tonnage and historic average production are used to estimate the remaining mine life. If the average mining rate seen over the past three years (6.789 million tonnes of potash ore mined and hoisted per year) is sustained, and if Mineral Reserves remain unchanged, then the Allan mine life is 53 years from December 31, 2024.
The mining of potash is a capital-intensive business subject to the normal risks and capital expenditure requirements associated with mining operations. The production and processing of ore may be subject to delays and costs resulting from mechanical failures, physical hazards such as fires, and other hazards such as: unusual or unexpected geological conditions, significant subsidence, brine inflows and gas seepages of varying degree, and other situations associated with any potash mining operation.
| 2.0 | INTRODUCTION |
The purpose of this document is to give a formal reporting of potash Mineral Resource and Reserve for Allan, and to provide a description of the method used to compute Mineral Resource and Reserve tonnages. Sources of geological and geotechnical information analysed from this study include:
| • | Publicly available geological maps, reports, and publications (listed in Section 27.0) |
| • | Data and internal reports on exploration drillholes |
| • | Hydrogeological analysis conducted in exploration drillholes |
| • | Geological studies conducted at the Allan mine over the past 50+ years |
| • | In-mine geophysical studies conducted at the Allan mine over the past 50+ years |
| • | Geotechnical studies conducted for the Allan mine over the past 50+ years |
| • | 2D & 3D surface seismic exploration data |
All data and reports are archived at the Nutrien corporate office in Saskatoon, the Allan mine site, or secure offsite commercial document storage facilities. In addition, drillhole data (well-log data, drilling reports, drill-stem test results, etc.) are archived with the Saskatchewan Ministry of Energy & Resources, Integrated Resource Information System (IRIS), and surface seismic data (shot records and stack) are archived through an offsite commercial data storage service.
10
All geological and geophysical data and information presented in this report were personally reviewed and inspected by qualified geoscience staff at Nutrien who are registered with the Association of Professional Engineers and Geoscientists of Saskatchewan (APEGS) under the supervision of Jodi Derkach, P. Geo. and Craig Funk, P. Eng., P. Geo. Jodi Derkach last visited Allan on November 14, 2024. Craig Funk last visited Allan on March 19, 2024. All reserve and resource estimates and mineral rights data presented in this report were personally evaluated and reviewed by the authors of this report. Each of these staff collaborates with Allan personnel multiple times per year.
The authors would like to acknowledge the many staff who provided information and expert reviews on portions of this report.
| 3.0 | RELIANCE ON OTHER EXPERTS |
Responsibility for the accuracy of the technical data presented in this report is assumed by the authors. Outside experts were not used in the preparation of this report.
| 4.0 | PROPERTY DESCRIPTION AND LOCATION |
| 4.1 | GENERAL |
The Allan mine is located in central Saskatchewan, approximately 45 km east of the city of Saskatoon, Saskatchewan. The general location is shown on the map in Figure 3.

Figure 3: Map showing location of Nutrien Operations, including Allan.
The legal land description (Saskatchewan Township / Range) of the Allan surface plant is Section 22 Township 34 Range 01 West of 3rd Meridian. More precisely, the Allan Shaft #2 collar is located at:
| – |
Latitude: |
51 degrees 55 minutes 55.56 seconds North | ||
| – |
Longitude: |
106 degrees 04 minutes 18.84 seconds West | ||
| – |
Elevation: |
524.26 metres above mean Sea Level (SL) | ||
| – |
Easting: |
426,303.225 m |
11
| – |
Northing: |
5,754,028.978 m | ||
| – |
Projection: |
UTM | ||
| – |
Datum: |
NAD83 | ||
| – |
Zone: |
13 |
The Company owns approximately 3,431 hectares (8,478 acres) of surface rights required for current Allan mine operations, including areas covered by the existing surface plant and TMA, and surface lands required for anticipated future Allan mine and expanded milling operations.
All permits and approvals required for the operation of a potash mine in Saskatchewan are in place at Allan.
Figure 4 is a more detailed map showing the location of Allan relative to the potash deposits in Saskatchewan (modified from Yang, 2009).

Figure 4: Nutrien’s potash operations, including Allan, relative to potash mineralization (pink) in Saskatchewan.
| 4.2 | MINERAL RIGHTS |
Mineral rights at Allan are mined pursuant to subsurface mineral leases with the Province of Saskatchewan, Canada (the Crown), and with non-Crown (Freehold) mineral rights owners. Crown mineral rights are governed by The Subsurface Mineral Tenure Regulations, 2015, and Crown Leases are approved and issued by the Saskatchewan Ministry of Energy & Resources.
The original Allan Crown Subsurface Mineral Lease, numbered KL 112, was made effective in September 1962. In the following years various amendments were made whereby certain lands were added, removed, or transferred between Company dispositions for realized synergies between mining operations. The last amendment was executed in January 2021, resulting in Crown Subsurface Mineral Lease KL 112R C (the “Allan Crown Lease” or simply “KL 112 C”).
12
KL 112 C covers an area of approximately 80,950 hectares (200,032 acres) as shown in Figure 5. At Allan, the Company has leased potash mineral rights for 50,690 hectares (125,257 acres) of Crown Land and owns or has leased approximately 27,071 hectares (66,893 acres) of Freehold Land within the lease boundary. The Allan Crown Lease term is for a period of 21 years and is renewable in accordance with The Subsurface Mineral Tenure Regulations, 2015 for successive 21-year periods. Freehold Lands also remain under lease providing, generally, that production is continuing and that there is a continuation of the Crown Lease.
Within the Allan Crown Lease area, 67,198 hectares (166,049 acres) are mined pursuant to unitization agreements with mineral rights holders (Crown and Freehold) within four unitized areas.
When underground workings of a potash mine are designed, there are inevitably regions that are mined with higher mining extraction (e.g. production panels) and other regions where mining extraction is lower (e.g. conveyor-belt development rooms). To treat mineral rights holders in both low extraction and high extraction areas fairly, and to promote good mining practices, a unitization agreement is the preferred method for determining royalty payouts. Under a unitization agreement, each mineral rights holder is paid a royalty based on their proportional share of the entire Unit Area regardless of whether their lands are mined. For example, if one mineral rights holder owns rights to 4,000 hectares within a 40,000-hectare Unit Area, they would be paid 10% of the total monthly royalty payout from that Unit Area.

Figure 5: Map showing Allan Crown Lease KL 112R C (blue).
| 5.0 | ACCESSIBILITY, CLIMATE, LOCAL RESOURCES, INFRASTRUCTURE AND PHYSIOGRAPHY |
The Allan mine surface facilities are accessed by an existing paved road that is part of the Saskatchewan Provincial Highway System. All potash product is shipped by rail over existing track. Location of Allan with respect to the features described in this section (major road and rail infrastructure, as well as nearby river systems) is shown in Figure 6.
The Allan mine is served by a number of villages within 50 km of the mine site. The nearest city is Saskatoon (45 km distant).
13
Allan is situated near the northern extent of the Great Plains of North America. Topography is relatively flat, with gently rolling hills and occasional valleys. There are no rivers or other major watercourse channels near the Allan mine site. Climate at the Allan mine is typical for an inland prairie location at latitude 52º North (often characterized as “mid-latitude steppe” climate).
Part of the normal surface infrastructure associated with operating the potash mine in Saskatchewan includes waste disposal on the land and disposal of salt brine into deep subsurface aquifers. Facilities to carry out all aspects of these tasks are in place at Allan (see Section 20.0).

Figure 6: Map showing infrastructure near Allan. Allan surface operations shown as red dot.
| 6.0 | HISTORY |
Ten potash mines were brought into production in Saskatchewan between 1962 and 1970. Until 2017, no new mine had been commissioned following the original ten. Most current potash production comes from conventional underground mines, while just three operate using solution mining methods. Generally, potash mines have contracted or expanded production over the years in response to the demand for potash.
Exploration drilling for potash in the Allan area was carried out in the 1950s and 1960s. The Allan mine was built by a consortium of companies (U. S. Borax, Homestake Potash Company, and Swift Canadian Company) in the 1960s. Potash production began at Allan in April 1968 and the mine has run on a continuous basis since then other than short-term shutdowns taken for inventory management purposes, occasional plant maintenance and construction work, or other outages that are typical for operations of this nature.
PotashCorp acquired a 60% ownership of the Allan mine in 1978 (through purchase of the U. S. Borax and Swift Canadian interests) and became the operator of the mine in 1981. In 1990, PotashCorp purchased the remaining 40% interest.
14
Effective January 1, 2018, PotashCorp and Agrium completed the Arrangement. As a result of completing the Arrangement, PotashCorp and Agrium are wholly-owned subsidiaries of Nutrien.
Both flotation and crystallization methods are used at Allan to produce potash products for agricultural and industrial application. Debottlenecking and compaction expansion projects were completed at Allan during two phases of construction in 2005 and 2007. A major refurbishment and expansion of the Allan mine was completed in 2013, increasing nameplate capacity to 4.0 million tonnes of finished potash products per year.
| 7.0 | GEOLOGICAL SETTING AND MINERALIZATION |
Much of southern Saskatchewan is underlain by the Prairie Evaporite Formation, a layered sequence of salts and anhydrite which contains one of the world’s largest deposits of potash. The potash extracted from the predominantly sylvinite ore has its main use as a fertilizer. A map showing the extent of the potash deposits in Saskatchewan is shown in Figure 4.
The 100 m to 200 m thick Prairie Evaporite Formation is overlain by between 400 and 500 m of Devonian carbonates, followed by approximately 100 m of Cretaceous sandstone, and between 400 and 500 m of Cretaceous shales and more recent Pleistocene glacial tills to surface; it is underlain by Devonian carbonates (Fuzesy, 1982). The Phanerozoic stratigraphy of Saskatchewan is remarkable in that units are flat-lying and relatively undisturbed over very large areas. A geological section representing Saskatchewan stratigraphy is shown in Figure 7 (modified from Fuzesy, 1982). A geological section representing the Prairie Evaporite Formation stratigraphy in the Saskatoon area is shown in Figure 8 (modified from Fuzesy, 1982).
15

Figure 7: Vertical section showing basic layered-Earth stratigraphy in a typical Saskatchewan potash region.
Potash mineralization in this region of Saskatchewan is predominantly sylvinite, which is comprised mainly of the minerals sylvite (KCl) and halite or rock salt (NaCl), with trace carnallite (KMgCl3 · 6H2O) and minor water insolubles. Potash fertilizer is concentrated, nearly pure KCl (i.e. greater than 95% pure KCl), but ore grade is traditionally reported on a % K2O equivalent basis. The “% K2O equivalent” gives a standard measurement of the nutrient value of different potassium-bearing rocks and minerals. To convert from % K2O equivalent tonnes to actual KCl tonnes, multiply by 1.58.
Over the past three years (2022, 2023, 2024), the average, measured potash ore grade of the mill feed at Allan was 25.0% K2O equivalent. The average ore grade reported from surface drillhole intersections, all within Allan Subsurface Mineral Lease KL 112R C, is 26.8% K2O equivalent (discussed further in Section 10.0). The average ore grade observed from thousands of in-mine samples collected to the end of 2024 is 24.5% K2O equivalent (discussed further in Section 11.2).
16

Figure 8: Geophysical wireline logs showing basic stratigraphy of the Prairie Evaporite Formation in the Saskatoon area.
| 8.0 | DEPOSIT TYPE |
There are three mineable potash members within the Prairie Evaporite Formation of Saskatchewan. Stratigraphically highest to lowest, these members are: Patience Lake, Belle Plaine, and Esterhazy. A geological section showing potash members that occur in Saskatchewan is shown in Figure 9.
The Allan potash deposit lies within the Patience Lake Member of Prairie Evaporite Formation. There are two potash seams named A Zone and B Zone within this member; at present, only the A Zone is being mined at Allan. Some test mining has been carried out in the B Zone, but no mining is done in this layer at present. The Belle Plaine Member and the Esterhazy Member are present but not necessarily well-developed in the Allan area.
Allan potash mineralization occurs at about 1,000 m depth below surface. The A Zone is approximately 3.35 m thick and occurs near the top of the Prairie Evaporite Formation salts. Salt cover from the ore zone to overlying units is approximately 12 m. The Allan mine operates as a conventional, underground potash mine.
17

Figure 9: Cross-section of the Prairie Evaporite Formation across southern Saskatchewan showing relative position of potash members.
| 9.0 | EXPLORATION |
Before the Allan mine was established in 1968, all exploration consisted of drilling from surface and analysis of core from these drillholes; drilling results are discussed in Section 10.0. Since mining began in 1968, exploration drilling has been infrequent. Now, drilling is most often used to derisk mining. A map showing potash exploration coverage at Allan (drillholes, 2D and 3D seismic coverage) is shown in Figure 10.
In most of southern Saskatchewan, potash mineralization is in place wherever Prairie Evaporite Formation salts exist, are flat-lying, and are undisturbed. Since the surface seismic exploration method is an excellent tool for mapping the top and bottom of Prairie Evaporite salts, this has become the main potash exploration tool in any existing Saskatchewan Subsurface (potash) Mineral Lease. Historically, 2D seismic, and now the more accurate and full coverage 3D seismic methods are used to infer continuity and extent of potash beds in flat-lying potash deposits. Seismic data are relied upon to identify collapse structures that must be avoided in the process of mine development since these structures can act as conduits for water ingress to the mine. As a result, isolation pillars or mining buffer zones are left around these anomalous features. This practice reduces the overall mining extraction ratio, but the risk of inflow to mine workings are effectively mitigated. Occasional, small-scale salt anomalies that are not mapped by seismic data do occur. When they do, they are dealt with in the normal course of mining and extraction through these areas is typically minimized. Where there is uncertainty in seismic interpretations, drilling is often used to confirm or improve refine the seismic interpretation.
Within the Allan Crown Lease, a total of 357 linear kilometres of 2D seismic lines, and 585 square kilometres of 3D seismic has been acquired to the end of December 2024.
18

Figure 10: Potash exploration at Allan including 3D seismic (purple), 2D seismic infill (orange lines), and potash drillholes (black dots).
A typical seismic section from Nutrien’s conventional seismic operations is shown in Figure 11. This is a cross-section extracted from a multi-program 3D seismic volume (earliest program was 2002). The vertical scale is in metres relative to sea level (SL). The seismic section is coloured by rock velocities computed from the seismic data and represents different rock types. Note that the Prairie Evaporite (salt) is continuous. This indicates an undisturbed, flat-lying salt within which potash is likely to be found based on over 50 years of mining experience at Allan.
Experience has shown that the potash mining horizon is continuous when seismic data are undisturbed and flat-lying, as shown in Figure 11. It is now Nutrien’s policy to collect detailed 3D seismic data ahead of mining. Any areas recognized as seismically unusual are identified early, and mine plans are adjusted as needed.
19

Figure 11: A seismic section showing relative rock velocities and major geological units at Nutrien’s conventional potash operations.
| 10.0 | DRILLING |
For the original Allan potash test holes drilled in the 1950s and 1960s, the primary objective was to sample potash horizons to establish basic mining parameters. The seismic method was still novel and crude at that time and as such, 2D seismic surveys were done sparingly, so the drillhole information was relied upon heavily to evaluate potash deposits. Test holes would penetrate the evaporite section with a hydrocarbon-based drilling mud (oil-based or diesel fuel) to protect the potash mineralization from dissolution. Basic geophysical well-logs were acquired, and in many cases, drill stem tests were run on the Dawson Bay Formation to help assess water-make potential of the caprock. Core samples from the targeted potash intersections were split or quartered (cut with a masonry saw), crushed and analysed to establish potash grades.
Relatively thin interbeds or seams of insoluble material, referred to as clay seams in the potash industry, are an ever-present component of the A Zone and B Zone at Allan. Figure 12 shows the basic stratigraphic relationships. These seams, along with the clay and other detrital minerals disseminated throughout the potash rock matrix, make up the water insoluble portion of the ore. The same sequences of clay seams can be correlated for many kilometres across the central Saskatchewan potash mining district.
At Allan, a particular sequence of three clay seams marks the top of the A Zone, as illustrated in Figure 12 (modified from Robertson, 1978). These seams are used to guide the vertical positioning of the mining machine. The uppermost portion of the sequence of three seams is maintained at the top of the mining cut to keep the mining machines “on grade”. Cutting too high above this upper seam or top marker results in dilution, as halite (rather than sylvinite) immediately overlies the production zone. In practice though, the top marker seam is slightly overcut (between 10 cm to 20 cm) to prevent an unstable condition from being created. Clay seams are often planes of weakness, and if they are undercut, material immediately below the clay seam becomes a hazard as it may separate and fall. Since the hazard must be remediated prior to proceeding, thus slowing production, the moderately diluted mineral grade that results from the overcutting is preferable from a safety point of view.
20
The A Zone mining interval was historically fixed at 3.35 m (11’). These mining heights allow for comfortable working headroom and efficient extraction of potash ore.

Figure 12: Stratigraphic section showing local nomenclature at, and adjacent to, the mining horizon.
The original exploration area was explored with several test holes spaced at intervals of 1.6 km to 6.4 km (1 – 4 miles). Assays from most of these original test holes were studied by independent consultant David S. Robertson and Associates (1978) and are found in Table 2. Drillholes following the original test holes were analysed by Nutrien staff and are listed in Table 2 below. All drilling and sampling were carried out following the regulations in place at the time.
In each case, the best 3.35 m (11’) mining interval intersected in each drillhole was determined from the assay values, using clay marker seams as a guide. Note that five test holes were omitted from the assay calculation for one of the following reasons: a section of missing core in the ore zone, erroneous assay data which could not be resolved, or anomalous ore grade of less than 15% K2O. Another drillhole was missing insoluble analytical results. With over 50 years of mining experience at Allan, it is the opinion of the authors that areas of low grade (i.e. <15% K2O) are localized with a relatively small lateral extent.
Drillhole assay data for the A Zone at Allan gives an estimated mean grade of 26.8% K2O with 4.9% water insolubles.
21
B Zone mineralization is indicated by gamma ray geophysical log response in each of the exploration drillholes listed in Table 2 indicating a potash Mineral Resource. Some test mining of the B Zone has been done. However, sustained production from that zone has not been established. Assay results for the B Zone are not presented here.
Table 2: Assay results for all potash test holes within Allan Lease KL 112R C.
| Average in 3.35 m (11’) mining interval (undiluted) |
||||||
| Drillhole |
Year Drilled |
% K2O |
% Water Insolubles |
|||
| 04-10-033-01 W3 |
1954 | * | * | |||
| 12-32-034-02 W3 |
1956 | 28.7 | 5.8 | |||
| 16-11-033-01W3 |
1956 | * | * | |||
| 04-29-034-01 W3 |
1957 | 25.8 | 4.7 | |||
| 01-25-034-01 W3 |
1957 | 28.1 | 4.7 | |||
| 16-11-034-02 W3 |
1957 | 29.1 | 3.4 | |||
| 13-11-034-01 W3 |
1957 | 28.8 | 4.5 | |||
| 13-11-034-03 W3 |
1957 | 22.0 | 1.7 | |||
| 16-09-035-01 W3 |
1957 | 25.0 | 5.1 | |||
| 05-26-035-01 W3 |
1957 | 16.8 | * | |||
| 09-29-033-02 W3 |
1957 | * | * | |||
| 09-28-034-01 W3 |
1961 | 29.5 | 5.3 | |||
| 09-27-034-01 W3 |
1961 | 30.6 | 4.5 | |||
| 09-26-034-01 W3 |
1961 | 27.7 | 6.3 | |||
| 09-33-034-01 W3 |
1961 | 24.0 | 5.39 | |||
| 08-34-034-01 W3 |
1961 | 26.3 | 5.8 | |||
| 09-35-034-01 W3 |
1961 | 25.9 | 8.6 | |||
| 05-22A-034-01 W3 |
1961 | 26.5 | 3.2 | |||
| 16-14-034-01 W3 |
1962 | 26.8 | 5.3 | |||
| 01-17-034-01 W3 |
1962 | 28.6 | 5.3 | |||
| 01-12-034-01 W3 |
1962 | * | * | |||
| 14-23-034-03 W3 |
1969 | 29.6 | 4.2 | |||
| 14-23-035-02 W3 |
2021 | 28.0 | 4.6 | |||
| 15-31-034-28 W2 |
2022 | 28.3 | 4.6 | |||
| 04-08-035-28 W2 |
2023 | 26.8 | 4.7 | |||
|
|
|
|||||
| Average (from 21 usable values): |
26.8 | 4.9 | ||||
|
|
|
|||||
Due to the remarkably consistent mineralogy and continuity of the resource, as experienced through decades of mine production, very little potash exploration drilling has been done at Allan since production began. Instead of exploration drillholes, seismic surveying has been relied upon to explore ahead of mine development. Where normal Prairie Evaporite sequences are mapped in the seismic data, potash beds have unfailingly been present. Occasional, small-scale salt anomalies not mapped by seismic data do occur. When they do, they are dealt with in the normal course of mining, and extraction through these areas is typically minimized. Anomalies associated with possible water inflow problems, which are mapped in the seismic data, are avoided.
| 11.0 | SAMPLING PREPARATION, ANALYSES AND SECURITY |
| 11.1 | BASIC APPROACH |
Exploration drilling in the Allan area was conducted in the 1950s and 1960s. Sampling and assaying of potash core samples was done using methods considered consistent with standard procedures for potash exploration at these times.
Drillhole sampling methods have remained essentially the same over the years. Potash core samples are acquired as described in earlier sections of this report. Short segments of core usually about 0.3 m (1’) in length are labeled based on visible changes in mineralization, and sometimes based on fixed intervals. Each segment of core is then split using some type of rock or masonry saw. The split portion of core is then bagged and labeled and sent to a laboratory for chemical analysis. Historical potash samples remain stored at the Subsurface Geological Laboratory (Regina, Saskatchewan) of the Saskatchewan Ministry of Energy & Resources.
22

Figure 13: Potash assay plot for PCS Allan 09-27-034-01 W3 indicating the best 3.35 m (11’) mining interval.
An assay plot for drillhole PCS Allan 09-27-034-01 W3 is shown above in Figure 13. Similar data were compiled for all historical potash test holes. The best 3.35 m (11’) mining interval intersected in each drillhole, as discussed in Section 10.0, is determined from the assay values, using clay seams as a guide. Table 3 lists the assay values plotted in Figure 13.
Table 3: Values for potash assay plot in Figure 13.

All new drilling efforts have targeted areas of geological uncertainty. Although normal ore zone conditions may occur in the tested areas, they are not targeted specifically. For this reason, and because ore grade is known to be locally variable, assays from drilling are not relied upon for ore grade estimation. Instead, grade determined from routinely collected in-mine ore zone samples are found to be most reliable. The long-term average from in-mine tends to best represent the larger ore zone as it normalizes local variability.
23
Thousands of in-mine ore grade samples were collected at Allan to the end of December 2024 (discussed further in section 11.2). All in-mine samples were analysed in the Allan mill laboratory using analysis techniques that were up-to-date for the era in which the sample was collected.
Regarding quality assurance for analytical results, the Company participates in the Canpotex Producer Sample Exchange Program using methods developed by the Saskatchewan Potash Producers Association (SPPA). The Sample Exchange Program monitors the accuracy of analytical procedures used in its labs. In the early 1970s, the SPPA initiated a round-robin Sample Exchange Program, the purpose of which was to assist the potash laboratories in developing a high level of confidence in analytical results. This program, now named the Canpotex Producer Sample Exchange Program using SPPA Methods (CPSEP), has continued up to the present. Current participants include all Canpotex member potash mine site labs, the Nutrien Pilot Plant Lab, and independent third-party surveyor labs. The CPSEP provides participants with three unknown potash samples for analysis quarterly. Results for the unknown sample analysis are correlated by an independent agency that distributes statistical analysis and a summary report to all participants. Completed exchange program samples can be used for control standards as required in QA/QC sections of standard analytical procedures.
The Nutrien Pilot Plant is secured in the same way as modern office buildings are secured. Authorized personnel have access and visitors are accompanied by staff. No special security measures are taken beyond that. Currently, no external laboratory certification is held by the Nutrien Pilot Plant. On occasion, product quality check samples are sent to the Saskatchewan Research Council (SRC), a fully certified analytical facility.
In the opinion of the authors, the sample preparation, security, and analytical procedures are acceptable, are consistent with industry-standard practices, and are adequate for Mineral Resource and Reserve estimation purposes.
| 11.2 | MEAN POTASH MINERAL GRADE FROM IN-MINE SAMPLES |
At Allan, in-mine grade samples are taken by collecting fine “muck” from the floor of the mine (i.e. grab sampling) approximately once per week per active mining face. This is roughly equivalent to a sample taken every 68 m to 74 m in production panels, and a sample taken every 85 m to 128 m in development panels. Since start-up in 1968 through to the end of 2024, a total of 7,967 in-mine potash mineral grade samples were collected from the Allan A Zone, the main potash horizon at Allan. All samples were analysed in the Allan mill laboratory using analysis techniques that were up-to-date for the era in which the sample was collected. Figure 14 shows a histogram of A Zone in-mine grade sample results from the Allan mine.

Figure 14: Histogram of potash ore grade from Allan in-mine grade samples (data from 1968 through to the end of 2024).
The median ore grade for this family of in-mine samples is 25.3% K2O equivalent and the mean ore grade is 24.5%. The five-year (2020 – 2024) mean ore grade is 21.9% K2O equivalent and was determined from 692 samples.
This is considered to be a more representative estimate of expected potash ore grade at Allan than drillhole assay results presented in Section 10.0.
For the B Zone at Allan, mineral grade is reported to be 20.2% K2O equivalent, the grade observed from thousands of in-mine samples at the Lanigan mine where the B Zone has been extensively mined.
24
Even though Allan mine is some distance from Lanigan, this is considered the best estimate of expected mineral grade for this potash layer because the deposit is known to be regionally continuous from west of Vanscoy to east of Lanigan (Fuzesy, 1982 and references therein). Although it is possible that once mining proceeds into the B Zone the reported grade could change from what is reported, it is expected that any such change would be minimal.
| 11.3 | POTASH ORE DENSITY FROM IN-MINE MINERAL GRADE MEASUREMENTS |
An estimate of in-situ rock density is used to calculate potash mineralization volumes in Mineral Resource and Reserve assessments. A common approach, and the one used by Nutrien, is to determine in-place Mineral Resource and Reserve volumes (m3), then multiply this number by in-situ bulk-rock density (tonnes / m3) to give in-place Mineral Resource and Reserve tonnes.
Well-log data from drillholes can be used to calculate bulk density if accurate and calibrated well-logs are acquired during exploration drilling. In practical terms, modern well-logs tend to meet these criteria, but historic well-logs (collected before the 1990s) do not. In Saskatchewan, almost all potash exploration drilling took place in the 1950s and 1960s, well before density logs were accurate and reliable.
Another approach, and the one used by Nutrien, is to look up density values for the minerals which constitute potash rock – values determined in a laboratory to a high degree of accuracy and published in reliable scientific journals / textbooks – then apply these densities to the bulk rock. Given that the density of each pure mineral is quantified and known, the only variable is what proportion of each mineral makes up the bulk rock. An obvious benefit of this approach is that a mean value computed on the in-mine samples shown in Figure 14 has a much greater confidence interval than a mean value computed from just a few drillhole assays.
The four main mineralogical components of the ore zones of Saskatchewan’s Prairie Evaporite Formation with their respective mineral densities are:
| Mineral |
Density (kg / m3) |
Components |
||||
| Halite | 2,170 | NaCl | ||||
| Sylvite | 1,990 | KCl | ||||
| Carnallite | 1,600 | KMgCl3 · 6(H2O) | ||||
| Insolubles | 2,510 | Anhydrite, dolomite, quartz, muscovite, and other minor mineral components (Nutrien Pilot Plant, 2018) |
All Nutrien potash mines measure and record the in-mine % K2O grade and insoluble content of the mined rock. The magnesium content is not measured at Allan since carnallite is a negligible component of the ore here. From this set of measurements, density of the ore can be calculated.
The value for insoluble density is based on known densities of the constituent parts of the insoluble components of the mineralization and the average occurrence of these insoluble components, which is known from over 50 years of mining experience at Allan. Assuming the lowest plausible density of insolubles known for Saskatchewan potash deposits of this nature, the effect upon overall bulk-rock ore density and Mineral Resource and Reserve calculations would be negligible.
From thousands of in-mine samples taken at Allan, bulk density has been determined to be:
= (halite density * % halite) + (sylvite density * % sylvite) + (insolubles density * % insolubles)
= (2,170 kg / m3 * 56.1%) + (1,990 kg / m3 * 38.8%) + (2,510 kg / m3 * 5.1%)
= 2,117 kg / m3
RHObulk-rock (Allan A Zone) = 2,117 kg / m3 = 2.12 tonnes / m3
This method is as accurate as the ore grade measurements and mineral density estimates.
Not enough test mining of the B Zone has been conducted at Allan to permit a bulk density calculation based on Allan in-mine grade samples. If test mining of the B Zone at Allan is conducted in future, there may be enough samples with all constituent minerals measured to warrant a change from what is reported. It is expected that any such change would have only a minimal effect on bulk-rock density used in tonnage calculations.
Instead, the potash bulk-rock density is calculated using thousands of in-mine grade samples from Lanigan B Zone:
25
RHObulk-rock (Allan B Zone) = RHObulk-rock (Lanigan B Zone) = 2,120 kg / m3 = 2.12 tonnes / m3
This estimate is considered acceptable since both Allan B Zone and Lanigan B Zone are the same potash seam. Should the Allan B Zone bulk density change from the predicted value of 2,120 kg / m3, the later defined Allan B Zone Mineral Resources and Reserves in Sections 14.2 and 15.2 will also change, albeit, insignificantly.
| 12.0 | DATA VERIFICATION |
| 12.1 | ASSAY DATA |
Most of the original drillhole assays were studied by independent consultant David S. Robertson and Associates (1978). Recently, drillhole core is prepared for sampling by Nutrien staff and, generally, sent to SRC Geoanalytical Laboratory for independent analyses.
The original assay results for core samples from historical drillholes were taken as accurate in these studies, as there is no way to reliably reanalyse these samples. Most of the remaining samples in storage have long since deteriorated to the point where they are not usable.
Ore grades of in-mine samples are measured in-house at the Allan mine laboratory by Company staff using modern, standard chemical analysis tools and procedures; an independent agency does not verify these results. However, check sampling through the CPSEP, discussed in Section 11.1, does occur.
It should be noted that assay results from historical drillholes match in-mine sample results reasonably well even though drillhole sample spacing is much greater. This correlation is further validation of the in-mine sampling methodology. Mean mineral grade determined from in-mine samples taken over decades of mining at Allan is thought to provide the most accurate measurement of potash grade for the Allan mine, also providing a good basis for estimating ore grade in areas of future mining at Allan.
| 12.2 | EXPLORATION DATA |
The purpose of any mineral exploration program is to determine extent, continuity, and grade of mineralization to a certain level of confidence and accuracy. For potash exploration, it is important to minimize the amount of cross-formational drilling, since each drillhole is a potential conduit for subsurface groundwater from overlying (or underlying) water-bearing formations into future mine workings. Every potash test drillhole from surface sterilizes potash mineralization as a safety pillar is required around every surface drillhole once underground mining commences.
Initial sampling and assaying of cores were done during potash exploration at Allan in the 1950s and 1960s. Methods were consistent with standard procedures for that era. The mine began production in 1968 and test drilling conducted after that was largely for the purpose of better understanding the caprock rather than potash mineralization. This approach to potash sampling is in accordance with widely accepted industry practice for areas adjacent and contiguous to an existing operating potash mine.
Assay of physical samples (drillhole cores and/or in-mine samples) is the only way to gain information about mineral grade, but extent and continuity of mineralization are correctly determined using data collected from seismic surveys correlated with drilling information. To date, surface seismic data at Allan have been collected, analysed, and verified by Company staff, at times, in cooperation with independent consultants.
Data for the Mineral Resource and Reserve estimates for Allan mine reported in Sections 14.0 and 15.0 were verified by Company staff as follows:
| • | Review of potash assay sample information (drillholes and in-mine grade samples), |
| • | Review and verify procedures used for in-mine grade sampling and laboratory analysis, |
| • | Review of surface geophysical exploration results (3D and 2D seismic data), |
| • | Crosscheck of mined tonnages reported by mine site technical staff with tonnages estimated from mine survey information, and |
| • | Crosscheck of Mineral Resource and Mineral Reserve calculations carried out by corporate technical staff. |
In the opinion of the authors, this approach to data verification of potash mineral grade and surface seismic information is in accordance with generally accepted industry practice for areas adjacent and contiguous to an existing operating potash mine.
26
| 13.0 | MINERAL PROCESSING AND METALLURGICAL TESTING |
At Allan, potash ore has been mined and concentrated using flotation and crystallization methods to produce saleable quantities of high-grade finished potash products since 1968.
Since opening in 1968, 192.352 million tonnes of potash ore have been mined and hoisted at Allan to produce 67.990 million tonnes of finished potash products. Given this level of sustained production over several decades, basic mineralogical processing and prospective metallurgical testing of Allan potash is not considered relevant.
See also Section 17.0.
| 14.0 | MINERAL RESOURCE ESTIMATES |
| 14.1 | DEFINITIONS OF MINERAL RESOURCE |
The CIM has defined Mineral Resource in The CIM Definition Standards for Mineral Resources and Reserves (2014) as:
| 1) | Inferred Mineral Resource: that part of a Mineral Resource for which quantity and grade or quality are estimated on the basis of limited geological evidence and sampling. Geological evidence is sufficient to imply but not verify geological and grade or quality continuity. |
| 2) | Indicated Mineral Resource: that part of a Mineral Resource for which quantity, grade or quality, densities, shape, and physical characteristics are estimated with sufficient confidence to allow the application of Modifying Factors in sufficient detail to support mine planning and evaluation of the economic viability of the deposit. Geological evidence is derived from adequately detailed and reliable exploration, sampling and testing and is sufficient to assume geological and grade quality continuity between points of observation. |
| 3) | Measured Mineral Resource: that part of a Mineral Resource for which quantity, grade or quality, densities, shape, and physical characteristics are estimated with confidence sufficient to allow the application of Modifying Factors to support detailed mine planning and final evaluation of the economic viability of the deposit. Geological evidence is derived from detailed and reliable exploration, sampling and testing and is sufficient to confirm geological and grade or quality continuity between points of observation. |
CIM defines Modifying Factors as “considerations used to convert Mineral Resources into Mineral Reserves. These include, but are not restricted to, mining, processing, metallurgical, infrastructure, economic, marketing, legal, environmental, social and governmental factors.”
In south-central Saskatchewan, where geological correlations are straightforward, and within a (potash) subsurface mineral lease at an operating potash mine, Mineral Resource categories are generally characterized by Nutrien as follows:
| 1) | Inferred Mineral Resource: areas of limited exploration, such as areas that have been investigated through regional geological studies, or areas with 2D regional surface seismic coverage, little or no drilling, at some distance from underground workings, and within Crown Subsurface Mineral Lease KL 112R C. |
| 2) | Indicated Mineral Resource: areas of adequate exploration, such as areas with 3D surface seismic coverage, little or no drilling, at some distance from underground workings, and within Crown Subsurface Mineral Lease KL 112R C. |
| 3) | Measured Mineral Resource: areas of detailed, physical exploration through actual drilling or mine sampling, near existing underground workings, and within Crown Subsurface Mineral Lease KL 112R C. |
The mine began production in 1968 and test drilling conducted after that was largely for the purpose of better understanding the caprock rather than potash mineralization. Instead, exploration involved collecting surface seismic data, which became better in quality over the years. Exploration drilling has demonstrated the presence of the potash horizon, and seismic coverage shows the continuity of the Prairie Evaporite Formation within which the potash horizon occurs.
27
Along with this approach, analysis of in-mine samples for potash grade has provided an observation-based understanding of the potash mineralized zone at Allan that is far superior to the level of understanding provided by any surface drilling-based exploration program. The authors believe that this approach provides a body of information that guides and constrains exploration inferences in a much better way than could be achieved from any conventional exploration investigation in areas immediately surrounding, and contiguous to, the Allan potash mine.
| 14.2 | ALLAN POTASH RESOURCE CALCULATIONS |
Exploration information used to calculate reported Mineral Resource tonnages at Allan consist of both physical sampling (drillhole and in-mine) and surface seismic (2D and 3D) as discussed in earlier sections. Based on the definitions and guidelines in Section 14.1, all mineral rights leased or owned by the Company, and within Crown Subsurface Mineral Lease KL 112R C, are assigned to one of the three Mineral Resource categories.
Mineral Resources are reported as mineralization in-place and are exclusive of Mineral Reserves. In-place tonnes were calculated for each of the Mineral Resource categories using the following parameters:
| Mining Height: | 3.35 m (11 feet) | |
| Ore Density: | 2.12 tonnes / m3 (A Zone) | |
| Ore Density: | 2.12 tonnes / m3 (B Zone) |
The Mineral Resources for Allan, as of December 31, 2024, are as follows:
Allan A Zone:
| Inferred Resource |
1,197 | millions of tonnes | ||||||
| Indicated Resource |
2,157 | millions of tonnes | ||||||
| Measured Resource |
1,625 | millions of tonnes | ||||||
|
|
||||||||
| Total A Zone Resource |
4,979 | millions of tonnes | ||||||
Allan B Zone:
| Inferred Resource |
1,197 | millions of tonnes | ||||
| Indicated Resource |
2,157 | millions of tonnes | ||||
| Measured Resource |
2,168 | millions of tonnes | ||||
|
|
||||||
| Total B Zone Resource |
5,522 | millions of tonnes | ||||
Total for Allan (A Zone + B Zone):
| Inferred Resource |
2,394 | millions of tonnes | ||||
| Indicated Resource |
4,314 | millions of tonnes | ||||
| Measured Resource |
3,793 | millions of tonnes | ||||
|
|
||||||
| Total A Zone + B Zone Resource |
10,501 | millions of tonnes | ||||
Allan Mineral Resources are plotted in Figure 15.
The average mineral grade of the Allan A Zone Mineral Resource is 24.5% K2O equivalent and was determined from thousands of in-mine samples at Allan. The average mineral grade of the Allan B Zone Mineral Resource is 20.2% K2O equivalent and was determined from thousands of in-mine samples at Lanigan mine where the B Zone has been extensively mined. See Section 11.2 for more detail.
The tonnage reported in the Allan A Zone Measured Resource is comprised of the potash that is within 1.6 km (1 mile) of a physically sampled location (i.e. drillholes or mine workings). Also included as Measured Resource is the potash in the pillars of mined-out areas of the Allan mine that is not already accounted for in the Proven Reserve estimation as there is the possibility of retrieving ore from the remnant mining pillars at some point in the future.
Portions of the B Zone that are immediately underlying the Proven and Probable A Zone Mineral Reserve as well as portions of the B Zone that are immediately underlying drillholes and the 1.6 km (1 mile) buffer placed around drillholes have been classified as Measured Resource.
28

Figure 15: Map showing Allan Mineral Resource as of December 2024.
| 15.0 | MINERAL RESERVE ESTIMATES |
| 15.1 | DEFINITIONS OF MINERAL RESERVE |
The CIM has defined Mineral Reserve in The CIM Definition Standards for Mineral Resources and Reserves (2014) as:
| 1) | Probable Mineral Reserve: the economically mineable part of an Indicated, and in some circumstances, a Measured Mineral Resource. The confidence in the Modifying Factors applying to a Probable Mineral Reserve is lower than that applying to a Proven Mineral Reserve. |
| 2) | Proven Mineral Reserve: the economically mineable part of a Measured Mineral Resource. A Proven Mineral Reserve implies a high degree of confidence in the Modifying Factors. |
CIM defines Modifying Factors as “considerations used to convert Mineral Resources into Mineral Reserves. These include, but are not restricted to, mining, processing, metallurgical, infrastructure, economic, marketing, legal, environmental, social and governmental factors.”
For Saskatchewan, in regions adjacent and contiguous to an operating potash mine and within a (potash) subsurface mineral lease, Mineral Reserve categories are characterized by Nutrien as follows:
| 1) | Probable Mineral Reserve: identified recoverable potash mineralization classified as a Measured Resource, within a 1.6 km (1 mile) radius of a sampled mine entry or exploration drillhole contiguous to mine workings, |
29
| and within Crown Subsurface Mineral Lease KL 112R C. |
| 2) | Proven Mineral Reserve: identified recoverable potash mineralization classified as a Measured Resource, delineated on at least three sides by sampled mined entries or exploration drillholes to a maximum of 3.2 km (2 miles) apart, and within Crown Subsurface Mineral Lease KL 112R C. |
Along with this approach, analysis of in-mine samples for potash grade has provided an observation-based understanding of the potash mineralized zone at Allan that is far superior to the level of understanding provided by any surface drilling-based exploration program. An understanding of the amount of ore that can be conventionally mined from the Measured Resource category using current mining practices comes from over 50 years of potash mining experience at Allan.
| 15.2 | ALLAN POTASH RESERVE CALCULATIONS |
Using the definitions outlined in Section 15.1, a portion of the Allan A Zone Measured Resource has been converted to Mineral Reserve. The assigned Mineral Reserve category is dependent on proximity to sampled mine entries also described in Section 15.1. An overall extraction ratio for the Allan mine has been applied to the qualifying areas outlined as Measured Resource in Figure 15. This extraction ratio is significantly lower than the local extraction ratio described in Section 16.1, as it takes into account areas which cannot be mined due to unfavorable geology.
The overall extraction ratio at the Allan mine is 28%. It was derived by dividing the total ore tonnes mined to date by the tonnage equivalent of the total area of the mine workings (i.e. the perimeter around the mine workings) less future mining blocks. This extraction ratio has been applied to the Probable Reserve, an area where no mining has occurred to date. To remain conservative in our estimations, and because a considerable amount of mining has already occurred in the Proven Reserve area, this extraction ratio has been applied only to the portion of the Proven Reserve that is anticipated to be mined in future. Future mining blocks within the Proven Reserve area vary from year-to-year as production continues. Pillars remaining that are not planned for mining remain a Measured Resource. Since an extraction ratio has been applied, Mineral Reserves are considered recoverable ore, and are reported as such. Note that only drillholes whose 1.6 km radii are contiguous to mine workings or the 1.6 km radius placed around mine workings are used to compute probable mineral reserve. The remaining non-contiguous drillholes remain in the Measured Resource category.
At times, irregular mining which resembles development mining occurs to support operational requirements (e.g. egress) or as geological conditions necessitate. While irregular mining increases confidence in the Mineral Resource by way of physical sampling, it can add considerable Mineral Reserve to broad areas not otherwise covered (or planned to be covered) by mine workings. Again, to remain conservative in our estimations, certain irregular mining may not have been converted from Measured Resource to Proven Reserve.
The Mineral Reserves for Allan as of December 31, 2024, are as follows:
Allan A Zone:
| Probable Reserve |
260 | millions of tonnes | ||||
| Proven Reserve |
99 | millions of tonnes | ||||
|
|
||||||
| Total A Zone Reserve |
359 | millions of tonnes | ||||
Allan B Zone:
| Probable Reserve |
nil | |||
| Proven Reserve |
nil | |||
|
|
||||
| Total B Zone Reserve |
nil | |||
Total for Allan (A Zone + B Zone):
| Probable Reserve |
260 | millions of tonnes | ||||
| Proven Reserve |
99 | millions of tonnes | ||||
|
|
||||||
| Total A Zone and B Zone Reserve |
359 | millions of tonnes | ||||
Allan Mineral Reserves are plotted in Figure 16.
The average mineral grade of the Allan A Zone Mineral Reserve is 24.5% K2O equivalent and was determined from thousands of in-mine samples at Allan.
30

Figure 16: Map showing Allan Mineral Reserve to December 2024.
| 16.0 | MINING METHOD |
| 16.1 | MINING OPERATIONS |
All conventional potash mines in Saskatchewan operate at 900 m to 1,200 m below surface within 9 m to 30 m of the top of the Prairie Evaporite Formation. Over the scale of any typical Saskatchewan potash mine, potash beds are tabular and regionally flat-lying, with only moderate local variations in dip. At Allan, potash ore is mined using conventional mining methods, whereby:
| • | Shafts are sunk to the potash ore body; |
| • | Continuous mining machines cut out the ore, which is hoisted to surface through the production shaft; |
| • | Raw potash is processed and concentrated in a mill on surface; and |
| • | Concentrated finished potash products (near-pure KCl) are sold and shipped to markets in North America and offshore. |
Sinking of the two original shafts (Shaft #1 and Shaft #2) from surface to the potash zone was completed in early 1968, and the first potash ore was hoisted in April of that year. The Allan mine has run on a continuous basis since the first ore was hoisted in 1968, other than short-term shutdowns taken for inventory management purposes or occasional plant maintenance and construction work, or other outages that are typical for operations of this nature.
In recent years, the Allan mine underwent a major expansion which brought the nameplate capacity up to 4.0 million tonnes of finished potash products per year. The operational capability at the Allan facility in 2024, was 2.4 million tonnes per year.
31
Virtually all Allan underground mining rooms are in one potash mineralized zone, the upper layer (or A Zone) of the Patience Lake Member of the Prairie Evaporite Formation (the host evaporite salt). Saskatchewan potash geology is illustrated in Figure 17. At Allan, mine elevations range from approximately 980 m to 1,120 m depth below surface. These depths to A Zone potash mineralization are anticipated over most of the Allan lease area. Mine workings are protected from aquifers in overlying formations by approximately 12 m of overlying salt and potash beds, along with salt plugged porosity in the Dawson Bay Formation, a carbonate layer lying immediately above potash hosting salt beds.
The Allan mine is a conventional underground mining operation whereby mining machines are used to excavate the potash ore by the stress-relief mining method. Continuous conveyor belts transport ore from the mining face to the bottom of the production shaft. Mining methods employed in Saskatchewan are discussed in Jones and Prugger (1982) and in Gebhardt (1993). The highest mineral grade section of the Allan potash seam is approximately 3.35 m (11’) thick, with gradations to lower grade salts immediately above and below the mining horizon. The actual mining thickness at Allan is dictated by the height of mining machines used to cut the ore. There are two types of mining machines at Allan; nine which are designed to cut at a thickness of 3.35 m (11’) and six which are designed to cut 3.65 m (12’).
As discussed in Section 10.0, Allan cuts to a marker (clay) seam that is slightly above the high-grade mineralized zone to establish a safe and stable mine roof. The top marker seam is slightly overcut by 10 cm to 20 cm. Clay seams are often planes of weakness, and if they are undercut, material immediately below the clay seam becomes a hazard as it may separate and fall. Since the hazard must be remediated prior to proceeding, thus slowing production, the moderately diluted mineral grade that results from the overcutting is preferable from a safety point of view.

Figure 17: Schematic cross-section through the Prairie Evaporite Formation, illustrating mining horizons at each of Nutrien’s conventional potash operations.
Conservative local extraction ratios (never exceeding 45% in any mining block) are employed at all Saskatchewan mines, including Allan, to minimize potential detrimental effects of mining on overlying strata; this is common practice in flat-lying, tabular ore bodies overlain by water-bearing layers.
From the shaft-bottom, potash ore is hoisted approximately 1,000 m from the potash level through the vertical shafts to a surface mill. In addition to hoisting potash ore to surface, the production shaft also provides fresh air ventilation to the mine and serves as a secondary egress. The Service Shaft is used for service access, and exhaust ventilation from the mine.
32
Since production began in 1968, 192.352 million tonnes of potash ore have been mined and hoisted at Allan to produce 67.990 million tonnes of finished potash products. The life-of-mine average concentration ratio (raw ore / finished potash products) is 2.83 and the overall extraction ratio over this period is 28%.
Actual potash production tonnages for the Allan mine, along with concentration ratios (tonnes mined / tonnes product), are plotted for the past decade in Figure 18.


33
| Figure | 18 |
Figure 18: Mined tonnes, product tonnes, and concentration ratio for the Allan mine over the past 10 years.
| 16.2 | RISKS TO POTASH MINING OPERATIONS, WITH EMPHASIS ON WATER INFLOWS |
The mining of potash is a capital-intensive business, subject to the normal risks and capital expenditure requirements associated with mining operations. The production and processing of ore may be subject to delays and costs resulting from mechanical failures, physical hazards such as fires, and other hazards such as: unusual or unexpected geological conditions, significant subsidence, brine inflows and gas seepages of varying degree, and other situations associated with any potash mining operation.
Potash beds in all regions of Saskatchewan are overlain by a number of water-bearing formations, and there are water zones underlying the potash beds as well. A water inflow into mine workings is generally significant in a potash mine since salt dissolves in water; an inflow can lead to anything from increased costs at best to closure of the mine at worst (e.g. see Prugger and Prugger, 1991).
When sinking of the Allan Shaft #1 was near the bottom of the Blairmore Formation at approximately 570 m depth, a breach developed in the ice wall and the shaft was flooded (Prugger and Prugger, 1991). A concrete plug was installed in the shaft bottom (underwater), and two additional freeze holes were drilled to seal the area of the breach and allow recovery of the shaft. The shaft was completed in 1968. In the mid-1990s the concrete shaft liner in an area of the Allan production shaft had deteriorated to the point where it required replacement. The concrete in the 671 m to 750m (2,203’ to 2,463’) level was replaced with iron tubbing segments in 1999, successfully repairing the shaft through this area. Small scale shaft liner repairs have since occurred in both the production and service shafts as part of an ongoing maintenance program. At present, inflow into the existing shafts is estimated at 23 litres / minute (6 US gallons / minute) for the Service Shaft and 117 litres / minute (31 US gallons / minute) for the Production Shaft.
There has not been any significant water ingress into underground workings at Allan since production began in 1968, other than several temporary nuisance connate brine inflows. At present, brine ingress into underground mine workings at Allan is negligible.
In 2022, a gas seepage developed in an active mining panel where gas was found to be coming out of cracks in the floor. The composition of the inert gas is dominated by nitrogen (which is harmless). To ensure ongoing workplace safety, the panel was abandoned. Given this occurrence, and a smaller gas seepage nearby in 2020, the decision was made to curtail mining in the area until the source of the gas is characterized, and controls are established for degassing should further seepages develop. To date, the mine ventilation system continues to function normally, and these gas seepages have had no impact on production at the Allan mine.
| 17.0 | RECOVERY METHODS |
At Allan, potash ore has been mined and concentrated to produce saleable quantities of high grade finished potash products since 1968. Products include granular, standard, soluble and chicklets which are used for agricultural application and industrial purposes.
Both flotation methods and crystallization methods are used to concentrate potash ore into finished potash products at the Allan mill.
34
A simplified process flow diagram is shown in Figure 19. Raw potash ore is processed on surface, and concentrated finished potash products (near-pure KCl) are sold and shipped to markets in North America and offshore.

Figure 19: Simplified flow diagram for potash flotation and crystallization milling methods used at Allan.
Over the past three years, production of finished potash products at Allan was:
2022: 2.501 million tonnes finished potash products at 61.18% K2O (average grade)
2023: 2.392 million tonnes finished potash products at 61.20% K2O (average grade)
2024: 2.397 million tonnes finished potash products at 61.16% K2O (average grade)
Over the past decade actual mill recovery rates have been between 85.6% and 88.2%, averaging 86.7% (see Figure 20). Given the long-term experience with potash geology and actual mill recovery at Allan, no fundamental potash milling problems are anticipated in the foreseeable future.
Quality control testing and monitoring geared towards fine-tuning and optimizing potash milling and concentrating processes are conducted on a continual basis at all Nutrien minesites and at Nutrien research facilities. At Allan, this is no exception; test work to optimize circuit performance and ensure product quality is carried out on an ongoing basis.

Figure 20: Allan mill recovery rate over the past 10 years.
35
| 18.0 | PROJECT INFRASTRUCTURE |
Infrastructure is in place to meet current and projected requirements for transportation, energy (electricity and natural gas), water and process materials at Allan. See also Section 5.0.
The Allan mine is served by a number of villages within 50 km of the mine site. The nearest city is Saskatoon (approximately 45 km distant).
The Allan surface facilities are accessed by existing paved roads and highways that are part of the Saskatchewan Provincial Highway System. All finished potash products are shipped by rail over existing track.
At present, high voltage power capacity at the Allan is 52 MVA. The ten-year projection of power utilization indicates that the utility can meet all foreseeable future demand.
The Allan operation requires a sustained fresh water supply for the milling process which is provided from a local reservoir called the Bradwell Reservoir (approximately 6 km distant). This provincially licensed water supply provides a source of process water for Allan milling operations and usage is regulated by terms of the license issued by the Water Security Agency.
| 19.0 | MARKET STUDIES AND CONTRACTS |
Potash from Company mines (including Allan) has been sold on a continuous basis since mining began in 1968. At present, Nutrien products are sold in more than 50 countries, to three types of end-use:
| 1. | Fertilizer, focused on balanced plant nutrition to boost crop yields to meet the world’s ever-increasing appetite for food (nitrogen, phosphate, potash) |
| 2. | Feed Supplements, focused on animal nutrition (mainly phosphate) |
| 3. | Industrial, focused on products for high-grade food, technical and other applications (nitrogen, phosphate, as phosphoric acid, potash) |
The Company owns and operates six potash mines in Saskatchewan and a potash mine in New Brunswick, Canada, which no longer produces potash and was permanently closed in 2018. Over the past three years (2022, 2023, 2024) the Company had potash sales of 39.639 million tonnes. Historical Company potash sales data for the past 10 years are plotted in Figure 21 and Figure 22.
Potash is mainly used for fertilizer, which typically makes up approximately 90% of the company’s annual potash sales volumes. By helping plants develop strong root systems and retain water, it enhances yields and promotes greater resistance to disease and insects. Because it improves the taste and nutritional value of food, potash is often called the “quality nutrient.” Industrial applications of potash include use in soaps, water softeners, de-icers, drilling muds and food products.
Potash fertilizer is sold primarily as solid granular and standard products. Granular product has a larger and more uniformly shaped particle than standard product and can be easily blended with solid nitrogen and phosphate fertilizers. It is typically used in more advanced agricultural markets such as the US and Brazil.
Most major potash consuming countries in Asia and Latin America have limited or no indigenous production capability and rely primarily on imports to meet their needs. This is an important difference between potash and the other major crop nutrient businesses. Trade typically accounts for more than three-quarters of demand for potash, which ensures a globally diversified marketplace.
The most significant exporters are producers with mines in the large producing regions of Canada, the Middle East, and the former Soviet Union, which all have relatively small domestic requirements.
36

Figure 21: Historical Company potash sales 2015 to 2024 in million tonnes / year.*

Figure 22: Historical Company potash net sales 2015 to 2024 in million USD $ / year.*
World consumption of potash fertilizer has grown over the last decade, with the primary growth regions being developing markets in Asia and Latin America. These are countries with expanding crop production requirements, where potash has historically been under-applied and crop yields lag behind those of the developed world. Although temporary pauses can occur in certain countries, the underlying fundamentals of food demand that encourage increased potash application are expected to continue the growth trends in key importing countries. See Figure 23 for world potash production and demand in 2024.
| * | Company sales data for years prior to 2018 includes only PotashCorp sales. |
37

Figure 23: World potash production and demand for 2024E.
Potash is used on many agricultural commodities. Wheat, rice, corn, oilseed, and sugar crops consume over half of the potash used worldwide. Fruits and vegetables are also important users of potash fertilizers, accounting for about 19 percent of the total consumption. The remainder goes to other consumer and industrial crops such as oil palm, rubber, cotton, coffee, and cocoa. See Table 4 for primary potash market profile. This diversity means that global potash demand is not tied to the market fundamentals for any single crop or growing region.
| Table | 4: Primary Potash Market Profile |
| Country/Region |
Growth Rate* |
Key Consuming Crops |
||
| China |
3.4% | Vegetables, rice, fruits, corn | ||
| India |
-0.5% | Rice, wheat, vegetables, sugar crops | ||
| Other Asia |
2.8% | Oil palm, rice, sugar crops, fruits, vegetables | ||
| Latin America |
5.1% | Soybeans, sugar crops, corn | ||
| North America |
3.2% | Corn, soybeans |
| * | 5-year CAGR for consumption (2019-2024E) |
Global potash shipments are estimated to have reached record levels at approximately 72.5 million tonnes in 2024, an increase of about 4.5 million tonnes from the previous year. Potash consumption has grown at an annualized rate of 2.6 percent over the past 5 years, driven by strong potash consumption trends in all major potash markets.
North American and South American growers applied significant amounts of potash to replenish soil nutrients removed by large harvests. Potash application rates are increasing in China and Southeast Asian countries as a result of increased soil testing and improved agronomic practices, along with a renewed focus on food security in China. Growers in these countries are also increasing acreage of potassium-intensive crops such as fruits, vegetables, and oil palm. India continues to face political barriers to significantly growing potash demand, however, the agronomic need and willingness of farmers to improve yields persists. The Company believes that supportive agriculture fundamentals and the need to address declining soil fertility levels will enable strong demand growth in the years ahead. World potash shipments and consumption in recent years is shown in Figure 24.
38

Figure 24: World potash shipments and consumption, 2019-2024E.
Canpotex Limited (Canpotex), the offshore marketing company owned by the Company and another Saskatchewan potash producer, handles all sales, marketing and distribution of potash produced by its member companies to customers outside of the US and Canada (including the potash produced at Allan).
In North America, Nutrien sells potash to retailers, cooperatives, and distributors, who provide storage and application services to farmers, the end-users. This includes sales to Nutrien’s retail distribution business, which has the largest retail distribution network in North America. Typically, the Company’s North American potash sales are larger in the first half of the year. The primary customers for potash fertilizer products for the Allan operation are retailers, dealers, cooperatives, distributors, and other fertilizer producers who have both distribution and application capabilities.
Nutrien’s market research group provides management with market information on a regular basis including global agriculture and fertilizer markets, demand and supply in fertilizer markets and general economic conditions that may impact fertilizer sales. These may include specific market studies and analyses on different topics as may be required. This information is reviewed on a regular basis and the author of this report takes this information into account in understanding the markets and the assumptions within this report.
Plans and arrangements for potash mining, mineral processing, product transportation, and product sales are established by Nutrien and are within industry norms.
| 20.0 | ENVIRONMENTAL STUDIES, PERMITTING, AND SOCIAL OR COMMUNITY IMPACT |
The tailings management strategy at all Nutrien potash mines in Saskatchewan, including Allan, is one of sequestering solid mine tailings in an engineered and provincially licenced TMA near the surface plant site. The Allan TMA currently covers an area of approximately 600 hectares (1,483 acres) of land owned by the Company. Solid potash mine tailings typically consist of 85% to 95% rock salt (NaCl) and 5% to 15% insolubles (carbonate mud = CaCO3, anhydrite mud = CaSO4, and clays like chlorite, illite, and so on). An engineered slurry-wall (in some portions, a compacted earth trench barrier) has been constructed where required around approximately half of the Allan TMA. In future years this wall can be expanded if required for operational needs. The slurry-wall provides secondary containment for any saline mine waters, minimizing brine impacts from the TMA to surrounding surface water bodies and near-surface aquifers. Areas surrounding the TMA are closely monitored: this includes everything from daily visual perimeter inspections to annual investigations and inspections of surrounding groundwater and aquifers.
Allan currently operates two brine disposal wells near the surface plant of the Allan mine (marked in Figure 25) where clear salt brine (i.e. no silt, insolubles, or other waste) is borehole-injected into the Winnipeg / Deadwood Formations, deep subsurface aquifers approximately 1,500 m to 1,700 m below the surface (marked in Figure 12). The disposal wells are provincially licensed and formation water in these extensive deep aquifers is naturally saline.
Emissions to air consisting primarily of particulate matter are kept below regulatory limits through various modern air pollution abatement systems (e.g.
39
dust collection systems built into mill processes) that are provincially licensed. This same procedure is followed at all Nutrien mines in Saskatchewan.
In Saskatchewan, all potash tailings management activities are carried out under an “Approval to Operate” granted by the Saskatchewan Ministry of Environment (MOE), the provincial regulator. Staff at the Allan mine actively monitor and inspect operations and routinely report the observations and measurements to the Environmental Protection Branch of MOE. The current Allan Approval to Operate has been granted to July 1, 2028, the renewal date.
In terms of long-term decommissioning, environmental regulations of the Province of Saskatchewan require that all operating potash mines in Saskatchewan create a long-term decommissioning and reclamation plan that will ensure all surface facilities are removed, and the site is left in a chemically and physically stable condition once mine operations are complete. The Company has conducted numerous studies of this topic, and the most recent decommissioning and reclamation plan for Allan was approved by MOE technical staff in January 2022. Because the current expected mine life for Allan is many decades into the future, it is not meaningful to come up with detailed engineering designs for decommissioning annually. Instead, decommissioning plans are reviewed every five years, and updated to accommodate new concepts, technological change, incorporation of new data, and adjustments of production forecasts and cost estimates. Any updated decommissioning and reclamation reports generated by this process are submitted to provincial regulatory agencies. For Allan, a revised decommissioning and reclamation plan is due to be submitted for MOE review in June 2026.
In addition to the long-term decommissioning plan, provincial regulations require that every potash producing company in Saskatchewan set up an Environmental Financial Assurance Fund, which is to be held in trust for the decommissioning, restoration, and rehabilitation of the plant site after mining is complete. This fund is for all mines operated by Nutrien in the province of Saskatchewan (i.e., Allan, Cory, Lanigan, Patience Lake, Rocanville, and Vanscoy).

Figure 25: Aerial photo showing the Allan surface operations, disposal wells, and Tailings Management Area.
40
| 21.0 | CAPITAL AND OPERATING COSTS |
The Allan mine has been in operation since 1968; in the years immediately preceding this, major capital investment was made to bring this mine into production. Since then, capital expenditures were made on a regular and ongoing basis to sustain production, and to expand production from time to time.
A major refurbishment and expansion of the Allan mine was completed in 2013, increasing nameplate capacity to 4.0 million tonnes of finished potash products per year. This work involved enhancement of hoists and shaft conveyances, major expansions of both mine and mill, improvements to loadout facilities, and some infrastructure improvements. All construction was carried out without significant disruption to existing potash production from the site.
| 22.0 | ECONOMIC ANALYSIS |
| 22.1 | FUNDAMENTALS |
The Company conducts ongoing and detailed economic analyses on each of its operations and on all aspects of its business. While the Company considers its operating costs and results on a per mine basis to be competitively sensitive and confidential information, the Company is confident that the economic analysis conducted routinely for each of the Company’s operating potash mines is complete, reasonable, and meets industry standards.
On a cash flow basis, The Company’s potash segment generated USD $14,647 million in net sales over the past three years (2022, 2023 and 2024) based on sales volume of 39.639 million tonnes of finished potash products. The annual average realized potash price for manufactured products (includes North American and offshore sales) over a 10-year period (2015 – 2024) is plotted in Figure 26.
Over the past three years (2022, 2023, and 2024 the Allan mine produced 7.290 million tonnes of finished potash products. In the past three years (2022, 2023, and 2024), the Allan mine accounted for 18% of total potash production at the Company over this period. Allan is currently making a positive contribution to the Company’s potash segment.
Given the Company’s previous history (including over 50 years of mining at the Allan operation), recent market conditions, and extensive reserve base, the economic analysis for Allan has met the Company’s internal hurdle rates.

Figure 26: Historic annual average realized potash price in USD / tonne.*
| * | Company sales data for years prior to 2018 includes only PotashCorp sales. |
41
| 22.2 | TAXES |
Royalties are paid to the Province of Saskatchewan in connection with the Company’s Potash operations, which holds most of the mineral rights in the lease areas, and royalties from Freehold lands are paid to various freeholders of mineral rights in the area. The Crown royalty rate is 3 percent and is governed by The Subsurface Mineral Royalty Regulations, 2017. The actual amount paid is dependent on selling price and production tonnes.
Municipal taxes are paid based on site property values to the applicable municipality in Saskatchewan. Saskatchewan potash production is taxed at the provincial level under The Mineral Taxation Act, 1983. This tax, governed by The Potash Production Tax Regulations, consists of a base payment and a profit tax, collectively known as the potash production tax. As a resource corporation in the Province of Saskatchewan, the Company is also subject to a resource surcharge equal to a percentage of the value of its resource sales (as defined in The Corporation Capital Tax Act of Saskatchewan). In addition to this, the Company pays federal and provincial income taxes based on corporate profits from all of its operations in Canada.
| 23.0 | ADJACENT PROPERTIES |
The Company’s Allan Lease KL 112R C is adjacent to the following Crown potash dispositions:
| • | Potash Corporation of Saskatchewan Inc. KL 109B (Nutrien Patience Lake) |
| • | Mosaic Potash Colonsay ULC KL 108 C |
| • | BHP Billiton Canada Inc. 100% KL 212, KL 213, and KL 224 |
Mosaic Potash Colonsay (Mosaic) operates a mine with extensive underground workings within Crown Subsurface Mineral Lease KL 108, which are immediately adjacent to Allan Lease KL 112R C. Nutrien and Mosaic each have a safety buffer between the two companies’ lease areas, where it is agreed that no mining will occur. This buffer ensures that mine workings in one company’s lease area will not impact workings of the other company.
| 24.0 | OTHER RELEVANT DATA AND INFORMATION |
Not applicable.
| 25.0 | INTERPRETATION AND CONCLUSIONS |
Nutrien has a long history of successful potash mining at Allan, where potash has been produced for over 50 years. The authors believe that the experience gained mining and milling potash for this length of time has produced a reliable body of information about potash mineralization, mining and milling at Allan.
In a Saskatchewan potash mine that has been producing for many decades, reduction of mine life through increased production is counter-balanced by development mining into new mineral land parcels. This increases mine life through increasing the potash Mineral Reserve.
For Allan, mine life can be estimated by dividing the total Mineral Reserve (Proven + Probable) of 359 million tonnes by the average annual mining rate (million tonnes of ore hoisted per year). For Allan, the mining rate is defined as equal to the actual three-year running average (consecutive, most recent years). The average mining rate at Allan over the last three years (2022, 2023 and 2024) was 6.789 million tonnes of potash ore mined and hoisted per year.
If this mining rate is sustained, and if Mineral Reserves remain unchanged, then the Allan mine life would be 53 years. This estimate of mine life is likely to change as mining advances further into new mining blocks, and / or if mining rates or mining methodologies change.
| 26.0 | RECOMMENDATIONS |
Not applicable for a potash mine that has been in operation since 1968.
42
| 27.0 | REFERENCES |
Companion Policy 43-101CP to National Instrument 43-101 Standards of Disclosure for Mineral Projects (2011). Retrieve this and related documents from many websites.
The CIM Definition Standards for Mineral Resources and Reserves (2014). Retrieve this and related documents from many websites.
Fuzesy, Anne (1982). Potash in Saskatchewan (44p). Saskatchewan Industry and Resources Report 181. https://publications.saskatchewan.ca/#/products/7307.
Gebhardt, E. (1993). Mine planning and design integration, CIM Bulletin, May 1993, pp. 41 – 49.
Government of Saskatchewan (2025). Saskatchewan Mining and Petroleum GeoAtlas. https://gisappl.saskatchewan.ca/Html5Ext/index.html?viewer=GeoAtlas. Accessed January 2025.
Government of Saskatchewan. The Corporation Capital Tax Act of Saskatchewan. Available online at http://www.qp.gov.sk.ca/documents/English/Statutes/Statutes/c38-1.pdf.
Government of Saskatchewan. The Mineral Taxation Act, 1983. Available online at http://www.qp.gov.sk.ca/documents/English/Statutes/Statutes/M17-1.pdf.
Government of Saskatchewan. The Potash Production Tax Regulations. Available online at https://publications.saskatchewan.ca/#/products/1263.
Government of Saskatchewan. The Subsurface Mineral Royalty Regulations, 2017. Available online at http://publications.gov.sk.ca/details.cfm?p=88223&cl=8.
Government of Saskatchewan. The Subsurface Mineral Tenure Regulations, 2015. Available online at http://www.publications.gov.sk.ca/details.cfm?p=72797.
Jones, P. R., and F. F. Prugger (1982). Underground mining in Saskatchewan potash. Mining Engineering, 34, pp. 1677 – 1683.
Nutrien Pilot Plant (2018). Personal communication on density of insoluble minerals in different ore zones.
Prugger, F.F., (1979), The flooding of the Cominco potash mine and its rehabilitation; CIM Bulletin, Vol. 72, No. 807, pp. 86 – 90.
Prugger, F. F. and A. F. Prugger (1991). Water problems in Saskatchewan potash mining – what can be learned from them? Bulletin of the Canadian Institute of Mining and Metallurgy (CIM Bulletin), Vol. 84, No. 945, pp. 58 – 66.
Robertson, David S., and Associates (1978). Summary Report on Evaluation of Potash Assets for Potash Corporation of Saskatchewan. Unpublished consultant’s report to Potash Corporation of Saskatchewan Inc.
Yang, C., Jensen, G., and Berenyi, J. (2009a). The Stratigraphic Framework of the Potash-rich Members of the Middle Devonian Upper Prairie Evaporite Formation, Saskatchewan; Summary of Investigations 2009, Volume 1, Saskatchewan Geological Survey.
43
Exhibit 99.2
NUTRIEN LTD.
CORY POTASH
NATIONAL INSTRUMENT 43-101 TECHNICAL REPORT ON
CORY POTASH DEPOSIT (KL 103 C),
SASKATCHEWAN, CANADA
FEBRUARY 20, 2025

PREPARED BY: JODI DERKACH, P. GEO.
CRAIG FUNK, P. ENG., P. GEO.
NUTRIEN LTD.
GEOSERVICES & LAND – POTASH ENGINEERING, TECHNOLOGY & CAPITAL
SUITE 1700, 211 19TH STREET EAST
SASKATOON, SASKATCHEWAN, CANADA
S7K 7G3
QUALIFIED PERSONS: JODI DERKACH, P. GEO. AND CRAIG FUNK, P. ENG., P. GEO.
DATE AND SIGNATURE PAGE
The scientific and technical information included in this report has been prepared under the supervision of persons who are ‘‘qualified persons’’ under Canadian National Instrument 43-101. Jodi Derkach, P. Geo. and Craig Funk, P. Eng., P. Geo. are the qualified persons who supervised the preparation of the information presented in this report and who verified the data disclosed herein.
| /s/ “Jodi Derkach” | ||||||||
| Signature | Jodi Derkach P. Geo. | |||||||
| Senior Manager, Land & Resource Nutrien Ltd. |
||||||||
| Date | February 20, 2025 | |||||||
| /s/ “Craig Funk” | ||||||||
| Signature | Craig Funk, P. Eng., P. Geo. | |||||||
| Director, GeoServices & Land Nutrien Ltd. |
||||||||
| Date | February 20, 2025 | |||||||
2
AUTHOR PAGE
The scientific and technical information included in this report has been prepared by, or under the supervision of, persons who are ‘‘qualified persons’’ under Canadian National Instrument 43-101.
Jodi Derkach, B. Sc., Cert. GIS, P. Geo. (APEGS Member # 14897)
| • | Senior Manager, Land & Resource—Engineering, Technology & Capital |
| • | B. Sc. (Geology), University of Saskatchewan, Saskatoon, Saskatchewan, Canada, 2007 |
| • | Geographic Information Science for Resource Management Certificate, Saskatchewan Polytechnic, Prince Albert, Saskatchewan, Canada, 2010 |
| • | with Nutrien or its subsidiaries since 2010 |
Craig Funk, B. Sc., M. Sc., P. Eng., P. Geo. (APEGS Member # 16034)
| • | Director, GeoServices & Land—Engineering, Technology & Capital |
| • | B. Sc. (Geological Engineering – Geophysics), University of Saskatchewan, Saskatoon, Saskatchewan, Canada, 1989 |
| • | M. Sc. (Geophysics), University of Saskatchewan, Saskatoon, Saskatchewan, Canada, 1992 |
| • | with Nutrien or its subsidiaries since 2008 |
are the qualified persons who supervised the preparation of all information presented in this report and who verified the data disclosed herein.
The team of persons who conducted the work presented within this report consists of:
Lisa MacKenzie, Cert. GIS
| • | Senior Advisor, Land—Engineering, Technology & Capital |
| • | Geographic Information Science for Resource Management Certificate, Saskatchewan Polytechnic, Prince Albert, Saskatchewan, Canada, 2012 |
| • | with Nutrien or its subsidiaries since 2012 |
Jennifer Nicolay Lawlor, B. Sc., P. Geo. (APEGS Member # 16167)
| • | Senior Advisor, Land & Resource – Engineering, Technology & Capital |
| • | B. Sc. (Geology), University of Regina, Regina, Saskatchewan, Canada, 2008 |
| • | with Nutrien or its subsidiaries since 2013 |
The authors would like to acknowledge the many staff who provided information and expert reviews on portions of this report, as well as past contributions of former (retired) staff Terrance Danyluk and Arnfinn Prugger.
3
TABLE OF CONTENTS
| DATE AND SIGNATURE PAGE | 2 | |||||||||
| AUTHOR PAGE | 3 | |||||||||
| TABLE OF CONTENTS | 4 | |||||||||
| LIST OF FIGURES | 6 | |||||||||
| LIST OF TABLES | 7 | |||||||||
| 1.0 | SUMMARY | 8 | ||||||||
| 2.0 | INTRODUCTION | 10 | ||||||||
| 3.0 | RELIANCE ON OTHER EXPERTS | 11 | ||||||||
| 4.0 | PROPERTY DESCRIPTION AND LOCATION | 11 | ||||||||
| 4.1. | General | 11 | ||||||||
| 4.2 | Mineral Rights |
12 | ||||||||
| 5.0 | ACCESSIBILITY, CLIMATE, LOCAL RESOURCES, INFRASTRUCTURE AND PHYSIOGRAPHY | 13 | ||||||||
| 6.0 | HISTORY | 14 | ||||||||
| 7.0 | GEOLOGICAL SETTING AND MINERALIZATION | 15 | ||||||||
| 8.0 | DEPOSIT TYPE | 16 | ||||||||
| 9.0 | EXPLORATION | 17 | ||||||||
| 10.0 | DRILLING | 19 | ||||||||
| 11.0 | SAMPLING PREPARATION, ANALYSES AND SECURITY | 21 | ||||||||
| 11.1 | Basic Approach | 21 | ||||||||
| 11.2 | Mean Potash Mineral Grade from In-mine Samples | 23 | ||||||||
| 11.3 | Potash Ore density from In-mine Mineral Grade Measurements | 24 | ||||||||
| 12.0 | DATA VERIFICATION | 25 | ||||||||
| 12.1 | Assay Data | 25 | ||||||||
| 12.2 | Exploration Data | 25 | ||||||||
| 13.0 | MINERAL PROCESSING AND METALLURGICAL TESTING | 26 | ||||||||
| 14.0 | MINERAL RESOURCE ESTIMATES | 26 | ||||||||
| 14.1 | Definitions of Mineral Resource | 26 | ||||||||
| 14.2 | Cory Potash Resource Calculations | 27 | ||||||||
4
| 15.0 | MINERAL RESERVE ESTIMATES | 28 | ||||||||
| 15.1 | Definitions of Mineral Reserve | 28 | ||||||||
| 15.2 | Cory Potash Reserve Calculations | 29 | ||||||||
| 16.0 | MINING METHOD | 30 | ||||||||
| 16.1 | Mining Operations | 30 | ||||||||
| 16.2 | Risks to Potash Mining Operations, with Emphasis on Water Inflows | 33 | ||||||||
| 17.0 | RECOVERY METHODS | 33 | ||||||||
| 18.0 | PROJECT INFRASTRUCTURE | 34 | ||||||||
| 19.0 | MARKET STUDIES AND CONTRACTS | 34 | ||||||||
| 20.0 | ENVIRONMENTAL STUDIES, PERMITTING, AND SOCIAL OR COMMUNITY IMPACT | 38 | ||||||||
| 21.0 | CAPITAL AND OPERATING COSTS | 39 | ||||||||
| 22.0 | ECONOMIC ANALYSIS | 39 | ||||||||
| 22.1 | Fundamentals | 39 | ||||||||
| 22.2 | Taxes | 40 | ||||||||
| 23.0 | ADJACENT PROPERTIES | 40 | ||||||||
| 24.0 | OTHER RELEVANT DATA AND INFORMATION | 41 | ||||||||
| 25.0 | INTERPRETATION AND CONCLUSIONS | 41 | ||||||||
| 26.0 | RECOMMENDATIONS | 41 | ||||||||
| 27.0 | REFERENCES | 42 | ||||||||
5
LIST OF FIGURES
Unless otherwise noted, figures for which a source and / or date are not provided are current as of the effective date of this report and were prepared by the Company.
| Figure 1: Aerial photo of Cory surface operations, 2020 |
8 | |||
| Figure 2: Actual finished potash products production from the Cory mine over the past 10 years |
9 | |||
| Figure 3: Map showing location of Nutrien Operations, including Cory |
11 | |||
| Figure 4: Nutrien’s potash operations, including Cory, relative to potash mineralization (pink) in Saskatchewan |
12 | |||
| Figure 5: Map showing Cory Crown Lease KL 103 C (blue) |
13 | |||
| Figure 6: Map showing infrastructure near Cory. Cory surface operations shown as red dot |
14 | |||
| Figure 7: Vertical section showing basic layered-Earth stratigraphy in a typical Saskatchewan potash region |
15 | |||
| Figure 8: Geophysical wireline logs showing basic stratigraphy of the Prairie Evaporite Formation in the Saskatoon area |
16 | |||
| Figure 9: Cross-section of the Prairie Evaporite Formation across southern Saskatchewan showing relative position of potash members |
17 | |||
| Figure 10: Potash exploration at Cory including 3D seismic (purple), 2D seismic infill (orange lines), and potash drillholes (black dots) |
18 | |||
| Figure 11: A seismic section showing relative rock velocities and major geological units at Nutrien’s conventional potash operations |
19 | |||
| Figure 12: Stratigraphic section showing local nomenclature at, and adjacent to, the mining horizon |
20 | |||
| Figure 13: Potash assay plot for drillhole Cory 05-30-036-06 W3 indicating the best 3.35 m (11’) mining interval |
22 | |||
| Figure 14: Histogram of potash ore grade from Cory in-mine grade samples (1968 to December 2024) |
23 | |||
| Figure 15: Map showing Cory Mineral Resource as of December 31, 2024 |
28 | |||
| Figure 16: Map showing Cory Mineral Reserve as of December 31, 2024 |
30 | |||
| Figure 17: Schematic cross-section through the Prairie Evaporite Formation, illustrating mining horizons at each of Nutrien’s conventional potash operations |
31 | |||
| Figure 18: Mined tonnes, product tonnes, and concentration ratio for the Cory mine over the past 10 years |
32 | |||
| Figure 19: Simplified flow diagram for potash flotation and crystallization milling methods used at Cory |
33 | |||
| Figure 20: Cory mill recovery rate over the past 10 years |
34 | |||
| Figure 21: Historical Company potash sales 2015 to 2024 in million tonnes / year* |
35 | |||
| Figure 22: Historical Company potash net sales 2015 to 2024 in million USD $ / year* |
36 | |||
| Figure 23: World potash production and demand for 2024E |
36 | |||
| Figure 24: World potash shipments and consumption, 2019-2024E |
37 | |||
| Figure 25: Aerial photo showing the Cory surface operations, disposal wells, and Tailings Management Area |
39 | |||
| Figure 26: Historic annual average realized potash price in USD / tonne* |
40 |
6
LIST OF TABLES
| Table 1: Potash Mineral Resources and Reserves for Cory, as of December 31, 2024 |
10 | |||
| Table 2: Assay results for all potash test holes within Cory Lease KL 103 C |
21 | |||
| Table 3: Values for potash assay plot in Figure 13 |
22 | |||
| Table 4: Primary Potash Market Profile |
37 |
7
EFFECTIVE DATE OF REPORT
The effective date of this report is December 31, 2024, except where otherwise noted.
| 1.0 | SUMMARY |
Effective January 1, 2018, Potash Corporation of Saskatchewan Inc. (“PotashCorp”) and Agrium Inc. (“Agrium”) completed a court-approved plan of arrangement (the “Arrangement”) involving, among others, PotashCorp, Agrium, and Nutrien Ltd. (“Nutrien”) the new parent company of PotashCorp and Agrium. As a result of completing the Arrangement, PotashCorp and Agrium are wholly owned subsidiaries of Nutrien. References to “the Company” means Nutrien, indirectly through PotashCorp, or, for references prior to the completion of the Arrangement, PotashCorp, as the context requires.
Nutrien is a leading global provider of crop inputs and services. We operate a world-class network of production, distribution and agriculture retail facilities that positions us to efficiently serve the needs of farmers.
Nutrien is a corporation organized under the Canada Business Corporations Act, the common shares of which are listed and publicly traded on the Toronto and New York stock exchanges (symbol NTR).
The Company owns and operates a potash mine at Cory, Saskatchewan, Canada (“Cory mine” or “Cory”). An aerial view of the Cory surface operations is shown in Figure 1. The Cory Crown Subsurface Mineral Lease is numbered KL 103 C (the “Cory Crown Lease”) and was last amended in December 2020. Production of potash from the Cory mine began in 1968.

Figure 1: Aerial photo of Cory surface operations, 2020.
In 2024, annual nameplate capacity for Cory was 3.0 million tonnes and annual operational capability was 2.1 million tonnes of finished potash products (concentrated KCl). Estimates of nameplate capacity are based on capacity as per design specifications or Canpotex entitlements once these have been determined. Operational capability is the estimated annual achievable production level at current staffing and operational readiness (estimated at beginning of year), not including any inventory-related shutdowns and unplanned downtime, and may vary during the year and year-to-year including as between our potash operations.
While the term potash refers to a wide variety of potassium bearing minerals, in the Cory region of Saskatchewan, the predominant potash mineralization is sylvinite, which is comprised mainly of the minerals sylvite (KCl / potassium-salt)
8
and halite (NaCl / rock salt), with minor amounts water insolubles. Carnallite (KMgCl3 · 6H2O) occurs only in trace amounts at Cory. Potash fertilizer is concentrated, nearly pure KCl (i.e. greater than 95% pure KCl), but ore grade is traditionally reported on a % K2O equivalent basis. The “% K2O equivalent” gives a standard measurement of the nutrient value of different potassium-bearing rocks and minerals. To convert from % K2O equivalent tonnes to actual KCl tonnes, multiply by 1.58.
The Cory mine is a conventional underground mining operation whereby continuous mining machines are used to excavate the potash ore by the stress-relief mining method, with continuous conveyor belt transport of ore from the mining face to the bottom of the production shaft. In addition to hoisting potash ore to surface, the production shaft provides fresh air ventilation to the mine and serves as a secondary egress. The Service Shaft is used for service access, primary egress, and exhausting ventilation from the mine. Raw potash ore is processed and concentrated on surface. Concentrated finished potash products (near-pure KCl) are sold and shipped to markets in North America and offshore.
Virtually all Cory underground mining rooms are in the potash mineralized zone situated approximately 12 m below the top of the host evaporite salt, the Prairie Evaporite Formation. More specifically, the Cory mine is located within the Patience Lake Potash Member of the Prairie Evaporite Formation. In this Potash Member, there are two potash seams named A Zone (the upper seam) and B Zone (the lower seam); at present, only the A Zone is being mined at Cory. Mine elevations range from approximately 965 m to 1,035 m depth below surface. These depths to A Zone potash mineralization are anticipated over most of the Cory lease area. Mine workings are protected from aquifers in overlying formations by salt which overlies the mineralized zone. Conservative local extraction rates (never exceeding 45% in any mining block) are employed at Cory to minimize potential detrimental effects of mining on overlying strata; this is common practice in flat-lying, tabular ore bodies overlain by water-bearing layers.
Part of the normal surface infrastructure associated with operating the potash mine in Saskatchewan includes waste disposal on the land and disposal of salt brine into deep subsurface aquifers. The Company stows salt tailings within an engineered and licensed Tailings Management Area (TMA) and operates four brine disposal wells near the surface plant of the Cory mine.
Since opening in 1968, 147.157 million tonnes of potash ore have been mined and hoisted to produce 45.934 million tonnes of finished potash product. The life-of-mine average concentration ratio (raw ore / finished potash products) is 3.20 and the overall extraction ratio over this time period is 24%. Actual production of finished potash products at Cory for the last 10 years is shown in Figure 2.

Figure 2: Actual finished potash products production from the Cory mine over the past 10 years.
Over the past three years (2022, 2023, 2024), actual potash production at Cory has totaled:
| • | 17.881 million tonnes of ore mined and hoisted (5.960 million tonnes per year, on average) |
| • | 5.494 million tonnes of finished potash products produced (1.831 million tonnes per year, on average) |
| • | Average mill feed ore grade was 23.0% K2O equivalent |
| • | Average concentration ratio (ore mined / potash produced) was 3.27 |
9
The Canadian Institute of Mining and Metallurgy and Petroleum (CIM) has defined Mineral Resources and Reserves in The CIM Definition Standards for Mineral Resources and Reserves (2014). Based on these guidelines, all mineral rights owned or leased by the Company at Cory can be assigned to Mineral Resource categories (Inferred, Indicated, and Measured) and Mineral Reserve categories (Probable and Proven). Mineral Resources (reported as in-place tonnes) and Mineral Reserves (reported as recoverable ore tonnes) for Cory as of December 31, 2024 are outlined in Table 1. Mineral Resources reported are exclusive of Mineral Reserves.
Table 1: Potash Mineral Resources and Reserves for Cory, as of December 31, 2024.
| Proven Mineral Reserve (millions of tonnes recoverable ore) |
58 | |||
| Probable Mineral Reserve (millions of tonnes recoverable ore) |
156 | |||
|
|
|
|||
| Total Mineral Reserve (millions of tonnes recoverable ore) |
214 | |||
| Measured Mineral Resource—A Zone (millions of tonnes in-place) |
1,271 | |||
| Measured Mineral Resource—B Zone (millions of tonnes in-place) |
1,632 | |||
| Indicated Mineral Resource—A Zone (millions of tonnes in-place) |
1,432 | |||
| Indicated Mineral Resource—B Zone (millions of tonnes in-place) |
1,432 | |||
| Inferred Mineral Resource—A Zone (millions of tonnes in-place) |
522 | |||
| Inferred Mineral Resource—B Zone (millions of tonnes in-place) |
522 | |||
|
|
|
|||
| Total Mineral Resource (millions of tonnes in-place) |
6,811 | |||
| Average % K2O Grade—A Zone (from Cory in-mine samples) |
20.7 | % | ||
| Average % K2O Grade—B Zone (from Lanigan in-mine samples) |
20.2 | % | ||
|
|
|
|||
| Years of Remaining Mine Life |
36 | |||
|
|
|
|||
The average mineral grade of the Cory Mineral Resource and Mineral Reserve is estimated to be 20.7% K2O equivalent and was determined from thousands of in-mine samples at Cory to the end of December 2024 (discussed further in Section 11.2).
Potash production in any given year at the Cory potash mine is a function of many variables, so actual production in any given year can vary dramatically from tonnages produced in previous years. The Mineral Reserve tonnage and historic average production are used to estimate the remaining mine life. If the average mining rate seen over the past three years (5.960 million tonnes of potash ore mined and hoisted per year) is sustained, and if Mineral Reserves remain unchanged, then the Cory mine life is 36 years from December 31, 2024.
The mining of potash is a capital-intensive business subject to the normal risks and capital expenditure requirements associated with mining operations. The production and processing of ore may be subject to delays and costs resulting from mechanical failures, physical hazards such as fires, and other hazards such as: unusual or unexpected geological conditions, significant subsidence, brine inflows and gas seepages of varying degree, and other situations associated with any potash mining operation.
| 2.0 | INTRODUCTION |
The purpose of this document is to give a formal reporting of potash Mineral Resource and Reserve for the Cory mine, and to provide a description of the method used to compute Mineral Resource and Reserve tonnages. Sources of geological and geotechnical information analysed from this study include:
| • | Publicly available geological maps, reports, and publications (listed in Section 27.0) |
| • | Data and internal reports on exploration drillholes |
| • | Hydrogeological analysis conducted in exploration drillholes |
| • | Geological studies conducted at the Cory mine over the past 50+ years |
| • | In-mine geophysical studies conducted at the Cory mine over the past 50+ years |
| • | Geotechnical studies conducted for the Cory mine over the past 50+ years |
| • | 2D & 3D surface seismic exploration data |
10
All data and reports are archived at the Nutrien corporate office in Saskatoon, the Cory mine site, or secure offsite commercial document storage facilities. In addition, drillhole data (well-log data, drilling reports, drill-stem test results, etc.) are archived with the Saskatchewan Ministry of Energy & Resources, Integrated Resource Information System (IRIS), and surface seismic data (shot records and stack) are archived through an offsite commercial data storage service.
All geological and geophysical data and information presented in this report were personally reviewed and inspected by qualified geoscience staff at Nutrien who are registered with the Association of Professional Engineers and Geoscientists of Saskatchewan (APEGS) under the supervision of Jodi Derkach, P. Geo. and Craig Funk, P. Eng., P. Geo. Jodi Derkach and Craig Funk last visited Cory on October 9, 2024. All reserve and resource estimates and mineral rights data presented in this report were personally evaluated and reviewed by the authors of this report. Each of these staff collaborates with Cory personnel multiple times per year.
The authors would like to acknowledge the many staff who provided information and expert reviews on portions of this report.
| 3.0 | RELIANCE ON OTHER EXPERTS |
Responsibility for the accuracy of the technical data presented in this report is assumed by the authors. Outside experts were not used in the preparation of this report.
| 4.0 | PROPERTY DESCRIPTION AND LOCATION |
| 4.1 | GENERAL |
The Cory mine is located in central Saskatchewan, approximately 7 km west of the city of Saskatoon, Saskatchewan. The general location is shown on the map in Figure 3.

Figure 3: Map showing location of Nutrien Operations, including Cory.
11
The Legal Land Description (Saskatchewan Township / Range) of the Cory surface plant is Section 18 Township 36 Range 06 West of 3rd Meridian. More precisely, the Cory service shaft collar is located at:
| • | Latitude: 52 degrees 05 minutes 30.15 seconds North |
| • | Longitude: 106 degrees 51 minutes 16.32 seconds West |
| • | Elevation: 503 metres above mean sea level (SL) |
| • | Easting: 372,951 m |
| • | Northing: 5,772,861 m |
| • | Projection: UTM |
| • | Datum: NAD83 |
| • | Zone: 13 |
The Company owns approximately 2,352 hectares (5,812 acres) of surface rights required for current Cory mine operations, including areas covered by the existing surface plant and TMA, and surface lands required for anticipated near-future Cory mine and expanded milling operations.
All permits and approvals required for the operation of a potash mine in Saskatchewan are in place at Cory.
Figure 4 is a more detailed map showing the location of the Cory mine relative to potash deposits in Saskatchewan (modified from Yang, 2009).

Figure 4: Nutrien’s potash operations, including Cory, relative to potash mineralization (pink) in Saskatchewan.
| 4.2 | MINERAL RIGHTS |
Mineral rights at Cory are mined pursuant to subsurface mineral leases with the Province of Saskatchewan, Canada (the Crown), and with non-Crown (Freehold) mineral rights owners. Crown mineral rights are governed by The Subsurface Mineral Tenure Regulations, 2015, and Crown Leases are approved and issued by the Saskatchewan Ministry of Energy & Resources.
12
The original Cory Crown Subsurface Mineral Lease, numbered KL 103, was made effective in September 1962. In the following years various amendments were made whereby certain lands were added, removed, or transferred between Company dispositions for realized synergies between mining operations. The last amendment was executed in December 2020, and resulted in KL 103 C (the “Cory Crown Lease” or simply “KL 103 C”).
KL 103 C covers an area of approximately 51,438 hectares (127,107 acres), as shown in Figure 5. At Cory, the Company has leased potash mineral rights for 28,507 hectares (70,442 acres) of Crown Land and owns or has leased approximately 23,002 hectares (56,840 acres) of Freehold Land within the lease boundary. The Cory Crown Lease term is for a period of 21 years and is renewable in accordance with The Subsurface Mineral Tenure Regulations, 2015 for successive 21-year periods. Freehold Lands also remain under lease providing, generally, that production is continuing and that there is a continuation of the Crown Lease.
Within the Cory Crown Lease area 29,772 hectares (73,569 acres) are mined pursuant to a unitization agreement with mineral rights holders (Crown and Freehold).
When underground workings of a potash mine are designed, there are inevitably regions that are mined with higher mining extraction (e.g. production panels) and other regions where mining extraction is lower (e.g. conveyor-belt development rooms). To treat mineral rights holders in both low extraction and high extraction areas fairly, and to promote good mining practices, a unitization agreement is the preferred method for determining mined potash allocation (on paper, for accounting purposes) and the resulting pro rata royalty. Under a unitization agreement, each mineral rights holder is paid a royalty based on their proportional share of the entire unit area regardless of whether or not their lands are actually mined. For example, if one mineral rights holder owns rights to 4,000 hectares within a 40,000 hectare unit area, they would be paid 10% of the total royalty payout from that unit area.

Figure 5: Map showing Cory Crown Lease KL 103 C (blue).
| 5.0 | ACCESSIBILITY, CLIMATE, LOCAL RESOURCES, INFRASTRUCTURE AND PHYSIOGRAPHY |
The Cory mine surface facilities are accessed by an existing paved road that is part of the Saskatchewan Provincial Highway System. Most potash product is shipped by rail over existing track, with some product shipped by truck over the North American highway system. Location of the Cory mine with respect to the features described in this section (major road and rail infrastructure, as well as nearby river systems) is shown in Figure 6.
13
The Cory mine is served by a number of villages within 50 km of the mine site. The nearest city is Saskatoon (7 km distant).
Cory is situated near the northern extent of the Great Plains of North America. Topography is relatively flat, with gently rolling hills and occasional valleys. The Cory surface plant lies approximately 10 km north-west of the South Saskatchewan River, a major continental drainage channel. Climate at Cory is typical for an inland prairie location at latitude 52º North (often characterized as “mid-latitude steppe” climate).
Part of the normal surface infrastructure associated with operating the potash mine in Saskatchewan includes waste disposal on the land and disposal of salt brine into deep subsurface aquifers. Facilities to carry out all aspects of these tasks are in place at Cory (see Section 20.0).

Figure 6: Map showing infrastructure near Cory. Cory surface operations shown as red dot.
| 6.0 | HISTORY |
Ten potash mines were brought into production in Saskatchewan between 1962 and 1970. Until 2017, no new mine had been commissioned following the original ten. Most current potash production comes from conventional underground mines, while just three operate using solution mining methods. Generally, potash mines have contracted or expanded production over the years in response to the demand for potash.
Exploration drilling for potash in the Cory area was carried out in the 1950s and 1960s. The Cory mine was built by a company called Duval Sulphur and Potash Company in the 1960s. Potash production began at Cory in 1968 and the mine has run on a continuous basis since then other than short-term shutdowns taken for inventory management purposes, occasional plant maintenance and construction work, or other outages that are typical for operations of this nature. PotashCorp acquired the Cory mine in 1976.
Effective January 1, 2018, PotashCorp and Agrium completed the Arrangement. As a result of completing the Arrangement, PotashCorp and Agrium are wholly owned subsidiaries of Nutrien.
14
Both flotation and crystallization methods are used at Cory to produce potash products for agricultural, industrial and feed application. A major refurbishment and expansion of the Cory mine was completed in 2013 increasing nameplate capacity to 3.0 million tonnes of finished potash products per year.
| 7.0 | GEOLOGICAL SETTING AND MINERALIZATION |
Much of southern Saskatchewan is underlain by the Prairie Evaporite Formation, a layered sequence of salts and anhydrite which contains one of the world’s largest deposits of potash. The potash extracted from the predominantly sylvinitic ore has its main use as a fertilizer. A map showing the extent of the potash deposits in Saskatchewan is shown in Figure 4.
The 100 m to 200 m thick Prairie Evaporite Formation is overlain by between 400 and 500 m of Devonian carbonates, followed by approximately 100 m of Cretaceous sandstone, and between 400 and 500 m of Cretaceous shales and more recent Pleistocene glacial tills to surface. The Prairie Evaporite Formation is underlain by Devonian carbonates. The Phanerozoic stratigraphy of Saskatchewan is remarkable in that units are flat-lying and relatively undisturbed over very large areas. A geological section representing Saskatchewan stratigraphy is shown in Figure 7 (modified from Fuzesy, 1982). A geological section representing the Prairie Evaporite Formation stratigraphy in the Saskatoon area is shown in Figure 8 (modified from Fuzesy, 1982).

Figure 7: Vertical section showing basic layered-Earth stratigraphy in a typical Saskatchewan potash region.
15
Potash mineralization in this region of Saskatchewan is predominantly sylvinite, which is comprised mainly of the minerals sylvite (KCl) and halite or rock salt (NaCl), with trace carnallite (KMgCl3 · 6H2O) and minor water insolubles. Potash fertilizer is concentrated, nearly pure KCl (i.e. greater than 95% pure KCl), but ore grade is traditionally reported on a % K2O equivalent basis. The “% K2O equivalent” gives a standard measurement of the nutrient value of different potassium-bearing rocks and minerals. To convert from % K2O equivalent tonnes to actual KCl tonnes, multiply by 1.58.
Over the past three years (2022, 2023, 2024), the average measured potash ore grade of the mill feed at Cory was 23.0% K2O equivalent. The average ore grade reported from 11 surface drillhole intersections, all within Cory Subsurface Mineral Lease KL 103 C, is 25.5% K2O equivalent (discussed further in Section 10.0). The average ore grade observed from thousands of in-mine samples collected to the end of December 2024 is 20.7% K2O equivalent (discussed further in Section 11.2).

Figure 8: Geophysical wireline logs showing basic stratigraphy of the Prairie Evaporite Formation in the Saskatoon area.
| 8.0 | DEPOSIT TYPE |
There are three mineable potash members within the Prairie Evaporite Formation of Saskatchewan. Stratigraphically highest to lowest, these members are: Patience Lake, Belle Plaine, and Esterhazy. A geological section showing potash members that occur in Saskatchewan is shown in Figure 9.
The Cory potash deposit lies within the Patience Lake Potash Member of Prairie Evaporite Formation. There are two potash seams named A Zone and B Zone within this Member; at present, only the A Zone is being mined at Cory. Some test mining has been carried out in the B Zone, but no mining is done in this layer at present. The Belle Plaine Potash Member is present but not well-developed in the Cory area. The Esterhazy Member is not present.
16
Cory potash mineralization occurs at a depth averaging approximately 1,010 m below surface. The A Zone is approximately 3.35 m thick and occurs near the top of the Prairie Evaporite Formation salts. Salt cover from the ore zone to overlying units is approximately 12 m. The Cory mine operates as a conventional, underground potash mine.

Figure 9: Cross-section of the Prairie Evaporite Formation across southern Saskatchewan showing relative position of potash members.
| 9.0 | EXPLORATION |
Before the Cory mine was established, all exploration consisted of drilling from surface and analysis of core from these drillholes; drilling results are discussed in Section 10.0. Since mining began in 1968, exploration drilling has been infrequent. Now, drilling is most often used to derisk mining. A map showing potash exploration coverage at Cory (drillholes, 2D and 3D seismic coverage) is shown in Figure 10.
In most of southern Saskatchewan, potash mineralization is in place wherever Prairie Evaporite Formation salts exist, are flat-lying, and are undisturbed. Since the surface seismic exploration method is an excellent tool for mapping the top and bottom of Prairie Evaporite salts, this has become the main potash exploration tool in any existing Saskatchewan Subsurface (potash) Mineral Lease. Historically, 2D seismic, and now the more accurate and full coverage 3D seismic methods are used to infer continuity and extent of potash beds in flat-lying potash deposits. Seismic data are relied upon to identify collapse structures that must be avoided in the process of mine development since these structures can act as conduits for water ingress to the mine. As a result, isolation pillars or mining buffer zones are left around these anomalous features. This practice reduces the overall mining extraction ratio, but the risk of inflow to mine workings are effectively mitigated. Occasional, small-scale salt anomalies that are not mapped by seismic data do occur. When they do, they are dealt with in the normal course of mining and extraction through these areas is typically minimized. Where there is uncertainty in seismic interpretations, drilling is often used to confirm or improve refine the seismic interpretation.
Within the Cory Crown Lease, a total of 220 linear kilometres of 2D seismic lines, and 407 square kilometres of 3D seismic has been acquired to the end of December 2024.
17

Figure 10: Potash exploration at Cory including 3D seismic (purple), 2D seismic infill (orange lines), and potash drillholes (black dots).
A typical seismic section from Nutrien’s conventional seismic operations is shown in Figure 11. This is a cross-section extracted from a multi-program 3D seismic volume (earliest program was 2002). The vertical scale is in metres relative to sea level (SL). The seismic section is coloured by rock velocities computed from the seismic data and represents different rock types. Note that the Prairie Evaporite (salt) is continuous. This indicates an undisturbed, flat-lying salt within which potash is likely to be found based on over 50 years of mining experience at Cory.
Experience has shown that the potash mining horizon is continuous when seismic data are undisturbed and flat-lying, as shown in Figure 11. It is now Nutrien’s policy to collect detailed 3D seismic data ahead of mining. Any areas recognized as seismically unusual are identified early, and mine plans are adjusted as needed.
18

Figure 11: A seismic section showing relative rock velocities and major geological units at Nutrien’s conventional potash operations.
| 10.0 | DRILLING |
For the original Cory potash test holes drilled in the 1950s and 1960s, the primary objective of drilling was to sample potash horizons to establish basic mining parameters. The seismic method was still novel and crude at that time and as such, 2D seismic surveys were done sparingly, so the drillhole information was relied upon heavily to evaluate potash deposits. Test holes would penetrate the evaporite section with a hydrocarbon-based drilling mud (oil-based or diesel fuel) to protect the potash mineralization from dissolution. Basic geophysical well-logs were acquired, and in many cases, drill stem tests were run on the Dawson Bay Formation to help assess water-make potential of the caprock. Core samples from the targeted potash intersections were split or quartered (cut with a masonry saw), crushed, and analysed to establish potash grades.
Relatively thin interbeds or seams of insoluble material, referred to as clay seams in the potash industry, are an ever-present component of the A Zone and B Zone at Cory. Figure 12 shows the basic stratigraphic relationships. These seams, along with the clay or clay-like material disseminated throughout the mining horizon, make up the water insoluble portion of the ore. The same sequences of clay seams can be correlated for many kilometres across the central Saskatchewan potash mining district.
At Cory, a particular sequence of three clay seams marks the top of the A Zone, as illustrated in Figure 12 (modified from Robertson, 1978). These seams are used to guide the vertical positioning of the mining machine. The uppermost portion of the sequence of three seams is maintained at the top of the mining cut to keep the cutting “on grade”. Cutting too high above this upper seam or top marker results in dilution, as halite (rather than sylvinite) immediately overlies the production zone. In practice though, the top marker seam is slightly overcut (between 10 cm to 20 cm) to prevent an unstable condition from being created. Clay seams are often planes of weakness, and if they are undercut, material immediately below the clay seam becomes a hazard as it may separate and fall. Since the hazard must be remediated prior to advancing mining, thus slowing production, the moderately diluted mineral grade that results from the overcutting is preferable from a safety point of view.
19
The A Zone mining interval at Cory has been fixed at 3.35 m (11’). This mining height allows for comfortable working headroom and efficient extraction of potash ore.

Figure 12: Stratigraphic section showing local nomenclature at, and adjacent to, the mining horizon.
The original exploration area was explored with 15 test holes laid out in an approximate 1.6 km by 6.4 km (1 mile by 4 mile) grid pattern. Of these 15 drillholes, two did not have assays performed and two have anomalous hydrogeological indicators and the area around them is excluded from mine development. Original drill core assays were studied by independent consultant David S. Robertson and Associates (1976). Drillholes following the original exploration drillholes were analysed by Nutrien staff and are listed in Table 2 below. All drilling and sampling were carried out following the regulations in place at the time.
In each case, the best 3.35 m (11’) mining interval intersected in the drillhole was determined from the assay values, using clay marker seams as a guide. With over 50 years of mining experience at Cory, it is the opinion of the authors that areas of low grade (i.e. <15% K2O) are localized with a relatively small lateral extent.
Drillhole assay data for the A Zone at Cory gives an estimated mean grade of 25.5% K2O with 4.9% water insolubles.
B Zone mineralization is indicated by gamma ray geophysical log response in each of the exploration drillholes listed in Table 2 indicating a potash Mineral Resource. Although some test mining has been carried out in the B Zone, sustained production from that zone has not been established. Assay results for the B Zone are not presented here.
20
Table 2: Assay results for all potash test holes within Cory Lease KL 103 C.
|
Average in 3.35 m (11’) mining interval (undiluted) |
||||||
| Drillhole |
Year Drilled | %K2O | % Water Insolubles | |||
| 14-28-036-06 W3 |
1954 | * | * | |||
| 04-28-037-07 W3 |
1955 | 24.9 | 4.6 | |||
| 01-11-037-07 W3 |
1955 | 26.0 | 4.8 | |||
| 08-22-036-07 W3 |
1956 | 29.1 | 4.6 | |||
| 16-06-037-08 W3 |
1957 | 24.5 | 3.2 | |||
| 04-16-036-07 W3 |
1965 | 27.0 | 6.2 | |||
| 16-34-035-07 W3 |
1965 | 28.0 | 4.9 | |||
| 01-25-035-07 W3 |
1965 | 17.3 | 6.8 | |||
| 01-32-036-07 W3 |
1965 | 26.4 | 5.2 | |||
| 06-18-036-06 W3 |
1965 | 23.8 | 3.9 | |||
| 05-07-036-06 W3 |
1965 | 26.5 | 4.7 | |||
| 04-04-036-06 W3 |
1965 | 29.4 (anomalous) | 4.6 (anomalous) | |||
| 05-30-036-06 W3 |
1965 | 27.3 | 4.9 | |||
| 01-16-036-06 W3 |
1965 | 25.6 (anomalous) | 5.7 (anomalous) | |||
| 13-01-038-08 W3 |
1968 | * | * | |||
|
|
|
|||||
| Average of 11 usable values: |
25.5 | 4.9 | ||||
|
|
|
|||||
Due to the remarkably consistent mineralogy and continuity of the resource as experienced over 50 years of mine production, only a few exploration drilling programs were conducted after the 1960s. Instead of exploration drillholes, seismic surveying has been relied upon to explore ahead of mine development. Where normal Prairie Evaporite sequences are mapped in the seismic data, potash beds have unfailingly been present. Occasional, small-scale salt anomalies not mapped by seismic data do occur. When they do, they are dealt with in the normal course of mining, and extraction through these areas is typically minimized. Anomalies associated with possible water inflow problems, which are mapped in the seismic data, are avoided.
| 11.0 | SAMPLING PREPARATION, ANALYSES AND SECURITY |
| 11.1 | BASIC APPROACH |
Exploration drilling in the Cory area was initially conducted in the 1950s and 1960s. Sampling and assaying of potash core samples was done using methods considered consistent with standard procedures for potash exploration at these times.
Drillhole sampling methods have remained essentially the same over the years. Potash core samples are acquired as described in earlier sections of this report. Short segments of core usually about 1 foot (0.3 m) in length are labeled based on visible changes in mineralization, and sometimes based on fixed intervals. Each segment of core is then split using some type of rock or masonry saw. The split portion of core is then bagged and labeled and sent to a laboratory for chemical analysis. Historical potash samples remain stored at the Subsurface Geological Laboratory (Regina, Saskatchewan) of the Saskatchewan Ministry of Energy & Resources. Most of these have deteriorated substantially.
21

Figure 13: Potash assay plot for drillhole Cory 05-30-036-06 W3 indicating the best 3.35 m (11’) mining interval.
An assay plot for drillhole Cory 05-30-036-06 W3 is shown in Figure 13. Similar data were compiled for all historical potash test holes. The best 3.35 m (11’) mining interval intersected in each drillhole, as discussed in Section 10.0, is determined from the assay values, using clay seams as a guide. Table 3 lists the assay values plotted in Figure 13.
Table 3: Values for potash assay plot in Figure 13.

Thousands of in-mine ore grade samples have been collected at Cory to the end of December 2024 (discussed further in Section 11.2). All in-mine samples were analysed in the Cory mill laboratory using analysis techniques that were up to date for the era in which the sample was collected.
22
Regarding quality assurance for analytical results, the Company participates in the Canpotex Producer Sample Exchange Program using methods developed by the Saskatchewan Potash Producers Association (SPPA). The Sample Exchange Program monitors the accuracy of analytical procedures used in its labs. In the early 1970s, the SPPA initiated a round-robin Sample Exchange Program, the purpose of which was to assist the potash laboratories in developing a high level of confidence in analytical results. This program, now named the Canpotex Producer Sample Exchange Program using SPPA Methods (CPSEP), has continued up to the present. Current participants include all Canpotex member potash mine site labs, the Nutrien Pilot Plant Lab, and independent third-party surveyor labs. The CPSEP provides participants with three unknown potash samples for analysis quarterly. Results for the unknown sample analysis are correlated by an independent agency that distributes statistical analysis and a summary report to all participants. Completed exchange program samples can be used for control standards as required in QA/QC sections of standard analytical procedures.
The Nutrien Pilot Plant is secured in the same way as modern office buildings are secured. Authorized personnel have access and visitors are accompanied by staff. No special security measures are taken beyond that. Currently, no external laboratory certification is held by the Nutrien Pilot Plant. On occasion, product quality check samples are sent to the Saskatchewan Research Council (SRC), a fully certified analytical facility.
In the opinion of the authors, the sample preparation, security, and analytical procedures are acceptable, are consistent with industry-standard practices, and are adequate for Mineral Resource and Reserve estimation purposes.
| 11.2 | MEAN POTASH MINERAL GRADE FROM IN-MINE SAMPLES |
It has been the practice at Cory for the past several years to acquire two in-mine grade samples at the start of every cutting sequence and is done by collecting fine “muck” from the floor of the mine. The sampling frequency is equivalent to two samples taken approximately every 25 m in production panels, and two samples taken approximately every 50 m in development panels. In-mine grade sampling practices at Cory have varied over the years resulting in an irregular sample set. It is the belief of the authors that the average grade reported from these in-mine samples will become increasingly representative of Cory A Zone potash mineralization as standardized sampling continues. It will also lead to a normalized data distribution. At Cory, mill feed grade data collected over the years suggests a higher average grade than is found in the in-mine sample set.
Since start-up in 1968 through to the end of December 2024, a total of 8,132 useable in-mine potash mineral grade samples were collected from the Cory A Zone, the main potash horizon at Cory. All samples were analysed in the Cory mill laboratory using analysis techniques that were up to date for the era in which the sample was collected. Figure 14 shows a histogram of A Zone in-mine grade sample results from the Cory mine.

Figure 14: Histogram of potash ore grade from Cory in-mine grade samples (1968 to December 2024).
The median ore grade for this family of in-mine samples is 21.9% K2O equivalent and the mean ore grade is 20.7%.
This is considered to be a more representative estimate of expected potash ore grade at Cory than drillhole assay results presented in Section 10.0.
For the B Zone at Cory, mineral grade is reported to be 20.2% K2O equivalent, the grade observed from thousands of in-mine samples at the Lanigan mine where the B Zone has been extensively mined.
23
Even though Cory mine is some distance from Lanigan, this is considered the best estimate of expected mineral grade for this potash layer because the deposit is known to be regionally continuous from west of Vanscoy to east of Lanigan (Fuzesy, 1982 and references therein). Although it is possible that if mining proceeds into the B Zone, the reported grade could change from what is reported. It is expected that any such change would be minimal.
| 11.3 | POTASH ORE DENSITY FROM IN-MINE MINERAL GRADE MEASUREMENTS |
An estimate of in-situ rock density is used to calculate potash mineralization volumes in Mineral Resource and Reserve assessments. A common approach, and the one used by Nutrien, is to determine in-place Mineral Resource and Reserve volumes (m3), then multiply this number by in-situ bulk-rock density (kg / m3) to give in-place Mineral Resource and Reserve tonnes.
Well-log data from drillholes can be used to calculate bulk density if accurate and calibrated well-logs are acquired during exploration drilling. In practical terms, modern well-logs tend to meet these criteria, but historic well-logs (collected before the 1990s) do not. In Saskatchewan, almost all potash exploration drilling took place in the 1950s and 1960s, well before density logs were accurate and reliable.
Another approach, and the one used by Nutrien, is to look up density values for the minerals which constitute potash rock – values determined in a laboratory to a high degree of accuracy and published in reliable scientific journals / textbooks – then apply these densities to the bulk rock. Given that the density of each pure mineral is quantified and known, the only variable is what proportion of each mineral makes up the bulk rock. An obvious benefit of this approach is that a mean value computed on the in-mine samples shown in Figure 14 has a much greater confidence interval than a mean value computed from just a few drillhole assays.
The four main mineralogical components of the ore zones of Saskatchewan’s Prairie Evaporite Formation with their respective mineral densities are:
| Mineral |
Density (kg / m3) |
Components |
||||
| Halite | 2,170 | NaCl | ||||
| Sylvite | 1,990 | KCl | ||||
| Carnallite | 1,600 | KMgCl3 · 6(H2O) | ||||
| Insolubles | 2,510 | Anhydrite, dolomite, quartz, muscovite, and other minor mineral components (Nutrien Pilot Plant, 2018) |
Historical Cory in-mine mineral grade analyses did not include measurements of the insoluble content, so the approach described above cannot be used at Cory. Instead, potash bulk-rock density is calculated using thousands of in-mine samples from the adjacent Vanscoy A Zone. All Nutrien potash mines now measure and record the in-mine % K2O grade and insoluble content of the mined rock. Magnesium content is not measured at Cory since carnallite is a negligible component of the ore here.
The value for insoluble density is based on known densities of the constituent parts of the insoluble components of the mineralization and the average occurrence of these insoluble components, which is known from over 50 years of mining experience at Vanscoy. Assuming the lowest plausible density of insolubles known for Saskatchewan potash deposits of this nature, the effect upon overall bulk-rock ore density and Mineral Resource and Reserve calculations would be negligible.
From thousands of in-mine samples taken at Vanscoy, bulk density for the Cory A Zone has been determined to be:
RHObulk-rock (Cory A Zone) = RHObulk-rock (Vanscoy A Zone) = 2,116 kg / m3 = 2.12 tonnes / m3
This method is as accurate as the ore grade measurements and mineral density estimates.
This estimate is considered acceptable since Cory and Vanscoy are mining the same potash seam, both mines use mining machines that are the same height (for the purpose of tonnage calculations), and both mines use the same basic mineral grade sampling methodology.
Not enough test mining of the B Zone has been conducted at Cory to permit a bulk density calculation based on Cory in-mine grade samples. If test mining of the B Zone at Cory is conducted in future, there may be enough samples with all constituent minerals measured to warrant a change from what is reported. It is expected that any such change would have only a minimal effect on bulk-rock density used in tonnage calculations.
24
Instead, the potash bulk-rock density is calculated using thousands of in-mine grade samples from Lanigan B Zone:
RHObulk-rock (Cory B Zone) = RHObulk-rock (Lanigan B Zone) = 2,120 kg / m3 = 2.12 tonnes / m3
This estimate is considered acceptable since both Cory B Zone and Lanigan B Zone are the same potash seam. Should the Cory B Zone bulk density change from the predicted value of 2,120 kg / m3, the later defined Cory B Zone Mineral Resources and Reserves in Sections 14.2 and 15.2 will also change, albeit, insignificantly.
| 12.0 | DATA VERIFICATION |
| 12.1 | ASSAY DATA |
The majority of original drill core assays were studied by independent consultant David S. Robertson and Associates (1976). The original assay results for core samples from historical drillholes were taken as accurate in these studies, as there is no way to reliably reanalyse these samples. Most of the remaining samples in storage have long since deteriorated to the point where they are not usable. Recently, drillhole core is prepared for sampling by Nutrien staff and, generally, sent to SRC Geoanalytical Laboratory for independent analyses.
Ore grades of in-mine samples are measured inhouse at the Cory mine laboratory by Company staff using modern, standard chemical analysis tools and procedures; an independent agency does not verify these results. However, check sampling through the CPSEP, discussed in Section 11.1, does occur.
It should be noted that assay results from historical drillholes match in-mine sample results reasonably well even though drillhole sample spacing is much greater. This correlation is further validation of the in-mine sampling methodology. Mean mineral grade determined from in-mine samples taken over decades of mining at Cory is thought to provide the most accurate measurement of potash grade for the Cory mine, also providing a good basis for estimating ore grade in areas of future mining at Cory.
| 12.2 | EXPLORATION DATA |
The purpose of any mineral exploration program is to determine extent, continuity, and grade of mineralization to a certain level of confidence and accuracy. For potash exploration, it is important to minimize the amount of cross-formational drilling, since each drillhole is a potential conduit for subsurface groundwater from overlying (or underlying) water-bearing formations into future mine workings. Every potash test drillhole from surface sterilizes potash mineralization; a safety pillar is required around every surface drillhole once underground mining commences.
Initial sampling and assaying of cores were done during potash exploration at Cory in the 1950s and 1960s. Methods were consistent with standard procedures for that era. The mine began production in 1968 and test drilling conducted after that was largely for the purpose of better understanding the caprock rather than potash mineralization. This approach to potash sampling is in accordance with widely accepted industry practice for areas adjacent and contiguous to an existing operating potash mine.
Assay of physical samples (drillhole cores and/or in-mine samples) is the only way to gain information about mineral grade, but extent and continuity of mineralization are correctly determined using data collected from seismic surveys correlated with drilling information. To date, surface seismic data at Cory have been collected, analysed, and verified by Company staff, at times, in cooperation with independent consultants.
Data for the Mineral Resource and Reserve estimates for Cory mine reported in Sections 14.0 and 15.0 were verified by Company staff as follows:
| • | Review of potash assay sample information (drillholes and in-mine grade samples), |
| • | Review and verify procedures used for in-mine grade sampling and laboratory analysis, |
| • | Review of surface geophysical exploration results (3D and 2D seismic data), |
| • | Crosscheck of mined tonnages reported by mine site technical staff with tonnages estimated from mine survey information, and |
| • | Crosscheck of Mineral Resource and Mineral Reserve calculations carried out by corporate technical staff. |
In the opinion of the authors, this approach to data verification of potash mineral grade and surface seismic information is in accordance with generally accepted industry practice for areas adjacent and contiguous to an existing operating potash mine.
25
| 13.0 | MINERAL PROCESSING AND METALLURGICAL TESTING |
At Cory, potash ore has been mined and concentrated using flotation and crystallization methods to produce saleable quantities of high-grade finished potash products since 1968.
Since opening in 1968, 147.157 million tonnes of potash ore have been mined and hoisted to produce 45.934 million tonnes of finished potash product. Given this level of sustained production over several decades, basic mineralogical processing and prospective metallurgical testing of Cory potash is not considered relevant.
See also Section 17.0.
| 14.0 | MINERAL RESOURCE ESTIMATES |
| 14.1 | DEFINITIONS OF MINERAL RESOURCE |
The CIM has defined Mineral Resource in The CIM Definition Standards for Mineral Resources and Reserves (2014) as:
| 1) | Inferred Mineral Resource: that part of a Mineral Resource for which quantity and grade or quality are estimated on the basis of limited geological evidence and sampling. Geological evidence is sufficient to imply but not verify geological and grade or quality continuity. |
| 2) | Indicated Mineral Resource: that part of a Mineral Resource for which quantity, grade or quality, densities, shape and physical characteristics are estimated with sufficient confidence to allow the application of Modifying Factors in sufficient detail to support mine planning and evaluation of the economic viability of the deposit. Geological evidence is derived from adequately detailed and reliable exploration, sampling and testing and is sufficient to assume geological and grade quality continuity between points of observation. |
| 3) | Measured Mineral Resource: that part of a Mineral Resource for which quantity, grade or quality, densities, shape, and physical characteristics are estimated with confidence sufficient to allow the application of Modifying Factors to support detailed mine planning and final evaluation of the economic viability of the deposit. Geological evidence is derived from detailed and reliable exploration, sampling and testing and is sufficient to confirm geological and grade or quality continuity between points of observation. |
CIM defines Modifying Factors as “considerations used to convert Mineral Resources into Mineral Reserves. These include, but are not restricted to, mining, processing, metallurgical, infrastructure, economic, marketing, legal, environmental, social and governmental factors.”
In south-central Saskatchewan, where geological correlations are straightforward, and within a (potash) Subsurface Mineral Lease with an operating potash mine, Mineral Resource categories are generally characterized by Nutrien as follows:
| 1) | Inferred Mineral Resource: areas of limited exploration, such as areas that have been investigated through regional geological studies, or areas with 2D regional surface seismic coverage, little or no drilling, at some distance from underground workings, and within Crown Subsurface Mineral Lease KL 103 C. |
| 2) | Indicated Mineral Resource: areas of adequate exploration, such as areas with 3D surface seismic coverage, little or no drilling, at some distance from underground workings, and within Crown Subsurface Mineral Lease KL 103 C. |
| 3) | Measured Mineral Resource: areas of detailed, physical exploration through actual drilling or mine sampling, near existing underground workings, and within Crown Subsurface Mineral Lease KL 103 C. |
The mine began production in 1968 and test drilling conducted after that was largely for the purpose of better understanding the caprock rather than potash mineralization. Instead, exploration involved collecting surface seismic data, which became better in quality over the years. Exploration drilling has demonstrated the presence of the potash horizon, and seismic coverage shows the continuity of the Prairie Evaporite Formation within which the potash horizon occurs.
Along with this approach, analysis of in-mine samples for potash grade has provided an observation-based understanding of the potash mineralized zone at Cory that is far superior to the level of understanding provided by any surface drilling based exploration program.
26
The authors believe that this approach provides a body of information that guides and constrains exploration inferences in a much better way than could be achieved from any conventional exploration investigation in areas immediately surrounding, and contiguous to, the Cory potash mine.
| 14.2 | CORY POTASH RESOURCE CALCULATIONS |
Exploration information used to calculate reported Mineral Resource tonnages at Cory consists of both physical sampling (drillhole and in-mine) and surface seismic (2D and 3D) as discussed in earlier sections. Based on the definitions and guidelines in Section 14.1, all mineral rights leased or owned by the Company, and within Crown Subsurface Mineral Lease KL 103 C, are assigned to one of the three Mineral Resource categories.
Mineral Resources are reported as mineralization in-place and are exclusive of Mineral Reserves. In-place tonnes were calculated for each of the Mineral Resource categories using the following parameters:
| Mining Height: | 3.35 m (11 feet) | |
| Ore Density: | 2.12 tonnes / m3 (A Zone) | |
| Ore Density: | 2.12 tonnes / m3 (B Zone) |
The Mineral Resources for Cory, as of December 31, 2024 are as follows:
Cory A Zone:
| Inferred Resource |
522 | millions of tonnes | ||||||
| Indicated Resource |
1,432 | millions of tonnes | ||||||
| Measured Resource |
1,271 | millions of tonnes | ||||||
|
|
||||||||
| Total A Zone Resource |
3,225 | millions of tonnes | ||||||
Cory B Zone:
| Inferred Resource |
522 | millions of tonnes | ||||||
| Indicated Resource |
1,432 | millions of tonnes | ||||||
| Measured Resource |
1,632 | millions of tonnes | ||||||
|
|
||||||||
| Total B Zone Resource |
3,586 | millions of tonnes | ||||||
Total Cory Resource (A Zone + B Zone):
| Inferred Resource |
1,044 | millions of tonnes | ||||||
| Indicated Resource |
2,864 | millions of tonnes | ||||||
| Measured Resource |
2,903 | millions of tonnes | ||||||
|
|
||||||||
| Total A Zone + B Zone Resource |
6,811 | millions of tonnes | ||||||
Cory Mineral Resources are plotted in Figure 15.
The average mineral grade of the Cory A Zone Mineral Resource is 20.7% K2O equivalent and was determined from thousands of in-mine samples at Cory. The average mineral grade of the Cory B Zone Mineral Resource is 20.2% K2O equivalent and was determined from thousands of in-mine samples at Lanigan mine where the B Zone has been extensively mined. See Section 11.2 for more detail.
The tonnage reported in the Cory A Zone Measured Resource is comprised of the potash that is within 1.6 km (1 mile) of physically sampled location (i.e. drillholes or mine workings). Also included as Measured Resource is the potash in the pillars of mined-out areas of the Cory mine that is not already accounted for in the Proven Reserve estimation as there is the possibility of retrieving ore from the remnant mining pillars at some point in the future.
Portions of the B Zone that are immediately underlying the Proven and Probable A Zone Mineral Reserve as well as portions of the B Zone that are immediately underlying drillholes and the 1.6 Km (1 mile) buffer placed around drillholes have been classified as Measured Resource.
27

Figure 15: Map showing Cory Mineral Resource as of December 31, 2024.
| 15.0 | MINERAL RESERVE ESTIMATES |
| 15.1 | DEFINITIONS OF MINERAL RESERVE |
The CIM has defined Mineral Reserve in The CIM Definition Standards for Mineral Resources and Reserves (2014) as:
| 1) | Probable Mineral Reserve: the economically mineable part of an Indicated, and in some circumstances, a Measured Mineral Resource. The confidence in the Modifying Factors applying to a Probable Mineral Reserve is lower than that applying to a Proven Mineral Reserve. |
| 2) | Proven Mineral Reserve: the economically mineable part of a Measured Mineral Resource. A Proven Mineral Reserve implies a high degree of confidence in the Modifying Factors. |
CIM defines Modifying Factors as “considerations used to convert Mineral Resources into Mineral Reserves. These include, but are not restricted to, mining, processing, metallurgical, infrastructure, economic, marketing, legal, environmental, social and governmental factors.”
For Saskatchewan, in regions adjacent and contiguous to an operating potash mine, Mineral Reserve categories are characterized by Nutrien as follows:
| 1) | Probable Mineral Reserve: identified recoverable potash mineralization classified as a Measured Resource, within a 1.6 km (1 mile) radius of a sampled mine entry or exploration drillhole contiguous to mine workings, and within Crown Subsurface Mineral Lease KL 103 C. |
28
| 2) | Proven Mineral Reserve: identified recoverable potash mineralization classified as a Measured Resource, delineated on at least three sides by sampled mined entries or exploration drillholes to a maximum of 3.2 km (2 miles) apart, and within Crown Subsurface Mineral Lease KL 103 C. |
Along with this approach, analysis of in-mine samples for potash grade has provided an observation-based understanding of the potash mineralized zone at Cory that is far superior to the level of understanding provided by any surface drilling based exploration program. An understanding of the amount of ore that can be conventionally mined from the Measured Resource category using current mining practices comes from over 50 years of potash mining experience at Cory.
| 15.2 | CORY POTASH RESERVE CALCULATIONS |
Using the definitions outlined in Section 15.1, a portion of the Cory A Zone Measured Resource has been converted to Mineral Reserve. The assigned Mineral Reserve category is dependent on proximity to sampled mined entries also described in Section 15.1. An overall extraction ratio for the Cory mine has been applied to the qualifying areas outlined as Measured Resource in Figure 15. This extraction ratio is significantly lower than the local extraction ratio described in Section 16.1, as it takes into account areas which cannot be mined due to unfavorable geology.
The overall extraction ratio at the Cory mine is 24%. It was derived by dividing the total ore tonnes mined to date by the tonnage equivalent of the total area of the mine workings (i.e. the perimeter around the mine workings) less future mining blocks. This extraction ratio has been applied to the Probable Reserve, an area where no mining has occurred to date. To remain conservative in our estimations, and because a considerable amount of mining has already occurred in the Proven Reserve area, this extraction ratio has been applied only to the portion of the Proven Reserve that is anticipated to be mined in future. Future mining blocks within the Proven Reserve area vary from year-to-year as production continues. Pillars remaining that are not planned for mining remain a Measured Resource. Since an extraction ratio has been applied, Mineral Reserves are considered recoverable ore, and are reported as such. Note that only drillholes whose 1.6 km radii are contiguous to mine workings or the 1.6 km radius placed around mine workings are used to compute probable mineral reserve. The remaining non-contiguous drillholes remain in the Measured Resource category.
At times, irregular mining which resembles development mining occurs to support operational requirements (e.g. egress) or as geological conditions necessitate. While irregular mining increases confidence in the Mineral Resource by way of physical sampling, it can add considerable Mineral Reserve to broad areas not otherwise covered (or planned to be covered) by mine workings. Again, to remain conservative in our estimations, certain irregular mining may not have been converted from Measured Resource to Proven Reserve.
The Mineral Reserves for Cory as of December 31, 2024 are as follows:
Cory A Zone:
| Probable Reserve |
156 | millions of tonnes | ||||||
| Proven Reserve |
58 | millions of tonnes | ||||||
|
|
||||||||
| Total A Zone Reserve |
214 | millions of tonnes | ||||||
Cory B Zone:
| Probable Reserve |
nil | |||||||
| Proven Reserve |
nil | |||||||
|
|
||||||||
| Total B Zone Reserve |
nil | |||||||
Total Cory Reserves (A Zone + B Zone):
| Probable Reserve |
156 | millions of tonnes | ||||||
| Proven Reserve |
58 | millions of tonnes | ||||||
|
|
||||||||
| Total A Zone + B Zone Reserve |
214 | millions of tonnes | ||||||
Cory Mineral Reserves are plotted in Figure 16.
The average mineral grade of the Cory A Zone Mineral Reserve is 20.7% K2O equivalent and was determined from thousands of in-mine samples at Cory. See Section 11.2 for more detail.
29

Figure 16: Map showing Cory Mineral Reserve as of December 31, 2024.
| 16.0 | MINING METHOD |
| 16.1 | MINING OPERATIONS |
All conventional potash mines in Saskatchewan operate at 900 m to 1200 m below surface within 9 m to 30 m of the top of the Prairie Evaporite Formation. Over the scale of any typical Saskatchewan potash mine, potash beds are tabular and regionally flat-lying, with only moderate local variations in dip. At Cory, potash ore is mined using conventional mining methods, whereby:
| • | Shafts are sunk to the potash ore body; |
| • | Continuous mining machines cut out the ore, which is hoisted to surface through the production shaft; |
| • | Raw potash is processed and concentrated in a mill on surface; and |
| • | Concentrated finished potash products (near-pure KCl) are sold and shipped to markets in North America and offshore. |
Sinking of the two original shafts (Shaft #1 and Shaft #2) from surface to the potash zone was completed in 1968, and the first potash ore was hoisted in the fall of that year. The Cory mine has run on a continuous basis since the first ore was hoisted in 1968, other than short-term shutdowns taken for inventory management purposes, occasional plant maintenance and construction work, or other outages that are typical for operations of this nature.
In recent years, the Cory mine underwent a major expansion which brought the nameplate capacity up to 3.0 million tonnes of finished potash products per year. The operational capability at the Cory facility in 2024 was 2.1 million tonnes per year.
30
Virtually all Cory underground mining rooms are in one potash mineralized zone, the upper layer (or A Zone) of the Patience Lake Member of the Prairie Evaporite Formation (the host evaporite salt). Saskatchewan potash geology and conventional mining horizons are illustrated in Figure 17. Mine elevations range from approximately 965 m to 1,035 m depth below surface. Mine workings are protected from aquifers in overlying formations by approximately 12 m of overlying salt and potash beds, along with salt plugged porosity in the Dawson Bay Formation, a carbonate layer lying immediately above potash hosting salt beds.
The Cory mine is a conventional underground mining operation whereby mining machines are used to excavate the potash ore by the stress-relief mining method. Continuous conveyor belts transport ore from the mining face to the bottom of the production shaft. Mining methods employed in Saskatchewan are discussed in Jones and Prugger (1982) and in Gebhardt (1993). The highest mineral grade section of the Cory potash seam is approximately 3.35 m (11’) thick, with gradations to lower grade salts immediately above and below the mining horizon. The actual mining thickness at Cory is dictated by the height of mining machines used to cut the ore. There are two types of mining machines at Cory; five which are designed to cut at a thickness of 3.35 m (11’) and six which are designed to cut 3.65 m (12’).
As discussed in Section 10.0, Cory cuts to a marker (clay) seam that is slightly above the high-grade mineralized zone to establish a safe and stable mine roof. The top marker seam is slightly overcut by 10 cm to 20 cm. Clay seams are often planes of weakness, and if they are undercut, material immediately below the clay seam becomes a hazard as it may separate and fall. Since the hazard must be remediated prior to proceeding, thus slowing production, the moderately diluted mineral grade that results from the overcutting is preferable from a safety point of view.

Figure 17: Schematic cross-section through the Prairie Evaporite Formation, illustrating mining horizons at each of Nutrien’s conventional potash operations.
Conservative local extraction ratios (never exceeding 45% in any mining block) are employed at all Saskatchewan mines, including Cory, in order to minimize potential detrimental effects of mining on overlying strata; this is common practice in flat-lying, tabular ore bodies overlain by water-bearing layers.
From the shaft-bottom, potash ore is hoisted approximately 1,000 m from the potash level through the vertical shafts to a surface mill. In addition to hoisting potash ore to surface, the production shaft provides fresh air ventilation to the mine and serves as a secondary egress. The Service Shaft is used for service access, primary egress, and exhausting ventilation from the mine.
31
Since production began in 1968, 147.157 million tonnes of potash ore have been mined and hoisted to produce 45.934 million tonnes of finished potash product. The life-of-mine average concentration ratio (raw ore / finished potash products) is 3.20 and the overall extraction ratio over this time period is 24%.
Actual potash production tonnages for the Cory mine, along with concentration ratios (tonnes mined / tonnes product), are plotted for the past decade in Figure 18.

Figure 18: Mined tonnes, product tonnes, and concentration ratio for the Cory mine over the past 10 years.
32
| 16.2 | RISKS TO POTASH MINING OPERATIONS, WITH EMPHASIS ON WATER INFLOWS |
The mining of potash is a capital-intensive business, subject to the normal risks and capital expenditure requirements associated with mining operations. The production and processing of ore may be subject to delays and costs resulting from mechanical failures, physical hazards such as fires, and other hazards such as: unusual or unexpected geological conditions, significant subsidence, brine inflows and gas seepages of varying degree, and other situations associated with any potash mining operation.
Potash beds in all regions of Saskatchewan are overlain by a number of water-bearing formations, and there are water zones underlying the potash beds as well. A water inflow into mine workings is generally significant in a potash mine since salt dissolves in water; an inflow can lead to anything from increased costs at best to closure of the mine at worst (e.g. see Prugger and Prugger, 1991).
Over the past 50+ years of mining at Cory, there have been numerous small brine inflows into underground mine workings. Each new inflow is treated with concern and appropriately investigated, and all active inflow sites are monitored. Currently there are four brine collection points in the mine. While flow rates vary with time, at present, the cumulative flow rate from these locations has been averaging about 337 litres / minute. Additionally, inflows into the existing shafts is estimated at 40 litres / minute. Collectively, brine inflows are managed according to an internal Nutrien guideline known as the Inflow Management Strategy. It is based on requirements provided by The Mines Regulations (Saskatchewan) and guidelines developed by the members of the Saskatchewan Mining Association for safe and effective management of brine inflows in potash mines. Accordingly, brine from these inflows is collected, then pumped up to surface for disposal in the Tailings Management Area.
It is typical with inflows in Saskatchewan potash mines that some hydrogen sulfide gas (H2S) are exsolved from the depressurized formation brines as they enter the mine workings. Average concentrations are low (below 5 ppm) and well within safe limits for mine personnel.
| 17.0 | RECOVERY METHODS |
At Cory, potash ore has been mined and concentrated to produce saleable quantities of high grade finished potash products since 1968. Products include granular, standard, soluble and chicklets which are used for industrial, agricultural, and feed application.
Both flotation methods and crystallization methods are used to concentrate potash ore into finished potash products at the Cory mill. A simplified process flow diagram is shown in Figure 19. Raw potash ore is processed on surface, and concentrated finished potash products (near-pure KCl) are sold and shipped to markets in North America and offshore.

Figure 19: Simplified flow diagram for potash flotation and crystallization milling methods used at Cory.
33
Over the past three years, production of finished potash products at Cory was:
| 2022: | 1.888 million tonnes finished potash products at 61.58% K2O (average grade) | |
| 2023: | 1.493 million tonnes finished potash products at 61.74% K2O (average grade) | |
| 2024: | 2.113 million tonnes finished potash products at 61.50% K2O (average grade) |
Over the past decade, actual mill recovery rates have been between 72.3% and 83.0%, averaging 77.8% (see Figure 20). Historically, mill recoveries at Cory were lower than at other Nutrien plants because a larger portion, and at one point all, of Cory’s total production was made through the crystallization process. Given the long-term experience with potash geology and actual mill recovery at Cory, no fundamental potash milling problems are anticipated in the foreseeable future.
Quality control testing and monitoring geared towards fine-tuning and optimizing potash milling and concentrating processes are conducted on a continual basis at all Nutrien mine sites and at Nutrien research facilities. At Cory, this is no exception; test work to optimize circuit performance and ensure product quality is carried out on an ongoing basis.

Figure 20: Cory mill recovery rate over the past 10 years.
| 18.0 | PROJECT INFRASTRUCTURE |
Infrastructure is in place to meet current and projected requirements for transportation, energy (electricity and natural gas), water and process materials at Cory. See also Section 5.0.
The Cory mine is served by a number of villages within 50 kilometres of the mine site. The nearest city is Saskatoon (7 km distant). Surface facilities are accessed by existing paved roads and highways that are part of the Saskatchewan Provincial Highway System. Most potash product is shipped by rail over existing track, with some product shipped by truck over the North American highway system.
At present, high voltage power capacity at Cory is 52 MVA. The ten-year projection of power utilization indicates that the utility can meet all foreseeable future demand.
The Cory operation requires a sustained fresh water supply for the milling process which is provided by a waterline from the South Saskatchewan River (approximately 10 km distant). This provincially licensed water supply provides a source of process water for Cory milling operations and usage is regulated by terms of the license issued by the Water Security Agency.
| 19.0 | MARKET STUDIES AND CONTRACTS |
Potash from Company mines (including Cory) has been sold on a continuous basis since mining began in 1968. At present, Nutrien products are sold in more than 50 countries, to three types of end-use:
| 1. | Fertilizer, focused on balanced plant nutrition to boost crop yields to meet the world’s ever-increasing appetite for food (nitrogen, phosphate, potash) |
34
| 2. | Feed Supplements, focused on animal nutrition (mainly phosphate) |
| 3. | Industrial, focused on products for high-grade food, technical and other applications (nitrogen, phosphate, as phosphoric acid, potash) |
The Company owns and operates six potash mines in Saskatchewan and a potash mine in New Brunswick, Canada, which no longer produces potash and was permanently closed in 2018. Over the past three years (2022, 2023, 2024) the Company had potash sales of 39.639 million tonnes. Historical Company potash sales data for the past 10 years are plotted in Figure 21 and Figure 22.
Potash is mainly used for fertilizer, which typically makes up approximately 90% of the company’s annual potash sales volumes. By helping plants develop strong root systems and retain water, it enhances yields and promotes greater resistance to disease and insects. Because it improves the taste and nutritional value of food, potash is often called the “quality nutrient.” Industrial applications of potash include use in soaps, water softeners, de-icers, drilling muds and food products.
Potash fertilizer is sold primarily as solid granular and standard products. Granular product has a larger and more uniformly shaped particle than standard product and can be easily blended with solid nitrogen and phosphate fertilizers. It is typically used in more advanced agricultural markets such as the US and Brazil.
Most major potash consuming countries in Asia and Latin America have limited or no indigenous production capability and rely primarily on imports to meet their needs. This is an important difference between potash and the other major crop nutrient businesses. Trade typically accounts for approximately three-quarters of demand for potash, which ensures a globally diversified marketplace.
The most significant exporters are producers with mines in the large producing regions of Canada, the former Soviet Union, and the Middle East, which all have relatively small domestic requirements.

Figure 21: Historical Company potash sales 2015 to 2024 in million tonnes / year.*
| * | Company sales data for years prior to 2018 includes only PotashCorp sales. |
35

Figure 22: Historical Company potash net sales 2015 to 2024 in million USD $ / year.*
World consumption of potash fertilizer has grown over the last decade, with the primary growth regions being developing markets in Asia and Latin America. These are countries with expanding crop production requirements, where potash has historically been under-applied and crop yields lag behind those of the developed world. Although temporary pauses can occur in certain countries, the underlying fundamentals of food demand that encourage increased potash application are expected to continue the growth trends in key importing countries. See Figure 23 for world potash production and demand in 2024.

Figure 23: World potash production and demand for 2024E.
Potash is used on many agricultural commodities. Wheat, rice, corn, oilseed, and sugar crops consume over half of the potash used worldwide. Fruits and vegetables are also important users of potash fertilizers, accounting for about 19 percent of the total consumption. The remainder goes to other consumer and industrial crops such as oil palm, rubber,
| * | Company sales data for years prior to 2018 includes only PotashCorp sales. |
36
cotton, coffee, and cocoa. See Table 4 for primary potash market profile. This diversity means that global potash demand is not tied to the market fundamentals for any single crop or growing region.
| Table 4: Primary Potash Market Profile
|
||||
| Country/Region |
Growth Rate* |
Key Consuming Crops |
||
| China | 3.4% | Vegetables, rice, fruits, corn | ||
| India | -0.5% | Rice, wheat, vegetables, sugar crops | ||
| Other Asia | 2.8% | Oil palm, rice, sugar crops, fruits, vegetables | ||
| Latin America | 5.1% | Soybeans, sugar crops, corn | ||
| North America | 3.2% | Corn, soybeans | ||
| * | 5-year CAGR for potash fertilizer consumption (2019-2024E) |
Global potash shipments are estimated to have reached record levels at approximately 72.5 million tonnes in 2024, an increase of more than 4.5 million tonnes from the previous year. Potash demand has grown at an annualized rate of 2.6 percent over the past 5 years, driven by strong potash consumption trends in all major potash markets.
North American and South American growers applied significant amounts of potash to replenish soil nutrients removed by large harvests. Potash application rates are increasing in China and Southeast Asian countries as a result of increased soil testing and improved agronomic practices, along with a renewed focus on food security in China. Growers in these countries are also increasing acreage of potassium-intensive crops such as fruits, vegetables, and oil palm. India continues to face political barriers to significantly growing potash demand, however, the agronomic need and willingness of farmers to improve yields persists. The Company believes that supportive agriculture fundamentals and the need to address declining soil fertility levels will enable strong demand growth in the years ahead. World potash shipments and consumption in recent years is shown in Figure 24.

Figure 24: World potash shipments and consumption, 2019-2024E.
Canpotex Limited (Canpotex), the offshore marketing company owned by the Company and another Saskatchewan potash producer, handles all sales, marketing and distribution of potash produced by its member companies to customers outside of the US and Canada (including the potash produced at Cory).
In North America, Nutrien sells potash to retailers, cooperatives, and distributors, who provide storage and application services to farmers, the end-users. This includes sales to Nutrien’s retail distribution business, which has the largest retail distribution network in North America. Typically, the Company’s North American potash sales are larger in the first half of the year. The primary customers for potash fertilizer products for the Cory operation are retailers, dealers, cooperatives, distributors, and other fertilizer producers who have both distribution and application capabilities.
Nutrien’s Market Research group provides management with market information on a regular basis including global agriculture and fertilizer prices, demand and supply in fertilizer markets and general economic conditions that may The tailings management strategy at all Nutrien potash mines in Saskatchewan, including Cory, is one of sequestering solid mine tailings in an engineered and provincially licenced TMA near the surface plant site.
37
impact fertilizer sales. These may include specific market studies and analyses on different topics as may be required. This information is reviewed on a regular basis and the author of this report takes this information into account in understanding the markets and the assumptions within this report.
Plans and arrangements for potash mining, mineral processing, product transportation, and product sales are established by Nutrien and are within industry norms.
| 20.0 | ENVIRONMENTAL STUDIES, PERMITTING, AND SOCIAL OR COMMUNITY IMPACT |
The Cory TMA currently covers an area of approximately 416 hectares (1,027 acres) of land owned by the Company. Solid potash mine tailings typically consist of 85% to 95% rock salt (NaCl) and 5% to 15% insolubles (carbonate mud = CaCO3, anhydrite mud = CaSO4, and clays like chlorite, illite, and so on). An engineered slurry-wall has been constructed on the north, west, and south sides of the Cory TMA in the areas where near-surface aquifers could be impacted by mine waters. Near-surface geology to the east of the TMA limits the possibility of brine migration into these areas. The slurry-wall provides secondary containment of any saline mine waters, stopping these brines from reaching surrounding near-surface aquifers. Areas surrounding the TMA are closely monitored: this includes everything from daily visual perimeter inspections to annual investigations and inspections of surrounding groundwater and aquifers.
Cory currently operates four brine disposal wells near the surface plant of the Cory mine (marked in Figure 25) where clear salt brine (i.e. no silt, insolubles, or other waste) is borehole-injected into the Winnipeg / Deadwood Formations, deep subsurface aquifers approximately 1,500 m to 1,700 m below the surface. The disposal wells are provincially licensed, and formation water in these extensive deep aquifers is naturally saline.
Emissions to air consisting primarily of particulate matter are kept below regulatory limits through various modern air pollution abatement systems (e.g. dust collection systems built into mill processes) that are provincially licensed. This same procedure is followed at all Nutrien mines in Saskatchewan.
In Saskatchewan, all potash tailings management activities are carried out under an “Approval to Operate” granted by the Saskatchewan Ministry of Environment (MOE), the provincial regulator. Staff at the Cory mine actively monitor and inspect operations and routinely report the observations and measurements to the Environmental Protection Branch of MOE. The current Cory Approval to Operate has been granted to July 1, 2028, the renewal date.
In terms of long-term decommissioning, environmental regulations of the Province of Saskatchewan require that all operating potash mines in Saskatchewan create a long-term decommissioning and reclamation plan that will ensure all surface facilities are removed, and the site is left in a chemically and physically stable condition once mine operations are complete. The Company has conducted numerous studies of this topic, and the most recent decommissioning and reclamation plan for Cory was approved by MOE technical staff in January 2022. Because the current expected mine life for Cory is many decades into the future, it is not meaningful to come up with detailed engineering designs for decommissioning annually. Instead, decommissioning plans are reviewed every five years, and updated to accommodate new concepts, technological change, incorporation of new data, and adjustments of production forecasts and cost estimates. Any updated decommissioning and reclamation reports generated by this process are submitted to provincial regulatory agencies. For Cory, a revised decommissioning and reclamation plan is due to be submitted for MOE review in June 2026.
In addition to the long-term decommissioning plan, provincial regulations require that every potash producing company in Saskatchewan set up an Environmental Financial Assurance Fund, which is to be held in trust for the decommissioning, restoration and rehabilitation of the plant site after mining is complete. This fund is for all mines operated by Nutrien in the province of Saskatchewan (i.e. Allan, Cory, Lanigan, Patience Lake, Rocanville, and Vanscoy).
38

Figure 25: Aerial photo showing the Cory surface operations, disposal wells, and Tailings Management Area.
| 21.0 | CAPITAL AND OPERATING COSTS |
The Cory mine has been in operation since 1968; in the years immediately preceding this, major capital investment was made to bring this mine into production. Since then, capital expenditures were made on a regular and ongoing basis to sustain production, and to expand production from time to time.
A major refurbishment and expansion of the Cory mine was completed in 2013 increasing nameplate capacity to 3.0 million tonnes of finished potash products per year. This work involved increased hoist capacity, infrastructure improvements, major expansions of mine and mill, and improvements to loadout facilities. All construction was carried out without significant disruption to existing potash production from the site.
| 22.0 | ECONOMIC ANALYSIS |
| 22.1 | FUNDAMENTALS |
The Company conducts ongoing and detailed economic analyses on each of its operations and on all aspects of its business. While the Company considers its operating costs and results on a per mine basis to be competitively sensitive and confidential information, the Company is confident that the economic analysis conducted routinely for each of the Company’s operating potash mines is complete, reasonable, and meets industry standards.
On a cash flow basis, the Company’s potash segment generated USD $14,647 million in net sales over the past three years (2022, 2023 and 2024) based on sales volume of 39.639 million tonnes of finished potash products. The annual average realized potash price for manufactured products (includes North American and offshore sales) over a 10-year period (2015 – 2024) if plotted in Figure 26.
39
Over the past three years (2022, 2023, and 2024) the Cory mine produced 5.494 million tonnes of finished potash products. In the past three years (2022, 2023, and 2024), the Cory mine accounted for 14% of total potash production at the Company over this period. Cory is currently making a positive contribution to the Company’s potash segment.
Given the Company’s previous history (including over 50 years of mining at the Cory operation), recent market conditions, and extensive reserve base, the economic analysis for Cory has met the Company’s internal hurdle rates.

Figure 26: Historic annual average realized potash price in USD / tonne.*
| 22.2 | TAXES |
Royalties are paid to the Province of Saskatchewan in connection with the Company’s Potash operations, which holds most of the mineral rights in the lease areas, and royalties from Freehold lands are paid to various freeholders of mineral rights in the area. The Crown royalty rate is 3 percent and is governed by The Subsurface Mineral Royalty Regulations, 2017. The actual amount paid is dependent on selling price and production tonnes.
Municipal taxes are paid based on site property values to the applicable municipality in Saskatchewan. Saskatchewan potash production is taxed at the provincial level under The Mineral Taxation Act, 1983. This tax, governed by The Potash Production Tax Regulations, consists of a base payment and a profit tax, collectively known as the potash production tax. As a resource corporation in the Province of Saskatchewan, the Company is also subject to a resource surcharge equal to a percentage of the value of its resource sales (as defined in The Corporation Capital Tax Act of Saskatchewan). In addition to this, the Company pays federal and provincial income taxes based on corporate profits from all of its operations in Canada.
| 23.0 | ADJACENT PROPERTIES |
Cory Crown Mineral Lease KL 103 C is adjacent to the following Crown potash dispositions:
| • | Agrium Potash Ltd. 100% KL 114 D (Nutrien Vanscoy) |
| • | BHP Billiton Canada Inc. 100% KL 208 |
| • | BHP Billiton Canada Inc. 100% KL 221 |
| • | BHP Billiton Canada Inc. 100% KL 229 |
Nutrien’s Vanscoy Mine (KL 114 D) has extensive underground workings immediately adjacent to Cory KL 103 C. While these two mines are both owned and operated by Nutrien, there remains a shared buffer between the two operations’ mine workings, where it is agreed that no mining will occur. This buffer ensures that mine workings at one operation will not negatively impact workings at the other.
| * | Company sales data for years prior to 2018 includes only PotashCorp sales. |
40
| 24.0 | OTHER RELEVANT DATA AND INFORMATION |
Not applicable.
| 25.0 | INTERPRETATION AND CONCLUSIONS |
Nutrien and PotashCorp, one of the legacy companies of Nutrien, has a long history of successful potash mining at Cory, where potash has been produced for over 50 years. The authors believe that the experience gained in mining and milling potash for this length of time has produced a reliable body of information about potash mineralization, mining, and milling at Cory.
In a Saskatchewan potash mine that has been producing for many decades, reduction of mine life through increased production is counter-balanced by development mining into new mineral land parcels. This increases mine life through increasing the potash Mineral Reserve.
For Cory, mine life can be estimated by dividing the total Mineral Reserve (Proven + Probable) of 214 million tonnes by the average annual mining rate (million tonnes of ore hoisted per year). For Cory, the mining rate is defined as equal to the actual three-year running average (consecutive, most recent years). The average mining rate at Cory over the past three years (2022, 2023, and 2024) was 5.960 million tonnes of potash ore mined and hoisted per year.
If this mining rate is sustained, and if Mineral Reserves remain unchanged, then the Cory mine life would be 36 years. This estimate of mine life is likely to change as mining advances further into new mining blocks, and / or if mining rates or mining methodologies change.
| 26.0 | RECOMMENDATIONS |
Not applicable for a potash mine that has been in operation since 1968.
41
| 27.0 | REFERENCES |
Companion Policy 43-101CP to National Instrument 43-101 Standards of Disclosure for Mineral Projects (2011). Retrieve this and related documents from many websites.
The CIM Definition Standards for Mineral Resources and Reserves (2014). Retrieve this and related documents from many websites.
Fuzesy, Anne (1982). Potash in Saskatchewan (44p). Saskatchewan Industry and Resources Report 181. https://publications.saskatchewan.ca/#/products/7307.
Gebhardt, E. (1993). Mine planning and design integration, CIM Bulletin, May 1993, pp. 41 – 49.
Government of Saskatchewan (2025). Saskatchewan Mining and Petroleum GeoAtlas. https://gisappl.saskatchewan.ca/Html5Ext/index.html?viewer=GeoAtlas. Accessed January 2025.
Government of Saskatchewan. The Corporation Capital Tax Act of Saskatchewan. Available online at http://www.qp.gov.sk.ca/documents/English/Statutes/Statutes/c38-1.pdf.
Government of Saskatchewan. The Mineral Taxation Act, 1983. Available online at http://www.qp.gov.sk.ca/documents/English/Statutes/Statutes/M17-1.pdf.
Government of Saskatchewan. The Mines Regulations, 2018. Available online at https://publications.saskatchewan.ca/#/products/100307.
Government of Saskatchewan. The Potash Production Tax Regulations. Available online at https://publications.saskatchewan.ca/#/products/1263.
Government of Saskatchewan. The Subsurface Mineral Royalty Regulations, 2017. Available online at https://publications.saskatchewan.ca/#/products/88291.
Government of Saskatchewan. The Subsurface Mineral Tenure Regulations, 2015. Available online at http://www.publications.gov.sk.ca/details.cfm?p=72797.
Jones, P. R. and F. F. Prugger (1982). Underground mining in Saskatchewan potash. Mining Engineering, 34, pp. 1677 – 1683.
Nutrien Pilot Plant (2018). Personal communication on density of insoluble minerals in different ore zones.
Prugger, F.F., (1979), The flooding of the Cominco potash mine and its rehabilitation; CIM Bulletin, Vol. 72, No. 807, pp. 86 – 90.
Prugger, F. F. and A. F. Prugger (1991). Water problems in Saskatchewan potash mining – what can be learned from them? Bulletin of the Canadian Institute of Mining and Metallurgy (CIM Bulletin), Vol. 84, No. 945, pp. 58 – 66.
Robertson, David S. and Associates (1978). Summary Report on Evaluation of Potash Assets for Potash Corporation of Saskatchewan. Unpublished consultant’s report to Potash Corporation of Saskatchewan Inc.
Yang, C., Jensen, G., and Berenyi, J. (2009a). The Stratigraphic Framework of the Potash-rich Members of the Middle Devonian Upper Prairie Evaporite Formation, Saskatchewan; Summary of Investigations 2009, Volume 1, Saskatchewan Geological Survey.
42
Exhibit 99.3
NUTRIEN LTD.
LANIGAN
NATIONAL INSTRUMENT 43-101 TECHNICAL REPORT ON
LANIGAN POTASH DEPOSIT (KLSA 001 D),
SASKATCHEWAN, CANADA
FEBRUARY 20, 2025

PREPARED BY: JODI DERKACH, P. GEO.
| CRAIG FUNK, P. ENG., P. GEO. |
NUTRIEN LTD.
GEOSERVICES & LAND – ENGINEERING, TECHNOLOGY & CAPITAL
SUITE 1700, 211 19TH STREET EAST
SASKATOON, SASKATCHEWAN, CANADA
S7K 5R6
QUALIFIED PERSONS: JODI DERKACH, P. GEO. AND CRAIG FUNK, P. ENG., P. GEO.
DATE AND SIGNATURE PAGE
The scientific and technical information included in this report has been prepared under the supervision of persons who are ‘‘qualified persons’’ under Canadian National Instrument 43-101. Jodi Derkach, P. Geo. and Craig Funk, P. Eng., P. Geo. are the qualified persons who supervised the preparation of the information presented in this report and who verified the data disclosed herein.
| /s/ “Jodi Derkach” | ||||||||
| Signature | Jodi Derkach P. Geo. | |||||||
| Senior Manager, Land & Resource Nutrien Ltd. |
||||||||
| Date | February 20, 2025 | |||||||
| /s/ “Craig Funk” | ||||||||
| Signature | Craig Funk, P. Eng., P. Geo. | |||||||
| Director, GeoServices & Land Nutrien Ltd. |
||||||||
| Date | February 20, 2025 | |||||||
2
AUTHOR PAGE
The scientific and technical information included in this report has been prepared by, or under the supervision of, persons who are ‘‘qualified persons’’ under Canadian National Instrument 43-101.
Jodi Derkach, B. Sc., Cert. GIS, P. Geo. (APEGS Member # 14897)
| • | Senior Manager, Land & Resource—Engineering, Technology & Capital |
| • | B. Sc. (Geology), University of Saskatchewan, Saskatoon, Saskatchewan, Canada, 2007 |
| • | Geographic Information Science for Resource Management Certificate, Saskatchewan Polytechnic, Prince Albert, Saskatchewan, Canada, 2010 |
| • | with Nutrien or its subsidiaries since 2010 |
Craig Funk, B. Sc., M. Sc., P. Eng., P. Geo. (APEGS Member # 16034)
| • | Director, GeoServices & Land—Engineering, Technology & Capital |
| • | B. Sc. (Geological Engineering – Geophysics), University of Saskatchewan, Saskatoon, Saskatchewan, Canada, 1989 |
| • | M. Sc. (Geophysics), University of Saskatchewan, Saskatoon, Saskatchewan, Canada, 1992 |
| • | with Nutrien or its subsidiaries since 2008 |
are the qualified persons who supervised the preparation of all information presented in this report and who verified the data disclosed herein.
The team of persons who conducted the work presented within this report consists of:
Lisa MacKenzie, Cert. GIS
| • | Senior Advisor, Land—Engineering, Technology & Capital |
| • | Geographic Information Science for Resource Management Certificate, Saskatchewan Polytechnic, Prince Albert, Saskatchewan, Canada, 2012 |
| • | with Nutrien or its subsidiaries since 2012 |
Jennifer Nicolay Lawlor, B. Sc., P. Geo. (APEGS Member # 16167)
| • | Senior Advisor, Land & Resource – Engineering, Technology & Capital |
| • | B. Sc. (Geology), University of Regina, Regina, Saskatchewan, Canada, 2008 |
| • | with Nutrien or its subsidiaries since 2013 |
The authors would like to acknowledge the many staff who provided information and expert reviews on portions of this report, as well as past contributions of former (retired) staff Terrance Danyluk and Arnfinn Prugger.
3
TABLE OF CONTENTS
| DATE AND SIGNATURE PAGE |
2 | |||||
| AUTHOR PAGE |
3 | |||||
| TABLE OF CONTENTS |
4 | |||||
| LIST OF FIGURES |
6 | |||||
| LIST OF TABLES |
7 | |||||
| 1.0 |
SUMMARY | 8 | ||||
| 2.0 |
INTRODUCTION | 10 | ||||
| 3.0 |
RELIANCE ON OTHER EXPERTS | 11 | ||||
| 4.0 |
PROPERTY DESCRIPTION AND LOCATION | 11 | ||||
| 4.1 |
GENERAL | 11 | ||||
| 4.2 |
MINERAL RIGHTS | 12 | ||||
| 5.0 |
ACCESSIBILITY, CLIMATE, LOCAL RESOURCES, INFRASTRUCTURE AND PHYSIOGRAPHY | 13 | ||||
| 6.0 |
HISTORY | 14 | ||||
| 7.0 |
GEOLOGICAL SETTING AND MINERALIZATION | 15 | ||||
| 8.0 |
DEPOSIT TYPE | 17 | ||||
| 9.0 |
EXPLORATION | 18 | ||||
| 10.0 |
DRILLING | 20 | ||||
| 11.0 |
SAMPLING PREPARATION, ANALYSES AND SECURITY | 23 | ||||
| 11.1 |
BASIC APPROACH | 23 | ||||
| 11.2 |
MEAN POTASH MINERAL GRADE FROM IN-MINE SAMPLES | 26 | ||||
| 11.3 |
POTASH ORE DENSITY FROM IN-MINE MINERAL GRADE MEASUREMENTS | 27 | ||||
| 12.0 |
DATA VERIFICATION | 28 | ||||
| 12.1 |
ASSAY DATA | 28 | ||||
| 12.2 |
EXPLORATION DATA | 29 | ||||
| 13.0 |
MINERAL PROCESSING AND METALLURGICAL TESTING | 29 | ||||
| 14.0 |
MINERAL RESOURCE ESTIMATES | 29 | ||||
| 14.1 |
DEFINITIONS OF MINERAL RESOURCE | 29 | ||||
| 14.2 |
LANIGAN POTASH RESOURCE CALCULATIONS | 30 | ||||
4
| 15.0 |
MINERAL RESERVE ESTIMATES | 32 | ||||
| 15.1 |
DEFINITIONS OF MINERAL RESERVE | 32 | ||||
| 15.2 |
LANIGAN POTASH RESERVE CALCULATIONS | 33 | ||||
| 16.0 |
MINING METHOD | 34 | ||||
| 16.1 |
MINING OPERATIONS | 34 | ||||
| 16.2 |
RISKS TO POTASH MINING OPERATIONS, WITH EMPHASIS ON WATER INFLOWS | 37 | ||||
| 17.0 |
RECOVERY METHODS | 38 | ||||
| 18.0 |
PROJECT INFRASTRUCTURE | 39 | ||||
| 19.0 |
MARKET STUDIES AND CONTRACTS | 39 | ||||
| 20.0 |
ENVIRONMENTAL STUDIES, PERMITTING, AND SOCIAL OR COMMUNITY IMPACT | 43 | ||||
| 21.0 |
CAPITAL AND OPERATING COSTS | 44 | ||||
| 22.1 |
FUNDAMENTALS | 44 | ||||
| 22.2 |
TAXES | 45 | ||||
| 23.0 |
ADJACENT PROPERTIES | 45 | ||||
| 24.0 |
OTHER RELEVANT DATA AND INFORMATION | 45 | ||||
| 25.0 |
INTERPRETATION AND CONCLUSIONS | 46 | ||||
| 26.0 |
RECOMMENDATIONS | 46 | ||||
| 27.0 |
REFERENCES | 47 | ||||
5
LIST OF FIGURES
Unless otherwise noted, figures for which a source and / or date are not provided are current as of the effective date of this report and were prepared by the Company.
| Figure 1: Aerial photo of Lanigan surface operations, 2018 |
8 | |||
| Figure 2: Actual finished potash products production from the Lanigan mine over the past 10 years (in million tonnes per year) |
9 | |||
| Figure 3: Map showing location of Nutrien Operations, including Lanigan |
11 | |||
| Figure 4: Nutrien’s potash operations, including Lanigan, relative to potash mineralization (pink) in Saskatchewan |
12 | |||
| Figure 5: Map showing Lanigan Crown Lease KLSA 001 D (blue) |
13 | |||
| Figure 6: Map showing infrastructure near Lanigan. Lanigan surface operations shown as red dot |
14 | |||
| Figure 7: Vertical section showing basic layered-Earth stratigraphy in a typical Saskatchewan potash region |
16 | |||
| Figure 8: Geophysical wireline logs showing basic stratigraphy of the Prairie Evaporite Formation in the Saskatoon area |
17 | |||
| Figure 9: Cross-section of the Prairie Evaporite Formation across southern Saskatchewan showing relative position of potash members |
18 | |||
| Figure 10: Potash exploration at Lanigan including 3D seismic (purple), 2D seismic infill (orange lines), and potash drillholes (black dots) |
19 | |||
| Figure 11: A seismic section showing relative rock velocities and major geological units at Nutrien’s conventional potash operations |
20 | |||
| Figure 12: Typical stratigraphic section correlated with composite photos covering both the A Zone and B Zone production intervals |
22 | |||
| Figure 13: Potash assay plot for drillhole PCS Lanigan 04-28-032-23 W2 indicating the best 3.66 m (12’) mining interval for A Zone and the best 4.88 m (~16’) mining interval for B Zone |
24 | |||
| Figure 14: Histogram of A Zone potash ore grade from Lanigan in-mine grade samples (2007 to December 2024) |
27 | |||
| Figure 15: Histogram of B Zone potash ore grade from Lanigan in-mine grade samples (1999 to December 2024) |
27 | |||
| Figure 16: Map showing Lanigan A Zone and B Zone Mineral Resource as of December 2024 |
32 | |||
| Figure 17: Map showing Lanigan A Zone and B Zone Mineral Reserve to December 2024 |
34 | |||
| Figure 18: Schematic cross-section through the Prairie Evaporite Formation, illustrating mining horizons at each of Nutrien’s conventional potash operations |
36 | |||
| Figure 19: Mined tonnes, product tonnes, and concentration ratio for the Lanigan mine over the past 10 years |
37 | |||
| Figure 20: Simplified flow diagram for potash flotation and crystallization milling methods used at Lanigan |
38 | |||
| Figure 21: Lanigan mill recovery rate over the past 10 years |
39 | |||
| Figure 22: Historical Company potash sales 2015 to 2024 in million tonnes / year* |
40 | |||
| Figure 23: Historical Company potash net sales 2015 to 2024 in million USD $ / year* |
41 | |||
| Figure 24: World potash production and demand for 2024 |
41 | |||
| Figure 25: World potash shipments and consumption, 2019-2024E |
42 | |||
| Figure 26: Aerial photo showing the Lanigan surface operations, disposal wells, and Tailings Management Area |
44 | |||
| Figure 27: Historic annual average realized potash price in USD / tonne* |
45 |
6
LIST OF TABLES
| Table 1: Mineral Resources and Reserves for Lanigan Potash, as of December 31, 2024 |
10 | |||
| Table 2: Assay results for all potash test holes within Lanigan Lease KLSA 001 D |
23 | |||
| Table 3: Values for potash assay plot in Figure 13 |
25 | |||
| Table 4: Primary Potash Market Profile |
42 |
7
EFFECTIVE DATE OF REPORT
The effective date of this report is December 31, 2024, other than where otherwise noted.
| 1.0 | SUMMARY |
Effective January 1, 2018, Potash Corporation of Saskatchewan Inc. (“PotashCorp”) and Agrium Inc. (“Agrium”) completed a court-approved plan of arrangement (the “Arrangement”), involving, among others, PotashCorp, Agrium and Nutrien Ltd. (“Nutrien”) the new parent company of PotashCorp and Agrium. As a result of completing the Arrangement, PotashCorp and Agrium are wholly owned subsidiaries of Nutrien. References to “the Company” means Nutrien, indirectly through PotashCorp, or, for references prior to the completion of the Arrangement, PotashCorp, as the context requires.
Nutrien is a leading global provider of crop inputs and services. We operate a world-class network of production, distribution and agriculture retail facilities that positions us to efficiently serve the needs of farmers.
Nutrien is a corporation organized under the Canada Business Corporations Act, the common shares of which are listed and publicly traded on the Toronto and New York stock exchanges (symbol NTR).
The Company owns and operates a potash mine at Lanigan, Saskatchewan, Canada (“Lanigan mine” or “Lanigan”). An aerial view of the Lanigan surface operations is shown in Figure 1. The Lanigan Crown Subsurface Mineral Lease is numbered KLSA 001 D (the “Lanigan Crown Lease”) and was last amended in September 2022. Production of potash from the Lanigan mine began in 1968.

Figure 1: Aerial photo of Lanigan surface operations, 2018.
In 2024, annual nameplate capacity for Lanigan was 3.8 million tonnes and annual operational capability was 3.0 million tonnes of finished potash products (concentrated KCl). Estimates of nameplate capacity are based on capacity as per design specifications or Canpotex entitlements once these have been determined. Operational capability is the estimated annual achievable production level at current staffing and operational readiness (estimated at beginning of year), not including any inventory-related shutdowns and unplanned downtime and may vary during the year and year-to-year including as between our potash operations.
While the term potash refers to a wide variety of potassium bearing minerals, in the Lanigan region of Saskatchewan, the predominant potash mineralization is sylvinite, which is comprised mainly of the minerals sylvite (KCl / potassium-salt) and halite (NaCl / rock salt), with minor amounts water insolubles.
8
Carnallite (KMgCl3 · 6H2O) usually occurs in minor amounts at Lanigan; areas of the B Zone where carnallite layering is sporadically present are avoided through selective mining (i.e. by identifying and avoiding cutting through these layers). Potash fertilizer is concentrated, nearly pure KCl (i.e. greater than 95% pure KCl), but ore grade is traditionally reported on a % K2O equivalent basis. The “% K2O equivalent” gives a standard measurement of the nutrient value of different potassium-bearing rocks and minerals. To convert from % K2O equivalent tonnes to actual KCl tonnes, multiply by 1.58.
Virtually all Lanigan underground mining rooms are in one of two potash mineralized zones within the Patience Lake Member of the Prairie Evaporite Formation (the host evaporite salt). The potash mineralized zones are referred to as A Zone (the upper seam) and B Zone (the lower seam). The Lanigan mine is a conventional underground mining operation whereby continuous mining machines are used to excavate potash ore by the stress-relief mining method in one ore zone (the A Zone) and the long-room and pillar mining method in another ore zone (the B Zone). Currently, in any specific mining block, only one zone is mined (i.e. bi-level mining is not in practice). Continuous conveyor belts transport ore from the mining face to the bottom of the production shaft. In addition to hoisting potash ore to surface, the production shaft provides fresh air ventilation to the mine and serves as secondary egress. The Service Shaft is used for service access, and exhausting ventilation from the mine. Raw potash ore is processed and concentrated on surface and concentrated finished potash products (near-pure KCl) are sold and shipped to markets in North America and offshore.
At Lanigan, mine elevations range from approximately 940 m to 1,030 m depth below surface. These depths to potash mineralization are anticipated over most of the Lanigan lease area. Mine workings are protected from aquifers in overlying formations by salt and potash beds which overlie the mineralized zone. Conservative local extraction ratios (never exceeding 45% in any mining block) are employed at Lanigan to minimize potential detrimental effects of mining on overlying strata; this is common practice in flat-lying, tabular ore bodies overlain by water-bearing layers.
Part of the normal surface infrastructure associated with operating the potash mine in Saskatchewan includes waste disposal on the land and disposal of salt brine into deep subsurface aquifers. The Company stows salt tailings within an engineered and licensed Tailings Management Area (TMA) and operates three brine disposal wells near the surface plant of the Lanigan mine.
Since opening in 1968, 255.996 million tonnes of potash ore have been mined and hoisted at Lanigan to produce 76.014 million tonnes of finished potash products. The life-of-mine average concentration ratio (raw ore / finished potash products) is 3.37 and the overall extraction ratio over this time period is 24%. Actual production of finished potash products at Lanigan for the last 10 years is shown in Figure 2.

Figure 2: Actual finished potash products production from the Lanigan mine over the past 10 years (in million tonnes per year).
Over the past three years (2022, 2023, 2024), actual potash production at Lanigan has totaled:
| • | 25.892 million tonnes of ore mined and hoisted (8.631 million tonnes per year, on average) |
| • | 8.749 million tonnes of finished potash products produced (2.916 million tonnes per year, on average) |
| • | Average mill feed ore grade was 25.1% K2O equivalent |
| • | Average concentration ratio (ore mined / potash produced) was 2.97 |
9
The Canadian Institute of Mining and Metallurgy and Petroleum (CIM) has defined Mineral Resources and Reserves in The CIM Definition Standards for Mineral Resources and Reserves (2014). Based on these guidelines, all mineral rights owned or leased by the Company at Lanigan Potash can be assigned to Mineral Resource categories (Inferred, Indicated, and Measured) and Mineral Reserve categories (Probable and Proven). Mineral Resources (reported as in-place tonnes) and Mineral Reserves (reported as recoverable ore tonnes) for Lanigan as of December 31, 2024 are outlined in Table 1. Mineral Resources reported are exclusive of Mineral Reserves.
Table 1: Mineral Resources and Reserves for Lanigan Potash, as of December 31, 2024.
| Proven Mineral Reserve—A Zone (millions of tonnes recoverable ore) |
32 | |||
| Proven Mineral Reserve—B Zone (millions of tonnes recoverable ore) |
63 | |||
| Probable Mineral Reserve—A Zone (millions of tonnes recoverable ore) |
225 | |||
| Probable Mineral Reserve—B Zone (millions of tonnes recoverable ore) |
140 | |||
|
|
|
|||
| Total Mineral Reserve (millions of tonnes recoverable ore) |
460 | |||
| Measured Mineral Resource—A Zone (millions of tonnes in-place) |
1,223 | |||
| Measured Mineral Resource—B Zone (millions of tonnes in-place) |
1,351 | |||
| Indicated Mineral Resource—A Zone (millions of tonnes in-place) |
1,939 | |||
| Indicated Mineral Resource—B Zone (millions of tonnes in-place) |
2.561 | |||
| Inferred Mineral Resource—A Zone (millions of tonnes in-place) |
207 | |||
| Inferred Mineral Resource—B Zone (millions of tonnes in-place) |
273 | |||
|
|
|
|||
| Total Mineral Resource (millions of tonnes in-place) |
7,554 | |||
| Average % K2O Grade—A Zone (from Lanigan in-mine samples) |
24.7 | % | ||
| Average % K2O grade—B Zone (from Lanigan in-mine samples) |
20.2 | % | ||
|
|
|
|||
| Years of Remaining Mine Life (A Zone) |
30 | |||
|
|
|
|||
| Years of Remaining Mine Life (B Zone) |
23 | |||
The average mineral grade of the Lanigan A Zone Mineral Resource and Mineral Reserve is estimated to be 24.7% K2O equivalent and was determined from thousands of in-mine samples at Lanigan to the end of December 2024 (discussed further in Section 11.2). The average mineral grade of the Lanigan B Zone Mineral Resource and Mineral Reserve is estimated to be 20.2% K2O equivalent and was determined from thousands of in-mine samples at Lanigan to the end of December 2024 (discussed further in Section 11.2).
Potash production in any given year at the Lanigan mine is a function of many variables, so actual production in any given year can vary dramatically from tonnages produced in previous years. The Mineral Reserve tonnage and historic average production are used to estimate the remaining mine life. If the average mining rate seen over the past three years (8.631 million tonnes of potash ore mined and hoisted per year) is sustained, and if Mineral Reserves remain unchanged, then Lanigan A Zone mine life is 30 years from December 31, 2024, and Lanigan B Zone mine life is 23 years from December 31, 2024.
The mining of potash is a capital-intensive business subject to the normal risks and capital expenditure requirements associated with mining operations. The production and processing of ore may be subject to delays and costs resulting from mechanical failures, physical hazards such as fires, and other hazards such as: unusual or unexpected geological conditions, significant subsidence, brine inflows and gas seepages of varying degree, and other situations associated with any potash mining operation.
| 2.0 | INTRODUCTION |
The purpose of this document is to give a formal reporting of potash Mineral Resource and Reserve for Lanigan, and to provide a description of the method used to compute Mineral Resource and Reserve tonnages. Sources of geological and geotechnical information analysed from this study include:
| • | Publicly available geological maps, reports, and publications (listed in Section 27.0) |
| • | Data and internal reports on exploration drillholes |
| • | Hydrogeological analysis conducted in exploration drillholes |
| • | Geological studies conducted at the Lanigan mine over the past 50+ years |
| • | In-mine geophysical studies conducted at the Lanigan mine over the past 50+ years |
| • | Geotechnical studies conducted for the Lanigan mine over the past 50+ years |
| • | 2D & 3D surface seismic exploration data |
10
All data and reports are archived at the Nutrien corporate office in Saskatoon, the Lanigan mine site, or secure offsite commercial document storage facilities. In addition, drillhole data (well-log data, drilling reports, drill-stem test results, etc.) are archived with the Saskatchewan Ministry of Energy & Resources, Integrated Resource Information System (IRIS), and surface seismic data (shot records and stack) are archived through an offsite commercial data storage service.
All geological and geophysical data and information presented in this report were personally reviewed and inspected by qualified geoscience staff at Nutrien who are registered with the Association of Professional Engineers and Geoscientists of Saskatchewan (APEGS) under the supervision of Jodi Derkach, P. Geo. and Craig Funk, P. Eng., P. Geo. Jodi Derkach and Craig Funk last visited Lanigan on July 22, 2024. All reserve and resource estimates and mineral rights data presented in this report were personally evaluated and reviewed by the authors of this report. Each of these staff collaborates with Lanigan personnel multiple times per year.
The authors would like to acknowledge the many staff who provided information and expert reviews on portions of this report.
| 3.0 | RELIANCE ON OTHER EXPERTS |
Responsibility for the accuracy of the technical data presented in this report is assumed by the authors. Outside experts were not used in the preparation of this report.
| 4.0 | PROPERTY DESCRIPTION AND LOCATION |
| 4.1 | GENERAL |
The Lanigan mine is located in central Saskatchewan, approximately 100 km east of the city of Saskatoon, Saskatchewan. The general location is shown on the map in Figure 3.

Figure 3: Map showing location of Nutrien Operations, including Lanigan.
11
The Legal Description (Saskatchewan Township / Range) of the Lanigan surface operation is Section 28 Township 33 Range 23 West of 2nd Meridian. More precisely, the Lanigan Shaft #2 collar is located at:
| • | Latitude: 51 degrees 51 minutes 20.48 seconds North |
| • | Longitude: 105 degrees 12 minutes 34.79 seconds West |
| • | Elevation: 535.34 metres above mean Sea Level (SL) |
| • | Easting: 485,560.306m |
| • | Northing: 5,745,008.726m |
| • | Projection: UTM |
| • | Datum: NAD83 |
| • | Zone: 13 |
The Company owns approximately 3,980 hectares (9,836 acres) of surface rights required for current Lanigan mine operations, including areas covered by the existing surface plant and TMA, and surface lands required for anticipated future Lanigan mine and expanded milling operations.
All permits and approvals required for the operation of a potash mine in Saskatchewan are in place at Lanigan.
Figure 4 is a more detailed map showing the location of Lanigan potash deposits in Saskatchewan (modified from Yang, 2009).

Figure 4: Nutrien’s potash operations, including Lanigan, relative to potash mineralization (pink) in Saskatchewan.
| 4.2 | MINERAL RIGHTS |
Mineral rights at Lanigan are mined pursuant to subsurface mineral leases with the Province of Saskatchewan, Canada (the Crown), and with non-Crown (Freehold) mineral rights owners. Crown mineral rights are governed by The Subsurface Mineral Tenure Regulations, 2015, and Crown Leases are approved and issued by the Saskatchewan Ministry of Energy & Resources.
12
The original Lanigan Crown Subsurface Mineral Lease, numbered KL 100, was made effective in March 1964. In the following years various amendments were made whereby certain lands were added, removed, or transferred between Company dispositions for realized synergies between mining operations. The last amendment was executed in September 2022, and resulted in Crown Subsurface Mineral Lease KLSA 001 D (the “Lanigan Crown Lease” or simply “KLSA 001 D”).
KLSA 001 D covers an area of approximately 63,022 hectares (155,732 acres), as shown in Figure 5. At Lanigan, the Company has leased potash mineral rights for 42,930 hectares (106,082 acres) of Crown Land and owns or has leased approximately 19,522 hectares (48,240 acres) of Freehold Land within the lease boundary. The Lanigan Crown Lease term is for a period of 21 years and is renewable in accordance with The Subsurface Mineral Tenure Regulations, 2015 for successive 21-year periods. Freehold Lands also remain under lease providing, generally, that production is continuing and that there is a continuation of the Crown Lease.
Within the Lanigan Crown Lease area, 55,950 hectares (138,256 acres) are mined pursuant to unitization agreements with mineral rights holders (Crown and Freehold) within two unitized areas.
When underground workings of a potash mine are designed, there are inevitably regions that are mined with higher mining extraction (e.g. production panels) and other regions where mining extraction is lower (e.g. conveyor-belt development rooms). To treat mineral rights holders in both low extraction and high extraction areas fairly, and to promote good mining practices, a unitization agreement is the preferred method for determining mined potash allocation (on paper, for accounting purposes) and the resulting pro rata royalty. Under a unitization agreement, each mineral rights holder is paid a royalty based on their proportional share of the entire unit area regardless of whether their lands are mined. For example, if one mineral rights holder owns rights to 4,000 hectares within a 40,000-hectare unit area, they would be paid 10% of the total royalty payout from that unit area.

Figure 5: Map showing Lanigan Crown Lease KLSA 001 D (blue).
| 5.0 | ACCESSIBILITY, CLIMATE, LOCAL RESOURCES, INFRASTRUCTURE AND PHYSIOGRAPHY |
The Lanigan mine surface facilities are accessed by an existing paved road that is part of the Saskatchewan Provincial Highway System.
13
All potash product is shipped by rail over existing track. The location of Lanigan Potash with respect to the features described in this section (major road and rail infrastructure, as well as nearby river systems) is shown in Figure 6.
The Lanigan mine is served by a number of villages within 50 km of the mine site. The nearest cities are Humboldt (approximately 45 km north of Lanigan) and Saskatoon (approximately 100 km west of Lanigan).
Lanigan is situated near the northern extent of the Great Plains of North America. Topography is relatively flat, with gently rolling hills and occasional valleys. There are no rivers or other major watercourse channels near the Lanigan mine site. Climate at the Lanigan mine is typical for an inland prairie location at latitude 52º North (often characterized as “mid-latitude steppe” climate).
Part of the normal surface infrastructure associated with operating the potash mine in Saskatchewan includes waste disposal on the land and disposal of salt brine into deep subsurface aquifers. Facilities to carry out all aspects of these tasks are in place at Lanigan (see Section 20.0).
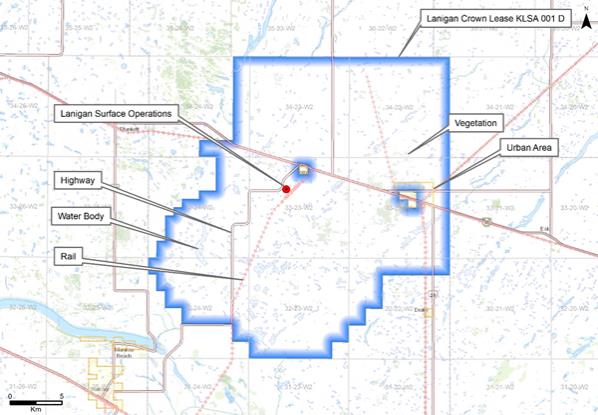
Figure 6: Map showing infrastructure near Lanigan. Lanigan surface operations shown as red dot.
| 6.0 | HISTORY |
Ten potash mines were brought into production in Saskatchewan between 1962 and 1970. Until 2017, no new mine had been commissioned following the original ten. Most current potash production comes from conventional underground mines, while just three operate using solution mining methods. Generally, potash mines have contracted or expanded production over the years in response to the demand for potash.
Exploration drilling for potash in the Lanigan area was carried out in the 1950s and 1960s. The Lanigan mine was built by a company named Alwinsal Potash of Canada Ltd., a consortium of German and French mining and fertilizer companies in the 1960s. Potash production began at Lanigan in 1968 and the mine has run on a continuous basis since then other than short-term shutdowns taken for inventory management purposes, occasional plant maintenance and construction work, or other outages that are typical for operations of this nature.
14
PotashCorp acquired the Lanigan mine in 1976.
Effective January 1, 2018, PotashCorp and Agrium completed the Arrangement. As a result of completing the Arrangement, PotashCorp and Agrium are wholly owned subsidiaries of Nutrien.
Both flotation and crystallization methods are used at Lanigan to produce potash products for agricultural application. Mill rehabilitation, mine expansion and hoist improvement projects were completed at Lanigan between 2005 and 2010. The expansion construction was carried out without significant disruption to existing potash production from the site. The annual nameplate capacity at Lanigan as of December 31, 2024, is 3.8 million tonnes.
| 7.0 | GEOLOGICAL SETTING AND MINERALIZATION |
Much of southern Saskatchewan is underlain by the Prairie Evaporite Formation, a layered sequence of salts and anhydrite which contains one of the world’s largest deposits of potash. The potash extracted from the predominantly sylvinitic ore has its main use as a fertilizer. A map showing the extent of the potash deposits in Saskatchewan is shown in Figure 4.
The 100 m to 200 m thick Prairie Evaporite Formation is overlain by between 400 and 500 m of Devonian carbonates, followed by approximately 100 m of Cretaceous sandstone, and between 400 and 500 m of Cretaceous shales and more recent Pleistocene glacial tills to surface. The Prairie Evaporite Formation is underlain by Devonian carbonates. The Phanerozoic stratigraphy of Saskatchewan is remarkable in that units are flat-lying and relatively undisturbed over very large areas. A geological section representing Saskatchewan stratigraphy is shown in Figure 7 (modified from Fuzesy, 1982). A geological section representing the Prairie Evaporite Formation stratigraphy in the Saskatoon area is shown in Figure 8 (modified from Fuzesy, 1982).
15

Figure 7: Vertical section showing basic layered-Earth stratigraphy in a typical Saskatchewan potash region.
Potash mineralization in this region of Saskatchewan is predominantly sylvinite, which is comprised mainly of the minerals sylvite (KCl) and halite or rock salt (NaCl), with trace carnallite (KMgCl3 · 6H2O) and minor water insolubles. Potash fertilizer is concentrated, nearly pure KCl (i.e. greater than 95% pure KCl), but ore grade is traditionally reported on a % K2O equivalent basis. The “% K2O equivalent” gives a standard measurement of the nutrient value of different potassium-bearing rocks and minerals. To convert from % K2O equivalent tonnes to actual KCl tonnes, multiply by 1.58.
Over the past three years (2022, 2023, 2024), the average measured potash ore grade of the mill feed at Lanigan was 25.1% K2O equivalent. The average ore grade reported from surface drillhole intersections, all within Lanigan Subsurface Mineral Lease KLSA 001 D, is 25.4% K2O equivalent for A Zone and 23.3% K2O equivalent for B Zone (discussed further in Section 10.0). The average ore grade observed from thousands of in-mine samples collected to the end of December 2024 is 24.7% K2O equivalent for A Zone and 20.2% K2O equivalent for B Zone (discussed further in Section 11.2).
16
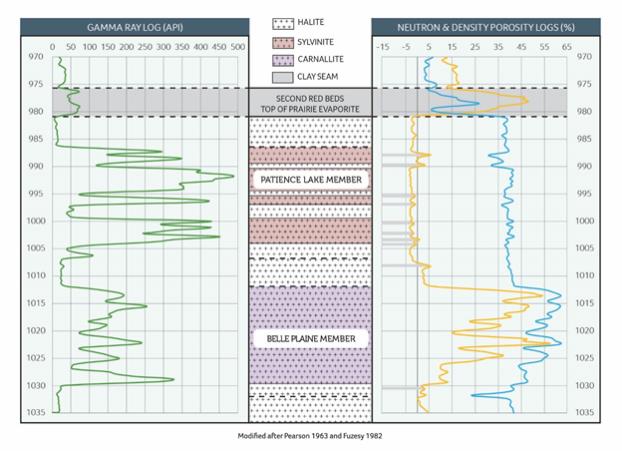
Figure 8: Geophysical wireline logs showing basic stratigraphy of the Prairie Evaporite Formation in the Saskatoon area.
| 8.0 | DEPOSIT TYPE |
There are three mineable potash members within the Prairie Evaporite Formation of Saskatchewan. Stratigraphically highest to lowest, these members are: Patience Lake, Belle Plaine, and Esterhazy. A geological section showing potash members that occur in Saskatchewan is shown in Figure 9.
The Lanigan potash deposit lies within the Patience Lake Member of Prairie Evaporite Formation. There are two potash seams named A Zone and B Zone within this member; both the A Zone and B Zone are being mined at Lanigan. Two other potash members are present at Lanigan: the Belle Plaine Member and the lesser developed Esterhazy Member.
Lanigan potash mineralization occurs at an average of about 990 m depth below surface. Salt cover from the top of the A Zone mining horizon to overlying units is approximately 7 m thick, and salt cover from the top of the B Zone mining horizon to overlying units is approximately 14 m thick. The Lanigan mine operates as a conventional, underground potash mine.
17

Figure 9: Cross-section of the Prairie Evaporite Formation across southern Saskatchewan showing relative position of potash members.
| 9.0 | EXPLORATION |
Before the Lanigan mine was established in 1968, all exploration consisted of drilling from surface and analysis of core from these drillholes; drilling results are discussed in Section 10.0. Since mining began in 1968, exploration drilling has been infrequent. Now, drilling is most often used to derisk mining. A map showing potash exploration coverage at Lanigan Potash (drillholes, 2D and 3D seismic coverage) is shown in Figure 10.
In most of southern Saskatchewan, potash mineralization is in place wherever Prairie Evaporite Formation salts exist, are flat-lying, and are undisturbed. Since the surface seismic exploration method is an excellent tool for mapping the top and bottom of Prairie Evaporite salts, this has become the main potash exploration tool in any existing Saskatchewan Subsurface (potash) Mineral Lease. Historically, 2D seismic, and now the more accurate and full coverage 3D seismic methods are used to infer continuity and extent of potash beds in flat-lying potash deposits. Seismic data are relied upon to identify collapse structures that must be avoided in the process of mine development since these structures can act as conduits for water ingress to the mine. As a result, isolation pillars or mining buffer zones are left around these anomalous features. This practice reduces the overall mining extraction ratio, but the risk of inflow to mine workings are effectively mitigated. Occasional, small-scale salt anomalies that are not mapped by seismic data do occur. When they do, they are dealt with in the normal course of mining and extraction through these areas is typically minimized. Where there is uncertainty in seismic interpretations, drilling is often used to confirm or improve refine the seismic interpretation.
Within the Lanigan Crown Lease, a total of 582 linear kilometres of 2D seismic lines, and 590 square kilometres of 3D seismic has been acquired to the end of December 2024.
18

Figure 10: Potash exploration at Lanigan including 3D seismic (purple), 2D seismic infill (orange lines), and potash drillholes (black dots).
A typical seismic section from Nutrien’s conventional seismic operations is shown in Figure 11. This is a cross-section extracted from a multi-program 3D seismic volume (earliest program was 2002). The vertical scale is in metres relative to sea level (SL). The seismic section is coloured by rock velocities computed from the seismic data and represents different rock types. Note that the Prairie Evaporite (salt) is continuous. This indicates an undisturbed, flat-lying salt within which potash is likely to be found based on over 50 years of mining experience at Lanigan.
Experience has shown that the potash mining horizon is continuous when seismic data are undisturbed and flat-lying, as shown in Figure 11. It is now Nutrien’s policy to collect detailed 3D seismic data ahead of mining. Any areas recognized as seismically unusual are identified early, and mine plans are adjusted as needed.
19

Figure 11: A seismic section showing relative rock velocities and major geological units at Nutrien’s conventional potash operations.
| 10.0 | DRILLING |
For the original Lanigan potash test holes drilled in the 1950s and 1960s, the primary objective was to sample potash horizons to establish basic mining parameters. The seismic method was still novel and crude at that time and as such, 2D seismic surveys were done sparingly, so the drillhole information was relied upon heavily to evaluate potash deposits. Test holes would penetrate the evaporite section with a hydrocarbon-based drilling mud (oil-based or diesel fuel) to protect the potash mineralization from dissolution. Basic geophysical well-logs were acquired, and in many cases, drill stem tests were run on the Dawson Bay Formation to help assess water-make potential of the caprock. Core samples from the targeted potash intersections were split or quartered (cut with a masonry saw), crushed and analysed to establish potash grades.
Drilling activity was limited at Lanigan during the 1970s. In 1973, a single exploration drillhole was completed, although assay results proved to be unusable. Subsequently, in 1975, a second saltwater disposal well, from which assay data were taken, was constructed.
In 1981, further exploration drilling was carried out at Lanigan as part of a mine expansion project. Five additional drillholes were completed, following similar drilling and sampling methodologies as the original 1950s and 1960s drillholes. Geophysical well-logging technology had improved and therefore the log suites collected in the 1981 drill program were of better quality than those collected previously. A 2D seismic survey had been carried out prior to the 1981 drilling program. Two of the five drillholes completed in 1981 targeted seismic (geological) anomalies as part of a seismic data verification process. The anomalies were confirmed and areas around these drillholes were excluded from mine development.
Relatively thin interbeds or seams of insoluble material, referred to as clay seams in the potash industry, are an ever-present component of the A Zone and B Zone at Lanigan. Figure 12 shows the basic stratigraphic relationships. These seams, along with the clay and other detrital minerals disseminated throughout the potash rock matrix, make up the water insoluble portion of the ore.
20
The same sequences of clay seams can be correlated for many kilometres across the central Saskatchewan potash mining district.
At Lanigan, a particular sequence of two clay seams marks the top of the A Zone, as illustrated in Figure 12 (modified from Robertson, 1978). A single distinct clay seam marks the top of the B Zone; this clay seam is immediately overlain by a much less consistent clay seam referred to as Shadowband at Lanigan. In 2013, Lanigan modified its cutting practices in the B Zone to improve mine roof stability. This modification involved cutting a slightly higher horizon, just above Shadowband, thus removing the hazard associated with the seam. The goal of improved mine roof stability was achieved; however, less potash and more salt is now being mined resulting in a slightly lower reported ore grade for B Zone.
Lanigan’s clay seams are illustrated in Figure 12. These seams are used to guide the vertical positioning of the mining machines in both A Zone and B Zone mining. The seams marking the top of each mining zone are maintained at the top of the mining cut to keep the mining machines “on grade”. Cutting too high above the upper seam or top marker results in ore grade dilution, as lower grade material immediately overlies each mining zone. In practice though, the top marker seam is slightly overcut (between 10 cm to 20 cm) to prevent an unstable mine roof condition from being created. Clay seams often act as planes of weakness in potash mining, and if they are undercut, materials immediately below the clay seam may separate and fall. As such, the moderate mineral grade dilution that results from the overcutting is preferable from a safety point of view.
The A Zone mining interval is fixed at 3.66 m (12’). B Zone mining machines have a fixed mining height of 2.74 m (9’). In a normal B Zone production room, ore is extracted in two lifts resulting in a mining height of approximately 4.88 m (16’). These mining heights allow for comfortable working headroom and efficient extraction of potash ore.
21

Figure 12: Typical stratigraphic section correlated with composite photos covering both the A Zone and B Zone production intervals.
Drill core assay results were studied by independent consultant David S. Robertson and Associates (1976) and by Nutrien technical staff (see Section 12.1). Results are found in Table 2. The best 3.66 m (12’) mining interval in A Zone, and the best approximately 4.88 m (16’) mining interval in B Zone was determined from the assay values in each potash test well, using clay marker seams as a guide. Note that while B Zone drillhole assays were derived using interval thicknesses of between 4.07 m to 7.30 m averaging 5.08 m, a more conservative mining height of 4.88 m is used for Mineral Resource and Reserve estimates.
The original Lanigan exploration area was explored with 12 test holes spaced at intervals of 1.6 km to 3.4 km (1 – 3 miles). Assays from most of these original test holes were studied by an independent consultant. Drillholes following the original test holes were analysed by Nutrien staff and are listed in Table 2 below. Certain drillholes within KLSA 001 D were not assayed, while others intersected abnormal geology whereby a normal potash zone could not be picked given the limited data available and, therefore, the resulting % K2O and % water insoluble content could not be evaluated with confidence. As such, these anomalous drillholes are not listed in Table 2 below. All drilling and sampling were carried out following the regulations in place at the time.
Drillhole assay data for the A Zone at Lanigan gives an estimated mean grade of 25.4% K2O with 5.8% water insolubles. Drillhole assay data for B Zone at Lanigan gives an estimated mean grade of 23.3% K2O with 5.8% water insolubles.
22
Table 2: Assay results for all potash test holes within Lanigan Lease KLSA 001 D
| Location |
Year Drilled |
A Zone | B Zone | |||||||||||
| Interval (m) |
% K2O Equiv. |
% Water Insol. |
Interval (m) |
% K2O Equiv. |
% Water Insol. |
|||||||||
| 01-29-033-22 W2 |
1955 | 3.66 | 27.7 | 6 | 5.49 | * | * | |||||||
| 13-34-033-23 W2 |
1956 | * | * | * | * | |||||||||
| 16-12-034-24 W2 |
1956 | * | * | 4.51 | 25.8 | * | ||||||||
| 12-24-034-23 W2 |
1957 | 3.66 | 25.6 | 2.8 | 5.12 | 18.5 | 2.4 | |||||||
| 04-28-033-23 W2 |
1958 | 3.66 | 25.9 | 2.1 | 4.85 | 25.8 | 6.3 | |||||||
| 04-29-032-22 W2 |
1959 | * | * | * | * | |||||||||
| 13-11-033-23 W2 |
1959 | 3.66 | 21.2 | 9.7 | 4.16 | 26.9 | 5.5 | |||||||
| 09-26-033-23 W2 |
1959 | 3.66 | 27.3 | 2.2 | 4.51 | 25.2 | 6.6 | |||||||
| 03-10-034-23 W2 |
1959 | 3.66 | 22.1 | * | 4.07 | 24.0 | 5.7 | |||||||
| 01-10-033-24 W2 |
1959 | 3.66 | 27.3 | * | 4.92 | 24.6 | 4.2 | |||||||
| 04-24-033-24 W2 |
1959 | 3.66 | 25.7 | 1.9 | 5.19 | 24.0 | 5 | |||||||
| 13-18-033-22 W2 |
1960 | 3.66 | 26.3 | 7.1 | 4.72 | 22.8 | 8.2 | |||||||
| 08-02-033-23 W2 |
1960 | 3.66 | 26.9 | 7.1 | 7.59 | 15.7 | 5.3 | |||||||
| 12-04-033-23 W2 |
1960 | 3.66 | 26.5 | 6.5 | 4.76 | 24.6 | 5.8 | |||||||
| 12-16-033-23 W2 |
1960 | 3.66 | 23.9 | 8.4 | 4.31 | 25.9 | 4.2 | |||||||
| 09-22-033-23 W2 |
1960 | 3.66 | 29.5 | 5.7 | 5.04 | 25.2 | 6.8 | |||||||
| 02-30-033-23 W2 |
1960 | * | * | * | * | |||||||||
| 13A-30-033-23 W2 |
1960 | 3.66 | 25.4 | 8.9 | 7.3 | 14.8 | 3.5 | |||||||
| 01-12-033-24 W2 |
1960 | 3.66 | 24.7 | 7.3 | 5.02 | 26.6 | 4.8 | |||||||
| 12-04-033-23 W2 |
1961 | * | * | * | * | |||||||||
| 08-03-033-23 W2 |
1973 | * | * | * | * | |||||||||
| 01-20-033-23 W2 |
1975 | * | * | 5.96 | 22.4 | 5.6 | ||||||||
| 04-07-033-22 W2 |
1981 | 3.66 | 22.8 | 4.2 | * | * | ||||||||
| 03-26-032-23 W2 |
1981 | 3.66 | 20.6 | 6.2 | 4.57 | 18.8 | 7.2 | |||||||
| 04-28-032-23 W2 |
1981 | 3.66 | 25.7 | * | 4.94 | 25.6 | 6.9 | |||||||
| 16-25-033-23 W2 |
1981 | * | * | * | * | |||||||||
| 13-25-032-24 W2 |
1981 | 3.66 | 25.6 | 6.4 | 4.88 | 24.0 | 6.8 | |||||||
| 11-05-033-22 W2 |
2020 | 3.66 | 26.6 | 6.7 | 4.62 | 23.5 | 7.0 | |||||||
| 16-11-33-22 W2 |
2021 | * | * | 25.6 | 8.6 | |||||||||
|
|
|
|
|
|
|
|||||||||
|
Average (of usable values): |
3.66 | 25.4 | 5.8 | 5.07 | 23.3 | 5.8 | ||||||||
|
|
|
|
|
|
|
|||||||||
Due to the remarkably consistent mineralogy and continuity of the resource, as experienced through decades of mine production, very little potash exploration drilling has been done at Lanigan since 1961. Instead of exploration drillholes, seismic surveying has been relied upon more and more to explore ahead of mine development. Where normal Prairie Evaporite sequences are mapped in the seismic data, potash beds have unfailingly been present. Occasional, small-scale salt anomalies that are not mapped by seismic data do occur. When they do, they are dealt with in the normal course of mining and extraction through these areas is typically minimized. Anomalies associated with possible water inflow problems, which are mapped in the seismic data, are avoided.
| 11.0 | SAMPLING PREPARATION, ANALYSES AND SECURITY |
| 11.1 | BASIC APPROACH |
Exploration drilling in the Lanigan area was conducted in the 1950s and 1960s. A second phase of drilling associated with a mine expansion project occurred in 1981. Sampling and assaying of potash core samples was done using methods considered consistent with standard procedures for potash exploration at these times.
Drillhole sampling methods have remained essentially the same over the years. Potash core samples are acquired as described in earlier sections of this report. Short segments of core usually about 0.3 m (1’) in length are labeled based on visible changes in mineralization, and sometimes based on fixed intervals. Each segment of core is then split using some type of rock or masonry saw. The split portion of core is then bagged and labeled and sent to a laboratory for chemical analysis.
23
Historical potash samples remain stored at the Subsurface Geological Laboratory (Regina, Saskatchewan) of the Saskatchewan Ministry of Energy & Resources.


Figure 13: Potash assay plot for drillhole PCS Lanigan 04-28-032-23 W2 indicating the best 3.66 m (12’) mining interval for A Zone and the best 4.88 m (~16’) mining interval for B Zone.
An assay plot for drillhole PCS Lanigan 04-28-032-23 W2 is shown above in Figure 13. Similar data were compiled for all historical potash test holes. In the A Zone, the best 3.66 m (12’) mining interval intersected in each drillhole, as discussed in Section 10.0, is determined from the assay values using clay seams as a guide. Likewise, the best approximately 4.88 m (16’) B Zone mining interval is determined from the assay values using clay seams as a guide. Note that while B Zone drillhole assays were derived using intervals of between 4.07 m to 7.30 m averaging 5.08 m, a more conservative mining height of 4.88 m is used for Mineral Resource and Reserve estimates. Table 3 lists the assay values plotted in Figure 13.
24
Table 3: Values for potash assay plot in Figure 13.

25
All new drilling efforts have targeted areas of geological uncertainty. Although normal ore zone conditions may occur in the tested areas, they are not targeted specifically. For this reason, and because ore grade is known to be locally variable, assays from drilling are not relied upon for ore grade estimation. Instead, grade determined from routinely collected in-mine ore zone samples are found to be most reliable. The long-term average from in-mine tends to best represent the larger ore zone as it normalizes local variability.
Thousands of in-mine ore grade samples were collected at Lanigan to the end of December 2024 (discussed further in Section 11.2). All in-mine samples were analysed in the Lanigan mill laboratory using analysis techniques that were up-to-date for the era in which the sample was collected.
Regarding quality assurance for analytical results, the Company participates in the Canpotex Producer Sample Exchange Program using methods developed by the Saskatchewan Potash Producers Association (SPPA). The Sample Exchange Program monitors the accuracy of analytical procedures used in its labs. In the early 1970s, the SPPA initiated a round-robin Sample Exchange Program, the purpose of which was to assist the potash laboratories in developing a high level of confidence in analytical results. This program, now named the Canpotex Producer Sample Exchange Program using SPPA Methods (CPSEP), has continued up to the present. Current participants include all Canpotex member potash mine site labs, the Nutrien Pilot Plant Lab, and independent third-party surveyor labs. The CPSEP provides participants with three unknown potash samples for analysis quarterly. Results for the unknown sample analysis are correlated by an independent agency that distributes statistical analysis and a summary report to all participants. Completed exchange program samples can be used for control standards as required in QA/QC sections of standard analytical procedures.
The Nutrien Pilot Plant is secured in the same way as modern office buildings are secured. Authorized personnel have access and visitors are accompanied by staff. No special security measures are taken beyond that. Currently, no external laboratory certification is held by the Nutrien Pilot Plant. On occasion, product quality check samples are sent to the Saskatchewan Research Council (SRC), a fully certified analytical facility.
In the opinion of the authors, the sample preparation, security, and analytical procedures are acceptable, are consistent with industry-standard practices, and are adequate for Mineral Resource and Reserve estimation purposes.
| 11.2 | MEAN POTASH MINERAL GRADE FROM IN-MINE SAMPLES |
In the Lanigan A Zone, in-mine grade samples are taken by collecting fine “muck” from the floor of the mine (i.e. grab sampling) at the start of every cutting sequence. This is equivalent to a sample taken approximately every 23 m (76’) in production panels, and a sample taken approximately every 47 m (155’) in development panels. Since mining began in the A Zone in 2007 through to the end of December 2024, a total of 5,518 in-mine potash mineral grade samples were collected from the Lanigan A Zone. All samples were analysed in the Lanigan mill laboratory using up-to-date analysis techniques. Figure 14 shows a histogram of A Zone in-mine grade sample results from the Lanigan mine.
The median ore grade for this family of in-mine samples is 25.7% K2O equivalent and the mean ore grade is 24.7%. The five-year (2020 – 2024) mean ore grade is 25.4% K2O equivalent and was determined from 3,053 samples.
This is considered to be a more representative estimate of expected potash ore grade in the A Zone at Lanigan than drillhole assay results presented in Section 10.0.

26
Figure 14: Histogram of A Zone potash ore grade from Lanigan in-mine grade samples (2007 to December 2024).
In the Lanigan B Zone, in-mine grade samples are taken from the floor every 60 m (200’) in newly mined rooms. In-mine grade data is available from 1999 through to the end of December 2024. A total of 22,175 in-mine potash mineral grade samples were collected from the Lanigan B Zone. All samples were analysed in the Lanigan mill laboratory using analysis techniques that were up-to-date for the era in which the sample was collected. Figure 15 shows a histogram of B Zone in-mine grade sample results from the Lanigan mine.
The median ore grade for this family of in-mine samples is 20.8% K2O equivalent and the mean ore grade is 20.2%. The five-year (2017 – 2024) mean ore grade is 19.1% K2O equivalent and was determined from 1,390 samples.
This is considered to be a more representative estimate of expected potash ore grade in the B Zone at Lanigan than drillhole assay results presented in Section 10.0.
In 2013, Lanigan modified its cutting practices in the B Zone to improve mine roof stability. This modification involved cutting in a slightly higher, but more stable horizon (described in more detail in Section 10.0). The goal of improved mine roof stability was achieved, however, less potash and more salt is now being mined which has resulted in a lower, more diluted reported B Zone ore grade.

Figure 15: Histogram of B Zone potash ore grade from Lanigan in-mine grade samples (1999 to December 2024).
| 11.3 | POTASH ORE DENSITY FROM IN-MINE MINERAL GRADE MEASUREMENTS |
An estimate of in-situ rock density is used to calculate potash mineralization volumes in Mineral Resource and Reserve assessments. A common approach, and the one used by Nutrien, is to determine in-place Mineral Resource and Reserve volumes (m3), then multiply this number by in-situ bulk-rock density (tonnes / m3) to give in-place Mineral Resource and Reserve tonnes.
Well-log data from drillholes can be used to calculate bulk density if accurate and calibrated well-logs are acquired during exploration drilling. In practical terms, modern well-logs tend to meet these criteria, but historic well-logs (collected before the 1990s) do not. In Saskatchewan, almost all potash exploration drilling took place in the 1950s and 1960s, well before density logs were accurate and reliable.
Another approach, and the one used by Nutrien, is to look up density values for the minerals which constitute potash rock – values determined in a laboratory to a high degree of accuracy and published in reliable scientific journals / textbooks – then apply these densities to the bulk rock. Given that the density of each pure mineral is quantified and known, the only variable is what proportion of each mineral makes up the bulk rock. An obvious benefit of this approach is that a mean value computed on the in-mine samples shown in Figure 14 and Figure 15 has a much greater confidence interval than a mean value computed from just a few drillhole assays.
The four main mineralogical components of the ore zones of Saskatchewan’s Prairie Evaporite Formation with their respective mineral densities are:
27
| Mineral |
Density (kg / m3) |
Components |
||||
| Halite | 2,170 | NaCl | ||||
| Sylvite | 1,990 | KCl | ||||
| Carnallite | 1,600 | KMgCl3 · 6(H2O) | ||||
| Insolubles | 2.870 | Anhydrite, dolomite, quartz, muscovite, and other minor mineral components (Nutrien Pilot Plant, 2018) |
All Nutrien potash mines measure and record the in-mine % K2O grade and insoluble content of the mined rock. In addition, carnallite content is also measured at Lanigan since it can be a component of the lower portion of the B Zone. From this set of measurements, density of the ore can be calculated.
The value for insoluble density is based on known densities of the constituent parts of the insoluble components of the mineralization and the average occurrence of these insoluble components, which is known from over 50 years of mining experience at Lanigan. Assuming the lowest plausible density of insolubles known for Saskatchewan potash deposits of this nature, the effect upon overall bulk-rock ore density and Mineral Resource and Reserve calculations would be negligible.
From thousands of in-mine samples taken at Lanigan, bulk density for the Lanigan A Zone has been determined to be:
= (halite density * % halite) + (sylvite density * % sylvite) + (insolubles density * % insolubles) + (carnallite density * % carnallite)
= (2,170 kg / m3 * 54.7%) + (1,990 kg / m3 * 38.2%) + (2,870 kg / m3 * 6.1%) + (1,600 kg / m3 * 1.0%)
= 2,138 kg / m3
RHObulk-rock (Lanigan A Zone) = 2,138 kg / m3 = 2.14 tonnes / m3
From thousands of in-mine samples taken at Lanigan, bulk density for the Lanigan B Zone has been determined to be:
= (halite density * % halite) + (sylvite density * % sylvite) + (insolubles density * % insolubles) + (carnallite density * % carnallite)
= (2,170 kg / m3 * 59.5%) + (1,990 kg / m3 * 30.8%) + (2,870 kg / m3 * 4.8%) + (1,600 kg / m3 * 4.9%)
= 2,120 kg / m3
RHObulk-rock (Lanigan B Zone) = 2,120 kg / m3 = 2.12 tonnes / m3
This method is as accurate as the ore grade measurements and mineral density estimates.
| 12.0 | DATA VERIFICATION |
| 12.1 | ASSAY DATA |
Original drill core assays were studied by independent consultant David S. Robertson and Associates (1976). The original assay results for core samples from historical drillholes were taken as accurate in these studies, as there is no way to reliably reanalyse these samples. Most of the remaining samples in storage have long since deteriorated to the point where they are not usable. Robertson (1976) assay analyses for the A Zone are not reported in Section 10.0 as they assumed a 3.4 m (11’) mining interval. Instead, Nutrien technical staff recalculated the historical assay results from the A Zone using a 3.66 m (12’) mining interval, the mining height currently used in the Lanigan A Zone. Recently, drillhole core is prepared for sampling by Nutrien staff and, generally, sent to SRC Geoanalytical Laboratory for independent analyses.
Ore grades of in-mine samples are measured inhouse at the Lanigan mine laboratory by Company staff using modern, standard chemical analysis tools and procedures; an independent agency does not verify these results. However, check sampling through the CPSEP, discussed in Section 11.1, does occur.
It should be noted that assay results from historical drillholes match in-mine sample results reasonably well even though drillhole sample spacing is much greater. This correlation is further validation of the in-mine sampling methodology. Mean mineral grade determined from in-mine samples taken over decades of mining at Lanigan is thought to provide the most accurate measurement of potash grade for the Lanigan mine, also providing a good basis for estimating ore grade in areas of future mining at Lanigan.
28
| 12.2 | EXPLORATION DATA |
The purpose of any mineral exploration program is to determine extent, continuity, and grade of mineralization to a certain level of confidence and accuracy. For potash exploration, it is important to minimize the amount of cross-formational drilling, since each drillhole is a potential conduit for subsurface groundwater from overlying (or underlying) water-bearing formations into future mine workings. Every potash test drillhole from surface sterilizes potash mineralization as a safety pillar is required around every surface drillhole once underground mining commences.
Initial sampling and assaying of cores were done during potash exploration at Lanigan in the 1950s and 1960s. Methods were consistent with standard procedures for that era. The mine began production in 1968 and test drilling conducted after that was largely for the purpose of better understanding the caprock rather than potash mineralization. This approach to potash sampling is in accordance with widely accepted industry practice for areas adjacent and contiguous to an existing operating potash mine.
Assay of physical samples (drillhole cores and/or in-mine samples) is the only way to gain information about mineral grade, but extent and continuity of mineralization are correctly determined using data collected from seismic surveys correlated with drilling information. To date, surface seismic data at Lanigan have been collected, analysed, and verified by Company staff, at times, in cooperation with independent consultants.
Data for the Mineral Resource and Reserve estimates for Lanigan mine reported in Sections 14.0 and 15.0 were verified by Company staff as follows:
| • | Review of potash assay sample information (drillholes and in-mine grade samples), |
| • | Review and verify procedures used for in-mine grade sampling and laboratory analysis, |
| • | Review of surface geophysical exploration results (3D and 2D seismic data), |
| • | Crosscheck of mined tonnages reported by mine site technical staff with tonnages estimated from mine survey information, and |
| • | Crosscheck of Mineral Resource and Mineral Reserve calculations carried out by corporate technical staff. |
In the opinion of the authors, this approach to data verification of potash mineral grade and surface seismic information is in accordance with generally accepted industry practice for areas adjacent and contiguous to an existing operating potash mine.
| 13.0 | MINERAL PROCESSING AND METALLURGICAL TESTING |
At Lanigan, potash ore has been mined and concentrated to produce saleable quantities of high-grade finished potash products since 1968.
Since opening in 1968, 255.996 million tonnes of potash ore have been mined and hoisted to produce 76.014 million tonnes of finished potash products. Given this level of sustained production over several decades, basic mineralogical processing, and prospective metallurgical testing of Lanigan potash is not considered relevant.
See also Section 17.0.
| 14.0 | MINERAL RESOURCE ESTIMATES |
| 14.1 | DEFINITIONS OF MINERAL RESOURCE |
The CIM has defined Mineral Resource in The CIM Definition Standards for Mineral Resources and Reserves (2014) as:
| 1) | Inferred Mineral Resource: that part of a Mineral Resource for which quantity and grade or quality are estimated on the basis of limited geological evidence and sampling. Geological evidence is sufficient to imply but not verify geological and grade or quality continuity. |
| 2) | Indicated Mineral Resource: that part of a Mineral Resource for which quantity, grade or quality, densities, shape, and physical characteristics are estimated with sufficient confidence to allow the application of Modifying Factors in sufficient detail to support mine planning and evaluation of the economic viability of the deposit. Geological evidence is derived from adequately detailed and reliable exploration, sampling and testing and is sufficient to assume geological and grade quality continuity between points of observation. |
29
| 3) | Measured Mineral Resource: that part of a Mineral Resource for which quantity, grade or quality, densities, shape, and physical characteristics are estimated with confidence sufficient to allow the application of Modifying Factors to support detailed mine planning and final evaluation of the economic viability of the deposit. Geological evidence is derived from detailed and reliable exploration, sampling and testing and is sufficient to confirm geological and grade or quality continuity between points of observation. |
CIM defines Modifying Factors as “considerations used to convert Mineral Resources into Mineral Reserves. These include, but are not restricted to, mining, processing, metallurgical, infrastructure, economic, marketing, legal, environmental, social and governmental factors.”
In south-central Saskatchewan, where geological correlations are straightforward, and within a (potash) subsurface mineral lease at an operating potash mine, Mineral Resource categories are generally characterized by Nutrien as follows:
| 1) | Inferred Mineral Resource: areas of limited exploration, such as areas that have been investigated through regional geological studies, or areas with 2D regional surface seismic coverage, little or no drilling, at some distance from underground workings, and within Crown Subsurface Mineral Lease KLSA 001 D. |
| 2) | Indicated Mineral Resource: areas of adequate exploration, such as areas with 3D surface seismic coverage, little or no drilling, at some distance from underground workings, and within Crown Subsurface Mineral Lease KLSA 001 D. |
| 3) | Measured Mineral Resource: areas of detailed, physical exploration through actual drilling or mine sampling, near existing underground workings, and within Crown Subsurface Mineral Lease KLSA 001 D. |
The mine began production in 1968 and test drilling conducted after that was largely for the purpose of better understanding the caprock rather than potash mineralization. Instead, exploration involved collecting surface seismic data, which became better in quality over the years. Exploration drilling has demonstrated the presence of the potash horizon, and seismic coverage shows the continuity of the Prairie Evaporite Formation within which the potash horizon occurs.
Along with this approach, analysis of in-mine samples for potash grade has provided an observation-based understanding of the potash mineralized zone at Lanigan that is far superior to the level of understanding provided by any surface drilling-based exploration program. The authors believe that this approach provides a body of information that guides and constrains exploration inferences in a much better way than could be achieved from any conventional exploration investigation in areas immediately surrounding, and contiguous to, the Lanigan potash mine.
| 14.2 | LANIGAN POTASH RESOURCE CALCULATIONS |
Exploration information used to calculate reported Mineral Resource tonnages at Lanigan consist of both physical sampling (drillhole and in-mine) and surface seismic (2D and 3D) as discussed in earlier sections. Based on the definitions and guidelines in Section 14.1, all mineral rights leased or owned by the Company, and within Crown Subsurface Mineral Lease KLSA 001 D, are assigned to one of the three Mineral Resource categories.
Mineral Resources are reported as mineralization in-place and are exclusive of Mineral Reserves. In-place tonnes were calculated for each of the Mineral Resource categories using the following parameters:
| Mining Height (A Zone): | 3.66 m (12’) | |
| Mining Height (B Zone): | 4.88 m (16’) | |
| Ore Density (A Zone): | 2.14 tonnes / m3 | |
| Ore Density (B Zone): | 2.12 tonnes / m3 | |
The Mineral Resources for Lanigan, as of December 31, 2024 are as follows:
Lanigan A Zone:
| Inferred Resource |
207 | millions of tonnes | ||||||
| Indicated Resource |
1,939 | millions of tonnes | ||||||
| Measured Resource |
1.223 | millions of tonnes | ||||||
|
|
||||||||
| Total A Zone Resource |
3,369 | millions of tonnes | ||||||
30
Lanigan B Zone:
| Inferred Resource |
273 | millions of tonnes | ||||
| Indicated Resource |
2,561 | millions of tonnes | ||||
| Measured Resource |
1,351 | millions of tonnes | ||||
|
|
||||||
| Total B Zone Resource |
4,185 | millions of tonnes | ||||
Total for Lanigan (A Zone + B Zone):
| Inferred Resource |
480 | millions of tonnes | ||||
| Indicated Resource |
4,500 | millions of tonnes | ||||
| Measured Resource |
2,574 | millions of tonnes | ||||
|
|
||||||
| Total A Zone + B Zone Resource |
7,554 | millions of tonnes | ||||
Lanigan Mineral Resources are plotted in Figure 16.
The average mineral grade of the Lanigan A Zone Mineral Resource is 24.7% K2O equivalent and was determined from thousands of in-mine samples at Lanigan. The average mineral grade of the Lanigan B Zone Mineral Resource is 20.2% K2O equivalent and was determined from thousands of in-mine samples at Lanigan. See Section 11.2 for more detail.
The tonnage reported in the Lanigan A Zone Measured Resource is comprised of the potash that is within 1.6 km (1 mile) of a physically sampled location (i.e. drillholes or mine workings). Likewise, the tonnage reported in the Lanigan B Zone Measured Resource is comprised of the potash that is within 1.6 km (1 mile) of physically sampled location (i.e. drillholes or mine workings). Also included as Measured Resource is the potash in the pillars of mined-out areas of the Lanigan mine that is not already accounted for in the Proven Reserve estimation as there is the possibility of retrieving ore from the remnant mining pillars at some point in the future.
31

Figure 16: Map showing Lanigan A Zone and B Zone Mineral Resource as of December 2024.
| 15.0 | MINERAL RESERVE ESTIMATES |
| 15.1 | DEFINITIONS OF MINERAL RESERVE |
The CIM has defined Mineral Reserve in The CIM Definition Standards for Mineral Resources and Reserves (2014) as:
| 1) | Probable Mineral Reserve: the economically mineable part of an Indicated, and in some circumstances, a Measured Mineral Resource. The confidence in the Modifying Factors applying to a Probable Mineral Reserve is lower than that applying to a Proven Mineral Reserve. |
| 2) | Proven Mineral Reserve: the economically mineable part of a Measured Mineral Resource. A Proven Mineral Reserve implies a high degree of confidence in the Modifying Factors. |
CIM defines Modifying Factors as “considerations used to convert Mineral Resources into Mineral Reserves. These include, but are not restricted to, mining, processing, metallurgical, infrastructure, economic, marketing, legal, environmental, social and governmental factors.”
For Saskatchewan, in regions adjacent and contiguous to an operating potash mine and within a (potash) subsurface mineral lease, Mineral Reserve categories are characterized by Nutrien as follows:
| 1) | Probable Mineral Reserve: identified recoverable potash mineralization classified as a Measured Resource, within a 1.6 km (1 mile) radius of a sampled mine entry or exploration drillhole contiguous to mine workings, and within Crown Subsurface Mineral Lease KLSA 001 D. |
32
| 2) | Proven Mineral Reserve: identified recoverable potash mineralization classified as a Measured Resource, delineated on at least three sides by sampled mined entries or exploration drillholes to a maximum of 3.2 km (2 miles) apart, and within Crown Subsurface Mineral Lease KLSA 001 D. |
Along with this approach, analysis of in-mine samples for potash grade has provided an observation-based understanding of the potash mineralized zone at Lanigan that is far superior to the level of understanding provided by any surface drilling-based exploration program. An understanding of the amount of ore that can be conventionally mined from the Measured Resource category using current mining practices comes from over 50 years of potash mining experience at Lanigan.
| 15.2 | LANIGAN POTASH RESERVE CALCULATIONS |
Using the definitions outlined in Section 15.1, a portion of the Lanigan A Zone and B Zone Measured Resource has been converted to Mineral Reserve. The assigned Mineral Reserve category is dependent on proximity to sampled mined entries also described in Section 15.1. An overall extraction ratio for the Lanigan mine has been applied to the qualifying area outlined as Measured Resource in Figure 16. This extraction ratio is significantly lower than the local extraction ratio described in Section 16.1, as it takes into account areas which cannot be mined due to unfavorable geology.
The overall extraction ratio at the Lanigan mine is 24%. It was derived by dividing the total ore tonnes mined to date by the tonnage equivalent of the total area of the mine workings (i.e. the perimeter around the mine workings) less future mining blocks. This extraction ratio has been applied to the Probable Reserve, an area where no mining has occurred to date. To remain conservative in our estimations, and because a considerable amount of mining has already occurred in the Proven Reserve area, this extraction ratio has been applied only to the portion of the Proven Reserve that is anticipated to be mined in future. Future mining blocks within the Proven Reserve area vary from year-to-year as production continues. Pillars remaining that are not planned for mining remain a Measured Resource. Since an extraction ratio has been applied, Mineral Reserves are considered recoverable ore, and are reported as such. Note that only drillholes whose 1.6 km radii are contiguous to mine workings or the 1.6 km radius placed around mine workings are used to compute probable mineral reserve. The remaining non-contiguous drillholes remain in the Measured Resource category.
At times, irregular mining which resembles development mining occurs to support operational requirements (e.g. egress) or as geological conditions necessitate. While irregular mining increases confidence in the Mineral Resource by way of physical sampling, it can add considerable Mineral Reserve to broad areas not otherwise covered (or planned to be covered) by mine workings. Again, to remain conservative in our estimations, certain irregular mining may not have been converted from Measured Resource to Proven Reserve.
Currently, in any specific mining block at Lanigan, only one zone is mined (i.e. bi-level mining is not in practice). As such, Mineral Reserve is assigned only to the ore zone that will be mined in the future so that A Zone Mineral Reserve and B Zone Mineral Reserve do not overlap. Unmined B Zone potash mineralization directly underlying the defined A Zone Mineral Reserve is classified as B Zone Measured Resource. In the same way, unmined A Zone potash mineralization directly overlying the defined B Zone Mineral Reserve is classified as A Zone Measured Resource.
The Mineral Reserves for Lanigan as of December 31, 2024 are as follows:
Lanigan A Zone:
| Probable Reserve |
225 | millions of tonnes | ||||
| Proven Reserve |
32 | millions of tonnes | ||||
|
|
||||||
| Total A Zone Reserve |
257 | millions of tonnes | ||||
Lanigan B Zone:
| Probable Reserve |
140 | millions of tonnes | ||||
| Proven Reserve |
63 | millions of tonnes | ||||
|
|
||||||
| Total B Zone Reserve |
203 | millions of tonnes | ||||
Total for Lanigan (A Zone + B Zone):
| Probable Reserve |
365 | millions of tonnes | ||||
| Proven Reserve |
95 | millions of tonnes | ||||
|
|
||||||
| Total A Zone and B Zone Reserve |
460 | millions of tonnes | ||||
33
Lanigan Mineral Reserves are plotted in Figure 17.
The average mineral grade of the Lanigan A Zone Mineral Resource is 24.7% K2O equivalent and was determined from thousands of in-mine samples at Lanigan. The average mineral grade of the Lanigan B Zone Mineral Resource is 20.2% K2O equivalent and was determined from thousands of in-mine samples at Lanigan. See Section 11.2 for more detail.

Figure 17: Map showing Lanigan A Zone and B Zone Mineral Reserve to December 2024.
| 16.0 | MINING METHOD |
| 16.1 | MINING OPERATIONS |
All conventional potash mines in Saskatchewan operate at 900 m to 1,200 m below surface within 9 m to 30 m of the top of the Prairie Evaporite Formation. Over the scale of any typical Saskatchewan potash mine, potash beds are tabular and regionally flat-lying, with only moderate local variations in dip. At Lanigan, potash ore is mined using conventional mining methods, whereby:
| • | Shafts are sunk to the potash ore body; |
| • | Continuous mining machines cut out the ore, which is hoisted to surface through the production shaft; |
| • | Raw potash is processed and concentrated in a mill on surface; and |
| • | Concentrated finished potash products (near-pure KCl) are sold and shipped to markets in North America and offshore. |
Potash ore was first hoisted at Lanigan in the fall of 1968. The Lanigan mine has run on a continuous basis since then, other than short-term shutdowns taken for inventory management purposes or occasional plant maintenance and construction work, or other outages that are typical for operations of this nature.
34
In recent years, the Lanigan mine underwent a major expansion which brought the nameplate capacity up to 3.8 million tonnes of finished potash products per year. The operational capability at the Lanigan facility in 2024 was 3.0 million tonnes per year
Virtually all Lanigan underground mining rooms are in one of two potash mineralized zones within the Patience Lake Member of the Prairie Evaporite Formation (the host evaporite salt). In this Member, there are two potash seams named A Zone (the upper seam) and B Zone (the lower seam); at present, both the A Zone and B Zone are being mined at Lanigan. The A Zone and B Zone are separated by approximately 4 m to 6 m of tabular salt. Saskatchewan potash geology is illustrated in Figure 18. At Lanigan, mine elevations range from approximately 940 m to 1,030 m depth below surface. These depths to potash mineralization are anticipated over most of the Lanigan lease area. Mine workings are protected from aquifers in overlying formations by approximately 7 m (A Zone) to 14 m (B Zone) of overlying salt and potash beds, along with salt plugged porosity in the Dawson Bay Formation, a carbonate layer lying immediately above potash hosting salt beds.
The Lanigan mine is a conventional underground mining operation whereby mining machines are used to excavate potash ore by the stress-relief mining method in the A Zone and the long-room and pillar mining method in the B Zone. Currently, in any specific mining block, only one zone is mined (i.e. bi-level mining is not in practice). Continuous conveyor belts transport ore from the mining face to the bottom of the production shaft. Mining methods employed in Saskatchewan are discussed in Jones and Prugger (1982) and in Gebhardt (1993).
The actual mining thickness at Lanigan is dictated by the height of mining machines used to cut the ore. The A Zone mining interval is fixed at 3.66 m (12’). The 3.66 m (12’) mining height also allows for comfortable working headroom and efficient extraction of potash ore. The thickness of the B Zone mining horizon varies somewhat and there is some flexibility in the thickness of the potash ore that is extracted there. Mining machines have a fixed mining height of 2.74 m (9’). In a normal production room, ore is extracted in two lifts resulting in a mining height of approximately 4.88 m (16’). The Lanigan mine regularly utilizes ten mining machines and has five additional machines cutting periodically.
Carnallite sometimes occurs in minor amounts in the basal part of the B Zone. Carnallite is an undesirable mill feed material. It is common at Lanigan to find carnallite in pod-like deposits and the larger pods can be mapped with seismic and avoided. Smaller pods are typically mapped using physical sampling or Ground Penetrating Radar after the first lift of a production room. When detected, the second production lift is not cut thus leaving the carnallite in the floor. In these instances, the B Zone mining height is just 2.74 m (9’). Carnallite is found in trace amounts in the A Zone; however, due to its low occurrence, mining practices remain unchanged when it is encountered.
As discussed in Section 10.0, mining systems used in both A Zone and B Zone cut to a marker (clay) seam that is slightly above the high-grade mineralized zone to establish a safe and stable mine roof. In both zones, the top marker seam is slightly overcut by 10 cm to 20 cm. Clay seams are often planes of weakness, and if they are undercut, material immediately below the clay seam becomes a hazard as it may separate and fall. Since the hazard must be remediated prior to proceeding, thus slowing production, the moderately diluted mineral grade that results from the overcutting is preferable from a safety point of view.
In 2013, Lanigan modified its cutting practices in the B Zone to improve mine roof stability. This modification involved cutting a slightly higher horizon. The goal of improved mine roof stability was achieved; however, less potash and more salt is now being mined resulting in a slightly lower reported ore grade for B Zone.
35

Figure 18: Schematic cross-section through the Prairie Evaporite Formation, illustrating mining horizons at each of Nutrien’s conventional potash operations.
Conservative local extraction ratios (never exceeding 45% in any mining block) are employed at all Saskatchewan mines, including Lanigan, to minimize potential detrimental effects of mining on overlying strata; this is common practice in flat-lying, tabular ore bodies overlain by water-bearing layers.
From the shaft-bottom, potash ore is hoisted approximately 1,000 m from the potash level through the vertical shafts to a surface mill. In addition to hoisting potash ore to surface, the production shaft provides fresh air ventilation to the mine and serves as secondary egress. The Service Shaft is used for service access, and exhausting ventilation from the mine.
Since production began in 1968, 255.996 million tonnes of potash ore have been mined and hoisted at Lanigan to produce 76.014 million tonnes of finished potash products ). The life-of-mine average concentration ratio (raw ore / finished potash products) is 3.37 and the overall extraction ratio over this time period is 24%.
Actual potash production tonnages for the Lanigan mine, along with concentration ratios (tonnes mined / tonnes product), are plotted for the past decade in Figure 19.
36


Figure 19: Mined tonnes, product tonnes, and concentration ratio for the Lanigan mine over the past 10 years.
| 16.2 | RISKS TO POTASH MINING OPERATIONS, WITH EMPHASIS ON WATER INFLOWS |
The mining of potash is a capital-intensive business, subject to the normal risks and capital expenditure requirements associated with mining operations. The production and processing of ore may be subject to delays and costs resulting from mechanical failures, physical hazards such as fires, and other hazards such as: unusual or unexpected geological conditions, significant subsidence, brine inflows and gas seepages of varying degree, and other situations associated with any potash mining operation.
37
Potash beds in all regions of Saskatchewan are overlain by a number of water-bearing formations, and there are water zones underlying the potash beds as well. A water inflow into mine workings is generally significant in a potash mine since salt dissolves in water; an inflow can lead to anything from increased costs at best to closure of the mine at worst (e.g. see Prugger and Prugger, 1991).
Over the past 50 years of mining at Lanigan, there have been numerous small brine inflows into underground workings. Analysis of water chemistry and stable isotope composition shows that these brines are from connate pockets of ancient, saturated brine trapped in the Prairie Evaporite Formation and / or the Dawson Bay Formation.
In 2012, an inflow located in an abandoned area of the Lanigan mine workings was discovered. At present, the inflow is estimated at approximately 490 litres / minute. Since it was discovered, this inflow has been characterized and successfully managed. The source of the brine is known to be the Souris River Formation. The inflow is managed according to an internal Nutrien guideline known as the Inflow Management Strategy. It is based on requirements provided by The Mines Regulations (Saskatchewan) and guidelines developed by the members of the Saskatchewan Mining Association for safe and effective management of brine inflows in potash mines. Accordingly, brine from this inflow is collected, then pumped up to surface for disposal directly into the Deadwood Formation (refer to Section 20 for more information on brine disposal). To date, this inflow has had no impact on Lanigan potash production.
It is typical with inflows in Saskatchewan potash mines that some hydrogen sulfide gas (H2S) is exsolved from the depressurized formation brines as they enter the mine workings. Average concentrations are low (below 5 ppm) and well within safe limits for mine personnel.
Inflow into each existing shaft at Lanigan, which were both designed to be water-tight, is estimated at nil (i.e. not measurable).
| 17.0 | RECOVERY METHODS |
At Lanigan, potash ore has been mined and concentrated to produce saleable quantities of high-grade finished potash products since 1968. Products include granular, standard and fine standard grade potash which are used for agricultural application.
Both flotation methods and crystallization methods are used to concentrate potash ore into finished potash products at the Lanigan mill. A simplified process flow diagram is shown in Figure 20. Raw potash ore is processed on surface, and concentrated red potash products (near-pure KCl) are sold and shipped to markets in North America and offshore.

Figure 20: Simplified flow diagram for potash flotation and crystallization milling methods used at Lanigan.
38
Over the past three years, production of finished potash products at Lanigan was:
2022: 2.457 million tonnes finished potash products at 60.99% K2O (average grade)
2023: 2.889 million tonnes finished potash products at 61.03% K2O (average grade)
2024: 3.403 million tonnes finished potash products at 60.97% K2O (average grade)
Over the past decade, actual mill recovery rates have been between 80.1% and 85.9%, averaging 82.7% (see Figure 21).
Given the long-term experience with potash geology and actual mill recovery at Lanigan, no fundamental potash milling problems are anticipated in the foreseeable future.
Quality control testing and monitoring geared towards fine-tuning and optimizing potash milling and concentrating processes are conducted on a continual basis at all Nutrien mine sites and at Nutrien research facilities. At Lanigan, this is no exception; test work to optimize circuit performance and ensure product quality is carried out on an ongoing basis.

Figure 21: Lanigan mill recovery rate over the past 10 years.
| 18.0 | PROJECT INFRASTRUCTURE |
Infrastructure is in place to meet current and projected requirements for transportation, energy (electricity and natural gas), water and process materials at Lanigan. See also Section 5.0.
The Lanigan mine is served by a number of villages within 50 kilometres of the mine site. The nearest cities are Humboldt (approximately 45 km distant) and Saskatoon (approximately 100 km distant).
The Lanigan surface facilities are accessed by existing paved roads and highways that are part of the Saskatchewan Provincial Highway System. All finished potash products are shipped by rail over existing track.
At present, high voltage power capacity at Lanigan is 72 MVA. The ten-year projection of power utilization indicates that the utility can meet all foreseeable future demand.
The Lanigan operation requires a sustained fresh water supply for the milling process which is provided by a waterline from the Dellwood Reservoir (approximately 10 km distant) and from a regional aquifer called the Hatfield Valley Aquifer. This provincially licensed water supply provides a source of process water for Lanigan milling operations and usage is regulated by terms of the license issued by the Water Security Agency.
| 19.0 | MARKET STUDIES AND CONTRACTS |
Potash from Company mines (including Lanigan) has been sold on a continuous basis since mining began in 1968. At present, Nutrien products are sold in more than 50 countries, to three types of end-use:
39
| 1. | Fertilizer, focused on balanced plant nutrition to boost crop yields to meet the world’s ever-increasing appetite for food (nitrogen, phosphate, potash) |
| 2. | Feed Supplements, focused on animal nutrition (mainly phosphate) |
| 3. | Industrial, focused on products for high-grade food, technical and other applications (nitrogen, phosphate, as phosphoric acid, potash) |
The Company owns and operates six potash mines in Saskatchewan and a potash mine in New Brunswick, Canada, which no longer produces potash and was permanently closed in 2018. Over the past three years (2022, 2023, 2024) the Company had potash sales of 39.639 million tonnes. Historical Company potash sales data for the past 10 years are plotted in Figure 22 and Figure 23.
Potash is mainly used for fertilizer, which typically makes up approximately 90% of the company’s annual potash sales volumes. By helping plants develop strong root systems and retain water, it enhances yields and promotes greater resistance to disease and insects. Because it improves the taste and nutritional value of food, potash is often called the “quality nutrient.” Industrial applications of potash include use in soaps, water softeners, de-icers, drilling muds and food products.
Potash fertilizer is sold primarily as solid granular and standard products. Granular product has a larger and more uniformly shaped particle than standard product and can be easily blended with solid nitrogen and phosphate fertilizers. It is typically used in more advanced agricultural markets such as the US and Brazil.
Most major potash consuming countries in Asia and Latin America have limited or no indigenous production capability and rely primarily on imports to meet their needs. This is an important difference between potash and the other major crop nutrient businesses. Trade typically accounts for more than three-quarters of demand for potash, which ensures a globally diversified marketplace.
The most significant exporters are producers with mines in the large producing regions of Canada, the Middle East, and the former Soviet Union, which all have relatively small domestic requirements.

Figure 22: Historical Company potash sales 2015 to 2024 in million tonnes / year.*
| * | Company sales data for years prior to 2018 includes only PotashCorp sales. |
40

Figure 23: Historical Company potash net sales 2015 to 2024 in million USD $ / year.*
World consumption of potash fertilizer has grown over the last decade, with the primary growth regions being developing markets in Asia and Latin America. These are countries with expanding crop production requirements, where potash has historically been under-applied and crop yields lag behind those of the developed world. Although temporary pauses can occur in certain countries, the underlying fundamentals of food demand that encourage increased potash application are expected to continue the growth trends in key importing countries. See Figure 24 for world potash production and demand in 2024.

Figure 24: World potash production and demand for 2024.
Potash is used on many agricultural commodities. Wheat, rice, corn, oilseed, and sugar crops consume over half of the potash used worldwide. Fruits and vegetables are also important users of potash fertilizers, accounting for about 19 percent of the total consumption. The remainder goes to other consumer and industrial crops such as oil palm, rubber,
| * | Company sales data for years prior to 2018 includes only PotashCorp sales. |
41
cotton, coffee, and cocoa. See Table 4 for primary potash market profile. This diversity means that global potash demand is not tied to the market fundamentals for any single crop or growing region.
Table 4: Primary Potash Market Profile
| Country/Region |
Growth Rate* |
Key Consuming Crops |
||
| China |
3.4% | Vegetables, rice, fruits, corn | ||
| India |
-0.5% | Rice, wheat, vegetables, sugar crops | ||
| Other Asia |
2.8% | Oil palm, rice, sugar crops, fruits, vegetables | ||
| Latin America |
5.1% | Soybeans, sugar crops, corn | ||
| North America |
3.2% | Corn, soybeans |
| * | 5-year CAGR for consumption (2019-2024E) |
Global potash shipments are estimated to have reached record levels at approximately 72.5 million tonnes in 2024, an increase of about 4.5 million tonnes from the previous year. Potash consumption has grown at an annualized rate of 2.6 percent over the past 5 years, driven by strong potash consumption trends in all major potash markets.
North American and South American growers applied significant amounts of potash to replenish soil nutrients removed by large harvests. Potash application rates are increasing in China and Southeast Asian countries as a result of increased soil testing and improved agronomic practices, along with a renewed focus on food security in China. Growers in these countries are also increasing acreage of potassium-intensive crops such as fruits, vegetables, and oil palm. India continues to face political barriers to significantly growing potash demand, however, the agronomic need and willingness of farmers to improve yields persists. The Company believes that supportive agriculture fundamentals and the need to address declining soil fertility levels will enable strong demand growth in the years ahead. World potash shipments and consumption in recent years is shown in Figure 25.

Figure 25: World potash shipments and consumption, 2019-2024E.
Canpotex Limited (Canpotex), the offshore marketing company owned by the Company and another Saskatchewan potash producer, handles all sales, marketing and distribution of potash produced by its member companies to customers outside of the US and Canada (including the potash produced at Lanigan).
In North America, Nutrien sells potash to retailers, cooperatives, and distributors, who provide storage and application services to farmers, the end-users. This includes sales to Nutrien’s retail distribution business, which has the largest retail distribution network in North America. Typically, the Company’s North American potash sales are larger in the first half of the year. The primary customers for potash fertilizer products for the Lanigan operation are retailers, dealers, cooperatives, distributors, and other fertilizer producers who have both distribution and application capabilities.
42
Nutrien’s market research group provides management with market information on a regular basis including global agriculture and fertilizer markets, demand and supply in fertilizer markets and general economic conditions that may impact fertilizer sales. These may include specific market studies and analyses on different topics as may be required. This information is reviewed on a regular basis and the author of this report takes this information into account in understanding the markets and the assumptions within this report.
Plans and arrangements for potash mining, mineral processing, product transportation, and product sales are established by Nutrien and are within industry norms.
| 20.0 | ENVIRONMENTAL STUDIES, PERMITTING, AND SOCIAL OR COMMUNITY IMPACT |
The tailings management strategy at all Nutrien potash mines in Saskatchewan, including Lanigan, is one of sequestering solid mine tailings in an engineered and provincially licenced TMA near the surface plant site. The Lanigan TMA currently covers an area of approximately 737 hectares (1,821 acres) of land owned by the Company. Solid potash mine tailings typically consist of 85% to 95% rock-salt (NaCl) and 5% to 15% insolubles (carbonate mud = CaCO3, anhydrite mud = CaSO4, and clays like chlorite, illite, and so on). An engineered slurry-wall has been constructed on the south and south-west sides of the Lanigan TMA in the areas where near-surface aquifers could be impacted by mine waters. Near-surface geology on all other sides of the TMA limits the possibility of brine migration into these areas. The slurry-wall provides secondary containment of any saline mine waters, stopping these brines from reaching surrounding near-surface aquifers. Areas surrounding the TMA are closely monitored; this includes everything from daily visual perimeter inspections to annual investigations and inspections of surrounding groundwater and aquifers.
Lanigan currently operates three brine disposal wells near the surface plant of the Lanigan mine (marked in Figure 26) where clear salt brine (i.e. no silt, insolubles, or other waste) is borehole-injected into the Winnipeg / Deadwood Formations, deep subsurface aquifers approximately 1,500 m to 1,700 m below surface (marked in Figure 7). The disposal wells are provincially licensed and formation water in these extensive deep aquifers is naturally saline.
Emissions to air (consisting primarily of particulate matter) are kept below regulatory limits through various modern air pollution abatement systems (e.g. dust collection systems built into mill processes) that are provincially licensed. This same procedure is followed at all Nutrien mines in Saskatchewan.
In Saskatchewan, all potash tailings management activities are carried out under an “Approval to Operate” granted by the Saskatchewan Ministry of Environment (MOE), the provincial regulator. Staff at the Lanigan mine actively monitor and inspect operations and routinely report the observations and measurements to the Environmental Protection Branch of MOE. The current Lanigan Approval to Operate has been granted to July 1, 2028, the renewal date.
In terms of long-term decommissioning, environmental regulations in the Province of Saskatchewan require that all operating potash mines in Saskatchewan create a long-term decommissioning and reclamation plan that will ensure all surface facilities are removed, and the site is left in a chemically and physically stable condition once mine operations are complete. The Company has conducted numerous studies of this topic, and the most recent decommissioning and reclamation plan for Lanigan was approved by MOE technical staff in January 2022. Because the current expected mine life for Lanigan is many decades into the future, it is not meaningful to come up with detailed engineering designs for decommissioning annually. Instead, decommissioning plans are reviewed every five years, and updated to accommodate new concepts, technological change, incorporation of new data, and adjustments of production forecasts and cost estimates. Any updated decommissioning and reclamation reports generated by this process are submitted to provincial regulatory agencies. For Lanigan, a revised decommissioning and reclamation plan is due to be submitted for MOE review in June 2026.
In addition to the long-term decommissioning plan, provincial regulations require that every potash producing company in Saskatchewan set up an Environmental Financial Assurance Fund, which is to be held in trust for the decommissioning, restoration, and rehabilitation of the plant site after mining is complete. This fund is for all mines operated by Nutrien in the province of Saskatchewan (i.e., Allan, Cory, Lanigan, Patience Lake, Rocanville, and Vanscoy).
43

Figure 26: Aerial photo showing the Lanigan surface operations, disposal wells, and Tailings Management Area.
| 21.0 | CAPITAL AND OPERATING COSTS |
The Lanigan mine has been in operation since 1968; in the years immediately preceding this, major capital investment was made to bring this mine into production. Since then, capital expenditures were made on a regular and ongoing basis to sustain production, and to expand production from time to time.
Most recently, mill rehabilitation, mine expansion and hoist improvement projects were completed at Lanigan between 2005 and 2010. The expansion construction was carried out without significant disruption to existing potash production from the site.
| 22.0 | ECONOMIC ANALYSIS |
| 22.1 | FUNDAMENTALS |
The Company conducts ongoing and detailed economic analyses on each of its operations and on all aspects of its business. While the Company considers its operating costs and results on a per mine basis to be competitively sensitive and confidential information, the Company is confident that the economic analysis conducted routinely for each of the Company’s operating potash mines is complete, reasonable, and meets industry standards.
On a cash flow basis, The Company’s potash segment generated USD $14,647 million in net sales over the past three years (2022, 2023 and 2024) based on sales volume of 39.639 million tonnes of finished potash products. The annual
44
average realized potash price for manufactured products (includes North American and offshore sales) over a 10-year period (2015 – 2024) is plotted in Figure 27.
Over the past three years (2022, 2023, and 2024) the Lanigan mine produced 8.749 million tonnes of finished potash products. In the past three years (2022, 2023, and 2024), the Lanigan mine accounted for 22% of total potash production at the Company over this period. Lanigan is currently making a positive contribution to the Company’s potash segment.
Given the Company’s previous history (including over 50 years of mining at the Lanigan operation), recent market conditions, and extensive reserve base, the economic analysis for Lanigan has met the Company’s internal hurdle rates.

Figure 27: Historic annual average realized potash price in USD / tonne.*
| 22.2 | TAXES |
Royalties are paid to the Province of Saskatchewan in connection with the Company’s Potash operations, which holds most of the mineral rights in the lease areas, and royalties from Freehold lands are paid to various freeholders of mineral rights in the area. The Crown royalty rate is 3 percent and is governed by The Subsurface Mineral Royalty Regulations, 2017. The actual amount paid is dependent on selling price and production tonnes.
Municipal taxes are paid based on site property values to the applicable municipality in Saskatchewan. Saskatchewan potash production is taxed at the provincial level under The Mineral Taxation Act, 1983. This tax, governed by The Potash Production Tax Regulations, consists of a base payment and a profit tax, collectively known as the potash production tax. As a resource corporation in the Province of Saskatchewan, the Company is also subject to a resource surcharge equal to a percentage of the value of its resource sales (as defined in The Corporation Capital Tax Act of Saskatchewan). In addition to this, the Company pays federal and provincial income taxes based on corporate profits from all of its operations in Canada.
| 23.0 | ADJACENT PROPERTIES |
The Company’s Lanigan Lease KLSA 001 D is adjacent to the following Crown potash dispositions:
| • | BHP Billiton Canada Inc. KLSA 011, KL 207, KL 211, KL 214, and KP 323 |
| 24.0 | OTHER RELEVANT DATA AND INFORMATION |
Not applicable.
| * | Company annual average realized potash price for years prior to 2018 includes only PotashCorp sales. |
45
| 25.0 | INTERPRETATION AND CONCLUSIONS |
Nutrien has a long history of successful potash mining at Lanigan, where potash has been produced for over 50 years. The Company believes that the experience gained mining and milling potash for this length of time has produced a reliable body of information about potash mineralization, mining and milling at Lanigan.
In a Saskatchewan potash mine that has been producing for many decades, reduction of mine life through increased production is counter-balanced by development mining into new mineral land parcels. This increases mine life through increasing the potash Mineral Reserve.
For Lanigan, mine life can be estimated by dividing the Mineral Reserve (Proven + Probable) for each A Zone (257 million tonnes) and B Zone (203 million tonnes) by the average annual mining rate (million tonnes of ore hoisted per year). For Lanigan, the mining rate is defined as equal to the actual three-year running average (consecutive, most recent years). The average mining rate at Lanigan over the past three years (2022, 2023 and 2024) was 8.63 million tonnes of potash ore mined and hoisted per year.
If this mining rate is sustained and if Mineral Reserves remain unchanged, then the Lanigan mine life would be 30 years in an A Zone only mining scenario, and 23 years in a B Zone only mining scenario. It should be noted that mine life estimates for A Zone and B Zone must remain independent and must not be added to arrive at a cumulative mine life. This is because Mineral Reserve was evaluated for each zone independently and – subsequently – the three-year average mining rate (in full) was applied to each. This estimate of mine life is likely to change as mining advances further into new mining blocks, and / or if mining rates or mining methodologies change.
| 26.0 | RECOMMENDATIONS |
Not applicable for a potash mine that has been in operation since 1968.
46
| 27.0 | REFERENCES |
Companion Policy 43-101CP to National Instrument 43-101 Standards of Disclosure for Mineral Projects (2011). Retrieve this and related documents from many websites.
The CIM Definition Standards for Mineral Resources and Reserves (2014). Retrieve this and related documents from many websites.
Fuzesy, Anne (1982). Potash in Saskatchewan (44p). Saskatchewan Industry and Resources Report 181. https://publications.saskatchewan.ca/#/products/7307.
Gebhardt, E. (1993). Mine planning and design integration, CIM Bulletin, May 1993, pp. 41 – 49.
Government of Saskatchewan (2025). Saskatchewan Mining and Petroleum GeoAtlas. https://gisappl.saskatchewan.ca/Html5Ext/index.html?viewer=GeoAtlas. Accessed January 2025.
Government of Saskatchewan. The Corporation Capital Tax Act of Saskatchewan. Available online at http://www.qp.gov.sk.ca/documents/English/Statutes/Statutes/c38-1.pdf.
Government of Saskatchewan. The Mineral Taxation Act, 1983. Available online at http://www.qp.gov.sk.ca/documents/English/Statutes/Statutes/M17-1.pdf.
Government of Saskatchewan. The Mines Regulations, 2018. Available online at https://publications.saskatchewan.ca/#/products/100307.
Government of Saskatchewan. The Potash Production Tax Regulations. Available online at https://publications.saskatchewan.ca/#/products/1263.
Government of Saskatchewan. The Subsurface Mineral Royalty Regulations, 2017. Available online at http://publications.gov.sk.ca/details.cfm?p=88223&cl=8.
Government of Saskatchewan. The Subsurface Mineral Tenure Regulations, 2015. Available online at http://www.publications.gov.sk.ca/details.cfm?p=72797.
Jones, P. R., and F. F. Prugger (1982). Underground mining in Saskatchewan potash. Mining Engineering, 34, pp. 1677 – 1683.
Nutrien Pilot Plant (2018). Personal communication on density of insoluble minerals in different ore zones.
Prugger, F.F., (1979), The flooding of the Cominco potash mine and its rehabilitation; CIM Bulletin, Vol. 72, No. 807, pp. 86 – 90.
Prugger, F. F. and A. F. Prugger (1991). Water problems in Saskatchewan potash mining – what can be learned from them? Bulletin of the Canadian Institute of Mining and Metallurgy (CIM Bulletin), Vol. 84, No. 945, pp. 58 – 66.
Robertson, David S. and Associates (1978). Summary Report on Evaluation of Potash Assets for Potash Corporation of Saskatchewan. Unpublished consultant’s report to Potash Corporation of Saskatchewan Inc.
Yang, C., Jensen, G., and Berenyi, J. (2009a). The Stratigraphic Framework of the Potash-rich Members of the Middle Devonian Upper Prairie Evaporite Formation, Saskatchewan; Summary of Investigations 2009, Volume 1, Saskatchewan Geological Survey.
47
Exhibit 99.4
NUTRIEN LTD.
ROCANVILLE
NATIONAL INSTRUMENT 43-101 TECHNICAL REPORT ON
ROCANVILLE POTASH DEPOSIT (KL 305),
SASKATCHEWAN, CANADA
FEBRUARY 20, 2025

PREPARED BY: JODI DERKACH, P. GEO.
| CRAIG FUNK, P. ENG., P. GEO. |
NUTRIEN LTD.
GEOSERVICES & LAND—ENGINEERING, TECHNOLOGY & CAPITAL
SUITE 1700, 211 19TH STREET EAST
SASKATOON, SASKATCHEWAN, CANADA
S7K 5R6
QUALIFIED PERSONS: JODI DERKACH, P. GEO. AND CRAIG FUNK, P. ENG., P. GEO.
DATE AND SIGNATURE PAGE
The scientific and technical information included in this report has been prepared under the supervision of persons who are ‘‘qualified persons’’ under Canadian National Instrument 43-101. Jodi Derkach, P. Geo. and Craig Funk, P. Eng., P. Geo. are the qualified persons who supervised the preparation of the information presented in this report and who verified the data disclosed herein.
| /s/ “Jodi Derkach” | ||||
| Signature | Jodi Derkach P. Geo. | |||
| Senior Manager, Land & Resource Nutrien Ltd. |
||||
| Date | February 20, 2025 | |||
| /s/ “Craig Funk” | ||||
| Signature | Craig Funk, P. Eng., P. Geo. | |||
| Director, GeoServices & Land Nutrien Ltd. |
||||
| Date | February 20, 2025 | |||
2
AUTHOR PAGE
The scientific and technical information included in this report has been prepared by, or under the supervision of, persons who are ‘‘qualified persons’’ under Canadian National Instrument 43-101.
Jodi Derkach, B. Sc., Cert. GIS, P. Geo. (APEGS Member # 14897)
| • | Senior Manager, Land & Resource – Engineering, Technology & Capital |
| • | B. Sc. (Geology), University of Saskatchewan, Saskatoon, Saskatchewan, Canada, 2007 |
| • | Geographic Information Science for Resource Management Certificate, Saskatchewan Polytechnic, Prince Albert, Saskatchewan, Canada, 2010 |
| • | with Nutrien or its subsidiaries since 2010 |
Craig Funk, B. Sc., M. Sc., P. Eng., P. Geo. (APEGS Member # 16034)
| • | Director, GeoServices & Land – Engineering, Technology & Capital |
| • | B. Sc. (Geological Engineering – Geophysics), University of Saskatchewan, Saskatoon, Saskatchewan, Canada, 1989 |
| • | M. Sc. (Geophysics), University of Saskatchewan, Saskatoon, Saskatchewan, Canada, 1992 |
| • | with Nutrien or its subsidiaries since 2008 |
are the qualified persons who supervised the preparation of all information presented in this report and who verified the data disclosed herein.
The team of persons who conducted the work presented within this report consists of:
Lisa MacKenzie, Cert. GIS
| • | Senior Advisor, Land – Engineering, Technology & Capital |
| • | Geographic Information Science for Resource Management Certificate, Saskatchewan Polytechnic, Prince Albert, Saskatchewan, Canada, 2012 |
| • | with Nutrien or its subsidiaries since 2012 |
Jennifer Nicolay Lawlor, B. Sc., P. Geo. (APEGS Member # 16167)
| • | Senior Advisor, Land & Resource – Engineering, Technology & Capital |
| • | B. Sc. (Geology), University of Regina, Regina, Saskatchewan, Canada, 2008 |
| • | with Nutrien or its subsidiaries since 2013 |
The authors would like to acknowledge the many staff who provided information and expert reviews on portions of this report, as well as past contributions of former (retired) staff Terrance Danyluk and Arnfinn Prugger.
3
TABLE OF CONTENTS
| DATE AND SIGNATURE PAGE |
2 | |||||
| AUTHOR PAGE |
3 | |||||
| TABLE OF CONTENTS |
4 | |||||
| LIST OF FIGURES |
6 | |||||
| LIST OF TABLES |
7 | |||||
| 1.0 | SUMMARY | 8 | ||||
| 2.0 | INTRODUCTION | 10 | ||||
| 3.0 | RELIANCE ON OTHER EXPERTS | 11 | ||||
| 4.0 | PROPERTY DESCRIPTION AND LOCATION | 11 | ||||
| 4.1 | GENERAL | 11 | ||||
| 4.2 | MINERAL RIGHTS | 13 | ||||
| 5.0 | ACCESSIBILITY, CLIMATE, LOCAL RESOURCES, INFRASTRUCTURE AND PHYSIOGRAPHY | 14 | ||||
| 6.0 | HISTORY | 15 | ||||
| 7.0 | GEOLOGICAL SETTING AND MINERALIZATION | 16 | ||||
| 8.0 | DEPOSIT TYPE | 17 | ||||
| 9.0 | EXPLORATION | 18 | ||||
| 10.0 | DRILLING | 20 | ||||
| 11.1 | BASIC APPROACH | 22 | ||||
| 11.2 | MEAN POTASH MINERAL GRADE FROM IN-MINE SAMPLES | 24 | ||||
| 11.3 | POTASH ORE DENSITY FROM IN-MINE MINERAL GRADE MEASUREMENTS | 25 | ||||
| 12.0 | DATA VERIFICATION | 25 | ||||
| 12.1 | ASSAY DATA | 25 | ||||
| 12.2 | EXPLORATION DATA | 26 | ||||
| 13.0 | MINERAL PROCESSING AND METALLURGICAL TESTING | 26 | ||||
| 14.0 | MINERAL RESOURCE ESTIMATES | 27 | ||||
| 14.1 | DEFINITIONS OF MINERAL RESOURCE | 27 | ||||
| 14.2 | ROCANVILLE POTASH RESOURCE CALCULATIONS | 27 | ||||
| 15.0 | MINERAL RESERVE ESTIMATES | 29 | ||||
4
| 15.1 | DEFINITIONS OF MINERAL RESERVE | 29 | ||||
| 15.2 | ROCANVILLE POTASH RESERVE CALCULATIONS | 29 | ||||
| 16.0 | MINING METHOD | 30 | ||||
| 16.1 | MINING OPERATIONS | 30 | ||||
| 16.2 | RISKS TO POTASH MINING OPERATIONS, WITH EMPHASIS ON WATER INFLOWS | 33 | ||||
| 17.0 | RECOVERY METHODS | 34 | ||||
| 18.0 | PROJECT INFRASTRUCTURE | 35 | ||||
| 19.0 | MARKET STUDIES AND CONTRACTS | 35 | ||||
| 20.0 | ENVIRONMENTAL STUDIES, PERMITTING, AND SOCIAL OR COMMUNITY IMPACT | 39 | ||||
| 21.0 | CAPITAL AND OPERATING COSTS | 40 | ||||
| 22.0 | ECONOMIC ANALYSIS | 40 | ||||
| 22.1 | FUNDAMENTALS | 40 | ||||
| 22.2 | TAXES | 41 | ||||
| 23.0 | ADJACENT PROPERTIES | 41 | ||||
| 24.0 | OTHER RELEVANT DATA AND INFORMATION | 42 | ||||
| 25.0 | INTERPRETATION AND CONCLUSIONS | 42 | ||||
| 26.0 | RECOMMENDATIONS | 42 | ||||
| 27.0 | REFERENCES | 43 | ||||
5
LIST OF FIGURES
Unless otherwise noted, figures for which a source and / or date are not provided are current as of the effective date of this report and were prepared by the Company.
| Figure 1: Aerial photo of Rocanville surface operations, 2020 |
8 | |||
| Figure 2: Actual finished potash products production from the Rocanville mine over the past 10 years (in million tonnes per year) |
9 | |||
| Figure 3: Map showing location of Nutrien Operations, including Rocanville |
11 | |||
| Figure 4: Nutrien’s potash operations, including Rocanville, relative to potash mineralization (pink) in Saskatchewan |
12 | |||
| Figure 5: Map showing Rocanville Crown Lease KL 305 (blue) and KL 279 (green) |
14 | |||
| Figure 6: Map showing infrastructure near Rocanville. Rocanville surface operations shown as red dot and Scissors Creek surface operations shown as green dot |
15 | |||
| Figure 7: Vertical section showing basic layered-Earth stratigraphy in a typical Saskatchewan potash region |
16 | |||
| Figure 8: Geophysical wireline logs showing basic stratigraphy of the Prairie Evaporite Formation in the Rocanville area |
17 | |||
| Figure 9: Cross-section of the Prairie Evaporite Formation across southern Saskatchewan showing relative position of potash members |
18 | |||
| Figure 10: Potash exploration at Rocanville including 3D seismic (purple), 2D seismic infill (orange lines), and potash drillholes (black dots) |
19 | |||
| Figure 11: A seismic section showing relative rock velocities and major geological units at Nutrien’s conventional potash operations |
20 | |||
| Figure 12: Potash assay plot for drillhole PCS Tantallon 08-02-18-32 W1 indicating the best 2.59 m (8.5’) mining interval |
23 | |||
| Figure 13: Histogram of potash ore grade from Rocanville in-mine grade samples (1970 to December 2024) |
24 | |||
| Figure 14: Map showing Rocanville Mineral Resource as of December 2024 |
28 | |||
| Figure 15: Map showing Rocanville Mineral Reserve to December 2024 |
30 | |||
| Figure 16: Schematic cross-section through the Prairie Evaporite Formation, illustrating mining horizons at each of Nutrien’s conventional potash operations |
32 | |||
| Figure 17: Mined tonnes, product tonnes, and concentration ratio for the Rocanville mine over the past 10 years |
33 | |||
| Figure 18: Simplified flow diagram for potash flotation and crystallization milling methods used at Rocanville |
34 | |||
| Figure 19: Rocanville mill recovery rate over the past 10 years |
35 | |||
| Figure 20: Historical Company potash sales 2015 to 2024 in million tonnes / year* |
36 | |||
| Figure 21: Historical Company potash net sales 2015 to 2024 in million USD $ / year* |
37 | |||
| Figure 22: World potash production and demand for 2024E |
37 | |||
| Figure 23: World potash shipments and consumption, 2019-2024E |
38 | |||
| Figure 24: Aerial photo showing the Rocanville surface operations, disposal wells, and Tailings Management Area |
40 | |||
| Figure 25: Historic annual average realized potash price in USD / tonne* |
41 |
6
LIST OF TABLES
| Table 1: Mineral Resources and Reserves for Rocanville, as of December 31, 2024 |
10 | |||
| Table 2: Assay results for all potash test holes within Rocanville Lease KL 305 |
22 | |||
| Table 3: Values for potash assay plot in Figure 13 |
23 | |||
| Table 4: Primary Potash Market Profile |
38 |
7
EFFECTIVE DATE OF REPORT
The effective date of this report is December 31, 2024, other than where otherwise noted.
| 1.0 | SUMMARY |
Effective January 1, 2018, Potash Corporation of Saskatchewan Inc. (“PotashCorp”) and Agrium Inc. (“Agrium”) completed a court-approved plan of arrangement (the “Arrangement”), involving, among others, PotashCorp, Agrium and Nutrien Ltd. (“Nutrien”) the new parent company of PotashCorp and Agrium. As a result of completing the Arrangement, PotashCorp and Agrium are wholly-owned subsidiaries of Nutrien. References to “the Company” means Nutrien, indirectly through PotashCorp, or, for references prior to the completion of the Arrangement, PotashCorp, as the context requires.
Nutrien is a leading global provider of crop inputs and services. We operate a world-class network of production, distribution and agriculture retail facilities that positions us to efficiently serve the needs of farmers.
Nutrien is a corporation organized under the Canada Business Corporations Act, the common shares of which are listed and publicly traded on the Toronto and New York stock exchanges (symbol NTR).
The Company owns and operates a potash mine at Rocanville, Saskatchewan, Canada (“Rocanville mine” or “Rocanville”). An aerial view of the Rocanville surface operations is shown in Figure 1. The Rocanville Crown Subsurface Mineral Lease is numbered KL 305 (the “Rocanville Crown Lease”) and was last amended in October 2017. Production of potash from the Rocanville mine began in 1970.

Figure 1: Aerial photo of Rocanville surface operations, 2020.
In 2024, annual nameplate capacity for Rocanville was 6.5 million tonnes and annual operational capability was 5.1 million tonnes of finished potash products (concentrated KCl). Estimates of nameplate capacity are based on capacity as per design specifications or Canpotex entitlements once these have been determined. Operational capability is the estimated annual achievable production level at current staffing and operational readiness (estimated at beginning of year), not including any inventory-related shutdowns and unplanned downtime and may vary during the year and year-to-year including as between our potash operations.
8
While the term potash refers to a wide variety of potassium bearing minerals, in the Rocanville region of Saskatchewan, the predominant potash mineralization is sylvinite, which is comprised mainly of the minerals sylvite (KCl) and halite or rock salt (NaCl), with minor carnallite (KMgCl3 · 6H2O) and water insolubles. Potash fertilizer is concentrated, nearly pure KCl (i.e. greater than 95% pure KCl), but ore grade is traditionally reported on a % K2O equivalent basis. The “% K2O equivalent” gives a standard measurement of the nutrient value of different potassium-bearing rocks and minerals. To convert from % K2O equivalent tonnes to actual KCl tonnes, multiply by 1.58.
The Rocanville mine is a conventional underground mining operation whereby continuous mining machines are used to excavate the potash ore by the long-room and pillar mining method. Continuous conveyor belts transport ore from the mining face to the bottom of the production shafts. In addition to hoisting potash ore to surface, the two production shafts are used to exhaust air from underground workings; a third shaft from surface is used for service access and to provide fresh air into the mine. All shafts can be used as an egress. Raw potash ore is processed and concentrated on surface and concentrated finished potash products (near-pure KCl) are sold and shipped to markets in North America and offshore.
Virtually all Rocanville underground mining rooms are in the potash mineralized zone situated approximately 30 m below the top of the host evaporite salt, the Prairie Evaporite Formation. More specifically, the Rocanville mine is located within the Esterhazy Member of the Prairie Evaporite Formation. Mine elevations range from approximately 895 m to 1,155 m depth below surface. Mine workings are protected from aquifers in overlying formations by salt and potash beds which overlie the mineralized zone. Conservative local extraction ratios (never exceeding 45% in any mining block) are employed at Rocanville to minimize potential detrimental effects of mining on overlying strata; this is common practice in flat-lying, tabular ore bodies overlain by water-bearing layers.
Part of the normal surface infrastructure associated with operating the potash mine in Saskatchewan includes waste disposal on the land and disposal of salt brine into deep subsurface aquifers. The Company stows salt tailings within an engineered and licensed Tailings Management Area (TMA) and operates five brine disposal wells near the surface plant of the Rocanville mine.
Since opening in 1970, 347.383 million tonnes of potash ore have been mined and hoisted at Rocanville to produce 111.271 million tonnes of finished potash products. The life-of-mine average concentration ratio (raw ore / finished potash products) is 3.12 and the overall extraction ratio over this period is 25%. Actual production of finished potash products at Rocanville for the last 10 years is shown in Figure 2.

Figure 2: Actual finished potash products production from the Rocanville mine over the past 10 years (in million tonnes per year).
Over the past three years (2022, 2023, 2024), actual potash production at Rocanville has totaled:
| • | 49.568 million tonnes of ore mined and hoisted (16.523 million tonnes per year, on average) |
| • | 14.874 million tonnes of finished potash products produced (4.958 million tonnes per year, on average) |
| • | Average mill feed ore grade was 21.6% K2O equivalent |
| • | Average concentration ratio (ore mined / potash produced) was 3.33 |
9
The Canadian Institute of Mining and Metallurgy and Petroleum (CIM) has defined Mineral Resources and Reserves in The CIM Definition Standards for Mineral Resources and Reserves (2014). Based on these guidelines, all mineral rights owned or leased by the Company at Rocanville can be assigned to Mineral Resource categories (Inferred, Indicated, and Measured) and Mineral Reserve categories (Probable and Proven). Mineral Resources (reported as in-place tonnes) and Mineral Reserves (reported as recoverable ore tonnes) for Rocanville as of December 31, 2024, are outlined in Table 1. Mineral Resources reported are exclusive of Mineral Reserves.
Table 1: Mineral Resources and Reserves for Rocanville, as of December 31, 2024.
| Proven Mineral Reserve (millions of tonnes recoverable ore) |
83 | |||
| Probable Mineral Reserve (millions of tonnes recoverable ore) |
260 | |||
|
|
|
|||
| Total Mineral Reserve (millions of tonnes recoverable ore) |
343 | |||
| Measured Mineral Resource (millions of tonnes in-place) |
2,258 | |||
| Indicated Mineral Resource (millions of tonnes in-place) |
2,042 | |||
| Inferred Mineral Resource (millions of tonnes in-place) |
347 | |||
|
|
|
|||
| Total Mineral Resource (millions of tonnes in-place) |
4,647 | |||
| Average % K2O Grade (from Rocanville in-mine samples) |
22.7 | % | ||
|
|
|
|||
| Years of Remaining Mine Life |
21 | |||
The average mineral grade of the Rocanville Mineral Resource and Mineral Reserve is estimated to be 22.7% K2O equivalent and was determined from thousands of in-mine samples at Rocanville to the end of December 2024 (discussed further in Section 11.2).
Potash production in any given year at the Rocanville mine is a function of many variables, so actual production in any given year can vary dramatically from tonnages produced in previous years. The Mineral Reserve tonnage and historic average production are used to estimate the remaining mine life. If the average mining rate seen over the past three years (16.523 million tonnes of potash ore mined and hoisted per year) is sustained, and if Mineral Reserves remain unchanged, then the Rocanville mine life is 21 years from December 31, 2024.
The mining of potash is a capital-intensive business subject to the normal risks and capital expenditure requirements associated with mining operations. The production and processing of ore may be subject to delays and costs resulting from mechanical failures, physical hazards such as fires, and other hazards such as: unusual or unexpected geological conditions, significant subsidence, brine inflows and gas seepages of varying degree, and other situations associated with any potash mining operation.
| 2.0 | INTRODUCTION |
The purpose of this document is to give a formal reporting of potash Mineral Resource and Reserve for Rocanville, and to provide a description of the method used to compute Mineral Resource and Reserve tonnages. Sources of geological and geotechnical information analysed from this study include:
| • | Publicly available geological maps, reports, and publications (listed in Section 27.0) |
| • | Data and internal reports on exploration drillholes |
| • | Hydrogeological analysis conducted in exploration drillholes |
| • | Geological studies conducted at the Rocanville mine over the past 50+ years |
| • | In-mine geophysical studies conducted at the Rocanville mine over the past 50+ years |
| • | Geotechnical studies conducted for the Rocanville mine over the past 50+ years |
| • | 2D & 3D surface seismic exploration data |
All data and reports are archived at the Nutrien corporate office in Saskatoon, the Rocanville mine site, or secure offsite commercial document storage facilities. In addition, drillhole data (well-log data, drilling reports, drill-stem test results, etc.) are archived with the Saskatchewan Ministry of Energy & Resources, Integrated Resource Information System (IRIS), and surface seismic data (shot records and stack) are archived through an offsite commercial data storage service.
All geological and geophysical data and information presented in this report were personally reviewed and inspected by qualified geoscience staff at Nutrien who are registered with the Association of Professional Engineers and Geoscientists of Saskatchewan (APEGS) under the supervision of Jodi Derkach, P. Geo. and Craig Funk, P. Eng., P.
10
Geo. Jodi Derkach last visited Rocanville on November 28, 2024. Craig Funk last visited Rocanville on July 18, 2024. All reserve and resource estimates and mineral rights data presented in this report were personally evaluated and reviewed by the authors of this report. Each of these staff collaborates with Rocanville personnel multiple times per year.
The authors would like to acknowledge the many staff who provided information and expert reviews on portions of this report.
| 3.0 | RELIANCE ON OTHER EXPERTS |
Responsibility for the accuracy of the technical data presented in this report is assumed by the authors. Outside experts were not used in the preparation of this report.
| 4.0 | PROPERTY DESCRIPTION AND LOCATION |
| 4.1 | GENERAL |
The Rocanville mine (surface plant) is located in southeastern Saskatchewan near the Saskatchewan-Manitoba Provincial Boundary, approximately 15 km north-east of the town of Rocanville, Saskatchewan. The general location is shown on the map in Figure 3.

Figure 3: Map showing location of Nutrien Operations, including Rocanville.
The legal land description (Saskatchewan Township / Range) of the Rocanville surface plant is Section 22 Township 17 Range 30 West of the 1st Meridian. More precisely, the Rocanville #2 Shaft collar is located at:
| – |
Latitude: |
50 degrees 28 minutes 19.54 seconds North | ||
| – |
Longitude: |
101 degrees 32 minutes 42.58 seconds West | ||
| – |
Elevation: |
480.36 metres above mean Sea Level (SL) | ||
| – |
Easting: |
745,137.307 m | ||
| – |
Northing: |
5,596,826.122 m |
11
| – |
Projection: |
UTM | ||
| – |
Datum: |
NAD83 | ||
| – |
Zone: |
13 |
The legal description (Saskatchewan Township / Range) of the Rocanville Scissors Creek Shaft is Section 13 Township 17 Range 32 West of the 1st Meridian and is approximately 12 kilometres north-west of the town of Rocanville, Saskatchewan. More precisely, the Shaft collar is located at:
| – |
Latitude: |
50 degrees 27 minutes 7.0632 seconds North | ||
| – |
Longitude: |
101 degrees 46 minutes 13.58 seconds West | ||
| – |
Elevation: |
525.35 metres above mean Sea Level (SL) | ||
| – |
Easting: |
729,253.35 m | ||
| – |
Northing: |
5,593,868.30 m | ||
| – |
Projection: |
UTM | ||
| – |
Datum: |
NAD83 | ||
| – |
Zone: |
13 |
The Company owns approximately 3,244 hectares (8,016 acres) of surface rights required for current Rocanville mine operations, including areas covered by the existing surface plant and TMA and surface lands required for anticipated future Rocanville mine and expanded milling operations.
All permits and approvals required for the operation of a potash mine in Saskatchewan are in place at Rocanville.
Figure 4 is a more detailed map showing the location of Rocanville relative to the potash deposits in Saskatchewan (modified from Yang, 2009).

Figure 4: Nutrien’s potash operations, including Rocanville, relative to potash mineralization (pink) in Saskatchewan.
12
| 4.2 | MINERAL RIGHTS |
Mineral rights at Rocanville are mined pursuant to subsurface mineral leases with the Province of Saskatchewan, Canada (the Crown), and with non-Crown (Freehold) mineral rights owners. Crown mineral rights are governed by The Subsurface Mineral Tenure Regulations, 2015, and Crown Leases are approved and issued by the Saskatchewan Ministry of Energy & Resources.
The original Rocanville Crown Subsurface Mineral Lease KL 111 was made effective in June 1966. In the following years various amendments were made whereby certain lands were added, removed, or transferred between Company dispositions for realized synergies between mining operations. The last amendment was executed in October 2017 and resulted in Crown Subsurface Mineral Lease KL 305 (the “Rocanville Crown Lease” or simply “KL 305”).
KL 305 covers an area of approximately 113,975 hectares (282,492 acres), as shown in Figure 5. At Rocanville, the Company has leased potash mineral rights for 54,184 hectares (133,891 acres) of Crown Land and owns or has leased approximately 47,286 hectares (116,847 acres) of Freehold Land within the lease boundary.
In May 2020, a Crown Subsurface Mineral Lease numbered KL 279, comprising 26,351 hectares (65,114 acres) of Crown Land, was acquired from North Atlantic Potash. KL 279 covers an area of approximately 56,540 hectares (139,712 acres), also shown in Figure 5.
The Rocanville Crown Lease terms are for a period of 21 years and are renewable in accordance with The Subsurface Mineral Tenure Regulations, 2015 for successive 21-year periods. Freehold Lands also remain under lease providing, generally, that production is continuing and that there is a continuation of the Crown Lease.
Within the current Rocanville Crown Lease area, 80,181 hectares (198,132 acres) are mined pursuant to unitization agreements with mineral rights holders (Crown and Freehold) within two unitized areas.
When underground workings of a potash mine are designed, there are inevitably regions that are mined with higher mining extraction (e.g. production panels) and other regions where mining extraction is lower (e.g. conveyor-belt development rooms). To treat mineral rights holders in both low extraction and high extraction areas fairly, and to promote good mining practices, a unitization agreement is the preferred method for determining mined potash allocation (on paper, for accounting purposes) and the resulting pro rata royalty. Under a unitization agreement, each mineral rights holder is paid a royalty based on their proportional share of the entire unit area regardless of whether their lands are mined. For example, if one mineral rights holder owns rights to 4,000 hectares within a 40,000-hectare unit area, they would be paid 10% of the total royalty payout from that unit area.
13

Figure 5: Map showing Rocanville Crown Lease KL 305 (blue) and KL 279 (green).
| 5.0 | ACCESSIBILITY, CLIMATE, LOCAL RESOURCES, INFRASTRUCTURE AND PHYSIOGRAPHY |
The Rocanville mine surface facilities are accessed by an existing paved road that is part of the Saskatchewan Provincial Highway System. Most finished potash products are shipped by rail over existing track, with some product shipped by truck over the North American Highway System. Location of Rocanville with respect to the features described in this section (major road and rail infrastructure, as well as nearby river systems) is shown in Figure 6.
The Rocanville mine is served by a number of towns and villages within 50 km of the minesite. The nearest towns are Rocanville (15 km distant), Moosomin and Esterhazy (both 50 km distant). The nearest city is Yorkton (100 km distant).
Rocanville is situated near the north extent of the Great Plains of North America. Topography is relatively flat, with gently rolling hills and occasional valleys. The Qu’Appelle River valley, a glacial outflow channel, lies just north of the minesite, and the Assiniboine River Valley is a few kilometres to the east. Climate at the Rocanville mine is typical for an inland prairie location at latitude 50º North (often characterized as “mid-latitude steppe” climate).
Part of the normal surface infrastructure associated with operating the potash mine in Saskatchewan includes waste disposal on the land and disposal of salt brine into deep subsurface aquifers. Facilities to carry out all aspects of these tasks are in place at Rocanville (for more information, see Section 20.0)
14

Figure 6: Map showing infrastructure near Rocanville. Rocanville surface operations shown as red dot and Scissors Creek surface operations shown as green dot.
| 6.0 | HISTORY |
Ten potash mines were brought into production in Saskatchewan between 1962 and 1970. Until 2017, no new mine had been commissioned following the original ten. Most current potash production comes from conventional underground mines, while just three operate using solution mining methods. Generally, potash mines have contracted or expanded production over the years in response to the demand for potash.
Exploration drilling for potash in the Rocanville, Saskatchewan area was carried out in the 1960s. Thirty-four potash test holes were drilled during this early exploration phase: 25 in Saskatchewan and nine in Manitoba. The Rocanville mine was built by a company called Sylvite of Canada Ltd. (a division of Hudson’s Bay Mining and Smelting Ltd.) in the late 1960s, and potash production began at Rocanville in 1970. The mine has run on a continuous basis since then other than short-term shutdowns taken for inventory management purposes, occasional plant maintenance and construction work, or other outages that are typical for operations of this nature. PotashCorp acquired the Rocanville mine in 1977.
Effective January 1, 2018, PotashCorp and Agrium completed the Arrangement. As a result of completing the Arrangement, PotashCorp and Agrium are wholly-owned subsidiaries of Nutrien.
Both flotation and crystallization methods are used at Rocanville to produce potash products for agricultural application. A major expansion to increase the nameplate capacity of Rocanville from 3.0 million tonnes to approximately 6.0 million tonnes of finished potash products per year was announced in 2007. Expansion work was substantially completed by the end of 2016, and production was ramped up through 2017 when a nameplate capacity of 6.5 million tonnes of finished potash product was announced.
15
| 7.0 | GEOLOGICAL SETTING AND MINERALIZATION |
Much of southern Saskatchewan is underlain by the Prairie Evaporite Formation, a layered sequence of salts and anhydrite which contains one of the world’s largest deposits of potash. The potash extracted from the predominantly sylvinitic ore has its main use as a fertilizer. A map showing the extent of the potash deposits in Saskatchewan is shown in Figure 4.
The 100 m to 200 m thick Prairie Evaporite Formation is overlain by between 400 and 500 m of Devonian carbonates, followed by approximately 100 m of Cretaceous sandstone, and between 400 and 500 m of Cretaceous shales and more recent Pleistocene glacial tills to surface. The Prairie Evaporite Formation is underlain by Devonian carbonates. The Phanerozoic stratigraphy of Saskatchewan is remarkable in that units are flat-lying and relatively undisturbed over very large areas. A geological section representing Saskatchewan stratigraphy is shown in Figure 7 (modified from Fuzesy, 1982). A geological section representing the Prairie Evaporite Formation stratigraphy in the Saskatoon area is shown in Figure 8 (modified from Fuzesy, 1982).

Figure 7: Vertical section showing basic layered-Earth stratigraphy in a typical Saskatchewan potash region.
Potash mineralization in this region of Saskatchewan is predominantly sylvinite, which is comprised mainly of the minerals sylvite (KCl) and halite or rock salt (NaCl), with trace carnallite (KMgCl3 · 6H2O) and minor water insolubles. Potash fertilizer is concentrated, nearly pure KCl (i.e. greater than 95% pure KCl), but ore grade is traditionally reported on a % K2O equivalent basis.
16
The “% K2O equivalent” gives a standard measurement of the nutrient value of different potassium-bearing rocks and minerals. To convert from % K2O equivalent tonnes to actual KCl tonnes, multiply by 1.58.
Over the past three years (2022, 2023, 2024), the average measured potash ore grade of the mill feed at Rocanville was 21.6% K2O equivalent. The average ore grade reported from surface drillhole intersections, all within Rocanville Subsurface Mineral Lease KL 305, is 22.3% K2O equivalent (discussed further in Section 10.0). The average ore grade observed from thousands of in-mine samples collected to the end of December 2024 is 22.7% K2O equivalent (discussed further in Section 11.2).

Figure 8: Geophysical wireline logs showing basic stratigraphy of the Prairie Evaporite Formation in the Rocanville area.
| 8.0 | DEPOSIT TYPE |
There are three mineable potash members within the Prairie Evaporite Formation of Saskatchewan. Stratigraphically highest to lowest, these members are: Patience Lake, Belle Plaine, and Esterhazy. A geological section showing potash members that occur in Saskatchewan is shown in Figure 9.
The Rocanville potash deposit lies within the Esterhazy Member of the Prairie Evaporite Formation. The Patience Lake Member potash beds are not present in the Rocanville Area. The Belle Plaine Member is present, but not well-developed. The potash zone at Rocanville is approximately 2.4 m thick and occurs near the top of the Prairie Evaporite Formation. Potash mineralization in this area is flat-lying and continuous. Mine elevations currently range from approximately 895 m to 1,155 m depth below surface. Salt cover from the ore zone to overlying units is approximately 30 m. The Rocanville mine operates as a conventional, underground potash mine.
17

Figure 9: Cross-section of the Prairie Evaporite Formation across southern Saskatchewan showing relative position of potash members.
| 9.0 | EXPLORATION |
Before the Rocanville mine was established, all exploration consisted of drilling from surface and analysis of core from these drillholes; drilling results are discussed in Section 10.0. Since mining began in 1970, exploration drilling has been infrequent. Now, drilling is most often used to derisk mining. A multi-drillhole program is currently underway at Rocanville. Assay results are not yet complete. A map showing potash exploration coverage at Rocanville (drillholes, 2D and 3D seismic coverage) is shown in Figure 10.
In most of southern Saskatchewan, potash mineralization is in place wherever Prairie Evaporite Formation salts exist, are flat-lying, and are undisturbed. Since the surface seismic exploration method is an excellent tool for mapping the top and bottom of Prairie Evaporite salts, this has become the main potash exploration tool in any existing Saskatchewan Subsurface (potash) Mineral Lease. Historically, 2D seismic, and now the more accurate and full coverage 3D seismic methods are used to infer continuity and extent of potash beds in flat-lying potash deposits. Seismic data are relied upon to identify collapse structures that must be avoided in the process of mine development since these structures can act as conduits for water ingress to the mine. As a result, isolation pillars or mining buffer zones are left around these anomalous features. This practice reduces the overall mining extraction ratio, but the risk of inflow to mine workings are effectively mitigated. Occasional, small-scale anomalies that are not mapped by seismic data do occur. When they do, they are dealt with in the normal course of mining and extraction through these areas is typically minimized. Where there is uncertainty in seismic interpretations, drilling is often used to confirm or improve refine the seismic interpretation.
Within the Rocanville Crown Lease, a total of 918 linear kilometres of 2D seismic lines, and 918 square kilometres of 3D seismic has been acquired to the end of December 2024.
18

Figure 10: Potash exploration at Rocanville including 3D seismic (purple), 2D seismic infill (orange lines), and potash drillholes (black dots).
A typical seismic section from Nutrien’s conventional seismic operations is shown in Figure 11. This is a cross-section extracted from a multi-program 3D seismic volume (earliest program was 2002). The vertical scale is in metres relative to sea level (SL). The seismic section is coloured by rock velocities computed from the seismic data and represents different rock types. Note that the Prairie Evaporite (salt) is continuous. This indicates an undisturbed, flat-lying salt within which potash is likely to be found based on over 50 years of mining experience at Rocanville.
Experience has shown that the potash mining horizon is continuous when seismic data are undisturbed and flat-lying, as shown in Figure 11. It is now Nutrien’s policy to collect detailed 3D seismic data ahead of mining. Any areas recognized as seismically unusual are identified early, and mine plans are adjusted as needed.
19

Figure 11: A seismic section showing relative rock velocities and major geological units at Nutrien’s conventional potash operations.
| 10.0 | DRILLING |
For the original Rocanville potash test holes drilled in 1960s, the primary objective was to sample the potash horizon to establish basic mining parameters. The seismic method was still novel and crude at that time and as such, 2D seismic surveys were done sparingly, so the drillhole information was relied upon heavily to evaluate potash deposits. Test holes would penetrate the evaporite section with a hydrocarbon-based drilling mud (oil-based or diesel fuel) to protect the potash mineralization from dissolution. Basic geophysical well-logs were acquired, and in many cases, drill stem tests were run on the Dawson Bay Formation, a carbonate immediately overlying the Prairie Evaporite Formation, to help assess water-make potential of the caprock. Core samples from the targeted potash intersections were split or quartered (cut with a masonry saw), crushed and analysed to establish potash grades.
Figure 12 shows the basic stratigraphic relationships of the Upper Prairie Evaporite Formation where the mining horizon within the Esterhazy Potash Member is located.
20

Figure 12: Stratigraphic section showing local nomenclature at, and adjacent to, the mining horizon.
Original Rocanville drillhole assay data are taken from Robertson et al. (1977), where the best 2.44 m (8’) mining interval – the original mining height at Rocanville – is reported. As explained in the Robertson Associates report, the Rocanville prospect was originally explored by 34 drillholes in Saskatchewan and Manitoba. Of these, 26 drillholes are located within the current Rocanville Lease KL 305 and are shown in Table 2. See also Figure 10 for drillhole locations. Drillholes following the original test holes were analysed by Nutrien staff and are listed in Table 2 below. All drilling and sampling were carried out following the regulations in place at the time.
Drillhole assay data for the Rocanville mining interval gives an estimated mean grade of 22.3% K2O, with 1.2% water insolubles, and 3.5% carnallite (Table 2).
Note that the potash intersections for two of the drillholes listed in Table 2 revealed anomalously low grades. With over 50 years of mining experience at Rocanville, it is the opinion of the authors that areas of low grade (i.e. <15% K2O) are localized with a relatively small lateral extent. Therefore, the average grade calculation does not include these drillholes. Also note that the 2008 and 2019 assay results are for the best 2.59 m (8.5’) mining interval. This mining height allows for more headroom with minimal negative impact on ore grade.
21
Table 2: Assay results for all potash test holes within Rocanville Lease KL 305.
| Weighted Average for 2.44 m (8’) Mining Interval |
||||||||
| Drillhole |
Year Drilled |
% K2O |
% Water Insolubles |
% Carnallite |
||||
|
01-04-17-30 W1 |
1957 | 23.8 | 1.2 | 4.3 | ||||
|
16-14-017-01W2 |
1957 | Excluded | N/A | N/A | ||||
|
04-20-17-32 W1 |
1958 | 22.7 | 1.0 | 1.8 | ||||
|
08-32-17-30 W1 |
1959 | 20.7 | 1.0 | 5.2 | ||||
|
10-12-17-30 W1 |
1959 | 16.4 | 1.0 | 7.6 | ||||
|
13-16-18-30 W1 |
1959 | 20.3 | 0.8 | 0.7 | ||||
|
05-07-18-30 W1 |
1961 | 20.0 | 1.1 | 4.9 | ||||
|
16-04-18-30 W1 |
1961 | 21.9 | 1.3 | 5.7 | ||||
|
02-11-18-30 W1 |
1961 | 24.9 | 1.0 | 0.2 | ||||
|
01-16-17-30 W1 |
1964 | 27.1 | 1.3 | 4.3 | ||||
|
04-20-17-30 W1 |
1964 | 23.9 | 1.2 | 0.2 | ||||
|
16-22-17-30 W1 |
1964 | 29.1 | 1.4 | 0.1 | ||||
|
14-36-17-30 W1 |
1964 | 17.1 | 0.9 | 6.8 | ||||
|
14-36-17-30 W1* |
1964 | 26.3 | 1.4 | 4.8 | ||||
|
03-28-17-30 W1 |
1966 | 26.3 | 1.3 | 6.5 | ||||
|
13-14-17-30 W1 |
1966 | 23.7 | 1.4 | 7.0 | ||||
|
04-24-17-30 W1 |
1966 | 17.9 | 0.8 | 0.2 | ||||
|
10-34-17-30 W1 |
1966 | 24.9 | 1.5 | 0.2 | ||||
|
11-25-17-30 W1 |
1966 | 19.6 | 1.2 | 2.1 | ||||
|
11-14-18-30 W1 |
1966 | 26.5 | 1.1 | 0.2 | ||||
|
13-22-17-30 W1 |
1967 | 35.1 | 1.3 | 5.4 | ||||
|
01-14-17-33 W1 |
1967 | 25.6 | 2.7 | 2.5 | ||||
|
13-22-17-33 W1 |
1967 | 21.8 | 2.6 | 7.2 | ||||
|
16-26-17-33 W1 |
1967 | 24.0 | 0.9 | 0.2 | ||||
|
14-05-17-30 W1 |
1969 | 15.6 | 1.0 | 10.3 | ||||
|
01-14-17-30 W1 |
1971 | 15.7 | 1.2 | N/A | ||||
|
04-01-019-31W1 |
1989 | 22.5 | 0.6 | 0.00 | ||||
|
06-13-17-32 W1** |
2008 | 23.6 | 0.4 | 0.3 | ||||
|
08-02-18-32 W1** |
2008 | 20.7 | 1.1 | 0.8 | ||||
|
13-09-16-33 W1** |
2008 | 23.4 | 1.4 | 8.3 | ||||
|
04-34-16-33 W1** |
2008 | 15.7 | 0.7 | 8.8 | ||||
|
09-11-18-33 W1** |
2008 | 18.0 | 0.4 | 0.3 | ||||
|
01-16-17-01 W2** |
2019 | 18.4 | 1.1 | 0.3 | ||||
|
08-16-18-01 W2** |
2019 | (5.3) Excluded | 1.2 | 0.2 | ||||
|
|
|
|
||||||
| Average of 32 useable values: |
22.3 | 1.2 | 3.5 | |||||
|
|
|
|
||||||
*Refers to a deflection, or whipstock, off original drillhole
**Refers to drillhole from the 2008 or 2019 exploration program, where the best 2.59 m (8.5’) mining interval is reported
Due to the remarkably consistent mineralogy and continuity of the potash, as experienced through decades of mine production, very little potash exploration drilling has been done at Rocanville since start-up. Instead of exploration drillholes, seismic surveying has been relied upon to explore ahead of mine development. Where normal Prairie Evaporite sequences are mapped in the seismic data, potash beds have unfailingly been present. Occasional, small-scale salt anomalies that are not mapped by seismic data do occur. When they do, they are dealt with in the normal course of mining and extraction through these areas is typically minimized. Anomalies associated with possible water inflow problems, which are mapped in the seismic data, are avoided.
| 11.0 | SAMPLING PREPARATION, ANALYSES AND SECURITY |
| 11.1 | BASIC APPROACH |
Exploration drilling in the Rocanville area was first conducted in the 1960s and then again in 2008 and 2019. Sampling and assaying of potash cores samples was done using methods considered consistent with standard procedures for potash exploration at these times.
Drillhole sampling methods have remained essentially the same over the years. Potash core samples are acquired as described in earlier sections of this report. Short segments of core usually about 0.3 m (1’) in length are labeled based on visible changes in mineralization, and sometimes based on fixed intervals. Each segment of core is then split using some type of rock or masonry saw.
22
The split portion of core is then bagged and labeled and sent to a laboratory for chemical analysis. Historical potash samples remain stored at the Subsurface Geological Laboratory (Regina, Saskatchewan) of the Saskatchewan Ministry of Energy & Resources.

Figure 12: Potash assay plot for drillhole PCS Tantallon 08-02-18-32 W1 indicating the best 2.59 m (8.5’) mining interval.
An assay plot for drillhole PCS Tantallon 08-02-18-32 W1 is shown above in Figure 13. Similar data were compiled for all historical potash test holes. The best 2.44 m (8’), or in newer drillholes, the best 2.58 m (8.5’) mining interval intersected in each drillhole, as discussed in Section 10.0, is determined from the assay values. At Rocanville, potassium sensing instrumentation on the mining machines is used to keep them centered on the optimal (highest mineral grade) portion of the potash seam. Note that while drillhole assays were derived using intervals of either 2.44 m or 2.58 m, a more conservative mining height of 2.51 m is used for Mineral Resource and Reserve estimates. Table 3 lists the assay values plotted in Figure 13.
Table 3: Values for potash assay plot in Figure 13.

23
All new drilling efforts have targeted areas of geological uncertainty. Although normal ore zone conditions may occur in the tested areas, they are not targeted specifically. For this reason, and because ore grade is known to be locally variable, assays from drilling are not relied upon for ore grade estimation. Instead, grade determined from routinely collected in-mine ore zone samples are found to be most reliable. The long-term average from in-mine tends to best represent the larger ore zone as it normalizes local variability.
Thousands of in-mine ore grade samples were collected at Rocanville to the end of December 2024 (discussed further in section 11.2). All in-mine samples were analysed in the Rocanville mill laboratory using analysis techniques that were up-to-date for the era in which the sample was collected.
Regarding quality assurance for analytical results, the Company participates in the Canpotex Producer Sample Exchange Program using methods developed by the Saskatchewan Potash Producers Association (SPPA). The Sample Exchange Program monitors the accuracy of analytical procedures used in its labs. In the early 1970s, the SPPA initiated a round-robin Sample Exchange Program, the purpose of which was to assist the potash laboratories in developing a high level of confidence in analytical results. This program, now named the Canpotex Producer Sample Exchange Program using SPPA Methods (CPSEP), has continued up to the present. Current participants include all Canpotex member potash mine site labs, the Nutrien Pilot Plant Lab, and independent third-party surveyor labs. The CPSEP provides participants with three unknown potash samples for analysis quarterly. Results for the unknown sample analysis are correlated by an independent agency that distributes statistical analysis and a summary report to all participants. Completed exchange program samples can be used for control standards as required in QA/QC sections of standard analytical procedures.
The Nutrien Pilot Plant is secured in the same way as modern office buildings are secured. Authorized personnel have access and visitors are accompanied by staff. No special security measures are taken beyond that. Currently, no external laboratory certification is held by the Nutrien Pilot Plant. On occasion, product quality check samples are sent to the Saskatchewan Research Council (SRC), a fully certified analytical facility.
In the opinion of the authors, the sample preparation, security, and analytical procedures are acceptable, are consistent with industry-standard practices, and are adequate for Mineral Resource and Reserve estimation purposes.
| 11.2 | MEAN POTASH MINERAL GRADE FROM IN-MINE SAMPLES |
In-mine grade samples are taken at 60 m intervals in every underground mine room at Rocanville. Up until 2015, Rocanville in-mine grade samples were collected as chips taken with a hammer along a sidewall from back (roof) to floor; this methodology is referred to as channel sampling. Now, in-mine samples are taken by collecting fine “muck” from the floor of the mine (i.e. grab sampling) at the same 60 m sampling interval, a method consistent with other Nutrien potash operations.

Figure 13: Histogram of potash ore grade from Rocanville in-mine grade samples (1970 to December 2024).
To the end of 2024, 56,903 in-mine ore grade samples were collected. All samples were analysed in the Rocanville mill laboratory using analysis techniques that were up-to-date for the era in which the sample was collected. Figure 14 shows a histogram of in-mine ore grade sample results from the Rocanville mine. The mean ore grade for this family of in-mine samples is 22.7% K2O equivalent, while the median ore grade for this family of in-mine samples is 23.0% K2O. The five-year (2020 – 2024) mean ore grade is 20.9% K2O equivalent and was determined from 12,432 samples.
24
The mean ore grade from in-mine samples is considered to be a more representative estimate of expected potash ore grade at Rocanville than drilling results presented in Section 10.0.
| 11.3 | POTASH ORE DENSITY FROM IN-MINE MINERAL GRADE MEASUREMENTS |
An estimate of in-situ rock density is used to calculate potash mineralization volumes in Mineral Resource and Reserve assessments. A common approach, and the one used by Nutrien, is to determine in-place Mineral Resource and Reserve volumes (m3), then multiply this number by in-situ bulk-rock density (tonnes / m3) to give in-place Mineral Resource and Reserve tonnes.
Well-log data from drillholes can be used to calculate bulk density if accurate and calibrated well-logs are acquired during exploration drilling. In practical terms, modern well-logs tend to meet these criteria, but historic well-logs (collected before the 1990s) do not. In Saskatchewan, almost all potash exploration drilling took place in the 1950s and 1960s, well before density logs were accurate and reliable.
Another approach, and the one used by Nutrien, is to look up density values for the minerals which constitute potash rock – values determined in a laboratory to a high degree of accuracy and published in reliable scientific journals / textbooks – then apply these densities to the bulk rock. Given that the density of each pure mineral is quantified and known, the only variable is what proportion of each mineral makes up the bulk rock. An obvious benefit of this approach is that a mean value computed on the in-mine samples shown in Figure 14 has a much greater confidence interval than a mean value computed from just a few drillhole assays.
The four main mineralogical components of the ore zones of Saskatchewan’s Prairie Evaporite Formation with their respective mineral densities are:
| Mineral |
Density (kg / m3) |
Components |
||||
| Halite | 2,170 | NaCl | ||||
| Sylvite | 1,990 | KCl | ||||
| Carnallite | 1,600 | KMgCl3 · 6(H2O) | ||||
| Insolubles | 2,790 | Anhydrite, dolomite, quartz, muscovite, and other minor mineral components (Nutrien Pilot Plant, 2018) |
All Nutrien potash mines measure and record the in-mine % K2O grade and insoluble content of the mined rock. In addition, carnallite content is also measured at Rocanville since it can be a component of the ore. From this set of measurements, density of the ore can be calculated.
The value for insoluble density is based on known densities of the constituent parts of the insoluble components of the mineralization and the average occurrence of these insoluble components, which is known from over 50 years of mining experience at Rocanville. Assuming the lowest plausible density of insolubles known for Saskatchewan potash deposits of this nature, the effect upon overall bulk-rock ore density and Mineral Resource and Reserve calculations would be negligible.
From thousands of in-mine samples taken at Rocanville, bulk density for Rocanville has been determined to be:
= (halite density * % halite) + (sylvite density * % sylvite) + (insolubles density * % insolubles) + (carnallite density * % carnallite)
= (2,170 kg / m3 * 57.5%) + (1,990 kg / m3 * 35.4%) + (2,790 kg / m3 * 1.0%) + (1,600 kg / m3 * 6.1%)
= 2,078 kg / m3
RHObulk-rock (Rocanville) = 2,078 kg / m3 = 2.08 tonnes / m3
This method is as accurate as the ore grade measurements and mineral density estimates.
| 12.0 | DATA VERIFICATION |
| 12.1 | ASSAY DATA |
Original drillhole ore grade assays were studied by independent consultant David S. Robertson and Associates (1977). The original assay results for core samples from historical drillholes were taken as accurate in these studies, as there is no way to reliably reanalyse these samples. Most of the remaining core samples in storage have long since deteriorated to the point where they are no longer usable.
25
Recently, drillhole core is prepared for sampling by Nutrien technical staff and, generally, sent to SRC Geoanalytical Laboratory for independent analyses.
Ore grades of in-mine samples are measured inhouse at the Rocanville mine laboratory by Company staff using modern, standard chemical analysis tools and procedures; an independent agency does not verify these results. However, check sampling through the CPSEP, discussed in Section 11.1, does occur.
It should be noted that assay results from historical drillholes match in-mine sample results reasonably well – within 1% – even though drillhole sample spacing is much greater. This correlation is further validation of the in-mine sampling methodology. Mean mineral grade determined from in-mine samples taken over decades of mining at Rocanville is thought to provide the most accurate measurement of potash grade for the Rocanville mine, also providing a good basis for estimating ore grade in areas of future mining at Rocanville.
| 12.2 | EXPLORATION DATA |
The purpose of any mineral exploration program is to determine extent, continuity, and grade of mineralization to a certain level of confidence and accuracy. For potash exploration, it is important to minimize the amount of cross-formational drilling, since each drillhole is a potential conduit for subsurface groundwater from overlying (or underlying) water-bearing formations into future mine workings. Every potash test drillhole from surface sterilizes potash mineralization as a safety pillar is required around every surface drillhole once underground mining commences.
Initial sampling and assaying of cores were done during potash exploration at Rocanville in the 1950s and 1960s. Methods were consistent with standard procedures for that era. The mine began production in 1970 and test drilling conducted after that was largely for the purpose of better understanding the caprock rather than potash mineralization. This approach to potash sampling is in accordance with widely accepted industry practice for areas adjacent and contiguous to an existing operating potash mine.
Assay of physical samples (drillhole cores and/or in-mine samples) is the only way to gain information about mineral grade, but extent and continuity of mineralization are correctly determined using data collected from seismic surveys correlated with drilling information. To date, surface seismic data at Rocanville has been collected, analysed, and verified by Company staff, at times, in cooperation with independent consultants.
Data for the Mineral Resource and Reserve estimates for Rocanville mine reported in Sections 14.0 and 15.0 were verified by Company staff as follows:
| • | Review of potash assay sample information (drillholes and in-mine grade samples), |
| • | Review and verify procedures used for in-mine grade sampling and laboratory analysis, |
| • | Review of surface geophysical exploration results (3D and 2D seismic data), |
| • | Crosscheck of mined tonnages reported by mine site technical staff with tonnages estimated from mine survey information, and |
| • | Crosscheck of Mineral Resource and Mineral Reserve calculations carried out by corporate technical staff. |
In the opinion of the authors, this approach to data verification of potash mineral grade and surface seismic information is in accordance with generally accepted industry practice for areas adjacent and contiguous to an existing operating potash mine.
| 13.0 | MINERAL PROCESSING AND METALLURGICAL TESTING |
At Rocanville, potash ore has been mined and concentrated using flotation and crystallization methods to produce saleable quantities of high-grade finished potash products since 1970.
Since opening in 1970, 347.383 million tonnes of potash ore have been mined and hoisted at Rocanville to produce 111.271 million tonnes of finished potash products. Given this level of sustained production over several decades, basic mineralogical processing and prospective metallurgical testing of Rocanville potash is not considered relevant.
See also Section 17.0.
26
| 14.0 | MINERAL RESOURCE ESTIMATES |
| 14.1 | DEFINITIONS OF MINERAL RESOURCE |
The CIM has defined Mineral Resource in The CIM Definition Standards for Mineral Resources and Reserves (2014) as:
| 1) | Inferred Mineral Resource: that part of a Mineral Resource for which quantity and grade or quality are estimated on the basis of limited geological evidence and sampling. Geological evidence is sufficient to imply but not verify geological and grade or quality continuity. |
| 2) | Indicated Mineral Resource: that part of a Mineral Resource for which quantity, grade or quality, densities, shape, and physical characteristics are estimated with sufficient confidence to allow the application of Modifying Factors in sufficient detail to support mine planning and evaluation of the economic viability of the deposit. Geological evidence is derived from adequately detailed and reliable exploration, sampling and testing and is sufficient to assume geological and grade quality continuity between points of observation. |
| 3) | Measured Mineral Resource: that part of a Mineral Resource for which quantity, grade or quality, densities, shape, and physical characteristics are estimated with confidence sufficient to allow the application of Modifying Factors to support detailed mine planning and final evaluation of the economic viability of the deposit. Geological evidence is derived from detailed and reliable exploration, sampling and testing and is sufficient to confirm geological and grade or quality continuity between points of observation. |
CIM defines Modifying Factors as “considerations used to convert Mineral Resources into Mineral Reserves. These include, but are not restricted to, mining, processing, metallurgical, infrastructure, economic, marketing, legal, environmental, social and governmental factors.”
In south-central Saskatchewan, where geological correlations are straightforward, and within a (potash) subsurface mineral lease at an operating potash mine, Mineral Resource categories are generally characterized by Nutrien as follows:
| 1) | Inferred Mineral Resource: areas of limited exploration, such as areas that have been investigated through regional geological studies, or areas with 2D regional surface seismic coverage, little or no drilling, at some distance from underground workings, and within Crown Subsurface Mineral Lease KL 305. |
| 2) | Indicated Mineral Resource: areas of adequate exploration, such as areas with 3D surface seismic coverage, little or no drilling, at some distance from underground workings, and within Crown Subsurface Mineral Lease KL 305. |
| 3) | Measured Mineral Resource: areas of detailed, physical exploration through actual drilling or mine sampling, near existing underground workings, and within Crown Subsurface Mineral Lease KL 305. |
The mine began production in 1970 and there has been very little exploration drilling carried out by the Company since then. Instead, exploration involved collecting surface seismic data, which became better in quality over the years. Exploration drilling has demonstrated the presence of the potash horizon, and seismic coverage shows the continuity of the Prairie Evaporite Formation within which the potash horizon occurs.
Along with this approach, analysis of in-mine samples for potash grade has provided an observation-based understanding of the potash mineralized zone at Rocanville that is far superior to the level of understanding provided by any surface drilling-based exploration program. The authors believe that this approach provides a body of information that guides and constrains exploration inferences in a much better way than could be achieved from any conventional exploration investigation in areas immediately surrounding, and contiguous to, the Rocanville potash mine.
| 14.2 | ROCANVILLE POTASH RESOURCE CALCULATIONS |
Exploration information used to calculate reported Mineral Resource tonnages at Rocanville consist of both physical sampling (drillhole and in-mine) and surface seismic (2D and 3D) as discussed in earlier sections. Based on the definitions and guidelines in Section 14.1, all mineral rights leased or owned by the Company, and within Crown Subsurface Mineral Lease KL 305, are assigned to one of the three Mineral Resource categories.
27
Mineral Resources are reported as mineralization in-place and are exclusive of Mineral Reserves. In-place tonnes were calculated for each of the Mineral Resource categories using the following parameters:
| Mining Height: | 2.51 m (8.25 feet) | |
| Ore Density: | 2.08 tonnes / m3 |
The Mineral Resources for Rocanville, as of December 31, 2024 are as follows:
| Inferred Resource |
347 | millions of tonnes | ||||||
| Indicated Resource |
2,042 | millions of tonnes | ||||||
| Measured Resource |
2,258 | millions of tonnes | ||||||
|
|
||||||||
| Total Resource |
4,647 | millions of tonnes | ||||||
Rocanville Mineral Resources are plotted in Figure 15.
The average mineral grade of the Rocanville Mineral Resource is 22.7% K2O equivalent and was determined from thousands of in-mine samples at Rocanville. See Section 11.2 for more detail.
The tonnage reported in the Rocanville Measured Resource is comprised of the potash that is within 1.6 km (1 mile) of a physically sampled location (i.e. drillholes or mine workings). Also included as Measured Resource is the potash in the pillars of mined-out areas of the Rocanville mine that is not already accounted for in the Proven Reserve estimation as there is the possibility of retrieving ore from the remnant mining pillars at some point in the future.

Figure 14: Map showing Rocanville Mineral Resource as of December 2024.
28
| 15.0 | MINERAL RESERVE ESTIMATES |
| 15.1 | DEFINITIONS OF MINERAL RESERVE |
The CIM has defined Mineral Reserve in The CIM Definition Standards for Mineral Resources and Reserves (2014) as:
| 1) | Probable Mineral Reserve: the economically mineable part of an Indicated, and in some circumstances, a Measured Mineral Resource. The confidence in the Modifying Factors applying to a Probable Mineral Reserve is lower than that applying to a Proven Mineral Reserve. |
| 2) | Proven Mineral Reserve: the economically mineable part of a Measured Mineral Resource. A Proven Mineral Reserve implies a high degree of confidence in the Modifying Factors. |
CIM defines Modifying Factors as “considerations used to convert Mineral Resources into Mineral Reserves. These include, but are not restricted to, mining, processing, metallurgical, infrastructure, economic, marketing, legal, environmental, social and governmental factors.”
For Saskatchewan, in regions adjacent and contiguous to an operating potash mine and within a (potash) subsurface mineral lease, Mineral Reserve categories are characterized by Nutrien as follows:
| 1) | Probable Mineral Reserve: identified recoverable potash mineralization classified as a Measured Resource, within a 1.6 km (1 mile) radius of a sampled mine entry or exploration drillhole contiguous to mine workings, and within Crown Subsurface Mineral Lease KL 305. |
| 2) | Proven Mineral Reserve: identified recoverable potash mineralization classified as a Measured Resource, delineated on at least three sides by sampled mined entries or exploration drillholes to a maximum of 3.2 km (2 miles) apart, and within Crown Subsurface Mineral Lease KL 305. |
Along with this approach, analysis of in-mine samples for potash grade has provided an observation-based understanding of the potash mineralized zone at Rocanville that is far superior to the level of understanding provided by any surface drilling-based exploration program. An understanding of the amount of ore that can be conventionally mined from the Measured Resource category using current mining practices comes from over 50 years of potash mining experience at Rocanville.
| 15.2 | ROCANVILLE POTASH RESERVE CALCULATIONS |
Using the definitions outlined in Section 15.1, a portion of the Rocanville Measured Resource has been converted to Mineral Reserve. The assigned Mineral Reserve category is dependent on proximity to sampled mined entries also described in Section 15.1. An overall extraction ratio for the Rocanville mine has been applied to the qualifying areas outlined as Measured Resource in Figure 15. This extraction ratio is significantly lower than the local extraction ratio described in Section 16.1, as it takes into account areas which cannot be mined due to unfavorable geology.
The overall extraction ratio at the Rocanville mine is 25%. It was derived by dividing the total ore tonnes mined to date by the tonnage equivalent of the total area of the mine workings (i.e. the perimeter around the mine workings) less future mining blocks. This extraction ratio has been applied to the Probable Reserve, an area where no mining has occurred to date. To remain conservative in our estimations, and because a considerable amount of mining has already occurred in the Proven Reserve area, this extraction ratio has been applied only to the portion of the Proven Reserve that is anticipated to be mined in future. Future mining blocks within the Proven Reserve area vary from year-to-year as production continues. Pillars remaining that are not planned for mining remain a Measured Resource.an extraction ratio has been applied, Mineral Reserves are considered recoverable ore, and are reported as such. Note that only drillholes whose 1.6 km radii are contiguous to mine workings or the 1.6 km radius placed around mine workings are used to compute probable mineral reserve. The remaining non-contiguous drillholes remain in the Measured Resource category.
At times, irregular mining which resembles development mining occurs to support operational requirements (e.g. egress) or as geological conditions necessitate. While irregular mining increases confidence in the Mineral Resource by way of physical sampling, it can add considerable Mineral Reserve to broad areas not otherwise covered (or planned to be covered) by mine workings. Again, to remain conservative in our estimations, certain irregular mining may not have been converted from Measured Resource to Proven Reserve.
29
The Mineral Reserves for Rocanville as of December 31, 2024 are as follows:
| Probable Reserve |
260 | millions of tonnes | ||||
| Proven Reserve |
83 | millions of tonnes | ||||
|
|
||||||
| Total Reserve |
343 | millions of tonnes | ||||
Rocanville Mineral Reserves are plotted in Figure 16.
The average mineral grade of the Rocanville Mineral Reserve is 22.7% K2O equivalent and was determined from thousands of in-mine samples at Rocanville.

Figure 15: Map showing Rocanville Mineral Reserve to December 2024.
| 16.0 | MINING METHOD |
| 16.1 | MINING OPERATIONS |
All conventional potash mines in Saskatchewan operate at 900 m to 1,200 m below surface within 9 m to 30 m of the top of the Prairie Evaporite Formation. Over the scale of any typical Saskatchewan potash mine, potash beds are tabular and regionally flat-lying, with only moderate local variations in dip. At Rocanville, potash ore is mined using conventional mining methods, whereby:
| • | Shafts are sunk to the potash ore body; |
| • | Continuous mining machines cut out the ore, which is hoisted to surface through the shafts; |
| • | Raw potash is processed and concentrated in a mill on surface; and |
| • | Concentrated finished potash products (near-pure KCl) are sold and shipped to markets in North America and offshore. |
30
Sinking of the two original shafts (Shaft #1 and Shaft #2) from surface to the potash zone was completed in early 1970, and the first potash ore was hoisted by the fall of that year. The Rocanville mine has run on a continuous basis since the first ore was hoisted in 1970, other than short-term shutdowns taken for inventory management purposes or occasional plant maintenance and construction work other than short-term shutdowns taken for inventory management purposes or occasional plant maintenance and construction work, or other outages that are typical for operations of this nature.
In recent years, the Rocanville mine underwent a major expansion which brought the nameplate capacity to 6.5 million tonnes of finished potash products per year. This work involved sinking a third shaft, enhancement of hoists, major expansions of both mine and mill, major improvements to loadout facilities, and other infrastructure improvements. The expansion was substantially complete in 2016 and production was ramped up through 2017. The operational capability of the Rocanville facility in 2024 was 5.1 million tonnes per year.
Virtually all Rocanville underground mining rooms are in one potash mineralized zone, within the Esterhazy Member the Prairie Evaporite Formation (the host evaporite salt). Saskatchewan potash geology is illustrated in Figure 17. Rocanville mine elevations range from approximately 895 m to 1,155 m depth below surface. Mine workings are protected from aquifers in overlying formations by approximately 30 m of overlying salt and potash beds, along with salt plugged porosity in the Lower Dawson Bay Formation, a carbonate layer lying immediately above potash hosting salt beds.
The Rocanville mine is a conventional underground mining operation whereby mining machines are used to excavate the potash ore by the long-room and pillar mining method. Continuous conveyor belts transport ore from the mining face to the bottom of the production shaft. Mining methods employed in Saskatchewan are discussed in Jones and Prugger (1982) and in Gebhardt (1993). The highest mineral grade section of the Rocanville potash seam is approximately 2.3 m (7.5’) thick, with gradations to lower grade sylvinite salts immediately above and below the mining horizon. The actual mining thickness at Rocanville is dictated by the height of mining machines used to cut the ore, which are designed to cut slightly thicker than the high-grade mineralized zone. Historically, Rocanville mining machines cut at a thickness of 2.44 m (8’). These five older machines were recently adjusted to cut a thicker 2.51 m (8.25’) mining height. Six newer mining machines cut a slightly thicker 2.59 m (8.5’) mining height and two newly acquired mining machines cut at 2.74 m (9’) mining height. This height allows for more headroom with minimal negative impact on ore grade.
Mining machines at Rocanville use potassium sensing technology to ensure that rooms are always cut in the best available potash ore. It is difficult to determine at which mining height certain Mineral Resources and Reserves will be cut in the future, so the more conservative mining height of 2.51 m (8.25’) was applied to Mineral Resource and Reserve calculations.
31

Figure 16: Schematic cross-section through the Prairie Evaporite Formation, illustrating mining horizons at each of Nutrien’s conventional potash operations.
Conservative local extraction ratios (never exceeding 45% in any mining block) are employed at all Saskatchewan mines, including Rocanville, to minimize potential detrimental effects of mining on overlying strata; this is common practice in flat-lying, tabular ore bodies overlain by water-bearing layers.
From the shaft-bottom, potash ore is hoisted approximately 960 m from the potash level through the vertical shafts to a surface mill. Both production shafts also provide exhaust ventilation from underground workings; the third shaft from surface at Scissors Creek is used for service access, fresh air ventilation and second egress.
Since production began in 1970, 347.383 million tonnes of potash ore have been mined and hoisted at Rocanville to produce 111.271 million tonnes of finished potash products. The life-of-mine average concentration ratio (raw ore / finished potash products) is 3.12 and the overall extraction ratio over this period is 25%.
Actual potash production tonnages for the Rocanville mine, along with concentration ratios (tonnes mined / tonnes product), are plotted for the past decade in Figure 17.
32

Figure 17: Mined tonnes, product tonnes, and concentration ratio for the Rocanville mine over the past 10 years.
| 16.2 | RISKS TO POTASH MINING OPERATIONS, WITH EMPHASIS ON WATER INFLOWS |
The mining of potash is a capital-intensive business, subject to the normal risks and capital expenditure requirements associated with mining operations. The production and processing of ore may be subject to delays and costs resulting from mechanical failures, physical hazards such as fires, and other hazards such as: unusual or unexpected geological conditions, significant subsidence, brine inflows and gas seepages of varying degree, and other situations associated with any potash mining operation.
33
Potash beds in all regions of Saskatchewan are overlain by a number of water-bearing formations, and there are water zones underlying the potash beds as well. A water inflow into mine workings is generally significant in a potash mine since salt dissolves in water; an inflow can lead to anything from increased costs at best to closure of the mine at worst (e.g. see Prugger and Prugger, 1991).
In November 1984 a major brine inflow occurred at Rocanville (Funk et al., 2019). A single production room mined into a previously unknown geological disturbance (a vertical “chimney-like” solution collapse), resulting in an uncontrolled inflow into the mine that was as high as approximately 18,927 litres / minute (5,000 US gallons / minute). Mining operations were suspended, and all the mine’s physical and human resources were devoted to sealing the inflow. By the end of January 1985, a concrete plug was installed at the inflow point, and in March 1985, high pressure valves in the plug were shut off. After four months of concerted effort, the brine inflow into the mine was completely contained. Since 1984 there has been no ingress of subsurface brines of any significance at Rocanville. At present, brine flow into underground workings at Rocanville is effectively nil (not measurable), and inflow into each existing shaft is estimated at less than 3 litres / minute (less than 1 US gallon / minute).
| 17.0 | RECOVERY METHODS |
At Rocanville, potash ore has been mined and concentrated to produce saleable quantities of high-grade finished potash products since 1970. Products include granular and standard grade potash which are used for agriculture application.
Both flotation methods and crystallization methods are used to concentrate potash ore into finished potash products at the Rocanville mill. A simplified process flow diagram is shown in Figure 19. Raw potash ore is processed on surface, and concentrated finished potash products (near-pure KCl) are sold and shipped to markets in North America and offshore.

Figure 18: Simplified flow diagram for potash flotation and crystallization milling methods used at Rocanville.
34
Over the past three years, production of finished potash products at Rocanville was:
2022: 4.886 million tonnes finished potash products at 60.51% K2O (average grade)
2023: 4.972 million tonnes finished potash products at 60.47% K2O (average grade)
2024: 5.015 million tonnes finished potash products at 60.49% K2O (average grade)
Over the past decade actual mill recovery rates have been between 82.4% and 84.9%, averaging 83.5% (see Figure 20). Given the long-term experience with potash geology and actual mill recovery at Rocanville, no fundamental potash milling problems are anticipated in the foreseeable future.
Quality control testing and monitoring geared towards fine-tuning and optimizing potash milling and concentrating processes are conducted on a continual basis at all Nutrien minesites and at Nutrien research facilities. At Rocanville, this is no exception; test work to optimize circuit performance and ensure product quality is carried out on an ongoing basis.

Figure 19: Rocanville mill recovery rate over the past 10 years.
| 18.0 | PROJECT INFRASTRUCTURE |
Infrastructure is in place to meet current and projected requirements for transportation, energy (electricity and natural gas), water and process materials at Rocanville. See also Section 5.0.
The Rocanville mine is served by a number of towns and villages within 50 km of the minesite. The nearest towns are Rocanville (15 km distant), Moosomin and Esterhazy (both 50 km distant). The nearest city is Yorkton (100 km distant).
The Rocanville mine surface facilities are accessed by an existing paved road that is part of the Saskatchewan Provincial Highway System. Most finished potash products are shipped by rail over existing track, with some product shipped by truck over the North American Highway System.
At present, high voltage power utilization at the Rocanville is 112 MVA (i.e. 82 MVA to the Rocanville Plant site plus 30 MVA to the Scissors Creek site). The ten-year projection of power utilization indicates that the utility can meet foreseeable future demand.
The Rocanville operation requires a sustained fresh water supply for the milling process which is sourced from two subsurface reservoirs called the Welby Plains Surficial Aquifer and the Welby Plains Middle Aquifer. This provincially licensed water supply provides a source of process water for Rocanville milling operations and usage is regulated by terms of the license issued by the Water Security Agency.
| 19.0 | MARKET STUDIES AND CONTRACTS |
Potash from the Company mines (including Rocanville) has been sold on a continuous basis since mining began in 1970. At present, Nutrien products are sold in more than 50 countries, to three types of end-use:
35
| 1. | Fertilizer, focused on balanced plant nutrition to boost crop yields to meet the world’s ever-increasing appetite for food (nitrogen, phosphate, potash) |
| 2. | Feed Supplements, focused on animal nutrition (mainly phosphate) |
| 3. | Industrial, focused on products for high-grade food, technical and other applications (nitrogen, phosphate, as phosphoric acid, potash) |
The Company owns and operates six potash mines in Saskatchewan and a potash mine in New Brunswick, Canada, which no longer produces potash and was permanently closed in 2018. Over the past three years (2022, 2023, 2024) the Company had potash sales of 39.639 million tonnes. Historical Company potash sales data for the past 10 years are plotted in Figure 20 and Figure 21.
Potash is mainly used for fertilizer, which typically makes up approximately 90% of the company’s annual potash sales volumes. By helping plants develop strong root systems and retain water, it enhances yields and promotes greater resistance to disease and insects. Because it improves the taste and nutritional value of food, potash is often called the “quality nutrient.” Industrial applications of potash include use in soaps, water softeners, de-icers, drilling muds and food products.
Potash fertilizer is sold primarily as solid granular and standard products. Granular product has a larger and more uniformly shaped particle than standard product and can be easily blended with solid nitrogen and phosphate fertilizers. It is typically used in more advanced agricultural markets such as the US and Brazil.
Most major potash consuming countries in Asia and Latin America have limited or no indigenous production capability and rely primarily on imports to meet their needs. This is an important difference between potash and the other major crop nutrient businesses. Trade typically accounts for more than three-quarters of demand for potash, which ensures a globally diversified marketplace.
The most significant exporters are producers with mines in the large producing regions of Canada, the Middle East, and the former Soviet Union, which all have relatively small domestic requirements.

Figure 20: Historical Company potash sales 2015 to 2024 in million tonnes / year.*
| * | Company sales data for years prior to 2018 includes only PotashCorp sales. |
36

Figure 21: Historical Company potash net sales 2015 to 2024 in million USD $ / year.*
World consumption of potash fertilizer has grown over the last decade, with the primary growth regions being developing markets in Asia and Latin America. These are countries with expanding crop production requirements, where potash has historically been under-applied and crop yields lag behind those of the developed world. Although temporary pauses can occur in certain countries, the underlying fundamentals of food demand that encourage increased potash application are expected to continue the growth trends in key importing countries. See Figure 22 for world potash production and demand in 2024.

Figure 22: World potash production and demand for 2024E.
Potash is used on many agricultural commodities. Wheat, rice, corn, oilseed, and sugar crops consume over half of the potash used worldwide. Fruits and vegetables are also important users of potash fertilizers, accounting for about 19 percent of the total consumption. The remainder goes to other consumer and industrial crops such as oil palm, rubber, cotton, coffee, and cocoa. See Table 4 for primary potash market profile. This diversity means that global potash demand is not tied to the market fundamentals for any single crop or growing region.
37
Table 4: Primary Potash Market Profile
| Country/Region |
Growth Rate* |
Key Consuming Crops |
||
| China |
3.4% | Vegetables, rice, fruits, corn | ||
| India |
-0.5% | Rice, wheat, vegetables, sugar crops | ||
| Other Asia |
2.8% | Oil palm, rice, sugar crops, fruits, vegetables | ||
| Latin America |
5.1% | Soybeans, sugar crops, corn | ||
| North America |
3.2% | Corn, soybeans |
| * | 5-year CAGR for consumption (2019-2024E) |
Global potash shipments are estimated to have reached record levels at approximately 72.5 million tonnes in 2024, an increase of about 4.5 million tonnes from the previous year. Potash consumption has grown at an annualized rate of 2.6 percent over the past 5 years, driven by strong potash consumption trends in all major potash markets.
North American and South American growers applied significant amounts of potash to replenish soil nutrients removed by large harvests. Potash application rates are increasing in China and Southeast Asian countries as a result of increased soil testing and improved agronomic practices, along with a renewed focus on food security in China. Growers in these countries are also increasing acreage of potassium-intensive crops such as fruits, vegetables, and oil palm. India continues to face political barriers to significantly growing potash demand, however, the agronomic need and willingness of farmers to improve yields persists. The Company believes that supportive agriculture fundamentals and the need to address declining soil fertility levels will enable strong demand growth in the years ahead. World potash shipments and consumption in recent years is shown in Figure 23.

Figure 23: World potash shipments and consumption, 2019-2024E.
Canpotex Limited (Canpotex), the offshore marketing company owned by the Company and another Saskatchewan potash producer, handles all sales, marketing and distribution of potash produced by its member companies to customers outside of the US and Canada (including the potash produced at Rocanville).
In North America, Nutrien sells potash to retailers, cooperatives, and distributors, who provide storage and application services to farmers, the end-users. This includes sales to Nutrien’s retail distribution business, which has the largest retail distribution network in North America. Typically, the Company’s North American potash sales are larger in the first half of the year. The primary customers for potash fertilizer products for the Rocanville operation are retailers, dealers, cooperatives, distributors, and other fertilizer producers who have both distribution and application capabilities.
Nutrien’s market research group provides management with market information on a regular basis including global agriculture and fertilizer markets, demand and supply in fertilizer markets and general economic conditions that may The tailings management strategy at all Nutrien potash mines in Saskatchewan, including Rocanville, is one of sequestering solid mine tailings in an engineered and provincially licenced TMA near the surface plant site.
38
impact fertilizer sales. These may include specific market studies and analyses on different topics as may be required. This information is reviewed on a regular basis and the author of this report takes this information into account in understanding the markets and the assumptions within this report.
Plans and arrangements for potash mining, mineral processing, product transportation, and product sales are established by Nutrien and are within industry norms.
| 20.0 | ENVIRONMENTAL STUDIES, PERMITTING, AND SOCIAL OR COMMUNITY IMPACT |
The Rocanville TMA currently covers an area of approximately 653 hectares (1,613 acres) of land owned by the Company. Solid potash mine tailings typically consist of 85% to 95% rock salt (NaCl) and 5% to 15% insolubles (carbonate mud = CaCO3, anhydrite mud = CaSO4, and clays like chlorite, illite, and so on). An engineered slurry-wall has been constructed around the entire Rocanville TMA. The slurry-wall provides secondary containment for any saline mine waters, minimizing brine impacts from the TMA to surrounding surface water bodies and near-surface aquifers. Areas surrounding the TMA are closely monitored: this includes everything from daily visual perimeter inspections to annual investigations and inspections of surrounding subsurface aquifers.
Rocanville currently operates five brine disposal wells near the surface plant of the Rocanville mine (marked in Figure 25) where clear salt brine (i.e. no silt, insolubles, or other waste) is borehole-injected into the Interlake Carbonates, at a depth of approximately 1,200 m to 1,400 m below surface (marked in Figure 7). The disposal wells are provincially licensed and formation water in these extensive deep aquifers is naturally saline.
Emissions to air consisting primarily of particulate matter are kept below regulatory limits through various modern air pollution abatement systems (e.g. dust collection systems built into mill processes) that are provincially licensed. This same procedure is followed at all Nutrien mines in Saskatchewan.
In Saskatchewan, all potash tailings management activities are carried out under an “Approval to Operate” granted by the Saskatchewan Ministry of Environment (MOE), the provincial regulator. Staff at the Rocanville mine actively monitor and inspect operations and routinely report the observations and measurements to the Environmental Protection Branch of MOE. The current Rocanville Approval to Operate has been granted to July 1, 2028, the renewal date.
In terms of long-term decommissioning, environmental regulations in the Province of Saskatchewan require that all operating potash mines in Saskatchewan create a long-term decommissioning and reclamation plan that will ensure all surface facilities are removed, and the site is left in a chemically and physically stable condition once mine operations are complete. Nutrien has conducted numerous studies of this topic, and the most recent decommissioning and reclamation plan for Rocanville was approved by MOE technical staff in January 2022. Because the current expected mine life for Rocanville is many decades into the future, it is not meaningful to come up with detailed engineering designs for decommissioning annually. Instead, decommissioning plans are reviewed every five years, and updated to accommodate new concepts, technological change, incorporation of new data, and adjustments of production forecasts and cost estimates. Any updated decommissioning and reclamation reports generated by this process are submitted to provincial regulatory agencies. For Rocanville, a revised decommissioning and reclamation plan is due to be submitted for MOE review in June 2026.
In addition to the long-term decommissioning plan, provincial regulations require that every potash producing company in Saskatchewan set up an Environmental Financial Assurance Fund, which is to be held in trust for the decommissioning, restoration, and rehabilitation of the plant site after mining is complete. This fund is for all mines operated by Nutrien in the province of Saskatchewan (i.e., Allan, Cory, Lanigan, Patience Lake, Rocanville, and Vanscoy).
39

Figure 24: Aerial photo showing the Rocanville surface operations, disposal wells, and Tailings Management Area.
| 21.0 | CAPITAL AND OPERATING COSTS |
The Rocanville mine has been in operation since 1970; in the years immediately preceding this, major capital investment was made to bring this mine into production. Since then, capital expenditures were made on a regular and ongoing basis to sustain production, and to expand production from time to time.
A major refurbishment and expansion of the Rocanville mine was completed in 2013, increasing nameplate capacity to 6.5 million tonnes of finished potash products per year. This work involved construction of a third shaft, enhancement of hoists and shaft conveyances, major expansions of both mine and mill, improvements to loadout facilities, and some infrastructure improvements. All construction was carried out without significant disruption to existing potash production from the site.
| 22.0 | ECONOMIC ANALYSIS |
| 22.1 | FUNDAMENTALS |
The Company conducts ongoing and detailed economic analyses on each of its operations and on all aspects of its business. While the Company considers its operating costs and results on a per mine basis to be competitively sensitive and confidential information, the Company is confident that the economic analysis conducted routinely for each of the Company’s operating potash mines is complete, reasonable, and meets industry standards.
On a cash flow basis, The Company’s potash segment generated USD $14,647 million in net sales over the past three years (2022, 2023 and 2024) based on sales volume of 39.639 million tonnes of finished potash products. The annual
40
average realized potash price for manufactured products (includes North American and offshore sales) over a 10-year period (2015 – 2024) is plotted in Figure 26.
Over the past three years (2022, 2023, and 2024) the Rocanville mine produced 14.874 million tonnes of finished potash products. In the past three years (2022, 2023, and 2024), the Rocanville mine accounted for 37% of total potash production at the Company over this period. Rocanville is currently making a positive contribution to the Company’s potash segment.
Given the Company’s previous history (including over 50 years of mining at the Rocanville operation), recent market conditions, and extensive reserve base, the economic analysis for Rocanville has met the Company’s internal hurdle rates.

Figure 25: Historic annual average realized potash price in USD / tonne.*
| 22.2 | TAXES |
Royalties are paid to the Province of Saskatchewan in connection with the Company’s Potash operations, which holds most of the mineral rights in the lease areas, and royalties from Freehold lands are paid to various freeholders of mineral rights in the area. The Crown royalty rate is 3 percent and is governed by The Subsurface Mineral Royalty Regulations, 2017. The actual amount paid is dependent on selling price and production tonnes.
Municipal taxes are paid based on site property values to the applicable municipality in Saskatchewan. Saskatchewan potash production is taxed at the provincial level under The Mineral Taxation Act, 1983. This tax, governed by The Potash Production Tax Regulations, consists of a base payment and a profit tax, collectively known as the potash production tax. As a resource corporation in the Province of Saskatchewan, the Company is also subject to a resource surcharge equal to a percentage of the value of its resource sales (as defined in The Corporation Capital Tax Act of Saskatchewan). In addition to this, the Company pays federal and provincial income taxes based on corporate profits from all of its operations in Canada.
| 23.0 | ADJACENT PROPERTIES |
The Company’s Rocanville Lease KL 305 is adjacent to the following potash dispositions:
| • | Potash Corporation of Saskatchewan Inc. KL 279 |
| • | Mosaic Esterhazy Holdings ULC KLSA 003 B, KL 105 B, and KL 126 C |
The Mosaic Company (Mosaic) operates a mine with underground workings within the potash lease areas listed above, which are immediately adjacent to Rocanville Lease KL 305. Nutrien and Mosaic have negotiated a safety buffer between the two companies’ lease areas, where it is agreed that no mining will occur. This buffer ensures that mine workings in one company’s lease area will not impact workings of the other company.
| * | Company sales data for years prior to 2018 includes only PotashCorp sales. |
41
| 24.0 | OTHER RELEVANT DATA AND INFORMATION |
Not applicable.
| 25.0 | INTERPRETATION AND CONCLUSIONS |
Nutrien has a long history of successful potash mining at Rocanville, where potash has been produced for over 50 years. The authors believe that the experience gained mining and milling potash for this length of time has produced a reliable body of information about potash mineralization, mining and milling at Rocanville.
In a Saskatchewan potash mine that has been producing for many decades, reduction of mine life through increased production is counter-balanced by development mining into new mineral land parcels. This increases mine life through increasing the potash Mineral Reserve.
For Rocanville, mine life can be estimated by dividing the total Mineral Reserve (Proven + Probable) of 343 million tonnes by the average annual mining rate (million tonnes of ore hoisted per year). For Rocanville, the mining rate is defined as equal to the actual three-year running average (consecutive, most recent years). The average mining rate at Rocanville over the past three years (2022, 2023 and 2024) was 16.523 million tonnes of potash ore mined and hoisted per year.
If this mining rate is sustained and if Mineral Reserves remain unchanged, then the Rocanville mine life would be 21 years. This estimate of mine life is likely to change as mining advances further into new mining blocks, and / or if mining rates or mining methodologies change.
| 26.0 | RECOMMENDATIONS |
Not applicable for a potash mine that has been in operation since 1970.
42
| 27.0 | REFERENCES |
Companion Policy 43-101CP to National Instrument 43-101 Standards of Disclosure for Mineral Projects (2011). Retrieve this and related documents from many websites.
The CIM Definition Standards for Mineral Resources and Reserves (2014). Retrieve this and related documents from many websites.
Funk, C., Isbister, J., Leblanc, T., Brehm, R. (2019). How Geophysics is Used to Understand Geohazards in Potash Mines, CSEG Recorder, Vol. 44 No. 07.
Fuzesy, Anne (1982). Potash in Saskatchewan (44p). Saskatchewan Industry and Resources Report 181. https://publications.saskatchewan.ca/#/products/7307.
Gebhardt, E. (1993). Mine planning and design integration, CIM Bulletin, May 1993, pp. 41 – 49.
Government of Saskatchewan (2025). Saskatchewan Mining and Petroleum GeoAtlas. https://gisappl.saskatchewan.ca/Html5Ext/index.html?viewer=GeoAtlas. Accessed January 2025.
Government of Saskatchewan. The Corporation Capital Tax Act of Saskatchewan. Available online at http://www.qp.gov.sk.ca/documents/English/Statutes/Statutes/c38-1.pdf.
Government of Saskatchewan. The Mineral Taxation Act, 1983. Available online at http://www.qp.gov.sk.ca/documents/English/Statutes/Statutes/M17-1.pdf.
Government of Saskatchewan. The Potash Production Tax Regulations. Available online at https://publications.saskatchewan.ca/#/products/1263.
Government of Saskatchewan. The Subsurface Mineral Royalty Regulations, 2017. Available online at http://publications.gov.sk.ca/details.cfm?p=88223&cl=8.
Government of Saskatchewan. The Subsurface Mineral Tenure Regulations, 2015. Available online at http://www.publications.gov.sk.ca/details.cfm?p=72797.
Jones, P. R., and F. F. Prugger (1982). Underground mining in Saskatchewan potash. Mining Engineering, 34, pp. 1677 – 1683.
Nutrien Pilot Plant (2018). Personal communication on density of insoluble minerals in different ore zones.
Prugger, F.F., (1979), The flooding of the Cominco potash mine and its rehabilitation; CIM Bulletin, Vol. 72, No. 807, pp. 86 – 90.
Prugger, F. F. and A. F. Prugger (1991). Water problems in Saskatchewan potash mining – what can be learned from them? Bulletin of the Canadian Institute of Mining and Metallurgy (CIM Bulletin), Vol. 84, No. 945, pp. 58 – 66.
Robertson, David S. and Associates (1978). Summary Report on Evaluation of Potash Assets for Potash Corporation of Saskatchewan. Unpublished consultant’s report to Potash Corporation of Saskatchewan Inc.
Yang, C., Jensen, G., and Berenyi, J. (2009a). The Stratigraphic Framework of the Potash-rich Members of the Middle Devonian Upper Prairie Evaporite Formation, Saskatchewan; Summary of Investigations 2009, Volume 1, Saskatchewan Geological Survey.
43
Exhibit 99.5
NUTRIEN LTD.
VANSCOY POTASH
NATIONAL INSTRUMENT 43-101 TECHNICAL REPORT ON
VANSCOY POTASH DEPOSIT (KL 114 D),
SASKATCHEWAN, CANADA
FEBRUARY 20, 2025

PREPARED BY: JODI DERKACH, P. GEO.
| CRAIG FUNK, P. ENG., P. GEO. |
NUTRIEN LTD.
GEOSERVICES & LAND – POTASH ENGINEERING, TECHNOLOGY & CAPITAL
SUITE 1700, 211 19TH STREET EAST
SASKATOON, SASKATCHEWAN, CANADA
S7K 5R6
QUALIFIED PERSONS: JODI DERKACH, P. GEO. AND CRAIG FUNK, P. ENG., P. GEO.
DATE AND SIGNATURE PAGE
The scientific and technical information included in this report has been prepared under the supervision of persons who are ‘‘qualified persons’’ under Canadian National Instrument 43-101. Jodi Derkach, P. Geo. and Craig Funk, P. Eng., P. Geo. are the qualified persons who supervised the preparation of the information presented in this report and who verified the data disclosed herein.
| /s/ “Jodi Derkach” | ||||
| Signature | Jodi Derkach P. Geo. | |||
| Senior Manager, Land & Resource Nutrien Ltd. |
||||
| Date | February 20, 2025 | |||
| /s/ “Craig Funk” | ||||
| Signature | Craig Funk, P. Eng., P. Geo. | |||
| Director, GeoServices & Land Nutrien Ltd. |
||||
| Date | February 20, 2025 | |||
2
AUTHOR PAGE
The scientific and technical information included in this report has been prepared by, or under the supervision of, persons who are ‘‘qualified persons’’ under Canadian National Instrument 43-101.
Jodi Derkach, B. Sc., Cert. GIS, P. Geo. (APEGS Member # 14897)
| • | Senior Manager, Land & Resource—Engineering, Technology & Capital |
| • | B. Sc. (Geology), University of Saskatchewan, Saskatoon, Saskatchewan, Canada, 2007 |
| • | Geographic Information Science for Resource Management Certificate, Saskatchewan Polytechnic, Prince Albert, Saskatchewan, Canada, 2010 |
| • | with Nutrien or its subsidiaries since 2010 |
Craig Funk, B. Sc., M. Sc., P. Eng., P. Geo. (APEGS Member # 16034)
| • | Director, GeoServices & Land—Engineering, Technology & Capital |
| • | B. Sc. (Geological Engineering – Geophysics), University of Saskatchewan, Saskatoon, Saskatchewan, Canada, 1989 |
| • | M. Sc. (Geophysics), University of Saskatchewan, Saskatoon, Saskatchewan, Canada, 1992 |
| • | with Nutrien or its subsidiaries since 2008 |
are the qualified persons who supervised the preparation of all information presented in this report and who verified the data disclosed herein.
The team of persons who conducted the work presented within this report consists of:
Lisa MacKenzie, Cert. GIS
| • | Senior Advisor, Land—Engineering, Technology & Capital |
| • | Geographic Information Science for Resource Management Certificate, Saskatchewan Polytechnic, Prince Albert, Saskatchewan, Canada, 2012 |
| • | with Nutrien or its subsidiaries since 2012 |
Jennifer Nicolay Lawlor, B. Sc., P. Geo. (APEGS Member # 16167)
| • | Senior Advisor, Land & Resource – Engineering, Technology & Capital |
| • | B. Sc. (Geology), University of Regina, Regina, Saskatchewan, Canada, 2008 |
| • | with Nutrien or its subsidiaries since 2013 |
The authors would like to acknowledge the many staff who provided information and expert reviews on portions of this report, as well as past contributions of former staff.
3
TABLE OF CONTENTS
| DATE AND SIGNATURE PAGE |
2 | |||||||||
| AUTHOR PAGE |
3 | |||||||||
| TABLE OF CONTENTS |
4 | |||||||||
| LIST OF FIGURES |
6 | |||||||||
| LIST OF TABLES |
7 | |||||||||
| 1.0 | SUMMARY | 8 | ||||||||
| 2.0 | INTRODUCTION | 10 | ||||||||
| 3.0 | RELIANCE ON OTHER EXPERTS | 11 | ||||||||
| 4.0 | PROPERTY DESCRIPTION AND LOCATION | 11 | ||||||||
| 4.1 | General | 11 | ||||||||
| 4.2 | Mineral Rights | 12 | ||||||||
| 5.0 | ACCESSIBILITY, CLIMATE, LOCAL RESOURCES, INFRASTRUCTURE AND PHYSIOGRAPHY | 13 | ||||||||
| 6.0 | HISTORY | 14 | ||||||||
| 7.0 | GEOLOGICAL SETTING AND MINERALIZATION | 15 | ||||||||
| 8.0 | DEPOSIT TYPE | 16 | ||||||||
| 9.0 | EXPLORATION | 17 | ||||||||
| 10.0 | DRILLING | 19 | ||||||||
| 11.0 | SAMPLING PREPARATION, ANALYSES AND SECURITY | 22 | ||||||||
| 11.1 | Basic Approach | 22 | ||||||||
| 11.2 | Mean Potash Mineral Grade from In-mine Samples | 24 | ||||||||
| 11.3 | Potash Ore density from In-mine Mineral Grade Measurements | 24 | ||||||||
| 12.0 | DATA VERIFICATION | 25 | ||||||||
| 12.1 | Assay Data | 25 | ||||||||
| 12.2 | Exploration Data | 26 | ||||||||
| 13.0 | MINERAL PROCESSING AND METALLURGICAL TESTING | 26 | ||||||||
| 14.0 | MINERAL RESOURCE ESTIMATES | 27 | ||||||||
| 14.1 | Definitions of Mineral Resource | 27 | ||||||||
| 14.2 | Vanscoy Potash Resource Calculations | 27 | ||||||||
4
| 15.0 | MINERAL RESERVE ESTIMATES | 29 | ||||||||
| 15.1 | Definitions of Mineral Reserve | 29 | ||||||||
| 15.2 | Vanscoy Potash Reserve Calculations | 30 | ||||||||
| 16.0 | MINING METHOD | 31 | ||||||||
| 16.1 | Mining Operations | 31 | ||||||||
| 16.2 | Risks to Potash Mining Operations, with Emphasis on Water Inflows | 34 | ||||||||
| 17.0 | RECOVERY METHODS | 34 | ||||||||
| 18.0 | PROJECT INFRASTRUCTURE | 36 | ||||||||
| 19.0 | MARKET STUDIES AND CONTRACTS | 36 | ||||||||
| 20.0 | ENVIRONMENTAL STUDIES, PERMITTING, AND SOCIAL OR COMMUNITY IMPACT | 39 | ||||||||
| 21.0 | CAPITAL AND OPERATING COSTS | 41 | ||||||||
| 22.0 | ECONOMIC ANALYSIS | 41 | ||||||||
| 22.1 | Fundamentals | 41 | ||||||||
| 22.2 | Taxes | 41 | ||||||||
| 23.0 | ADJACENT PROPERTIES | 42 | ||||||||
| 24.0 | OTHER RELEVANT DATA AND INFORMATION | 42 | ||||||||
| 25.0 | INTERPRETATION AND CONCLUSIONS | 42 | ||||||||
| 26.0 | RECOMMENDATIONS | 42 | ||||||||
| 27.0 | REFERENCES | 43 | ||||||||
5
LIST OF FIGURES
Unless otherwise noted, figures for which a source and / or date are not provided are current as of the effective date of this report and were prepared by the Company.
| Figure 1: Aerial photo of Vanscoy surface operations, 2020 |
8 | |||
| Figure 2: Actual finished potash products production from the Vanscoy mine over the past 10 years |
9 | |||
| Figure 3: Map showing location of Nutrien Operations, including Vanscoy |
11 | |||
| Figure 4: Nutrien’s potash operations, including Vanscoy, relative to potash mineralization (pink) in Saskatchewan |
12 | |||
| Figure 5: Map showing Vanscoy Crown Lease KL 114 D (blue) |
13 | |||
| Figure 6: Map showing infrastructure near Vanscoy. Vanscoy surface operations shown as red dot |
14 | |||
| Figure 7: Vertical section showing basic layered-Earth stratigraphy in a typical Saskatchewan potash region |
15 | |||
| Figure 8: Geophysical wireline logs showing basic stratigraphy of the Prairie Evaporite Formation in the Saskatoon area |
16 | |||
| Figure 9: Cross-section of the Prairie Evaporite Formation across southern Saskatchewan showing relative position of potash members |
17 | |||
| Figure 10: Potash exploration at Vanscoy including 3D seismic (purple), 2D seismic infill (orange lines), and potash drillholes (black dots) |
18 | |||
| Figure 11: A seismic section showing relative rock velocities and major geological units at Nutrien’s conventional potash operations |
19 | |||
| Figure 12: Stratigraphic section showing local nomenclature at, and adjacent to, the mining horizon |
20 | |||
| Figure 13: Potash assay plot for drillhole Nutrien Vanscoy 02-25-035-08 W3 indicating the best 3.35 m (11’) mining interval |
22 | |||
| Figure 14: Histogram of potash ore grade from Vanscoy in-mine grade samples (1969 to December 2024) |
24 | |||
| Figure 15: Map showing Vanscoy Mineral Resource as of December 31, 2024 |
29 | |||
| Figure 16: Map showing Vanscoy Mineral Reserve as of December 31, 2024 |
31 | |||
| Figure 17: Schematic cross-section through the Prairie Evaporite Formation, illustrating mining horizons at each of Nutrien’s conventional potash operations |
32 | |||
| Figure 18: Mined tonnes, product tonnes, and concentration ratio for the Vanscoy mine over the past 10 years |
33 | |||
| Figure 19: Simplified flow diagram for potash flotation and crystallization milling methods used at Vanscoy |
35 | |||
| Figure 20: Vanscoy mill recovery rate over the past 10 years |
35 | |||
| Figure 21: Historical Company potash sales 2015 to 2024 in million tonnes / year* |
37 | |||
| Figure 22: Historical Company potash net sales 2015 to 2024 in million USD $ / year* |
37 | |||
| Figure 23: World potash production and demand for 2024E |
38 | |||
| Figure 24: World potash shipments and consumption, 2019-2024E |
39 | |||
| Figure 25: Aerial photo showing the Vanscoy surface operations, disposal wells, and Tailings Management Area |
40 | |||
| Figure 26: Historic annual average realized potash price in USD / tonne* |
41 |
6
LIST OF TABLES
| Table 1: Potash Mineral Resources and Reserves for Vanscoy, as of December 31, 2024 |
10 | |||
| Table 2: Assay results for all potash test holes within Vanscoy Lease KL 114 D |
21 | |||
| Table 3: Values for potash assay plot in Figure 13 |
23 | |||
| Table 4: Primary Potash Market Profile |
38 |
7
EFFECTIVE DATE OF REPORT
The effective date of this report is December 31, 2024, except where otherwise noted.
| 1.0 | SUMMARY |
Effective January 1, 2018, Potash Corporation of Saskatchewan Inc. (“PotashCorp”) and Agrium Inc. (“Agrium”) completed a court-approved plan of arrangement (the “Arrangement”) involving, among others, PotashCorp, Agrium, and Nutrien Ltd. (“Nutrien”) the new parent company of PotashCorp and Agrium. As a result of completing the Arrangement, PotashCorp and Agrium are wholly owned subsidiaries of Nutrien. References to “the Company” means Nutrien, indirectly through Agrium, or, for references prior to the completion of the Arrangement, Agrium, as the context requires.
Nutrien is a leading global provider of crop inputs and services. We operate a world-class network of production, distribution and agriculture retail facilities that positions us to efficiently serve the needs of farmers.
Nutrien is a corporation organized under the Canada Business Corporations Act, the common shares of which are listed and publicly traded on the Toronto and New York stock exchanges (symbol NTR).
The Company owns and operates a potash mine at Vanscoy, Saskatchewan, Canada (“Vanscoy mine” or “Vanscoy”). An aerial view of the Vanscoy surface operations is shown in Figure 1. The Vanscoy Crown Subsurface Mineral Lease is numbered KL 114 D (the “Vanscoy Crown Lease”) and was last amended in November 2021. Production of potash from the Vanscoy mine began in 1969.

Figure 1: Aerial photo of Vanscoy surface operations, 2020.
In 2024, annual nameplate capacity for Vanscoy was 3.0 million tonnes and annual operational capability was 1.1 million tonnes of finished potash products (concentrated KCl). Estimates of nameplate capacity are based on capacity as per design specifications or Canpotex entitlements once these have been determined. Operational capability is the estimated annual achievable production level at current staffing and operational readiness (estimated at beginning of year), not including any inventory-related shutdowns and unplanned downtime, and may vary during the year and year-to-year including as between our potash operations.
While the term potash refers to a wide variety of potassium bearing minerals, in the Vanscoy region of Saskatchewan, the predominant potash mineralization is sylvinite, which is comprised mainly of the minerals sylvite (KCl / potassium-salt) and halite (NaCl / rock salt), with minor amounts water insolubles. Carnallite (KMgCl3 · 6H2O) occurs only in trace amounts at Vanscoy. Potash fertilizer is concentrated, nearly pure KCl (i.e. greater than 95% pure KCl), but ore grade is traditionally reported on a % K2O equivalent basis.
8
The “% K2O equivalent” gives a standard measurement of the nutrient value of different potassium-bearing rocks and minerals. To convert from % K2O equivalent tonnes to actual KCl tonnes, multiply by 1.58.
The Vanscoy mine is a conventional underground mining operation whereby continuous mining machines are used to excavate the potash ore by the long-room and pillar, and in recent years, by the stress-relief mining method. Continuous conveyor belts transport ore from the mining face to the bottom of the production shaft. In addition to hoisting potash ore to surface, the production shaft is used for exhaust ventilation from the mine and serves as a secondary egress. The Service Shaft is used for service access, primary egress, and fresh air ventilation into the mine. Raw potash ore is processed and concentrated on surface. Concentrated finished potash products (near-pure KCl) are sold and shipped to markets in North America and offshore.
Virtually all Vanscoy underground mining rooms are in the potash mineralized zone situated approximately 12 m below the top of the host evaporite salt, the Prairie Evaporite Formation. More specifically, the Vanscoy mine is located within the Patience Lake Potash Member of the Prairie Evaporite Formation. In this Potash Member, there are two potash seams named A Zone (the upper seam) and B Zone (the lower seam); at present, only the A Zone is being mined at Vanscoy. Mine elevations range from approximately 1,000 m to 1,120 m depth below surface. Mine workings are protected from aquifers in overlying formations by salt which overlies the mineralized zone. Conservative local extraction ratios (never exceeding 45% in any mining block) are employed at Vanscoy to minimize potential detrimental effects of mining on overlying strata; this is common practice in flat-lying, tabular ore bodies overlain by water-bearing layers.
Part of the normal surface infrastructure associated with operating the potash mine in Saskatchewan includes waste disposal on the land and disposal of salt brine into deep subsurface aquifers. The Company stows salt tailings within an engineered and licensed Tailings Management Area (TMA) and operates two brine disposal wells near the surface
plant of the Vanscoy mine.
Since opening in 1969, 192.349 million tonnes of potash ore have been mined and hoisted at Vanscoy to produce 65.024 million tonnes of finished potash products. The life-of-mine average concentration ratio (raw ore / finished potash products) is 2.96 and the overall extraction ratio over this period is 22%. Actual production of finished potash products at Vanscoy for the last 10 years is shown in Figure 2.

Figure 2: Actual finished potash products production from the Vanscoy mine over the past 10 years.
Over the past three years (2022, 2023, 2024), actual potash production at Vanscoy has totaled:
| • | 9.261 million tonnes of ore mined and hoisted (3.087 million tonnes per year, on average) |
| • | 3.092 million tonnes of finished potash products produced (1.031 million tonnes per year, on average) |
| • | Average mill feed ore grade was 24.9% K2O equivalent |
| • | Average concentration ratio (ore mined / potash produced) was 2.99 |
The Canadian Institute of Mining and Metallurgy and Petroleum (CIM) has defined Mineral Resources and Reserves in The CIM Definition Standards for Mineral Resources and Reserves (2014). Based on these guidelines, all mineral rights owned or leased by the Company at Vanscoy can be assigned to Mineral Resource categories (Inferred, Indicated, and Measured) and Mineral Reserve categories (Probable and Proven).
9
Mineral Resources (reported as in-place tonnes) and Mineral Reserves (reported as recoverable ore tonnes) for Vanscoy as of December 31, 2024 are outlined in Table 1. Mineral Resources reported are exclusive of Mineral Reserves.
Table 1: Potash Mineral Resources and Reserves for Vanscoy, as of December 31, 2024.
| Proven Mineral Reserve (millions of tonnes recoverable ore) |
114 | |||
| Probable Mineral Reserve (millions of tonnes recoverable ore) |
263 | |||
|
|
|
|||
| Total Mineral Reserve (millions of tonnes recoverable ore) |
377 | |||
| Measured Mineral Resource - A Zone (millions of tonnes in-place) |
2,291 | |||
| Measured Mineral Resource - B Zone (millions of tonnes in-place) |
2,861 | |||
| Indicated Mineral Resource - A Zone (millions of tonnes in-place) |
1,547 | |||
| Indicated Mineral Resource - B Zone (millions of tonnes in-place) |
1,547 | |||
| Inferred Mineral Resource - A Zone (millions of tonnes in-place) |
1,120 | |||
| Inferred Mineral Resource - B Zone (millions of tonnes in-place) |
1,120 | |||
|
|
|
|||
| Total Mineral Resource (millions of tonnes in-place) |
10,486 | |||
| Average % K2O Grade - A Zone (from Vanscoy in-mine samples) |
23.8 | % | ||
| Average % K2O Grade - B Zone (from Lanigan in-mine samples) |
20.2 | % | ||
|
|
|
|||
| Years of Remaining Mine Life |
122 | |||
The average mineral grade of the Vanscoy Mineral Resource and Mineral Reserve is estimated to be 23.8% K2O equivalent and was determined from thousands of in-mine samples at Vanscoy to the end of December 2024 (discussed further in Section 11.2).
Potash production in any given year at the Vanscoy potash mine is a function of many variables, so actual production in any given year can vary dramatically from tonnages produced in previous years. The Mineral Reserve tonnage and historic average production are used to estimate the remaining mine life. If the average mining rate seen over the past three years (3.087 million tonnes of potash ore mined and hoisted per year) is sustained, and if Mineral Reserves remain unchanged, then the Vanscoy mine life is 122 years from December 31, 2024.
The mining of potash is a capital-intensive business subject to the normal risks and capital expenditure requirements associated with mining operations. The production and processing of ore may be subject to delays and costs resulting from mechanical failures, physical hazards such as fires, and other hazards such as: unusual or unexpected geological conditions, significant subsidence, brine inflows and gas seepages of varying degree, and other situations associated with any potash mining operation.
| 2.0 | INTRODUCTION |
The purpose of this document is to give a formal reporting of potash Mineral Resource and Reserve for the Vanscoy mine, and to provide a description of the method used to compute Mineral Resource and Reserve tonnages. Sources of geological and geotechnical information analysed from this study include:
| • | Publicly available geological maps, reports, and publications (listed in Section 27.0) |
| • | Data and internal reports on exploration drillholes |
| • | Hydrogeological analysis conducted in exploration drillholes |
| • | Geological studies conducted at the Vanscoy mine over the past 50+ years |
| • | In-mine geophysical studies conducted at the Vanscoy mine over the past 50+ years |
| • | Geotechnical studies conducted for the Vanscoy mine over the past 50+ years |
| • | 2D & 3D surface seismic exploration data |
All data and reports are archived at the Nutrien corporate office in Saskatoon, the Vanscoy mine site, or secure offsite commercial document storage facilities. In addition, drillhole data (well-log data, drilling reports, drill-stem test results, etc.) are archived with the Saskatchewan Ministry of Energy & Resources, Integrated Resource Information System (IRIS), and surface seismic data (shot records and stack) are archived through an offsite commercial data storage service.
10
All geological and geophysical data and information presented in this report were personally reviewed and inspected by qualified geoscience staff at Nutrien who are registered with the Association of Professional Engineers and Geoscientists of Saskatchewan (APEGS) under the supervision of Jodi Derkach, P. Geo. and Craig Funk, P. Eng., P. Geo. Jodi Derkach and Craig Funk last visited Vanscoy on March 21, 2024. All reserve and resource estimates and mineral rights data presented in this report were personally evaluated and reviewed by the authors of this report. Each of these staff collaborates with Vanscoy personnel multiple times per year.
The authors would like to acknowledge the many staff who provided information and expert reviews on portions of this report.
| 3.0 | RELIANCE ON OTHER EXPERTS |
Responsibility for the accuracy of the technical data presented in this report is assumed by the authors. Outside experts were not used in the preparation of this report.
| 4.0 | PROPERTY DESCRIPTION AND LOCATION |
| 4.1 | GENERAL |
The Vanscoy mine is located in central Saskatchewan, approximately 26 km west of the city of Saskatoon, Saskatchewan. The general location is shown on the map in Figure 3.

Figure 3: Map showing location of Nutrien Operations, including Vanscoy.
The Legal Land Description (Saskatchewan Township / Range) of the Vanscoy surface plant is Section 16 Township 35 Range 08 West of 3rd Meridian. More precisely, the Vanscoy service shaft collar is located at:
| • | Latitude: 52 degrees 00 minutes 28.74 seconds North |
| • | Longitude: 107 degrees 05 minutes 25.18 seconds West |
| • | Elevation: 505 metres above mean sea level (SL) |
| • | Easting: 356,531 m |
11
| • | Northing: 5,763,989 m |
| • | Projection: UTM |
| • | Datum: NAD83 |
| • | Zone: 13 |
The Company owns approximately 2,740 hectares (6,771 acres) of surface rights required for current Vanscoy mine operations, including areas covered by the existing surface plant and TMA, and surface lands required for anticipated near-future Vanscoy mine and expanded milling operations.
All permits and approvals required for the operation of a potash mine in Saskatchewan are in place at Vanscoy.
Figure 4 is a more detailed map showing the location of the Vanscoy mine relative to potash deposits in Saskatchewan (modified from Yang, 2009).

Figure 4: Nutrien’s potash operations, including Vanscoy, relative to potash mineralization (pink) in Saskatchewan.
| 4.2 | MINERAL RIGHTS |
Mineral rights at Vanscoy are mined pursuant to subsurface mineral leases with the Province of Saskatchewan, Canada (the Crown), and with non-Crown (Freehold) mineral rights owners. Crown mineral rights are governed by The Subsurface Mineral Tenure Regulations, 2015, and Crown Leases are approved and issued by the Saskatchewan Ministry of Energy & Resources.
The original Vanscoy Crown Subsurface Mineral Lease, numbered KL 114, was made effective in January 1969. In the following years various amendments were made whereby certain lands were added, removed, or transferred between Company dispositions for realized synergies between mining operations. The last amendment, executed in November 2021, resulted in KL 114 D (the “Vanscoy Crown Lease” or simply “KL 114 D”).
KL 114 D covers an area of approximately 79,504 hectares (196,459 acres), as shown in Figure 5. At Vanscoy, the Company has leased potash mineral rights for 61,865 hectares (152,872 acres) of Crown land and owns or has leased from freeholders approximately 16,111 hectares (39,813 acres) within the lease boundary.
12
The Vanscoy Crown Lease term is for a period of 21 years and is renewable in accordance with The Subsurface Mineral Tenure Regulations, 2015 for successive 21-year periods. Freehold lands also remain under lease providing, generally, that production is continuing and that there is a continuation of the Crown Lease.
Within the Vanscoy Crown Lease area 12,672 hectares (31,312 acres) are mined pursuant to a unitization agreement. Mining has occurred outside of the unit in lands that are leased but not unitized.
When underground workings of a potash mine are designed, there are inevitably regions that are mined with higher mining extraction (e.g. production panels) and other regions where mining extraction is lower (e.g. conveyor-belt development rooms). To treat mineral rights holders in both low extraction and high extraction areas fairly, and to promote good mining practices, a unitization agreement is the preferred method for determining mined potash allocation (on paper, for accounting purposes) and the resulting pro rata royalty. Under a unitization agreement, each mineral rights holder is paid a royalty based on their proportional share of the entire unit area regardless of whether or not their lands are actually mined. For example, if one mineral rights holder owns rights to 4,000 hectares within a 40,000 hectare unit area, they would be paid 10% of the total royalty payout from that unit area.

Figure 5: Map showing Vanscoy Crown Lease KL 114 D (blue).
| 5.0 | ACCESSIBILITY, CLIMATE, LOCAL RESOURCES, INFRASTRUCTURE AND PHYSIOGRAPHY |
The Vanscoy mine surface facilities are accessed by an existing paved road that is part of the Saskatchewan Provincial Highway System. Most potash product is shipped by rail over existing track, with some product shipped by truck over the North American highway system. Location of the Vanscoy mine with respect to the features described in this section (major road and rail infrastructure, as well as nearby river systems) is shown in Figure 6.
The Vanscoy mine is served by a number of villages within 50 km of the mine site. The nearest city is Saskatoon (26 km distant).
Vanscoy is situated near the northern extent of the Great Plains of North America. Topography is relatively flat, with gently rolling hills and occasional valleys. The Vanscoy surface plant lies approximately 20 km north-west of the South Saskatchewan River, a major continental drainage channel. Climate at Vanscoy is typical for an inland prairie location at latitude 52º North (often characterized as “mid-latitude steppe” climate).
13
Part of the normal surface infrastructure associated with operating the potash mine in Saskatchewan includes waste disposal on the land and disposal of salt brine into deep subsurface aquifers. Facilities to carry out all aspects of these tasks are in place at Vanscoy (see Section 20.0).

Figure 6: Map showing infrastructure near Vanscoy. Vanscoy surface operations shown as red dot.
| 6.0 | HISTORY |
Ten potash mines were brought into production in Saskatchewan between 1962 and 1970. Until 2017, no new mine had been commissioned following the original ten. Most current potash production comes from conventional underground mines, while just three operate using solution mining methods. Generally, potash mines have contracted or expanded production over the years in response to the demand for potash.
Exploration drilling for potash in the Vanscoy area was first carried out in the 1960s. The Vanscoy mine was built by Cominco Ltd. (formerly the Consolidated Mining and Smelting Company of Canada Limited) in the 1960s. Potash production began at Vanscoy in April 1969. With the exception of the 1970 inflow (described further in Section 16.2) which halted production for two years, the Vanscoy mine has run on a continuous basis since then other than short-term shutdowns taken for inventory management purposes, occasional plant maintenance and construction work, or other outages that are typical for operations of this nature.
In 1993, Cominco Fertilizers Ltd. was formed as a separate entity from Cominco Ltd. In 1995 all Cominco involvement in Cominco Fertilizers Ltd. ceased and shares were transferred to the new entity, Agrium.
Effective January 1, 2018, PotashCorp and Agrium completed the Arrangement. As a result of completing the Arrangement, PotashCorp and Agrium are wholly owned subsidiaries of Nutrien.
Both flotation and crystallization methods are used at Vanscoy to produce potash products for agricultural application. A major refurbishment and expansion of the Vanscoy mine was completed in 2015, increasing nameplate capacity to 3.0 million tonnes of finished potash products per year.
14
| 7.0 | GEOLOGICAL SETTING AND MINERALIZATION |
Much of southern Saskatchewan is underlain by the Prairie Evaporite Formation, a layered sequence of salts and anhydrite which contains one of the world’s largest deposits of potash. The potash extracted from the predominantly sylvinitic ore has its main use as a fertilizer. A map showing the extent of the potash deposits in Saskatchewan is shown in Figure 4.
The 100 m to 200 m thick Prairie Evaporite Formation is overlain by between 400 and 500 m of Devonian carbonates, followed by approximately 100 m of Cretaceous sandstone, and between 400 and 500 m of Cretaceous shales and more recent Pleistocene glacial tills to surface. The Prairie Evaporite Formation is underlain by Devonian carbonates. The Phanerozoic stratigraphy of Saskatchewan is remarkable in that units are flat-lying and relatively undisturbed over very large areas. A geological section representing Saskatchewan stratigraphy is shown in Figure 7 (modified from Fuzesy, 1982). A geological section representing the Prairie Evaporite Formation stratigraphy in the Saskatoon area is shown in Figure 8 (modified from Fuzesy, 1982).

Figure 7: Vertical section showing basic layered-Earth stratigraphy in a typical Saskatchewan potash region.
Potash mineralization in this region of Saskatchewan is predominantly sylvinite, which is comprised mainly of the minerals sylvite (KCl) and halite or rock salt (NaCl), with trace carnallite (KMgCl3 · 6H2O) and minor water insolubles. Potash fertilizer is concentrated, nearly pure KCl (i.e. greater than 95% pure KCl), but ore grade is traditionally reported on a % K2O equivalent basis. The “% K2O equivalent” gives a standard measurement of the nutrient value of different potassium-bearing rocks and minerals. To convert from % K2O equivalent tonnes to actual KCl tonnes, multiply by 1.58.
15
Over the past three years (2022, 2023, 2024), the average measured potash ore grade of the mill feed at Vanscoy was 24.9% K2O equivalent. The average ore grade reported from surface drillhole intersections, all within Vanscoy Subsurface Mineral Lease KL 114 D, is 25.2% K2O equivalent (discussed further in Section 10.0). The average ore grade observed from thousands of in-mine samples collected to the end of December 2024 is 23.8% K2O equivalent (discussed further in Section 11.2).

Figure 8: Geophysical wireline logs showing basic stratigraphy of the Prairie Evaporite Formation in the Saskatoon area.
| 8.0 | DEPOSIT TYPE |
There are three mineable potash members within the Prairie Evaporite Formation of Saskatchewan. Stratigraphically highest to lowest, these members are: Patience Lake, Belle Plaine, and Esterhazy. A geological section showing potash members that occur in Saskatchewan is shown in Figure 9.
The Vanscoy potash deposit lies within the Patience Lake Potash Member of Prairie Evaporite Formation. There are two potash seams named A Zone and B Zone within this Member; at present, only the A Zone is being mined at Vanscoy and no test mining has been carried out in the B Zone to date. The Belle Plaine Potash Member is present but not well-developed in the Vanscoy area. The Esterhazy Member is not present.
Vanscoy potash mineralization occurs at approximately 1,000 m to 1,120 m depth below surface. The A Zone is approximately 3.35 m thick and occurs near the top of the Prairie Evaporite Formation salts. Salt cover from the ore zone to overlying units is approximately 12 m. The Vanscoy mine operates as a conventional, underground potash mine.
16

Figure 9: Cross-section of the Prairie Evaporite Formation across southern Saskatchewan showing relative position of potash members.
| 9.0 | EXPLORATION |
Before the Vanscoy mine was established, all exploration consisted of drilling from surface and analysis of core from these drillholes; drilling results are discussed in Section 10.0. Since mining began in 1969, several exploration drillholes have intersected the Prairie Evaporite Formation. Recently, drilling is most often used to derisk mining. A map showing potash exploration coverage at Vanscoy (drillholes, 2D and 3D seismic coverage) is shown in Figure 10.
In most of southern Saskatchewan, potash mineralization is in place wherever Prairie Evaporite Formation salts exist, are flat-lying, and are undisturbed. Since the surface seismic exploration method is an excellent tool for mapping the top and bottom of Prairie Evaporite salts, this has become the main potash exploration tool in any existing Saskatchewan Subsurface (potash) Mineral Lease. Historically, 2D seismic, and now the more accurate and full coverage 3D seismic methods are used to infer continuity and extent of potash beds in flat-lying potash deposits. Seismic data are relied upon to identify collapse structures that must be avoided in the process of mine development since these structures can act as conduits for water ingress to the mine. As a result, isolation pillars or mining buffer zones are left around these anomalous features. This practice reduces the overall mining extraction ratio, but the risk of inflow to mine workings are effectively mitigated.. Occasional, small-scale salt anomalies that are not mapped by seismic data do occur. When they do, they are dealt with in the normal course of mining and extraction through these areas is typically minimized. Where there is uncertainty in seismic interpretations, drilling is often used to confirm or improve refine the seismic interpretation.
Within the Vanscoy Crown Lease, a total of 106 linear kilometres of 2D seismic lines, and 579 square kilometres of 3D seismic has been acquired to the end of December 2024.
17

Figure 10: Potash exploration at Vanscoy including 3D seismic (purple), 2D seismic infill (orange lines), and potash drillholes (black dots).
A typical seismic section from Nutrien’s conventional seismic operations is shown in Figure 11. This is a cross-section extracted from a multi-program 3D seismic volume (earliest program was 2002). The vertical scale is in metres relative to sea level (SL). The seismic section is coloured by rock velocities computed from the seismic data and represents different rock types. Note that the Prairie Evaporite (salt) is continuous. This indicates an undisturbed, flat-lying salt within which potash is likely to be found based on over 50 years of mining experience at Vanscoy.
Experience has shown that the potash mining horizon is continuous when seismic data are undisturbed and flat-lying, as shown in Figure 11. It is now Nutrien’s policy to collect detailed 3D seismic data ahead of mining. Any areas recognized as seismically unusual are identified early, and mine plans are adjusted as needed.
18

Figure 11: A seismic section showing relative rock velocities and major geological units at Nutrien’s conventional potash operations.
| 10.0 | DRILLING |
For the original Vanscoy potash test holes drilled in the 1950s and 1960s, the primary objective of drilling was to sample potash horizons to establish basic mining parameters. The seismic method was still novel and crude at that time and as such, 2D seismic surveys were done sparingly, so the drillhole information was relied upon heavily to evaluate potash deposits. Test holes would penetrate the evaporite section with a hydrocarbon-based drilling mud (oil-based or diesel fuel) to protect the potash mineralization from dissolution. Basic geophysical well-logs were acquired, and in many cases, drill stem tests were run on the Dawson Bay Formation to help assess water-make potential of the caprock. Core samples from the targeted potash intersections were split or quartered (cut with a masonry saw), crushed, and analysed to establish potash grades.
Relatively thin interbeds or seams of insoluble material, referred to as clay seams in the potash industry, are an ever-present component of the A Zone and B Zone at Vanscoy. Figure 12 shows the basic stratigraphic relationships. These seams, along with the clay or clay-like material disseminated throughout the mining horizon, make up the water insoluble portion of the ore. The same sequences of clay seams can be correlated for many kilometres across the central Saskatchewan potash mining district.
At Vanscoy, a particular sequence of three clay seams marks the top of the A Zone, as illustrated in Figure 12 (modified from Robertson, 1978). These seams are used to guide the vertical positioning of the mining machine. The uppermost portion of the sequence of three seams is maintained at the top of the mining cut to keep the cutting “on grade”. Cutting too high above this upper seam or top marker results in dilution, as halite (rather than sylvinite) immediately overlies the production zone. In practice though, the top marker seam is slightly overcut (between 10 cm to 20 cm) to prevent an unstable condition from being created. Clay seams are often planes of weakness, and if they are undercut, material immediately below the clay seam becomes a hazard as it may separate and fall. Since the hazard must be remediated prior to advancing mining, thus slowing production, the moderately diluted mineral grade that results from the overcutting is preferable from a safety point of view.
19
The A Zone mining interval at Vanscoy has been fixed at 3.35 m (11’). This mining height allows for comfortable working headroom and efficient extraction of potash ore.

Figure 12: Stratigraphic section showing local nomenclature at, and adjacent to, the mining horizon.
The original exploration area was explored with 23 test holes laid out in an approximate 1.6 km by 3.2 km (1 mile by 2 mile) grid pattern. Initial exploratory drilling was conducted under the engineering supervision of E.D. Bietz of J.C. Sproule & Associates, and under the well site geological supervision of Dr. W.J. Pearson and D.M. Lane of C.M.&S. Since mining commenced in 1969, 19 additional drillholes have been completed. These later holes were conducted under the engineering supervision of either Cavern Engineering Ltd., Artisan Consulting, or Barlon Engineering Group Ltd., and under the well site geological supervision of either R.H. Brown Consulting Geologists Ltd. or North Rim Exploration Consultants Ltd. Logging and assaying of the core was performed by ADM Consulting Ltd. More recently, drillholes were analysed by Nutrien staff. All drilling and sampling were carried out following the regulations in place at the time.
Assays from all drillholes within Vanscoy’s current Crown Lease (KL 114 D) are provided in Table 2. In each case, the best 3.35 m (11’) mining interval intersected in the drillhole was determined from the assay values, using clay marker seams as a guide. With over 50 years of mining experience at Vanscoy, it is the opinion of the authors that areas of low grade (i.e. <15% K2O) are localized with a relatively small lateral extent.
20
Drillhole assay data for the A Zone at Vanscoy gives an estimated mean grade of 25.2% K2O with 5.2% water insolubles.
B Zone mineralization is indicated by gamma ray geophysical log response in each of the exploration drillholes listed in Table 2 indicating a potash Mineral Resource, but no test mining has been carried out in the B Zone to date. Assay results for the B Zone are not presented here.
Table 2: Assay results for all potash test holes within Vanscoy Lease KL 114 D.
| Average in 3.35 m (11’) mining interval (undiluted) |
||||||
| Drillhole |
Year Drilled |
%K2O |
% Water Insolubles |
|||
| 13-22-036-08 W3 |
1957 | 27.6 | 2.4 | |||
| 15-32-034-08 W3 |
1964 | 6.5 | 5.9 | |||
| 16-28-034-08 W3 |
1964 | 29.4 | 4.3 | |||
| 04-36-035-09 W3 |
1964 | 29.1 | 7.8 | |||
| 04-10-035-08 W3 |
1964 | 26.3 | 6.4 | |||
| 04-18-035-08 W3 |
1964 | 25.8 | 5.6 | |||
| 04-20-035-08 W3 |
1964 | 26.3 | 4.8 | |||
| 04-22-035-08 W3 |
1964 | 29.7 | 3.5 | |||
| 04-24-035-08 W3 |
1964 | 1.6 | 5.2 | |||
| 04-28-035-08 W3 |
1964 | 28.1 | 2.7 | |||
| 04-34-035-08 W3 |
1964 | 26.8 | 4.4 | |||
| 13-01-035-08 W3 |
1964 | 28.9 | 5.8 | |||
| 13-11-035-08 W3 |
1964 | 28.6 | 5.5 | |||
| 14-29-035-08 W3 |
1964 | 25.9 | 4.3 | |||
| 16-06-035-08 W3 |
1964 | 27.4 | 4.3 | |||
| 16-08-035-08 W3 |
1964 | 28.0 | 6.3 | |||
| 11-16-035-08 W3 |
1965 | 26.1 | 5.6 | |||
| 13-16-035-08 W3 |
1965 | 26.5 | 6.0 | |||
| 13-23-035-08 W3 |
1965 | 28.9 | 3.9 | |||
| 02-16-036-08 W3 |
1989 | 26.7 | 5.4 | |||
| 01-24-034-08 W3 |
1999 | 25.7 | 4.3 | |||
| 04-03-035-07 W3 |
2007 | 27.9 | 6.2 | |||
| 01-21-034-07 W3 |
2010 | 27.7 | 5.5 | |||
| 12-31-034-07 W3 |
2010 | 24.5 | 3.6 | |||
| 13-35-033-08 W3 |
2010 | 26.7 | 5.9 | |||
| 01-11-035-07 W3 |
2011 | 29.4 | 4.0 | |||
| 01-15-035-07 W3 |
2011 | 18.2 | 6.8 | |||
| 01-29-034-07 W3 |
2011 | 9.1 | 4.2 | |||
| 08-07-034-07 W3 |
2011 | 19.1 | 3.4 | |||
| 08-11-035-07 W3 |
2011 | * | * | |||
| 13-09-034-07 W3 |
2011 | * | * | |||
| 13-23-034-07 W3 |
2011 | 26.8 | 6.8 | |||
| 15-28-034-08 W3 |
2011 | 27.4 | 5.0 | |||
| 16-26-034-07 W3 |
2011 | 29.3 | 6.2 | |||
| 04-05-034-07 W3 |
2011 | 27.2 | 6.0 | |||
| 06-03-034-07 W3 |
2011 | 25.0 | 5.2 | |||
| 07-07-034-06 W3 |
2018 | 25.9 | 5.1 | |||
| 02-25-035-08 W3 |
2019 | 23.6 | 6.4 | |||
| 16-20-35-07 W3 |
2021 | 27.4 | 4.4 | |||
| 01-32-34-09 W3 |
2022 | 30.1 | 6.8 | |||
| 05-15-35-07 W3 |
2022 | 29.5 | 5.7 | |||
|
|
|
|||||
| Average of 39 usable values: |
25.2 | 5.2 | ||||
|
|
|
|||||
Due to the remarkably consistent mineralogy and continuity of the resource as experienced over 50 years of mine production, only a few exploration drilling programs were conducted after the 1960s. Instead of exploration drillholes, seismic surveying has been relied upon to explore ahead of mine development. Where normal Prairie Evaporite sequences are mapped in the seismic data, potash beds have unfailingly been present.
21
Occasional, small-scale salt anomalies not mapped in seismic data do occur. When they do, they are dealt with in the normal course of mining, and extraction through these areas is typically minimized. Anomalies associated with possible water inflow problems, which are mapped in the seismic data, are avoided.
| 11.0 | SAMPLING PREPARATION, ANALYSES AND SECURITY |
| 11.1 | BASIC APPROACH |
Exploration drilling in the Vanscoy area was initially conducted in the 1950s and 1960s. Sampling and assaying of potash core samples was done using methods considered consistent with standard procedures for potash exploration at these times.
Drillhole sampling methods have remained essentially the same over the years. Potash core samples are acquired as described in earlier sections of this report. Short segments of core usually about 1 foot (0.3 m) in length are labeled based on visible changes in mineralization, and sometimes based on fixed intervals. Each segment of core is then split using some type of rock or masonry saw. The split portion of core is then bagged and labeled and sent to a laboratory for chemical analysis. Historical potash samples remain stored at the Subsurface Geological Laboratory (Regina, Saskatchewan) of the Saskatchewan Ministry of Energy & Resources. Most of these have deteriorated substantially.

Figure 13: Potash assay plot for drillhole Nutrien Vanscoy 02-25-035-08 W3 indicating the best 3.35 m (11’) mining interval.
An assay plot for drillhole Nutrien Vanscoy 02-25-035-08 W3 is shown in Figure 13. Similar data were compiled for all historical potash test holes. The best 3.35 m (11’) mining interval intersected in each drillhole, as discussed in Section 10.0, is determined from the assay values, using clay seams as a guide. Table 3 lists the assay values plotted in Figure 13.
22
Table 3: Values for potash assay plot in Figure 13.

All new drilling efforts have targeted areas of geological uncertainty. Although normal ore zone conditions may occur in the tested areas, they are not targeted specifically. For this reason, and because ore grade is known to be locally variable, assays from drilling are not relied upon for ore grade estimation. Instead, grade determined from routinely collected in-mine ore zone samples are found to be most reliable. The long-term average from in-mine tends to best represent the larger ore zone as it normalizes local variability.
Thousands of in-mine ore grade samples have been collected at Vanscoy to the end of December 2024 (discussed further in Section 11.2). All in-mine samples were analysed in the Vanscoy mill laboratory using analysis techniques that were up to date for the era in which the sample was collected.
Regarding quality assurance for analytical results, the Company participates in the Canpotex Producer Sample Exchange Program using methods developed by the Saskatchewan Potash Producers Association (SPPA). The Sample Exchange Program monitors the accuracy of analytical procedures used in its labs. In the early 1970s, the SPPA initiated a round-robin Sample Exchange Program, the purpose of which was to assist the potash laboratories in developing a high level of confidence in analytical results. This program, now named the Canpotex Producer Sample Exchange Program using SPPA Methods (CPSEP), has continued up to the present. Current participants include all Canpotex member potash mine site labs, the Nutrien Pilot Plant Lab, and independent third-party surveyor labs. The CPSEP provides participants with three unknown potash samples for analysis quarterly. Results for the unknown sample analysis are correlated by an independent agency that distributes statistical analysis and a summary report to all participants. Completed exchange program samples can be used for control standards as required in QA/QC sections of standard analytical procedures.
The Nutrien Pilot Plant is secured in the same way as modern office buildings are secured. Authorized personnel have access and visitors are accompanied by staff. No special security measures are taken beyond that. Currently, no external laboratory certification is held by the Nutrien Pilot Plant.
23
On occasion, product quality check samples are sent to the Saskatchewan Research Council (SRC), a fully certified analytical facility.
In the opinion of the authors, the sample preparation, security, and analytical procedures are acceptable, are consistent with industry-standard practices, and are adequate for Mineral Resource and Reserve estimation purposes.
| 11.2 | MEAN POTASH MINERAL GRADE FROM IN-MINE SAMPLES |
At Vanscoy, in-mine grade samples have been acquired by 1) sampling ore from the beltline, 2) channel samples from the sidewall, or 3) collecting fine “muck” from the floor of the mine. At present, fine muck sampling from the floor is most common, and each mining room is sampled at a frequency of approximately 95 m to 125 m. Since start-up in 1969 through to the end of December 2024, a total of 3,435 useable in-mine potash mineral grade samples were collected from the Vanscoy A Zone, the main potash horizon at Vanscoy. All samples were analysed in the Vanscoy mill laboratory using analysis techniques that were up to date for the era in which the sample was collected. Figure 14 shows a histogram of A Zone in-mine grade sample results from the Vanscoy mine.

Figure 14: Histogram of potash ore grade from Vanscoy in-mine grade samples (1969 to December 2024).
The median ore grade for this family of in-mine samples is 25.2% K2O equivalent and the mean ore grade is 23.8%.
This is considered to be a more representative estimate of expected potash ore grade at Vanscoy than drillhole assay results presented in Section 10.0.
For the B Zone at Vanscoy, mineral grade is reported to be 20.2% K2O equivalent, the grade observed from thousands of in-mine samples at the Lanigan mine where the B Zone has been extensively mined. Even though Vanscoy mine is some distance from Lanigan, this is considered the best estimate of expected mineral grade for this potash layer because the deposit is known to be regionally continuous from west of Vanscoy to east of Lanigan (Fuzesy, 1982 and references therein). Although it is possible that if mining proceeds into the B Zone, the reported grade could change from what is reported. It is expected that any such change would be minimal.
| 11.3 | POTASH ORE DENSITY FROM IN-MINE MINERAL GRADE MEASUREMENTS |
An estimate of in-situ rock density is used to calculate potash mineralization volumes in Mineral Resource and Reserve assessments. A common approach, and the one used by Nutrien, is to determine in-place Mineral Resource and Reserve volumes (m3), then multiply this number by in-situ bulk-rock density (kg / m3) to give in-place Mineral Resource and Reserve tonnes.
Well-log data from drillholes can be used to calculate bulk density if accurate and calibrated well-logs are acquired during exploration drilling. In practical terms, modern well-logs tend to meet these criteria, but historic well-logs (collected before the 1990s) do not. In Saskatchewan, almost all potash exploration drilling took place in the 1950s and 1960s, well before density logs were accurate and reliable.
Another approach, and the one used by Nutrien, is to look up density values for the minerals which constitute potash rock – values determined in a laboratory to a high degree of accuracy and published in reliable scientific journals / textbooks – then apply these densities to the bulk rock.
24
Given that the density of each pure mineral is quantified and known, the only variable is what proportion of each mineral makes up the bulk rock. An obvious benefit of this approach is that a mean value computed on the in-mine samples shown in Figure 14 has a much greater confidence interval than a mean value computed from just a few drillhole assays.
The four main mineralogical components of the ore zones of Saskatchewan’s Prairie Evaporite Formation with their respective mineral densities are:
| Mineral |
Density (kg / m3) |
Components |
||||
| Halite | 2,170 | NaCl | ||||
| Sylvite | 1,990 | KCl | ||||
| Carnallite | 1,600 | KMgCl3 · 6(H2O) | ||||
| Insolubles | 2,510 | Anhydrite, dolomite, quartz, muscovite, and other minor mineral components (Nutrien Pilot Plant, 2018) |
All Nutrien potash mines measure and record the in-mine % K2O grade and insoluble content of the mined rock. The magnesium content is not measured at Vanscoy since carnallite is a negligible component of the ore here. From this set of measurements, density of the ore can be calculated.
The value for insoluble density is based on known densities of the constituent parts of the insoluble components of the mineralization and the average occurrence of these insoluble components, which is known from over 50 years of mining experience at Vanscoy. Assuming the lowest plausible density of insolubles known for Saskatchewan potash deposits of this nature, the effect upon overall bulk-rock ore density and Mineral Resource and Reserve calculations would be negligible.
From thousands of in-mine samples taken at Vanscoy, bulk density for the Vanscoy A Zone has been determined to be:
= (halite density * % halite) + (sylvite density * % sylvite) + (insolubles density * % insolubles)
= (2,170 kg / m3 * 57.3%) + (1,990 kg / m3 * 38.3%) + (2,510 kg / m3 * 4.4%)
= 2,116 kg / m3
RHObulk-rock (Vanscoy A Zone) = 2,116 kg / m3 = 2.12 tonnes / m3
This method is as accurate as the ore grade measurements and mineral density estimates.
No test mining of the B Zone has been conducted at Vanscoy to permit a bulk density calculation based on Vanscoy in-mine grade samples. If test mining of the B Zone at Vanscoy is conducted in future, there may be enough samples with all constituent minerals measured to warrant a change from what is reported. It is expected that any such change would have only a minimal effect on bulk-rock density used in tonnage calculations.
Instead, the potash bulk-rock density is calculated using thousands of in-mine grade samples from Lanigan B Zone:
RHObulk-rock (Vanscoy B Zone) = RHObulk-rock (Lanigan B Zone) = 2,120 kg / m3 = 2.12 tonnes / m3
This estimate is considered acceptable since both Vanscoy B Zone and Lanigan B Zone are the same potash seam. Should the Vanscoy B Zone bulk density change from the predicted value of 2,120 kg / m3, the later defined Vanscoy B Zone Mineral Resources and Reserves in Sections 14.2 and 15.2 will also change, albeit, insignificantly.
| 12.0 | DATA VERIFICATION |
| 12.1 | ASSAY DATA |
Most of the original drillhole assays were sent to Core Laboratories Canada Ltd. in Calgary, Alberta for analyses. Later drillholes, along with two historical drillholes still intact, were prepared for sampling by ADM Consulting Ltd. and sent to SRC Geoanalytical Laboratory for analyses using accredited assaying procedures. Recently, drillhole core is prepared for sampling by Nutrien technical staff and, generally, sent to SRC Geoanalytical Laboratory for independent analyses.
The original assay results for core samples from historical drillholes were taken as accurate in these studies, as there is no way to reliably reanalyse these samples.
25
Most of the remaining samples in storage have long since deteriorated to the point where they are not usable.
Ore grades of in-mine samples are measured inhouse at the Vanscoy mine laboratory by Company staff using modern, standard chemical analysis tools and procedures; an independent agency does not verify these results. However, check sampling through the CPSEP, discussed in Section 11.1, does occur.
It should be noted that assay results from historical drillholes match in-mine sample results reasonably well even though drillhole sample spacing is much greater. This correlation is further validation of the in-mine sampling methodology. Mean mineral grade determined from in-mine samples taken over decades of mining at Vanscoy is thought to provide the most accurate measurement of potash grade for the Vanscoy mine, also providing a good basis for estimating ore grade in areas of future mining at Vanscoy.
| 12.2 | EXPLORATION DATA |
The purpose of any mineral exploration program is to determine extent, continuity, and grade of mineralization to a certain level of confidence and accuracy. For potash exploration, it is important to minimize the amount of cross-formational drilling, since each drillhole is a potential conduit for subsurface groundwater from overlying (or underlying) water-bearing formations into future mine workings. Every potash test drillhole from surface sterilizes potash mineralization; a safety pillar is required around every surface drillhole once underground mining commences.
Initial sampling and assaying of cores were done during potash exploration at Vanscoy in the 1950s and 1960s. Methods were consistent with standard procedures for that era. The mine began production in 1969 and test drilling conducted after that was largely for the purpose of better understanding the caprock rather than potash mineralization. This approach to potash sampling is in accordance with widely accepted industry practice for areas adjacent and contiguous to an existing operating potash mine.
Assay of physical samples (drillhole cores and/or in-mine samples) is the only way to gain information about mineral grade, but extent and continuity of mineralization are correctly determined using data collected from seismic surveys correlated with drilling information. To date, surface seismic data at Vanscoy have been collected, analysed, and verified by Company staff, at times, in cooperation with independent consultants.
Data for the Mineral Resource and Reserve estimates for Vanscoy mine reported in Sections 14.0 and 15.0 were verified by Company staff as follows:
| • | Review of potash assay sample information (drillholes and in-mine grade samples), |
| • | Review and verify procedures used for in-mine grade sampling and laboratory analysis, |
| • | Review of surface geophysical exploration results (3D and 2D seismic data), |
| • | Crosscheck of mined tonnages reported by mine site technical staff with tonnages estimated from mine survey information, and |
| • | Crosscheck of Mineral Resource and Mineral Reserve calculations carried out by corporate technical staff. |
In the opinion of the authors, this approach to data verification of potash mineral grade and surface seismic information is in accordance with generally accepted industry practice for areas adjacent and contiguous to an existing operating potash mine.
| 13.0 | MINERAL PROCESSING AND METALLURGICAL TESTING |
At Vanscoy, potash ore has been mined and concentrated using flotation and crystallization methods to produce saleable quantities of high-grade finished potash products since 1969.
Since opening in 1969, 192.349 million tonnes of potash ore have been mined and hoisted to produce 65.024 million tonnes of finished potash product. Given this level of sustained production over several decades, basic mineralogical processing and prospective metallurgical testing of Vanscoy potash is not considered relevant.
See also Section 17.0.
26
| 14.0 | MINERAL RESOURCE ESTIMATES |
| 14.1 | DEFINITIONS OF MINERAL RESOURCE |
The CIM has defined Mineral Resource in The CIM Definition Standards for Mineral Resources and Reserves (2014) as:
| 1) | Inferred Mineral Resource: that part of a Mineral Resource for which quantity and grade or quality are estimated on the basis of limited geological evidence and sampling. Geological evidence is sufficient to imply but not verify geological and grade or quality continuity. |
| 2) | Indicated Mineral Resource: that part of a Mineral Resource for which quantity, grade or quality, densities, shape and physical characteristics are estimated with sufficient confidence to allow the application of Modifying Factors in sufficient detail to support mine planning and evaluation of the economic viability of the deposit. Geological evidence is derived from adequately detailed and reliable exploration, sampling and testing and is sufficient to assume geological and grade quality continuity between points of observation. |
| 3) | Measured Mineral Resource: that part of a Mineral Resource for which quantity, grade or quality, densities, shape, and physical characteristics are estimated with confidence sufficient to allow the application of Modifying Factors to support detailed mine planning and final evaluation of the economic viability of the deposit. Geological evidence is derived from detailed and reliable exploration, sampling and testing and is sufficient to confirm geological and grade or quality continuity between points of observation. |
CIM defines Modifying Factors as “considerations used to convert Mineral Resources into Mineral Reserves. These include, but are not restricted to, mining, processing, metallurgical, infrastructure, economic, marketing, legal, environmental, social and governmental factors.”
In south-central Saskatchewan, where geological correlations are straightforward, and within a (potash) Subsurface Mineral Lease with an operating potash mine, Mineral Resource categories are generally characterized by Nutrien as follows:
| 1) | Inferred Mineral Resource: areas of limited exploration, such as areas that have been investigated through regional geological studies, or areas with 2D regional surface seismic coverage, little or no drilling, at some distance from underground workings, and within Crown Subsurface Mineral Lease KL 114 D. |
| 2) | Indicated Mineral Resource: areas of adequate exploration, such as areas with 3D surface seismic coverage, little or no drilling, at some distance from underground workings, and within Crown Subsurface Mineral Lease KL 114 D. |
| 3) | Measured Mineral Resource: areas of detailed, physical exploration through actual drilling or mine sampling, near existing underground workings, and within Crown Subsurface Mineral Lease KL 114 D. |
The mine began production in 1969 and test drilling conducted after that was largely for the purpose of better understanding the caprock rather than potash mineralization. Instead, exploration involved collecting surface seismic data, which became better in quality over the years. Exploration drilling has demonstrated the presence of the potash horizon, and seismic coverage shows the continuity of the Prairie Evaporite Formation within which the potash horizon occurs.
Along with this approach, analysis of in-mine samples for potash grade has provided an observation-based understanding of the potash mineralized zone at Vanscoy that is far superior to the level of understanding provided by any surface drilling-based exploration program. The authors believe that this approach provides a body of information that guides and constrains exploration inferences in a much better way than could be achieved from any conventional exploration investigation in areas immediately surrounding, and contiguous to, the Vanscoy potash mine.
| 14.2 | VANSCOY POTASH RESOURCE CALCULATIONS |
Exploration information used to calculate reported Mineral Resource tonnages at Vanscoy consists of both physical sampling (drillhole and in-mine) and surface seismic (2D and 3D) as discussed in earlier sections. Based on the definitions and guidelines in Section 14.1, all mineral rights leased or owned by the Company, and within Crown Subsurface Mineral Lease KL 114 D, are assigned to one of the three Mineral Resource categories.
27
Mineral Resources are reported as mineralization in-place and are exclusive of Mineral Reserves. In-place tonnes were calculated for each of the Mineral Resource categories using the following parameters:
| Mining Height: | 3.35 m (11 feet) | |
| Ore Density: | 2.12 tonnes / m3 (A Zone) | |
| Ore Density: | 2.12 tonnes / m3 (B Zone) | |
The Mineral Resources for Vanscoy, as of December 31, 2024 are as follows:
Vanscoy A Zone:
| Inferred Resource |
1,120 | millions of tonnes | ||||||
| Indicated Resource |
1,547 | millions of tonnes | ||||||
| Measured Resource |
2,291 | millions of tonnes | ||||||
|
|
||||||||
| Total A Zone Resource |
4,958 | millions of tonnes | ||||||
| Vanscoy B Zone: |
||||||||
| Inferred Resource |
1,120 | millions of tonnes | ||||||
| Indicated Resource |
1,547 | millions of tonnes | ||||||
| Measured Resource |
2,861 | millions of tonnes | ||||||
|
|
||||||||
| Total B Zone Resource |
5,528 | millions of tonnes | ||||||
| Total Vanscoy Resource (A Zone + B Zone): |
||||||||
| Inferred Resource |
2,240 | millions of tonnes | ||||||
| Indicated Resource |
3,094 | millions of tonnes | ||||||
| Measured Resource |
5,152 | millions of tonnes | ||||||
|
|
||||||||
| Total A Zone + B Zone Resource |
10,486 | millions of tonnes | ||||||
Vanscoy Mineral Resources are plotted in Figure 15.
The average mineral grade of the Vanscoy A Zone Mineral Resource is 23.8% K2O equivalent and was determined from thousands of in-mine samples at Vanscoy. The average mineral grade of the Vanscoy B Zone Mineral Resource is 20.2% K2O equivalent and was determined from thousands of in-mine samples at Lanigan mine where the B Zone has been extensively mined. See Section 11.2 for more detail.
The tonnage reported in the Vanscoy A Zone Measured Resource is comprised of the potash that is within 1.6 km (1 mile) of physically sampled location (i.e. drillholes or mine workings). Also included as Measured Resource is the potash in the pillars of mined-out areas of the Vanscoy mine that is not already accounted for in the Proven Reserve estimation as there is the possibility of retrieving ore from the remnant mining pillars at some point in the future.
Portions of the B Zone that are immediately underlying the Proven and Probable A Zone Mineral Reserve as well as portions of the B Zone that are immediately underlying drillholes and the 1.6 km (1 mile) buffer placed around drillholes have been classified as Measured Resource.
28

Figure 15: Map showing Vanscoy Mineral Resource as of December 31, 2024.
| 15.0 | MINERAL RESERVE ESTIMATES |
| 15.1 | DEFINITIONS OF MINERAL RESERVE |
The CIM has defined Mineral Reserve in The CIM Definition Standards for Mineral Resources and Reserves (2014) as:
| 1) | Probable Mineral Reserve: the economically mineable part of an Indicated, and in some circumstances, a Measured Mineral Resource. The confidence in the Modifying Factors applying to a Probable Mineral Reserve is lower than that applying to a Proven Mineral Reserve. |
| 2) | Proven Mineral Reserve: the economically mineable part of a Measured Mineral Resource. A Proven Mineral Reserve implies a high degree of confidence in the Modifying Factors. |
CIM defines Modifying Factors as “considerations used to convert Mineral Resources into Mineral Reserves. These include, but are not restricted to, mining, processing, metallurgical, infrastructure, economic, marketing, legal, environmental, social and governmental factors.”
For Saskatchewan, in regions adjacent and contiguous to an operating potash mine, Mineral Reserve categories are characterized by Nutrien as follows:
| 1) | Probable Mineral Reserve: identified recoverable potash mineralization classified as a Measured Resource, within a 1.6 km (1 mile) radius of a sampled mine entry or exploration drillhole contiguous to mine workings, and within Crown Subsurface Mineral Lease KL 114 D. |
29
| 2) | Proven Mineral Reserve: identified recoverable potash mineralization classified as a Measured Resource, delineated on at least three sides by sampled mined entries or exploration drillholes to a maximum of 3.2 km (2 miles) apart, and within Crown Subsurface Mineral Lease KL 114 D. |
Along with this approach, analysis of in-mine samples for potash grade has provided an observation-based understanding of the potash mineralized zone at Vanscoy that is far superior to the level of understanding provided by any surface drilling-based exploration program. An understanding of the amount of ore that can be conventionally mined from the Measured Resource category using current mining practices comes from over 50 years of potash mining experience at Vanscoy.
| 15.2 | VANSCOY POTASH RESERVE CALCULATIONS |
Using the definitions outlined in Section 15.1, a portion of the Vanscoy A Zone Measured Resource has been converted to Mineral Reserve. The assigned Mineral Reserve category is dependent on proximity to sampled mined entries also described in Section 15.1. An overall extraction ratio for the Vanscoy mine has been applied to the qualifying areas outlined as Measured Resource in Figure 15. This extraction ratio is significantly lower than the local extraction ratio described in Section 16.1, as it takes into account areas which cannot be mined due to unfavorable geology.
The overall extraction ratio at the Vanscoy mine is 22%. It was derived by dividing the total ore tonnes mined to date by the tonnage equivalent of the total area of the mine workings (i.e. the perimeter around the mine workings) less future mining blocks. This extraction ratio has been applied to the Probable Reserve, an area where no mining has occurred to date. To remain conservative in our estimations, and because a considerable amount of mining has already occurred in the Proven Reserve area, this extraction ratio has been applied only to the portion of the Proven Reserve that is anticipated to be mined in future. Future mining blocks within the Proven Reserve area vary from year-to-year as production continues. Pillars remaining that are not planned for mining remain a Measured Resource. Since an extraction ratio has been applied, Mineral Reserves are considered recoverable ore, and are reported as such. Note that only drillholes whose 1.6 km radii are contiguous to mine workings or the 1.6 km radius placed around mine workings are used to compute probable mineral reserve. The remaining non-contiguous drillholes remain in the Measured Resource category.
At times, irregular mining which resembles development mining occurs to support operational requirements (e.g. egress) or as geological conditions necessitate. While irregular mining increases confidence in the Mineral Resource by way of physical sampling, it can add considerable Mineral Reserve to broad areas not otherwise covered (or planned to be covered) by mine workings. Again, to remain conservative in our estimations, certain irregular mining may not have been converted from Measured Resource to Proven Reserve.
The Mineral Reserves for Vanscoy as of December 31, 2024 are as follows:
Vanscoy A Zone:
| Probable Reserve |
263 | millions of tonnes | ||||||
| Proven Reserve |
114 | millions of tonnes | ||||||
|
|
||||||||
| Total A Zone Reserve |
377 | millions of tonnes | ||||||
| Vanscoy B Zone: |
||||||||
| Probable Reserve |
nil | |||||||
| Proven Reserve |
nil | |||||||
|
|
||||||||
| Total B Zone Reserve |
nil | |||||||
| Total Vanscoy Reserves (A Zone + B Zone): |
||||||||
| Probable Reserve |
263 | millions of tonnes | ||||||
| Proven Reserve |
114 | millions of tonnes | ||||||
|
|
||||||||
| Total A Zone + B Zone Reserve |
377 | millions of tonnes | ||||||
Vanscoy Mineral Reserves are plotted in Figure 16.
The average mineral grade of the Vanscoy A Zone Mineral Reserve is 23.8% K2O equivalent and was determined from thousands of in-mine samples at Vanscoy. See Section 11.2 for more detail.
30

Figure 16: Map showing Vanscoy Mineral Reserve as of December 31, 2024.
| 16.0 | MINING METHOD |
| 16.1 | MINING OPERATIONS |
All conventional potash mines in Saskatchewan operate at 900 m to 1200 m below surface within 9 m to 30 m of the top of the Prairie Evaporite Formation. Over the scale of any typical Saskatchewan potash mine, potash beds are tabular and regionally flat-lying, with only moderate local variations in dip. At Vanscoy, potash ore is mined using conventional mining methods, whereby:
| • | Shafts are sunk to the potash ore body; |
| • | Continuous mining machines cut out the ore, which is hoisted to surface through the production shaft; |
| • | Raw potash is processed and concentrated in a mill on surface; and |
| • | Concentrated finished potash products (near-pure KCl) are sold and shipped to markets in North America and offshore. |
Sinking of the two original shafts (Shaft #1 and Shaft #2) from surface to the potash zone was completed in 1968, and the first potash ore was hoisted the year after. With the exception of the 1970 inflow (described further in Section 16.2) which halted production for two years, the Vanscoy mine has run on a continuous basis other than short-term shutdowns taken for inventory management purposes, occasional plant maintenance and construction work, or other outages that are typical for operations of this nature.
In recent years, the Vanscoy mine underwent a major expansion which brought the nameplate capacity up to 3.0 million tonnes of finished potash products per year. The operational capability at the Vanscoy facility in 2024 was 1.1 million tonnes per year.
31
Virtually all Vanscoy underground mining rooms are in one potash mineralized zone, the upper layer (or A Zone) of the Patience Lake Member of the Prairie Evaporite Formation (the host evaporite salt). Saskatchewan potash geology and conventional mining horizons are illustrated in Figure 17. Mine elevations range from approximately 1,000 m to 1,120 m depth below surface. Mine workings are protected from aquifers in overlying formations by approximately 12 m of overlying salt and potash beds, along with salt plugged porosity in the Dawson Bay Formation, a carbonate layer lying immediately above potash hosting salt beds.
The Vanscoy mine is a conventional underground mining operation whereby mining machines are used to excavate the potash ore by long-room and pillar and stress-relief mining methods. Continuous conveyor belts transport ore from the mining face to the bottom of the production shaft. Mining methods employed in Saskatchewan are discussed in Jones and Prugger (1982) and in Gebhardt (1993). The highest mineral grade section of the Vanscoy potash seam is approximately 3.35 m (11’) thick, with gradations to lower grade salts immediately above and below the mining horizon. The actual mining thickness at Vanscoy is dictated by the height of mining machine used to cut the ore which has been fixed at 3.35 m (11’).
As discussed in Section 10.0, Vanscoy cuts to a marker (clay) seam that is slightly above the high-grade mineralized zone to establish a safe and stable mine roof. The top marker seam is slightly overcut by 10 cm to 20 cm. Clay seams are often planes of weakness, and if they are undercut, material immediately below the clay seam becomes a hazard as it may separate and fall. Since the hazard must be remediated prior to proceeding, thus slowing production, the moderately diluted mineral grade that results from the overcutting is preferable from a safety point of view.

Figure 17: Schematic cross-section through the Prairie Evaporite Formation, illustrating mining horizons at each of Nutrien’s conventional potash operations.
Conservative local extraction ratios (never exceeding 45% in any mining block) are employed at all Saskatchewan mines, including Vanscoy, in order to minimize potential detrimental effects of mining on overlying strata; this is common practice in flat-lying, tabular ore bodies overlain by water-bearing layers.
From the shaft-bottom, potash ore is hoisted approximately 1,000 m from the potash level through the vertical shafts to a surface mill. In addition to hoisting potash ore to surface, the production shaft is used for exhaust ventilation from the mine and serves as a secondary egress. The Service Shaft is used for service access, primary egress, and fresh air ventilation into the mine.
Since production began in 1969, 192.349 million tonnes of potash ore have been mined and hoisted at Vanscoy to produce 65.024 million tonnes of finished potash products. The life-of-mine average concentration ratio (raw ore / finished potash products) is 2.96 and the overall extraction ratio over this period is 22%.
32
Actual potash production tonnages for the Vanscoy mine, along with concentration ratios (tonnes mined / tonnes product), are plotted for the past decade in Figure 18.


Figure 18: Mined tonnes, product tonnes, and concentration ratio for the Vanscoy mine over the past 10 years.
33
| 16.2 | RISKS TO POTASH MINING OPERATIONS, WITH EMPHASIS ON WATER INFLOWS |
The mining of potash is a capital-intensive business, subject to the normal risks and capital expenditure requirements associated with mining operations. The production and processing of ore may be subject to delays and costs resulting from mechanical failures, physical hazards such as fires, and other hazards such as: unusual or unexpected geological conditions, significant subsidence, brine inflows and gas seepages of varying degree, and other situations associated with any potash mining operation.
Potash beds in all regions of Saskatchewan are overlain by several water-bearing formations, and there are water zones underlying the potash beds as well. A water inflow into mine workings is generally significant in a potash mine since salt dissolves in water; an inflow can lead to anything from increased costs at best to closure of the mine at worst (e.g. see Prugger and Prugger, 1991).
In August of 1970, Vanscoy experienced a major water inflow which they fully recovered from. During routine grouting of the concrete shaft lining, drilling intersected an inadequately abandoned freeze-hole in Shaft #2 (Prugger, 1979). The compromised freeze-hole effectively became a conduit linking the grout hole with the overlying aquifers of the Blairmore and Nisku Formations. Water under high pressure was entering the shaft, charged with sand, at rates as high as 65 m3 / min. Within five days, the entire mine was flooded, and the waters started rising in the shafts. After that, efforts shifted to recovering the mine. The inflow was stopped using grout lines and a surface drill rig to cement off the inflow which permitted focused and successful dewatering that was completed in June 1971. The first mining unit became operational in April of 1972, and with further recovery and rehabilitation efforts, the mine was back to full operation in August 1972, two years after the inflow event commenced. Industry standard practices for shaft maintenance are now used to avoid a recurrence of such an event. Prior to any drilling in shaft liners, non-destructive testing methods are used to assess the integrity of the lining. Should drilling be required, blowout preventors are used to control any high-pressure formation fluids that might be encountered.
Since 1985, Vanscoy has been managing a brine inflow of 475 litres / min known to be coming from the Dawson Bay Formation. Since inception, this inflow has been fully characterized and successfully managed according to an internal Nutrien guideline known as the Inflow Management Strategy. It is based on requirements provided by The Mines Regulations, 2018 (Saskatchewan) and guidelines developed by the members of the Saskatchewan Mining Association for safe and effective management of brine inflows in potash mines. Accordingly, brine from this inflow is collected, then pumped up to surface for disposal into the Deadwood Formation (refer to Section 20 for more information on brine disposal). To date, this inflow has had no impact on Vanscoy potash production.
It is typical with inflows in Saskatchewan potash mines that some hydrogen sulfide gas (H2S) are exsolved from the depressurized formation brines as they enter the mine workings. Average concentrations are low (below 5 ppm) and well within safe limits for mine personnel.
| 17.0 | RECOVERY METHODS |
At Vanscoy, potash ore has been mined and concentrated to produce saleable quantities of high grade finished potash products since 1969. Products include granular, standard, and fine standard potash which are used for agricultural application.
Both flotation methods and crystallization methods are used to concentrate potash ore into finished potash products at the Vanscoy mill. A simplified process flow diagram is shown in Figure 19. Raw potash ore is processed on surface, and concentrated finished potash products (near-pure KCl) are sold and shipped to markets in North America and offshore.
34

Figure 19: Simplified flow diagram for potash flotation and crystallization milling methods used at Vanscoy.
Over the past three years, production of finished potash products at Vanscoy was:
2022: 1.010 million tonnes finished potash products at 59.98% K2O (average grade)
2023: 1.052 million tonnes finished potash products at 60.97% K2O (average grade)
2024: 1.031 million tonnes finished potash products at 61.07% K2O (average grade)
Over the past decade, actual mill recovery rates have been between 76.0% and 83.3%, averaging 80.6% (see Figure 20). Given the long-term experience with potash geology and actual mill recovery at Vanscoy, no fundamental potash milling problems are anticipated in the foreseeable future.
Quality control testing and monitoring geared towards fine-tuning and optimizing potash milling and concentrating processes are conducted on a continual basis at all Nutrien mine sites and at Nutrien research facilities. At Vanscoy, this is no exception; test work to optimize circuit performance and ensure product quality is carried out on an ongoing basis.

Figure 20: Vanscoy mill recovery rate over the past 10 years.
35
| 18.0 | PROJECT INFRASTRUCTURE |
Infrastructure is in place to meet current and projected requirements for transportation, energy (electricity and natural gas), water and process materials at Vanscoy. See also Section 5.0.
The Vanscoy mine is served by a number of villages within 50 kilometres of the mine site. The nearest city is Saskatoon (26 km distant). Surface facilities are accessed by existing paved roads and highways that are part of the Saskatchewan Provincial Highway System. Most potash product is shipped by rail over existing track, with some product shipped by truck over the North American highway system.
At present, high voltage power capacity at Vanscoy is 57 MVA. The ten-year projection of power utilization indicates that the utility can meet all foreseeable future demand.
The Vanscoy operation requires a sustained fresh water supply for the milling process which is provided by a waterline from the Saskatchewan River (approximately 20 km distant). This provincially licensed water supply provides a source of process water for Vanscoy milling operations and usage is regulated by terms of the license issued by the Water Security Agency.
| 19.0 | MARKET STUDIES AND CONTRACTS |
Potash from Company mines (including Vanscoy) has been sold on a continuous basis since mining began in 1969. At present, Nutrien products are sold in more than 50 countries, to three types of end-use:
| 1. | Fertilizer, focused on balanced plant nutrition to boost crop yields to meet the world’s ever-increasing appetite for food (nitrogen, phosphate, potash) |
| 2. | Feed Supplements, focused on animal nutrition (mainly phosphate) |
| 3. | Industrial, focused on products for high-grade food, technical and other applications (nitrogen, phosphate, as phosphoric acid, potash) |
The Company owns and operates six potash mines in Saskatchewan and a potash mine in New Brunswick, Canada, which no longer produces potash and was permanently closed in 2018. Over the past three years (2022, 2023, 2024) the Company had potash sales of 39.639 million tonnes. Historical Company potash sales data for the past 10 years are plotted in Figure 21 and Figure 22.
Potash is mainly used for fertilizer, which typically makes up approximately 90% of the company’s annual potash sales volumes. By helping plants develop strong root systems and retain water, it enhances yields and promotes greater resistance to disease and insects. Because it improves the taste and nutritional value of food, potash is often called the “quality nutrient.” Industrial applications of potash include use in soaps, water softeners, de-icers, drilling muds and food products.
Potash fertilizer is sold primarily as solid granular and standard products. Granular product has a larger and more uniformly shaped particle than standard product and can be easily blended with solid nitrogen and phosphate fertilizers. It is typically used in more advanced agricultural markets such as the US and Brazil.
Most major potash consuming countries in Asia and Latin America have limited or no indigenous production capability and rely primarily on imports to meet their needs. This is an important difference between potash and the other major crop nutrient businesses. Trade typically accounts for approximately three-quarters of demand for potash, which ensures a globally diversified marketplace.
The most significant exporters are producers with mines in the large producing regions of Canada, the former Soviet Union, and the Middle East, which all have relatively small domestic requirements.
36

Figure 21: Historical Company potash sales 2015 to 2024 in million tonnes / year.*

Figure 22: Historical Company potash net sales 2015 to 2024 in million USD $ / year.*
World consumption of potash fertilizer has grown over the last decade, with the primary growth regions being developing markets in Asia and Latin America. These are countries with expanding crop production requirements, where potash has historically been under-applied and crop yields lag behind those of the developed world. Although temporary pauses can occur in certain countries, the underlying fundamentals of food demand that encourage increased potash application are expected to continue the growth trends in key importing countries. See Figure 23 for world potash production and demand in 2024.
| * | Company sales data for years prior to 2018 includes only PotashCorp sales. |
37

Figure 23: World potash production and demand for 2024E.
Potash is used on many agricultural commodities. Wheat, rice, corn, oilseed, and sugar crops consume over half of the potash used worldwide. Fruits and vegetables are also important users of potash fertilizers, accounting for about 19 percent of the total consumption. The remainder goes to other consumer and industrial crops such as oil palm, rubber, cotton, coffee, and cocoa. See Table 4 for primary potash market profile. This diversity means that global potash demand is not tied to the market fundamentals for any single crop or growing region.
Table 4: Primary Potash Market Profile
| Country / Region |
Growth Rate* |
Key Consuming Crops |
||
| China | 3.4% | Vegetables, rice, fruits, corn | ||
| India | -0.5% | Rice, wheat, vegetables, sugar crops | ||
| Other Asia | 2.8% | Oil palm, rice, sugar crops, fruits, vegetables | ||
| Latin America | 5.1% | Soybeans, sugar crops, corn | ||
| North America | 3.2% | Corn, soybeans |
| * | 5-year CAGR for potash fertilizer consumption (2019-2024E) |
Global potash shipments are estimated to have reached record levels at approximately 72.5 million tonnes in 2024, an increase of more than 4.5 million tonnes from the previous year. Potash demand has grown at an annualized rate of 2.6 percent over the past 5 years, driven by strong potash consumption trends in all major potash markets.
North American and South American growers applied significant amounts of potash to replenish soil nutrients removed by large harvests. Potash application rates are increasing in China and Southeast Asian countries as a result of increased soil testing and improved agronomic practices, along with a renewed focus on food security in China. Growers in these countries are also increasing acreage of potassium-intensive crops such as fruits, vegetables, and oil palm. India continues to face political barriers to significantly growing potash demand, however, the agronomic need and willingness of farmers to improve yields persists. The Company believes that supportive agriculture fundamentals and the need to address declining soil fertility levels will enable strong demand growth in the years ahead. World potash shipments and consumption in recent years is shown in Figure 24.
38

Figure 24: World potash shipments and consumption, 2019-2024E.
Canpotex Limited (Canpotex), the offshore marketing company owned by the Company and another Saskatchewan potash producer, handles all sales, marketing and distribution of potash produced by its member companies to customers outside of the US and Canada (including the potash produced at Vanscoy).
In North America, Nutrien sells potash to retailers, cooperatives, and distributors, who provide storage and application services to farmers, the end-users. This includes sales to Nutrien’s retail distribution business, which has the largest retail distribution network in North America. Typically, the Company’s North American potash sales are larger in the first half of the year. The primary customers for potash fertilizer products for the Vanscoy operation are retailers, dealers, cooperatives, distributors, and other fertilizer producers who have both distribution and application capabilities.
Nutrien’s Market Research group provides management with market information on a regular basis including global agriculture and fertilizer prices, demand and supply in fertilizer markets and general economic conditions that may impact fertilizer sales. These may include specific market studies and analyses on different topics as may be required. This information is reviewed on a regular basis and the author of this report takes this information into account in understanding the markets and the assumptions within this report.
Plans and arrangements for potash mining, mineral processing, product transportation, and product sales are established by Nutrien and are within industry norms.
| 20.0 | ENVIRONMENTAL STUDIES, PERMITTING, AND SOCIAL OR COMMUNITY IMPACT |
The tailings management strategy at all Nutrien potash mines in Saskatchewan, including Vanscoy, is one of sequestering solid mine tailings in an engineered and provincially licenced TMA near the surface plant site. The Vanscoy TMA currently covers an area of approximately 603 hectares (1,491 acres) of land owned by the Company. Solid potash mine tailings typically consist of 85% to 95% rock salt (NaCl) and 5% to 15% insolubles (carbonate mud = CaCO3, anhydrite mud = CaSO4, and clays like chlorite, illite, and so on). An engineered slurry-wall (bentonite cut-off wall) has been constructed around the Vanscoy TMA. In future years this wall can be expanded if required for operational needs. The slurry-wall provides secondary containment for any saline mine waters, minimizing brine impacts from the TMA to surrounding surface water bodies and near-surface aquifers. Areas surrounding the TMA are closely monitored: this includes everything from daily visual perimeter inspections to annual investigations and inspections of surrounding groundwater and aquifers.
Vanscoy currently operates two brine disposal wells near the surface plant of the Vanscoy mine (marked in Figure 25) where clear salt brine (i.e. no silt, insolubles, or other waste) is borehole-injected into the Winnipeg / Deadwood Formations, deep subsurface aquifers approximately 1,500 m to 1,700 m below the surface. The disposal wells are provincially licensed, and formation water in these extensive deep aquifers is naturally saline.
39
Emissions to air consisting primarily of particulate matter are kept below regulatory limits through various modern air pollution abatement systems (e.g. dust collection systems built into mill processes) that are provincially licensed. This same procedure is followed at all Nutrien mines in Saskatchewan.
In Saskatchewan, all potash tailings management activities are carried out under an “Approval to Operate” granted by the Saskatchewan Ministry of Environment (MOE), the provincial regulator. Staff at the Vanscoy mine actively monitor and inspect operations and routinely report the observations and measurements to the Environmental Protection Branch of MOE. The current Vanscoy Approval to Operate has been granted to July 1, 2028, the renewal date.
In terms of long-term decommissioning, environmental regulations of the Province of Saskatchewan require that all operating potash mines in Saskatchewan create a long-term decommissioning and reclamation plan that will ensure all surface facilities are removed, and the site is left in a chemically and physically stable condition once mine operations are complete. The Company has conducted numerous studies of this topic, and the most recent decommissioning and reclamation plan for Vanscoy was approved by MOE technical staff in January 2022. Because the current expected mine life for Vanscoy is many decades into the future, it is not meaningful to come up with detailed engineering designs for decommissioning annually. Instead, decommissioning plans are reviewed every five years, and updated to accommodate new concepts, technological change, incorporation of new data, and adjustments of production forecasts and cost estimates. Any updated decommissioning and reclamation reports generated by this process are submitted to provincial regulatory agencies. For Vanscoy, a revised decommissioning and reclamation plan is due to be submitted for MOE review in June 2026.
In addition to the long-term decommissioning plan, provincial regulations require that every potash producing company in Saskatchewan set up an Environmental Financial Assurance Fund, which is to be held in trust for the decommissioning, restoration and rehabilitation of the plant site after mining is complete. This fund is for all mines operated by Nutrien in the province of Saskatchewan (i.e. Allan, Cory, Lanigan, Patience Lake, Rocanville, and Vanscoy).

Figure 25: Aerial photo showing the Vanscoy surface operations, disposal wells, and Tailings Management Area.
40
| 21.0 | CAPITAL AND OPERATING COSTS |
The Vanscoy mine has been in operation since 1969; in the years immediately preceding this, major capital investment was made to bring this mine into production. Since then, capital expenditures were made on a regular and ongoing basis to sustain production, and to expand production from time to time.
A major refurbishment and expansion of the Vanscoy mine was completed in 2015, increasing nameplate capacity to 3.0 million tonnes of finished potash products per year. This work involved increased hoist capacity, infrastructure improvements, major expansions of mine, mill, and TMA. All construction was carried out without significant disruption to existing potash production from the site.
| 22.0 | ECONOMIC ANALYSIS |
| 22.1 | FUNDAMENTALS |
The Company conducts ongoing and detailed economic analyses on each of its operations and on all aspects of its business. While the Company considers its operating costs and results on a per mine basis to be competitively sensitive and confidential information, the Company is confident that the economic analysis conducted routinely for each of the Company’s operating potash mines is complete, reasonable, and meets industry standards.
On a cash flow basis, the Company’s potash segment generated USD $14,647 million in net sales over the past three years (20122, 2023 and 2024) based on sales volume of 39.639 million tonnes of finished potash products. The annual average realized potash price for manufactured products (includes North American and offshore sales) over a 10-year period (2015 – 2024) is plotted in Figure 26.
Over the past three years (2022, 2023, and 2024) the Vanscoy mine produced 3.092 million tonnes of finished potash products. In the past three years (2022, 2023, and 2024), the Vanscoy mine accounted for 8% of total potash production at the Company over this period. Vanscoy is currently making a positive contribution to the Company’s potash segment.
Given the Company’s previous history (including over 50 years of mining at the Vanscoy operation), recent market conditions, and extensive reserve base, the economic analysis for Vanscoy has met the Company’s internal hurdle rates.

Figure 26: Historic annual average realized potash price in USD / tonne.*
| 22.2 | TAXES |
Royalties are paid to the Province of Saskatchewan in connection with the Company’s Potash operations, which holds most of the mineral rights in the lease areas, and royalties from Freehold lands are paid to various freeholders of
| * | Company sales data for years prior to 2018 includes only PotashCorp sales. |
41
mineral rights in the area. The Crown royalty rate is 3 percent and is governed by The Subsurface Mineral Royalty Regulations, 2017. The actual amount paid is dependent on selling price and production tonnes.
Municipal taxes are paid based on site property values to the applicable municipality in Saskatchewan. Saskatchewan potash production is taxed at the provincial level under The Mineral Taxation Act, 1983. This tax, governed by The Potash Production Tax Regulations, consists of a base payment and a profit tax, collectively known as the potash production tax. As a resource corporation in the Province of Saskatchewan, the Company is also subject to a resource surcharge equal to a percentage of the value of its resource sales (as defined in The Corporation Capital Tax Act of Saskatchewan). In addition to this, the Company pays federal and provincial income taxes based on corporate profits from all of its operations in Canada.
| 23.0 | ADJACENT PROPERTIES |
Vanscoy Crown Mineral Lease KL 114 D is adjacent to the following Crown potash dispositions:
| • | Potash Corporation of Saskatchewan Inc. 100% KL 103C (Nutrien Cory) |
| • | BHP Billiton Canada Inc. 100% KL 208 |
Nutrien’s Cory Mine (KL 103 C) has extensive underground workings immediately adjacent to Vanscoy KL 114 D. While these two mines are both owned and operated by Nutrien, there remains a shared buffer between the two operations’ mine workings, where it is agreed that no mining will occur. This buffer ensures that mine workings at one operation will not negatively impact workings at the other.
| 24.0 | OTHER RELEVANT DATA AND INFORMATION |
Not applicable.
| 25.0 | INTERPRETATION AND CONCLUSIONS |
Nutrien and Agrium, one of the legacy companies of Nutrien, has a long history of successful potash mining at Vanscoy, where potash has been produced for over 50 years. The authors believe that the experience gained in mining and milling potash for this length of time has produced a reliable body of information about potash mineralization, mining, and milling at Vanscoy.
In a Saskatchewan potash mine that has been producing for many decades, reduction of mine life through increased production is counter-balanced by development mining into new mineral land parcels. This increases mine life through increasing the potash Mineral Reserve.
For Vanscoy, mine life can be estimated by dividing the total Mineral Reserve (Proven + Probable) of 377 million tonnes by the average annual mining rate (million tonnes of ore hoisted per year). For Vanscoy, the mining rate is defined as equal to the actual three-year running average (consecutive, most recent years). The average mining rate at Vanscoy over the past three years (2022, 2023, and 2024) was 3.087 million tonnes of potash ore mined and hoisted per year.
If this mining rate is sustained, and if Mineral Reserves remain unchanged, then the Vanscoy mine life would be 122 years. This estimate of mine life is likely to change as mining advances further into new mining blocks, and / or if mining rates or mining methodologies change.
| 26.0 | RECOMMENDATIONS |
Not applicable for a potash mine that has been in operation since 1969.
42
| 27.0 | REFERENCES |
Companion Policy 43-101CP to National Instrument 43-101 Standards of Disclosure for Mineral Projects (2011). Retrieve this and related documents from many websites.
The CIM Definition Standards for Mineral Resources and Reserves (2014). Retrieve this and related documents from many websites.
Fuzesy, Anne (1982). Potash in Saskatchewan (44p). Saskatchewan Industry and Resources Report 181. https://publications.saskatchewan.ca/#/products/7307.
Gebhardt, E. (1993). Mine planning and design integration, CIM Bulletin, May 1993, pp. 41 – 49.
Government of Saskatchewan (2025). Saskatchewan Mining and Petroleum GeoAtlas. https://gisappl.saskatchewan.ca/Html5Ext/index.html?viewer=GeoAtlas. Accessed January 2025.
Government of Saskatchewan. The Corporation Capital Tax Act of Saskatchewan. Available online at http://www.qp.gov.sk.ca/documents/English/Statutes/Statutes/c38-1.pdf.
Government of Saskatchewan. The Mineral Taxation Act, 1983. Available online at http://www.qp.gov.sk.ca/documents/English/Statutes/Statutes/M17-1.pdf.
Government of Saskatchewan. The Mines Regulations, 2018. Available online at https://publications.saskatchewan.ca/#/products/100307.
Government of Saskatchewan. The Potash Production Tax Regulations. Available online at https://publications.saskatchewan.ca/#/products/1263.
Government of Saskatchewan. The Subsurface Mineral Royalty Regulations, 2017. Available online at http://publications.gov.sk.ca/details.cfm?p=88223&cl=8.
Government of Saskatchewan. The Subsurface Mineral Tenure Regulations, 2015. Available online at http://www.publications.gov.sk.ca/details.cfm?p=72797.
Jones, P. R. and F. F. Prugger (1982). Underground mining in Saskatchewan potash. Mining Engineering, 34, pp. 1677 – 1683.
Nutrien Pilot Plant (2018). Personal communication on density of insoluble minerals in different ore zones.
Prugger, F.F., (1979), The flooding of the Cominco potash mine and its rehabilitation; CIM Bulletin, Vol. 72, No. 807, pp. 86 – 90.
Prugger, F. F. and A. F. Prugger (1991). Water problems in Saskatchewan potash mining – what can be learned from them? Bulletin of the Canadian Institute of Mining and Metallurgy (CIM Bulletin), Vol. 84, No. 945, pp. 58 – 66.
Robertson, David S. and Associates (1978). Summary Report on Evaluation of Potash Assets for Potash Corporation of Saskatchewan. Unpublished consultant’s report to Potash Corporation of Saskatchewan Inc.
Yang, C., Jensen, G., and Berenyi, J. (2009a). The Stratigraphic Framework of the Potash-rich Members of the Middle Devonian Upper Prairie Evaporite Formation, Saskatchewan; Summary of Investigations 2009, Volume 1, Saskatchewan Geological Survey.
43