UNITED STATES
SECURITIES AND EXCHANGE COMMISSION
Washington, DC 20549
FORM 6-K
Report of Foreign Private Issuer
Pursuant to Rule 13a-16 or 15d-16
Under the Securities Exchange Act of 1934
For the month of February, 2025
Cameco Corporation
(Commission file No. 1-14228)
2121-11th Street West
Saskatoon, Saskatchewan, Canada S7M 1J3
(Address of Principal Executive Offices)
Indicate by check mark whether the registrant files or will file annual reports under cover Form 20-F or Form 40-F.
Form 20-F ☐ Form 40-F ☒
Indicate by check mark whether the registrant by furnishing the information contained in this Form is also thereby furnishing the information to the Commission pursuant to Rule 12g3-2(b) under the Securities Exchange Act of 1934.
Yes ☐ No ☒
If “Yes” is marked, indicate below the file number assigned to the registrant in connection with Rule 12g3-2(b):
Exhibit Index
The Company hereby incorporates by reference into the Company’s registration statements on Form S-8 (File Nos. 333-11736, 333-06180, 333-139165, 333-196422 and 333-281406) and Form F-10 (File No. 333-283140) the information contained in Exhibits 99.2, 99.3 and 99.4 to this Form 6-K.
SIGNATURE
Pursuant to the requirements of the Securities Exchange Act of 1934, the registrant has duly caused this report to be signed on its behalf by the undersigned, thereunto duly authorized.
| Date: February 20, 2025 | Cameco Corporation | |||||
| By: | /s/ Sean A. Quinn | |||||
| Sean A. Quinn | ||||||
| Senior Vice-President, Chief Legal Officer and Corporate Secretary | ||||||
Exhibit 99.1
|
|
||||
| TSX: CCO | website: cameco.com | |||
| NYSE: CCJ | currency: Cdn (unless noted) |
2121 – 11th Street West, Saskatoon, Saskatchewan, S7M 1J3 Canada
Tel: 306-956-6200 Fax: 306-956-6201
Cameco announces 2024 results; strong performance across all segments; Westinghouse distribution; strategy centered on marketing, production, financial discipline expected to generate full-cycle value; positive outlook for nuclear energy
Saskatoon, Saskatchewan, Canada, February 20, 2025 . . . . . . . . . . . . . . . .
Cameco (TSX: CCO; NYSE: CCJ) today reported its consolidated financial and operating results for the fourth quarter and year ended December 31, 2024, in accordance with International Financial Reporting Standards (IFRS).
“Our 2024 full-year financial performance benefitted from strong fourth quarter results delivered by our uranium and Westinghouse segments,” said Tim Gitzel, Cameco’s president and CEO. “Although both net earnings and adjusted net earnings in 2024 were lower than in 2023 primarily due to the impact of purchase accounting related to the Westinghouse acquisition, our other key financial metrics improved significantly. We expect our strong financial performance to continue in 2025, driven by the supportive market conditions we are seeing throughout the fuel cycle and across the nuclear sector, and through the continued benefits flowing from our investment in Westinghouse. Over the coming year, we expect to continue investing to help ensure reliability and sustainability of our existing operations, while positioning ourselves for future production flexibility and growth – growth that will be strategic, deliberate, disciplined, and with a focus on generating full-cycle value.
“It was another positive year for the nuclear industry, with support for both existing nuclear reactors and nuclear new build continuing to grow. In fact, we believe the outlook for nuclear power and nuclear fuel fundamentals is more favourable than it has been for decades. Continued global geopolitical uncertainty is bringing energy security and national security into focus, which puts nuclear in what we believe is a durable growth mode, and as we see that growth translate into demand and a cycle of replacement rate contracting, we too expect to be back in durable growth mode. We believe the risks to uranium and nuclear fuel supplies and services are greater than the risks to demand, and we expect that will create a renewed focus on ensuring long-term availability of nuclear fuel supplies.
“This past year in our uranium segment, despite relatively muted long-term contracting volumes as utilities focused first on securing enrichment and conversion services, we continued to negotiate off-market contracts and selectively add to our long-term portfolio, which now totals approximately 220 million pounds. That only represents about a quarter of our current reserve and resource base, meaning we can be strategically patient in our contracting discussions, and we are retaining exposure to the improving demand from our customers. We continue to have a large and growing pipeline of uranium business under negotiation and our focus remains on obtaining market-related pricing mechanisms that benefit from a constructive price environment, while also providing adequate downside protection. In addition, strong demand driving prices to historic highs in the conversion market is being captured in additional long-term contracts in our fuel services segment, with total contracted volumes of approximately 85 million kgU of UF6 supporting our fuel services operations for years to come.
“We have more than 35 years of experience operating across the fuel cycle, and we have designed our strategy of full-cycle value capture to be resilient. Given the nature of nuclear fuel contracting and our long-term contract book, we have good visibility into when and where we need to deliver material, allowing us to carefully plan and prudently invest in our existing and potential supply sources, well into the future. When we consider the supply tools and flexibility we have in place to self-manage risk and to work with our customers to satisfy their ongoing fuel requirements, we can be selective and opportunistic with our sourcing of supply, including spot market purchases, and we can be disciplined when considering future investments in our primary supply pipeline.
- 1 -
“The positive market conditions that we expect to benefit our core uranium and fuel services businesses are also presenting significant future growth opportunities for Westinghouse, which we own with our partner Brookfield. In 2024, we saw continued interest in AP1000® new build opportunities in Poland, Bulgaria, Ukraine and Slovenia. In early 2025, Westinghouse announced a settlement agreement in its technology and export dispute with Korea Electric Power Corporation and Korea Hydro & Nuclear Power Co., Ltd., which resolves the dispute and establishes a framework for additional deployments outside of South Korea, to the mutual and material benefit of Westinghouse, KEPCO and KHNP.
“Cameco will continue to align our production with our contract portfolio and market opportunities, demonstrating that we continue to responsibly manage our supply in accordance with our customers’ needs. We will continue to look for opportunities to improve operational effectiveness, improve our safety performance and reduce our impact on the environment, including through the use of digital and automation technologies to allow us to operate our assets with more flexibility and efficiency. Thanks to our disciplined strategy, our balance sheet is strong, and we expect it will enable us to continue executing our strategy while self-managing risk, including risks related to global macro-economic uncertainty and volatility, and uncertain trade policy decisions.
“We are a responsible, commercial supplier with long-lived, tier-one assets, and a proven operating track record. We are invested across the nuclear fuel cycle and believe we have the right strategy to help achieve a secure energy future in a manner that reflects our values. Embedded in our decisions is a commitment to address the risks and opportunities that we believe will make our business sustainable over the long term.”
Summary of Q4 and 2024 results and developments:
| • | Annual net earnings of $172 million; adjusted net earnings of $292 million: Annual results reflected a return to our tier-one production level, with higher sales volumes and an improvement in average realized prices as market conditions continued to improve, catalyzed by security of supply concerns. In 2024, we generated $905 million in cash from operations with full year adjusted EBITDA increasing by approximately 73% to over $1.5 billion compared to $884 million in 2023. Our 2024 annual results include $483 million in adjusted EBITDA from our investment in Westinghouse. Adjusted net earnings and adjusted EBITDA are non-IFRS measures, see page 5. |
| • | Fourth quarter net earnings of $135 million; adjusted net earnings of $157 million: Strong fourth quarter results in the uranium and Westinghouse segments contributed to the strong annual results. As expected, quarterly results were impacted by normal variations in contract deliveries and the timing of Westinghouse’s customer requirements, which were heavily weighted to the fourth quarter in 2024. Adjusted net earnings is a non-IFRS measure, see page 5. |
| • | Strong adjusted EBITDA from Westinghouse: Westinghouse reported a full-year net loss of $218 million (our share) as expected, due to the impact of purchase accounting, which required the revaluation of its inventories based on market prices at time of acquisition, and the expensing of some other non-operating acquisition-related transition costs. The impact of these items was largely isolated to the first half of 2024 and are expected to have a smaller impact in future years, although the increased depreciation and amortization charges related to purchase accounting, will impact Westinghouse’s net earnings on an ongoing basis. Our share of adjusted EBITDA, which we view as a measure that better reflects Westinghouse’s underlying performance, was $483 million for the year. Due to normal variability in the timing of its customer requirements, and delivery and outage schedules, we saw stronger performance from the Westinghouse segment in the fourth quarter, which we expect again in the fourth quarter of 2025. See Our earnings from Westinghouse in our annual MD&A for more information. |
| • | Westinghouse technology export: In January 2025, Westinghouse reached a resolution in its technology and export dispute with Korea Electric Power Corporation and Korea Hydro & Nuclear Power Co., Ltd., which establishes a framework for additional deployments to the mutual and material benefit of all parties. |
| • | Westinghouse distribution: In February 2025 we received $49 million (US), which represents our share of a $100 million (US) distribution paid by Westinghouse. This is the first distribution since the acquisition closed. |
| • | Strong uranium and conversion segment performance: In our uranium segment, we delivered 33.6 million pounds of uranium at an average realized price of $79.70 per pound. Our share of production was 23.4 million pounds in 2024, slightly higher than our expectation of about 23.1 million pounds as a result of record annual production from the Key Lake mill. In our fuel services segment, we delivered 12.1 million kgU under contract at an average realized price of $37.87 per kgU, and produced 13.5 million kgU, which was within our guidance range for 2024. |
- 2 -
| • | Record production at McArthur River/Key Lake: 2024 packaged production of 20.3 million pounds sets both a new annual production record for the Key Lake mill, as well as a world record for annual production from any uranium mill. The increased run rate was made possible in part by our off-cycle investments during care and maintenance in automation, digitization and optimization projects to improve the Key Lake mill. The mill also had access to sufficient ore feed material that included the ore mined at McArthur River in 2024 (which was lower than its plan), supplemented by broken ore inventory at McArthur River and Key Lake that was carried over from prior years and is now largely depleted. See Uranium – Tier-one operations – McArthur River/Key Lake in our 2024 annual MD&A. |
| • | Lower JV Inkai production: Production at Inkai continued to be impacted by the ongoing supply chain issues in Kazakhstan, most notably, related to the stability of sulfuric acid deliveries. As a result, total 2024 production from Inkai on a 100% basis was 7.8 million pounds (3.6 million pounds our share), 0.6 million pounds lower than in 2023. Issues at Inkai carried into 2025 when production was halted on January 1 at the direction of Kazatomprom, the controlling partner in the JV, due to the delayed submission of certain regulatory documents to Kazakhstan’s Ministry of Energy. Production resumed on January 23, 2025. Cameco and Kazatomprom continue to work with JV Inkai to determine the impact of the production suspension on the operation’s 2025 production plans. If Inkai production and/or deliveries vary from our expectations, committed purchases may vary and we will rely on our other sources of supply. See Uranium – Tier-one operations – Inkai in our 2024 annual MD&A. |
| • | Disciplined long-term contracting continues: As of December 31, 2024, in our uranium segment, we had commitments to deliver an average of about 28 million pounds of uranium per year from 2025 through 2029, with commitment levels higher than the average in 2025 through 2027, and lower than the average in 2028 and 2029. Our total portfolio of long-term contracts includes commitments for approximately 220 million pounds of uranium. We continue to have a large and growing pipeline of business under discussion. Our focus continues to be on obtaining market-related pricing mechanisms that benefit from a constructive price environment, while also providing adequate downside protection. In addition, with strong demand in the UF6 conversion market, we were successful in adding new long-term contracts that bring our total contracted volumes to over 85 million kgU of UF6, underpinning our fuel services operations for years to come. |
| • | Solid 2025 financial and operational outlook: In our uranium segment, we continued to execute our strategy in 2024, ramping up our tier-one assets and continuing to optimize performance and reliability. With continuing improvement of market conditions, the long-term contract book we have put in place, and an ongoing pipeline of both on and off-market contracting discussions, our plan is to produce 18 million pounds (100% basis) at each of McArthur River/Key Lake and Cigar Lake in 2025. We are also undertaking capital projects to help ensure reliability and sustainability of our existing operations, including projects to address aging infrastructure and potential bottlenecks at the Key Lake mill and the advancement of freezing at the McArthur River mine. While no decision on changes to future production levels has been made, we will continue to position ourselves for future production flexibility. Following the halt of production in January 2025 at Inkai, production plans for 2025 and subsequent years remain uncertain, and we remain in discussions with JV Inkai and our partner, Kazatomprom, to determine our purchase obligation for 2025. In our fuel services segment, we plan to produce between 13 million and 14 million kgU in 2025 to satisfy our book of long-term business for conversion and fuel services. As a result of these plans, we expect strong financial performance in 2025, including cash flow generation. See Outlook for 2025 and Uranium – Tier-one operations in our 2025 annual MD&A. |
| • | Maintaining financial discipline and balanced liquidity to execute on strategy: |
| • | Strong balance sheet: As of December 31, 2024, we had $600 million in cash and cash equivalents, and $1.3 billion in total debt. We successfully refinanced $500 million senior unsecured debentures in 2024. The refinanced debt matures in 2031 with credit spreads reflective of a higher credit rating than we have currently been assigned. In addition, we have a $1.0 billion undrawn credit facility, which matures October 1, 2028. We expect strong cash flow generation in 2025. |
| • | Focused debt reduction: Thanks to our risk-managed financial discipline and strong cash flow generation, in 2024 we made repayments of $400 million (US) on the $600 million (US) floating-rate term loan that was used to finance the acquisition of Westinghouse. In January 2025, we made the final repayment of $200 million (US), extinguishing the term loan. |
| • | JV Inkai dividend: In 2024, we received a cash dividend from JV Inkai totaling $129 million (US), net of withholdings. JV Inkai distributes excess cash, net of working capital requirements, to the partners as dividends. See Uranium – Tier-one operations – Inkai in our 2024 annual MD&A. |
- 3 -
| • | Increased annual dividend: In November, the board of directors approved an increase to the annual dividend from $0.12 per common share in 2023, to $0.16 per common share in 2024. In addition, to recognize the return to our tier-one run rate, and in line with the principles of our capital allocation framework, we have recommended to our board of directors a dividend growth plan for consideration. Based on this plan, we expect an annual increase of at least $0.04 per common share in each of 2025 and 2026 to achieve a doubling of the 2023 dividend from $0.12 per common share, to $0.24, per common share. |
Consolidated financial results
| THREE MONTHS ENDED | YEAR ENDED | |||||||||||||||
| CONSOLIDATED HIGHLIGHTS | DECEMBER 31 | DECEMBER 31 | ||||||||||||||
| ($ MILLIONS EXCEPT WHERE INDICATED) |
2024 | 2023 | 2024 | 2023 | ||||||||||||
| Revenue |
1,183 | 844 | 3,136 | 2,588 | ||||||||||||
| Gross profit |
250 | 133 | 783 | 562 | ||||||||||||
| Net earnings attributable to equity holders |
135 | 80 | 172 | 361 | ||||||||||||
| $ per common share (basic) |
0.31 | 0.18 | 0.40 | 0.83 | ||||||||||||
| $ per common share (diluted) |
0.31 | 0.18 | 0.39 | 0.83 | ||||||||||||
| Adjusted net earnings (non-IFRS, see page 5)1 |
157 | 108 | 292 | 383 | ||||||||||||
| $ per common share (adjusted and diluted) |
0.36 | 0.25 | 0.67 | 0.88 | ||||||||||||
| Adjusted EBITDA (non-IFRS, see page 5) |
524 | 336 | 1,531 | 884 | ||||||||||||
| Cash provided by operations |
530 | 201 | 905 | 688 | ||||||||||||
| 1 | In 2024, we revised our calculation of adjusted net earnings to adjust for unrealized foreign exchange gains and losses as well as for share-based compensation because it better reflects how we assess our operational performance. We restated comparative periods to reflect this change. |
The 2024 annual financial statements have been audited; however, the 2023 fourth quarter and 2024 fourth quarter financial information presented is unaudited. You can find a copy of our 2024 annual MD&A and our 2024 audited financial statements on our website at cameco.com.
- 4 -
NET EARNINGS
The following table shows what contributed to the change in net earnings and adjusted net earnings (non-IFRS measure, see page 5) in the three months and year ended December 31, 2024, compared to the same period in 2023.
| THREE MONTHS ENDED | YEAR ENDED | |||||||||||||||||
| CHANGES IN EARNINGS |
DECEMBER 31 | DECEMBER 31 | ||||||||||||||||
| ($ MILLIONS) |
IFRS | ADJUSTED | IFRS | ADJUSTED | ||||||||||||||
| Net earnings - 2023 |
80 | 108 | 361 | 383 | ||||||||||||||
|
|
|
|
|
|
|
|
|
|||||||||||
| Change in gross profit by segment |
||||||||||||||||||
| (we calculate gross profit by deducting from revenue the cost of products and services sold, and depreciation and amortization (D&A), net of hedging benefits) |
|
|||||||||||||||||
| Uranium |
Impact from sales volume changes |
29 | 29 | 22 | 22 | |||||||||||||
| Higher realized prices ($US) |
107 | 107 | 390 | 390 | ||||||||||||||
| Foreign exchange impact on realized prices |
11 | 11 | 26 | 26 | ||||||||||||||
| Higher costs |
(30 | ) | (30 | ) | (203 | ) | (203 | ) | ||||||||||
|
|
|
|
|
|
|
|
|
|||||||||||
| change – uranium |
117 | 117 | 235 | 235 | ||||||||||||||
|
|
|
|
|
|
|
|
|
|||||||||||
| Fuel services |
Impact from sales volume changes |
— | — | 2 | 2 | |||||||||||||
| Higher realized prices ($Cdn) |
13 | 13 | 27 | 27 | ||||||||||||||
| Higher costs |
(16 | ) | (16 | ) | (47 | ) | (47 | ) | ||||||||||
|
|
|
|
|
|
|
|
|
|||||||||||
| change – fuel services |
(3 | ) | (3 | ) | (18 | ) | (18 | ) | ||||||||||
|
|
|
|
|
|
|
|
|
|||||||||||
| Other changes |
||||||||||||||||||
| Higher administration expenditures |
(18 | ) | (18 | ) | (7 | ) | (7 | ) | ||||||||||
| Higher exploration expenditures |
(7 | ) | (7 | ) | (17 | ) | (17 | ) | ||||||||||
| Change in reclamation provisions |
70 | 7 | 30 | (3 | ) | |||||||||||||
| Change in gains on derivatives |
(198 | ) | (6 | ) | (221 | ) | (10 | ) | ||||||||||
| Change in unrealized foreign exchange gains or losses |
50 | (5 | ) | 50 | (6 | ) | ||||||||||||
| Change in earnings from equity-accounted investees |
10 | (32 | ) | (165 | ) | (122 | ) | |||||||||||
| Change in share-based compensation |
— | 5 | — | (19 | ) | |||||||||||||
| Lower finance income |
(16 | ) | (16 | ) | (91 | ) | (91 | ) | ||||||||||
| Higher finance costs |
16 | 16 | (31 | ) | (31 | ) | ||||||||||||
| Change in income tax recovery or expense |
29 | (14 | ) | 41 | (7 | ) | ||||||||||||
| Other |
5 | 5 | 5 | 5 | ||||||||||||||
|
|
|
|
|
|
|
|
|
|||||||||||
| Net earnings - 2024 |
135 | 157 | 172 | 292 | ||||||||||||||
|
|
|
|
|
|
|
|
|
|||||||||||
Non-IFRS measures
The non-IFRS measures referenced in this document are supplemental measures, which are used as indicators of our financial performance. Management believes that these non-IFRS measures provide useful supplemental information to investors, securities analysts, lenders and other interested parties in assessing our operational performance and our ability to generate cash flows to meet our cash requirements. These measures are not recognized measures under IFRS, do not have standardized meanings, and are therefore unlikely to be comparable to similarly-titled measures presented by other companies. Accordingly, these measures should not be considered in isolation or as a substitute for the financial information reported under IFRS. We are not able to reconcile our forward-looking non-IFRS guidance because we cannot predict the timing and amounts of discrete items, which could significantly impact our IFRS results. The following are the non-IFRS measures used in this document.
ADJUSTED NET EARNINGS
Adjusted net earnings (ANE) is our net earnings attributable to equity holders, adjusted for non-operating or non-cash items such as gains and losses on derivatives, unrealized foreign exchange gains and losses, share-based compensation, and adjustments to reclamation provisions flowing through other operating expenses, that we believe do not reflect the underlying financial performance for the reporting period. In 2024, we revised our calculation of adjusted net earnings to adjust for unrealized foreign exchange gains and losses as well as for share-based compensation because it better reflects how we assess our operational performance. We have restated comparative periods to reflect this change. Other items may also be adjusted from time to time. We adjust this measure for certain of the items that our equity-accounted investees make in arriving at other non-IFRS measures.
- 5 -
Adjusted net earnings is one of the targets that we measure to form the basis for a portion of annual employee and executive compensation (see Measuring our results in our 2024 annual MD&A).
In calculating ANE we adjust for derivatives. We do not use hedge accounting under IFRS and, therefore, we are required to report gains and losses on all hedging activity, both for contracts that close in the period and those that remain outstanding at the end of the period. For the contracts that remain outstanding, we must treat them as though they were settled at the end of the reporting period (mark-to-market). However, we do not believe the gains and losses that we are required to report under IFRS appropriately reflect the intent of our hedging activities, so we make adjustments in calculating our ANE to better reflect the impact of our hedging program in the applicable reporting period. See Foreign exchange in our 2024 annual MD&A for more information.
We also adjust for changes to our reclamation provisions that flow directly through earnings. Every quarter we are required to update the reclamation provisions for all operations based on new cash flow estimates, discount and inflation rates. This normally results in an adjustment to our asset retirement obligation asset in addition to the provision balance. When the assets of an operation have been written off due to an impairment, as is the case with our Rabbit Lake and US ISR operations, the adjustment is recorded directly to the statement of earnings as “other operating expense (income)”. See note 16 of our annual financial statements for more information. This amount has been excluded from our ANE measure.
As a result of the change in ownership of Westinghouse when it was acquired by Cameco and Brookfield, Westinghouse’s inventories at the acquisition date were revalued based on the market price at that date. As these quantities are sold, Westinghouse’s cost of products and services sold reflect these market values, regardless of their historic costs. Our share of these costs is included in earnings from equity-accounted investees and recorded in cost of products and services sold in the investee information (see note 12 to the financial statements). Since this expense is non-cash, outside of the normal course of business and only occurred due to the change in ownership, we have excluded our share from our ANE measure.
Westinghouse has also expensed some non-operating acquisition-related transition costs that the acquiring parties agreed to pay for, which resulted in a reduction in the purchase price paid. Our share of these costs is included in earnings from equity accounted investees and recorded in other expenses in the investee information (see note 12 to the financial statements). Since this expense is outside of the normal course of business and only occurred due to the change in ownership, we have excluded our share from our ANE measure.
The following table reconciles adjusted net earnings with our net earnings for the three months and years ended December 31, 2024, and 2023.
| THREE MONTHS ENDED | YEAR ENDED | |||||||||||||||
| DECEMBER 31 | DECEMBER 31 | |||||||||||||||
| ($ MILLIONS) |
2024 | 2023 | 2024 | 2023 | ||||||||||||
| Net earnings attributable to equity holders |
135 | 80 | 172 | 361 | ||||||||||||
|
|
|
|
|
|
|
|
|
|||||||||
| Adjustments |
||||||||||||||||
| Adjustments on derivatives |
133 | (59 | ) | 152 | (59 | ) | ||||||||||
| Unrealized foreign exchange gains |
(56 | ) | (1 | ) | (66 | ) | (10 | ) | ||||||||
| Share-based compensation |
17 | 12 | 44 | 63 | ||||||||||||
| Adjustments on other operating expense (income) |
(23 | ) | 40 | (35 | ) | (2 | ) | |||||||||
| Income taxes on adjustments |
(37 | ) | 6 | (46 | ) | 2 | ||||||||||
| Adjustments on equity investees (net of tax): |
||||||||||||||||
| Inventory purchase accounting |
3 | 20 | 53 | 20 | ||||||||||||
| Acquisition-related transition costs |
— | — | 22 | — | ||||||||||||
| Unrealized foreign exchange losses (gains) |
(16 | ) | 10 | (7 | ) | 8 | ||||||||||
| Long-term incentive plan |
1 | — | 3 | — | ||||||||||||
|
|
|
|
|
|
|
|
|
|||||||||
| Adjusted net earnings |
157 | 108 | 292 | 383 | ||||||||||||
|
|
|
|
|
|
|
|
|
|||||||||
EBITDA
EBITDA is defined as net earnings attributable to equity holders, adjusted for the costs related to the impact of the company’s capital and tax structure including depreciation and amortization, finance income, finance costs (including accretion) and income taxes.
- 6 -
ADJUSTED EBITDA
Adjusted EBITDA is defined as EBITDA, as further adjusted for the impact of certain costs or benefits incurred in the period which are either not indicative of the underlying business performance or that impact the ability to assess the operating performance of the business. These adjustments include the amounts noted in the adjusted net earnings definition.
In calculating adjusted EBITDA, we also adjust for items included in the results of our equity-accounted investees. These items are reported as part of marketing, administrative and general expenses within the investee financial information and are not representative of the underlying operations. These include gain/loss on undesignated hedges, transaction costs related to acquisitions and gain/loss on disposition of a business.
We also adjust for the unwinding of the effect of purchase accounting on the sale of inventories which is included in our share of earnings from equity-accounted investee and recorded in the cost of products and services sold in the investee information (see note 12 to the financial statements).
The company may realize similar gains or incur similar expenditures in the future.
ADJUSTED EBITDA MARGIN
Adjusted EBITDA margin is defined as adjusted EBITDA divided by revenue for the appropriate period.
EBITDA, adjusted EBITDA, and adjusted EBITDA margin are measures which allow us and other users to assess results of operations from a management perspective without regard for our capital structure. To facilitate a better understanding of these measures, the table below reconciles earnings before income taxes with EBITDA and adjusted EBITDA for the fourth quarters and years ended 2024 and 2023.
For the year ended December 31, 2024:
| ($ MILLIONS) |
URANIUM1 | FUEL SERVICES |
WESTINGHOUSE | OTHER | TOTAL | |||||||||||||||
| Net earnings (loss) attributable to equity holders |
904 | 108 | (218 | ) | (622 | ) | 172 | |||||||||||||
| Depreciation and amortization |
239 | 37 | — | 5 | 281 | |||||||||||||||
| Finance income |
— | — | — | (21 | ) | (21 | ) | |||||||||||||
| Finance costs |
— | — | — | 147 | 147 | |||||||||||||||
| Income taxes |
— | — | — | 85 | 85 | |||||||||||||||
|
|
|
|
|
|
|
|
|
|
|
|||||||||||
| 1,143 | 145 | (218 | ) | (406 | ) | 664 | ||||||||||||||
| Adjustments on equity investees |
||||||||||||||||||||
| Depreciation and amortization |
23 | — | 357 | — | 380 | |||||||||||||||
| Finance income |
(1 | ) | — | (4 | ) | — | (5 | ) | ||||||||||||
| Finance expense |
— | — | 225 | — | 225 | |||||||||||||||
| Income taxes |
58 | — | (61 | ) | — | (3 | ) | |||||||||||||
|
|
|
|
|
|
|
|
|
|
|
|||||||||||
| Net adjustments on equity investees |
80 | — | 517 | — | 597 | |||||||||||||||
|
|
|
|
|
|
|
|
|
|
|
|||||||||||
| EBITDA |
1,223 | 145 | 299 | (406 | ) | 1,261 | ||||||||||||||
| Gain on derivatives |
— | — | — | 152 | 152 | |||||||||||||||
| Other operating income |
(35 | ) | — | — | — | (35 | ) | |||||||||||||
| Share-based compensation |
— | — | — | 44 | 44 | |||||||||||||||
| Unrealized foreign exchange gains |
— | — | — | (66 | ) | (66 | ) | |||||||||||||
|
|
|
|
|
|
|
|
|
|
|
|||||||||||
| (35 | ) | — | — | 130 | 95 | |||||||||||||||
| Adjustments on equity investees |
||||||||||||||||||||
| Inventory purchase accounting |
— | — | 71 | — | 71 | |||||||||||||||
| Acquisition-related transition costs |
— | — | 29 | — | 29 | |||||||||||||||
| Other expenses |
— | — | 78 | — | 78 | |||||||||||||||
| Foreign exchange gains |
(9 | ) | — | 2 | — | (7 | ) | |||||||||||||
|
|
|
|
|
|
|
|
|
|
|
|||||||||||
| Net adjustments on equity investees |
(9 | ) | — | 184 | — | 175 | ||||||||||||||
|
|
|
|
|
|
|
|
|
|
|
|||||||||||
| Adjusted EBITDA |
1,179 | 145 | 483 | (276 | ) | 1,531 | ||||||||||||||
|
|
|
|
|
|
|
|
|
|
|
|||||||||||
| 1 | JV Inkai EBITDA is included in the uranium segment. See Financial results by segment – Uranium in our 2024 annual MD&A. |
- 7 -
For the year ended December 31, 2023:
| ($ MILLIONS) |
URANIUM1 | FUEL SERVICES |
WESTINGHOUSE | OTHER | TOTAL | |||||||||||||||
| Net earnings (loss) attributable to equity holders |
606 | 129 | (24 | ) | (350 | ) | 361 | |||||||||||||
| Depreciation and amortization |
175 | 35 | — | 10 | 220 | |||||||||||||||
| Finance income |
— | — | — | (112 | ) | (112 | ) | |||||||||||||
| Finance costs |
— | — | — | 116 | 116 | |||||||||||||||
| Income taxes |
— | — | — | 126 | 126 | |||||||||||||||
|
|
|
|
|
|
|
|
|
|
|
|||||||||||
| 781 | 164 | (24 | ) | (210 | ) | 711 | ||||||||||||||
| Adjustments on equity investees |
||||||||||||||||||||
| Depreciation and amortization |
14 | — | 61 | — | 75 | |||||||||||||||
| Finance income |
— | — | (2 | ) | — | (2 | ) | |||||||||||||
| Finance expense |
— | — | 30 | — | 30 | |||||||||||||||
| Income taxes |
42 | — | (7 | ) | — | 35 | ||||||||||||||
|
|
|
|
|
|
|
|
|
|
|
|||||||||||
| Net adjustments on equity investees |
56 | — | 82 | — | 138 | |||||||||||||||
|
|
|
|
|
|
|
|
|
|
|
|||||||||||
| EBITDA |
837 | 164 | 58 | (210 | ) | 849 | ||||||||||||||
| Loss on derivatives |
— | — | — | (59 | ) | (59 | ) | |||||||||||||
| Other operating income |
(2 | ) | — | — | — | (2 | ) | |||||||||||||
| Share-based compensation |
— | — | — | 63 | 63 | |||||||||||||||
| Unrealized foreign exchange gains |
— | — | — | (10 | ) | (10 | ) | |||||||||||||
|
|
|
|
|
|
|
|
|
|
|
|||||||||||
| (2 | ) | — | — | (6 | ) | (8 | ) | |||||||||||||
| Adjustments on equity investees |
||||||||||||||||||||
| Inventory purchase accounting |
— | — | 27 | — | 27 | |||||||||||||||
| Other expenses |
— | — | 8 | — | 8 | |||||||||||||||
| Foreign exchange gains |
— | — | 8 | — | 8 | |||||||||||||||
|
|
|
|
|
|
|
|
|
|
|
|||||||||||
| Net adjustments on equity investees |
— | — | 43 | — | 43 | |||||||||||||||
|
|
|
|
|
|
|
|
|
|
|
|||||||||||
| Adjusted EBITDA |
835 | 164 | 101 | (216 | ) | 884 | ||||||||||||||
|
|
|
|
|
|
|
|
|
|
|
|||||||||||
| 1 | JV Inkai EBITDA is included in the uranium segment. See Financial results by segment - Uranium in our 2024 annual MD&A. |
The following Westinghouse financial outlook for 2025 is reported in Canadian dollars and prepared in accordance with IFRS and reflects Cameco’s 49% ownership share. It reconciles the Westinghouse outlook for net earnings with EBITDA and adjusted EBITDA.
| CAMECO SHARE (49%) |
$USD MILLIONS |
|||
| Net loss |
(20-70 | ) | ||
| Depreciation and amortization |
260-275 | |||
| Finance income |
(1-2 | ) | ||
| Finance costs |
120-135 | |||
| Income tax expense (recovery) |
5-(10 | ) | ||
|
|
|
|||
| EBITDA |
320-370 | |||
| Inventory purchase accounting |
1-5 | |||
| Restructuring costs |
15-30 | |||
| Other expenses |
10-25 | |||
|
|
|
|||
| Adjusted EBITDA |
355-405 | |||
|
|
|
|||
The outlook for adjusted EBITDA from Westinghouse for 2025 and its growth over the next five years are based on the following assumptions:
| • | A compound annual growth rate in revenue from its core business of 6% to 8%, which is slightly higher than the anticipated average growth rate of the nuclear industry based on the World Nuclear Association’s Reference Case. In addition to orders for PWR reactor fuel and services, this includes orders for VVER, BWR fuel and services, and a phase out of AGR fuel. The |
- 8 -
| outlook assumes that work is fulfilled on the timelines and scope expected based on current orders received, and additional work is secured based on past trends. The expected margins for the core business are aligned with the historic margins of 16% to 19%, with the variability expected to come from product mix compared to in previous years. |
| • | Growth in its new build business from new AP1000 reactor projects based on agreements that have been signed and announcements where AP1000 technology has been selected. This includes Poland, Bulgaria and Ukraine, as well as the expected benefit over this period for deployment of reactor designs using Westinghouse’s technology. It is assumed that work on announced agreements and announced selections to be done by Westinghouse would proceed on the timelines and revenue pattern noted under the New Build Framework. A delay in project timelines or cancellation of announced projects would result in a growth rate near the bottom of the range. The top of the growth range assumes the announced projects continue and two additional projects are secured within the timeframe from the group of planned and proposed projects. For all new build projects, the growth assumes Westinghouse undertakes only the Engineering and Procurement work required prior to a new reactor project breaking ground, which is a small component of the overall potential. |
| • | Estimates and assumptions, including growth capital timelines, new build development timelines for both announced and potential reactor builds which are subject to regulatory approval, as well as risks related to the current geopolitical and macro-economic environment, may differ significantly from those assumed. |
| • | Contributions from new technologies are outside the 5-year time frame. Timelines for investment in research and development for new technologies, including the eVinci™ microreactor and AP300™ small modular reactor, may differ from that assumed. |
| • | The outlook for capital expenditures includes growth capex for expansion of fuel fabrication capabilities, as well as work to evaluate cost, timeline and infrastructure required to bring back conversion capacity and consider the potential future opportunities at the Springfields site in the UK. As with Cameco’s other investments, planning for this site will align with market opportunities. |
Selected segmented highlights
| THREE MONTHS ENDED DECEMBER 31 |
YEAR ENDED DECEMBER 31 |
|||||||||||||||||||||||||||||
| HIGHLIGHTS |
2024 | 2023 | CHANGE | 2024 | 2023 | CHANGE | ||||||||||||||||||||||||
| Uranium |
Production volume (million lbs) | 6.1 | 5.7 | 7 | % | 23.4 | 17.6 | 33 | % | |||||||||||||||||||||
| Sales volume (million lbs) | 12.8 | 9.8 | 30 | % | 33.6 | 32.0 | 5 | % | ||||||||||||||||||||||
| Average realized price1 | ($US/lb) | 58.45 | 52.35 | 12 | % | 58.34 | 49.76 | 17 | % | |||||||||||||||||||||
| ($Cdn/lb) | 80.90 | 71.65 | 13 | % | 79.70 | 67.31 | 18 | % | ||||||||||||||||||||||
| Revenue ($ millions) | 1,035 | 700 | 48 | % | 2,677 | 2,153 | 24 | % | ||||||||||||||||||||||
| Gross profit ($ millions) | 213 | 96 | >100 | % | 681 | 445 | 53 | % | ||||||||||||||||||||||
| Earnings before income taxes | 289 | 122 | >100 | % | 904 | 606 | 49 | % | ||||||||||||||||||||||
| Adjusted EBITDA2 | 391 | 231 | 70 | % | 1,179 | 835 | 41 | % | ||||||||||||||||||||||
| Fuel services |
Production volume (million kgU) | 3.6 | 3.7 | (3 | )% | 13.5 | 13.3 | 2 | % | |||||||||||||||||||||
| Sales volume (million kgU) | 4.2 | 4.2 | — | 12.1 | 12.0 | 1 | % | |||||||||||||||||||||||
| Average realized price3 | ($Cdn/kgU) | 35.41 | 32.19 | 10 | % | 37.87 | 35.61 | 6 | % | |||||||||||||||||||||
| Revenue ($ millions) | 148 | 134 | 10 | % | 459 | 426 | 8 | % | ||||||||||||||||||||||
| Earnings before income taxes | 37 | 40 | (8 | )% | 108 | 129 | (16 | )% | ||||||||||||||||||||||
| Adjusted EBITDA2 | 49 | 51 | (4 | )% | 145 | 164 | (12 | )% | ||||||||||||||||||||||
| Adjusted EBITDA margin (%)2 | 33 | 38 | (13 | )% | 32 | 38 | (16 | )% | ||||||||||||||||||||||
| Westinghouse |
Revenue | 841 | 521 | 61 | % | 2,892 | 521 | >100 | % | |||||||||||||||||||||
| (our share) |
Net earnings (loss) | 9 | (24 | ) | > | (100%) | (218 | ) | (24 | ) | >100 | % | ||||||||||||||||||
| Adjusted EBITDA2 | 162 | 101 | 60 | % | 483 | 101 | >100 | % | ||||||||||||||||||||||
| 1 | Uranium average realized price is calculated as the revenue from sales of uranium concentrate, transportation and storage fees divided by the volume of uranium concentrates sold. |
| 2 | Non-IFRS measure, see page 5. |
- 9 -
| 3 | Fuel services average realized price is calculated as revenue from the sale of conversion and fabrication services, including fuel bundles and reactor components, transportation and storage fees divided by the volumes sold. |
Management’s discussion and analysis (MD&A) and financial statements
The 2024 annual MD&A and consolidated financial statements provide a detailed explanation of our operating results for the three and twelve months ended December 31, 2024, as compared to the same periods last year, and our outlook for 2025. This news release should be read in conjunction with these documents, as well as our most recent annual information form, all of which are available on our website at cameco.com, on SEDAR+ at www.sedarplus.com, and on EDGAR at sec.gov/edgar.shtml.
Qualified persons
The technical and scientific information discussed in this document for our material properties McArthur River/Key Lake, Cigar Lake and Inkai was approved by the following individuals who are qualified persons for the purposes of NI 43-101:
MCARTHUR RIVER/KEY LAKE
| • | Greg Murdock, general manager, McArthur River, Cameco |
| • | Daley McIntyre, general manager, Key Lake, Cameco |
INKAI
| • | Sergey Ivanov, deputy director general, technical services, Cameco Kazakhstan LLP |
CIGAR LAKE
| • | Kirk Lamont, general manager, Cigar Lake, Cameco |
Caution about forward-looking information
This news release includes statements and information about our expectations for the future, which we refer to as forward-looking information. Forward-looking information is based on our current views, which can change significantly, and actual results and events may be significantly different from what we currently expect.
Examples of forward-looking information in this news release include: our views regarding the outlook for nuclear energy and nuclear fuel fundamentals never having been more favourable; our expectation of strong financial performance and cash flow generation in 2025 driven by market conditions and through the continued benefits of our investment in Westinghouse, including our belief that Westinghouse is well-positioned for long-term growth, and our expected share of its adjusted EBITDA for 2025 and growth over the next five years; our expectation that Westinghouse’s investments in new technologies will be made in accordance with Westinghouse’s current business plan and our expectations regarding the effects on Westinghouse’s adjusted EBITDA; our expectation to continue investing to help ensure reliability and sustainability of our existing operations, while positioning us for future production flexibility and growth; our views regarding supply and demand for nuclear power, that the risks to uranium and nuclear fuel supplies and services are greater than the risk to demand, and our expectation of a renewed focus on ensuring long-term availability of nuclear fuel supplies; our ability to operate our assets sustainably, and our expectations regarding the value they will generate for us; our views regarding the impact on the nuclear power industry of geopolitical events; our ability to invest in our existing and potential supply sources; the durability of the nuclear industry and our growth, and our ability to pursue growth and generate full-cycle value; our contract portfolio strategy and pipeline of business; our supply plans, including production levels at McArthur River/Key Lake, Cigar Lake and Inkai, as well as at our fuel services segment; our capital projects plans; our ability to continue to be resilient and to position ourselves for future production flexibility; our belief that we have the right strategy to help achieve a secure energy future in a manner that reflects our values; our views regarding the long-term sustainability of our business and our ability to self-manage risk; our expectations for dividend payments in 2025 and 2026; and the expected date for announcement of our 2025 first quarter results.
- 10 -
Material risks that could lead to different results include: unexpected changes in uranium supply, demand, long-term contracting, and prices; changes in consumer demand for nuclear power and uranium as a result of changing societal views and objectives regarding nuclear power, electrification and decarbonization; risks to Westinghouse’s business associated with potential production disruptions, the implementation of its business objectives, compliance with licensing or quality assurance requirements, or otherwise be unable to achieve expected growth; the risk that we may not be able to implement changes to future operating and production levels for Cigar Lake and McArthur River/Key Lake and Inkai, or at our fuel services segment, to the planned levels within the expected timeframes, or that the costs involved in doing so, exceed our expectations; the risk that our revenues and cash flows may not achieve the levels expected; the risk of Inkai shipment delays due to the continuation or outcome of the conflict between Ukraine and Russia; the risk that we may not be able to meet sales commitments for any reason; the risk that we may not be able to continue to be resilient or continue to improve our financial performance; the risks to our business associated with potential production disruptions, including those related to global supply chain disruptions, global economic uncertainty and political volatility; risks associated with the application of, or developments in, laws or regulations that affect us or any of our joint ventures, including mining regulations, taxes, tariffs and sanctions; the risk that we may not be able to implement our business objectives in a manner consistent with our values; the risk that any of the strategies that we or any of our joint ventures are pursuing may prove unsuccessful, or that that may not be executed successfully; and the risk that we may be delayed in announcing our future financial results.
In presenting the forward-looking information, we have made material assumptions which may prove incorrect about: uranium demand, supply, consumption, long-term contracting, growth in the demand for and global public acceptance of nuclear energy, and prices; our production, purchases, sales, deliveries and costs; the market conditions and other factors upon which we have based our future plans and forecasts; the success of our plans and strategies, including planned operating and production changes; assumptions about Westinghouse’s production, purchases, sales, deliveries and costs, the absence of business disruptions, and the success of its plans and strategies; the absence of new and adverse government regulations, policies or decisions, including the application of, or developments in, laws that may adversely affect us, such as mining regulations, taxes, tariffs and sanctions; that there will not be any significant unanticipated adverse consequences to our business resulting from production disruptions, including those relating to supply disruptions, and economic or political uncertainty and volatility; and our ability to announce future financial results when expected.
Please also review the discussion in our 2024 annual MD&A and most recent annual information form for other material risks that could cause actual results to differ significantly from our current expectations, and other material assumptions we have made. Forward-looking information is designed to help you understand management’s current views of our near-term and longer-term prospects, and it may not be appropriate for other purposes. We will not necessarily update this information unless we are required to by securities laws.
Conference call
We invite you to join our fourth quarter conference call on Thursday, February 20, 2025, at 8:00 a.m. Eastern.
The call will be open to all investors and the media. To join the call, please dial (844) 763-8274 (Canada and US) or (647) 484-8814. An operator will put your call through. The slides and a live webcast of the conference call will be available from a link at cameco.com. See the link on our home page on the day of the call.
A recorded version of the proceedings will be available:
| • | on our website, cameco.com, shortly after the call |
| • | on post view until midnight, Eastern, April 20, 2025, by calling (855) 669-9658 (Canada and US) or (412) 317-0088 (Passcode 6056817) |
2025 first quarter report release date
We plan to announce our 2025 first quarter results before markets open on May 1, 2025.
Profile
Cameco is one of the largest global providers of the uranium fuel needed to energize a clean-air world. Our competitive position is based on our controlling ownership of the world’s largest high-grade reserves and low-cost operations, as well as significant investments across the nuclear fuel cycle, including ownership interests in Westinghouse Electric Company and Global Laser Enrichment. Utilities around the world rely on Cameco to provide global nuclear fuel solutions for the generation of safe, reliable, carbon-free nuclear power.
- 11 -
Our shares trade on the Toronto and New York stock exchanges. Our head office is in Saskatoon, Saskatchewan, Canada.
As used in this news release, the terms we, us, our, the Company and Cameco mean Cameco Corporation and its subsidiaries unless otherwise indicated.
– End –
Investor inquiries:
Cory Kos
306-716-6782
cory_kos@cameco.com
Media inquiries:
Veronica Baker
306-385-5541
veronica_baker@cameco.com
- 12 -
Exhibit 99.2

Cameco Corporation
2024 consolidated financial statements
February 19, 2025
Report of management’s accountability
The accompanying consolidated financial statements have been prepared by management in accordance with International Financial Reporting Standards as issued by the International Accounting Standards Board. Management is responsible for ensuring that these statements, which include amounts based upon estimates and judgments, are consistent with other information and operating data contained in the annual financial review and reflect the corporation’s business transactions and financial position.
Management is also responsible for the information disclosed in the management’s discussion and analysis including responsibility for the existence of appropriate information systems, procedures and controls to ensure that the information used internally by management and disclosed externally is complete and reliable in all material respects.
In addition, management is responsible for establishing and maintaining an adequate system of internal control over financial reporting. The internal control system includes an internal audit function and a code of conduct and ethics, which is communicated to all levels in the organization and requires all employees to maintain high standards in their conduct of the Company’s affairs. Such systems are designed to provide reasonable assurance that the financial information is relevant, reliable and accurate and that the Company’s assets are appropriately accounted for and adequately safeguarded. Management conducted an evaluation of the effectiveness of the system of internal control over financial reporting based on the criteria established in “Internal Control – Integrated Framework (2013)” issued by the Committee of Sponsoring Organizations of the Treadway Commission. Based on this evaluation, management concluded that the Company’s system of internal control over financial reporting was effective as of December 31, 2024.
KPMG LLP has audited the consolidated financial statements in accordance with the standards of the Public Company Accounting Oversight Board (United States).
The board of directors annually appoints an audit and finance committee comprised of directors who are not employees of the corporation. This committee meets regularly with management, the internal auditor and the shareholders’ auditors to review significant accounting, reporting and internal control matters. Both the internal and shareholders’ auditors have unrestricted access to the audit and finance committee. The audit and finance committee reviews the consolidated financial statements, the report of the shareholders’ auditors, and management’s discussion and analysis and submits its report to the board of directors for formal approval.
| Original signed by Tim S. Gitzel | Original signed by Grant E. Isaac | |
| President and Chief Executive Officer | Executive Vice-President and Chief Financial Officer | |
| February 19, 2025 | February 19, 2025 |
2
Report of independent registered public accounting firm
To the Shareholders and Board of Directors of Cameco Corporation
Opinion on the consolidated financial statements
We have audited the accompanying consolidated statements of financial position of Cameco Corporation (the “Company”) as of December 31, 2024 and 2023, the related consolidated statements of earnings, comprehensive income, changes in equity and cash flows for each of the years then ended, and the related notes (collectively, the “consolidated financial statements”). In our opinion, the consolidated financial statements present fairly, in all material respects, the financial position of the Company as of December 31, 2024 and 2023, and the financial performance and its cash flows for each of the years then ended, in conformity with International Financial Reporting Standards as issued by the International Accounting Standards Board.
We also have audited, in accordance with the standards of the Public Company Accounting Oversight Board (United States) (“PCAOB”), the Company’s internal control over financial reporting as of December 31, 2024, based on criteria established in Internal Control – Integrated Framework (2013) issued by the Committee of Sponsoring Organizations of the Treadway Commission, and our report dated February 19, 2025 expressed an unqualified opinion on the effectiveness of the Company’s internal control over financial reporting.
Basis for opinion
These consolidated financial statements are the responsibility of the Company’s management. Our responsibility is to express an opinion on these consolidated financial statements based on our audits. We are a public accounting firm registered with the PCAOB and are required to be independent with respect to the Company in accordance with the U.S. federal securities laws and the applicable rules and regulations of the Securities and Exchange Commission and the PCAOB.
We conducted our audits in accordance with the standards of the PCAOB. Those standards require that we plan and perform the audit to obtain reasonable assurance about whether the consolidated financial statements are free of material misstatement, whether due to error or fraud. Our audits included performing procedures to assess the risks of material misstatement of the consolidated financial statements, whether due to error or fraud, and performing procedures that respond to those risks. Such procedures included examining, on a test basis, evidence regarding the amounts and disclosures in the consolidated financial statements. Our audits also included evaluating the accounting principles used and significant estimates made by management, as well as evaluating the overall presentation of the consolidated financial statements. We believe that our audits provide a reasonable basis for our opinion.
Critical audit matter
The critical audit matter communicated below is a matter arising from the current period audit of the consolidated financial statements that was communicated or required to be communicated to the audit and finance committee and that: (1) relates to accounts or disclosures that are material to the consolidated financial statements and (2) involved our especially challenging, subjective, or complex judgments. The communication of a critical audit matter does not alter in any way our opinion on the consolidated financial statements, taken as a whole, and we are not, by communicating the critical audit matter below, providing a separate opinion on the critical audit matter or on the accounts or disclosures to which it relates.
Assessment of recoverability of deferred tax assets
As discussed in note 21 to the consolidated financial statements, as of December 31, 2024 the Company has recorded a deferred tax asset of $843,131,000. The realization of this deferred tax asset is dependent on the generation of future taxable income in certain jurisdictions during the periods in which the Company’s deferred tax assets are available. Based on projections of future taxable income over the periods in which the deferred tax assets are available, realization of these deferred tax assets is probable. As discussed in note 5D, the calculation of income taxes requires the use of judgment and estimates. The determination of the recoverability of deferred tax assets is dependent on assumptions and judgments regarding future market conditions and production rates, which can materially impact estimated future taxable income.
3
We identified the assessment of the recoverability of the deferred tax asset as a critical audit matter due to the high degree of judgment required in assessing the significant assumptions and judgments that are reflected in the projections of future taxable income.
The following are the primary procedures we performed to address this critical audit matter. We evaluated the design and tested the operating effectiveness of certain internal controls related to the Company’s assessment of the recoverability of the deferred tax asset, including controls related to the assumptions and judgments used in the projections of future taxable income. To assess the Company’s ability to estimate future taxable income, we compared the Company’s previous forecasts to actual results. To assess the Company’s estimate of future taxable income, we evaluated certain significant assumptions in the projections. We compared future market conditions of forecast uranium sales prices to published view of independent market participants. We compared forecast production rates to historical data, board approved budgets and life of mine plans. We involved income tax professionals with specialized skills and knowledge to assist in assessing the Company’s application of the tax regulations in relevant jurisdictions.
Original signed by KPMG LLP
Chartered Professional Accountants
We have served as the Company’s auditor since 1988.
Saskatoon, Canada
February 19, 2025
4
Report of independent registered public accounting firm
To the Shareholders and Board of Directors of Cameco Corporation
Opinion on internal control over financial reporting
We have audited Cameco Corporation’s (the “Company”) internal control over financial reporting as of December 31, 2024, based on criteria established in Internal Control – Integrated Framework (2013) issued by the Committee of Sponsoring Organizations of the Treadway Commission. In our opinion, the Company maintained, in all material respects, effective internal control over financial reporting as of December 31, 2024, based on criteria established in Internal Control – Integrated Framework (2013) issued by the Committee of Sponsoring Organizations of the Treadway Commission.
We also have audited, in accordance with the standards of the Public Company Accounting Oversight Board (United States) (“PCAOB”), the consolidated statements of financial position of the Company as of December 31, 2024 and 2023, the related consolidated statements of earnings, comprehensive income, changes in equity and cash flows for each of the years then ended, and the related notes (collectively, the “consolidated financial statements”) and our report dated February 19, 2025 expressed an unqualified opinion on those consolidated financial statements.
Basis for opinion
The Company’s management is responsible for maintaining effective internal control over financial reporting and for its assessment of the effectiveness of internal control over financial reporting, included in the accompanying Report of management’s accountability. Our responsibility is to express an opinion on the Company’s internal control over financial reporting based on our audit. We are a public accounting firm registered with the PCAOB and are required to be independent with respect to the Company in accordance with the U.S. federal securities laws and the applicable rules and regulations of the Securities and Exchange Commission and the PCAOB.
We conducted our audit in accordance with the standards of the PCAOB. Those standards require that we plan and perform the audit to obtain reasonable assurance about whether effective internal control over financial reporting was maintained in all material respects. Our audit of internal control over financial reporting included obtaining an understanding of internal control over financial reporting, assessing the risk that a material weakness exists, and testing and evaluating the design and operating effectiveness of internal control based on the assessed risk. Our audit also included performing such other procedures as we considered necessary in the circumstances. We believe that our audit provides a reasonable basis for our opinion.
Definition and limitations of internal control over financial reporting
A company’s internal control over financial reporting is a process designed to provide reasonable assurance regarding the reliability of financial reporting and the preparation of financial statements for external purposes in accordance with generally accepted accounting principles. A company’s internal control over financial reporting includes those policies and procedures that (1) pertain to the maintenance of records that, in reasonable detail, accurately and fairly reflect the transactions and dispositions of the assets of the company; (2) provide reasonable assurance that transactions are recorded as necessary to permit preparation of financial statements in accordance with generally accepted accounting principles, and that receipts and expenditures of the company are being made only in accordance with authorizations of management and directors of the company; and (3) provide reasonable assurance regarding prevention or timely detection of unauthorized acquisition, use, or disposition of the company’s assets that could have a material effect on the financial statements.
Because of its inherent limitations, internal control over financial reporting may not prevent or detect misstatements. Also, projections of any evaluation of effectiveness to future periods are subject to the risk that controls may become inadequate because of changes in conditions, or that the degree of compliance with the policies or procedures may deteriorate.
5
Original signed by KPMG LLP
Chartered Professional Accountants
Saskatoon, Canada
February 19, 2025
6
Consolidated statements of earnings
| For the years ended December 31 ($Cdn thousands, except per share amounts) |
Note | 2024 | 2023 | |||||||
| Revenue from products and services |
18 | $ | 3,135,772 | $ | 2,587,758 | |||||
| Cost of products and services sold |
2,072,488 | 1,805,768 | ||||||||
| Depreciation and amortization |
280,702 | 220,324 | ||||||||
|
|
|
|
|
|||||||
| Cost of sales |
28 | 2,353,190 | 2,026,092 | |||||||
|
|
|
|
|
|||||||
| Gross profit |
782,582 | 561,666 | ||||||||
| Administration |
253,150 | 245,539 | ||||||||
| Exploration |
19,419 | 17,551 | ||||||||
| Research and development |
36,540 | 21,036 | ||||||||
| Other operating income |
16 | (37,683 | ) | (7,509 | ) | |||||
| Loss on disposal of assets |
1,042 | 2,188 | ||||||||
|
|
|
|
|
|||||||
| Earnings from operations |
510,114 | 282,861 | ||||||||
| Finance costs |
20 | (147,171 | ) | (115,869 | ) | |||||
| Gain (loss) on derivatives |
26 | (183,103 | ) | 37,791 | ||||||
| Finance income |
21,228 | 111,670 | ||||||||
| Share of earnings (loss) from equity-accounted investees |
12 | (10,844 | ) | 154,462 | ||||||
| Foreign exchange gains |
65,517 | 15,692 | ||||||||
| Other income |
975 | 546 | ||||||||
|
|
|
|
|
|||||||
| Earnings before income taxes |
256,716 | 487,153 | ||||||||
| Income tax expense |
21 | 84,874 | 126,337 | |||||||
|
|
|
|
|
|||||||
| Net earnings |
$ | 171,842 | $ | 360,816 | ||||||
|
|
|
|
|
|||||||
| Net earnings (loss) attributable to: |
||||||||||
| Equity holders |
171,853 | 360,847 | ||||||||
| Non-controlling interest |
(11 | ) | (31 | ) | ||||||
|
|
|
|
|
|||||||
| Net earnings |
$ | 171,842 | $ | 360,816 | ||||||
|
|
|
|
|
|||||||
| Earnings per common share attributable to equity holders: |
||||||||||
| Basic |
22 | $ | 0.40 | $ | 0.83 | |||||
|
|
|
|
|
|||||||
| Diluted |
22 | $ | 0.39 | $ | 0.83 | |||||
|
|
|
|
|
|||||||
See accompanying notes to consolidated financial statements.
7
Consolidated statements of comprehensive income
| For the years ended December 31 ($Cdn thousands) |
Note | 2024 | 2023 | |||||||
| Net earnings |
$ | 171,842 | $ | 360,816 | ||||||
| Other comprehensive income (loss), net of taxes: |
||||||||||
| Items that will not be reclassified to net earnings: |
||||||||||
| Remeasurements of defined benefit liability1 |
25 | (2,276 | ) | (5,205 | ) | |||||
| Remeasurements of defined benefit liability - equity-accounted investee2 |
19,585 | (20,199 | ) | |||||||
| Items that are or may be reclassified to net earnings: |
||||||||||
| Exchange differences on translation of foreign operations |
132,933 | (76,960 | ) | |||||||
| Gains on derivatives designated as cash flow hedges - equity-accounted investee3 |
11,889 | 3,506 | ||||||||
| Exchange differences on translation of foreign operations - equity-accounted investee |
(10,646 | ) | 23,520 | |||||||
|
|
|
|
|
|||||||
| Other comprehensive income (loss), net of taxes |
151,485 | (75,338 | ) | |||||||
|
|
|
|
|
|||||||
| Total comprehensive income |
$ | 323,327 | $ | 285,478 | ||||||
|
|
|
|
|
|||||||
| Other comprehensive income (loss) attributable to: |
||||||||||
| Equity holders |
$ | 151,483 | $ | (75,338 | ) | |||||
| Non-controlling interest |
2 | — | ||||||||
|
|
|
|
|
|||||||
| Other comprehensive income (loss) for the year |
$ | 151,485 | $ | (75,338 | ) | |||||
|
|
|
|
|
|||||||
| Total comprehensive income (loss) attributable to: |
||||||||||
| Equity holders |
$ | 323,336 | $ | 285,509 | ||||||
| Non-controlling interest |
(9 | ) | (31 | ) | ||||||
|
|
|
|
|
|||||||
| Total comprehensive income for the year |
$ | 323,327 | $ | 285,478 | ||||||
|
|
|
|
|
|||||||
| 1 | Net of tax (2024 - $969; 2023 - $1,581) |
| 2 | Net of tax (2024 - $(6,217); 2023 - $5,144) |
| 3 | Net of tax (2024 - $(4,272); 2023 - $(909)) |
See accompanying notes to consolidated financial statements.
8
Consolidated statements of financial position
| As at December 31 ($Cdn thousands) |
Note | 2024 | 2023 | |||||||
| Assets |
||||||||||
| Current assets |
||||||||||
| Cash and cash equivalents |
$ | 600,462 | $ | 566,809 | ||||||
| Accounts receivable |
7 | 346,800 | 422,333 | |||||||
| Current tax assets |
2,579 | 974 | ||||||||
| Inventories |
8 | 826,863 | 692,261 | |||||||
| Supplies and prepaid expenses |
145,390 | 149,352 | ||||||||
| Current portion of long-term receivables, investments and other |
11 | 1,093 | 10,161 | |||||||
|
|
|
|
|
|||||||
| Total current assets |
1,923,187 | 1,841,890 | ||||||||
|
|
|
|
|
|||||||
| Property, plant and equipment |
9 | 3,286,515 | 3,368,772 | |||||||
| Intangible assets |
10 | 39,822 | 43,577 | |||||||
| Long-term receivables, investments and other |
11 | 595,896 | 613,773 | |||||||
| Investment in equity-accounted investees |
12 | 3,218,456 | 3,173,185 | |||||||
| Deferred tax assets |
21 | 843,131 | 892,860 | |||||||
|
|
|
|
|
|||||||
| Total non-current assets |
7,983,820 | 8,092,167 | ||||||||
|
|
|
|
|
|||||||
| Total assets |
$ | 9,907,007 | $ | 9,934,057 | ||||||
|
|
|
|
|
|||||||
| Liabilities and shareholders’ equity |
||||||||||
| Current liabilities |
||||||||||
| Accounts payable and accrued liabilities |
13 | $ | 619,035 | $ | 577,550 | |||||
| Current tax liabilities |
21,225 | 24,076 | ||||||||
| Current portion of long-term debt |
14 | 285,707 | 499,821 | |||||||
| Current portion of other liabilities |
15 | 221,820 | 48,544 | |||||||
| Current portion of provisions |
16 | 37,974 | 39,113 | |||||||
|
|
|
|
|
|||||||
| Total current liabilities |
1,185,761 | 1,189,104 | ||||||||
|
|
|
|
|
|||||||
| Long-term debt |
14 | 995,583 | 1,284,353 | |||||||
| Other liabilities |
15 | 363,497 | 343,420 | |||||||
| Provisions |
16 | 997,833 | 1,022,871 | |||||||
|
|
|
|
|
|||||||
| Total non-current liabilities |
2,356,913 | 2,650,644 | ||||||||
|
|
|
|
|
|||||||
| Shareholders’ equity |
||||||||||
| Share capital |
2,935,367 | 2,914,165 | ||||||||
| Contributed surplus |
210,784 | 215,679 | ||||||||
| Retained earnings |
3,099,264 | 2,979,743 | ||||||||
| Other components of equity |
118,892 | (15,282 | ) | |||||||
|
|
|
|
|
|||||||
| Total shareholders’ equity attributable to equity holders |
6,364,307 | 6,094,305 | ||||||||
| Non-controlling interest |
26 | 4 | ||||||||
|
|
|
|
|
|||||||
| Total shareholders’ equity |
6,364,333 | 6,094,309 | ||||||||
|
|
|
|
|
|||||||
| Total liabilities and shareholders’ equity |
$ | 9,907,007 | $ | 9,934,057 | ||||||
|
|
|
|
|
|||||||
Commitments and contingencies [notes 9, 16, 21]
See accompanying notes to consolidated financial statements.
9
Consolidated statements of changes in equity
| Attributable to equity holders | ||||||||||||||||||||||||||||||||||||
| ($Cdn thousands) |
Share capital |
Contributed surplus |
Retained earnings |
Foreign currency translation |
Cash flow hedges |
Equity investments at FVOCI |
Total | Non- controlling interest |
Total equity |
|||||||||||||||||||||||||||
| Balance at January 1, 2024 |
$ | 2,914,165 | $ | 215,679 | $ | 2,979,743 | $ | (18,040 | ) | $ | 3,506 | $ | (748 | ) | $ | 6,094,305 | $ | 4 | $ | 6,094,309 | ||||||||||||||||
| Net earnings (loss) |
— | — | 171,853 | — | — | — | 171,853 | (11 | ) | 171,842 | ||||||||||||||||||||||||||
| Other comprehensive income |
— | — | 17,309 | 122,285 | 11,889 | — | 151,483 | 2 | 151,485 | |||||||||||||||||||||||||||
|
|
|
|
|
|
|
|
|
|
|
|
|
|
|
|
|
|
|
|||||||||||||||||||
| Total comprehensive income (loss) |
— | — | 189,162 | 122,285 | 11,889 | — | 323,336 | (9 | ) | 323,327 | ||||||||||||||||||||||||||
|
|
|
|
|
|
|
|
|
|
|
|
|
|
|
|
|
|
|
|||||||||||||||||||
| Share-based compensation |
— | 6,775 | — | — | — | — | 6,775 | — | 6,775 | |||||||||||||||||||||||||||
| Stock options exercised |
21,202 | (4,546 | ) | — | — | — | — | 16,656 | — | 16,656 | ||||||||||||||||||||||||||
| Restricted share units released |
— | (7,124 | ) | — | — | — | — | (7,124 | ) | — | (7,124 | ) | ||||||||||||||||||||||||
| Dividends |
— | — | (69,641 | ) | — | — | — | (69,641 | ) | — | (69,641 | ) | ||||||||||||||||||||||||
| Transactions with owners - contributed equity |
— | — | — | — | — | — | — | 31 | 31 | |||||||||||||||||||||||||||
|
|
|
|
|
|
|
|
|
|
|
|
|
|
|
|
|
|
|
|||||||||||||||||||
| Balance at December 31, 2024 |
$ | 2,935,367 | $ | 210,784 | $ | 3,099,264 | $ | 104,245 | $ | 15,395 | $ | (748 | ) | $ | 6,364,307 | $ | 26 | $ | 6,364,333 | |||||||||||||||||
|
|
|
|
|
|
|
|
|
|
|
|
|
|
|
|
|
|
|
|||||||||||||||||||
| Balance at January 1, 2023 |
$ | 2,880,336 | $ | 224,687 | $ | 2,696,379 | $ | 35,400 | $ | — | $ | (748 | ) | $ | 5,836,054 | $ | 11 | $ | 5,836,065 | |||||||||||||||||
| Net earnings (loss) |
— | — | 360,847 | — | — | — | 360,847 | (31 | ) | 360,816 | ||||||||||||||||||||||||||
| Other comprehensive income (loss) |
— | — | (25,404 | ) | (53,440 | ) | 3,506 | — | (75,338 | ) | — | (75,338 | ) | |||||||||||||||||||||||
|
|
|
|
|
|
|
|
|
|
|
|
|
|
|
|
|
|
|
|||||||||||||||||||
| Total comprehensive income (loss) |
— | — | 335,443 | (53,440 | ) | 3,506 | — | 285,509 | (31 | ) | 285,478 | |||||||||||||||||||||||||
|
|
|
|
|
|
|
|
|
|
|
|
|
|
|
|
|
|
|
|||||||||||||||||||
| Share-based compensation |
— | 3,692 | — | — | — | — | 3,692 | — | 3,692 | |||||||||||||||||||||||||||
| Stock options exercised |
33,829 | (6,292 | ) | — | — | — | — | 27,537 | — | 27,537 | ||||||||||||||||||||||||||
| Restricted share units released |
— | (6,408 | ) | — | — | — | — | (6,408 | ) | — | (6,408 | ) | ||||||||||||||||||||||||
| Dividends |
— | — | (52,079 | ) | — | — | — | (52,079 | ) | — | (52,079 | ) | ||||||||||||||||||||||||
| Transactions with owners - contributed equity |
— | — | — | — | — | — | — | 24 | 24 | |||||||||||||||||||||||||||
|
|
|
|
|
|
|
|
|
|
|
|
|
|
|
|
|
|
|
|||||||||||||||||||
| Balance at December 31, 2023 |
$ | 2,914,165 | $ | 215,679 | $ | 2,979,743 | $ | (18,040 | ) | $ | 3,506 | $ | (748 | ) | $ | 6,094,305 | $ | 4 | $ | 6,094,309 | ||||||||||||||||
|
|
|
|
|
|
|
|
|
|
|
|
|
|
|
|
|
|
|
|||||||||||||||||||
See accompanying notes to consolidated financial statements.
10
Consolidated statements of cash flows
| For the years ended December 31 ($Cdn thousands) |
Note | 2024 | 2023 | |||||||||
| Operating activities |
||||||||||||
| Net earnings |
$ | 171,842 | $ | 360,816 | ||||||||
| Adjustments for: |
||||||||||||
| Depreciation and amortization |
280,702 | 220,324 | ||||||||||
| Deferred sales |
18 | 61,180 | (21,468 | ) | ||||||||
| Unrealized loss (gain) on derivatives |
149,629 | (61,658 | ) | |||||||||
| Share-based compensation |
24 | 6,775 | 3,692 | |||||||||
| Loss on disposal of assets |
1,042 | 2,188 | ||||||||||
| Finance costs |
20 | 147,171 | 115,869 | |||||||||
| Finance income |
(21,228 | ) | (111,670 | ) | ||||||||
| Share of loss (earnings) from equity-accounted investees |
12 | 10,844 | (154,462 | ) | ||||||||
| Other income |
(307 | ) | (546 | ) | ||||||||
| Foreign exchange gains |
(65,517 | ) | (15,692 | ) | ||||||||
| Other operating income |
16 | (37,683 | ) | (7,509 | ) | |||||||
| Income tax expense |
21 | 84,874 | 126,337 | |||||||||
| Interest received |
21,228 | 113,797 | ||||||||||
| Income taxes received (paid) |
(38,486 | ) | 70,372 | |||||||||
| Dividends from equity-accounted investee |
31 | 185,447 | 113,642 | |||||||||
| Other operating items |
23 | (52,225 | ) | (65,896 | ) | |||||||
|
|
|
|
|
|||||||||
| Net cash provided by operations |
905,288 | 688,136 | ||||||||||
|
|
|
|
|
|||||||||
| Investing activities |
||||||||||||
| Additions to property, plant and equipment |
9 | (211,635 | ) | (153,631 | ) | |||||||
| Acquisition |
6 | — | (3,028,977 | ) | ||||||||
| Decrease in short-term investments |
— | 1,136,687 | ||||||||||
| Decrease in long-term receivables, investments and other |
4,816 | 1,000 | ||||||||||
| Proceeds from sale of property, plant and equipment |
377 | 69 | ||||||||||
|
|
|
|
|
|||||||||
| Net cash used in investing |
(206,442 | ) | (2,044,852 | ) | ||||||||
|
|
|
|
|
|||||||||
| Financing activities |
||||||||||||
| Increase in long-term debt |
14 | 497,022 | 816,582 | |||||||||
| Decrease in long-term debt |
14 | (1,041,590 | ) | — | ||||||||
| Interest paid |
(88,818 | ) | (40,798 | ) | ||||||||
| Proceeds from issuance of shares, stock option plan |
16,656 | 27,537 | ||||||||||
| Lease principal payments |
(2,051 | ) | (2,430 | ) | ||||||||
| Dividends paid |
(69,641 | ) | (52,079 | ) | ||||||||
|
|
|
|
|
|||||||||
| Net cash provided by (used in) financing |
(688,422 | ) | 748,812 | |||||||||
|
|
|
|
|
|||||||||
| Increase (decrease) in cash and cash equivalents, during the year |
10,424 | (607,904 | ) | |||||||||
| Exchange rate changes on foreign currency cash balances |
23,229 | 31,039 | ||||||||||
| Cash and cash equivalents, beginning of year |
566,809 | 1,143,674 | ||||||||||
|
|
|
|
|
|||||||||
| Cash and cash equivalents, end of year |
$ | 600,462 | $ | 566,809 | ||||||||
|
|
|
|
|
|||||||||
| Cash and cash equivalents is comprised of: |
||||||||||||
| Cash |
$ | 204,715 | $ | 229,732 | ||||||||
| Cash equivalents |
395,747 | 337,077 | ||||||||||
|
|
|
|
|
|||||||||
| Cash and cash equivalents |
$ | 600,462 | $ | 566,809 | ||||||||
|
|
|
|
|
|||||||||
See accompanying notes to consolidated financial statements.
11
Notes to consolidated financial statements
For the years ended December 31, 2024 and 2023
| 1. | Cameco Corporation |
Cameco Corporation is incorporated under the Canada Business Corporations Act. The address of its registered office is 2121 11th Street West, Saskatoon, Saskatchewan, S7M 1J3. The consolidated financial statements as at and for the year ended December 31, 2024 comprise Cameco Corporation and its subsidiaries (collectively, the Company or Cameco) and the Company’s interests in associates and joint arrangements.
Cameco is one of the world’s largest providers of the uranium needed to generate clean, reliable baseload electricity around the globe. The Company has operations in northern Saskatchewan and the United States, as well as a 40% interest in Joint Venture Inkai LLP (JV Inkai), a joint arrangement with Joint Stock Company National Atomic Company Kazatomprom (Kazatomprom), located in Kazakhstan. Cameco also has a 49% interest in Westinghouse Electric Company (Westinghouse), a joint venture with Brookfield Renewable Partners and its institutional partners (collectively, Brookfield). Westinghouse is one of the world’s largest nuclear services businesses with corporate headquarters in Pennsylvania and operations around the world. Both JV Inkai and Westinghouse are accounted for on an equity basis (see note 12).
Cameco has two operating mines, Cigar Lake and McArthur River as well as a mill at Key Lake. The Rabbit Lake operation was placed in care and maintenance in 2016. Cameco’s operations in the United States, Crow Butte and Smith Ranch-Highland, are not currently producing as the decision was made in 2016 to curtail production and defer all wellfield development. See note 28 for the financial statement impact.
The Company is also a leading provider of nuclear fuel processing services, supplying much of the world’s reactor fleet with the fuel to generate one of the cleanest sources of electricity available today. It operates the world’s largest commercial refinery in Blind River, Ontario, controls a significant portion of the world UF6 primary conversion capacity in Port Hope, Ontario and is a leading manufacturer of fuel assemblies and reactor components for CANDU reactors at facilities in Port Hope and Cobourg, Ontario.
| 2. | Material accounting policies |
| A. | Statement of compliance |
These consolidated financial statements have been prepared in accordance with International Financial Reporting Standards (IFRS) as issued by the International Accounting Standards Board (IASB).
These consolidated financial statements were authorized for issuance by the Company’s board of directors on February 19, 2025.
| B. | Basis of presentation |
These consolidated financial statements are presented in Canadian dollars, which is the Company’s functional currency. All financial information is presented in Canadian dollars, unless otherwise noted. Amounts presented in tabular format have been rounded to the nearest thousand except per share amounts and where otherwise noted. Amounts presented in text have been rounded to the nearest thousand but presented in whole dollars.
The consolidated financial statements have been prepared on the historical cost basis except for the following material items which are measured on an alternative basis at each reporting date:
12
| Derivative financial instruments | Fair value through profit or loss (FVTPL) | |
| Equity investments | Fair value through other comprehensive income (FVOCI) |
|
| Liabilities for cash-settled share-based payment arrangements | FVTPL | |
| Net defined benefit liability | Fair value of plan assets less the present value of the defined benefit obligation |
|
The preparation of the consolidated financial statements in conformity with IFRS requires management to make judgments, estimates and assumptions that affect the application of accounting policies and the reported amounts of assets, liabilities, revenue and expenses. Actual results may vary from these estimates.
Estimates and underlying assumptions are reviewed on an ongoing basis. Revisions to accounting estimates are recognized in the period in which the estimates are revised and in any future periods affected. The areas involving a higher degree of judgment or complexity, or areas where assumptions and estimates are significant to the consolidated financial statements are disclosed in note 5.
This summary of material accounting policies is a description of the accounting methods and practices that have been used in the preparation of these consolidated financial statements and is presented to assist the reader in interpreting the statements contained herein. These accounting policies have been applied consistently to all entities within the consolidated group.
| C. | Consolidation principles |
| i. | Business combinations |
The acquisition method of accounting is used to account for the acquisition of subsidiaries by the Company. The Company measures goodwill at the acquisition date as the fair value of the consideration transferred, including the recognized amount of any non-controlling interests in the acquiree, less the net recognized amount (generally fair value) of the identifiable assets acquired and liabilities assumed, all measured as of the acquisition date. When the excess is negative, a bargain purchase gain is recognized immediately in earnings. In a business combination achieved in stages, the acquisition date fair value of the Company’s previously held equity interest in the acquiree is also considered in computing goodwill.
Consideration transferred includes the fair values of the assets transferred, liabilities incurred and equity interests issued by the Company. Consideration also includes the fair value of any contingent consideration and share-based compensation awards that are replaced mandatorily in a business combination.
The Company elects on a transaction-by-transaction basis whether to measure any non-controlling interest at fair value, or at their proportionate share of the recognized amount of the identifiable net assets of the acquiree, at the acquisition date.
Acquisition-related costs are expensed as incurred, except for those costs related to the issue of debt or equity instruments.
| ii. | Subsidiaries |
The consolidated financial statements include the accounts of Cameco and its subsidiaries. Subsidiaries are entities over which the Company has control. Subsidiaries are fully consolidated from the date on which control is acquired by the Company and are deconsolidated from the date that control ceases.
| iii. | Joint arrangements |
A joint arrangement can take the form of a joint operation or joint venture. All joint arrangements involve a contractual arrangement that establishes joint control.
13
A joint operation is a joint arrangement whereby the parties that have joint control of the arrangement have rights to the assets, and obligations for the liabilities, relating to the arrangement. A joint operation may or may not be structured through a separate vehicle. These arrangements involve joint control of one or more of the assets acquired or contributed for the purpose of the joint operation. The consolidated financial statements of the Company include its share of the assets in such joint operations, together with its share of the liabilities, revenues and expenses arising jointly or otherwise from those operations. All such amounts are measured in accordance with the terms of each arrangement.
A joint venture is a joint arrangement whereby the parties that have joint control of the arrangement have rights to the net assets of the arrangement. A joint venture is always structured through a separate vehicle. It operates in the same way as other entities, controlling the assets of the joint venture, earning its own revenue and incurring its own liabilities and expenses. Interests in joint ventures are accounted for using the equity method of accounting, whereby the Company’s proportionate interest in the assets, liabilities, revenues and expenses of jointly controlled entities are recognized on a single line in the consolidated statements of financial position and consolidated statements of earnings. The share of joint ventures results is recognized in the Company’s consolidated financial statements from the date that joint control commences until the date at which it ceases.
When acquiring an additional interest in a joint arrangement, previously held interests are not remeasured at fair value. In an acquisition of an asset or group of assets that does not constitute a business, the directly attributable transaction costs are included in the cost of the asset or group of assets.
| iv. | Investments in equity-accounted investees |
Cameco’s investments in equity-accounted investees include investments in joint ventures and an associate.
Associates are those entities over which the Company has significant influence, but not control or joint control, over the financial and operating policies. Significant influence is presumed to exist when the Company holds between 20% and 50% of the voting power of another entity but can also arise where the Company holds less than 20% if it has the power to be actively involved and influential in policy decisions affecting the entity. A joint venture is an arrangement in which the Company has joint control, whereby it has rights to the net assets of the arrangement, rather than rights to its assets and obligations for its liabilities.
Investments in the joint ventures and associate are accounted for using the equity method. The equity method involves the recording of the initial investment at cost and the subsequent adjusting of the carrying value of the investment for Cameco’s proportionate share of the earnings or loss and OCI and any other changes in the associates’ net assets, such as dividends. The cost of the investment includes transaction costs.
Adjustments are made to align the accounting policies of the joint ventures and associate with those of the Company before applying the equity method. When the Company’s share of losses exceeds its interest in an equity-accounted investee, the carrying amount of that interest is reduced to zero, and the recognition of further losses is discontinued except to the extent that the Company has incurred legal or constructive obligations or made payments on behalf of the associate. If the associate subsequently reports profits, Cameco resumes recognizing its share of those profits only after its share of the profits equals the share of losses not recognized.
| v. | Transactions eliminated on consolidation |
Intra-group balances and transactions, and any unrealized income and expenses arising from intra-group transactions, are eliminated in preparing the consolidated financial statements. Unrealized gains arising from transactions with its equity-accounted investees JV Inkai and Westinghouse are eliminated against the investment to the extent of the Company’s interest in the investee. Unrealized losses are eliminated in the same manner as unrealized gains, but only to the extent that there is no evidence of impairment.
14
| D. | Foreign currency translation |
Items included in the financial statements of each of Cameco’s subsidiaries, associates and joint arrangements are measured using their functional currency, which is the currency of the primary economic environment in which the entity operates. The consolidated financial statements are presented in Canadian dollars, which is Cameco’s functional and presentation currency.
| i. | Foreign currency transactions |
Foreign currency transactions are translated into the respective functional currency of the Company and its entities using the average monthly exchange rates prevailing at the date of the transactions. At the reporting date, monetary assets and liabilities denominated in foreign currencies are translated to the functional currency at the exchange rate at that date. Non-monetary items that are measured in terms of historical cost in a foreign currency are translated using the average monthly exchange rate at the date of the transaction. The applicable exchange gains and losses arising on these transactions are reflected in earnings with the exception of foreign exchange gains or losses on provisions for decommissioning and reclamation activities that are in a foreign currency, which are capitalized in property, plant and equipment.
| ii. | Foreign operations |
The assets and liabilities of foreign operations, including goodwill and fair value adjustments arising on acquisition, are translated to Canadian dollars at exchange rates at the reporting dates. The revenues and expenses of foreign operations are translated to Canadian dollars at the average monthly exchange rate at the dates of the transactions.
Foreign currency differences are recognized in other comprehensive income. When a foreign operation is disposed of, in whole, the relevant amount in the foreign currency translation account is transferred to earnings as part of the gain or loss on disposal.
When the settlement of a monetary item receivable from or payable to a foreign operation is neither planned nor likely in the foreseeable future, foreign exchange gains and losses arising from such a monetary item are considered to form part of the net investment in a foreign operation, and are recognized in other comprehensive income and presented within equity in the foreign currency translation account.
| E. | Cash and cash equivalents |
Cash and cash equivalents consists of balances with financial institutions and investments in money market instruments, which have a term to maturity of three months or less at the time of purchase and are measured at amortized cost.
| F. | Inventories |
Inventories of broken ore, uranium concentrates, and refined and converted products are measured at the lower of cost and net realizable value. The cost of inventories is based on the weighted average method.
Cost includes direct materials, direct labour, operational overhead expenses and depreciation. Net realizable value is the estimated selling price in the ordinary course of business, less the estimated costs of completion and selling expenses.
Consumable supplies and spares are valued at the lower of cost or replacement value.
| G. | Property, plant and equipment |
| i. | Buildings, plant and equipment and other |
Items of property, plant and equipment are measured at cost less accumulated depreciation and impairment charges. The cost of self-constructed assets includes the cost of materials and direct labour, borrowing costs and any other costs directly attributable to bringing the assets to the location and condition necessary for them to be capable of operating in the manner intended by management, including the initial estimate of the cost of dismantling and removing the items and restoring the site on which they are located.
When components of an item of property, plant and equipment have different useful lives, they are accounted for as separate items of property, plant and equipment and depreciated separately.
15
Gains and losses on disposal of an item of property, plant and equipment are determined by comparing the proceeds from disposal with the carrying amount of property, plant and equipment, and are recognized in earnings.
| ii. | Mineral properties and mine development costs |
The decision to develop a mine property within a project area is based on an assessment of the commercial viability of the property, the availability of financing and the existence of markets for the product. Once the decision to proceed to development is made, development and other expenditures relating to the project area are deferred as part of assets under construction and disclosed as a component of property, plant and equipment with the intention that these will be depreciated by charges against earnings from future mining operations. No depreciation is charged against the property until the production stage commences. After a mine property has been brought into the production stage, costs of any additional work on that property are expensed as incurred, except for large development programs, which will be deferred and depreciated over the remaining life of the related assets.
The production stage is reached when a mine property is in the condition necessary for it to be capable of operating in the manner intended by management. The criteria used to assess the start date of the production stage are determined based on the nature of each mine construction project, including the complexity of a mine site. A range of factors is considered when determining whether the production stage has been reached, which includes, but is not limited to, the demonstration of sustainable production at or near the level intended (such as the demonstration of continuous throughput levels at or above a target percentage of the design capacity).
| iii. | Depreciation |
Depreciation is calculated over the depreciable amount, which is the cost of the asset less its residual value. Assets which are unrelated to production are depreciated according to the straight-line method based on estimated useful lives as follows:
| Land |
Not depreciated | |||
| Buildings |
15 - 25 years | |||
| Plant and equipment |
3 - 15 years | |||
| Furniture and fixtures |
3 - 10 years | |||
| Other |
3 - 5 years |
Mining properties and certain mining and conversion assets for which the economic benefits from the asset are consumed in a pattern which is linked to the production level are depreciated according to the unit-of-production method. For conversion assets, the amount of depreciation is measured by the portion of the facilities’ total estimated lifetime production that is produced in that period. For mining assets and properties, the amount of depreciation or depletion is measured by the portion of the mines’ proven and probable mineral reserves recovered during the period.
Depreciation methods, useful lives and residual values are reviewed at each reporting period and are adjusted if appropriate.
| iv. | Repairs and maintenance |
The cost of replacing a component of property, plant and equipment is capitalized if it is probable that future economic benefits embodied within the component will flow to the Company. The carrying amount of the replaced component is derecognized. Costs of routine maintenance and repair are charged to products and services sold.
| H. | Goodwill and intangible assets |
Goodwill arising from the acquisition of subsidiaries is initially recognized at cost, measured as the excess of the fair value of the consideration paid over the fair value of the identifiable net assets acquired. Goodwill is subsequently measured at cost, less accumulated impairment losses.
16
Intangible assets acquired individually or as part of a group of assets are initially recognized at cost and measured subsequently at cost less accumulated amortization and impairment losses. Subsequent expenditure is capitalized only when it increases the future economic benefits embodied in the specific asset to which it relates. The cost of a group of intangible assets acquired in a transaction, including those acquired in a business combination that meet the specified criteria for recognition apart from goodwill, is allocated to the individual assets acquired based on their relative fair values.
Intangible assets that have finite useful lives are amortized using the units of production method over their estimated remaining useful lives. Amortization methods and useful lives are reviewed at each reporting period and are adjusted if appropriate.
| I. | Leases |
Cameco recognizes a right-of-use asset and a lease liability at the lease commencement date. The right-of-use asset is initially measured at cost, which is the initial amount of the lease liability adjusted for any lease payments made at or before the commencement date, plus any initial direct costs incurred, less any lease incentives received, and subsequently at cost less any accumulated depreciation and impairment losses. The right-of-use asset is subsequently depreciated using the straight-line method from the commencement date to the end of the lease term, unless the cost of the right-of-use asset reflects that the Company will exercise a purchase option, in which case the right-of-use asset will be depreciated on the same basis as that of property, plant and equipment.
The lease liability is measured at amortized cost using the effective interest method. It is initially measured at the present value of the lease payments that are not paid at the commencement date, discounted using the interest rate implicit in the lease, or, if that rate cannot be readily determined, the Company’s incremental borrowing rate. Generally, Cameco uses its incremental borrowing rate as the discount rate. Current borrowing rates available for classes of leased assets are compared with the rates of Cameco’s existing debt facilities to ensure that use of the Company’s incremental borrowing rate is reasonable.
The lease liability is subsequently increased by the interest cost on the lease liability and decreased by lease payments made. It is remeasured when there is a change in future lease payments arising from a change in an index or rate, a change in the estimate of the amount expected to be payable under a residual value guarantee, or as appropriate, changes in the assessment of whether a purchase or extension option is reasonably certain to be exercised or a termination option is reasonably certain not to be exercised.
Cameco uses judgement in determining the lease term for some lease contracts that include renewal options. The assessment of whether the Company is reasonably certain to exercise such options impacts the lease term, which affects the amount of lease liabilities and right-of-use assets recognized.
The Company has elected not to recognize right-of-use assets and lease liabilities for leases of low-value assets and short-term leases that have a lease term of 12 months or less. The lease payments associated with these leases are recognized as an expense on a straight-line basis over the lease term.
| J. | Finance income and finance costs |
Finance income comprises interest income on funds invested. Interest income and interest expense are recognized in earnings as they accrue, using the effective interest method. Finance costs are comprised of interest and fees on borrowings and unwinding of the discount on provisions.
Borrowing costs that are not directly attributable to the acquisition, construction or production of a qualifying asset are expensed in the period incurred.
| K. | Research and development costs |
Expenditures on research are charged against earnings when incurred. Development costs are recognized as assets when the Company can demonstrate technical feasibility and that the asset will generate probable future economic benefits.
17
| L. | Impairment |
| i. | Non-derivative financial assets |
Cameco recognizes loss allowances for expected credit losses (ECLs) on financial assets measured at amortized cost and contract assets. It measures loss allowances at an amount equal to lifetime ECLs, except for debt securities that are determined to have low credit risk at the reporting date and other debt securities, loans advanced and bank balances for which credit risk has not increased significantly since initial recognition. For these, loss allowances are measured equal to 12-month ECLs.
Lifetime ECLs are the ECLs that result from all possible default events over the expected life of a financial instrument while 12-month ECLs are the portion of ECLs that result from default events that are possible within the 12 months after the reporting date (or a shorter period if the expected life of the instrument is less than 12 months). The maximum period considered when estimating ECLs is the maximum contractual period over which the Company is exposed to credit risk.
ECLs are a probability-weighted estimate of credit losses. Credit losses are measured as the present value of the difference between the cash flows due to the entity in accordance with the contract and the cash flows that the Company expects to receive. ECLs are discounted at the effective interest rate of the financial asset.
When determining whether the credit risk of a financial asset has increased significantly since initial recognition and when estimating ECLs, the Company considers reasonable and supportable information that is relevant and available without undue cost or effort. This includes both quantitative and qualitative information and analysis, based on the Company’s historical experience and informed credit assessment and including forward-looking information.
The Company considers a financial asset to be in default when the borrower is unlikely to pay its credit obligations in full, without recourse by Cameco to actions such as realizing security (if any is held).
The Company considers a debt security to have low credit risk when it is at least an A (low) DBRS or A- S&P rating.
Financial assets carried at amortized cost. A financial asset is ‘credit-impaired’ when one or more events that have a detrimental effect on the estimated future cash flows of the financial asset have occurred. Evidence can include significant financial difficulty of the borrower or issuer, a breach of contract, restructuring of an amount due to the Company on terms that the Company would not consider otherwise, indications that a debtor or issuer will enter bankruptcy or other financial reorganization, or the disappearance of an active market for a security.
Loss allowances for financial assets measured at amortized cost are deducted from the gross carrying amount of the assets. The gross carrying amount of a financial asset is written off when the Company has no reasonable expectations of recovering a financial asset in its entirety or a portion thereof.
| ii. | Non-financial assets |
The carrying amounts of Cameco’s non-financial assets are reviewed throughout the year to determine whether there is any indication of impairment. If any such indication exists, then the asset’s recoverable amount is estimated. Goodwill is tested annually for impairment.
For impairment testing, assets are grouped together into CGUs which are the smallest group of assets that generate cash inflows from continuing use that are largely independent of the cash inflows of other assets or CGUs. Goodwill arising from a business combination is allocated to CGUs or groups of CGUs that are expected to benefit from the synergies of the combination.
18
The recoverable amount of an asset or CGU is the greater of its value in use and its fair value less costs to sell. Value in use is based on the estimated future cash flows, discounted to their present value using a pre-tax discount rate that reflects current market assessments of the time value of money and the risks specific to the asset or CGU. Fair value is determined as the amount that would be obtained from the sale of the asset or CGU in an arm’s-length transaction between knowledgeable and willing parties. For exploration properties, fair value is based on the implied fair value of the resources in place using comparable market transaction metrics.
An impairment loss is recognized if the carrying amount of an asset or its CGU exceeds its recoverable amount. Impairment losses are recognized in earnings. Impairment losses recognized in respect of CGUs are allocated first to reduce the carrying amount of any goodwill allocated to the CGU, and then to reduce the carrying amounts of the other assets in the CGU on a pro rata basis.
Impairment losses recognized in prior periods are assessed throughout the year, whenever events or changes in circumstances indicate that the impairment may have reversed. If the impairment has reversed, the carrying amount of the asset is increased to its recoverable amount. An impairment loss is reversed only to the extent that the asset’s carrying amount does not exceed the carrying amount that would have been determined, net of depreciation or amortization, if no impairment loss had been recognized. A reversal of an impairment loss is recognized immediately in earnings. An impairment loss in respect of goodwill is not reversed.
| M. | Exploration and evaluation expenditures |
Exploration and evaluation expenditures are those expenditures incurred by the Company in connection with the exploration for and evaluation of mineral resources before the technical feasibility and commercial viability of extracting a mineral resource are demonstrable. These expenditures include researching and analyzing existing exploration data, conducting geological studies, exploratory drilling and sampling, and compiling prefeasibility and feasibility studies. Exploration and evaluation expenditures are charged against earnings as incurred, except when there is a high degree of confidence in the viability of the project and it is probable that these costs will be recovered through future development and exploitation.
Exploration and evaluation costs that have been acquired in a business combination or asset acquisition are capitalized under the scope of IFRS 6, Exploration for and Evaluation of Mineral Resources, and are reported as part of property, plant and equipment.
| N. | Provisions |
A provision is recognized if, as a result of a past event, the Company has a present legal or constructive obligation that can be estimated reliably, and it is probable that an outflow of economic benefits will be required to settle the obligation. Provisions are determined by discounting the risk-adjusted expected future cash flows at a pre-tax risk-free rate that reflects current market assessments of the time value of money. The unwinding of the discount is recognized as a finance cost.
| i. | Environmental restoration |
The mining, extraction and processing activities of the Company normally give rise to obligations for site closure and environmental restoration. Closure and restoration can include facility decommissioning and dismantling, removal or treatment of waste materials, as well as site and land restoration. The Company provides for the closure, reclamation and decommissioning of its operating sites in the financial period when the related environmental disturbance occurs, based on the estimated future costs using information available at the reporting date. Costs included in the provision comprise all closure and restoration activity expected to occur gradually over the life of the operation and at the time of closure. Routine operating costs that may impact the ultimate closure and restoration activities, such as waste material handling conducted as a normal part of a mining or production process, are not included in the provision.
19
The timing of the actual closure and restoration expenditure is dependent upon a number of factors such as the life and nature of the asset, the operating licence conditions and the environment in which the mine operates. Closure and restoration provisions are measured at the expected value of future cash flows, discounted to their present value using a current pre-tax risk-free rate. Significant judgments and estimates are involved in deriving the expectations of future activities and the amount and timing of the associated cash flows.
At the time a provision is initially recognized, to the extent that it is probable that future economic benefits associated with the reclamation, decommissioning and restoration expenditure will flow to the Company, the corresponding cost is capitalized as an asset. The capitalized cost of closure and restoration activities is recognized in property, plant and equipment and depreciated on a unit-of-production basis. The value of the provision is gradually increased over time as the effect of discounting unwinds. The unwinding of the discount is an expense recognized in finance costs.
Closure and rehabilitation provisions are also adjusted for changes in estimates. The provision is reviewed at each reporting date for changes to obligations, legislation or discount rates that effect change in cost estimates or life of operations. The cost of the related asset is adjusted for changes in the provision resulting from changes in estimated cash flows or discount rates, and the adjusted cost of the asset is depreciated prospectively.
| ii. | Waste disposal |
The refining, conversion and manufacturing processes generate certain uranium-contaminated waste. The Company has established strict procedures to ensure this waste is disposed of safely. A provision for waste disposal costs in respect of these materials is recognized when they are generated. Costs associated with the disposal, the timing of cash flows and discount rates are estimated both at initial recognition and subsequent measurement.
| O. | Employee future benefits |
| i. | Pension obligations |
The Company accrues its obligations under employee benefit plans. The Company has both defined benefit and defined contribution plans. A defined contribution plan is a pension plan under which the Company pays fixed contributions into a separate entity. A defined benefit plan is a pension plan other than a defined contribution plan.
The liability recognized in the consolidated statements of financial position in respect of defined benefit pension plans is the present value of the defined benefit obligation at the reporting date less the fair value of plan assets. The defined benefit obligation is calculated annually, by qualified independent actuaries using the projected unit credit method prorated on service and management’s best estimate of expected plan investment performance, salary escalation, retirement ages of employees and expected health care costs. The present value of the defined benefit obligation is determined by discounting the estimated future cash outflows using interest rates of high-quality corporate bonds that are denominated in the currency in which the benefits will be paid, and that have terms to maturity approximating the terms of the related pension liability.
The Company recognizes all actuarial gains and losses arising from defined benefit plans in other comprehensive income, and reports them in retained earnings. When the benefits of a plan are improved, the portion of the increased benefit relating to past service by employees is recognized immediately in earnings.
For defined contribution plans, the contributions are recognized as employee benefit expense in earnings in the periods during which services are rendered by employees. Prepaid contributions are recognized as an asset to the extent that a cash refund or a reduction in future payments is available.
20
| ii. | Other post-retirement benefit plans |
The Company provides certain post-retirement health care benefits to its retirees. The entitlement to these benefits is usually conditional on the employee remaining in service up to retirement age and the completion of a minimum service period. The expected costs of these benefits are accrued over the period of employment using the same accounting methodology as used for defined benefit pension plans. Actuarial gains and losses are recognized in other comprehensive income in the period in which they arise. These obligations are valued annually by independent qualified actuaries.
| iii. | Short-term employee benefits |
Short-term employee benefit obligations are measured on an undiscounted basis and are expensed as the related service is provided. A liability is recognized for the amount expected to be paid under short-term cash bonus plans if the Company has a present legal or constructive obligation to pay this amount as a result of past service provided by the employee, and the obligation can be measured reliably.
| iv. | Termination benefits |
Termination benefits are payable when employment is terminated by the Company before the normal retirement date, or whenever an employee accepts an entity’s offer of benefits in exchange for termination of employment. Cameco recognizes termination benefits as an expense at the earlier of when the Company can no longer withdraw the offer of those benefits and when the Company recognizes costs for a restructuring. If benefits are payable more than 12 months after the reporting period, they are discounted to their present value.
| v. | Share-based compensation |
For equity-settled plans, the grant date fair value of share-based compensation awards granted to employees is recognized as an employee benefit expense, with a corresponding increase in equity, over the period that the employees unconditionally become entitled to the awards. The amount recognized as an expense is adjusted to reflect the number of awards for which the related service and vesting conditions are expected to be met, such that the amount ultimately recognized as an expense is based on the number of awards that meet the related service and non-market performance conditions at the vesting date.
For cash-settled plans, the fair value of the amount payable to employees is recognized as an expense, with a corresponding increase in liabilities, over the period that the employees unconditionally become entitled to payment. The liability is re-measured at each reporting date and at settlement date. Any changes in the fair value of the liability are recognized as employee benefit expense in earnings.
When the terms and conditions of equity-settled plans at the time they were granted are subsequently modified, the fair value of the share-based payment under the original terms and conditions and under the modified terms and conditions are both determined at the date of the modification. Any excess of the modified fair value over the original fair value is recognised over the remaining vesting period in addition to the grant date fair value of the original share-based payment. The share-based payment expense is not adjusted if the modified fair value is less than the original fair value.
Cameco’s contributions under the employee share ownership plan are expensed during the year of contribution. Shares purchased with Company contributions and with dividends paid on such shares become unrestricted on January 1 of the second plan year following the date on which such shares were purchased.
| P. | Revenue recognition |
Cameco supplies uranium concentrates, uranium conversion services, fabrication services and other services. Revenue is measured based on the consideration specified in a contract with a customer. The Company recognizes revenue when it transfers control, as described below, over a good or service to a customer. Customers do not have the right to return products, except in limited circumstances.
21
Cameco’s sales arrangements with its customers are pursuant to enforceable contracts that indicate the nature and timing of satisfaction of performance obligations, including significant payment terms, where payment is usually due in 30 days. Each delivery is considered a separate performance obligation under the contract.
Uranium supply
In a uranium supply arrangement, Cameco is contractually obligated to provide uranium concentrates to its customers. Cameco-owned uranium may be physically delivered to either the customer or to conversion facilities (Converters).
For deliveries to customers, terms in the sales contract specify the location of delivery. Revenue is recognized when the uranium has been delivered and accepted by the customer at that location.
When uranium is delivered to Converters, the Converter will credit Cameco’s account for the volume of accepted uranium. Based on delivery terms in the sales contract with its customer, Cameco instructs the Converter to transfer title of a contractually specified quantity of uranium to the customer’s account at the Converter’s facility. At this point, control has been transferred and Cameco recognizes revenue for the uranium supply.
Toll conversion services
In a toll conversion arrangement, Cameco is contractually obligated to convert customer-owned uranium to a chemical state suitable for enrichment. Based on delivery terms in a sales contract with its customer, Cameco either (i) physically delivers converted uranium to enrichment facilities (Enrichers) where it instructs the Enricher to transfer title of a contractually specified quantity of converted uranium to the customer’s account at the Enricher’s facility, or (ii) transfers title of a contractually specified quantity of converted uranium to either an Enricher’s account or the customer’s account at Cameco’s Port Hope conversion facility. At this point, the customer obtains control and Cameco recognizes revenue for the toll conversion services.
Conversion supply
A conversion supply arrangement is a combination of uranium supply and toll conversion services. Cameco is contractually obligated to provide converted uranium to its customers. Based on delivery terms in the sales contract, Cameco either (i) physically delivers converted uranium to the Enricher where it instructs the Enricher to transfer title of a contractually specified quantity of converted uranium to the customer’s account at the Enricher’s facility, or (ii) transfers title of a contractually specified quantity of converted uranium to either an Enricher’s account or a customer’s account at Cameco’s Port Hope conversion facility. At this point, the customer obtains control and Cameco recognizes revenue for both the uranium supplied and the conversion service provided.
Fabrication services
In a fabrication services arrangement, Cameco is contractually obligated to provide fuel bundles or reactor components to its customers. In a contract for fuel bundles, the bundles are inspected and accepted by the customer at Cameco’s Port Hope fabrication facility or another location based on delivery terms in the sales contract. At this point, the customer obtains control and Cameco recognizes revenue for the fabrication services.
In some contracts for reactor components, the components are made to a customer’s specification and if a contract is terminated by the customer, Cameco is entitled to reimbursement of the costs incurred to date, including a reasonable margin. Since the customer controls all of the work in progress as the products are being manufactured, revenue and associated costs are recognized over time, before the goods are delivered to the customer’s premises. Revenue is recognized on the basis of units produced as the contracts reflect a per unit basis. Revenue from these contracts represents an insignificant portion of Cameco’s total revenue. In other contracts where the reactor components are not made to a specific customer’s specification, when the components are delivered to the location specified in the contract, the customer obtains control and Cameco recognizes revenue for the services.
22
Other services
Uranium concentrates and converted uranium are regulated products and can only be stored at regulated facilities. In a storage arrangement, Cameco is contractually obligated to store uranium products at its facilities on behalf of the customer. Cameco invoices the customer in accordance with the contract terms and recognizes revenue on a monthly basis.
Cameco also provides customers with transportation of its uranium products. In the contractual arrangements where Cameco is acting as the principal, revenue is recognized as the product is delivered.
| Q. | Financial instruments |
A financial instrument is any contract that gives rise to a financial asset of one entity and a financial liability or equity instrument of another.
Trade receivables and debt securities are initially recognized when they are originated. All other financial assets and liabilities are initially recognized when the company becomes a party to the contractual provisions of the instrument. A financial asset (unless it is a trade receivable without a significant financing component) or financial liability is initially measured at fair value plus, for an item not at fair value through profit or loss, transaction costs that are directly attributable to its acquisition or issue. A trade receivable without a significant financing component is initially measured at the transaction price.
| i. | Financial assets |
On initial recognition, financial assets are classified as measured at: amortized cost, fair value through other comprehensive income, or fair value through profit or loss based on the Company’s business model for managing its financial assets and their cash flow characteristics. Classifications are not changed subsequent to initial recognition unless the Company changes its business model for managing its financial assets, in which case all affected financial assets are reclassified on the first day of the first reporting period following the change in business model.
Amortized cost
A financial asset is measured at amortized cost if it is not designated as at fair value through profit or loss, is held within a business model whose objective is to hold assets to collect contractual cash flows and its contractual terms give rise to cash flows on specified dates that are solely payments of principal and interest on the principal amount outstanding. Assets in this category are subsequently measured at amortized cost using the effective interest method. The amortized cost is reduced by impairment losses. Interest income, foreign exchange gains and losses and impairment are recognized in profit or loss, as is any gain or loss on derecognition. The Company’s financial assets measured at amortized cost include cash and cash equivalents, short-term investments and accounts receivable.
Fair value through other comprehensive income (FVOCI)
A debt investment is measured at FVOCI if it is not designated as at fair value through profit or loss, is held within a business model whose objective is achieved by both collecting contractual cash flows and selling financial assets and its contractual terms give rise to cash flows on specified dates that are solely payments of principal and interest on the principal amount outstanding. These assets are subsequently measured at fair value. Interest income calculated using the effective interest method, foreign exchange gains and losses and impairment are recognized in profit or loss. Other net gains and losses are recognized in other comprehensive income (OCI). On derecognition, gains and losses accumulated in OCI are reclassified to profit or loss.
On initial recognition of an equity investment that is not held for trading, Cameco may irrevocably elect to present subsequent changes in the investments fair value in OCI. This election is made on an investment-by-investment basis. These assets are subsequently measured at fair value. Dividends are recognized as income in profit or loss unless the dividend clearly represents a recovery of part of the cost of the investment. Other net gains and losses are recognized in OCI and are never reclassified to profit or loss.
23
Fair value through profit or loss (FVTPL)
All financial assets not classified as measured at amortized cost or FVOCI are measured at FVTPL. This includes all derivative financial assets. On initial recognition, the Company may irrevocably designate a financial asset that otherwise meets the requirements to be measured at amortized cost or at FVOCI as at FVTPL if doing so eliminates or significantly reduces an accounting mismatch that would otherwise arise. These assets are subsequently measured at fair value. Net gains and losses, including any interest or dividend income, are recognized in profit or loss. The Company’s financial assets measured at FVTPL include foreign currency contracts.
Derecognition of financial assets
Cameco derecognizes a financial asset when the contractual rights to the cash flows from the asset expire, or it transfers the rights to receive the contractual cash flows in a transaction in which substantially all of the risks and rewards of ownership of the financial asset are transferred or in which it neither transfers or retains substantially all of the risks and rewards of ownership and it does not retain control of the financial asset.
If the Company enters into a transaction whereby it transfers assets recognized in its statement of financial position, but retains either all or substantially all of the risks and rewards of the transferred assets, the transferred assets would not be derecognized.
| ii. | Financial liabilities |
On initial recognition, financial liabilities are classified as measured at amortized cost or FVTPL. A financial liability is classified as FVTPL if it is classified as held-for-trading, is a derivative or is designated as such on initial recognition. Financial liabilities at FVTPL are measured at fair value and net gains and losses, including any interest expense, are recognized in profit or loss. Other financial liabilities are subsequently measured at amortized cost using the effective interest method. Interest expense and foreign exchange gains and losses are recognized in profit or loss as is any gain or loss on derecognition. The Company’s financial liabilities measured at amortized cost include accounts payable and accrued liabilities, lease obligations and long-term debt. The Company’s financial liabilities measured at FVTPL include foreign currency contracts and interest rate contracts.
A financial liability is derecognized when its contractual obligations are discharged or cancelled, or expire. The Company also derecognizes a financial liability when its terms are modified and the cash flows of the modified liability are substantially different, in which case a new financial liability based on the modified terms is recognized at fair value. On derecognition of a financial liability, the difference between the carrying amount extinguished and the consideration paid (including any non-cash assets transferred or liabilities assumed) is recognized in profit or loss.
| iii. | Derivative financial instruments |
The Company holds derivative financial instruments to reduce exposure to fluctuations in foreign currency exchange rates and interest rates. Embedded derivatives are separated from the host contract and accounted for separately if the host contract is not a financial asset and certain criteria are met.
Derivative financial instruments are initially measured at fair value in the consolidated statements of financial position, with any directly attributable transaction costs recognized in profit or loss as incurred. Subsequent to initial recognition, derivatives are measured at fair value, and changes in fair value are recognized in profit or loss.
The purpose of hedging transactions is to modify the Company’s exposure to one or more risks by creating an offset between changes in the fair value of, or the cash flows attributable to, the hedged item and the hedging item. When hedge accounting is appropriate, the hedging relationship is designated as a fair value hedge, a cash flow hedge, or a foreign currency risk hedge related to a net investment in a foreign operation. While Cameco does not have any instruments that have been designated as hedge transactions at December 31, 2024 and 2023, its equity-investee Westinghouse does. These cash flow hedges are recognized in other comprehensive income.
24
R. Income tax
Income tax expense is comprised of current and deferred taxes. Current tax and deferred tax are recognized in earnings except to the extent that it relates to a business combination, or items recognized directly in equity or in other comprehensive income.
Current tax is the expected tax payable or receivable on the taxable income or loss for the year, using tax rates enacted or substantively enacted at the reporting date, and any adjustments to tax payable in respect of previous years. Current tax assets and liabilities are measured at the amount expected to be paid or recovered from the taxation authorities.
Deferred tax is recognized in respect of temporary differences between the carrying amounts of assets and liabilities for financial reporting purposes and the amounts used for taxation purposes. In addition, deferred tax is not recognized for taxable temporary differences arising on the initial recognition of goodwill. Deferred tax is measured at the tax rates that are expected to be applied to temporary differences when they reverse, based on the laws that have been enacted or substantively enacted by the reporting date. Deferred tax assets and liabilities are offset if there is a legally enforceable right to offset current tax liabilities and assets, and they relate to income taxes levied by the same tax authority on the same taxable entity, or on different tax entities, but they intend to settle current tax liabilities and assets on a net basis or their tax assets and liabilities will be realized simultaneously.
A deferred tax asset is recognized for unused tax losses, tax credits and deductible temporary differences, to the extent that it is probable that future taxable income will be available against which they can be utilized. Deferred tax assets are reviewed at each reporting date and are reduced to the extent that it is no longer probable that the related tax benefit will be realized.
The Company’s exposure to uncertain tax positions is evaluated and a provision is made where it is probable that this exposure will materialize.
| S. | Share capital |
Common shares are classified as equity. Incremental costs directly attributable to the issue of common shares are recognized as a reduction of equity, net of any tax effects.
| T. | Earnings per share |
The Company presents basic and diluted earnings per share data for its common shares. Earnings per share is calculated by dividing the net earnings attributable to equity holders of the Company by the weighted average number of common shares outstanding.
Diluted earnings per share is determined by adjusting the net earnings attributable to equity holders of the Company and the weighted average number of common shares outstanding, for the effects of all dilutive potential common shares. The calculation of diluted earnings per share assumes that outstanding options which are dilutive to earnings per share are exercised and the proceeds are used to repurchase shares of the Company at the average market price of the shares for the period. The effect is to increase the number of shares used to calculate diluted earnings per share.
| U. | Segment reporting |
An operating segment is a component of the Company that engages in business activities from which it may earn revenues and incur expenses, including revenues and expenses that relate to transactions with any of the Company’s other segments. To be classified as a segment, discrete financial information must be available and operating results must be regularly reviewed by the Company’s executive team. Cameco has three reportable segments, uranium, fuel services and Westinghouse.
Segment capital expenditure is the total cost incurred during the period to acquire property, plant and equipment, and intangible assets other than goodwill.
25
| 3. | Accounting standards |
| A. | Changes in accounting policy |
A number of amendments to existing standards became effective January 1, 2024 but, other than the one noted below, they were not applicable to the Company’s financial statements.
| i. | Classification of liabilities as current or non-current |
In January 2020 and October 2022, the International Accounting Standards Board (IASB) issued amendments to IAS 1, Presentation of Financial Statements (IAS 1). The amendments clarify certain requirements for determining whether a liability is classified as current or non-current and require new disclosures for non-current loan liabilities that are subject to covenants within 12 months after the end of the reporting period. The amendments did not have a material impact on its financial statements.
| B. | New standards and interpretations not yet adopted |
A number of amendments to existing standards are not yet effective for the year ended December 31, 2024 and have not been applied in preparing these consolidated financial statements. Cameco does not intend to early adopt any of the amendments and does not expect them to have a material impact on its financial statements. The one new standard that is expected to have an impact on disclosures is described below.
| i. | Financial statement presentation |
In April 2024, the IASB issued IFRS 18, Presentation and Disclosure of Financial Statements (IFRS 18). IFRS 18 is effective for periods beginning on or after January 1, 2027, with early adoption permitted. IFRS 18 is expected to improve the quality of financial reporting by requiring defined subtotals in the statement of profit of loss, requiring disclosure about management-defined performance measures, and adding new principles for aggregation and disaggregation of information. Cameco has not yet determined the impact of this standard on its disclosures.
| 4. | Determination of fair values |
A number of the Company’s accounting policies and disclosures require the measurement of fair value, for both financial and non-financial assets and liabilities.
The fair value of an asset or liability is generally estimated as the amount that would be received on sale of an asset, or paid to transfer a liability in an orderly transaction between market participants at the reporting date. Fair values of assets and liabilities traded in an active market are determined by reference to last quoted prices, in the principal market for the asset or liability. In the absence of an active market for an asset or liability, fair values are determined based on market quotes for assets or liabilities with similar characteristics and risk profiles, or through other valuation techniques. Fair values determined using valuation techniques require the use of inputs, which are obtained from external, readily observable market data when available. In some circumstances, inputs that are not based on observable data must be used. In these cases, the estimated fair values may be adjusted in order to account for valuation uncertainty, or to reflect the assumptions that market participants would use in pricing the asset or liability.
All fair value measurements are categorized into one of three hierarchy levels, described below, for disclosure purposes. Each level is based on the transparency of the inputs used to measure the fair values of assets and liabilities:
Level 1 – Values based on unadjusted quoted prices in active markets that are accessible at the reporting date for identical assets or liabilities.
Level 2 – Values based on quoted prices in markets that are not active or model inputs that are observable either directly or indirectly for substantially the full term of the asset or liability.
26
Level 3 – Values based on prices or valuation techniques that require inputs that are both unobservable and significant to the overall fair value measurement.
When the inputs used to measure fair value fall within more than one level of the hierarchy, the level within which the fair value measurement is categorized is based on the lowest level input that is significant to the fair value measurement in its entirety.
Transfers between levels of the fair value hierarchy are recognized at the end of the reporting period during which the transfer occurred. There were no transfers between level 1, level 2, or level 3 during the period. Cameco does not have any recurring fair value measurements that are categorized as level 1 or level 3 as of the reporting date.
Further information about the techniques and assumptions used to measure fair values is included in the following notes:
Note 6 - Acquisitions
Note 24 - Share-based compensation plans
Note 26 - Financial instruments and risk management
| 5. | Use of estimates and judgments |
The preparation of the consolidated financial statements in conformity with IFRS requires management to make judgments, estimates and assumptions that affect the application of accounting policies and the reported amounts of assets, liabilities, revenues and expenses. Actual results may differ from these estimates.
Estimates and underlying assumptions are reviewed on an ongoing basis. Revisions to accounting estimates are recognized in the period in which the estimates are revised and in any future period affected.
Information about critical judgments in applying the accounting policies that have the most significant effect on the amounts recognized in the consolidated financial statements is discussed below. Further details of the nature of these judgments, estimates and assumptions may be found in the relevant notes to the consolidated financial statements.
| A. | Recoverability of long-lived and intangible assets and investments |
Cameco assesses the carrying values of property, plant and equipment, intangible assets and investments in associates and joint ventures when there is an indication of possible impairment. If it is determined that carrying values of assets cannot be recovered, the unrecoverable amounts are charged against current earnings. Recoverability is dependent upon assumptions and judgments regarding market conditions, compound annual growth rates in Westinghouse’s core business, costs of production, sustaining capital requirements, mineral reserves and the impact of geopolitical events. Other assumptions used in the calculation of recoverable amounts are discount rates, future cash flows and profit margins. A material change in assumptions may significantly impact the potential impairment of these assets.
| B. | Cash generating units |
In performing impairment assessments of long-lived assets, assets that cannot be assessed individually are grouped together into the smallest group of assets that generates cash inflows that are largely independent of the cash inflows from other assets or groups of assets. Management is required to exercise judgment in identifying these CGUs.
| C. | Provisions for decommissioning and reclamation of assets |
Significant decommissioning and reclamation activities are often not undertaken until near the end of the useful lives of the productive assets. Regulatory requirements and alternatives with respect to these activities are subject to change over time. A significant change to either the estimated costs, timing of the cash flows or mineral reserves may result in a material change in the amount charged to earnings.
27
| D. | Income taxes |
Cameco operates in a number of tax jurisdictions and is, therefore, required to estimate its income taxes in each of these tax jurisdictions in preparing its consolidated financial statements. In calculating income taxes, consideration is given to factors such as tax rates in the different jurisdictions, non-deductible expenses, changes in tax law and management’s expectations of future operating results. Cameco estimates deferred income taxes based on temporary differences between the income and losses reported in its consolidated financial statements and its taxable income and losses as determined under the applicable tax laws. The tax effect of these temporary differences is recorded as deferred tax assets or liabilities in the consolidated financial statements. The calculation of income taxes requires the use of judgment and estimates. The determination of the recoverability of deferred tax assets is dependent on assumptions and judgments regarding future market conditions and production rates, which can materially impact estimated future taxable income. If these judgments and estimates prove to be inaccurate, future earnings may be materially impacted.
| E. | Mineral reserves |
Depreciation on property, plant and equipment is primarily calculated using the unit-of-production method. This method allocates the cost of an asset to each period based on current period production as a portion of total lifetime production or a portion of estimated mineral reserves. Estimates of life-of-mine and amounts of mineral reserves are updated annually and are subject to judgment and significant change over time. If actual mineral reserves prove to be significantly different than the estimates, there could be a material impact on the amounts of depreciation charged to earnings.
| 6. | Acquisition |
| A. | Westinghouse Electric Company (Westinghouse) |
On November 7, 2023, Cameco acquired a 49% interest in Westinghouse, one of the world’s largest nuclear services businesses, in partnership with Brookfield Asset Management alongside its publicly listed affiliate Brookfield Renewable Partners (Brookfield) and its institutional partners. Brookfield, with its institutional partners, owns the other 51%. The acquisition represents an investment in additional nuclear fuel cycle assets that the Company expects will augment the core of its business.
During the year, the purchase price was finalized with amounts released from escrow, resulting in Cameco’s share of the purchase price being reduced by $6,063,000 ($4,434,000 US)). To finance its 49% share of the purchase price, $2,938,998,000 ($2,135,871,000 (US)), Cameco used a combination of cash, debt and equity. The Company used $2,113,398,000 ($1,535,871,000 (US)) of cash and $825,600,000 ($600,000,000 (US)) in term loans (see note 14). In 2022, Cameco had issued 34,057,250 common shares pursuant to a public offering to help fund the acquisition.
The purchase price was allocated to the underlying assets and liabilities assumed based on their fair values at the date of acquisition. During the fourth quarter, the measurement period ended and the purchase price allocation was finalized. Including insignificant measurement period adjustments, the final values assigned to Cameco’s share of the net assets acquired were as follows:
28
| USD | CAD | |||||||||||||||
| Preliminary | Final | Final | ||||||||||||||
| Net assets acquired |
allocation | Adjustments | allocation | allocation | ||||||||||||
| Cash and cash equivalents |
$ | 254,800 | $ | 1,124 | $ | 255,924 | $ | 352,151 | ||||||||
| Other current assets |
938,413 | 12,187 | 950,600 | 1,308,026 | ||||||||||||
| Property, plant and equipment |
787,278 | 10,249 | 797,527 | 1,097,397 | ||||||||||||
| Intangible assets |
2,852,780 | (13,230 | ) | 2,839,550 | 3,907,221 | |||||||||||
| Goodwill |
568,631 | 9,059 | 577,690 | 794,940 | ||||||||||||
| Non-current assets |
346,891 | 83 | 346,974 | 477,437 | ||||||||||||
| Current portion of long-term debt |
(167,886 | ) | (557 | ) | (168,443 | ) | (231,777 | ) | ||||||||
| Other current liabilities |
(996,735 | ) | (19,137 | ) | (1,015,872 | ) | (1,397,840 | ) | ||||||||
| Long-term debt |
(1,686,607 | ) | (2,971 | ) | (1,689,578 | ) | (2,324,860 | ) | ||||||||
| Other non-current liabilities |
(757,260 | ) | (1,241 | ) | (758,501 | ) | (1,043,697 | ) | ||||||||
|
|
|
|
|
|
|
|
|
|||||||||
| Total |
$ | 2,140,305 | $ | (4,434 | ) | $ | 2,135,871 | $ | 2,938,998 | |||||||
|
|
|
|
|
|
|
|
|
|||||||||
| Cash |
1,540,305 | (4,434 | ) | 1,535,871 | 2,113,398 | |||||||||||
| Term loans [note 14] |
600,000 | — | 600,000 | 825,600 | ||||||||||||
|
|
|
|
|
|
|
|
|
|||||||||
| Total |
$ | 2,140,305 | $ | (4,434 | ) | $ | 2,135,871 | $ | 2,938,998 | |||||||
|
|
|
|
|
|
|
|
|
|||||||||
Fair values were determined using a number of different valuation methodologies depending on the characteristics of the assets being valued. Methods included discounted cash flows, relief from royalty and multi-period excess earnings, quoted market prices and the direct cost method.
Intangible assets include customer relationships and contracts, developed technology, the Westinghouse trade name and product development costs. Goodwill reflects the value assigned to the expected future earnings capabilities of the organization. This is the earnings potential that we anticipate will be realized through new business arrangements.
| 7. | Accounts receivable |
| 2024 | 2023 | |||||||
| Trade receivables |
$ | 309,570 | $ | 413,792 | ||||
| GST/VAT receivables |
28,674 | 6,772 | ||||||
| Other receivables |
8,556 | 1,769 | ||||||
|
|
|
|
|
|||||
| Total |
$ | 346,800 | $ | 422,333 | ||||
|
|
|
|
|
|||||
The Company’s exposure to credit and currency risks as well as credit losses related to trade and other receivables, excluding goods and services tax (GST)/value added tax (VAT) receivables, is disclosed in note 26.
29
| 8. | Inventories |
| 2024 | 2023 | |||||||
| Uranium |
||||||||
| Concentrate |
$ | 651,901 | $ | 511,654 | ||||
| Broken ore |
27,892 | 71,463 | ||||||
|
|
|
|
|
|||||
| 679,793 | 583,117 | |||||||
| Fuel services |
146,612 | 108,711 | ||||||
| Other |
458 | 433 | ||||||
|
|
|
|
|
|||||
| Total |
$ | 826,863 | $ | 692,261 | ||||
|
|
|
|
|
|||||
Cameco expensed $2,049,675,000 of inventory as cost of sales during 2024 (2023 - $1,833,000,000).
| 9. | Property, plant and equipment |
At December 31, 2024
| Land | Plant | Furniture | Exploration | |||||||||||||||||||||
| and | and | and | Under | and | ||||||||||||||||||||
| buildings | equipment | fixtures | construction | evaluation | Total | |||||||||||||||||||
| Cost |
||||||||||||||||||||||||
| Beginning of year |
$ | 5,213,324 | $ | 2,897,605 | $ | 90,719 | $ | 237,280 | $ | 1,068,442 | $ | 9,507,370 | ||||||||||||
| Additions |
206 | 734 | 61 | 210,172 | 462 | 211,635 | ||||||||||||||||||
| Transfers |
72,014 | 105,291 | 4,299 | (181,550 | ) | — | 54 | |||||||||||||||||
| Change in reclamation provision [note 16] |
(54,991 | ) | — | — | — | — | (54,991 | ) | ||||||||||||||||
| Disposals |
(210 | ) | (3,004 | ) | (1,300 | ) | (255 | ) | — | (4,769 | ) | |||||||||||||
| Effect of movements in exchange rates |
54,888 | 15,514 | 296 | 18 | 1,332 | 72,048 | ||||||||||||||||||
|
|
|
|
|
|
|
|
|
|
|
|
|
|||||||||||||
| End of year |
5,285,231 | 3,016,140 | 94,075 | 265,665 | 1,070,236 | 9,731,347 | ||||||||||||||||||
|
|
|
|
|
|
|
|
|
|
|
|
|
|||||||||||||
| Accumulated depreciation |
|
|||||||||||||||||||||||
| Beginning of year |
3,412,990 | 2,159,021 | 83,676 | 36,798 | 456,912 | 6,149,397 | ||||||||||||||||||
| Depreciation charge |
164,525 | 105,545 | 4,523 | — | — | 274,593 | ||||||||||||||||||
| Change in reclamation provision [note 16](a) |
(37,683 | ) | — | — | — | — | (37,683 | ) | ||||||||||||||||
| Disposals |
(14 | ) | (2,064 | ) | (1,274 | ) | — | — | (3,352 | ) | ||||||||||||||
| Effect of movements in exchange rates |
52,799 | 15,404 | 286 | — | 2,720 | 71,209 | ||||||||||||||||||
|
|
|
|
|
|
|
|
|
|
|
|
|
|||||||||||||
| End of year |
3,592,617 | 2,277,906 | 87,211 | 36,798 | 459,632 | 6,454,164 | ||||||||||||||||||
|
|
|
|
|
|
|
|
|
|
|
|
|
|||||||||||||
|
Right-of-use assets |
|
|||||||||||||||||||||||
| Beginning of year |
8,326 | 401 | 2,072 | — | — | 10,799 | ||||||||||||||||||
| Additions |
696 | 385 | 20 | — | — | 1,101 | ||||||||||||||||||
| Depreciation charge |
(1,291 | ) | (251 | ) | (972 | ) | — | — | (2,514 | ) | ||||||||||||||
| Transfers |
(26 | ) | (28 | ) | — | — | — | (54 | ) | |||||||||||||||
|
|
|
|
|
|
|
|
|
|
|
|
|
|||||||||||||
| End of year |
7,705 | 507 | 1,120 | — | — | 9,332 | ||||||||||||||||||
|
|
|
|
|
|
|
|
|
|
|
|
|
|||||||||||||
| Net book value at December 31, 2024 |
$ | 1,700,319 | $ | 738,741 | $ | 7,984 | $ | 228,867 | $ | 610,604 | $ | 3,286,515 | ||||||||||||
|
|
|
|
|
|
|
|
|
|
|
|
|
|||||||||||||
| (a) | Asset retirement obligation assets are adjusted when the Company updates its reclamation provisions due to new cash flow estimates or changes in discount and inflation rates. When the assets of an operation have been written off due to an impairment, as is the case with our Rabbit Lake operation and some of our operations in the United States, the adjustment is recorded directly to the statement of earnings as other operating expense or income. |
30
At December 31, 2023
| Land | Plant | Furniture | Exploration | |||||||||||||||||||||
| and | and | and | Under | and | ||||||||||||||||||||
| buildings | equipment | fixtures | construction | evaluation | Total | |||||||||||||||||||
| Cost |
||||||||||||||||||||||||
| Beginning of year |
$ | 5,197,138 | $ | 2,812,309 | $ | 84,080 | $ | 234,590 | $ | 1,088,234 | $ | 9,416,351 | ||||||||||||
| Additions |
9,062 | 29,498 | 3,461 | 111,518 | 92 | 153,631 | ||||||||||||||||||
| Transfers |
40,011 | 63,819 | 3,334 | (106,835 | ) | — | 329 | |||||||||||||||||
| Change in reclamation provision |
(5,343 | ) | — | — | — | — | (5,343 | ) | ||||||||||||||||
| Disposals |
(13,604 | ) | (3,744 | ) | (69 | ) | (1,989 | ) | — | (19,406 | ) | |||||||||||||
| Effect of movements in exchange rates |
(13,940 | ) | (4,277 | ) | (87 | ) | (4 | ) | (19,884 | ) | (38,192 | ) | ||||||||||||
|
|
|
|
|
|
|
|
|
|
|
|
|
|||||||||||||
| End of year |
5,213,324 | 2,897,605 | 90,719 | 237,280 | 1,068,442 | 9,507,370 | ||||||||||||||||||
|
|
|
|
|
|
|
|
|
|
|
|
|
|||||||||||||
| Accumulated depreciation |
|
|||||||||||||||||||||||
| Beginning of year |
3,300,869 | 2,067,999 | 79,576 | 36,798 | 467,071 | 5,952,313 | ||||||||||||||||||
| Depreciation charge |
146,574 | 98,694 | 4,267 | — | — | 249,535 | ||||||||||||||||||
| Transfers |
— | 11 | (11 | ) | — | — | — | |||||||||||||||||
| Change in reclamation provision(a) |
(7,509 | ) | — | — | — | — | (7,509 | ) | ||||||||||||||||
| Disposals |
(13,604 | ) | (3,456 | ) | (69 | ) | — | — | (17,129 | ) | ||||||||||||||
| Effect of movements in exchange rates |
(13,340 | ) | (4,227 | ) | (87 | ) | — | (10,159 | ) | (27,813 | ) | |||||||||||||
|
|
|
|
|
|
|
|
|
|
|
|
|
|||||||||||||
| End of year |
3,412,990 | 2,159,021 | 83,676 | 36,798 | 456,912 | 6,149,397 | ||||||||||||||||||
|
|
|
|
|
|
|
|
|
|
|
|
|
|||||||||||||
|
Right-of-use assets |
|
|||||||||||||||||||||||
| Beginning of year |
5,959 | 1,565 | 1,928 | — | — | 9,452 | ||||||||||||||||||
| Additions |
3,398 | 126 | 844 | — | — | 4,368 | ||||||||||||||||||
| Disposals |
— | (214 | ) | — | — | — | (214 | ) | ||||||||||||||||
| Depreciation charge |
(1,003 | ) | (399 | ) | (1,076 | ) | — | — | (2,478 | ) | ||||||||||||||
| Transfers |
(28 | ) | (677 | ) | 376 | — | — | (329 | ) | |||||||||||||||
|
|
|
|
|
|
|
|
|
|
|
|
|
|||||||||||||
| End of year |
8,326 | 401 | 2,072 | — | — | 10,799 | ||||||||||||||||||
|
|
|
|
|
|
|
|
|
|
|
|
|
|||||||||||||
| Net book value at December 31, 2023 |
$ | 1,808,660 | $ | 738,985 | $ | 9,115 | $ | 200,482 | $ | 611,530 | $ | 3,368,772 | ||||||||||||
|
|
|
|
|
|
|
|
|
|
|
|
|
|||||||||||||
| (a) | Asset retirement obligation assets are adjusted when the Company updates its reclamation provisions due to new cash flow estimates or changes in discount and inflation rates. When the assets of an operation have been written off due to an impairment, as is the case with our Rabbit Lake operation and some of our operations in the United States, the adjustment is recorded directly to the statement of earnings as other operating expense or income. |
Cameco has contractual capital commitments of approximately $148,131,000 at December 31, 2024. Certain of the contractual commitments may contain cancellation clauses, however the Company discloses the commitments based on management’s intent to fulfill the contract. The majority of this amount is expected to be incurred in 2025.
31
| 10. | Intangible asset |
| 2024 | 2023 | |||||||
| Cost |
||||||||
| Beginning of year |
$ | 118,819 | $ | 118,819 | ||||
|
|
|
|
|
|||||
| End of year |
118,819 | 118,819 | ||||||
|
|
|
|
|
|||||
| Accumulated amortization |
||||||||
| Beginning of year |
75,242 | 71,758 | ||||||
| Amortization charge |
3,755 | 3,484 | ||||||
|
|
|
|
|
|||||
| End of year |
78,997 | 75,242 | ||||||
|
|
|
|
|
|||||
| Net book value at December 31 |
$ | 39,822 | $ | 43,577 | ||||
|
|
|
|
|
|||||
The intangible asset value relates to intellectual property acquired with Cameco Fuel Manufacturing Inc.. It is being amortized on a unit-of-production basis over its remaining life. Amortization is allocated to the cost of inventory and is recognized in cost of products and services sold as inventory was sold.
| 11. | Long-term receivables, investments and other |
| 2024 | 2023 | |||||||
| Derivatives [note 26] |
103 | 28,467 | ||||||
| Investment tax credits |
96,199 | 95,940 | ||||||
| Amounts receivable related to tax dispute [note 21](a) |
209,125 | 209,125 | ||||||
| Product loan(b) |
288,294 | 288,294 | ||||||
| Other |
3,268 | 2,108 | ||||||
|
|
|
|
|
|||||
| 596,989 | 623,934 | |||||||
| Less current portion |
(1,093 | ) | (10,161 | ) | ||||
|
|
|
|
|
|||||
| Net |
$ | 595,896 | $ | 613,773 | ||||
|
|
|
|
|
|||||
| (a) | Cameco was required to remit or otherwise secure 50% of the cash taxes and transfer pricing penalties, plus related interest and instalment penalties assessed, in relation to its dispute with Canada Revenue Agency (CRA). In light of our view of the likely outcome of the case, Cameco expects to recover the amounts remitted to CRA, including cash taxes, interest and penalties paid. |
| (b) | Cameco loaned 5,400,000 pounds of uranium concentrate to its joint venture partner, Orano Canada Inc., (Orano). Orano is obligated to repay the Company in kind with uranium concentrate no later than December 31, 2028. As at December 31, 2024, 3,000,000 pounds have been returned as repayment on this loan (December 31, 2023 - 3,000,000 pounds). |
Cameco also loaned Orano 1,148,200 kgU of conversion supply and an additional 1,200,000 pounds of uranium concentrate over the period 2022 to 2024. Repayment to Cameco is to be made in kind with U3O8 quantities drawn being repaid by December 31, 2027 and quantities of UF6 drawn by December 31, 2035.
As at December 31, 2024, 3,600,000 pounds of U3O8 (December 31, 2023 - 3,600,000 pounds) and 1,148,200 kgU of UF6 conversion supply (December 31, 2023 - 1,148,200 kgU) were drawn on the loans and are recorded at Cameco’s weighted average cost of inventory.
32
| 12. | Equity-accounted investees |
| 2024 | 2023 | |||||||
| Interest in Westinghouse |
$ | 2,931,746 | $ | 2,899,379 | ||||
| Interest in JV Inkai |
286,710 | 273,806 | ||||||
| Interest in Global Laser Enrichment LLC (GLE) |
— | — | ||||||
|
|
|
|
|
|||||
| $ | 3,218,456 | $ | 3,173,185 | |||||
|
|
|
|
|
|||||
| A. | Joint ventures |
| i. | Westinghouse |
Westinghouse is a nuclear reactor technology original equipment manufacturer and a global provider of products and services to commercial utilities and government agencies. Effective November 7, 2023, Cameco holds a 49% interest and Brookfield holds 51%. Cameco has joint control with Brookfield over the strategic operating, investing and financing activities of Westinghouse. The Company determined that the joint arrangement should be classified as a joint venture after concluding that neither the legal form of the separate entity, the terms of the contractual arrangement, or other facts and circumstances would give the Company rights to the assets and obligations for the liabilities relating to the arrangement. As a result, Cameco accounts for Westinghouse on an equity basis.
Westinghouse provides outage and maintenance services, engineering support, instrumentation and controls equipment, plant modification, and components and parts to nuclear reactors. Westinghouse has three fabrication facilities that design and manufacture nuclear fuel supplies for light water reactors. In addition, Westinghouse designs, develops and procures equipment for the build of new nuclear reactor plants.
The following table summarizes the total comprehensive loss of Westinghouse (100%). Prior period comprehensive loss is for the period commencing November 7, 2023:
| 2024 | 2023 | |||||||
| Revenue from products and services |
$ | 5,902,993 | $ | 1,063,417 | ||||
| Cost of products and services sold |
(2,075,469 | ) | (408,745 | ) | ||||
| Depreciation and amortization |
(728,294 | ) | (124,012 | ) | ||||
| Marketing, administrative and general expenses |
(2,980,932 | ) | (498,775 | ) | ||||
| Finance income |
8,941 | 3,846 | ||||||
| Finance costs |
(459,567 | ) | (59,414 | ) | ||||
| Other expense |
(238,158 | ) | (39,641 | ) | ||||
| Income tax recovery |
124,717 | 13,555 | ||||||
|
|
|
|
|
|||||
| Net loss |
(445,769 | ) | (49,769 | ) | ||||
| Other comprehensive income |
42,506 | 13,933 | ||||||
|
|
|
|
|
|||||
| Total comprehensive loss |
$ | (403,263 | ) | $ | (35,836 | ) | ||
|
|
|
|
|
|||||
33
The following table summarizes the financial information of Westinghouse (100%) for the year ending December 31 and reconciles it to the carrying amount of Cameco’s interest:
| 2024 | 2023 | |||||||
| Cash and cash equivalents |
$ | 255,589 | $ | 265,146 | ||||
| Other current assets |
2,737,164 | 2,364,602 | ||||||
| Intangible assets |
7,821,802 | 7,655,386 | ||||||
| Goodwill |
1,698,174 | 1,534,947 | ||||||
| Non-current assets |
3,113,031 | 3,102,566 | ||||||
| Current portion of long-term debt |
(44,576 | ) | (208,959 | ) | ||||
| Other current liabilities |
(2,751,396 | ) | (2,255,099 | ) | ||||
| Long-term debt |
(4,924,398 | ) | (4,554,227 | ) | ||||
| Other non-current liabilities |
(2,078,688 | ) | (2,130,446 | ) | ||||
|
|
|
|
|
|||||
| Net assets |
$ | 5,826,702 | 5,773,916 | |||||
| Net assets attributable to non-controlling interest |
(25,127 | ) | (24,036 | ) | ||||
|
|
|
|
|
|||||
| Net assets attributable to shareholders |
$ | 5,801,575 | $ | 5,749,880 | ||||
| Cameco’s share of net assets attributable to shareholders (49%) |
2,842,772 | 2,817,441 | ||||||
| Acquisition costs(a) |
83,896 | 83,916 | ||||||
| Impact of foreign exchange on acquisition costs |
5,078 | (1,978 | ) | |||||
|
|
|
|
|
|||||
| Carrying amount of interest in Westinghouse |
$ | 2,931,746 | 2,899,379 | |||||
|
|
|
|
|
|||||
| (a) | Cameco incurred $83,896,000 of acquisition costs that were included in the cost of the investment. |
| ii. | Global Laser Enrichment LLC (GLE) |
GLE is the exclusive licensee of the proprietary Separation of Isotopes by Laser Excitation (SILEX) laser enrichment technology, a third-generation uranium enrichment technology. Cameco owns a 49% interest in GLE with an option to attain a majority interest of up to 75% ownership. Cameco has joint control with SILEX over the strategic operating, investing and financing activities and as a result, accounts for GLE on an equity basis. In 2014, an impairment charge was recognized for its full carrying value of $183,615,000. Following the impairment, under the equity method of accounting, Cameco discontinued recognizing its share of losses in GLE. Cameco’s contributions to GLE are recorded in earnings as research and development.
34
| B. | Associate |
| i. | JV Inkai |
JV Inkai is the operator of the Inkai uranium deposit located in Kazakhstan. Cameco holds a 40% interest and Kazatomprom holds a 60% interest in JV Inkai. Cameco does not have joint control over the joint venture and as a result, Cameco accounts for JV Inkai on an equity basis.
JV Inkai is a uranium mining and milling operation that utilizes in-situ recovery (ISR) technology to extract uranium. The participants in JV Inkai purchase uranium from Inkai and, in turn, derive revenue directly from the sale of such product to third-party customers.
The following table summarizes the total comprehensive income of JV Inkai (100%):
| 2024 | 2023 | |||||||
| Revenue from products and services |
$ | 934,759 | $ | 708,679 | ||||
| Cost of products and services sold |
(147,103 | ) | (99,160 | ) | ||||
| Depreciation and amortization |
(57,739 | ) | (35,187 | ) | ||||
| Finance income |
3,010 | 1,343 | ||||||
| Finance costs |
(704 | ) | (1,069 | ) | ||||
| Other expense |
(13,453 | ) | (34,738 | ) | ||||
| Income tax expense |
(143,974 | ) | (106,419 | ) | ||||
|
|
|
|
|
|||||
| Net earnings |
574,796 | 433,449 | ||||||
| Other comprehensive income |
— | — | ||||||
|
|
|
|
|
|||||
| Total comprehensive income |
$ | 574,796 | $ | 433,449 | ||||
|
|
|
|
|
|||||
The following table summarizes the financial information of JV Inkai (100%) and reconciles it to the carrying amount of Cameco’s interest:
| 2024 | 2023 | |||||||
| Cash and cash equivalents |
$ | 47,282 | $ | 24,074 | ||||
| Other current assets |
694,041 | 551,917 | ||||||
| Non-current assets |
307,801 | 332,655 | ||||||
| Current liabilities |
(42,368 | ) | (40,985 | ) | ||||
| Non-current liabilities |
(27,802 | ) | (30,211 | ) | ||||
|
|
|
|
|
|||||
| Net assets |
978,954 | 837,450 | ||||||
| Cameco’s share of net assets (40%) |
391,582 | 334,980 | ||||||
| Consolidating adjustments(a) |
(93,365 | ) | (74,223 | ) | ||||
| Fair value increment(b) |
77,992 | 81,090 | ||||||
| Dividends declared but not received |
9,760 | 5,952 | ||||||
| Dividends in excess of ownership percentage(c) |
(107,179 | ) | (74,843 | ) | ||||
| Impact of foreign exchange |
7,920 | 850 | ||||||
|
|
|
|
|
|||||
| Carrying amount of interest in JV Inkai |
$ | 286,710 | $ | 273,806 | ||||
|
|
|
|
|
|||||
| (a) | Cameco records certain consolidating adjustments to eliminate unrealized profit and amortize historical differences in accounting policies. This amount is amortized to earnings over units of production. |
| (b) | Upon restructuring, Cameco assigned fair values to the assets and liabilities of JV Inkai. This increment is amortized to earnings over units of production. |
| (c) | Cameco’s share of dividends follows its production purchase entitlements which is currently higher than its ownership interest. |
35
| 13. | Accounts payable and accrued liabilities |
| 2024 | 2023 | |||||||
| Trade payables |
$ | 129,832 | $ | 99,847 | ||||
| Non-trade payables |
121,644 | 108,856 | ||||||
| Payables due to related parties [notes 24, 31] |
367,559 | 368,847 | ||||||
|
|
|
|
|
|||||
| Total |
$ | 619,035 | $ | 577,550 | ||||
|
|
|
|
|
|||||
The Company’s exposure to currency and liquidity risk related to trade and other payables is disclosed in note 26.
| 14. | Long-term debt |
| 2024 | 2023 | |||||||
| Unsecured debentures |
||||||||
| Series F - 5.09% debentures due November 14, 2042 |
$ | 99,395 | $ | 99,374 | ||||
| Series G - 4.19% debentures due June 24, 2024 |
— | 499,821 | ||||||
| Series H - 2.95% debentures due October 21, 2027 |
398,936 | 398,582 | ||||||
| Series I - 4.94% debentures due May 24, 2031 |
497,252 | — | ||||||
| Term loans |
285,707 | 786,397 | ||||||
|
|
|
|
|
|||||
| 1,281,290 | 1,784,174 | |||||||
| Less current portion |
(285,707 | ) | (499,821 | ) | ||||
|
|
|
|
|
|||||
| Total |
$ | 995,583 | $ | 1,284,353 | ||||
|
|
|
|
|
|||||
Cameco has a $1,000,000,000 unsecured revolving credit facility that is available until October 1, 2028. Upon mutual agreement, the facility can be extended for an additional year on the anniversary date. In addition to direct borrowings under the facility, up to $100,000,000 can be used for the issuance of letters of credit and, to the extent necessary, it may be used to provide liquidity support for the Company’s commercial paper program. The agreement also provides the ability to increase the revolving credit facility above $1,000,000,000 by increments no less than $50,000,000, to a total of $1,250,000,000. The facility ranks equally with all of Cameco’s other senior debt. As of December 31, 2024 and 2023, there were no amounts outstanding under this facility.
Cameco has $1,890,028,000 (2023 - $1,771,663,000) in letter of credit facilities. Outstanding and committed letters of credit at December 31, 2024 amounted to $1,527,815,000 (2023 - $1,383,689,000), the majority of which relate to future decommissioning and reclamation liabilities (note 16) and CRA reassessments (note 21).
On May 24, 2024, Cameco issued $500,000,000 of Series I debentures which bear interest at a rate of 4.94% per annum. The net proceeds of the issue after deducting expenses were approximately $497,000,000. The debentures mature on May 24, 2031 and are being amortized at an effective interest rate of 5.04%. In conjunction with the issuance of the Series I debentures, on June 24, 2024, the $500,000,000 principal amount of the Series G debentures was redeemed.
On November 7, 2023, the Company utilized a term loan for $600,000,000 (US) to finance the 49% acquisition of Westinghouse. The term loan consisted of two $300,000,000 (US) tranches. The first tranche had a floating interest rate of SOFR plus 1.80% and was to mature on November 7, 2025. The second tranche had a floating interest rate of SOFR plus 2.05% and was to mature on November 7, 2026. The second tranche was fully repaid on June 10, 2024. On September 9, 2024, Cameco repaid $100,000,000 (US) on the first tranche of the term loan and subsequent to year-end, on January 13, 2025, repaid the remaining $200,000,000 (US) balance.
36
Cameco is bound by a covenant in its revolving credit facility and term loan. The covenant requires a funded debt to tangible net worth ratio equal to or less than 1:1. Non-compliance with this covenant could result in accelerated payment and termination of the revolving credit facility and term loan. At December 31, 2024, Cameco was in compliance with the covenant and does not expect its operating and investing activities in 2025 to be constrained by it.
The table below represents currently scheduled maturities of long-term debt:
| 2025 |
2026 | 2027 | 2028 | 2029 | Thereafter | Total | ||||||||||||||||||
| $285,707 |
— | 398,936 | — | — | 596,647 | $ | 1,281,290 | |||||||||||||||||
|
|
|
|
|
|
|
|
|
|
|
|
|
|||||||||||||
| 15. | Other liabilities |
| 2024 | 2023 | |||||||
| Deferred sales [notes 18, 31] |
$ | 106,569 | $ | 45,372 | ||||
| Derivatives [note 26] |
143,609 | 22,344 | ||||||
| Accrued pension and post-retirement benefit liability [note 25] |
78,674 | 77,002 | ||||||
| Lease obligation |
9,839 | 10,816 | ||||||
| Product loan(a) |
177,623 | 166,052 | ||||||
| Sales contracts |
4,304 | 6,314 | ||||||
| Other |
64,699 | 64,064 | ||||||
|
|
|
|
|
|||||
| 585,317 | 391,964 | |||||||
| Less: current portion |
(221,820 | ) | (48,544 | ) | ||||
|
|
|
|
|
|||||
| Net |
$ | 363,497 | $ | 343,420 | ||||
|
|
|
|
|
|||||
Expenses related to short-term leases and leases of low-value assets were insignificant during 2024.
| (a) | The Company has standby product loan facilities with various counterparties. The arrangements allow it to borrow up to 1,768,000 kgU of UF6 conversion services and 4,940,000 pounds of U3O8 by September 30, 2027 with repayment in kind up to December 31, 2027. Under the facilities, standby fees of up to 1.5% are payable based on the market value of the facilities and interest is payable on the market value of any amounts drawn at rates ranging from 0.5% to 3.0%. At December 31, 2024, we have 1,567,000 kgU of UF6 conversion services (December 31, 2023 - 1,777,000 kgU) drawn on the loans with repayment in the following years: |
| 2025 | 2026 | Total | ||||||||||
| kgU of UF6 |
318,000 | 1,249,000 | 1,567,000 | |||||||||
|
|
|
|
|
|
|
|||||||
We also have 2,506,000 pounds of U3O8 (December 31, 2023 - 2,756,000 pounds) drawn with repayment in the following years:
| 2025 | 2026 | Total | ||||||||||
| lbs of U3O8 |
630,000 | 1,876,000 | 2,506,000 | |||||||||
|
|
|
|
|
|
|
|||||||
The loans are recorded at Cameco’s weighted average cost of inventory.
37
| 16. | Provisions |
| Reclamation | Waste disposal | Total | ||||||||||
| Beginning of year |
$ | 1,051,167 | $ | 10,817 | $ | 1,061,984 | ||||||
| Changes in estimates and discount rates [note 9] |
||||||||||||
| Capitalized in property, plant and equipment |
(17,308 | ) | — | (17,308 | ) | |||||||
| Recognized in earnings [note 9] |
(37,683 | ) | 331 | (37,352 | ) | |||||||
| Provisions used during the period |
(34,064 | ) | (682 | ) | (34,746 | ) | ||||||
| Unwinding of discount [note 20] |
35,941 | 302 | 36,243 | |||||||||
| Effect of movements in exchange rates |
26,986 | — | 26,986 | |||||||||
|
|
|
|
|
|
|
|||||||
| End of period |
$ | 1,025,039 | $ | 10,768 | $ | 1,035,807 | ||||||
|
|
|
|
|
|
|
|||||||
| Current |
$ | 34,063 | $ | 3,911 | $ | 37,974 | ||||||
| Non-current |
990,976 | 6,857 | 997,833 | |||||||||
|
|
|
|
|
|
|
|||||||
| $ | 1,025,039 | $ | 10,768 | $ | 1,035,807 | |||||||
|
|
|
|
|
|
|
|||||||
| A. | Reclamation provision |
Cameco’s estimates of future decommissioning obligations are based on reclamation standards that satisfy regulatory requirements. Elements of uncertainty in estimating these amounts include potential changes in regulatory requirements, decommissioning and reclamation alternatives and amounts to be recovered from other parties.
Cameco estimates total undiscounted future decommissioning and reclamation costs for its existing operating assets to be $1,382,661,000 (2023 - $1,356,018,000). The expected timing of these outflows is based on life-of-mine plans with the majority of expenditures expected to occur after 2029. These estimates are reviewed by Cameco technical personnel as required by regulatory agencies or more frequently as circumstances warrant. In connection with future decommissioning and reclamation costs, Cameco has provided financial assurances of $1,125,194,000 (2023 - $1,060,769,000) in the form of letters of credit to satisfy current regulatory requirements.
The reclamation provision relates to the following segments:
| 2024 | 2023 | |||||||
| Uranium |
$ | 865,574 | $ | 874,773 | ||||
| Fuel services |
159,465 | 176,394 | ||||||
|
|
|
|
|
|||||
| Total |
$ | 1,025,039 | $ | 1,051,167 | ||||
|
|
|
|
|
|||||
| B. | Waste disposal |
The fuel services segment consists of the Blind River refinery, Port Hope conversion facility and Cameco Fuel Manufacturing Inc.. The refining, conversion and manufacturing processes generate certain uranium contaminated waste. These include contaminated combustible material (paper, rags, gloves, etc.) and contaminated non-combustible material (metal parts, soil from excavations, building and roofing materials, spent uranium concentrate drums, etc.). These materials can in some instances be recycled or reprocessed. A provision for waste disposal costs in respect of these materials is recognized when they are generated.
Cameco estimates total undiscounted future costs related to existing waste disposal to be $9,663,000 (2023 - $9,681,000). The majority of these expenditures are expected to occur within the next three years.
38
| 17. | Share capital |
Authorized share capital:
| • | Unlimited number of first preferred shares |
| • | Unlimited number of second preferred shares |
| • | Unlimited number of voting common shares, no stated par value, not convertible or redeemable, and |
| • | One Class B share |
| A. | Common Shares |
| Number issued (number of shares) |
2024 | 2023 | ||||||
| Beginning of year |
434,175,752 | 432,518,470 | ||||||
| Issued: |
||||||||
| Stock option plan [note 24] |
1,136,331 | 1,657,282 | ||||||
|
|
|
|
|
|||||
| End of year |
435,312,083 | 434,175,752 | ||||||
|
|
|
|
|
|||||
All issued shares are fully paid. Holders of the common shares are entitled to exercise one vote per share at meetings of shareholders, are entitled to receive dividends if, as and when declared by our Board of Directors and are entitled to participate in any distribution of remaining assets following a liquidation.
The shares of Cameco are widely held and no shareholder, resident in Canada, is allowed to own more than 25% of the Company’s outstanding common shares, either individually or together with associates. A non-resident of Canada is not allowed to own more than 15%. In addition, no more than 25% of total shareholder votes cast may be cast by non-resident shareholders.
| B. | Class B share |
One Class B share issued during 1988 and assigned $1 of share capital entitles the shareholder to vote separately as a class in respect of any proposal to locate the head office of Cameco to a place not in the province of Saskatchewan.
| C. | Dividends |
Dividends on Cameco Corporation common shares are declared in Canadian dollars. For the year ended December 31, 2024, the dividend declared per share was $0.16 (December 31, 2023 - $0.12).
| 18. | Revenue |
Cameco’s sales contracts with customers contain both fixed and market-related pricing. Fixed-price contracts are typically based on a term-price indicator at the time the contract is accepted and escalated over the term of the contract. Market-related contracts are based on either the spot price or long-term price, and the price is quoted at the time of delivery rather than at the time the contract is accepted. These contracts often include a floor and/or ceiling prices, which are usually escalated over the term of the contract. Escalation is generally based on a consumer price index. The Company’s contracts contain either one of these pricing mechanisms or a combination of the two. There is no variable consideration in the contracts and therefore no revenue is considered constrained at the time of delivery. Cameco expenses the incremental costs of obtaining a contract as incurred as the amortization period is less than a year.
39
The following table summarizes Cameco’s sales disaggregated by geographical region and contract type and includes a reconciliation to the Company’s reportable segments (note 28):
For the year ended December 31, 2024
| Uranium | Fuel services | Other | Total | |||||||||||||
| Customer geographical region |
||||||||||||||||
| Americas |
$ | 1,401,742 | $ | 334,936 | $ | — | $ | 1,736,678 | ||||||||
| Europe |
488,718 | 75,055 | — | 563,773 | ||||||||||||
| Asia |
786,160 | 49,161 | — | 835,321 | ||||||||||||
|
|
|
|
|
|
|
|
|
|||||||||
| $ | 2,676,620 | $ | 459,152 | $ | — | $ | 3,135,772 | |||||||||
|
|
|
|
|
|
|
|
|
|||||||||
| Contract type |
||||||||||||||||
| Fixed-price |
$ | 791,701 | $ | 413,148 | $ | — | $ | 1,204,849 | ||||||||
| Market-related |
1,884,919 | 46,004 | — | 1,930,923 | ||||||||||||
|
|
|
|
|
|
|
|
|
|||||||||
| $ | 2,676,620 | $ | 459,152 | $ | — | $ | 3,135,772 | |||||||||
|
|
|
|
|
|
|
|
|
|||||||||
For the year ended December 31, 2023
| Uranium | Fuel services | Other | Total | |||||||||||||
| Customer geographical region |
||||||||||||||||
| Americas |
$ | 1,044,386 | $ | 307,885 | $ | 9,048 | $ | 1,361,319 | ||||||||
| Europe |
592,068 | 88,759 | — | 680,827 | ||||||||||||
| Asia |
516,699 | 28,913 | — | 545,612 | ||||||||||||
|
|
|
|
|
|
|
|
|
|||||||||
| $ | 2,153,153 | $ | 425,557 | $ | 9,048 | $ | 2,587,758 | |||||||||
|
|
|
|
|
|
|
|
|
|||||||||
| Contract type |
||||||||||||||||
| Fixed-price |
$ | 822,869 | $ | 414,289 | $ | 9,048 | $ | 1,246,206 | ||||||||
| Market-related |
1,330,284 | 11,268 | — | 1,341,552 | ||||||||||||
|
|
|
|
|
|
|
|
|
|||||||||
| $ | 2,153,153 | $ | 425,557 | $ | 9,048 | $ | 2,587,758 | |||||||||
|
|
|
|
|
|
|
|
|
|||||||||
Deferred sales
The following table provides information about contract liabilities (note 15) from contracts with customers:
| 2024 | 2023 | |||||||
| Beginning of year |
$ | 45,372 | $ | 66,845 | ||||
| Additions |
159,712 | 25,935 | ||||||
| Recognized in revenue |
(98,532 | ) | (47,403 | ) | ||||
| Effect of movements in exchange rates |
17 | (5 | ) | |||||
|
|
|
|
|
|||||
| End of year |
$ | 106,569 | $ | 45,372 | ||||
|
|
|
|
|
|||||
Deferred sales primarily relates to advance consideration received from customers for future uranium and conversion deliveries as well as revenue related to the storage of uranium and converted uranium held at Cameco facilities. The revenue related to storage is recognized over time while the revenue related to future uranium and conversion deliveries is expected to be recognized between 2025 and 2028 as deliveries occur.
40
Cameco recognized an increase of revenue of $42,000 (2023 - decrease of revenue of $648,000) during 2024 from performance obligations satisfied (or partially satisfied) in previous periods. This is due to the difference between actual pricing indices and the estimates at the time of invoicing.
Future sales commitments
Cameco’s sales portfolio consists of short and long-term sales commitments. The contracts can be executed well in advance of a delivery and include both fixed and market-related pricing. The following table summarizes the expected future revenue, by segment, related to only fixed-price contracts with remaining future deliveries as follows:
| 2025 | 2026 | 2027 | 2028 | 2029 | Thereafter | Total | ||||||||||||||||||||||
| Uranium |
$ | 826,196 | $ | 510,118 | $ | 514,192 | $ | 517,771 | $ | 451,746 | $ | 686,197 | $ | 3,506,220 | ||||||||||||||
| Fuel services |
420,843 | 453,485 | 449,008 | 427,821 | 398,127 | 1,633,192 | 3,782,476 | |||||||||||||||||||||
|
|
|
|
|
|
|
|
|
|
|
|
|
|
|
|||||||||||||||
| Total |
$ | 1,247,039 | $ | 963,603 | $ | 963,200 | $ | 945,592 | $ | 849,873 | $ | 2,319,389 | $ | 7,288,696 | ||||||||||||||
|
|
|
|
|
|
|
|
|
|
|
|
|
|
|
|||||||||||||||
The sales contracts are denominated largely in US dollars and converted from US to Canadian dollars at a rate of $1.40.
The amounts in the table represent the consideration the Company will be entitled to receive when it satisfies the remaining performance obligations in the contracts. The amounts include assumptions about volumes for contracts that have volume flexibility. Cameco’s total revenue that will be earned will also include revenue from contracts with market-related pricing. The Company has elected to exclude these amounts from the table as the transaction price will not be known until the time of delivery. Contracts with an original duration of one year or less have been included in the table.
| 19. | Employee benefit expense |
The following employee benefit expenses are included in cost of products and services sold, administration, exploration, research and development and property, plant and equipment:
| 2024 | 2023 | |||||||
| Wages and salaries |
$ | 386,686 | $ | 340,910 | ||||
| Statutory and company benefits |
71,477 | 63,657 | ||||||
| Expenses related to defined benefit plans [note 25] |
10,929 | 5,572 | ||||||
| Expenses related to defined contribution plans [note 25] |
20,218 | 18,644 | ||||||
| Equity-settled share-based compensation [note 24] |
11,656 | 8,152 | ||||||
| Cash-settled share-based compensation [note 24] |
37,201 | 59,225 | ||||||
|
|
|
|
|
|||||
| Total |
$ | 538,167 | $ | 496,160 | ||||
|
|
|
|
|
|||||
| 20. | Finance costs |
| 2024 | 2023 | |||||||
| Interest on long-term debt |
$ | 91,921 | $ | 52,426 | ||||
| Unwinding of discount on provisions [note 16] |
36,243 | 39,619 | ||||||
| Other charges |
19,007 | 23,824 | ||||||
|
|
|
|
|
|||||
| Total |
$ | 147,171 | $ | 115,869 | ||||
|
|
|
|
|
|||||
No borrowing costs were determined to be eligible for capitalization during the year.
41
| 21. | Income taxes |
| A. | Significant components of deferred tax assets and liabilities |
| Recognized in earnings | As at December 31 | |||||||||||||||
| 2024 | 2023 | 2024 | 2023 | |||||||||||||
| Assets |
||||||||||||||||
| Property, plant and equipment |
$ | (41,454 | ) | $ | 67,736 | $ | 475,008 | $ | 515,872 | |||||||
| Provision for reclamation |
(11,237 | ) | (4,157 | ) | 188,422 | 199,659 | ||||||||||
| Inventories |
(4,979 | ) | 3,292 | 6,561 | 11,540 | |||||||||||
| Foreign exploration and development |
(398 | ) | (51 | ) | 2,191 | 2,589 | ||||||||||
| Income tax losses (gains) |
(8,108 | ) | (141,907 | ) | 85,668 | 93,776 | ||||||||||
| Defined benefit plan actuarial losses |
— | — | 5,233 | 4,279 | ||||||||||||
| Long-term investments and other |
14,880 | (17,704 | ) | 80,048 | 65,145 | |||||||||||
|
|
|
|
|
|
|
|
|
|||||||||
| Deferred tax assets |
(51,296 | ) | (92,791 | ) | 843,131 | 892,860 | ||||||||||
|
|
|
|
|
|
|
|
|
|||||||||
| Liabilities |
||||||||||||||||
| Property, plant and equipment |
— | — | — | — | ||||||||||||
| Inventories |
— | — | — | — | ||||||||||||
|
|
|
|
|
|
|
|
|
|||||||||
| Deferred tax liabilities |
— | — | — | — | ||||||||||||
|
|
|
|
|
|
|
|
|
|||||||||
| Net deferred tax asset (liability) |
$ | (51,296 | ) | $ | (92,791 | ) | $ | 843,131 | $ | 892,860 | ||||||
|
|
|
|
|
|
|
|
|
|||||||||
| Deferred tax allocated as |
2024 | 2023 | ||||||
| Deferred tax assets |
$ | 843,131 | $ | 892,860 | ||||
| Deferred tax liabilities |
— | — | ||||||
|
|
|
|
|
|||||
| Net deferred tax asset |
$ | 843,131 | $ | 892,860 | ||||
|
|
|
|
|
|||||
Cameco has recorded a deferred tax asset of $843,131,000 (2023 - $892,860,000). The realization of this deferred tax asset is dependent upon the generation of future taxable income in certain jurisdictions during the periods in which the Company’s deferred tax assets are available. The Company considers whether it is probable that all or a portion of the deferred tax assets will not be realized. In making this assessment, management considers all available evidence, including recent financial operations, projected future taxable income and tax planning strategies. Based on projections of future taxable income over the periods in which the deferred tax assets are available, realization of these deferred tax assets is probable and consequently the deferred tax assets have been recorded.
42
| B. | Movement in net deferred tax assets and liabilities |
| 2024 | 2023 | |||||||
| Deferred tax asset at beginning of year |
$ | 892,860 | $ | 984,071 | ||||
| Expense for the year in net earnings |
(51,296 | ) | (92,791 | ) | ||||
| Recovery for the year in other comprehensive income |
969 | 1,581 | ||||||
| Effect of movements in exchange rates |
598 | (1 | ) | |||||
|
|
|
|
|
|||||
| End of year |
$ | 843,131 | $ | 892,860 | ||||
|
|
|
|
|
|||||
| C. | Significant components of unrecognized deferred tax assets |
| 2024 | 2023 | |||||||
| Income tax losses |
$ | 379,695 | $ | 357,148 | ||||
| Property, plant and equipment |
2,496 | 2,299 | ||||||
| Provision for reclamation |
81,984 | 68,038 | ||||||
| Long-term investments and other |
162,278 | 127,420 | ||||||
|
|
|
|
|
|||||
| Total |
$ | 626,453 | $ | 554,905 | ||||
|
|
|
|
|
|||||
| D. | Tax rate reconciliation |
The provision for income taxes differs from the amount computed by applying the combined expected federal and provincial income tax rate to earnings before income taxes. The reasons for these differences are as follows:
| 2024 | 2023 | |||||||
| Earnings before income taxes |
$ | 256,716 | $ | 487,153 | ||||
| Combined federal and provincial tax rate |
26.9 | % | 26.9 | % | ||||
|
|
|
|
|
|||||
| Computed income tax expense |
69,057 | 131,044 | ||||||
| Increase (decrease) in taxes resulting from: |
||||||||
| Difference between Canadian rates and rates applicable to subsidiaries in other countries |
(4,482 | ) | 2,990 | |||||
| Change in unrecognized deferred tax assets |
75,923 | 16,759 | ||||||
| Non-taxable portion of capital loss |
6,775 | — | ||||||
| Loss (Income) in equity-accounted investees |
(60,343 | ) | (41,519 | ) | ||||
| Change in uncertain tax positions |
— | (9,331 | ) | |||||
| Other taxes |
15,453 | 11,709 | ||||||
| Foreign exchange permanent differences |
(14,939 | ) | 12,044 | |||||
| Other permanent differences |
(2,570 | ) | 2,641 | |||||
|
|
|
|
|
|||||
| Income tax expense |
$ | 84,874 | $ | 126,337 | ||||
|
|
|
|
|
|||||
43
| E. | Earnings and income taxes by jurisdiction |
| 2024 | 2023 | |||||||
| Earnings (loss) before income taxes |
||||||||
| Canada |
$ | 401,080 | $ | 562,139 | ||||
| Foreign |
(144,364 | ) | (74,986 | ) | ||||
|
|
|
|
|
|||||
| $ | 256,716 | $ | 487,153 | |||||
|
|
|
|
|
|||||
| Current income taxes |
||||||||
| Canada |
$ | 24,149 | $ | 26,230 | ||||
| Foreign |
9,429 | 7,316 | ||||||
|
|
|
|
|
|||||
| $ | 33,578 | $ | 33,546 | |||||
| Deferred income taxes (recovery) |
||||||||
| Canada |
$ | 39,115 | $ | 104,885 | ||||
| Foreign |
12,181 | (12,094 | ) | |||||
|
|
|
|
|
|||||
| $ | 51,296 | $ | 92,791 | |||||
|
|
|
|
|
|||||
| Income tax expense |
$ | 84,874 | $ | 126,337 | ||||
|
|
|
|
|
|||||
Cameco has operations in countries where the global minimum top-up tax has been enacted or substantively enacted effective January 1, 2024, including: Canada, Australia, Barbados, Germany, Luxembourg, Switzerland and the United Kingdom. The exposure is currently only in Switzerland, as all other constituent entities have effective tax rates higher than 15% and the transitional safe harbour rules are expected to be met. As a result of this exposure, additional income tax expense of $4,005,000 (2023 - $0) has been recorded relating to the profits earned in Switzerland.
| F. | Reassessments |
Canada
On February 18, 2021, the Supreme Court of Canada (Supreme Court) dismissed Canada Revenue Agency’s (CRA) application for leave to appeal the June 26, 2020 decision of the Federal Court of Appeal (Court of Appeal). The dismissal means that the dispute for the 2003, 2005 and 2006 tax years is fully and finally resolved in the Company’s favour.
In September 2018, the Tax Court of Canada (Tax Court) ruled that the marketing and trading structure involving foreign subsidiaries, as well as the related transfer pricing methodology used for certain intercompany uranium sales and purchasing agreements, were in full compliance with Canadian law for the tax years in question. Management believes the principles in the decision apply to all subsequent tax years, and that the ultimate resolution of those years will not be material to Cameco’s financial position, results of operations or liquidity in the year(s) of resolution.
As CRA continues to pursue reassessments for tax years subsequent to 2006, Cameco is utilizing its appeal rights under Canadian federal and provincial tax rules.
44
| G. | Income tax losses |
At December 31, 2024, income tax losses carried forward of $1,827,706,000 (2023 - $1,760,518,000) are available to reduce taxable income. These losses expire as follows:
| Date of expiry |
Canada | US | Other | Total | ||||||||||||
| 2026 |
$ | — | $ | — | $ | 15,543 | $ | 15,543 | ||||||||
| 2027 |
— | — | 295 | 295 | ||||||||||||
| 2028 |
— | — | 120 | 120 | ||||||||||||
| 2029 |
47 | — | 13,393 | 13,440 | ||||||||||||
| 2030 |
— | — | 2,145 | 2,145 | ||||||||||||
| 2031 |
— | 23,100 | 42,681 | 65,781 | ||||||||||||
| 2032 |
272 | 24,879 | — | 25,151 | ||||||||||||
| 2033 |
— | 38,240 | — | 38,240 | ||||||||||||
| 2034 |
— | 17,748 | 4,476 | 22,224 | ||||||||||||
| 2035 |
— | 8,089 | 7,425 | 15,514 | ||||||||||||
| 2036 |
— | 49,475 | 5,849 | 55,324 | ||||||||||||
| 2037 |
27 | 37,059 | 3,064 | 40,150 | ||||||||||||
| 2038 |
— | — | 328 | 328 | ||||||||||||
| 2039 |
66 | — | 143 | 209 | ||||||||||||
| 2040 |
37 | — | 372 | 409 | ||||||||||||
| 2041 |
77 | — | 166 | 243 | ||||||||||||
| 2042 |
49 | — | — | 49 | ||||||||||||
| 2043 |
71 | — | — | 71 | ||||||||||||
| 2044 |
56 | — | — | 56 | ||||||||||||
| No expiry |
— | 511,655 | 1,020,759 | 1,532,414 | ||||||||||||
|
|
|
|
|
|
|
|
|
|||||||||
| $ | 702 | $ | 710,245 | $ | 1,116,759 | $ | 1,827,706 | |||||||||
|
|
|
|
|
|
|
|
|
|||||||||
Included in the table above is $1,542,137,000 (2023 - $1,447,529,000) of temporary differences related to loss carry forwards where no future benefit has been recognized.
45
| 22. | Per share amounts |
Per share amounts have been calculated based on the weighted average number of common shares outstanding during the period. The weighted average number of paid shares outstanding in 2024 was 434,870,473 (2023 - 433,382,879).
| 2024 | 2023 | |||||||
| Basic earnings per share computation |
||||||||
| Net earnings attributable to equity holders |
$ | 171,853 | $ | 360,847 | ||||
| Weighted average common shares outstanding |
434,870 | 433,383 | ||||||
|
|
|
|
|
|||||
| Basic earnings per common share |
$ | 0.40 | $ | 0.83 | ||||
|
|
|
|
|
|||||
| Diluted earnings per share computation |
||||||||
| Net earnings attributable to equity holders |
$ | 171,853 | $ | 360,847 | ||||
| Weighted average common shares outstanding |
434,870 | 433,383 | ||||||
| Dilutive effect of stock options |
1,086 | 1,972 | ||||||
|
|
|
|
|
|||||
| Weighted average common shares outstanding, assuming dilution |
435,956 | 435,355 | ||||||
|
|
|
|
|
|||||
| Diluted earnings per common share |
$ | 0.39 | $ | 0.83 | ||||
|
|
|
|
|
|||||
The average market value of the Company’s shares for the purposes of calculating the dilutive effect of share options was based on quoted market prices for the year during which the options were outstanding.
| 23. | Supplemental cash flow information |
Other operating items included in the statements of cash flows are as follows:
| 2024 | 2023 | |||||||
| Changes in non-cash working capital: |
||||||||
| Accounts receivable |
$ | 78,562 | $ | (242,416 | ) | |||
| Inventories |
(115,679 | ) | 38,394 | |||||
| Supplies and prepaid expenses |
4,151 | 8,410 | ||||||
| Accounts payable and accrued liabilities |
21,400 | 169,044 | ||||||
| Reclamation payments |
(34,746 | ) | (38,982 | ) | ||||
| Other |
(5,913 | ) | (346 | ) | ||||
|
|
|
|
|
|||||
| Total |
$ | (52,225 | ) | $ | (65,896 | ) | ||
|
|
|
|
|
|||||
46
The changes arising from financing activities in 2024 were as follows:
| Long-term | Interest | Lease | Dividends | Share | ||||||||||||||||||||
| debt | payable | obligation | payable | capital | Total | |||||||||||||||||||
| Balance at January 1, 2024 |
$ | 1,784,174 | $ | 14,087 | $ | 10,816 | $ | — | $ | 2,914,165 | $ | 4,723,242 | ||||||||||||
| Changes from financing cash flows: |
||||||||||||||||||||||||
| Dividends paid |
— | — | — | (69,641 | ) | — | (69,641 | ) | ||||||||||||||||
| Interest paid |
— | (88,333 | ) | (485 | ) | — | — | (88,818 | ) | |||||||||||||||
| Lease principal payments |
— | — | (2,051 | ) | — | — | (2,051 | ) | ||||||||||||||||
| Shares issued, stock option plan |
— | — | — | — | 16,656 | 16,656 | ||||||||||||||||||
| Debenture issuance |
497,022 | — | — | — | — | 497,022 | ||||||||||||||||||
| Debenture repayment |
(500,000 | ) | — | — | — | — | (500,000 | ) | ||||||||||||||||
| Term loan repayment |
(541,590 | ) | — | — | — | — | (541,590 | ) | ||||||||||||||||
|
|
|
|
|
|
|
|
|
|
|
|
|
|||||||||||||
| Total cash changes |
(544,568 | ) | (88,333 | ) | (2,536 | ) | (69,641 | ) | 16,656 | (688,422 | ) | |||||||||||||
|
|
|
|
|
|
|
|
|
|
|
|
|
|||||||||||||
| Non-cash changes: |
||||||||||||||||||||||||
| Amortization of issue costs |
7,342 | — | — | — | — | 7,342 | ||||||||||||||||||
| Dividends declared |
— | — | — | 69,641 | — | 69,641 | ||||||||||||||||||
| Interest expense |
— | 84,094 | 485 | — | — | 84,579 | ||||||||||||||||||
| Right-of-use asset additions |
— | — | 1,100 | — | — | 1,100 | ||||||||||||||||||
| Other |
— | — | (27 | ) | — | — | (27 | ) | ||||||||||||||||
| Shares issued, stock option plan |
— | — | — | — | 4,546 | 4,546 | ||||||||||||||||||
| Foreign exchange |
34,342 | 225 | 1 | — | — | 34,568 | ||||||||||||||||||
|
|
|
|
|
|
|
|
|
|
|
|
|
|||||||||||||
| Total non-cash changes |
41,684 | 84,319 | 1,559 | 69,641 | 4,546 | 201,749 | ||||||||||||||||||
|
|
|
|
|
|
|
|
|
|
|
|
|
|||||||||||||
| Balance at December 31, 2024 |
$ | 1,281,290 | $ | 10,073 | $ | 9,839 | $ | — | $ | 2,935,367 | $ | 4,236,569 | ||||||||||||
|
|
|
|
|
|
|
|
|
|
|
|
|
|||||||||||||
47
The changes arising from financing activities in 2023 were as follows:
| Long-term | Interest | Lease | Dividends | Share | ||||||||||||||||||||
| debt | payable | obligation | payable | capital | Total | |||||||||||||||||||
| Balance at January 1, 2023 |
$ | 997,000 | $ | 4,011 | $ | 9,287 | $ | — | $ | 2,880,336 | $ | 3,890,634 | ||||||||||||
| Changes from financing cash flows: |
||||||||||||||||||||||||
| Dividends paid |
— | — | — | (52,079 | ) | — | (52,079 | ) | ||||||||||||||||
| Interest paid |
— | (40,439 | ) | (359 | ) | — | — | (40,798 | ) | |||||||||||||||
| Lease principal payments |
— | — | (2,430 | ) | — | — | (2,430 | ) | ||||||||||||||||
| Shares issued, stock option plan |
— | — | — | — | 27,537 | 27,537 | ||||||||||||||||||
| Term loan issuance |
816,582 | — | — | — | — | 816,582 | ||||||||||||||||||
|
|
|
|
|
|
|
|
|
|
|
|
|
|||||||||||||
| Total cash changes |
816,582 | (40,439 | ) | (2,789 | ) | (52,079 | ) | 27,537 | 748,812 | |||||||||||||||
|
|
|
|
|
|
|
|
|
|
|
|
|
|||||||||||||
| Non-cash changes: |
||||||||||||||||||||||||
| Amortization of issue costs |
1,377 | — | — | — | — | 1,377 | ||||||||||||||||||
| Dividends declared |
— | — | — | 52,079 | — | 52,079 | ||||||||||||||||||
| Interest expense |
— | 50,690 | 359 | — | — | 51,049 | ||||||||||||||||||
| Right-of-use asset additions |
— | — | 4,368 | — | — | 4,368 | ||||||||||||||||||
| Other |
— | 142 | (411 | ) | — | — | (269 | ) | ||||||||||||||||
| Shares issued, stock option plan |
— | — | — | — | 6,292 | 6,292 | ||||||||||||||||||
| Foreign exchange |
(30,785 | ) | (317 | ) | 2 | — | — | (31,100 | ) | |||||||||||||||
|
|
|
|
|
|
|
|
|
|
|
|
|
|||||||||||||
| Total non-cash changes |
(29,408 | ) | 50,515 | 4,318 | 52,079 | 6,292 | 83,796 | |||||||||||||||||
|
|
|
|
|
|
|
|
|
|
|
|
|
|||||||||||||
| Balance at December 31, 2023 |
$ | 1,784,174 | $ | 14,087 | $ | 10,816 | $ | — | $ | 2,914,165 | $ | 4,723,242 | ||||||||||||
|
|
|
|
|
|
|
|
|
|
|
|
|
|||||||||||||
| 24. | Share-based compensation plans |
The Company has the following plans:
| A. | Stock option plan |
The Company has established a stock option plan under which options to purchase common shares may be granted to employees of Cameco. Options granted under the stock option plan have an exercise price of not less than the closing price quoted on the Toronto Stock Exchange (TSX) for the common shares of Cameco on the trading day prior to the date on which the option is granted. The options carry vesting periods of one to three years, and expire eight years from the date granted.
The aggregate number of common shares that may be issued pursuant to the Cameco stock option plan shall not exceed 43,017,198 of which 33,332,390 shares have been issued.
48
Stock option transactions for the respective years were as follows:
| (Number of options) |
2024 | 2023 | ||||||
| Beginning of year |
1,396,289 | 3,053,571 | ||||||
| Options granted |
— | — | ||||||
| Options exercised [note 17] |
(1,136,331 | ) | (1,657,282 | ) | ||||
|
|
|
|
|
|||||
| End of year |
259,958 | 1,396,289 | ||||||
|
|
|
|
|
|||||
| Exercisable |
259,958 | 1,396,289 | ||||||
|
|
|
|
|
|||||
Weighted average share prices were as follows:
| 2024 | 2023 | |||||||
| Beginning of year |
$ | 14.73 | $ | 15.75 | ||||
| Options granted |
— | — | ||||||
| Options exercised |
14.66 | 16.62 | ||||||
|
|
|
|
|
|||||
| End of year |
$ | 15.05 | $ | 14.73 | ||||
|
|
|
|
|
|||||
| Exercisable |
$ | 15.05 | $ | 14.73 | ||||
|
|
|
|
|
|||||
The weighted average share price at the dates of exercise during 2024 was $69.86 per share (2023 - $45.19).
Total options outstanding and exercisable at December 31, 2024 were as follows:
| Options outstanding | Options exercisable | |||||||||||||||||||
| Option price per share |
Number | Weighted average remaining life |
Weighted average exercisable price |
Number | Weighted average exercisable price |
|||||||||||||||
| $11.32 |
14,600 | 1.2 | $ | 11.32 | 14,600 | $ | 11.32 | |||||||||||||
| $15.27 |
245,358 | 2.2 | $ | 15.27 | 245,358 | $ | 15.27 | |||||||||||||
|
|
|
|
|
|||||||||||||||||
| 259,958 | 259,958 | |||||||||||||||||||
|
|
|
|
|
|||||||||||||||||
The foregoing options have expiry dates ranging from February 28, 2026 to February 28, 2027.
49
B. Executive performance share unit (PSU)
The Company has established a PSU plan whereby it provides each plan participant an annual grant of PSUs in an amount determined by the board. Each PSU represents one phantom common share that entitles the participant to a payment of one Cameco common share purchased on the open market, or cash with an equivalent market value, at the participant’s discretion provided they have met their ownership requirements, at the end of each three-year period if certain performance and vesting criteria have been met. The final value of the PSUs will be based on the value of Cameco common shares at the end of the three-year period and the number of PSUs that ultimately vest. During the vesting period, dividend equivalents accrue to the participants in the form of additional share units as of each normal cash dividend payment date of Cameco’s common shares. Vesting of PSUs at the end of the three-year period is based on Cameco’s ability to meet its annual operating targets and whether the participating executive remains employed by Cameco at the end of the three-year vesting period. If the participant elects a cash payout, the redemption amount will be based on the volume-weighted average trading price of Cameco’s common shares on March 1 or, if March 1 is not a trading day, on the first trading day following March 1. As of December 31, 2024, the total number of PSUs held by the participants, after adjusting for forfeitures on retirement, was 636,588 (2023 - 830,279).
C. Restricted share unit (RSU)
The Company has established an RSU plan whereby it provides each plan participant an annual grant of RSUs in an amount determined by the board. Each RSU represents one phantom common share that entitles the participant to a payment of one Cameco common share purchased on the open market, or cash with an equivalent market value, at the board’s discretion. The RSUs carry vesting periods of one to three years, and the final value of the units will be based on the value of Cameco common shares at the end of the vesting periods. In addition, certain eligible participants have a single vesting date on the third anniversary of the date of the grant. These same participants, if they have met or are not subject to share ownership requirements, may elect to have their award paid as a lump sum cash amount. During the vesting period, dividend equivalents accrue to the participants in the form of additional share units as of each normal cash dividend payment date of Cameco’s common shares. As of December 31, 2024, the total number of RSUs held by the participants was 734,000 (2023 - 814,683).
D. Phantom stock option
The Company has established a phantom stock option plan for eligible non-North American employees. Employees receive the equivalent value of shares in cash when exercised. Options granted under the phantom stock option plan have an award value equal to the closing price quoted on the TSX for the common shares of Cameco on the trading day prior to the date on which the option is granted. The options vest over three years and expire eight years from the date granted. As of December 31, 2024, the number of options held by participating employees was 35,361 (2023 - 45,551) with exercise prices ranging from $11.61 to $15.27 per share (2023 - $11.61 to $15.27) and a weighted average exercise price of $12.48 (2023 - $12.29).
E. Phantom restricted share unit (PRSU)
The Company has established a PRSU plan whereby it provides non-North American employees an annual grant of PRSUs in an amount determined by the board. Each PRSU represents one phantom common share that entitles the participant to a payment of cash with an equivalent market value. The PRSUs carry vesting periods of one to three years, and the final value of the units will be based on the value of Cameco common shares at the end of the vesting periods. In addition, certain eligible participants have a single vesting date on the third anniversary of the date of the grant. During the vesting period, dividend equivalents accrue to the participants in the form of additional share units as of each normal cash dividend payment date of Cameco’s common shares. As of December 31, 2024, the total number of PRSUs held by the participants was 25,560 (2023 - 28,000).
50
F. Employee share ownership plan
Cameco also has an employee share ownership plan, whereby both employee and Company contributions are used to purchase shares on the open market for employees. The Company’s contributions are expensed during the year of contribution. Under the plan, employees have the opportunity to participate in the program to a maximum of 6% of eligible earnings each year with Cameco matching the first 3% of employee-paid shares by 50%. Cameco contributes $1,000 of shares annually to each employee that is enrolled in the plan. Shares purchased with Company contributions and with dividends paid on such shares become unrestricted 12 months from the date on which such shares were purchased. At December 31, 2024, there were 3,065 participants in the plan (2023 - 2,838). The total number of shares purchased in 2024 with Company contributions was 76,926 (2023 - 100,379). In 2024, the Company’s contributions totaled $4,881,000 (2023 - $4,460,000).
G. Deferred share unit (DSU)
Cameco offers a DSU plan to non-employee directors. A DSU is a notional unit that reflects the market value of a single common share of Cameco. 60% of each director’s annual retainer is paid in DSUs. In addition, on an annual basis, directors can elect to receive 25%, 50%, 75% or 100% of the remaining 40% of their annual retainer and any additional fees in the form of DSUs. If a director meets their ownership requirements, the director may elect to take 25%, 50%, 75% or 100% of their annual retainer and any fees in cash, with the balance, if any, to be paid in DSUs. Each DSU fully vests upon award. Dividend equivalents accrue to the participants in the form of additional share units as of each normal cash dividend payment date of Cameco’s common shares. The DSUs will be redeemed for cash upon a director leaving the board. The redemption amount will be based upon the weighted average of the closing prices of the common shares of Cameco on the TSX for the last 20 trading days prior to the redemption date multiplied by the number of DSUs held by the director. As of December 31, 2024, the total number of DSUs held by participating directors was 310,604 (2023 - 564,401).
Equity-settled plans
Cameco records compensation expense under its equity-settled plans with an offsetting credit to contributed surplus, to reflect the estimated fair value of units granted to employees. During the year, the Company recognized the following expenses under these plans:
| 2024 | 2023 | |||||||
| Employee share ownership plan |
$ | 4,881 | $ | 4,460 | ||||
| Restricted share unit plan |
6,775 | 3,692 | ||||||
|
|
|
|
|
|||||
| Total |
$ | 11,656 | $ | 8,152 | ||||
|
|
|
|
|
|||||
Fair value measurement of equity-settled plans
The fair value of RSUs granted was determined based on their intrinsic value on the date of grant. Expected volatility was estimated by considering historic average share price volatility.
The inputs used in the measurement of the fair values at grant date of the equity-settled RSU plan were as follows:
| Grant date | ||||
| Mar 1/24 | ||||
| Number of options granted |
203,648 | |||
| Average strike price |
$ | 55.00 | ||
| Expected forfeitures |
11 | % | ||
| Weighted average grant date fair values |
$ | 55.00 | ||
51
Cash-settled plans
Cameco has recognized the following expenses under its cash-settled plans:
| 2024 | 2023 | |||||||
| Performance share unit plan |
$ | 13,249 | $ | 22,013 | ||||
| Restricted share unit plan |
13,125 | 19,045 | ||||||
| Deferred share unit plan |
9,221 | 15,447 | ||||||
| Phantom stock option plan |
743 | 1,908 | ||||||
| Phantom restricted share unit plan |
863 | 812 | ||||||
|
|
|
|
|
|||||
| Total |
$ | 37,201 | $ | 59,225 | ||||
|
|
|
|
|
|||||
At December 31, 2024, a liability of $65,881,000 (2023 - $79,792,000) was included in the consolidated statement of financial position to recognize accrued but unpaid expenses for cash-settled plans.
Fair value measurement of cash-settled plans
The fair value of the units granted through the PSU plan was determined based on Monte Carlo simulation and projections of the non-market criteria. The fair value of RSUs and PRSUs granted was determined based on their intrinsic value on the date of grant. The phantom stock option plan was measured based on the Black-Scholes option-pricing model. Expected volatility is estimated by considering historic average share price volatility.
The inputs used in the measurement of the fair values of the cash-settled share-based payment plans at the March 1, 2024 grant date were as follows:
| Phantom | ||||||||||||
| PSU | RSU | RSU | ||||||||||
| Number of units |
178,600 | 119,010 | 9,096 | |||||||||
| Expected vesting |
78 | % | — | — | ||||||||
| Expected life of option |
3 years | 3 years | 3 years | |||||||||
| Expected forfeitures |
9 | % | 9 | % | 7 | % | ||||||
| Weighted average measurement date fair values |
$ | 55.00 | $ | 55.00 | $ | 55.00 | ||||||
The inputs used in the measurement of the fair values of the cash-settled share-based payment plans at the reporting date were as follows:
| Phantom | Phantom | |||||||||||||||
| stock options | PSU | RSU | RSU | |||||||||||||
| Number of units |
35,361 | 636,588 | 423,453 | 25,560 | ||||||||||||
| Expected vesting |
— | 65 | % | — | — | |||||||||||
| Average strike price |
$ | 12.48 | — | — | — | |||||||||||
| Expected dividend |
$ | 0.16 | — | — | $ | 0.16 | ||||||||||
| Expected volatility |
43 | % | — | — | — | |||||||||||
| Risk-free interest rate |
2.9 | % | — | — | — | |||||||||||
| Expected life of option |
2.9 years | 0.9 years | 1.0 years | 1.0 years | ||||||||||||
| Expected forfeitures |
7 | % | 4 | % | 8 | % | 7 | % | ||||||||
| Weighted average measurement date fair values |
$ | 61.98 | $ | 73.91 | $ | 73.91 | $ | 73.91 | ||||||||
In addition to these inputs, other features of the PSU grant were incorporated into the measurement of fair value. The non-market criteria relating to realized selling prices and operating targets have been incorporated into the valuation at both grant and reporting date by reviewing prior history and corporate budgets.
52
25. Pension and other post-retirement benefits
Cameco maintains both defined benefit and defined contribution plans providing pension benefits to substantially all of its employees. All regular and temporary employees participate in a registered defined contribution plan. This plan is registered under the Pension Benefits Standard Act, 1985. In addition, all Canadian-based executives participate in a non-registered supplemental executive pension plan which is a defined benefit plan.
Under the supplemental executive pension plan (SEPP), Cameco provides a lump sum benefit equal to the present value of a lifetime pension benefit based on the executive’s length of service and final average earnings. The plan provides for unreduced benefits to be paid at the normal retirement age of 65, however unreduced benefits could be paid if the executive was at least 60 years of age and had 20 years of service at retirement. This program provides for a benefit determined by a formula based on earnings and service, reduced by the benefits payable under the registered base plan. Security is provided for the SEPP benefits through a letter of credit held by the plan’s trustee. The face amount of the letter of credit is determined each year based on the wind-up liabilities of the supplemental plan, less any plan assets currently held with the trustee. A valuation is required annually to determine the letter of credit amount. Benefits will continue to be paid from plan assets until the fund is exhausted, at which time Cameco will begin paying benefits from corporate assets.
Cameco also maintains non-pension post-retirement plans (“other benefit plans”) which are defined benefit plans that cover such benefits as group life insurance and supplemental health and dental coverage to eligible employees and their dependents. The costs related to these plans are charged to earnings in the period during which the employment services are rendered. These plans are funded by Cameco as benefit claims are made.
The board of directors of Cameco has final responsibility and accountability for the Cameco retirement programs. The board is ultimately responsible for managing the programs to comply with applicable legislation, providing oversight over the general functions and setting certain policies.
Cameco expects to pay $2,040,196 in contributions and letter of credit fees to its defined benefit plans in 2025.
The post-retirement plans expose Cameco to actuarial risks, such as longevity risk, market risk, interest rate risk, liquidity risk and foreign currency risk. The other benefit plans expose Cameco to risks of higher supplemental health and dental utilization than expected. However, the other benefit plans have limits on Cameco’s annual benefits payable.
The effective date of the most recent valuation for funding purposes on the registered defined benefit pension plans is January 1, 2024. The next planned effective date for valuations is January 1, 2027.
53
Cameco has more than one defined benefit plan and has generally provided aggregated disclosures in respect of these plans, on the basis that these plans are not exposed to materially different risks. Information relating to Cameco’s defined benefit plans is shown in the following table:
| Pension benefit plans | Other benefit plans | |||||||||||||||
| 2024 | 2023 | 2024 | 2023 | |||||||||||||
| Fair value of plan assets, beginning of year |
$ | 3,717 | $ | 4,402 | $ | — | $ | — | ||||||||
| Interest income on plan assets |
150 | 201 | — | — | ||||||||||||
| Return on assets excluding interest income |
95 | 18 | — | — | ||||||||||||
| Employer contributions |
943 | — | — | — | ||||||||||||
| Benefits paid |
(911 | ) | (901 | ) | — | — | ||||||||||
| Administrative costs paid |
(3 | ) | (3 | ) | — | — | ||||||||||
|
|
|
|
|
|
|
|
|
|||||||||
| Fair value of plan assets, end of year |
$ | 3,991 | $ | 3,717 | $ | — | $ | — | ||||||||
|
|
|
|
|
|
|
|
|
|||||||||
| Defined benefit obligation, beginning of year |
$ | 60,038 | $ | 51,218 | $ | 20,681 | $ | 19,364 | ||||||||
| Current service cost |
2,008 | 1,567 | 849 | 689 | ||||||||||||
| Interest cost |
2,619 | 2,527 | 948 | 987 | ||||||||||||
| Actuarial loss (gain) arising from: |
||||||||||||||||
| - financial assumptions |
(909 | ) | 4,784 | — | 443 | |||||||||||
| - experience adjustment |
4,242 | 1,559 | 7 | 18 | ||||||||||||
| Past service cost |
— | — | 4,652 | — | ||||||||||||
| Benefits paid |
(10,972 | ) | (1,704 | ) | (1,837 | ) | (820 | ) | ||||||||
| Foreign exchange |
339 | 87 | — | — | ||||||||||||
|
|
|
|
|
|
|
|
|
|||||||||
| Defined benefit obligation, end of year |
$ | 57,365 | $ | 60,038 | $ | 25,300 | $ | 20,681 | ||||||||
|
|
|
|
|
|
|
|
|
|||||||||
| Defined benefit liability [note 15] |
$ | (53,374 | ) | $ | (56,321 | ) | $ | (25,300 | ) | $ | (20,681 | ) | ||||
|
|
|
|
|
|
|
|
|
|||||||||
The percentages of the total fair value of assets in the pension plans for each asset category at December 31 were as follows:
| Pension benefit plans | ||||||||
| 2024 | 2023 | |||||||
| Asset category(a) |
||||||||
| Canadian equity securities |
8 | % | 7 | % | ||||
| U.S. equity securities |
14 | % | 12 | % | ||||
| Global equity securities |
6 | % | 6 | % | ||||
| Canadian fixed income |
35 | % | 31 | % | ||||
| Other(b) |
37 | % | 44 | % | ||||
|
|
|
|
|
|||||
| Total |
100 | % | 100 | % | ||||
|
|
|
|
|
|||||
| (a) | The defined benefit plan assets contain no material amounts of related party assets at December 31, 2024 and 2023 respectively. |
| (b) | Relates mainly to the value of the refundable tax account held by the Canada Revenue Agency. The refundable total is approximately equal to half of the sum of the realized investment income plus employer contributions less half of the benefits paid by the plan. |
54
The following represents the components of net pension and other benefit expense included primarily as part of administration.
| Pension benefit plans | Other benefit plans | |||||||||||||||
| 2024 | 2023 | 2024 | 2023 | |||||||||||||
| Current service cost |
$ | 2,008 | $ | 1,567 | $ | 849 | $ | 689 | ||||||||
| Net interest cost |
2,469 | 2,326 | 948 | 987 | ||||||||||||
| Past service cost |
— | — | 4,652 | — | ||||||||||||
| Administration cost |
3 | 3 | — | — | ||||||||||||
|
|
|
|
|
|
|
|
|
|||||||||
| Defined benefit expense [note 19] |
4,480 | 3,896 | 6,449 | 1,676 | ||||||||||||
| Defined contribution pension expense [note 19] |
20,218 | 18,644 | — | — | ||||||||||||
|
|
|
|
|
|
|
|
|
|||||||||
| Net pension and other benefit expense |
$ | 24,698 | $ | 22,540 | $ | 6,449 | $ | 1,676 | ||||||||
|
|
|
|
|
|
|
|
|
|||||||||
The total amount of actuarial losses recognized in other comprehensive income is:
| Pension benefit plans | Other benefit plans | |||||||||||||||
| 2024 | 2023 | 2024 | 2023 | |||||||||||||
| Actuarial loss |
$ | 3,333 | $ | 6,343 | $ | 7 | $ | 461 | ||||||||
| Return on plan assets excluding interest income |
(95 | ) | (18 | ) | — | — | ||||||||||
|
|
|
|
|
|
|
|
|
|||||||||
| $ | 3,238 | $ | 6,325 | $ | 7 | $ | 461 | |||||||||
|
|
|
|
|
|
|
|
|
|||||||||
The assumptions used to determine the Company’s defined benefit obligation and net pension and other benefit expense were as follows at December 31 (expressed as weighted averages):
| Pension benefit plans | Other benefit plans | |||||||||||||||
| 2024 | 2023 | 2024 | 2023 | |||||||||||||
| Discount rate - obligation |
3.9 | % | 3.8 | % | 4.6 | % | 4.6 | % | ||||||||
| Discount rate - expense |
3.8 | % | 4.5 | % | 4.6 | % | 5.1 | % | ||||||||
| Rate of compensation increase |
2.9 | % | 2.9 | % | — | — | ||||||||||
| Health care cost trend rate |
— | — | 5.0 | % | 5.0 | % | ||||||||||
| Dental care cost trend rate |
— | — | 4.5 | % | 4.5 | % | ||||||||||
At December 31, 2024, the weighted average duration of the defined benefit obligation for the pension plans was 18.4 years (2023 - 17.9 years) and for the other benefit plans was 10.6 years (2023 - 11.4 years).
A 1% change at the reporting date to one of the relevant actuarial assumptions, holding other assumptions constant, would have affected the defined benefit obligation by the following:
| Pension benefit plans | Other benefit plans | |||||||||||||||
| Increase | Decrease | Increase | Decrease | |||||||||||||
| Discount rate |
$ | (7,537 | ) | $ | 9,601 | $ | (2,434 | ) | $ | 2,956 | ||||||
| Rate of compensation increase |
1,978 | (1,814 | ) | n/a | n/a | |||||||||||
A 1% change in any of the other assumptions would not have a significant impact on the defined benefit obligation.
The methods and assumptions used in preparing the sensitivity analyses are the same as the methods and assumptions used in determining the financial position of Cameco’s plans as at December 31, 2024. The sensitivity analyses are determined by varying the sensitivity assumption and leaving all other assumptions unchanged. Therefore, the sensitivity analyses do not recognize any interdependence in the assumptions. The methods and assumptions used in determining the above sensitivity are consistent with the methods and assumptions used in the previous year.
55
In addition, an increase of one year in the expected lifetime of plan participants in the pension benefit plans would increase the defined benefit obligation by $474,000.
To measure the longevity risk for these plans, the mortality rates were reduced such that the average life expectancy for all members increased by one year. The reduced mortality rates were subsequently used to re-measure the defined benefit obligation of the entire plan.
26. Financial instruments and related risk management
Cameco is exposed in varying degrees to a variety of risks from its use of financial instruments. Management and the board of directors, both separately and together, discuss the principal risks of our businesses. The board sets policies for the implementation of systems to manage, monitor and mitigate identifiable risks. Cameco’s risk management objective in relation to these instruments is to protect and minimize volatility in cash flow. The types of risks Cameco is exposed to, the source of risk exposure and how each is managed is outlined below.
Market risk
Market risk is the risk that changes in market prices, such as commodity prices, foreign currency exchange rates and interest rates, will affect the Company’s earnings or the fair value of its financial instruments. Cameco engages in various business activities which expose the Company to market risk. As part of its overall risk management strategy, Cameco uses derivatives to manage some of its exposures to market risk that result from these activities.
Derivative instruments may include financial and physical forward contracts. Such contracts may be used to establish a fixed price for a commodity, an interest-bearing obligation or a cash flow denominated in a foreign currency. Market risks are monitored regularly against defined risk limits and tolerances.
Cameco’s actual exposure to these market risks is constantly changing as the Company’s portfolios of foreign currency and interest rate contracts change.
The types of market risk exposure and the way in which such exposure is managed are as follows:
A. Commodity price risk
As a significant producer and supplier of uranium and nuclear fuel processing services, Cameco bears significant exposure to changes in prices for these products. A substantial change in prices will affect the Company’s net earnings and operating cash flows. Prices for Cameco’s products are volatile and are influenced by numerous factors beyond the Company’s control, such as supply and demand fundamentals and geopolitical events.
Cameco’s sales contracting strategy focuses on reducing the volatility in future earnings and cash flow, while providing both protection against decreases in market price and retention of exposure to future market price increases. To mitigate the risks associated with the fluctuations in the market price for uranium products, Cameco seeks to maintain a portfolio of uranium product sales contracts with a variety of delivery dates and pricing mechanisms that provide a degree of protection from pricing volatility.
B. Foreign exchange risk
The relationship between the Canadian and US dollar affects financial results of the uranium business as well as the fuel services business. Sales of uranium product, conversion and fuel manufacturing services are routinely denominated in US dollars while production costs are largely denominated in Canadian dollars.
56
Cameco attempts to provide some protection against exchange rate fluctuations by planned hedging activity designed to smooth volatility. To mitigate risks associated with foreign currency, Cameco enters into forward sales and option contracts to establish a price for future delivery of the foreign currency. These foreign currency contracts are not designated as hedges and are recorded at fair value with changes in fair value recognized in earnings. Cameco also has a natural hedge against US currency fluctuations because a portion of its annual cash outlays, including purchases of uranium and conversion services, is denominated in US dollars.
Cameco holds a number of financial instruments denominated in foreign currencies that expose the Company to foreign exchange risk. Cameco measures its exposure to foreign exchange risk on financial instruments as the change in carrying values that would occur as a result of reasonably possible changes in foreign exchange rates, holding all other variables constant. As of the reporting date, the Company has determined its pre-tax exposure to foreign currency exchange risk on financial instruments to be as follows based on a 5% weakening of the Canadian dollar:
| Carrying value | ||||||||||||
| Currency | (Cdn) | Gain (loss) | ||||||||||
| Cash and cash equivalents |
USD | $ | 418,968 | $ | 20,948 | |||||||
| Accounts receivable |
USD | 275,123 | 13,756 | |||||||||
| Accounts payable and accrued liabilities |
USD | (325,504 | ) | (16,275 | ) | |||||||
| Long-term debt |
USD | (285,707 | ) | (14,285 | ) | |||||||
| Net foreign currency derivatives |
USD | (140,334 | ) | (163,978 | ) | |||||||
C. Interest rate risk
The Company has a strategy of minimizing its exposure to interest rate risk by maintaining target levels of fixed and variable rate borrowings. The proportions of outstanding debt carrying fixed and variable interest rates are reviewed by senior management to ensure that these levels are within approved policy limits. At December 31, 2024, the proportion of Cameco’s outstanding debt that carries fixed interest rates is 72% (2023 - 51%).
Cameco was exposed to interest rate risk during the year through its interest rate swap contracts whereby fixed rate payments on a notional amount of $75,000,000 of the Series H senior unsecured debentures were swapped for variable rate payments. Under the terms of the swap, Cameco makes interest payments based on the daily Canada Overnight Repo Rate Average plus an average margin of 1.3% and receives fixed interest payments of 2.95%. At December 31, 2024, the fair value of Cameco’s interest rate swap net liability was $3,172,000 (2023 - $5,819,000).
Cameco is also exposed to interest rate risk through its $200,000,000 (US) term loan which has a floating interest rate of SOFR plus 1.80% and matures on November 7, 2025. Subsequent to year-end, on January 13, 2025, Cameco repaid the $200,000,000 (US), remaining outstanding balance.
Cameco measures its exposure to interest rate risk as the change in cash flows that would occur as a result of reasonably possible changes in interest rates, holding all other variables constant. As of the reporting date, the Company has determined the impact on earnings of a 1% increase in interest rate on its variable rate financial instruments to be as follows:
| Gain (loss) | ||||
| Interest rate contracts |
$ | (759 | ) | |
| Floating rate term loan |
(2,629 | ) | ||
57
Counterparty credit risk
Counterparty credit risk is associated with the ability of counterparties to satisfy their contractual obligations to Cameco, including both payment and performance. The maximum exposure to credit risk, as represented by the carrying amount of the financial assets, at December 31 was:
| 2024 | 2023 | |||||||
| Cash and cash equivalents |
$ | 600,462 | $ | 566,809 | ||||
| Accounts receivable [note 7] |
318,126 | 415,561 | ||||||
| Derivative assets [note 11] |
103 | 28,467 | ||||||
Cash and cash equivalents
Cameco held cash and cash equivalents of $600,000,000 at December 31, 2024 (2023 - $567,000,000). Cameco mitigates its credit risk by ensuring that balances are held with counterparties with high credit ratings. The Company monitors the credit rating of its counterparties on a monthly basis and has controls in place to ensure prescribed exposure limits with each counterparty are adhered to.
Impairment on cash and cash equivalents has been measured on a 12-month ECL basis and reflects the short maturities of the exposures. The Company considers that its cash and cash equivalents have low credit risk based on the external credit ratings of the counterparties. Cameco has assessed its counterparty credit risk on cash and cash equivalents by applying historic global default rates to outstanding cash balances based on S&P rating. The conclusion of this assessment is that the loss allowance is insignificant.
Accounts receivable
Cameco’s sales of uranium product, conversion and fuel manufacturing services expose the Company to the risk of non-payment. Cameco manages the risk of non-payment by monitoring the credit-worthiness of its customers and seeking pre-payment or other forms of payment security from customers with an unacceptable level of credit risk.
A summary of the Company’s exposure to credit risk for trade receivables is as follows:
| Carrying value |
||||
| Investment grade credit rating |
$ | 291,492 | ||
| Non-investment grade credit rating |
18,078 | |||
|
|
|
|||
| Total gross carrying amount |
$ | 309,570 | ||
| Loss allowance |
— | |||
|
|
|
|||
| Net |
$ | 309,570 | ||
|
|
|
|||
At December 31, 2024, there were no significant concentrations of credit risk and no amounts were held as collateral. Historically, Cameco has experienced minimal customer defaults and, as a result, considers the credit quality of its accounts receivable to be high.
Cameco uses customer credit rating data, historic default rates and aged receivable analysis to measure the ECLs of trade receivables from corporate customers, which comprise a small number of large balances. Since the Company has not experienced customer defaults in the past, applying historic default rates in calculating ECLs, as well as considering forward-looking information, resulted in an insignificant allowance for losses.
58
The following table provides information about Cameco’s aged trade receivables as at December 31, 2024:
| Corporate customers |
Other customers |
Total | ||||||||||
| Current (not past due) |
$ | 304,684 | $ | 4,036 | 308,720 | |||||||
| 1-30 days past due |
— | 227 | 227 | |||||||||
| More than 30 days past due |
558 | 65 | 623 | |||||||||
|
|
|
|
|
|
|
|||||||
| Total |
$ | 305,242 | $ | 4,328 | 309,570 | |||||||
|
|
|
|
|
|
|
|||||||
Liquidity risk
Financial liquidity represents Cameco’s ability to fund future operating activities and investments. Cameco ensures that there is sufficient capital in order to meet short-term business requirements, after taking into account cash flows from operations and the Company’s holdings of cash and cash equivalents. The Company believes that these sources will be sufficient to cover the likely short-term and long-term cash requirements.
The table below outlines the Company’s available debt facilities at December 31, 2024:
| Total amount | Outstanding and committed |
Amount available |
||||||||||
| Unsecured revolving credit facility [note 14] |
$ | 1,000,000 | $ | — | $ | 1,000,000 | ||||||
| Letter of credit facilities [note 14] |
1,890,028 | 1,527,815 | 362,213 | |||||||||
The tables below present a maturity analysis of Cameco’s financial liabilities, including principal and interest, based on the expected cash flows from the reporting date to the contractual maturity date:
| Carrying amount |
Contractual cash flows |
Due in less than 1 year |
Due in 1-3 years |
Due in 3-5 years |
Due after 5 years |
|||||||||||||||||||
| Accounts payable and accrued liabilities |
$ | 619,035 | $ | 619,035 | $ | 619,035 | $ | — | $ | — | $ | — | ||||||||||||
| Long-term debt |
1,281,290 | 1,287,680 | 287,680 | 400,000 | — | 600,000 | ||||||||||||||||||
| Foreign currency contracts |
140,437 | 140,437 | 82,570 | 57,521 | 346 | — | ||||||||||||||||||
| Interest rate contracts |
3,172 | 3,172 | 1,320 | 1,852 | — | — | ||||||||||||||||||
| Lease obligation |
9,839 | 11,550 | 2,131 | 3,545 | 2,316 | 3,558 | ||||||||||||||||||
|
|
|
|
|
|
|
|
|
|
|
|
|
|||||||||||||
| Total contractual repayments |
$ | 2,053,773 | $ | 2,061,874 | $ | 992,736 | $ | 462,918 | $ | 2,662 | $ | 603,558 | ||||||||||||
|
|
|
|
|
|
|
|
|
|
|
|
|
|||||||||||||
| Total | Due in less than 1 year |
Due in 1-3 years |
Due in 3-5 years |
Due after 5 years |
||||||||||||||||
| Total interest payments on long-term debt |
$ | 304,933 | $ | 58,953 | $ | 83,180 | $ | 59,580 | $ | 103,220 | ||||||||||
|
|
|
|
|
|
|
|
|
|
|
|||||||||||
59
Measurement of fair values
| A. | Accounting classifications and fair values |
The following tables summarize the carrying amounts and accounting classifications of Cameco’s financial instruments at the reporting date:
At December 31, 2024
| FVTPL | Amortized cost |
Total | ||||||||||
| Financial assets |
||||||||||||
| Cash and cash equivalents |
$ | — | $ | 600,462 | $ | 600,462 | ||||||
| Accounts receivable [note 7] |
— | 346,800 | 346,800 | |||||||||
| Derivative assets [note 11] |
||||||||||||
| Foreign currency contracts |
103 | — | 103 | |||||||||
|
|
|
|
|
|
|
|||||||
| $ | 103 | $ | 947,262 | $ | 947,365 | |||||||
|
|
|
|
|
|
|
|||||||
| Financial liabilities |
||||||||||||
| Accounts payable and accrued liabilities [note 13] |
$ | — | $ | 619,035 | $ | 619,035 | ||||||
| Current portion of long-term debt [note 14] |
— | 285,707 | 285,707 | |||||||||
| Lease obligation [note 15] |
— | 9,839 | 9,839 | |||||||||
| Derivative liabilities [note 15] |
||||||||||||
| Foreign currency contracts |
140,437 | — | 140,437 | |||||||||
| Interest rate contracts |
3,172 | — | 3,172 | |||||||||
| Long-term debt [note 14] |
— | 995,583 | 995,583 | |||||||||
|
|
|
|
|
|
|
|||||||
| 143,609 | 1,910,164 | 2,053,773 | ||||||||||
|
|
|
|
|
|
|
|||||||
| Net |
$ | (143,506 | ) | $ | (962,902 | ) | $ | (1,106,408 | ) | |||
|
|
|
|
|
|
|
|||||||
60
At December 31, 2023
| FVTPL | Amortized cost |
Total | ||||||||||
| Financial assets |
||||||||||||
| Cash and cash equivalents |
$ | — | $ | 566,809 | $ | 566,809 | ||||||
| Accounts receivable [note 7] |
— | 422,333 | 422,333 | |||||||||
| Derivative assets [note 11] |
||||||||||||
| Foreign currency contracts |
28,467 | — | 28,467 | |||||||||
|
|
|
|
|
|
|
|||||||
| $ | 28,467 | $ | 989,142 | $ | 1,017,609 | |||||||
|
|
|
|
|
|
|
|||||||
| Financial liabilities |
||||||||||||
| Accounts payable and accrued liabilities [note 13] |
$ | — | $ | 577,550 | $ | 577,550 | ||||||
| Current portion of long-term debt [note 14] |
— | 499,821 | 499,821 | |||||||||
| Lease obligation [note 15] |
— | 10,816 | 10,816 | |||||||||
| Derivative liabilities [note 15] |
||||||||||||
| Foreign currency contracts |
16,525 | — | 16,525 | |||||||||
| Interest rate contracts |
5,819 | — | 5,819 | |||||||||
| Long-term debt [note 14] |
— | 1,284,353 | 1,284,353 | |||||||||
|
|
|
|
|
|
|
|||||||
| 22,344 | 2,372,540 | 2,394,884 | ||||||||||
|
|
|
|
|
|
|
|||||||
| Net |
$ | 6,123 | $ | (1,383,398 | ) | $ | (1,377,275 | ) | ||||
|
|
|
|
|
|
|
|||||||
Cameco has pledged $162,276,000 of cash as security against certain of its letter of credit facilities. This cash is being used as collateral for an interest rate reduction on the letter of credit facilities. The collateral account has a term of five years effective November 1, 2023. Cameco retains full access to this cash.
Cameco has not irrevocably designated a financial asset that would otherwise meet the requirements to be measured at amortized cost at FVOCI or FVTPL to eliminate or significantly reduce an accounting mismatch that would otherwise arise.
The following tables summarize the carrying amounts and level 2 fair value measurements of Cameco’s financial instruments:
As at December 31, 2024
| Carrying value | Fair value | |||||||
| Derivative assets [note 11] |
||||||||
| Foreign currency contracts |
$ | 103 | $ | 103 | ||||
| Current portion of long-term debt [note 14] |
(285,707 | ) | (285,707 | ) | ||||
| Derivative liabilities [note 15] |
||||||||
| Foreign currency contracts |
(140,437 | ) | (140,437 | ) | ||||
| Interest rate contracts |
(3,172 | ) | (3,172 | ) | ||||
| Long-term debt [note 14] |
(995,583 | ) | (1,058,055 | ) | ||||
|
|
|
|
|
|||||
| Net |
$ | (1,424,796 | ) | $ | (1,487,268 | ) | ||
|
|
|
|
|
|||||
61
As at December 31, 2023
| Carrying value | Fair value | |||||||
| Derivative assets [note 11] |
||||||||
| Foreign currency contracts |
$ | 28,467 | $ | 28,467 | ||||
| Current portion of long-term debt [note 14] |
(499,821 | ) | (500,000 | ) | ||||
| Derivative liabilities [note 15] |
||||||||
| Foreign currency contracts |
(16,525 | ) | (16,525 | ) | ||||
| Interest rate contracts |
(5,819 | ) | (5,819 | ) | ||||
| Long-term debt [note 14] |
(1,284,353 | ) | (1,303,681 | ) | ||||
|
|
|
|
|
|||||
| Net |
$ | (1,778,051 | ) | $ | (1,797,558 | ) | ||
|
|
|
|
|
|||||
The preceding tables exclude fair value information for financial instruments whose carrying amounts are a reasonable approximation of fair value. The carrying values of Cameco’s cash and cash equivalents, accounts receivable, and accounts payable and accrued liabilities approximate their fair values as a result of the short-term nature of the instruments.
There were no transfers between level 1 and level 2 during the period. Cameco does not have any financial instruments that are classified as level 1 or level 3 as of the reporting date.
| B. | Financial instruments measured at fair value |
Cameco measures its derivative financial instruments and long-term debt at fair value. Derivative financial instruments and long-term debt are classified as a recurring level 2 fair value measurement.
The fair value of Cameco’s long-term debt is determined using quoted market yields as of the reporting date, which ranged from 2.8% to 3.3% (2023 - 3.1% to 4.9%). The fair value of the floating rate term loan is equal to its carrying value.
Foreign currency derivatives consist of foreign currency forward contracts, options and swaps. The fair value of foreign currency options is measured based on the Black Scholes option-pricing model. The fair value of foreign currency forward contracts and swaps is measured using a market approach, based on the difference between contracted foreign exchange rates and quoted forward exchange rates as of the reporting date.
Interest rate derivatives consist of interest rate swap contracts. The fair value of interest rate swaps is determined by discounting expected future cash flows from the contracts. The future cash flows are determined by measuring the difference between fixed interest payments to be received and floating interest payments to be made to the counterparty based on Canada Overnight Repo Rate Average forward interest rate curves.
Where applicable, the fair value of the derivatives reflects the credit risk of the instrument and includes adjustments to take into account the credit risk of the Company and counterparty. These adjustments are based on credit ratings and yield curves observed in active markets at the reporting date.
62
Derivatives
The following table summarizes the fair value of derivatives and classification on the consolidated statements of financial position:
| 2024 | 2023 | |||||||
| Non-hedge derivatives: |
||||||||
| Foreign currency contracts |
$ | (140,334 | ) | $ | 11,942 | |||
| Interest rate contracts |
(3,172 | ) | (5,819 | ) | ||||
|
|
|
|
|
|||||
| Net |
$ | (143,506 | ) | $ | 6,123 | |||
|
|
|
|
|
|||||
| Classification: |
||||||||
| Current portion of long-term receivables, investments and other [note 11] |
$ | 68 | $ | 9,137 | ||||
| Long-term receivables, investments and other [note 11] |
35 | 19,330 | ||||||
| Current portion of other liabilities [note 15] |
(83,890 | ) | (14,338 | ) | ||||
| Other liabilities [note 15] |
(59,719 | ) | (8,006 | ) | ||||
|
|
|
|
|
|||||
| Net |
$ | (143,506 | ) | $ | 6,123 | |||
|
|
|
|
|
|||||
The following table summarizes the different components of the gains (losses) on derivatives included in net earnings:
| 2024 | 2023 | |||||||
| Non-hedge derivatives: |
||||||||
| Foreign currency contracts |
$ | (182,988 | ) | $ | 38,975 | |||
| Interest rate contracts |
(115 | ) | (1,184 | ) | ||||
|
|
|
|
|
|||||
| Net |
$ | (183,103 | ) | $ | 37,791 | |||
|
|
|
|
|
|||||
| 27. | Capital management |
Cameco’s management considers its capital structure to consist of bank overdrafts, long-term debt, short-term debt (net of cash and cash equivalents), non-controlling interest and shareholders’ equity.
Cameco’s capital structure reflects its strategy and the environment in which it operates. Delivering returns to long-term shareholders is a top priority. The Company’s objective is to maximize cash flow while maintaining its investment grade rating through close capital management of our balance sheet metrics. Capital resources are managed to allow it to support achievement of its goals while managing financial risks such as weakness in the market, litigation risk and refinancing risk. The overall objectives for managing capital in 2024 reflect the environment that the Company is operating in, similar to the prior comparative period.
63
The capital structure at December 31 was as follows:
| 2024 | 2023 | |||||||
| Current portion of long-term debt [note 14] |
$ | 285,707 | $ | 499,821 | ||||
| Long-term debt [note 14] |
995,583 | 1,284,353 | ||||||
| Cash and cash equivalents |
(600,462 | ) | (566,809 | ) | ||||
|
|
|
|
|
|||||
| Net debt |
680,828 | 1,217,365 | ||||||
|
|
|
|
|
|||||
| Non-controlling interest |
26 | 4 | ||||||
| Shareholders’ equity |
6,364,307 | 6,094,305 | ||||||
|
|
|
|
|
|||||
| Total equity |
6,364,333 | 6,094,309 | ||||||
|
|
|
|
|
|||||
| Total capital |
$ | 7,045,161 | $ | 7,311,674 | ||||
|
|
|
|
|
|||||
Cameco is bound by certain covenants in its general credit facilities. The financial covenants place restrictions on total debt, including guarantees and other financial assurances. As of December 31, 2024, Cameco met these requirements.
| 28. | Segmented information |
Cameco has three reportable segments: uranium, fuel services and Westinghouse. Cameco’s reportable segments are strategic business units with different products, processes and marketing strategies. The uranium segment involves the exploration for, mining, milling, purchase and sale of uranium concentrate. The fuel services segment involves the refining, conversion and fabrication of uranium concentrate and the purchase and sale of conversion services. The Westinghouse segment reflects our earnings from this equity-accounted investment (see note 12). Westinghouse is a nuclear reactor technology original equipment manufacturer and a global provider of products and services to commercial utilities and government agencies. It provides outage and maintenance services, engineering support, instrumentation and controls equipment, plant modification, and components and parts to nuclear reactors.
Cost of sales in the uranium segment includes care and maintenance costs for our operations that have had production suspensions. Cameco expensed $51,626,000 of care and maintenance costs during the year (2023 - $50,615,000).
Accounting policies used in each segment are consistent with the policies outlined in the summary of material accounting policies.
64
| A. | Business segments - 2024 |
For the year ended December 31, 2024
| Uranium | Fuel services |
(i) WEC |
(i) Adjustments |
Other | Total | |||||||||||||||||||
| Revenue |
$ | 2,676,620 | $ | 459,152 | $ | 2,892,467 | $ | (2,892,467 | ) | $ | — | $ | 3,135,772 | |||||||||||
| Expenses |
||||||||||||||||||||||||
| Cost of products and services sold |
1,757,155 | 316,040 | 1,016,980 | (1,016,980 | ) | (707 | ) | 2,072,488 | ||||||||||||||||
| Depreciation and amortization |
238,726 | 37,236 | 356,864 | (356,864 | ) | 4,740 | 280,702 | |||||||||||||||||
|
|
|
|
|
|
|
|
|
|
|
|
|
|||||||||||||
| Cost of sales |
1,995,881 | 353,276 | 1,373,844 | (1,373,844 | ) | 4,033 | 2,353,190 | |||||||||||||||||
|
|
|
|
|
|
|
|
|
|
|
|
|
|||||||||||||
| Gross profit (loss) |
680,739 | 105,876 | 1,518,623 | (1,518,623 | ) | (4,033 | ) | 782,582 | ||||||||||||||||
| Administration |
— | — | 1,460,657 | (1,460,657 | ) | 253,150 | 253,150 | |||||||||||||||||
| Exploration |
19,419 | — | — | — | — | 19,419 | ||||||||||||||||||
| Research and development |
— | — | — | — | 36,540 | 36,540 | ||||||||||||||||||
| Other operating income |
(35,090 | ) | (2,593 | ) | — | — | — | (37,683 | ) | |||||||||||||||
| (Gain) loss on disposal of assets |
253 | 791 | — | — | (2 | ) | 1,042 | |||||||||||||||||
| Finance costs |
— | — | 225,188 | (225,188 | ) | 147,171 | 147,171 | |||||||||||||||||
| Loss on derivatives |
— | — | — | — | 183,103 | 183,103 | ||||||||||||||||||
| Finance income |
— | — | (4,381 | ) | 4,381 | (21,228 | ) | (21,228 | ) | |||||||||||||||
| Share of loss (earnings) from equity-accounted investees |
(207,583 | ) | — | — | 218,427 | — | 10,844 | |||||||||||||||||
| Foreign exchange gains |
— | — | — | — | (65,517 | ) | (65,517 | ) | ||||||||||||||||
| Other expense (income) |
— | — | 116,697 | (116,697 | ) | (975 | ) | (975 | ) | |||||||||||||||
|
|
|
|
|
|
|
|
|
|
|
|
|
|||||||||||||
| Earnings (loss) before income taxes |
903,740 | 107,678 | (279,538 | ) | 61,111 | (536,275 | ) | 256,716 | ||||||||||||||||
| Income tax expense |
84,874 | |||||||||||||||||||||||
|
|
|
|||||||||||||||||||||||
| Net earnings |
171,842 | |||||||||||||||||||||||
|
|
|
|
|
|
|
|
|
|
|
|
|
|||||||||||||
| Capital expenditures for the year |
$ | 132,827 | $ | 48,667 | $ | 176,229 | $ | (176,229 | ) | $ | 30,141 | $ | 211,635 | |||||||||||
|
|
|
|
|
|
|
|
|
|
|
|
|
|||||||||||||
| (i) | Consistent with the presentation of financial information for internal management purposes, Cameco’s share of Westinghouse’s financial results have been presented as a separate segment. In accordance with IFRS, this investment is accounted for by the equity method of accounting in these consolidated financial statements and the associated revenues and expenses are eliminated in the “Adjustments” column. |
65
For the year ended December 31, 2023
| Uranium | Fuel services |
(i) WEC |
(i) Adjustments |
Other | Total | |||||||||||||||||||
| Revenue |
$ | 2,153,153 | $ | 425,557 | $ | 521,074 | $ | (521,074 | ) | $ | 9,048 | $ | 2,587,758 | |||||||||||
| Expenses |
||||||||||||||||||||||||
| Cost of products and services sold |
1,532,316 | 266,062 | 200,285 | (200,285 | ) | 7,390 | 1,805,768 | |||||||||||||||||
| Depreciation and amortization |
175,457 | 35,426 | 60,766 | (60,766 | ) | 9,441 | 220,324 | |||||||||||||||||
|
|
|
|
|
|
|
|
|
|
|
|
|
|||||||||||||
| Cost of sales |
1,707,773 | 301,488 | 261,051 | (261,051 | ) | 16,831 | 2,026,092 | |||||||||||||||||
|
|
|
|
|
|
|
|
|
|
|
|
|
|||||||||||||
| Gross profit (loss) |
445,380 | 124,069 | 260,023 | (260,023 | ) | (7,783 | ) | 561,666 | ||||||||||||||||
| Administration |
— | — | 244,400 | (244,400 | ) | 245,539 | 245,539 | |||||||||||||||||
| Exploration |
17,551 | — | — | — | — | 17,551 | ||||||||||||||||||
| Research and development |
— | — | — | — | 21,036 | 21,036 | ||||||||||||||||||
| Other operating income |
(1,875 | ) | (5,634 | ) | — | — | — | (7,509 | ) | |||||||||||||||
| Loss on disposal of assets |
1,825 | 363 | — | — | — | 2,188 | ||||||||||||||||||
| Finance costs |
— | — | 26,274 | (26,274 | ) | 115,869 | 115,869 | |||||||||||||||||
| Loss (gain) on derivatives |
— | — | 2,838 | (2,838 | ) | (37,791 | ) | (37,791 | ) | |||||||||||||||
| Finance income |
— | — | (1,885 | ) | 1,885 | (111,670 | ) | (111,670 | ) | |||||||||||||||
| Share of loss (earnings) from equity-accounted investee |
(178,848 | ) | — | — | 24,386 | — | (154,462 | ) | ||||||||||||||||
| Foreign exchange gains |
— | — | — | — | (15,692 | ) | (15,692 | ) | ||||||||||||||||
| Other expense (income) |
(545 | ) | — | 19,424 | (19,424 | ) | (1 | ) | (546 | ) | ||||||||||||||
|
|
|
|
|
|
|
|
|
|
|
|
|
|||||||||||||
| Earnings (loss) before income taxes |
607,272 | 129,340 | (31,028 | ) | 6,642 | (225,073 | ) | 487,153 | ||||||||||||||||
| Income tax expense |
126,337 | |||||||||||||||||||||||
|
|
|
|||||||||||||||||||||||
| Net earnings |
360,816 | |||||||||||||||||||||||
|
|
|
|
|
|
|
|
|
|
|
|
|
|||||||||||||
| Capital expenditures for the year |
$ | 105,384 | $ | 42,546 | $ | 42,405 | $ | (42,405 | ) | $ | 5,701 | $ | 153,631 | |||||||||||
|
|
|
|
|
|
|
|
|
|
|
|
|
|||||||||||||
| (i) | Consistent with the presentation of financial information for internal management purposes, Cameco’s share of Westinghouse’s financial results have been presented as a separate segment. In accordance with IFRS, this investment is accounted for by the equity method of accounting in these consolidated financial statements and the associated revenues and expenses are eliminated in the “Adjustments” column. |
| B. | Geographic segments |
Revenue is attributed to the geographic location based on the location of the entity providing the services. The Company’s revenue from external customers is as follows:
| 2024 | 2023 | |||||||
| Canada |
$ | 2,495,748 | $ | 1,877,742 | ||||
| United States |
640,024 | 710,016 | ||||||
|
|
|
|
|
|||||
| $ | 3,135,772 | $ | 2,587,758 | |||||
|
|
|
|
|
|||||
66
The Company’s non-current assets, excluding deferred tax assets and financial instruments, by geographic location are as follows:
| 2024 | 2023 | |||||||
| Canada |
$ | 2,859,401 | $ | 2,947,395 | ||||
| United States |
3,015,292 | 2,975,148 | ||||||
| Australia |
383,338 | 389,152 | ||||||
| Kazakhstan |
286,759 | 273,834 | ||||||
| Germany |
3 | 5 | ||||||
|
|
|
|
|
|||||
| $ | 6,544,793 | $ | 6,585,534 | |||||
|
|
|
|
|
|||||
| C. | Major customers |
Cameco relies on a small number of customers to purchase a significant portion of its uranium concentrates and uranium conversion services. During 2024, revenues from three customers of Cameco’s uranium and fuel services segments represented approximately $1,062,733,000 (2023 - $254,786,000), approximately 34% (2023 - 10%) of Cameco’s total revenues from these segments. As customers are relatively few in number, accounts receivable from any individual customer may periodically exceed 10% of accounts receivable depending on delivery schedule.
| 29. | Group entities |
The following are the principal subsidiaries, associate and joint venture of the Company:
| Principal place | Ownership interest | |||||||||||
| of business | 2024 | 2023 | ||||||||||
| Subsidiaries: |
||||||||||||
| Cameco Fuel Manufacturing Inc. |
Canada | 100 | % | 100 | % | |||||||
| Cameco Marketing Inc. |
Canada | 100 | % | 100 | % | |||||||
| Cameco Inc. |
US | 100 | % | 100 | % | |||||||
| Power Resources, Inc. |
US | 100 | % | 100 | % | |||||||
| Crow Butte Resources, Inc. |
US | 100 | % | 100 | % | |||||||
| Cameco U.S. Holdings, Inc. |
US | 100 | % | 100 | % | |||||||
| Cameco Australia Pty. Ltd. |
Australia | 100 | % | 100 | % | |||||||
| Cameco Europe Ltd. |
Switzerland | 100 | % | 100 | % | |||||||
| Associate: |
||||||||||||
| JV Inkai |
Kazakhstan | 40 | % | 40 | % | |||||||
| Joint Venture: |
||||||||||||
| Watt New Aggregator L.P. (Westinghouse) |
US | 49 | % | 49 | % | |||||||
| 30. | Joint operations |
Cameco conducts a portion of its exploration, development, mining and milling activities through joint operations. Operations are governed by agreements that provide for joint control of the strategic operating, investing and financing activities among the partners. These agreements were considered in the determination of joint control. Cameco’s significant Canadian uranium joint operation interests are McArthur River, Key Lake and Cigar Lake. The Canadian uranium joint operations allocate uranium production to each joint operation participant and the joint operation participant derives revenue directly from the sale of such product. Mining and milling expenses incurred by joint operations are included in the cost of inventory.
67
Cameco reflects its proportionate interest in these assets and liabilities as follows:
| Principal place | ||||||||||||||||
| of business | Ownership | 2024 | 2023 | |||||||||||||
| Total assets |
||||||||||||||||
| McArthur River |
Canada | 69.81 | % | $ | 963,183 | $ | 1,048,746 | |||||||||
| Key Lake |
Canada | 83.33 | % | 485,635 | 504,508 | |||||||||||
| Cigar Lake |
Canada | 54.55 | % | 1,010,646 | 1,158,583 | |||||||||||
|
|
|
|
|
|||||||||||||
| $ | 2,459,464 | $ | 2,711,837 | |||||||||||||
|
|
|
|
|
|||||||||||||
| Total liabilities |
||||||||||||||||
| McArthur River |
69.81 | % | $ | 53,373 | $ | 50,199 | ||||||||||
| Key Lake |
83.33 | % | 248,107 | 244,480 | ||||||||||||
| Cigar Lake |
54.55 | % | 57,125 | 48,967 | ||||||||||||
|
|
|
|
|
|||||||||||||
| $ | 358,605 | $ | 343,646 | |||||||||||||
|
|
|
|
|
|||||||||||||
| 31. | Related parties |
| A. | Transactions with key management personnel |
Key management personnel are those persons that have the authority and responsibility for planning, directing and controlling the activities of the Company, directly or indirectly. Key management personnel of the Company include executive officers, vice-presidents, other senior managers and members of the board of directors.
In addition to their salaries, Cameco also provides non-cash benefits to executive officers and vice-presidents and contributes to pension plans on their behalf (note 25). Senior management and directors also participate in the Company’s share-based compensation plans (note 24).
Executive officers are subject to terms of notice ranging from three to six months. Upon resignation at the Company’s request, they are entitled to termination benefits of up to the lesser of 18 to 24 months or the period remaining until age 65. The termination benefits include gross salary plus the target short-term incentive bonus for the year in which termination occurs.
Compensation for key management personnel was comprised of:
| 2024 | 2023 | |||||||
| Short-term employee benefits |
$ | 39,224 | $ | 30,733 | ||||
| Share-based compensation(a) |
27,373 | 41,694 | ||||||
| Post-employment benefits |
12,128 | 6,730 | ||||||
| Termination benefits |
1,389 | 541 | ||||||
|
|
|
|
|
|||||
| Total |
$ | 80,114 | $ | 79,698 | ||||
|
|
|
|
|
|||||
| (a) | Excludes deferred share units held by directors (see note 24). |
Certain key management personnel, or their related parties, hold positions in other entities that result in them having control or significant influence over the financial or operating policies of those entities.
Cameco purchases a significant amount of goods and services for its Saskatchewan mining operations from northern Saskatchewan suppliers to support economic development in the region, where the president of several of these suppliers is a member of the board of directors. During the year ended December 31, 2024, Cameco paid these suppliers $87,708,000 (2023 - $27,373,000). The transactions were conducted in the normal course of business and were accounted for at the exchange amount. Accounts payable includes a balance of $1,156,000 at the reporting date (2023 - $1,817,000).
68
| B. | Other related party transactions |
| Transaction value | Balance outstanding | |||||||||||||||
| year ended | as at | |||||||||||||||
| 2024 | 2023 | 2024 | 2023 | |||||||||||||
| Joint venture |
||||||||||||||||
| Sales revenue(a) |
$ | 45,433 | $ | 27 | $ | 32 | $ | — | ||||||||
| Fuel storage and handling(a) |
50 | — | 26 | — | ||||||||||||
| Deferred sales(a) |
— | — | 75,083 | 21,909 | ||||||||||||
| Dividends received(b) |
— | — | — | — | ||||||||||||
| Associate |
||||||||||||||||
| Product purchases(c) |
456,963 | 392,656 | 301,652 | 289,055 | ||||||||||||
| Dividends received |
185,447 | 113,642 | — | — | ||||||||||||
| (a) | Cameco has entered into various agreements with Westinghouse and its subsidiaries and has recognized sales revenue related to fuel supply agreements and incurred costs related to fuel storage and handling fees. Contract terms are in the normal course of business and were accounted for at the exchange amount. |
| (b) | Subsequent to year-end, on February 19, 2025, Cameco received a dividend of $49,000,000 (US). |
| (c) | Cameco purchases uranium concentrate from JV Inkai. Purchases from JV Inkai are based on the prevailing uranium spot price less a 5% discount with extended payment terms. |
69
Exhibit 99.3

Management’s discussion and analysis
February 20, 2025
| 10 | MARKET OVERVIEW AND DEVELOPMENTS |
|
| 17 | 2024 PERFORMANCE HIGHLIGHTS |
|
| 22 | OUR VALUES AND STRATEGY |
|
| 32 | OUR SUSTAINABILITY PRINCIPLES AND PRACTICES |
|
| 35 | MEASURING OUR RESULTS |
|
| 37 | FINANCIAL RESULTS |
|
| 73 | OPERATIONS AND PROJECTS |
|
| 107 | MINERAL RESERVES AND RESOURCES |
|
| 112 | ADDITIONAL INFORMATION |
|
This management’s discussion and analysis (MD&A) includes information that will help you understand management’s perspective of our audited consolidated financial statements (financial statements) and notes for the year ended December 31, 2024. The information is based on what we knew as of February 19, 2025.
We encourage you to read our audited consolidated financial statements and notes as you review this MD&A. You can find more information about Cameco, including our financial statements and our most recent annual information form, on our website at cameco.com, on SEDAR+ at www.sedarplus.ca, or on EDGAR at www.sec.gov. You should also read our annual information form before making an investment decision about our securities.
The financial information in this MD&A and in our financial statements and notes is prepared according to International Financial Reporting Standards (IFRS), unless otherwise indicated.
Unless we have specified otherwise, all dollar amounts are in Canadian dollars.
Throughout this document, the terms we, us, our, the Company and Cameco mean Cameco Corporation and its subsidiaries, unless otherwise indicated.
Caution about forward-looking information
Our MD&A includes statements and information about our expectations for the future. When we discuss our strategy, plans, future financial and operating performance, or other things that have not yet taken place, we are making statements considered to be forward-looking information or forward-looking statements under Canadian and United States (US) securities laws. We refer to them in this MD&A as forward-looking information.
Key things to understand about the forward-looking information in this MD&A:
| • | It typically includes words and phrases about the future, such as: anticipate, believe, estimate, expect, forecast, goal, intend, outlook, plan, project, strategy, target, vision, and will (see examples below). |
| • | It represents our current views and can change significantly. |
| • | It is based on a number of material assumptions, including those we have listed on page 5, which may prove to be incorrect. |
| • | Actual results and events may be significantly different from what we currently expect, due to the risks associated with our business. We list a number of these material risks on page 4. We recommend you also review our most recent annual information form, which includes a discussion of other material risks that could cause actual results to differ significantly from our current expectations. |
| • | Forward-looking information is designed to help you understand management’s current views of our near- and longer-term prospects, and it may not be appropriate for other purposes. We will not necessarily update this information unless we are required to by securities laws. |
Examples of forward-looking information in this MD&A
| • | our view that we have the strengths to take advantage of the world’s rising demand for safe, secure, reliable, affordable and carbon-free energy |
| • | that we will continue to focus on delivering our products responsibly and addressing the risks and opportunities that we believe will make our business sustainable and will build long-term value |
| • | our expectations about when future reactors will come online |
| • | our expectations about 2025 and future global uranium supply, consumption, contracting, demand, geopolitical issues and the market including the discussion under the heading Market overview and developments |
| • | our expectations for the future of the nuclear industry and the potential for new enrichment technology, including that nuclear power must be a central part of the solution to the world’s shift to a low-carbon climate-resilient economy and that our investment in enrichment technology, if successful, will allow us to participate in the entire nuclear fuel value chain |
| • | our efforts to participate in the commercialization and deployment of small modular reactors (SMRs) and increase our contributions to decarbonization and help provide energy security by exploring SMRs and other emerging opportunities within the fuel cycle |
| • | our expectations about future demand for SMRs |
| • | our views on our ability to self-manage risk |
| • | the discussion under the heading Our business |
| • | the discussion under the heading Our strategy |
| • | our expectations regarding the effect of supply scarcity on our long-term contract portfolio |
| • | our expectations regarding the operation of, and production levels for, the Cigar Lake mine and McArthur River/Key Lake operation and fuel services, as well as our exploration activities at these and other sites |
| • | our expectations regarding the future average unit cost of production at McArthur River/Key Lake at Cigar Lake and at JV Inkai operations |
| • | our expectations regarding our licences for McArthur River, Key Lake and Crow Butte |
| • | Kazatomprom’s planned production levels for JV Inkai and the timing of deliveries, and our other expectations regarding JV Inkai |
| • | the discussion under the heading Our Sustainability principles and practices including our belief that we can be part of the solution to enhance national, energy and climate security, and our position to deliver significant long-term business value |
| • | our expectations for uranium purchases, sales and deliveries |
| • | our intentions regarding future dividend payments |
| • | the discussion of our expectations relating to our Canada Revenue Agency (CRA) transfer pricing dispute, including our confidence that the courts would reject any attempt by CRA to utilize the same or similar positions for other tax years currently in dispute, our plan to file a notice of objection for 2018 and our belief that CRA should return the full amount of cash and security that has been paid or otherwise secured by us |
| • | the discussion of our future plans for Cigar Lake and McArthur River/Key Lake under the heading 2024 performance highlights |
| • | our views on our ability to align our production with market opportunities and our contract portfolio |
| • | our expectation regarding opportunities to improve operational effectiveness and to reduce our impact on the environment, including through the use of digital and automation technologies |
| • | the discussion under the heading Outlook for 2025, including expected business resiliency, expectations for 2025 average unit cost of sales, average purchase price per pound, deliveries and production, 2025 financial outlook, our revenue, tax rates, adjusted net earnings and cash flow sensitivity, and our price sensitivity analysis for our uranium segment |
2 CAMECO CORPORATION
| • | the discussion under the heading Liquidity and capital resources, including expected liquidity to meet our 2025 obligations |
| • | our expectation that the uranium contract portfolio we have built will continue to provide a solid revenue stream, and our portfolio management strategy, including our inventory strategy and the extent of our spot market purchases |
| • | our expectation that our cash balances and operating cash flows will meet our anticipated 2025 capital requirements |
| • | our expectations for our and Westinghouse Electric Company’s (Westinghouse) future capital expenditures and sources of funds |
| • | our expectation that in 2025 we will be able to comply with all the covenants in our credit agreements |
| • | our expectation that Westinghouse will continue to comply with the covenants in its credit agreements |
| • | life of mine operating cost estimates for the Cigar Lake, McArthur River/Key Lake and JV Inkai operations |
| • | our future plans and expectations for uranium properties, advanced uranium projects, and fuel services operating sites, including production levels and suspension of production at certain properties, pace of advancement and expansion capacity, carbon reduction targets and mine life, and that our core growth is expected to come from our existing mining and fuel services assets |
| • | our expectations related to care and maintenance costs |
| • | our mineral reserve and resource estimates |
| • | our decommissioning estimates |
| • | the discussion of our expectations relating to our 49% interest in Westinghouse, including the investment in Westinghouse expanding our participation in the nuclear fuel value chain, Westinghouse providing a platform for further growth, and various factors and drivers for Westinghouse’s business segment |
| • | our expectation that our investment in Westinghouse will enhance our participation in the nuclear fuel cycle |
| • | our expectation that our investment in Westinghouse will be accretive to us and augment the core of our business |
| • | our expectation of Westinghouse being well positioned to participate in the growing demand profile for nuclear energy |
| • | our plans to update our physical climate risk assessments, incorporate these findings into our internal risk management review and developing an adaptation action plan template and our expectations regarding the timing for implementation of these plans |
| • | our expectations regarding our research and development expenses for 2025 |
| • | our expectations regarding the Canadian Nuclear Safety Commission’s review of our preliminary decommissioning cost estimate for the Port Hope conversion facility |
| • | our expectations regarding which extraction methods we will use in the future |
| • | our expectation that Westinghouse’s durable and growing business will allow Westinghouse to self-fund its approved annual operating budget, maintain its existing capacity to service its annual financial obligations from de-risked cash flows, and pay annual distributions to its owners |
| • | our 2025 outlook for Westinghouse, including Adjusted EBITDA, capital expenditures and revenue |
| • | our expectation that strategic initiatives, including the development of the AP300™ small modular reactor and the eVinci™ microreactor, will provide new business opportunities for Westinghouse that will make a meaningful contribution to Westinghouse’s long-term financial performance |
| • | our expectation for Westinghouse projects generating multi-year revenue streams and EBITDA for Westinghouse |
| • | our expectation that the timing of cash distributions from Westinghouse will be aligned with the timing of Westinghouse’s cash flows |
| • | our expectation that Westinghouse’s new opportunities will allow Westinghouse to compete for and win new business |
| • | our expectation that Westinghouse’s reputation and position will benefit its core business as Eastern European countries seek to develop a reliable fuel supply chain |
| • | our expectations regarding the growth of Westinghouse’s Adjusted EBITDA over the next five years |
| • | our estimates in respect of the framework for the timing of revenue flows and profitability of contracts under a new build project |
| • | our expectations with respect to the development of the AP300 small modular reactor and eVinci microreactor |
| • | our expectation on Westinghouse being well-positioned for future growth |
| • | our expectations regarding when Global Laser Enrichment’s technology will be deployed at a commercial scale |
MANAGEMENT’S DISCUSSION AND ANALYSIS 3
Material risks
| • | actual sales volumes or market prices for any of our products or services are lower than we expect, or cost of sales is higher than we expect, for any reason, including changes in market prices, loss of market share to a competitor, trade restrictions, geopolitical issues or the impact of a pandemic |
| • | we are adversely affected by changes in currency exchange rates, interest rates, royalty rates, tax rates, tariffs or inflation |
| • | our production costs are higher than planned, or necessary supplies are not available, or not available on commercially reasonable terms |
| • | our strategies may change, be unsuccessful or have unanticipated consequences, or we may not be able to achieve anticipated operational flexibility and efficiency |
| • | changing views of governments regarding the pursuit of carbon reduction strategies or our view may prove to be inaccurate on the role of nuclear power in pursuit of those strategies |
| • | our estimates and forecasts prove to be inaccurate, including production, purchases, deliveries, cash flow, revenue, costs, decommissioning, reclamation expenses, or timing or receipt of future dividends from JV Inkai |
| • | that we may not realize the expected benefits from our investment in Westinghouse or any of our other joint venture investments |
| • | Westinghouse fails to generate sufficient cash flow to fund its approved annual operating budget or make distributions to the partners |
| • | we are unable to enforce our legal rights under our existing agreements, permits or licences |
| • | we are subject to litigation or arbitration that has an adverse outcome |
| • | that the courts may accept the same, similar or different positions and arguments advanced by CRA to reach decisions that are adverse to us for other tax years |
| • | the possibility of a materially different outcome in disputes with CRA for other tax years |
| • | that CRA does not agree that the court rulings for the years that have been resolved in Cameco’s favour should apply to subsequent tax years |
| • | that CRA will not return all or substantially all of the cash and security that has been paid or otherwise secured in a timely manner, or at all |
| • | there are defects in, or challenges to, title to our properties |
| • | our mineral reserve and resource estimates are not reliable, or there are unexpected or challenging geological, hydrological or mining conditions |
| • | we are affected by environmental, safety and regulatory risks, including workforce health and safety or increased regulatory burdens or delays resulting from a pandemic or other causes |
| • | we are adversely affected by subsurface contamination from current or legacy operations |
| • | necessary permits or approvals from government authorities cannot be obtained or maintained |
| • | we are affected by political risks, including developments in US foreign policy, global conflicts, sanctions or any potential future unrest in Kazakhstan |
| • | we may be affected by crime, corruption, making improper payments or providing benefits that may violate Canadian or US law or laws relating to foreign corrupt practices or sanctions |
| • | operations are disrupted due to problems with our own or our suppliers’ or customers’ facilities, the unavailability of reagents, equipment, operating parts and supplies critical to production, equipment failure, lack of tailings capacity, labour shortages, labour relations issues, strikes or lockouts, underground floods, cave-ins, ground movements, tailings dam failures, transportation disruptions or accidents, aging infrastructure or other development and operating risks |
| • | we are affected by terrorism, sabotage, blockades, civil unrest, social or political activism, outbreak of illness (such as a pandemic), accident or a deterioration in political support for, or demand for, nuclear energy |
| • | a major accident at a nuclear power plant |
| • | we are impacted by changes in the regulation or public perception of the safety of nuclear power plants, which adversely affect the construction of new plants, the relicensing of existing plants and the demand for uranium |
| • | government laws, regulations, policies or decisions that adversely affect us, including tax and trade laws, tariffs and sanctions, including changes in mining laws or regulations |
| • | our uranium suppliers or purchasers fail to fulfil their commitments |
| • | our McArthur River development, mining or production plans are delayed or do not succeed for any reason |
| • | our Cigar Lake development, mining or production plans are delayed or do not succeed for any reason |
| • | our production plans for our fuel services segment do not succeed for any reason |
| • | the McClean Lake’s mill production plan is delayed or does not succeed for any reason |
| • | water quality and environmental concerns could result in a potential deferral of production and additional capital and operating expenses required for the Cigar Lake and McArthur River/Key Lake operations |
| • | JV Inkai’s development, mining or production plans are delayed or do not succeed for any reason, or JV Inkai is unable to transport and deliver its production |
| • | we may be unsuccessful in pursuing innovation or implementing advanced technologies, including the risk that the commercialization and deployment of SMRs or new enrichment technology may incur unanticipated delays or expenses, or ultimately prove to be unsuccessful |
| • | our expectations relating to care and maintenance costs prove to be inaccurate |
| • | the risk that we may not be able to realize our expected cash flow |
| • | the risk that we may become unable to pay future dividends at the expected rate |
4 CAMECO CORPORATION
| • | we are affected by natural phenomena, including inclement weather, fire, flood and earthquakes |
| • | the risks that generally apply to all our operations and advanced uranium projects that are discussed under the heading Managing the risks beginning on page 70 |
| • | the risks relating to our tier-one uranium operations discussed under the heading McArthur River mine/Key Lake mill – Managing Our Risks beginning on page 75, under the heading Cigar Lake – Managing Our Risks beginning on page 79, and under the heading Inkai – Managing Our Risks beginning on page 83 |
| • | unexpected changes in uranium supply, demand, long-term contracting, and prices |
| • | changes in consumer demand for nuclear power and uranium as a result of changing societal views and objectives regarding nuclear power, electrification and decarbonization |
| • | the risk that our views regarding nuclear power, its growth profile, and benefits may prove to be incorrect |
| • | the risk that we and Westinghouse may not be able to meet sales commitments for any reason |
| • | the risk that Westinghouse may not achieve the expected growth in its business |
| • | the risk to Westinghouse’s business associated with potential production disruptions, including those related to global supply chain disruptions, global economic uncertainty, political volatility, labour relations issues, and operating risks |
| • | the risk that Westinghouse may not be able to implement its business objectives in a manner consistent with its or our sustainability principles and other values |
| • | the risk that Westinghouse’s strategies may change, be unsuccessful, or have unanticipated consequences |
| • | the risk that Westinghouse may be unsuccessful in respect of its new business |
| • | the risk that Westinghouse may be delayed in announcing its future financial results |
| • | the risk that Westinghouse may fail to comply with nuclear licence and quality assurance requirements at its facilities |
| • | the risk that Westinghouse may lose protections against liability for nuclear damage, including discontinuation of global nuclear liability regimes and indemnities |
| • | the risk that increased trade barriers may adversely impact our business, or the business of any of the joint ventures in which we have invested |
| • | the risk that Westinghouse may default under its credit facilities, impacting adversely Westinghouse’s ability to fund its ongoing operations and to make distributions |
| • | the risk that liabilities at Westinghouse may exceed our estimates and the discovery of unknown or undisclosed liabilities |
| • | the risk that occupational health and safety issues may arise at Westinghouse’s operations |
| • | the risk that there may be disputes between us and Brookfield Renewable Partners (Brookfield) regarding our strategic partnership, or disputes between us and any of our other joint venture partners |
| • | the risk that we may default under the governance agreement with Brookfield, including us losing some or all of our interest in Westinghouse |
Material assumptions
| • | our expectations regarding sales and purchase volumes and prices for uranium and fuel services, cost of sales, trade restrictions, inflation and that counterparties to our sales and purchase agreements will honour their commitments |
| • | our expectations for the nuclear industry, including its growth profile, market conditions, geopolitical issues and the demand for and supply of uranium |
| • | the continuing pursuit of carbon reduction strategies by governments and the role of nuclear in the pursuit of those strategies |
| • | the assumptions discussed under the heading 2025 Financial Outlook |
| • | our expectations regarding spot prices and realized prices for uranium, and other factors discussed under the heading Price sensitivity analysis: uranium segment |
| • | Westinghouse’s ability to generate cash flow and fund its approved annual operating budget and make distributions to the partners |
| • | our ability to compete for additional business opportunities so as to generate additional revenue for us as a result of our investment in Westinghouse |
| • | market conditions and other factors upon which we based our investment in Westinghouse and our related forecasts will be as expected |
| • | the success of our plans and strategies relating to our investment in Westinghouse and our other joint venture investments |
| • | that the construction of new nuclear power plants and the relicensing of existing nuclear power plants will not be more adversely affected than expected by changes in regulation or in the public perception of the safety of nuclear power plants |
| • | our ability to continue to supply our products and services in the expected quantities and at the expected times |
| • | our expected production levels for Cigar Lake, McArthur River/Key Lake, JV Inkai and our fuel services operating sites |
| • | our cost expectations, including production costs, operating costs, and capital costs |
| • | our expectations regarding tax payments, tax rates, tariffs, royalty rates, currency exchange rates and interest rates |
| • | our entitlement to and ability to receive expected refunds and payments from CRA |
MANAGEMENT’S DISCUSSION AND ANALYSIS 5
| • | in our dispute with CRA, that courts will reach consistent decisions for other tax years that are based upon similar positions and arguments |
| • | that CRA will not successfully advance different positions and arguments that may lead to different outcomes for other tax years |
| • | our expectation that we will recover all or substantially all of the amounts paid or secured in respect of the CRA dispute to date |
| • | our decommissioning and reclamation estimates, including the assumptions upon which they are based, are reliable |
| • | our mineral reserve and resource estimates, and the assumptions upon which they are based, are reliable |
| • | our understanding of the geological, hydrological and other conditions at our uranium properties |
| • | our Cigar Lake and McArthur River development, mining and production plans succeed |
| • | our Key Lake mill production plan succeeds |
| • | the McClean Lake mill is able to process Cigar Lake ore as expected |
| • | our production plans for our fuel services segment succeed |
| • | JV Inkai’s development, mining and production plans succeed, and that JV Inkai will be able to transport and deliver its production |
| • | the ability of JV Inkai to pay dividends, or the timing of their payments |
| • | that care and maintenance costs will be as expected |
| • | our and our contractors’ ability to comply with current and future environmental, safety and other regulatory requirements, and to obtain and maintain required regulatory approvals |
| • | that we will be successful in our efforts to renew our operating licence for Crow Butte |
| • | assumptions regarding our expected cash flow |
| • | our operations and those of our joint venture investments are not significantly disrupted as a result of political instability, sanctions, nationalization, developments in US foreign policy, terrorism, sabotage, blockades, civil unrest, breakdown, natural disasters, outbreak of illness (such as a pandemic), governmental or political actions, litigation or arbitration proceedings, the unavailability of reagents, equipment, operating parts and supplies critical to production, labour shortages, labour relations issues, strikes or lockouts, underground floods, cave-ins, ground movements, tailings dam failure, lack of tailings capacity, transportation disruptions or accidents, aging infrastructure or other development or operating risks |
| • | that no major accident at a nuclear power plant will occur |
| • | nuclear power and uranium demand, supply, consumption, long-term contracting, growth in the demand for and global public acceptance of nuclear energy, and prices |
| • | Westinghouse’s production, purchases, sales, deliveries, and costs |
| • | the assumptions and discussion set out under the heading Westinghouse Electric Company – Future Prospects |
| • | the market conditions and other factors upon which we have based Westinghouse’s future plans and forecasts |
| • | Westinghouse’s ability to mitigate adverse consequences of delays in production and construction |
| • | the success of Westinghouse’s plans and strategies |
| • | the absence of new and adverse laws, government regulations, policies or decisions in any country where such developments would affect us, including with respect to changes in mining laws or regulations |
| • | that there will not be any significant adverse consequences to Westinghouse’s business resulting from business disruptions, including those relating to supply disruptions, economic or political uncertainty and volatility, labour relation issues, and operating risks |
| • | Westinghouse’s ability to announce future financial results when expected |
| • | Westinghouse will comply with the covenants in its credit agreements |
| • | Westinghouse will comply with nuclear licence and quality assurance requirements at its facilities |
| • | Westinghouse maintaining protections against liability for nuclear damage, including continuation of global nuclear liability regimes and indemnities |
| • | that known and unknown liabilities at Westinghouse will not materially exceed our estimates |
| • | the absence of disputes between us and Brookfield or any of our other joint venture partners regarding our strategic partnership or joint venture arrangements, and that we do not default under the governance agreement with Brookfield or any other joint venture agreement to which we are a party |
6 CAMECO CORPORATION
[This page is intentionally left blank.]
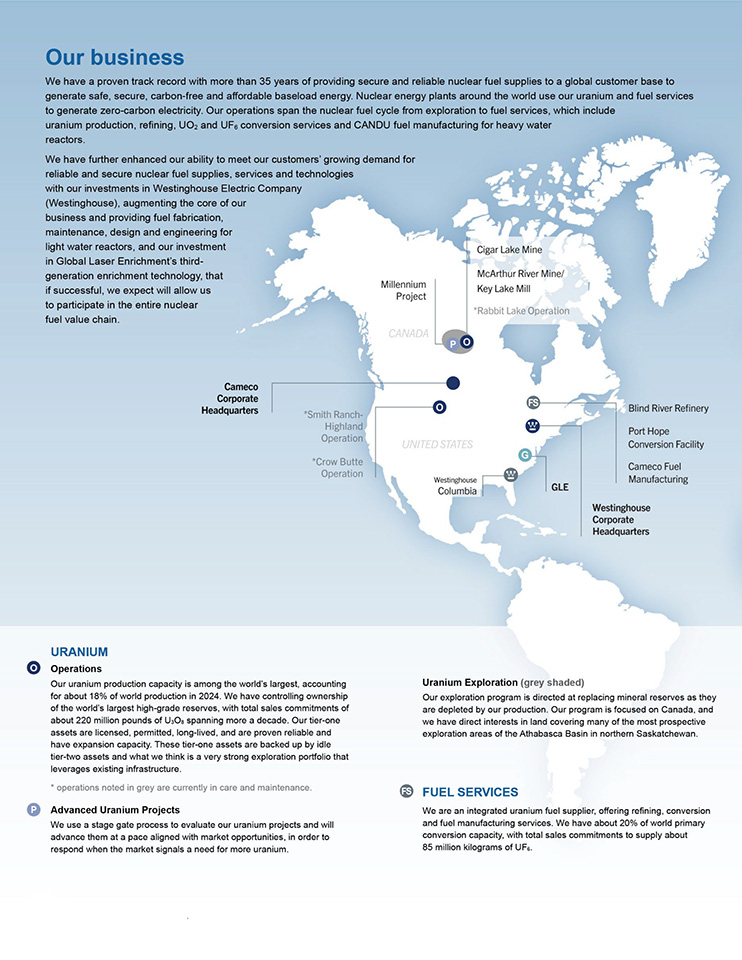
8 CAMECO CORPORATION
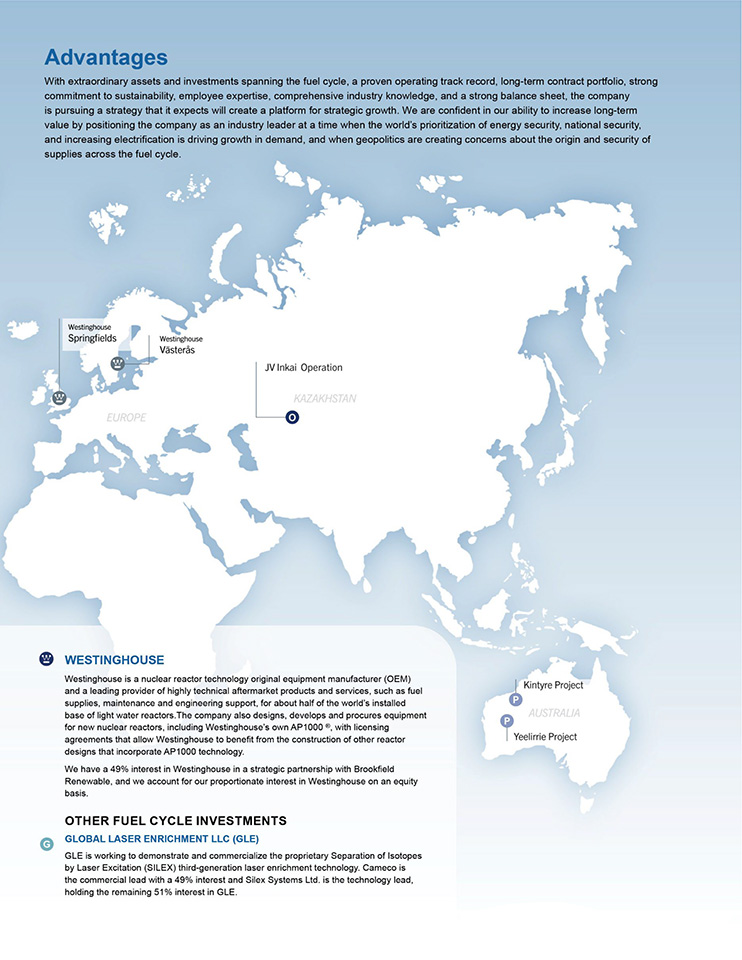
MANAGEMENT’S DISCUSSION AND ANALYSIS 9
Market overview and developments
A market in transition
In 2024, geopolitical uncertainty and heightened concerns about energy security, national security, and climate change continued to improve the demand and supply fundamentals for the nuclear power industry and the fuel cycle that is required to support it. Increasingly, countries and companies around the globe are recognizing the critical role nuclear power must play in providing carbon-free and secure baseload power which was evidenced at the 29th Conference of Parties (COP29), where a total of 31 countries have now signed the declaration to triple nuclear energy capacity by 2050. This growing support has led to a rise in demand as closed reactors are returning to service, reactors are being saved from retirement, life extensions are being sought and approved for existing reactor fleets, and numerous commitments and plans are advancing for the construction of new nuclear generating capacity. In addition, there is increasing interest in small modular reactors (SMR), including smaller versions of existing technology and advanced technology designs, with companies in energy intensive sectors looking to nuclear to help achieve their decarbonization plans. The potential expansion of the markets and use cases for nuclear energy could add significant demand in the decades to come, with a growing number of agreements being signed and several projects already underway.
While demand for uranium and nuclear fuel continues to increase, future supply is not keeping pace. Heightened supply risk caused by growing geopolitical uncertainty, shrinking secondary supplies and a lack of investment in new capacity over the past decade has motivated utilities to evaluate their near-, mid- and long-term nuclear fuel supply chains. The uncertainty about where nuclear fuel supplies will come from to satisfy growing demand has led to significant long-term contracting activity in recent years. In 2024, about 119 million pounds of uranium was placed under long-term contracts by utilities. While the volume remains below replacement rate, this potentially increases the cumulative level of uncovered requirements in the future, when primary supply is expected to be limited, and secondary supply stocks have been drawn down. Prices across the nuclear fuel cycle continued to trend higher in 2024, reaching historic highs in conversion, where spot price increased 111% and term price rose 46% compared to 2023, and in enrichment, where spot and term prices rose over 23% and 10% respectively compared to 2023. At the front end of the cycle, uranium spot prices experienced volatility and averaged $85 (US) per pound for 2024, while the long-term uranium price increased 19% over the prior year, ending 2024 above $80 (US) per pound. We expect continued competition to secure uranium, conversion services and enrichment services under long-term contracts with proven sustainable producers and suppliers who have a diversified portfolio of assets in geopolitically attractive jurisdictions, and on terms that help ensure a reliable supply is available to satisfy demand.
DURABLE DEMAND GROWTH
The benefits of nuclear energy have come clearly into focus, supporting a level of durability that, we believe, has not been previously seen. The durability is being driven not only by the geopolitical realignment in energy markets but also by a global focus on achieving the net-zero carbon targets set by countries and companies around the world. Geopolitical uncertainty has deepened concerns about energy security and national security, highlighting the role of energy policy in balancing three main objectives: providing a reliable and secure baseload profile; providing an affordable, levelized cost profile; and providing a clean emissions profile. Net-zero carbon targets are also turning global attention to a broader triple challenge: about one-third of the global population must be lifted out of energy poverty by improving access to clean and reliable baseload electricity; approximately 80% of the current global electricity grids that run on carbon-emitting sources of thermal power must be replaced with a carbon-free, reliable alternative; and global power grids must grow by electrifying industries, such as private and commercial transportation, and home and industrial heating, which today are largely powered with carbon-emitting sources of thermal energy. There is increasing recognition that nuclear power meets these objectives and has a key role to play in achieving energy security and decarbonization goals. The growth in demand is not just long-term and in the form of new builds, but medium-term in the form of reactor restarts and life extensions, and near-term with early reactor retirement plans being deferred or cancelled and new markets continuing to emerge. Long-term momentum remains very supportive with the installed base of nuclear capacity and an increasing focus on large-scale new build and the development of SMRs.
10 CAMECO CORPORATION
Demand and energy policy highlights
| • | The inaugural Nuclear Energy Summit was held in Brussels in March, jointly organized by Belgium and the International Atomic Energy Agency (IAEA) with representatives from 32 countries in attendance. The leaders backed supportive measures in areas including financing, regulatory cooperation, technological innovation and workforce training to enable the expansion of nuclear power to help address climate change and boost energy security. |
| • | At the 29th annual Conference of Parties (COP29), the 2024 United Nations Climate Change Conference held in Baku, Azerbaijan, six new countries were added to the declaration to triple nuclear energy capacity by 2050, bringing the total to 31. It was recognized that financing mechanisms will play a key role in meeting targets, and the increased interest and investment from some of the world’s largest and advanced technology companies could help support future nuclear deployment. |
| • | The International Energy Agency’s (IEA) 2024 World Energy Outlook report was released in October. The projections for global electricity demand in the Stated Policies Scenario (SPS) increased 6%, or 2,200 terawatt-hours (TWh) higher in 2035, driven primarily by light industrial consumption, cooling, mobility, and data centers and artificial intelligence (AI). Nuclear generation showed a modest increase in the SPS while the Net Zero Scenario (NZE) shows a 16% increase to 7,000 TWh by 2050, compared to 6,000 TWh in the previous report. |
| • | In China, China National Nuclear Corporation (CNNC) started construction at Zhangzhou unit 3 in early 2024, a domestically designed Hualong One (HPR1000), with plans for six more units at the site. CNNC also commenced construction at the Jinqimen nuclear project where it has plans for six HPR1000s. Additionally, China General Nuclear announced that Fangchenggang unit 4, an HPR1000, began loading fuel in February and began operating on April 1. Finally, in August, four new CAP1400 reactors that use Westinghouse technology were approved, bringing the total number of approved reactors in China to 16. |
| • | In Japan, Onagawa unit 2 restarted in October, becoming the first boiling water reactor (BWR) to return to operation under the post-2011 Japanese Nuclear Regulatory Authority (NRA) safety regime. Additionally, Chugoku Electric Power Company successfully restarted Shimane unit 2 in December, bringing the total number of restarted reactors to 14. Finally, the NRA approved a 10-year life extension for two of Kansai’s reactors, Ohi units 3 and 4, from 30 years to 40 years, allowing them to operate until 2061 and 2063, respectively. |
| • | In South Korea, Korea Hydro & Nuclear Power (KHNP) announced that Shin Hanul unit 2 entered commercial operation, while units 3 and 4 are proceeding toward construction. In addition, Saeul units 3 and 4 are progressing through construction, which upon completion will mark 30 units operating in the country. KHNP also initiated the process to extend the lives of Wolsong units 2, 3 and 4. |
| • | In India, the Atomic Energy Commission reaffirmed the country’s plan to triple nuclear power generation by 2030 from current output of 7.5 GWe, with an additional nine reactors currently under construction and additional units planned at various sites, which could potentially include SMRs. The most recent activity has been at Rajasthan unit 7, which is expected to be fully operational in early 2025, and Rajasthan unit 8 which is expected to come online in early 2026. |
| • | In the Czech Republic, the government announced KHNP as the preferred bid for the construction of two additional units at the existing Dukovany nuclear site and two at the Temelin site. |
| • | Energoatom saw first concrete poured in the construction of Khmelnitski units 5 and 6. The new reactors will be the first built in Ukraine using Westinghouse’s AP1000® technology. |
| • | Italy is moving towards a reversal of the country’s current ban on nuclear power production with plans to finalize a nuclear reintroduction strategy by the end of 2027. |
| • | In Poland, the government approved a plan to build an SMR based on designs from Rolls-Royce. Additionally, Polskie Elektrownie Jądrowe announced it has received a Letter of Interest for $1.5 billion (US) in potential financing from Export Development Canada to support Poland’s AP1000 project, which aims to be the country’s first nuclear power plant. |
| • | In Romania, the US Exim Bank approved a $98 million (US) loan commitment for the financing of an SMR project utilizing NuScale technology, with additional funding announcements at the G7 leaders’ summit, totaling up to $275 million (US). The project aims for 462 MWe of capacity at a retired coal plant in the country, with a total of six 77 MWe modules to be constructed. |
| • | In Egypt, the fourth and final VVER-1200 unit at El Dabba began construction. Unit 1 is expected to begin commercial operation in 2029 with the remaining three to follow in the early to mid-2030s. |
| • | Following a lengthy legal battle, Brazilian utility Electronuclear was successful in appealing the government ordered suspension of activity at Angra unit 3, a 1,350 MWe reactor, allowing it to continue construction. |
MANAGEMENT’S DISCUSSION AND ANALYSIS 11
| • | In the US, Southern Company announced that Vogtle unit 4, a Westinghouse AP1000, moved into commercial operation, making it the second new reactor to come online in the US in over 28 years. |
| • | The US Nuclear Regulatory Commission approved Dominion’s North Anna units 1 and 2 for an extension of their operating licences from 60 to 80 years, keeping the reactors online until the 2050s, while Vistra received approval to operate Comanche Peak units 1 and 2 for up to 60 years. Additionally, approval was received to extend Pacific Gas & Electric’s two-unit Diablo Canyon plant operation until 2030, while filings have already been made to extend the operating lives of the units a further 20 years, until the mid-2040s. |
| • | The US Department of Energy (DOE) released its Advanced Nuclear Commercial Liftoff report, outlining the need to add 200 GWe of new generating capacity in order to triple US nuclear capacity by 2050, as part of their net-zero emissions target. Starting in 2030, the report calls for a 13 GWe annual increase in output for 15 years to reach 300 GWe by 2050. This increase is expected to come from extending reactor operating licences, uprating of capacity, and restarting shutdown reactors, along with new large scale and advanced reactors. The report also calls for a significant increase in capacity across the nuclear fuel supply chain and notably, a secure supply of uranium from the US, allies, and partners. |
| • | The US DOE announced plans to finance $900 million (US) for deployment of light-water SMRs, with $800 million (US) of the funding for two of the “first-mover teams” which can include utilities, SMR producers, vendors, and other end-users. In addition, former President Biden signed the Accelerating Deployment of Versatile, Advanced Nuclear for Clean Energy (ADVANCE) Act into law, which builds on prior legislation to modernize licensing, speed up the licensing process and reduce fees, while simplifying the environmental review process. |
| • | Numerous utilities made positive progress towards restarting shutdown nuclear plants in 2024. Holtec International announced their intention to restart the Palisades 800 MWe pressurized water reactor in Michigan, with both state and federal governments backing the effort, which would mark the first US reactor to restart after being shut down for decommissioning. Additionally, NextEra Energy announced they have initiated the regulatory process to restart the Duane Arnold plant, which could see the reactor returning to operation as early as 2028. Finally, Constellation Energy announced their $1.6 billion (US) plan to restart the 835 MWe Crane Clean Energy Center (formerly Three Mile Island Unit 1) in Pennsylvania. The restart is planned for 2028 with Microsoft agreeing to a 20-year power purchase agreement to support the investments in restarting the plant. |
| • | With the rapid expansion of AI and data center demand, numerous other technology companies also made commitments to nuclear for both large scale and SMR projects. Notably, Google announced a deal with Kairos Power to buy the output from at least six first-of-a-kind fluoride salt-cooled, high-temperature reactors. Additionally, Amazon and Energy Northwest announced an agreement for Amazon to fund the development of SMRs, with the right to purchase power from the first four Xe-100 units (320 MWe) and an option for Energy Northwest to build up to eight additional units (640 MWe). Finally, Sabey, a US data center developer, is working with TerraPower to explore the deployment of Natrium SMRs at current and future data center sites. |
| • | In Canada, Bruce Power submitted plans for its Bruce C Project, planning to add 4.8 GWe of new generation to complement 6.5 GWe of existing generation. In early 2025, the Ontario government announced plans for Ontario Power Group (OPG) to construct a 10 GWe nuclear plant near Port Hope. In addition, OPG is proceeding with refurbishments of Pickering B’s four units, expected to be completed by the mid-2030s and extending the plants’ operating lives by 30 years. OPG also successfully completed initial site preparation at the Darlington plant for the first of four GE-Hitachi BWRX-300 SMRs, with the nuclear portion of construction for the first unit set to start in early 2025, with planned commercial operation in 2029. |
| • | Westinghouse opened a new nuclear engineering hub in Kitchener, Ontario, where 50 engineers will be stationed. In addition, SaskPower, Westinghouse, and Cameco signed a Memorandum of Understanding to evaluate Saskatchewan’s clean energy needs involving discussions on the AP1000, AP300 and eVinci reactors. The province will be evaluating the suitability of its infrastructure for a nuclear fuel supply chain through SaskNuclear, a newly formed subsidiary of SaskPower. |
12 CAMECO CORPORATION
According to the IAEA, globally there are currently 440 operable reactors and 62 reactors under construction. Several nations are appreciating the energy security and carbon-free energy benefits of nuclear power and have reaffirmed their commitment with plans underway to support existing reactor units and review policies to encourage more nuclear generation. Several other non-nuclear countries have emerged as candidates for new nuclear capacity. In some countries where phase-out policies have been in place, policy reversals and decisions have been made to keep reactors running, with public opinion polls showing increasing support. With a number of reactor construction projects recently approved and many more planned, demand for uranium continues to improve. There is growing recognition of the role nuclear must play in providing safe, affordable, carbon-free baseload electricity to achieve a low-carbon economy, with geopolitical uncertainty causing some utilities to move away from Russian energy supplies and seek nuclear fuel suppliers whose values are aligned with their own, or whose origin of supply better protects them from potential interruptions.
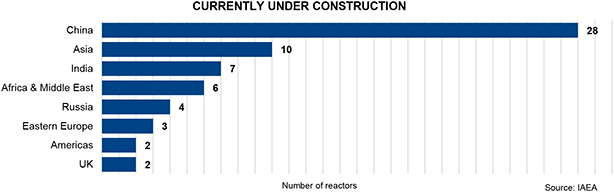
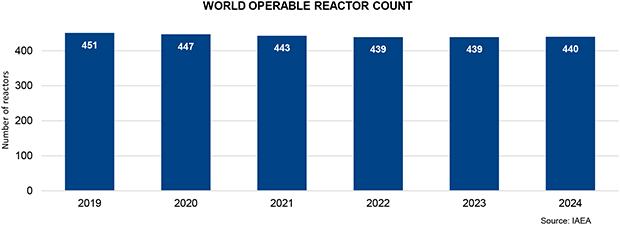
SUPPLY UNCERTAINTY
Geopolitical uncertainty, energy security, and national security remained the most notable factors impacting security of supply in 2024. Driven by the Russian invasion of Ukraine, the mine suspension in Niger, and supply chain challenges, particularly in Kazakhstan, many governments and utilities are re-examining procurement strategies that rely on nuclear fuel supplies from these jurisdictions. In addition, sanctions on Russia and import/export restrictions added to the delivery risks for nuclear fuel supplies coming out of Central Asia. Several uranium projects restarted in 2024 in support of increased demand, though delays and higher-than-expected production costs were a common theme. Despite the positive price trend in 2024, the deepening geopolitical uncertainty, sanctions and trade policy restrictions, and years of underinvestment in new uranium and fuel cycle service capacities has shifted risk from producers to utilities.
MANAGEMENT’S DISCUSSION AND ANALYSIS 13
Supply and trade policy highlights
| • | The Prohibiting Russian Uranium Imports Act (H.R. 1042) went into effect in August with the intent to prohibit the imports of Russian low-enriched uranium (LEU) into the US until 2040. It contains a US DOE waiver process available until 2028, where utilities can apply through a public process for an exception to the import ban in situations concerning energy and national security. In November, the Russian government issued a decree to immediately limit the export of LEU to the US, which was meant to be symmetrical to the trade actions taken by the US earlier in the year. This resulted in two ships departing from St. Petersburg to Baltimore without any of their intended enriched uranium product cargo onboard. |
| • | The DOE approved funding of up to $2.7 billion (US) to support domestic production of LEU and high-assay low-enriched uranium (HALEU) by creating a guaranteed buyer of US-produced nuclear fuel to restore US nuclear fuel production capabilities. Initial awards were granted for HALEU in October and LEU in December. |
| • | In January 2025, Kazatomprom (KAP) announced that 2024 production increased 10% from the prior year to 60.5 million pounds U3O8. No update was provided on 2025 production guidance beyond its previous announcement from August 2024, where it lowered its 2025 guidance range to 65 million to 68.9 million pounds U3O8 (previously 79.3 million to 81.9 million pounds U3O8), citing project delays and continued sulfuric acid shortages. A significant portion of the reduced 2025 guidance resulted from production delays at Appak LLP, as well as JV Budenovskoye LLP. Additionally, KAP reduced production guidance for JV KATCO LLP below annual production capacity until at least 2026. |
| • | In July, the government of Kazakhstan introduced amendments to the Tax Code of the Republic of Kazakhstan which involved changes to the Mineral Extraction Tax (MET) rate for uranium. The MET rate will increase from 6% in 2024, to 9% in 2025, with the introduction of a progressive system based on actual annual production volumes under each subsoil use agreement, starting in 2026, where the highest rate is 18% for operations producing over 10.4 million pounds. An additional MET of up to 2.5% based on the spot market price of uranium, will also be added in 2026. The MET is incurred and paid by the mining entities, impacting both KAP and different JVs and subsidiaries. |
| • | In October, Orano announced plans to temporarily suspend operations at their SOMAIR mine in Niger due to growing financial difficulties resulting from the coup d’état in July 2023 and the subsequent closure of the main supply and export route in Niger. Orano confirmed in December that the Nigerien authorities have taken operational control of the project, resulting from escalating conflicts between the company and the country’s ruling military junta. Earlier in the year, Orano also reported that the Nigerien government revoked their operating permit for their undeveloped Imouraren deposit. Further in the region, GoviEx Uranium Inc. (GoviEx) was informed by the Nigerien government that they no longer have rights over the perimeter of the Madaouela mining permit. In December, both Orano and GoviEx initiated arbitration proceedings against the Republic of Niger for the Imouraren and Madaouela projects respectively. |
| • | In March, Paladin Energy Ltd. (Paladin) announced the restart of its Langer Heinrich mine in Namibia which has an annual production capacity of 5.2 million pounds U3O8 and had been in care and maintenance since 2018. In November, Paladin updated their 2025 production guidance from 4.0-4.5 million pounds U3O8 to 3.0-3.6 million pounds U3O8 due to ongoing challenges and operational variability in ramping up production. |
| • | In 2024, several other uranium projects also restarted production including Boss Energy’s Honeymoon ISR project in Australia, Uranium Energy Corp.’s Christensen Ranch ISR operations in Wyoming, enCore Energy’s Alta Mesa Uranium Central Processing Plant and Wellfield in Texas, and Peninsula Energy Ltd.’s Lance ISR project in Wyoming. In June, Terrafame also reported it officially started recovering natural uranium at its industrial site in Sotkamo, Finland. |
| • | Sprott Physical Uranium Trust (SPUT) purchased about three million pounds U3O8 in 2024, bringing total purchases since inception to nearly 48 million pounds U3O8, and a total physical position of 66.2 million pounds U3O8. Volatility in the equity market impacts SPUT’s ability to raise funds to purchase uranium based on its share price trading at a discount or a premium to the net asset value (NAV) of the uranium it holds; in 2024 SPUT was at a discount to NAV for most of the year, negatively impacting its ability to buy uranium. |
| • | Following 2023 announcements from both Urenco and Orano to proceed with enrichment capacity expansion projects, 2024 saw advancements with the first new centrifuges being installed at Urenco USA and Orano starting construction at its Georges Besse II (GBII) expansion in France. A total capacity expansion of 1.8 million separative work units (SWU) is planned across three Urenco facilities including in Germany and the Netherlands, which represents a 10% capacity increase, whereas Orano seeks to grow GBII’s enrichment capacity by approximately 2.5 million SWU annually, a 30% increase. |
14 CAMECO CORPORATION
Long-term contracting creates full-cycle value for proven productive assets
Like other commodities, the demand for uranium is cyclical. However, unlike other commodities, uranium is not traded in meaningful quantities on a commodity exchange. The uranium market is principally based on bilaterally negotiated long-term contracts covering the annual run-rate requirements of nuclear power plants, with a small spot market to serve discretionary demand. History demonstrates that in general, when prices are rising and high, uranium is perceived as scarce, and more contracting activity takes place with proven and reliable suppliers. The higher demand discovered during this contracting cycle drives investment in higher-cost sources of production, which due to lengthy development timelines, tend to miss the contracting cycle and ramp up after demand has already been won by proven producers. When prices are declining and low, there is no perceived urgency to contract, and contracting activity and investment in new supply dramatically decreases. After years of low prices, and a lack of investment in supply, and as the uncommitted material available in the spot market begins to thin, security-of-supply tends to overtake price concerns. Utilities typically re-enter the long-term contracting market to ensure they have a reliable future supply of uranium to run their reactors.
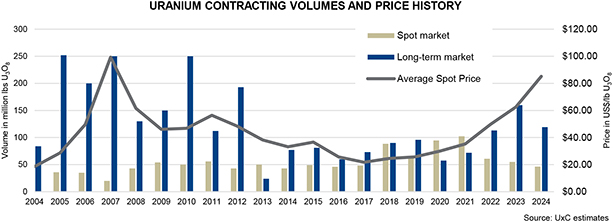
UxC reports that over the last five years approximately 534 million pounds U3O8 equivalent have been locked-up in the long-term market, while approximately 798 million pounds U3O8 equivalent have been consumed in reactors. We remain confident that utilities have a growing gap to fill.
We believe the current backlog of long-term contracting presents a substantial opportunity for proven and reliable suppliers with tier-one productive capacity and a record of honoring supply commitments. As a low-cost producer, we manage our operations to increase value throughout these price cycles.
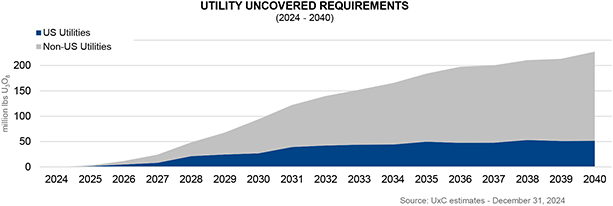
In our industry, customers do not come to the market right before they need to load nuclear fuel into their reactors. To operate a reactor that could run for more than 60 years, natural uranium and the downstream services have to be purchased years in advance, allowing time for a number of processing steps before a finished fuel bundle arrives at the power plant. At present, we believe there is a significant amount of uranium that needs to be contracted to keep reactors running into the next decade.
MANAGEMENT’S DISCUSSION AND ANALYSIS 15
UxC estimates that cumulative uncovered requirements are about 2.1 billion pounds to the end of 2040. With the lack of investment over the past decade, there is growing uncertainty about where uranium will come from to satisfy growing demand, and utilities are becoming increasingly concerned about the availability of material to meet their long-term needs. In addition, secondary supplies have diminished, and the material available in the spot market has thinned as producers and financial funds continue to purchase material. Furthermore, geopolitical uncertainty is causing some utilities to seek nuclear fuel suppliers whose values are aligned with their own or whose origin of supply better protects them from potential interruptions, including from transportation challenges or the possible imposition of formal sanctions.
We will continue to take the actions we believe are necessary to position the company for long-term success. Therefore, we will continue to align our production decisions with our customers’ needs under our contract portfolio. We will undertake contracting activity which is intended to ensure we have adequate protection while maintaining exposure to the benefits that come from having uncommitted, low-cost supply to place into a strengthening market.
16 CAMECO CORPORATION
2024 performance highlights
In 2024, we revised our calculation of adjusted net earnings to adjust for unrealized foreign exchange gains and losses as well as for share-based compensation because it better reflects how we assess our operational performance. We have restated comparative periods to reflect this change. See non-IFRS measures starting on page 65 for more information.
Financial performance
| HIGHLIGHTS DECEMBER 31 ($ MILLIONS EXCEPT WHERE INDICATED) |
2024 | 2023 | CHANGE | |||||||||
| Revenue |
3,136 | 2,588 | 21 | % | ||||||||
| Gross profit |
783 | 562 | 39 | % | ||||||||
| Net earnings attributable to equity holders |
172 | 361 | (52 | )% | ||||||||
| $ per common share (diluted) |
0.39 | 0.83 | (52 | )% | ||||||||
| Adjusted net earnings (non-IFRS, see page 65) |
292 | 383 | (24 | )% | ||||||||
| $ per common share (adjusted and diluted) |
0.67 | 0.88 | (24 | )% | ||||||||
| Adjusted EBITDA (non-IFRS, see page 65) |
1,531 | 884 | 73 | % | ||||||||
| Cash provided by operations |
905 | 688 | 32 | % | ||||||||
Net earnings attributable to equity holders (net earnings) and adjusted net earnings were lower in 2024 compared to 2023 primarily due to the impact of purchase accounting on the full year results of Westinghouse. As a result, we believe adjusted EBITDA is a better measure to assess our operating performance. See 2024 consolidated financial results beginning on page 38 for more information. Of note, we:
| • | increased adjusted EBITDA by 73% as a result of improving results in our uranium segment due to the return to our tier-one production levels, as well as full year results from Westinghouse, our share of its adjusted EBITDA being $483 million for 2024. See non-IFRS measures starting on page 65 for more information. |
| • | generated $905 million in cash from operations |
| • | received a cash dividend of $129 million (US), net of withholdings, from JV Inkai |
| • | received $49 million (US) in February 2025, which represents our share of a $100 million (US) distribution paid by Westinghouse |
| • | successfully refinanced $500 million in unsecured debentures that matured in 2024. The refinanced debt now matures in 2031 with credit spreads reflective of a higher credit rating than we currently have been assigned |
| • | prioritized repayment of $400 million (US) of the $600 million (US) term loan utilized to finance the acquisition of Westinghouse, reducing total debt to $1.3 billion. The remaining $200 million (US) was repaid in January 2025, extinguishing the term loan. See Liquidity starting on page 50 for more information. |
| • | increased our annual dividend to $0.16 per common share in 2024, with a plan to increase the dividend to at least $0.24 per common share over time. See Return for more details. |
Our segment updates and other fuel cycle investment updates
In our uranium segment, we continued to execute our strategy, further ramping up our tier-one assets which had a positive impact on our operations. Of note in 2024, we:
| • | delivered 33.6 million pounds of uranium in alignment with the commitments under our contract portfolio |
| • | produced 16.9 million pounds (100% basis) at Cigar Lake. Production did not meet our expectations due to a lower production rate at Orano’s McClean Lake mill. |
| • | produced 20.3 million pounds (100% basis) at McArthur River/Key Lake, setting a new production record for a uranium mining operation anywhere in the world, due in large part to off-cycle investments in automation, digitization and optimization projects at Key Lake. |
| • | purchased 11.0 million pounds of uranium, including our spot purchases and committed purchase volumes (including JV Inkai purchases) |
| • | received the final 1.2 million pounds of our share of JV Inkai’s 2023 production, as well as 2.7 million pounds of our total share of JV Inkai’s 2024 production. The remainder of our share of 2024 production, about 0.9 million pounds, is being |
MANAGEMENT’S DISCUSSION AND ANALYSIS 17
| stored at JV Inkai for future delivery in order to optimize transportation and delivery costs. The timing of future deliveries is uncertain. |
| • | maintained Rabbit Lake and US ISR operations in care and maintenance |
In 2024, in our fuel services segment, we:
| • | delivered 12.1 million kgU under contract |
| • | produced 13.5 million kgU, including 10.8 million kgU of UF6 |
See Operations and projects beginning on page 73 for more information.
| HIGHLIGHTS |
2024 | 2023 | CHANGE | |||||||||||||
| Uranium |
Production volume (million lbs) |
23.4 | 17.6 | 33 | % | |||||||||||
| Sales volume (million lbs) |
33.6 | 32.0 | 5 | % | ||||||||||||
| Average realized price1 |
($US/lb) |
58.34 | 49.76 | 17 | % | |||||||||||
| ($Cdn/lb) |
79.70 | 67.31 | 18 | % | ||||||||||||
| Revenue ($ millions) |
2,677 | 2,153 | 24 | % | ||||||||||||
| Gross profit ($ millions) |
681 | 445 | 53 | % | ||||||||||||
| Earnings before income taxes |
904 | 606 | 49 | % | ||||||||||||
| Adjusted EBITDA (non-IFRS, see page 65) |
1,179 | 835 | 41 | % | ||||||||||||
| Fuel services | Production volume (million kgU) |
13.5 | 13.3 | 2 | % | |||||||||||
| Sales volume (million kgU) |
12.1 | 12.0 | 1 | % | ||||||||||||
| Average realized price 2 |
($Cdn/kgU) | 37.87 | 35.61 | 6 | % | |||||||||||
| Revenue ($ millions) |
459 | 426 | 8 | % | ||||||||||||
| Earnings before income taxes |
108 | 129 | (16 | )% | ||||||||||||
| Adjusted EBITDA (non-IFRS, see page 65) |
145 | 164 | (12 | )% | ||||||||||||
| Westinghouse3 | Revenue ($ millions) |
2,892 | 521 | >100 | % | |||||||||||
| (our share) |
Net loss |
(218 | ) | (24 | ) | >100 | % | |||||||||
| Adjusted EBITDA (non-IFRS, see page 65) |
483 | 101 | >100 | % | ||||||||||||
| 1 | Uranium average realized price is calculated as the revenue from sales of uranium concentrate, transportation and storage fees divided by the volume of uranium concentrates sold. |
| 2 | Fuel services average realized price is calculated as revenue from the sale of conversion and fabrication services, including fuel bundles and reactor components, transportation and storage fees divided by the volumes sold. |
| 3 | This table includes comparative results for the period beginning on the date of acquisition until the end of 2023 |
It was another positive year for the nuclear energy industry. Demand for nuclear power, including support for existing reactors, continues to grow, with a focus on energy security and national security amid continued global geopolitical uncertainty. We believe nuclear energy is in durable growth mode, and as we see the growth translate into contracts, we too will be back in durable growth mode. This growth will be sought in the same manner as we approach all aspects of our business; strategic, deliberate, disciplined and responsible and with a focus on generating full-cycle value.
Strong fourth quarter results in the uranium and Westinghouse segments provided a boost to annual results, as expected. Net earnings were $135 million for the quarter and $172 million for the year compared to $80 million for the quarter and $361 for the year in 2023, while adjusted net earnings were $157 million for the quarter and $292 million for the year compared to $108 million for the quarter and $383 million for the year in 2023. The 2024 annual results were lower compared to 2023 primarily due to the impact of purchase accounting on the full year results of Westinghouse. We use adjusted EBITDA to assess our operational performance. Full year adjusted EBITDA increased by approximately $647 million to $1.5 billion compared to $884 million in 2023 mainly due to the contributions from the uranium segment, reflective of a return to our tier-one production levels and an improving price environment, as well as the benefit from a full year of our Westinghouse investment, which was acquired in November 2023.
In our uranium segment, despite muted contracting volumes for the industry as utilities focused first on securing enrichment and conversion, we continued to negotiate off-market contracts and add to our long-term portfolio.
18 CAMECO CORPORATION
After delivering our 2024 sales, the long-term portfolio now totals about 220 million pounds, representing about 25% of our current reserve and resource base and retaining exposure to the improving demand from our customers as they look to secure their long-term needs. We continue to have a large and growing pipeline of uranium business under discussion. Our focus remains on obtaining market-related pricing mechanisms that benefit from a constructive price environment, while also providing adequate downside protection. We are being strategically patient in our discussions to maximize value in our contract portfolio and to maintain exposure to higher prices with unencumbered future productive capacity. In addition, with strong demand and pricing at historic highs in the UF6 conversion market, we were successful in adding new long-term contracts that bring our total contracted volumes to about 85 million kgU of UF6 that will underpin our fuel services operations for years to come.
Cameco has more than 35 years of experience in this market, and we have designed our strategy of full-cycle value capture to be resilient. Given the nature of our contracts, we have good visibility into when and where we need to deliver material, and we have put in place a number of tools that allow us to self-manage risk.
We have built a strong reputation as a proven and reliable supplier, with a diversified production portfolio that provides us with the flexibility to work with our customers to ensure they maintain access to our reliable supplies to satisfy their ongoing fuel requirements. In addition to our production, we can source material from market purchases today, and while these purchases would be more expensive than our production, our strategy positions us to benefit from added demand for nuclear fuel supplies and services. We have exposure to higher prices under the market-related contracts in our long-term portfolio and a pipeline of contracting discussions underway, which we expect will also benefit from the increased focus on securing access to scarce supplies and generate long-term value for Cameco. Also, we do not have to buy every pound in the spot market. We can source from inventory, to be replaced by production or purchases later. Further, we have the ability to pull forward long-term purchase arrangements that we put in place in a much lower-price environment, and with licensed storage facilities, we have secured the ability to borrow product under the terms of some of our storage agreements. See Managing our Contract Commitments on page 27 for more information on our sourcing options.
The tailwinds that are expected to benefit our core uranium and fuel services businesses are also presenting significant future growth opportunities for Westinghouse, which we own with our partner Brookfield Renewable Partners (Brookfield) (Cameco’s share is 49%). In 2024, we saw the continued advancement of AP1000® new build opportunities in Poland, Bulgaria, Ukraine and Slovenia. In early 2025, Westinghouse also announced a settlement agreement in its technology and export dispute with Korea Electric Power Corporation and Korea Hydro & Nuclear Power Co., Ltd. (KEPCO and KHNP), which resolves the dispute and establishes a framework for additional deployments outside of South Korea, to the mutual and material benefit of Westinghouse, KEPCO and KHNP. See Westinghouse Electric Company starting on page 98 for more information.
Thanks to our disciplined strategy, our balance sheet is strong, and we expect it will enable us to continue executing our strategy while self-managing risk, including risks related to global macro-economic uncertainty and volatility, and uncertain trade policy decisions. As of December 31, 2024, we had $600 million in cash and cash equivalents with $1.3 billion in total debt. In addition, we have a $1.0 billion undrawn credit facility.
In the current environment, we believe the risk to uranium supply is greater than the risk to uranium demand and expect it will create a renewed focus on ensuring availability of long-term supply to fuel nuclear reactors.
We will continue to align our production with our contract portfolio and market opportunities, demonstrating that we continue to responsibly manage our supply in accordance with our customers’ needs.
We will continue to look for opportunities to improve operational effectiveness, to improve our safety performance and reduce our impact on the environment, including through the use of digital and automation technologies to allow us to operate our assets with more flexibility and efficiency. This is key to our ability to continue to align our production decisions with our contract portfolio commitments and opportunities. With a solid base of contracts to underpin our tier-one productive capacity, and a growing contracting pipeline we expect we will continue to generate strong financial performance.
As we execute on our strategy, we will continue to focus on protecting the health and safety of our employees, delivering our products safely and responsibly and addressing the risks and opportunities that we believe will make our business sustainable and will build long-term value.
MANAGEMENT’S DISCUSSION AND ANALYSIS 19
Industry prices
| 2024 | 2023 | CHANGE | ||||||||||
| Uranium ($US/lb U3O8)1 |
||||||||||||
| Average annual spot market price |
85.14 | 62.51 | 36 | % | ||||||||
| Average annual long-term price |
78.88 | 58.20 | 36 | % | ||||||||
| Fuel services ($US/kgU as UF6)1 |
||||||||||||
| Average annual spot market price |
||||||||||||
| North America |
68.29 | 41.23 | 66 | % | ||||||||
| Europe |
68.21 | 41.23 | 65 | % | ||||||||
| Average annual long-term price |
||||||||||||
| North America |
40.57 | 30.55 | 33 | % | ||||||||
| Europe |
40.47 | 30.55 | 32 | % | ||||||||
Note: the industry does not publish UO2 prices.
| 1 | Average of prices reported by TradeTech and UxC, LLC (UxC) |
On the spot market, where purchases call for delivery within one year, the volume reported by UxC for 2024 decreased to 46 million pounds U3O8 equivalent, compared to 57 million pounds U3O8 equivalent in 2023. In 2024, total spot purchases by producers, junior uranium companies, financial funds and intermediaries was approximately 40 million pounds U3O8 equivalent, compared to approximately 43 million pounds U3O8 equivalent in 2023; in 2024, these purchases represented over 85% of spot market purchases compared to over 76% in 2023. In 2024, the uranium spot price ranged from a month-end high of $100.25 (US) per pound to a month-end low of $72.63 (US), averaging $85.14 (US) for the year. This average was up $22.63 (US) per pound, or 36%, compared to the 2023 average.
Long-term contracts generally call for deliveries to begin more than two years after the contract is finalized, and use a number of pricing formulas, including base-escalated prices set at time of contracting and escalated over the term of the contract, and market referenced prices (spot and long-term indicators) determined near the time of delivery, which also often include floor prices and ceiling prices that are also escalated to time of delivery. The volume of long-term contracting reported by UxC for 2024 was about 119 million pounds U3O8 equivalent, down from about 161 million pounds U3O8 equivalent in 2023. The contracting volume in 2023 was higher due to significant non-US utilities diversifying away from Russian supply, including our contracts with Ukraine and Bulgaria, one of which totaled over 40 million pounds. The lower long-term uranium volumes reported in 2024 can be attributed in part to US utilities awaiting clarity on implementation of the Russian uranium import ban, the US waiver process, and Russian export restraints, although requests for proposals from utilities are continuing alongside requests for direct off-market negotiations.
The average reported long-term price at the end of the year was $80.50 (US) per pound, up $12.50 (US) from the end of 2023. During the year, the uranium long-term price steadily increased from a month-end low of $72.00 (US) per pound in January to a high of $81.50 (US) per pound in November, averaging $78.88 (US) for the year.
With increased demand for western conversion services, pricing in both North America and Europe continues to be strong. At the end of 2024, the average reported spot price for North American delivery reached a record high of $97.00 (US) per kilogram uranium as UF6 (US/kgU as UF6), up $51.00 (US) from the end of 2023. Long-term UF6 conversion prices for North American delivery also reached a record high and finished 2024 at $50.00 (US/kgU as UF6), up $15.75 (US) from the end of 2023.
20 CAMECO CORPORATION
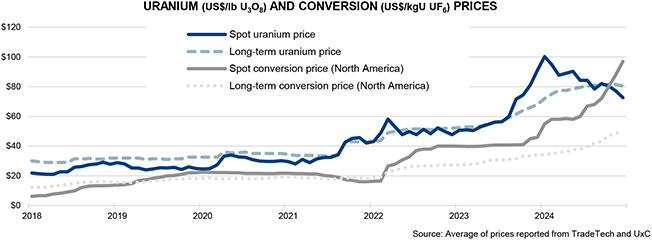
MANAGEMENT’S DISCUSSION AND ANALYSIS 21
Our values and strategy
We believe we have the right strategy to add long-term value and we will do so in a manner that reflects our values. For over 35 years, we have been delivering our products responsibly. Building on that strong foundation, we remain committed to our efforts to operate in a responsible and sustainable manner, identifying and addressing the risks and opportunities that we believe may have a significant impact on our ability to add long-term value for our stakeholders.
Committed to our values
Our values are discussed below. They define who we are as a company, are at the core of everything we do, and help to embed sustainability principles and practices as we execute on our strategy. They are:
| • | safety and environment |
| • | people |
| • | integrity |
| • | excellence |
SAFETY AND ENVIRONMENT
The safety of people and protection of the environment are the foundations of our work. All of us share in the responsibility of continually improving the safety of our workplace and the quality of our environment.
We are committed to keeping people safe and conducting our business with respect and care for both the local and global environment.
PEOPLE
We value the contribution of every employee, and we treat people fairly by demonstrating our respect for individual dignity, creativity and cultural diversity. By being open and honest, we achieve the strong relationships we seek.
We are committed to developing and supporting a flexible, skilled, stable and diverse workforce, in an environment that:
| • | attracts and retains talented people and inspires them to be fully productive and engaged |
| • | encourages relationships that build the trust, credibility and support we need to grow our business |
INTEGRITY
Through personal and professional integrity, we lead by example, earn trust, honour our commitments and conduct our business ethically.
We are committed to acting with integrity in every area of our business, wherever we operate.
EXCELLENCE
We pursue excellence in all that we do. Through leadership, collaboration and innovation, we strive to achieve our full potential and inspire others to reach theirs.
Our strategy
We are a pure-play investment in the growing demand for nuclear energy, focused on taking advantage of the near-, medium-, and long-term growth occurring in our industry. We provide nuclear fuel and nuclear power products, services, and technologies across the fuel cycle, complemented by our investment in Westinghouse, that support the generation of secure, carbon-free, reliable, and affordable energy. Our strategy is set within the context of what we believe is a transitioning market environment. Increasing populations, a growing focus on electrification and decarbonization, and concerns about energy security and affordability are driving a global focus on tripling nuclear power capacity by 2050, which is expected to durably strengthen the long-term fundamentals for our industry. Nuclear energy must be a central part of the solution to the world’s shift to a low-carbon, secure energy economy. It is an option that can provide the power needed, not only reliably, but also safely and affordably, and in a way that will help achieve climate, energy and national security objectives.
Our strategy is to capture full-cycle value by:
| • | remaining disciplined in our contracting activity, building a balanced portfolio in accordance with our contracting framework |
22 CAMECO CORPORATION
| • | profitably producing from our tier-one assets and aligning our production decisions in all segments of the fuel cycle with contracted demand and customer needs |
| • | being financially disciplined to allow us to: |
| • | execute our strategy |
| • | invest in new opportunities that are expected to add long-term value |
| • | to self-manage risk |
| • | exploring other emerging opportunities within the nuclear power value chain, which align with our commitment to manage our business responsibly and sustainably, contribute to decarbonization, and help to provide secure and affordable energy |
We expect our strategy will allow us to increase long-term value, and we will execute it with an emphasis on safety, people and the environment.
URANIUM
Uranium production is central to our strategy, as it is the biggest value driver of the nuclear fuel cycle and our business. We have tier-one assets that are licensed, permitted, long-lived, and are proven reliable with capacity to expand. These tier-one assets are backed up by idle tier-two assets and what we think is the best exploration portfolio of mineral reserves and resources that in some cases can leverage our existing infrastructure. Currently, we believe that we have ample productive capacity with the ability to expand as the demand for nuclear energy and nuclear fuel grows.
We are focused on protecting and extending the value of our contract portfolio, on aligning our production decisions with our contract portfolio and market opportunities thereby optimizing the value of our lowest cost assets. We also prioritize maintaining a strong balance sheet, and on efficiently managing the company. We have undertaken a number of deliberate and disciplined actions, including a focus on operational effectiveness to allow us to operate our assets more efficiently and with more flexibility.
FUEL SERVICES
Our fuel services segment supports our strategy to capture full-cycle value by providing our customers with access to refining and conversion services for both heavy-water and light-water reactors, and CANDU fuel and reactor component manufacturing for heavy-water reactors.
As in our uranium segment, we are focused on securing new long-term contracts and on aligning our production decisions with our contract portfolio that will allow us to continue to profitably produce and consistently support the long-term needs of our customers.
In addition, we are pursuing non-traditional markets for our UO2 and fuel fabrication business and have been actively securing new contracts for reactor components to support refurbishment of Canadian reactors.
WESTINGHOUSE
In 2023, we completed the acquisition of Westinghouse, a global provider of mission-critical and specialized technologies, products and services for light-water reactors across most phases of the nuclear power sector, in a strategic partnership with Brookfield. We own a 49% interest in Westinghouse.
We are enhancing our ability to compete for more business by investing in additional nuclear fuel cycle assets that we expect will augment the core of our business and offer more solutions to our customers across the nuclear fuel cycle. Like Cameco, Westinghouse has nuclear assets that are strategic, proven, licensed and permitted, and that are in geopolitically attractive jurisdictions. We expect these assets, like ours, will participate in the growing demand profile for nuclear energy.
Westinghouse has a stable and predictable core business generating durable cash flows. Like Cameco, Westinghouse has a long-term contract portfolio, which we believe positions it well to compete for growing demand for new nuclear reactors and reactor services, as well as the fuel supplies and services needed to keep the global reactor fleet operating safely and reliably. This strong base of business also helps protect Westinghouse from macro-economic headwinds as utility customers run their critical nuclear power plants. Its durable and growing business is expected to allow Westinghouse to self-fund its approved annual operating budget, to service its annual financial obligations from de-risked cash flows, and to pay annual distributions to its owners. See Westinghouse starting on page 98 for more information.
MANAGEMENT’S DISCUSSION AND ANALYSIS 23
OTHER NUCLEAR FUEL CYCLE INVESTMENTS
We continually evaluate investment opportunities within the nuclear fuel value chain that align well with our commitment to add long-term value by managing our business responsibly and sustainably, and allow us to contribute to energy security solutions. Expanding our participation in the fuel cycle is expected to complement our tier-one uranium and fuel services assets, creating new revenue opportunities, and it enhances our ability to meet the increasing needs of existing and new customers for secure, reliable nuclear fuel supplies, services and technologies.
In particular, we are interested in the second largest value driver of the fuel cycle, enrichment, and have a 49% interest in Global Laser Enrichment LLC (GLE). GLE is the exclusive licensee of the proprietary SILEX laser enrichment technology, a third-generation uranium enrichment technology. We are the commercial lead for the GLE project with an option to attain a majority interest of up to 75% ownership. See Global Laser Enrichment starting on page 106 for more information.
Additionally, we have signed a number of non-binding arrangements to explore several areas of cooperation to advance the commercialization and deployment of small modular reactors in Canada and around the world.
We will make an investment decision when an opportunity is available at the right time and the right price. We strive to pursue corporate development initiatives that will leave us and our stakeholders in a fundamentally stronger position. As such, an investment opportunity is never assessed in isolation. Investments must compete for investment capital with our own internal growth opportunities. They are subject to our capital allocation process described under Capital Allocation – Disciplined Financial Management, starting on page 29.
BUILDING A BALANCED PORTFOLIO
The purpose of our contracting framework is to deliver value. Our approach is to secure a solid base of earnings and cash flow by maintaining a balanced contract portfolio that optimizes our realized price.
Contracting decisions in all segments of our business need to consider the nuclear fuel market structure, the nature of our competitors, and the current market environment. The vast majority of run-rate fuel requirements are procured under long-term contracts. The spot market is thinly-traded, where certain utilities may buy small, discretionary volumes. This market structure is reflective of the baseload nature of nuclear power and the relatively small proportion of the overall operating costs the fuel represents compared to other sources of baseload electricity. Additionally, about half of the fuel supply typically comes from state-owned entities with production volume strategies or ambitions to serve state nuclear power ambitions with low-cost fuel supplies, or from diversified mining companies that produce uranium as a by-product. We evaluate our strategy in the context of our market environment and continue to adjust our actions in accordance with our contracting framework:
| • | First, we build a long-term contract portfolio by layering in volumes over time. In addition to our committed sales, we will compete for customer demand in the market where we think we can obtain value and, in general, as part of longer-term contracts. We will take advantage of opportunities the market provides, where it makes sense from an economic, logistical, diversification and strategic point of view. Those opportunities may come in the form of spot, mid-term or long-term demand, and will be additive to our current committed sales. |
| • | Based on our portfolio of long-term contracts, we decide how to best source material to satisfy that demand, planning our production in accordance with our contract portfolio and other available sources of supply. We will not produce from our tier-one assets to sell into an oversupplied spot market. |
| • | We do not intend to build an inventory of excess uranium. Excess inventory serves to contribute to the sense that uranium is abundant and creates an overhang on the market, and it ties up working capital on our balance sheet. |
| • | Depending on the timing and volume of our production, purchase commitments, and our inventory volumes, we may be active buyers in the market in order to meet our annual delivery commitments. Historically, prior to the tier one supply curtailments that we undertook from 2016-2022, we have generally planned our annual delivery commitments to slightly exceed the annual supply we expect to come from our annual production and our long-term purchase commitments and have therefore relied on the spot market to meet a small portion of our delivery commitments. In general, if we choose to purchase material to meet demand, we expect the cost of that material will be more than offset by the volume of commitments in our sales portfolio that are exposed to market prices at the time of delivery over the long-term. |
In addition to this framework, our contracting decisions always factor in who the customer is, our desire for regional diversification, the product form, and logistical factors.
24 CAMECO CORPORATION
Ultimately, our goal is to protect and extend the value of our contract portfolio on terms that recognize the value of our assets, including future development projects, and pricing mechanisms that provide adequate protection when prices go down and exposure to rising prices. We believe using this framework will allow us to create long-term value. Our focus will continue to be on ensuring we have the financial capacity to execute on our strategy and self-manage risk.
LONG-TERM CONTRACTING
Uranium is not traded in meaningful quantities on a commodity exchange. Utilities have historically bought the majority of their uranium and fuel services products under long-term contracts that are bilaterally negotiated with suppliers. The spot market is discretionary and typically used for one-time volumes, not to satisfy annual demand. We sell uranium and fuel products and services directly to nuclear utilities around the world as uranium concentrates, UO2 and UF6, conversion services, or fuel fabrication and reactor components for CANDU heavy water reactors. We have a solid portfolio of long-term sales contracts that reflect our reputation as a proven, reliable supplier of geographically stable supply, and the long-term relationships we have built with our customers.
In general, we are active in the market when it is beneficial for us and in support of our long-term contract portfolio. We undertake activity in the spot and term markets prudently, looking at the prices and other business factors to decide whether it is appropriate to purchase or sell into the spot or term market. Not only is this activity a source of profit, but it also gives us insight into underlying market fundamentals.
We deliver the majority of our uranium under long-term contracts each year, some of which are tied to market-related pricing mechanisms quoted at time of delivery. Therefore, our net earnings and operating cash flows are generally affected by changes in the uranium price. Market prices are influenced by the fundamentals of supply and demand, market access and trade policy issues, geopolitical events, disruptions in planned supply and demand, and other market factors.
The objectives of our contracting strategy are to:
| • | optimize realized price by balancing exposure to future market prices while providing some certainty for our future earnings and cash flow |
| • | focus on meeting the nuclear industry’s growing annual uncovered requirements with our tier-one production |
| • | establish and grow market share with strategic and regionally diverse customers |
We have a portfolio of long-term contracts, each bilaterally negotiated with customers, that have a mix of base-escalated pricing and market-related pricing mechanisms, including provisions that provide exposure to rising market prices and also protect us when the market price is declining. This is a balanced and flexible approach that allows us to adapt to market conditions, put a floor on our average realized price and deliver the best value over the long term.
This approach has allowed our realized price to outperform the market during periods of weak uranium demand, and we expect it will enable us to realize increases linked to higher market prices in the future.
Base-escalated contracts for uranium: use a pricing mechanism based on a term-price indicator at the time the contract is accepted and escalated to the time of each delivery over the term of the contract.
Market-related contracts for uranium: are different from base-escalated contracts in that the pricing mechanism may be based on either the spot price or the long-term price, and that price is generally set a month or more prior to delivery rather than at the time the contract is accepted. These contracts may provide for discounts and typically include floor prices and/or ceiling prices, which are established at time of contract acceptance and usually escalate over the term of the contract.
Fuel services contracts: the majority of our fuel services contracts use a base-escalated mechanism per kgU and reflect the market at the time the contract is accepted.
MANAGEMENT’S DISCUSSION AND ANALYSIS 25
OPTIMIZING OUR CONTRACT PORTFOLIO
We work with our customers to optimize the value of our contract portfolio. With respect to new contracting activity, there is often a lag from when contracting discussions begin and when contracts are executed. With our large pipeline of business under negotiation in our uranium segment, and a value driven strategy, we continue to be strategically patient in considering the commercial terms we are willing to accept. We layer in contracts over time, with higher commitments in the near term and declining over time in accordance with utilities growing uncovered requirements. Demand may come in the form of off-market negotiations or through on-market requests for proposals. We remain confident that we can add acceptable new sales commitments to our portfolio of long-term contracts to underpin the ongoing operation of our productive capacity and capture long-term value.
Given our view that additional long-term supply will need to be incented to meet the growing demand for safe, reliable, carbon-free nuclear energy, our preference today is to sign long-term contracts with market-related pricing mechanisms. However, we believe our customers expect prices to rise and prefer to lock-in today’s prices, with a fixed-price mechanism. Our goal is to balance all these factors, along with our desire for customer and regional diversification, with product form, and logistical factors to ensure we have adequate protection and will have exposure to rising market prices under our contract portfolio, while maintaining the benefits that come from having low-cost supply to deliver into a strengthening market.
At times, we may also look for opportunities to optimize the value of our portfolio. In cases where there is a changing policy, operating, or economic environment, including the introduction of new taxes or tariffs in certain jurisdictions, we manage risk accordingly. We have taken actions such as positioning material ahead of expected deliveries, revising our contract terms to protect us from unexpected future implementation of taxes or tariffs, and adjusting our contracts to minimize potential negative impacts while maintaining strong customer relationships, and we will continue to consider additional mitigation in the future.
CONTRACT PORTFOLIO STATUS
We have executed contracts to sell about 220 million pounds of U3O8 with 41 customers worldwide in our uranium segment, and about 85 million kilograms as UF6 conversion with 34 customers worldwide in our fuel services segment. We sell uranium and fuel services products to nuclear utilities in 16 countries.
Customers – U3O8:
Five largest customers account for 58% of commitments Five largest customers account for 59% of commitments
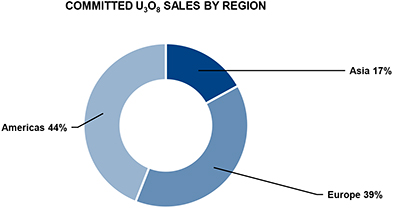
26 CAMECO CORPORATION
Customers – UF6 conversion:
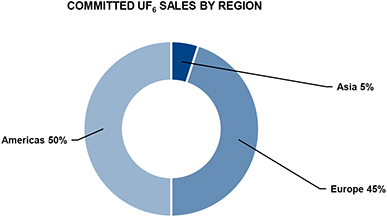
MANAGING OUR CONTRACT COMMITMENTS
We allow sales volumes to vary year-to-year depending on:
| • | the level of sales commitments in our long-term contract portfolio |
| • | market opportunities |
| • | our sources of supply |
To meet our delivery commitments and to mitigate risk, we have access to a number of sources of supply, which includes uranium obtained from:
| • | our productive capacity |
| • | purchases under our JV Inkai agreement, under long-term agreements and in the spot market |
| • | our inventory in excess of our working requirements |
| • | product loans |
OUR SUPPLY DISCIPLINE
As spot is not the fundamental market, true value is built under a long-term contract portfolio and is measured over the full commodity cycle. Therefore, we align our uranium production decisions with our contract commitments and market opportunities to avoid carrying excess inventory or having to sell into an oversupplied spot market. In accordance with market conditions, and to mitigate risk, we evaluate the optimal mix of our production, inventory and purchases in order to satisfy our contractual commitments and in order to realize the best return over the entire commodity cycle. During a prolonged period of uncertainty, this could mean leaving our uranium in the ground. For the years 2016 through 2022, we left more than 130 million pounds of uranium in the ground (100% basis) by curtailing our production. We purchased more than 60 million pounds including spot and long-term purchases and in 2018 we drew down our inventory by almost 20 million pounds. That totals over 210 million pounds (100% basis) of uranium that were not available to the market.
However, today we believe the uranium market is in transition, driven by the growing demand for nuclear energy and the increasing recognition that it is essential for energy security, national security, and the clean-energy transition. As the market continues to transition, we expect to continue placing our uranium under long-term contracts and meet rising demand with production from our best margin operations.
With the improvements in the market, the new long-term contracts we have put in place, and a pipeline of contracting discussions, we plan to produce 18 million pounds (100% basis) at McArthur River/Key Lake and 18 million pounds (100% basis) at Cigar Lake in 2025. We are still in discussions with JV Inkai and KAP to determine our purchase entitlement for 2025.
Our production decisions will continue to be aligned with market opportunities and our ability to secure the appropriate long-term contract homes for our unencumbered, in-ground inventory, demonstrating that we continue to responsibly manage our assets in accordance with our customers’ needs.
MANAGEMENT’S DISCUSSION AND ANALYSIS 27
Our production plans for McArthur River/Key Lake and Cigar Lake are expected to generate strong financial performance by allowing us to source the majority of our committed sales from the lower cost produced pounds. We are investing in capital projects to help ensure the reliability and sustainability of our existing operations, and to replace aging infrastructure in order to maintain capacity at current production levels and to position us for future production flexibility, although no decision on future production levels has been made. In addition, with conversion demand elevated, we have been successful in securing long-term sales commitments that will support increased production at Port Hope, which is expected to further improve its contribution to our financial results. However, this is not an end to our supply discipline. Our Rabbit Lake and US ISR assets remain in a safe state of care and maintenance, and we expect to continue to adjust our production in accordance with our contract portfolio. This will remain our production plan until we see further improvements in the uranium market and contracting progress, once again demonstrating that we are a responsible fuel supplier.
MANAGING OUR COSTS
Production costs
In order to operate efficiently and cost-effectively, we manage operating costs and improve plant reliability by prudently investing in production infrastructure, new technology, and business process improvements. Like all mining companies, our uranium segment is affected by the cost of inputs such as labour and fuel.
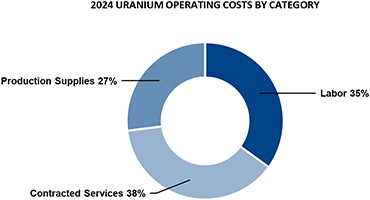
| * | Production supplies include reagents, fuel and other items. Contracted services include utilities and camp costs, air charters, mining and maintenance contractors and security and ground freight. |
The annual cash cost of production reflects the operating cost of mining and milling our share of the Cigar Lake, McArthur River, and Key Lake operations. The annual cost of production will reflect a combined cost of all our operating uranium assets. See 2024 financial results by segment – Uranium starting on page 57 for more information. In 2025, our cash production costs may continue to be affected by inflation, the availability of personnel with the necessary skills and experience, supply chain challenges impacting the availability of materials and reagents, and continued work to maintain the long-term reliability of our assets.
Operating costs in our fuel services segment are mainly fixed. In 2024, labour and contracted services accounted for about 53% of the total. The largest variable operating cost is for anhydrous hydrogen fluoride, followed by zirconium, and energy (natural gas and electricity).
We continue to look to adopt innovative and advanced digital and automation technologies to improve efficiency and operational flexibility and to further reduce costs.
Care and maintenance costs
In 2025, we expect to incur between $62 million and $67 million in care and maintenance costs related to the suspension of production at our Rabbit Lake mine and mill, and our US operations. Production at these operations is higher-cost and the timing of a restart is uncertain. We continue to evaluate our options in order to minimize these costs.
28 CAMECO CORPORATION
Purchases and inventory costs
Our costs are also affected by the purchases of uranium and conversion services we make under long-term contracts and on the spot market.
To meet our delivery commitments, we make use of our mined production, inventories, purchases of our share of material from Inkai, purchases under long-term contracts, purchases we make on the spot market and product loans. In 2025, we expect the price for the majority of our purchases will be quoted at the time of delivery.
The cost of purchased material may be higher or lower than our other sources of supply, depending on market conditions. The cost of purchased material affects our cost of sales, which is determined by calculating the average of all of our sources of supply, including opening inventory, production, and purchases, and adding royalties, selling costs, and care and maintenance costs. Our cost of sales could be impacted if we do not achieve our annual production plan, or if we are unable to source uranium as planned, and we are required to purchase uranium at prices that differ from our cost of inventory.
Potential tariff impact
Currently, the US has threatened the imposition of a 10% tariff on Canadian energy products. We have proactively taken steps to minimize the potential impact of imposed tariffs, and while we currently do not anticipate the direct impact of a 10% tariff to be material on our 2025 financial results, there continues to be uncertainty around the exact details of how these tariffs may be applied or if they will be applied to uranium products.
Financial impact
The growing demand for nuclear power due to its safety, carbon-free energy, reliability, security and affordability attributes has contributed to increased demand for nuclear fuel products and services. As a result, we have seen significant price increases across the nuclear fuel value chain, which reflect the need for capacity increases to satisfy the projected growth.
The deliberate and disciplined actions we took to curtail production and streamline operations over the past decade came with near-term costs like care and maintenance costs, operational readiness costs, and purchase costs higher than our production costs. However, we considered these costs as investments in our future.
Today, thanks to our investments, and with our continued ability to secure new long-term sales commitments, we believe we are well-positioned for growth. Our core growth is expected to come from our existing mining and fuel services assets. We do not have to build new capacity to pursue new opportunities. We believe we have sufficient productive capacity to expand, a position we have not enjoyed in previous price cycles.
And, with the acquisition of a 49% interest in Westinghouse, we expect to be able to expand our growth profile by extending our reach in the nuclear fuel cycle at a time when there are tremendous tailwinds for the nuclear power industry. We are extending our reach with an investment in assets that like ours, are strategic, proven, licensed and permitted, that are located in geopolitically favourable jurisdictions, and that we expect will be able to grow from their existing footprint. These assets are also expected to provide new opportunities for our existing suite of uranium and fuel services assets.
We believe our actions and investments have helped position the company to self-manage risk, generate strong financial performance, and allow us to execute on our strategy while rewarding our stakeholders for their continued patience and support of our strategy to build long-term value.
CAPITAL ALLOCATION – DISCIPLINED FINANCIAL MANAGEMENT
Delivering long-term value is a top priority. While we navigate by our investment-grade rating with a focus on reducing leverage, we continually evaluate our investment options to ensure we allocate our capital in a way that we believe will:
| • | sustain our assets and grow our core business in a manner that we expect will generate ongoing liquidity and create sustainable long-term value |
| • | maintain a strong balance sheet that will allow us to execute on our strategy, take advantage of strategic opportunities and self-manage risk |
| • | allow us to sustainably deliver a dividend while considering the cyclical nature of our earnings and cash flow |
MANAGEMENT’S DISCUSSION AND ANALYSIS 29
To generate value, free cash flow must be productively reinvested in the business. We start by determining how much cash we have to invest (investable capital). Investable capital takes into account our expected cash flow from operations, including the expected cash distributions from JV Inkai and our Westinghouse investment, minus the cash required to satisfy our financing costs, for working capital purposes, and the other uses of cash we consider to be higher priority, such as dividends. This investable capital can be reinvested in the core business of the company. We expect that we will generate free cash flow sufficient to support ongoing investment in the long-term sustainable production from our tier-one assets. Additional free cash flow can be used to take advantage of opportunities in line with our long-term strategy, to manage our balance sheet for the future, or it could be returned to shareholders.
Reinvestment / Investment
We have a multidisciplinary capital allocation committee that evaluates all sustaining, capacity replacement, or growth investment opportunities.
For our core business, opportunities are ranked using return criteria that includes both financial and non-financial metrics, with a current priority focus on five main value drivers:
| • | cost reduction |
| • | enabling digital technology |
| • | operational flexibility |
| • | improving safety performance |
| • | emission reduction |
Only those that meet the required risk-adjusted return criteria are considered for investment.
Growth opportunities across the fuel cycle and new and existing investments must also demonstrate a sufficient risk-adjusted return to support deployment of capital.
We also must identify, at the corporate level, the expected impact on cash flow, earnings, and the balance sheet. All project risks must be identified, including the risks of not investing. Allocation of capital only occurs once an investment has cleared these hurdles.
This may result in some opportunities being held back in favour of higher return investments and should allow us to generate the best return on investment decisions when faced with multiple prospects, while also controlling our costs and meeting sustainability objectives.
Supported by a similar capital allocation process, we expect Westinghouse to self-fund opportunities identified in its business plan and to provide us with a distribution to the extent the funds are not prioritized for reinvestment.
Return
We believe in returning cash to shareholders under appropriate circumstances and we plan our dividend to be sustainable. In 2024, the board of directors approved an increase of the annual dividend from $0.12 per common share in 2023, to $0.16 per common share in 2024. In addition, to recognize the return to our tier-one run rate, and in line with the principles of our capital allocation framework, we have recommended, to our board of directors, a dividend growth plan for consideration. Based on our plan, we expect an annual increase of at least $0.04 per common share in each of 2025 and 2026 to achieve a doubling of the 2023 dividend from $0.12 per common share, to $0.24 per common share.
If we have excess cash and determine the best use is to return it to shareholders, we can do that through a share repurchase or dividend—an annual dividend, one-time supplemental dividend or a progressive dividend. The decision to return capital and the type of return is evaluated regularly by our board of directors with careful consideration of our cash flow, liquidity, financial position, strategy, capital structure and other relevant factors including appropriate alignment with the cyclical nature of our earnings.
In Action
During 2024, as we continued the return to our tier-one cost structure, the focus was to ensure we had the financial capacity to execute on our 2024 production plan and to source material for our 2024 deliveries. In addition, we began work to extend the mine life at Cigar Lake and to evaluate the work and investment required to expand production at McArthur River/Key Lake up to its licensed capacity of 25 million pounds per year (100% basis).
30 CAMECO CORPORATION
We refinanced $500 million senior unsecured debentures in 2024, which effectively extended the maturity of the indebtedness to 2031. We also made repayments of $400 million (US) on the $600 million (US) floating-rate term loan that was used to finance the acquisition of Westinghouse. In January 2025, we made the final repayment of $200 million (US), so the term loan is now fully extinguished. See Liquidity and capital resources – Financing Activities starting on page 50 for more information about the term loan.
A distribution of $100 million (US) from Westinghouse was paid in February 2025, of which we received $49 million (US) representing our share of the distribution. This is the first distribution since the acquisition closed.
Our priorities in 2025 remain focused on delivering from our tier-one assets. We are investing to help ensure reliability and sustainability of existing operations, and to replace aging infrastructure to maintain capacity at current production levels, while positioning for future production flexibility, including to achieve licensed capacity at McArthur River/Key Lake of 25 million pounds per year (100% basis) in line with market demand, although no decision to increase production has been made. Additionally, we will maintain our focus on improving operational effectiveness across the company through, for example, the use of digital and automation technologies. The particular goals of this work are to reduce operating costs, increase operational flexibility, improve our safety performance and reduce our impact on the environment, including the reduction of our GHG emissions.
If the market transition continues as expected, our priorities might include consideration of:
| • | the opportunities available to add value with our licensed and permitted tier-two assets and brownfield infrastructure |
| • | further value-adding opportunities in the nuclear fuel value chain |
| • | the return of excess cash to shareholders |
Any opportunities will be rigorously assessed by our capital allocation committee and our board of directors before an investment decision is made.
Shares and stock options outstanding
At February 18, 2025, we had:
| • | 435,312,083 common shares and one Class B share outstanding |
| • | 259,958 stock options outstanding, with exercise prices ranging from $11.32 to $15.27 |
Dividend
In 2024, our board of directors declared a 2024 annual dividend of $0.16 per common share which was paid on December 13, 2024. See the section titled Return on page 30 for more information regarding the factors the board considers in deciding to declare an annual dividend.
MANAGEMENT’S DISCUSSION AND ANALYSIS 31
Our sustainability principles and practices
A key part of our strategy, reflecting our values
We are committed to delivering our products responsibly and profitably. We integrate sustainability principles and practices into every aspect of our business, from our corporate objectives and approach to compensation, to our overall corporate strategy, risk management, and day-to-day operations, and they align with our values. We seek to be transparent with our stakeholders, keeping them updated on the risks and opportunities that we believe may have a significant impact on our ability to achieve our strategic plan and add long-term value. We recognize the importance of integrating certain sustainability factors, such as safety performance, a clean environment and supportive communities, into our executive compensation strategy as we see success in these areas as critical to the long-term success of the company.
Our board of directors holds the highest level of oversight for our business strategy and strategic risks, including sustainability matters. Oversight of sustainability reporting and disclosure has been delegated by the board to the Safety, Health and Environment (SHE) committee of the board. We also have a multi-disciplinary sustainability steering committee, chaired by our senior vice-president and chief corporate officer that includes representatives from across the organization whose role is to review our sustainability governance and reporting, as well as our current approach to sustainability, against evolving trends. Additional information about the governance of our sustainability matters is included in our most recent Sustainability Report.
In an effort to continually evolve the robustness of our sustainability commitments and communications, we aim to stay up to date with sustainability related reporting standards. In 2020, we began to work to report in alignment with Sustainability Accounting Standards Board (SASB). In 2022, we began to address the recommendations of the Task Force on Climate-Related Financial Disclosures (TCFD) in our Sustainability Report. We are now working to understand the requirements of the IFRS S1 sustainability disclosure standards, and S2 climate-related disclosure standard released in 2023, alongside the Canadian Sustainability Standards Board adapted versions, the Canadian Sustainability Disclosure Standards 1 and 2, which were published in 2024. It is still unclear when and to what extent the Canadian Securities Administrators may adopt these standards.
In July 2024, we published our 2023 Sustainability Report. The report sets out our strategy and the policies and programs we use to govern and manage sustainability issues that are important to our stakeholders. In addition to SASB and TCFD, the report provides key sustainability performance indicator data based on the Global Reporting Initiative’s Sustainability Framework as well as some unique corporate indicators, to measure and report our performance on environmental, social and economic impacts in the areas we believe have a significant impact on our sustainability in the long-term and are important to our stakeholders. This is our sustainability report card to our stakeholders. You can find our report at cameco.com/about/sustainability.
At Cameco, our approach to stewardship is guided by our corporate governance framework, which includes a strong and established Cameco Management System (CMS) which sets out our vision, values, and measures of success. The CMS describes the framework of policies, programs, and procedures we use to help us fulfill all the tasks required to achieve our objectives, strategy and practices, and are continuously evaluated and reviewed to improve their rigour.
There are ten policies identified in the CMS which provide high-level direction to Cameco across all sustainability topics, the specific policies include: Code of Conduct and Ethics; Corporate Disclosure; Delegation of Financial Authority; Electronic Information and Information Technology Security; Mineral Reserve and Resource; Our People; Procurement of Goods and Services; Risk Management; Safety, Health, Environment and Quality; and Sustainability. These policies help speak to our strategic planning process, leadership alignment and accountability, compliance and assessment, people and culture, process identification and work management, risk management, communications and stakeholder support, knowledge and information management, change management, problem identification and resolution, and continual improvement.
ENVIRONMENT
We acknowledge and embrace our responsibility to manage our activities with care for the protection of environmental resources. Our stewardship is guided by established policies and programs designed to minimize our impacts on air, land, and water, and to safeguard the biodiversity of surrounding ecosystems.
32 CAMECO CORPORATION
Within our CMS, we have an integrated Safety, Health, Environment and Quality Management System. Alignment with, and certification to, the ISO standards is important to us as it is one of the world’s most widely recognized set of standards. Due to the multi-disciplinary nature of this system, we maintain ISO 14001 certification of the environmental components of the management system at the corporate level and align the safety and health components of the management system with ISO 45001.
Climate Action
We recognize the critical nature of the fight against climate change, and want our employees, customers, investors, and community partners near our operations to know we are committed to being an active and constructive partner in addressing this challenge. The reduction of carbon and greenhouse gas (GHG) emissions is important and necessary in Canada and around the world. Policy makers and major industries recognize that nuclear power must be a central part of the solution to the world’s shift to a low-carbon, climate-resilient economy. Several nations have reaffirmed their commitments to nuclear power and are developing plans to support existing reactors and are reviewing their policies to encourage more nuclear capacity. There are now 31 countries that have signed on to the Net Zero Nuclear declaration that was launched at COP28 to triple nuclear energy capacity by 2050.
As one of the world’s largest producers of the uranium needed to fuel nuclear reactors, we believe this represents a significant business opportunity for us. By delivering our products and services responsibly and profitably, we can be a part of the solution to enhance national, energy and climate security given 100% of our product is used to produce reliable carbon-free base-load electricity. We enable secure baseload power and emissions reductions globally through nuclear power and are committed to transforming our already low operational GHG emissions footprint to achieve our ambition of having net-zero emissions while delivering significant long-term business value.
Cameco has put its support behind Net Zero Nuclear, an initiative between government, industry leaders and civil society to triple global nuclear capacity to achieve carbon neutrality by 2050. As a strategic partner, we can assist with deepening industry support for this initiative, which was launched by the World Nuclear Association and the Emirates Nuclear Energy Corporation, with the support of the Atoms4NetZero initiative launched by the International Atomic Energy Agency at the 2023 World Nuclear Symposium in London. Since its launch, more than 120 companies have endorsed the Net Zero Nuclear Industry Pledge, along with 14 financial institutions and 31 countries that have signed the declaration.
Previously, we undertook a planning process to outline our overarching Low Carbon Transition Plan. Within this plan, we set a target to reduce our combined Scope 1 and 2 GHG emissions by 30% by 2030, from 2015 levels. We also identified the practical and achievable actions that we expect to take to decarbonize our operations and manage climate-related risks. In doing so, we are working to demonstrate our alignment with the ambitions of the Paris Agreement and Canadian legislative framework to, “limit global temperature rise to well below 2 degrees Celsius (°C), above pre-industrial levels, and to pursue efforts to limit global temperature rise even further to 1.5°C”.
We recognize that climate change, including shifts in temperature, precipitation and more frequent severe weather events could affect our operations in a range of possible ways. As part of our efforts, we have completed climate change scenario analyses to understand how projected long-term changing climate conditions could impact our employees, assets, and operations in Canada and the United States. We leveraged internal subject matter expertise with help from a third-party expert to complete the assessments.
The physical risk assessment studies were undertaken to deliver initial forward-looking physical climate risk assessments and identify possible risk management and adaptation options across our underground and in situ mining, milling and fuel services operations.
When it comes to climate change, we have tracked and reported our GHG emissions for more than two decades. A summary of our activities to understand and mitigate the risks associated with climate change scenarios is reported to the board of directors on a regular basis in accordance with our Risk Management program, including the mitigating controls and management actions taken to reduce these risks.
MANAGEMENT’S DISCUSSION AND ANALYSIS 33
SOCIAL
Our relationships with our workforce, Indigenous Peoples, and local communities are fundamental to our success. The safety and protection of our workforce and the public is our top priority in our assessment of risk and planning for safe operations and product transport. To deliver on our strategy, we invest in programs to attract and retain a skilled workforce that has a broad range of complementary skills, abilities and experience, that reflect the communities in which we operate and to help increase the participation of underrepresented groups in trades and technical positions. We want to build a workforce that is dedicated to continuous improvement and shares our values.
We have a five-pillar approach to develop and maintain long-term relationships and provide opportunities to those living in areas near our operations. The five-pillars include workforce development, business development, community investment, environmental stewardship, and community engagement. To strengthen relationships and shape them into mutually beneficial partnerships, we have established agreements with northern and Indigenous communities near our operations that allow us to determine focus areas based on the community’s unique needs, optimizing benefits to the community, providing certainty around community investment and local business opportunities.
GOVERNANCE
We believe that sound governance is the foundation for strong corporate performance. Our diverse and independent board of directors’ primary role is to provide strategic direction and risk oversight in order to help the company achieve its objectives. The board guides the company to operate as a sustainable business, to optimize financial returns while effectively managing risk, and to conduct business in a way that is transparent, independent, and ethical.
The board has formal governance guidelines that set out our approach to governance and the board’s governance role and practices. The guidelines are intended to ensure that we comply with all of the applicable governance rules and legislation in Canada and the US, conduct ourselves in the best interests of our stakeholders, and meet industry best practices. The guidelines are reviewed and updated regularly.
Risk and Risk Management
Our board of directors oversees management’s implementation of appropriate risk management processes and controls. We have a Risk Policy that is supported by our formal Risk Management Program.
Our Risk Management Program involves a broad, systematic approach to identifying, assessing, monitoring, reporting and managing the significant risks we face in our business and operations, including risks that could impact our four measures of success. The program is based on the ISO 31000 Risk Management guidelines. ISO 31000 provides guidance on risk management activities with internationally recognized practices and provides sound principles for effective management and governance of risks. Our program applies to all risks facing the company. The program establishes clear accountabilities for employees throughout the company to take ownership of risks specific to their area and to effectively manage those risks. The program is reviewed annually to ensure that it continues to meet our needs.
We use a common risk matrix throughout the company. Any risk that has the potential to significantly affect our ability to achieve our corporate objectives or strategic plan is considered an enterprise risk and is brought to the attention of senior management and the board. We continually update our risk profile by performing regular monitoring of risks across the organization. Regular monitoring helps us to properly manage risks and identify any new risks. Detailed risk reporting is provided on a quarterly basis to senior management and the board and its committees on the status of the mitigating and/or monitoring plans for each of the enterprise risks. Management also reviews monthly updates on the company’s progress in managing these risks.
In addition to considering the other information in this MD&A, you should carefully consider the material risks discussed starting on page 4, under the heading Managing the risks, starting on page 74, and the specific risks discussed under each operation, advanced project, and other fuel cycle investment update in this document. These risks, however, are not a complete list of the potential risks our operations, advanced projects, or other investments face. There may be others we are not aware of or risks we feel are not material today that could become material in the future.
We recommend you also review our annual information form, which includes a discussion of other material risks that could have an impact on our business.
34 CAMECO CORPORATION
Measuring our results
Targets and Metrics: The link to executive pay
Each year, we set corporate objectives that are aligned with our strategic plan. These objectives fall under our four measures of success: outstanding financial performance, safe, healthy and rewarding workplace, clean environment and supportive communities. Performance against specific targets under these objectives forms the foundation for a portion of annual employee and executive compensation. See our most recent management proxy circular for more information on how executive compensation is determined.
We saw a significant improvement in our financial performance (earnings and cash flow) as our tier-one production increased and our average realized price reflected the improving market. However, we did not meet all our targets, including our safety performance, in 2024. We remain committed to improvement as reflected in our objectives for 2025.
| 2024 OBJECTIVES1 |
TARGET |
RESULTS |
||
| OUTSTANDING FINANCIAL PERFORMANCE | ||||
| Earnings measure | Achieve targeted adjusted net earnings. | • adjusted net earnings was above the target |
||
| Cash flow measure | Achieve targeted cash flow from operations (before working capital changes). | • cash flow from operations was below the target |
||
| SAFE, HEALTHY AND REWARDING WORKPLACE | ||||
| Workplace safety measure | Strive for no injuries at all Cameco-operated sites. Maintain a long-term downward trend in combined employee and contractor total recordable injury rate while achieving targets on specified leading indicators. | • we did not achieve our target for TRIR and results remained similar to 2023
• performance of the leading indicators was within the target range |
||
| CLEAN ENVIRONMENT | ||||
| Environmental performance measures | Achieve corporate environmental targets.
Publish total Scope 3 emissions value and method of quantification. |
• performance on corporate environmental measures was within the target range
• performance on the Scope 3 emissions measure was above the target |
||
| SUPPORTIVE COMMUNITIES | ||||
| Stakeholder support measure | Enhance Residents of Saskatchewan’s North (RSN) skill development and progression focused on internal development for progression and external trades training | • performance on the RSN skill enhancement measure was above the target |
||
| 1 | Detailed results for our 2024 corporate objectives and the related targets will be provided in our 2025 management proxy circular prior to our Annual Meeting of Shareholders on May 9, 2025. |
MANAGEMENT’S DISCUSSION AND ANALYSIS 35
2025 objectives
OUTSTANDING FINANCIAL PERFORMANCE
| • | Achieve targeted financial measures. |
SAFE, HEALTHY AND REWARDING WORKPLACE
| • | Improve workplace safety performance at all sites. |
CLEAN ENVIRONMENT
| • | Improve environmental performance at all sites and continue to execute on our Low Carbon Transition Plan. |
SUPPORTIVE COMMUNITIES
| • | Build and sustain strong stakeholder support for our activities. |
36 CAMECO CORPORATION
Financial results
This section of our MD&A discusses our performance, financial condition and outlook for the future.
| 38 |
2024 CONSOLIDATED FINANCIAL RESULTS |
|
| 46 |
OUTLOOK FOR 2025 |
|
| 50 |
LIQUIDITY AND CAPITAL RESOURCES |
|
| 57 |
2024 FINANCIAL RESULTS BY SEGMENT |
|
| 57 |
URANIUM |
|
| 59 |
FUEL SERVICES |
|
| 59 |
WESTINGHOUSE |
|
| 60 |
FOURTH QUARTER FINANCIAL RESULTS |
|
| 60 |
CONSOLIDATED RESULTS |
|
| 62 |
URANIUM |
|
| 64 |
FUEL SERVICES |
|
| 64 |
WESTINGHOUSE |
|
| 65 |
NON-IFRS MEASURES |
MANAGEMENT’S DISCUSSION AND ANALYSIS 37
2024 consolidated financial results
In the fourth quarter of 2023, we announced the closing of the acquisition of a 49% interest in Westinghouse. Effective November 7, 2023, we began equity accounting for this investment. Our share of Westinghouse’s earnings has been reflected in our financial results from that date.
In the second quarter of 2022, we along with Orano acquired Idemitsu Canada Resources Ltd.’s 7.875% participating interest in the Cigar Lake Joint Venture. Our ownership stake in Cigar Lake now stands at 54.547%, 4.522 percentage points higher than it was prior to the transaction. Effective May 19, 2022, we have reflected our share of production and financial results based on this new ownership stake.
| HIGHLIGHTS | CHANGE FROM | |||||||||||||||
| DECEMBER 31 ($ MILLIONS EXCEPT WHERE INDICATED) |
2024 | 2023 | 2022 | 2023 TO 2024 | ||||||||||||
| Revenue |
3,136 | 2,588 | 1,868 | 21 | % | |||||||||||
| Gross profit |
783 | 562 | 233 | 39 | % | |||||||||||
| Net earnings attributable to equity holders |
172 | 361 | 89 | (52 | )% | |||||||||||
| $ per common share (basic) |
0.40 | 0.83 | 0.22 | (53 | )% | |||||||||||
| $ per common share (diluted) |
0.39 | 0.83 | 0.22 | (52 | )% | |||||||||||
| Adjusted net earnings (non-IFRS, see page 65)1 |
292 | 383 | 123 | (24 | )% | |||||||||||
| $ per common share (adjusted and diluted) |
0.67 | 0.88 | 0.30 | (24 | )% | |||||||||||
| Adjusted EBITDA (non-IFRS, see page 65) |
1,531 | 884 | 431 | 73 | % | |||||||||||
| Cash provided by operations |
905 | 688 | 305 | 32 | % | |||||||||||
| 1 | In 2024, we revised our calculation of adjusted net earnings to adjust for unrealized foreign exchange gains and losses as well as for share-based compensation because it better reflects how we assess our operational performance. We have restated comparative periods to reflect this change. |
38 CAMECO CORPORATION
Net earnings
The following table shows what contributed to the change in net earnings (loss) in 2024 compared to 2023 and 2022.
| ($ MILLIONS) |
2024 | 2023 | 2022 | |||||||||||
| Net earnings (losses) - previous year |
361 | 89 | (103 | ) | ||||||||||
|
|
|
|
|
|
|
|||||||||
| Change in gross profit by segment |
|
|||||||||||||
| (we calculate gross profit by deducting from revenue the cost of products and services sold, and depreciation and amortization (D&A), net of hedging benefits) |
|
|||||||||||||
| Uranium |
Impact from sales volume changes | 22 | 30 | (6 | ) | |||||||||
| Higher realized prices ($US) |
390 | 208 | 328 | |||||||||||
| Foreign exchange impact on realized prices |
26 | 95 | 44 | |||||||||||
| Higher costs | (203 | ) | (9 | ) | (137 | ) | ||||||||
|
|
|
|
|
|
|
|||||||||
| change – uranium | 235 | 324 | 229 | |||||||||||
|
|
|
|
|
|
|
|||||||||
| Fuel services | Impact from sales volume changes |
2 | 9 | (21 | ) | |||||||||
| Higher realized prices ($Cdn) |
27 | 32 | 33 | |||||||||||
| Higher costs | (47 | ) | (34 | ) | (13 | ) | ||||||||
|
|
|
|
|
|
|
|||||||||
| change – fuel services | (18 | ) | 7 | (1 | ) | |||||||||
|
|
|
|
|
|
|
|||||||||
| Other changes |
||||||||||||||
| Higher administration expenditures |
(7 | ) | (74 | ) | (44 | ) | ||||||||
| Higher exploration and research and development expenditures |
(17 | ) | (16 | ) | (8 | ) | ||||||||
| Change in reclamation provisions |
30 | 31 | (31 | ) | ||||||||||
| Change in gains or losses on derivatives |
(221 | ) | 111 | (86 | ) | |||||||||
| Change in foreign exchange gains or losses |
50 | (58 | ) | 74 | ||||||||||
| Change in earnings from equity-accounted investees |
(165 | ) | 60 | 26 | ||||||||||
| Canadian Emergency Wage Subsidy |
— | — | (21 | ) | ||||||||||
| Bargain purchase gain on CLJV ownership interest increase |
— | (23 | ) | 23 | ||||||||||
| Higher (lower) finance income |
(91 | ) | 75 | 30 | ||||||||||
| Higher finance costs |
(31 | ) | (30 | ) | (9 | ) | ||||||||
| Change in income tax recovery or expense |
41 | (130 | ) | 3 | ||||||||||
| Other |
5 | (5 | ) | 7 | ||||||||||
|
|
|
|
|
|
|
|||||||||
| Net earnings - current year |
172 | 361 | 89 | |||||||||||
|
|
|
|
|
|
|
|||||||||
Average realized prices
| CHANGE FROM | ||||||||||||||||||||
| 2024 | 2023 | 2022 | 2023 TO 2024 | |||||||||||||||||
| Uranium1 |
$ | US/lb | 58.34 | 49.76 | 44.73 | 17 | % | |||||||||||||
| $ | Cdn/lb | 79.70 | 67.31 | 57.85 | 18 | % | ||||||||||||||
|
|
|
|
|
|
|
|
|
|||||||||||||
| Fuel services |
$ | Cdn/kgU | 37.87 | 35.61 | 32.92 | 6 | % | |||||||||||||
|
|
|
|
|
|
|
|
|
|||||||||||||
| 1 | Average realized foreign exchange rate ($US/$Cdn): 2024 – 1.37, 2023 – 1.35 and 2022 – 1.29. |
Revenue
The following table shows what contributed to the change in revenue for 2024.
| ($ MILLIONS) |
||||
| Revenue – 2023 |
2,588 | |||
|
|
|
|||
| Uranium |
||||
| Higher sales volume |
107 | |||
| Higher realized prices ($Cdn) |
416 | |||
|
|
|
|||
| Fuel services |
||||
| Higher sales volume |
7 | |||
| Higher realized prices ($Cdn) |
27 | |||
|
|
|
|||
| Other |
(9 | ) | ||
|
|
|
|||
| Revenue – 2024 |
3,136 | |||
|
|
|
|||
See 2024 Financial results by segment on page 57 for more detailed discussion.
MANAGEMENT’S DISCUSSION AND ANALYSIS 39
THREE-YEAR TREND
In 2023, revenue increased by 39% compared to 2022 due to a 45% increase in the uranium segment and a 17% increase in our fuel services segment. Both segments saw increases in the average realized price and sales volume.
In 2024, revenue increased by 21% compared to 2023 due to a 24% increase in the uranium segment and an 8% increase in our fuel services segment. Both segments saw significant increases in the average realized price and while sales volume remained constant in fuel services, the uranium segment saw an increase in volume. See notes 18 and 28 in our annual financial statements for more information.
SALES DELIVERY OUTLOOK FOR 2025
For 2025 we have committed sales volumes in our uranium segment of between 31 and 34 million pounds.
In our uranium and fuel services segments, our customers choose when in the year to receive deliveries. As a result, our quarterly delivery patterns and, therefore, our sales volumes and revenue can vary significantly. We expect a greater share of uranium deliveries in 2025 to be in the second half of the year as shown below. However, not all delivery notices have been received to date and the expected delivery pattern could change. Typically, we receive notices six months in advance of the requested delivery date.
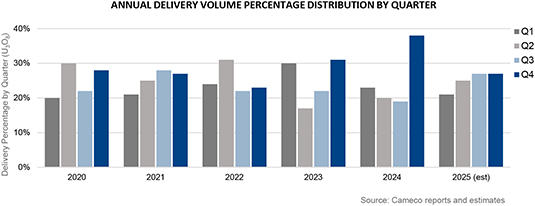
Corporate expenses
ADMINISTRATION
| ($ MILLIONS) |
2024 | 2023 | CHANGE | |||||||||
| Direct administration1 |
212 | 186 | 14 | % | ||||||||
| Stock-based compensation1 |
41 | 60 | (32 | )% | ||||||||
|
|
|
|
|
|
|
|||||||
| Total administration |
253 | 246 | 3 | % | ||||||||
|
|
|
|
|
|
|
|||||||
| 1 | Direct administration and stock-based compensation are supplementary financial measures. They are components of administration expense as shown on the statement of earnings and calculated according to IFRS. |
Direct administration costs in 2024 were $26 million higher than in 2023 largely due to the impacts of inflation and higher payments under Collaboration Agreements tied to increased production volumes.
We recorded $41 million in stock-based compensation expenses in 2024, $19 million lower compared to 2023 due to both the grant and vesting of a lower number of share-based awards compared to the same period last year. See note 24 to the financial statements.
Administration outlook for 2025
We expect direct administration costs to be between $220 million to $230 million.
40 CAMECO CORPORATION
EXPLORATION AND RESEARCH & DEVELOPMENT
Our 2024 exploration activities were focused primarily on Canada. As planned, our spending increased from $18 million in 2023 to $19 million in 2024.
We also had research and development expenditures in 2024 of $37 million compared to $21 million in 2023. These expenses are related to our investment in Global Laser Enrichment LLC (GLE). See Global Laser Enrichment on page 106.
Exploration and research & development outlook for 2025
We expect exploration expenses to be about $27 million in 2025. The focus for 2025 will be on our core projects in Saskatchewan. We expect research and development expenses to be about $47 million in 2025, primarily related to our investment in GLE. See Global Laser Enrichment on page 106.
FINANCE COSTS
Finance costs were $147 million, an increase from $116 million in 2023 primarily due to interest on the US term loan put in place to finance the acquisition of Westinghouse. See note 20 to the financial statements.
FINANCE INCOME
Finance income was $21 million compared to $112 million in 2023 mainly due to a lower short-term investment balance throughout 2024 due to the closing of the Westinghouse acquisition in November 2023 and $400 million (US) in debt repayments made in 2024.
GAINS AND LOSSES ON DERIVATIVES
In 2024, we recorded $183 million in losses on our derivatives compared to $38 million in gains in 2023. The losses reflect a weaker Canadian dollar compared to the US dollar in 2024 compared to 2023. See Foreign exchange on page 44 and note 26 to the financial statements.
INCOME TAXES
We recorded an income tax expense of $85 million in 2024 compared to an expense of $126 million in 2023 primarily as a result of lower earnings in Canada compared to 2023. Equity-accounted investees are included in both Canadian and foreign earnings net of tax paid in the jurisdictions in which they operate. Foreign earnings include losses in some jurisdictions for which no future tax benefit has been recognized.
In 2024, we recorded earnings of $401 million in Canada compared to earnings of $562 million in 2023, while in foreign jurisdictions, we recorded a loss of $144 million compared to a loss of $75 million in 2023.
| ($ MILLIONS) |
2024 | 2023 | ||||||
| Net earnings (loss) before income taxes |
||||||||
| Canada |
401 | 562 | ||||||
| Foreign |
(144 | ) | (75 | ) | ||||
|
|
|
|
|
|||||
| Total net earnings before income taxes |
257 | 487 | ||||||
|
|
|
|
|
|||||
| Income tax expense (recovery) |
||||||||
| Canada |
63 | 131 | ||||||
| Foreign |
22 | (5 | ) | |||||
|
|
|
|
|
|||||
| Total income tax expense |
85 | 126 | ||||||
|
|
|
|
|
|||||
| Effective tax rate |
33 | % | 26 | % | ||||
|
|
|
|
|
|||||
TRANSFER PRICING DISPUTE
Background
Since 2008, Canada Revenue Agency (CRA) has disputed our marketing and trading structure and the related transfer pricing methodology we used for certain intercompany uranium sale and purchase agreements.
MANAGEMENT’S DISCUSSION AND ANALYSIS 41
For the years 2003 to 2014, CRA shifted Cameco Europe Limited’s income (as recalculated by CRA) back to Canada and applied statutory tax rates, interest and instalment penalties, and, from 2007 to 2011, transfer pricing penalties. In addition, for 2014 to 2017, CRA has advanced an alternate reassessing position, see Reassessments, remittances and next steps below for more information.
In September 2018, the Tax Court of Canada (Tax Court) ruled that our marketing and trading structure involving foreign subsidiaries, as well as the related transfer pricing methodology used for certain intercompany uranium sales and purchasing agreements, were in full compliance with Canadian law for the tax years in question (2003, 2005 and 2006). On June 26, 2020, the Federal Court of Appeal (Court of Appeal) upheld the Tax Court’s decision.
On February 18, 2021, the Supreme Court of Canada (Supreme Court) dismissed CRA’s application for leave to appeal the June 26, 2020 decision of the Court of Appeal. The dismissal means that the dispute for the 2003, 2005 and 2006 tax years is fully and finally resolved in our favour. Although not technically binding, there is nothing in the reasoning of the lower court decisions that should result in a different outcome for the 2007 through 2014 tax years, which were reassessed on the same basis.
Refund and cost award
The Minister of National Revenue issued new reassessments for the 2003 through 2006 tax years in accordance with the decision and in July 2021, refunded the tax paid for those years. In October 2023, pursuant to a cost award from the courts, we received a payment of approximately $12 million for disbursements which is in addition to the $10 million we received from CRA in April 2021 as reimbursement for legal fees.
Reassessments, remittances and next steps
The Canadian income tax rules include provisions that generally require larger companies like us to remit or otherwise secure 50% of the cash tax plus related interest and penalties at the time of reassessment. Following the Supreme Court’s dismissal of CRA’s application for leave to appeal, we wrote to CRA requesting reversal of CRA’s transfer pricing adjustments for 2007 through 2013 and the return of the $780 million in cash and letters of credit we paid or provided for those years. Given the strength of the court decisions received, our request was made on the basis that the Tax Court would reject any attempt by CRA to defend its reassessments for the 2007 through 2013 tax years applying the same or similar positions already denied for previous years.
In March 2023, CRA issued revised reassessments for the 2007 through 2013 tax years, which resulted in a refund of $297 million of the $780 million in cash and letters of credit held by CRA at the time. The refund consisted of cash in the amount of $86 million and letters of credit in the amount of $211 million, which were returned in the second quarter.
The series of court decisions that were completely and unequivocally in our favour for the 2003, 2005 and 2006 tax years, determined that the income earned by our foreign subsidiary from the sale of non-Canadian produced uranium was not taxable in Canada. In accordance with these decisions, CRA issued reassessments reducing the proposed transfer pricing adjustment from $5.1 billion to $3.3 billion, resulting in a reduction of $1.8 billion in income taxable in Canada compared to the previous reassessments issued to us by CRA for the 2007 through 2013 tax years.
The remaining transfer pricing adjustment of $3.3 billion for the 2007 to 2013 tax years relates to the sale of Canadian-produced uranium by our foreign subsidiary. We maintain that the clear and decisive court decisions described above apply, and that CRA should fully reverse the remaining transfer pricing adjustments for these years and return all cash and security being held.
In October 2021, due to a lack of significant progress on our points of contention, we filed a notice of appeal with the Tax Court for the years 2007 through 2013. We have asked the Tax Court to order the complete reversal of CRA’s transfer pricing adjustment for those years and the return of all cash and letters of credit being held, with costs.
42 CAMECO CORPORATION
In 2020, CRA advanced an alternate reassessing position for the 2014 tax year in the event the basis for its original reassessment, noted above, is unsuccessful. Subsequent to this, we received a reassessment for the 2015, 2016 and 2017 tax years, all reflecting this alternative reassessing position. While CRA did not require additional security for the tax debts they considered owing for 2014 through 2016, CRA did require additional letters of credit related to the tax debts they considered owing for 2017. CRA continues to hold $555 million ($209 million in cash and $346 million in letters of credit) that we have remitted or secured to date. The new basis of reassessment is inconsistent with the methodology CRA has pursued for prior years and we are disputing it separately. Our view is that this alternate methodology will not result in a materially different outcome from our 2014 to 2017 filing positions. We filed appeals with the Tax Court for each year from 2014 through 2017.
In late 2024, we received a reassessment for the 2018 tax year. The reassessment relates to contracts other than those discussed above. CRA has advanced another alternate reassessing position for the 2018 tax year. We plan to file a notice of objection for 2018.
We will not be in a position to determine the definitive outcome of the dispute for any tax year other than 2003 through 2006 until such time as all reassessments have been issued advancing CRA’s arguments and final resolution is reached for that tax year. CRA may also advance alternative reassessment methodologies for years other than 2003 through 2006, such as the alternative reassessing position advanced for 2014 through 2017, or the new alternative reassessing position advanced for 2018.
Caution about forward-looking information relating to our CRA tax dispute
This discussion of our expectations relating to our tax dispute with CRA and future tax reassessments by CRA is forward-looking information that is based upon the assumptions and subject to the material risks discussed under the heading Caution about forward-looking information beginning on page 2 and also on the more specific assumptions and risks listed below. Actual outcomes may vary significantly.
Assumptions
| • | the courts will reach consistent decisions for subsequent tax years that are based on similar positions and arguments |
| • | CRA will not successfully advance different positions and arguments that may lead to a different outcome for other tax years |
Material risks that could cause actual results to differ materially
| • | the possibility the courts may accept the same, similar or different positions and arguments advanced by CRA to reach decisions that are adverse to us for other tax years |
| • | the possibility that we will not be successful in eliminating all double taxation |
| • | the possibility that CRA does not agree that the court decisions for the years that have been resolved in Cameco’s favour should apply to subsequent tax years |
| • | the possibility CRA will not return all or substantially all of the cash and security that has been paid or otherwise secured by Cameco in a timely manner, or at all |
| • | the possibility of a materially different outcome in disputes for other tax years |
Tax outlook for 2025
Our consolidated tax rate is a blend of the statutory rates applicable to taxable income earned or tax losses incurred in Canada and in our foreign subsidiaries. Since 2017, our global marketing organization has been mainly consolidated in Canada in order to achieve efficiencies, resulting in more income earned in Canada. In addition, equity-accounted investees are included in Canadian and foreign earnings net of tax paid in the jurisdiction in which they operate. We continue to expect our consolidated tax rate will trend toward the Canadian statutory rate in the longer term.
The actual effective tax rate will vary from year-to-year, primarily due to the actual distribution of earnings among jurisdictions and differences between accounting earnings and income for tax purposes. In addition, the Organization for Economic Co-operation and Development has proposed the introduction of rules that would impose a global minimum tax rate of 15% beginning in 2024. Switzerland, Luxembourg, and Germany have all enacted or substantively enacted these rules.
MANAGEMENT’S DISCUSSION AND ANALYSIS 43
FOREIGN EXCHANGE
The exchange rate between the Canadian dollar and US dollar affects the financial results of our uranium and fuel services segments.
We sell the majority of our uranium and fuel services products under long-term sales contracts, which are routinely denominated in US dollars. While our product purchases are denominated in US dollars, our production costs are largely denominated in Canadian dollars. To provide cash flow predictability, we hedge a portion of our net US/Cdn exposure (e.g. total US dollar sales less US dollar expenditures and product purchases) to manage shorter term exchange rate volatility. Our results are therefore affected by the movements in the exchange rate, and in particular on the unhedged portion of our net exposure.
Our risk management policy is based on a 60-month period and permits us to hedge 35% to 100% of our expected net exposure in the first 12-month period. Our normal practice is to layer in hedge contracts over a three- to four-year period with the hedge ratios being highest in the first 12 months and decreasing hedge ratios in subsequent years. The portion of our net exposure that remains unhedged is subject to prevailing market exchange rates for the period. A weakening Canadian dollar would have a positive effect on the unhedged exposure, and a strengthening Canadian dollar would have a negative effect.
Impact of hedging on IFRS earnings
We do not use hedge accounting under IFRS and, therefore, we are required to report gains and losses on all hedging activity, both for contracts that close in the period and those that remain outstanding at the end of the period. For the contracts that remain outstanding, we must treat them as though they were settled at the end of the reporting period (mark-to-market).
However, we do not believe the gains and losses that we are required to report under IFRS appropriately reflect the intent of our hedging activities, so we make adjustments in calculating our ANE to better reflect the impact of our hedging program in the applicable reporting period.
Impact of hedging on ANE
We designate contracts for use in particular periods, based on our expected net exposure in that period. Hedge contracts are layered in over time based on this expected net exposure. The result is that our current hedge portfolio is made up of a number of contracts which are currently designated to net exposures we expect in 2025 and future years and we will recognize the gains or losses in ANE in those periods.
For the purposes of ANE, gains and losses on derivatives are reported based on the difference between the effective hedge rate of the contracts designated for use in the particular period and the exchange rate at the time of settlement. This results in an adjustment to current period IFRS earnings to effectively remove reported gains or losses on derivatives that arise from contracts put in place for use in future periods. The effective hedge rate will lag the market in periods of rapid currency movement. See Non-IFRS measures on page 65.
The table below provides a summary of our hedge portfolio at December 31, 2024. You can use this information to estimate the expected gains or losses on derivatives for 2025 on an ANE basis. Additionally, if we add contracts to the portfolio that are designated for use in 2025 or if there are changes in the US/Cdn exchange rates in the year, those expected gains or losses could change.
44 CAMECO CORPORATION
Hedge portfolio summary
| DECEMBER 31, 2024 | AFTER | |||||||||||||||
| ($ MILLIONS) |
2025 | 2025 | TOTAL | |||||||||||||
| US dollar forward contracts |
($ millions | ) | 1,070 | 1,210 | 2,280 | |||||||||||
| Average contract rate1 |
(US/Cdn dollar | ) | 1.35 | 1.35 | 1.35 | |||||||||||
|
|
|
|
|
|
|
|||||||||||
| Total US dollar hedge contracts |
($ millions | ) | 1,070 | 1,210 | 2,280 | |||||||||||
| Average hedge rate |
(US/Cdn dollar | ) | 1.35 | 1.35 | 1.35 | |||||||||||
| Hedge ratio2 |
63 | % | 14 | % | 22 | % | ||||||||||
| 1 | The average contract rate is the weighted average of the rates stipulated in the outstanding contracts. |
| 2 | Hedge ratio is calculated by dividing the amount (in foreign currency) of outstanding derivative contracts by estimated future net exposures. |
At December 31, 2024:
| • | The value of the US dollar relative to the Canadian dollar was $1.00 (US) for $1.44 (Cdn), up from $1.00 (US) for $1.32 (Cdn) at December 31, 2023. The exchange rate averaged $1.00 (US) for $1.37 (Cdn) over the year. |
| • | The mark-to-market position on all foreign exchange contracts was a $140 million loss compared to a $12 million gain at December 31, 2023. The mark-to-market position is a component of gains/losses on derivatives as shown on the statement of earnings and calculated in accordance with IFRS. |
We manage counterparty risk associated with hedging by dealing with highly rated counterparties and diversifying our exposure. At December 31, 2024, all of our hedging counterparties had a S&P Global Ratings credit rating of A or better.
For information on the impact of foreign exchange on our intercompany balances, see note 26 to the financial statements.
MANAGEMENT’S DISCUSSION AND ANALYSIS 45
Outlook for 2025
Our outlook for 2025 reflects our plan to produce 18 million pounds (100% basis) at each of Cigar Lake and McArthur River/Key Lake, and 13 million to 14 million kgU in our fuel services segment, as well as continued work to extend the mine life at Cigar Lake.
In 2025, we expect strong financial performance, including cash flow generation. Our financial performance and the amount of cash generated will be dependent on sourcing the material required to meet our deliveries as planned, including achieving our production plans.
As in prior years, we will incur care and maintenance costs for the ongoing curtailment of our tier-two assets, which are expected to be between $62 million and $67 million.
2024 outlook compared to actual
Our actual results were largely in-line with the outlook provided in our third quarter MD&A. Average unit cost of sales in our fuel services segment was $29.14 per kgU compared to our outlook of $25.50 to $26.50 per kgU due to 2024 production being at the low end of the range provided in the third quarter MD&A combined with inflationary pressures.
See 2024 Financial results by segment on page 57 for details.
2025 Financial outlook
| CONSOLIDATED | URANIUM | FUEL SERVICES | WESTINGHOUSE | |||||||||||||
| Production (owned and operated properties) |
— | 22.4 million lbs | 13 to 14 million kgU | — | ||||||||||||
| Market purchases |
— | up to 3 million lbs | — | — | ||||||||||||
| Committed purchases (including Inkai purchase volumes) |
— | 9 million lbs | — | — | ||||||||||||
| Sales/delivery volume |
— | 31 to 34 million lbs | 13 to 14 million kgU | — | ||||||||||||
| Revenue |
$ | 3,300 to 3,550 million | $ | 2,800 to 3,000 million | $ | 500-550 million | — | |||||||||
| Average realized price |
— | $ | 84.00/lb | 1 | — | — | ||||||||||
| Average unit cost of sales (including D&A) |
— | $ | 59.50-63.00/lb | 2 | $ | 27.00-$28.75/kgU | 3 | — | ||||||||
| Direct administration costs |
$ | 220-230 million | — | — | — | |||||||||||
| Exploration costs |
— | $ | 27 million | — | — | |||||||||||
| Research and development |
$ | 47 million | — | — | — | |||||||||||
| Capital expenditures |
$ | 360-400 million | $ | 285-310 million | $ | 70-80 million | — | |||||||||
| Adjusted EBITDA (non-IFRS measure see page 65) (USD) |
— | — | — | $ | 355-405 million | |||||||||||
| 1 | Uranium average realized price is calculated as the revenue from sales of uranium concentrate, transportation and storage fees divided by the volume of uranium concentrates sold |
| 2 | Uranium average unit cost of sales is calculated as the cash and non-cash costs of the product sold, royalties, care and maintenance and selling costs, divided by the volume of uranium concentrates sold. |
| 3 | Fuel services average unit cost of sales is calculated as the cash and non-cash costs of the product sold, transportation and weighing and sampling costs, as well as care and maintenance costs, divided by the volume of products sold. |
We do not provide an outlook for the items in the table that are marked with a dash.
The following assumptions were used to prepare the outlook in the table above:
| • | Market purchases reflect the market purchases we have made to date or plan to make in 2025. Market purchases may vary if planned production varies. In addition, if we decide to increase our working inventory from current levels our market purchases could be higher. Our market purchases could also be lower if, instead of making market purchases, we choose to source the required volumes by temporarily reducing inventory levels, by pulling forward long-term purchase commitments, or by drawing on loan arrangements we have in place. |
46 CAMECO CORPORATION
| • | Committed purchases are based on the 4.8 million pounds we currently have commitments to acquire under contract in 2025 and our JV Inkai purchases, which we have assumed will be equivalent to our 2024 purchase volume of 4.2 million pounds. Following the halt of production in January 2025 at Inkai, we are in discussions with JV Inkai and KAP to determine how the halt will impact production at Inkai in 2025 and thereafter and our corresponding purchase entitlements. If Inkai production and/or deliveries vary, committed purchases will vary and we may have to rely on our other sources of supply described above. We equity account for our minority ownership interest in JV Inkai. We record our share of its production as a purchase. However, this does not reflect our share of the economic benefit. Our share of the economic benefit is based on the difference between our purchase price and JV Inkai’s lower production cost and is reflected in the line item on our statement of earnings called, “share of earnings from equity-accounted investees”. As a result, increases in the spot price increase our cost of purchases from JV Inkai and also our “share of earnings from equity-accounted investees”. The benefit is realized, through receipt of a cash dividend, when declared and paid by JV Inkai. |
| • | Our 2025 outlook for sales/delivery volume does not include sales between our uranium and fuel services segments. |
| • | Sales/delivery volume is based on the volumes we currently have commitments to deliver under contract in 2025. |
| • | Uranium revenue and average realized price are based on a uranium spot price of $71.75 (US) per pound (the UxC spot price on December 30, 2024), a long-term price indicator of $79.00 (US) per pound (the UxC long-term indicator on December 30, 2024) and an exchange rate of $1.00 (US) for $1.40 (Cdn). |
| • | Uranium average unit cost of sales (including D&A) is based on the expected unit cost of sales for produced material, the planned market purchases and committed purchases noted in the outlook at an anticipated average purchase price of about $100 (Cdn) per pound and includes care and maintenance costs of between $62 million and $67 million. We expect overall unit cost of sales could vary if there are changes in production and market or committed purchase volumes or the mix of supply sources used to meet our contract deliveries, uranium spot prices, and/or care and maintenance costs in 2025. In addition, unit cost of sales could be impacted by the imposition of tariffs in the US, see Managing our costs on page 28 for more information. |
| • | The adjusted EBITDA outlook for Westinghouse is based on the assumptions listed later in this section. |
| • | Westinghouse and JV Inkai are accounted for using the equity method for our share. Under equity accounting Westinghouse and JV Inkai capital expenditures are not presented within our consolidated financial statements and are therefore not included in our outlook for capital expenditures. |
For more information on how changes in the exchange rate or uranium prices can impact our outlook see Revenue, adjusted net earnings, and cash flow sensitivity analysis below, and Foreign exchange starting on page 44.
In 2025 we expect our share of adjusted EBITDA from our equity investment in Westinghouse to be between $355 million and $405 million in US dollars. Over the next five years, we expect its adjusted EBITDA will grow at a compound annual growth rate of 6% to 10%.
| $USD | ||||
| CAMECO SHARE (49%) |
MILLIONS | |||
| Net loss |
(20-70 | ) | ||
| Depreciation and amortization |
260-275 | |||
| Finance income |
(1-2 | ) | ||
| Finance costs |
120-135 | |||
| Income tax expense (recovery) |
5-(10 | ) | ||
|
|
|
|||
| EBITDA |
320-370 | |||
| Inventory purchase accounting |
1-5 | |||
| Restructuring costs |
15-30 | |||
| Other expenses |
10-25 | |||
|
|
|
|||
| Adjusted EBITDA (non-IFRS, see page 65) |
355-405 | |||
|
|
|
|||
Note: the ranges for 2025 outlook for EBITDA and adjusted EBITDA are not determined using the high and low estimates of the ranges provided for each of the detailed reconciling line items.
We expect that earnings and adjusted EBITDA will be weak in the first half of the year and weighted to the fourth quarter.
The outlook for adjusted EBITDA from Westinghouse for 2025 and its growth over the next five years are based on the following assumptions:
MANAGEMENT’S DISCUSSION AND ANALYSIS 47
| • | A compound annual growth rate in revenue from its core business of 6% to 8%, which is slightly higher than the anticipated average growth rate of the nuclear industry based on the World Nuclear Association’s Reference Case. In addition to orders for pressurized water reactor fuel and services, this includes orders for VVER, BWR fuel and services, and a phase out of AGR fuel. The outlook assumes that work is fulfilled on the timelines and scope expected based on current orders received, and additional work is secured based on past trends. The expected margins for the core business are aligned with the historic margins of 16% to 19%, with the variability expected to come from product mix compared to in previous years. |
| • | Growth in its new build business from new AP1000 reactor projects based on agreements that have been signed and announcements where AP1000 technology has been selected. This includes Poland, Bulgaria and Ukraine, as well as the expected benefit over this period for deployment of reactor designs using Westinghouse’s technology. It is assumed that work on announced agreements and announced selections to be done by Westinghouse would proceed on the timelines and revenue pattern noted under the New Build Framework. A delay in project timelines or cancellation of announced projects would result in a growth rate near the bottom of the range. The top of the growth range assumes the announced projects continue and two additional projects are secured within the timeframe from the group of planned and proposed projects. For all new build projects, the growth assumes Westinghouse undertakes only the engineering and procurement work required prior to a new reactor project breaking ground, which is a small component of the overall potential. |
| • | Estimates and assumptions, including growth capital timelines, new build development timelines for both announced and potential reactor builds which are subject to regulatory approval, as well as risks related to the current geopolitical and macro-economic environment, may differ significantly from those assumed. |
| • | Contributions from new technologies are outside the 5-year time frame. Timelines for investment in research and development for new technologies, including the eVinci microreactor and AP300 small modular reactor, may differ from that assumed. |
| • | The outlook for capital expenditures includes growth capex for expansion of fuel fabrication capabilities, as well as work to evaluate cost, timeline and infrastructure required to bring back conversion capacity and consider the potential future opportunities at the Springfields site in the UK. As with Cameco’s other investments, planning for this site will align with market opportunities. |
Westinghouse 2025 capital spending outlook
| CAMECO’S SHARE ($USD MILLIONS) |
2025 PLAN | |||
| Total |
120-150 | |||
|
|
|
|||
| Sustaining capital |
60-75 | |||
| Growth capital |
60-75 | |||
Westinghouse debt
At December 31, 2024, Westinghouse had the following outstanding debt:
| • | $3.5 billion (US) term loan with a maturity of January 2031 |
| • | credit facilities of $500 million (US), which were undrawn and mature in January 2029 |
| • | financial assurances including letters of credit of about $330 million (US) issued and surety bonds of $294 million (US) |
The credit agreements are non-recourse to Cameco, but come with certain covenants, which if breached, could result in all amounts outstanding thereunder to be immediately due and payable by Westinghouse. We expect Westinghouse to continue to comply with these covenants in 2025.
Caution about forward-looking information relating to our future earnings and adjusted EBITDA form Westinghouse
This discussion of our expectations for Westinghouse’s future earnings and adjusted EBITDA and our share thereof is forward-looking information that is based upon the assumptions and subject to the material risks discussed under the headings Caution about forward-looking information beginning on page 2. Actual results and events may be significantly different from what we currently expect.
REVENUE, ADJUSTED NET EARNINGS, AND CASH FLOW SENSITIVITY ANALYSIS
We have sensitivity to the uranium price through both our sales and purchase commitments. However, at the current price levels many of the market-related sales contracts we have delivered into or are delivering into this year are subject to ceiling prices and therefore are generally less sensitive than our purchase commitments.
48 CAMECO CORPORATION
As a result, if the uranium spot price increased by $5 (US) per pound, we expect revenue would increase by $64 million, while ANE would increase by $18 million and cash flow would decrease by $14 million. From a cash flow perspective, the sensitivity does not adequately capture the impact of JV Inkai purchases, which straddle two fiscal reporting periods due to when dividends are declared and paid by JV Inkai. The cash flow sensitivity includes the cash outflow for the 4.2 million pounds of uranium assumed to be purchased from JV Inkai in 2025 at a 5% discount to the spot price but does not account for an associated increase in the cash dividend expected, which will be tied to our agreed to 2025 production purchase entitlement and is expected to be received in 2026. JV Inkai distributes excess cash as dividends to its owners, net of working capital requirements. In the case of a $5 (US) per pound increase in uranium prices, the JV Inkai purchases are responsible for about a $28 million decrease in cash flow, and we expect the impact of these purchases on the 2025 cash flow will be partially offset by dividends once declared and paid in 2026.
If the uranium spot price decreased by $5 (US) per pound, we expect revenue to decrease by $65 million, ANE to decrease by $19 million, and cash flow to increase by $13 million. From a cash flow perspective, the impact of the noted decrease in uranium price on the assumed purchase of uranium from JV Inkai is expected to have the opposite impact from that described above for the noted uranium price increase.
In the case of a $5 (US) increase or decrease in the uranium spot price, the sensitivity for ANE compared to the sensitivity for cash flow is less due to the impact on our net earnings from the inclusion of our share of earnings from our equity-accounted investment in JV Inkai in the reporting period, the rate of inventory turnover, and income taxes.
The following assumptions were used to prepare the revenue, ANE and cash flow sensitivity analysis above:
| • | 4.8 million pounds of purchases are sourced from the market. |
| • | Total JV Inkai purchases for the year are equivalent to our 2024 purchase volume of 4.2 million pounds. |
| • | For market-related contracts not yet priced and for delivery in 2025, subject to any floors or ceilings, we used a uranium spot price of $71.75 (US) per pound (the UxC spot price as of December 30, 2024), a long-term price indicator of $79.00 (US) per pound (the UxC long-term indicator on December 30, 2024) and an exchange rate of $1.00 (US) for $1.40 (Cdn). |
To the extent that our market purchases or Inkai purchases vary, the sensitivity of our ANE and cash flow to changes in the spot and long-term prices may be impacted. In the case of decreased market or Inkai purchases, our sensitivity would be reduced. In the case of increased market or Inkai purchases, our sensitivity would be greater.
A one cent increase or decrease in the value of the US dollar compared to the Canadian dollar would respectively increase or decrease expected revenue by $22 million, ANE by $3 million and cash flow by $2 million. The majority of our sales are denominated in US dollars, resulting in sensitivity to foreign exchange rates. Revenue will be recognized at the prevailing foreign exchange rate at the time of the sale. ANE and cash flow are less sensitive to foreign exchange rates as we have layered in foreign exchange hedges to provide cash flow certainty. Currently, for 2025, we have $1,070 million (US) hedged at an average rate of 1.35, meaning for ANE and cash flow purposes that this portion of our net exposure to the US dollar will realize a rate of 1.35 USDCAD instead of prevailing rates. See Foreign Exchange starting on page 44 for more details.
PRICE SENSITIVITY ANALYSIS: URANIUM SEGMENT
As discussed under the Long-term contracting section on page 25, our average realized price is based on pricing terms established in our portfolio of long-term contracts, which includes a mix of base-escalated and market-related contracts that are layered in over time. Each confidential contract is bilaterally negotiated with the customer and delivery generally does not begin until two years or more after signing.
| • | Base-escalated contracts will reflect market conditions and pricing at the time each contract was finalized, with escalation factors applied based on when the material is delivered. |
| • | Market-related contracts reference a pricing mechanism that may be based on either the spot price or the long-term price, and that price is generally set a month or more prior to delivery, subject to specific terms unique to each contract, such as floors and ceilings set relative to market pricing at time of negotiation and typically escalated to time of delivery. |
As a result of these contracting dynamics, changes to our average realized price will generally lag changes in market prices in both rising and falling price conditions. The magnitude and direction of the deviation can vary based on the degree of market price volatility between the time the contract price is set, and the time the product is delivered.
MANAGEMENT’S DISCUSSION AND ANALYSIS 49
To help understand how the pricing under our current portfolio of commitments is expected to react at various spot prices at December 31, 2024, we have constructed the table that follows.
The table is based on the volumes and pricing terms under the long-term commitments in our contract portfolio that have been finalized as at December 31, 2024. The table does not include volumes and pricing terms in contracts under negotiation or those that have been accepted but are still subject to contract finalization. Based on the terms and volumes under contracts that have been finalized, the table is designed to indicate how our average realized price would react under various spot price assumptions at a point in time. In other words, the prices shown in the table would only be realized if the contract portfolio remained exactly as it was on December 31, 2024, using the following assumptions:
| • | The uranium price remains fixed at a given spot level for each annual period shown |
| • | Deliveries based on commitments under finalized contracts include best estimates of the expected deliveries and flexibility under contract terms |
| • | To reflect escalation mechanisms contained in existing contracts, the long-term US inflation rate target of 2% is used, for modeling purposes only |
It is important to note, that the table is not a forecast of prices we expect to receive. The prices we actually realize will be different from the prices shown in the table. We intend to update this table each quarter in our MD&A to reflect deliveries made and changes to our contract portfolio. As a result, we expect the table to change from quarter to quarter.
Expected realized uranium price sensitivity under various spot price assumptions at December 31, 2024
| (rounded to the nearest $1.00) | ||||||||||||||||||||||||||||
| SPOT PRICES | ||||||||||||||||||||||||||||
| ($US/lb U3O8) |
$20 | $40 | $60 | $80 | $100 | $120 | $140 | |||||||||||||||||||||
| 2025 |
43 | 47 | 55 | 61 | 64 | 65 | 65 | |||||||||||||||||||||
| 2026 |
42 | 45 | 56 | 66 | 69 | 70 | 72 | |||||||||||||||||||||
| 2027 |
42 | 45 | 57 | 69 | 73 | 75 | 77 | |||||||||||||||||||||
| 2028 |
48 | 50 | 59 | 71 | 76 | 78 | 80 | |||||||||||||||||||||
| 2029 |
50 | 52 | 61 | 73 | 81 | 84 | 86 | |||||||||||||||||||||
As of December 31, 2024, we had commitments requiring delivery of an average of about 28 million pounds per year from 2025 through 2029, with commitment levels in 2025 through 2027 higher than the average and in 2028 and 2029 lower than the average, reflecting our disciplined approach to contracting. As the market improves, we expect to continue to layer in volumes capturing greater upside using market-related pricing mechanisms.
Liquidity and capital resources
Our financial objective is to ensure we have the cash and access to capital to fund our operating activities, investments and other financial obligations in order to execute our strategy, take advantage of opportunities and to self-manage risk. We regularly consider our financing options so we can take advantage of favourable market conditions when they arise. We have a number of alternatives to fund future capital requirements, including using our operating cash flow, drawing on our existing credit facilities, entering new credit facilities, and raising additional capital through debt or equity financings, including by offering securities on our base shelf prospectus or utilizing our at-the-market equity program.
At the end of 2024, we had cash and cash equivalents of $600 million, while our total debt amounted to $1.3 billion. We have a risk management policy to manage our cash balances and investments, which are largely held in government securities or with banks that are party to our lending facilities. On January 13, 2025, we repaid the remaining $200 million (US) on our US term loan, extinguishing the term loan and further reducing our total debt outstanding. A distribution of $100 million (US) from Westinghouse was paid in February 2025, of which we received $49 million (US) representing our share of the distribution.
We expect to continue to see strong earnings and cash flow generation in 2025.
50 CAMECO CORPORATION
We have large, creditworthy customers that continue to need our nuclear fuel products and services irrespective of weak economic conditions or uncertain trade policies, therefore we expect the contract portfolio we have built to continue to provide a solid revenue stream. In our uranium segment, we have commitments to deliver an average of 28 million pounds per year from 2025 through 2029, with commitment levels in 2025 through 2027 higher than the average and in 2028 and 2029 lower than the average.
We expect the low-cost production from our tier one assets will continue to generate strong cash flows which we expect will meet our capital requirements during 2025. However, cash flow from operations for 2025 will be dependent on our ability to source the material required to meet our deliveries as planned, including achieving our production plans.
With the Supreme Court’s dismissal of CRA’s application for leave, the dispute of the 2003 through 2006 tax years are fully and finally resolved in our favour. Furthermore, we are confident the courts would reject any attempt by CRA to utilize the same position and arguments for tax years 2007 through 2014, or its alternate reassessing position for tax years 2014 through 2017, or its new alternative reassessing position for 2018 and believe CRA should return all cash and letters of credit (to date, $555 million) being held. However, timing of any further payments is uncertain, and there can be no assurance that the courts will take this position. See page 41 for more information.
Financial condition
| 2024 | 2023 | |||||||
| Cash position ($ millions) |
||||||||
| (cash and cash equivalents) |
600 | 567 | ||||||
|
|
|
|
|
|||||
| Cash provided by operations ($ millions) |
||||||||
| (net cash flow generated by our operating activities after changes in working capital) |
905 | 688 | ||||||
|
|
|
|
|
|||||
| Cash from operations/net debt |
||||||||
| (net debt is total consolidated debt, less cash position) |
133 | % | 57 | % | ||||
|
|
|
|
|
|||||
| Net debt/total capitalization |
||||||||
| (total capitalization is net debt and equity) |
10 | % | 17 | % | ||||
|
|
|
|
|
|||||
Credit ratings
The credit ratings assigned by external ratings agencies are important as they impact our ability to raise capital at competitive pricing to support our business operations and execute our strategy.
Third-party ratings for our commercial paper and senior debt as of February 19, 2025 are as follows:
| SECURITY |
DBRS | S&P | ||||||
| Commercial paper |
R-2 (middle) | A-3 | ||||||
| Senior unsecured debentures |
BBB | BBB- | ||||||
| Rating trend / rating outlook |
Stable | 1 | Positive | 2 | ||||
| 1 | On September 9, 2024, DBRS confirmed the rating and outlook. |
| 2 | On December 19, 2024, S&P revised Cameco’s rating outlook to positive and affirmed the rating. |
The rating agencies may revise or withdraw these ratings if they believe circumstances warrant. The rating trend/outlook represents the rating agency’s assessment of the likelihood and direction that the rating could change in the future.
A change in our credit ratings could affect our cost of funding and our access to capital through the capital markets.
MANAGEMENT’S DISCUSSION AND ANALYSIS 51
Liquidity
| ($ MILLIONS) |
2024 | 2023 | ||||||
| Cash and cash equivalents at beginning of year |
567 | 2,282 | ||||||
|
|
|
|
|
|||||
| Cash from operations |
905 | 688 | ||||||
|
|
|
|
|
|||||
| Investment activities |
||||||||
| Additions to property, plant and equipment and acquisitions |
(212 | ) | (3,183 | ) | ||||
| Other investing activities |
5 | — | ||||||
|
|
|
|
|
|||||
| Financing activities |
||||||||
| Change in debt |
(545 | ) | 817 | |||||
| Interest paid |
(89 | ) | (41 | ) | ||||
| Issue of shares |
17 | 28 | ||||||
| Dividends |
(70 | ) | (52 | ) | ||||
| Other financing activities |
(1 | ) | (3 | ) | ||||
|
|
|
|
|
|||||
| Exchange rate on changes on foreign currency cash balances |
23 | 31 | ||||||
|
|
|
|
|
|||||
| Cash and cash equivalents at end of year |
600 | 567 | ||||||
|
|
|
|
|
|||||
CASH FROM OPERATIONS
Cash from operations in 2024 was higher than in 2023 due to higher earnings and a higher dividend payment from JV Inkai in 2024, partially offset by the $86 million cash refund received from CRA in 2023 and higher interest received due to higher cash and investment balances in 2023. Not including working capital requirements, our operating cash flows in the year were up $203 million. See note 23 to the financial statements.
INVESTING ACTIVITIES
Cash used in investing includes acquisitions and capital spending.
Capital spending
We classify capital spending as sustaining, capacity replacement or growth. As a mining company, sustaining capital is the money we spend to keep our facilities running in their present state, which would follow a gradually decreasing production curve, while capacity replacement capital is spent to maintain current production levels at those operations. Growth capital is money we invest to generate incremental production, and for business development. We have a capital allocation process to approve our capital spend. See Capital Allocation beginning on page 29 for more information.
| CAMECO’S SHARE ($ MILLIONS) |
2024 ACTUAL | 2025 PLAN | ||||||
| Sustaining capital |
||||||||
| Uranium |
70 | 80-85 | ||||||
| Fuel services |
41 | 65-70 | ||||||
| Other |
9 | 5-10 | ||||||
|
|
|
|
|
|||||
| Total sustaining capital |
120 | 150-165 | ||||||
|
|
|
|
|
|||||
| Capacity replacement capital |
||||||||
| Uranium |
65 | 145-160 | ||||||
| Fuel services |
— | — | ||||||
|
|
|
|
|
|||||
| Total capacity replacement capital |
65 | 145-160 | ||||||
|
|
|
|
|
|||||
| Growth capital |
||||||||
| Uranium |
19 | 60-65 | ||||||
| Fuel services |
8 | 5-10 | ||||||
|
|
|
|
|
|||||
| Total growth capital |
27 | 65-75 | ||||||
|
|
|
|
|
|||||
| Total sustaining, capacity replacement and growth |
212 | 360-400 | ||||||
|
|
|
|
|
|||||
52 CAMECO CORPORATION
Outlook for investing activities
| CAMECO’S SHARE ($ MILLIONS) |
2025 PLAN | 2026 PLAN | 2027 PLAN | |||||||||
| Total uranium & fuel services |
360-400 | 375-425 | 280-330 | |||||||||
|
|
|
|
|
|
|
|||||||
| Sustaining capital |
150-165 | 135-150 | 130-145 | |||||||||
| Capacity replacement capital |
145-160 | 140-155 | 125-140 | |||||||||
| Growth capital |
65-75 | 100-120 | 25-45 | |||||||||
Our 2025, 2026 and 2027 capital spending estimates assume that we produce 18 million pounds (100% basis) per year at McArthur River/Key Lake and Cigar Lake and between 13 million and 14 million kgU in fuel services. If our production plans change, then our capital spending estimates may change.
Our estimate for capital spending in 2025 has been increased to between $360 million and $400 million (previously between $200 million and $250 million) and in 2026 has been increased to between $375 million and $425 million (previously between $200 million and $250 million) due mainly to capital projects to help ensure reliability and sustainability of existing operations. Projects include addressing aging infrastructure and potential bottlenecks at Key Lake and the advancement of freezing at McArthur River. While these projects are required to support and maintain capacity at current production levels, they have been classified as growth because they also position us for future production flexibility. No decision on changes to future production levels has been made.
Capital expenditures for JV Inkai are expected to be covered by JV Inkai cash flows and Westinghouse capital expenditures are expected to be covered by Westinghouse cash flows in 2025. Both are included in our overall equity investments.
Major capital expenditures expected in 2025 include:
| • | Investments required to refresh aging infrastructure and mobile equipment to help ensure reliable and sustainable production at all our operations as planned, including work required to upgrade the calciner and crystallization circuit at Key Lake. |
| • | Cigar Lake – continued work on the Cigar Lake extension. See Cigar Lake starting on page 81. |
| • | McArthur River – freeze plant expansion and freeze distribution to next mining zone. |
This information regarding currently expected capital expenditures for future periods is forward-looking information and is based upon the assumptions and subject to the material risks discussed on pages 4 to 6. Our actual capital expenditures for future periods may be significantly different.
FINANCING ACTIVITIES
Cash from financing includes borrowing and repaying debt, and other financial transactions including paying dividends and providing financial assurance.
Contractual obligations
| 2026 AND | 2028 AND | 2030 AND | ||||||||||||||||||
| DECEMBER 31 ($ MILLIONS) |
2025 | 2027 | 2029 | BEYOND | TOTAL | |||||||||||||||
| Debt1 |
288 | 400 | — | 600 | 1,288 | |||||||||||||||
| Interest on debt1 |
59 | 83 | 60 | 103 | 305 | |||||||||||||||
| Provision for reclamation |
35 | 96 | 108 | 1,144 | 1,383 | |||||||||||||||
| Provision for waste disposal |
4 | 5 | 1 | — | 10 | |||||||||||||||
| Other liabilities |
87 | 65 | 5 | 77 | 234 | |||||||||||||||
| Capital commitments |
148 | — | — | — | 148 | |||||||||||||||
| Unconditional product purchase obligations |
415 | 190 | 12 | — | 617 | |||||||||||||||
|
|
|
|
|
|
|
|
|
|
|
|||||||||||
| Total |
1,036 | 839 | 186 | 1,924 | 3,985 | |||||||||||||||
|
|
|
|
|
|
|
|
|
|
|
|||||||||||
| 1 | Debt and interest on debt are calculated as of December 31, 2024 and assume that all debt is held to maturity and as such do not incorporate the 2025 repayment of the term loan outstanding, or any other reductions, and the associated impact on interest payments. |
We have contractual capital commitments of approximately $148 million at December 31, 2024. Certain of the contractual commitments may contain cancellation clauses; however, we disclose the commitments based on management’s intent to fulfil the contracts.
MANAGEMENT’S DISCUSSION AND ANALYSIS 53
We have borrowing capacity including the following, which we expect to be sufficient to meet our needs in 2025:
| • | A $1.0 billion unsecured revolving credit facility that matures October 1, 2028. Each calendar year, upon mutual agreement, the facility can be extended for an additional year. We may increase the revolving credit facility above $1.0 billion, by increments of no less than $50 million, up to a total of $1.25 billion. The facility ranks equally with all of our other senior debt. At December 31, 2024, there were no amounts outstanding under this facility. |
| • | Financial assurance facilities with various financial institutions and insurers of approximately $1.9 billion. At December 31, 2024, we had approximately $1.5 billion outstanding on these facilities. For more information see Financial Assurances below. |
On May 24, 2024, we issued debentures in the amount of $500 million, at an interest rate of 4.94% per annum, the Series I senior unsecured debentures mature on May 24, 2031. The proceeds from the issuance were used to retire our outstanding $500 million Series G debentures bearing interest of 4.19% at maturity on June 24, 2024.
In total we have $1.0 billion in senior unsecured debentures outstanding:
| • | $400 million bearing interest at 2.95% per year, maturing on October 21, 2027 |
| • | $500 million bearing interest at 4.94% per year, maturing on May 24, 2031 |
| • | $100 million bearing interest at 5.09% per year, maturing on November 14, 2042 |
Additionally, after making partial prepayments of $400 million (US) in 2024, $200 million (US) remained outstanding at December 31, 2024 on the term loan debt incurred in connection with the Westinghouse acquisition. The remaining principal of $200 million (US) was repaid in full on January 13, 2025.
Debt covenants
Our credit agreements include the following financial covenants:
| • | our funded debt to tangible net worth ratio must be 1:1 or less |
| • | other customary covenants and events of default |
Funded debt is total consolidated debt less non-recourse debt, $100 million in letters of credit, cash and cash equivalents and short-term investments.
Not complying with any of these covenants could result in accelerated payment and termination of our credit agreements. At December 31, 2024, we complied with all covenants, and we expect to continue to comply in 2025.
OFF-BALANCE SHEET ARRANGEMENTS
We had three kinds of off-balance sheet arrangements at the end of 2024:
| • | purchase commitments |
| • | financial assurances |
| • | other arrangements |
Purchase commitments
We make purchases under long-term contracts where it is beneficial for us to do so and to support our long-term contract portfolio. The following table is based on our purchase commitments in our uranium and fuel services segments at December 31, 20242, but does not include purchases of our share of Inkai production. These commitments include a mix of fixed-price and market-related contracts. Actual payments will be different as a result of changes to our purchase commitments and, in the case of contracts with market-related pricing, the market prices in effect at the time of delivery. We will update this table as required in our MD&A to reflect material changes to our purchase commitments and changes in the prices used to estimate our commitments under market-related contracts.
| 2026 AND | 2028 AND | 2030 AND | ||||||||||||||||||
| DECEMBER 31, 2024 ($ MILLIONS) |
2025 | 2027 | 2029 | BEYOND | TOTAL | |||||||||||||||
| Purchase commitments1,2 |
415 | 190 | 12 | — | 617 | |||||||||||||||
|
|
|
|
|
|
|
|
|
|
|
|||||||||||
| 1 | Denominated in US dollars and Japanese yen, converted from US dollars to Canadian dollars at the rate of 1.40 and from Japanese yen to Canadian dollars at the rate of $0.01. |
| 2 | These amounts have been adjusted for any additional purchase commitments that we have entered into since December 31, 2024, but does not include deliveries taken under contract since December 31, 2024. |
54 CAMECO CORPORATION
We have commitments of $617 million (Cdn) for the following:
| • | approximately 7.8 million pounds of U3O8 equivalent from 2025 to 2028 |
| • | approximately 0.2 million kgU as UF6 in conversion services in 2025 |
| • | about 0.3 million SWU of enrichment services to meet existing forward sales commitments under agreements with a non-Western supplier |
The suppliers do not have the right to terminate agreements other than pursuant to customary events of default provisions.
Financial assurances
We use standby letters of credit and surety bonds mainly to provide financial assurance for the decommissioning and reclamation of our mining and fuel services facilities. We also use financial assurances to support obligations relating to the CRA dispute, for ordinary course of business and as overdraft protection. At December 31, 2024 our financial assurances totaled $1.5 billion, up from $1.4 billion at December 31, 2023. Our financial assurances were made up of $1.13 billion related to our decommissioning and reclamation obligations and $346 million in relation to the CRA tax dispute. Our financial assurances renew automatically on an annual basis, unless otherwise advised by the issuing institution.
Once we have permanently stopped mining and processing activities at an operating site, we are required to decommission the site to the satisfaction of the regulators. We have developed preliminary decommissioning plans for our operating sites and use them to estimate our decommissioning costs. Regulators review and accept our preliminary decommissioning plans on a regular basis. As the site approaches or goes into decommissioning, regulators review the detailed decommissioning plans. This can result in further regulatory process, as well as additional requirements, costs and financial assurances.
We have submitted updates to all Saskatchewan operations’ Preliminary Decommissioning Plan (PDP) and Preliminary Decommissioning Cost Estimate (PDCE) documents in accordance with the five-year timeline specified in the regulations. Upon acceptance of the PDP and PDCE documents by the Saskatchewan Ministry of Environment and Canadian Nuclear Safety Commission (CNSC) staff, a formal Commission proceeding will be required for final approval of the PDP and PDCE by the Commission. Existing financial assurances are in place and will be updated upon regulatory acceptance of the updated documents.
The PDP and PDCE for the Blind River refinery and Cameco Fuel Manufacturing were approved by the CNSC in 2022; for the Port Hope conversion facility, they were revised in 2022, approved by the Commission in May 2024 and the financial assurance was updated in June 2024.
For Smith Ranch-Highland, the 2024 surety was approved and is awaiting approval by the State of Wyoming. For Crow Butte, the 2024 annual update was submitted to the federal Nuclear Regulatory Commission and Nebraska Department of Environmental Quality in September 2024.
At the end of 2024, our estimate of total decommissioning and reclamation costs was $1.38 billion. This is the undiscounted value of the obligation and is based on our current operations. We had accounting provisions of $1.03 billion at the end of 2024 (the present value of the $1.38 billion). Regulatory approval is required prior to beginning decommissioning. The expected timing for these costs in based on each mine or fuel service facility’s expected operating life. Our required costs for decommissioning and reclamation in each of the next five years are not expected to be material. However, we may choose to undertake progressive reclamation activities, for example, as we do at our US assets and through our Vision in Motion project at our Port Hope fuel services facilities.
Other arrangements
We have arranged for standby product loan facilities with various counterparties. The arrangements allow us to borrow up to 1.8 million kgU of UF6 conversion services and 4.9 million pounds of U3O8 by September 30, 2027 with repayment in kind up to December 31, 2027. Under the loan facilities, standby fees of up to 1.5% are payable based on the market value of the facilities and interest is payable on the market value of any amounts drawn at rates ranging from 0.5% to 3.0%. At December 31, 2024, we have 1.6 million kgU of UF6 conversion services and 2.5 million pounds of U3O8 drawn on the loans.
MANAGEMENT’S DISCUSSION AND ANALYSIS 55
BALANCE SHEET
| DECEMBER 31, | CHANGE | |||||||||||||||
| ($ MILLIONS EXCEPT PER SHARE AMOUNTS) |
2024 | 2023 | 2022 | 2023 TO 2024 | ||||||||||||
| Inventory |
827 | 692 | 665 | 20 | % | |||||||||||
| Total assets |
9,907 | 9,934 | 8,633 | — | ||||||||||||
| Total non-current liabilities |
2,357 | 2,651 | 2,236 | (11 | )% | |||||||||||
| Dividends per common share |
0.16 | 0.12 | 0.12 | 33 | % | |||||||||||
Total product inventories increased by 20% to $827 million this year primarily due to the higher cost of purchased material and a higher inventory volume. At December 31, 2024, our average cost for uranium was $59.39 per pound, up from $49.62 per pound at December 31, 2023. As of December 31, 2024, we held an inventory of 11.0 million pounds of U3O8 equivalent (excluding broken ore), compared to 10.3 million pounds at the end of 2023.
At the end of 2024, our total assets amounted to $9.9 billion, no change compared to 2023. In 2023, the total asset balance increased by $1.3 billion compared to 2022, due mainly to the addition of Westinghouse as an equity-accounted investee, partially offset by the decrease in cash and cash equivalents and short-term investments used to fund the acquisition.
56 CAMECO CORPORATION
2024 financial results by segment
Uranium
| HIGHLIGHTS |
2024 | 2023 | CHANGE | |||||||||||||
| Production volume (million lbs) |
23.4 | 17.6 | 33 | % | ||||||||||||
|
|
|
|
|
|
|
|||||||||||
| Sales volume (million lbs) |
33.6 | 32.0 | 5 | % | ||||||||||||
|
|
|
|
|
|
|
|||||||||||
| Average spot price |
($US/lb | ) | 85.14 | 62.51 | 36 | % | ||||||||||
| Average long-term price |
($US/lb | ) | 78.88 | 58.20 | 36 | % | ||||||||||
| Average realized price |
($US/lb | ) | 58.34 | 49.76 | 17 | % | ||||||||||
| ($Cdn/lb | ) | 79.70 | 67.31 | 18 | % | |||||||||||
|
|
|
|
|
|
|
|||||||||||
| Average unit cost of sales (including D&A) |
($Cdn/lb | ) | 59.47 | 53.41 | 11 | % | ||||||||||
|
|
|
|
|
|
|
|||||||||||
| Revenue ($ millions) |
2,677 | 2,153 | 24 | % | ||||||||||||
|
|
|
|
|
|
|
|||||||||||
| Gross profit ($ millions) |
681 | 445 | 53 | % | ||||||||||||
|
|
|
|
|
|
|
|||||||||||
| Gross profit (%) |
25 | 21 | 19 | % | ||||||||||||
|
|
|
|
|
|
|
|||||||||||
| Earnings before income taxes |
904 | 606 | 49 | % | ||||||||||||
|
|
|
|
|
|
|
|||||||||||
| Adjusted EBITDA (non-IFRS, see page 65)1 |
1,179 | 835 | 41 | % | ||||||||||||
|
|
|
|
|
|
|
|||||||||||
| 1 | Includes JV Inkai adjusted EBITDA of $279 million in 2024 and $235 million in 2023. See JV Inkai contribution to uranium segment below. |
Production volumes in 2024 increased by 33% compared to 2023. See Uranium – production overview on page 76 for more information.
Uranium revenues this year were up 24% compared to 2023 due to an increase in sales volumes of 5% and an increase of 18% in the Canadian dollar average realized price due to the impact of the increase in average US dollar spot price on market-related contracts. For more information on the impact of spot price changes on average realized price, see Price sensitivity analysis: uranium segment on page 49.
Total cost of sales (including D&A) increased by 17% ($2.0 billion compared to $1.7 billion in 2023) due primarily to an increase in sales volume of 5% as well as an 11% increase in unit cost of sales. Unit cost of sales is higher than in the same period in 2023 due to the higher cost of purchased material in 2024 compared to the same period in 2023 partially offset by lower production costs.
The net effect was a $236 million increase in gross profit for the year.
The following table shows the costs of produced and purchased uranium incurred in the reporting periods (see Non-IFRS measures starting on page 65). These costs do not include care and maintenance costs and selling costs such as royalties, transportation and commissions, nor do they reflect the impact of opening inventories on our reported cost of sales.
| ($CDN/LB) |
2024 | 2023 | CHANGE | |||||||||
| Produced |
||||||||||||
| Cash cost |
21.60 | 24.12 | (10 | )% | ||||||||
| Non-cash cost |
9.75 | 11.60 | (16 | )% | ||||||||
|
|
|
|
|
|
|
|||||||
| Total production cost 1 |
31.35 | 35.72 | (12 | )% | ||||||||
|
|
|
|
|
|
|
|||||||
| Quantity produced (million lbs)1 |
23.4 | 17.6 | 33 | % | ||||||||
|
|
|
|
|
|
|
|||||||
| Purchased |
||||||||||||
| Cash cost1 |
102.04 | 81.02 | 26 | % | ||||||||
|
|
|
|
|
|
|
|||||||
| Quantity purchased (million lbs)1 |
11.0 | 11.3 | (3 | )% | ||||||||
|
|
|
|
|
|
|
|||||||
| Totals |
||||||||||||
| Produced and purchased costs |
53.95 | 53.43 | 1 | % | ||||||||
|
|
|
|
|
|
|
|||||||
| Quantities produced and purchased (million lbs) |
34.4 | 28.9 | 19 | % | ||||||||
|
|
|
|
|
|
|
|||||||
| 1 | Due to equity accounting for JV Inkai, our share of production is shown as a purchase at the time of delivery. JV Inkai purchases will fluctuate during the quarters and timing of purchases will not match production. In 2024 we purchased 4.2 million pounds at a purchase price per pound of $108.56 ($79.48 (US)) (2023 – 4.2 million pounds at a purchase price per pound of $92.72 ($67.69 (US))). |
MANAGEMENT’S DISCUSSION AND ANALYSIS 57
The average cash cost of production was 10% lower compared to 2023, due to higher production at Cigar Lake and McArthur River/Key Lake.
In 2025, we expect the average unit cost of production at McArthur River/Key Lake to continue to be higher than the average unit life of mine operating costs reflected in our most recent annual information form as we continue work to realize the benefits from the operational improvements that have been made. The average unit production cost at Cigar Lake is expected to trend down with higher planned production. The estimated average unit life of mine operating costs reflected in our most recent annual information form are $16.70 per pound at McArthur River/Key Lake and $20.58 per pound at Cigar Lake.
We equity account for our share of JV Inkai. As a result, we record our share of its production as a purchase, which under Kazakhstan’s pricing regulations, requires we purchase the material at a price equal to the uranium spot price, less a 5% discount. However, this does not reflect the economic benefit to Cameco. Our share of the economic benefit is based on the difference between our purchase price and JV Inkai’s lower production cost and is reflected in the line item on our statement of earnings called, “share of earnings from equity-accounted investees.” This benefit is realized through receipt of a cash dividend, when declared and paid by JV Inkai. Excess cash, net of working capital requirements is distributed to the partners as dividends. If there is a significant disruption to JV Inkai’s operations for any reason, it may not achieve its production plans, there may be a delay in production, and it may experience increased costs to produce uranium.
Our purchases in 2024, totaled about $1.12 billion, representing an average annual cost of $102.04 per pound, about $70.00 per pound higher than our total unit production cost for the year. Although purchased pounds are transacted in US dollars, we account for the purchases in Canadian dollars. The average cost of purchased material in Canadian dollar terms increased by 26% this year compared to 2023. The average cash cost of purchased material was $102.04 (Cdn), or $74.86 (US) per pound, compared to $81.02 (Cdn), or $59.42 (US) per pound in the same period in 2023.
JV Inkai contribution to uranium segment
Net earnings before income taxes includes $108 million from JV Inkai and $279 million is included in adjusted EBITDA from JV Inkai, compared to $129 million and $235 million respectively in 2023.
The increase in JV Inkai’s equity earnings and adjusted EBITDA was largely driven by the higher uranium prices in 2024 compared to 2023, partially offset by increased costs. In April, we received a cash dividend of $129 million (US), net of withholdings, based on JV Inkai’s 2023 financial performance. From a cash flow perspective, we expect to realize the benefit from JV Inkai’s 2024 financial performance in 2025, once the dividend for 2024 is declared and paid.
The following table reconciles our share of earnings from JV Inkai to adjusted EBITDA:
| ($ MILLIONS) |
2024 | 2023 | CHANGE | |||||||||
| Share of earnings from equity-accounted investee |
208 | 179 | 16 | % | ||||||||
| Depreciation and amortization |
23 | 14 | 64 | % | ||||||||
| Finance income |
(1 | ) | — | — | ||||||||
| Income tax expense |
58 | 42 | 38 | % | ||||||||
|
|
|
|
|
|
|
|||||||
| EBITDA |
288 | 235 | 23 | % | ||||||||
|
|
|
|
|
|
|
|||||||
| Unrealized foreign exchange gains |
(9 | ) | — | — | ||||||||
|
|
|
|
|
|
|
|||||||
| Adjusted EBITDA (non-IFRS, see page 65) attributable to JV Inkai |
279 | 235 | 19 | % | ||||||||
|
|
|
|
|
|
|
|||||||
ROYALTIES
We pay royalties on the sale of all uranium extracted at our mines in the province of Saskatchewan. Two types of royalties are paid:
| • | Basic royalty: calculated as 5% of gross sales of uranium, less the Saskatchewan resource credit of 0.75%. |
| • | Profit royalty: a 10% royalty is charged on profit up to and including $28.732/kg U3O8 ($13.03/lb) and a 15% royalty is charged on profit in excess of $28.732/kg U3O8. Profit is determined as revenue less certain operating, exploration, reclamation and capital costs. Both exploration and capital costs are deductible at the discretion of the producer. |
As a resource corporation in Saskatchewan, we also pay a corporate resource surcharge of 3% of the value of resource sales.
58 CAMECO CORPORATION
Fuel services
| (includes results for UF6, UO2, UO3 and fuel fabrication) HIGHLIGHTS |
2024 | 2023 | CHANGE | |||||||||||||
| Production volume (million kgU) |
13.5 | 13.3 | 2 | % | ||||||||||||
| Sales volume (million kgU) |
12.1 | 12.0 | 1 | % | ||||||||||||
| Average realized price |
($ | Cdn/kgU | ) | 37.87 | 35.61 | 6 | % | |||||||||
| Average unit cost of sales (including D&A) |
($ | Cdn/kgU | ) | 29.14 | 25.23 | 15 | % | |||||||||
| Revenue ($ millions) |
459 | 426 | 8 | % | ||||||||||||
| Earnings before income taxes |
108 | 129 | (16 | )% | ||||||||||||
| Adjusted EBITDA (non-IFRS, see page 65) |
145 | 164 | (12 | )% | ||||||||||||
| Adjusted EBITDA margin (non-IFRS, see page 65) |
32 | 38 | (16 | )% | ||||||||||||
Total revenue increased by 8% from 2023 due mainly to a 6% increase in the realized price. The increase in realized price was mainly the result of increased prices due to the impact of improving market conditions on our long-term contract portfolio.
Total cost of products and services sold (including D&A) increased 17% ($353 million compared to $301 million in 2023), due primarily to a 15% increase in average unit cost of sales compared to 2023 due to higher input costs.
The net effect was a $21 million decrease in earnings before income taxes.
Westinghouse
On November 7, 2023, we announced the closing of the acquisition of Westinghouse in a strategic partnership with Brookfield. Cameco now owns a 49% interest and Brookfield owns the remaining 51%. Under the equity method of accounting, beginning on November 7, 2023, we have included our share of Westinghouse’s earnings in our financial results.
| ($MILLIONS) (our share) |
2024 | 2023 | CHANGE | |||||||||
| Net loss1 |
(218 | ) | (24 | ) | >100 | % | ||||||
| Depreciation and amortization |
357 | 61 | >100 | % | ||||||||
| Finance income |
(4 | ) | (2 | ) | 100 | % | ||||||
| Finance costs |
225 | 30 | >100 | % | ||||||||
| Income tax recovery |
(61 | ) | (7 | ) | >100 | % | ||||||
|
|
|
|
|
|
|
|||||||
| EBITDA (non-IFRS, see page 65) |
299 | 58 | >100 | % | ||||||||
| Inventory purchase accounting2 |
71 | 27 | >100 | % | ||||||||
| Acquisition-related transition costs |
29 | — | — | |||||||||
| Other expenses |
78 | 8 | >100 | % | ||||||||
| Unrealized foreign exchange losses |
2 | 8 | (75 | )% | ||||||||
| Long-term incentive plan |
4 | — | — | |||||||||
|
|
|
|
|
|
|
|||||||
| Adjusted EBITDA (non-IFRS, see page 65) |
483 | 101 | >100 | % | ||||||||
|
|
|
|
|
|
|
|||||||
| Capital expenditures |
176 | 42 | >100 | % | ||||||||
|
|
|
|
|
|
|
|||||||
| Adjusted free cash flow (non-IFRS, see page 65) |
307 | 59 | >100 | % | ||||||||
|
|
|
|
|
|
|
|||||||
| Revenue |
2,892 | 521 | >100 | % | ||||||||
|
|
|
|
|
|
|
|||||||
| Adjusted EBITDA margin (non-IFRS, see page 65) |
17 | % | 19 | % | (14 | )% | ||||||
|
|
|
|
|
|
|
|||||||
| 1 | This table includes comparative results for the period beginning on the date of acquisition until the end of 2023. |
| 2 | Net earnings for 2023 and 2024 were impacted by purchase price accounting. Inventories acquired were assigned values based on the market price at the date of the acquisition. As these quantities are sold, cost of products and services sold reflects these market values, regardless of Westinghouse’s historic costs. |
The impact of purchase accounting, which required the revaluation of its inventories based on market prices at time of acquisition and the expensing of some other non-operating acquisition-related transition costs have resulted in a net loss of $218 million. The impact of these items was largely isolated to the first half of 2024 and are expected to have a smaller impact in future years. Increased depreciation and amortization charges will however continue to impact Westinghouse’s net earnings on an ongoing basis as a result of the revaluation of its assets upon our acquisition.
We use adjusted EBITDA as a performance measure as the impact of the revaluation of Westinghouse’s inventory and assets and the non-operating acquisition-related transition costs do not reflect the underlying performance for the reporting period. Adjusted EBITDA was $483 million in 2024.
MANAGEMENT’S DISCUSSION AND ANALYSIS 59
Fourth quarter financial results
Consolidated results
| THREE MONTHS ENDED | ||||||||||||
| HIGHLIGHTS | DECEMBER 31 | |||||||||||
| ($ MILLIONS EXCEPT WHERE INDICATED) |
2024 | 2023 | CHANGE | |||||||||
| Revenue |
1,183 | 844 | 40 | % | ||||||||
| Gross profit |
250 | 133 | 88 | % | ||||||||
| Net earnings attributable to equity holders |
135 | 80 | 69 | % | ||||||||
| $ per common share (basic) |
0.31 | 0.18 | 72 | % | ||||||||
| $ per common share (diluted) |
0.31 | 0.18 | 72 | % | ||||||||
| Adjusted net earnings (non-IFRS, see page 65) |
157 | 108 | 45 | % | ||||||||
| $ per common share (adjusted and diluted) |
0.36 | 0.25 | 44 | % | ||||||||
| Adjusted EBITDA (non-IFRS, see page 65) |
524 | 336 | 56 | % | ||||||||
| Cash provided by operations |
530 | 201 | >100 | % | ||||||||
Quarterly trends
| HIGHLIGHTS | 2024 | 2023 | ||||||||||||||||||||||||||||||
| ($ MILLIONS EXCEPT PER SHARE AMOUNTS) |
Q4 | Q3 | Q2 | Q1 | Q4 | Q3 | Q2 | Q1 | ||||||||||||||||||||||||
| Revenue |
1,183 | 721 | 598 | 634 | 844 | 575 | 482 | 687 | ||||||||||||||||||||||||
| Net earnings (loss) attributable to equity holders |
135 | 7 | 36 | (7 | ) | 80 | 148 | 14 | 119 | |||||||||||||||||||||||
| $ per common share (basic) |
0.31 | 0.02 | 0.08 | (0.02 | ) | 0.18 | 0.34 | 0.03 | 0.27 | |||||||||||||||||||||||
| $ per common share (diluted) |
0.31 | 0.02 | 0.08 | (0.02 | ) | 0.18 | 0.34 | 0.03 | 0.27 | |||||||||||||||||||||||
| Adjusted net earnings (non-IFRS, see page 65) |
157 | 24 | 65 | 46 | 108 | 96 | 46 | 133 | ||||||||||||||||||||||||
| $ per common share (adjusted and diluted) |
0.36 | 0.06 | 0.15 | 0.11 | 0.25 | 0.22 | 0.11 | 0.31 | ||||||||||||||||||||||||
| Cash from operations |
530 | 52 | 260 | 63 | 201 | 185 | 87 | 215 | ||||||||||||||||||||||||
Key things to note:
| • | The timing of customer requirements, which tends to vary from quarter to quarter, drives revenue in the uranium and fuel services segments, meaning quarterly results are not necessarily a good indication of annual results due to the variability in customer requirements. |
| • | Net earnings do not trend directly with revenue due to unusual items and transactions that occur from time to time. We use adjusted net earnings, a non-IFRS measure, as a more meaningful way to compare our results from period to period (see page 65 for more information). |
| • | Cash from operations tends to fluctuate as a result of the timing of deliveries and product purchases in our uranium and fuel services segments. |
| • | We acquired our share of Westinghouse on November 7, 2023. Our quarterly results are impacted by variability in the timing of Westinghouse’s customer requirements and delivery and outage schedules. The first quarter is typically weaker, with stronger expected performance in the second half of the year, and higher expected cash flows in the fourth quarter. In 2024, the revaluation of Westinghouse’s inventory had a significant impact on Westinghouse’s quarterly results in the first half of the year. Westinghouse’s results were and will continue to be impacted by the amortization of the intangible assets that arose as a result of the fair values assigned to Westinghouse’s net assets at the time of the acquisition. See Westinghouse, starting on page 64 for more information. |
60 CAMECO CORPORATION
The table that follows presents the differences between net earnings (losses) and adjusted net earnings (losses) for the previous seven quarters.
| HIGHLIGHTS | 2024 | 2023 | ||||||||||||||||||||||||||||||
| ($ MILLIONS EXCEPT PER SHARE AMOUNTS) |
Q4 | Q3 | Q2 | Q1 | Q4 | Q3 | Q2 | Q1 | ||||||||||||||||||||||||
| Net earnings (loss) attributable to equity holders |
135 | 7 | 36 | (7 | ) | 80 | 148 | 14 | 119 | |||||||||||||||||||||||
| Adjustments |
||||||||||||||||||||||||||||||||
| Adjustments on derivatives |
133 | (28 | ) | 14 | 33 | (59 | ) | 41 | (35 | ) | (6 | ) | ||||||||||||||||||||
| Unrealized foreign exchange losses (gains) |
(56 | ) | 15 | (7 | ) | (18 | ) | (1 | ) | (57 | ) | 43 | 5 | |||||||||||||||||||
| Share-based compensation |
17 | 4 | 15 | 8 | 12 | 22 | 11 | 18 | ||||||||||||||||||||||||
| Adjustments on other operating expense (income) |
(23 | ) | 5 | (2 | ) | (15 | ) | 40 | (48 | ) | 8 | (2 | ) | |||||||||||||||||||
| Income taxes on adjustments |
(37 | ) | 7 | (7 | ) | (9 | ) | 6 | (10 | ) | 7 | (1 | ) | |||||||||||||||||||
| Adjustments on equity investees (net of tax): |
||||||||||||||||||||||||||||||||
| Inventory purchase accounting |
3 | — | 12 | 38 | 20 | — | — | — | ||||||||||||||||||||||||
| Acquisition-related transition costs |
— | 4 | 5 | 14 | — | — | — | — | ||||||||||||||||||||||||
| Unrealized foreign exchange losses (gains) |
(16 | ) | 9 | (1 | ) | 1 | 10 | — | (2 | ) | — | |||||||||||||||||||||
| Long-term incentive plan |
1 | 1 | — | 1 | — | — | — | — | ||||||||||||||||||||||||
| Adjusted net earnings (non-IFRS, see page 65) |
157 | 24 | 65 | 46 | 108 | 96 | 46 | 133 | ||||||||||||||||||||||||
Corporate expenses
ADMINISTRATION
| THREE MONTHS ENDED | ||||||||||||
| DECEMBER 31 | ||||||||||||
| ($ MILLIONS) |
2024 | 2023 | CHANGE | |||||||||
| Direct administration |
62 | 48 | 29 | % | ||||||||
| Stock-based compensation |
15 | 11 | 36 | % | ||||||||
| Total administration |
77 | 59 | 31 | % | ||||||||
Direct administration costs were $62 million in the quarter, $14 million higher than the same period last year primarily due to higher labour costs and the impact of higher inflationary adjustments. We recorded $15 million in stock-based compensation expenses in the fourth quarter of 2024, $4 million higher compared to 2023 due to the increase in our share price compared to the same period last year.
MANAGEMENT’S DISCUSSION AND ANALYSIS 61
Fourth quarter financial results by segment
Uranium
| THREE MONTHS ENDED | ||||||||||||||||
| DECEMBER 31 | ||||||||||||||||
| HIGHLIGHTS |
2024 | 2023 | CHANGE | |||||||||||||
| Production volume (million lbs) |
6.1 | 5.7 | 7 | % | ||||||||||||
|
|
|
|
|
|
|
|||||||||||
| Sales volume (million lbs) |
12.8 | 9.8 | 30 | % | ||||||||||||
|
|
|
|
|
|
|
|||||||||||
| Average spot price |
($US/lb | ) | 76.75 | 82.21 | (7 | )% | ||||||||||
| Average long-term price |
($US/lb | ) | 81.17 | 66.00 | 23 | % | ||||||||||
| Average realized price |
($US/lb | ) | 58.45 | 52.35 | 12 | % | ||||||||||
| ($Cdn/lb | ) | 80.90 | 71.65 | 13 | % | |||||||||||
|
|
|
|
|
|
|
|||||||||||
| Average unit cost of sales (including D&A) |
($Cdn/lb | ) | 64.24 | 61.90 | 4 | % | ||||||||||
|
|
|
|
|
|
|
|||||||||||
| Revenue ($ millions) |
1,035 | 700 | 48 | % | ||||||||||||
|
|
|
|
|
|
|
|||||||||||
| Gross profit ($ millions) |
213 | 96 | >100 | % | ||||||||||||
|
|
|
|
|
|
|
|||||||||||
| Gross profit (%) |
21 | 14 | 50 | % | ||||||||||||
|
|
|
|
|
|
|
|||||||||||
| Earnings before income taxes |
289 | 122 | >100 | % | ||||||||||||
|
|
|
|
|
|
|
|||||||||||
| Adjusted EBITDA (non-IFRS, see page 65)1 |
391 | 231 | 70 | % | ||||||||||||
|
|
|
|
|
|
|
|||||||||||
| 1 | Includes JV Inkai adjusted EBITDA of $90 million in 2024 and $116 million in 2023. See JV Inkai contribution to uranium segment below. |
Production volumes this quarter increased by 7% compared to the fourth quarter of 2023. See Uranium – production overview on page 76 for more information.
Uranium revenues were up 48% due to a 30% increase in sales volume due to the timing of sales, which were in line with the delivery pattern disclosed in our 2023 annual MD&A, and a 13% increase in the Canadian dollar average realized price. While the average US dollar spot price for uranium decreased by 7% compared to the same period in 2023, the Canadian dollar average realized price increased by 13% due to the lagging effect of spot price impacts on market-related contracts in 2023 and 2024. For more information on the impact of spot price changes on average realized price, see Price sensitivity analysis: uranium segment on page 49.
Total cost of sales (including D&A) increased by 36% ($821 million compared to $605 million in 2023). This was primarily the result of the 30% increase in sales volume as well as an increase of 4% in the average unit cost of sales which was due to the higher cost of purchased material.
The net effect was a $117 million increase in gross profit.
The following table shows the costs of produced and purchased uranium incurred in the reporting periods (see Non-IFRS measures starting on page 65). These costs do not include care and maintenance costs, selling costs such as royalties, transportation and commissions, nor do they reflect the impact of opening inventories on our reported cost of sales.
62 CAMECO CORPORATION
| THREE MONTHS ENDED | ||||||||||||
| DECEMBER 31 | ||||||||||||
| ($/LB) |
2024 | 2023 | CHANGE | |||||||||
| Produced |
||||||||||||
| Cash cost |
23.57 | 21.07 | 12 | % | ||||||||
| Non-cash cost |
10.00 | 10.95 | (9 | )% | ||||||||
|
|
|
|
|
|
|
|||||||
| Total production cost 1 |
33.57 | 32.02 | 5 | % | ||||||||
|
|
|
|
|
|
|
|||||||
| Quantity produced (million lbs)1 |
6.1 | 5.7 | 7 | % | ||||||||
|
|
|
|
|
|
|
|||||||
| Purchased |
||||||||||||
| Cash cost1 |
104.49 | 89.89 | 16 | % | ||||||||
|
|
|
|
|
|
|
|||||||
| Quantity purchased (million lbs)1 |
4.8 | 6.3 | (24 | )% | ||||||||
|
|
|
|
|
|
|
|||||||
| Totals |
||||||||||||
| Produced and purchased costs |
64.80 | 62.40 | 4 | % | ||||||||
|
|
|
|
|
|
|
|||||||
| Quantities produced and purchased (million lbs) |
10.9 | 12.0 | (9 | )% | ||||||||
|
|
|
|
|
|
|
|||||||
| 1 | Due to equity accounting for JV Inkai, our share of production will be shown as a purchase at the time of delivery. JV Inkai purchases will fluctuate during the quarters and timing of purchases will not match production. During the quarter we purchased 3 million pounds at a purchase price per pound of $100.72 ($73.10 (US)) (Q4 2023 – 2.8 million pounds at a purchase price per pound of $105.74 ($77.13 (US))). |
The average cash cost of production for the fourth quarter was 12% higher compared to the same period in the prior year. Cash cost was higher due to the impact of inflationary pressures.
Although purchased pounds are transacted in US dollars, we account for the purchases in Canadian dollars. In the fourth quarter, the average cash cost of purchased material was $104.49 (Cdn) per pound, or $76.13 (US) per pound in US dollar terms, compared to $89.89 (Cdn) per pound, or $65.67 (US) per pound in the fourth quarter of 2023.
JV Inkai contribution to uranium segment
Net earnings before income taxes includes $56 million from Inkai and $90 million is included in adjusted EBITDA from JV Inkai, compared to $79 million and $116 million respectively in 2023.
The following table reconciles our share of earnings from JV Inkai to adjusted EBITDA:
| THREE MONTHS ENDED | ||||||||||||
| DECEMBER 31 | ||||||||||||
| ($ MILLIONS) |
2024 | 2023 | CHANGE | |||||||||
| Share of earnings from equity-accounted investee |
56 | 79 | (29)% | |||||||||
| Depreciation and amortization |
11 | 8 | 45% | |||||||||
| Income tax expense |
30 | 27 | 11% | |||||||||
|
|
|
|
|
|
|
|||||||
| EBITDA |
97 | 114 | (15)% | |||||||||
|
|
|
|
|
|
|
|||||||
| Unrealized foreign exchange losses (gains) |
(7 | ) | 2 | >(100%) | ||||||||
|
|
|
|
|
|
|
|||||||
| Adjusted EBITDA (non-IFRS, see page 65) attributable to JV Inkai |
90 | 116 | (22)% | |||||||||
|
|
|
|
|
|
|
|||||||
MANAGEMENT’S DISCUSSION AND ANALYSIS 63
Fuel services
| (includes results for UF6, UO2, UO3 and fuel fabrication) | ||||||||||||||||
| THREE MONTHS ENDED | ||||||||||||||||
| DECEMBER 31 | ||||||||||||||||
| HIGHLIGHTS |
2024 | 2023 | CHANGE | |||||||||||||
| Production volume (million kgU) |
3.6 | 3.7 | (3 | )% | ||||||||||||
|
|
|
|
|
|
|
|||||||||||
| Sales volume (million kgU) |
4.2 | 4.2 | — | |||||||||||||
|
|
|
|
|
|
|
|||||||||||
| Average realized price |
($ | Cdn/kgU | ) | 35.41 | 32.19 | 10 | % | |||||||||
|
|
|
|
|
|
|
|||||||||||
| Average unit cost of sales (including D&A) |
($ | Cdn/kgU | ) | 26.53 | 22.69 | 17 | % | |||||||||
|
|
|
|
|
|
|
|||||||||||
| Revenue ($ millions) |
148 | 134 | 10 | % | ||||||||||||
|
|
|
|
|
|
|
|||||||||||
| Earnings before income taxes |
37 | 40 | (8 | )% | ||||||||||||
|
|
|
|
|
|
|
|||||||||||
| Adjusted EBITDA (non-IFRS, see page 65) |
49 | 51 | (4 | )% | ||||||||||||
|
|
|
|
|
|
|
|||||||||||
| Adjusted EBITDA margin (non-IFRS, see page 65) |
33 | 38 | (13 | )% | ||||||||||||
|
|
|
|
|
|
|
|||||||||||
Total revenue increased by 10% due to a 10% increase in average realized price. The increase in average realized price was mainly the result of increased prices for UF6 due to the impact of improving market conditions on our long-term contract portfolio.
Total cost of sales (including D&A) increased by 17% to $111 million compared to the fourth quarter of 2023 due to an increase of 17% in the average unit cost of sales. Unit cost of sales increased mainly as a result of higher input costs.
The net effect was a $3 million decrease in earnings before income taxes.
Westinghouse
| THREE MONTHS ENDED | ||||||||||||
| DECEMBER 31 | ||||||||||||
| ($MILLIONS) (our share) |
2024 | 2023 | CHANGE | |||||||||
| Net earnings (loss)1 |
9 | (24 | ) | >(100%) | ||||||||
| Depreciation and amortization |
90 | 61 | 48% | |||||||||
| Finance income |
(2 | ) | (2 | ) | — | |||||||
| Finance costs |
53 | 30 | 77% | |||||||||
| Income tax recovery |
(11 | ) | (7 | ) | 57% | |||||||
|
|
|
|
|
|
|
|||||||
| EBITDA (non-IFRS, see page 65) |
139 | 58 | >100% | |||||||||
| Inventory purchase accounting2 |
5 | 27 | (81)% | |||||||||
| Other expenses |
26 | 8 | >100% | |||||||||
| Unrealized foreign exchange losses (gains) |
(9 | ) | 8 | >(100%) | ||||||||
| Long-term incentive plan |
1 | — | — | |||||||||
|
|
|
|
|
|
|
|||||||
| Adjusted EBITDA (non-IFRS, see page 65) |
162 | 101 | 60% | |||||||||
|
|
|
|
|
|
|
|||||||
| Capital expenditures |
78 | 42 | 86% | |||||||||
|
|
|
|
|
|
|
|||||||
| Adjusted free cash flow (non-IFRS, see page 65) |
84 | 59 | 42% | |||||||||
|
|
|
|
|
|
|
|||||||
| Revenue |
841 | 521 | 61% | |||||||||
|
|
|
|
|
|
|
|||||||
| Adjusted EBITDA margin (non-IFRS, see page 65) |
19 | % | 19 | % | (1)% | |||||||
|
|
|
|
|
|
|
|||||||
| 1 | This table includes comparative results for the period beginning on the date of acquisition until the end of 2023. |
| 2 | Net earnings for 2023 and 2024 were impacted by purchase price accounting. Inventories acquired were assigned values based on the market price at the date of the acquisition. As these quantities are sold, cost of products and services sold reflects these market values, regardless of Westinghouse’s historic costs. |
On November 7, 2023, we announced the closing of the acquisition of a 49% interest in Westinghouse and began to equity account for this investment. Our share of Westinghouse’s earnings has been reflected in our financial results from that date. In the fourth quarter, Westinghouse reported net earnings of $9 million (our share), compared to a $24 million loss (our share) in the same quarter last year.
Adjusted EBITDA was $162 million, compared to $101 million in the fourth quarter of 2023. We use adjusted EBITDA as a performance measure as the impact of the revaluation of Westinghouse’s inventory and assets and the non-operating acquisition-related transition costs do not reflect the underlying performance for the reporting period.
64 CAMECO CORPORATION
Westinghouse’s results were and will continue to be impacted by the amortization of the intangible assets that arose as a result of the fair values assigned to Westinghouse’s net assets at the time of acquisition.
Non-IFRS measures
The non-IFRS measures referenced in this document are supplemental measures, which are used as indicators of our financial performance. Management believes that these non-IFRS measures provide useful supplemental information to investors, securities analysts, lenders and other interested parties in assessing our operational performance and our ability to generate cash flows to meet our cash requirements. These measures are not recognized measures under IFRS, do not have standardized meanings, and are therefore unlikely to be comparable to similarly-titled measures presented by other companies. Accordingly, these measures should not be considered in isolation or as a substitute for the financial information reported under IFRS. We are not able to reconcile our forward-looking non-IFRS guidance because we cannot predict the timing and amounts of discrete items, which could significantly impact our IFRS results.
The following are the non-IFRS measures used in this document.
ADJUSTED NET EARNINGS
Adjusted net earnings (ANE) is our net earnings attributable to equity holders, adjusted for non-operating or non-cash items such as gains and losses on derivatives, unrealized foreign exchange gains and losses, share-based compensation, adjustments to reclamation provisions flowing through other operating expenses, and bargain purchase gains, that we believe do not reflect the underlying financial performance for the reporting period. In 2024, we revised our calculation of adjusted net earnings to adjust for unrealized foreign exchange gains and losses as well as for share-based compensation because it better reflects how we assess our operational performance. We have restated comparative periods to reflect this change. Other items may also be adjusted from time to time. We adjust this measure for certain of the items that our equity-accounted investees make in arriving at other non-IFRS measures. Adjusted net earnings is one of the targets that we measure to form the basis for a portion of annual employee and executive compensation (see Measuring our results starting on page 35).
In calculating ANE we adjust for derivatives. We do not use hedge accounting under IFRS and, therefore, we are required to report gains and losses on all hedging activity, both for contracts that close in the period and those that remain outstanding at the end of the period. For the contracts that remain outstanding, we must treat them as though they were settled at the end of the reporting period (mark-to-market). However, we do not believe the gains and losses that we are required to report under IFRS appropriately reflect the intent of our hedging activities, so we make adjustments in calculating our ANE to better reflect the impact of our hedging program in the applicable reporting period. See Foreign exchange starting on page 44 for more information.
We also adjust for changes to our reclamation provisions that flow directly through earnings. Every quarter we are required to update the reclamation provisions for all operations based on new cash flow estimates, discount and inflation rates. This normally results in an adjustment to our asset retirement obligation asset in addition to the provision balance. When the assets of an operation have been written off due to an impairment, as is the case with our Rabbit Lake and US ISR operations, the adjustment is recorded directly to the statement of earnings as “other operating expense (income)”. See note 16 of our annual financial statements for more information. This amount has been excluded from our ANE measure.
As a result of the change in ownership of Westinghouse when it was acquired by Cameco and Brookfield, Westinghouse’s inventories at the acquisition date were revalued based on the market price at that date. As these quantities are sold, Westinghouse’s cost of products and services sold reflect these market values, regardless of their historic costs. Our share of these costs is included in earnings from equity-accounted investees and recorded in cost of products and services sold in the investee information (see note 12 to the financial statements). Since this expense is non-cash, outside of the normal course of business and only occurred due to the change in ownership, we have excluded our share from our ANE measure.
Westinghouse has also expensed some non-operating acquisition-related transition costs that the acquiring parties agreed to pay for, which resulted in a reduction in the purchase price paid. Our share of these costs is included in earnings from equity accounted investees and recorded in other expenses in the investee information (see note 12 to the financial statements). Since this expense is outside of the normal course of business and only occurred due to the change in ownership, we have excluded our share from our ANE measure.
MANAGEMENT’S DISCUSSION AND ANALYSIS 65
To facilitate a better understanding of these measures, the table below reconciles adjusted net earnings with our net earnings for the fourth quarter and year ended 2024, and compares it to the same periods in 2023 as well as the year ended 2022.
| THREE MONTHS ENDED | YEAR ENDED | |||||||||||||||||||
| DECEMBER 31 | DECEMBER 31 | |||||||||||||||||||
| ($ MILLIONS) |
2024 | 2023 | 2024 | 2023 | 2022 | |||||||||||||||
| Net earnings attributable to equity holders |
135 | 80 | 172 | 361 | 89 | |||||||||||||||
|
|
|
|
|
|
|
|
|
|
|
|||||||||||
| Adjustments |
||||||||||||||||||||
| Adjustments on derivatives |
133 | (59 | ) | 152 | (59 | ) | 76 | |||||||||||||
| Unrealized foreign exchange gains |
(56 | ) | (1 | ) | (66 | ) | (10 | ) | (34 | ) | ||||||||||
| Share-based compensation |
17 | 12 | 44 | 63 | 28 | |||||||||||||||
| Adjustments on other operating expense (income) |
(23 | ) | 40 | (35 | ) | (2 | ) | 26 | ||||||||||||
| Adjustment to other income |
— | — | — | — | (23 | ) | ||||||||||||||
| Income taxes on adjustments |
(37 | ) | 6 | (46 | ) | 2 | (40 | ) | ||||||||||||
| Adjustments on equity investees (net of tax): |
||||||||||||||||||||
| Inventory purchase accounting |
3 | 20 | 53 | 20 | — | |||||||||||||||
| Acquisition-related transition costs |
— | — | 22 | — | — | |||||||||||||||
| Unrealized foreign exchange losses (gains) |
(16 | ) | 10 | (7 | ) | 8 | 1 | |||||||||||||
| Long-term incentive plan |
1 | — | 3 | — | — | |||||||||||||||
|
|
|
|
|
|
|
|
|
|
|
|||||||||||
| Adjusted net earnings |
157 | 108 | 292 | 383 | 123 | |||||||||||||||
|
|
|
|
|
|
|
|
|
|
|
|||||||||||
The following table shows what contributed to the change in adjusted net earnings (non-IFRS measure, see above) in 2024 compared to the same period in 2023 and 2022.
| ($ MILLIONS) |
2024 | 2023 | 2022 | |||||||||||
| Adjusted net earnings (losses) - previous year |
383 | 123 | (64 | ) | ||||||||||
|
|
|
|
|
|
|
|||||||||
| Change in gross profit by segment |
||||||||||||||
| (we calculate gross profit by deducting from revenue the cost of products and services sold, and depreciation and amortization (D&A), net of hedging benefits) |
|
|||||||||||||
| Uranium |
Impact from sales volume changes |
22 | 30 | (6 | ) | |||||||||
| Higher realized prices ($US) |
390 | 208 | 328 | |||||||||||
| Foreign exchange impact on realized prices |
26 | 95 | 44 | |||||||||||
| Higher costs |
(203 | ) | (9 | ) | (137 | ) | ||||||||
|
|
|
|
|
|
|
|||||||||
| change – uranium |
235 | 324 | 229 | |||||||||||
|
|
|
|
|
|
|
|||||||||
| Fuel services |
Impact from sales volume changes |
2 | 9 | (21 | ) | |||||||||
| Higher realized prices ($Cdn) |
27 | 32 | 33 | |||||||||||
| Higher costs |
(47 | ) | (34 | ) | (13 | ) | ||||||||
|
|
|
|
|
|
|
|||||||||
| change – fuel services |
(18 | ) | 7 | (1 | ) | |||||||||
|
|
|
|
|
|
|
|||||||||
| Other changes |
||||||||||||||
| Higher administration expenditures |
(7 | ) | (74 | ) | (44 | ) | ||||||||
| Higher exploration and research and development expenditures |
(17 | ) | (16 | ) | (8 | ) | ||||||||
| Change in reclamation provisions |
(3 | ) | 3 | 3 | ||||||||||
| Change in gains on derivatives |
(10 | ) | (24 | ) | (23 | ) | ||||||||
| Change in unrealized foreign exchange gains or losses |
(6 | ) | (34 | ) | 40 | |||||||||
| Change in earnings from equity-accounted investees |
(122 | ) | 87 | 27 | ||||||||||
| Canadian Emergency Wage Subsidy |
— | — | (21 | ) | ||||||||||
| Change in share-based compensation |
(19 | ) | 35 | (18 | ) | |||||||||
| Higher (lower) finance income |
(91 | ) | 75 | 30 | ||||||||||
| Higher finance costs |
(31 | ) | (30 | ) | (9 | ) | ||||||||
| Change in income tax recovery or expense |
(7 | ) | (88 | ) | (25 | ) | ||||||||
| Other |
5 | (5 | ) | 7 | ||||||||||
|
|
|
|
|
|
|
|||||||||
| Adjusted net earnings - current year |
292 | 383 | 123 | |||||||||||
|
|
|
|
|
|
|
|||||||||
The following table shows what contributed to the change in net earnings and adjusted net earnings (non-IFRS measure, see above) in the fourth quarter of 2024 compared to the same period in 2023.
66 CAMECO CORPORATION
| ($ MILLIONS) |
IFRS | Adjusted | ||||||||
| Net earnings - 2023 |
80 | 108 | ||||||||
|
|
|
|
|
|||||||
| Change in gross profit by segment |
||||||||||
| (we calculate gross profit by deducting from revenue the cost of products and services sold, and depreciation and amortization (D&A), net of hedging benefits) |
|
|||||||||
| Uranium |
Impact from sales volume changes |
29 | 29 | |||||||
| Higher realized prices ($US) |
107 | 107 | ||||||||
| Foreign exchange impact on realized prices |
11 | 11 | ||||||||
| Higher costs |
(30 | ) | (30 | ) | ||||||
|
|
|
|
|
|||||||
| change – uranium |
117 | 117 | ||||||||
|
|
|
|
|
|||||||
| Higher realized prices ($Cdn) |
13 | 13 | ||||||||
| Higher costs |
(16 | ) | (16 | ) | ||||||
|
|
|
|
|
|||||||
| change – fuel services |
(3 | ) | (3 | ) | ||||||
|
|
|
|
|
|||||||
| Other changes |
||||||||||
| Higher administration expenditures |
(18 | ) | (18 | ) | ||||||
| Higher exploration and research and development expenditures |
(7 | ) | (7 | ) | ||||||
| Change in reclamation provisions |
70 | 7 | ||||||||
| Change in gains on derivatives |
(198 | ) | (6 | ) | ||||||
| Change in unrealized foreign exchange gains or losses |
50 | (5 | ) | |||||||
| Change in earnings from equity-accounted investees |
10 | (32 | ) | |||||||
| Change in share-based compensation |
— | 5 | ||||||||
| Lower finance income |
(16 | ) | (16 | ) | ||||||
| Higher finance costs |
16 | 16 | ||||||||
| Change in income tax recovery or expense |
29 | (14 | ) | |||||||
| Other |
5 | 5 | ||||||||
|
|
|
|
|
|||||||
| Net earnings - 2024 |
135 | 157 | ||||||||
|
|
|
|
|
|||||||
EBITDA
EBITDA is defined as net earnings attributable to equity holders, adjusted for the costs related to the impact of the company’s capital and tax structure including depreciation and amortization, finance income, finance costs (including accretion) and income taxes.
ADJUSTED EBITDA
Adjusted EBITDA is defined as EBITDA, as further adjusted for the impact of certain costs or benefits incurred in the period which are either not indicative of the underlying business performance or that impact the ability to assess the operating performance of the business. These adjustments include the amounts noted in the adjusted net earnings definition.
In calculating adjusted EBITDA, we also adjust for items included in the results of our equity-accounted investees. These items are reported as part of marketing, administrative and general expenses within the investee financial information and are not representative of the underlying operations. These include gain/loss on undesignated hedges, transaction costs related to acquisitions and gain/loss on disposition of a business.
We also adjust for the unwinding of the effect of purchase accounting on the sale of inventories which is included in our share of earnings from equity-accounted investee and recorded in the cost of products and services sold in the investee information (see note 12 to the financial statements).
The company may realize similar gains or incur similar expenditures in the future.
ADJUSTED FREE CASH FLOW
Adjusted free cash flow is defined as adjusted EBITDA less capital expenditures for the period.
ADJUSTED EBITDA MARGIN
Adjusted EBITDA margin is defined as adjusted EBITDA divided by revenue for the appropriate period.
MANAGEMENT’S DISCUSSION AND ANALYSIS 67
EBITDA, adjusted EBITDA, adjusted free cash flow, and adjusted EBITDA margin are measures which allow us and other users to assess results of operations from a management perspective without regard for our capital structure. To facilitate a better understanding of these measures, the table below reconciles earnings before income taxes with EBITDA and adjusted EBITDA for the fourth quarters and years ended 2024 and 2023.
For the year ended December 31, 2024:
| FUEL | ||||||||||||||||||||
| ($ MILLIONS) |
URANIUM1 | SERVICES | WESTINGHOUSE | OTHER | TOTAL | |||||||||||||||
| Net earnings (loss) before income taxes2 |
904 | 108 | (218 | ) | (622 | ) | 172 | |||||||||||||
| Depreciation and amortization |
239 | 37 | — | 5 | 281 | |||||||||||||||
| Finance income |
— | — | — | (21 | ) | (21 | ) | |||||||||||||
| Finance costs |
— | — | — | 147 | 147 | |||||||||||||||
| Income taxes |
— | — | — | 85 | 85 | |||||||||||||||
|
|
|
|
|
|
|
|
|
|
|
|||||||||||
| 1,143 | 145 | (218 | ) | (406 | ) | 664 | ||||||||||||||
| Adjustments on equity investees |
||||||||||||||||||||
| Depreciation and amortization |
23 | — | 357 | — | 380 | |||||||||||||||
| Finance income |
(1 | ) | — | (4 | ) | — | (5 | ) | ||||||||||||
| Finance expense |
— | — | 225 | — | 225 | |||||||||||||||
| Income taxes |
58 | — | (61 | ) | — | (3 | ) | |||||||||||||
|
|
|
|
|
|
|
|
|
|
|
|||||||||||
| Net adjustments on equity investees |
80 | — | 517 | — | 597 | |||||||||||||||
|
|
|
|
|
|
|
|
|
|
|
|||||||||||
| EBITDA |
1,223 | 145 | 299 | (406 | ) | 1,261 | ||||||||||||||
| Gain on derivatives |
— | — | — | 152 | 152 | |||||||||||||||
| Other operating income |
(35 | ) | — | — | — | (35 | ) | |||||||||||||
| Share-based compensation |
— | — | — | 44 | 44 | |||||||||||||||
| Unrealized foreign exchange gains |
— | — | — | (66 | ) | (66 | ) | |||||||||||||
|
|
|
|
|
|
|
|
|
|
|
|||||||||||
| (35 | ) | — | — | 130 | 95 | |||||||||||||||
| Adjustments on equity investees |
||||||||||||||||||||
| Inventory purchase accounting |
— | — | 71 | — | 71 | |||||||||||||||
| Acquisition-related transition costs |
— | — | 29 | — | 29 | |||||||||||||||
| Other expenses |
— | — | 78 | — | 78 | |||||||||||||||
| Unrealized foreign exchange losses (gains) |
(9 | ) | — | 2 | — | (7 | ) | |||||||||||||
| Long-term incentive plan |
— | — | 4 | — | 4 | |||||||||||||||
|
|
|
|
|
|
|
|
|
|
|
|||||||||||
| Net adjustments on equity investees |
(9 | ) | — | 184 | — | 175 | ||||||||||||||
|
|
|
|
|
|
|
|
|
|
|
|||||||||||
| Adjusted EBITDA |
1,179 | 145 | 483 | (276 | ) | 1,531 | ||||||||||||||
|
|
|
|
|
|
|
|
|
|
|
|||||||||||
| 1 | JV Inkai EBITDA of $279 million is included in the uranium segment. See Financial results by segment – Uranium for reconciliation. |
| 2 | Westinghouse earnings are after income taxes |
68 CAMECO CORPORATION
For the year ended December 31, 2023:
| FUEL | ||||||||||||||||||||
| ($ MILLIONS) |
URANIUM1 | SERVICES | WESTINGHOUSE | OTHER | TOTAL | |||||||||||||||
| Net earnings (loss) before income taxes2 |
606 | 129 | (24 | ) | (350 | ) | 361 | |||||||||||||
| Depreciation and amortization |
175 | 35 | — | 10 | 220 | |||||||||||||||
| Finance income |
— | — | — | (112 | ) | (112 | ) | |||||||||||||
| Finance costs |
— | — | — | 116 | 116 | |||||||||||||||
| Income taxes |
— | — | — | 126 | 126 | |||||||||||||||
|
|
|
|
|
|
|
|
|
|
|
|||||||||||
| 781 | 164 | (24 | ) | (210 | ) | 711 | ||||||||||||||
| Adjustments on equity investees |
||||||||||||||||||||
| Depreciation and amortization |
14 | — | 61 | — | 75 | |||||||||||||||
| Finance income |
— | — | (2 | ) | — | (2 | ) | |||||||||||||
| Finance expenses |
— | — | 30 | — | 30 | |||||||||||||||
| Income taxes |
42 | — | (7 | ) | — | 35 | ||||||||||||||
|
|
|
|
|
|
|
|
|
|
|
|||||||||||
| Net adjustments on equity investees |
56 | — | 82 | — | 138 | |||||||||||||||
|
|
|
|
|
|
|
|
|
|
|
|||||||||||
| EBITDA |
837 | 164 | 58 | (210 | ) | 849 | ||||||||||||||
| Loss on derivatives |
— | — | — | (59 | ) | (59 | ) | |||||||||||||
| Other operating income |
(2 | ) | — | — | — | (2 | ) | |||||||||||||
| Share-based compensation |
— | — | — | 63 | 63 | |||||||||||||||
| Unrealized foreign exchange gains |
— | — | — | (10 | ) | (10 | ) | |||||||||||||
|
|
|
|
|
|
|
|
|
|
|
|||||||||||
| (2 | ) | — | — | (6 | ) | (8 | ) | |||||||||||||
| Adjustments on equity investees |
||||||||||||||||||||
| Inventory purchase accounting |
— | — | 27 | — | 27 | |||||||||||||||
| Other expenses |
— | — | 8 | — | 8 | |||||||||||||||
| Unrealized foreign exchange losses |
— | — | 8 | — | 8 | |||||||||||||||
|
|
|
|
|
|
|
|
|
|
|
|||||||||||
| Net adjustments on equity investees |
— | — | 43 | — | 43 | |||||||||||||||
|
|
|
|
|
|
|
|
|
|
|
|||||||||||
| Adjusted EBITDA |
835 | 164 | 101 | (216 | ) | 884 | ||||||||||||||
|
|
|
|
|
|
|
|
|
|
|
|||||||||||
| 1 | JV Inkai EBITDA of $235 million is included in the uranium segment. See Financial results by segment – Uranium for reconciliation. |
| 2 | Westinghouse earnings are after income taxes |
MANAGEMENT’S DISCUSSION AND ANALYSIS 69
For the quarter ended December 31, 2024:
| FUEL | ||||||||||||||||||||
| ($ MILLIONS) |
URANIUM1 | SERVICES | WESTINGHOUSE | OTHER | TOTAL | |||||||||||||||
| Net earnings (loss) before income taxes2 |
289 | 37 | 9 | (199 | ) | 136 | ||||||||||||||
| Depreciation and amortization |
91 | 12 | — | 1 | 104 | |||||||||||||||
| Finance income |
— | — | — | (3 | ) | (3 | ) | |||||||||||||
| Finance costs |
— | — | — | 31 | 31 | |||||||||||||||
| Income taxes |
— | — | — | (2 | ) | (2 | ) | |||||||||||||
|
|
|
|
|
|
|
|
|
|
|
|||||||||||
| 380 | 49 | 9 | (172 | ) | 266 | |||||||||||||||
| Adjustments on equity investees |
||||||||||||||||||||
| Depreciation and amortization |
11 | — | 90 | — | 101 | |||||||||||||||
| Finance income |
— | — | (2 | ) | — | (2 | ) | |||||||||||||
| Finance expense |
— | — | 53 | — | 53 | |||||||||||||||
| Income taxes |
30 | — | (11 | ) | — | 19 | ||||||||||||||
|
|
|
|
|
|
|
|
|
|
|
|||||||||||
| Net adjustments on equity investees |
41 | — | 130 | — | 171 | |||||||||||||||
|
|
|
|
|
|
|
|
|
|
|
|||||||||||
| EBITDA |
421 | 49 | 139 | (172 | ) | 437 | ||||||||||||||
| Gain on derivatives |
— | — | — | 133 | 133 | |||||||||||||||
| Other operating income |
(23 | ) | — | — | — | (23 | ) | |||||||||||||
| Share-based compensation |
— | — | — | 17 | 17 | |||||||||||||||
| Unrealized Foreign exchange gains |
— | — | — | (56 | ) | (56 | ) | |||||||||||||
|
|
|
|
|
|
|
|
|
|
|
|||||||||||
| (23 | ) | — | — | 94 | 71 | |||||||||||||||
| Adjustments on equity investees |
||||||||||||||||||||
| Inventory purchase accounting |
— | — | 5 | — | 5 | |||||||||||||||
| Other expenses |
— | — | 26 | — | 26 | |||||||||||||||
| Unrealized foreign exchange gains |
(7 | ) | — | (9 | ) | — | (16 | ) | ||||||||||||
| Long-term incentive plan |
— | — | 1 | — | 1 | |||||||||||||||
|
|
|
|
|
|
|
|
|
|
|
|||||||||||
| Net adjustments on equity investees |
(7 | ) | — | 23 | — | 16 | ||||||||||||||
|
|
|
|
|
|
|
|
|
|
|
|||||||||||
| Adjusted EBITDA |
391 | 49 | 162 | (78 | ) | 524 | ||||||||||||||
|
|
|
|
|
|
|
|
|
|
|
|||||||||||
| 1 | JV Inkai EBITDA of $90 million is included in the uranium segment. See Financial results by segment – Uranium for reconciliation. |
| 2 | Westinghouse earnings are after income taxes |
70 CAMECO CORPORATION
For the quarter ended December 31, 2023:
| FUEL | ||||||||||||||||||||
| ($ MILLIONS) |
URANIUM1 | SERVICES | WESTINGHOUSE | OTHER | TOTAL | |||||||||||||||
| Net earnings (loss) before income taxes2 |
122 | 40 | (24 | ) | (57 | ) | 81 | |||||||||||||
| Depreciation and amortization |
32 | 11 | — | 3 | 46 | |||||||||||||||
| Finance income |
— | — | — | (19 | ) | (19 | ) | |||||||||||||
| Finance costs |
— | — | — | 47 | 47 | |||||||||||||||
| Income taxes |
— | — | — | 27 | 27 | |||||||||||||||
|
|
|
|
|
|
|
|
|
|
|
|||||||||||
| 154 | 51 | (24 | ) | 1 | 182 | |||||||||||||||
| Adjustments on equity investees |
||||||||||||||||||||
| Depreciation and amortization |
8 | — | 61 | — | 69 | |||||||||||||||
| Finance income |
— | — | (2 | ) | — | (2 | ) | |||||||||||||
| Finance expenses |
— | — | 30 | — | 30 | |||||||||||||||
| Income taxes |
27 | — | (7 | ) | — | 20 | ||||||||||||||
|
|
|
|
|
|
|
|
|
|
|
|||||||||||
| Net adjustments on equity investees |
35 | — | 82 | — | 117 | |||||||||||||||
|
|
|
|
|
|
|
|
|
|
|
|||||||||||
| EBITDA |
189 | 51 | 58 | 1 | 299 | |||||||||||||||
| Loss on derivatives |
— | — | — | (59 | ) | (59 | ) | |||||||||||||
| Other operating expense |
40 | — | — | — | 40 | |||||||||||||||
| Share-based compensation |
— | — | — | 12 | 12 | |||||||||||||||
| Unrealized foreign exchange gains |
— | — | — | (1 | ) | (1 | ) | |||||||||||||
|
|
|
|
|
|
|
|
|
|
|
|||||||||||
| 40 | — | — | (48 | ) | (8 | ) | ||||||||||||||
| Adjustments on equity investees |
||||||||||||||||||||
| Inventory purchase accounting |
— | — | 27 | — | — | |||||||||||||||
| Other expenses |
— | — | 8 | — | — | |||||||||||||||
| Unrealized foreign exchange losses |
2 | — | 8 | — | 10 | |||||||||||||||
|
|
|
|
|
|
|
|
|
|
|
|||||||||||
| Net adjustments on equity investees |
2 | — | 43 | — | 45 | |||||||||||||||
|
|
|
|
|
|
|
|
|
|
|
|||||||||||
| Adjusted EBITDA |
231 | 51 | 101 | (47 | ) | 336 | ||||||||||||||
|
|
|
|
|
|
|
|
|
|
|
|||||||||||
| 1 | JV Inkai EBITDA of $116 million is included in the uranium segment. See Financial results by segment – Uranium for reconciliation. |
| 2 | Westinghouse earnings are after income taxes |
CASH COST PER POUND, NON-CASH COST PER POUND AND TOTAL COST PER POUND FOR PRODUCED AND PURCHASED URANIUM
Cash cost per pound, non-cash cost per pound and total cost per pound for produced and purchased uranium are non-IFRS measures. We use these measures in our assessment of the performance of our uranium business. These measures are not necessarily indicative of operating profit or cash flow from operations as determined under IFRS.
MANAGEMENT’S DISCUSSION AND ANALYSIS 71
To facilitate a better understanding of these measures, the table below reconciles these measures to cost of product sold and depreciation and amortization for the fourth quarters and years ended 2024 and 2023.
| THREE MONTHS | YEAR ENDED | |||||||||||||||
| ENDED DECEMBER 31 | DECEMBER 31 | |||||||||||||||
| ($ MILLIONS) |
2024 | 2023 | 2024 | 2023 | ||||||||||||
| Cost of product sold |
730.2 | 573.3 | 1,757.2 | 1,532.3 | ||||||||||||
| Royalties |
(51.5 | ) | (10.6 | ) | (139.9 | ) | (71.7 | ) | ||||||||
| Other selling costs |
(4.7 | ) | (3.8 | ) | (16.9 | ) | (10.9 | ) | ||||||||
| Care and maintenance |
(13.6 | ) | (11.6 | ) | (50.9 | ) | (46.7 | ) | ||||||||
| Change in inventories |
(15.0 | ) | 139.1 | 78.4 | (63.0 | ) | ||||||||||
|
|
|
|
|
|
|
|
|
|||||||||
| Cash operating costs (a) |
645.4 | 686.4 | 1,627.9 | 1,340.0 | ||||||||||||
| Depreciation and amortization |
91.2 | 31.6 | 238.7 | 175.5 | ||||||||||||
| Care and maintenance |
(0.2 | ) | (0.5 | ) | (0.8 | ) | (3.9 | ) | ||||||||
| Change in inventories |
(30.0 | ) | 31.3 | (9.8 | ) | 32.6 | ||||||||||
|
|
|
|
|
|
|
|
|
|||||||||
| Total operating costs (b) |
706.4 | 748.8 | 1,856.0 | 1,544.2 | ||||||||||||
|
|
|
|
|
|
|
|
|
|||||||||
| Uranium produced & purchased (million lbs) (c) |
10.9 | 12.0 | 34.4 | 28.9 | ||||||||||||
|
|
|
|
|
|
|
|
|
|||||||||
| Cash costs per pound (a ÷ c) |
59.21 | 57.20 | 47.32 | 46.37 | ||||||||||||
| Total costs per pound (b ÷ c) |
64.80 | 62.40 | 53.95 | 53.43 | ||||||||||||
|
|
|
|
|
|
|
|
|
|||||||||
72 CAMECO CORPORATION
Operations, projects and investments
This section of our MD&A is an overview of the mining, milling and processing facilities we operate or have an interest in, our curtailed operations, our advanced uranium projects and our exploration activities, what we accomplished this year, our plans for the future and how we manage risk. It also includes an overview of our investments in Westinghouse and GLE.
| 74 |
MANAGING THE RISKS |
|
| 76 |
URANIUM – PRODUCTION OVERVIEW |
|
| 76 |
PRODUCTION OUTLOOK |
|
| 77 |
URANIUM – TIER-ONE OPERATIONS |
|
| 77 |
MCARTHUR RIVER MINE / KEY LAKE MILL |
|
| 81 |
CIGAR LAKE |
|
| 85 |
INKAI |
|
| 89 |
URANIUM – TIER-TWO OPERATIONS |
|
| 89 |
RABBIT LAKE |
|
| 90 |
US ISR |
|
| 91 |
URANIUM – ADVANCED PROJECTS |
|
| 91 |
MILLENNIUM |
|
| 91 |
YEELIRRIE |
|
| 91 |
KINTYRE |
|
| 93 |
URANIUM – EXPLORATION |
|
| 95 |
FUEL SERVICES |
|
| 95 |
BLIND RIVER REFINERY |
|
| 96 |
PORT HOPE CONVERSION SERVICES |
|
| 96 |
CAMECO FUEL MANUFACTURING INC. (CFM) |
|
| 98 |
WESTINGHOUSE ELECTRIC COMPANY |
|
| 106 |
OTHER NUCLEAR FUEL CYCLE INVESTMENTS |
|
| 106 |
GLOBAL LASER ENRICHMENT (GLE) |
|
MANAGEMENT’S DISCUSSION AND ANALYSIS 73
Managing the risks
The nature of our business means we face many kinds of potential risks and hazards – some that relate to the nuclear energy industry in general, safety, health and environmental risks associated with any mining and chemical processing company and others that apply to specific properties, operations, planned operations, Westinghouse or other fuel cycle investments. Our uranium and fuel services and Westinghouse segments also face unique risks associated with radiation. These risks could have a significant impact on our business, earnings, cash flows, financial condition, results of operations or prospects, which may result in a significant decrease in the market price of our common shares.
Risks and hazards generally applicable to the mining, milling and processing facilities we operate, and advanced projects include:
| • | catastrophic accidents resulting in large-scale releases of hazardous chemicals, or a tailings facility failure |
| • | industrial safety accidents |
| • | environmental incidents or subsurface contamination from current or legacy operations |
| • | transportation incidents, which may involve the release of radioactive or other hazardous materials |
| • | labour shortages, disputes or strikes |
| • | availability of personnel with the necessary skills and experience |
| • | cost increases for labour, contracted or purchased materials, supplies and services |
| • | shortages of, or interruptions in the supply of, required materials, supplies, services and equipment |
| • | transportation and delivery disruptions |
| • | interruptions in the supply of electricity, water, and other utilities or infrastructure |
| • | inability of our innovation initiatives to achieve the expected cost saving and operational flexibility objectives |
| • | equipment failures or aging facilities |
| • | cyberattacks |
| • | joint venture disputes or litigation |
| • | non-compliance with legal requirements, including exceeding applicable air or water limits |
| • | inability to obtain and renew the licences and other approvals needed to restart, operate, and to increase production at our mines, mills, processing facilities, to develop new mines, or for Westinghouse to operate its fuel fabrication or other facilities or undertake its other commercial activities |
| • | increased workforce health and safety risks or increased regulatory burdens resulting from a pandemic or other causes |
| • | fires |
| • | blockades or other acts of social or political activism |
| • | uncertain impact of changing regulations or policy leading to higher annual operating costs, including GHG pricing and regulations (e.g., carbon pricing, the Canadian Clean Fuel Standard) |
| • | natural phenomena, such as forest fires, floods and earthquakes as well as shifts in temperature, precipitation, and the impact of more frequent severe weather conditions on our operations as a result of climate change |
| • | outbreak of communicable illness (such as a pandemic) |
| • | unusual, unexpected or adverse mining or geological conditions |
| • | underground water inflows at our mining operations |
| • | ground movement or cave-ins at our mining operations |
| • | reserve and resource estimates are not precise |
Risks and hazards generally applicable to Westinghouse and our ownership interest in Westinghouse include:
| • | failure to realize any or all of the anticipated benefits from the acquisition |
| • | Westinghouse’s failure to generate sufficient cash flow to fund its approved annual operating budget or make distributions to us and Brookfield |
| • | Westinghouse’s failure to comply with nuclear licence and quality assurance requirements at its facilities |
| • | Westinghouse’s loss of protections against liability for nuclear damage, including discontinuation of global nuclear liability regimes and indemnities |
| • | adverse public perception of nuclear energy |
| • | adverse public reaction to an unforeseen nuclear incident resulting in a lessening of demand for nuclear generators |
| • | threat of increased trade barriers adversely impacting Westinghouse’s business |
| • | our inability to control Westinghouse |
| • | liabilities at Westinghouse exceeding our estimates and the discovery of unknown or undisclosed liabilities |
| • | default by Westinghouse under its credit facilities impacting adversely Westinghouse’s ability to fund its ongoing operations |
| • | occupational health and safety issues arising at Westinghouse’s operations |
74 CAMECO CORPORATION
| • | disputes between us and Brookfield regarding our strategic partnership |
| • | Cameco defaulting under the governance agreement with Brookfield, including us losing some or all of our interest in Westinghouse |
We have a Risk Policy that is supported by our formal Risk Management Program.
Our Risk Management Program involves a broad, systematic approach to identifying, assessing, monitoring, reporting and managing the significant risks we face in our business and operations, including risks that could impact our four measures of success. For more information about our risk management program see the Risk and Risk Management section in this MD&A, as well as our most recent Sustainability Report at cameco.com.
We have insurance to cover some of these risks and hazards, but not all of them, and not to the full amount of losses or liabilities that could potentially arise.
In addition to considering the other information in this MD&A and the risks noted above, you should carefully consider the material risks discussed starting on page 4, and the specific risks discussed under the update for each operation, advanced project, Westinghouse, and GLE in this section. These risks, however, are not a complete list of the potential risks our operations, advanced projects, or other investments face. There may be others we are not aware of or risks we feel are not material today that could become material in the future.
We recommend you also review our most recent annual information form, which includes a discussion of other material risks that could have an impact on our business.
MANAGEMENT’S DISCUSSION AND ANALYSIS 75
Uranium – production overview
Our share of production in our uranium segment in the fourth quarter was 6.1 million pounds, 7% higher compared to the same period in 2023, while production for the year was 23.4 million pounds, 33% higher than in 2023. Total production in 2024 was 0.3 million pounds above the revised production plan we announced in the third quarter. See Uranium – Tier-one operations starting on page 77 for more information.
The Rabbit Lake operation remained in a safe and sustainable state of care and maintenance, and we are no longer developing new wellfields at Crow Butte and Smith Ranch-Highland. See Uranium – Tier-two operations beginning on page 89 for more information.
Uranium production
| CAMECO SHARE | THREE MONTHS ENDED DECEMBER 31 |
YEAR ENDED DECEMBER 31 |
||||||||||||||||||||||
| (MILLION LBS) |
2024 | 2023 | 2024 | 2023 | 2024 PLAN | 2025 PLAN | ||||||||||||||||||
| Cigar Lake |
2.5 | 2.6 | 9.2 | 8.2 | up to 9.8 | 9.8 | ||||||||||||||||||
| McArthur River/Key Lake |
3.6 | 3.1 | 14.2 | 9.4 | up to 13.3 | 1 | 12.6 | |||||||||||||||||
|
|
|
|
|
|
|
|
|
|
|
|
|
|||||||||||||
| Total |
6.1 | 5.7 | 23.4 | 17.6 | up to 23.1 | 22.4 | ||||||||||||||||||
|
|
|
|
|
|
|
|
|
|
|
|
|
|||||||||||||
| 1 | During the third quarter, we updated our McArthur River/Key Lake production forecast to 19 million pounds (100% basis) in 2024 (previously 18 million pounds). |
PRODUCTION OUTLOOK
We remain focused on taking advantage of the long-term growth we see coming in our industry, while maintaining the ability to respond to market conditions as they evolve. Our strategy includes a focus, in our uranium segment, on protecting and extending the value of our contract portfolio, on aligning our production decisions with our contract portfolio and market opportunities in order to increase long-term value, and to do that with an emphasis on safety, people and the environment.
In 2025, we are planning production of 22.4 million pounds (our share).
Due to equity accounting, our share of production from Inkai is shown as a purchase. Based on KAP’s announcement on January 27, 2025, production in Kazakhstan is expected to remain below the level stipulated in the subsoil use agreements. With the halt of production in January 2025, we are still in discussions with JV Inkai and KAP to determine how this may impact production at Inkai in 2025 and thereafter and therefore our corresponding purchase entitlements. See Uranium – Tier-one operations- Inkai beginning on page 85 for more information.
76 CAMECO CORPORATION
Uranium – Tier-one operations
McArthur River mine / Key Lake mill
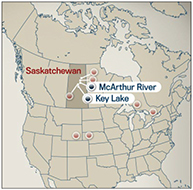
|
2024 Production (our share) | |
| 14.2M lb | ||
| 2025 Production Outlook (our share) | ||
| 12.6M lb | ||
| Estimated Reserves (our share) | ||
| 251.0M lb | ||
| Estimated Mine Life | ||
| 2044 |
McArthur River is the world’s largest, high-grade uranium mine, and Key Lake is the world’s largest uranium mill. We are the operator of both the mine and mill.
McArthur River is considered a material uranium property for us. There is a technical report dated March 29, 2019 (effective December 31, 2018) that can be downloaded from SEDAR+ (www.sedarplus.ca) or from EDGAR (www.sec.gov).
| Location | Saskatchewan, Canada | |||
| Ownership | McArthur River – 69.805% | |||
| Key Lake – 83.33% | ||||
| Mine type | Underground | |||
| Mining methods | Blasthole stoping and raiseboring | |||
| End product | Uranium concentrate | |||
| Certification | ISO 14001 certified | |||
| Estimated reserves | 251.0 million pounds (proven and probable), average grade U3O8: 6.55% | |||
| Estimated resources | 4.7 million pounds (measured and indicated), average grade U3O8: 2.29% | |||
| 1.7 million pounds (inferred), average grade U3O8: 2.95% | ||||
| Licensed capacity | Mine and mill: 25.0 million pounds per year | |||
| Licence term | Through October 2043 | |||
| Total packaged production: | 2000 to 2024 | 358.1 million pounds (McArthur River/Key Lake) (100% basis) | ||
| 1983 to 2002 | 209.8 million pounds (Key Lake) (100% basis) | |||
| 2024 production | 14.2 million pounds (20.3 million pounds on 100% basis) | |||
| 2025 production outlook | 12.6 million pounds (18.0 million pounds on 100% basis) | |||
| Estimated decommissioning cost | $51.4 million – McArthur River (100% basis) | |||
| $276.7 million – Key Lake (100% basis) | ||||
All values shown, including reserves and resources, represent our share only, unless indicated.
MANAGEMENT’S DISCUSSION AND ANALYSIS 77
BACKGROUND
Mine description
The mineral reserves at McArthur River are contained within seven zones: zones 1, 2, 3, 4, 4 South, A and B. There are currently two active mining zones (zone 2 and 4), one with development significantly advanced (zone 1), and one in the early-to mid-stages of development (zone 4 South).
Zone 2 has been actively mined since production began in 1999. The ore zone was initially divided into three freeze panels. As the freeze wall was expanded, the inner connecting freeze walls were decommissioned to recover the inaccessible uranium around the active freeze pipes. Mining of zone 2 is almost complete. About 3.1 million pounds of mineral reserves remain secured behind a freeze wall, and we expect to recover them using a combination of raisebore and blasthole stope mining.
Zone 4 has been actively mined since 2010. The zone was divided into four freeze panels, and like in zone 2, as the freeze wall was expanded, the inner connecting freeze walls were decommissioned. Zone 4 has 87.5 million pounds of mineral reserves secured behind freeze walls, and it will be the main source of production for the next several years. Raisebore and blasthole stope mining will be used to recover the mineral reserves.
Zone 1 is the next planned mine area to be brought into production. Freeze hole drilling was completed in 2023 and brine distribution construction and commissioning was completed in 2024. All freeze walls are actively freezing and it is predicted that an active freeze wall will be in place in the second quarter of 2025. Once an active freeze wall has been established, drill and extraction chamber development will need to be completed prior to the start of production (first production expected late 2025). Once complete, an additional 48.0 million pounds of mineral reserves will be secured behind freeze walls. Blasthole stope mining is currently planned as the main extraction method in zone 1.
Zone 4 South remains in the early development stages. Development for the freeze drifts is in progress on the lower levels and freeze drilling continues on the completed upper freeze drifts. Brine distribution work is scheduled to begin on the upper levels in 2025.
We have successfully packaged approximately 358.1 million pounds (100% basis) since we began mining in 1999.
Mining methods and techniques
All the mineralized areas discovered to date at McArthur River are in, or partially in, water-bearing ground with significant pressure at mining depths.
There are three approved mining methods at McArthur River: raisebore mining, blasthole stope mining and boxhole mining. However, only raisebore and blasthole stope mining remain in use. Before we begin mining an area, we freeze the ground around it by circulating chilled brine through freeze holes to form an impermeable frozen barrier.
Blasthole stope mining
Blasthole stope mining began in 2011 and is the main extraction method planned for future production. It is planned in areas where blastholes can be accurately drilled and small stable stopes excavated without jeopardizing the freeze wall integrity. The use of this method has allowed the site to improve operating costs by increasing overall extraction efficiency by reducing underground development, concrete consumption, mineralized waste generation and improving extraction cycle time.
Raisebore mining
Raisebore mining is an innovative non-entry approach that we adapted to meet the unique challenges at McArthur River, and it has been used since mining began in 1999. This method is favourable for mining the weaker rock mass areas of the deposit and is suitable for massive high-grade zones where there is access both above and below the ore zone.
Initial processing
McArthur River produces two product streams, high grade slurry and low-grade mineralized rock. Both product streams are shipped to Key Lake mill to produce uranium ore concentrate.
The high-grade material is ground and thickened into a slurry underground and then pumped to surface. The material is then thickened and blended for grade control and shipped to Key Lake in slurry totes using haul trucks.
78 CAMECO CORPORATION
The low-grade mineralized material is hoisted to surface and shipped as a dry product to Key Lake using covered haul trucks. Once at Key Lake, the material is ground, thickened and blended with the high-grade slurry to a nominal 5% U3O8 mill feed grade. It is then processed into uranium ore concentrate and packaged in drums for further processing offsite.
Tailings capacity
Based on the current licence conditions, tailings capacity at Key Lake is sufficient to mill all the known McArthur River mineral reserves and resources, should they be converted to reserves, with additional capacity to toll mill ore from other regional deposits.
Licensed annual production capacity
The McArthur River mine and Key Lake mill are both licensed to produce up to 25 million pounds (100% basis) per year. To achieve annual production at the licensed capacity, additional investment will be required.
2024 UPDATE
Production
The McArthur River and Key Lake operation continued with production rampup and optimization activities in 2024.
Total packaged production from McArthur River and Key Lake in 2024 was 20.3 million pounds (14.2 million pounds our share), compared to 13.5 million pounds (9.4 million pounds our share) in 2023. Production in 2024 exceeded our annual expectation of 19 million pounds (13.3 million pounds our share).
The McArthur River mine produced 15.8 million pounds, which was less than its plan to mine 18.3 million pounds, primarily due to an unplanned shutdown at the mine to accommodate ventilation repairs in Shaft 2. In addition, the mine’s performance was impacted by the availability of mobile equipment and certain workforce skills.
The Key Lake mill saw notable improvements in its operational performance in 2024, with the site becoming more familiar and experienced with new equipment and control system upgrades. In addition, the systematic understanding of process bottlenecks and efforts to remove or decrease their impacts allowed Key Lake to optimize the mill throughput rates.
Of note, our 2024 packaged production of 20.3 million pounds of U3O8 sets both a new annual production record for the Key Lake mill, as well as a new world record for annual production from any uranium mill. These significant achievements were made possible in part by our off-cycle investments during care and maintenance to improve and optimize the Key Lake mill, and by having sufficient ore feed material available, which included the ore mined at McArthur River in 2024 (which was lower than its plan), supplemented by broken ore inventory at McArthur River and Key Lake that was carried over from prior years.
Exploration
Underground exploration at McArthur River continued in 2024 with the main focus areas being infill drilling of zones A and B.
PLANNING FOR THE FUTURE
Production
We plan to produce 18 million pounds (100% basis) in 2025. Although the performance of the Key Lake mill in 2024 demonstrated production rates and capacities that, when annualized, exceeded 18 million pounds, the operation’s output is currently constrained by the McArthur River mine’s limited ability to increase the production of mined ore to feed the mill, and because the majority of the previously mined, excess broken ore inventory that allowed the mill to exceed production expectations in 2024, has been processed. In 2025, we expect to bring zone 1 into production and advance zone 4 south development while we continue adding to our workforce and replacing mobile equipment. We also plan to expand both underground and surface exploration activities in 2025.
MANAGEMENT’S DISCUSSION AND ANALYSIS 79
We are addressing aging infrastructure and potential bottlenecks at Key Lake and the advancement of freezing at McArthur River to ensure reliability and sustainability. While these projects are required to support and maintain capacity at current production levels, they have been classified as growth because they also position us for future production flexibility, including to its licensed annual capacity of 25 million pounds, although no decision on changes to future production levels has been made. We will plan our production in line with market opportunities and our contract portfolio, demonstrating that we continue to be a responsible, long-term supplier of uranium fuel.
MANAGING OUR RISKS
The McArthur River deposit presents unique challenges that are not typical of traditional hard or soft rock mines. These challenges are the result of mining in or near high pressure ground water in challenging ground conditions with significant radiation concerns due to the high-grade uranium. We take significant steps and precautions to reduce the risks. Mine designs and mining methods are selected based on their ability to mitigate hydrological, radiological and geotechnical risks. Operational experience gained since the start of production has resulted in a significant reduction in risk. However, there is no guarantee that our efforts to mitigate risk will be successful.
In addition to the risks listed on pages 74 to 75, in 2024 we are focused on the management of the following risks:
Equipment availability
In 2024, the McArthur River mine was impacted by mobile equipment availability, mainly due to the time required to order, receive and commission new mining equipment. A significant amount of new equipment is expected to be delivered to site in 2025. In addition, some of the equipment is customized for use specifically at McArthur River and it therefore requires extensive testing and commissioning time, resulting in notable operational risks related to mobile equipment availability in 2025.
Inflation, labour shortages and supply chain issues
Inflation, the availability of personnel with the necessary skills and experience, and the potential impact of supply chain challenges on the availability of materials and reagents, create additional risks to our production plans and could result in production delays and increased costs in 2025 and future years.
Labour relations
The collective agreement with the United Steelworkers Local 8914 expires in December 2025. As such, the risk of labour dispute impacts is expected to be minimal in 2025.
Water inflow risk
All the mineralized areas discovered to date at McArthur River are in, or partially in, water-bearing ground with significant pressure at mining depths. This high-pressure water source is isolated from active development and production areas to reduce the inherent risk of an inflow. McArthur River relies on pressure grouting and ground freezing, and sufficient pumping, water treatment and above ground storage capacity to mitigate the risks of the high-pressure ground water.
McArthur River has not experienced a significant disruption to its mining or development activities resulting from a water inflow since 2008. The consequences of another water inflow at McArthur River would depend on its magnitude, location and timing, but could include a significant interruption or reduction in production, a material increase in costs or a loss of mineral reserves.
Transition to new mine areas
In 2025, McArthur River is scheduled to transition into two new mine areas within zone 1 and the zone 4 clay area. The risk of unforeseen challenges during the development of these areas could impact our production schedule. The impact would depend on the magnitude of the delay and the mine’s ability to substitute with production from alternative mining areas.
80 CAMECO CORPORATION
Uranium – Tier-one operations
Cigar Lake
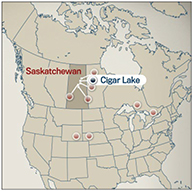
|
2024 Production (our share) | |
| 9.2M lb | ||
| 2025 Production Outlook (our share) | ||
| 9.8M lb | ||
| Estimated Reserves (our share) | ||
| 105.2M lb | ||
| Estimated Mine Life | ||
| 2036 |
Cigar Lake is the world’s highest-grade uranium mine. We are a 54.5% owner and the mine operator. Cigar Lake ore is milled at Orano’s McClean Lake mill.
Cigar Lake is considered a material uranium property for us. There is a technical report dated March 22, 2024 (effective December 31, 2023) that can be downloaded from SEDAR+ (www.sedarplus.ca) or from EDGAR (www.sec.gov).
| Location | Saskatchewan, Canada | |||
| Ownership | 54.547% | |||
| Mine type | Underground | |||
| Mining method | Jet boring system | |||
| End product | Uranium concentrate | |||
| Certification | ISO 14001 certified | |||
| Estimated reserves | 105.2 million pounds (proven and probable), average grade U3O8: 15.87% | |||
| Estimated resources | 12.9 million pounds (measured and indicated), average grade U3O8: 4.93% | |||
|
10.9 million pounds (inferred), average grade U3O8: 5.55% |
||||
| Licensed capacity | 18.0 million pounds per year (our share 9.8 million pounds per year) | |||
| Licence term | Through June 2031 | |||
| Total packaged production: 2014 to 2024 | 155.4 million pounds (100% basis) | |||
| 2024 production | 9.2 million pounds (16.9 million pounds on 100% basis) | |||
| 2025 production outlook | 9.8 million pounds (18.0 million pounds on 100% basis) | |||
| Estimated decommissioning cost | $76.5 million (100% basis) | |||
All values shown, including reserves and resources, represent our share only, unless otherwise indicated.
BACKGROUND
Mine description
Cigar Lake’s geological setting is similar to McArthur River’s. However, unlike McArthur River, the Cigar Lake deposit is horizontally oriented. The Cigar Lake deposit was historically divided into two parts. The eastern portion, previously referred to as Phase 1, is now the Cigar Lake Main (CLMain) portion of the deposit, whereas the western portion, previously referred to as Phase 2 and the area where we have begun development work, is now the Cigar Lake Extension (CLExt).
Mine development is carried out in the basement rocks below the ore horizon. New mine development is required throughout the mine life to gain access to the ore above.
MANAGEMENT’S DISCUSSION AND ANALYSIS 81
Mining method
At Cigar Lake, the permeable sandstone which overlays the deposit and basement rocks, contains large volumes of water at significant pressure. Before we begin mining, we freeze the ore zone and surrounding ground. We use a jet boring system to mine the ore.
Jet boring system (JBS) mining
As a result of the unique geological conditions at Cigar Lake, we are unable to utilize traditional mining methods that require access above the ore, which necessitated the development of a non-entry mining method specifically adapted for this deposit. After many years of test mining, we selected jet boring, and it has been used since mining began in 2014. This method involves:
| • | drilling a pilot hole into the frozen orebody, inserting a high-pressure water jet and cutting a cavity out of the frozen ore |
| • | collecting the ore and water mixture (slurry) from the cavity and pumping it to a storage sump, allowing it to settle |
| • | using a clamshell, transporting the ore from the storage sump to an underground grinding and processing circuit |
| • | once mining is complete, filling each cavity in the orebody with concrete |
| • | starting the process again with the next cavity. |
We have divided the orebody into production panels and at least three production panels need to be frozen at one time to achieve the annual production rate. A JBS machine is located below a frozen panel with three JBS machines available for operation. Two machines actively mine at any given time while the third is moving, setting up, or undergoing maintenance.
We have successfully packaged approximately 155.4 million pounds (100% basis) since we began mining in 2014.
Initial processing
We carry out initial processing of the extracted ore at Cigar Lake before shipping it to McClean Lake. To accomplish this, we:
| • | grind the ore and mix it with water to form a slurry in our underground circuit |
| • | pump the slurry 500 metres to the surface and store it in one of two ore slurry holding tanks, where it is blended and thickened to remove excess water |
| • | the final slurry, at an average grade of approximately 16% U3O8, is pumped into transport truck containers and shipped to McClean Lake mill on a 69-kilometre all-weather road |
Water from this process, including water from underground operations, is treated on the surface. Any excess treated water is released into the environment.
Milling
All of Cigar Lake’s ore slurry is being processed at the McClean Lake mill, operated by Orano. Given the McClean Lake mill’s capacity, it is able to:
| • | process up to 18 million pounds U3O8 per year |
| • | process and package all of Cigar Lake’s current mineral reserves |
Licensing annual production capacity
The Cigar Lake mine is licensed to produce up to 18 million pounds (100% basis) per year. Orano’s McClean Lake mill is licensed to produce 24 million pounds annually.
2024 UPDATE
Production
Total packaged production from Cigar Lake in 2024 was 16.9 million pounds U3O8 (9.2 million pounds our share) compared to 15.1 million pounds U3O8 (8.2 million pounds our share) in 2023.
Lower productivity from the mine was primarily the result of a lower production rate at the McClean Lake mill. At various times during the year, the mill was impacted by ore quality variances, like lower ore grades and/or higher arsenic levels, and by unplanned maintenance at the McClean Lake mill. The majority of downtime occurred in the first and fourth quarters of the year.
82 CAMECO CORPORATION
During the year, we:
| • | produced from and continued development work in the CLMain orebody in alignment with our long-term production plan |
| • | successfully executed a planned 28-day annual maintenance outage |
| • | fully completed the ground freezing program for CLMain orebody by finishing the outfitting of the final freeze holes |
| • | began physical surface work for development of the CLExt portion of the orebody |
| • | completed an expansion of the waste rock storage pads to support the remaining mine development, including development in both the CLMain and CLExt portions of the orebody |
Underground development
Underground mine development continued in 2024. We completed development of two production crosscuts; one in the eastern portion and one in the western portion of CLMain. Development also continued for access to the CLExt orebody.
PLANNING FOR THE FUTURE
Production
In 2025, we expect to produce 18 million pounds (100% basis) at Cigar Lake; our share is approximately 9.8 million pounds.
In 2025, we plan to continue production and development activities in CLMain, as well as development drifts to access CLExt in alignment with our long-term mine plan. We will also continue earthworks and construction of surface services to support the expansion of freeze activities required for future production from CLExt.
CIGAR LAKE EXTENSION
A new NI 43-101 technical report for Cigar Lake was filed March 22, 2024, replacing the previous Cigar Lake Operation technical report, filed in March 2016. Key highlights of the report include:
| • | extension of the mine life to 2036 subject to receipt of all regulatory approvals, with estimated full annual production of 18 million pounds (100% basis) (9.8 million pounds our share) U3O8 recovered from the mill for 10 years followed by a two-year ramp down until depletion |
| • | conversion of 73.4 million pounds (100% basis) (40 million pounds our share) of CLExt mineral resources into mineral reserves |
| • | mine development and capital expenditures for CLExt expected to be approximately $895 million (Cameco’s share – $487 million), including approximately $520 million (Cameco’s share – $284 million) required in advance of first ore from CLExt in 2030 |
| • | increase in estimated average cash operating costs per pound—from $18.75 to $20.58 |
More detailed descriptions of the scientific and technical information on which the mineral reserves and mine plan are based are included in the relevant sections of the technical report. A copy is available on SEDAR+ (www.sedarplus.ca), on EDGAR (www.sec.gov), and on Cameco’s website (www.cameco.com/media/media-library).
MANAGING OUR RISKS
The Cigar Lake deposit presents unique challenges that are not typical of traditional hard or soft rock mines. These challenges are the result of mining in or near high-pressure ground water in challenging ground conditions with significant radiation concerns due to the high-grade uranium and elements of concern in the orebody with respect to water quality. We take significant steps and precautions to reduce the risks. Mine designs and the mining method are selected based on their ability to mitigate hydrological, radiological, and geotechnical risks. Operational experience gained since the start of production has resulted in a significant reduction in risk. However, there is no guarantee that our efforts to mitigate risk will be successful.
In addition to the risks listed on pages 74 to 75, in 2025 we are focused on the management of the following risks:
Inflation, labour shortages, and supply chain challenges
Inflation, the availability of personnel with the necessary skills and experience, and the potential impact of supply chain challenges on the availability of materials and reagents, create additional risks to our production plans and could result in production delays and increased costs in 2025 and future years.
MANAGEMENT’S DISCUSSION AND ANALYSIS 83
Transition to new mining areas
In order to successfully achieve the planned production schedule, we must continue to successfully transition into new mining areas, which includes mine development and investment in critical support infrastructure, and deployment of the jet boring method in new areas. If development or infrastructure construction work is delayed for any reason, including if the performance of our jet boring method is materially different in new areas than in previously mined areas, our ability to meet our future production plans may be impacted.
Water inflow risk
The sandstone that overlays the Cigar Lake deposit and basement rocks is water-bearing with significant pressure at mining depths. This high-pressure water source is isolated from active development and production areas in order to reduce the inherent risk of an inflow. Cigar Lake relies on ground freezing and sufficient pumping, water treatment and above ground storage capacity to mitigate the risks of the high-pressure ground water.
Cigar Lake has not experienced a significant disruption resulting from a water inflow since 2008. The consequences of another water inflow at Cigar Lake would depend on its magnitude, location and timing, but could include a significant interruption or reduction in production, a material increase in costs or a loss of mineral reserves.
84 CAMECO CORPORATION
Uranium – Tier-one operations
Inkai
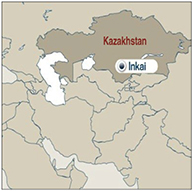
|
2024 Production (100% basis) | |
| 7.8M lb | ||
| 2025 Production Outlook (100% basis) | ||
| See Planning for the future – Production on page 87 | ||
| Estimated Reserves (our share) | ||
| 100.4M lb | ||
| Estimated Mine Life | ||
| 2045 (based on licence term) |
Inkai is a very significant uranium deposit, located in Kazakhstan. The operator is JV Inkai limited liability partnership, which we jointly own (40%)1 with Kazatomprom (KAP) (60%).
Inkai is considered a material uranium property for us. There is a technical report dated November 12, 2024 (effective September 30, 2024) that can be downloaded from SEDAR+ (www.sedarplus.ca) or from EDGAR (www.sec.gov).
| Location |
South Kazakhstan | |||
| Ownership |
40%1 | |||
| Mine type |
In situ recovery (ISR) | |||
| End product |
Uranium concentrate | |||
| Certifications |
BSI OHSAS 18001 | |||
| ISO 14001 certified | ||||
| Estimated reserves |
100.4 million pounds (proven and probable), average grade U3O8: 0.03% | |||
| Estimated resources |
37.1 million pounds (measured and indicated), average grade U3O8: 0.03% | |||
| 8.9 million pounds (inferred), average grade U3O8: 0.03% | ||||
| Licensed capacity (wellfields) |
10.4 million pounds per year (our share 4.2 million pounds per year)1 | |||
| Licence term |
Through July 2045 | |||
| Total packaged production: 2009 to 2024 |
98.0 million pounds (100% basis) | |||
| 2024 production |
7.8 million pounds (100% basis)1 | |||
| 2025 production outlook |
See Planning for the future – Production on page 871 | |||
| Estimated decommissioning cost (100% basis) |
$35.4 million (US) (100% basis) | |||
All values shown, including reserves and resources, represent our share only, unless indicated.
| 1 | Our ownership interest in the joint venture is 40% and we equity account for our investment. As such, our share of production is shown as a purchase. |
MANAGEMENT’S DISCUSSION AND ANALYSIS 85
BACKGROUND
Mine description
The Inkai uranium deposit is a roll-front type orebody within permeable sandstones. The more porous and permeable units host several stacked and relatively continuous, sinuous “roll-fronts” of low-grade uranium forming a regional system. Superimposed over this regional system are several uranium projects and active mines.
Inkai’s mineralization ranges in depths from about 260 metres to 530 metres. The deposit has a surface projection of about 40 kilometres in length, and the width ranges from 40 to 1,600 metres. The deposit has hydrogeological and mineralization conditions favourable for use of in situ recovery (ISR) technology.
Mining and milling method
JV Inkai uses conventional, well-established, and very efficient ISR technology, developed after extensive test work and operational experience. The process involves five major steps:
| • | leach the uranium in situ by circulating an acid-based solution through the host formation |
| • | recover it from solution with ion exchange resin (takes place at both main and satellite processing plants) |
| • | precipitate the uranium with hydrogen peroxide |
| • | thicken, dewater, and dry it |
| • | package the uranium peroxide product in drums |
JV Inkai has successfully packaged approximately 98.0 million pounds (100% basis) since it began mining in 2009.
2024 UPDATE
Production
Production was impacted by the continued procurement and supply chain issues in Kazakhstan, most notably, related to the stability of sulfuric acid deliveries. As a result, total 2024 production from JV Inkai on a 100% basis was 7.8 million pounds (3.6 million pounds our share), 0.6 million pounds lower than in 2023. Production was impacted by differences in the annual mine plan, a shift in the acidification schedule for new wellfields, and unstable acid supply throughout the year.
We received 2.7 million pounds of our total share of Inkai’s 2024 production. The remainder of our share of 2024 production, about 0.9 million pounds, is being stored at JV Inkai for future delivery in order to optimize transportation and delivery costs. The timing of future deliveries is uncertain.
Production purchase entitlements
Under the terms of a restructuring agreement signed with our partner KAP in 2016, our ownership interest in JV Inkai is 40% and KAP’s share is 60%. However, during production ramp-up to the licensed limit of 10.4 million pounds, we are entitled to purchase 57.5% of the first 5.2 million pounds of annual production, and as annual production increases over 5.2 million pounds, we are entitled to purchase 22.5% of such incremental production, to the maximum annual share of 4.2 million pounds. Once the ramp-up to 10.4 million pounds annually is complete, we will be entitled to purchase 40% of such annual production, matching our ownership interest.
Based on the production purchase entitlement under the 2016 JV Inkai restructuring agreement, for 2024 we were entitled to purchase 3.6 million pounds, or 45.9% of JV Inkai’s 2024 production of 7.8 million pounds. Timing of our JV Inkai purchases will fluctuate during the quarters and may not match production, and similar to 2023, the 2024 timing was impacted by shipping delays. Total purchases in 2024 were 4.2 million pounds, of which 2.5 million pounds were related to our 2024 entitlement.
Cash distribution
Excess cash, net of working capital requirements, will be distributed to the partners as dividends. In 2024, we received a cash dividend from JV Inkai of $129 million (US), net of withholdings. Our share of dividends follows our production purchase entitlements as described above. Delays in deliveries of our share of production could reduce the dividend that JV Inkai is able to declare for the calendar year.
86 CAMECO CORPORATION
UPDATED INKAI OPERATION TECHNICAL REPORT
A new NI 43-101 technical report for Inkai Operation was filed November 12, 2024, replacing the previous Inkai Operation technical report, filed in January of 2018. Key highlights of the report include:
| • | Increase in average price used in the economic analysis to $87.50 per pound U3O8 from $54.40 (US) |
| • | increase in estimated average cash operating costs per pound to $12.66 from $9.55 |
| • | expected total packed production of 213.3 million pounds U3O8 based on mineral reserves from 2024 through the projected mine life extending to mid-2045 |
| • | decrease in estimated after-tax internal rate of return of 26.9%, using the total capital investments, along with the operating and capital cost estimates, from 27.1% |
| • | total estimated Inkai capital to bring the remaining mineral reserves into production is approximately $1.5 billion, an increase of 106% when compared to the 2018 Technical Report’s 2024 to mid-2045 time frame. The change is mostly related to wellfield development activities with increased drilling tariffs and higher costs for sulfuric acid and other materials. |
PLANNING FOR THE FUTURE
Expansion project
Engineering work for a process expansion of the Inkai circuit to support a nominal production of at least 10.4 million pounds U3O8 per year has been completed and construction is in progress. The expansion project includes an upgrade to the yellowcake filtration and packaging units, and the addition of a pre-dryer and calciner. Please refer to Section 17.4 of the updated Technical Report for further details. Currently, Inkai estimates the completion of the expansion project in 2025, subject to it successfully managing the schedule risk related to contractor performance.
Production
On December 31, 2024, we were unexpectedly informed that Kazatomprom, as majority owner and controlling partner of the joint venture, had directed JV Inkai to suspend production activity as of January 1, 2025. The suspension was implemented pending approval by Kazakhstan’s Ministry of Energy of an extension to submit an updated Project for Uranium Deposit Development documentation. When the extension had not yet been granted at 2024 year-end as expected, Kazatomprom made the decision to halt production in order to avoid potential violation of Kazakhstan legislation. The extension was approved and JV Inkai resumed production on January 23, 2025. Cameco and Kazatomprom continue to work with JV Inkai to determine the impact of the approximately three-week production suspension on the operation’s 2025 production plans.
Our share of production is purchased at a discount to the spot price and included at this value in inventory. In addition, JV Inkai capital is not included in our outlook for capital expenditures.
Mineral extraction tax
In July 2024, the government of the Republic of Kazakhstan introduced amendments to the country’s Tax Code which involves changes to the Mineral Extraction Tax (MET) rate for uranium. The MET rate will increase from the current rate of 6%, to a rate of 9% in 2025, with a further change in 2026 that will see the introduction of a progressive MET system based on actual annual production volumes under each subsoil use agreement. Under the progressive system that will take effect in 2026, the highest rate is 18% for operations producing over 10.4 million pounds. Additionally, a further MET of up to 2.5% based on the spot market price of uranium, will also be introduced in 2026. The MET is incurred and paid by the mining entities, which is expected to have a significant impact on JV Inkai’s cost structure.
MANAGING OUR RISKS
In addition to the risks listed on pages 74 to 75, JV Inkai also manages the following risks:
Production forecast
Production plans for 2025 and subsequent years are uncertain and being reassessed. JV Inkai’s target for production in 2024 was 8.3 million pounds of U3O8 (100% basis). However, this target was tentative and contingent upon receipt of sufficient quantities of sulfuric acid on a specified schedule. Actual 2024 production volume of 7.8 million pounds is a decrease of more than 20% of the original approved production volume of 10.4 million pounds.
MANAGEMENT’S DISCUSSION AND ANALYSIS 87
Presently, JV Inkai is experiencing procurement and supply chain issues, most notably, related to the stability of sulfuric acid deliveries. It is also experiencing challenges related to construction delays and inflationary pressures on its production costs.
A significant disruption to JV Inkai’s previous production plans for 2025 and subsequent years could result in financial penalties and further escalation of production costs. In addition, JV Inkai’s costs could be impacted by potential changes to the tax code in Kazakhstan and by possible increased financial contributions to social and other state causes, although these risks cannot be quantified or estimated at this time.
Depending on production levels at Inkai and the outcome of our discussions related thereto with JV Inkai and KAP, our share of production and earnings from this equity-accounted investee and the amount and timing of our dividends from the joint venture may be impacted.
Transportation
The geopolitical situation continues to cause transportation risks in the region. We could continue to experience delays in our expected Inkai deliveries. To mitigate this risk, we have inventory, long-term purchase agreements and loan arrangements in place we can draw on. Depending on when we receive shipments of our share of Inkai’s production, our share of earnings from this equity-accounted investee and the timing of the receipt of our share of dividends from the joint venture may be impacted.
Political
Kazakhstan declared itself independent in 1991 after the dissolution of the Soviet Union. Our investment in JV Inkai is subject to the greater risks associated with doing business in developing countries, which have significant potential for social, economic, political, legal and fiscal instability. Kazakhstan laws and regulations, including those affecting the regulation of mining, are complex and still developing and their application can be difficult to predict. The other owner of JV Inkai is Kazatomprom, an entity majority owned by the government of Kazakhstan. We have entered into agreements with JV Inkai and Kazatomprom intended to mitigate political risk. This risk includes the imposition of governmental laws or policies that could restrict or hinder JV Inkai paying us dividends, or selling us our share of JV Inkai production, or that impose discriminatory taxes or currency controls on these transactions. The restructuring of JV Inkai, which took effect January 1, 2018, was undertaken with the objective to better align the interests of Cameco and Kazatomprom and includes a governance framework that provides for protection for us as a minority owner of JV Inkai.
For more details on this risk, please see our most recent annual information form under the heading political risks.
88 CAMECO CORPORATION
Uranium – Tier-two operations
Rabbit Lake
Located in Saskatchewan, Canada, our 100% owned Rabbit Lake operation opened in 1975, and has the second largest uranium mill in the world. Due to market conditions, we suspended production at Rabbit Lake during the second quarter of 2016.
| Location | Saskatchewan, Canada | |||
| Ownership | 100% | |||
| End product | Uranium concentrates | |||
| ISO certification | ISO 14001 certified | |||
| Mine type | Underground | |||
| Estimated reserves | — | |||
| Estimated resources | 38.6 million pounds (indicated), average grade U3O8: 0.95% | |||
| 33.7 million pounds (inferred), average grade U3O8: 0.62% | ||||
| Mining methods | Vertical blasthole stoping | |||
| Licensed capacity | Mill: maximum 16.9 million pounds per year; currently 11 million | |||
| Licence term | Through October 2038 | |||
| Total production: 1975 to 2024 | 202.2 million pounds | |||
| 2024 production | 0 million pounds | |||
| 2025 production outlook | 0 million pounds | |||
| Estimated decommissioning cost | $294.8 million | |||
OPERATING STATUS
The site remained in a safe state of care and maintenance throughout 2024.
While in standby, we continue to evaluate our options in order to minimize care and maintenance costs. We expect standby operating costs in care and maintenance to range between $43 million and $47 million in 2025, an increase from 2024 due to project work related to containment improvements.
FUTURE PRODUCTION
We do not expect any production from Rabbit Lake in 2025.
MANAGING OUR RISKS
We manage the risks listed on pages 74 to 75.
MANAGEMENT’S DISCUSSION AND ANALYSIS 89
US ISR Operations
Located in Nebraska and Wyoming in the US, the Crow Butte and Smith Ranch-Highland (including the North Butte satellite) operations began production in 1991 and 1975, respectively. Each operation has its own processing facility. Due to market conditions, we curtailed production and deferred all wellfield development at these operations during the second quarter of 2016.
| Ownership | 100% | |||
| End product | Uranium concentrates | |||
| ISO certification | ISO 14001 certified | |||
| Estimated reserves | Smith Ranch-Highland: | — | ||
| North Butte-Brown Ranch: | — | |||
| Crow Butte: | — | |||
| Estimated resources | Smith Ranch-Highland: | 24.9 million pounds (measured and indicated), average grade U3O8: 0.06% | ||
| 7.7 million pounds (inferred), average grade U3O8: 0.05% | ||||
| North Butte-Brown Ranch: | 9.4 million pounds (measured and indicated), average grade U3O8: 0.07% | |||
| 0.4 million pounds (inferred), average grade U3O8: 0.06% | ||||
| Crow Butte: | 13.9 million pounds (measured and indicated), average grade U3O8: 0.25% | |||
| 1.8 million pounds (inferred), average grade U3O8: 0.16% | ||||
| Mining methods | In situ recovery (ISR) | |||
| Licensed capacity | Smith Ranch-Highland:1 | Wellfields: 3 million pounds per year; processing plants: 5.5 million pounds per year | ||
| Crow Butte: | Processing plants and wellfields: 2 million pounds per year | |||
| Licence term | Smith Ranch-Highland: | Through September 2028 | ||
| Crow Butte: | Through October 2024 (in timely renewal) | |||
| Total production: 2002 to 2024 | 33.0 million pounds | |||
| 2024 production | 0 million pounds | |||
| 2025 production outlook | 0 million pounds | |||
| Estimated decommissioning cost | Smith Ranch-Highland: $248.6 million (US), including North Butte | |||
|
Crow Butte: $65.4 million (US) |
||||
| 1 | Including Highland mill |
PRODUCTION CURTAILMENT
As a result of our 2016 decision, commercial production at the US operations ceased in 2018. We expect ongoing cash and non-cash care and maintenance costs to range between $14 million (US) and $15 million (US) for 2025.
FUTURE PRODUCTION
We do not expect any production in 2025.
MANAGING OUR RISKS
In September 2024, the operating licence renewal for Crow Butte was submitted and timely renewal is now in process by the Nuclear Regulatory Commission.
We also manage the risks listed on pages 74 to 75.
90 CAMECO CORPORATION
Uranium – advanced projects
Our advanced projects are part of our project pipeline, and these resources are supportive of growth beyond our existing suite of tier-one and tier-two assets. We plan to advance these projects at a pace aligned with market opportunities.
Millennium
| Location | Saskatchewan, Canada | |||
| Ownership | 69.9% | |||
| End product | Uranium concentrates | |||
| Potential mine type | Underground | |||
| Estimated resources (our share) | 53.0 million pounds (indicated), average grade U3O8: 2.39% | |||
| 20.2 million pounds (inferred), average grade U3O8: 3.19% | ||||
BACKGROUND
The Millennium deposit was discovered in 2000 and was delineated through geophysical surveys and surface drilling work between 2000 and 2013.
Yeelirrie
| Location |
Western Australia | |||
| Ownership |
100% | |||
| End product |
Uranium concentrates | |||
| Potential mine type |
Open pit | |||
| Estimated resources |
128.1 million pounds (measured and indicated), average grade U3O8: 0.15% | |||
BACKGROUND
The Yeelirrie deposit was discovered in 1972 and is a near-surface calcrete-style deposit that is amenable to open pit mining techniques. It is one of Australia’s largest undeveloped uranium deposits.
Kintyre
| Location |
Western Australia | |||
| Ownership |
100% | |||
| End product |
Uranium concentrates | |||
| Potential mine type |
Open pit | |||
| Estimated resources |
53.5 million pounds (indicated), average grade U3O8: 0.62% | |||
| 6.0 million pounds (inferred), average grade U3O8: 0.53% | ||||
BACKGROUND
The Kintyre deposit was discovered in 1985 and is amenable to open pit mining techniques.
2024 PROJECT UPDATES
We believe that we have some of the best undeveloped uranium projects in the world. However, our current focus is on producing from our tier-one uranium assets at a pace aligned with our contract portfolio and market opportunities.
PLANNING FOR THE FUTURE
2025 Planned activity
No work is planned at Millennium, Yeelirrie or Kintyre in 2025.
MANAGEMENT’S DISCUSSION AND ANALYSIS 91
MANAGING THE RISKS
Project approval
A project description for Millennium was submitted to the Saskatchewan Ministry of Environment and the CNSC in 2009, along with a draft Environmental Impact Statement (EIS) in 2012. The EIS received Ministerial Approval from Saskatchewan in December 2013. In May 2014, Cameco notified the CNSC that it did wish to proceed with the CNSC’s licensing process due to economic conditions. The CNSC’s Environmental Assessment and licensing process remains on hold and can be reopened at Cameco’s request. The provincial approval remains valid, as it was renewed in 2018 and again in 2023.
The approval for the Yeelirrie project, received from the prior state government, required substantial commencement of the project by January 2022, and this was not achieved. The current government declined to grant us an extension to achieve it. In the future, we can again apply for an extension of time to achieve substantial commencement of the project. If granted by a future government we could commence the Yeelirrie project, provided we have all other required regulatory approvals. Approval for the Yeelirrie project at the federal level was granted in 2019 and extends until 2043. Approval of the Kintyre project at the federal level was granted in 2015 and extends until 2045.
The approval received for Kintyre from the prior state government required substantial commencement of the project by March 2020, being within five years of the grant of the approval, and this was not achieved. The current government declined to grant us an extension to achieve it. In the future, we can apply for an extension of time to achieve substantial commencement of the project. If granted by a future government we could commence the Kintyre project, provided we have all other required regulatory approvals.
For all of our advanced projects, we manage the risks listed on pages 74 to 75.
92 CAMECO CORPORATION
Uranium – exploration
Our exploration program is focused on replacing mineral reserves as they are depleted by our production, which is key to sustaining our business, meeting our commitments, and ensuring long-term growth. Our exploration activity is adjusted annually in line with market signals and at a pace aligned with Cameco’s mining plans and marketing requirements. In recent years, as we began to bring back our tier-one production, we also increased exploration spending, all in response to the positive momentum in the nuclear fuel market, which has provided a clear signal that more uranium production will be required in the next decade, setting the stage for a renewed exploration cycle.
Our position as one of the world’s largest uranium producers and our continued growth across the nuclear fuel cycle has been driven by decades of experience and our history of exploration, discovery and mining successes. Our land position totals 754,000 hectares (1.8 million acres) that cover exploration and development prospects in Canada, Australia, Kazakhstan and the US that are among the best in the world. In northern Saskatchewan alone, we have direct interests in 660,000 hectares (1.6 million acres) that cover many of the most prospective areas of the Athabasca Basin.
In northern Saskatchewan, our well-established infrastructure includes licensed and fully permitted uranium mills and mines in the eastern Athabasca basin, supported by a network of roads, airstrips and electricity supply. This infrastructure provides us with an advantage that not only underpins the potential development of our advanced exploration projects, but also supports our ongoing work to both delineate existing prospects and deposits, and to identify undiscovered uranium potential. Additionally, our decades of work to establish a positive corporate reputation by prioritizing our relationships with northern Saskatchewan Indigenous communities, confirms our long-term commitment to continually engage and provide ongoing benefits to the people that call the region home.
The well-known uranium endowment of the Athabasca Basin, where we are involved in 45 projects (including partner-operated joint ventures, previously 39 projects in 2023), is the result of its unique geology, creating a remarkable mining jurisdiction that hosts the highest uranium grades and some of the largest uranium deposits in the world. On our projects, numerous uranium occurrences have been identified, along with several prospects and undeveloped deposits of variable grades and sizes which have progressed through multiple stages of evaluation. Depending on the potential deposit size, ore and ground quality, evolving mining technologies and the uranium market environment, some of these prospects are expected to become viable, economic deposits in a uranium market and price environment that supports new primary production and provides an adequate risk-adjusted return.
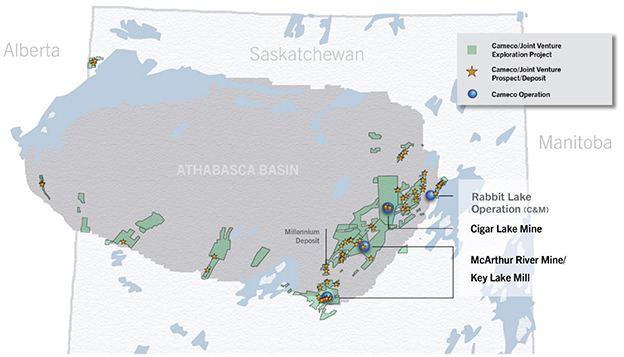
MANAGEMENT’S DISCUSSION AND ANALYSIS 93
The combination of our large land position and proven expertise in discovering and developing world class uranium deposits provides the foundation for future mill-supported exploration projects, ranging from early to advanced stages of greenfield exploration and for brownfield opportunities to extend the lives of our existing operations.
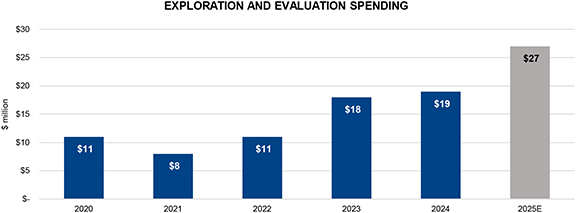
2024 UPDATE
Brownfields and advanced exploration
Brownfields and advanced exploration activities include exploration near our existing operations and expenditures for maintaining advanced projects and delineation drilling where uranium mineralization is being defined. In 2024, we spent about $4 million in Saskatchewan, $2 million in Australia and $1 million in the US on brownfield and advanced exploration projects. The spending in Saskatchewan was primarily focused on advanced exploration on the Dawn Lake project.
On the LaRocque Lake corridor of the Dawn Lake project located approximately 45 km northwest of the Rabbit Lake operation, our 2024 exploration drilling continued to expand the footprint of known uranium mineralization with additional high-grade mineralized intercepts. Although the deposit remains at an early stage of exploration, the results to date are comparable to those of other mines and known deposits in the Athabasca Basin.
Regional exploration
Regional exploration is defined as projects that are considered greenfields. In 2024, we spent over $8 million on regional exploration programs that are comprised of target generation geophysical surveys and diamond drilling primarily in northern Saskatchewan.
PLANNING FOR THE FUTURE
We plan to continue to focus on our core projects in Saskatchewan under our long-term exploration framework. Our leadership position and industry expertise in both exploration and corporate social responsibility makes us a partner of choice. For properties and projects that meet our investment criteria, we may partner with other companies through strategic alliances, equity holdings and traditional joint venture arrangements to optimize our exploration activity and spending.
Brownfields and Advanced Exploration
In 2025, we plan to spend about $9 million on brownfields and advanced exploration, primarily to refine the footprint of the mineralization identified on the LaRocque Lake corridor of the Dawn Lake project, and to undertake a brownfield exploration program at McArthur River.
Regional Exploration
We plan to spend approximately $12 million on diamond drilling and target generation geophysical surveys on our core regional projects in Saskatchewan, in 2025.
94 CAMECO CORPORATION
Fuel services
Refining, conversion and fuel manufacturing
We have about 20% of world UF6 primary conversion capacity and are a supplier of natural UO2. Our focus is on cost-competitiveness and operational efficiency, as well as increasing our production of UF6 in line with our contract portfolio and market opportunities.
Our fuel services segment is strategically important because it helps support the growth of the uranium segment. Offering a range of products and services to customers helps us broaden our business relationships and meet customer needs.
Blind River Refinery
|
Licensed Capacity
24.0M kgU as UO3
Licence renewal in
February 2032 |
Blind River is the world’s largest commercial uranium refinery, refining uranium concentrates from mines around the world into UO3.
| Location | Ontario, Canada | |||
| Ownership | 100% | |||
| End product | UO3 | |||
| ISO certification | ISO 14001 certified | |||
| Licensed capacity | 18.0 million kgU as UO3 per year, approved to 24.0 million subject to the completion of certain equipment upgrades (advancement depends on market conditions) | |||
| Licence term | Through February 2032 | |||
| Estimated decommissioning cost | $58 million | |||
MANAGEMENT’S DISCUSSION AND ANALYSIS 95
Port Hope Conversion Services
|
Licensed Capacity
12.5M kgU as UF6
2.8M kgU as UO2
Licence renewal in
February 2027 |
Port Hope is the only uranium conversion facility in Canada and a supplier of UO2 for Canadian-made CANDU heavy-water reactors.
| Location | Ontario, Canada | |
| Ownership | 100% | |
| End product | UF6, UO2 | |
| ISO certification | ISO 14001 certified | |
| Licensed capacity | 12.5 million kgU as UF6 per year | |
| 2.8 million kgU as UO2 per year | ||
| Licence term | Through February 2027 | |
| Estimated decommissioning cost | $138.2 million | |
Cameco Fuel Manufacturing Inc. (CFM)

|
Licensed Capacity
1.65M kgU as UO2 fuel pellets
Licence renewal in
February 2043 |
CFM produces fuel bundles and reactor components for CANDU heavy-water reactors.
| Location | Ontario, Canada | |
| Ownership | 100% | |
| End product | CANDU fuel bundles and components | |
| ISO certification | ISO 9001 certified, ISO 14001 certified | |
| Licensed capacity | 1.65 million kgU as UO2 fuel pellets | |
| Licence term | Through February 2043 | |
| Estimated decommissioning cost | $10.8 million | |
96 CAMECO CORPORATION
2024 UPDATE
Production
Fuel services produced 13.5 million kgU in 2024, similar to 2023. This included UF6 production of 10,781 tonnes, lower than our expectation of 11,000 to 11,500 tonnes of UF6 due to temporary operational issues in one of the processing circuits at the UF6 plant during the first half of the year.
Port Hope conversion facility cleanup and modernization (Vision in Motion)
Vision in Motion is a unique opportunity that demonstrates our continued commitment to a clean environment. It has been made possible by the opening of a long-term waste management facility by the Government of Canada’s Port Hope Area Initiative project. There is a limited opportunity during the life of this project to engage in clean-up and renewal activities that address legacy waste at the Port Hope Conversion facility inherited from historic operations. Progress continued over the past year with the removal of old buildings and structures on site, and the project will continue to be active in the year ahead, including the construction of a new warehouse building.
PLANNING FOR THE FUTURE
Production
We plan to produce between 13 million and 14 million kgU in our fuel services segment in 2025.
MANAGING OUR RISKS
We take significant steps and precautions to reduce risk. However, there is no guarantee that our efforts to mitigate risk will be successful.
In addition to the risks listed on pages 74 to 75, in 2024 we are focused on the management of the following risks:
Production plans
Inflation, the availability of personnel with the necessary skills and experience, aging infrastructure, and the potential impact of supply chain challenges on the availability of materials and reagents carry the risk of not achieving our production plans, production delays, and increased costs in 2025 and future years.
Labour relations
The collective agreement with unionized employees at our Port Hope conversion facility expires in June 2025. There is a risk to the production plan if we are unable to reach an agreement and there is a labour dispute.
MANAGEMENT’S DISCUSSION AND ANALYSIS 97
Westinghouse Electric Company
Westinghouse is a nuclear reactor technology original equipment manufacturer (OEM) and a leading provider of highly technical aftermarket products and services to commercial nuclear power utilities and government agencies globally. Westinghouse’s history in the energy industry stretches back over a century, during which time the company became a pioneer in nuclear energy.
Like Cameco, Westinghouse enables carbon-free, baseload and dispatchable energy that is needed to strengthen energy security, reinforce national security, and support the energy transition, all of which, we believe, make the company well-positioned for long-term growth.
| Corporate headquarters | Cranberry Township, Pennsylvania (United States)
|
|
| Locations | Three fuel fabrication facilities (US, Sweden, United Kingdom), approximately 90 facilities, engineering centers, and workshops, with over 10,000 employees in more than 21 countries, including major nuclear component fabrication facilities in the US and Italy.
|
|
| Ownership | 49% - equity-accounted
|
|
| Business activities | Core business: Designs and manufactures nuclear fuel supplies and intermediate products and provides fuel cycle services for light water reactors. Westinghouse is the OEM or a technology provider to about 50% of the global nuclear reactor fleet, for which it provides outage and maintenance services, engineering support, instrumentation and controls equipment, plant modifications, and components and parts for the installed base of nuclear reactors and new reactors as they are brought on-line.
|
|
| New build: Designs, develops and procures equipment for new AP1000 nuclear reactors, with licensing agreements that allow Westinghouse to benefit from the construction of other reactor designs that incorporate AP1000 technology. This business line also includes the design of new small and micro reactors
|
||
| Certifications | ISO 14001
|
|
| ISO 45001
|
||
| Estimated decommissioning cost | $299.9 million (US) |
BACKGROUND
On November 7, 2023, we announced the closing of the acquisition of Westinghouse in partnership with Brookfield. Our share of the purchase price was $2.1 billion (US). Brookfield beneficially owns a 51% interest in Westinghouse, and we beneficially own 49%. Bringing together Cameco’s expertise in the nuclear industry with Brookfield’s expertise in clean energy, positions nuclear power at the heart of the energy transition and creates a powerful platform for strategic growth across the nuclear sector.
The acquisition of Westinghouse was completed in the form of a limited partnership with Brookfield. The board of directors governing the limited partnership consists of six directors, three appointed by Cameco and three appointed by Brookfield. Decision-making by the board corresponds to percentage ownership interests in the limited partnership (51% Brookfield and 49% Cameco). However, decisions with respect to certain reserved matters under the partnership agreement, such as the approval of the annual budget and business plan, require the presence and support of both Cameco and Brookfield appointees to the board as long as certain ownership thresholds are met.
As of November 7, 2023, we receive the economic benefit of our ownership in Westinghouse. We account for our proportionate interest in Westinghouse on an equity basis.
We expect this strategic acquisition will be transformative and accretive to Cameco and like Cameco, Westinghouse has nuclear assets that are strategic, proven, licensed and permitted, and that are in geopolitically attractive jurisdictions. We expect these assets, like ours, will participate in the growing demand profile for nuclear energy.
98 CAMECO CORPORATION
BUSINESS ACTIVITIES
Westinghouse’s main business activities span two key stages of the life cycle of a nuclear reactor:
| • | Core business, including the operations and maintenance of the installed base, and |
| • | New build, which designs, develops and procures equipment for new nuclear reactors. |
Westinghouse’s total 2024 revenue was $4.3 billion (US), broken down by region as follows:
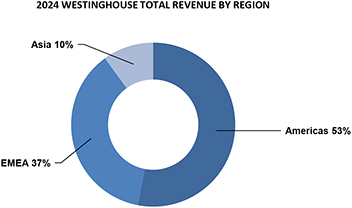
Core business
In 2024, Westinghouse’s core business covered two main business units: Operating Plant Services (OPS) and Nuclear Fuel. Effective January 1, 2025, the OPS business unit will be transformed into two new global business units: Long-Term Operations and Outage & Maintenance Services. Going forward, Westinghouse’s core business will therefore encompass Nuclear Fuel, Outage & Maintenance Services and Long-term Operations.
Core business: Operating Plant Services (OPS)
The OPS business unit served the installed global base of reactors across two business lines:
| • | Outage and maintenance services generates revenue entirely from providing refueling, maintenance, inspection and repair services to the existing global installed reactor base and it is not reliant on new plant projects. These services are provided under long-term customer relationships and demand is driven by safety-related maintenance, regulatory compliance, and asset performance. |
| • | Long term operations offer solutions to enhance the reliability, safety, lifespan, and cost-effectiveness of customer operations and supplies replacement parts and products as well as operational and technical support. The following services are provided within this business line: |
| • | Engineering services generates stable revenue by engineering bespoke replacement components or equipment, and delivering engineering studies to validate that changes to plant operation are within plant design safety margins, and through studies designed to establish the best course of action to improve plant performance (e.g. do nothing, repair, replace) for emergent issues. Demand for these services is driven by the long-term relationships Westinghouse has built with its customers through prompt response to emergent customer business needs, and through providing services to recently completed nuclear units. |
| • | Instrumentation and controls generates revenue by providing advanced digital systems that include core safety and non-safety instrumentation, automation, and control systems through product development, design, assembly and testing of advanced products. This business line also provides simulation services for multiple nuclear reactor technologies. |
MANAGEMENT’S DISCUSSION AND ANALYSIS 99
| • | Parts generates revenue by providing specialized manufacturing and commercial dedication capabilities to support Westinghouse’s ability to make tailored parts that are challenging to replicate. Westinghouse can offer qualified replacement parts (e.g., control rod drives) and products (safety and non-safety), as well as operational and technical support. Demand is largely driven by the need for consumables used during and between outages to maintain safe and efficient operation of nuclear power plants. |
The 2024 revenue for OPS was approximately $2.5 billion (US), representing about 58% of Westinghouse’s total 2024 revenue. Westinghouse’s 2024 revenue by region for OPS was as follows:
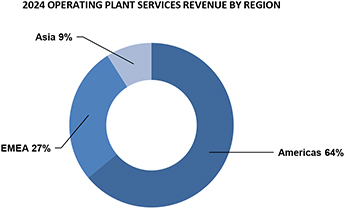
Core business: Nuclear Fuel
The Nuclear Fuel business unit designs and fabricates highly engineered, bespoke fuel assemblies that maximize power in a specific reactor. Westinghouse primarily supplies fuel assemblies for pressurized water reactors, although it has made advancements and can also provide certified fuel assemblies for a variety of reactor technologies, including boiling water reactors, advanced gas-cooled reactors and water-water energetic reactors (VVER).
The nuclear fuel business unit benefits from long-term customer relationships and has predictable demand for its products and services. To allow consistent power generation, these reactors require an outage to refuel every 18 to 24 months during which one-third of the fuel assemblies are replaced.
The 2024 revenue from the nuclear fuel business unit was approximately $1.5 billion (US), representing approximately 36% of Westinghouse’s total 2024 revenue. Westinghouse’s 2024 revenue by region for nuclear fuel was as follows:
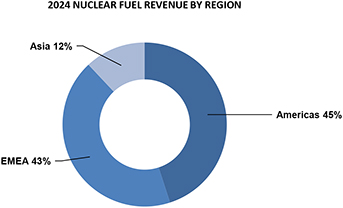
100 CAMECO CORPORATION
Core business: Planning for the future
The importance of nuclear power in providing carbon-free, secure and affordable baseload power as an essential part of the electricity grid in many countries, is creating opportunities to add significant long-term value for Westinghouse. The announcements of reactor life extensions and reactor restarts are creating new and extended opportunities for both the OPS and Nuclear Fuel business units to service, maintain and fuel existing reactors. Expanded fabrication services for different types of reactor technology, including those for which Westinghouse is not the OEM, as well as the introduction of fuel types that can reduce outage frequency and optimize fuel burnup (LEU+ fuels), creates opportunities in the core business as well.
Of note, Westinghouse’s role in the design, development, engineering and procurement of equipment for new reactors, can create further opportunities for the core business through future reactor services and fuel supply contracts once a reactor begins commercial operation.
Springfields Fuels Limited
Westinghouse’s portfolio of global operations includes Springfields Fuels Limited (SFL), in the United Kingdom. Unique to SFL is a licence that is not limited to low-enriched uranium; the site can handle any U-235 enrichment level across a range of facilities that currently include capabilities related to fuel fabrication and nuclear materials management.
The potential for a conversion plant is among the most attractive emerging opportunities for SFL. Since the 1960s, the site has hosted several conversion lines, most recently operating under a toll-conversion agreement with Cameco, which ended in 2014. The conclusion of that contract and weak market conditions at the time resulted in the closure and partial decommissioning of the Line 4 conversion facility, which had been in operation since 1993. However, the current geopolitical environment has resulted in a potential opportunity for additional western-based conversion capacity and has brought SFL’s historic conversion capabilities and unique licence into focus. Westinghouse is currently evaluating the cost, timeline and infrastructure required to bring back conversion capacity at SFL. The evaluation must also carefully consider other potential opportunities available to the site, including the optimization of shared infrastructure that could be required to expand to other nuclear fuel products, as well as potential external funding options in light of the site’s unique licence.
Similar to any segment of the nuclear fuel cycle, the decision to add conversion capacity at SFL must be underpinned by a portfolio of long-term contracts to support any investment.
New Build
The importance of nuclear power in providing carbon-free, secure and affordable baseload power as an essential part of the electricity grid in many countries, is creating opportunities for the New Build business unit to add significant long-term value for Westinghouse. In addition to its role in the design, development, engineering and procurement of equipment for new reactors (it does not provide construction services or assume any construction risk), once a new reactor begins commercial operation, further opportunities can be added to the OPS and Nuclear Fuel business through future reactor services and fuel supply contracts. Its technology and experience provide a competitive advantage as the engineering and procurement aspects of new build programs are initiated.
The 2024 revenue from the New Build business unit was approximately $300 million (US) representing approximately 6% of Westinghouse’s total 2024 revenue. Westinghouse’s 2024 revenue by region for the new build business was as follows:
MANAGEMENT’S DISCUSSION AND ANALYSIS 101
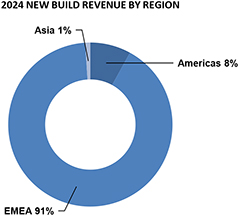
New Build: Contracting framework
Following an announcement of a successful bid, there are a number of contracts that must be signed before work commences and revenue is realized. Once contracts are signed and work begins, new build projects are expected to generate multi-year revenue streams and EBITDA for Westinghouse.
Front end engineering and design (FEED) contracts often precede engineering services contracts, which are required before work can begin. The chart below is an illustrative framework and the assumptions used for the expected timing of revenue flows and profitability as these large, one-time decisions by utilities to construct new nuclear power plants using Westinghouse’s proven AP1000 reactor design are made.
Assumptions and estimates:
| • | Cost to construct new AP1000 reactor in the US based on an MIT (Massachusetts Institute of Technology) study: $6 billion to $8 billion (US), although it can vary significantly depending on in-country labour and construction productivity rates. There is a measured and noticeable scale effect where multiple reactors have been built – for example, in China, where four AP1000 reactors are in operation and twelve more are under construction, compared to the US, where two are in operation and there are currently none under construction. |
| • | Engineering and procurement work: 25% to 40% of total plant cost, depending on the scope of the project – excluding China, where Westinghouse’s scope is typically less than 10% of the total project cost, and any benefits accruing from the settlement agreement with KEPCO and KHNP. |
| • | EBITDA margin for new build activity is expected to be aligned with the overall core business, although it can vary between 10% and 20%. |
102 CAMECO CORPORATION
Illustrative framework of Westinghouse revenue flow for reactor new build project
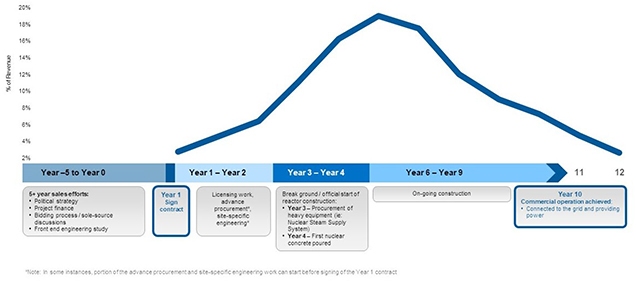
New Build: Planning for the future
In addition to the AP1000 reactors already deployed (US and China), Poland, Bulgaria and Ukraine have each chosen the AP1000 reactor for their new nuclear energy programs and signed contracts (FEED-1 or engineering services contracts), with several other nations evaluating technology options that include the AP1000:
| • | Poland does not currently have any nuclear capacity and is planning to build up to three reactors at the Lubiatowo-Kopalino nuclear power plant, and three more at a second site (to be determined). Westinghouse is working under engineering services contracts for the first three reactors and the Polish government continues to work towards a potential Final Investment Decision (FID). |
| • | Bulgaria has produced nuclear power since the 1970’s using Soviet-era water-water energetic (VVER) reactor technology at the Kozloduy nuclear power plant. The site hosts two operating VVER reactors and four retired VVER rectors that are being decommissioned. The country is planning to build two AP1000s at the Kozloduy facility and Westinghouse is working under a FEED-1 contract on the first of the two, and the Bulgarian government continues to work towards an FID. |
| • | Ukraine has a long history with nuclear power and currently operates 15 VVER reactors across four nuclear plants, as well as having four reactors that have been retired and are in different stages of decommissioning. Two additional VVER reactors were under construction until 1990 when work was suspended. The country is now planning/proposing to build up to nine AP1000 reactors across multiple new and existing plant sites, with Westinghouse working under a FEED-1 contract on the first of two AP1000 units planned at the Khmelnitski nuclear power plant. The timing of an FID for planned and proposed reactors in Ukraine is unknown. |
Westinghouse was also recently awarded a contract to evaluate the deployment of an AP1000 reactor in Slovenia.
Technology export
On January 16, 2025, Westinghouse announced it had resolved its technology and export dispute with KEPCO and KHNP, which resolves the dispute and establishes a framework for additional deployments outside of South Korea, to the mutual and material benefit of Westinghouse, KEPCO and KHNP.
Business cycles
Westinghouse’s core business is characterized by recurring and predictable revenue and cash flow streams, the majority of which are secured in advance under long-term contracts with durations that can range from three to more than ten years, depending on the product or service being provided. The 18-to 24-month outage cycle for most reactors drives some variability in annual cash flow.
MANAGEMENT’S DISCUSSION AND ANALYSIS 103
Cash distributions
Annually, we and Brookfield (the partners) approve a budget and business plan, which outline Westinghouse’s financial projections and capital allocation priorities. The determination of whether to make cash distributions to us and Brookfield will be based on the approved budgeted expenditures and capital allocation priorities, including growth investment opportunities, as well as available cash balances. However, the timing of cash distributions is expected to be aligned with the timing of Westinghouse’s cash flows.
A distribution of $100 million (US) from Westinghouse was paid in February 2025, of which we received $49 million (US) representing our share of the distribution. This is the first distribution since the acquisition closed.
FUTURE PROSPECTS
Amid the ongoing demand growth and global energy security concerns, we expect there will be new opportunities for Westinghouse to compete for and win new business. Westinghouse’s reputation as a global leader in the nuclear industry and its position as the only fully European supplier for certified VVER fuel assemblies are expected to benefit its Core business as Central and Eastern European countries seek to develop a reliable fuel supply chain independent of Russia.
In term of new construction, beyond the countries currently advancing plans to invest in nuclear energy and approaching an FID, several other countries are considering or reconsidering the deployment of new nuclear plants. Sweden, Finland, Slovenia, Netherlands, Slovakia, UK, US and Canada are all considering nuclear energy and each represents a potential opportunity for Westinghouse’s AP1000 technology.
In addition to its AP1000 reactor design, Westinghouse has submitted its pre-application Regulatory Engagement Plan with the US Nuclear Regulatory Commission for the development of its 300 Mw AP300 small modular reactor, which is based on the proven and licensed AP1000 reactor design, while its 5 Mw eVinci microreactor design was awarded additional US Department of Energy funding for the detailed engineering and experiment planning (DEEP) process for a test reactor at Idaho National Lab. The AP300 small modular reactor and the eVinci microreactor are expected to offer the same carbon-free baseload benefits as larger nuclear reactor technologies, but are tailored for specific applications, including industrial, remote mining, off-grid communities, defense facilities and critical infrastructure. As with the AP1000 reactor, they are expected to have applications beyond electricity generation, including district and process heat, desalination and hydrogen production. We remain optimistic about the future competitiveness of these technologies and their potential to make a meaningful contribution to Westinghouse’s long-term financial performance. However, both are currently in the development phase with a market and business case for these new products continuing to evolve.
Caution about forward-looking information relating to Westinghouse
This discussion of our expectations relating to the future prospects of Westinghouse is subject to the assumptions and risks that are discussed under the heading Caution about forward-looking information beginning on page 2 and may be subject to the risks listed under the heading Managing the risks, starting on page 74, which include:
Assumptions
| • | the market conditions and other factors upon which we have based Westinghouse’s future plans and forecasts |
| • | Westinghouse’s ability to mitigate adverse consequences of delays in production and construction, and the success of its plans and strategies |
| • | the absence of new and adverse government regulations, policies or decisions, and that Westinghouse will comply with nuclear licence and quality assurance requirements at its facilities |
| • | that there will not be any significant adverse consequences to Westinghouse’s business resulting from business disruptions, including those relating to supply disruptions, economic or political uncertainty and volatility, labour relation issues, and operating risks |
Material risks that could cause actual results to differ materially
| • | the risk that Westinghouse may not be able to meet sales commitments for any reason |
| • | the risk that Westinghouse may not achieve the expected growth or success in its business |
| • | the risk to Westinghouse’s business associated with potential production disruptions, including those related to global supply chain disruptions, global economic uncertainty, political volatility, labour relations issues, and operating risks |
| • | the risk that Westinghouse’s strategies may change, be unsuccessful, or have unanticipated consequences |
| • | the risk that Westinghouse may fail to comply with nuclear licence and quality assurance requirements at its facilities |
| • | the risk that Westinghouse’s new technologies may not work as anticipated |
104 CAMECO CORPORATION
We also recommend that you review our most recent AIF, which discusses other material risks that could have an impact on Westinghouse’s performance. Actual outcomes may vary significantly.
MANAGEMENT’S DISCUSSION AND ANALYSIS 105
Other Nuclear Fuel Cycle Investments
Global Laser Enrichment
Global Laser Enrichment LLC (GLE) is the exclusive worldwide licensee of the proprietary Separation of Isotopes by Laser Excitation (SILEX) laser uranium enrichment technology (a third-generation enrichment technology). Following the restructure of GLE in early 2021, Cameco is the commercial lead for the GLE project with a 49% interest and an option to attain a majority interest of 75%. Silex Systems Ltd. (Silex Systems) is the licensor of the SILEX technology and is the technology lead for the project, currently holding the remaining 51% interest in GLE.
Subject to completion of the technology demonstration program and its progression through to commercialization, GLE has the potential to offer a variety of advantages to the global nuclear energy sector, including:
| • | re-enriching depleted uranium tails left over as a by-product of first-generation gaseous diffusion enrichment operations, repurposing the legacy material into a commercial source of uranium and conversion products to fuel nuclear reactors, and aiding in the responsible clean-up of legacy tails inventories as per GLE’s agreement with the US Department of Energy (DOE) |
| • | producing commercial low-enriched uranium (LEU) to fuel the world’s existing and future fleet of large-scale light-water reactors (as well as for SMRs that require LEU-based fuel, if a commercial market develops) with greater efficiency and flexibility than current enrichment technologies |
| • | producing high-assay low-enriched uranium (HALEU) to serve the SMR and advanced reactor designs that, if commercially deployed, would require the development of a HALEU-based fuel cycle. |
Our view is that re-enriching US Government inventories of depleted uranium tails into a commercial source of uranium and conversion is GLE’s lowest-risk path to the market. This opportunity is underpinned by an agreement between GLE and the DOE, which gives GLE access to DOE tails and is expected to help address the growing supply gap for Western-origin nuclear fuel supplies and services. However, expansion of a potential tails re-enrichment facility to enable GLE to produce LEU or HALEU would require significant, additional capital expenditure and market support.
GLE continues to focus its efforts on technology demonstration and aims to commence Technology Readiness Level 6 (TRL-6) testing in the first quarter of 2025. The successful demonstration of TRL-6, the sixth step of a nine-step model under the DOE’s Technology Readiness Assessment Guide to assess the technical maturity, will include the completion of integrated testing and test results validation by way of a report prepared by an independent third-party. Successful demonstration of TRL-6 is expected to confirm reliable, full system performance under relevant conditions (pilot-scale demonstration), representing a major step in a technology’s demonstrated readiness. Pending the commencement of TRL-6 enrichment testing in the first quarter of 2025, we anticipate GLE could successfully complete the TRL-6 demonstration, including receipt of the third-party validation report, by the end of Q3 2025, which supports a commercial online date for a tails re-enrichment facility in 2030.
GLE’s 2025 operational budget will remain materially unchanged from its 2024 budget in order to prioritize the demonstration of TRL-6. GLE is continuing work to prepare and submit a US Nuclear Regulatory Commission licence application and anticipates receipt of the third full-scale laser system module from Silex Systems in 2025. The third full-scale laser system represents an iterative design and will be used to better understand the operability and manufacturability of specific components as part of GLE’s technology maturation program.
We expect that GLE’s path to commercialization will depend on several factors, including but not limited to, the successful progression and completion of GLE’s technology demonstration and maturation program, a clear commercial use case for its technology, supportive market fundamentals, future Russian fuel imports to the US, the ability to secure substantial government support and funding (specifically, accelerated commercial pathways related to LEU and, potentially, HALEU, are reliant on government funding), and assured industry support by way of a long-term contract portfolio.
We remain supportive of and committed to the project and in potentially increasing our equity interest, but we have no plans to exercise our option to increase our ownership in GLE from 49% to 75% at this time.
MANAGING OUR RISKS
GLE is subject to the risks relating to the nuclear industry discussed under the heading Caution about forward-looking information beginning on page 2.
106 CAMECO CORPORATION
Mineral reserves and resources
Our mineral reserves and resources are the foundation of our company and fundamental to our success.
We have interests in a number of uranium properties. The tables in this section show the estimates of the proven and probable mineral reserves, and measured, indicated, and inferred mineral resources at those properties. However, only three of the properties listed in those tables are material uranium properties for us: McArthur River/Key Lake, Cigar Lake and Inkai. Mineral reserves and resources are all reported as of December 31, 2024.
We estimate and disclose mineral reserves and resources in five categories, using the definition standards adopted by the Canadian Institute of Mining, Metallurgy and Petroleum Council, and in accordance with National Instrument 43-101 – Standards of Disclosure for Mineral Projects (NI 43-101), developed by the Canadian Securities Administrators.
About mineral resources
Mineral resources do not have to demonstrate economic viability but have reasonable prospects for eventual economic extraction. They fall into three categories: measured, indicated and inferred. Our reported mineral resources are exclusive of mineral reserves.
| • | measured and indicated mineral resources can be estimated with sufficient confidence to allow the appropriate application of technical, economic, marketing, legal, and sustainability factors to support evaluation of the economic viability of the deposit |
| • | measured resources: we can confirm both geological and grade continuity to support detailed mine planning |
| • | indicated resources: we can reasonably assume geological and grade continuity to support mine planning |
| • | inferred mineral resources are estimated using limited geological evidence and sampling information. We do not have enough confidence to evaluate their economic viability in a meaningful way. You should not assume that all or any part of an inferred mineral resource will be upgraded to an indicated or measured mineral resource, but it is reasonably expected that the majority of inferred mineral resources could be upgraded to indicated mineral resources with continued exploration. |
Our share of uranium in the following mineral resource tables is based on our respective ownership interests. Reported mineral resources have not demonstrated economic viability.
About mineral reserves
Mineral reserves are the economically mineable part of measured and/or indicated mineral resources demonstrated by at least a preliminary feasibility study. The reference point at which mineral reserves are defined is the point where the ore is delivered to the processing plant, except for ISR operations where the reference point is where the mineralization occurs under the existing or planned wellfield patterns. Mineral reserves fall into two categories:
| • | proven reserves: the economically mineable part of a measured resource for which at least a preliminary feasibility study demonstrates that, at the time of reporting, economic extraction could be reasonably justified with a high degree of confidence |
| • | probable reserves: the economically mineable part of a measured and/or indicated resource for which at least a preliminary feasibility study demonstrates that, at the time of reporting, economic extraction could be reasonably justified with a degree of confidence lower than that applying to proven reserves |
For properties where we are the operator, we use current geological models, an average uranium price of $63 (US) per pound U3O8, and current or projected operating costs and mine plans to report our mineral reserves, allowing for dilution and mining losses. We apply our standard data verification process for every estimate. For properties in which we have an interest but are not the operator, we will take reasonable steps to ensure that the reserve and resource estimates that we report are reliable.
Our share of uranium in the mineral reserves table below is based on our respective ownership interests.
MANAGEMENT’S DISCUSSION AND ANALYSIS 107
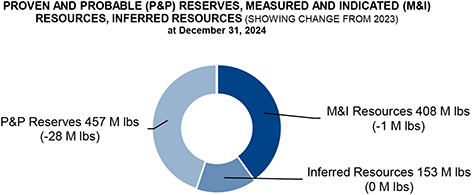
Changes this year
Our share of proven and probable mineral reserves decreased from 485 million pounds U3O8 at the end of 2023 to 457 million pounds at the end of 2024. The change was primarily the result of:
| • | production at Cigar Lake, Inkai and McArthur River, which removed 27 million pounds of proven and probable reserves from our mineral inventory. |
The remaining changes are attributable to other adjustments based on the mineral reserve estimate updates at Cigar Lake, McArthur River and Inkai.
Our share of measured and indicated mineral resources decreased from 409 million pounds U3O8 at the end of 2023 to 408 million pounds at the end of 2024. Our share of inferred mineral resources remained unchanged at 153 million pounds U3O8.
108 CAMECO CORPORATION
Qualified persons
The technical and scientific information discussed in this MD&A for our material properties (McArthur River/Key Lake, Cigar Lake and Inkai) was approved by the following individuals who are qualified persons for the purposes of NI 43-101:
MCARTHUR RIVER/KEY LAKE
| • | Greg Murdock, general manager, McArthur River, Cameco |
| • | Daley McIntyre, general manager, Key Lake, Cameco |
| • | Alain D. Renaud, principal resource geologist, technical services, Cameco |
| • | Biman Bharadwaj, principal metallurgist, technical services, Cameco |
CIGAR LAKE
| • | Kirk Lamont, general manager, Cigar Lake, Cameco |
| • | Scott Bishop, director, technical services, Cameco |
| • | Alain D. Renaud, principal resource geologist, technical services, Cameco |
| • | Biman Bharadwaj, principal metallurgist, technical services, Cameco |
INKAI
| • | Alain D. Renaud, principal resource geologist, technical services, Cameco |
| • | Scott Bishop, director, technical services, Cameco |
| • | Biman Bharadwaj, principal metallurgist, technical services, Cameco |
| • | Sergey Ivanov, deputy director general, technical services, Cameco Kazakhstan LLP |
Important information about mineral reserve and resource estimates
Although we have carefully prepared and verified the mineral reserve and resource figures in this document, the figures are estimates, based in part on forward-looking information.
Estimates are based on knowledge, mining experience, analysis of drilling results, the quality of available data and management’s best judgment. They are, however, imprecise by nature, may change over time, and include many variables and assumptions, including:
| • | geological interpretation |
| • | extraction plans |
| • | commodity prices and currency exchange rates |
| • | recovery rates |
| • | operating and capital costs |
There is no assurance that the indicated levels of uranium will be produced, and we may have to re-estimate our mineral reserves based on actual production experience. Changes in the price of uranium, production costs or recovery rates could make it unprofitable for us to operate or develop a particular site or sites for a period of time. See page 2 for information about forward-looking information.
Please see our mineral reserves and resources section of our most recent annual information form for the specific assumptions, parameters and methods used for McArthur River, Inkai and Cigar Lake mineral reserve and resource estimates.
Important information for US investors
We present information about mineralization, mineral reserves and resources as required by National Instrument 43-101 – Standards of Disclosure for Mineral Projects of the Canadian Securities Administrators (NI 43-101), in accordance with applicable Canadian securities laws. As a foreign private issuer filing reports with the US Securities and Exchange Commission (SEC) under the Multijurisdictional Disclosure System, we are not required to comply with the SEC’s disclosure requirements relating to mining properties. Investors in the United States should be aware that the disclosure requirements of NI 43-101 are different from those under applicable SEC rules, and the information that we present concerning mineralization, mineral reserves and resources may not be comparable to information made public by companies that comply with the SEC’s reporting and disclosure requirements for mining companies.
MANAGEMENT’S DISCUSSION AND ANALYSIS 109
Mineral reserves
As of December 31, 2024 (100% – only the shaded column shows our share)
PROVEN AND PROBABLE
(tonnes in thousands; pounds in millions)
| OUR | ||||||||||||||||||||||||||||||||||||||||||||||
| SHARE | ||||||||||||||||||||||||||||||||||||||||||||||
| PROVEN | PROBABLE | TOTAL MINERAL RESERVES | RESERVES | |||||||||||||||||||||||||||||||||||||||||||
| MINING | GRADE | CONTENT | GRADE | CONTENT | GRADE | CONTENT | CONTENT | METALLURGICAL | ||||||||||||||||||||||||||||||||||||||
| PROPERTY |
METHOD |
TONNES | % U3O8 | (LBS U3O8) | TONNES | % U3O8 | (LBS U3O8) | TONNES | % U3O8 | (LBS U3O8) | (LBS U3O8) | RECOVERY (%) | ||||||||||||||||||||||||||||||||||
| Cigar Lake |
UG | 322.0 | 16.68 | 118.4 | 229.4 | 14.73 | 74.5 | 551.4 | 15.87 | 192.9 | 105.2 | 98.7 | ||||||||||||||||||||||||||||||||||
| Key Lake |
OP | 61.1 | 0.52 | 0.7 | — | — | — | 61.1 | 0.52 | 0.7 | 0.6 | 95.0 | ||||||||||||||||||||||||||||||||||
| McArthur River |
UG | 1,970.3 | 6.81 | 295.8 | 520.4 | 5.56 | 63.7 | 2,490.7 | 6.55 | 359.6 | 251.0 | 99.2 | ||||||||||||||||||||||||||||||||||
| Inkai |
ISR | 277,232.9 | 0.03 | 201.6 | 90,850.8 | 0.02 | 49.4 | 368,083.7 | 0.03 | 251.0 | 100.4 | 85.0 | ||||||||||||||||||||||||||||||||||
|
|
|
|
|
|
|
|
|
|
|
|
|
|
|
|
|
|
|
|
|
|
|
|||||||||||||||||||||||||
| Total |
279,586.3 | — | 616.5 | 91,600.6 | — | 187.6 | 371,187.0 | — | 804.1 | 457.2 | — | |||||||||||||||||||||||||||||||||||
|
|
|
|
|
|
|
|
|
|
|
|
|
|
|
|
|
|
|
|
|
|
|
|||||||||||||||||||||||||
(UG – underground, OP – open pit, ISR – in situ recovery)
Note that the estimates in the above table:
| • | use a constant dollar average uranium price of approximately $63 (US) per pound U3O8 |
| • | are based on exchange rates of $1.00 US=$1.28 Cdn and $1.00 US=475 Kazakhstan Tenge |
| • | may not add due to rounding |
Our estimate of mineral reserves and mineral resources may be positively or negatively affected by the occurrence of one or more of the material risks discussed under the heading Caution about forward-looking information beginning on page 2, as well as certain property-specific risks. See Uranium – Tier-one operations starting on page 77.
Metallurgical recovery
We report mineral reserves as the quantity of contained ore supporting our mining plans and provide an estimate of the metallurgical recovery for each uranium property. The estimate of the amount of valuable product that can be physically recovered by the metallurgical extraction process is obtained by multiplying the quantity of contained metal (content) by the planned metallurgical recovery percentage. The content and our share of uranium in the table above are before accounting for estimated metallurgical recovery.
110 CAMECO CORPORATION
Mineral resources
As of December 31, 2024 (100% – only the shaded columns show our share)
MEASURED, INDICATED AND INFERRED
(tonnes in thousands; pounds in millions)
| OUR SHARE |
OUR SHARE |
|||||||||||||||||||||||||||||||||||||||||||||||
| MEASURED RESOURCES (M) | INDICATED RESOURCES (I) | INFERRED RESOURCES | ||||||||||||||||||||||||||||||||||||||||||||||
| TOTAL M+I | TOTAL M+I | INFERRED | ||||||||||||||||||||||||||||||||||||||||||||||
| GRADE | CONTENT | GRADE | CONTENT | CONTENT | CONTENT | GRADE | CONTENT | CONTENT | ||||||||||||||||||||||||||||||||||||||||
| PROPERTY |
TONNES | % U3O8 | (LBS U3O8) | TONNES | % U3O8 | (LBS U3O8) | (LBS U3O8) | (LBS U3O8) | TONNES | % U3O8 | (LBS U3O8) | (LBS U3O8) | ||||||||||||||||||||||||||||||||||||
| Cigar Lake |
75.5 | 4.88 | 8.1 | 141.3 | 4.95 | 15.4 | 23.6 | 12.9 | 163.4 | 5.55 | 20.0 | 10.9 | ||||||||||||||||||||||||||||||||||||
| Fox Lake |
— | — | — | — | — | — | — | — | 386.7 | 7.99 | 68.1 | 53.3 | ||||||||||||||||||||||||||||||||||||
| Kintyre |
— | — | — | 3,897.7 | 0.62 | 53.5 | 53.5 | 53.5 | 517.1 | 0.53 | 6.0 | 6.0 | ||||||||||||||||||||||||||||||||||||
| McArthur River |
71.8 | 2.28 | 3.6 | 60.3 | 2.31 | 3.1 | 6.7 | 4.7 | 36.4 | 2.95 | 2.4 | 1.7 | ||||||||||||||||||||||||||||||||||||
| Millennium |
— | — | — | 1,442.6 | 2.39 | 75.9 | 75.9 | 53.0 | 412.4 | 3.19 | 29.0 | 20.2 | ||||||||||||||||||||||||||||||||||||
| Rabbit Lake |
— | — | — | 1,836.5 | 0.95 | 38.6 | 38.6 | 38.6 | 2,460.9 | 0.62 | 33.7 | 33.7 | ||||||||||||||||||||||||||||||||||||
| Tamarack |
— | — | — | 183.8 | 4.42 | 17.9 | 17.9 | 10.3 | 45.6 | 1.02 | 1.0 | 0.6 | ||||||||||||||||||||||||||||||||||||
| Yeelirrie |
27,172.9 | 0.16 | 95.9 | 12,178.3 | 0.12 | 32.2 | 128.1 | 128.1 | — | — | — | — | ||||||||||||||||||||||||||||||||||||
| Crow Butte |
1,558.1 | 0.19 | 6.6 | 939.3 | 0.35 | 7.3 | 13.9 | 13.9 | 531.4 | 0.16 | 1.8 | 1.8 | ||||||||||||||||||||||||||||||||||||
| Gas Hills - Peach |
687.2 | 0.11 | 1.7 | 3,626.1 | 0.15 | 11.6 | 13.3 | 13.3 | 3,307.5 | 0.08 | 6.0 | 6.0 | ||||||||||||||||||||||||||||||||||||
| Inkai |
75,923.1 | 0.03 | 58.2 | 63,488.4 | 0.02 | 34.5 | 92.7 | 37.1 | 33,742.2 | 0.03 | 22.3 | 8.9 | ||||||||||||||||||||||||||||||||||||
| North Butte - Brown Ranch |
604.2 | 0.08 | 1.1 | 5,530.3 | 0.07 | 8.4 | 9.4 | 9.4 | 294.5 | 0.06 | 0.4 | 0.4 | ||||||||||||||||||||||||||||||||||||
| Ruby Ranch |
— | — | — | 2,215.3 | 0.08 | 4.1 | 4.1 | 4.1 | 56.2 | 0.13 | 0.2 | 0.2 | ||||||||||||||||||||||||||||||||||||
| Shirley Basin |
89.2 | 0.15 | 0.3 | 1,638.2 | 0.11 | 4.1 | 4.4 | 4.4 | 508.0 | 0.10 | 1.1 | 1.1 | ||||||||||||||||||||||||||||||||||||
| Smith Ranch - Highland |
3,703.5 | 0.10 | 7.9 | 14,372.3 | 0.05 | 17.0 | 24.9 | 24.9 | 6,861.0 | 0.05 | 7.7 | 7.7 | ||||||||||||||||||||||||||||||||||||
|
|
|
|
|
|
|
|
|
|
|
|
|
|
|
|
|
|
|
|
|
|
|
|
|
|||||||||||||||||||||||||
| Total |
109,885.6 | — | 183.4 | 111,550.5 | — | 323.6 | 507.0 | 408.2 | 49,323.5 | — | 199.8 | 152.6 | ||||||||||||||||||||||||||||||||||||
|
|
|
|
|
|
|
|
|
|
|
|
|
|
|
|
|
|
|
|
|
|
|
|
|
|||||||||||||||||||||||||
Note that mineral resources:
| • | do not include amounts that have been identified as mineral reserves |
| • | do not have demonstrated economic viability |
| • | totals may not add due to rounding |
MANAGEMENT’S DISCUSSION AND ANALYSIS 111
Additional information
Due to the nature of our business, we are required to make estimates that affect the amount of assets and liabilities, revenues and expenses, commitments and contingencies we report. We base our estimates on our experience, our best judgment, guidelines established by the Canadian Institute of Mining, Metallurgy and Petroleum and on assumptions we believe are reasonable.
We believe the following critical accounting estimates reflect the more significant judgments used in the preparation of our financial statements. These estimates affect all of our segments, unless otherwise noted.
Decommissioning and reclamation
In our uranium and fuel services segments, we are required to estimate the cost of decommissioning and reclamation for each operation, but we normally do not incur these costs until an asset is nearing the end of its useful life. Regulatory requirements and decommissioning methods could change during that time, making our actual costs different from our estimates. A significant change in these costs or in our mineral reserves could have a material impact on our net earnings and financial position. See note 16 to the financial statements.
Carrying value of assets
We depreciate property, plant and equipment primarily using the unit-of-production method, where the carrying value is reduced as resources are depleted. A change in our mineral reserves would change our depreciation expenses, and such a change could have a material impact on amounts charged to earnings.
We assess the carrying values of property, plant and equipment, intangibles and investments in associates and joint ventures every year, or more often if necessary. If we determine that we cannot recover the carrying value of an asset, we write off the unrecoverable amount against current earnings. We base our assessment of recoverability on assumptions and judgments we make about future prices, compound annual growth rates in Westinghouse’s core business, production costs, our requirements for sustaining capital, our ability to economically recover mineral reserves and the impact of geopolitical events. A material change in any of these assumptions could have a significant impact on the potential impairment of these assets.
In performing impairment assessments of long-lived assets, assets that cannot be assessed individually are grouped together into the smallest group of assets that generates cash inflows that are largely independent of the cash inflows from other assets or groups of assets. Management is required to exercise judgment in identifying these cash generating units.
Taxes
When we are preparing our financial statements, we estimate taxes in each jurisdiction we operate in, taking into consideration different tax rates, non-deductible expenses, valuation of deferred tax assets, changes in tax laws and our expectations for future results.
We base our estimates of deferred income taxes on temporary differences between the assets and liabilities we report in our financial statements, and the assets and liabilities determined by the tax laws in the various countries we operate in. We record deferred income taxes in our financial statements based on our estimated future cash flows, which includes estimates of non-deductible expenses, future market conditions, production levels and intercompany sales. If these estimates are not accurate, there could be a material impact on our net earnings and financial position.
Controls and procedures
We have evaluated the effectiveness of our disclosure controls and procedures and internal control over financial reporting as of December 31, 2024, as required by the rules of the US Securities and Exchange Commission and the Canadian Securities Administrators.
112 CAMECO CORPORATION
Management, including our Chief Executive Officer (CEO) and our Chief Financial Officer (CFO), supervised and participated in the evaluation, and concluded that our disclosure controls and procedures are effective to provide a reasonable level of assurance that the information we are required to disclose in reports we file or submit under securities laws is recorded, processed, summarized and reported accurately, and within the time periods specified. It should be noted that, while the CEO and CFO believe that our disclosure controls and procedures provide a reasonable level of assurance that they are effective, they do not expect the disclosure controls and procedures or internal control over financial reporting to be capable of preventing all errors and fraud. A control system, no matter how well conceived or operated, can provide only reasonable, not absolute, assurance that the objectives of the control system are met.
Management, including our CEO and our CFO, is responsible for establishing and maintaining internal control over financial reporting and conducted an evaluation of the effectiveness of our internal control over financial reporting based on the Internal Control — Integrated Framework (2013) issued by the Committee of Sponsoring Organizations of the Treadway Commission (COSO). Based on this evaluation, management concluded that our internal control over financial reporting was effective as of December 31, 2024.
In April 2024, we implemented SAP S/4 HANA, an enterprise resource planning (ERP) system across the entire organization. The implementation process included extensive involvement by key end users and required significant pre-implementation planning, design, and testing. As a result of this implementation, we modified certain existing internal controls and implemented new controls and procedures. We have taken actions to monitor and maintain appropriate internal controls over financial reporting during this period of change, including performing additional verifications and analysis to ensure data integrity. We also conducted extensive post-implementation monitoring and testing to ensure that internal controls over financial reporting are properly designed.
There have been no other changes in our internal control over financial reporting during the year that have materially affected, or are reasonably likely to materially affect, our internal control over financial reporting.
New standards adopted
A number of amendments to existing standards became effective January 1, 2024, but they did not have an effect on our financial statements.
A number of amendments to existing standards are not yet effective for the year ended December 31, 2024, and have not been applied in preparing these consolidated financial statements. We do not intend to early adopt any of the amendments and do not expect them to have a material impact on our financial statements.
MANAGEMENT’S DISCUSSION AND ANALYSIS 113
Exhibit 99.4
Consent of Independent Registered Public Accounting Firm
The Board of Directors
Cameco Corporation
We consent to the incorporation by reference in the Registration Statements on Form S-8 (File Nos. 333-11736, 333-06180, 333-139165, 333-196422 and 333-281406) and the Registration Statement on Form F-10 (File No. 333-283140) of our reports dated February 19, 2025 with respect to the consolidated financial statements of Cameco Corporation (the “Entity”), which comprise the consolidated statements of financial position as of December 31, 2024 and 2023, the related consolidated statements of earnings, comprehensive income, changes in equity and cash flows for each of the years then ended, and the related notes, and the effectiveness of internal control over financial reporting as of December 31, 2024, which reports appear in Exhibit 99.2 to this Form 6-K of the Entity dated February 20, 2025.
/s/ KPMG LLP
Chartered Professional Accountants
February 20, 2025
Saskatoon, Canada