UNITED STATES
SECURITIES AND EXCHANGE COMMISSION
WASHINGTON, D.C. 20549
Form 6-K
REPORT OF FOREIGN PRIVATE ISSUER
PURSUANT TO RULE 13a-16 OR 15d-16
UNDER THE SECURITIES EXCHANGE ACT OF 1934
For the month of February 2025
Commission File Number: 1-9059
Barrick Gold Corporation
(Registrant’s name)
| Brookfield Place, TD Canada Trust Tower, Suite 3700 161 Bay Street, P.O. Box 212 Toronto, Ontario Canada M5J 2S1 (800) 720-7415 |
310 South Main Street Suite 1150 Salt Lake City, Utah 84101 (801) 990-3745 |
(Address of principal executive offices)
Indicate by check mark whether the registrant files or will file annual reports under cover of Form 20-F or Form 40-F.
Form 20-F ☐ Form 40-F ☒
SIGNATURES
Pursuant to the requirements of the Securities Exchange Act of 1934, the registrant has duly caused this report to be signed on its behalf by the undersigned, thereunto duly authorized.
| Date: February 19, 2025 | BARRICK GOLD CORPORATION | |||||
| By: | /s/ Poupak Bahamin |
|||||
| Name: | Poupak Bahamin | |||||
| Title: | General Counsel | |||||
EXHIBIT INDEX
| Exhibit |
Description |
|
| 99.1 | NI 43-101 Technical Report on the Lumwana Expansion Project, Republic of Zambia | |
Exhibit 99.1
NI 43-101 Technical Report on the
Lumwana Expansion Project, Republic of
Zambia

February 19, 2025
Effective Date: December 31, 2024
Qualified Persons:
Simon P. Bottoms, CGeol, FAusIMM
Richard Peattie, FAusIMM
Derek Holm, FAusIMM
Marius Swanepoel, Pr.Eng.
Graham E. Trusler, Pr.Eng.
|
|
NI 43-101 Technical Report on the Lumwana Expansion Project |
|
Cautionary Statement on Forward-Looking Information: This Technical Report contains forward-looking statements. All statements, other than statements of historical fact regarding Lumwana Mining Company Limited (“LMC”), Barrick Gold Corporation (“Barrick”) or the Lumwana Mine, are forward-looking statements. The words “believe”, “expect”, “anticipate”, “contemplate”, “target”, “plan”, “intend”, “project”, “continue”, “budget”, “estimate”, “potential”, “may”, “will”, “can”, “could” and similar expressions identify forward-looking statements. In particular, this Technical Report contains forward-looking statements with respect to: an economic analysis of the Lumwana Expansion Project, including forecasted net present value, internal rate of return and cash flow forecasts; projected capital; operating and exploration expenditure; mine life and production rates; potential mineralization and metal or mineral recoveries; anticipated timelines and plans for project development, operation and closure; the ability and timeline to secure all relevant rights, licenses, permits and authorizations; LMC’s and Barrick’s strategy, plans, targets and goals in respect of environmental and social issues and sustainability matters; stakeholder engagement; sufficiency of infrastructure, systems and consultants and personnel; operating or technical challenges in connection with mining or development activities, including geotechnical challenges, tailings dam and storage facilities, and the maintenance or provision of required infrastructure and information technology systems; and information pertaining to potential improvements to financial and operating performance and mine life are necessarily based on opinions and estimates made as of the date such statements are made and are subject to important risk factors and uncertainties, many of which cannot be controlled or predicted. Material assumptions regarding forward-looking statements are discussed in this Technical Report, where applicable. In addition to such assumptions, the forward-looking statements are inherently subject to significant business, economic, political, security and competitive uncertainties, and contingencies. Known and unknown factors could cause actual results to differ materially from those projected in the forward-looking statements. Such factors include, but are not limited to: fluctuations in the spot and forward price of commodities (including gold, copper, diesel fuel, natural gas and electricity); the speculative nature of mineral exploration and development; risks associated with projects in the early stages of evaluation and development and for which additional technical, engineering and other analysis is required; disruption of supply routes which may cause delays in development, construction and mining activities; changes in mineral production performance, exploitation and exploration successes; diminishing quantities or grades of reserves; increased costs, delays, suspensions, and technical challenges associated with the construction of capital projects; operating or technical difficulties in connection with mining or development activities, including disruptions in the maintenance or provision of required infrastructure and information technology systems; damage to LMC’s or Barrick’s reputation due to the actual or perceived occurrence of any number of events, including negative publicity with respect to the handling of environmental matters or dealings with community groups, whether true or not; risk of loss due to acts of war, terrorism, sabotage and civil disturbances; uncertainty whether capital projects, including the Lumwana Expansion Project, will meet Barrick’s capital allocation objectives; the impact of global liquidity and credit availability on the timing of cash flows and the values of assets and liabilities based on projected future cash flows; the impact of inflation; fluctuations in the currency markets; changes in interest rates; changes in national and local government legislation, taxation, controls or regulations and/or changes in the administration of laws, policies and practices; expropriation or nationalization of property and political or economic developments in Zambia; the possibility of political instability in Zambia; failure to comply with environmental and health and safety laws and regulations; timing of receipt of, or failure to comply with, necessary permits and approvals; lack of certainty with respect to foreign legal systems, corruption and other factors that are inconsistent with the rule of law; litigation; contests over title to properties or over access to water, power and other required infrastructure; increased costs and physical risks including extreme weather events and resource shortages, related to climate change; risks associated with working with partners in jointly controlled assets; and availability and increased costs associated with mining inputs and labour. In addition, there are risks and hazards associated with the business of mineral exploration, development, and mining, including environmental hazards, industrial accidents, unusual or unexpected formations, ground conditions, pressures, cave-ins, flooding and gold and copper ore losses (and the risk of inadequate insurance, or inability to obtain insurance, to cover these risks).
Many of these uncertainties and contingencies can affect LMC’s actual results and could cause actual results to differ materially from those expressed or implied in any forward-looking statements made by, or on behalf of, LMC. All of the forward-looking statements made in this Technical Report are qualified by these cautionary statements. LMC, Barrick, and the Qualified Persons who authored this Technical Report undertake no obligation to update publicly or otherwise revise any forward-looking statements whether as a result of new information or future events or otherwise, except as may be required by law. Many of these uncertainties and contingencies can affect LMC’s actual results and could cause actual results to differ materially from those expressed or implied in any forward-looking statements made by, or on behalf of, LMC. All of the forward-looking statements made in this Technical Report are qualified by these cautionary statements. LMC, Barrick, and the Qualified Persons who authored this Technical Report undertake no obligation to update publicly or otherwise revise any forward-looking statements whether as a result of new information or future events or otherwise, except as may be required by law.
|
February 19, 2025 |
Page i |
|
|
NI 43-101 Technical Report on the Lumwana Expansion Project |
|
Table of Contents
| 1 | Summary | 1 | ||||||
| 1.1 | Description, Location, and Ownership | 1 | ||||||
| 1.2 | Geology and Mineralisation | 2 | ||||||
| 1.3 | Exploration Status | 3 | ||||||
| 1.4 | Mineral Resource Estimate | 3 | ||||||
| 1.5 | Mineral Reserve Estimate | 6 | ||||||
| 1.6 | Mining Methods | 9 | ||||||
| 1.7 | Mineral Processing | 11 | ||||||
| 1.8 | Project Infrastructure | 12 | ||||||
| 1.9 | Market Studies and Contracts | 13 | ||||||
| 1.10 | Environmental, Permitting and Social Considerations | 13 | ||||||
| 1.11 | Capital and Operating Costs | 15 | ||||||
| 1.12 | Economic Analysis | 15 | ||||||
| 1.13 | Interpretations and Conclusions | 16 | ||||||
| 1.14 | Recommendations | 24 | ||||||
| 2 | Introduction | 26 | ||||||
| 2.1 | Effective Date | 27 | ||||||
| 2.2 | Qualified Persons | 27 | ||||||
| 2.3 | Site Visits of Qualified Persons | 27 | ||||||
| 2.4 | Information Sources | 28 | ||||||
| 2.5 | Abbreviations and Acronyms | 29 | ||||||
| 3 | Reliance on Other Experts | 30 | ||||||
| 4 | Property Description and Location | 31 | ||||||
| 4.1 | Project Location | 31 | ||||||
| 4.2 | Mineral Rights | 32 | ||||||
| 4.3 | Surface Rights | 34 | ||||||
| 4.4 | Royalties, Payments, and Other Obligations | 35 | ||||||
| 4.5 | Permits | 35 | ||||||
| 4.6 | Environmental Liabilities | 36 | ||||||
| 4.7 | Other Significant Factors and Risks | 36 | ||||||
| 5 | Accessibility, Climate, Local Resources, Infrastructure and Physiography | 38 | ||||||
| 5.1 | Accessibility | 38 | ||||||
|
February 19, 2025 |
Page i |
|
|
NI 43-101 Technical Report on the Lumwana Expansion Project |
|
| 5.2 | Climate and Physiography | 38 | ||||||
| 5.3 | Local Resources and Infrastructure | 40 | ||||||
| 5.4 | Sufficiency of Surface Rights | 40 | ||||||
| 6 |
History | 42 | ||||||
| 6.1 | Ownership | 42 | ||||||
| 6.2 | Development and Operations | 42 | ||||||
| 6.3 | Historical Mineral Resources and Mineral Reserves | 43 | ||||||
| 6.4 | Past Production | 43 | ||||||
| 7 |
Geological Setting and Mineralisation | 45 | ||||||
| 7.1 | Regional Geology | 45 | ||||||
| 7.2 | Local Geology | 47 | ||||||
| 7.3 | Property Geology | 48 | ||||||
| 7.4 | QP Comment on Geological Setting and Mineralisation | 54 | ||||||
| 8 |
Deposit Types | 55 | ||||||
| 8.1 | Deposit Type | 55 | ||||||
| 9 |
Exploration | 56 | ||||||
| 9.1 | Previous Exploration | 56 | ||||||
| 9.2 | Current Exploration | 57 | ||||||
| 9.3 | Planned Exploration | 64 | ||||||
| 9.4 | QP Comment on Exploration | 64 | ||||||
| 10 |
Drilling | 65 | ||||||
| 10.1 | Drilling Summary | 65 | ||||||
| 10.2 | Drilling Methods | 74 | ||||||
| 10.3 | QP Comments on Drilling | 76 | ||||||
| 11 |
Sample Preparation, Analyses, and Security | 77 | ||||||
| 11.1 | Sample Preparation | 77 | ||||||
| 11.2 | Sample Analysis | 78 | ||||||
| 11.3 | Sample Security | 78 | ||||||
| 11.4 | Quality Assurance and Quality Control | 79 | ||||||
| 11.5 | QP Comments on Sample Preparation, Analyses, and Security | 87 | ||||||
| 12 |
Data Verification | 88 | ||||||
| 12.1 | Historical Data | 88 | ||||||
| 12.2 | Current Data | 88 | ||||||
| 12.3 | Internal Reviews and Audits | 88 | ||||||
|
February 19, 2025 |
Page ii |
|
|
NI 43-101 Technical Report on the Lumwana Expansion Project |
|
| 12.4 | External Reviews and Audits | 89 | ||||||
| 12.5 | QP Comments on Data Verification | 90 | ||||||
| 13 |
Mineral Processing and Metallurgical Testing | 91 | ||||||
| 13.1 | Recent Metallurgical Test Work | 91 | ||||||
| 13.2 | Existing Processing Plant Performance | 102 | ||||||
| 13.3 | Recovery Estimates | 107 | ||||||
| 13.4 | Deleterious Elements | 109 | ||||||
| 13.5 | QP Comments on Mineral Processing and Metallurgical Testing | 109 | ||||||
| 14 |
Mineral Resource Estimates | 110 | ||||||
| 14.1 | Resource Database | 113 | ||||||
| 14.2 | Geological Modelling | 115 | ||||||
| 14.3 | Bulk Density | 117 | ||||||
| 14.4 | Compositing | 119 | ||||||
| 14.5 | Capping and Outliers | 121 | ||||||
| 14.6 | Block Model | 121 | ||||||
| 14.7 | Variography | 125 | ||||||
| 14.8 | Resource Estimation | 128 | ||||||
| 14.9 | Block Model Validation | 132 | ||||||
| 14.10 | Resource Classification | 136 | ||||||
| 14.11 | Stockpiles | 141 | ||||||
| 14.12 | Cut-off Grade | 141 | ||||||
| 14.13 | Mineral Resource Statement | 142 | ||||||
| 14.14 | 2024 Versus 2023 End of Year Comparison | 144 | ||||||
| 14.15 | External Review | 145 | ||||||
| 14.16 | QP Comments on Mineral Resource Estimates | 146 | ||||||
| 15 |
Mineral Reserve Estimate | 147 | ||||||
| 15.1 | Mineral Reserve Estimation Process | 149 | ||||||
| 15.2 | Open Pit Optimisation | 149 | ||||||
| 15.3 | Sensitivities | 160 | ||||||
| 15.4 | Mine Design and Pit Shell Comparison | 165 | ||||||
| 15.5 | Mineral Reserve Statement | 165 | ||||||
| 15.6 | 2024 Versus 2023 End of Year Comparison | 168 | ||||||
| 15.7 | External Reviews | 169 | ||||||
| 15.8 | QP Comments on Mineral Reserve Estimates | 170 | ||||||
|
February 19, 2025 |
Page iii |
|
|
NI 43-101 Technical Report on the Lumwana Expansion Project |
|
| 16 |
Mining Methods | 171 | ||||||
| 16.1 | Mining Methods | 171 | ||||||
| 16.2 | Geotechnical and Hydrogeological Considerations | 173 | ||||||
| 16.3 | Mine Design | 181 | ||||||
| 16.4 | Mining Equipment | 196 | ||||||
| 16.5 | LOM Production Schedule | 197 | ||||||
| 16.6 | External Reviews | 202 | ||||||
| 16.7 | QP Comments on Mining Methods | 203 | ||||||
| 17 |
Recovery Methods | 204 | ||||||
| 17.1 | Process Plant Description | 204 | ||||||
| 17.2 | Metallurgical Accounting | 215 | ||||||
| 17.3 | Power, Water, and Process Reagents Requirements | 216 | ||||||
| 17.4 | QP Comments on Recovery Methods | 217 | ||||||
| 18 |
Project Infrastructure | 219 | ||||||
| 18.1 | Access and Roads | 221 | ||||||
| 18.2 | Power Supply | 221 | ||||||
| 18.3 | Water Management | 223 | ||||||
| 18.4 | Supply Chain | 227 | ||||||
| 18.5 | Site Common Purpose Infrastructure | 228 | ||||||
| 18.6 | Tailings Storage Facilities | 234 | ||||||
| 18.7 | QP Comments on Infrastructure | 239 | ||||||
| 19 |
Market Studies and Contracts | 240 | ||||||
| 19.1 | Markets | 240 | ||||||
| 19.2 | Lumwana Concentrates | 241 | ||||||
| 19.3 | Commodity Price Assumptions | 241 | ||||||
| 19.4 | Contracts | 241 | ||||||
| 19.5 | QP Comment on Market Studies and Contracts | 242 | ||||||
| 20 |
Environmental Studies, Permitting, and Social or Community Impact | 243 | ||||||
| 20.1 | Permitting | 244 | ||||||
| 20.2 | Environmental Assessment and Studies | 245 | ||||||
| 20.3 | Environmental Considerations | 251 | ||||||
| 20.4 | Water Management | 252 | ||||||
| 20.5 | Costs | 254 | ||||||
| 20.6 | Social and Community Requirements | 255 | ||||||
|
February 19, 2025 |
Page iv |
|
|
NI 43-101 Technical Report on the Lumwana Expansion Project |
|
| 20.7 | Mine Closure and Reclamation | 258 | ||||||
| 20.8 | QP Comments on Environmental and Social | 260 | ||||||
| 21 |
Capital and Operating Costs | 261 | ||||||
| 21.1 | Basis and Sources of Cost Estimates | 261 | ||||||
| 21.2 | Capital Costs | 262 | ||||||
| 21.3 | Operating Costs | 265 | ||||||
| 21.4 | QP Comments on Capital and Operating Costs | 267 | ||||||
| 22 |
Economic Analysis | 269 | ||||||
| 22.1 | Assumptions and Inputs | 269 | ||||||
| 22.2 | Taxes and Royalties | 270 | ||||||
| 22.3 | Financial Model Summary | 271 | ||||||
| 22.4 | Sensitivity | 280 | ||||||
| 22.5 | QP Comments on Economic Analysis | 282 | ||||||
| 23 |
Adjacent Properties | 283 | ||||||
| 24 |
Other Relevant Data and Information | 284 | ||||||
| 25 |
Interpretation and Conclusions | 285 | ||||||
| 25.1 | Mineral Tenure, Rights, Royalties and Agreements | 285 | ||||||
| 25.2 | Geology and Mineral Resources | 285 | ||||||
| 25.3 | Mineral Reserves | 286 | ||||||
| 25.4 | Mining | 286 | ||||||
| 25.5 | Mineral Processing | 287 | ||||||
| 25.6 | Infrastructure | 287 | ||||||
| 25.7 | Environment and Social Aspects | 288 | ||||||
| 25.8 | Capital and Operating Costs | 289 | ||||||
| 25.9 | Project Economics | 289 | ||||||
| 25.10 | Risks | 290 | ||||||
| 26 |
Recommendations | 293 | ||||||
| 26.1 | Mineral Tenure, Rights, Royalties and Agreements | 293 | ||||||
| 26.2 | Geology and Mineral Resources | 293 | ||||||
| 26.3 | Mining and Mineral Reserves | 293 | ||||||
| 26.4 | Mineral Processing | 294 | ||||||
| 26.5 | Infrastructure | 294 | ||||||
| 26.6 | Environmental, Permitting and Social Aspects | 294 | ||||||
| 26.7 | Capital and Operating Costs | 294 | ||||||
|
February 19, 2025 |
Page v |
|
|
NI 43-101 Technical Report on the Lumwana Expansion Project |
|
| 26.8 | Risks | 294 | ||||||
| 27 |
References | 295 | ||||||
| 28 |
Date and Signature Page | 297 | ||||||
| 29 |
Certificates of Qualified Persons | 298 | ||||||
| 29.1 | Simon P. Bottoms | 298 | ||||||
| 29.2 | Richard Peattie | 300 | ||||||
| 29.3 | Derek Holm | 302 | ||||||
| 29.4 | Marius Swanepoel | 303 | ||||||
| 29.5 | Graham E. Trusler | 305 | ||||||
List of Tables
| Table 1-1 |
Lumwana Mineral Resource Estimate as of December 31, 2024 |
5 | ||||
| Table 1-2 |
Summary of Lumwana Mineral Reserve Estimate as of December 31, 2024 |
8 | ||||
| Table 1-3 |
After-Tax Copper Price Sensitivity Analysis Results |
15 | ||||
| Table 1-4 |
Expansion Project Risk Summary |
22 | ||||
| Table 2-1 |
QP Responsibilities |
27 | ||||
| Table 2-2 |
Table of Abbreviations |
29 | ||||
| Table 4-1 |
Summary of Lumwana Mining Licences |
32 | ||||
| Table 4-2 |
Royalty Charge Relation to Copper Price |
35 | ||||
| Table 4-3 |
Summary of major required permitting |
36 | ||||
| Table 5-1 |
Annual Average Climatic Conditions in North-Western Province, Zambia |
39 | ||||
| Table 6-1 |
Summary of Lumwana Ownership |
42 | ||||
| Table 6-2 |
Summary of Lumwana Project Development |
42 | ||||
| Table 6-3 |
Past Production Records for Lumwana |
43 | ||||
| Table 10-1 |
Lumwana Drilling Summary to June 2024 |
65 | ||||
| Table 11-1 |
Summary of Laboratories and Analytical Methods |
77 | ||||
| Table 11-2 |
QA/QC Sample Insertion Rates for DD Samples Submitted between January 2022 and June 2024 |
79 | ||||
| Table 13-1 |
Metallurgical Test Work Samples |
92 | ||||
| Table 13-2 |
Summary of Phase 1 Comminution Test Work Results |
97 | ||||
| Table 13-3 |
Summary of Phase 2 Comminution Test Work Results |
97 | ||||
| Table 13-4 |
Locked Cycle Test Work Results (Phase 2) |
100 | ||||
| Table 14-1 |
Lumwana Mineral Resource Estimate as of December 31, 2024 |
112 | ||||
| Table 14-2 |
Summary of Mineral Resource Drilling and Model Dates |
113 | ||||
| Table 14-3 |
Drilling in the Mineral Resource Database |
114 | ||||
| Table 14-4 |
Modelled Geological Domains |
116 | ||||
| Table 14-5 |
Ratios Used to Define Oxidation Zones |
117 | ||||
| Table 14-6 |
Dry Bulk Density Assignment |
118 | ||||
| Table 14-7 |
Chimiwungo Mineralised Domain Assay and Composite Comparison |
120 | ||||
| Table 14-8 |
Malundwe Mineralised Domain Assay and Composite Comparison |
120 | ||||
| Table 14-9 |
Kamisengo Fresh Mineralised Domain Assay and Composite Comparison |
120 | ||||
| Table 14-10 |
Kababisa Mineralised Domain Assay and Composite Comparison |
120 | ||||
| Table 14-11 |
Chimiwungo Copper Top-cut and High-grade Yield Summary |
122 | ||||
| Table 14-12 |
Kababisa Copper Top-cut and High-grade Yield Summary |
122 |
|
February 19, 2025 |
Page vi |
|
|
NI 43-101 Technical Report on the Lumwana Expansion Project |
|
| Table 14-13 |
Malundwe Copper Top-cut and High-grade Yield Summary |
123 | ||||
| Table 14-14 |
Kamisengo Copper Top-cut and High-grade Yield Summary |
123 | ||||
| Table 14-15 |
Block Model Parameters |
124 | ||||
| Table 14-16 |
Chimiwungo ‘Geol = 21’ Fresh Copper Estimation Parameters |
129 | ||||
| Table 14-17 |
Malundwe ‘Geol = 3’ Fresh Copper Estimation Parameters |
129 | ||||
| Table 14-18 |
Kamisengo ‘Geol = 10 and 20’ Mineralised Fresh Copper Estimation Parameters |
130 | ||||
| Table 14-19 |
Kababisa Mineralised Fresh Copper Estimation Parameters |
130 | ||||
| Table 14-20 |
Comparison of Sample and Estimated Grades in the Chimiwungo Main Mineralisation Domains (RC Area) |
132 | ||||
| Table 14-21 |
Comparison of Sample and Estimated Grades in the Malundwe Main Mineralisation Domains (RC Area) |
133 | ||||
| Table 14-22 |
Comparison of Sample and Estimated Grades in the Kamisengo Mineralisation Domains (Inferred Area) |
133 | ||||
| Table 14-23 |
Comparison of Sample and Estimated Grades in the Kababisa Mineralisation Domains (Inferred Area) |
133 | ||||
| Table 14-24 |
Lumwana Mineral Resource Classification Criteria |
136 | ||||
| Table 14-25 |
Resource Cut-off Grade Calculations |
141 | ||||
| Table 14-26 |
Lumwana Mineral Resource Estimate as of December 31, 2024 |
143 | ||||
| Table 14-27 |
Chimiwungo 2024 vs. 2023 Mineral Resource Comparison |
144 | ||||
| Table 14-28 |
Malundwe 2024 vs. 2023 Mineral Resource Comparison |
144 | ||||
| Table 14-29 |
Kamisengo 2024 vs 2023 Mineral Resource Comparison |
145 | ||||
| Table 15-1 |
Summary of Lumwana Mineral Reserve Estimate as of December 31, 2024 |
148 | ||||
| Table 15-2 |
Summary of Lumwana Pit Optimisation Parameters |
151 | ||||
| Table 15-3 |
Minimum Block Size |
152 | ||||
| Table 15-4 |
GCO Dilution and Recovery Summary |
152 | ||||
| Table 15-5 |
Lumwana 2024 Year-End Reconciliation Performance |
153 | ||||
| Table 15-6 |
Historic Reconciliation Performance |
154 | ||||
| Table 15-7 |
Overall Slope Angles for Pit Optimisation |
155 | ||||
| Table 15-8 |
Chimiwungo Pit Optimisation Results |
157 | ||||
| Table 15-9 |
Malundwe Pit Optimisation Results |
158 | ||||
| Table 15-10 |
Kamisengo Pit Optimisation Results |
159 | ||||
| Table 15-11 |
Kababisa Pit Optimisation Results |
159 | ||||
| Table 15-12 |
Comparison of Optimised Pit Shells and Final Pit Designs |
165 | ||||
| Table 15-13 |
Summary of Lumwana Mineral Reserve Estimate as of December 31, 2024 |
167 | ||||
| Table 15-14 |
Comparison to 2023 Mineral Reserve Statement |
169 | ||||
| Table 16-1 |
Length of Geotechnical Logged Core |
173 | ||||
| Table 16-2 |
Chimiwungo Slope Design Parameters |
176 | ||||
| Table 16-3 |
Malundwe Slope Design Parameters |
178 | ||||
| Table 16-4 |
Kamisengo Slope Design Parameters |
179 | ||||
| Table 16-5 |
Kababisa Slope Design Domains |
179 | ||||
| Table 16-6 |
Dump Design Parameters |
180 | ||||
| Table 16-7 |
In-Pit Dump Design Parameters |
180 | ||||
| Table 16-8 |
Waste Dump Design Summary |
190 | ||||
| Table 16-9 |
Long-term Stockpile Summary |
195 | ||||
| Table 16-10 |
Life of Mine Equipment Requirement Summary |
196 | ||||
| Table 16-11 |
Equipment Availability and Utilisation Inputs |
197 | ||||
| Table 16-12 |
Equipment Productivity Assumptions |
197 | ||||
| Table 16-13 |
Summary of LOM Production Schedule |
200 | ||||
| Table 17-1 |
Estimated Annual Power Consumption of Major Process Equipment Following the Completion of the Expansion Project |
216 |
|
February 19, 2025 |
Page vii |
|
|
NI 43-101 Technical Report on the Lumwana Expansion Project |
|
| Table 17-2 |
Summary of Annual Reagents for the Process Plant Following the Expansion Project |
217 | ||||
| Table 17-3 |
Summary of Annual Consumables for the Process Plant Following the Expansion Project |
217 | ||||
| Table 20-1 |
Key E&S Impact Summary |
248 | ||||
| Table 20-2 |
Annual Costs Included in G&A Costing for Environmental Management |
254 | ||||
| Table 21-1 |
Exchange Rates and Exposure |
261 | ||||
| Table 21-2 |
Capital Cost Estimate Summary – Including Non-Expansion Capital Items |
262 | ||||
| Table 21-3 |
Construction Capital Expenditure Summary by Area (2025 to 2028) |
263 | ||||
| Table 21-4 |
Growth Capital Expenditure Summary |
263 | ||||
| Table 21-5 |
Sustaining Capital Expenditure Summary |
264 | ||||
| Table 21-6 |
LOM Average Unit Operating Costs Summary |
265 | ||||
| Table 22-1 |
Sliding Scale of the Applicable Royalty Rates |
270 | ||||
| Table 22-2 |
Lumwana Expansion Before and After-Tax Annual Cash Flow Summary at Barrick Reserve Case Price (3.00$/lb Cu) |
273 | ||||
| Table 22-3 |
Lumwana Expansion Before and After-Tax Annual Cash Flow Summary at 3-year trailing average Cu price ($4.03/lb Cu) |
276 | ||||
| Table 22-4 |
Lumwana Expansion Case Financial Model Summary at Barrick Reserve Price ($3.00/lb Cu), and 3 year trailing average Cu price ($4.03/lb) |
279 | ||||
| Table 22-5 |
After-Tax Copper Price Sensitivity Analysis Results |
280 | ||||
| Table 25-1 |
Expansion Project Risk Summary |
291 |
List of Figures
| Figure 1-1 |
Layout of Expansion Project Planned Infrastructure |
14 | ||||
| Figure 4-1 |
Lumwana Location Map |
31 | ||||
| Figure 4-2 |
Lumwana Mining Licences and Surface Rights |
33 | ||||
| Figure 5-1 |
Monthly Average Temperature and Precipitation for North-Western Province, Zambia |
39 | ||||
| Figure 5-2 |
Lumwana Mine Existing Infrastructure |
41 | ||||
| Figure 7-1 |
Geological Map of the Central African Copperbelt highlighting Key Geological Features and Lithological Boundaries |
46 | ||||
| Figure 7-2 |
Local Geology of the Kabompo and Mwombezhi Domes Area |
47 | ||||
| Figure 7-3 |
Lumwana Property Geology |
49 | ||||
| Figure 7-4 |
Chimiwungo Geological Cross-section 378600mE (Looking East) |
50 | ||||
| Figure 7-5 |
Malundwe Geological Cross-section 8644975mN (Looking South) |
51 | ||||
| Figure 7-6 |
Kamisengo Geological Cross-section 8656100mN (Looking North) |
52 | ||||
| Figure 7-7 |
Kababisa Geological Cross-section 8652500mN (Looking North) |
54 | ||||
| Figure 9-1 |
Lumwana Main Deposits and Exploration Prospects |
58 | ||||
| Figure 9-2 |
Lumwana Regolith Map: Residual Soils (Rp), Erosional (Eo & Ep), Ferruginous (Fp), Possible Thin Duricrust, Depositional (Da & Dc) |
60 | ||||
| Figure 9-3 |
Kamisengo Soil Samples and Regolith Map: Residual Soils (Rp), Erosional (Eo & Ep), Ferruginous (Fp), Possible Thin Duricrust, Depositional (Da & Dc) |
62 | ||||
| Figure 10-1 |
Plan View Map of Drilling at Chimiwungo |
67 | ||||
| Figure 10-2 |
Representative Cross-section Chimiwungo 378600 mE (Looking East) |
68 | ||||
| Figure 10-3 |
Plan View Map of Drilling at Malundwe |
69 | ||||
| Figure 10-4 |
Representative Cross-section at Malundwe 8645300mN (Looking North) |
70 | ||||
| Figure 10-5 |
Plan View Map of Drilling at Kamisengo |
71 | ||||
| Figure 10-6 |
Representative Cross-section at Kamisengo 8656100 mN (Looking North) |
72 | ||||
| Figure 10-7 |
Plan View Map of Drilling at Kababisa |
73 |
|
February 19, 2025 |
Page viii |
|
|
NI 43-101 Technical Report on the Lumwana Expansion Project |
|
| Figure 10-8 |
Representative Cross-section at Kababisa 8652500 m N (Looking North) |
74 | ||||
| Figure 11-1 |
Copper (%) for CRMs at SGS Kalulushi |
80 | ||||
| Figure 11-2 |
Copper (%) for CRMs at SGS Lumwana Laboratory |
80 | ||||
| Figure 11-3 |
Copper (%) for CRMs at Bureau Veritas Laboratory |
81 | ||||
| Figure 11-4 |
Copper (%) for CRMs at ALS Johannesburg Laboratory |
81 | ||||
| Figure 11-5 |
Copper (%) for Blanks Submitted at SGS Kalulushi |
82 | ||||
| Figure 11-6 |
Copper (%) for Blanks Submitted at SGS Lumwana |
83 | ||||
| Figure 11-7 |
Copper (%) for Blanks Submitted at BV Laboratory |
83 | ||||
| Figure 11-8 |
Copper (%) for Blanks Submitted at ALS Laboratory |
84 | ||||
| Figure 11-9 |
HARD Plot of DD Field Duplicates Assayed by SGS Kalulushi |
85 | ||||
| Figure 11-10 |
HARD Plot of Pulp Duplicates Assayed by SGS Lumwana |
86 | ||||
| Figure 11-11 |
Log Scatter Plot of Samples Analysed at SGS Laboratories and ALS Chemex Umpire Laboratory |
87 | ||||
| Figure 13-1 |
Chimiwungo Metallurgical Test Work Sample Locations |
92 | ||||
| Figure 13-2 |
Malundwe Metallurgical Test Work Sample Locations |
93 | ||||
| Figure 13-3 |
Kamisengo Metallurgical Test Work Sample Locations |
94 | ||||
| Figure 13-4 |
Kababisa Metallurgical Test Work Sample Locations |
95 | ||||
| Figure 13-5 |
Open Circuit Flotation Test Work Flowsheet |
98 | ||||
| Figure 13-6 |
Summary of Phase 1 Open Circuit Flotation Test Work Results |
99 | ||||
| Figure 13-7 |
Summary of Existing Processing Plant Throughput, Head Grade and Tails Grade |
102 | ||||
| Figure 13-8 |
Summary of Existing Processing Plant Copper Recovery and Concentrate Grades |
103 | ||||
| Figure 13-9 |
Relationship between Concentrate Grades and Head Grades |
104 | ||||
| Figure 13-10 |
Relationship between Recovery and Head Grades |
104 | ||||
| Figure 13-11 |
Relationship between Grade and Recovery for 2019 to 2022 |
105 | ||||
| Figure 13-12 |
Variation of Mill Throughput from August 2023 to July 2024 |
105 | ||||
| Figure 13-13 |
Variation of Copper Recovery from August 2023 to July 2024 |
106 | ||||
| Figure 13-14 |
Variation of Copper Concentrate Grade from August 2023 to July 2024 |
106 | ||||
| Figure 13-15 |
Variation of Head Grade from August 2023 to July 2024 |
107 | ||||
| Figure 13-16 |
FS Test Work Recovery and Actual Plant Recoveries for Chimiwungo and Malundwe |
108 | ||||
| Figure 14-1 |
QQ Plot for DD-RC Pairs within 2 m |
115 | ||||
| Figure 14-2 |
3D Model of MS Domains and Faults at Chimiwungo (Looking North East) |
116 | ||||
| Figure 14-3 |
Chimiwungo Fresh Density for Copper Grade Bins |
118 | ||||
| Figure 14-4 |
Malundwe Fresh Density for Copper Grade Bins |
119 | ||||
| Figure 14-5 |
Experimental Semi-variograms and Semi-variogram Models for Chimiwungo Main MS |
125 | ||||
| Figure 14-6 |
Experimental Semi-variograms and Semi-variogram Models for Malundwe Main MS |
126 | ||||
| Figure 14-7 |
Experimental Normal Scores Semi-variograms and Semi-variogram Model for Kamisengo Combined MS Domains 30, 40, 50, 60 and 70 |
127 | ||||
| Figure 14-8 |
Experimental Normal Scores Semi-variograms and Semi-variogram Models for Kababisa Combined MS |
128 | ||||
| Figure 14-9 |
Chimiwungo Block Model within the Mineral Resource Pit Shell (Looking North East) |
131 | ||||
| Figure 14-10 |
Contact Profile Plot between Oxide, Transitional, and Fresh MS at Chimiwungo |
131 | ||||
| Figure 14-11 |
Contact Profile Plot between Mineralised and Waste Domains at Chimiwungo |
132 | ||||
| Figure 14-12 |
Chimiwungo Visual Validation of Assay and Estimated Copper Grades – Long Section 378600E (Looking East) |
134 |
|
February 19, 2025 |
Page ix |
|
|
NI 43-101 Technical Report on the Lumwana Expansion Project |
|
| Figure 14-13 |
Chimiwungo Main Domain 11 and 89 Example Swath Plots within GC Drill Campaign |
135 | ||||
| Figure 14-14 |
Chimiwungo Mineral Resource Classification Plan View |
137 | ||||
| Figure 14-15 |
Malundwe Mineral Resource Classification Plan View |
138 | ||||
| Figure 14-16 |
Kamisengo Mineral Resource Classification Plan View |
139 | ||||
| Figure 14-17 |
Kababisa Mineral Resource Classification Plan View |
140 | ||||
| Figure 15-1 |
Chimiwungo Pit Optimisation Tonnage Grade Curve |
160 | ||||
| Figure 15-2 |
Malundwe Pit Optimisation Tonnage Grade Curve |
161 | ||||
| Figure 15-3 |
Kamisengo Pit Optimisation Tonnage Grade Curve |
161 | ||||
| Figure 15-4 |
Chimiwungo Pit Optimisation Mining Cost Sensitivity |
163 | ||||
| Figure 15-5 |
Malundwe Pit Optimisation Mining Cost Sensitivity |
163 | ||||
| Figure 15-6 |
Kamisengo Pit Optimisation Mining Cost Sensitivity |
164 | ||||
| Figure 15-7 |
Chimiwungo Super-Pit Design with Existing Open Pits and Estimated Copper Grades |
168 | ||||
| Figure 16-1 |
Slope Stability Section Locations in the Chimiwungo Pit |
175 | ||||
| Figure 16-2 |
Chimiwungo Fresh Rock Design Domains |
177 | ||||
| Figure 16-3 |
Kamisengo Fresh Rock Design Domains |
178 | ||||
| Figure 16-4 |
Final Pit Design for Chimiwungo |
182 | ||||
| Figure 16-5 |
Final Pit Design for Malundwe |
183 | ||||
| Figure 16-6 |
Final Pit Design for Kamisengo |
184 | ||||
| Figure 16-7 |
Final Pit Design for Kababisa |
185 | ||||
| Figure 16-8 |
Basic Mining Layout of Chimiwungo and the Super-Pit |
187 | ||||
| Figure 16-9 |
Basic Mining Layout of Malundwe |
188 | ||||
| Figure 16-10 |
Basic Mining Layout of Kamisengo |
189 | ||||
| Figure 16-11 |
Chimiwungo Planned Waste Dumps |
191 | ||||
| Figure 16-12 |
Malundwe Planned Waste Dumps |
192 | ||||
| Figure 16-13 |
Kamisengo Planned Waste Dumps |
193 | ||||
| Figure 16-14 |
Kababisa Planned Waste Dumps |
194 | ||||
| Figure 16-15 |
Production Schedule for the LOM |
201 | ||||
| Figure 17-1 |
Process Flow Diagram of the Existing Processing Plant |
205 | ||||
| Figure 17-2 |
Process Flow Diagram for the Expansion Project |
206 | ||||
| Figure 18-1 |
Layout of Expansion Project Planned Infrastructure |
220 | ||||
| Figure 18-2 |
Layout of Existing and Planned TSF and Water Management Infrastructure |
224 | ||||
| Figure 20-1 |
Environmental and Social Impact Assessment Process Followed |
247 | ||||
| Figure 20-2 |
Hydrological Setting of the Expansion Project Development Area |
254 | ||||
| Figure 20-3 |
Communities and Social Infrastructure |
255 | ||||
| Figure 22-1 |
Cumulative After-Tax Net Cash Flow |
271 | ||||
| Figure 22-2 |
After-Tax Sensitivity Analysis Results to NPV8% |
281 | ||||
| Figure 22-3 |
After-Tax Sensitivity Analysis Results to IRR |
281 |
|
February 19, 2025 |
Page x |
|
|
NI 43-101 Technical Report on the Lumwana Expansion Project |
|
| 1 | Summary |
This Technical Report on the Lumwana Open Pit Copper Mine (Lumwana, Lumwana Mine, or the Mine), located in the North-Western Province of the Republic of Zambia has been prepared by Barrick Gold Corporation (Barrick). The purpose of this Technical Report is to support public disclosure of the Feasibility Study (FS) completed on the Lumwana Expansion Project (the Expansion Project) and updated Mineral Resource and Mineral Reserve estimates as of December 31, 2024. This Technical Report conforms to National Instrument 43-101 Standards of Disclosure for Mineral Projects (NI 43-101).
Barrick is a Canadian publicly traded mining company with a portfolio of operating mines and advanced exploration and development projects. Barrick is the issuer of this Technical Report and is the 100% shareholder in Zambian registered Lumwana Mining Company Limited (LMC), an exploration and mining company, and the owner of the Mine.
Lumwana is an operating mine with two open pits, Chimiwungo and Malundwe, a conventional sulphide flotation processing plant, and associated infrastructure. In 2024, Barrick completed an FS for the Expansion Project (Barrick, 2024b), which entails an expansion of the current mining operations at Chimiwungo and Malundwe, the opening of two new open pits at Kamisengo and Kababisa, the expansion of the current processing plant, tailings and water supply infrastructure, and an upgrade of existing site infrastructure. As of December 31, 2024, the total Proven and Probable Mineral Reserves are estimated to be 1,600 million tonnes (Mt) at 0.52% Cu for 8.3 Mt Cu. Proven and Probable Mineral Reserves have increased from 510 Mt in 2023 to 1,600 Mt. The increase in Mineral Reserves, presented in the FS, represents a 180% increase in contained copper since 2023. The expansion will substantially increase the mine’s production capacity, extending its operational life by 17 years to 2057, and doubling the capacity of the processing plant from 27 million tonnes per annum (Mtpa) to a peak design of 54 Mtpa, with 52 Mtpa feed targeted for the production schedule. Annual copper output will increase from the current range of 120 thousand tonnes (kt) to 140 kt, to an average of 240 kt annually over life of mine, and will bring Lumwana to the top 25 copper producers globally (CIBC, 2024).
All costs presented in this document are in USD (US$ or $) unless otherwise noted.
| 1.1 | Description, Location, and Ownership |
| 1.1.1 | Location |
The Mine is located in the North-Western Province of Zambia approximately 60 km west from the provincial capital of Solwezi and 400 km northwest of the national capital, Lusaka. The Mine is
|
February 19, 2025 |
Page 1 |
|
|
NI 43-101 Technical Report on the Lumwana Expansion Project |
|
covered by six large scale mining licences (the Mining Licences) with a total area of 1,192 km2. The Mining Licences are held by LMC.
The Mine is situated within a degazetted area of the Acres National Forest 105 (National Forest), where LMC owns the surface rights. Some of the planned Expansion Project infrastructure, including the Kamisengo Inflow Control Dam (KICD) and the Kamisengo open pit, are situated in an 8,800 ha area of the National Forest, which has not been degazetted, and will require obtaining permission and a licence to operate within the National Forest. LMC is in the process of submitting an application to obtain permission and licence to operate in a National Forest, as well as acquiring surface rights, with approval expected before the end of 2025.
| 1.1.2 | Ownership |
Barrick is a Canadian publicly traded gold and copper mining company with a portfolio of operating mines and projects across North America, Africa, South America, and Asia.
LMC is 100% owned by Barrick.
| 1.1.3 | History |
Copper mineralisation was initially discovered in the 1930s with exploration and mining studies completed between the 1950s and 1990s by previous owners including Roan Selection Trust Limited (RST), Azienda General Italiana Petroli (AGIP), and Phelps Dodge Corporation (Phelps Dodge). The Mine was brought into production in 2008 by Equinox Copper Ventures (Equinox) which was acquired by Barrick in 2011.
The first commercial copper production was achieved in 2009 and total production to 2024 is 352.13 Mt milled at a 0.57% Cu head grade for 1,845 thousand tonnes (kt) Cu (91.84% recovery).
| 1.2 | Geology and Mineralisation |
The copper deposits at Lumwana are large, tabular bodies of disseminated mineralisation, which are often referred to as basement hosted copper deposits. They are hosted within the Mwombezhi Dome, which is part of the Domes Region of the Lufilian Arc. The Domes Region is part of the Central African Copperbelt, which is a metallogenic province in the border region of Zambia and the Democratic Republic of the Congo. The deposits are characterised by pyrite, chalcopyrite, and occasional bornite, which is typically associated with higher copper grades. The mineralisation is hosted within either biotite or muscovite dominant schists.
|
February 19, 2025 |
Page 2 |
|
|
NI 43-101 Technical Report on the Lumwana Expansion Project |
|
There are four main deposits at Lumwana. The principal deposit is Chimiwungo, with additional deposits Malundwe (6 km northwest of Chimiwungo), Kamisengo (14 km NNE of Chimiwungo), and Kababisa (10 km NNW of Chimiwungo). The deposits generally comprise a hanging wall gneiss, a mineralised schist containing barren gneiss, and a footwall gneiss, with Kamisengo being more geometrically complex than the other three deposits. All have relatively shallow dips between 5° and 25° and extend from surface to maximum depths of between 250 m and 950 m.
| 1.3 | Exploration Status |
Significant exploration has been undertaken over the life of the Mine. This exploration has included geological mapping, soil geochemistry, ground and airborne geophysics, and exploration drilling targeting near surface mineralisation, and has led to the discovery of the four main deposits, as well as other exploration prospects.
Exploration completed since 2022 has focused on delineating mineralisation in areas where significant infrastructure is planned for the Expansion Project. Sufficient exploration has now been completed to ensure that potential mineralisation will not be impacted by planned infrastructure.
Further exploration will focus on understanding the geology and structural controls at the Greater Odile prospect located approximately 3 km west of Malundwe.
| 1.4 | Mineral Resource Estimate |
The Mineral Resource estimates have been prepared according to the Canadian Institute of Mining, Metallurgy and Petroleum (CIM) 2014 Definition Standards for Mineral Resources and Mineral Reserves dated May 10, 2014 (CIM (2014) Standards) as incorporated with NI 43-101. Mineral Resource estimates were also prepared using the guidance outlined in CIM Estimation of Mineral Resources and Mineral Reserves (MRMR) Best Practice Guidelines 2019 (CIM (2019) MRMR Best Practice Guidelines).
Significant drilling, including 290,908 m of diamond drilling (DD) and 448,541 m reverse circulation (RC) drilling, has been completed to further define the extent, continuity, and structural controls on mineralisation at each of the four main deposits. Information gained from drilling, and supported by operational knowledge, has been used to produce geological models for Mineral Resource estimation.
The current Mineral Resource estimate consists of surface stockpiles and in-situ open pit material from four deposits; Chimiwungo, Malundwe, Kamisengo, and Kababisa. The open pit Mineral Resources are those that demonstrate reasonable prospects for eventual economic extraction
|
February 19, 2025 |
Page 3 |
|
|
NI 43-101 Technical Report on the Lumwana Expansion Project |
|
(RPEEE). These are defined as those above the in-situ marginal cut-off grade within a pit shell using a copper price of US$4.00/lb Cu.
Since 2023 there have been changes to the Mineral Resource through exploration and drilling, including extensions to the existing Chimiwungo, Malundwe and Kamisengo deposits, and the reporting of new Mineral Resource estimates for Kababisa. There has also been depletion of the previously estimated Mineral Resources through mining at the Chimiwungo and Malundwe open pits and processing of stockpiled ore.
Table 1-1 summarises the Lumwana Mineral Resources, inclusive of Mineral Reserves, as of December 31, 2024.
The Measured and Indicated Mineral Resources have increased by 41% (2.9 Mt Cu) and the Inferred Mineral Resources have decreased by 77% (3.1 Mt Cu) since 2023.
The estimate was reviewed internally as well as externally and approved by the Qualified Person (QP) and Barrick prior to release. The QP is not aware of any environmental, permitting, legal, title, taxation, socio-economic, marketing, political, metallurgical, fiscal, or other relevant factors that are not discussed in this Technical Report, that could materially affect the Mineral Resource estimate.
|
February 19, 2025 |
Page 4 |
|
|
NI 43-101 Technical Report on the Lumwana Expansion Project |
|
Table 1-1 Lumwana Mineral Resource Estimate as of December 31, 2024
| Measured | Indicated | Measured + Indicated | Inferred | |||||||||||||||||||||
|
Tonnes (Mt) |
Grade (% Cu) |
Contained Metal (Mt Cu) |
Tonnes (Mt) |
Grade (% Cu) |
Contained Metal (Mt Cu) |
Tonnes (Mt) |
Grade (% Cu) |
Contained Metal (Mt Cu) |
Tonnes (Mt) |
Grade (% Cu) |
Contained Metal (Mt Cu) |
|||||||||||||
| Stockpiles |
20 | 0.32 | 0.064 | - | - | - | 20 | 0.32 | 0.064 | - | - | - | ||||||||||||
| Chimiwungo |
130 | 0.43 | 0.56 | 1,300 | 0.55 | 7.1 | 1,400 | 0.53 | 7.6 | 180 | 0.4 | 0.74 | ||||||||||||
| Kababisa |
- | - | - | 7.2 | 0.39 | 0.028 | 7.2 | 0.39 | 0.028 | 0.14 | 0.4 | 0.00056 | ||||||||||||
| Kamisengo |
- | - | - | 350 | 0.32 | 1.1 | 350 | 0.32 | 1.1 | 40 | 0.3 | 0.13 | ||||||||||||
| Malundwe |
24 | 0.64 | 0.15 | 180 | 0.57 | 1.0 | 200 | 0.58 | 1.2 | 11 | 0.4 | 0.046 | ||||||||||||
|
Open Pit Subtotal |
150 | 0.46 | 0.71 | 1,800 | 0.50 | 9.2 | 2,000 | 0.50 | 9.9 | 230 | 0.4 | 0.91 | ||||||||||||
| Total |
170 | 0.45 | 0.77 | 1,800 | 0.50 | 9.2 | 2,000 | 0.50 | 10.0 | 230 | 0.4 | 0.91 | ||||||||||||
Notes:
| ● | Mineral Resources are reported on a 100% basis. |
| ● | The Mineral Resource estimate has been prepared according to CIM (2014) Standards and using CIM (2019) MRMR Best Practice Guidelines. |
| ● | All Mineral Resource tabulations are reported inclusive of that material which is then modified to form Mineral Reserves. |
| ● | Open pit Mineral Resources are those within a US$4.00/lb pit shell at a cut-off grade of 0.13% Cu for both transitional and fresh mineralisation. |
| ● | The Mineral Resource has been depleted with mined surfaces up to December 31, 2024. |
| ● | Mineral Resources that are not Mineral Reserves do not have demonstrated economic viability. |
| ● | Mineral Resources were reviewed by Richard Peattie, FAusIMM, an employee of Barrick and QP. |
| ● | Numbers may not add due to rounding. Tonnes and contained copper are rounded to 2 significant figures. All Measured and Indicated grades are reported to 2 decimal places whilst Inferred Mineral Resource grades are reported to 1 decimal place. |
|
February 19, 2025 |
Page 5 |
|
|
NI 43-101 Technical Report on the Lumwana Expansion Project |
|
| 1.5 | Mineral Reserve Estimate |
The Mineral Reserve estimates have been prepared according to the Canadian Institute of Mining, Metallurgy and Petroleum 2014 Definition Standards for Mineral Resources and Mineral Reserves dated 10 May 2014 (CIM (2014) Standards) as incorporated with National Instrument 43-101 Standards of Disclosure for Mineral Projects (NI 43-101). Mineral Reserve estimates were also prepared using the guidance outlined in CIM Estimation of Mineral Resource and Mineral Reserve Best Practice Guidelines 2019 (CIM (2019) MRMR Best Practice Guidelines).
The Mineral Reserves have been estimated from the Measured and Indicated Mineral Resources and do not include any Inferred Mineral Resources.
Mineral Reserves were estimated following pit optimisation, pit design, and the development of a Life of Mine (LOM) schedule. The optimisation was based on the 2024 Mineral Resource models and the geotechnical and cost outputs from FS updates of the prior Pre-feasibility Study (PFS), (Barrick, 2024a). For optimisation, the Mineral Resource block model was converted into selective mining units using software that performed an economic evaluation of various combinations of resource blocks, and flagged material as ore or waste. That output allowed planned dilution and waste to be included and was used for optimisation and scheduling work. Metallurgical recoveries were based on the last five years of processing plant data and additional PFS and FS test work. Validations were performed to ensure that the difference between the final FS outputs and the early study inputs did not materially change the optimisation work.
The Mineral Reserve estimate, as of December 31, 2024 consists of surface stockpiles and in-situ open pit material from four deposits: Chimiwungo, Malundwe, Kababisa, and Kamisengo. Open pit Mineral Reserves are reported at a copper price of $3.00/lb Cu.
2024 Mineral Reserves have increased substantially from 2023. The increase was driven by the inclusion of additional Indicated Mineral Resources due to infill and resource definition drilling and changes to the pit optimisation and design at Chimiwungo and Malundwe made as part of the FS. The addition of Kamisengo and Kababisa to the Mineral Reserves also contributed to the increase.
A summary of the Mineral Reserves is shown in Table 1-2.
The total Proven and Probable Mineral Reserves are estimated to be 1,600 Mt at 0.52% Cu for 8.3 Mt Cu. Proven and Probable Mineral Reserves have increased from 510 Mt in 2023 to 1,600 Mt. This results in an increase in contained copper of 180% since 2023. Chimiwungo contains approximately 78% of the total copper processed, followed by Malundwe with 12% and Kamisengo with 10%. Kababisa contains 0.3% of the total and is considered a satellite deposit.
|
February 19, 2025 |
Page 6 |
|
|
NI 43-101 Technical Report on the Lumwana Expansion Project |
|
The estimate was reviewed internally as well as externally and approved by the QP and Barrick prior to release. The QP is not aware of any mining, metallurgical, infrastructure, permitting, or other relevant factors which could materially affect the Mineral Reserve estimates.
|
February 19, 2025 |
Page 7 |
|
|
NI 43-101 Technical Report on the Lumwana Expansion Project |
|
Table 1-2 Summary of Lumwana Mineral Reserve Estimate as of December 31, 2024
| Source | Proven | Probable | Total | |||||||||||||||||
|
Tonnes (Mt) |
Grade (% Cu) |
Contained Metal (Mt Cu) |
Tonnes (Mt) |
Grade % Cu) |
Contained Metal (Mt Cu) |
Tonnes (Mt) |
Grade (% Cu) |
Contained Metal (Mt Cu) |
||||||||||||
|
Stockpiles |
ROM Pad Chimiwungo | 18 | 0.32 | 0.057 | - | - | - | 18 | 0.32 | 0.057 | ||||||||||
| ROM Pad Malundwe | 1.6 | 0.34 | 0.0056 | - | - | - | 1.6 | 0.34 | 0.0056 | |||||||||||
| COS | 0.18 | 0.85 | 0.0015 | - | - | - | 0.18 | 0.85 | 0.0015 | |||||||||||
| Stockpile Subtotal | 20 | 0.32 | 0.064 | - | - | - | 20 | 0.32 | 0.064 | |||||||||||
| Open Pit |
Malundwe | 18 | 0.72 | 0.13 | 140 | 0.60 | 0.83 | 160 | 0.61 | 0.96 | ||||||||||
| Chimiwungo | 100 | 0.48 | 0.48 | 1,100 | 0.56 | 6 | 1,200 | 0.55 | 6.5 | |||||||||||
| Kamisengo | 240 | 0.34 | 0.82 | 240 | 0.34 | 0.82 | ||||||||||||||
| Kababisa | 5.3 | 0.43 | 0.023 | 2.3 | 0.43 | 0.023 | ||||||||||||||
| Open Pit Subtotal | 118 | 0.52 | 0.62 | 1,500 | 0.53 | 7.6 | 1,600 | 0.53 | 8.3 | |||||||||||
|
Total |
140 | 0.49 | 0.67 | 1,500 | 0.53 | 7.6 | 1,600 | 0.52 | 8.3 | |||||||||||
Notes:
| ● | Mineral Reserves are reported on a 100% basis. |
| ● | The Mineral Reserve estimate has been prepared according to CIM (2014) Standards and using CIM (2019) MRMR Best Practice Guidelines . |
| ● | Open Pit Mineral Reserves are reported at a copper price of $3.00/lb, and at a pit rim cut-off grade of 0.14% Cu |
| ● | Dilution and losses were applied through the Grade Control Optimiser (GCO) process. |
| ● | The Mineral Reserve estimate was reviewed by Derek Holm, FAusIMM, an employee of Barrick and QP. |
| ● | Numbers may not add due to rounding. Tonnes and contained metal are rounded to 2 significant figures, whilst Proven and Probable grades are reported to 2 decimal places. |
|
February 19, 2025 |
Page 8 |
|
|
NI 43-101 Technical Report on the Lumwana Expansion Project |
|
| 1.6 | Mining Methods |
Current operations involve open pit mining of two deposits, Chimiwungo, which comprises three individual open pits; Chimiwungo West, Chimiwungo East, and Chimiwungo South, and Malundwe. Total mine production in 2024 was 141 Mt, of which 26.0 Mt was ore at a grade of 0.55% Cu.
As part of the Expansion Project, both Chimiwungo and Malundwe will be expanded, resulting in the three open pits at Chimiwungo being merged into a single large ‘Super-Pit’. Additionally, two new satellite open pits, Kababisa and Kamisengo, will be developed from 2035 and 2036 respectively.
The ramp-up from the current mining capacity of 157 million tonnes per annum (Mtpa) takes an initial step to over 200 Mtpa in 2026, then a later step to approximately 300 Mtpa in 2030. A further step up takes place in 2039, when production attains the peak rate of approximately 354 Mtpa.
The LOM, based on the FS and Mineral Reserve estimate, increases from the current 16 years to 33 years, ending in 2057, with the final two years allocated only to stockpile processing.
Open pit mining is carried out using conventional drill, blast, load, and haul surface mining methods, with extensive grade control drilling completed prior to mining. There will be no major changes to this method for the Expansion Project.
Mining is undertaken with two fleets, the pre-strip fleet (120 t to 200 t shovels, 91 t trucks) that mines oxide material and the smaller pits, and main ultra class fleet (700 t to 800 t shovels, 290 t trucks) that mines fresh waste and ore in the larger pits. Ore is fresh sulphide material (oxide material is sent to waste) which is currently hauled to two run-of-mine (ROM) pads.
For the Expansion Project, a new pit rim crusher is planned to the north of Chimiwungo in 2027, with a later in-pit crusher also planned in 2031 on completion of CE-4 pushback. These will allow increased volumes to be crushed and also reduce ore haulage distances and subsequent mining costs. A new crusher is also planned to be constructed at Kamisengo in 2035, and Kababisa ore will be trucked to the existing Malundwe crusher.
LMC owns and operates the pre-strip and production load and haul equipment. Explosives and blasting services are supplied through a down-the-hole contract with an explosive provider, Maxam.
| 1.6.1 | Geotechnical |
The open pits are primarily composed of fresh, stable rock, with a transitional layer above, and a soft saprolite cap at the surface. The saprolite requires dewatering to support steeper slope angles, whereas the fresh rock below is robust and generally allows for relatively steep pit walls.
|
February 19, 2025 |
Page 9 |
|
|
NI 43-101 Technical Report on the Lumwana Expansion Project |
|
Comprehensive geotechnical assessments, including detailed testing and stability analysis, have been conducted across all deposits. Due to the rock’s competency, slope design is primarily constrained by catch berm requirements to manage rockfall risk. However, in saprolite areas, slope angles are further constrained by the rock’s inherent low strength. Double-benching, where feasible, has been recommended and significantly increases slope angles. A programme is underway to improve blasting and therefore enable double benching, which will be increasingly required from 2027. Three-dimensional (3D) modelling work confirmed the viability of the proposed Chimiwungo ‘Super-Pit’ and waste dump designs, with only small changes required.
| 1.6.2 | Hydrogeology |
The groundwater table in the saprolite is generally shallow, with pre-mining levels averaging 2 m to 10 m below the surface. Effective depressurisation in the saprolite zones is essential for slope stability and safe mining at steeper angles. Active pumping from strategically placed perimeter wells along the pit crest has proven effective in drawing down groundwater to the targeted levels. Most water inflows are attributed to surface water infiltration from rainfall, but certain natural fractures also allow water inflow through the fresh rock.
A monitoring network with groundwater observation points has been established around the Chimiwungo open pits. Piezometers are being installed at Malundwe and the two new open pit locations, Kamisengo and Kababisa. Robust hydrogeological models are in place for Chimiwungo, and development of a similar model that will encompass Malundwe, Kamisengo, and Kababisa is underway.
| 1.6.3 | Design and Schedule |
Pit designs were based on the selected optimised pit shells. Pushbacks were kept large enough to support effective production, but small enough to produce a reasonable ore delivery profile that does not require overly large long-term stockpiles.
Waste dumps were placed as close to the pits as possible without sterilising future pushbacks, with 25% of the planned waste placed into in-pit dumps in areas where the mineralisation is completely mined out. Dumping was sequenced to follow the mining faces as closely as possible.
The expanded process plant has a peak design capacity of 54 Mtpa, with 52 Mtpa targeted for the production schedule. In 2028, the first year the expanded plant will operate, 48 Mt will be processed due to commissioning of the expanded processing plant. These ore targets are supported by a ramp-up in mining starting in 2026.
Chimiwungo is the mainstay of production and is mined for the LOM. It contains 1,164 Mt of ore at a head grade of 0.55% Cu and strip ratio of 5.0. Malundwe will continue to be mined until 2048 and
|
February 19, 2025 |
Page 10 |
|
|
NI 43-101 Technical Report on the Lumwana Expansion Project |
|
Kamisengo will start in 2036. Malundwe contains 157 Mt of ore at 0.61% Cu and a strip ratio of 7.0, while Kamisengo contains 244 Mt of ore at a grade of 0.34% Cu and a strip ratio of 1.7. Annual copper output will increase from the current range of 120 kt to 140 kt, to between 200 kt to 300 kt at an average of 240 kt.
Overall, 1.57 Bt of ore will be mined over the LOM at 0.53% Cu, with 7.33 Bt of waste, for an overall strip ratio of 4.7.
| 1.6.4 | Mining Equipment |
The current ultra class fleet and the split of a pre-strip and main production fleet will be retained for the Expansion Project. At peak capacity, in 2045, the plan requires 91 x 300 t trucks, 15 x 700 t shovels, and 38 x blast hole rigs, increasing from the current fleet size of 49 x 300 t trucks, 6 x 700 t shovels, and 28 x blast hole rigs. The ratio of support equipment to production equipment will be increased to sustain high volumes of production and the geographical spread of mining. Primary fleet was based on modelled cycle times and the production schedule, while support fleet was based on simpler cycle times or empirical ratios.
Future availability, utilisation, and production rates are based on benchmarked values, with a programme underway to reach those values with the existing equipment. These rates have been achieved during 2024 and will be made more consistent during a two-year transition period.
| 1.7 | Mineral Processing |
The Lumwana processing plant has been operating since 2009 and has consistently produced saleable copper concentrate. It was initially designed for a 20 Mtpa throughput but was expanded to process 27 Mtpa in 2020. The plant consists of two primary crushing facilities, one at Malundwe and one at Chimiwungo, each delivering crushed ore via overland conveyors to a single crushed ore stockpile (COS). Primary crushed ore is drawn from the stockpile and fed to a Semi-autogenous Grinding (SAG)-ball grinding circuit.
The product from the grinding circuit, following classification by cyclone clusters, is fed into two parallel rougher flotation banks. Rougher concentrate is subject to multiple cleaner flotation stages. The final cleaner flotation concentrate is dewatered using a thickener, filtered, and stockpiled to load onto road transport to off-site smelters. Rougher tailings are thickened and pumped to the Tailings Storage Facility (TSF).
To meet increased production, processing rates will be increased from the current 27 Mtpa to 52 Mtpa with peak design capacity of 54 Mtpa. This will be achieved through the construction of a parallel processing plant. The new processing plant will use a similar flowsheet to the current plant
|
February 19, 2025 |
Page 11 |
|
|
NI 43-101 Technical Report on the Lumwana Expansion Project |
|
and will involve the installation of two new primary crushing and overland conveying systems in 2027, with a further in-pit crusher being installed in 2041.
For the FS, metallurgical test work was completed on samples that reflect the ore supply proportions. The test work determined plant parameters required to produce a saleable copper concentrate from the new Kamisengo and Kababisa open pits as well as the extensions to the existing Chimiwungo and Malundwe open pits. No material difference is expected in recovery and concentrate grades between currently processed mineralisation and expected mineralisation to be processed from the expansion.
The expected average recovery is 92.7% copper based on the current LOM plan and test work completed to date. Changes in the feed material characteristics may impact the actual achieved recovery.
| 1.8 | Project Infrastructure |
Lumwana is an established and mature operation that was commissioned in 2008. It has well-developed infrastructure supporting the current operations and detailed plans for additional infrastructure to support the Expansion Project.
The most significant changes to infrastructure are increases in power supply and power infrastructure, a significant increase in capacity of the TSF, and significant changes to the Water Storage Facility (WSF).
Power demand will increase from 60 MVA to 177 MVA. The current peak supply is 65 MVA and a Power Supply Agreement (PSA) with Zambia Electricity Supply Company (ZESCO) has been executed to increase the peak supply to 180 MVA.
In the short term, several upgrades to ZESCO’s network infrastructure will be completed by introducing a static synchronous compensators (STATCOM) at identified locations in close proximity to Lumwana, and constructing an additional 330 kV overhead line from Kalumbila to Lumwana. These measures will increase the available power to Lumwana, without increasing national power generation requirements. The additional available power will be sufficient for the Expansion Project requirements.
Expansion of the existing TSF capacity from 360 Mt to an ultimate capacity of 2 Bt will commence in 2025. The existing WSF will be dewatered and filled with tailings as part of the TSF expansion from 2029. A new WSF, KICD, will be constructed in 2026 upstream of Kamisengo which will divert outflow through a new diversion channel into the Malundwe Stream. The ultimate water storage capacity will be reduced from 65 Mm3 in the current WSF to 40 Mm3 in the new KICD, minimising the affected
|
February 19, 2025 |
Page 12 |
|
|
NI 43-101 Technical Report on the Lumwana Expansion Project |
|
footprint, whilst maintaining the ability to supply water to the operations throughout LOM. Proposed infrastructure is shown in Figure 1-1.
| 1.9 | Market Studies and Contracts |
The Lumwana operations produce a readily saleable copper concentrate.
Zambia has several major copper smelters that process copper concentrates. Projections indicate that domestic smelting capacity will be sufficient to handle the additional concentrate expected from both the Lumwana Expansion Project and the overall increase in supply from the Zambian market.
Given the presence of multiple copper cathode and copper concentrate purchasers within the country, Barrick is not reliant on a single customer for copper sales. Additionally, the option to export concentrate remains available, with no identified barriers to export at this time outside of purely commercial factors being an export fee for which waivers can be applied for.
As of December 31, 2024, the Company had no copper derivative contracts in place. As a result, all of Barrick’s copper production is currently subject to market prices.
While there are numerous contracts in place at Lumwana, there are no contracts, apart from product sales, in place or planned which are considered to be material to Barrick.
| 1.10 | Environmental, Permitting and Social Considerations |
The Lumwana Mine has been operating successfully since 2008. All environmental permits are in place for the existing operations. The Environmental and Social Impact Assessment (ESIA) for the Expansion Project was approved in November 2024 with other permits on schedule for approval prior to commencement of construction.
The Expansion Project requires a significant increase in the footprint of the Mine. As a result, a Resettlement Action Plan (RAP) has been developed for the resettlement of 279 households in Kamisengo and has been submitted to Zambia Environmental Management Agency (ZEMA) with approval expected in Q1 2025. Household agreements for the affected households are more than 95% completed, with the remaining households expected to sign agreements in Q1 2025.
Ongoing management of Environmental and Social (E&S) impacts is completed through the environmental management system (EMS) including management plans, monitoring programmes, internal and external auditing, and implementation of the Reducing Emissions from Deforestation and Forest Degradation in Developing Countries (REDD+) Project.
|
February 19, 2025 |
Page 13 |
|
|
NI 43-101 Technical Report on the Lumwana Expansion Project |
|

Source: Barrick, 2024
Figure 1-1 Layout of Expansion Project Planned Infrastructure
|
February 19, 2025 |
Page 14 |
|
|
NI 43-101 Technical Report on the Lumwana Expansion Project |
|
| 1.11 | Capital and Operating Costs |
Lumwana is an operational project with an extensive basis to enable accurate estimation of future capital and operating costs. Cost estimates correspond with an accuracy of +/-15%.
The estimated total capital cost over the LOM is US$14,319 M. This includes construction capital of US$1,998 M to be spent from January 1, 2025 to December 31, 2028, growth capital of US$2,013 M which relates to Expansion Project capital expected to be incurred after December 2028, sustaining capital of US$1,652 M, and capitalised stripping of US$8,656 M.
The operating costs for the LOM were developed considering mining, operating, processing, general and administrative (G&A), downstream, and closure costs. The average LOM unit operating cost is estimated at $18.23/t of processed ore.
| 1.12 | Economic Analysis |
A financial analysis was carried out using a discounted cash flow approach to support the declaration of Mineral Reserves. The model included yearly cash inflows, or revenues, and subtracting yearly cash outflows such as operating costs, capital costs, and taxes.
Financial analysis of the Lumwana Expansion Project results in after-tax net present value (NPV) at a discount rate of 8%, internal rate of return (IRR), and payback periods from 2028 as shown in Table 1-3. LMC is estimated to pay a total of $1,888 M in taxes across the LOM.
Table 1-3 After-Tax Copper Price Sensitivity Analysis Results
| Copper Price |
Cumulative After-Tax Net Cash Flow (US$ Bn) |
After- Tax Bn) |
Project IRR (%) |
Payback Period Post Ramp-up (years) |
||||
| $3.00/lb (Base Case) |
4.4 | 0.2 | 10% | 8 | ||||
| $3.25/lb |
7.0 | 1.1 | 17% | 5 | ||||
| $3.50/lb |
9.6 | 2.0 | 26% | 3 | ||||
| $3.75/lb |
12.3 | 2.9 | 36% | 2 | ||||
| $4.00/lb |
14.9 | 3.8 | 48% | 2 | ||||
| $4.03/lb (3-year trailing average) |
15.2 | 3.9 | 49% | 2 | ||||
| $4.13/lb |
16.2 | 4.3 | 55% | 2 | ||||
| $4.20/lb (Consensus) |
17.0 | 4.5 | 59% | 2 | ||||
| $4.25/lb |
17.5 | 4.7 | 63% | 2 | ||||
| $4.50/lb |
20.1 | 5.6 | 84% | 1 | ||||
| $4.75/lb |
22.7 | 6.5 | 120% | 1 |
|
February 19, 2025 |
Page 15 |
|
|
NI 43-101 Technical Report on the Lumwana Expansion Project |
|
| Copper Price |
Cumulative After-Tax Net Cash Flow (US$ Bn) |
After- Tax Bn) |
Project IRR (%) |
Payback Period Post Ramp-up (years) | ||||
| $5.00/lb |
25.3 | 7.4 | 219% | 1 |
Notes:
| 1. | Consensus pricing is based on the Canadian Imperial Bank of Commerce (CIBC) consensus as at August 2024. |
| 1.13 | Interpretations and Conclusions |
The QPs present the following interpretations and conclusions in their respective areas of expertise, based on the review of data available for this Technical Report.
The Project as a whole has been designed to use industry standard practices and deploy conventional technology with many of the technologies already employed by Barrick at other mines they operate, reducing the implementation and operational risks. Where technologies are not employed by Barrick, benchmarked sites have been visited by the Project team to validate equipment selection and adopt best practices. Though new and emerging technologies are not included in the base case, the Project has been designed to allow for the adoption of technologies during the operational phase which, if realised, may result in potential improvements in operational performance from that which is presented in this Technical Report.
| 1.13.1 | Mineral Tenure, Rights, Royalties and Agreements |
| ● | LMC owns the surface rights in the form of a 99 year lease covering the current operations and a majority of the planned infrastructure, including the proposed TSF and Process Plant expansions, and the Chimiwungo, Malundwe and Kababisa open pits. |
| ● | The KICD and the Kamisengo open pit are situated in an area which is within the Acres National Forest 105 and will require either degazetting or obtaining permission and licence to operate in the 8,800 ha of the Acres National Forest 105. LMC’s current surface rights area includes 28,500 ha of Acres National Forest 105 previously degazetted by the President of Zambia in 2009, and as such, subject to obtaining the necessary permission and a licence, LMC does not anticipate that there are any barriers preventing the development of aforementioned infrastructure. |
| 1.13.2 | Geology and Mineral Resources |
| ● | Significant exploration, drilling, and operational data provides a good understanding of the deposit geology as well as an understanding of the geometry, thickness, and grade continuity of the mineralisation at Chimiwungo, Malundwe, Kamisengo, and Kababisa. |
| ● | Procedures for drilling, logging, sampling, analyses, and security are in place and meet industry standards. Data validation and data verification procedures indicate that the data within the database is suitable for Mineral Resource estimation. |
|
February 19, 2025 |
Page 16 |
|
|
NI 43-101 Technical Report on the Lumwana Expansion Project |
|
| ● | Extensive drilling has resulted in substantial increases in Indicated Mineral Resources at Chimiwungo, Malundwe, and Kamisengo, and the addition of new Mineral Resources at Kababisa. The extensive and closer spaced drilling has resulted in increased confidence in the controls on mineralisation which has increased confidence in the geological models used for Mineral Resource estimation. The geo-metallurgical understanding of the deposit has also improved and, as a result, oxidation zones are now better-defined using ratios of acid soluble copper, total copper, and sulphur. |
| ● | In June 2024, RSC Consulting Limited (RSC) completed a site visit and external audit of the Mineral Resource and its informing data and processes. RSC concluded that the processes underlying the generation and declaration of the Mineral Resource reflected good practice. |
| 1.13.3 | Mineral Reserves |
| ● | The Mineral Reserve estimate is based on a comprehensive process of evaluation, starting with the Mineral Resource block model that was optimised using geotechnical, technical and economic parameters, after which the various pits were designed and scheduled. |
| ● | Final FS parameters for operating costs and recoveries differed slightly from the optimisation and scheduling input costs. These differences are considered usual during a project and do not materially affect the outcomes. |
| ● | The Expansion Project schedule supports the doubling of the throughput of the processing plant and extension of the LOM to 33 years. |
| ● | Dilution and loss estimates are applied to the expansion mine plan to provide realistic estimates of grade and tonnes supplied by the mining operation. Initial planned dilution is determined through software, while unplanned dilution and losses are accounted for in model adjustments following reconciliation work. |
| ● | The highest undiscounted cash flow shells were selected from the optimisation results. |
| ● | In December 2024, AMC Consultants (AMC) completed a site visit and external review of the mining portion of the FS and its informing data, modifying factors, mine planning, and scheduling processes. AMC concluded that these did not present any fatal flaws and that the requirements of an FS were met. |
| 1.13.4 | Mining |
| ● | Mining envisaged for the Expansion Project uses the same mining methods and the same types of equipment as the current operation, substantially reducing risks to the Expansion Project. |
| ● | Notable increases in output per machine are planned through changes to the equipment availability, utilisation, and productivity. The estimated operating cost and capital cost of the production fleet is based on this higher productivity rate, and in the lead up to the completion of the FS, the operations team demonstrated that the required FS output parameters could be achieved. An extensive improvement plan is underway, with a two-year transition period included in the FS. |
| ● | Double benching has been proposed for the final Chimiwungo Super-Pit walls from 2027 onwards. A programme to improve current mining practices in order to implement double benching is underway. |
|
February 19, 2025 |
Page 17 |
|
|
NI 43-101 Technical Report on the Lumwana Expansion Project |
|
| ● | In November 2024, third party geotechnical reviews were completed by Itasca (Itasca, 2024) and PSM (PSM, 2024) to validate assumptions used in the mine planning and scheduling process. The reviews concluded that there were no fatal flaws and that the geotechnical data and analysis are reasonable and the slope design parameters are suitable for the FS. |
| 1.13.5 | Mineral Processing |
| ● | The process flowsheet and process design criteria (PDC) have been developed based on a thorough test work programme, two years of operating processing plant data, and application of current industry best practices. They were developed and reviewed by both Barrick and Lycopodium Minerals Pty Ltd (Lycopodium) as part of the FS. |
| ● | The overall criteria in developing the flowsheet and PDC was to reflect the physical and metallurgical properties of the ore and inclusion of flexibility to accommodate variability in ore that could result in a wide range of concentrate mass pulls. |
| ● | Operational data compares well to the test work data, and there is a clear indication that there is no material difference in metallurgical characteristics between currently processed ore and expected ore from the Expansion Project. |
| ● | When the PDC was being developed, not all new bench-top flotation tests were completed, and the rougher flotation concentrate mass pull was calculated based on the 85th percentile of the combined available operational data and new rougher flotation test results. Cleaner flotation flowsheet and mass pulls were based on analysis of the simulations developed by the high-intensity flotation vendors, which were based on locked cycle dilution flotation test work. Flotation retention time and reagents addition rates were based on the flotation conditions as per the baseline open cycle test conditions. |
| ● | Flux rates for concentrate and tailings thickener sizing were based on Metso’s thickening test work results. Thickener test work by Vietti and FLSmidth yielded similar results |
| ● | Concentrate filtration rate was based on historical filtration test work performed by LAROX. |
| 1.13.6 | Infrastructure |
| ● | Necessary infrastructure for the current LOM is already in place. |
| ● | As mining ramps up for the Expansion Project, additional site common purpose infrastructure is planned as well as expansions to existing infrastructure. This includes an expansion to the maintenance workshop, on-site and off-site accommodation, expansion of mining infrastructure, a new airstrip, and an upgrade to the existing road network. |
| ● | The operation relies on a combination of state-supplied grid power and on-site diesel generation to meet its current electrical load of 60 MVA, with plans to expand capacity to accommodate future demands, which are expected to peak at 177 MVA. As part of this expansion, additional 33 kV infrastructure is being developed, and an agreement with ZESCO for a peak supply of 180 MVA has been executed. |
| ● | To address power supply challenges, a grid study identified key constraints, prompting immediate plans to upgrade ZESCO’s infrastructure and enhance power stability through a new STATCOM and transmission lines. Barrick aims to secure a sustainable long-term power supply by collaborating with independent power producers and establishing alternative supply agreements. |
|
February 19, 2025 |
Page 18 |
|
|
NI 43-101 Technical Report on the Lumwana Expansion Project |
|
| ● | To meet the requirements of the Expansion Project, the TSF will be expanded to a capacity of 2 Bt. The expanded TSF design is based on the current TSF and has considered all necessary design requirements as stipulated by the Barrick Tailings Management Standard, Global Industry Standard on Tailings Management (GISTM), and Zambian Authorities. |
| ● | A new WSF, the KICD, will be constructed upstream Kamisengo and will outflow through a new diversion channel into the Malundwe Stream. Water and salt balance modelling shows that the proposed site-wide water management infrastructure meets water demand requirements and Zambian quality standards, and will effectively separate clean groundwater and rainwater from water runoff into the mining area. |
| 1.13.7 | Environment and Social Aspects |
| ● | An ESIA process was commissioned to identify and quantify the E&S impacts, which could arise from the Expansion Project. The ESIA process was undertaken as required by ZEMA and the Good International Industry Practices (GIIP), such as the International Finance Corporation (IFC) Performance Standards on Social Sustainability. Based on the outcomes of the impact assessment and effective implementation of identified mitigation and management measures by Lumwana, the Expansion Project is not expected to result in a significant irreversible environmental or social impact (or fatal flaw/s) that will outweigh the continuation of socio-economic and potential regional biodiversity benefits from extending the LOM at Lumwana. |
| ● | The ESIA for the Expansion Project was approved by ZEMA in November 2024, and a decision letter has been issued. |
| ● | Vegetation removal, topsoil stripping and infrastructure construction will impact soil through direct or indirect loss of soil resources, soil erosion, and degradation or soil competition and contamination. The infrastructure was positioned to avoid critical habitats where possible and to implement the Biodiversity Action Plan (BAP). Successful implementation of the BAP is expected to result in positive environmental impacts, as new habitats would be created. |
| ● | Extensive water management, such as through the KICD and associated Malundwe Stream diversions, is required to manage water inflow. This prevents a loss of catchment yields as the vast majority of the diverted water is conserved within the same drainage network downstream of the Malundwe mining areas. The impacts on groundwater are expected to be negligible and manageable with the implementation of the Environmental and Social Management Plan (ESMP) measures. Continuous monitoring of the effectiveness of stormwater management infrastructure, periodic updates of the water balance and continuous monitoring (quality and quantity) downstream of the diversions is ongoing. |
| ● | Subject to the mitigation and management measures prescribed in the ESMP being correctly implemented, the post-mitigation (residual) significance ratings are expected to be acceptable as the benefits of executing the Expansion Project will outweigh the negative impacts. |
| ● | The Expansion Project involves acquiring approximately 14,000 ha of land within the Kamisengo Moratorium Area, affecting 279 households and 1,873 individuals. Physical resettlement of affected households and culturally significant sites will need to take place. Resettlement will include compensation for project-affected households (PAHs) based on specific eligibility criteria, along with transitional support. A livelihood restoration programme will be provided, and the RAP will be monitored and evaluated in accordance with IFC Performance Standards and Barrick’s internal guidelines. |
|
February 19, 2025 |
Page 19 |
|
|
NI 43-101 Technical Report on the Lumwana Expansion Project |
|
| ● | Household agreements signings for the Kamisengo RAP are well advanced, with more than 90% of agreements signed. Final agreements are expected to be signed in Q1 2025. |
| 1.13.8 | Capital and Operating Costs |
| ● | Capital and operating costs estimates for the study were estimated at what is considered sufficient for a Feasibility Study (+/- 15%). The costs were estimated as of Q3 2024 and are considered current for the purpose of this Technical Report and the declaration of Mineral Reserves. |
| ● | Capital cost estimates include initial capital, growth capital as well as sustaining capital costs. The planned Project requires an estimated LOM total capital cost of $5,663 M excluding capitalised stripping. |
| ● | Operating cost estimates includes all operational activities required for the mining, processing, G&A costs, and offsite costs (including freight & refining and royalties) for all of the forecasted production. |
| ● | The LOM operating cost for the Project is estimated to be $28,975 M with unit operating costs of $18.23/t. |
| ● | Based on the cost analysis for the operating costs of the Expansion Project including the mining, processing, G&A costs as well as the treatment and refining costs, it can be concluded that the costs and effective per unit rates have been appropriately determined and disclosed. |
| ● | The capital spend for the Expansion Project, including expansion and sustaining costs, has been appropriately determined based on underlying support and investigations conducted. The capital spend adequately reflects the spend necessary to proceed from the feasibility stage to the execution stage. |
| 1.13.9 | Project Economics |
| ● | Both the capital spend and operating costs have been evaluated through a financial analysis including the consideration of various sensitivities across prominent assumptions. The outcome of the financial analysis confirms that the Expansion Project will generate a return that exceeds Barrick’s minimum investment requirement, as well as positively contributes to the local and national economy. |
| ● | Based on the economic analysis presented in this document and a consensus price of $4.03/lb, the Project generates positive pre- and post-tax financial results with a post-tax free cash flow of $15,186 M, NPV8% of $3,926 M and IRR of 49%. |
| ● | The Project’s NPV is most sensitive to changes in copper price and operating costs. Changes in these parameters from those listed in this Technical Report will impact the NPV. |
| 1.13.10 | Risks |
The QPs have examined the various risks and uncertainties known or identified that could reasonably be expected to affect reliability or confidence in the exploration information, the Mineral Resources or Mineral Reserves of the Mine, or projected economic outcomes contained in this Technical Report. They have considered the controls that are in place or proposed to be implemented and have
|
February 19, 2025 |
Page 20 |
|
|
NI 43-101 Technical Report on the Lumwana Expansion Project |
|
determined the residual risk post mitigation measures. The post mitigation risk rating is evaluated consistent with guidance provided by Barrick’s Formal Risk Assessment Procedure (FRA) and considers the likelihood and consequence of the risk’s occurrence and impact.
Table 1-4 details the significant risks and uncertainties as determined by the QPs for the Expansion Project.
|
February 19, 2025 |
Page 21 |
|
|
NI 43-101 Technical Report on the Lumwana Expansion Project |
|
Table 1-4 Expansion Project Risk Summary
| Area | Risk | Mitigation | Post Mitigation Risk Rating |
|||
| Location, Accessibility, Climate, Local Resources and Infrastructure | Inability to execute project due to lack of power in the Zambian national grid |
● PSA signed with ZESCO to secure power requirements for LOM.
● STATCOM and transmission lines planned as part of Expansion Project to mitigate power instability and increase power availability.
● Wheeling agreements concluded with power suppliers to increase supply.
● Backup power increased as part of Expansion Project to mitigate outages.
|
High | |||
| Geology and Mineral Resources | Lower than predicted grades and tonnes relative to recovery model |
● Mineral Resource audit completed with no fatal flaws identified.
● Consistently well performing reconciliation results between modelled grades and plant results.
● Extensive drilling programme concluded to de-risk geological model.
|
Low - Medium | |||
| Mining and Mineral Reserves | Underperformance in ultra class fleet productivities relative to Mine plan assumptions |
● Operations demonstrated that FS Parameters can be achieved during the course of 2024.
● Improvement plans implemented, time frames built into FS mine plan to consistently reach expected levels of productivity.
|
High | |||
| Operating Costs | Higher than modelled operating costs |
● Improvement programmes in place and demonstrating capability of ultra class mining fleet to deliver planned levels of productivities.
● Infrastructure design for the expansion reduces operating costs: e.g., in-pit crushing and conveying, electrical shovels.
● Benchmarked planned costs against other similar operations.
|
High | |||
| Capital Costs | Capital Cost Overruns |
● FS engineering was completed to +/-15% accuracy.
● Contracts and vendor quotes obtained for key equipment.
● Cost control and package management during project execution.
|
Medium | |||
|
February 19, 2025 |
Page 22 |
|
|
NI 43-101 Technical Report on the Lumwana Expansion Project |
|
| Area | Risk | Mitigation | Post Mitigation Risk Rating |
|||
|
● Long-lead items for processing and mining secured during 2024.
|
||||||
| Mineral Processing | Underperformance of flowsheet to achieve required grades/recoveries |
● Flowsheet built from two years of existing processing plant data, and extensive metallurgical test work of future ore sources.
● Existing plant operating at 27 Mtpa capacity with similar flowsheet, processing similar ore types.
● Schedule requires 52 Mtpa out of 54 Mtpa peak design capacity.
|
Medium | |||
| Tailings | Tailings dam failure |
● Expanded tailings dam to follow existing design principles from existing tailings dam in place since 2008.
● Ongoing independent tailings review process.
● Design for expansion of tailings dam supported by detailed site investigation work and operating experience.
|
Medium | |||
| Environmental and Social | Environmental Impact of habitats and communities |
● Infrastructure placement designed to minimise impacts on critical habitats and undisturbed areas.
● ESMP to be updated for the Expansion Project.
● RAP to be approved and implemented in Kamisengo in order to minimise social impacts.
● ESIA for Expansion Project approved by ZEMA.
|
Medium | |||
|
February 19, 2025 |
Page 23 |
|
|
NI 43-101 Technical Report on the Lumwana Expansion Project |
|
| 1.14 | Recommendations |
The key recommendation is to proceed with the Expansion Project and commence detailed design with the selected EPCM contractor. Further recommendations by discipline are summarised as follows:
| 1.14.1 | Mineral Tenure, Rights, Royalties and Agreements |
| ● | Begin the process of converting the Moratorium Area from Customary Tenure to State Tenure in order to gain title to the land and secure surface rights. |
| ● | Obtain the permission and licence to operate in 8,800 ha of the National Forest. |
| ● | Maintain good standing of Mining Licences and permits. |
| 1.14.2 | Geology and Mineral Resources |
| ● | Continue to improve geo-metallurgical understanding through integration of multi-element data to potentially improve recoveries and process costs. |
| ● | Follow existing resource definition drilling with infill and subsequent grade control drilling. |
| ● | Develop identified exploration prospects. |
| 1.14.3 | Mining and Mineral Reserves |
| ● | To mitigate risk to mining costs, complete the ongoing drill and blast improvement project including double benching. Consider flattening interim pushbacks to reduce blasting interaction in areas with two concurrent pushbacks. |
| ● | Further define zones of potential localised minor shear structures through ongoing improvements to structural modelling. |
| ● | Revisit prior studies on trolley assist for potential operational savings. |
| ● | Investigate the technical and economic impact of crushing and conveying of waste to further reduce mining costs. |
| ● | Complete further detailed planning to refine pushback designs, development sequences, and working spaces to enable better productivities and reduce production risk. |
| ● | Refine geotechnical model and analysis for low rock strength Chimiwungo domains. |
| 1.14.4 | Mineral Processing |
| ● | Continue to refine the optimal blend ratios for Kamisengo and Chimiwungo ore feed. |
| ● | Continue to perform further test work on low grade marginal sulphide ore to increase the definition of the recovery model. |
|
February 19, 2025 |
Page 24 |
|
|
NI 43-101 Technical Report on the Lumwana Expansion Project |
|
| ● | Continue with planned procurement strategies of long lead equipment and closely monitor vendor performance to ensure timely data availability for detailed engineering. |
| 1.14.5 | Infrastructure |
| ● | Expedite the STATCOM and transmission line upgrades to mitigate the power supply risk and reduce plant downtime from grid outages. |
| ● | Ensure continuous monitoring and testing of backup power systems. |
| ● | Ensure the installation of advanced real-time monitoring systems for TSF and WSF embankment stability, and test evacuation procedures regularly. |
| ● | Continue to ensure that tailings dam operations conform to detailed design. |
| 1.14.6 | Environmental, Permitting and Social Aspects |
| ● | Ensure that the resettlement process proceeds according to the RAP to be approved by ZEMA. |
| ● | Continue to engage with authorities through the stakeholder engagement plan. |
| ● | Update ESMP to reflect the Expansion Project. |
| 1.14.7 | Capital and Operating Costs |
| ● | Continue to refine capital and operating cost models through the detailed engineering phase prior to Project execution. |
| 1.14.8 | Risks |
| ● | Ongoing updates and revisions to the Project risk register are recommended as the Project progresses through basis engineering into construction and operation. Active monitoring and implementation of mitigation plans are recommended for key risks in accordance with Barrick’s established risk management practices. |
|
February 19, 2025 |
Page 25 |
|
|
NI 43-101 Technical Report on the Lumwana Expansion Project |
|
| 2 | Introduction |
This Technical Report on the Lumwana Open Pit Copper Mine (Lumwana, Lumwana Mine, or the Mine), located in the North-Western Province of the Republic of Zambia has been prepared by Barrick Gold Corporation (Barrick). The purpose of this Technical Report is to support public disclosure of the Feasibility Study (FS) completed on the Lumwana Expansion Project (the Expansion Project) and updated Mineral Resource and Mineral Reserve estimates as of December 31, 2024.
Barrick is a Canadian publicly traded mining company with a portfolio of operating mines and advanced exploration and development projects. Barrick is the issuer of this Technical Report as a 100% shareholder in Lumwana Mining Company (LMC).
The Mine consists of two operating open pits, Chimiwungo and Malundwe, and a conventional sulphide flotation processing plant, together with associated mining operations and infrastructure. The processing plant produces copper concentrate for smelting by third party operated smelters in Zambia.
In 2024 Barrick completed an FS (Barrick, 2024b) for the Expansion Project, which includes expansion of the current processing, tailings, water supply, and mining operations, with the current open pits at Chimiwungo being merged into a single large ‘Super-Pit’, the opening of two new pits at the recently defined satellite deposits, Kababisa and Kamisengo, the establishment of an airstrip, a new employee town, and an industrial supplier park. The FS was completed using +/-15% accuracy cost estimations and is used to support the Mineral Resource and Mineral Reserve estimates outlined in this Technical Report.
The Expansion Project involves a ramp-up of mining production from 150 million tonnes per annum (Mtpa) to 350 Mtpa, which is expected to commence in 2026. It also involves the expansion of the processing plant throughput from 27 Mtpa to 52 Mtpa with peak design capacity of 54 Mtpa. Construction of the Expansion Project is planned to commence in 2025 with completion in 2028.
This Technical Report conforms to National Instrument 43-101 Standards of Disclosure for Mineral Projects (NI 43-101). The Mineral Resource and Mineral Reserve estimates have been prepared according to the Canadian Institute of Mining, Metallurgy and Petroleum (CIM) Definition Standards for Mineral Resources and Mineral Reserves dated 10 May 2014 (CIM (2014) Standards) as incorporated by reference in NI 43-101. Mineral Resource and Mineral Reserve estimates were also prepared using the guidance outlined in CIM Estimation of Mineral Resources and Mineral Reserves Best Practice Guidelines 2019 (CIM (2019) MRMR Best Practice Guidelines).
|
February 19, 2025 |
Page 26 |
|
|
NI 43-101 Technical Report on the Lumwana Expansion Project |
|
| 2.1 | Effective Date |
The effective date of this Technical Report is December 31, 2024.
| 2.2 | Qualified Persons |
This Technical Report was prepared by Barrick.
The Qualified Persons (QPs) and their responsibilities for this Technical Report are listed in Section 29 Certificates of Qualified Persons and summarised in Table 2-1.
Table 2-1 QP Responsibilities
| Qualified Person | Company | Title/Position | Sections | |||
| Simon P. Bottoms, CGeol, FAusIMM | Barrick Gold Corporation | Mineral Resource Manager and Evaluation Executive | 3, 4, 5, 6, 19, 21, 22, 23, 24 | |||
| Richard Peattie, FAusIMM | Barrick Gold Corporation | Mineral Resources Manager: Africa and Middle East (AME) | 7, 8, 9, 10, 11, 12, 14 | |||
| Derek Holm, FAusIMM | Barrick Gold Corporation | AME Planning Lead | 15, 16 | |||
| Marius Swanepoel, Pr.Eng. | Barrick Gold Corporation | Head of Metallurgy, AME | 13, 17, 18 | |||
| Graham E. Trusler, Pr Eng, MIChE, MSAIChE | Digby Wells Environmental Holdings Limited | CEO | 20 | |||
| All | - | - | 1, 2, 25, 26 and 27 | |||
| 2.3 | Site Visits of Qualified Persons |
Details of the QPs’ most recent site visits are summarised as follows:
| ● | Richard Peattie is employed by Barrick as the Mineral Resources Manager AME. He visited the Mine several times in 2024, where he reviewed the exploration programme results, Mineral Resource and grade control model updates, mine plans, mining performance results and associated financials, mine strategy, results of external audits, and board meeting reviews. His most recent visit to the Mine was September 30 to October 3, 2024. |
| ● | Derek Holm is employed by Barrick as AME Planning Lead. He visited the Mine several times in 2024, when he reviewed current mining practices and productivities, geotechnical work and conditions, modifying factors, medium and long term plans, and broader mining strategies. His most recent visit to the Mine was September 28 to October 3, 2024. |
| ● | Marius Swanepoel is employed by Barrick as AME Head of Metallurgy. He has visited the Mine several times in recent years and his most recent visit was from December 11 to |
|
February 19, 2025 |
Page 27 |
|
|
NI 43-101 Technical Report on the Lumwana Expansion Project |
|
| December 16, 2024, where he reviewed the Expansion Project status, metallurgical test work, capital and operating cost estimates and associated financials, mine strategy, results of external audits, and board meeting reviews. |
| ● | Simon Bottoms is employed by Barrick as the Mineral Resource Management and Evaluation Executive. He visited Lumwana several times in 2024, and his most recent visit to the Mine was September 30 to October 3, 2024, where he reviewed the exploration programme results, Mineral Resource and grade control model updates, mine plans, mining performance results and associated financials, mine strategy, results of external audits, and board meeting reviews. |
| ● | Graham Trusler is the CEO of Digby Wells Environmental Holdings Limited (Digby Wells). He visited the Mine most recently from April 23, 2024 to April 28, 2024, where he reviewed the current and planned water management system compliance, uranium issues in the Malundwe open pit, and the pool management on the Tailings Storage Facility (TSF). He also visited rehabilitation projects, assessed the TSF closure plans, held a workshop to update the mine’s biodiversity action plans, and evaluated the closure plans and costs. |
| 2.4 | Information Sources |
Barrick used the Lumwana Expansion Feasibility Study (Barrick, 2024b), as well as internal presentations, memos, reports, and previous Technical Reports in the compilation of this Technical Report. The documentation reviewed, and other sources of information, are listed in Section 27 of this Technical Report.
|
February 19, 2025 |
Page 28 |
|
|
NI 43-101 Technical Report on the Lumwana Expansion Project |
|
| 2.5 | Abbreviations and Acronyms |
Units of measurement used in this Technical Report conform to the metric system unless otherwise noted. All currency in this Technical Report is in US dollars (US$ or $) unless otherwise noted. Abbreviations and acronyms used in this Technical Report are included in Table 2-2.
Table 2-2 Table of Abbreviations
| Unit | Measure | Unit | Measure | |||
| ° | degree | m | metre | |||
| °C | degree Celsius | m2 | square metre | |||
| µm | micrometre | m3 | cubic metre | |||
| A | ampere | |||||
| Au | gold | m3/d | cubic metre per day | |||
| CFM | cubic feet per minute | m3/h | cubic metres per hour | |||
| cm | centimetre | m3/s | cubic metres per second | |||
| ft | foot | Ma | million years | |||
| G | giga (billion) | min | minute | |||
| g | gram | mm | millimetre | |||
| g/cm3 | grams per cubic centimetre | Moz | million ounces | |||
| g/L | grams per litre | MPa | megapascal | |||
| g/t | grams per tonne | Mt | million metric tonnes | |||
| ha | hectare | Mtpa | million metric tonnes per annum | |||
| hrs | hours | MW | megawatt | |||
| hr | hour | oz | Troy ounce (31.10348 g) | |||
| in | inch | P80 | 80% passing | |||
| k | kilo (thousand) | ppm | parts per million | |||
| kg | kilogram | s | second | |||
| kL/min | thousand litres per minute | t | metric tonne | |||
| km | kilometre | t/h | metric tonnes per hour | |||
| km2 | square kilometre | t/m3 | metric tonne per cubic metre | |||
| koz | thousand ounces | tpa | metric tonnes per annum | |||
| kPa | kilopascal | tpd | metric tonnes per day | |||
| kt | thousand metric tonnes | US$ | United States dollar | |||
| ktpa | thousand tonne per annum | V | volt | |||
| kV | kilovolt | VAC | Volts Alternating Current | |||
| kW | kilowatt | W | watt | |||
| kWh | kilowatt-hour | Wi | Work Index | |||
| L | litre | wt% | content by weight | |||
| L/s | litres per second | w/w | weight per weight | |||
| M | mega (million) | yr | year | |||
|
February 19, 2025 |
Page 29 |
|
|
NI 43-101 Technical Report on the Lumwana Expansion Project |
|
| 3 | Reliance on Other Experts |
This report was compiled by Barrick. The information, conclusions, opinions, and estimates contained herein are based on:
| ● | Information available at the time of preparation of this Technical Report, |
| ● | Assumptions, conditions, and qualifications as set forth in this Technical Report. |
For the purpose of this report, the QPs have relied upon information provided by Barrick’s legal counsel regarding the validity of the permits and the fiscal regime applicable in accordance with Zambian Law as part of ongoing reviews. This opinion has been relied upon in Section 4 (Property Description and Location) and in the summary of this report.
Except for the purposes legislated under provincial securities laws, any use of this Technical Report by any third party is at that party’s sole risk.
|
February 19, 2025 |
Page 30 |
|
|
NI 43-101 Technical Report on the Lumwana Expansion Project |
|
| 4 | Property Description and Location |
| 4.1 | Project Location |
Lumwana is located in the North-Western Province of Zambia (12°15'1.42"S, 25°51'48.34"E), approximately 60 km west from the provincial capital of Solwezi, 220 km west of Chingola, and 400 km northwest of the national capital, Lusaka (Figure 4-1). The Lumwana Mining Licences cover an area of 1,192 km2.

Source: RPA, 2012.
Figure 4-1 Lumwana Location Map
|
February 19, 2025 |
Page 31 |
|
|
NI 43-101 Technical Report on the Lumwana Expansion Project |
|
| 4.2 | Mineral Rights |
In Zambia, mining rights and surface rights are distinct concepts administered under separate legal frameworks: Mines and Minerals Development Act No.11 of 2015 (the ‘Mines Act’) and the Lands Act, 1995 (the ‘Lands Act’) respectively.
As per the Mines Act, the Mine is covered by a total of six large-scale Mining Licences (LML, the Mining Licences). The Mining Licence details are summarised in Table 4-1 and their locations are shown in Figure 4-2. The Mining Licences were granted for the mining of copper, cobalt, gold, silver, uranium, and sulphur. The Mining Licences also permit exploration and mineral processing without the requirement to apply for a separate exploration licence or mineral processing licence.
Table 4-1 Summary of Lumwana Mining Licences
| Licence Number | Name | Licence Type | Surface Area (km2) |
Expiry Date | ||||
| 8089-HQ-LML | Lumwana | LML | 244.500 | 05/01/2029 | ||||
| 9000-HQ-LML | North Dome | LML | 239.770 | 06/11/2029 | ||||
| 9001-HQ-LML | Malundwe North | LML | 165.595 | 06/11/2029 | ||||
| 9002-HQ-LML | Lubwe | LML | 212.900 | 06/11/2029 | ||||
| 9003-HQ-LML | Mutoma | LML | 85.849 | 06/11/2029 | ||||
| 9004-HQ-LML | Chimiwungo South | LML | 243.547 | 06/11/2029 | ||||
All Mining Licences are held by LMC. LMC is a company limited by shares, incorporated and domiciled in Zambia. The beneficial owners of the company are the shareholders of Barrick African Copper Pty Limited. Barrick African Copper Pty Limited is 100% owned by Barrick Copper Overseas (Pty) Ltd, which is 100% owned by Barrick Resources (Australia) Pty Ltd, which is owned by Equinox Limited Ontario, which is 100% owned by Barrick.
All taxes relating to the Mining Licences have been paid and the Mining Licenses are in good standing as of the Effective Date.
In the QP’s opinion, all appropriate Mining Licences have been acquired and obtained to conduct the work proposed for the property.
The processes to obtain and renew required permits, access, and rights are well understood by LMC and similar permits, access, and rights have been granted to the operations in the past. LMC expects to be granted all permits, access, and rights necessary and sees no impediment to approval of these in the future.
The QP is not aware of any significant risks that could result in the loss of ownership of the deposits or loss of the Mining Licences, in part or in whole or that the Mining Licences will not be renewed in the future.
|
February 19, 2025 |
Page 32 |
|
|
NI 43-101 Technical Report on the Lumwana Expansion Project |
|

Source: Barrick, 2024
Figure 4-2 Lumwana Mining Licences and Surface Rights
|
February 19, 2025 |
Page 33 |
|
|
NI 43-101 Technical Report on the Lumwana Expansion Project |
|
| 4.3 | Surface Rights |
In Zambia, Mining Licences do not automatically give the holder surface rights, nor exclusive access to the land surface. There are two land tenure systems that define surface rights: State Tenure, as administered under the Lands Act, and Customary Tenure, which the Lands Act recognises. Customary Tenure is administered by traditional authorities and State Tenure is administered by government authorities. Acquisition of surface rights, defined in Zambian Law as ‘Title’, requires a conversion of Customary Tenure to State Tenure through a process of approval by the relevant Traditional Leadership and local council. Through this process, surface rights are granted for periods of 99 years.
To operate on land under Customary Tenure, in the absence of surface rights, consent is required from Traditional Leadership as per the Mines Act. In 2005, a Memorandum of Understanding (MOU) was executed between Chiefs Mukumbi, Mumena and Matebo,1 which gave LMC consent to exercise LMC’s mining rights within the area covered by its Mining Licences.
Subsequent to the MOU, in 2009 LMC applied for and secured surface rights to an area of land measuring 35,000 ha valid for a period of 99 years until 2108. This area is shown in Figure 4-2 as the ‘Surface Rights Boundary’ and covers the Lumwana Estate, the current mining operations and infrastructure, and the planned location of the majority of the Expansion Project infrastructure including the expanded processing plant, TSF, maintenance workshop, expansions to mine accommodation, Chimiwungo Super-Pit, and Malundwe and Kababisa open pits.
The remaining Expansion Project infrastructure, the Kamisengo Inflow Control Dam (KICD) and the Kamisengo open pit, is located on Customary Tenure, on which LMC has consent from Traditional Leadership to exercise its mining rights through the 2005 MOU (Figure 4-2).
Within the Customary Tenure a Moratorium Area, measuring 14,000 ha, was established in 2023 through an agreement between Traditional Leadership and LMC. This is shown in Figure 4-2 as the ‘Moratorium Boundary’. No further residential development or population influx is permitted within the Moratorium Area. The Moratorium Area also incorporates 8,800 ha of the Acres National Forest 105 (National Forest) (Figure 4-2) which requires either degazetting or a licence to operate from the Ministry of Green Economy and the Environment before the commencement of development. This is further discussed in Section 4.5.
LMC aims to acquire the land title, and therefore secure surface rights, to the Moratorium Area. LMC reached agreement with Traditional Leadership in December 2024 to acquire the Moratorium Area,
1 Memorandum of Understanding between HRH Chief Mumena, HRH Chief Mukumbi, Matebo Royal Establishment and Equinox Copper Ventures, 2005.
|
February 19, 2025 |
Page 34 |
|
|
NI 43-101 Technical Report on the Lumwana Expansion Project |
|
and commence conversion from Customary Tenure to State Tenure, and is expected to complete the conversion process and secure title before the end of 2025.
In the QP’s opinion, the surface rights already secured for Lumwana are sufficient to allow for the construction and operation of the majority of the required Expansion Project infrastructure, and the appropriate processes are being followed to imminently secure the remaining surface rights.
| 4.4 | Royalties, Payments, and Other Obligations |
On December 29, 2021, the Income Tax Amendment Act 43 of 2021 was published, such that commodity royalties are tax deductible for corporate income tax purposes from January 1, 2022.
In 2022, the Zambian government amended the taxation of mineral royalties effective January 1, 2023. It specifically amended the mineral royalty sliding scale to tax only the incremental value in each price range when the mineral price crosses each mineral royalty price threshold, rather than an increasing royalty rate that applied to the entire revenue, as under the previous regime (Table 4-2).
Table 4-2 Royalty Charge Relation to Copper Price
| Price Range | Rate (%) | Taxable Amount | ||
|
Less than US$4,000 per tonne |
4 | The first US$4,000 per tonne | ||
|
Between US$4,001 and US$5,000 per tonne |
6.5 | The next US$1,000 per tonne | ||
|
Between US$5,001 and US$7,000 per tonne |
8.5 | The next US$2,000 per tonne | ||
|
US$7,001 per tonne or more |
10 | Balance |
Corporate tax is charged at a rate of 30%.
| 4.5 | Permits |
All environmental permits are in place for the existing operations. There are also a total of 50 operating licences in place which are renewed annually as part of ongoing operations. A detailed discussion on environmental permitting requirements and permit status is included in Section 20.1 of this Technical Report.
The Mine is situated within the National Forest. In 2009, LMC received Presidential approval to degazette an area of the National Forest measuring 28,500 ha. This degazetted area covers the Lumwana Estate, the current mining operations and infrastructure, and the planned location of the majority of the Expansion Project infrastructure including the expanded processing plant, TSF,
|
February 19, 2025 |
Page 35 |
|
|
NI 43-101 Technical Report on the Lumwana Expansion Project |
|
maintenance workshop, expansions to mine accommodation, planned Chimiwungo Super-Pit, and planned Malundwe and Kababisa open pits.
The KICD and the Kamisengo open pit are situated within 8,800 ha of additional land in the National Forest (Figure 4-2) which will require permission and a licence to operate within the National Forest. LMC is in the process of submitting an application to obtain permission and licence to operate in a National Forest, with approval expected before the end of 2025.
The key outstanding approval for the Project is the RAP, which is anticipated to be approved by ZEMA in the first quarter of 2025. The Environmental Impact Assessment (EIA) for the Expansion Project was approved in November 2024.
Table 4-3 summarises the key permits needed for the Expansion Project.
Table 4-3 Summary of major required permitting
| Approvals Required | Status | Expected Approval Timeline | ||
|
Environmental Impact Assessment |
Approved | |||
|
Resettlement Action Plan |
Submitted | Q1 2025 | ||
|
Licence to Operate within Acres National Forest Area 105 |
Submitted | H2 2025 |
| 4.6 | Environmental Liabilities |
Environmental liabilities are determined and updated annually to reflect current conditions. The planned closure liabilities are well understood and accounted for in the Expansion Project.
The Mine conducts quarterly and annual monitoring of surface, groundwater, and air quality, as well as ongoing review of closure and reclamation obligations to ensure best management of these liabilities.
Environmental considerations and monitoring programmes for the Mine are discussed in Section 20 of this Technical Report.
| 4.7 | Other Significant Factors and Risks |
The processes to obtain and renew required permits, access, and rights are well understood by LMC and similar permits, access, and rights have been granted to the operations in the past. LMC expects to be granted all permits, access, and rights necessary and sees no impediment to approval of these in the future.
|
February 19, 2025 |
Page 36 |
|
|
NI 43-101 Technical Report on the Lumwana Expansion Project |
|
To the extent known to the QP, there are no significant factors or risks other than those identified that may affect access, title, or the right or ability to perform work on the Mine that are not discussed in this Technical Report.
|
February 19, 2025 |
Page 37 |
|
|
NI 43-101 Technical Report on the Lumwana Expansion Project |
|
| 5 | Accessibility, Climate, Local Resources, Infrastructure and Physiography |
| 5.1 | Accessibility |
The Mine is accessed via a 10 km road branching off the North West Highway T-5. The T-5 highway is an all-weather fully sealed two lane road, which connects Jimbe on the Angolan border 243 km to the west and terminates at the T3 highway at Chingola 258 km to the east. This road links the provincial capital Solwezi to the rest of the Copperbelt and other parts of the North-Western Province (Figure 4-1).
Commercial airstrips are situated at Solwezi, 60 km to the east of Lumwana, and Kalumbila, approximately 45 km to the west, with regular flights to and from Lusaka (Figure 4-1).
Construction of a new 2 km airstrip on the Lumwana Mining Licences is planned to commence during 2025, which will facilitate flights directly to the operation from Lusaka, during the construction and commissioning of the Expansion Project. In the long-term, this is planned to be extended to 3.6 km to support international travel. Approvals and other regulatory work will need to be concluded before the airstrip can become operational.
| 5.2 | Climate and Physiography |
The Mine is located in an area with a monsoon-influenced humid tropical climate characterised by relatively high temperatures and a large difference in precipitation between the driest months and wettest months. There are three distinct seasons; a hot and dry season in mid-August to mid-November, a wet season in mid-November to April, and a cool, dry season in May to mid-August. The climate during wet seasons has an adverse impact on ground conditions, reducing dig rates of mining operations. Despite this, operations take place all year round. The wet season conditions could impact on construction timing for the Expansion Project but this has been considered in the Expansion Project execution schedule.
Table 5-1 and Figure 5-1 outline the historical and observed climate baseline data from 1991 to 2020 in the North-Western Province.
The topography of the Mine area is characterised by gently rolling hills incised by the Lumwana East River, the Malundwe Stream, and their tributary streams. Elevations range from approximately 1,270 m above mean sea level (AMSL) within the Lumwana East River watercourse to approximately 1,410
|
February 19, 2025 |
Page 38 |
|
|
NI 43-101 Technical Report on the Lumwana Expansion Project |
|
m AMSL at the Mine. The predominant vegetation is ‘Miombo’ woodland and the area has generally good vegetation cover.
Table 5-1 Annual Average Climatic Conditions in North-Western Province, Zambia
| Annual Average Climate Variables |
Values | |
| Minimum Temperature |
14.01°C | |
| Mean Temperature |
21.59°C | |
| Maximum Temperature |
29.22°C | |
| Mean Annual Precipitation (MAP) |
1,126 mm |
Source: Climate Knowledge Portal (2024)
Notes: Reference Period 1991 to 2020

Source: Climate Knowledge Portal (2024)
Notes: Reference Period 1991 to 2020
Figure 5-1 Monthly Average Temperature and Precipitation for North-Western Province, Zambia
|
February 19, 2025 |
Page 39 |
|
|
NI 43-101 Technical Report on the Lumwana Expansion Project |
|
| 5.3 | Local Resources and Infrastructure |
To support the current operations a fully sustainable township, Lumwana Estate, has been constructed for employees, contractors, and their dependants. The township is located approximately five kilometres by road to the mine entrance at the R2 gate (Figure 5-2).
Other than the Lumwana Estate, the nearest population centre is Manyama Township, located one kilometre from the Mine on the southern size of the T5 highway outside the surface rights boundary (Figure 5-2). Access to the mine from Manyama is controlled through the R1 gate. Manyama is home to approximately 40,000 people and consists of residences, basic manufacturing, and small shops and businesses.
Mining supplies, contractors, and skilled labour are sourced from larger centres in the Zambian Copperbelt, for example Kitwe, a city with approximately 500,000 residents approximately 310 km east of Lumwana.
Existing mining infrastructure includes the open pits at Chimiwungo and Malundwe, stockpiles, waste dumps, a processing plant, overland ore conveyors, a Water Storage Facility (WSF), and a TSF. General site infrastructure includes gravel and tarred roads, mining offices, employee accommodation, and a maintenance workshop. The current infrastructure is shown in Figure 5-2.
High voltage electrical power at 330 kV is delivered to the Mine from ZESCO which operates the national grid. Raw water is sourced from the WSF, a dam located upstream of the current TSF (Figure 5-2).
Site infrastructure and planned infrastructure for the Technical Report is discussed in further detail Section 18 of this Technical Report.
| 5.4 | Sufficiency of Surface Rights |
Surface rights are discussed in detail in Section 4 of this Technical Report. Current surface rights are sufficient for the current operations and infrastructure as well as the majority of the planned infrastructure for the Expansion Project, including the expanded processing plant, TSF, maintenance workshops, mine accommodation, the Chimiwungo Super-Pit, and Malundwe and Kababisa open pits. Surface rights need to be acquired for the remaining Expansion Project infrastructure, the KICD and the Kamisengo open pit.
In the QP’s opinion, the surface rights already secured for Lumwana are sufficient to allow for the construction and operation of the majority of required the Expansion Project infrastructure, and the appropriate processes are being followed to imminently secure the remaining surface rights.
|
February 19, 2025 |
Page 40 |
|
|
NI 43-101 Technical Report on the Lumwana Expansion Project |
|

Source: Barrick, 2024
Figure 5-2 Lumwana Mine Existing Infrastructure
|
February 19, 2025 |
Page 41 |
|
|
NI 43-101 Technical Report on the Lumwana Expansion Project |
|
| 6 | History |
| 6.1 | Ownership |
Table 6-1 summarises changes in Lumwana Mine ownership to date.
Table 6-1 Summary of Lumwana Ownership
| Operator | Year | Comment | ||
| Roan Selection Trust Limited (RST) |
1950s | RST acquired Lumwana | ||
| Mwinilunga Limited |
1970 | American Metal Climax Inc (AMAX) took over RST and formed a new company, Mwinilunga Limited, in a joint venture with Anglo American Plc. | ||
| Mindeco Limited (Mindeco) |
1975 | The Zambian copper industry was fully nationalised and Lumwana was transferred to Mindeco, a precursor to Zambia Consolidated Copper Mines Limited (ZCCM). | ||
| Azienda General Italiana Petroli (AGIP) |
1981 | AGIP entered in to a joint-venture with Compagnie Générale Des Matières Nucléaires (COGEMA) | ||
| Phelps Dodge Corporation (Phelps Dodge) |
1992 | Phelps Dodge acquired Mwombezhi Dome Exploration Licence | ||
| Equinox Copper Ventures (Equinox) |
1999 | Equinox entered into a joint venture with Phelps Dodge in 1999, earned a 51% interest in 2003 and acquired the remaining 49% interest in 2004. | ||
| Barrick |
2011 | Barrick acquired Equinox in 2011. |
| 6.2 | Development and Operations |
Table 6-2 summarises the exploration and development work completed by the previous owners of Lumwana.
Table 6-2 Summary of Lumwana Project Development
| Operator | Year | Comment | ||
|
Prospectors |
1930s | Copper was discovered in the Lumwana East River. | ||
| RST |
1957 to 1961 | Regional geochemical and geophysical exploration covering Lumwana. | ||
| 1961 | Malundwe discovery hole drilled. | |||
| 1962 | Chimiwungo and Kamisengo discovery holes drilled. | |||
| 1962 to 1965 | Definition drilling of Chimiwungo. | |||
| 1968 | Maiden Mineral Resource and Mineral Reserve estimates, and Scoping Study for Chimiwungo. | |||
| 1970s | Discovery of Chimiwungo South mineralisation. | |||
| AGIP- COGEMA |
1981 to 1990 | Drilling and Pre-feasibility Study (PFS) focused on developing a copper-uranium deposit at Malundwe and extensions to Chimiwungo. | ||
| Phelps Dodge |
1992 to 1996 | Exploration focusing on Malundwe and Chimiwungo and PFS exploring different scenarios. |
|
February 19, 2025 |
Page 42 |
|
|
NI 43-101 Technical Report on the Lumwana Expansion Project |
|
| Operator | Year | Comment | ||
|
Equinox |
2001 | PFS including reporting of Mineral Resources and mine design. | ||
| 2003 | Bankable Feasibility Study (BFS) | |||
| 2004 to 2005 | Discovery of the Chimiwungo North deposit through exploration including an induced polarisation (IP) survey and RC drilling. | |||
| 2005 | Commencement of project development with construction. | |||
| 2007 | Pre-production mining commenced in the Malundwe open pit. | |||
| 2008 | Commissioning of the Lumwana Copper Project. | |||
| 2009 | Exploration and discovery of Odile, North Dome, and the Kamisengo Trend prospects. | |||
| 2010 to 2012 | Resource definition and extension drilling at Chimiwungo. |
| 6.3 | Historical Mineral Resources and Mineral Reserves |
Historical Mineral Resources and Mineral Reserves have been superseded by the Mineral Resources and Mineral Reserves presented in Sections 14 and 15 of this Technical Report, respectively.
| 6.4 | Past Production |
Total production, since mining commenced in 2009 to year end 2024 is 352.13 Mt milled at a 0.57% Cu head grade for 1,845 kt Cu (91.84% recovery). The details of past production are summarised in Table 6-3.
Table 6-3 Past Production Records for Lumwana
| Year |
Tonnes Milled (t) |
Head Grade (% Cu) |
Copper (t) |
Copper (t) |
Recovery (%) |
|||||
|
2009 |
13,689,505 | 0.94 | 128,960 | 109,413 | 84.8 | |||||
|
2010 |
18,578,698 | 0.86 | 160,670 | 146,690 | 91.3 | |||||
|
2011 |
20,985,994 | 0.61 | 128,381 | 117,022 | 91.2 | |||||
|
2012 |
18,904,457 | 0.48 | 90,670 | 81,144 | 89.5 | |||||
|
2013 |
21,910,077 | 0.58 | 126,275 | 117,968 | 93.4 | |||||
|
2014 |
15,748,080 | 0.66 | 103,849 | 97,058 | 93.5 | |||||
|
2015 |
21,632,184 | 0.65 | 139,695 | 130,366 | 93.3 | |||||
|
2016 |
21,694,039 | 0.60 | 129,727 | 122,871 | 94.7 | |||||
|
2017 |
23,447,196 | 0.53 | 124,293 | 116,171 | 93.5 | |||||
|
2018 |
21,861,396 | 0.50 | 109,760 | 101,474 | 92.5 | |||||
|
2019 |
24,935,665 | 0.47 | 116,100 | 107,902 | 92.9 | |||||
|
2020 |
25,290,039 | 0.53 | 133,440 | 124,970 | 93.7 | |||||
|
2021 |
25,710,848 | 0.46 | 117,786 | 109,815 | 93.2 | |||||
|
February 19, 2025 |
Page 43 |
|
|
NI 43-101 Technical Report on the Lumwana Expansion Project |
|
| Year |
Tonnes Milled (t) |
Head Grade (% Cu) |
Copper (t) |
Copper (t) |
Recovery (%) |
|||||
|
2022 |
25,165,547 | 0.52 | 130,224 | 121,095 | 93.0 | |||||
|
2023 |
26,796,553 | 0.49 | 132,023 | 118,001 | 89.4 | |||||
|
2024 |
25,782,749 | 0.53 | 136,632 | 122,723 | 89.82 | |||||
|
Total |
352,133,027 | 0.57 | 2,008,485 | 1,844,683 | 91.84 | |||||
|
February 19, 2025 |
Page 44 |
|
|
NI 43-101 Technical Report on the Lumwana Expansion Project |
|
| 7 | Geological Setting and Mineralisation |
| 7.1 | Regional Geology |
The Lufilian Arc in Southern Africa is a major tectonic province. It is characterised by broadly north-directed thrust structures and antiformal Paleo-Mesoproterozoic basement domes, surrounded and overlain by metasediments of the Neoproterozoic Katangan Supergroup which include the Roan, Nguba, and Kundelungu Groups (Figure 7-1). The Paleo-Mesoproterozoic basement, and parts of the Katangan Supergroup, host the Central African Copperbelt, a metallogenic province that stretches from the Copperbelt Province in Zambia, through the Katangan Province of the Democratic Republic of the Congo and into the North-Western Province of Zambia.
After the deposition of the Katangan Supergroup, the basin was inverted, deformed, metamorphosed, and uplifted during the Lufilian Orogeny. This produced the late Neoproterozoic–Cambrian Lufilian Arc which is divided into five geotectonic domains; Katangan Core, Synclinorial Belt, Domes Region, Fold and Thrust Belt, and Kundelungu Foreland (Figure 7-1).
Copper mineralisation at Lumwana is hosted in the basement Lufubu Schist and is located in the Domes Region of the Lufilian Arc (Figure 7-1).
|
February 19, 2025 |
Page 45 |
|
|
NI 43-101 Technical Report on the Lumwana Expansion Project |
|

Source: Barrick 2024
Figure 7-1 Geological Map of the Central African Copperbelt highlighting Key Geological Features and Lithological Boundaries
|
February 19, 2025 |
Page 46 |
|
|
NI 43-101 Technical Report on the Lumwana Expansion Project |
|
| 7.2 | Local Geology |
Within the Domes Region the Kabompo and Mwombezhi Domes are the most significant with respect to mineralisation. The mineralisation at Lumwana is associated with the Mwombezhi Dome (Figure 7-2).
The Mwombezhi Dome is orientated northeast-southwest and is approximately 67 km in a northeast direction and up to 20 km wide in a northwest direction. The basement stratigraphy comprises a sequence of granites, pegmatites, schists, gneisses, amphibolites, and metasediments. Two monzogranites form the core of the dome and are sheared at the margins. Several layer-parallel shear zones are also recognised cross-cutting a tectono-stratigraphic package of gneisses.
The edge of the Mwombezhi Dome is interpreted as a regional unconformity on top of which lie semi-continuous lenses of quartzite interpreted to be from the Lower Roan of the Katangan Supergroup (referred to locally as the Rimming Quartzite). In places this unit is observed to be intensely sheared.

Source: Sillitoe, 2015
Figure 7-2 Local Geology of the Kabompo and Mwombezhi Domes Area
|
February 19, 2025 |
Page 47 |
|
|
NI 43-101 Technical Report on the Lumwana Expansion Project |
|
| 7.3 | Property Geology |
There are four copper deposits (with subordinate uranium) at Lumwana (Figure 7-3).
| 1. | Chimiwungo, located in the south of Mwombezhi Dome. This deposit strikes east-west and dips approximately 5° to 10° to the south. It measures approximately 8 km in length, 4 km in width, has variable thickness of between 75 m and more than 200 m, and is truncated by post-mineralisation east-west orientated normal faults. Copper mineralisation is present from surface, where it outcrops and continues to an approximate depth of 950 m. The dominant copper mineral is chalcopyrite hosted in mineralised schist (MS) and gneiss. |
| 2. | Malundwe, located on the west of the Mwombezhi Dome. This deposit strikes north-south and dips 10° to 15° to the west. It measures approximately 6 km in length, 1.5 km in width, and 14 m in thickness. Mineralisation is present from surface, where it outcrops and continues to a depth of approximately 380 m. The deposit is also impacted by east-west orientated post-mineralisation normal faulting. The dominant copper minerals are chalcopyrite and bornite hosted in MS and gneiss. |
| 3. | Kamisengo, located on the east side of Mwombezhi Dome. This deposit strikes NNW and dips 0° to 20° to the northeast. It measures approximately 4.5 km in length, 2 km in width, and from 70 m to 200 m in thickness. Kamisengo is composed of several MS separated by barren gneisses. Mineralisation is present from surface where it outcrops and continues to approximately 580 m in depth. The dominant copper mineral is chalcopyrite. |
| 4. | Kababisa, located on the internal west flank of the Mwombezhi Dome. This deposit strikes north-south and dips approximately 25° towards the west. It measures 2 km in length, 1 km in width, and from 15 m to 20 m in thickness. Mineralisation is outcropping at surface and has been drilled to a depth of approximately 250 m. While the dominant trend is north-south, the MS curves towards the northeast in the north of the deposit. The dominant copper mineral is chalcopyrite. |
There are four weathering zones present: oxide, transitional, fresh, and a deep weathering zone around faults which extends into the fresh zone. The oxide zone is typically 10 m to 40 m deep and contains copper oxide minerals such as malachite, cuprite and chrysocolla. The transitional zone is approximately 15 m to 50 m thick and is a supergene enriched layer which is not fully developed. It contains a mixture of primary (bornite and chalcopyrite) and secondary (supergene chalcocite) sulphides with occasional oxide copper coatings. The fresh zone comprises primary sulphides (hypogene chalcocite, bornite and chalcopyrite). The deep weathering zone has mineralogy similar to the transitional zone.
|
February 19, 2025 |
Page 48 |
|
|
NI 43-101 Technical Report on the Lumwana Expansion Project |
|

Source: Barrick, 2024
Figure 7-3 Lumwana Property Geology
|
February 19, 2025 |
Page 49 |
|
|
NI 43-101 Technical Report on the Lumwana Expansion Project |
|
| 7.3.1 | Chimiwungo |
The geology at Chimiwungo comprises four main units; a hanging wall gneiss, MS containing slithers of barren gneiss, and a footwall gneiss, which has a gradational contact with the MS (Figure 7-4).

Source: Barrick, 2024
Figure 7-4 Chimiwungo Geological Cross-section 378600mE (Looking East)
Within the MS there are two high-grade mineralisation trends; the Roan Shoot to the west and the Equinox Shoot to the east. These are orientated north-south with an approximate dip of 5° to the south and an approximate plunge of 5° to the southeast. The Roan Shoot is approximately 5 km in length, 1 km wide with a thickness of approximately 150 m. The Equinox Shoot is approximately 5 km in length, 200 m wide with a thickness of approximately 200 m. The internal geometry and thickness of the MS package and the development of the high-grade shoots is controlled by boudin development with the high-grade shoots present as zones in the necks of gneissic boudins.
Several east-west trending post-mineralisation normal faults offset the mineralisation and result in a series of fault blocks (Figure 7-3 and Figure 7-4).
The primary mineralisation is predominantly chalcopyrite but displays well developed vertical copper mineral species zonation from (footwall to hanging wall) bornite > chalcopyrite > pyrite > pyrrhotite. The grade profile over the Life of Mine (LOM) indicates increasing grade with depth which is likely in response to the increase of bornite dominance down plunge.
Subordinate uranium occurs in disseminated brannerite and uraninite within the MS, where it is confined to small discrete zones along or adjacent to the hanging wall and footwall contacts. There are also local remobilised pockets of uranium mineralisation within the oxide zone.
|
February 19, 2025 |
Page 50 |
|
|
NI 43-101 Technical Report on the Lumwana Expansion Project |
|
| 7.3.2 | Malundwe |
The geology at Malundwe is, in general, very similar to Chimiwungo and is subdivided into four lithologies; a hanging wall gneiss, barren gneiss within the MS, MS, and a footwall gneiss, which has a gradational contact with the MS (Figure 7-5).

Source: Barrick, 2024
Figure 7-5 Malundwe Geological Cross-section 8644975mN (Looking South)
Malundwe has a higher grade, thinner MS which strikes north-south, outcrops to the east, dips approximately 10° to 15 °to the west, and plunges approximately 5° to the south (Figure 7-3 and Figure 7-5). It measures approximately 6 km in length, is up to 1.5 km wide, and extends to a maximum depth of approximately 380 m below surface.
Like Chimiwungo, the internal geometry and thickness of the MS package, and the development of the high-grade shoots, is controlled by boudin development with the high-grade shoots present as zones in the necks of gneissic boudins. In addition, the same east-west trending normal fault system that affects Chimiwungo extends further west into the southern reaches of Malundwe (Figure 7-3).
Malundwe is generally higher grade than Chimiwungo due to a bornite dominant mineral assemblage. Vertical zonation from footwall to hanging wall is also observed; bornite > chalcopyrite > pyrite > pyrrhotite. Uraninite and brannerite also occur as pockets within the MS but these pockets are higher in grade and larger in extent than at Chimiwungo.
| 7.3.3 | Kamisengo |
The geology at Kamisengo comprises three major geological units: banded gneiss, foliated granitoid, and predominantly MS, with several variants and minor lithologies such as pegmatites and amphibolitic units (Figure 7-6).
|
February 19, 2025 |
Page 51 |
|
|
NI 43-101 Technical Report on the Lumwana Expansion Project |
|

Source: Barrick, 2024
Figure 7-6 Kamisengo Geological Cross-section 8656100mN (Looking North)
Mineralisation is related to a large anastomosing shear zone with alternating schists and barren gneisses (Figure 7-6). There is a strong correlation between strain intensity and grade of mineralisation with high-strain zones concentrating the higher grades in boudin necks/pressure shadows.
The shear zone strikes NNW and dips from surface approximately 10° to 20° to the east, sub-parallel to the average orientation of the gneissic banding and schist foliation Figure 7-3 and Figure 7-6). It has a strike length of over 4.5 km and is 2 km wide. Kamisengo is not impacted by post-mineralisation faults.
Several MS units tend to converge in the west, in a pressure shadow developed between the larger gneiss boudins, which results in local thickening. Here the MS measures over 70 m thick at surface and forms the main portion of the Kamisengo deposit. There are steeper (approximately 45°), narrower (approximately 20 m) mineralised structures to the east which generally have higher grades. The controls on these structures are not well understood but do appear to be parallel to sub-parallel to a magnetic signature in the geophysics, possibly indicating a structural boundary in the east of Kamisengo. The MS pinches out down-dip towards the east, near the projection of the identified steep structures. The foliated granitoid forms the footwall of the deposit (Figure 7-6).
There are two notable NNE-SSW trending shoots; Kamisengo West and Kamisengo East. The orientation suggests they are likely influenced by the broader regional stress regime which may have caused localised zones of intense deformation or strain.
|
February 19, 2025 |
Page 52 |
|
|
NI 43-101 Technical Report on the Lumwana Expansion Project |
|
Chalcopyrite, commonly associated with pyrrhotite, is the main copper-bearing mineral sulphide with very rare bornite and chalcocite. Pyrite is noted as zoning the MS in the hanging wall and footwall. Well mineralised quartz veins and quartz-sealed breccias commonly cross-cut the MS.
Kamisengo has lower copper grades than both Chimiwungo and Malundwe. This is attributed to the more complex geological setting at Kamisengo. There are also no major post-mineralisation structures that could have caused copper remobilisation and subsequent development of higher-grade minerals like bornite and chalcocite.
Uranium mineralisation in the Kamisengo deposit is of low grade and occurs as small pockets. It is assumed that the mineralogy is similar to Chimiwungo and Malundwe.
| 7.3.4 | Kababisa |
Kababisa is the simplest geologically of the deposits and is broadly separated into three units; a hanging wall gneiss, an MS, and a footwall unit consisting of mottled schist and footwall pink gneiss, which is particular to this deposit being both mappable at surface and a feature in magnetic and electromagnetic (EM) surveys (Figure 7-7).
Kababisa is boudinaged with variations in thickness influenced by flexures of the underlying footwall granite. The mineralisation strikes north-south and dips approximately 25° towards the west (Figure 7-3 and Figure 7-7). A flexure in the north of the deposit has changed the strike in that location from north-south to north-northeast as well as generating a slightly flatter dip. The mineralisation has a length of approximately 2 km, a width of 1 km, and ranges from 15 m to 20 m thick.
The mineral assemblages are characterised by a vertical zonation of bornite > chalcopyrite > pyrite > pyrrhotite from footwall to hanging wall. However, the proportion of copper sulphides is inversely proportional, with bornite present in the lowest proportions.
Uranium is also present in Kababisa as small discontinuous pockets across the deposit.
|
February 19, 2025 |
Page 53 |
|
|
NI 43-101 Technical Report on the Lumwana Expansion Project |
|

Source: Barrick, 2024
Figure 7-7 Kababisa Geological Cross-section 8652500mN (Looking North)
| 7.4 | QP Comment on Geological Setting and Mineralisation |
In the opinion of the QP:
| ● | The understanding of the deposit settings, lithologies, and geological, structural, and alteration controls on mineralisation is sufficient to support estimation of Mineral Resources and Mineral Reserves. |
| ● | The mineralisation styles and settings are well understood with a high quantity of supporting drill data and can support declaration of Mineral Resources and Mineral Reserves. |
| ● | The QP has reviewed the mineralisation and confirms that the controls are well understood, sampled appropriately, and modelled accurately within the known geometry of the mineralisation style. |
|
February 19, 2025 |
Page 54 |
|
|
NI 43-101 Technical Report on the Lumwana Expansion Project |
|
| 8 | Deposit Types |
| 8.1 | Deposit Type |
The Lumwana copper deposits are large, tabular bodies of disseminated mineralisation, hosted within the Mwombezhi Dome of the Lufilian Arc, and are typically referred to as basement hosted copper deposits. The Domes Region is part of the Central African Copperbelt, which is a metallogenic province in the border region of Zambia and the Democratic Republic of Congo.
The main copper-bearing minerals at the Lumwana deposits are pyrite, chalcopyrite and occasional bornite, which is typically associated with higher grades. Copper mineralisation is hosted within either biotite or muscovite dominant schists.
The morphology of the deposits is controlled by pre- and syn-mineralisation structures. Later deformation of the structures may have reactivated the mineralising system and aided development of plunging mineralised shoots, such as those observed at Chimiwungo.
The copper deposits at Lumwana are in contrast to other deposits in the Central African Copperbelt, which are generally stratiform, sediment hosted deposits where mineralisation generally conforms to the orientation of the host rock strata (Kirkham, 1989).
|
February 19, 2025 |
Page 55 |
|
|
NI 43-101 Technical Report on the Lumwana Expansion Project |
|
| 9 | Exploration |
The initial approach to exploration is similar to that of typical sediment or basement hosted copper deposits, where methods such as geological mapping, soil geochemistry, ground and airborne geophysics, and exploratory drilling are used. These methods have proven successful, resulting in the discovery of the main outcropping deposits Chimiwungo, Malundwe, and Kamisengo. Covered deposits typically require exploration by drilling and deep geophysics.
| 9.1 | Previous Exploration |
| 9.1.1 | 2011 to 2019 |
Following the acquisition of Lumwana in 2011, Barrick completed reviews of existing exploration data from across the Mwombezhi Dome. The review enabled assessment of exploration prospects and planning of delineation programmes which were completed in 2013 and included:
| ● | A 1 km by 1 km tenement-wide (950 km2) soil sampling programme with several 500 m by 500 m in-fill areas (1,877 samples in total) |
| ● | A narrower spaced soil sampling programme (200 m by 600 m) over Kamalamba, Kababisa, and North Dome |
| ● | 2D IP survey over Kamalamba, Kababisa, and North Dome (62-line km) |
| ● | Re-logging of historic core (33 holes) |
| ● | Outcrop mapping (211 outcrop points) |
The data collected was analysed, reviewed, and interpreted to generate and prioritise targets, and to create a new geological map of the Mwombezhi Dome. A total of twelve targets were identified and efforts were focused on drilling around the Chimiwungo and Malundwe deposits.
| 9.1.2 | 2019 to 2022 |
In January 2019, Barrick and Randgold Resources Limited (Randgold) merged, and exploration focused on gaining new perspectives on existing exploration data and fully testing known prospective areas. In 2021, a review of historical exploration data indicated prospective copper mineralisation at Kamisengo which was tested with a 45,758 m drilling programme in 2022.
|
February 19, 2025 |
Page 56 |
|
|
NI 43-101 Technical Report on the Lumwana Expansion Project |
|
| 9.2 | Current Exploration |
Exploration completed since 2022 focused on North Dome, North East Dome, Chimimata, Kababisa, Kababisa North, Kamalamba, Greater Odile, and exploring for extensions to Kamisengo (Figure 9-1). Exploration involved desktop studies of existing data, including integration of soil geochemistry with geophysical surveys (regional scale EM, magnetics, and local scale IP surveys), and completion of further soil surveys and field mapping to refine and validate the existing data. The results were used to make geological interpretations and three-dimensional (3D) conceptual models that were tested with drilling.
|
February 19, 2025 |
Page 57 |
|
|
NI 43-101 Technical Report on the Lumwana Expansion Project |
|

Source: Barrick, 2024
Figure 9-1 Lumwana Main Deposits and Exploration Prospects
|
February 19, 2025 |
Page 58 |
|
|
NI 43-101 Technical Report on the Lumwana Expansion Project |
|
| 9.2.1 | Geophysics and Remote Sensing |
Regolith Map
In 2023 and 2024, a detailed desktop regolith map was created across all Mining Licences to identify areas where regolith may conceal mineralisation (Figure 9-2). The map was created by integrating Light Detection and Ranging (LiDAR) data, radiometrics, Sentinel satellite imagery, and outcrop observation points.
The map indicates that significant portions of the Mwombezhi Dome fall within an erosional (Ep) and residual (Rp) regime where soil sampling has proven to be an effective exploration tool. Some regions, such as Greater Odile, have thin ferruginous soils (Fp) where any geochemical responses to mineralisation could be effective but slightly dispersed. On the basis of this regolith map, soil sampling programmes were completed at Chimimata and Greater Odile in 2024.
Electromagnetic 2.5D Inversion
In 2023, Barrick used existing licence-wide EM data (collected in 2011) to generate a 2.5D inversion for the area west of Malundwe (Figure 9-1) with the aim of understanding how this data may improve knowledge on structural controls in the Mwombezhi Dome. Review of the data indicated a potential geological link between Malundwe and Greater Odile, and also indicated potential for covered mineralisation in the Mwombezhi Dome. Consequently, this exercise was replicated across the Mining Licences in 2024 and has been used to support geological interpretation at Chimimata and Greater Odile.
Litho-structural Review
In 2023 a revised litho-structural domain interpretation was completed for the Mwombezhi Dome. This included integration of data from magnetics (conducted in 2011), EM 2.5D inversions, magnetic inversions, radiometrics, outcrop data, and litho-geochemical responses from regional soil samples. The revised regional interpretation assisted in the structural understanding of the area between Kamalamba and Kababisa known as the ‘Kamalamba-Kababisa Trend’ and improved the geological context for the North East Dome (Figure 9-2).
|
February 19, 2025 |
Page 59 |
|
|
NI 43-101 Technical Report on the Lumwana Expansion Project |
|

Source: Barrick, 2024
Figure 9-2 Lumwana Regolith Map: Residual Soils (Rp), Erosional (Eo & Ep), Ferruginous (Fp), Possible Thin Duricrust, Depositional (Da & Dc)
|
February 19, 2025 |
Page 60 |
|
|
NI 43-101 Technical Report on the Lumwana Expansion Project |
|
| 9.2.2 | Geochemical Sampling |
During 2023 and 2024, infill soil sampling campaigns (100 m by 100 m spacing) were completed at Chimimata, Greater Odile, and Shinyinda. The aim of the sampling was to define copper anomalies but also to gain multi-element geochemical data to support more robust litho-geochemical interpretations. Before planning the soil sampling a regolith map is created from remote sensing data, and test pits may be excavated to validate the map and provide further information on aspects of the regolith that may impact the results. During sampling the surface is cleared of vegetation, a 30 cm deep hole is excavated, and a 1 kg sample is collected. This is dried, sieved to 80 µm before multi-element analyses by X-ray fluorescence spectroscopy (XRF). Depth of the sample hole is adapted to ensure that the correct soil horizon is sampled to avoid any sample biases.
| 9.2.3 | Exploration Prospects |
Kamisengo Extensions
Infrastructure for the Expansion Project is planned close to Kamisengo. Exploration was completed to ensure that the planned infrastructure would not impact on potential mineralisation.
Historical soil sampling (collected by Equinox in 2009) and ground magnetics (conducted in 2022) were reviewed and completed to test for mineralisation to the south, west, and north of Kamisengo (Figure 9-1). Residual soil anomalies (>200 ppm Cu) were identified and interpreted to be associated with the southern extension of the Kamisengo mineralisation, up-dip projections of a potential ’Kamisengo Lower’ mineralisation, and newly identified, lower-grade mineralisation located above the northeast plunging hanging wall foliated granitoid (Figure 9-3). Drill testing confirmed these geological interpretations but also found the mineralisation to be uneconomic and have no impact on planned infrastructure.
|
February 19, 2025 |
Page 61 |
|
|
NI 43-101 Technical Report on the Lumwana Expansion Project |
|

Source: Barrick, 2024
Figure 9-3 Kamisengo Soil Samples and Regolith Map: Residual Soils (Rp), Erosional (Eo & Ep), Ferruginous (Fp), Possible Thin Duricrust, Depositional (Da & Dc)
Kababisa-Kamalamba Trend
Potential extensions to the Kababisa mineralisation were identified in the Kababisa-Kamalamba Trend (Figure 9-1).
|
February 19, 2025 |
Page 62 |
|
|
NI 43-101 Technical Report on the Lumwana Expansion Project |
|
In 2022, IP data (collected in 2013) for the Kababisa-Kamalamba Trend was reprocessed and remodelled to confirm the presence of a historically mapped zone of high apparent chargeability coincident with anomalous copper in soil sampling (collected in 2008 and 2009). Structural interpretation was also completed on historical magnetic data to determine structural controls on the copper anomaly. A 9,200 m drilling programme was executed to test the chargeable zone.
During 2023, four exploration diamond drill holes were drilled along the Kababisa-Kamalamba Trend in order to confirm the geological link between Kababisa and Kamalamba. The geological concept drilling was successful, however, no significant mineralisation was intersected.
North East Dome
Infrastructure for the Expansion Project is planned close to the North East Dome. Exploration was completed to ensure that the planned infrastructure would not impact potential mineralisation.
An interpretation of the North East Dome was generated through integration of the licence-wide EM (2011), magnetics (2011), and soil sampling (collected by Equinox). Data from the soil geochemistry, was used to define lithological domains. The overall geometry observed is a semi-regional fold pattern, likely a northeast plunging anticline. This is truncated by later northeast trending structural features which generate minor offsets.
Copper grade contours generated from soil geochemistry follow a schist trend between the footwall and hanging wall gneiss. Drilling was planned and executed in 2023 to test the geochemical anomaly. Drilling results confirmed that the soil anomaly is associated with MS units with no material impact on the location of the planned infrastructure.
Chimimata
Chimimata, located on the north side of the Mwombezhi Dome (Figure 9-1), was identified as a near surface exploration prospect.
The 2023 litho-structural interpretation, combined with regional soil geochemistry, indicated a curvilinear schist with an exaggerated thickness to the north, which may represent a north plunging fold or flattening dip, a favourable structural setting for development of mineralisation. A soil sampling programme (1,457 samples) was completed in 2023 and 2024 to constrain the geochemical anomaly and to refine the litho-structural interpretation.
A copper anomaly was identified and was associated with a shear corridor wrapping around the core of the Mwombezhi Dome. Drilling of two holes in 2024 indicated that the soil anomaly is associated with weakly mineralised strain zones in amphibolitic units and Chimimata does not currently hold potential for significant mineralisation. No further work is planned at this deposit.
|
February 19, 2025 |
Page 63 |
|
|
NI 43-101 Technical Report on the Lumwana Expansion Project |
|
Greater Odile
Greater Odile was identified as a potential near surface high-grade target close to the existing Mine. A reinterpretation and integration of available geological and geophysical data indicates that the hanging wall gneiss at Greater Odile is a continuation of the same unit at Malundwe and the two are likely connected. This also suggests that the MS may extend from Malundwe to Greater Odile. Exploration work is planned to further understand and define the mineralisation at Greater Odile.
| 9.3 | Planned Exploration |
Exploration at Lumwana is structured to simultaneously advance brownfield targets, as many of the known deposits retain additional prospectivity, whilst also continuing to develop greenfield targets to replenish the target pipeline and sustain the long-term growth of the mine. Accordingly, Barrick will continue to explore the Lumwana Mining License area actively.
Exploration focus includes identifying:
| ● | Interpreted structural corridors that can act as conduits for mineralising fluids; |
| ● | Favourable lithofacies that provide favourable reductants and hosts for mineralisation; |
| ● | Identification of targets with the potential to host higher grade and lower strip ratio mineralisation than the deposits that form the Expansion Project mine plan. |
| ● | A combination of drilling and deep geophysics to test for deeper higher grade mineralisation. |
| 9.4 | QP Comment on Exploration |
In the opinion of the QP, the exploration programmes completed to date are appropriate for the deposit type at Lumwana and the deposit type of the wider Domes Region. All samples collected to date by the current and previous operators are representative and unbiased.
Sufficient exploration work has been completed to ensure that potential mineralisation will not be impacted by the infrastructure planned for the Expansion Project. Lumwana retains significant brownfields exploration potential, and accordingly, additional exploration activities will continue to be undertaken.
|
February 19, 2025 |
Page 64 |
|
|
NI 43-101 Technical Report on the Lumwana Expansion Project |
|
| 10 | Drilling |
| 10.1 | Drilling Summary |
Lumwana is an advanced project, with operating open pits and drilling completed regularly as part of mining operations. DD is used for exploration, Mineral Resource definition, and infill drilling. RC drilling is used for grade control, which is completed with 12 to 18 months of production coverage ahead of active mining. Rotary air blast (RAB) and tri-cone bit drilling have been used historically for first pass exploration and sterilisation drilling but are not used to support Mineral Resource estimation. Table 10-1 summarises the drilling completed at Lumwana to June 2024.
Table 10-1 Lumwana Drilling Summary to June 2024
| Date | Company | DD (incl tails) | RC |
RAB/Air Core/Tri- Cone |
Total | |||||||||||||
|
Hole Count |
Metres (m) |
Hole Count |
Metres (m) |
Hole Count |
Metres (m) |
Hole Count |
Metres (m) |
|||||||||||
|
1961 - 1975 |
RST | 379 | 72,031 | 2 | 162 | 0 | 0 | 381 | 72,193 | |||||||||
|
1982 - 1987 |
AGIP | 208 | 38,245 | 12 | 1,367 | 114 | 12,939 | 334 | 52,552 | |||||||||
|
1993 -1994 |
Phelps Dodge | 31 | 5,173 | 18 | 955 | - | - | 49 | 6,128 | |||||||||
|
2000 - 2011 |
Equinox | 433 | 84,222 | 27,560 | 503,271 | 176 | 5,835 | 28,169 | 593,328 | |||||||||
|
2011 |
Barrick | 145 | 55,255 | 2,760 | 67,079 | - | - | 2,905 | 122,334 | |||||||||
|
2012 |
Barrick | 590 | 247,717 | 2,424 | 129,185 | - | - | 3,014 | 376,902 | |||||||||
|
2013 |
Barrick | 42 | 9,756 | 1,539 | 86,553 | - | - | 1,581 | 96,309 | |||||||||
|
2014 |
Barrick | - | - | 1,405 | 64,198 | - | - | 1,405 | 64,198 | |||||||||
|
2015 |
Barrick | - | - | 1,553 | 75,930 | - | - | 1,553 | 75,930 | |||||||||
|
2016 |
Barrick | 6 | 1,043 | 881 | 48,932 | - | - | 887 | 49,975 | |||||||||
|
2017 |
Barrick | 65 | 11,914 | 802 | 47,156 | - | - | 867 | 59,070 | |||||||||
|
2018 |
Barrick | 54 | 12,770 | 429 | 22,970 | - | - | 483 | 35,740 | |||||||||
|
2019 |
Barrick | 19 | 3,435 | 963 | 73,068 | - | - | 982 | 76,503 | |||||||||
|
2020 |
Barrick | 111 | 20,136 | 1,341 | 99,620 | - | - | 1,452 | 119,756 | |||||||||
|
2021 |
Barrick | 114 | 26,375 | 2,40 | 191,738 | - | - | 2,534 | 218,113 | |||||||||
|
2022 |
Barrick | 239 | 67,882 | 1,867 | 187,998 | - | - | 2,106 | 255,880 | |||||||||
|
2023 |
Barrick | 607 | 176,401 | 1782 | 184,189 | - | - | 2,389 | 360,590 | |||||||||
|
2024 |
Barrick | 190 | 46,625 | 786 | 76,354 | - | - | 976 | 122,979 | |||||||||
|
Total |
3,233 | 878,980 | 48,544 | 1,860,725 | 290 | 18,774 | 50,160 | 2,758,480 | ||||||||||
Both historical and current drilling is used to support the Mineral Resource estimate. Drilling completed before 1994 by RST, AGIP, and Phelps Dodge is considered historical. For this drilling, data collection and verification procedures are largely unknown and the data is of unknown quality and reliability. However, drilling from this period accounts for only 3.1% of the drilling used to support the Mineral Resource estimate and is largely in depleted areas. It is therefore considered to have limited impact on the Mineral Resource. Drilling completed since 2000 by both Equinox and Barrick
|
February 19, 2025 |
Page 65 |
|
|
NI 43-101 Technical Report on the Lumwana Expansion Project |
|
is considered current and has followed documented drilling and sampling procedures that have remained largely unchanged.
Drill spacing varies across the deposits. RC drilling completed for grade control is the closest spaced at 12.5 m by 25 m. The DD completed for infill drilling is spaced at 50 m to 100 m, and DD drilling completed for Mineral Resource definition is spaced at 100 m to 100 m.
| 10.1.1 | Chimiwungo Drilling |
A total of 70.5 km of DD was completed at Chimiwungo in 2023 and 2024 bringing the average drill hole spacing to 100 m by 100 m. The objective of this drilling was to gain an understanding of the continuity and structure of the mineralisation, to provide increased confidence in the Mineral Resource estimate and to reduce risks for mine planning. In addition, ongoing close spaced infill DD and RC drilling was completed at a spacing of 50 m and 100 m and 12.5 m by 25 m respectively. Figure 10-1 and Figure 10-2 show the drilling at Chimiwungo in plan view and cross-section.
|
February 19, 2025 |
Page 66 |
|
|
NI 43-101 Technical Report on the Lumwana Expansion Project |
|

Source: Barrick, 2024
Figure 10-1 Plan View Map of Drilling at Chimiwungo
|
February 19, 2025 |
Page 67 |
|
|
NI 43-101 Technical Report on the Lumwana Expansion Project |
|

Source: Barrick, 2024
Figure 10-2 Representative Cross-section Chimiwungo 378600 mE (Looking East)
| 10.1.2 | Malundwe Drilling |
A total of 16.9 km of DD was completed at Malundwe in 2023 and 2024 bringing the average drill spacing to 100 m by 100 m. The objective of this drilling was to evaluate along strike extensions to the known mineralisation. In addition, ongoing close spaced infill DD and RC drilling was completed at a spacing of 50 m by 100 m and 12.5 m by 25 m respectively. Figure 10-3 and Figure 10-4 show the drilling at Malundwe in plan view and cross-section.
|
February 19, 2025 |
Page 68 |
|
|
NI 43-101 Technical Report on the Lumwana Expansion Project |
|

Source: Barrick, 2024
Figure 10-3 Plan View Map of Drilling at Malundwe
|
February 19, 2025 |
Page 69 |
|
|
NI 43-101 Technical Report on the Lumwana Expansion Project |
|

Source: Barrick, 2024
Figure 10-4 Representative Cross-section at Malundwe 8645300mN (Looking North)
| 10.1.3 | Kamisengo Drilling |
A total of 90 km of DD drilling was completed at Kamisengo in 2023 and 2024. Drilling was completed to define the extents of the mineralisation and for Mineral Resource definition, resulting in a final drill spacing of 100 m by 100 m. Figure 10-5 and Figure 10-6 show the drilling at Kamisengo in plan view and cross-section.
|
February 19, 2025 |
Page 70 |
|
|
NI 43-101 Technical Report on the Lumwana Expansion Project |
|

Source: Barrick, 2024
Figure 10-5 Plan View Map of Drilling at Kamisengo
|
February 19, 2025 |
Page 71 |
|
|
NI 43-101 Technical Report on the Lumwana Expansion Project |
|

Source: Barrick, 2024
Figure 10-6 Representative Cross-section at Kamisengo 8656100 mN (Looking North)
| 10.1.4 | Kababisa Drilling |
A total of 3.3 km of DD drilling was completed at Kababisa in 2023 and 2024. The objective of the drilling was to identify any potential extension to the mineralisation and ensure that infrastructure placement did not sterilise mineralisation. This resulted in a final drill spacing of 100 m by 200 m. Figure 10-7 and Figure 10-8 show the drilling at Kababisa in plan view and cross-section.
|
February 19, 2025 |
Page 72 |
|
|
NI 43-101 Technical Report on the Lumwana Expansion Project |
|

Source: Barrick, 2024
Figure 10-7 Plan View Map of Drilling at Kababisa
|
February 19, 2025 |
Page 73 |
|
|
NI 43-101 Technical Report on the Lumwana Expansion Project |
|

Source: Barrick, 2024
Figure 10-8 Representative Cross-section at Kababisa 8652500 m N (Looking North)
| 10.2 | Drilling Methods |
The following drilling procedures apply to DD and RC drilling completed by Equinox and Barrick since 2000. Over this period procedures have remained generally consistent.
| 10.2.1 | Diamond Core Drilling |
DD has been undertaken by several different companies including Capital Drilling, Boart Longyear, Infraca Drilling, Ore Search Drilling and, more recently, since 2020, Bamboo Drilling, T3 Drilling, and Tectonic Drilling. Additional drilling capacity was sourced from Ox Drilling, Blu Rock Drilling, Baba Drilling, Simplex Drilling, and Leos Investment Ltd.
PQ rods (85.0 mm) were used in the weathered saprolite typically to a depth of 50 m to 60 m, unless RC collaring was used. Within fresh rock, HQ rods (63.5 mm) were predominantly used.
Collar positions were marked out by qualified surveyors and surveyed using differential global positioning systems (DGPS) and/or total station methods.
All DD holes were surveyed downhole, and currently Reflex Gyro survey tools are used. Single shot surveys were conducted at 50 m intervals during drilling to monitor deviation as drilling progresses and a continuous survey (in and out) was then conducted at the end of hole for use in de-surveying for Mineral Resource definition. Downhole survey data was directly synchronised with the drilling database, using the Imdex Hub as a secure transfer system. All drill core was orientated for structural measurements; previously a spear tool was used but more recently a Reflex EZ-Trac tool was used.
Drill core was stored in plastic core trays, marked up, and quick logged before transfer to the core shed, which happened within 24 hours. Core was transported from the field to the core shed by LMC
|
February 19, 2025 |
Page 74 |
|
|
NI 43-101 Technical Report on the Lumwana Expansion Project |
|
field technicians. At the core shed the core was pre-screened for elevated uranium, magnetic susceptibility, marked up, and photographed with a high-resolution camera before cutting.
Geological and structural logging was completed at the core shed and included descriptions of lithology, weathering, mineralisation, alteration, and free dig boundary. Core recovery measurements were taken at the core shed and core recovery is generally reported to be over 95% in mineralisation.
The core was cut into one-metre sample intervals with half core submitted for analysis and half of the core retained in storage.
All data was captured digitally and was transferred to the digital database.
| 10.2.2 | Reverse Circulation Drilling |
RC drilling was undertaken by various companies, including Capital Drilling, Tectonic Drilling, Ore Search Drilling, Wallis Drilling, Bamboo Drilling, and Four Zero One Mining services. Generally RC holes were drilled using a 142 mm drill bit.
Collar positions were marked out by qualified surveyors using DGPS.
Since 2019, all drill holes have been surveyed at 20 m intervals and data automatically synchronised with the drill hole database. Before then surveys were taken less frequently but deviation was recognised as a potential issue due to foliation in the rocks, and so the frequency of surveys was increased accordingly.
RC samples were initially collected at one-metre intervals, but in 2021 the sample size was increased to two-metre intervals, resulting in a sample weighing between 3.5 kg and 5.0 kg. RC samples were collected from a rig-mounted riffle splitters until 2023 when Gilson riffle splitters were introduced.
Since 2023, sample weights have been used to monitor sample recovery, which is reported on a weekly basis. Since 2023, sample recovery has averaged 78% in transitional material and 80% in fresh material; no sample recovery information is available before 2023, however, this is not considered to have a significant impact on the Mineral Resource, particularly since the volumes are largely already mined out. To manage wet samples, boosters are used and drilling depth is generally restricted to 150 m to prevent water ingress and sample contamination.
RC chip samples were geologically logged at two-metre intervals. The samples were bagged in calico, tied, labelled with a permanent marker, and stored in plastic sacks, before being removed from the drill site at the end of each 8-hour shift. The samples were stored in a 24-hour manned facility and dispatched to the laboratory at least once a day.
|
February 19, 2025 |
Page 75 |
|
|
NI 43-101 Technical Report on the Lumwana Expansion Project |
|
| 10.3 | QP Comments on Drilling |
In the opinion of the QP, the quantity and quality of lithological, geotechnical, collar and downhole survey data collected in the drill programmes are sufficient to support Mineral Resource and Mineral Reserve estimation.
The drilling, sampling methods, and collection process are representative of the material with no known factors that would introduce any biases of significant note. The QA/QC results show that there are no major issues and demonstrate the homogeneity of the ore bodies.
No other material factors were identified with the data collection from the drill programmes that would significantly affect the accuracy and reliability of drilling results or the Mineral Resource and Mineral Reserve estimation.
|
February 19, 2025 |
Page 76 |
|
|
NI 43-101 Technical Report on the Lumwana Expansion Project |
|
| 11 | Sample Preparation, Analyses, and Security |
Procedures for sample preparation, analysis, and security are not available for samples collected from historical drilling. Procedures are available for samples collected from drilling by Equinox and Barrick since 2000, over which period procedures have remained largely the same.
Various laboratories were used for sample preparation, analysis, and quality assurance and quality control (QA/QC) analysis, and include independent laboratories Alfred H Knight (AHK), Genalysis (GLS), Bureau Veritas (BV), ALS Chemex (ALS), and SGS (Table 11-1). Samples were also prepared and analysed at the onsite laboratory, by SGS Lumwana. The equipment and facility are owned by LMC but were previously maintained and managed by AHK and, since October 2022, SGS. SGS Lumwana is not accredited but is managed by SGS, which is a reputable and accredited organisation.
Table 11-1 Summary of Laboratories and Analytical Methods
| Laboratory | Sample | Dates | Method | Accreditation | ||||||
| Preparation | Analysis | Type | ||||||||
| AHK, Kitwe, Zambia |
AHK, Kitwe, Zambia | DD | 2002 to 2021 | ICP-AES | ISO 17025 | |||||
|
N/A1 |
GLS, Perth, Australia | DD | 2002 to 2013 | ICP-AES | ISO 17025 | |||||
| AHK, Lumwana |
AHK, Lumwana | RC | 2008 to 2022 | XRF | ISO 17025 | |||||
|
BV, Ndola, Zambia |
BV, Vancouver, Canada | DD | 2023 to 2024 | ICP-MS | ISO 17025 | |||||
|
SGS, Kalulushi, Zambia |
SGS, Randfontein, South Africa | DD | 2019 to 2023 | ICP-AES | ISO 17025 | |||||
|
SGS, Kalulushi, Zambia |
SGS, Kalulushi, Zambia | DD | 2010 to present | ICP-AES | ISO 170252 | |||||
| SGS, Lumwana |
SGS, Lumwana | RC | 2022 to 2024 | XRF | - | |||||
|
SGS, Lumwana |
SGS, Lumwana | All | 2024 to present | ICP-AES | - | |||||
|
ALS, Ndola, Zambia |
ALS, Johannesburg, South Africa | DD | 2001 to present | ICP-AES | ISO 17025 | |||||
Notes:
| 1. | Used as umpire laboratory and so no preparation required. |
| 2. | Accreditation for ICP-AES method in progress. |
| 11.1 | Sample Preparation |
Until May 2024, all DD samples were prepared at offsite laboratories and RC samples were prepared on site (Table 11-1). In 2024, SGS Lumwana was refitted and new sample preparation analytical equipment was commissioned in May 2024. Since then, both RC and DD samples have been prepared at SGS Lumwana.
DD samples weighing approximately 4 kg were dispatched to the laboratory where they were dried at 105°C for six to eight hours, crushed to 90% passing a 2.35 mm, and pulverised to achieve 90% passing 75 µm. A sample of approximately 200 g of sample pulp was submitted for analysis.
|
February 19, 2025 |
Page 77 |
|
|
NI 43-101 Technical Report on the Lumwana Expansion Project |
|
RC samples weighing between 3.5 kg and 5 kg were dispatched to the laboratory where they were dried at 105°C for eight hours, split using a riffle splitter, and pulverised to achieve 90% passing 75 µm. A sample pulp of approximately 200 g was produced and from this an aliquot of 5 g was collected, weighed, and transferred into a vial. An additional 0.75 g of cellulose wax was placed in with the sample which was homogenised and pressed to create the sample used for analysis.
| 11.2 | Sample Analysis |
Until May 2024, DD samples were analysed at offsite laboratories using four-acid digest and inductively coupled plasma atomic emission spectrometry (ICP-AES) or inductively coupled plasma mass spectrometry (ICP-MS) (Table 11-1). Samples were analysed for copper, uranium, cobalt, sulphur, iron, magnesium, aluminium, and silica.
Until May 2024, RC samples were analysed at SGS Lumwana using energy dispersive X-ray fluorescence spectrometry (EDXRF) (Table 11-1). Atomic absorption spectroscopy (AAS) analysis was used for copper and sulphur values greater than 5%.
Since May 2024, all samples have been analysed at SGS Lumwana using ICP-AES (Table 11-1). On rare occasions, overflow samples may still be sent to offsite laboratories.
Density measurements were taken by LMC staff at the core yard. Samples measuring 10 cm to 20 cm were cut from the core in both mineralised and unmineralised lithologies. Dry bulk density was measured using the water displacement method (based on Archimedes principle) with a wax coating applied to weathered or porous samples. Samples were collected for representative holes and amount to at least 25% of the DD drill holes.
| 11.3 | Sample Security |
Procedures were in place to maintain chain of custody and security of samples. Drill core was stored in plastic core trays and was transferred from the drill site to the core shed by LMC technicians. After cutting, the half-core samples were placed in calico bags, tagged, tied, and labelled. The samples were securely packaged in plastic sacks and then packed in a one tonne bulk bag, all of which were labelled and transported to the laboratory. The sample dispatch sheet was signed by both the transport team and the receiving laboratory.
The remaining half-core was stored at the onsite core storage facility. RC sample coarse and pulp rejects were stored for approximately six months and infill drilling pulp rejects are retained for at least a year or until the area has been mined out.
|
February 19, 2025 |
Page 78 |
|
|
NI 43-101 Technical Report on the Lumwana Expansion Project |
|
| 11.4 | Quality Assurance and Quality Control |
QA/QC procedures are in place and entail monitoring of Certified Reference Materials (CRMs), coarse blanks, duplicates, and umpire samples. Each laboratory has its own internal QA/QC analysis which is also monitored separately by LMC.
| 11.4.1 | QA/QC Diamond Drilling |
In this section, QA/QC analysis and results for copper in DD samples are presented for the period January 1, 2022 to June 30, 2024. This reflects the period when significant drilling was undertaken for the FS. Past QA/QC practices are similar to those presented for this period and QA/QC results are monitored on a monthly basis as part of ongoing drilling operations.
Table 11-2 summarises the planned and actual submission rates for QA/QC samples in this period.
Table 11-2 QA/QC Sample Insertion Rates for DD Samples Submitted between January 2022 and June 2024
| Sample Type | Number of Samples | Actual Submission Rate |
Planned Submission Rate |
|||
| Primary Samples | 120,433 | |||||
| CRMs | 9,936 | 8.3% | 5% | |||
| Coarse Blanks | 10,025 | 8.3% | 5% | |||
| Field Duplicates | 2,037 | 1.7% | 2% | |||
| Pulp Duplicates | 1,303 | 1.1% | 2% | |||
| Coarse Reject Duplicates | 0 | 0% | 2% | |||
| Umpire Samples | 4,340 | 3.6% | 4% |
Assay results were reported from the laboratory in comma separated value (csv) files which were imported into a database and validated. If a QA/QC failure was noted, the laboratory was requested to re-analyse the five samples before and after the failed sample. If the issue was resolved, the re-analysed analytical value was used. If there was no resolution, all analytical values from that batch were rejected and the batch was re-analysed. Usually, the re-analysis of the entire batch resolved any issues, but in rare cases where failures remained, the results were excluded from the Mineral Resource database.
Certified Reference Materials
CRMs are intended to monitor accuracy and a total of 17 different CRMs, purchased from Ore Research & Exploration Pty Ltd, covering a range of grades and material types, were used.
A CRM result was considered a pass when it was within three standard deviations (3SD) of the expected value. In this period, 95% of CRM values were within 3SD. The performance of the CRMs
|
February 19, 2025 |
Page 79 |
|
|
NI 43-101 Technical Report on the Lumwana Expansion Project |
|
at SGS Kalulushi, SGS Lumwana, BV, and ALS Johannesburg is illustrated in Figure 11-1 to Figure 11-4. The laboratories were requested to re-analyse the failed samples according to the procedure described earlier in section 11.4.1.

Figure 11-1 Copper (%) for CRMs at SGS Kalulushi

Figure 11-2 Copper (%) for CRMs at SGS Lumwana Laboratory
|
February 19, 2025 |
Page 80 |
|
|
NI 43-101 Technical Report on the Lumwana Expansion Project |
|

Figure 11-3 Copper (%) for CRMs at Bureau Veritas Laboratory

Figure 11-4 Copper (%) for CRMs at ALS Johannesburg Laboratory
Blanks
Blanks have levels of the element of interest below detection limit to allow monitoring of contamination at the analytical laboratory. Before 2019, fine blanks were used, but following an audit recommendation from Optiro in 2019 coarse quarry blank material was introduced instead (Optiro, 2019).
|
February 19, 2025 |
Page 81 |
|
|
NI 43-101 Technical Report on the Lumwana Expansion Project |
|
A blank was considered to have passed when the analytical result was within the ‘failure limit’ set at ten times the detection limit. For the period under consideration, over 99% of blank results passed, which indicates no significant sample contamination at the analytical laboratories. The laboratories were requested to re-analyse the failed samples according to the procedure described earlier in section 11.4.1.
The performance of the blanks at SGS Kalulushi, SGS Lumwana, BV, and ALS Johannesburg is shown in Figure 11-5 to Figure 11-8. There was an increase in the detection limit at SGS Kalulushi in October 2023 resulting in an upwards shift in the minimum blank values (Figure 11-5).

Figure 11-5 Copper (%) for Blanks Submitted at SGS Kalulushi
|
February 19, 2025 |
Page 82 |
|
|
NI 43-101 Technical Report on the Lumwana Expansion Project |
|

Figure 11-6 Copper (%) for Blanks Submitted at SGS Lumwana

Figure 11-7 Copper (%) for Blanks Submitted at BV Laboratory
|
February 19, 2025 |
Page 83 |
|
|
NI 43-101 Technical Report on the Lumwana Expansion Project |
|

Figure 11-8 Copper (%) for Blanks Submitted at ALS Laboratory
Duplicates
Field Duplicates
Field duplicates are collected after splitting the core, with one half being the primary sample and the second being the duplicate. They are intended to measure precision which may be impacted by short-scale grade variation in mineralisation or errors in sampling and analysis. All duplicate analysis was completed at SGS Kalulushi.
Results were analysed using Half Absolute Relative Difference (HARD) plots. An acceptable limit was considered to be 90% of samples within 20% HARD and less than 5% bias.
Sample pairs with a grade of less than 0.04% Cu were excluded from the analysis (due to poor precision close to the detection limit). For the remaining 1,913, the plot in Figure 11-9 shows that 90% of samples have less than 20% HARD, which indicates adequate precision.
|
February 19, 2025 |
Page 84 |
|
|
NI 43-101 Technical Report on the Lumwana Expansion Project |
|

Figure 11-9 HARD Plot of DD Field Duplicates Assayed by SGS Kalulushi
Pulp Duplicates
Pulp duplicates were obtained from the pulverised 75-micron sample that was returned from the laboratory and were used to assess precision which may be impacted by sampling and analytical errors after sample pulverisation. Pulp duplicates were chosen to be representative of the entire deposit. An acceptable limit was considered to be 90% of samples within 20% HARD and less than 5% bias.
A slight low-grade bias was identified in the duplicate samples, but the HARD plot in Figure 11-10 shows good precision with 90% of samples having precision less than 10% HARD.
|
February 19, 2025 |
Page 85 |
|
|
NI 43-101 Technical Report on the Lumwana Expansion Project |
|

Figure 11-10 HARD Plot of Pulp Duplicates Assayed by SGS Lumwana
Umpire Assays
Umpire analysis is undertaken by submitting a selection of pulp samples to an independent laboratory to assess for bias at the primary laboratory. Samples from SGS Lumwana and SGS Kalulushi were selected for umpire analysis at ALS Chemex in Johannesburg.
The original and umpire samples are compared on the scatter plot in Figure 11-11. The scatter plot shows a good correlation between the samples indicating no significant bias. Less than 2% of the pairs plot outside of the acceptance limits (±10%). The umpire laboratory was requested to re-analyse the failed samples according to the procedure described earlier in section 11.4.1.
|
February 19, 2025 |
Page 86 |
|
|
NI 43-101 Technical Report on the Lumwana Expansion Project |
|

Figure 11-11 Log Scatter Plot of Samples Analysed at SGS Laboratories and ALS Chemex Umpire Laboratory
| 11.4.2 | QA/QC RC Drilling |
RC samples are not discussed in detail in this Technical Report, however, the QA/QC practices and performance for RC samples are comparable to those for DD samples but with slightly lower insertion rates. Over the same period, QA/QC for the RC samples included 1,400 blank samples (1%), which showed no contamination, and 7,676 CRMs (4.8%), indicating adequate accuracy. The precision, as measured from duplicate samples (6.4%), was also found to be satisfactory. For field duplicates, precision improved after moving from rig-mounted to manual riffle splitting in April 2023.
| 11.5 | QP Comments on Sample Preparation, Analyses, and Security |
Despite using multiple laboratories throughout the course of the FS drilling programme, it is the QP’s opinion that the sampling, sample preparation and analytical methods are acceptable, are in line with industry-standard practices, and are adequate for Mineral Resource and Mineral Reserve estimation and mine planning purposes.
The QA/QC procedures and management are consistent with industry standards and the assay results within the database are suitable for use in Mineral Resource estimation. The QP has not identified any issues that could materially affect the accuracy, reliability, or representativeness of the results.
|
February 19, 2025 |
Page 87 |
|
|
NI 43-101 Technical Report on the Lumwana Expansion Project |
|
| 12 | Data Verification |
| 12.1 | Historical Data |
Historical data refers to data collected by RST, AGIP, and Phelps Dodge up to 1994. For this period the data collection and verification procedures are unknown, and the data is of unknown quality and reliability. Since 2022, infill drilling campaigns have been completed with the aim of verifying historical drilling results. These drilling campaigns intersected mineralisation as expected.
After exclusion of depleted areas and drilling falling outside of the Mineral Resource areas, the data from historical drilling forms a small proportion (3.1%) of the Mineral Resource database (discussed in Section 10.1 and Section 14.1 of this Technical Report). Therefore, the historical drilling is not considered to have a material impact on the Mineral Resources.
| 12.2 | Current Data |
Current data refers to all data collected since 2000, first by Equinox and later by Barrick. Data collection procedures have broadly remained unchanged over this period.
Digital logging solutions are used by geologists to prevent transcription errors. Data was initially directly captured and stored in an acQuire database but in 2023, that database migrated to a Datashed SQL. Assay data is imported directly from the laboratory CSV files and only the fully trained and authorised users can upload laboratory data. A full-time database and QA/QC focused geologist is employed at Lumwana to manage the database.
The Datashed database is backed up daily and monthly to two separately located onsite servers. Daily backups are kept for 14 days and monthly backups for two years. There are currently no offsite backups of data but there are plans to implement this when planned infrastructure upgrades are made.
A comprehensive QA/QC programme is in place including the insertion of CRMs, coarse blanks, field duplicates, and umpire assays. These show that the assays are of adequate quality and reliability for Mineral Resource estimation.
| 12.3 | Internal Reviews and Audits |
The QP typically visits Lumwana two to four times per year. These visits include:
|
February 19, 2025 |
Page 88 |
|
|
NI 43-101 Technical Report on the Lumwana Expansion Project |
|
| ● | Observing DD and RC drilling to ensure that drilling, core handling, and RC sample handling procedures are followed. |
| ● | Reviews of the latest core intersections along with spot checks of core against database entries and assay results. |
| ● | Database reviews to ensure validation checks are completed appropriately and that extractions from the database are valid. |
| ● | Visits to the SGS Lumwana laboratory to observe sample preparation and analytical procedures. |
The QP also reviews monthly, quarterly, and annual QA/QC reports and attends monthly meetings with the SGS Lumwana laboratory to discuss performance, and resolution of any issues.
| 12.4 | External Reviews and Audits |
External database reviews have been completed regularly since 2018, with the latest being in 2023 in anticipation of the database being migrated from acQuire to Datashed. Any recommendations made during this audit were implemented on migration of the database.
An external audit of the Mineral Resource data collection procedures was completed in 2019 by Optiro (Optiro, 2019). No fatal flaws were identified but several recommendations were made. A potential bias between assays from DD and RC drilling was raised as an issue. This was subsequently assessed through twin hole analyses and though based on a modest data set, the difference between the results from the different drilling types was found to be within acceptable limits. Other recommendations adopted from the audit included use of field duplicates for grade control RC drilling, improvements in the frequency of umpire laboratory testing, and granting the site database manager full administrator rights to the database.
The latest external audit was completed by RSC in 2024 (RSC, 2024). An independent review of the Mineral Resource and its informing data and processes was undertaken, and recommendations were subject to the following ranking:
| ● | Critical: must be addressed immediately to remedy/rectify a fatal flaw or radical error. |
| ● | Recommended: an issue causing moderate causes of concern to be addressed prior to the next major Mineral Resource update (mid-2025). |
| ● | Value-added: of minor concern and includes suggestions for further investigation. |
RSC did not identify any critical issues or fatal flaws and concluded that the processes underlying the generation and declaration of the Mineral Resource reflected good practice. For the recommended and value-added suggestions, an action plan with corrective strategies was developed. All recommended items, and most of the value-added items, have since been closed out and include the following for informing data and quality control:
|
February 19, 2025 |
Page 89 |
|
|
NI 43-101 Technical Report on the Lumwana Expansion Project |
|
| ● | The Data Quality Objectives (DQOs) and QC for each data process were clarified and included in the Standard Operating Procedures (SOP). |
| ● | Improvements and training in the density SOP was completed. |
| ● | QC of laboratory processes was reviewed to include a daily assessment (to address any variations as they occur), as well as a longer-term assessment (over a quarter or a year) to identify longer-term trends or special-cause variations. |
| ● | All RC rigs are fitted with dust suppression systems which are now being used. |
| ● | RC recoveries are being calculated and reviewed on a daily, weekly and monthly basis and used to drive recovery improvements with drill contractors. |
| ● | Screen passing test results are being obtained from all laboratories and included in the monthly reports. |
| ● | Umpire testing is now being completed on a quarterly basis instead of annual. |
| 12.5 | QP Comments on Data Verification |
In the QP’s opinion, an appropriate level of data verification has been completed, and no material issues have been identified from the programmes undertaken. The QP has reviewed and completed checks on the data and is of the opinion that the data verification and QA/QC programmes undertaken on the database adequately support the geological interpretations and Mineral Resource estimation process.
|
February 19, 2025 |
Page 90 |
|
|
NI 43-101 Technical Report on the Lumwana Expansion Project |
|
| 13 | Mineral Processing and Metallurgical Testing |
The Lumwana processing plant has been operating for an extended period of time but as part of the Expansion Project capacity is expected to increase by 100%.
The existing processing plant commenced operation in 2008 with commercial copper production achieved in 2009. The processing plant operated at a nominal capacity of 20 Mtpa from commissioning and increased to 27 Mtpa in 2020 by increasing the flotation feed grind size from P80, 212 µm to P80, 400 µm.
The Expansion Project aims to increase processing capacity to a peak design capacity of 54 Mtpa, through construction of an additional processing plant, duplicating the same flowsheet as the existing processing plant, and by utilising a grind size of P80, 300 µm to achieve optimum flotation kinetics. The existing and new processing plants will handle increased throughput from the existing Chimiwungo and Malundwe open pits and from the new Kamisengo and Kababisa open pits.
The material processed is either fresh or transitional, which is defined by mineralogy and the ratio of acid soluble copper (AsCu) to total copper (TCu). Acid soluble copper is present in copper mineral species such as oxides.
| 13.1 | Recent Metallurgical Test Work |
Metallurgical test work has been undertaken using samples collected from new areas of the existing Chimiwungo and Malundwe open pits as well as from the new Kamisengo and Kababisa satellite deposits. This test work aimed to determine the plant parameters required to produce a saleable copper concentrate from these areas.
The test work included mineralogical examination, comminution test work, flotation test work, and thickening test work. The test work was completed from October 2023 to August 2024 under the direction of Barrick and Lycopodium Minerals Pty Ltd (Lycopodium) at SGS in Randfontein, South Africa.
| 13.1.1 | Sample Selection |
The test work samples were chosen by LMC geologists and metallurgists. The samples represent high, average, and low-grade ore envisaged to be treated by the processing plant. The majority of the samples were selected from the proposed Chimiwungo Super-Pit, with the remaining samples selected from Kamisengo, Malundwe, and Kababisa (Table 13-1 and Figure 13-1 to Figure 13-4). A smaller number of samples were selected from Malundwe as there is operational data available for
|
February 19, 2025 |
Page 91 |
|
|
NI 43-101 Technical Report on the Lumwana Expansion Project |
|
this deposit since 2008, thus the ore body is already well understood and the test work was for confirmation purposes.
Table 13-1 Metallurgical Test Work Samples
| Ore type | Percentage Throughput1 (%) | Number of Samples | ||
|
Chimiwungo |
75.0 | 92 | ||
|
Kamisengo |
13.0 | 35 | ||
|
Kababisa |
0.3 | 11 | ||
|
Malundwe |
11.0 | 3 | ||
Notes:
| 1. | Proportion to the LOM throughput |
The samples are representative of the mineralisation at the different deposits, were selected from a representative range of locations, and were sufficient in quantity and size for the test work completed.

Source: Barrick, 2024
Figure 13-1 Chimiwungo Metallurgical Test Work Sample Locations
|
February 19, 2025 |
Page 92 |
|
|
NI 43-101 Technical Report on the Lumwana Expansion Project |
|

Source: Barrick, 2024
Figure 13-2 Malundwe Metallurgical Test Work Sample Locations
|
February 19, 2025 |
Page 93 |
|
|
NI 43-101 Technical Report on the Lumwana Expansion Project |
|

Source: Barrick, 2024
Figure 13-3 Kamisengo Metallurgical Test Work Sample Locations
|
February 19, 2025 |
Page 94 |
|
|
NI 43-101 Technical Report on the Lumwana Expansion Project |
|

Source: Barrick, 2024
Figure 13-4 Kababisa Metallurgical Test Work Sample Locations
| 13.1.2 | Mineralogical Test Work |
Mineralogical test work was completed in two phases; Phase 1-Kamisengo samples, and Phase 2-Chimiwungo, Malundwe and Kababisa samples. Phase 1 samples were completed as part of the Expansion Project PFS (Barrick, 2024a), where Phase 2 samples were completed as part of the Expansion Project FS (Barrick, 2024b).
Kamisengo Samples (Phase 1)
Thirty copper-bearing samples were submitted in Phase 1 and the following observations were made:
|
February 19, 2025 |
Page 95 |
|
|
NI 43-101 Technical Report on the Lumwana Expansion Project |
|
| ● | The samples tended to have relatively consistent mineralogy, with abundant quartz, generally more than 40% w/w. Other major contributors to the gangue mineralogy included micas (both muscovite and biotite were identified) and pyrrhotite. |
| ● | The copper mineralisation in the samples tends to be consistently hosted in chalcopyrite, contributing more than 95% to the total copper content in most samples. |
| ● | Chalcocite is noted in some samples as a host to copper mineralisation. |
| ● | The chalcopyrite tends to be relatively coarse in the samples where it is the predominant phase, with an average of 37% w/w coarser than 100 µm. The minor chalcopyrite occurring in the samples host to significant copper silicates is notably finer grained than the other samples. |
| ● | In the samples where chalcopyrite is the predominant host to the copper (25 of the tested 30 samples), it is consistently more than 75% w/w to 80% w/w liberated. The chalcopyrite liberation is poorer in the samples containing copper silicate-bearing minerals, with liberation ranging from 25% w/w to 72% w/w. |
| ● | When present, the unliberated chalcopyrite tends to have limited association with quartz, biotite, muscovite, chlorite, and copper silicates. |
| ● | These findings with respect to chalcopyrite suggest that finer grinding is beneficial to the process when compared to the current plant conditions and confirm the metallurgical test work outcomes. |
Chimiwungo, Malundwe, and Kababisa Samples (Phase 2)
A total of 128 samples were submitted in Phase 2 and the following observations were made:
| ● | The head samples have relatively consistent mineralogy, including significant quartz and micas, with detectable amounts of chalcopyrite (at an average abundance of 1.6%). Bornite is also present in a number of samples with an average of 0.6% mass, although in a number of samples it is not detected. |
| ● | Pyrite and pyrrhotite tend to be present in several samples, with an average of 0.6 mass %. These sulphides are entirely absent in a number of samples. |
| ● | The copper deportment in the head samples indicates that the mineralisation tends to be primarily chalcopyrite and, to a lesser extent, bornite. |
| ● | Overall, the copper sulphide mineralisation tends to be moderately sized, predominantly between 50 µm and 200 µm, for the majority of the samples. |
| ● | The copper sulphides in the feed samples tend to be consistently well liberated, with the exception of two samples. |
| ● | Due to the small number of samples and very small amount of ore to be treated from Kababisa, the results were not examined. |
| 13.1.3 | Comminution Test Work |
Comminution test work was performed in the same two phases and included Bond Crusher Work index (CWi), Bond Abrasion Index (Ai), Bond Ball mill index (BWi), Semi-autogenous Grinding (SAG)
|
February 19, 2025 |
Page 96 |
|
|
NI 43-101 Technical Report on the Lumwana Expansion Project |
|
Power Index (SPI), and SAG Mill Comminution (SMC) test work based correlation between CWi and Dropweight index (Dwi). A total of 35 samples were included in Phase 1 test work and 108 samples in Phase 2 test work. A summary of the comminution test results is shown in Table 13-2 and Table 13-3.
Table 13-2 Summary of Phase 1 Comminution Test Work Results
| Parameter | Maximum | Minimum | Average |
Standard Deviation |
||||
|
CWi |
24 | 8.9 | 19.9 | 3.4 | ||||
|
Ai |
0.247 | 0.01 | 0.108 | 0.052 | ||||
|
BWi |
31.7 | 8.5 | 16 | 4.2 | ||||
|
SPI |
55.5 | 2.3 | 28 | 12.2 | ||||
|
A |
71.5 | 61.5 | 65.3 | 2.4 | ||||
|
B |
2 | 0.7 | 1.4 | 0.3 | ||||
|
Mia |
16.2 | 7.7 | 10.1 | 1.6 | ||||
|
Mih |
11.7 | 4.6 | 6.4 | 1.3 | ||||
|
Mic |
6 | 2.4 | 3.3 | 0.7 | ||||
Table 13-3 Summary of Phase 2 Comminution Test Work Results
| Parameter | Maximum | Minimum | Average |
Standard Deviation |
||||
|
CWi |
16.7 | 1.6 | 14.9 | 1.9 | ||||
|
Ai |
0.266 | 0.032 | 0.151 | 0.045 | ||||
|
BWi |
25.5 | 12.0 | 16.7 | 2.7 | ||||
|
A |
73.8 | 57.6 | 65.5 | 3.0 | ||||
|
b |
2.3 | 0.8 | 1.3 | 0.2 | ||||
|
Mia |
14.6 | 7.1 | 10.9 | 1.6 | ||||
|
Mih |
10.3 | 4.1 | 7.1 | 1.3 | ||||
|
Mic |
5.3 | 2.1 | 3.7 | 0.7 | ||||
The Phase 1 comminution results indicate that the Kamisengo ore is classified as hard in terms of crushing using and ball milling but soft in terms of SAG milling. The Phase 2 results indicate that the material from Chimiwungo (Malundwe and Kababisa) is moderately hard for crushing and ball milling but soft in terms of SAG milling. Overall the ore is classified as a moderately competent ore body which is competent in a crushing application but still breaks easily in a SAG mill application.
| 13.1.4 | Flotation Test Work |
Flotation test work was also completed in two phases; open circuit test work on Phase 1 followed by both open cycle and locked cycle tests on Phase 2. A summary of open cycle test work from Phase 1 and locked cycle test work from Phase 2 are presented in this Technical Report. The Phase 2 open cycle tests are not included since locked cycle test results are considered conclusive.
|
February 19, 2025 |
Page 97 |
|
|
NI 43-101 Technical Report on the Lumwana Expansion Project |
|
Open Circuit Flotation Test Work (Phase 1)
A total of 67 samples were tested during the Phase 1 test work. The test work included grind size optimisation but used the existing process plant conditions and reagent suite. The flowsheet of the open circuit flotation test work is shown in Figure 13-5 and results are shown in Figure 13-6.

Source: Barrick, 2024
Figure 13-5 Open Circuit Flotation Test Work Flowsheet
|
February 19, 2025 |
Page 98 |
|
|
NI 43-101 Technical Report on the Lumwana Expansion Project |
|

Figure 13-6 Summary of Phase 1 Open Circuit Flotation Test Work Results
The Phase 1 test work included additional optimisation tests but results are not presented in this report. All of the optimisation test work failed to produce concentrates with the required target grades of above 31.0% Cu. However, the tests with a higher pH (12) demonstrated an increase in the concentrate grades up to 31.0% Cu (average) but with a very low recovery (approximately 70%). The average grade achieved was 26.3% Cu over all the high pH tests. It is recommended that a higher pH be used when processing Kamisengo ore.
The copper mineralisation in the samples tends to be consistently hosted in chalcopyrite, contributing more than 95% to the total copper content in most samples. In some samples (such as LBE023 and LBE112) chalcocite hosts the copper mineralisation. However, this contribution is less than 15% of the total copper. Samples LBE115-7 m, LBE035-7 m, LBE014-29 m, LBE080-20 m, and LBE038 (collected from shallow depths between 7 m and 20 m) have notably different copper mineralisation than the other samples, with the majority of the copper occurring in copper silicates, and in the case of LBE038 also in the copper weak acid dissociation This corresponds with a notably lower grade than seen in the other samples, which is expected as it is a very shallow sample.
The occurrence of chalcocite in the test samples explains the low recoveries observed in the test work for Kamisengo ore. Blending test work was recommended to investigate how to optimise the grade and recovery produced from a combined Chimiwungo-Kamisengo-Malundwe feed. Kamisengo represents a 13% overall feed contribution to the LOM throughput, and recoveries in the mine plan will be modelled according to a blended ratio between test work results and recovery models for all deposits.
|
February 19, 2025 |
Page 99 |
|
|
NI 43-101 Technical Report on the Lumwana Expansion Project |
|
Locked Circuit Flotation Test Work (Phase 2)
Six composite samples with head grades ranging from 0.30% Cu to 0.81% Cu were investigated during the Phase 2 locked cycle test work. A summary of the results is shown in Table 13-4.
Table 13-4 Locked Cycle Test Work Results (Phase 2)
| Test No. |
Mass Pull (%w/w) |
Recovery | Grade | Calculated Head Grade | ||||||||||||||||
| Cu (%) | Fe (%) | S (%) | Cu (%) | Fe (%) | S (%) | Cu (%) | Fe (%) | S (%) | ||||||||||||
|
Blend 1 |
1.92 | 95.7 | 12.8 | 58.3 | 26.5 | 26.4 | 26.3 | 0.53 | 3.96 | 0.87 | ||||||||||
|
Blend 2 |
2.13 | 95.3 | 18 | 53.9 | 23.8 | 28.4 | 31.1 | 0.53 | 3.36 | 1.23 | ||||||||||
|
Blend 3 |
2.21 | 95.4 | 15.9 | 85.3 | 35 | 23.1 | 29.1 | 0.81 | 3.2 | 0.75 | ||||||||||
|
Blend 4 |
2.38 | 96.5 | 19.5 | 70.6 | 30 | 26.7 | 32.9 | 0.74 | 3.26 | 1.11 | ||||||||||
|
Blend 5 |
1.07 | 92.1 | 8.7 | 50.1 | 26 | 30 | 32.7 | 0.3 | 3.69 | 0.7 | ||||||||||
|
Blend 6 |
1.31 | 94 | 6 | 24.8 | 19.9 | 0.35 | 4.36 | |||||||||||||
The results indicate that the recoveries varied from 92.1% Cu to 96.5% Cu with an average of 94.8% Cu. The concentrate grades also varied between 23.8% Cu and 35% Cu with an average of 27.7% Cu.
The following conclusions can be drawn from the flotation test work.
| ● | The optimum grind for the Kamisengo ore and the Chimiwungo ore is 80% passing (P80) 300 µm. Further test work could be conducted on plant samples to ascertain whether a coarser grind can be implemented in the future. |
| ● | Kamisengo samples, when processed on their own, could not produce the targeted concentrate grade of 27.8% Cu. The maximum grade achieved was 25.5% Cu. Therefore, blending with Chimiwungo ore will be required to comply with grade requirements. The optimum blending ratio between the two ore bodies will be confirmed with further test work. The Kamisengo ore is a small proportion of the overall deposit with 13% of the LOM ore. |
| ● | Ore from the proposed Chimiwungo Super-Pit will generally meet the required recovery and grade specifications. However, some areas of the ore body that are problematic (i.e., higher association with gangue material) may require further liberation or blending with better performing ore. |
| 13.1.5 | Thickening Test Work |
Thickening and filtration test work was completed on flotation concentrate and tailings samples at three equipment vendor facilities: Vietti, Metso, and FLSmidth. The tailings samples were prepared to replicate the actual flotation tailings. However, an additional sample at -150 µm, to imitate pre-screening with cyclones prior to thickening, was also sent to Metso and FLSmidth. Filtration rates were based on operating filter performance on the existing LAROX filter press.
|
February 19, 2025 |
Page 100 |
|
|
NI 43-101 Technical Report on the Lumwana Expansion Project |
|
Vietti Thickener Test Work
The tailings thickening test work conducted at Vietti indicated that at a flocculant dosage rate of 10 g/t using SNF 910 SH, an underflow density operating window of between 50% w/w and 60% w/w can be achieved for the final tailings sample. Within this operating window, a relatively low un-sheared mud bed yield stress of between 23 Pa and 78 Pa was observed. Optimum solids loading rates (flux rates) were determined to be from 0.5 t/m2h to 0.7 t/m2h.
The results indicated that, based on a tailings thickener feed rate of 3,282 t/h solids, the recommended thickener is either a single 75 m diameter thickener or two 55 m diameter thickeners.
Metso Thickener Test Work
Two tail samples labelled ‘As Is’ and ‘-150 µm’, and one concentrate sample were submitted to Metso for thickening test work. The results indicated Magnafloc 336 to be the optimum flocculant type for producing fast settling rates, well-sized aggregates, and good overflow clarity for all the samples.
Over a flux rate range of 0.4 t/m2h to 1.0 t/m2h, the ‘As Is’ tailings sample returned thickener underflow densities of 56.2% to 65.6% solids (w/w) with yield stresses of 45 Pa to 165 Pa. Over a flux rate range of 0.4 t/m2h to 1.0 t/m2h, the ‘-150 µm’ tailings sample returned thickener underflow densities of 51.7% solids (w/w) to 61.3% solids (w/w) with yield stresses of 60 Pa to 105 Pa.
Over a flux rate range of 0.25 t/m2h to 0.6 t/m2h, the concentrate sample returned thickener underflow densities of up to 65.9% solids (w/w) with yield stresses of 90 Pa to 160 Pa. Metso recommended using a flux rate of 0.8 t/m2h for both the ‘As-Is’ and ‘-150 µm’ tails samples and 0.25 t/m2h for the concentrate sample.
The results indicated that, at feed rates of 3,282 t/h and 1,641 t/h tails solids, a 72 m and 51 m diameter tails thickeners would be required, respectively. The results also indicated that, at a feed rate of 136 t/h concentrate, a 27 m diameter concentrate thickener would be required.
FLSmidth Thickener Test Work
Two tailings samples called ‘Tailings’ and ‘-150 µm Tailings’, were submitted to FLSmidth for thickening test work. The results indicated the optimum flocculant dosage and type as 20 g/t of AN 923 VHM for the Tailings sample and 45 g/t of M336 for the -150 µm Tailings sample. The feed percent solids that provided the best settling characteristics were 15% w/w for the Tailings sample and 10% w/w for the -150 µm Tailings sample. The initial settling velocity was determined to be 1.786 m/h for the Tailings sample and 15.54 m/h for the 150 µm Tailings sample. The best flux rate achieved was 1.51 t/m2h for the Tailings sample with AN 923 VHM as the flocculant type, and 0.83 t/m2h for the -150 µm Tailings sample with M336 as the flocculant type. The yield stress was
|
February 19, 2025 |
Page 101 |
|
|
NI 43-101 Technical Report on the Lumwana Expansion Project |
|
approximately 71 Pa at approximately 60% w/w solids for the Tailings sample and approximately 60 Pa at approximately 54% w/w solids for the -150 µm Tailings sample.
The test results indicated that, based on the best achievable fluxes, the tails thickener of 58 m diameter is required for the tails sample and a thickener of size 55 m is required for the ‘-150 m Tailings’ samples.
| 13.2 | Existing Processing Plant Performance |
A summary of plant operating data from January 2021 to August 2024 is shown in Figure 13-7 and Figure 13-8.

Figure 13-7 Summary of Existing Processing Plant Throughput, Head Grade and Tails Grade
|
February 19, 2025 |
Page 102 |
|
|
NI 43-101 Technical Report on the Lumwana Expansion Project |
|

Figure 13-8 Summary of Existing Processing Plant Copper Recovery and Concentrate Grades
The data indicates that the concentrate grades varied between 24.9% Cu and 32.9% Cu with an average of 28.1% Cu, which is in line with the target concentrate grade of 27.8% Cu. Similarly, the flotation recoveries varied between 81.5% Cu and 94.6% Cu with an average of 89.6% Cu.
The quarterly average concentrate grades, recoveries, and the head grades since 2021 were plotted with the objective of identifying any relationship (Figure 13-9 and Figure 13-10).
As expected, the data shown in Figure 13-9 indicates that the concentrate grade correlates well with the head grades with a correlation coefficient of 0.90.
The data in Figure 13-10 shows that the correlation between the recoveries and head grades for the past three years is not strong (0.33). However, during this time (specifically end of 2022 to 2024) the feed to the processing plant included transitional ore which constitutes partially weathered and semi-oxidised material. It is anticipated that the processing of the transitional ore may have contributed to the weaker correlations between the head grade and recovery.
In this context, the grade recovery curve for the period of 2019 to 2022 was plotted (Figure 13-11). This illustrates that the fresh ore head grade correlates well with recovery with a correlation coefficient of 0.87.
|
February 19, 2025 |
Page 103 |
|
|
NI 43-101 Technical Report on the Lumwana Expansion Project |
|

Figure 13-9 Relationship between Concentrate Grades and Head Grades

Figure 13-10 Relationship between Recovery and Head Grades
|
February 19, 2025 |
Page 104 |
|
|
NI 43-101 Technical Report on the Lumwana Expansion Project |
|

Figure 13-11 Relationship between Grade and Recovery for 2019 to 2022
The plant performance during the 12 months from August 2023 to July 2024 is compared with the forecasted performance and shown in Figure 13-12 to Figure 13-15.
The data indicates that the throughput fluctuated against the forecast, with September 2023 having the lowest throughput performance. It appears that, in general, the plant has achieved or exceeded the design throughput at approximately 60% of the operating time during the past year.

Figure 13-12 Variation of Mill Throughput from August 2023 to July 2024
|
February 19, 2025 |
Page 105 |
|
|
NI 43-101 Technical Report on the Lumwana Expansion Project |
|

Figure 13-13 Variation of Copper Recovery from August 2023 to July 2024
The recovery data in Figure 13-13 indicates that the plant was able to achieve or exceed the forecast recovery during approximately 50% of the operating time during the year. The lowest recovery occurred in February 2024 when recovery fell to 70%, due to a large portion of transitional material being fed into the plant.

Figure 13-14 Variation of Copper Concentrate Grade from August 2023 to July 2024
|
February 19, 2025 |
Page 106 |
|
|
NI 43-101 Technical Report on the Lumwana Expansion Project |
|

Figure 13-15 Variation of Head Grade from August 2023 to July 2024
In summary, the operating data indicates that the plant was able to consistently achieve reasonable recoveries, with an average of 89.6%, and produced saleable copper concentrates over the past three years of operation. This is in line with the expectation based on the plant operation since commissioning in 2008.
| 13.3 | Recovery Estimates |
The FS metallurgical test work demonstrated that copper recovery for the Chimiwungo and Malundwe samples varied from 92.1% Cu to 96.5% Cu with an average of 94.8% Cu as shown in Figure 13-16. This is in line with current process plant operating data from these deposits which indicated a range of recoveries with a three-year average of 89.6% Cu. The three year lower average is due to treatment of transitional material in the years 2022 to 2024 as shown in Figure 13-13.
The test work for Kamisengo demonstrated that higher recoveries are not achievable with the target concentrate grades of 27.8% Cu if the material is processed separately. Test work recoveries ranged from 81.3 % Cu to 92.3% Cu recovery with an average of 90.8% Cu.
The FS recovery model, presented in Figure 13-16, was generated for the Chimiwungo and Malundwe deposits based on a regression formula using plant operational data from 2019 to 2021, to exclude periods where transitional material was processed. The recovery model was validated with the FS metallurgical test work data for future ore sources in Chimiwungo and Malundwe.
|
February 19, 2025 |
Page 107 |
|
|
NI 43-101 Technical Report on the Lumwana Expansion Project |
|
The estimated Kamisengo recoveries were assumed at 90% based on the reduced recoveries identified in the FS metallurgical test work programme. Due to lack of data, and geological similarity, Kababisa was assumed to be similar to Kamisengo with a 90% recovery.

Figure 13-16 FS Test Work Recovery and Actual Plant Recoveries for Chimiwungo and Malundwe
According to the current mining schedule, Kamisengo ore will be blended with the Chimiwungo ore and processed only after 2036. Further, the LOM blending programme has been designed to ensure Kamisengo ore will not be more than 13% of total ore fed to the plant at any given time. Thus, the reduced recoveries observed in test work are not a concern for the Expansion Project.
Grades below 0.3% in Chimiwungo and Malundwe are blended with higher grades to achieve the target feed grade and metal output, which is the current operating practice at the Mine. Due to lack of available plant data below 0.3% Cu, the recovery model is extrapolated from the existing regression model at these head grades to account for blocks with lower grade and therefore lower recoveries.
Oxide material cannot be recovered and is currently treated as waste. A fixed recovery of 78% was applied to transitional and deep weathering material where the grade is above 0.3% Cu. This was based on metallurgical test work caried out on samples taken from the transitional material in 2024.
|
February 19, 2025 |
Page 108 |
|
|
NI 43-101 Technical Report on the Lumwana Expansion Project |
|
Below 0.3% Cu, recovery estimates are extrapolated due to lack of data to reflect lower grades and recoveries. Transitional material represents approximately 2% of the total feed over LOM.
| 13.4 | Deleterious Elements |
Elements with deleterious impact include insoluble material, carbonaceous material, pyrrhotite, and uranium. Almost all of these elements exist in small quantities and are not expected to generate smelter penalties over the LOM. Uranium head grades are higher than LOM average for the Malundwe ore, however, this ore will be blended with Chimiwungo ore, which has a lower uranium content, to ensure no-net smelter penalty over the LOM or negative impacts on outflow water quality.
| 13.5 | QP Comments on Mineral Processing and Metallurgical Testing |
The QP considers that the samples selected are representative for the intended test work and studies. In addition to metallurgical test work, existing operating data collected since 2008 has also been incorporated into the design of the processing plant for the Expansion Project.
There are no known processing factors or deleterious elements that could have a significant effect on economic extraction.
The test work completed is considered appropriate to support recovery and deleterious element assumptions for LOM planning purposes.
|
February 19, 2025 |
Page 109 |
|
|
NI 43-101 Technical Report on the Lumwana Expansion Project |
|
| 14 | Mineral Resource Estimates |
This section describes the work undertaken to estimate Mineral Resources, including the key assumptions and parameters applied.
The Mineral Resource estimates have been prepared according to the Canadian Institute of Mining, Metallurgy and Petroleum (CIM) 2014 Definition Standards for Mineral Resources and Mineral Reserves dated May 10, 2014 (CIM (2014) Standards) as incorporated with National Instrument 43-101 Standards of Disclosure for Mineral Projects (NI 43-101). Mineral Resource estimates were also prepared using the guidance outlined in CIM Estimation of Mineral Resources and Mineral Reserves (MRMR) Best Practice Guidelines 2019 (CIM (2019) MRMR Best Practice Guidelines).
Since 2023 there have been changes to the Mineral Resource through exploration and drilling, including extensions to the existing Chimiwungo, Malundwe and Kamisengo deposits and the reporting of new Mineral Resource estimates for Kababisa. There has also been depletion of the previously estimated Mineral Resources through mining at the Chimiwungo and Malundwe open pits, and processing of stockpiled ore. Advances in understanding of geological controls on mineralisation to support improved geological modelling have been made and there has been ongoing development and optimisation of Mineral Resource estimation methods.
The Mineral Resource estimate was reviewed internally as well as externally before release.
The Lumwana Mineral Resource estimate, as of December 31, 2024 is presented in Table 14-1. The Mineral Resource estimate consists of surface stockpiles and in-situ open pit material from four deposits; Chimiwungo, Malundwe, Kababisa, and Kamisengo. The Measured and Indicated Mineral Resources are estimated to be 2,000 Mt at 0.50% Cu for 10.0 Mt Cu, with an additional Inferred Mineral Resource of 230 Mt at 0.40% Cu for 0.91 Mt Cu.
The Measured and Indicated Mineral Resources have increased by 41% (2.9 Mt Cu) and the Inferred Mineral Resources have decreased by 77% (3.1 Mt Cu) since December 31, 2023. This change is due to significant infill drilling providing sufficient confidence to allow Inferred Mineral Resources to be categorised as Indicated Mineral Resource, and the addition of Kababisa to the Mineral Resource estimate for the first time.
The open pit Mineral Resources are those that demonstrate reasonable prospects for eventual economic extraction (RPEEE). These are defined as those above the in-situ marginal cut-off grade within a pit shell using a copper price of US$4.00/lb Cu.
|
February 19, 2025 |
Page 110 |
|
|
NI 43-101 Technical Report on the Lumwana Expansion Project |
|
The QP is not aware of any environmental, permitting, legal, title, taxation, socio-economic, marketing, political, metallurgical, fiscal, or other relevant factors that are not discussed in this Technical Report, that could materially affect the Mineral Resource estimate.
|
February 19, 2025 |
Page 111 |
|
|
NI 43-101 Technical Report on the Lumwana Expansion Project |
|
Table 14-1 Lumwana Mineral Resource Estimate as of December 31, 2024
| Measured | Indicated | Measured + Indicated | Inferred | |||||||||||||||||||||
|
Tonnes (Mt) |
Grade (% Cu) |
Contained Metal |
Tonnes (Mt) |
Grade (% Cu) |
Contained Metal |
Tonnes (Mt) |
Grade (% Cu) |
Contained Metal |
Tonnes (Mt) |
Grade (% Cu) |
Contained Metal |
|||||||||||||
|
Stockpiles |
20 | 0.32 | 0.064 | - | - | - | 20 | 0.32 | 0.064 | - | - | - | ||||||||||||
| Chimiwungo |
130 | 0.43 | 0.56 | 1,300 | 0.55 | 7.1 | 1,400 | 0.53 | 7.6 | 180 | 0.4 | 0.74 | ||||||||||||
| Kababisa |
- | - | - | 7.2 | 0.39 | 0.028 | 7.2 | 0.39 | 0.028 | 0.14 | 0.4 | 0.00056 | ||||||||||||
| Kamisengo |
- | - | - | 350 | 0.32 | 1.1 | 350 | 0.32 | 1.1 | 40 | 0.3 | 0.13 | ||||||||||||
| Malundwe |
24 | 0.64 | 0.15 | 180 | 0.57 | 1.0 | 200 | 0.58 | 1.2 | 11 | 0.4 | 0.046 | ||||||||||||
|
Open Pit Subtotal |
150 | 0.46 | 0.71 | 1,800 | 0.50 | 9.2 | 2,000 | 0.50 | 9.9 | 230 | 0.4 | 0.91 | ||||||||||||
| Total |
170 | 0.45 | 0.77 | 1,800 | 0.50 | 9.2 | 2,000 | 0.50 | 10.0 | 230 | 0.4 | 0.91 | ||||||||||||
Notes:
| ● | Mineral Resources are reported on a 100% basis. |
| ● | The Mineral Resource estimate has been prepared according to CIM (2014) Standards and using CIM (2019) MRMR Best Practice Guidelines. |
| ● | All Mineral Resource tabulations are reported inclusive of that material which is then modified to form Mineral Reserves. |
| ● | Open pit Mineral Resources are those within a US$4.00/lb pit shell at a cut-off grade of 0.13% Cu for both transitional and fresh mineralisation. |
| ● | The Mineral Resource has been depleted with mined surfaces up to December 31, 2024. |
| ● | Mineral Resources that are not Mineral Reserves do not have demonstrated economic viability. |
| ● | Mineral Resources were reviewed by Richard Peattie, FAusIMM, an employee of Barrick and QP. |
| ● | Numbers may not add due to rounding. Tonnes and contained copper are rounded to 2 significant figures. All Measured and Indicated grades are reported to 2 decimal places whilst Inferred Mineral Resource grades are reported to 1 decimal place. |
|
February 19, 2025 |
Page 112 |
|
|
NI 43-101 Technical Report on the Lumwana Expansion Project |
|
| 14.1 | Resource Database |
Table 14-2 summarises the cut-off dates for drilling used to support the Mineral Resource estimate.
Table 14-2 Summary of Mineral Resource Drilling and Model Dates
| Deposit | Producing Status | Drilling Cut-Off Date | Model Release Date | |||
|
Chimiwungo |
Active | 23/04/2024 | 27/06/2024 | |||
|
Malundwe |
Active | 17/06/2024 | 04/07/2024 | |||
|
Kamisengo |
Not started | 11/04/2024 | 03/07/2024 | |||
|
Kababisa |
Not started | 27/03/2024 | 09/07/2024 | |||
Before Mineral Resource estimation, the database was validated. Drill holes with incorrect or missing collar coordinates, incorrect or inaccurate downhole surveys, or other downhole data errors that could not be corrected (for example, overlapping intervals), were removed from the database. Holes drilled using RAB or tri-cone drilling, and holes with samples analysed only using portable XRF were also removed. Table 14-3summarises the drilling in the resulting Mineral Resource database.
RC drilling completed for grade control accounts for 66% of the drilled meters in the Mineral Resource database (Table 14-3). Although this RC drilling accounts for a large proportion of the drilling meters, due to the close spacing, and mostly occurring in depleted areas, it supports a small volume of the Mineral Resource. In terms of the copper metal content, RC data informs approximately 6% of the Mineral Resource. Over 90% of the current Mineral Resource is supported by DD completed since 2000 by Equinox and Barrick.
Samples from both DD and RC drilling were used for the Mineral Resource estimate. A statistical comparison of copper assay grades was made to assess for bias between the two different sample types (RSC, 2024). Despite a high-grade bias towards RC samples at grades significantly below cut-off (<0.005%) no significant bias was noted at or around the economic cut-off grade indicating that both types of samples are suitable to be used for Mineral Resource estimation (Figure 14-1).
|
February 19, 2025 |
Page 113 |
|
|
NI 43-101 Technical Report on the Lumwana Expansion Project |
|
Table 14-3 Drilling in the Mineral Resource Database
| Company | Period | RC (m) |
DD (m) |
Total (m) |
Company (%) |
|||||
| Chimiwungo | ||||||||||
|
RST |
1961 - 1975 | - | 33,042 | 33,042 | 2.0% | |||||
|
AGIP |
1982 - 1987 | - | 2,488 | 2,488 | 0.1% | |||||
|
Phelps Dodge |
1993 - 1994 | 200 | 2,984 | 3,184 | 0.2% | |||||
|
Equinox |
2000 - 2011 | 64,060 | 61,296 | 125,356 | 7.5% | |||||
|
Barrick |
2011 - 2019 | 467,893 | 306,007 | 773,900 | 46.6% | |||||
|
Barrick |
2020 - 2024 | 546,483 | 178,040 | 724,523 | 43.6% | |||||
|
Total (m) |
1,078,636 | 583,857 | 1,662,493 | 100.0% | ||||||
|
RC vs DD (%) |
65% | 35% | ||||||||
| Malundwe | ||||||||||
|
RST |
1961 - 1975 | - | 17,878 | 17,878 | 3.7% | |||||
|
AGIP |
1982 - 1987 | - | 12,618 | 12,618 | 2.6% | |||||
|
Phelps Dodge |
1993 - 1994 | 306 | 1,243 | 1,549 | 0.3% | |||||
|
Equinox |
2000 - 2011 | 255,676 | 9,526 | 265,202 | 54.7% | |||||
|
Barrick |
2011 - 2019 | 64,947 | - | 64,947 | 13.4% | |||||
|
Barrick |
2020 - 2024 | 101,038 | 21,868 | 122,906 | 25.3% | |||||
|
Total (m) |
421,967 | 63,133 | 485,100 | 100.0% | ||||||
|
RC vs DD (%) |
87% | 13% | ||||||||
| Kamisengo | ||||||||||
|
Equinox |
2000 - 2011 | 1,136 | 4,148 | 5,284 | 3.9% | |||||
|
Barrick |
2020 - 2024 | 2,408 | 127,382 | 129,790 | 96.1% | |||||
|
Total (m) |
3,544 | 131,530 | 135,074 | 100.0% | ||||||
|
RC vs DD (%) |
3% | 97% | ||||||||
| Kababisa | ||||||||||
|
Equinox |
2000 - 2011 | 4,911 | 292 | 5,203 | 34.8% | |||||
|
Barrick |
2020 - 2024 | 2,468 | 7,295 | 9,763 | 65.2% | |||||
|
Total (m) |
7,379 | 7,587 | 14,966 | 100.0% | ||||||
|
RC vs DD (%) |
49% | 51% | ||||||||
| Total | ||||||||||
|
RST |
1961 - 1975 | - | 50,920 | 50,920 | 2.2% | |||||
|
AGIP |
1982 - 1987 | - | 15,106 | 15,106 | 0.7% | |||||
|
Phelps Dodge |
1993 - 1994 | 506 | 4,227 | 4,733 | 0.2% | |||||
|
Equinox |
2000 - 2011 | 325,783 | 75,262 | 401,045 | 17.5% | |||||
|
Barrick |
2012 - 2019 | 532,840 | 306,007 | 838,847 | 36.5% | |||||
|
Barrick |
2020 - 2024 | 652,397 | 334,585 | 986,982 | 43.0% | |||||
|
Total (m) |
1,511,526 | 786,107 | 2,297,633 | 100.0% | ||||||
|
RC vs DD (%) |
66% | 34% | ||||||||
|
February 19, 2025 |
Page 114 |
|
|
NI 43-101 Technical Report on the Lumwana Expansion Project |
|

Source: RSC, 2024
Figure 14-1 QQ Plot for DD-RC Pairs within 2 m
| 14.2 | Geological Modelling |
All geological modelling was completed using Leapfrog Geo software.
Detailed geological logging was simplified and interpreted to create 3D geological models of the major geological domains; leached overburden, hanging wall lithologies, MS, internal barren gneiss, and footwall lithologies, which were all limited to the topography. Along with the geological data, a minimum grade of 0.10% Cu and a minimum thickness of two metres was used to define the MS, and a maximum grade of 0.2% Cu was used to define barren gneiss. Faults were modelled from structural logging data and those with major displacements were used to define domains for grade interpolation. The number and type of geological domains are summarised in Table 14-4 and a 3D model of MS and faults at Chimiwungo is shown Figure 14-2.
|
February 19, 2025 |
Page 115 |
|
|
NI 43-101 Technical Report on the Lumwana Expansion Project |
|
Table 14-4 Modelled Geological Domains
| Geological Domain | Number of Geological Domains | |||||||
| Chimiwungo | Malundwe | Kamisengo | Kababisa | |||||
|
MS |
3 | 2 | 7 | 1 | ||||
|
Internal Barren Gneiss |
3 | 2 | 1 | |||||
|
Hanging Wall Lithologies |
3 | 2 | ||||||
|
Footwall Lithologies |
3 | 2 | ||||||
|
Hanging Wall and Footwall Lithologies |
11 | |||||||
|
Stringer Schists |
2 | 1 | ||||||
|
Total |
14 | 9 | 9 | 2 | ||||

Source: Barrick, 2024
Figure 14-2 3D Model of MS Domains and Faults at Chimiwungo (Looking North East)
The degree of oxidation is interpreted using the ratio between AsCu and TCu for Chimiwungo, Malundwe, and Kamisengo, and the ratio between S and TCu for Kababisa (Table 14-5). Based on these ratios, surfaces for the different oxidation zones were modelled.
|
February 19, 2025 |
Page 116 |
|
|
NI 43-101 Technical Report on the Lumwana Expansion Project |
|
Oxide minerals cannot be recovered by the plant and so oxide material is not reported as Mineral Resources. Transitional material is reported as Mineral Resources, but comprises approximately 2% of the Mineral Resources. The majority of the reported Mineral Resources is fresh material.
Table 14-5 Ratios Used to Define Oxidation Zones
| Deposit | AsCu/TCu Ratio | Oxidation Zone | Copper Species | |||
|
Chimiwungo, Malundwe & Kamisengo |
0.00 to 0.075 | Fresh | Sulphides | |||
| 0.075 to 0.25 | Transitional | Mixed Sulphides & Oxides | ||||
| 0.25 to 1.00 | Oxide | Oxides | ||||
| Deposit | S/TCu Ratio | Oxidation Zone | Copper Species | |||
|
Kababisa |
0.00 to 0.15 | Oxide | Oxides | |||
| >0.15 | Fresh | Sulphides | ||||
Drilling density varies across the deposits, and different domains were also produced to reflect the different drilling densities during Mineral Resource estimation. Three domains were created; for RC drilling spaced at 12.5 m to 25 m, infill drilling spaced at 50 m to 100 m, and Mineral Resource definition and exploration drilling spaced over 100 m to 100 m.
| 14.3 | Bulk Density |
Dry bulk density values were applied to the block model based on geological logging of weathering, geological domain, and copper grade (Table 14-6).
Domain densities were defined by compositing density samples within their geological domains and grade intervals. Any outliers were removed, and where sufficient samples were available, the densities were divided into bins based on copper grades and plotted to identify any trends.
|
February 19, 2025 |
Page 117 |
|
|
NI 43-101 Technical Report on the Lumwana Expansion Project |
|
Table 14-6 Dry Bulk Density Assignment
|
Oxidation Zone |
Geological Domain |
Grade (% Cu) |
Assigned Density (t/m3) | |||||||||
| Malundwe | Chimiwungo | Kababisa | Kamisengo | |||||||||
|
Oxide |
Overburden | - | 1.73 | 1.73 | 1.73 | 1.73 | ||||||
| All lithologies | - | 2.10 | 2.10 | 2.10 | 2.10 | |||||||
|
Transition |
All lithologies | - | 2.72 | 2.72 | 2.72 | 2.72 | ||||||
|
Fresh |
Hanging Wall Lithologies | - | 2.75 | 2.74 | 2.75 | 2.78 | ||||||
| Internal Barren Gneiss | - | 2.78 | 2.77 | 2.78 | ||||||||
| Footwall Lithologies | - | 2.79 | 2.81 | 2.79 | ||||||||
| Mineralised Schist | 0.00-0.10 | 2.79 | 2.78 | 2.79 | 2.81 | |||||||
| 0.10-0.25 | 2.79 | 2.79 | ||||||||||
| 0.25-0.50 | 2.79 | 2.80 | 2.79 | |||||||||
| 0.50-0.75 | 2.80 | 2.81 | 2.80 | |||||||||
| 0.75-1.00 | 2.80 | 2.81 | 2.80 | |||||||||
| 1.00-1.25 | 2.81 | 2.82 | 2.81 | |||||||||
| 1.25-1.50 | 2.82 | 2.82 | 2.82 | |||||||||
| 1.50-1.75 | 2.83 | 2.83 | 2.83 | |||||||||
| 1.75-2.00 | 2.83 | 2.84 | 2.83 | |||||||||
| 2.00-2.25 | 2.84 | 2.85 | 2.84 | |||||||||
| 2.25-2.50 | 2.84 | 2.84 | ||||||||||
| >2.50 | 2.84 | 2.84 | ||||||||||
Density was based on analysis of a total of 4,406 samples for Chimiwungo and 517 samples for Malundwe. For both deposits, analysis revealed a gradual increase in density with grade, and so the mean density for each copper grade bin was assigned to the block model (Figure 14-3 and Figure 14-4).

Figure 14-3 Chimiwungo Fresh Density for Copper Grade Bins
|
February 19, 2025 |
Page 118 |
|
|
NI 43-101 Technical Report on the Lumwana Expansion Project |
|

Figure 14-4 Malundwe Fresh Density for Copper Grade Bins
For Kamisengo, a total of 3,370 density measurements were analysed. There were insufficient samples in the oxide and transition zones for Kamisengo, and therefore density samples from those zones at Chimiwungo were used. For the fresh zone at Kamisengo, the mean density per geological domain was used (Table 14-6). For Kababisa, density values for Malundwe, which has similar geology, were used.
| 14.4 | Compositing |
Compositing and Mineral Resource estimation was completed in Vulcan software.
Samples were composited prior to top cutting. A composite of two metres was chosen to agree with the current standard RC sample length. A ‘best fit’ method was used to divide the composites equally within geological domains. Statistical analysis of the original sample and the composite sample confirms that the coefficient of variation (CV), standard deviation, and mean were comparable at this length (Table 14-7 to Table 14-10).
Missing sample intervals were reviewed and found to be due to insufficient sample recovery, with a very small number of lost samples. These missing samples were ignored during compositing.
|
February 19, 2025 |
Page 119 |
|
|
NI 43-101 Technical Report on the Lumwana Expansion Project |
|
Table 14-7 Chimiwungo Mineralised Domain Assay and Composite Comparison
| Statistic | Sample Type |
Domain | ||||||||||||
| 1 | 11 | 21 | 79 | 89 | 99 | |||||||||
|
Number of Data |
Sample | 39,299 | 129,237 | 18,927 | 45,661 | 145,648 | 22,188 | |||||||
| Composite | 30,949 | 106,356 | 17,394 | 34,483 | 117,116 | 19,895 | ||||||||
|
Mean Cu Grade (%) |
Sample | 0.92 | 0.78 | 0.59 | 0.06 | 0.06 | 0.08 | |||||||
| Composite | 0.92 | 0.76 | 0.60 | 0.06 | 0.06 | 0.08 | ||||||||
|
Coefficient of Variation (CV) |
Sample | 0.83 | 0.78 | 0.64 | 2.10 | 1.49 | 0.96 | |||||||
| Composite | 0.80 | 0.71 | 0.62 | 1.10 | 1.01 | 0.87 | ||||||||
Table 14-8 Malundwe Mineralised Domain Assay and Composite Comparison
| Statistic | Sample Type | Domain | ||||||||
| 3 | 13 | 5 | 15 | |||||||
|
Number of Data |
Sample | 44,905 | 397 | 25,115 | 399 | |||||
| Composite | 41,519 | 295 | 23385 | 270 | ||||||
|
Mean Cu Grade (%) |
Sample | 1.16 | 1.02 | 0.07 | 0.05 | |||||
| Composite | 1.14 | 0.97 | 0.07 | 0.06 | ||||||
|
Coefficient of Variation (CV) |
Sample | 0.81 | 0.753 | 1.24 | 1.28 | |||||
| Composite | 0.77 | 0.69 | 0.81 | 1.01 | ||||||
Table 14-9 Kamisengo Fresh Mineralised Domain Assay and Composite Comparison
| Statistic | Sample Type |
Domain | ||||||||||||||||
| 10 | 20 | 30 | 40 | 50 | 60 | 70 | 89 | |||||||||||
|
Number of Data |
Sample | 203 | 856 | 1,243 | 3,082 | 1,014 | 10,175 | 1,461 | 830 | |||||||||
| Composite | 106 | 452 | 680 | 1,659 | 549 | 5,340 | 780 | 497 | ||||||||||
|
Mean Cu Grade (%) |
Sample | 0.50 | 0.48 | 0.37 | 0.34 | 0.32 | 0.41 | 0.32 | 0.07 | |||||||||
| Composite | 0.48 | 0.47 | 0.37 | 0.33 | 0.31 | 0.41 | 0.32 | 0.07 | ||||||||||
|
Coefficient of Variation (CV) |
Sample | 0.92 | 0.76 | 0.72 | 0.69 | 0.77 | 0.99 | 1.06 | 0.71 | |||||||||
| Composite | 0.71 | 0.65 | 0.58 | 0.57 | 0.62 | 0.77 | 0.71 | 0.51 | ||||||||||
Table 14-10 Kababisa Mineralised Domain Assay and Composite Comparison
| Statistic | Sample Type | Domain | ||||||
| 3 | 31 | 2 | ||||||
|
Number of Data |
Sample | 485 | 143 | 3,580 | ||||
| Composite | 327 | 62 | 1,931 | |||||
|
Mean Cu Grade (%) |
Sample | 0.49 | 0.22 | 0.01 | ||||
| Composite | 0.49 | 0.18 | 0.01 | |||||
|
Coefficient of Variation (CV) |
Sample | 0.79 | 1.25 | 1.95 | ||||
| Composite | 0.75 | 0.74 | 1.56 | |||||
|
February 19, 2025 |
Page 120 |
|
|
NI 43-101 Technical Report on the Lumwana Expansion Project |
|
| 14.5 | Capping and Outliers |
Top-cutting and high-grade yields were used to reduce the impact of outliers on the grade estimate. Statistical analysis was used to identify outliers and to choose an optimum top-cut and high-grade yield value for each domain.
For top-cutting, when a composite grade exceeds the top-cut value its grade is reduced to this value. For high-grade (HG) yields, any composite above the chosen high-grade yield value has its influence restricted to a specified distance during grade estimation. This restricts the influence of the sample on the grade estimate. The top-cuts and high-grade yields used for each deposit are summarised in Table 14-11 to Table 14-14.
| 14.6 | Block Model |
Block models were flagged to reflect the different lithological, oxidation, and drilling density domains. When choosing the block size, consideration was given to selectivity during mine design and planning relative to the geology, spatial variability, and drill spacing, and the resulting block models have multiple parent and sub-block sizes. Although these sub-blocked models honour the domain boundaries, they are highly selective and so the models were regularised to account for mining dilution. The regularised block models are used to report Mineral Resources. The block model parameters are summarised in Table 14-15.
The block models were limited to the topographic surface which is generated from a 0.15 m resolution LiDAR survey flown in 2015 for Chimiwungo, Malundwe, and Kababisa and from 5 m resolution aerial photogrammetry for Kamisengo. The block models for active mining areas were also limited by depletion surfaces which are generated from 15 mm resolution DGPS and/or total station surveys. The current Mineral Resource has been depleted with the surveys up to December 31, 2024.
|
February 19, 2025 |
Page 121 |
|
|
NI 43-101 Technical Report on the Lumwana Expansion Project |
|
Table 14-11 Chimiwungo Copper Top-cut and High-grade Yield Summary
| Location | Domain |
Total Samples |
High Yield (% Cu) |
Top Cap (% Cu) |
Samples Capped | Mean (% Cu) | CV | |||||||||||||||||
| Number | % | Before Capping |
After Capping |
Change (%) |
Before Capping |
After Capping |
Change (%) |
|||||||||||||||||
| South | 6 | 11,543 | 0.20 | 0.35 | 96 | 0.90 | 0.03 | 0.02 | -8.8% | 2.83 | 2.18 | -23% | ||||||||||||
| 4 | 239 | 0.41 | 1.01 | 12 | 5.40 | 0.34 | 0.32 | -6.3% | 0.98 | 0.83 | -16% | |||||||||||||
| 3 | 98 | 0.58 | 1.28 | 3 | 3.10 | 0.31 | 0.29 | -6.1% | 1.24 | 1.07 | -13% | |||||||||||||
| 2 | 859 | 1.37 | 1.84 | 15 | 1.80 | 0.36 | 0.35 | -3.1% | 1.33 | 1.23 | -7% | |||||||||||||
| 1 | 35,829 | 3.20 | 5.16 | 6 | 0.10 | 0.88 | 0.88 | -0.1% | 0.82 | 0.81 | -1% | |||||||||||||
| 79 | 38,244 | 0.25 | 0.30 | 662 | 1.80 | 0.07 | 0.06 | -11.5% | 1.89 | 1.07 | -43% | |||||||||||||
| 7 | 8,205 | 0.20 | 0.38 | 28 | 0.40 | 0.03 | 0.02 | -9.3% | 3.17 | 1.77 | -44% | |||||||||||||
| Main | 16 | 62,519 | 0.20 | 0.35 | 130 | 0.30 | 0.01 | 0.01 | -7.7% | 3.77 | 2.30 | -39% | ||||||||||||
| 14 | 72 | 0.57 | 1.19 | 6 | 8.50 | 0.44 | 0.42 | -4.6% | 0.88 | 0.80 | -10% | |||||||||||||
| 11 | 120,058 | 3.20 | 4.20 | 55 | 0.10 | 0.75 | 0.75 | -0.1% | 0.72 | 0.71 | -1% | |||||||||||||
| 89 | 132,358 | 0.20 | 0.30 | 1027 | 0.80 | 0.07 | 0.07 | -3.3% | 1.32 | 1.00 | -24% | |||||||||||||
| 17 | 33,392 | 0.20 | 0.32 | 211 | 0.70 | 0.03 | 0.03 | -9.3% | 2.71 | 1.60 | -41% | |||||||||||||
| North | 26 | 2,968 | - | 0.21 | 19 | 0.20 | 0.02 | 0.02 | -2.2% | 1.81 | 1.49 | -17% | ||||||||||||
| 21 | 23,826 | 2.00 | 3.49 | 12 | 0.10 | 0.57 | 0.57 | -0.1% | 0.65 | 0.64 | -2% | |||||||||||||
| 99 | 27,552 | 0.20 | 0.30 | 239 | 0.90 | 0.09 | 0.09 | -1.4% | 0.88 | 0.82 | -8% | |||||||||||||
| 27 | 11,761 | - | 0.23 | 201 | 1.80 | 0.03 | 0.03 | -16.9% | 2.73 | 1.45 | -47% | |||||||||||||
Table 14-12 Kababisa Copper Top-cut and High-grade Yield Summary
| Location | Domain |
Total Samples |
High Yield (% Cu) |
Top Cap (% Cu) |
Samples Capped | Mean (% Cu) | CV | |||||||||||||||||
| Number | % | Before Capping |
After Capping |
Change (%) |
Before Capping |
After Capping |
Change (%) |
|||||||||||||||||
| Kababisa | 3 | 1,092 | 1.26 | 1.54 | 3 | 0.5 | 0.45 | 0.45 | -0.2% | 0.81 | 0.79 | -0.02 | ||||||||||||
| 31 | 217 | 0.38 | 0.55 | 5 | 7.8 | 0.20 | 0.18 | -8% | 0.94 | 0.63 | -0.33 | |||||||||||||
| 2 | 266 | 0.10 | 0.14 | 10 | 0.3 | 0.02 | 0.02 | -3% | 1.38 | 1.33 | -0.04 | |||||||||||||
|
February 19, 2025 |
Page 122 |
|
|
NI 43-101 Technical Report on the Lumwana Expansion Project |
|
Table 14-13 Malundwe Copper Top-cut and High-grade Yield Summary
| Location | Domain |
Total Samples |
High Yield (% Cu) |
Top Cap (% Cu) |
Samples Capped | Mean (% Cu) | CV | |||||||||||||||||
| Number | % | Before Capping |
After Capping |
Change (%) |
Before Capping |
After Capping |
Change (%) |
|||||||||||||||||
| South | 12 | 1,092 | - | 0.11 | 3 | 0.30 | 0.01 | 0.01 | -2.3% | 2.51 | 2.35 | -6.4% | ||||||||||||
| 13 | 217 | 1.88 | 2.87 | 4 | 1.90 | 0.85 | 0.85 | -0.8% | 0.80 | 0.78 | -2.4% | |||||||||||||
| 15 | 266 | - | 0.20 | 4 | 1.60 | 0.05 | 0.05 | -1.4% | 1.13 | 1.10 | -2.6% | |||||||||||||
| 14 | 746 | - | 0.10 | 10 | 1.50 | 0.02 | 0.01 | -3.4% | 1.52 | 1.40 | -7.3% | |||||||||||||
| 6 | 366 | 0.93 | 1.48 | 7 | 2.00 | 0.24 | 0.22 | -6.2% | 1.48 | 1.21 | -18.3% | |||||||||||||
| North | 2 | 33,418 | - | 0.17 | 55 | 0.20 | 0.01 | 0.01 | -4.1% | 2.37 | 1.44 | -38.9% | ||||||||||||
| 3 | 48,895 | 6.78 | 10.74 | 5 | 0.10 | 1.06 | 1.06 | 0.0% | 0.82 | 0.81 | -0.9% | |||||||||||||
| 5 | 27,125 | 0.26 | 0.29 | 53 | 0.20 | 0.08 | 0.08 | -1.0% | 0.89 | 0.76 | -14.5% | |||||||||||||
| 4 | 15,625 | - | 0.20 | 58 | 0.40 | 0.02 | 0.02 | -10.6% | 3.43 | 1.30 | -62.1% | |||||||||||||
| 6 | 366 | 0.93 | 1.48 | 7 | 2.00 | 0.24 | 0.22 | -6.2% | 1.48 | 1.21 | -18.3% | |||||||||||||
Table 14-14 Kamisengo Copper Top-cut and High-grade Yield Summary
| Location | Domain |
Total Samples |
High Yield (% Cu) |
Top Cap (% Cu) |
Samples Capped | Mean (% Cu) | CV | |||||||||||||||||
| Number | % | Before Capping |
After Capping |
Change (%) |
Before Capping |
After Capping |
Change (%) |
|||||||||||||||||
| Kamisengo | 10 | 106 | - | 1.28 | 3 | 3.90 | 0.50 | 0.47 | -5.5% | 0.79 | 0.70 | -10.9% | ||||||||||||
| 20 | 452 | 1.22 | 1.34 | 1 | 0.30 | 0.47 | 0.47 | -0.4% | 0.66 | 0.65 | -1.4% | |||||||||||||
| 30 | 680 | - | 1.24 | 1 | 0.80 | 0.37 | 0.37 | -0.2% | 0.58 | 0.57 | -1.3% | |||||||||||||
| 40 | 1,654 | 0.83 | 1.07 | 4 | 0.30 | 0.33 | 0.33 | 0.0% | 0.57 | 0.57 | -0.2% | |||||||||||||
| 50 | 549 | 0.71 | 0.95 | 6 | 1.10 | 0.32 | 0.31 | -0.6% | 0.64 | 0.62 | -3.1% | |||||||||||||
| 60 | 5,302 | 1.28 | 3.46 | 6 | 0.20 | 0.41 | 0.41 | -0.5% | 0.81 | 0.76 | -6.0% | |||||||||||||
| 70 | 780 | - | 1.43 | 2 | 0.40 | 0.32 | 0.32 | -2.1% | 0.87 | 0.70 | -19.4% | |||||||||||||
| 89 | 497 | - | 0.15 | 4 | 1.10 | 0.07 | 0.07 | -1.3% | 0.55 | 0.51 | -7.7% | |||||||||||||
| 99 | 30,715 | - | 0.14 | 1100 | 3.60 | 0.03 | 0.02 | -14.3% | 2.12 | 1.48 | -30.1% | |||||||||||||
|
February 19, 2025 |
Page 123 |
|
|
NI 43-101 Technical Report on the Lumwana Expansion Project |
|
Table 14-15 Block Model Parameters
| Block Extents | Easting (X) | Northing (Y) | Elevation (Z) | |||
| Chimiwungo | ||||||
| Origin | 376,000 | 8,638,000 | 404 | |||
| Minimum Offset | 0 | 0 | 0 | |||
| Maximum Offset | 5,000 | 7,000 | 1008 | |||
| Parent Block Size (m) = EXP | 50 | 50 | 4 | |||
| Limits Block Size (m) = AGC | 25 | 25 | 4 | |||
| Limits Block Size (m) = GC | 6.25 | 6.25 | 4 | |||
| Sub Cell Size (m) | 6.25 | 6.25 | 1 | |||
| Regularised Block Size | 6.25 | 6.25 | 12 | |||
| Rotation (Degrees) | 90 | 0 | 0 | |||
| Malundwe | ||||||
| Origin | 369,500 | 8,642,910 | 992 | |||
| Minimum Offset | 0 | 0 | 0 | |||
| Maximum Offset | 3,800 | 7,600 | 408 | |||
| Parent Block Size (m) = EXP | 50 | 50 | 4 | |||
| Limits Block Size (m) = AGC | 25 | 25 | 4 | |||
| Limits Block Size (m) = GC | 6.25 | 6.25 | 4 | |||
| Sub Cell Size (m) | 3.125 | 3.125 | 1 | |||
| Regularised Block Size | 6.25 | 6.25 | 8 | |||
| Rotation (Degrees) | 90 | 0 | 0 | |||
| Kamisengo | ||||||
| Origin | 382900 | 8652200 | 704 | |||
| Minimum Offset | 0 | 0 | 0 | |||
| Maximum Offset | 5200 | 7300 | 816 | |||
| Parent Block Size (m) = EXP | 25 | 25 | 4 | |||
| Limits Block Size (m) = AGC | - | - | - | |||
| Limits Block Size (m) = GC | - | - | - | |||
| Sub Cell Size (m) | 2.5 | 2.5 | 1 | |||
| Regularised Block Size | 6.25 | 6.25 | 6 | |||
| Rotation (Degrees) | 90 | 0 | 0 | |||
| Kababisa | ||||||
| Origin | 373000 | 8650300 | 764 | |||
| Minimum Offset | 0 | 0 | 0 | |||
| Maximum Offset | 2000 | 3800 | 756 | |||
| Parent Block Size (m) = EXP | 12.5 | 25 | 2 | |||
| Limits Block Size (m) = AGC | - | - | - | |||
| Limits Block Size (m) = GC | - | - | - | |||
| Sub Cell Size (m) | 1.5625 | 1.5625 | 0.5 | |||
| Regularised Block Size | 3.125 | 3.125 | 8 | |||
| Rotation (Degrees) | 90 | 0 | 0 | |||
Note. EXP = exploration; AGC = infill; GC = RC
|
February 19, 2025 |
Page 124 |
|
|
NI 43-101 Technical Report on the Lumwana Expansion Project |
|
| 14.7 | Variography |
Exploratory data analysis (EDA) and variography were conducted using Snowden Supervisor v8.14 software.
Spatial continuity at Chimiwungo and Malundwe was modelled using standardised semi-variograms (with sill normalised to one) without transform while spatial continuity at Kamisengo and Kababisa was modelled using normal score transformed data (with sill normalised to one). Variography was completed on each domain individually. Experimental semi-variograms were created in three dimensions to identify the direction of maximum continuity.
Directions of maximum continuity were defined as 006° azimuth, 10° plunge, and 12° dip towards the east for Chimiwungo; 004° azimuth, 05° plunge, and 14° dip towards the west for Malundwe; 10° azimuth, 04° plunge, and 15° dip towards the east for Kamisengo; and 355° azimuth, -2° plunge and 25° dip towards the west for Kababisa.
Table 14-10 shows an example of semi-variogram models for the main MS at Chimiwungo. The majority of variance (80%) is reached within 45 m along strike and 30 m across strike with a 26% nugget modelled.

Figure 14-5 Experimental Semi-variograms and Semi-variogram Models for Chimiwungo Main MS
|
February 19, 2025 |
Page 125 |
|
|
NI 43-101 Technical Report on the Lumwana Expansion Project |
|
Figure 14-6 shows an example of semi-variogram models for the main MS at Malundwe. The majority of variance (80%) is reached within 50 m along strike and 20 m across strike with a 24% nugget modelled.

Figure 14-6 Experimental Semi-variograms and Semi-variogram Models for Malundwe Main MS
At Kamisengo data was divided into two groups for variography; the first containing domains 10 and 20 and the second containing domains 30, 40, 50, 60, and 70. Figure 14-7 shows an example of semi-variogram models for the MS at Kamisengo. The majority of variance (80%) is reached within 75 m along strike, 40 m across strike, with a 16% nugget modelled.
|
February 19, 2025 |
Page 126 |
|
|
NI 43-101 Technical Report on the Lumwana Expansion Project |
|

Figure 14-7 Experimental Normal Scores Semi-variograms and Semi-variogram Model for
Kamisengo Combined MS Domains 30, 40, 50, 60 and 70
|
February 19, 2025 |
Page 127 |
|
|
NI 43-101 Technical Report on the Lumwana Expansion Project |
|
Figure 14-8 shows an example of semi-variogram models for the Kababisa combined mineralised schists; variograms were transformed to normal scores and then back transformed afterwards. The majority of the variance (80%) was reached within 100 m along strike and 75 m across strike/down dip.

Figure 14-8 Experimental Normal Scores Semi-variograms and Semi-variogram Models for
Kababisa Combined MS
The grade continuity observed is in line with expectations for this style of deposit.
| 14.8 | Resource Estimation |
| 14.8.1 | Search Strategy |
Quantitative Kriging Neighbourhood Analysis (QKNA) was used to define grade estimation parameters including search neighbourhood size, minimum and maximum sample numbers, and discretisation. Optimisation also looked at kriging efficiency (KE) and slope of regression (SR) to support the choice of search neighbourhood size. Analysis was completed for all major mineralised domains individually.
|
February 19, 2025 |
Page 128 |
|
|
NI 43-101 Technical Report on the Lumwana Expansion Project |
|
For each deposit, a large number of domains were generated to account for lithology, oxidation, and drilling density. An example of the copper grade estimation parameters for one domain at Chimiwungo is shown in Table 14-16. For all domains at Chimiwungo, discretisation of 5 m by 5 m by 3 m was used with a total of three samples per drill hole in RC drilling areas and four or five samples per drill hole in the other domains.
Table 14-16 Chimiwungo ‘Geol = 21’ Fresh Copper Estimation Parameters
| Drilling Domain |
Block Size (m) |

|
Search Radius (m) |
No. Samples |
Max per DH |
Discretisation (m) |
HY Value (%) |
HY Restriction | ||||||||||||||||||||||||||
| X | Y | Z | Y | X | Z | Min | Max | X | Y | Z | X | Y | Z | |||||||||||||||||||||
|
RC |
6.25 | 6.25 | 4.0 | 1 | 40 | 30 | 4 | 12 | 24 | 3 | 5 | 5 | 3 | 2.00 | 80 | 60 | 16 | |||||||||||||||||
| 2 | 80 | 60 | 8 | 12 | 24 | 3 | 2.00 | 80 | 60 | 16 | ||||||||||||||||||||||||
| 3 | 300 | 150 | 15 | 6 | 18 | 3 | 2.00 | 80 | 60 | 16 | ||||||||||||||||||||||||
|
Infill |
25.0 | 25.0 | 4.0 | 1 | 130 | 65 | 10 | 12 | 24 | 3 | 5 | 5 | 3 | 2.00 | 50 | 50 | 9 | |||||||||||||||||
| 2 | 300 | 150 | 15 | 12 | 24 | 3 | 2.00 | 100 | 100 | 12 | ||||||||||||||||||||||||
| 3 | 450 | 275 | 150 | 6 | 18 | 3 | 2.00 | 100 | 100 | 12 | ||||||||||||||||||||||||
|
Res.Def |
50.0 | 50.0 | 4.0 | 1 | 300 | 150 | 15 | 12 | 24 | 3 | 5 | 5 | 3 | - | - | - | - | |||||||||||||||||
| 2 | 600 | 300 | 60 | 12 | 24 | - | - | - | - | - | ||||||||||||||||||||||||
| 3 | 600 | 300 | 100 | 6 | 18 | - | - | - | - | - | ||||||||||||||||||||||||
An example of the copper grade estimation parameters for the mineralised domains at Malundwe is shown in Table 14-17. For all domains at Malundwe, discretisation of 5 m by 5 m by 2 m was used (matching the number of two-metre composites that fit within the four-metre parent block z-height). A maximum of three or four samples per drill hole was used for RC areas and maximum of four or five samples per drill hole in other domains, and in second and third runs this restriction was removed.
Table 14-17 Malundwe ‘Geol = 3’ Fresh Copper Estimation Parameters
| Domain (Geol) |
Block Size (m) |
|
Search Radius (m) |
No. Samples |
Max per DH |
Discretisation (m) |
HY Value (%) |
HY Restriction | ||||||||||||||||||||||||||
| X | Y | Z | Y | X | Z | Min | Max | X | Y | Z | X | Y | Z | |||||||||||||||||||||
|
RC |
6.25 | 6.25 | 4 | 1 | 40 | 30 | 4 | 12 | 24 | 3 | 5 | 5 | 2 | 6.78 | 25 | 25 | 4 | |||||||||||||||||
| 2 | 80 | 60 | 8 | 12 | 24 | 3 | 6.78 | 25 | 25 | 4 | ||||||||||||||||||||||||
| 3 | 240 | 120 | 20 | 4 | 22 | 4 | 6.78 | 25 | 25 | 4 | ||||||||||||||||||||||||
|
Infill |
25 | 25 | 4 | 1 | 150 | 50 | 15 | 10 | 22 | 5 | 5 | 5 | 2 | 6.78 | 50 | 50 | 4 | |||||||||||||||||
| 2 | 300 | 150 | 15 | 10 | 22 | - | 6.78 | 50 | 50 | 4 | ||||||||||||||||||||||||
| 3 | 450 | 275 | 150 | 2 | 22 | - | 6.78 | 50 | 50 | 4 | ||||||||||||||||||||||||
|
Res Def |
50 | 50 | 4 | 1 | 300 | 150 | 15 | 8 | 22 | 5 | 5 | 5 | 2 | 6.78 | 100 | 100 | 8 | |||||||||||||||||
| 2 | 600 | 300 | 60 | 6 | 22 | - | 6.78 | 100 | 100 | 8 | ||||||||||||||||||||||||
| 3 | 600 | 300 | 100 | 2 | 22 | - | 6.78 | 100 | 100 | 8 | ||||||||||||||||||||||||
|
February 19, 2025 |
Page 129 |
|
|
NI 43-101 Technical Report on the Lumwana Expansion Project |
|
Table 14-18 shows an example of the copper grade estimation parameters for the mineralised zone at Kamisengo. A maximum of three samples per drill hole was used to estimate copper grade in first and second passes, with no restriction used in other estimation runs.
Table 14-18 Kamisengo ‘Geol = 10 and 20’ Mineralised Fresh Copper Estimation Parameters
| Domain (Geol) |
Block Size (m) |
|
Search Radius (m) |
No. Samples |
Max per DH |
Discretisation (m) |
HY Value (%) |
HY Restriction | ||||||||||||||||||||||||||
| X | Y | Z | Y | X | Z | Min | Max | X | Y | Z | X | Y | Z | |||||||||||||||||||||
|
10 |
25 | 25 | 4 | 1 | 500 | 220 | 30 | 12 | 24 | 3 | 5 | 5 | 5 | - | - | - | - | |||||||||||||||||
| 2 | 750 | 300 | 45 | 9 | 18 | 3 | - | - | - | - | ||||||||||||||||||||||||
| 3 | 1,400 | 1,000 | 60 | 6 | 12 | - | - | - | - | - | ||||||||||||||||||||||||
|
20 |
25 | 25 | 4 | 1 | 500 | 220 | 30 | 12 | 24 | 3 | 5 | 5 | 5 | 1.22 | 100 | 100 | 10 | |||||||||||||||||
| 2 | 750 | 300 | 45 | 9 | 18 | 3 | 1.22 | 100 | 100 | 10 | ||||||||||||||||||||||||
| 3 | 1,400 | 1,000 | 60 | 6 | 12 | - | - | - | - | - | ||||||||||||||||||||||||
Table 14-19 shows an example of the copper grade estimation parameters for the mineralised zone at Kababisa.
Table 14-19 Kababisa Mineralised Fresh Copper Estimation Parameters
| Domain (Geol) |
Block Size (m) |
|
Search Radius (m) |
No. Samples |
Max per DH |
Discretisation (m) |
HY Value (%) |
HY Restriction | ||||||||||||||||||||||||||
| X | Y | Z | Y | X | Z | Min | Max | X | Y | Z | X | Y | Z | |||||||||||||||||||||
|
3 |
12 | 25 | 2 | 1 | 220 | 220 | 10 | 12 | 36 | 3 | 5 | 5 | 5 | 1.26 | 100 | 100 | 10 | |||||||||||||||||
| 2 | 440 | 440 | 20 | 12 | 36 | 3 | 1.26 | 100 | 100 | 10 | ||||||||||||||||||||||||
| 3 | 880 | 880 | 30 | 12 | 36 | 3 | 1.26 | 100 | 100 | 10 | ||||||||||||||||||||||||
|
31 |
12 | 25 | 2 | 1 | 220 | 220 | 10 | 12 | 36 | 3 | 5 | 5 | 5 | 0.38 | 100 | 100 | 10 | |||||||||||||||||
| 2 | 440 | 440 | 20 | 12 | 36 | 3 | 0.38 | 100 | 100 | 10 | ||||||||||||||||||||||||
| 3 | 880 | 880 | 30 | 12 | 36 | 3 | 0.38 | 100 | 100 | 10 | ||||||||||||||||||||||||
| 14.8.2 | Grade Interpolation |
Grades for copper, cobalt, sulphur, uranium, and AsCu were interpolated into a block model using Ordinary Kriging (OK) in multiple passes. Dynamic anisotropy (DA) was used to orientate the search neighbourhood to better reflect the local variations in orientation within the deposit. The orientations used for DA were generated from the modelled hanging wall and footwall surfaces. Figure 14-9 shows the interpolated block model for Chimiwungo.
|
February 19, 2025 |
Page 130 |
|
|
NI 43-101 Technical Report on the Lumwana Expansion Project |
|

Figure 14-9 Chimiwungo Block Model within the Mineral Resource Pit Shell (Looking North East)
Contact analysis was completed to assess the nature of the boundaries between the lithological and oxidation domains. Analysis showed that the boundaries between the different oxidation domains of the same lithology were soft. Figure 14-10 shows an example of this type of boundary at Chimiwungo.

Figure 14-10 Contact Profile Plot between Oxide, Transitional, and Fresh MS at Chimiwungo
Analysis also showed that the boundary between mineralisation and waste domains is hard. Figure 14-11 shows an example of this type of boundary at Chimiwungo.
|
February 19, 2025 |
Page 131 |
|
|
NI 43-101 Technical Report on the Lumwana Expansion Project |
|

Figure 14-11 Contact Profile Plot between Mineralised and Waste Domains at Chimiwungo
| 14.9 | Block Model Validation |
The following block model validation checks were completed:
| ● | Volume comparison between the block model domains and corresponding wireframes |
| ● | Statistical comparison of the composite and block model grades |
| ● | Swath plot comparison of composite and block model grades |
| ● | Visual comparison of composite and block model grades |
Comparison of block and wireframe volumes found that differences in volume were generally less than 1%.
Statistical comparison of the declustered composite means and the estimated means for each of the domains were found to be comparable. The mineralised domains compared very well with the estimated means reproducing the input data means with less than 4% difference. Examples from domains in each deposit are shown in Table 14-20 to Table 14-23.
Table 14-20 Comparison of Sample and Estimated Grades in the Chimiwungo Main Mineralisation
Domains (RC Area)
| Domain |
Geology Domain |
Capped Mean (% Cu) |
BM Mean (% Cu) |
Difference (Cap-BM) (% Cu) |
Change (%) |
Declustered Mean (% Cu) |
Difference (BM -Decl. Mean) (% Cu) |
Difference (BM- Decl. Mean) (%) |
||||||||
|
Mineralised |
Geol 1 | 0.86 | 0.85 | -0.0015 | -0.15% | 0.81 | -0.04 | -4% | ||||||||
| Geol 11 | 0.71 | 0.69 | -0.022 | -2.2% | 0.70 | -0.03 | -3% | |||||||||
| Geol 21 | 0.56 | 0.56 | 0.0015 | 0.15% | 0.53 | -0.03 | -3% | |||||||||
|
Waste |
Geol 79 | 0.07 | 0.06 | -0.074 | -7.42% | 0.07 | 0.01 | 1% | ||||||||
| Geol 89 | 0.07 | 0.07 | -0.029 | -0.29% | 0.08 | 0.01 | 1% | |||||||||
| Geol 99 | 0.09 | 0.09 | 0.0026 | 0.26% | 0.09 | 0.01 | 1% | |||||||||
|
February 19, 2025 |
Page 132 |
|
|
NI 43-101 Technical Report on the Lumwana Expansion Project |
|
Table 14-21 Comparison of Sample and Estimated Grades in the Malundwe Main Mineralisation
Domains (RC Area)
| Domain |
Geology Domain |
Capped Mean (% Cu) |
BM Mean (% Cu) |
Difference (Cap-BM) (% Cu) |
Change (%) |
Declustered Mean (% Cu) |
Difference (BM -Decl. Mean) (% Cu) |
Difference (BM- Decl. Mean) (%) |
||||||||
| Mineralised | Geol 3 | 1.078 | 1.010 | -0.062 | -6.2% | 0.97 | -0.03 | -3% | ||||||||
| Waste | Geol 5 | 0.078 | 0.075 | -0.044 | -4.4% | 0.08 | 0.01 | 1% | ||||||||
Table 14-22 Comparison of Sample and Estimated Grades in the Kamisengo Mineralisation
Domains (Inferred Area)
| Domain |
Geology Domain |
Capped Mean (% Cu) |
BM Mean (% Cu) |
Difference (Cap-BM) (% Cu) |
Change (%) |
Declustered Mean (% Cu) |
Difference (BM -Decl. Mean) (% Cu) |
Difference (BM- Decl. Mean) (%) |
||||||||
|
Mineralised |
Geol 40 | 0.32 | 0.31 | -0.01 | -3% | 0.31 | 0.001 | 0.2% | ||||||||
| Geol 60 | 0.40 | 0.39 | -0.01 | -3% | 0.39 | 0.002 | 1% | |||||||||
| Waste | Geol 99 | 0.03 | 0.02 | -0.01 | -33% | 0.03 | -0.007 | -26% | ||||||||
Table 14-23 Comparison of Sample and Estimated Grades in the Kababisa Mineralisation Domains
(Inferred Area)
| Domain |
Geology Domain |
Capped Mean (% Cu) |
BM Mean (% Cu) |
Difference (Cap-BM) (% Cu) |
Change (%) |
Declustered Mean (% Cu) |
Difference (BM -Decl. Mean) (% Cu) |
Difference (BM- Decl. Mean) (%) |
||||||||
|
Mineralised |
Geol 3 | 0.45 | 0.46 | 0.022 | 2.2% | 0.46 | 0.004 | 1% | ||||||||
| Geol 31 | 0.18 | 0.19 | 0.032 | 3.2% | 0.18 | 0.002 | 1% | |||||||||
| Waste | Geol 2 | 0.02 | 0.02 | 0.082 | 8.2% | 0.02 | -0.002 | -13% | ||||||||
Swath plots were created for each geological domain to compare the estimated block grade with the composite grade in the X, Y, and Z directions. The swath plots demonstrate that the grades and trends exhibited in the input data are well reflected in the estimate. An example swath plot for mineralised domain 11 at Chimiwungo is illustrated in Figure 14-13.
Visual comparison on cross-sections and long sections showed that the estimated block grades represented the input composite grades. An example of this comparison for Chimiwungo is shown in Figure 14-13.
|
February 19, 2025 |
Page 133 |
|
|
NI 43-101 Technical Report on the Lumwana Expansion Project |
|

Source: Barrick, 2024
Figure 14-12 Chimiwungo Visual Validation of Assay and Estimated Copper Grades – Long Section
378600E (Looking East)
|
February 19, 2025 |
Page 134 |
|
|
NI 43-101 Technical Report on the Lumwana Expansion Project |
|

Figure 14-13 Chimiwungo Main Domain 11 and 89 Example Swath Plots within GC Drill Campaign
|
February 19, 2025 |
Page 135 |
|
|
NI 43-101 Technical Report on the Lumwana Expansion Project |
|
| 14.10 | Resource Classification |
Mineral Resources are classified as Measured, Indicated, or Inferred based on data quality, drilling density, geological continuity, confidence (including style of mineralisation), the variogram range continuity, plus quality of estimate indicators (SR and KE). Mineral Resource classification criteria are listed in Table 14-24. Measured, Indicated, and Inferred Mineral Resources are reported for Chimiwungo and Malundwe, and Indicated and Inferred Mineral Resources are reported for Kamisengo and Kababisa (Figure 14-14 to Figure 14-17).
Table 14-24 Lumwana Mineral Resource Classification Criteria
| Resource Classification |
Criteria | Chimiwungo | Malundwe | Kamisengo | Kababisa | |||||
|
Measured |
Maximum Drill Spacing | 12.5 m by 25 m | 12.5 m by 25 m | - | - | |||||
| Geological Continuity (down plunge) | High (400 m+) | High (400 m+) | - | - | ||||||
| Minimum Samples | 6 to 8 | 4 to 12 | - | - | ||||||
| Minimum SR | 0.8 | 0.8 | - | - | ||||||
|
Indicated |
Maximum Drill Spacing | 100 m by 100 m | 100 m by 100 m | 100 m by 100 m | 100 m by 100 m | |||||
| Geological Continuity (down plunge) | High (400 m+) | High (400 m+) | High (400 m+) | High (400 m+) | ||||||
| Minimum Samples | 6 | 6 | 6 | 6 | ||||||
| SR | 90% >0.40 | 90% >0.40 | 90% >0.40 | 90% >0.40 | ||||||
|
Inferred |
Minimum Drill Spacing | 100 m x 200 m | 100 m x 200 m | 100 m x 200 m | 100 m x 200 m | |||||
| Geological Continuity (down plunge) | Moderate (> 200 m) | Moderate (> 200 m) | Moderate (> 200 m) | Moderate (> 200 m) | ||||||
| Minimum Samples | 6 | 6 | 6 | 6 |
|
February 19, 2025 |
Page 136 |
|
|
NI 43-101 Technical Report on the Lumwana Expansion Project |
|

Source: Barrick, 2024
Figure 14-14 Chimiwungo Mineral Resource Classification Plan View
|
February 19, 2025 |
Page 137 |
|
|
NI 43-101 Technical Report on the Lumwana Expansion Project |
|

Source: Barrick, 2024
Figure 14-15 Malundwe Mineral Resource Classification Plan View
|
February 19, 2025 |
Page 138 |
|
|
NI 43-101 Technical Report on the Lumwana Expansion Project |
|

Source: Barrick, 2024
Figure 14-16 Kamisengo Mineral Resource Classification Plan View
|
February 19, 2025 |
Page 139 |
|
|
NI 43-101 Technical Report on the Lumwana Expansion Project |
|

Source: Barrick, 2024
Figure 14-17 Kababisa Mineral Resource Classification Plan View
|
February 19, 2025 |
Page 140 |
|
|
NI 43-101 Technical Report on the Lumwana Expansion Project |
|
| 14.11 | Stockpiles |
Stockpiles are comprised of ore stored at one of two surface run-of-mine (ROM) pads, one at Chimiwungo and one at Malundwe, or in the plant area on the coarse ore stockpile (COS).
Each stockpile comprises similar material types, with an established grade range and oxidation state. The stockpile volumes are measured from weekly and monthly drone surveys and grades are tracked from in-pit source to stockpile destination. The in-pit source grade is based on the in-situ block model estimates.
| 14.12 | Cut-off Grade |
To demonstrate RPEEE, Mineral Resources are reported above the in-situ marginal cut-off grade for either transitional or fresh material within an optimised pit shell generated using a price of US$4.00/lb Cu (Table 14-25). Apart from the copper price and related royalty charge (also set at US$4.00/lb), all the other assumptions are the same as those used for the Mineral Reserve. The copper recovery at cut-off grade (COG) was determined from the metallurgical recovery model and ore loss and dilution have been accounted for in the Mineral Resource block model by the regularisation process described in Section 14.6 of this Technical Report.
Table 14-25 Resource Cut-off Grade Calculations
| Parameter | Unit/Rate | Chimiwungo | Malundwe | Kamisengo | Kababisa | |||||
| Copper Price |
$/lb | 4.00 | 4.00 | 4.00 | 4.00 | |||||
| Copper Payable |
% | 96.55 | 96.55 | 96.55 | 96.55 | |||||
| Royalty (Gross basis) |
% | 6.54 | 6.54 | 6.54 | 6.54 | |||||
| Selling Cost (smelter, refinery, transport, royalty) |
$/lb | 0.73 | 0.73 | 0.73 | 0.73 | |||||
| Copper Recovery at COG |
% | As per recovery estimates in Section 13.4 | ||||||||
| ROM Rehandle Cost |
US$/t processed | 0.23 | 0.23 | 0.23 | 0.23 | |||||
| General & Admin Cost |
US$/t processed | 1.26 | 1.26 | 1.26 | 1.26 | |||||
| Incremental Mining Costs associated with mining material as ore instead of waste |
US$/t processed | 0.04 | 0.04 | 0.04 | 0.04 | |||||
| Processing Cost |
US$/t processed | 3.95 | 3.89 | 4.15 | 4.00 | |||||
| Cut-off Grade |
% | 0.13 | 0.13 | 0.13 | 0.13 | |||||
|
February 19, 2025 |
Page 141 |
|
|
NI 43-101 Technical Report on the Lumwana Expansion Project |
|
| 14.13 | Mineral Resource Statement |
The Mineral Resource estimates have been prepared according to the Canadian Institute of Mining, Metallurgy and Petroleum (CIM) 2014 Definition Standards for Mineral Resources and Mineral Reserves dated 10 May 2014 (CIM (2014) Standards) as incorporated with National Instrument 43-101 Standards of Disclosure for Mineral Projects (NI 43-101). Mineral Resource estimates were also prepared using the guidance outlined in CIM Estimation of Mineral Resources and Mineral Reserves (MRMR) Best Practice Guidelines 2019 (CIM (2019) MRMR Best Practice Guidelines).
The open pit Mineral Resources are those that demonstrate RPEEE. These are defined as those above the in-situ marginal cut-off grade for transitional and fresh material within a pit shell using a copper price of US$4.00/lb Cu.
The Mineral Resource estimate consists of surface stockpiles and in-situ open pit material from four deposits; Chimiwungo, Malundwe, Kababisa, and Kamisengo. The Measured and Indicated Mineral Resources are estimated to be 2,000 Mt at 0.50% Cu for 10.0 Mt Cu, with an additional Inferred Mineral Resource of 230 Mt at 0.4% Cu for 0.91 Mt Cu (Table 14-26).
The QP is not aware of any environmental, permitting, legal, title, taxation, socio-economic, marketing, political, metallurgical, fiscal, or other relevant factors that are not discussed in this Technical Report, that could materially affect the Mineral Resource estimate.
|
February 19, 2025 |
Page 142 |
|
|
NI 43-101 Technical Report on the Lumwana Expansion Project |
|
Table 14-26 Lumwana Mineral Resource Estimate as of December 31, 2024
| Measured | Indicated | Measured + Indicated | Inferred | |||||||||||||||||||||
|
Tonnes (Mt) |
Grade (% Cu) |
Contained Metal (Mt Cu) |
Tonnes (Mt) |
Grade (% Cu) |
Contained (Mt Cu) |
Tonnes (Mt) |
Grade (% Cu) |
Contained (Mt Cu) |
Tonnes (Mt) |
Grade (% Cu) |
Contained Metal (Mt Cu) |
|||||||||||||
| Stockpiles |
20 | 0.32 | 0.064 | - | - | - | 20 | 0.32 | 0.064 | - | - | - | ||||||||||||
| Chimiwungo |
130 | 0.43 | 0.56 | 1,300 | 0.55 | 7.1 | 1,400 | 0.53 | 7.6 | 180 | 0.4 | 0.74 | ||||||||||||
| Kababisa |
- | - | - | 7.2 | 0.39 | 0.028 | 7.2 | 0.39 | 0.028 | 0.14 | 0.4 | 0.00056 | ||||||||||||
| Kamisengo |
- | - | - | 350 | 0.32 | 1.1 | 350 | 0.32 | 1.1 | 40 | 0.3 | 0.13 | ||||||||||||
| Malundwe |
24 | 0.64 | 0.15 | 180 | 0.57 | 1.0 | 200 | 0.58 | 1.2 | 11 | 0.4 | 0.046 | ||||||||||||
|
Open Pit Subtotal |
150 | 0.46 | 0.71 | 1,800 | 0.50 | 9.2 | 2,000 | 0.50 | 9.9 | 230 | 0.4 | 0.91 | ||||||||||||
| Total |
170 | 0.45 | 0.77 | 1,800 | 0.50 | 9.2 | 2,000 | 0.50 | 10.0 | 230 | 0.4 | 0.91 | ||||||||||||
Notes:
| ● | Mineral Resources are reported on a 100% basis. |
| ● | The Mineral Resource estimate has been prepared according to CIM (2014) Standards and using CIM (2019) MRMR Best Practice Guidelines. |
| ● | All Mineral Resource tabulations are reported inclusive of that material which is then modified to form Mineral Reserves. |
| ● | Open pit Mineral Resources are those within a US$4.00/lb pit shell at a cut-off grade of 0.13% Cu for both transitional and fresh mineralisation. |
| ● | The Mineral Resource has been depleted with mined surfaces up to December 31, 2024. |
| ● | Mineral Resources that are not Mineral Reserves do not have demonstrated economic viability. |
| ● | Mineral Resources were reviewed by Richard Peattie, FAusIMM, an employee of Barrick and QP. |
| ● | Numbers may not add due to rounding. Tonnes and contained copper are rounded to 2 significant figures. All Measured and Indicated grades are reported to 2 decimal places whilst Inferred Mineral Resource grades are reported to 1 decimal place. |
|
February 19, 2025 |
Page 143 |
|
|
NI 43-101 Technical Report on the Lumwana Expansion Project |
|
| 14.14 | 2024 Versus 2023 End of Year Comparison |
Since December 31, 2023, the Measured and Indicated Mineral Resources have increased by 41% (2.9 Mt Cu) and the Inferred Mineral Resources have decreased by 77% (3.1 Mt Cu).
Table 14-27 shows the comparison between the current Mineral Resource for Chimiwungo and Mineral Resource reported as of December 31, 2023. Measured and Indicated Mineral Resources have increased since 2023 as infill drilling has allowed Mineral Resources previously classified as Inferred to be classified as Indicated. For the same reason, Inferred Mineral Resources have decreased since 2023.
Table 14-27 Chimiwungo 2024 vs. 2023 Mineral Resource Comparison
| Chimiwungo | Measured & Indicated Mineral Resource | Inferred Mineral Resource | ||||||||||
| Tonnes (Mt) |
Cu Grade |
Contained (Mt Cu) |
Tonnes (Mt) |
Cu Grade (% Cu) |
Contained (Mt Cu) |
|||||||
| 2023 |
1,112.28 | 0.52 | 5.74 | 513.83 | 0.52 | 2.69 | ||||||
| 2024 |
1,422.65 | 0.53 | 7.61 | 181.44 | 0.41 | 0.74 | ||||||
|
Net Change |
27.90% | 1.92% | 32.58% | -64.69% | -21.15% | -72.49% | ||||||
Table 14-28 shows the comparison between the current Mineral Resource for Malundwe and the Mineral Resource reported as of December 31, 2023. Due to infill drilling and changes to the model, Measured and Indicated Mineral Resource tonnes have increased and grade has decreased, while metal content is largely unchanged. There was a large decrease in Inferred Mineral Resources which is attributed to changes in the model following infill drilling.
Table 14-28 Malundwe 2024 vs. 2023 Mineral Resource Comparison
| Malundwe |
Measured & Indicated Mineral Resource |
Inferred Mineral Resource | ||||||||||
| Tonnes (Mt) |
Cu Grade |
Contained Metal (Mt Cu) |
Tonnes (Mt) |
Cu Grade (% Cu) |
Contained Metal (Mt cu) |
|||||||
| 2023 |
179.67 | 0.63 | 1.13 | 93.31 | 0.46 | 0.43 | ||||||
| 2024 |
201.16 | 0.58 | 1.16 | 10.83 | 0.42 | 0.05 | ||||||
| Net Change |
11.96% | -7.94% | 2.65% | -88.39% | -8.70% | -88.37% | ||||||
Table 14-29 shows the comparison between the current Mineral Resource for Kamisengo and the Mineral Resource reported as of December 31, 2023. Measured and Indicated Mineral Resources have increased since 2023 as infill drilling has allowed Mineral Resources previously classified as Inferred to be classified as Indicated.
|
February 19, 2025 |
Page 144 |
|
|
NI 43-101 Technical Report on the Lumwana Expansion Project |
|
Table 14-29 Kamisengo 2024 vs 2023 Mineral Resource Comparison
| Kamisengo |
Measured & Indicated Mineral Resource |
Inferred Mineral Resource | ||||||||||
|
Tonnes (Mt) |
Cu Grade (% Cu) |
Contained Metal (Mt Cu) |
Tonnes (Mt) |
Cu Grade (% Cu) |
Contained Metal (Mt Cu) |
|||||||
| 2023 |
43.98 | 0.32 | 0.14 | 304.99 | 0.30 | 0.91 | ||||||
| 2024 |
350.13 | 0.32 | 1.12 | 40.16 | 0.31 | 0.13 | ||||||
| Net Change |
696.11% | 0.00% | 700.00% | -86.83% | 3.33% | -85.71% | ||||||
Mineral Resources are reported for the first time at Kababisa.
| 14.15 | External Review |
In June 2024, RSC completed a site visit and independent technical review of the Mineral Resource data and Mineral Resource estimate (RSC, 2024). The recommendations made were subject to the following ranking:
| ● | Critical: must be addressed immediately to remedy/rectify a fatal flaw or radical error. |
| ● | Recommended: an issue causing moderate causes of concern to be addressed prior to the next major Mineral Resource update (mid-2025). |
| ● | Value-added: of minor concern and includes suggestions for further investigation. |
RSC did not identify any critical issues or fatal flaws and concluded that the processes underlying the generation and declaration of the Mineral Resource reflected good practice. Conclusions and comments relating to geological modelling and Mineral Resource estimation included:
| ● | The geological model was deemed to accurately reflect contacts between the mineralised schist and hanging wall/footwall, as well as accurately reflect with internal dilution. |
| ● | Statistical analysis and grade capping were well implemented but involve many steps, which presents a risk for continuity and repeatability. The top cut/high-grade yield treatment could be simplified and delustering may have a stronger impact on the characterisation of the mean for the various distributions than the presence of high-grade values. |
| ● | Variography follows good and robust practice, but improvements could be made when modelling the nugget. |
| ● | Use of OK was considered appropriate and the use of hard boundaries is justified. |
All recommended items, and most of the value-added items, have since been implemented and include the following for geological modelling and grade estimation:
| ● | Model process and validation checklists have been created with version control in repositories accessible to all resource model stakeholders. |
|
February 19, 2025 |
Page 145 |
|
|
NI 43-101 Technical Report on the Lumwana Expansion Project |
|
| ● | An SOP for database extraction, with sign-off procedures for final data used in estimation, have been created, as well as an SOP for geological modelling. |
| ● | The nugget values obtained for the back-transformed semi-variogram models have been benchmarked against the raw downhole and the one-metre interval variograms. |
| ● | Post-processing of Mineral Resource classification has been undertaken to increase geometrical consistency of classification shapes. |
| 14.16 | QP Comments on Mineral Resource Estimates |
The QP considers the Mineral Resource estimation process including the data quality, geological modelling, treatment of outliers, grade estimation processes, and resource classification to be in line with industry best practices and free of any material forms of error.
The QP offers the following conclusions regarding the relative accuracy/confidence of the 2024 Mineral Resource estimate:
| ● | The Mineral Resource estimate has been prepared according to the CIM (2014) Standards as incorporated with NI 43-101, as well as using the guidance outlined in the CIM (2019) MRMR guidelines. |
| ● | A robust and industry standard QA/QC system is in place to minimise errors and timeously detect and rectify any issues. |
| ● | The geo-metallurgical understanding of the deposit has improved which included the utilisation of acid soluble copper, total copper, and sulphur ratios for defining and refining the oxide, transitional, and sulphide mineralogy domains. The utilisation of multi-element analysis and Quick Leach Tests (QLT) are recommended for future refinement of the mineral species modelling. |
| ● | The Mineral Resource is largely drilled out to a 100 m by 100 m spacing for Indicated Resource confidence and, as per the current operational drilling strategy, only requires infill and GC drilling to be upgraded to Measured classification prior to production. |
| ● | The Mineral Resource is constrained within optimised pit shells and reported above the in-situ marginal cut-off grades based on a $4.00/lb copper price which demonstrates reasonable prospects for eventual economic extraction. |
The QP is not aware of any environmental, permitting, legal, title, taxation, socio-economic, marketing, political, metallurgical, fiscal, or other relevant factors that are not discussed in this Technical Report, that could materially affect the Mineral Resource estimate.
|
February 19, 2025 |
Page 146 |
|
|
NI 43-101 Technical Report on the Lumwana Expansion Project |
|
| 15 | Mineral Reserve Estimate |
The Lumwana Mineral Reserve estimate, as of December 31, 2024 is presented in Table 15-1. The Mineral Reserve estimate consists of surface stockpiles and in-situ open pit material from four deposits; Chimiwungo, Malundwe, Kababisa, and Kamisengo. The total Proven and Probable Mineral Reserves are estimated to be 1,600 Mt at 0.52% Cu for 8.3 Mt Cu, which is an increase of 5,351 Mt Cu since 2023.
The QP is not aware of any mining, metallurgical, infrastructure, permitting, or other relevant factors which could materially affect the Mineral Reserve estimates.
The Mineral Reserve estimates have been prepared according to CIM (2014) Standards as incorporated with NI 43-101. Mineral Resource estimates were also prepared using the guidance outlined in CIM (2019) MRMR Best Practice Guidelines.
Definitions for Mineral Reserve categories used in this report are consistent with those defined by CIM (2014) and adopted by NI 43-101. In the CIM classification, a Mineral Reserve is defined as ‘the economically mineable part of a Measured and/or Indicated Mineral Resource. It includes diluting materials and allowances for losses, which may occur when the material is mined or extracted and is defined by studies at Pre-feasibility or Feasibility level as appropriate that include application of Modifying Factors. Such studies demonstrate that, at the time of reporting, extraction could reasonably be justified.’ Mineral Reserves are classified into Proven and Probable categories.
The Mineral Reserves have been estimated from the Measured and Indicated Mineral Resources and do not include any Inferred Mineral Resources. Mineral Reserves include material that will be mined by open pit and existing stockpiles.
The Mineral Reserve estimate uses updated economic factors, the latest Mineral Resource, geotechnical and hydrological inputs, and metallurgical processing and recovery updates.
For the open pit Mineral Reserves, economic pit shells were generated using the Pseudoflow algorithm within Geovia’s Whittle software.
Stockpile Mineral Reserves were obtained from survey measurements which are completed periodically, i.e., weekly and monthly. Each stockpile assumes a grade and density value which is an average of the total ore dumped on it, estimated from the block model.
|
February 19, 2025 |
Page 147 |
|
|
NI 43-101 Technical Report on the Lumwana Expansion Project |
|
Table 15-1 Summary of Lumwana Mineral Reserve Estimate as of December 31, 2024
| Source | Proven | Probable | Total | |||||||||||||||||
| Tonnes (Mt) |
Grade (% Cu) |
Contained Metal (Mt Cu) |
Tonnes (Mt) |
Grade (% Cu) |
Contained Metal (Mt Cu) |
Tonnes (Mt) |
Grade (% Cu) |
Contained Metal (Mt Cu) |
||||||||||||
|
Stockpiles |
ROM Pad Chimiwungo | 18 | 0.32 | 0.057 | - | - | - | 18 | 0.32 | 0.057 | ||||||||||
| ROM Pad Malundwe | 1.6 | 0.34 | 0.0056 | - | - | - | 1.6 | 0.34 | 0.0056 | |||||||||||
| COS | 0.18 | 0.85 | 0.0015 | - | - | - | 0.18 | 0.85 | 0.0015 | |||||||||||
| Stockpile Subtotal | 20 | 0.32 | 0.064 | - | - | - | 20 | 0.32 | 0.064 | |||||||||||
| Open Pit |
Malundwe | 18 | 0.72 | 0.13 | 140 | 0.60 | 0.83 | 160 | 0.61 | 0.96 | ||||||||||
| Chimiwungo | 100 | 0.48 | 0.48 | 1,100 | 0.56 | 6 | 1,200 | 0.55 | 6.5 | |||||||||||
| Kamisengo | 240 | 0.34 | 0.82 | 240 | 0.34 | 0.82 | ||||||||||||||
| Kababisa | 5.3 | 0.43 | 0.023 | 5.3 | 0.43 | 0.023 | ||||||||||||||
| Open Pit Subtotal | 118 | 0.52 | 0.62 | 1,500 | 0.53 | 7.6 | 1,600 | 0.53 | 8.3 | |||||||||||
|
Total |
140 | 0.49 | 0.67 | 1,500 | 0.53 | 7.6 | 1,600 | 0.52 | 8.3 | |||||||||||
Notes:
| ● | Mineral Reserves are reported on a 100% basis. |
| ● | The Mineral Reserve estimate has been prepared according to CIM (2014) Standards and using CIM (2019) MRMR Best Practice Guidelines. |
| ● | Open Pit Mineral Reserves are reported at a copper price of $3.00/lb, and at a pit rim cut-off grade of 0.14% Cu |
| ● | Dilution and losses were applied through the Grade Control Optimiser (GCO) process. |
| ● | The Mineral Reserve estimate was reviewed by Derek Holm, FAusIMM, an employee of Barrick and QP. |
| ● | Numbers may not add due to rounding. Tonnes and contained metal are rounded to 2 significant figures, whilst Proven and Probable grades are reported to 2 decimal places. |
|
February 19, 2025 |
Page 148 |
|
|
NI 43-101 Technical Report on the Lumwana Expansion Project |
|
A financial model was populated and reviewed to demonstrate that the Mineral Reserves are economically viable.
Mineral Reserves are estimated:
| ● | As of December 31, 2024. |
| ● | Using a copper price of $3.00/lb. |
| ● | As ROM grades and tonnage delivered to the primary crushing facility. |
| ● | For Chimiwungo, Malundwe, Kamisengo, Kababisa, and several surface ore stockpiles. |
| 15.1 | Mineral Reserve Estimation Process |
| 15.1.1 | Open Pit |
Mineral Reserves for the open pits are constrained by detailed pit designs which were guided by optimised pit shells. To define ore within the pit designs, a variable cut-off grade was applied to each block during the optimisation and scheduling processes. The cut-off grade varied depending on the location, expected metallurgical recovery, and other relevant Modifying Factors under the CIM definitions described above.
The process and key inputs for determining the optimised pit shell are outlined in Section 15.2 of this Technical Report and the criteria used for the pit designs used to constrain the Mineral Reserve are described in Section 16.3 of this Technical Report.
| 15.1.2 | Stockpiles |
Stockpiles comprise ore stored at various surface locations. The volume of the stockpiles is obtained from survey measurements which are completed periodically, i.e., weekly and monthly. Each stockpile assumes a grade and density value which is an average of the total ore dumped on it, estimated from a block model. Ore dumped on the stockpile is tracked by the Fleet Management System.
The tonnage contained in stockpiles accounts for a small portion of the Mineral Reserves.
| 15.2 | Open Pit Optimisation |
Pit optimisation was used to define the pit that yielded the maximum possible cashflow over the LOM for a given set of economic and geotechnical parameters. The only infrastructure constraint applied
|
February 19, 2025 |
Page 149 |
|
|
NI 43-101 Technical Report on the Lumwana Expansion Project |
|
was a minor section of the Chimiwungo open pit, during the final iterations, to avoid rehandling a large amount of waste dump material for a small gain in ore. No permitting limits impacted the pit shells for the Expansion Project.
Various economic parameters were used to estimate the block value and resultant ore or waste categorisation of each block. The pit optimisation input parameters are supported by the PFS (Barrick, 2024a) and based on historical performance, supplier quotations, and corporate guidance. Final FS input parameters were compared to the optimisation inputs and the overall cost difference was within reasonable limits, with the break-even cut-off grade (BCOG) increasing by 3.8% with the FS costs.
The block value is determined by estimating the revenue of the block and subtracting the costs to process the block as ore; those blocks that have a positive value are flagged as ore and included in the Mineral Reserve estimate; the remaining blocks are treated as waste and provide no revenue.
The BCOG excludes the base mining cost. The full cost is already considered in the determination of the pit limits, so when determining if a mined area is ore or waste, only the cost difference between ore and waste, and post mining costs, are used to determine the economic value of that area.
A summary of the key pit optimisation inputs is shown in Table 15-2.
| 15.2.1 | Resource Model |
The Mineral Reserve estimate and pit optimisation uses the 2024 Mineral Resource block model as described in Section 14 of this Technical Report.
| 15.2.2 | Metal Price |
The metal price used for the Mineral Reserve estimate is US$3.00/lb of copper as per Barrick 2024 corporate guidance assumptions for the long-term metal prices.
| 15.2.3 | Break Even Cut-off Grade |
The cut-off grade was dynamically calculated for each block, initially by the optimisation software (Whittle) and again by the reblocking software (GCO). Table 15-2 gives the optimisation inputs, which were the same as the reblocking inputs, and the break-even cut-off head grade.
|
February 19, 2025 |
Page 150 |
|
|
NI 43-101 Technical Report on the Lumwana Expansion Project |
|
Table 15-2 Summary of Lumwana Pit Optimisation Parameters
|
Parameter |
Unit | Inputs | ||||||||
| Chimiwungo | Malundwe | Kamisengo | Kababisa | |||||||
|
Modifying Factors |
||||||||||
| Pit Slope (Oxide) | ° | Variable by Domain | ||||||||
| Pit Slope (Transitional) | ° | |||||||||
| Pit Slope (Fresh) | ° | |||||||||
| Process Recovery (Transitional) | % | As per recovery in Section 13.4 | ||||||||
| Process Recovery (Fresh) | % | |||||||||
| Planned Dilution | % | Regularisation + GCO | Regularisation | |||||||
| Planned Losses | % | |||||||||
|
Revenue |
||||||||||
| Metal Price | US$/lb copper | 3.00 | ||||||||
|
Operating Costs |
||||||||||
| Mining Cost | US$/t mined | 2.02 | 2.00 | 2.02 | 2.00 | |||||
| Incremental Mining Cost | US$/t/10m mined | 0.02 | 0.02 | 0.02 | 0.02 | |||||
| Average Mining Cost | US$/t mined | 2.3 | 2.17 | 2.13 | 2.08 | |||||
| Rehandle Cost | US$/t processed | 0.23 | 0.23 | 0.23 | 0.23 | |||||
| Incremental $/Tonne | US$/t processed | 0.04 | 0.04 | 0.04 | 0.04 | |||||
| Crushing and conveying | US$/t processed | 0.25 | 0.19 | 0.45 | 0.30 | |||||
| Processing Operating Cost | US$/t processed | 3.70 | 3.70 | 3.70 | 3.70 | |||||
| Processing Cost | US$/t processed | 3.95 | 3.89 | 4.15 | 4 | |||||
| General & Administration | US$/t processed | 1.26 | 1.26 | 1.26 | 1.26 | |||||
|
Selling Costs |
||||||||||
| Payability Factor | % | 96.55 | ||||||||
| Trucking Cost | US$/lb payable | 0.08 | ||||||||
| Freight Realisation (Smelter to Market) | US$/lb | 0.25 | ||||||||
| Treatment Charge | US$/dmt | 50.00 | ||||||||
| Refining Charge | US$/lb | 0.05 | ||||||||
| Concentrate moisture content | % | 10.00 | ||||||||
| Handling Losses | % | 0.12 | ||||||||
| Insurance | % | 0.00 | ||||||||
| Penalties | US$/dmt | 2.50 | ||||||||
| Royalty (Gross basis) | % | 5.48 | ||||||||
| Royalties | US$/lb | 0.16 | ||||||||
| Total Selling Costs | US$/lb copper | 0.63 | ||||||||
|
Economics |
||||||||||
| Discount Rate | % | 8.00 | ||||||||
|
Cut-off Grade |
||||||||||
| Fresh Rock BCOG | % | 0.14% | 0.14% | 0.15% | 0.15% | |||||
| Transitional BCOG | % | 0.14% | 0.14% | 0.15% | 0.14% | |||||
Note: The BCOG excludes the base mining cost as all blocks within the pit limit will be mined, the only decision after that is to either process or dump the material.
|
February 19, 2025 |
Page 151 |
|
|
NI 43-101 Technical Report on the Lumwana Expansion Project |
|
| 15.2.4 | Mining Recovery and Dilution Factors |
The Mineral Resource block model was regularised to account for expected equipment size, dilution, and recovery.
To improve the accuracy of the modelled dilution and recovery, a further step was introduced for Mineral Reserve estimation. Maptek’s GCO was used to assess the likely dilution and losses on a bench-by-bench basis by delineating the ore blocks into selective mining units (SMU). The changes in block sizes during the regularisation and GCO process are illustrated in Table 15-3.
Table 15-3 Minimum Block Size
| Block Cells | Minimum Block Size (m) | |||||||
| Chimiwungo | Malundwe | Kamisengo | Kababisa | |||||
| Parent Cell | 50 x 50 x 6 | 50 x 50 x 4 | 25 x 25 x 4 | 25 x 50 x 4 | ||||
| Sub-Cell | 6.25 x 6.25 x 2 | 6.25 x 6.25 x 2 | 2.5 x 2.5 x 1 | 1.5625 x 1.5625 x 0.5 | ||||
| Regularised Cell | 6.25 x 6.25 x 12 | 6.25 x 6.25 x 8 | 6.25 x 6.25 x 8 | 6.25 x 6.25 x 8 | ||||
| Selective Mining Unit | 12.5 x 12.5 x 12 | 12.5 x 12.5 x 8 | 12.5 x 12.5 x 8 | 6.25 x 6.25 x 8 | ||||
This process adds a net 1.4% to the total ore tonnes and results in a 1.6% loss in grade. The GCO results are summarised by deposit in Table 15-4.
Table 15-4 GCO Dilution and Recovery Summary
| Model Classification |
Chimiwungo | Malundwe | Kamisengo | Kababisa | Total | |||||||||||||||
| (Mt) | (% Cu) | (Mt) | (% Cu) | (Mt) | (% Cu) | (Mt) | (% Cu) | (Mt) | (% Cu) | |||||||||||
| Resource Model | ||||||||||||||||||||
| Measured | 47 | 0.56 | 9 | 0.92 | 7 | 0.4 | 63 | 0.59 | ||||||||||||
| Indicated | 370 | 0.58 | 61 | 0.72 | 12 | 0.34 | 7 | 0.51 | 443 | 0.59 | ||||||||||
| Total | 417 | 0.58 | 70 | 0.75 | 19 | 0.36 | 7 | 0.51 | 506 | 0.6 | ||||||||||
| GCO Output | ||||||||||||||||||||
| Measured | 48 | 0.55 | 9 | 0.92 | 7 | 0.4 | 64 | 0.59 | ||||||||||||
| Indicated | 375 | 0.57 | 61 | 0.72 | 12 | 0.34 | 7 | 0.52 | 448 | 0.58 | ||||||||||
| Total | 423 | 0.57 | 71 | 0.74 | 19 | 0.36 | 7 | 0.52 | 513 | 0.59 | ||||||||||
| % Difference | ||||||||||||||||||||
| Measured | 3% | -2% | 1% | 0% | 0% | 0% | - | - | 2% | -1% | ||||||||||
| Indicated | 1% | -1% | 0% | -1% | 1% | 0% | -6% | 1% | 1% | -1% | ||||||||||
| Total | 2% | -1% | 0% | -1% | 0% | 0% | -6% | 1% | 1% | -2% | ||||||||||
Any further differences between modelled estimates and actual mine performance are classed as unplanned dilution and losses. This includes differences due to dig block definition, model changes, true dilution and loss, and measurement errors.
|
February 19, 2025 |
Page 152 |
|
|
NI 43-101 Technical Report on the Lumwana Expansion Project |
|
Barrick has a standard weekly, end of month, and end of quarter production measurement system that reports and provides reconciliation between grade control and the monthly mine production. The overall 2024 reconciliation is presented in Table 15-5 and shows a 99% reconciliation on tonnage, 99% on grade, and 98% on metal. The GC Adjustment (difference between the GC Theoretical and the GC Actual Feed) was related to the re-sampling and re-evaluation of long-standing stockpiles during 2024.
Table 15-5 Lumwana 2024 Year-End Reconciliation Performance
| Department | # | Recon Ore Mine, Stockpiles and Plant out |
Tonnage (Mt) |
Grade (% Cu) |
Metal (kt Cu) |
|||||
| Grade Control | 1 | Mined | 26.1 | 0.55 | 145 | |||||
| Grade Control | 5 | GC Theoretical Feed | 25.9 | 0.55 | 143 | |||||
| Grade Control | 6 | GC Actual Feed | 26.0 | 0.54 | 139 | |||||
| Grade Control | 7 | GC Adjustment | -0.1 | -4.24 | 4 | |||||
| Grade Control | 17 | GC Call | 26.1 | 0.54 | 140 | |||||
| Plant | 18 | Mills Check-in | 25.8 | 0.53 | 137 | |||||
| Plant | 19 | Mills Check-out | 25.8 | 0.53 | 137 | |||||
| GC vs Plant | 20 | Reconciliation | 99 | 99 | 98 |
This calculation includes the impact of unplanned dilution and losses. Following reconciliation, future grade control models are adjusted to take dilution and loss into account, allowing a close reconciliation. The overall impact of that adjustment is shown in Table 15-6. This provides a comparison between the long-term model estimates and the short-term grade control estimates on an annual basis.
Due to the low annual variability of reconciliation performance illustrated in Table 15-6, no additional dilution and recovery factors are included in the Mineral Reserve estimate beyond the application of GCO.
The QP considers that the process applied through regularisation and GCO leads to a reasonable estimate of dilution and losses for the estimation of Mineral Reserves.
|
February 19, 2025 |
Page 153 |
|
|
NI 43-101 Technical Report on the Lumwana Expansion Project |
|
Table 15-6 Historic Reconciliation Performance
| Year | Ore Mined | Tonnage | Grade | Metal | ||||
| (Mt) | (% Cu) | (kt Cu) | ||||||
| 2021 | Reported | 33.5 | 0.45 | 151 | ||||
| Planned | 33.4 | 0.47 | 158 | |||||
| Variance | -0.30% | 4.67% | 4.35% | |||||
| 2022 | Reported | 20.3 | 0.61 | 123 | ||||
| Planned | 19.7 | 0.62 | 123 | |||||
| Variance | -2.72% | 2.61% | -0.18% | |||||
| 2023 | Reported | 26.0 | 0.51 | 132 | ||||
| Planned | 27.1 | 0.51 | 138 | |||||
| Variance | 4.15% | -0.28% | 3.85% | |||||
| 2024 | Reported | 26.1 | 0.55 | 145 | ||||
| Planned | 25.8 | 0.55 | 142 | |||||
| Variance | -0.90% | -0.66% | -1.56% | |||||
| Total | Actual | 105.9 | 0.52 | 552 | ||||
| Planned | 106.1 | 0.53 | 561 | |||||
| Variance | 0.18% | 1.49% | 1.67% |
Due to the low annual variability of reconciliation performance illustrated in Table 15-6, no additional dilution and recovery factors are included in the Mineral Reserve estimate beyond the application of GCO.
The QP considers that the process applied through regularisation and GCO leads to a reasonable estimate of dilution and losses for the estimation of Mineral Reserves.
| 15.2.5 | Metallurgical Recoveries |
Metallurgical recoveries were estimated for each block using different formulae depending on the oxidation state of the material and the recovery assumptions for each deposit discussed in Section 13.3.
The oxidation state was determined by the ratio of AsCu to TCu and the ratio of S to TCu and flagged in the block model as described in Section 14.2 and 14.6 of this Technical Report.
Recoveries were estimated using equations derived from processing plant performance data. There was more process plant performance data available for grades above 0.3% Cu and so different equations were used to estimate recoveries above and below this grade threshold.
|
February 19, 2025 |
Page 154 |
|
|
NI 43-101 Technical Report on the Lumwana Expansion Project |
|
Oxide material cannot be recovered and is currently treated as waste. A fixed recovery of 78% was applied to transitional and deep weathering material where the grade is above 0.3% Cu. This was based on metallurgical test work caried out on samples taken from the transitional material in 2024.
For fresh material above 0.3% Cu, a regression model derived from three years of processing plant performance was used. Recoveries were estimated using regression analysis correlating recovery with the AsCu:TCu ratio, and TCu. For the Kamisengo and Kababisa deposits, where there is no AsCu data available, the regression uses TCu alone.
For copper grades below 0.3% Cu in both fresh and transitional material, recovery was estimated using a regression model derived from process plant performance and extrapolated to extreme low grades.
The maximum metallurgical input recoveries for the Chimiwungo, Malundwe, and Kababisa open pits reach 94.3%, while at Kamisengo recoveries reach 90%.
Resulting recovery estimates ranged from 90.6% for grades of approximately 0.3% Cu, up to the maximum of 93.4%. The estimate provides an average recovery over the LOM of 92.7%.
For scheduling and Mineral Reserve estimation, the grade threshold which determined the recovery equations used was changed from 0.3% Cu to 0.22% Cu as more process plant performance data became available. Slight adjustments were also made to the recovery equations.
| 15.2.6 | Geotechnical Slope Parameters |
A range of geotechnical studies have been completed by both consulting geotechnical engineers and the LMC geotechnical team and detail on geotechnical parameters is provided in Section 16.2 of this Technical Report.
The overall slope angles (OSA), which are generally inter-ramp slope angles (IRA) with some adjustment for ramp intervals used in the pit optimisation, are summarised in Table 15-7.
Table 15-7 Overall Slope Angles for Pit Optimisation
| Pit | OSA (°) by Oxidation Zone | |||||
| Saprolite | Transitional | Fresh | ||||
| Chimiwungo | 24.95 | 40.21 | 40.38 to 45.31 | |||
| Malundwe | 25.10 to 25.80 | 39 to orebody dip | 44.80 to orebody dip | |||
| Kamisengo | 30.00 | 43.00 | 41.84 to 45.64 | |||
| Kababisa | 25.10 to 25.80 | 39 to orebody dip | 44.80 to orebody dip | |||
|
February 19, 2025 |
Page 155 |
|
|
NI 43-101 Technical Report on the Lumwana Expansion Project |
|
| 15.2.7 | Mining Costs |
The mine operating costs used for pit optimisation were estimated using a zero-based costing exercise, which derives the expected cost from operational performance along with the fleet requirements, labour requirements, and productivities defined in the Expansion Project PFS. The base mining cost includes fuel, drilling and blasting, load and haul, pit dewatering, rehabilitation, day works and contractor costs, and the mining department costs. The costs account for several operational improvements that are expected as a result of purchasing new fleet and changes defined during the PFS.
An incremental mining cost is added on a bench-by-bench basis as a function of the additional fuel consumption, burn rate, and maintenance costs while the truck is moving from one bench to another.
| 15.2.8 | Processing Costs |
The processing costs used were defined in the PFS (Barrick, 2024a) with consideration for the operation of the existing processing plant, the planned Expansion Project processing plant, and the additional crushing and conveying infrastructure required to service each open pit.
Ore rehandling costs were derived from current operation performance with a rehandle target of 40% for the expanded operation.
Ore from Kamisengo and Malundwe will be crushed and conveyed to the processing plant. For Chimiwungo, the ore destination is expected to alternate between crusher locations. Kababisa ore will be trucked to the existing Malundwe crusher.
An additional ore hauling cost was added to the variance in haulage distance between waste rock dumps and the crushers. This is estimated to be a further 1,200 m for ore haulage, an average applied to all of the open pits.
| 15.2.9 | General and Administration |
The general and administration (G&A) costs were estimated based on historical cost performance modified for the expansion of operations as defined in the PFS (Barrick, 2024a). The average annual G&A costs were apportioned to the processing plant throughput and included as a cost per tonne of ore processed.
| 15.2.10 | Sustaining Capital |
Sustaining capital for processing and mining costs was included as an input for the GCO.
|
February 19, 2025 |
Page 156 |
|
|
NI 43-101 Technical Report on the Lumwana Expansion Project |
|
| 15.2.11 | Royalties and Selling Costs |
Downstream costs for pit optimisation were estimated based on current costs incurred with adjustments for the copper price used.
| 15.2.12 | Optimisation Results and Final Shell Selection |
For each open pit, pit optimisation was carried out allocating revenue to Measured, Indicated, and Inferred categories. Revenue has been assigned to Inferred material for pit optimisation purposes only. This was done to provide an ultimate shell boundary. No Inferred material is converted to Mineral Reserves or contributes to revenue in the cost modelling supporting the Mineral Reserve estimate. Cashflow figures are nominal and exclude capital cost.
The final pit shell selected was the revenue factor 1 pit with a metal price of US$3.00/lb Cu.
Previously, pit optimisation for Chimiwungo and Malundwe was based on peak net present value (NPV), while for the Expansion Project it is based on peak cash flow. The difference between these at Chimiwungo is defined as a series of ‘Super-Pit’ shells and push backs. The final pit limit selected was where the operation breaks even (an outcome of ‘revenue factor 1’).
An NPV at 8% means that larger pit shells beyond year 12 contribute revenue so far in the future that they do not add to the discounted value of the operation. To account for this later revenue, and to leave the mine running long enough to capture any future copper price increases, a peak undiscounted cash flow has been used to determine the final pit shell.
Table 15-8 details the pit optimisation results for Chimiwungo.
Table 15-8 Chimiwungo Pit Optimisation Results
| Pit Shell |
Rev Factor |
Ore |
Met Recovery |
Waste (Mt) |
Total Rock (Mt) |
Strip Ratio t:t |
Recovered Copper |
Undiscounted Cash Flow (US$M) |
||||||||||
| (Mt) | (% Cu) | |||||||||||||||||
|
1 |
0.30 | 3 | 1.15 | 0.90 | 1 | 3 | 0.3 | 27 | 120 | |||||||||
|
6 |
0.40 | 20 | 0.89 | 0.89 | 10 | 30 | 0.7 | 145 | 610 | |||||||||
|
11 |
0.50 | 50 | 0.70 | 0.89 | 60 | 120 | 1.1 | 345 | 1,280 | |||||||||
|
16 |
0.60 | 270 | 0.61 | 0.89 | 590 | 860 | 2.2 | 1,461 | 4,400 | |||||||||
|
21 |
0.70 | 410 | 0.60 | 0.89 | 1,130 | 1,550 | 2.7 | 2,214 | 6,040 | |||||||||
|
26 |
0.80 | 770 | 0.56 | 0.89 | 2,410 | 3,170 | 3.1 | 3,806 | 8,800 | |||||||||
|
31 |
0.90 | 900 | 0.55 | 0.89 | 3,070 | 3,970 | 3.4 | 4,409 | 9,390 | |||||||||
|
32 |
0.92 | 990 | 0.56 | 0.89 | 3,760 | 4,750 | 3.8 | 4,899 | 9,660 | |||||||||
|
33 |
0.94 | 1,000 | 0.56 | 0.89 | 3,820 | 4,820 | 3.8 | 4,949 | 9,680 | |||||||||
|
34 |
0.96 | 1,010 | 0.56 | 0.89 | 3,870 | 4,880 | 3.8 | 4,990 | 9,690 | |||||||||
|
35 |
0.98 | 1,090 | 0.56 | 0.89 | 4,410 | 5,490 | 4.0 | 5,361 | 9,770 | |||||||||
|
February 19, 2025 |
Page 157 |
|
|
NI 43-101 Technical Report on the Lumwana Expansion Project |
|
| Pit Shell |
Rev Factor |
Ore |
Met Recovery |
Waste (Mt) |
Total Rock (Mt) |
Strip Ratio t:t |
Recovered Copper |
Undiscounted Cash Flow (US$M) |
||||||||||
| (Mt) | (% Cu) | |||||||||||||||||
|
36* |
1.00 | 1,170 | 0.56 | 0.89 | 5,180 | 6,360 | 4.4 | 5,842 | 9,780 | |||||||||
|
37 |
1.02 | 1,190 | 0.56 | 0.89 | 5,250 | 6,440 | 4.4 | 5,892 | 9,780 | |||||||||
|
38 |
1.04 | 1,210 | 0.56 | 0.89 | 5,440 | 6,650 | 4.5 | 6,006 | 9,760 | |||||||||
|
39 |
1.06 | 1,220 | 0.56 | 0.89 | 5,510 | 6,730 | 4.5 | 6,051 | 9,740 | |||||||||
|
40 |
1.08 | 1,240 | 0.56 | 0.89 | 5,670 | 6,920 | 4.6 | 6,151 | 9,700 | |||||||||
Note.* Selected pit shell
To test the viability of the optimisation results, once the pits were designed, scheduled and costed, the final FS operating cost was applied to the Chimiwungo pit optimisation. This final operating cost had a processing cost higher and a mining cost lower than the initial optimisation. The net result was similar to the shell values selected in this earlier phase of work.
Table 15-9 details the contents of the nested pit shells for Malundwe.
Table 15-9 Malundwe Pit Optimisation Results
| Pit Shell |
Rev Factor |
Ore |
Met Recovery |
Waste (Mt) |
Total Rock (Mt) |
Strip Ratio t:t |
Recovered Copper (kt) |
Undiscounted Cash Flow (US$ M) |
||||||||||
| (Mt) | (% Cu) | |||||||||||||||||
|
1 |
0.30 | 2 | 1.16 | 92.4 | 1 | 3 | 0.4 | 24 | 114 | |||||||||
|
6 |
0.40 | 11 | 0.95 | 92.9 | 13 | 24 | 1.3 | 94 | 403 | |||||||||
|
11 |
0.50 | 24 | 0.85 | 93.1 | 53 | 77 | 2.2 | 190 | 730 | |||||||||
|
16 |
0.60 | 48 | 0.78 | 93.1 | 151 | 199 | 3.2 | 346 | 1,170 | |||||||||
|
21 |
0.70 | 64 | 0.71 | 92.9 | 201 | 265 | 3.2 | 420 | 1,335 | |||||||||
|
26 |
0.80 | 81 | 0.66 | 92.7 | 272 | 353 | 3.4 | 498 | 1,459 | |||||||||
|
28 |
0.84 | 88 | 0.65 | 92.6 | 310 | 398 | 3.5 | 533 | 1,498 | |||||||||
|
29 |
0.86 | 154 | 0.62 | 92.8 | 758 | 912 | 4.9 | 890 | 1,842 | |||||||||
|
30 |
0.88 | 157 | 0.62 | 92.7 | 774 | 931 | 4.9 | 904 | 1,853 | |||||||||
|
31 |
0.90 | 160 | 0.62 | 92.7 | 787 | 947 | 4.9 | 916 | 1,862 | |||||||||
|
32 |
0.92 | 163 | 0.61 | 92.7 | 800 | 963 | 4.9 | 926 | 1,868 | |||||||||
|
33 |
0.94 | 173 | 0.61 | 92.7 | 865 | 1,038 | 5.0 | 971 | 1,885 | |||||||||
|
34 |
0.96 | 182 | 0.60 | 92.7 | 916 | 1,098 | 5.0 | 1,008 | 1,898 | |||||||||
|
35 |
0.98 | 187 | 0.59 | 92.6 | 942 | 1,129 | 5.0 | 1,028 | 1,902 | |||||||||
|
36* |
1.00 | 194 | 0.59 | 92.6 | 972 | 1,166 | 5.0 | 1,050 | 1,903 | |||||||||
Note.* Selected pit shell
Table 15-10 details the contents of the nested pit shells for Kamisengo.
|
February 19, 2025 |
Page 158 |
|
|
NI 43-101 Technical Report on the Lumwana Expansion Project |
|
Table 15-10 Kamisengo Pit Optimisation Results
| Pit Shell |
Rev Factor |
Ore |
Met Recovery (% Cu) |
Waste (Mt) |
Total (Mt) |
Strip t:t |
Recovered (kt) |
Undiscounted (US$ M) |
||||||||||
| (Mt) | (%Cu) | |||||||||||||||||
|
7 |
0.54 |
1.3 |
0.49 |
87.5 |
1.2 |
2 |
0.9 |
12 | 17 | |||||||||
|
12 |
0.64 |
49.4 |
0.38 |
88.3 |
42.0 |
91 |
0.9 |
369 | 428 | |||||||||
|
17 |
0.74 |
129.4 |
0.35 |
88.0 |
125.8 |
255 |
1.0 |
873 | 851 | |||||||||
|
22 |
0.84 |
189.7 |
0.34 |
87.8 |
213.3 |
403 |
1.1 |
1,234 | 1,065 | |||||||||
|
23 |
0.86 |
205.8 |
0.34 |
87.8 |
247.2 |
453 |
1.2 |
1,335 | 1,108 | |||||||||
|
24 |
0.88 |
214.5 |
0.33 |
87.8 |
263.4 |
478 |
1.2 |
1,386 | 1,128 | |||||||||
|
25 |
0.90 |
222.7 |
0.33 |
87.7 |
281.1 |
504 |
1.3 |
1,435 | 1,143 | |||||||||
|
26 |
0.92 |
232.5 |
0.33 |
87.7 |
302.0 |
535 |
1.3 |
1,492 | 1,158 | |||||||||
|
27 |
0.94 |
240.4 |
0.33 |
87.7 |
318.7 |
559 |
1.3 |
1,537 | 1,167 | |||||||||
|
28 |
0.96 |
248.1 |
0.33 |
87.7 |
338.1 |
586 |
1.4 |
1,583 | 1,173 | |||||||||
|
29 |
0.98 |
255.3 |
0.33 |
87.7 |
355.9 |
611 |
1.4 |
1,624 | 1,177 | |||||||||
|
30* |
1.00 |
263.0 |
0.33 |
87.6 |
379.6 |
643 |
1.4 |
1,672 | 1,178 | |||||||||
Note.* Selected pit shell
Table 15-11 details the contents of the nested pit shells for Kababisa.
Table 15-11 Kababisa Pit Optimisation Results
| Pit Shell |
Rev Factor |
Ore |
Met Recovery (% Cu) |
Waste (Mt) |
Total (Mt) |
Strip t:t |
Recovered (kt) |
Undiscounted (US$ M) |
||||||||||
| (Mt) | (%Cu) | |||||||||||||||||
|
7 |
0.72 |
0.1 |
0.44 |
78.0 |
0 |
0 |
1.4 |
0 | 0 | |||||||||
|
12 |
0.82 |
1.9 |
0.44 |
82.1 |
7 |
9 |
3.5 |
7 | 9 | |||||||||
|
16 |
0.90 |
2.9 |
0.42 |
82.3 |
10 |
13 |
3.4 |
10 | 12 | |||||||||
|
17 |
0.92 |
3.2 |
0.42 |
82.6 |
11 |
14 |
3.5 |
11 | 12 | |||||||||
|
18 |
0.94 |
3.3 |
0.42 |
82.6 |
11 |
15 |
3.5 |
11 | 12 | |||||||||
|
19 |
0.96 |
3.9 |
0.41 |
83.2 |
14 |
18 |
3.7 |
14 | 13 | |||||||||
|
20 |
0.98 |
4.2 |
0.41 |
83.1 |
16 |
20 |
3.7 |
15 | 13 | |||||||||
|
21* |
1.00 |
4.3 |
0.41 |
83.2 |
16 |
21 |
3.8 |
15 | 12 | |||||||||
|
22 |
1.02 |
4.4 |
0.41 |
83.4 |
17 |
21 |
3.8 |
15 | 12 | |||||||||
|
23 |
1.04 |
4.5 |
0.41 |
83.3 |
17 |
22 |
3.8 |
15 | 12 | |||||||||
|
24 |
1.06 |
4.9 |
0.41 |
83.5 |
19 |
24 |
4.0 |
16 | 12 | |||||||||
|
25 |
1.08 |
5.0 |
0.41 |
83.6 |
20 |
25 |
4.0 |
17 | 11 | |||||||||
Note.* Selected pit shell
|
February 19, 2025 |
Page 159 |
|
|
NI 43-101 Technical Report on the Lumwana Expansion Project |
|
| 15.3 | Sensitivities |
| 15.3.1 | Cut-off Grade |
A series of grade tonnage curves were generated to understand the sensitivity of each deposit to cut-off grade within the selected final pit shell (Figure 15-1 to Figure 15-3). A 50% increase in the cut-off grade, from 0.16 % Cu to 0.24% Cu, would result in a 5.89% reduction in contained copper in Chimiwungo, a 3.45 % Cu reduction in contained copper in Malundwe, and 11.73 % Cu reduction in contained copper in Kamisengo. Given its small size, no cut-off grade sensitivity is provided for Kababisa.
This indicates that the deposits are relatively insensitive to changes in cut-off grade.

Figure 15-1 Chimiwungo Pit Optimisation Tonnage Grade Curve
|
February 19, 2025 |
Page 160 |
|
|
NI 43-101 Technical Report on the Lumwana Expansion Project |
|

Figure 15-2 Malundwe Pit Optimisation Tonnage Grade Curve

Figure 15-3 Kamisengo Pit Optimisation Tonnage Grade Curve
| 15.3.2 | Mining Costs |
A further sensitivity analysis was completed to determine the impact of a change in mining cost. Each deposit was tested with rates up to a +/- 30 % variation in mining unit cost. Results for Kababisa have been omitted given its small size.
|
February 19, 2025 |
Page 161 |
|
|
NI 43-101 Technical Report on the Lumwana Expansion Project |
|
The sensitivity of the Chimiwungo deposit to mining cost changes is shown in Figure 15-4.
| ● | The deposit is sensitive to mining cost changes. A 5% cost increase leads to a 6% ore loss and a 17% loss in waste tonnes, which is in keeping with the high stripping ratio towards the end of the mine life. A 5% cost decrease leads to a 7.5% increase in ore tonnes, and a similar increase in waste tonnes. |
| ● | The maximum and minimum change of +/-30% in mining cost leads to a similar change in ore tonnes, and a larger change in waste volume of between 44% and 49%. |
| ● | The area most affected by cost changes is the far southeast portion of the pit. |
|
February 19, 2025 |
Page 162 |
|
|
NI 43-101 Technical Report on the Lumwana Expansion Project |
|

Figure 15-4 Chimiwungo Pit Optimisation Mining Cost Sensitivity

Figure 15-5 Malundwe Pit Optimisation Mining Cost Sensitivity
|
February 19, 2025 |
Page 163 |
|
|
NI 43-101 Technical Report on the Lumwana Expansion Project |
|
The sensitivity of the Malundwe deposit to mining cost changes is shown in Figure 15-5.
| ● | A 5% increase in mining cost leads to a 9% loss of ore tonnes, while a 5% decrease leads to a 7% increase in ore tonnes. |
| ● | A 30% increase in mining cost sees the ore tonnes reduce by over 50%, while a decrease in cost of 30% sees a 23% increase in ore tonnes. |
| ● | The area most affected by the changes is the lower-grade southern area. |
The sensitivity of the Kamisengo deposit to mining cost changes is shown in Figure 15-6.
| ● | The change in Kamisengo is relatively linear; a +/-30% change in mining cost leads to a similar change in ore tonnes. However, at the lower mining cost, the increase in ore tonnes comes with a much higher stripping ratio, so the revenue gain is lower. |

Figure 15-6 Kamisengo Pit Optimisation Mining Cost Sensitivity
In the QP’s opinion, these results are representative of the changes that would take place in the Mineral Reserves under the same conditions.
|
February 19, 2025 |
Page 164 |
|
|
NI 43-101 Technical Report on the Lumwana Expansion Project |
|
| 15.4 | Mine Design and Pit Shell Comparison |
The selected optimised pit shells are used as the basis of the final pit design used to estimate Mineral Reserves. The pit design includes adjustments for geotechnical design parameters, access ramps, and geotechnical berms to produce a practicable open pit. Table 15-12 shows the comparison between the optimised pit shells and the final pit designs.
Table 15-12 Comparison of Optimised Pit Shells and Final Pit Designs
| Pit | Ore (Mt) |
Grade (% Cu) |
Metal (kt) |
Waste (Mt) |
Total (Mt) |
Strip Ratio (w:o) |
||||||||
|
Chimiwungo |
Pit Shell | 1,194 | 0.55 | 6,571 | 5,558 | 6,752 | 4.7 | |||||||
| Pit Designs | 1,173 | 0.55 | 6,495 | 5,918 | 7,090 | 5.0 | ||||||||
| Variance | -2% | 1% | -1% | 6% | 5% | 8% | ||||||||
|
Malundwe |
Pit Shell | 185 | 0.61 | 1,134 | 929 | 1,115 | 5.0 | |||||||
| Pit Designs | 173 | 0.65 | 1,118 | 961 | 1,134 | 5.5 | ||||||||
| Variance | -6% | 5% | -1% | 3% | 2% | 11% | ||||||||
|
Kamisengo |
Pit Shell | 224 | 0.31 | 699 | 311 | 535 | 1.4 | |||||||
| Pit Designs | 205 | 0.33 | 679 | 366 | 571 | 1.8 | ||||||||
| Variance | -8% | 6% | -3% | 18% | 7% | 29% | ||||||||
|
Kababisa |
Pit Shell | 11 | 0.45 | 51 | 32 | 43 | 2.8 | |||||||
| Pit Designs | 8 | 0.52 | 40 | 40 | 48 | 5.2 | ||||||||
| Variance | -33% | 16% | -22% | 25% | 10% | 86% | ||||||||
From the optimised pit shell to final pit design, there is a 1.5% (123 kt Cu) decrease in copper metal content due to the exclusion of some minor satellite pits. There is a 4.7% (398 Mt) increase in total material moved due to practical mining adjustments.
| 15.5 | Mineral Reserve Statement |
The Lumwana Mineral Reserve estimate, as of December 31, 2024, is presented in Table 15-1. The Mineral Reserve estimate consists of surface stockpiles and in-situ open pit material from four deposits; Chimiwungo, Malundwe, Kababisa, and Kamisengo. Mineral Reserves are reported at a copper price of $3.00/lb. The total Proven and Probable Mineral Reserves are estimated to be 1,600 Mt at 0.52% Cu for 8.3 Mt Cu.
The QP is not aware of any mining, metallurgical, infrastructure, permitting, or other relevant factors which could materially affect the Mineral Reserve estimates.
The Mineral Reserve estimates have been prepared according to the CIM (2014) Standards as incorporated with NI 43-101. Mineral Reserve estimates were also prepared using the guidance outlined in CIM (2019) MRMR Best Practice Guidelines.
|
February 19, 2025 |
Page 165 |
|
|
NI 43-101 Technical Report on the Lumwana Expansion Project |
|
The estimate uses updated economic factors, the latest Mineral Resource block model, geotechnical and hydrological inputs, and metallurgical processing and recovery updates. The QP responsible for estimating the Mineral Reserves has performed an independent verification of the block model tonnes and grade, and in their opinion the process has been carried out to industry standards.
For the open pit, optimised pit shells were generated using the Pseudoflow algorithm within Geovia’s Whittle software and then used in the open pit mine design process and Mineral Reserve estimation.
Stockpile Mineral Reserves are obtained from survey measurements which are done periodically, i.e., weekly and monthly. Each stockpile assumes a grade and density value which is an average of the total ore dumped on it, estimated from the block model.
A site-specific financial model was populated and reviewed to demonstrate that the Mineral Reserves are economically viable.
A Mineral Reserves statement is shown in Table 15-13.
|
February 19, 2025 |
Page 166 |
|
|
NI 43-101 Technical Report on the Lumwana Expansion Project |
|
Table 15-13 Summary of Lumwana Mineral Reserve Estimate as of December 31, 2024
| Source | Proven | Probable | Total | |||||||||||||||||
|
Tonnes (Mt) |
Grade (% Cu) |
Contained (Mt Cu) |
Tonnes (Mt) |
Grade (% Cu) |
Contained Metal (Mt Cu) |
Tonnes (Mt) |
Grade (% Cu) |
Contained Metal (Mt Cu) |
||||||||||||
|
Stockpiles |
ROM Pad Chimiwungo | 18 | 0.32 | 0.057 | - | - | - | 18 | 0.32 | 0.057 | ||||||||||
| ROM Pad Malundwe | 1.6 | 0.34 | 0.0056 | - | - | - | 1.6 | 0.34 | 0.0056 | |||||||||||
| COS | 0.18 | 0.85 | 0.0015 | - | - | - | 0.18 | 0.85 | 0.0015 | |||||||||||
| Stockpile Subtotal | 20 | 0.32 | 0.064 | - | - | - | 20 | 0.32 | 0.064 | |||||||||||
|
Open Pit |
Malundwe | 18 | 0.72 | 0.13 | 140 | 0.60 | 0.83 | 160 | 0.61 | 0.96 | ||||||||||
| Chimiwungo | 100 | 0.48 | 0.48 | 1,100 | 0.56 | 6 | 1,200 | 0.55 | 6.5 | |||||||||||
| Kamisengo | 240 | 0.34 | 0.82 | 240 | 0.34 | 0.82 | ||||||||||||||
| Kababisa | 5.3 | 0.43 | 0.023 | 2.3 | 0.43 | 0.023 | ||||||||||||||
| Open Pit Subtotal | 118 | 0.52 | 0.62 | 1,500 | 0.53 | 7.6 | 1,600 | 0.53 | 8.3 | |||||||||||
|
Total |
140 | 0.49 | 0.67 | 1,500 | 0.53 | 7.6 | 1,600 | 0.52 | 8.3 | |||||||||||
Notes:
| ● | Mineral Reserves are reported on a 100% basis. |
| ● | The Mineral Reserve estimate has been prepared according to CIM (2014) Standards and using CIM (2019) MRMR Best Practice Guidelines. |
| ● | Open Pit Mineral Reserves are reported at a copper price of $3.00/lb, and at a pit rim cut-off grade of 0.14% Cu |
| ● | Dilution and losses were applied through the Grade Control Optimiser (GCO) process. |
| ● | The Mineral Reserve estimate was reviewed by Derek Holm, FAusIMM, an employee of Barrick and QP. |
| ● | Numbers may not add due to rounding. Tonnes and contained metal are rounded to 2 significant figures, whilst Proven and Probable grades are reported to 2 decimal places. |
|
February 19, 2025 |
Page 167 |
|
|
NI 43-101 Technical Report on the Lumwana Expansion Project |
|
| 15.6 | 2024 Versus 2023 End of Year Comparison |
There have been notable changes since the 2023 Mineral Reserve estimate. Through the FS the Super-Pit portion of Chimiwungo and the new Kamisengo and Kababisa deposits have been added to the Mineral Reserves. Changes since 2023 have resulted in net increase of 5,351 kt Cu in the Mineral Reserves. Table 15-14 summarises the changes between the current and the 2023 Mineral Reserve estimate.
Figure 15-7 shows the Chimiwungo Super-Pit design alongside the current open pits.

Source: Barrick, 2024.
Figure 15-7 Chimiwungo Super-Pit Design with Existing Open Pits and Estimated Copper Grades
|
February 19, 2025 |
Page 168 |
|
|
NI 43-101 Technical Report on the Lumwana Expansion Project |
|
Table 15-14 Comparison to 2023 Mineral Reserve Statement
| Change | Tonnes (Mt) |
Grade (%Cu) |
Contained Metal (kt Cu) |
Comments | ||||
| 2023 Mineral Reserves | 510.3 | 0.58% | 2,972 | |||||
| Mining Depletion | -26.0 | 0.55% | -143 | Total mined out in 2024 | ||||
| Geological Model Updates | -1.4 | 1.50% | -21 | Changes based on grade control drilling | ||||
| Geotechnical Changes | -15.7 | 1.13% | -177 | Application of refined geotechnical parameters in the Feasibility Study | ||||
| New Deposits | 249.3 | 0.34% | 847 | Addition of Kamisengo and Kababisa to the Mineral Reserve | ||||
| Feasibility Study Changes (including additional Indicated Mineral Resources) | 869.1 | 0.56% | 4,888 | Update to optimisation and mine design | ||||
| Reconciliation Difference | 3.5 | -1.20% | -42 | Difference between reconciliation calculation and declared Reserves | ||||
| 2024 Mineral Reserves | 1,589.1 | 0.52% | 8,324 | |||||
| Change from 2023 vs 2024 | 1,078.8 | 0.50% | 5,351 |
The largest increase in the Mineral Reserves, 4,888 kt Cu, is a result of changes to the optimisation and mine design at both Chimiwungo and Malundwe brought about by the FS, and the inclusion of additional Indicated Mineral Resources brought about by infill drilling. The optimisation work was also based on cash flow rather than a shorter term NPV which allowed a larger pit shell to be selected. Other changes to input factors had smaller impacts but contributed to the overall change. An increase in the Mineral Reserves of 847 kt Cu was due to the addition of two new deposits, Kamisengo and Kababisa to the Mineral Reserves.
Decreases in the Mineral Reserves were primarily due to mining depletion (143 kt Cu), decrease due to mining in 2024, geological block model changes due to grade control drilling (21 kt Cu), and decrease due to the application of refined geotechnical parameters (177 kt Cu).
| 15.7 | External Reviews |
In September 2024, AMC Consultants (AMC) completed an independent review of the mining portion of the FS, reviewing the optimisation and mine design, schedule and fleet productivity, overall mining methods, risks and opportunity, and operating costs (AMC, 2024).
Recommendations from this review were integrated into the FS. These included a recommendation to evaluate the economics of individual pushbacks, which was completed for the larger final pushbacks of the Super-Pit, while several pushbacks were modified to improve cash flow timing
Further recommendations provided were subject to the following ranking:
|
February 19, 2025 |
Page 169 |
|
|
NI 43-101 Technical Report on the Lumwana Expansion Project |
|
| ● | Critical: must be addressed immediately to remedy/rectify a fatal flaw or radical error. |
| ● | Recommended: an issue causing moderate causes of concern to be addressed. |
| ● | Value-added: of minor concern and includes suggestions for further investigation. |
AMC did not identify any critical issues or fatal flaws and concluded that the processes underlying the development of the mine design and schedule met the standards required of an FS.
Recommendations included:
| ● | A potential to reduce the size of phases and have more phases open at any given time. This allows the pit to develop closer to the optimisation sequence and provides the added benefit of spreading the truck fleet over more access roads to reduce congestion. |
Value-added observations included:
| ● | Independent accesses for each pushback result in additional waste being mined. Developing accesses on the shallow dipping footwall could reduce waste and improve backfilling work. |
| ● | The distribution of in-pit power supply needs to be reviewed to reduce maximum cable runs. |
These recommendations will be considered in the annual LOM updates, which focus in more detail over the next 5-year period.
| 15.8 | QP Comments on Mineral Reserve Estimates |
The QP responsible for the Mineral Reserves has supervised the Mineral Reserve estimation process. In the QP’s opinion, Mineral Reserve estimation has been carried out to industry standards using appropriate modifying factors for the conversion of Mineral Resources to Mineral Reserves.
The QP is not aware of any mining, metallurgical, infrastructure, permitting, or other relevant factors which could materially affect the Mineral Reserve estimates.
|
February 19, 2025 |
Page 170 |
|
|
NI 43-101 Technical Report on the Lumwana Expansion Project |
|
| 16 | Mining Methods |
The Lumwana operations involve open pit mining of two deposits, Chimiwungo, which comprises individual open pits; Chimiwungo West, Chimiwungo East, and Chimiwungo South, and Malundwe. As part of the Expansion Project, both open pits will be expanded, resulting in the three open pits at Chimiwungo being merged into a single ‘Super-Pit’. Additionally, two new satellite open pits, Kamisengo and Kababisa will be developed.
Total mine production in 2024 was 141 Mt, of which 26.1 Mt was ore at a grade of 0.55% Cu. A total of 25.8 Mt was milled at a head grade of 0.53% Cu for a total of 123 kt Cu (at 89.82% recovery), the difference in mining and milling coming from various stockpiles. Total production since mining commenced in 2009 to year-end 2024 is 352.13 Mt milled at a 0.57% Cu head grade for 1,845 kt Cu (91.84% recovery).
The Expansion Project is anticipated to increase annual mining capacity from 157 Mt to 354 Mt (ore and waste) while increasing plant throughput from 27 Mtpa to 52 Mtpa. The mining rate ramp-up is planned to begin in 2026, with the total material mined increasing from 157 Mtpa to an average of 215 Mtpa in 2027. This ramp-up will continue until 2030 when the rate reaches 305 Mtpa. A further increase to 354 Mtpa is planned for 2039.
Mining is proposed to start at the new open pits Kababisa and Kamisengo in 2035 and 2036, respectively. The southern side of the Kababisa open pit will be backfilled with waste material as an overland conveyor system and a section of the TSF will be situated over the pit.
The remaining LOM is projected to increase from 17 years, based upon Barrick’s Mineral Reserve estimate as of December 31, 2023, to 33 years until 2057, based upon the Mineral Reserve estimate as of December 31, 2024, with the processing of ROM ore stockpiles in the final two years.
| 16.1 | Mining Methods |
Open pit mining currently takes place at Chimiwungo and Malundwe, which are approximately 7 km apart, and the ore is processed at one central processing plant. Open pit mining is carried out using conventional drill, blast, load, and haul surface mining methods, with extensive grade control drilling completed prior to mining. There will be no major change to the current mining method for the Expansion Project.
There are two distinct mining operations: the pre-stripping operation, which focuses on mining oxide material which does not need blasting, and the main production operation, which focuses on mining fresh waste, termed stripping, and ore. While oxide material is mineralised, it is not currently
|
February 19, 2025 |
Page 171 |
|
|
NI 43-101 Technical Report on the Lumwana Expansion Project |
|
economic to recover copper from it, so it is treated as waste. The ore supplied to the plant is typically a fresh rock sulphide ore.
Ore is currently hauled to two ROM pads; one at Malundwe and one at Chimiwungo. These two ROM pads will continue to operate as part of the Expansion Project. An additional crusher is planned to support future Chimiwungo and Super-Pit mining with the opportunity for an in-pit crusher to be installed later in the LOM. A new ROM pad will be constructed at Kamisengo and ore from Kababisa will be trucked to the Malundwe ROM pad.
LMC owns and operates the pre-stripping and production load and haul equipment. Drilling uses a combination of Barrick and contractor operations. Explosives and blasting services are supplied through a down-the-hole (DTH) contract with an explosive provider, Maxam.
The pre-strip fleet consists of a combination of 120-tonne to 200-tonne shovels, including Komatsu PC2000 and PC1250 models, paired with 91-tonne trucks, primarily Komatsu HD785s. This fleet supports pre-strip mining at Chimiwungo and performs both ore and waste mining at Malundwe.
The ultra-class production fleet, which currently operates exclusively at Chimiwungo, consists of 700-tonne to 800-tonne shovels, including Komatsu PC7000 and PC8000 models, some of which are electric, paired with 290-tonne trucks, mainly Komatsu 830Es.
Mining operations are overseen and managed using an office-based Hexagon dispatch system.
The LMC drilling fleet at the Chimiwungo pit includes Epiroc DML rotary drill rigs and Sandvik D650i DTH rigs. Contractors conduct drilling operations at Malundwe and provide support for pre-split drilling at Chimiwungo using Sandvik D650i rigs.
There are no significant changes planned for the mining fleet as part of the Expansion Project. The equipment type and size will remain consistent, but the fleet will be expanded proportionally to accommodate the increased mining rate.
Blasting is carried out with a water-based emulsion and electronic detonators. Blasts are taken daily during the wet season and every other day during the dry season, with a focus on achieving the correct ore fragmentation. Blast patterns vary by pit while trim blasting and pre-splitting are used to ensure wall stability.
As the Mine expands, the overall blasting method will remain consistent; however, improvements have been incorporated into the Expansion Project to enhance efficiency and blasting performance. Kababisa will be mined with the Malundwe fleet, while Kamisengo will utilise ultra-class equipment.
In the QP’s opinion, while some operational improvements will need to be fully executed as part of the Expansion Project, the method is considered suitable for the mine expansion.
|
February 19, 2025 |
Page 172 |
|
|
NI 43-101 Technical Report on the Lumwana Expansion Project |
|
| 16.2 | Geotechnical and Hydrogeological Considerations |
Geotechnical and hydrogeological work for the Expansion Project was completed by Barrick and builds upon operational experience as well as studies completed by external consultants.
| 16.2.1 | Geotechnical Studies |
Data Collection
Geotechnical data, including rock mass classification and structural orientation data, was collected from 69,432 m of DD core from Chimiwungo, Kamisengo, Malundwe, and Kababisa (Table 16-1). The main rock types at Lumwana are gneiss and schist, with lesser amphibolite and pegmatite that make up less than 1% of the total rock.
Table 16-1 Length of Geotechnical Logged Core
| Lithology | Length of Logged Core (m) | |||||||||
| Chimiwungo | Kamisengo | Malundwe | Kababisa | Total | ||||||
| Gneiss |
25,351 | 14,741 | 7,058 | 1,742 | 48,892 | |||||
|
Schist |
6,213 | 10,046 | 3,156 | 1,125 | 20,540 | |||||
|
Total |
31,564 | 24,787 | 10,214 | 2,867 | 69,432 | |||||
Face mapping data has also been used to complement the logging data. Data coverage across all deposits provides sufficient geotechnical information for the FS. However, additional drilling is underway to improve data coverage in the Chimiwungo pushback slopes and at Malundwe.
Laboratory testing completed on the soils and rocks include:
| ● | Uniaxial compressive strength (UCM/UCS) |
| ● | Triaxial compressive strength (TCM/TCS) |
| ● | Brazilian tensile strength (UTB) |
| ● | Shear box tests on open joints (SHJO) |
| ● | Point Load Testing (PLT) |
| ● | Triaxial Consolidated undrained on undisturbed soil samples (CU) |
| ● | Particle size distribution on soil samples (PSD) |
| ● | Atterberg Limits on disturbed soil samples (AL) |
Material properties have been characterised using the results of logging and laboratory testing; the strength of the saprolite has been characterised by the Mohr-Coulomb strength criterion, the transitional and fresh rock by the Hoek-Brown criterion, and the rock structures by the Barton-Bandis
|
February 19, 2025 |
Page 173 |
|
|
NI 43-101 Technical Report on the Lumwana Expansion Project |
|
criterion. Statistical distributions for each of the parameters have also been defined and used in stability analysis to calculate probability of failure.
Fresh Rock Structural Domains
Structural models for Chimiwungo, Malundwe, and Kamisengo were created by TECT Consulting (TECT, 2024) and include lithological contacts, major structures such as faults, and rock fabric such as schistosity and banding within the gneiss.
Shear structures within the rock mass cause bench scale instability, particularly at Chimiwungo, and work is continuing to improve the data collection so that the shears can be modelled reliably. The geotechnical domains for the fresh rock have been defined through interrogation of the structural models and stereographic assessment of rock fabric data.
Slope Stability Analysis
The Design Acceptance Criteria (DAC) adopted for slope stability at Lumwana aligns with the Barrick Ground Control Standard. For most inter-ramp slopes, a minimum Factor of Safety (FoS) of 1.2 has been used, or 1.3 for inter-ramp slopes with a higher consequence of failure (above a ramp for example). A FoS ≥ 1.3 has been adopted for the overall slope.
The stability of the saprolite slopes is largely influenced by the inherent weakness of the material, and pore water pressure within the slope. Shallow dewatering wells operating within six months ahead of mining have proved effective in stabilising the saprolite slopes.
Limit equilibrium analysis using Rocscience SLIDE2 software has been used to determine the FoS for different combinations of IRA and groundwater saturation scenarios. The results indicate that for an IRA of 30°, the FoS is 1.4 for fully depressurised conditions and 1.2 for partially depressurised.
The slope design for the fresh rock slopes has been determined from a combination of rockfall catchment requirement using the modified Richie criterion (Ryan and Prior, 2000) and the required berm width to contain spillage from bench scale instability. Both single and double benching has been assessed. Historical bench losses due to back-break have also been considered when determining berm design bench widths. The resultant bench width is based upon the whichever is greater between spill width analysis and the modified Richie criterion.
Assessment of inter-ramp and overall slope stability for each of the pits has been completed using Rocscience SLIDE2 limit equilibrium analysis software.
The analysis sections for Chimiwungo are presented in Figure 16-1. These focus on the eastern and southern slopes of Chimiwungo where the slope heights are greatest. One section was also included through Chimiwungo Domain 4, where lower values of Geological Strength Index (GSI) have been
|
February 19, 2025 |
Page 174 |
|
|
NI 43-101 Technical Report on the Lumwana Expansion Project |
|
identified. The section lines for the other pits, where the slope heights are less, are not shown. Disturbance due to blasting, and seismic loading has also been included in analysis.
The analysis results all achieve the DAC FoS ≥ 1.3. It is noted however that the Probability of Failure (PoF) for inter-ramp slopes along Section 2 in geotechnical Domain 4 are high and do not achieve the DAC for PoF ≤ 25%. Further geotechnical investigation and analysis is required to confirm the design for Domain 4.

Source: Barrick, 2024
Figure 16-1 Slope Stability Section Locations in the Chimiwungo Pit
The proposed FS slopes for Chimiwungo were confirmed through 3D numerical modelling using FLAC3D software, that primarily aimed to:
| ● | Determine slope stability for current and predicted conditions. |
| ● | Determine depressurisation targets and slope design modifications if stability in any phase drops below Barrick’s DAC. |
The results from the FLAC3D model indicate that with depressurised slopes, the Super-Pit slopes are viable. The modelling also indicated that as the pits gets deeper, pore pressures will become
|
February 19, 2025 |
Page 175 |
|
|
NI 43-101 Technical Report on the Lumwana Expansion Project |
|
critical to slope stability in the fresh rock slopes. Required depressurisation targets to ensure slope stability were determined from pore pressure sensitivity analyses. These targets will be incorporated in the pit dewatering/depressurisation strategy going forward.
Other Considerations
The slope design recommendations for the Expansion Project assume an improvement in blasting and a reduction in crest loss due to blasting. Double benching is also recommended as an option for Chimiwungo to increase the IRAs and improve economics, and good drill and blast practice is a prerequisite for this to be achievable. Blast improvement initiatives have been put place, and trials being conducted to optimise the entire blasting process. Double benching is not expected to start until mid-2027, allowing two years for blasting practices to be optimised.
Recommended Slope Angles
Geological surfaces are used to divide all slopes into three weathering domains; saprolite (oxide), transition, and fresh.
At Chimiwungo and Kamisengo, the fresh rock domains have been further subdivided to allow for modifications to slope parameters for rock structure. For all pit designs the following apply:
| ● | Maximum inter-ramp slope height of 48 m in saprolite and transitional, 144 m in fresh rock. |
| ● | A 20 m wide berm to be included at the base of the weathered zone, a 30 m wide berm at the base of each inter-ramp slope in fresh rock. |
Chimiwungo was divided into 13 geotechnical domains (Table 16-2 and Figure 16-2). Due to unfavourable shear structures in Domain 1a and Domain 1b, double benching is not recommended in these two domains. The IRAs in Domain 4a and Domain 4b require review due to the low rock strength in these areas.
Table 16-2 Chimiwungo Slope Design Parameters
| Domain | Single Benching | Double Benching | Comment | |||||||||||||||||
| Bench Height (m) |
BFA (°) |
Berm Width (m) |
IRA (°) |
Bench Height (m) |
BFA (°) |
Berm Width (m) |
IRA (°) |
|||||||||||||
|
Saprolite |
6 | 55 | 6.2 | 30 | - | - | - | - |
No double benching: weak rock |
|||||||||||
|
Transition |
12 | 70 | 6.4 | 48 | - | - | - | - | ||||||||||||
|
Fresh |
1a | 12 | 8.0 | 8.0 | 47 | - | - | - | - |
No double benching: unfavourable fabric |
||||||||||
| 1b | 12 | 8.0 | 8.0 | 47 | - | - | - | - | ||||||||||||
|
Fresh |
2a | 12 | 9.0 | 9.0 | 53 | 24 | 12.8 | 12.8 | 62 | |||||||||||
| 2b | 12 | 8.0 | 8.0 | 47 | 24 | 15.6 | 15.6 | 57 | ||||||||||||
|
February 19, 2025 |
Page 176 |
|
|
NI 43-101 Technical Report on the Lumwana Expansion Project |
|
| Domain | Single Benching | Double Benching | Comment | |||||||||||||||||
| Bench Height (m) |
BFA (°) |
Berm Width (m) |
IRA (°) |
Bench Height (m) |
BFA (°) |
Berm Width (m) |
IRA (°) |
|||||||||||||
| 2c | 12 | 9.0 | 9.0 | 53 | 24 | 12.8 | 12.8 | 62 | ||||||||||||
|
Fresh |
3a | 12 | 9.0 | 9.0 | 53 | 24 | 12.8 | 12.8 | 62 | |||||||||||
| 3b | 12 | 8.0 | 8.0 | 47 | 24 | 15.6 | 15.6 | 57 | ||||||||||||
| 3c | 12 | 9.0 | 9.0 | 53 | 24 | 12.8 | 12.8 | 62 | ||||||||||||
|
Fresh |
4a | 12 | 9.0 | 9.0 | 53 | 24 | 12.8 | 12.8 | 62 |
Slope angles to be reviewed for low rock mass strength |
||||||||||
| 4b | 12 | 8.0 | 8.0 | 47 | 24 | 15.6 | 15.6 | 57 | ||||||||||||
|
Fresh |
5a | 12 | 9.0 | 9.0 | 53 | 24 | 12.8 | 12.8 | 62 | |||||||||||
| 5b | 12 | 8.0 | 8.0 | 47 | 24 | 15.6 | 15.6 | 57 | ||||||||||||
| Fresh |
6 | 12 | 6.9 | 6.9 | 50 | 24 | 15.6 | 15.6 | 57 | |||||||||||

Source: Barrick, 2024
Figure 16-2 Chimiwungo Fresh Rock Design Domains
The slope design parameters for Malundwe are presented in Table 16-3. The potential for higher benches and steeper IRAs will be assessed as part of the future planned works.
|
February 19, 2025 |
Page 177 |
|
|
NI 43-101 Technical Report on the Lumwana Expansion Project |
|
Table 16-3 Malundwe Slope Design Parameters
| Domain | Bench Height (m) |
BFA (°) |
Berm Width (m) |
IRA (°) |
||||
| Saprolite |
6 | 50 | 5.4 | 30 | ||||
| Transition |
8 | 75 | 5.1 | 48 | ||||
| Fresh |
8 | 85 | 6 | 50 |
The recommended slope design parameters for Kamisengo are presented in Table 16-4 and fresh rock domains are presented in Figure 16-3. The west and northwest (east and southeast facing) slopes in Domain 2 have reduced bench face angle (BFA) and IRA to allow for increased likelihood of structurally controlled instability in this area.

Source: Barrick, 2024
Figure 16-3 Kamisengo Fresh Rock Design Domains
|
February 19, 2025 |
Page 178 |
|
|
NI 43-101 Technical Report on the Lumwana Expansion Project |
|
Table 16-4 Kamisengo Slope Design Parameters
| Domain | Wall | Bench Height (m) |
BFA (°) |
Berm Width (m) |
IRA (°) |
|||||||
|
Saprolite |
All | 6 | 55 | 6.2 | 30 | |||||||
|
Transition |
All | 12 | 70 | 6.4 | 48 | |||||||
|
Fresh |
1 | All | 12 | 90 | 8.4 | 55 | ||||||
| 2a | W, NW | 12 | 70 | 6.8 | 47 | |||||||
| 2b | All others | 12 | 90 | 8.4 | 55 | |||||||
Due to similarities in rock mass properties, similar slope design parameters have been adopted for Kababisa (Table 16-5) to that of Malundwe. It is noted that the weathering profile is deeper at Kababisa, which is expected to result in a greater thickness of saprolite and transitional material in the pit slopes. These recommendations will be revisited when a structural model and further geotechnical analysis has been completed.
Table 16-5 Kababisa Slope Design Domains
| Domain | Bench Height (m) |
BFA (°) |
IRA (°) |
Berm Width (m) |
||||
| Saprolite |
6 | 50 | 30 | 5.8 | ||||
| Transition |
8 | 75 | 48 | 5.1 | ||||
| Fresh |
8 | 85 | 50 | 6 |
Waste Dumps and Stockpiles
Waste dump and stockpile designs for the Expansion Project were assessed according to the waste dump and stockpile classification system outlined in Hawley and Cunning, 2017. Most dumps were classified as low or very low hazard, with the exception of the Chimiwungo East dump which is categorised as a moderate hazard due to its large volume. The classification system requires detailed site investigation and stability analysis for this dump.
A stability assessment for the dumps has been completed using existing drilling and laboratory testing data to characterise the dump foundations.
Stability analysis on the Chimiwungo East dump was completed using SLIDE2 limit equilibrium software and an assumed saturated dump foundation. A sensitivity analysis was completed for different levels of saturation within the dump. The results indicate an IRA of 20° to be suitable for a conservative partially saturated case, to achieve a FoS of 1.2. To maintain the stability of the dump faces, the weaker saprolitic material must be tipped within the centre of the dump and enclosed with competent waste rock.
The parameters used for dump design are presented in Table 16-6.
|
February 19, 2025 |
Page 179 |
|
|
NI 43-101 Technical Report on the Lumwana Expansion Project |
|
Table 16-6 Dump Design Parameters
| Parameter | Unit | Value | ||
| Lift Height |
m | 20 | ||
| Face Angle |
° | 36 | ||
| Berm Width |
m | 30 | ||
| Inter-ramp Angle |
° | 19 |
In-pit dumps are planned for the Chimiwungo and Malundwe. They are required for Kababisa as a conveyor and part of the TSF is planned over the south of the mined-out pit. Two in-pit dumps are currently active, with a 24 m bench height in use. Ground conditions are being investigated with a view to increasing the lift height. The design parameters summarised in Table 16-7 are based on SLIDE2 limit equilibrium analysis completed by the LMC geotechnical team in 2016.
Table 16-7 In-Pit Dump Design Parameters
| Current | Potential | |||||
| Bench Height |
24 m | 36 m | 48 m | |||
| Corresponding Berm Width |
16 m | 24 m | 32 m | |||
| Bench Face Angle |
36° | |||||
| Inter-Ramp Angle |
26° | |||||
| 16.2.2 | Hydrogeology |
Depressurisation is mainly required within the saprolite slopes to improve stability and to allow mining of steeper slopes. The water table in the saprolite is generally shallow and pre-mining is an average of 2 m to 10 m below the surface. The saprolite shows a good response to active pumping from perimeter wells positioned behind the pit crest, and the groundwater drawdown target of below the saprolite shown to be achievable.
The majority of water inflow is from surface water ingress from rainfall and this is managed through in-pit sump pumps that feed booster pumps that pump the water out of the pit into settling ponds prior to release to the environment. A 24-hour, 1 in 100-year rainfall event is used to design surface water management and dewatering requirements in the pits, which feeds into the dewatering capital expenditure requirements and general pit dewatering strategy development. In-pit boreholes are also being trialled to draw down the water below the pit floor to improve mining conditions.
Groundwater Monitoring
A network of groundwater monitoring points exists around the Chimiwungo open pit including vibrating wire piezometers, open standpipes, and water level measurements from dewatering wells. The monitoring network around the wider Expansion Project area is not as comprehensive, but there is sufficient data to provide an estimate of regional groundwater levels for input into stability analysis.
|
February 19, 2025 |
Page 180 |
|
|
NI 43-101 Technical Report on the Lumwana Expansion Project |
|
Data Collection
Significant effort has been made to characterise hydraulic properties including packer, falling head, shut-in, and pumping tests. Testing has been completed on over 30 holes around Chimiwungo, and additional holes around Kababisa and Kamisengo.
Pumping tests were completed for Kababisa and Kamisengo for environmental purposes, and further, more accurate tests are planned for input into the mine area groundwater models. Other planned and ongoing works to complement the FS include:
| ● | In-situ permeability testing of twelve drill holes at Malundwe, five holes at Chimiwungo, and eight holes at Kababisa. |
| ● | 26 km of ground based geophysical surveys at Chimiwungo, Malundwe, Kababisa, and Kamisengo. |
| ● | Hydrogeological test wells including five wells at Chimiwungo, seven at Malundwe, five at Kamisengo, and four at Kababisa. |
| ● | Vibrating Wire Piezometer installations in 21 drill holes across Mine site. |
| ● | Groundwater and surface water sampling and laboratory analysis. |
Hydrogeological Modelling
Numerical hydrogeological models are used to understand the current and future groundwater conditions behind the pit slopes and likely inflows into the pits, this inputs into stability analysis and helps define future dewatering requirements. Both low resolution (appropriate for a PFS), and high resolution (more suitable for an FS) models have been developed. Groundwater inflow is a very small proportion of the water flowing into Malundwe and so the existing model is considered suitable.
| 16.3 | Mine Design |
Pit design parameters were selected based on the overall pit geometry, geotechnical analysis, and planned production rates.
The QP considers the proposed design parameters have been reasonably determined and are suitable for the proposed Expansion Project.
| 16.3.1 | Pit Design Parameters |
Pit and internal phases were designed using Deswik software, integrating the recommended standards for road width and minimum mining width for the size of mining equipment chosen for each
|
February 19, 2025 |
Page 181 |
|
|
NI 43-101 Technical Report on the Lumwana Expansion Project |
|
pit. The chosen optimised pit shell for each deposit was adjusted by the inclusion of access ramps, geotechnical berms, and hydrogeological considerations to produce a practicable final pit design.
The final pit design is based on the following parameters:
| ● | Bench heights which vary by pit and geotechnical domain from 4 m to 24 m with single and double benching where appropriate. |
| ● | In-pit ramps in all pits were designed to be 43 m wide for ultra-class trucks and 30 m wide where pre-strip trucks are exclusively used, all with a maximum gradient of 9 %. |
| ● | A minimum mining width for phase designs of 120 m at Chimiwungo and 80 m at the other three deposits. |
Geotechnical parameters were determined for each pit and are detailed in Section 16.3.1 of this Technical Report.
| 16.3.2 | Final Pit Designs |
The final designs for each open pit are illustrated in Figure 16-4 to Figure 16-7.

Source: Barrick, 2024
Figure 16-4 Final Pit Design for Chimiwungo
|
February 19, 2025 |
Page 182 |
|
|
NI 43-101 Technical Report on the Lumwana Expansion Project |
|

Source: Barrick, 2024
Figure 16-5 Final Pit Design for Malundwe
|
February 19, 2025 |
Page 183 |
|
|
NI 43-101 Technical Report on the Lumwana Expansion Project |
|

Source: Barrick, 2024
Figure 16-6 Final Pit Design for Kamisengo
|
February 19, 2025 |
Page 184 |
|
|
NI 43-101 Technical Report on the Lumwana Expansion Project |
|

Source: Barrick, 2024
Figure 16-7 Final Pit Design for Kababisa
|
February 19, 2025 |
Page 185 |
|
|
NI 43-101 Technical Report on the Lumwana Expansion Project |
|
| 16.3.3 | Pushback Designs |
Pushback designs were based on the optimised pit shells. Pushback selection factors included revenue, stripping ratio, minimum mining widths, and backfilling opportunities. The chosen pit shells help ensure consistent ore feed, balance the volume of material mined, and meet practical mining constraints. Adjustments were made to avoid infrastructure changes, omit small satellite pits, and allow for future in-pit crusher placement.
Chimiwungo and Malundwe are mined in a north-to-south direction, while Kamisengo is mined from east to west. Kababisa does not require any pushbacks and will be mined in a single cut.
The existing Chimiwungo mine plan includes six pushbacks, three in the eastern pit, two in the southern pit, and one in the western pit. These have been incorporated into the LOM plan for the Expansion Project. As part of the Expansion Project, the three Chimiwungo pits will merge into a single ‘Super-Pit’ which contains seven principal pushbacks, and two satellite pits which are located to the north and west (Figure 16-8). An additional three satellite pits, SP10, SP11, and SP12 were excluded from scheduling due to high-stripping ratios but highlight additional future potential.
Malundwe consists of 13 pushbacks, with a satellite pit in the southeast and a pushback in the northwest which contains mostly Inferred Mineral Resources. The pushbacks containing Inferred Mineral Resources have not been included in the Mineral Reserve estimate or base case financial modelling. The main open pit consists of three regions from north to south, within which individual pushbacks were designed (Figure 16-9).
Kamisengo is a relatively simple pit with three pushbacks in the main pit, and two additional satellite pits towards the northeast and southeast of the main pit (Figure 16-10). The orebody geometry of Kamisengo dips towards the east dictating the overall mining sequence.
|
February 19, 2025 |
Page 186 |
|
|
NI 43-101 Technical Report on the Lumwana Expansion Project |
|

Source: Barrick, 2024
Figure 16-8 Basic Mining Layout of Chimiwungo and the Super-Pit
|
February 19, 2025 |
Page 187 |
|
|
NI 43-101 Technical Report on the Lumwana Expansion Project |
|

Source: Barrick, 2024
Figure 16-9 Basic Mining Layout of Malundwe
|
February 19, 2025 |
Page 188 |
|
|
NI 43-101 Technical Report on the Lumwana Expansion Project |
|

Source: Barrick, 2024
Figure 16-10 Basic Mining Layout of Kamisengo
|
February 19, 2025 |
Page 189 |
|
|
NI 43-101 Technical Report on the Lumwana Expansion Project |
|
| 16.3.4 | Waste Dumps |
A total of 32 dumping areas have been designated, of which five are currently active (Table 16-8). An in-pit dumping strategy has been included as part of the Expansion Project with a total of 11 in-pit dumping areas identified.
Current and planned waste dumps are placed as close to open pit exits as possible. To prevent sterilisation of ore, planned surface dump designs are offset by 50 m from an expanded pit shell generated with a US$4.50/lb copper price. In-pit dumps have been designed where feasible and in some cases merge with surface dumps.
Dump capacities were calculated by applying a swell factor of 25% to the in-situ density of 2.80 t/m³ for fresh rock waste material.
Table 16-8 Waste Dump Design Summary
|
Mining Area |
Dump Name | Dumps |
Dump Capacity
|
Used Capacity
|
Remaining
|
Required
|
||||||
| No. | (Mm3) | (Mm3) | (Mm3) | (Mm3) | ||||||||
| Chimiwungo | In-Pit Dumps | 8 | 621 | 12 | 609 | |||||||
| Ex-Pit Dumps | 8 | 2,206 | 125 | 2,081 | ||||||||
| Total | 16 | 2,827 | 137 | 2,690 | 2,561 | |||||||
| Malundwe | In-Pit Dumps | 3 | 221 | 5 | 216 | |||||||
| Ex-Pit Dumps | 7 | 424 | 101 | 323 | ||||||||
| Total | 10 | 645 | 105 | 539 | 602 | |||||||
| Kamisengo | Ex-Pit Dumps | 5 | 555 | 0 | 555 | |||||||
| Total | 5 | 555 | 0 | 555 | 223 | |||||||
| Kababisa | Ex-Pit Dumps | 1 | 26 | 0 | 26 | |||||||
| Total | 1 | 26 | 0 | 26 | 16 | |||||||
| Total | Total | 32 | 4,053 | 243 | 3,810 | 3,402 |
The dumping sequence in Chimiwungo and Malundwe is driven by the mining sequence from north to south. It is expected that the dumping schedule will be periodically reviewed to optimise haul cycles.
Before production mining begins at Kamisengo, a water control dam will need to be constructed north of the pit. The material for this dam may be sourced from the Kamisengo pit areas. Additionally, a large tailings dam embankment will be required south of the pit to provide adequate storage capacity for tailings later in the mine’s life. While separate waste dumps have been planned, priority will be given to using Kamisengo rock for these construction projects to reduce costs.
|
February 19, 2025 |
Page 190 |
|
|
NI 43-101 Technical Report on the Lumwana Expansion Project |
|

Source: Barrick, 2024
Figure 16-11 Chimiwungo Planned Waste Dumps
|
February 19, 2025 |
Page 191 |
|
|
NI 43-101 Technical Report on the Lumwana Expansion Project |
|

Source: Barrick, 2024
Figure 16-12 Malundwe Planned Waste Dumps
|
February 19, 2025 |
Page 192 |
|
|
NI 43-101 Technical Report on the Lumwana Expansion Project |
|

Source: Barrick, 2024
Figure 16-13 Kamisengo Planned Waste Dumps
|
February 19, 2025 |
Page 193 |
|
|
NI 43-101 Technical Report on the Lumwana Expansion Project |
|

Source: Barrick, 2024
Figure 16-14 Kababisa Planned Waste Dumps
|
February 19, 2025 |
Page 194 |
|
|
NI 43-101 Technical Report on the Lumwana Expansion Project |
|
The Kababisa pit will be back filled with material from Kababisa, either while mining or through rehandling after mining, as an overland conveyor will pass over the pit to deliver ore from Kamisengo to the Malundwe ROM pad.
The total estimated Potentially Acid Generating (PAG) (material over 0.3 % S) content is 7.7 Mt over the LOM, or 0.1% of the total waste mined which will be fully encapsulated within the wider waste dumps due to the small proportion of overall waste.
The planned waste dump locations are illustrated in Figure 16-11 to Figure 16-14.
| 16.3.5 | Stockpiles |
Two ROM pads are in operation, one at Chimiwungo and one at Malundwe. The ROM pads are used to ensure a consistent ore feed to the crushers, carry out blending as required, minimise truck queuing times, and provide a short-term production buffer. Currently 40 % of ore feed to the crushers is rehandle from short-term ROM stockpiles. The current short-term ROM stockpiles provide a total capacity of 12.8 Mm3 at Chimiwungo and 0.5 Mm3 at Malundwe. Blending fingers are categorised by grade and weathering.
To support the Expansion Project, the existing ROM pads will be upgraded and two new ROM pads will be constructed, one at Chimiwungo and one at Kamisengo. An additional ROM pad and crusher area at Chimiwungo to the north of the Super-Pit will include 0.8 Mm3 of stockpile capacity. The Kamisengo ROM pad will be located to the west of the Kamisengo pit and provide short-term stockpile capacity of 2.5 Mm3.
For the Expansion Project, long-term stockpiles for Chimiwungo, Malundwe, and Kamisengo will accommodate ore that exceeds the capacity of the ROM stockpiles. These stockpiles will store low-grade ore. Oxide material is not currently stockpiled; in the long term, mineralised oxide material may be stockpiled to give the opportunity to recover copper in the future. The stockpile design criteria are provided in Section 16.2.1 and their capacity is summarised in Table 16-9.
The stockpiles are illustrated in Figure 16-8 to Figure 16-10.
Table 16-9 Long-term Stockpile Summary
| Long-Term Stockpile | Dump Capacity (Mm3) |
Remaining
Volume (Mm3) |
||
|
Chimiwungo Long Term Stockpile |
26.8 | 26.0 | ||
|
Malundwe Long Term Stockpile |
19.0 | 3.1 | ||
|
Kamisengo Long-Term Stockpile |
5.4 | 3.7 | ||
|
Total Long-Term Stockpile |
51.2 | 32.8 | ||
|
February 19, 2025 |
Page 195 |
|
|
NI 43-101 Technical Report on the Lumwana Expansion Project |
|
| 16.4 | Mining Equipment |
No changes to the size or type of mining equipment are planned as part of the Expansion Project. Table 16-10 outlines the current fleet of loading, hauling, and drilling equipment, as well as some sample years over the life of mine. These were based on the planned increase in production, with fleet demand ramping up from 2026.
Table 16-10 Life of Mine Equipment Requirement Summary
| Equipment Type | Sample Year | 2024 | 2026 | 2037 | 2045 | |||||
|
Material Mined (Mt) |
143 | 205 | 305 | 354 | ||||||
|
|
||||||||||
|
300t Truck |
Komatsu 930E_5 | 25 | 34 | 95 | 91 | |||||
|
300t Truck |
Hitachi E5000 | 24 | 23 | 1 | 0 | |||||
|
700t Diesel Shovel |
Komatsu PC7000_6BH | 1 | 2 | 5 | 5 | |||||
|
700t Electric Shovel |
Komatsu PC7000_6FS | 2 | 2 | 7 | 10 | |||||
|
800t Electric Shovel |
Komatsu PC8000_6 | 3 | 3 | 1 | 0 | |||||
|
400t Diesel Shovel |
Komatsu PC4000_11 | 1 | 1 | 4 | 6 | |||||
|
200t Diesel Shovel |
Komatsu PC2000_11RBH | 6 | 6 | 9 | 11 | |||||
|
120t Diesel Shovel |
Komatsu PC1250_11RBH | 5 | 8 | 3 | 2 | |||||
|
240t Front End Loader |
Caterpillar 994K | 2 | 2 | 1 | 1 | |||||
|
130t Front End Loader |
Caterpillar 993K | 2 | 1 | 1 | 1 | |||||
|
91t Rigid Frame Dump Truck |
Caterpillar HD785_7DT | 55 | 67 | 56 | 30 | |||||
|
40t Articulated Dump Truck |
Komatsu HM400_3RDT | 23 | 23 | 40 | 32 | |||||
|
70t Bulldozer |
Caterpillar D10T/Komatsu D375 | 5 | 6 | 15 | 15 | |||||
|
100t Bulldozer |
Caterpillar D11/ Komatsu D475 | 12 | 19 | 18 | 18 | |||||
|
75t-7.3m Blade Motor Grader |
Caterpillar 24 | 3 | 4 | 9 | 9 | |||||
|
32t-4.9m Blade Motor Grader |
Caterpillar 16M | 0 | 3 | 3 | 3 | |||||
|
50t Rotary Blast Hole Drill |
Epiroc DML_HP | 12 | 12 | 0 | 0 | |||||
|
70t Rotary/DTH Blast Hole Drill |
Sandvik DR410i | 0 | 9 | 24 | 34 | |||||
|
25t Top Hammer Drill |
Sandvik DI650i | 2 | 4 | 4 | 4 | |||||
|
100t Wheel Dozer |
Komatsu WD900 | 0 | 3 | 3 | 3 | |||||
Equipment requirements for the Expansion Project have been modelled from first principles using availability, utilisation, and productivity drivers which are determined from actual performance and industry benchmarks. Several improvements have been included with productivities expected to improve with the purchase of new equipment. On site a productivity improvement initiative is underway, the equipment requirement estimates account for a 2-year transition period where productivities are improved gradually. Haul truck productivity has been estimated by allocating mining tasks between the two fleets and modelling the planned haul profiles. Operational performance has been factored into the capacity and cycle time assumptions.
|
February 19, 2025 |
Page 196 |
|
|
NI 43-101 Technical Report on the Lumwana Expansion Project |
|
A summary of the modelling inputs is summarised in Table 16-11 and Table 16-12.
Table 16-11 Equipment Availability and Utilisation Inputs
| Fleet | Equipment Type | Availability (%) | Utilisation (%) | |||||||
| Current | LOM | Current | LOM | |||||||
|
Pre-Strip |
Loading Units | 86 | 85 | 77 | 84 | |||||
| Hauling Units | 95 | 83 | 89 | 85 | ||||||
|
Production |
Loading Units | 67 - 72 | 76 - 85 | 77 - 79 | 84 - 85 | |||||
| Hauling Units | 73 | 85 | 73 | 85 | ||||||
|
Drilling Fleet |
68 | 80 | 82 | 65 | ||||||
Table 16-12 Equipment Productivity Assumptions
| Fleet | Unit | Equipment | Productivity | |||||
| Current | LOM | |||||||
|
Loading Units |
t/h | Komatsu PC4000 | n/a | 2,200 | ||||
| t/h | Komatsu PC1250 | 678 | 1,000 | |||||
| t/h | Komatsu PC2000 | 1,100 | 1,400 | |||||
| t/h | Komatsu PC7000 | 2,581 | 3,200 | |||||
| t/h | Komatsu PC8000 | 2,477 | 3,000 | |||||
|
Drilling Units |
m/h | BH rig | 22 | 32 | ||||
The QP considers the proposed fleet is appropriate for the planned mining. Production rates are higher than currently achieved, but somewhat below international benchmarks. The planned productivity improvement programme will need to be completed to be able to realise some of the fleet projections. The plan to use electric shovels depends on a reliable future power supply.
| 16.5 | LOM Production Schedule |
| 16.5.1 | Scheduling Parameters |
Mining losses and dilution were modelled as described in Section 15.2.4 of this Technical Report but unplanned dilution and losses were omitted from production scheduling. The Mineral Resource model is regularised to an SMU size in line with the expected mining equipment and bench heights. The regularised model is modified by Maptek’s GCO software. GCO delineates ore and waste on a bench-by-bench basis and ensures practical mining shapes are achieved.
In order to delineate ore and waste, GCO applies a dynamic cut-off grade on a bench-by-bench basis. The average BCOG applied to fresh and transitional rock is described in Table 15-2. The GCO process uses similar inputs to pit optimisation but adjustments were made including the introduction of process sustaining capital costs along with G&A costs of approximately 10%.
|
February 19, 2025 |
Page 197 |
|
|
NI 43-101 Technical Report on the Lumwana Expansion Project |
|
Following ore and waste delineation, material is further separated into eight material categories, five ore categories and three waste categories, based on oxidation state and copper grade. This categorisation determines the material destination and allows for blending.
Uranium is also considered during scheduling and, to avoid incurring smelter penalties, a limit of 100 ppm U is required is required. Due to metallurgical characteristics the Malundwe feed is limited to 25 ppm U while the Chimiwungo feed is limited to 50 ppm U.
Uranium content is not expected to be a significant scheduling constraint over the LOM, however, a small volume of high grade uranium mineralisation is expected from Malundwe pushbacks 10 and 11 from 2027 to 2031. Blending will be required to achieve the target grades. The LOM average uranium content is below 10 ppm.
| 16.5.2 | Life-of-Mine Schedule |
The primary objectives of the LOM schedule are to meet the capacity of the existing processing plant, as well as the planned expansion, while achieving a 10% internal rate of return (IRR) and ensuring consistent positive operating cash flows throughout the LOM at the Mineral Reserve commodity price of $3.00/lb.
The current process capacity is 27 Mtpa, and the expanded peak design capacity will be 54 Mtpa. The expansion of the process plant will be commissioned in late 2027. The combined plant capacity is expected to reach 44 Mt in 2028 and is scheduled to be fed at a rate of 52 Mt from 2029 onwards. The remaining plant capacity may be used either as an opportunity to produce more or to reduce production risk.
The schedule supports a consistent copper output of 200 kt to 300 kt per annum, with an average of 235 ktpa for the LOM.
Production targets for each pit and period are set according to the size and extent of each pushback. Bench drop-down rates range from six to twelve benches per year, depending on the pushback size. The larger pushbacks in the Super-Pit enable production of up to 140 Mtpa.
A stockpiling strategy has been used to stabilise the ore feed profile during pushback development. Scheduling limits the peak stockpiled tonnage to less than one year of production while ensuring two to three months’ supply of full-grade ore is available at all times to support blending.
The mining ramp-up will start in 2026 when total material mined will increase from 157 Mt per annum to just over 200 Mtpa. The ramp-up will continue for another two years until a total of 300 Mtpa is reached in 2030. A further step up takes place in 2038, with the start of Kamisengo, to the peak rates of approximately 354 Mtpa. These totals are determined by the ore demand.
|
February 19, 2025 |
Page 198 |
|
|
NI 43-101 Technical Report on the Lumwana Expansion Project |
|
Mining will start in the new Kababisa and Kamisengo pits from 2035 and 2036, respectively. The LOM production schedule is summarised in Table 16-13 and Figure 16-15. As per the Mineral Reserve Statement, approximately 19.7 Mt of existing stockpile material is fed over the LOM.
|
February 19, 2025 |
Page 199 |
|
|
NI 43-101 Technical Report on the Lumwana Expansion Project |
|
Table 16-13 Summary of LOM Production Schedule
| Unit | LOM Total |
2025 | 2026 | 2027 | 2028 | 2029 | 2030 | 2031 | 2032 | 2033 | 2034 | 2035 | 2036 | 2037 | 2038 | 2039 | 2040 | 2041 | ||||||||||||||||||||
|
Total Mined |
Mt | 8,899 | 157 | 205 | 215 | 214 | 231 | 304 | 305 | 305 | 305 | 305 | 302 | 305 | 305 | 344 | 354 | 353 | 344 | |||||||||||||||||||
|
Waste Mined |
Mt | 7,324 | 122 | 179 | 179 | 170 | 162 | 240 | 259 | 240 | 248 | 258 | 227 | 240 | 238 | 292 | 294 | 278 | 283 | |||||||||||||||||||
|
Ore Mined |
Mt | 1,569 | 35 | 26 | 36 | 45 | 69 | 64 | 46 | 65 | 57 | 47 | 75 | 65 | 67 | 51 | 58 | 75 | 60 | |||||||||||||||||||
|
Strip Ratio (w:o) |
t:t | 4.7 | 3.5 | 6.7 | 5.0 | 3.8 | 2.3 | 3.8 | 5.7 | 3.7 | 4.4 | 5.5 | 3.0 | 3.7 | 3.6 | 5.7 | 5.1 | 3.7 | 4.7 | |||||||||||||||||||
|
Grade Mined |
% Cu | 0.53 | 0.50 | 0.62 | 0.48 | 0.53 | 0.56 | 0.56 | 0.46 | 0.42 | 0.53 | 0.45 | 0.54 | 0.50 | 0.53 | 0.42 | 0.40 | 0.40 | 0.45 | |||||||||||||||||||
|
Ore Tonnes Fed |
Mt | 1,589 | 28 | 28 | 29 | 44 | 52 | 52 | 52 | 52 | 52 | 52 | 52 | 52 | 52 | 52 | 52 | 52 | 52 | |||||||||||||||||||
|
Grade Fed |
% Cu | 0.52 | 0.61 | 0.62 | 0.54 | 0.55 | 0.67 | 0.63 | 0.44 | 0.47 | 0.55 | 0.43 | 0.65 | 0.57 | 0.61 | 0.44 | 0.41 | 0.45 | 0.47 | |||||||||||||||||||
|
Recovery (%) |
% | 93 | 94 | 94 | 94 | 94 | 95 | 94 | 93 | 93 | 94 | 93 | 94 | 94 | 94 | 92 | 92 | 92 | 92 | |||||||||||||||||||
|
Cu Output |
kt | 7,760 | 157 | 162 | 145 | 223 | 330 | 312 | 212 | 230 | 271 | 209 | 319 | 280 | 299 | 209 | 196 | 215 | 225 | |||||||||||||||||||
| 2042 | 2043 | 2044 | 2045 | 2046 | 2047 | 2048 | 2049 | 2050 | 2051 | 2052 | 2053 | 2054 | 2055 | 2056 | 2057 | |||||||||||||||||||||||
|
Total Mined |
Mt | 354 | 354 | 354 | 354 | 354 | 354 | 354 | 343 | 338 | 297 | 240 | 197 | 124 | 26 | 0 | 0 | |||||||||||||||||||||
|
Waste Mined |
Mt | 327 | 312 | 299 | 288 | 322 | 318 | 309 | 308 | 287 | 236 | 205 | 142 | 54 | 6 | 0 | 0 | |||||||||||||||||||||
|
Ore Mined |
Mt | 27 | 42 | 54 | 65 | 32 | 36 | 45 | 36 | 51 | 61 | 35 | 56 | 70 | 21 | 0 | 0 | |||||||||||||||||||||
|
Strip Ratio (w:o) |
t:t | 12.3 | 7.5 | 5.5 | 4.4 | 10.0 | 8.8 | 6.9 | 8.6 | 5.7 | 3.9 | 5.8 | 2.5 | 0.8 | 0.3 | 0 | 0 | |||||||||||||||||||||
|
Grade Mined |
% Cu | 0.39 | 0.42 | 0.52 | 0.57 | 0.49 | 0.52 | 0.55 | 0.58 | 0.57 | 0.62 | 0.58 | 0.63 | 0.75 | 0.89 | 0 | 0 | |||||||||||||||||||||
|
Ore Tonnes Fed |
Mt | 52 | 52 | 52 | 52 | 52 | 52 | 52 | 52 | 52 | 52 | 52 | 52 | 52 | 52 | 52 | 6 | |||||||||||||||||||||
|
Grade Fed |
% Cu | 0.32 | 0.40 | 0.54 | 0.65 | 0.40 | 0.44 | 0.51 | 0.47 | 0.56 | 0.69 | 0.47 | 0.66 | 0.84 | 0.57 | 0.24 | 0.23 | |||||||||||||||||||||
|
Recovery |
% | 90 | 92 | 93 | 94 | 91 | 91 | 93 | 92 | 94 | 95 | 93 | 95 | 95 | 94 | 87 | 85 | |||||||||||||||||||||
|
Cu Output |
kt | 147 | 190 | 265 | 320 | 191 | 208 | 248 | 227 | 275 | 339 | 227 | 325 | 414 | 276 | 107 | 12 | |||||||||||||||||||||
|
February 19, 2025 |
Page 200 |
|
|
NI 43-101 Technical Report on the Lumwana Expansion Project |
|

Figure 16-15 Production Schedule for the LOM
|
February 19, 2025 |
Page 201 |
|
|
NI 43-101 Technical Report on the Lumwana Expansion Project |
|
| 16.6 | External Reviews |
Initial fleet calculations were reviewed by Fraser MacGill Mining & Minerals Advisory (Fraser McGill, 2024) and found to be acceptable.
In September 2024, AMC completed an independent review of the mining portion of the FS, reviewing the schedule and fleet productivity, overall mining methods, risks and opportunity, and operating costs (AMC, 2024).
A number of initial recommendations from this review were integrated into the FS. These related to poorly sequenced faces, high drop down rates, and working areas that were too small for the planned fleet complement. The pits were rescheduled to resolve these issues for the FS.
The remaining recommendations provided in were subject to the following ranking:
| ● | Critical: must be addressed immediately to remedy/rectify a fatal flaw or radical error. |
| ● | Recommended: an issue causing moderate causes of concern to be addressed. |
| ● | Value-added: of minor concern and includes suggestions for further investigation. |
AMC did not identify any critical issues or fatal flaws and concluded that the processes underlying the development of the mine design and schedule met the standards required of an FS.
Recommendations included:
| ● | Improving the handling of cables, truck overloading, floor conditions, and haul roads may enable the planned production rates to be met and reduce mining costs lower than current site mining costs. |
| ● | The proposed pit development sequence, available shovel faces, and vertical advance rates meet the requirements for an FS mine plan but are not considered best practice. These aspects should be considered in further detail in the next iteration of the production schedule. |
| ● | Planned loading and hauling unit costs are driven by forecast fleet productivity increases. These are considered to be optimistic versus the current mine performance and are more in line with drier climate mines. If these are not achieved, unit costs can be expected to increase accordingly. The implementation of a comprehensive fleet productivity improvement programme is recommended. |
Value-added observations included:
| ● | The production rates proposed are in line with international benchmarks but higher dry season rates are aggressive when compared to other operations, particularly given that double sided loading will be difficult due to the size of the equipment. |
|
February 19, 2025 |
Page 202 |
|
|
NI 43-101 Technical Report on the Lumwana Expansion Project |
|
| ● | The programmes of blast fragmentation improvement, operator training, and fleet management should be continued. |
| ● | At least two weeks and up to four weeks of production should be available in blasted stock. |
A number of these recommendations are included in the planned productivity improvement programme that was already in place, and will be addressed over the next two years. Peak equipment production rates will be re-evaluated as the production programmes are completed. The changes to the scheduled pit development will be considered during annual LOM updates, which focus on more detail over the next 5 year period.
The geotechnical models, pit slope designs, and waste dump parameters were reviewed by PSM (PSM, December 2024). PSM did not identify any critical flaws and concluded that the analysis and results were suitable for an FS. Conclusions and recommendations for future geotechnical investigations included:
| ● | Identification of zones of potential adverse shear structures and their impact on slope stability through ongoing improvements to the structural model. |
| ● | Update of the geotechnical model and analysis for Chimiwungo Domain 4a and Domain 4b. |
| ● | Targeted installation of groundwater monitoring instrumentation to inform pore pressures behind pit slopes. |
Given its size and depth, a further check was performed on the final Super-Pit design, which was geotechnically evaluated using 3D stability modelling by ITASCA (ITASCA, December 2024). ITASCA did not identify any critical flaws and concluded that the proposed design was suitable for an FS. Conclusions and comments related to geotechnical work included:
| ● | Some mine localised sections require design modifications, which include some sectors parallel to geological faults. |
| ● | Due to the depth and estimated rock mass strength, the impact of pore pressures becomes critical to slope stability in the fresh rock slopes. Depressurisation will be required in sections of the pit to ensure slope stability. |
These changes will be incorporated in future design reviews and the pit dewatering/depressurisation strategy going forward.
| 16.7 | QP Comments on Mining Methods |
It is the opinion of the QP that the mining methods, the mining equipment and productivities, the mine designs and input parameters are suitable for the Lumwana operations and estimation of Mineral Reserves.
|
February 19, 2025 |
Page 203 |
|
|
NI 43-101 Technical Report on the Lumwana Expansion Project |
|
| 17 | Recovery Methods |
| 17.1 | Process Plant Description |
The existing processing plant was initially designed for a 20 Mtpa throughput but expanded to process 27 Mtpa in 2020. The plant consists of two primary crushing facilities, each delivering crushed ore via overland conveyors to a single coarse ore stockpile (COS). Primary crushed ore is withdrawn from the stockpile and fed to a SAG-ball (SAB) grinding circuit.
The grinding circuit product from classification cyclone clusters is fed directly into two parallel rougher flotation banks. Rougher concentrate is subject to multiple cleaner flotation stages. The final cleaner flotation concentrate is dewatered using a thickener, filtered, and stockpiled to load onto road transport to offsite smelters. Rougher tailings are thickened and pumped to the TSF. Reagents mixing and dosing and services (water, compressed air, etc.) facilities are provided. A process flow diagram for the existing processing plant is shown in Figure 17-1.
The Expansion Project will involve installing two new primary crushing and overland conveying systems and adding a second parallel processing plant to expand capacity to a peak design of 54 Mtpa with a scheduled feed of 52 Mtpa. The expanded process plant design was developed by Barrick and Lycopodium. The process flow diagram for the expanded processing plant is shown in Figure 17-2. The process flowsheet and process design criteria (PDC) have been developed based on a thorough test work programme, operational plant processing data, and application of current industry best practices.
The existing processing plant flowsheet will also be optimised to improve processing capacity with more modern technology to reduce downtime and operating costs.
| 17.1.1 | Primary Crushing |
At all primary crusher installations, ore will be hauled by dump trucks to the ROM tipping area. It will either be directly tipped into the crusher dump pocket or tipped onto stockpiles on the ROM pad, which will be later reclaimed by a front-end loader (FEL). The crushed ore will be transported via overland conveyors from each open pit to the coarse ore stockpiles.
Chimiwungo Primary Crushing
The existing Chimiwungo primary crusher installation will remain largely unchanged with a variable speed apron feeder controlling the crusher discharge. The crusher already has a tramp metal magnet, but a new online particle size and a metal grade analyser (to monitor copper, iron, and sulphur content) will be installed on the sacrificial conveyor.
|
February 19, 2025 |
Page 204 |
|
|
NI 43-101 Technical Report on the Lumwana Expansion Project |
|

Source: Barrick, 2024
Figure 17-1 Process Flow Diagram of the Existing Processing Plant
|
February 19, 2025 |
Page 205 |
|
|
NI 43-101 Technical Report on the Lumwana Expansion Project |
|

Figure 17-2 Process Flow Diagram for the Expansion Project
|
February 19, 2025 |
Page 206 |
|
|
NI 43-101 Technical Report on the Lumwana Expansion Project |
|
Two additional primary crushers will be installed at the Chimiwungo Super-Pit as part of the Expansion Project. The crusher installations will be similar to the existing Chimiwungo and Malundwe arrangements with some improvements.
The first crusher will be a pit-rim crusher which will be installed in 2027 and the second crusher will be an in-pit crusher which will be installed in 2031. Each gyratory crusher will crush ore, which will be withdrawn from the discharge chamber by a variable-speed apron feeder. The feeders will each discharge onto a short sacrificial conveyor.
As per the existing Chimiwungo arrangements, a fixed rock breaker will be installed near the dump.
Malundwe Primary Crushing
The Malundwe primary crusher and overland conveyor arrangements will be modified as part of the Expansion Project. The existing overland conveyor will be decommissioned, and a new overland conveyor will be installed alongside it. The new conveyor alignment is required to deliver a higher feed rate of crushed ore into the modified arrangements and to allow crushed ore to be fed to the existing or new stockpile.
Kamisengo Primary Crushing
As part of the Expansion Project, a single primary crusher installation at Kamisengo will commence construction in 2035. The installation will be the same as the Chimiwungo Super-Pit crusher. The gyratory crusher will crush ore, which will be withdrawn from the discharge chamber by a variable-speed apron feeder. The feeders will each discharge onto a short sacrificial conveyor.
As per the existing Chimiwungo arrangement, a fixed rock breaker will be installed near the dump.
Coarse Ore Stockpiles
A new coarse ore stockpile will be constructed in addition to the existing one. The crushed ore from all four open pits will feed ore from any or all of the crushers to either stockpile.
The new stockpile will feed the new grinding circuit but may also feed the existing grinding circuit.
The new stockpile will have two reclaim tunnels, each housing three variable-speed apron feeders. One set of feeders will discharge onto the SAG Mill 2 Feed Conveyor, equipped with a weightometer to control the feed rate to SAG Mill 2.
The other three feeders will discharge onto the SAG Mill 1 Reclaim Conveyor, which will deliver onto the SAG Mill 1 Transfer Conveyor and onto the existing SAG Mill Feed Conveyor. A weightometer
|
February 19, 2025 |
Page 207 |
|
|
NI 43-101 Technical Report on the Lumwana Expansion Project |
|
will be installed on the SAG Mill 1 Reclaim Conveyor to control the feed rate to SAG Mill 1 when reclaiming from the new stockpile.
The crushed product from the SAG Mill 2 pebble crushing installation will discharge onto the SAG Mill Feed Conveyor 2. A new pebble crushing facility will be added to the existing grinding circuit, and the crushed product will discharge onto the SAG Mill 1 Transfer Conveyor.
Grinding media for the new SAG mill will be fed onto the SAG Mill 2 Feed Conveyor by a ball indexer from a bunker topped up with a front-end loader. A similar ball indexer will be installed at the existing SAG Mill Feed Conveyor to facilitate media addition to the existing SAG mill.
| 17.1.2 | Grinding |
Existing Grinding Circuit
The existing grinding circuit consists of a SAG mill, followed by ball mill operating in closed circuit with cyclones.
The SAG mill trommel undersize discharges into a hopper and is pumped to conventional hydrocyclones, operating in closed circuit with a ball mill. The hydrocyclones overflow, with a particle size distribution of P80 of 380 µm, reports to flotation, and the cyclone underflow returns to the ball mill for further size reduction. The existing operation flotation feed size will be reduced to P80 of 300 µm once the Expansion Project processing plant is commissioned.
This grinding circuit will be upgraded with the addition of a pebble-crushing facility which includes conveyor extensions and installation of two cone crushers operating in parallel. The existing SAB circuit, once converted to SAG and Ball with Pebble Crusher (SABC) operation, will function as currently.
New Grinding Circuit
The new grinding circuit will use the same size and installed power SAG and ball mills as the existing grinding circuit.
Crushed ore from the new stockpile will be fed into the SAG Mill 2 feed chute from the SAG Mill 2 feed conveyor. Process water will be added as dilution to the SAG mill feed to control the slurry solids in the mill. Lime and collector will be added to the SAG mill feed. The SAG mill will discharge slurry via trommel screen for pebble removal.
Pebbles will be withdrawn from the feed bin by two variable speed vibrating feeders that deliver into two cone crushers operating in parallel. The crushed material will drop onto the crushed pebble conveyor that delivers them back onto the SAG Mill 2 feed conveyor.
|
February 19, 2025 |
Page 208 |
|
|
NI 43-101 Technical Report on the Lumwana Expansion Project |
|
The SAG mill trommel undersize will gravitate from the trommel to the cyclone cluster. SAG mill trommel screen undersize and ball mill discharge will be pumped from the cyclone feed hopper to cyclone cluster. Dilution water will be added to the hopper to control the slurry solids content in the cyclone feed slurry.
Cyclone cluster overflow will gravitate via two stages of splitter boxes to feed four vibrating scalping screens operating in parallel.
Cyclone cluster underflow will return to feed the ball mill. The ball mill will discharge via a trommel screen. Trommel oversize will be discharged to a scat bunker.
| 17.1.3 | Rougher Flotation |
Existing Plant - Rougher Train 1 and 2
The existing grinding circuit’s new scalping screen undersize stream will pass through a new multi-stage sampler and gravitate to the new Train 1 (TR1) and 2 (TR2) rougher surge tank. The tank will be equipped with a mechanical agitator for solids suspension and mixing.
Facilities to add lime, collector, depressant, and frother to the surge tank will be provided. The slurry in the surge tank will be pumped separately to the first rougher cell in both TR1 and TR2 by the rougher flotation feed pumps. A common stand-by pump will be installed.
The existing WemcoTM self-induced flotation machines will be replaced with forced-air flotation mechanisms. Staged addition of collectors to cells 2, 4, and 6 will be provided for.
Combined rougher concentrates from the first two cells in both banks will be collected in the existing rougher 1 and 2 concentrate hopper and pumped to the new cleaner scalper trash screen ahead of the cleaner scalper float cell.
The remaining rougher concentrate from cells 3 to 7 in both banks will be collected separately in the existing rougher concentrate hoppers, respectively and pumped to another new cleaner-scalper trash screen.
The rougher tails from the final cell in both banks will gravitate, via separate launders, to a new tails sampler. The sampler will collect a shift composite sample for accounting and process control and optimisation.
|
February 19, 2025 |
Page 209 |
|
|
NI 43-101 Technical Report on the Lumwana Expansion Project |
|
New Plant - Rougher Train 3
The new grinding circuit’s new scalping screen undersize stream will pass through a new multi-stage sampler and gravitate to a surge tank similar in design and duty to the new TR1 and TR2 rougher surge tank. The tank will be equipped with a mechanical agitator for solids suspension and mixing.
The rougher conditioning feed pumps will pump the slurry from the surge tank to a conditioning tank ahead of the new rougher flotation circuit.
New facilities will be provided to add lime, collector, depressant, and frother to the rougher conditioning tank. The conditioning tank will be equipped with a mechanical agitator for solids suspension and mixing.
The slurry in the conditioning tank will overflow to feed the first rougher cell in Train 3 (TR3). A new single bank of forced air rougher cells will be installed for TR3.
TR3 rougher concentrates will be collected in a hopper and pumped to the TR2 cleaner scalper feed trash screen feed box.
Rougher concentrate pumps will deliver concentrate slurry to the trash screen via its own pipeline. Each pipeline will be equipped with an in-line sampler to collect a rougher concentrate sample.
The final rougher flotation cell tails will gravitate to the tailings thickener 2 sampler feed box via a standpipe. The TR3 rougher flotation tails sand pump will pump coarse solids that may settle out as slurry from the base of the standpipe back into the tail launder.
| 17.1.4 | Cleaner Flotation |
Existing Plant - Cleaner Train 1
Rougher Train 1 and 2 will be pumped by the TR1 cleaner scalper feed pump to the TR1 cleaner scalper cell. The existing plant has a Jameson cell installed, which will be reused as the cleaner scalper cell for cleaner TR1.
TR1 cleaner scalper concentrate will gravitate via a sampler to the TR1 flotation concentrate hopper (which was renamed the cleaner concentrate hopper).
Depending on the ore type, there will also be the option to direct TR1 cleaner scalper concentrate to the TR1 for further upgrading in the recleaner cells to meet the required final concentrate grade.
TR1 cleaner scalper tails will gravitate to the TR1 cleaner scavenger feed hopper and will be pumped by TR1 cleaner scavenger feed pump to the TR1 cleaner scavenger flotation bank. The existing
|
February 19, 2025 |
Page 210 |
|
|
NI 43-101 Technical Report on the Lumwana Expansion Project |
|
cleaner (4) and cleaner scavenger (3) flotation cells will be reused and configured as the TR1 cleaner scavenger (7) cells.
The TR1 cleaner scavenger concentrate will be pumped into the TR1 recleaner flotation cell. The TR1 recleaner flotation cell will be a high intensity forced air flotation cell. The TR1 cleaner scavenger tails from the final cell will gravitate to the TR1 cleaner scavenger tailings hopper and will be pumped by the TR1 cleaner scavenger tailings pump to the new tails sampler.
The existing recleaner cells (5) will be decommissioned and will be replaced by a high intensity cell.
The TR1 recleaner concentrate will be combined with the TR1 cleaner scalper concentrate in the TR1 flotation concentrate hopper and pumped to the concentrate trash screen feed box in the concentrate dewatering area as the final flotation concentrate.
TR1 recleaner tails will typically be returned to the TR1 cleaner-scavenger cells, but a part of the stream will be recycled to the TR1 recleaner feed hopper to maintain a constant feed rate despite any variation in the fresh feed.
New facilities to add lime, collector, depressant, and frother to TR1 cleaner scalper feed hopper will be provided.
New Plant - Cleaner Train 2
TR3 rougher flotation concentrates will be pumped to the TR2 cleaner scalper feed trash screen feed box and flow onto the TR2 cleaner scalper feed trash screen. Any trash will be recovered to a skip bin for removal.
Screen undersize will gravitate to the TR2 cleaner scalper feed hopper and be pumped by TR2 cleaner scalper feed pumps to the TR2 cleaner scalper cell. The TR2 cleaner scalper cell will be a high intensity forced air flotation cell.
TR2 cleaner scalper concentrate will be collected in the TR2 flotation concentrate hopper and will be pumped to the final concentrate dewatering area. Depending on the ore type, there will also be the option to direct TR2 cleaner scalper concentrate to the TR2 recleaner feed for further upgrading to meet the required final concentrate grade.
A portion of the TR2 cleaner scalper tails will be recycled to the TR2 cleaner scalper feed hopper. This will allow the high-intensity cell to maintain a constant feed rate despite any variation in the new feed.
The balance of the tail stream will be collected in the TR2 cleaner scavenger feed hopper and pumped to the TR2 cleaner scavenger flotation cells by the TR2 cleaner scavenger feed pumps.
|
February 19, 2025 |
Page 211 |
|
|
NI 43-101 Technical Report on the Lumwana Expansion Project |
|
The TR2 cleaner scavenger flotation bank will consist of conventional forced air tank cells. The TR2 cleaner scavenger concentrate will gravitate via a sampler for on-stream analysis to the TR2 recleaner feed hopper. It will be pumped by the TR2 recleaner pumps to the TR2 recleaner cell. TR2 cleaner scavenger tails will gravitate via a sampler, for on-stream analysis, to the TR2 cleaner scavenger tails hopper and will be pumped to the tailings thickener 2 feed box by the TR2 cleaner scavenger tails pumps.
The TR2 recleaner cell will be a high intensity forced air cell. The TR2 recleaner cell concentrate will gravitate via a sampler for on-stream analysis to the TR2 flotation concentrate hopper. TR2 recleaner concentrate will be combined with the TR2 cleaner scalper concentrate in the TR2 flotation concentrate hopper and pumped to the concentrate trash screen feed box in the concentrate dewatering area as the final flotation concentrate. The concentrate stream will be sampled by an in-line pressure pipe sampler for on-stream analysis.
TR2 recleaner tails will typically be returned to the TR2 cleaner scavenger feed hopper, but a part of the stream will be recycled to the TR2 recleaner feed hopper to maintain a constant feed rate despite any variation in the fresh feed.
Facilities will be provided to add lime, collector, depressant, and frother to the TR2 cleaner scalper, the TR2 recleaner, and the TR2 Cleaner scavenger bank.
| 17.1.5 | Concentrate Dewatering |
Concentrate Thickening
Combined concentrate from TR1 and TR2 flotation concentrate hoppers will be pumped to the concentrate trash screen feed box. Each stream will pass through a dedicated slurry sampler to collect a shift composite sample from each train for accounting, process control, and optimisation purposes. The concentrate trash screen undersize will gravitate to the feed into the new concentrate thickener via a de-aeration tank. Any trash will be recovered and placed in a skip bin for removal.
Flocculant solution will be dosed to the thickener feed launder and feedwell via a dilution system to enhance the solids’ settling rate. An option to dose coagulant and lime into the thickener will be provided.
The concentrate thickener underflow will be pumped into one of four concentrate storage tanks, two existing and two new tanks, by two sets of peristaltic underflow pumps. The concentrate storage tanks will provide process surge capacity ahead of the two concentrate filters, one existing and one new.
|
February 19, 2025 |
Page 212 |
|
|
NI 43-101 Technical Report on the Lumwana Expansion Project |
|
The new concentrate thickener overflow will gravitate into an overflow standpipe, and the concentrate thickener overflow pump will deliver a solution to the clarifier feed. The clarifier is the re-purposed existing concentrate thickener.
The clarifier underflow solids will be pumped back to the concentrate thickener feed. The clarifier overflow will gravitate into the existing overflow standpipe, and the clarifier overflow pump will deliver the supernatant to either the existing or new plant process water ponds.
The clarifier can also operate as a concentrate thickener under certain conditions. The TR2 cleaner flotation concentrate pumps will be able to divert final concentrates to the (existing renamed) clarifier feed trash screen feed box if necessary. The option for the clarifier underflow pumps to pump concentrate to the concentrate storage tanks will also be retained when the clarifier is used as a concentrate thickener.
Concentrate Filters
The existing concentrate filter will continue to be utilised, and a second filter will be installed to increase filtration capacity. The new filter will be the same type and model as the existing one for the commonality of spares.
The new concentrate storage tanks will each be equipped with a concentrate filter feed pump and a mechanical agitator for solids suspension and mixing.
Concentrate from any of the concentrate storage tanks will be able to feed the existing and new filters.
The arrangement for the new filter will be the same as the existing one. The filter feed pumps will be operated under sequence control with the pressure filters to fill the press before excess water is removed from the cake, and the cake will be discharged before the cycle is repeated.
The filtrate will be drained from the presses via a separator into froth filtrate return hoppers. The filtrate will be pumped to the concentrate trash screen feed box from both filters. The existing filter has a single pump, but the new filter will be equipped with froth/filtrate return pumps. The return pumps will operate continuously, and the hopper fluid levels will be maintained using a clarifier overflow solution.
Like the existing unit, the new filter will include a wash water tank supplied with raw water and duty cloth wash and manifold flush pumps.
For cake drying, high-pressure compressed air will be supplied to each filter from the respective plant’s air system.
|
February 19, 2025 |
Page 213 |
|
|
NI 43-101 Technical Report on the Lumwana Expansion Project |
|
The existing filter cake discharge currently drops into a bunker for FEL removal. For the Expansion Project, a new concentrate filter discharge conveyor will be installed. The new filter will also be installed with a discharge conveyor. Both filter’s discharge conveyors will deliver filter cake onto the new concentrate conveyor that delivers or onto a new stockpile. Accumulated concentrates will be periodically recovered from the pile by FEL.
The concentrate conveyor will be equipped with a weightometer to measure concentrate production and a cross-belt sampler, which will collect a shift composite sample for accounting, process control, and optimisation.
Stockpile concentrate will be loaded into a truck for road transport to the offsite smelters. An additional weighbridge will be installed.
| 17.1.6 | Tailings Dewatering and Pumping |
Existing Tailings Thickener
The existing plant thickener is overloaded at the increased operating throughput. To reduce the thickener solids feed rate, a cyclone separation step will be introduced ahead of the thickener classifying the tailings stream. The cyclone overflow will be sent to the existing tails thickener for thickening, reducing the solids loading, and allowing the cyclone-thickener combination to accommodate the increased throughput.
TR1 and TR2 rougher tails and TR1 cleaner scavenger tails will be fed to a new tailings sampler ahead of the new cyclone cluster. The sampler will collect a shift composite sample for accounting, process control, and optimisation purposes.
The tailings sampler discharge will gravitate to the new tailings cyclone cluster feed hopper. The slurry in the hopper will be pumped by the cyclone cluster feed pump to the tailings cyclone cluster. Cyclone underflow will discharge into the new TR1 tailings thickener underflow hopper. The cyclone cluster overflow will gravitate to the existing tailings thickener feedwell.
Flocculant and coagulant (if needed) will be dosed to the thickener feed launder and feedwell via a dilution system to enhance the solids settling rate.
The thickener underflow slurry will be transferred by the tailings thickener underflow pump to the new TR1 tailings thickener underflow hopper. Thickener overflow will gravitate to the process water pond.
The recombined cyclone and dewatered thickener underflow streams will be pumped to the TSF by a multi-stage TR1 tailings pump installation.
|
February 19, 2025 |
Page 214 |
|
|
NI 43-101 Technical Report on the Lumwana Expansion Project |
|
The TSF supernatant solution will be recycled back to the process water ponds. The TSF decant return water pump installation will be upgraded as part of the Expansion Project. The upgraded TSF decant water pumping system will pump to the existing and new plant process water ponds.
New Tailings Thickener
The new plant will include a new single large tailings thickener to dewater rougher and cleaner scavenger tails from the new flotation circuit.
TR3 rougher tails and TR2 cleaner scavenger tails will be fed to a new tailings sampler ahead of the tailings thickener. The sampler will collect a shift composite sample for accounting and process control and optimisation.
The tailings sampler reject will gravitate to the new thickener feed box.
Flocculant and coagulant (if needed) will be dosed to the thickener feed box, feed launder, and feedwell via a dilution system to enhance the solids settling rate.
Thickener underflow slurry will be pumped by multi-stage Train 2 tailings pump installation to the TSF.
A peristaltic recycle pump will be installed at the new tailings thickener 2 underflow to remove material building up in the thickener cone due to the rake action when the plant is offline.
Thickener overflow will gravitate to the tailings thickener 2 overflow tank. The tank will be connected to the suction manifold for the new plant’s process water pumps and overflow to the new process water dam.
| 17.2 | Metallurgical Accounting |
Weightometers for metal accounting and control purposes will be provided on the primary crushed ore conveyors and the SAG mill feed and pebble recycle conveyors. The mass flow will be displayed on the Operator Information Terminal (OIT). Weightometers will have a 4-20 mA output for mass flow rate and a digital pulsed output for totalised flow. Instantaneous and totalised measurements will be displayed on the OIT.
The tonnage process in key slurry streams will be accounted for using volumetric flow measurement by magnetic flowmeters, and slurry solid content will be measured using nuclear density meters. Slurry solids content and flow rate measurements will be integrated into the PLC, and instantaneous and totalised mass flow measurements will be displayed on the OIT.
|
February 19, 2025 |
Page 215 |
|
|
NI 43-101 Technical Report on the Lumwana Expansion Project |
|
Automatic sampling of key slurry streams (i.e., flotation feed and tailings streams) will provide representative shift composite samples for metallurgical accounting and process control.
The grades of elements of interest (copper, iron, and sulphur) in various flotation sample streams will be measured using automated analysers that continuously measure samples of slurry from the relevant process streams.
Samplers will be used to provide a continuous slurry stream to the analysers. The analysers will generate a composite process slurry sample for metallurgical accounting purposes for each shift.
| 17.3 | Power, Water, and Process Reagents Requirements |
| 17.3.1 | Power |
Power is supplied to the processing plant from the mainline, which is 33 kV and feeds into the substation on site and is then reduced to 525 VAC for plant distribution. The current demand of the process plant is 53.5 MW. The operational steady-state energy demand (including expansion loads) was calculated as 107 MW. This is expected to double with the expansion of the process plant which includes the installation of the new SAG mill (16 MW) and ball mill (18 MW) along with crushers, conveyors, flotation circuits, thickeners, filters, and other equipment.
Estimated annual power consumption for major process equipment following the completion of the Expansion Project is shown in Table 17-1.
Table 17-1 Estimated Annual Power Consumption of Major Process Equipment Following the Completion of the Expansion Project
| Equipment |
Power Consumption (GWh) |
|
|
Primary Crushers |
20.25 | |
|
SAG Mill |
230.4 | |
|
Ball Mill |
259.2 | |
|
Pebble Crushers |
5.76 | |
| 17.3.2 | Water |
The source of process water is the concentrate thickener and the flotation tailings thickener overflows. Process water is used in milling and thickeners as top-up and is supplied by dedicated operating and standby process water pumps. Process water is also used as service water for flushing, hosing, and screen spraying applications.
|
February 19, 2025 |
Page 216 |
|
|
NI 43-101 Technical Report on the Lumwana Expansion Project |
|
With the Expansion Project, the average reclaim water pumped from the TSF will increase from the current 35.0 m3/yr to 38.2 Mm3/yr as the tailings thickener operation improves following equipment upgrades. The average raw water consumption is estimated to increase from the current 3.93 Mm3/yr to 10.4 m3/yr due to the increase in demand from the additional equipment installed in both the new and existing plant.
| 17.3.3 | Process Consumable Requirements |
The annual consumption of the process reagents and consumables is estimated based on the average monthly consumption and adjusted for the increased throughput of 52 Mtpa. A summary of the key process reagent and consumable consumptions are shown in Table 17-2 and Table 17-3.
Table 17-2 Summary of Annual Reagents for the Process Plant Following the Expansion Project
| Reagent | Current Annual Consumption (t) |
Expansion Annual Consumption (t) |
||
|
Frother |
702 | 1,352 | ||
|
Collector (Overall) |
122 | 236 | ||
|
Flocculant |
583 | 1,123 | ||
|
Talc-Depressant |
189 | 364 | ||
|
Lime - Quick |
3,240 | 6,240 | ||
Table 17-3 Summary of Annual Consumables for the Process Plant Following the Expansion Project
| Equipment type | Parameters | Unit | Current Annual Consumption |
Expansion Annual Consumption |
||||
|
Gyratory Crusher |
Concave Liners | sets | 4 | 8 | ||||
| Mantle Liners | sets | 4 | 8 | |||||
|
SAG Mill |
Media Consumption | t | 8,370 | 16,120 | ||||
| Steel Liner Consumption | sets | 2 | 4 | |||||
|
Ball Mill |
Media Consumption | t | 7,290 | 14,040 | ||||
| Steel Liner Consumption | sets | 1.5 | 3 | |||||
|
Pebble Crusher |
Liners | sets | 0 | 37 | ||||
| 17.4 | QP Comments on Recovery Methods |
The Lumwana processing plant has been operating since 2008 and consistently producing saleable copper concentrates. The proposed expansion of the processing plant is well supported by current operational data.
The FS presents the processing flowsheet and addresses the additional equipment required for the process plant. All long lead equipment has been bought, further to this a risk analysis, operational
|
February 19, 2025 |
Page 217 |
|
|
NI 43-101 Technical Report on the Lumwana Expansion Project |
|
readiness review, and constructability review have been completed. All remaining equipment will be selected during the Front End Engineering and Design (FEED) study.
It is the opinion of the QP that the current and planned expansion facilities are suitable for processing the ore sources envisaged in the LOM plan and the designed maximum throughput exceeds that of the feed schedule, providing additional throughput capacity.
|
February 19, 2025 |
Page 218 |
|
|
NI 43-101 Technical Report on the Lumwana Expansion Project |
|
| 18 | Project Infrastructure |
Lumwana is an established and mature project that has been operating since 2008. It has well-developed infrastructure supporting the current operations and detailed plans for additional infrastructure to support the Expansion Project.
Existing infrastructure includes warehouses and office buildings, roads, waste dumps, a processing plant, employee accommodation and township, maintenance facilities, fuel storage, water supply, WSF, and TSF.
The Expansion Project proposes the following additions to the existing infrastructure:
| ● | An additional processing plant (discussed in Section 17 of this Technical Report). |
| ● | Expansion of the existing TSF |
| ● | A new WSF and water supply infrastructure |
| ● | Upgrade of the existing road network |
| ● | Expansion and upgrade of existing power distribution infrastructure |
| ● | Expansion of mining infrastructure |
| ● | Additional onsite and offsite accommodation |
| ● | Expansion of maintenance facilities |
| ● | New airstrip |
The planned infrastructure and surface rights are illustrated in Figure 18-1.
|
February 19, 2025 |
Page 219 |
|
|
NI 43-101 Technical Report on the Lumwana Expansion Project |
|

Source: Barrick, 2024
Figure 18-1 Layout of Expansion Project Planned Infrastructure
|
February 19, 2025 |
Page 220 |
|
|
NI 43-101 Technical Report on the Lumwana Expansion Project |
|
| 18.1 | Access and Roads |
Two sealed main roads provide access to the Mine from the T5 highway. These are the R1 road, which leads to the mine administration offices and the accommodation camp, and the R5 road, which leads to the maintenance workshop (Figure 18-1). A further network of internal gravel roads provide access to other infrastructure such as the Manyama township, process plant, administration offices, explosives storage, mining areas, mining offices, exploration areas, water boreholes, and overhead line routes.
The road construction methodology is determined by the expected traffic volume and vehicle types. Primary routes with heavier traffic are sealed with bitumen, while lower-traffic areas are treated with less intensive surface treatments. In mining areas or low-traffic zones, roads are untreated.
As part of the Expansion Project, modifications will be made to the internal road network to support planned operations, improve traffic management, and enhance road safety. Planned changes to the network include a combination of upgrades to existing roads, construction of new roads, and realignment of sections to accommodate the future needs of the mining activities. Various road features, including culverts, drainage systems, embankments, overpasses and sediment control measures, will ensure the durability and safety of the roads in alignment with environmental and operational requirements.
| 18.2 | Power Supply |
| 18.2.1 | Distribution |
Power is supplied by Zambia’s state-owned power company ZESCO and distributed across the site from the main 33 kV consumer substation located adjacent to the processing plant. As part of the Expansion Project, an additional 33 kV distribution board is being commissioned, along with overhead power lines and ring mains around the Chimiwungo and Kamisengo open pits.
Power for the township is delivered through a separate 33 kV line to a substation near the township.
The primary power supply is supplemented by an onsite diesel-fired power station with a current capacity of 23.5 MW, to mitigate any grid outages. This capacity is being expanded to 30 MW to support the Expansion Project. Diesel-fired power generation is supplied by a third-party rental agreement.
|
February 19, 2025 |
Page 221 |
|
|
NI 43-101 Technical Report on the Lumwana Expansion Project |
|
| 18.2.2 | Supply |
Power for the mining operation is supplied from the Lumwana main transmission substation. Currently, the mine requires an average electrical load of 60.0 MVA. The Lumwana substation is supplied by the Zambian national grid and forms part of the regional ring network. The Lumwana substation is situated between the Luano substation to the east and the Kalumbila substation to the west.
The Lumwana substation currently relies on power from the Kariba Hydroelectric Dam and Kafue Gorge, while the Kalumbila substation receives power from Itezhi-Tezhi, Victoria Falls, and Maamba Coal Plant.
Power demand for the Expansion Project will increase from 60 MVA to 177 MVA due to infrastructure changes including the additional processing plant, electrical mining equipment, conveyors, and additional dewatering operations. The current peak supply is 65 MVA and an agreement with Zambia Electricity Supply Company (ZESCO) has been executed to increase the peak supply to 180 MVA.
Total power demand is forecasted to ramp up from 2027 to 2030. The maximum demand forecast for Lumwana was formally submitted to ZESCO in Q1 2024 and has since been acknowledged and approved through the signing of a power supply agreement.
Recent droughts have reduced hydroelectric generation capacity, which has caused load shedding and grid stability issues throughout Zambia. As a result, Barrick has completed a grid study. The grid study, conducted by an external consultant in collaboration with ZESCO, confirmed the location of existing grid capacity constraints and the nature of power stability challenges.
Two primary objectives have been identified: (1) improving network stability and transmission capacity, and (2) securing future generating capacity.
In the short term, the strategy focuses on upgrading ZESCO’s network infrastructure by introducing a static synchronous compensators (STATCOM) in the Northwestern power corridor in close proximity to Lumwana and constructing an additional 330 kV overhead line from Kalumbila to Lumwana. These measures will increase the available power to Lumwana, without increasing national power generation requirements. The additional available power will be sufficient for the Expansion Project requirements.
In the medium and long term, the focus shifts to securing generating capacity through a sustainable, long-term power supply solution. Lumwana is collaborating with various independent power producers, key Zambian grid utility partners, and financiers to identify opportunities.
LMC has completed Wheeling Agreements with alternative suppliers in case of a supply shortage in the national grid.
|
February 19, 2025 |
Page 222 |
|
|
NI 43-101 Technical Report on the Lumwana Expansion Project |
|
| 18.3 | Water Management |
The current operations include an extensive system of water management infrastructure. Infrastructure is designed to manage open pit water, collect stormwater from operational areas, divert flows from undisturbed catchments around the Mine, and accommodate the TSF.
The Lumwana East River, along with its main tributaries, the Malundwe Stream and Chimiwungo Stream, are the primary fresh watercourses in the Mine area (Figure 18-2).
The Lumwana East River has been diverted to facilitate mining of the Malundwe deposit and the construction of the TSF. This diversion consists of approximately 20 km of channels and two main diversion dams: the Lumwana Dam and the Chimiwungo Dam (Figure 18-2). The diversion channels ultimately report back into the Lumwana East River downstream of the Malundwe open pit.
To support the Expansion Project, several changes to the water management infrastructure are required. The components of the expansion are shown in Figure 18-2 and include:
| ● | Kamisengo Inflow Control Dam (KICD) with a capacity of 40 Mm3. |
| ● | Lumwana East River diversion channel extending from KICD towards the north into the Malundwe Stream. |
| ● | TSF pond with additional 15 Mm3 water storage capacity for process water supply during dry months. |
| ● | Realignment of the existing Lumwana East River diversion channel around the southern end of the Malundwe open pit. |
| ● | Extensive network of clean water diversion channels and contact stormwater collection channels. |
| ● | Multiple sediment dams. |
| ● | Pit sumps, perimeter dewatering boreholes, and pit depressurisation boreholes. |
| ● | Constructed wetlands for treating mine water. |
| ● | Water treatment plant for potable water. |
| ● | Sewage treatment plant. |
| ● | Extensive network of pumps and pipelines. |
|
February 19, 2025 |
Page 223 |
|
|
NI 43-101 Technical Report on the Lumwana Expansion Project |
|

Source: Barrick, 2024
Figure 18-2 Layout of Existing and Planned TSF and Water Management Infrastructure
|
February 19, 2025 |
Page 224 |
|
|
NI 43-101 Technical Report on the Lumwana Expansion Project |
|
The current TSF is located within a valley which required upstream impoundment of the Lumwana East River in the WSF. A diversion channel routes WSF outflow around the southern perimeter of the TSF into the Chimiwungo Dam, and outflow continues northwest into the Malundwe Stream (Figure 18-2).
The Expansion Project includes a large extension to the TSF which will displace the current WSF from Q4 2029 (Figure 18-2). The Lumwana East River diversion channel will be retained. To facilitate the TSF extension, KICD will be commissioned to collect runoff water from the upstream undisturbed catchment and divert flows north into the Malundwe Stream which flows around the northern perimeter of the Mine (Figure 18-2). During extended wet periods, excess water from the TSF will be discharged into the existing Lumwana East River diversion channel, which will ultimately report into the Malundwe Stream.
Extension of the existing Malundwe open pit to the south requires realignment of the Lumwana East River diversion channel to be commissioned by 2033 to convey outflows from the Chimiwungo Dam into the Malundwe Stream. A small section of the Malundwe Stream will be diverted to accommodate the northwestern pit extension.
Stormwater and groundwater from all open pits will be managed through in-pit sumps and perimeter dewatering wells. Pit sump dewatering water will be treated via constructed wetlands. The wetlands aim to remove suspended solids and nitrates prior to discharge to the Malundwe Stream catchment. Water from the Malundwe open pit will be treated by an existing ion exchange plant prior to the wetland if uranium levels are above regulatory standards.
| 18.3.1 | Water Supply |
A site-wide water and salt balance was developed as part of the ESIA for the Expansion Project in alignment with International Finance Corporation (IFC) Environmental, Health & Safety (EHS) Guidelines for Mining (2007).
The Mine is located in a region characterised by relatively high temperatures and a large difference in precipitation between the driest months and wettest months. Mean annual precipitation is 1,126 mm with minimal rainfall between May and September and 180 mm to 250 mm per month between November and March during average climatic conditions.
The water balance considers all inflows and outflows into the mine reticulation system together with storage and recycled water within the system. The site-wide water balance was developed to analyse the future flows and water management requirements. The site-wide salt balance was developed to analyse the future water qualities and manage downstream impacts, if any.
|
February 19, 2025 |
Page 225 |
|
|
NI 43-101 Technical Report on the Lumwana Expansion Project |
|
The modelling indicates that levels of dissolved solids, sulphates, and copper at the downstream compliance point in the Malundwe Stream remain within guidelines through the management of nitrates and uranium. In addition to this, the water quality is assessed against Zambian and World Health Organisation drinking water standards and IFC guidelines for mining effluent. Excess water from the TSF will be monitored and, if required, treated at the ion exchange plant prior to discharge.
| 18.3.2 | Raw and Process Water |
Process plant throughput is planned to increase from 27 Mtpa to 52 Mtpa requiring increased water supply.
At full production rate the process water requirements include:
| ● | Process water for the plant: 0.86 Mm3/month. |
| ● | Water lost to TSF: 0.43 Mm3/month. |
| ● | Dust suppression: 0.97 Mm3/month dry season to 0.39 Mm3/month wet season. |
| ● | Crushers, wash bays, drilling, etc.: 0.40 Mm3/month. |
Primary sources of raw and process water within the current operation are listed below, and these will provide sufficient process water for the Expansion Project:
| ● | TSF reclaim water (88% of water in tailings) is used at the process plant. |
| ● | Stormwater inflow to KICD is used at the process plant and potable water supply. |
| ● | Pit dewatering is used for dust suppression. |
| ● | Chimiwungo Dam is used for dust suppression. |
| ● | Dewatering boreholes for potable water supply. |
| 18.3.3 | Potable Water |
Raw water is currently treated to potable quality using a modular (containerised) treatment plant in the mine village. The water is then reticulated to supply the mine village, process plant, and maintenance workshop.
The water treatment process involves pre-chlorination, aeration, multimedia filtration, reverse osmosis, and UV sterilisation to ensure potable water meets Zambian Drinking Water Standards.
The Mine’s potable water requirements are planned to increase to a peak of 2,520 m3 per day, based on 280 litres per day for 9,000 people. To support the Expansion Project, two additional modules with a capacity of 500 m3/day will be commissioned with further expansions as demand increases throughout the LOM.
|
February 19, 2025 |
Page 226 |
|
|
NI 43-101 Technical Report on the Lumwana Expansion Project |
|
| 18.3.4 | Sewage |
Sewage is currently conveyed by pumping stations which include duty/standby submersible macerator pumps and pipelines to a sewage treatment plant at the mine village. Treated sewage water is discharged to the TSF. As part of the Expansion Project, the sewage treatment plant is undergoing upgrades including the construction of three additional settling ponds and two containerised sewage treatment plants, which will increase the volumetric capacity to be treated daily from 1,200 m3 to 3,000 m3.
| 18.4 | Supply Chain |
| 18.4.1 | Operations |
Procurement for Lumwana is carried out by supply chain partner, Tradecorp Logistics (TCL), with goods primarily sourced from South Africa where a consolidated warehouse is located.
The mining spares and consumables are shipped from various origin ports worldwide to the below destination ports:
| ● | Durban, South Africa for reagents, spare components, machinery, pumps, conveyor belts, pipes, structural steel members |
| ● | Dar es Salaam, Tanzania for mill liners, reagents, and conveyor belts |
| ● | Walvis Bay, Namibia for mining tyres and spares |
After arriving on the continent, goods are typically transported to the site by truck. The cargo enters Zambia via the Chirundu border from Zimbabwe, the Katima Mulilo border from Namibia, and the Kazungula border from Botswana. In Zambia, the main transport routes are the T2, T3, and T5 highways, which connect Lusaka to Kitwe and Kitwe to Solwezi, leading to the North-Western Province. The trucks travel on two-way paved roads.
All reagents are delivered in bulk bags. As part of the Expansion Project, lime will be trucked in tankers from in-country suppliers. All other reagents, including steel balls, are trucked.
| 18.4.2 | Expansion Project |
The Expansion Project will employ an Integrated Project Team (IPT) model, combining Barrick and LMC’s expertise with that of the selected Engineering and Construction Management Partner (EPCM) firm, specialist contractors, contractors, and suppliers/vendors.
|
February 19, 2025 |
Page 227 |
|
|
NI 43-101 Technical Report on the Lumwana Expansion Project |
|
The procurement and contracting strategy adopted for the Expansion Project will be based on the principle of obtaining the best value for funds invested. Each procurement and construction package will be awarded based on a uniformly applied evaluation and adjudication process.
The use of local labour will be promoted to develop the local workforce, transfer technology, and maximise Zambian content. Local Zambian contractors and suppliers will be encouraged to tender for Project works and contracts will be awarded based on their ability to meet the required conditions.
A FEED study has identified various long lead items for which procurement has begun and is on schedule.
TCL has been contracted to deliver procurement services for the sourcing of international parts and arrangement of logistic for international delivery to the site.
| 18.5 | Site Common Purpose Infrastructure |
| 18.5.1 | Explosives Production and Magazine |
The mine is currently supported by a bulk emulsion plant which has the capacity to produce approximately 200 tpd of emulsion explosive and support the associated blasting services provided by the contractor. The requirement for emulsion is expected to exceed the plant capacity in 2033 at which point the plant will be expanded to produce 300 tpd. The associated maintenance and storage facilities will be expanded to support the ramp-up in explosive usage at the mine.
Ammonium Nitrate (AN) and other raw materials are stored on site. The current AN storage warehouse has adequate capacity until 2027 following which an expansion will be required. The storage capacity can support peak production for 30 days to mitigate any supply chain risk.
Four stainless steel explosive silos were installed in 2024, replacing the existing mild steel silos. This satisfies the storage capacity requirements, providing stock for four days of demand. Further silos will be required beyond 2030 as explosives demand increases with mining rates.
Operations are supported by one magazine centrally located between Malundwe and Chimiwungo pits, the storage capacity will be expanded to support the Expansion Project. An additional magazine will also be constructed to support the Kamisengo mining area.
| 18.5.2 | Fuel Storage |
The fuel distribution infrastructure includes a primary fuel farm located near the maintenance workshop. Additionally, two fuel dispensing farms are situated within the in-pit service areas at
|
February 19, 2025 |
Page 228 |
|
|
NI 43-101 Technical Report on the Lumwana Expansion Project |
|
Chimiwungo and Malundwe. To support the Expansion Project, mobile fuel dispensing units will supply remote locations such as Kamisengo and waste dumps.
Current fuel storage capacity on site is approximately 6.6 million litres. With an annual fuel consumption of 83 million litres in 2023, this provides the site with approximately one month of fuel storage capacity. The Expansion Project is forecast to increase site fuel consumption to 225 million litres per year. To provide for the Expansion Project, an additional 4.2 million litres of fuel storage will be constructed, thereby reducing storage capacity to approximately two weeks of storage. The additional fuel storage will also be sufficient to support the expansion of the emergency power generation infrastructure.
Currently fuel deliveries are handled by third party suppliers. A portion of the fuel requirement is trucked from Beira, Mozambique to site. The remainder is delivered via the TAZAMA pipeline, which delivers fuel from Dar es Salaam, Tanzania to Ndola, Zambia. Fuel is then trucked from Ndola and delivered to the third party depot at Lumwana.
| 18.5.3 | Offices, Workshops, and Warehouses |
Administration Buildings
There are four distinct office areas: the central administration offices, the mining offices located in the Chimiwungo in-pit service area, the process offices situated by the process plant, and the maintenance offices by the workshops.
The existing central administration office complex accommodates senior and administrative personnel as well as discipline functions not specific to processing or mining activities.
The plant area includes the necessary buildings for the operations personnel related to the process operation including a gate house, change house, engineering offices, laboratory, and control room. To support the Expansion Project, a new process change house, control room and laboratory are to be constructed.
For the Expansion Project, offices will be constructed to accommodate the expanded workforce at mining areas, maintenance workshop, as well as the expanded process plant.
In-pit Service Areas
Chimiwungo and Malundwe are each serviced by respective In-Pit Services (IPS) (Figure 18-1).
The Chimiwungo IPS consists of a mining office, pre-shift area, shovel maintenance pad, core shed, cable yard, haul truck refuelling bays, and dewatering service yard. As the mining operation at Chimiwungo is expanded, the IPS will be further developed with additional infrastructure and
|
February 19, 2025 |
Page 229 |
|
|
NI 43-101 Technical Report on the Lumwana Expansion Project |
|
modifications including increased canteen facilities, increased locker room facilities, a new shovel maintenance pad, repurposed training building, and expansion of the fuel storage area.
The Malundwe IPS includes satellite mining office and shift-change buildings which will be expanded to support the additional workforce. An emulsion distribution silo will also be constructed to improve blasting process efficiency.
Due to the considerable distance from the current operations to Kamisengo, the Kamisengo mining area will operate as a fully independent satellite site. Pre-shift facilities for operators and offices for technical staff will be built on site. A containerised refuelling and tyre workshop area will also be established (Figure 18-1).
Due to the short term nature of mining at Kababisa, any infrastructure required, such as offices and maintenance workshops, will be relocated to Kamisengo after the completion of mining activities in Kababisa.
Mobile Fleet Maintenance Workshop
The existing maintenance workshop has been in operation since 2008 and will continue to service the operations for the remaining LOM (Figure 18-1). This workshop is divided into three separate areas for dump trucks, ancillary equipment, and the boilermaker sections.
To support the Expansion Project, the maintenance workshop will be upgraded to meet the service requirements of the expanded mining fleet and larger ultra-class equipment. This includes new workshops, tyre change facilities, wash bays, diesel and lubricant facilities, and dedicated go-lines.
Existing workshops will be repurposed to support maintenance of different equipment types.
The bulk lubrication storage will be expanded. Bulk lubricants will be pumped and metered to the new heavy vehicle workshops. The bulk lubricant facility will be designed to allow for field service trucks to drive through and fill up with lubricants. Two new 40 m3 waste oil storage tanks will be installed. Provision shall be made for waste oil collection and removal.
Light Vehicle Workshop
The existing light vehicle workshop has been in operation since 2008 (Figure 18-1). The current workshop utilises four drive-in bays fitted with vehicle lifts. The workshop has a second extension with eight bays and an additional two vehicle post lifts. A vehicle wash bay is located next to the light vehicle workshop.
A new light vehicle workshop, located adjacent to the existing one, is proposed as part of the Expansion Project.
|
February 19, 2025 |
Page 230 |
|
|
NI 43-101 Technical Report on the Lumwana Expansion Project |
|
Process Plant Buildings
The current process plant is supported by a plant workshop area which is undergoing upgrades to accommodate future needs. An additional warehouse to be located at the existing storage yard will be required to cater for the increased stock holding for spares and consumables.
Construction Buildings and Laydown Areas
During the construction, additional facilities will be required for management and supervision of the construction phase. This will include project offices, construction offices, and laydown areas.
Laydown and office areas have been located and sized to accommodate storage and workforce requirements. The majority of offices and laydown areas will be temporary, with only useful additions being retained for operational purposes.
| 18.5.4 | Accommodation |
A significant proportion of Lumwana employees live within the surrounding villages and towns. The largest, Manyama Township, is administered by a local council, and has grown over the course of the LOM to a current population of approximately 40,000 people (Figure 18-1).
Accommodation is also provided at Lumwana Estate which was constructed by LMC during the inception of the mine and was intended for use as residence for the mine’s employees (Figure 18-1). Lumwana Township is currently administered by Lumwana Property Development Company (LPDC), a sister company to LMC operating under Barrick African Copper Pty Limited.
Lumwana Township is a 4,500-bed township divided into five areas: Junior Township, Senior Township, Rental Estate, Contractors Camp, and Drillers Camp. Accommodation is generally variations of prefabricated buildings as well as concrete block buildings. The township includes utilities and amenities such as water and sewage treatment, fire water provision, a medical clinic, shop, school, recreational facilities, and messing.
To support the construction phase of the Expansion Project, an additional 2,500 personnel will be accommodated on site. Accordingly, during the construction phase, accommodation buildings for 2,500 beds are planned within the existing Lumwana Township with supporting infrastructure and facilities.
A long-term corporate strategy is in place to develop another 2,000-house township outside of the Lumwana mine site to enable employees to own their own land and their own homes. This will overlap with the construction period of the Expansion Project, and results in long-term estimates where the Lumwana Township will be reduced to approximately 1,000 beds.
|
February 19, 2025 |
Page 231 |
|
|
NI 43-101 Technical Report on the Lumwana Expansion Project |
|
| 18.5.5 | Airstrip |
The Mine is currently serviced by airstrips at Solwezi and Kalumbila, 90 km and 63 km by road, respectively. The construction of an airstrip at Lumwana, close to Manyama, has been planned as part of the Expansion Project (Figure 18-1).
The airstrip will support the increase in workforce travel during the construction phase, improve medical evacuation times, and support Barrick’s long-term strategy to develop an economic hub in northwestern Zambia.
Detailed design work, site investigations, and sterilisation drilling are complete with initial designs allowing for a 2 km strip which will be expanded in the long term to 3.6 km to support International travel. Approvals and other regulatory work will need to be concluded before the airstrip can become operational.
| 18.5.6 | Emergency Response and Medical Facilities |
A medical clinic is situated at Lumwana Township. The clinic has facilities for stabilisation and basic emergency care. If advanced emergency care is required, patients are transferred from site by road to Solwezi General Hospital and onwards to Lusaka.
Situated inside the active mine area is the emergency response (ER) centre. The Lumwana operation has a well-established ER team, procedures, and standards. The ER team consists of 25 fully trained, full-time members which work on a rotational shift to provide 24-hour coverage. The ER team responds to fire, rescue, and hazardous materials events with medical personnel available for injury and illness.
The ER team utilise a dedicated, fully equipped fire tender with foam and water storage alongside three fully equipped ambulances. Ambulances are attended by a team of paramedics and emergency medical technicians.
To support the additional workforce required for the Expansion Project, an additional road ambulance is to be procured and a new emergency medical clinic at the Lumwana Estate is being constructed.
| 18.5.7 | Waste Management |
The Lumwana operation has a long-established waste management and housekeeping programme on site. The waste management strategy follows the principles of Reduce, Reuse, and Recycle, aiming to minimise the volume of waste sent to landfill and maximise resource efficiency.
|
February 19, 2025 |
Page 232 |
|
|
NI 43-101 Technical Report on the Lumwana Expansion Project |
|
At the designated waste disposal site, steel, industrial, and wood waste are sorted for recycling or proper disposal. General and household waste is discarded in colour-coded containers to ensure effective separation of waste streams, facilitating efficient recycling and reducing contamination.
Inert waste, such as paper and plastic, is baled, while materials of value or usefulness are sold to the community, contributing to local sustainability efforts. Biodegradable waste, after composting, is repurposed for rehabilitation and closure activities. Medical waste and hydrocarbon-contaminated waste are incinerated on site, ensuring the safe and compliant disposal of hazardous materials.
All remaining waste is managed by contractors who are responsible for its recycling or disposal.
Hydrocarbon waste generated at Lumwana is collected and stored at the waste oil storage facility tanks located at the maintenance workshop. Waste hydrocarbons are then sold exclusively to companies licensed by the regulator ZEMA. The used hydrocarbons can serve as an energy source for boilers and kilns in bakeries and cement production facilities.
| 18.5.8 | Security |
To mitigate the risks of intrusion and criminal activity, LMC employs an internal security department that includes a dedicated crime investigation group. This team works alongside a contracted private security firm and the Zambia Police Service, both of which maintain an onsite presence.
The Mine site covers approximately 1,265 km2 and currently has three main access points, each secured by guarded checkpoints. An additional checkpoint is planned to serve the Kamisengo mining area. Due to the extent of the site, the perimeter is not completely fenced, however, 24-hour patrols are in place with heightened security focused on critical infrastructure areas. Individual security posts are strategically positioned throughout the site for enhanced coverage, and a comprehensive site-wide surveillance system is in operation to further strengthen security.
The onsite security team and procedures are well established, with a strong track record of effectively controlling crime and other security risks. As operations expand, additional personnel will be brought in to integrate with the existing teams. Furthermore, the planned infrastructure additions include all necessary security provisions, which will be incorporated into the detailed engineering designs.
| 18.5.9 | Communications |
The site communication infrastructure comprises two telecommunication systems:
| ● | An Optical Communication System which utilises fibre-optic communication systems to transmit information. The site is using Open Transport Network (OTN) as a backbone. |
| ● | A Radio Communication System where information flows through the use of a radio working with the aid of a transmitter and a receiver. There are six communication towers/masts |
|
February 19, 2025 |
Page 233 |
|
|
NI 43-101 Technical Report on the Lumwana Expansion Project |
|
| situated around mine site for business partners and three tower/masts are being specifically used for LMC’s radio/wireless communication requirements. |
The communication infrastructure coverage area extends to approximately 300 km2 which covers the Chimiwungo and Malundwe deposits, using Wired (Line Communication) and Wireless (Space Communication) approaches. The switched network encompasses of 134 Cisco Nodes and 16 OTN Nodes.
The Barrick office based in Lusaka is connected to the mine site via a data link provided by a commercial communication company which is used to connect to other remote sites and services.
The radio and Wi-Fi network will be extended to Kamisengo through the construction of two new 51 m tower masts which will include WLAN infrastructure similar to that deployed at the existing open pits.
| 18.6 | Tailings Storage Facilities |
| 18.6.1 | Existing Facility |
The construction of the existing TSF, WSF, river diversion system, and sediment control structure commenced in 2006. The TSF is situated in a natural waterway within the former Lumwana East River valley, which runs from the northeast to the southwest (Figure 5-2). The embankments are clay core rockfill structures constructed using materials from borrow pits and select waste material from mining.
The original design capacity of the TSF was 360 Mt which is predicted to be reached by mid-2025 at the current rate of production. During 2024, the existing TSF stormwater diversion channel was realigned, widened, regraded, and a flood bund was constructed along the entire channel. The upgraded diversion channel allows for stormwater management in accordance with Global Industry Standard on Tailings Management (GISTM) and the Barrick Tailings Management Standards. It also provides the TSF with an additional storage capacity of 40 Mt bringing the current total capacity to 400 Mt.
| 18.6.2 | Expansion |
In 2024, an FS was completed for the expansion of the Lumwana TSF to accommodate a total of 2 Bt of tailings. A multi-criteria accounts analysis (MAA) was completed following the GISTM and internal Barrick guidelines to assess the environmental, social, technical, and financial characteristics of various possible locations for TSF expansion. The study identified Option 3C as the most advantageous out of the eleven options studied. This involves the expansion of the current
|
February 19, 2025 |
Page 234 |
|
|
NI 43-101 Technical Report on the Lumwana Expansion Project |
|
TSF footprint into the current WSF footprint, as well as the construction of a drainage channel to manage runoff in the eastern swamp area through the Maheba catchment (Figure 18-2).
| 18.6.3 | TSF General Design Aspects |
The design of the TSF expansion has been developed considering:
| ● | Zambian legislation and guidelines |
| ● | Barrick Tailings Management Standard (March 2022) |
| ● | Global Tailings Review (GTR) GISTM (August 2020) |
| ● | Canadian Dam Association (CDA). Technical Bulletin: Guideline for Tailings Dam Breach Analysis (2021) |
| ● | Mines and Minerals (Environmental) Regulations No. 29 of 1997 |
| ● | Environmental Protection and Pollution Control (Environmental Impact Assessment) Regulations SI No. 28 of 1997 (EIA Regulations) |
| ● | Australian National Committee on Large Dams (ANCOLD), ‘Guidelines on Tailings Dams’, (July 2019) |
| ● | International Commission on Large Dams Commission (ICOLD), ‘Tailings Dam Safety (daft)’, (2022) |
The overall design objectives adopted for the TSF expansion are summarised as follows:
| ● | Ensure permanent and secure containment of tailings. |
| ● | Maximise tailings density using sub-aerial deposition. |
| ● | Remove free water for recycling through the process plant. |
| ● | Remove excess water from the facility for discharge to prevent accumulation of water in the system. |
| ● | Reduce catchment areas. |
| ● | Control and reduce seepage from the facility. |
| ● | Maintain excess capacity on the facility to retain water volumes resulting from 100 yr average return interval (ARI) storm events. |
| ● | Ensure flood routing capacity sufficient to safely manage a 10,000 yr ARI storm event. |
| ● | Utilise materials for embankment construction in a cost-effective manner. |
| ● | Implement As-Low-As-Reasonably-Practicable (ALARP) risk principles during the design and operation. |
| ● | Consider an efficient closure configuration during development and operation of the TSF. |
| ● | Ensure a long-term stable configuration at closure. |
| ● | Comply with relevant design guidelines and standards. |
|
February 19, 2025 |
Page 235 |
|
|
NI 43-101 Technical Report on the Lumwana Expansion Project |
|
The general TSF layout will be maintained within the existing embankment (EMB1) and proposed new embankment (EMB7) forming the western and eastern extents of the facility (Figure 18-2). The southern abutment of EMB1 will extend eastward to join existing Diversion Dam (DD3-2) and form a new embankment (EMB8) adjacent to the plant site (Figure 18-2). A saddle dam (EMB4) will be required between the low-lying swamp area to the east of Lumwana Township and the expanded TSF (Figure 18-2). The existing Diversion Channel DC3 (DC3a to DC3b) will be replaced with a new Diversion System DC7 further up-slope forming the southern boundary. The northern edge of the facility will migrate further up-slope towards the ridgeline to the Malundwe River requiring a saddle dam (EMB3) (Figure 18-2).
Initially, the existing TSF and expansion TSF will operate as independent facilities. Once the tailings level in the expanded TSF reaches the crest of the existing WSF Embankment 2 (EMB2) (Figure 18-2), the two facilities will be integrated and from that point on will effectively operate as a single facility. Any changes to the deposition plan of the current TSF are recorded within the Deviance Accountability Report, as required by the GISTM standard. The changes are considered and incorporated into the LOM plan.
For the expanded facility, surface water runoff management will divert as much water as practical past the facility using existing and new diversion systems. A controlled discharge system for excess water captured within the TSF will be maintained.
All embankments will be constructed and raised in a downstream manner. The embankment fill will comprise low permeability fill, transition fill if required, structural fill, and mine waste fill. Erosion protection and drainage layers are incorporated in the design of some embankments as well as seepage control and underdrainage collection systems. The final embankment crest heights vary between 17 m (EMB3) and 70 m (EMB7).
The main materials to be used for the larger construction stages, associated with the expansion of the TSF, will derive from mine waste and diversion channel excavations. Borrow pits within the ultimate TSF basin extents will be developed as required. The flattening of deeper cut channel slopes as well as the widening of diversion channels, which will remain post closure, will also be used as material sources.
| 18.6.4 | Consequence Classification |
Dam Breach Analyses (DBA) were undertaken by Knight Piésold for the TSF expansion to assess the Population at Risk (PAR), Potential Loss of Life (PLL), business risk, and environmental impact in the event of a dam failure. The DBA was completed to help stakeholders understand the significance of the dam designs and implications regarding risk management. The assessments were carried out based on credible failure modes, in accordance with the CDA and GISTM,
|
February 19, 2025 |
Page 236 |
|
|
NI 43-101 Technical Report on the Lumwana Expansion Project |
|
guidelines and were completed for the final height of the embankments EMB1, EMB3, EMB4, and EMB7. The results from the DBA are summarised as follows:
| ● | EMB1 is the critical structure of the TSF, potentially inundating the Malundwe open pit and releasing to the environment. EMB7 can also release to Kamisengo open pit, however, the supernatant pond is remote from the embankment. |
| ● | A failure of EMB3 and EMB4 will result in mostly environmental damage with some infrastructure at risk. |
| ● | A water release at Diversion Dam 3-2 (DD3-2) can inundate portions of the process plant, potentially damaging thickeners and switchyards. |
| ● | The Lumwana Township and Chimiwungo open pits are not considered at risk. |
The PAR was determined to be mine personnel working within the TSF operations and construction areas as well as within the Malundwe open pit operations and is estimated to be less than 100. The PLL is related to mine personnel working within the Malundwe open pit and is estimated to be less than ten. The results of the DBAs were used to determine the GISTM Dam Failure Consequence Classification. Based on the results from the DBAs, the Consequence Classification would be rated as HIGH due to a PAR less than 100 and a PLL less than 10. Irrespective of the consequence classification, Barrick’s internal standard on tailings dam design requires the TSF expansion to be designed so it meets the EXTREME Consequence Classification design requirements.
The Emergency Response Plan will be updated to include both open pits and the process plant over time as the embankments develop in height.
| 18.6.5 | Tailings Deposition |
The slurry, i.e., tailings mixed with water, will be transported from the process plant to the TSF through pipelines and subsequently discharged into the facility by sub-aerial deposition methods, using a combination of single point and spigot discharges. The active tailings beach will be regularly rotated around the facility to maximise air drying and therefore improve tailings density. This will be achieved by depositing from each deposition point for a few days, then changing to the next. The tailings beach, the pond shape, and position are adjusted by varying the rotation timing based on visual observations of the pond location in relation to the decant location.
| 18.6.6 | TSF Water Management |
Management of water is critical in terms of the process plant operation, TSF design, decant return water, and discharge water pumping requirements. A water management model, developed during the initial design phases of the existing TSF, has been refined over the past 15 years using performance monitoring data of the facility. Using the calibrated model, forecasts of expected future performance of the expanded facility under a range of climatic conditions have been generated.
|
February 19, 2025 |
Page 237 |
|
|
NI 43-101 Technical Report on the Lumwana Expansion Project |
|
Based on the performance over 15 years of operation of the TSF, with respect to water quality and seepage rates, it is considered that there is no technical requirement to construct or install a formal basin liner system.
The expanded TSF is designed to contain the Environmental Design Flood (EDF), equivalent to a 1:100 ARI storm event, during its operational life. Water will be pumped back from the supernatant pond to the process plant using the current configuration of a decant barge with submersible pumps or, alternatively, through decant towers installed with submersible pumps. Although the process plant throughput is doubled with the planned expansion, the return water flows from the TSF to the two plants will remain in a similar order of magnitude as with the currently operating process plant. Due to the increasing TSF catchment, it is expected that the TSF will accumulate considerably more water than current accumulation. Therefore, an increase in discharge capacity from the TSF is also planned. If a storm event exceeds the design water containment capacity of the TSF, excess water will be released in a controlled manner via a spillway, designed to cater for a storm event equivalent to the 10,000 yr ARI.
| 18.6.7 | Operating, Maintenance and Surveillance Activities |
An operating, maintenance, and surveillance (OMS) manual is available for the TSF and the water management system at the facility. This document is regularly updated in line with the changing design and operation conditions.
The performance of the TSF is monitored on a weekly basis through a selection of key performance indicators. These include:
| ● | Tailings beach slope. |
| ● | Achieved in-situ tailings density. |
| ● | Supernatant pond volume. |
| ● | Tailings beach elevation at critical locations. |
| ● | Raw water makeup/recycle volume. |
| ● | Discharge water volume. |
| ● | Supernatant pond distance to critical embankments. |
| ● | Phreatic surface through embankments. |
A review of the key performance indicators will be undertaken on a regular basis, typically monthly, with a formal report provided to LMC after each review.
Annual inspections by the Engineer of Record will be scheduled for the TSF (as per current operations undertaken on site). A standalone technical dam safety inspection report will be generated for the tailings and water management systems.
|
February 19, 2025 |
Page 238 |
|
|
NI 43-101 Technical Report on the Lumwana Expansion Project |
|
Maintenance of the TSF and WSF embankments, spillways, and associated diversion channels primarily concern control of erosion and maintaining the spillway and culvert entrances clear of obstruction. More specific maintenance requirements exist for the tailings, decant, and discharge pumping and piping systems.
| 18.6.8 | Emergency Preparedness and Response Plan |
The existing Emergency Preparedness and Response Plan (EPRP) will be reviewed and updated to handle TSF operational emergencies for the expanded facility.
| 18.6.9 | Third Party Review Programme |
As part of the external audit and tailings review programme, Barrick have assigned an Independent Tailings Review Board (ITRB), which reviews the current and future plans for the TSF and associated structures on an annual basis.
Independent dam safety reviews of the TSF are also undertaken with regular intervals, as per requirements of the GISTM.
Findings and recommended actions from independent reviews are considered and incorporated as required into the design and operations of the TSF.
| 18.6.10 | Closure and Post-Closure Considerations |
A conceptual closure design for the TSF has been developed to provide the basis for the update of the site-wide mine closure plan. It is proposed that a dry cover is established over the TSF beach. Furthermore, the closure plan considers aspects such as removal of infrastructure, long-term water management, and flattening of slopes for long-term stabilisation.
| 18.7 | QP Comments on Infrastructure |
In the opinion of the QP, the existing mine infrastructure and planned expansion infrastructure, as outlined in this Technical Report, are sufficient to support the LOM plan and have been engineered to a level of study suitable to support the declaration of Mineral Reserves.
|
February 19, 2025 |
Page 239 |
|
|
NI 43-101 Technical Report on the Lumwana Expansion Project |
|
| 19 | Market Studies and Contracts |
| 19.1 | Markets |
Copper is a metal with inherent characteristics of excellent electrical conductivity, heat transfer, and resistance to corrosion. Copper is used principally in telecommunications, power infrastructure, automobiles, construction and consumer durables. Copper is freely traded, primarily on the London Metal Exchange (LME), the New York Commodity Exchange, and the Shanghai Futures Exchange, and no market studies are relevant as a result. The price of copper as reported on these exchanges is influenced by numerous factors, including:
| ● | the worldwide balance of copper demand and supply; |
| ● | rates of global economic growth, including in China, which has become the largest consumer of refined copper in the world; |
| ● | speculative investment positions in copper and copper futures; |
| ● | the availability and cost of substitute materials; and |
| ● | currency exchange fluctuations, including the relative strength of the US dollar. |
The copper market is volatile and cyclical. Over the last 15 years, LME prices per pound have ranged from a low of $1.37 to a high of $4.92, reached in March 2022. During 2024, LME copper prices traded in a range of $3.69/lb to an all-time high of $5.04/lb, averaged $4.15/lb, up 8% from the average of $3.85/lb in 2023, and closed the year at $3.95/lb. Copper prices are significantly influenced by physical demand from emerging markets, especially China. Copper prices in 2024 were impacted by low global economic growth, especially in China, which is the world’s largest purchaser of copper, tempered by supply disruptions. Subsequent to year end, copper prices have continued to trade within prior year ranges due to a continuation of these trends.
The Lumwana operation consists of active mining and processing operations which produces a readily saleable copper concentrate. Given the existing operations, no recent market studies have been carried out.
As of December 31, 2024, Barrick had no copper derivative contracts in place. As a result, all of Barrick’s copper production is currently subject to market prices. There are no agency relationships relevant to the marketing strategies used.
Barrick is not dependent upon the sale of copper to any one customer and its product is sold to a variety of traders and smelters.
|
February 19, 2025 |
Page 240 |
|
|
NI 43-101 Technical Report on the Lumwana Expansion Project |
|
| 19.2 | Lumwana Concentrates |
Zambia has several major copper smelters that process copper concentrates. Projections indicate that domestic smelting capacity will be sufficient to handle the additional concentrate expected from both the Expansion Project and the overall increase in supply from the Zambian market.
Given the presence of multiple copper cathode and copper concentrate purchasers within the region, Barrick is not reliant on a single customer for copper sales.
Additionally, the option to export concentrate remains available, with no identified barriers to export at this time outside of purely commercial factors being an export fee for which waivers can be applied for.
| 19.3 | Commodity Price Assumptions |
Barrick sets metal price forecasts by reviewing the LOM for the operations, which is over 30 years, and considering the commodity price for that duration. The guidance is based on a combination of historical and current contract pricing, contract negotiations, knowledge of its key markets from a long operations production record, short-term versus long-term price forecasts prepared by Barrick’s internal marketing group, public documents, and analyst forecasts when considering the long-term commodity price forecasts.
Metal prices used for Mineral Resource and Mineral Reserve estimation are:
| ● | Mineral Resources: US$4.00/lb Cu |
| ● | Mineral Reserves: US$3.00/lb Cu |
Both pricing assumptions are below current market spot price as at the date of this report, with higher metal prices being used for the Mineral Resource estimates and for the positioning of long-term infrastructure to ensure that future potential higher copper price pit pushbacks are not sterilised.
| 19.4 | Contracts |
The Lumwana operation has established policies and procedures for letting of contracts. There are numerous contracts in place to supply the goods and services necessary for its operations, with contracts negotiated and renewed as required.
Lumwana currently has signed contracts in place for the sale of concentrate to domestic smelters which include treatment and refining charges consistent with industry benchmarks.
|
February 19, 2025 |
Page 241 |
|
|
NI 43-101 Technical Report on the Lumwana Expansion Project |
|
While there are numerous contracts in place at Lumwana, there are no contracts in place or planned which are considered to be material to Barrick.
| 19.5 | QP Comment on Market Studies and Contracts |
The QP notes the terms assumed for sales contracts are typical and consistent with standard industry practice.
The QP has reviewed commodity pricing assumptions used in this study and considers them appropriate to the commodity and mine life projections. Additionally, the QP considers marketing assumptions and the current major contract areas acceptable for the use in estimating Mineral Reserves and the supporting economic analysis.
|
February 19, 2025 |
Page 242 |
|
|
NI 43-101 Technical Report on the Lumwana Expansion Project |
|
| 20 | Environmental Studies, Permitting, and Social or Community Impact |
The Lumwana Mine has been operating successfully since 2008 without significant environmental or social incidents. All environmental permits are in place for the current Mine, with permits for the Expansion Project on schedule for approval prior to commencement of construction. The only remaining significant milestone is the approval of the RAP, which is expected to be received in the first quarter of 2025.
The approval for the ESIA has been received for the Expansion Project described in this Technical Report. Zambian authorities use the term ‘Environmental Impact Statement (EIS)’ for an Environmental and Social Impact Assessment (ESIA); an ESIA is also known as an Environmental Impact Assessment (EIA) and the terms are used interchangeably in this Technical Report.
A number of environmental and social studies have been conducted, including environmental baseline studies in 2003, a full EIA study for the current Mine in 2005, an EIA for the Lumwana Estate in 2006, and most recently the Expansion Project ESIA completed in 2024. These studies were completed in adherence with Zambian legislation, international standards, and Good International Industry Practice (GIIP).
Ongoing management of Environmental and Social (E&S) impacts is completed through the Environmental Management System (EMS) including management plans, monitoring programmes, and internal and external auditing. The Expansion Project requires a significant expansion in the footprint of the mine and related infrastructure. As a result, a resettlement programme is required for 279 households with a RAP having been developed. In addition, updates to the overall Environmental and Social Management Plan (ESMP) and Biodiversity Action Plan (BAP) are required to account for the additional surface footprint and expanded facilities. These updates do not affect the Expansion Project execution and will be done in due course.
As a member of the International Council on Mining and Metal (ICMM), Barrick continues to implement environmental practices aligned with GIIP, such as initiating the Reducing Emissions from Deforestation and Forest Degradation in Developing Countries (REDD+) Project, which is aligned to Zambia’s National REDD+ Strategy (2015). The REDD+ Project is aimed in the Kalumbila District of Zambia, to address deforestation and its effects on climate change and biodiversity, while providing local communities with alternative livelihoods and a long-term source of revenue through the sale of carbon credits. Barrick is also dedicated to adhering to its policy of no net loss of Key Biodiversity Features and committed to net gain biodiversity through the implementation of a BAP and/or Biodiversity Offset Plan.
|
February 19, 2025 |
Page 243 |
|
|
NI 43-101 Technical Report on the Lumwana Expansion Project |
|
| 20.1 | Permitting |
This section describes the environmental and social approvals and permits required for the existing and planned operations. The Mining Licences applicable for Lumwana (including the Expansion Project), along with land use and access approvals, are described in Section 4 of this Technical Report.
LMC complies with the applicable laws of Zambia, promulgated by ZEMA, formerly Environmental Council of Zambia (ECZ), the Water Resource Management Agency (WARMA), and Mine Safety Department (MSD). These laws govern the environmental management in the mining sector in Zambia and include:
| ● | Environmental Management Act No. 12 of 2011, which provides for the issuance of environmental management licences; |
| ● | Water Resource Management Act No. 21 of 2011 for managing Zambia’s surface and groundwater resources in terms of quality and quantity; |
| ● | Mines and Minerals Development Act No. 11 of 2015; |
| ● | Environmental Protection and Pollution Control (Environmental Impact Assessment) Regulations SI No. 28 1997 (EIA Regulations). |
| ● | Mines and Minerals (Environmental Protection Fund) Regulations SI No. 102 of 1998 |
In addition to the Mining Licences, LMC also has the following approvals/permits to operate in place:
| ● | ZEMA: |
| ○ | EIS approval (including expansion of tailings and waste facilities). This is for the ESIA and the ESMP submitted as part of the Expansion Project. |
| ◾ | Final approval was received on November 11, 2024. |
| ○ | ESMP approval. |
| ◾ | Status: the existing ESMP is approved. The ESIA for the Expansion Project incorporated an ESMP which described activities required to be executed for the Expansion Project. The RAP has been submitted for review and will require 60 days to review and approve (expected in the first quarter of 2025). |
| ○ | Specific operational permits including for the use of pesticides and toxic substances; emissions; hazardous wastes; waste management; and ozone depleting substances. |
| ◾ | Status: all operational permits are in place and valid until 2026. They are renewed on a 3-year cycle with no issues previously encountered when updating. Specific additional permits related to the Expansion Project will be required and will be applied for once engineering designs are finalised. |
| ● | WARMA - water permits (including abstraction from Lumwana East River and Chimiwungo Stream), dewatering permit, water borehole sinking permit, storage dam permit, and |
|
February 19, 2025 |
Page 244 |
|
|
NI 43-101 Technical Report on the Lumwana Expansion Project |
|
| associated annual water fees (access, usage, and re-use), and permit for construction of water works dam. |
| ◾ | Status: all required water permits for existing operation are in place and valid; abstraction permits are valid until 2025 and will be updated in 2025. Dewatering permits are applied for on an annual basis. Additional permits for new boreholes or construction of water works are applied for as and when required. Specific additional permits related to the Expansion Project (including additional modifications to the Lumwana East River diversion) have been applied for and are expected to be approved in Q1 2025. |
| ● | Other licences held include those for the medical staff, clinics, and radiation licences for testing equipment (e.g., process plant density gauges and compaction density testing equipment); these are issued by the Health Professionals Council of Zambia, General Nursing Council, Kalumbila District Council, and the Radiation Protection Authority. |
| ◾ | Status: all Health and Safety permits for the existing operation are approved on an annual basis and will be updated as and when additional facilities are required. |
The 2005 EIA was reviewed and approved in October 2005 by ZEMA (then ECZ). Authorisation was subject to conditions which highlighted relevant legislation and other standard requirements (such as implementing the environmental management plans included in the EIA) in the letter of authorisation from the ECZ. Failure to adhere to the conditions could result in the authorisation being revoked. In addition to an ESMP, a radiation management plan was developed to mitigate and manage uranium-bearing dust. It was developed following the uranium EIA (2009), discussed further in Section 20.2.1.
A part of the E&S impact assessment approval process includes the requirement to develop an ESMP. The ESMP for the Lumwana Mine was approved in 2014 and will be required to be updated to include changes that have taken place in mining operations (subsequent to it being approved) along with expected changes relating to the Expansion Project.
Licensing verification inspections are carried out every three years by Government representatives, prior to environmental licences being renewed or issued through ZEMA. Independent parties (specialists) must carry out an audit of dumps on behalf of mines every two years and the audit reports are required to be submitted to the Ministry of Mines (Mine Safety Department).
| 20.2 | Environmental Assessment and Studies |
| 20.2.1 | Studies |
A number of EIAs have been completed at Lumwana Mine from pre-mining in 2005 to the latest ESIA to inform the Expansion Project in 2024. In addition, there have been a variety of other studies and audits relating to the existing operational management of the site. It is noted that the EIAs were
|
February 19, 2025 |
Page 245 |
|
|
NI 43-101 Technical Report on the Lumwana Expansion Project |
|
completed in line with national Zambian legislation requirements along with international standards, specifically the IFC Performance Standards, in place at the relevant time.
The following key EIA studies have been completed for the Lumwana concession:
| ● | Lumwana Copper Project EIA (Equinox, 2005). Equinox carried out the EIA as required by Zambian law in support of applying for authorisation to develop the mine (which had an expected LOM of 18 years). This included a baseline study undertaken for the 2003 BFS. This was the main tool for environmental approval of the operation. |
| ● | Lumwana Estate EIA (Equinox, 2006). This EIA was undertaken specifically for the Estate that would provide accommodation for employees, contractors, and suppliers (within the Mining Licence area). ECZ instructed Equinox to proceed with the EIA without the need to submit a Project brief and scoping report; this was based on the recent knowledge of the Mine. The 2003 baseline studies were used to assess impacts associated with the Lumwana Estate. |
| ● | Lumwana Uranium Project EIA (Knight Piésold, 2008). A PFS on the uranium mineralisation was carried out in 2002 to 2003, and then an FS in 2007 to 2008. Following the successful FS, Knight Piésold was appointed to carry out an EIA; including an update to baseline studies. Impacts were assessed with specific reference to the uranium project but also with reference to impacts already identified for the copper project. The EIA was reviewed by ECZ and the project was approved in May 2009. However, the processing plant was ultimately not constructed, and Lumwana Mine informed ZEMA that this project would not be going ahead (Barrick, 2014). |
| ● | Chimiwungo open pit and development of the waste rock dump ‘Chimiwungo Extension Project’ EIA (Eco-Wise Solutions, 2013). Exploration activities confirmed the Lumwana and Chimiwungo open pits could be extended with mine life continuing to approximately 2039; the Chimiwungo northern dump will be developed in association with the mine extension. The EIA was required in line with regulation 7(2) of the EIA Regulations. |
| ● | Reclamation of copper from Malundwe stockpiles with elevated uranium EIA (AMC, 2019). This EIA was specifically submitted and approved in view of the change in the way this stockpile (material) was to be handled to allow for a better understanding of the associated impacts. Reclaim of the stockpile commenced at the end of 2019 through to 2021 when the stockpile was completed. |
| ● | Expansion Project ESIA (Digby Wells, 2024). This latest ESIA was completed in order to gain environmental approval for the following facilities: |
| ○ | Expansion of the Chimiwungo open pits to form the ‘Chimiwungo Super-Pit’ and the associated waste dumps (including progressive in-pit dumping), and construction of a flood control dam and associated infrastructure; |
| ○ | Expansion of the Malundwe open pit and the associated waste dumps (including progressive in-pit dumping), and construction of an associated diversion of the Malundwe Stream and associated infrastructure; |
| ○ | Development of the Kamisengo and Kababisa open pit mining areas, waste dumps. and associated infrastructure, including an overland conveyor and stream diversion dams and channels; |
| ○ | Expansion of the TSF once the current TSF reaches its current storage design capacity; |
|
February 19, 2025 |
Page 246 |
|
|
NI 43-101 Technical Report on the Lumwana Expansion Project |
|
| ○ | Expansion of the existing processing plant and construction of a duplicate processing plant to achieve a combined maximum processing capacity of 54 Mtpa; and |
| ○ | Development of various water management structures (i.e., dams, diversion channels, sediment ponds, etc.), relocation of the airstrip, expansion of the construction camp, haul roads or laydown areas. |
The 2024 ESIA process followed for the Expansion Project is presented in Figure 20-1, which comprises three main phases namely the Screening Phase, the Scoping and Terms of Reference (ToR) Phase, and the ESIA Phase. All stages of the ESIA process in Figure 20-1 have been undertaken including the final round of stakeholder engagement; the final ESIA was submitted to ZEMA in August 2024 for approval, following which the Environmental Decision letter approving the Expansion Project was received, dated November 11, 2024.
The environmental baseline studies were conducted through desktop assessments and in-field assessments/surveys undertaken by Digby Wells 2023 to 2024. The baseline conditions of the area inform the identified potential impacts that will need to be managed and monitored. The baseline studies provide the pre-disturbance conditions and characterise how significant the changes in the areas surrounding the Mine will be throughout the LOM. The baseline studies identified sensitive habitats or species in the project development area (PDA) and identified existing disturbances that are not part of the Mine impacts. The PDA includes the Surface Rights Boundary (SRB) and current Moratorium Area where infrastructure will be directly developed for the Expansion Project.

Source: Digby Wells, 2024
Figure 20-1 Environmental and Social Impact Assessment Process Followed
| 20.2.2 | Impacts |
A summary of the key E&S impacts relating to the Expansion Project from the 2024 ESIA (Digby Wells, 2024) is provided in Table 20-1.
|
February 19, 2025 |
Page 247 |
|
|
NI 43-101 Technical Report on the Lumwana Expansion Project |
|
Table 20-1 Key E&S Impact Summary
| Area | Impact Description | Key Mitigation Measures | ||
| Resettlement |
Pre-mining, an absence of private landholdings and residential development for the first stages of development - no resettlement was required. Since the mine commenced, there has been a large influx of people.
For the Expansion Project, land acquisition of the Kamisengo Moratorium Area will result in physical and economic displacement of 279 households, associated farmlands, and some community infrastructure. This will also result in the loss of access to natural resources in the Moratorium Area (up to approximately 14,000 ha). |
● The RAP has been developed and, once approved, must be adhered to (includes community health and safety (CHS) plans); ● Constant engagement with traditional authorities, District Council, and PAHs regarding host sites; ● RAP implementation and monitoring. |
||
| Socio-economics | Positive impacts on the local and regional socio-economic environment (multiplier effect, employment), welfare benefits (housing and provision of services for the workforce), improved infrastructure and access.
Negative impacts include influx of jobseekers (increased pressure on existing socio-economic infrastructure and may give rise to social ills as newcomers interact and integrate with indigenous communities), disruption of traditional norms and values and increased traffic. |
● Adhere to and evolve the ESMP; ● Continued employment and additional job creation and skills development; ● Continued creation of indirect employment and business opportunities through increased purchasing power and procurement of local goods and services; ● Active and constant monitoring, inspections, and audits with corrective actions where required. |
||
| Cultural heritage |
Pre-historic rock engravings and other culturally significant sites within the Expansion Project area.
For the Expansion Project, there are several burial sites within the Moratorium Area and immediate surroundings as well as archaeological sites.
Impacts include destruction or degradation of sites, obstructing access. |
● Avoid disturbing culturally significant pre-historic sites where possible;
● Remove and relocate in line with community and national requirements where avoidance is not possible;
● Ensure access to cultural sites remains unimpeded. |
||
| Community health and safety | Exposure of community to potentially dangerous situations/environments, increased traffic, security threats.
Impacts include long-term health deterioration, injury. |
● Adhere to and evolve the ESMP; ● Active and constant monitoring, inspections, and audits with corrective actions where required. |
||
| Surface Water | Main watercourses comprise those in the Lumwana East River catchment; its main tributaries the Malundwe and Chimiwungo Streams. The Expansion Project includes establishment of the KICD and associated diversion into the Malundwe Stream catchment, as well as various other diversions around other infrastructure to facilitate mining activities are proposed. Diversions will significantly alter the |
● Reduce the footprint to minimise excess disturbance of soils and the probability of sedimentation and siltation of nearby watercourses; ● Construction should be undertaken and/or prioritised during the dry period (May to October); |
|
February 19, 2025 |
Page 248 |
|
|
NI 43-101 Technical Report on the Lumwana Expansion Project |
|
| Area | Impact Description | Key Mitigation Measures | ||
| hydrological patterns and flows in the local sub-catchments. Catchment yield will be maintained in the Lumwana East River downstream of the Mine.
Impacts on water quality, ecology, and water flow downstream. Sediment loading from operations has been impacting freshwater ecology. |
● Install silt fences, erosion blankets prior to soil stabilisation on steep surfaces to reduce chances of erosion; ● Active and constant monitoring, inspections, and audits with corrective actions where required; ● Establish compliance point in downstream Maheba River; ● Implement the Stormwater Management Plan (SWMP). |
|||
| Ground Water | Groundwater comprises a shallow, unconfined aquifer, a transition zone (saprock) and a deeper fractured aquifer. Recharge occurs mainly through rainfall infiltration.
Impacts on water quality due to leaching from the open pits, waste dumps, and/or TSF, and reduced availability of groundwater to surrounding users due to the dewatering drawdown cone. |
● Minimise the footprint of disturbance particularly close to drainage lines; ● Prevent chemical/oil spills; ● Active and constant monitoring, inspections, and audits with corrective actions where required; ● Waste dumps should be capped with soil and vegetation to limit infiltration of rainwater and seepage; ● Update studies when required including groundwater models, geochemical assessments. |
||
| Biodiversity | The Expansion Project situated in area of high biodiversity (Acres National Forest Area 105 protected area) and natural habitat (Miombo Woodland), along with critical habitat including peatland, wetlands, and rocky outcrops. The Expansion Project footprint will result in the loss of approximately 6,470 ha of natural habitat including 2,164.25 ha of wetlands and 281.53 ha of peatlands/histosols.
Impacts to biodiversity levels through loss of habitat including threats to species of conservation concern (SCC). Additional impacts on climate adaptation through removal of peatlands and wetlands (effective carbon sinks and flood attenuation). |
● Minimise the footprint of disturbance - particularly wetland and peatland areas; ● Natural vegetation must be preserved as much as possible; ● Onsite nursery has been established to provide planting stock for revegetating areas; ● Store topsoil and rehabilitate sites as soon as possible; ● Install effective dust, sediment and erosion control measures; ● Active and constant monitoring, inspections, and audits with corrective actions where required; ● Implement the BAP. ● Offset and compensate for habitat and biodiversity loss through protection from anthropological impacts through implementation of the REDD+ Project. |
||
| Soil |
Pre-mining soils were heavily leached, low in nutrients, and low fertility. Subsistence farming using slash and burn method was the main livelihood activity prior to mining.
Impacts include soil erosion, degradation and loss of soil quality due to vegetation removal, topsoil stripping and infrastructure construction. Post-closure impacts include impact on food and vegetation quality. |
● Minimise the footprint of disturbance; ● Prevent chemical/oil spills; ● Store topsoil and rehabilitate sites as soon as possible. |
|
February 19, 2025 |
Page 249 |
|
|
NI 43-101 Technical Report on the Lumwana Expansion Project |
|
| Area | Impact Description | Key Mitigation Measures | ||
| Climate Change Adaptation | Global climate change has already increased occurrence of floods and droughts in the local area, which are expected to increase over time in line with global trends.
Impacts include flooding affecting operations and activities, water supply issues, power supply. |
● Protect peatlands and wetlands as effective carbon sinks and flood attenuation; ● A flood control dam to be built as part of the Expansion Project. ● Assess adaptation options including energy dissipaters in streams/rivers; ● Implement the SWMP. |
||
| Climate change mitigation | Greenhouse gas (GHG) emissions released from machinery, facilities, and forest, peatland, and wetland removal.
Impacts are adding to the impacts of climate change, globally. |
● GHG emissions measured annually, and inventory developed (currently 99% of Scope 1 emissions from diesel machinery); ● Energy consumption to be assessed to identify opportunities for reduced energy usage across the site; ● Investigate potential decarbonisation initiatives throughout operations; ● Offset and compensate for hard-to-abate emissions through the REDD+ Project. |
|
February 19, 2025 |
Page 250 |
|
|
NI 43-101 Technical Report on the Lumwana Expansion Project |
|
| 20.3 | Environmental Considerations |
| 20.3.1 | Management and Monitoring |
As per conditions attached to the ZEMA authorisation, the Mine has implemented and continuously develops the ESMP. Lumwana has an existing operational ESMP, which will remain in place and be updated to account for additional measures related to the Expansion Project.
The ESMP is a tool utilised to ensure the mitigation and optimisation measures are effectively implemented and that any unforeseen or unidentified impacts of the Expansion Project are detected and addressed. The ESMP is implemented to minimise the negative impacts and enhance the positive impacts throughout the LOM and outlines the roles and responsibilities for implementation. The mitigation and management measures follow the mitigation hierarchy which aims to anticipate and avoid, and where avoidance is not possible, minimise, and where residual impacts remain, compensate/offset for risks, and impacts to workers, affected communities, and the environment.
A monitoring programme was also developed as part of the ESIA and ESMP with the objective of providing information necessary to determine the Expansion Project’s operation and environmental performance within and around the proposed mining area. Regular monitoring serves as an indication of the efficiency of the mitigation and management measures, as well as compliance with standards, guidelines, and permit conditions imposed. The key environmental aspects which form the monitoring programme are:
| ● | Surface water (quality and quantity); |
| ● | Groundwater (quality and quantity); |
| ● | Air quality and noise nuisance; |
| ● | Biodiversity (including a separate BAP); and |
| ● | Soils, land, closure and rehabilitation; |
| ● | Waste. |
Lumwana Mine obtained ISO 14001 certification during the audit that was conducted in December 2019 by NQA and was most recently recertified in November 2022, with the certification valid until January 2026.
| 20.3.2 | Waste Management |
Waste is managed according to the material type. It is broadly split into mine waste and non-mine waste (facilities). The mine waste is split into waste rock and process plant tailings. The TSF expansion represents one of the highest risk aspects of the Lumwana operation. The Expansion
|
February 19, 2025 |
Page 251 |
|
|
NI 43-101 Technical Report on the Lumwana Expansion Project |
|
Project will increase the approved capacity from 360 Mt to 2 Bt, which represents a material increase and will require the most significant proportion of the expanded footprint of the operations. The proposed changes to the TSF are summarised below and are discussed in further detail in Section 18.6 of this Technical Report:
| ● | Current tailings: 334 Mt (end Q2 2024) |
| ● | Current TSF Capacity: 360 Mt |
| ● | Total Life of Mine (with Expansion Project): 2,000 Mt (no contingency). |
| ● | Average annual throughput: 27 Mtpa increasing to 52 Mtpa. |
The geochemical characteristics associated with the pits, waste dumps, and tailings were identified as the generation of alkaline mine drainage with the potential parameters of concern being alkalinity (pH), electrical conductivity, aluminium, cobalt, copper, manganese, nitrate, nickel and selenium, when assessed against the Zambian Effluent Guidelines and the IFC limits. The Acid-Base Accounting (ABA) and Net Acid Generation (NAG) assessments indicate that all waste rock samples are Potentially Acid Neutralising (PAN), while the ore samples indicate 30% to be uncertain and 70% to be PAN. The tailings also displayed alkaline pH (9.00 to 10.40) and the ABA and NAG assessments indicated the tailings to be PAN. The total estimated PAG (material over 0.3% S) content is 7.7 Mt over the LOM, or 0.1% of the total waste mined, which will be fully encapsulated within the wider waste dumps due to the small proportion of overall waste.
In terms of waste rock, the current and planned waste dump designs have been placed as close to pit exits as possible. In-pit dumps have been designed where feasible and in some cases merge with surface dumps. A total of 32 dumping areas have been designated, and of these, five are currently active. Before production mining begins in the Expansion Project area, water and sediment control dams will need to be constructed.
| 20.4 | Water Management |
The PDA is made up of three catchment areas and features undulating hills intersecting the Lumwana East River and its smaller tributary streams, the Malundwe and Chimiwungo Streams (Figure 20-2). There are four systems directly associated with the study area, including the Malundwe Stream (drains in southerly direction through the Malundwe deposit area), the Chimiwungo Stream (drains in a northwesterly direction through the Chimiwungo deposit area, joining the Lumwana East River at the margins of the Malundwe pit), the Maheba Stream east of Chimiwungo pit (drains in a southwesterly direction through largely modified areas), and the Lumwana East River, which originates approximately 30 km further upstream of the mining activities. Studies into groundwater broadly categorised the hydrogeology of units at Lumwana as consisting of a shallow, unconfined aquifer, a transition zone (saprock) and a deeper fractured aquifer.
|
February 19, 2025 |
Page 252 |
|
|
NI 43-101 Technical Report on the Lumwana Expansion Project |
|
Water quality impacts are considered one of the key management aspects associated with the Expansion Project. It is noted that the drinking water source for the communities is mainly from groundwater (75%) with 25% from surface water (Lumwana River). For groundwater, there are no receptors in the cone of depression and Barrick considers the impact on water quality and local water supply would be negligible, as demonstrated by the updated water and salt balance completed as part of the ESIA for the expansion. Plume modelling from the TSF and waste dumps has been completed to assess the long-term impacts on water levels and quality.
Water quality monitoring shows that all of the historical parameters at the monitoring locations downstream of the mine in the Lumwana East River are within acceptable mine effluent discharge limits as defined by Zambian standards.
Baseflow in the Lumwana East River may be impacted during dry season due to upstream impoundment at KICD and evaporation losses from the TSF. This may be mitigated by pumping from KICD during the dry season if overflow from KICD ceases.
Water management planning is part of the consolidated ESMP described above. Further details on mine water management are discussed in Section 18.3 of this Technical Report.
|
February 19, 2025 |
Page 253 |
|
|
NI 43-101 Technical Report on the Lumwana Expansion Project |
|
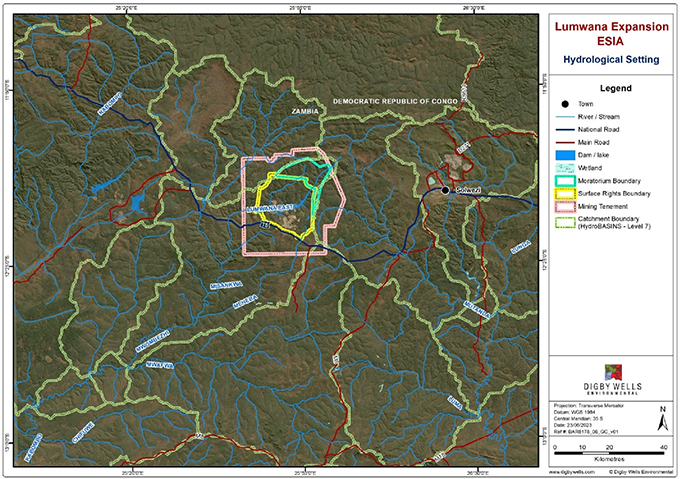
Source: Digby Wells, 2024
Figure 20-2 Hydrological Setting of the Expansion Project Development Area
| 20.5 | Costs |
Costs associated with environmental management are included in the financial assessment of the Mine. This includes the sample analysis cost, additional monitoring equipment (one off) and the labour to manage the increased footprint. Table 20-2 below summarises the major annual cost components for the Expansion Project:
Table 20-2 Annual Costs Included in G&A Costing for Environmental Management
| Item | Cost Estimates (US$ M) | |
|
Labour Total Compensation Estimate |
0.125 | |
|
Sample Analysis |
0.09 | |
|
Monitoring Equipment |
0.2 | |
|
Waste Management |
0.095 | |
|
Consultancy work |
0.055 | |
|
Estimated Total Cost |
0.565 | |
|
February 19, 2025 |
Page 254 |
|
|
NI 43-101 Technical Report on the Lumwana Expansion Project |
|
| 20.6 | Social and Community Requirements |
| 20.6.1 | Social Context |
During the pre-mining EIA (2005), the communities in the area around Lumwana were scattered, with a low population density. Livelihoods were based mainly around small-scale subsistence farming and natural resource collection along with small-scale commercial businesses. The social landscape has changed significantly since the development of Lumwana: within ten years, the area has been transformed from one of small rural settlements and limited linear-based development (along the R1 road), to now include Lumwana Township within the Mine area, and significantly larger and more developed surrounding communities, particularly along the T5 route. Figure 20-3 provides a snapshot of the social context surrounding Lumwana with key sites within the Expansion Project also identified.

Source: Digby Wells, 2024
Figure 20-3 Communities and Social Infrastructure
Culturally sensitive sites were identified in the affected areas for the Expansion Project. Impacts on these sites will be mitigated as follows:
|
February 19, 2025 |
Page 255 |
|
|
NI 43-101 Technical Report on the Lumwana Expansion Project |
|
| ● | Avoid disturbing culturally significant pre-historic sites where possible; |
| ● | Remove and relocate in line with community and national requirements where avoidance is not possible; |
| ● | Ensure access to cultural sites remains unimpeded. |
Communities within the study area broadly fall under four categories with distinct socio-economic characteristics:
| ● | Older, more established rural settlements away from the T5 road such as Mangala, Mukumbi, and Lubinga; |
| ● | The more recent rural settlement within Kamisengo, away from the T5 road; |
| ● | Settlements developed in a linear manner along the T5, including Lumwana East, Shinda, Nkulumazhiba, and Kabanga; and |
| ● | Manyama. Whilst this community is also located along the T5 near other settlements, this area has experienced the most significant and rapid population growth, resulting in significantly different socio-economic characteristics of the population. |
Education and literacy levels of the population are relatively low, and current access to educational and health care facilities is inadequate, with some people having to travel considerable distances to access social services. Moreover, available facilities are facing capacity constraints that limit the quality of teaching or care provided. Access to agricultural inputs and to markets to sell products is also limited and highlighted as one of the key challenges to improving food security and livelihoods.
Households in Manyama have significantly higher education and formal employment levels than surrounding communities; income levels, whilst still low when compared to estimates of the cost of living, are higher than elsewhere in the study area, education levels are higher, and access to markets, services, and finance exceeds that of other households. However, the town has experienced rapid influx, and now faces challenges with insufficient infrastructure and services, with residents highlighting concerns over alcohol, drug abuse, and prevalence of sex work.
Gender inequalities are apparent across the study area, in the distribution of household responsibilities, with females generally having lower land ownership rights, lower education and literacy levels, lower average income levels, and lower access to finance than males. A number of vulnerable groups were also noted, including female-headed households, elderly households often with responsibilities for dependants, disabled individuals, and previously displaced households, all of whom may have limited capacity to respond to changes in the social and physical environment related to the development of the Expansion Project.
It is noted that development benefits associated with the Expansion Project will also be supported via an updated Community Development Plan (CDP).
|
February 19, 2025 |
Page 256 |
|
|
NI 43-101 Technical Report on the Lumwana Expansion Project |
|
| 20.6.2 | Resettlement |
The Expansion Project will result in the acquisition of approximately 14,000 ha of land within the Kamisengo Moratorium Area, impacting a total of 279 households comprising 1,873 individuals. There are some culturally important sites within the PDA that may require relocation, including burial grounds and archaeological sites.
The resettlement will involve compensation of PAHs based on a specifically developed set of eligibility criteria, which will include transitional support and has been agreed with key stakeholders. The RAP will be accompanied by a livelihood restoration programme. The RAP will be, following implementation, monitored and evaluated as stipulated in IFC Performance Standards and internal Barrick guidelines.
Household agreements for the Kamisengo RAP are more than 95% completed, with the remaining households expected to sign their agreements in Q1 2025.
| 20.6.3 | Community Management and Stakeholder Engagement |
Community relations are managed by a dedicated team from Lumwana. The team works with the three local communities of Mukumbi, Mumena, and Matebo to support infrastructure projects including housing, rural health centres, classrooms, abattoir, and sanitation.
Stakeholder engagement is a fundamental activity with a dedicated community relations team on site. Key stakeholders include Government Authorities, Traditional Authorities, Affected Communities, PAPs, Host Communities, Vulnerable and Disadvantaged Groups, Non-Governmental Organisations (NGOs), Civil Society and the LMC Project Team.
| 20.6.4 | Grievance Management and Procedures |
Barrick’s overall company aim for managing grievances/complaints is to work proactively with communities to avoid any occurring. However, a grievance mechanism is in place should a grievance/complaint be raised by communities or other stakeholders. The mechanism is organised into three categories comprising:
| ● | Grievances that can be resolved between Lumwana Mine and the complainant. |
| ● | Grievances that require external representation and a committee. |
| ● | Grievances that are referred to the Zambian judicial system. |
The grievance mechanism provides a structure, timeframe, feedback methods, processes for monitoring and evaluating the grievance procedure (with key performance indicators), and disclosure.
|
February 19, 2025 |
Page 257 |
|
|
NI 43-101 Technical Report on the Lumwana Expansion Project |
|
| 20.6.5 | Health and Safety |
A Health and Safety Management Plan (HSMP) exists and was updated to integrate occupational health and safety (OHS) elements into the Expansion Project in November 2024. The objective is to establish secure work environments at every stage and implement management processes that empower the project team to strive towards eradicating serious incidents and fatalities. This endeavour was underpinned by the vision of achieving zero harm as part of Barrick’s Journey to Zero initiative.
| 20.7 | Mine Closure and Reclamation |
| 20.7.1 | Closure Planning |
A mine closure and rehabilitation plan (MCRP), which is based on Barrick’s over-arching closure objectives for mines, was finalised for the Lumwana Mine in 2014 and updated in 2016, 2023, and most recently 2024 as part of the Expansion Project FS. An important approval condition for the Mine was that consultation with customary landowners and communities is required for post-mining land use, and that identification of post-mining infrastructure use by third parties would be assessed. The design of the closure plan considers several interrelated components. These include legal and other obligations, closure objectives, environmental and social considerations, technical design criteria, closure assumptions, health and safety hazards, and relinquishment conditions. The plan was prepared in accordance with the following Barrick environmental standards or guidelines:
| ● | Barrick Mine Closure Standards and Guidelines. |
| ● | Barrick Mine Closure Cost Estimate Guideline. |
| ● | Barrick Social Closure Guidance. |
| ● | Barrick Biodiversity Standard. |
| ● | Barrick Water Conservation Standard, and |
| ● | GISTM. |
The closure objectives as set out in the MCRP and adopted for the Expansion Project include:
| ● | Ensure that all reclaimed properties support productive uses considering pre-mining conditions; |
| ● | Ensure safety and health of workers during closure activities; |
| ● | Ensure that local communities utilising the site after closure are not exposed to unacceptable risks; |
|
February 19, 2025 |
Page 258 |
|
|
NI 43-101 Technical Report on the Lumwana Expansion Project |
|
| ● | Properly manage all reagents and chemicals. Neutralise or control-and-treat all potentially harmful residual discharges from decommissioned facilities so that water and land resources are properly protected; |
| ● | Physically and chemically stabilise remaining structures to ensure proper drainage, minimise erosion and sedimentation, and limit the quantity of water requiring management; |
| ● | Reclaim mine properties to protect and enhance pre-existing plant and animal communities; |
| ● | Utilise closure strategies that relinquish properties in a self-sustaining condition with little or no need for ongoing care and maintenance; |
| ● | Understand and address community concerns regarding closure. Safeguard the sustainability of community interest to the greatest extent practicable; and |
| ● | Comply with mine closure permitting and regulatory requirements and obtain documented confirmation of meeting all closure requirements. |
The overall, long term post-closure land use objective for the site is to return it to a self-sustaining condition suitable to support pre-mining land use activities, such as subsistence agriculture, with the final landform not adversely affecting water resources.
During the operational phase, a number of activities are already underway to ensure a smooth transition into the post-closure phase:
| ● | An onsite nursery has been established to provide planting stock for revegetating areas being disturbed. |
| ● | Mining areas – including pits, waste rock dumps and tailings - are landscaped to ensure safety, consider water management, and to allow for future revegetation programmes. |
| ● | Waste handling procedures are continually assessed to prevent, identify, and address waste handling, spillages on site, and manage chemical handling and storage. |
| ● | Infrastructure that is no longer utilised is decommissioned, dismantled and removed from site (or sold to third-parties) where possible. |
| ● | Engineering trials and assessments of options (including hydrology/hydrogeology studies) are completed throughout the operational phase with MCRP updated where necessary. |
| ● | Concurrent/progressive closure options are assessed to take advantage of areas which can be closed ahead of the main closure period and distribute financial burden throughout LOM. |
| ○ | A total of 279 ha of disturbed land on the waste dump has been rehabilitated as of December 31, 2024, along with a rehabilitation trial of 58.5 ha on the TSF area. |
| ● | Closure cost re-evaluated annually based on any changes identified. |
| 20.7.2 | Cost Estimate |
The immediate closure cost estimate for the Lumwana operation as at 2023, excluding the Expansion Project, was US$ 97 million (excluding VAT).
|
February 19, 2025 |
Page 259 |
|
|
NI 43-101 Technical Report on the Lumwana Expansion Project |
|
As part of the 2024 Expansion Project ESIA, a Closure Cost Assessment (CCA) was determined using a risk-based approach and aligned with the current site wide MCRP for Lumwana, known rehabilitation measures, and previous CCA for the existing operations. The actions are used to inform the costing for the Expansion Project and refer to the LOM closure scenario only. To ensure that aspects are not double accounted, only the Expansion Project activities that will require actions at planned closure are costed. The CCA totalled US$78 M (excluding VAT) only for the expansion activities. Total closure cost for the current operations and the Expansion Project is estimated at US$175 M. No reclamation bonds are required.
| 20.8 | QP Comments on Environmental and Social |
The Project has been scoped and is being conducted to meet the requirements of international standards (IFC Performance Standards, which are considered benchmarks for the industry), as well as Barrick’s own policies and standards. Key management plans are being incorporated into the Project development in line with both industry standards and Barrick’s internal practices and knowledge based on extensive experience operating in similar jurisdictions.
|
February 19, 2025 |
Page 260 |
|
|
NI 43-101 Technical Report on the Lumwana Expansion Project |
|
| 21 | Capital and Operating Costs |
Capital and operating costs used as the basis for the Lumwana Expansion Project FS are summarised in this section. The capital and operating cost estimates for the Expansion Project are based on current costs or are supported by a minimum of feasibility level studies. The cost estimates correspond with an accuracy range of +/-15%, which is the typical level of a Feasibility Study.
All costs presented are in real US dollar values as of Q3 2024, without any allowance for inflation or escalation. The costs presented constitute key assumptions used for the Economic Analysis presented in Section 22 of this Technical Report.
| 21.1 | Basis and Sources of Cost Estimates |
The capital cost estimate was developed in the Expansion Project FS by Barrick, with support from Lycopodium, responsible for process plant expansion, accommodation, mobile fleet maintenance workshop, and associated infrastructure; Knight Piésold, which contributed to estimating the capital required for the TSF, WSF, airstrip, water management, and geotechnical investigations; and Digby Wells, which supported the cost estimate for the RAP. A project-specific Work Breakdown Structure (WBS) defines the Expansion Project cost estimate allocation, which has formed the basis for the Expansion Project scope and cost distribution within the estimate. The estimate base date was based on quotations and pricing obtained throughout 2024. The mine plan used as the basis of the estimates is detailed in Section 16 of this Technical Report.
The foreign exchange rates adopted for the capital cost estimate and the foreign currency exposure are shown in Table 21-1.
Table 21-1 Exchange Rates and Exposure
| Currency | Exchange Rate |
Percentage of Capital Estimate (%) |
||
|
USD |
1.00 | 80 | ||
|
AUD |
0.643 | 5 | ||
|
EUR |
1.064 | 7 | ||
|
GBP |
1.247 | >1 | ||
|
ZAR |
0.0527 | 8 | ||
Quantities for the capital cost estimate were defined using four methods: detailed take-offs from design drawings, general take-offs from engineering sketches, estimates based on general plot plans and prior experience, and factored quantities derived from previous projects and expected ratios. All
|
February 19, 2025 |
Page 261 |
|
|
NI 43-101 Technical Report on the Lumwana Expansion Project |
|
take-off quantities were measured as net in place, with waste provisions incorporated into the unit cost rates for accuracy and efficiency in estimation.
The mining fleet requirement was modelled as part of the FS (outlined in Chapter 16 of this Technical Report) while cost estimates are based on quotations received from original equipment manufacturer (OEM) suppliers for each equipment type. Ancillary costs such as freight, duties, taxes, assembly, and installation costs were then derived from current costs and contractor quotations.
Barrick’s provision for Owner’s indirect capital costs has been estimated based on current cost performance and the expected organogram for the Expansion Project development. Contingency provision for the mining fleet capital and Owner’s costs has not been included having been derived from current operational costs.
| 21.2 | Capital Costs |
| 21.2.1 | Project Capital Costs |
The estimated total capital cost over the life of mine, which has been included in the cash flow model presented in Section 22 is US$5,663 M exclusive of capitalised stripping and US$14,319 M inclusive of capitalised stripping. Table 21-2 summarises the total capital spend from initial construction to the end of LOM.
Table 21-2 Capital Cost Estimate Summary – Including Non-Expansion Capital Items
| Description | Totals (US$ M) |
|
|
Construction Capital – Refer to Table 21-3 (2025 to 2028) |
1,998 | |
|
Growth Capital (LOM) |
2,013 | |
|
Sustaining Capital (LOM) |
1,652 | |
|
Capitalised Stripping (LOM) |
8,656 | |
|
Total |
14,319 | |
The capital estimate is broken down as follows:
| ● | Construction Capital, which relates to the cash outflows to be spent from January 1, 2025 to December 31, 2028 for the Expansion Project, |
| ● | Growth Capital, which relates to all Expansion Project capital expected to be incurred after December 31, 2028, |
| ● | Sustaining Capital, which, includes sustaining capital costs that have been budgeted throughout the LOM to support the current and expanded operation, |
| ● | Capitalised waste stripping is an allocation from operating costs to capital costs reflecting the waste stripping phases over the LOM, |
|
February 19, 2025 |
Page 262 |
|
|
NI 43-101 Technical Report on the Lumwana Expansion Project |
|
| ● | Capitalised stripping has been determined on a per cutback basis across the different pits and calculated based on the following two parameters: |
| ○ | Where no ore is mined in a particular phase, the total waste is capitalised, |
| ○ | Where ore and waste is mined, the portion of the stripping ratio above the LOM average for that particular cutback is capitalised. |
The construction capital costs are further summarised in Table 21-3.
Table 21-3 Construction Capital Expenditure Summary by Area (2025 to 2028)
| Main Area | 2025 (US$ M) |
2026 (US$ M) |
2027 (US$ M) |
2028 (US$ M) |
Total (US$ M) |
|||||
|
Mining |
119 | 139 | 99 | 40 | 397 | |||||
|
Ore Handling |
70 | 82 | 59 | 24 | 235 | |||||
|
Processing Plant |
80 | 94 | 67 | 27 | 268 | |||||
|
Tailings/Reclaim & Water |
26 | 30 | 22 | 9 | 87 | |||||
|
Mine Site Infrastructure |
76 | 89 | 64 | 25 | 254 | |||||
|
Airstrip |
3 | 3 | 3 | 1 | 10 | |||||
|
Sub Total |
374 | 437 | 314 | 126 | 1,251 | |||||
|
Indirect Costs (Owner’s) |
44 | 51 | 36 | 15 | 146 | |||||
|
Contractor Distributables |
114 | 132 | 95 | 38 | 379 | |||||
|
Freight and Duties |
19 | 22 | 15 | 6 | 62 | |||||
|
Contingency |
48 | 56 | 40 | 16 | 160 | |||||
|
Total |
599 | 698 | 500 | 201 | 1,998 | |||||
Table 21-4 Growth Capital Expenditure Summary
| Main Area | 2025 -
LOM (US$ M) |
|
|
Mining |
853 | |
|
Processing Plant |
470 | |
|
Tailings/Reclaim & Water |
582 | |
|
Mine Site Infrastructure |
2 | |
|
Sub Total |
1,907 | |
|
Indirect Costs (Owner’s) |
106 | |
|
Total |
2,013 | |
The costs outlined in Table 21-3 comprise the following:
| ● | Mining – Mining fleet, haul and pit road spend, dewatering, earthworks, and mine equipment maintenance facilities. |
| ● | Ore handling – Primary crushing, ore conveying, coarse ore stockpiling, and ore reclaim. |
| ● | Process plant – All equipment relating to grinding, flotation, concentrate and tailings handling, as well as plant servicing. |
|
February 19, 2025 |
Page 263 |
|
|
NI 43-101 Technical Report on the Lumwana Expansion Project |
|
| ● | Tailings/Reclaim and water – TSF construction costs, water management, effluent treatment, and water services. |
| ● | Mine site infrastructure – Accommodation costs (including earthworks and electricals), Kamisengo earthworks, and onsite roads and platforms. |
| ● | Airstrip – Costs for the construction and development of the runway. |
| ● | Owner’s costs – Owner’s team personnel costs, auxiliary fleet rebuilds, and workshop infrastructure. |
| ● | Contractor distributables - TSF and Kamisengo earthworks, EPCM cost, contractor implementation costs, and temporary facility costs. |
| ● | Freight and duties – Importation costs. |
| ● | Contingency – Costs included based on deterministic assessment of relative accuracy of estimation methods. |
| 21.2.2 | Sustaining Capital Costs |
A summary of the sustaining costs for the LOM is provided in Table 21-5.
Table 21-5 Sustaining Capital Expenditure Summary
| Main Area | 2025-LOM (US$ M) | |
|
Mining Open Pit |
111 | |
|
Processing |
341 | |
|
Engineering |
41 | |
|
Fleet |
1,060 | |
|
Rebuilds |
88 | |
|
Internal Infrastructure |
12 | |
|
Total |
1,652 | |
The sustaining capital costs outlined in
Table 21-5. comprise the following:
| ● | Mining Open Pit – Haul and pit road spend, drilling, piezometers, and monitoring radar. |
| ● | Processing – Cyclone Pump upgrades, plant maintenance, corrosion protection, and fire and water suppression systems |
| ● | Engineering – Critical spares and cranage |
| ● | Fleet – Capital spend on numerous fleet requirements including haul trucks, shovels, water trucks, service trucks, and other fleet |
| ● | Rebuilds – Hitachi, Komatsu and shovel major components as well as ancillary equipment major components |
| ● | Internal Infrastructure – Network modernization and connectivity upgrades, fuel management infrastructure, and fencing projects |
|
February 19, 2025 |
Page 264 |
|
|
NI 43-101 Technical Report on the Lumwana Expansion Project |
|
| 21.3 | Operating Costs |
Barrick has compiled the operating cost estimates as part of the FS with support from Lycopodium. The estimate includes mining operating, processing, G&A, downstream, and other costs.
The operating cost estimate for the FS has been estimated on an annual basis for the LOM, with the expanded process plant assumed to be in production from 2028 to 2057. Operating costs related to the plant expansion incurred before commissioning and ramp-up are included as preproduction and working capital costs. Operating costs related to the current operation are included in the overall FS model which combines the existing and growth operations. All costs are stated on a real (2024) basis.
A summary of the operating costs for the LOM is provided in Table 21-6.
Table 21-6 LOM Average Unit Operating Costs Summary
| Operating Costs | LOM Average |
Total LOM (US$ M) |
||
|
Mining – OP |
$2.07/t mined | 18,405 | ||
|
Processing |
$4.29/t processed | 6,826 | ||
|
General & Administration |
$1.18/t processed | 1,874 | ||
|
Freight & Refining Costs |
$0.47/lb sold | 7,686 | ||
|
Royalty |
$1.71/t processed | 2,711 | ||
|
Total Direct Operating Costs |
$23.60/t processed | 37,502 | ||
|
Stockpile Movements |
$0.08/t processed | 126 | ||
|
Capitalised Mining - OP |
$5.45/t processed | (8,653) | ||
|
Total Operating Costs |
$18.23/t processed | 28,975 | ||
| ● | Direct operating costs include the mining, processing, G&A, freight and refining costs, and royalty costs. |
| ● | Total operating costs includes total direct operating costs plus net stockpile movements less capitalised stripping costs. |
| 21.3.1 | Processing |
Processing operating costs include costs related to crushing, conveying, and producing copper concentrate in the new and existing plants. The inputs for the estimate include both quantities or consumption rates, and costs. These inputs have been derived from a variety of methods and data sources.
Quantities were primarily derived from processing plant performance, modelling, test work, and guidance from Lycopodium’s benchmarked cost databases. Comminution modelling was carried out by Orway Mineral Consultants (OMC, 2023), while reagent consumption was derived from existing plant performance and metallurgical test work results. Fuel and energy consumption is based on
|
February 19, 2025 |
Page 265 |
|
|
NI 43-101 Technical Report on the Lumwana Expansion Project |
|
mechanical equipment lists produced during engineering study work. The mobile equipment requirements and associated operating costs have been estimated from operational data and benchmarked against Barrick’s other operating assets.
Consumable and reagent costs, maintenance allowances, power supply unit costs, laboratory costs, and water treatment costs were sourced from historical performance, Lycopodium databases, and vendor quotations. Diesel and power costs were defined based on current supply agreements. Delivery costs were derived from historical cost performance.
First principles estimates are based on typical operational data and standard industry practice.
| 21.3.2 | Mining |
Mining operating cost drivers include planned mine physicals, equipment hours, labour projections, consumables forecasts, and other expected costs.
Equipment requirements have been modelled from first principles using availability, utilisation, and productivity drivers which are determined from operating performance. Several improvements have been included with productivity expected to significantly improve with the purchase of new equipment and implementation of a productivity improvement initiative.
Haul truck productivity has been estimated by allocating mining tasks and modelling the planned haul profiles. Historical performance has been factored into the capacity and cycle time assumptions.
The requirements for blasting services, explosives, and accessory consumption are derived from the LOM drilling schedule and blast pattern designs described in Section 16 of this Technical Report.
As discussed in Section 16 of this Technical Report, no significant changes to the mining method are required for the Expansion Project. Therefore, unit costs associated with the operation of equipment and associated mining activities are based on existing supply agreements, labour requirements, maintenance costs, contractor rates, and consumable prices.
| 21.3.3 | General and Administration |
The G&A costs were estimated based on historical cost performance modified for the expansion of operations.
The operating cost estimate includes costs related to the finance team, camp housing (Including food, accommodation, and maintenance), IT costs, HR costs, security costs, and other general admin costs.
|
February 19, 2025 |
Page 266 |
|
|
NI 43-101 Technical Report on the Lumwana Expansion Project |
|
Given that Lumwana has been in operation for many years, an established G&A function already exists. Large changes to the number of people in the administrative team is not expected with the expansion of the Mine and LOM assumptions are based on historical actual results.
| ● | Housing - Lumwana has existing accommodation and housing on site as well as an underlying agreement in place with a camp services provider. Therefore the underlying costs per person and maintenance costs are understood and have been applied to the FS based on current actual costs. |
| ● | Finance - The finance function at Lumwana is well established ensuring finance related costs such as salaries, insurance costs, printing and rates and taxes are readily available and can be accurately estimated. |
| ● | IT - IT costs include licence and software cost allocations as well as ongoing communication costs. |
| ● | HR - The HR function at Lumwana is well established ensuring recruitment and human resource management related are readily available and can be accurately estimated. |
| 21.3.4 | Downstream and Selling |
A detailed estimate for downstream selling costs has been produced as part of the FS. This includes consideration for all smelter-related costs such as payability factor, treatment charge, refining charge and penalties; sales and marketing; and product freight costs including insurance and handling losses.
As Lumwana is an existing operation, downstream costs are well understood. Cost rates are driven by historical performance and existing agreements.
| 21.3.5 | Other |
Other costs related to capital stripping as well as movements in inventory.
Opening stocks for working capital were factored from existing minimum stock levels at the current operation, ensuring adequate material availability. Movements in stockpile, stock in solution, and finished goods balances were the included in the operating costs section of the FS model.
Capital stripping costs were calculated as illustrated in the Section 21.1 of this Technical Report.
| 21.4 | QP Comments on Capital and Operating Costs |
The capital and operating estimates for the Expansion Project have been built up on a detailed basis based on Barrick’s global operating experience as a producing issuer and are well supported by technical studies.
|
February 19, 2025 |
Page 267 |
|
|
NI 43-101 Technical Report on the Lumwana Expansion Project |
|
The QP has validated that the recent operational costs reconcile well against the projected forecast costs and considers the cost assumptions used for the Mineral Resource and Mineral Reserves to be appropriate.
|
February 19, 2025 |
Page 268 |
|
|
NI 43-101 Technical Report on the Lumwana Expansion Project |
|
| 22 | Economic Analysis |
The economic analysis is based on the Lumwana Expansion Project Financial Model developed to estimate annual cash flows and sensitivities for the Expansion Project. The economic model is based on FS engineering inputs described in Sections 16, 17 and 18 of this Technical Report and is intended to illustrate economic results in support of the declaration of Mineral Reserves.
After-tax cash flow has been developed from the LOM production schedule and capital and operating costs to approximate investment value. The Lumwana Expansion Project represents a material expansion of current production and as such the results have been included in this Technical Report.
The model includes all operating costs, capital costs, long-term rehabilitation costs, and all tax, royalties, and other obligations.
Sensitivity analysis was performed for variation in metal prices, operating costs, and capital costs to determine their relative importance as value drivers.
| 22.1 | Assumptions and Inputs |
The following points highlight the key inputs into the financial model used in the economic analysis.
Mine Plan
| ● | The basis of the model is the production schedule/mine plan as presented in Section 16 of this Technical Report which includes mined tonnes (ore and waste), processed ore tonnes, grade, recoveries, and the Mineral Resource and Mineral Reserve estimates presented in Sections 14 and 15 of this Technical Report, respectively. |
| ● | No Inferred Mineral Resources are included in the mine plan. Where Inferred Mineral Resources fall within the pit design, they are treated as waste. Mineral Resources that are not Mineral Reserves do not have demonstrated economic viability. |
| ● | Mine life of 33 years with an average mining rate of 287 Mtpa and a post ramp-up throughput of 52 Mtpa up till 2057. Mining parameters are further described in Section 16. |
Revenue
| ● | The copper price is based on the long-term Barrick Corporate Reserve guidance assumptions for a base case of US$3.00/lb copper described in Section 19. |
| ● | Revenue is driven by tonnes of concentrate sold to smelters, with revenue realised after delivery. |
|
February 19, 2025 |
Page 269 |
|
|
NI 43-101 Technical Report on the Lumwana Expansion Project |
|
Capital and Operating Costs
| ● | Costs are presented as real US dollar values (i.e., no escalation or inflation is applied). |
| ● | Capital costs applied as described in Section 21 of this Technical Report including construction capital of US$1,998 M, LOM growth capital of US$2,013 M, and LOM sustaining capital of US$1,652 M. |
| ● | Operating costs applied as described in Section 21 of this Technical Report including average all-in LOM operating costs of US$2.62/lb copper. All-in operating costs include all capital, inclusive of the construction and growth capital. |
Financial Parameters
| ● | Foreign exchange rates during the period of capital cost estimation have been applied to native costs as described in Section 21 of this Technical Report. |
| ● | Royalties and treatment and refining charges (TCRC) are applied as described in Section 4 and Section 21 of this Technical Report, respectively. |
| ● | The average royalty rate is 5.48% and is applied as described in Section 4 of this Technical Report. |
| ● | LMC pays income tax at a rate of 30% to the Zambian government, applied as described in Section 4 of this Technical Report. |
| ● | A discount rate of 8% is applied, which is in line with what is typically used in industry for copper-gold projects. |
| 22.2 | Taxes and Royalties |
The Mine will be subject to income tax at a rate of 30% and the Zambian Mineral Royalty Tax (MRT) detailed in Section 4.4 and summarised in Table 22-1. These rates are current as of the date of this Technical Report and may be subject to change in the future. FS pricing resulted in an effective MRT rate of 5.48% for the base case.
Based on these and the other financial assumptions outlined, LMC is expected to have corporation taxes payable of $1,888 M over the mine life.
Table 22-1 Sliding Scale of the Applicable Royalty Rates
| Price Range (US$/t Cu) | Rate (%) | Taxable Amount (US$/t Cu) | ||
|
Less than US$4,000 |
4 | The first US$4,000 | ||
|
Between US$4,001 and US$5,000 |
6.5 | The next US$1,000 | ||
|
Between US$5,001 and US$7,000 |
8.5 | The next US$2,000 | ||
|
US$7,001 or more |
10 | Balance | ||
|
February 19, 2025 |
Page 270 |
|
|
NI 43-101 Technical Report on the Lumwana Expansion Project |
|
| 22.3 | Financial Model Summary |
A financial analysis of the Project was carried out using a discounted cash flow (DCF) approach to support the declaration of Mineral Reserves. This method of valuation requires projecting yearly cash inflows, or revenues, and subtracting yearly cash outflows such as operating costs, capital costs, and taxes. The resulting net annual cash flows are discounted back to the date of valuation and totalled to determine the NPV of the Project at selected discount rates.
Values presented in this Technical Report are on a 100% basis. All values are presented in real 2024 US dollar values unless otherwise stated. The economic analysis has been run with no additional inflation (constant dollar basis).
The model includes the development and expansion capital costs, sustaining capital costs, operating costs, and longer-term rehabilitation costs, and all tax, royalties, and other obligations.
Consensus pricing of US$4.20/lb Cu is used as per CIBC in October 2024. As per Figure 22-1, the price of US$4.03/lb Cu represents the 3 year trailing average Cu price.
| 22.3.1 | Cash Flow Model |
A summary of the annual production and cumulative after-tax net cash flow calculated from the FS economic model is shown in Figure 22-1.
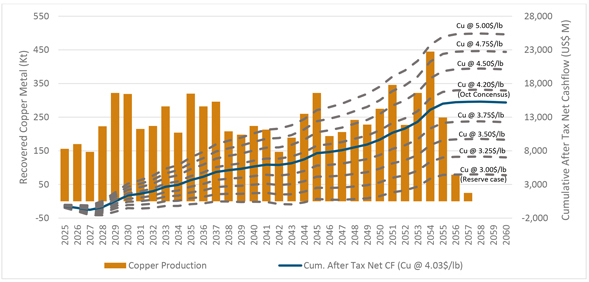
Figure 22-1 Cumulative After-Tax Net Cash Flow
|
February 19, 2025 |
Page 271 |
|
|
NI 43-101 Technical Report on the Lumwana Expansion Project |
|
| 22.3.2 | Economic Model Analysis |
Table 22-2 and Table 22-3 present summaries of economic results including both before and after tax cash flows at the $3.00/lb Cu Reserve Case and $4.03/lb Cu trailing average copper price respectively.
|
February 19, 2025 |
Page 272 |
|
|
NI 43-101 Technical Report on the Lumwana Expansion Project |
|
Table 22-2 Lumwana Expansion Before and After-Tax Annual Cash Flow Summary at Barrick Reserve Case Price (3.00$/lb Cu)
| Summary Cash Flow | Unit | LOM Total | 2025 | 2026 | 2027 | 2028 | 2029 | 2030 | 2031 | 2032 | 2033 | 2034 | 2035 | 2036 | ||||||||||||||
|
Mining |
||||||||||||||||||||||||||||
|
Total ore |
Mt | 1,567 | 35 | 27 | 36 | 44 | 66 | 66 | 46 | 65 | 61 | 42 | 75 | 66 | ||||||||||||||
|
Total waste |
Mt | 7,333 | 122 | 178 | 178 | 171 | 165 | 239 | 259 | 240 | 244 | 263 | 230 | 239 | ||||||||||||||
|
Processing |
||||||||||||||||||||||||||||
|
Total ore |
Mt | 1,592 | 28 | 28 | 29 | 44 | 52 | 52 | 52 | 52 | 52 | 52 | 52 | 52 | ||||||||||||||
|
Copper Grade |
% | 0.52% | 0.60% | 0.67% | 0.55% | 0.55% | 0.65% | 0.65% | 0.45% | 0.46% | 0.58% | 0.42% | 0.65% | 0.58% | ||||||||||||||
|
Recovery |
% | 93.16% | 93.95% | 92.04% | 93.83% | 93.45% | 94.47% | 94.46% | 91.88% | 92.95% | 94.06% | 92.51% | 94.38% | 93.84% | ||||||||||||||
|
Recovered Copper Metal |
kt | 7,759 | 156 | 170 | 147 | 223 | 322 | 319 | 215 | 224 | 282 | 204 | 320 | 282 | ||||||||||||||
|
Revenue |
||||||||||||||||||||||||||||
|
Copper Revenue |
US$ M | 49,510 | 995 | 1,086 | 937 | 1,424 | 2,053 | 2,034 | 1,372 | 1,429 | 1,802 | 1,304 | 2,041 | 1,797 | ||||||||||||||
|
Total Freight & Refining Costs |
US$ M | -7,688 | -155 | -169 | -146 | -221 | -319 | -316 | -213 | -222 | -280 | -202 | -317 | -279 | ||||||||||||||
|
Total Royalty |
US$ M | -2,711 | -55 | -59 | -51 | -78 | -112 | -111 | -75 | -78 | -99 | -71 | -112 | -98 | ||||||||||||||
|
Total Minesite Revenue |
US$ M | 39,112 | 785 | 858 | 740 | 1,125 | 1,622 | 1,607 | 1,084 | 1,129 | 1,423 | 1,031 | 1,612 | 1,420 | ||||||||||||||
|
Operating Costs |
||||||||||||||||||||||||||||
|
Mining |
US$ M | -18,405 | -403 | -484 | -537 | -538 | -578 | -637 | -634 | -634 | -625 | -637 | -625 | -625 | ||||||||||||||
|
Capitalised Stripping |
US$ M | 8,655 | 194 | 268 | 256 | 192 | 249 | 276 | 334 | 241 | 325 | 285 | 279 | 169 | ||||||||||||||
|
Processing |
US$ M | -6,826 | -129 | -128 | -129 | -185 | -221 | -221 | -221 | -221 | -220 | -221 | -229 | -223 | ||||||||||||||
|
General and Administration |
US$ M | -1,874 | -69 | -65 | -65 | -65 | -63 | -65 | -65 | -65 | -64 | -60 | -60 | -60 | ||||||||||||||
|
Total Operating Costs |
US$ M | -18,449 | -407 | -409 | -475 | -596 | -613 | -647 | -586 | -679 | -584 | -633 | -635 | -739 | ||||||||||||||
|
Operating Cashflow |
US$ M | 20,663 | 378 | 449 | 265 | 529 | 1,009 | 960 | 498 | 450 | 839 | 398 | 977 | 681 | ||||||||||||||
|
Summary Capex |
||||||||||||||||||||||||||||
|
Construction Capital |
US$ M | -1,998 | -539 | -607 | -547 | -305 | 0 | 0 | 0 | 0 | 0 | 0 | 0 | 0 | ||||||||||||||
|
Growth Capital |
US$ M | -2,013 | -99 | -49 | -12 | -12 | -261 | -124 | -171 | -95 | -100 | -26 | -231 | -240 | ||||||||||||||
|
Sustaining Capital |
US$ M | -1,652 | -79 | -35 | -25 | -20 | -20 | -20 | -20 | -20 | -44 | -54 | -63 | -39 | ||||||||||||||
|
Capitalised Stripping |
US$ M | -8,655 | -194 | -268 | -256 | -192 | -249 | -276 | -334 | -241 | -325 | -285 | -279 | -169 | ||||||||||||||
|
Grand Total Capex |
US$ M | -14,318 | -911 | -959 | -840 | -529 | -530 | -420 | -525 | -356 | -469 | -365 | -573 | -448 | ||||||||||||||
|
Closure Costs |
US$ M | -174 | 0 | 0 | 0 | 0 | 0 | 0 | 0 | 0 | 0 | 0 | 0 | 0 | ||||||||||||||
|
Working Capital |
US$ M | 104 | 66 | -2 | -4 | -2 | 25 | 5 | -35 | 2 | 24 | -33 | 39 | -5 | ||||||||||||||
|
Pre-Tax Cashflow |
US$ M | 6,275 | -467 | -512 | -579 | -2 | 504 | 545 | -62 | 96 | 394 | 0 | 443 | 228 | ||||||||||||||
|
Taxes |
||||||||||||||||||||||||||||
|
Corporation Tax |
US$ M | -1,888 | 0 | 0 | 0 | 0 | 0 | 0 | 0 | 0 | -100 | -1 | -179 | -118 | ||||||||||||||
|
After-Tax Cashflow |
US$ M | 4,385 | -467 | -512 | -579 | -2 | 504 | 545 | -62 | 96 | 294 | -1 | 264 | 110 | ||||||||||||||
|
February 19, 2025 |
Page 273 |
|
|
NI 43-101 Technical Report on the Lumwana Expansion Project |
|
| Summary Cash Flow | Unit | LOM Total | 2037 | 2038 | 2039 | 2040 | 2041 | 2042 | 2043 | 2044 | 2045 | 2046 | 2047 | 2048 | ||||||||||||||
|
Mining |
||||||||||||||||||||||||||||
|
Total ore |
Mt | 1,567 | 64 | 52 | 60 | 75 | 57 | 27 | 41 | 53 | 66 | 33 | 35 | 43 | ||||||||||||||
|
Total waste |
Mt | 7,333 | 241 | 292 | 294 | 279 | 280 | 327 | 313 | 301 | 288 | 321 | 318 | 311 | ||||||||||||||
|
Processing |
||||||||||||||||||||||||||||
|
Total ore |
Mt | 1,592 | 52 | 52 | 52 | 52 | 52 | 52 | 52 | 52 | 52 | 52 | 52 | 52 | ||||||||||||||
|
Copper Grade |
% | 0.52% | 0.61% | 0.43% | 0.41% | 0.47% | 0.45% | 0.32% | 0.40% | 0.54% | 0.66% | 0.41% | 0.44% | 0.50% | ||||||||||||||
|
Recovery |
% | 93.16% | 93.77% | 91.93% | 91.59% | 92.24% | 91.81% | 89.67% | 91.66% | 93.30% | 93.89% | 91.41% | 90.66% | 93.06% | ||||||||||||||
|
Recovered Copper Metal |
kt | 7,759 | 296 | 208 | 198 | 224 | 213 | 147 | 189 | 260 | 322 | 194 | 206 | 242 | ||||||||||||||
|
Revenue |
||||||||||||||||||||||||||||
|
Copper Revenue |
US$ M | 49,510 | 1,886 | 1,327 | 1,261 | 1,429 | 1,358 | 939 | 1,207 | 1,658 | 2,057 | 1,241 | 1,314 | 1,542 | ||||||||||||||
|
Total Freight & Refining Costs |
US$ M | -7,688 | -293 | -206 | -196 | -222 | -211 | -146 | -187 | -257 | -319 | -193 | -204 | -239 | ||||||||||||||
|
Total Royalty |
US$ M | -2,711 | -103 | -73 | -69 | -78 | -74 | -51 | -66 | -91 | -113 | -68 | -72 | -84 | ||||||||||||||
|
Total Minesite Revenue |
US$ M | 39,112 | 1,490 | 1,048 | 996 | 1,129 | 1,073 | 742 | 954 | 1,310 | 1,625 | 980 | 1,038 | 1,219 | ||||||||||||||
|
Operating Costs |
||||||||||||||||||||||||||||
|
Mining |
US$ M | -18,405 | -613 | -643 | -655 | -658 | -660 | -662 | -637 | -676 | -637 | -673 | -635 | -651 | ||||||||||||||
|
Capitalised Stripping |
US$ M | 8,655 | 233 | 325 | 283 | 282 | 466 | 464 | 352 | 250 | 357 | 390 | 360 | 405 | ||||||||||||||
|
Processing |
US$ M | -6,826 | -227 | -226 | -226 | -216 | -216 | -215 | -216 | -212 | -214 | -217 | -230 | -225 | ||||||||||||||
|
General and Administration |
US$ M | -1,874 | -60 | -60 | -60 | -60 | -60 | -60 | -60 | -60 | -60 | -55 | -55 | -55 | ||||||||||||||
|
Total Operating Costs |
US$ M | -18,449 | -667 | -604 | -658 | -652 | -470 | -473 | -561 | -698 | -554 | -555 | -560 | -526 | ||||||||||||||
|
Operating Cashflow |
US$ M | 20,663 | 823 | 444 | 338 | 477 | 603 | 269 | 393 | 612 | 1,071 | 425 | 478 | 693 | ||||||||||||||
|
Summary Capex |
||||||||||||||||||||||||||||
|
Construction Capital |
US$ M | -1,998 | 0 | 0 | 0 | 0 | 0 | 0 | 0 | 0 | 0 | 0 | 0 | 0 | ||||||||||||||
|
Growth Capital |
US$ M | -2,013 | -141 | -81 | -40 | -9 | -22 | -9 | -32 | -31 | -12 | -16 | -9 | -41 | ||||||||||||||
|
Sustaining Capital |
US$ M | -1,652 | -20 | -20 | -81 | -119 | -118 | -95 | -84 | -66 | -61 | -84 | -126 | -112 | ||||||||||||||
|
Capitalised Stripping |
US$ M | -8,655 | -233 | -325 | -283 | -282 | -466 | -464 | -352 | -250 | -357 | -390 | -360 | -405 | ||||||||||||||
|
Grand Total Capex |
US$ M | -14,318 | -394 | -426 | -404 | -410 | -606 | -568 | -468 | -347 | -430 | -490 | -495 | -558 | ||||||||||||||
|
Closure Costs |
US$ M | -174 | 0 | 0 | 0 | 0 | 0 | 0 | 0 | 0 | 0 | 0 | 0 | 0 | ||||||||||||||
|
Working Capital |
US$ M | 104 | 2 | -23 | -12 | 4 | 13 | -28 | 40 | 29 | -2 | -38 | -9 | 10 | ||||||||||||||
|
Pre-Tax Cashflow |
US$ M | 6,275 | 431 | -5 | -78 | 71 | 10 | -327 | -35 | 294 | 639 | -103 | -26 | 145 | ||||||||||||||
|
Taxes |
||||||||||||||||||||||||||||
|
Corporation Tax |
US$ M | -1,888 | -137 | -7 | 0 | -35 | -31 | 0 | 0 | 0 | -136 | 0 | 0 | -25 | ||||||||||||||
|
After-Tax Cashflow |
US$ M | 4,385 | 294 | -12 | -78 | 36 | -21 | -327 | -35 | 294 | 503 | -103 | -26 | 120 | ||||||||||||||
|
February 19, 2025 |
Page 274 |
|
|
NI 43-101 Technical Report on the Lumwana Expansion Project |
|
| Summary Cash Flow | Unit | LOM Total | 2049 | 2050 | 2051 | 2052 | 2053 | 2054 | 2055 | 2056 | 2057 | 2058 | 2059 | 2060 | ||||||||||||||
|
Mining |
||||||||||||||||||||||||||||
|
Total ore |
Mt | 1,567 | 36 | 51 | 62 | 36 | 56 | 70 | 21 | 0 | 0 | 0 | 0 | 0 | ||||||||||||||
|
Total waste |
Mt | 7,333 | 308 | 289 | 237 | 204 | 142 | 54 | 6 | 0 | 0 | 0 | 0 | 0 | ||||||||||||||
|
Processing |
||||||||||||||||||||||||||||
|
Total ore |
Mt | 1,592 | 52 | 52 | 52 | 52 | 52 | 52 | 52 | 46 | 13 | 0 | 0 | 0 | ||||||||||||||
|
Copper Grade |
% | 0.52% | 0.47% | 0.56% | 0.70% | 0.47% | 0.66% | 0.90% | 0.51% | 0.20% | 0.23% | 0.00% | 0.00% | 0.00% | ||||||||||||||
|
Recovery |
% | 93.16% | 92.52% | 93.85% | 94.74% | 92.61% | 94.53% | 95.40% | 93.10% | 86.73% | 84.90% | 0.00% | 0.00% | 0.00% | ||||||||||||||
|
Recovered Copper Metal |
kt | 7,759 | 228 | 275 | 346 | 227 | 322 | 445 | 249 | 79 | 25 | 0 | 0 | 0 | ||||||||||||||
|
Revenue |
||||||||||||||||||||||||||||
|
Copper Revenue |
US$ M | 49,510 | 1,455 | 1,757 | 2,209 | 1,447 | 2,057 | 2,840 | 1,587 | 505 | 160 | 0 | 0 | 0 | ||||||||||||||
|
Total Freight & Refining Costs |
US$ M | -7,688 | -226 | -273 | -343 | -225 | -319 | -441 | -246 | -78 | -25 | 0 | 0 | 0 | ||||||||||||||
|
Total Royalty |
US$ M | -2,711 | -80 | -96 | -121 | -79 | -113 | -156 | -87 | -28 | -9 | 0 | 0 | 0 | ||||||||||||||
|
Total Minesite Revenue |
US$ M | 39,112 | 1,149 | 1,388 | 1,745 | 1,143 | 1,625 | 2,243 | 1,254 | 399 | 126 | 0 | 0 | 0 | ||||||||||||||
|
Operating Costs |
||||||||||||||||||||||||||||
|
Mining |
US$ M | -18,405 | -629 | -622 | -617 | -545 | -506 | -421 | -306 | 0 | 0 | 0 | 0 | 0 | ||||||||||||||
|
Capitalised Stripping |
US$ M | 8,655 | 476 | 256 | 330 | 358 | 0 | 0 | 0 | 0 | 0 | 0 | 0 | 0 | ||||||||||||||
|
Processing |
US$ M | -6,826 | -237 | -237 | -224 | -215 | -230 | -220 | -227 | -197 | -52 | 0 | 0 | 0 | ||||||||||||||
|
General and Administration |
US$ M | -1,874 | -55 | -55 | -55 | -55 | -55 | -55 | -30 | -30 | -10 | 0 | 0 | 0 | ||||||||||||||
|
Total Operating Costs |
US$ M | -18,449 | -445 | -658 | -566 | -457 | -791 | -696 | -563 | -227 | -62 | 0 | 0 | 0 | ||||||||||||||
|
Operating Cashflow |
US$ M | 20,663 | 704 | 730 | 1,179 | 686 | 834 | 1,547 | 691 | 172 | 64 | 0 | 0 | 0 | ||||||||||||||
|
Summary Capex |
||||||||||||||||||||||||||||
|
Construction Capital |
US$ M | -1,998 | 0 | 0 | 0 | 0 | 0 | 0 | 0 | 0 | 0 | 0 | 0 | 0 | ||||||||||||||
|
Growth Capital |
US$ M | -2,013 | -10 | -10 | -46 | -7 | -28 | -4 | -38 | -3 | -3 | -1 | 0 | 0 | ||||||||||||||
|
Sustaining Capital |
US$ M | -1,652 | -74 | -53 | -32 | -20 | -13 | -10 | -9 | -8 | -8 | 0 | 0 | 0 | ||||||||||||||
|
Capitalised Stripping |
US$ M | -8,655 | -476 | -256 | -330 | -358 | 0 | 0 | 0 | 0 | 0 | 0 | 0 | 0 | ||||||||||||||
|
Grand Total Capex |
US$ M | -14,318 | -560 | -319 | -408 | -385 | -41 | -14 | -47 | -11 | -11 | -1 | 0 | 0 | ||||||||||||||
|
Closure Costs |
US$ M | -174 | 0 | 0 | 0 | 0 | 0 | 0 | 0 | 0 | 0 | -54 | -54 | -66 | ||||||||||||||
|
Working Capital |
US$ M | 104 | -19 | 9 | -5 | 65 | -51 | 64 | 43 | -107 | -44 | 83 | 0 | 0 | ||||||||||||||
|
Pre-Tax Cashflow |
US$ M | 6,275 | 125 | 420 | 766 | 366 | 742 | 1,597 | 687 | 54 | 9 | 28 | -54 | -66 | ||||||||||||||
|
Taxes |
||||||||||||||||||||||||||||
|
Corporation Tax |
US$ M | -1,888 | -21 | -90 | -218 | -48 | -194 | -424 | -124 | 0 | 0 | 0 | 0 | 0 | ||||||||||||||
|
After-Tax Cashflow |
US$ M | 4,385 | 104 | 330 | 548 | 318 | 548 | 1,173 | 563 | 54 | 9 | 28 | -54 | -66 | ||||||||||||||
|
February 19, 2025 |
Page 275 |
|
|
NI 43-101 Technical Report on the Lumwana Expansion Project |
|
Table 22-3 Lumwana Expansion Before and After-Tax Annual Cash Flow Summary at 3-year trailing average Cu price ($4.03/lb Cu)
| SUMMARY CASH FLOW | Units | LOM Total | 2025 | 2026 | 2027 | 2028 | 2029 | 2030 | 2031 | 2032 | 2033 | 2034 | 2035 | 2036 | ||||||||||||||
|
Mining |
||||||||||||||||||||||||||||
|
Total ore |
Mt | 1,567 | 35 | 27 | 36 | 44 | 66 | 66 | 46 | 65 | 61 | 42 | 75 | 66 | ||||||||||||||
|
Total waste |
Mt | 7,333 | 122 | 178 | 178 | 171 | 165 | 239 | 259 | 240 | 244 | 263 | 230 | 239 | ||||||||||||||
|
Processing |
||||||||||||||||||||||||||||
|
Total ore |
Mt | 1,592 | 28 | 28 | 29 | 44 | 52 | 52 | 52 | 52 | 52 | 52 | 52 | 52 | ||||||||||||||
|
Copper Grade |
% | 0.52% | 0.60% | 0.67% | 0.55% | 0.55% | 0.65% | 0.65% | 0.45% | 0.46% | 0.58% | 0.42% | 0.65% | 0.58% | ||||||||||||||
|
Recovery |
% | 93.16% | 93.95% | 92.04% | 93.83% | 93.45% | 94.47% | 94.46% | 91.88% | 92.95% | 94.06% | 92.51% | 94.38% | 93.84% | ||||||||||||||
|
Recovered Copper Metal |
kt | 7,759 | 156 | 170 | 147 | 223 | 322 | 319 | 215 | 224 | 282 | 204 | 320 | 282 | ||||||||||||||
|
Revenue |
||||||||||||||||||||||||||||
|
Copper Revenue |
$M | 66,506 | 1,337 | 1,458 | 1,259 | 1,913 | 2,758 | 2,732 | 1,844 | 1,919 | 2,420 | 1,751 | 2,742 | 2,414 | ||||||||||||||
|
Total Freight & Refining Costs |
$M | -7,688 | -155 | -169 | -146 | -221 | -319 | -316 | -213 | -222 | -280 | -202 | -317 | -279 | ||||||||||||||
|
Total Royalty |
$M | -4,367 | -88 | -96 | -83 | -126 | -181 | -179 | -121 | -126 | -159 | -115 | -180 | -159 | ||||||||||||||
|
Total Minesite Revenue |
$M | 54,451 | 1,094 | 1,193 | 1,030 | 1,566 | 2,258 | 2,237 | 1,510 | 1,571 | 1,981 | 1,434 | 2,245 | 1,976 | ||||||||||||||
|
Operating Costs |
||||||||||||||||||||||||||||
|
Mining |
$M | -18,403 | -403 | -484 | -537 | -538 | -578 | -637 | -634 | -634 | -625 | -637 | -625 | -625 | ||||||||||||||
|
Capitalised Stripping |
$M | 8,655 | 194 | 268 | 256 | 192 | 249 | 276 | 334 | 241 | 325 | 285 | 279 | 169 | ||||||||||||||
|
Processing |
$M | -6,827 | -129 | -128 | -129 | -185 | -221 | -221 | -221 | -221 | -220 | -221 | -229 | -223 | ||||||||||||||
|
General and Administration |
$M | -1,874 | -69 | -65 | -65 | -65 | -63 | -65 | -65 | -65 | -64 | -60 | -60 | -60 | ||||||||||||||
|
Total Operating Costs |
$M | -18,449 | -407 | -409 | -475 | -596 | -613 | -647 | -586 | -679 | -584 | -633 | -635 | -739 | ||||||||||||||
|
Operating Cashflow |
$M | 36,002 | 687 | 784 | 555 | 970 | 1,645 | 1,590 | 924 | 892 | 1,397 | 801 | 1,610 | 1,237 | ||||||||||||||
|
Summary Capex |
||||||||||||||||||||||||||||
|
Construction Capital |
$M | -1,998 | -539 | -607 | -547 | -305 | 0 | 0 | 0 | 0 | 0 | 0 | 0 | 0 | ||||||||||||||
|
Growth Capital |
$M | -2,013 | -99 | -49 | -12 | -12 | -261 | -124 | -171 | -95 | -100 | -26 | -231 | -240 | ||||||||||||||
|
Sustaining Capital |
$M | -1,652 | -79 | -35 | -25 | -20 | -20 | -20 | -20 | -20 | -44 | -54 | -63 | -39 | ||||||||||||||
|
Capitalised Stripping |
$M | -8,655 | -194 | -268 | -256 | -192 | -249 | -276 | -334 | -241 | -325 | -285 | -279 | -169 | ||||||||||||||
|
Grand Total Capex |
$M | -14,318 | -911 | -959 | -840 | -529 | -530 | -420 | -525 | -356 | -469 | -365 | -573 | -448 | ||||||||||||||
|
Closure Costs |
$M | -174 | 0 | 0 | 0 | 0 | 0 | 0 | 0 | 0 | 0 | 0 | 0 | 0 | ||||||||||||||
|
Working Capital |
$M | 104 | 66 | -2 | -4 | -2 | 25 | 5 | -35 | 2 | 24 | -33 | 39 | -5 | ||||||||||||||
|
Pre-Tax Cashflow |
$M | 21,614 | -158 | -177 | -289 | 439 | 1,140 | 1,175 | 364 | 538 | 952 | 403 | 1,076 | 784 | ||||||||||||||
|
Taxes |
||||||||||||||||||||||||||||
|
Corporation Tax |
$M | -6,428 | -68 | -77 | 0 | -37 | -279 | -305 | -108 | -155 | -291 | -122 | -368 | -285 | ||||||||||||||
|
After-Tax Cashflow |
$M | 15,186 | -226 | -254 | -289 | 402 | 861 | 870 | 256 | 383 | 661 | 281 | 708 | 499 | ||||||||||||||
|
February 19, 2025 |
Page 276 |
|
|
NI 43-101 Technical Report on the Lumwana Expansion Project |
|
| SUMMARY CASH FLOW | Units | LOM Total | 2037 | 2038 | 2039 | 2040 | 2041 | 2042 | 2043 | 2044 | 2045 | 2046 | 2047 | 2048 | ||||||||||||||
|
Mining |
||||||||||||||||||||||||||||
|
Total ore |
Mt | 1,567 | 64 | 52 | 60 | 75 | 57 | 27 | 41 | 53 | 66 | 33 | 35 | 43 | ||||||||||||||
|
Total waste |
Mt | 7,333 | 241 | 292 | 294 | 279 | 280 | 327 | 313 | 301 | 288 | 321 | 318 | 311 | ||||||||||||||
|
Processing |
||||||||||||||||||||||||||||
|
Total ore |
Mt | 1,592 | 52 | 52 | 52 | 52 | 52 | 52 | 52 | 52 | 52 | 52 | 52 | 52 | ||||||||||||||
|
Copper Grade |
% | 0.52% | 0.61% | 0.43% | 0.41% | 0.47% | 0.45% | 0.32% | 0.40% | 0.54% | 0.66% | 0.41% | 0.44% | 0.50% | ||||||||||||||
|
Recovery |
% | 93.16% | 93.77% | 91.93% | 91.59% | 92.24% | 91.81% | 89.67% | 91.66% | 93.30% | 93.89% | 91.41% | 90.66% | 93.06% | ||||||||||||||
|
Recovered Copper Metal |
kt | 7,759 | 296 | 208 | 198 | 224 | 213 | 147 | 189 | 260 | 322 | 194 | 206 | 242 | ||||||||||||||
|
Revenue |
||||||||||||||||||||||||||||
|
Copper Revenue |
$M | 66,506 | 2,534 | 1,782 | 1,694 | 1,919 | 1,824 | 1,261 | 1,621 | 2,228 | 2,763 | 1,667 | 1,765 | 2,071 | ||||||||||||||
|
Total Freight & Refining Costs |
$M | -7,688 | -293 | -206 | -196 | -222 | -211 | -146 | -187 | -257 | -319 | -193 | -204 | -239 | ||||||||||||||
|
Total Royalty |
$M | -4,367 | -166 | -117 | -111 | -126 | -120 | -83 | -106 | -146 | -181 | -109 | -116 | -136 | ||||||||||||||
|
Total Minesite Revenue |
$M | 54,451 | 2,075 | 1,459 | 1,387 | 1,571 | 1,493 | 1,032 | 1,328 | 1,825 | 2,263 | 1,365 | 1,445 | 1,696 | ||||||||||||||
|
Operating Costs |
||||||||||||||||||||||||||||
|
Mining |
$M | -18,403 | -613 | -643 | -655 | -658 | -660 | -662 | -637 | -676 | -637 | -673 | -635 | -651 | ||||||||||||||
|
Capitalised Stripping |
$M | 8,655 | 233 | 325 | 283 | 282 | 466 | 464 | 352 | 250 | 357 | 390 | 360 | 405 | ||||||||||||||
|
Processing |
$M | -6,827 | -227 | -226 | -226 | -216 | -216 | -215 | -216 | -212 | -214 | -217 | -230 | -225 | ||||||||||||||
|
General and Administration |
$M | -1,874 | -60 | -60 | -60 | -60 | -60 | -60 | -60 | -60 | -60 | -55 | -55 | -55 | ||||||||||||||
|
Total Operating Costs |
$M | -18,449 | -667 | -604 | -658 | -652 | -470 | -473 | -561 | -698 | -554 | -555 | -560 | -526 | ||||||||||||||
|
Operating Cashflow |
$M | 36,002 | 1,408 | 855 | 729 | 919 | 1,023 | 559 | 767 | 1,127 | 1,709 | 810 | 885 | 1,170 | ||||||||||||||
|
Summary Capex |
||||||||||||||||||||||||||||
|
Construction Capital |
$M | -1,998 | 0 | 0 | 0 | 0 | 0 | 0 | 0 | 0 | 0 | 0 | 0 | 0 | ||||||||||||||
|
Growth Capital |
$M | -2,013 | -141 | -81 | -40 | -9 | -22 | -9 | -32 | -31 | -12 | -16 | -9 | -41 | ||||||||||||||
|
Sustaining Capital |
$M | -1,652 | -20 | -20 | -81 | -119 | -118 | -95 | -84 | -66 | -61 | -84 | -126 | -112 | ||||||||||||||
|
Capitalised Stripping |
$M | -8,655 | -233 | -325 | -283 | -282 | -466 | -464 | -352 | -250 | -357 | -390 | -360 | -405 | ||||||||||||||
|
Grand Total Capex |
$M | -14,318 | -394 | -426 | -404 | -410 | -606 | -568 | -468 | -347 | -430 | -490 | -495 | -558 | ||||||||||||||
|
Closure Costs |
$M | -174 | 0 | 0 | 0 | 0 | 0 | 0 | 0 | 0 | 0 | 0 | 0 | 0 | ||||||||||||||
|
Working Capital |
$M | 104 | 2 | -23 | -12 | 4 | 13 | -28 | 40 | 29 | -2 | -38 | -9 | 10 | ||||||||||||||
|
Pre-Tax Cashflow |
$M | 21,614 | 1,016 | 406 | 313 | 513 | 430 | -37 | 339 | 809 | 1,277 | 282 | 381 | 622 | ||||||||||||||
|
Taxes |
||||||||||||||||||||||||||||
|
Corporation Tax |
$M | -6,428 | -312 | -130 | -106 | -180 | -157 | -4 | -84 | -226 | -368 | -97 | -116 | -192 | ||||||||||||||
|
After-Tax Cashflow |
$M | 15,186 | 704 | 276 | 207 | 333 | 273 | -41 | 255 | 583 | 909 | 185 | 265 | 430 | ||||||||||||||
|
February 19, 2025 |
Page 277 |
|
|
NI 43-101 Technical Report on the Lumwana Expansion Project |
|
| SUMMARY CASH FLOW | Units | LOM Total | 2049 | 2050 | 2051 | 2052 | 2053 | 2054 | 2055 | 2056 | 2057 | 2058 | 2059 | 2060 | ||||||||||||||
|
Mining |
||||||||||||||||||||||||||||
|
Total ore |
Mt | 1,567 | 36 | 51 | 62 | 36 | 56 | 70 | 21 | 0 | 0 | 0 | 0 | 0 | ||||||||||||||
|
Total waste |
Mt | 7,333 | 308 | 289 | 237 | 204 | 142 | 54 | 6 | 0 | 0 | 0 | 0 | 0 | ||||||||||||||
|
Processing |
||||||||||||||||||||||||||||
|
Total ore |
Mt | 1,592 | 52 | 52 | 52 | 52 | 52 | 52 | 52 | 46 | 13 | 0 | 0 | 0 | ||||||||||||||
|
Copper Grade |
% | 0.52% | 0.47% | 0.56% | 0.70% | 0.47% | 0.66% | 0.90% | 0.51% | 0.20% | 0.23% | 0.00% | 0.00% | 0.00% | ||||||||||||||
|
Recovery |
% | 93.16% | 92.52% | 93.85% | 94.74% | 92.61% | 94.53% | 95.40% | 93.10% | 86.73% | 84.90% | 0.00% | 0.00% | 0.00% | ||||||||||||||
|
Recovered Copper Metal |
kt | 7,759 | 228 | 275 | 346 | 227 | 322 | 445 | 249 | 79 | 25 | 0 | 0 | 0 | ||||||||||||||
|
Revenue |
||||||||||||||||||||||||||||
|
Copper Revenue |
$M | 66,506 | 1,954 | 2,360 | 2,968 | 1,943 | 2,763 | 3,816 | 2,132 | 679 | 215 | 0 | 0 | 0 | ||||||||||||||
|
Total Freight & Refining Costs |
$M | -7,688 | -226 | -273 | -343 | -225 | -319 | -441 | -246 | -78 | -25 | 0 | 0 | 0 | ||||||||||||||
|
Total Royalty |
$M | -4,367 | -128 | -155 | -195 | -128 | -181 | -251 | -140 | -45 | -14 | 0 | 0 | 0 | ||||||||||||||
|
Total Minesite Revenue |
$M | 54,451 | 1,600 | 1,932 | 2,430 | 1,590 | 2,263 | 3,124 | 1,746 | 556 | 176 | 0 | 0 | 0 | ||||||||||||||
|
Operating Costs |
||||||||||||||||||||||||||||
|
Mining |
$M | -18,403 | -629 | -622 | -617 | -545 | -506 | -421 | -306 | 0 | 0 | 0 | 0 | 0 | ||||||||||||||
|
Capitalised Stripping |
$M | 8,655 | 476 | 256 | 330 | 358 | 0 | 0 | 0 | 0 | 0 | 0 | 0 | 0 | ||||||||||||||
|
Processing |
$M | -6,827 | -237 | -237 | -224 | -215 | -230 | -220 | -227 | -197 | -52 | 0 | 0 | 0 | ||||||||||||||
|
General and Administration |
$M | -1,874 | -55 | -55 | -55 | -55 | -55 | -55 | -30 | -30 | -13 | 0 | 0 | 0 | ||||||||||||||
|
Total Operating Costs |
$M | -18,449 | -445 | -658 | -566 | -457 | -791 | -696 | -563 | -227 | -65 | 0 | 0 | 0 | ||||||||||||||
|
Operating Cashflow |
$M | 36,002 | 1,155 | 1,274 | 1,864 | 1,133 | 1,472 | 2,428 | 1,183 | 329 | 111 | 0 | 0 | 0 | ||||||||||||||
|
Summary Capex |
||||||||||||||||||||||||||||
|
Construction Capital |
$M | -1,998 | 0 | 0 | 0 | 0 | 0 | 0 | 0 | 0 | 0 | 0 | 0 | 0 | ||||||||||||||
|
Growth Capital |
$M | -2,013 | -10 | -10 | -46 | -7 | -28 | -4 | -38 | -3 | -3 | -1 | 0 | 0 | ||||||||||||||
|
Sustaining Capital |
$M | -1,652 | -74 | -53 | -32 | -20 | -13 | -10 | -9 | -8 | -8 | 0 | 0 | 0 | ||||||||||||||
|
Capitalised Stripping |
$M | -8,655 | -476 | -256 | -330 | -358 | 0 | 0 | 0 | 0 | 0 | 0 | 0 | 0 | ||||||||||||||
|
Grand Total Capex |
$M | -14,318 | -560 | -319 | -408 | -385 | -41 | -14 | -47 | -11 | -11 | -1 | 0 | 0 | ||||||||||||||
|
Closure Costs |
$M | -174 | 0 | 0 | 0 | 0 | 0 | 0 | 0 | 0 | 0 | -54 | -54 | -66 | ||||||||||||||
|
Working Capital |
$M | 104 | -19 | 9 | -5 | 65 | -51 | 64 | 43 | -107 | -44 | 83 | 0 | 0 | ||||||||||||||
|
Pre-Tax Cashflow |
$M | 21,614 | 576 | 964 | 1,451 | 813 | 1,380 | 2,478 | 1,179 | 211 | 56 | 28 | -54 | -66 | ||||||||||||||
|
Taxes |
||||||||||||||||||||||||||||
|
Corporation Tax |
$M | -6,428 | -156 | -253 | -424 | -183 | -385 | -688 | -272 | 0 | 0 | 0 | 0 | 0 | ||||||||||||||
|
After-Tax Cashflow |
$M | 15,186 | 420 | 711 | 1,027 | 630 | 995 | 1,790 | 907 | 211 | 56 | 28 | -54 | -66 | ||||||||||||||
|
February 19, 2025 |
Page 278 |
|
|
NI 43-101 Technical Report on the Lumwana Expansion Project |
|
The analysis shows that the Lumwana Expansion Project Reserve Case scenario is economically viable with an after-tax NPV at a discount rate of 8% (NPV8%) of approximately US$225 M and an after-tax IRR of 10%. The after-tax cumulative cash flow graph (Figure 22-1) shows a Reserve Case scenario payback period for the Expansion Project of eight years. The financial model summary for the Reserve Case and 3-year trailing average case is shown in Table 22-4.
The incremental after-tax IRR is 7% which has been calculated based on the differential after-tax cash flow between the Expansion Project scenario and the continuation of the existing operations.
Table 22-4 Lumwana Expansion Case Financial Model Summary at Barrick Reserve Price
($3.00/lb Cu), and 3 year trailing average Cu price ($4.03/lb)
| Item | Unit | Value ($3.00/lb) | Value ($4.03/lb) | |||
|
Mining Cost (LOM) |
US$/t mined | 2.07 | 2.07 | |||
|
Processing (LOM) |
US$/t processed | 4.29 | 4.29 | |||
|
G&A (LOM) |
US$/t processed | 1.18 | 1.18 | |||
|
Freight & Refining (LOM) |
US$/lb | 0.47 | 0.47 | |||
|
Mine Life |
Years | 31 | 31 | |||
|
Mining Rate – Average |
Mtpa | 287 | 287 | |||
|
Mined Tonnage – Total LOM |
Mt | 8,900 | 8,900 | |||
|
LOM Stripping Ratio (w:o) |
t:t | 4.7 | 4.7 | |||
|
Processing Life |
Years | 33 | 33 | |||
|
Processing Rate – Post ramp-up |
Mtpa | 52 | 52 | |||
|
Processing Tonnage – Total LOM |
Mt | 1,589 | 1,589 | |||
|
Metallurgical Recovery |
% | 93.2% | 93.2% | |||
|
Grade – Average |
% | 0.52% | 0.52% | |||
|
LOM Metal Produced |
kt | 7,757 | 7,757 | |||
|
C1 Direct Costs (LOM) |
US$/lb | 1.59 | 1.59 | |||
|
All-In Sustaining Costs (LOM) |
US$/lb | 2.38 | 2.48 | |||
|
All-in Costs (LOM) |
US$/lb | 2.62 | 2.72 | |||
|
Total Capital (LOM) |
US$ M | 5,663 | 5,663 | |||
|
Construction Capital (2025 to 2028) |
US$ M | 1,998 | 1,998 | |||
|
Growth Capital (LOM) |
US$ M | 2,013 | 2,013 | |||
|
Sustaining Capital (LOM) |
US$ M | 1,652 | 1,652 | |||
|
NPV8% (2025–LOM) – After-Tax |
US$ M | 216 | 3,926 | |||
|
FCF (2025–LOM) |
US$ M | 4,385 | 15,186 | |||
|
NPV8% (2029-LOM) – After-Tax |
US$ M | 1,945 | 5,772 | |||
|
Lumwana IRR – After-Tax (LOM) |
% | 10% | 49% | |||
|
Incremental Project IRR – After-Tax (LOM) |
% | 7% | 20% | |||
|
Payback Period – After-Tax (Post ramp-up) |
Years | 8 | 2 | |||
|
February 19, 2025 |
Page 279 |
|
|
NI 43-101 Technical Report on the Lumwana Expansion Project |
|
| 22.4 | Sensitivity |
Project risks can be identified in both economic and non-economic terms. Key economic risks have been examined by undertaking economic model sensitivity analysis. Sensitivity analysis has been undertaken on copper price, mining costs or operating costs, capital costs, freight and refining costs, and discount rate.
The Expansion Project is most sensitive to changes to the copper price assumption. Table 22-5 shows model sensitivity at US$0.25/lb increments in copper price, with the upside matching the downside given the conservative nature of the US$3.00/lb Cu modelled Reserve Case.
For copper price sensitivity, the MRT rates have been adjusted and applied according to the sliding scale in Table 22-1.
Table 22-5 After-Tax Copper Price Sensitivity Analysis Results
|
Copper Price (US/lb) |
Cumulative After-Tax Net (US$ Bn) |
After-Tax (US$ Bn) |
Project IRR (%) |
Payback Period (years) |
||||
|
3.00 (Base Case) |
4.4 | 0.2 | 10% | 8 | ||||
|
3.25 |
7.0 | 1.1 | 17% | 5 | ||||
|
3.50 |
9.6 | 2.0 | 26% | 3 | ||||
|
3.75 |
12.3 | 2.9 | 36% | 2 | ||||
|
4.00 |
14.9 | 3.8 | 48% | 2 | ||||
|
4.03 (3-year trailing average) |
15.2 | 3.9 | 49% | 2 | ||||
|
4.13 |
16.2 | 4.3 | 55% | 2 | ||||
|
4.20 (Consensus) |
17.0 | 4.5 | 59% | 2 | ||||
|
4.25 |
17.5 | 4.7 | 63% | 2 | ||||
|
4.50 |
20.1 | 5.6 | 84% | 1 | ||||
|
4.75 |
22.7 | 6.5 | 120% | 1 | ||||
|
5.00 |
25.3 | 7.4 | 219% | 1 | ||||
Notes:
| 1. | Consensus pricing is based on the Canadian Imperial Bank of Commerce (CIBC) consensus as at October 2024. |
The results of the sensitivity analysis presented in Table 22-5 indicate that, at a consensus price of US$4.20/lb, would result in a total free cash flow (FCF) over the LoM of US$17.0 billion, with an NPV8% of US$4.5 billion, an after-tax IRR of 59%, and a payback period of two years.
A set of sensitivity analyses were performed over a range of +/-15% for variations in metal prices, foreign exchange rate, operating costs, and capital costs to determine their relative importance as value drivers. The Project is most sensitive to copper price and operating costs.
|
February 19, 2025 |
Page 280 |
|
|
NI 43-101 Technical Report on the Lumwana Expansion Project |
|
Sensitivities impact of key drivers on NPV8% and IRR are shown in Figure 22-2 and Figure 22-3, respectively.

Figure 22-2 After-Tax Sensitivity Analysis Results to NPV8%

Figure 22-3 After-Tax Sensitivity Analysis Results to IRR
|
February 19, 2025 |
Page 281 |
|
|
NI 43-101 Technical Report on the Lumwana Expansion Project |
|
| 22.5 | QP Comments on Economic Analysis |
The QP considers that the economic analysis and modelling is appropriate for the Project and supports the estimation of Mineral Resources and Mineral Reserves. It shows that the Mineral Reserves are economically viable over a range of cost and revenue factors which adequately account for likely technical risks and possible changes in fiscal operating environment.
|
February 19, 2025 |
Page 282 |
|
|
NI 43-101 Technical Report on the Lumwana Expansion Project |
|
| 23 | Adjacent Properties |
This section is not applicable for this Technical Report.
|
February 19, 2025 |
Page 283 |
|
|
NI 43-101 Technical Report on the Lumwana Expansion Project |
|
| 24 | Other Relevant Data and Information |
No additional information or explanation is necessary to make this Technical Report understandable and not misleading.
|
February 19, 2025 |
Page 284 |
|
|
NI 43-101 Technical Report on the Lumwana Expansion Project |
|
| 25 | Interpretation and Conclusions |
The QPs present the following interpretations and conclusions in their respective areas of expertise, based on the review of data available for this Technical Report.
The Project as a whole has been designed to utilise industry standard practices and deploy conventional technology with many of the technologies already employed by Barrick at other mines they operate, reducing the implementation operational risks. Where technologies are not employed by Barrick, benchmarked sites have been visited by the Project team to validate equipment selection and adopt best practices. Though new and emerging technologies are not included in the base case, the Project has been designed to allow for the adoption of technologies during the operational phase which, if realised, may result in potential improvements in operational performance from that which is presented in this Technical Report.
| 25.1 | Mineral Tenure, Rights, Royalties and Agreements |
| ● | LMC owns the surface rights in the form of a 99 year lease covering the current operations and a majority of the planned infrastructure, including the proposed TSF and Process Plant expansions, and the Chimiwungo, Malundwe and Kababisa open pits. |
| ● | The KICD and the Kamisengo open pit are situated within the Acres National Forest 105 and will require obtaining permission and licence to operate in an 8,800 ha are of the Acres National Forest 105 that has not yet been degazetted. LMC’s current surface rights area includes 28,500 ha of Acres National Forest 105 previously degazetted by the President of Zambia in 2009, and as such, subject to obtaining the necessary permission and a licence, LMC does not anticipate that there are any barriers preventing the development of aforementioned infrastructure. |
| 25.2 | Geology and Mineral Resources |
| ● | Significant exploration, drilling, and operational data provides a good understanding of the deposit geology as well as an understanding of the geometry, thickness, and grade continuity of the mineralisation at Chimiwungo, Malundwe, Kamisengo, and Kababisa. |
| ● | Procedures for drilling, logging, sampling, analyses, and security are in place and meet industry standards. Data validation and data verification procedures indicate that the data within the database is suitable for Mineral Resource estimation. |
| ● | Extensive drilling has resulted in substantial increases in Indicated Mineral Resources at Chimiwungo, Malundwe, and Kamisengo, and the addition of new Mineral Resources at Kababisa. The extensive and closer spaced drilling has resulted in increased confidence in the controls on mineralisation which has increased confidence in the geological models used for Mineral Resource estimation. The geo-metallurgical understanding of the deposit has |
|
February 19, 2025 |
Page 285 |
|
|
NI 43-101 Technical Report on the Lumwana Expansion Project |
|
| also improved and as a result oxidation zones are now better-defined using ratios of acid soluble copper, total copper, and sulphur. |
| ● | In June 2024, RSC completed a site visit and external audit of the Mineral Resource and its informing data and processes. RSC concluded that the processes underlying the generation and declaration of the Mineral Resource reflected good practice. |
| 25.3 | Mineral Reserves |
| ● | The Mineral Reserve estimate is based on a comprehensive process of evaluation, starting with the Mineral Resource block model that was optimised using geotechnical, technical and economic parameters, after which the various pits were designed and scheduled. |
| ● | Final FS parameters for operating costs and recoveries differed slightly from the optimisation and scheduling input costs. These differences are considered usual during a project and do not materially affect the outcomes. |
| ● | The Expansion Project schedule supports the doubling of the throughput of the processing plant and extension of the LOM to 33 years. |
| ● | Dilution and loss estimates are applied to the expansion mine plan to provide realistic estimates of grade and tonnes supplied by the mining operation. Initial planned dilution is determined through software, while unplanned dilution and losses are accounted for in model adjustments following reconciliation work. |
| ● | The highest undiscounted cash flow shells were selected from the optimisation results. |
| ● | In December 2024, AMC completed a site visit and external review of the mining portion of the FS and its informing data, modifying factors, mine planning and scheduling processes. AMC concluded that these did not present any fatal flaws and that the requirements of an FS were met. |
| 25.4 | Mining |
| ● | Mining envisaged for the Expansion Project uses the same mining methods and the same types of equipment as the current operation, substantially reducing risks to the Expansion Project. |
| ● | Notable increases in output per machine are planned through changes to the equipment availability, utilisation, and productivity. The estimated operating cost and capital cost of the production fleet is based on this higher productivity rate, and in the lead up to the completion of the FS, the operations team demonstrated that the required FS output parameters could be achieved. An extensive improvement plan is underway, with a two-year transition period included in the FS. |
| ● | Double benching has been proposed for the final Chimiwungo Super-Pit walls from 2027 onwards. A programme to improve current mining practices in order to implement double benching is underway. |
| ● | In November 2024, third party geotechnical reviews were completed by Itasca (Itasca, 2024) and PSM (PSM,2024) to validate assumptions used in the mine planning and scheduling |
|
February 19, 2025 |
Page 286 |
|
|
NI 43-101 Technical Report on the Lumwana Expansion Project |
|
| process. The reviews concluded that there were no fatal flaws and that the geotechnical data and analysis are reasonable and the slope design parameters are suitable for the FS. |
| 25.5 | Mineral Processing |
| ● | The process flowsheet and process design criteria (PDC) have been developed based on a thorough test work programme, two years of operating processing plant data, and application of current industry best practices. They were developed and reviewed by both Barrick and Lycopodium as part of the FS. |
| ● | The overall criteria in developing the flowsheet and PDC was to reflect the physical and metallurgical properties of the ore and inclusion of flexibility to accommodate variability in ore that could result in a wide range of concentrate mass pulls. |
| ● | Operational data compares well to the test work data, and there is a clear indication that there is no material difference in metallurgical characteristics between currently processed ore and expected ore from the Expansion Project. |
| ● | When the PDC was being developed, not all new bench-top flotation tests were completed, and the rougher flotation concentrate mass pull was calculated based on the 85th percentile of the combined available operational data and new rougher flotation test results. Cleaner flotation flowsheet and mass pulls were based on analysis of the simulations developed by the high-intensity flotation vendors, which were based on locked cycle dilution flotation test work. Flotation retention time and reagents addition rates were based on the flotation conditions as per the baseline open cycle test conditions. |
| ● | Flux rates for concentrate and tailings thickener sizing were based on Metso’s thickening test work results. Thickener test work by Vietti and FLSmidth yielded similar results. |
| ● | Concentrate filtration rate was based on historical filtration test work performed by LAROX. |
| 25.6 | Infrastructure |
| ● | Necessary infrastructure for the current LOM is already in place. |
| ● | As mining ramps up for the Expansion Project, additional site common purpose infrastructure is planned as well as expansions to existing infrastructure. This includes an expansion to the maintenance workshop, on-site and off-site accommodation, expansion of mining infrastructure, a new airstrip, and an upgrade to the existing road network. |
| ● | The operation relies on a combination of state-supplied grid power and on-site diesel generation to meet its current electrical load of 60 MVA, with plans to expand capacity to accommodate future demands, which are expected to peak at 177 MVA. As part of this expansion, additional 33 kV infrastructure is being developed, and an agreement with ZESCO for a peak supply of 180 MVA has been executed. |
| ● | To address power supply challenges, a grid study identified key constraints, prompting immediate plans to upgrade ZESCO’s infrastructure and enhance power stability through a new STATCOM and transmission lines. Barrick aims to secure a sustainable long-term power |
|
February 19, 2025 |
Page 287 |
|
|
NI 43-101 Technical Report on the Lumwana Expansion Project |
|
| supply by collaborating with independent power producers and establishing alternative supply agreements. |
| ● | To meet the requirements of the Expansion Project, the TSF will be expanded to a capacity of 2 Bt. The expanded TSF design is based on the current TSF and has considered all necessary design requirements as stipulated by the Barrick Tailings Management Standard, GISTM, and Zambian Authorities. |
| ● | A new WSF, the KICD, will be constructed upstream Kamisengo and will outflow through a new diversion channel into the Malundwe Stream. Water and salt balance modelling shows that the proposed site-wide water management infrastructure meets water demand requirements and Zambian quality standards, and will effectively separate clean groundwater and rainwater from water runoff into the mining area. |
| 25.7 | Environment and Social Aspects |
| ● | An ESIA process was commissioned to identify and quantify the E&S impacts, which could arise from the Expansion Project. The ESIA process was undertaken as required by ZEMA and the GIIP, such as the International Finance Corporation Performance Standards on Social Sustainability. Based on the outcomes of the impact assessment and effective implementation of identified mitigation and management measures by Lumwana, the Expansion Project is not expected to result in a significant irreversible environmental or social impact (or fatal flaw/s) that will outweigh the continuation of socio-economic and potential regional biodiversity benefits from extending the LOM at Lumwana. |
| ● | The ESIA for the Expansion Project was approved by ZEMA in November 2024, and a decision letter has been issued. |
| ● | Vegetation removal, topsoil stripping and infrastructure construction will impact soil through direct or indirect loss of soil resources, soil erosion, and degradation or soil competition and contamination. The infrastructure was positioned to avoid critical habitats where possible and to implement the BAP. Successful implementation of the BAP is expected to result in positive environmental impacts, as new habitats would be created. |
| ● | Extensive water management, such as through the KICD and associated Malundwe Stream diversions, is required to manage water inflow. This prevents a loss of catchment yields as the vast majority of the diverted water is conserved within the same drainage network downstream of the Malundwe mining areas. The impacts on groundwater are expected to be negligible and manageable with the implementation of the ESMP measures. Continuous monitoring of the effectiveness of stormwater management infrastructure, periodic updates of the water balance and continuous monitoring (quality and quantity) downstream of the diversions is ongoing. |
| ● | Subject to the mitigation and management measures prescribed in the ESMP being correctly implemented, the post-mitigation (residual) significance ratings are expected to be acceptable as the benefits of executing the Expansion Project will outweigh the negative impacts. |
| ● | The Expansion Project involves acquiring approximately 14,000 ha of land within the Kamisengo Moratorium Area, affecting 279 households and 1,873 individuals. Physical resettlement of affected households and culturally significant sites will need to take place. Resettlement will include compensation for project-affected households (PAHs) based on |
|
February 19, 2025 |
Page 288 |
|
|
NI 43-101 Technical Report on the Lumwana Expansion Project |
|
| specific eligibility criteria, along with transitional support. A livelihood restoration program will be provided, and the RAP will be monitored and evaluated in accordance with IFC Performance Standards and Barrick’s internal guidelines |
| ● | Household agreements signings for the Kamisengo RAP are well advanced, with more than 90% of agreements signed. Final agreements are expected to be signed in Q1 2025. |
| 25.8 | Capital and Operating Costs |
| ● | Capital and operating costs estimates for the study were estimated to a level considered sufficient for a Feasibility Study (+/- 15%). The costs were estimated as of Q3 2024 and are considered current for the purpose of this Technical Report and the declaration of Mineral Reserves. |
| ● | Capital cost estimates include initial capital, growth capital as well as sustaining capital costs. The planned Project requires an estimated LOM total of $5,663 M excluding capitalised stripping. |
| ● | Operating cost estimates includes all operational activities required for the mining, processing, G&A costs, and offsite costs (including freight & refining and royalties) for all of the forecasted production. |
| ● | The LOM operating cost for the Project is estimated to be $28,975 M with unit operating costs of $18.23/t. |
| ● | Based on the cost analysis for the operating costs of the Expansion Project including the mining, processing, G&A costs as well as the treatment and refining costs, it can be concluded that the costs and effective per unit rates have been appropriately determined and disclosed. |
| ● | The capital spend for the Expansion Project, including expansion and sustaining costs, has been appropriately determined based on underlying support and investigations conducted. The capital spend adequately reflects the spend necessary to proceed from the feasibility stage to the execution stage. |
| 25.9 | Project Economics |
| ● | Both the capital spend and operating costs have been evaluated through a financial analysis including the consideration of various sensitivities across prominent assumptions. The outcome of the financial analysis confirms that the Expansion Project will generate a return that exceeds Barrick’s minimum investment requirement, as well as will positively contribute to the local and national economy. |
| ● | Based on the economic analysis presented in this document and a consensus price of $4.03/lb, the Project generates positive pre- and post-tax financial results with a post-tax free cash flow of $15,186 M, NPV8% of $3,926 M and IRR of 49%. |
| ● | The Project’s NPV is most sensitive to changes in copper price and operating costs. Changes in these parameters from those listed in this Technical Report will impact the NPV. |
|
February 19, 2025 |
Page 289 |
|
|
NI 43-101 Technical Report on the Lumwana Expansion Project |
|
| 25.10 | Risks |
The QPs have examined the various risks and uncertainties known or identified that could reasonably be expected to affect reliability or confidence in the exploration information, the Mineral Resources or Mineral Reserves of the Mine, or projected economic outcomes contained in this Technical Report. They have considered the controls that are in place or proposed to be implemented and determined the residual risk post mitigation measures. The post mitigation risk rating is evaluated consistent with guidance provided by Barrick’s Formal Risk Assessment Procedure (FRA) and considers the likelihood and consequence of the risk’s occurrence and impact.
Table 25-1 details the significant risks and uncertainties as determined by the QPs for the Expansion Project.
|
February 19, 2025 |
Page 290 |
|
|
NI 43-101 Technical Report on the Lumwana Expansion Project |
|
Table 25-1 Expansion Project Risk Summary
| Area | Risk | Mitigation | Post Mitigation Risk Rating |
|||
| Location, Accessibility, Climate, Local Resources and Infrastructure | Inability to execute project due to lack of power in the Zambian national grid | ● PSA signed with ZESCO to secure power requirements for LOM.
● STATCOM and transmission lines planned as part of Expansion Project to mitigate power instability and increase power availability.
● Wheeling agreements concluded with power suppliers to increase supply.
● Backup power increased as part of Expansion Project to mitigate outages. |
High | |||
| Geology and Mineral Resources |
Lower than predicted grades and tonnes relative to recovery model | ● Mineral Resource audit completed with no fatal flaws identified.
● Consistently well performing reconciliation results between modelled grades and plant results.
● Extensive drilling programme concluded to de-risk geological model. |
Low - Medium | |||
| Mining
and Mineral Reserves |
Underperformance in ultra class fleet productivities relative to Mine plan assumptions | ● Operations demonstrated that FS Parameters can be achieved during the course of 2024.
● Improvement plans implemented, time frames built into FS mine plan to consistently reach expected levels of productivity. |
High | |||
| Operating Costs | Higher than modelled operating costs | ● Improvement programmes in place and demonstrating capability of ultra class mining fleet to deliver planned levels of productivities.
● Infrastructure design for the expansion reduces operating costs: e.g., in-pit crushing and conveying, electrical shovels.
● Benchmarked planned costs against other similar operations. |
High | |||
| Capital Costs | Capital Cost Overruns | ● FS engineering was completed to +/-15% accuracy.
● Contracts and vendor quotes obtained for key equipment.
● Cost control and package management during project execution. |
Medium | |||
|
February 19, 2025 |
Page 291 |
|
|
NI 43-101 Technical Report on the Lumwana Expansion Project |
|
| Area | Risk | Mitigation | Post Mitigation Risk Rating |
|||
| ● Long-lead items for processing and mining secured during 2024. |
||||||
| Mineral Processing | Underperformance of flowsheet to achieve required grades/recoveries | ● Flowsheet built from two years of existing processing plant data, and extensive metallurgical test work of future ore sources.
● Existing plant operating at 27 Mtpa capacity with similar flowsheet, processing similar ore types.
● Schedule requires 52 Mtpa out of 54 Mtpa peak design capacity. |
Medium | |||
| Tailings | Tailings dam failure | ● Expanded tailings dam to follow existing design principles from existing tailings dam in place since 2008.
● Ongoing independent tailings review process.
● Design for expansion of tailings dam supported by detailed site investigation work and operating experience. |
Medium | |||
| Environmental and Social | Environmental Impact of habitats and communities | ● Infrastructure placement designed to minimise impacts on critical habitats and undisturbed areas.
● ESMP to be updated for the Expansion Project.
● RAP to be approved and implemented in Kamisengo in order to minimise social impacts.
● ESIA for Expansion Project approved by ZEMA. |
Medium | |||
|
February 19, 2025 |
Page 292 |
|
|
NI 43-101 Technical Report on the Lumwana Expansion Project |
|
| 26 | Recommendations |
The key recommendation is to proceed with the Expansion Project and commence detailed design with the selected EPCM contractor. Further recommendations by discipline are summarised as follows:
| 26.1 | Mineral Tenure, Rights, Royalties and Agreements |
| ● | Begin the process of converting the Moratorium Area from Customary Tenure to State Tenure in order to gain title to the land and secure surface rights. |
| ● | Obtain the permission and licence to operate in 8,800 ha of the National Forest. |
| ● | Maintain good standing of Mining Licences and permits. |
| 26.2 | Geology and Mineral Resources |
| ● | Continue to improve geo-metallurgical understanding through integration of multi-element data to potentially improve recoveries and process costs. |
| ● | Follow existing resource definition drilling with infill and subsequent grade control drilling. |
| ● | Develop identified exploration prospects. |
| 26.3 | Mining and Mineral Reserves |
| ● | To mitigate risk to mining costs, complete the ongoing drill and blast improvement project including double benching. Consider flattening interim pushbacks to reduce blasting interaction in areas with two concurrent pushbacks. |
| ● | Further define zones of potential localised minor shear structures through ongoing improvements to structural modelling. |
| ● | Revisit prior studies on trolley assist for potential operational savings. |
| ● | Investigate the technical and economic impact of crushing and conveying of waste to further reduce mining costs. |
| ● | Complete further detailed planning to refine pushback designs, development sequences, and working spaces to enable better productivities and reduce production risk. |
| ● | Refine geotechnical model and analysis for low rock strength Chimiwungo domains. |
|
February 19, 2025 |
Page 293 |
|
|
NI 43-101 Technical Report on the Lumwana Expansion Project |
|
| 26.4 | Mineral Processing |
| ● | Continue to refine the optimal blend ratios for Kamisengo and Chimiwungo ore feed. |
| ● | Continue to perform further test work on low grade marginal sulphide ore to increase the definition of the recovery model. |
| ● | Continue with planned procurement strategies of long lead equipment and closely monitor vendor performance to ensure timely data availability for detailed engineering. |
| 26.5 | Infrastructure |
| ● | Expedite the STATCOM and transmission line upgrades to mitigate the power supply risk and reduce plant downtime from grid outages. |
| ● | Ensure continuous monitoring and testing of backup power systems. |
| ● | Ensure the installation of advanced real-time monitoring systems for TSF and WSF embankment stability, and test evacuation procedures regularly. |
| ● | Continue to ensure that tailings dam operations conform to detailed design. |
| 26.6 | Environmental, Permitting and Social Aspects |
| ● | Ensure that the resettlement process proceeds according to the RAP to be approved by ZEMA. |
| ● | Continue to engage with authorities through the stakeholder engagement plan. |
| ● | Update ESMP to reflect the Expansion Project. |
| 26.7 | Capital and Operating Costs |
| ● | Continue to refine capital and operating cost models through the detailed engineering phase prior to Project execution. |
| 26.8 | Risks |
| ● | Ongoing updates and revisions to the Project risk register are recommended as the Project progresses through basis engineering into construction and operation. Active monitoring and implementation of mitigation plans are recommended for key risks in accordance with Barrick’s established risk management practices. |
|
February 19, 2025 |
Page 294 |
|
|
NI 43-101 Technical Report on the Lumwana Expansion Project |
|
| 27 | References |
AMC Consultants, 2019. Reclamation of copper from Malundwe stockpiles with elevated uranium EIA.
AMC Consultants, 2024. Lumwana Expansion Mining Review Updated Schedule Review.
Australian National Committee on Large Dams (ANCOLD), 2019. Guidelines on Tailings Dams (July 2019).
Barrick, 2014. Technical Report on the Lumwana Mine, North-Western Province, Republic of Zambia. Barrick Gold Corporation
Barrick, 2024a. Lumwana Expansion Project Pre-Feasibility Study, December 2024.
Barrick, 2024b. Lumwana Expansion Project Feasibility Study, December 2024.
CIM. 2014. Canadian Institute of Mining, Metallurgy and Petroleum (CIM) Definition Standards for Mineral Resources and Mineral Reserves, adopted by the CIM Council on May 10, 2014.
CIM. 2019. CIM Estimation of Mineral Resources & Mineral Reserves Best Practice Guidelines, adopted by the CIM Council on November 29, 2019.
Climate Change Knowledge Portal-Zambia, https://climateknowledgeportal.worldbank.org/country/zambia, October 2024.
Digby Wells Environmental, 2024a. Environmental Social Impact Assessment (ESIA), Lumwana Expansion Project.
Digby Wells Environmental, 2024b. Resettlement Action Plan for the Lumwana Expansion Project.
Eco-Wise Solutions, 2013. Chimiwungo open pit and development of the waste rock dump ‘Chimiwungo Extension Project’ EIA
Equinox Copper Ventures Limited, 2005. Lumwana Copper Project EIA.
Equinox Copper Ventures Limited, 2006. Lumwana Estate EIA.
Fraser McGill, 2024. Lumwana LoM Fleet Optimisation and Verification Study.
Hawley M. and Cunning J., 2017. Mine Waste Dump and Stockpile Design. CSIRO Publishing, Australia.
International Commission On Large Dams Commission (ICOLD), 2022. Tailings Dam Safety (draft).
International Finance Corporation (IFC), 2007. Environmental, Health & Safety (EHS) Guidelines for Mining Effluent (2007).
|
February 19, 2025 |
Page 295 |
|
|
NI 43-101 Technical Report on the Lumwana Expansion Project |
|
Itasca, 2024. Lumwana Super Pit 3D Stability Analysis.
Kirkham, R.V., (1989). Distribution, settings, and genesis of sediment-hosted stratiform copper deposits. Geological Association of Canada Special Paper 36, pp 3–38.
Knight Piésold, 2008. Lumwana Uranium Project EIA.
Knight Piésold, 2024. 2Bt Life of Mine Expansion, Tailings and Water Management Feasibility Study
Orway Mineral Consultants, 2023. Comminution Circuit Expansion
Optiro, 2019. Lumwana Mining Company, Lumwana Mineral Resource process review - June 2019.
PSM, 2024. External Support of The Geotechnical Feasibility Study for the Lumwana Mine Expansion Project
RPA, 2012. Technical Report on the Lumwana Mine, North-Western Province, Republic of Zambia. Barrick Gold Corporation.
RSC, 2024. RSC Mineral Resource Audit, Lumwana Zambia, August 2024
Ryan T.M. and Pryor P.R. (2000). Designing catch benches and interramp slopes. In Slope Stability in Surface Mining (ed. WA Hustrulid, MK McCarter and DJA Van Zyl), pp 27-38. SME, Colorado
Sillitoe, R.H., Perello, J., Creaser, R.A., & Wilton, J., (2015). Two Ages of Copper Mineralization in the Mwombezhi Dome, Northwestern Zambia: Metallogenic Implications for the Central African Copperbelt. Economic Geology 110(8), pp-1917-1923
TECT, August 2024. Chimiwungo, Malundwe and Kamisengo 3D Structural Review for Feasibility Study For Downstream Geotechnical and MRE Application.
World Health Organisation, 2017. Word Health Organisation (WHO) Guidelines for Drinking-water Quality (2017)
Zambian Bureau of Standards, 2022. Zambia Drinking Water Standards (Zambian Bureau of Standards, (2022)
|
February 19, 2025 |
Page 296 |
|
|
NI 43-101 Technical Report on the Lumwana Expansion Project |
|
| 28 | Date and Signature Page |
This report titled “NI 43-101 Technical Report on the Lumwana Expansion Project, Republic of Zambia” with an effective date of December 31, 2024 and dated February 19, 2025 was prepared and signed by the following authors:
| (Signed) Simon P. Bottoms |
||||
| Dated at London, UK
February 19, 2025 |
|
Simon P. Bottoms, CGeol, MGeol, FGS, FAusIMM Mineral Resource Management and Evaluation Executive Barrick Gold Corporation |
||
| (Signed) Richard Peattie |
||||
| Dated at London, UK
February 19, 2025 |
Richard Peattie, M.Phil, FAusIMM Africa and Middle East, Mineral Resource Manager Barrick Gold Corporation |
|||
| (Signed) Derek Holm |
||||
| Dated at London, UK
February 19, 2025 |
Derek Holm, BSc, FAusIMM AME Planning Lead Barrick Gold Corporation |
|||
| (Signed) Marius Swanepoel |
||||
| Dated at London, UK
February 19, 2025 |
Marius Swanepoel, Pr. Eng. Head of Metallurgy, Africa and Middle East |
|||
| (Signed) Graham Trusler |
||||
| Dated at London, UK
February 19, 2025 |
Graham E. Trusler, MSc, Pr Eng, MIChE, MSAIChE CEO Digby Wells Environmental |
|||
|
February 19, 2025 |
Page 297 |
|
|
NI 43-101 Technical Report on the Lumwana Expansion Project |
|
| 29 | Certificates of Qualified Persons |
| 29.1 | Simon P. Bottoms |
I, Simon P. Bottoms, CGeol, MGeol, FGS, FAusIMM, as an author of this report entitled “NI 43-101 Technical Report on the Lumwana Expansion Project, Republic of Zambia” with an effective date of December 31, 2024 and dated February 19, 2025 prepared for Barrick Gold Corporation, do hereby certify that:
| 1. | I am Executive Vice President, Mineral Resource Management and Evaluations, with Barrick Gold Corporation, of 3rd Floor, Unity Chambers, 28 Halkett Street, St. Helier, Jersey, JE2 4WJ, Channel Islands. |
| 2. | I am a graduate of the University of Southampton, UK in 2009 with a Masters of Geology degree. |
| 3. | I am registered as a Chartered Geologist registered (1023769) with the Geological Society, London, and a Fellow of the Australasian Institute of Mining and Metallurgy (313276). I have worked as a geologist continuously for 14 years since my graduation. My relevant experience for the purpose of the Technical Report is: |
| ● | I am the global lead technical executive for the Barrick group, and have direct responsibility for managing all mineral resources, mineral reserves, mine planning, mine geology, evaluations, including associated technical studies spanning from preliminary economic assessments through to feasibility studies. I am also responsible for reviewing and approving all related public project disclosures by Barrick as the lead Qualified Person in accordance with National Instrument 43-101. |
| ● | Practical experience in development, construction and operational management of mine operations. |
| ● | Previously, held positions in exploration and mine geology across Africa, Central Asia, Russia and Australia. |
| 4. | I have read the definition of “qualified person” set out in National Instrument 43-101 (NI 43-101) and certify that by reason of my education, affiliation with a professional association (as defined in NI 43-101) and past relevant work experience, I fulfil the requirements to be a “qualified person” for the purposes of NI 43-101. |
| 5. | I visited the Lumwana Mine most recently from September 30 to October 3, 2024. |
| 6. | I am responsible for Sections 3, 4, 5, 6, 19, 21, 22, 23, and 24 and related disclosure in Sections 1, 2, and 25 to 27 of the Technical Report. |
| 7. | I am not independent of the Issuer applying the test set out in Section 1.5 of NI 43-101, as I have been a full-time employee of Barrick Gold Corporation (previously Randgold Resources Limited) since 2013. |
| 8. | I have had prior involvement with the property that is the subject of the Technical Report, with exploration programme results, Mineral Resource and grade control model updates, mine plans, |
|
February 19, 2025 |
Page 298 |
|
|
NI 43-101 Technical Report on the Lumwana Expansion Project |
|
| mining performance results and associated financials, mine strategy, results of external audits, and board meeting reviews. |
| 9. | I have read NI 43-101, and the sections of the Technical Report for which I am responsible have been prepared in compliance with NI 43-101 and Form 43-101F1. |
| 10. | At the effective date of the Technical Report, to the best of my knowledge, information, and belief the sections of the Technical Report for which I am responsible contain all scientific and technical information that is required to be disclosed to make the Technical Report not misleading. |
Dated this 19th day of February, 2025
(Signed) Simon P. Bottoms
Simon P. Bottoms, CGeol, MGeol, FGS, FAusIMM
|
February 19, 2025 |
Page 299 |
|
|
NI 43-101 Technical Report on the Lumwana Expansion Project |
|
| 29.2 | Richard Peattie |
I, Richard Peattie, M.Phil, FAusIMM, as an author of this report entitled “NI 43-101 Technical Report on the Lumwana Expansion Project, Republic of Zambia” with an effective date of December 31, 2024 and dated February 19, 2025, prepared for Barrick Gold Corporation, do hereby certify that:
| 1. | I am the Africa and Middle East Mineral Resource Manager with Barrick Gold Corporation, of 3rd Floor, Unity Chambers, 28 Halkett Street, St. Helier, Jersey, JE2 4WJ, Channel Islands. |
| 2. | I am a graduate of the University of Witwatersrand, South Africa, in 1993 with a Bachelors degree in Environmental Earth Science, and graduate of the University of Queensland, Australia in 2007 with a Master of Philosophy degree in Geostatistics |
| 3. | I am a Fellow of the Australasian Institute of Mining and Metallurgy (301029). I have worked as a geologist for a total of 27 years since my graduation. My relevant experience for the purpose of the Technical Report is: |
| ● | Leading Mineral Resource estimation, mine geology Mineral Reserve estimation and mine planning for all operations within the Barrick Africa & Middle East Region since 2022. Including evaluation of mine projects from preliminary economic assessments to pre-feasibility and feasibility studies across multi-commodity operations, spanning both underground and open pit production. |
| ● | Practical experience in development, construction and operational management of mine operations. |
| ● | Previously, held positions in exploration and mine geology across Africa. |
| 4. | I have read the definition of “qualified person” set out in National Instrument 43-101 (NI 43-101) and certify that by reason of my education, affiliation with a professional association (as defined in NI 43-101) and past relevant work experience, I fulfill the requirements to be a “qualified person” for the purposes of NI 43-101. |
| 5. | I visited the Lumwana Mine most recently from September 30 to October 3, 2024. |
| 6. | I am responsible for Sections 7 to 12 and 14 and related disclosure in related disclosure in Sections 1, 2, and 25 to 27 of the Technical Report. |
| 7. | I am not independent of the Issuer applying the test set out in Section 1.5 of NI 43-101, as I am a full-time employee of Barrick Gold Corporation. |
| 8. | I have had prior involvement with the property that is the subject of the Technical Report, with exploration programme results, Mineral Resource and grade control model updates, mine plans, mining performance results and associated financials, mine strategy, results of external audits, and board meeting reviews. I have read NI 43-101, and the Technical Report has been prepared in compliance with NI 43-101 and Form 43-101F1. |
|
February 19, 2025 |
Page 300 |
|
|
NI 43-101 Technical Report on the Lumwana Expansion Project |
|
| 9. | At the effective date of the Technical Report, to the best of my knowledge, information, and belief, the sections of the Technical Report for which I am responsible contain all scientific and technical information that is required to be disclosed to make the Technical Report not misleading. |
Dated this 19th day of February, 2025
(Signed) Richard Peattie
Richard Peattie, M.Phil, FAusIMM
|
February 19, 2025 |
Page 301 |
|
|
NI 43-101 Technical Report on the Lumwana Expansion Project |
|
| 29.3 | Derek Holm |
I, Derek Holm, FAusIMM, as an author of this report entitled “NI 43-101 Technical Report on the Lumwana Expansion Project, Republic of Zambia” with an effective date of December 31, 2024 and dated February 19, 2025 prepared for Barrick Gold Corporation, do hereby certify that:
| 1. | I am Planning Lead for Africa and Middle East with Barrick Gold Corporation, of 3rd Floor, Unity Chambers, 28 Halkett Street, St. Helier, Jersey, JE2 4WJ, Channel Islands. |
| 2. | I am a graduate of the University of Witwatersrand, South Africa, in 2000, with a B.Sc. (Honours) degree in Mining Engineering. |
| 3. | I am a Fellow of the Australian Institute of Mining and Metallurgy (3138099). I have worked as a mining engineer for a total of 24 years since my graduation. My relevant experience for the purpose of the Technical Report is: |
| ● | Numerous mine optimisations, designs, and schedules for open pit operations, including various Feasibility Study contributions and several Mineral Reserve estimates. |
| ● | Oversight of medium term and strategic planning work for various open pit operations, including Lumwana and other, prior, large operations. |
| ● | Various project contributions including production fleet and labour estimates, and mining costs. |
| 4. | I have read the definition of “qualified person” set out in National Instrument 43-101 (NI 43-101) and certify that by reason of my education, affiliation with a professional association (as defined in NI 43-101) and past relevant work experience, I fulfill the requirements to be a “qualified person” for the purposes of NI 43-101. |
| 5. | I visited the Lumwana Mine most recently from September 28 to October 3, 2024. |
| 6. | I am responsible for Sections 15 and 16 and related disclosure in Sections 1, 2, and 25 to 27 of the Technical Report. |
| 7. | I am not independent of the Issuer applying the test set out in Section 1.5 of NI 43-101, as I am a full-time employee of Barrick Gold Corporation. |
| 8. | I have had prior involvement with the property that is the subject of the Technical Report, with, mine plans, mining performance results and associated financials, mine strategy, results of external audits, and board meeting reviews. |
| 9. | I have read NI 43-101, and the Technical Report has been prepared in compliance with NI 43-101 and Form 43-101F1. |
| 10. | At the effective date of the Technical Report, to the best of my knowledge, information, and belief, the sections of the Technical Report for which I am responsible contain all scientific and technical information that is required to be disclosed to make the Technical Report not misleading. |
Dated this 19th day of February, 2025
(Signed) Derek Holm
Derek Holm, FAusIMM
|
February 19, 2025 |
Page 302 |
|
|
NI 43-101 Technical Report on the Lumwana Expansion Project |
|
| 29.4 | Marius Swanepoel |
I, Marius Swanepoel, Pr.Eng, as an author of this report entitled “Technical Report on the Lumwana Mine, North-Western Province, Republic of Zambia” with an effective date of December 31, 2024 and dated February 19, 2025 prepared for Barrick Gold Corporation, do hereby certify that:
| 1. | I am Head of Metallurgy, Africa Middle East (AME) with Barrick Gold Corporation, of 3rd Floor, Unity Chambers, 28 Halkett Street, St. Helier, Jersey, JE2 4WJ, Channel Islands. |
| 2. | I am a graduate of the University Pretoria, South Africa in 2001 with a Bachelor of Engineering degree in Extractive Metallurgy Engineering. |
| 3. | I am registered as a Professional Engineer with the Engineering Council of South Africa (20100471). I am also a Member of the Southern African Institute of Mining and Metallurgy (704701). I have worked as an engineer continuously for 23 years since my graduation from university. My relevant experience for the purpose of the Technical Report is: |
| ● | I am the regional lead executive for Metallurgy for the Barrick group, for Africa Middle East (AME) and have direct responsibility for managing all metallurgy, processing plants, and associated projects, including associated technical studies spanning from preliminary economic assessments through to feasibility studies. |
| ● | I am also responsible for reviewing and approving all related public project disclosures by Barrick as a Qualified Person in accordance with National Instrument 43-101. |
| ● | I am also the Accountable lead for Tailings Storage Facilities Barrick AME. |
| ● | Throughout my career, I have experience in designing, constructing and operating mines and facilities to treat geologically and metallurgically complex ore bodies. I have been highly focussed on geometallurgical assessments, design of processing plants and operational experience in gold and copper processing. I have extensive experience in the field of metallurgy beginning my career operationally with De Beers training and Mineral process engineer CTP Kimberley (3 years) as an Ore Dressing Studies Specialist at De Beers Debtech (3 years). I then founded and managed my own metallurgical consultancy firms (5 years), OreProx and GeMet. Subsequently, I served as Principal Process Engineer at TWP/Senet (9 years). More recently, I gained operational experience as Process Manager at the Jabal Sayid copper operation in Saudi Arabia (5 years). |
| 4. | I have read the definition of “qualified person” set out in National Instrument 43-101 (NI 43-101) and certify that by reason of my education, affiliation with a professional association (as defined in NI 43-101) and past relevant work experience, I fulfil the requirements to be a “qualified person” for the purposes of NI 43-101. |
| 5. | I visited the Lumwana Mine most recently from December 11 to December 16, 2024. |
| 6. | I am responsible for Sections 13, 17, and 18 and related disclosure in Sections 1, 2, and 25 to 27 of the Technical Report. |
| 7. | I am not independent of the Issuer applying the test set out in Section 1.5 of NI 43-101, as I have been a full-time employee of Barrick Gold Corporation and subsidiary Maaden Barrick Copper Corporation since 2019. |
|
February 19, 2025 |
Page 303 |
|
|
NI 43-101 Technical Report on the Lumwana Expansion Project |
|
| 8. | I have had prior involvement with the property that is the subject of the Technical Report with processing operations, recovery methods, metallurgical accounting audits, plant and infrastructure design reviews, and assessment of plant additions as well as board meeting reviews. |
| 9. | I have read NI 43-101, and the sections of the Technical Report for which I am responsible have been prepared in compliance with NI 43-101 and Form 43-101F1. |
| 10. | At the effective date of the Technical Report, to the best of my knowledge, information, and belief the sections of the Technical Report for which I am responsible contain all scientific and technical information that is required to be disclosed to make the Technical Report not misleading. |
Dated this 19th day of February, 2025
(Signed) Marius Swanepoel
Marius Swanepoel, Pr.Eng
|
February 19, 2025 |
Page 304 |
|
|
NI 43-101 Technical Report on the Lumwana Expansion Project |
|
| 29.5 | Graham E. Trusler |
I, Graham E. Trusler, MSc, Pr. Eng, MIChE, MSAIChE, as an author of this report entitled “NI 43-101 Technical Report on the Lumwana Expansion Project, Republic of Zambia” with an effective date of December 31, 2024 and dated February 19, 2025 prepared for Barrick Gold Corporation, do hereby certify that:
| 1. | I am CEO of Digby Wells Environmental Holdings Limited of Henwood House, Henwood, Ashford, Kent, TN24 8DH. |
| 2. | I am a graduate of the University of KwaZulu-Natal, South Africa in 1988 with a Master of Chemical Engineering degree. |
| 3. | I am registered as a Professional Engineer (920088) with the Engineering Council of South Africa. I am also registered as a Member of the Institution of Chemical Engineers (SAIChE) since 1994. I am also registered as a Chartered Chemical Engineer with the Institution of Chemical Engineers, as a Fellow of the Water Institute of South Africa, and a lifetime member of the American Society of Mining and Reclamation. I have worked as an engineer for a total of 34 years since my graduation. My relevant experience for the purpose of the Technical Report is: |
| ● | Over 30 years of experience within the mining industry in metallurgical production, research, and environmental issues. |
| ● | Working on environmental matters affecting the mining industry for more than 30 years. |
| ● | Having conducted numerous projects and managed processes related to the needs of numerous gold and copper mines. |
| 4. | I have read the definition of “qualified person” set out in National Instrument 43-101 (NI 43-101) and certify that by reason of my education, affiliation with a professional association (as defined in NI 43-101) and past relevant work experience, I fulfil the requirements to be a “qualified person” for the purposes of NI 43-101. |
| 5. | I visited the Lumwana Mine most recently from April 23 to April 28, 2024. |
| 6. | I am responsible for Section 20 and related disclosure in Sections 1, 2, and 25 to 27 of the Technical Report. |
| 7. | I am independent of the Issuer applying the test set out in Section 1.5 of NI 43-101. |
| 8. | I have had prior involvement with the property that is the subject of the Technical Report. As CEO of Digby Wells I have been involved with the property through Environmental and Social studies completed since 2020. |
| 9. | I have read NI 43-101, and the sections of the Technical Report for which I am responsible have been prepared in compliance with NI 43-101 and Form 43-101F1. |
|
February 19, 2025 |
Page 305 |
|
|
NI 43-101 Technical Report on the Lumwana Expansion Project |
|
| 10. | At the effective date of the Technical Report, to the best of my knowledge, information, and belief the Technical Report contains all scientific and technical information that is required to be disclosed to make the Technical Report not misleading. |
Dated this 19th day of February, 2024
(Signed) Graham E. Trusler
Graham E. Trusler, MSc, Pr. Eng, MIChE, MSAIChE
|
February 19, 2025 |
Page 306 |

