UNITED STATES
SECURITIES AND EXCHANGE COMMISSION
WASHINGTON, D.C. 20549
Form 6-K
REPORT OF FOREIGN PRIVATE ISSUER
PURSUANT TO RULE 13a-16 OR 15d-16
UNDER THE SECURITIES EXCHANGE ACT OF 1934
For the month of February 2025
Commission File Number: 1-9059
Barrick Gold Corporation
(Registrant’s name)
| Brookfield Place, TD Canada Trust Tower, Suite 3700 161 Bay Street, P.O. Box 212 Toronto, Ontario Canada M5J 2S1 (800) 720-7415 |
310 South Main Street Suite 1150 Salt Lake City, Utah 84101 (801) 990-3745 |
(Address of principal executive offices)
Indicate by check mark whether the registrant files or will file annual reports under cover of Form 20-F or Form 40-F.
Form 20-F ☐ Form 40-F ☒
SIGNATURES
Pursuant to the requirements of the Securities Exchange Act of 1934, the registrant has duly caused this report to be signed on its behalf by the undersigned, thereunto duly authorized.
| Date: February 19, 2025 | BARRICK GOLD CORPORATION | |||||
| By: | /s/ Poupak Bahamin |
|||||
| Name: | Poupak Bahamin | |||||
| Title: | General Counsel | |||||
EXHIBIT INDEX
| Exhibit | Description |
|
| 99.1 | NI 43-101 Technical Report on the Reko Diq Project, Balochistan, Pakistan |
Exhibit 99.1

NI 43-101 Technical Report on the Reko
Diq Project, Balochistan, Pakistan

February 19, 2025
Effective Date: December 31, 2024
Simon Bottoms, CGeol, FGS, FAusIMM
Peter Jones, MAIG
Mike Saarelainen, FAusIMM
Daniel Nel, MIMMM
David Morgan, MIEAust, CPEng, IntPE(Aus)
Ashley Price, FAusIMM
|
|
NI 43-101 Technical Report on the Reko Diq Project |
|
Cautionary Statement on Forward-Looking Information
This Technical Report contains forward-looking statements. All statements, other than statements of historical fact regarding Reko Diq Mining Company (Private) Limited (“RDMC”), Barrick Gold Corporation (“Barrick”), or the Reko Diq Project, are forward-looking statements. The words “believe”, “expect”, “anticipate”, “contemplate”, “target”, “plan”, “intend”, “project”, “continue”, “budget”, “estimate”, “potential”, “may”, “will”, “can”, “could” and similar expressions identify forward-looking statements. In particular, this Technical Report contains forward-looking statements with respect to: an economic analysis of the Reko Diq Project, including forecasted net present value, internal rate of return and cash flow forecasts; projected capital; operating and exploration expenditure; mine life and production rates; potential mineralization and metal or mineral recoveries; anticipated timelines and plans for project development, operation and closure; the ability and timeline to secure all relevant rights, licenses, permits and authorizations; RDMC’s strategy, plans, targets and goals in respect of environmental and social issues and sustainability matters; stakeholder engagement; the power strategy for the Reko Diq Project including renewable energy sources; sufficiency of infrastructure, systems and consultants and personnel; operating or technical challenges in connection with mining or development activities, including geotechnical challenges, tailings dam and storage facilities, and the maintenance or provision of required infrastructure and information technology systems; and information pertaining to potential improvements to financial and operating performance and mine life are necessarily based on opinions and estimates made as of the date such statements are made and are subject to important risk factors and uncertainties, many of which cannot be controlled or predicted. Material assumptions regarding forward-looking statements are discussed in this Technical Report, where applicable. In addition to such assumptions, the forward-looking statements are inherently subject to significant business, economic, political, security and competitive uncertainties, and contingencies. Known and unknown factors could cause actual results to differ materially from those projected in the forward-looking statements. Such factors include, but are not limited to: fluctuations in the spot and forward price of commodities (including gold, copper, diesel fuel, natural gas and electricity); the speculative nature of mineral exploration and development; risks associated with projects in the early stages of evaluation and development and for which additional technical, engineering and other analysis is required; disruption of supply routes which may cause delays in development, construction and mining activities; changes in mineral production performance, exploitation and exploration successes; diminishing quantities or grades of reserves; increased costs, delays, suspensions, and technical challenges associated with the construction of capital projects; operating or technical difficulties in connection with mining or development activities, including disruptions in the maintenance or provision of required infrastructure and information technology systems; damage to RDMC’s, or Barrick’s reputation due to the actual or perceived occurrence of any number of events, including negative publicity with respect to the handling of environmental matters or dealings with community groups, whether true or not; risk of loss due to acts of war, terrorism, sabotage and civil disturbances; uncertainty whether the Reko Diq Project will meet RDMC’s or Barrick’s capital allocation objectives; the impact of global liquidity and credit availability on the timing of cash flows and the values of assets and liabilities based on projected future cash flows; the impact of inflation; fluctuations in the currency markets; changes in interest rates; changes in national and local government legislation, taxation, controls or regulations and/or changes in the administration of laws, policies and practices; expropriation or nationalization of property and political or economic developments in the Islamic Republic of Pakistan or the Province of Balochistan; the possibility of political instability in the Islamic Republic of Pakistan or the Province of Balochistan; failure to comply with environmental and health and safety laws and regulations; timing of receipt of, or failure to comply with, necessary permits and approvals; lack of certainty with respect to foreign legal systems, corruption and other factors that are inconsistent with the rule of law; litigation; contests over title to properties or over access to water, power and other required infrastructure; increased costs and physical risks including extreme weather events and resource shortages, related to climate change; risks associated with working with partners in jointly controlled assets; and availability and increased costs associated with mining inputs and labour. In addition, there are risks and hazards associated with the business of mineral exploration, development, and mining, including environmental hazards, industrial accidents, unusual or unexpected formations, ground conditions, pressures, cave-ins, flooding and gold and copper ore losses (and the risk of inadequate insurance, or inability to obtain insurance, to cover these risks).
Many of these uncertainties and contingencies can affect RDMC’s actual results and could cause actual results to differ materially from those expressed or implied in any forward-looking statements made by, or on behalf of, RDMC. All of the forward-looking statements made in this Technical Report are qualified by these cautionary statements. RDMC, Barrick, and the Qualified Persons who authored this Technical Report undertake no obligation to update publicly or otherwise revise any forward-looking statements whether as a result of new information or future events or otherwise, except as may be required by law.
|
February 19, 2025 |
Page 2 |
|
|
NI 43-101 Technical Report on the Reko Diq Project |
|
Table of Contents
| 1 | Summary | 15 | ||||||
| 1.1 | Description, Location, and Ownership | 15 | ||||||
| 1.2 | Geology and Mineralisation | 16 | ||||||
| 1.3 | Exploration Status | 17 | ||||||
| 1.4 | Mineral Resource Estimate | 17 | ||||||
| 1.5 | Mineral Reserve Estimate | 20 | ||||||
| 1.6 | Mining Methods | 22 | ||||||
| 1.7 | Mineral Processing | 22 | ||||||
| 1.8 | Project Infrastructure | 23 | ||||||
| 1.9 | Market Studies and Contracts | 24 | ||||||
| 1.10 | Environmental, Permitting and Social Considerations | 24 | ||||||
| 1.11 | Capital and Operating Costs | 25 | ||||||
| 1.12 | Economic Analysis | 25 | ||||||
| 1.13 | Interpretations and Conclusions | 26 | ||||||
| 1.14 | Recommendations | 32 | ||||||
| 2 | Introduction | 34 | ||||||
| 2.1 | Effective Date | 36 | ||||||
| 2.2 | Qualified Persons | 36 | ||||||
| 2.3 | Site Visits of Qualified Persons | 37 | ||||||
| 2.4 | Information Sources | 37 | ||||||
| 2.5 | List of Abbreviations | 38 | ||||||
| 3 | Reliance on Other Experts | 39 | ||||||
| 4 | Property Description and Location | 40 | ||||||
| 4.1 | Project Location | 40 | ||||||
| 4.2 | Property Rights and Ownership | 42 | ||||||
| 4.3 | Royalties, Payments, and Other Obligations | 46 | ||||||
| 4.4 | Permits | 48 | ||||||
| 4.5 | Environmental Liabilities | 49 | ||||||
| 4.6 | QP Comment on Property Description and Location | 49 | ||||||
| 5 | Accessibility, Climate, Local Resources, Infrastructure and Physiography | 51 | ||||||
| 5.1 | Accessibility | 51 | ||||||
| 5.2 | Climate and Physiography | 51 | ||||||
|
February 19, 2025 |
Page 3 |
|
|
NI 43-101 Technical Report on the Reko Diq Project |
|
| 5.3 | Seismicity | 52 | ||||||
| 5.4 | Local Resources and Infrastructure | 52 | ||||||
| 5.5 | Sufficiency of Surface Rights | 52 | ||||||
| 6 |
History | 53 | ||||||
| 6.1 | Project Development | 53 | ||||||
| 6.2 | Previous Mineral Resources | 55 | ||||||
| 6.3 | Production History | 55 | ||||||
| 7 |
Geological Setting and Mineralization | 56 | ||||||
| 7.1 | Regional Geology | 56 | ||||||
| 7.2 | Structure | 57 | ||||||
| 7.3 | Local Geology | 58 | ||||||
| 7.4 | Property Geology | 60 | ||||||
| 7.5 | QP Comment on Geological Setting and Mineralization | 64 | ||||||
| 8 |
Deposit Types | 65 | ||||||
| 9 |
Exploration | 67 | ||||||
| 9.1 | Exploration Concept | 67 | ||||||
| 9.2 | BHP 1996 – 1997 | 67 | ||||||
| 9.3 | TCC 2000 – 2006 | 69 | ||||||
| 9.4 | TCC 2006 -2010 | 69 | ||||||
| 9.5 | TCC 2010 – 2022 | 70 | ||||||
| 9.6 | RDMC Post 2022 | 70 | ||||||
| 9.7 | Exploration Potential | 71 | ||||||
| 9.8 | QP Comment on Exploration | 72 | ||||||
| 10 |
Drilling | 73 | ||||||
| 10.1 | Drilling Summary | 73 | ||||||
| 10.2 | Drill Methods | 74 | ||||||
| 10.3 | Collar Surveys | 81 | ||||||
| 10.4 | Down Hole Surveys | 81 | ||||||
| 10.5 | Drill Planning | 82 | ||||||
| 10.6 | Internal and External Audits | 82 | ||||||
| 10.7 | QP Comments on Drilling | 87 | ||||||
| 11 |
Sample Preparation, Analyses and Security | 88 | ||||||
| 11.1 | Sample Analysis | 90 | ||||||
| 11.2 | Sample Security | 92 | ||||||
|
February 19, 2025 |
Page 4 |
|
|
NI 43-101 Technical Report on the Reko Diq Project |
|
| 11.3 | Quality Assurance and Quality Control | 92 | ||||||
| 11.4 | QP Comments on Sample Preparation, Analyses, and Security | 105 | ||||||
| 12 | Data Verification | 106 | ||||||
| 12.1 | Internal Reviews and Audits | 106 | ||||||
| 12.2 | External Reviews and Audits | 107 | ||||||
| 12.3 | QP Comments on Data Verification | 108 | ||||||
| 13 | Mineral Processing and Metallurgical Testing | 109 | ||||||
| 13.1 | Metallurgical Testwork | 109 | ||||||
| 13.2 | Metallurgical Projections | 119 | ||||||
| 13.3 | Blending | 124 | ||||||
| 13.4 | QP Comments on Mineral Processing and Metallurgical Testing | 125 | ||||||
| 14 | Mineral Resource Estimate | 126 | ||||||
| 14.1 | Introduction | 126 | ||||||
| 14.2 | Resource Database | 126 | ||||||
| 14.3 | Area of Mineral Resources | 127 | ||||||
| 14.4 | Western Porphyries | 128 | ||||||
| 14.5 | Tanjeel | 161 | ||||||
| 14.6 | Resource Classification | 177 | ||||||
| 14.7 | Resource Reporting | 180 | ||||||
| 14.8 | Mineral Resource Statement | 183 | ||||||
| 14.9 | 2024 Versus 2022 Model Comparison | 185 | ||||||
| 14.10 | QP Comments on Mineral Resource Estimate | 186 | ||||||
| 15 | Mineral Reserve Estimate | 187 | ||||||
| 15.1 | Summary | 188 | ||||||
| 15.2 | Mineral Reserves Estimation Process | 189 | ||||||
| 15.3 | Open Pit Optimization | 189 | ||||||
| 15.4 | Sensitivities | 200 | ||||||
| 15.5 | Reconciliation | 201 | ||||||
| 15.6 | Mineral Reserve Statement | 202 | ||||||
| 15.7 | QP Comments on Mineral Reserve Estimate | 205 | ||||||
| 16 | Mining Methods | 206 | ||||||
| 16.1 | Mining Methods | 206 | ||||||
| 16.2 | Geotechnical and Hydrogeological Considerations | 207 | ||||||
| 16.3 | Mine Design | 212 | ||||||
|
February 19, 2025 |
Page 5 |
|
|
NI 43-101 Technical Report on the Reko Diq Project |
|
| 16.4 | Mining Equipment | 231 | ||||||
| 16.5 | Mining Workforce | 232 | ||||||
| 16.6 | LOM Production Schedule | 233 | ||||||
| 16.7 | QP Comments on Mining Methods | 237 | ||||||
| 17 |
Recovery Methods | 238 | ||||||
| 17.1 | Design Basis | 238 | ||||||
| 17.2 | Process Plant Description | 240 | ||||||
| 17.3 | Power, Water, and Process Reagents Requirements | 246 | ||||||
| 17.4 | QP Comments on Recovery Methods | 248 | ||||||
| 18 |
Project Infrastructure | 249 | ||||||
| 18.1 | Overview | 249 | ||||||
| 18.2 | Logistical Infrastructure | 251 | ||||||
| 18.3 | Power Supply | 254 | ||||||
| 18.4 | Water Supply | 256 | ||||||
| 18.5 | Water Management | 258 | ||||||
| 18.6 | Site Common Purpose Infrastructure | 261 | ||||||
| 18.7 | Tailings Storage Facilities | 268 | ||||||
| 18.8 | Waste Rock Storage | 274 | ||||||
| 18.9 | Stockpiles | 275 | ||||||
| 18.10 | QP Comments on Project Infrastructure | 275 | ||||||
| 19 |
Market Studies and Contracts | 276 | ||||||
| 19.1 | Market Studies | 276 | ||||||
| 19.2 | Reko Diq Concentrates | 277 | ||||||
| 19.3 | Commodity Price Assumptions | 277 | ||||||
| 19.4 | Contracts | 278 | ||||||
| 19.5 | QP Comment on Market Studies and Contracts | 278 | ||||||
| 20 |
Environmental Studies, Permitting, and Social or Community Impact | 279 | ||||||
| 20.1 | Summary | 279 | ||||||
| 20.2 | Environmental Assessment and Studies | 280 | ||||||
| 20.3 | Environmental Considerations | 283 | ||||||
| 20.4 | Permitting | 287 | ||||||
| 20.5 | Social and Community Requirements | 288 | ||||||
| 20.6 | Mine Closure and Reclamation | 292 | ||||||
| 20.7 | Environmental and Social Related Risks | 294 | ||||||
|
February 19, 2025 |
Page 6 |
|
|
NI 43-101 Technical Report on the Reko Diq Project |
|
| 20.8 | QP Comments on Environmental and Social | 295 | ||||||
| 21 | Capital and Operating Costs | 296 | ||||||
| 21.1 | Basis and Sources of Cost Estimates | 296 | ||||||
| 21.2 | Capital Costs | 296 | ||||||
| 21.3 | Operating Costs | 299 | ||||||
| 21.4 | QP Comments on Capital and Operating Costs | 300 | ||||||
| 22 | Economic Analysis | 301 | ||||||
| 22.1 | Assumptions and Inputs | 301 | ||||||
| 22.2 | Taxes and Royalties | 302 | ||||||
| 22.3 | Financial Model Summary | 303 | ||||||
| 22.4 | Sensitivity | 312 | ||||||
| 22.5 | QP Comments on Economic Analysis | 314 | ||||||
| 23 | Adjacent Properties | 315 | ||||||
| 24 | Other Relevant Data and Information | 316 | ||||||
| 25 | Interpretation and Conclusions | 317 | ||||||
| 25.1 | Mineral Tenure, Rights, Royalties and Agreements | 317 | ||||||
| 25.2 | Geology and Mineral Resources | 317 | ||||||
| 25.3 | Mining and Mineral Reserves | 318 | ||||||
| 25.4 | Mineral Processing | 318 | ||||||
| 25.5 | Infrastructure | 319 | ||||||
| 25.6 | Environment and Social Aspects | 319 | ||||||
| 25.7 | Market Studies and Contracts | 319 | ||||||
| 25.8 | Capital and Operating Costs | 320 | ||||||
| 25.9 | Project Economics | 320 | ||||||
| 25.10 | Risks | 321 | ||||||
| 26 | Recommendations | 324 | ||||||
| 26.1 | Mineral Tenure, Rights, Royalties and Agreements | 324 | ||||||
| 26.2 | Geology and Mineral Resources | 324 | ||||||
| 26.3 | Mining and Mineral Reserves | 324 | ||||||
| 26.4 | Mineral Processing | 325 | ||||||
| 26.5 | Infrastructure | 325 | ||||||
| 26.6 | Environmental, Permitting, and Social Aspects | 325 | ||||||
| 26.7 | Market Studies and Contracts | 325 | ||||||
| 26.8 | Capital and Operating Costs | 326 | ||||||
|
February 19, 2025 |
Page 7 |
|
|
NI 43-101 Technical Report on the Reko Diq Project |
|
| 26.9 | Risks | 326 | ||||||
| 27 | References | 327 | ||||||
| 28 | Date and Signature Page | 329 | ||||||
| 29 | Certificates of Qualified Persons | 331 | ||||||
| 29.1 | Simon Bottoms | 331 | ||||||
| 29.2 | Peter Jones | 333 | ||||||
| 29.3 | Mike Saarelainen | 335 | ||||||
| 29.4 | Daniel Nel | 337 | ||||||
| 29.5 | David Morgan | 339 | ||||||
| 29.6 | Ashley Price | 341 | ||||||
|
February 19, 2025 |
Page 8 |
|
|
NI 43-101 Technical Report on the Reko Diq Project |
|
List of Tables
| Table 1-1 |
Reko Diq Mineral Resources Summary, 100% Basis, as of December 31, 2024 |
19 | ||||
| Table 1-2 |
Reko Diq Mineral Reserves Statement, December 31, 2024 |
21 | ||||
| Table 1-3 |
Copper Price Impact on Free Cash, NPV8, IRR and Payback Period |
26 | ||||
| Table 1-4 |
Risk Analysis Summary |
30 | ||||
| Table 2-1 |
QP Responsibilities |
36 | ||||
| Table 2-2 |
Table of Abbreviations |
38 | ||||
| Table 4-1 |
Mining Leases Details |
43 | ||||
| Table 4-2 |
Mining Leases Coordinates |
43 | ||||
| Table 4-3 |
Exportation License Coordinates |
44 | ||||
| Table 4-4 |
Surface Lease Coordinates |
46 | ||||
| Table 4-5 |
Summary of Taxes and Other Obligations |
47 | ||||
| Table 6-1 |
Reko Diq Development History |
53 | ||||
| Table 10-1 |
Tabulation of Drilling by Year and Area |
73 | ||||
| Table 10-2 |
Downhole Survey Methods by Drilling Type |
81 | ||||
| Table 10-3 |
Twin Hole Analysis - Copper, 15m Bench Composites |
84 | ||||
| Table 10-4 |
Twin Hole Analysis - Gold, 15m Bench Composite |
86 | ||||
| Table 11-1 |
Rotary Divider Set-up |
90 | ||||
| Table 11-2 |
CRM’s Utilized in the 2003 to 2009 Exploration |
94 | ||||
| Table 11-3 |
Summary of CRM, by Types by Assay Method and Laboratory |
95 | ||||
| Table 11-4 |
In-House CRM Values and Parameters |
96 | ||||
| Table 11-5 |
Summary Results of In-House CRM’s |
98 | ||||
| Table 11-6 |
Statistics for Field Blanks Results Reported by ALS |
99 | ||||
| Table 11-7 |
Drill campaigns 1996-1997 and 2003-2009: Field Duplicates Summary Results |
101 | ||||
| Table 11-8 |
Summary of Umpire Sampling program (2003-2009) |
105 | ||||
| Table 13-1 |
Metallurgical Testwork Samples |
109 | ||||
| Table 13-2 |
Metallurgical Testwork Summary |
110 | ||||
| Table 13-3 |
Ore Properties for Comminution Circuit Design |
116 | ||||
| Table 13-4 |
Key Criteria Derived from Testwork |
118 | ||||
| Table 13-5 |
Metso HSC Sim Metal Plan Simulation Results |
122 | ||||
| Table 13-6 |
Expected Elemental and Chemical Grade of Final Concentrate |
124 | ||||
| Table 14-1 |
Drill Summary by Company and Year at the Western Porphyries and Tanjeel |
127 | ||||
| Table 14-2 |
Lithological Units and Grouping Applied |
130 | ||||
| Table 14-3 |
Hydrothermal Alteration Assemblages, Mineralogy and Codes |
131 | ||||
| Table 14-4 |
Univariate Statistics for Cu (%) by Lithology |
133 | ||||
| Table 14-5 |
Univariate Statistics for Cu % Assays by Alteration Codes |
134 | ||||
| Table 14-6 |
Univariate Statistics for Assay Au Grades (g/t) by Lithology |
135 | ||||
| Table 14-7 |
Univariate Statistics for Au (g/t) Assays by Alteration Codes |
136 | ||||
| Table 14-8 |
Metals Correlations |
136 | ||||
| Table 14-9 |
Copper and Gold Domains by Lithology and Alteration Code |
137 | ||||
| Table 14-10 |
Univariate Statistics - Density by Lithology |
139 | ||||
| Table 14-11 |
Boundary Types for Copper |
140 | ||||
| Table 14-12 |
Boundary Types for Gold |
140 | ||||
| Table 14-13 |
Copper High-Grade Cut Per Domain |
141 | ||||
| Table 14-14 |
Gold High-Grade Cut Per Domain |
142 | ||||
| Table 14-15 |
Variogram Models for Copper Domains |
143 | ||||
| Table 14-16 |
Modelled Correlograms |
145 | ||||
| Table 14-17 |
Block Model Geometric Parameters |
146 | ||||
| Table 14-18 |
Seach Ellipse Parameters Per Domain |
148 | ||||
| Table 14-19 |
Gold Estimate - First Pass Estimation parameters |
149 |
|
February 19, 2025 |
Page 9 |
|
|
NI 43-101 Technical Report on the Reko Diq Project |
|
| Table 14-20 |
Comparison of OK. IDW and NN estimates - Copper |
150 | ||||
| Table 14-21 |
Comparison of OK, IDW and NN Estimates - Gold |
150 | ||||
| Table 14-22 |
Univariate Statistics - S and S2 Assays |
156 | ||||
| Table 14-23 |
Partition Analysis - Total and Sulfide Sulfur |
159 | ||||
| Table 14-24 |
Univariate Statistics - Total Sulfur by Domain |
160 | ||||
| Table 14-25 |
Univariate Statistics - Sulfide Sulfur by Domain |
160 | ||||
| Table 14-26 |
S/S2 Regression Formulas |
160 | ||||
| Table 14-27 |
S Estimation Parameters |
160 | ||||
| Table 14-28 |
Lithological Grouping for Tanjeel |
162 | ||||
| Table 14-29 |
Hydrothermal Alteration Assemblages, Mineralogy and Codes |
164 | ||||
| Table 14-30 |
Initial Mineral Zone Model |
165 | ||||
| Table 14-31 |
Univariate Statistics for Cu % |
166 | ||||
| Table 14-32 |
Univariate Statistics - S and S2 Assays |
167 | ||||
| Table 14-33 |
Univariate Statistics by Lithology |
168 | ||||
| Table 14-34 |
Boundary Types for Copper |
169 | ||||
| Table 14-35 |
Copper High-Grade Cut Applied Per Domain |
171 | ||||
| Table 14-36 |
Variogram Models for Copper Domains |
172 | ||||
| Table 14-37 |
Block Model Parameters |
173 | ||||
| Table 14-38 |
Seach Ellipse Parameters Per Domain |
173 | ||||
| Table 14-39 |
Multipliers for CuCN Estimation in Un-estimated Blocks |
174 | ||||
| Table 14-40 |
Estimation Parameters for Copper and Cyanide Soluble Copper |
174 | ||||
| Table 14-41 |
Comparison of OK. IDW and NN estimates – Copper |
175 | ||||
| Table 14-42 |
Estimation Parameters for Total Sulphur and Co-estimated Sulphide Sulphur |
176 | ||||
| Table 14-43 |
Total and Sulphide Sulphur Assigned Values |
177 | ||||
| Table 14-44 |
Mineral Resources Classification Criteria |
177 | ||||
| Table 14-45 |
Pit Optimization and NSR Input Parameters |
180 | ||||
| Table 14-46 |
Reko Diq Mineral Resources Statement, 100% Basis, as of December 31, 2024 |
184 | ||||
| Table 15-1 |
Pit Optimization and NSR Input Parameters |
190 | ||||
| Table 15-2 |
Metal Prices for Pit Optimization |
191 | ||||
| Table 15-3 |
Western Porphyries Metal Recoveries and Cu Concentrate Grade |
193 | ||||
| Table 15-4 |
Tanjeel Metal Recoveries and Cu Concentrate Grade |
194 | ||||
| Table 15-5 |
Open Pit Overall Slope Angles for Whittle |
194 | ||||
| Table 15-6 |
Sustaining Capital |
195 | ||||
| Table 15-7 |
Offsite Concentrate Costs |
196 | ||||
| Table 15-8 |
Royalties |
196 | ||||
| Table 15-9 |
Taxes on Operating Costs for Pit Optimization |
196 | ||||
| Table 15-10 |
Mine Closure Cost |
196 | ||||
| Table 15-11 |
Operating Costs for Pit Optimization |
197 | ||||
| Table 15-12 |
Whittle Pit Shell Results – Western Porphyries |
198 | ||||
| Table 15-13 |
Whittle Pit Shell Results – Tanjeel Porphyries |
199 | ||||
| Table 15-14 |
Reko Diq Mineral Reserves Statement, December 31, 2024 |
204 | ||||
| Table 16-1 |
Summary of RMR89 Data for Western Porphyries Rock Mass Units |
208 | ||||
| Table 16-2 |
Reko Diq Western Porphyries FS Slope Design Base Case |
209 | ||||
| Table 16-3 |
Reko Diq Tanjeel FS Slope Design Base Case |
210 | ||||
| Table 16-4 |
Estimated Groundwater Ingress into Western Porphyries and Tanjeel Pits |
211 | ||||
| Table 16-5 |
WP Ultimate Pit Design and Whittle Shell Comparison |
214 | ||||
| Table 16-6 |
Western Porphyries Phase Design Volumetrics |
216 | ||||
| Table 16-7 |
Tanjeel Ultimate Pit Design and Whittle Shell Comparison |
219 | ||||
| Table 16-8 |
Tanjeel Phase Design Volumetrics |
219 | ||||
| Table 16-9 |
Waste Rock Classification |
222 | ||||
| Table 16-10 |
Ultimate Pit by Waste Classification |
223 |
|
February 19, 2025 |
Page 10 |
|
|
NI 43-101 Technical Report on the Reko Diq Project |
|
| Table 16-11 |
Destinations for Waste Materials |
223 | ||||
| Table 16-12 |
Waste Totals by Type and Destination |
223 | ||||
| Table 16-13 |
Waste Dump & Stockpile Design Parameters |
225 | ||||
| Table 16-14 |
Waste Dump Design Capacity |
225 | ||||
| Table 16-15 |
North Waste Dump Design Volume |
226 | ||||
| Table 16-16 |
South Waste Dump Design Volume |
227 | ||||
| Table 16-17 |
Tanjeel Waste Dump Design Volume |
228 | ||||
| Table 16-18 |
Stockpile Design Capacities |
229 | ||||
| Table 16-19 |
Fleet Requirements for Reko Diq |
232 | ||||
| Table 16-20 |
Peak Mining Workforce Numbers |
233 | ||||
| Table 16-21 |
LOM Mine and Plant Feed Schedule |
236 | ||||
| Table 17-1 |
Key Design Criteria |
239 | ||||
| Table 17-2 |
Primary Equipment |
242 | ||||
| Table 17-3 |
Phase 1 Reagent Requirements |
248 | ||||
| Table 18-1 |
Rail Project Rolling Stock Key Requirements |
252 | ||||
| Table 18-2 |
Reko Diq Power Demand Summary |
255 | ||||
| Table 18-3 |
Raw Water Demand – Phase 1 Production |
258 | ||||
| Table 21-1 |
Capital Cost Estimate Summary |
296 | ||||
| Table 21-2 |
Initial and Expansion Project Capital Expenditure Summary |
297 | ||||
| Table 21-3 |
Sustaining Capital Expenditure Summary |
298 | ||||
| Table 21-4 |
Operating Costs Summary |
299 | ||||
| Table 22-1 |
Estimated Tax Payable |
302 | ||||
| Table 22-2 |
Reko Diq Project Case Financial Model Summary |
305 | ||||
| Table 22-3 |
Annual Cashflow Summary - Feasibility Study Case |
306 | ||||
| Table 22-4 |
Annual Cashflow Summary - Reserve Case |
309 | ||||
| Table 22-5 |
Copper Price Impact on Free Cash, NPV8, IRR and Payback Period |
312 | ||||
| Table 25-1 |
Risk Analysis Summary |
322 |
|
February 19, 2025 |
Page 11 |
|
|
NI 43-101 Technical Report on the Reko Diq Project |
|
List of Figures
| Figure 1-1 |
On-site Infrastructure |
24 | ||||
| Figure 2-1 |
Holding Structure of the Reko Diq Project |
35 | ||||
| Figure 4-1 |
Property Location |
41 | ||||
| Figure 4-2 |
Reko Diq Mining Company Leases |
45 | ||||
| Figure 6-1 |
Tabulation of Drilling by Year and Company |
55 | ||||
| Figure 7-1 |
Regional Geology and Structure of Chagai Belt |
57 | ||||
| Figure 7-2 |
Location of Porphyry Surface Expressions in the Reko Diq Area |
58 | ||||
| Figure 7-3 |
Regional Chagai Stratigraphy |
59 | ||||
| Figure 7-4 |
Local Geology Surface Map |
60 | ||||
| Figure 7-5 |
Host Rocks to Chagai Belt Porphyry Cu Systems |
62 | ||||
| Figure 8-1 |
Conceptual Porphyry Cu-Au Deposit Model |
66 | ||||
| Figure 9-1 |
Satellite Image with Sediment Sampling Results for Gold and Copper |
68 | ||||
| Figure 9-2 |
Plan view of the Reko Diq Velocity Model at N900 m depth, |
71 | ||||
| Figure 10-1 |
Typical Drilling Cross Sections – Western Porphyries (Top), Tanjeel (Bottom) |
74 | ||||
| Figure 10-2 |
Plan of Drilling Locations |
75 | ||||
| Figure 10-3 |
Flow Chart Summary of RC Sample Preparation |
79 | ||||
| Figure 10-4 |
Location of Twinned Holes within 10-year Mining Pit |
83 | ||||
| Figure 10-5 |
Scatter Plot of Copper Grades |
85 | ||||
| Figure 10-6 |
Scatter Plot of Gold Grades |
87 | ||||
| Figure 11-1 |
Diamond Drill Core and Reverse Circulation Sample Flowchart |
89 | ||||
| Figure 11-2 |
Example of Commercial CRM Graph |
96 | ||||
| Figure 11-3 |
Example of In-House Standard Graph |
99 | ||||
| Figure 11-4 |
Blank Assays Results |
100 | ||||
| Figure 11-5 |
ANALABS Duplicate Plots 1996-1997 Au assays (Left), Cu Assay (Right) |
101 | ||||
| Figure 11-6 |
2003 to 2010 ALS Duplicates Au (left), Cu (Right) |
102 | ||||
| Figure 11-7 |
2003 to 2010 SGS-KAR Duplicates Au (left), Cu (Right) |
102 | ||||
| Figure 11-8 |
Re-assayed Pulps Location and 10-year Mining Pit |
103 | ||||
| Figure 11-9 |
Scatter Plots Cu (Top) Au (Bottom) of Grades in Historic and Re-assayed Pulps |
104 | ||||
| Figure 13-1 |
Isometric View of the Zone 2 (Left) and Zone 3 (right) composite Holes |
113 | ||||
| Figure 13-2 |
Isometric View H4 Composite Sample |
113 | ||||
| Figure 13-3 |
Spatial Distribution of All of the Metallurgical Samples (Isometric View), Western Porphyries (Top) and Tanjeel (Bottom) |
114 | ||||
| Figure 13-4 |
Rougher Mass Pull as a Function of Cu:S2- Ratio |
119 | ||||
| Figure 13-5 |
Units of copper recovered as a function of copper head grade |
120 | ||||
| Figure 13-6 |
Copper Concentrate Grade as a function of Cu:S2- Ratio |
121 | ||||
| Figure 13-7 |
Simulation Results: Rougher Mass Pull Over LOM |
122 | ||||
| Figure 13-8 |
Simulation Results: Metal Recovery Over LOM |
123 | ||||
| Figure 13-9 |
Simulation Results: Final Cu Concentrate Grade and Mass Pull Over LOM |
123 | ||||
| Figure 14-1 |
Location of the Resource Areas |
128 | ||||
| Figure 14-2 |
General Plan- Interpreted Faults and Drilling Data |
129 | ||||
| Figure 14-3 |
Lithology Model and Drilling Cross Section (+/-50m) |
130 | ||||
| Figure 14-4 |
Alteration Model and Drilling Cross Section (+/-50m) |
131 | ||||
| Figure 14-5 |
Oblique View Looking Northeast – Density Determinations |
138 | ||||
| Figure 14-6 |
Histogram of Raw Density |
138 | ||||
| Figure 14-7 |
Example Variogram Model (Domain: pfb1_scc_in) |
144 | ||||
| Figure 14-8 |
Example Sage Output (Domain: volc_pot_in) |
145 | ||||
| Figure 14-9 |
Example Planes through Ellipsoids (Domain: pfb_2_3_in) |
146 | ||||
| Figure 14-10 |
Left: Plan View LVA Input Meshes. Right: Block Model Slice LVA at Block Scale |
147 | ||||
| Figure 14-11 |
Copper Block Estimates |
151 |
|
February 19, 2025 |
Page 12 |
|
|
NI 43-101 Technical Report on the Reko Diq Project |
|
| Figure 14-12 |
Gold distribution in Block Model and composites |
152 | ||||
| Figure 14-13 |
Example Copper Estimate Swath Plots |
153 | ||||
| Figure 14-14 |
Example Gold Swath Plots |
154 | ||||
| Figure 14-15 |
Tonnage-Grade and Change of Support Curves (Top Cu, Bottom Au) |
155 | ||||
| Figure 14-16 |
Pass Percentage by Domain |
156 | ||||
| Figure 14-17 |
Oblique View - Sulfur (Top) and Sulphide (Right) Assays |
157 | ||||
| Figure 14-18 |
Plan View - Logged Pyrite (Top) and Chalcopyrite (Bottom) |
158 | ||||
| Figure 14-19 |
Partition Analysis - Sulfide Sulfur (Left), Total Sulfur (Right) |
159 | ||||
| Figure 14-20 |
Example Structural Plan View |
162 | ||||
| Figure 14-21 |
Lithology Plan View |
163 | ||||
| Figure 14-22 |
Lithology Model and Drilling Vertical Section (+/-50 m) |
163 | ||||
| Figure 14-23 |
Typical Alteration Cross-Section |
164 | ||||
| Figure 14-24 |
Tanjeel Min Zone Model Section |
165 | ||||
| Figure 14-25 |
Top Left – TCu (%), Top Right – CSCu (%), Bottom – ASCu (%) |
166 | ||||
| Figure 14-26 |
Plan View – Total Sulfur (%) |
167 | ||||
| Figure 14-27 |
Oblique View Showing Density Determinations |
168 | ||||
| Figure 14-28 |
Histogram of Raw Density |
169 | ||||
| Figure 14-29 |
Example Contact Analysis Plot |
170 | ||||
| Figure 14-30 |
Probability Plots for Supergene High Grade (left), Supergene Low Grade (middle)and Hypogene (right) |
171 | ||||
| Figure 14-31 |
Example Variogram Model (Domain pfb1_scc_in as shown in purple) |
172 | ||||
| Figure 14-32 |
Pass Percentage by Domain |
174 | ||||
| Figure 14-33 |
Example Copper Estimates Swath Plots |
176 | ||||
| Figure 14-34 |
Mineral Resource Classification – Western Porphyries |
178 | ||||
| Figure 14-35 |
Mineral Classification - Tanjeel |
179 | ||||
| Figure 14-36 |
Section Views through H14 of Resource Pit and Copper Distribution in WP |
181 | ||||
| Figure 14-37 |
Section Views of Resource Pit and Copper Distribution in Tanjeel |
182 | ||||
| Figure 14-38 |
Comparison of 2022 and 2024 Western Porphyries models |
185 | ||||
| Figure 14-39 |
Comparison of 2022 and 2024 Tanjeel models |
186 | ||||
| Figure 15-1 |
WP Pit Shell Contained Metal by Revenue Factor |
198 | ||||
| Figure 15-2 |
Tanjeel Pit Shell Contained Metal by Revenue Factor |
199 | ||||
| Figure 15-3 |
WP Pit Shell Sensitivity to Economic Inputs – Cu Mt (Left), Au Moz (Right) |
201 | ||||
| Figure 15-4 |
Tanjeel Pit Shell Sensitivity to Economic Inputs – Cu Mt |
201 | ||||
| Figure 16-1 |
Diversion Concept for the Pit (2032) |
212 | ||||
| Figure 16-2 |
Typical Dual Haulage Ramp Cross-Section |
213 | ||||
| Figure 16-3 |
WP Ultimate Pit Design |
215 | ||||
| Figure 16-4 |
Western Porphyries Phase Designs |
217 | ||||
| Figure 16-5 |
Tanjeel Ultimate Pit Design |
218 | ||||
| Figure 16-6 |
Tanjeel Phase Designs |
220 | ||||
| Figure 16-7 |
Site Waste Dump and Stockpile Layout |
221 | ||||
| Figure 16-8 |
North Waste Dump Design |
226 | ||||
| Figure 16-9 |
South Waste Dump Design |
227 | ||||
| Figure 16-10 |
Tanjeel Waste Dump Design |
228 | ||||
| Figure 16-11 |
Western Porphyries Stockpile Layout |
230 | ||||
| Figure 16-12 |
Tanjeel Stockpile Layout |
230 | ||||
| Figure 16-13 |
LOM Production Schedule – Mined Tonnes |
235 | ||||
| Figure 16-14 |
LOM Production Schedule – Mill Feed Tonnes |
235 | ||||
| Figure 17-1 |
Block Flow Diagram – Reko Diq Process Plant |
241 | ||||
| Figure 18-1 |
Regional Logistical Infrastructure |
249 | ||||
| Figure 18-2 |
On-Site Infrastructure |
250 | ||||
| Figure 18-3 |
PIBT Option |
254 |
|
February 19, 2025 |
Page 13 |
|
|
NI 43-101 Technical Report on the Reko Diq Project |
|
| Figure 18-4 |
Water NOC Location Plan |
257 | ||||
| Figure 18-5 |
Basic Flow Diagram Outlining Main Flows and Planned Water Infrastructure |
260 | ||||
| Figure 18-6 |
Potential Tailings Storage Sites |
269 | ||||
| Figure 18-7 |
TSF Stage 1 (Left) and TSF Stage Final (Right) General Arrangement |
272 | ||||
| Figure 18-8 |
RF1 and RF2 - Typical Embankment Cross-Sections |
272 | ||||
| Figure 18-9 |
Cleaner TSF Stage 1 and TSF Stage Final (Right) General Arrangement |
273 | ||||
| Figure 18-10 |
Cleaner TSF Typical Embankment Cross-Sections |
273 | ||||
| Figure 22-1 |
Copper Price Impact on Post Tax Cash Flow (Undiscounted) |
304 | ||||
| Figure 22-2 |
Sensitivity Chart: NPV8 |
313 | ||||
| Figure 22-3 |
Sensitivity Chart: IRR |
313 |
|
February 19, 2025 |
Page 14 |
|
|
NI 43-101 Technical Report on the Reko Diq Project |
|
| 1 | Summary |
This Technical Report on the Reko Diq Project (the Project), located in the Balochistan Province of Pakistan has been prepared by Barrick Gold Corporation (Barrick). The purpose of this Technical Report is to support public disclosure of Mineral Resource, maiden Mineral Reserve estimate and a Feasibility Study at the Project as of December 31, 2024.
Barrick is a Canadian publicly traded mining company with a portfolio of operating mines and advanced exploration and development projects. Barrick is the issuer of this Technical Report and indirectly owns 50% of the Project, and is the operator on behalf of Reko Diq Mining Company (Private) Limited (RDMC).
The recently completed Feasibility Study details two phases of project development:
| ● | Phase 1 – Initial throughput of 45 Mtpa of ore that commences production in 2028; and |
| ● | Phase 2 – Expansion to a total throughput of 90 Mtpa that is planned to occur from 2034 onwards. |
The Project will comprise of two open pit mines, the main open pit at Western Porphyries and a satellite pit at Tanjeel, and a processing plant, together with other associated mine operation and regional infrastructure. The Project will produce copper concentrate which includes gold for smelting by third-party operated smelters.
All costs presented in this document are in USD (US$ or $) unless otherwise noted.
| 1.1 | Description, Location, and Ownership |
| 1.1.1 | Location |
The Project is located in the north-western corner of the Balochistan Province of Pakistan (Figure 4-1). Balochistan borders Iran to the west, Afghanistan to the north, the Punjab and Sindh Provinces of Pakistan to the east, and the Arabian Sea to the south. The population of Balochistan is approximately 6.5 million people and the capital city is Quetta.
| 1.1.2 | Ownership |
RDMC is indirectly owned 50% by Barrick and 50% by Pakistani stakeholders.
|
February 19, 2025 |
Page 15 |
|
|
NI 43-101 Technical Report on the Reko Diq Project |
|
Barrick is a Canadian publicly traded gold and copper mining company with a portfolio of operating mines and projects across North America, Africa, South America, and Asia.
The 50% Pakistan stakeholder interests comprise a 10% free-carried, non-contributing share held directly by the Government of Balochistan (the GoB), an additional 15% held by the GoB indirectly through Balochistan Mineral Resources Limited (BMRL) a special purpose company wholly owned by the GoB and 25% indirectly owned by the Government of Pakistan (the GoP) through three Pakistani state-owned enterprises (the SOEs), Oil & Gas Development Company Limited (OGDCL), Government Holdings (Private) Ltd. (GHPL) and Pakistan Petroleum Ltd. (PPL). The SOEs hold their interests (in equal thirds) through Pakistan Minerals (Private) Ltd. (PMPL).
| 1.1.3 | History |
Several companies have held interests in the Project since 1996 with approximately 360 km of drilling being undertaken to date within the Exploration License. Exploration commenced in 1996 with several campaigns of drilling being completed, culminating with the latest drilling to support the Mineral Resources finishing in 2009. The project was put on hold in 2010 after disputes arose with the GoB and the GoP.
In November 2011, Tethyan Copper Company Pty. Limited (TCC, which is now known as RDMC) filed for arbitration against the Government of Pakistan and the Government of Balochistan in respect of contractual and treaty investment claims relating to the Reko Diq Project. By July 2019, arbitration tribunals ruled in favour of TCC and, among other things, rendered a multi-billion-dollar damages award against the GoP (the Award). Barrick, Antofagasta, the GoB, and the GoP subsequently engaged in discussions regarding alternatives for the resolution of the Award that maximally satisfied the objectives of each party and all related stakeholders. Ultimately, these negotiations resulted in the reconstitution of the Project. The Project was formally reconstituted in December 2022. The reconstitution was approved by the Government of Balochistan, the Government of Pakistan and the Supreme Court which issued a favourable opinion in respect of the legality of the agreements concluded as part of the reconstitution under Pakistan law. The agreements include the Project Joint Venture Agreement and Mineral Agreement which respectively form the basis for the governance of the Project and the applicable royalty and tax regime, including fiscal stabilisation.
The process above is referred to as the “Reconstitution”. The Agreements above are referred to in the Report collectively as “Project Agreements”.
| 1.2 | Geology and Mineralisation |
Copper and gold mineralization is associated with a regional-scale porphyry system primarily contained within a series of diorite to quartz-diorite bodies that have intruded the Dalbandin and
|
February 19, 2025 |
Page 16 |
|
|
NI 43-101 Technical Report on the Reko Diq Project |
|
Reko Diq formations. These intrusions are fine to medium-grained displaying porphyritic textures with alteration halos radiating outwards. Mineralization is primarily within the intrusives, however, also occurs in the adjacent altered wall rock. The intrusions occur as stocks, dykes, sills, and dyke swarms, with bodies typically ranging in size, but have diameters less than 3 km.
The Western Porphyries display a minor (<50 m) leach cap with primary mineralization occurring at surface. The limited leach cap formed when the system was uplifted quickly during deformation resulting in the minor development of a supergene system. Mineralization at the Western Porphyries is primary hypogene with chalcopyrite dominant near surface with bornite abundance increasing at depth. Extensive pyrite has been identified (generally less than 4%) with minimal oxide mineralization identified.
Tanjeel is a supergene system with mineralization occurring as a moderately well developed, sub-horizontal, copper enrichment blanket. The system is relatively small compared to Western Porphyries (representing approximately 6% of the total recovered copper for the life of the Project) and contains an upper pyrite-chalcocite system with a pyrite-chalcopyrite hypogene underlying system. Copper oxide is common and occurs as malachite, copper wad, as well as chalcanthite where exposed chalcocite has oxidized. The pyrite content can reach 12% accounting for the required generation of sulphur to mobilize copper in the supergene system.
| 1.3 | Exploration Status |
Significant exploration and resource drilling has been undertaken on the Project resulting in the Mineral Resources and Mineral Reserve reported in this Report. The Project is a development asset, with early construction works underway, as well as ongoing development, infill, and exploration drilling to support detailed design and initial operations.
| 1.4 | Mineral Resource Estimate |
The Mineral Resource estimate has been prepared according to the Canadian Institute of Mining, Metallurgy and Petroleum 2014 Definition Standards for Mineral Resources and Mineral Reserves dated 10 May 2014 (CIM (2014) Standards) as incorporated in National Instrument 43-101 Standards of Disclosure for Mineral Projects (NI 43-101). Mineral Resource estimate was also prepared using the guidance outlined in CIM Estimation of Mineral Resources and Mineral Reserves (MRMR) Best Practice Guidelines 2019 (CIM (2019) MRMR Best Practice Guidelines).
Since the Statement of Mineral Resources reported by Barrick as of December 31, 2022, there have been minor changes to the Resource estimate. The main drivers were changes in the operating costs
|
February 19, 2025 |
Page 17 |
|
|
NI 43-101 Technical Report on the Reko Diq Project |
|
and processing recoveries which underpin the cut off grade and pit shell determinations used for reporting. No additional drilling is included in the updated Mineral Resource estimate.
Mineral Resources considered amenable to open pit mining methods were constrained within a Lerchs-Grossmann pit shell that used a copper price of $4.00/lb, and a gold price of $1,900/oz. Value-based routing was used in generating the cost and cash value of each block to determine reasonable prospects for economic extraction. This is demonstrated in the results of the pit optimization process based on the processing recoveries, and mining costs outlined below. Within the pit optimization, the Mineral Resources were reported using an NSR approach based on the same parameters.
The estimate was reviewed internally as well as externally and approved by the Qualified Person and Barrick prior to release.
The QP is not aware of any environmental, permitting, legal, title, taxation, socio-economic, marketing, political, or other relevant factors which could materially affect the Mineral Resource estimate.
Table 1-1 summarises the Reko Diq Mineral Resources, inclusive of Mineral Reserves, as of December 31, 2024.
|
February 19, 2025 |
Page 18 |
|
|
NI 43-101 Technical Report on the Reko Diq Project |
|
Table 1-1 Reko Diq Mineral Resources Summary, 100% Basis, as of December 31, 2024
|
Location |
Measured | Indicated | Measured + Indicated | Inferred | ||||||||||||||||||||
| Tonnes | Grade | Contained | Tonnes | Grade | Contained | Tonnes | Grade | Contained | Tonnes | Grade | Contained | |||||||||||||
| (Mt) |
Cu (%) |
Cu (M)t |
(Mt) |
Cu (%) |
Cu (Mt) |
(Mt) |
Cu (%) |
Cu (Mt) |
(Mt) |
Cu (%) |
Cu (Mt) |
|||||||||||||
| Western Porphyries | - | - | - | 3,653 | 0.42 | 15 | 3,653 | 0.42 | 15 | 1,276 | 0.3 | 4.2 | ||||||||||||
| Tanjeel | - | - | - | 277 | 0.45 | 1.3 | 277 | 0.45 | 1.3 | 102 | 0.3 | 0.3 | ||||||||||||
| Reko Diq Total | 3,930 | 0.43 | 17 | 3,930 | 0.43 | 17 | 1,378 | 0.3 | 4.5 | |||||||||||||||
|
Location |
Measured | Indicated | Measured + Indicated | Inferred | ||||||||||||||||||||
| Tonnes | Grade | Contained | Tonnes | Grade | Contained | Tonnes | Grade | Contained | Tonnes | Grade | Contained | |||||||||||||
| (Mt) |
Au (g/t) |
Au (Moz) |
(Mt) |
Au (g/t) |
Au (Moz) |
(Mt) |
Au (g/t) |
Au (Moz) |
(Mt) |
Au (g/t) |
Au (Mg/t) |
|||||||||||||
| Western Porphyries | - | - | - | 3,653 | 0.25 | 29 | 3,653 | 0.25 | 29 | 1,276 | 0.2 | 7.8 | ||||||||||||
| Reko Diq Total | 3,653 | 0.25 | 29 | 3,653 | 0.25 | 29 | 1,276 | 0.2 | 7.8 | |||||||||||||||
Notes:
| ● | Mineral Resources are reported on 100% basis. Barrick’s attributable share of the Mineral Resource is based on its 50% interest in Reko Diq. |
| ● | The Mineral Resource estimate has been prepared according to CIM (2014) Standards and using CIM (2019) MRMR Best Practice Guidelines. |
| ● | Mineral Resources are reported based on an economic pit shell. |
| ● | Mineral Resources are reported using a long-term price of US$4.00/lb Cu and US$1,900/oz Au. |
| ● | NSR calculation considers smelting, refining and treatment charges, and payment terms, concentrate transport, metallurgical recoveries and royalties. |
| ● | Mineral Resources are inclusive of Mineral Reserves. |
| ● | Contained metal is reported in millions of tonnes of copper and million troy ounces of gold. |
| ● | Numbers may not add due to rounding. |
| ● | The QP responsible for this Mineral Resource Estimate is Peter Jones (MAIG). |
|
February 19, 2025 |
Page 19 |
|
|
NI 43-101 Technical Report on the Reko Diq Project |
|
| 1.5 | Mineral Reserve Estimate |
The Mineral Reserve estimate has been prepared according to the Canadian Institute of Mining, Metallurgy and Petroleum 2014 Definition Standards for Mineral Resources and Mineral Reserves dated 10 May 2014 (CIM (2014) Standards) as incorporated with National Instrument 43-101 Standards of Disclosure for Mineral Projects (NI 43-101). Mineral Reserve estimate was also prepared using the guidance outlined in CIM Estimation of Mineral Resource and Mineral Reserve Best Practice Guidelines 2019 (CIM (2019) MRMR Best Practice Guidelines).
The Mineral Reserves have been estimated from the Indicated Mineral Resources (as shown in Table 1-1 above, there are currently no Measured Mineral Resources) and do not include any Inferred Mineral Resources. Mineral Reserves include material that will be mined by open pit.
The estimate uses economic assumptions, the Mineral Resource and geological models (as described in Section 14), and modifying factors including geotechnical, and metallurgical recovery parameters. The Qualified Person responsible for estimating the Mineral Reserves has performed an independent verification of the block model tonnes and grade, and in their opinion the process has been carried out to industry standards.
The final pit limit selection and design process is outlined in Section 16. A site-specific financial model was populated and reviewed which demonstrates that the Mineral Reserves are economically viable.
A summary of the Mineral Reserves is shown in Table 1-2. Mineral Reserves are estimated:
| ● | As of December 31, 2024. |
| ● | Using a copper price of $3.00/lb. |
| ● | Using a gold price of $1,400/ oz. |
| ● | As ROM grades and tonnage delivered to the primary crushing facility. |
|
February 19, 2025 |
Page 20 |
|
|
NI 43-101 Technical Report on the Reko Diq Project |
|
Table 1-2 Reko Diq Mineral Reserves Statement, December 31, 2024
| Location | Proven | Probable | Proven and Probable | |||||||||||||||
| Tonnes | Grade | Contained | Tonnes | Grade | Contained | Tonnes | Grade | Contained | ||||||||||
| (Mt) | Cu (%) |
Cu (Mt) |
(Mt) | Cu (%) |
Cu (M)t |
(Mt) | Cu (%) |
Cu (Mt) |
||||||||||
|
Western Porphyries |
- | - | - | 2,861 | 0.48 | 14 | 2,861 | 0.48 | 14 | |||||||||
|
Tanjeel |
- | - | - | 147 | 0.62 | 1 | 147 | 0.62 | 1 | |||||||||
|
Reko Diq Total |
3,008 | 0.48 | 15 | 3,008 | 0.48 | 15 | ||||||||||||
| Location | Proven | Probable | Proven and Probable | |||||||||||||||
| Tonnes | Grade | Contained | Tonnes | Grade | Contained | Tonnes | Grade | Contained | ||||||||||
| (Mt) | Au (g/t) |
Au (Moz) |
(Mt) | Au (g/t) |
Au (Moz) |
(Mt) | Au (g/t) |
Au (Moz) |
||||||||||
|
Western Porphyries |
- | - | - | 2,861 | 0.28 | 26 | 2,861 | 0.28 | 26 | |||||||||
|
Reko Diq Total |
2,861 | 0.28 | 26 | 2,861 | 0.28 | 26 | ||||||||||||
Notes:
| ● | Proven and Probable Mineral Reserves are reported on 100% basis. Barrick’s attributable share of the Mineral Resource is based on its 50% interest in Reko Diq. |
| ● | The Mineral Reserve estimate has been prepared according to CIM (2014) Standards and using CIM (2019) MRMR Best Practice Guidelines. |
| ● | Mineral Reserves are reported at a copper price of US$3.00/lb and a gold price of US$1,400/oz. |
| ● | Pit optimizations were run at US$3.00/lb Cu and US$1,300/oz Au. The additional material as a result of US$1,400/oz Au represented no material change to the Mineral Reserve. |
| ● | Mineral Reserves are estimated based on an economic pit design applying appropriate costs and modifying factors. |
| ● | Mineral Reserves are based on a NSR cut-off considering smelting, refining and treatment charges, and payment terms, concentrate transport, metallurgical recoveries and royalties. |
| ● | All reported metal is contained before process recovery; metal recoveries are variable based on material type |
| ● | Contained metal is reported in millions of tonnes of copper and million troy ounces of gold. |
| ● | Numbers may not add due to rounding. |
| ● | The QP responsible for the Mineral Reserve Estimate is Mike Saarelainen, FAusIMM. |
|
February 19, 2025 |
Page 21 |
|
|
NI 43-101 Technical Report on the Reko Diq Project |
|
| 1.6 | Mining Methods |
The Reko Diq mine has been designed as two large-scale open pit operations. The Western Porphyries will be mined with electric rope and hydraulic shovels while Tanjeel will utilize hydraulic shovels. Both operations will utilize 360-t haul trucks. Mining will be carried out year-round, 24 hours per day using conventional drill, blast, and load and haul methods. At peak production the Western Porphyries pit is forecast to reach a total material movement rate of 250 Mtpa while Tanjeel will achieve 40 Mtpa.
Haul trucks will deliver run-of-mine (ROM) ore from the open pits directly to the primary crushers or nearby ROM pad, or to temporary longer-term ore stockpiles. Waste rock will be placed in one of three onsite waste rock dumps or used for tailings storage facility construction.
Over the life-of-mine, an estimated 3,008 million tonnes of ore will be delivered to the plant at an average grade of 0.48% copper and 0.26 g/t gold. There is an estimated total of 3,205 million tonnes of waste rock mined, resulting in an average strip ratio of 1.07 waste to ore. The strip ratio in the first 10 years of production is 0.64 waste to ore. The total mine life is expected to be approximately 37 years from commissioning of the plant in 2028. Mining is forecast to finish in 2061 followed by three years of processing of stockpiles to 2064.
| 1.7 | Mineral Processing |
The process flowsheet was selected based on metallurgical testwork conducted from 2023 to 2024 which built upon previous work conducted between 2007 and 2009.
The 2007 to 2009 testwork program was undertaken in three phases and included flotation and comminution variability samples, bench testing and pilot plant testwork, and High Pressure Grinding Roll testwork.
The primary goal of the 2023 to 2024 testwork program was intended to ensure suitability of the process flowsheet and forecast recoveries to underpin the LOM plan and focused on the initial 10 years of production. The program included comminution testwork, conventional, high-shear and coarse particle flotation testwork, and ancillary vendor testwork in line with industry standards for the level of study.
The expected average recovery is 89.9% copper, and 69.9% gold based on the current life-of-mine plan and testwork completed to date. Copper recovery in the first 10 years is forecasted at 90.1%.
|
February 19, 2025 |
Page 22 |
|
|
NI 43-101 Technical Report on the Reko Diq Project |
|
The process flowsheet is based on industry standard proven technology that will comprise feed preparation using two-stage crushing and high-pressure grinding rolls followed by a closed-circuit ball milling circuit. Product from the comminution circuit will feed a bulk sulphide rougher flotation circuit with rougher concentrate reground and upgraded to final concentrate grade in a two stage cleaner circuit. The final concentrate handling circuit will consist of concentrate thickening and filtration, with filter cake stored on site before being transported to the port via rail.
| 1.8 | Project Infrastructure |
The Project proposes to utilize rail, road, and port infrastructure throughout the region, including an existing rail network route to Port Qasim for export to international markets (for which upgrades to meet Project requirements will be required). The Project is planned to be connected to the National Highway N40 via a purpose built 45 km road. Site roads will connect the various areas within the Project and allow for haulage of mined material and other vehicle movements.
Power will be supplied by an onsite hybrid microgrid power solution, comprising heavy fuel oil power generating sets, diesel generating sets, a solar photovoltaic array, and a battery energy storage system. The base case for the Feasibility Study assumes the power supply will be sourced from the national grid from Year 15 of mining with the heavy fuel oil generating sets remaining on standby.
Groundwater is planned as the primary water supply. Water will be supplied from boreholes located north of the mine and will be supplied via a pipeline of approximately 70 km. Water demand has been calculated and based on expected water usage for both construction and operations. Water distribution will be via dedicated service lines at the required pressures and flows, to all required facilities and buildings on site.
A conventional thickened tailings storage facility will be constructed and will be sized to accommodate the anticipated life-of-mine material. The facility will be located to the southwest of the process plant.
Site infrastructure includes security facilities, airstrip, roads, accommodation village, maintenance facilities, stockpiles, and other auxiliary buildings. The site common purpose infrastructure will be initially developed to support Phase 1 with allowance for expansion where appropriate to support Phase 2.
The on-site infrastructure is shown in Figure 1-1.
|
February 19, 2025 |
Page 23 |
|
|
NI 43-101 Technical Report on the Reko Diq Project |
|
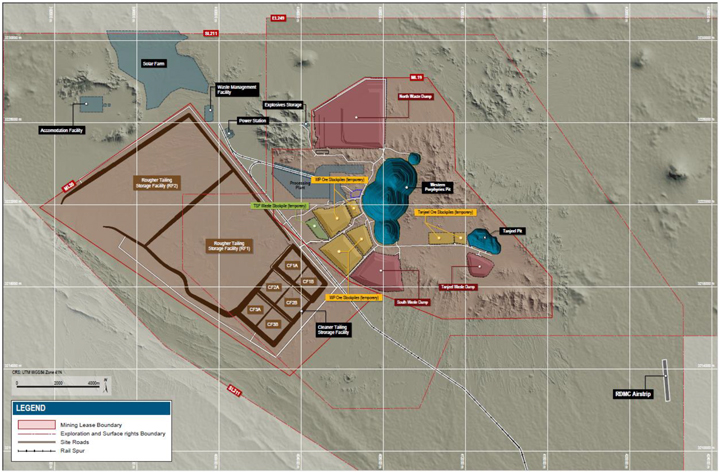
Source: Barrick, 2024
Figure 1-1 On-site Infrastructure
| 1.9 | Market Studies and Contracts |
The planned product is a conventional copper concentrate with payable levels of gold. This product is not projected to contain deleterious elements at penalty levels and is expected to be readily marketable to smelters. As of December 31, 2024, there were no offtake contracts in place.
While there are numerous contracts in place at the Project, there are no currently executed contracts considered to be material to Barrick.
| 1.10 | Environmental, Permitting and Social Considerations |
An Early Works Environmental and Social Impact Assessment (ESIA) was produced in February 2024, which the regulators approved in May 2024. Subsequently, a Project ESIA aligned to the Feasibility Study was completed in late 2024. Approval from the regulators, the Balochistan and Sindh Environmental Protection Agencies, is expected in early 2025.
|
February 19, 2025 |
Page 24 |
|
|
NI 43-101 Technical Report on the Reko Diq Project |
|
These assessments were completed in line with the relevant National and Provincial Environment and Social legislative requirements, the Equator Principles 4, and the International Finance Corporation’s Environment and Social Performance Standards and Guidelines.
The work conducted for the Feasibility Study and Project ESIA identified potential environmental and social impacts. Corresponding mitigation and management measures were developed in an Environmental and Social Management and Monitoring Plan.
The Project ESIA summarises the proposed risk mitigation measures for the above identified environmental and social risks. These proposed risk mitigation measures comprise a combination of design, management, and stakeholder engagement.
| 1.11 | Capital and Operating Costs |
Cost estimates correspond with an accuracy of +/-15%. The Phase 1 project capital cost is estimated to be $5,566M in order to reach initial production of 45Mtpa. The Phase 2 project capital is estimated to be $3,264M to increase the production capacity to 90Mtpa. Sustaining capital costs are $3,825M over the life of the mine with an estimated closure cost of $72M.
Operating costs over the life-of-mine are $57,489M with unit operating costs of $25.42/t and $18.58/t for Phase 1 and Phase 2 respectively.
The portion of the Phase 1 Initial capital costs attributable to Barrick under the terms of the JVA are $3,092M on a 100% equity basis, assuming no debt.
| 1.12 | Economic Analysis |
A financial analysis was carried out using a discounted cash flow approach to support the declaration of Minerals Reserves. The model included yearly cash inflows, or revenues, and subtracted yearly cash outflows such as operating costs, capital costs, and taxes.
Financial analysis of the Project shows after-tax NPV (at a discount rate of 8%), internal rate of return (IRR), and payback periods from 2028 as shown in Table 1-3. Reko Diq Mining Company is estimated to pay a total of $7,076M in taxes across the life of the mine.
|
February 19, 2025 |
Page 25 |
|
|
NI 43-101 Technical Report on the Reko Diq Project |
|
Table 1-3 Copper Price Impact on Free Cash, NPV8, IRR and Payback Period
|
Copper Price ($/lb) |
Gold Price ($/oz) |
Free Cash ($M) |
After Tax NPV ($M) |
Project IRR (%) |
Payback Period (yrs) |
|||||
| 3.001 |
1,4001 | 33,994 | 4,032 | 12.89% | 8.46 | |||||
| 3.25 |
2,045 | 50,376 | 8,073 | 17.01% | 7.06 | |||||
| 3.50 |
2,045 | 56,710 | 9,653 | 18.45% | 6.70 | |||||
| 3.75 |
2,045 | 63,044 | 11,234 | 19.83% | 6.42 | |||||
| 4.03 |
2,045 | 70,178 | 13,014 | 21.32% | 6.16 | |||||
| 4.13 |
2,045 | 72,672 | 13,636 | 21.82% | 6.08 | |||||
| 4.20 |
2,045 | 74,446 | 14,079 | 22.18% | 6.02 | |||||
| 4.50 |
2,045 | 82,046 | 15,975 | 23.66% | 5.78 | |||||
| 4.75 |
2,045 | 88,380 | 17,556 | 24.84% | 5.57 | |||||
| 5.00 |
2,045 | 94,714 | 19,136 | 26.00% | 5.33 |
Notes:
| 1. | Reserve Pricing Case |
| 1.13 | Interpretations and Conclusions |
The QPs note the following interpretations and conclusions in their respective areas of expertise, based on the review of data available for this Report.
The Project as a whole has been designed to utilize industry standard practices and deploy conventional technology, with many of the technologies already employed at other mines Barrick operates, reducing the implementation operational risks. Where technologies are not employed by Barrick, benchmarked sites have been visited by the Project team to validate equipment selection and adopt best practices. Though new and emerging technologies are not included in the base case, the Project has been designed to allow for the adoption of technologies during the operational phase which, if realized, may result in potential improvements in operational performance from that which is presented in this Report.
| 1.13.1 | Mineral Tenure, Rights, Royalties and Agreements |
| ● | The Mineral Agreement, applicable Statutory Regulatory Orders and the Foreign Investment Promotion and Protection Act, 2022 (FDI Act), codified an agreed-to fiscal regime and 30-year stabilization period for the Project (i.e., until December 15, 2052) with automatic renewals for incremental periods of up to 30 years, at the request of RDMC. The JVA provides for the governance of the Project while the Mineral Agreement outlines the royalties and tax regime applicable to the Project, including tax holidays, among other things. |
| ● | The various rights secured for the Project are considered sufficient to support the Mineral Resources, Mineral Reserves, and life-of-mine plan presented in this Report. |
|
February 19, 2025 |
Page 26 |
|
|
NI 43-101 Technical Report on the Reko Diq Project |
|
| 1.13.2 | Geology and Mineral Resources |
| ● | The understanding of the deposit settings, lithologies, and geologic, structural, and alteration controls on mineralization is sufficient to support the estimation of Mineral Resources and subsequent Mineral Reserves. |
| ● | Drilling, sample collection and QA/QC procedures that support the Mineral Resources have been conducted in accordance with industry standards at the relevant time and are supported by recent verification work. Therefore, are considered sufficient to support the declaration of the Mineral Resources and the classification presented in this Report. |
| ● | Snowden Optiro was engaged to complete an independent audit of the underlying data and the Mineral Resource estimation for Western Porphyries and Tanjeel. The audit concluded that the Mineral Resource estimate and the data collected to inform them do not present any fatal flaws and are logical and well considered. |
| ● | The estimated Mineral Resources currently in consideration for mining are defined by existing drilling, however, the Western Porphyries and Tanjeel remain open at depth and there is potential to expand the Minerals Resources with further drilling. |
| ● | The Project includes several exploration targets that have the potential to add to the existing Mineral Resource base and are considered substantial enough to warrant continued investment in parallel with the Project’s development. |
| 1.13.3 | Mining and Mineral Reserves |
| ● | The mine will employ conventional open pit truck and shovel mining methods. These methods are typical at Barrick operations as well as at mines operated by others in a variety of jurisdictions globally. |
| ● | Geotechnical recommendations were based on dedicated geotechnical drilling and testwork programs which were used in the mine design parameters and included the appropriate factors of safety. Recommendations were reviewed and verified by third parties. |
| ● | Mineral Reserves were estimated at copper and gold prices that are below current spot prices for both metals and are therefore considered resilient to changes in commodity prices. All other modifying factors used in the determination of the Mineral Reserves are appropriate for the Project and style of mineralization. |
| ● | There are Inferred Resources that sits within and below the currently designed open pits. Should this material be able to be converted to Indicated Resources, there is potential to increase the size of the Mineral Reserve. |
| 1.13.4 | Mineral Processing |
| ● | The process plant design is based on sufficient metallurgical testwork for this level of study to support the development of the flowsheet, forecast recoveries, and projected concentrate characteristics. |
| ● | The selected processing technology is conventional and includes comminution, floatation, thickening, and filtration. The design is at a scale comparable to other operations in the industry. |
|
February 19, 2025 |
Page 27 |
|
|
NI 43-101 Technical Report on the Reko Diq Project |
|
| ● | The expected average recovery is 89.9% copper, and 69.9% gold based on the current life-of-mine plan and testwork completed to date. Copper recovery in the first 10 years is forecasted at 90.1%. Changes in the feed material characteristics may impact the actual achieved recovery. |
| 1.13.5 | Infrastructure |
| ● | Regional road, rail, and port infrastructure will be used during the construction and operation of the Project. Some upgrades and increased maintenance are required to meet the needs of the Project, which have been studied, and costs are included as appropriate. |
| ● | Most of the planned site infrastructure (waste storage facilities, offices, workshops, etc.), requires construction, and once constructed, is considered sufficient to support the mining operation as planned. Some aspects of the infrastructure will require expansion during the Phase 2, for which sufficient space has been allowed, as well as potential for further expansion beyond the stated Phase 2 capacity. |
| ● | The tailings storage facility is designed using conventional tailings deposition method and will be operated in accordance with Barrick’s internal policies and industry standard practices (including GISTM). The initial construction and subsequent planned dam raises provide sufficient storage capacity to support the stated Mineral Reserves. The tailings storage facility is designed in such a way that it can handle capacity beyond the stated Mineral Reserve with additional capital investment. |
| 1.13.6 | Environment, Permitting and Social Considerations |
| ● | The Project has been scoped and is being conducted to meet the requirements of international standards (IFC Performance Standards and Equator Principals 4, which are considered benchmarks for the industry), as well as Barrick’s own policies and standards. |
| ● | The Project has been granted many of the permits to support ongoing early works. However, as of the date of this Technical Report, a number of permits and approvals are still in the process of being obtained necessary for construction and operation. The expected permitting timeline allows for the development of the Project inline with the schedule presented in this Report (detailed in item 20 of the Report). |
| 1.13.7 | Market Studies and Contracts |
| ● | Copper concentrate is freely and regularly traded by a large number of parties. Barrick is not dependent upon the sale of copper to any one customer and its product is sold to a variety of traders and smelters. |
| ● | The planned concentrate product is expected to be readily marketable to third-party smelters. |
| ● | While there are numerous contracts in place, there are no currently executed contracts considered to be material to Barrick. |
| 1.13.8 | Capital and Operating Costs |
| ● | Capital and operating costs estimates for the study were estimated at what is considered sufficient for a Feasibility Study (+/- 15%). The costs were estimated as of Q3 2024 and are |
|
February 19, 2025 |
Page 28 |
|
|
NI 43-101 Technical Report on the Reko Diq Project |
|
| considered current for the purpose of this Technical Report and the declaration of Mineral Reserves. |
| ● | Operating cost estimates include all operational activities required for the mining, processing, general and administrative costs, and offsite costs (including freight & refining and royalties) for all of the forecasted production. |
| 1.13.9 | Project Economics |
| ● | As a result of the Reconstitution of the Project and associated agreements, obligations such as tax and royalties, are well understood and have been reflected in the economic analysis. |
| ● | The Project’s NPV is most sensitive to changes in copper price and operating costs. Changes in these parameters from those listed in this Report will impact the NPV. |
| 1.13.10 | Risk |
The QPs have examined the various risks and uncertainties known or identified that could reasonably be expected to affect reliability or confidence in the exploration information, the Mineral Resources or Mineral Reserves of the Mine, or projected economic outcomes contained in this Technical Report. They have considered the controls that are in place or proposed to be implemented and have determined the residual risk post mitigation measures. The post mitigation risk rating is evaluated consistent with guidance provided by Barrick’s Formal Risk Assessment Procedure (FRA) and considers the likelihood and consequence of the risk’s occurrence and impact.
Table 1-4 details the significant risks and uncertainties as determined by the QPs for the Expansion Project.
|
February 19, 2025 |
Page 29 |
|
|
NI 43-101 Technical Report on the Reko Diq Project |
|
Table 1-4 Risk Analysis Summary
| Area | Risk | Mitigation | Post Mitigation Risk Rating |
|||
| Geology and Mineral Resources | Lower than modelled grades/tonnes |
● A number of internal and third-party reviews have been undertaken to date. ● Continue with reviews/audits of models on a regular basis ● Update model with reconciliation based on production data and infill grade control drilling once available. |
Medium | |||
| Mining and Mineral Reserves | Underperformance relative to FS mine plan | ● A number of internal and third-party reviews have been undertaken to date. ● Mine designs to adhere to geotechnical guidance for pit slopes and ramps. ● Dual ramp access to mining phases where practical. ● Mine plan to build ore stockpile inventory. ● Continue with geotechnical audits and compliance to design. |
Medium | |||
| Processing | Recovery lower than modelled due to ore variability / inadequate test work | ● Use of conventional process technology. ● Significant variability and bulk pilot testwork undertaken. ● Update process recovery curves with production data once available. ● Vendor testwork completed to determine processing performance and equipment selection as part of FS and BE. |
Medium | |||
| Project Infrastructure | Inadequate to support operations / planned capacity (site and regional) | ● The Feasibility Study engineering included all project infrastructure required to support the project. ● Redundancy design in key areas (e.g., power, spares, concentrate storage at site and port facility, etc.). ● Continued engagement with regional infrastructure partners (rail/port) and monitoring/maintenance of facilities. |
Medium | |||
| Tailings | Dam failure | ● Ongoing independent tailings review board process. ● No persons working/living downstream from the facility with dam breach analysis. |
High | |||
| Environmental | Impact on regional environment/habitat | ● Variety of environmental management plans have already been developed. ● Ongoing monitoring of performance and updating of management plans. |
Medium | |||
| Supply Chain | Disruption of supply chain for supplies, spares, fuel etc. | ● Plan for mine to hold multiple months of capacity for critical items. ● Initial fills and quantities of critical spares developed with major vendors. |
Medium | |||
| Human resources | Availability of qualified construction and operational personnel (contractor and owner) | ● Participate in market surveys to identify skills and define appropriate compensation for staff. ● Operational readiness and associated training programs. |
Medium | |||
|
February 19, 2025 |
Page 30 |
|
|
NI 43-101 Technical Report on the Reko Diq Project |
|
| Area | Risk | Mitigation | Post Mitigation Risk Rating |
|||
|
Security |
Terrorism or other attack (people and/or property) |
● Security management strategy in place (physical infrastructure and management plans). ● Monitoring of in-country risk status and intelligence monitoring. |
High | |||
|
Regulatory |
Delays in permits for construction and operation |
● A number of key permits have already been granted. ● Ongoing of applicable permitting requirements and understanding of key regulatory processes to facilitate early engagement on key planning and approvals items. |
Medium | |||
|
Regulatory |
Loss of permits and tenements (renewals) |
● Detailed renewal regime and express rights of renewal negotiated as part of the Project Agreements. ● Agreements negotiated and ratified by the GoP, GoB, and Supreme Court of Pakistan. |
High | |||
|
Country & Political |
Loss of relevant government support |
● Agreements negotiated and ratified by the GoP GoB, and Supreme Court of Pakistan. ● Continued engagement with government stakeholders. |
High | |||
|
Construction Schedule |
Project delays - financing/construction |
● Commitment to contracts with key long lead item suppliers. ● Project design and development in accordance with international financing standards. |
Medium | |||
| Capital Costs |
Capital cost overruns |
● The Feasibility Study engineering included all project infrastructure required to support the project. ● Contracts and vendor quotes obtained for key equipment. ● Cost control and package management during project execution. ● Long-lead items for processing and mining secured during 2024. |
Medium | |||
| Operating Costs |
Higher than modelled operating costs |
● Feasibility Study level engineering estimates completed. ● Monitoring key input costs and revise estimates as appropriate. ● Benchmarked costs across similar operations. ● Update estimates with mine actuals once in operation. |
High | |||
|
February 19, 2025 |
Page 31 |
|
|
NI 43-101 Technical Report on the Reko Diq Project |
|
| 1.14 | Recommendations |
The key recommendation is to proceed with the Project. Further recommendations by discipline are summarized as follows:
| 1.14.1 | Mineral Tenure, Rights, Royalties and Agreements |
| ● | While the 30-year stabilization period resulting from the Reconstitution provides assurance for the Project, ongoing engagement with local, regional and national government is recommended. |
| 1.14.2 | Geology and Mineral Resources |
| ● | Conduct additional drilling within the areas of the Mineral Resources that make up initial production years with the aim of converting the material from Indicated to Measured category ahead of production. |
| ● | Continue exploration activities to explore the potential to add to the Mineral Resource base. |
| ● | As appropriate, adopt recommendations from the Snowden Optiro in future versions of the Mineral Resource Estimate. Should any material revisions of the model occur in the future, additional third-party audits should be completed. |
| 1.14.3 | Mining and Mineral Reserves |
| ● | Update the mine plan to take into account revisions of the Mineral Resources as infill drilling, exploration, and confirmatory testwork programs are completed. |
| ● | Review and incorporate outcomes from ongoing geotechnical investigations as well as slope performance in early mine life into final pit designs. |
| 1.14.4 | Mineral Processing |
| ● | Conduct a metallurgical test work program as part of the infill and exploration drilling programs. The metallurgical budget is included in the respective exploration and infill budget presented above. |
| 1.14.5 | Infrastructure |
| ● | Complete investigation in the Southern Groundwater System area to sufficiently define the area as a supplementary source of water, in particular, to determine optimal land lease area(s). |
| ● | Continue additional studies relating to alternative energy sources to heavy fuel oil with the goal of increasing the amount of energy from renewable sources and/or reducing operating costs. |
|
February 19, 2025 |
Page 32 |
|
|
NI 43-101 Technical Report on the Reko Diq Project |
|
| ● | Continue engagement with the national power authority (National Transmission & Despatch Company) to support connecting to the national power grid network. |
| ● | Continue engagement with regional infrastructure stakeholders to advance port and rail aspects in accordance with the Project’s execution timeline. |
| 1.14.6 | Environmental, Permitting, and Social Considerations |
| ● | Continue stakeholder engagement and public education programs as outlined in the ESIA. |
| ● | Advance outstanding permits required for Project operation. |
| ● | Active, ongoing monitoring of the local and regional security environment is critical. Security management plans and procedures should be reviewed and updated regularly as required. |
| ● | Continue to ensure the project is developed in accordance with IFC Performance Standards and Equator Principals 4 to support financing efforts. |
| 1.14.7 | Market Studies and Contracts |
| ● | Execute agreements with concentrate customers to better establish final product terms and potential credits associated with the planned production. |
| 1.14.8 | Capital and Operating Costs |
| ● | Re-evaluate estimated capital and operating costs on an ongoing basis as further engineering, tender responses, executed contracts, and/or operational information becomes available. |
| 1.14.9 | Risks |
| ● | Ongoing updates and revisions to the project risk register are recommended as the Project progresses through basic engineering into construction and operation. Active monitoring and implementation of mitigation plans are recommended for key risks in accordance with Barrick’s established risk management practices. |
|
February 19, 2025 |
Page 33 |
|
|
NI 43-101 Technical Report on the Reko Diq Project |
|
| 2 | Introduction |
This Technical Report (the Report or the Technical Report) on the Reko Diq Project (Reko Diq, the Project, or the Reko Diq Project), located in the Balochistan Province of Pakistan has been prepared by Barrick Gold Corporation (Barrick). The purpose of this Technical Report is to support public disclosure of Mineral Resource, maiden Mineral Reserve estimate and the results of a Feasibility Study at the Project as of December 31, 2024. The Mineral Reserve presented in this report is the first for the property reported by Barrick and is the triggering event for this Technical Report.
Barrick is a Canadian publicly traded mining company with a portfolio of operating mines and advanced exploration and development projects across four continents. Barrick is the issuer of this Technical Report.
The Reko Diq Project is owned by the Reko Diq Mining Company (Private) Limited (RDMC) which is indirectly owned 50% by Barrick and 50% by Pakistani stakeholders. The 50% Pakistan stakeholder interests in RDMC comprise a 10% free-carried, non-contributing share held directly by the Provincial Government of Balochistan (the GoB), an additional 15% held by the GoB indirectly through Balochistan Mineral Resources Limited (BMRL) a special purpose company wholly owned by the GoB and 25% indirectly owned by the Government of Pakistan (the GoP) through three Pakistani state-owned enterprises (the SOEs), Oil & Gas Development Company Limited (OGDCL), Government Holdings (Private) Limited (GHPL) and Pakistan Petroleum Limited (PPL). The SOEs hold their interests (in equal thirds) through Pakistan Minerals (Private) Limited (PMPL).
The Project will be operated by Barrick on behalf of the Project owner RDMC.
|
February 19, 2025 |
Page 34 |
|
|
NI 43-101 Technical Report on the Reko Diq Project |
|

Source: Barrick, 2024
Figure 2-1 Holding Structure of the Reko Diq Project
A Feasibility Study (FS) has recently been completed for the Project which entails two phases of project development:
| ● | Phase 1 – Initial throughput of 45 Mtpa of ore that will commence production in 2028; and |
| ● | Phase 2 – Expansion to a total throughput of 90 Mtpa that is planned to occur from 2034 onwards. |
Reko Diq will comprise two open pit mines, the main open pit Western Porphyries operation and a satellite pit at Tanjeel, a processing plant, together with other associated mine operation and regional infrastructure. The Project will produce copper concentrate that contains gold for smelting by third-party operated smelters.
The Mineral Resource and Mineral Reserve estimates have been prepared according to the Canadian Institute of Mining, Metallurgy and Petroleum CIM (2014) Standards as incorporated by reference in National Instrument 43-101 (NI 43-101). Mineral Resource and Mineral Reserve estimates were also prepared using the guidance outlined in CIM Estimation of Mineral Resources and Mineral Reserves Best Practice Guidelines 2019 (CIM (2019) MRMR Best Practice Guidelines).
|
February 19, 2025 |
Page 35 |
|
|
NI 43-101 Technical Report on the Reko Diq Project |
|
The capital and operating cost estimates presented in this Report were estimated at what is considered sufficient for a Feasibility Study (+/- 15%).
All costs presented in this Report are in United States Dollars (US$ or $) unless otherwise noted.
All measurement units used in this Report are metric unless otherwise noted.
| 2.1 | Effective Date |
The effective date of this Technical Report is December 31, 2024.
| 2.2 | Qualified Persons |
This Technical Report was prepared by Barrick Gold Corporation.
The Qualified Persons (QPs) and their responsibilities for this Technical Report are listed in Section 29 Certificates of Qualified Persons and summarized in Table 2-1.
Table 2-1 QP Responsibilities
| Qualified Person | Company | Title/Position | Sections | |||
|
Simon Bottoms |
Barrick Gold Corporation | Executive Vice President Mineral Resource Management & Evaluations | 1, 2, 3, 4, 5, 6, 19, 21, 22, 23, 24, 25.1, 25.7, 25.8, 25.9, 25.10, 26.1, 26.7, 26.8, 26.9, 27 | |||
|
Peter Jones |
Barrick Gold Corporation | Manager of Mineral Resources and Evaluations | 7, 8, 9,10, 11,12, 14, 25.2, 26.2 | |||
|
Mike Saarelainen |
Barrick Gold Corporation | Head of Mining for Reko Diq | 15, 16, 18.8, 18.9, 25.3, 26.3 | |||
|
Daniel Nel |
Barrick Gold Corporation | Engineering Manager for Reko Diq | 13, 17, 18.1 to 18.3, 18.5, 18.6, 18.10, 25.4, 25.5, 26.4, 26.5 | |||
|
David Morgan |
Knight Peisold | Managing Director at Knight Piesold Pty Ltd | 18.7 | |||
|
Ashley Price |
Barrick Gold Corporation | ESIA Manager for Reko Diq | 18.4, 20, 25.6, 26.6 | |||
|
February 19, 2025 |
Page 36 |
|
|
NI 43-101 Technical Report on the Reko Diq Project |
|
| 2.3 | Site Visits of Qualified Persons |
| ● | Simon Bottoms is employed by Barrick Gold Corporation as the Mineral Resource Management and Evaluation Executive. He visited the Reko Diq project several times since 2022, and his most recent visit to the Project was January 13 to 16, 2024 where he reviewed the exploration programme results, Mineral Resource, mine plans, associated financials, mine strategy, results of external audits, and board meeting reviews. |
| ● | Peter Jones is employed by Barrick Gold Corporation as the Manager of Mineral Resources and Evaluations - Latin America & Asia Pacific. He visited the Reko Diq project several times since 2023, and his most recent visit to the Project was December 05 to 09, 2024 where he reviewed the Mineral Resource updates, recent drilling programs for resource conversion, and latest analytical results from drill samples. |
| ● | Mike Saarelainen is employed by Barrick Gold Corporation as Head of Mining for Reko Diq. He visited the Reko Diq project several times since 2023, and his most recent visit to the Project was December 10 to 12, 2024 where he reviewed the geological modeling supporting reserves, mining strategy, stockpile locations, TSF build sequence and associated site infrastructure related to mining. |
| ● | Daniel Nel is employed by Barrick Gold Corporation as Engineering Manager for Reko Diq. He visited the Reko Diq project several times since 2023, and his most recent visit to the Project was September 8 to 14, 2024 where he reviewed the processing design, metallurgical program and results. |
| ● | David Morgan is employed by Knight Piesold Pty Ltd as Managing Director. He visited the Reko Diq project several times since 2007, and his most recent visit to the Project was September 09 to 12, 2024 where he reviewed ongoing geotechnical investigations of the proposed tailings facility location and other materials for construction. |
| ● | Ashley Price is employed by Barrick Gold Corporation as ESIA Manager for Reko Diq. He frequently visits Reko Diq, and his most recent visit to the Project was November 18, 2024, where he reviewed the environmental, social, and Balochistan and Sindh Environmental Protection Agency approvals related to the project. |
| 2.4 | Information Sources |
The key information source for this Report was the Feasibility Study, supporting studies and underlying data prepared by Barrick, RDMC, previous owners, and various third-party consultants.
Barrick has utilised various other presentations, memos, reports, and various technical reports in the compilation of this Technical Report. The documentation reviewed, and other sources of information, are listed at the end of this Report in Section 27.
|
February 19, 2025 |
Page 37 |
|
|
NI 43-101 Technical Report on the Reko Diq Project |
|
| 2.5 | List of Abbreviations |
Abbreviations used in this Technical Report are included in Table 2-2.
Table 2-2 Table of Abbreviations
| Unit | Measure | Unit | Measure | |||
| ° | degree | m3 | cubic metre | |||
| °C | degree Celsius | m3/d | cubic metre per day | |||
| A | ampere | m3/h | cubic metres per hour | |||
| ANFO | Ammonium Nitrate Fuel Oil | m3/s | cubic metres per second | |||
| Au | gold | Ma | million years | |||
| ARD | Acid Rock Drainage | masl | metres above sea level | |||
| CFM | cubic feet per minute | min | minute | |||
| cm | centimetre | mm | millimetre | |||
| CoG | cut-off grade | Moz | million ounces | |||
| DD | Diamond Drill Holes | Mpa | megapascal | |||
| EIA | Environmental Impact Assessment | Mt | million metric tonnes | |||
| ft | foot | Mtpa | million metric tonnes per annum | |||
| G | giga (billion) | MW | megawatt | |||
| g | gram | oz | Troy ounce (31.10348 g) | |||
| g/cm3 | grams per cubic centimetre | P80 | 80% passing | |||
| g/L | grams per litre | PoO | Plan of Operation | |||
| g/t | grams per tonne | ppm | parts per million | |||
| GSI | Geological strength index | QA/QC | quality assurance and quality control | |||
| ha | hectare | QP | Qualified Person | |||
| hrs | hours | RC | reverse circulation drilling | |||
| km | kilometre | RQD | Rock Quality Designation | |||
| hr | hour | RWi | Bond Rod Mill Work Index | |||
| in | inch | s | second | |||
| k | kilo (thousand) | SAG | Semi-Autogenous grinding | |||
| kg | kilogram | t | metric tonne | |||
| kL/min | thousand litres per minute | tpd | metric tonnes per day | |||
| km | kilometre | tph | metric tonnes per hour | |||
| km2 | square kilometre | t/m3 | metric tonne per cubic metre | |||
| koz | thousand ounces | tpa | metric tonnes per annum | |||
| kPa | kilopascal | TR | Turquoise Ridge | |||
| kt | thousand metric tonnes | TSF | Tailings Storage Facility | |||
| ktpa | thousand tonne per annum | UCS | Unconfined Compressive Strength | |||
| kV | kilovolt | US$ | United States dollar | |||
| kW | kilowatt | µm | micrometre | |||
| kWh | kilowatt-hour | V | volt | |||
| L | litre | W | watt | |||
| L/s | litres per second | Wi | Work Index | |||
| LOM | Life-of-mine | WP | Western Porphyries | |||
| M | mega (million) | wt% | content by weight | |||
| m | meter | yr | year | |||
| m2 | square metre | % | percentage | |||
|
February 19, 2025 |
Page 38 |
|
|
NI 43-101 Technical Report on the Reko Diq Project |
|
| 3 | Reliance on Other Experts |
This Report has been prepared by Barrick. The information, conclusions, opinions, and estimates contained herein are based on:
| ● | Information available at the time of preparation of this Technical Report, |
| ● | Assumptions, conditions, and qualifications as set forth in this Technical Report. |
For the purpose of this Report, the QPs have relied upon information provided by RDMC’s legal counsel regarding the validity of the material permits as well as the fiscal and tax regime applicable in accordance with the laws and regulations of Pakistan and Balochistan. This opinion has been relied upon in Section 1 (Summary), Section 4 (Property Description and Location) and, Section 22 (Economic Analysis) of this Report. Except for the purposes legislated under provincial securities law, any use of this Technical Report by any third party is at that party’s sole risk.
|
February 19, 2025 |
Page 39 |
|
|
NI 43-101 Technical Report on the Reko Diq Project |
|
| 4 | Property Description and Location |
The Project is a large scale Copper (Cu) and Gold (Au) development project which is planned to be mined via typical open pit mining methods. Significant exploration has been undertaken resulting in the definition of the Mineral Resource and maiden Mineral Reserve estimates declared in this Report. Early works recently started, including the construction of site fences and offices as part of the preparation for full-scale construction.
| 4.1 | Project Location |
The Reko Diq Project is located in the north-western corner of Balochistan Province of Pakistan (see Figure 4-1). Balochistan borders Iran to the west, Afghanistan and the Federally Administered Tribal Areas (FATA) to the north, the Punjab and Sind Provinces of Pakistan to the east and the Arabian Sea to the south. The population of Balochistan is approximately 6.5M and the capital city is Quetta.
The Reko Diq Project is centred on 29º 5’ north (3221654 mN UTM), longitude 62º 3’ east (407575 mE UTM), in the Chagai District of Balochistan off the main Quetta-Zaheden railway line and highway N40 near the town of Nok Kundi. The Afghan border is approximately 35 km north, with the Iranian border approximately 55 km west. The area surrounding the Project can be characterised as harsh stony desert.
|
February 19, 2025 |
Page 40 |
|
|
NI 43-101 Technical Report on the Reko Diq Project |
|

Source: Barrick, 2024
Figure 4-1 Property Location
|
February 19, 2025 |
Page 41 |
|
|
NI 43-101 Technical Report on the Reko Diq Project |
|
| 4.2 | Property Rights and Ownership |
| 4.2.1 | Mineral Rights |
The mineral titles held by RDMC were issued pursuant to an amendment to the Regulation of Mines and Oilfields and Mineral Development (Government Control) Act, 1948, which permits the granting of mineral title through private negotiations. The various mineral titles held by RDMC were customized for the Project as part of the Reconstitution (defined below) and are not generally subject to the Balochistan Mineral Rules, 2002 (the BMR).
The principal agreements and mineral title documents executed in connection with the Reconstitution of the Project (executed in 2022) include the following:
| ● | a Joint Venture Agreement (the JVA) which provides for the governance of the Project among the RDMC Shareholders (namely Barrick Reko Diq Holdings Limited, PMPL and BMRL), the GoP and the GoB and the appointment of Barrick as the Project Operator; |
| ● | a Management Services Agreement which provides for the compensation to be paid to Barrick, in its capacity as the Operator, for the management services provided to the Project; |
| ● | a Mineral Agreement entered into with the GoP and GoB which provides the right to develop the Project, certain investment protections, and fiscal stability, as well as commitments to develop and operate the Project in accordance with applicable laws and best practices and to provide specific benefits to Balochistan and Pakistan over the life of the Project; and |
| ● | two Mining Leases, an Exploration License, a Surface Rights Lease, and two Water Exploration Permits or Non-Objection Certificates (Water NOCs), in each case issued to RDMC. Described in more detail below. |
As part of the Reconstitution, PMPL, BMRL and the GoB acquired their respective interests in the Project and a reorganization was implemented to give effect to the current ownership structure.
The implementation of the above is referred to as the “Reconstitution”. The Agreements above are referred to in the Report collectively as “Project Agreements”.
The GoB issued two Mining Leases in 2022, an Exploration License (which replaced a previously issued exploration license), a Surface Rights Lease, as well as two Water NOCs covering ten areas across two districts.
The approved Mining Leases (ML-19 and ML-20) cover an aggregate mining lease area of 164 km2 and have an initial term of 30 years with automatic renewals for incremental periods of up to 30 years, at the request of RDMC. The Mining Leases provide RDMC with exclusive rights to extract, process, transport and sell for its own account copper, gold, molybdenum and/or other mineral deposits (including other base and precious metals and rare earth minerals) from the areas covered
|
February 19, 2025 |
Page 42 |
|
|
NI 43-101 Technical Report on the Reko Diq Project |
|
by the Mining Leases. Among other things, the Mining Leases are subject to annual rental fees and a one-time security deposit.
In 2024, RDMC submitted an application to amend ML-20 to accommodate the optimised design of the Project tailings storage facility (TSF) and to ensure the optimised TSF will remain within the boundaries of ML-20. The proposed amendment will result in an increase in the size of ML-20 from 64 km2 to 93 km2 resulting in a total aggregate mining lease area of 193 km2. The proposed amendment to ML-20 includes the same terms and is in the same form as the currently approved ML-20. A diagrammatic representation of the proposed amendment to ML-20 is shown in Figure 4-2. For further details of the TSF refer to Section 18. The amended ML-20 is expected to be issued sufficiently in advance of operational requirements for the development of the Project TSF. It is noted that the TSF design is within the approved Surface Lease as described in Section 4.2.2 which meets regulatory requirements for the construction and operation of the TSF.
Table 4-1 and Table 4-2 provides Mining Lease details and includes details for the submitted ML-20 amendment.
Table 4-1 Mining Leases Details
| Mining Leases | Permit No. | Surface Area (km2) |
Expiry Year | |||
| Eastern Lease |
ML-19 | 100 | 2052 (with initial extension to 2082) | |||
| Western Lease |
ML-20 | 93 |
2052 (with initial extension to 2082) |
Table 4-2 Mining Leases Coordinates
| Mining Leases | Permit No. |
Northing (UTM) |
Easting (UTM) |
|||
| Eastern Lease |
ML-19 | 3,228,206.55 | 407,096.44 | |||
| 3,228,207.20 | 410,177.15 | |||||
| 3,226,482.94 | 411,446.05 | |||||
| 3,223,678.35 | 411,525.43 | |||||
| 3,218,460.70 | 416,229.34 | |||||
| 3,216,493.04 | 416,243.01 | |||||
| 3,216,426.89 | 410,901.72 | |||||
| 3,218,252.16 | 406,396.62 | |||||
| 3,221,374.52 | 402,655.16 | |||||
| 3,224,722.06 | 402,594.98 | |||||
| 3,224,714.54 | 404,522.88 | |||||
| 3,226,603.35 | 404,503.19 | |||||
| Western Lease |
ML-20 | 3,217,709.53 | 407,735.92 | |||
| 3,213,654.46 | 403,442.08 | |||||
| 3,221,866.70 | 391,242.61 | |||||
| 3,226,969.62 | 398,595.21 | |||||
| 3,221,942.29 | 402,644.95 | |||||
| 3,221,374.52 | 402,655.16 | |||||
| 3,218,252.16 | 406,396.62 | |||||
| 3,217,709.53 | 407,735.92 |
|
February 19, 2025 |
Page 43 |
|
|
NI 43-101 Technical Report on the Reko Diq Project |
|
All Mineral Resources and Mineral Reserves declared in this Report are contained within these Mining Leases.
The Exploration License (EL-249) covers an aggregate area of 312 km2. The Exploration License provides RDMC with exclusive rights to conduct mineral exploration in the area covered by the license. The initial term of the Exploration License will end on the third anniversary of Commercial Production (as defined in the Mineral Agreement), and is subject to renewal at the option of RDMC for two additional three-year terms. The renewal applies to the entire Exploration License area without relinquishment. RDMC also has the right to convert all or a part of the lands covered by the Exploration Licence into one or more mining leases by written request to the GoB. Table 4-3 provides details on the Exploration Lease.
Table 4-3 Exportation License Coordinates
| Mining Leases | Permit No. |
Northing (UTM) |
Easting (UTM) |
|||
| Exploration License |
EL- 249 | 3,231,124.04 | 426,993.00 | |||
| 3,224,664.47 | 426,944.45 | |||||
| 3,224,656.45 | 428,210.67 | |||||
| 3,222,385.33 | 428,196.40 | |||||
| 3,222,352.65 | 433,604.66 | |||||
| 3,215,594.64 | 433,565.47 | |||||
| 3,215,633.34 | 411,271.47 | |||||
| 3,212,077.76 | 409,763.46 | |||||
| 3,212,063.46 | 405,546.63 | |||||
| 3,218,831.25 | 398,213.81 | |||||
| 3,222,522.20 | 398,213.81 | |||||
| 3,222,561.88 | 402,300.00 | |||||
| 3,231,125.39 | 402,300.00 |
Figure 4-2 shows the Mining Lease and Exploration License boundaries.
|
February 19, 2025 |
Page 44 |
|
|
NI 43-101 Technical Report on the Reko Diq Project |
|

Source: Barrick, 2024
Figure 4-2 Reko Diq Mining Company Leases
|
February 19, 2025 |
Page 45 |
|
|
NI 43-101 Technical Report on the Reko Diq Project |
|
| 4.2.2 | Surface Rights |
The Surface Rights Lease (SL-211) provides RDMC with exclusive surface rights on the subject area, including all improvements, buildings, structures, fixtures and fittings located thereon. The Surface Rights Lease covers an aggregate surface lease area of 643 km2 and has an initial term of 30 years renewable pursuant to the terms of Mineral Agreement. Table 4-4 provides details on the Surface Rights Lease.
Table 4-4 Surface Lease Coordinates
| Mining Leases | Permit No. |
Northing (UTM) |
Easting (UTM) |
|||
| Surface Lease |
SL-211 | 3,190,254.24 | 438,421.21 | |||
| 3,189,174.14 | 437,701.12 | |||||
| 3,215,096.56 | 397,376.44 | |||||
| 3,223,196.93 | 389,519.25 | |||||
| 3,250,597.96 | 389,455.54 | |||||
| 3,230,307.94 | 413,398.31 | |||||
| 3,217,072.87 | 422,644.92 | |||||
| 3,200,598.51 | 422,685.76 |
| 4.2.3 | Water Rights |
The Water NOCs permit the exploration of water including activities such as; drilling wells, geophysical surveying, and pumping of test wells were issued by the Deputy Commissioners of the Chagai and Washuk districts in Balochistan. The NOCs are valid for five years from date of award (15 December 2022). These are extendable for 12 month intervals after the original five years. Specific clauses on purchasing of land on the NOCs is defined in the agreement and is to be facilitated by the government.
| 4.3 | Royalties, Payments, and Other Obligations |
The Mineral Agreement, applicable Statutory Regulatory Orders and the Foreign Investment Promotion and Protection Act, 2022 (FDI Act), codified an agreed-to fiscal regime and 30-year stabilization period for the Project (i.e., until December 15, 2052). The Mineral Agreement outlines the royalties and tax regime, including tax holidays. Taxes inclusive of agreed holiday periods have been incorporated into the economic analysis presented in Section 22 and are described further below.
|
February 19, 2025 |
Page 46 |
|
|
NI 43-101 Technical Report on the Reko Diq Project |
|
| 4.3.1 | Royalties |
The GoB has a 5% net smelter return (NSR) royalty payable. To ensure that Balochistan is receiving significant cash flows during the development and construction phases of the Project, the Mineral Agreement provides for the following advance royalty payments, to be paid on an annual basis on or before the end of the relevant year:
| ● | Year 1: $5 million. |
| ● | Year 2: $7.5 million; and |
| ● | Year 3 and beyond (until commercial production): $10 million per year. |
The maximum amount of advance royalty payments is $50 million. The lesser of 25% or $12.5 million of the total amount advanced will be credited against Balochistan royalty payments during each of the first four years from commercial production.
The GoP has a 1% NSR royalty final tax regime payable (subject to a 15-year exemption following commercial production), and a 0.5% NSR royalty export processing zone surcharge.
| 4.3.2 | Taxes and Other Obligations |
The Mineral Agreement outlines the agreed tax regime for the Project. During the initial 30-year term of the Mineral Agreement (i.e. until 15 December 2052), the Project will only be subject to the fiscal terms agreed in the Mineral Agreement and will not be subject to any other taxes or other fiscal obligations in Pakistan. The fiscal terms that are applicable during any renewal term will be subject to renegotiation with the GoP and GoB, in accordance with certain parameters agreed in the Mineral Agreement. A summary of the agreed tax structure is presented in Table 4-5.
Table 4-5 Summary of Taxes and Other Obligations
| Tax Description | Rate | Basis | Holiday | |||
| Export Processing Zone (EPZ) surcharges |
0.5% | NSR, with no freight deduction | (Not Applicable) | |||
| Dividend Withholding Tax (WHT) for non-resident shareholders |
0% during holiday. Before commercial production and after the holiday, stabilised at current rates (0-20%, depending on shareholder’s domicile). | (Not Applicable) | 15 years commencing at commercial production | |||
| WHT on Shareholder Loan (SHL) interest |
0% during holiday. Before commercial production and after the holiday, stabilized at current rates |
(Not Applicable) | 15 years commencing at commercial production | |||
| WHT on third-party interest | Nil while any third-party debt financing raised for project construction, including expansions | (Not Applicable) | (Not Applicable) | |||
| WHT on services | 0% during holiday. Before commercial production and after the 15-year holiday, stabilized at current rates. | (Not Applicable) |
15 years commencing at commercial production |
|||
|
February 19, 2025 |
Page 47 |
|
|
NI 43-101 Technical Report on the Reko Diq Project |
|
| Tax Description | Rate | Basis | Holiday | |||
| WHT on goods | 0% during holiday. Before commercial production and after the 15-year holiday, stabilized at current rates. | (Not Applicable) | 15 years commencing at commercial production | |||
| Federal Worker Profit Participation Fund (WPPF) |
0% |
(Not Applicable) |
(Not Applicable) | |||
| Social spending on capital | 1% | Development and expansion capital costs | (Not Applicable) | |||
| Social spending on revenue | 0.4% | Revenue following commercial production | (Not Applicable) | |||
| Balochistan and Sindh Sales Tax on Services |
0% during holiday; 15% before and thereafter | Non-capitalized services (excluding goods) | 10 years commencing at commercial production | |||
| 4.4 | Permits |
The Mineral Agreement (dated December 15, 2022) sets out a list of permits and approvals from various governmental authorities that are expected to be required in connection with the construction, development and operation of the Project.
As noted above, the GoB issued two Mining Leases, an Exploration License (which replaced a previously issued exploration license) and a Surface Rights Lease, as well as two Water NOCs covering ten areas across two districts. In addition to these permits the full Project Environmental and Social Impact Assessment (ESIA) was submitted to the Balochistan and Sindh Environmental Protection Agencies in late 2024 and is expected to be approved in early 2025.
The Project has obtained leasehold tenure rights and permits to abstract water within the Fan Sediments in support of construction activities. Further leasehold tenure rights and permits in the Fan Sediments will be required to support the supply of water for operations.
The principal agencies from which permits, licences, and agreements are required for mine operation in Pakistan include:
| ● | Government of Pakistan |
| ● | Provincial Government of Balochistan |
| ● | Directorate General Mines & Minerals |
| ● | Board of Revenue |
| ● | Deputy Commissioner Chagai |
| ● | Deputy Commissioner Washuk |
| ● | District Water Board |
|
February 19, 2025 |
Page 48 |
|
|
NI 43-101 Technical Report on the Reko Diq Project |
|
| ● | Chief Inspector of Mines (Balochistan) |
| ● | Balochistan Environmental Protection Agency |
| ● | National Highways Authority of Pakistan |
| ● | Ministry of Railways (Pakistan) |
| ● | Port Qasim Authority |
| ● | Ministry of Energy (Pakistan) |
The processes to obtain and renew permits are well understood by RDMC and similar permits have been granted in the past. RDMC expects to be granted all permits and approvals necessary and see no impediment to such. For permits that require renewal, RDMC expects to obtain them in the normal course of business.
Section 20 has a detailed discussion on the Project’s Environmental and Social permitting requirements.
| 4.5 | Environmental Liabilities |
There are no environmental liabilities associated with the property as at the Effective Date of the Report that are considered material to Barrick. As the Project is progressed, environmental liabilities will result from its development and operations which have been included in the economic analysis presented in this Report.
| 4.6 | QP Comment on Property Description and Location |
To the extent known, there are no significant factors or risks other than those identified that may affect access, title, or the right or ability to perform work on the Project that are not discussed in this Report.
All appropriate Mining Leases have been acquired and obtained to conduct the work proposed for the property and there are no known risks that could result in the loss of ownership of the deposits or loss of the Mining Leases, in part or in whole.
The mineral, surface and water rights secured for the Project are sufficient to allow for the operation of all required Project infrastructure, and sufficient surface area remains if expansions to the existing infrastructure are required.
The extent of all environmental liabilities to which the property is subject to have been appropriately met.
Barrick conducts or participates in mining and other activities in many countries, including in a number of emerging markets. Barrick has a long history of successfully developing and operating mines in emerging
|
February 19, 2025 |
Page 49 |
|
|
NI 43-101 Technical Report on the Reko Diq Project |
|
markets and has the structures and protocols in place to manage the regulatory, legal, linguistic and cultural risks associated with having operations in these jurisdictions.
The Reconstitution of the Project and associated agreement provides the Project additional certainty regarding the financial obligations, such tax and royalties over a 30-year stabilization period as well as security around the various permits, mining leases and mineral rights.
|
February 19, 2025 |
Page 50 |
|
|
NI 43-101 Technical Report on the Reko Diq Project |
|
| 5 | Accessibility, Climate, Local Resources, Infrastructure and Physiography |
| 5.1 | Accessibility |
The region of the Project is sparsely populated with the nearest settlement being Humai approximately 19 km away. Nok Kundi approximately 75 km away is the closest major regional centre which has a population of approximately 30,000 to 50,000.
Access to the Project from major regional centers is via the national highway N40 (40 km away) which runs from Quetta to the border with Iran, along with a ‘parallel’ rail line along this corridor. From Nok Kundi the Project is accessed by regional gravel road, which while adequate for exploration and drilling requirements, will be upgraded to support construction and operational needs.
The nationally controlled Pakistan Railways (PR) line is located approximately 40 km away from the site which connects Nok Kundi to the proposed loading facility at Port Qasim to export products to market. This port is 1,326 km by rail from Nok Kundi and is 20 km southeast of Karachi.
Within the Surface Rights Lease RDMC have constructed an airstrip that facilitates charter flights. The airstrip is approximately 1,700 m by 30 m and can facilitate various aircrafts, such as an ATR42 or Dash 8.
| 5.2 | Climate and Physiography |
The Project area is approximately 915 m above sea level, with a Hyper-arid climate and is in the Sistan Desert ecological region characterised by nutrient-deficient sandy and gravelly surfaces with little to no vegetation other than desert grass.
The climatic conditions are typically hot and dry, with high sunshine exposure throughout the year. The region’s average yearly temperature is 26ºC, however, this ranges throughout the year with extreme summers up to maximum of 45ºC during June/July with mild winter months in January/February 4ºC. The region has an average rainfall of less than 35 mm per annum, which occurs predominately in the early part of the year. The climate is not considered to materially impact mining operations.
Perennial surface water is rare being limited to a few springs and one known groundwater fed wetland across the Iranian border.
|
February 19, 2025 |
Page 51 |
|
|
NI 43-101 Technical Report on the Reko Diq Project |
|
| 5.3 | Seismicity |
The Project is located within a relatively low-strain rate region, however it is adjacent to higher hazard areas in western Iran. A geohazard assessment was completed by Lettis Consultants International, Inc. (LCI) (LCI 2024). The key finding was that the Tozzi fault and secondary strands should be considered active during Quaternary period based on existing information. These faults should be considered as potential seismic sources in updated probabilistic and deterministic seismic hazard assessments.
| 5.4 | Local Resources and Infrastructure |
The Project is located in a remote location with the closest regional centre Nok Kundi being 75 km away. As such, there are limited local resources, including labor, water, power, natural gas, and infrastructure other than the rail line and national highway located 40 km away to support ongoing works.
There is currently an exploration camp near the Tanjeel porphyry that is approximately 0.1 km2, containerized with accommodation, mess, and recreational facilities which has a 600-person capacity.
Given the scale of the Project and expected labour requirements, technical or skilled labor will be required to be sourced from outside of local communities.
Regionally, there is available labor to support non-skilled labor requirements. RDMC will prioritize local employment and will endeavor to appropriately train and develop local employees for positions they can become qualified in and competent and safe to deliver within the construction and commissioning timeframe.
The Project location has moderate topography with competent ground conditions providing suitable locations for project infrastructure including the tailings facility. Two main internally draining basins are located within 100 km of the mine-site which can provide sufficient water for the project. Currently no power transmissions connect to the Project area so stand-alone power will be required for project commissioning. The proposed site infrastructure is discussed in Section 18.
| 5.5 | Sufficiency of Surface Rights |
The surface rights secured for the Reko Diq Project are considered sufficient to allow for the development and operation of both phases of the Project, including mining-related infrastructure such as the open pits, process plant, workshops, offices, the TSF, and waste rock storage facilities.
Surface rights to support the current site and planned mining operations are discussed in Section 4.
|
February 19, 2025 |
Page 52 |
|
|
NI 43-101 Technical Report on the Reko Diq Project |
|
| 6 | History |
| 6.1 | Project Development |
The Project history is summarized in Table 6-1.
Table 6-1 Reko Diq Development History
| Operator | Year | Comment | ||
|
Prospectors |
1968 | Copper-gold mineralization was first detected in the Chagai area by the Geological Survey of Pakistan. | ||
|
BHP |
1991-2000 | Reko Diq copper-gold porphyry deposits were discovered by BHP. The Western Porphyries and Tanjeel, two of at least 13 principal mineralized porphyries within the Reko Diq Project area, were drilled for the first time in 1996. By the end of 1998, after drilling over 18,588 m in Reko Diq.
A further 3,773 m (8 holes) of reverse circulation (RC) exploration drilling was carried out on the regional targets at Ting- Dargun, Ziarat Pir Sultan, Kirtaka, and Durban Chah and only weak, sub-economic hypogene Cu sulphide mineralization was encountered. |
||
|
Mincor Resources NL (Mincor) |
2000-2002 | The GoB formally consented to the transfer between BHP and Mincor contemplated in the agreement, and Mincor subsequently exercised its option in October 2000.
TCC focussed on Tanjeel and undertook a detailed exploration drilling program to delineate the potential of the supergene chalcocite blanket. A total of 30 drill holes totalling 3,468 m were drilled; comprising 2,881 m of RC and 587 m of diamond core. |
||
|
Tethyan Copper Company Pty Limited (TCCA)
(Owned by Mincor) |
2002-2006 | The formal Alliance Agreement was executed between BHP and Tethyan Copper Company Pty Limited (TCCA), a special purpose company incorporated and wholly owned by Mincor, in October 2002.
TCCA incorporated the Project Company as a wholly owned subsidiary (which, at the time, was named Tethyan Copper Company Pakistan (Private) Limited) (together with TCCA, TCC) The Alliance Agreement provided for TCC to earn a share of BHP’s 75% interest in the Project by developing the JV mining area.
During this period, 215 resource drill holes were completed, for a total of 47,795 m. This program comprised 19,842 m of RC drilling, 1,764.7 m diamond drilling (DD) from surface and an additional 26,188 m diamond tail drilling. |
||
|
Tethyan Copper Company Pty Limited (TCCA)
(Owned by Antofagasta & Barrick) |
2006-2010 | TCCA was subsequently acquired from Mincor by Atacama Copper Pty Ltd, a holding company owned by Antofagasta.
Antofagasta sold 50% of Atacama Copper to Barrick, resulting in effective ownership in the Project of 37.5% for each of Antofagasta and Barrick and 25% for the GoB. |
||
|
February 19, 2025 |
Page 53 |
|
|
NI 43-101 Technical Report on the Reko Diq Project |
|
| Operator | Year | Comment | ||
| From 2006 to 2009, a total 745 holes had been completed for 287,151 m and by August 2009, a prefeasibility study had been completed (Reko Diq IMD Prefeasibility Report 2009).
In August 2010, TCC submitted its application for a mining lease. In November 2010, several Pakistani parties filed petitions before the Supreme Court of Pakistan challenging TCC’s eligibility to hold a mining lease.
By July 2019, an ICSID tribunal ruled in favour of TCC and rendered a multi-billion dollar damages award against the GoP while an ICC tribunal rendered a partial award (collectively, the Award). |
||||
| Tethyan Copper Company Pty Limited (TCCA)
Renamed: Reko Diq Mining Company (Private)Limited (RDMC)
(Owned by Barrick, GoB, GoP
Operator: Barrick) |
2022- Present |
Barrick, Antofagasta, the GoB, and the GoP subsequently engaged in discussions regarding alternatives for the resolution of the Award that maximally satisfied the objectives of each party and all related stakeholder which ultimately, these negotiations resulted in the settlement of the Award and Reconstitution of the Project.
The Project was reconstituted on 15 December 2022 under the Mineral Agreement and associated JVA.
As described in Section 2 above; Barrick holds an effective 50% interest in the Project owner RMDC, the GoP SOEs, through PMPL, collectively hold an effective 25% interest in the Project, the GoB, through BMRL, holds an effective 15% funding interest in the Project, and the GoB holds, directly, a freely carried 10% interest in the Project.
A total of 18,968 meters of geotechnical and 2,973 m of metallurgical holes was conducted in 2023-24 using DD. |
||
The historical drilling as outlined in the table above is shown on a timescale graphically in Figure 6-1. This includes exploration drilling, resource definition drilling and development drilling in support of the FS (sterilization, geotechnical and metallurgical testwork). The drilling quantities outlined below are within the Project area only, additional drilling has been completed by various companies outside the permit boundaries.
|
February 19, 2025 |
Page 54 |
|
|
NI 43-101 Technical Report on the Reko Diq Project |
|
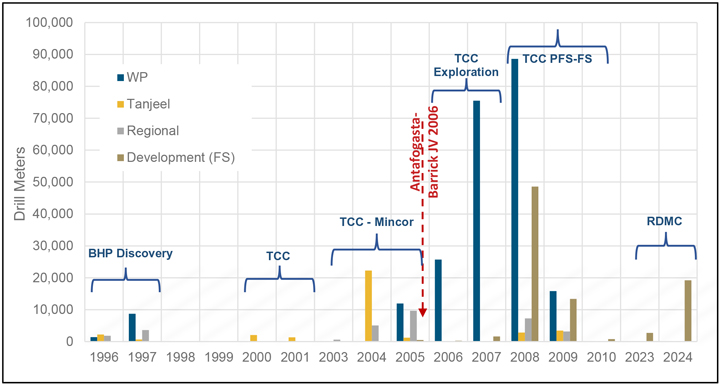
Source: Barrick, 2024
Figure 6-1 Tabulation of Drilling by Year and Company
| 6.2 | Previous Mineral Resources |
The latest publicly reported Mineral Resources estimated in accordance with CIM (2019) MRMR Best Practices Guidelines were reported by Barrick as of 31 December 2023 and do not differ materially from those presented in this Report, see Section 14. The Mineral Resources presented in this Report supersede any historical estimates.
| 6.3 | Production History |
No mining has been undertaken at the Project, and therefore there is no production history to report.
|
February 19, 2025 |
Page 55 |
|
|
NI 43-101 Technical Report on the Reko Diq Project |
|
| 7 | Geological Setting and Mineralization |
| 7.1 | Regional Geology |
The Chagai belt is an east-trending belt of calc-alkaline plutonic, volcanic, and sedimentary rocks that extends for about 500 km along the Chagai Hills and adjacent ranges of the Balochistan plateau of northwestern Balochistan Province, western Pakistan, and southern Afghanistan (Figure 7-1). The belt is interpreted to have formed along the southern edge of the Eurasian continent during and after the amalgamation of the Central Iran and Afghanistan microcontinental blocks during the final closing stages of the Neo Tethys Ocean. The belt comprises over 45 deposits and prospects of predominantly porphyry Cu and Cu-Au types, but small manto-type Cu, Kuroko-type volcanogenic massive sulfide, and magnetite-rich contact metasomatic occurrences are also known. From north to south, the region can be divided into four broadly southerly convex morphological and structural units: the Chagai Hills, Dalbandin Trough, and Mirjawa and Ras Koh ranges (Figure 7-1).
The Chagai belt has long been recognized as part of the larger 5,000 km Tethyan collage extending from central Europe and Mediterranean Türkiye through Iran to western Pakistan. Adjacent segments of the belt, approximately 600 km to 700 km to the west in south-eastern Iran, contain the large porphyry Cu deposits at Sar Cheshmeh and Meiduk, as well as a smaller number of porphyry Cu prospects in the Kerman region, whereas distant segments in north-eastern Iran host the Sungun porphyry Cu deposit near the border with Armenia.
The Tethyan Cu-Au metallogenic belt is extremely complex and made up of multiple sub-belts, segments, porphyry clusters, and isolated deposits that formed in distinct tectono-magmatic environments during numerous metallogenic epochs that started in the Late Cretaceous and were related to subduction and collision events during the closure of the neo-Tethys Ocean. Extension in the Late Cretaceous and early Paleocene accompanied the formation of a multitude of volcanogenic massive sulfide deposits and local porphyry Cu, skarn, and epithermal Au deposits in diachronous island arcs in the Balkan-Pontide metallogenic belt from Romania to Türkiye, as well as iron oxide-Cu-Au mineralization in southeastern Türkiye. Post-collisional, subduction-related magmatism dominated from the Eocene onward and generated widespread porphyry Cu mineralization of various sizes and contrasting metal suites along with additional Cu skarns and high-sulphidation epithermal in Türkiye and high-sulphidation epithermal and Carlin-like Au mineralization in Iran.
|
February 19, 2025 |
Page 56 |
|
|
NI 43-101 Technical Report on the Reko Diq Project |
|
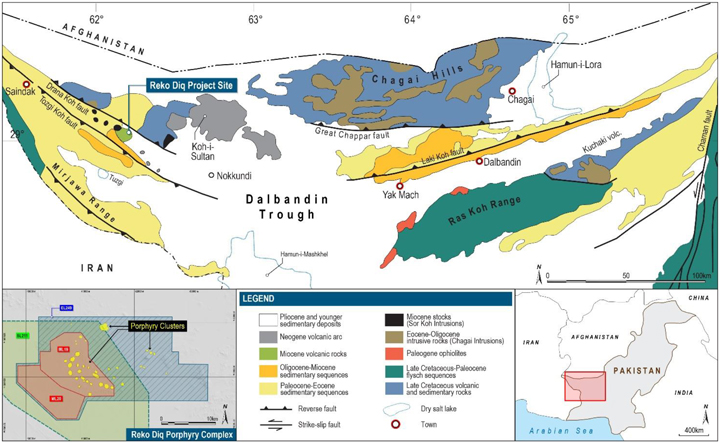
Source: Barrick, 2024 (Based on Perello et al., 2008)
Figure 7-1 Regional Geology and Structure of Chagai Belt
| 7.2 | Structure |
The main structural control for the region is east-west following the Tozgi Fault, which is parallel to the Makran subduction zone (Figure 7-1). This D1 or dominant structure is locally WNW trending, which is crossed by a D2 or secondary structure with a NNE trend. These structures have created pathways for the main porphyry bodies to intrude, with the H13, H14, H15, and H79 porphyries, which make up the Mineral Resource, located along the D2 structure (Figure 7-2). H13 is aligned with D1 (although being located within the D2 structure), while H14/15/79 shows strong alignment to D2. The intrusions have a younging direction from north to south, with H79 being the oldest (Figure 7-5).
H4, or the Tanjeel porphyry, aligns with the D1 structure with local D2 structures, offsetting the sub-horizontal intrusion. The lithology offset seen in Tanjeel is not recognized in the Western Porphyries, which is likely due to the age of emplacement during the deformation event.
The intrusion of the Western Porphyries is expressed as a bulge which is mappable in the pebble units within the Dalbandin Formation. The wall rock and porphyries show no major tilting or offset (other than the limited offset mentioned at H4).
|
February 19, 2025 |
Page 57 |
|
|
NI 43-101 Technical Report on the Reko Diq Project |
|

Source: Barrick, 2024
Figure 7-2 Location of Porphyry Surface Expressions in the Reko Diq Area
| 7.3 | Local Geology |
The Western Chagai belt consists of 10 km of volcanic, volcano-sedimentary, and sedimentary basin fill. The oldest is the Late Cretaceous Sinjrani Group, which consists of layered lava flows, pyroclastic units, limestones, sandstones, and shales. The sedimentary horizons contain Late Cretaceous marine fossils which have been used to determine the age of the unit.
The Sinjrani is overlain by the Humai Formation, which includes the approximately 300 m thick biohermal Humai limestone. This unit is the latest of the Cretaceous period.
The Humai Formation is overlain by the Juzzak (Paleocene), Saindak (Eocene) and Amalaf (Oligocene) Formations. These formations consist of volcanic debris and lava flows (Figure 7-3).
|
February 19, 2025 |
Page 58 |
|
|
NI 43-101 Technical Report on the Reko Diq Project |
|

Source: Barrick, 2024 (Based on Perello et al., 2008)
Figure 7-3 Regional Chagai Stratigraphy
|
February 19, 2025 |
Page 59 |
|
|
NI 43-101 Technical Report on the Reko Diq Project |
|
| 7.4 | Property Geology |
The main outcropping units within the Project are sub-aerial volcanic units within the Reko Diq Formation. These units contain porphyritic andesites, autoclastic volcanic breccias and pyroclastic lapilli and breccias which can be 400 m in thickness locally. This formation was dated between 23 and 25 Ma and was based on K-Ar and U-Pb zircon samples (Perello et al., 2008).
The Reko Diq Formation sits conformably above the Dalbandin Formation (Figure 7-3) with a transition zone of interfingered lava flows, breccias, and conglomerates. The Dalbandin Formation is a volcanogenic sedimentary unit of sandstone, siltstone, and mudstone with local lenses of gravel units.
Mineralization is hosted in a series of intrusive rocks of diorite to quartz-diorite composition that have intruded the Dalbandin and Reko Diq formations. These intrusions are fine to medium-grained with porphyritic textures. The alteration halos radiate from these units outwards with mineralization occurring within the intrusive and altered wall rock. The intrusions occur as stocks, dykes, sills, and dyke swarms, with units typically ranging in size but have diameters less than 3 km (Figure 7-4). Multiple intrusive events are recognized based on changes in chemistry, texture, metal content, and spatial distribution, with the main mineralized intrusions dated between 10 Ma and 23 Ma.

Source: Barrick, 2024
Figure 7-4 Local Geology Surface Map
|
February 19, 2025 |
Page 60 |
|
|
NI 43-101 Technical Report on the Reko Diq Project |
|
| 7.4.1 | Lithology |
The wall rock of the Western Porphyries and Tanjeel consists of the basal Dalbandin formation modeled as the Volcanic Finely Laminated (VFL), which consists of a volcanoclastic sedimentary unit of mainly fine-grained siltstone and mudstone. Local lenses of gravelly units are mappable across the unit and are modeled as Volcanic Pebble Unit (VPU).
Overlying the VFL is the Intermediate Volcanics (VIN) which consists of a porphyry andesite, lapilli pyroclastic and autoclastic breccia sequence. The VIN represents the top 300 m to 400 m of the deposit wall rock.
The porphyry units that host the main mineralization are broken into several units identified by texture, changes in mineral content, and distribution. In the Western Porphyries, the host rocks are diorite porphyries with dominantly feldspar and biotite assemblages. These have been named PFB1 to PFB3 (Feldspar-Biotite Porphyry). PFB1 is the oldest and most fertile, while PFB3 is the least fertile based on current drilling. PFB1 and PFB2 are volumetrically similar and consist of the main mineralization in the core of the system around H14 and H15. Two older and less mineralized feldspar-hornfels and feldspar-quartz (PFH and PFQ) porphyries occur at the north end of H15 and in H79.
The porphyry units at Tanjeel are older (Figure 7-5) than the Western Porphyries and are feldspar-quartz or quartz-feldspar diorites (PFQ and PQF). These intrusions are sub-horizontal compared to the sub-vertical PFB units in Western Porphyries. A key differentiation is the supergene enrichment zone at Tanjeel, with some hypogene mineralization at depth. The main intrusive feeder for the system appears to be found at depth to the south-east of Tanjeel.
|
February 19, 2025 |
Page 61 |
|
|
NI 43-101 Technical Report on the Reko Diq Project |
|
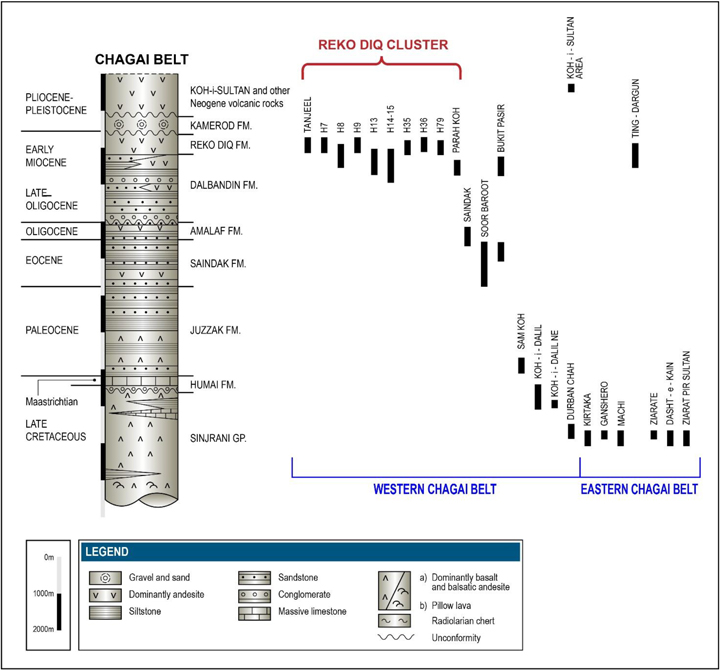
Source: Barrick, 2024 (Based on Perello et al., 2008)
Figure 7-5 Host Rocks to Chagai Belt Porphyry Cu Systems
| 7.4.2 | Alteration |
The hydrothermal alteration at the Western Porphyries follows typical porphyry halos of potassic, argillic and potassic/chloritic. The degree of argillic alteration is weak at the Western Porphyries and stronger in Tanjeel where a supergene zone has developed. The uplift during deformation and emplacement resulted in the ceasing of the development of the hydrothermal alteration resulting in primary mineralization at surface at the Western Porphyry versus the older Tanjeel system, however there is a weak zone of leaching in the Western Porphyries. The leaching in Tanjeel is more prominent with supergene enrichment with cycling events to remobilize and enrich mineralization.
|
February 19, 2025 |
Page 62 |
|
|
NI 43-101 Technical Report on the Reko Diq Project |
|
Potassic (POT) alteration is identified within the core of the Western Porphyries from surface to the defined depth of drilling. A metal transition can be interpreted at PFB3 where mineralogy changes to less copper and gold to stronger molybdenum. This is interpreted as a hotter and more sodic zone of the porphyry consistent with late-stage development.
The POT core is typically surrounded by a weak argillic sericite-clay-chlorite (SCC) alteration. The SCC is found within the porphyries and within the wall rock surrounding the intrusions. A mixed (MIX) POT/SCC alteration is also identified which sporadically occurs throughout the system. The overall grade variations between the POT, MIX and SCC indicate that there are minor alteration overprint halos (See Section 14) which impacts the domaining of the mineralization. This overprint has been incorporated in the resource estimation via the use of logging and geochemical analysis.
Outside the SCC zone is the propylitic (PRO) or advanced argillic zone distal to the mineralization. This is mostly barren with sparse mineralization associated with veining and weak overprinting.
There is a recognized gypsum and anhydrite zones within the ore body. These transitions are logged in core and may be important in the comminution and slope stability. These zones will continue to be an area of focus during the initial years of operation.
Alteration at H4 is categorized in terms of supergene enrichment with a Leached LEA (LEA) zone at the surface followed by High Chalcocite (HCC) blanket and an Enriched (EN) zone before transitioning to a Hypogene (HYP) style of mineralization. Zones of Enriched Low (ENL) were broken out to capture lower-grade supergene mineralization and down-structure zones of mixed Oxide/Supergene.
| 7.4.3 | Mineralization |
Mineralization at the Western Porphyries is primary hypogene mineralization. The dominant copper mineral is chalcopyrite with an increase in bornite at depth. Extensive pyrite is found in the system (generally less than 4%) with minimal oxide mineralization identified. Where oxide mineralization has been defined it typically occurs in the top 50 m within the weathering horizon. Weathering is seen as minor oxidation and increased fracturing, with very little saprolite occurring.
The copper concentration >0.2% occurs at the surface with increasing grades at depth towards the bornite rich zones. A range of sulfide zoning has been identified and separated by pyrite dominant to chalcopyrite dominant to bornite dominate with various intermediate stages. Refer to Section 14 regarding the impact of sulfides on the estimation and subsequent metallurgical recoveries forecast.
As noted in Section 14, there is no direct correlation globally between copper and gold with gold typically associated with the bornite where it is found within the crystal matrix. Gold is also found in pyrite in HS/LS type mineral assemblages at shallow depths. Within the bornite rich zones, gold is
|
February 19, 2025 |
Page 63 |
|
|
NI 43-101 Technical Report on the Reko Diq Project |
|
approximately 1:1 on a % copper to g/t gold ratio. Where copper has been leached, or gold is present in pyrite this ratio can increase to over 2:1.
Gold is also associated with quartz in the system however is not recoverable due to its limited occurrence, low grade, and cost of recovery. Please refer to Section 13 for additional information.
Tanjeel is a distinctly supergene system with surface copper oxide common which occurs as malachite, copper wad, as well as chalcanthite where exposed chalcocite has oxidized. The HCC zone represents the richest of the supergene blanket and is dominantly chalcocite and pyrite. The pyrite content at Tanjeel can reach over 10% accounting for the required generation of sulphur to mobilize copper in the supergene system.
Within the EN and ENL zones there is minor covellite along with the more dominant chalcocite. These zones also exhibit strong pyrite zoning and veining. At depth the hypogene system is characterized by chalcopyrite and pyrite.
The MIX zones at Tanjeel that follow down dip structures are surface fluid pathways that allow oxidation to occur. These zones are characterized by oxide development at depth with malachite and chalcocite co-existing in the same structures. These zones also show chalcanthite infillings where oxidation of the chalcocite have occurred.
| 7.5 | QP Comment on Geological Setting and Mineralization |
In the opinion of the QP, the understanding of the deposit settings, lithologies, and geological, structural, and alteration controls on mineralisation is sufficient to support estimation of Mineral Resources and Mineral Reserves.
The mineralisation styles and settings are well understood with a high quantity of supporting drill data and can support declaration of Mineral Resources and Mineral Reserves.
The QP has reviewed the mineralisation and confirms that the controls are well understood, sampled appropriately, and modeled accurately within the known geometry of the mineralisation style.
|
February 19, 2025 |
Page 64 |
|
|
NI 43-101 Technical Report on the Reko Diq Project |
|
| 8 | Deposit Types |
Copper, gold, and molybdenum mineralization is interpreted to be associated with a regional scale porphyry system. On a global scale, porphyry deposits are concentrated around the Pacific Rim, China through Uzbekistan and into Eastern Europe, Iran and Pakistan (Figure 7-1). These regions coincide with convergent plate boundaries and include oceanic island arcs and continental (Andean-type) arcs. Groups of deposits or clusters occur within a few kilometers of one another and close or within major fault zones. Multiple deposits can form in belts over 100 km long, with the dimensions of each cluster up to 10 km laterally. Some deposits are within porphyry intrusions, whereas others are proximal to, or even distal from, intrusions.
Wide alteration haloes surround porphyry deposits, with estimates that some are 10 km3 to 100 km3 in volume and extend to at least 2 km from the core (Kouzmanov & Pokrovski, 2012). Alteration zones are typically referred to as potassic, sodic–calcic, sericitic and argillic, with a chlorite–sericite zone as well (Figure 8-1). More distal alteration includes chloritic and propylitic zones. The majority of these zones have been identified at Reko Diq.
Vein networks are a fundamental component of porphyry deposits and have multiple orientations and cross-cutting relationships that may allow local distinction of veins by their relative ages and by the vein and wall-rock alteration mineral assemblages. Individual veins may be only millimetres thick, and it is the frequency and grades of such veins that are important economically.
A supergene system like the one found at Tanjeel is uncommon in the Chagai region. This is a copper hypogene deposit with a moderately well developed, sub-horizontal, supergene enrichment blanket. The system is relatively small compared to the Western Porphyries. Tanjeel is a pyrite-chalcocite system with pyrite-chalcopyrite hypogene underlying system.
The Western Porphyries display a minor, <50 m, leach cap with primary mineralization occurring at surface. Rapid uplift of the system, lower sulphide content, and limited exposure to meteoric fluids have frozen the development of the system and limited the extend of leaching.
|
February 19, 2025 |
Page 65 |
|
|
NI 43-101 Technical Report on the Reko Diq Project |
|
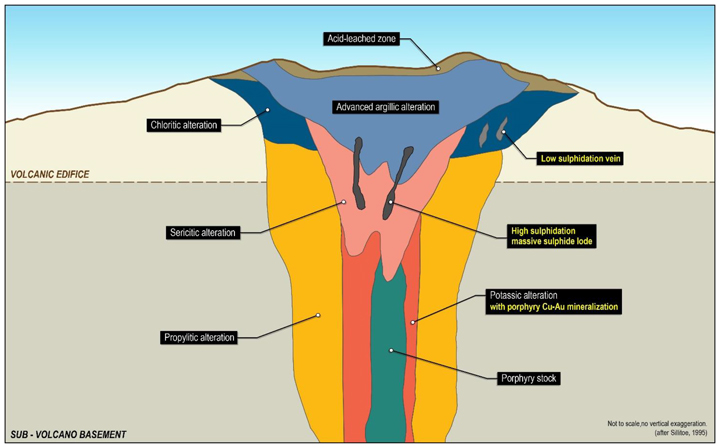
Source: Barrick, 2024 (after Sillitoe, 1995)
Figure 8-1 Conceptual Porphyry Cu-Au Deposit Model
|
February 19, 2025 |
Page 66 |
|
|
NI 43-101 Technical Report on the Reko Diq Project |
|
| 9 | Exploration |
The Chagai region is noted for several other porphyry Cu occurrences. These were initially referenced in 1901 during geological surveys as part of Eastern Persia, however the region was first noted as a discovery during a joint Geological Survey of Pakistan (GSP) and United States Geological Survey project in 1961. Copper-gold mineralization was first noted in the Reko Diq area by the GSP in 1968. The Reko Diq Cu-Au porphyry was first discovered by BHP in 1994 with first drilling occurring in 1996.
Several companies have completed exploration work on the Project to date as outlined in Table 6-1. Systematic exploration commenced in 1996 by BHP, which completed both ground exploration and drilling. This was followed by TCC and subsequently by the TCC-Mincor JV prior to Barrick joining the JV. As shown in the figure and table, the majority of the drilling was completed between 2006 and 2009. Exploration recommenced in 2023 with further drilling, geophysical surveys and regional sampling being undertaken by RDMC.
| 9.1 | Exploration Concept |
The Reko Diq area is very prospective for porphyry style mineralization. Limited structural mapping and regional interpretation is available in comparison to other porphyry regions globally. The full potential of deeper mineralization and feeder systems providing economic mineralization within the area is undefined.
| 9.2 | BHP 1996 – 1997 |
A 13,000 km2 area was granted for one year during which approximately 5,000 reconnaissance samples were collected, which outlined over 10 prospective areas, inclusive of but also beyond the Reko Diq area. The Project area became the focus of BHP activity during 1996-1997 which completed a detailed exploration program between July 1996 to April 1998. This program included geological mapping, geochemical rock chip sampling, and reverse circulation (RC) drilling and diamond drilling (DD). Geophysical surveys (ground magnetic, induced polarization (IP), and ground electromagnetic (EM) orientation) were undertaken to help target definition from 1997. During BHP’s tenure of the Project, the following programs were undertaken as part of exploration activities:
| ● | Grid surface sampling over most of the complexes (nominal 100 m by 100 m with 50 m by 50 m infill) Figure 9-1; |
| ● | Geological mapping at 1:10,000 of the Reko Diq complex area; |
|
February 19, 2025 |
Page 67 |
|
|
NI 43-101 Technical Report on the Reko Diq Project |
|
| ● | Geological mapping at 1:2,000 of each individual porphyry complex; |
| ● | Ground magnetics survey (50 m line spacing with 10 m reading interval) in 1996/1998; |
| ● | (IP) survey (dipole-dipole technique); |
| ● | Petrographic and radiometric age dating studies; and |
| ● | Exploration drilling (RC and DD) (Table 10-1). |
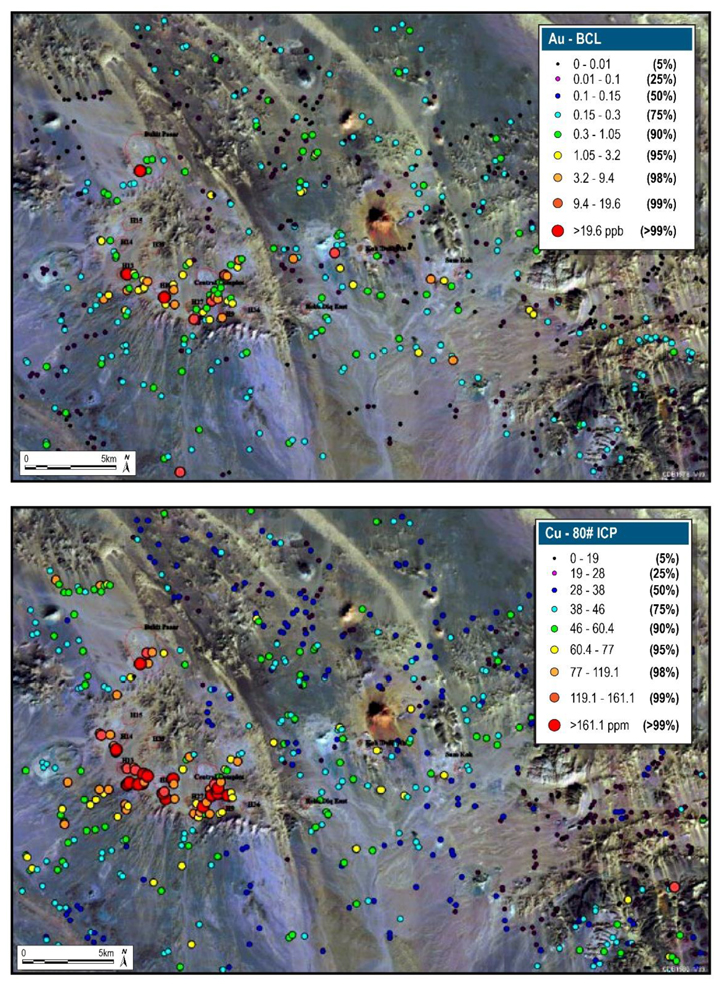
Source: Barrick, 2024
Figure 9-1 Satellite Image with Sediment Sampling Results for Gold and Copper
|
February 19, 2025 |
Page 68 |
|
|
NI 43-101 Technical Report on the Reko Diq Project |
|
Drilling in this period included 84 holes for a total of a 18,588 m (10,894 m of reverse circulation (RC) and 7,694 m of diamond core (DD) and diamond tail (DT) within the Reko Diq area. This drilling encountered significant mineralization in 13 porphyry centres.
A further 3,773 m (eight holes) of RC exploration drilling was carried out on the regional targets at Ting-Dargun, Ziarat Pir Sultan, Kirtaka, and Durban Chah and only weak hypogene copper sulfide mineralization was encountered. These are not within the tenement permit held by RDMC.
| 9.3 | TCC 2000 – 2006 |
In 2000, BHP finalized an agreement with Mincor NL to form a new entity named TCC. From November 2000 to January 2001, TCC focused exploration on the H4 area and undertook a detailed drilling program to delineate the potential of the supergene chalcocite blanket. 40 drill holes for 3,468 m were drilled, comprising 2,881 m of RC and 587 m of diamond core.
From 2003 to 2005, TCC conducted additional phases of drilling to determine the resource potential of Tanjeel and the Western Porphyries H14 and H15 and to test some of the other previously discovered porphyries in the Project area. During this period, 215 resource drill holes were completed for a total of 47,794.45 m. This program comprised 19,842 m of RC, 1,764.7 m of DD from surface and an additional 26,188 m diamond tail drilling.
Additional hypogene porphyry Cu-Au centres were identified at the Koh-i-Dalil and Sam Koh, whereas the Parra Koh system was identified by TCC in June 2004.
| 9.4 | TCC 2006 -2010 |
In March 2006, TCC was sold to Antofagasta Minerals and Barrick, who agreed to share ownership of the Project 50:50. As outlined in the Section 4, TCC acquired the whole of BHP’s interest in EL-5. The partnership changed the focus from Tanjeel to the Western Porphyries, recognizing the primary Cu-Au potential. Exploration activities were limited to field mapping and interpretation as the focused shifted to defining the Western Porphyry deposit. An aggressive drilling campaign over the subsequent three years resulted in delineation of the Mineral Resources as defined in this Report. This program totalled 745 holes for 287,151 m and included resource drilling, metallurgical drilling, condemnation drilling, environmental drilling (piezometers), hydrological drilling (water boreholes), engineering drilling (foundation testing for infrastructure) and geotechnical drilling (Table 10-1).
|
February 19, 2025 |
Page 69 |
|
|
NI 43-101 Technical Report on the Reko Diq Project |
|
Based on these exploration results, all the other Prospecting Licenses (PLs) (PFS Report 2009) were relinquished except the Reko Diq and Koh-i-Sultan PLs which were retained for further exploration and follow-up studies. Geological mapping and geochemical sampling results from the Koh-i-Sultan PL indicated low prospectivity and the PL was relinquished in 1999. The Reko Diq PL was also extended to the east to include the Koh-i-Dalil and Sam Koh areas.
| 9.5 | TCC 2010 – 2022 |
Exploration activities were stopped, and the project was put on hold due to disputes with GoB and GoP.
| 9.6 | RDMC Post 2022 |
RDMC completed a detailed remote survey using ASTER and Sentinel 2 satellite information over EL-249 in 2022 to add to the available regional exploration dataset. This information was reviewed as part of the ongoing exploration and growth programs.
In 2023 a surface sampling program was commenced to infill areas that were historically not sampled or were sampled at large grid intervals. A total of 4,370 samples were collected in grids of 100 m by 100 m, 200 m by 200 m and 400 m by 400 m. The samples were selected from exposed in-situ rock outcrops and were sent for geochemical analysis including copper, gold and whole rock geochemistry.
As part of ongoing studies, drilling was recommenced in August of 2023 with a total of 18,968 m of geotechnical and 2,973 m of metallurgical holes completed using diamond drilling.
In 2024, Ambient Noise Tomography (ANT) surveys over the Reko Diq porphyry clusters within ML-19 was completed. Geodes were deployed over a series of grids of 1km, 500 m and 250 m spacing over various targets. A series of velocity models were generated to inform growth drilling on potential targets related to structural and mineralized controls within ML-19. Figure 9-2 shows an example of the velocity model showing lineaments, with satellite image overlay highlighting the location of the various targets.
|
February 19, 2025 |
Page 70 |
|
|
NI 43-101 Technical Report on the Reko Diq Project |
|
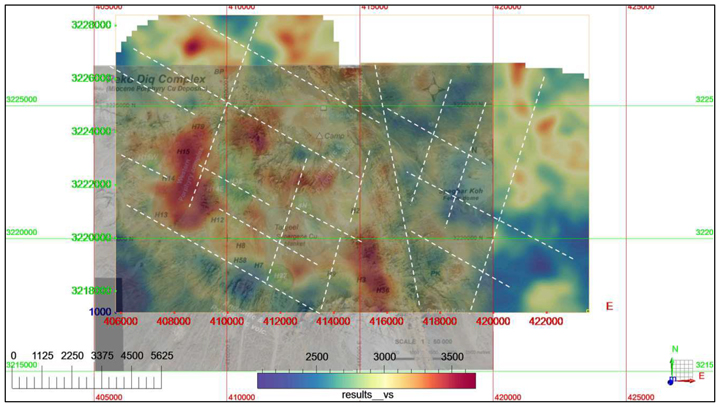
Source: Fleet Space Technologies, 2024
Figure 9-2 Plan view of the Reko Diq Velocity Model at N900 m depth,
| 9.7 | Exploration Potential |
As described in Section 4.2.1, RDMC holds an Exploration License (EL-249) which encompasses the Western Porphyries and Tanjeel. Within this license, 15 porphyry surface expressions (including WP and Tanjeel) have been defined by exploration works. These range in exploration status from conceptual targets supported by remote sensing, geophysics, surface sampling and geological mapping to advanced targets with drilling and assays.
Since the reconstitution of the Project in December 2022, RDMC has been actively adding to the existing exploration knowledge in an effort to expand the mineral resource base of the Project. RDMC has identified several key targets that demonstrate the potential to add further copper and gold resources to the Project from nearby porphyry surface expressions including the depth extension of the currently defined resources and regional exploration targets. Defining economic viability, continuity of mineralization and assessing the application of modifying factors to the nearby porphyry surface expressions is currently underway.
As part of this plan, RDMC has already completed an infill surface geochemistry campaign (as discussed in Section 9.5), acquired satellite imagery and analysis, and conducted passive seismic surveys to fill gaps in the historical data sets. Drilling on new targets commenced in 2024 with initial
|
February 19, 2025 |
Page 71 |
|
|
NI 43-101 Technical Report on the Reko Diq Project |
|
results supporting the updated interpretations and warranting the continuation of exploration. Further work is required to verify the data and if successful may inform future mine plan updates.
Exploration is structured to simultaneously advance brownfield targets, as many of the known deposits retain additional prospectivity, whilst also continuing to develop identified targets to sustain the long-term growth of the Project. Accordingly, Barrick will continue to actively explore the project area.
| 9.8 | QP Comment on Exploration |
In the opinion of the QP, the exploration programs completed to date are appropriate for the style of the deposits and prospects within the Reko Diq Project. Sufficient exploration work has been completed to ensure that potential mineralisation will not be impacted by the infrastructure planned for the Project.
All samples collected to date by the current and previous operators are considered to be representative and unbiased.
The potential to add to the existing mineral resource base, through successful exploration at these targets is considered substantial enough to warrant continued investment in parallel with the project development as outlined in this Report.
|
February 19, 2025 |
Page 72 |
|
|
NI 43-101 Technical Report on the Reko Diq Project |
|
| 10 | Drilling |
| 10.1 | Drilling Summary |
Drilling campaigns have been conducted by most of the participating companies during the history of the Reko Diq Project, including BHP, Antofagasta, RDMC and Barrick. Reverse circulation (RC) and diamond drilling (DD) have been used to support Mineral Resource estimation. From 1996 to 2010 a total of 1,270 holes for 387.2 km have been completed by the various owners including 448 DD, 505 RC and 243 diamond tails of drilling. Of these, 1,116 holes for 361 km have been completed within the Reko Diq Project area. The additional holes are outside the current permits, however do include water supply bores which form part of the FS.
Of these totals, 817 holes including 404 DD, 203 RC holes and 210 diamond tails totalling 286.2 km have been undertaken at the Western Porphyries and Tanjeel and form the basis for the Mineral Resources in this Report. The database cut-off date for the Mineral Resource Estimate was June 2023 prior to recommencement of drilling.
Initially, wide-spaced 250 m to 500 m reconnaissance drill holes were undertaken on geochemical or magnetic anomalies. Subsequent drilling in mineralized areas were carried out on 200 m to 150 m spaced holes on nominally rectilinear grids. Spacing was further reduced to about 100 m for detailed resource definition and in some cases to 45 m where lack of inter-hole continuity was required to support the classifications applied in this Report.
The drilling is summarized in Table 10-1 by year, area and type, which are graphically shown in Figure 10-2 in plan while typical cross sections are shown in Figure 10-2 as well as Section 14.
Table 10-1 Tabulation of Drilling by Year and Area
| Period | Tanjeel | WP | Regional | Development (FS) | Type | |||||||||||||
| Number | Meters | Number | Meters | Number | Meters | Number | Meters | |||||||||||
| 1996 | 12 | 2,220 | 8 | 1,375 | 13 | 1,847 | - | - | RC | |||||||||
| 1997 | 5 | 693 | 26 | 8,736 | 19 | 3,599 | - | - | RC-DT-DD | |||||||||
| 1998 | 1 | 119 | - | - | - | - | - | - | DD | |||||||||
| 1999 | - | - | - | - | - | - | - | - | (No Drilling) | |||||||||
| 2000 | 18 | 2,048 | - | - | - | - | - | - | RC-DD | |||||||||
| 2001 | 11 | 1,320 | - | - | 1 | 100 | - | - | RC | |||||||||
| 2003 | 1 | 111 | 1 | 150 | 2 | 614 | 1 | 100 | RC-DT-DD | |||||||||
| 2004 | 143 | 22,261 | - | - | 17 | 5,037 | 2 | 178 | RC-DT-DD | |||||||||
| 2005 | 21 | 1,240 | 28 | 11,919 | 29 | 9,668 | 4 | 516 | RC-DT-DD | |||||||||
| 2006 | 1 | 150 | 57 | 25,711 | - | - | 2 | 271 | RC-DT-DD | |||||||||
| 2007 | - | - | 146 | 75,517 | - | - | 13 | 1,631 | RC-DT-DD | |||||||||
| 2008 | 18 | 2,843 | 177 | 88,584 | 15 | 7,264 | 181 | 48,562 | RC-DT-DD | |||||||||
| 2009 | 26 | 3,466 | 48 | 15,838 | 9 | 3,169 | 46 | 13,380 | RC-DT-DD | |||||||||
| 2010 | - | - | - | - | - | - | 6 | 766 | RC | |||||||||
| 2023 | - | - | - | - | - | - | 4 | 2,722 | DD | |||||||||
| 2024 | - | - | - | - | - | - | 65 | 19,219 | DD | |||||||||
| Total | 257 | 36,471 | 491 | 227,830 | 105 | 31,298 | 324 | 87,345 | 257 | |||||||||
|
February 19, 2025 |
Page 73 |
|
|
NI 43-101 Technical Report on the Reko Diq Project |
|
| 10.2 | Drill Methods |
As shown in Figure 10-2, three different drilling methods have been employed. DD inclusive of diamond tails (RC/DD) was used for exploration, resource evaluation work, hydrogeological work, geotechnical work and for collecting metallurgical samples. RC holes were used for exploration and resource infill drilling. When the water table was intersected, typically below 70 m depth, no issues were typically encountered with the quality of the sample return. The maximum depth for the RC rigs was about 350 m and below this depth, holes were continued with cored diamond drill tails. A typical drilling cross section is shown in Figure 10-1. Methods described in this section are based on work done from 2006 to present.
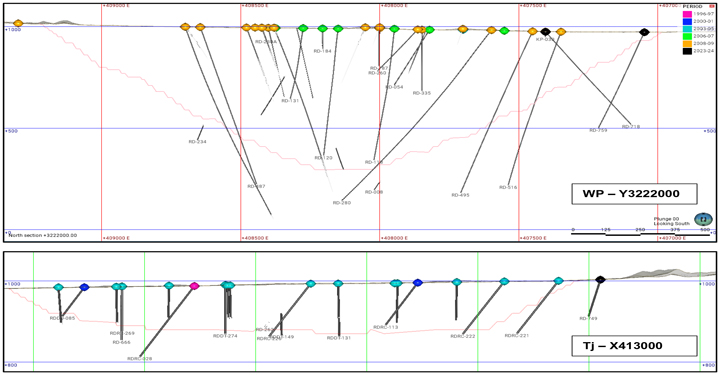
Source: Barrick, 2024
Figure 10-1 Typical Drilling Cross Sections – Western Porphyries (Top), Tanjeel (Bottom)
|
February 19, 2025 |
Page 74 |
|
|
NI 43-101 Technical Report on the Reko Diq Project |
|
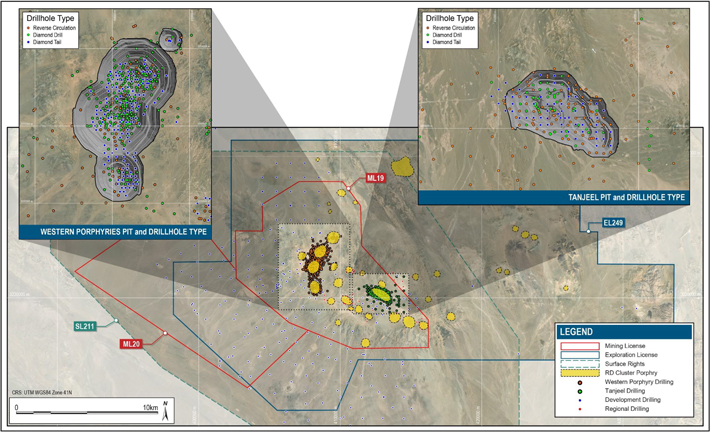
Source: Barrick, 2024
Figure 10-2 Plan of Drilling Locations
|
|
|
February 19, 2025 |
Page 75 |
|
|
NI 43-101 Technical Report on the Reko Diq Project |
|
| 10.2.1 | Diamond Core Drilling |
DD is primarily used to establish a robust geological understanding of the controls on mineralization, for Mineral Resource, and for geotechnical, hydrogeological, or metallurgical investigation. DD holes were drilled at PQ (83 mm) to NQ (45 mm) core size, which is considered suitable for the style of mineralization at the Project.
DD has generally been completed by independent drilling contractors overseen by the operating company at the time. The average drill core recovery is >95% in all weathering areas.
A total of 18,968 meters of geotechnical drilling was conducted in 2023 and 2024 (combined) using DD. PQ3-sized drilling (83 mm core diameter) was employed in weathered and weak rock formations, typically extending up to 40 m depending on the rock conditions, before switching to HQ3-sized drilling (61.1 mm core diameter) for deeper, more competent rock. Triple-tube core barrels were used to ensure maximum core recovery, especially in fractured zones.
Drilling Procedure
All drilling was supervised by senior geologists, to ensure that the drill rig is lined up as per the drill plan and to supervise drilling, core orientation, and down hole surveying. Once each 3 m drilling run was complete, the drill core was removed from the drill rod and placed in an angled iron rack so an orientation mark can be marked with red chinagraph pencil or crayon, as indicated by a Reflex ACT II Core Orientation Tool. The apex of the structure was also marked on the core in a chinagraph pencil or crayon by the core technician.
DD core was transferred into metal core trays and a wooden down hole depth marker was placed at the end of each core run with the depth marked on it. All areas of core loss were identified, and the run markers updated with the core recovery. Each drill core box was marked with the hole ID, top and bottom depth of the core, and the box number. The core was then transferred to the core yard facility, where the core was first place on the V-rail for the marking of orientation line (OL) and then logging and, sampling was conducted.
Logging
DD core was geologically logged using digital tablets with standardised log sheets that include weathering, grain size, mineralization, alteration style, lithology, vein types and style, structural measurements, and redox data. This was logged in acQuire (information management software) offline object and synchronised in main SQL server database after the responsible geologist validated their inputs.
|
February 19, 2025 |
Page 76 |
|
|
NI 43-101 Technical Report on the Reko Diq Project |
|
The geologists at the time log the core samples according to the existing lithological, alteration and mineralogical nomenclature of the deposit as well as sulphide content, veining and any mineralization observed within each internal.
Geologists created a sampling plan using sampling plan sheets and labelled the boxes and core with sample codes. The core (both wet and dry) was then digitally photographed using a purpose-built imaging station and high resolution camera. These photos were stored on a file server and later transferred to IMAGO software for ease of sharing.
All DD core was oriented and, where orientation was not possible, the core was assembled with previous runs to extend the orientation line.
A dedicated external consultant conducted geotechnical core logging for the entire geotechnical drilling campaign. The geotechnical core logging was initially conducted in spreadsheets, and upon respective QA/QC was then imported to acQuire.
Geotechnical core logging during the 2023-2024 geotechnical program followed a structural approach to capture key geological and geotechnical data. Interval logging was performed and data logged by depth intervals on geotechnical boundaries, recovered core length, RQD length, fracture count, structure sets, fabric, rock type, rock weathering, intact rock strength, average defect alteration, average defect roughness, and soil classification (if needed). Point logging was conducted to record geological and geotechnical features of all type of discontinuities including position, orientation, orientation confidence, structure type, defect weathering, wall strength, roughness, alteration, aperture and infill type. Sample logging was used to record all the necessary details, date, sample tested by/selected by, position, depth, sample id, rock type, core diameter, core length, sample moisture, PLT load (KN) and PLT failure mechanism, Additionally, samples were selected for geomechanical tests. Point load tests were conducted every meter of drill core in HQ to assess the strength of rock.
After completing all required geological, RQD and geotechnical work on the core, the sample intervals were marked by the geologist responsible for the diamond hole. Sampling intervals were marked by a green grease pencil perpendicular to the log core axis. An arrow was then marked either side of sampling boundary pointing in the direction of the sample.
For geotechnical holes, after completing all the required geotechnical logging and assessment, samples were taken by the geotechnical loggers. The corresponding section of core was replaced with properly labelled pipe to maintain the integrity of the core box records. Each sample initially wrapped in cling with an inner sample tag placed between the core and the cling wrap. The sample was then wrapped in bubble wrap, with an outer sample tag attached. This double wrapping and labelling procedure ensured sample protection and accurate identification during transport and storage.
|
February 19, 2025 |
Page 77 |
|
|
NI 43-101 Technical Report on the Reko Diq Project |
|
Diamond core samples were taken on 3 m intervals unless otherwise specified or to match where PQ core changes to HQ core or HQ core changes to NQ core. In these cases, the sample interval can be greater than or less than 3 m.
After completion of sampling marks, the sampling intervals are recorded in the computerized diamond sampling form. A centre line was marked along the core by geotechnicians with a pencil and cutting was undertaken along the line using a brick saw/almonte core saw. Sampling was typically taken on the left-hand side of the core, with the right-hand side displaying all measurements.
Cut samples were placed into calico sample bags, each of which displayed Hole ID, from, to and Sample ID. At the completion of diamond sampling, all samples were transferred to the Reko Diq Sample Preparation Lab and placed in sequence. All remaining core was stored for future reference and remains on site.
Geophysical Logging
Geophysical logging was conducted on all the drilled holes using the advance tools to improve the quality of subsurface characterization. These methods include Gamma Ray and Caliper logging (GR-CAL), optical and acoustic televiewer OTA/ATV logging and full wave sonic (FWS) logging. These techniques provided all the information including lithology, structural data and mechanical properties across the borehole.
Geotechnical Instruments
Geotechnical monitoring instrument were installed across the site to track subsurface condition and movements. A total of 65 Vibrating Wire Piezometers (VWPs) were used to measure pore water pressure, 14 Time Domain Reflectometers (TDRs) were installed to monitor ground deformations, and eight Inclinometers were placed to measure ground deformations. These instruments provide suitable data for supporting on going evaluation of subsurface conditions and informing future design adjustments, stability assessments and risk mitigation strategies for upcoming years.
| 10.2.2 | Reverse Circulation Drilling |
Drilling Procedure
A geologist was required be on site prior to drilling commencing, to ensure that the drill rig is lined up as per the drill plan and to supervising drilling, sampling and down hole surveying, RC holes were drilled using a 140 mm or 137 mm bit diameter. Recovery was 70% to 80%, with some dust loss.
|
February 19, 2025 |
Page 78 |
|
|
NI 43-101 Technical Report on the Reko Diq Project |
|
Sampling
Field RC samples were formed as 3 m composite samples following collection of samples every meter. The field collection of RC samples is summarized in Figure 10-3. The supervising geologist was responsible for ensuring maximum sample recovery which was recorded by weight of each sample after the cyclone collection.

Source: Tethyan Copper Company Limited, 2009
Figure 10-3 Flow Chart Summary of RC Sample Preparation
|
February 19, 2025 |
Page 79 |
|
|
NI 43-101 Technical Report on the Reko Diq Project |
|
Given the generation of the drilling, the driller had marks on the mast which are recognized when the head crosses these marks. The driller indicated to the cyclone operator to open the flap for sample collection in a 50 L plastic sample bucket contained within a locally constructed dust collector. The 1 m sample is removed from the dust collector and replaced with an empty 50 L bucket for collection of the next sample, drilling remained continuous throughout sample collection.
The weight of the sample bucket was recorded in kilograms on spring loaded market scales prior to field splitting. To eliminate interpretation and bias, those readings falling between the whole number and 0.5 kg are recorded as X.3 kg, while those readings falling between 0.5 kg and the whole number are recorded as X.7 kg. The sample weight was recorded on the RC sampling sheet by the geotechnicians.
The first 1 m sample is passed through a 3-tiered Jones riffle splitter where it underwent a 1:8 split from the upper most tier. The sample was collected in a pre-numbered calico bag that displays the drill hole and interval. The sample bag was temporarily closed until the following intervals are collected and split. The successive three splits constitute a 3 m composite sample. The splitter and sample collection bins were cleaned with a fine bristled paintbrush between the collection of 1m samples whilst compressed air was to be used at the completion of the composite sample.
After the sample was split in the field, the reject was either placed on the ground or in a green UV stabilized bag. When the composite sample was complete, the field technician randomly selects sieves and washes material collected from the reject bag or reject pile. The sieved sample was placed within the nominated sample interval of the chip tray for evaluation by the supervising geologist. The calico bag containing the sample was tied and its weight (sample split weight) recorded on the scales in the same process as the initial 1 m cyclone sample.
Once the sampled intervals reached the core shed, they were split using the middle tier of a second 3-tiered Jones riffle splitter. Splitting was undertaken inside the core shed within a controlled environment with the sample for analysis collected in pre-numbered calico bags.
The sampling practice outlined above was for dry RC sampling, which was common practice at Reko Diq. However, in the event of groundwater inception, wet samples were placed in poly weave field bags, numbered conventionally (including drill hole identification and interval) and allowed to dry at the core shed prior to any splitting and sample collection. RC drilling ceased once significant ground water was intercepted, so wet samples were minimal.
Logging
RC chips were geologically logged using digital tablets as acQuire offline object with standardised log sheets that include weathering, grain size, mineralization, alteration style, lithology, structural measurements, and redox data. This was synchronised in the main SQL server database. manually after the responsible geologist had validated their inputs.
|
February 19, 2025 |
Page 80 |
|
|
NI 43-101 Technical Report on the Reko Diq Project |
|
The geologists at the time logged the core samples according to the existing lithological, alteration and mineralogical nomenclature of the deposit as well as sulphide content, veining and any mineralization observed within each internal.
| 10.3 | Collar Surveys |
The Project uses the UTM Zone 41N datum WGS84 grid for drill hole coordinates. Subsequent to drilling, all drill collar locations are surveyed using differential GPS methods by third-party surveyors.
Barrick notes that the DGPS system utilized is typically within a 10 cm accuracy range, which is suitable for the classification applied. Importantly, the error noted by Barrick is not considered material to the global resource.
Historical drilling collars were corrected to align with high-resolution topography. This correction was done to a minimum number of holes and was not considered material.
| 10.4 | Down Hole Surveys |
The various drilling contractors have surveyed the majority of drill holes with a gyroscope instrument, some with a gyroscope and a Reflex EZ-shot multi-shot camera instrument or a single shot camera instrument. A summary of the drill hole surveys per drill method is shown in Table 10-2, it is noted that multiple downhole survey methods have been employed in the one hole, which results in the variation from the total drillholes completed.
Typically down hole surveys were completed every 20 m downhole using the gyro or 30 m to 50 m with the Reflex camera. It is noted that these intervals vary, with some larger downhole intervals of up to 100 m.
Table 10-2 Downhole Survey Methods by Drilling Type
| Survey Type | Holes Surveyed | |||||||
| DD | RC | RC/DD | Total | |||||
| Collar downhole survey* | 51 | 227 | 5 | 283 | ||||
| Gyro | 330 | 43 | 144 | 517 | ||||
| Reflect Multi Shot Camera | 94 | 2 | 1 | 97 | ||||
| Single Shot | 40 | 146 | 84 | 271 | ||||
*Refers to collar downhole survey not location survey, not all holes had collar DH surveys completed.
Given the style of the mineralization identified within the Project, the use of the various downhole survey methods is reasonable, and the downhole lengths will not result in any bias due to magnetite material.
|
February 19, 2025 |
Page 81 |
|
|
NI 43-101 Technical Report on the Reko Diq Project |
|
| 10.5 | Drill Planning |
Given the long exploration history and extensive drilling undertaken, several drill orientations have been utilized which range from vertical holes to holes which dip 60o. Given the near vertical plunge of mineralization, the range of orientations and dips is considered suitable.
The drilling collar location was located by GPS and a wooden peg was placed at the hole location. The Hole ID, easting, and northing were recorded on the peg. An appropriately sized drill pad was then cleared around the collar marker to allow for the drill rig, auxiliary equipment, and sample collection. If the drill hole was completed using DD, a sump was dug in the corner of the pad to collect the drilling returns.
Once drilling was completed, the sump, if present, was backfilled and the drill site was remediated if required. A PVC pipe was inserted into the collar to prevent collapse and to mark its location, and a concrete surround was emplaced which was labelled with the drill hole ID.
| 10.6 | Internal and External Audits |
An external audit of the drilling procedures was previously completed in September 2009 by Behre Dolbear, indicating that the field data collection procedures were fit for purpose (Behre Dolbear, 2009).
Internal QA/QC audits have kept a focus on quality control throughout the data acquisition process have applied corrective methods to identified problematic areas when required. Geological logging of sulphides and alteration effects is important in resource definition and estimation and requires constant monitoring. It is recommended that random checks are regularly carried out on sulphide distribution and alteration effects in drill hole logs.
| 10.6.1 | Twin Drilling Studies |
In 2024, 13 historical drillholes were twinned as part of drilling for metallurgical testing within the 10-year mining pit. Drillholes were planned in different locations at Western Porphyries to obtain representative as shown in Figure 10-2.
|
February 19, 2025 |
Page 82 |
|
|
NI 43-101 Technical Report on the Reko Diq Project |
|
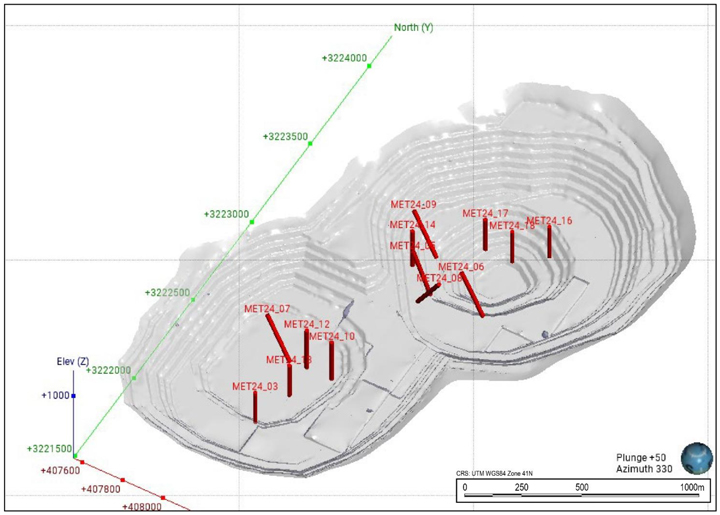
Source: Barrick, 2024
Figure 10-4 Location of Twinned Holes within 10-year Mining Pit
The metallurgical holes twinned historical holes drilled at 2 m to 13 m distance (6.5 m on average) with the same HQ diameter. Mining bench intervals of 15 m were selected for metallurgy samples with the interval selection based on historical assays. Collected high grade intervals were assayed for copper at the metallurgy (ALS Balchatta) laboratory with four acid digestion and ICP finish (ME-OG62) with a comparison shown in the Table 10-3. The mean and median values are generally consistent between twin pairs, with some minor deviations.
|
February 19, 2025 |
Page 83 |
|
|
NI 43-101 Technical Report on the Reko Diq Project |
|
Table 10-3 Twin Hole Analysis - Copper, 15m Bench Composites
| Pair | Distance (m) |
DHID | Year | Type | Assay Method |
Comps No |
Min | Max | Mean | Median | Std Dev |
CoV | ||||||||||||
|
1 |
2.0 | RD-176 | 2007 | DD | ME-OG62 | 8 | 0.42 | 0.85 | 0.59 | 0.58 | 0.150 | 0.254 | ||||||||||||
| RD-724 | 2024 | DD | ME-OG62 | 8 | 0.40 | 0.781 | 0.57 | 0.56 | 0.128 | 0.227 | ||||||||||||||
|
2 |
6.8 | RD-219 | 2008 | DD | ME-OG62 | 8 | 0.32 | 0.92 | 0.61 | 0.62 | 0.214 | 0.352 | ||||||||||||
| RD-726 | 2024 | DD | ME-OG62 | 8 | 0.38 | 0.761 | 0.55 | 0.532 | 0.147 | 0.267 | ||||||||||||||
|
3 |
6.6 | RD-188 | 2007 | DD | ME-OG62 | 16 | 0.40 | 1.86 | 0.61 | 0.50 | 0.351 | 0.580 | ||||||||||||
| RD-728 | 2024 | DD | ME-OG62 | 16 | 0.26 | 0.837 | 0.53 | 0.536 | 0.128 | 0.240 | ||||||||||||||
|
4 |
4.3 | RD-032 | 2006 | DD | ME-OG62 | 13 | 0.41 | 0.75 | 0.55 | 0.50 | 0.109 | 0.197 | ||||||||||||
| RD-729 | 2024 | DD | ME-OG62 | 13 | 0.25 | 0.853 | 0.53 | 0.52 | 0.169 | 0.319 | ||||||||||||||
|
5 |
8.8 | RD-198 | 2007 | DD | ME-OG62 | 13 | 0.38 | 0.90 | 0.57 | 0.55 | 0.134 | 0.236 | ||||||||||||
| RD-730 | 2024 | DD | ME-OG62 | 13 | 0.29 | 0.651 | 0.47 | 0.46 | 0.110 | 0.232 | ||||||||||||||
|
6 |
3.4 | RD-231 | 2008 | DD | ME-OG62 | 10 | 0.39 | 1.12 | 0.63 | 0.58 | 0.224 | 0.357 | ||||||||||||
| RD-731 | 2024 | DD | ME-OG62 | 10 | 0.34 | 0.913 | 0.60 | 0.59 | 0.162 | 0.271 | ||||||||||||||
|
7 |
7.4 | RD-069 | 2006 | DD | ME-OG62 | 13 | 0.39 | 0.75 | 0.52 | 0.51 | 0.092 | 0.178 | ||||||||||||
| RD-732 | 2024 | DD | ME-OG62 | 13 | 0.39 | 0.743 | 0.52 | 0.52 | 0.102 | 0.196 | ||||||||||||||
|
8 |
12.0 | RD-085 | 2007 | DD | ME-OG62 | 12 | 0.46 | 0.81 | 0.65 | 0.63 | 0.099 | 0.153 | ||||||||||||
| RD-733 | 2024 | DD | ME-OG62 | 12 | 0.42 | 0.806 | 0.59 | 0.58 | 0.121 | 0.206 | ||||||||||||||
|
9 |
13.0 | RD-082 | 2007 | DD | ME-OG62 | 7 | 0.34 | 0.81 | 0.49 | 0.44 | 0.164 | 0.331 | ||||||||||||
| RD-734 | 2024 | DD | ME-OG62 | 7 | 0.38 | 0.483 | 0.42 | 0.39 | 0.043 | 0.103 | ||||||||||||||
|
10 |
7.4 | RD-248 | 2008 | DD | ME-OG62 | 12 | 0.47 | 0.97 | 0.67 | 0.69 | 0.142 | 0.212 | ||||||||||||
| RD-735 | 2024 | DD | ME-OG62 | 12 | 0.52 | 0.88 | 0.66 | 0.64 | 0.108 | 0.164 | ||||||||||||||
|
11 |
2.8 | RD-238 | 2008 | DD | ME-OG62 | 13 | 0.37 | 0.80 | 0.61 | 0.63 | 0.140 | 0.231 | ||||||||||||
| RD-736 | 2024 | DD | ME-OG62 | 13 | 0.37 | 0.877 | 0.67 | 0.69 | 0.142 | 0.210 | ||||||||||||||
|
12 |
3.6 | RD-040 | 2006 | DD | ME-OG62 | 7 | 0.40 | 0.58 | 0.46 | 0.45 | 0.064 | 0.138 | ||||||||||||
| RD-737 | 2024 | DD | ME-OG62 | 7 | 0.30 | 0.411 | 0.36 | 0.35 | 0.042 | 0.117 | ||||||||||||||
|
13 |
5.9 | RD-241 | 2008 | DD | ME-OG62 | 13 | 0.41 | 1.08 | 0.68 | 0.66 | 0.183 | 0.270 | ||||||||||||
| RD-738 | 2024 | DD | ME-OG62 | 13 | 0.35 | 0.742 | 0.58 | 0.61 | 0.118 | 0.203 | ||||||||||||||
This analysis is supported by the scatter plot of the pairs as shown in Figure 10-5, with a slightly lower copper grades in the new holes; however, the data maintains a strong alignment along the 1:1 line, reflecting a high degree of consistency between the assay sets.
|
February 19, 2025 |
Page 84 |
|
|
NI 43-101 Technical Report on the Reko Diq Project |
|
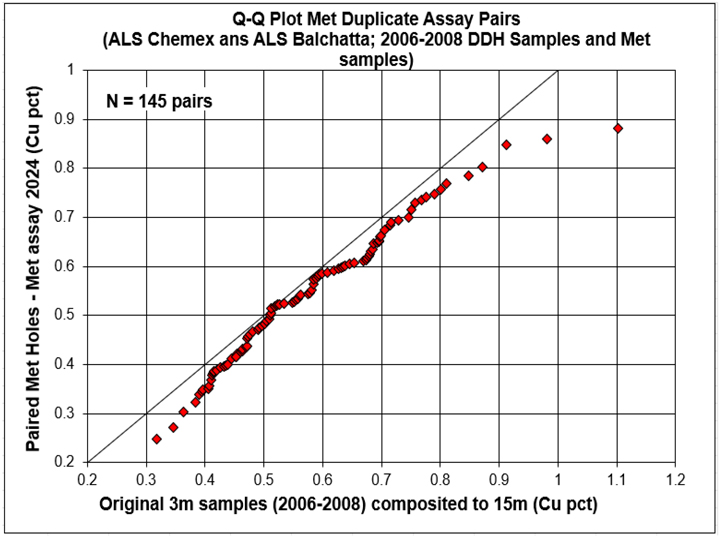
Source: Barrick, 2024
Figure 10-5 Scatter Plot of Copper Grades
Gold assays of the holes were performed using fire assay methods: Au-AA25 for historic and Au-AA24 in the new holes. The comparison of the 15 m composites shows a reasonable global statistical comparison as shown in the Table 10-4.
|
February 19, 2025 |
Page 85 |
|
|
NI 43-101 Technical Report on the Reko Diq Project |
|
Table 10-4 Twin Hole Analysis - Gold, 15m Bench Composite
| Pair |
Distance (m) |
DHID | Year | Type | Assay Method | Comps No |
Min | Max | Mean | Median | Std Dev |
CoV | ||||||||||||
|
1 |
2.0 | RD-176 | 2007 | DD | Au-AA25 | 8 | 0.15 | 0.34 | 0.23 | 0.22 | 0.073 | 0.318 | ||||||||||||
| RD-724 | 2024 | DD | Au-AA24 | 8 | 0.11 | 0.48 | 0.26 | 0.26 | 0.113 | 0.439 | ||||||||||||||
|
2 |
6.8 | RD-219 | 2008 | DD | Au-AA25 | 8 | 0.14 | 0.427 | 0.28 | 0.29 | 0.097 | 0.350 | ||||||||||||
| RD-726 | 2024 | DD | Au-AA24 | 8 | 0.22 | 0.362 | 0.28 | 0.278 | 0.056 | 0.201 | ||||||||||||||
|
3 |
6.6 | RD-188 | 2007 | DD | Au-AA25 | 16 | 0.14 | 0.31 | 0.21 | 0.19 | 0.052 | 0.252 | ||||||||||||
| RD-728 | 2024 | DD | Au-AA24 | 16 | 0.12 | 0.371 | 0.21 | 0.215 | 0.070 | 0.328 | ||||||||||||||
|
4 |
4.3 | RD-032 | 2006 | DD | Au-AA25 | 13 | 0.22 | 0.42 | 0.30 | 0.26 | 0.072 | 0.239 | ||||||||||||
| RD-729 | 2024 | DD | Au-AA24 | 13 | 0.21 | 0.515 | 0.34 | 0.34 | 0.096 | 0.279 | ||||||||||||||
|
5 |
8.8 | RD-198 | 2007 | DD | Au-AA25 | 13 | 0.19 | 0.44 | 0.30 | 0.29 | 0.069 | 0.232 | ||||||||||||
| RD-730 | 2024 | DD | Au-AA24 | 13 | 0.16 | 0.373 | 0.27 | 0.28 | 0.070 | 0.257 | ||||||||||||||
|
6 |
3.4 | RD-231 | 2008 | DD | Au-AA25 | 10 | 0.18 | 0.63 | 0.32 | 0.31 | 0.129 | 0.405 | ||||||||||||
| RD-731 | 2024 | DD | Au-AA24 | 10 | 0.17 | 0.571 | 0.32 | 0.31 | 0.120 | 0.373 | ||||||||||||||
|
7 |
7.4 | RD-069 | 2006 | DD | Au-AA25 | 13 | 0.19 | 0.39 | 0.28 | 0.27 | 0.051 | 0.183 | ||||||||||||
| RD-732 | 2024 | DD | Au-AA24 | 13 | 0.16 | 0.323 | 0.27 | 0.30 | 0.053 | 0.193 | ||||||||||||||
|
8 |
12.0 | RD-085 | 2007 | DD | Au-AA25 | 12 | 0.29 | 0.55 | 0.43 | 0.43 | 0.077 | 0.181 | ||||||||||||
| RD-733 | 2024 | DD | Au-AA24 | 12 | 0.26 | 0.572 | 0.40 | 0.37 | 0.091 | 0.228 | ||||||||||||||
|
9 |
13.0 | RD-082 | 2007 | DD | Au-AA25 | 7 | 0.23 | 0.44 | 0.29 | 0.28 | 0.070 | 0.240 | ||||||||||||
| RD-734 | 2024 | DD | Au-AA24 | 7 | 0.19 | 0.32 | 0.25 | 0.26 | 0.054 | 0.220 | ||||||||||||||
|
10 |
7.4 | RD-248 | 2008 | DD | Au-AA25 | 12 | 0.35 | 0.78 | 0.47 | 0.44 | 0.119 | 0.254 | ||||||||||||
| RD-735 | 2024 | DD | Au-AA24 | 12 | 0.33 | 0.73 | 0.49 | 0.48 | 0.107 | 0.217 | ||||||||||||||
|
11 |
2.8 | RD-238 | 2008 | DD | Au-AA25 | 13 | 0.17 | 0.54 | 0.34 | 0.28 | 0.124 | 0.369 | ||||||||||||
| RD-736 | 2024 | DD | Au-AA24 | 13 | 0.20 | 0.65 | 0.36 | 0.36 | 0.114 | 0.317 | ||||||||||||||
|
12 |
3.6 | RD-040 | 2006 | DD | Au-AA25 | 7 | 0.15 | 0.21 | 0.19 | 0.20 | 0.020 | 0.108 | ||||||||||||
| RD-737 | 2024 | DD | Au-AA24 | 7 | 0.11 | 0.173 | 0.15 | 0.15 | 0.020 | 0.138 | ||||||||||||||
|
13 |
5.9 | RD-241 | 2008 | DD | Au-AA25 | 13 | 0.25 | 0.66 | 0.47 | 0.48 | 0.120 | 0.255 | ||||||||||||
| RD-738 | 2024 | DD | Au-AA24 | 13 | 0.25 | 0.564 | 0.43 | 0.44 | 0.093 | 0.217 | ||||||||||||||
The scatter plot for 145 pairs for gold aligns closely, indicating good agreement in assay values between the two sets (Figure 10-6). While some variation does occur, the scatter demonstrates generally good repeatability between older (2006–2008) and recent (2024) drill hole assays, with most pairs showing close alignment in for both copper gold content, as evidenced by the QQ plot.
In this twin hole analysis, 1⁄4-core samples from new drill holes are compared with 1⁄2-core samples from historical drilling. Based on the results there appears to be no systematic bias interpreted and supports the use of the historical drilling results. It should however be noted that the results are based on a larger 15 m composite length, which reflect the mining bench height, and supports the use of the classifications applied.
|
February 19, 2025 |
Page 86 |
|
|
NI 43-101 Technical Report on the Reko Diq Project |
|

Source: Barrick, 2024
Figure 10-6 Scatter Plot of Gold Grades
| 10.7 | QP Comments on Drilling |
In the opinion of the QP, the quantity and quality of lithological, geotechnical, collar and downhole survey data collected in the drill programs are sufficient to support Mineral Resource and Mineral Reserve estimation.
The drilling, sampling methods, and collection process are representative of the material with no known factors that would introduce any biases of significant note. The QA/QC results show that there are no major issues and demonstrate the homogeneity within acceptable limits of the sampling methodologies.
No other material factors were identified with the data collection from the drill programs that would significantly affect the accuracy and reliability of drilling results nor the Mineral Resource and Mineral Reserve estimation.
|
February 19, 2025 |
Page 87 |
|
|
NI 43-101 Technical Report on the Reko Diq Project |
|
| 11 | Sample Preparation, Analyses and Security |
Drilling commenced in 1996 and continued until 2009 across serval programs. Recently explorations recommenced in 2023 as outlined in Sections 9 and 10. While several companies undertook exploration, all used similar sampling and assays procedures. Since November 2006, all sample preparation to 2 mm crushed material was completed at the Reko Diq Sample Preparation Lab with samples subsequently dispatched to independent ISO accredited laboratories for pulverisation and assaying. Prior to the construction of the onsite preparation laboratory, diamond core samples were cut and sampled onsite and sent to laboratory for processing with all sample preparation occur at the laboratory.
Five laboratories, Analabs Perth, SGS Karachi, ALS-Chemex Perth, Genalysis Perth and SGS Perth were used for total copper (TCu or Cu) analysis over the generations of exploration. SGS Karachi was initially the primary laboratory for TCu. However, ALS Perth became (and continues to be) the primary laboratory in 2003.
Two laboratories were used for cyanide soluble copper determinations: ALS Perth being the primary laboratory and Genalysis providing independent checks on selected repeat samples. SGS Karachi remained the primary preparation laboratory throughout the drilling with pulverized samples then sent to the various laboratories. It is noted that SGS Perth provided some additional TCu determinations on samples submitted to SGS Karachi early in the programme.
All samples submitted for assay since November 2006 were prepared by exploration staff at the onsite sample preparation laboratory and subsequently analysed at the various laboratories noted above. The onsite laboratory samples are prepared in a similar manner for half drill core and reverse circulation chips. The sample preparation flow chart is shown in Figure 11-1. Samples are checked-in based on sample submission form. Samples are dried in an oven at 105°C. Drill core samples are first crushed using the jaw crusher with the plates set at 6 mm. All dried samples are crushed to ensure that 75% of the sample is below 2 mm.
|
February 19, 2025 |
Page 88 |
|
|
NI 43-101 Technical Report on the Reko Diq Project |
|

Source: Tethyan Copper Company Limited, 2009
Figure 11-1 Diamond Drill Core and Reverse Circulation Sample Flowchart
The crushed sample was passed through a rotary divider fitted with the appropriate sample collection segment. The rotary divider was equipped to extract either a one quarter or a one tenth fraction. The exact sample splitting protocol depended on the initial sample weight and the specified weight of the final product. Refer to Table 11-1 for details.
|
February 19, 2025 |
Page 89 |
|
|
NI 43-101 Technical Report on the Reko Diq Project |
|
Table 11-1 Rotary Divider Set-up
|
Sample Wt. (kg) |
RD Segments Installed |
Sample Subdivided |
Initial Split Subdivided |
Approx. Wt. (g) |
||||
|
2 |
Small (x2) | 1 | 0 | 400 | ||||
|
3 |
Small | 1 | 0 | 300 | ||||
|
4 |
Small | 1 | 0 | 400 | ||||
|
5 |
Small | 1 | 0 | 500 | ||||
|
6 |
Large | 1 | 1 | 375 | ||||
|
7 |
Large | 1 | 1 | 440 | ||||
|
8 |
Large | 1 | 1 | 500 | ||||
|
9 |
Large | 1 | 1 | 560 | ||||
|
10 |
Small (x2) | 1 | 1 | 400 | ||||
|
11 |
Small (x2) | 1 | 1 | 440 | ||||
|
12 |
Small (x2) | 1 | 1 | 480 | ||||
|
13 |
Small (x2) | 1 | 1 | 520 | ||||
|
14 |
Small (x2) | 1 | 1 | 560 | ||||
|
15 |
Large Small |
1 | 1 | 375 | ||||
|
16 |
Large Small |
1 | 1 | 400 | ||||
|
17 |
Large Small |
1 | 1 | 425 | ||||
|
18 |
Large Small |
1 | 1 | 450 | ||||
|
19 |
Large Small |
1 | 1 | 475 | ||||
|
20 |
Large Small |
1 | 1 | 500 | ||||
| 11.1 | Sample Analysis |
Samples from the 1996-1997 drill campaign were analyzed by Analabs and SGS. Samples from 2001-2002 were analyzed by either ALS or SGS. Between 2003 and 2009, ALS Perth was the main laboratory assigned to analyze the drill samples.
Samples are pulverized to minus (-) 75 microns (µm), with a criterion of >85% passing -75 µm. ALS completed analyses using a combination of four acid digest with ICP-OES finish for TCu, Ag, As, Mo, Zn, Pb and a fire assay with AAS finish on a 30 g split for gold. The detection limit for Cu and Au were 0.001% and 0.01 ppm respectively. Cyanide soluble copper that assays using the Cu-AA17 (Cyanide Leach) method.
Values above 1,000 ppm As were reported in early samples from Tanjeel. However, recent checks have shown those results to be below 50 ppm, so the method does not have validity in this context. It is noted that As does not impact the Cu recovery as such these issues are not material.
|
February 19, 2025 |
Page 90 |
|
|
NI 43-101 Technical Report on the Reko Diq Project |
|
Methodology at the umpire laboratory is not congruent with the method used at ALS, particularly for the low gold values occurring at Reko Diq. The methods are illustrated by the variation shown in analytical checks for gold as is further discussed below.
Sulphide sulphur was determined using a Laboratory Equipment Company (LECO) instrument and sulphate by carbonate precipitation. A total sulphur analysis by LECO was carried out on every fifth sample.
A recent independent audit of laboratories in Australia, by ioGlobal, concluded that the protocols, chain of custody, accuracy and reproducibility of the sample results and data management were, for the most part, fit for purpose, in particular for Cu. For Au values below 5 ppm, however, it was difficult to assign a precision greater than +/- 10%.
Density Determinations
To date, 18,000 rock bulk density (BD) determinations were conducted of which over 9,000 are within the estimate area. These determinations were made on core using industry standard Archimedes wax emersion method. The BD was calculated by applying the following relationship:
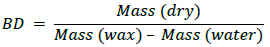
Densities were initially measured at 3 m intervals in early drilling but reduced in frequency to 15 – 50 m intervals in later holes. Results give the following average BDs:
| ● | Oxide/Leached cap 2.45 g/cm3 |
| ● | Supergene zone 2.65 g/cm3 |
| ● | Hypogene zone 2.70 g/cm3 |
Lithological densities applied to the block model in the H14 porphyry were:
| ● | PFB1 and 2, and PBL; 2.68 g/cm3 |
| ● | VIN; 2.66 g/cm3 |
| ● | VFL; 2.72 g/cm3 |
An applied density was allocated to RC intercepts at 3 m intervals, using a conservative SG of 2.45 g/cm3.
Density of broken/lost core intercepts at the tops of holes were not measured. This may lead to over-estimating the density of broken near-surface material. To remedy this, it is recommended to re-
|
February 19, 2025 |
Page 91 |
|
|
NI 43-101 Technical Report on the Reko Diq Project |
|
examine core photographs, carry out spot checks on holes with broken initial intervals and confirm near-surface density with shallow pits, prior to negotiating earth-moving contracts.
| 11.2 | Sample Security |
Samples were under secure observation by RDMC representatives from collection at rig to processing at the site core yard to delivery at the laboratory. There are armed guards at each drill rig for security.
Diamond drill core is picked up twice a day in a specific core run and brought to the core sheds for logging and mark up. The core is tied down and covered with canvas during transit. At the end of each shift, a RDMC representative takes the RC samples and chip trays back to the core shed.
RC samples on the rig are bagged, tied with custom tags, weighed, and documented. The samples are stored in a secure warehouse facility. DD samples are stored in core boxes with the appropriate numbering and markings at the core shed area. The samples are securely and directly shipped to Karachi and then via air to the ALS laboratory.
Sample submission forms are completed and sent to the laboratory with the samples as part of the chain of custody. These are checked at the laboratory to ensure that all samples are received. Sample security relies on samples always being attended or locked in appropriate sample storage areas, prior to dispatch to sample preparation facilities.
The sample tracking spreadsheet links the ALS dispatch number to the shipment number, Hole ID and sample numbers. The spreadsheet documents when the samples left camp, when they were shipped from Karachi, when samples are received by both labs and when results are reported back.
| 11.3 | Quality Assurance and Quality Control |
During the discovery phase of drilling, between 1996 and 2002, no documentation readily exists showing systematic QAQC. However, as the project moved into delineation, exploration, and pre-feasibility/feasibility stages, a QAQC program was instituted utilizing certified reference material (CRM), in house standards, blanks and duplicates. The quality control procedures during this period include the insertion of QAQC samples typically on the following frequency which was repeated every 11th sample:
| ● | Field Duplicate as 11th sample; |
| ● | CRM as 22nd sample; |
| ● | Field Duplicate as 33rd sample; |
|
February 19, 2025 |
Page 92 |
|
|
NI 43-101 Technical Report on the Reko Diq Project |
|
| ● | Blank as 44th sample and |
| ● | Field Duplicates as 55th sample |
Below is a summary of the outcomes of the QAQC samples.
| 11.3.1 | Certified Reference Materials |
During the 3 main drilling programs (see Figure 6-1) different sets of certified reference materials (CRM’s) were utilized. Limited information had been sourced regarding the CRM’s utilized for the 1996-1997 and 2001-2002 drill campaigns, however, for the drill program completed between 2003 and 2009 suitable information was available to analyse the results to sufficient details.
Five commercially available CRM’s from OREAS were utilized since 2003 along with eight in-house standards. To evaluate the precision and accuracy of the primary assays based on the CRM results, mathematical analysis and control charts were prepared to identify any sample out of the acceptable range and determine if bias as a quantitative measure of accuracy can be determined. The rules which were considered for evaluation included:
| ● | Any value outside of 3 standard deviations from the average (precision). |
| ● | If a standard failed 3 standard deviations, then 10 samples were re-assayed—5 above and 5 below the failed CRM. The batch was re-assayed if two or more consecutive standards failed 3 standard deviations. |
| ● | Any value of consecutive standards outside of the 2 standard deviations in the same area of the mean, above or below it (bias). However, any isolated sample that falls within this range is considered as acceptable. The percentage of bias is evaluated as: |
| ○ | Good >-5% and <5% |
| ○ | Questionable <-5% and >-10% or >5% and <10% |
| ○ | Unacceptable <-10% and >10% |
Commercial CRM’s
The CRM’s from OREAS which were inserted to evaluate the laboratory analytical accuracy are shown in Table 11-2. The grades range from the near COG to ROM grades as outlined in this Report.
|
February 19, 2025 |
Page 93 |
|
|
NI 43-101 Technical Report on the Reko Diq Project |
|
Table 11-2 CRM’s Utilized in the 2003 to 2009 Exploration
| StandardID | Element_Unit | Standard Best Value |
Accepted Min |
Accepted Max |
||||
|
OREAS50P |
Au (g/t) | 0.727 | 0.647 | 0.807 | ||||
| Cu (%) | 0.691 | 0.653 | 0.729 | |||||
|
OREAS50Pb |
Au (g/t) | 0.841 | 0.778 | 0.904 | ||||
| Cu (%) | 0.744 | 0.702 | 0.786 | |||||
|
OREAS52Pb |
Au (g/t) | 0.307 | 0.272 | 0.342 | ||||
| Cu (%) | 0.334 | 0.319 | 0.349 | |||||
|
OREAS53P |
Au (g/t) | 0.380 | 0.342 | 0.418 | ||||
| Cu (%) | 0.413 | 0.244 | 0.583 | |||||
|
OREAS53Pb |
Au (g/t) | 0.623 | 0.581 | 0.666 | ||||
| Cu (%) | 0.546 | 0.519 | 0.573 | |||||
|
ST312EH |
Au (g/t) | 0.430 | 0.370 | 0.490 | ||||
| Cu (%) | 0.752 | 0.684 | 0.821 | |||||
A total of 1,659 CRMs were inserted in sample batches between 2004 and 2009 divided into six CRM types. The results of the CRM are outlined in Table 11-3 and summarised by the number of CRM’s per assay method, CRMs that fall outside the warning and error limits, as well as the main statistics. Based on the criteria noted above, results per element include:
| ● | Gold: |
| ○ | ALS failed 42 CRM’s out of a total of 1,093, this represents 3.8%. |
| ○ | Re-assays were conducted for all failed CRMs, including 10 primary samples—5 above and 5 below the CRM. The re-assay results were satisfactory. |
| ○ | Genalysis failed 29 out of the 410 representing a failure rate of 7%, with a maximum bias of 6%. |
| ○ | No action taken on Genalysis failed CRMs as CRMs were passed by primary lab. |
| ● | Copper: |
| ○ | ALS failed 15 CRM, which represents an error rate of 1.5%. |
| ○ | Re-assays were conducted for all failed CRMs, including 10 primary samples—5 above and 5 below the CRM. The re-assay results were satisfactory. |
| ○ | Genalysis failed 24 CRM out of 422 results. |
| ○ | No action taken on Genalysis failed CRMs as CRMs were passed by primary lab. |
|
February 19, 2025 |
Page 94 |
|
|
NI 43-101 Technical Report on the Reko Diq Project |
|
The review of the CRM results indicated that while there are several results which fail the above criteria the majority are acceptable given the results do not indicate systematic bias. This was supported by the visual review of control charts, an example of which is shown in Figure 11-2.
Overall, the data show no bias or significant deviations from expected results. Accepted failures do not appear to pose a significant risk to the estimation and results are deemed to be fit for purpose. It is however highlighted that, the discovery and delineation phases of the drilling have no laboratory check samples, so a review of sample submittals and certificates from this drilling period is recommended, with a comparison to the surrounding samples to ensure no inconsistencies.
Table 11-3 Summary of CRM, by Types by Assay Method and Laboratory
| CRM ID | Lab Assay Name | Laboratory | No. | Outside | Best | Mean | Std. | CV | Error | Mean | ||||||||||||
| Error | Error Limit |
Value | Dev. | Rate (%) |
Bias (%) |
|||||||||||||||||
| Limit | (%) | |||||||||||||||||||||
|
OREAS50P |
Au_Au-AA25_ppm | ALS | 41 | 2 | 4.88 | 0.73 | 0.72 | 0.06 | 0.1 | 4.65 | -1.64 | |||||||||||
| Cu_ME-OG62_pct | ALS | 40 | 1 | 2.5 | 0.69 | 0.69 | 0.02 | 0 | 2.44 | -0.36 | ||||||||||||
|
OREAS50Pb |
Au_Au-AA25_ppm | ALS | 329 | 7 | 2.13 | 0.84 | 0.85 | 0.04 | 0 | 2.08 | 0.81 | |||||||||||
| Au_FA25/AAS_ppm | GENALYSIS | 147 | 8 | 5.44 | 0.84 | 0.86 | 0.09 | 0.1 | 5.16 | 1.69 | ||||||||||||
| Cu_A/AAS_pct | GENALYSIS | 154 | 5 | 3.25 | 0.74 | 0.72 | 0.05 | 0.1 | 3.14 | -3.58 | ||||||||||||
| Cu_ME-OG62_pct | ALS | 339 | 1 | 0.3 | 0.74 | 0.73 | 0.02 | 0 | 0.29 | -1.64 | ||||||||||||
|
OREAS52Pb |
Au_Au-AA25_ppm | ALS | 320 | 11 | 3.44 | 0.31 | 0.31 | 0.02 | 0.1 | 3.32 | 1.27 | |||||||||||
| Au_FA25/AAS_ppm | GENALYSIS | 155 | 8 | 5.16 | 0.31 | 0.33 | 0.05 | 0.2 | 4.91 | 5.99 | ||||||||||||
| Cu_A/AAS_pct | GENALYSIS | 157 | 10 | 6.37 | 0.34 | 0.34 | 0.03 | 0.1 | 5.99 | -0.89 | ||||||||||||
| Cu_ME-OG62_pct | ALS | 326 | 3 | 0.92 | 0.34 | 0.34 | 0.02 | 0.1 | 0.91 | -0.44 | ||||||||||||
|
OREAS53P |
Au_Au-AA25_ppm | ALS | 99 | 7 | 7.07 | 0.38 | 0.38 | 0.06 | 0.2 | 6.6 | 1.05 | |||||||||||
| Cu_MB 01_pct | SGS | 26 | 0 | 0 | 0.38 | 0.41 | 0.02 | 0 | 0 | 6.92 | ||||||||||||
| Cu_ME-OG62_pct | ALS | 96 | 1 | 1.04 | 0.41 | 0.41 | 0.04 | 0.1 | 1.03 | 0.07 | ||||||||||||
| Cu_ME- | ALS | 7 | 0 | 0 | 0.4 | 0.4 | 0 | 0 | 0 | 3.7 | ||||||||||||
|
OGPH01_pct |
||||||||||||||||||||||
|
OREAS53Pb |
Au_Au-AA25_ppm | ALS | 304 | 15 | 4.93 | 0.62 | 0.63 | 0.04 | 0.1 | 4.7 | 0.56 | |||||||||||
| Au_FA25/AAS_ppm | GENALYSIS | 108 | 13 | 12.04 | 0.62 | 0.63 | 0.07 | 0.1 | 10.74 | 1.56 | ||||||||||||
| Cu_A/AAS_pct | GENALYSIS | 111 | 9 | 8.11 | 0.55 | 0.52 | 0.05 | 0.1 | 7.5 | -3.92 | ||||||||||||
| Cu_ME-OG62_pct | ALS | 310 | 2 | 0.65 | 0.55 | 0.54 | 0.01 | 0 | 0.64 | -1.15 | ||||||||||||
|
ST312EH |
Au_Au-AA25_ppm | ALS | 61 | 12 | 19.67 | 0.43 | 0.41 | 0.09 | 0.2 | 16.44 | -5.65 | |||||||||||
| Cu_ME-OG62_pct | ALS | 62 | 5 | 8.06 | 0.75 | 0.74 | 0.12 | 0.2 | 7.46 | -1.7 | ||||||||||||
|
February 19, 2025 |
Page 95 |
|
|
NI 43-101 Technical Report on the Reko Diq Project |
|

Source: Barrick, 2024
Figure 11-2 Example of Commercial CRM Graph
In-House Standards
The In-House standards used during the target delineation, exploration, and pre-feasibility through feasibility level drill campaigns (2004 to 2007) included eight standards, all prefixed RD. These standards cover a variety of Au and Cu ranges as shown in Table 11-4, though some standards are also certified for Mo, Zn, and As.
Table 11-4 In-House CRM Values and Parameters
| StandardID | Element_Unit | Standard BestValue |
Accepted Min | Accepted Max | ||||
|
RD1 |
Cu_pct | 0.863 | 0.793 | 0.934 | ||||
| CuCN_pct | 0.740 | 0.674 | 0.806 | |||||
|
RD2 |
Cu_pct | 0.948 | 0.868 | 1.028 | ||||
| CuCN_pct | 0.839 | 0.771 | 0.908 | |||||
|
RD3 |
Ag_ppm | 2.700 | 1.960 | 3.440 | ||||
| Au_ppm | 0.320 | 0.278 | 0.362 | |||||
| Cu_pct | 0.319 | 0.300 | 0.337 | |||||
|
RD4 |
Ag_ppm | 1.100 | 0.760 | 1.440 | ||||
| Au_ppm | 0.400 | 0.342 | 0.458 | |||||
| Cu_pct | 0.598 | 0.569 | 0.628 | |||||
|
RD5 |
Ag_ppm | 1.600 | 1.220 | 1.980 | ||||
| Au_ppm | 0.540 | 0.440 | 0.640 | |||||
| Cu_pct | 0.970 | 0.928 | 1.013 | |||||
|
RD6 |
Ag_ppm | 0.850 | 0.502 | 1.198 | ||||
| Au_ppm | 0.464 | 0.352 | 0.578 | |||||
| Cu_pct | 0.579 | 0.541 | 0.616 | |||||
|
RD8 |
Ag_ppm | 1.420 | 0.688 | 2.152 | ||||
| Au_ppm | 0.527 | 0.463 | 0.591 | |||||
| Cu_pct | 0.557 | 0.531 | 0.583 | |||||
|
RD9 |
Ag_ppm | 2.850 | 2.184 | 3.516 | ||||
| Au_ppm | 0.894 | 0.742 | 1.046 | |||||
| Cu_pct | 1.070 | 1.007 | 1.133 | |||||
|
February 19, 2025 |
Page 96 |
|
|
NI 43-101 Technical Report on the Reko Diq Project |
|
The results of the In-House standards are outlined in Table 11-5 and are summarised by the number of standards per assay method, samples that falls outside the warning and error limits, as well as the main statistics. A total of 1,805 standards were inserted between 2004 and 2009 divided into 5 standard types. Based on the criteria noted above, results per element include:
| ● | Gold: |
| ○ | ALS failed 30 samples out of a total of 1,263 samples, which represents 2.37%. |
| ○ | Re-assays were conducted for all failed CRMs, including 10 primary samples—5 above and 5 below the CRM. The re-assay results were satisfactory. |
| ○ | Genalysis failed 29 out of the 244 samples representing a failure rate of 11.8%, with a maximum bias of 6%. |
| ○ | No action taken on Genalysis failed CRMs as CRMs were passed by primary lab. |
| ● | Copper: |
| ○ | ALS analysed 1,420 samples for Cu, with error rates between -1.77% and 3.31% with 12 failures. |
| ○ | Re-assays were conducted for all failed CRMs, including 10 primary samples—5 above and 5 below the CRM. The re-assay results were satisfactory. |
| ○ | Genalysis analysed 257 samples of which 26 failed. The error rates varied between 6.59% and 17.95%, which is relatively high. However, the biases are within the +/-5% limits, except for standard RD9, which reports a bias of -9.12%, it should be noted that only 9 samples for this standard were analysed which is a very low proportion. |
| ○ | SGS (including SGS-KAR) analysed 128 samples of RD1 and RD2 standards. All Cu results show biases lower than the +/-5% accepted limit. For standard RD1, SGS failed 2 out of 73 samples however only 1 sample out of 31 failed for RD2. |
Of note, ALS utilized two analytical methods for Cu, however, the reason for this change is unknown. All CRM graphs (example in Figure 11-3) show that the CRM’s were, generally, repeatable showing no systematic bias for any laboratory was detected with the exception of SGS. As such, it can be concluded that, during this period, the data served to evaluate the mineralization at the head grades of the expected feed material.
|
February 19, 2025 |
Page 97 |
|
|
NI 43-101 Technical Report on the Reko Diq Project |
|
Table 11-5 Summary Results of In-House CRM’s
| CRM ID |
Lab Assay | Laboratory | No. | Outside | Best | Mean | Std. | CV | Error | Mean | ||||||||||||
| Name | Error | Value | Dev | Rate | Bias | |||||||||||||||||
| Limit |
Limit (%) |
(%) | (%) | |||||||||||||||||||
|
RD1 |
Cu_A/AAS_pct | GENALYSIS | 9 | 0 | 0 | 0.86 | 0.83 | 0.01 | 0.02 | - | -3.34 | |||||||||||
| Cu_AAS22S_pct | SGS | 31 | 1 | 3.23 | 0.86 | 0.83 | 0.04 | 0.05 | 3.13 | -3.65 | ||||||||||||
| Cu_Cu-OG62_pct | ALS | 2 | 0 | 0 | 0.86 | 0.87 | 0 | 0.00 | 0 | 0.76 | ||||||||||||
| Cu_MB 01_pct | SGS-KAR | 42 | 1 | 2.38 | 0.86 | 0.81 | 0.03 | 0.04 | 2.33 | -6.4 | ||||||||||||
| Cu_ME-OG62_pct | ALS | 23 | 0 | 0 | 0.86 | 0.85 | 0.02 | 0.02 | - | -1.38 | ||||||||||||
| Cu_ME-OGPH01_pct | ALS | 68 | 0 | 0 | 0.86 | 0.86 | 0.03 | 0.03 | - | -0.52 | ||||||||||||
|
RD2 |
Cu_A/AAS_pct | GENALYSIS | 5 | 0 | 0 | 0.95 | 0.92 | 0.02 | 0.02 | - | -3.27 | |||||||||||
| Cu_AAS22S_pct | SGS | 24 | 1 | 4.17 | 0.95 | 0.92 | 0.04 | 0.04 | 4 | -3.46 | ||||||||||||
| Cu_Cu-OG62_pct | ALS | 3 | 0 | 0 | 0.95 | 0.94 | 0.04 | 0.04 | - | -0.47 | ||||||||||||
| Cu_MB 01_pct | SGS-KAR | 31 | 1 | 3.23 | 0.95 | 0.89 | 0.03 | 0.03 | 3.13 | -6.41 | ||||||||||||
| Cu_ME-OG62_pct | ALS | 9 | 0 | 0 | 0.95 | 0.94 | 0.01 | 0.01 | - | -0.43 | ||||||||||||
| Cu_ME-OGPH01_pct | ALS | 50 | 1 | 2.22 | 1 | 0.9 | 0 | 0.00 | 2.2 | -1 | ||||||||||||
|
RD3 |
Au_Au-AA25_ppm | ALS | 421 | 7 | 1.66 | 0.3 | 0.32 | 0.02 | 0.07 | 1.64 | 5.23 | |||||||||||
| Au_FA25/AAS_ppm | GENALYSIS | 56 | 6 | 10.71 | 0.3 | 0.32 | 0.05 | 0.16 | 9.68 | 8.1 | ||||||||||||
| Cu_A/AAS_pct | GENALYSIS | 56 | 4 | 7.14 | 0.32 | 0.33 | 0.05 | 0.17 | 6.67 | 2.26 | ||||||||||||
| Cu_ME-OG62_pct | ALS | 422 | 3 | 0.71 | 0.32 | 0.31 | 0.01 | 0.02 | 0.71 | -1.16 | ||||||||||||
|
RD4 |
Au_Au-AA25_ppm | ALS | 376 | 11 | 2.93 | 0.4 | 0.39 | 0.04 | 0.10 | 2.84 | -2.75 | |||||||||||
| Au_FA25/AAS_ppm | GENALYSIS | 87 | 4 | 4.6 | 0.4 | 0.4 | 0.05 | 0.12 | 4.4 | -1 | ||||||||||||
| Cu_A/AAS_pct | GENALYSIS | 85 | 6 | 7.06 | 0.6 | 0.6 | 0.02 | 0.04 | 6.59 | 0.02 | ||||||||||||
| Cu_ME-OG62_pct | ALS | 376 | 3 | 0.8 | 0.6 | 0.6 | 0.03 | 0.04 | 0.79 | -0.53 | ||||||||||||
|
RD5 |
Au_Au-AA25_ppm | ALS | 263 | 7 | 2.66 | 0.54 | 0.54 | 0.07 | 0.13 | 2.59 | -0.41 | |||||||||||
| Au_FA25/AAS_ppm | GENALYSIS | 44 | 3 | 6.82 | 0.5 | 0.6 | 0 | 0.00 | 6.4 | 3.3 | ||||||||||||
| Cu_A/AAS_pct | GENALYSIS | 44 | 6 | 13.64 | 0.97 | 0.95 | 0.07 | 0.08 | 12 | -2.46 | ||||||||||||
| Cu_ME-OG62_pct | ALS | 263 | 2 | 0.76 | 0.97 | 0.95 | 0.05 | 0.05 | 0.75 | -1.77 | ||||||||||||
|
RD6 |
Au_Au-AA25_ppm | ALS | 61 | 1 | 1.64 | 0.46 | 0.44 | 0.06 | 0.14 | 1.61 | -4.44 | |||||||||||
| Au_FA25/AAS_ppm | GENALYSIS | 17 | 1 | 5.88 | 0.5 | 0.4 | 0 | 0.00 | 5.6 | -9 | ||||||||||||
| Cu_A/AAS_pct | GENALYSIS | 17 | 2 | 11.76 | 0.58 | 0.54 | 0.15 | 0.27 | 10.5 | -6.77 | ||||||||||||
| Cu_ME-OG62_pct | ALS | 61 | 1 | 1.64 | 0.58 | 0.59 | 0.05 | 0.08 | 1.61 | 1.99 | ||||||||||||
|
RD8 |
Au_Au-AA25_ppm | ALS | 88 | 3 | 3.41 | 0.53 | 0.52 | 0.05 | 0.09 | 3.3 | -1.69 | |||||||||||
| Au_FA25/AAS_ppm | GENALYSIS | 31 | 1 | 3.23 | 0.5 | 0.5 | 0 | 0.00 | 3.1 | -2 | ||||||||||||
| Cu_A/AAS_pct | GENALYSIS | 32 | 7 | 21.88 | 0.56 | 0.57 | 0.03 | 0.05 | 18 | 3.23 | ||||||||||||
| Cu_ME-OG62_pct | ALS | 89 | 2 | 2.25 | 0.56 | 0.58 | 0.01 | 0.02 | 2.2 | 3.3 | ||||||||||||
|
RD9 |
Au_Au-AA25_ppm | ALS | 54 | 1 | 1.85 | 0.89 | 0.92 | 0.09 | 0.10 | 1.82 | 2.49 | |||||||||||
| Au_FA25/AAS_ppm | GENALYSIS | 9 | 2 | 22.22 | 0.9 | 0.9 | 0 | 0.00 | 18 | 2.9 | ||||||||||||
| Cu_A/AAS_pct | GENALYSIS | 9 | 1 | 11.11 | 1.07 | 0.97 | 0.29 | 0.30 | 10 | -9.12 | ||||||||||||
| Cu_ME-OG62_pct | ALS | 54 | 0 | 0 | 1.07 | 1.1 | 0.02 | 0.02 | - | 2.16 | ||||||||||||
|
February 19, 2025 |
Page 98 |
|
|
NI 43-101 Technical Report on the Reko Diq Project |
|
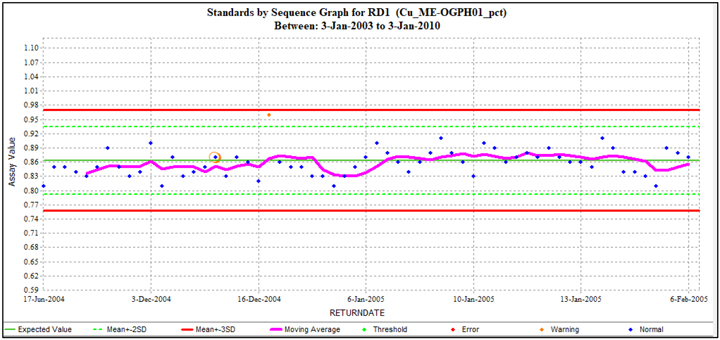
Source: Barrick, 2024
Figure 11-3 Example of In-House Standard Graph
| 11.3.2 | Blanks |
Between February 2007 and October 2009, a total of 1,099 field blank samples were inserted and analysed for Cu, of which 161 samples were assayed for Au (Table 11-6). For analysis of the data a failure is defined as a value that exceeds five times the detection limit (DL), i.e. maximum value of 0.05 g/t Au and 0.005 % Cu. Review of the data shows 15 samples fail for Au assay and 229 for Cu, which means error rate of 9.32% and 20.84%, respectively.
Table 11-6 Statistics for Field Blanks Results Reported by ALS
| Standard | Assay Field | Detection Limit |
Failure limit | # of Analyses |
No. failed |
Error Rate | ||||||
|
BlankTCC |
Au_Au-AA25_ppm | 0.01 | 0.05 (g/t) | 161 | 15 | 9.32% | ||||||
| Cu_ME-OG62_pct | 0.001 | 0.005 (%) | 1099 | 229 | 20.84% | |||||||
Blank assay results were plotted by time (batch number) as shown on Figure 11-4. The red line represents the failure limit for Cu and Au. As can be observed, a large proportion of the over-limit values for Cu are below 0.02%, which is well below both the Mineral Resources and Reserves COG of approximately 0.16% Cu, with only two samples being above this level. Of these two samples both the Au and Cu values are elevated suggesting this is an incorrectly labelled sample.
It is considered that there were issues with the source of the blank material that likely caused the elevated Cu and Au above background which leads to over limit values. While there is potential for minor issues with the cleaning of the sample preparation, the impact of these would not have a material impact on either the global or local variability of the Mineral Resource. It is the QP’s opinion that the source of the blank is the key issue and there is no systematic bias in the sample preparation
|
February 19, 2025 |
Page 99 |
|
|
NI 43-101 Technical Report on the Reko Diq Project |
|
within the primary lab. This is supported with the Umpire Assays completed which show no material issues.
This issue is noted and new procedures are being developed and blank material from outside the region are being sourced to underpin its industry standard QAQC procedures, refer to Section 12.

Source: Barrick, 2024
Figure 11-4 Blank Assays Results
| 11.3.3 | Duplicates |
A total of 4,376 field duplicates have been completed throughout generations of drilling. Two types of field duplicates were undertaken based on the type of drilling:
|
February 19, 2025 |
Page 100 |
|
|
NI 43-101 Technical Report on the Reko Diq Project |
|
| ● | RC Drilling: Duplicates were taken via riffle splitting the rejects directly from the rig in the field. |
| ● | DD: 50:50 split of the crushed half core was utilised as the field duplicate. This was considered to be more representative than a 1⁄4 core duplicate. |
The number of samples per element per laboratory is summarised in Table 11-7. As shown, the vast number of duplicates have been completed by ALS, which was the primary laboratory during the 2003 to 2009 drilling campaigns.
Table 11-7 Drill campaigns 1996-1997 and 2003-2009: Field Duplicates Summary Results
| Lab | SGS-KAR | ANALABS | ALS | SGS - Perth | ||||||||||||
| Year | Number Samples | Number Samples | Number Samples | Number Samples | ||||||||||||
| Cu | Au | Cu | Au | Cu | Au | Cu | Au | |||||||||
|
1996 -1997 |
30 | 14 | 160 | 152 | - | - | - | - | ||||||||
|
2003-2009 |
281 | 162 | - | - | 3,642 | 3,179 | 105 | 0 | ||||||||
|
Total |
479 | 328 | 160 | 152 | 3,792 | 3,179 | 105 | 0 | ||||||||
Duplicates are evaluated through acQuire® charts; to determine the precision of the sampling stage primarily through scatter plots showing the original and duplicate samples. The following series of graphs show the Scatter plots for selective samples for each laboratory described in Table 11-7.
Selective scatter plots for ANALABS Au assay results during the generation 1996-1997 are shown in Figure 11-5. The plots indicate that Au grades have relatively poor repeatability with scatter, while the Cu duplicates align reasonably well with minimal failures outside acceptable limits. Given the relatively small number of samples from SGS-KAR no plots are displayed, however no material issues were noted.

Source: Barrick, 2024
Figure 11-5 ANALABS Duplicate Plots 1996-1997 Au assays (Left), Cu Assay (Right)
Three different laboratories were utilized for the duplicate analysis between 2003 and 2010. Representative plots for Au and Cu for the primary laboratory at ALS are shown in Figure 11-6.
|
February 19, 2025 |
Page 101 |
|
|
NI 43-101 Technical Report on the Reko Diq Project |
|
Similar to the analysis from the 1996 and 1998 data, these plots indicate that while Cu shows a reasonable degree of correlation, Au shows a fair degree of scatter and failures outside the 20% threshold particularly below 1 g/t.
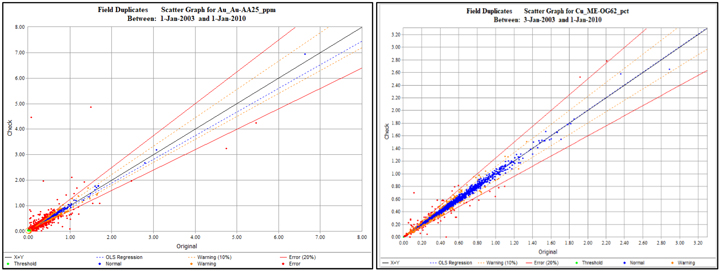
Source: Barrick, 2024
Figure 11-6 2003 to 2010 ALS Duplicates Au (left), Cu (Right)
The results for both Au and Cu from the SGS-KAR duplicates perform well within acceptable limits with the majority of failures occurring at very low grades below the COG.
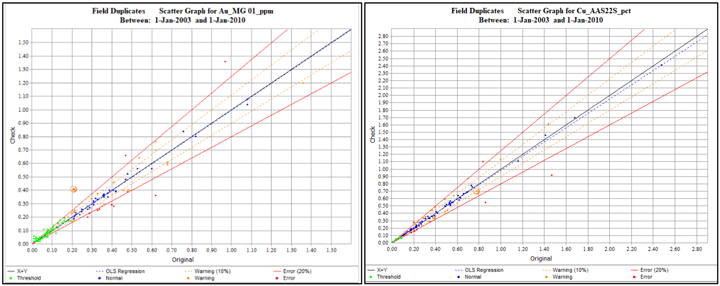
Source: Barrick, 2024
Figure 11-7 2003 to 2010 SGS-KAR Duplicates Au (left), Cu (Right)
Prep Duplicates
No preparation duplicates were inserted.
|
February 19, 2025 |
Page 102 |
|
|
NI 43-101 Technical Report on the Reko Diq Project |
|
Historical Pulp Duplicates
In 2024, 1,596 historical pulp duplicates with six holes from 2005 to 2008 period were re-assayed at ALS Perth. These samples which are within two cross-sections of H14 and H15 within the 10-year mining area as shown in Figure 11-8.

Source: Barrick, 2024
Figure 11-8 Re-assayed Pulps Location and 10-year Mining Pit
As can be seen in scatter plot (Figure 11-9) the Cu pulp re-assays show a strong correlation to the original assays with a regression correlation of 0.996. The re-assays for Au were more scattered than the copper dataset, particularly at lower assay values. This indicates higher variability or lower precision in gold assays at the low values. It is noted that historically the assay method was used Au-AA25 method has a range of 0.01-100 ppm, with the recently used Au-AA23 – 0.005-10 ppm (both are fire assay with 30 g sample). As a rule, precision of the Au assay becomes increasingly unreliable near the lower end of its range., which is shown in this dataset with a reason correlation >0.2 g/t.
|
February 19, 2025 |
Page 103 |
|
|
NI 43-101 Technical Report on the Reko Diq Project |
|
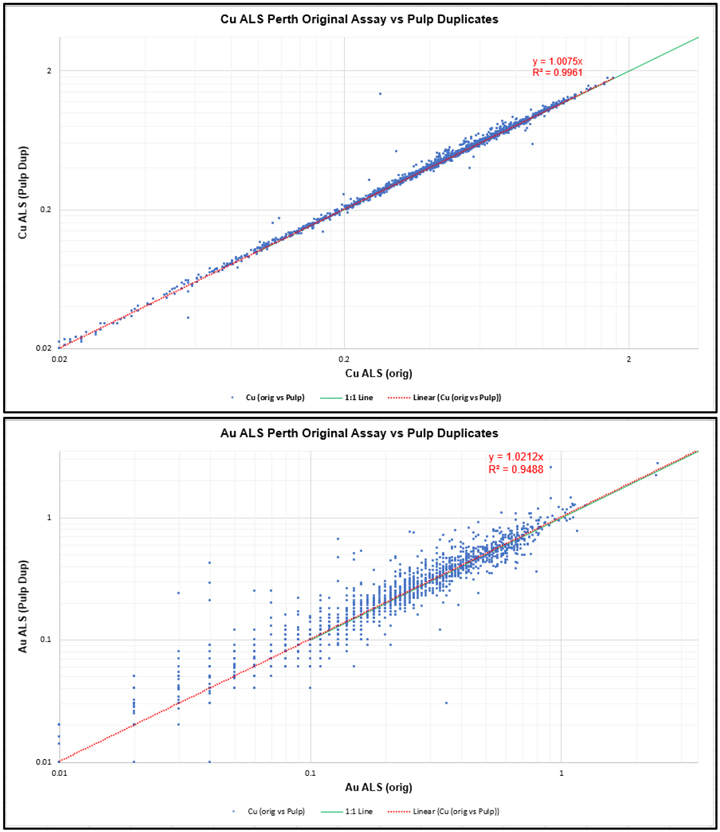
Source: Barrick, 2024
Figure 11-9 Scatter Plots Cu (Top) Au (Bottom) of Grades in Historic and Re-assayed Pulps
Overall it is considered that the re-assays of the historical assays show a reasonable correlation given the style of sample.
| 11.3.4 | Umpire Assays |
To confirm the accuracy of the primary laboratory (ALS) between 2003 and 2009, more than 4,000 samples were sent to Genalysis as an umpire assay lab. A total of 4,391 samples were assayed for Au, while 854 Cu assays were completed using three sets of methods (Table 11-8). The biases, slightly positive, vary from 0.23 to 4.9% (including outliers) which might be considered acceptable and free from material bias that could potentially affect the stated mineral resource.
|
February 19, 2025 |
Page 104 |
|
|
NI 43-101 Technical Report on the Reko Diq Project |
|
Table 11-8 Summary of Umpire Sampling program (2003-2009)
| Assay Field | No. Samples |
No. Failure | Corr. Coeff |
Bias | RMA Error |
|||||
|
Au_FA_AAS_ppm |
4,391 | 791 | 0.889 | 3.80% | 18.61% | |||||
|
Cu_Total_3A_AAS_pct |
718 | 39 | 0.990 | 4.90% | 10.20% | |||||
|
Cu_Total_4A_AAS_pct |
12 | 1 | 0.995 | 0.23% | 3.98% | |||||
|
Cu_Total_4A_ICPOES_pct |
124 | 1 | 0.997 | 0.61% | 3.22% | |||||
| 11.3.5 | Internal Laboratory QAQC |
While not provided in detail, the laboratories all included internal standards and duplicates in their QAQC procedures. The results of these samples were included in each sample report provided along with the QC certificate of the laboratory.
| 11.4 | QP Comments on Sample Preparation, Analyses, and Security |
It is the QP’s opinion that the sampling, sample preparation and analytical methods are acceptable, are in line with industry-standard practices, and are adequate for Mineral Resource and Mineral Reserve estimation and mine planning purposes.
The QA/QC procedures and management are consistent with industry standards and the assay results within the database are suitable for use in Mineral Resource estimation. The QP has not identified any issues that could materially affect the accuracy, reliability, or representativeness of the results.
Of note, the QAQC program has been adequate according to the industry practice at all relevant times and the workflow outlined in the two internal and external audits (see Section 12) describe acceptable procedures of rejecting data around a failing returned QC sample.
Analysis of the QC charts and data have demonstrated that the accepted certified reference material results show no material bias or significant deviations from expected results. Accepted failures do not appear to pose a material risk to the estimation.
As noted in Section 12, Barrick and RDMC have updated the sampling and QAQC procedures to be consistent with present day industry standards to address the minor issues noted.
|
February 19, 2025 |
Page 105 |
|
|
NI 43-101 Technical Report on the Reko Diq Project |
|
| 12 | Data Verification |
Early exploration data was initially stored within the structured tables of the Tethyan Geological Database, housed and managed by Maxwell Geoservices in Fremantle, Australia. Maxwell Geoservices also undertook loading of assay data and the provision of quarterly QA/QC reports.
In October 2006, the data on-site was transferred into the acQuire data format and moved to Tablet-PC-assisted logging. All assay data loading and QA/QC were then managed on-site by RDMC personnel in acQuire.
All data including collar, survey, density, sample assay, geotechnical, and density data was routinely checked by the Database Administrator. Any errors identified (e.g. download survey DLS failure, depth variance, overlaps, and gaps) were immediately corrected, or, if assays were outside a 3s variance limit, repeat analyses were requested from the laboratory.
The QP completed an additional data review prior to Mineral Resource estimation.
| 12.1 | Internal Reviews and Audits |
As part of ongoing work, all assay data was quality-checked against the standard values, and acceptable minimum and maximum values were held in the acQuire Standards Assay table during import. Depending on the degree to which the company standards fail, the laboratory is requested to re-analyze five or six samples on either side of the company-submitted standard. When the QC checks are returned from the laboratory, they are compared with the original assays to ascertain whether there are any discrepancies. These assays are then loaded into the database to replace those that failed QAQC. Assay laboratory job numbers are saved against assay results, so these assays can be discriminated against, as per industry standards.
During the exploration and data acquisition process, biennial internal QA/QC audits focused on quality control, and RDMC staff applied corrective methods to identify problem areas when required. Geological logging of sulfides and alteration effects was recognized as important in resource definition and estimation and, as such, required constant monitoring for consistency.
In addition to the ongoing monitoring of the database, two internal QA/QC reports were completed, where 5% and 20% of the data were reviewed. Items reviewed included:
| ● | collar coordinates |
| ● | survey |
| ● | lithology codes |
|
February 19, 2025 |
Page 106 |
|
|
NI 43-101 Technical Report on the Reko Diq Project |
|
| ● | alteration codes |
| ● | sulfide codes |
| ● | laboratory assay certificates |
The first review was conducted in May 2009, and the second in July 2009 after the drill program was complete.
In 2022, Barrick undertook a campaign to update the acQuire® database and completed a data validation process. Collars, logging codes, assay priorities, and survey errors were corrected.
In 2024 RDMC drilled 13 twinned holes within the WP with comparison between the grade profile results suggests that the twin holes provide similar information on the spatial distribution of grade within the deposit. The modern twinned drillholes confirm historical (2006 to 2008) data.
Also, in 2024 RDMC re-assayed 1,596 historical pulp duplicates from 2005 to 2008 period. Location of pulp duplicates from six drillholes covers two cross-sections of H14 and H15 porphyry complexes.
Recently, Barrick and RDMC completed a detailed review of all drilling, sampling, assaying, and QAQC procedures. This review was focused on updating the procedure to be in line with current industry standards and, importantly, incorporating issues highlighted in the previous drilling and QAQC, including the blanks used.
| 12.2 | External Reviews and Audits |
Rigorous QAQC procedures were at the heart of data gathering at Reko Diq from 2003 and external audits have reviewed procedures and results.
An external database and QAQC consultant, Cameron Cairns, reviewed geological procedures at Reko Diq in April 2004, and reported on QAQC associated with the Tanjeel data. In 2005, he reported on QAQC in relation to exploration at the Western Porphyries and this was followed by a report on data input on H15, part of the Western Porphyries cluster, by Kirsty Reid, in 2007. Early in 2009, ioGlobal carried out an audit of sampling, assay and data management procedures and processes. Following this, Khuram Hasan carried out an appraisal of data being input into a re-estimation of the Western Porphyries.
In addition to data procedures and reviews completed in 2009, Behre Dolbear was engaged in reviewing the integrity of data collection and database management, as well as the validity of resource modeling and resource estimation parameters. Behre Dolbear’s site audit indicates field, laboratory and office data acquisition procedures, QAQC processes and data management standards are fit for purpose and data were in line with NI 43-101 guidelines at the time.
|
February 19, 2025 |
Page 107 |
|
|
NI 43-101 Technical Report on the Reko Diq Project |
|
An external review of the database was conducted by RSC Consultants before updating the geological wireframes in 2022. Survey errors, missing lithology, and missing assays were noted. These were not material in the construction of the wireframes, and hole with errors were omitted from the modeling and estimation process.
All the above audits were carried out professionally and demonstrated that data has acceptable precision and accuracy for inclusion in resource estimates, with maximum variability found in gold analyses as standards and duplicates were not completely congruent with the samples submitted to the laboratory, values were often low and there was some inconsistency in the assay laboratory pulverizing technique. These factors were subsequently addressed during exploration, and control procedures raised the quality of control over gold assays, which are considered representative of inclusion in feasibility studies.
| 12.3 | QP Comments on Data Verification |
In the QP’s opinion, an appropriate level of verification has been completed, and no material issues have been identified from the programs undertaken. The QP has reviewed and completed checks on the data and is of the opinion that the data verification and QAQC programs undertaken on the database adequately support the geological interpretations and Mineral Resource estimation process.
|
February 19, 2025 |
Page 108 |
|
|
NI 43-101 Technical Report on the Reko Diq Project |
|
| 13 | Mineral Processing and Metallurgical Testing |
| 13.1 | Metallurgical Testwork |
The process flowsheet was selected based on a metallurgical testwork program conducted from 2023 to 2024 at ALS Metallurgy (ALS), Perth which built upon previous work conducted between 2007 and 2009 performed by AMMTEC (now ALS) and reported by SNC Lavalin.
The 2007 to 2009 testwork program was undertaken in three phases and included flotation and comminution variability samples, bench testing and pilot plant testwork, and High Pressure Grinding Roll (HPGR) testwork.
The program included comminution testwork, conventional, high-shear and coarse particle flotation (CPF) testwork and ancillary vendor testwork in line with industry standards for the level of study.
The primary goal of the 2023 to 2024 testwork program was to ensure suitability of the process flowsheet and forecast recoveries to underpin the LOM plan and focused on the initial 10 years of production. The program included comminution testwork, conventional, high-shear and CPF testwork, and ancillary vendor testwork in line with industry standards for the level of study.
Table 13-1 summarizes the number of metallurgical tests conducted.
Table 13-1 Metallurgical Testwork Samples
|
Number of Tests
|
Comminution |
Flotation
|
Thickening | |||||||||
|
Rougher
|
Cleaner | LCT | CPF | |||||||||
| pre-2010 |
175 | 132 | 499 | 137 | 0 | 8 | ||||||
| 2023 - now |
30 | 198 | 85 | 21 | 16 | 14 | ||||||
| Total |
205 | 330 | 584 | 158 | 16 | 22 | ||||||
Table 13-2 summarizes the metallurgical studies completed on the Reko Diq project completed to date.
|
February 19, 2025 |
Page 109 |
|
|
NI 43-101 Technical Report on the Reko Diq Project |
|
Table 13-2 Metallurgical Testwork Summary
| Study | Phase | Quantity (tonnes) | Samples Composited | Objective Comminution | Findings | |||||
| 2010 FS | Phase 1 | 30 tonnes comprised of 4 shipments consisting of H14, H15 and H4 | 30 tonnes comprised of 4 shipments consisting of H14, H15 and H4:
175 Variability Samples - 175 × SMC Variability Composites - 96 × Rougher / Cleaner Regrind Variability Samples (Shipment 1, 2 & 3) - OPT 1 (PFB-POT) & OPT 2 (VIN-MIX) - 29 × MIN Comp Samples (Site Water + NaCN) - 6 × Tanjeel Variability Samples (Shipment 1 & 2) |
Metallurgical Classification: • Head Grade Analysis • Mineralogy • Comminution: o SMC Test o BWi, RWi and Ai o Grinding Tests o HPGR vs. SAG Trade Off
Processing: • Establish primary grind target • Identify rougher flotation conditions • Establish cleaner configuration • Establish regrind fineness • Identify key flotation parameter using Opt 1 and Opt 2 Composites to carry out detailed ore variability study • Flash flotation feasibility • Gravity Gold Feasibility |
Comminution: HPGR delivers a 20% power saving resulting in a 1.3 year payback period
Flotation: • Major findings from Opt 1 &2 using Perth tap water • Flotation Feed Grind: 80 % passing 212 micrometers • Rougher Flotation: Natural pH • Collector: Potassium amyl xanthate • Promoter: Cytec A3894 • Frother: MIBC • Cleaner pH: o pH 12 (Perth tap water) o pH 10.2 (site water) requiring 270 g/t lime and 20 g/t NaCN addition • Regrinding: 80 % passing 25 micrometers before cleaner flotation • Acceptable grades and recoveries for copper and gold achieved
• Site Water Use: Required cyanide as pyrite depressant • Problem: High lime demand due to buffering effects, resulting in lower copper grades and recoveries
• New Approach: Aerated Sodium Metabisulphite (MBS-Aeration) scheme • Results: Good copper and gold recoveries, attractive copper concentrate grade • Success: Effective with site water
• Major findings from OCT Min Comp: o Cu Recovery: 86% o Cu Grade: 30% o Au Recovery: 69 % o Final Conc Mass Pull: 1.6%
• Major findings from LCT Min Comp: o Cu Recovery: 88.6% o Cu Grade: 30% o Au Recovery: 74.9% o Final Conc Mass Pull: 1.6%
Thickening: • Tests on rougher tailings have indicated an underflow maximum of 67% solids, and 45% for flotation cleaner tailings would likely be achieved by full-scale thickeners. |
|||||
| Phase 2 | 24 tonnes for Metallurgy and 15 tonnes for HPGR (Polysius & KHD, Germany) | 24 tonnes for Metallurgy and 15 tonnes for HPGR (Polysius & KHD, Germany)
5 × SCC Composites 16 × Drop Weight Composites (DWT) 3 × HPGR Composites - PFB-POT (A) - VIN-MIX (B) - VIN-SCC (C) |
Comminution: • Confirm regrind energy requirements through specific large scale HPGR tests at Polysius and KHD Homboldt in Germany.
Flotation: • Additional bench testing and pilot plant test work • Optimize the performance of SCC ore types (20 % of orebody) • Develop alternative reagent scheme to lime/NaCN |
Comminution: • Together, test work and comminution simulation exercises, demonstrated that HPGR processing offered Reko Diq a power saving of almost 4 kWh/t compared to SAG milling.
Flotation: • Lime addition with site water: Detrimental to flotation (high Ca, Mg) • Replacing PAX with Maxgold MX950: Performance improved • MBS as pyrite depressant: Superior to others, better than cyanide • Aeration post-regrind: Improved flotation (better Cu kinetics) • MBS-Aeration instead of Cyanide: Cu recovery +7%, Cu grade +3% • Au recovery: Variable (low Au grades error) |
||||||
|
February 19, 2025 |
Page 110 |
|
|
NI 43-101 Technical Report on the Reko Diq Project |
|
| • Confirm SMBS-Aeration scheme with SCC, DWT and HPRG Composites A, B and C |
• Cyanide scheme: Au recovery unclear (possible leaching) • Significant -7 micron Au in cleaner scavenger tailings |
|||||||||
| Phase 3 | 11 tonnes twinned holes based on Phase 2 work |
Commissioning Composite |
Comminution: • Regrind energy requirement testwork • ATWAL Tests
Flotation: • Pilot plant testwork to confirm flotation conditions and selected reagent scheme • Confirm regrind size |
Pilot Plant Findings: • Inert regrind media: Critical (low chrome steel negative for selectivity) • Discontinue MBS in regrind mill: Reaction with iron • Stage MBS addition in cleaners: Improved performance. • Discontinue Maxgold MX950: Improved rougher selectivity, better cleaner performance • Add third cleaning stage: Improved Cu concentrate grade |
||||||
| Pilot Plant Composite | ||||||||||
| 30 | Pilot Plant 1 - 7 Y | |||||||||
| 24 | Pilot Plant 8 - LOM Y | |||||||||
| 15 | Additional HPGR (Polysius) | |||||||||
| 11 | 33 × ATWAL Composites | |||||||||
| FS1 & FS2 Composites | ||||||||||
| 2024 FS | 5.56 | 30 x Comminution Variability Composites |
Comminution: • Confirm ore comminution characteristics • Expand on Tanjeel comminution database |
Comminution: • Confirmed that very little variation exists in the hardness of the ore being mined • Tanjeel ore exhibit softer characteristics, having A×b values of 52, compared to 14 of Western Porphyries at the 25th percentile |
||||||
| 0.66 | Z3 Composite | Flotation: • Confirm primary grind size sensitivity, reagent selection and dosage, regrind size optimization, conditioning times, flotation kinetics, flotation slurry density, thickening and filtration characteristics, tailings characterization and regrind energy establishment • Generate a representative final concentrate for offtake agreements |
Flotation: • Confirmed the use of the reagent scheme developed in the 2010 FS • Confirmed >89% expected recovery at a coarser grind of 300 µm • Developed the SMBS and regrind requirement for lower and higher Cu:S2- ores (Z2 and Z3 respectively) |
|||||||
| 0.41 | Z2 Composite | |||||||||
| 0.23 | H4 Composite 1 | |||||||||
| 1.16 | H4 Composite 2 | |||||||||
| 2.58 |
Smelter Composite
|
|||||||||
| 1.34 | 48 × Flotation Variability Composites |
• Expand on our variability database, and understand the effect of coarsening the primary grind. |
||||||||
| 0.27 | Sighter Composite (or CPF Sighter Composite) |
• Develop the CPF conditions and reagent scheme. Determine a CPF concentrate regrind size • Determine how the CPF process reacts to different types of ore |
CPF: • PAX addition dramatically increased CPF stage recovery • Cu stage recoveries of ~40 % observed |
|||||||
| 0.26 | CPF Optimization Composite | |||||||||
| 0.35 | 5 × CPF Variability Samples | |||||||||
|
February 19, 2025 |
Page 111 |
|
|
NI 43-101 Technical Report on the Reko Diq Project |
|
| 13.1.1 | Sample Representativeness |
The location of each sample was recorded, including geographical coordinates and elevation. During the sampling process, attention was given to the geological logging and mineralogical composition, with core recovery percentages and structural features noted. Employing a systematic sampling technique, homogeneity and representativity were carefully considered inline with industry standards.
Samples were generated from large-diameter quarter and half split HQ and PQ core drilling, which was selected to provide suitable sized samples for metallurgical test work. The samples were selected to represent the mineralization expected to be processed over the LOM, with a primary focus on the lithology and alteration domains.
Three phases of sampling were carried out by TCC to detail the Reko Diq metallurgical characteristics as part of the 2007 to 2009 testwork:
| ● | Phase 1 commenced with four shipments of Western Porphyries (H14 and H15), as well as Tanjeel flotation and comminution variability samples. |
| ● | Phase 2 was based on 24 t of the various Western Porphyries (H14 and H15) and Tanjeel lithology/alteration types selected for additional bench testing and pilot plant test work. |
| ● | Phase 3 work was comprised of pilot plant test work of the Western Porphyries (H14 and H15) and HPGR test work. |
Samples selected for the FS were strategically taken to ensure representation of each domain and with spatial distribution of the first 10 years of the mine life as shown in Figure 13-1 and Figure 13-2.
Figure 13-3 shows the spatial distribution of all of the metallurgical samples within the Western Porphyries and Tanjeel pit.
|
February 19, 2025 |
Page 112 |
|
|
NI 43-101 Technical Report on the Reko Diq Project |
|

Source: Barrick, 2024
Figure 13-1 Isometric View of the Zone 2 (Left) and Zone 3 (right) composite Holes
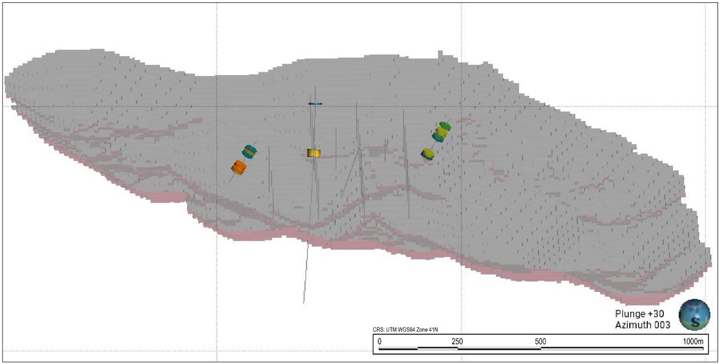
Source: Barrick, 2024
Figure 13-2 Isometric View H4 Composite Sample
|
February 19, 2025 |
Page 113 |
|
|
NI 43-101 Technical Report on the Reko Diq Project |
|
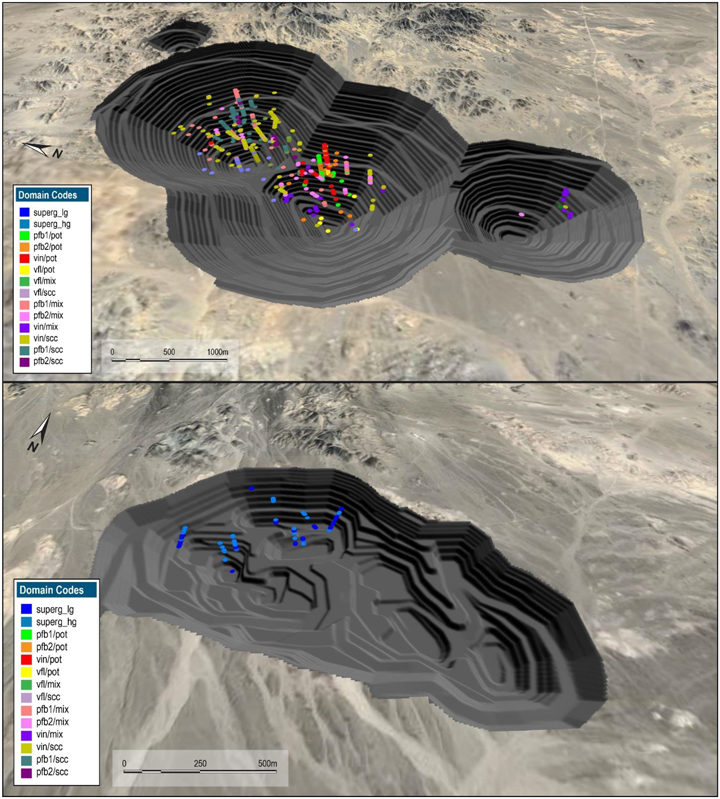
Source: Barrick, 2024
Figure 13-3 Spatial Distribution of All of the Metallurgical Samples (Isometric View), Western
Porphyries (Top) and Tanjeel (Bottom)
|
February 19, 2025 |
Page 114 |
|
|
NI 43-101 Technical Report on the Reko Diq Project |
|
| 13.1.2 | Metallurgy Testwork Results |
Mineralogy
QEMSCAN mineralogy analysis was completed on the initial metallurgy testwork from the 2010 study, for geological modelling of sulphide zones in 2009, and for head samples for metallurgy testwork in 2023 and 2024. The 2023 and 2024 testwork included additional separation of samples into sulphide species categories based on pyrite to copper sulphide ratios. Higher pyrite zones are identified as Z2 (zone 2) and higher copper sulphides zones as Z3 (zone 3). QEMSCAN results were completed on Z2, Z3 and H4 composites after grinding to P80 212 µm and P80 350 µm as follows:
| ● | Western Porphyries (Z2 and Z3 Composites): For Z2 and Z3 composites, the mineralogy identified pyrite and chalcopyrite to be the most abundant sulphide species, with a higher abundance of pyrite in Z2 than in Z3. In terms of Cu deportment, chalcopyrite is the dominant Cu-bearing mineral in both feed samples, contributing about 90% of the Cu content in the samples. Minor bornite is present and hosts approximately 10% of the Cu. A trace of chalcocite/digenite/covellite mineral group accounts for less than 0.5% of the Cu. |
| ● | Tanjeel (H4 Composite): The H4 composite showed a significantly higher sulphide presence than Western Porphyries samples, driven by the abundance of pyrite. Chalcopyrite is the most abundant Cu-(Fe)-sulphide species. In terms of Cu deportment, chalcopyrite accounts for half of the total Cu, and chalcocite/digenite/covellite accounts for the other half, with trace bornite hosting less than 4% of the Cu. |
Comminution
The 2024 comminution testing was conducted to increase confidence in the equipment selection and throughput of the comminution circuit, and to support a higher level of accuracy. Comminution sample testing included SMC tests, Bond rod mill work index (RWi), Bond ball mill work index (BWi) and Bond abrasion index (Ai).
The full comminution database of 205 comminution samples including all historical testwork results was considered when nominating the process design criteria. All data points were considered equally representative with accepted standard testing methods and reputable laboratories having been used in all phases. The variability in comminution characteristics is very low across the samples tested, irrespective of lithology or alteration as outlined below.
The Axb values are low (inversely correlated, i.e. lower value indicates higher competency), and the DWi values are high. Both design points are higher than the 90th percentile in the JKTech database, indicating that the fresh ore is very competent and requires high breakage energy. The RWi and BWi (106 µm and 150 µm CSS) range from moderate to high hardness. The abrasion index indicates low to moderate abrasiveness for these ores.
|
February 19, 2025 |
Page 115 |
|
|
NI 43-101 Technical Report on the Reko Diq Project |
|
A summary of the key ore properties for the H14 / H15 samples used for the comminution circuit design is presented in Table 13-3.
Table 13-3 Ore Properties for Comminution Circuit Design
| Parameter |
Unit | Value | Source | |||
| CWi (tested) |
kWh/t | 17.1 | Average, 75th Percentile | |||
| CWi (calculated by OMC from Axb value) |
kWh/t | 22.2 | Calculated | |||
| RWi |
kWh/t | 21.0 | 75th Percentile | |||
| BWi |
kWh/t | 16.5 | 75th Percentile | |||
| Abrasion Index |
g | 0.256 | Average | |||
| Axb |
29.8 | 25th Percentile | ||||
| Mih |
kWh/t | 17.9 | 75th Percentile | |||
| SG |
t/m³ | 2.67 | Average |
Flotation Testwork
The flotation circuit has evolved from a significant body of testwork completed in 2007 to 2010 by AMMTEC (now ALS) and again in 2023/2024 at the ALS Metallurgy Laboratory (ALS). The initial design basis for flotation was the SNC Lavalin study completed in 2009 based on a primary grind P80 of 212 µm. The 2023/2024 test program was intended to fill in gaps in sampling as well as to test CPF. As a result, the initial work in 2023 started from the SNC design basis and a primary grind P80 of 212 µm. Upon these results the grind was to change to P80 of 300 µm, and subsequent test programs focussed on maintaining the existing flotation regime and measuring the impact of the coarser grind.
Initial SNC testwork (2007 to 2010) employed a pyrite suppression regime using sodium metabisulphite (SMBS) and aeration, forming the basis of a three-stage cleaner circuit design. The infill test program (2023 to 2024) validated the SMBS-Aeration regime and explored rougher concentrate mass pull variability, ranging from 6% to 15%. High-shear flotation technology was evaluated, and Metso Concorde cells were selected for their improved concentrate grade consistency.
Thickener
The following results are relevant to the P80 @ 300 µm design flowsheet:
| ● | Rougher Tailings: at a feed flux rate of 1.0 t/m2/h and 5 g/t flocculant dosage, an underflow density of 72.7% w/w solids is achieved. The test procedure is modified to 3 minutes of raking to simulate the hybrid HRT thickener selection. |
| ● | Cleaner Scavenger Tailings: at a feed flux rate of 0.5 t/m2/h and 60 g/t flocculant dosage, an underflow density of 40.1% w/w solids is achieved for Z3 composite and 47.1% w/w solids for Z2 composite. The results of the H4 Bulk tests are still pending, however represent less than 10% of mill feed. |
|
February 19, 2025 |
Page 116 |
|
|
NI 43-101 Technical Report on the Reko Diq Project |
|
| ● | Final Concentrate: at a feed flux rate of 0.25 t/m2/h and 35 g/t flocculant dosage, an underflow density of 61.6% w/w solids is achieved for the combined final concentrate. |
Filtration
A number of filtration tests on final concentrate samples were conducted throughout the various programs by Metso at their Perth laboratory. Testwork was undertaken to facilitate equipment selection for the final concentrate stream. Additional filtration testwork was conducted for other process streams from the conventional and CPF flowsheets as part of the water efficiency trade-off study.
The following results are relevant to the P80 @ 300µm design flowsheet:
| ● | For a combined final Z2/Z3/H4 concentrate stream filtered using the Metso Labox 100 Pressure Filter, an 11.1% cake moisture can be achieved at a filtration rate of 305 kgDS/m2h. Applying 0.3m3/t DS wash liquid, the Metso pressure filter can dewater the combined final concentrate sample #1 at a filtration rate of 270 kg DS/m2/h and achieved a cake moisture of approximately 10.6%. |
| ● | For a combined CPF OPT final concentrate, an 11.7% cake moisture can be achieved at a filtration rate of 322 kgDS/m2/h. |
Metallurgical Variability
Within the Western Porphyries, metallurgical sampling was based on nine main ore-types that have been defined from typical porphyry style lithologies and alterations. As noted previously, the three main lithology types of the Western Porphyries are intermediate volcanics, feldspar-biotite porphyry that can be further subdivided into PFB1 and PFB2 defining two separate phases of porphyry intrusive, and very finely laminated sediments. The porphyries are hosted within an upper horizontal bed of intermediate volcanic, which are underlain by very fine laminated sediments. All three lithologies host copper/gold mineralization associated with the porphyry intrusives. The three predominant alteration types within the Western Porphyries are comprised of potassic, mixed (up to 80% SCC), and sericite, chlorite and clay. All three alteration types host copper-gold mineralization. Comminution testwork indicates low variability throughout the ore body with the less competent ore in the upper benches of the deposit. Flotation recovery variability is driven by pyrite content which is higher in the initial mining and decreases at depth as the chalcopyrite and bornite become the more dominant of the sulphide species.
The 30 Comminution Variability Composites were selected to represent the H14 and H15 porphyries primarily in terms of DAL codes. The samples were also spatially distributed to ensure variability in relation to the physical locations in the ore body are sufficiently covered. From the 30 samples eight were from Tanjeel.
|
February 19, 2025 |
Page 117 |
|
|
NI 43-101 Technical Report on the Reko Diq Project |
|
The 48 Flotation Variability Composites were selected to represent the H14 and H15 porphyries in terms of DAL codes as well as zones. The samples were also spatially distributed to ensure variability in relation to the physical locations in the ore body are sufficiently covered. From the 48 samples, 8 were from Tanjeel, the Tanjeel composite numbers are 12 to 15 and 44 to 47. No variability tests were performed on 44 to 47, due to lack of sample size.
Key Criteria from Testwork
Table 13-4 summarises the key criteria that have been derived from the testwork.
Table 13-4 Key Criteria Derived from Testwork
| Parameter |
Units | Value | ||
| Crushing Work Index (CWi) |
kWh/t | 17.1 | ||
| HPGR Comminution Index (Mih) |
kWh/t | 17.9 | ||
| Drop Weight Index (DWi) |
kWh/m3 | 8.9 | ||
| Rod Mill Work Index (RWi) |
kWh/t | 21.0 | ||
| Ball Mill Work Index (BWi) |
kWh/t | 16.5 | ||
| Abrasion Index (Ai) |
g | 0.256 | ||
| JK Breakage Parameter Axb |
29.8 | |||
| Ore SG |
2.67 | |||
| Rougher Feed Conditioning |
min | 3 | ||
| Rougher Flotation Time – Conventional Cells |
min | 15 | ||
| Rougher Concentrate Regrind Target P80 |
µm | 20 / 25 | ||
| Stage 1 Rougher Concentrate Regrind Specific Energy |
kWh/t | 8-9 | ||
| Stage 2 Rougher Concentrate Regrind Specific Energy |
kWh/t | 12-13 | ||
| Cleaner Feed Aeration |
min | 30 | ||
| Cleaner Feed Conditioning |
min | 4 | ||
| Cleaner Flotation Time – Conventional Cells |
min | 16.5 | ||
| Rougher Tailings Thickener Feed Flux Rate |
t/h/m2 | 1.0 | ||
| Cleaner Tailings Thickener Feed Flux Rate |
t/h/m2 | 0.5 | ||
| Final Concentrate Thickener Feed Flux Rate |
t/h/m2 | 0.25 | ||
| Final Concentrate Filtration Rate |
t/h/m2 | 0.238 | ||
| Aero 3894 (A3894) Dosage |
g/t mill feed | 9.0 | ||
| Aero 7249 (A7249) Dosage |
g/t mill feed | 29.6 | ||
| MAXGOLD 900 (MX900) Dosage |
g/t mill feed | 7.4 | ||
| Sodium Metabisulphite (SMBS) Dosage |
g/t mill feed | 600 - 1,000 | ||
| Methyl Isobutyl Carbinol (MIBC) Dosage |
g/t mill feed | 14.5 | ||
| Rougher Tailings Flocculant Dosage |
g/t thickener feed | 30 | ||
| Cleaner Tailings Flocculant Dosage |
g/t thickener feed | 30 |
Notes
| 1. | Comminution parameters derived from current and historical test results. |
| 2. | Flotation times as applied in bench scale tests. |
|
February 19, 2025 |
Page 118 |
|
|
NI 43-101 Technical Report on the Reko Diq Project |
|
13.2 Metallurgical Projections
13.2.1 Recovery Estimates
An assessment of the copper recovery was conducted for the design case P80 @ 300 µm conventional flotation flowsheet. The following data sets have been applied:
| ● | Four cleaner tests, all from Western Porphyries ores (two samples from each of zone 2 and zone 3) |
| ● | 21 locked cycle tests, one from Tanjeel and 20 from Western Porphyries (11 zone 2 samples, 8 zone 3 samples, 1 zone 5 sample) |
| ● | 46 rougher tests, three from Tanjeel and 43 from Western Porphyries (25 zone 2 samples, 17 zone 3 samples, one zone 5 sample). |
Grind sensitivity impact on recovery showed an average drop in copper recovery from a P80 grind of 212 to 300 µm of ~1 - 2%.
Mass Pull to Rougher Concentrate
It was observed from 39 variability tests at 300 µm primary grind that the Cu:S2- ratio can be used for predicting the rougher mass pull. The data presented in Figure 13-4 was obtained from the variability samples testwork, the results were smoothed by sorting the data based on the Cu:S2- ratio and smoothing the results by binning it into four equally sized data sets.
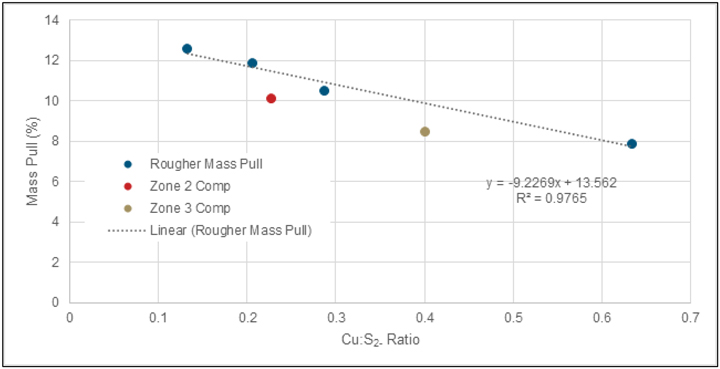
Source: Barrick, 2024
Figure 13-4 Rougher Mass Pull as a Function of Cu:S2- Ratio
|
February 19, 2025 |
Page 119 |
|
|
NI 43-101 Technical Report on the Reko Diq Project |
|
Copper Recovery
Expressing copper recovery in units rather than percentages provides a more accurate representation of the actual mass of copper recovered, aligning directly with economic value and operational performance. It avoids misleading interpretations caused by variations in ore grade, ensuring clarity in evaluating recovery efforts. In the locked cycle test work, the tested ore exhibited a strong linear correlation of contained copper in the feed against the contained copper recovered. The results were smoothed by sorting the data based on the Cu units and smoothing the results by binning it into four equally sized data sets. The linear nature indicated that a constant recovery percentage can be expected within the expected LOM feed grade range as shown in Figure 13-5.

Source: Barrick, 2024
Figure 13-5 Units of copper recovered as a function of copper head grade
The observed recovery formula is given below:

Copper Concentrate Grade
It was observed from 13 variability LCT test (excluding 3 outlier results) at 300 µm primary grind that the Cu:S2- ratio can be used as a marker for predicting the final concentrate grade. The data presented in Figure 13-6 was obtained from the variability samples testwork results. Since the grade
|
February 19, 2025 |
Page 120 |
|
|
NI 43-101 Technical Report on the Reko Diq Project |
|
and recovery are known, the mass pull can be calculated. The outliers presented in the figure are samples with copper grade well below the average feed grade with copper to sulphur and sulfur to sulphide ratios outside the normal distribution of the main ore body and therefore are considered non-representative.
Regrind and SMBS sensitivity tests showed that the concentrate grade can further be increased at lower Cu:S2- ratios by decreasing the regrind size or increasing the SMBS dosage.

Source: Barrick, 2024
Figure 13-6 Copper Concentrate Grade as a function of Cu:S2- Ratio
The observed copper concentrate grade formula is given below:

Process Plant Simulation
The metal and production plan is based on Deswik Life-of-Mine plan and has been facilitated through the use of Metso’s HSC simulation software. The key simulation results can be seen in Table 13-5 and Figure 13-7, Figure 13-8, Figure 13-9 show the rougher mass pull, metal recovery, and concentrate grade respectively.
The HSC simulation builds on the empirical analysis and was built using recovery kinetics obtained through test work which has demonstrated the ability to predict the performance of the porphyry copper flotation concentrator at Reko Diq. The dynamic nature of the simulation model allows for continuous improvement and recalibration as more data becomes available, ensuring sustained
|
February 19, 2025 |
Page 121 |
|
|
NI 43-101 Technical Report on the Reko Diq Project |
|
accuracy and operational efficiency. In addition, the simulation is able to account for process stream interactions within the flotation process.
A comprehensive analysis of recovery, mass pull, and concentrate grade has been achieved through the careful selection of representative composite samples (Z2, Z3) and the application of detailed kinetic models.
Table 13-5 Metso HSC Sim Metal Plan Simulation Results
| Description |
10y Averages | LOM Averages | ||
| Copper Concentrate Grade (%) |
28.6% | 27.0% | ||
| Cu Recovery (%) |
90.1% | 89.9% | ||
| Gold Recovery (%) |
69.7% | 69.9% | ||
| Rougher Mass Pull (%) |
8.9% | 9.1% | ||
| Cleaner Mass Pull (%) |
1.77% | 1.62% |
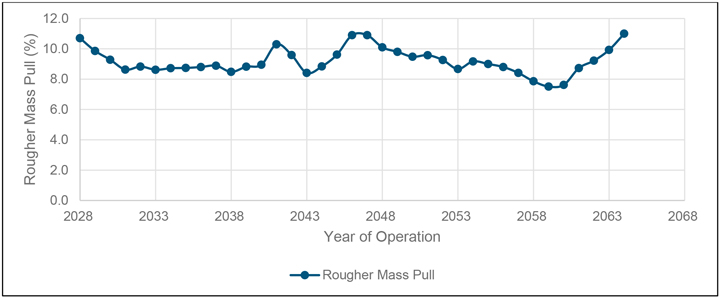
Source: Barrick, 2024
Figure 13-7 Simulation Results: Rougher Mass Pull Over LOM
|
February 19, 2025 |
Page 122 |
|
|
NI 43-101 Technical Report on the Reko Diq Project |
|

Source: Barrick, 2024
Figure 13-8 Simulation Results: Metal Recovery Over LOM

Source: Barrick, 2024
Figure 13-9 Simulation Results: Final Cu Concentrate Grade and Mass Pull Over LOM
13.2.2 Deleterious Elements
Depending upon the specific processing facility, several processing factors or deleterious elements could have an economic impact on extraction efficiency of a certain ore source, based either on the presence, absence, or concentration of the following constituents in the processing stream:
| ● | Organic carbon; |
| ● | Sulfide sulfur; |
|
February 19, 2025 |
Page 123 |
|
|
NI 43-101 Technical Report on the Reko Diq Project |
|
| ● | Carbonate carbon; |
| ● | Arsenic; |
| ● | Mercury; and |
| ● | Antimony. |
The expected grades of elements and chemicals are given in Table 13-6. Based on comprehensive testing of representative composites (as outlined in Section 13.1.1) and pilot plant testing, concentrate produced is expected to comfortably meet these levels.
Table 13-6 Expected Elemental and Chemical Grade of Final Concentrate
| Element or Chemical | Unit | Value | ||||
| Copper | Cu | % | >26 | |||
| Gold | Au | g/t | 9 | |||
| Silver | Ag | g/t | 35 | |||
| Molybdenum | Mo | ppm | 1600 - 2700 | |||
| Sulphur | S | % | 32 - 37 | |||
| Iron | Fe | % | 27 - 33 | |||
| Arsenic | As | % | < 0.05 | |||
| Antimony | Sb | % | < 0.002 | |||
| Bismuth | Bi | % | < 0.006 | |||
| Cadmium | Cd | % | < 0.004 | |||
| Lead | Pb | % | < 0.2 | |||
| Zinc | Zn | % | < 0.5 | |||
| Mercury | Hg | ppm | < 3.0 | |||
| Fluorine | F | % | < 0.02 | |||
| Chlorine | Cl | % | < 0.02 | |||
| Selenium | Se | % | < 0.001 | |||
| Tellurium | Te | % | < 0.001 | |||
| Nickel | Ni | % | < 0.01 | |||
| Cobalt | Co | % | < 0.02 | |||
| Aluminium oxide | Al2O3 | % | < 2.0 | |||
| Magnesium oxide | MgO | % | < 0.1 | |||
| Calcium oxide | CaO | % | < 0.1 | |||
| Silicon dioxide | SiO2 | % | < 3.0 | |||
| Al2O3 & MgO | % | < 2.0 | ||||
13.3 Blending
No material blending is planned for the mill ore feed at Western Porphyries. Tanjeel material will be limited to 20% of the feed through the comminution circuit to minimize HPGR screen blockage based on the higher clay values present within the supergene system. The majority of the material will be processed based on payable metal grade rather than metallurgical requirements based on the testwork and design criteria.
|
February 19, 2025 |
Page 124 |
|
|
NI 43-101 Technical Report on the Reko Diq Project |
|
| 13.4 | QP Comments on Mineral Processing and Metallurgical Testing |
The QP considers that the samples selected are representative for the intended testwork and studies. In addition, the metallurgical test work collected since 2022 has also been incorporated into the design of the processing plant.
There are no known processing factors or deleterious elements that could have a significant effect on economic extraction.
The test work completed is considered appropriate to support recovery and deleterious element assumptions for LOM planning purposes.
|
February 19, 2025 |
Page 125 |
|
|
NI 43-101 Technical Report on the Reko Diq Project |
|
| 14 | Mineral Resource Estimate |
| 14.1 | Introduction |
The Mineral Resource estimate has been prepared according to the Canadian Institute of Mining, Metallurgy and Petroleum (CIM) 2014 Definition Standards for Mineral Resources and Mineral Reserves dated 10 May 2014 (CIM (2014) Standards) as incorporated with National Instrument 43-101 Standards of Disclosure for Mineral Projects (NI 43-101). Mineral Resource estimate was also prepared using the guidance outlined in CIM Estimation of Mineral Resources and Mineral Reserves (MRMR) Best Practice Guidelines 2019 (CIM (2019) MRMR Best Practice Guidelines).
Since Barrick’s Statement of Mineral Resources as of 31 December 2023, there have been minor changes to the Resource estimate. The main drivers were changes in the operating costs and processing recoveries which underpin the cut off grade and pit shell determinations used for reporting. No additional drilling is included in the updated Mineral Resource estimate.
| 14.2 | Resource Database |
All drill core, survey, geological, geochemical, density, and assay information used for the resource estimation have been validated and had filters applied for consistent exports. The resource definition database (which is a subset of the total drilling) as of June 2023, consisted of 764 holes for 269,107.9 m of drilling. Holes have been drilled over several drill campaigns using a mix of RC and DDH, and RC pre-collar with diamond tails with a total of 495 holes completed at Western Porphyries and 264 competed at Tanjeel. Further detailed is provided in Section 10.
This merged dataset was provided in a suitable format containing collar, down-hole survey, assay, geochemical and logged lithology, and alteration for inputs into geologic modeling and Mineral Resource estimation. The data is split relatively evenly between RC and DD (including tails).
A summary of drilling by year and by Company is presented in Table 14-1 and Figure 6-1, while data validation and verification is described in Section 12.
It is noted that Table 14-1 includes the 2023 and 2024 drilling that has occurred since the database cut-off date for the Mineral Resource Estimate was focused on collecting geotechnical and metallurgical information rather than specifically supporting the estimation of the Project’s Mineral Resources. This information has been included in the table as it was used in the validation and verification of historical data as noted in Section 10.6.1. In addition, results from the drilling are considered by the QP to not have a material impact on the Mineral Resource estimate presented in this Report.
|
February 19, 2025 |
Page 126 |
|
|
NI 43-101 Technical Report on the Reko Diq Project |
|
No holes have been excluded from the Mineral Resource estimate that were completed prior to the cut-off date.
Table 14-1 Drill Summary by Company and Year at the Western Porphyries and Tanjeel
|
Company |
Year |
RC |
DD |
DT |
Total |
|||||||||||||
|
Number |
Meters |
Number |
Meters |
Number |
Meters |
Number |
Meters |
|||||||||||
| BHP | 1996 -1997 | 34 | 6,425 | 4 | 884 | 13 | 5,714 | 51 | 13,023 | |||||||||
| TCC | 2000 -2001 | 24 | 2,781 | 5 | 587 | - | - | 29 | 3,368 | |||||||||
| Mincor Resources | 2003-2005 | 95 | 14,254 | 26 | 3,522 | 73 | 17,906 | 194 | 35,681 | |||||||||
| TCC | 2006 -2007 | 28 | 7,320 | 71 | 30,039 | 105 | 64,019 | 204 | 101,378 | |||||||||
| TCC | 2008 -2009 | 22 | 3,721 | 228 | 93,168 | 19 | 13,843 | 269 | 110,732 | |||||||||
| RDMC | 2023-2024 | - | - | 69 | 21,941 | - | - | 69 | 21,941 | |||||||||
| Total | All | 203 | 34,500 | 404 | 150,259 | 210 | 101,483 | 817 | 286,242 | |||||||||
| 14.3 | Area of Mineral Resources |
The reported Mineral Resources consist of two areas, as outlined below and shown in Figure 14-1:
| ● | Western Porphyries – This area consists of four separate, but related, steeply dipping porphyry bodies termed H13, H14, H15, and H79 which display a primarily hypogene style of mineralization. These have been estimated as a single porphyry system, are genetically related and, as noted in Section 15, form a single pit over the LOM. |
| ● | Tanjeel (H4) – This area is the only supergene-enriched porphyry being reported. This area is located to the east of the Western Porphyries (Figure 14-1). |
|
February 19, 2025 |
Page 127 |
|
|
NI 43-101 Technical Report on the Reko Diq Project |
|

Source: Barrick, 2024
Figure 14-1 Location of the Resource Areas
| 14.4 | Western Porphyries |
| 14.4.1 | Geological Modeling |
The Mineral Resources of the Western Porphyries are supported by a series of geological models based on the interpretation that mineralization is associated with steeply dipping porphyries and hosted in volcanic and sedimentary rocks. The Cu-Au mineralization occurs in a suite of three porphyry stocks named PFB1, PFB2, and PFB3. The former two porphyries are the oldest and contain the majority of the reported Cu-Au mineralization. The current geological understanding interpreted from drilling and logging was used to construct structural, lithological and alteration 3-D models with characteristics described below. These models were subsequently combined and analyzed, along with various statistical approaches to determine the appropriate domaining for estimation.
Geologic modeling for the Western Porphyries (H13; H14; H15, and H79) was completed in Leapfrog® initially by independent RSC consultants in June 2022 (RSC, 2022) and subsequently updated in September 2023 to reflect a topography survey acquired in January 2023. All modeling inputs and data remained unchanged from the June 2022 model that was semi-implicit, with implicitly generated shapes initially interpreted. These shapes were refined or adjusted with polylines and
|
February 19, 2025 |
Page 128 |
|
|
NI 43-101 Technical Report on the Reko Diq Project |
|
points, along with structural trends were considered appropriate and consistent with the geological interpretation.
Structural Model
Based on the geological drill hole logging, the structural model contains a total of 16 faults. Modeled faults are supported by intercepts of faults in drill holes, as shown in Figure 14-2. Age relationships between faults are not entirely clear, with some uncertainties regarding inaccuracies of logging, drill hole surveys, and lack of detailed structural mapping. No offset between faults has been applied, with this uncertainty reflected in the classification applied to the Mineral Resources (Section 14.6).

Source: Barrick, 2024
Figure 14-2 General Plan- Interpreted Faults and Drilling Data
|
February 19, 2025 |
Page 129 |
|
|
NI 43-101 Technical Report on the Reko Diq Project |
|
Lithology Model
The lithological model was based on units from logging codes in the drilling database and were grouped by interpreting similar mineralization styles (Table 14-2). As can be seen in Figure 14-3, a typical cross-section shows the Western Porphyries is composed of a volcanic sequence that has been intruded by a suite of porphyries from the oldest PFB1, followed by the PFB2 and a later PFB3, which occur vertically top to bottom. These three porphyries contain the bulk of the reported resources, however, mineralization also occurs in other lithologies, including breccias, altered sediments, and volcanics. While not noted in Figure 14-3, the lithological model has incorporated all separate rock types to allow for detailed geostatistical analysis.
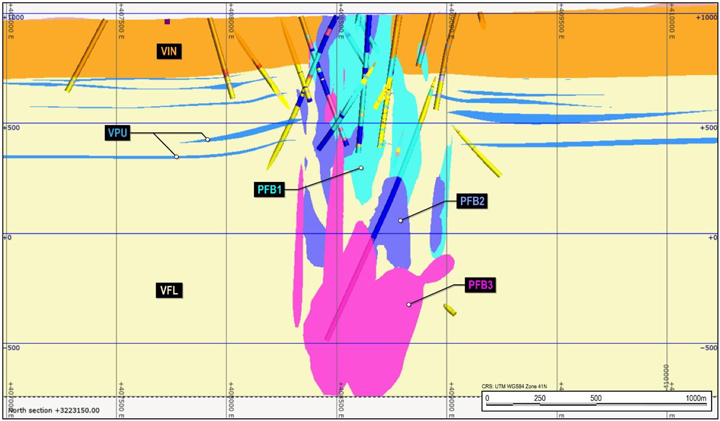
Source: Barrick, 2024
Figure 14-3 Lithology Model and Drilling Cross Section (+/-50m)
Table 14-2 Lithological Units and Grouping Applied
| Group |
Lithology Code | |
| Sediments |
SCO, SLI, SSA, SSH | |
| Volcanics |
VBC, VBF, VFE,VFL, VIN,VMA, VPU,VVC | |
| Older porphyries |
PBH, PFH, PFQ | |
| PFB_GR |
PFB | |
| PFB1_GR - Early Granodiorite Porphyry |
PFB1 | |
| PFB2_GR |
PFB2 | |
| PFB3_GR |
PFB3 | |
| Breccias |
BCN, BCO, BHT, BHY, BTE,PBC, PPC,PSC,PVC | |
| Younger Porphyries |
PBL, PQF, PQF2 | |
| Dykes |
IFE, IIN, IMA | |
| Quaternary |
CAL, CAV, CCV, COV |
|
February 19, 2025 |
Page 130 |
|
|
NI 43-101 Technical Report on the Reko Diq Project |
|
Alteration Model
The alteration model was created based on the logged alteration codes within the database. These codes were based on the mineralization assemblages and are comparable to the typical mineralogical assemblage often observed for porphyry copper deposits. The codes used and the mineralogy of the assemblages are presented in Table 14-3, while a typical cross section (same section as Figure 14-3), is shown in Figure 14-4.

Source: Barrick, 2024
Figure 14-4 Alteration Model and Drilling Cross Section (+/-50m)
Table 14-3 Hydrothermal Alteration Assemblages, Mineralogy and Codes
| Alteration Assemblage |
Mineralogy | Code | ||
| Potassic |
Biotite + K-Feldspar + Magnetite | POT | ||
| Mixed Potassic |
Biotite + K-Feldspar + Magnetite + Muscovite—Chlorite | MIX | ||
| Sericite – Chlorite |
Sericite + Chlorite | SCC | ||
| Phyllic |
Quartz + Sericite + Pyrite | PHY | ||
| Propylitic |
Chlorite + Epidote+ Pyrite+ Carbonate | PRO | ||
| Quartz Sericite Argillic |
Quartz + Sericite + Argillic | QSA |
Mineralization Model
The mineralization model was developed based on the sulfide logging within the drillholes and included relative abundance on a quantitative level. The model developed is considered a guide to
|
February 19, 2025 |
Page 131 |
|
|
NI 43-101 Technical Report on the Reko Diq Project |
|
understanding mineralization and was not used in estimating and interpreting the domains for grade interpolation. A general zonation of higher chalcopyrite and bornite toward porphyry centers is observed, which is considered consistent with the style of mineralization.
| 14.4.2 | Statistical Analyses and Domains |
Raw Assays-Copper
Univariant statistical analysis was completed for copper assays merged with logged codes for lithology and hydrothermal alteration assemblages. Logged lithology consisted of 33 codes grouped into 12 larger units, including volcanics, sediments, breccias, and porphyry groups (pre-mineral, intra-mineral and post-mineral genesis) (Table 14-4). Sediment, inter-mineral porphyries (PFB1 and PFB) and breccia are the units with the highest average Cu grades and display similar statistical populations and characteristics.
|
February 19, 2025 |
Page 132 |
|
|
NI 43-101 Technical Report on the Reko Diq Project |
|
Table 14-4 Univariate Statistics for Cu (%) by Lithology
| Lithology Grouping | Lithology Codes | Count | Length | Mean | Std. Dev. | CV | Var | Min | q25 | Median | q75 | Max | ||||||||||||
| Breccias | BCN | 14 | 26 | 0.41 | 0.16 | 0.4 | 0 | 0.2 | 0.2 | 0.44 | 0.5 | 0.69 | ||||||||||||
| BHY | 3 | 4 | 0.12 | 0.07 | 0.6 | 0 | 0.1 | 0.1 | 0.11 | 0.1 | 0.21 | |||||||||||||
| BTE | 4 | 10 | 0.64 | 0.17 | 0.3 | 0 | 0.5 | 0.5 | 0.54 | 0.8 | 0.88 | |||||||||||||
| PPC | 73 | 138 | 0.54 | 0.25 | 0.5 | 0.1 | 0.1 | 0.4 | 0.52 | 0.6 | 1.62 | |||||||||||||
| PSC | 162 | 281 | 0.46 | 0.29 | 0.6 | 0.1 | 0 | 0.2 | 0.42 | 0.6 | 1.87 | |||||||||||||
| PVC | 736 | 1,419 | 0.39 | 0.22 | 0.6 | 0.1 | 0 | 0.2 | 0.36 | 0.5 | 1.45 | |||||||||||||
| Dykes | IFE | 15 | 35 | 0.1 | 0.05 | 0.6 | 0 | 0 | 0.1 | 0.09 | 0.2 | 0.19 | ||||||||||||
| IIN | 218 | 576 | 0.14 | 0.13 | 0.9 | 0 | 0 | 0.1 | 0.08 | 0.2 | 0.63 | |||||||||||||
| IMA | 5 | 12 | 0.1 | 0.04 | 0.4 | 0 | 0.1 | 0.1 | 0.08 | 0.1 | 0.15 | |||||||||||||
| Faults | FST | 30 | 32 | 0.26 | 0.14 | 0.5 | 0 | 0.1 | 0.1 | 0.21 | 0.4 | 0.53 | ||||||||||||
| Older porphyries | PFH | 25 | 57 | 0.23 | 0.14 | 0.6 | 0 | 0 | 0.1 | 0.25 | 0.3 | 0.56 | ||||||||||||
| PFQ | 502 | 1,296 | 0.1 | 0.1 | 0.9 | 0 | 0 | 0.1 | 0.08 | 0.1 | 0.83 | |||||||||||||
| PFB1_GR | PFB1 | 9,064 | 22,028 | 0.48 | 0.32 | 0.7 | 0.1 | 0 | 0.3 | 0.41 | 0.6 | 6.28 | ||||||||||||
| PFB2_GR | PFB2 | 6,705 | 16,069 | 0.29 | 0.24 | 0.8 | 0.1 | 0 | 0.2 | 0.25 | 0.4 | 7.54 | ||||||||||||
| PFB3_GR | PFB3 | 1,452 | 3,604 | 0.25 | 1.92 | 7.7 | 3.7 | 0 | 0.1 | 0.14 | 0.2 | 65.7 | ||||||||||||
| PFB_GR | PFB | 102 | 289 | 0.6 | 0.8 | 1.3 | 0.7 | 0 | 0.3 | 0.45 | 0.7 | 7.91 | ||||||||||||
| Quaternary | CAL | 6 | 18 | 0.02 | 0.01 | 0.6 | 0 | 0 | 0 | 0.01 | 0 | 0.03 | ||||||||||||
| CAV | 10 | 21 | 0.03 | 0.03 | 1.2 | 0 | 0 | 0 | 0.01 | 0 | 0.14 | |||||||||||||
| CCV | 12 | 18 | 0.05 | 0.08 | 1.5 | 0 | 0 | 0 | 0.01 | 0.1 | 0.31 | |||||||||||||
| COV | 2 | 6 | 0.01 | 0 | 0 | 0 | 0 | 0 | 0.01 | 0 | 0.01 | |||||||||||||
| Sediments | SCO | 7 | 9 | 0.26 | 0.4 | 1.5 | 0.2 | 0 | 0 | 0.07 | 0.3 | 0.91 | ||||||||||||
| SSA | 191 | 385 | 0.3 | 0.23 | 0.8 | 0.1 | 0 | 0.2 | 0.24 | 0.4 | 1.48 | |||||||||||||
| SSH | 20 | 50 | 0.4 | 0.2 | 0.5 | 0 | 0.1 | 0.2 | 0.4 | 0.5 | 0.73 | |||||||||||||
| Volcanics | VBF | 13 | 21 | 0.37 | 0.13 | 0.3 | 0 | 0.1 | 0.3 | 0.39 | 0.5 | 0.49 | ||||||||||||
| VFE | 202 | 493 | 0.1 | 0.08 | 0.8 | 0 | 0 | 0 | 0.07 | 0.2 | 0.3 | |||||||||||||
| VFL | 13,912 | 31,083 | 0.22 | 0.22 | 1 | 0.1 | 0 | 0.1 | 0.17 | 0.3 | 5.77 | |||||||||||||
| VIN | 23,778 | 62,244 | 0.15 | 0.17 | 1.1 | 0 | 0 | 0.1 | 0.11 | 0.2 | 8 | |||||||||||||
| VMA | 668 | 1,523 | 0.16 | 0.15 | 1 | 0 | 0 | 0.1 | 0.11 | 0.2 | 1.3 | |||||||||||||
| VPU | 1,560 | 3,202 | 0.22 | 0.21 | 1 | 0 | 0 | 0.1 | 0.16 | 0.3 | 2.48 | |||||||||||||
| VVC | 22 | 27 | 0.19 | 0.13 | 0.7 | 0 | 0.1 | 0.1 | 0.14 | 0.3 | 0.37 | |||||||||||||
| Younger porphyries | PBL | 172 | 411 | 0.13 | 0.12 | 0.9 | 0 | 0 | 0.1 | 0.09 | 0.2 | 0.67 | ||||||||||||
| PQF | 13 | 31 | 0.05 | 0.02 | 0.4 | 0 | 0 | 0 | 0.05 | 0.1 | 0.09 | |||||||||||||
| PQF2 | 168 | 326 | 0.29 | 0.28 | 1 | 0.1 | 0 | 0.1 | 0.25 | 0.4 | 1.96 |
|
February 19, 2025 |
Page 133 |
|
|
NI 43-101 Technical Report on the Reko Diq Project |
|
Logged alteration codes were also reviewed as geological controls on the Cu grade distribution. Table 14-5 shows statistics for Cu grades by alteration type. Potassic (Pot), Sericite-Chlorite (SCC) and Quartz-Sericite Argillic (QSA) are the alteration assemblages with higher average
Table 14-5 Univariate Statistics for Cu % Assays by Alteration Codes
| Alteration | Count | Length | Mean | Std. Dev. |
CV | Var | Min | q25 | Median | q75 | Max | |||||||||||
|
MIX |
13,385 | 32,097 | 0.51 | 0.26 | 0.50 | 0.07 | 0.01 | 0.33 | 0.49 | 0.65 | 2.76 | |||||||||||
|
OXI |
656 | 1,777 | 0.07 | 0.08 | 1.14 | 0.01 | 0.00 | 0.02 | 0.04 | 0.09 | 0.83 | |||||||||||
|
PHY |
1,203 | 3,069 | 0.08 | 0.13 | 1.59 | 0.02 | 0.00 | 0.02 | 0.04 | 0.09 | 2.18 | |||||||||||
|
POT |
8,707 | 20,476 | 0.60 | 0.34 | 0.57 | 0.12 | 0.00 | 0.40 | 0.56 | 0.76 | 5.73 | |||||||||||
|
PRO |
651 | 1,774 | 0.08 | 0.06 | 0.73 | 0.00 | 0.00 | 0.05 | 0.07 | 0.10 | 0.70 | |||||||||||
|
QSA |
1,527 | 3,422 | 0.54 | 0.32 | 0.59 | 0.10 | 0.00 | 0.31 | 0.52 | 0.74 | 2.21 | |||||||||||
|
SCC |
34,886 | 86,221 | 0.35 | 0.26 | 0.75 | 0.07 | 0.00 | 0.15 | 0.30 | 0.49 | 3.64 | |||||||||||
Raw Assays-Gold
Similar to Cu, univariant statistical analysis was carried out for Au assays with the merged logged codes for lithology and hydrothermal alteration assemblages. Statistics for Au assays for the lithological logging are shown in Table 14-6, while the alteration statistics are shown in Table 14-7. A review of the results indicates that the Inter-mineral porphyries (PFB1 and PFB) are the units with the highest average Au grades, with POT alterations having the highest Au. These are similar to the Cu distributions and indicate a degree of correlation (Table 14-8).
|
February 19, 2025 |
Page 134 |
|
|
NI 43-101 Technical Report on the Reko Diq Project |
|
Table 14-6 Univariate Statistics for Assay Au Grades (g/t) by Lithology
| Grouping | Lith | Count | Length | Mean | Std Dev |
CV | Variance | Min | q25 | Median | q75 | Max | ||||||||||||
| Breccias | BCN | 14 | 26 | 0.41 | 0.16 | 0.4 | 0.03 | 0.21 | 0.2 | 0.44 | 0.5 | 0.69 | ||||||||||||
| BHY | 3 | 4 | 0.12 | 0.07 | 0.6 | 0.01 | 0.06 | 0.1 | 0.11 | 0.1 | 0.21 | |||||||||||||
| BTE | 4 | 10 | 0.64 | 0.17 | 0.3 | 0.03 | 0.51 | 0.5 | 0.54 | 0.8 | 0.88 | |||||||||||||
| PPV | 73 | 138 | 0.54 | 0.25 | 0.5 | 0.06 | 0.1 | 0.4 | 0.52 | 0.6 | 1.62 | |||||||||||||
| PSC | 162 | 281 | 0.46 | 0.29 | 0.6 | 0.09 | 0.02 | 0.2 | 0.42 | 0.6 | 1.87 | |||||||||||||
| PVC | 736 | 1,419 | 0.39 | 0.22 | 0.6 | 0.05 | 0.03 | 0.2 | 0.36 | 0.5 | 1.45 | |||||||||||||
| Dykes | IFE | 15 | 35 | 0.1 | 0.05 | 0.6 | 0 | 0.04 | 0.1 | 0.09 | 0.2 | 0.19 | ||||||||||||
| IIN | 218 | 576 | 0.14 | 0.13 | 0.9 | 0.02 | 0.01 | 0.1 | 0.08 | 0.2 | 0.63 | |||||||||||||
| IMA | 5 | 12 | 0.1 | 0.04 | 0.4 | 0 | 0.06 | 0.1 | 0.08 | 0.1 | 0.15 | |||||||||||||
| Faults | FST | 30 | 32 | 0.26 | 0.14 | 0.5 | 0.02 | 0.05 | 0.1 | 0.21 | 0.4 | 0.53 | ||||||||||||
| Older porphyries | PFH | 25 | 57 | 0.23 | 0.14 | 0.6 | 0.02 | 0.02 | 0.1 | 0.25 | 0.3 | 0.56 | ||||||||||||
| PFQ | 502 | 1,296 | 0.1 | 0.1 | 0.9 | 0.01 | 0.01 | 0.1 | 0.08 | 0.1 | 0.83 | |||||||||||||
| PFB1_GR | PFB1 | 9,064 | 22,028 | 0.48 | 0.32 | 0.7 | 0.1 | 0.01 | 0.3 | 0.41 | 0.6 | 6.28 | ||||||||||||
| PFB2_GR | PFB2 | 6,705 | 16,069 | 0.29 | 0.8 | 0.06 | 0.01 | 0.2 | 0.25 | 0.4 | 7.54 | |||||||||||||
| PFB3_GR | PFB3 | 1,452 | 3,604 | 0.25 | 1.92 | 7.7 | 3.69 | 0.01 | 0.1 | 0.14 | 0.2 | 65.7 | ||||||||||||
| PFB_GR | PFB | 102 | 289 | 0.6 | 0.8 | 1.3 | 0.65 | 0.02 | 0.3 | 0.45 | 0.7 | 7.91 | ||||||||||||
| Quaternary | CAL | 6 | 18 | 0.02 | 0.01 | 0.6 | 0 | 0.01 | 0 | 0.01 | 0 | 0.03 | ||||||||||||
| CAV | 10 | 21 | 0.03 | 0.04 | 1.2 | 0 | 0.01 | 0 | 0.01 | 0 | 0.14 | |||||||||||||
| CCV | 12 | 18 | 0.05 | 0.08 | 1.5 | 0.01 | 0.01 | 0 | 0.01 | 0.1 | 0.31 | |||||||||||||
| COV | 2 | 6 | 0.01 | 0 | 0 | 0 | 0.01 | 0 | 0.01 | 0 | 0.01 | |||||||||||||
| Sediments | SCO | 7 | 9 | 0.26 | 0.4 | 1.5 | 0.16 | 0.04 | 0 | 0.07 | 0.3 | 0.91 | ||||||||||||
| SSA | 191 | 385 | 0.3 | 0.23 | 0.8 | 0.05 | 0.02 | 0.2 | 0.24 | 0.4 | 1.48 | |||||||||||||
| SSH | 20 | 50 | 0.4 | 0.2 | 0.5 | 0.04 | 0.1 | 0.2 | 0.4 | 0.5 | 0.73 | |||||||||||||
| Volcanics | VBF | 13 | 21 | 0.37 | 0.13 | 0.3 | 0.02 | 0.08 | 0.3 | 0.39 | 0.5 | 0.49 | ||||||||||||
| VFE | 202 | 493 | 0.1 | 0.08 | 0.8 | 0.01 | 0.01 | 0 | 0.07 | 0.2 | 0.3 | |||||||||||||
| VFL | 13,912 | 31,083 | 0.22 | 0.22 | 1 | 0.05 | 0.01 | 0.1 | 0.17 | 0.3 | 5.77 | |||||||||||||
| VIN | 23,778 | 62,244 | 0.15 | 0.17 | 1.1 | 0.03 | 0.01 | 0.1 | 0.11 | 0.2 | 8 | |||||||||||||
| VMA | 668 | 1,523 | 0.16 | 0.15 | 1 | 0.02 | 0.01 | 0.1 | 0.11 | 0.2 | 1.3 | |||||||||||||
| VPU | 1,560 | 3,202 | 0.22 | 0.21 | 1 | 0.04 | 0.01 | 0.1 | 0.16 | 0.3 | 2.48 | |||||||||||||
| VVC | 22 | 27 | 0.19 | 0.13 | 0.7 | 0.02 | 0.05 | 0.1 | 0.14 | 0.3 | 0.37 | |||||||||||||
|
Younger porphyries |
PBL | 172 | 411 | 0.13 | 0.12 | 0.9 | 0.01 | 0.01 | 0.1 | 0.09 | 0.2 | 0.67 | ||||||||||||
| PQF | 13 | 31 | 0.06 | 0.02 | 0.4 | 0 | 0.02 | 0 | 0.05 | 0.1 | 0.09 | |||||||||||||
| PQF2 | 168 | 326 | 0.29 | 0.28 | 1 | 0.08 | 0.01 | 0.1 | 0.25 | 0.4 | 1.96 | |||||||||||||
|
February 19, 2025 |
Page 135 |
|
|
NI 43-101 Technical Report on the Reko Diq Project |
|
Table 14-7 Univariate Statistics for Au (g/t) Assays by Alteration Codes
|
Alteration |
Count | Length | Mean | Std Dev | CV | Variance | Min | q25 | Median | q75 | Max | |||||||||||
|
MIX |
13,348 | 32,010 | 0.29 | 0.21 | 0.72 | 0.04 | 0.01 | 0.15 | 0.24 | 0.39 | 4.75 | |||||||||||
|
OXI |
478 | 1,282 | 0.11 | 0.19 | 1.72 | 0.04 | 0.01 | 0.02 | 0.04 | 0.10 | 1.51 | |||||||||||
|
PHY |
937 | 2,363 | 0.05 | 0.06 | 1.35 | 0.00 | 0.01 | 0.01 | 0.03 | 0.05 | 0.77 | |||||||||||
|
POT |
8,624 | 20,249 | 0.41 | 0.35 | 0.84 | 0.12 | 0.01 | 0.22 | 0.33 | 0.50 | 6.28 | |||||||||||
|
PRO |
615 | 1,672 | 0.05 | 0.05 | 0.95 | 0.00 | 0.01 | 0.02 | 0.03 | 0.06 | 0.40 | |||||||||||
|
QSA |
1,504 | 3,356 | 0.29 | 0.24 | 0.86 | 0.06 | 0.03 | 0.12 | 0.23 | 0.38 | 1.79 | |||||||||||
|
SCC |
34,334 | 84,739 | 0.19 | 0.45 | 2.39 | 0.20 | 0.01 | 0.06 | 0.12 | 0.25 | 65.70 | |||||||||||
Metal Correlations
As shown in Table 14-8, while there seems to be a reasonable global correlation between Cu and Au, there is no correlation between these and sulfur or sulfide. The lack of correlation is likely due to the Cu being contained within Chalcocite, with the majority of the sulfur being contained within other sulphide minerals such as pyrite. This correlation is consistent with the style of mineralization.
Table 14-8 Metals Correlations
| Cu | Au | |||
| Cu | 1 | 0.47 | ||
| Au | 0.47 | 1 | ||
| Sulph_S | -0.065 | -0.07 | ||
| S | 0.004 | -0.078 | ||
14.4.3 Domaining
A combination of lithology and alteration were used to define spatial and statistical distributions for copper and gold grades to determine suitable domains. In addition to the geological controls, copper and gold grade envelopes were modeled to further separate low- and higher-grade populations.
The interpreted Domain codes with corresponding lithology, alteration codes, and whether the sample/composite or block is in- or out- side the grade envelope models are shown Table 14-9.
|
February 19, 2025 |
Page 136 |
|
|
NI 43-101 Technical Report on the Reko Diq Project |
|
Table 14-9 Copper and Gold Domains by Lithology and Alteration Code
| Element | Domain | Lithology | Alteration |
Cu Grade Envelope |
||||
| (0.2 % Cu) | ||||||||
| Cu |
pfb1_pot_in | pfb1 | potassic, qsa | in | ||||
| pfb1_scc_in | scc,mix | |||||||
| pfb2_3_in | pfb2, pfb3 | any | ||||||
| volc_pot_in | vfl,vin,vpu_gr | pot,qsa,mix | ||||||
| volc_scc_in | scc | |||||||
| volc_pot_out | vfl,vin,vpu_gr | pot,qsa,mix | out | |||||
| volc_scc_out | scc | |||||||
| pfb_gr_out | pfb1,pfb2,pfb3,pfb_gr | any | ||||||
| pro_phy_lg | any | pro,phy | - | |||||
| Element |
Domain | Lithology | Alteration |
Au Grade Envelope (0.20 g/t Au) |
||||
| Au |
pfb1_pot_in | pfb1 | potassic, qsa | in | ||||
| pfb1_scc_in | scc,mix | |||||||
| pfb2_in | pfb2 | pot | ||||||
| pfb2_3_in | pfb2,pfb3 | any except pot | ||||||
| volc_pot_in | vfl,vin,vpu_gr | pot,qsa,mix | ||||||
| volc_scc_in | scc | |||||||
| pfb_gr_out | pfb2, pfb3 | any except pot | out | |||||
| volc_pot_out | vfl,vin,vpu_gr | pot,qsa,mix | ||||||
| volc_scc_out | scc | |||||||
|
pro_phy_lg
|
any | pro,phy | - |
| 14.4.4 | Bulk Density |
The database for density consists of 3,411 density determinations from 38 holes. The data was flagged with the lithology, mineralization and alteration envelopes for evaluation and reviewed for spatial coverage. As shown in the plan view with the location of samples with density in Figure 14-5, the majority of samples are within the pit shell used to report the Mineral Resources.
|
February 19, 2025 |
Page 137 |
|
|
NI 43-101 Technical Report on the Reko Diq Project |
|
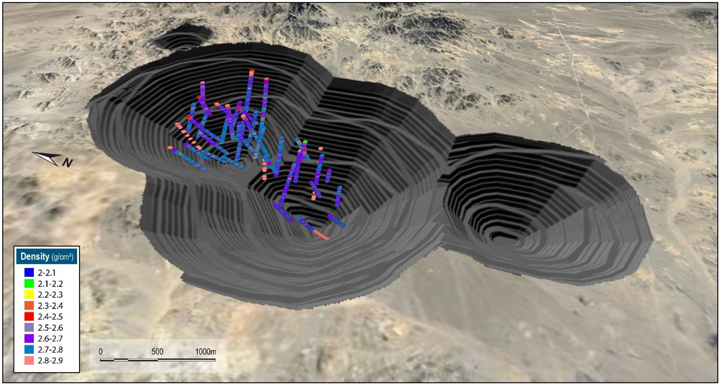
Source: Barrick, 2024
Figure 14-5 Oblique View Looking Northeast – Density Determinations
Statistics of raw density is presented in the histogram of Figure 14-6, and shows the entire dataset has a mean density of 2.7 t/m3. Outlier analysis was undertaken with 50 data points flagged and discarded from the final analysis. No material impact on the overall statistics resulted from removing the outliers.

Source: Barrick, 2024
Figure 14-6 Histogram of Raw Density
|
February 19, 2025 |
Page 138 |
|
|
NI 43-101 Technical Report on the Reko Diq Project |
|
The review of density statistics by lithology, alteration, mineral zones, copper, and gold grades showed that lithology is the main density control. Block model density was populated by assigning the outlier trimmed median values by lithology unit (Table 14-10).
Table 14-10 Univariate Statistics - Density by Lithology
| Lith | Count | Min | Max | Mean | Q1 | Med | Q3 | SD | Var | CoVar | ||||||||||
| pfb1 |
722 | 2.42 | 2.91 | 2.70 | 2.67 | 2.70 | 2.72 | 0.06 | 0.00 | 0.02 | ||||||||||
| pfb2 |
325 | 2.4 | 2.92 | 2.70 | 2.67 | 2.69 | 2.73 | 0.06 | 0.00 | 0.02 | ||||||||||
| pfb3 |
28 | 2.4 | 2.78 | 2.68 | 2.67 | 2.69 | 2.71 | 0.06 | 0.00 | 0.02 | ||||||||||
| vfl |
1,030 | 2.39 | 2.92 | 2.74 | 2.71 | 2.74 | 2.77 | 0.06 | 0.00 | 0.02 | ||||||||||
| vin |
1,134 | 2.39 | 2.98 | 2.68 | 2.63 | 2.68 | 2.73 | 0.08 | 0.01 | 0.03 | ||||||||||
| vpu_gr |
122 | 2.42 | 2.89 | 2.72 | 2.67 | 2.72 | 2.76 | 0.07 | 0.00 | 0.02 | ||||||||||
| Total |
3,361 | 2.39 | 2.98 | 2.70 | 2.67 | 2.71 | 2.75 | 0.07 | 0.00 | 0.03 | ||||||||||
| 14.4.5 | Compositing |
The sets of mineralised envelopes were used to code the assay database to allow identification of the resource intersections. A review of the assay sample lengths shows that approximately 99% are 3 m. As such, a 3 m composite length was selected. Raw assay data was composited to 3 m down-hole composites, independent of lithology, and alteration, with missing assay values excluded. Composites less than 1.5 m were merged with the previous interval to limit short-length composites and provide more equal support for estimation. The composites were back-flagged with the lithology, alteration and grade shells and then coded by estimation domains. A 15 m composite set was back-flagged with the lithology, alteration and grade shells and then coded by estimation domains generated for input to the nearest neighbour (NN) estimate.
| 14.4.6 | Contact Analysis |
Contact grade profiles across the domain boundaries were examined to assess the appropriate type boundary for the envelopes for grade estimation for each element. A mix of boundary types were interpreted which are summarised in Table 14-11 and Table 14-12.
|
February 19, 2025 |
Page 139 |
|
|
NI 43-101 Technical Report on the Reko Diq Project |
|
Table 14-11 Boundary Types for Copper
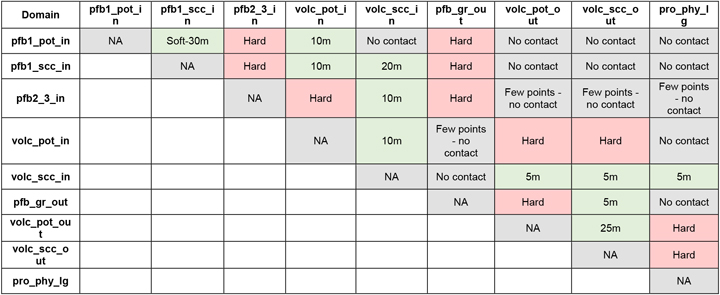
Table 14-12 Boundary Types for Gold
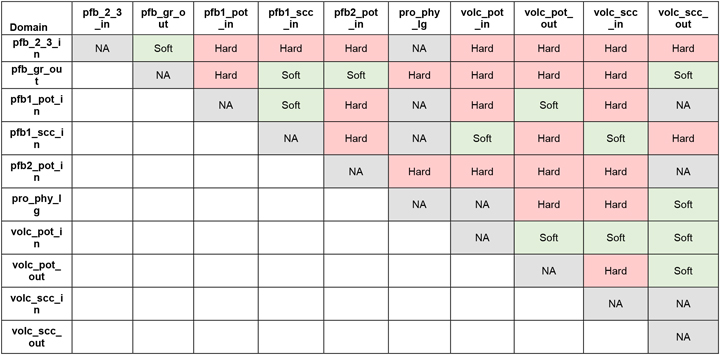
| 14.4.7 | High Grade Capping |
A statistical analysis of the composited samples inside the domains was used to determine the high-grade capping applied to the grades in the domains used for grade interpolation. All assays above the selected capping value were assigned the capping value. This was undertaken to eliminate any high-grade outliers in the assay populations, which could result in conditional bias within the resource estimate.
|
February 19, 2025 |
Page 140 |
|
|
NI 43-101 Technical Report on the Reko Diq Project |
|
Copper
Cumulative probability plots and decile analysis were initially assessed to determine high-grade capping values in each of the domains. Metal contained in the last decile for copper domains is less than 40%, suggesting that no capping is warranted. However, probability plots show slope changes or discontinuities in the distributions. The interpreted capping values were based on these ‘inflection’ points with the metal removed, and number of composites capped for each copper domain presented in Table 14-13.
Table 14-13 Copper High-Grade Cut Per Domain
| Domain |
Capping |
|||||
|
Capping Value |
Metal Removed (%) |
Comps Capped |
||||
| pfb_gr_out |
0.3 | 1.2 | 23 | |||
| pfb1_pot_in |
2 | 0.4 | 14 | |||
| pfb1_scc_in |
1.5 | 0.3 | 37 | |||
| pfb2_3_in |
1.5 | 0.3 | 14 | |||
| pro_phy_lg |
0.45 | 3.3 | 30 | |||
| volc_pot_in |
1.5 | 0.2 | 24 | |||
| volc_pot_out |
0.3 | 0.7 | 27 | |||
| volc_scc_in |
1.7 | 0.2 | 24 | |||
| volc_scc_out |
0.4 | 0.3 | 37 | |||
| All |
2.0 | 0.3 | 230 | |||
Gold
Similar to copper, two capping methodologies (cumulative probability plots and decile analysis) were assessed to determine appropriate high-grade capping values. The cumulative probability approach was chosen as the final cap method as it was determined that the decile analysis top-cuts removed either insufficient metal or no metal. For gold, the probability plot approach capped between 0.1% and 2.6% of the data in the domains (globally 0.3%) and reduced the metal globally by 1.4%. The cap value by domain for gold are summarized in Table 14-14, along with the number of composites and percentage of metal removed.
|
February 19, 2025 |
Page 141 |
|
|
NI 43-101 Technical Report on the Reko Diq Project |
|
Table 14-14 Gold High-Grade Cut Per Domain
| Domain |
Cap |
Number |
% Metal |
|||
|
Value (g/t) |
Capped |
Removed |
||||
| pfb_2_3_in |
2 | 15 | 6.60% | |||
| pfb_gr_out |
0.35 | 33 | 0.80% | |||
| pfb1_pot_in |
2.25 | 19 | 1.60% | |||
| pfb1_scc_in |
1.75 | 9 | 0.20% | |||
| pfb2_pot_in |
1 | 29 | 1.90% | |||
| pro_phy_lg |
0.6 | 8 | 2.40% | |||
| volc_pot_in |
2 | 9 | 0.30% | |||
| volc_pot_out |
0.55 | 8 | 0.30% | |||
| volc_scc_in |
2 | 29 | 1.60% | |||
| volc_scc_out |
0.65 | 20 | 0.20% | |||
| Total |
- | 179 | 1.40% | |||
| 14.4.8 | Variography |
For each selected domain a geospatial analysis was undertaken to determine spatial variability of each element. Three orthogonal directions (axes) of the ellipsoid were set using variogram fans of composite data, and an understanding of the geological orientation of each domain. A mathematical model was interpreted for each domain to best-fit the shape of the calculated variogram in each of the orthogonal directions.
Copper
Variograms were interpreted and modelled in Supervisor® using the capped 3 m composite database. Experimental variograms were interpreted with the following parameters:
| ● | Spatial continuity explored to distances of 500 m to 750 m |
| ● | Lag distances 25 m and 75 m |
| ● | Bandwidth set at 15 m |
| ● | 10 degrees of angular tolerance. |
| ● | Nugget effect obtained from downhole variograms with 3 m lags |
| ● | Normal scores transformation and back |
Variogram models were interpreted considering:
| ● | Direction of maximum continuity from variogram maps |
| ● | Spatial distribution of grades |
| ● | Geological trends: |
| ○ | Porphyries are mainly controlled by vertical contacts and N30°E bearing |
|
February 19, 2025 |
Page 142 |
|
|
NI 43-101 Technical Report on the Reko Diq Project |
|
| ○ | Volcanics shows sub-horizontal trends |
| ● | Minimum pairs of used for models set to 350. |
Reasonable experimental variograms suitable for modeling were obtained for the following domains:
| ● | pfb1_scc_in |
| ● | pfb2_3_in |
| ● | volc_pot_in |
| ● | volc_scc_in |
| ● | volc_scc_out |
Variogram parameters per domain are shown in the Table 14-15, while examples of variogram models for domain pfb1_scc_in are shown in the Figure 14-7.
Table 14-15 Variogram Models for Copper Domains
| Domain | Type | Str. | Sill | Ranges | Rotation (ZXY, LRL) | |||||||||||||
|
Major |
Semi |
Minor |
Z’ |
X’ |
Y’ |
|||||||||||||
|
pfb1_scc_in |
- | C0 | 0.174 | - | - | - | - | - | - | |||||||||
| Sph | C1 | 0.146 | 95 | 60 | 120 | 220 | 0 | 40 | ||||||||||
| Sph | C2 | 0.679 | 270 | 230 | 380 | 220 | 0 | 40 | ||||||||||
|
pfb_2_3_in |
- | C0 | 0.22 | - | - | - | - | - | - | |||||||||
| Sph | C1 | 0.326 | 30 | 25 | 15 | 90 | 80 | -180 | ||||||||||
| Sph | C2 | 0.454 | 445 | 330 | 210 | 90 | 80 | -180 | ||||||||||
|
volc_pot_in |
- | C0 | 0.148 | - | - | - | - | - | - | |||||||||
| Sph | C1 | 0.185 | 105 | 35 | 35 | 30 | 0 | -40.0 | ||||||||||
| Sph | C2 | 0.667 | 450 | 425 | 280 | 30 | 0 | -40.0 | ||||||||||
|
volc_scc_in |
- | C0 | 0.18 | - | - | - | - | - | - | |||||||||
| Exp | C1 | 0.32 | 25 | 60 | 15 | 262.727 | 67.731 | 25.506 | ||||||||||
| Sph | C2 | 0.5 | 340 | 480 | 285 | 262.727 | 67.731 | 25.506 | ||||||||||
|
volc_scc_out |
C0 | 0.158 | - | - | - | - | - | - | ||||||||||
| Sph | C1 | 0.229 | 30 | 20 | 15 | 100 | 80 | -180 | ||||||||||
| Sph | C2 | 0.613 | 445 | 450 | 160 | 100 | 80 | -180 | ||||||||||
|
February 19, 2025 |
Page 143 |
|
|
NI 43-101 Technical Report on the Reko Diq Project |
|
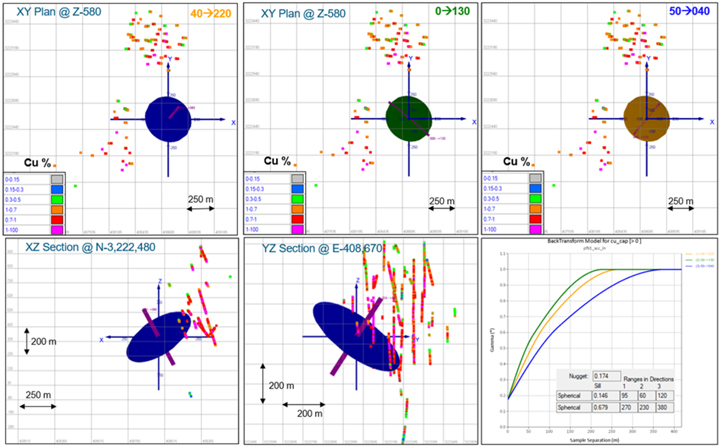
Source: Barrick, 2024
Figure 14-7 Example Variogram Model (Domain: pfb1_scc_in)
Gold
Three-dimensional correlogram models were generated using the composited data using Sage2001® software. Correlograms were calculated every 30º in Azimuth and 15º in dip using a 75 m lag spacing. The nugget effect was based on the down-hole correlograms and used to fit the final model. Vulcan® GsLib (ZXY, LRL) rotation conventions were used.
The modelled variograms are presented in Table 14-16 below along with example output from Sage in Figure 14-8 along with example planes through the ellipsoids in Figure 14-9.
|
February 19, 2025 |
Page 144 |
|
|
NI 43-101 Technical Report on the Reko Diq Project |
|
Table 14-16 Modelled Correlograms
| Domain | Type | Str. | Sill | Ranges | Rotation (ZXY, LRL) | |||||||||||||
|
Major |
Semi |
Minor |
Z’ |
X’ |
Y’ |
|||||||||||||
|
pfb1_pot_in |
- | C0 | 0.2 | - | - | - | - | - | - | |||||||||
| Exp | C1 | 0.8 | 597 | 206.7 | 191.4 | 19 | -15 | -38 | ||||||||||
|
pfb1_scc_in |
- | C0 | 0.3 | - | - | - | - | - | - | |||||||||
| Exp | C1 | 0.238 | 84.7 | 21.2 | 53.7 | 14 | 3 | 61 | ||||||||||
| Exp | C2 | 0.462 | 314.3 | 487.6 | 515.9 | 14 | 3 | 61 | ||||||||||
|
pfb_gr_out |
- | C0 | 0.35 | - | - | - | - | - | - | |||||||||
| Exp | C1 | 0.65 | 100.3 | 402.5 | 684.9 | 95 | -6 | 35 | ||||||||||
|
pfb_2_3_in |
- | C0 | 0.35 | - | - | - | - | - | - | |||||||||
| Exp | C1 | 0.648 | 521.2 | 103.3 | 57.5 | -1 | -9 | -5 | ||||||||||
| Exp | C2 | 0.002 | 702.5 | 272.1 | 699.1 | -1 | -9 | -5 | ||||||||||
|
pro_phy_lg |
- | C0 | 0.3 | - | - | - | - | - | - | |||||||||
| Exp | C1 | 0.592 | 51.4 | 35.2 | 108.4 | 77 | 18 | 2 | ||||||||||
| Exp | C2 | 0.108 | 326.5 | 142.3 | 352.1 | -33 | -33 | -47 | ||||||||||
|
volc_pot_in |
- | C0 | 0.3 | - | - | - | - | - | - | |||||||||
| Exp | C1 | 0.318 | 89 | 40.4 | 57.8 | 6 | -3 | 52 | ||||||||||
| Exp | C2 | 0.382 | 394.5 | 293.8 | 798.6 | 9 | 4 | -5 | ||||||||||
|
volc_pot_out |
- | C0 | 0.3 | - | - | - | - | - | - | |||||||||
| Exp | C1 | 0.322 | 131 | 54.4 | 29.4 | -19 | 16 | -35 | ||||||||||
| Exp | C2 | 0.378 | 394.5 | 293.8 | 798.6 | 8 | 6 | 9 | ||||||||||
|
volc_scc_in |
- | C0 | 0.3 | - | - | - | - | - | - | |||||||||
| Exp | C1 | 0.408 | 82.2 | 63.1 | 47.5 | -99 | 4 | -2 | ||||||||||
| Exp | C2 | 0.292 | 195.5 | 370.9 | 485.1 | -47 | 5 | 46 | ||||||||||
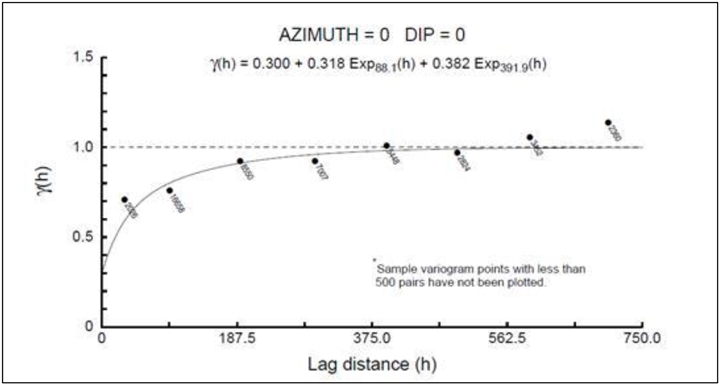
Source: Barrick, 2024
Figure 14-8 Example Sage Output (Domain: volc_pot_in)
|
February 19, 2025 |
Page 145 |
|
|
NI 43-101 Technical Report on the Reko Diq Project |
|

Source: Barrick, 2024
Figure 14-9 Example Planes through Ellipsoids (Domain: pfb_2_3_in)
| 14.4.9 | Block Model |
The block model was created in Vulcan® to encompass the full extent of the resource area as currently defined by drilling. The block dimensions used in the model were 25 m north-south (along strike) by 25 m east-west (across strike) by 15 m vertical with sub-cells of 6.25 m by 6.25 m by 7.5 m based on the drill spacing and mining bench height. The block model origin, extent, and attributes are shown in Table 14-17.
Table 14-17 Block Model Geometric Parameters
| Origin | Rotation | Schema | Offset (m) | Block Size (m) | ||||||||||||||||
| East | 406,500 | Bearing | 90 | East | North | Elev | East | North | Elev | |||||||||||
| North | 3,219,500 | Plunge | 0 | Parent | 3,750 | 5,350 | 1,830 | 25 | 25 | 15 | ||||||||||
| Elev | -685 | Dip | 0 | Sub-block | 3,750 | 5,350 | 1,830 | 6.25 | 6.25 | 7.5 | ||||||||||
Geology was coded in the block model from the wireframes (solids) for lithology, hydrothermal alteration, weathering, and grade shells for both copper and gold. In addition, estimation variables were created to store estimated capped and uncapped grades for sulfur, sulfide sulfur, copper and gold, estimation parameters (number of holes, number of composites, average distance), resource classification, and density.
A locally variable anisotropy (LVA) model was implemented to represent local controls on grade orientation. High-grade copper and gold trends observed in the data, combined with selected, modeled, structural controls, were utilized to construct a series of wireframes. These meshes, capturing the grade trends, were used as input to the LVA modeling tool in Vulcan®, with the output bearing, dip and plunge angles stored in the block model (Figure 14-10).
|
February 19, 2025 |
Page 146 |
|
|
NI 43-101 Technical Report on the Reko Diq Project |
|

Source: Barrick, 2024
Figure 14-10 Left: Plan View LVA Input Meshes. Right: Block Model Slice LVA at Block Scale
| 14.4.10 | Estimation Parameters and Methodology |
Each domain object was used as a boundary type as noted in Section 14.5 for the interpolation of all elements. The Ordinary Kriging (OK) algorithm was selected for grade interpolation in Vulcan ®. The OK algorithm was selected to minimize smoothing within the estimate and to give a more reliable weighting of clustered samples.
Copper
Three passes each with increasing search distances depending on the domain was utilised for the estimation of copper. The following parameters are common to the three runs:
| ● | Discretization 4 by 4 by 6 (XYZ) |
| ● | Parent Cell estimation |
| ● | Search ellipsoids oriented using the LVA model |
For copper estimation search distances for each pass are described in Table 14-18
|
February 19, 2025 |
Page 147 |
|
|
NI 43-101 Technical Report on the Reko Diq Project |
|
Table 14-18 Seach Ellipse Parameters Per Domain
| Pass 1 | Pass 2 | Pass 3 | ||||||||||||||||||
| Element | Domain | Major | Semi | Minor | Major | Semi | Minor | Major | Semi | Minor | ||||||||||
|
Cu |
pfb1_pot_in | 130 | 90 | 80 | 255 | 180 | 155 | 380 | 270 | 230 | ||||||||||
| pfb1_scc_in | 130 | 90 | 80 | 380 | 270 | 230 | 435 | 310 | 265 | |||||||||||
| pfb2_3_in | 130 | 90 | 80 | 380 | 270 | 230 | 435 | 310 | 265 | |||||||||||
| volc_pot_in | 130 | 90 | 80 | 380 | 270 | 230 | 435 | 310 | 265 | |||||||||||
| volc_scc_in | 130 | 90 | 80 | 380 | 270 | 230 | 530 | 375 | 315 | |||||||||||
| volc_pot_out | 225 | 155 | 135 | 450 | 310 | 270 | 560 | 385 | 335 | |||||||||||
| volc_scc_out | 450 | 310 | 270 | 450 | 310 | 270 | 845 | 580 | 505 | |||||||||||
| pfb_gr_out | 225 | 155 | 135 | 600 | 400 | 350 | 560 | 385 | 335 | |||||||||||
| pro_phy_lg | 450 | 310 | 270 | 600 | 400 | 350 | 845 | 580 | 505 | |||||||||||
|
Au |
pfb1_pot_in | 150 | 150 | 75 | 225 | 225 | 90 | 600 | 600 | 150 | ||||||||||
| pfb1_scc_in | 150 | 150 | 75 | 225 | 225 | 90 | 600 | 600 | 150 | |||||||||||
| pfb2_pot_in | 150 | 150 | 75 | 225 | 225 | 90 | 600 | 600 | 150 | |||||||||||
| pfb_gr_out | 150 | 150 | 75 | 225 | 225 | 90 | 600 | 600 | 150 | |||||||||||
| pfb_2_3_in | 150 | 150 | 75 | 225 | 225 | 90 | 600 | 600 | 150 | |||||||||||
| pro_phy_lg | 150 | 150 | 75 | 225 | 225 | 90 | 600 | 600 | 150 | |||||||||||
| volc_pot_in | 150 | 150 | 75 | 225 | 225 | 90 | 600 | 600 | 150 | |||||||||||
| volc_pot_out | 150 | 150 | 75 | 225 | 225 | 90 | 600 | 600 | 150 | |||||||||||
| volc_scc_in | 150 | 150 | 75 | 225 | 225 | 90 | 600 | 600 | 150 | |||||||||||
| volc_scc_out | 150 | 150 | 75 | 225 | 225 | 90 | 600 | 600 | 150 | |||||||||||
The interpolation was carried out in three search passes, with each subsequent pass having more relaxed criteria. The first two passes require a minimum of three and maximum of 12 samples from at least two drillholes. The third pass is less restrictive and a minimum of two composites was required, and blocks can be informed from a single drillhole.
Gold
Gold estimation search distances were set to 150 m in the major and intermediate axes, and 75 m in the minor axis direction for Pass 1, which was expanded for Pass 2 and Pass 3 as shown in Table 14-19. A minimum of three composites from at least two different drillholes were required to estimate a block, with a number of maximum composites block varying from 10 to 15 per block, depending on the estimation domain as shown in Table 14-19.
|
February 19, 2025 |
Page 148 |
|
|
NI 43-101 Technical Report on the Reko Diq Project |
|
Table 14-19 Gold Estimate - First Pass Estimation parameters
| Domain | Composites | High Yield Limit | Soft Boundary | |||||||||||||||
| Min. | Max. | Per Hole |
Use | COG | Dist. (m) |
Use | Domain |
Max. Dist (m) |
||||||||||
| pfb_2_3_in |
3 | 10 | 2 | No | - | - | Yes | pfb_gr_out | 10 | |||||||||
| pfb_gr_out |
3 | 15 | 2 | No | - | - | Yes | pfb1_scc_in, pfb2_pot_in, volc_scc_out |
10 | |||||||||
| pfb1_pot_in |
3 | 10 | 2 | No | - | - | Yes | pfb1_scc_in, volc_pot_out |
10 | |||||||||
| pfb1_scc_in |
3 | 12 | 2 | No | - | - | Yes | pfb1_scc_in, volc_pot_out |
10 | |||||||||
| pfb2_pot_in |
3 | 10 | 2 | No | - | - | No | - | - | |||||||||
| pro_phy_lg |
3 | 15 | 2 | Yes | 0.5 | 50 | Yes | volc_scc_out | 10 | |||||||||
|
volc_pot_in |
3 | 12 | 2 | No | - | - | Yes | volc_scc_out, volc_scc_in, volc_pot_out |
10 | |||||||||
|
volc_pot_out |
3 | 12 | 2 | No | - | - | Yes | NA | NA | |||||||||
|
volc_scc_in |
3 | 12 | 2 | No | - | - | Yes | NA | NA | |||||||||
|
volc_scc_out |
3 | 12 | 2 | No | - | - | Yes | NA | NA | |||||||||
| 14.4.11 | Resource Block Model and Validation |
Several checks were carried out to ensure that the estimate was valid; these included:
| ● | Checks for global bias, by comparison of mean grades at zero cut-off against the OK grade estimation, as well as other estimation methods including inverse distance squared (IDW) and nearest neighbour (NN). |
| ● | Visual checks of estimate in both plan and section view comparing composite data against the estimate, |
| ● | Checks for local bias using swath plots in easting, northing, and elevation considering widths of 50 m in the north and east direction and 34 m in elevation |
| ● | Comparison of the top 5% of blocks against high grade composites. |
The mean grade of kriged (OK), inverse distance squared (IDW) and nearest neighbour (NN) were compared by domain for copper in Table 14-20 and for gold in Table 14-21.
For the copper estimate, the comparison was constrained for blocks inside the pit-shell and classified as Indicated or Inferred. The comparison was separated into different domains. Domains inside the grade-shell domains show global biases (average relative difference of OK with NN estimate) within +/- 1.5%, however domains outside the grade shell show higher but acceptable global bias, within +/- 7%. Only domain pro_phy_lg has a very high bias which is related to less drilling information, and likely attributed to composites incorrectly flagged inside the domain. This high bias inside the pro-phy_lg domain is not considered material to the mineral resource since this low-grade material is mainly waste.
|
February 19, 2025 |
Page 149 |
|
|
NI 43-101 Technical Report on the Reko Diq Project |
|
Table 14-20 Comparison of OK. IDW and NN estimates - Copper
| Domain | Cu OK (%) |
Cu IDW (%) |
Cu NN (%) |
Difference | ||||||
| (OK-IDW)/OK | (OK-NN)/OK | |||||||||
| pfb1_pot_in |
0.83 | 0.83 | 0.83 | -0.12% | -0.60% | |||||
| pfb1_scc_in |
0.67 | 0.67 | 0.66 | -0.15% | 1.34% | |||||
| pfb2_3_in |
0.46 | 0.46 | 0.46 | 0.43% | 1.08% | |||||
| volc_pot_in |
0.49 | 0.48 | 0.49 | 2.24% | -0.41% | |||||
| volc_scc_in |
0.41 | 0.41 | 0.41 | -0.25% | -0.49% | |||||
| pfb_gr_out |
0.13 | 0.13 | 0.13 | 0.00% | -2.34% | |||||
| pro_phy_lg |
0.14 | 0.13 | 0.08 | 7.14% | 42.14% | |||||
| volc_pot_out |
0.14 | 0.14 | 0.14 | 0.00% | 5.59% | |||||
| volc_scc_out |
0.12 | 0.12 | 0.12 | 0.83% | 2.48% | |||||
| Total |
0.40 | 0.40 | 0.40 | -0.25% | 0.50% | |||||
For gold estimates, the mean grade of the first pass OK estimate was compared with NN and IDW estimates at a zero-cut-off grade (Table 14-21). All domains were well within the commonly accepted limits of ±7%.
Table 14-21 Comparison of OK, IDW and NN Estimates - Gold
| Domain | Au OK (g/t) |
Au IDW (g/t) |
Au NN (g/t) |
Difference | ||||||
| (OK-IDW)/OK | (OK-NN)/OK | |||||||||
| pfb_2_3_in |
0.34 | 0.34 | 0.35 | 0.7% | -2.8% | |||||
| pfb_gr_out |
0.12 | 0.12 | 0.12 | 1.4% | 2.2% | |||||
| pfb1_pot_in |
0.68 | 0.68 | 0.70 | -0.3% | -2.9% | |||||
| pfb1_scc_in |
0.48 | 0.48 | 0.47 | 0.1% | 1.9% | |||||
| pfb2_pot_in |
0.41 | 0.41 | 0.42 | -0.4% | -3.1% | |||||
| pro_phy_lg |
0.05 | 0.05 | 0.05 | 1.2% | -1.1% | |||||
| volc_pot_in |
0.36 | 0.36 | 0.36 | -0.4% | -0.4% | |||||
| volc_pot_out |
0.13 | 0.13 | 0.13 | 1.3% | 1.6% | |||||
| volc_scc_in |
0.33 | 0.33 | 0.33 | 0.1% | -0.2% | |||||
| volc_scc_out |
0.09 | 0.09 | 0.08 | 0.9% | 1.6% | |||||
| Total |
0.30 | 0.30 | 0.30 | 0.1% | -1.0% | |||||
Local bias of the copper estimates was assessed with swath plots between kriged (OK) estimates and nearest neighbour declustered estimate (NN), and no significant local bias was detected. Swath plots for domains pfb1_pot_in and pfb1_scc_in are presented in (Figure 14-13). Plots show that for areas that are well drilled, kriged and NN curves plot close to one another and grade trends from the informing data are properly reproduced by the kriged estimate. In contrast in those areas with less drilling (100 composites or less), OK and NN swath plots depart from each other, and local bias is observed.
|
February 19, 2025 |
Page 150 |
|
|
NI 43-101 Technical Report on the Reko Diq Project |
|

Source: Barrick, 2024
Figure 14-11 Copper Block Estimates
|
February 19, 2025 |
Page 151 |
|
|
NI 43-101 Technical Report on the Reko Diq Project |
|
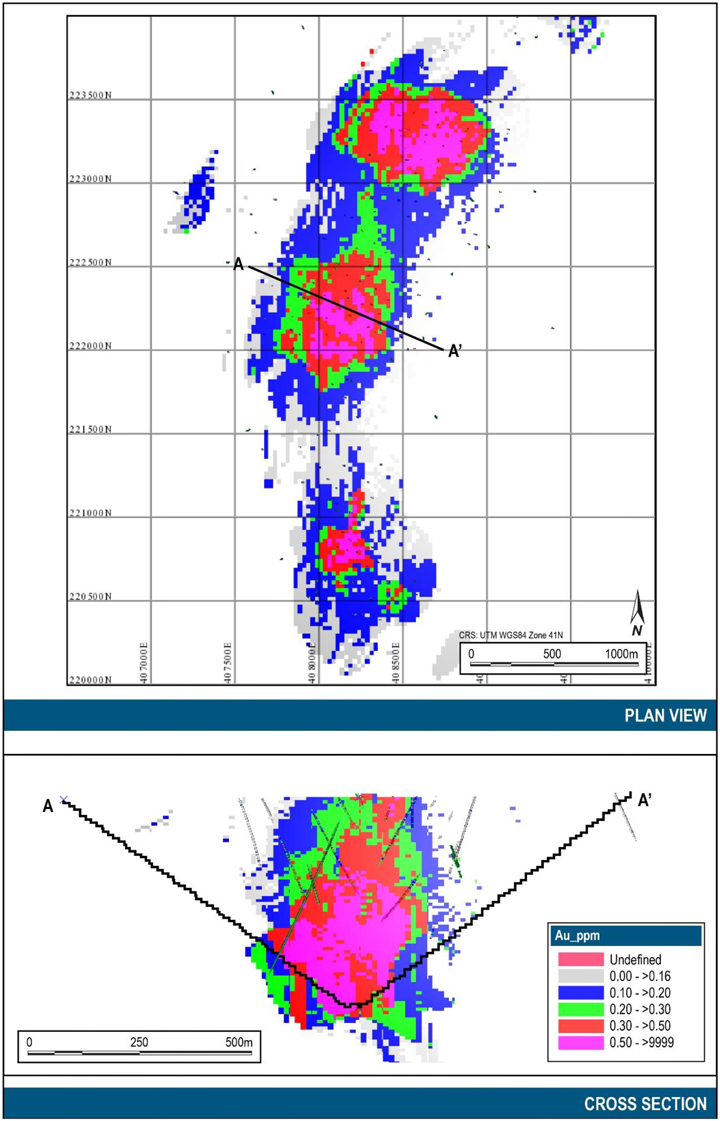
Source: Barrick, 2024
Figure 14-12 Gold distribution in Block Model and composites
|
February 19, 2025 |
Page 152 |
|
|
NI 43-101 Technical Report on the Reko Diq Project |
|
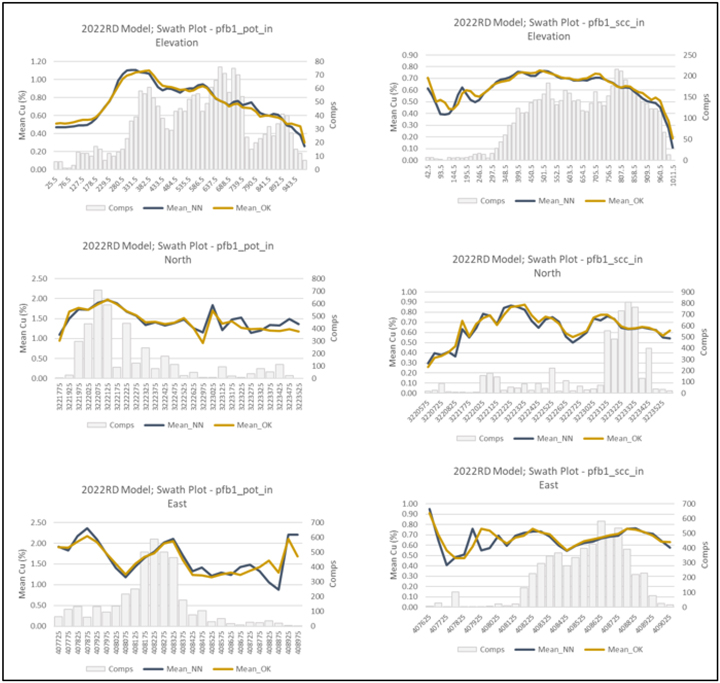
Source: Barrick, 2024
Figure 14-13 Example Copper Estimate Swath Plots
Similar validation using swath plots for gold OK and NN grades were prepared (as shown in Figure 14-14). No significant local bias was observed, and differences are related to lower drilling density areas.
|
February 19, 2025 |
Page 153 |
|
|
NI 43-101 Technical Report on the Reko Diq Project |
|
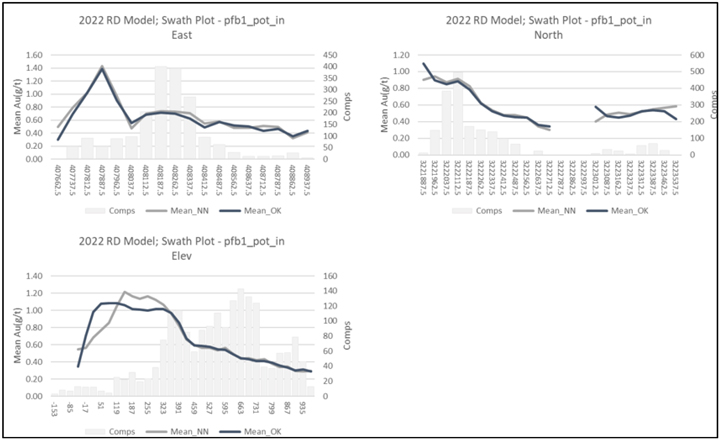
Source: Barrick, 2024
Figure 14-14 Example Gold Swath Plots
Copper and gold block estimates were validated by the change of support from 3 m composites to blocks of 25 m by 25 m by 15 m. Assessment of the degree of smoothing through change of support indicates that Cu and Au resource models are suitably calibrated using the 25 m by 25 m by 15 m smallest mining unit (SMU) (Figure 14-15)
Difference for tonnes and grade between corrected (change of support) and estimation models are within +/-5% at a 0.15% Cu cut off.
|
February 19, 2025 |
Page 154 |
|
|
NI 43-101 Technical Report on the Reko Diq Project |
|
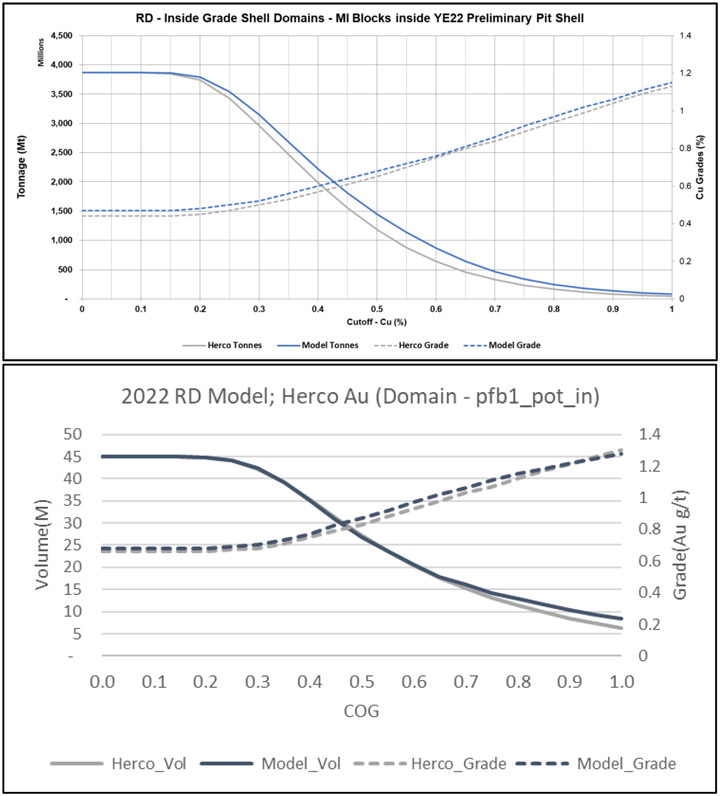
Source: Barrick, 2024
Figure 14-15 Tonnage-Grade and Change of Support Curves (Top Cu, Bottom Au)
The percentage of blocks filled in each estimation run for Cu and Au is shown in Figure 14-16. The majority of each domain is estimated in the first two passes for both Cu and Au. Of note is the domain ‘pro_phy_lg’ which has a large proportion of estimated blocks in pass 3 and 4, particularly for Au. It is noted that this domain is a low-grade domain, and as such, is not considered material to the reported Mineral Resources.
|
February 19, 2025 |
Page 155 |
|
|
NI 43-101 Technical Report on the Reko Diq Project |
|
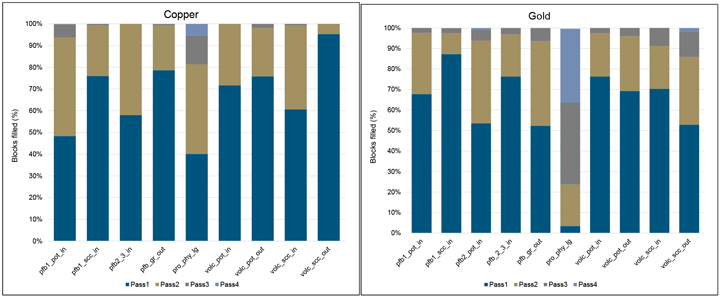
Source: Barrick, 2024
Figure 14-16 Pass Percentage by Domain
| 14.4.12 | Sulfur/Sulfide Sulfur |
While not reported within of the Western Porphyries Mineral Resources, the sulfur content was included in the grade estimates for inclusion in the mine planning process. Below is a description of the process used to determine sulfur grades.
The assay database for sulfur (S) and sulfide sulfur (S2) is summarised in Table 14-22. There are significantly different distributions between the two species of sulfur and spatially, higher S grades are located on the periphery of the porphyry intrusions (Figure 14-17). This coincides with high relative pyrite and low chalcopyrite content logged in drilling (Figure 14-18) and indicates that they are inversely related.
Table 14-22 Univariate Statistics - S and S2 Assays
| Analysis | Count | Mean | SD | Variance | CV | Max | Q3 | Median | Q1 | Min | ||||||||||
| S (%) | 5,164 | 3.85 | 2.24 | 5.00 | 0.58 | 36.90 | 4.88 | 3.64 | 2.54 | 0.005 | ||||||||||
| S2 (%) | 4,003 | 1.76 | 1.95 | 3.78 | 1.10 | 37.10 | 2.42 | 1.28 | 0.53 | 0.005 | ||||||||||
|
February 19, 2025 |
Page 156 |
|
|
NI 43-101 Technical Report on the Reko Diq Project |
|
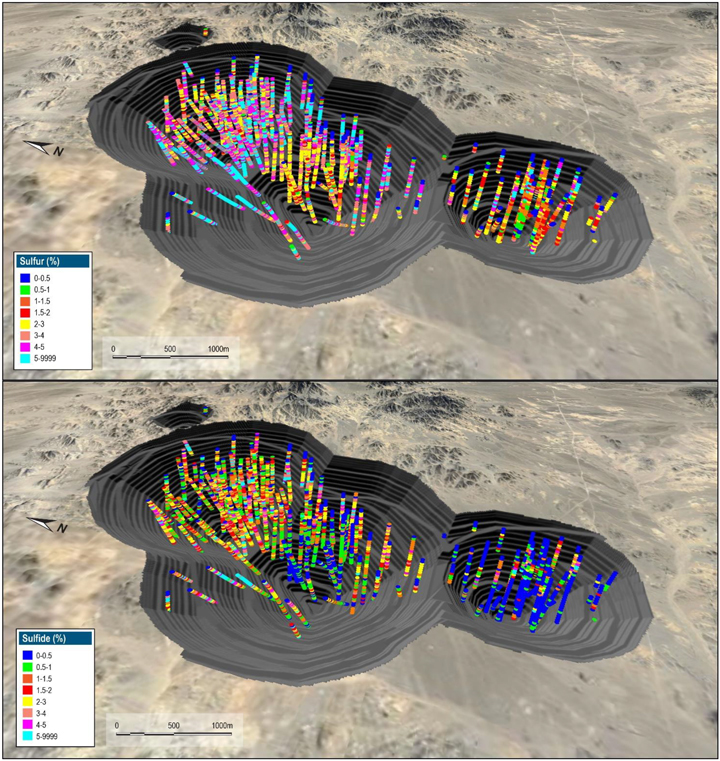
Source: Barrick, 2024
Figure 14-17 Oblique View - Sulfur (Top) and Sulphide (Right) Assays
|
February 19, 2025 |
Page 157 |
|
|
NI 43-101 Technical Report on the Reko Diq Project |
|
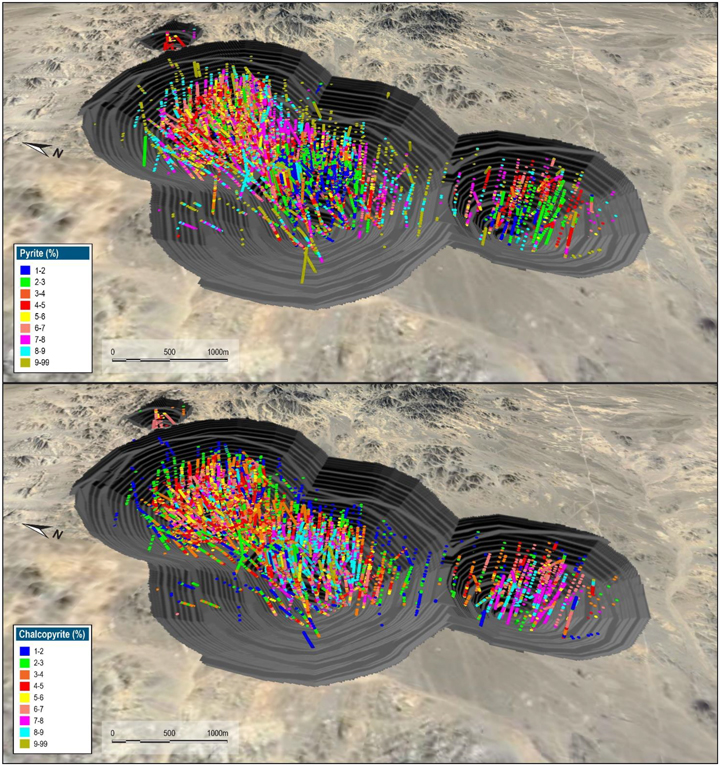
Source: Barrick, 2024
Figure 14-18 Plan View - Logged Pyrite (Top) and Chalcopyrite (Bottom)
A statistical review was undertaken to confirm the above interpretation and how sulfur could be incorporated into the estimation domaining. The raw assay data was merged with alteration and lithology, and sulfide zones were logged for analysis. Of importance, only samples that had pairs with all datasets were included in the analysis, with all others excluded.
|
February 19, 2025 |
Page 158 |
|
|
NI 43-101 Technical Report on the Reko Diq Project |
|
Partitioning was used as a first pass at domaining. The partition indicated that logged chalcopyrite intensity (CPY) was the best discriminator of both sulfur and sulfide sulfur, with three clusters identified (Table 14-23, Figure 14-19). These were reviewed spatially for continuity, which showed some intermixing of CPY intensity 5 material. This material was included in Domain 3.
Table 14-23 Partition Analysis - Total and Sulfide Sulfur
| CPY Intensity | Sulfur | Sulfide | Domain | |||
| Cluster | Cluster | |||||
| 1 | 1 | 1 | 1 | |||
| 2 | ||||||
| 3 | 2 | 2 | 2 | |||
| 4 | ||||||
| 5 | 3 | 3 | ||||
| 6 | 3 | |||||
| 7 | ||||||
| 8 | ||||||
| 9 | ||||||
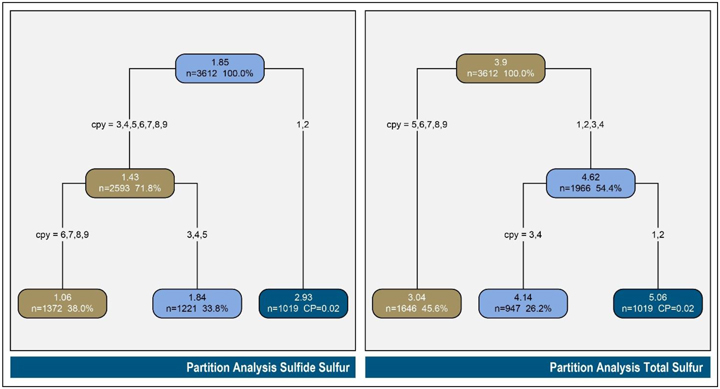
Source: Barrick, 2024
Figure 14-19 Partition Analysis - Sulfide Sulfur (Left), Total Sulfur (Right)
Subsequent to partitioning, univariant statistics was undertaken per domain, with sulfur shown in Table 14-24 and sulfide sulfur shown in Table 14-25.
|
February 19, 2025 |
Page 159 |
|
|
NI 43-101 Technical Report on the Reko Diq Project |
|
Table 14-24 Univariate Statistics - Total Sulfur by Domain
| Domain | Count | Min | Max | Mean | Q1 | Med | Q3 | SD | Var | CoVar | ||||||||||
| 1 | 1,019 | 0.05 | 36.3 | 5.06 | 3.64 | 4.74 | 6.10 | 2.42 | 5.85 | 0.48 | ||||||||||
| 2 | 1,221 | 0.01 | 36.9 | 4.05 | 2.87 | 3.80 | 4.78 | 2.18 | 4.77 | 0.54 | ||||||||||
| 3 | 1,372 | 0.05 | 16.2 | 2.91 | 1.94 | 2.66 | 3.52 | 1.57 | 2.46 | 0.54 | ||||||||||
Table 14-25 Univariate Statistics - Sulfide Sulfur by Domain
| Domain | Count | Min | Max | Mean | Q1 | Med | Q3 | SD | Var | CoVar | ||||||||||
| 1 | 1,019 | 0.005 | 36.3 | 2.93 | 1.57 | 2.52 | 3.79 | 2.26 | 5.11 | 0.77 | ||||||||||
| 2 | 1,221 | 0.005 | 30.3 | 1.84 | 0.82 | 1.46 | 2.36 | 1.70 | 2.90 | 0.92 | ||||||||||
| 3 | 1,372 | 0.005 | 12.5 | 1.06 | 0.38 | 0.72 | 1.40 | 1.05 | 1.11 | 1.00 | ||||||||||
As there were unequal numbers of total and sulfide sulfur, direct estimation of S2 was not considered to be the most suitable method, as it was essential to maintain the relationship between the two variables for sample support requirements. Regression analysis was therefore used to derive the relationship by domain. The final derived relationship by domain is shown in Table 14-26. Any negative values resulting from the formula were calculated as 0.1 times the estimated S grade to match the low-grade tail observed in the data.
Table 14-26 S/S2 Regression Formulas
| Domain | Regression | |
| 1 | S2 = –1.8 + 0.93*S | |
| 2 | S2 = –1.3 + 0.78*S | |
| 3 | S2 = –1.1 + 0.78*S | |
Sulphur was estimated to the block model using inverse distance cubed (ID3). Table 14-27 outlines the estimation plan used for the first pass with LVA used to locally modify the search orientation. It should be noted that Sulphur is under sampled throughout the porphyry system and was estimated for mine planning purposes only.
Table 14-27 S Estimation Parameters
| DOM | Discretization | Par Cell Est. |
Search(m) | Composites | High Yield Limit | Soft Boundaries | ||||||||||||||||||||||||||||||
| X | Y | Z | Maj. | Semi | Min. | Min. | Max. | Per | Use | COG | Dist (m) | Use? | Doms | Dist? | ||||||||||||||||||||||
| X | Y | Z | ||||||||||||||||||||||||||||||||||
| 1 | 4 | 4 | 6 | Y | 150 | 150 | 75 | 3 | 15 | 2 | Y | 15 | 75 | 75 | 35 | N | ||||||||||||||||||||
| 2 | 4 | 4 | 6 | Y | 150 | 150 | 75 | 3 | 8 | 2 | Y | 15 | 75 | 75 | 35 | Y | 3 | 50 | ||||||||||||||||||
| 3 | 4 | 4 | 6 | Y | 150 | 150 | 75 | 3 | 15 | 2 | Y | 15 | 75 | 75 | 35 | Y | 2 | 50 | ||||||||||||||||||
|
February 19, 2025 |
Page 160 |
|
|
NI 43-101 Technical Report on the Reko Diq Project |
|
| 14.5 | Tanjeel |
| 14.5.1 | Geological Modeling |
The Tanjeel Cu porphyry has a developed supergene copper enrichment blanket. The leached zone is relatively thin (<50 m), predominantly geothitic over the cupriferous zones and mixed jarositic-goethitic in composition over the external, pyrite-bearing sericitic halos. Gypsum, the hydration product of anhydrite, is common to average depths of approximately 400 m.
Supergene copper sulphide enrichment at Tanjeel occurs as supergene chalcocite on hypogene sulphides. Supergene enrichment formed a relatively large chalcocite blanket, with an average thickness of between 50 m and 70 m.
The three main lithologies hosting Tanjeel in order of decreasing age are: Intermediate volcanics (VIN) – comprising andesitic lavas and volcanoclastics of the Reko Diq Formation; feldspar-quartz (PFQ) and quartz-feldspar (PQF) granodioritic porphyries of the Sor Koh group of intrusions. The main porphyry intrusives have elongate dyke like form and may dip northwards (Perelló et al., 2008). Locally small bodies and dykes of feldspar hornblende porphyry (PFH) and small-scale late stage hydrothermal breccias (± tourmaline) and andesitic – basaltic andesite dykes are found crosscutting the main units. Hypogene alteration in the Tanjeel system has a concentric form with a central zone of intense sericitic (quartz-sericte-pyrite) alteration flanked by weakly developed chlorite-epidote bearing propylitic assemblages.
Geologic modeling for Tanjeel was completed in Leapfrog® initially by RSC consultants in November 2023. The modeling approach was semi-implicit, with implicitly generated shapes initially interpreted. These shapes were refined or adjusted with polylines and points, along with structural trends, where considered appropriate and consistent with the geological interpretation.
Structural Model
Based on the geological drill hole logging, eight modelled faults are interpreted, in two main sets NW and NE trending (Figure 14-20). Only Faults 2,4 and 6 (NE trending) are activated in the model (F8 has only minor apparent offset, so was not activated), while the NW trending sets were determined to have minimal impact on the modeled volumes and would complicate the model workflow through additional fault blocks. All faults were modelled from polylines and were not directly linked to drillholes.
|
February 19, 2025 |
Page 161 |
|
|
NI 43-101 Technical Report on the Reko Diq Project |
|
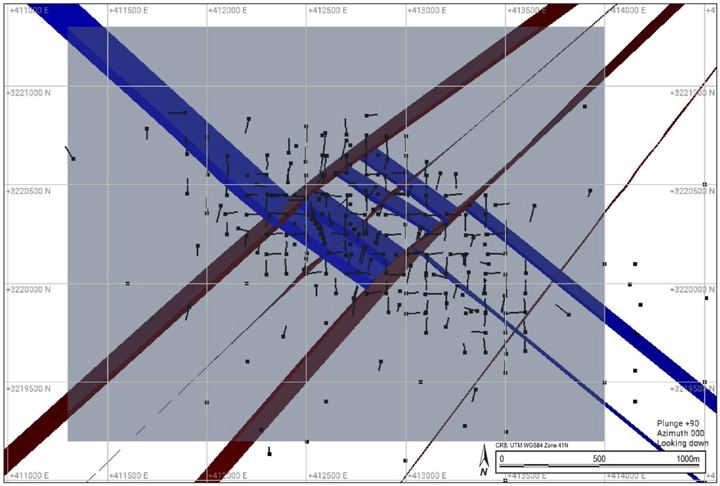
Source: Barrick, 2024
Figure 14-20 Example Structural Plan View
Lithology Model
The lithological model is based on grouped units from logging codes in the drilling database (Table 14-28). Figure 14-22 shows a vertical cross section with the grouped lithology. The model is comprised of a volcanic sequence intruded by a suite of porphyries from the oldest PFQ_Old, followed by the PQF_Young and a latter PFB and PFH.
Table 14-28 Lithological Grouping for Tanjeel
| Group |
Lithology Code | |
| Contact_BX |
PBC, BCO, VBC | |
| Hydro_BX |
BHY, BHT | |
| IIN |
IIN | |
| IMA |
IMA | |
| PFB |
PFB | |
| PFH |
PFH | |
| PFQ_Old |
PFQ | |
| PQF_Young |
PQF, PQF2 | |
| Quaternary |
CAL, CCV, CAV, COV | |
| Sediments |
SSA, SCO | |
| Tectonic_BX |
BTE | |
| VIN |
VIN | |
| Volcanics_Other |
VFL, VFE, VM |
|
February 19, 2025 |
Page 162 |
|
|
NI 43-101 Technical Report on the Reko Diq Project |
|
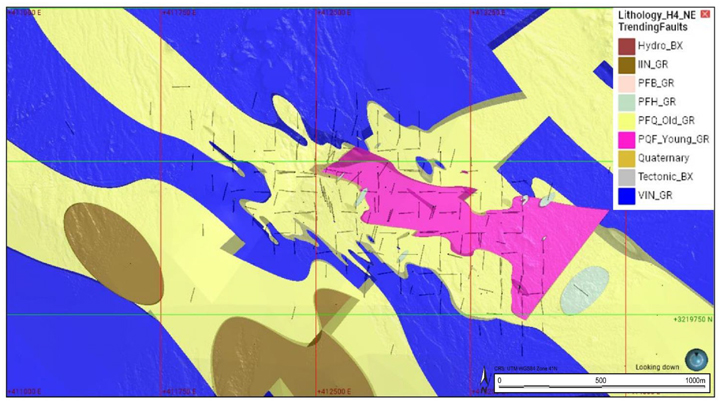
Source: Barrick, 2024
Figure 14-21 Lithology Plan View
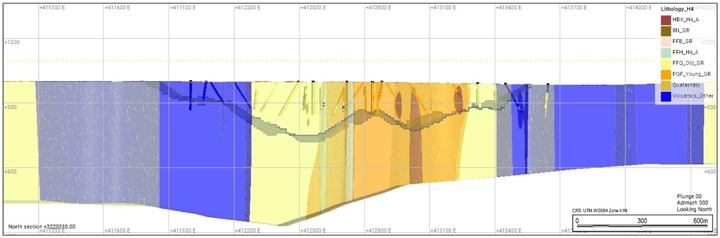
Source: Barrick, 2024
Figure 14-22 Lithology Model and Drilling Vertical Section (+/-50 m)
Alteration Model
The alteration model was created based on the logged alteration codes within the database. Alteration at H4 consists of a Leach Cap at the surface with a thickness of about 50 m. Below this supergene alteration horizon there is a zone of PHY alteration, below which SCC alteration occurs
|
February 19, 2025 |
Page 163 |
|
|
NI 43-101 Technical Report on the Reko Diq Project |
|
(Figure 14-23). For modelling purposes, the logged alteration was grouped as outlined in Table 14-29.
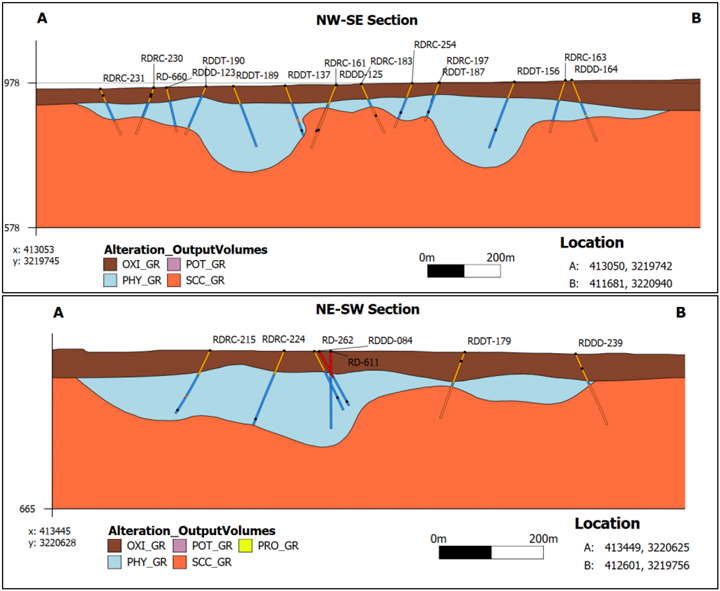
Source: Barrick, 2024
Figure 14-23 Typical Alteration Cross-Section
Table 14-29 Hydrothermal Alteration Assemblages, Mineralogy and Codes
| Group |
Alteration | |
| ARG |
ARG | |
| OXI |
OXI, LEA | |
| PHY |
PHY | |
| POT |
POT | |
| QSA |
QSA | |
| SCC |
SCC |
|
February 19, 2025 |
Page 164 |
|
|
NI 43-101 Technical Report on the Reko Diq Project |
|
Mineralization Model
The mineralization model was developed based on the sulfide logging within the drill holes and included relative abundance on a quantitative level. Mineralization at Tanjeel is a combination of primary hypogene porphyry mineralization and secondary supergene mineralization. The supergene mineralization is controlled by the presence of hypogene Cu-bearing sulphides (mainly chalcopyrite), the porosity and permeability of the rock mass, and the presence of water-bearing structures (faults). The hypogene mineralization is controlled by the presence of enriched porphyry stocks.
Initially a three-component model, consisting of hypogene, supergene and leach cap were modelled based on the presence of sulfide species, as summarised in Table 14-30.
Table 14-30 Initial Mineral Zone Model
| Zone |
Sulphides | |
| Leach Cap |
None | |
| Supergene |
Chalcocite, Covellite | |
| Hypogene |
Chalcopyrite, Pyrite |
The supergene model was then further refined using copper grade to distinguish background, low, and high-grade supergene volumes (Figure 14-24).

Source: Barrick, 2024
Figure 14-24 Tanjeel Min Zone Model Section
|
February 19, 2025 |
Page 165 |
|
|
NI 43-101 Technical Report on the Reko Diq Project |
|
| 14.5.2 | Statistical Analyses and Domains |
Raw Assays-Copper
The assay table in the drillhole database contains results of chemical analysis of copper including:
| ● | Total Copper (TCu %) |
| ● | Acid Soluble Copper (ASCu %) |
| ● | Cyanide Soluble Copper (CNCu %) |
Basic statistics for each copper species are presented in Table 14-31. Of note, copper assays are not determined equally at all sample locations. Acid soluble copper is the least determined assay with only 5% of the sample intervals determined, while cyanide soluble copper data is available for 61% of the sample intervals. Figure 14-25 shows the spatial locations for each of the three copper determinations.
Table 14-31 Univariate Statistics for Cu %
| Assay Name | Count | Length | Mean | Std.Dev | CV | Var | Min | Q1 | Med | Q3 | Max | |||||||||||
| Total Cu % |
11,788 | 25,093 | 0.42 | 0.51 | 1.2 | 0.26 | 0.00 | 0.11 | 0.26 | 0.53 | 7.3 | |||||||||||
| Cyanide Soluble % |
7,655 | 15,364 | 0.42 | 0.52 | 1.2 | 0.27 | 0.00 | 0.08 | 0.25 | 0.57 | 7 | |||||||||||
| Acid Soluble % |
624 | 1,170 | 0.14 | 0.14 | - | 0.02 | 0.00 | 0.08 | 0.13 | 0.18 | 2.6 |
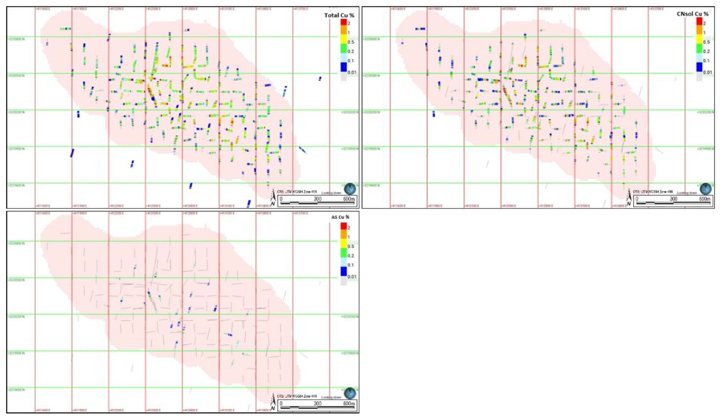
Source: Barrick, 2024
Figure 14-25 Top Left – TCu (%), Top Right – CSCu (%), Bottom – ASCu (%)
|
February 19, 2025 |
Page 166 |
|
|
NI 43-101 Technical Report on the Reko Diq Project |
|
Sulfur
Assay for sulphur data is available for 2,556 samples collected mainly from the supergene enrichment zone. Table 14-32 shows the statistics and Figure 14-26 shows the sample location of the total sulphur assays.
Table 14-32 Univariate Statistics - S and S2 Assays
| Analysis | Count | Length | Mean | SD | Variance | CV | Min | Q1 | Median | Q3 | Max | |||||||||||
| S (%) |
2,556 | 9,038 | 4.93 | 1.90 | 0.38 | 3.62 | 0.16 | 3.75 | 4.72 | 5.88 | 21.90 | |||||||||||
| S2 (%) |
2,556 | 9,038 | 4.36 | 1.80 | 0.41 | 3.24 | 0.06 | 3.24 | 4.15 | 5.29 | 19.85 |

Source: Barrick, 2024
Figure 14-26 Plan View – Total Sulfur (%)
| 14.5.3 | Bulk Density |
The database consists of 4,911 density determinations from 101 holes. The data was flagged with the lithology, mineralization and alteration envelopes for analysis and reviewed for spatial coverage. As shown in the plan view with the location of samples with density in Figure 14-27, the samples are located throughout the deposit and are not clustered. As such, the data are considered suitable to support the estimation of density within the model.
|
February 19, 2025 |
Page 167 |
|
|
NI 43-101 Technical Report on the Reko Diq Project |
|
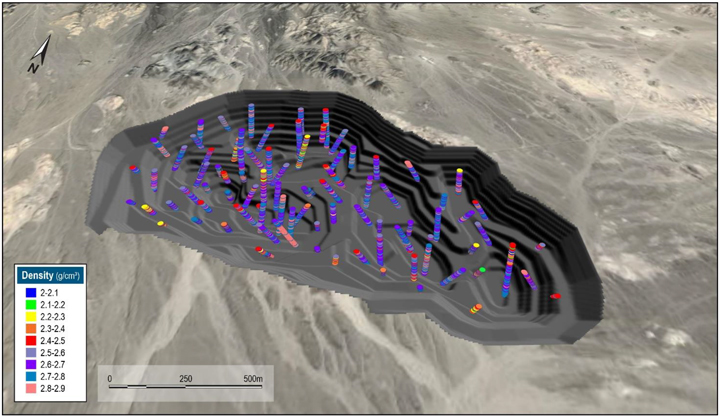
Source: Barrick, 2024
Figure 14-27 Oblique View Showing Density Determinations
Statistics of raw density shows a slightly negatively skewed distribution centred around 2.7 g/cm3 and a tail of values below 2.5 g/cm3 and a few values above 3.0 g/cm3
Outliers were identified using the modified Z-score method, using an absolute Z-Score of >=3.5. This flagged five values as outliers (<=2.04 and >=3.82). The outliers were selected in the database and subsequently excluded from further analysis. The review of the density statistics by lithology, alteration, mineral zones, copper, and gold grades showed that lithology is the main density control. Block model density was populated by assigning the outlier trimmed median values by lithology unit (Table 14-33) with histograms shown in Figure 14-28.
Table 14-33 Univariate Statistics by Lithology
| Lith | Count | Min | Max | Mean | Q1 | Med | Q3 | SD | Var | CoVar | ||||||||||
| leach_cap |
74 | 2.13 | 2.85 | 2.53 | 2.40 | 2.53 | 2.68 | 0.18 | 0.03 | 0.07 | ||||||||||
| super_bckgr |
122 | 2.10 | 2.84 | 2.62 | 2.55 | 2.66 | 2.72 | 0.14 | 0.02 | 0.05 | ||||||||||
| superg_lg |
2,389 | 2.09 | 3.08 | 2.67 | 2.62 | 2.69 | 2.75 | 0.13 | 0.02 | 0.05 | ||||||||||
| superg_hg |
967 | 2.10 | 3.20 | 2.66 | 2.58 | 2.66 | 2.74 | 0.13 | 0.02 | 0.05 | ||||||||||
| hypogene |
1,321 | 2.09 | 3.21 | 2.70 | 2.64 | 2.71 | 2.76 | 0.12 | 0.02 | 0.05 | ||||||||||
| N/A |
33 | 2.52 | 2.94 | 2.81 | 2.79 | 2.82 | 2.85 | 0.07 | 0.01 | 0.03 | ||||||||||
| Total |
4,906 | 2.09 | 3.21 | 2.67 | 2.61 | 2.69 | 2.75 | 0.13 | 0.02 | 0.05 |
|
February 19, 2025 |
Page 168 |
|
|
NI 43-101 Technical Report on the Reko Diq Project |
|
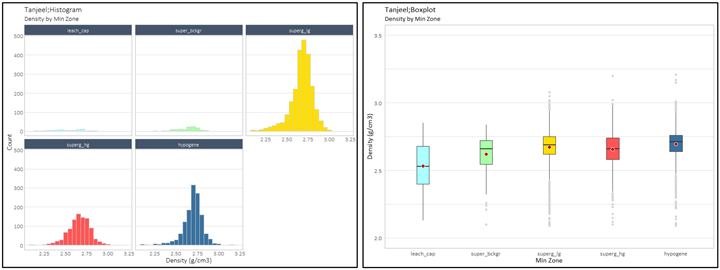
Source: Barrick, 2024
Figure 14-28 Histogram of Raw Density
| 14.5.4 | Compositing |
The sets of mineralized envelopes were used to code the assay database to allow identification of the resource intersections. A review of the assay sample lengths shows that approximately 90% are 2 m. As such, a 2 m composite length was used. Composites were back flagged from the lithology, alteration, weathering, and mineralization wireframes.
| 14.5.5 | Contact Analysis |
Contact grade profiles across the domain boundaries were examined to assess the appropriate type of envelope for grade estimation for each element. The majority of boundary types were interpreted to be hard. The contact analysis is summarised in Table 14-34, while an example contact plot is shown in Figure 14-29.
Table 14-34 Boundary Types for Copper
|
Leach Cap |
Supergene Background |
Supergene Low-Grade |
Supergene High-Grade |
Hypogene | ||||||
|
Leach Cap |
Hard | Hard | Hard | Hard | ||||||
|
Supergene Background |
Hard | Hard | Soft (10m) | |||||||
|
Supergene Low-Grade |
Hard | Hard | ||||||||
|
Supergene High-Grade |
Hard | |||||||||
|
Hypogene |
||||||||||
|
February 19, 2025 |
Page 169 |
|
|
NI 43-101 Technical Report on the Reko Diq Project |
|
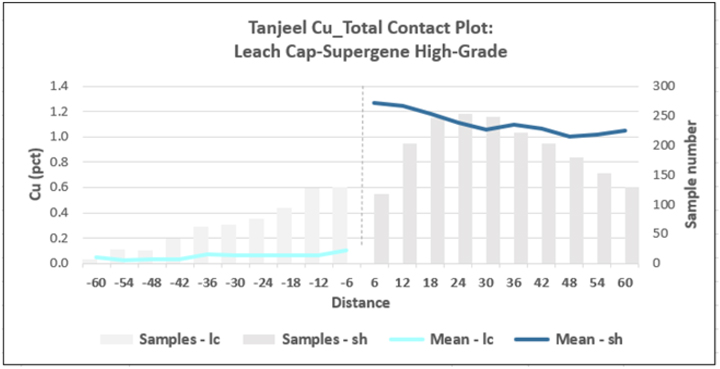
Source: Barrick, 2024
Figure 14-29 Example Contact Analysis Plot
| 14.5.6 | Capping and Outliers |
| 14.5.7 | Copper |
The statistical analysis of the composited samples inside the domains was used to determine the high-grade cuts applied to the grades in the domains used for grade interpolation. All assays above the selected cut value were assigned the cut value. This was undertaken to eliminate any high-grade outliers in the assay populations, which could result in conditional bias within the resource estimate.
Decile analysis and probability plot inspection were used to analyse for extreme or outlier values for each domain. High grade capping determined for each method of analysis is summarized in Table 14-35. The decile (statistical) analysis indicates that the high-grade supergene, low grade supergene, and hypogene domains required no capping. However, the probability plot of copper grades indicates breaks and slope changes in the upper end of the statistical distributions (Figure 14-30). These breaks are interpreted to represent changes in the distributions, and as such, samples above these points were capped. The probability plot approach was chosen as the final cap value.
|
February 19, 2025 |
Page 170 |
|
|
NI 43-101 Technical Report on the Reko Diq Project |
|
Table 14-35 Copper High-Grade Cut Applied Per Domain
| Min Flag | Decile Analysis | Prob Plot | ||||||||||||||||||
| Cap Value |
No. Capped |
Capped (%) |
Metal Reduction |
Metal Red. |
Cap Value |
No. Capped |
Capped (%) |
Metal Reduction |
Metal Red. |
|||||||||||
| leach_cap |
0.3 | 68 | 5% | 41 | 20% | 0.65 | 24 | 2% | 13 | 6% | ||||||||||
| super_bckgr |
0.45 | 37 | 4.8% | 35 | 19% | 1 | 13 | 1.7% | 11 | 6.2% | ||||||||||
| superg_lg |
No capping warranted | 2 | 12 | 0.2% | 30 | 0.8% | ||||||||||||||
| superg_hg |
No capping warranted | 4.5 | 11 | 0.4 | 32 | 0.6 | ||||||||||||||
| hypogene |
No capping warranted | 0.6 | 13 | 0.7. | 8 | 1.3 | ||||||||||||||
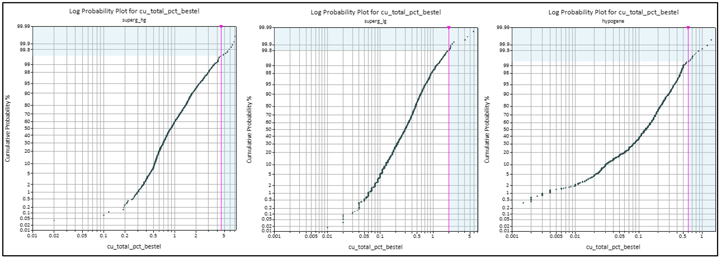
Source: Barrick, 2024
Figure 14-30 Probability Plots for Supergene High Grade (left), Supergene Low Grade (middle)and Hypogene (right)
| 14.5.8 | Variography |
For the supergene domain a geospatial analysis was undertaken to determine spatial variability of each element. Three orthogonal directions (axes) of the ellipsoid were set using variogram fans of composite data, and an understanding of the geological orientation of each domain. A mathematical model was interpreted for each domain to best-fit the shape of the calculated variogram in each of the orthogonal directions.
Variogram parameters per domain are shown in the Table 14-36, while examples of variogram models for the supergene domain are shown in the Figure 14-31.
|
February 19, 2025 |
Page 171 |
|
|
NI 43-101 Technical Report on the Reko Diq Project |
|
Table 14-36 Variogram Models for Copper Domains
| Structure 1 | Structure 2 | |||||||||||||||||||||
| Nug | Range (m) | Range (m) | ||||||||||||||||||||
| Domain | C1 | Type | Major | Semi | Minor | C2 | Type | Major | Semi | Minor | ||||||||||||
| 0.125 | 0.63 | Spherical | 50 | 18 | 14 | 0.51 | Spherical | 330 | 239 | 154 | ||||||||||||
| Rotation (ZYX) - Structure 1&2 - Vulcan Convention | ||||||||||||||||||||||
| Supergene |
Bearing | Plunge | Dip | |||||||||||||||||||
| -18 | 2 | -12 | ||||||||||||||||||||

Source: Barrick, 2024
Figure 14-31 Example Variogram Model (Domain pfb1_scc_in as shown in purple)
| 14.5.9 | Block Model |
The block model was created in Vulcan® to encompass the full extent of the resource area as currently defined by drilling. The block dimensions used in the model were 15 m north-south (along strike) by 15 m east-west (across strike) by 10 m vertical with no sub-cells. The block model origin, extent and attributes are shown in Table 14-37.
|
February 19, 2025 |
Page 172 |
|
|
NI 43-101 Technical Report on the Reko Diq Project |
|
Table 14-37 Block Model Parameters
| Origin | Rotation | Schema | Offset (m) | Block Size (m) | ||||||||||||||||
| East | 411,300 | Bearing | 90 | East | North | Elev | East | North | Elev | |||||||||||
| North | 3,219,200 | Plunge | 0 | Parent | 3,750 | 5,350 | 1830 | 25 | 25 | 15 | ||||||||||
| Elev | 720 | Dip | 0 | Sub-block | No sub-cells | |||||||||||||||
Geology was coded in the block model from the wireframes (solids) for lithology, hydrothermal alteration, weathering, fault blocks and grade shells for copper. In addition, estimation variables were created to store estimated capped and uncapped grades for sulfur, sulfide sulfur, copper and gold, estimation parameters (number of holes, number of composites, average distance), resource classification and density.
| 14.5.10 | Estimation and Parameters and Methodology |
Copper
Each domain object was used as a boundary type as noted in Section 14.5 for the interpolation of copper and cyanide soluble copper. The Ordinary Kriging (OK) algorithm was selected for grade interpolation in Vulcan ®. The OK algorithm was selected to minimise smoothing within the estimate and to give a more reliable weighting of clustered samples.
Block grades were interpolated through three estimation passes with increasing search distances (Table 14-38). Sample selection criteria is presented in Table 14-40, with search ellipsoids oriented with same rotation scheme as the variogram anisotropy ellipsoid. A reasonable match between geological trends, copper grade spatial distribution and variogram model was observed in the variogram analysis (Table 14-36). The three estimation runs for total copper were executed considering block discretization of 3 m by 3 m by 5 m (XYZ) and regular block size.
Table 14-38 Seach Ellipse Parameters Per Domain
| Estimation Pass |
Search Distance (m) | |||||
| Major | Semi | Minor | ||||
| 1 | 100 | 60 | 30 | |||
| 2 | 170 | 100 | 50 | |||
| 3 | 270 | 160 | 80 | |||
The third estimation pass reduced composite requirements so blocks can be estimated with composites from one drillhole. Any un-estimated blocks remaining after three passes were manually set to a copper value of 0.001 and pass was set to a value of 4.
Un-estimated blocks for cyanide soluble copper were assigned to a value calculated with a multiplier from paired regression analysis between total and cyanide soluble copper by domain (Table 14-39).
|
February 19, 2025 |
Page 173 |
|
|
NI 43-101 Technical Report on the Reko Diq Project |
|
Table 14-39 Multipliers for CuCN Estimation in Un-estimated Blocks
| Domain |
Formula | |
| leach_cap |
cucn = 0.93*cu | |
| super_bckgr |
cucn = 0.87*cu | |
| superg_lg |
cucn = 0.78*cu | |
| superg_hg |
cucn = 0.9*cu | |
| hypogene |
cucn = 0.53*cu |
Acid soluble copper was assigned into each block as the difference between total copper and cyanide soluble copper block estimates.
Table 14-40 Estimation Parameters for Copper and Cyanide Soluble Copper
| Domain | Composites | Soft Boundary | Search Orient. | |||||||||||||||||
| Min. | Max. |
Max Per Hole |
Use | Use | Doms. | Max. | Bearing | Plunge | Dip | |||||||||||
| Y/N | Y/N | Dist (m) | (Z) | (Y) | (X) | |||||||||||||||
|
leach_cap |
3 | 12 | 2 | N | N | - | - | -18 | 2 | -12 | ||||||||||
|
super_bckgr |
3 | 12 | 2 | N | Y | Hyp | 10 | -18 | 2 | -12 | ||||||||||
|
superg_lg |
3 | 12 | 2 | N | N | - | - | -18 | 2 | -12 | ||||||||||
|
superg_hg |
3 | 12 | 2 | N | N | - | - | -18 | 2 | -12 | ||||||||||
|
hypogene |
3 | 12 | 2 | N | Y | Super-Bckgr | 10 | -18 | 2 | -12 | ||||||||||
The percentage of blocks filled in each estimation run for total copper is shown in Figure 14-32. The supergene zone (superg_lg and superg_hg) had 87% and 100% of the blocks estimated in the first two passes, respectively. The remaining domains had a much higher proportion of blocks estimated in pass 3 or were assigned. As these are low-grade and peripheral to the main mineralization, the higher proportion of un-estimated blocks is not considered material to the resource estimate.
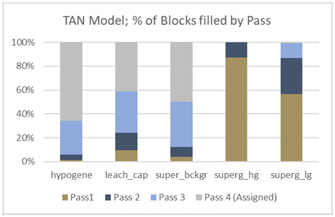
Source: Barrick, 2024
Figure 14-32 Pass Percentage by Domain
|
February 19, 2025 |
Page 174 |
|
|
NI 43-101 Technical Report on the Reko Diq Project |
|
| 14.5.11 | Resource Block Model and Validation |
Several checks were carried out to ensure that the estimate was valid; these included:
| ● | Checks for global bias, by comparison of mean grades at zero cut-off against the OK grade estimation and nearest neighbour (NN). |
| ● | Visual checks of estimate in both plan and section against composite data and the estimate, |
| ● | Checks for local bias, by swath plots in easting, northing, and elevation considering widths of 40 m in the north, 45 m in the east direction and 15 m in elevation |
| ● | Comparison of the top 5% of blocks against high grade composites |
Mean grades of kriged (OK) and NN estimates were compared by domain within Pass 1 and Pass 2 for copper (Table 14-41). A review indicates that the supergene low- and high-grade domains show un-biased estimation, with bias of -0.1% and 5%, respectively. The non-mineralized domains show significant bias (>10%). For leached cap, OK grades are significantly lower than NN grades. The higher average NN grade in the Leach Cap zone is influenced by outlier values.
Table 14-41 Comparison of OK. IDW and NN estimates – Copper
| Domain | Cu OK | Cu NN | (OK-NN)/OK | |||
| (%) | (%) | |||||
|
leach_cap |
0.055 | 0.155 | 64.60% | |||
|
super_bckgr |
0.111 | 0.132 | 15.40% | |||
|
superg_hg |
1.006 | 1.006 | -0.10% | |||
|
superg_lg |
0.352 | 0.37 | 5.00% | |||
|
hypogene |
0.197 | 0.209 | 5.70% | |||
Local bias of the copper estimate was assessed using swath plots between kriged (OK) estimates and nearest neighbour declustered estimate (NN), and no significant local bias was detected. Swath plots for the Super_hg domain is presented in (Figure 14-33). The plots show that in areas that are well drilled, the kriged and NN curves plot close to one another and grade trends from the informing data are properly reproduced by the kriged estimate. In contrast, in those areas with less drilling (100 composites or less), OK and NN swath plots depart from each other, and local bias is observed.
|
February 19, 2025 |
Page 175 |
|
|
NI 43-101 Technical Report on the Reko Diq Project |
|
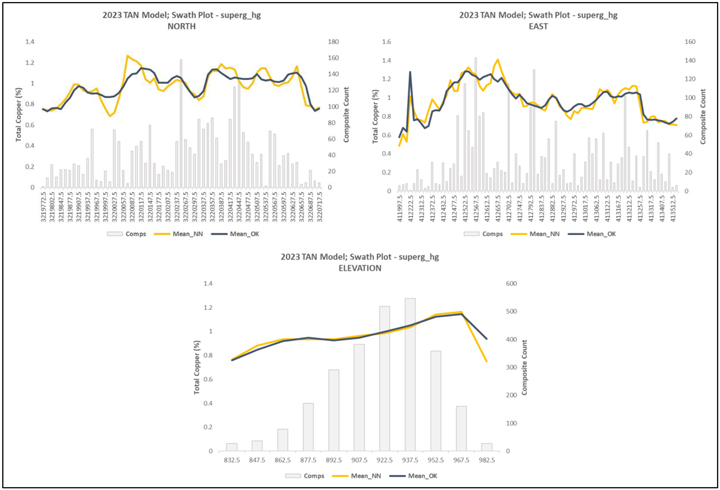
Source: Barrick, 2024
Figure 14-33 Example Copper Estimates Swath Plots
| 14.5.12 | Sulfur/Sulfide Estimate |
While not reported in the Tanjeel Statement of Mineral Resources, an estimate was included for mine planning purposes
The Sulfur/Sulfide Sulfur estimate was undertaken out using the same domains as copper, however, given the data availability only domains within supergene zone were estimated. Grade interpolation was setup to estimate total sulphur as main element and sulphide sulphur being co-estimated as an extra variable (i.e., using the exact same estimation parameters).
Table 14-42 Estimation Parameters for Total Sulphur and Co-estimated Sulphide Sulphur
| Domain | Composites | Soft Boundary | Search Orient. | |||||||||||||||||
| Min. | Max. |
Per Hole |
Use | Use | Doms. | Max. | Bearing | Plunge | Dip | |||||||||||
| Y/N | Y/N |
Dist (m) |
(Z) | (Y) | (X) | |||||||||||||||
|
super_bckgr |
3 | 12 | 2 | N | Y | Hyp | 10 | -18 | 2 | -12 | ||||||||||
|
superg_lg |
3 | 12 | 2 | N | N | NA | NA | -18 | 2 | -12 | ||||||||||
|
superg_hg |
3 | 12 | 2 | N | N | NA | NA | -18 | 2 | -12 | ||||||||||
|
February 19, 2025 |
Page 176 |
|
|
NI 43-101 Technical Report on the Reko Diq Project |
|
Leach-cap and hypogene domains were assigned with the mean value by domain (Table 12-49).
Table 14-43 Total and Sulphide Sulphur Assigned Values
| Domain | Total Sulphur % | Sulphide sulphur | ||
|
Leach Cap |
2.282 | 1.689 | ||
|
Hypogene |
4.476 | 3.594 | ||
| 14.6 | Resource Classification |
Mineral Resources were classified in accordance with CIM Best Practice Guidelines. The Mineral Resource was classified as Indicated and Inferred Mineral Resources based on a range of criteria including geological continuity, data quality, drill hole spacing, modelling technique, and estimation derived properties including search strategy, the number of informing data points, and distance of data points from blocks. The Mineral Resource has been constrained within a pit shell based on long term pricing assumptions as outlined in Table 14-44. Any mineralization outside this pit shell has not been classified. Mineral Resources have been classified using the following criteria in Table 14-44 with the results shown graphically in Figure 14-34. Drillhole spacing was calculated from average distances to the three closest composites from three different drillholes.
Table 14-44 Mineral Resources Classification Criteria
| Classification | Block Code |
Drill Hole Spacing (m) |
No. of Holes |
Average Distance (m) |
||||
| Western Porphyries | ||||||||
|
Measured |
N/A | N/A | N/A | N/A | ||||
|
Indicated |
2 | ≤150m | 3 | 102 | ||||
|
Inferred |
3 | ≤200m | 3 | 173 | ||||
|
Unclassified |
4 | ≤300m | 3 | 256 | ||||
|
Unclassified |
5 | >300m | - | - | ||||
| Tanjeel | ||||||||
|
Measured |
N/A | N/A | N/A | |||||
|
Indicated |
2 | ≤100m | 3 | |||||
|
Inferred |
3 | ≤200m | 3 | |||||
|
Unclassified |
4 | ≤300m | 3 | |||||
|
Unclassified |
5 | >300m | - | |||||
|
February 19, 2025 |
Page 177 |
|
|
NI 43-101 Technical Report on the Reko Diq Project |
|

Source: Barrick, 2024
Figure 14-34 Mineral Resource Classification – Western Porphyries
|
February 19, 2025 |
Page 178 |
|
|
NI 43-101 Technical Report on the Reko Diq Project |
|

Source: Barrick, 2024
Figure 14-35 Mineral Classification - Tanjeel
|
February 19, 2025 |
Page 179 |
|
|
NI 43-101 Technical Report on the Reko Diq Project |
|
| 14.7 | Resource Reporting |
The evaluation of reasonable prospects of eventual economic extraction assumes a conventional open pit mining method. The Mineral Resources have been reported with two pit shells, one for the Western Porphyries and one for Tanjeel, with all material outside of these shells unclassified. The ultimate pit shells were created based on the same technical parameters (metallurgical recoveries, and pit slope angles) that were used for defining Mineral Reserves (see Section 15 and Section 16); however, the prices were increased for the Mineral Resource. Table 14-45 details the Pit Optimisation and subsequent NSR input parameters. A breakeven NSR was applied to each block based on the grades.
Table 14-45 Pit Optimization and NSR Input Parameters
| Units | WP | Tanjeel | ||||
|
Metal Prices |
||||||
|
Cu Price |
$/lb | 4.00 | 4.00 | |||
|
Au Price |
$/oz | 1,900 | - | |||
|
Processing Recoveries |
||||||
|
Cu Average Process Recovery |
% | 90.88 | 86.65 | |||
|
Au Average Process Recovery |
% | 69.52 | - | |||
|
Concentrate Commercial Terms |
||||||
|
Cu Average Concentrate Grade |
% | 31.48 | 23.40 | |||
|
% Payable Cu in concentrate |
% | 96.50 | 96.50 | |||
|
% Payable Au in concentrate |
% | 94.00 | 94.00 | |||
|
Treatment Charge |
$/dmt | 85.00 | 85.00 | |||
|
Refining Charge, Cu |
$/lb | 0.09 | 0.09 | |||
|
Refining Charge, Au |
$/oz | 6.00 | 6.00 | |||
|
Transportation & Handling |
$/wmt | 94.54 | 94.54 | |||
|
Mining Cost |
||||||
|
Base Mining Cost |
$/t rock | 2.06 | 2.22 | |||
|
Incremental Mining Cost (< RL 1010 m) |
$/t/15m | 0.040 | ||||
|
Average Mining Cost |
$/t rock | 2.84 | 2.22 | |||
|
Processing Cost |
||||||
|
Process Cost |
$/t ore | 5.67 | 5.67 | |||
|
Stockpile Rehandle |
$/t ore | 0.27 | 0.27 | |||
|
Additional Ore Haul Cost |
$/t ore | 0.50 | ||||
|
G&A & Social |
||||||
|
Unit Cost |
$/t ore | 1.39 | 1.39 | |||
|
Royalties (NSR basis exc freight) |
||||||
|
Total NSR Charges |
% | 6.12 | 6.12 | |||
|
Taxes on Opex |
||||||
|
Taxes on Opex & Royalties |
% | 8.02 | 8.02 | |||
|
Sustaining Capital |
||||||
|
Mining |
$/t rock | 0.32 | 0.32 | |||
|
Process, TSF G&A |
$/t ore | 0.48 | 0.48 | |||
|
Other |
||||||
|
Incremental Closure Cost |
$/t ore | 0.05 | 0.05 | |||
|
Pit Slopes |
||||||
|
Overall slopes for optimization |
Deg | 38.00 | 39.00 | |||
Notes:
| 1. | Cu recoveries for Western Porphyries resources range from 90.1% to 91.0%, with an average of 90.9% (refer to Section 13). |
| 2. | Au recoveries for Western Porphyries resources range from 44.5% to 80.2%, with an average of 69.5% (refer to Section 13). |
| 3. | Cu concentrate grades for Western Porphyries resources range from 24.8% to 37.6%, with an average of 31.3%. |
| 4. | Cu recoveries for Tanjeel resources assume a constant 86.7% (refer to Section 13). |
| 5. | Cu concentrate grades for Tanjeel resources assume a constant 23.4%. |
|
February 19, 2025 |
Page 180 |
|
|
NI 43-101 Technical Report on the Reko Diq Project |
|

Source: Barrick, 2024
Figure 14-36 Section Views through H14 of Resource Pit and Copper Distribution in WP
|
February 19, 2025 |
Page 181 |
|
|
NI 43-101 Technical Report on the Reko Diq Project |
|
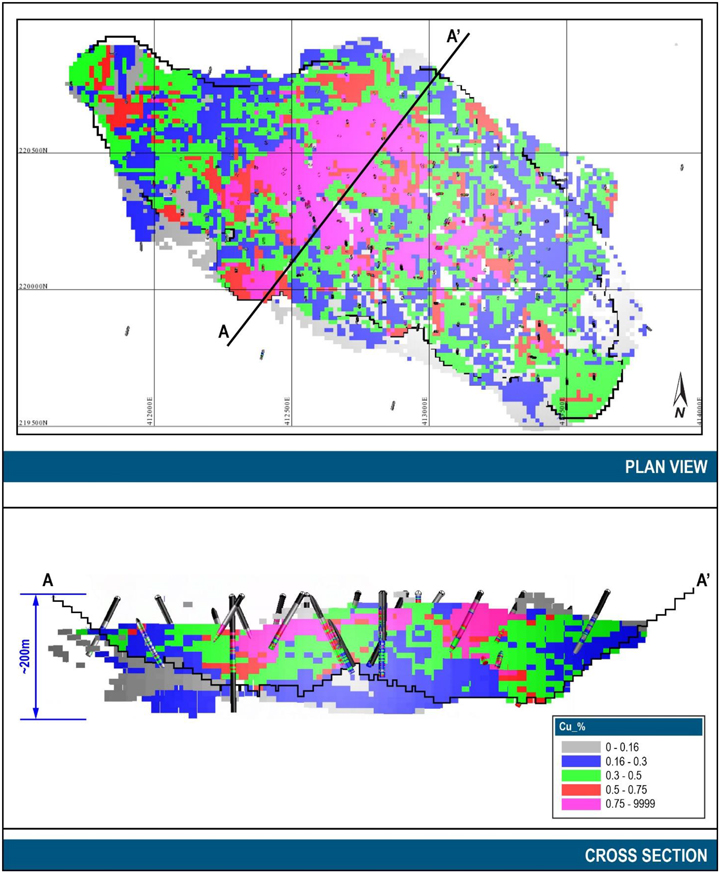
Source: Barrick, 2024
Figure 14-37 Section Views of Resource Pit and Copper Distribution in Tanjeel
|
February 19, 2025 |
Page 182 |
|
|
NI 43-101 Technical Report on the Reko Diq Project |
|
| 14.7.1 | Cut Off Grade |
The Project utilizes an NSR for cut-off determination. Based on the parameters in Table 14-45, the net smelter revenue for each block within the resource pit limit was calculated and assigned. Those blocks that produce a revenue greater than zero were flagged in the model as a Mineral Resource while those that were less than or equal to zero were assigned as waste.
Based on the parameters applied to calculate the NSR for each block, a comparable Cu COG grade of 0.13% and 0.15% was calculated for the Western Porphyries and Tanjeel, respectively.
| 14.8 | Mineral Resource Statement |
The Mineral Resource estimate have been prepared according to the Canadian Institute of Mining, Metallurgy and Petroleum (CIM) 2014 Definition Standards for Mineral Resources and Mineral Reserves dated 10 May 2014 (CIM (2014) Standards) as incorporated with National Instrument 43-101 Standards of Disclosure for Mineral Projects (NI 43-101). Mineral Resource estimate was also prepared using the guidance outlined in CIM Estimation of Mineral Resources and Mineral Reserves (MRMR) Best Practice Guidelines 2019 (CIM (2019) MRMR Best Practice Guidelines).
Total Mineral Resources for the Project on a 100% basis, shown in Table 14-46, are estimated to be the following:
| ● | Indicated categories: 3,930 Mt at an average grade of 0.43 % Cu and 0.23 g/t Au for 16.7 Mt Cu and 29.3 Moz Au; and |
| ● | Inferred category: 1,378 Mt at an average grade of 0.3 % Cu and 0.2 g/t Au for 4.5 Mt Cu and 7.8 Moz Au; |
The Mineral Resources, as shown in Table 14-46, are shown on a 100% basis and are reported inclusive of Mineral Reserves. The Mineral Resources are reported within a pit shell using an NSR calculation, i.e. any block with an NSR value greater than zero within the pit shell was reported as a Mineral Resource.
|
February 19, 2025 |
Page 183 |
|
|
NI 43-101 Technical Report on the Reko Diq Project |
|
Table 14-46 Reko Diq Mineral Resources Statement, 100% Basis, as of December 31, 2024
| Location | Measured | Indicated | Measured + Indicated | Inferred | ||||||||||||||||||||
| Tonnes | Grade | Contained | Tonnes | Grade | Contained | Tonnes | Grade | Contained | Tonnes | Grade | Contained | |||||||||||||
| (Mt) |
Cu (%) |
Cu (M)t | (Mt) |
Cu (%) |
Cu (Mt) | (Mt) |
Cu (%) |
Cu (Mt) | (Mt) |
Cu (%) |
Cu (Mt) |
|||||||||||||
| Western Porphyries | - | - | - | 3,653 | 0.42 | 15 | 3,653 | 0.42 | 15 | 1,276 | 0.3 | 4.2 | ||||||||||||
|
Tanjeel |
- | - | - | 277 | 0.45 | 1.3 | 277 | 0.45 | 1.3 | 102 | 0.3 | 0.3 | ||||||||||||
| Reko Diq Total | 3,930 | 0.43 | 17 | 3,930 | 0.43 | 17 | 1,378 | 0.3 | 4.5 | |||||||||||||||
| Location | Measured | Indicated | Measured + Indicated | Inferred | ||||||||||||||||||||
| Tonnes | Grade | Contained | Tonnes | Grade | Contained | Tonnes | Grade | Contained | Tonnes | Grade | Contained | |||||||||||||
| (Mt) |
Au (g/t) |
Au (Moz) | (Mt) |
Au (g/t) |
Au (Moz) | (Mt) |
Au (g/t) |
Au (Moz) | (Mt) |
Au (g/t) |
Au (Mg/t) |
|||||||||||||
| Western Porphyries | - | - | - | 3,653 | 0.25 | 29 | 3,653 | 0.25 | 29 | 1,276 | 0.2 | 7.8 | ||||||||||||
| Reko Diq Total | 3,653 | 0.25 | 29 | 3,653 | 0.25 | 29 | 1,276 | 0.2 | 7.8 | |||||||||||||||
Notes:
| ● | Mineral Resources are reported on 100% basis. Barrick’s attributable share of the Mineral Resource is based on its 50% interest in Reko Diq. |
| ● | The Mineral Resource estimate has been prepared according to CIM (2014) Standards and using CIM (2019) MRMR Best Practice Guidelines. |
| ● | Mineral Resources are reported based on an economic pit shell. |
| ● | Mineral Resources are reported using a long-term price of US$4.00/lb Cu and US$1,900/oz Au. |
| ● | NSR calculation considers smelting, refining and treatment charges, and payment terms, concentrate transport, metallurgical recoveries and royalties. |
| ● | Mineral Resources are inclusive of Mineral Reserves. |
| ● | Contained metal is reported in millions of tonnes of copper and million troy ounces of gold. |
| ● | Numbers may not add due to rounding. |
| ● | The QP responsible for this Mineral Resource Estimate is Peter Jones (MAIG). |
|
February 19, 2025 |
Page 184 |
|
|
NI 43-101 Technical Report on the Reko Diq Project |
|
| 14.9 | 2024 Versus 2022 Model Comparison |
| 14.9.1 | Western Porphyries |
A comparison of the 2024 Western Porphyries (H13-14-15-79) estimate against the previous reported model in 2022 is shown in Figure 14-38. This comparison was completed within the optimised pit shell generated on the 2022 model, using the economic assumptions outlined above and a 0.15% Cu cut-off grade. Note that this comparison is for validation purposes only and totals do not represent Mineral Resources as reported.
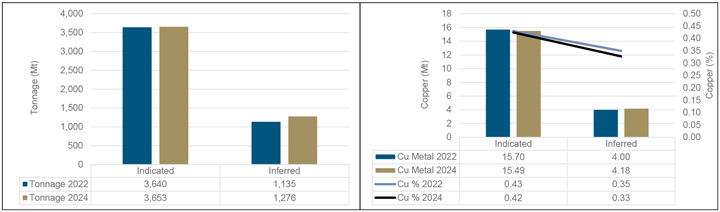
Source: Barrick, 2024
Figure 14-38 Comparison of 2022 and 2024 Western Porphyries models
As noted in Figure 14-38, very little difference is observed between the 2022 and 2024 estimates with the minor changes are due to adjustments to the geological interpretation, the inclusion of an updated topographic survey and differing pit optimization parameters.
| 14.9.2 | Tanjeel |
Comparison of the 2024 estimate against the previous model constructed in 2022 is shown in Figure 14-39. This comparison was completed within the optimised pit shell generated on prices of US$3.75/lb Cu, US$1,700 /oz Au for 2022 and US$4.00/lb Cu, US$1,900/oz Au for 2024. Note that this comparison is for validation purposes only and totals do not represent mineral resources as reported.
|
February 19, 2025 |
Page 185 |
|
|
NI 43-101 Technical Report on the Reko Diq Project |
|
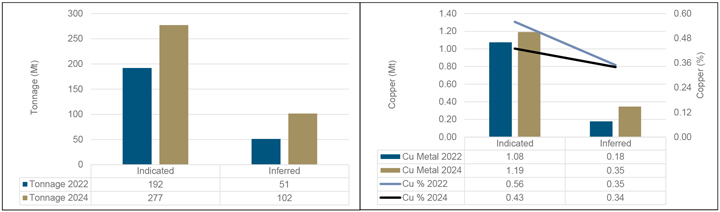
Source: Barrick, 2024
Figure 14-39 Comparison of 2022 and 2024 Tanjeel models
| 14.10 | QP Comments on Mineral Resource Estimate |
| 14.10.1 | External Mineral Resource Audit |
In September 2024, Barrick engaged a third-party consultant (Snowden Optiro) to complete an independent audit of the Mineral Resource estimation for Western Porphyries and Tanjeel Mineral Resource data and Mineral Resource estimate. The recommendations made were subject to the following ranking:
| ● | Critical: must be addressed immediately to remedy/rectify a fatal flaw or radical error. |
| ● | Recommended: an issue causing moderate causes of concern to be addressed prior to the next major Mineral Resource update (mid-2025). |
| ● | Value-added: of minor concern and includes suggestions for further investigation. |
Snowden Optiro did not identify any critical issues or fatal flaws and concluded that the processes underlying the generation and declaration of the Mineral Resource reflected good practice. Conclusions and comments relating to geological modeling and Mineral Resource estimation included:
| ● | The data analysis and modelling workflows are logical and well considered. |
| ● | The geology controls are well understood and documented. |
| ● | The current version of the Reko Diq block model has been estimated with diligence and attention to good modelling practice and validation techniques. |
All recommended items, and most of the value-added items, have since been implemented and includes the following for geological modelling and grade estimation:
|
February 19, 2025 |
Page 186 |
|
|
NI 43-101 Technical Report on the Reko Diq Project |
|
| ● | Barrick should create hybrid models of the key PFB1 to PFB3 units that use vein modelling and intrusion modelling techniques to improve the understanding of the porphyry orientations and interactions. |
| ● | Barrick should generate separate variograms for the H14 and H15 porphyries, given the different controls on mineralisation and lithological types. |
| ● | Barrick should strive to generate mineralization domains based upon geological, alteration, and/or mineralogical criteria. |
| 14.10.2 | Relative Accuracy/Confidence of the 2024 Mineral Resource Estimate |
The QP has reviewed the mineralization within Reko Diq, and confirms that the controls are well understood, sampled appropriately, and modeled accurately within the known geometry of the mineralization style.
The QP offers the following conclusions regarding the relative accuracy/confidence of the 2024 Mineral Resource estimate:
| ● | The Mineral Resource estimate has been prepared according to the CIM (2014) Standards as incorporated with NI 43-101, as well as using the guidance outlined in the CIM (2019) MRMR guidelines. |
| ● | The Mineral Resource and informing data have been reviewed independently by Snowden Optiro, who did not identify any fatal flaws and concluded that the Mineral Resource estimate and the data collected to inform them do not present any fatal flaws and are logical and well considered. |
| ● | The geo-metallurgical understanding of the deposit has improved through additional variability and bulk test work. Testing included an increased range of grind sizes and a detailed review of reagents throughout the concentrator to optimize the process design and reliability of estimates. |
| ● | The Mineral Resource is largely drilled out to a 100m by 100m spacing for Indicated Resource confidence and infill drilling to define appropriate Measured classification commenced in 2024 and will be completed prior to commissioning |
| ● | The Mineral Resource is constrained within optimised pit shells and reported above the in-situ marginal cut-off grades based on a $4.00/lb copper price and $1900/oz gold price which demonstrates reasonable prospects for eventual economic extraction. |
| ● | The drill data validation, compositing, domaining, outlier handling and estimation approach are appropriate, and reflect industry best practice, and therefore considers the Mineral Resources at Reko Diq to be appropriately estimated and classified and free of any material forms of error. |
The QP is not aware of any environmental, permitting, legal, title, taxation, socioeconomic, marketing, political, metallurgical, fiscal, or other relevant factors that are not discussed in this Report, that could materially affect the Mineral Resource estimate.
|
February 19, 2025 |
Page 187 |
|
|
NI 43-101 Technical Report on the Reko Diq Project |
|
| 15 | Mineral Reserve Estimate |
| 15.1 | Summary |
The Reko Diq Mineral Reserve estimate, as of 31 December 2024 is presented in Table 15-14. The Mineral Reserve estimate consists of in-situ open pit material from Western Porphyries and Tanjeel. The total Proven and Probable Mineral Reserves are estimated to be 3,008Mt of ore at 0.48% copper and 0.26 g/t gold with a contained 14.6Mt of copper and 25.6Moz of gold.
The estimate uses the Mineral Resource and geological models (as described in Section 14), economic assumptions, and modifying factors including geotechnical inputs, and metallurgical recovery estimates. The Qualified Person responsible for estimating the Mineral Reserves has performed an independent verification of the block model tonnes and grade, and in their opinion the process has been carried out to industry standards.
The Mineral Reserve estimate has been prepared according to CIM (2014) Standards as incorporated with NI 43-101. Mineral Reserve estimate was also prepared using the guidance outlined in CIM (2019) MRMR Best Practice Guidelines.
Definitions for Mineral Reserve categories used in this report are consistent with those defined by CIM (2014) and adopted by NI 43-101. In the CIM classification, a Mineral Reserve is defined as ‘the economically mineable part of a Measured and/or Indicated Mineral Resource. It includes diluting materials and allowances for losses, which may occur when the material is mined or extracted and is defined by studies at Feasibility level as appropriate that include application of Modifying Factors. Such studies demonstrate that, at the time of reporting, extraction could reasonably be justified.’ Mineral Reserves are classified into Proven and Probable categories.
The Mineral Reserves have been estimated from the Measured and Indicated Mineral Resources and do not include any Inferred Mineral Resources. Mineral Reserves include material that will be mined by open pit.
The QP is not aware of any mining, metallurgical, infrastructure, permitting, or other relevant factors which could materially affect the Mineral Reserve estimate.
Details of the Reserves estimation process are described below.
|
February 19, 2025 |
Page 188 |
|
|
NI 43-101 Technical Report on the Reko Diq Project |
|
| 15.2 | Mineral Reserves Estimation Process |
The Mineral Reserves for the open pits are based on detailed pit designs informed by GEOVIA Whittle® (Whittle) pit optimization software, incorporating the Lerch-Grossman algorithm optimized pit shells. In this process, each block of the pit design is designated as being ore or waste based on a net value calculation.
The process and key inputs for determining the optimized pit shell are outlined in Section 15.3.
The parameters and factors relevant to the detailed mine design are derived from recently completed interim studies undertaken by Barrick.
There are no existing stockpiles at Reko Diq. Stockpiles will be used during the course of the operation but are planned to contain material from within the stated Mineral Reserve, and do not represent any additional ore.
| 15.3 | Open Pit Optimization |
Determination of ultimate pit limits was undertaken using Whittle pit optimization software, incorporating the Lerch-Grossman algorithm.
No physical restrictions were applied to limit the size of the Western Porphyries and Tanjeel pits. Permanent infrastructure was sited outside an upside scenario pit shell and all leases are sufficient to cover the current mining and reasonable expansion scenarios. Grades relevant to the economic value calculation for each block are copper and gold.
Various economic parameters were used to estimate the block value and resultant ore or waste categorisation of the blocks within the ultimate pit shell.
The general process of determining the value is to estimate the revenue of the block and subtract the costs to process the block as ore; those blocks that have a positive value are flagged as plant feed within the pit shell. The remaining blocks are treated as waste and provide no revenue to the Project.
Table 15-2 summarizes the key input parameter for the pit optimization process.
|
February 19, 2025 |
Page 189 |
|
|
NI 43-101 Technical Report on the Reko Diq Project |
|
Table 15-1 Pit Optimization and NSR Input Parameters
| Units | WP | Tanjeel | ||||
|
Metal Prices |
||||||
|
Cu Price |
$/lb | 3.00 | 3.00 | |||
|
Au Price |
$/oz | 1,300 | - | |||
|
Processing Recoveries |
||||||
|
Cu Average Process Recovery |
% | 90.91 | 86.65 | |||
|
Au Average Process Recovery |
% | 69.35 | ||||
|
Concentrate Commercial Terms |
||||||
|
Cu Average Concentrate Grade |
% | 31.45 | 23.40 | |||
|
% Payable Cu in concentrate |
% | 96.50 | 96.50 | |||
|
% Payable Au in concentrate |
% | 94.00 | 94.00 | |||
|
Treatment Charge |
$/dmt | 85.00 | 85.00 | |||
|
Refining Charge, Cu |
$/lb | 0.09 | 0.09 | |||
|
Refining Charge, Au |
$/oz | 6.00 | 6.00 | |||
|
Transportation & Handling |
$/wmt | 94.54 | 94.54 | |||
|
Mining Cost |
||||||
|
Base Mining Cost |
$/t rock | 1.99 | 2.25 | |||
|
Incremental Mining Cost (< RL 981 m) |
$/t/15m | 0.035 | ||||
|
Average Mining Cost |
$/t rock | 2.54 | 2.25 | |||
|
Processing Cost |
||||||
|
Process Cost |
$/t ore | 5.67 | 5.67 | |||
|
Stockpile Rehandle |
$/t ore | 0.30 | 0.30 | |||
|
Additional Ore Haul Cost |
$/t ore | 0.50 | ||||
|
G&A & Social |
||||||
|
Unit Cost |
$/t ore | 1.39 | 1.39 | |||
|
Royalties (NSR basis exc freight) |
||||||
|
Total NSR Charges |
% | 6.12 | 6.12 | |||
|
Taxes on Opex |
||||||
|
Taxes on Opex & Royalties |
% | 8.02 | 8.02 | |||
|
Sustaining Capital |
||||||
|
Mining |
$/t rock | 0.33 | 0.33 | |||
|
Process, TSF G&A |
$/t ore | 0.48 | 0.48 | |||
|
Other |
||||||
|
Incremental Closure Cost |
$/t ore | 0.05 | 0.05 | |||
|
Pit Slopes |
||||||
|
Overall slopes for optimization |
Deg | 38 | 39 | |||
Notes:
| 1. | Cu recoveries for Western Porphyries reserves range from 90.1% to 91.0%, with an average of 90.9% (refer to Section 13). |
| 2. | Au rec recoveries for Western Porphyries reserves range from 44.5% to 80.2%, with an average of 69.5% (refer to Section 13). |
| 3. | Cu concentrate grades for Western Porphyries reserves range from 24.8% to 37.6%, with an average of 31.3%. |
| 4. | Cu recoveries for Tanjeel reserves assume a constant 86.7% (refer to Section 13). |
| 5. | Cu concentrate grades for Tanjeel reserves assume a constant 23.4%. |
| 15.3.1 | Mineral Resource Model |
The Mineral Reserve estimate and optimization process utilized the Mineral Resource block models for the Western Porphyries (WP) and Tanjeel deposits developed by Barrick and contractors working directly for Barrick. These models were then modified with the addition of variables, which were populated with data specifically for scheduling and Mineral Reserve estimation purposes.
|
February 19, 2025 |
Page 190 |
|
|
NI 43-101 Technical Report on the Reko Diq Project |
|
Only blocks with Indicated resource classifications were considered as potential plant feed for pit optimization. Inferred resource blocks were treated as waste material and, as shown in Section 14, it is noted there are no Measured resources within the Mineral Resources.
| 15.3.2 | Metal Price and Exchange Rate |
Metal prices used for the Mineral Reserves estimate are listed in Table 15-2.
Table 15-2 Metal Prices for Pit Optimization
| Metal | Unit | Price (US$) | ||
|
Copper |
$/lb | 3.00 | ||
|
Gold |
$/oz | 1,300 | ||
Pit optimizations were run on $1,300 per ounce gold prices prior to Barrick issuing guidance of $1,400 per ounce for reserves. A comparison was run to determine the impact of the additional reserves that would result from the price change, and it was considered not material. Mine designs are based on the $1,300 per ounce gold price optimizations for this report.
There are currently no plans to recover any other metals at Reko Diq in the LOM plan. Costs sourced in local currency, as outlined in Section 22, were covered to USD based on assumed exchange rates.
| 15.3.3 | Mining Recovery and Dilution Factors |
The Western Porphyries resource block model used for pit optimization had block dimensions of 25 m by 25 m by 15 m in the X, Y and Z directions respectively following being regularised. The block dimensions are typical of the assumed selective mining unit (SMU) size for large 1400t class rope shovels. The 15 m height of the blocks matches the assumed mining bench height.
The Tanjeel resource block model had block dimensions of 15 m by 15 m by 10 m in the X, Y and Z directions respectively. The grade distribution is less continuous than in the Western Porphyries due to the sub-horizontal layering resulting from supergene enrichment. Mining of the Tanjeel deposit will be undertaken using smaller 700t class hydraulic shovels on 10m benches.
The block dimensions for the Western Porphyries and Tanjeel resource models represent the practical SMU suitable for the equipment in use at the operation. Dilution and ore loss are considered to be adequately incorporated into the selected block size. No additional mining recovery or dilution assumptions are applied for the optimization and block value calculations.
|
February 19, 2025 |
Page 191 |
|
|
NI 43-101 Technical Report on the Reko Diq Project |
|
| 15.3.4 | Metallurgical Recoveries |
The processing plant plans to produce a copper concentrate. Details of the process plant can be found in Section 17.
Metal recoveries and concentrate grades for mine planning were based on the 2010 Expansion Prefeasibility Study and capped at 91%. Final recoveries in the metal plan are based on recoveries in Table 13-5, mass pull in Figure 13-7, recovery in Figure 13-8 and concentrate grade in Figure 13-9.
Western Porphyries
Processing metal recoveries and copper concentrate grades for the Western Porphyries are listed in Table 15-3. The Western Porphyries resource block model was provided with a DAL code (deposit, alteration, and lithology) populated into the model. Metallurgical recoveries and concentrate grades for pit optimization were subsequently coded into the mine planning block model using a Maptek Vulcan® (Vulcan) script.
Material within the leached zone near surface was assigned metal recoveries and concentrate grades of zero. This material was identified in the resource block model, where the field “Weathering” contained a value of “weathered”.
|
February 19, 2025 |
Page 192 |
|
|
NI 43-101 Technical Report on the Reko Diq Project |
|
Table 15-3 Western Porphyries Metal Recoveries and Cu Concentrate Grade
|
DAL Code |
Deposit | Alteration | Lithology | Concentrate Cu % |
Recovery % Cu |
Recovery % Au |
||||||
|
3102 |
H13 | pot | pfb2 | 36.60 | 91.00 | 52.60 | ||||||
|
3103 |
H13 | pot | vin | 31.85 | 91.00 | 74.70 | ||||||
|
3104 |
H13 | pot | vfl or vpu_gr | 35.65 | 90.85 | 63.45 | ||||||
|
3151 |
H13 | mix | pfb1 | 33.05 | 91.00 | 67.25 | ||||||
|
3152 |
H13 | mix | pfb2 | 34.40 | 91.00 | 68.30 | ||||||
|
3153 |
H13 | mix | vin | 34.00 | 91.00 | 68.10 | ||||||
|
3154 |
H13 | mix | vfl or vpu_gr | 35.00 | 91.00 | 73.25 | ||||||
|
3201 |
H13 | scc | pfb1 | 29.00 | 91.00 | 79.50 | ||||||
|
3202 |
H13 | scc | pfb2 | 24.80 | 90.60 | 70.50 | ||||||
|
3203 |
H13 | scc | vin | 28.72 | 91.00 | 75.70 | ||||||
|
3204 |
H13 | scc | vfl or vpu_gr | 33.30 | 90.40 | 70.60 | ||||||
|
4101 |
H14 | pot | pfb1 | 37.60 | 91.00 | 73.45 | ||||||
|
4102 |
H14 | pot | pfb2 | 36.60 | 91.00 | 52.60 | ||||||
|
4103 |
H14 | pot | vin | 31.85 | 91.00 | 74.70 | ||||||
|
4104 |
H14 | pot | vfl or vpu_gr | 35.65 | 90.85 | 63.45 | ||||||
|
4151 |
H14 | mix | pfb1 | 33.05 | 91.00 | 67.25 | ||||||
|
4152 |
H14 | mix | pfb2 | 34.40 | 91.00 | 68.30 | ||||||
|
4153 |
H14 | mix | vin | 34.00 | 91.00 | 68.10 | ||||||
|
4154 |
H14 | mix | vfl or vpu_gr | 35.00 | 91.00 | 73.25 | ||||||
|
4201 |
H14 | scc | pfb1 | 29.00 | 91.00 | 79.50 | ||||||
|
4202 |
H14 | scc | pfb2 | 24.80 | 90.60 | 70.50 | ||||||
|
4203 |
H14 | scc | vin | 28.72 | 91.00 | 75.70 | ||||||
|
4204 |
H14 | scc | vfl or vpu_gr | 33.30 | 90.40 | 70.60 | ||||||
|
5101 |
H15 | pot | pfb1 | 34.70 | 91.00 | 64.30 | ||||||
|
5102 |
H15 | pot | pfb2 | 34.40 | 91.00 | 68.30 | ||||||
|
5103 |
H15 | pot | vin | 33.70 | 91.00 | 57.20 | ||||||
|
5104 |
H15 | pot | vfl or vpu_gr | 36.80 | 90.10 | 44.50 | ||||||
|
5151 |
H15 | mix | pfb1 | 34.70 | 91.00 | 64.30 | ||||||
|
5152 |
H15 | mix | pfb2 | 34.40 | 91.00 | 68.30 | ||||||
|
5153 |
H15 | mix | vin | 33.70 | 91.00 | 57.20 | ||||||
|
5154 |
H15 | mix | vfl or vpu_gr | 36.80 | 90.10 | 44.50 | ||||||
|
5201 |
H15 | scc | pfb1 | 32.25 | 91.00 | 71.10 | ||||||
|
5202 |
H15 | scc | pfb2 | 24.80 | 90.60 | 70.50 | ||||||
|
5203 |
H15 | scc | vin | 27.80 | 91.00 | 70.20 | ||||||
|
5204 |
H15 | scc | vfl or vpu_gr | 26.90 | 91.00 | 80.20 | ||||||
|
Other |
0 | 0 | 0 | |||||||||
Tanjeel
Metal recoveries and concentrate grades for Tanjeel are listed in Table 15-4. The DAL codes were coded into the mine planning block model using a Vulcan script based on the Zone and Litho codes provided in the resource block model. Copper recoveries and concentrate grades were then assigned in the model based on the DAL codes.
|
February 19, 2025 |
Page 193 |
|
|
NI 43-101 Technical Report on the Reko Diq Project |
|
Table 15-4 Tanjeel Metal Recoveries and Cu Concentrate Grade
|
DAL Code |
Deposit | Zone | Litho | Conc Cu % |
Rec % Cu |
|||||||||
| 412 | 400 | superg_lg | pfq_old,tectonic_bx | 23.4 | 86.65 | |||||||||
| 413 | 400 | superg_lg | pqf_young, hydro_bx | 23.4 | 86.65 | |||||||||
| 414 | 400 | superg_lg | pfh | 23.4 | 86.65 | |||||||||
| 416 | 400 | superg_lg | iin, vin | 23.4 | 86.65 | |||||||||
| 422 | 400 | superg_hg | pfq_old,tectonic_bx | 23.4 | 86.65 | |||||||||
| 423 | 400 | superg_hg | pqf_young, hydro_bx | 23.4 | 86.65 | |||||||||
| 424 | 400 | superg_hg | pfh | 23.4 | 86.65 | |||||||||
| 426 | 400 | superg_hg | iin, vin | 23.4 | 86.65 | |||||||||
| 452 | 400 | hypogene | pfq_old,tectonic_bx | 23.4 | 86.65 | |||||||||
| 453 | 400 | hypogene | pqf_young, hydro_bx | 23.4 | 86.65 | |||||||||
| 454 | 400 | hypogene | pfh | 23.4 | 86.65 | |||||||||
| Other | 400 | 0 | 0 | |||||||||||
| 15.3.5 | Geotechnical Slope Parameters |
Various geotechnical studies of the pits have been completed since 2006 and have been updated, where relevant, as the various studies have progressed. The work to date has been completed by a combination of consulting geotechnical engineers and the geotechnical teams.
The geotechnical parameters are given in more detail in Section 16.3, however, overall slope angles (generally inter-ramp slope angles (IRA) with some adjustment for ramp intervals) were used in the optimisation work. The IRAs are given in Table 15 7.
Table 15-5 Open Pit Overall Slope Angles for Whittle
| Parameter | Unit | Western Porphyries |
Tanjeel | |||
|
Leached Cap |
° | 38.0 | 39.0 | |||
|
Fresh |
° | 38.0 | 39.0 | |||
| 15.3.6 | Operating Costs |
Operating costs assumed for pit optimization are summarized in Table 15-3. Operating costs were generally derived from a project interim financial model developed in September 2023 (2023 Financial Model).
Mining Costs
For the mine optimization workflow, mining operating costs were estimated based on the scenario mine plan from the financial model. The mining cost assumes a conventional large scale open pit mining operation using ultra-class shovels and trucks. Costs for TSF construction overhauls,
|
February 19, 2025 |
Page 194 |
|
|
NI 43-101 Technical Report on the Reko Diq Project |
|
incremental ore haulage from the Tanjeel pit, and stockpile ore rehandle were excluded from the mining cost.
In Western Porphyries, an incremental cost increase with depth of $0.035/t per 15-m bench was applied to blocks below a reference elevation of 981 m. This was to account for increased haulage cost with pit depth. The resulting average mining cost in Western Porphyries was $2.54/t. In Tanjeel an average mining cost of $2.25/t was used due to the relatively shallow depth of this pit.
Processing and General and Administration Costs
Processing and general and administration costs were derived from the financial model. LOM average costs were assumed for pit optimization. Allowances for ore stockpile rehandle and the incremental haulage cost from the Tanjeel pit to the Western Porphyries crushers were included in the processing cost for pit optimization.
Sustaining Capital
Allowances for sustaining capital were included in the mining and ore costs for pit optimization and are listed in Table 15-6. Sustaining capital allowances were derived from the financial model. Mining sustaining capital primarily considers mobile equipment replacements. Ore sustaining capital includes ongoing TSF construction capital.
Table 15-6 Sustaining Capital
| Item | Unit | WP | Tanjeel | |||
|
Mining |
$/t rock | 0.33 | 0.33 | |||
|
Process, TSF G&A |
$/t ore | 0.48 | 0.48 | |||
Offsite Concentrate Costs
Offsite concentrate treatment and refining costs were provided by RDMC and are summarized in Table 15-7. Concentrate inland transport costs assume rail transport from site to the port of Qasim.
|
February 19, 2025 |
Page 195 |
|
|
NI 43-101 Technical Report on the Reko Diq Project |
|
Table 15-7 Offsite Concentrate Costs
| Item | Unit | Value | ||
|
Concentrate Treatment Charge |
$/dmt | 85.00 | ||
|
Refining Charge per payable Cu lb |
$/lb | 0.09 | ||
|
Refining Charge per Payable Au oz |
$/oz | 6.00 | ||
|
Concentrate Moisture Content |
% | 8.00 | ||
|
Concentrate Inland Freight & Handling |
$/wmt | 45.32 | ||
|
Concentrate Ocean Freight & Handling |
$/wmt | 49.22 | ||
|
Concentrate Total Freight & Handling |
$/wmt | 94.54 | ||
|
Penalties |
$/dmt | 0.00 | ||
Royalties
Royalty costs are described in further detail in Section 22. A summary is shown in Table 15-8.
Table 15-8 Royalties
| Item | Unit | Year 01-15 |
Year 16+ |
LOM Average |
||||
|
Balochistan Royalty |
% | 5.00 | 5.00 | 5.00 | ||||
|
EPZ Surcharge |
% | 0.50 | 0.50 | 0.50 | ||||
|
Final Tax Regime LOM |
% | 0.00 | 1.00 | 0.62 | ||||
|
Total Royalty |
% | 5.50 | 6.50 | 6.12 | ||||
Taxes on Operating Costs
An allowance was included in the pit optimization for taxes levied on operating costs. Taxes on operating costs, applied as a percentage of operating costs, are listed in Table 15-9. A LOM average was derived from the Financial Model and adopted for pit optimization. The taxes were applied to mining, processing, G&A and offsite operating costs.
Table 15-9 Taxes on Operating Costs for Pit Optimization
| Item | Unit |
Year 01-09 |
Year 10 |
Year 11+ |
LOM Average |
|||||
|
Taxes on Operating Costs |
% | 0.00 | 5.20 | 10.08 | 8.02 | |||||
Closure
A nominal allowance was included for reclamation and mine closure and is listed in Table 15-10.
Table 15-10 Mine Closure Cost
| Item | Unit | WP | Tanjeel | |||
|
Closure |
$/t ore | 0.05 | 0.05 | |||
|
February 19, 2025 |
Page 196 |
|
|
NI 43-101 Technical Report on the Reko Diq Project |
|
Cost Summary
For a nominal block from the resource model, the total ore cost per tonne mined is illustrated in Table 15-11.
Table 15-11 Operating Costs for Pit Optimization
| Item | Unit | WP | Tanjeel | |||
|
Mining Cost |
||||||
|
Average Mining Operating Cost |
$/t rock | 2.54 | 2.25 | |||
|
Taxes on Operating Cost |
$/t rock | 0.20 | 0.18 | |||
|
Sustaining Capital |
$/t rock | 0.33 | 0.33 | |||
|
Total Average Mining Cost |
$/t rock | 3.07 | 2.76 | |||
|
Processing Cost |
||||||
|
Process Cost |
$/t ore | 5.67 | 5.67 | |||
|
Stockpile Rehandle |
$/t ore | 0.30 | 0.30 | |||
|
Additional Ore Haul Cost |
$/t ore | 0.50 | ||||
|
G&A & Social |
$/t ore | 1.39 | 1.39 | |||
|
Taxes on Operating Cost |
$/t ore | 0.59 | 0.63 | |||
|
Sustaining Capital |
$/t ore | 0.48 | 0.48 | |||
|
Closure |
$/t ore | 0.05 | 0.05 | |||
|
Total Ore Cost |
$/t ore | 8.48 | 9.02 | |||
Note: Totals may not add due to rounding.
| 15.3.7 | Optimisation Results and Final Shell Selection |
Table 15-12 and Table 15-12 lists the tonnages for the series of nested pit shells obtained in the optimization for Western Porphyries and Tanjeel respectively. Ore tonnes, waste tonnes, contained gold and copper are illustrated for varying revenue factors in Figure 15-1 for Western Porphyries and Figure 15-2 for Tanjeel. The contents of each revenue factor pit shell were evaluated assuming a copper price of $3.00/lb and gold price of $1,300/oz.
|
February 19, 2025 |
Page 197 |
|
|
NI 43-101 Technical Report on the Reko Diq Project |
|
Table 15-12 Whittle Pit Shell Results – Western Porphyries
| Revenue Factor |
Copper Price |
Gold Price |
Total Tonnes |
Ore Tonnes | Cu Grade |
Au Grade |
Contained Copper |
Contained Gold |
||||||||
| ($/lb) | ($/oz) | (kt) | (kt) | (%) | (g/t) | (Mt) | (Moz) | |||||||||
|
0.750 |
2.250 | 975.00 | 4,667,298 | 2,600,088 | 0.49 | 0.28 | 12.70 | 23.27 | ||||||||
|
0.775 |
2.325 | 1,007.50 | 4,775,115 | 2,633,409 | 0.49 | 0.28 | 12.83 | 23.58 | ||||||||
|
0.800 |
2.400 | 1,040.00 | 4,924,188 | 2,680,655 | 0.49 | 0.28 | 13.01 | 23.99 | ||||||||
|
0.825 |
2.475 | 1,072.50 | 4,992,798 | 2,702,664 | 0.48 | 0.28 | 13.09 | 24.17 | ||||||||
|
0.850 |
2.550 | 1,105.00 | 5,155,217 | 2,744,648 | 0.48 | 0.28 | 13.25 | 24.56 | ||||||||
|
0.875 |
2.625 | 1,137.50 | 5,222,866 | 2,764,638 | 0.48 | 0.28 | 13.32 | 24.72 | ||||||||
|
0.900 |
2.700 | 1,170.00 | 5,351,437 | 2,799,273 | 0.48 | 0.28 | 13.45 | 25.01 | ||||||||
|
0.925 |
2.775 | 1,202.50 | 5,530,321 | 2,852,046 | 0.48 | 0.28 | 13.61 | 25.44 | ||||||||
|
0.950 |
2.850 | 1,235.00 | 5,638,612 | 2,880,110 | 0.48 | 0.28 | 13.71 | 25.66 | ||||||||
|
0.975 |
2.925 | 1,267.50 | 5,707,443 | 2,904,088 | 0.47 | 0.28 | 13.78 | 25.81 | ||||||||
|
1.000 |
3.000 | 1,300.00 | 5,799,962 | 2,923,573 | 0.47 | 0.28 | 13.85 | 25.98 | ||||||||
|
1.025 |
3.075 | 1,332.50 | 5,904,447 | 2,952,337 | 0.47 | 0.28 | 13.94 | 26.17 | ||||||||
|
1.050 |
3.150 | 1,365.00 | 5,921,483 | 2,959,035 | 0.47 | 0.28 | 13.96 | 26.20 | ||||||||
|
1.075 |
3.225 | 1,397.50 | 6,039,472 | 2,995,529 | 0.47 | 0.27 | 14.05 | 26.41 | ||||||||
|
1.100 |
3.300 | 1,430.00 | 6,196,652 | 3,033,139 | 0.47 | 0.27 | 14.17 | 26.67 | ||||||||
|
1.125 |
3.375 | 1,462.50 | 6,221,589 | 3,041,887 | 0.47 | 0.27 | 14.19 | 26.72 | ||||||||
|
1.150 |
3.450 | 1,495.00 | 6,297,407 | 3,060,612 | 0.47 | 0.27 | 14.24 | 26.83 | ||||||||
|
1.175 |
3.525 | 1,527.50 | 6,368,252 | 3,072,905 | 0.46 | 0.27 | 14.29 | 26.93 | ||||||||
|
1.200 |
3.600 | 1,560.00 | 6,409,264 | 3,080,251 | 0.46 | 0.27 | 14.31 | 26.98 | ||||||||
|
1.225 |
3.675 | 1,592.50 | 6,538,778 | 3,110,615 | 0.46 | 0.27 | 14.39 | 27.16 | ||||||||
|
1.250 |
3.750 | 1,625.00 | 6,583,563 | 3,121,241 | 0.46 | 0.27 | 14.42 | 27.23 | ||||||||

Source: Barrick, 2024
Figure 15-1 WP Pit Shell Contained Metal by Revenue Factor
|
February 19, 2025 |
Page 198 |
|
|
NI 43-101 Technical Report on the Reko Diq Project |
|
Table 15-13 Whittle Pit Shell Results – Tanjeel Porphyries
| Revenue Factor | Copper Price |
Gold Price | Total Tonnes | Ore Tonnes | Cu Grade | Contained Copper |
||||||
| ($/lb) | ($/oz) | (kt) | (kt) | (%) | (Mt) | |||||||
|
0.750 |
2.250 | 975.00 | 162,385 | 87,967 | 0.77 | 0.68 | ||||||
|
0.775 |
2.325 | 1,007.50 | 172,566 | 95,540 | 0.74 | 0.71 | ||||||
|
0.800 |
2.400 | 1,040.00 | 184,413 | 105,142 | 0.71 | 0.75 | ||||||
|
0.825 |
2.475 | 1,072.50 | 197,051 | 113,321 | 0.69 | 0.78 | ||||||
|
0.850 |
2.550 | 1,105.00 | 210,790 | 121,772 | 0.67 | 0.82 | ||||||
|
0.875 |
2.625 | 1,137.50 | 226,841 | 131,645 | 0.65 | 0.85 | ||||||
|
0.900 |
2.700 | 1,170.00 | 239,181 | 140,434 | 0.63 | 0.88 | ||||||
|
0.925 |
2.775 | 1,202.50 | 252,223 | 149,312 | 0.61 | 0.91 | ||||||
|
0.950 |
2.850 | 1,235.00 | 262,401 | 155,715 | 0.60 | 0.94 | ||||||
|
0.975 |
2.925 | 1,267.50 | 277,994 | 165,457 | 0.58 | 0.97 | ||||||
|
1.000 |
3.000 | 1,300.00 | 300,525 | 176,847 | 0.57 | 1.01 | ||||||
|
1.025 |
3.075 | 1,332.50 | 314,216 | 183,390 | 0.56 | 1.03 | ||||||
|
1.050 |
3.150 | 1,365.00 | 325,094 | 189,626 | 0.55 | 1.05 | ||||||
|
1.075 |
3.225 | 1,397.50 | 335,768 | 195,201 | 0.55 | 1.06 | ||||||
|
1.100 |
3.300 | 1,430.00 | 342,552 | 199,421 | 0.54 | 1.08 | ||||||
|
1.125 |
3.375 | 1,462.50 | 356,339 | 205,958 | 0.53 | 1.10 | ||||||
|
1.150 |
3.450 | 1,495.00 | 363,696 | 210,194 | 0.53 | 1.11 | ||||||
|
1.175 |
3.525 | 1,527.50 | 372,877 | 214,813 | 0.52 | 1.12 | ||||||
|
1.200 |
3.600 | 1,560.00 | 380,606 | 218,732 | 0.52 | 1.13 | ||||||
|
1.225 |
3.675 | 1,592.50 | 384,895 | 220,864 | 0.51 | 1.14 | ||||||
|
1.250 |
3.750 | 1,625.00 | 390,738 | 223,101 | 0.51 | 1.14 | ||||||
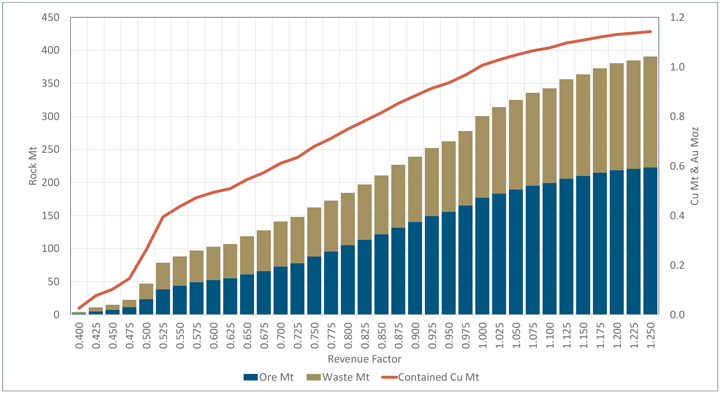
Source: Barrick, 2024
Figure 15-2 Tanjeel Pit Shell Contained Metal by Revenue Factor
|
February 19, 2025 |
Page 199 |
|
|
NI 43-101 Technical Report on the Reko Diq Project |
|
An exercise was undertaken to assess the impact of discounting on the Western Porphyries ultimate pit shell. The “Discount by Depth” optimization technique was used in the Whittle® software package. This technique discounts the value of a block by its depth in the model and attempts to account for time when generating the pit shells. the Western Porphyries ultimate pit shell in the H14 and H15 deposits is limited by the vertical extent of the indicated resources. The application of discounting results in a marginally smaller pit in the lower grade H13 portion of the Western Porphyries deposit.
The maximum undiscounted value (revenue factor 1.0) pit shell was chosen as the basis for subsequent pit design (further detailed in Section 16.3). This shell used US$3.00/lb for copper and US$1,300/oz for gold. A comparison of the volume (tonnages) difference between the selected whittle pit shell and final pit design is presented in Section 16.4.
The selection of this pit maximizes contained metal versus net present value (NPV). Selection of the maximum undiscounted value pit was considered appropriate for a long-life asset such as Reko Diq, with a project life of approximately 40 years based on the pit optimisation quantities and forecast production rate.
| 15.4 | Sensitivities |
A series of sensitivities were performed on the selected optimised shell by adjusting gold metal price, ore processing costs, and mining costs independently. The results of the total pit tonnes and the contained copper tonnes and contained gold ounces within the optimised shell for each sensitivity are shown below for the Western Porphyries and Tanjeel pits, respectively.
| 15.4.1 | Western Porphyries |
The sensitivity analysis of the Western Porphyries pit shell to economic inputs indicates that the physical size of the pit and contained metal is most sensitive to metal price. Contained metal is relatively insensitive to operating costs, metal recoveries, and pit slopes.
|
February 19, 2025 |
Page 200 |
|
|
NI 43-101 Technical Report on the Reko Diq Project |
|

Source: Barrick, 2024
Figure 15-3 WP Pit Shell Sensitivity to Economic Inputs – Cu Mt (Left), Au Moz (Right)
| 15.4.2 | Tanjeel |
The sensitivity analysis of the Tanjeel pit shell indicates that the physical size of the pit and contained metal is most sensitive to metal price. The pit physical size and contained metal are insensitive to pit slope as the Tanjeel pit is relatively shallow with a maximum depth of approximately 180 m below surface.

Source: Barrick, 2024
Figure 15-4 Tanjeel Pit Shell Sensitivity to Economic Inputs – Cu Mt
| 15.5 | Reconciliation |
There has been no historical production from the Project and therefore no reconciliation has been undertaken.
|
February 19, 2025 |
Page 201 |
|
|
NI 43-101 Technical Report on the Reko Diq Project |
|
| 15.6 | Mineral Reserve Statement |
The Mineral Reserve estimate have been prepared according to the Canadian Institute of Mining, Metallurgy and Petroleum (CIM) 2014 Definition Standards for Mineral Resources and Mineral Reserves dated 10 May 2014 (CIM (2014) Standards) as incorporated with National Instrument 43-101 Standards of Disclosure for Mineral Projects (NI 43-101). Mineral Reserve estimate was also prepared using the guidance outlined in CIM Estimation of Mineral Resource and Mineral Reserve Best Practice Guidelines 2019 (CIM (2019) MRMR Best Practice Guidelines).
The Mineral Reserves have been estimated from the Indicated Mineral Resources and do not include any Inferred Mineral Resources. Mineral Reserves include material that will be mined by open pit methods.
The estimate uses the latest Mineral Resource and geological models (as described in Section 14), economic assumptions, and modifying factors including geotechnical, and metallurgical recovery parameters. The QP responsible for estimating the Mineral Reserves have performed an independent verification of the block model tonnes and grade, and in their opinion the process has been carried out to industry standards.
The Western Porphyries complexes are massive, disseminated deposits with good grade continuity. Within the deposits, there is little, significant grade variation over short distances (i.e., few sharp ore and waste contacts). Grade changes are gradual and are generally highest in the centre of the porphyries, reducing towards the edges of the deposits. A block size study indicated that the deposit is relatively insensitive to block dimensions, with only minor variations in tonnage, grades and contained metal. Mining will primarily be undertaken using large electric rope shovels on 15m benches.
The grade distribution in Tanjeel is less continuous than in the Western Porphyries due to the sub-horizontal layering resulting from supergene enrichment. The Tanjeel deposit will be mined using smaller hydraulic shovels on 10m benches.
Dilution and ore loss are considered to be adequately incorporated into the selected Western Porphyries and Tanjeel block sizes and no additional factors have been applied in the mine planning process.
For the open pit, economic pit shells were generated using the Whittle® pit optimization software, incorporating the Lerch-Grossman algorithm and then used in the open pit mine design process and Mineral Reserve estimation. The final pit limit selection and design process is outlined in Section 16.
A site specific financial model was populated and reviewed to demonstrate that the Mineral Reserves are economically viable.
|
February 19, 2025 |
Page 202 |
|
|
NI 43-101 Technical Report on the Reko Diq Project |
|
The Mineral Reserves Statement is shown in Table 15-14. Mineral Reserves are estimated:
| ● | As of December 31, 2024. |
| ● | Using a copper price of $3.00/lb. |
| ● | Using a gold price of $1,400/oz. |
| ● | As ROM grades and tonnage delivered to the primary crushing facility. |
|
February 19, 2025 |
Page 203 |
|
|
NI 43-101 Technical Report on the Reko Diq Project |
|
Table 15-14 Reko Diq Mineral Reserves Statement, December 31, 2024
| Location | Proven | Probable | Proven and Probable | |||||||||||||||
| Tonnes | Grade | Contained | Tonnes | Grade | Contained | Tonnes | Grade | Contained | ||||||||||
| (Mt) | Cu (%) |
Cu (Mt) |
(Mt) | Cu (%) |
Cu (M)t |
(Mt) | Cu (%) |
Cu (Mt) |
||||||||||
|
Western Porphyries |
- | - | - | 2,861 | 0.48 | 14 | 2,861 | 0.48 | 14 | |||||||||
|
Tanjeel |
- | - | - | 147 | 0.62 | 1 | 147 | 0.62 | 1 | |||||||||
|
Reko Diq Total |
3,008 | 0.48 | 15 | 3,008 | 0.48 | 15 | ||||||||||||
| Location | Proven | Probable | Proven and Probable | |||||||||||||||
| Tonnes | Grade | Contained | Tonnes | Grade | Contained | Tonnes | Grade | Contained | ||||||||||
| (Mt) | Au (g/t) |
Au (Moz) |
(Mt) | Au (g/t) |
Au (Moz) |
(Mt) | Au (g/t) |
Au (Moz) |
||||||||||
|
Western Porphyries |
- | - | - | 2,861 | 0.28 | 26 | 2,861 | 0.28 | 26 | |||||||||
|
Reko Diq Total |
2,861 | 0.28 | 26 | 2,861 | 0.28 | 26 | ||||||||||||
Notes:
| ● | Proven and Probable Mineral Reserves are reported on 100% basis. Barrick’s attributable share of the Mineral Reserve is based on its 50% interest in Reko Diq. |
| ● | The Mineral Reserve estimate has been prepared according to CIM (2014) Standards and using CIM (2019) MRMR Best Practice Guidelines. |
| ● | Mineral Reserves are reported at a copper price of US$3.00/lb and a gold price of US$1,400/oz. |
| ● | Pit optimizations were run at US$3.00/lb Cu and US$1,300/oz Au. The additional material as a result of US$1,400/oz Au represented no material change to the Mineral Reserve. |
| ● | Mineral Reserves are estimated based on an economic pit design applying appropriate costs and modifying factors. |
| ● | Mineral Reserves are based on a NSR cut-off considering smelting, refining and treatment charges, and payment terms, concentrate transport, metallurgical recoveries and royalties. |
| ● | All reported metal is contained before process recovery; metal recoveries are variable based on material type. |
| ● | Contained metal is reported in millions of tonnes of copper and million troy ounces of gold. |
| ● | Numbers may not add due to rounding. |
| ● | The QP responsible for the Mineral Reserve Estimate is Mike Saarelainen, FAusIMM. |
|
February 19, 2025 |
Page 204 |
|
|
NI 43-101 Technical Report on the Reko Diq Project |
|
| 15.7 | QP Comments on Mineral Reserve Estimate |
The QP responsible for the Mineral Reserves has supervised the estimation process, and in their opinion, the process has been carried out to industry standards using appropriate modifying factors and costs for the conversion of Mineral Resources to Mineral Reserves.
The QP is not aware of any environmental, legal, title, socioeconomic, marketing, mining, metallurgical, infrastructure, permitting, fiscal, or other relevant factors that could materially affect the Mineral Reserve estimate. As noted in Section 4, while the permitting process for the Project is not finalized, Reko Diq sees no impediment to obtaining all required permits in the normal course of business.
| 15.7.1 | External Reviews |
In October 2024, Barrick engaged a third-party consultant (SRK Consulting) to complete an independent review of the mining components of the Reko Diq feasibility study. No material gaps were identified relating to mining elements of the study supporting the conversion of Mineral Resources to Mineral Reserves.
|
February 19, 2025 |
Page 205 |
|
|
NI 43-101 Technical Report on the Reko Diq Project |
|
| 16 | Mining Methods |
| 16.1 | Mining Methods |
The Reko Diq mine has been designed as a large-scale open pit operation. Mining will be carried out year-round, 24 hours per day using conventional drill, blast, load and haul methods. The primary shovel fleet includes electric rope and diesel hydraulic shovels with 360-t class haul trucks. The primary fleet is supported by front-end wheel loaders and ancillary equipment.
Haul trucks will deliver run-of-mine (ROM) ore from the open pits directly to the primary crushers or nearby ROM pad, or to temporary longer-term ore stockpiles. Waste rock will be placed in one of three onsite waste dumps or used for tailings storage facility construction.
Mining will be undertaken in two physically separate areas, termed the Western Porphyries and Tanjeel. The Western Porphyries pit incorporates the deposits referred to as H79, H15, H14 and H13. The smaller Tanjeel pit lies approximately 4 km to the east of the Western Porphyries pit and exploits the H4 deposit. The relative location of the porphyry complexes is illustrated in Figure 7-2.
The Western Porphyries deposits are circular, deep, large-scale copper-gold porphyry complexes. Mining in the Western Porphyries pit is forecast to reach a peak rate of 250 Mtpa (685 ktpd) and the deposit is amenable to the deployment of 1400 t class rope shovels as the primary loading tool.
The Tanjeel copper porphyry deposit features sub-horizontal layering resulting from supergene enrichment and has a more irregular ore distribution when comparted against the Western Porphyries deposit. Peak mining rate in the Tanjeel pit reaches approximately 40 Mtpa (110 ktpd) and the primary loading unit will be 700 t (34 m3 bucket) class diesel hydraulic shovels. The Tanjeel pit represents only 4% of the total mined tonnage in the mine plan.
For Western Porphyries, dilution and ore loss are considered to be adequately incorporated into the selected 25 m by 25 m by 15 m block size and no additional factors have been applied in the mine planning process based on a block size study conducted. The Tanjeel deposit resource model uses block dimensions of 15 m by 15 m by 10 m, reflecting the assumed selectivity of the chosen 700-t class shovel. No detailed dilution or ore loss studies have been undertaken for the Tanjeel deposit. The assumed selectivity for the 700-t class shovel size is consistent with other operations within Barrick.
A mining bench height of 15 m was selected for the Western Porphyries pit. This bench height is common for large porphyry deposit open pits using ultra class mining fleet. A bench height of 10 m was selected for Tanjeel due to the smaller scale of the pit and to enable increased selectivity.
|
February 19, 2025 |
Page 206 |
|
|
NI 43-101 Technical Report on the Reko Diq Project |
|
An excavation assessment (Coffey Mining, Sep 2009) indicated that fresh rock (VIN, VFL, porphyry) should be blasted. The assessment for weathered rocks indicates that approximately 90% of these materials may be removed by mechanical means (free dig). As this is not practical for the proposed 15 m bench height, all weathered material will be blasted. Production blastholes will be drilled using rotary drills that have penetration rates that vary by rock type. When pre-splitting is required, percussive drills will be used to drill these holes.
A full-service blasting contract is envisaged for at least the initial years at Reko Diq due to the scarcity of qualified personnel in Pakistan. This service would include the supply of bulk explosives and initiation systems, blasting engineering services, priming, loading and firing blasts, and management of explosives.
| 16.2 | Geotechnical and Hydrogeological Considerations |
| 16.2.1 | Geotechnical |
Various geotechnical studies have been undertaken on the Reko Diq project from 2009 to 2024 including:
| ● | Reko Diq Western Porphyries Open Pit Geotechnical Feasibility Study and Addendum (Coffey Mining Sep 2009 & Dec 2009); |
| ● | Reko Diq H13 Geotechnical Review (Coffey Mining April 2010); |
| ● | Reko Diq Tanjeel Geotechnical Review (Coffey Mining February 2010); and |
| ● | Reko Diq Western Porphyries 3D Slope Stability Modelling (Gecko Geotechnics June 2024). |
Geotechnical data was collected from:
| ● | 27 purpose-designed geotechnical diamond drill holes during the period from 2007 to 2009 investigation programmes. The IMD FS investigation programme consisted of 19 holes drilled in proposed pit wall locations; |
| ● | Materials test work performed on samples from these investigations; and |
| ● | Simple open hole piezometer, standpipe piezometer and vibrating wire piezometer information obtained from the regional groundwater exploration programme and from specifically designed monitoring installations located around the proposed pit location. |
An additional geotechnical diamond drilling campaign commenced in October 2023 to move the study from FS to DC (Design and Construct) for the initial mining phases (first 10 years) and ultimate pits by 2026. The additional drilling has, so far, not identified any major differences to the previous geotechnical model.
|
February 19, 2025 |
Page 207 |
|
|
NI 43-101 Technical Report on the Reko Diq Project |
|
Western Porphyries
Four geotechnical domains are interpreted for Western Porphyries. The geotechnical domains are weathering and lithology based and include Weathered rock (to a maximum depth of 50 m below surface), VIN (fresh rock); VFL (fresh rock); and, Porphyry (fresh rock).
The rock masses at Western Porphyries have been classified according to the Rock Mass Rating (RMR89) which provides five classification classes based on the following range of values:
|
● Class I |
Very good rock |
RMR89: 81 to 100 |
||||
|
● Class II |
Good rock |
RMR89: 61 to 80 |
||||
|
● Class III |
Fair rock |
RMR89: 41 to 60 |
||||
|
● Class IV |
Poor rock |
RMR89: 21 to 40 |
||||
|
● Class V |
Very poor rock |
RMR89: less than 21. |
||||
The VIN, VFL and Porphyry rock masses are of good quality (RMR89 ~ 68) with high RQD and strong intact rock strengths (60-75 MPa for fresh rock). RMR89 values for the geotechnical domains are shown in Table 16-1.
Table 16-1 Summary of RMR89 Data for Western Porphyries Rock Mass Units
| Item | Weathered Rock |
Fresh VIN | Fresh VLF | Fresh POR | Fault Zones | |||||
|
Parameter |
RMR89 | RMR89 | RMR89 | RMR89 | RMR89 | |||||
|
Mean |
38 | 68 | 69 | 68 | 29 | |||||
|
Median |
32 | 69 | 70 | 70 | 29 | |||||
|
Mode |
29 | 70 | 70 | 70 | 29 | |||||
|
Standard Deviation |
14 | 6.3 | 6.8 | 5.7 | 6.5 | |||||
|
Minimum |
21 | 21 | 29 | 43 | 21 | |||||
|
Maximum |
82 | 82 | 82 | 82 | 58 | |||||
|
Number of drill core intervals classified |
1,176 | 3,898 | 4,938 | 3,720 | 679 | |||||
Rock mass strength is influenced by structures, both open and healed, and is estimated at 35 MPa to 45 MPa, determined empirically after Laubscher (1990). For weathered rock, intact rock strength is up to 50% weaker than the fresh rock. Discontinuity shear strengths are relatively high with effective shear strengths of approximately 45º. A geotechnical domain model has been developed which is weathering and lithology based (sectors VIN; VFL; and Porphyry).
Stability analyses have demonstrated that open pit slope stability will be controlled by batter scale instabilities and that control could be most effectively achieved by a careful selection of batter angle and berm width combinations and by de-coupling inter-ramp slope heights which would have a limit of 120 m. The base case slope design parameters for the Western Porphyries are shown in Table 16-2.
|
February 19, 2025 |
Page 208 |
|
|
NI 43-101 Technical Report on the Reko Diq Project |
|
The pit slopes will be revised as mining progresses and rock characteristics are better understood. There is potential for the selected slope angles to improve for the final pushbacks, reducing waste movement requirements, however additional studies and testwork are required to confirm.
Table 16-2 Reko Diq Western Porphyries FS Slope Design Base Case
| Design | ID | Pit Sector |
Domain |
Slope Dip Direction | IRSA1 | Batter Angle |
Batter Height |
Berm Width |
||||||||||||
| From (º) | To (º) | (º) | (º) | (m) | (m) | |||||||||||||||
|
UP (Ultimate Pit) |
UP W1 |
All slopes | Leached cap | All slopes | 43.8 | 60 | 15 | 7.0 | ||||||||||||
| Fresh Rock Domains, 30 m continuity, 30 m batter heights | ||||||||||||||||||||
| UP F1 | 1 | NW | VIN | 115 | 200 | 48.0 | 65 | 30 | 13 | |||||||||||
| VFL | 48.0 | 65 | 30 | 13 | ||||||||||||||||
| POR | 48.0 | 65 | 30 | 13 | ||||||||||||||||
| 2 | NE | VIN | 200 | 300 | 48.0 | 65 | 30 | 13 | ||||||||||||
| VFL | 48.0 | 65 | 30 | 13 | ||||||||||||||||
| POR | 48.0 | 65 | 30 | 13 | ||||||||||||||||
| 3 | ESE | VIN | 300 | 325 | 48.0 | 65 | 30 | 13 | ||||||||||||
| VFL | 48.0 | 65 | 30 | 13 | ||||||||||||||||
| POR | 48.0 | 65 | 30 | 13 | ||||||||||||||||
| 4 | S | VIN | 325 | 75 | 48.0 | 65 | 30 | 13 | ||||||||||||
| VFL | 48.0 | 65 | 30 | 13 | ||||||||||||||||
| POR | 48.0 | 65 | 30 | 13 | ||||||||||||||||
| 5 | WSW | VIN | 75 | 115 | 48.0 | 65 | 30 | 13 | ||||||||||||
| VFL | 48.0 | 65 | 30 | 13 | ||||||||||||||||
| POR | 48.0 | 65 | 30 | 13 | ||||||||||||||||
| De-couple slope every 120 m with a geotechnical berm or 25 m wide bench (i.e., every 4th bench) | ||||||||||||||||||||
|
IMP (Initial Mining Phases H14-00; H15-00) |
IMP W1 |
All slopes | Leached cap | All slopes | 40.3 | 60 | 15 | 9.0 | ||||||||||||
| Fresh Rock Domains, 30 m continuity, 30 m batter heights | ||||||||||||||||||||
|
IMP F1 |
1 | NW | VIN | 115 | 200 | 46.0 | 65 | 30 | 15 | |||||||||||
| VFL | 46.0 | 65 | 30 | 15 | ||||||||||||||||
| POR | 46.0 | 65 | 30 | 15 | ||||||||||||||||
| 2 | NE | VIN | 200 | 300 | 46.0 | 65 | 30 | 15 | ||||||||||||
| VFL | 46.0 | 65 | 30 | 15 | ||||||||||||||||
| POR | 46.0 | 65 | 30 | 15 | ||||||||||||||||
| 3 | ESE | VIN | 300 | 325 | 46.0 | 65 | 30 | 15 | ||||||||||||
| VFL | 46.0 | 65 | 30 | 15 | ||||||||||||||||
| POR | 46.0 | 65 | 30 | 15 | ||||||||||||||||
| 4 | S | VIN | 325 | 75 | 46.0 | 65 | 30 | 15 | ||||||||||||
| VFL | 46.0 | 65 | 30 | 15 | ||||||||||||||||
| POR | 46.0 | 65 | 30 | 15 | ||||||||||||||||
| 5 | WSW | VIN | 75 | 115 | 46.0 | 65 | 30 | 15 | ||||||||||||
| VFL | 46.0 | 65 | 30 | 15 | ||||||||||||||||
| POR | 46.0 | 65 | 30 | 15 | ||||||||||||||||
| De-couple slope every 120 m with a geotechnical berm or 25 m wide bench (i.e., every 4th bench) | ||||||||||||||||||||
Notes:
| 1. | Inter-ramp Slope Angle (IRSA) |
Tanjeel
For Tanjeel a geotechnical model was developed using geotechnical domain characterisation, based on weathering / alteration and lithology. The model identified:
| ● | Major structure (faults) predominantly trending northwest-southeast with an inferred sub-vertically dip. |
| ● | Two dominant mineralised vein trends within the porphyry bodies which strike northeast-southwest and east-west. |
|
February 19, 2025 |
Page 209 |
|
|
NI 43-101 Technical Report on the Reko Diq Project |
|
The base case slope design parameters for Tanjeel are shown in Table 16-3.
Table 16-3 Reko Diq Tanjeel FS Slope Design Base Case
| ID |
Pit Sector |
Domain | Slope Dip Direction | OS | IRSA | Batter Angle |
Batter Height |
Berm Width |
||||||||||||
| From (º) | To (º) | (º) | (º) | (º) | (m) | (m) | ||||||||||||||
|
T W1 |
All slopes | Leached cap | All slopes | 39.2 | 60 | 10 | 6.5 | |||||||||||||
|
T F1 |
Fresh Rock Domains, 20 m continuity, 20 m batter heights | |||||||||||||||||||
| 1 | NW | All | 115 | 200 | 48.3 | 65 | 20 | 8.5 | ||||||||||||
| 2 | NE | All | 200 | 300 | 48.3 | 65 | 20 | 8.5 | ||||||||||||
| 3 | ESE | All | 300 | 325 | 48.3 | 65 | 20 | 8.5 | ||||||||||||
| 4 | S | All | 325 | 75 | 48.3 | 65 | 20 | 8.5 | ||||||||||||
| 5 | WSW | All | 75 | 115 | 48.3 | 65 | 20 | 8.5 | ||||||||||||
| De-couple slope every 120 m with a geotechnical berm or 25 m wide bench (i.e., every 4th bench) | ||||||||||||||||||||
Pit Stability Analysis
Three-dimensional slope stability analyses were performed using limit equilibrium, block failure and finite element methods in order to determine Factors of Safety (FoS) and identify potential simple and complex failure mechanisms.
No fatal flaws were identified with the current Western Porphyries Life-of-Mine design.
3D slope stability analysis was not performed for Tanjeel since the pit is relatively shallow and the economic risks are considerably lower than for Western Porphyries.
Ground Control Management Plan
In order to maintain a consistent high standard of geomechanics management, RDMC will develop and implement an effective ground control management plan (GCMP), based on local ground conditions and regulatory requirements in this jurisdiction. A generalized outline of GCMP guidelines is as follows:
| ● | Commitment and leadership; |
| ● | Site investigation – characterization and history; |
| ● | Design implementation – geological and operational limits; |
| ● | Performance monitoring – instrumentation; |
| ● | Management review and improvement; and |
| ● | Roles and responsibilities. |
| 16.2.2 | Hydrogeology |
Mine dewatering is not expected to be a major issue during the mine development.
|
February 19, 2025 |
Page 210 |
|
|
NI 43-101 Technical Report on the Reko Diq Project |
|
Hydrogeological impact assessment modelling (Digby Wells 2024) has indicated a peak groundwater inflow of approximately 9.2 L/s, which can be handled by local sumps where water is collected for use in dust suppression on haul roads and the loading face. A capital allowance has been made for diesel and pumps for this purpose. Estimated groundwater ingress into the Western Porphyries and Tanjeel pits is listed in Table 16-4.
Table 16-4 Estimated Groundwater Ingress into Western Porphyries and Tanjeel Pits
| WP Pit | Tanjeel Pit | |||||||||
| Year | Period |
Ingress (m3/d) |
Ingress (L/s) |
Ingress (m3/d) |
Ingress (L/s) |
|||||
|
1 |
2027 | 0 | 0 | - | - | |||||
|
2 |
2028 | 0 | 0 | - | - | |||||
|
3 |
2029 | 89 | 1.0 | - | - | |||||
|
4 |
2030 | 366 | 4.2 | - | - | |||||
|
5 |
2031 | 272 | 3.1 | - | - | |||||
|
6 |
2032 | 204 | 2.4 | - | - | |||||
|
7 |
2033 | 346 | 4.0 | - | - | |||||
|
8 |
2034 | 400 | 4.6 | - | - | |||||
|
9 |
2035 | 450 | 5.2 | - | - | |||||
|
10 |
2036 | 473 | 5.5 | - | - | |||||
|
11 |
2037 | 458 | 5.3 | 2 | 0.0 | |||||
|
16 |
2042 | 434 | 5.0 | 41 | 0.5 | |||||
|
21 |
2047 | 481 | 5.6 | 53 | 0.6 | |||||
|
26 |
2052 | 798 | 9.2 | 25 | 0.3 | |||||
|
31 |
2057 | 659 | 7.6 | 19 | 0.2 | |||||
|
36 |
2062 | 381 | 4.4 | 15 | 0.2 | |||||
|
136 |
21621 | 125 | 1.4 | 10 | 0.1 | |||||
Note:
| 1. | 100 years after closure. |
An allowance has been included in the mine operating costs for the drilling of sub-horizontal holes to depressurise the pit slopes. Conceptually, the holes would be approximately 200 m long with a 2o to 5o inclination above horizontal, and spaced 100 m apart. Drilling would start when the pit has reached approximately 150 m below surface. The design will be optimised as site operational experience is gained. Pit haulage ramps will be designed with ditches to direct the water to local sumps.
Concepts for diverting surface flows away from the pits during storm events were developed by Knight Piesold. This could be achieved through a channel 690 m long for 2027, then an additional 570 m long for the 2032 pit. The concept is illustrated in Figure 16-1. A capital allowance has been included for the pumping infrastructure to pump out the pit in 21 days after a 100-year 24-hour event. The required pumping rate for the ultimate pit ranges from 600 L/s assuming no surface diversions, to 500 L/s with diversions. The water will be pumped to the tailings storage facility.
|
February 19, 2025 |
Page 211 |
|
|
NI 43-101 Technical Report on the Reko Diq Project |
|
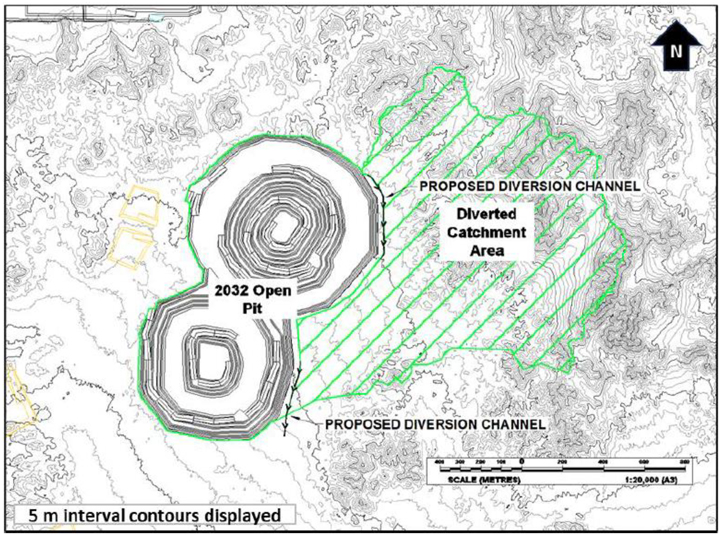
Source: Barrick 2024
Figure 16-1 Diversion Concept for the Pit (2032)
| 16.3 | Mine Design |
The pit shell resulting from the optimization described in Section 15.3 was used as the basis of the final pit design. The mine design process uses the pit shell as a foundation and adjusted by inclusion of access ramps, geotechnical berms, hydrogeological considerations, etc. to produce a practicable final pit design.
The contents of the Western Porphyries and Tanjeel ultimate pit designs were evaluated using Vulcan software. Scripts were developed to calculate the economic value of each block within the mining block model. The block value economic inputs were based on LOM average costs and were the same as used for pit optimization.
Any resource model block with a classification of measured or indicated, and a positive block value was considered as potential plant feed. Inferred resources were reported as waste.
|
February 19, 2025 |
Page 212 |
|
|
NI 43-101 Technical Report on the Reko Diq Project |
|
| 16.3.1 | Western Porphyries |
Pit Design Parameters
The final pit design is based on the following parameters:
| ● | No significant pre-stripping of waste rock is required before encountering ore in the centre of the H15 and H14 porphyry deposits. Ore is typically found at less than 20 m below surface in the initial mining phases. |
| ● | A mining bench height of 15 m was selected with geotechnical recommendations, allowing for a double bench configuration (30 m) except in the upper weathered zone where a single 15 m bench is required. |
| ● | Main haul roads are designed with 40 m width and maximum 10% gradient suitable for the safe operation of up to 360 tonne payload rigid rear dump haul trucks. A typical layout is displayed in Figure 16-2. |
| ● | Pit phase designs generally incorporate dual ramp access to facilitate continuous haulage and to lessen traffic density on individual ramps where multiple shovels are operating in the same phase. |
| ● | The minimum mining width for phase design is generally targeted to be 150 m; however, locally can be narrowed to 120 m where required. |
The geotechnical parameters are described in more detail in Section 16.3.
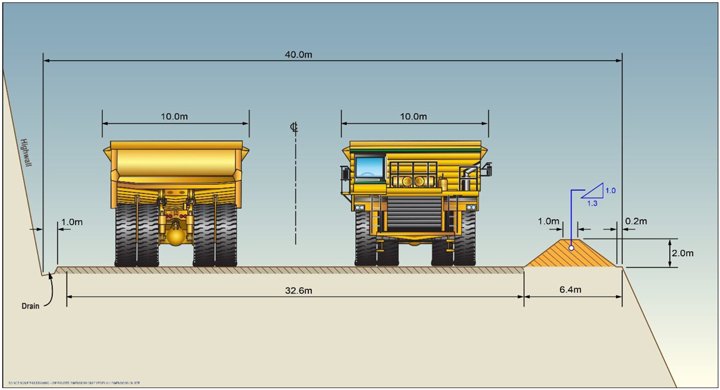
Source: Barrick, 2024
Figure 16-2 Typical Dual Haulage Ramp Cross-Section
|
February 19, 2025 |
Page 213 |
|
|
NI 43-101 Technical Report on the Reko Diq Project |
|
Ultimate Pit Design
The Western Porphyries ultimate pit design is illustrated in Figure 16-3. The ultimate pit extends approximately 4.5 km from northeast to southwest and is 2.3 km at its widest. The pit reaches a maximum depth of approximately 840 m below surface.
A volumetric comparison of the Western Porphyries ultimate pit design and Whittle® shell is provided in Table 16-5.
Table 16-5 WP Ultimate Pit Design and Whittle Shell Comparison
| Item | Unit | Design | Whittle | Variance | ||||||
|
Ore Tonnes |
Mt | 2,911 | 2,924 | -12 | -0.4% | |||||
|
Copper Grade |
% | 0.47 | 0.47 | 0.00 | -0.2% | |||||
|
Gold Grade |
g/t | 0.27 | 0.28 | 0.00 | -0.6% | |||||
|
Contained Copper Metal |
Mt | 13.8 | 13.8 | -0.1 | -0.7% | |||||
|
Contained Gold Metal |
Moz | 25.7 | 26.0 | -0.3 | -1.0% | |||||
|
Waste Tonnes |
Mt | 2,990 | 2,876 | 114 | 4.0% | |||||
|
Total Mined Tonnes |
Mt | 5,901 | 5,800 | 101 | 1.7% | |||||
|
Strip Ratio |
t/t | 1.03 | 0.98 | 0.04 | 4.4% | |||||
|
February 19, 2025 |
Page 214 |
|
|
NI 43-101 Technical Report on the Reko Diq Project |
|
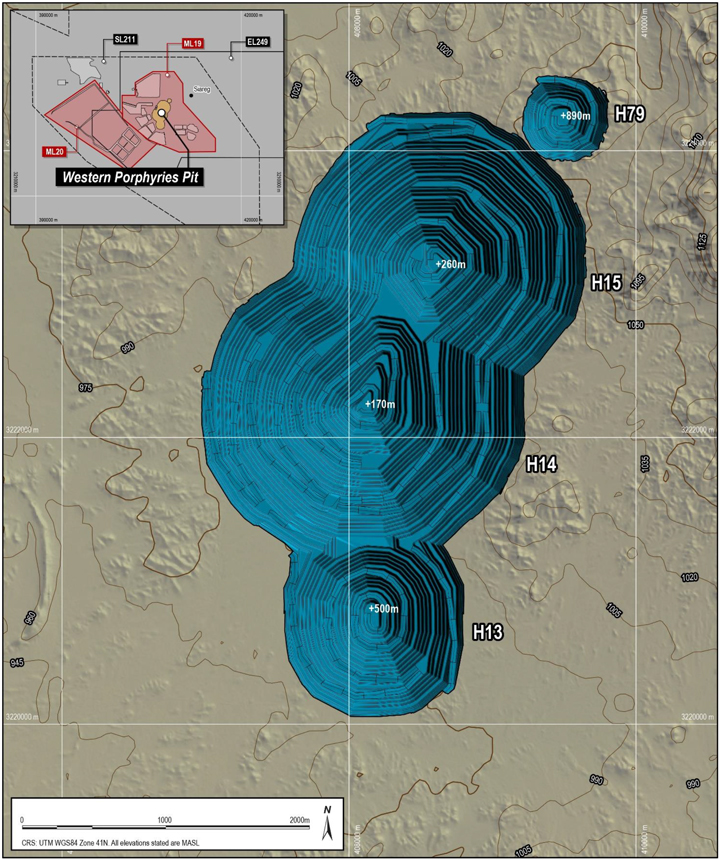
Source: Barrick, 2024
Figure 16-3 WP Ultimate Pit Design
|
February 19, 2025 |
Page 215 |
|
|
NI 43-101 Technical Report on the Reko Diq Project |
|
Phase Design
The Western Porphyries ultimate pit was divided into fourteen phases based on optimized nested pit shell guidance. Each phase was designed with independent access ramps. Dual ramp access was provided to individual phases as far as practicable.
Western Porphyries phase design volumetrics are listed in Table 16-6 and are illustrated in Figure 16-4.
Table 16-6 Western Porphyries Phase Design Volumetrics
| Phase | Ore Tonnes (Mt) |
Copper Grade (%) |
Gold Grade (%) |
Waste Tonnes (Mt) |
Total Tonnes (Mt) |
Strip Ratio (t/t) |
||||||
|
01_H15-00 |
227 | 0.50 | 0.31 | 43 | 270 | 0.19 | ||||||
|
02_H14-00 |
122 | 0.51 | 0.26 | 39 | 161 | 0.32 | ||||||
|
03_H15-01 |
292 | 0.50 | 0.28 | 116 | 408 | 0.40 | ||||||
|
04_H14-01 |
196 | 0.48 | 0.22 | 69 | 265 | 0.35 | ||||||
|
05_H15-2E |
139 | 0.48 | 0.25 | 174 | 313 | 1.25 | ||||||
|
06_H14-2E |
196 | 0.50 | 0.23 | 131 | 327 | 0.67 | ||||||
|
07_H15-2W |
256 | 0.47 | 0.27 | 122 | 378 | 0.48 | ||||||
|
08_H14-2W |
141 | 0.51 | 0.24 | 115 | 256 | 0.81 | ||||||
|
09_h15-3N |
213 | 0.47 | 0.28 | 439 | 652 | 2.06 | ||||||
|
10_H14-3S |
357 | 0.50 | 0.26 | 631 | 987 | 1.77 | ||||||
|
11_H15-3W |
439 | 0.53 | 0.35 | 718 | 1,157 | 1.63 | ||||||
|
12_H13-01 |
45 | 0.32 | 0.33 | 47 | 91 | 1.04 | ||||||
|
13_h13-02 |
263 | 0.27 | 0.24 | 311 | 574 | 1.19 | ||||||
|
00_H79-00 |
26 | 0.28 | 0.22 | 35 | 61 | 1.36 | ||||||
|
WP TOTAL |
2,911 | 0.47 | 0.27 | 2,990 | 5,901 | 1.03 | ||||||
|
February 19, 2025 |
Page 216 |
|
|
NI 43-101 Technical Report on the Reko Diq Project |
|
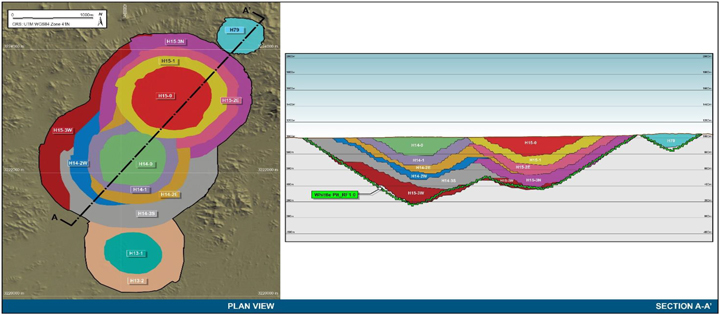
Source: Barrick, 2024
Figure 16-4 Western Porphyries Phase Designs
| 16.3.2 | Tanjeel |
Pit Design Parameters
The final pit design is based on the same parameters as described above for the Western Porphyries with the exception of the bench height. A bench height of 10 m was selected for Tanjeel due to the smaller scale of the pit and to enable increased selectivity. Mining will be undertaken at Tanjeel with smaller hydraulic shovels. Double benches (20 m) were employed for the fresh material.
The geotechnical parameters are described in more detail in Section 16.2.
Ultimate Pit Design
The Tanjeel ultimate pit design is illustrated in Figure 16-5. The pit is significantly smaller than the Western Porphyries pit and extends approximately 1.6 km from west to east, and by 1.0 km at its widest from north to south. The topography is gentle and ranges from an elevation of 1010 masl to 980 masl. The pit reaches a maximum depth of approximately 180 m below surface.
|
February 19, 2025 |
Page 217 |
|
|
NI 43-101 Technical Report on the Reko Diq Project |
|
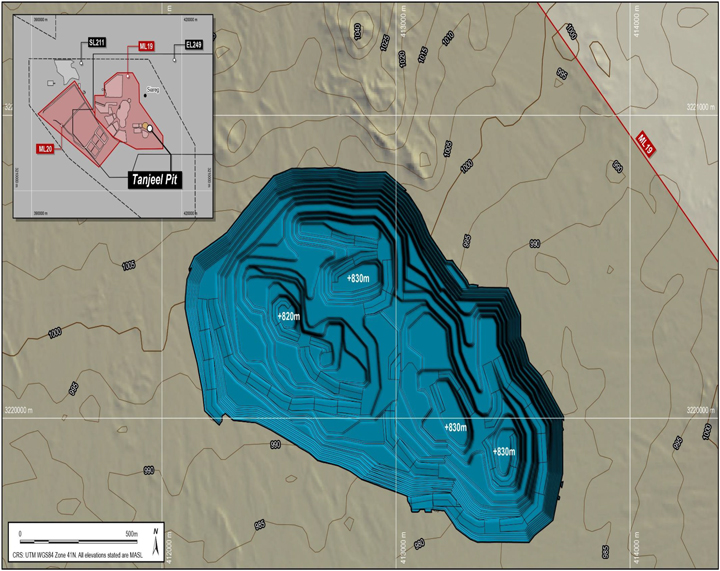
Source: Barrick, 2024
Figure 16-5 Tanjeel Ultimate Pit Design
|
February 19, 2025 |
Page 218 |
|
|
NI 43-101 Technical Report on the Reko Diq Project |
|
A comparison of the Tanjeel ultimate pit design and Whittle® shell is provided in Table 16-7.
Table 16-7 Tanjeel Ultimate Pit Design and Whittle Shell Comparison
| Item | Unit | Design | Whittle | Variance | ||||||
|
Ore Tonnes |
Mt | 176 | 177 | -1 | -0.7% | |||||
|
Copper Grade |
% | 0.56 | 0.57 | -0.01 | -0.9% | |||||
|
Gold Grade |
g/t | 0.00 | 0.00 | 0.00 | 0.0% | |||||
|
Contained Copper Metal |
Mt | 1.0 | 1.0 | 0.0 | -1.6% | |||||
|
Contained Gold Metal |
Moz | 0.0 | 0.0 | 0.0 | 0.0% | |||||
|
Waste Tonnes |
Mt | 132 | 124 | 9 | 6.9% | |||||
|
Total Mined Tonnes |
Mt | 308 | 301 | 7 | 2.4% | |||||
|
Strip Ratio |
t/t | 0.75 | 0.70 | 0.05 | 7.7% | |||||
Phase Design
The Tanjeel ultimate pit was divided into four phases based on optimized nested pit shell guidance. Tanjeel phase volumetrics are provided in Table 16-8 and are illustrated in Figure 16-6.
Table 16-8 Tanjeel Phase Design Volumetrics
| Phase |
Ore (Mt) |
Copper (%) |
Gold (%) |
Waste (Mt) |
Total (Mt) |
Strip Ratio (t/t) |
||||||
|
01-TJ |
27 | 0.73 | 0.00 | 34 | 61 | 1.24 | ||||||
|
02-TJ |
34 | 0.81 | 0.00 | 27 | 61 | 0.80 | ||||||
|
03-TJ |
82 | 0.47 | 0.00 | 41 | 123 | 0.51 | ||||||
|
04-TJ |
33 | 0.42 | 0.00 | 30 | 62 | 0.91 | ||||||
|
TJ TOTAL |
176 | 0.56 | 0.00 | 132 | 308 | 0.75 | ||||||
|
February 19, 2025 |
Page 219 |
|
|
NI 43-101 Technical Report on the Reko Diq Project |
|

Source: Barrick, 2024
Figure 16-6 Tanjeel Phase Designs
| 16.3.3 | Waste Rock Storage |
Waste rock at Reko Diq will consist of material from the Western Porphyries and Tanjeel pits that is uneconomic to process. Resource model blocks classified as Inferred or lower confidence have also been considered as waste rock. This rock will be placed in external waste dumps located to the north and south of Western Porphyries pit, to the south of Tanjeel pit and used as embankment bulk fill within the TSF located to the southwest of the Western Porphyries pit. The overall site waste dump and stockpile layout is illustrated in Figure 16-7.
|
February 19, 2025 |
Page 220 |
|
|
NI 43-101 Technical Report on the Reko Diq Project |
|
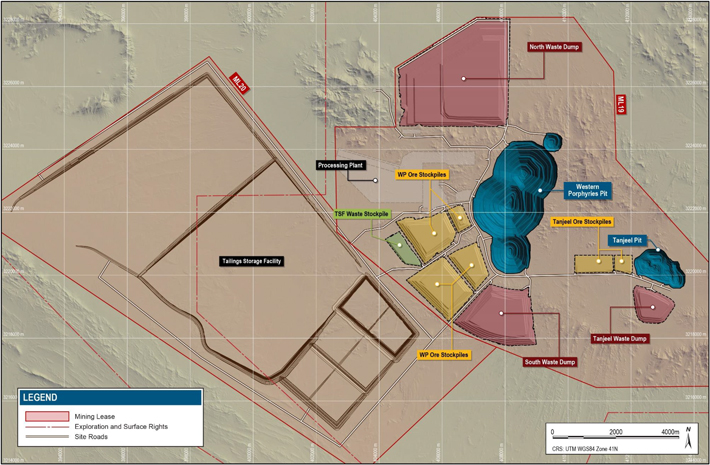
Source: Barrick, 2024
Figure 16-7 Site Waste Dump and Stockpile Layout
|
February 19, 2025 |
Page 221 |
|
|
NI 43-101 Technical Report on the Reko Diq Project |
|
Waste material will be required to construct the embankments for the rougher and cleaner tailings storage facilities. A temporary stockpile has been designed to store waste rock for construction of the TSF embankments. This stockpile is located to the southwest of the pit and decouples the TSF construction activities from the pit mining operation. The stockpile location was selected to mitigate potential issues with overheating of truck tyres due to the long haulage distances between the pit and TSF. A swell factor of 35% has been applied in the calculation of the size of the waste dump storage facilities and ore stockpiles. This is consistent with the swell factor used in the tailings dam construction estimates and was based on the experience of the TSF design engineer, Knight Piesold. Further details on the TSF design are provided in Section 18.
Policies and statutory regulations applicable to the storage, disposal or other handling of waste materials are defined in Section 20. Permitting considerations are described in Section 4.
Over the LOM, approximately 3,205 Mt of waste rock will be stored in the permanent waste dumps and TSF embankments. Waste rock will be produced at a combined maximum rate of approximately 200 Mtpa from both the Western Porphyries and Tanjeel pits.
Waste Rock Description
Acid generation and metal leaching test work from the deposits wall rocks indicates that virtually all mineralized rocks to be extracted have the potential to generate acid and leach metals (SRK, 2009). Those rock types that do not contain sulphide are essentially inert, but no rock type was identified with any appreciable buffering capacity. The classifications have implications on waste rock use and water management and are summarized in Table 16-9.
Table 16-9 Waste Rock Classification
| ARD | ARD | ARD | Construction | Water Management | ||||
| Code | Class | Description | Requirements | Requirements | ||||
|
HPAF |
3 | High Potential Acid Forming material |
Low quality material, limited use - fill only |
Requires runoff collection, minimize seepage |
||||
|
LPAF |
2 | Low Potential Acid Forming material |
No limitations |
Requires runoff collection, minimize seepage |
||||
|
NPAF |
1 | Negligible Potential Acid Forming material |
No limitations | No limitations | ||||
Waste quantities in the Western Porphyries and Tanjeel ultimate pits are summarized by Acid Rock Drainage (ARD) classification in Table 16-10.
|
February 19, 2025 |
Page 222 |
|
|
NI 43-101 Technical Report on the Reko Diq Project |
|
Table 16-10 Ultimate Pit by Waste Classification
| ARD | ARD | WP | Tanjeel | Total | % Waste | |||||||||
| Code | Class | Mt | Mt | Mt | WP | Tanjeel | Total | |||||||
|
HPAF |
3 | 492 | 135 | 627 | 16% | 82% | 20% | |||||||
|
LPAF |
2 | 2,222 | 29 | 2,251 | 73% | 18% | 70% | |||||||
|
NPAF |
1 | 327 | 0 | 327 | 11% | 0% | 10% | |||||||
|
Total |
3,040 | 164 | 3,205 | 100% | 100% | 100% | ||||||||
Source and Destination
No restrictions were placed on the haulage of HPAF material to the waste dumps due to the low rainfall present at the project site and low expected permeability of the final waste dump structures. HPAF material was however considered unsuitable for construction of the TSF embankments.
Inferred and mineralized waste material was routed to the waste dumps and not considered for TSF embankment construction. This was to ensure sufficient suitable TSF construction material was generated from the mining plan.
Possible final destinations for waste materials are summarized in Table 16-11. Waste quantities by type and destination resulting from the production schedule are summarised in
Table 16-12.
Table 16-11 Destinations for Waste Materials
| Waste Type | Destinations | |
|
HPAF |
Waste Dumps | |
|
LPAF |
Waste Dumps or Tailings Storage Facility | |
|
NPAF |
Waste Dumps or Tailings Storage Facility | |
|
Inferred |
Waste Dumps | |
|
Mineralized |
Waste Dumps | |
Table 16-12 Waste Totals by Type and Destination
| Waste Type | Units | WP North | WP South | TSF | Tanjeel | Total | ||||||
| Dump | Dump | Dump | ||||||||||
|
HPAF |
Mt | 184 | 56 | 0 | 92 | 331 | ||||||
|
LPAF |
Mt | 1,299 | 393 | 238 | 27 | 1,957 | ||||||
|
NPAF |
Mt | 73 | 22 | 19 | 5 | 119 | ||||||
|
Inferred |
Mt | 294 | 89 | 0 | 3 | 386 | ||||||
|
Mineralized |
Mt | 287 | 87 | 0 | 38 | 412 | ||||||
|
Total |
Mt | 2,137 | 647 | 257 | 164 | 3,205 | ||||||
|
February 19, 2025 |
Page 223 |
|
|
NI 43-101 Technical Report on the Reko Diq Project |
|
Waste Rock Dump Design
Considerations for the location of the permanent waste dumps (excluding the TSF embankments) included:
| ● | Within the mining lease boundary; |
| ● | Areas where condemnation drilling has not shown any potentially economic mineralization; |
| ● | Outside the limits of an upside pit optimization shell, using an upside resource block model and assuming higher metal prices of $5.00/lb for copper and $2000/oz for gold; and |
| ● | As close as practical to the pits. |
The Western Porphyries north and south dumps, and the Tanjeel dump are located on generally flat topography. The area to the east of the Western Porphyries pit has not been considered for potential dumping of waste since condemnation drilling has not been completed. This area contains mineralized zones of interest.
No detailed geotechnical investigations have been undertaken for the waste rock dumps. Review of the geotechnical studies undertaken to date (Bar, 2022) identified this as a gap; however, waste rock dumps and stockpiles are considered low risk structures due to:
| ● | Large spatial extents and low overall heights of the rock fill structures and general competent nature of the host rocks. |
| ● | Relatively flat foundation terrain. |
| ● | Shallow soil and weak rock profile based on nearby drilling. |
| ● | Dry climate and foundation. |
Waste dumps will be built from the bottom up in 30 m lifts. The toe of each subsequent lift will be set back a minimum of 20 m from the crest of the previous lift, resulting in an overall dump angle of 2H:1V (26.6°). Haulage ramps were designed to an overall width of 40 m and a maximum gradient of 10%.
Temporary ore stockpiles have been designed using the same parameters; however, they will be constructed in 15 m dumping lifts with a berm left every 30 m vertically. Reclaiming of the stockpiles will be undertaken using the mining loading fleet on a 15 m bench height. Stockpiles will be reclaimed from top down. Maintaining a consistent stockpile dumping and reclaiming bench height will aid with inventory modelling and reclaim planning.
Waste dump and stockpile design parameters are listed in Table 16-13.
|
February 19, 2025 |
Page 224 |
|
|
NI 43-101 Technical Report on the Reko Diq Project |
|
Table 16-13 Waste Dump & Stockpile Design Parameters
| Facility |
Overall Slope (°) |
Batter height (m) |
Batter Angle (°) |
Berm Width (m) |
Swell Factor (%) |
|||||
|
Waste Dumps |
26.6 | 30 | 37 | 20 | 35% | |||||
|
Ore Stockpiles |
26.6 | 30 | 37 | 20 | 35% | |||||
The overall site waste dump and stockpile layout was illustrated in Figure 16-7.
Waste dump design volume and tonnage capacities are provided in Table 16-14. The design volumes of the waste dumps and stockpiles are marginally larger than their storage requirement.
Table 16-14 Waste Dump Design Capacity
| Waste Dump | Volume (Mm3) |
Tonnes (Mt) |
||
|
North Dump |
1,058 | 2,116 | ||
|
South Dump |
340 | 680 | ||
|
Tanjeel Dump |
110 | 220 | ||
|
TSF Embankment |
147 | 294 | ||
|
Total |
1,655 | 3,311 | ||
The North Waste Dump is the largest of the planned waste dumps in terms of storage capacity and height. The final dump is approximately 3.0 km long by 3.0 km wide and reaches 175 m above the topographic surface. The dump will accommodate waste primarily from the H79, H15 and H14 deposits and will be operational for the life of the project The ultimate North Waste Dump design is illustrated in Figure 16-8.
|
February 19, 2025 |
Page 225 |
|
|
NI 43-101 Technical Report on the Reko Diq Project |
|
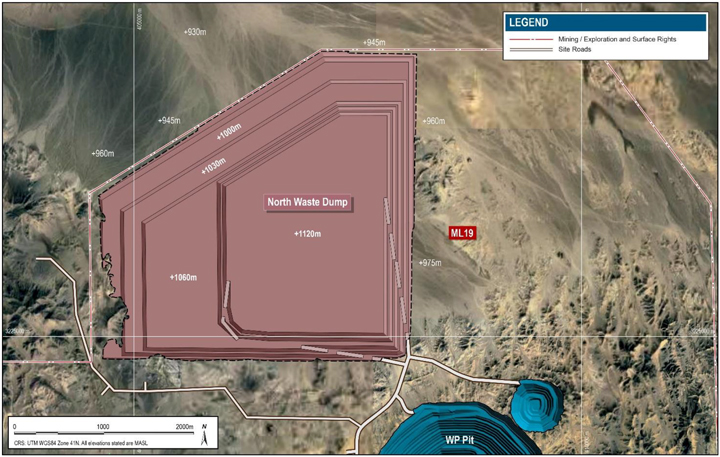
Source: Barrick, 2024
Figure 16-8 North Waste Dump Design
Volumetric capacity by dumping lift is provided in Table 16-15.
Table 16-15 North Waste Dump Design Volume
|
Waste Dump |
Lift RL (m) |
Volume (Mm3) |
Tonnes (Mt) |
|||
|
North Dump |
970 | 123 | 247 | |||
| 1000 | 256 | 513 | ||||
| 1030 | 237 | 473 | ||||
| 1060 | 191 | 383 | ||||
| 1090 | 133 | 266 | ||||
| 1120 | 117 | 235 | ||||
| Total | 1,058 | 2,116 | ||||
The South Waste Dump is approximately one-third the capacity of the North Dump, measuring 1.5 km long by 1.5 km wide, and reaches a maximum height of 155 m above surface. The dump accommodates waste from the H13 and H14 deposits and commences receiving waste rock from the 2029, or three years after mining commences. The dump remains operational through to 2061, or when mining of the Western Porphyries pit is complete. The ultimate South Dump design is illustrated in Figure 16-9.
|
February 19, 2025 |
Page 226 |
|
|
NI 43-101 Technical Report on the Reko Diq Project |
|

Source: Barrick, 2024
Figure 16-9 South Waste Dump Design
Volumetric capacity by dumping lift is provided in Table 16-16
Table 16-16 South Waste Dump Design Volume
|
Waste Dump |
Lift RL (m) |
Volume (Mm3) |
Tonnes (Mt) |
|||
|
South Dump |
980 | 62 | 124 | |||
| 1010 | 88 | 176 | ||||
| 1040 | 76 | 151 | ||||
| 1070 | 63 | 126 | ||||
| 1100 | 51 | 103 | ||||
| Total | 340 | 680 | ||||
The Tanjeel Waste Dump is located adjacent to the Tanjeel pit and is the smallest of the waste rock dumps. The dump reaches a maximum height of 90 m above surface and extends approximately 1.0 km in length by 1.0 km in width. The dump accommodates only waste rock from the Tanjeel pit and will be operational for a period of 11 years from 2037 to 2047. The ultimate Tanjeel Waste Dump design is shown in Figure 16-10.
|
February 19, 2025 |
Page 227 |
|
|
NI 43-101 Technical Report on the Reko Diq Project |
|
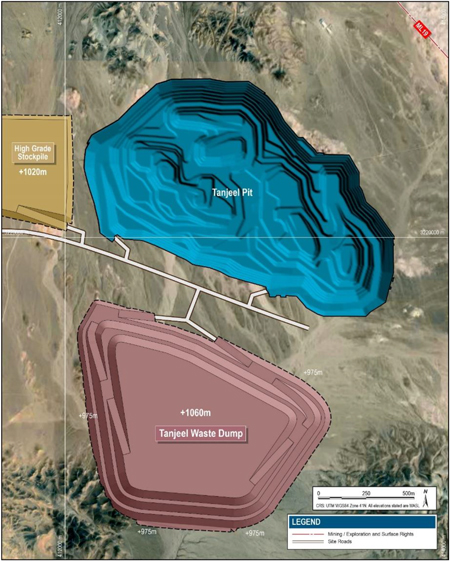
Source: Barrick, 2024
Figure 16-10 Tanjeel Waste Dump Design
Volumetric capacity by dumping lift is provided in Table 16-17.
Table 16-17 Tanjeel Waste Dump Design Volume
|
Waste Dump |
Lift RL (m) |
Volume (Mm3) |
Tonnes (Mt) |
|||
|
Tajeel Dump |
1000 | 44 | 89 | |||
| 1030 | 38 | 76 | ||||
| 1060 | 27 | 55 | ||||
| Total | 110 | 220 | ||||
Waste Dump Management
Environmental monitoring will be carried out throughout the mine site by the environmental team to measure dust, noise, water quality and other relevant characteristics of the mine operation.
|
February 19, 2025 |
Page 228 |
|
|
NI 43-101 Technical Report on the Reko Diq Project |
|
Waste rock dump stability will be monitored in accordance with the GCMP.
Material classified as NPAF (Class 1) will not require any specific water management for runoff. All materials placed in ARD Class 2 (LPAF) will require suitable drainage control for infrequent but heavy precipitation events. This will involve channelling of runoff into evaporation areas or back to the process plant for use on site. HPAF material should be placed on a suitable repository with drainage control for the infrequent but potentially heavy precipitation events. The quantities of each waste classification are summarized in Table 16-10.
Due to the arid climactic conditions, groundwater is not expected to affect the waste dump stability. As noted in Section 5.2 rainfall is minor on a yearly basis with an average of less than 35 mm.
Water Management is described in further detail in Section 18.
| 16.3.4 | Stockpiles |
The mine plan incorporates an elevated cut-off grade strategy, where higher value ore is preferentially fed to the process plant with objective of reducing the project capital payback period. Lower value ore is stockpiled and reclaimed later in the mine life. Four primary stockpiles were designed to accommodate this material near the Western Porphyries pit and two stockpiles near the Tanjeel pit. A waste stockpile was also designed for TSF embankment fill.
The stockpiles will be constructed from the bottom up in 15 m lifts. A 20 m wide berm will be included every 30 m vertically. The stockpiles will be reclaimed from the top down in 15 m lifts. This lift height is suitable for the application of large wheel loaders.
The design capacities of the stockpiles are summarized in Table 16-18 which have been designed to a larger capacity than the mine plan storage requirement.
Table 16-18 Stockpile Design Capacities
| Location | Temporary Stockpiles | Cut-off NSR ($/t) |
Volume (Mm3) |
Tonnes (Mt) |
||||
|
Western Porphyries |
Very High-Grade Ore | >=35.8 | 19 | 38 | ||||
| High Grade Ore | >=25.67 | 59 | 118 | |||||
| Medium Grade Ore | >=17.7 | 132 | 265 | |||||
| Low Grade Ore | >=Breakeven | 187 | 373 | |||||
| Total Ore | 397 | 794 | ||||||
| TSF Waste | 36 | 72 | ||||||
|
Tanjeel |
High Grade Ore | >=17.93 | 6 | 12 | ||||
| Medium Grade Ore | >=13.79 | 26 | 52 | |||||
| Total | 32 | 64 | ||||||
The layout of the stockpiles near the Western Porphyries pit is illustrated in Figure 16-11. The Tanjeel stockpile layout is shown in Figure 16-12.
|
February 19, 2025 |
Page 229 |
|
|
NI 43-101 Technical Report on the Reko Diq Project |
|
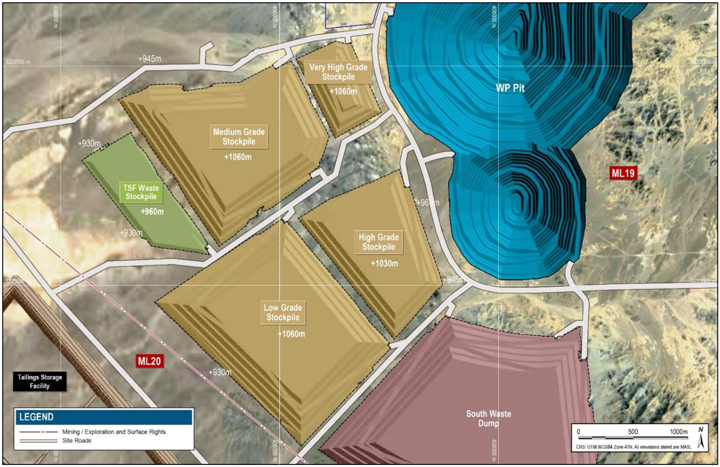
Source: Barrick, 2024
Figure 16-11 Western Porphyries Stockpile Layout
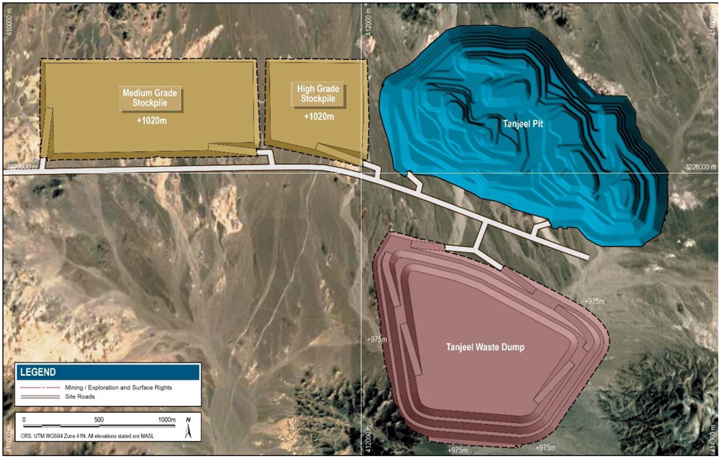
Source: Barrick, 2024
Figure 16-12 Tanjeel Stockpile Layout
|
February 19, 2025 |
Page 230 |
|
|
NI 43-101 Technical Report on the Reko Diq Project |
|
| 16.4 | Mining Equipment |
The mine operations will use conventional drilling, blasting, truck, and loader methods with various support ancillary equipment. Equipment models listed in this Report are indicative for the purposes of sizing, costing, and equipment requirements. The actual models used by the Project are subject to final selection following equipment procurement processes.
For the Western Porphyries pit, the primary loading units will be electric rope shovels (Komatsu 4100XPC), and secondary loading units are hydraulic face shovels (Komatsu PC7000-11). The Tanjeel pit will only use hydraulic face shovels (Komatsu PC7000-11). In both pits, these shovels will be matched with Komatsu 980E-5 haul trucks. Ore rehandling activities utilize haul truck primary production equipment and Komatsu WE2350 wheeled loaders. Reclaiming and transport of waste rock stockpiled for TSF embankment bulk fill will be undertaken using a separate fleet of Cat 995 wheeled loaders and Cat 789D haul trucks.
Blasting patterns are designed to accommodate drilling equipment with consideration to factors including geomechanics, material type and/or hardness, and ore location. Blast holes are planned to be drilled using a fixed drill hole diameter, Western Porphyries will use 270 mm and Tanjeel will use 251 mm. Pre-split blast hole will use 165 mm diameter holes. Blast hole depths will be based on bench height with suitable subdrill.
Explosives will be supplied and loaded into blast holes by an explosive’s contractor. A blend of Emulsion and ANFO will be used. Appropriate powder factors will be used to match ore, and waste types based on required fragmentation and other outcomes.
Ancillary activities will be performed using various equipment. This equipment consists of small excavators (CAT 395), tracked dozers (CAT D11), wheeled dozers (CAT 854K), motor graders (CAT 24M), water carts (CAT 789), and smaller front-end loaders.
Table 16-19 summarizes the primary loading, hauling, and drilling equipment fleet planned to be used.
|
February 19, 2025 |
Page 231 |
|
|
NI 43-101 Technical Report on the Reko Diq Project |
|
Table 16-19 Fleet Requirements for Reko Diq
| Model | Type | Phase 1 | Phase 2 | Ramp Down |
||||||
| [2027-2032] | [2033-2042] | [2043-2057] | ||||||||
|
KOM 4100XPC |
Rope Shovel | 5 | 6 | 8 | 7 | |||||
|
KOM PC7000-11 |
Face Shovel | 2 | 4 | 5 | 2 | |||||
|
KOM WE2350 |
Wheeled Loader | 2 | 3 | 4 | 6 | |||||
|
CAT 995 |
Wheeled Loader | TSF | 1 | 1 | 1 | 1 | |||||
|
KOM 980E-5 |
Haul Truck | 52 | 82 | 130 | 115 | |||||
|
CAT 789 |
Haul Truck | TSF | 8 | 11 | 6 | 6 | |||||
|
CAT 395 |
Support Excavator | 6 | 8 | 9 | 4 | |||||
|
CAT D11 |
Tracked Dozer | 14 | 20 | 23 | 13 | |||||
|
CAT D10 |
Tracked Dozer | TSF | 2 | 2 | 2 | 2 | |||||
|
CAT 854K |
Wheeled Dozer | 4 | 6 | 7 | 4 | |||||
|
CAT 24M |
Grader | 8 | 13 | 17 | 13 | |||||
|
CAT 777 (Service) |
Service Truck | 8 | 11 | 13 | 8 | |||||
|
CAT 789 (Water) |
Water Truck | 6 | 9 | 13 | 10 | |||||
|
CAT 993 (Cable Reeler) |
Cable Reeler | 3 | 4 | 4 | 2 | |||||
|
SANDVIK DR412i |
Production Drill Rig | 9 | 15 | 15 | 11 | |||||
|
SANDVIK DI650i |
Pre-Split Drill Rig | 2 | 3 | 3 | 2 | |||||
| 16.5 | Mining Workforce |
The key goal in developing the mine workforce is to grow the skills and capability of the local workforce. This will be achieved through investment in education, training and employment. Early operations will be supported by a higher contingent of international resources to supervise and train the developing pool of local workers. Where possible, skills and capabilities will be preferentially sourced from within Pakistan.
The peak workforce numbers for the mining group are summarised in Table 16-20. This includes the expected workforce requirements for both the fixed and variable workforce numbers across each of the respective phases of the mine life.
|
February 19, 2025 |
Page 232 |
|
|
NI 43-101 Technical Report on the Reko Diq Project |
|
Table 16-20 Peak Mining Workforce Numbers
| Functional Area | Phase 1 | Phase 2 | ||||
| 2032 | 2042 | 2051 | ||||
|
Mining Operations: |
||||||
|
Mine Production Operators – Loading |
19 | 30 | 32 | |||
|
Mine Production Operators – Hauling |
143 | 241 | 371 | |||
|
Mine Production Operators – Ancillary |
105 | 154 | 175 | |||
|
Mine Production Operators – Drilling |
28 | 43 | 45 | |||
|
Mine Production Operators - Leave Coverage |
30 | 47 | 62 | |||
|
Mine Production Supervision |
21 | 21 | 21 | |||
|
Specialist Support |
119 | 149 | 188 | |||
|
Mine Production Contractors |
102 | 129 | 129 | |||
|
Mobile Mining Equipment Maintenance: |
||||||
|
Mobile Mining Equipment Maintenance Trades |
349 | 487 | 600 | |||
|
Mobile Mining Equipment Maintenance Trades - Leave Coverage |
23 | 37 | 49 | |||
|
Mobile Mining Equipment Maintenance Supervision |
29 | 29 | 29 | |||
|
Specialist Support |
138 | 138 | 138 | |||
|
Mobile Mining Equipment Maintenance Contractors |
6 | 10 | 10 | |||
|
MANAGEMENT And TECHNICAL: |
||||||
|
Mine Production |
2 | 2 | 2 | |||
|
Mobile Mining Equipment Maintenance |
33 | 33 | 33 | |||
|
Technical Services |
151 | 151 | 151 | |||
|
Specialist Functions |
||||||
|
Safety |
6 | 6 | 6 | |||
|
Training |
21 | 21 | 21 | |||
|
Administration |
8 | 8 | 8 | |||
|
Mine Control |
23 | 23 | 23 | |||
|
Maximum Number of Workers |
1,356 | 1,759 | 2,093 | |||
|
Maximum Number of Workers (Including TSF) |
1,430 | 1,801 | 2,160 | |||
| 16.6 | LOM Production Schedule |
A strategic mine schedule was initially developed using the Minemax Scheduler® mine schedule optimisation software package (Minemax). The objective function of the software was to maximise the NPV8 of the schedule subject to the economic and technical inputs and constraints applied by the user. This optimised schedule was then used as guidance for producing a more detailed, tactical production schedule using the Deswik.CAD and Deswik.SCHED software packages.
|
February 19, 2025 |
Page 233 |
|
|
NI 43-101 Technical Report on the Reko Diq Project |
|
| 16.6.1 | Strategic Schedule |
The strategic schedule was done using MineMax and identifies the mine development sequence, mining rate, processing rate, and COG and stockpiling strategy which maximises the value of the deposit. It then provides the key inputs to the tactical schedule which provides more detail illustrating how the strategic schedule can be implemented. Alastri Haul Infinity software was used to develop a haulage model which was then integrated into the Minemax schedule model. Detailed haul truck cycle estimation generates the haulage hours required for strategic life-of-mine planning. The model incorporated the pit phase designs and presently proposed site layout including waste dump locations, tailings storage facility embankments, ore stockpiles, primary crusher, and associated haulage routes.
| 16.6.2 | Tactical Schedule |
The tactical schedule was prepared using the Deswik suite of mine design and scheduling tools, including CAD, Sched, LHS and Blend modules. Open pit designs and mining models were used to create the mining inventory with waste dump and TSF embankment designs were used to model destination landforms.
The tactical life-of-mine schedule was scheduled in a combination of monthly periods (2027-2029 inclusive), quarterly periods (2030-2034 inclusive) and annual periods (2035+). The schedule was resource based (excavators and trucks) with detailed pit stage / bench mine sequencing, and appropriate equipment proximity constraints. This includes consideration of pit access, mining ramp-up profiles and trucking capacity constraints for pit ramps.
| 16.6.3 | LOM Schedule Summary |
Mining is planned to start in January 2027 with mill feed expected in July 2028. The mining will ramp up to provide the phase 1 mill capacity of 45 Mtpa by 2030. Phase 2 ramp up is scheduled to start in 2033, reaching the Phase 2 capacity of 90 Mtpa in 2035. Mill feed material from Tanjeel with start in 2038. Mining operations are currently planned to deplete the Mineral Reserves in 2061 with stockpile reclaim scheduled until 2064.
Over the life-of-mine, a total of 3,008 million tonnes of plant feed are expected to be delivered to the mill at an average grade of 0.48% copper and 0.26 g/t gold. There is anticipated to be a total of 3,205 million tonnes of waste rock mined, resulting in an average strip ratio of 1.07 w:o. There is little expected pre-stripping ahead of production due to the exposure of ore at surface. Throughout the mine life, a total of 677 million tonnes of ore are delivered to the low-grade, medium-grade or high-grade stockpiles before being delivered to the mill. The total mine life is 37 years of operation from commissioning of the plant in 2028. As referenced above, mining is forecast to finish in 2061 followed by three years of processing of stockpiles to 2064.
|
February 19, 2025 |
Page 234 |
|
|
NI 43-101 Technical Report on the Reko Diq Project |
|
The mine schedule and plant feed are summarized in Table 16-21. Figure 16-13 and Figure 16-14 show the mined and milled tonnes respectively.
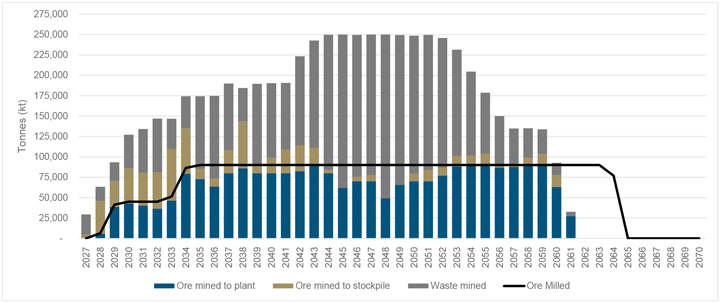
Source: Barrick 2024
Figure 16-13 LOM Production Schedule – Mined Tonnes

Source: Barrick 2024
Figure 16-14 LOM Production Schedule – Mill Feed Tonnes
|
February 19, 2025 |
Page 235 |
|
|
NI 43-101 Technical Report on the Reko Diq Project |
|
Table 16-21 LOM Mine and Plant Feed Schedule
| Units | LOM | 2027 | 2028 | 2029 | 2030 | 2031 | 2032 | 2033 | 2034 | 2035 | 2036 | 2037 | 2038 | 2039 | 2040 | 2041 | 2042 | 2043 | 2044 | 2045 | 2046 | |||||||||||||||||||||||
|
Mining |
||||||||||||||||||||||||||||||||||||||||||||
|
Total Ore Mined |
Mt | 3,008 | 5 | 46 | 70 | 86 | 81 | 81 | 110 | 135 | 85 | 73 | 108 | 144 | 90 | 99 | 109 | 114 | 111 | 84 | 62 | 76 | ||||||||||||||||||||||
|
Total Waste Mined |
Mt | 3,205 | 25 | 17 | 23 | 41 | 54 | 66 | 37 | 39 | 89 | 101 | 82 | 40 | 99 | 92 | 82 | 109 | 132 | 166 | 188 | 174 | ||||||||||||||||||||||
|
Total Material Mined |
Mt | 6,212 | 29 | 63 | 93 | 127 | 134 | 147 | 147 | 174 | 174 | 175 | 190 | 184 | 190 | 190 | 191 | 223 | 243 | 250 | 250 | 250 | ||||||||||||||||||||||
|
Rehandle - Long Term Stockpile |
Mt | 677 | - | 0.6 | 2.6 | 2.2 | 4.7 | 8.6 | 5.1 | 7.2 | 17.2 | 26.4 | 10.0 | 4.1 | 10.0 | 10.0 | 10.0 | 7.6 | 0.6 | 10.0 | 28.2 | 20.0 | ||||||||||||||||||||||
|
Rehandle - ROM Pad |
Mt | 466 | - | 1.2 | 7.8 | 8.6 | 8.1 | 7.3 | 9.3 | 15.9 | 14.6 | 12.7 | 16.0 | 17.2 | 16.0 | 16.0 | 16.0 | 16.5 | 17.9 | 16.0 | 12.4 | 14.0 | ||||||||||||||||||||||
|
Rehandle - TSF |
Mt | 211 | 6.2 | 6.7 | 6.7 | 6.7 | 6.7 | 6.7 | 6.7 | 11.0 | 11.0 | 11.0 | 11.0 | 6.6 | 6.6 | 6.6 | 6.6 | 2.3 | 3.9 | 3.9 | 3.9 | 3.9 | ||||||||||||||||||||||
|
Total Re-handle |
Mt | 1,354 | 6.2 | 8.5 | 17.1 | 17.5 | 19.5 | 22.6 | 21.1 | 34.0 | 42.7 | 50.1 | 37.0 | 27.9 | 32.6 | 32.6 | 32.6 | 26.4 | 22.4 | 29.9 | 44.4 | 37.9 | ||||||||||||||||||||||
|
Strip Ratio |
t/t | 1.07 | 5.29 | 0.38 | 0.33 | 0.48 | 0.67 | 0.82 | 0.34 | 0.29 | 1.04 | 1.38 | 0.76 | 0.28 | 1.10 | 0.93 | 0.75 | 0.96 | 1.19 | 1.98 | 3.04 | 2.30 | ||||||||||||||||||||||
|
Mined Grade - Copper |
% | 0.48 | 0.23 | 0.38 | 0.44 | 0.48 | 0.51 | 0.44 | 0.42 | 0.50 | 0.58 | 0.48 | 0.45 | 0.50 | 0.61 | 0.55 | 0.55 | 0.51 | 0.50 | 0.50 | 0.55 | 0.41 | ||||||||||||||||||||||
|
Mined Grade - Gold |
g/t | 0.26 | 0.21 | 0.23 | 0.26 | 0.27 | 0.29 | 0.22 | 0.21 | 0.25 | 0.32 | 0.26 | 0.23 | 0.23 | 0.26 | 0.25 | 0.19 | 0.20 | 0.24 | 0.32 | 0.30 | 0.17 | ||||||||||||||||||||||
|
Mined Grade - Cu Eq % (approx.)1 |
% | 0.63 | 0.34 | 0.51 | 0.58 | 0.63 | 0.67 | 0.56 | 0.53 | 0.63 | 0.75 | 0.62 | 0.57 | 0.63 | 0.75 | 0.68 | 0.65 | 0.62 | 0.63 | 0.68 | 0.71 | 0.51 | ||||||||||||||||||||||
|
Milling |
||||||||||||||||||||||||||||||||||||||||||||
|
Direct Feed Ore |
Mt | 2,331 | - | 6 | 39 | 43 | 40 | 36 | 46 | 79 | 73 | 64 | 80 | 86 | 80 | 80 | 80 | 82 | 89 | 80 | 62 | 70 | ||||||||||||||||||||||
|
Stockpile Reclaim Ore |
Mt | 677 | - | 1 | 3 | 2 | 5 | 9 | 5 | 7 | 17 | 26 | 10 | 4 | 10 | 10 | 10 | 8 | 1 | 10 | 28 | 20 | ||||||||||||||||||||||
|
Total Ore Milled |
Mt | 3,008 | - | 6 | 41 | 45 | 45 | 45 | 51 | 87 | 90 | 90 | 90 | 90 | 90 | 90 | 90 | 90 | 90 | 90 | 90 | 90 | ||||||||||||||||||||||
|
Feed Grade - Copper |
% | 0.48 | - | 0.56 | 0.51 | 0.59 | 0.61 | 0.58 | 0.57 | 0.58 | 0.53 | 0.53 | 0.53 | 0.60 | 0.63 | 0.61 | 0.63 | 0.57 | 0.54 | 0.50 | 0.48 | 0.41 | ||||||||||||||||||||||
|
Feed Grade - Gold |
g/t | 0.26 | - | 0.37 | 0.31 | 0.35 | 0.36 | 0.32 | 0.32 | 0.32 | 0.29 | 0.29 | 0.28 | 0.30 | 0.28 | 0.29 | 0.23 | 0.23 | 0.28 | 0.31 | 0.25 | 0.17 | ||||||||||||||||||||||
|
Contained Metal - Copper |
Mt | 14.6 | - | 0.036 | 0.212 | 0.266 | 0.275 | 0.260 | 0.292 | 0.503 | 0.478 | 0.478 | 0.478 | 0.541 | 0.563 | 0.547 | 0.564 | 0.510 | 0.486 | 0.447 | 0.436 | 0.371 | ||||||||||||||||||||||
|
Contained Metal - Gold |
Moz | 25.6 | - | 0.075 | 0.415 | 0.513 | 0.524 | 0.464 | 0.531 | 0.889 | 0.841 | 0.849 | 0.812 | 0.871 | 0.812 | 0.828 | 0.657 | 0.677 | 0.824 | 0.894 | 0.722 | 0.499 | ||||||||||||||||||||||
|
Recovery - Copper |
% | 89.9 | - | 89.4 | 89.6 | 89.9 | 90.2 | 90.0 | 90.2 | 90.4 | 90.1 | 90.1 | 90.1 | 90.2 | 90.2 | 90.1 | 89.6 | 89.8 | 90.3 | 90.1 | 89.9 | 89.2 | ||||||||||||||||||||||
|
Recovery - Gold |
% | 69.9 | - | 70.4 | 70.6 | 70.0 | 70.5 | 71.0 | 71.0 | 70.6 | 69.5 | 69.6 | 69.8 | 70.5 | 70.3 | 69.3 | 68.6 | 69.0 | 70.1 | 69.4 | 68.2 | 68.1 | ||||||||||||||||||||||
|
Recovered Metal - Copper |
Mt | 13.1 | - | 0.03 | 0.19 | 0.24 | 0.25 | 0.23 | 0.26 | 0.45 | 0.43 | 0.43 | 0.43 | 0.49 | 0.51 | 0.49 | 0.51 | 0.46 | 0.44 | 0.40 | 0.39 | 0.33 | ||||||||||||||||||||||
|
Recovered Metal - Gold |
Moz | 17.9 | - | 0.05 | 0.29 | 0.36 | 0.37 | 0.33 | 0.38 | 0.63 | 0.58 | 0.59 | 0.57 | 0.61 | 0.57 | 0.57 | 0.45 | 0.47 | 0.58 | 0.62 | 0.49 | 0.34 | ||||||||||||||||||||||
| Units | LOM | 2047 | 2048 | 2049 | 2050 | 2051 | 2052 | 2053 | 2054 | 2055 | 2056 | 2057 | 2058 | 2059 | 2060 | 2061 | 2062 | 2063 | 2064 | |||||||||||||||||||||||||
| Mining |
||||||||||||||||||||||||||||||||||||||||||||
| Total Ore Mined |
Mt | 3,008 | 78 | 49 | 66 | 80 | 84 | 87 | 101 | 102 | 104 | 91 | 91 | 99 | 104 | 78 | 27 | - | - | - | ||||||||||||||||||||||||
| Total Waste Mined |
Mt | 3,205 | 172 | 201 | 184 | 169 | 166 | 159 | 130 | 103 | 75 | 59 | 44 | 36 | 30 | 15 | 5 | - | - | - | ||||||||||||||||||||||||
| Total Material Mined |
Mt | 6,212 | 250 | 250 | 249 | 249 | 250 | 246 | 231 | 205 | 179 | 150 | 135 | 135 | 134 | 93 | 33 | - | - | - | ||||||||||||||||||||||||
| Rehandle - Long Term Stockpile |
Mt | 677 | 20.0 | 40.8 | 24.4 | 20.0 | 20.0 | 12.9 | 1.7 | - | - | 3.4 | 2.3 | - | - | 27.0 | 62.6 | 90.0 | 90.0 | 77.0 | ||||||||||||||||||||||||
| Rehandle - ROM Pad |
Mt | 466 | 14.0 | 9.8 | 13.1 | 14.0 | 14.0 | 15.4 | 17.7 | 18.0 | 18.0 | 17.3 | 17.5 | 18.0 | 18.0 | 12.6 | 5.5 | - | - | 0.0 | ||||||||||||||||||||||||
| Rehandle - TSF |
Mt | 211 | 3.9 | 3.9 | 5.7 | 5.7 | 5.2 | 5.2 | 5.2 | 5.2 | 5.2 | 5.2 | 5.3 | 5.3 | 2.8 | 3.0 | 3.0 | 3.0 | 3.0 | 0.9 | ||||||||||||||||||||||||
| Total Re-handle |
Mt | 1,354 | 37.9 | 54.6 | 43.3 | 39.7 | 39.2 | 33.5 | 24.6 | 23.2 | 23.2 | 25.9 | 25.2 | 23.3 | 20.8 | 42.6 | 71.1 | 93.0 | 93.0 | 77.9 | ||||||||||||||||||||||||
| Strip Ratio |
t/t | 1.07 | 2.21 | 4.08 | 2.80 | 2.12 | 1.98 | 1.83 | 1.29 | 1.01 | 0.72 | 0.66 | 0.48 | 0.37 | 0.29 | 0.19 | 0.19 | - | - | - | ||||||||||||||||||||||||
| Mined Grade - Copper |
% | 0.48 | 0.38 | 0.39 | 0.42 | 0.44 | 0.46 | 0.47 | 0.47 | 0.49 | 0.51 | 0.46 | 0.48 | 0.52 | 0.53 | 0.48 | 0.39 | - | - | - | ||||||||||||||||||||||||
| Mined Grade - Gold |
g/t | 0.26 | 0.13 | 0.15 | 0.24 | 0.27 | 0.24 | 0.22 | 0.26 | 0.28 | 0.28 | 0.26 | 0.29 | 0.36 | 0.47 | 0.49 | 0.43 | - | - | - | ||||||||||||||||||||||||
| Mined Grade - Cu Eq % (approx.)1 |
% | 0.63 | 0.45 | 0.47 | 0.55 | 0.59 | 0.58 | 0.60 | 0.61 | 0.64 | 0.66 | 0.60 | 0.63 | 0.71 | 0.79 | 0.75 | 0.63 | - | - | - | ||||||||||||||||||||||||
| Milling |
||||||||||||||||||||||||||||||||||||||||||||
| Direct Feed Ore |
Mt | 2,331 | 70 | 49 | 66 | 70 | 70 | 77 | 88 | 90 | 90 | 87 | 88 | 90 | 90 | 63 | 27 | - | - | - | ||||||||||||||||||||||||
| Stockpile Reclaim Ore |
Mt | 677 | 20 | 41 | 24 | 20 | 20 | 13 | 2 | - | - | 3 | 2 | - | - | 27 | 63 | 90 | 90 | 77 | ||||||||||||||||||||||||
| Total Ore Milled |
Mt | 3,008 | 90 | 90 | 90 | 90 | 90 | 90 | 90 | 90 | 90 | 90 | 90 | 90 | 90 | 90 | 90 | 90 | 90 | 77 | ||||||||||||||||||||||||
| Feed Grade - Copper |
% | 0.48 | 0.39 | 0.37 | 0.40 | 0.45 | 0.47 | 0.49 | 0.51 | 0.52 | 0.55 | 0.47 | 0.48 | 0.55 | 0.58 | 0.37 | 0.37 | 0.20 | 0.21 | 0.23 | ||||||||||||||||||||||||
| Feed Grade - Gold |
g/t | 0.26 | 0.14 | 0.15 | 0.21 | 0.26 | 0.24 | 0.23 | 0.28 | 0.30 | 0.31 | 0.26 | 0.29 | 0.39 | 0.53 | 0.38 | 0.24 | 0.09 | 0.09 | 0.07 | ||||||||||||||||||||||||
|
Contained Metal - Copper |
Mt | 14.6 | 0.349 | 0.333 | 0.359 | 0.406 | 0.425 | 0.439 | 0.461 | 0.472 | 0.498 | 0.419 | 0.435 | 0.493 | 0.523 | 0.337 | 0.333 | 0.184 | 0.189 | 0.178 | ||||||||||||||||||||||||
|
Contained Metal - Gold |
Moz | 25.6 | 0.399 | 0.429 | 0.618 | 0.750 | 0.702 | 0.657 | 0.811 | 0.878 | 0.903 | 0.753 | 0.840 | 1.114 | 1.527 | 1.087 | 0.702 | 0.260 | 0.249 | 0.178 | ||||||||||||||||||||||||
|
Recovery - Copper |
% | 89.9 | 89.2 | 89.5 | 89.6 | 89.7 | 89.7 | 89.8 | 90.1 | 89.9 | 90.0 | 90.0 | 90.2 | 90.5 | 90.6 | 90.4 | 90.0 | 89.9 | 89.5 | 89.1 | ||||||||||||||||||||||||
|
Recovery - Gold |
% | 69.9 | 68.4 | 69.0 | 69.7 | 70.0 | 69.9 | 70.5 | 71.2 | 70.5 | 70.5 | 70.5 | 70.6 | 71.1 | 71.5 | 71.3 | 70.1 | 70.3 | 68.8 | 67.9 | ||||||||||||||||||||||||
|
Recovered Metal - Copper |
Mt | 13.1 | 0.31 | 0.30 | 0.32 | 0.36 | 0.38 | 0.39 | 0.42 | 0.42 | 0.45 | 0.38 | 0.39 | 0.45 | 0.47 | 0.31 | 0.30 | 0.17 | 0.17 | 0.16 | ||||||||||||||||||||||||
|
Recovered Metal - Gold |
Moz | 17.9 | 0.27 | 0.30 | 0.43 | 0.52 | 0.49 | 0.46 | 0.58 | 0.62 | 0.64 | 0.53 | 0.59 | 0.79 | 1.09 | 0.77 | 0.49 | 0.18 | 0.17 | 0.12 | ||||||||||||||||||||||||
Note:
| 1. | The Copper Equivalent value has been calculated as CuEq = (Cu Grade) + (Au * 0.54) based on the pit optimization parameters |
|
February 19, 2025 |
Page 236 |
|
|
NI 43-101 Technical Report on the Reko Diq Project |
|
| 16.7 | QP Comments on Mining Methods |
It is the opinion of the QP that the mining methods, the mining equipment and productivities, the mine designs and input parameters are suitable for the estimation of Mineral Reserves.
| 16.7.1 | External Reviews |
In October 2024, Barrick engaged a third-party consultant (SRK Consulting) to complete an independent review of the mining components of the Reko Diq feasibility study. No material gaps were identified relating to mining methods for estimation of reserves.
SRK concluded that emphasis must be placed on the operational readiness phase of the project due to its scale and location. Additionally, integrating ESG considerations will further strengthen the project by aligning with stakeholder expectations for sustainable development and ensuring regulatory compliance
|
February 19, 2025 |
Page 237 |
|
|
NI 43-101 Technical Report on the Reko Diq Project |
|
| 17 | Recovery Methods |
| 17.1 | Design Basis |
The process design criteria (PDC) used information that was derived from various sources including:
| ● | Metallurgical test work as described in Section 13. |
| ● | Recovery Estimate data as noted in Section 13. |
| ● | Vendor data or recommendation. |
| ● | Industry standard or practice based on proven technologies. |
| ● | Engineering handbooks. |
| ● | Assumption based on experience of the Barrick and independent experts. |
| ● | External consultants engaged by the Barrick or previous owners. |
Table 17-1 summarizes the key process design criteria.
|
February 19, 2025 |
Page 238 |
|
|
NI 43-101 Technical Report on the Reko Diq Project |
|
| Table 17-1
|
Key Design Criteria
|
|||||||||||||||||
| Parameter | Units | Value | Source | Parameter | Units | Value | Source | |||||||||||
| Throughput |
Mtpa | 47 | RDMC | Ball Mill (each) | m | 7.92 x 13.41 | OMC/Vendor | |||||||||||
| Design Feed grade-Cu |
% | 0.59 | RDMC | Rougher Feed Conditioning | min | 3 | Testwork | |||||||||||
| Design Feed grade-Au |
g Au/t | 0.34 | RDMC | Rougher Flotation Time-Laboratory | min | 15 | Testwork | |||||||||||
| Design Feed grade-S2- |
% | 2.4 | RDMC | Plant Scaleup | # | 2 | Industry/Lyco | |||||||||||
| Primary Crushing Plant Operating Hours |
h/a | 6,570 | Agreed | Rougher Concentrate Mass Pull (Min/Nom/Max) | % | 6/12/15 | Testwork | |||||||||||
| Secondary Crushing Plant Operating Hours |
h/a | 7,709 | Agreed | Rougher Concentrate Regrind Target P80 | µm | 20 / 25 | Testwork | |||||||||||
| Wet Plant Operating Hours |
h/a | 7,709 | Agreed | Rougher Regrind Stage 1 Configuration | Closed Circuit | Vendor | ||||||||||||
| Crushing Work Index (CWi) |
kWh/t | 17.1 | Testwork | Rougher Regrind Specific Energy (Stage 1) | kWh/t | 8-9 | Vendor/Testwork | |||||||||||
| HPGR Comminution Index (Mih) |
kWh/t | 17.9 | Testwork | Regrind Stage 1 Recirculating Load | % | 200 | Vendor/Lyco | |||||||||||
| Drop Weight Index (DWi) |
kWh/ m3 |
8.9 | Testwork | Regrind Stage 1 Transfer Size P80 | µm | 38 | Vendor | |||||||||||
| Rod Mill Work Index (RWi) |
kWh/t | 21 | Testwork | Rougher Regrind Stage 2 Configuration | Open Circuit | Vendor | ||||||||||||
| Ball Mill Work Index (BWi @ 106µm closing) |
kWh/t | 16.5 | Testwork | Rougher Regrind Specific Energy (Stage 2) | kWh/t | 12-13 | Vendor/Testwork | |||||||||||
| Abrasion Index (Ai) |
g | 0.256 | Testwork | Cleaner Feed Aeration | min | 30 | Testwork | |||||||||||
| JK Breakage Parameter Axb |
29.8 | Testwork | Cleaner Feed Conditioning | min | 4 | Testwork | ||||||||||||
| Ore SG |
2.67 | Testwork | Cleaner Flotation Time-Conventional Cells | min | 16.5 | Testwork | ||||||||||||
| Angle of Repose |
degree | 37 | Lyco/Testwork | 1st Stage Cleaners | Concorde | Vendor/Client | ||||||||||||
| Angle of Withdrawal |
degree | 55 | Lyco/Testwork | 2nd Stage Cleaners | Concorde | Vendor/Client | ||||||||||||
| Angle of Surcharge |
degree | 20 | Lyco/Testwork | Rougher Tailings Thickener Feed Flux Rate | t/h/m2 | 1 | Testwork/Vendor | |||||||||||
| Primary Crusher OSS |
mm | 178 | OMC/Vendor | Rougher Tailings Thickener Underflow Density | % w/w | 65 | Testwork | |||||||||||
| Coarse Ore Stockpile |
hrs | 10 | Agreed | Cleaner Tailings Thickener Feed Flux Rate | t/h/m2 | 0.5 | Testwork/Vendor | |||||||||||
| Dry Screens (Each) |
m x m | 4.3 x 8.5 |
OMC | Cleaner Tailings Thickener Underflow Density | % w/w | 45 | Testwork | |||||||||||
| Screen Apertures (Top/Bottom) |
mm | 80/50 | OMC | Final Concentrate Thickener Feed Flux Rate | t/h/m2 | 0.25 | Testwork/Vendor | |||||||||||
| Dry Screen Oversize (Fraction Of Feed) |
% | 53 | OMC | Final Concentrate Thickener Underflow Density | % w/w | 60 | Testwork | |||||||||||
| Secondary Crusher CSS |
mm | 50 | OMC | Final Concentrate Filtration Rate | t/h/m2 | 0.238 | Testwork/Vendor | |||||||||||
| Dry Screen Undersize P80 |
mm | 36 | OMC | Final Concentrate Storage | Days | 30 | Client | |||||||||||
| HPGR Size |
m x m | 2.40 x 2.25 |
Agreed | Aero 3894 (A3894) Promoter Dosage | g/t mill feed | 9 | Testwork | |||||||||||
| HPGR Pressing Force |
N/mm2 | 4.3 | Vendor | Aero 7249 (A7249) Promoter Dosage | g/t mill feed | 29.6 | Testwork | |||||||||||
| HPGR Product P80 |
mm | 13.5 | OMC | MAXGOLD 900 (MX900) Promoter Dosage | g/t mill feed | 7.4 | Testwork | |||||||||||
| Fine Ore Bin Capacity |
h | 3 | Lycopodium | Sodium Metabisulphite (SMBS) Dosage | g/t mill feed | 600 - 1,000 | Testwork | |||||||||||
| Wet Screens (Each) |
m x m | 4.3 x 8.5 |
OMC | Methyl Isobutyl Carbinol (MIBC) Dosage | g/t mill feed | 14.5 | Testwork | |||||||||||
| Screen Apertures (Top/Bottom) |
mm | 12/8.5 | OMC | Rougher Tailings Flocculant Dosage | g/t thickener feed | 5 | Testwork | |||||||||||
| Screen Oversize (Fraction of Feed) |
% | 40 | OMC | Cleaner Concentrate Flocculant Dosage | g/t thickener feed | 35 | Testwork | |||||||||||
| Grinding Product P80 |
µm | 300 | RDMC | Cleaner Tailings Flocculant Dosage | g/t thickener feed | 60 | Testwork | |||||||||||
| Grinding Recirculating Load (Nom./Max) |
% | 300/360 | OMC/Lyco | |||||||||||||||
|
February 19, 2025 |
Page 239 |
|
|
NI 43-101 Technical Report on the Reko Diq Project |
|
| 17.2 | Process Plant Description |
A phased approach to process plant development will be undertaken. Phase 1 will comprise design, construction and commissioning of the first stage process plant with a nominal capacity of 45 Mtpa to treat the first five years of mined ore. Phase 2 will comprise duplication of the Phase 1 processing facilities with a parallel plant to achieve a total capacity of 90 Mtpa.
The two plants will operate largely independently but with common support facilities, services and concentrate and tails handling.
The flowsheet adopted is summarized in block form in Figure 17-1. The below description and associated values summarise the Phase 1 plant only.
The primary equipment design parameter and capacities for the primary crusher, HPGR, ball mills, flotation cells, rougher regrind vertical mills and thickener are shown in Table 17-2.
|
February 19, 2025 |
Page 240 |
|
|
NI 43-101 Technical Report on the Reko Diq Project |
|

Source: Barrick, 2024
Figure 17-1 Block Flow Diagram – Reko Diq Process Plant
|
February 19, 2025 |
Page 241 |
|
|
NI 43-101 Technical Report on the Reko Diq Project |
|
Table 17-2 Primary Equipment
| Equipment | Description | Size | Quantity Phase 1* |
Power kW/unit |
||||
| Primary Crushing |
||||||||
| Dump Pocket |
Steel Bin | 744 dry t/h | 2 | |||||
| Gyratory Crushers |
Gyratory | 60 x 89 Mk III | 2 | 750 | ||||
| Surge Pocket |
Steel Bin | 930 dry t/h | 2 | |||||
| Discharge Feeder |
Apron | 3577 dry t/h | 2 | |||||
| Discharge Conveyor |
Overland | 3577 dry t/h | 2 | |||||
| Primary Crusher 2 Transfer Conveyor |
3577 dry t/h | 2 | ||||||
| Coarse Ore Stockpile Feed Conveyor |
7154 dry t/h | 1 | ||||||
| Coarse Ore Stockpile |
Un-covered | 60 kt | 1 | |||||
| Secondary Crushing |
||||||||
| Coarse Ore Reclaim Feeders |
Apron | 2032 dry t/h | 3 | |||||
| Coarse Ore Reclaim Conveyor |
Moving Head | 12978 dry t/h | 1 | |||||
| Coarse Ore Screen Feed Bins |
Steel Bin | 406 m3 / 649 dry t/h | 5 | |||||
| Coarse Ore Screen Feeder |
Vibrating Feeder | 3244 dry t/h | 5 | |||||
| Coarse Ore Screen |
Vibrating, multi slope, double deck | 4.3 m x 8.5 m | 5 | |||||
| Secondary Crusher Feed Bins |
Steel Bins | 412 m3 / 659 dry t/h | 5 | |||||
| Secondary Crusher Feeders |
Belt | 1720 dry t/h | 5 | |||||
| Secondary Crushers |
Cone | MP 1250 | 5 | 933 | ||||
| Secondary Crushing Dewatering Static Screen |
Inclined Static | 0.9 m x 1.2 m | 1 | |||||
| Secondary Crushing Dewatering Screen |
Vibrating Screen | 0.3 m x 1.2 m | 1 | |||||
| Secondary Crushing Dewatering Cyclones |
100 mm | 10 | ||||||
| HPGR Circuit |
||||||||
| HPGR Feed Bins |
Steel bin | 525 m3 / 840 dry t/h | 3 | |||||
| HPGR Feeders |
Belt | 3359 dry t/h | 3 | |||||
| HPGR |
HPGR | RPM 32 240/225 | 3 | 2 x 4600 | ||||
| Fine Ore Storage Bins |
Steel bins | 6000 m3 / 9601 dry t/h | 3 | |||||
| Fine Ore Reclaim Feeders |
Feeder Conveyor | 1680 dry t/h | 6 | |||||
| Fine Ore Screens |
Vibrating, multi slope, double deck | 4.3 m x 8.5 m | 6 | |||||
|
Grinding |
||||||||
| Ball Mills |
Overflow Discharge | 7.92m x 13.6m | 3 | |||||
| Ball Mill Drive |
GMD | 17 MW | 3 | 17,000 | ||||
| Cyclone Feed Pumps |
Centrifugal | TBD | 6 | |||||
| Grinding Cyclone Clusters |
800mm | 36 | ||||||
| Ball Mill Magnetics Dewatering Screen |
Single Deck Horizontal Vibrating Screen | 0.6 m x 0.9 m | 3 | |||||
|
Flotation |
||||||||
| Rougher Flotation Cells |
Tank Cells | 500 m³ | 18 | 250 | ||||
| Rougher Concentrate Regrind Stage 1 Cyclones |
400 mm | 64 | ||||||
| 1st Stage Regrind |
Vertimills | VTM 3750 | 4 | 2800 | ||||
| Rougher Concentrate Regrind Stage 2 Cyclones |
250 mm | 80 | ||||||
| 2nd Stage Regrind |
HIG Mills | HIG 3850 23000 | 4 | 3850 | ||||
| Cleaner Aeration Tanks |
Aerated / Agitated w/ Overflow | 30 min | 3 | |||||
| Cleaner Scalper |
CD-5500-16 EL | 5.5m Ø | 3 | |||||
| Cleaner Scavenger |
Tank Cells | 130m3 | 9 | |||||
| ReCleaner |
CD-2500-16 EL | 2.5m Ø | 3 | |||||
| Concentrate Dewatering |
||||||||
| Concentrate Trash Screen |
Vibrating Screen, Single Deck | TBD | 1 | |||||
| Concentrate Thickener |
28m HRT | 28m Ø | 1 | |||||
| Concentrate Filter |
Larox | PF 168/168 | 3 | |||||
| Tailings Thickening & Handling |
||||||||
| Cleaner Tailings Thickener |
45m HRT | 45m Ø | 1 | |||||
| Cleaner Tailings Pumps |
TBD | TBD | 2 | |||||
| Rougher Tailings Thickener |
48m HRT (1:4 slope) | 48m Ø | 3 | |||||
| Rougher Tailings Pumps |
TBD | TBD | 3 | |||||
|
February 19, 2025 |
Page 242 |
|
|
NI 43-101 Technical Report on the Reko Diq Project |
|
| 17.2.1 | Primary Crushing & Coarse Ore Handling |
Haul trucks will deliver ROM ore from the open pits to the ROM pad where it will be direct tipped into one of the two primary crushers for both Phase 1 and 2 plants (combined four crushers). At each crusher, the ROM dump hopper will have a live capacity of two haul trucks and will feed directly to a 1,520 mm x 2,260 mm (60’’ x 89’’) primary gyratory crusher mounted in a concrete vault. The crushers will have a maximum rock size of 1,200 mm to nominally 80% passing 150 mm. Each crusher will have an instantaneous capacity of approximately 4,650 t/h at this product size.
A cross-conveyor will transfer crushed ore to combine the two products onto the coarse ore stockpile feed conveyor. The stockpile feed conveyor will discharge onto the coarse ore stockpile (COS). The uncovered stockpile will be sized for 10 hours live capacity.
The secondary crushing circuit will comprise four duty and one standby crushing and screening modules to maximise the operating availability to ensure downstream feed provision. The secondary crushers will be MP1250 (933 kW) units with a coarse bowl liner.
| 17.2.2 | HPGR Comminution and Wet Screening |
The secondary crushing circuit product conveyor will deliver the crushed product to the HPGR feed conveyor. Three parallel HPGR trains will consist of Enduron RPM32 units with 2.40 m dia. x 2.25 m rolls each unit fitted with twin 4600 kW motors and variable speed drives.
The HPGR product will report to the fine ore storage feed conveyor, feeding the three fine ore storage bins (FOB). The product bin feeder conveyors (six in total) will each feed a fine ore screen feed conveyor into the HPGR closed circuit screens. Sizing at 8.5 mm has been selected to utilize the available power in the mills and reduce the pulping water required to allow building up the density in the cyclone feed to coarsen the overflow product. Screen undersize will flow directly to the ball mill discharge hopper and be pumped to the cyclones for classification and densification prior to feeding each ball mill. Screen oversize (combined product from both top and middling decks) will be recycled to the HPGR feed.
| 17.2.3 | Ball Milling |
The milling circuit will consist of three trains of ball mills each operating in closed circuit with a cyclone cluster. The circuit design target is a grind P80 of 300 µm based on H14 and H15 ores. The ball mills will be 7.9 m diameter x 13.4 m Effective Grinding Length (26’ x 44’) with 17.0 MW gearless drives (ring motors). For each train, undersize slurry from a pair of fines screens will report to the ball mill discharge hopper to combine with the mill discharge slurry and a level controlling water flow.
|
February 19, 2025 |
Page 243 |
|
|
NI 43-101 Technical Report on the Reko Diq Project |
|
Discharge from the ball mill will be combined with the fine screen undersize to feed the cyclones. Building a high circulating load to raise the cyclone feed density will be mandatory to achieve the coarse overflow P80 target. The cyclone clusters will each comprise 12 x 800 mm cyclones with relatively shallow cone angles arranged at 45° to the horizontal to maximize the coarseness of the cut.
| 17.2.4 | Rougher Flotation Circuit |
The rougher flotation circuit will consist of feed conditioning, rougher flotation, concentrate pumping and tails pumping. The rougher flotation circuit will be arranged as three separate and independent trains each with an independent feed, flotation, concentrate and tails pumping system. Each rougher train will consist of six 500 m3 tank cells arranged in series.
| 17.2.5 | Rougher Concentrate Regrind Circuit |
Concentrate from the rougher flotation circuit will report to a distribution box from which it will feed one of four regrind circuits (three duty, one standby). The circuit will consist of two stages:
| ● | Stage 1 will be based on 4 Vertimill (VTM 3750) circuits in closed circuit with cyclones. Product size from Stage 1 will be a P80 size of 38 µm. |
| ● | Stage 2 will be based on 4 HIG mills (HIG3850/23000) in open circuit with scalping cyclones. Product size from Stage 2 will be a P80 size of 20 µm. |
The rougher flotation circuit mass pull shows a significant range from as low as 6% of rougher feed to as high as 15% of rougher feed. The nominal design point, based on statistical analysis of test data is 12% of rougher feed.
| 17.2.6 | Cleaner Flotation Circuit |
The cleaner circuit will consist of three separate trains each consisting of conditioning flotation, concentrate and tails pumping. The flotation cells will be a mix of high shear cells producing final concentrate and conventional tank cells for scavenging. The circuit will include multiple conditioning stages ahead of flotation and will be monitored using in stream analysis to provide assay data on key streams.
Stage 2 Regrind product will be pumped to a distribution box with three separate discharge lines. These lines will feed each of the three aeration tanks in the cleaner conditioning area. Air will be introduced via a sparge at the base of each conditioning tank and will be mixed using an agitator. Aerated slurry from each aeration tank will overflow into a dedicated Stage 1 flotation conditioning tank via a metallurgical sampler. SMBS will be dosed into the conditioning tank based on the mass flow of reground concentrate feeding the cleaner circuit. Stage 1 conditioning tank slurry will overflow
|
February 19, 2025 |
Page 244 |
|
|
NI 43-101 Technical Report on the Reko Diq Project |
|
into the Stage 2 conditioning tank where A7429 and Aero 900 promoters will be dosed. From here the slurry will overflow into the cleaner scalper feed hopper.
The first stage of flotation will employ high shear Concorde cells. The Concorde cell is a high shear pneumatic flotation cell which uses supersonic velocities to increase bubble/particle interaction. The Cleaner Scalper cell will be a CD-5500-16-250 EL unit. This unit will include 16 x 250 NB blast tubes. Feed to the Cleaner Scalper will consist of new circuit feed, recirculating scalper tails and recleaner tails.
Tails from each Cleaner Scalper cell will feed a scavenger conditioning tank which will overflow into the first of three 130 m3 tank cells in series.
Concentrate from each train of scavenger cells will gravitate to a common scavenger concentrate launder which will flow via an in-line sampler into the recleaner conditioning tank. The recleaner conditioning tank will provide another opportunity to add reagents if required. This tank will overflow into the recleaner feed hopper.
The Recleaner cell will be a CD-2500-4-250 EL unit which will include 4 x 250 NB blast tubes. Feed to the recleaner will consist of scavenger concentrate and recycled recleaner tails. This will be pumped into the recleaner cell and be distributed to the four blast tubes via a slurry manifold. Compressed air will be introduced into each blast tube and will accelerate the slurry down the tube. Slurry discharging from the blast tube will strike an impingement bowl creating high shear turbulence.
| 17.2.7 | Concentrate Handling |
The final copper concentrate produced will be dewatered and transported in rotainers by rail to Port Qasim near Karachi. The concentrate handling circuit will consist of a concentrate thickener, three duty concentrate pressure filters, a concentrate stockpile, and a rail loading system. The concentrate handling area is located adjacent to the rail yard requiring an overland pumping system to transfer the flotation concentrate to the concentrate handling area.
The cleaner scalper and recleaner flotation cell concentrates produced by the three separate cleaner flotation trains will be combined as a final copper concentrate. The concentrate thickener will be a 28 m diameter high rate thickener, targeting a minimum underflow density of 60% by weight solids and an overflow clarity of less than 100 ppm suspended solids.
Thickened concentrate will be pumped to one of three fully automated pressure filters housed in an enclosed filter building. The three duty filters will each have a filtration area of 168 m². The pressure filters will target a filter cake moisture content of 10% by weight solids.
The concentrate will be stockpiled in an enclosed storage shed. The concentrate stockpile feed conveyor will discharge filtered concentrate along the length of the stockpile using a tripper car. The
|
February 19, 2025 |
Page 245 |
|
|
NI 43-101 Technical Report on the Reko Diq Project |
|
bulk storage capacity of the concentrate stockpile will be approximately 30 days of nominal concentrate production.
| 17.2.8 | Tailings Handling |
The plant will produce two different types of tailings which will be managed separately. The rougher flotation circuit will generate low sulphur tailings which will be disposed of in the low sulphur TSF. The cleaner flotation circuit will generate high sulphur tailings which will be disposed of in the separate lined high sulphur TSF.
Separating the rougher and cleaner flotation tailings handling will reduce the size of the lined tailings facility required for the net acid forming (NAF) high sulphur tailings stream. It will also enable better process water management to minimise the influence of residual reagents on flotation pulp chemistry.
The TSF is planned to be a cross-valley storage facility formed by multi-zoned earth fill embankment approximately 6.0 km southwest of the processing plant site which is described in Section 18.7.
| 17.3 | Power, Water, and Process Reagents Requirements |
| 17.3.1 | Power |
Power will be distributed across the site via a 220 kV transmission from the power station to the main process plant area. The operational steady-state energy demand for Phase 1 is 58 MW for the Dry Plant and 113 MW for the Wet Plant. The demand for Phase 2 is 99 MW for the Dry Plant and 224 MW for the Wet Plant. The Ball Mill with be the largest load with a 17 MW drive motor.
| 17.3.2 | Water |
This section details the water supply and use in the processing plant. Further information on site-wide water supply can be found in Section 18.4. The annual hourly raw water demand for process make up water is 1,923 m3/h. The requirements of the processing facilities have been incorporated into the mine site water balance. Details of the water balance are shown in Section 18.5.
Process Water
Two independent process water distribution systems will be employed. Plant process water will service the comminution, rougher flotation, rougher tailings and tailings plant areas. Cleaner flotation circuit water will service the cleaner flotation, final concentrate and cleaner tailings plant areas.
|
February 19, 2025 |
Page 246 |
|
|
NI 43-101 Technical Report on the Reko Diq Project |
|
Process water will be pumped through a pressurized distribution network for use in the crushing/HPGR area (via local tanks), grinding area, rougher flotation and rougher tails areas. Process water will be used for all dilution, spray water and service water requirements.
Cleaner flotation circuit water is recovered from the concentrate thickener overflow, concentrate filter filtrate, cleaner tailings thickener overflow and high sulphur decant return water and will be used as process water in the high sulphur circuit. Process water will be pumped through a pressurized distribution network for use as dilution water, spray water and service water in the rougher concentrate regrind, cleaner flotation, and concentrate handling areas.
A set of high pressure pumps will provide process water to monitoring cannons which will be located throughout the plant.
A sump pump will be provided for spillage cleanup in the area.
Gland Water
Reverse Osmosis (RO) water will be drawn from the plant RO water tank and distributed to gland water tanks, which will service local areas within the process plant, and costs are allocated to processing, in the following areas:
| ● | Plant, to provide gland water to the flotation area. |
| ● | Grinding facility, to provide gland water to the grinding and classification area. |
| ● | Concentrate facility, to provide gland water to the concentrate area and filter area. |
| ● | Tails facility, to provide gland water to the rougher tails and cleaner tails facilities. |
| 17.3.3 | Reagent Requirements |
The reagents area will consist of bulk reagent storage, mixing, storage, and dosing facilities for the various reagents used in the process plant. This area also includes the storage and handling of grinding media for the ball mills, VertiMills and HIGMills.
A summary of the key reagent consumption is shown in Table 17-3.
|
February 19, 2025 |
Page 247 |
|
|
NI 43-101 Technical Report on the Reko Diq Project |
|
Table 17-3 Phase 1 Reagent Requirements
| Process | Reagent |
Value (tpa) |
||
| Grinding Media |
Ball Mill – High Chrome, 80 mm diameter |
18,585 | ||
|
VertiMills - High Chrome, 19 mm diameter |
576 | |||
|
HIGMills – Ceramic Beads, 3 mm diameter |
351 | |||
| Promoters |
Promotor 1 – Aero 3894 |
405 | ||
|
Promotor 2 – Aero MAXGOLD 900 |
333 | |||
|
Promotor 3 – Aero 7249 |
1,332 | |||
| Collectors |
Potassium Amyl Xanthate |
1,410 | ||
| Frothers |
Frother 1 – MIBC |
653 | ||
| Frother 2 – Kemtec F160-05 |
705 | |||
| SMBS |
Sodium Metabisulphite (SMBS) |
36,000 | ||
| Flocculant |
Flocculant 1 (Concentrate Thickener) – Anionic Polymer |
28 | ||
|
Flocculant 2 (Rougher and Cleaner Tailings Thickeners) – BASF Magnafloc M155 |
473 |
| 17.4 | QP Comments on Recovery Methods |
The proposed facilities are designed using conventional technology and are suitable for processing the ores envisaged in the LOM plan.
|
February 19, 2025 |
Page 248 |
|
|
NI 43-101 Technical Report on the Reko Diq Project |
|
| 18 | Project Infrastructure |
| 18.1 | Overview |
The regional logistical infrastructure is shown in Figure 18-1 and described further in the following sections.
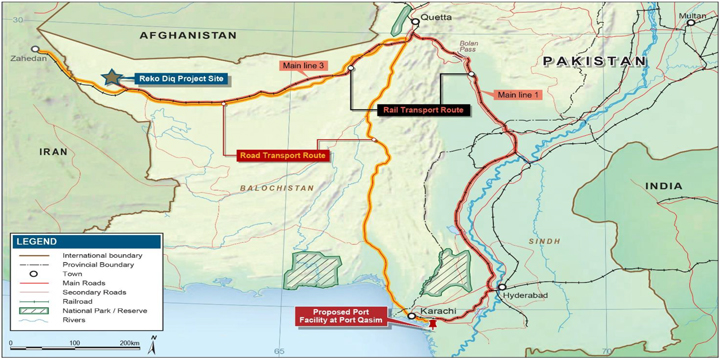
Source: Barrick, 2024
Figure 18-1 Regional Logistical Infrastructure
The proposed on-site infrastructure is shown in Figure 18-1 and described further in the following sections.
|
February 19, 2025 |
Page 249 |
|
|
NI 43-101 Technical Report on the Reko Diq Project |
|

Source: Barrick, 2024
Figure 18-2 On-Site Infrastructure
|
February 19, 2025 |
Page 250 |
|
|
NI 43-101 Technical Report on the Reko Diq Project |
|
| 18.2 | Logistical Infrastructure |
The Project proposes to utilize a series of rail, road and port infrastructure throughout the region.
| 18.2.1 | Rail |
Pakistan has a state-owned railway company (Pakistan Railways) which owns over 7,700 km of operational track across the country. Existing rail infrastructure passes about 46 km to the south the Reko Diq Project site and connects to Port Qasim.
The Project will utilize the existing rail network for transporting copper and gold concentrate via a 1,326 km route from the Project to Port Qasim, as well as supplying the mine with petroleum products, reagents and other supplies. The route is in variable condition, and will require investment to bring certain parts up to sufficient operating standards and conditions to meet Project requirements.
The proposed route requires various upgrades to physical infrastructure, including mainline rail, passing loops and stations, signal and telecommunications facilities, as well as construction or upgrading of operating and maintenance facilities, mid route, and port to support operation of the rail and loco fleet.
Construction of a new rail spur from the Project to connect the existing Pakistan Railways network is planned after commencement of production.
The mainline upgrade works and the rolling stock will be funded outside of the project. As such, this delivery model results in higher operating costs for the rail in the Project’s financial model, with no capital cost included for these items in the cost estimate.
An options study was conducted to select the rolling stock proposed for the rail, in order to meet the Project objectives and pre-existing local constraints. Table 18-1 lists the selected rolling stock models and related key requirements:
|
February 19, 2025 |
Page 251 |
|
|
NI 43-101 Technical Report on the Reko Diq Project |
|
Table 18-1 Rail Project Rolling Stock Key Requirements
| Rolling Stock Item | Description | |
| Main Line Locomotive |
• Traction: Diesel Electric • Configuration: Dual cab locomotive • Engine Horsepower and Transmission: 1650 kW / 2200 hp, AC/AC transmission • Axle Arrangement: C0-C0 |
|
| Shunting Locomotive |
• Type of Traction: Diesel-electric • Configuration: single-cab, bi-directional • Engine Horsepower: around 900-1100 kW / 1200-1500 hp: • Axle Arrangement: Bo-Bo |
|
| Wagon |
• Model: Lightweight Container Wagons (Skeleton wagons), transporting 2 x 20’ containers • Loading Capacity: 55 t minimum • Brake System: Air compressed • Type: Ride control or steering bogies • Coupler: AAR E or 13B, grade E cast steel connectable with AAR E/F type couplers • Maximum Gross Weight of the wagon loaded: 72 tons • Wheel Material: Class C – AAR M107/208 or equivalent • Roller Bearing: Class-D |
|
| Rotainer |
• Model: 20 ft Reinforced Sealed Rotainers to transport Copper Concentrate • Height: 1.8 m • CuCon Density Range (1.9 – 2.1t/m³) • External Dimensions: Length: 6,058 mm; Width: 2,438 mm; Height: 1,800 mm |
|
| Tank Container For HFO |
• Model: ISO Heavy Fuel Tank Container 20ft (HSFO 180 cst) • Insulation: steam/hot water heating system • External Dimensions: Length: 6,058 mm; Width: 2,438 mm; Height: 2,591 mm |
|
| Tank Container For Diesel |
• ISO Tank Container 20 ft • External Dimensions: Length: 6,058 mm; Width: 2438 mm; Height: 2591 mm |
|
| Shipping Container |
• Model: Standard Shipping Container 20 ft, to transport various materials, including hazardous materials • External Dimensions: Length: 6,058 mm; Width: 2438 mm; Height: 2591 mm |
| 18.2.2 | Roads |
The Project is located near to the two lane paved National Highway N40 which is a public road and maintained by the National Highway Authority. The Project is planning to build a 45 km road connecting the N40 highway to the Project site, which will serve as the primary access method.
| 18.2.3 | Port |
The Pakistan International Bulk Terminals (PIBT) at Port Qasim near Karachi has been selected as the base case location for export facilities for concentrate from the Project.
|
February 19, 2025 |
Page 252 |
|
|
NI 43-101 Technical Report on the Reko Diq Project |
|
The port is currently operational and handles bulk materials for other users.
PIBT has an existing and largely idle bulk materials handling facility, a receptive bulk terminal operator, good rail connection and a nearby marshalling yard. Water, sewerage and power systems are in place at PIBT. PIBT holds a concession and license to import and export bulk materials such as coal, cement and clinker, and the license will need to be updated to allow export of concentrate.
The existing marine facilities at PIBT were built in 2017 and are in good condition, although in need of some maintenance. They are sized for a range of vessel specifications, including the Handysize and Supramax vessels recommended for sales. Piloting and tug assisted berthing is provided by the Port Qasim Authority.
RDMC will develop, operate and maintain a concentrate storage and export facilities within PIBT’s concession area, with PIBT as the existing operator and concession holder facilitating the integration of the Project concentrate export operations into its export conveyor system.
Copper and gold concentrate will arrive at the marshalling yard nearby to PIBT by train, unloaded using reach stackers, and stored before trucking to the PIBT port area for storage of the concentrate in a fully enclosed 225 m by 48.6 m shed. Concentrate will be reclaimed using front-end loaders, and fed via hoppers and belt feeders onto the export shipping conveyor line. The facility will be operated year round.
The PIBT port solution layout is illustrated in Figure 18-3.
|
February 19, 2025 |
Page 253 |
|
|
NI 43-101 Technical Report on the Reko Diq Project |
|

Source: Barrick, 2024
Figure 18-3 PIBT Option
| 18.3 | Power Supply |
Power Demand
Average operating demand is forecast to be 149.7 MW for Phase 1 operations, rising to 264.8MW for Phase 2. Annual energy consumption is expected to be 1,312 MWh (Phase 1) and 2,320 MWh (Phase 2). Power demand summary is shown in Table 18-2.
|
February 19, 2025 |
Page 254 |
|
|
NI 43-101 Technical Report on the Reko Diq Project |
|
Table 18-2 Reko Diq Power Demand Summary
| Description | Unit | Phase 1 | Phase 21 | |||
|
Maximum Demand |
MW | 195.042 | 359.2 | |||
|
Dry Plant |
MW | 57.99 | 99.0 | |||
|
Wet Plant |
MW | 113.04 | 223.8 | |||
|
Infrastructure |
MW | 20.61 | 30.0 | |||
|
Transmission Losses |
MW | 2.0 | 3.8 | |||
|
Distribution Losses |
MW | 1.4 | 2.6 | |||
|
Average Operating Demand |
MW | 149.7 | 264.8 | |||
|
Annual Energy Consumption |
MWh | 1,312 | 2,320 | |||
Note:
| 1. | Phase 2 load demand requirements were factored based on the Phase 1 demand and the increase in throughput to 90Mtpa. |
| 2. | Exclusion of CPF (future) and Rougher Concentrate Regrind Train 4 (standby) loads. |
Power Generation
Multiple factors were considered for selection of the Project’s power strategy such as availability and ease of access, capital, operating and maintenance costs.
Power for Phase 1 will be supplied by an onsite hybrid microgrid power solution, comprising Heavy Fuel Oil (HFO) fired medium speed generating sets, diesel generating sets, a 150 MW solar PV array and a 50 MW/100 MWh Battery Energy Storage System (BESS).
The HFO power station generation configuration consists of N+1 generators. High speed diesel power station to provide emergency back-up supply to the site and provide additional redundancy to the HFO power station.
HFO will be delivered by rail and stored adjacent to the power station. Storage is equivalent to 43 days’ supply with solar PV production or 32 days excluding solar PV production.
Power will be distributed across the site via a 220 kV transmission line from the power station to the main process plant area and the solar PV facility. Three 220 kV transmission substations will be constructed at the power station, process plant and solar PV areas, and voltages will be stepped down to suit individual subsystems/loads.
Facilities have been sized with an area provisioned to allow for the capacity of existing power supply sources to be increased to meet Phase 2 requirements. However, the base case assumes the power supply for the Project will be sourced from the national grid from Year 15 of operations and the HFO will be placed on standby as a backup power source. The Project has advanced this strategy with Pakistan’s National Transmission and Despatch Company to ensure it aligns with the strategic direction for the countries power connectivity.
|
February 19, 2025 |
Page 255 |
|
|
NI 43-101 Technical Report on the Reko Diq Project |
|
Pakistan has over 37 Gigawatt (GW) of installed generation capacity and a combined customer demand of 25 GW, therefore a significant reserve generation capacity is available. Importantly, large proportions of the current power generation across the grid are provided from hydropower, with the potential to increase renewable power sources.
Furthermore, additional studies are being undertaken to assess the feasibility of other power sources to increase the percentage of power delivered from the national grid or by renewable energy sources to reduce the dependence on HFO.
| 18.4 | Water Supply |
Groundwater is planned as the primary water supply for the Project.
Water will be supplied from a borefield installed in the Northern Groundwater System located 70 km to the northwest of the site with raw water (RW) supplied via pipeline.
Water demand has been calculated and based on expected water usage for both construction and operations. Water distribution will be via dedicated water service lines and will be distributed/supplied at the required pressures and flows, to all facilities and buildings. In some cases, water will be trucked to certain locations, from where it will be pumped to a storage tank. From this local tank, water will be distributed to the facilities that require it using pumps etc.
There are two main groundwater systems within the study area of the Project. The Northern Groundwater System to the north-west of the surface lease and forms part of the Sistan Depression. The Southern Groundwater System lies to the south of the N40 highway and north of the Makran Range. RDMC is exploring both systems in order sustain the LOM of the Project. RDMC has obtained ten Water NOCs which are detailed in Section 4. Three permits were selected as the focus of the study including Fan Sediments (Northern Groundwater System), and Nokkundi South and Patangaz (Southern Groundwater System) (Figure 18-4).
|
February 19, 2025 |
Page 256 |
|
|
NI 43-101 Technical Report on the Reko Diq Project |
|
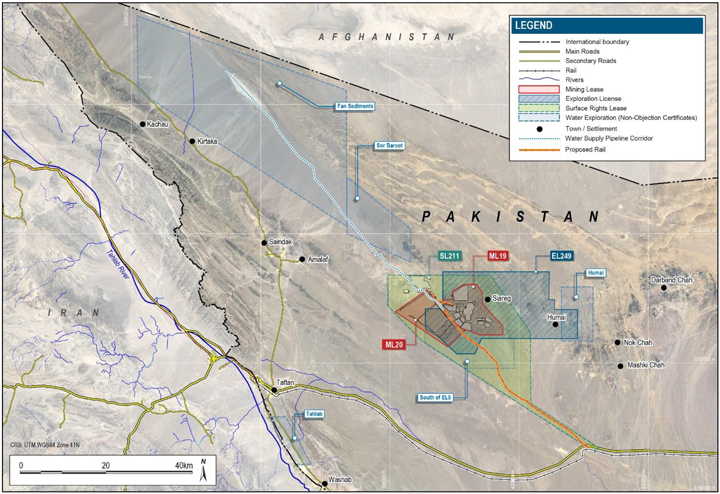
Source: Barrick, 2024
Figure 18-4 Water NOC Location Plan
As noted, water for construction and operations (Phases 1 and 2), will be sourced from the Northern Groundwater System, a major sedimentary aquifer system located approximately 70 km to the northwest of the mining area. The system represents a localised and isolated part of a much larger basin with no communities or community water sources located within the proposed bore field or its area of influence. There are currently no planned developments or other identified users of the target groundwater system, and the scope of the Project does not preclude future use of the broader basin by others.
Raw water from the boreholes is pumped to a booster pump station location that delivers water to the process plant via three pipelines, an early works pipeline that provides water during the construction phase, and two large diameter pipeline to supply process water required for Phase 1 and Phase 2. The raw water dam will consist of two 200,000 m3 compartments providing approximately five to seven days raw water storage at the mine site.
The Project requires a continuous and consistent supply of water of varying volumes for the different stages of the Project: construction, operation (Phases 1 and 2), and decommissioning. The water
|
February 19, 2025 |
Page 257 |
|
|
NI 43-101 Technical Report on the Reko Diq Project |
|
requirements for each stage will progressively increase until decommissioning, after which water requirements are expected to revert to volumes similar to those required for construction.
The Project water requirements have been calculated using estimates from the primary users, including process, mining, power generation and camp services. The mine processing facility, which utilizes flotation methods, is the primary user of raw water.. Table 18-3 provides a break-down of raw water demand requirements for mining activities for Phase 1 Production. Water consumption estimates include water recycling and efficiencies captured in the processing and tailings disposal facilities.
Table 18-3 Raw Water Demand – Phase 1 Production
| Average Water Demands | m3/h | |
|
Total Makeup Water |
1,923 | |
|
Raw Water to RO Plant |
727 | |
|
Raw Water Dust Suppression |
118 | |
|
Raw Water to Mine Services |
48 | |
|
Raw Water to HFO Plant |
2 | |
|
Raw Water to Potable Water Treatment Plant |
60 | |
|
Total Raw Water Demand |
2,878 | |
|
Mining Tonnes Phase 1 (Mtpa) |
45 | |
|
Total Raw Water Demand (m3/tonne) |
0.56 | |
The overall peak water demand for the Project site will be during the Phase 2 operations and is estimated to be 50.4 GL/year (50.4 million m3/year), which translates to around 1,598 L/s (5,753 m3/hr or 138,082 m3/d or 36.53 MGD). The bore fields design from each of the three locations is designed to cater for a flow of 1,100 L/s.
A Water Treatment Plant (WTP) will be installed at the Project site to provide potable water to the accommodation facility and work areas. The raw water will be pre-treated using filtration processes and chemical dosing with chlorine and soda ash to kill bacteria and correct the pH. The water will then be further processed through a Reverse Osmosis (RO) plant to reduce the Total Dissolved Solids (TDS) to drinking water quality standards.
| 18.5 | Water Management |
The mining area lies on a water catchment divide between two large, internally draining basins; the Mashkhel Basin to the south, located mainly within Pakistan, and the Sistan Depression to the north, most of which is located within neighbouring Afghanistan. The mine-site is situated in a desert region with hyper-arid climatic conditions, with average annual rainfall of 32 mm, and there are limited surface water resources.
|
February 19, 2025 |
Page 258 |
|
|
NI 43-101 Technical Report on the Reko Diq Project |
|
The deposits targeted by the Project occur in geological formations with low permeability and minimal hydraulic connection to a regional groundwater system, such that dewatering volumes are expected to be very low, and drawdown impacts constrained largely to the mine area.
Mine dewatering will be achieved through installation of sub-horizontal drainage holes into the pit walls along the mine benches, with the seepage water to be collected in pit sumps before being pumped and trucked from the pit for use in dust suppression operations. The maximum groundwater inflows, as determined from numerical groundwater modelling, are expected to be in the order of 825 m3/d (9.2 L/s) due to the arid environment and limited groundwater around the mining area. Average rainfall contributions to dewatering inflows are expected to reach about 500 m3/d (5.8 L/s) at the end of mining operations, when the pit outline area will be at a maximum. The water will be collected and used as for the groundwater inflows.
Mine processes have been designed to minimise water requirements, and in average rainfall years all water will be contained on site and reused in the process water system or for dust suppression. A water balance model has been developed such that no water is planned to be discharged from site.
Stormwater management strategies have been developed to direct potentially contaminated water from tailings storage facilities, waste rock dumps, ore stockpiles, and/or the process plant to settlement ponds for collection and reuse in the water process system. Diversion drains and berms are also proposed to divert surface water flows generated during occasional extreme rainfall events away from areas of potential contamination and into the natural drainage system.
Event based monitoring is proposed for surface water flows and water quality, and detailed groundwater monitoring programs have been provided for assessment of potential impacts on the groundwater system in the mining area and at the NGWS water supply bore field.
Water Balance
The Reko Diq mine site water balance was developed and incorporates environmental flows and planned water reticulation and infrastructure on site. Inputs to the water balance were developed as part of the FS engineering by Barrick and its third-party consultants.
Figure 18-5 shows the basic flow diagram for the mine site water balance; it shows the water lines and connections between facilities with only major flows considered.
|
February 19, 2025 |
Page 259 |
|
|
NI 43-101 Technical Report on the Reko Diq Project |
|
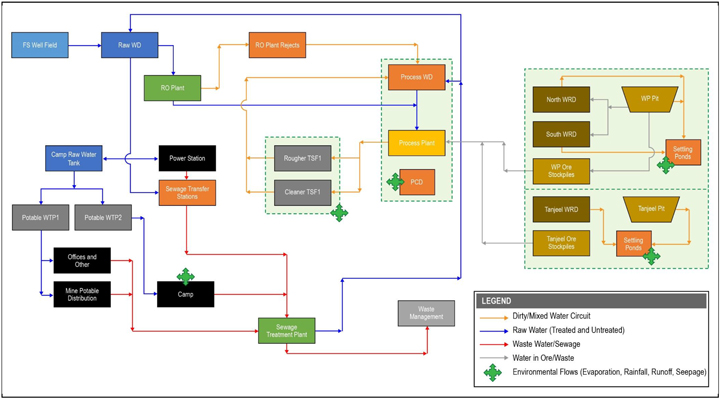
Source: Barrick, 2024
Figure 18-5 Basic Flow Diagram Outlining Main Flows and Planned Water Infrastructure
|
February 19, 2025 |
Page 260 |
|
|
NI 43-101 Technical Report on the Reko Diq Project |
|
| 18.6 | Site Common Purpose Infrastructure |
The buildings and facilities have been designed and laid out to align to the planned operations and maintenance activities taking into consideration personnel logistics (shifts changeovers), operations and maintenance practices, administration, security and evacuation, and environmental events (such as dust storms, earthquakes, etc.).
Facilities have been laid out to support both phases of the Project. Where additional space is required for Phase 2, space has been reserved. All permanent infrastructure has been located outside the blast zone boundary. Every facility will be serviced by water (plumbed or trucked), power, sewage (plumbed or truck removal), and comms services.
All of the facilities will be constructed within the security fence.
| 18.6.1 | Security |
The Project has developed a security strategy that is suitable for the Project context and location. The foundations of this strategy were agreed between Barrick, the GoB, and the GoP as part of the Reconstitution.
The strategy takes a three-tiered approach:
| 1. | A private security force at and within the mine site, |
| 2. | The Balochistan provincial security force, the Balochsitan Levies, |
| 3. | Pakistan’s regional security force, the Frontier Corps. |
The Project’s security strategy includes the development and implementation of strict security protocols for all employees, contractors, and visitors, as well as the formation of a security committee to ensure effective operational communication between the security service providers.
The security strategy and implementation arrangements for Reko Diq are based on international best practice and include commitments for all security personnel to be trained on Barrick’s Human Rights Policy and to uphold international human rights standards, such as the UN Voluntary Principles on Security and Human Rights.
An early works program for security is underway. This program includes establishing a perimeter boundary fence, gatehouse and surveillance systems. The gatehouse will employ full personnel and vehicle screening throughout the operation.
|
February 19, 2025 |
Page 261 |
|
|
NI 43-101 Technical Report on the Reko Diq Project |
|
The plant and accommodation village and other infrastructure areas will have fencing surrounding major areas with details to be developed during the execution phase.
| 18.6.2 | Airstrip |
The site has an existing airstrip used for the exploration and project development. The airstrip will be improved to accommodate night navigation and landing to support emergency response requirements.
| 18.6.3 | Site Roads |
Gravel surfaced internal roads will provide access within the Project between the mine, plant, and site facilities. Roads have been designed to allow for a mix of light and heavy vehicles. A number of roads will be built to allow for material haulage so that mine trucks can haul ore, and waste to the various destinations.
| 18.6.4 | Accommodation Facilities |
Given the scale of the Project and its location, a dedicated accommodation village will be required to support the construction and operation which will be located on the western side of the Project site. It is designed to be constructed in stages mirroring the build-up of site personnel (both construction workers and operations staff).
Facilities in the village will include:
| ● | Accommodation units (single and multiple occupancy); |
| ● | Ablutions (in addition to in-room ablutions); |
| ● | Meals area / kitchen; |
| ● | Recreational facilities; |
| ● | Administration area; |
| ● | Medical clinic; |
| ● | Emergency services; |
| ● | Security area; |
| ● | Bus stop and parking; and |
| ● | LV parking. |
To support movement of people, a dedicated bus service will be put in place for the movement of people between the camp and operational areas.
|
February 19, 2025 |
Page 262 |
|
|
NI 43-101 Technical Report on the Reko Diq Project |
|
| 18.6.5 | Administration and Control Buildings |
Administration Buildings
Administration buildings will be located at the mine and plant. Administration buildings are single storey structures that house the management and technical services personnel for the operators and maintenance staff. The administration building will also include meeting rooms, supplies and equipment storage, IT server room, kitchenettes, ablutions, and printing facilities. The seating capacity of buildings has been based on the peak number of personnel per shift over the life of the mine plus a 10% allowance.
Mine Operations Control
The mine operations control is a single standalone building that will serve as the control centre for monitoring and coordinating all mining operations.
Plant Control Room
A plant control facility has been designed as a double-story building and will house the operations staff who will manage the plant from a central control room, which will centralize controls between mine and process plant systems.
Laboratory
There will be two adjacent laboratories located in the plant area. The assay laboratory is expected to process approximately 300 samples per day from mine production drilling and mill operation. The metallurgical laboratory is expected to analyze the metallographic structure, which seeks to provide valuable information about the material quality.
Other Buildings
The training buildings are located at the mine and the plant. They will provide the necessary training facilities required by both the operators and maintenance technicians.
A central shift change room and ablutions have been placed near the bus drop off / pick up area in the mine services and plant administration areas. Personnel will change into their working attire before their shift and out of them prior to returning to the accommodation village. Separate areas will be provided for male and female personnel. The accommodation village will originally be constructed to allow for all personnel in Phase 1 followed by an expansion to accommodate additional personnel in Phase 2.
|
February 19, 2025 |
Page 263 |
|
|
NI 43-101 Technical Report on the Reko Diq Project |
|
Prayer rooms have been included in the design across the site as opposed to a central location. In doing so, it allows personnel not to travel, congregate, and congest the site. Designs have separate male and female prayer areas.
| 18.6.6 | Maintenance Facilities |
Mobile Equipment Workshops
The repair and maintenance area is planned to provide the necessary facilities required for the servicing and repair of Heavy Vehicles and Light Vehicles (HV and LV) for the mine site. The layout has been designed to establish a structured flow through the separate HV and LV maintenance areas, and includes facilities for washdown, repairs, servicing, tyre changing, and refuelling. Bays have been sized for the planned equipment and include suitably sized overhead cranes.
Maintenance facilities are sized to accommodate the requirements during the respective phases of the mine life and allow for further expansion. The heavy equipment repair shop and preventative maintenance shop have been sited and designed to allow for expansion to service the mobile equipment required for Phase 2 of the Project.
Plant Maintenance Workshops
The plant workshop is designed to provide support for routine maintenance work to the ore handling plant and non-process infrastructure equipment and is located within close proximity to the ore handling area.
The four maintenance bays are designed to maintain all fixed plant associated with the process plant and non-process infrastructure equipment. One of the bays is drive through setup. The two boiler making bays are used to modify all fixed plant up to the largest screen. All six bays can be serviced via the main 40t Over Head Travel Crane and the 5t auxiliary crane.
The Original Equipment Manufacturer (OEM) area consist of a separate set of workshops. The OEM workshop layouts have been provided by the relevant OEMs. These purpose-built facilities provide office space, ablutions, training and storage areas for maintenance and management staff.
Rail Workshop
As part of construction of the rail spur to the Project, a rail workshop has been allowed for to provide support for maintenance work on the rail fleet. This workshop includes offices, ablutions, kitchen and meals area.
|
February 19, 2025 |
Page 264 |
|
|
NI 43-101 Technical Report on the Reko Diq Project |
|
Lubrication Storage and Distribution
Facilities for lubricant storage and distribution are located adjacent to the workshops where the majority of vehicle fluid changes is planned. Bulk lubricant will be stored at the rail marshalling yard. From here, lubricants will be delivered to the mine services area (MSA) lubricant storage areas with integrated desiccant breathers to prevent contamination. The storage capacity of each fluid is based on the weekly and monthly consumption rates of the heavy and light vehicle fleets, respectively.
Warehouses and Laydown Areas
Warehouses within the MSA will be forward stores that receive, store, control, and issue spare parts and consumables utilised by the vehicle fleet. Two separate warehouses have been included. The first warehouse caters for the HV fleet and is located adjacent to the HV repair workshop, in doing so, a direct access point between the two facilities will be achieved which increases workflow efficiency and faster access to any necessary specialised tooling and/or parts. The second warehouse serves the LV fleet and has the same design philosophy / functions as the HV warehouse. The HV and LV warehouses have footprints of approximately 6,750 m2 and 1,300 m2, respectively.
For large spares (such as spare dump bodies and rotable HV trays) that are unaffected by the elements, open laydown areas have been included for both HV and LV components. The laydown areas are approximately 84,000 m2 and 6,500 m2 for HV and LV, respectively.
Warehouse and spares inventory is based on the specific components with the initial capital including a first fills component as defined with the main equipment suppliers, followed by the risk based inventory strategy. Critical spares have been negotiated with the main suppliers for plant and mining and these will be held either at site or in the UAE.
Tyre Storage and Change
The storage of tyres at the MSA are within open laydown areas where delivery trucks can directly drop off new tyres and/or pick up tyres for disposal. The storage of HV tyres is located along the eastern battery limit of the MSA and has a total capacity of 15,000 m2. The LV tyre storage area has 6,500 m2 capacity and is located north of the LV maintenance area, smaller quantities will be stored within the LV maintenance area. Both areas are based on a minimum of three months’ supply of nominal stock comprising of all types of HV and LV fleet tyres.
| 18.6.7 | Fuel Storage and Refueling |
Diesel fuel oil (diesel) will be delivered to the Project and transferred to the bulk storage diesel tanks. Prior to construction of the rial spur, trucks will be used to delivery diesel to the Project, after which trains will be the primary transport of fuel.
|
February 19, 2025 |
Page 265 |
|
|
NI 43-101 Technical Report on the Reko Diq Project |
|
The diesel fuel will be unloaded to eight 110 kL tanks for intermediate storage during unloading which can accommodate the expected diesel fuel volume per delivery.
Duty / standby pumps then transfer the diesel fuel from the intermediate tanks to the four onsite diesel bulk storage tanks located in the MSA via approximately 2 km of piping. This facility consists of API 650 welded tanks placed within a concrete open dike. The number of tanks and their capacity is primarily based on two main factors: a thirty-day storage capacity and their rationalisation across the Mine Plan. Four 2.5 ML tanks have been allowed for per phase, for a total of 12 tanks over the LOM. This includes a 20% design factor to accommodate for fluctuating peaks in consumption.
Refueling facilities will be provided for both heavy and light vehicles. A LV refuelling facility has been placed to the south-east of the bulk diesel storage facility. The HV refuelling facility has been placed to the southeast of the MSA next to the mine haul roads. This fuel farm consists of two 110 kL self bunded containerised fuel tanks each resting on strip footings. Two additional 110 kL tanks have been considered as part of Phase 2.
| 18.6.8 | Explosive Storage |
Explosive storage will consist of two facilities:
| ● | Explosives Magazine Storage (detonator buildings, magazines buildings); and |
| ● | Explosives Manufacturing Plant (warehouse, manufacturing plant, wash bay, workshop) |
Road access has been provided both from the loadout area and from the haul road. Both facilities will have a security hut at the entrance. For safety reasons there is physical separation (1 km) between the two areas.
Explosives storage locations are designed to meet local and international standards for safe offset distance.
| 18.6.9 | Emergency Response and Medical Facilities |
All areas have been designed to allow appropriate emergency response (i.e. medical, fire etc.) to enable unfretted access to plant, camp and Site.
Emergency response facilities include first aid / medical clinics and emergency response outposts located within the MSA and in the plant administration area that will be staffed 24 hours a day and provide a base to respond to an emergency. The emergency response facilities have been designed to include sick bays, offices for first responders (two medical personnel and six firefighters), storage rooms (medical records, supplies and equipment), kitchenette, and disability accessible ablutions. Parking bays for ambulances, and other vehicles have also been allowed for.
|
February 19, 2025 |
Page 266 |
|
|
NI 43-101 Technical Report on the Reko Diq Project |
|
If required, all patients will be transported to the main clinic located at the camp. The injured person will be sent to the village medical centre for further assessment and subsequent evacuation.
| 18.6.10 | Communications |
The communication network for the Project site consists of a backbone network with 96C or 2 X 48C Single Mode Optic fibre, reticulating between all areas of site. Each network switch is connected with two 48-core fiber optic cables, providing both redundancy and diversity.
A redundant fibre communication backbone system manages the data transmission of the distributed control system, third-party PLCs, motor controls, fire detection system, Vo-IP telephone system, and computers around the mine site.
| 18.6.11 | Waste Management |
The sewage will be treated to a quality that is complaint with the relevant bioanalytical equivalents, before either discharge or reuse.
All hazardous wastes, such as hydrocarbons and process water will be stored in dedicated facilities and be disposed off site through a certified and approved waste contractor, as per the local guidelines.
All medical waste will be packaged in specialized containers and transported offsite for incineration, which will be managed by the Project approved medical service provider
A landfill will be located between the camp and processing process.
| 18.6.12 | Fire Protection |
All infrastructure is supported by appropriate firefighting equipment such as hydrants and extinguishers. To enable the use of hydrants a fire network design has been developed to provide the necessary volumes of water (at fire water pressure). Fire skids and booster pumps have been designed to allow the containment of fire, in case of a fire incident.
Fire water reserve is held in tanks located at the water treatment plant. From here a fire water transfer pump supplies feed fire water to the camp. A separate fire water skid supplies fire water to the sewage treatment plant and waste management facility.
| 18.6.13 | Dust Control |
Dust build-up and maintenance access has been considered for all infrastructure design by allowing sufficient space for maintenance trucks, and orientation of the buildings away from the predominate
|
February 19, 2025 |
Page 267 |
|
|
NI 43-101 Technical Report on the Reko Diq Project |
|
wind paths as well as providing air lock entries to all administration and offices and other dust sensitive areas such as food halls, clinics etc.
All unpaved roads will be sprayed with water or water based solutions for dust control.
| 18.7 | Tailings Storage Facilities |
The plant will produce a copper and gold concentrate (approximately 2% of ore). The remaining material will report to tailings and be comprised of two components, namely:
| ● | Rougher tailings derived from the first stage flotation circuit comprising 88% of the ore; and |
| ● | Cleaner tailings derived from a fine grind and secondary flotation circuit comprising 10% of ore. |
For the first five years of operation, the plant will operate at a nominal throughput rate of 45 Mtpa. From Year 6 onwards the plant will operate at 90 Mtpa. Tailings placement rates have considered this in design and scheduling.
| 18.7.1 | Site Selection |
Sixteen potential tailings storage sites were identified within a 100 km radius of the project. The TSF sites constrained by the Pakistan border and lease constraints were ignored. A multiple account analysis (MAA) was conducted to identify candidate tailings management alternatives and a pre-screening was used to filter out unfeasible alternatives from further detailed assessment. The base case evaluation in the MAA clearly indicated that Site 0E (Figure 18-6) located approximately 6km from the processing plant is the preferred site, with the use of conventionally thickened tailings as the preferred tailings technology.
The preferred option for assessment was Option 0E-B. This option is conceptually similar to Option 0E; however, the facility was moved 1,900 m to the north-west to optimise the design and accommodate the nominated 200 m offset from the identified Tozgi fault. The 200 m offset requires that an embankment will be constructed along the south of the facility parallel to the Tozgi fault. The Cleaner cells were relocated to the south-eastern embankment and will be external to the Rougher cells. After LCI completes additional fault characterisation work, amendments to the design may be incorporated in subsequent design phases. It is noted that there will be several years of development before a final decision on the offset is required.
|
February 19, 2025 |
Page 268 |
|
|
NI 43-101 Technical Report on the Reko Diq Project |
|
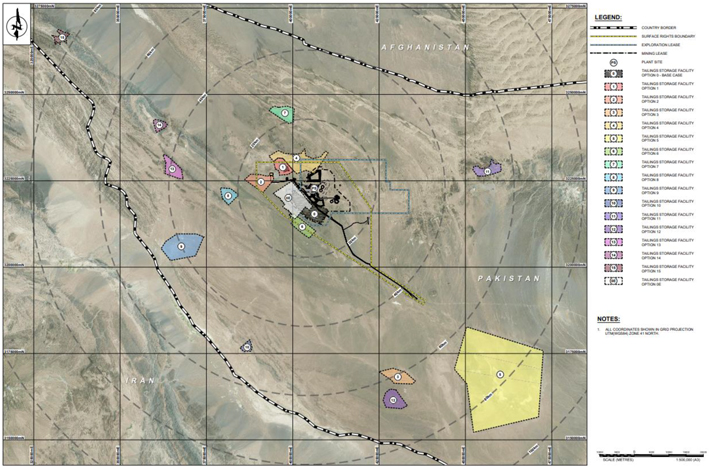
Source: Barrick, 2024
Figure 18-6 Potential Tailings Storage Sites
|
February 19, 2025 |
Page 269 |
|
|
NI 43-101 Technical Report on the Reko Diq Project |
|
| 18.7.2 | Engineering Studies |
The FS includes a comprehensive site investigation program of geological surface mapping, geotechnical boreholes, geophysics survey, test pits and groundwater monitoring wells.
The 2023/2024 geotechnical investigation scope of work for the proposed TSF and waste storage dump (WSD) was defined by Knight Piesold. The investigation was designed to augment the previous study investigation which covered the majority of the Rougher TSF Cell 1 footprint and the Cleaner Cells 1 to 3 footprints. As the investigation was undertaken in parallel with optimisation of the TSF layouts during the course of the investigation, additional investigation locations were added to the scope of work during the course of the investigation.
Representative samples of the in-situ soils were taken from the test pits and boreholes for laboratory testing. The purpose of the laboratory testing was to classify and characterise the in-situ materials to enable assessment of their characteristics under embankment and foundation loading, and their suitability for use in earthworks. Testing on disturbed samples of the near-surface TSF soil materials indicates:
| ● | Predominantly mixtures of sand and silt with lesser proportions of gravel. |
| ● | The average fines content is 45% and the fines are typically low plasticity to non-plastic silt. |
| ● | Shear box tests indicate an effective friction angle of between 22° and 41°, averaging 29°, and dependent on the relative proportion of the soil fractions in the samples. These values are within the range that would be expected for these materials. |
| ● | Remoulded permeabilities of surficial soils at 95 % Maximum Dry Density (MMDD), show that fifteen out of seventeen tests achieved low permeability results (less than 5 x 10⁻⁸ m/s). |
| ● | Point load tests on core samples from a range of depths up to 25 m in the TSF boreholes reported rock of medium strength on average with some intersections of high and very high strength (rock of mostly sedimentary origin). The test results are broadly consistent with the borehole logs. |
| 18.7.3 | Storage Requirement |
The plant will produce copper and gold concentrate equivalent to approximately 2% of ore, and a tailings stream comprising two components: Rougher tailings (equivalent to 88% of the ore) and Cleaner tailings (10% of the ore). The Rougher tailings will be stored in two cells, Rougher Facility No. 1 (RF1) and Rougher Facility No. 2 (RF2). RF1 will be developed initially and provide 21.5 years of storage capacity and RF2 will be constructed and commissioned in Years 20-21 to provide the remaining 17 years of storage.
The Cleaner tailings will be stored in three cleaner facilities: Cleaner Facility No. 1 (CF1), Cleaner Facility No. 2 (CF2), and Cleaner Facility No. 3 (CF3). Each facility comprises two cells, A and B (i.e. six storage cells in total). CF1 will be developed initially and provide approximately 15.5 years of
|
February 19, 2025 |
Page 270 |
|
|
NI 43-101 Technical Report on the Reko Diq Project |
|
storage capacity, CF2 will then provide 11 years of capacity, and CF3 will provide the remaining 12 years of storage capacity.
| 18.7.4 | Design |
The Stage 1 TSF is designed for the initial 18 months of storage capacity, as selected by RDMC. Subsequently, the TSF will be constructed in annual raises to suit storage requirements. However, this may be adjusted to biennial raises to suit mine scheduling during the operation.
The TSF basin area will be cleared, grubbed, and topsoil stripped, although this is expected to be limited. A 150 mm compacted soil liner will be constructed in the TSF basin area, comprising either reworked in-situ material or imported low-permeability material. The area within the TSF basin will be lined with 1.5 mm LLDPE geomembrane liner, overlying the compacted soil liner.
The TSF design incorporates an underdrainage system to reduce pressure head acting on the basin liner system, seepage, increase tailings densities, and improve the geotechnical stability of the embankments. The underdrainage system comprises a network of collector and branch drains. The underdrainage system drains by gravity to a collection sump located at the lowest point in the TSF basin. The water recovered from the underdrainage system will be directed to the underdrainage outflow pond via the underdrainage outflow trench. Water reporting to the underdrainage outflow pond will be returned to the top of the tailings mass via a submersible pump, reporting to the supernatant pond.
Rougher Facility
The rougher cells will initially comprise a cross-valley storage facility formed by multi-zoned earth fill embankments. Stage 1 footprint area (including the basin area) comprises of approximately 1,140 ha and 1,432 ha for RF1 and RF2 respectively. At final stage, RF1 and RF2 will have total footprint areas of 2,819 ha and 2,657 ha, respectively. RF1 and RF2 are designed to accommodate a total of 2,816 Mt of Rougher tailings. Both downstream and centreline raise construction methods will be utilised for all TSF embankment raises. Downstream construction methods will be utilised for the embankments running parallel to the Tozgi Fault and for embankments within the expected supernatant pond extents, otherwise centreline construction methods will be utilised. General arrangements of Stage 1 and final stage are shown on Source: Barrick, 2024
Figure 18-7. Typical embankment cross-sections and details are shown on Source: Barrick, 2024
Figure 18-8.
|
February 19, 2025 |
Page 271 |
|
|
NI 43-101 Technical Report on the Reko Diq Project |
|

Source: Barrick, 2024
Figure 18-7 TSF Stage 1 (Left) and TSF Stage Final (Right) General Arrangement
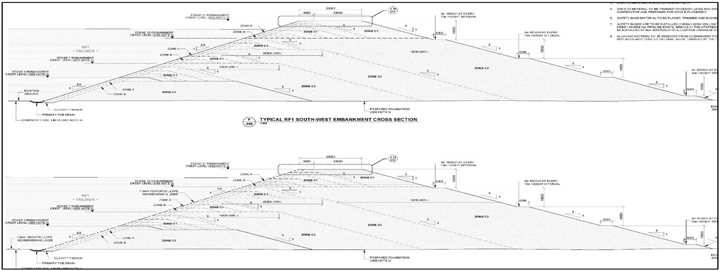
Source: Barrick, 2024
Figure 18-8 RF1 and RF2 - Typical Embankment Cross-Sections
Cleaner Facility
The cleaner cells will initially comprise of a side hill storage facility formed by multi-zoned earth fill embankments, comprising a total Stage 1 footprint area (including the basin area) of approximately 186 ha, 213 ha and 272.5 ha for CF1, CF2 and CF3, respectively. The cells become closed, forming a paddock facility in years 7.5, 18.5 and 28.5 for CF1, CF2 and CF3, respectively. The facilities will have a total footprint area of approximately 389 ha, 358 ha and 377 ha, respectively at final stage. CF1, CF2 and CF3 are designed to accommodate a total of 320 Mt of tailings (i.e. 10% of the current
|
February 19, 2025 |
Page 272 |
|
|
NI 43-101 Technical Report on the Reko Diq Project |
|
Mineral Reserve). Further expansion of the TSF is possible. General arrangements of the Cleaner TSF at Stage 1 and final stage are shown on Source: Barrick, 2024
Figure 18-9. Typical embankment cross sections and details are shown on Source: Barrick, 2024
Figure 18-10.
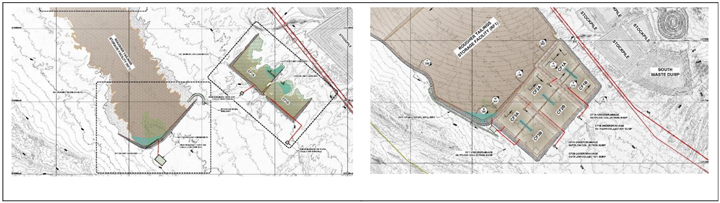
Source: Barrick, 2024
Figure 18-9 Cleaner TSF Stage 1 and TSF Stage Final (Right) General Arrangement
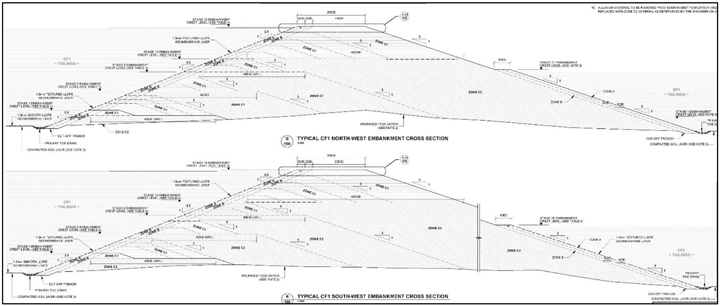
Source: Barrick, 2024
Figure 18-10 Cleaner TSF Typical Embankment Cross-Sections
| 18.7.5 | Construction |
Construction associated with the TSF is expected to commence in 2026. Based on the mine schedule, the Stage 1 Zone C2 material placement will commence in January 2027. The mine schedule indicates that sufficient mine waste will be available to supply the TSF construction. The construction of the TSF will initially be completed in parallel by the mining fleet and a civil contractor.
|
February 19, 2025 |
Page 273 |
|
|
NI 43-101 Technical Report on the Reko Diq Project |
|
| 18.7.6 | Operation |
Tailings deposition into the TSF will commence in 2028 and continue until 2064. The cells will be phased as follows:
| ● | RF1 will be developed initially and provide 21.5 years of storage capacity and RF2 will be constructed and commissioned in Years 20-21 to provide the remaining 17 years of storage. |
| ● | CF1 will be developed initially and provide 15.5 years of storage capacity, CF2 will then provide 11 years of capacity, and CF3 will provide the remaining 12 years of storage capacity. |
During operations, for the Rougher facility, an emergency spillway will be constructed at the south-west corner of RF1 to convey overflow should an extreme rainfall event occur that results in design freeboard being exceeded. The Cleaner Facility design concept is to contain all runoff from the 10,000 ARI storm event. It is therefore proposed to not construct an emergency spillway for the Cleaner Facilities
| 18.7.7 | Closure |
The conceptual closure plan vision is to develop a safe, stable, erosion resistant and non-polluting landform with no requirement for ongoing maintenance post closure. The Post Mining Land Use (PMLU) is to resemble the surrounding landscape where practicable. Site trials and progressive closure of TSF cells will occur during operation and will form the basis for closure design updates as the site approaches mine closure.
The proposed Rougher TSF closure design is contoured berms and swales over the tailings surface with exposed beaches in between. A small ephemeral pool will be located in front of each closure spillway to shed runoff from the facility. The proposed Cleaner TSF closure design is a full gravel or mine waste cover over the entire tailings surface. The surface will be profiled to a closure spillway in each cell, cascading runoff between cells before discharging off site. Downstream batters of all facilities will be profiled to an overall 3.5H:1V slope of waste rock, preferably during operation.
| 18.8 | Waste Rock Storage |
Three waste rock dumps will be constructed.
| ● | North Waste Dump which will contain waste mined from the Western Porphyries Pit; |
| ● | South Waste Dump which will contain waste mined from the Western Porphyries Pit; and |
| ● | Tanjeel Waste Dump which will contain waste mined from the Tanjeel Pit. |
|
February 19, 2025 |
Page 274 |
|
|
NI 43-101 Technical Report on the Reko Diq Project |
|
Waste dumps are designed to accommodate all of the waste material forecast to be mined within the LOM plan. They will be located in areas where condemnation drilling has been completed, as close as possible to pit ramp exits.
Waste rock dump design and management are described in Section 16.3.3.
| 18.9 | Stockpiles |
Ore stockpiles will be located to the south of the processing facility and ore will be placed into four main areas low grade, medium grade, high grade and very high grade based on the characteristics of the material and the needs of the mine plan at the time.
The stockpile is designed to hold a total up to approximately 858 Mt of ore across the facility.
Stockpile management and blending are discussed in Section 16.3.4.
| 18.10 | QP Comments on Project Infrastructure |
The project infrastructure as outlined in this Report is sufficient to support the Project operation as planned and has been engineered to level of study suitable to support the declaration of Mineral Reserves.
The planned grid connection has significant benefits, including the introduction of reliable power to towns and communities along proposed transmission routes, the fact that there is already significant renewable penetration on the National Grid, will reduce greenhouse gas emissions of the Project and there would not be a need to transport large volumes of HFO. However, various constraints make this option unfeasible until later in the project life.
|
February 19, 2025 |
Page 275 |
|
|
NI 43-101 Technical Report on the Reko Diq Project |
|
| 19 | Market Studies and Contracts |
| 19.1 | Market Studies |
Copper is a metal with inherent characteristics of excellent electrical conductivity, heat transfer, and resistance to corrosion. Copper is used principally in telecommunications, power infrastructure, automobiles, construction and consumer durables. Copper is freely traded, primarily on the London Metal Exchange (LME), the New York Commodity Exchange and the Shanghai Futures Exchange, and no market studies are relevant as a result. The price of copper as reported on these exchanges is influenced by numerous factors, including:
| ● | the worldwide balance of copper demand and supply; |
| ● | rates of global economic growth, including in China, which has become the largest consumer of refined copper in the world; |
| ● | speculative investment positions in copper and copper futures; |
| ● | the availability and cost of substitute materials; and |
| ● | currency exchange fluctuations, including the relative strength of the U.S. dollar. |
The copper market is volatile and cyclical. Over the last 15 years, LME prices per pound have ranged from a low of $1.37 to a high of $4.92, reached in March 2022. During 2024, LME copper prices traded in a range of $3.69 per pound to an all-time high of $5.04 per pound, averaged $4.15 per pound, up 8% from the average of $3.85 per pound in 2023, and closed the year at $3.95 per pound. Copper prices are significantly influenced by physical demand from emerging markets, especially China. Copper prices in 2024 were impacted by low global economic growth, especially in China, which is the world’s largest purchaser of copper, tempered by supply disruptions. Subsequent to year end, copper prices have continued to trade within prior year ranges due to a continuation of these trends.
As of December 31, 2024, the Company had no copper derivative contracts in place. As a result, all of Barrick’s copper production is currently subject to market prices.
There are no agency relationships relevant to the marketing strategies used.
Barrick is not dependent upon the sale of copper to any one customer and its product is sold to a variety of traders and smelters.
|
February 19, 2025 |
Page 276 |
|
|
NI 43-101 Technical Report on the Reko Diq Project |
|
| 19.2 | Reko Diq Concentrates |
The product of the Project will be a conventional copper concentrate. This product is not projected to contain deleterious elements at penalty levels and is expected to be readily marketable to smelters in Asia, Europe, and South America. Test results to date have typically yielded a 27% copper concentrate.
In additional to the copper in the concentrate, gold at a grade 9 g/t is expected to contribute revenue as a byproduct. Approximately 75% and 25% of LOM gross revenue is estimated to come from the copper and gold contained in this concentrate, respectively.
As of December 31, 2024, there were no offtake contracts in place.
Letter of Intent (LOIs) for the long-term supply of copper concentrate have been executed with six potential offtakers, distributed between Japan, Korea, Germany, Sweden and Finland. The LOIs represent total annual concentrate offtake of 660 ktpa for a 12-year term, equivalent to 91% of Line 1 average annual production of 729 ktpa (excluding the first production year) during that same time period.
| 19.3 | Commodity Price Assumptions |
Barrick sets metal price forecasts by reviewing the LOM for the operations, which is 40+ years, and considering the commodity price for that duration. The guidance is based on a combination of historical and current contract pricing, contract negotiations, knowledge of its key markets from a long-term operations production record, short-term versus long-term price forecasts prepared by Barrick’s internal marketing group, public documents, and analyst forecasts when considering the long-term commodity price forecasts.
The long-term commodity price forecasts used to support Mineral Resources and Mineral Reserves as of 31 December 2024 are:
| ● | Mineral Resources: US$4.00lb Cu; US$1,900/oz Au; |
| ● | Mineral Reserves: US$3.00/lb Cu; US$1,400/oz Au; |
Both pricing assumptions are below the current market spot price as of the date of this report, with higher metal prices being used for the Mineral Resource estimate utilised for the positioning of long-term infrastructure to ensure that future potential higher copper price pit pushbacks are not sterilised.
|
February 19, 2025 |
Page 277 |
|
|
NI 43-101 Technical Report on the Reko Diq Project |
|
| 19.4 | Contracts |
The Reko Diq Project will be a large modern operation and will be operated by major international firm with policies and procedures for the letting of contracts. Barrick has many supply contracts in place currently. The largest in-place contracts are for mining and process equipment associated with key equipment for the mine capital period which are in place to derisk key capital cost inputs. RDMC is expected to enter into other construction and operational contracts as the Project progresses.
While there are numerous contracts in place at the Reko Diq Project, there are no currently executed contracts considered to be material to Barrick.
| 19.5 | QP Comment on Market Studies and Contracts |
The QP notes the terms assumed for sales contracts are typical and consistent with standard industry practice.
The QP has reviewed commodity pricing assumptions used in this study and considers them appropriate to the commodity and mine life projections. Additionally, the QP considers marketing assumptions acceptable for the use in estimating Mineral Reserves and the supporting economic analysis.
|
February 19, 2025 |
Page 278 |
|
|
NI 43-101 Technical Report on the Reko Diq Project |
|
| 20 | Environmental Studies, Permitting, and Social or Community Impact |
| 20.1 | Summary |
RDMC produced an Early Works Environmental and Social Impact Assessment (ESIA) in February 2024, which the regulators approved in May 2024. Subsequently, a Project ESIA aligned to the Feasibility Study was completed in late 2024. Approval from the regulators is expected in early 2025.
The Early Works ESIA and the Project ESIA were completed in line with the relevant National and Provincial Environment and Social (E&S) legislative requirements, the Equator Principles 4 (EP4), and the International Finance Corporation’s (IFC) E&S Performance Standards (PS) and Guidelines.
The Project is located near Nok Kundi in the underdeveloped Chagai district of the Balochistan province of Pakistan. The Project area is located in one of the most arid parts of Pakistan, with sparse vegetation, an average rainfall of less than 35 mm per annum, and extreme temperatures which range from -9°C to 45°C. The desert terrain includes extensive sand dunes, rocky outcrops, and no perennial surface water sources, creating a challenging environment for both human and plant and animal habitation.
The work conducted for the Feasibility Study and the Project ESIA identified potential Project E&S impacts. These relate to:
| ● | Water and wastewater management; |
| ● | Dust and other emissions; |
| ● | Biodiversity; |
| ● | Social impacts (positive and negative) such as: |
| o | Improvements in livelihoods through direct employment, training and upliftment and other economic activity; |
| o | Social development initiatives such as education, health and clean drinking water; |
| o | Population increases due to influx of people seeking employment opportunities; |
| o | Impacts from increased noise and traffic. |
Corresponding mitigation and management measures were developed in an Environmental and Social Management and Monitoring Plan (ESMMP) developed as part of the Project ESIA.
In addition to E&S impacts, the Project ESIA also identified several related risk areas, including:
| ● | Human Rights and Site Security Risks. |
|
February 19, 2025 |
Page 279 |
|
|
NI 43-101 Technical Report on the Reko Diq Project |
|
| ● | Climate Change Risk (Physical Risks). |
| ● | Acid rock drainage and metal leaching (ARDML) from Pits and Waste Rock Dumps (WRDs). |
| ● | ARDML from the cleaner tailings TSF. |
| ● | Health and safety. |
| ● | Contamination of soils and water resources at the Project. |
| ● | Contamination of marine habitat and impacts to marine biodiversity at Port Qasim. |
The Project ESIA summarises the proposed risk mitigation measures for the above identified E&S risks. These proposed risk mitigation measures comprise a combination of design, management and stakeholder engagement.
| 20.2 | Environmental Assessment and Studies |
| 20.2.1 | Environmental and Social Impact Assessment |
In February 2024, an Early Works ESIA was submitted. A subsequent Project ESIA was prepared in support of the Feasibility Study and was completed in late 2024. The Project ESIA encompasses all aspects of the Project execution from construction, operations (including the facilities to be constructed at Port Qasim in Karachi required for concentrate export) and closure.
The Early Works ESIA and full Project ESIA were completed in line with the relevant National and Provincial E&S legislative requirements, the EP4, and the IFC E&S PS and Guidelines. In addition, the Global Industry Standard on Tailings Management (GISTM) was utilised to direct the assessment of tailings placement, technology, and management of the Project’s tailings handling and storage facilities. At the group level, Barrick has committed to aligning with the provisions under these international principles, standards and guidelines, as well as their own suite of corporate standards, code of conduct and policies.
The Early Works ESIA was approved in May 2024. The Project ESIA was submitted to Balochistan and Sindh Environmental Protection Agencies in late 2024, as the Project facilities span both Balochistan and Sindh provinces in Pakistan. The Project and Rail Transport Route extending from the Project to Dera Allah Yar falls within the provincial jurisdiction of Balochistan. The Rail Transport Route from Dera Allah Yar to Port Qasim, along with Port Qasim, are under the provincial jurisdiction of the Sindh province. Barrick expects approval of the Project ESIA in early 2025.
| 20.2.2 | Environmental and Social Baseline Assessment |
An E&S baseline assessment and impact assessment were completed and documented as part of both the Early Works ESIA and the Project ESIA. These assessments incorporated information
|
February 19, 2025 |
Page 280 |
|
|
NI 43-101 Technical Report on the Reko Diq Project |
|
acquired in August 2010 as part of the 2010 Feasibility Study, where appropriate, as well as all information gathered prior to their respective issue dates.
The Project will include the following key components:
| ● | Two Open Pits – the Western Porphyries Open Pit and the Tanjeel Open Pit. |
| ● | Three Waste Rock Dumps (WRDs) – two WRDs located adjacent to the Western Porphyries Open Pit, and one WRD located adjacent to the Tajeel Pit. |
| ● | Processing Plant. |
| ● | Tailings Storage Facility (TSF). |
| ● | Other supporting infrastructure. |
| ● | Groundwater extraction network utilising boreholes and a pumping system. |
In additionally, there will be upgrades to the third-party railway line as well as construction of material handling facilities at Port Qasim.
Broad summaries of the baseline and potential impacts include:
Baseline Situation
| ● | Ambient Air Quality – the baseline ambient air quality is generally good and within the Balochistan Environmental Quality Standards (BEQS). However, the common occurrence of dust storms can result in localized elevated Total Suspended Particulates (TSP) concentrations during these events. |
| ● | Ambient Noise – generally the monitored ambient noise levels at the residential areas are within the BEQS. However, some nighttime noise levels exceedances are experienced predominantly due to high wind speeds. |
| ● | Soils – most soil in Balochistan has a homogenous porous structure, invariably calcareous in nature, with a low organic matter content. Most of the surface of mountains and hill slopes are bare rock without soil cover. The soils at the Project site are thin and consist largely of sands and gravels with fines. |
| ● | Waste Characterisation – approximately 90% of the waste rock is potentially acid forming. However, the extremely arid conditions and low expected permeability of the final waste rock dump structures will limit the potential for impacts to ground and surface water resources. |
| ● | Biodiversity: |
| o | Habitats – the Project area is differentiated into generally common habitat types which include Clayey Plains, Dry Streambeds, Gravel Plains, Mountains/Hills, Sandy Plains/Sand Dunes, and Wetlands. A mangrove ecosystem has been identified near Port Qasim. |
| o | Flora and Vegetation – all species observed in the flora surveys were classified as Least Concern or Data Deficient according to IUCN Red List of Threatened Species. |
|
February 19, 2025 |
Page 281 |
|
|
NI 43-101 Technical Report on the Reko Diq Project |
|
| o | Fauna – all species observed in the fauna surveys were classified as Least Concern according to IUCN Red List of Threatened Species except Neophron percnopterus (listed as Endangered), Chlamydotis macqueenii (listed as Vulnerable), Calidris ferruginea (listed as Near Threatened) and Gazella subgutturosa (listed as Vulnerable). Alcock’s Toad-Headed Agama (Phrynocephalus euptilopus) recorded in the surveys is presently understood to have a restricted distribution in the region. |
| o | Protected Areas in Project Vicinity – there is no Protected Area near the Project area. |
| ● | Cultural Heritage – four archaeological sites were identified within the Project footprint, but these appear to have been transitory and RDMC considers them unlikely to host buried remains. Eleven artificial rock features (eight in the proposed mining area, and three in the Northern Groundwater System area) were investigated and none were determined to have cultural significance. Twenty-five railway stations of heritage value built between 1917 and 1920 were identified along the rail transport route, but these will not be affected by the Project. |
| ● | Social – the population of Balochistan province is predominantly poor, rural, and thinly distributed over a vast, arid terrain. The province has a wealth of mineral resources; however, its limited water resources, low rates of literacy, limited health care facilities, and lack of infrastructure and social services have hindered its socio-economic development. The settlements located east of the Project Site are primarily rural, while the settlements west of the Project Site are a combination of rural and rangeland. There are few employment opportunities within the Socioeconomic Study Area, with most of the people depending on cross border trade for their livelihood with high unemployment being a key characteristic of the area. |
| ● | Security – the Project area and the general region have inherent security concerns and considerations. These include potential threats of terrorist and/or criminal activity resulting in sabotage, or violence and the perceived threat of human rights violations related to the response to such events. |
| ● | Water – Section 18.4 provides a summary of baseline water resources. |
Impact Management
| ● | Site Dust Emissions – Primarily related to dust emissions from the TSF and wind dispersion of tailings during operations. To reduce the potential dust emissions from the TSF, the Project proposes to progressively rehabilitate the TSF by covering the cells with waste rock. |
| ● | Tailings Management – The cleaner tailings from the secondary flotation circuit have been characterized as potentially acid-forming and will be stored in designated HDPE-lined cells. The rougher tailings from the first stage flotation circuit have been characterized as non-acid forming and will be stored separately in unlined cells. Cleaner and Rougher flotation tailings water will be collected in designated facilities for reuse in processing. |
| ● | Site Security – RDMC proposes to develop and implement a series of security action management policies and plans (Section 20.5.7) to address, prevent, manage and mitigate security impacts and to prevent human rights abuses. |
| ● | Social and community concerns – The Feasibility Study and the Project ESIA describe appropriate management strategies and plans to address potential impacts and community concerns. |
|
February 19, 2025 |
Page 282 |
|
|
NI 43-101 Technical Report on the Reko Diq Project |
|
| ● | Stakeholder Engagement – RDMC has conducted extensive community engagement both as part of the ESIA process and more broadly. RDMC will continue to update and implement the Stakeholder Engagement Plan. |
| ● | Water – Industry standard surface water management measures will be implemented including minimizing land disturbance, maintaining sediment and erosion control measures, diverting uncontaminated surface flows, containing hazardous materials, and implementing a site opportunistic surface water quality monitoring program. |
| 20.3 | Environmental Considerations |
| 20.3.1 | Compliance Monitoring |
The National Mineral Policy 1995 and the Balochistan Mineral Rules, 2002 require that mining projects comply with the Sindh Environmental Quality Standards (SEQS) and Balochistan Environmental Quality Standards (BEQS). The BEQS are currently in draft phase and therefore, the National Environmental Quality Standards, 2000 (NEQS) remains applicable in Balochistan.
To this end, RDMC is developing an overall Environmental and Social Management System (ESMS) with supporting Environmental and Social Management Plans (ESMPs).
The proposed Environmental Monitoring Program for the Project is designed to:
| ● | Ensure compliance with applicable national and provincial legislation, standards and guidelines. |
| ● | Adhere to internationally acceptable good environmental monitoring practices. |
| ● | Allow periodic reassessment of the Project’s effects and subsequent review of mitigation and management measures. |
| ● | Be simple to implement and report results. |
| ● | Be auditable. |
For each of the E&S monitoring aspects, the Environmental and Social Monitoring Program for the Project describes the monitoring element/area, type of monitoring and frequency of monitoring.
The Project’s management plans propose to address any potential compliance issues with regulatory agencies through the Project approval process.
| 20.3.2 | Air Emissions Management |
Ambient air quality baseline assessments were undertaken as part of the Feasibility Study and the Project ESIA. The recorded air quality parameters were within the 24-hour limits prescribed in the
|
February 19, 2025 |
Page 283 |
|
|
NI 43-101 Technical Report on the Reko Diq Project |
|
Balochistan Environmental Quality Standards (BEQS). However, the common occurrence of dust storms can result in localized elevated TSP concentrations.
Construction and operational dust emissions will be generally localized and can be managed through standard industry dust management measures. However, dust emissions from the TSF and other site areas (i.e. haul roads and mining operations) and wind dispersion of tailings during operations may cause an exceedance of the applicable standards from time to time. To reduce the potential dust emissions, the Project proposes to progressively rehabilitate the cleaner tailings cells of the TSF by covering with waste rock. The Project also proposes that continuous 24-hour dust monitoring will be undertaken (i.e. dust monitoring for PM10 and PM2.5).
No impacts to any community receptors are anticipated, however ongoing monitoring will be conducted regardless.
| 20.3.3 | Waste Management |
The site waste management system will be established as part of the Early Works and be further developed during Project construction. Solid non-hazardous domestic and industrial waste will be recycled and reused wherever possible. In cases where recycling and reuse are not feasible, this waste will either be stored onsite until an incinerator is installed at the site (expected in 2025) or treated and appropriately disposed of according to standard practices, such as to an approved landfill site or vendor.
A waste management plan will be developed and implemented for the Project and will also include measures to manage potential impacts associated with the contamination of soil and water resources, and biodiversity. These measures will include the appropriate handling and storage of wastes and hazardous materials, and spill response and clean up.
| 20.3.4 | Water Management |
The proposed Project water supply and water management are discussed in Chapter 18. Potential E&S impacts and considerations of the water supply and water management are as follows.
| ● | No significant community or biodiversity receptors have been identified in the Northern Groundwater System area (i.e. the proposed Project water supply source). |
| ● | Aquifer recharge is generally limited due to low regional rainfall; therefore groundwater extraction for mining purposes will affect water levels in the surrounding areas. Therefore, minimizing water loss from storage facilities, ore processing, mine infrastructure and tailings outflow and maximizing water recovery from the TSF is important for water conservation. |
| ● | Due to the expected low mine dewatering volumes, no significant groundwater impacts from dewatering have been identified. However, a site groundwater level and quality monitoring program will be implemented. |
|
February 19, 2025 |
Page 284 |
|
|
NI 43-101 Technical Report on the Reko Diq Project |
|
| ● | The following potential surface water impacts have been identified: |
| o | Alteration of flow paths, patterns, and channel geometry due to construction activity. |
| o | Impacts on the Gaud-i-Zirreh dry lakebed from groundwater abstraction for Project water supply appear unlikely from hydrogeological assessment. |
| o | Industry standard surface water management measures will be implemented to mitigate these potential surface water impacts. These measures include minimizing land disturbance, maintaining sediment and erosion control measures, diverting uncontaminated surface flows, containing hazardous materials, and conducting opportunistic surface water quality monitoring on the rare occasions where there is adequate rainfall to generate surface runoff. |
| 20.3.5 | Acid Rock Drainage |
Geochemical Characterisation study of the waste rock and tailings was completed by SRK Consulting UK Ltd in February 2010 with further sampling and analysis completed during 2023 and 2024. The study classified and quantified the acid rock drainage and metal leaching (ARDML) potential of the materials mined and at each mine waste storage facility. It predicted the change in the chemistry of seepage or discharge from these facilities during operations and post-closure. Materials were classified as low potential acid forming (LPAF), negligible potential acid forming (NPAF), and high potential acid forming (HPAF).
Approximately 90 % of the waste rock is potentially acid forming (i.e. LPAF and HPAF). However, the extremely arid conditions of this site and the low expected permeability of the final waste rock dump structures will limit the potential for impacts to ground and surface water resources. As such, RDMC is not planning to implement restrictions on the haulage and placement of HPAF material in the waste rock dumps. HPAF materials are considered unsuitable for the structural elements of the TSF wall construction, so they have been excluded from this use.
The cleaner tailings from the secondary flotation circuit have been characterized as potentially acid forming and will be stored in designated High-density polyethylene (HDPE) lined cells. The cleaner tailings water will be collected in designated facilities for reuse on the processing.
The rougher tailings from the first stage flotation circuit have been characterized as NPAF and will be stored separately from the cleaner tailings, in unlined cells. The rougher tailings water will also be collected in designated facilities for reuse in processing.
Good industry standards for geochemical and ARDML monitoring measures will be implemented for the Project. These measures include geochemical characterization of pit wall materials for each pit, regular/opportunistic monitoring of the WRD runoff and seepage, and regular monitoring of pit water quality and seepage quality from the WRD/TSF.
Sections 16 and 18 discuss the management of waste rock and tailings.
|
February 19, 2025 |
Page 285 |
|
|
NI 43-101 Technical Report on the Reko Diq Project |
|
| 20.3.6 | Biodiversity and Conservation |
In 2010 Hagler Bailly Pakistan Pvt. Ltd (HBP) completed baseline flora and fauna surveys of the Reko Diq site and the offsite supporting infrastructure areas. An updated Ecology Baseline Assessment was completed in 2023 and documented in the Project ESIA, with further updates in October 2024. The key findings are:
| ● | Flora and vegetation: |
| o | All recorded native species and most introduced species were classified as Least Concern according to the IUCN Red List of Threatened Species. One introduced species, River Red Gum (Eucalyptus camaldulensis), was recorded in the agricultural areas and is listed as Near Threatened. However, it is an invasive species so is not considered a conservation concern as it poses a risk to the native flora. |
| o | Invasive plant species Bermuda Grass (Cynodon dactylon), Mesquite (Prosopis spp.) and Giant Reed (Arundo donax), were also recorded in the surrounding areas. |
| ● | Fauna: |
| o | Birds – Two bird species of conservation concern were recorded. One listed endangered species Egyptian Vulture (Neophron percnopterus) and one listed vulnerable species MacQueen’s bustard (Chlamydotis macqueenii). The rest of the recorded bird species were classified as Least Concern. |
| o | Herpetofauna (amphibians and reptiles) – one species (Alcock’s Toad-Headed Agama, Phrynocephalus euptilopus) primarily recorded in the Northern Groundwater System area is listed as Least Concern but is presently understood to have a restricted range in the Chagai district. Data on the distribution and habitats of this species is limited and RDMC proposes to conduct further surveys to improve regional knowledge. No other species of concern were recorded. Mammals – One mammal species of conservation concern was recorded. The Goitered Gazelle (Gazella subgutturosa) is listed as Vulnerable. The rest of the recorded mammal species were classified as Least Concern. |
| o | Invertebrates – All the recorded invertebrate species were listed as Least Concern. |
| o | Marine and littoral – pelagic fish of conservation concern were identified at Port Qasim. Two fish species, namely the Shortfin Mako (Isurus oxyrinchus) and Sliver Pomfret (Pampus argenteus), are listed as Endangered and Vulnerable, respectively, in the IUCN Red List of Threatened Species. |
| ● | Protected Areas – There are no Protected Areas near or within the vicinity of the Project area. However, two national parks, four wildlife sanctuaries and Ramsar sites, and three key biodiversity areas are located within approximately a 500 km radius of the Project site. These areas are not expected to be impacted by the Project. |
| ● | Critical Habitat Assessment – the habitat areas for most of the Project area are described as Natural Habitat, a small fraction of the total Project area comprises habitats that are described as Modified Habitat (i.e. built-up areas and agricultural areas), and the recorded species of conservation concern generally have a wide distribution range. Critical Habitat as defined under IFC PS6 may however be identified where: |
|
February 19, 2025 |
Page 286 |
|
|
NI 43-101 Technical Report on the Reko Diq Project |
|
| o | Alcock’s Toad-Headed Agama is recorded, due to its restricted range (IFC PS6 Criterion 2). |
| o | Mangrove ecosystems are found near Port Qasim (IFC PS6 Criterion 4), although RDMC expects that the Project will have no direct impact on them. |
The following potential biodiversity impacts have been identified for the Project:
| ● | Terrestrial habitat loss due to land disturbance. |
| ● | Impacts on abundance and diversity of terrestrial flora and fauna including threatened species caused by habitat loss or modification due to Project activities. |
| ● | Introduction and spread of Alien Invasive Species (AIS) to the Project due to Project-related transportation and vehicular movement. |
Industry-standard biodiversity management measures will be implemented to mitigate these potential biodiversity impacts. These measures include the production of a Biodiversity Management/Action Plan, progressive rehabilitation of disturbed areas, and regular inspections around the Project facilities (including the port facility) to identify any potential biodiversity-related issues.
| 20.3.7 | Soils Management |
There is a potential for local impacts to soils due to the construction and operation of the Project (including the water supply pipeline from the Northern Groundwater System Area to the Project). These impacts comprise erosion, compaction, loss of structure, and reduced soil fertility. The Project will adopt a minimal land disturbance approach through the development of an operational Ground Disturbance Control Plan. Soil quality and erosion will be monitored, and progressive rehabilitation of temporary will be undertaken.
| 20.4 | Permitting |
The key National and Provincial Environmental and Social (E&S) related legislative requirements that are applicable to the Project are as follows:
| ● | Balochistan Environmental Protection Act 2012. |
| ● | Sindh Environmental Protection Act 2014. |
| ● | National Environmental Quality Standards, 1993. |
| ● | Sindh Environmental Quality Standards 2016. |
| ● | National Mineral Policy, 1995. |
| ● | Balochistan Ground Water Rights Administration Ordinance (1978). |
|
February 19, 2025 |
Page 287 |
|
|
NI 43-101 Technical Report on the Reko Diq Project |
|
| ● | Export Processing Zones Authority Rules, 1981. |
The Balochistan Environmental Protection Agency (BEPA) is responsible for the environmental assessment and approval of mining projects in the Balochistan Province. The Balochistan Environmental Protection Act 2012 requires that mining companies produce an ESIA for a mining project and submit this to BEPA for approval. As noted in 20.2.1, two ESIAs have been submitted in line with this requirement.
The Balochistan Mines and Minerals Department regulates mining projects in the Balochistan Province. Whilst generally not applicable to the Project, the Balochistan Mineral Rules, 2002, outlines the procedures for obtaining mining licences, environmental management, site closure, and mining companies associated financial responsibilities. They also require that an Environmental and Social Monitoring and Management Section is included in the Project ESIA that is to be submitted for approval, which was included in RDMC’s submission.
There is no provision in the environmental regulations or the Project agreements, for the provision of an environmental bond.
A number of permits will be required for construction and operation and including key E&S permits.
In addition to the above E&S approvals and permits, other permits are discussed further in Section 4.
| 20.5 | Social and Community Requirements |
| 20.5.1 | Social Impacts |
RDMC completed a social baseline, and a preliminary impact assessment was completed as part of the Feasibility Study.
The population of Balochistan province is predominantly poor, rural, and thinly distributed over a vast, arid terrain. The province has a wealth of mineral resources; however, its limited water resources, low literacy levels, limited healthcare facilities, and lack of infrastructure and social services have hindered its socio-economic development. The predominantly agro-pastoral economy and severe recurring droughts and floods contribute to the vulnerability of the population.
Social aspects that will require consideration during Project development, which are typical within the industry, include maintaining cultural integrity, community investment, skills acquisition and job creation, and social issues arising from the population influx to the area.
|
February 19, 2025 |
Page 288 |
|
|
NI 43-101 Technical Report on the Reko Diq Project |
|
The Project ESIA completed a socioeconomic survey of settlements across the Chagai area. The settlements located east of the Project site are primarily in a rural setting, while the settlements located west of the Project Site are in a combination of rural and rangeland settings. There are few employment opportunities within the study area. Most of the population depends on cross-border trade for their livelihood, and unemployment is common.
The Project ESIA identified potential positive and negative social impacts which can result from the Project. Potential positive impacts include:
| ● | increases in local employment; |
| ● | community development initiatives; and |
| ● | social development projects. |
Negative impacts include:
| ● | population influx, which can result in pressure on existing infrastructure and services, and possibly lead to an increase in social ills if not managed; |
| ● | dust and noise emissions; and |
| ● | increase in traffic and resulting community safety risks. |
Industry standard social management measures will be implemented to mitigate these potential impacts. These measures include developing an Influx Management Plan, grievance management, stakeholder engagement (see Section 20.5.4), regular monitoring of local socioeconomic data, and noise and dust monitoring programs.
| 20.5.2 | Community Relations |
RMDC has, as part of the Project ESIA, developed measures to mitigate adverse impacts and optimize potential benefits of the Reko Diq Project. These measures have been incorporated into the Project ESMP and will include stakeholder engagement, local workforce development, education, health and training, partnerships with international donors, local procurement and supplier development, community development projects, management of in-migration, a Gender Action Plan (GAP) and the continued implementation of a grievance mechanism.
RDMC has also developed a Community Development Programme Framework, to ensure a long-term relationship and cooperative development strategy with local stakeholders. The Community Development Programme Framework encompasses five sustainable community development pillars, Education, Access to Healthcare, Water and Environment, Food Security, and Local Economic Development.
|
February 19, 2025 |
Page 289 |
|
|
NI 43-101 Technical Report on the Reko Diq Project |
|
RDMC has established Community Development Committees to oversee and coordinate the implementation of the Community Development Programme.
| 20.5.3 | Grievance Management and Procedures |
A Grievance Redress Mechanism (GRM) has been developed for the Project. The objective of the GRM is to record and address grievances in a timely and appropriate manner. The implementation of the GRM will help to identify any issues at an early stage so that they can be dealt with effectively.
| 20.5.4 | Stakeholder Engagement |
Stakeholder engagement for the Project has been developed in accordance with relevant Pakistan legislative requirements, IFC PSs and Barrick corporate policies.
An initial round of scoping consultation was completed as part of the Feasibility Study, which was subsequently expanded and updated as part of the Project ESIA. The key stakeholder groups identified were:
| ● | Local Communities. |
| ● | Vulnerable Groups. |
| ● | Government Institutions. |
| ● | Civil Society and Non-Governmental Organisations (NGOs). |
| ● | Commerce and Industry. |
The Project ESIA stakeholder consultations were conducted in 2022, 2023, and 2024. Specific engagement campaigns were undertaken for each of the following project areas:
| ● | Mine Area. |
| ● | Northern Groundwater System and other Water NOCs. |
| ● | Rail Transport Route. |
| ● | Port Qasim. |
| ● | Institutional Consultation. |
The stakeholder engagement and consultation identified comments, issues, and concerns. These include the creation of permanent local employment opportunities, development of and access to local community infrastructure (i.e. for health, water supply and transport), and health and safety concerns associated with the Project’s operation.
Similarly, institutional consultation identified comments, issues and concerns, which include management of biodiversity, air and noise emissions, Greenhouse Gas Emissions (GHG) emissions,
|
February 19, 2025 |
Page 290 |
|
|
NI 43-101 Technical Report on the Reko Diq Project |
|
waste management, water resource use, traffic, security, and general social management and development programs.
RDMC maintains a stakeholder consultation register which records the information.
A Stakeholder Engagement Plan (SEP) is in place. It details RDMC’s approach to stakeholder engagement and the steps that it intends to take during the development and operation of the Project, including a grievance mechanism. The SEP was developed, and is being implemented, in accordance with Barrick policy and the IFC PS. It forms a component of the Reko Diq ESMS.
Ongoing community engagement activities relevant to the ESIA include:
| ● | Reporting on progress on the implementation of environmental and social management measures identified in the ESIA process and recording comments on the effectiveness of these measures; |
| ● | Updating communities about new project developments and addressing feedback; and |
| ● | Implementation of the GRM. |
RDMC will continue to update the stakeholder engagement process as part of the Project development and operation.
| 20.5.5 | Human Resources |
Effective Human Resources (HR) management for the Project will include the establishment of partnerships with relevant local and regional stakeholders. These partnerships will provide the foundation for the development of effective local recruitment, training, and learning strategies specific to Project and region. The Project will develop an HR database system to support the sourcing, recruiting, and training of new employees. These systems will to be centralized at the operation site with partnerships and satellite training facilities in association with the local educational infrastructure. Training will include simulators to enhance training and learning effectiveness for many of the key operational activities.
RDMC has adopted Barrick’s Human Rights Policy, Global Harassment Standard, and Code of Business Conduct and Ethics. A key part of these is ensuring compliance with national and provincial labour laws. A comprehensive health and safety management system is also place.
| 20.5.6 | Human Rights |
RDMC has adopted and is committed to implementing Barrick’s Human Rights Policy which sets out commitments to: respect human rights; and always strive to act in accordance with the UN Guiding Principles on Business and Human Rights, the Organisation for Economic Co-operation and
|
February 19, 2025 |
Page 291 |
|
|
NI 43-101 Technical Report on the Reko Diq Project |
|
Development (OECD Guidelines) for Multinational Enterprises, and the Voluntary Principles on Security and Human Rights.
A Human Rights Assessment (HRA) was completed for the Project. The objective of the HRA is to assess the Project’s level of risk exposure as defined by its human rights obligations or expectations, actual or perceived; the positive contributions that the site has made towards respecting human rights; and the progress made in reducing the risk of infringing upon individuals’ human rights.
| 20.5.7 | Site Security |
The Project assessed potential site security issues. Identified risks and issues included the temporary breakdown of regional law, direct violent attack by a hostile force, increases in local criminal activity, sabotage of equipment and structures, and Project security staff becoming implicated in human rights abuses.
The security assessment also identified the following anticipated operational security challenges:
| ● | Trespass / Illegal Mining. |
| ● | Labour Volatility. |
| ● | Security of People in Transit. |
| ● | Security of Goods in Transit. |
| ● | Security of Assets. |
To address the identified security issues/risks and challenges, RDMC proposes to develop and implement a series of security action management policies and plans. These will include management of areas such as security of assets, trespass, illegal mining, kidnap and ransom, secure transportation, and personnel evacuations.
| 20.6 | Mine Closure and Reclamation |
There are no specific Pakistan regulations with regards to mine closure. The Project’s closure obligations are set out in the Mineral Agreement. The Project ESIA includes an initial/conceptual Mine Closure and Rehabilitation Plan (CP). The CP was developed in line with the International Council of Mining and Metals’ (ICMM) Integrated Mine Closure Good Practice Guideline, international ESIA requirements, and the Barrick Mine Closure Standard.
The general obligations that relate to the Project closure and reclamation comprise the setting of closure objectives, criteria and tasks, establishing an agreed post-closure land use, including the financial feasibility of mine closure in the business feasibility analysis, and undertaking stakeholder engagement on mine closure.
|
February 19, 2025 |
Page 292 |
|
|
NI 43-101 Technical Report on the Reko Diq Project |
|
The key E&S conditions that affect the conceptual closure approach are the remoteness of the site, the extremely arid conditions and the frequent dust storms that occur, and that the surrounding area is generally devoid of vegetation and sparsely populated. Based on these key E&S conditions, the RDMC closure vision for the proposed operation is “to establish a safe, stable, and non-polluting, post-mining landscape that is sustainable over the long-term while achieving the desired end land use”. Revegetation is not proposed for any of the site facilities as there is extremely minimal existing vegetation in the area.
The initial closure objectives that have been adopted for the Project cover such areas as regulatory compliance, landform physical and chemical integrity, post closure site security, addressing community concerns regarding closure, and the safety and health of workers and local communities.
Preliminary site closure criteria have not yet been set. The criteria will be developed and finalized through a closure stakeholder engagement process along with the Final Land Use Plan (FLUP). The CP proposes that post closure monitoring program will be implemented for a minimum period of three years.
An initial closure related risk assessment has been completed with the aim of informing the rehabilitation and closure measures required to meet the proposed closure objectives. The identified key closure risks comprise:
| ● | Impacts on mine employees and the local community – the need to transition to other employment on mine closure may lead to an increase in unemployment and poverty in the local area. |
| ● | Impacts on local businesses/suppliers – the Project will no longer be able to support local businesses/suppliers after closure which will reduce the local economic opportunities. |
| ● | Impacts on regional air quality. |
| ● | Cumulative impacts on regional groundwater. |
The CP proposes to mitigate closure risks by addressing the transition from active mining to the planned end land use, conducting a structured stakeholder engagement process, and continuing to implement community development projects.
In addition to the key closure risks, the CP also identifies that there may be potential residual/latent risks post closure that are associated with cumulative impacts on groundwater in the region, and impacts on air quality in the region. These potential residual/latent risks will be assessed, monitored mitigated within the proposed post closure monitoring period of three years.
The CP proposes the specific industry standard site closure measures and tasks to cover the mining aspects/areas, WRDs remaining at closure, stockpiles and laydown areas, process plant, TSF, and on-site infrastructure. In addition, closure inspection, monitoring and maintenance measures will
|
February 19, 2025 |
Page 293 |
|
|
NI 43-101 Technical Report on the Reko Diq Project |
|
cover rehabilitated areas, key permanent features and facilities, air emissions, and groundwater levels and quality.
A closure cost estimate was completed as part of a mine closure report by third-party consultants Digby Wells. The closure cost was estimated to be US$72M, incorporating contingency of 15% (about US$11M). The majority (approximately 80%) of the closure cost estimate is associated with the TSF, demolition of buildings, and general and administrative costs. This amount accounts for end of mine life costs only. Costs associated with progressive closure of the TSF during the LOM are included in the operating cost estimates.
There is no provision in the environmental regulations or the Project agreements, for the provision of an environmental bond.
| 20.7 | Environmental and Social Related Risks |
In addition to identified impacts, a number of additional risks have also been identified, including:
| ● | Human Rights and Site Security Risks – an HRA has been completed for the Project, which includes the assessment of human resources and site security risks. |
| ● | Climate Change Risks – a Climate Change Risk and Vulnerability Assessment has been completed for the Project, which assesses both the physical and transition risks. The key risks identified were associated with physical climate changes risks, and comprise extreme rainfall, flooding, and storm surges, increased temperatures, sea level rise, and chronic climatic changes and extreme weather events. These risks will be mitigated through a combination of design, monitoring, maintenance, management and emergency response measures. |
| ● | ARDML from Pits and WRDs – RDMC considers this to be a low risk due to the overall low rainfall environment. However, RDMC will adopt the proposed ARDML monitoring and management measures for the pits and WRDs. |
| ● | ARDML from the cleaner tailings TSF – the TSF will be HDPE lined, and RDMC will adopt the proposed TSF seepage and ARDML measures. |
| ● | Health and safety – RDMC will continue the implementation of the health and safety management system. |
| ● | Contamination of soils and water resources at the Project – RDMC will adopt the ESIA proposed soil, surface water and waste management measures. |
|
February 19, 2025 |
Page 294 |
|
|
NI 43-101 Technical Report on the Reko Diq Project |
|
| 20.8 | QP Comments on Environmental and Social |
The Project has been scoped and is being conducted to meet the requirements of international standards (IFC Performance Standards and Equator Principals 4, which are considered benchmarks for the industry), as well as Barrick’s own policies and standards. Key management plans are being incorporated into the Project development inline with both industry standards and Barrick’s internal practices and knowledge based on extensive experience operating in similar jurisdictions.
|
February 19, 2025 |
Page 295 |
|
|
NI 43-101 Technical Report on the Reko Diq Project |
|
| 21 | Capital and Operating Costs |
| 21.1 | Basis and Sources of Cost Estimates |
Capital and operating costs for the Project are based on cost estimates prepared from first principles by Barrick and third-party consultants supported by studies and associated cost estimates prepared within an accuracy range of +/-15%, which is the typical level of a Feasibility Study.
The costs are supported by engineering quantities estimates from detailed design drawings and equipment lists, with some smaller items factored from other comparable projects. Prices were determined by secured contracts, and vendor quotes with smaller items sourced from in-house databases.
Capital and operating costs reflect current price trends and exchange rates as of the effective date of this Report.
All costs presented are in real USD as of Q3 2024, without allowance for further inflation.
| 21.2 | Capital Costs |
Capital costs have been presented to reflect the phased nature of the Project, separate into Phase 1 Initial Capital and Phase 2 Expansion Capital as well as sustaining capital through the life of the operation. The life-of-mine capital cost estimates are presented in Table 21-1.
Table 21-1 Capital Cost Estimate Summary
| Description |
Totals (US$ M) |
|
| Phase 1 – Initial Capital |
5,698 | |
| Phase 2 – Expansion Capital |
3,301 | |
| Sustaining Capital (LOM) |
3,825 | |
| Total |
12,824 |
| 21.2.1 | Project Capital Costs |
Phase 1 Initial Capital Costs are required to meet initial production of 45Mtpa. Additional capital investment is required to expand the Project production to 90Mtpa from 2034.Table 21-2 summarises the Initial and Expansion Capital.
|
February 19, 2025 |
Page 296 |
|
|
NI 43-101 Technical Report on the Reko Diq Project |
|
Table 21-2 Initial and Expansion Project Capital Expenditure Summary
| Description |
Phase 1 Initial |
Phase 2 Expansion |
Total Project Capital |
|||
| ($M) | ($M) | ($M) | ||||
| Open Pit Mine |
894 | 47 | 942 | |||
| Processing Plant |
1,065 | 986 | 2,052 | |||
| Tailings Facilities |
174 | 54 | 229 | |||
| On-Site Infrastructure |
1,039 | 716 | 1,755 | |||
| Off-Site Infrastructure |
335 | 251 | 586 | |||
| Direct Cost Total |
3,508 | 2,054 | 5,563 | |||
| Owner’s Cost |
480 | 214 | 693 | |||
| Indirect Cost |
1,055 | 686 | 1,741 | |||
| Indirect Cost Total |
1,535 | 900 | 2,435 | |||
| Contingency |
523 | 310 | 833 | |||
| Total Project Capital |
5,566 | 3,264 | 8,830 | |||
| Other Capitalized Non-Project Costs |
132 | 37 | 169 | |||
| Total |
5,698 | 3,301 | 8,999 |
Open Pit Mine costs include mobile equipment purchase, pre-production mine development, mine equipment maintenance facilities, explosives magazines, site preparation, mine roads, and ancillary mine services facilities.
Processing Plant costs include all major equipment, civil, concrete, structural steel, architectural, mechanical, piping, electrical, instrumentation, and other costs associated with processing facilities.
Tailing Facilities costs include site preparation and tailings impoundment costs prior to initial production.
On-site infrastructure costs include site roads, power facilities, fuel storage, site communications, bulk storage, accommodation village, administration building, warehouse, laboratory, and other non-process related facilities.
Off-site infrastructure costs include bore field water supply, off-site water pipelines, rail facilities, and port facility upgrades.
Owner’s Costs include spares/inventory, first fills, pre-production operating costs, owner’s management team, permitting, public relations, community engagement, as well as other project related costs.
Indirect Costs include EPCM, temporary services, temporary facilities, temporary camp and catering, freight and commissioning services.
|
February 19, 2025 |
Page 297 |
|
|
NI 43-101 Technical Report on the Reko Diq Project |
|
Contingency is an allowance for normal and expected items of work which have to be performed within the defined scope of work and project execution plan. This was estimated based on the scope and source of the estimate items. Values were determined using an industry standard quantitative risk assessment by work breakdown structure code. The weighted average contingency across the capital estimate is approximately 10%.
Other Capitalized Non-Project Costs includes costs for general and administrative (G&A) operating expense, royalties, and social spending that occurs before production (2028) which includes pre-payment of royalties as per the Mineral Agreement.
| 21.2.2 | Sustaining Capital Costs |
In addition to the initial and expansion capital, sustaining capital is required for the continuation of the mining operations.
During the LOM $3,825M of sustaining capital costs are expected to be incurred which is outlined in Table 21-3.
Table 21-3 Sustaining Capital Expenditure Summary
| Description |
Phase 1 – Sustaining (2028-2034) ($M) |
Phase 2 – Sustaining (2034-2065) ($M) |
Total 2028-LOM ($M) |
|||
|
Open Pit Mine |
297 | 1,739 | 2,035 | |||
|
Processing Plant |
14 | 182 | 196 | |||
|
Tailings Facilities |
88 | 1,281 | 1,369 | |||
|
On-Site Infrastructure |
3 | 36 | 39 | |||
|
Off-Site Infrastructure |
1 | 186 | 186 | |||
|
Total |
403 | 3,422 | 3,825 | |||
Open Pit Mining includes items such as replacement and additional equipment, capitalised mobile maintenance components, new and upgraded mining infrastructure, geotechnical risk management equipment, light vehicles, and others.
Processing Plant includes major equipment rebuilds, and other non-operating costs associated with the processing facility.
Tailings Storage Facilities includes dam raises above the starter dam limit.
On-Site Infrastructure includes power plant major repairs, IT and communication equipment upgrades, warehouse improvements, building improvements, and others.
Off-Site Infrastructure includes ongoing maintenance and an allowance of $180M in Phase 2 for the connection to grid power in Year 15 of operations.
|
February 19, 2025 |
Page 298 |
|
|
NI 43-101 Technical Report on the Reko Diq Project |
|
Indirect costs are nested within the respective sustaining capital items and, therefore, are not explicitly stated.
Owner’s cost is part of ongoing G&A operating costs and not included in sustaining capital.
| 21.2.3 | Closure Costs |
A closure cost estimate was prepared as part of the Feasibility Study and conforms to the process which is covered in the Mineral Agreements. Closure costs are estimated to be $72.4 M. The majority (approximately 80%) of the closure cost estimate is associated with the TSF, demolition of buildings, and G&A costs. A contingency amount of 15% of the direct costs has been included. All closure costs are incurred in the last 10 years of mine operation as the Project pays into the closure fund on a straight-line basis (as required by the Project Mineral Agreement).
The closure costs incurred at cessation of operations, are in addition to the progressive closure of the TSF during the LOM which are included in the operating cost estimates.
| 21.3 | Operating Costs |
The operating costs for the LOM were developed considering the planned mine physicals, equipment hours, labor projections, consumables forecasts, and other expected incurred costs.
Cost estimates were developed by Barrick and third-party consultants from first principles as part of the Feasibility Study. In addition to LOM operating costs, the costs are presented in two Phases to align with the different mill throughputs contemplated for the Project.
A summary of the forecasted operating costs for the LOM Mineral Reserves is shown in Table 21-4.
Table 21-4 Operating Costs Summary
| Life-of-Mine 2028-LOM |
Phase 1 2028-2033 |
Phase 2 2034 - LOM |
||||||||||||||||||||||
| Description | Total ($M) |
Unit Cost ($/t) |
Total ($M) |
Unit Cost ($/t) |
Total ($M) |
Unit Cost ($/t) |
||||||||||||||||||
|
Mining |
17,512 | 5.82 | 1,781 | 7.61 | 15,730 | 5.67 | ||||||||||||||||||
|
Processing |
16,822 | 5.59 | 1,626 | 6.94 | 15,196 | 5.48 | ||||||||||||||||||
|
General and Administration |
4,357 | 1.45 | 757 | 3.23 | 3,600 | 1.30 | ||||||||||||||||||
|
Total Direct Operating Costs |
38,691 | 12.86 | 4,165 | 17.78 | 34,526 | 12.45 | ||||||||||||||||||
|
Freight & Refining Costs |
11,019 | 3.66 | 1,097 | 4.68 | 9,923 | 3.58 | ||||||||||||||||||
|
Royalty |
7,779 | 2.59 | 692 | 2.96 | 7,087 | 2.56 | ||||||||||||||||||
|
Total Operating Costs |
57,489 | 19.11 | 5,954 | 25.42 | 50,127 | 18.58 | ||||||||||||||||||
|
February 19, 2025 |
Page 299 |
|
|
NI 43-101 Technical Report on the Reko Diq Project |
|
Phase 2 operating costs include a reduction in power costs associated with connecting to grid power in Year 15 of mine operations, for which associated capital costs have been reflected in the sustaining capital costs.
Mining costs include activities related to mining of ore including blasting, loading, hauling, mining equipment maintenance, and stockpile costs. They include fuel, labour, consumables, and other costs.
Processing costs include activities related to the processing of ore produced from the mine, including grinding, floatation, thickening, plant maintenance, and tailings management (excluding dam raises). This includes labour, power, reagents, and other associated costs.
G&A costs include items associated with the site and not directly related to mining or processing. This includes items such as accommodation village, water treatment, security, site roads, management, administration, and other site wide costs
Freight and refining include offsite costs associated with the rail, port, shipping, and treatment of concentrate from the Project.
Gold has not been included as a by-product credit as it is included in revenue calculations. No other elements are considered as by-product credits as part of this Report.
| 21.4 | QP Comments on Capital and Operating Costs |
The capital and operating estimates for the project are based Barrick’s global mining experience as a producing issuer and well supported by technical studies at a Feasibility Study level and the estimates were prepared in accordance normal engineering and cost estimation practices.
Appropriate provision has been made in the estimates for the expected mine operating usages including labour, fuel and power and for closure and environmental considerations.
The costs assumptions used in the determination of the Mineral Resource and Mineral Reserves are appropriate.
|
February 19, 2025 |
Page 300 |
|
|
NI 43-101 Technical Report on the Reko Diq Project |
|
| 22 | Economic Analysis |
A financial analysis of the Project was carried out using a discounted cash flow (DCF) approach to support the declaration of Minerals Reserves. This method of valuation requires projecting yearly cash inflows, or revenues, and subtracting yearly cash outflows such as operating costs, capital costs, and taxes. The resulting net annual cash flows are discounted back to the date of valuation and totalled to determine the net present value (NPV) of the Project at the selected discount rate.
The Project was modelled on a 100% basis and not based on the attributable positions as set out in the JVA. Values presented in this Report are on a 100% Project basis. All values are presented in real 2024 US dollar values unless otherwise stated. The economic analysis has been run with no additional inflation (constant dollar basis).
The model includes the development and expansion capital costs, sustaining capital costs, operating costs, and longer-term rehabilitation costs, and all tax, royalties and other obligations.
| 22.1 | Assumptions and Inputs |
The following points highlight the key inputs into the financial model used in the economic analysis.
Mine Plan
| ● | Basis of the model is the production/mine plan as presented in Section 16 which includes mined tonnes (ore and waste), processed ore tonnes, grade, and recoveries and the Mineral Resource and Mineral Reserve estimates presented in Sections 14 and 15 of this Report, respectively. |
| ● | No Inferred Mineral Resources are included in the mine plan as ore and are considered waste. Mineral Resources that are not Mineral Reserves do not have demonstrated economic viability. |
Revenue
| ● | Metal prices are based on the three year trailing average for both copper and gold. The model uses prices of: |
| o | Copper $4.03/lb |
| o | Gold $2,045/oz |
| ● | Revenue is driven by tonnes of concentrate with no offset to account for any shipment delivery times. |
|
February 19, 2025 |
Page 301 |
|
|
NI 43-101 Technical Report on the Reko Diq Project |
|
Capital and Operating Costs
| ● | All costs are presented as of December 31, 2024 (i.e. no escalation or inflation is applied) in US dollars ($ or US$) unless otherwise noted. |
| ● | Capital and operating costs have been applied as described in Section 21. |
Financial Parameters
| ● | Taxes, royalties, treatment and refining charges are applied as described in Section 4 and Section 21. |
| ● | The Project is modelled on a 100% equity basis with no debt. |
| ● | No commodity streams are considered as none are in place for the Project. |
| ● | A discount rate of 8% is applied, which is in line with what is typically used in industry for copper-gold projects. |
| ● | USD/PKR is the largest currency rate exposure. Exchange rate assumption of 300PKR:1USD. Other exchange rates were applied, where appropriate at prevailing market rates. |
Other Assumptions
| ● | Accounts receivable days: 30 |
| ● | Accounts payable days: 45 |
| ● | Warehouse and spares: 120 days of inventory |
| 22.2 | Taxes and Royalties |
The Project will be subject to the various taxes, royalties, and other obligations as outlined in Section 4. These rates are current as of the effective date of this Report and may be subject to change following the initial 30-year term of the Mineral Agreement.
Based on these and the other financial assumptions outlined, RDMC is expected to have payable income and mining taxes of $7,076M over the mine life as shown in Table 22-1.
Table 22-1 Estimated Tax Payable
| Description |
Value ($M) |
|
|
Balochistan and Sindh Sales Tax on Services and With Holding Tax on Operating Costs |
3,855 | |
|
With Holding Tax on Capital Costs |
179 | |
|
Workers’ Profit Participation Fund Contribution |
2,219 | |
|
Final Tax Regime |
823 | |
|
Total Tax |
7,076 | |
|
February 19, 2025 |
Page 302 |
|
|
NI 43-101 Technical Report on the Reko Diq Project |
|
During the course of the mine life, and based on the LOM plan RDMC will pay royalties of $7,779M.
These estimates take into account tax and royalty holidays that are currently in place as part of the Reconstitution of the Project for 30 years (i.e. until 15 December 2052). Any changes to the tax regime would alter the total tax and royalty paid by the Project (as covered in Section 4.3).
| 22.3 | Financial Model Summary |
The economic modelling shows that the Project (including expansion and closure allowances) is economically viable, having a positive after-tax net present value (NPV). The economic analysis indicates the Project has a net present value of $13,014M at a discount rate of 8% (NPV8) Based on the LOM plan, the Project is forecasted to produce an undiscounted net cash flow of $70,178M. The Project as modelled yields an internal rate of return (IRR) of 21.32%. The IRR is expressed as the discount rate that yields a zero NPV.
The payback period is the time calculated from the start of production until all project capital expenditures have been recovered. The payback period for the Project (Phase 1 and Phase 2) is 6 years.
Consensus pricing used is as of CIBC in October 2024.
Figure 22-1 presents the copper metal produced over the LOM with the impact of price assumptions on cumulative undiscounted post-tax cash flow including prices for the Feasibility Study case and the Mineral Reserve estimate.
|
February 19, 2025 |
Page 303 |
|
|
NI 43-101 Technical Report on the Reko Diq Project |
|
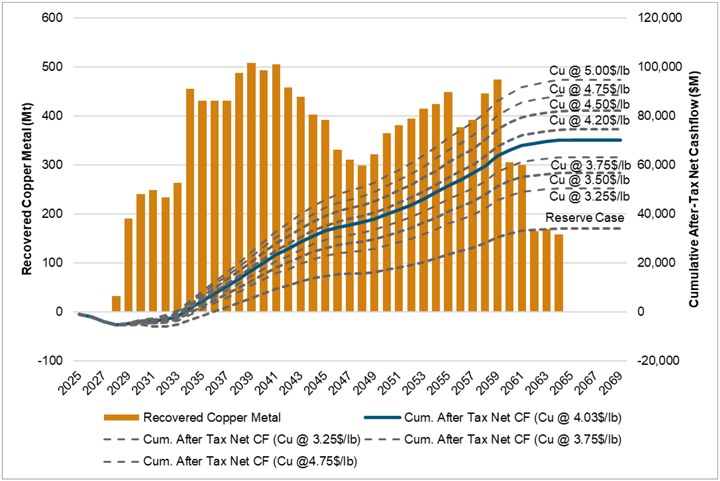
Note: The Gold price remains constant at $2,045 Au/oz with the exception of the Reserves case which uses $3.00/lb Cu and $1,400 Au/oz which is aligned with the prices used for the declaration of Mineral Reserves in this Report.
Source: Barrick, 2024
Figure 22-1 Copper Price Impact on Post Tax Cash Flow (Undiscounted)
A summary of two cases from the financial model are shown in Table 22-2. A detailed breakdown of the annual cashflow is shown in Table 22-3 and Table 22-4 for the Feasibility Study and Reserve case respectively.
|
February 19, 2025 |
Page 304 |
|
|
NI 43-101 Technical Report on the Reko Diq Project |
|
Table 22-2 Reko Diq Project Case Financial Model Summary
| Description | Unit | Reserve Case | Feasibility Study Case | |||
|
Copper Price |
$/lb | 3.00 | 4.03 | |||
|
Gold Price |
$/oz | 1,400 | 2,045 | |||
|
Mining Cost (LOM) |
US$/t mined | 2.83 | 2.83 | |||
|
Processing (LOM) |
US$/t milled | 5.59 | 5.59 | |||
|
G&A (LOM) |
US$/t milled | 1.45 | 1.45 | |||
|
Freight & Refining (LOM) |
US$/t milled | 3.66 | 3.66 | |||
|
Mine Life |
Years | 37 | 37 | |||
|
Mining Rate – Average |
Mtpa | 177 | 177 | |||
|
Mined Tonnage – Total LOM |
Mt | 6,212 | 6,212 | |||
|
LOM Stripping Ratio |
t:t | 1.07 | 1.07 | |||
|
Processing Life |
Years | 37 | 37 | |||
|
Processing Rate – Post Ramp-up |
Mtpa | 45/90 | 45/90 | |||
|
Processing Tonnage – Total LOM |
Mt | 3,008 | 3,008 | |||
|
Metallurgical Recovery |
% | 90% | 90% | |||
|
Grade – Average |
% | 0.48% | 0.48% | |||
|
LOM Metal Produced |
kt | 13,114 | 13,114 | |||
|
C1 Direct Costs (LOM) |
US$/lb | 0.91 | 0.52 | |||
|
All-In Sustaining Costs (LOM) |
US$/lb | 1.24 | 0.93 | |||
|
All-In Costs (LOM) |
US$/lb | 1.24 | 0.93 | |||
|
Total Capital (LOM) |
US$ M | 12,824 | 12,824 | |||
|
Project Development Capital |
US$ M | 8,830 | 8,830 | |||
|
Sustaining Capital (LOM) |
US$ M | 3,825 | 3,825 | |||
|
NPV8% (2025–LOM) – After-Tax |
US$ M | 4,031 | 13,014 | |||
|
FCF (2025–LOM) – After-Tax |
US$ M | 33,993 | 70,178 | |||
|
Reko Diq IRR – After-Tax (LOM) |
% | 12.89% | 21.32% | |||
|
Payback Period – After-Tax |
Years | 8.6 | 6.2 | |||
|
February 19, 2025 |
Page 305 |
|
|
NI 43-101 Technical Report on the Reko Diq Project |
|
Table 22-3 Annual Cashflow Summary - Feasibility Study Case
| SUMMARY CASH FLOW | Units | LOM Total | 2025 | 2026 | 2027 | 2028 | 2029 | 2030 | 2031 | 2032 | 2033 | 2034 | 2035 | 2036 | 2037 | 2038 | 2039 | 2040 | ||||||||||||||||||
|
Mining |
||||||||||||||||||||||||||||||||||||
|
Total ore |
Mt | 3,008 | - | - | 5 | 46 | 70 | 86 | 81 | 81 | 110 | 135 | 85 | 73 | 108 | 144 | 90 | 99 | ||||||||||||||||||
|
Total waste |
Mt | 3,205 | - | - | 25 | 17 | 23 | 41 | 54 | 66 | 37 | 39 | 89 | 101 | 82 | 40 | 99 | 92 | ||||||||||||||||||
|
Processing |
||||||||||||||||||||||||||||||||||||
|
Total ore |
Mt | 3,008 | - | - | - | 6 | 41 | 45 | 45 | 45 | 51 | 87 | 90 | 90 | 90 | 90 | 90 | 90 | ||||||||||||||||||
|
Copper Grade |
% | 0.48% | - | - | - | 0.56% | 0.51% | 0.59% | 0.61% | 0.58% | 0.57% | 0.58% | 0.53% | 0.53% | 0.53% | 0.60% | 0.63% | 0.61% | ||||||||||||||||||
|
Gold Grade |
g/t | 0.26 | - | - | - | 0.37 | 0.31 | 0.35 | 0.36 | 0.32 | 0.32 | 0.32 | 0.29 | 0.29 | 0.28 | 0.30 | 0.28 | 0.29 | ||||||||||||||||||
|
Recovered Copper Metal |
kt | 13,114 | - | - | - | 32 | 190 | 240 | 248 | 234 | 263 | 455 | 431 | 431 | 431 | 488 | 507 | 493 | ||||||||||||||||||
|
Recovered Gold Metal |
koz | 17,915 | - | - | - | 53 | 293 | 359 | 369 | 329 | 377 | 628 | 585 | 591 | 567 | 613 | 570 | 574 | ||||||||||||||||||
| - | - | - | ||||||||||||||||||||||||||||||||||
|
Revenue |
||||||||||||||||||||||||||||||||||||
|
Copper Revenue |
$M | 112,479 | - | - | - | 273 | 1,627 | 2,056 | 2,126 | 2,008 | 2,258 | 3,899 | 3,697 | 3,696 | 3,695 | 4,187 | 4,352 | 4,228 | ||||||||||||||||||
|
Gold Revenue |
$M | 35,165 | - | - | - | 104 | 575 | 705 | 725 | 646 | 740 | 1,232 | 1,148 | 1,160 | 1,112 | 1,204 | 1,120 | 1,126 | ||||||||||||||||||
|
Total Revenue |
$M | 147,644 | - | - | - | 377 | 2,203 | 2,761 | 2,851 | 2,655 | 2,998 | 5,131 | 4,844 | 4,856 | 4,807 | 5,391 | 5,472 | 5,354 | ||||||||||||||||||
|
Total Freight & Refining Costs |
$M | -5,435 | - | - | - | -13 | -79 | -96 | -98 | -94 | -106 | -181 | -175 | -175 | -175 | -193 | -200 | -195 | ||||||||||||||||||
|
Total Royalty |
$M | -7,779 | - | - | - | -15 | -106 | -136 | -141 | -136 | -159 | -272 | -257 | -257 | -255 | -286 | -290 | -284 | ||||||||||||||||||
|
Total Minesite Revenue |
$M | 134,430 | - | - | - | 349 | 2,018 | 2,529 | 2,612 | 2,425 | 2,732 | 4,678 | 4,413 | 4,424 | 4,378 | 4,912 | 4,982 | 4,875 | ||||||||||||||||||
|
OPERATING COSTS |
||||||||||||||||||||||||||||||||||||
|
Mining |
$M | -17,512 | - | - | - | -179 | -244 | -301 | -321 | -355 | -380 | -430 | -426 | -438 | -480 | -511 | -475 | -491 | ||||||||||||||||||
|
Processing |
$M | -16,822 | - | - | - | -68 | -296 | -301 | -299 | -301 | -360 | -549 | -565 | -566 | -567 | -568 | -564 | -565 | ||||||||||||||||||
|
Freight |
$M | -5,585 | - | - | - | -20 | -101 | -120 | -122 | -117 | -130 | -198 | -195 | -195 | -195 | -205 | -208 | -206 | ||||||||||||||||||
|
General and Administration |
$M | -4,357 | - | - | - | -138 | -124 | -125 | -126 | -119 | -125 | -138 | -134 | -135 | -134 | -137 | -142 | -137 | ||||||||||||||||||
|
Total Operating Costs |
$M | -44,276 | - | - | - | -406 | -765 | -848 | -869 | -892 | -995 | -1,315 | -1,320 | -1,333 | -1,377 | -1,421 | -1,389 | -1,398 | ||||||||||||||||||
|
Operating Cashflow |
$M | 90,154 | - | - | - | -56 | 1,253 | 1,681 | 1,743 | 1,533 | 1,737 | 3,363 | 3,093 | 3,090 | 3,001 | 3,491 | 3,593 | 3,477 | ||||||||||||||||||
|
Summary Capex by Project Phase |
||||||||||||||||||||||||||||||||||||
|
Phase 1 - Initial Capital |
$M | -5,566 | -979 | -1,120 | -1,809 | -1,237 | -420 | - | - | - | - | - | - | - | - | - | - | - | ||||||||||||||||||
|
Phase 2 - Expansion Capital |
$M | -3,264 | - | - | - | - | -146 | -640 | -1,519 | -766 | -193 | - | - | - | - | - | - | - | ||||||||||||||||||
|
Sustaining Capital |
$M | -3,645 | - | - | - | - | -14 | -162 | -66 | -95 | -66 | -161 | -54 | -55 | -79 | -183 | -55 | -69 | ||||||||||||||||||
|
Additional Expansion (Grid) |
$M | -180 | - | - | - | - | - | - | - | - | - | - | - | - | - | - | - | - | ||||||||||||||||||
|
Non-project capitalized G&A |
$M | -169 | -45 | -37 | -39 | -12 | -6 | -6 | -15 | -8 | -2 | - | - | - | - | - | - | - | ||||||||||||||||||
|
Closure Costs |
$M | -72 | - | - | - | - | - | - | - | - | - | - | - | - | - | - | - | - | ||||||||||||||||||
|
Grand Total Capex |
$M | -12,896 | -1,024 | -1,157 | -1,847 | -1,250 | -586 | -808 | -1,601 | -869 | -260 | -161 | -54 | -55 | -79 | -183 | -55 | -69 | ||||||||||||||||||
|
Working Capital |
$M | -4 | 4 | 0 | -1 | -34 | -95 | -34 | 2 | -2 | -46 | -118 | 40 | -1 | 7 | -24 | -9 | 7 | ||||||||||||||||||
|
PRE-TAX CASHFLOW |
$M | 77,254 | -1,020 | -1,157 | -1,848 | -1,340 | 571 | 839 | 144 | 662 | 1,431 | 3,084 | 3,079 | 3,035 | 2,929 | 3,284 | 3,529 | 3,415 | ||||||||||||||||||
|
Taxes |
||||||||||||||||||||||||||||||||||||
|
BSTS & WHT on Operating Cost |
$M | -3,855 | - | - | - | -4 | - | - | - | - | - | - | - | - | -20 | -123 | -160 | -161 | ||||||||||||||||||
|
WHT on Capital Cost |
$M | -179 | - | - | - | - | - | - | - | - | - | - | - | - | -1 | -11 | -3 | -4 | ||||||||||||||||||
|
WPPF Contribution |
$M | -2,219 | - | - | - | - | - | - | - | - | - | - | - | - | - | - | - | - | ||||||||||||||||||
|
Final Tax Regime |
$M | -823 | - | - | - | - | - | - | - | - | - | - | - | - | - | - | - | - | ||||||||||||||||||
|
Total Tax |
$M | -7,076 | - | - | - | -4 | - | - | - | - | - | - | - | - | -21 | -134 | -163 | -165 | ||||||||||||||||||
|
AFTER-TAX NET CASHFLOW |
$M | 70,178 | -1,020 | -1,157 | -1,848 | -1,344 | 571 | 839 | 144 | 662 | 1,431 | 3,084 | 3,079 | 3,035 | 2,908 | 3,150 | 3,366 | 3,250 | ||||||||||||||||||
|
February 19, 2025 |
Page 306 |
|
|
NI 43-101 Technical Report on the Reko Diq Project |
|
| SUMMARY CASH FLOW | Units | LOM Total | 2041 | 2042 | 2043 | 2044 | 2045 | 2046 | 2047 | 2048 | 2049 | 2050 | 2051 | 2052 | 2053 | 2054 | 2055 | 2056 | ||||||||||||||||||
|
Mining |
||||||||||||||||||||||||||||||||||||
|
Total ore |
Mt | 3,008 | 109 | 114 | 111 | 84 | 62 | 76 | 78 | 49 | 66 | 80 | 84 | 87 | 101 | 102 | 104 | 91 | ||||||||||||||||||
|
Total waste |
Mt | 3,205 | 82 | 109 | 132 | 166 | 188 | 174 | 172 | 201 | 184 | 169 | 166 | 159 | 130 | 103 | 75 | 59 | ||||||||||||||||||
|
Processing |
||||||||||||||||||||||||||||||||||||
|
Total ore |
Mt | 3,008 | 90 | 90 | 90 | 90 | 90 | 90 | 90 | 90 | 90 | 90 | 90 | 90 | 90 | 90 | 90 | 90 | ||||||||||||||||||
|
Copper Grade |
% | 0.48% | 0.63% | 0.57% | 0.54% | 0.50% | 0.48% | 0.41% | 0.39% | 0.37% | 0.40% | 0.45% | 0.47% | 0.49% | 0.51% | 0.52% | 0.55% | 0.47% | ||||||||||||||||||
|
Gold Grade |
g/t | 0.26 | 0.23 | 0.23 | 0.28 | 0.31 | 0.25 | 0.17 | 0.14 | 0.15 | 0.21 | 0.26 | 0.24 | 0.23 | 0.28 | 0.30 | 0.31 | 0.26 | ||||||||||||||||||
|
Recovered Copper Metal |
kt | 13,114 | 506 | 458 | 439 | 403 | 392 | 331 | 311 | 298 | 322 | 364 | 381 | 394 | 415 | 425 | 449 | 377 | ||||||||||||||||||
|
Recovered Gold Metal |
koz | 17,915 | 451 | 467 | 577 | 620 | 492 | 340 | 273 | 296 | 431 | 525 | 490 | 463 | 577 | 619 | 637 | 530 | ||||||||||||||||||
|
Revenue |
||||||||||||||||||||||||||||||||||||
|
Copper Revenue |
$M | 112,479 | 4,336 | 3,927 | 3,761 | 3,453 | 3,363 | 2,837 | 2,669 | 2,559 | 2,761 | 3,122 | 3,267 | 3,382 | 3,560 | 3,641 | 3,847 | 3,231 | ||||||||||||||||||
|
Gold Revenue |
$M | 35,165 | 885 | 917 | 1,133 | 1,217 | 967 | 667 | 536 | 582 | 845 | 1,030 | 962 | 909 | 1,132 | 1,214 | 1,249 | 1,041 | ||||||||||||||||||
|
Total Revenue |
$M | 147,644 | 5,221 | 4,843 | 4,894 | 4,670 | 4,329 | 3,504 | 3,205 | 3,140 | 3,606 | 4,151 | 4,229 | 4,291 | 4,692 | 4,855 | 5,097 | 4,272 | ||||||||||||||||||
|
Total Freight & Refining Costs |
$M | -5,435 | -202 | -184 | -176 | -166 | -163 | -144 | -137 | -132 | -140 | -154 | -160 | -164 | -170 | -174 | -181 | -157 | ||||||||||||||||||
|
Total Royalty |
$M | -7,779 | -276 | -256 | -259 | -248 | -229 | -185 | -169 | -165 | -191 | -220 | -224 | -227 | -249 | -257 | -270 | -226 | ||||||||||||||||||
|
Total Minesite Revenue |
$M | 134,430 | 4,744 | 4,403 | 4,459 | 4,257 | 3,937 | 3,175 | 2,899 | 2,843 | 3,276 | 3,777 | 3,845 | 3,901 | 4,273 | 4,424 | 4,645 | 3,889 | ||||||||||||||||||
|
OPERATING COSTS |
||||||||||||||||||||||||||||||||||||
|
Mining |
$M | -17,512 | -488 | -545 | -570 | -605 | -647 | -630 | -670 | -664 | -684 | -698 | -705 | -700 | -681 | -629 | -569 | -494 | ||||||||||||||||||
|
Processing |
$M | -16,822 | -470 | -470 | -469 | -468 | -467 | -470 | -472 | -473 | -476 | -472 | -473 | -473 | -474 | -474 | -473 | -472 | ||||||||||||||||||
|
Freight |
$M | -5,585 | -208 | -184 | -179 | -172 | -168 | -156 | -151 | -148 | -130 | -132 | -140 | -155 | -163 | -158 | -169 | -156 | ||||||||||||||||||
|
General and Administration |
$M | -4,357 | -130 | -128 | -128 | -131 | -126 | -121 | -119 | -119 | -126 | -125 | -125 | -125 | -127 | -132 | -124 | -115 | ||||||||||||||||||
|
Total Operating Costs |
$M | -44,276 | -1,295 | -1,327 | -1,346 | -1,376 | -1,408 | -1,378 | -1,413 | -1,404 | -1,416 | -1,427 | -1,443 | -1,453 | -1,445 | -1,393 | -1,335 | -1,237 | ||||||||||||||||||
|
Operating Cashflow |
$M | 90,154 | 3,449 | 3,076 | 3,112 | 2,881 | 2,528 | 1,797 | 1,486 | 1,439 | 1,860 | 2,350 | 2,402 | 2,448 | 2,828 | 3,031 | 3,310 | 2,652 | ||||||||||||||||||
|
Summary Capex by Project Phase |
||||||||||||||||||||||||||||||||||||
|
Phase 1 - Initial Capital |
$M | -5,566 | - | - | - | - | - | - | - | - | - | - | - | - | - | - | - | - | ||||||||||||||||||
|
Phase 2 - Expansion Capital |
$M | -3,264 | - | - | - | - | - | - | - | - | - | - | - | - | - | - | - | - | ||||||||||||||||||
|
Sustaining Capital |
$M | -3,645 | -55 | -270 | -130 | -159 | -216 | -77 | -175 | -237 | -226 | -133 | -166 | -130 | -46 | -118 | -36 | -28 | ||||||||||||||||||
|
Additional Expansion (Grid) |
$M | -180 | - | -180 | - | - | - | - | - | - | - | - | - | - | - | - | - | - | ||||||||||||||||||
|
Non-project capitalized G&A |
$M | -169 | - | - | - | - | - | - | - | - | - | - | - | - | - | - | - | - | ||||||||||||||||||
|
Closure Costs |
$M | -72 | - | - | - | - | - | - | - | - | - | - | - | - | - | - | -7 | -7 | ||||||||||||||||||
|
Grand Total Capex |
$M | -12,896 | -55 | -450 | -130 | -159 | -216 | -77 | -175 | -237 | -226 | -133 | -166 | -130 | -46 | -118 | -43 | -35 | ||||||||||||||||||
|
Working Capital |
$M | -4 | -4 | 25 | 8 | 20 | 1 | 32 | 8 | 8 | -15 | -25 | -10 | -6 | -9 | -1 | -11 | 43 | ||||||||||||||||||
|
PRE-TAX CASHFLOW |
$M | 77,254 | 3,390 | 2,650 | 2,991 | 2,742 | 2,314 | 1,753 | 1,319 | 1,210 | 1,618 | 2,191 | 2,226 | 2,311 | 2,772 | 2,912 | 3,256 | 2,660 | ||||||||||||||||||
|
Taxes |
||||||||||||||||||||||||||||||||||||
|
BSTS & WHT on Operating Cost |
$M | -3,855 | -151 | -152 | -153 | -155 | -158 | -153 | -156 | -155 | -157 | -159 | -162 | -163 | -163 | -158 | -153 | -141 | ||||||||||||||||||
|
WHT on Capital Cost |
$M | -179 | -3 | -26 | -8 | -9 | -12 | -4 | -10 | -14 | -13 | -8 | -10 | -8 | -3 | -7 | -2 | -2 | ||||||||||||||||||
|
WPPF Contribution |
$M | -2,219 | - | - | -67 | -123 | -105 | -71 | -55 | -52 | -73 | -99 | -101 | -104 | -125 | -135 | -150 | -119 | ||||||||||||||||||
|
Final Tax Regime |
$M | -823 | - | - | -24 | -45 | -42 | -34 | -31 | -30 | -35 | -40 | -41 | -41 | -45 | -47 | -49 | -41 | ||||||||||||||||||
|
Total Tax |
$M | -7,076 | -154 | -178 | -251 | -332 | -318 | -262 | -252 | -251 | -278 | -306 | -313 | -316 | -335 | -347 | -354 | -302 | ||||||||||||||||||
|
AFTER-TAX NET CASHFLOW |
$M | 70,178 | 3,236 | 2,471 | 2,740 | 2,409 | 1,997 | 1,491 | 1,067 | 959 | 1,340 | 1,885 | 1,913 | 1,995 | 2,437 | 2,565 | 2,902 | 2,358 | ||||||||||||||||||
|
February 19, 2025 |
Page 307 |
|
|
NI 43-101 Technical Report on the Reko Diq Project |
|
| SUMMARY CASH FLOW | Units | LOM Total | 2057 | 2058 | 2059 | 2060 | 2061 | 2062 | 2063 | 2064 | 2065 | |||||||||||
|
Mining |
||||||||||||||||||||||
|
Total ore |
Mt | 3,008 | 91 | 99 | 104 | 78 | 27 | - | - | - | - | |||||||||||
|
Total waste |
Mt | 3,205 | 44 | 36 | 30 | 15 | 5 | - | - | - | - | |||||||||||
|
Processing |
||||||||||||||||||||||
|
Total ore |
Mt | 3,008 | 90 | 90 | 90 | 90 | 90 | 90 | 90 | 77 | - | |||||||||||
|
Copper Grade |
% | 0.48% | 0.48% | 0.55% | 0.58% | 0.37% | 0.37% | 0.20% | 0.21% | 0.23% | - | |||||||||||
|
Gold Grade |
g/t | 0.26 | 0.29 | 0.39 | 0.53 | 0.38 | 0.24 | 0.09 | 0.09 | 0.07 | - | |||||||||||
|
Recovered Copper Metal |
kt | 13,114 | 392 | 446 | 474 | 305 | 299 | 165 | 169 | 158 | - | |||||||||||
|
Recovered Gold Metal |
koz | 17,915 | 593 | 792 | 1,092 | 775 | 492 | 183 | 171 | 121 | - | |||||||||||
|
Revenue |
||||||||||||||||||||||
|
Copper Revenue |
$M | 112,479 | 3,363 | 3,826 | 4,065 | 2,616 | 2,567 | 1,417 | 1,449 | 1,357 | - | |||||||||||
|
Gold Revenue |
$M | 35,165 | 1,164 | 1,554 | 2,144 | 1,521 | 966 | 358 | 336 | 237 | - | |||||||||||
|
Total Revenue |
$M | 147,644 | 4,527 | 5,380 | 6,210 | 4,137 | 3,533 | 1,776 | 1,785 | 1,594 | - | |||||||||||
|
Total Freight & Refining Costs |
$M | -5,435 | -161 | -179 | -189 | -132 | -131 | -87 | -89 | -81 | - | |||||||||||
|
Total Royalty |
$M | -7,779 | -240 | -286 | -331 | -220 | -187 | -93 | -93 | -83 | - | |||||||||||
|
Total Minesite Revenue |
$M | 134,430 | 4,125 | 4,916 | 5,690 | 3,784 | 3,215 | 1,596 | 1,603 | 1,430 | - | |||||||||||
|
OPERATING COSTS |
||||||||||||||||||||||
|
Mining |
$M | -17,512 | -472 | -487 | -494 | -400 | -225 | -152 | -140 | -130 | - | |||||||||||
|
Processing |
$M | -16,822 | -470 | -470 | -471 | -472 | -466 | -470 | -473 | -414 | - | |||||||||||
|
Freight |
$M | -5,585 | -159 | -168 | -173 | -144 | -139 | -78 | -73 | -67 | - | |||||||||||
|
General and Administration |
$M | -4,357 | -111 | -116 | -124 | -85 | -72 | -45 | -45 | -44 | - | |||||||||||
|
Total Operating Costs |
$M | -44,276 | -1,212 | -1,241 | -1,262 | -1,101 | -903 | -745 | -732 | -655 | - | |||||||||||
|
Operating Cashflow |
$M | 90,154 | 2,913 | 3,674 | 4,428 | 2,683 | 2,312 | 850 | 871 | 775 | - | |||||||||||
|
Summary Capex by Project Phase |
||||||||||||||||||||||
|
Phase 1 - Initial Capital |
$M | -5,566 | 0 | 0 | 0 | 0 | 0 | 0 | 0 | 0 | - | |||||||||||
|
Phase 2 - Expansion Capital |
$M | -3,264 | 0 | 0 | 0 | 0 | 0 | 0 | 0 | 0 | - | |||||||||||
|
Sustaining Capital |
$M | -3,645 | -52 | -45 | -113 | -33 | -17 | -18 | -18 | -87 | - | |||||||||||
|
Additional Expansion (Grid) |
$M | -180 | 0 | 0 | 0 | 0 | 0 | 0 | 0 | 0 | - | |||||||||||
|
Non-project capitalized G&A |
$M | -169 | 0 | 0 | 0 | 0 | 0 | 0 | 0 | 0 | - | |||||||||||
|
Closure Costs |
$M | -72 | -7 | -7 | -7 | -7 | -7 | -7 | -7 | -7 | - | |||||||||||
|
Grand Total Capex |
$M | -12,896 | -60 | -52 | -120 | -40 | -24 | -25 | -25 | -94 | - | |||||||||||
|
Working Capital |
$M | -4 | -7 | -29 | -11 | 93 | 8 | 69 | -3 | 9 | 107 | |||||||||||
|
PRE-TAX CASHFLOW |
$M | 77,254 | 2,846 | 3,593 | 4,297 | 2,736 | 2,297 | 894 | 844 | 690 | 107 | |||||||||||
|
Taxes |
||||||||||||||||||||||
|
BSTS & WHT on Operating Cost |
$M | -3,855 | -138 | -143 | -146 | -124 | -104 | -84 | -83 | -74 | - | |||||||||||
|
WHT on Capital Cost |
$M | -179 | -3 | -3 | -7 | -2 | -1 | -1 | -1 | -5 | - | |||||||||||
|
WPPF Contribution |
$M | -2,219 | -132 | -171 | -208 | -123 | -106 | -34 | -36 | -31 | - | |||||||||||
|
Final Tax Regime |
$M | -823 | -44 | -52 | -60 | -40 | -34 | -17 | -17 | -15 | - | |||||||||||
|
Total Tax |
$M | -7,076 | -318 | -369 | -421 | -289 | -245 | -136 | -136 | -125 | - | |||||||||||
|
AFTER-TAX NET CASHFLOW |
$M | 70,178 | 2,528 | 3,224 | 3,876 | 2,447 | 2,052 | 758 | 707 | 564 | 107 | |||||||||||
|
February 19, 2025 |
Page 308 |
|
|
NI 43-101 Technical Report on the Reko Diq Project |
|
Table 22-4 Annual Cashflow Summary - Reserve Case
| SUMMARY CASH FLOW | Units | LOM Total | 2025 | 2026 | 2027 | 2028 | 2029 | 2030 | 2031 | 2032 | 2033 | 2034 | 2035 | 2036 | 2037 | 2038 | 2039 | 2040 | ||||||||||||||||||
|
Mining |
||||||||||||||||||||||||||||||||||||
|
Total ore |
Mt | 3,008 | - | - | 5 | 46 | 70 | 86 | 81 | 81 | 110 | 135 | 85 | 73 | 108 | 144 | 90 | 99 | ||||||||||||||||||
|
Total waste |
Mt | 3,205 | - | - | 25 | 17 | 23 | 41 | 54 | 66 | 37 | 39 | 89 | 101 | 82 | 40 | 99 | 92 | ||||||||||||||||||
|
Processing |
||||||||||||||||||||||||||||||||||||
|
Total ore |
Mt | 3,008 | - | - | - | 6 | 41 | 45 | 45 | 45 | 51 | 87 | 90 | 90 | 90 | 90 | 90 | 90 | ||||||||||||||||||
|
Copper Grade |
% | 0.48% | - | - | - | 0.56% | 0.51% | 0.59% | 0.61% | 0.58% | 0.57% | 0.58% | 0.53% | 0.53% | 0.53% | 0.60% | 0.63% | 0.61% | ||||||||||||||||||
|
Gold Grade |
g/t | 0.26 | - | - | - | 0.37 | 0.31 | 0.35 | 0.36 | 0.32 | 0.32 | 0.32 | 0.29 | 0.29 | 0.28 | 0.30 | 0.28 | 0.29 | ||||||||||||||||||
|
Recovered Copper Metal |
kt | 13,114 | - | - | - | 32 | 190 | 240 | 248 | 234 | 263 | 455 | 431 | 431 | 431 | 488 | 507 | 493 | ||||||||||||||||||
|
Recovered Gold Metal |
koz | 17,915 | - | - | - | 53 | 293 | 359 | 369 | 329 | 377 | 628 | 585 | 591 | 567 | 613 | 570 | 574 | ||||||||||||||||||
|
Revenue |
||||||||||||||||||||||||||||||||||||
|
Copper Revenue |
$M | 83,699 | - | - | - | 203 | 1,211 | 1,530 | 1,582 | 1,494 | 1,680 | 2,902 | 2,751 | 2,750 | 2,750 | 3,116 | 3,239 | 3,146 | ||||||||||||||||||
|
Gold Revenue |
$M | 24,078 | - | - | - | 71 | 394 | 483 | 496 | 443 | 507 | 844 | 786 | 794 | 762 | 824 | 767 | 771 | ||||||||||||||||||
|
Total Revenue |
$M | 107,777 | - | - | - | 274 | 1,605 | 2,012 | 2,078 | 1,937 | 2,187 | 3,745 | 3,537 | 3,544 | 3,511 | 3,940 | 4,005 | 3,917 | ||||||||||||||||||
|
Total Freight & Refining Costs |
$M | -5,435 | - | - | - | -13 | -79 | -96 | -98 | -94 | -106 | -181 | -175 | -175 | -175 | -193 | -200 | -195 | ||||||||||||||||||
|
Total Royalty |
$M | -5,586 | - | - | - | -9 | -73 | -95 | -98 | -96 | -114 | -196 | -185 | -185 | -184 | -206 | -209 | -205 | ||||||||||||||||||
|
Total Minesite Revenue |
$M | 96,756 | - | - | - | 252 | 1,453 | 1,822 | 1,882 | 1,747 | 1,966 | 3,368 | 3,177 | 3,184 | 3,153 | 3,541 | 3,596 | 3,517 | ||||||||||||||||||
|
OPERATING COSTS |
||||||||||||||||||||||||||||||||||||
|
Mining |
$M | -17,512 | - | - | - | -179 | -244 | -301 | -321 | -355 | -380 | -430 | -426 | -438 | -480 | -511 | -475 | -491 | ||||||||||||||||||
|
Processing |
$M | -16,822 | - | - | - | -68 | -296 | -301 | -299 | -301 | -360 | -549 | -565 | -566 | -567 | -568 | -564 | -565 | ||||||||||||||||||
|
Freight |
$M | -5,585 | - | - | - | -20 | -101 | -120 | -122 | -117 | -130 | -198 | -195 | -195 | -195 | -205 | -208 | -206 | ||||||||||||||||||
|
General and Administration |
$M | -4,198 | - | - | - | -138 | -122 | -122 | -123 | -116 | -122 | -133 | -129 | -129 | -129 | -132 | -136 | -131 | ||||||||||||||||||
|
Total Operating Costs |
$M | -44,116 | - | - | - | -405 | -763 | -845 | -866 | -889 | -992 | -1,310 | -1,315 | -1,328 | -1,371 | -1,416 | -1,383 | -1,392 | ||||||||||||||||||
|
Operating Cashflow |
$M | 52,640 | - | - | - | -153 | 690 | 977 | 1,016 | 857 | 974 | 2,058 | 1,862 | 1,856 | 1,782 | 2,126 | 2,213 | 2,125 | ||||||||||||||||||
|
Summary Capex by Project Phase |
||||||||||||||||||||||||||||||||||||
|
Phase 1 - Initial Capital |
$M | -5,566 | -979 | -1,120 | -1,809 | -1,237 | -420 | - | - | - | - | - | - | - | - | - | - | - | ||||||||||||||||||
|
Phase 2 - Expansion Capital |
$M | -3,264 | - | - | - | - | -146 | -640 | -1,519 | -766 | -193 | - | - | - | - | - | - | - | ||||||||||||||||||
|
Sustaining Capital |
$M | -3,645 | - | - | - | - | -14 | -162 | -66 | -95 | -66 | -161 | -54 | -55 | -79 | -183 | -55 | -69 | ||||||||||||||||||
|
Additional Expansion (Grid) |
$M | -180 | - | - | - | - | - | - | - | - | - | - | - | - | - | - | - | - | ||||||||||||||||||
|
Non-project capitalized G&A |
$M | -169 | -45 | -37 | -39 | -12 | -6 | -6 | -15 | -8 | -2 | - | - | - | - | - | - | - | ||||||||||||||||||
|
Closure Costs |
$M | -72 | - | - | - | - | - | - | - | - | - | - | - | - | - | - | - | - | ||||||||||||||||||
|
Grand Total Capex |
$M | -12,896 | -1,024 | -1,157 | -1,847 | -1,250 | -586 | -808 | -1,601 | -869 | -260 | -161 | -54 | -55 | -79 | -183 | -55 | -69 | ||||||||||||||||||
|
Working Capital |
$M | -4 | 4 | 0 | -1 | -19 | -80 | -25 | 1 | -2 | -34 | -88 | 28 | -1 | 7 | -15 | -6 | 4 | ||||||||||||||||||
|
PRE-TAX CASHFLOW |
$M | 39,739 | -1,020 | -1,157 | -1,848 | -1,422 | 24 | 143 | -584 | -13 | 680 | 1,810 | 1,836 | 1,801 | 1,710 | 1,928 | 2,152 | 2,061 | ||||||||||||||||||
|
Taxes |
||||||||||||||||||||||||||||||||||||
|
BSTS & WHT on Operating Cost |
$M | -3,843 | - | - | - | -4 | - | - | - | - | - | - | - | - | -20 | -123 | -160 | -160 | ||||||||||||||||||
|
WHT on Capital Cost |
$M | -179 | - | - | - | 0 | - | - | - | - | - | - | - | - | -1 | -11 | -3 | -4 | ||||||||||||||||||
|
WPPF Contribution |
$M | -1,132 | - | - | - | 0 | - | - | - | - | - | - | - | - | - | - | - | - | ||||||||||||||||||
|
Final Tax Regime |
$M | -591 | - | - | - | 0 | - | - | - | - | - | - | - | - | - | - | - | - | ||||||||||||||||||
|
Total Tax |
$M | -5,745 | - | - | - | -4 | - | - | - | - | - | - | - | - | -21 | -133 | -163 | -164 | ||||||||||||||||||
|
AFTER-TAX NET CASHFLOW |
$M | 33,994 | -1,020 | -1,157 | -1,848 | -1,426 | 24 | 143 | -584 | -13 | 680 | 1,810 | 1,836 | 1,801 | 1,688 | 1,795 | 1,990 | 1,897 | ||||||||||||||||||
|
February 19, 2025 |
Page 309 |
|
|
NI 43-101 Technical Report on the Reko Diq Project |
|
| SUMMARY CASH FLOW | Units | LOM Total | 2041 | 2042 | 2043 | 2044 | 2045 | 2046 | 2047 | 2048 | 2049 | 2050 | 2051 | 2052 | 2053 | 2054 | 2055 | 2056 | ||||||||||||||||||
|
Mining |
||||||||||||||||||||||||||||||||||||
|
Total ore |
Mt | 3,008 | 109 | 114 | 111 | 84 | 62 | 76 | 78 | 49 | 66 | 80 | 84 | 87 | 101 | 102 | 104 | 91 | ||||||||||||||||||
|
Total waste |
Mt | 3,205 | 82 | 109 | 132 | 166 | 188 | 174 | 172 | 201 | 184 | 169 | 166 | 159 | 130 | 103 | 75 | 59 | ||||||||||||||||||
|
Processing |
||||||||||||||||||||||||||||||||||||
|
Total ore |
Mt | 3,008 | 90 | 90 | 90 | 90 | 90 | 90 | 90 | 90 | 90 | 90 | 90 | 90 | 90 | 90 | 90 | 90 | ||||||||||||||||||
|
Copper Grade |
% | 0.48% | 0.63% | 0.57% | 0.54% | 0.50% | 0.48% | 0.41% | 0.39% | 0.37% | 0.40% | 0.45% | 0.47% | 0.49% | 0.51% | 0.52% | 0.55% | 0.47% | ||||||||||||||||||
|
Gold Grade |
g/t | 0.26 | 0.23 | 0.23 | 0.28 | 0.31 | 0.25 | 0.17 | 0.14 | 0.15 | 0.21 | 0.26 | 0.24 | 0.23 | 0.28 | 0.30 | 0.31 | 0.26 | ||||||||||||||||||
|
Recovered Copper Metal |
kt | 13,114 | 506 | 458 | 439 | 403 | 392 | 331 | 311 | 298 | 322 | 364 | 381 | 394 | 415 | 425 | 449 | 377 | ||||||||||||||||||
|
Recovered Gold Metal |
koz | 17,915 | 451 | 467 | 577 | 620 | 492 | 340 | 273 | 296 | 431 | 525 | 490 | 463 | 577 | 619 | 637 | 530 | ||||||||||||||||||
|
Revenue |
||||||||||||||||||||||||||||||||||||
|
Copper Revenue |
$M | 83,699 | 3,227 | 2,922 | 2,799 | 2,569 | 2,502 | 2,111 | 1,986 | 1,904 | 2,054 | 2,323 | 2,431 | 2,517 | 2,649 | 2,709 | 2,863 | 2,404 | ||||||||||||||||||
|
Gold Revenue |
$M | 24,078 | 606 | 628 | 776 | 833 | 662 | 457 | 367 | 398 | 579 | 705 | 659 | 622 | 775 | 831 | 856 | 713 | ||||||||||||||||||
|
Total Revenue |
$M | 107,777 | 3,833 | 3,550 | 3,575 | 3,403 | 3,164 | 2,568 | 2,353 | 2,302 | 2,633 | 3,028 | 3,090 | 3,139 | 3,424 | 3,541 | 3,718 | 3,117 | ||||||||||||||||||
|
Total Freight & Refining Costs |
$M | -5,435 | -202 | -184 | -176 | -166 | -163 | -144 | -137 | -132 | -140 | -154 | -160 | -164 | -170 | -174 | -181 | -157 | ||||||||||||||||||
|
Total Royalty |
$M | -5,586 | -200 | -185 | -187 | -178 | -165 | -133 | -122 | -119 | -137 | -158 | -161 | -164 | -179 | -185 | -195 | -163 | ||||||||||||||||||
|
Total Minesite Revenue |
$M | 96,756 | 3,432 | 3,180 | 3,211 | 3,059 | 2,836 | 2,290 | 2,094 | 2,051 | 2,356 | 2,715 | 2,769 | 2,812 | 3,075 | 3,182 | 3,342 | 2,797 | ||||||||||||||||||
|
OPERATING COSTS |
||||||||||||||||||||||||||||||||||||
|
Mining |
$M | -17,512 | -488 | -545 | -570 | -605 | -647 | -630 | -670 | -664 | -684 | -698 | -705 | -700 | -681 | -629 | -569 | -494 | ||||||||||||||||||
|
Processing |
$M | -16,822 | -470 | -470 | -469 | -468 | -467 | -470 | -472 | -473 | -476 | -472 | -473 | -473 | -474 | -474 | -473 | -472 | ||||||||||||||||||
|
Freight |
$M | -5,585 | -208 | -184 | -179 | -172 | -168 | -156 | -151 | -148 | -130 | -132 | -140 | -155 | -163 | -158 | -169 | -156 | ||||||||||||||||||
|
General and Administration |
$M | -4,198 | -124 | -123 | -123 | -126 | -121 | -117 | -116 | -116 | -122 | -120 | -120 | -121 | -122 | -127 | -119 | -110 | ||||||||||||||||||
|
Total Operating Costs |
$M | -44,116 | -1,290 | -1,322 | -1,341 | -1,371 | -1,404 | -1,374 | -1,410 | -1,401 | -1,412 | -1,423 | -1,438 | -1,448 | -1,440 | -1,387 | -1,329 | -1,233 | ||||||||||||||||||
|
Operating Cashflow |
$M | 52,640 | 2,142 | 1,858 | 1,871 | 1,689 | 1,432 | 916 | 685 | 650 | 944 | 1,293 | 1,330 | 1,364 | 1,635 | 1,794 | 2,013 | 1,565 | ||||||||||||||||||
|
Summary Capex by Project Phase |
||||||||||||||||||||||||||||||||||||
|
Phase 1 - Initial Capital |
$M | -5,566 | - | - | - | - | - | - | - | - | - | - | - | - | - | - | - | - | ||||||||||||||||||
|
Phase 2 - Expansion Capital |
$M | -3,264 | - | - | - | - | - | - | - | - | - | - | - | - | - | - | - | - | ||||||||||||||||||
|
Sustaining Capital |
$M | -3,645 | -55 | -270 | -130 | -159 | -216 | -77 | -175 | -237 | -226 | -133 | -166 | -130 | -46 | -118 | -36 | -28 | ||||||||||||||||||
|
Additional Expansion (Grid) |
$M | -180 | - | -180 | - | - | - | - | - | - | - | - | - | - | - | - | - | - | ||||||||||||||||||
|
Non-project capitalized G&A |
$M | -169 | - | - | - | - | - | - | - | - | - | - | - | - | - | - | - | - | ||||||||||||||||||
|
Closure Costs |
$M | -72 | - | - | - | - | - | - | - | - | - | - | - | - | - | - | -7 | -7 | ||||||||||||||||||
|
Grand Total Capex |
$M | -12,896 | -55 | -450 | -130 | -159 | -216 | -77 | -175 | -237 | -226 | -133 | -166 | -130 | -46 | -118 | -43 | -35 | ||||||||||||||||||
|
Working Capital |
$M | -4 | -1 | 17 | 5 | 14 | - | 23 | 5 | 6 | -12 | -19 | -7 | -4 | -6 | - | -7 | 32 | ||||||||||||||||||
|
PRE-TAX CASHFLOW |
$M | 39,739 | 2,086 | 1,425 | 1,746 | 1,543 | 1,217 | 863 | 514 | 419 | 706 | 1,141 | 1,157 | 1,229 | 1,582 | 1,677 | 1,963 | 1,562 | ||||||||||||||||||
|
Taxes |
||||||||||||||||||||||||||||||||||||
|
BSTS & WHT on Operating Cost |
$M | -3,843 | -150 | -152 | -153 | -155 | -158 | -153 | -156 | -155 | -156 | -159 | -161 | -162 | -162 | -157 | -152 | -140 | ||||||||||||||||||
|
WHT on Capital Cost |
$M | -179 | -3 | -26 | -8 | -9 | -12 | -4 | -10 | -14 | -13 | -8 | -10 | -8 | -3 | -7 | -2 | -2 | ||||||||||||||||||
|
WPPF Contribution |
$M | -1,132 | - | - | -36 | -63 | -50 | -26 | -15 | -13 | -28 | -46 | -48 | -50 | -65 | -73 | -85 | -64 | ||||||||||||||||||
|
Final Tax Regime |
$M | -591 | - | - | -17 | -32 | -30 | -24 | -22 | -22 | -25 | -29 | -29 | -30 | -33 | -34 | -35 | -30 | ||||||||||||||||||
|
Total Tax |
$M | -5,745 | -154 | -178 | -213 | -259 | -251 | -208 | -203 | -203 | -222 | -241 | -248 | -250 | -263 | -271 | -275 | -236 | ||||||||||||||||||
|
AFTER-TAX NET CASHFLOW |
$M | 33,994 | 1,932 | 1,247 | 1,532 | 1,284 | 966 | 654 | 311 | 216 | 484 | 899 | 909 | 979 | 1,320 | 1,405 | 1,688 | 1,326 | ||||||||||||||||||
|
February 19, 2025 |
Page 310 |
|
|
NI 43-101 Technical Report on the Reko Diq Project |
|
| SUMMARY CASH FLOW | Units | LOM Total | 2057 | 2058 | 2059 | 2060 | 2061 | 2062 | 2063 | 2064 | 2065 | |||||||||||
|
Mining |
||||||||||||||||||||||
|
Total ore |
Mt | 3,008 | 91 | 99 | 104 | 78 | 27 | - | - | - | - | |||||||||||
|
Total waste |
Mt | 3,205 | 44 | 36 | 30 | 15 | 5 | - | - | - | - | |||||||||||
|
Processing |
||||||||||||||||||||||
|
Total ore |
Mt | 3,008 | 90 | 90 | 90 | 90 | 90 | 90 | 90 | 77 | - | |||||||||||
|
Copper Grade |
% | 0.48% | 0.48% | 0.55% | 0.58% | 0.37% | 0.37% | 0.20% | 0.21% | 0.23% | - | |||||||||||
|
Gold Grade |
g/t | 0.26 | 0.29 | 0.39 | 0.53 | 0.38 | 0.24 | 0.09 | 0.09 | 0.07 | - | |||||||||||
|
Recovered Copper Metal |
kt | 13,114 | 392 | 446 | 474 | 305 | 299 | 165 | 169 | 158 | - | |||||||||||
|
Recovered Gold Metal |
koz | 17,915 | 593 | 792 | 1,092 | 775 | 492 | 183 | 171 | 121 | - | |||||||||||
|
Revenue |
||||||||||||||||||||||
|
Copper Revenue |
$M | 83,699 | 2,502 | 2,847 | 3,025 | 1,947 | 1,910 | 1,055 | 1,078 | 1,010 | - | |||||||||||
|
Gold Revenue |
$M | 24,078 | 797 | 1,064 | 1,468 | 1,041 | 661 | 245 | 230 | 162 | - | |||||||||||
|
Total Revenue |
$M | 107,777 | 3,299 | 3,911 | 4,493 | 2,988 | 2,572 | 1,300 | 1,309 | 1,172 | - | |||||||||||
|
Total Freight & Refining Costs |
$M | -5,435 | -161 | -179 | -189 | -132 | -131 | -87 | -89 | -81 | - | |||||||||||
|
Total Royalty |
$M | -5,586 | -173 | -205 | -237 | -157 | -134 | -67 | -67 | -60 | - | |||||||||||
|
Total Minesite Revenue |
$M | 96,756 | 2,965 | 3,527 | 4,068 | 2,699 | 2,306 | 1,146 | 1,153 | 1,031 | - | |||||||||||
|
OPERATING COSTS |
||||||||||||||||||||||
|
Mining |
$M | -17,512 | -472 | -487 | -494 | -400 | -225 | -152 | -140 | -130 | - | |||||||||||
|
Processing |
$M | -16,822 | -470 | -470 | -471 | -472 | -466 | -470 | -473 | -414 | - | |||||||||||
|
Freight |
$M | -5,585 | -159 | -168 | -173 | -144 | -139 | -78 | -73 | -67 | - | |||||||||||
|
General and Administration |
$M | -4,198 | -106 | -110 | -117 | -80 | -68 | -43 | -43 | -42 | - | |||||||||||
|
Total Operating Costs |
$M | -44,116 | -1,208 | -1,236 | -1,255 | -1,096 | -899 | -743 | -730 | -654 | - | |||||||||||
|
Operating Cashflow |
$M | 52,640 | 1,758 | 2,292 | 2,813 | 1,602 | 1,407 | 403 | 423 | 377 | - | |||||||||||
|
Summary Capex by Project Phase |
||||||||||||||||||||||
|
Phase 1 - Initial Capital |
$M | -5,566 | - | - | - | - | - | - | - | - | - | |||||||||||
|
Phase 2 - Expansion Capital |
$M | -3,264 | - | - | - | - | - | - | - | - | - | |||||||||||
|
Sustaining Capital |
$M | -3,645 | -52 | -45 | -113 | -33 | -17 | -18 | -18 | -87 | - | |||||||||||
|
Additional Expansion (Grid) |
$M | -180 | - | - | - | - | - | - | - | - | - | |||||||||||
|
Non-project capitalized G&A |
$M | -169 | - | - | - | - | - | - | - | - | - | |||||||||||
|
Closure Costs |
$M | -72 | -7 | -7 | -7 | -7 | -7 | -7 | -7 | -7 | - | |||||||||||
|
Grand Total Capex |
$M | -12,896 | -60 | -52 | -120 | -40 | -24 | -25 | -25 | -94 | - | |||||||||||
|
Working Capital |
$M | -4 | -5 | -21 | -8 | 67 | 9 | 48 | -2 | 7 | 82 | |||||||||||
|
PRE-TAX CASHFLOW |
$M | 39,739 | 1,693 | 2,218 | 2,685 | 1,629 | 1,392 | 426 | 396 | 291 | 82 | |||||||||||
|
Taxes |
||||||||||||||||||||||
|
BSTS & WHT on Operating Cost |
$M | -3,843 | -138 | -143 | -145 | -124 | -104 | -84 | -83 | -74 | - | |||||||||||
|
WHT on Capital Cost |
$M | -179 | -3 | -3 | -7 | -2 | -1 | -1 | -1 | -5 | - | |||||||||||
|
WPPF Contribution |
$M | -1,132 | -75 | -102 | -127 | -69 | -61 | -12 | -13 | -11 | - | |||||||||||
|
Final Tax Regime |
$M | -591 | -31 | -37 | -43 | -29 | -24 | -12 | -12 | -11 | - | |||||||||||
|
Total Tax |
$M | -5,745 | -247 | -284 | -322 | -223 | -190 | -109 | -109 | -101 | - | |||||||||||
|
AFTER-TAX NET CASHFLOW |
$M | 33,994 | 1,446 | 1,934 | 2,363 | 1,406 | 1,202 | 317 | 286 | 190 | 82 | |||||||||||
|
February 19, 2025 |
Page 311 |
|
|
NI 43-101 Technical Report on the Reko Diq Project |
|
| 22.4 | Sensitivity |
A set of sensitivity analyses were performed over a range of +/- 15% for variations in metal prices, foreign exchange rate, operating costs, and capital costs to determine their relative importance as value drivers. The Project is most sensitive to copper price and operating costs.
Sensitivity of the Mineral Reserves is discussed in Section 15.
Impact of Copper Price on Undiscounted Net Cash Flow
Copper is the primary revenue driver of the Project, accounting for roughly 76% of the revenue. Table 22-5 shows the impact of copper price on free cash, NPV8, IRR and Payback Period. Note that the Gold price remains constant with the exception of the Reserves case which uses $3.00/lb Cu and $1400 Au/oz which is aligned with the prices used for the declaration of Mineral Reserves in this Report.
Table 22-5 Copper Price Impact on Free Cash, NPV8, IRR and Payback Period
| Copper Price ($/lb) |
Gold Price ($/oz) |
Free Cash ($M) |
After Tax NPV ($M) |
Project IRR (%) |
Payback Period (yrs) |
|||||
|
3.001 |
1,4001 | 33,994 | 4,032 | 12.89% | 8.46 | |||||
|
3.25 |
2,045 | 50,376 | 8,073 | 17.01% | 7.06 | |||||
|
3.50 |
2,045 | 56,710 | 9,653 | 18.45% | 6.70 | |||||
|
3.75 |
2,045 | 63,044 | 11,234 | 19.83% | 6.42 | |||||
|
4.03 |
2,045 | 70,178 | 13,014 | 21.32% | 6.16 | |||||
|
4.13 |
2,045 | 72,672 | 13,636 | 21.82% | 6.08 | |||||
|
4.20 |
2,045 | 74,446 | 14,079 | 22.18% | 6.02 | |||||
|
4.50 |
2,045 | 82,046 | 15,975 | 23.66% | 5.78 | |||||
|
4.75 |
2,045 | 88,380 | 17,556 | 24.84% | 5.57 | |||||
|
5.00 |
2,045 | 94,714 | 19,136 | 26.00% | 5.33 | |||||
Notes:
| 1. | Reserve Pricing Case |
Key Drivers Impact on NPV and IRR
Sensitivities impact of key drivers on NPV8 and IRR are shown in Figure 22-2 and Figure 22-3 respectively.
|
February 19, 2025 |
Page 312 |
|
|
NI 43-101 Technical Report on the Reko Diq Project |
|
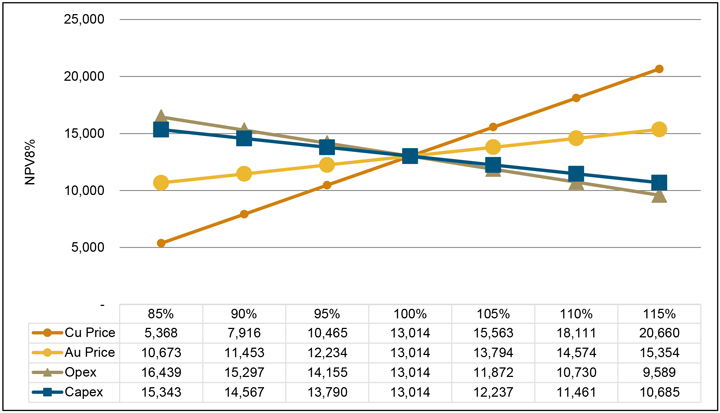
Source: Barrick, 2024
Figure 22-2 Sensitivity Chart: NPV8
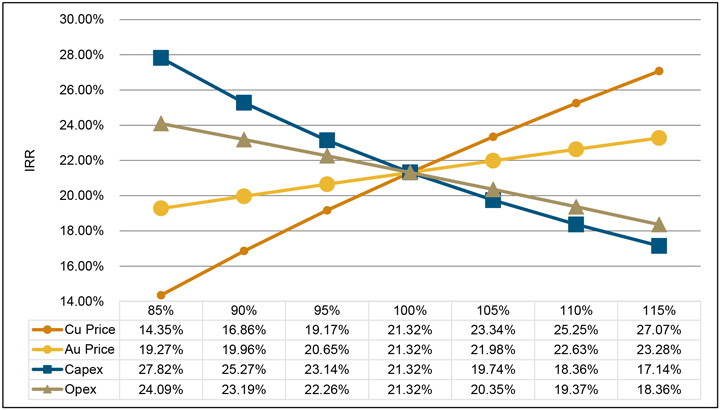
Source: Barrick, 2024
Figure 22-3 Sensitivity Chart: IRR
|
February 19, 2025 |
Page 313 |
|
|
NI 43-101 Technical Report on the Reko Diq Project |
|
| 22.5 | QP Comments on Economic Analysis |
The QP considers that the economic analysis and modelling is appropriate for the Project and supports the estimation of Mineral Resources and Mineral Reserves. It shows that the Mineral Reserves are economically viable over a range of cost and revenue factors which adequately account for likely technical risks and possible changes in fiscal operating environment.
|
February 19, 2025 |
Page 314 |
|
|
NI 43-101 Technical Report on the Reko Diq Project |
|
| 23 | Adjacent Properties |
There are no adjacent properties which are considered by the QP to be material to the Reko Diq Project.
|
February 19, 2025 |
Page 315 |
|
|
NI 43-101 Technical Report on the Reko Diq Project |
|
| 24 | Other Relevant Data and Information |
No additional information or explanation is necessary to make this Technical Report understandable and not misleading.
|
February 19, 2025 |
Page 316 |
|
|
NI 43-101 Technical Report on the Reko Diq Project |
|
| 25 | Interpretation and Conclusions |
The QPs note the following interpretations and conclusions in their respective areas of expertise, based on the review of data available for this Report.
The Project as a whole has been designed to utilize industry standard practices and deploy conventional technology with many of the technologies already employed by Barrick at other mines they operate, reducing the implementation operational risks. Where technologies are not employed by Barrick, benchmarked sites have been visited by the Project team to validate equipment selection and adopt best practices. Though new and emerging technologies are not included in the base case, the Project has been designed to allow for the adoption of technologies during the operational phase which, if realized, may result in potential improvements in operational performance from that which is presented in this Report.
| 25.1 | Mineral Tenure, Rights, Royalties and Agreements |
| ● | The JVA, Mineral Agreement, applicable Statutory Regulatory Orders and the FDI Act codified an agreed-to fiscal regime and 30-year stabilization period for the Project (i.e., until December 15, 2052) with automatic renewals for incremental periods of up to 30 years, at the request of RDMC. The JVA provides for the governance of the Project while the Mineral Agreement outlines the royalties and tax regime applicable to the Project, including tax holidays, among other things. |
| ● | The various rights secured for the Project are considered sufficient to support the Mineral Resources, Mineral Reserves and life-of-mine plan presented in this Report. |
| 25.2 | Geology and Mineral Resources |
| ● | The understanding of the deposit settings, lithologies, and geologic, structural, and alteration controls on mineralization is sufficient to support the estimation of Mineral Resources and subsequent Mineral Reserves. |
| ● | Drilling, sample collection, and QA/QC procedures that support the Mineral Resources have been conducted in accordance with industry standards at the relevant time and are supported by recent verification work. Therefore, are considered sufficient to support the declaration of the Mineral Resources and the classification presented in this Report. |
| ● | The estimated Mineral Resources contain 3,930 Mt of Indicated Material at and average grade of 0.43% Cu and 0.23 g/t Au and 1,378 Mt of Inferred Material at and average grade of 0.3% Cu and 0.2 g/t Au. The Project has no Measured Mineral Resources at this time. |
| ● | Snowden Optiro was engaged to complete an independent audit of the underlying data and the Mineral Resource estimation for Western Porphyries and Tanjeel. The audit concluded |
|
February 19, 2025 |
Page 317 |
|
|
NI 43-101 Technical Report on the Reko Diq Project |
|
| that the Mineral Resource estimate and the data collected to inform them do not present any fatal flaws and are logical and well considered. |
| ● | The estimated Mineral Resources currently in consideration for mining are defined by existing drilling, however, the Western Porphyries and Tanjeel remain open at depth and there is potential to expand the Minerals Resources with further drilling. |
| ● | The Project includes several exploration targets that have the potential to add to the existing Mineral Resource base and are considered substantial enough to warrant continued investment in parallel with the Project’s development. |
| 25.3 | Mining and Mineral Reserves |
| ● | The mine will employ conventional open pit truck and shovel mining methods using conventional equipment. These methods are typical at Barrick operations as well as at mines operated by others in a variety of jurisdictions globally. |
| ● | Geotechnical recommendations were based on dedicated geotechnical drilling and testwork programs which were used in the mine design parameters and included the appropriate factors of safety. Recommendations were reviewed and verified by third parties. |
| ● | The Mineral Reserves contain an estimated 3,008 Mt of Probable Material at and expected average grade of 0.48% Cu and 0.26 g/t Au. The current Mineral Reserves have a life-of-mine of approximately 36.5 years from commissioning of the plant. |
| ● | Mineral Reserves were estimated at copper and gold prices that are below current spot prices for both metals and are therefore considered resilient to changes in commodity prices. All other modifying factors used in the determination of the Mineral Reserves are appropriate for the Project and style of mineralization. |
| ● | The Mineral Reserves are supported by a Feasibility Study and were prepared according to the Canadian Institute of Mining, Metallurgy and Petroleum CIM (2014) Standards as well as using the guidance outlined in CIM Estimation of Mineral Resources and Mineral Reserves Best Practice Guidelines 2019 (CIM (2019) MRMR Best Practice Guidelines). |
| ● | There are Inferred Resources that sits within and below the currently designed open pits. Should this material be able to be converted to Indicated Resources, there is potential to increase the size of the Mineral Reserve. |
| 25.4 | Mineral Processing |
| ● | The process plant design is based on sufficient metallurgical testwork for this level of study to support the development of the flowsheet, forecast recoveries, and projected concentrate characteristics. |
| ● | The selected processing technology is conventional and includes comminution, floatation, thickening, and filtration. The design is at a scale comparable to other operations in the industry. |
| ● | The expected average recovery is 89.9% copper, and 69.9% gold based on the current life-of-mine plan and testwork completed to date. Copper recovery in the first 10 years is |
|
February 19, 2025 |
Page 318 |
|
|
NI 43-101 Technical Report on the Reko Diq Project |
|
| forecasted at 90.1%. Changes in the feed material characteristics may impact the actual achieved recovery. |
| 25.5 | Infrastructure |
| ● | Regional road, rail, and port infrastructure will be used during the construction and operation of the Project. Some upgrades and increased maintenance are required to meet the needs of the Project, which have been studied, and costs are included as appropriate. |
| ● | Most of the planned site infrastructure (waste storage facilities, offices, workshops, etc.), requires construction, and once constructed, is considered sufficient to support the mining operation as planned. Some aspects of the infrastructure will require expansion during the Phase 2, for which sufficient space has been allowed, as well as potential for further expansion beyond the stated Phase 2 capacity. |
| ● | The tailings storage facility is designed using conventional tailings deposition method and will be operated in accordance with Barrick’s internal policies and industry standard practices (including GISTM). The initial construction and subsequent planned dam raises provide sufficient storage capacity to support the stated Mineral Reserves. The tailings storage facility is designed in such a way that it can handle capacity beyond the stated Mineral Reserve with additional capital investment. |
| 25.6 | Environment and Social Aspects |
| ● | The Project has been scoped and is being conducted to meet the requirements of international standards (IFC Performance Standards and Equator Principals 4, which are considered benchmarks for the industry), as well as Barrick’s own policies and standards. |
| ● | The Project has been granted many of the permits to support ongoing early works. However, as of the date of this Technical Report, a number of permits and approvals are still in the process of being obtained necessary for construction and operation. The expected permitting timeline allows for the development of the Project inline with the schedule presented in this Report (detailed in item 20 of the Report). |
| 25.7 | Market Studies and Contracts |
| ● | The Project is expected to produce conventional copper concentrate. The concentrate is forecasted to be of good quality with occurrences of penalty elements expected to be below limits that influence smelter terms or saleability of the concentrate. No contracts are currently in place for any concentrate production from the Project. |
| ● | Copper concentrate is freely and regularly traded by a large number of parties. Barrick is not dependent upon the sale of copper to any one customer and its product is sold to a variety of traders and smelters. |
| ● | The planned concentrate product is expected to be readily marketable to third-party smelters. |
|
February 19, 2025 |
Page 319 |
|
|
NI 43-101 Technical Report on the Reko Diq Project |
|
| ● | While there are numerous contracts in place, there are no currently executed contracts considered to be material to Barrick. |
| 25.8 | Capital and Operating Costs |
| ● | Capital and operating costs estimates for the study were estimated at what is considered sufficient for a Feasibility Study (+/- 15%). The costs were estimated as of Q3 2024 and are considered current for the purpose of this Technical Report and the declaration of Mineral Reserves. |
| ● | Capital cost estimates include development capital, expansion capital as well as sustaining capital costs (inclusive of mine closure). The planned Project requires an estimated LOM total of $12,824M. |
| ● | Phase 1 capital of an estimated $5,566M is required to reach an initial design capacity throughput rate of 45Mtpa and an additional $3,264M for Phase 2 to reach full throughput capacity 90Mtpa. |
| ● | Operating cost estimates include all operational activities required for the mining, processing, general and administrative costs, and offsite costs (including freight & refining and royalties) for all of the forecasted production. |
| ● | The LOM operating cost for the Project is estimated to be $57,489M with unit operating costs of $25.42/t and $18.58/t for Phase 1 and Phase 2 respectively. |
| 25.9 | Project Economics |
| ● | As a result of the Reconstitution of the Project and associated agreements, obligations such as tax and royalties, are well understood and have been reflected in the economic analysis. |
| ● | Based on the economic analysis presented in this document, the Project generates positive pre- and post-tax financial results with a post tax free cash flow of $70,178M, NPV8 of $13,014M and IRR of 21%. |
| ● | The Project’s NPV is most sensitive to changes in copper price and operating costs Changes in these parameters from those listed in this Report will impact the NPV. |
|
February 19, 2025 |
Page 320 |
|
|
NI 43-101 Technical Report on the Reko Diq Project |
|
| 25.10 | Risks |
The QPs have examined the various risks and uncertainties known or identified that could reasonably be expected to affect reliability or confidence in the exploration information, the Mineral Resources or Mineral Reserves of the Project, or projected economic outcomes contained in this Report. They have considered the controls that are in place or proposed to be implemented and determined the residual risk post mitigation measures. The post mitigation risk rating is evaluated consistent with guidance provided by Barrick’s Formal Risk Assessment Procedure (FRA) and considers the likelihood and consequence of the risk’s occurrence and impact.
Table 25-1 details the significant risks and uncertainties as determined by the QPs for the Project.
|
February 19, 2025 |
Page 321 |
|
|
NI 43-101 Technical Report on the Reko Diq Project |
|
Table 25-1 Risk Analysis Summary
| Area | Risk | Mitigation | Post Mitigation Risk Rating |
|||
|
Geology and Mineral Resources |
Lower than modelled grades/tonnes |
• A number of internal and third-party reviews have been undertaken to date. • Continue with reviews/audits of models on a regular basis • Update model with reconciliation based on production data and infill grade control drilling once available. |
Medium | |||
|
Mining and Mineral Reserves |
Underperformance relative to FS mine plan |
• A number of internal and third-party reviews have been undertaken to date. • Mine designs to adhere to geotechnical guidance for pit slopes and ramps. • Dual ramp access to mining phases where practical. • Mine plan to build ore stockpile inventory. • Continue with geotechnical audits and compliance to design. |
Medium | |||
|
Processing |
Recovery lower than modelled due to ore variability / inadequate test work |
• Use of conventional process technology. • Significant variability and bulk pilot testwork undertaken. • Update process recovery curves with production data once available. • Vendor testwork completed to determine processing performance and equipment selection as part of FS and BE. |
Medium | |||
|
Project Infrastructure |
Inadequate to support operations / planned capacity (site and regional) |
• The Feasibility Study engineering included all project infrastructure required to support the project. • Redundancy design in key areas (e.g., power, spares, concentrate storage at site and port facility, etc.). • Continued engagement with regional infrastructure partners (rail/port) and monitoring/maintenance of facilities. |
Medium | |||
|
Tailings |
Dam failure |
• Ongoing independent tailings review board process. • No persons working/living downstream from the facility with dam breach analysis. |
High | |||
|
Environmental |
Impact on regional environment/habitat |
• Variety of environmental management plans have already been developed. • Ongoing monitoring of performance and updating of management plans. |
Medium | |||
|
Supply Chain |
Disruption of supply chain for supplies, spares, fuel etc. |
• Plan for mine to hold multiple months of capacity for critical items. • Initial fills and quantities of critical spares developed with major vendors. |
Medium | |||
|
Human resources |
Availability of qualified construction and operational personnel (contractor and owner) |
• Participate in market surveys to identify skills and define appropriate compensation for staff. • Operational readiness and associated training programs. |
Medium | |||
|
Security |
Terrorism or other attack (people and/or property) |
• Security management strategy in place (physical infrastructure and management plans). • Monitoring of in-country risk status and intelligence monitoring. |
High | |||
|
February 19, 2025 |
Page 322 |
|
|
NI 43-101 Technical Report on the Reko Diq Project |
|
| Area | Risk | Mitigation | Post Mitigation Risk Rating |
|||
|
Regulatory |
Delays in permits for construction and operation |
• A number of key permits have already been granted. • Ongoing of applicable permitting requirements and understanding of key regulatory processes to facilitate early engagement on key planning and approvals items. |
Medium | |||
|
Regulatory |
Loss of permits and tenements (renewals) |
• Detailed renewal regime and express rights of renewal negotiated as part of the Project Agreements. • Agreements negotiated and ratified by the GoP, GoB, and Supreme Court of Pakistan. |
High | |||
|
Country & Political |
Loss of relevant government support |
• Agreements negotiated and ratified by the GoP GoB, and Supreme Court of Pakistan. • Continued engagement with government stakeholders. |
High | |||
|
Construction Schedule |
Project delays - financing/construction |
• Commitment to contracts with key long lead item suppliers. • Project design and development in accordance with international financing standards. |
Medium | |||
|
Capital Costs |
Capital cost overruns |
• The Feasibility Study engineering included all project infrastructure required to support the project. • Contracts and vendor quotes obtained for key equipment. • Cost control and package management during project execution. • Long-lead items for processing and mining secured during 2024. |
Medium | |||
|
Operating Costs |
Higher than modelled operating costs |
• Feasibility Study level engineering estimates completed. • Monitoring key input costs and revise estimates as appropriate. • Benchmarked costs across similar operations. • Update estimates with mine actuals once in operation. |
High | |||
|
February 19, 2025 |
Page 323 |
|
|
NI 43-101 Technical Report on the Reko Diq Project |
|
| 26 | Recommendations |
The QPs have made the following recommendations for further work and note any attributable costs, if relevant, are incorporated into the operating or capital costs.
| 26.1 | Mineral Tenure, Rights, Royalties and Agreements |
| ● | While the 30-year stabilization period provides assurance for the Project, ongoing engagement with local, regional and national government is recommended. |
| 26.2 | Geology and Mineral Resources |
| ● | Conduct additional drilling within the areas of the Mineral Resources that make up initial production years with the aim of converting the material category from Indicated to Measured ahead of production. |
| ● | Continue exploration activities to explore the potential to add to the Mineral Resource base. |
| ● | Continue planned infill drilling to define the appropriate drill spacing for measured mineral resources and execute planned infill drilling during construction ahead of commissioning. |
| ● | As appropriate, adopt recommendations from the Snowden Optiro in future versions of the Mineral Resource Estimate. Should any material revisions of the model occur in the future, additional third-party audits should be completed. |
| o | Material (Fatal Flaw) Recommendations |
| o | None |
| o | Value Add |
| o | Create hybrid models of the key PFB1 to PFB3 units that use vein modelling and intrusion modelling techniques to improve the understanding of the porphyry orientations and interactions. |
| o | Generate separate variograms for the H14 and H15 porphyries, given the different controls on mineralisation and lithological types. |
| o | Long-Term (Opportunity) |
Generate mineralization domains based upon geological, alteration, and/or mineralogical criteria.
| 26.3 | Mining and Mineral Reserves |
| ● | Update the mine plan to take into account revisions of the Mineral Resources as infill drilling, exploration, and confirmatory test work programs are completed. |
|
February 19, 2025 |
Page 324 |
|
|
NI 43-101 Technical Report on the Reko Diq Project |
|
| ● | Review and incorporate outcomes from ongoing geotechnical investigations as well as slope performance in early mine life into final pit designs. |
| ● | Review ongoing metallurgical test work and incorporate updated processing performance assumptions. |
| 26.4 | Mineral Processing |
| ● | Conduct a metallurgical test work program as part of the infill and exploration drilling programs. The metallurgical budget is included in the respective exploration and infill budget presented above. |
| 26.5 | Infrastructure |
| ● | Complete investigation in the Southern Groundwater System area to sufficiently define the area as a supplementary source of water, in particular, to determine optimal land lease area(s). The estimated land lease costs are included in the Project capital costs. |
| ● | Continue additional studies relating to alternative energy sources to heavy fuel oil with the goal of increasing the amount of energy from renewable sources and/or reducing operating costs. |
| ● | Continue engagement with the national power authority (National Transmission & Despatch Company) to support connecting to the national power grid network. |
| ● | Continue engagement with regional infrastructure stakeholders to advance port and rail upgrades in accordance with the Project’s execution timeline. |
| 26.6 | Environmental, Permitting, and Social Aspects |
| ● | Continue stakeholder engagement and public education programs as outlined in the ESIA. |
| ● | Advance outstanding permits required for Project operation. |
| ● | Active, ongoing monitoring of the local and regional security environment is critical. Security management plans and procedures should be reviewed and updated regularly as required. |
| ● | Continue to ensure the project is developed in accordance with IFC PS and EP4 to support financing efforts. |
| 26.7 | Market Studies and Contracts |
| ● | Execute agreements with concentrate customers to better establish final product terms and potential credits associated with the planned production. |
|
February 19, 2025 |
Page 325 |
|
|
NI 43-101 Technical Report on the Reko Diq Project |
|
| 26.8 | Capital and Operating Costs |
| ● | Re-evaluate estimated capital and operating costs on an ongoing basis as further engineering, tender responses, executed contracts, and/or operational information becomes available. |
| 26.9 | Risks |
| ● | Ongoing updates and revisions to the risk register are recommended as the project progresses through basic engineering into construction and operation. Active monitoring and implementation of mitigation plans are recommended for key risks in accordance with Barrick’s established risk management practices. |
|
February 19, 2025 |
Page 326 |
|
|
NI 43-101 Technical Report on the Reko Diq Project |
|
| 27 | References |
Bar, N. 2022, Geotechnical Review Of Reko Diq Copper-Gold Mine, Pakistan, Prepared for Barrick Gold Corporation (December 2022)
Barrick, 2023, 2023 Financial Model “RD-FS-V9.0.2023.09.11 Base (Mine-Sc01j_200) Base 9+3F.xlsx”. Internal file. (September 2023)
Behre Dolbear & Company Limited, 2009, Audit Of Exploration Data Collection, Database And Resource Estimation At Reko Diq, Chagai District, Pakistan, prepared for Tethyan Copper Company (Pakistan) Ltd. (September 30, 2009).
Cairns, C., 2004, Geological procedures at the Reko Diq porphyry copper-gold porphyry prospect, Pakistan, prepared for Tethyan Copper Company (April 2004).
Cairns, C., 2004, QA/QC associated with the H4 resource drilling programme, prepared for Tethyan Copper Company (March 2004).
Canadian Institute of Mining, Metallurgy and Petroleum (CIM), 2014, CIM Definition Standards for Mineral Resources & Mineral Reserves, Prepared by the CIM Standing Committee on Reserve Definitions (May 2014)
Canadian Institute of Mining, Metallurgy and Petroleum (CIM), 2019, CIM Estimation of Mineral Resources & Mineral Reserves Best Practice Guidelines, Prepared by the CIM Mineral Resource & Mineral Reserve Committee (November 2019)
Coffey Mining, 2009, Reko Diq Western Porphyries Open Pit Geotechnical Feasibility Study and Addendum, prepared for Tethyan Copper Company Pakistan (September, 30, 2009).
Coffey Mining, 2010, Reko Diq H13 Geotechnical Review, prepared for Tethyan Copper Company Pakistan (April, 20, 2010).
Coffey Mining, 2010, Reko Diq Tanjeel Geotechnical Review, prepared for Tethyan Copper Company Pakistan (March, 22, 2010).
Digby Wells, 2024, Water Balance and Dewatering Management for Western Porphyry and Tanjeel Pits, Prepared for RDMC (July 2024)
Gecko Geotechnics, 2024, Reko Diq Western Porphyries 3D Slope Stability Modelling, prepared for Barrick Gold Corporation (June, 28, 2024).
|
February 19, 2025 |
Page 327 |
|
|
NI 43-101 Technical Report on the Reko Diq Project |
|
Hasan, K., 2009, Validation and audit of Western Porphyries data for feasibility study, Reko Diq, prepared for Tethyan Copper Company (August 2009).
ioGlobal Pty Ltd., 2009, QAQC review of Tethyan Copper’s Reko Diq project, incorporating laboratory and site audits, procedure review and QC data analysis, prepared for Tethyan Copper Company (February 2009).
Laubscher, D. H., 1990, A geomechanics classification system for the rating of rock mass in mine design, Journal of the South African Institute of Mining & Metallurgy, Volume 90, Number 10, p257-272, (October 1990)
Lettis Consultants International, Inc., 2024, Reko Diq Mine Site Phase 1 Geohazard Assessment Report, Balochistan Province, Pakistan, prepared for Knight Piésold Pty. Ptd. (May 21, 2024).
Perelló et al., 2008, The Chagai Porphyry Copper Belt, Baluchistan Province, Pakistan, Economic Geology 103(8):1583-1612 (December 2008)
Reid, K., 2007, QA/QC data associated with the H15 resource drilling programme (March 2006 to mid-2007.), prepared for Tethyan Copper Company (June 2007).
RSC, 2022, Barrick Reko Diq Model Handover Notes, prepared for Barrick Gold Corporation (2022).
SNC Lavalin, 2009, Reko Diq Project IMD Prefeasibility Report, 2009, Prepared for Tethyan Copper Company (July 2009)
SNC Lavalin, 2010, Reko Diq Expansion Study Pre-Feasibility Study, Prepared for Tethyan Copper Company (July 2010)
SNC Lavalin, 2010, Reko Diq Feasibility Study, Prepared for Tethyan Copper Company (August 2010)
SRK, 2009, Geochemical characterization of waste rock, ore and tailings, Reko Diq Project: Feasibility Study. Prepared for Tethyan Copper Company Pakistan (Private) Limited (March 2009).
|
February 19, 2025 |
Page 328 |
|
|
NI 43-101 Technical Report on the Reko Diq Project |
|
| 28 | Date and Signature Page |
This report titled “NI 43-101 Technical Report on the Reko Diq Project, Balochistan, Pakistan” dated February 19, 2025 with an effective date of December 31, 2024, was prepared and signed by the following authors:
| (Signed) Simon Bottoms |
||
| Dated at London, UK
February 19, 2025 |
Simon Bottoms, CGeol, FGS, FAusIMM Executive Vice President Mineral Resource Management & Evaluations Barrick Gold Corporation |
|
| (Signed) Peter Jones |
||
| Dated at Santiago, Chile
February 19, 2025 |
Peter Jones, MAIG Manager of Resources and Evaluations - Latin America & Asia Pacific Barrick Gold Corporation |
|
| (Signed) Mike Saarelainen |
||
| Dated at Dubai, UAE
February 19, 2025 |
Mike Saarelainen, FAusIMM Head of Mining for Reko Diq Barrick Gold Corporation |
|
| (Signed) Daniel Nel |
||
| Dated at Dubai, UAE
February 19, 2025 |
Daniel Nel, MIMMM Engineering Manager for Reko Diq Barrick Gold Corporation |
|
|
February 19, 2025 |
Page 329 |
|
|
NI 43-101 Technical Report on the Reko Diq Project |
|
| (Signed) David Morgan |
||
| Dated at Perth, Australia
February 19, 2025 |
David Morgan, MIEAust, CPEng, IntPE(Aus) Managing Director at Knight Piésold Pty Ltd Knight Piésold |
|
| (Signed) Ashley Price |
||
| Dated at Dubai, UAE
February 19, 2025 |
Ashley Price, FAusIMM ESIA Manager for Reko Diq Barrick Gold Corporation |
|
|
February 19, 2025 |
Page 330 |
|
|
NI 43-101 Technical Report on the Reko Diq Project |
|
| 29 | Certificates of Qualified Persons |
| 29.1 | Simon Bottoms |
I, Simon P. Bottoms, CGeol, MGeol, FGS, FAusIMM, as an author of this report titled “NI 43-101 Technical Report on the Reko Diq Project, Balochistan, Pakistan” prepared for Barrick Gold Corporation by Reko Diq Mining Company and dated February 19, 2025 with an effective date of December 31, 2024 do hereby certify that:
| 1. | I am Executive Vice President Mineral Resource Management & Evaluations with Barrick Gold Corporation, of the 3rd floor, Unity Chambers, 28 Halkett Street, St. Helier, Jersey, Channel Islands, UK, OJE2. |
| 2. | I am a graduate of the University of Southampton, UK in 2009 with a Masters of Geology degree. |
| 3. | I am registered as a Chartered Geologist registered (#1023769) with the Geological Society of London. I am a current Fellow of the Australasian Institute of Mining and Metallurgy (313276). |
| 4. | I have worked as a geologist continuously for 14 years since my graduation from University. My relevant experience for the purpose of the Technical Report is: |
| ● | I am the global lead technical executive for the Barrick group, and have direct responsibility for managing all mineral resources, mineral reserves, mine planning, mine geology, evaluations, including associated technical studies spanning from preliminary economic assessments through to feasibility studies. I am also responsible for reviewing and approving all related public project disclosures by Barrick as the lead Qualified Person in accordance with National Instrument 43-101. |
| ● | Practical experience in development, construction and operational management of mine operations. |
| ● | Previously, held positions in exploration and mine geology across Africa, Central Asia, Russia and Australia. |
| 5. | I have read the definition of “qualified person” set out in National Instrument 43-101 (NI 43-101) and certify that by reason of my education, affiliation with a professional association (as defined in NI 43-101) and past relevant work experience, I fulfil the requirements to be a “qualified person” for the purposes of NI 43-101. |
| 6. | I visited the Reko Diq Project site most recently on 13 January to 16 January 2024. |
| 7. | I am responsible for the following Sections of the Technical Report; 1, 2, 3, 4, 5, 6, 19, 21, 22, 23, 24, 25.1, 25.7, 25.8, 25.9, 25.10, 26.1, 26.7, 26.8, 26.9, and 27. |
|
February 19, 2025 |
Page 331 |
|
|
NI 43-101 Technical Report on the Reko Diq Project |
|
| 8. | I am not independent of the Issuer applying the test set out in Section 1.5 of NI 43-101, as I have been a full-time employee of Barrick Gold Corporation (previously Randgold Resources) since 2013. |
| 9. | I have had prior involvement with the property that is the subject of the Technical Report, with exploration programme results, Mineral Resource and grade control model updates, mine plans, and associated financials, mine strategy, results of external audits, and Joint Venture board meeting reviews. |
| 10. | I have read NI 43-101, and the sections of the Technical Report for which I am responsible have been prepared in compliance with NI 43-101 and Form 43-101F1. |
| 11. | At the effective date of the Technical Report, to the best of my knowledge, information, and belief, the Technical Report contains all scientific and technical information that is required to be disclosed to make the Technical Report not misleading. |
Dated February 19, 2025
(Signed) Simon P. Bottoms
Simon P. Bottoms, CGeol, MGeol, FGS, FAusIMM
|
February 19, 2025 |
Page 332 |
|
|
NI 43-101 Technical Report on the Reko Diq Project |
|
| 29.2 | Peter Jones |
I, Peter Jones, MAIG, as an author of this report entitled “NI 43-101 Technical Report on the Reko Diq Project, Balochistan, Pakistan” prepared for Barrick Gold Corporation by Reko Diq Mining Company and dated February 19, 2025, with an effective date of December 31, 2024, do hereby certify that:
| 1. | I am the Manager of Mineral Resources and Evaluations - Latin America & Asia Pacific with Barrick Gold Corporation of Avda. Ricardo Lyon 222, Piso 8, Providencia, Santiago, Chile |
| 2. | I am a graduate of the University of Waikato, New Zealand, graduating in 1995 with a Bachelors of Earth Science Degree. I also hold a Postgraduate Diploma of Science from the University of Waikato, New Zealand, awarded in 1999. |
| 3. | I am a Member of the Australian Institute of Geoscientists (AIG) (#6159). |
| 4. | I have worked as a geologist for over 29 years since my graduation. My relevant experience for the purpose of the Technical Report is: |
| ● | I have been involved in mining and exploration projects for gold, silver and copper in New Zealand, Australia, United States, Ghana, Burkina Faso, Papua New Guinea, the Dominican Republic, Peru, Argentina, Pakistan and Chile during various stages of exploration, mine development, evaluations, resource estimation and operations. |
| 5. | I have read the definition of “qualified person” set out in National Instrument 43-101 (NI 43-101) and certify that by reason of my education, affiliation with a professional association (as defined in NI 43-101) and past relevant work experience, I fulfil the requirements to be a “qualified person” for the purposes of NI 43-101. |
| 6. | I visited the Reko Diq Project site most recently on 5 December to 9 December 2024. |
| 7. | I am responsible for the following Sections of the Technical Report; 7, 8, 9, 10, 11, 12, 14, 25.2, and 26.2. |
| 8. | I am not independent of the Issuer applying the test set out in Section 1.5 of NI 43-101, as I have been a full-time employee of Barrick Gold Corporation since 2020. |
| 9. | I have had prior involvement with the Reko Diq since 2022 in my current role of Manager – Resource Geology, Latin America – Asia Pacific. Involvement includes data validation and verification, geologic modelling review, estimation of mineral resources, review and validation of resource estimates. |
| 10. | I have read NI 43-101, and the sections of the Technical Report for which I am responsible have been prepared in compliance with NI 43-101 and Form 43-101F1. |
| 11. | At the effective date of the Technical Report, to the best of my knowledge, information, and belief the Technical Report contains all scientific and technical information that is required to be disclosed to make the Technical Report not misleading. |
|
February 19, 2025 |
Page 333 |
|
|
NI 43-101 Technical Report on the Reko Diq Project |
|
Dated February 19, 2025
(Signed) Peter Jones
Peter Jones, MAIG
|
February 19, 2025 |
Page 334 |
|
|
NI 43-101 Technical Report on the Reko Diq Project |
|
| 29.3 | Mike Saarelainen |
I, Mike Saarelainen, B.E. Mining (Hons), as an author of this report entitled “NI 43-101 Technical Report on the Reko Diq Project, Balochistan, Pakistan” prepared for Barrick Gold Corporation by Reko Diq Mining Company and dated February 19, 2025, with an effective date of December 31, 2024, do hereby certify that:
| 1. | I am the Head of Mining, Reko Diq with Barrick Gold Corporation, of Almas Tower, Office 39D, JLT, Dubai, United Arab Emirates. |
| 2. | I am a graduate of the University of Queensland, Queensland, Australia, graduating in 1991 with a Bachelor of Engineering (Mining). |
| 3. | I am a Fellow of the Australasian Institute of Mining and Metallurgy (FAusIMM, #110008). |
| 4. | I have worked as a mining engineer for a total of 30 years in various site based and corporate roles. My relevant experience for the purposes of the Technical Report includes: |
| ● | Leading and undertaking mine planning activities and studies for gold and copper projects in Tanzania, Alaska, Dominican Republic, Chile, Argentina, Papua New Guinea and Zambia. This includes the estimation of mineral reserves for large scale open pit copper and gold projects. |
| 5. | I have read the definition of “qualified person” set out in National Instrument 43-101 (NI 43-101) and certify that by reason of my education, affiliation with a professional association (as defined in NI 43-101) and past relevant work experience, I fulfil the requirements to be a “qualified person” for the purposes of NI 43-101. |
| 6. | I visited the Reko Diq Project site most recently on 10 December to 12 December 2024. |
| 7. | I am responsible for the following Sections of the Technical Report; 15, 16, 18.8, 18.9, 25.3, and 26.3. |
| 8. | I am not independent of the Issuer applying the test set out in Section 1.5 of NI 43-101, as I have been a full-time employee of Reko Diq Mining Company since 2023 and Barrick Gold Corporation since 2006. |
| 9. | I have had prior involvement with the property that is the subject of the Technical Report, in my previous role as Chief Mining Engineer, Latin America Asia Pacific for Barrick Gold Corporation. I provided oversight of mining related studies since 2022. |
| 10. | I have read NI 43-101, and the sections of the Technical Report for which I am responsible have been prepared in compliance with NI 43-101 and Form 43-101F1. |
| 11. | At the effective date of the Technical Report, to the best of my knowledge, information, and belief the Technical Report contains all scientific and technical information that is required to be disclosed to make the Technical Report not misleading. |
|
February 19, 2025 |
Page 335 |
|
|
NI 43-101 Technical Report on the Reko Diq Project |
|
Dated February 19, 2025
(Signed) Mike Saarelainen
Mike Saarelainen, B.Eng., FAusIMM
|
February 19, 2025 |
Page 336 |
|
|
NI 43-101 Technical Report on the Reko Diq Project |
|
| 29.4 | Daniel Nel |
I, Daniel W. Nel, MIMMM, as an author of this report entitled “NI 43-101 Technical Report on the Reko Diq Project, Balochistan, Pakistan” prepared for Barrick Gold Corporation by Reko Diq Mining Company and dated February 19, 2025, with an effective date of December 31, 2024, do hereby certify that:
| 1. | I am the Engineering Manager for Reko Diq with Barrick Gold Corporation, of Almas Tower, Office 39D, JLT, Dubai, United Arab Emirates. |
| 2. | I am a graduate of the North-West University, South Africa, graduating in 2012 with a Bachelor of Chemical Engineering with Specialization in Minerals Processing. |
| 3. | I also have a Master of Business Management and Administration (MBA) where I graduated from the University of Stellenbosch in 2018. |
| 4. | I am a current Member of Institute of Materials, Minerals & Mining (#667321). |
| 5. | I have worked as an engineer for over 12 years since my graduation. My relevant experience for the purpose of the Technical Report is: |
| ● | I am the manager for engineering, metallurgy and capital projects for the Reko Diq Mining Company, and have direct responsibility for managing all engineering, metallurgy and capital projects, including associated technical studies spanning from preliminary economic assessments through to feasibility studies. Throughout my career, I have experience in designing, constructing and operating mines and facilities to treat geologically and metallurgically complex ore bodies. |
| 6. | I have read the definition of “qualified person” set out in National Instrument 43-101 (NI 43-101) and certify that by reason of my education, affiliation with a professional association (as defined in NI 43-101) and past relevant work experience, I fulfil the requirements to be a “qualified person” for the purposes of NI 43-101. |
| 7. | I visited the Reko Diq Project site most recently on 8 September to 14 September 2024. |
| 8. | I am responsible for the following Sections of the Technical Report; 13, 17, 18.1 to 18.3, 18.5, 18.6, 18.10, 25.4, 25.5, 26.4, and 26.5. |
| 9. | I am not independent of the Issuer applying the test set out in Section 1.5 of NI 43-101, as I have been a full-time employee of Reko Diq Mining Company since 2023. |
| 10. | I have had prior involvement with the Reko Diq since 2023 in my current role. |
| 11. | I have read NI 43-101, and the sections of the Technical Report for which I am responsible have been prepared in compliance with NI 43-101 and Form 43-101F1. |
| 12. | At the effective date of the Technical Report, to the best of my knowledge, information, and belief the Technical Report contains all scientific and technical information that is required to be disclosed to make the Technical Report not misleading. |
|
February 19, 2025 |
Page 337 |
|
|
NI 43-101 Technical Report on the Reko Diq Project |
|
Dated February 19, 2025
(Signed) Daniel W. Nel
Daniel W. Nel, MIMMM
|
February 19, 2025 |
Page 338 |
|
|
NI 43-101 Technical Report on the Reko Diq Project |
|
| 29.5 | David Morgan |
I, David Morgan, MIEAust CPEng APEC Engineer IntPE(Aus), as an author of this report entitled “NI 43-101 Technical Report on the Reko Diq Project, Balochistan, Pakistan” prepared for Barrick Gold Corporation by Reko Diq Mining Company and dated February 19, 2025, with an effective date of December 31, 2024, do hereby certify that:
| 1. | I am the Managing Director, Australia with Knight Piésold, of Level 1, 184 Adelaide Terrace, East Perth, WA 6004. |
| 2. | I am a graduate of the University of Manchester and University of Southampton, United Kingdom, graduating in 1980 and 1981 with a Bachelor of Science, Civil Engineering and a Master of Science, Irrigation Engineering, respectively. |
| 3. | I am a Chartered Civil Engineer (#974219). |
| 4. | I have worked as a Civil Engineer for over 40 years since my graduation. My relevant experience for the purpose of the Technical Report is: |
| ● | Ity Gold Project - Project Director for the development phase from preliminary designs, through feasibility studies, project construction and acting as Engineer of Record during the Operations Phase. 2013 – ongoing. |
| ● | Yaoure Gold Project - Project Director for the development phase from preliminary designs, through feasibility studies, project construction and acting as Engineer of Record during the Operations Phase. 2016 – ongoing. |
| ● | Hounde Gold Project - Project Director for the development phase from preliminary designs, through feasibility studies, project construction and acting as Engineer of Record during the Operations Phase. 2012 – ongoing. |
| ● | Fekola Gold Project - Project Director for the development phase from preliminary designs, through feasibility studies, project construction and acting as Engineer of Record during the Operations Phase. 2013 – ongoing. |
| ● | Tropicana Gold Project - Project Director for the development phase from preliminary designs, through feasibility studies, project construction and acting as Deputy Engineer of Record during the Operations Phase. 2007 – ongoing. |
| ● | Boddington Gold Project - Project Director for the development phase from preliminary designs, through feasibility studies and project construction. 2003 – ongoing. |
| 5. | I have read the definition of “qualified person” set out in National Instrument 43-101 (NI 43-101) and certify that by reason of my education, affiliation with a professional association (as defined in NI 43-101) and past relevant work experience, I fulfil the requirements to be a “qualified person” for the purposes of NI 43-101. |
| 6. | I visited the Reko Diq Project site most recently on 9 September to 12 September 2024. |
| 7. | I am responsible for the following Sections of the Technical Report; 18.7 |
|
February 19, 2025 |
Page 339 |
|
|
NI 43-101 Technical Report on the Reko Diq Project |
|
| 8. | I am independent of the Issuer applying the test set out in Section 1.5 of NI 43-101, as I have been a full-time employee of Knight Piésold since 1992. |
| 9. | I have had prior involvement with the Reko Diq Project, intermittently since 2007 in my current role. |
| 10. | I have read NI 43-101, and the sections of the Technical Report for which I am responsible have been prepared in compliance with NI 43-101 and Form 43-101F1. |
| 11. | At the effective date of the Technical Report, to the best of my knowledge, information, and belief the Technical Report contains all scientific and technical information that is required to be disclosed to make the Technical Report not misleading. |
Dated February 19, 2025
(Signed) David Morgan
David Morgan, MIEAust CPEng APEC Engineer IntPE(Aus)
|
February 19, 2025 |
Page 340 |
|
|
NI 43-101 Technical Report on the Reko Diq Project |
|
| 29.6 | Ashley Price |
I, Ashley Price, BSc, MHydGWM, MBA, FAusIMM, as an author of this report entitled “NI 43-101 Technical Report on the Reko Diq Project, Balochistan, Pakistan” prepared for Barrick Gold Corporation by Reko Diq Mining Company and dated February 19, 2025, with an effective date of December 31, 2024, do hereby certify that:
| 1. | I am the ESIA Manager for Reko Diq with Barrick Gold Corporation, of Almas Tower, Office 39D, JLT, Dubai, United Arab Emirates. |
| 2. | I am a graduate of the Murdoch University, Australia, graduating in 2008 with a Bachelor of Science. |
| 3. | I am a Fellow of the Australasian Institute of Mining and Metallurgy, (#3049615). |
| 4. | I have worked as an Environmental, Social and Water Management Professional for over 16 years since my graduation. My relevant experience for the purpose of the Technical Report is: |
| ● | Consultant/Senior Consultant, Aquaterra, Perth Australia and Ulaanbaatar Mongolia (2007 – 2012). |
| ● | Principal Consultant, Environmental Resource Management, Chengdu China (2012 – 2014). |
| ● | Manager Sustainable Development and Risk, Geopacific Resources, Perth Australia (2017 – 2021). |
| ● | Principal Fortescue Future Industries, Perth Australia (2021 – 2023). |
| ● | ESIA Manager, Reko Diq Mining Company, Dubai (2023 – present). |
| 5. | I have read the definition of “qualified person” set out in National Instrument 43-101 (NI 43-101) and certify that by reason of my education, affiliation with a professional association (as defined in NI 43-101) and past relevant work experience, I fulfil the requirements to be a “qualified person” for the purposes of NI 43-101. |
| 6. | I visited the Reko Diq Project site most recently on 18 November 2024. |
| 7. | I am responsible for the following Sections of the Technical Report; 18.4, 20, 25.6, and 26.6. |
| 8. | I am not independent of the Issuer applying the test set out in Section 1.5 of NI 43-101, as I have been a full-time employee of Reko Diq Mining Company since April, 2023. |
| 9. | I have had prior involvement with the Reko Diq since April, 2023 in my current role. |
| 10. | I have read NI 43-101, and the sections of the Technical Report for which I am responsible have been prepared in compliance with NI 43-101 and Form 43-101F1. |
| 11. | At the effective date of the Technical Report, to the best of my knowledge, information, and belief the Technical Report contains all scientific and technical information that is required to be disclosed to make the Technical Report not misleading. |
|
February 19, 2025 |
Page 341 |
|
|
NI 43-101 Technical Report on the Reko Diq Project |
|
Dated February 19, 2025
(Signed) Ashley Price
Ashley Price, BSc, MHydGWM, MBA, FAusIMM
|
February 19, 2025 |
Page 342 |