| ☐ | Registration statement pursuant to Section 12 of the Securities Exchange Act of 1934 |
| ☒ | Annual report pursuant to Section 13(a) or 15(d) of the Securities Exchange Act of 1934 |
| For the fiscal year ended October 31, 2024 | Commission File Number 001-13354 |
Title Of Each Class |
Trading Symbol |
Name Of Each Exchange On Which Registered |
||
Common Shares |
BMO |
New York Stock Exchange |
Common Shares |
729,585,048 | |||
Class B Preferred Shares Series 31 (Non-Viability Contingent Capital (NVCC))1
|
12,000,000 | |||
Class B Preferred Shares Series 33 (Non-Viability Contingent Capital (NVCC)) |
8,000,000 | |||
Class B Preferred Shares Series 44 (Non-Viability Contingent Capital (NVCC)) |
16,000,000 | |||
Class B Preferred Shares Series 48 (Non-Viability Contingent Capital (NVCC)) |
1,250,000 | |||
Class B Preferred Shares Series 49 (Non-Viability Contingent Capital (NVCC)) |
750,000 | |||
Class B Preferred Shares Series 50 (Non-Viability Contingent Capital (NVCC)) |
500,000 | |||
Class B Preferred Shares Series 51 (Non-Viability Contingent Capital (NVCC)) |
1,000,000 | |||
Class B Preferred Shares Series 52 (Non-Viability Contingent Capital (NVCC)) |
650,000 | |||
Class B Preferred Shares Series 53 (Non-Viability Contingent Capital (NVCC)) 2
|
1,000,000 | |||
Class B Preferred Shares Series 54 (Non-Viability Contingent Capital (NVCC)) 3
|
750,000 |
DISCLOSURE CONTROLS AND PROCEDURES |
||
INTERNAL CONTROL OVER FINANCIAL REPORTING |
||
AUDIT AND CONDUCT REVIEW COMMITTEE FINANCIAL EXPERT |
||
CODE OF ETHICS |
||
PRINCIPAL ACCOUNTANT FEES AND SERVICES |
||
OFF-BALANCE SHEET ARRANGEMENTS |
||
CONTRACTUAL AND OTHER OBLIGATIONS |
||
IDENTIFICATION OF THE AUDIT AND CONDUCT REVIEW COMMITTEE |
||
SUMMARY OF SIGNIFICANT CORPORATE GOVERNANCE DIFFERENCES |
||
NOTE ON CERTAIN ACTIVITIES |
||
UNDERTAKING |
||
SIGNATURES |
||
EXHIBIT INDEX |
||
Bank of Montreal Clawback and Recoupment Policy |
||
Annual Information Form |
||
Management’s Discussion and Analysis for the Fiscal Year Ended October 31, 2024 |
||
Consolidated Financial Statements for the Fiscal Year Ended October 31, 2024 |
||
Consent of Independent Registered Public Accounting Firm dated December 5, 2024 |
||
Section 302 Certifications of Chief Executive Officer |
||
Section 302 Certifications of Chief Financial Officer |
||
Section 906 Certifications |
||
Code of Conduct |
||
Inline Interactive Data File |
||
Cover Page Interactive Data File |
||
By: |
/s/ Tayfun Tuzun |
|
Tayfun Tuzun |
||
Chief Financial Officer |
||
Date: December 5, 2024 |
||
Exhibits |
Description |
|
97.1 |
||
99.1 |
||
99.2 |
||
99.3 |
||
99.4 |
||
99.5 |
||
99.6 |
||
99.7 |
||
99.8 |
||
101 |
Inline Interactive Data File |
|
104 |
Cover Page Interactive Data File (formatted as Inline XBRL and contained in Exhibit 101) |
|
Exhibit 99.1
BANK OF MONTREAL

ANNUAL INFORMATION FORM
FOR THE YEAR ENDED OCTOBER 31, 2024
Dated December 5, 2024
| Annual Information Form |
2024 Financial Statements1 |
2024 MD&A1 | ||||
| EXPLANATORY NOTES AND CAUTIONS |
2 | |||||
| Caution Regarding Forward-Looking Statements |
2 | 15 | ||||
| CORPORATE STRUCTURE |
2 | Note 27 | ||||
| GENERAL DEVELOPMENT OF THE BUSINESS |
3 | 16, 33-52 | ||||
| Three-Year History |
3 | |||||
| DESCRIPTION OF THE BUSINESS |
3 | |||||
| Business |
3 | Note 26 | 16, 33-52 | |||
| Supervision and Regulation in Canada |
4 | 60-62, 70, 104-106 | ||||
| Supervision and Regulation in the United States |
4 | 60-62, 70, 104-106, 114 | ||||
| International Supervision and Regulation |
5 | 60-62, 70, 104-106 | ||||
| Competition |
5 | |||||
| Environmental, Social and Governance Issues |
6 | 70, 107-109 | ||||
| Risk Factors |
6 | 68-109 | ||||
| DIVIDENDS |
6 | Note 17 | 65-66 | |||
| DESCRIPTION OF CAPITAL STRUCTURE |
6 | Notes 17 and 20 | 62-66 | |||
| Description of Common Shares |
6 | Note 17 | ||||
| Description of Preferred Shares |
6 | Note 17 | ||||
| Certain Conditions of the Class A Preferred Shares as a Class |
7 | Note 17 | ||||
| Certain Conditions of the Class B Preferred Shares as a Class |
7 | Note 17 | ||||
| Description of Other Equity Instruments – Subordinated Capital Notes |
8 | Note 17 | ||||
| Certain Provisions of the Subordinated Capital Notes |
8 | |||||
| Description of Other Equity Instruments – Limited Recourse Capital Notes |
9 | Note 17 | ||||
| Certain Provisions of the Limited Recourse Capital Notes |
9 | |||||
| Restraints on Bank Shares under the Bank Act |
11 | |||||
| Ratings |
11 | Note 8 | 95 | |||
| MARKET FOR SECURITIES |
12 | |||||
| Trading Price and Volume |
12 | |||||
| Prior Sales |
12 | Notes 16 and 17 | 58-59 | |||
| ESCROWED SECURITIES AND SECURITIES SUBJECT TO CONTRACTUAL RESTRICTION ON TRANSFER |
13 | |||||
| DIRECTORS AND EXECUTIVE OFFICERS |
13 | |||||
| Board of Directors |
13 | |||||
| Board Committee Members |
14 | |||||
| Executive Officers |
14 | |||||
| Shareholdings of Directors and Executive Officers |
14 | |||||
| Additional Disclosure for Directors and Executive Officers |
15 | |||||
| LEGAL PROCEEDINGS AND REGULATORY ACTIONS |
15 | Note 25 | ||||
| TRANSFER AGENT AND REGISTRAR |
15 | |||||
| INTERESTS OF EXPERTS |
15 | |||||
| AUDIT AND CONDUCT REVIEW COMMITTEE INFORMATION |
16 | |||||
| Composition of the Audit and Conduct Review Committee |
16 | |||||
| Shareholders’ Auditors Pre-Approval Policies and Procedures and Fees |
16 | 115 | ||||
| ADDITIONAL INFORMATION |
16 | |||||
| APPENDIX I: BANK OF MONTREAL AUDIT AND CONDUCT REVIEW COMMITTEE CHARTER |
I-1 | |||||
| APPENDIX II: CREDIT RATING CATEGORIES |
II-1 | |||||
1 As indicated, parts of the Bank’s Consolidated Financial Statements (2024 Financial Statements) and Management’s Discussion and Analysis (2024 MD&A) for the fiscal year ended October 31, 2024 are incorporated by reference into this Annual Information Form. The 2024 Financial Statements and the 2024 MD&A are available on SEDAR+ (www.sedarplus.ca).
1
EXPLANATORY NOTES AND CAUTIONS
Unless specifically stated otherwise in this Annual Information Form:
| ● | all amounts are in Canadian dollars |
| ● | BMO Financial Group, the Bank, BMO, we, or our means Bank of Montreal and, as applicable, its subsidiaries |
| ● | information is as at October 31, 2024 |
Caution Regarding Forward-Looking Statements
Bank of Montreal’s public communications often include written or oral forward-looking statements. Statements of this type are included in this document, and may be included in other filings with Canadian securities regulators or the U.S. Securities and Exchange Commission, or in other communications. All such statements are made pursuant to the “safe harbor” provisions of, and are intended to be forward-looking statements under, the United States Private Securities Litigation Reform Act of 1995 and any applicable Canadian securities legislation. Forward-looking statements in this document may include, but are not limited to, statements with respect to our objectives and priorities for fiscal 2025 and beyond, our strategies or future actions, our targets and commitments (including with respect to net zero emissions), expectations for our financial condition, capital position, the regulatory environment in which we operate, the results of, or outlook for, our operations or the Canadian, U.S. and international economies, and include statements made by our management. Forward-looking statements are typically identified by words such as “will”, “would”, “should”, “believe”, “expect”, “anticipate”, “project”, “intend”, “estimate”, “plan”, “goal”, “commit”, “target”, “may”, “might”, “schedule”, “forecast”, “outlook”, “timeline”, “suggest”, “seek” and “could” or negative or grammatical variations thereof.
By their nature, forward-looking statements require us to make assumptions and are subject to inherent risks and uncertainties, both general and specific in nature. There is significant risk that predictions, forecasts, conclusions or projections will not prove to be accurate, that our assumptions may not be correct, and that actual results may differ materially from such predictions, forecasts, conclusions or projections. We caution readers of this document not to place undue reliance on our forward-looking statements, as a number of factors – many of which are beyond our control and the effects of which can be difficult to predict – could cause actual future results, conditions, actions or events to differ materially from the targets, expectations, estimates or intentions expressed in the forward-looking statements.
The future outcomes that relate to forward-looking statements may be influenced by many factors, including, but not limited to: general economic and market conditions in the countries in which we operate, including labour challenges and changes in foreign exchange and interest rates; changes to our credit ratings; cyber and information security, including the threat of data breaches, hacking, identity theft and corporate espionage, as well as the possibility of denial of service resulting from efforts targeted at causing system failure and service disruption; technology resilience, innovation and competition; failure of third parties to comply with their obligations to us; political conditions, including changes relating to, or affecting, economic or trade matters; disruptions of global supply chains; environmental and social risk, including climate change; the Canadian housing market and consumer leverage; inflationary pressures; changes in laws, including tax legislation and interpretation, or in supervisory expectations or requirements, including capital, interest rate and liquidity requirements and guidance, and the effect of such changes on funding costs and capital requirements; changes in monetary, fiscal or economic policy; weak, volatile or illiquid capital or credit markets; the level of competition in the geographic and business areas in which we operate; exposure to, and the resolution of, significant litigation or regulatory matters, the appeal of favourable outcomes and our ability to successfully appeal adverse outcomes of such matters and the timing, determination and recovery of amounts related to such matters; the accuracy and completeness of the information we obtain with respect to our customers and counterparties; our ability to execute our strategic plans, complete proposed acquisitions or dispositions and integrate acquisitions, including obtaining regulatory approvals, and realize any anticipated benefits from such plans and transactions; critical accounting estimates and judgments, and the effects of changes in accounting standards, rules and interpretations on these estimates; operational and infrastructure risks, including with respect to reliance on third parties; global capital markets activities; the emergence or continuation of widespread health emergencies or pandemics, and their impact on local, national or international economies, as well as their heightening of certain risks that may affect our future results; the possible effects on our business of war or terrorist activities; natural disasters, such as earthquakes or flooding, and disruptions to public infrastructure, such as transportation, communications, power or water supply; and our ability to anticipate and effectively manage risks arising from all of the foregoing factors.
We caution that the foregoing list is not exhaustive of all possible factors. Other factors and risks could adversely affect our results. For more information, please refer to the discussion in the Risks That May Affect Future Results section, and the sections related to credit and counterparty, market, insurance, liquidity and funding, operational non-financial, legal and regulatory, strategic, environmental and social, and reputation risk in the Enterprise-Wide Risk Management section of the 2024 MD&A, as may be updated by quarterly reports, all of which outline certain key factors and risks that may affect our future results. Investors and others should carefully consider these factors and risks, as well as other uncertainties and potential events, and the inherent uncertainty of forward-looking statements. We do not undertake to update any forward-looking statements, whether written or oral, that may be made from time to time by the organization or on its behalf, except as required by law. The forward-looking information contained or incorporated by reference in this document is presented for the purpose of assisting shareholders and analysts in understanding our financial position as at and for the periods ended on the dates presented, as well as our strategic priorities and objectives, and may not be appropriate for other purposes.
Material economic assumptions underlying the forward-looking statements contained or incorporated by reference in this document include those set out in the Economic Developments and Outlook section of the 2024 MD&A as well as in the Allowance for Credit Losses section of the 2024 MD&A, each as may be updated by quarterly reports. Assumptions about the performance of the Canadian and U.S. economies, as well as overall market conditions and their combined effect on our business, are material factors we consider when determining our strategic priorities, objectives and expectations for our business. In determining our expectations for economic growth, we primarily consider historical economic data, past relationships between economic and financial variables, changes in government policies, and the risks to the domestic and global economy.
CORPORATE STRUCTURE
Bank of Montreal started business in Montreal in 1817 and was incorporated in 1821 by an Act of Lower Canada as the first Canadian chartered bank. Since 1871, the Bank has been a chartered bank under the Bank Act (Canada) (the Bank Act) and is named in Schedule I of the Bank Act. The Bank Act is the charter of the Bank and governs its operations.
2
The Bank’s head office is 129 rue Saint Jacques, Montreal, Québec, H2Y 1L6. Its executive offices are 100 King Street West, 1 First Canadian Place, Toronto, Ontario, M5X 1A1.
Bank of Montreal brands the organization’s member companies as BMO Financial Group. Note 27 of the 2024 Financial Statements lists the intercorporate relationships among Bank of Montreal and its significant subsidiaries. The Bank incorporates this Note herein by reference. These subsidiaries are incorporated or organized under the laws of the state or country of their principal office, except for: BMO Financial Corp. and BMO Capital Markets Corp., which are incorporated under the laws of the state of Delaware, United States.
GENERAL DEVELOPMENT OF THE BUSINESS
Three-Year History
During the first fiscal quarter of 2022, BMO completed the sale of its EMEA Asset Management business, as well as the transfer of certain U.S. asset management clients, to Ameriprise Financial, Inc.
On December 20, 2021, BMO announced a definitive agreement with BNP Paribas (BNP) to acquire Bank of the West and its subsidiaries. On February 1, 2023, we completed the acquisition of Bank of the West and its subsidiaries from BNP for a cash purchase price of US$13.8 billion. The conversion of the Bank of the West customer accounts and systems to our respective BMO platforms was completed in September 2023.
On June 8, 2022, BMO announced the appointment of Piyush Agrawal as Deputy Chief Risk Officer effective July 1, 2022 and, after a transition period with Patrick Cronin, became Chief Risk Officer effective November 1, 2022.
On February 15, 2023, BMO announced the appointment of Nadim Hirji as Group Head, BMO Commercial Bank, North America and Co-Head, Personal and Commercial Banking, effective March 1, 2023.
On April 20, 2023, BMO announced the appointment of Darrel Hackett as U.S. Chief Executive Officer of BMO Financial Group, President & CEO of BMO Bank N.A., and CEO of BMO’s U.S. holding company, BMO Financial Corp., effective June 1, 2023.
On June 1, 2023, BMO completed the acquisition of the AIR MILES Reward Program (AIR MILES) business of LoyaltyOne Co. for a cash purchase price of US$160 million. The AIR MILES business operates as a wholly-owned subsidiary of BMO.
On August 30, 2023, BMO announced the appointment of Hazel Claxton, former Executive Vice-President and Chief Human Resources Officer of Morneau Shepell Inc. (now part of TELUS Health), to its Board of Directors, effective August 30, 2023.
On October 10, 2023, BMO announced the appointment of Alan Tannenbaum as Chief Executive Officer & Group Head, BMO Capital Markets, effective November 1, 2023.
On October 29, 2024, BMO announced the appointment of Diane L. Cooper and Brian McManus to its Board of Directors, effective October 28, 2024. Ms. Cooper was formerly President and CEO of GE Capital’s Commercial Distribution business and an officer of GE Company. Mr. McManus is the Executive Chair of Polycor Inc., a global leader in the natural stone industry.
During the years ended October 31, 2022, 2023 and 2024, the Bank did not have share buyback programs in place and did not repurchase any of its common shares for cancellation.
For additional information on the general development of BMO’s business and its strategies for the upcoming year, see pages 16 and 33 to 52 of the 2024 MD&A, which pages the Bank incorporates herein by reference.
This Three-Year History section contains forward-looking statements. Please see the Caution Regarding Forward-Looking Statements on page 2.
DESCRIPTION OF THE BUSINESS
Business
BMO Financial Group is a highly diversified financial services provider based in North America, providing a broad range of personal and commercial banking, wealth management, global markets and investment banking products and services directly and through Canadian and non-Canadian subsidiaries, offices, and branches. As at October 31, 2024, BMO had approximately 54,000 full-time equivalent employees. The Bank has more than 1,800 bank branches and approximately 5,800 BMO automated banking machines, as well as online and mobile digital banking platforms. It operates in Canada, the United States and select markets globally through its offices in a number of jurisdictions around the world. BMO Financial Corp. (BFC) is based in Chicago and wholly-owned by Bank of Montreal. BFC operates primarily through its subsidiary BMO Bank N.A. (BBNA), formerly BMO Harris Bank N.A., which provides banking, financing, investing, and cash management services in the United States. BMO provides a range of investment dealer services through entities, including BMO Nesbitt Burns Inc., a major fully integrated Canadian investment dealer, and BMO Capital Markets Corp., Bank of Montreal’s wholly-owned registered broker dealer in the United States.
3
BMO conducts business through three operating groups: Personal and Commercial Banking (P&C), comprising the Canadian P&C and U.S. P&C operating segments; BMO Wealth Management; and BMO Capital Markets; supported by Corporate Services.
For additional information regarding BMO’s businesses, see pages 16 and 33 to 52 of the 2024 MD&A and Note 26 of the 2024 Financial Statements. The Bank incorporates these pages and Note herein by reference.
This Business section contains forward-looking statements. Please see the Caution Regarding Forward-Looking Statements on page 2.
Supervision and Regulation in Canada
Bank of Montreal’s activities in Canada are governed by the Bank Act.
Under the Bank Act, a bank can operate its regular banking business as well as some additional activities, such as dealing with real property and various financial technology and information services. A bank is restricted when it undertakes certain activities, including fiduciary activities, dealing in securities, insurance activities, and personal property leasing. For example, other than for authorized types of insurance, a bank may not offer insurance products through its branch system or bank website.
The Bank Act grants a bank broad power to invest in the securities of other corporations and entities, but limits substantial investments. Under the Bank Act, a bank generally has a substantial investment in a body corporate when (1) the bank and entities controlled by the bank beneficially own more than 10% of the voting shares of the body corporate or (2) the bank and entities controlled by the bank beneficially own shares representing more than 25% of the total shareholders’ equity of the body corporate. A bank can have a substantial investment in entities that meet the substantial investment requirements as set out in Part IX of the Bank Act. In certain cases, the Minister of Finance or the Superintendent of Financial Institutions (Canada) (the Superintendent) must approve before a bank can make an investment.
The Superintendent is responsible to the Minister of Finance for administering the Bank Act. The Superintendent provides guidelines for disclosing a bank’s financial information. The Superintendent must also examine each bank annually to ensure compliance with the Bank Act and that each bank is in sound financial condition and has adequate policies and procedures to protect itself against threats to its integrity or security. The Superintendent’s examination report is submitted to the Minister of Finance.
The Bank’s Canadian trust, loan and insurance subsidiaries are federally regulated financial institutions governed by the Trust and Loan Companies Act (Canada) and the Insurance Companies Act (Canada), respectively, and under provincial laws in respect of their activities in the provinces. The Bank and its Canadian trust, loan and insurance subsidiaries are also subject to regulation by the Financial Consumer Agency of Canada (the FCAC). The FCAC enforces consumer-related provisions of the federal statutes which govern these financial institutions. Certain activities of the Bank and its subsidiaries acting as securities brokers, dealers, underwriters, advisors and investment fund managers are regulated in Canada under provincial securities legislation and, in some cases, by a self-regulatory organization (Canadian Investment Regulatory Organization).
Under Canadian bank resolution powers, the Canada Deposit Insurance Corporation (CDIC) may, in circumstances where the Bank has ceased, or is about to cease, to be viable, assume temporary control or ownership of the Bank and may be granted broad powers by one or more orders of the Governor in Council (Canada), including the power to sell or dispose of all or a part of the assets of the Bank, and the power to carry out or cause the Bank to carry out a transaction or a series of transactions the purpose of which is to restructure the business of the Bank. As part of the Canadian bank resolution powers, certain provisions of, and regulations under the Bank Act, the Canada Deposit Insurance Corporation Act (CDIC Act) and certain other Canadian federal statutes pertaining to banks (collectively, the “Bail-in Regime”) provide for a bank recapitalization regime for banks designated by the Superintendent as domestic systemically important banks. Effective September 23, 2018, under the Bail-in Regime, subject to an order of the Governor in Council (Canada) having been issued, CDIC may, having assumed temporary control or ownership of the Bank, amongst other actions, carry out a conversion, by converting or causing the Bank to convert, in whole or in part – by means of a transaction or series of transactions and in one or more steps – the shares and liabilities of the Bank that are subject to the Bail-in Regime into common shares of the Bank or any of its affiliates. For a more detailed description of Canadian bank resolution powers and the consequent risk factors attaching to certain liabilities of the Bank, reference is made to https://www.bmo.com/ir/files/F18%20Files/Bail_In_TLAC_Disclosure.pdf. The information on the Bank’s website does not form a part of this Annual Information Form.
Additional information about supervision and regulation in Canada is found under the headings “Regulatory Capital Requirements”, “Regulatory Capital and Total Loss Absorbing Capacity Ratios”, “Regulatory Capital and Total Loss Absorbing Capacity Elements” and “Regulatory Capital Developments” in the Enterprise-Wide Capital Management section on pages 60 to 62, “Regulatory Environment and Changes” in the Risks That May Affect Future Results section on page 70, and “Legal and Regulatory Risk” on pages 104 to 106 of the 2024 MD&A, which pages the Bank incorporates herein by reference.
Supervision and Regulation in the United States
In the United States, the operations of Bank of Montreal and its subsidiaries are supervised, regulated, and examined by regulatory and government agencies at the federal and state level. As a foreign bank, Bank of Montreal is subject to various U.S. laws and regulations, including the United States International Banking Act of 1978, the United States Bank Holding Company Act of 1956, and related regulations. The Board of Governors of the Federal Reserve System, including the Federal Reserve Banks (the Federal Reserve), and state banking regulators oversee Bank of Montreal’s branch and office operations in the United States. The U.S. Securities and Exchange Commission (the SEC), the Financial Industry Regulatory Authority, and state securities regulators regulate Bank of Montreal’s broker-dealer subsidiaries. The SEC and state securities regulators regulate Bank of Montreal’s registered investment advisor subsidiaries.
Bank of Montreal and its subsidiaries own two Federal Deposit Insurance Corporation (FDIC) insured depository institutions in the United States, BBNA and BMO Harris Central N.A. (BHC). BBNA provides banking, financing, investing, and cash management services across the United States. BHC provides limited cash management services. They are both supervised and regulated by the Office of the Comptroller of the Currency (OCC). The Federal Reserve generally needs to approve acquiring (a) more than 5% of voting shares, (b) control, or (c) all (or substantially all) of the assets of a bank holding company, bank, or savings association.
The Bank is also subject to the Dodd-Frank Wall Street Reform and Consumer Protection Act (Dodd-Frank) and related regulations. Dodd-Frank provides for consumer protections, regulation of over-the-counter derivatives markets, restrictions on proprietary trading and the ownership and sponsorship of private investment funds by banks and their affiliates (referred to as the Volcker Rule), imposition of heightened prudential standards, and broader application of leverage and risk-based capital requirements.
Bank of Montreal is subject to the Federal Reserve’s rule regarding the supervision and regulation of foreign banking organizations (FBO Rule), promulgated to implement Dodd Frank’s requirements for enhanced prudential standards for the U.S. operations of non-U.S. banks, such as BMO. The rule establishes requirements relating to an intermediate holding company structure, risk-based capital and leverage requirements, capital stress testing requirements, U.S. risk management and risk governance, liquidity risk management and liquidity stress testing frameworks.
4
In May 2018, the U.S. enacted the Economic Growth, Regulatory Relief, and Consumer Protection Act (EGRRCP), which made reforms to Dodd-Frank, including raising the threshold for heightened prudential standards from US$50 billion to US$250 billion in total consolidated assets. The Federal Reserve in October 2019 issued final rules that modify capital and liquidity requirements, single counterparty credit limits, and enhanced prudential standards for bank holding companies and foreign banking organizations.
OCC guidelines establish heightened standards for large national banks with average total consolidated assets of US$50 billion or more, including BBNA. The guidelines set out minimum standards for the design and implementation of a bank’s risk governance framework and minimum standards for oversight of that framework by a bank’s board of directors. The framework must ensure the bank’s risk profile is easily distinguished and separate from that of its parent for risk management purposes. A bank’s board of directors is responsible for informed oversight of, and providing credible challenge to, management’s risk management recommendations and decisions. We comply with these guidelines.
Additional information about supervision and regulation in the United States is found under the headings “Regulatory Capital Requirements”, “Regulatory Capital Developments” and “Regulatory Capital and Total Loss Absorbing Capacity Review” in the Enterprise-Wide Capital Management section on pages 60 to 62, “Regulatory Environment and Changes” in the Risks That May Affect Future Results section on page 70, “Legal and Regulatory Risk” on pages 104 to 106, and “Other Regulatory Developments” on page 114 of the 2024 MD&A, which pages the Bank incorporates herein by reference.
This Supervision and Regulation in the United States section contains forward-looking statements. Please see the Caution Regarding Forward-Looking Statements on page 2.
International Supervision and Regulation
Outside Canada and the U.S., each of Bank of Montreal’s branches, agencies and subsidiaries must comply with the regulatory requirements of the country or jurisdiction where it conducts business. These include the Basel Committee on Banking Supervision capital, liquidity and prudential rules (Basel III), or local variations on Basel III, which are intended to strengthen the banking sector’s capital and liquidity frameworks. Since the first quarter of 2013, regulatory capital requirements for Bank of Montreal have been determined on a Basel III basis. Additional information about international supervision and regulation is found under the headings “Regulatory Capital Requirements”, “Regulatory Capital and Total Loss Absorbing Capacity Ratios”, “Regulatory Capital and Total Loss Absorbing Capacity Elements” and “Regulatory Capital Developments” in the Enterprise-Wide Capital Management section on pages 60 to 62, “Regulatory Environment and Changes” in the Risks That May Affect Future Results section on page 70, and “Legal and Regulatory Risk” on pages 104 to 106 of the 2024 MD&A, which pages the Bank incorporates herein by reference.
Competition
Canada’s financial services industry is highly competitive. It includes domestic banks and foreign bank subsidiaries, branches, and lending branches, as well as trust companies, credit unions, online and full-service brokerages, investment dealers, insurance companies, mutual fund dealers, and large monoline financial institutions, as well as non-bank competitors, among others. Bank of Montreal competes with most of these companies in some form across its businesses. However, the Bank’s range of services compares most directly to those of the other five major Canadian banks, and they are direct competitors in almost all the Bank’s businesses and markets in Canada. Bank of Montreal is the fourth largest chartered bank in Canada as measured by assets and equity, and the third largest as measured by market capitalization, as at October 31, 2024. In North America, the Bank is the eighth largest bank as measured by assets, ninth largest as measured by equity, and ninth largest as measured by market capitalization, as at October 31, 2024. BMO is the third largest Canadian bank, as measured by global retail branches, as at October 31, 2024.
The six major banks play a prominent role in the Canadian banking system, each maintaining an extensive branch network, augmented by automated banking machines, dedicated contact centres and digital and mobile banking platforms. The industry is considered mature with moderate growth. Although the major banks offer similar products and services, they compete on product offerings, pricing, service models, digital capabilities and customer experience, with a goal of attracting and retaining customers, gaining a strategic advantage and growing market share and scale. The financial services industry continues to operate in a rapidly changing environment as the advancement of technological capabilities is shaping the future of everyday banking for individuals and businesses.
The financial services landscape in the United States remains highly competitive. As a top 10 full-service U.S. bank1, BMO offers Personal, Commercial, Private Wealth and Capital Markets services with offices in 32 U.S. states and national digital platforms, competing with large U.S. banks, regional banks as well as community banks and non-bank financial service providers.
In Personal and Commercial banking, BMO serves millions of customers across Canada and the United States. Personal and Business Banking (P&BB) offers a range of everyday banking products and services including deposits, home lending, consumer credit, small business lending, credit cards, cash management, everyday financial and investment advice and other banking services. In Canada, P&BB serves customers through a network of almost 900 branches, over 3,200 automated banking machines, customer contact centres and digital banking platforms. In the United States, P&BB’s core branch footprint spans twenty-two states, serving customers through a network of nearly 1,000 branches as well as nationwide access to a digital banking platform and access to more than 40,000 BMO and Allpoint® automated banking machines. Commercial Banking offers a range of commercial banking products and services, including a variety of financing options, treasury and payment solutions and risk management products to customers across Canada and the United States with strong market share positions.
BMO Wealth Management serves a range of clients from individuals and families to business owners and institutions, and offers a wide spectrum of wealth, asset management and insurance products and services. BMO competes with domestic banks, insurance companies, trust companies, global private banks, investment counselling and advisory firms, and investment fund and asset management companies, among others. BMO North American Private Wealth provides full-service investing, banking and wealth advisory services to mass affluent, high net worth and ultra-high net worth clients in Canada and the United States. BMO InvestorLine provides a range of digital investment services that compete with online brokerages and digital advice providers in Canada. BMO Global Asset Management provides investment management services in Canada to institutional, retail and high net worth investors, offering a range of innovative, client-focused solutions and strategies to help clients meet their investment objectives. BMO Insurance competes with Canadian insurance companies in providing individual life and annuity products as well as pension de-risking solutions.
BMO Capital Markets offers a range of products and services to corporate, institutional and government clients, including investment and corporate banking services, as well as global market sales and trading solutions. It primarily focuses on the North American market and operates in 30 locations around the world in a highly competitive environment with a diverse range of competitors, including large money centre banks and boutique investment firms.
1 Top 10 U.S. Banks by assets: JP Morgan, Bank of America, Citibank, Wells Fargo, U.S. Bank, PNC Bank, Truist Bank, The Toronto-Dominion Bank, Capital One, Bank of Montreal.
5
Environmental, Social and Governance Issues
The Bank publishes a Sustainability Report and Public Accountability Statement, outlining how the Bank is addressing environmental, social, and governance issues. This report is part of a broader suite of sustainability reporting including the BMO Climate Report, and other related information that is available on the Bank’s website, www.bmo.com. The information on the Bank’s website does not form a part of this Annual Information Form. Additional information about the Bank’s environmental and social risks is under the heading “Environmental and Social Risk, including Climate Change” in the Risks That May Affect Future Results section on page 70 and “Environmental and Social Risk” in the Enterprise-Wide Risk Management section on pages 107 to 109 of the 2024 MD&A, which pages the Bank incorporates herein by reference.
Risk Factors
A description of certain key factors and risks faced by the Bank and its businesses can be found in the “Enterprise-Wide Risk Management” section on pages 68 to 109 of the 2024 MD&A, which pages the Bank incorporates herein by reference.
DIVIDENDS
You can find information about the Bank’s dividends paid or payable per share on the common shares and each outstanding series of preferred shares in each of the three most recently completed years under the heading “Outstanding Shares and NVCC Instruments” on pages 65 to 66 of the 2024 MD&A, which pages the Bank incorporates herein by reference. Information about restrictions on the payment of dividends appears under the heading “Share Redemption and Dividend Restrictions” in Note 17 of the 2024 Financial Statements, which Note is incorporated herein by reference.
The Bank cannot (a) declare dividends on its preferred or common shares if paying those dividends would contravene the capital adequacy, liquidity, or other regulations under the Bank Act; (b) pay common share dividends unless the Bank has paid all dividends declared and payable on its preferred shares or set aside sufficient funds to do so; and (c) in certain circumstances, pay Class B Preferred Share dividends unless the Bank pays dividends on the Class B Preferred Shares Series 48 (NVCC), Class B Preferred Shares Series 49 (NVCC), Class B Preferred Shares Series 51 (NVCC), Class B Preferred Shares Series 53 (NVCC) and Class B Preferred Shares Series 54 (NVCC) (each as defined below). In the event that interest due and payable on the Bank’s Subordinated Capital Notes (as defined below) is not paid in full, the Bank will not declare dividends on its common shares or preferred shares or, subject to certain exceptions, redeem, purchase or otherwise retire such shares until the month commencing after such interest payments have been made in full. The Board of Directors determines the amount and payment of future dividends. The determination by the Board of Directors depends on the Bank’s operations, financial condition, cash requirements, future regulatory restrictions on the payment of dividends, and other factors the Board of Directors finds relevant. You can find information about the Bank’s dividends and dividend payout range on page 66 of the 2024 MD&A, which page the Bank incorporates herein by reference.
Currently, these limitations do not restrict the payment of dividends on common or preferred shares.
DESCRIPTION OF CAPITAL STRUCTURE
The following summarizes certain provisions of the Bank’s common shares, preferred shares, Subordinated Capital Notes and Limited Recourse Capital Notes. This summary is qualified in its entirety by the Bank’s by-laws and the actual terms and conditions of such securities. For more detail on the Bank’s capital structure, see pages 62 to 66 of the 2024 MD&A and Notes 17 and 20 of the 2024 Financial Statements. The Bank incorporates those pages and Notes herein by reference.
Description of Common Shares
The authorized capital of the Bank includes an unlimited number of common shares without nominal or par value for unlimited consideration. The holders of common shares are entitled to:
| (i) | Vote at all Bank shareholders’ meetings, except for meetings where only holders of a specified class or series of shares are entitled to vote. |
| (ii) | Receive dividends as and when declared by the Board of Directors, subject to the preference of the Bank’s holders of preferred shares. |
| (iii) | Receive the remaining property of the Bank if it is liquidated, dissolved, or wound up, only after paying the Bank’s holders of preferred shares and paying all outstanding debt. |
Description of Preferred Shares
The authorized capital of the Bank includes an unlimited number of Class A Preferred Shares and Class B Preferred Shares without nominal or par value, in series, for unlimited consideration. Class B Preferred Shares may be issued in a foreign currency. The following describes certain general terms and conditions of the preferred shares.
6
Certain Conditions of the Class A Preferred Shares as a Class
Issuable in Series
From time to time, the Board of Directors may resolve to issue Class A Preferred Shares in one or more series with rights, privileges, restrictions, and conditions, which the Board of Directors may also decide. As at December 4, 2024, there were no outstanding Class A Preferred Shares.
The Class A Preferred Shares of each series rank equally to all other series of Class A and Class B Preferred Shares and are entitled to preference over the common shares and over any other shares ranking junior to the Class A Preferred Shares and the Class B Preferred Shares with respect to the payment of dividends and in the distribution of property in the event of the liquidation, dissolution or winding up of the Bank.
Creating and Issuing Shares
Under the Bank Act, the Bank needs approval from the holders of Class A Preferred Shares to create any other class of shares with equal or superior rank to Class A Preferred Shares. Shareholders must give this approval as set out below in “Shareholder Approvals.” The Bank Act and other laws may also require other forms of approval.
The Bank does not require shareholder approval to create or issue additional Class A Preferred Shares or shares of equal rank if, on the date they are created or issued, the Bank has declared and paid or set apart for payment all dividends payable on cumulative and non-cumulative Class A Preferred Shares, including for the most recently completed fiscal period.
Voting Rights
The holders of the Class A Preferred Shares only have voting rights as a class on certain matters (see below) or as the law requires.
Shareholder Approvals
Holders of the Class A Preferred Shares can give their approval if 66 2/3% or more holders casting vote in favour of doing so at a meeting where the majority of Class A Preferred Shares is represented, or if no quorum is present at such a meeting, at an adjourned meeting at which no quorum requirements apply.
Certain Conditions of the Class B Preferred Shares as a Class
Issuable in Series
From time to time, the Board of Directors may resolve to issue Class B Preferred Shares in one or more series with rights, privileges, restrictions, and conditions, which the Board of Directors may also decide.
The Class B Preferred Shares of each series rank equally to all the other series of Class B and Class A Preferred Shares and are entitled to preference over the common shares and any other shares ranking junior to the Class A Preferred Shares and the Class B Preferred Shares with respect to the payment of dividends and in the distribution of property in the event of the liquidation, dissolution or winding up of the Bank.
Creating and Issuing Shares
Under the Bank Act, the Bank needs approval from holders of Class B Preferred Shares to create any other class of shares with equal or superior rank to Class B Preferred Shares. The Bank Act or other laws may also require other forms of approval.
The Bank does not require shareholder approval to create or issue additional Class B Preferred Shares or shares of equal rank if, on the date they are created or issued, the Bank has declared and paid or set apart for payment all dividends payable on cumulative and non-cumulative Class B Preferred Shares, including for the most recently completed fiscal period. As at December 4, 2024, none of the outstanding Class B Preferred Shares have the right to cumulative dividends.
Voting Rights
The holders of the Class B Preferred Shares only have voting rights as a class on certain matters (see below) or as the law requires.
Shareholder Approvals
Holders of the Class B Preferred Shares can give their approval if 66 2/3% or more holders casting vote in favour of doing so at a meeting where the majority of Class B Preferred Shares is represented, or if no quorum is present at such meeting, at an adjourned meeting at which no quorum requirements apply.
Contingent Conversion of Certain Series of Class B Preferred Shares
Upon the occurrence of certain specified trigger events relating to the viability of the Bank, the Class B Preferred Shares Series 33 (Non-Viability Contingent Capital (NVCC)), Class B Preferred Shares Series 44 (Non-Viability Contingent Capital (NVCC)), Class B Preferred Shares Series 48 (Non-Viability Contingent Capital (NVCC)), Class B Preferred Shares Series 49 (Non-Viability Contingent Capital (NVCC)), Class B Preferred Shares Series 50 (Non-Viability Contingent Capital (NVCC)), Class B Preferred Shares Series 51 (Non-Viability Contingent Capital (NVCC)), Class B Preferred Shares Series 52 (Non-Viability Contingent Capital (NVCC)), Class B Preferred Shares Series 53 (Non-Viability Contingent Capital (NVCC)) and Class B Preferred Shares Series 54 (Non-Viability Contingent Capital (NVCC)) will immediately and automatically be converted into common shares of the Bank. The number of common shares into which such Class B Preferred Shares would be converted upon the occurrence of such a trigger event will be determined in accordance with a pre-determined conversion formula specified at the time of issuance of such Class B Preferred Shares.
7
Description of Other Equity Instruments – Subordinated Capital Notes
The Bank currently has outstanding US$500 million 4.800% Fixed Rate Resetting Non-Cumulative Subordinated Additional Tier 1 Capital Notes (Non-Viability Contingent Capital (NVCC)) (“Subordinated Capital Notes”) which are classified as equity and form part of the Bank’s additional tier 1 non-viability contingent capital. The Subordinated Capital Notes are compound financial instruments that have both equity and liability features. For more details, see “Other Equity Instruments” in Note 17 of the 2024 Financial Statements.
The Subordinated Capital Notes are direct unsecured obligations of the Bank and, in the event of the Bank’s insolvency or winding-up, will rank subordinate to all of the Bank’s subordinated indebtedness and in right of payment equally with and not prior to indebtedness that ranks equally in right of payment with, or is subordinated to, the Subordinated Capital Notes (other than indebtedness which by its terms ranks subordinate to the Subordinated Capital Notes, including but not limited to the Limited Recourse Capital Notes). The Subordinated Capital Notes will constitute subordinated indebtedness for the purposes of the Bank Act. In the event of the Bank’s insolvency or winding-up, the Subordinated Capital Notes will rank ahead of the Bank’s common shares and Preferred Shares.
Upon the occurrence of certain specified trigger events relating to the viability of the Bank, the Subordinated Capital Notes will immediately and automatically be converted into common shares of the Bank. The number of common shares into which the Subordinated Capital Notes would be converted upon the occurrence of such a trigger event will be determined in accordance with a pre-determined conversion formula specified at the time of issuance of the Subordinated Capital Notes.
Certain Provisions of the Subordinated Capital Notes
Distributions and Restrictions on Dividend and Retirement of Shares
Interest on the Subordinated Capital Notes was payable semi-annually in arrears for the initial five years, which ended on August 25, 2024 (the “First Reset Date”). Following the First Reset Date, the interest rate will reset every five years and interest will accrue at a fixed rate. While interest is payable on a semi-annual basis, the Bank may, at its discretion, with prior notice, cancel the payments. If the Bank does not pay the interest in full to the note holders, the Bank will not declare dividends on its common shares or preferred shares or redeem, purchase or otherwise retire such shares until the month commencing after the Bank resumes full interest payments on the Subordinated Capital Notes.
Maturity and Redemption
The Subordinated Capital Notes have no scheduled maturity or redemption date. Accordingly, the Bank is not required to make any repayment of the principal amount of the Subordinated Capital Notes except in the event of bankruptcy or insolvency and provided that the NVCC requirements have not been triggered. The Subordinated Capital Notes are redeemable at par on any interest payment date on or after the First Reset Date solely at the option of the Bank, or following certain regulatory or tax events, in accordance with their terms. All redemptions are subject to regulatory consent.
Purchase for Cancellation
Subject to regulatory consent, the Bank may at any time, purchase for cancellation any Subordinated Capital Notes at any price in the open market.
Events of Default
An event of default in respect of the Subordinated Capital Notes will occur only if the Bank becomes bankrupt or insolvent or becomes subject to the provisions of the Winding-up and Restructuring Act (Canada), or if the Bank goes into liquidation, either voluntarily or under an order of a court of competent jurisdiction, passes a resolution for the winding-up, liquidation or dissolution of the Bank or otherwise acknowledges its insolvency. Neither a failure to make a payment on the Subordinated Capital Notes when due (including any interest payment, whether as a result of cancellation or otherwise) nor an NVCC automatic conversion upon the occurrence of a trigger event will constitute an event of default.
Issuance of other Senior or Pari Passu Securities
The terms governing the Subordinated Capital Notes do not limit the Bank’s ability to incur additional indebtedness or issue or repurchase securities, other than the restriction on retirement of shares noted above. The Bank may incur additional indebtedness without the authorization of the holders of the Subordinated Capital Notes.
Voting Rights
The holders of Subordinated Capital Notes are not entitled to any rights of holders of common shares, including any rights of shareholders to receive notice, to attend or to vote at any meeting of the shareholders of the Bank. If the Subordinated Capital Notes are converted into common shares of the Bank under NVCC requirements, holders of the Subordinated Capital Notes will become holders of the Bank’s common shares and will only have rights as holders of common shares.
8
Description of Other Equity Instruments – Limited Recourse Capital Notes
The Bank currently has outstanding $1.25 billion 4.300% Limited Recourse Capital Notes, Series 1 (Non-Viability Contingent Capital (NVCC)) (“LRCN 1”), $750 million 5.625% Limited Recourse Capital Notes, Series 2 (Non-Viability Contingent Capital (NVCC)) (“LRCN 2”), $1 billion 7.325% Limited Recourse Capital Notes, Series 3 (Non-Viability Contingent Capital (NVCC)) (“LRCN 3”), US$1 billion 7.700% Limited Recourse Capital Notes, Series 4 (Non-Viability Contingent Capital (NVCC)) (“LRCN 4”) and US$750 million 7.300% Limited Recourse Capital Notes, Series 5 (Non-Viability Contingent Capital (NVCC)) (“LRCN 5”, collectively with the LRCN 1, LRCN 2, LRCN 3 and LRCN 4, the “Limited Recourse Capital Notes”) which are classified as equity and form part of the Bank’s additional tier 1 non-viability contingent capital. The Limited Recourse Capital Notes are compound financial instruments that have both equity and liability features. For more details, see “Other Equity Instruments” in Note 17 of the 2024 Financial Statements.
The Limited Recourse Capital Notes are direct unsecured obligations of the Bank and, in the event of the Bank’s insolvency or winding-up (prior to the occurrence of specified trigger events), will rank: (a) subordinate in right of payment to the prior payment in full of all indebtedness, including certain subordinated indebtedness (including but not limited to the Subordinated Capital Notes); and (b) in right of payment, equally with and not prior to indebtedness which by its terms ranks equally in right of payment with, or is subordinate to, the Limited Recourse Capital Notes (other than indebtedness which by its terms ranks subordinate to the Limited Recourse Capital Notes) in each case, from time to time outstanding, and will be subordinate in right of payment to the claims of the Bank’s depositors and other unsubordinated creditors. The Limited Recourse Capital Notes will constitute subordinated indebtedness for the purposes of the Bank Act. In the event of the Bank’s insolvency or winding-up, the Limited Recourse Capital Notes will rank ahead of the Bank’s common shares and Preferred Shares.
In the event of a non-payment by the Bank of the principal amount of, or interest on the Limited Recourse Capital Notes when due, while a holder of Limited Recourse Capital Notes will have a claim against the Bank for the principal amount of the Limited Recourse Capital Notes and any accrued and unpaid interest (which will then be due and payable), the sole remedy of each holder of Limited Recourse Capital Notes is the delivery of such holder’s proportionate share of the assets of a limited recourse trust. As of the date hereof, the limited recourse trust’s assets in respect of the LRCN 1 consist of 1,250,000 Class B Preferred Shares, Series 48 (Non-Viability Contingent Capital (NVCC)) (“Class B Preferred Shares Series 48 (NVCC)”), in respect of the LRCN 2 consist of 750,000 Class B Preferred Shares, Series 49 (Non-Viability Contingent Capital (NVCC)) (“Class B Preferred Shares Series 49 (NVCC)”), in respect of the LRCN 3 consist of 1,000,000 Class B Preferred Shares, Series 51 (Non-Viability Contingent Capital (NVCC)) (“Class B Preferred Shares Series 51 (NVCC)”), in respect of the LRCN 4 consist of 1,000,000 Class B Preferred Shares, Series 53 (Non-Viability Contingent Capital (NVCC)) (“Class B Preferred Shares Series 53 (NVCC)”) and in respect of the LRCN 5 consist of 750,000 Class B Preferred Shares, Series 54 (Non-Viability Contingent Capital (NVCC)) (“Class B Preferred Shares Series 54 (NVCC)”).
Upon the occurrence of certain specified trigger events relating to the viability of the Bank, the Class B Preferred Shares Series 48 (NVCC), Class B Preferred Shares Series 49 (NVCC), Class B Preferred Shares Series 51 (NVCC), Class B Preferred Shares Series 53 (NVCC) and Class B Preferred Shares Series 54 (NVCC) will immediately and automatically be converted into common shares of the Bank. The number of common shares into which the Class B Preferred Shares Series 48 (NVCC), Class B Preferred Shares Series 49 (NVCC), Class B Preferred Shares Series 51 (NVCC), Class B Preferred Shares Series 53 (NVCC) and Class B Preferred Shares Series 54 (NVCC) would be converted upon the occurrence of such a trigger event will be determined in accordance with a pre-determined conversion formula specified at the time of the issuance of the Class B Preferred Shares Series 48 (NVCC), Class B Preferred Shares Series 49 (NVCC), Class B Preferred Shares Series 51 (NVCC), Class B Preferred Shares Series 53 (NVCC) and Class B Preferred Shares Series 54 (NVCC). Subject to certain limitations, each holder of the Limited Recourse Capital Notes would receive such holder’s proportionate share of such common shares of the Bank.
Certain Provisions of the Limited Recourse Capital Notes
Distributions and Restrictions on Dividend and Retirement of Shares
Interest on the Limited Recourse Capital Notes is paid semi-annually in arrears for the initial five years. Thereafter, the interest will reset every five years and accrue at a fixed rate.
Until revoked, the trustee of the limited recourse trust has waived its right to receive any and all dividends on the Class B Preferred Shares Series 48 (NVCC). Accordingly, until such waiver is revoked by the trustee of the limited recourse trust, no dividends are expected to be declared or paid on the Class B Preferred Shares Series 48 (NVCC). To the extent the waiver is no longer in effect and the limited recourse trust is the sole holder of the Class B Preferred Shares Series 48 (NVCC), if the Bank does not declare and pay dividends on the Class B Preferred Shares Series 48 (NVCC), it will not declare and pay dividends on any of the other outstanding series of Class B Preferred Shares of the Bank.
Until revoked, the trustee of the limited recourse trust has waived its right to receive any and all dividends on the Class B Preferred Shares Series 49 (NVCC). Accordingly, until such waiver is revoked by the trustee of the limited recourse trust, no dividends are expected to be declared or paid on the Class B Preferred Shares Series 49 (NVCC). To the extent the waiver is no longer in effect and the limited recourse trust is the sole holder of the Class B Preferred Shares Series 49 (NVCC), if the Bank does not declare and pay dividends on the Class B Preferred Shares Series 49 (NVCC), it will not declare and pay dividends on any of the other outstanding series of Class B Preferred Shares of the Bank.
Until revoked, the trustee of the limited recourse trust has waived its right to receive any and all dividends on the Class B Preferred Shares Series 51 (NVCC). Accordingly, until such waiver is revoked by the trustee of the limited recourse trust, no dividends are expected to be declared or paid on the Class B Preferred Shares Series 51 (NVCC). To the extent the waiver is no longer in effect and the limited recourse trust is the sole holder of the Class B Preferred Shares Series 51 (NVCC), if the Bank does not declare and pay dividends on the Class B Preferred Shares Series 51 (NVCC), it will not declare and pay dividends on any of the other outstanding series of Class B Preferred Shares of the Bank.
Until revoked, the trustee of the limited recourse trust has waived its right to receive any and all dividends on the Class B Preferred Shares Series 53 (NVCC). Accordingly, until such waiver is revoked by the trustee of the limited recourse trust, no dividends are expected to be declared or paid on the Class B Preferred Shares Series 53 (NVCC). To the extent the waiver is no longer in effect and the limited recourse trust is the sole holder of the Class B Preferred Shares Series 53 (NVCC), if the Bank does not declare and pay dividends on the Class B Preferred Shares Series 53 (NVCC), it will not declare and pay dividends on any of the other outstanding series of Class B Preferred Shares of the Bank.
9
Until revoked, the trustee of the limited recourse trust has waived its right to receive any and all dividends on the Class B Preferred Shares Series 54 (NVCC). Accordingly, until such waiver is revoked by the trustee of the limited recourse trust, no dividends are expected to be declared or paid on the Class B Preferred Shares Series 54 (NVCC). To the extent the waiver is no longer in effect and the limited recourse trust is the sole holder of the Class B Preferred Shares Series 54 (NVCC), if the Bank does not declare and pay dividends on the Class B Preferred Shares Series 54 (NVCC), it will not declare and pay dividends on any of the other outstanding series of Class B Preferred Shares of the Bank.
Maturity and Redemption
The LRCN 1 are scheduled to mature on November 26, 2080. The LRCN 1 are redeemable, at the option of the Bank, at their principal amount every five years after issuance, or following certain regulatory or tax events, in accordance with their terms. Upon any redemption of the Class B Preferred Shares Series 48 (NVCC) held by the limited recourse trust, the Bank shall redeem LRCN 1 with an aggregate principal amount equal to the aggregate face amount of the Class B Preferred Shares Series 48 (NVCC) redeemed by the Bank. All redemptions are subject to regulatory consent.
The LRCN 2 are scheduled to mature on May 26, 2082. The LRCN 2 are redeemable, at the option of the Bank, at their principal amount every five years after issuance, or following certain regulatory or tax events, in accordance with their terms. Upon any redemption of the Class B Preferred Shares Series 49 (NVCC) held by the limited recourse trust, the Bank shall redeem LRCN 2 with an aggregate principal amount equal to the aggregate face amount of the Class B Preferred Shares Series 49 (NVCC) redeemed by the Bank. All redemptions are subject to regulatory consent.
The LRCN 3 are scheduled to mature on November 26, 2082. The LRCN 3 are redeemable, at the option of the Bank, at their principal amount every five years after issuance, or following certain regulatory or tax events, in accordance with their terms. Upon any redemption of the Class B Preferred Shares Series 51 (NVCC) held by the limited recourse trust, the Bank shall redeem LRCN 3 with an aggregate principal amount equal to the aggregate face amount of the Class B Preferred Shares Series 51 (NVCC) redeemed by the Bank. All redemptions are subject to regulatory consent.
The LRCN 4 are scheduled to mature on May 26, 2084. The LRCN 4 are redeemable, at the option of the Bank, at their principal amount every five years after issuance, or following certain regulatory or tax events, in accordance with their terms. Upon any redemption of the Class B Preferred Shares Series 53 (NVCC) held by the limited recourse trust, the Bank shall redeem LRCN 4 with an aggregate principal amount equal to the aggregate face amount of the Class B Preferred Shares Series 53 (NVCC) redeemed by the Bank. All redemptions are subject to regulatory consent.
The LRCN 5 are scheduled to mature on November 26, 2084. The LRCN 5 are redeemable, at the option of the Bank, at their principal amount every five years after issuance, or following certain regulatory or tax events, in accordance with their terms. Upon any redemption of the Class B Preferred Shares Series 54 (NVCC) held by the limited recourse trust, the Bank shall redeem LRCN 5 with an aggregate principal amount equal to the aggregate face amount of the Class B Preferred Shares Series 54 (NVCC) redeemed by the Bank. All redemptions are subject to regulatory consent.
Purchase for Cancellation
Subject to regulatory consent, the Bank may at any time, purchase for cancellation any LRCN 1, LRCN 2, LRCN 3, LRCN 4 and LRCN 5 at any price in the open market. Prior to any such cancellation, the Bank shall, subject to regulatory consent, redeem, as applicable, a corresponding number of Class B Preferred Shares Series 48 (NVCC), Class B Preferred Shares Series 49 (NVCC), Class B Preferred Shares Series 51 (NVCC), Class B Preferred Shares Series 53 (NVCC) or Class B Preferred Shares Series 54 (NVCC) (the aggregate face amount of which shall equal the aggregate principal amount of the Notes to be cancelled) then held by the limited recourse trust for cancellation.
Events of Default
An event of default in respect of the Limited Recourse Capital Notes (“Event of Default”), will occur only if the Bank becomes bankrupt or insolvent or becomes subject to the provisions of the Winding-up and Restructuring Act (Canada), or if the Bank goes into liquidation, either voluntarily or under an order of a court of competent jurisdiction, passes a resolution for the winding-up, liquidation or dissolution of the Bank or otherwise acknowledges its insolvency. Upon an Event of Default, the sole remedy of each holder of LRCN 1 is the delivery of such holder’s proportionate share of the Class B Preferred Shares Series 48 (NVCC), the sole remedy of each holder of LRCN 2 is the delivery of such holder’s proportionate share of the Class B Preferred Shares Series 49 (NVCC), the sole remedy of each holder of LRCN 3 is the delivery of such holder’s proportionate share of the Class B Preferred Shares Series 51 (NVCC), the sole remedy of each holder of LRCN 4 is the delivery of such holder’s proportionate share of the Class B Preferred Shares Series 53 (NVCC) and the sole remedy of each holder of LRCN 5 is the delivery of such holder’s proportionate share of the Class B Preferred Shares Series 54 (NVCC).
Issuance of other Senior or Pari Passu Securities
The terms governing the Limited Recourse Capital Notes do not limit the Bank’s ability to incur additional indebtedness or issue or repurchase securities. The Bank may incur additional indebtedness without the authorization of the holders of the Limited Recourse Capital Notes.
Voting Rights
The holders of the Limited Recourse Capital Notes are not entitled to any rights of holders of common shares, including any rights of shareholders to receive notice, to attend or to vote at any meeting of the shareholders of the Bank. If the Class B Preferred Shares Series 48 (NVCC), Class B Preferred Shares Series 49 (NVCC), Class B Preferred Shares Series 51 (NVCC), Class B Preferred Shares Series 53 (NVCC) or Class B Preferred Shares Series 54 (NVCC) are converted into common shares of the Bank, holders of the LRCN 1, LRCN 2, LRCN 3, LRCN 4 and LRCN 5 as applicable, will become holders of the Bank’s common shares and will only have rights as holders of common shares.
This Certain Provisions of the Limited Recourse Capital Notes section contains forward-looking statements. Please see the Caution Regarding Forward-Looking Statements on page 2.
10
Restraints on Bank Shares under the Bank Act
The Bank Act restricts the beneficial ownership of shares of a bank. No person may be a major shareholder of a bank if the bank has equity of $12 billion or more, which applies to the Bank. A major shareholder is defined as a person, or group of persons under common control or acting jointly or in concert, that beneficially owns more than 20% of any class of voting shares or more than 30% of any class of non-voting shares of the bank.
In addition, no person may have a significant interest in any class of shares of a bank, including the Bank, unless the person first receives the approval of the Minister of Finance. A person has a significant interest in a class of shares of a bank when the person, or group of persons under common control or acting jointly or in concert, beneficially owns more than 10% of any class of shares of the bank.
Governments and their agents are also restricted from acquiring shares of a bank, except for certain cases that require the Minister of Finance’s consent.
Ratings
The credit ratings that external rating agencies assign to some of the Bank’s securities are important in the raising of both capital and funding to support the Bank’s business operations. The credit ratings and outlook that the rating agencies assigned are based on their own views and methodologies. Maintaining strong credit ratings allows the Bank to access the capital markets at competitive pricing levels. Should the Bank’s credit ratings experience a downgrade, its cost of funds would likely increase and its access to funding and capital through capital markets could be reduced. A material downgrade of the Bank’s ratings could also have other consequences, including those set out in Note 8 of the 2024 Financial Statements, which Note the Bank incorporates herein by reference. The following table sets out ratings the Bank has received for its outstanding securities from the rating agencies, which are current as at December 4, 2024.
| S&P
|
Moody’s
|
DBRS
|
Fitch
|
|||||||||||||
|
Rating
|
Rank1
|
Rating
|
Rank1
|
Rating
|
Rank1
|
Rating
|
Rank1
|
|||||||||
|
Short-term instruments
|
A-1 | 1 of 6 | P-1 | 1 of 4 | R-1 (high) | 1 of 6 | F1+ | 1 of 7 | ||||||||
|
Senior debt3 |
A- | 3 of 10 | A2 | 3 of 9 | AA (low) | 2 of 10 | AA- | 2 of 10 | ||||||||
|
Long Term Deposits / Legacy Senior Debt4 |
A+ | 3 of 10 | Aa2 | 2 of 9 | AA | 2 of 10 | AA | 2 of 10 | ||||||||
|
Subordinated debt
Subordinated debt – NVCC2 |
A-
BBB+ |
3 of 10
4 of 10 |
Baa1
Baa1(hyb) |
4 of 9
4 of 9 |
A (high)
A (low) |
3 of 10
3 of 10 |
A
A |
3 of 10
3 of 10 |
||||||||
|
Subordinated Capital Notes –NVCC2 |
BBB- | 4 of 10 | Baa3(hyb) | 4 of 9 | N/A | N/A | N/A | N/A | ||||||||
|
Limited Recourse Capital Notes –NVCC2 |
BBB- | 4 of 10 | Baa3(hyb) | 4 of 9 | BBB (high) | 4 of 10 | N/A | N/A | ||||||||
|
Preferred shares
Preferred shares –NVCC2 |
BBB
BBB- |
3 of 9
3 of 9 |
Baa3
Baa3(hyb) |
4 of 9
4 of 9 |
Pfd-2 (high)
Pfd-2 |
2 of 6
2 of 6 |
N/A
N/A |
N/A
N/A |
||||||||
|
Trend/Outlook
|
Stable | -- | Stable | -- | Stable | -- | Stable | -- | ||||||||
Notes: 1 Rank, according to each rating agency’s public website, refers to the assigned ratings ranking of all major assignable ratings for each debt or share class, 1 being the highest. Each assignable major rating may be modified further (+/-, high/low) to show relative standing within the major rating categories.
2 Non-viability contingent capital or NVCC.
3 Subject to conversion under the Bail-In Regime.
4 Long Term Deposits / Legacy Senior Debt Includes: (a) Senior debt issued prior to September 23, 2018; and (b) Senior debt issued on or after September 23, 2018 which is excluded from the Bail-In Regime.
A definition of the categories of each rating as at December 4, 2024 from each rating agency’s website is outlined in Appendix II to this Annual Information Form. Further information may be obtained from the applicable rating agency. S&P, Moody’s, DBRS and Fitch each have a stable outlook on BMO’s long-term credit ratings.
During fiscal 2024 there were no changes to ratings assigned by S&P, Moody’s, DBRS or Fitch.
Credit ratings are not recommendations to purchase, hold, or sell securities and do not address the market price or suitability of a specific security for a particular investor. Credit ratings may not reflect the potential impact of all risks on the value of securities. In addition, real or anticipated changes in the rating assigned to a security will generally affect the market value of that security. The Bank cannot know for certain that a rating will remain in effect for any given period of time or that a rating agency will not revise or withdraw it entirely in the future.
The Bank paid fees to credit rating agencies to obtain its credit ratings. The Bank may also pay fees for other services from credit rating agencies in the ordinary course of business.
For additional information on the credit ratings assigned to the Bank’s short-term and senior-long term debt securities by external rating agencies, see page 95 of the 2024 MD&A, which page the Bank incorporates herein by reference.
This Ratings section contains forward-looking statements. Please see the Caution Regarding Forward-Looking Statements on page 2.
11
MARKET FOR SECURITIES
Trading Price and Volume
The outstanding common shares of the Bank are listed for trading on the Toronto Stock Exchange (TSX) and on the New York Stock Exchange (NYSE) under the trading symbol BMO. The outstanding preferred shares of the Bank set out below are listed on the TSX with the following trading symbols: BMO.PR.Y for the Class B Preferred Shares Series 33 (Non-Viability Contingent Capital (NVCC)) and BMO.PR.E for the Class B Preferred Shares Series 44 (Non-Viability Contingent Capital (NVCC)).
The following table sets out the reported high and low trading prices in Canadian dollars and the trading volumes of the common and preferred shares of Bank of Montreal on the TSX for the given periods. Prices are based on the reported data from the TSX Historical Data Access.
| BMO Common |
PR.S1 Series 27 |
PR.T2 Series 29 |
PR.W3 Series 31 |
PR.Y Series 33 |
PR.E Series 44 |
PR.F4 Series 46 |
||||||||||||||||||||||
| November 2023 |
||||||||||||||||||||||||||||
| - High Price ($) |
112.49 | 19.76 | 18.55 | 18.00 | 18.57 | 24.07 | 24.50 | |||||||||||||||||||||
| - Low Price ($) |
103.40 | 18.17 | 17.00 | 16.64 | 16.20 | 22.05 | 23.27 | |||||||||||||||||||||
|
- Volume |
41,403,176 | 427,528 | 208,545 | 86,606 | 72,383 | 258,801 | 82,906 | |||||||||||||||||||||
| December 2023 |
||||||||||||||||||||||||||||
| - High Price ($) |
132.11 | 19.85 | 18.90 | 18.47 | 19.52 | 24.40 | 24.99 | |||||||||||||||||||||
| - Low Price ($) |
109.76 | 19.00 | 17.30 | 16.96 | 18.09 | 23.75 | 24.11 | |||||||||||||||||||||
|
- Volume |
48,690,950 | 174,808 | 189,153 | 121,161 | 62,814 | 357,153 | 95,149 | |||||||||||||||||||||
| January 2024 |
||||||||||||||||||||||||||||
| - High Price ($) |
131.84 | 21.53 | 20.25 | 19.61 | 20.17 | 25.15 | 24.97 | |||||||||||||||||||||
| - Low Price ($) |
125.50 | 19.50 | 18.34 | 17.77 | 18.75 | 24.24 | 24.53 | |||||||||||||||||||||
|
- Volume |
71,330,750 | 703,424 | 410,767 | 222,658 | 190,065 | 264,652 | 392,566 | |||||||||||||||||||||
| February 2024 |
||||||||||||||||||||||||||||
| - High Price ($) |
129.60 | 22.55 | 21.10 | 20.52 | 20.95 | 25.10 | 24.90 | |||||||||||||||||||||
| - Low Price ($) |
119.51 | 21.01 | 19.68 | 18.79 | 19.50 | 24.40 | 24.55 | |||||||||||||||||||||
|
- Volume |
64,569,727 | 1,001,433 | 272,673 | 295,882 | 179,289 | 347,781 | 343,302 | |||||||||||||||||||||
| March 2024 |
||||||||||||||||||||||||||||
| - High Price ($) |
132.68 | 24.45 | 24.00 | 23.99 | 23.24 | 24.99 | 25.02 | |||||||||||||||||||||
| - Low Price ($) |
122.28 | 22.46 | 20.85 | 20.31 | 20.27 | 24.58 | 24.76 | |||||||||||||||||||||
|
- Volume |
34,867,142 | 1,127,495 | 1,025,060 | 336,253 | 380,063 | 309,133 | 160,589 | |||||||||||||||||||||
| April 2024 |
||||||||||||||||||||||||||||
| - High Price ($) |
133.95 | 25.15 | 24.68 | 24.25 | 23.99 | 25.46 | 25.25 | |||||||||||||||||||||
| - Low Price ($) |
122.64 | 24.15 | 23.70 | 23.63 | 22.95 | 24.87 | 24.90 | |||||||||||||||||||||
|
- Volume |
59,584,254 | 2,217,980 | 1,337,869 | 772,576 | 444,199 | 197,894 | 394,492 | |||||||||||||||||||||
| May 2024 |
||||||||||||||||||||||||||||
| - High Price ($) |
131.40 | 25.10 | 24.61 | 24.20 | 23.94 | 25.78 | 25.02 | |||||||||||||||||||||
| - Low Price ($) |
118.71 | 24.90 | 24.00 | 23.50 | 23.52 | 25.10 | 24.91 | |||||||||||||||||||||
|
- Volume |
59,284,465 | 2,816,357 | 475,140 | 1,283,797 | 175,979 | 264,509 | 1,275,051 | |||||||||||||||||||||
| June 2024 |
||||||||||||||||||||||||||||
| - High Price ($) |
121.79 | n.a. | 24.92 | 24.40 | 23.90 | 25.70 | n.a. | |||||||||||||||||||||
| - Low Price ($) |
113.75 | n.a. | 23.77 | 22.91 | 22.70 | 25.00 | n.a. | |||||||||||||||||||||
|
- Volume |
47,549,265 | n.a. | 234,724 | 238,208 | 149,758 | 201,325 | n.a. | |||||||||||||||||||||
| July 2024 |
||||||||||||||||||||||||||||
| - High Price ($) |
121.33 | n.a. | 25.15 | 24.86 | 24.45 | 25.96 | n.a. | |||||||||||||||||||||
| - Low Price ($) |
113.75 | n.a. | 24.81 | 24.20 | 23.63 | 25.23 | n.a. | |||||||||||||||||||||
|
- Volume |
73,173,912 | n.a. | 1,565,977 | 431,459 | 219,116 | 361,992 | n.a. | |||||||||||||||||||||
| August 2024 |
||||||||||||||||||||||||||||
| - High Price ($) |
120.25 | n.a. | 25.00 | 24.88 | 24.14 | 26.14 | n.a. | |||||||||||||||||||||
| - Low Price ($) |
109.02 | n.a. | 24.92 | 23.81 | 23.81 | 25.16 | n.a. | |||||||||||||||||||||
|
- Volume |
65,226,808 | n.a. | 2,590,873 | 153,315 | 190,025 | 371,750 | n.a. | |||||||||||||||||||||
| September 2024 |
||||||||||||||||||||||||||||
| - High Price ($) |
123.47 | n.a. | n.a. | 24.78 | 24.14 | 26.26 | n.a. | |||||||||||||||||||||
| - Low Price ($) |
110.94 | n.a. | n.a. | 23.79 | 23.77 | 25.80 | n.a. | |||||||||||||||||||||
|
- Volume |
48,990,423 | n.a. | n.a. | 159,735 | 100,176 | 354,568 | n.a. | |||||||||||||||||||||
| October 2024 |
||||||||||||||||||||||||||||
| - High Price ($) |
130.17 | n.a. | n.a. | 25.17 | 24.63 | 26.72 | n.a. | |||||||||||||||||||||
| - Low Price ($) |
121.18 | n.a. | n.a. | 23.77 | 23.92 | 25.95 | n.a. | |||||||||||||||||||||
|
- Volume |
86,747,649 | n.a. | n.a. | 1,105,335 | 112,559 | 186,042 | n.a. | |||||||||||||||||||||
1 The Bank redeemed all of its outstanding Class B Preferred Shares Series 27 (Non-Viability Contingent Capital (NVCC)) on May 25, 2024.
2 The Bank redeemed all of its outstanding Class B Preferred Shares Series 29 (Non-Viability Contingent Capital (NVCC)) on August 25, 2024.
3 The Bank redeemed all of its outstanding Class B Preferred Shares Series 31 (Non-Viability Contingent Capital (NVCC)) on November 25, 2024.
4 The Bank redeemed all of its outstanding Class B Preferred Shares Series 46 (Non-Viability Contingent Capital (NVCC)) on May 25, 2024.
Prior Sales
From time to time, the Bank issues principal at risk notes, securities for which the amount payable at maturity is determined by reference to the price, value or level of an underlying interest such as a stock index, an exchange traded fund or a notional portfolio of equities or other securities. In addition, the Bank periodically issues subordinated debt, preferred shares and other equity instruments which are not listed or quoted on a marketplace.
For information about the Bank’s issuances of common shares, preferred shares, subordinated indebtedness and other equity instruments since October 31, 2023, see the “Subordinated Debt” and “Equity” sections on pages 58 to 59 of the 2024 MD&A and Notes 16 and 17 of the 2024 Financial Statements, which pages and Notes are incorporated herein by reference. Also refer to the Description of Common Shares, Description of Preferred Shares, Description of Other Equity Instruments – Subordinated Capital Notes and Description of Other Equity Instruments – Limited Recourse Capital Notes sections above.
12
ESCROWED SECURITIES AND SECURITIES SUBJECT TO CONTRACTUAL RESTRICTION ON TRANSFER
| Designation of class
|
Number of securities held in escrow or that are subject to a contractual restriction on transfer |
Percentage of class
|
||
|
Class B Preferred Shares Series 48 (NVCC) 1 |
1,250,000 | 100% of the Class B Preferred Shares Series 48 (NVCC) | ||
|
Class B Preferred Shares Series 49 (NVCC) 2 |
750,000 | 100% of the Class B Preferred Shares Series 49 (NVCC) | ||
|
Class B Preferred Shares Series 51 (NVCC) 3 |
1,000,000 | 100% of the Class B Preferred Shares Series 51 (NVCC) | ||
|
Class B Preferred Shares Series 53 (NVCC) 4 |
1,000,000 | 100% of the Class B Preferred Shares Series 53 (NVCC) | ||
|
Class B Preferred Shares Series 54 (NVCC) 5 |
750,000 | 100% of the Class B Preferred Shares Series 54 (NVCC) | ||
1 The Class B Preferred Shares Series 48 (NVCC) are held in a limited recourse trust and are restricted from being transferred except to satisfy the recourse of the holders of the LRCN 1 in respect of non-payment by the Bank of the principal amount of, or interest on, the LRCN 1 when due.
2 The Class B Preferred Shares Series 49 (NVCC) are held in a limited recourse trust and are restricted from being transferred except to satisfy the recourse of the holders of the LRCN 2 in respect of non-payment by the Bank of the principal amount of, or interest on, the LRCN 2 when due.
3 The Class B Preferred Shares Series 51 (NVCC) are held in a limited recourse trust and are restricted from being transferred except to satisfy the recourse of the holders of the LRCN 3 in respect of non-payment by the Bank of the principal amount of, or interest on, the LRCN 3 when due.
4 The Class B Preferred Shares Series 53 (NVCC) are held in a limited recourse trust and are restricted from being transferred except to satisfy the recourse of the holders of the LRCN 4 in respect of non-payment by the Bank of the principal amount of, or interest on, the LRCN 4 when due.
5 The Class B Preferred Shares Series 54 (NVCC) are held in a limited recourse trust and are restricted from being transferred except to satisfy the recourse of the holders of the LRCN 5 in respect of non-payment by the Bank of the principal amount of, or interest on, the LRCN 5 when due.
Also refer to the Certain Provisions of the Limited Recourse Capital Notes section above.
DIRECTORS AND EXECUTIVE OFFICERS
Board of Directors
As at December 4, 2024, the following were directors of the Bank.
|
DIRECTOR NAME AND PRINCIPAL OCCUPATION
|
MUNICIPALITY OF RESIDENCE
|
DIRECTOR SINCE
|
||
| Jan Babiak Corporate Director |
Nashville, Tennessee U.S.A. |
October 23, 2012 | ||
| Craig Broderick Corporate Director |
Greenwich, Connecticut U.S.A. |
August 27, 2018 | ||
| Hazel Claxton Corporate Director |
Toronto, Ontario Canada |
August 30, 2023 | ||
| Diane L. Cooper Corporate Director |
Gravois Mills, Missouri U.S.A. |
October 28, 2024 | ||
| George A. Cope, C.M. Chair of the Board, Bank of Montreal |
Toronto, Ontario Canada |
July 25, 2006 | ||
| Stephen Dent Managing Director and co-founder Birch Hill Equity Partners, a private equity firm |
Toronto, Ontario Canada |
April 7, 2021 | ||
| Christine Edwards Corporate Director |
Lake Forest, Illinois U.S.A. |
August 1, 2010 | ||
| Dr. Martin S. Eichenbaum Charles Moskos Professor of Economics Northwestern University |
Glencoe, Illinois U.S.A. |
March 31, 2015 | ||
| David Harquail Chair of the Board Franco-Nevada Corporation, a royalty and streaming company |
Toronto, Ontario Canada |
April 5, 2018 | ||
| Eric R. La Flèche President and Chief Executive Officer Metro Inc., a food retailer and distributor |
Montreal, Québec Canada |
March 20, 2012 | ||
| Brian McManus Executive Chair Polycor Inc., a natural stone company |
Beaconsfield, Québec Canada |
October 28, 2024 | ||
| Lorraine Mitchelmore Corporate Director |
Calgary, Alberta Canada |
March 31, 2015 | ||
| Madhu Ranganathan President, CFO & Corporate Development |
Saratoga, California U.S.A. |
April 7, 2021 | ||
| Darryl White Chief Executive Officer BMO Financial Group |
Toronto, Ontario Canada |
May 24, 2017 | ||
13
A director of the Bank holds office until the next annual meeting of shareholders or until a successor is elected or appointed, unless their seat is vacated before they can do so.
Since November 1, 2019, the directors have held the principal occupations above, or other positions with the same, predecessor, or associated firms except for Mr. Cope who before January 2020 was CEO of BCE Inc., Ms. Edwards who before February 2021 was a capital partner at Winston & Strawn LLP, Mr. Harquail who before May 6, 2020 was Chief Executive Officer of Franco-Nevada Corporation and Mr. McManus who from May 2021 to August 2023 was Executive Chair and CEO of Uni-Select Inc. and from January 2020 to December 2020 was a Partner and Strategic Advisor at Cafa Financial Corporation.
Board Committee Members
There are four committees of the Board of Directors made up of the following members:
Audit and Conduct Review Committee: Jan Babiak (Chair), Craig Broderick, Hazel Claxton, Diane L. Cooper1, Dr. Martin S. Eichenbaum and Madhu Ranganathan.
Governance and Nominating Committee: Christine Edwards (Chair), Jan Babiak, Craig Broderick, George Cope and Lorraine Mitchelmore.
Human Resources Committee: Lorraine Mitchelmore (Chair), George Cope, Stephen Dent, Christine Edwards, David Harquail and Eric La Flèche.
Risk Review Committee: Craig Broderick (Chair), Diane L. Cooper1, Stephen Dent, Dr. Martin S. Eichenbaum, David Harquail, Brian McManus and Lorraine Mitchelmore.
1 Membership effective December 6, 2024.
Executive Officers
As at December 4, 2024, the following were executive officers of the Bank:
|
EXECUTIVE OFFICER NAME
|
PRINCIPAL OCCUPATION
|
MUNICIPALITY OF RESIDENCE
|
||
| Darryl White |
Chief Executive Officer | Toronto, Ontario Canada |
||
| Piyush Agrawal |
Chief Risk Officer | Short Hills, New Jersey U.S.A. |
||
| Darrel Hackett |
U.S. Chief Executive Officer | Chicago, Illinois U.S.A. |
||
| Sharon Haward-Laird |
General Counsel | Toronto, Ontario Canada |
||
| Nadim Hirji |
Group Head, BMO Commercial Bank, North America and Co-Head, Personal and Commercial Banking | Mississauga, Ontario Canada |
||
| Ernie (Erminia) Johannson |
Group Head, North American Personal and Business Banking and Co-Head, Personal and Commercial Banking | Toronto, Ontario Canada |
||
| Deland Kamanga |
Group Head, BMO Wealth Management | Toronto, Ontario Canada |
||
| Mona Malone |
Chief Human Resources Officer and Head of People, Culture & Brand | Toronto, Ontario Canada |
||
| Alan Tannenbaum |
Chief Executive Officer & Group Head, BMO Capital Markets | Bearsville, New York U.S.A. |
||
| Steve Tennyson |
Chief Technology Officer & Operations Officer | Toronto, Ontario Canada |
||
| Tayfun Tuzun |
Chief Financial Officer | Cincinnati, Ohio U.S.A. |
All the executive officers named above have held their present positions or other senior positions with Bank of Montreal or its subsidiaries for the past five years, other than Mr. Tuzun and Mr. Agrawal. Prior to joining BMO, Mr. Tuzun was Executive Vice President and Chief Financial Officer, Fifth Third Bancorp, where he held positions including Senior Vice President, Treasurer and other senior treasury and finance roles. Prior to joining BMO, Mr. Agrawal was Chief Risk Officer and Global Head of Climate Risk, Citibank, N.A., where he held positions including Chief Operating Officer of Citibank N.A., Chief Risk Officer of Asia Pacific, and Head of Corporate Strategy.
Shareholdings of Directors and Executive Officers
To the knowledge of the Bank, as at October 31, 2024, the directors and executive officers of Bank of Montreal, as a group, beneficially owned, directly or indirectly, or exercised control or direction over an aggregate of 255,289 common shares of Bank of Montreal, representing less than 0.1% of Bank of Montreal’s issued and outstanding common shares.
14
Additional Disclosure for Directors and Executive Officers
To the Bank’s knowledge, no director or executive officer of the Bank:
| (a) | is, as at December 4, 2024, or was, within the 10 years before, a director, chief executive officer or chief financial officer of any company (including the Bank): |
| (i) | subject to an order (including a cease trade order or an order similar to a cease trade order or an order that denied the relevant company access to any exemption under securities legislation for a period of more than 30 consecutive days), that was issued while the director or executive officer was acting in the capacity as director, chief executive officer or chief financial officer; or |
| (ii) | subject to an order (including a cease trade order or an order similar to a cease trade order or an order that denied the relevant company access to any exemption under securities legislation for a period of more than 30 consecutive days) that was issued after the director or executive officer ceased to be a director, chief executive officer or chief financial officer and which resulted from an event that occurred while that person was acting in the capacity as director, chief executive officer or chief financial officer; |
| (b) | is, as at December 4, 2024, or has been, within the 10 years before, a director or executive officer of any company (including the Bank), that while that person was acting in that capacity or within a year of the person ceasing to act in that capacity, became bankrupt, made a proposal under any legislation relating to bankruptcy or insolvency or was subject to or instituted any proceedings, arrangement or compromise with creditors or had a receiver, receiver manager or trustee appointed to hold its assets; or |
| (c) | has, within the 10 years before December 4, 2024, become bankrupt, made a proposal under any legislation relating to bankruptcy or insolvency, or become subject to or instituted any proceedings, arrangement or compromise with creditors, or had a receiver, receiver manager or trustee appointed to hold the assets of the director or executive officer, |
except as follows:
| Stephen Dent, a director of the Bank, was a director of Mastermind GP Inc. when it announced on November 23, 2023 that it sought and obtained an initial order for creditor protection under the Companies’ Creditors Arrangement Act. He ceased to be a director of Mastermind on January 16, 2024. |
To the Bank’s knowledge, none of its directors or executive officers have been subject to: (a) any penalties or sanctions imposed by a court relating to securities legislation or by a securities regulatory authority or has entered into a settlement agreement with a securities regulatory authority; or (b) any other penalties or sanctions imposed by a court or regulatory body, that would likely be considered important to a reasonable investor in making an investment decision.
LEGAL PROCEEDINGS AND REGULATORY ACTIONS
A description of certain legal proceedings to which the Bank is a party appears under the heading “Legal Proceedings” in Note 25 of the 2024 Financial Statements, which Note the Bank incorporates herein by reference.
In the ordinary course of business, the Bank and its subsidiaries may be assessed fees or fines by a Canadian securities regulatory authority in relation to administrative matters, including late filings or reporting, which may be considered penalties or sanctions pursuant to Canadian securities regulations but which are not, individually or in the aggregate, material to the Bank. In addition, the Bank and its subsidiaries are subject to numerous regulatory authorities around the world, and accordingly fees, administrative penalties, settlement agreements and sanctions may be categorized differently by certain regulators. Any such penalties imposed under these categories against the Bank and its subsidiaries in the 2024 fiscal year, however, are not material, nor would they likely be considered important to a reasonable investor in making an investment decision. Since November 1, 2023, the Bank and its subsidiaries have not entered into any material settlement agreements with a court relating to securities legislation or with a securities regulatory authority.
TRANSFER AGENT AND REGISTRAR
The registrar and transfer agent for the Bank’s common and preferred shares is Computershare Trust Company of Canada. This agent has transfer facilities in Montreal, Toronto, Calgary and Vancouver. In addition, Computershare Investor Services PLC and Computershare Trust Company, N.A. serve as co-transfer agent and registrar for the common shares in Bristol, United Kingdom and for the common and preferred shares in Canton, Maine, U.S.A., respectively.
INTERESTS OF EXPERTS
The Bank’s Shareholders’ Auditors are KPMG LLP. KPMG LLP audited the Bank’s 2024 Financial Statements, which comprise the consolidated balance sheets as at October 31, 2024 and October 31, 2023, the consolidated statements of income, comprehensive income, changes in equity and cash flows for the years then ended, and notes to the consolidated financial statements, including a summary of material accounting policy information. KPMG LLP have confirmed that they are independent with respect to the Bank within the meaning of the relevant rules and related interpretations prescribed by the relevant professional bodies in Canada and any applicable legislation or regulation, and are independent with respect to the Bank in accordance with the U.S. federal securities laws and the applicable rules and regulations of the U.S. Securities and Exchange Commission and the Public Company Accounting Oversight Board.
15
AUDIT AND CONDUCT REVIEW COMMITTEE INFORMATION
Composition of the Audit and Conduct Review Committee
The following six members make up the Bank’s Audit and Conduct Review Committee: Jan Babiak (Chair), Craig Broderick, Hazel Claxton, Diane L. Cooper1, Dr. Martin S. Eichenbaum and Madhu Ranganathan. The Committee’s responsibilities and duties are set out in the Committee’s charter, which is included in Appendix I to this Annual Information Form.
The Board of Directors has determined that the members of the Audit and Conduct Review Committee reflect a high level of financial literacy and expertise. Each member of the Audit and Conduct Review Committee is “independent” and “financially literate” according to the definitions under Canadian and United States securities laws and the NYSE corporate governance listing standards, and each of Ms. Babiak, Mr. Broderick and Ms. Ranganathan is an “Audit Committee Financial Expert” as defined under United States securities laws. The Board bases these decisions on each Committee member’s education and experience. The following paragraphs describe the relevant education and experience of each Committee member:
Ms. Babiak holds a B.B.A. in accounting from the University of Oklahoma and an M.B.A. from Baldwin Wallace University. She is a Chartered Accountant in the United Kingdom and a Certified Public Accountant in the United States. Ms. Babiak serves on the boards of other public and private companies and was formerly a Managing Partner at Ernst & Young LLP.
Mr. Broderick holds a B.A. from the College of William and Mary. He was formerly a Senior Director, the Chief Risk Officer, a member of the Management Committee, and chair or co-chair of key risk committees of Goldman, Sachs & Co. He spent 32 years with Goldman Sachs, primarily in the risk field.
Ms. Claxton holds a B.Comm (Honours) from Queen’s University and the ICD.D designation from the Institute of Corporate Directors. She is also a Chartered Professional Accountant and Chartered Accountant in Ontario. Ms. Claxton serves on the boards of other public and private companies and was formerly Executive Vice President and Chief HR Officer of Morneau Shepell Inc. (now part of TELUS Health). Prior to that, Ms. Claxton spent 29 years at PwC Canada, where she progressed to hold several leadership roles.
Ms. Cooper holds a B.A. (Business) and M.B.A. from Baker University. She was formerly President and CEO of GE Capital’s Commercial Distribution business and an officer of GE Company. She also led the GE Capital Equipment Finance and Franchise Finance businesses and previously held senior roles in Franchise Finance, Real Estate and Consumer Finance at GE. She serves on the Board of BMO’s U.S. subsidiary BMO Financial Corp, BMO Bank N.A. and StoneX Group.
Dr. Eichenbaum received a B.Comm from McGill University and a Doctorate in Economics from the University of Minnesota. He served on the advisory council of the Global Markets Institute at Goldman Sachs. He completed a four-year term as co-editor of the American Economic Review in 2015. He has served as a consultant to the Federal Reserve Banks in Atlanta and Chicago and the International Monetary Fund.
Ms. Ranganathan holds an M.B.A. from the University of Massachusetts and a B.S. Accounting from the University of Madras. She is a member of the Institute of Chartered Accountants in India and member of the American Institute of Certified Public Accountants in the United States. Ms. Ranganathan is the Executive Vice President and Chief Financial Officer of OpenText Corporation. Prior to March 2018, she was the Chief Finance Officer of [24]7.ai, Inc. Ms. Ranganathan currently serves as a Board Member & Audit Committee Chair for Akamai Technologies, Inc.
1 Membership effective December 6, 2024.
Shareholders’ Auditors’ Pre-Approval Policies and Procedures and Fees
For information about the fees paid to KPMG LLP, in the years ended October 31, 2024 and 2023, and the related pre-approval policies and procedures, see page 115 of the 2024 MD&A, which page the Bank incorporates herein by reference.
ADDITIONAL INFORMATION
You can find additional information about Bank of Montreal on the Bank’s web site at https://www.bmo.com/main/about-bmo/banking/investor-relations/home, on SEDAR+ (System for Electronic Document Analysis and Retrieval) at www.sedarplus.ca, and on the SEC’s web site at www.sec.gov/edgar. Information contained in or otherwise accessible through the websites mentioned herein does not form part of this document.
The Bank’s proxy circulars contain more information, including directors’ and executive officers’ compensation, debt, principal holders of the Bank’s securities, and shareholdings under equity compensation plans, in each case where applicable. The most recent circular is dated February 7, 2024, in connection with the Bank’s Annual Meeting of Shareholders on April 16, 2024 (the 2024 Proxy Circular). The Bank expects the next proxy circular to be approved January 24, 2025 and dated as of February 5, 2025, in connection with the Bank’s Annual Meeting of Shareholders on April 11, 2025.
The 2024 Financial Statements and the 2024 MD&A for the fiscal year ended October 31, 2024 provide additional financial information.
16
You can get copies of this Annual Information Form, as well as copies of the 2024 Financial Statements, the 2024 MD&A, the Bank’s 2024 Annual Report, and the 2024 Proxy Circular (after the Bank has mailed these documents to shareholders) by contacting the Bank at:
Bank of Montreal
Corporate Secretary’s Department
100 King Street West
Toronto, Ontario
Canada M5X 1A1
Telephone: 416 867 6785
Email: corp.secretary@bmo.com
17
APPENDIX I
BANK OF MONTREAL
AUDIT AND CONDUCT REVIEW COMMITTEE CHARTER
1 First Canadian Place, 9th Floor The Committee is responsible for assisting the Board in fulfilling its oversight responsibilities for the integrity of the Bank’s financial and sustainability reporting, including climate disclosures; the effectiveness of the Bank’s internal controls; the independent auditor’s qualifications, independence and performance; the Bank’s compliance with legal and regulatory requirements; transactions involving related parties; conflicts of interest and confidential information; standards of business conduct and ethics; and consumer protection measures and complaints.
| In addition, the Committee will also act as the audit and conduct review committee of Designated Subsidiaries. | ||||
|
|
||||
|
PART I MANDATE |
||||
|
|
||||
The Committee will, either directly or through one or more sub-committees, perform the duties set out in this Charter and such other duties as may be necessary or appropriate including:
| 1.1 | Financial Reporting |
| 1.1.1 | reviewing, together with management and the Shareholders’ Auditors: |
| (i) | the appropriateness of, and any changes to, the Bank’s accounting and financial reporting; |
| (ii) | the accounting treatment, presentation and impact of significant risks and uncertainties; |
| (iii) | any material relevant proposed changes in accounting standards and securities policies or regulations; |
| (iv) | key estimates and judgments of management; |
| (v) | significant auditing and financial reporting issues and the method of resolution; |
| (vi) | tax matters that are material to the financial statements; and |
| (vii) | enterprise sustainability disclosures required to be included in financial reporting. |
| 1.1.2 | reviewing, together with management and the Shareholders’ Auditors, and approving or, if appropriate, recommending to the Board: |
| (i) | prior to Board review or public disclosure, the audited annual and unaudited interim financial statements and related management’s discussion and analysis, the annual information form, and any other financial or non-financial (as considered appropriate) information in material public disclosure documents (other than earnings coverage ratios, capitalization tables and summary financial information derived from any of the foregoing); and |
| (ii) | such returns to OSFI requiring review under the Bank Act (Canada); |
| 1.1.3 | seeking confirmation from management that the Bank’s annual and interim financial filings, fairly present in all material respects the financial condition, results of operations and cash flows of the Bank as of the relevant date and for the relevant periods, prior to recommending to the Board for approval; |
| 1.1.4 | reviewing the types of information to be provided and types of presentations to be made to rating agencies and analysts (if any) relating to earnings guidance, and |
| 1.1.5 | satisfying itself that adequate procedures are in place for the review of financial information extracted or derived from the Bank’s financial statements that is to be publicly disclosed and has not otherwise been reviewed by the Committee. |
| 1.2 | Internal Controls |
| 1.2.1 | overseeing the design, implementation, maintenance and effectiveness of the Bank’s internal controls, including those related to the prevention, identification and detection of fraud; and reviewing and monitoring other Bank Corporate Policies as the Committee considers appropriate; |
| 1.2.2 | requiring management to design, implement, and maintain appropriate internal control procedures; |
| 1.2.3 | reviewing management’s certifications and assessment of the Bank’s internal control over financial reporting and the associated Shareholders’ Auditors’ report; |
| 1.2.4 | reviewing reports on the effectiveness of disclosure controls and procedures; |
| 1.2.5 | reviewing and discussing reports from management and the Chief Auditor as to the identification of any significant deficiencies or material weaknesses in the design or operation of the Bank’s internal control, risk management, and governance systems and processes, including controls over financial reporting; reviewing any recommendations, as well as remediation plans, including the status of remediation plans implemented by management to rectify any such deficiencies identified; and discussing whether similar or related deficiencies may exist elsewhere in the Bank; and |
I-1
| 1.2.6 | reviewing as required, correspondence relating to inquiries or investigations by regulators concerning internal controls. |
| 1.3 | Internal Audit Function |
| 1.3.1 | overseeing and reviewing at least annually the overall internal audit function, its resources and independence, and reviewing and approving the annual audit plan, including assurance that the audit plan is risk-based and encompasses appropriate audit coverage, audit cycle requirements, and provides a basis for reliance by the Committee; |
| 1.3.2 | reviewing and approving the Bank’s Corporate Audit Mandate setting out the terms of reference of the internal audit function and the Chief Auditor; |
| 1.3.3 | reviewing, and jointly with the Human Resources Committee, recommending to the Board, the appointment, re-assignment or dismissal of the Chief Auditor, as required; and annually assessing the effectiveness of the Chief Auditor, in conjunction with the Human Resources Committee, and reviewing and approving his or her mandate; |
| 1.3.4 | annually reviewing and approving the organizational structure, budget, resource plan and strategic priorities of the Corporate Audit function and assessing its effectiveness having regard to its role as an independent control function; |
| 1.3.5 | reviewing the results of periodic independent reviews of the Corporate Audit function; |
| 1.3.6 | reviewing the quarterly report of the Chief Auditor, together with management’s response; |
| 1.3.7 | reviewing any other reports submitted to the Committee by the Chief Auditor; |
| 1.3.8 | communicating directly with the Chief Auditor and participating in his or her initial and ongoing engagement and evaluation; and |
| 1.3.9 | overseeing the resolution of any disagreements between the Chief Auditor and management. |
| 1.4 | Shareholders’ Auditors |
| 1.4.1 | reviewing and evaluating the quality, independence, objectivity and professional skepticism of the Shareholders’ Auditors and the lead audit partner; |
| 1.4.2 | annually reviewing the performance of the Shareholders’ Auditors including assessing their effectiveness and quality of service, to facilitate an informed recommendation on re-appointment of the Shareholders’ Auditors and, on a periodic basis, performing a comprehensive review of the performance of the Shareholders’ Auditors over multiple years to assess the audit firm, its independence and application of professional skepticism; |
| 1.4.3 | reviewing Shareholders’ Auditors’ audit findings reports with the Shareholders’ Auditors, the Chief Auditor, and management including: |
| (i) | the quality of the financial statements; |
| (ii) | the Shareholders’ Auditors’ evaluation of the Bank’s internal control over financial reporting; |
| (iii) | the degree of cooperation the Shareholders’ Auditors received from management; any problems or difficulties experienced by the Shareholders’ Auditors in conducting the audit, including management’s responses in respect thereof, any restrictions imposed by management or significant accounting issues on which there was a disagreement with management; |
| (iv) | any concerns expressed by the Shareholders’ Auditors related to accounting and auditing matters, including the risk of material misstatements; |
| (v) | the appropriateness and quality of all critical accounting policies and practices used by the Bank and of the selection of new policies and practices; and |
| (vi) | any material judgments that have been discussed with management, the ramifications of their use and the Shareholders’ Auditors’ preferred treatment, as well as any other material communications with management, and advising the Board of these matters as considered appropriate; |
| 1.4.4 | overseeing the resolution of any disagreements between the Shareholders’ Auditors and management; |
| 1.4.5 | reviewing all material correspondence between the Shareholders’ Auditors and management related to audit findings; |
| 1.4.6 | reviewing the Shareholders’ Auditors’ report under Section 328 of the Bank Act (Canada); |
| 1.4.7 | obtaining and reviewing a report from the Shareholders’ Auditors at least annually addressing: (i) the Shareholders’ Auditors’ internal quality control procedures; (ii) any material issues raised by the most recent internal quality-control review or peer review of the Shareholders’ Auditors, or by any inquiry or investigation by governmental or professional authorities including the Canadian Public Accountability Board and the Public Company Accounting Oversight Board, within the preceding five years, respecting one or more audits carried out by the Shareholders’ Auditors; (iii) any steps taken to deal with any such issues; (iv) the Shareholders’ Auditors’ internal procedures to ensure independence; and (v) the delineation of all relationships between the Shareholders’ Auditors and the Bank; |
| 1.4.8 | reviewing any notices required to be communicated/delivered by the Shareholders’ Auditors to the Committee, including those required by the Canadian Public Accountability Board, Office of the Superintendent of Financial Institutions, and the U.S. Public Accounting Oversight Board, and taking such action and making recommendations to the Board as appropriate in connection therewith; |
| 1.4.9 | reviewing and approving the terms of the Shareholders’ Auditors’ engagement, the annual audit plan, including assurance that the audit plan is risk-based and appropriately addresses the risks of material misstatement, as well as any change in the materiality level used by the Shareholders’ Auditors, and audit partner rotation and reviewing and recommending to the Board for approval the fees payable to the Shareholders’ Auditors; |
| 1.4.10 | reviewing an annual written confirmation of the Shareholders’ Auditors that they are independent in accordance with applicable independence rules and report directly to the Committee, as representatives of the Bank’s shareholders; |
I-2
| 1.4.11 | reviewing and recommending to the Board the approval of the Bank’s Auditor Independence Standard; |
| 1.4.12 | pre-approving audit services and permitted non-audit services by the Shareholders’ Auditors in accordance with the Bank’s Auditor Independence Standard; and |
| 1.4.13 | reviewing and approving the Bank’s policies for hiring current or former partners or employees of the current or former Shareholders’ Auditors. |
| 1.5 | Finance, Legal & Regulatory Compliance Functions |
| 1.5.1 | reviewing and, jointly with the Human Resources Committee, recommending to the Board the respective appointment, re-assignment or dismissal of the Chief Financial Officer, the General Counsel and the Chief Compliance Officer, as required; and annually assessing, in conjunction with the Human Resources Committee, the effectiveness of the Chief Financial Officer, the General Counsel and the Chief Compliance Officer, and reviewing and approving their respective mandates; |
| 1.5.2 | annually reviewing and approving the organizational structure, budget, resource plan and strategic priorities of the finance and legal & compliance functions and assessing their effectiveness having regard to their respective roles as independent control functions; |
| 1.5.3 | reviewing the results of periodic independent reviews of the finance and compliance functions; and |
| 1.5.4 | reviewing and overseeing the status of remediation plans implemented by management to rectify any deficiencies identified. |
| 1.6 | Financial Risk Management |
| 1.6.1 | monitoring the Bank’s major financial risk exposures and the steps management has taken to monitor and control such exposures; and |
| 1.6.2 | reviewing investments or transactions that could adversely affect the wellbeing of the Bank which the Shareholders’ Auditors or any officer of the Bank may bring to the Committee’s attention. |
| 1.7 | Legal & Regulatory Compliance |
| 1.7.1 | reviewing and approving the Legal, Regulatory and Reputation Risk Corporate Policy; |
| 1.7.2 | reviewing, with the Bank’s General Counsel and the Chief Compliance Officer, the adequacy and effectiveness of the Bank’s enterprise compliance program and the results of related monitoring and oversight activities; |
| 1.7.3 | reviewing with the Bank’s General Counsel an annual report on significant matters arising from litigation, asserted claims or regulatory non-compliance and reviewing quarterly any material developments; |
| 1.7.4 | reviewing and approving the appointment, re-assignment or dismissal of the Chief Anti-Money Laundering Officer, as required; |
| 1.7.5 | reviewing and approving the Bank’s Anti-Money Laundering and Anti-Terrorist Financing Program framework, including key policies and any significant amendments and the budget, resources and strategic priorities for the Anti-Money Laundering and Anti-Terrorist Financing Program function; |
| 1.7.6 | meeting, at least annually, with the Chief Anti-Money Laundering Officer and the Chief Auditor to review their respective reports on the Anti-Money Laundering and Anti-Terrorist Financing Program; |
| 1.7.7 | meeting annually with representatives of OSFI as a Committee or as part of the Board, to receive OSFI’s report on the results of its annual examination of the Bank; and |
| 1.7.8 | reviewing any other relevant reports of regulators to the Bank and any required action by management. |
| 1.8 | Business Conduct and Sustainability |
| 1.8.1 | reviewing and recommending for Board approval BMO’s Code of Conduct; |
| 1.8.2 | approving any exceptions from BMO’s Code of Conduct, as appropriate; |
| 1.8.3 | assessing the effectiveness of the Bank’s governance frameworks aimed at (i) fostering an ethical culture, (ii) encouraging compliance with both the letter and spirit of applicable laws, regulations and consumer protections, and (iii) reducing misconduct; |
| 1.8.4 | reviewing BMO’s Whistleblower Process for the confidential anonymous submission and handling of misconduct concerns, including concerns about financial fraud, accounting irregularities, internal controls over financial reporting or auditing matters, by anyone inside or outside of the Bank; |
| 1.8.5 | reviewing reports from the Chief Ethics Officer and Head, Customer Complaint Appeals relating to whistleblower and/or customer concerns; |
| 1.8.6 | approving prior to disclosure BMO’s Sustainability Report and Public Accountability Statement, including the BMO Climate Report, and related disclosures, overseeing internal controls on sustainability reporting, and overseeing any external assurances or attestations regarding reported sustainability metrics; |
| 1.8.7 | assessing the effectiveness of the Bank’s governance of sustainability issues; and |
| 1.8.8 | reviewing and approving the Bank’s Statement Against Modern Slavery and Human Trafficking. |
I-3
| 1.9 | Self Dealing |
| 1.9.1 | overseeing the effectiveness of self-dealing identification and procedures established by management for related and affected parties and monitoring compliance with applicable laws; |
| 1.9.2 | reviewing and approving as considered appropriate: (i) practices to identify related party transactions that could have a material effect on the stability or solvency of the Bank and; (ii) the measurement criteria and benchmarks for permitted related party transactions; |
| 1.9.3 | reviewing and, if advisable, approving the terms and conditions of related party loans that exceed established benchmarks; and |
| 1.9.4 | reviewing reports to the Committee on related and affected party transactions. |
| 1.10 | Conflicts of Interest and Confidential Information |
| 1.10.1 | overseeing the Bank’s procedures to identify, resolve and, where possible, reduce incidences of, conflicts of interest; |
| 1.10.2 | overseeing the Bank’s procedures to restrict the use and disclosure of confidential information; |
| 1.10.3 | reviewing and approving the Bank’s Disclosure Standard; |
| 1.10.4 | reviewing reports to the Committee relating to the use and disclosure of customer and employee information; and |
| 1.10.5 | overseeing the Bank’s compliance with privacy legislation. |
| 1.11 | Consumer Protection Measures and Complaints |
| 1.11.1 | overseeing and reviewing the Bank’s consumer protection procedures to comply with the Consumer Provisions, as such term is defined in the Financial Consumer Agency of Canada Act; |
| 1.11.2 | reviewing an annual report on the implementation of the consumer protection procedures, and on any other activities that the Bank carries out in relation to the protection of its customers; |
| 1.11.3 | reviewing the annual report of the Customer Complaint Appeal Office on complaint resolution; and |
| 1.11.4 | overseeing the Bank’s compliance with any orders or compliance agreements imposed by the FCAC. |
| 1.12 | Aircraft and Chief Executive Officer Expense Accounts |
| 1.12.1 | reviewing and approving, on an annual basis, the report on Bank aircraft and Chief Executive Officer expense accounts; and |
| 1.12.2 | the chair of the Committee will review, on a quarterly basis, the report on Chief Executive Officer expense accounts. |
I-4
|
|
PART II
COMPOSITION
|
|
| 2.1 | Members |
| 2.1.1 | The Committee will consist of three or more directors as determined by the Board. At least a majority of the members of the Committee will not be “affiliated” with the Bank for the purposes of the Bank Act (Canada). Each member of the Committee will be: (i) a director who is not an officer or employee of the Bank or an affiliate of the Bank; and (ii) “independent” for the purposes of applicable Canadian and United States securities laws and the New York Stock Exchange Rules. |
| 2.1.2 | Committee members will be Financially Literate or become so within a reasonable period after appointment to the Committee. At least one Committee member will qualify as an Audit Committee Financial Expert. Committee members will not serve on more than three public company audit committees without the approval of the Board. |
| 2.1.3 | The Board will, having considered the recommendation of the Governance and Nominating Committee, appoint the members of the Committee and the chair of the Committee annually following the meeting of the shareholders at which directors are elected each year. The Board may appoint a member to fill a vacancy which occurs in the Committee between annual elections of directors and increase the number of Committee members as it determines appropriate. If a member of the Committee becomes “affiliated” with the Bank for the purposes of the Bank Act (Canada), the member may continue as a member of the Committee with the approval of the Governance and Nominating Committee, in consultation with the Bank’s General Counsel. Any member of the Committee may be removed or replaced at any time by the Board. |
| 2.1.4 | In addition to any orientation provided by the Governance and Nominating Committee, the chair of the Committee will provide orientation to new members of the Committee with respect to their duties and responsibilities as members of the Committee. |
| 2.1.5 | The Committee may invite other directors to attend Committee meetings or otherwise provide input as needed to acquire additional specific skills as required to carry out its mandate. |
|
|
PART III
COMMITTEE PROCEDURE
|
|
| 3.1 | Meetings |
| 3.1.1 | The Committee will meet as frequently as it determines necessary but not less than once each quarter. Meetings may be called by the Chair of the Board, the chair of the Committee or any two members of the Committee. The chair of the Committee must call a meeting when requested to do so by any member of the Committee, the Shareholders’ Auditors, the Chief Auditor, the Chair of the Board, the Chief Executive Officer, the Chief Financial Officer or the General Counsel |
| 3.1.2 | Notice of the time and place of each meeting of the Committee, other than ad hoc meetings, will be given to each member of the Committee and the Shareholders’ Auditors, not less than 48 hours before the time when the meeting is to be held. A quorum of the Committee will be a majority of its members. The powers of the Committee may be exercised at a meeting at which a quorum of the Committee is present in person or by telephone or other electronic means or by a resolution signed by all members entitled to vote on that resolution at a meeting of the Committee. Each member is entitled to one vote in Committee proceedings. |
| 3.1.3 | Notice of the time and place of ad hoc meetings will be given to each member not less than two hours before the time when the meeting is to be held. |
| 3.1.4 | The chair of the Committee will preside at all meetings of the Committee at which he or she is present and will, in consultation with the Chief Financial Officer, the Chief Auditor, the General Counsel and the Shareholders’ Auditors, develop the agenda for each Committee meeting. The agenda for each meeting of the Committee, other than ad hoc meetings, will be delivered together with such other materials as the chair determines necessary, to each member of the Committee at least 48 hours prior to the meeting. The chair will designate from time to time a person who may be, but need not be, a member of the Committee, to be secretary of the Committee. Minutes will be kept of all meetings of the Committee and will be maintained by the Bank’s Corporate Secretary. |
| 3.1.5 | The procedure at meetings is to be determined by the Committee unless otherwise determined by the By-Laws of the Bank, by a resolution of the Board or by this Charter. |
| 3.1.6 | The Committee will meet at least quarterly in separate private sessions with each of the Shareholders’ Auditors and the Chief Auditor, and as appropriate with management including the Chief Financial Officer, the General Counsel, the Chief Compliance Officer and the Chief Anti-Money Laundering Officer. |
| 3.1.7 | The Committee will meet at the end of each meeting with only members of the Committee present. |
I-5
| 3.1.8 | The Committee may invite any director, officer or employee of the Bank or the Bank’s counsel or the Shareholders’ Auditors or any other person, as appropriate, to attend meetings of the Committee to assist in the discussion and examination of the matters under consideration by the Committee. The Shareholders’ Auditors will, at the expense of the Bank, be entitled to attend and be heard at any meeting of the Committee. |
| 3.2 | Reports |
| 3.2.1 | The Committee will report the proceedings of each meeting and all recommendations made by the Committee at such meeting to the Board at the Board’s next meeting. The Committee will make such recommendations to the Board as it may deem appropriate and will have such decision-making authority as the Board may determine from time to time. The Committee will approve the report of the Committee to be included in the Bank’s Management Proxy Circular and such other reports relating to the activities of the Committee as may be required by the Bank or the Board from time to time. In addition, the Committee will prepare and submit to the Board for its review and approval the reports required to be submitted by the Board within 90 days after the financial year-end of the Bank concerning the activities of the Committee during the year to (i) OSFI in carrying out its conduct review responsibilities and (ii) the FCAC in carrying out its consumer protection review responsibilities. |
| 3.3 | Access to Management and Outside Advisors and Continuing Education |
| 3.3.1 | The Committee will have full, free and unrestricted access to management and employees, the Chief Auditor and the Shareholders’ Auditors. The Committee has the authority to engage independent legal counsel, consultants or other advisors, with respect to any issue or to assist it in fulfilling its responsibilities without consulting or obtaining the approval of any officer of the Bank and the Bank will provide appropriate funding, as determined by the Committee, for the payment of: compensation to the Shareholders’ Auditors engaged for the purpose of preparing or issuing an auditor’s report or performing the audit, review or attest services for the Bank; compensation to any advisors employed by the Committee; and ordinary administrative expenses of the Committee that are necessary or appropriate in carrying out its duties. |
| 3.3.2 | The Committee will have access to continuing education programs to assist the Committee in fulfilling its responsibilities and the Bank will provide appropriate funding for such programs. |
| 3.4 | Annual Review and Assessment |
| 3.4.1 | The Committee will ensure that an annual review and assessment of the Committee’s performance and effectiveness, including a review of its compliance with this Charter, will be conducted in accordance with the process developed by the Board’s Governance and Nominating Committee and approved by the Board. The results thereof will be reported in accordance with the process established by the Board’s Governance and Nominating Committee and approved by the Board. |
| 3.4.2 | The Committee will review and assess the adequacy of this Charter on an annual basis taking into account all legislative and regulatory requirements applicable to the Committee as well as any best practice guidelines recommended by regulators or stock exchanges with whom the Bank has a reporting relationship and, if appropriate, will recommend changes to the Board’s Governance and Nominating Committee. |
| 3.5 | Definitions |
“Audit Committee Financial Expert” means a person who has the following attributes:
| (i) | an understanding of generally accepted accounting principles and financial statements; |
| (ii) | the ability to assess the general application of such principles in connection with the accounting for estimates, accruals and reserves; |
| (iii) | experience preparing, auditing, analyzing or evaluating financial statements that present a breadth and level of complexity of accounting issues that are generally comparable to the breadth and complexity of issues that can reasonably be expected to be raised by the Bank’s financial statements, or experience actively supervising one or more persons engaged in such activities; |
| (iv) | an understanding of internal control over financial reporting; and |
| (v) | an understanding of audit committee functions, acquired through any one or more of the following: |
| a) | education and experience as a principal financial officer, principal accounting officer, controller, public accountant or auditor or experience in one or more positions that involve the performance of similar functions; |
| b) | experience actively supervising a principal financial officer, principal accounting officer, controller, public accountant, auditor or person performing similar functions; |
| c) | experience overseeing or assessing the performance of companies or public accountants with respect to the preparation, auditing or evaluation of financial statements; or |
| d) | other relevant experience. |
I-6
“Auditor Independence Standard” means the Bank’s Auditor Independence Standard that provides guidance for engaging the Shareholders’ Auditors to perform audit and permitted non-audit services for the Bank, its subsidiaries and material entities over which the Bank has significant influence.
“Bank” means Bank of Montreal and as the context requires, subsidiaries of the Bank.
“Board” means the Board of Directors of Bank of Montreal.
“Committee” means the Audit and Conduct Review Committee of the Board of Directors of Bank of Montreal.
“Designated Subsidiary” means as requested by the Board, those subsidiaries of the Bank for which the Committee will act as audit and conduct review committee.
“FCAC” means the Financial Consumer Agency of Canada.
“Financially Literate” means the ability to read and understand a set of financial statements that present a breadth and level of complexity of accounting issues that are generally comparable to the breadth and complexity of the issues that can reasonably be expected to be raised by the Bank’s financial statements.
“OSFI” means the Office of the Superintendent of Financial Institutions.
“Shareholders’ Auditors” mean the independent financial statement auditors of the Bank.
I-7
APPENDIX II
CREDIT RATING CATEGORIES
| (a) | Standard & Poor’s (“S&P”) |
S&P has different rating scales for short-term debt, long-term debt and preferred shares. S&P short-term issue credit ratings are generally assigned to those obligations considered short-term in the relevant market. Short-term ratings are also used to indicate the creditworthiness of an obligor with respect to put features on long-term obligations. A short-term obligation rated A-1 is in the highest category and indicates S&P’s view that an obligor’s capacity to meet its financial commitments on these obligations is strong.
S&P long-term issue credit ratings are based, in varying degrees, on the analysis of the following considerations: likelihood of payment—capacity and willingness of the obligor to meet its financial commitments on an obligation in accordance with the terms of the obligation; nature of and provisions of the financial obligation; and protection afforded to, and relative position of, the financial obligation in the event of bankruptcy, reorganization, or other arrangement under the laws of bankruptcy and other laws affecting creditors’ rights. An obligation rated A means the obligation is somewhat more susceptible to the adverse effects of changes in circumstances and economic conditions than obligations in higher-rated categories, however, the obligor’s capacity to meet its financial commitment on the obligation is still strong. An obligation rated BBB indicates that the obligation exhibits adequate protection parameters, however, adverse economic conditions or changing circumstances are more likely to weaken the obligor’s capacity to meet its financial commitments on the obligation. Ratings from AA to CCC may be modified by the addition of a plus (+) or minus (–) sign to show relative standing within the rating categories.
The S&P preferred share rating on the Canadian scale is a forward-looking opinion about the creditworthiness of an obligor with respect to a specific preferred share obligation issued in the Canadian market, relative to preferred shares issued by other issuers in the Canadian market. The Canadian scale rating is fully determined by the applicable global scale rating, and there are no additional analytical criteria associated with the determination of ratings on the Canadian scale. The BBB and BBB- preferred share ratings on the Global Scale correspond to a P-2 and P-2(Low) rating, respectively, on the Canadian National Preferred Share Scale.
A rating outlook assesses the potential direction of a long-term credit rating over the intermediate term (generally up to two years). In determining a rating outlook, consideration is given to any changes in the economic and/or fundamental business conditions. A positive or negative outlook is not necessarily a precursor of a future rating change or CreditWatch listing.
The “Stable” rating outlook means that a rating is not likely to change.
| (b) | Moody’s Investors Service (“Moody’s”) |
Moody’s has different rating scales for short-term ratings and long-term ratings.
Ratings assigned by Moody’s are forward-looking opinions of the relative credit risks of financial obligations issued by non-financial corporates, financial institutions, structured finance vehicles, project finance vehicles, and public sector entities.
Moody’s short-term ratings are assigned to obligations with an original maturity of 13 months or less and reflect both on the likelihood of a default or impairment on contractual financial obligations and the expected financial loss suffered in the event of default or impairment. The P-1 rating is the highest of four rating categories and indicates issuers (or supporting institutions) that have a superior ability to repay short-term debt obligations.
Moody’s long-term ratings are assigned to issuers or obligations with an original maturity of 11 months or more and reflect both on the likelihood of a default or impairment on contractual financial obligations and the expected financial loss suffered in the event of default or impairment. Obligations rated Aa are judged to be of high quality and are subject to very low credit risk. Obligations rated A are judged to be upper-medium grade and subject to low credit risk. Obligations rated Baa are judged to be medium-grade and subject to moderate credit risk and as such may possess certain speculative characteristics. Moody’s appends numerical modifiers 1, 2, and 3 to each generic rating classification from Aa through Caa. The modifier 1 indicates that the obligation ranks in the higher end of its generic rating category; the modifier 2 indicates a mid-range ranking; and the modifier 3 indicates a ranking in the lower end of that generic rating category. Additionally, a “(hyb)” indicator is appended to all ratings of hybrid securities issued by banks, insurers, finance companies, and securities firms.
Moody’s Issuer Ratings are opinions of the ability of entities to honour senior unsecured debt and debt-like obligations.
The Moody’s rating outlook is an opinion regarding the likely rating direction over the medium term.
The “Stable” outlook indicates a low likelihood of a rating change over the medium term.
| (c) | DBRS Morningstar (“DBRS”) |
DBRS has different rating scales for short-term debt, long-term debt and preferred shares. DBRS rating approach is based on a combination of quantitative and qualitative considerations.
The DBRS short-term debt rating scale provides an opinion on the risk that an issuer will not meet its short-term financial obligations in a timely manner. The R-1 and R-2 rating categories are further denoted by the subcategories “high”, “middle” and “low”. An obligation rated R-1(high) is of the highest credit quality and indicates the capacity for the payment of short-term financial obligations as they fall due is exceptionally high; unlikely to be adversely affected by future events.
II-1
The DBRS long-term rating scale provides an opinion on the risk of default. That is, the risk that an issuer will fail to satisfy its financial obligations in accordance with the terms under which the obligations have been issued. All rating categories other than AAA and CCC also contain subcategories “(high)” and “(low)”. The absence of either a “(high)” or “(low)” designation indicates the rating is in the middle of the category. Long-term financial obligations rated AA are of superior credit quality and the capacity for payment is considered high; credit quality differs from AAA only to a small degree; unlikely to be significantly vulnerable to future events. Long-term financial obligations rated A are of good credit quality and the capacity for payment is considered substantial, but of lesser credit quality than AA; may be vulnerable to future events but qualifying negative factors are considered manageable.
The DBRS preferred share rating scale is used in the Canadian securities market and reflects an opinion on the risk that an issuer will not fulfill its obligations with respect to both dividend and principal commitments in accordance with the terms under which the relevant preferred shares were issued. Each rating category may be denoted by the subcategories “high” and “low”. The absence of either a “high” or “low” designation indicates the rating is in the middle of the category. The Pfd-2 rating generally indicates good credit quality.
The Rating Trend indicates the direction in which DBRS Morningstar considers the rating may move if present circumstances continue.
The “Stable” rating trend indicates a lower likelihood that the rating could change in the future than would be the case if the rating trend was “Positive” or “Negative”.
| (d) | Fitch |
Fitch publishes opinions on a variety of scales.
A short-term issuer or obligation rating is based on the short-term vulnerability to default of the rated entity and relates to the capacity to meet financial obligations in accordance with the documentation governing the relevant obligation. For banks, “short term” typically means up to 13 months. A rating of F1+ indicates the highest short-term credit quality. The added “+” denotes an exceptionally strong credit feature.
Rated entities in a number of sectors, including financial and non-financial corporations, are generally assigned Issuer Default Ratings (“IDRs”). IDRs opine on an entity’s relative vulnerability to default on financial obligations. A rating of AA indicates a very high credit quality and denotes expectation of very low default risk. A rating of A indicates a high credit quality and denotes expectation of low default risk. The modifiers “+” or “-” may be appended to a rating to denote relative status within major rating categories.
Rating Outlooks indicate the direction a rating is likely to move over a one to two-year period. They reflect financial or other trends that have not yet reached or been sustained at the level that would cause a rating action, but which may do so if such trends continue. A Positive or Negative Rating Outlook does not imply that a rating change is inevitable.
The “Stable” rating outlook means that the rating is not likely to change over a one to two-year period.
II-2
Topic |
EDTF Disclosure |
Page number |
||||||||||||
Annual Report |
SFI |
SRCI |
||||||||||||
General |
1. Risk-related information in each report, including an index for easy navigation |
68-109 | Index | Index | ||||||||||
2. Risk terminology, measures and key parameters |
72-109,117-119 |
|||||||||||||
3. Top and emerging risks |
68-70 | |||||||||||||
4. Plans to meet new key regulatory ratios once applicable rules are finalized |
62 | |||||||||||||
|
Risk Governance, Risk Management and Business Model |
5. Risk management and governance framework, processes and key functions |
72-76 | ||||||||||||
6. Risk culture, risk appetite and procedures to support the culture |
76 | |||||||||||||
7. Risks that arise from business models and activities |
74-75 | |||||||||||||
8. Stress testing within the risk governance and capital frameworks |
76 | |||||||||||||
|
Capital Adequacy and Risk-Weighted Assets (RWA) |
9. Pillar 1 capital requirements |
60-63 | 5-6,15 | |||||||||||
10. Composition of capital components and reconciliation of the accounting balance sheet to the regulatory balance sheet. A main features template can be found at: Regulatory Disclosure |
63-64 | 5-7,17-18 | ||||||||||||
11. Flow statement of movements in regulatory capital, including changes in Common Equity Tier 1 Capital, Additional Tier 1 Capital and Tier 2 Capital |
8 | |||||||||||||
12. Capital management and strategic planning |
59,65-66 | |||||||||||||
13. Risk-weighted assets (RWA) by operating group |
64 | 16 | ||||||||||||
14. Analysis of capital requirements for each method used in calculating RWA |
63-64,77-80 | |
16,23-50,
56-68,87-92
|
|
||||||||||
15. Tabulate credit risk in the banking book for Basel asset classes and major portfolios |
|
23-50,52-68, 90-92 |
|
|||||||||||
16. Flow statement that reconciles movements in RWA by credit risk and market risk |
51,84 | |||||||||||||
17. Basel validation and back-testing process, including estimated and actual loss parameter information |
103-104 | 93-95 | ||||||||||||
Liquidity |
18. Management of liquidity needs and liquidity reserve held to meet those needs |
91-97 | ||||||||||||
Funding |
19. Encumbered and unencumbered assets disclosed by balance sheet category |
93 | 44 | |||||||||||
20. Consolidated total assets, liabilities and off-balance sheet commitments by remaining contractual maturity |
98-99 | |||||||||||||
21. Analysis of funding sources and funding strategy |
94-95 | |||||||||||||
Market Risk |
22. Linkage of trading and non-trading market risk to the consolidated balance sheet |
89 | ||||||||||||
23. Significant trading and non-trading market risk factors |
85-89 | |||||||||||||
24. Market risk model assumptions, validation procedures and back-testing |
85-89,104 | |||||||||||||
25. Primary techniques for risk measurement and risk assessment, including risk of loss |
85-89 | |||||||||||||
Credit Risk |
26. Analysis of credit risk profile, exposures and concentration |
|
77-84, 148-155
|
|
24-41 | 16-82 | ||||||||
27. Policies to identify impaired loans and renegotiated loans |
148-150,155 | |||||||||||||
28. Reconciliation of opening and closing balances of impaired loans and allowance for credit losses |
83,151 | |||||||||||||
29. Counterparty credit risk arising from derivative transactions |
77-78,84,167-168 | 56-74 | ||||||||||||
30. Credit risk mitigation |
|
77-78,150,159, 200-201
|
|
22,52-53,69 |
||||||||||
Other Risks |
31. Discussion of other risks |
72-74,100-109 | ||||||||||||
32. Publicly known risk events involving material or potentially material loss events |
100-109 | |||||||||||||
| BMO Financial Group 207th Annual Report 2024 | 13 |
Index |
||||
15 |
||||||
16 |
||||||
17 |
||||||
20 |
||||||
21 |
||||||
25 |
||||||
26 |
||||||
33 |
||||||
33 |
||||||
34 |
||||||
35 |
||||||
39 |
||||||
43 |
||||||
47 |
||||||
50 |
||||||
52 |
||||||
53 |
||||||
55 |
||||||
57 |
||||||
57 |
||||||
59 |
||||||
66 |
||||||
68 |
||||||
110 |
||||||
110 |
||||||
113 |
||||||
113 |
||||||
114 |
||||||
114 |
||||||
115 |
||||||
116 |
||||||
117 |
||||||
125 |
||||||
14 |
BMO Financial Group 207th Annual Report 2024 |
| BMO Financial Group 207th Annual Report 2024 | 15 |
• |
Thriving economy |
• |
Sustainable future |
• |
Inclusive society |
• |
World-class |
• |
Winning culture |
• |
Digital First |
• |
Be our clients’ lead partner |
• |
Superior management risk capital funding |
• |
Integrity |
• |
Diversity |
• |
Responsibility |
• |
Empathy |
16 |
BMO Financial Group 207th Annual Report 2024 |
| Financial objectives (adjusted) | Reported basis | Adjusted basis (1) | ||||||||||||||||||||||||||||||||
| As at and for the periods ended October 31, 2024 | 1-year | 3-year (2) (3) |
5-year (2) (3) |
1-year |
3-year (2) (3) |
5-year (2) (3) |
||||||||||||||||||||||||||||
Earnings per share growth (%)
|
7-10% | 65.1 | (6.3 | ) | 1.9 | (18.0 | ) | (9.3 | ) | 0.5 | ||||||||||||||||||||||||
Average return on equity (%)
|
15% or more | 9.7 | 12.9 | 12.7 | 9.8 | 12.5 | 12.9 | |||||||||||||||||||||||||||
Average return on tangible common equity (%)
|
18% or more | 13.5 | 15.7 | 15.2 | 13.1 | 15.3 | 15.4 | |||||||||||||||||||||||||||
Operating leverage (%) (2)
|
2% or more | 19.8 | 0.4 | 1.7 | 1.6 | (1.3 | ) | 1.0 | ||||||||||||||||||||||||||
Common Equity Tier 1 Ratio (%)
|
Exceed regulatory requirement | 13.6 | na | na | na | na | na | |||||||||||||||||||||||||||
Total shareholder return (%)
|
Top-tier | 27.4 | 2.6 | 10.2 | na | na | na | |||||||||||||||||||||||||||
| (1) | Adjusted results and measures are non-GAAP amounts and measures and are discussed in the Non-GAAP and Other Financial Measures section. |
| (2) | Prior to November 1, 2022, we presented adjusted revenue on a basis net of insurance claims, commissions and changes in policy benefit liabilities (CCPB) and operating leverage was calculated based on revenue, net of CCPB. Beginning fiscal 2023, we no longer report CCPB, given the adoption and retrospective application of IFRS 17, Insurance Contracts non-GAAP amounts. |
| (3) | The 3-year and 5-year EPS growth rate and operating leverage, net of CCPB, reflect compound annual growth rates (CAGR). |
|
Earnings per Share Growth All references to earnings per share (EPS) are to diluted EPS, unless otherwise indicated. EPS was $9.51 in fiscal 2024, an increase of $3.75 or 65% from $5.76 in fiscal 2023. Adjusted EPS was $9.68, a decrease of $2.13 or 18% from $11.81 in fiscal 2023. EPS reflected higher earnings on a reported basis and lower earnings on an adjusted basis, as well as a higher number of common shares outstanding. Net income available to common shareholders increased 69% year-over-year on a reported basis and decreased 16% on an adjusted basis. The average number of diluted common shares outstanding increased 3% from fiscal 2023, reflecting common shares issued during the year under the Shareholder Dividend Reinvestment and Share Purchase Plan (DRIP). Certain comparative figures have been reclassified for changes in accounting policy. |
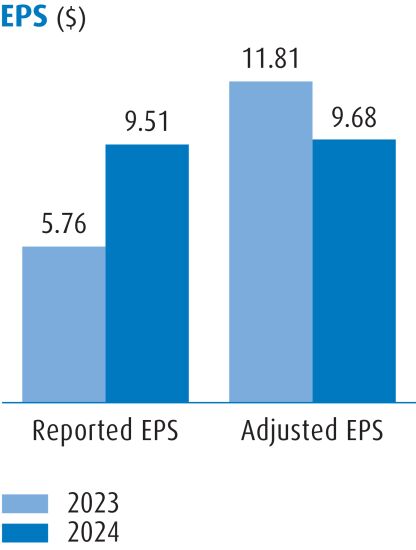
|
|
Earnings per Share (EPS) |
||
| BMO Financial Group 207th Annual Report 2024 | 17 |
|
Return on Equity and Return on Tangible Common Equity Reported return on equity (ROE) was 9.7% in fiscal 2024 and adjusted ROE was 9.8%, compared with 6.2% and 12.6%, respectively, in fiscal 2023. Reported ROE increased due to higher net income, partially offset by an increase in average common shareholders’ equity. Adjusted ROE decreased due to lower adjusted net income and an increase in average common shareholders’ equity. There was an increase of $2,838 million in reported net income available to common shareholders and a decrease of $1,338 million in adjusted net income available to common shareholders in the current year, primarily due to higher provisions for credit losses. Average common shareholders’ equity increased $5.4 billion or 8% from fiscal 2023, primarily due to the issuance of common shares under the DRIP, an increase in accumulated other comprehensive income and growth in retained earnings. Reported return on tangible common equity (ROTCE) was 13.5%, compared with 8.4% in fiscal 2023, and adjusted ROTCE was 13.1%, compared with 16.3% in fiscal 2023. Reported ROTCE increased due to higher earnings, partially offset by higher tangible common equity, and adjusted ROTCE decreased due to lower adjusted earnings and higher tangible common equity. Book value per share increased 9% from the prior year to $104.40, reflecting the increase in shareholders’ equity. Certain comparative figures have been reclassified for changes in accounting policy. |
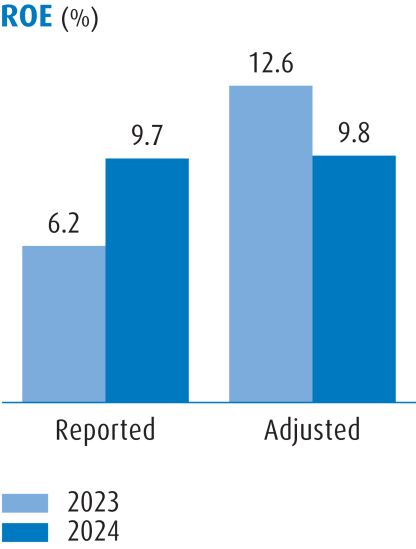
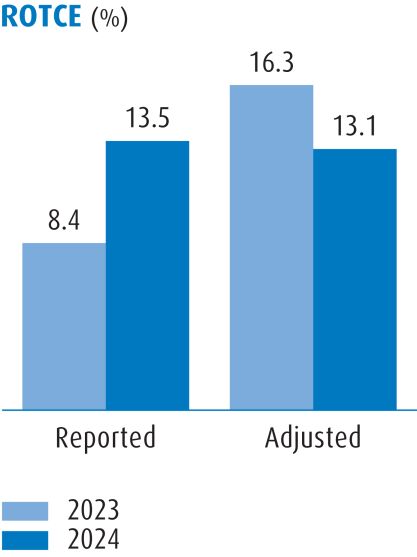
|
|
|
Return on Common Shareholders’ Equity (ROE) Return on Tangible Common Equity (ROTCE) |
||
|
|
||
|
Efficiency Ratio and Operating Leverage BMO’s reported efficiency ratio was 59.5% in fiscal 2024, compared with 72.2% in fiscal 2023. Adjusted efficiency ratio (1) was 58.6%, compared with 59.5% in fiscal 2023. The decrease in the reported efficiency ratio reflected revenue growth and lower expenses, and the decrease in the adjusted efficiency ratio reflected revenue growth in excess of expense growth.Reported operating leverage was 19.8% in fiscal 2024, compared with negative 43.7% in fiscal 2023, and adjusted operating leverage was 1.6% in fiscal 2024, compared with negative 7.6% in fiscal 2023. (1) Prior to November 1, 2022, we presented adjusted revenue on a basis net of insurance claims, commissions and changes in policy benefit liabilities (CCPB). Beginning the first quarter of fiscal 2023, we no longer report CCPB, given the adoption and retrospective application of IFRS 17,
Insurance Contracts |
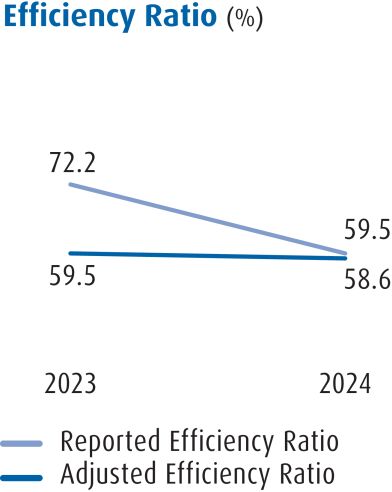
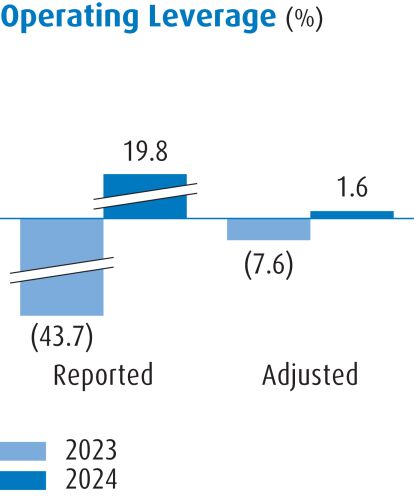
|
|
|
Efficiency Ratio (or expense-to-revenue non-interest expense divided by total revenue (on a taxable equivalent basis in the operating groups).Operating Leverage non-interest expense. Adjusted operating leverage is calculated using adjusted revenue and adjusted non-interest expense. |
||
|
|
||
18 |
BMO Financial Group 207th Annual Report 2024 |
|
Common Equity Tier 1 Ratio Our Common Equity Tier 1 (CET1) Ratio was 13.6% as at October 31, 2024, compared with 12.5% as at October 31, 2023. Our CET1 Ratio increased from the prior year, primarily as a result of internal capital generation, common shares issued under the DRIP and lower source-currency risk-weighted assets (RWA). There was a positive impact to the ratio from the reversal of a fiscal 2022 legal provision associated with a predecessor bank, M&I Marshal and Ilsley Bank, which increased internal capital generation and reduced RWA.
|
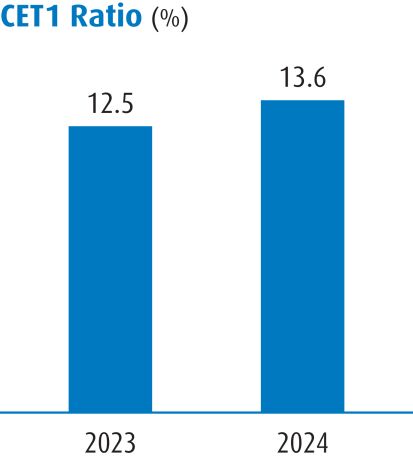 |
|
|
Common Equity Tier 1 (CET1) Ratio |
||
| For the year ended October 31 | 2024 |
2023 | 2022 | 2021 | 2020 |
3-year
CAGR |
5-year
CAGR |
|||||||||||||||||||||
Closing market price per common share ($)
|
126.88 |
104.79 | 125.49 | 134.37 | 79.33 | (1.9 |
) |
5.4 |
||||||||||||||||||||
Dividends paid ($ per share)
|
6.04 |
5.72 | 5.11 | 4.24 | 4.21 | 12.5 |
8.6 |
|||||||||||||||||||||
Dividend yield (%)
|
4.8 |
5.5 | 4.3 | 3.2 | 5.3 | nm |
nm |
|||||||||||||||||||||
Increase (decrease) in share price (%)
|
21.1 |
(16.5 | ) | (6.6 | ) | 69.4 | (18.6 | ) | nm |
nm |
||||||||||||||||||
Total annual shareholder return (%) (2)
|
27.4 |
(12.5 | ) | (3.1 | ) | 75.9 | (14.6 | ) | 2.6 |
10.2 |
||||||||||||||||||
Canadian peer group average (excluding BMO) (3)
|
49.4 |
(8.8 | ) | (6.2 | ) | 56.1 | (11.5 | ) | 7.9 |
11.6 |
||||||||||||||||||
| (1) | Compound annual growth rate (CAGR) expressed as a percentage. |
| (2) | Total annual shareholder return assumes reinvestment of quarterly dividends and therefore does not equal the sum of dividend and share price returns in the table. |
| (3) | As at October 31, 2024. Canadian peer group: The Bank of Nova Scotia, Canadian Imperial Bank of Commerce, National Bank of Canada, Royal Bank of Canada, and The Toronto-Dominion Bank. |
| BMO Financial Group 207th Annual Report 2024 | 19 |
| (Canadian $ in millions, except as noted) | 2024 |
2023 | ||||||
Summary Income Statement (1) (2)
|
||||||||
Net interest income |
19,468 |
18,681 | ||||||
Non-interest revenue |
13,327 |
10,578 | ||||||
Revenue |
32,795 |
29,259 | ||||||
Provision for credit losses on impaired loans |
3,066 |
1,180 | ||||||
Provision for credit losses on performing loans |
695 |
998 | ||||||
Total provision for credit losses (PCL) |
3,761 |
2,178 | ||||||
Non-interest expense |
19,499 |
21,134 | ||||||
Provision for income taxes |
2,208 |
1,510 | ||||||
Net income |
7,327 |
4,437 | ||||||
Net income available to common shareholders |
6,932 |
4,094 | ||||||
Adjusted net income |
7,449 |
8,735 | ||||||
Adjusted net income available to common shareholders |
7,054 |
8,392 | ||||||
Common Share Data ($, except as noted) (1)
|
||||||||
Basic earnings per share |
9.52 |
5.77 | ||||||
Diluted earnings per share |
9.51 |
5.76 | ||||||
Adjusted diluted earnings per share |
9.68 |
11.81 | ||||||
Book value per share |
104.40 |
95.90 | ||||||
Closing share price |
126.88 |
104.79 | ||||||
Number of common shares outstanding (in millions)
|
||||||||
End of period |
729.5 |
720.9 | ||||||
Average basic |
727.7 |
709.4 | ||||||
Average diluted |
728.5 |
710.5 | ||||||
Market capitalization ($ billions)
|
92.6 |
75.5 | ||||||
Dividends declared per share |
6.12 |
5.80 | ||||||
Dividend yield (%)
|
4.8 |
5.5 | ||||||
Dividend payout ratio (%)
|
64.3 |
100.5 | ||||||
Adjusted dividend payout ratio (%)
|
63.1 |
49.0 | ||||||
Financial Measures and Ratios (%) (1) (2)
|
||||||||
Return on equity |
9.7 |
6.2 | ||||||
Adjusted return on equity |
9.8 |
12.6 | ||||||
Return on tangible common equity |
13.5 |
8.4 | ||||||
Adjusted return on tangible common equity |
13.1 |
16.3 | ||||||
Efficiency ratio |
59.5 |
72.2 | ||||||
Adjusted efficiency ratio (3)
|
58.6 |
59.5 | ||||||
Operating leverage |
19.8 |
(43.7 | ) | |||||
Adjusted operating leverage (3)
|
1.6 |
(7.6 | ) | |||||
Net interest margin on average earning assets |
1.57 |
1.63 | ||||||
Adjusted net interest margin, excluding trading net interest income, and trading and insurance assets |
1.85 |
1.88 | ||||||
Effective tax rate |
23.2 |
25.4 | ||||||
Adjusted effective tax rate |
22.9 |
22.4 | ||||||
Total PCL-to-average |
0.57 |
0.35 | ||||||
PCL on impaired loans-to-average |
0.47 |
0.19 | ||||||
Balance Sheet and Other Information |
||||||||
Assets |
1,409,647 |
1,347,006 | ||||||
Average earning assets |
1,237,245 |
1,145,870 | ||||||
Gross loans and acceptances |
682,731 |
668,583 | ||||||
Net loans and acceptances |
678,375 |
664,776 | ||||||
Deposits |
982,440 |
910,879 | ||||||
Common shareholders’ equity |
76,163 |
69,137 | ||||||
Total risk-weighted assets (4)
|
420,838 |
424,197 | ||||||
Assets under administration |
770,584 |
808,985 | ||||||
Assets under management |
422,701 |
332,947 | ||||||
Capital and Liquidity Measures (%) (4)
|
||||||||
Common Equity Tier 1 Ratio |
13.6 |
12.5 | ||||||
Tier 1 Capital Ratio |
15.4 |
14.1 | ||||||
Total Capital Ratio |
17.6 |
16.2 | ||||||
Leverage Ratio |
4.4 |
4.2 | ||||||
TLAC Ratio |
29.3 |
27.0 | ||||||
Liquidity Coverage Ratio (LCR) |
132 |
128 | ||||||
Net Stable Funding Ratio (NSFR) |
117 |
115 | ||||||
Foreign Exchange Rates ($)
|
||||||||
As at October 31, Canadian/U.S. dollar |
1.3909 |
1.3868 | ||||||
Average Canadian/U.S. dollar |
1.3591 |
1.3492 | ||||||
| (1) | Adjusted results exclude certain items from reported results and are used to calculate our adjusted measures as presented in the table above. Management assesses performance on a reported basis and an adjusted basis, and considers both to be useful. For further information, refer to the Non-GAAP and Other Financial Measures section. For details on the composition of non-GAAP amounts, measures and ratios, as well as supplementary financial measures, refer to the Glossary of Financial Terms. |
| (2) | Effective the first quarter of fiscal 2024, the bank adopted IFRS 17, Insurance Contracts |
| (3) | Prior to November 1, 2022, we presented adjusted revenue on a basis net of insurance claims, commissions and changes in policy benefit liabilities (CCPB). Beginning the first quarter of fiscal 2023, we no longer report CCPB, given the adoption and retrospective application of IFRS 17. For periods prior to November 1, 2022, efficiency ratio and operating leverage were calculated based on revenue, net of CCPB. Revenue, net of CCPB, was $34,393 million in fiscal 2022. Measures and ratios presented on a basis net of CCPB are non-GAAP amounts. |
| (4) | Capital and liquidity measures are disclosed in accordance with the Capital Adequacy Requirements (CAR) Guideline and the Liquidity Adequacy Requirements (LAR) Guideline, as set out by OSFI, as applicable. |
20 |
BMO Financial Group 207th Annual Report 2024 |
| BMO Financial Group 207th Annual Report 2024 | 21 |
| (Canadian $ in millions, except as noted) | 2024 |
2023 | ||||||
Reported Results |
||||||||
Net interest income |
19,468 |
18,681 | ||||||
Non-interest revenue |
13,327 |
10,578 | ||||||
Revenue |
32,795 |
29,259 | ||||||
Provision for credit losses |
(3,761 |
) |
(2,178 | ) | ||||
Non-interest expense |
(19,499 |
) |
(21,134 | ) | ||||
Income before income taxes |
9,535 |
5,947 | ||||||
Provision for income taxes |
(2,208 |
) |
(1,510 | ) | ||||
Net income |
7,327 |
4,437 | ||||||
Diluted EPS ($)
|
9.51 |
5.76 | ||||||
Adjusting Items Impacting Revenue (Pre-tax)
|
||||||||
Management of fair value changes on the purchase of Bank of the West (1)
|
– |
(2,011 | ) | |||||
Legal provision/reversal (including related interest expense and legal fees) (2)
|
547 |
(30 | ) | |||||
Impact of Canadian tax measures (3)
|
– |
(138 | ) | |||||
Impact of loan portfolio sale (4)
|
(164 |
) |
– | |||||
Impact of adjusting items on revenue (pre-tax)
|
383 |
(2,179 | ) | |||||
Adjusting Items Impacting Provision for Credit Losses (Pre-tax)
|
||||||||
Initial provision for credit losses on purchased performing loans (pre-tax) (5)
|
– |
(705 | ) | |||||
Adjusting Items Impacting Non-Interest Expense (Pre-tax)
|
||||||||
Acquisition and integration costs (6)
|
(172 |
) |
(2,045 | ) | ||||
Amortization of acquisition-related intangible assets (7)
|
(450 |
) |
(357 | ) | ||||
Legal provision/reversal (including related interest expense and legal fees) (2)
|
588 |
3 | ||||||
Impact of Canadian tax measures (3)
|
– |
(22 | ) | |||||
FDIC special assessment (8)
|
(476 |
) |
– | |||||
Impact of adjusting items on non-interest expense (pre-tax)
|
(510 |
) |
(2,421 | ) | ||||
Impact of adjusting items on reported net income (pre-tax)
|
(127 |
) |
(5,305 | ) | ||||
Adjusting Items Impacting Revenue (After-tax)
|
||||||||
Management of fair value changes on the purchase of Bank of the West (1)
|
– |
(1,461 | ) | |||||
Legal provision/reversal (including related interest expense and legal fees) (2)
|
401 |
(23 | ) | |||||
Impact of Canadian tax measures (3)
|
– |
(115 | ) | |||||
Impact of loan portfolio sale (4)
|
(136 |
) |
– | |||||
Impact of adjusting items on revenue (after-tax)
|
265 |
(1,599 | ) | |||||
Adjusting Items Impacting Provision for Credit Losses (After-tax)
|
||||||||
Initial provision for credit losses on purchased performing loans (after-tax) (5)
|
– |
(517 | ) | |||||
Adjusting Items Impacting Non-Interest Expense (After-tax)
|
||||||||
Acquisition and integration costs (6)
|
(129 |
) |
(1,533 | ) | ||||
Amortization of acquisition-related intangible assets (7)
|
(334 |
) |
(264 | ) | ||||
Legal provision/reversal (including related interest expense and legal fees) (2)
|
433 |
2 | ||||||
Impact of Canadian tax measures (3)
|
– |
(16 | ) | |||||
FDIC special assessment (8)
|
(357 |
) |
– | |||||
Impact of adjusting items on non-interest expense (after-tax)
|
(387 |
) |
(1,811 | ) | ||||
Adjusting Items Impacting Provision for Income Taxes |
||||||||
Impact of Canadian tax measures (3)
|
– |
(371 | ) | |||||
Impact of adjusting items on reported net income (after-tax)
|
(122 |
) |
(4,298 | ) | ||||
Impact on diluted EPS ($)
|
(0.17 |
) |
(6.05 | ) | ||||
Adjusted Results |
||||||||
Net interest income |
18,921 |
19,094 | ||||||
Non-interest revenue |
13,491 |
12,344 | ||||||
Revenue |
32,412 |
31,438 | ||||||
Provision for credit losses |
(3,761 |
) |
(1,473 | ) | ||||
Non-interest expense |
(18,989 |
) |
(18,713 | ) | ||||
Income before income taxes |
9,662 |
11,252 | ||||||
Provision for income taxes |
(2,213 |
) |
(2,517 | ) | ||||
Net income |
7,449 |
8,735 | ||||||
Diluted EPS ($)
|
9.68 |
11.81 | ||||||
| (1) | Management of the impact of interest rate changes between the announcement and closing of the acquisition of Bank of the West on its fair value and goodwill, recorded in Corporate Services. Fiscal 2023 comprised $1,628 million of mark-to-market |
| (2) | Impact of a lawsuit associated with a predecessor bank, M&I Marshall and Ilsley Bank, recorded in Corporate Services. Fiscal 2024: Reversal of a fiscal 2022 legal provision, including accrued interest comprising a reversal of $547 million of interest expense and $588 million of non-interest expense. Fiscal 2023: A provision comprising a $30 million interest expense and a $3 million recovery of non-interest expense. For further information, refer to the Provisions and Contingent Liabilities section in Note 25 of the audited annual consolidated financial statements. |
| (3) | Impact of certain tax measures enacted by the Canadian government, recorded in Corporate Services. Fiscal 2023: $371 million one-time tax expense, comprising a $312 million Canada Recovery Dividend and $59 million related to the pro-rated fiscal 2022 impact of the 1.5% tax rate increase, net of a deferred tax asset remeasurement; and a $131 million ($160 million pre-tax) charge related to the amended GST/HST definition for financial services, comprising $138 million recorded in non-interest revenue and $22 million recorded in non-interest expense. |
| (4) | Net accounting loss on the sale of a portfolio of recreational vehicle loans related to balance sheet optimization, recorded in non-interest revenue in Corporate Services. |
| (5) | Initial provision for credit losses on the purchased Bank of the West performing loan portfolio, recorded in Corporate Services. |
22 |
BMO Financial Group 207th Annual Report 2024 |
| (6) | Acquisition and integration costs, recorded in non-interest expense in the related operating group. Bank of the West recorded in Corporate Services: $97 million ($129 million pre-tax) in fiscal 2024 and $1,520 million ($2,027 million pre-tax) in fiscal 2023. Radicle and Clearpool recorded in BMO Capital Markets: $15 million ($20 million pre-tax) in fiscal 2024 and $4 million ($5 million pre-tax) in fiscal 2023. AIR MILES recorded in Canadian P&C: $17 million ($23 million pre-tax) in fiscal 2024 and $9 million ($13 million pre-tax) in fiscal 2023. |
| (7) | Amortization of acquisition-related intangible assets and any impairments, recorded in non-interest expense in the related operating group. Fiscal 2024 included an $18 million write-down related to the acquisition of Radicle, recorded in BMO Capital Markets. |
| (8) | Impact of a U.S. Federal Deposit Insurance Corporation (FDIC) special assessment, recorded in non-interest expense in Corporate Services. |
| (Canadian $ in millions, except as noted) | Canadian P&C |
U.S. P&C |
Total P&C |
BMO Wealth Management |
BMO Capital Markets |
Corporate Services |
Total Bank |
U.S. Segment (US$ in millions) |
||||||||||||||||||||||||
2024 |
||||||||||||||||||||||||||||||||
Reported net income (loss) |
3,457 |
1,829 |
5,286 |
1,248 |
1,492 |
(699 |
) |
7,327 |
2,112 |
|||||||||||||||||||||||
Adjusting Items |
||||||||||||||||||||||||||||||||
Acquisition and integration costs |
17 |
– |
17 |
– |
15 |
97 |
129 |
76 |
||||||||||||||||||||||||
Amortization of acquisition-related intangible assets |
13 |
283 |
296 |
7 |
31 |
– |
334 |
222 |
||||||||||||||||||||||||
Legal provision/reversal (including related interest expense and legal fees) |
– |
– |
– |
– |
– |
(834 |
) |
(834 |
) |
(616 |
) |
|||||||||||||||||||||
Impact of loan portfolio sale |
– |
– |
– |
– |
– |
136 |
136 |
102 |
||||||||||||||||||||||||
Impact of FDIC special assessment |
– |
– |
– |
– |
– |
357 |
357 |
263 |
||||||||||||||||||||||||
Adjusted net income (loss) |
3,487 |
2,112 |
5,599 |
1,255 |
1,538 |
(943 |
) |
7,449 |
2,159 |
|||||||||||||||||||||||
2023 |
||||||||||||||||||||||||||||||||
Reported net income (loss) |
3,573 | 2,489 | 6,062 | 1,146 | 1,625 | (4,396 | ) | 4,437 | 15 | |||||||||||||||||||||||
Adjusting Items (2)
|
||||||||||||||||||||||||||||||||
Acquisition and integration costs |
9 | – | 9 | – | 4 | 1,520 | 1,533 | 1,124 | ||||||||||||||||||||||||
Amortization of acquisition-related intangible assets |
6 | 234 | 240 | 4 | 20 | – | 264 | 186 | ||||||||||||||||||||||||
Management of fair value changes on the purchase of Bank of the West |
– | – | – | – | – | 1,461 | 1,461 | 1,093 | ||||||||||||||||||||||||
Legal provision/reversal (including related interest expense and legal fees) |
– | – | – | – | – | 21 | 21 | 15 | ||||||||||||||||||||||||
Impact of Canadian tax measures |
– | – | – | – | – | 502 | 502 | – | ||||||||||||||||||||||||
Initial provision for credit losses on purchased performing loans |
– | – | – | – | – | 517 | 517 | 379 | ||||||||||||||||||||||||
Adjusted net income (loss) |
3,588 | 2,723 | 6,311 | 1,150 | 1,649 | (375 | ) | 8,735 | 2,812 | |||||||||||||||||||||||
| (1) | U.S. segment reported and adjusted results comprise net income recorded in U.S. P&C and our U.S. operations in BMO Wealth Management, BMO Capital Markets and Corporate Services. |
| (2) | Refer to footnotes (1) to (8) in the Non-GAAP and Other Financial Measures table for further information on adjusting items. |
|
(Canadian $ in millions, except as noted) For the year ended October 31 |
2024 |
2023 | ||||||
Reported net income |
7,327 |
4,437 | ||||||
Net income attributable to non-controlling interest in subsidiaries |
9 |
12 | ||||||
Net income attributable to bank shareholders |
7,318 |
4,425 | ||||||
Dividends on preferred shares and distributions on other equity instruments |
(386 |
) |
(331 | ) | ||||
Net income available to common shareholders (A)
|
6,932 |
4,094 | ||||||
After-tax amortization of acquisition-related intangible assets |
334 |
264 | ||||||
Net income available to common shareholders after adjusting for amortization of acquisition-related intangible assets (B)
|
7,266 |
4,358 | ||||||
After-tax impact of other adjusting items (1)
|
(212 |
) |
4,034 | |||||
Adjusted net income available to common shareholders (C)
|
7,054 |
8,392 | ||||||
Average common shareholders’ equity (D)
|
71,817 |
66,444 | ||||||
Goodwill |
(16,385 |
) |
(13,466 | ) | ||||
Acquisition-related intangible assets |
(2,642 |
) |
(2,197 | ) | ||||
Net of related deferred liabilities |
960 |
857 | ||||||
Average tangible common equity (E)
|
53,750 |
51,638 | ||||||
Return on equity (%) (= A/D)
|
9.7 |
6.2 | ||||||
Adjusted return on equity (%) (= C/D)
|
9.8 |
12.6 | ||||||
Return on tangible common equity (%) (= B/E)
|
13.5 |
8.4 | ||||||
Adjusted return on tangible common equity (%) (= C/E)
|
13.1 |
16.3 | ||||||
| (1) | Refer to footnotes (1) to (8) in the Non-GAAP and Other Financial Measures table for further information on adjusting items. |
| BMO Financial Group 207th Annual Report 2024 | 23 |
2024 |
||||||||||||||||||||||||||||||||
| (Canadian $ in millions, except as noted) | Canadian P&C |
U.S. P&C |
Total P&C |
BMO Wealth Management |
BMO Capital Markets |
Corporate Services |
Total Bank |
U.S. Segment (US$ in millions) |
||||||||||||||||||||||||
Reported |
||||||||||||||||||||||||||||||||
Net income available to common shareholders |
3,415 |
1,773 |
5,188 |
1,239 |
1,455 |
(950 |
) |
6,932 |
2,087 |
|||||||||||||||||||||||
Total average common equity |
15,986 |
33,235 |
49,221 |
4,770 |
13,172 |
4,654 |
71,817 |
31,782 |
||||||||||||||||||||||||
Return on equity (%)
|
21.4 |
5.4 |
10.5 |
26.0 |
11.0 |
na |
9.7 |
6.6 |
||||||||||||||||||||||||
Adjusted (3)
|
||||||||||||||||||||||||||||||||
Net income available to common shareholders |
3,445 |
2,056 |
5,501 |
1,246 |
1,501 |
(1,194 |
) |
7,054 |
2,134 |
|||||||||||||||||||||||
Total average common equity |
15,986 |
33,235 |
49,221 |
4,770 |
13,172 |
4,654 |
71,817 |
31,782 |
||||||||||||||||||||||||
Return on equity (%)
|
21.5 |
6.2 |
11.2 |
26.1 |
11.4 |
na |
9.8 |
6.7 |
||||||||||||||||||||||||
| 2023 | ||||||||||||||||||||||||||||||||
| (Canadian $ in millions, except as noted) | Canadian P&C | U.S. P&C | Total P&C | BMO Wealth Management |
BMO Capital Markets |
Corporate Services |
Total Bank | U.S. Segment (2) (US$ in millions) |
||||||||||||||||||||||||
Reported |
||||||||||||||||||||||||||||||||
Net income available to common shareholders |
3,534 | 2,438 | 5,972 | 1,138 | 1,592 | (4,608 | ) | 4,094 | (17 | ) | ||||||||||||||||||||||
Total average common equity |
13,269 | 27,569 | 40,838 | 4,623 | 11,833 | 9,150 | 66,444 | 27,203 | ||||||||||||||||||||||||
Return on equity (%)
|
26.6 | 8.8 | 14.6 | 24.6 | 13.4 | na | 6.2 | (0.1 | ) | |||||||||||||||||||||||
Adjusted (3)
|
||||||||||||||||||||||||||||||||
Net income available to common shareholders |
3,549 | 2,672 | 6,221 | 1,142 | 1,616 | (587 | ) | 8,392 | 2,780 | |||||||||||||||||||||||
Total average common equity |
13,269 | 27,569 | 40,838 | 4,623 | 11,833 | 9,150 | 66,444 | 27,203 | ||||||||||||||||||||||||
Return on equity (%)
|
26.7 | 9.7 | 15.2 | 24.7 | 13.6 | na | 12.6 | 10.2 | ||||||||||||||||||||||||
| (1) | Return on equity is based on allocated capital. For further information, refer to the How BMO Reports Operating Group Results section. |
| (2) | U.S. segment reported and adjusted results comprise net income and allocated capital recorded in U.S. P&C and our U.S. operations in BMO Wealth Management, BMO Capital Markets and Corporate Services. |
| (3) | Refer to footnotes (1) to (8) in the Non-GAAP and Other Financial Measures table for further information on adjusting items. |
24 |
BMO Financial Group 207th Annual Report 2024 |
| (1) | All time periods in this section refer to the calendar year rather than BMO’s fiscal year. |
| BMO Financial Group 207th Annual Report 2024 | 25 |
| (Canadian $ in millions, except as noted) |
2024 vs. 2023 |
|||
Canadian/U.S. dollar exchange rate (average) |
||||
2024 |
1.3591 |
|||
2023 |
1.3492 |
|||
Effects on U.S. Segment Reported Results |
||||
Increased (Decreased) net interest income |
66 |
|||
Increased (Decreased) non-interest revenue |
21 |
|||
Increased (Decreased) total revenue |
87 |
|||
Decreased (Increased) provision for credit losses |
(9 |
) |
||
Decreased (Increased) non-interest expense |
(79 |
) |
||
Decreased (Increased) provision for income taxes |
1 |
|||
Increased (Decreased) net income |
– |
|||
Impact on earnings per share ($)
|
– |
|||
Effects on U.S. Segment Adjusted Results (1)
|
||||
Increased (Decreased) net interest income |
69 |
|||
Increased (Decreased) non-interest revenue |
33 |
|||
Increased (Decreased) total revenue |
102 |
|||
Decreased (Increased) provision for credit losses |
(4 |
) |
||
Decreased (Increased) non-interest expense |
(62 |
) |
||
Decreased (Increased) provision for income taxes |
(8 |
) |
||
Increased (Decreased) net income |
28 |
|||
Impact on earnings per share ($)
|
0.04 |
|||
• |
The reversal of a fiscal 2022 legal provision (1) , including accrued interest, associated with a predecessor bank, M&I Marshall and Ilsley Bank, of $834 million ($1,135 million pre-tax) in the current year, comprising a reversal of interest expense of $547 million and a reversal of non-interest expense of $588 million, compared with a provision of $21 million ($27 million pre-tax) in the prior year, comprising interest expense of $30 million and a reversal of non-interest expense of $3 million. |
• |
Acquisition and integration costs of $129 million ($172 million pre-tax) in the current year and $1,533 million ($2,045 million pre-tax) in the prior year. |
• |
Amortization of acquisition-related intangible assets of $334 million ($450 million pre-tax) in the current year, including an $18 million write-down related to the acquisition of Radicle Group Inc. (Radicle) in BMO Capital Markets, and $264 million ($357 million pre-tax) in the prior year. |
• |
The impact of the U.S. Federal Deposit Insurance Corporation (FDIC) special assessment of $357 million ($476 million pre-tax) in the current year. |
| (1) | For further information, refer to the Provisions and Contingent Liabilities section in Note 25 of the audited annual consolidated financial statements. |
26 |
BMO Financial Group 207th Annual Report 2024 |
• |
A net accounting loss of $136 million ($164 million pre-tax) in the current year on the sale of a $9.6 billion (US$7.2 billion) portfolio of recreational vehicle loans related to balance sheet optimization. |
• |
A loss of $1,461 million ($2,011 million pre-tax) in the prior year related to the management of the impact of interest rate changes between the announcement and closing of the Bank of the West acquisition on its fair value and goodwill. |
• |
Initial provision for credit losses of $517 million ($705 million pre-tax) in the prior year on the purchased Bank of the West performing loan portfolio. |
• |
Impact of certain tax measures enacted by the Canadian government in the prior year, including a one-time tax expense of $371 million, and a charge of $131 million ($160 million pre-tax) related to the amended GST/HST definition for financial services, comprising non-interest revenue of $138 million and non-interest expense of $22 million. |
|
(Canadian $ in millions, on a
pre-tax basis)For the year ended October 31 |
2024 |
2023 | ||||||
Net interest income |
19,468 |
18,681 | ||||||
Non-interest revenue |
13,327 |
10,578 | ||||||
Total revenue |
32,795 |
29,259 | ||||||
Management of fair value changes on the purchase of Bank of the West (2)
|
– |
2,011 | ||||||
Legal provision/reversal (including related interest expense and legal fees) (3)
|
(547 |
) |
30 | |||||
Impact of loan portfolio sale (4)
|
164 |
– | ||||||
Impact of Canadian tax measures (5)
|
– |
138 | ||||||
Impact of adjusting items on revenue |
(383 |
) |
2,179 | |||||
Adjusted revenue |
32,412 |
31,438 | ||||||
| (1) | Adjusted results exclude certain items from reported results and are used to calculate our adjusted measures as presented in the table above. Management assesses performance on a reported basis and an adjusted basis, and considers both to be useful. For further information, refer to the Non-GAAP and Other Financial Measures section. |
| (2) | Management of the impact of interest rate changes between the announcement and closing of the acquisition of Bank of the West on its fair value and goodwill, recorded in Corporate Services. Fiscal 2023 comprised $1,628 million of mark-to-market |
| (3) | Impact of a lawsuit associated with a predecessor bank, M&I Marshall and Ilsley Bank, recorded in Corporate Services. Fiscal 2024: $547 million reversal of interest expense relating to a fiscal 2022 legal provision. Fiscal 2023: $30 million interest expense provision. For further information, refer to the Provisions and Contingent Liabilities section in Note 25 of the audited annual consolidated financial statements. |
| (4) | Net accounting loss on the sale of a portfolio of recreational vehicle loans related to balance sheet optimization, recorded in non-interest revenue in Corporate Services. |
| (5) | Impact of certain tax measures enacted by the Canadian government related to the amended GST/HST definition for financial services, recorded in non-interest revenue in Corporate Services. |
| BMO Financial Group 207th Annual Report 2024 | 27 |
Net interest margin |
||||||||||||||||||||||||||||||||
| (Canadian $ in millions, except as noted) |
Net interest income |
Average earning assets |
(in basis points) | |||||||||||||||||||||||||||||
| For the year ended October 31 | 2024 |
2023 | 2024 |
2023 | 2024 |
2023 | ||||||||||||||||||||||||||
Canadian P&C |
8,852 |
8,043 | 319,795 |
296,164 | 277 |
272 | ||||||||||||||||||||||||||
U.S. P&C |
8,162 |
7,607 | 215,987 |
195,363 | 378 |
389 | ||||||||||||||||||||||||||
Personal and Commercial Banking (P&C) |
17,014 |
15,650 | 535,782 |
491,527 | 318 |
318 | ||||||||||||||||||||||||||
All other operating groups and Corporate Services (4)
|
2,454 |
3,031 | 701,463 |
654,343 | na |
na | ||||||||||||||||||||||||||
Total reported |
19,468 |
18,681 | 1,237,245 |
1,145,870 | 157 |
163 | ||||||||||||||||||||||||||
Total adjusted |
18,921 |
19,094 | 1,237,245 |
1,145,870 | 153 |
167 | ||||||||||||||||||||||||||
Trading net interest income, trading and insurance assets |
169 |
900 | 222,149 |
180,005 | na |
na | ||||||||||||||||||||||||||
Total reported, excluding trading and insurance |
19,299 |
17,781 | 1,015,096 |
965,865 | 190 |
184 | ||||||||||||||||||||||||||
Total adjusted, excluding trading and insurance |
18,752 |
18,194 | 1,015,096 |
965,865 | 185 |
188 | ||||||||||||||||||||||||||
U.S. P&C (US$ in millions)
|
6,006 |
5,635 | 158,919 |
144,732 | 378 |
389 | ||||||||||||||||||||||||||
| (1) | Adjusted results and ratios are on a non-GAAP basis and are discussed in the Non-GAAP and Other Financial Measures section. |
| (2) | Operating group revenue is presented on a taxable equivalent basis (teb) in net interest income. For further information, refer to the How BMO Reports Operating Group Results section. |
| (3) | Average earning assets represent the daily average balance of deposits at central banks, deposits with other banks, securities borrowed or purchased under resale agreements, securities and loans over the period. Average earning assets, excluding trading and insurance assets, exclude trading and insurance earning assets. |
| (4) | For further information on net interest income for these other operating groups and Corporate Services, refer to the 2024 Operating Groups Performance Review section. |
28 |
BMO Financial Group 207th Annual Report 2024 |
|
(Canadian $ in millions) For the year ended October 31 |
2024 |
2023 | ||||||
Securities commissions and fees |
1,106 |
1,025 | ||||||
Deposit and payment service charges |
1,626 |
1,517 | ||||||
Trading revenue (loss) |
2,377 |
(216 | ) | |||||
Lending fees |
1,464 |
1,548 | ||||||
Card fees |
847 |
700 | ||||||
Investment management and custodial fees |
2,056 |
1,851 | ||||||
Mutual fund revenue |
1,324 |
1,244 | ||||||
Underwriting and advisory fees |
1,399 |
1,107 | ||||||
Securities gains, other than trading |
200 |
180 | ||||||
Foreign exchange, other than trading |
263 |
234 | ||||||
Insurance service results |
340 |
389 | ||||||
Insurance investment results |
105 |
171 | ||||||
Share of profit in associates and joint ventures |
207 |
185 | ||||||
Other |
13 |
643 | ||||||
Total reported |
13,327 |
10,578 | ||||||
Management of fair value changes on the purchase of Bank of the West (1)
|
– |
1,628 | ||||||
Impact of loan portfolio sale (2)
|
164 |
– | ||||||
Impact of Canadian tax measures (3)
|
– |
138 | ||||||
Adjusted non-interest revenue |
13,491 |
12,344 | ||||||
| (1) | Mark-to-market |
| (2) | Net accounting loss on the sale of a portfolio of recreational vehicle loans related to balance sheet optimization, recorded in Corporate Services. |
| (3) | Impact of certain tax measures enacted by the Canadian government related to the amended GST/HST definition for financial services. |
|
(Canadian $ in millions) (taxable equivalent basis) For the year ended October 31 |
2024 |
2023 | ||||||
Interest rates |
1,003 |
770 | ||||||
Foreign exchange |
579 |
638 | ||||||
Equities |
781 |
931 | ||||||
Commodities |
150 |
192 | ||||||
Other |
55 |
(1,526 | ) | |||||
Total (teb) (2)
|
2,568 |
1,005 | ||||||
Teb offset |
22 |
321 | ||||||
Reported total |
2,546 |
684 | ||||||
Management of fair value changes on the purchase of Bank of the West (3)
|
– |
1,628 | ||||||
Adjusted total trading revenue |
2,546 |
2,312 | ||||||
Reported as: |
||||||||
Net interest income |
191 |
1,221 | ||||||
Non-interest revenue – trading revenue (loss) |
2,377 |
(216 | ) | |||||
Total (teb) |
2,568 |
1,005 | ||||||
Teb offset |
22 |
321 | ||||||
Reported total, net of teb offset |
2,546 |
684 | ||||||
Adjusted total trading revenue |
2,546 |
2,312 | ||||||
| (1) | Reported and adjusted revenue measures are on a non-GAAP basis and are discussed in the Non-GAAP and Other Financial Measures section. |
| (2) | Trading-related revenue presented on a taxable equivalent basis (teb) is a non-GAAP measure. Similar to other banks, BMO analyzes trading-related revenue on a teb basis, which reflects an increase in net interest income on tax-exempt securities to equivalent pre-tax amounts and is useful in facilitating comparisons of income from taxable and tax-exempt sources. |
| (3) | Mark-to-market |
| BMO Financial Group 207th Annual Report 2024 | 29 |
| (Canadian $ in millions) | Canadian P&C |
U.S. P&C |
Total P&C |
BMO Wealth Management |
BMO Capital Markets |
Corporate Services |
Total Bank |
|||||||||||||||||||||
2024 |
||||||||||||||||||||||||||||
Provision for credit losses on impaired loans |
1,326 |
1,274 |
2,600 |
26 |
367 |
73 |
3,066 |
|||||||||||||||||||||
Provision for (recovery of) credit losses on performing loans |
333 |
389 |
722 |
5 |
2 |
(34 |
) |
695 |
||||||||||||||||||||
Total provision for credit losses |
1,659 |
1,663 |
3,322 |
31 |
369 |
39 |
3,761 |
|||||||||||||||||||||
Total PCL-to-average (%)
|
0.51 |
0.82 |
0.63 |
0.07 |
0.45 |
nm |
0.57 |
|||||||||||||||||||||
PCL on impaired loans-to-average (%)
|
0.41 |
0.63 |
0.49 |
0.06 |
0.44 |
nm |
0.47 |
|||||||||||||||||||||
2023 |
||||||||||||||||||||||||||||
Provision for credit losses on impaired loans |
724 | 364 | 1,088 | 5 | 9 | 78 | 1,180 | |||||||||||||||||||||
Provision for credit losses on performing loans |
185 | 142 | 327 | 13 | 9 | 649 | 998 | |||||||||||||||||||||
Total provision for credit losses |
909 | 506 | 1,415 | 18 | 18 | 727 | 2,178 | |||||||||||||||||||||
Initial provision for credit losses on purchased performing loans (1)
|
– | – | – | – | – | (705 | ) | (705 | ) | |||||||||||||||||||
Adjusted total provision for credit losses (2)
|
909 | 506 | 1,415 | 18 | 18 | 22 | 1,473 | |||||||||||||||||||||
Total PCL-to-average (%)
|
0.30 | 0.27 | 0.29 | 0.05 | 0.02 | nm | 0.35 | |||||||||||||||||||||
PCL on impaired loans-to-average (%)
|
0.24 | 0.19 | 0.22 | 0.01 | 0.01 | nm | 0.19 | |||||||||||||||||||||
| (1) | Initial provision for credit losses on the purchased Bank of the West performing loan portfolio, recorded in Corporate Services. |
| (2) | Adjusted results exclude certain items from reported results and are used to calculate our adjusted measures as presented in the table above. Management assesses performance on a reported basis and an adjusted basis, and considers both to be useful. For further information, refer to the Non-GAAP and Other Financial Measures section, and for details on the composition of non-GAAP amounts, measures and ratios, as well as supplementary financial measures, refer to the Glossary of Financial Terms. |
30 |
BMO Financial Group 207th Annual Report 2024 |
|
(Canadian $ in millions, on a
pre-tax basis)For the year ended October 31
|
2024 |
2023 | ||||||
Employee compensation |
||||||||
Salaries |
5,747 |
6,557 | ||||||
Performance-based compensation |
3,742 |
3,561 | ||||||
Employee benefits |
1,383 |
1,342 | ||||||
Total employee compensation |
10,872 |
11,460 | ||||||
Total premises and equipment |
4,117 |
4,870 | ||||||
Amortization of intangible assets |
1,112 |
1,008 | ||||||
Other expenses |
||||||||
Advertising and business development |
837 |
812 | ||||||
Communications |
388 |
367 | ||||||
Professional fees |
583 |
863 | ||||||
Association, clearing and annual regulator fees |
321 |
272 | ||||||
Other |
1,269 |
1,482 | ||||||
Total other expenses |
3,398 |
3,796 | ||||||
Total non-interest expense |
19,499 |
21,134 | ||||||
Acquisition and integration costs (1)
|
(172 |
) |
(2,045 | ) | ||||
Amortization of acquisition-related intangible assets (2)
|
(450 |
) |
(357 | ) | ||||
Legal provision/reversal (including related interest expense and legal fees) (3)
|
588 |
3 | ||||||
Impact of Canadian tax measures (4)
|
– |
(22 | ) | |||||
FDIC special assessment (5)
|
(476 |
) |
– | |||||
Impact of adjusting items on non-interest expense |
(510 |
) |
(2,421 | ) | ||||
Total adjusted non-interest expense |
18,989 |
18,713 | ||||||
Efficiency ratio (%)
|
59.5 |
72.2 | ||||||
Adjusted efficiency ratio (%)
|
58.6 |
59.5 | ||||||
| (1) | Acquisition and integration costs, recorded in non-interest expense in the related operating group. Bank of the West recorded in Corporate Services: $129 million pre-tax in fiscal 2024 and $2,027 million pre-tax in fiscal 2023. Radicle and Clearpool recorded in BMO Capital Markets: $20 million pre-tax in fiscal 2024 and $5 million pre-tax in fiscal 2023. AIR MILES recorded in Canadian P&C: $23 million pre-tax in fiscal 2024 and $13 million pre-tax in fiscal 2023. |
| (2) | Amortization of acquisition-related intangible assets and any impairments, recorded in non-interest expense in the related operating group. Fiscal 2024 included an $18 million write-down related to the acquisition of Radicle, recorded in BMO Capital Markets. |
| (3) | Impact of a lawsuit associated with a predecessor bank, M&I Marshall and Ilsley Bank, recorded in Corporate Services. Fiscal 2024: $588 million reversal of a fiscal 2022 legal provision. Fiscal 2023: $3 million recovery of non-interest expense. For further information, refer to the Provisions and Contingent Liabilities section in Note 25 of the audited annual consolidated financial statements. |
| (4) | Impact of certain tax measures enacted by the Canadian government related to the amended GST/HST definition for financial services, recorded in Corporate Services. |
| (5) | Impact of a U.S. Federal Deposit Insurance Corporation (FDIC) special assessment recorded in Corporate Services. |
| BMO Financial Group 207th Annual Report 2024 | 31 |
|
(Canadian $ in millions, except as noted) For the year ended October 31 |
2024 |
2023 | ||||||
Income before income taxes |
9,535 |
5,947 | ||||||
Provision for income taxes |
2,208 |
1,510 | ||||||
Government levies other than income taxes (other taxes) (1)
|
||||||||
Payroll levies |
534 |
517 | ||||||
Property taxes |
70 |
40 | ||||||
Provincial capital taxes |
52 |
50 | ||||||
Business taxes |
26 |
24 | ||||||
Harmonized sales tax, GST, VAT and other sales taxes |
483 |
563 | ||||||
Sundry taxes |
1 |
1 | ||||||
Total government levies other than income taxes (other taxes) |
1,166 |
1,195 | ||||||
Provision for income taxes and other taxes (2) (3)
|
3,374 |
2,705 | ||||||
Reported Tax Rates |
||||||||
Effective income tax rate (%)
|
23.2 |
25.4 | ||||||
Effective total tax rate |
31.5 |
37.9 | ||||||
Adjusted Results and Tax Rates (4)
|
||||||||
Adjusted income before income taxes |
9,662 |
11,252 | ||||||
Adjusted provision for income taxes |
2,213 |
2,517 | ||||||
Adjusted effective income tax rate (%)
|
22.9 |
22.4 | ||||||
| (1) | Government levies other than income taxes (other taxes) are included in various non-interest expense categories. |
| (2) | Provision for income taxes and other taxes are on a non-GAAP basis and are discussed in the Non-GAAP and Other Financial Measures section. |
| (3) | Fiscal 2024 comprised $1,266 million incurred in Canada, with $485 million included in the provision for income taxes and the remaining $781 million recorded in total government levies other than income taxes (other taxes). |
| (4) | Adjusted results exclude certain items from reported results and are used to calculate our adjusted ratios. Refer to footnotes (1) to (8) in the Non-GAAP and Other Financial Measures table for further information on adjusting items. |
32 |
BMO Financial Group 207th Annual Report 2024 |
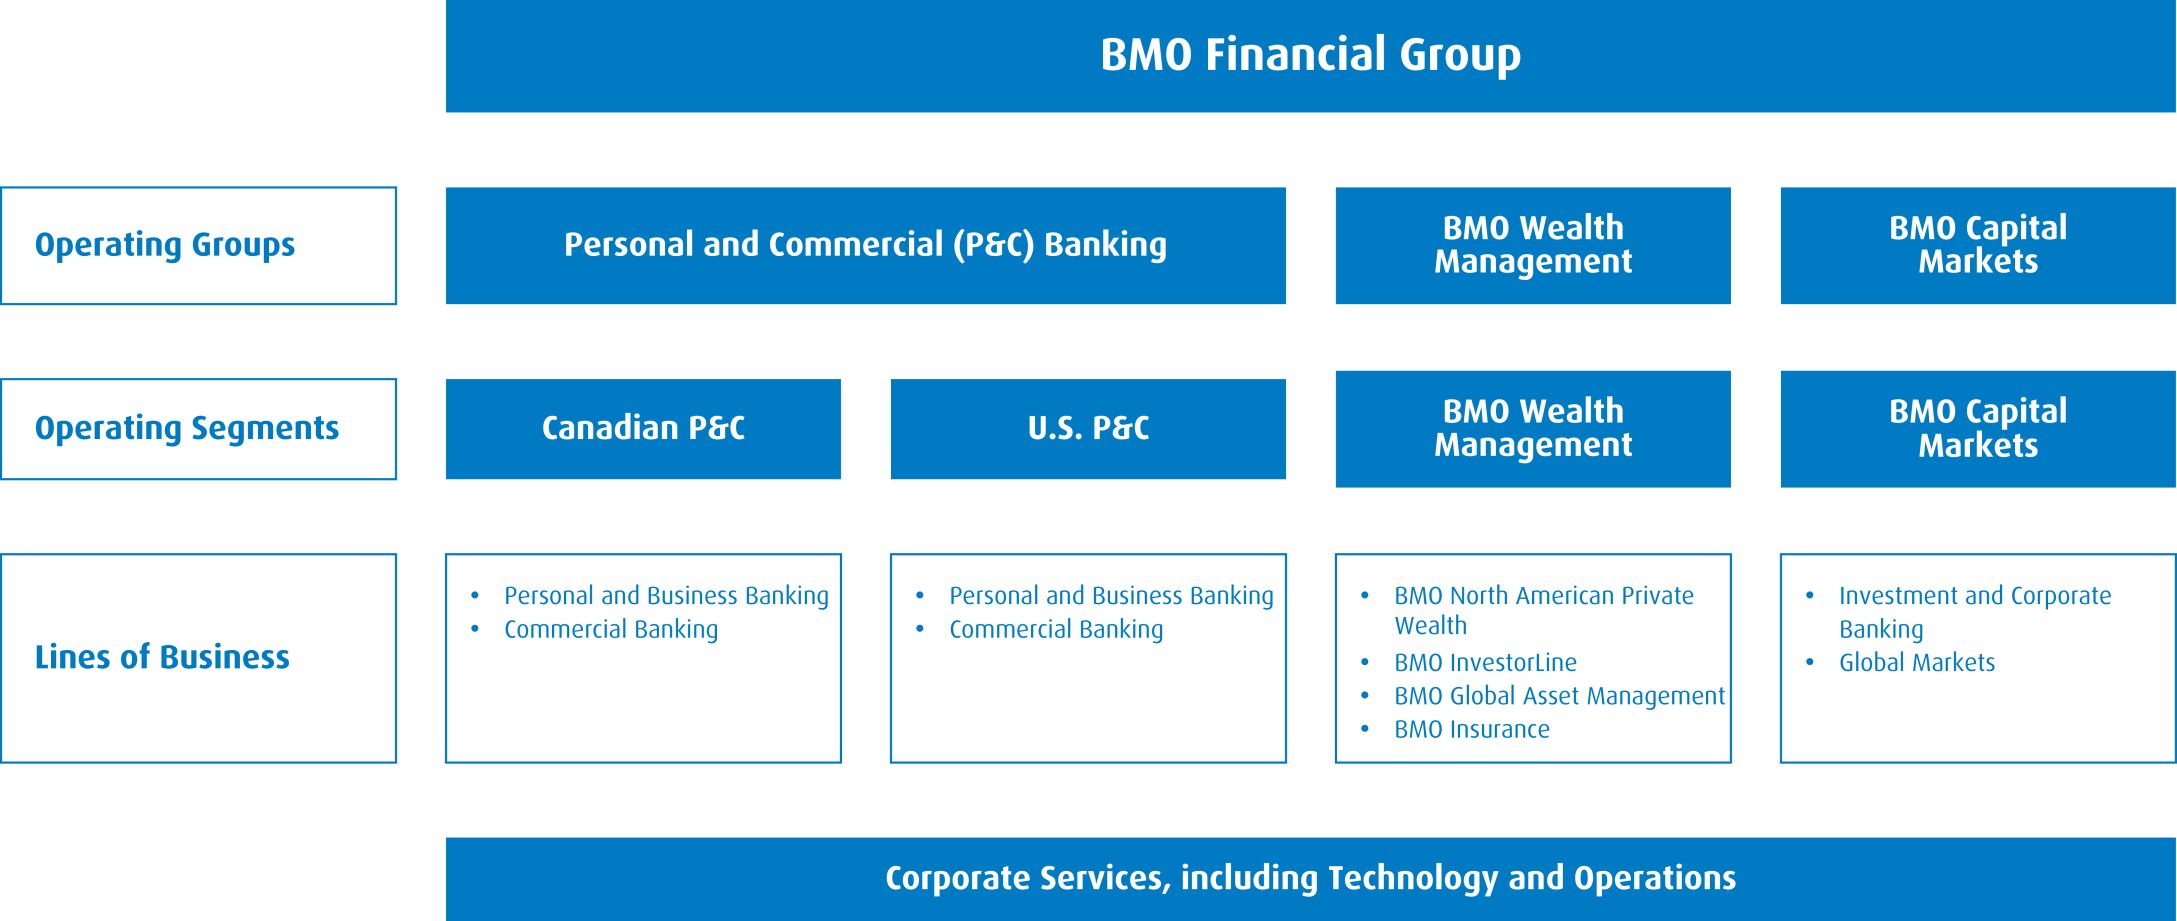
| BMO Financial Group 207th Annual Report 2024 | 33 |
|
(Canadian $ in millions, except as noted) As at or for the year ended October 31 |
Canadian P&C |
U.S. P&C |
Total P&C |
|||||||||||||||||||||||||||||
2024 |
2023 | 2024 |
2023 | 2024 |
2023 | |||||||||||||||||||||||||||
Net interest income (teb) (2)
|
8,852 |
8,043 | 8,162 |
7,607 | 17,014 |
15,650 | ||||||||||||||||||||||||||
Non-interest revenue |
2,587 |
2,516 | 1,602 |
1,573 | 4,189 |
4,089 | ||||||||||||||||||||||||||
Total revenue (teb) (2)
|
11,439 |
10,559 | 9,764 |
9,180 | 21,203 |
19,739 | ||||||||||||||||||||||||||
Provision for credit losses on impaired loans |
1,326 |
724 | 1,274 |
364 | 2,600 |
1,088 | ||||||||||||||||||||||||||
Provision for credit losses on performing loans |
333 |
185 | 389 |
142 | 722 |
327 | ||||||||||||||||||||||||||
Total provision for credit losses |
1,659 |
909 | 1,663 |
506 | 3,322 |
1,415 | ||||||||||||||||||||||||||
Non-interest expense |
5,005 |
4,723 | 5,898 |
5,444 | 10,903 |
10,167 | ||||||||||||||||||||||||||
Income before income taxes |
4,775 |
4,927 | 2,203 |
3,230 | 6,978 |
8,157 | ||||||||||||||||||||||||||
Provision for income taxes (teb) (2)
|
1,318 |
1,354 | 374 |
741 | 1,692 |
2,095 | ||||||||||||||||||||||||||
Reported net income |
3,457 |
3,573 | 1,829 |
2,489 | 5,286 |
6,062 | ||||||||||||||||||||||||||
Acquisition and integration costs (3)
|
17 |
9 | – |
– | 17 |
9 | ||||||||||||||||||||||||||
Amortization of acquisition-related intangible assets (4)
|
13 |
6 | 283 |
234 | 296 |
240 | ||||||||||||||||||||||||||
Adjusted net income |
3,487 |
3,588 | 2,112 |
2,723 | 5,599 |
6,311 | ||||||||||||||||||||||||||
Net income available to common shareholders |
3,415 |
3,534 | 1,773 |
2,438 | 5,188 |
5,972 | ||||||||||||||||||||||||||
Adjusted net income available to common shareholders |
3,445 |
3,549 | 2,056 |
2,672 | 5,501 |
6,221 | ||||||||||||||||||||||||||
| (1) | Adjusted results are on a non-GAAP basis and are discussed in the Non-GAAP and Other Financial Measures section. |
| (2) | Taxable equivalent basis (teb) amounts of $36 million in fiscal 2024 and $33 million in fiscal 2023, recorded in net interest income, revenue and provision for income taxes. |
| (3) | Acquisition and integration costs related to AIR MILES, recorded in non-interest expense. |
| (4) | Amortization of acquisition-related intangible assets and any impairments, recorded in non-interest expense. |
34 |
BMO Financial Group 207th Annual Report 2024 |
• |
Maintained strong customer loyalty in both Personal and Business Banking and Commercial Banking, as measured by Net Promoter Score (1) |
• |
Named Best Commercial Bank in Canada for the 10 th consecutive year and Best Retail Bank in Canada for the third consecutive year by World Finance |
• |
Received the 2024 Excellence in Customer Service Award in the Transformation of the Year category by Business Intelligence Group for our agile delivery of self-serve functionality with Interactive Voice Response through BMO Virtual Connect – our customer contact centre – using advanced analytics and customer research to enhance the customer experience |
• |
Continued to drive our One Client strategy through stronger collaboration across businesses to address customer needs holistically |
• |
Drive strong customer loyalty, leveraging enhanced capabilities across customer channels |
• |
Leverage our One Client strategy to provide a connected and integrated experience to our clients, with a holistic approach that addresses their needs across our businesses |
• |
Continued to grow market share in key categories, including deposits, mortgages and credit cards, supported by our strongest year-over-year growth in customer acquisition |
• |
Enhanced our AIR MILES Reward Program with new partnerships and features, including the new brand campaign Collect More Moments |
• |
Helped customers grow their savings through the BMO Savings Goals feature and BMO Savings Amplifier ® Account, now surpassing one million accounts |
• |
Strengthened our offerings to support new Canadians by providing award-winning digital and product experience, supported by a robust partnership ecosystem: |
• |
Partnered with Nova Credit, a leading cross-border credit bureau, to access customers’ international credit history and make their financial transition to Canada faster, easier and more inclusive |
• |
Provided access to our BMO SmartProgress ® online financial education platform, which provides newcomers with a customized, on-demand and interactive learning experience on the Canadian banking system |
• |
Welcomed new Canadians with BMO’s award-winning BMO NewStart ® Program – supporting them with special banking offers and personalized solutions |
• |
Partnered with PeaceGeeks to support financial literacy through the Welcome to Canada app |
• |
Enhanced our support for Indigenous customers by launching the Virtual Indigenous Branch, a relationship-based banking option for rural and northern Indigenous communities; updated our Indigenous Mortgage Lending Program; and launched a tailored financial education program through BMO SmartProgress ® |
| (1) | Net Promoter Score (NPS): The percentage of customers surveyed who would recommend BMO to a friend or colleague. |
| BMO Financial Group 207th Annual Report 2024 | 35 |
• |
Drive customer acquisition through our differentiated value proposition, enabled by analytics and digital marketing capabilities |
• |
Deliver differentiated products and services that meet customers’ needs and help them make real financial progress |
• |
Continue to build on our AIR MILES Reward Program through product relationships with collectors and reward program partners |
• |
Maintained our second-place ranking in national lending market share with strong positions in key regions |
• |
Named the silver medalist in the Datos Insights 2024 Impact Awards in the Commercial Banking, Artificial Intelligence (AI) and Advanced Analytics category, for the development of our One Client relationship network platform that provides greater insight into our clients and their needs, better enabling BMO to offer them holistic and tailored solutions |
• |
Established a Sustainable Banking and Clean Energy team, launched climate-related products across sectors and rolled out climate training for Commercial bankers in support of BMO’s Climate Ambition to be our clients’ lead partner in the transition to a net zero world |
• |
Deepened client relationships through our robust Online Banking for Business platform and the integration of North American B2B digital platforms, contributing to strong deposit growth |
• |
Continue to invest in core sectors and geographies, with a focus on optimizing returns and prudently managing risk |
• |
Deepen relationships through simplification and digital innovation to drive deposit growth |
• |
Continue to develop climate and carbon transition solutions for our clients |
• |
Ranked first among Canadian financial institutions by EMARKETER in its Canada Mobile Banking Emerging Features Benchmark 2024, with a top overall mobile app score, as well as in the Account Management, Alerts and Digital Money Management categories |
• |
Received two Digital Customer Experience (CX) Awards from The Digital Banker ® financial education platform, and Best Technology Implementation for Digital CX, recognizing the BMO Savings Goals feature in the BMO Mobile Banking app |
• |
Recognized by The Digital Banker first-of-its-kind |
• |
Received the Design Concept 2024 award from Red Dot in the Interaction, User Interface and User Experience category for redesigning the digital business banking experience for a select group of small and medium-sized enterprise clients in Canada – the first bank in North America to win this award |
• |
Enhanced our integration with Xero, a global cloud-based accounting platform that enables clients to connect to multiple companies, improving functionality and expanding the offering based on customer feedback |
• |
Continue to simplify and digitize processes to enhance efficiency and make it easier and faster for customers to interact with us |
• |
Continue to strengthen digital capabilities, leveraging existing and new partnerships and delivering leading digital experiences to our customers |
• |
Recognized at the Business Transformation and Operational Excellence Awards summit for transforming BMO Virtual Connect, our customer-contact centre, into a world-class virtual financial services employer |
• |
Delivered strong employee engagement and winning culture, with index scores in specific areas, including engagement, diversity and ethics, that place us among leading global companies |
• |
Continue to attract and develop a diverse workforce and promote an inclusive workplace |
• |
Maintain a world-class, winning culture and continue to drive leading employee engagement |
36 |
BMO Financial Group 207th Annual Report 2024 |
|
(Canadian $ in millions, except as noted) As at or for the year ended October 31 |
2024 |
2023 | ||||||
Net interest income |
8,852 |
8,043 | ||||||
Non-interest revenue |
2,587 |
2,516 | ||||||
Total revenue |
11,439 |
10,559 | ||||||
Provision for credit losses on impaired loans |
1,326 |
724 | ||||||
Provision for credit losses on performing loans |
333 |
185 | ||||||
Total provision for credit losses |
1,659 |
909 | ||||||
Non-interest expense |
5,005 |
4,723 | ||||||
Income before income taxes |
4,775 |
4,927 | ||||||
Provision for income taxes |
1,318 |
1,354 | ||||||
Reported net income |
3,457 |
3,573 | ||||||
Acquisition and integration costs (2)
|
17 |
9 | ||||||
Amortization of acquisition-related intangible assets (3)
|
13 |
6 | ||||||
Adjusted net income |
3,487 |
3,588 | ||||||
Adjusted non-interest expense |
4,964 |
4,702 | ||||||
Net income available to common shareholders |
3,415 |
3,534 | ||||||
Adjusted net income available to common shareholders |
3,445 |
3,549 | ||||||
Key Performance Metrics |
||||||||
Personal and Business Banking revenue |
8,231 |
7,537 | ||||||
Commercial Banking revenue |
3,208 |
3,022 | ||||||
Return on equity (%) (4)
|
21.4 |
26.6 | ||||||
Adjusted return on equity (%) (4)
|
21.5 |
26.7 | ||||||
Operating leverage (%)
|
2.3 |
(0.4 | ) | |||||
Adjusted operating leverage (%)
|
2.7 |
– | ||||||
Efficiency ratio (%)
|
43.8 |
44.7 | ||||||
PCL on impaired loans to average net loans and acceptances (%)
|
0.41 |
0.24 | ||||||
Net interest margin on average earning assets (%)
|
2.77 |
2.72 | ||||||
Average earning assets |
319,795 |
296,164 | ||||||
Average gross loans and acceptances |
324,082 |
307,296 | ||||||
Average net loans and acceptances |
322,304 |
305,931 | ||||||
Average deposits |
301,278 |
272,573 | ||||||
Full-time equivalent employees |
16,140 |
16,100 | ||||||
| (1) | Adjusted results and ratios are on a non-GAAP basis and are discussed in the Non-GAAP and Other Financial Measures section. |
| (2) | Acquisition and integration costs related to AIR MILES, recorded in non-interest expense. |
| (3) | Amortization of acquisition-related intangible assets and any impairments, recorded in non-interest expense. |
| (4) | Return on equity is based on allocated capital. Effective fiscal 2024, the capital allocation rate increased to 11.5% of risk-weighted assets, compared with 11.0% in fiscal 2023. For further information, refer to the Non-GAAP and Other Financial Measures section. |
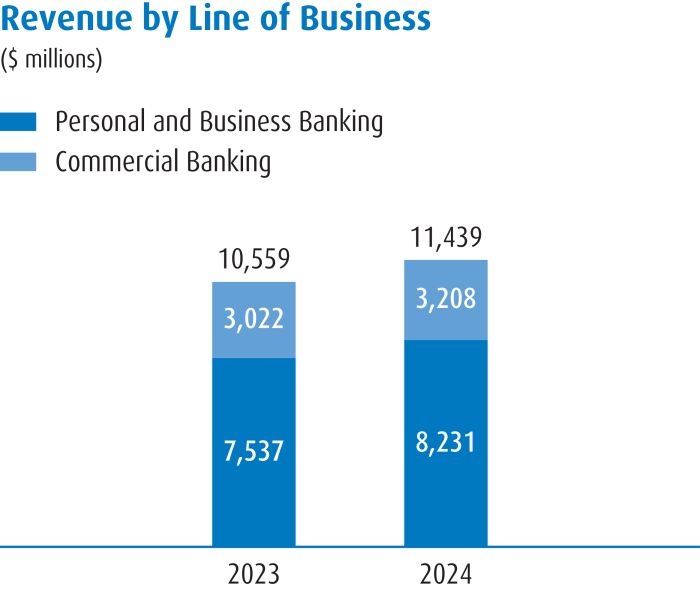
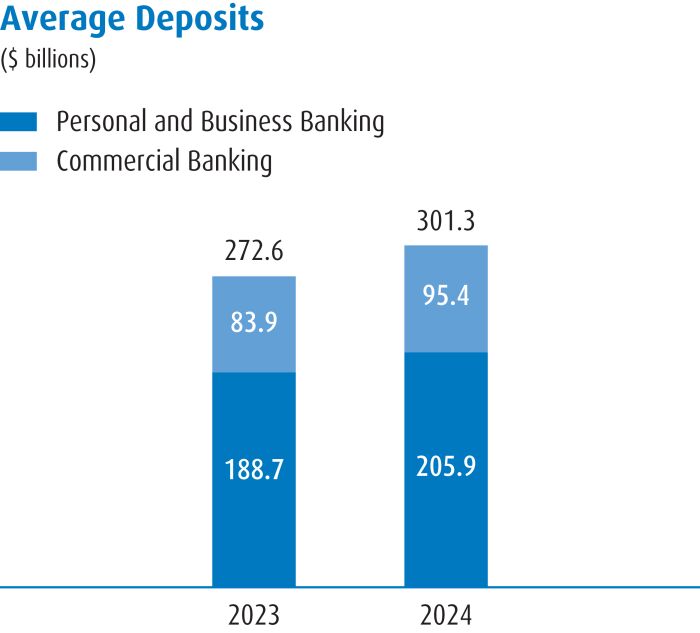
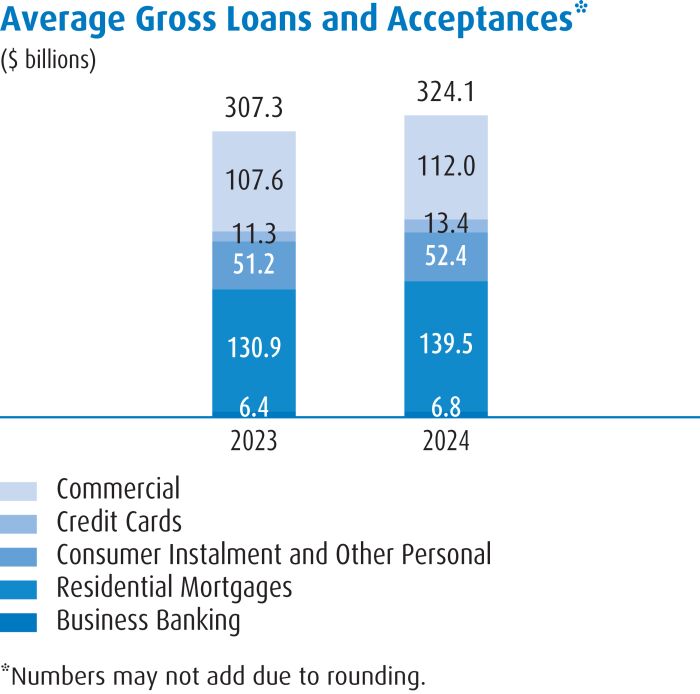
| BMO Financial Group 207th Annual Report 2024 | 37 |
38 |
BMO Financial Group 207th Annual Report 2024 |
• |
Achieved strong customer loyalty in both Personal and Business Banking and Commercial Banking, as measured by Net Promoter Score (1) |
• |
Named Best Commercial Bank in the United States for the second consecutive year by World Finance |
• |
Received the 2024 Celent Model Bank Award for integration excellence and in recognition of best practices in migrating and onboarding nearly two million Bank of the West customers to BMO within a short time frame, reflecting our Digital First, customer-centric approach |
• |
Rated Outstanding by the Office of the Comptroller of the Currency for our Community Reinvestment Act (2) , demonstrating our commitment to supporting communities with moderate or low income levels |
• |
Drive strong customer loyalty, leveraging enhanced capabilities across customer channels |
• |
Leverage our One Client strategy to provide a connected and integrated experience to our clients, with a holistic approach that addresses their needs across our businesses |
• |
Continued to build our digital sales and service capabilities, with more than one third of our core banking products purchased and delivered digitally, our digital adoption rate increasing nearly 300 basis points year-over-year, and more than 80% of service transactions completed through self-serve channels, allowing our front-line employees to focus on delivering leading advisory services |
• |
Achieved strong customer acquisition across our markets through a differentiated value proposition and marketing investments, leveraging strong brand awareness |
• |
Continued to empower members of historically underserved communities, including Asian, veteran, LGBTQ+, Black, Latinx, Native American and women-owned businesses by providing access to affordable credit, partnerships and resources for sustainable growth |
• |
Engaged in personalized conversations through more than one million Real Financial Progress TM Progress Checks to help our customers identify and achieve their financial goals |
• |
Launched the Greener Future Financing program for small and medium-sized agriculture businesses, offering climate resiliency loan discounts and green business advisory services to support, educate and advise business owners |
| (1) | Net Promoter Score (NPS): The percentage of customers surveyed who would recommend BMO to a friend or colleague. |
| (2) | Announced in fiscal 2024: Outstanding rating for BMO’s Community Reinvestment Act |
| BMO Financial Group 207th Annual Report 2024 | 39 |
• |
Drive customer acquisition through our differentiated value proposition enabled by digital and marketing capabilities, leveraging our expanded footprint and realizing synergies of scale |
• |
Deliver differentiated products and services that meet customers’ needs and help them make real financial progress |
• |
Maintained Top 10 ranking in commercial banking, based on total wholesale loans |
• |
Added a dedicated local Media Finance team in Los Angeles to support our commercial banking clients in the media and entertainment sector, building on the longstanding success of our Canadian team |
• |
Expanded BMO’s service to the wine and spirits industry by growing the commercial coverage team and adding specialized middle market mergers and acquisitions experts to complement our leading wine lending business |
• |
Recognized as Global Finance |
• |
Received the 2024 Leadership Award from Midwest Food Matters: Global Midwest Alliance in recognition of our Food, Consumer and Agribusiness Group |
• |
Maintain a focus on key sectors and geographies while leveraging our wider footprint to unlock synergies, with a focus on optimizing returns and prudently managing risk |
• |
Deepen relationships through simplification and digital innovation to drive deposit growth |
• |
Continue to develop solutions and capabilities to support our clients on their climate and carbon transition journey |
• |
Implemented enhanced digital capabilities in BMO Virtual Connect, our customer-contact centre, improving the caller experience, reducing wait times for customers, and creating operational efficiencies |
• |
Invested in key digital capabilities, such as launching PaySmart TM , a credit card instalment feature that simplifies card transactions and helps customers build a credit history, as well as enhancing the Online Banking and Mobile Banking app customer experience, including the Increase My Security feature |
• |
Partnered with Elavon to offer an innovative acquiring and payment processing solutions platform to our merchant services clients to make accepting payments easier for our clients and their customers |
• |
Launched Virtual Account Management services for commercial clients to help reduce their administrative costs, save time, reconcile accounts more efficiently and manage liquidity across entities |
• |
Ranked among Fast Company |
• |
Recognized as a leader in the Financial Fitness Category on Javelin’s 2024 Online Banking Scorecard |
• |
Named a 2024 CIO 100 award winner for BMO Alto TM , our online high-yielding deposit account offering available to customers nationally |
• |
Continue to simplify and digitize processes to enhance efficiency and make it easier and faster for customers to interact with us |
• |
Continue to strengthen digital capabilities, leveraging existing and new partnerships and delivering leading digital experiences to our customers |
• |
Received a top score on the Disability Equality Index ®
|
• |
Recognized by Forbes |
• |
Expanded BMORE, our inclusive hiring and employment program focused on improving access to careers, skills and advancement in the financial industry, with a recruiting focus in Phoenix, Los Angeles, Chicago, Milwaukee and Madison |
• |
Delivered solid employee engagement and winning culture, with index scores in specific areas, including diversity and ethics, that place us among leading global companies |
• |
Continue to attract and develop a diverse workforce and promote an inclusive workplace |
• |
Maintain a world-class, winning culture and continue to drive strong employee engagement |
40 |
BMO Financial Group 207th Annual Report 2024 |
|
(Canadian $ in millions, except as noted) As at or for the year ended October 31 |
2024 |
2023 | ||||||
Net interest income (teb) (2)
|
8,162 |
7,607 | ||||||
Non-interest revenue |
1,602 |
1,573 | ||||||
Total revenue (teb) (2)
|
9,764 |
9,180 | ||||||
Provision for credit losses on impaired loans |
1,274 |
364 | ||||||
Provision for credit losses on performing loans |
389 |
142 | ||||||
Total provision for credit losses |
1,663 |
506 | ||||||
Non-interest expense |
5,898 |
5,444 | ||||||
Income before income taxes |
2,203 |
3,230 | ||||||
Provision for income taxes (teb) (2)
|
374 |
741 | ||||||
Reported net income |
1,829 |
2,489 | ||||||
Amortization of acquisition-related intangible assets (3)
|
283 |
234 | ||||||
Adjusted net income |
2,112 |
2,723 | ||||||
Adjusted non-interest expense |
5,517 |
5,129 | ||||||
Net income available to common shareholders |
1,773 |
2,438 | ||||||
Adjusted net income available to common shareholders |
2,056 |
2,672 | ||||||
Average earning assets |
215,987 |
195,363 | ||||||
Average gross loans and acceptances |
204,794 |
189,667 | ||||||
Average deposits |
222,276 |
198,714 | ||||||
| (US$ equivalent in millions) | ||||||||
Net interest income (teb) (2)
|
6,006 |
5,635 | ||||||
Non-interest revenue |
1,179 |
1,165 | ||||||
Total revenue (teb) (2)
|
7,185 |
6,800 | ||||||
Provision for credit losses on impaired loans |
935 |
270 | ||||||
Provision for credit losses on performing loans |
283 |
106 | ||||||
Total provision for credit losses |
1,218 |
376 | ||||||
Non-interest expense |
4,339 |
4,033 | ||||||
Income before income taxes |
1,628 |
2,391 | ||||||
Provision for income taxes (teb) (2)
|
276 |
548 | ||||||
Reported net income |
1,352 |
1,843 | ||||||
Amortization of acquisition-related intangible assets (3)
|
209 |
173 | ||||||
Adjusted net income |
1,561 |
2,016 | ||||||
Adjusted non-interest expense |
4,059 |
3,800 | ||||||
Net income available to common shareholders |
1,310 |
1,805 | ||||||
Adjusted net income available to common shareholders |
1,521 |
1,983 | ||||||
Key Performance Metrics (US$ basis)
|
||||||||
Personal and Business Banking revenue |
2,769 |
2,607 | ||||||
Commercial Banking revenue |
4,416 |
4,193 | ||||||
Return on equity (%) (4)
|
5.4 |
8.8 | ||||||
Adjusted return on equity (%) (4)
|
6.2 |
9.7 | ||||||
Operating leverage (teb) (%)
|
(1.9 |
) |
(30.4 | ) | ||||
Adjusted operating leverage (teb) (%)
|
(1.1 |
) |
(20.6 | ) | ||||
Efficiency ratio (teb) (%)
|
60.4 |
59.3 | ||||||
Adjusted efficiency ratio (teb) (%)
|
56.5 |
55.9 | ||||||
Net interest margin on average earning assets (teb) (%)
|
3.78 |
3.89 | ||||||
PCL on impaired loans to average net loans and acceptances (%)
|
0.63 |
0.19 | ||||||
Average earning assets |
158,919 |
144,732 | ||||||
Average gross loans and acceptances |
150,687 |
140,508 | ||||||
Average net loans and acceptances |
149,396 |
139,236 | ||||||
Average deposits |
163,540 |
147,218 | ||||||
Full-time equivalent employees |
11,540 |
12,177 | ||||||
| (1) | Adjusted results and ratios are on a non-GAAP basis and are discussed in the Non-GAAP and Other Financial Measures section. |
| (2) | Taxable equivalent basis (teb) amounts of $36 million in fiscal 2024 and $33 million in fiscal 2023, recorded in net interest income, revenue and provision for income taxes, and were reflected in the ratios. On a source currency basis: US$25 million in both fiscal 2024 and fiscal 2023. |
| (3) | Amortization of acquisition-related intangible assets and any impairments, recorded in non-interest expense. On a source currency basis: US$280 million in fiscal 2024 and US$233 million in fiscal 2023. |
| (4) | Return on equity is based on allocated capital. Effective fiscal 2024, the capital allocation rate increased to 11.5% of risk-weighted assets, compared with 11.0% in fiscal 2023. For further information, refer to the Non-GAAP and Other Financial Measures section. |
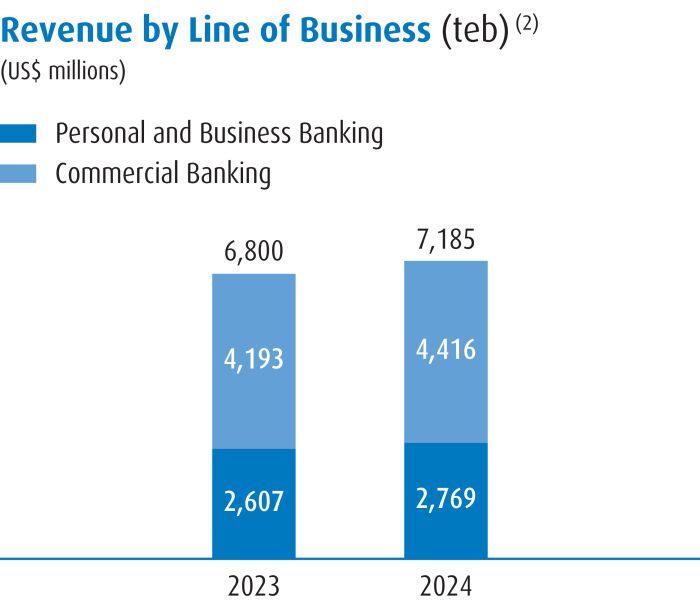
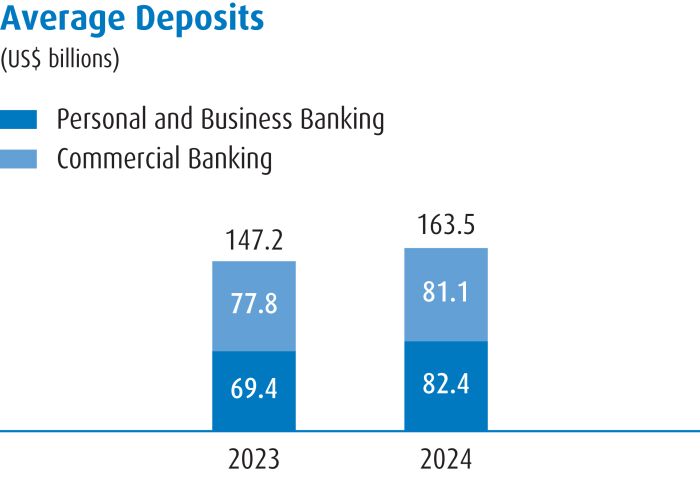
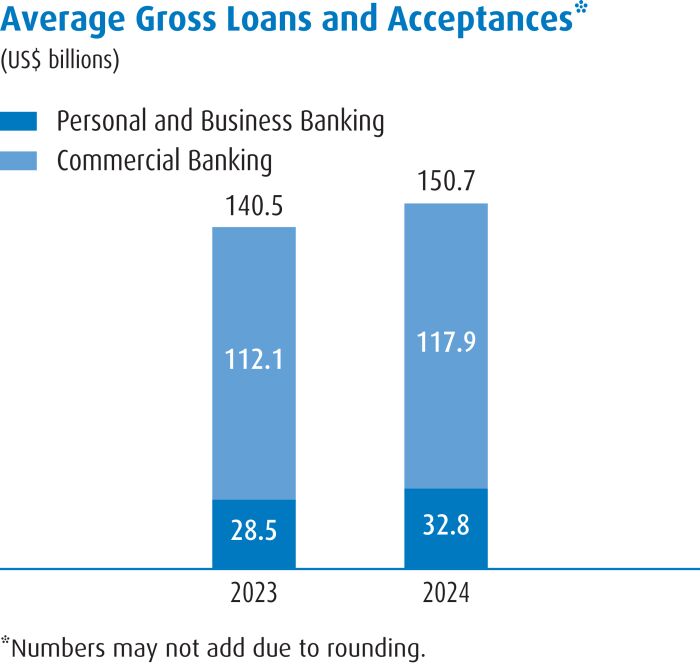
| BMO Financial Group 207th Annual Report 2024 | 41 |
42 |
BMO Financial Group 207th Annual Report 2024 |
• |
Achieved our highest ever loyalty scores across most of our businesses as measured by Net Promoter Score (1) , reflecting our continued investment in improving the client experience |
• |
Named Best Private Bank in Canada for the 14 th consecutive year and Best Private Bank in the United States for the second consecutive year by World Finance magazine, in recognition of our commitment to clients, customers and the communities we serve |
• |
Expanded our U.S. Wealth Management’s Law Practice advisory services to incorporate a national approach and provide clients with curated solutions for both law firms and lawyers, deepening our One Client offerings with commercial clients |
• |
Delivered holistic client solutions, continued to strengthen our differentiated service offerings and won significant mandates by forming cross-BMO deal teams |
• |
Responded to individual client needs and preferences by introducing complementary investment solutions and channels, ranging from self-directed to full-service investing |
• |
Accelerate growth across our client base by strengthening product and service offerings, deepening client relationships and growing distribution in core markets across North America, while maintaining top-tier client loyalty scores |
• |
Ranked #1 in satisfaction with the Wealth Management digital experience among full-service investors in the J.D. Power (2) 2024 Canada Wealth Management Digital Experience Study |
• |
BMO Global Equity Fund received a 5-star Morningstar rating and BMO Global Asset Management received top-tier rankings for most of the global mandates for which it is the portfolio manager, contributing to increased mutual fund flows |
• |
Maintained a leadership position in exchange-traded funds (ETFs) net flows (3) , with six new ETFs launched, including the BMO Gold Bullion ETF, making the precious metals market accessible to more clients |
• |
Received 23 FundGrade A+ ® Awards from analytics firm Fundata Canada Inc. for consistent, risk-adjusted performance. BMO won awards for four mutual funds and 19 ETFs – the most ETF awards among all fund providers rated in 2023 (4) |
• |
Received 10 Canada LSEG Lipper Fund Awards (5) , which recognize funds and fund management firms that provide consistently strong risk-adjusted performance relative to their peers. Six best-in-class |
| (1) | Net Promoter Score (NPS): The percentage of customers surveyed who would recommend BMO to a friend or colleague. |
| (2) | For more information, refer to www.jdpower.com/business. |
| (3) | National Bank ETF Report as at December 31, 2023. |
| (4) | Announced in fiscal 2024. |
| (5) | Announced in fiscal 2024: 2023 Canada LSEG Lipper Fund Awards. |
| BMO Financial Group 207th Annual Report 2024 | 43 |
• |
BMO Insurance was the first Canadian provider to offer a 30-year Guaranteed Interest Annuity (GIA) as part of our focus on offering innovative solutions to meet the growing retirement needs of Canadians |
• |
Recognized by Institutional Connect with its Climate Change Partner Award for our approach to investment management, stewardship strategy and product development through market education initiatives (1) |
• |
Partnered with Tree Canada to plant a tree for each BMO Private Wealth account that is switched from paper to electronic delivery of documents during September and October 2024, a testament to our commitment to be our clients’ lead partner in the transition to a net zero world – in collaboration with Tree Canada, we are on track to plant more than 4,000 trees |
• |
Expand product solutions and distribution across BMO channels to deliver innovative, competitive and client-centric products to all BMO clients |
• |
Achieved top-tier user rating for our BMO Invest mobile app for both iOS and Android platforms, reflecting our ongoing investment in the digital client experience (2) |
• |
Offered an enhanced Active Trader experience through the introduction of new tools to the BMO InvestorLine ® platform, including strategy builders, options screeners and the ability to trade multi-leg options, as well as lower commission rates – among the lowest in Canada |
• |
Expanded BMO digital banking services to include digital wires to U.S. Private Bank and Family Office, making it easier for clients to bank with BMO |
• |
BMO Insurance launched an artificial intelligence (AI) powered digital assistant in Canada, designed to enhance and accelerate the underwriting process, coupled with program improvements that simplify requirements and provide an enhanced digital self-serve channel, delivering more accessible life insurance coverage to Canadian customers when and where they need it |
• |
Continue to invest in technology platforms to simplify, streamline and integrate digital experiences for our clients, along with leading advisor-facing tools and practice support |
• |
Delivered solid employee engagement and winning culture, with index scores in specific areas, including diversity and ethics, that place us among leading global companies |
• |
Introduced programs intended to provide meaningful enhancements to employee wellness and support |
• |
Launched new leadership development programs to unlock the growth potential of our workforce and drive performance |
• |
Launched a BMO Insurance rotational program for recent graduates in the actuarial field, demonstrating our commitment to attracting and developing diverse talent by providing access to development opportunities and meaningful career experience |
• |
Continue to attract and develop a diverse workforce with critical skill sets aligned with our strategic focus |
| (1) | Announced in fiscal 2024: 2023 Institutional Connect Awards. |
| (2) | App Store Rating as at October 31, 2024. |
44 |
BMO Financial Group 207th Annual Report 2024 |
|
(Canadian $ in millions, except as noted) As at or for the year ended October 31 |
2024 |
2023 | ||||||
Net interest income |
1,313 |
1,380 | ||||||
Non-interest revenue |
4,333 |
4,031 | ||||||
Total revenue |
5,646 |
5,411 | ||||||
Provision for credit losses on impaired loans |
26 |
5 | ||||||
Provision for credit losses on performing loans |
5 |
13 | ||||||
Total provision for credit losses |
31 |
18 | ||||||
Non-interest expense |
3,968 |
3,878 | ||||||
Income before income taxes |
1,647 |
1,515 | ||||||
Provision for income taxes |
399 |
369 | ||||||
Reported net income |
1,248 |
1,146 | ||||||
Amortization of acquisition-related intangible assets (2)
|
7 |
4 | ||||||
Adjusted net income |
1,255 |
1,150 | ||||||
Adjusted non-interest expense |
3,959 |
3,871 | ||||||
Net income available to common shareholders |
1,239 |
1,138 | ||||||
Adjusted net income available to common shareholders |
1,246 |
1,142 | ||||||
Key Performance Metrics |
||||||||
Wealth and Asset Management reported net income |
1,012 |
824 | ||||||
Wealth and Asset Management adjusted net income |
1,019 |
828 | ||||||
Insurance reported net income |
236 |
322 | ||||||
Return on equity (%) (3)
|
26.0 |
24.6 | ||||||
Adjusted return on equity (%) (3)
|
26.1 |
24.7 | ||||||
Operating leverage (%) (4)
|
2.0 |
11.3 | ||||||
Adjusted operating leverage (%) (4)
|
2.1 |
(4.4 | ) | |||||
Efficiency ratio (%)
|
70.3 |
71.7 | ||||||
Adjusted efficiency ratio (%)
|
70.1 |
71.6 | ||||||
PCL on impaired loans to average net loans and acceptances (%)
|
0.06 |
0.01 | ||||||
Average assets |
64,674 |
60,092 | ||||||
Average gross loans and acceptances |
42,905 |
40,855 | ||||||
Average net loans and acceptances |
42,855 |
40,809 | ||||||
Average deposits |
61,453 |
61,627 | ||||||
Assets under administration (AUA) (5)
|
361,250 |
416,352 | ||||||
Assets under management (AUM) |
422,701 |
332,947 | ||||||
Full-time equivalent employees |
6,244 |
6,417 | ||||||
U.S. Business Select Financial Data (US$ in millions)
|
||||||||
Total revenue |
771 |
766 | ||||||
Non-interest expense |
583 |
600 | ||||||
Reported net income |
133 |
119 | ||||||
Adjusted non-interest expense |
576 |
595 | ||||||
Adjusted net income |
138 |
123 | ||||||
Average gross loans and acceptances |
10,574 |
9,776 | ||||||
Average deposits |
11,464 |
11,975 | ||||||
| (1) | Adjusted results and ratios are on a non-GAAP basis and are discussed in the Non-GAAP and Other Financial Measures section. |
| (2) | Amortization of acquisition-related intangible assets and any impairments, recorded in non-interest expense. |
| (3) | Return on equity is based on allocated capital. Effective fiscal 2024, the capital allocation rate increased to 11.5% of risk-weighted assets, compared with 11.0% in fiscal 2023. For further information, refer to the Non-GAAP and Other Financial Measures section. |
| (4) | Prior to November 1, 2022, we presented adjusted revenue on a basis net of insurance claims, commissions and changes in policy benefit liabilities (CCPB). Beginning the first quarter of fiscal 2023, we no longer report CCPB, given the adoption and retrospective application of IFRS 17. For periods prior to November 1, 2022, efficiency ratio and operating leverage were calculated based on revenue, net of CCPB. Revenue, net of CCPB, was $5,190 million in fiscal 2022. Measures and ratios presented on a basis net of CCPB are non-GAAP amounts. For more information, refer to the Insurance Claims, Commissions and Changes in Policy Benefit Liabilities section of the 2023 Annual MD&A. |
| (5) | Certain assets under management that are also administered by BMO are included in assets under administration. |
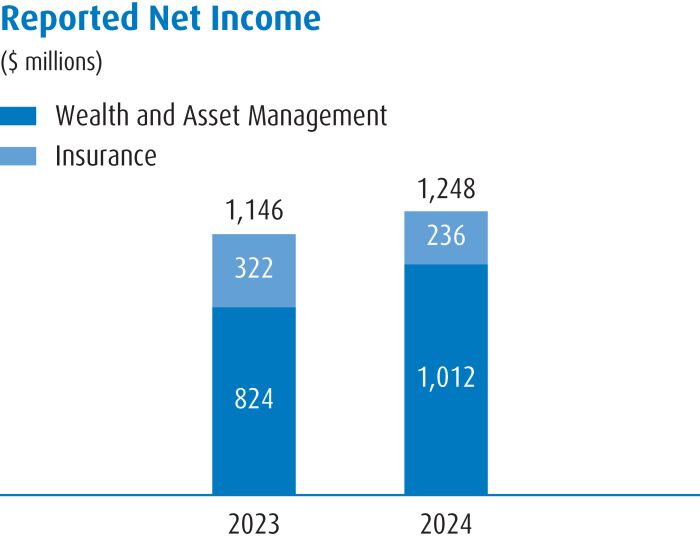
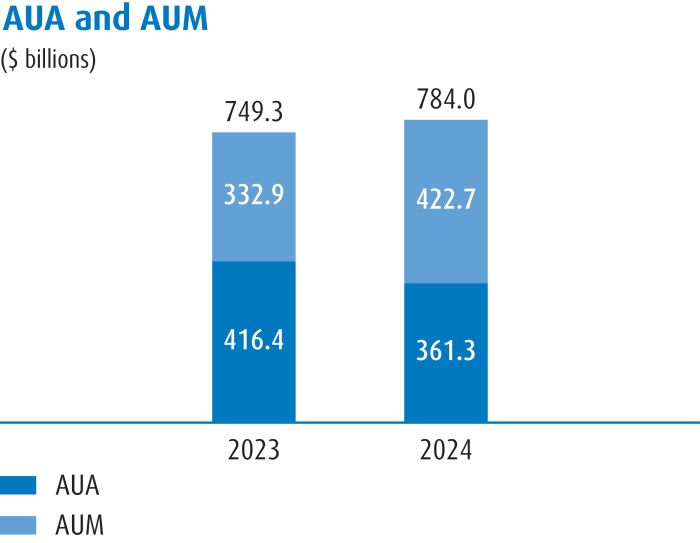
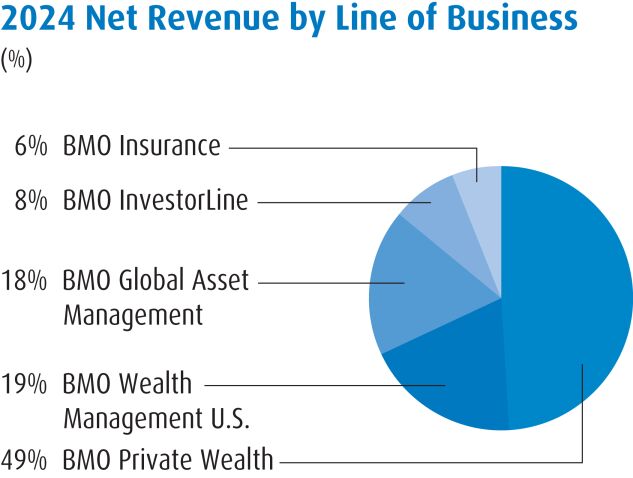
| BMO Financial Group 207th Annual Report 2024 | 45 |
46 |
BMO Financial Group 207th Annual Report 2024 |
• |
Delivered integrated, holistic coverage to our clients, resulting in notable One Client wins and mandates with multiple touchpoints across BMO, including partnering with Commercial Banking for WinCup’s inaugural bank market issuance, and executing with BMO Wealth Management the largest series of exchange-traded funds transactions in Canadian market history |
• |
Led several market firsts, including the inaugural Canadian tri-party repo trade through the Canadian Collateral Management System and the largest at-the-market |
• |
Designated and accredited as a Gilt-edged Market Maker in the United Kingdom, expanding our international footprint as a primary dealer to meet the evolving needs of our global clients |
• |
Maintained global leadership in metals and mining: recognized as Best Metals & Mining Investment Bank of the Year by Global Finance magazine for the 15th consecutive year, launched BMO’s first Canadian regulated precious metals investment fund storage transaction and led significant deals in the industry |
• |
Deepened client relationships with expertise and insights through leading investor conferences such as our 33 rd Global Metals, Mining & Critical Minerals conference, 19th Farm-to-Market th Media & Telecom conference, and the largest Women in FICC forum in 18 years |
• |
Drive greater collaboration and connectivity across BMO to better serve our clients and grow market share where we have competitive strength and opportunity |
• |
Advanced BMO’s environmental, social and governance initiatives and innovation in sustainable finance solutions, such as advising Canada Growth Fund on its investment in carbon capture and sequestration |
• |
Ranked first in Canadian sustainability structuring agent rankings and held key roles in marquee transactions, including supporting Ontario Power Generation (OPG) with the launch of a new sustainable finance framework and acted as a co-sustainability structuring agent and joint bookrunner on OPG’s $1 billion green bond issuance |
• |
Continue to provide solutions to support our clients’ climate transition |
• |
Delivered digital and artificial intelligence (AI)-driven solutions to enhance analytical, hedging and risk management tools |
• |
Automated processes to improve risk assessments, pricing accuracy and day-to-day |
• |
Enhanced employee productivity with new technology and tools, such as a mobile client relationship management app and centralized access to critical applications, to drive actionable insights |
• |
Advanced our electronic trading execution capabilities, resulting in the capture of a significant market share of U.S. treasuries flows |
| BMO Financial Group 207th Annual Report 2024 | 47 |
• |
Drive technology transformation, data-centric decision-making and innovative solutions |
• |
Build scale and maximize return on investment with end-to-end |
• |
Achieved solid employee engagement and winning culture, with index scores in specific areas, including ethics, that place us among leading global companies |
• |
Invested in the growth and development of our talent through enhanced delivery of learning programs and a heightened focus on building critical skills and capabilities |
• |
Fostered a culture of inclusion through knowledge sharing, community building and employee-led programming, such as the WOMEN+ Affinity group and employee resource groups |
• |
Advanced our Zero Barriers to Inclusion strategy to reflect the diversity of backgrounds, education and experiences in our workforce |
• |
Supported the communities we serve through hallmark programs, including record contributions by employees to BMO’s Employee Giving Campaign, Equity Through Education and Trees from Trades |
• |
Continue to attract and develop a diverse workforce and promote an inclusive workplace |
48 |
BMO Financial Group 207th Annual Report 2024 |
|
(Canadian $ in millions, except as noted) As at or for the year ended October 31 |
2024 |
2023 | ||||||
Net interest income (teb) (2)
|
1,731 |
2,490 | ||||||
Non-interest revenue |
4,785 |
3,902 | ||||||
Total revenue (teb) (2)
|
6,516 |
6,392 | ||||||
Provision for credit losses on impaired loans |
367 |
9 | ||||||
Provision for credit losses on performing loans |
2 |
9 | ||||||
Total provision for credit losses |
369 |
18 | ||||||
Non-interest expense |
4,278 |
4,278 | ||||||
Income before income taxes |
1,869 |
2,096 | ||||||
Provision for income taxes (teb) (2)
|
377 |
471 | ||||||
Reported net income |
1,492 |
1,625 | ||||||
Acquisition and integration costs (3)
|
15 |
4 | ||||||
Amortization of acquisition-related intangible assets (4)
|
31 |
20 | ||||||
Adjusted net income |
1,538 |
1,649 | ||||||
Adjusted non-interest expense |
4,216 |
4,246 | ||||||
Net income available to common shareholders |
1,455 |
1,592 | ||||||
Adjusted net income available to common shareholders |
1,501 |
1,616 | ||||||
Key Performance Metrics |
||||||||
Global Markets revenue |
3,898 |
3,833 | ||||||
Investment and Corporate Banking revenue |
2,618 |
2,559 | ||||||
Return on equity (%) (5)
|
11.0 |
13.4 | ||||||
Adjusted return on equity (%) (5)
|
11.4 |
13.6 | ||||||
Operating leverage (teb) (%)
|
1.9 |
(6.4 | ) | |||||
Adjusted operating leverage (teb) (%)
|
2.6 |
(6.4 | ) | |||||
Efficiency ratio (teb) (%)
|
65.7 |
66.9 | ||||||
Adjusted efficiency ratio (teb) (%)
|
64.7 |
66.4 | ||||||
PCL on impaired loans to average net loans and acceptances (%)
|
0.44 |
0.01 | ||||||
Average assets |
468,963 |
466,030 | ||||||
Average gross loans and acceptances |
83,024 |
77,600 | ||||||
Average net loans and acceptances |
82,669 |
77,293 | ||||||
Full-time equivalent employees |
2,714 |
2,717 | ||||||
U.S. Business Select Financial Data (US$ in millions)
|
||||||||
Total revenue (teb) (2)
|
2,286 |
2,028 | ||||||
Non-interest expense |
1,599 |
1,616 | ||||||
Reported net income |
350 |
283 | ||||||
Adjusted non-interest expense |
1,580 |
1,603 | ||||||
Adjusted net income |
364 |
292 | ||||||
Average assets |
157,876 |
161,628 | ||||||
Average gross loans and acceptances |
31,795 |
29,003 | ||||||
| (1) | Adjusted results and ratios are on a non-GAAP basis and are discussed in the Non-GAAP and Other Financial Measures section. |
| (2) | Beginning January 1, 2024, we treated certain Canadian dividends as non-deductible for tax purposes, due to legislation that was enacted in the third quarter of fiscal 2024. As a result, we no longer report this revenue on a taxable equivalent basis (teb). Teb amounts of $22 million in fiscal 2024 and $321 million in fiscal 2023. On a source currency basis for our U.S. businesses: teb amounts of $2 million in fiscal 2024 and $nil in fiscal 2023. These amounts were recorded in net interest income and provision for income taxes, and reflected in the ratios. For further information, refer to the Other Regulatory Developments section. |
| (3) | Acquisition and integration costs related to Clearpool and Radicle, recorded in non-interest expense. |
| (4) | Amortization of acquisition-related intangible assets and any impairments, recorded in non-interest expense. Fiscal 2024 included an $18 million write-down related to the acquisition of Radicle. |
| (5) | Return on equity is based on allocated capital. Effective fiscal 2024, the capital allocation rate increased to 11.5% of risk-weighted assets, compared with 11.0% in fiscal 2023. For further information, refer to the Non-GAAP and Other Financial Measures section. |
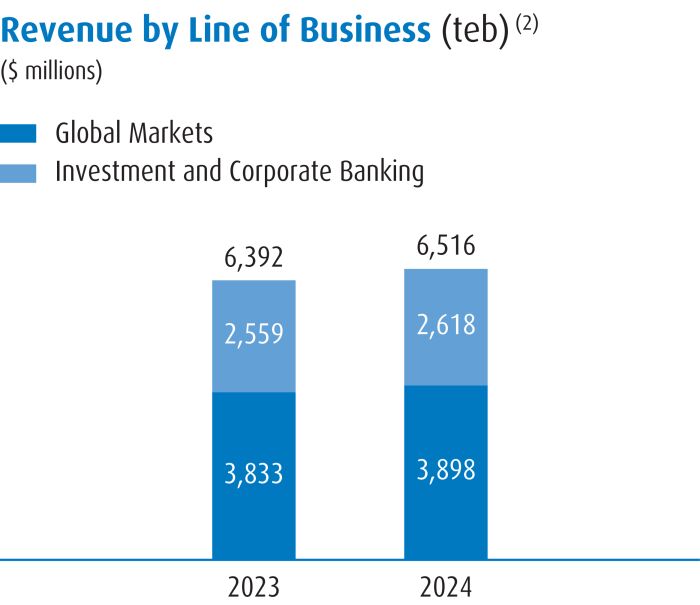
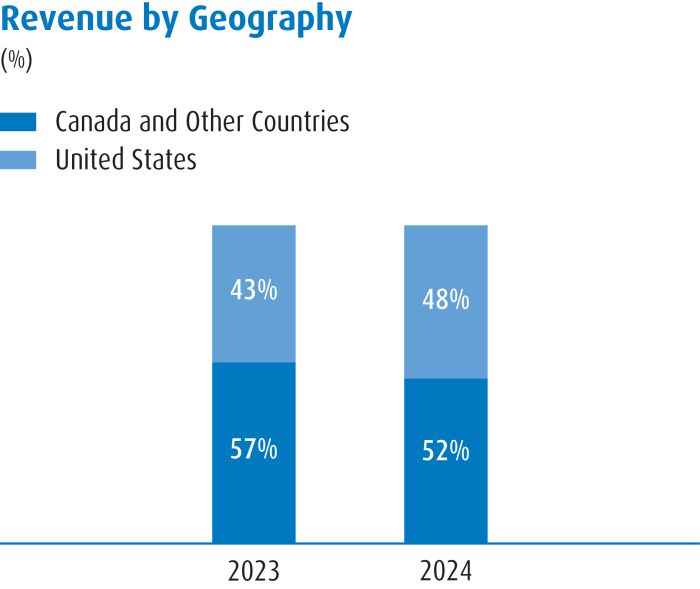
| BMO Financial Group 207th Annual Report 2024 | 49 |
50 |
BMO Financial Group 207th Annual Report 2024 |
| (Canadian $ in millions, except as noted) As at or for the year ended October 31 |
2024 |
2023 | ||||||
Net interest income before group teb offset |
(532 |
) |
(485 | ) | ||||
Group teb offset |
(58 |
) |
(354 | ) | ||||
Net interest income (teb) |
(590 |
) |
(839 | ) | ||||
Non-interest revenue |
20 |
(1,444 | ) | |||||
Total revenue (teb) |
(570 |
) |
(2,283 | ) | ||||
Provision for credit losses on impaired loans |
73 |
78 | ||||||
Provision for (recovery of) credit losses on performing loans |
(34 |
) |
649 | |||||
Total provision for credit losses |
39 |
727 | ||||||
Non-interest expense |
350 |
2,811 | ||||||
Loss before income taxes |
(959 |
) |
(5,821 | ) | ||||
Recovery of income taxes (teb) |
(260 |
) |
(1,425 | ) | ||||
Reported net loss |
(699 |
) |
(4,396 | ) | ||||
Acquisition and integration costs (2)
|
97 |
1,520 | ||||||
Management of fair value changes on the purchase of Bank of the West (3)
|
– |
1,461 | ||||||
Legal provision/reversal (including related interest expense and legal fees) (4)
|
(834 |
) |
21 | |||||
FDIC special assessment (5)
|
357 |
– | ||||||
Impact of loan portfolio sale (6)
|
136 |
– | ||||||
Impact of Canadian tax measures (7)
|
– |
502 | ||||||
Initial provision for credit losses on purchased performing loans (8)
|
– |
517 | ||||||
Adjusted net loss |
(943 |
) |
(375 | ) | ||||
Adjusted total revenue (teb) |
(953 |
) |
(104 | ) | ||||
Adjusted total provision for credit losses |
39 |
22 | ||||||
Adjusted non-interest expense |
333 |
765 | ||||||
Net loss available to common shareholders |
(950 |
) |
(4,608 | ) | ||||
Adjusted net loss available to common shareholders |
(1,194 |
) |
(587 | ) | ||||
Full-time equivalent employees |
16,959 |
18,356 | ||||||
U.S. Business Select Financial Data (US$ in millions)
|
||||||||
Total revenue (teb) (9)
|
401 |
(838 | ) | |||||
Total provision for credit losses |
3 |
521 | ||||||
Non-interest expense |
47 |
1,731 | ||||||
Provision for (recovery of) income taxes (teb) (9)
|
74 |
(860 | ) | |||||
Reported net income (loss) |
277 |
(2,230 | ) | |||||
Adjusted total revenue |
118 |
689 | ||||||
Adjusted total provision for credit losses |
3 |
4 | ||||||
Adjusted non-interest expense |
36 |
233 | ||||||
Adjusted net income |
96 |
381 | ||||||
| (1) | Adjusted results are on a non-GAAP basis and are discussed in the Non-GAAP and Other Financial Measures section. Adjusted results exclude the impact of the items described in footnotes (2) to (8). |
| (2) | Acquisition and integration costs related to the acquisition of Bank of the West, recorded in non-interest expense. Fiscal 2024: $129 million pre-tax. Fiscal 2023: $2,027 million pre-tax. |
| (3) | Management of the impact of interest rate changes between the announcement and closing of the acquisition of Bank of the West on its fair value and goodwill. Fiscal 2023 comprised $1,628 million of mark-to-market |
| (4) | Impact of a lawsuit associated with a predecessor bank, M&I Marshall and Ilsley Bank. Fiscal 2024: Reversal of a fiscal 2022 legal provision, including accrued interest, comprising a reversal of $547 million of interest expense and $588 million of non-interest expense. Fiscal 2023: Provision comprised a $30 million interest expense and a $3 million recovery of non-interest expense. For further information, refer to the Provisions and Contingent Liabilities section in Note 25 of the audited annual consolidated financial statements. |
| (5) | Impact of a U.S. Federal Deposit Insurance Corporation (FDIC) special assessment, recorded in non-interest expense ($476 million pre-tax). |
| (6) | Net accounting loss on the sale of a portfolio of recreational vehicle loans related to balance sheet optimization, recorded in non-interest revenue ($164 million pre-tax). |
| (7) | Impact of certain tax measures enacted by the Canadian government. Fiscal 2023: $371 million one-time tax expense, comprising a $312 million Canada Recovery Dividend and $59 million related to the pro-rated fiscal 2022 impact of the 1.5% tax rate increase, net of a deferred tax asset remeasurement; and a $131 million ($160 million pre-tax) charge related to the amended GST/HST definition for financial services, comprising $138 million recorded in non-interest revenue and $22 million recorded in non-interest expense. |
| (8) | Initial provision for credit losses on the purchased Bank of the West performing loan portfolio ($705 million pre-tax). |
| (9) | U.S. businesses teb offset amounts, recorded in revenue and provision for (recovery of) income taxes. Teb amounts of US$27 million in fiscal 2024 and US$25 million in fiscal 2023. |
| BMO Financial Group 207th Annual Report 2024 | 51 |
| (Canadian $ in millions, except as noted) | Q4-2024 |
Q3-2024 |
Q2-2024 |
Q1-2024 |
Q4-2023 |
Q3-2023 |
Q2-2023 |
Q1-2023 |
||||||||||||||||||||||||
Net interest income |
5,438 |
4,794 |
4,515 |
4,721 |
4,941 | 4,905 | 4,814 | 4,021 | ||||||||||||||||||||||||
Non-interest revenue |
3,519 |
3,398 |
3,459 |
2,951 |
3,378 | 3,147 | 2,975 | 1,078 | ||||||||||||||||||||||||
Revenue (2)
|
8,957 |
8,192 |
7,974 |
7,672 |
8,319 | 8,052 | 7,789 | 5,099 | ||||||||||||||||||||||||
Provision for credit losses on impaired loans |
1,107 |
828 |
658 |
473 |
408 | 333 | 243 | 196 | ||||||||||||||||||||||||
Provision for credit losses on performing loans |
416 |
78 |
47 |
154 |
38 | 159 | 780 | 21 | ||||||||||||||||||||||||
Total provision for credit losses |
1,523 |
906 |
705 |
627 |
446 | 492 | 1,023 | 217 | ||||||||||||||||||||||||
Non-interest expense |
4,427 |
4,839 |
4,844 |
5,389 |
5,679 | 5,572 | 5,501 | 4,382 | ||||||||||||||||||||||||
Income before income taxes |
3,007 |
2,447 |
2,425 |
1,656 |
2,194 | 1,988 | 1,265 | 500 | ||||||||||||||||||||||||
Provision for income taxes |
703 |
582 |
559 |
364 |
484 | 423 | 236 | 367 | ||||||||||||||||||||||||
Reported net income (see below)
|
2,304 |
1,865 |
1,866 |
1,292 |
1,710 | 1,565 | 1,029 | 133 | ||||||||||||||||||||||||
Acquisition and integration costs |
27 |
19 |
26 |
57 |
433 | 370 | 549 | 181 | ||||||||||||||||||||||||
Amortization of acquisition-related intangible assets |
92 |
79 |
79 |
84 |
88 | 85 | 85 | 6 | ||||||||||||||||||||||||
Legal provision/reversal (including related interest expense and legal fees) |
(870 |
) |
13 |
12 |
11 |
12 | (3 | ) | 6 | 6 | ||||||||||||||||||||||
Impact of loan portfolio sale |
– |
– |
– |
136 |
– | – | – | – | ||||||||||||||||||||||||
FDIC special assessment |
(11 |
) |
5 |
50 |
313 |
– | – | – | – | |||||||||||||||||||||||
Impact of Canadian tax measures |
– |
– |
– |
– |
– | 131 | – | 371 | ||||||||||||||||||||||||
Management of fair value changes on the purchase of Bank of the West |
– |
– |
– |
– |
– | – | – | 1,461 | ||||||||||||||||||||||||
Initial provision for credit losses on purchased performing loans |
– |
– |
– |
– |
– | – | 517 | – | ||||||||||||||||||||||||
Adjusted net income (3)
|
1,542 |
1,981 |
2,033 |
1,893 |
2,243 | 2,148 | 2,186 | 2,158 | ||||||||||||||||||||||||
Operating Group Reported Revenue |
||||||||||||||||||||||||||||||||
Canadian P&C |
2,934 |
2,908 |
2,819 |
2,778 |
2,796 | 2,716 | 2,490 | 2,557 | ||||||||||||||||||||||||
U.S. P&C |
2,468 |
2,453 |
2,389 |
2,454 |
2,488 | 2,414 | 2,544 | 1,734 | ||||||||||||||||||||||||
BMO Wealth Management |
1,486 |
1,439 |
1,393 |
1,328 |
1,465 | 1,525 | 1,293 | 1,128 | ||||||||||||||||||||||||
BMO Capital Markets |
1,600 |
1,666 |
1,661 |
1,589 |
1,651 | 1,463 | 1,579 | 1,699 | ||||||||||||||||||||||||
Corporate Services |
469 |
(274 |
) |
(288 |
) |
(477 |
) |
(81 | ) | (66 | ) | (117 | ) | (2,019 | ) | |||||||||||||||||
Total revenue (2)
|
8,957 |
8,192 |
7,974 |
7,672 |
8,319 | 8,052 | 7,789 | 5,099 | ||||||||||||||||||||||||
Key Performance Metrics |
||||||||||||||||||||||||||||||||
Diluted earnings per share ($) (4)
|
2.94 |
2.48 |
2.36 |
1.73 |
2.19 | 2.12 | 1.26 | 0.14 | ||||||||||||||||||||||||
Adjusted diluted earnings per share ($)
|
1.90 |
2.64 |
2.59 |
2.56 |
2.93 | 2.94 | 2.89 | 3.06 | ||||||||||||||||||||||||
PCL-to-average (%)
|
0.91 |
0.54 |
0.44 |
0.38 |
0.27 | 0.30 | 0.65 | 0.15 | ||||||||||||||||||||||||
Effective tax rate (%)
|
23.4 |
23.8 |
23.1 |
22.0 |
22.1 | 21.3 | 18.6 | 73.5 | ||||||||||||||||||||||||
Adjusted effective tax rate (%)
|
21.7 |
23.9 |
23.3 |
22.4 |
22.9 | 22.1 | 22.5 | 22.0 | ||||||||||||||||||||||||
Canadian/U.S. dollar average exchange rate ($)
|
1.3641 |
1.3705 |
1.3625 |
1.3392 |
1.3648 | 1.3331 | 1.3564 | 1.3426 | ||||||||||||||||||||||||
| (1) | Adjusted results exclude certain items from reported results and are used to calculate our adjusted measures as presented in the table above. Management assesses performance on a reported basis and an adjusted basis, and considers both to be useful. For further information, refer to the Non-GAAP and Other Financial Measures section. For details on the composition of non-GAAP amounts, measures and ratios, as well as supplementary financial measures, refer to the Glossary of Financial Terms. |
| (2) | Effective the first quarter of fiscal 2024, the bank adopted IFRS 17, Insurance Contracts |
| (3) | Adjusted results exclude certain items from reported results and are used to calculate our adjusted ratios. Refer to footnotes (1) to (8) in the Non-GAAP and Other Financial Measures table for further information on adjusting items. |
| (4) | Net income and earnings from our business operations are attributable to shareholders by way of EPS and diluted EPS. Adjusted EPS and adjusted diluted EPS are non-GAAP measures. For further information, refer to the Non-GAAP and Other Financial Measures section. |
52 |
BMO Financial Group 207th Annual Report 2024 |
| BMO Financial Group 207th Annual Report 2024 | 53 |
54 |
BMO Financial Group 207th Annual Report 2024 |
| (Canadian $ in millions) | Canadian P&C |
U.S. P&C |
Total P&C |
BMO Wealth Management |
BMO Capital Markets |
Corporate Services |
Total Bank |
|||||||||||||||||||||
2023 |
||||||||||||||||||||||||||||
Net interest income (loss) (1)
|
8,043 | 7,607 | 15,650 | 1,380 | 2,490 | (839 | ) | 18,681 | ||||||||||||||||||||
Non-interest revenue |
2,516 | 1,573 | 4,089 | 4,031 | 3,902 | (1,444 | ) | 10,578 | ||||||||||||||||||||
Revenue (1)
|
10,559 | 9,180 | 19,739 | 5,411 | 6,392 | (2,283 | ) | 29,259 | ||||||||||||||||||||
Provision for credit losses |
909 | 506 | 1,415 | 18 | 18 | 727 | 2,178 | |||||||||||||||||||||
Non-interest expense |
4,723 | 5,444 | 10,167 | 3,878 | 4,278 | 2,811 | 21,134 | |||||||||||||||||||||
Income (loss) before income taxes |
4,927 | 3,230 | 8,157 | 1,515 | 2,096 | (5,821 | ) | 5,947 | ||||||||||||||||||||
Provision for (recovery of) income taxes (1)
|
1,354 | 741 | 2,095 | 369 | 471 | (1,425 | ) | 1,510 | ||||||||||||||||||||
Net income (loss) |
3,573 | 2,489 | 6,062 | 1,146 | 1,625 | (4,396 | ) | 4,437 | ||||||||||||||||||||
Acquisition and integration costs |
9 | – | 9 | – | 4 | 1,520 | 1,533 | |||||||||||||||||||||
Amortization of acquisition-related intangible assets |
6 | 234 | 240 | 4 | 20 | – | 264 | |||||||||||||||||||||
Management of fair value changes on the purchase of Bank of the West |
– | – | – | – | – | 1,461 | 1,461 | |||||||||||||||||||||
Legal provision (including related interest expense and legal fees) |
– | – | – | – | – | 21 | 21 | |||||||||||||||||||||
Initial provision for credit losses on purchased performing loans |
– | – | – | – | – | 517 | 517 | |||||||||||||||||||||
Impact of Canadian tax measures |
– | – | – | – | – | 502 | 502 | |||||||||||||||||||||
Adjusted net income (loss) |
3,588 | 2,723 | 6,311 | 1,150 | 1,649 | (375 | ) | 8,735 | ||||||||||||||||||||
2022 |
||||||||||||||||||||||||||||
Net interest income (loss) (1)
|
7,228 | 4,795 | 12,023 | 1,173 | 3,135 | (446 | ) | 15,885 | ||||||||||||||||||||
Non-interest revenue |
2,416 | 1,265 | 3,681 | 3,334 | 2,977 | 7,833 | 17,825 | |||||||||||||||||||||
Revenue (1)
|
9,644 | 6,060 | 15,704 | 4,507 | 6,112 | 7,387 | 33,710 | |||||||||||||||||||||
Insurance claims, commissions and changes in policy benefit liabilities (CCPB) |
– | – | – | (683 | ) | – | – | (683 | ) | |||||||||||||||||||
Revenue, net of CCPB (2)
|
9,644 | 6,060 | 15,704 | 5,190 | 6,112 | 7,387 | 34,393 | |||||||||||||||||||||
Provision for (recovery of) credit losses |
282 | (2 | ) | 280 | (2 | ) | (43 | ) | 78 | 313 | ||||||||||||||||||
Non-interest expense |
4,296 | 2,972 | 7,268 | 3,566 | 3,853 | 1,507 | 16,194 | |||||||||||||||||||||
Income before income taxes |
5,066 | 3,090 | 8,156 | 1,626 | 2,302 | 5,802 | 17,886 | |||||||||||||||||||||
Provision for income taxes (1)
|
1,322 | 708 | 2,030 | 389 | 574 | 1,356 | 4,349 | |||||||||||||||||||||
Net income |
3,744 | 2,382 | 6,126 | 1,237 | 1,728 | 4,446 | 13,537 | |||||||||||||||||||||
Acquisition and integration costs |
– | – | – | – | 8 | 237 | 245 | |||||||||||||||||||||
Amortization of acquisition-related intangible assets |
1 | 5 | 6 | 3 | 14 | – | 23 | |||||||||||||||||||||
Impact of divestitures (3)
|
– | – | – | – | – | 55 | 55 | |||||||||||||||||||||
Legal provision (including related interest expense and legal fees) |
– | – | – | – | – | 846 | 846 | |||||||||||||||||||||
Management of fair value changes on the purchase of Bank of the West |
– | – | – | – | – | (5,667 | ) | (5,667 | ) | |||||||||||||||||||
Adjusted net income (loss) |
3,745 | 2,387 | 6,132 | 1,240 | 1,750 | (83 | ) | 9,039 | ||||||||||||||||||||
| (1) | Operating group revenue, net interest income and provision for income taxes are presented on a taxable equivalent basis (teb). The offset to the groups’ teb adjustments is reflected in Corporate Services. For further information, refer to the How BMO Reports Operating Group Results section. |
| (2) | Prior to November 1, 2022, we presented adjusted revenue on a basis net of insurance claims, commissions and changes in policy benefit liabilities (CCPB). Beginning the first quarter of fiscal 2023, we no longer report CCPB, given the adoption and retrospective application of IFRS 17. Revenue, net of CCPB, and adjusted results and ratios are on a non-GAAP basis and are discussed in the Non-GAAP and Other Financial Measures section. |
| (3) | Impact of divestitures related to the sale of our EMEA and U.S. Asset Management businesses in fiscal 2022, recorded in Corporate Services. |
| BMO Financial Group 207th Annual Report 2024 | 55 |
56 |
BMO Financial Group 207th Annual Report 2024 |
|
(Canadian $ in millions) As at October 31 |
2024 |
2023 | ||||||
Assets |
||||||||
Cash and cash equivalents and interest bearing deposits with banks |
68,738 |
82,043 | ||||||
Securities |
396,880 |
320,084 | ||||||
Securities borrowed or purchased under resale agreements |
110,907 |
115,662 | ||||||
Net loans |
678,016 |
656,665 | ||||||
Derivative instruments |
47,253 |
39,976 | ||||||
Other assets |
107,853 |
132,576 | ||||||
Total assets |
1,409,647 |
1,347,006 | ||||||
Liabilities and Equity |
||||||||
Deposits |
982,440 |
910,879 | ||||||
Derivative instruments |
58,303 |
50,193 | ||||||
Securities lent or sold under repurchase agreements |
110,791 |
106,108 | ||||||
Other liabilities |
165,450 |
195,475 | ||||||
Subordinated debt |
8,377 |
8,228 | ||||||
Equity |
84,250 |
76,095 | ||||||
Non-controlling interest in subsidiaries |
36 |
28 | ||||||
Total liabilities and equity |
1,409,647 |
1,347,006 | ||||||
|
(Canadian $ in millions) As at October 31 |
2024 |
2023 | ||||||
Trading |
168,926 |
123,718 | ||||||
Fair value through profit or loss (FVTPL) (1)
|
19,064 |
16,733 | ||||||
Fair value through other comprehensive income – Debt and equity (2)
|
93,702 |
62,819 | ||||||
Debt securities at amortized cost (3)
|
115,188 |
116,814 | ||||||
Total securities |
396,880 |
320,084 | ||||||
| (1) | Included securities mandatorily measured at FVTPL of $6,850 million as at October 31, 2024 ($6,730 million as at October 31, 2023) and securities designated at fair value of $12,214 million as at October 31, 2024 ($10,003 million as at October 31, 2023). |
| (2) | Included allowances for credit losses on debt securities recorded at fair value through other comprehensive income of $3 million as at October 31, 2024 ($3 million as at October 31, 2023). |
| (3) | Net of allowances for credit losses of $4 million as at October 31, 2024 ($3 million as at October 31, 2023). |
|
(Canadian $ in millions) As at October 31 |
2024 |
2023 | ||||||
Residential mortgages |
191,080 |
177,250 | ||||||
Consumer instalment and other personal |
92,687 |
104,042 | ||||||
Credit cards |
13,612 |
12,294 | ||||||
Businesses and governments |
384,993 |
366,886 | ||||||
Gross loans |
682,372 |
660,472 | ||||||
Allowance for credit losses |
(4,356 |
) |
(3,807 | ) | ||||
Total net loans |
678,016 |
656,665 | ||||||
| BMO Financial Group 207th Annual Report 2024 | 57 |
|
(Canadian $ in millions) As at October 31 |
2024 |
2023 | ||||||
Banks |
33,266 |
29,587 | ||||||
Businesses and governments |
618,761 |
575,957 | ||||||
Individuals |
330,413 |
305,335 | ||||||
Total deposits |
982,440 |
910,879 | ||||||
58 |
BMO Financial Group 207th Annual Report 2024 |
|
(Canadian $ in millions) As at October 31 |
2024 |
2023 | ||||||
Share capital |
||||||||
Preferred shares and other equity instruments |
8,087 |
6,958 | ||||||
Common shares |
23,921 |
22,941 | ||||||
Contributed surplus |
354 |
328 | ||||||
Retained earnings |
46,469 |
44,006 | ||||||
Accumulated other comprehensive income |
5,419 |
1,862 | ||||||
Total equity |
84,250 |
76,095 | ||||||
• |
Is appropriate given BMO’s target regulatory capital ratios and internal assessment of economic capital requirements |
• |
Underpins BMO’s operating groups’ business strategies and considers the market environment |
• |
Supports depositor, investor and regulator confidence, and dividends, while building long-term shareholder value |
• |
Is consistent with BMO’s target credit ratings. |
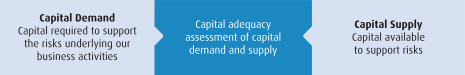
| BMO Financial Group 207th Annual Report 2024 | 59 |
| (% of risk-weighted assets or leverage exposures) | Minimum capital, leverage and TLAC requirements |
Total Pillar 1 Capital buffers (1) |
Tier 1 Capital buffer (2) |
Domestic stability buffer (3) |
Minimum capital, leverage and TLAC requirements including capital buffers |
BMO capital, leverage and TLAC ratios as at October 31, 2024 |
||||||||||||||||||
Common Equity Tier 1 Ratio |
4.5% | 3.5% | na | 3.5% | 11.5% | 13.6% | ||||||||||||||||||
Tier 1 Capital Ratio |
6.0% | 3.5% | na | 3.5% | 13.0% | 15.4% | ||||||||||||||||||
Total Capital Ratio |
8.0% | 3.5% | na | 3.5% | 15.0% | 17.6% | ||||||||||||||||||
TLAC Ratio |
21.5% | na | na | 3.5% | 25.0% | 29.3% | ||||||||||||||||||
Leverage Ratio |
3.0% | na | 0.5% | na | 3.5% | 4.4% | ||||||||||||||||||
TLAC Leverage Ratio |
6.75% | na | 0.5% | na | 7.25% | 8.3% | ||||||||||||||||||
| (1) | Pillar 1 Capital buffers, which will be met with CET1 Capital, include a capital conservation buffer of 2.5%, a Common Equity Tier 1 surcharge for D-SIBs of 1.0% and a countercyclical buffer, as prescribed by OSFI (immaterial for the fourth quarter of fiscal 2024). |
| (2) | D-SIBs are required to meet a 0.5% Tier 1 Capital buffer requirement for Leverage and TLAC Leverage Ratios. |
| (3) | The DSB buffer was confirmed at 3.5% in June 2024. |
60 |
BMO Financial Group 207th Annual Report 2024 |
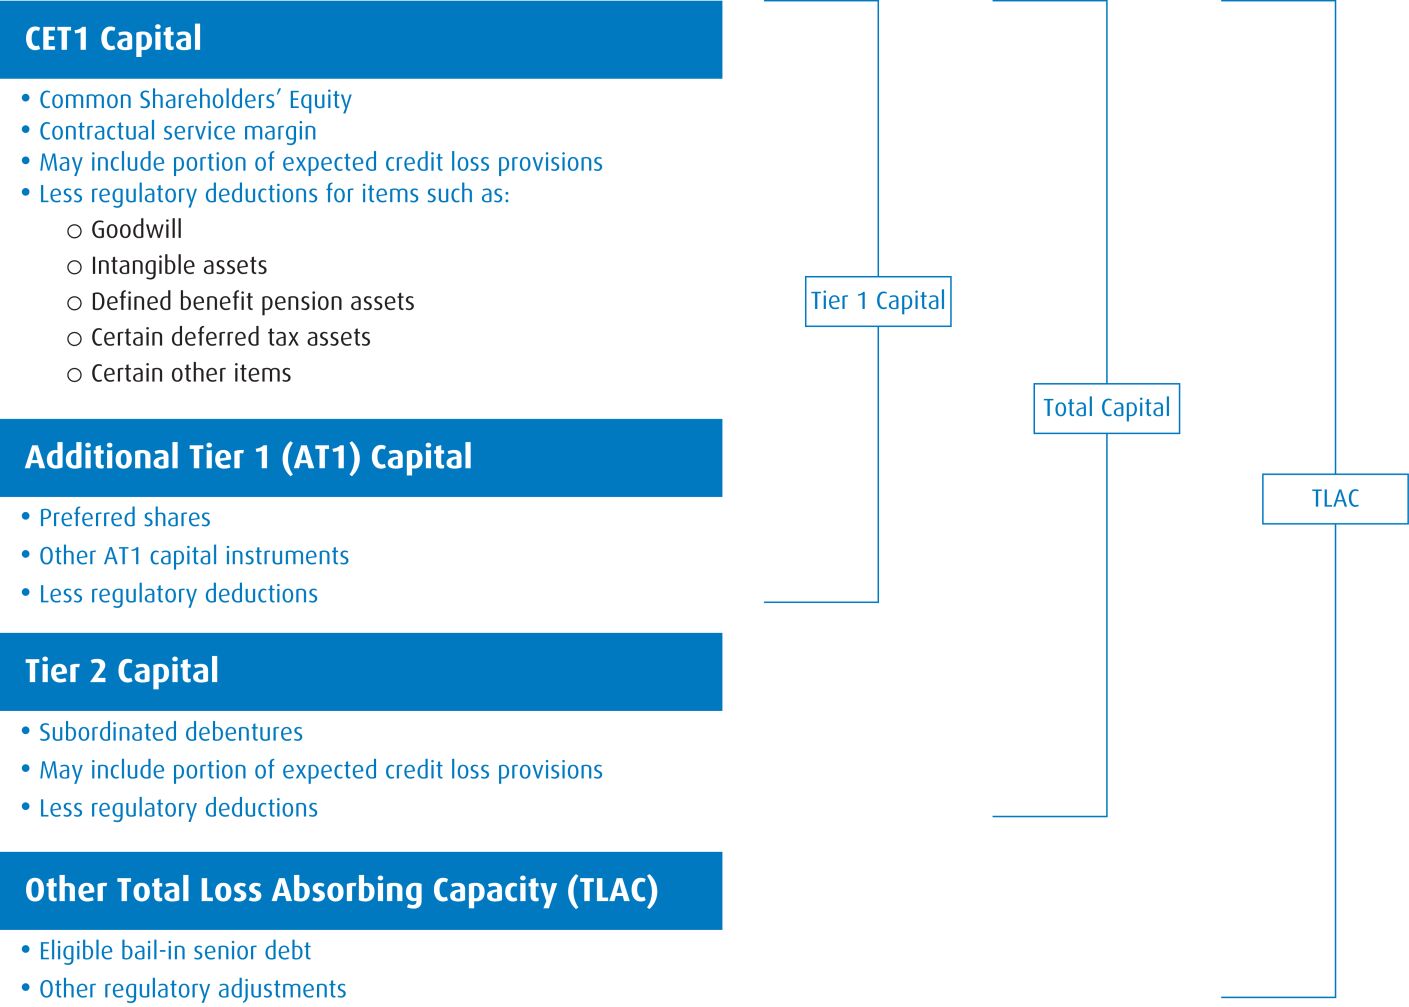
| BMO Financial Group 207th Annual Report 2024 | 61 |
62 |
BMO Financial Group 207th Annual Report 2024 |
|
(Canadian $ in millions, except as noted)
As at October 31
|
2024 |
2023 | ||||||
Common Equity Tier 1 Capital: Instruments and Reserves |
||||||||
Directly issued qualifying common share capital plus related stock surplus |
24,275 |
23,269 | ||||||
Retained earnings |
46,469 |
44,920 | ||||||
Accumulated other comprehensive income (and other reserves) |
5,419 |
1,862 | ||||||
Goodwill and other intangibles (net of related tax liability) |
(20,349 |
) |
(20,899 | ) | ||||
Other common equity Tier 1 capital deductions |
1,240 |
3,762 | ||||||
Common Equity Tier 1 Capital (CET1) |
57,054 |
52,914 | ||||||
Additional Tier 1 Capital: Instruments |
||||||||
Directly issued qualifying Additional Tier 1 instruments plus related stock surplus |
7,787 |
6,958 | ||||||
Total regulatory adjustments applied to Additional Tier 1 Capital |
(106 |
) |
(87 | ) | ||||
Additional Tier 1 Capital (AT1) |
7,681 |
6,871 | ||||||
Tier 1 Capital (T1 = CET1 + AT1) |
64,735 |
59,785 | ||||||
Tier 2 Capital: Instruments and Provisions |
||||||||
Directly issued qualifying Tier 2 instruments plus related stock surplus |
8,230 |
8,082 | ||||||
General allowance |
954 |
902 | ||||||
Total regulatory adjustments to Tier 2 Capital |
(8 |
) |
(51 | ) | ||||
Tier 2 Capital (T2) |
9,176 |
8,933 | ||||||
Total Capital (TC = T1 + T2) |
73,911 |
68,718 | ||||||
Non-Regulatory Capital Elements of TLAC |
||||||||
Directly issued qualifying Other TLAC instruments |
49,465 |
45,773 | ||||||
Total regulatory adjustments applied to Other TLAC |
(88 |
) |
(89 | ) | ||||
Other TLAC |
49,377 |
45,684 | ||||||
TLAC (TLAC = TC + Other TLAC) |
123,288 |
114,402 | ||||||
Risk-Weighted Assets and Leverage Ratio Exposures |
||||||||
Risk-Weighted Assets |
420,838 |
424,197 | ||||||
Leverage Ratio Exposures |
1,484,962 |
1,413,036 | ||||||
Capital Ratios
(%)
|
||||||||
Common Equity Tier 1 Ratio |
13.6 |
12.5 | ||||||
Tier 1 Capital Ratio |
15.4 |
14.1 | ||||||
Total Capital Ratio |
17.6 |
16.2 | ||||||
TLAC Ratio |
29.3 |
27.0 | ||||||
Leverage Ratio |
4.4 |
4.2 | ||||||
TLAC Leverage Ratio |
8.3 |
8.1 | ||||||
| (1) | Calculated in accordance with OSFI’s CAR Guideline and LR Guideline, as applicable. Non-qualifying Additional Tier 1 and Tier 2 Capital instruments were phased out at a rate of 10% per year from January 1, 2013 to January 1, 2022. |
| BMO Financial Group 207th Annual Report 2024 | 63 |
2024 |
2023 | |||||||||||||||||||||||||||
|
RWA |
||||||||||||||||||||||||||||
|
(Canadian $ in millions) As at October 31 |
Total exposure |
Average risk weight |
IRB |
|||||||||||||||||||||||||
Standardized |
FIRB |
AIRB |
Total |
Total RWA | ||||||||||||||||||||||||
Credit Risk |
||||||||||||||||||||||||||||
Wholesale |
||||||||||||||||||||||||||||
Corporate, including specialized lending |
405,215 |
45.1% |
31,325 |
69,424 |
82,171 |
182,920 |
180,523 | |||||||||||||||||||||
Corporate small and medium-sized enterprises |
32,050 |
62.3% |
3,499 |
4 |
16,478 |
19,981 |
20,869 | |||||||||||||||||||||
Sovereign |
278,919 |
1.7% |
170 |
– |
4,700 |
4,870 |
4,081 | |||||||||||||||||||||
Bank |
25,137 |
16.6% |
32 |
4,148 |
– |
4,180 |
4,837 | |||||||||||||||||||||
Retail |
||||||||||||||||||||||||||||
Residential mortgages, excluding home equity line of credit |
190,200 |
11.3% |
4,257 |
– |
17,260 |
21,517 |
18,867 | |||||||||||||||||||||
Home equity line of credit |
75,049 |
10.7% |
953 |
– |
7,065 |
8,018 |
7,877 | |||||||||||||||||||||
Qualifying revolving retail |
56,887 |
24.5% |
540 |
– |
13,386 |
13,926 |
10,738 | |||||||||||||||||||||
Other retail, excluding small and medium-sized enterprises |
31,046 |
55.7% |
10,467 |
– |
6,821 |
17,288 |
26,657 | |||||||||||||||||||||
Retail small and medium-sized enterprises |
19,239 |
66.0% |
3,445 |
– |
9,252 |
12,697 |
12,140 | |||||||||||||||||||||
Equity |
11,819 |
136.7% |
16,154 |
– |
– |
16,154 |
14,574 | |||||||||||||||||||||
Trading book |
53,033 |
23.0% |
4,829 |
6,328 |
1,043 |
12,200 |
12,421 | |||||||||||||||||||||
Securitization |
91,327 |
14.7% |
2,462 |
– |
10,963 |
13,425 |
12,627 | |||||||||||||||||||||
Other credit risk assets – non-counterparty managed assets |
20,210 |
114.2% |
23,085 |
– |
– |
23,085 |
23,641 | |||||||||||||||||||||
Total Credit Risk |
1,290,131 |
– |
101,218 |
79,904 |
169,139 |
350,261 |
349,852 | |||||||||||||||||||||
Market Risk |
– |
– |
17,797 |
– |
– |
17,797 |
16,981 | |||||||||||||||||||||
Operational Risk |
– |
– |
52,780 |
– |
– |
52,780 |
57,364 | |||||||||||||||||||||
Risk-Weighted Assets before floor |
1,290,131 |
– |
171,795 |
79,904 |
169,139 |
420,838 |
424,197 | |||||||||||||||||||||
Floor adjustment (3)
|
– |
– |
– |
– |
– |
– |
– | |||||||||||||||||||||
Total Risk-Weighted Assets |
1,290,131 |
– |
171,795 |
79,904 |
169,139 |
420,838 |
424,197 | |||||||||||||||||||||
| (1) | Exposure and RWA are grouped by the obligor’s asset class. |
| (2) | Exposure represents exposure at default (EAD) after the application of credit risk mitigation and the credit conversion factor for undrawn exposures. |
| (3) | The bank is subject to capital floor requirements as prescribed in OSFI’s CAR Guideline. Total RWA is increased by a floor adjustment amount, which is calculated based on the standardized methodology. The capital floor was not operative at October 31, 2024 and October 31, 2023. |
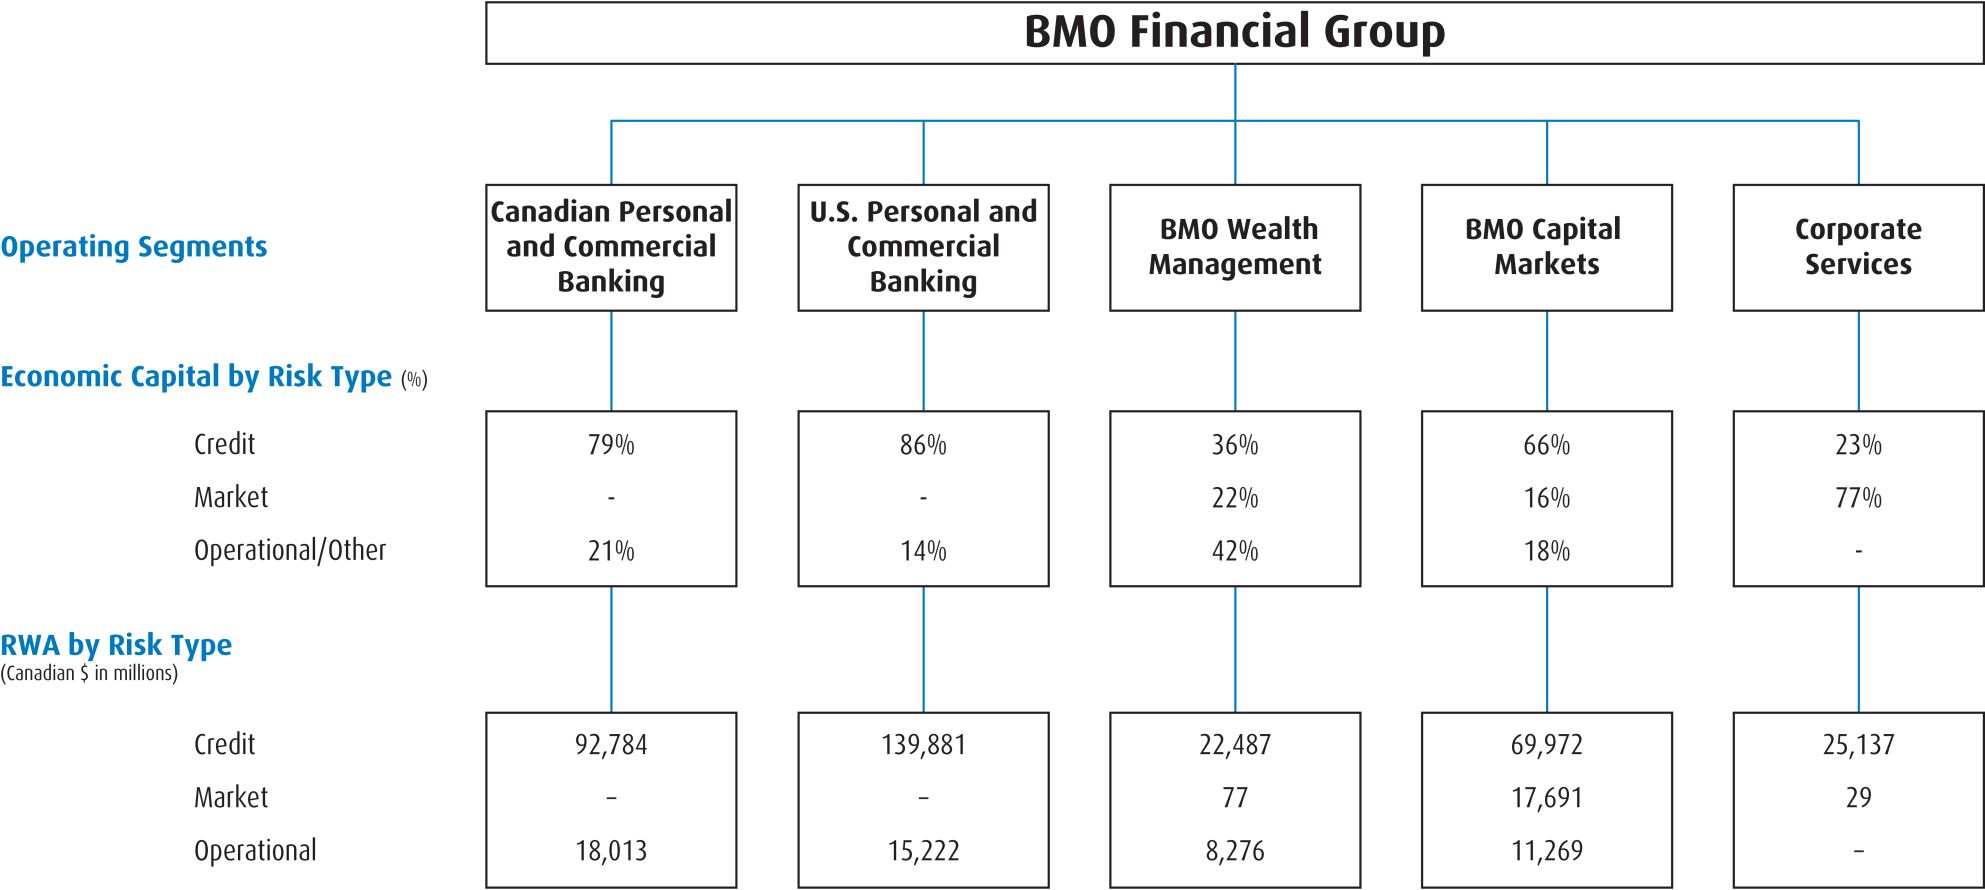
64 |
BMO Financial Group 207th Annual Report 2024 |
| As at October 31, 2024 | Issuance or redemption date |
Number of shares (in millions) |
Balance (Canadian $ in millions, except as noted) |
|||||||||
Common shares issued |
8.6 | $ 980 | ||||||||||
Tier 1 Capital |
||||||||||||
Issuance of 7.700% Limited Recourse Capital Notes, Series 4 |
March 8, 2024 | US$ |
||||||||||
Redemption of Non-Cumulative 5-year Rate Reset Class B Preferred Shares, Series 27 |
May 25, 2024 | 20.0 | $ 500 | |||||||||
Redemption of Non-Cumulative 5-year Rate Reset Class B Preferred Shares, Series 46 |
May 25, 2024 | 14.0 | $ 350 | |||||||||
Issuance of 7.300% Limited Recourse Capital Notes, Series 5 |
July 17, 2024 | US$ 750 | ||||||||||
Redemption of Non-Cumulative 5-year Rate Reset Class B Preferred Shares, Series 29 |
August 25, 2024 | 16.0 | $ 400 | |||||||||
Tier 2 Capital |
||||||||||||
Issuance of Medium-Term Notes, Series M, Second Tranche |
July 3, 2024 | $ |
||||||||||
Redemption of Medium-Term Notes, Series J, First Tranche |
September 17, 2024 | $ |
||||||||||
|
Number of shares or dollar amount (in millions) |
Dividends declared per share | |||||||||||||||
| As at October 31 | 2024 |
2023 | 2022 | |||||||||||||
Common shares |
730 | $ |
6.12 |
$ | 5.80 | $ | 5.44 | |||||||||
Class B Preferred shares |
||||||||||||||||
Series 27* (1)
|
– | $ |
0.48 |
$ | 0.96 | $ | 0.96 | |||||||||
Series 29* (2)
|
– | $ |
0.68 |
$ | 0.91 | $ | 0.91 | |||||||||
Series 31* (3)
|
$ | 300 | $ |
0.96 |
$ | 0.96 | $ | 0.96 | ||||||||
Series 33* |
$ | 200 | $ |
0.76 |
$ | 0.76 | $ | 0.76 | ||||||||
Series 44* |
$ | 400 | $ |
1.70 |
$ | 1.21 | $ | 1.21 | ||||||||
Series 46* (4)
|
– | $ |
0.64 |
$ | 1.28 | $ | 1.28 | |||||||||
Series 50* |
$ | 500 | $ |
73.73 |
$ | 73.73 | $ | 24.64 | ||||||||
Series 52* |
$ | 650 | $ |
70.57 |
$ | 57.52 | – | |||||||||
Additional Tier 1 Capital Notes* |
||||||||||||||||
4.800% Additional Tier 1 Capital Notes (5)
|
US$ | 500 | na |
na | na | |||||||||||
4.300% Limited Recourse Capital Notes, Series 1 (6)
|
$ | 1,250 | na |
na | na | |||||||||||
5.625% Limited Recourse Capital Notes, Series 2 (6)
|
$ | 750 | na |
na | na | |||||||||||
7.325% Limited Recourse Capital Notes, Series 3 (6)
|
$ | 1,000 | na |
na | na | |||||||||||
7.700% Limited Recourse Capital Notes, Series 4 (6)
|
US$ | 1,000 | na |
na | na | |||||||||||
7.300% Limited Recourse Capital Notes, Series 5 (6)
|
US$ | 750 | na |
na | na | |||||||||||
Medium-Term Notes* (7)
|
||||||||||||||||
3.803% Subordinated Notes |
US$ | 1,250 | na |
na | na | |||||||||||
Series J – Second Tranche |
$ | 1,250 | na |
na | na | |||||||||||
Series K – First Tranche |
$ | 1,000 | na |
na | na | |||||||||||
3.088% Subordinated Notes |
US$ | 1,250 | na |
na | na | |||||||||||
Series L – First Tranche |
$ | 750 | na |
na | na | |||||||||||
Series M – First Tranche |
$ | 1,150 | na |
na | na | |||||||||||
Series M – Second Tranche |
$ | 1,000 | na |
na | na | |||||||||||
Stock options |
||||||||||||||||
Vested |
2.9 | |||||||||||||||
Non-vested |
3.7 | |||||||||||||||
| * | Convertible into common shares. |
| (1) | Redeemed on May 25, 2024. |
| (2) | Redeemed on August 25, 2024. |
| (3) | Redeemed on November 25, 2024. |
| (4) | Redeemed on May 25, 2024. |
| (5) | The notes had an initial interest rate of 4.800% and reset on August 25, 2024 to 6.709%. |
| (6) | Convertible into common shares by virtue of recourse to the Preferred Shares Series 48, Preferred Shares Series 49, Preferred Shares Series 51, Preferred Shares Series 53 and Preferred Shares Series 54, respectively. Refer to Note 17 of the audited annual consolidated financial statements for conversion details. |
| (7) | Note 16 of the audited annual consolidated financial statements includes details on the NVCC Medium-Term Notes. |
| BMO Financial Group 207th Annual Report 2024 | 65 |
66 |
BMO Financial Group 207th Annual Report 2024 |
| BMO Financial Group 207th Annual Report 2024 | 67 |
| |
68 |
|
||||
| |
72 |
|
||||
| |
77 |
|
||||
| |
85 |
|
||||
| |
90 |
|
||||
| |
91 |
|
68 |
BMO Financial Group 207th Annual Report 2024 |
BMO Financial Group 207th Annual Report 2024 |
69 |
70 |
BMO Financial Group 207th Annual Report 2024 |
| BMO Financial Group 207th Annual Report 2024 | 71 |
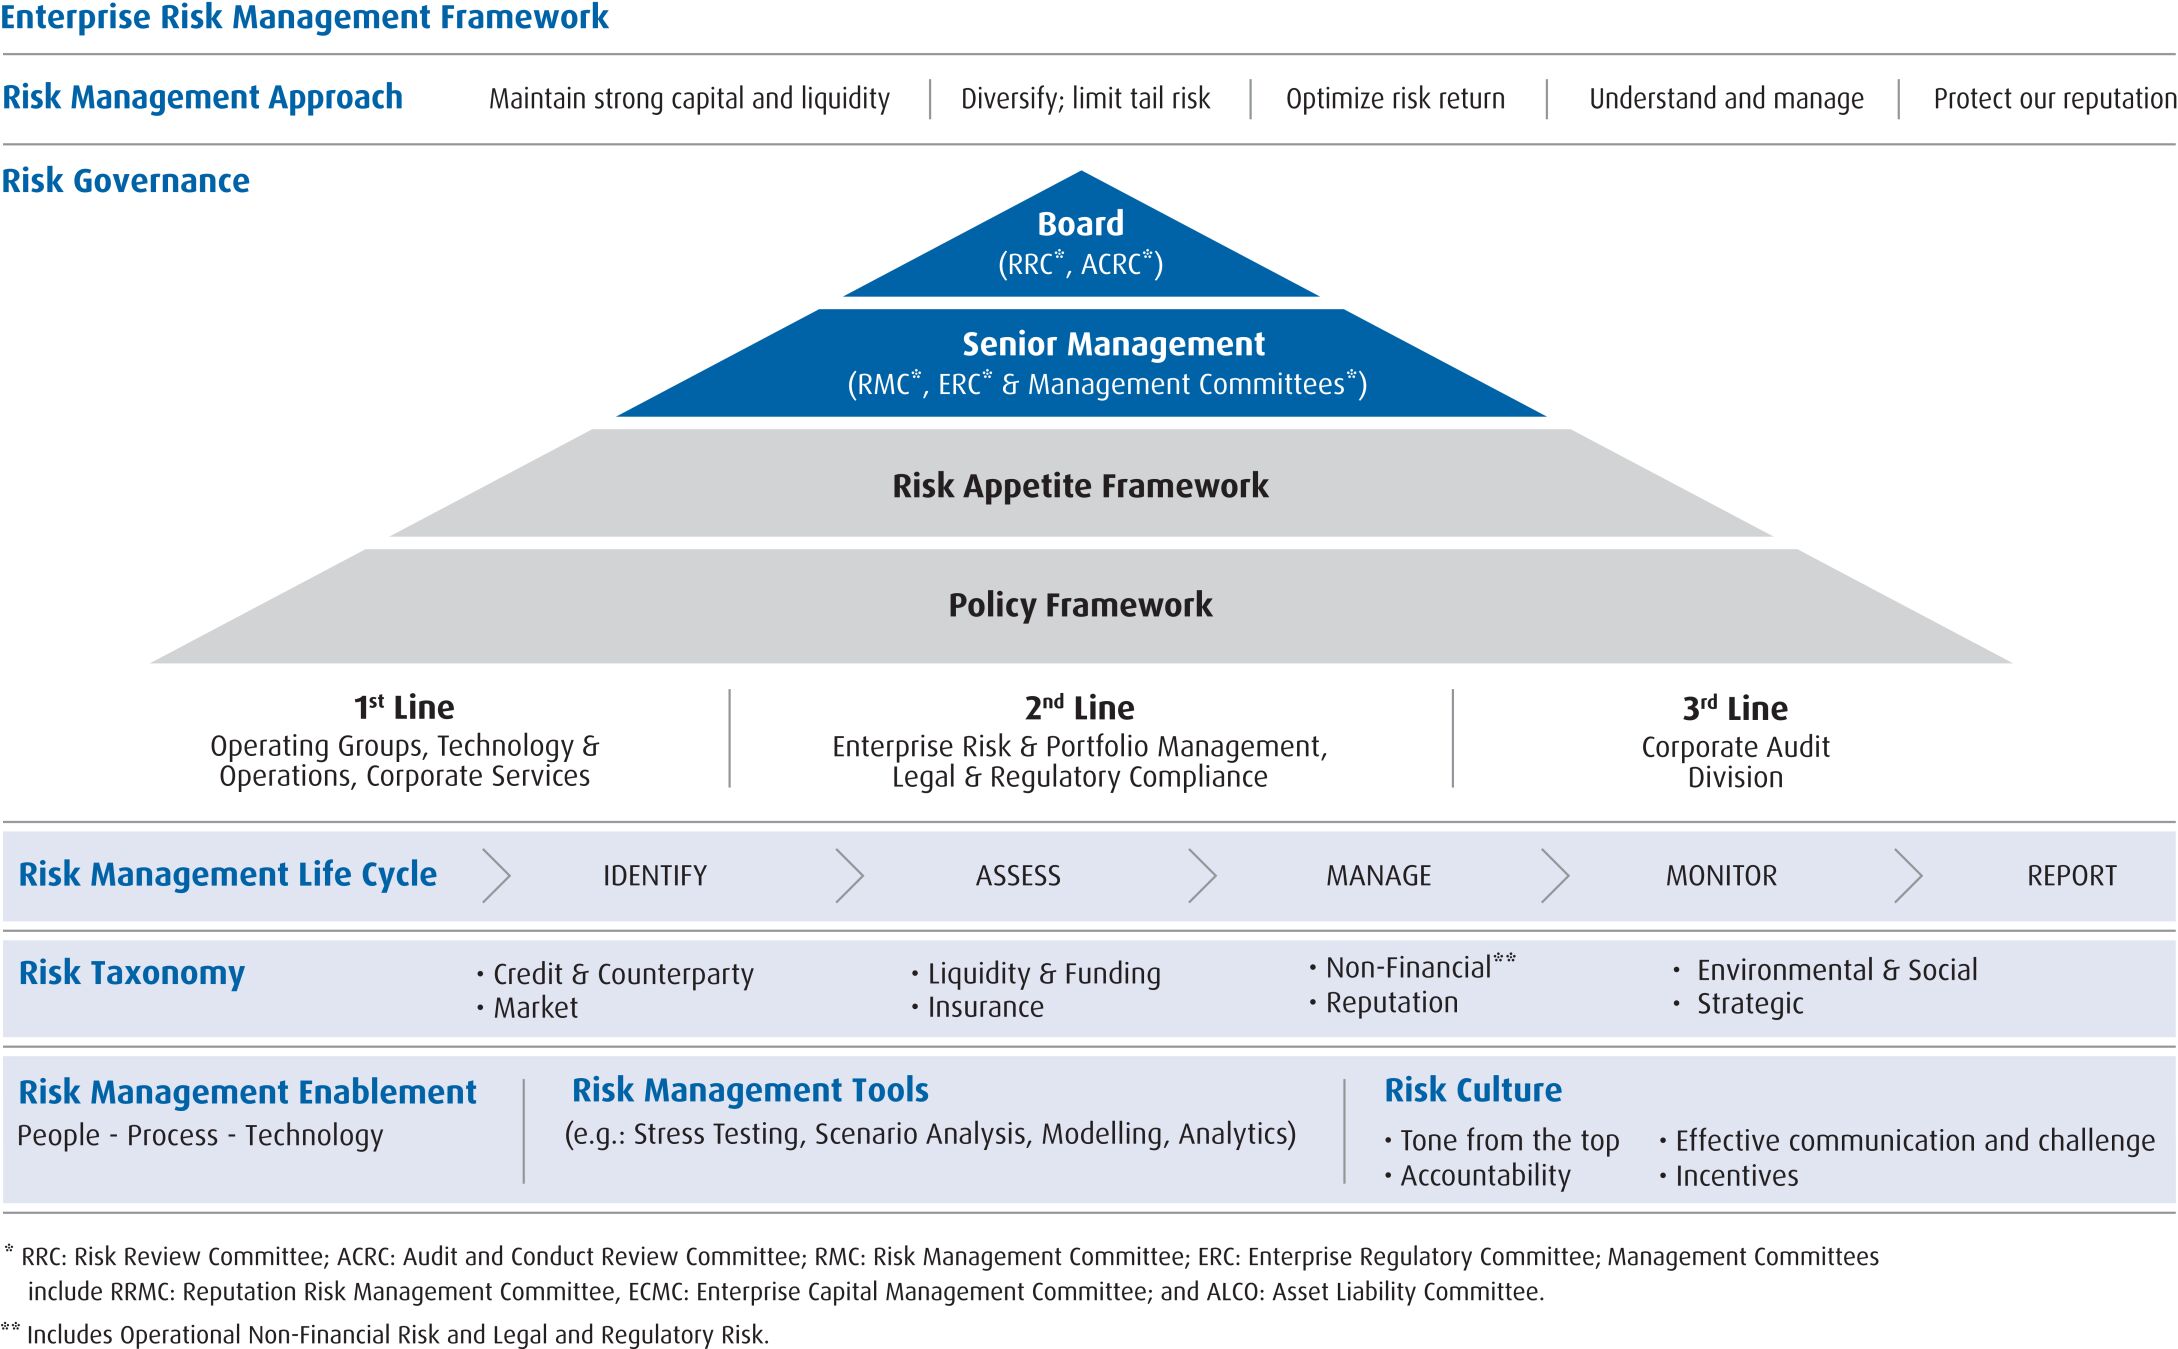
72 |
BMO Financial Group 207th Annual Report 2024 |
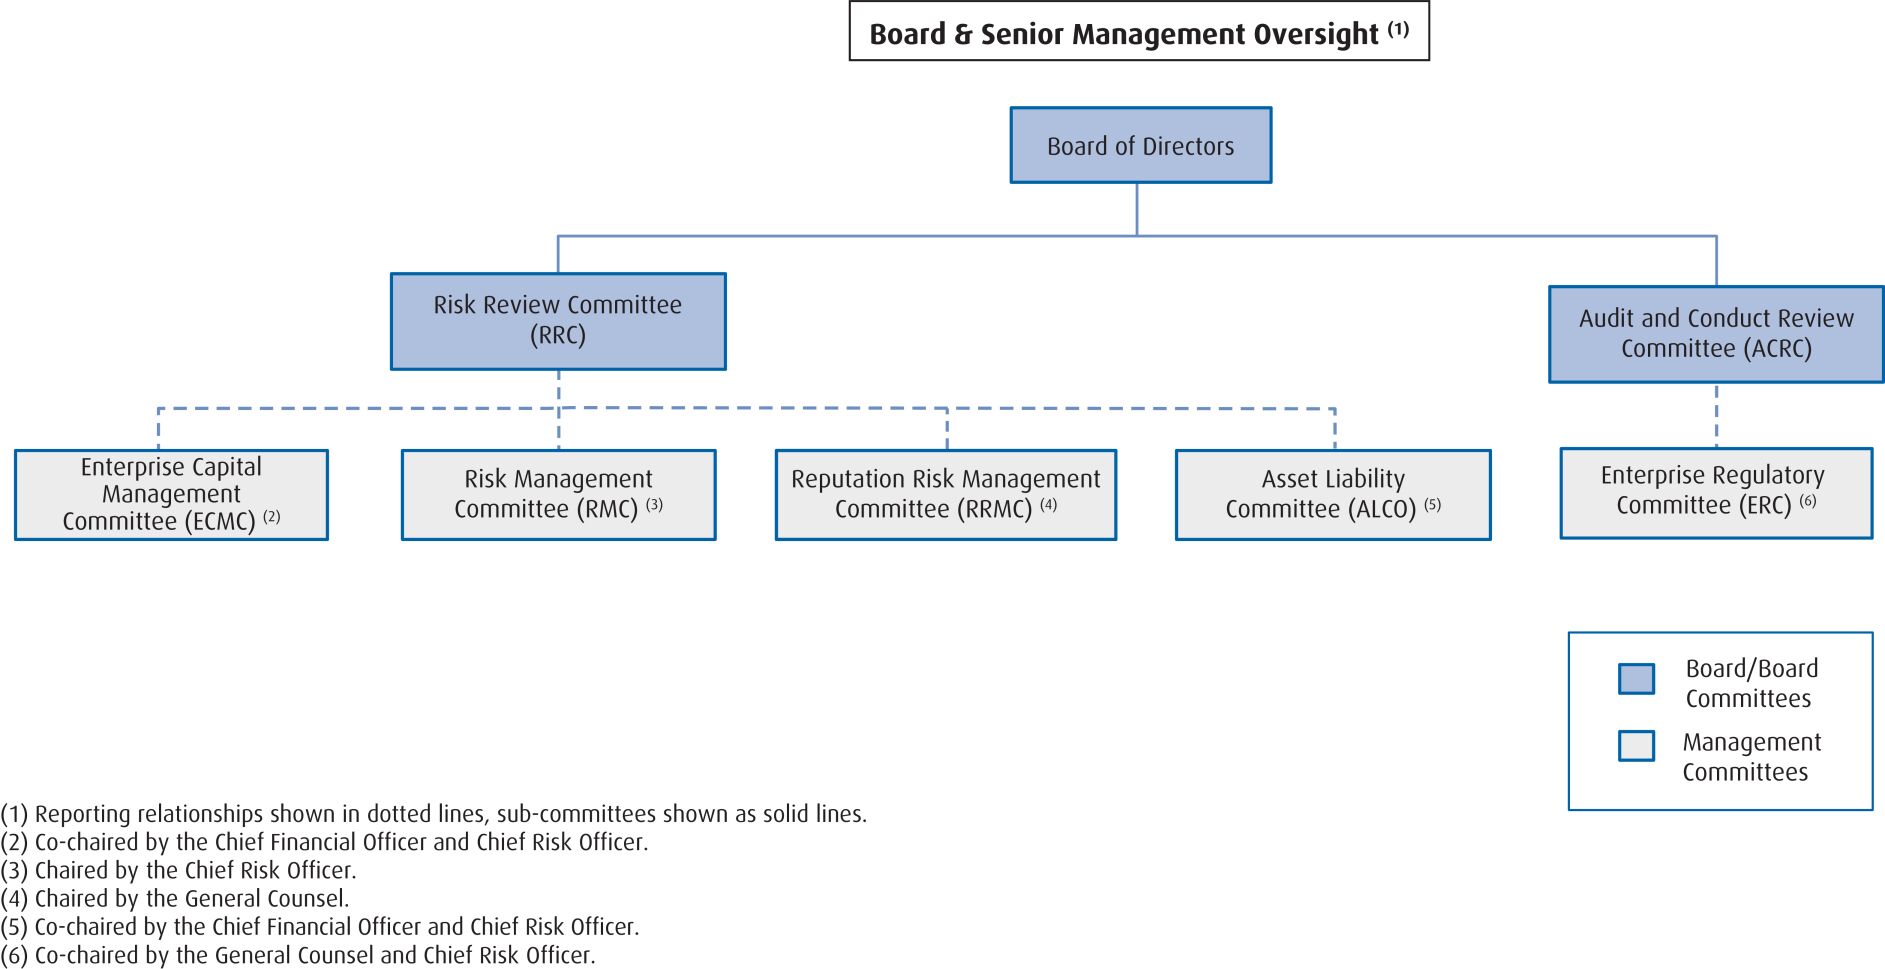
| BMO Financial Group 207th Annual Report 2024 | 73 |
• |
Understand and Manage |
• |
Protect BMO’s Reputation |
• |
Diversify. Limit Tail Risk low-probability, high-impact events. |
• |
Maintain Strong Capital and Liquidity |
• |
Optimize Risk Return |
• |
Credit and Counterparty Risk |
• |
Market Risk |
• |
Insurance Risk |
• |
Liquidity and Funding Risk |
• |
Operational Non-Financial Risknon-financial risks that may have financial consequences. |
74 |
BMO Financial Group 207th Annual Report 2024 |
• |
Operating groups and Corporate Services, which includes Technology and Operations, serve as our first line of defence. They are accountable for the risks arising from their businesses, operations and exposures. They are expected to pursue business opportunities within their established risk appetite and to identify, assess, manage (which includes mitigation), monitor and report on risks in, or arising from, their businesses, operations and exposures. The first line fulfills its responsibilities by applying risk management and reporting methodologies, by establishing appropriate internal controls in accordance with the ERMF, and by monitoring the effectiveness of such controls. These processes and controls serve as the framework for our lines of business to act within their delegated risk-taking authority and risk limits, as set out in corporate policies and the Risk Appetite Framework. Corporate Services, while part of our first line of defence, may also serve in a governance capacity when specific roles and responsibilities are assigned to individuals or groups under the Enterprise Policy Framework. In such instances, governance accountabilities will be carried out independent of the individuals or groups responsible for risk-taking. |
• |
The second line of defence comprises ERPM and Legal & Regulatory Compliance. The second line exercises independent oversight, performs effective challenge and provides independent assessment of risks and risk management practices, including transactions, product and portfolio risk management decisions, regulatory compliance, and processes and controls applied in the first line of defence. The second line establishes enterprise-wide risk management policies, frameworks, processes, methodologies and practices that the first and second lines use to identify, assess, manage (which includes mitigation), monitor and report on risks across the enterprise. |
• |
Corporate Audit Division is the third line of defence. It provides an independent assessment of the effectiveness of internal controls across the enterprise, including controls that support the risk management and governance processes, and reports its findings to the Board of Directors. |
• |
Portfolio transactions – transactions are approved through risk assessment processes for all types of transactions at all levels of the enterprise, which include operating group recommendations and ERPM approval of credit risk, and transactional and position limits for market risk. |
• |
Structured transactions – new structured products and transactions with significant legal and regulatory, accounting or tax implications are reviewed by the Global Markets Risk Committee, as appropriate, and are also assessed under the operational risk management process if they involve structural or operational complexity that may give rise to significant operational risk. Transactions that may give rise to significant or heightened reputation risk are reviewed by the Reputation Risk Management Committee. |
• |
Investment initiatives – documentation of risk assessments is formalized through the investment assessment and approval process, and is reviewed and approved by Corporate Services based on the size of an initiative’s investment spending and its inherent risk. |
• |
New products and services – policies and procedures for the approval of new or modified products and services offered to customers are the responsibility of both the first and second lines of defence, including appropriate senior business leaders, and are reviewed and approved by subject matter experts and senior management in Corporate Services, as well as by other senior management committees. |
| BMO Financial Group 207th Annual Report 2024 | 75 |
• |
Tone from the Top: |
• |
Accountability: three-lines-of-defence |
• |
Effective Communication and Challenge: |
• |
Incentives: |
76 |
BMO Financial Group 207th Annual Report 2024 |
BMO Financial Group 207th Annual Report 2024 |
77 |
78 |
BMO Financial Group 207th Annual Report 2024 |
• |
Exposure at Default (EAD) |
• |
Loss Given Default (LGD) |
• |
Probability of Default (PD) one-year time horizon. |
• |
Expected Loss (EL) |
(Canadian $ in millions) |
Drawn (3) (7) |
Commitments (undrawn) (3) (8) |
Other off-balance
sheet items (3) (9) |
OTC derivatives (4) (10) |
Repo-style transactions (4) (5) (11) |
Total (1) |
||||||||||||||||||||||||||||||||||||||||||||||||||||||||||||||
2024 |
2023 |
2024 |
2023 |
2024 |
2023 |
2024 |
2023 |
2024 |
2023 |
2024 |
2023 |
|||||||||||||||||||||||||||||||||||||||||||||||||||||||||
| Individual |
287,741 |
281,087 |
65,568 |
63,812 |
– |
13 |
– |
– |
– |
– |
353,309 |
344,912 |
||||||||||||||||||||||||||||||||||||||||||||||||||||||||
| Financial institutions |
105,378 |
95,366 |
20,484 |
18,690 |
7,447 |
7,201 |
27,393 |
19,307 |
17,712 |
16,177 |
178,414 |
156,741 |
||||||||||||||||||||||||||||||||||||||||||||||||||||||||
| Governments |
230,353 |
219,795 |
3,024 |
2,551 |
1,760 |
1,575 |
4,481 |
8,193 |
1,070 |
5,870 |
240,688 |
237,984 |
||||||||||||||||||||||||||||||||||||||||||||||||||||||||
| Manufacturing |
33,561 |
33,046 |
15,555 |
16,059 |
1,696 |
1,915 |
1,049 |
807 |
– |
– |
51,861 |
51,827 |
||||||||||||||||||||||||||||||||||||||||||||||||||||||||
| Real estate |
66,650 |
61,734 |
8,632 |
11,843 |
1,234 |
971 |
412 |
224 |
– |
– |
76,928 |
74,772 |
||||||||||||||||||||||||||||||||||||||||||||||||||||||||
| Retail trade |
30,595 |
27,825 |
4,262 |
4,621 |
645 |
441 |
152 |
129 |
– |
– |
35,654 |
33,016 |
||||||||||||||||||||||||||||||||||||||||||||||||||||||||
| Service industries |
54,433 |
56,588 |
13,830 |
13,552 |
3,192 |
3,172 |
990 |
696 |
– |
– |
72,445 |
74,008 |
||||||||||||||||||||||||||||||||||||||||||||||||||||||||
| Wholesale trade |
21,868 |
19,997 |
7,212 |
7,618 |
670 |
611 |
268 |
167 |
– |
– |
30,018 |
28,393 |
||||||||||||||||||||||||||||||||||||||||||||||||||||||||
| Oil and gas |
3,180 |
3,335 |
3,010 |
2,889 |
623 |
788 |
610 |
1,444 |
– |
– |
7,423 |
8,456 |
||||||||||||||||||||||||||||||||||||||||||||||||||||||||
| Utilities |
10,068 |
11,101 |
9,304 |
8,767 |
3,799 |
4,547 |
2,444 |
1,850 |
– |
– |
25,615 |
26,265 |
||||||||||||||||||||||||||||||||||||||||||||||||||||||||
| Others
(2)
|
54,173 |
63,210 |
19,247 |
18,132 |
4,343 |
4,009 |
2,306 |
1,634 |
– |
– |
80,069 |
86,985 |
||||||||||||||||||||||||||||||||||||||||||||||||||||||||
| Total exposure at default
(6)
|
898,000 |
873,084 |
170,128 |
168,534 |
25,409 |
25,243 |
40,105 |
34,451 |
18,782 |
22,047 |
1,152,424 |
1,123,359 |
||||||||||||||||||||||||||||||||||||||||||||||||||||||||
(1) |
Credit exposure excluding equity, securitization and other assets, such as non-significant investments, goodwill, deferred tax assets and intangibles. |
(2) |
Includes remaining industries that individually comprise less than 2% of total exposures. |
(3) |
Represents gross credit exposures without accounting for collateral. |
(4) |
Credit exposure at default is inclusive of collateral. |
(5) |
Repo-style transactions include repos, reverse repos and securities lending transactions, which represent both asset and liability exposures. The impact of collateral on the credit exposure for repo-style transactions is $270,482 million ($228,691 million in fiscal 2023). |
(6) |
Excludes exposures arising from derivative and repo-style transactions that are cleared through a clearing house or a central counterparty totalling $7,086 million ($9,025 million in fiscal 2023). |
(7) |
Drawn exposures include loans, acceptances, deposits with regulated financial institutions and certain securities. |
(8) |
Undrawn commitments cover unutilized authorizations associated with the drawn exposures noted above, including any authorizations that are unconditionally cancellable. EAD for undrawn commitments is model-generated, based on internal empirical data. |
(9) |
Other off-balance sheet exposures include items such as guarantees, standby letters of credit and documentary credits. |
(10) |
Over-the-counter |
(11) |
EAD for repo-style transactions is the calculated exposure, net of collateral. |
BMO Financial Group 207th Annual Report 2024 |
79 |
• |
A PD estimate long-run average of one-year default rates over the economic cycle. |
• |
An LGD estimate |
• |
An EAD estimate non-revolving products, such as mortgages, EAD is equal to 100% of the current outstanding balance and has no undrawn component. |
| Risk profile | Probability of default band | |
Exceptionally low |
≤ 0.05% |
|
Very low |
> 0.05% to 0.20% | |
Low |
> 0.20% to 0.75% | |
Medium |
> 0.75% to 7.00% | |
High |
> 7.00% to 99.99% | |
Default |
100% |
BMO rating |
Moody’s Investors Service implied equivalent |
Standard & Poor’s implied equivalent |
||
Acceptable |
||||
I-1 to I-7
|
Aaa to Baa3 |
AAA to BBB- |
||
S-1 to S-4
|
Ba1 to B1 |
BB+ to B+ |
||
Watchlist |
||||
P-1 to P-3
|
B2 to Ca |
B to CC |
||
Default/Impaired |
||||
D-1 to D-4
|
C |
C to D |
||
80 |
BMO Financial Group 207th Annual Report 2024 |
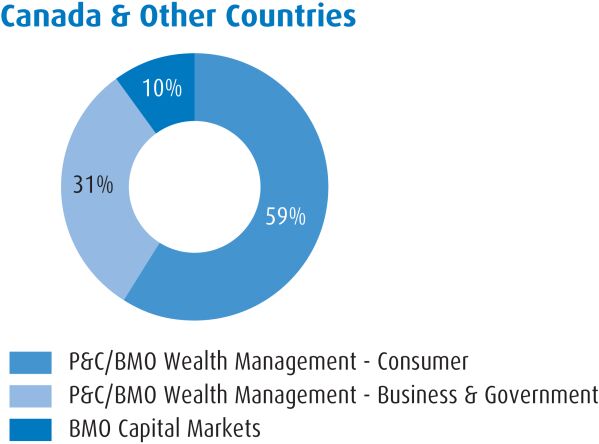 |
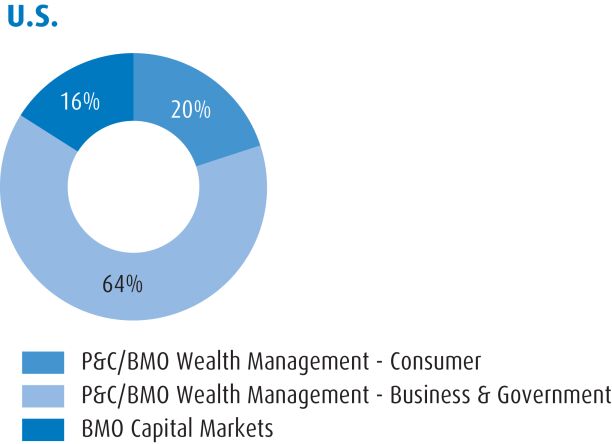 |
| (Canadian $ in millions) |
Residential
mortgages (1)
|
Amortizing
home equity
lines of credit
|
Total amortizing
real estate
secured lending
|
Non-amortizing real estate
secured lending
|
Total Canadian
real estate
secured lending
|
|||||||||||||||
As at October 31, 2024 |
158,910 |
36,326 |
195,236 |
13,614 |
208,850 |
|||||||||||||||
As at October 31, 2023 |
150,575 | 35,741 | 186,316 | 12,982 | 199,298 | |||||||||||||||
| (1) | Residential mortgage balances in prior periods included certain insured multi-unit residential mortgages subsequently reclassified as commercial real estate ($1.6 billion as at October 31, 2023). |
| BMO Financial Group 207th Annual Report 2024 | 81 |
As at October 31, 2024 |
As at October 31, 2023 | |||||||||||||||||||||||||||||||||||||||||||
| (Canadian $ in millions, except as noted) | Outstanding balances |
For the 12 months ended |
Outstanding balances | For the 12 months ended |
||||||||||||||||||||||||||||||||||||||||
| Region (2) |
Insured |
Uninsured |
Total |
% of total |
Average LTV uninsured |
Insured (3) | Uninsured | Total | % of total | Average LTV uninsured (4) |
||||||||||||||||||||||||||||||||||
Atlantic |
3,261 |
3,802 |
7,063 |
3.7% |
70% |
3,347 | 3,452 | 6,799 | 3.8% | 71% | ||||||||||||||||||||||||||||||||||
Quebec |
8,811 |
13,647 |
22,458 |
11.8% |
71% |
9,242 | 12,903 | 22,145 | 12.5% | 71% | ||||||||||||||||||||||||||||||||||
Ontario |
14,199 |
64,107 |
78,306 |
41.0% |
70% |
14,643 | 56,798 | 71,441 | 40.3% | 70% | ||||||||||||||||||||||||||||||||||
Alberta |
9,551 |
8,175 |
17,726 |
9.3% |
73% |
9,885 | 7,302 | 17,187 | 9.7% | 73% | ||||||||||||||||||||||||||||||||||
British Columbia |
4,504 |
25,011 |
29,515 |
15.4% |
68% |
4,746 | 24,391 | 29,137 | 16.5% | 67% | ||||||||||||||||||||||||||||||||||
All other Canada |
2,180 |
1,662 |
3,842 |
2.0% |
72% |
2,264 | 1,602 | 3,866 | 2.2% | 73% | ||||||||||||||||||||||||||||||||||
Total Canada |
42,506 |
116,404 |
158,910 |
83.2% |
70% |
44,127 | 106,448 | 150,575 | 85.0% | 70% | ||||||||||||||||||||||||||||||||||
United States |
67 |
32,103 |
32,170 |
16.8% |
76% |
68 | 26,607 | 26,675 | 15.0% | 77% | ||||||||||||||||||||||||||||||||||
Total |
42,573 |
148,507 |
191,080 |
100% |
71% |
44,195 | 133,055 | 177,250 | 100% | 71% | ||||||||||||||||||||||||||||||||||
| (1) | Reporting methodologies are in accordance with OSFI’s Residential Mortgage Underwriting Practices and Procedures (B-20) Guideline. |
| (2) | Region is based upon address of the property mortgaged. |
| (3) | Insured mortgages are defined as mortgages that are insured individually or in bulk through an eligible insurer (i.e., CMHC, Sagen MI Canada TM ). |
| (4) | Loan-to-value (LTV) is based on original outstanding balances for mortgages and authorized amounts for HELOCs, divided by the value of the collateral at point of origination. |
As at October 31, 2024 |
As at October 31, 2023 | |||||||||||||||||||||||||||||||||||||||||||
| (Canadian $ in millions, except as noted) | Portfolio |
For the 12 months ended |
Portfolio | For the 12 months ended |
||||||||||||||||||||||||||||||||||||||||
| Region (2) | Outstanding balances |
% |
Authorizations |
% |
Average LTV |
Outstanding balances |
% | Authorizations | % | Average LTV (4) | ||||||||||||||||||||||||||||||||||
Atlantic |
1,051 |
1.9% |
2,028 |
1.7% |
62% |
996 | 1.8% | 1,922 | 1.7% | 60% | ||||||||||||||||||||||||||||||||||
Quebec |
9,216 |
16.3% |
18,530 |
15.9% |
68% |
9,149 | 16.6% | 18,071 | 15.9% | 67% | ||||||||||||||||||||||||||||||||||
Ontario |
25,313 |
44.8% |
47,222 |
40.6% |
60% |
24,601 | 44.6% | 45,351 | 40.0% | 59% | ||||||||||||||||||||||||||||||||||
Alberta |
3,200 |
5.7% |
7,156 |
6.1% |
61% |
3,203 | 5.8% | 6,970 | 6.2% | 62% | ||||||||||||||||||||||||||||||||||
British Columbia |
10,432 |
18.5% |
19,867 |
17.1% |
59% |
10,029 | 18.2% | 18,899 | 16.7% | 59% | ||||||||||||||||||||||||||||||||||
All other Canada |
728 |
1.3% |
1,485 |
1.3% |
65% |
745 | 1.3% | 1,474 | 1.3% | 66% | ||||||||||||||||||||||||||||||||||
Total Canada |
49,940 |
88.5% |
96,288 |
82.7% |
61% |
48,723 | 88.3% | 92,687 | 81.8% | 61% | ||||||||||||||||||||||||||||||||||
United States |
6,497 |
11.5% |
20,146 |
17.3% |
59% |
6,471 | 11.7% | 20,615 | 18.2% | 60% | ||||||||||||||||||||||||||||||||||
Total |
56,437 |
100% |
116,434 |
100% |
61% |
55,194 | 100% | 113,302 | 100% | 61% | ||||||||||||||||||||||||||||||||||
Amortization period |
||||||||||||||||||||||||||||||||
As at October 31, 2024 |
< 5 years |
6-10 years |
11-15 years |
16-20 years |
21-25 years |
26-30 years |
31-35 years |
> 35 years |
||||||||||||||||||||||||
Canada (3)
|
0.7% |
2.6% |
6.6% |
16.1% |
33.8% |
26.5% |
3.6% |
10.1% |
||||||||||||||||||||||||
United States (4)
|
0.4% |
1.7% |
4.0% |
2.4% |
9.0% |
82.3% |
0.1% |
0.1% |
||||||||||||||||||||||||
Total |
0.6% |
2.5% |
6.2% |
13.8% |
29.6% |
35.9% |
3.0% |
8.4% |
||||||||||||||||||||||||
| Amortization period | ||||||||||||||||||||||||||||||||
| As at October 31, 2023 | < 5 years |
6-10 years |
11-15 years |
16-20 years |
21-25 years |
26-30 years |
31-35 years |
> 35 years | ||||||||||||||||||||||||
Canada (3)
|
0.7% | 2.5% | 6.1% | 13.6% | 32.1% | 18.0% | 2.1% | 24.9% | ||||||||||||||||||||||||
United States (4)
|
0.5% | 2.2% | 5.3% | 2.8% | 10.4% | 78.6% | 0.1% | 0.1% | ||||||||||||||||||||||||
Total |
0.7% | 2.5% | 5.9% | 12.0% | 28.8% | 27.1% | 1.8% | 21.2% | ||||||||||||||||||||||||
| (1) | In Canada, the remaining amortization is based on the current balance, interest rate, customer payment amount and payment frequency. The contractual payment schedule is used in the United States. |
| (2) | Reporting methodologies are in accordance with OSFI’s B-20 Guideline. |
| (3) | As a result of increases in interest rates, the portfolio included $9.3 billion ($29.9 billion as at October 31, 2023) of variable-rate mortgages in negative amortization, with all of the contractual payments in the current period being applied to interest, and the portion of interest due that is not met by each payment added to the principal. |
| (4) | A large proportion of U.S.-based mortgages in the longer-amortization band are primarily associated with modification programs for troubled borrowers and regulator-initiated mortgage refinancing programs. |
| (1) | Certain comparative figures have been reclassified to conform with the current year’s presentation. |
82 |
BMO Financial Group 207th Annual Report 2024 |
| (Canadian $ in millions, except as noted) For the year ended October 31 |
2024 |
2023 | ||||||||||||||||||||||||||||||||||||||
GIL, beginning of year |
3,960 |
1,991 | ||||||||||||||||||||||||||||||||||||||
Classified as impaired during the year |
7,419 |
4,047 | ||||||||||||||||||||||||||||||||||||||
Purchased credit impaired during the year |
– |
415 | ||||||||||||||||||||||||||||||||||||||
Transferred to not impaired during the year |
(1,086 |
) |
(545 | ) | ||||||||||||||||||||||||||||||||||||
Net repayments |
(1,938 |
) |
(1,214 | ) | ||||||||||||||||||||||||||||||||||||
Amounts written off |
(2,430 |
) |
(753 | ) | ||||||||||||||||||||||||||||||||||||
Recoveries of loans and advances previously written off |
– |
– | ||||||||||||||||||||||||||||||||||||||
Disposals of loans |
(107 |
) |
(24 | ) | ||||||||||||||||||||||||||||||||||||
Foreign exchange and other movements |
25 |
43 | ||||||||||||||||||||||||||||||||||||||
GIL, end of year |
5,843 |
3,960 | ||||||||||||||||||||||||||||||||||||||
GIL as a % of gross loans and acceptances |
0.86 |
0.59 | ||||||||||||||||||||||||||||||||||||||
| BMO Financial Group 207th Annual Report 2024 | 83 |
| As at October 31, 2024 | As at October 31, 2023 |
|||||||||||||||||||||||||||||||||||||||||||||||||||||||||||||||||||||||
| (Canadian $ in millions) | Funded lending and commitments | Securities | Repo-style transactions and derivatives |
|||||||||||||||||||||||||||||||||||||||||||||||||||||||||||||||||||||
| Region | Bank | Corporate | Sovereign | Total | Bank | Corporate | Sovereign | Total | Bank | Corporate | Sovereign | Total | Total net exposure |
Total net exposure |
||||||||||||||||||||||||||||||||||||||||||||||||||||||||||
Europe (excluding United Kingdom) |
1,025 |
3,357 |
– |
4,382 |
354 |
159 |
4,802 |
5,315 |
671 |
150 |
152 |
973 |
10,670 |
11,281 | ||||||||||||||||||||||||||||||||||||||||||||||||||||||||||
United Kingdom |
51 |
7,278 |
362 |
7,691 |
416 |
130 |
1,219 |
1,765 |
97 |
872 |
68 |
1,037 |
10,493 |
6,135 | ||||||||||||||||||||||||||||||||||||||||||||||||||||||||||
Latin America |
2,891 |
5,345 |
– |
8,236 |
– |
110 |
– |
110 |
3 |
266 |
13 |
282 |
8,628 |
10,270 | ||||||||||||||||||||||||||||||||||||||||||||||||||||||||||
Asia-Pacific |
3,625 |
2,317 |
130 |
6,072 |
575 |
32 |
3,097 |
3,704 |
138 |
193 |
197 |
528 |
10,304 |
12,289 | ||||||||||||||||||||||||||||||||||||||||||||||||||||||||||
Middle East and Africa |
1,785 |
908 |
105 |
2,798 |
– |
– |
18 |
18 |
10 |
130 |
983 |
1,123 |
3,939 |
2,471 | ||||||||||||||||||||||||||||||||||||||||||||||||||||||||||
Other (1)
|
– |
6 |
52 |
58 |
9 |
– |
3,592 |
3,601 |
3 |
– |
1,543 |
1,546 |
5,205 |
5,575 | ||||||||||||||||||||||||||||||||||||||||||||||||||||||||||
Total |
9,377 |
19,211 |
649 |
29,237 |
1,354 |
431 |
12,728 |
14,513 |
922 |
1,611 |
2,956 |
5,489 |
49,239 |
48,021 | ||||||||||||||||||||||||||||||||||||||||||||||||||||||||||
| (1) | Primarily exposure to supranational entities. |
| (Canadian $ in millions) |
Non-centrally cleared |
Centrally cleared | Total | |||||||||||||||||||||||||||||
| As at October 31 | 2024 |
2023 | 2024 |
2023 | 2024 |
2023 | ||||||||||||||||||||||||||
Interest Rate Contracts |
||||||||||||||||||||||||||||||||
Swaps |
469,244 |
413,856 | 16,376,733 |
9,197,174 | 16,845,977 |
9,611,030 | ||||||||||||||||||||||||||
Forward rate agreements |
7,464 |
5,439 | 3,406,985 |
127,214 | 3,414,449 |
132,653 | ||||||||||||||||||||||||||
Purchased options |
253,694 |
130,000 | – |
– | 253,694 |
130,000 | ||||||||||||||||||||||||||
Written options |
255,721 |
118,524 | – |
– | 255,721 |
118,524 | ||||||||||||||||||||||||||
Total interest rate contracts |
986,123 |
667,819 | 19,783,718 |
9,324,388 | 20,769,841 |
9,992,207 | ||||||||||||||||||||||||||
Foreign Exchange Contracts (1)
|
||||||||||||||||||||||||||||||||
Cross-currency swaps |
102,302 |
95,932 | – |
– | 102,302 |
95,932 | ||||||||||||||||||||||||||
Cross-currency interest rate swaps |
900,021 |
685,022 | – |
– | 900,021 |
685,022 | ||||||||||||||||||||||||||
Forward foreign exchange contracts |
673,839 |
555,031 | 6,088 |
9,335 | 679,927 |
564,366 | ||||||||||||||||||||||||||
Purchased options |
76,576 |
51,143 | – |
– | 76,576 |
51,143 | ||||||||||||||||||||||||||
Written options |
88,210 |
55,370 | – |
– | 88,210 |
55,370 | ||||||||||||||||||||||||||
Total foreign exchange contracts |
1,840,948 |
1,442,498 | 6,088 |
9,335 | 1,847,036 |
1,451,833 | ||||||||||||||||||||||||||
Commodity Contracts |
||||||||||||||||||||||||||||||||
Swaps |
20,326 |
18,573 | 2 |
1 | 20,328 |
18,574 | ||||||||||||||||||||||||||
Purchased options |
5,495 |
5,319 | – |
– | 5,495 |
5,319 | ||||||||||||||||||||||||||
Written options |
4,268 |
4,218 | – |
– | 4,268 |
4,218 | ||||||||||||||||||||||||||
Total commodity contracts |
30,089 |
28,110 | 2 |
1 | 30,091 |
28,111 | ||||||||||||||||||||||||||
Equity Contracts |
138,194 |
116,011 | 320 |
129 | 138,514 |
116,140 | ||||||||||||||||||||||||||
Credit Contracts (2)
|
||||||||||||||||||||||||||||||||
Purchased |
1,902 |
1,705 | 21,448 |
15,222 | 23,350 |
16,927 | ||||||||||||||||||||||||||
Written |
1,279 |
1,080 | 14,932 |
8,930 | 16,211 |
10,010 | ||||||||||||||||||||||||||
Total credit default swaps |
3,181 |
2,785 | 36,380 |
24,152 | 39,561 |
26,937 | ||||||||||||||||||||||||||
Total |
2,998,535 |
2,257,223 | 19,826,508 |
9,358,005 | 22,825,043 |
11,615,228 | ||||||||||||||||||||||||||
| (1) | Gold contracts are included with foreign exchange contracts. |
| (2) | Credit contracts exclude loan commitment derivatives with notionals of $2,498 million as at October 31, 2024 ($1,805 million as at October 31, 2023). |
84 |
BMO Financial Group 207th Annual Report 2024 |
BMO Financial Group 207th Annual Report 2024 |
85 |
|
As at or for the year ended October 31 (Pre-tax Canadian $ equivalent in millions) |
2024 |
2023 |
||||||||||||||||||||||||||||||||||
Year-end |
Average |
High |
Low |
Year-end |
Average |
High |
Low |
|||||||||||||||||||||||||||||
Commodity VaR |
2.1 |
3.8 |
5.4 |
2.0 |
4.0 |
2.4 |
6.1 |
1.2 |
||||||||||||||||||||||||||||
Equity VaR |
24.0 |
16.1 |
24.0 |
8.1 |
13.6 |
14.0 |
24.5 |
8.5 |
||||||||||||||||||||||||||||
Foreign exchange VaR |
1.0 |
1.2 |
2.9 |
0.4 |
1.7 |
2.9 |
5.6 |
1.3 |
||||||||||||||||||||||||||||
Interest rate VaR
(2)
|
23.0 |
30.8 |
44.7 |
22.1 |
38.3 |
38.2 |
54.8 |
26.0 |
||||||||||||||||||||||||||||
Diversification |
(17.6 |
) |
(19.7 |
) |
nm |
nm |
(25.0 |
) |
(25.4 |
) |
nm |
nm |
||||||||||||||||||||||||
Total Trading VaR |
32.5 |
32.2 |
45.5 |
23.1 |
32.6 |
32.1 |
47.9 |
21.2 |
||||||||||||||||||||||||||||
(1) |
One-day measure using a 99% confidence interval. Gains are presented in brackets and losses are presented as positive numbers. |
(2) |
Interest rate VaR includes general credit spread risk. |
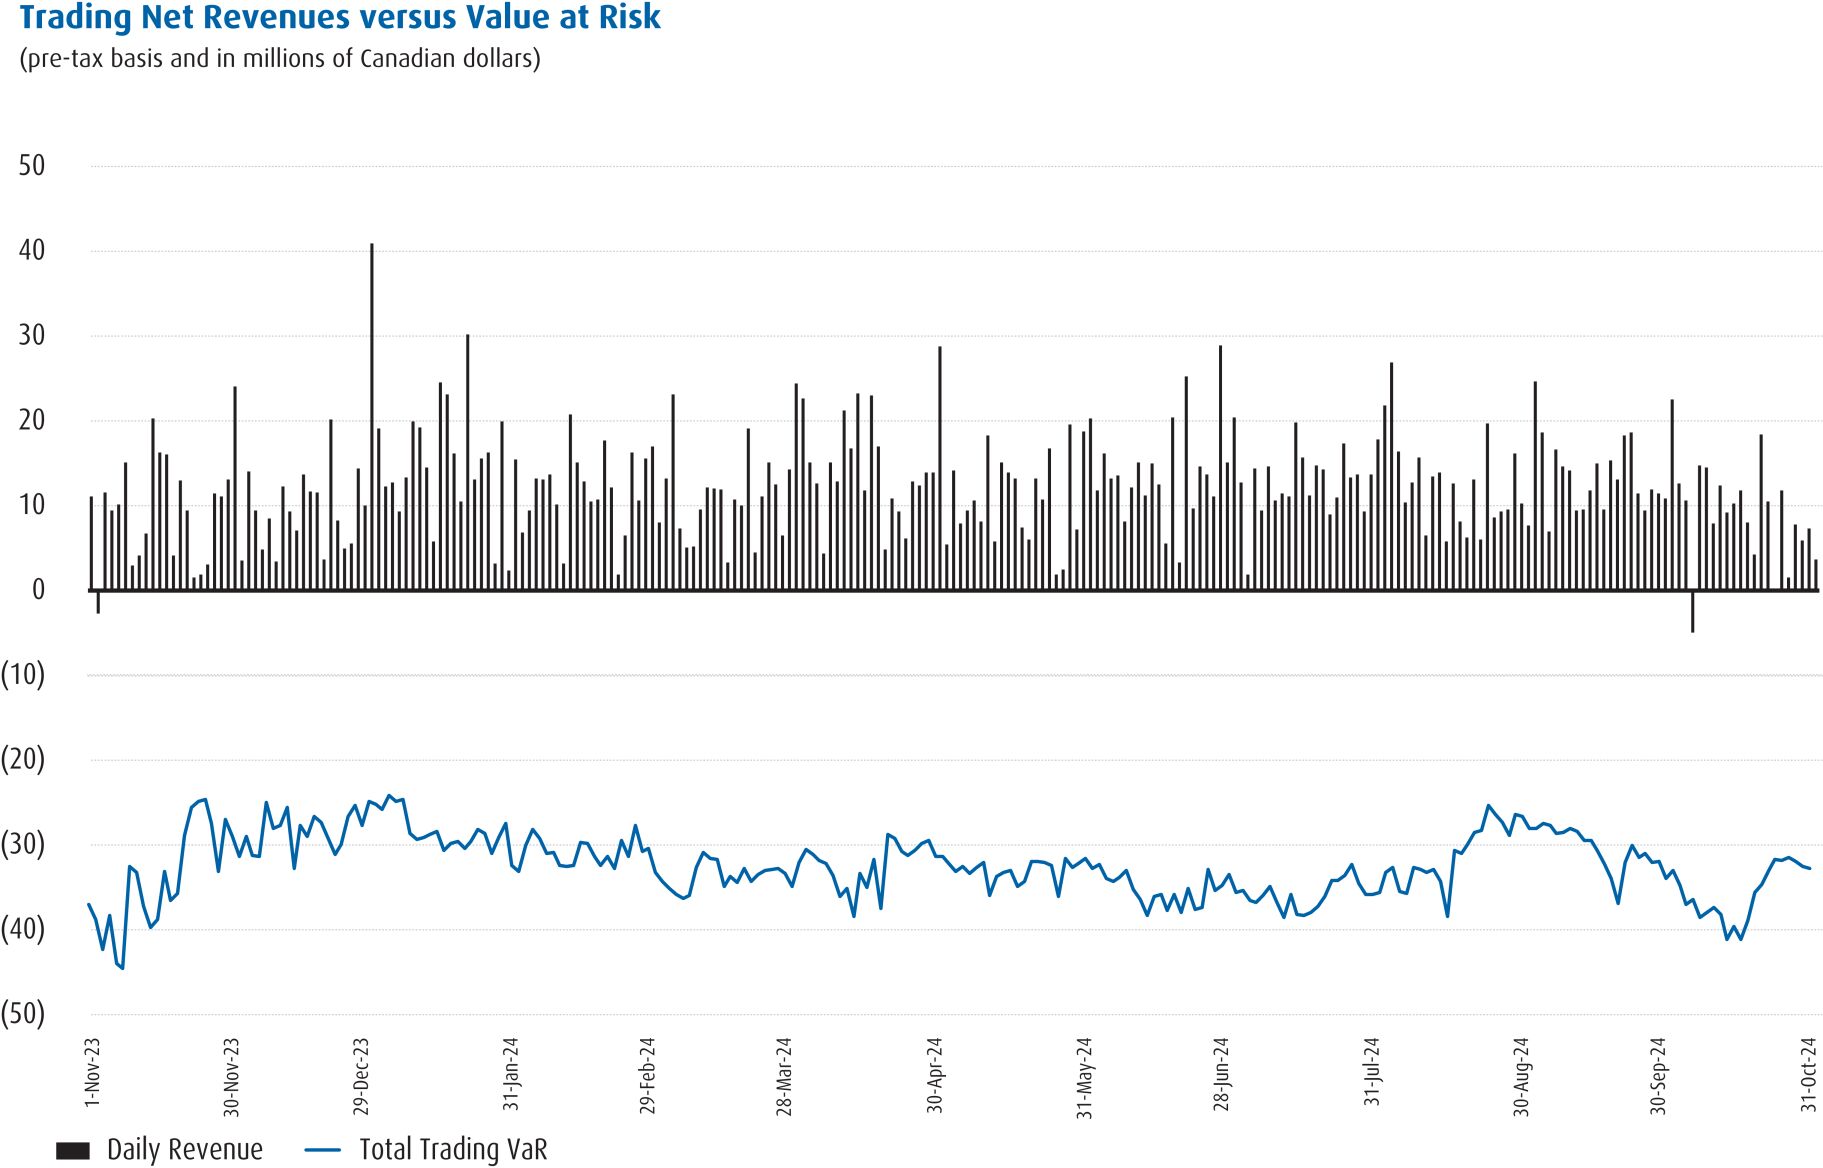
86 |
BMO Financial Group 207th Annual Report 2024 |
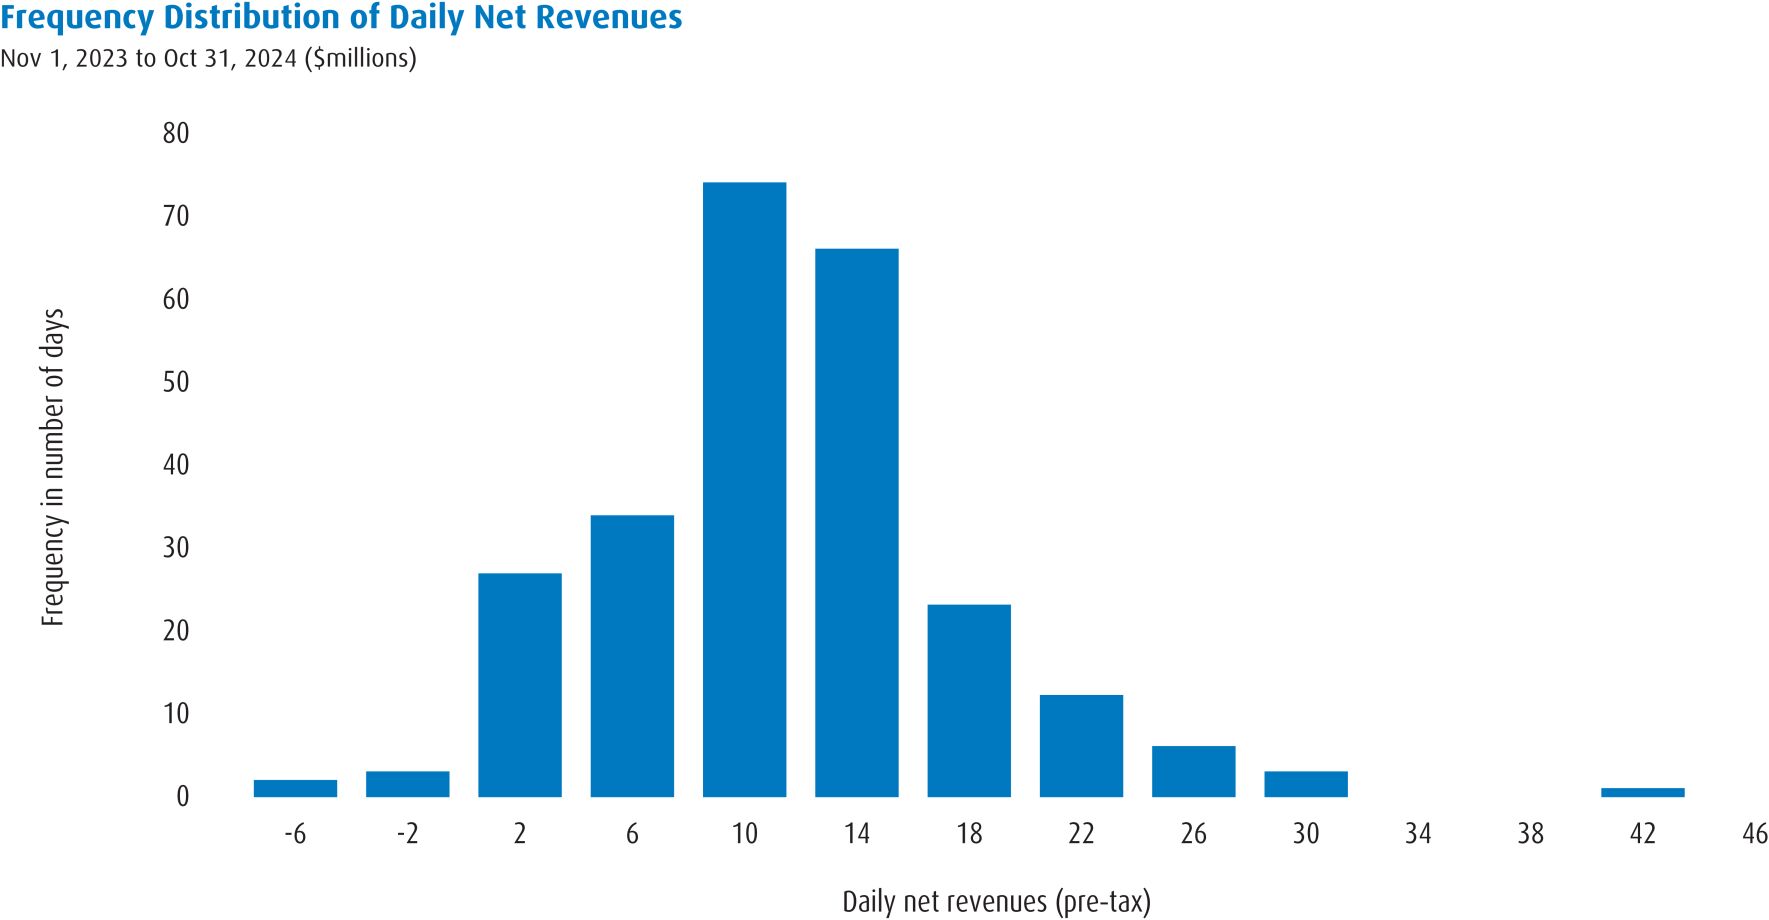
BMO Financial Group 207th Annual Report 2024 |
87 |
Economic value sensitivity |
Earnings sensitivity |
|||||||||||||||||||||||||||||||||||
(Pre-tax Canadian $ equivalent in millions) |
October 31, 2024 |
October 31, 2023 |
October 31, 2024 |
October 31, 2023 |
||||||||||||||||||||||||||||||||
Canada |
United States |
Total |
Total |
Canada |
United States |
Total |
Total |
|||||||||||||||||||||||||||||
| 100 basis point increase |
(693 |
) |
(790 |
) |
(1,483 |
) |
(1,849 |
) |
139 |
228 |
367 |
304 |
||||||||||||||||||||||||
| 100 basis point decrease |
597 |
63 |
660 |
1,492 |
(101 |
) |
(109 |
) |
(210 |
) |
(325 |
) | ||||||||||||||||||||||||
(1) |
Losses are presented in brackets and gains are presented as positive numbers. |
(2) |
Interest rate sensitivities assume an immediate and sustained parallel shift in assumed interest rates across the entire yield curve as at the end of the period, using a constant balance sheet. |
(3) |
Includes Canadian dollar and other currencies. |
(Canadian $ in millions) |
2024 |
2023 |
||||||||||||||||||||||||||||||||||||||||||||||
| Fixed rate (1)
|
||||||||||||||||||||||||||||||||||||||||||||||||
| Contractual amounts that will reprice/repay within 3 months |
213,314 |
213,854 |
||||||||||||||||||||||||||||||||||||||||||||||
| Contractual amounts that will reprice/repay after 3 months |
254,872 |
248,688 |
||||||||||||||||||||||||||||||||||||||||||||||
| Floating rate (2)
|
202,031 |
186,327 |
||||||||||||||||||||||||||||||||||||||||||||||
| Non-rate sensitive (3)
|
8,158 |
15,907 |
||||||||||||||||||||||||||||||||||||||||||||||
| Total |
678,375 |
664,776 |
||||||||||||||||||||||||||||||||||||||||||||||
(1) |
Includes index-based loans. |
(2) |
Floating rate only includes loans that reprice immediately upon a change in interest rates. |
(3) |
Includes credit card balances that are paid when due, customers’ liability under acceptances, impaired loans and allowance for cr e dit losses. |
88 |
BMO Financial Group 207th Annual Report 2024 |
(Pre-tax Canadian $ in millions) |
2024 |
2023 |
||||||||||||||||||||||||||||||||||||||||||||||
50 basis point increase |
6 |
23 |
||||||||||||||||||||||||||||||||||||||||||||||
50 basis point decrease |
(9 |
) |
(30 |
) |
||||||||||||||||||||||||||||||||||||||||||||
(1) |
Interest rate sensitivities assume a parallel shift in assumed interest rates across the entire yield curve as at the end of the period, with no change in the ultimate risk-free rate. |
As at October 31, 2024 |
As at October 31, 2023 |
|||||||||||||||||||||||||||||||||||||||
Subject to market risk |
Subject to market risk |
Primary risk factors for non-traded risk balances |
||||||||||||||||||||||||||||||||||||||
(Canadian $ in millions) |
Consolidated Balance Sheet |
Traded risk |
Non-traded risk |
Not subject to market risk |
Consolidated Balance Sheet |
Traded risk (1) |
Non-traded risk (2) |
Not subject to market risk |
||||||||||||||||||||||||||||||||
Assets Subject to Market Risk |
||||||||||||||||||||||||||||||||||||||||
Cash and cash equivalents |
65,098 |
– |
65,098 |
– |
77,934 |
– |
77,934 |
– |
Interest rate |
|||||||||||||||||||||||||||||||
Interest bearing deposits with banks |
3,640 |
201 |
3,439 |
– |
4,109 |
236 |
3,873 |
– |
Interest rate |
|||||||||||||||||||||||||||||||
Securities |
396,880 |
153,833 |
243,047 |
– |
320,084 |
122,926 |
197,158 |
– |
Interest rate, credit spread, equity |
|||||||||||||||||||||||||||||||
Securities borrowed or purchased under resale agreements |
110,907 |
– |
110,907 |
– |
115,662 |
– |
115,662 |
– |
Interest rate |
|||||||||||||||||||||||||||||||
Loans and acceptances (net of allowance for credit losses) |
678,016 |
6,085 |
671,931 |
– |
656,665 |
4,412 |
652,253 |
– |
Interest rate, foreign exchange |
|||||||||||||||||||||||||||||||
Derivative instruments |
47,253 |
42,879 |
4,374 |
– |
39,976 |
34,004 |
5,972 |
– |
Interest rate, foreign exchange |
|||||||||||||||||||||||||||||||
Customers’ liabilities under acceptances |
359 |
– |
359 |
– |
8,111 |
– |
8,111 |
– |
Interest rate |
|||||||||||||||||||||||||||||||
Other assets |
107,494 |
9,485 |
59,070 |
38,939 |
124,465 |
4,734 |
82,008 |
37,723 |
Interest rate |
|||||||||||||||||||||||||||||||
Total Assets |
1,409,647 |
212,483 |
1,158,225 |
38,939 |
1,347,006 |
166,312 |
1,142,971 |
37,723 |
||||||||||||||||||||||||||||||||
Liabilities Subject to Market Risk |
||||||||||||||||||||||||||||||||||||||||
Deposits |
982,440 |
45,223 |
937,217 |
– |
910,879 |
35,300 |
875,579 |
– |
Interest rate, foreign exchange |
|||||||||||||||||||||||||||||||
Derivative instruments |
58,303 |
54,713 |
3,590 |
– |
50,193 |
43,166 |
7,027 |
– |
Interest rate, foreign exchange |
|||||||||||||||||||||||||||||||
Acceptances |
359 |
– |
359 |
– |
8,111 |
– |
8,111 |
– |
Interest rate |
|||||||||||||||||||||||||||||||
Securities sold but not yet purchased |
35,030 |
35,030 |
– |
– |
43,774 |
43,774 |
– |
– |
Interest rate |
|||||||||||||||||||||||||||||||
Securities lent or sold under repurchase agreements |
110,791 |
– |
110,791 |
– |
106,108 |
– |
106,108 |
– |
Interest rate |
|||||||||||||||||||||||||||||||
Other liabilities |
130,061 |
– |
129,590 |
471 |
143,590 |
33 |
143,497 |
60 |
Interest rate |
|||||||||||||||||||||||||||||||
Subordinated debt |
8,377 |
– |
8,377 |
– |
8,228 |
– |
8,228 |
– |
Interest rate |
|||||||||||||||||||||||||||||||
Total Liabilities |
1,325,361 |
134,966 |
1,189,924 |
471 |
1,270,883 |
122,273 |
1,148,550 |
60 |
||||||||||||||||||||||||||||||||
(1) |
Primarily comprises balance sheet items that are subject to the trading and underwriting risk management framework and recorded at fair value through profit or loss. |
(2) |
Primarily comprises balance sheet items that are subject to the structural balance sheet insurance risk management framework and secured financing transactions. |
BMO Financial Group 207th Annual Report 2024 |
89 |
• |
Claims risk – the risk that the actual magnitude or frequency of claims will differ from those assumed in the pricing or underwriting process, including mortality risk, morbidity risk, longevity risk and catastrophic risk. |
• |
Policyholder behaviour risk – the risk that the behaviour of policyholders in regard to premium payments, withdrawals or loans, as well as policy lapses and surrenders and other voluntary terminations, will differ from the behaviour assumed in the pricing process. |
• |
Expense risk – the risk that actual expenses arising from acquiring and administering policies and processing claims will exceed the expenses assumed in the pricing process. |
2024 |
2023 |
|||||||||||||||||||||||||||||||||||||||||||
(Canadian $ in millions) |
Contractual service margin |
Profit or loss |
Contractual service margin |
Profit or loss |
||||||||||||||||||||||||||||||||||||||||
Gross |
Net |
Gross |
Net |
Gross |
Net |
Gross |
Net |
|||||||||||||||||||||||||||||||||||||
Policy-related assumptions |
||||||||||||||||||||||||||||||||||||||||||||
Mortality rates (1% increase) (1)
|
(17 |
) |
10 |
1 |
1 |
(14 |
) |
9 |
– |
– |
||||||||||||||||||||||||||||||||||
Lapse rates (10% increase) (2)
|
(151 |
) |
(52 |
) |
(10 |
) |
(4 |
) |
(161 |
) |
(63 |
) |
(4 |
) |
(2 |
) |
||||||||||||||||||||||||||||
Expenses (5% increase) (3)
|
(15 |
) |
(15 |
) |
– |
– |
(9 |
) |
(9 |
) |
– |
– |
||||||||||||||||||||||||||||||||
(1) |
Mortality relates to the occurrence of death and is a key assumption for our life insurance business. |
(2) |
Policies are terminated through lapses and surrenders, where lapses represent the termination of policies due to non-payment of premiums and surrenders represent the voluntary termination of policies by policyholders. |
(3) |
Directly attributable operating expense assumptions reflect the projected costs of maintaining and servicing in-force policies, including associated directly attributable overhead expenses. |
90 |
BMO Financial Group 207th Annual Report 2024 |
BMO Financial Group 207th Annual Report 2024 |
91 |
As at October 31, 2024 |
As at October 31, 2023 |
|||||||||||||||||||||||||||
(Canadian $ in millions) |
Bank-owned
assets |
Other cash and securities received |
Total gross assets |
Encumbered assets |
Net unencumbered assets |
Net unencumbered assets (3) |
||||||||||||||||||||||
Cash and cash equivalents |
65,098 |
– |
65,098 |
80 |
65,018 |
77,809 |
||||||||||||||||||||||
Deposits with other banks |
3,640 |
– |
3,640 |
– |
3,640 |
4,109 |
||||||||||||||||||||||
Securities and securities borrowed or purchased under resale agreements |
||||||||||||||||||||||||||||
Sovereigns / Central banks / Multilateral development banks |
180,915 |
103,484 |
284,399 |
134,273 |
150,126 |
122,686 |
||||||||||||||||||||||
NHA mortgage-backed securities and U.S. agency mortgage-backed securities and collateralized mortgage obligations |
105,081 |
11,147 |
116,228 |
54,499 |
61,729 |
56,729 |
||||||||||||||||||||||
Corporate and other debt |
37,994 |
21,374 |
59,368 |
15,646 |
43,722 |
34,358 |
||||||||||||||||||||||
Corporate equity |
72,890 |
59,066 |
131,956 |
79,627 |
52,329 |
42,716 |
||||||||||||||||||||||
Total securities and securities borrowed or purchased under resale agreements |
396,880 |
195,071 |
591,951 |
284,045 |
307,906 |
256,489 |
||||||||||||||||||||||
NHA mortgage-backed securities (reported as loans at amortized cost) (4)
|
25,266 |
– |
25,266 |
5,492 |
19,774 |
19,502 |
||||||||||||||||||||||
Total liquid assets |
490,884 |
195,071 |
685,955 |
289,617 |
396,338 |
357,909 |
||||||||||||||||||||||
(1) |
Effective the first quarter of fiscal 2024, we changed our accounting policy for securities transactions from settlement date to trade date, resulting in an increase in other assets and other liabilities due to the earlier recognition of transactions, as well as the reclassification of certain balance sheet items. Fiscal 2023 comparative figures have been reclassified to conform with the current period’s methodology. For further information, refer to the Changes in Accounting Policies in 2024 section. |
(2) |
Gross assets include bank-owned assets and cash and securities received from third parties. |
(3) |
Net unencumbered liquid assets are defined as total gross assets less encumbered assets. |
(4) |
Under IFRS, National Housing Act (NHA) mortgage-backed securities that include mortgages owned by BMO as the underlying collateral are classified as loans. Unencumbered NHA mortgage-backed securities have liquidity value and are included as liquid assets under BMO’s Liquidity and Funding Risk Management Framework. This amount is shown as a separate line item, NHA mortgage-backed securities. |
92 |
BMO Financial Group 207th Annual Report 2024 |
Encumbered |
Net unencumbered |
|||||||||||||||||||
| (Canadian $ in millions) As at October 31, 2024 |
Total gross assets |
Pledged as collateral |
Other encumbered |
Other unencumbered |
Available as collateral |
|||||||||||||||
| Cash and deposits with other banks |
68,738 |
– |
80 |
– |
68,658 |
|||||||||||||||
| Securities (6)
|
617,217 |
233,907 |
55,630 |
24,824 |
302,856 |
|||||||||||||||
| Loans |
652,750 |
69,615 |
1,804 |
427,863 |
153,468 |
|||||||||||||||
| Other assets |
||||||||||||||||||||
| Derivative instruments |
47,253 |
– |
– |
47,253 |
– |
|||||||||||||||
| Customers’ liability under acceptances |
359 |
– |
– |
359 |
– |
|||||||||||||||
| Premises and equipment |
6,249 |
– |
– |
6,249 |
– |
|||||||||||||||
| Goodwill |
16,774 |
– |
– |
16,774 |
– |
|||||||||||||||
| Intangible assets |
4,925 |
– |
– |
4,925 |
– |
|||||||||||||||
| Current tax assets |
2,219 |
– |
– |
2,219 |
– |
|||||||||||||||
| Deferred tax assets |
3,024 |
– |
– |
3,024 |
– |
|||||||||||||||
| Receivable from brokers, dealers and clients |
31,916 |
– |
– |
31,916 |
– |
|||||||||||||||
| Other |
42,387 |
10,314 |
– |
32,073 |
– |
|||||||||||||||
| Total other assets |
155,106 |
10,314 |
– |
144,792 |
– |
|||||||||||||||
| Total assets |
1,493,811 |
313,836 |
57,514 |
597,479 |
524,982 |
|||||||||||||||
Encumbered (3) |
Net unencumbered |
|||||||||||||||||||
| (Canadian $ in millions) As at October 31, 2023 |
Total gross assets (2) |
Pledged as collateral |
Other encumbered |
Other unencumbered (4) |
Available as collateral (5) |
|||||||||||||||
| Cash and deposits with other banks |
82,043 |
– |
125 |
– |
81,918 |
|||||||||||||||
| Securities (6)
|
535,215 |
209,091 |
50,133 |
14,612 |
261,379 |
|||||||||||||||
| Loans |
632,682 |
93,931 |
511 |
342,398 |
195,842 |
|||||||||||||||
| Other assets |
||||||||||||||||||||
| Derivative instruments |
39,976 |
– |
– |
39,976 |
– |
|||||||||||||||
| Customers’ liability under acceptances |
8,111 |
– |
– |
8,111 |
– |
|||||||||||||||
| Premises and equipment |
6,241 |
– |
– |
6,241 |
– |
|||||||||||||||
| Goodwill |
16,728 |
– |
– |
16,728 |
– |
|||||||||||||||
| Intangible assets |
5,216 |
– |
– |
5,216 |
– |
|||||||||||||||
| Current tax assets |
2,052 |
– |
– |
2,052 |
– |
|||||||||||||||
| Deferred tax assets |
3,420 |
– |
– |
3,420 |
– |
|||||||||||||||
| Receivable from brokers, dealers and clients |
53,002 |
– |
– |
53,002 |
– |
|||||||||||||||
| Other |
37,806 |
10,596 |
– |
27,210 |
– |
|||||||||||||||
| Total other assets |
172,552 |
10,596 |
– |
161,956 |
– |
|||||||||||||||
| Total assets |
1,422,492 |
313,618 |
50,769 |
518,966 |
539,139 |
|||||||||||||||
(1) |
Effective the first quarter of fiscal 2024, we changed our accounting policy for securities transactions from settlement date to trade date, resulting in an increase in other assets and other liabilities due to the earlier recognition of transactions, as well as the reclassification of certain balance sheet items. Fiscal 2023 comparative figures have been reclassified to conform with the current period’s methodology. For further information, refer to the Changes in Accounting Policies in 2024 section. |
(2) |
Gross assets include on-balance sheet and off-balance sheet assets. |
(3) |
Pledged as collateral refers to the portion of on-balance sheet assets and other cash and securities that is pledged through repurchase agreements, securities lending, derivative contracts and requirements associated with participation in clearing houses and payment systems. Other encumbered assets include assets that are restricted for legal or other reasons, such as minimum required deposits at central banks, short sales and certain U.S. agency securities that have been sold to third parties but are consolidated under IFRS. |
(4) |
Other unencumbered assets include select liquid asset holdings that management believes are not readily available to support BMO’s liquidity requirements. These include securities of $24.8 billion as at October 31, 2024, and include securities held at BMO’s insurance subsidiary, seller financing securities and certain investments held at our merchant banking business. Other unencumbered assets include mortgages and loans that may be securitized to access secured funding. |
(5) |
Loans included in available as collateral represent loans currently lodged at central banks that may be used to access central bank funding. Loans available for pledging as collateral do not include other sources of additional liquidity that may be realized from BMO’s loan portfolio, such as incremental securitization, covered bond issuances and U.S. Federal Home Loan Bank (FHLB) advances. |
(6) |
Includes securities, securities borrowed or purchased under resale agreements and NHA mortgage-backed securities (reported as loans at amortized cost). |
(Canadian $ in millions) |
As at October 31, 2024 |
As at October 31, 2023 |
||||||
| BMO (parent) |
240,796 |
225,913 |
||||||
| BMO Bank N.A. |
128,521 |
109,476 |
||||||
| Broker dealers |
27,021 |
22,520 |
||||||
| Total net unencumbered liquid assets by legal entity |
396,338 |
357,909 |
||||||
(1) |
Effective the first quarter of fiscal 2024, we changed our accounting policy for securities transactions from settlement date to trade date, resulting in an increase in other assets and other liabilities due to the earlier recognition of transactions, as well as the reclassification of certain balance sheet items. Fiscal 2023 comparative figures have been reclassified to conform with the current period’s methodology. For further information, refer to the Changes in Accounting Policies in 2024 section. |
BMO Financial Group 207th Annual Report 2024 |
93 |
As at October 31, 2024 |
As at October 31, 2023 |
|||||||||||||||||||||||||||||||||||||||
(Canadian $ in millions) |
Less than 1 month |
1 to 3 months |
3 to 6 months |
6 to 12 months |
Subtotal less than 1 year |
1 to 2 years |
Over 2 years |
Total |
Total |
|||||||||||||||||||||||||||||||
| Deposits from banks |
2,531 |
1,283 |
556 |
1,222 |
5,592 |
7 |
– |
5,599 |
7,714 |
|||||||||||||||||||||||||||||||
| Certificates of deposit and commercial paper |
12,023 |
23,099 |
23,525 |
30,838 |
89,485 |
864 |
– |
90,349 |
94,372 |
|||||||||||||||||||||||||||||||
| Bearer deposit notes |
1,437 |
2,332 |
462 |
407 |
4,638 |
– |
– |
4,638 |
954 |
|||||||||||||||||||||||||||||||
| Asset-backed commercial paper (ABCP) |
1,702 |
2,453 |
5,114 |
343 |
9,612 |
– |
– |
9,612 |
6,005 |
|||||||||||||||||||||||||||||||
| Senior unsecured medium-term notes |
609 |
5,120 |
3,096 |
12,443 |
21,268 |
7,374 |
39,271 |
67,913 |
70,749 |
|||||||||||||||||||||||||||||||
| Senior unsecured structured notes (2)
|
– |
– |
14 |
297 |
311 |
498 |
10,283 |
11,092 |
9,415 |
|||||||||||||||||||||||||||||||
| Secured funding |
||||||||||||||||||||||||||||||||||||||||
| Mortgage and HELOC securitizations |
25 |
781 |
909 |
1,474 |
3,189 |
2,752 |
12,246 |
18,187 |
17,916 |
|||||||||||||||||||||||||||||||
| Covered bonds |
– |
– |
– |
4,117 |
4,117 |
12,267 |
10,585 |
26,969 |
28,412 |
|||||||||||||||||||||||||||||||
| Other asset-backed securitizations (3)
|
– |
– |
– |
– |
– |
1,330 |
5,786 |
7,116 |
7,661 |
|||||||||||||||||||||||||||||||
| Federal Home Loan Bank advances |
– |
– |
– |
1,460 |
1,460 |
1,391 |
2,782 |
5,633 |
18,148 |
|||||||||||||||||||||||||||||||
| Subordinated debt |
– |
– |
– |
– |
– |
25 |
8,378 |
8,403 |
8,227 |
|||||||||||||||||||||||||||||||
| Total |
18,327 |
35,068 |
33,676 |
52,601 |
139,672 |
26,508 |
89,331 |
255,511 |
269,573 |
|||||||||||||||||||||||||||||||
| Of which: |
||||||||||||||||||||||||||||||||||||||||
| Secured |
1,727 |
3,234 |
6,023 |
7,394 |
18,378 |
17,740 |
31,399 |
67,517 |
78,142 |
|||||||||||||||||||||||||||||||
| Unsecured |
16,600 |
31,834 |
27,653 |
45,207 |
121,294 |
8,768 |
57,932 |
187,994 |
191,431 |
|||||||||||||||||||||||||||||||
| Total (4)
|
18,327 |
35,068 |
33,676 |
52,601 |
139,672 |
26,508 |
89,331 |
255,511 |
269,573 |
|||||||||||||||||||||||||||||||
(1) |
Wholesale unsecured funding primarily includes funding raised through the issuance of negotiable marketable securities. Wholesale funding excludes repo transactions and bankers’ acceptances, which are disclosed in the Contractual Maturities of Assets and Liabilities and Off-Balance Sheet Commitments section, and also excludes ABCP issued by certain ABCP conduits that are not consolidated for financial reporting purposes. |
(2) |
Primarily issued to institutional investors. |
(3) |
Includes credit card, auto and transportation finance loan securitizations. |
(4) |
Total wholesale funding comprised Canadian-dollar-denominated funding of $51.8 billion and U.S.-dollar-denominated and other foreign-currency-denominated funding of $203.7 billion as at October 31, 2024. |
94 |
BMO Financial Group 207th Annual Report 2024 |
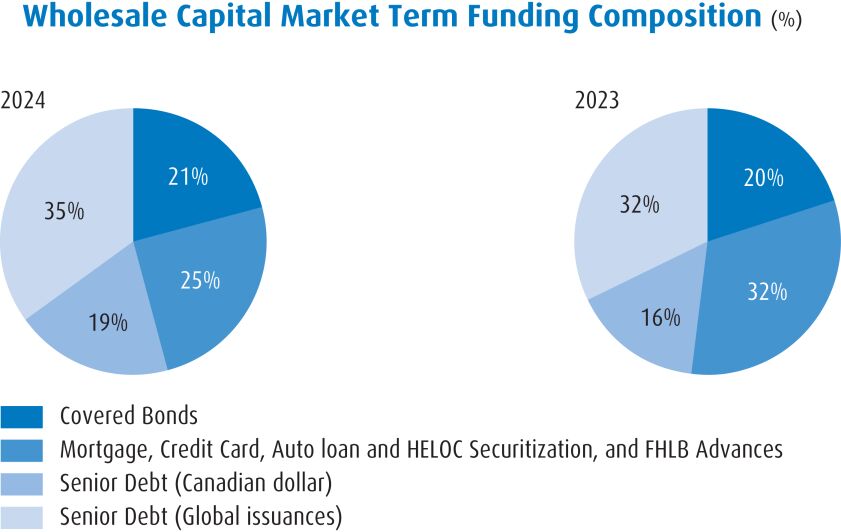
| As at October 31, 2024 | ||||||||||
| Rating agency | Short-term debt |
Senior debt (1) |
Long-term deposits /
Legacy senior debt (2) |
Subordinated debt (NVCC) |
Outlook | |||||
Moody’s |
P-1 |
A2 | Aa2 | Baa1 (hyb) | Stable | |||||
S&P |
A-1 |
A- | A+ | BBB+ | Stable | |||||
Fitch |
F1+ | AA- | AA | A | Stable | |||||
DBRS |
R-1 (high) |
AA (low) | AA | A (low) | Stable | |||||
| (1) | Subject to conversion under the Bank Recapitalization (Bail-In) Regime. |
| (2) | Long-term deposits / Legacy senior debt includes senior debt issued prior to September 23, 2018 and senior debt issued on or after September 23, 2018 that is excluded from the Bank Recapitalization (Bail-In) Regime. |
| BMO Financial Group 207th Annual Report 2024 | 95 |
As at October 31, 2024 |
||||||||
| (Canadian $ in billions, except as noted) |
Total unweighted value (1) (2)
(average) |
Total weighted value (2) (3)
(average) |
||||||
High-Quality Liquid Assets |
||||||||
Total high-quality liquid assets (HQLA) |
* |
253.4 |
||||||
Cash Outflows |
||||||||
Retail deposits and deposits from small business customers, of which: |
302.3 |
21.7 |
||||||
Stable deposits |
139.9 |
4.2 |
||||||
Less stable deposits |
162.4 |
17.5 |
||||||
Unsecured wholesale funding, of which: |
312.7 |
137.4 |
||||||
Operational deposits (all counterparties) and deposits in networks of cooperative banks |
153.5 |
38.0 |
||||||
Non-operational deposits (all counterparties) |
140.0 |
80.2 |
||||||
Unsecured debt |
19.2 |
19.2 |
||||||
Secured wholesale funding |
* |
23.0 |
||||||
Additional requirements, of which: |
258.7 |
52.4 |
||||||
Outflows related to derivatives exposures and other collateral requirements |
32.4 |
8.7 |
||||||
Outflows related to loss of funding on debt products |
2.7 |
2.7 |
||||||
Credit and liquidity facilities |
223.6 |
41.0 |
||||||
Other contractual funding obligations |
0.8 |
– |
||||||
Other contingent funding obligations |
544.3 |
11.3 |
||||||
Total cash outflows |
* |
245.8 |
||||||
Cash Inflows |
||||||||
Secured lending (e.g., reverse repos) |
164.0 |
24.1 |
||||||
Inflows from fully performing exposures |
18.1 |
9.9 |
||||||
Other cash inflows |
19.4 |
19.4 |
||||||
Total cash inflows |
201.5 |
53.4 |
||||||
|
Total adjusted value (4)
|
||||||||
Total HQLA |
253.4 |
|||||||
Total net cash outflows |
192.4 |
|||||||
Liquidity Coverage Ratio (%)
|
132 |
|||||||
| For the quarter ended October 31, 2023 | Total adjusted value (4) | |||||||
Total HQLA |
228.4 | |||||||
Total net cash outflows |
178.5 | |||||||
Liquidity Coverage Ratio (%)
|
128 | |||||||
| (1) | Unweighted values are calculated at market value (for HQLA) or as outstanding balances maturing or callable within 30 days (for inflows and outflows). |
| (2) | Values are calculated based on the simple average of the daily LCR over 62 business days in the fourth quarter of fiscal 2024. |
| (3) | Weighted values are calculated after the application of the weights prescribed under the OSFI Liquidity Adequacy Requirements (LAR) Guideline for HQLA and cash inflows and outflows. |
| (4) | Adjusted values are calculated based on total weighted values after applicable caps, as defined in the LAR Guideline. |
96 |
BMO Financial Group 207th Annual Report 2024 |
For the quarter ended October 31, 2024 |
||||||||||||||||||||
Unweighted value by residual maturity |
Weighted (2)
value |
|||||||||||||||||||
| (Canadian $ in billions, except as noted) |
No (1)
maturity |
Less than 6 months |
6 to 12 months |
Over 1 year |
||||||||||||||||
Available Stable Funding (ASF) Item |
||||||||||||||||||||
Capital: |
– |
– |
– |
95.4 |
95.4 |
|||||||||||||||
Regulatory capital |
– |
– |
– |
95.4 |
95.4 |
|||||||||||||||
Other capital instruments |
– |
– |
– |
– |
– |
|||||||||||||||
Retail deposits and deposits from small business customers: |
227.4 |
70.2 |
41.8 |
74.4 |
379.8 |
|||||||||||||||
Stable deposits |
114.2 |
27.5 |
17.3 |
15.4 |
166.5 |
|||||||||||||||
Less stable deposits |
113.2 |
42.7 |
24.5 |
59.0 |
213.3 |
|||||||||||||||
Wholesale funding: |
310.0 |
275.0 |
66.4 |
106.4 |
293.0 |
|||||||||||||||
Operational deposits |
151.0 |
– |
– |
– |
75.5 |
|||||||||||||||
Other wholesale funding |
159.0 |
275.0 |
66.4 |
106.4 |
217.5 |
|||||||||||||||
Liabilities with matching interdependent assets |
– |
1.3 |
0.6 |
13.9 |
– |
|||||||||||||||
Other liabilities: |
3.0 |
* |
* |
77.5 |
20.5 |
|||||||||||||||
NSFR derivative liabilities |
* |
* |
* |
5.3 |
* |
|||||||||||||||
All other liabilities and equity not included in the above categories |
3.0 |
51.5 |
0.3 |
20.4 |
20.5 |
|||||||||||||||
Total ASF |
* |
* |
* |
* |
788.7 |
|||||||||||||||
Required Stable Funding (RSF) Item |
||||||||||||||||||||
Total NSFR high-quality liquid assets (HQLA) |
* |
* |
* |
* |
18.5 |
|||||||||||||||
Deposits held at other financial institutions for operational purposes |
– |
0.2 |
– |
– |
0.1 |
|||||||||||||||
Performing loans and securities: |
202.3 |
211.3 |
74.3 |
362.1 |
538.3 |
|||||||||||||||
Performing loans to financial institutions secured by Level 1 HQLA |
– |
94.1 |
3.2 |
– |
4.0 |
|||||||||||||||
Performing loans to financial institutions secured by non-Level 1 HQLA and unsecured performing loans to financial institutions |
32.0 |
61.5 |
8.7 |
21.3 |
65.0 |
|||||||||||||||
Performing loans to non-financial corporate clients, loans to retail and small business customers, and loans to sovereigns, central banks and public sector entities, of which: |
124.8 |
39.4 |
44.3 |
167.8 |
287.9 |
|||||||||||||||
With a risk weight of less than or equal to 35% under the Basel II standardized approach for credit risk |
– |
– |
– |
– |
– |
|||||||||||||||
Performing residential mortgages, of which: |
13.6 |
13.8 |
17.7 |
143.7 |
127.9 |
|||||||||||||||
With a risk weight of less than or equal to 35% under the Basel II standardized approach for credit risk |
13.6 |
13.8 |
17.7 |
143.7 |
127.9 |
|||||||||||||||
Securities that are not in default and do not qualify as HQLA, including exchange-traded equities |
31.9 |
2.5 |
0.4 |
29.3 |
53.5 |
|||||||||||||||
Assets with matching interdependent liabilities |
– |
1.3 |
0.6 |
13.9 |
– |
|||||||||||||||
Other assets: |
46.6 |
* |
* |
101.7 |
94.6 |
|||||||||||||||
Physical traded commodities, including gold |
9.5 |
* |
* |
* |
8.1 |
|||||||||||||||
Assets posted as initial margin for derivative contracts and contributions to default funds of CCPs |
* |
* |
* |
17.7 |
15.0 |
|||||||||||||||
NSFR derivative assets |
* |
* |
* |
3.8 |
– |
|||||||||||||||
NSFR derivative liabilities before deduction of variation margin posted |
* |
* |
* |
14.6 |
0.7 |
|||||||||||||||
All other assets not included in the above categories |
37.1 |
41.0 |
0.3 |
24.3 |
70.8 |
|||||||||||||||
Off-balance sheet items |
– |
– |
– |
623.3 |
21.8 |
|||||||||||||||
Total RSF |
* |
* |
* |
* |
673.3 |
|||||||||||||||
Net Stable Funding Ratio (%)
|
* |
* |
* |
* |
117 |
|||||||||||||||
| For the quarter ended October 31, 2023 | Weighted value (2) |
|||||||||||||||||||
Total ASF |
724.1 | |||||||||||||||||||
Total RSF |
627.8 | |||||||||||||||||||
Net Stable Funding Ratio (%)
|
115 | |||||||||||||||||||
| (1) | Items in the no maturity column do not have a stated maturity. These may include, but are not limited to, non-maturity deposits, short positions, open maturity positions, non-HQLA equities, physical traded commodities and demand loans. |
| (2) | Weighted values are calculated after the application of the weights prescribed under the OSFI LAR Guideline for ASF and RSF. |
| BMO Financial Group 207th Annual Report 2024 | 97 |
2024 |
||||||||||||||||||||||||||||||||||||||||
(Canadian $ in millions) |
0 to 1 month |
1 to 3 months |
3 to 6 months |
6 to 9 months |
9 to 12 months |
1 to 2 years |
2 to 5 years |
Over 5 years |
No maturity |
Total |
||||||||||||||||||||||||||||||
On-Balance Sheet Financial Instruments Assets |
||||||||||||||||||||||||||||||||||||||||
Cash and cash equivalents |
62,827 |
– |
– |
– |
– |
– |
– |
– |
2,271 |
65,098 |
||||||||||||||||||||||||||||||
Interest bearing deposits with banks |
2,513 |
628 |
481 |
18 |
– |
– |
– |
– |
– |
3,640 |
||||||||||||||||||||||||||||||
Securities |
6,787 |
14,011 |
7,840 |
6,707 |
9,720 |
21,264 |
84,775 |
172,886 |
72,890 |
396,880 |
||||||||||||||||||||||||||||||
Securities borrowed or purchased under resale agreements |
85,185 |
16,803 |
5,701 |
2,330 |
888 |
– |
– |
– |
– |
110,907 |
||||||||||||||||||||||||||||||
Loans
(1)
|
||||||||||||||||||||||||||||||||||||||||
Residential mortgages |
1,683 |
3,284 |
6,413 |
6,653 |
9,252 |
52,489 |
77,867 |
33,227 |
212 |
191,080 |
||||||||||||||||||||||||||||||
Consumer instalment and other personal |
581 |
974 |
1,703 |
1,827 |
2,671 |
14,815 |
24,595 |
18,830 |
26,691 |
92,687 |
||||||||||||||||||||||||||||||
Credit cards |
– |
– |
– |
– |
– |
– |
– |
– |
13,612 |
13,612 |
||||||||||||||||||||||||||||||
Business and government |
8,647 |
14,418 |
16,461 |
19,448 |
21,828 |
63,613 |
105,740 |
32,444 |
102,394 |
384,993 |
||||||||||||||||||||||||||||||
Allowance for credit losses |
– |
– |
– |
– |
– |
– |
– |
– |
(4,356 |
) |
(4,356 |
) |
||||||||||||||||||||||||||||
Total loans, net of allowance |
10,911 |
18,676 |
24,577 |
27,928 |
33,751 |
130,917 |
208,202 |
84,501 |
138,553 |
678,016 |
||||||||||||||||||||||||||||||
Other assets |
||||||||||||||||||||||||||||||||||||||||
Derivative instruments |
5,573 |
7,996 |
7,211 |
2,482 |
1,660 |
6,365 |
8,374 |
7,592 |
– |
47,253 |
||||||||||||||||||||||||||||||
Customers’ liabilities under acceptances |
359 |
– |
– |
– |
– |
– |
– |
– |
– |
359 |
||||||||||||||||||||||||||||||
Receivable from brokers, dealers and clients |
31,916 |
– |
– |
– |
– |
– |
– |
– |
– |
31,916 |
||||||||||||||||||||||||||||||
Other |
3,847 |
1,012 |
948 |
31 |
14 |
13 |
13 |
7,717 |
61,983 |
75,578 |
||||||||||||||||||||||||||||||
Total other assets |
41,695 |
9,008 |
8,159 |
2,513 |
1,674 |
6,378 |
8,387 |
15,309 |
61,983 |
155,106 |
||||||||||||||||||||||||||||||
Total assets |
209,918 |
59,126 |
46,758 |
39,496 |
46,033 |
158,559 |
301,364 |
272,696 |
275,697 |
1,409,647 |
||||||||||||||||||||||||||||||
2024 |
||||||||||||||||||||||||||||||||||||||||
(Canadian $ in millions) |
0 to 1 month |
1 to 3 months |
3 to 6 months |
6 to 9 months |
9 to 12 months |
1 to 2 years |
2 to 5 years |
Over 5 years |
No maturity |
Total |
||||||||||||||||||||||||||||||
Liabilities and Equity |
||||||||||||||||||||||||||||||||||||||||
Deposits
(2) (3)
|
47,637 |
74,759 |
69,479 |
68,110 |
48,835 |
51,789 |
87,297 |
25,602 |
508,932 |
982,440 |
||||||||||||||||||||||||||||||
Other liabilities |
||||||||||||||||||||||||||||||||||||||||
Derivative instruments |
6,769 |
10,541 |
10,828 |
3,311 |
2,160 |
6,470 |
9,112 |
9,112 |
– |
58,303 |
||||||||||||||||||||||||||||||
Acceptances |
359 |
– |
– |
– |
– |
– |
– |
– |
– |
359 |
||||||||||||||||||||||||||||||
Securities sold but not yet purchased
(4)
|
35,030 |
– |
– |
– |
– |
– |
– |
– |
– |
35,030 |
||||||||||||||||||||||||||||||
Securities lent or sold under repurchase agreements
(4)
|
99,364 |
7,777 |
721 |
106 |
1,016 |
1,807 |
– |
– |
– |
110,791 |
||||||||||||||||||||||||||||||
Securitization and structured entities’ liabilities |
44 |
981 |
1,072 |
2,183 |
152 |
4,353 |
9,913 |
21,466 |
– |
40,164 |
||||||||||||||||||||||||||||||
Insurance-related liabilities |
93 |
89 |
18 |
18 |
30 |
83 |
195 |
701 |
17,543 |
18,770 |
||||||||||||||||||||||||||||||
Payable to brokers, dealers and clients |
34,407 |
– |
– |
– |
– |
– |
– |
– |
– |
34,407 |
||||||||||||||||||||||||||||||
Other |
12,409 |
2,968 |
805 |
144 |
1,611 |
2,492 |
4,058 |
2,799 |
9,434 |
36,720 |
||||||||||||||||||||||||||||||
Total other liabilities |
188,475 |
22,356 |
13,444 |
5,762 |
4,969 |
15,205 |
23,278 |
34,078 |
26,977 |
334,544 |
||||||||||||||||||||||||||||||
Subordinated debt |
– |
– |
– |
– |
– |
25 |
25 |
8,327 |
– |
8,377 |
||||||||||||||||||||||||||||||
Total equity |
– |
– |
– |
– |
– |
– |
– |
– |
84,286 |
84,286 |
||||||||||||||||||||||||||||||
Total liabilities and equity |
236,112 |
97,115 |
82,923 |
73,872 |
53,804 |
67,019 |
110,600 |
68,007 |
620,195 |
1,409,647 |
||||||||||||||||||||||||||||||
(1) |
Loans receivable on demand have been included under no maturity. |
(2) |
Deposits payable on demand and payable after notice have been included under no maturity. |
(3) |
Deposits totalling $29,136 million as at October 31, 2024 have a fixed maturity date; however, they can be redeemed early (either fully or partially) by customers without penalty. These are classified as payable on a fixed date due to their stated contractual maturity date. |
(4) |
Presented based on their earliest maturity date. |
2024 |
||||||||||||||||||||||||||||||||||||||||
(Canadian $ in millions) |
0 to 1 month |
1 to 3 months |
3 to 6 months |
6 to 9 months |
9 to 12 months |
1 to 2 years |
2 to 5 years |
Over 5 years |
No maturity |
Total |
||||||||||||||||||||||||||||||
Off-Balance Sheet Commitments |
||||||||||||||||||||||||||||||||||||||||
Commitments to extend credit
(1)
|
3,720 |
5,220 |
10,229 |
16,052 |
16,284 |
47,054 |
130,664 |
7,048 |
– |
236,271 |
||||||||||||||||||||||||||||||
Letters of credit
(2)
|
2,109 |
5,235 |
6,113 |
6,761 |
6,163 |
2,310 |
3,689 |
36 |
– |
32,416 |
||||||||||||||||||||||||||||||
Backstop liquidity facilities |
283 |
213 |
213 |
3,408 |
1,132 |
3,047 |
9,110 |
818 |
– |
18,224 |
||||||||||||||||||||||||||||||
Other commitments
(3)
|
30 |
78 |
94 |
87 |
187 |
399 |
486 |
98 |
– |
1,459 |
||||||||||||||||||||||||||||||
(1) |
Commitments to extend credit exclude personal lines of credit and credit cards that are unconditionally cancellable at BMO’s discretion. A large majority of these commitments expire without being drawn upon. As a result, the total contractual amounts may not be representative of the funding likely to be required for these commitments. |
(2) |
Letters of credit can be drawn down at any time. These are classified based on their stated contractual maturity. |
(3) |
Other commitments comprise purchase obligations and lease commitments for leases signed but not yet commenced. |
98 |
BMO Financial Group 207th Annual Report 2024 |
2023 |
||||||||||||||||||||||||||||||||||||||||
(Canadian $ in millions) |
0 to 1 month |
1 to 3 months |
3 to 6 months |
6 to 9 months |
9 to 12 months |
1 to 2 years |
2 to 5 years |
Over 5 years |
No maturity |
Total |
||||||||||||||||||||||||||||||
|
On-Balance Sheet Financial InstrumentsAssets |
||||||||||||||||||||||||||||||||||||||||
Cash and cash equivalents |
75,473 |
– |
– |
– |
– |
– |
– |
– |
2,461 |
77,934 |
||||||||||||||||||||||||||||||
Interest bearing deposits with banks |
2,775 |
680 |
383 |
153 |
118 |
– |
– |
– |
– |
4,109 |
||||||||||||||||||||||||||||||
Securities |
4,115 |
8,556 |
7,225 |
5,585 |
6,602 |
29,930 |
64,250 |
139,501 |
54,320 |
320,084 |
||||||||||||||||||||||||||||||
Securities borrowed or purchased under resale agreements |
93,707 |
12,311 |
6,903 |
2,491 |
– |
250 |
– |
– |
– |
115,662 |
||||||||||||||||||||||||||||||
Loans
(1)
|
||||||||||||||||||||||||||||||||||||||||
Residential mortgages |
1,121 |
2,188 |
3,403 |
4,246 |
4,761 |
27,229 |
107,347 |
26,689 |
266 |
177,250 |
||||||||||||||||||||||||||||||
Consumer instalment and other personal |
285 |
621 |
1,028 |
1,343 |
1,542 |
8,094 |
35,467 |
29,992 |
25,670 |
104,042 |
||||||||||||||||||||||||||||||
Credit cards |
– |
– |
– |
– |
– |
– |
– |
– |
12,294 |
12,294 |
||||||||||||||||||||||||||||||
Business and government |
19,671 |
10,920 |
12,550 |
16,370 |
16,953 |
49,366 |
114,289 |
27,880 |
98,887 |
366,886 |
||||||||||||||||||||||||||||||
Allowance for credit losses |
– |
– |
– |
– |
– |
– |
– |
– |
(3,807 |
) |
(3,807 |
) |
||||||||||||||||||||||||||||
Total loans, net of allowance |
21,077 |
13,729 |
16,981 |
21,959 |
23,256 |
84,689 |
257,103 |
84,561 |
133,310 |
656,665 |
||||||||||||||||||||||||||||||
Other assets |
||||||||||||||||||||||||||||||||||||||||
Derivative instruments |
2,797 |
4,539 |
2,670 |
2,827 |
1,555 |
7,804 |
9,325 |
8,459 |
– |
39,976 |
||||||||||||||||||||||||||||||
Customers’ liabilities under acceptances |
4,682 |
3,423 |
6 |
– |
– |
– |
– |
– |
– |
8,111 |
||||||||||||||||||||||||||||||
Receivable from brokers, dealers and clients |
53,002 |
– |
– |
– |
– |
– |
– |
– |
– |
53,002 |
||||||||||||||||||||||||||||||
Other |
3,580 |
814 |
336 |
42 |
4 |
10 |
19 |
7,629 |
59,029 |
71,463 |
||||||||||||||||||||||||||||||
Total other assets |
64,061 |
8,776 |
3,012 |
2,869 |
1,559 |
7,814 |
9,344 |
16,088 |
59,029 |
172,552 |
||||||||||||||||||||||||||||||
Total assets |
261,208 |
44,052 |
34,504 |
33,057 |
31,535 |
122,683 |
330,697 |
240,150 |
249,120 |
1,347,006 |
||||||||||||||||||||||||||||||
2023 |
||||||||||||||||||||||||||||||||||||||||
(Canadian $ in millions) |
0 to 1 month |
1 to 3 months |
3 to 6 months |
6 to 9 months |
9 to 12 months |
1 to 2 years |
2 to 5 years |
Over 5 years |
No maturity |
Total |
||||||||||||||||||||||||||||||
Liabilities and Equity |
||||||||||||||||||||||||||||||||||||||||
Deposits
(2) (3)
|
48,986 |
63,728 |
64,939 |
60,911 |
52,040 |
47,624 |
80,829 |
18,624 |
473,198 |
910,879 |
||||||||||||||||||||||||||||||
Other liabilities |
||||||||||||||||||||||||||||||||||||||||
Derivative instruments |
3,103 |
8,450 |
3,033 |
2,278 |
2,014 |
7,694 |
11,748 |
11,873 |
– |
50,193 |
||||||||||||||||||||||||||||||
Acceptances |
4,682 |
3,423 |
6 |
– |
– |
– |
– |
– |
– |
8,111 |
||||||||||||||||||||||||||||||
Securities sold but not yet purchased
(4)
|
43,774 |
– |
– |
– |
– |
– |
– |
– |
– |
43,774 |
||||||||||||||||||||||||||||||
Securities lent or sold under repurchase agreements
(4)
|
99,006 |
4,751 |
476 |
539 |
– |
1,336 |
– |
– |
– |
106,108 |
||||||||||||||||||||||||||||||
Securitization and structured entities’ liabilities |
97 |
717 |
1,199 |
2,195 |
592 |
4,896 |
9,870 |
7,528 |
– |
27,094 |
||||||||||||||||||||||||||||||
Insurance-related liabilities |
81 |
86 |
15 |
15 |
39 |
77 |
163 |
546 |
13,436 |
14,458 |
||||||||||||||||||||||||||||||
Payable to brokers, dealers and clients |
53,754 |
– |
– |
– |
– |
– |
– |
– |
– |
53,754 |
||||||||||||||||||||||||||||||
Other |
13,185 |
2,188 |
101 |
95 |
69 |
14,032 |
2,601 |
5,614 |
10,399 |
48,284 |
||||||||||||||||||||||||||||||
Total other liabilities |
217,682 |
19,615 |
4,830 |
5,122 |
2,714 |
28,035 |
24,382 |
25,561 |
23,835 |
351,776 |
||||||||||||||||||||||||||||||
Subordinated debt |
– |
– |
– |
– |
– |
– |
25 |
8,203 |
– |
8,228 |
||||||||||||||||||||||||||||||
Total equity |
– |
– |
– |
– |
– |
– |
– |
– |
76,123 |
76,123 |
||||||||||||||||||||||||||||||
Total liabilities and equity |
266,668 |
83,343 |
69,769 |
66,033 |
54,754 |
75,659 |
105,236 |
52,388 |
573,156 |
1,347,006 |
||||||||||||||||||||||||||||||
(1) |
Loans receivable on demand have been included under no maturity. |
(2) |
Deposits payable on demand and payable after notice have been included under no maturity. |
(3) |
Deposits totalling $30,852 million as at October 31, 2023 have a fixed maturity date; however, they can be redeemed early (either fully or partially) by customers without penalty. These are classified as payable on a fixed date due to their stated contractual maturity date. |
(4) |
Presented based on their earliest maturity date. |
2023 |
||||||||||||||||||||||||||||||||||||||||
(Canadian $ in millions) |
0 to 1 month |
1 to 3 months |
3 to 6 months |
6 to 9 months |
9 to 12 months |
1 to 2 years |
2 to 5 years |
Over 5 years |
No maturity |
Total |
||||||||||||||||||||||||||||||
Off-Balance Sheet Commitments |
||||||||||||||||||||||||||||||||||||||||
Commitments to extend credit
(1)
|
2,216 |
4,874 |
9,377 |
14,499 |
14,190 |
41,713 |
129,634 |
5,927 |
– |
222,430 |
||||||||||||||||||||||||||||||
Letters of credit
(2)
|
1,641 |
5,088 |
5,739 |
5,397 |
6,065 |
3,663 |
3,778 |
48 |
– |
31,419 |
||||||||||||||||||||||||||||||
Backstop liquidity facilities |
212 |
241 |
666 |
2,207 |
2,039 |
3,951 |
8,643 |
846 |
– |
18,805 |
||||||||||||||||||||||||||||||
Other commitments
(3)
|
46 |
91 |
106 |
101 |
155 |
354 |
626 |
141 |
– |
1,620 |
||||||||||||||||||||||||||||||
(1) |
Commitments to extend credit exclude personal lines of credit and credit cards that are unconditionally cancellable at BMO’s discretion. A large majority of these commitments expire without being drawn upon. As a result, the total contractual amounts may not be representative of the funding likely to be required for these commitments. |
(2) |
Letters of credit can be drawn down at any time. These are classified based on their stated contractual maturity. |
(3) |
Other commitments comprise purchase obligations and lease commitments for leases signed but not yet commenced. |
BMO Financial Group 207th Annual Report 2024 |
99 |
100 |
BMO Financial Group 207th Annual Report 2024 |
• |
BMO has transitioned to a new program for the assessment of non-financial risk, known as Product/Service and Process Risk Assessment . This program is used by our operating groups and Corporate Services to assess the controls and residual risk exposures in their business operations by focusing on the key controls applied to their products, services, internal activities and processes. It provides a current and forward-looking view of the impact of both our internal controls and the external business environment on the risk profiles of our operating groups and Corporate Services, supporting the proactive identification, assessment, management, monitoring and mitigation of risk. |
• |
BMO’s Initiative Assessment and Approval Process is used to assess, document and approve new products and services when a new business, product or service is developed, or existing products and services are enhanced, as well as review projects which could impact the existing control environment. This process supports continuous oversight of change in risk exposure by setting out specific requirements for due diligence, approval, monitoring and reporting that apply at all levels of the organization. |
• |
Material trends, metrics and risk assessments comprising Key Risk Indicators, Issues Management and Internal Loss Data Events are integral components of an operational risk profile and are utilized to assess specific risk exposures in relation to BMO’s overall risk appetite. |
• |
Historical Internal Loss Data Events are recorded and maintained within the bank’s central operational risk platform. Our policies and standards require the timely, concise and accurate reporting of events, including second line effective challenge. Root cause analysis is undertaken on material events and loss data is monitored based on the bank’s risk appetite. |
• |
Operational Risk Capital Measurement : The bank’s operational risk capital is determined using the Basel III Standardized Approach (SA), which is a product of the Business Indicator Component (BIC) and Internal Loss Multiplier (ILM). BIC is a financial statement-based proxy representing activity within the bank and ILM is a proxy representing the control environment relative to activity. ILM is a mathematical calculation based on 10-year average historical losses (net of recoveries) and the three-year average BIC. |
• |
Stress Testing Scenario Analysis assesses the potential impact of severe, hypothetical but plausible scenarios covering material and emerging risks, as well as critical business processes at the bank. Results of the stress test scenarios are leveraged to derive operational loss projections that may be used for risk management (understanding areas of concentration, susceptibility, prioritizing incremental risk mitigation strategies, etc.) and risk measurement (understanding exposures, benchmarking, developing KRIs, controls and supporting regulatory stress submissions). |
• |
BMO’s Corporate Risk & Insurance (CR&I) group provides a second layer of mitigation for certain operational risk exposures. CR&I is also accountable for establishing and maintaining the enterprise-wide insurance program. We purchase insurance when required by law, regulation or contractual agreement, and when it is economically attractive and practicable to mitigate our risks, in order to provide adequate protection against unexpected material loss. The policy structures and coverage provisions of our insurance positions are assessed annually to confirm alignment with BMO’s overall risk tolerance. |
• |
BMO is evolving its approach to overseeing payment risk by horizontally assessing both financial and non-financial risks, which can arise at any stage in the end-to-end life cycle of its products and services. |
| BMO Financial Group 207th Annual Report 2024 | 101 |
102 |
BMO Financial Group 207th Annual Report 2024 |
| BMO Financial Group 207th Annual Report 2024 | 103 |
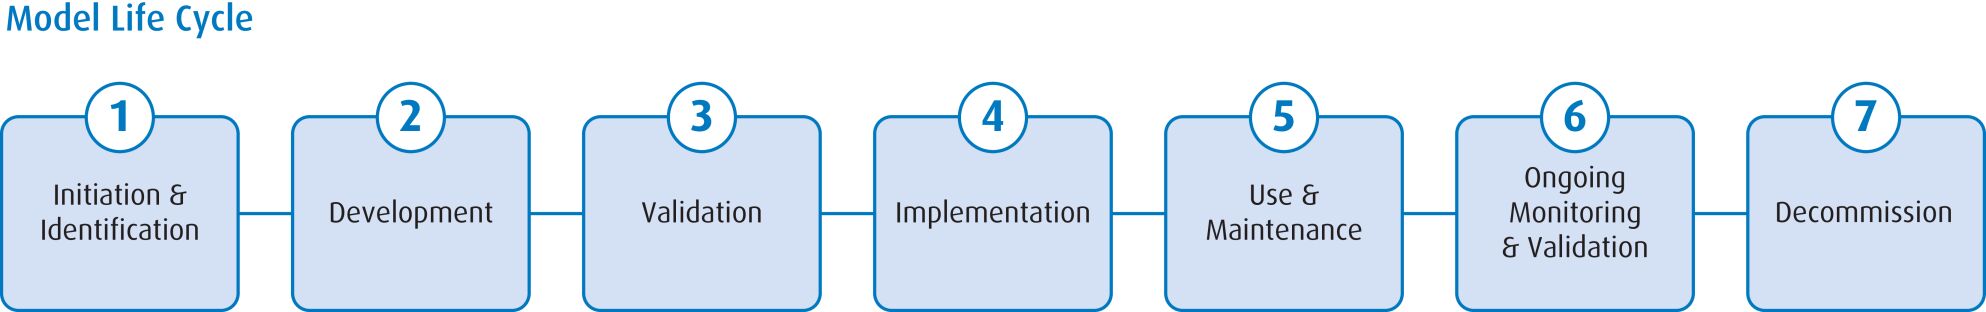
104 |
BMO Financial Group 207th Annual Report 2024 |
| BMO Financial Group 207th Annual Report 2024 | 105 |
• |
Capital: In July 2023, the U.S. banking agencies issued new rule proposals that would revise the regulatory capital framework for large bank holding companies and their depository institutions, including BMO Financial Corp. (BFC), BMO’s U.S. holding company, and BMO Bank N.A. These proposals would implement the risk-based capital standards contained in the Basel III Reforms (referred to as Basel III Endgame) published by the Basel Committee on Banking Supervision. On September 10, 2024, the Federal Reserve Board indicated that the proposed rules will be revised and re-issued as a new proposal. |
• |
Long-term debt: In August 2023, the U.S. banking agencies issued a new rule proposal that would require large banks with total assets of $100 billion or more to maintain a layer of long-term debt, which would improve financial stability by increasing the resolvability and resilience of such institutions. |
106 |
BMO Financial Group 207th Annual Report 2024 |
| BMO Financial Group 207th Annual Report 2024 | 107 |
108 |
BMO Financial Group 207th Annual Report 2024 |
| BMO Financial Group 207th Annual Report 2024 | 109 |
110 |
BMO Financial Group 207th Annual Report 2024 |
• |
Developing and maintaining valuation policies, procedures and methodologies in accordance with International Financial Reporting Standards (IFRS) and regulatory requirements. |
• |
Establishing official rate sources for valuation data inputs. |
• |
Providing independent review of portfolios for which prices supplied by traders are used for valuation. |
| BMO Financial Group 207th Annual Report 2024 | 111 |
112 |
BMO Financial Group 207th Annual Report 2024 |
| BMO Financial Group 207th Annual Report 2024 | 113 |
114 |
BMO Financial Group 207th Annual Report 2024 |
• |
Annually reviewing the audit plan in two separate meetings, including a consideration of the impact of business risks on the audit plan and an assessment of the reasonableness of the audit fee |
• |
Reviewing the qualifications of the senior engagement team members |
• |
Monitoring the execution of the audit plan of the shareholders’ auditors, with a focus on the more complex and challenging areas of the audit |
• |
Reviewing and evaluating the audit findings, including during in-camera sessions |
• |
Evaluating audit quality and performance, including recent Canadian Public Accountability Board (CPAB) and Public Company Accounting Oversight Board (PCAOB) inspection reports on the shareholders’ auditors and their peer firms |
• |
At a minimum, holding quarterly meetings with the chair of the ACRC and the lead audit partner to discuss audit-related issues independently of management |
• |
Performing a comprehensive review of the shareholders’ auditors every five years, and performing an annual review in the years between these comprehensive reviews, following the guidelines set out by the Chartered Professional Accountants of Canada (CPA Canada) and the CPAB. |
|
(Canadian $ in millions)
Fees (1)
|
2024 |
2023 | ||||||
Audit fees (2)
|
30.5 |
34.4 | ||||||
Audit-related fees (3)
|
3.4 |
2.6 | ||||||
Tax services fees (4)
|
0.1 |
0.2 | ||||||
All other fees (5)
|
2.1 |
1.3 | ||||||
Total |
36.1 |
38.5 | ||||||
| (1) | The classification of fees is based on applicable Canadian securities laws and U.S. Securities and Exchange Commission definitions. |
| (2) | Includes fees paid for the audit of the consolidated financial statements of the bank, including the audit of the bank’s internal controls over financial reporting and any financial statement audits of the bank’s subsidiaries. Audit fees also include fees paid for services in connection with statutory and regulatory filings, including those related to prospectuses. |
| (3) | Includes fees paid for specified procedures on BMO’s Proxy Circular and other services, and French translation of financial statements, related continuous disclosures and other public documents containing financial information. |
| (4) | Includes fees paid for tax compliance services provided to various BMO-managed investment company complexes. |
| (5) | Includes other fees paid by BMO-managed investment company complexes, and for ESG-related services. |
| BMO Financial Group 207th Annual Report 2024 | 115 |
• |
Pertain to the maintenance of records that, in reasonable detail, accurately and fairly reflect the transactions and dispositions of the assets of BMO. |
• |
Are designed to provide reasonable assurance that transactions are recorded as necessary to permit preparation of the consolidated financial statements in accordance with IFRS and the requirements of the SEC in the United States, as applicable, and that receipts and expenditures of BMO are being made only in accordance with authorizations by management and directors of BMO. |
• |
Are designed to provide reasonable assurance that any unauthorized acquisition, use or disposition of BMO’s assets that could have a material effect on the consolidated financial statements is prevented or detected in a timely manner. |
116 |
BMO Financial Group 207th Annual Report 2024 |
|
($ millions) As at or for the year ended October 31 |
2024 |
2023 | 2022 | 2021 | 2020 | 2019 | 2018 | 2017 | 2016 | 2015 | ||||||||||||||||||||||||||||||
Condensed Consolidated Balance Sheet |
||||||||||||||||||||||||||||||||||||||||
Assets |
||||||||||||||||||||||||||||||||||||||||
Cash and cash equivalents |
65,098 |
77,934 | 87,466 | 93,261 | 57,408 | 48,803 | 42,142 | 32,599 | 31,653 | 40,295 | ||||||||||||||||||||||||||||||
Interest bearing deposits with banks |
3,640 |
4,109 | 5,677 | 8,303 | 9,035 | 7,987 | 8,305 | 6,490 | 4,449 | 7,382 | ||||||||||||||||||||||||||||||
Securities |
396,880 |
320,084 | 272,551 | 232,849 | 234,260 | 189,438 | 180,935 | 163,198 | 149,985 | 130,918 | ||||||||||||||||||||||||||||||
Securities borrowed or purchased under resale agreements |
110,907 |
115,662 | 113,194 | 107,382 | 111,878 | 104,004 | 85,051 | 75,047 | 66,646 | 68,066 | ||||||||||||||||||||||||||||||
Loans, net of allowances |
678,016 |
656,665 | 551,814 | 458,262 | 447,420 | 426,984 | 384,172 | 358,507 | 357,518 | 321,531 | ||||||||||||||||||||||||||||||
Other |
155,106 |
172,552 | 142,695 | 88,118 | 89,260 | 74,979 | 72,688 | 73,763 | 77,709 | 73,689 | ||||||||||||||||||||||||||||||
Total assets |
1,409,647 |
1,347,006 | 1,173,397 | 988,175 | 949,261 | 852,195 | 773,293 | 709,604 | 687,960 | 641,881 | ||||||||||||||||||||||||||||||
Liabilities |
||||||||||||||||||||||||||||||||||||||||
Deposits |
982,440 |
910,879 | 776,547 | 685,631 | 659,034 | 568,143 | 520,928 | 479,792 | 470,281 | 438,169 | ||||||||||||||||||||||||||||||
Other |
334,544 |
351,776 | 317,662 | 238,128 | 225,218 | 225,981 | 199,862 | 180,438 | 170,910 | 159,383 | ||||||||||||||||||||||||||||||
Subordinated debt |
8,377 |
8,228 | 8,150 | 6,893 | 8,416 | 6,995 | 6,782 | 5,029 | 4,439 | 4,416 | ||||||||||||||||||||||||||||||
Total liabilities |
1,325,361 |
1,270,883 | 1,102,359 | 930,652 | 892,668 | 801,119 | 727,572 | 665,259 | 645,630 | 601,968 | ||||||||||||||||||||||||||||||
Total equity |
84,286 |
76,123 | 71,038 | 57,523 | 56,593 | 51,076 | 45,721 | 44,345 | 42,330 | 39,913 | ||||||||||||||||||||||||||||||
Total liabilities and equity |
1,409,647 |
1,347,006 | 1,173,397 | 988,175 | 949,261 | 852,195 | 773,293 | 709,604 | 687,960 | 641,881 | ||||||||||||||||||||||||||||||
Condensed Consolidated Statement of Income |
||||||||||||||||||||||||||||||||||||||||
Net interest income |
19,468 |
18,681 | 15,885 | 14,310 | 13,971 | 12,888 | 11,438 | 11,275 | 10,945 | 9,796 | ||||||||||||||||||||||||||||||
Non-interest revenue |
13,327 |
10,578 | 17,825 | 12,876 | 11,215 | 12,595 | 11,467 | 10,832 | 10,015 | 9,593 | ||||||||||||||||||||||||||||||
Total revenue |
32,795 |
29,259 | 33,710 | 27,186 | 25,186 | 25,483 | 22,905 | 22,107 | 20,960 | 19,389 | ||||||||||||||||||||||||||||||
Insurance claims, commissions and changes in policy benefit liabilities (CCPB) (1)
|
– | – | (683 | ) | 1,399 | 1,708 | 2,709 | 1,352 | 1,538 | 1,543 | 1,254 | |||||||||||||||||||||||||||||
Provision for credit losses (PCL) |
3,761 |
2,178 | 313 | 20 | 2,953 | 872 | 662 | 746 | 771 | 544 | ||||||||||||||||||||||||||||||
Non-interest expense |
19,499 |
21,134 | 16,194 | 15,509 | 14,177 | 14,630 | 13,477 | 13,192 | 12,916 | 12,250 | ||||||||||||||||||||||||||||||
Income before income taxes |
9,535 |
5,947 | 17,886 | 10,258 | 6,348 | 7,272 | 7,414 | 6,631 | 5,730 | 5,341 | ||||||||||||||||||||||||||||||
Provision for income taxes |
2,208 |
1,510 | 4,349 | 2,504 | 1,251 | 1,514 | 1,961 | 1,292 | 1,100 | 936 | ||||||||||||||||||||||||||||||
Net income |
7,327 |
4,437 | 13,537 | 7,754 | 5,097 | 5,758 | 5,453 | 5,339 | 4,630 | 4,405 | ||||||||||||||||||||||||||||||
Net income available to common shareholders |
6,932 |
4,094 | 13,306 | 7,510 | 4,850 | 5,547 | 5,269 | 5,153 | 4,471 | 4,253 | ||||||||||||||||||||||||||||||
Condensed Consolidated Statement of Changes in Equity |
||||||||||||||||||||||||||||||||||||||||
Preferred shares and other equity instruments |
8,087 |
6,958 | 6,308 | 5,558 | 6,598 | 5,348 | 4,340 | 4,240 | 3,840 | 3,240 | ||||||||||||||||||||||||||||||
Common shares |
23,921 |
22,941 | 17,744 | 13,599 | 13,430 | 12,971 | 12,929 | 13,032 | 12,539 | 12,313 | ||||||||||||||||||||||||||||||
Contributed surplus |
354 |
328 | 317 | 313 | 302 | 303 | 300 | 307 | 294 | 299 | ||||||||||||||||||||||||||||||
Retained earnings |
46,469 |
44,006 | 45,117 | 35,497 | 30,745 | 28,725 | 25,850 | 23,700 | 21,207 | 18,930 | ||||||||||||||||||||||||||||||
Accumulated other comprehensive income |
5,419 |
1,862 | 1,552 | 2,556 | 5,518 | 3,729 | 2,302 | 3,066 | 4,426 | 4,640 | ||||||||||||||||||||||||||||||
Non-controlling interest in subsidiaries |
36 |
28 | – | – | – | – | – | – | 24 | 491 | ||||||||||||||||||||||||||||||
Total equity |
84,286 |
76,123 | 71,038 | 57,523 | 56,593 | 51,076 | 45,721 | 44,345 | 42,330 | 39,913 | ||||||||||||||||||||||||||||||
| (1) | Beginning 2023, the Bank no longer reports insurance claims, commissions and changes in policy benefit liabilities (CCPB), and non-GAAP measures and metrics net of CCPB, given the adoption and retrospective application of IFRS 17. |
| BMO Financial Group 207th Annual Report 2024 | 117 |
|
($ millions, except as noted) As at or for the year ended October 31 |
2024 |
2023 | 2022 | 2021 | 2020 | 2019 | 2018 | 2017 | 2016 | 2015 | ||||||||||||||||||||||||||||||
Other Financial Measures |
||||||||||||||||||||||||||||||||||||||||
Common Share Data ($)
|
||||||||||||||||||||||||||||||||||||||||
Basic earnings per share |
9.52 |
5.77 | 20.04 | 11.60 | 7.56 | 8.68 | 8.19 | 7.93 | 6.94 | 6.59 | ||||||||||||||||||||||||||||||
Diluted earnings per share |
9.51 |
5.76 | 19.99 | 11.58 | 7.55 | 8.66 | 8.17 | 7.90 | 6.92 | 6.57 | ||||||||||||||||||||||||||||||
Dividends declared per share |
6.12 |
5.80 | 5.44 | 4.24 | 4.24 | 4.06 | 3.78 | 3.56 | 3.40 | 3.24 | ||||||||||||||||||||||||||||||
Book value per share |
104.40 |
95.90 | 95.60 | 80.18 | 77.40 | 71.54 | 64.73 | 61.91 | 59.57 | 56.31 | ||||||||||||||||||||||||||||||
Closing share price |
126.88 |
104.79 | 125.49 | 134.37 | 79.33 | 97.50 | 98.43 | 98.83 | 85.36 | 76.04 | ||||||||||||||||||||||||||||||
Number outstanding (in thousands)
|
||||||||||||||||||||||||||||||||||||||||
End of year |
729,530 |
720,909 | 677,107 | 648,136 | 645,889 | 639,232 | 639,330 | 647,816 | 645,761 | 642,583 | ||||||||||||||||||||||||||||||
Market capitalization ($ billions)
|
92.6 |
75.5 | 85.0 | 87.1 | 51.2 | 62.3 | 62.9 | 64.0 | 55.1 | 48.9 | ||||||||||||||||||||||||||||||
Price-to-earnings |
13.3 |
18.2 | 6.3 | 11.6 | 10.5 | 11.3 | 12.0 | 12.5 | 12.3 | 11.6 | ||||||||||||||||||||||||||||||
Market-to-book |
1.22 |
1.09 | 1.31 | 1.68 | 1.02 | 1.36 | 1.52 | 1.60 | 1.43 | 1.35 | ||||||||||||||||||||||||||||||
Dividend yield (%)
|
4.8 |
5.5 | 4.3 | 3.2 | 5.3 | 4.2 | 3.8 | 3.6 | 4.0 | 4.3 | ||||||||||||||||||||||||||||||
Dividend payout ratio (%)
|
64.3 |
100.5 | 27.1 | 36.5 | 56.1 | 46.8 | 46.1 | 44.9 | 49.0 | 49.2 | ||||||||||||||||||||||||||||||
Financial Measures and Ratios (%)
|
||||||||||||||||||||||||||||||||||||||||
Return on equity |
9.7 |
6.2 | 22.9 | 14.9 | 10.1 | 12.6 | 13.3 | 13.2 | 12.1 | 12.5 | ||||||||||||||||||||||||||||||
Efficiency ratio |
59.5 |
72.2 | 48.0 | 57.0 | 56.3 | 57.4 | 58.8 | 59.7 | 61.6 | 63.2 | ||||||||||||||||||||||||||||||
Net interest margin on average earning assets |
1.57 |
1.63 | 1.62 | 1.59 | 1.64 | 1.70 | 1.67 | 1.74 | 1.76 | 1.69 | ||||||||||||||||||||||||||||||
Total PCL-to-average |
0.57 |
0.35 | 0.06 | – | 0.63 | 0.20 | 0.17 | 0.20 | 0.22 | 0.17 | ||||||||||||||||||||||||||||||
PCL on impaired loans-to-average |
0.47 |
0.19 | 0.10 | 0.11 | 0.33 | 0.17 | 0.18 | 0.22 | 0.22 | – | ||||||||||||||||||||||||||||||
Return on average assets |
0.53 |
0.34 | 1.22 | 0.79 | 0.54 | 0.69 | 0.72 | 0.74 | 0.65 | 0.66 | ||||||||||||||||||||||||||||||
Return on average risk-weighted assets (%) (2)
|
1.74 |
1.10 | 3.89 | 2.38 | 1.51 | 1.86 | 1.97 | 1.98 | 1.71 | 1.84 | ||||||||||||||||||||||||||||||
Average assets ($ millions)
|
1,369,415 |
1,299,524 | 1,106,512 | 981,140 | 942,450 | 833,252 | 754,295 | 722,626 | 707,122 | 664,391 | ||||||||||||||||||||||||||||||
Capital Measures (%) (2)
|
||||||||||||||||||||||||||||||||||||||||
Common Equity Tier 1 Ratio |
13.6 |
12.5 | 16.7 | 13.7 | 11.9 | 11.4 | 11.3 | 11.4 | 10.1 | 10.7 | ||||||||||||||||||||||||||||||
Tier 1 Capital Ratio |
15.4 |
14.1 | 18.4 | 15.4 | 13.6 | 13.0 | 12.9 | 13.0 | 11.6 | 12.3 | ||||||||||||||||||||||||||||||
Total Capital Ratio |
17.6 |
16.2 | 20.7 | 17.6 | 16.2 | 15.2 | 15.2 | 15.1 | 13.6 | 14.4 | ||||||||||||||||||||||||||||||
Leverage Ratio |
4.4 |
4.2 | 5.6 | 5.1 | 4.8 | 4.3 | 4.2 | 4.4 | 4.2 | 4.2 | ||||||||||||||||||||||||||||||
Other Statistical Information |
||||||||||||||||||||||||||||||||||||||||
Number of employees |
53,597 |
55,767 | 46,722 | 43,863 | 43,360 | 45,513 | 45,454 | 45,200 | 45,234 | 46,353 | ||||||||||||||||||||||||||||||
Number of bank branches |
1,861 |
1,890 | 1,383 | 1,405 | 1,409 | 1,456 | 1,483 | 1,503 | 1,522 | 1,535 | ||||||||||||||||||||||||||||||
Number of automated teller machines |
5,766 |
5,765 | 4,717 | 4,851 | 4,820 | 4,967 | 4,828 | 4,731 | 4,599 | 4,761 | ||||||||||||||||||||||||||||||
| (2) | Capital ratios and risk-weighted assets are disclosed in accordance with the CAR Guideline, as set out by OSFI, as applicable. |
118 |
BMO Financial Group 207th Annual Report 2024 |
2024 |
2023 | |||||||||||||||||||||||
|
($ millions, except as noted)
For the year ended October 31
|
Average balances |
Average (%)
interest rate |
Interest income/ expense |
Average balances |
Average interest rate (%) |
Interest income/ expense |
||||||||||||||||||
Assets |
||||||||||||||||||||||||
Canadian Dollar |
||||||||||||||||||||||||
Interest bearing deposits with banks and other interest bearing assets |
24,992 |
5.23 |
1,307 |
33,105 | 4.77 | 1,579 | ||||||||||||||||||
Securities |
106,313 |
4.30 |
4,574 |
93,723 | 4.12 | 3,859 | ||||||||||||||||||
Securities borrowed or purchased under resale agreements |
46,510 |
5.73 |
2,665 |
47,239 | 4.90 | 2,316 | ||||||||||||||||||
Loans |
||||||||||||||||||||||||
Residential mortgages |
152,790 |
4.46 |
6,816 |
143,958 | 3.96 | 5,696 | ||||||||||||||||||
Consumer instalment and other personal |
68,681 |
6.20 |
4,256 |
69,614 | 5.70 | 3,970 | ||||||||||||||||||
Credit cards |
11,225 |
15.44 |
1,733 |
9,519 | 14.69 | 1,399 | ||||||||||||||||||
Business and government |
129,118 |
5.55 |
7,170 |
114,720 | 4.86 | 5,574 | ||||||||||||||||||
Total loans |
361,814 |
5.52 |
19,975 |
337,811 | 4.93 | 16,639 | ||||||||||||||||||
Total Canadian dollar |
539,629 |
5.29 |
28,521 |
511,878 | 4.77 | 24,393 | ||||||||||||||||||
U.S. Dollar and Other Currencies |
||||||||||||||||||||||||
Interest bearing deposits with banks and other interest bearing assets |
62,340 |
5.17 |
3,221 |
66,212 | 4.33 | 2,866 | ||||||||||||||||||
Securities |
267,313 |
3.91 |
10,464 |
217,804 | 3.46 | 7,533 | ||||||||||||||||||
Securities borrowed or purchased under resale agreements |
68,998 |
6.05 |
4,177 |
69,405 | 5.11 | 3,544 | ||||||||||||||||||
Loans |
||||||||||||||||||||||||
Residential mortgages |
28,485 |
4.90 |
1,395 |
20,168 | 4.41 | 890 | ||||||||||||||||||
Consumer instalment and other personal |
23,931 |
6.73 |
1,611 |
29,021 | 6.54 | 1,899 | ||||||||||||||||||
Credit cards |
1,509 |
12.23 |
185 |
1,264 | 10.70 | 135 | ||||||||||||||||||
Business and government |
239,652 |
6.85 |
16,411 |
225,568 | 6.35 | 14,314 | ||||||||||||||||||
Total loans |
293,577 |
6.68 |
19,602 |
276,021 | 6.25 | 17,238 | ||||||||||||||||||
Total U.S. dollar and other currencies |
692,228 |
5.41 |
37,464 |
629,442 | 4.95 | 31,181 | ||||||||||||||||||
Other non-interest bearing assets |
137,558 |
158,204 | ||||||||||||||||||||||
Total All Currencies |
||||||||||||||||||||||||
Total assets and interest income |
1,369,415 |
4.82 |
65,985 |
1,299,524 | 4.28 | 55,574 | ||||||||||||||||||
Liabilities |
||||||||||||||||||||||||
Canadian Dollar |
||||||||||||||||||||||||
Deposits |
||||||||||||||||||||||||
Banks |
4,362 |
2.47 |
108 |
4,415 | 2.01 | 89 | ||||||||||||||||||
Business and government |
201,417 |
3.91 |
7,881 |
181,936 | 3.46 | 6,301 | ||||||||||||||||||
Individuals |
181,924 |
2.72 |
4,950 |
166,015 | 2.02 | 3,352 | ||||||||||||||||||
Total deposits |
387,703 |
3.34 |
12,939 |
352,366 | 2.76 | 9,742 | ||||||||||||||||||
Securities sold but not yet purchased and securities lent or sold under repurchase agreements |
54,882 |
5.17 |
2,839 |
54,948 | 4.26 | 2,340 | ||||||||||||||||||
Subordinated debt and other interest bearing liabilities |
26,077 |
3.83 |
999 |
25,750 | 3.58 | 921 | ||||||||||||||||||
Total Canadian dollar |
468,662 |
3.58 |
16,777 |
433,064 | 3.00 | 13,003 | ||||||||||||||||||
U.S. Dollar and Other Currencies |
||||||||||||||||||||||||
Deposits |
||||||||||||||||||||||||
Banks |
27,243 |
5.12 |
1,395 |
25,940 | 4.43 | 1,148 | ||||||||||||||||||
Business and government |
397,331 |
4.18 |
16,626 |
368,237 | 3.70 | 13,617 | ||||||||||||||||||
Individuals |
136,679 |
2.65 |
3,620 |
119,710 | 1.70 | 2,040 | ||||||||||||||||||
Total deposits |
561,253 |
3.86 |
21,641 |
513,887 | 3.27 | 16,805 | ||||||||||||||||||
Securities sold but not yet purchased and securities lent or sold under repurchase agreements |
106,751 |
5.68 |
6,068 |
100,084 | 4.95 | 4,957 | ||||||||||||||||||
Subordinated debt and other interest bearing liabilities |
34,188 |
5.94 |
2,031 |
33,403 | 6.37 | 2,128 | ||||||||||||||||||
Total U.S. dollar and other currencies |
702,192 |
4.24 |
29,740 |
647,374 | 3.69 | 23,890 | ||||||||||||||||||
Other non-interest bearing liabilities |
119,015 |
145,830 | ||||||||||||||||||||||
Total All Currencies |
||||||||||||||||||||||||
Total liabilities and interest expense |
1,289,869 |
3.61 |
46,517 |
1,226,268 | 3.01 | 36,893 | ||||||||||||||||||
Total equity |
79,546 |
73,256 | ||||||||||||||||||||||
Total Liabilities, Equity and Interest Expense |
1,369,415 |
3.40 |
46,517 |
1,299,524 | 2.84 | 36,893 | ||||||||||||||||||
Net interest margin |
||||||||||||||||||||||||
– based on earning assets |
1.57 |
1.63 | ||||||||||||||||||||||
– based on total assets |
1.42 |
1.44 | ||||||||||||||||||||||
Net interest income |
19,468 |
18,681 | ||||||||||||||||||||||
| BMO Financial Group 207th Annual Report 2024 | 119 |
2024/2023 |
||||||||||||
Increase (decrease) due to change in |
||||||||||||
|
($ millions) For the year ended October 31 |
Average balance |
Average rate |
Total |
|||||||||
Assets |
||||||||||||
Canadian Dollar |
||||||||||||
Interest bearing deposits with banks and other interest bearing assets |
(387 |
) |
115 |
(272 |
) |
|||||||
Securities |
518 |
197 |
715 |
|||||||||
Securities borrowed or purchased under resale agreements |
(36 |
) |
385 |
349 |
||||||||
Loans |
||||||||||||
Residential mortgages |
349 |
771 |
1,120 |
|||||||||
Consumer instalment and other personal |
(53 |
) |
339 |
286 |
||||||||
Credit cards |
251 |
83 |
334 |
|||||||||
Business and government |
700 |
896 |
1,596 |
|||||||||
Total loans |
1,247 |
2,089 |
3,336 |
|||||||||
Change in Canadian dollar interest income |
1,342 |
2,786 |
4,128 |
|||||||||
U.S. Dollar and Other Currencies |
||||||||||||
Interest bearing deposits with banks and other interest bearing assets |
(168 |
) |
523 |
355 |
||||||||
Securities |
1,713 |
1,218 |
2,931 |
|||||||||
Securities borrowed or purchased under resale agreements |
(21 |
) |
654 |
633 |
||||||||
Loans |
||||||||||||
Residential mortgages |
367 |
138 |
505 |
|||||||||
Consumer instalment and other personal |
(333 |
) |
45 |
(288 |
) |
|||||||
Credit cards |
26 |
24 |
50 |
|||||||||
Business and government |
894 |
1,203 |
2,097 |
|||||||||
Total loans |
954 |
1,410 |
2,364 |
|||||||||
Change in U.S. dollar and other currencies interest income |
2,478 |
3,805 |
6,283 |
|||||||||
Total All Currencies |
||||||||||||
Change in total interest income (a)
|
3,820 |
6,591 |
10,411 |
|||||||||
Liabilities |
||||||||||||
Canadian Dollar |
||||||||||||
Deposits |
||||||||||||
Banks |
(1 |
) |
20 |
19 |
||||||||
Business and government |
675 |
905 |
1,580 |
|||||||||
Individuals |
321 |
1,277 |
1,598 |
|||||||||
Total deposits |
995 |
2,202 |
3,197 |
|||||||||
Securities sold but not yet purchased and securities lent or sold under repurchase agreements |
(3 |
) |
502 |
499 |
||||||||
Subordinated debt and other interest bearing liabilities |
11 |
67 |
78 |
|||||||||
Change in Canadian dollar interest expense |
1,003 |
2,771 |
3,774 |
|||||||||
U.S. Dollar and Other Currencies |
||||||||||||
Deposits |
||||||||||||
Banks |
58 |
189 |
247 |
|||||||||
Business and government |
1,077 |
1,932 |
3,009 |
|||||||||
Individuals |
289 |
1,291 |
1,580 |
|||||||||
Total deposits |
1,424 |
3,412 |
4,836 |
|||||||||
Securities sold but not yet purchased and securities lent or sold under repurchase agreements |
330 |
781 |
1,111 |
|||||||||
Subordinated debt and other interest bearing liabilities |
50 |
(147 |
) |
(97 |
) |
|||||||
Change in U.S. dollar and other currencies interest expense |
1,804 |
4,046 |
5,850 |
|||||||||
Total All Currencies |
||||||||||||
Change in total interest expense (b)
|
2,807 |
6,817 |
9,624 |
|||||||||
Change in total net interest income (a – b)
|
1,013 |
(226 |
) |
787 |
||||||||
120 |
BMO Financial Group 207th Annual Report 2024 |
| ($ millions) | Canada | United States | Other countries | Total | ||||||||||||||||||||||||||||
| As at October 31 | 2024 |
2023 | 2024 |
2023 | 2024 |
2023 | 2024 |
2023 | ||||||||||||||||||||||||
Consumer |
||||||||||||||||||||||||||||||||
Residential mortgages |
158,902 |
150,570 | 32,168 |
26,675 | – |
– | 191,070 |
177,245 | ||||||||||||||||||||||||
Consumer instalment and other personal |
69,557 |
69,921 | 22,962 |
33,969 | – |
– | 92,519 |
103,890 | ||||||||||||||||||||||||
Credit cards |
12,271 |
10,880 | 1,341 |
1,414 | – |
– | 13,612 |
12,294 | ||||||||||||||||||||||||
Total consumer |
240,730 |
231,371 | 56,471 |
62,058 | – |
– | 297,201 |
293,429 | ||||||||||||||||||||||||
Business and government |
||||||||||||||||||||||||||||||||
Commercial real estate |
41,317 |
34,399 | 34,032 |
35,242 | 3 |
48 | 75,352 |
69,689 | ||||||||||||||||||||||||
Construction (non-real estate) |
2,712 |
2,378 | 4,402 |
5,112 | 82 |
– | 7,196 |
7,490 | ||||||||||||||||||||||||
Retail trade |
17,682 |
16,526 | 15,555 |
13,631 | 58 |
184 | 33,295 |
30,341 | ||||||||||||||||||||||||
Wholesale trade |
6,968 |
6,580 | 18,470 |
16,757 | 51 |
182 | 25,489 |
23,519 | ||||||||||||||||||||||||
Agriculture |
13,449 |
13,087 | 5,031 |
5,321 | – |
– | 18,480 |
18,408 | ||||||||||||||||||||||||
Communications |
817 |
1,310 | 559 |
600 | – |
– | 1,376 |
1,910 | ||||||||||||||||||||||||
Financing products |
– |
– | 7,070 |
4,566 | – |
144 | 7,070 |
4,710 | ||||||||||||||||||||||||
Manufacturing |
7,949 |
8,188 | 30,678 |
31,067 | 1,593 |
1,201 | 40,220 |
40,456 | ||||||||||||||||||||||||
Mining |
1,015 |
763 | 433 |
744 | 1,876 |
1,731 | 3,324 |
3,238 | ||||||||||||||||||||||||
Oil and gas |
2,345 |
2,914 | 860 |
605 | 261 |
164 | 3,466 |
3,683 | ||||||||||||||||||||||||
Transportation |
4,594 |
4,976 | 9,936 |
10,525 | 16 |
96 | 14,546 |
15,597 | ||||||||||||||||||||||||
Utilities |
7,031 |
7,401 | 3,365 |
3,940 | 589 |
783 | 10,985 |
12,124 | ||||||||||||||||||||||||
Forest products |
708 |
601 | 648 |
693 | – |
– | 1,356 |
1,294 | ||||||||||||||||||||||||
Service industries |
27,695 |
27,234 | 36,052 |
37,833 | 386 |
469 | 64,133 |
65,536 | ||||||||||||||||||||||||
Financial |
11,965 |
11,057 | 52,757 |
53,944 | 7,076 |
6,285 | 71,798 |
71,286 | ||||||||||||||||||||||||
Government |
1,870 |
1,912 | 341 |
450 | 459 |
370 | 2,670 |
2,732 | ||||||||||||||||||||||||
Other |
3,232 |
2,264 | 873 |
188 | 16 |
5 | 4,121 |
2,457 | ||||||||||||||||||||||||
Total business and government |
151,349 |
141,590 | 221,062 |
221,218 | 12,466 |
11,662 | 384,877 |
374,470 | ||||||||||||||||||||||||
Total loans and acceptances, net of allowance for credit losses on impaired loans |
392,079 |
372,961 | 277,533 |
283,276 | 12,466 |
11,662 | 682,078 |
667,899 | ||||||||||||||||||||||||
Allowance for credit losses on performing loans |
(1,531 |
) |
(1,272 | ) | (2,141 |
) |
(1,833 | ) | (31 |
) |
(18 | ) | (3,703 |
) |
(3,123 | ) | ||||||||||||||||
Total net loans and acceptances |
390,548 |
371,689 | 275,392 |
281,443 | 12,435 |
11,644 | 678,375 |
664,776 | ||||||||||||||||||||||||
| (1) | Segmented credit information by geographic area is based upon the country of ultimate risk. |
| (2) | Consumer and Business and government Net Loans and Acceptances balances are net of allowance for credit losses on impaired loans only. |
|
($ millions)
As at October 31
|
2024 |
2023 | ||||||
Net Loans and Acceptances in Canada by Province |
||||||||
Atlantic provinces |
19,431 |
17,741 | ||||||
Quebec |
57,974 |
55,978 | ||||||
Ontario |
177,878 |
171,423 | ||||||
Prairie provinces |
60,975 |
57,877 | ||||||
British Columbia and territories |
74,290 |
68,670 | ||||||
Total net loans and acceptances in Canada |
390,548 |
371,689 | ||||||
| (1) | Segmented credit information by geographic area is based upon the country of ultimate risk. |
| BMO Financial Group 207th Annual Report 2024 | 121 |
| ($ millions, except as noted) | Canada | United States | Other countries | Total | ||||||||||||||||||||||||||||
| As at October 31 | 2024 |
2023 | 2024 |
2023 | 2024 |
2023 | 2024 |
2023 | ||||||||||||||||||||||||
Consumer |
||||||||||||||||||||||||||||||||
Residential mortgages |
444 |
249 | 213 |
175 | – |
– | 657 |
424 | ||||||||||||||||||||||||
Consumer instalment and other personal |
369 |
290 | 208 |
259 | – |
– | 577 |
549 | ||||||||||||||||||||||||
Total consumer |
813 |
539 | 421 |
434 | – |
– | 1,234 |
973 | ||||||||||||||||||||||||
Business and government |
||||||||||||||||||||||||||||||||
Commercial real estate |
270 |
187 | 463 |
240 | – |
– | 733 |
427 | ||||||||||||||||||||||||
Construction (non-real estate) |
82 |
63 | 162 |
60 | – |
– | 244 |
123 | ||||||||||||||||||||||||
Retail trade |
269 |
181 | 239 |
298 | – |
– | 508 |
479 | ||||||||||||||||||||||||
Wholesale trade |
75 |
61 | 294 |
182 | – |
– | 369 |
243 | ||||||||||||||||||||||||
Agriculture |
84 |
53 | 85 |
82 | – |
– | 169 |
135 | ||||||||||||||||||||||||
Communications |
7 |
3 | 2 |
1 | – |
– | 9 |
4 | ||||||||||||||||||||||||
Financing products |
– |
– | – |
– | – |
– | – |
– | ||||||||||||||||||||||||
Manufacturing |
155 |
136 | 635 |
286 | – |
– | 790 |
422 | ||||||||||||||||||||||||
Mining |
15 |
– | 1 |
2 | – |
– | 16 |
2 | ||||||||||||||||||||||||
Oil and gas |
1 |
– | 2 |
22 | – |
– | 3 |
22 | ||||||||||||||||||||||||
Transportation |
246 |
17 | 218 |
153 | – |
– | 464 |
170 | ||||||||||||||||||||||||
Utilities |
2 |
2 | 3 |
1 | – |
– | 5 |
3 | ||||||||||||||||||||||||
Forest products |
4 |
3 | 1 |
1 | – |
– | 5 |
4 | ||||||||||||||||||||||||
Service industries |
410 |
363 | 760 |
505 | 3 |
– | 1,173 |
868 | ||||||||||||||||||||||||
Financial |
4 |
10 | 22 |
42 | – |
– | 26 |
52 | ||||||||||||||||||||||||
Government |
– |
2 | – |
1 | – |
– | – |
3 | ||||||||||||||||||||||||
Other |
76 |
9 | 19 |
21 | – |
– | 95 |
30 | ||||||||||||||||||||||||
Total business and government |
1,700 |
1,090 | 2,906 |
1,897 | 3 |
– | 4,609 |
2,987 | ||||||||||||||||||||||||
Total gross impaired loans and acceptances (GIL) |
2,513 |
1,629 | 3,327 |
2,331 | 3 |
– | 5,843 |
3,960 | ||||||||||||||||||||||||
Condition Ratios |
||||||||||||||||||||||||||||||||
GIL as a % of gross loans and acceptances |
||||||||||||||||||||||||||||||||
Consumer |
0.34 |
0.23 | 0.75 |
0.70 | – |
– | 0.41 |
0.33 | ||||||||||||||||||||||||
Business and government |
1.12 |
0.77 | 1.31 |
0.86 | 0.02 |
– | 1.20 |
0.80 | ||||||||||||||||||||||||
Total |
0.64 |
0.44 | 1.20 |
0.82 | 0.02 |
– | 0.86 |
0.59 | ||||||||||||||||||||||||
| (1) | Segmented credit information by geographic area is based upon the country of ultimate risk. |
| ($ millions, except as noted) | Canada | United States | Other countries | Total | ||||||||||||||||||||||||||||
| As at October 31 | 2024 |
2023 | 2024 |
2023 | 2024 |
2023 | 2024 |
2023 | ||||||||||||||||||||||||
Gross impaired loans and acceptances (GIL), beginning of year |
||||||||||||||||||||||||||||||||
Consumer |
539 |
391 | 434 |
216 | – |
– | 973 |
607 | ||||||||||||||||||||||||
Business and government |
1,090 |
767 | 1,897 |
604 | – |
13 | 2,987 |
1,384 | ||||||||||||||||||||||||
Total GIL, beginning of year |
1,629 |
1,158 | 2,331 |
820 | – |
13 | 3,960 |
1,991 | ||||||||||||||||||||||||
Purchased credit impaired (PCI) loans |
||||||||||||||||||||||||||||||||
Consumer |
– |
– | – |
104 | – |
– | – |
104 | ||||||||||||||||||||||||
Business and government |
– |
– | – |
311 | – |
– | – |
311 | ||||||||||||||||||||||||
Total PCI |
– |
– | – |
415 | – |
– | – |
415 | ||||||||||||||||||||||||
Additions to impaired loans and acceptances |
||||||||||||||||||||||||||||||||
Consumer |
1,355 |
897 | 351 |
332 | – |
– | 1,706 |
1,229 | ||||||||||||||||||||||||
Business and government |
1,491 |
819 | 4,219 |
1,994 | 3 |
5 | 5,713 |
2,818 | ||||||||||||||||||||||||
Total additions |
2,846 |
1,716 | 4,570 |
2,326 | 3 |
5 | 7,419 |
4,047 | ||||||||||||||||||||||||
Reductions to impaired loans and acceptances (2)
|
||||||||||||||||||||||||||||||||
Consumer |
(649 |
) |
(506 | ) | (168 |
) |
(80 | ) | – |
– | (817 |
) |
(586 | ) | ||||||||||||||||||
Business and government |
(480 |
) |
(413 | ) | (1,810 |
) |
(723 | ) | 1 |
(18 | ) | (2,289 |
) |
(1,154 | ) | |||||||||||||||||
Total reductions to impaired loans and acceptances |
(1,129 |
) |
(919 | ) | (1,978 |
) |
(803 | ) | 1 |
(18 | ) | (3,106 |
) |
(1,740 | ) | |||||||||||||||||
Write-offs (3)
|
||||||||||||||||||||||||||||||||
Consumer |
(432 |
) |
(243 | ) | (196 |
) |
(138 | ) | – |
– | (628 |
) |
(381 | ) | ||||||||||||||||||
Business and government |
(401 |
) |
(83 | ) | (1,400 |
) |
(289 | ) | (1 |
) |
– | (1,802 |
) |
(372 | ) | |||||||||||||||||
Total write-offs |
(833 |
) |
(326 | ) | (1,596 |
) |
(427 | ) | (1 |
) |
– | (2,430 |
) |
(753 | ) | |||||||||||||||||
GIL, end of year |
||||||||||||||||||||||||||||||||
Consumer |
813 |
539 | 421 |
434 | – |
– | 1,234 |
973 | ||||||||||||||||||||||||
Business and government |
1,700 |
1,090 | 2,906 |
1,897 | 3 |
– | 4,609 |
2,987 | ||||||||||||||||||||||||
Total GIL, end of year |
2,513 |
1,629 | 3,327 |
2,331 | 3 |
– | 5,843 |
3,960 | ||||||||||||||||||||||||
| (1) | Segmented credit information by geographic area is based upon the country of ultimate risk. |
| (2) | Includes impaired amounts returned to performing status, sales, repayments, the impact of foreign exchange fluctuations and offsets for consumer write-offs which have not been recognized in formations. |
| (3) | Excludes certain loans that are written off directly and not classified as new formations. |
122 |
BMO Financial Group 207th Annual Report 2024 |
| ($ millions, except as noted) | Canada | United States | Other countries | Total | ||||||||||||||||||||||||||||
| As at October 31 | 2024 |
2023 | 2024 |
2023 | 2024 |
2023 | 2024 |
2023 | ||||||||||||||||||||||||
Consumer |
||||||||||||||||||||||||||||||||
Residential mortgages |
8 |
5 | 2 |
– | – |
– | 10 |
5 | ||||||||||||||||||||||||
Consumer instalment and other personal |
136 |
118 | 32 |
34 | – |
– | 168 |
152 | ||||||||||||||||||||||||
Total consumer |
144 |
123 | 34 |
34 | – |
– | 178 |
157 | ||||||||||||||||||||||||
Business and government |
||||||||||||||||||||||||||||||||
Commercial real estate |
24 |
31 | 15 |
3 | – |
– | 39 |
34 | ||||||||||||||||||||||||
Construction (non-real estate) |
33 |
29 | 11 |
26 | – |
– | 44 |
55 | ||||||||||||||||||||||||
Retail trade |
28 |
80 | 18 |
87 | – |
– | 46 |
167 | ||||||||||||||||||||||||
Wholesale trade |
24 |
23 | 14 |
20 | – |
– | 38 |
43 | ||||||||||||||||||||||||
Agriculture |
2 |
2 | 5 |
2 | – |
– | 7 |
4 | ||||||||||||||||||||||||
Communications |
1 |
– | 1 |
– | – |
– | 2 |
– | ||||||||||||||||||||||||
Financing products |
– |
– | – |
– | – |
– | – |
– | ||||||||||||||||||||||||
Manufacturing |
48 |
45 | 44 |
16 | – |
– | 92 |
61 | ||||||||||||||||||||||||
Mining |
– |
– | – |
– | – |
– | – |
– | ||||||||||||||||||||||||
Oil and gas |
1 |
22 | 1 |
– | – |
– | 2 |
22 | ||||||||||||||||||||||||
Transportation |
46 |
5 | 22 |
15 | – |
– | 68 |
20 | ||||||||||||||||||||||||
Utilities |
2 |
2 | – |
– | – |
– | 2 |
2 | ||||||||||||||||||||||||
Forest products |
3 |
2 | – |
– | – |
– | 3 |
2 | ||||||||||||||||||||||||
Service industries |
93 |
86 | 17 |
22 | – |
– | 110 |
108 | ||||||||||||||||||||||||
Financial |
2 |
2 | – |
7 | – |
– | 2 |
9 | ||||||||||||||||||||||||
Government |
– |
– | – |
– | – |
– | – |
– | ||||||||||||||||||||||||
Other |
10 |
5 | 10 |
(5 | ) | – |
– | 20 |
– | |||||||||||||||||||||||
Total business and government |
317 |
334 | 158 |
193 | – |
– | 475 |
527 | ||||||||||||||||||||||||
Total allowance for credit losses on impaired loans |
461 |
457 | 192 |
227 | – |
– | 653 |
684 | ||||||||||||||||||||||||
Total allowance for credit losses on performing loans |
1,531 |
1,272 | 2,141 |
1,833 | 31 |
18 | 3,703 |
3,123 | ||||||||||||||||||||||||
Total allowance for credit losses on loans |
1,992 |
1,729 | 2,333 |
2,060 | 31 |
18 | 4,356 |
3,807 | ||||||||||||||||||||||||
Allowance for credit losses related to off-balance sheet instruments |
193 |
169 | 318 |
287 | 69 |
4 | 580 |
460 | ||||||||||||||||||||||||
Total allowance for credit losses |
2,185 |
1,898 | 2,651 |
2,347 | 100 |
22 | 4,936 |
4,267 | ||||||||||||||||||||||||
Coverage Ratios |
||||||||||||||||||||||||||||||||
Allowance for credit losses (ACL) on impaired loans as a % of gross impaired loans and acceptances |
||||||||||||||||||||||||||||||||
Consumer |
17.71 |
22.82 | 8.08 |
7.83 | – |
– | 14.42 |
16.14 | ||||||||||||||||||||||||
Business and government |
18.65 |
30.64 | 5.44 |
10.17 | – |
– | 10.31 |
17.64 | ||||||||||||||||||||||||
Total |
18.34 |
28.05 | 5.77 |
9.74 | – |
– | 11.18 |
17.27 | ||||||||||||||||||||||||
| (1) | Segmented credit information by geographic area is based upon the country of ultimate risk. |
| (2) | Amounts exclude Allowance for Credit Losses related to off-balance sheet instruments, which are reported in Other Liabilities. |
| ($ millions, except as noted) | Canada | United States | Other countries | Total | ||||||||||||||||||||||||||||
| As at October 31 | 2024 |
2023 | 2024 |
2023 | 2024 |
2023 | 2024 |
2023 | ||||||||||||||||||||||||
Allowance for credit losses (ACL), beginning of year |
||||||||||||||||||||||||||||||||
Consumer |
1,074 |
851 | 462 |
173 | – |
– | 1,536 |
1,024 | ||||||||||||||||||||||||
Business and government |
824 |
797 | 1,885 |
1,162 | 22 |
15 | 2,731 |
1,974 | ||||||||||||||||||||||||
Total ACL, beginning of year |
1,898 |
1,648 | 2,347 |
1,335 | 22 |
15 | 4,267 |
2,998 | ||||||||||||||||||||||||
Provision for credit losses (2)
|
||||||||||||||||||||||||||||||||
Consumer |
1,225 |
789 | 258 |
437 | – |
– | 1,483 |
1,226 | ||||||||||||||||||||||||
Business and government |
407 |
124 | 1,778 |
845 | 83 |
(9 | ) | 2,268 |
960 | |||||||||||||||||||||||
Total provision for credit losses |
1,632 |
913 | 2,036 |
1,282 | 83 |
(9 | ) | 3,751 |
2,186 | |||||||||||||||||||||||
Recoveries |
||||||||||||||||||||||||||||||||
Consumer |
230 |
121 | 143 |
63 | – |
– | 373 |
184 | ||||||||||||||||||||||||
Business and government |
106 |
26 | 88 |
55 | – |
– | 194 |
81 | ||||||||||||||||||||||||
Total recoveries |
336 |
147 | 231 |
118 | – |
– | 567 |
265 | ||||||||||||||||||||||||
Write-offs |
||||||||||||||||||||||||||||||||
Consumer |
(1,032 |
) |
(621 | ) | (316 |
) |
(196 | ) | – |
– | (1,348 |
) |
(817 | ) | ||||||||||||||||||
Business and government |
(401 |
) |
(83 | ) | (1,400 |
) |
(289 | ) | (1 |
) |
– | (1,802 |
) |
(372 | ) | |||||||||||||||||
Total write-offs |
(1,433 |
) |
(704 | ) | (1,716 |
) |
(485 | ) | (1 |
) |
– | (3,150 |
) |
(1,189 | ) | |||||||||||||||||
Other, including foreign exchange rate changes |
||||||||||||||||||||||||||||||||
Consumer |
(132 |
) |
(66 | ) | (103 |
) |
(15 | ) | – |
– | (235 |
) |
(81 | ) | ||||||||||||||||||
Business and government |
(116 |
) |
(40 | ) | (144 |
) |
112 | (4 |
) |
16 | (264 |
) |
88 | |||||||||||||||||||
Total other, including foreign exchange rate changes |
(248 |
) |
(106 | ) | (247 |
) |
97 | (4 |
) |
16 | (499 |
) |
7 | |||||||||||||||||||
ACL, end of year |
||||||||||||||||||||||||||||||||
Consumer |
1,365 |
1,074 | 444 |
462 | – |
– | 1,809 |
1,536 | ||||||||||||||||||||||||
Business and government |
820 |
824 | 2,207 |
1,885 | 100 |
22 | 3,127 |
2,731 | ||||||||||||||||||||||||
Total ACL, end of year |
2,185 |
1,898 | 2,651 |
2,347 | 100 |
22 | 4,936 |
4,267 | ||||||||||||||||||||||||
Net write-offs as a % of average net loans and acceptances (3)
|
0.29 |
0.15 | 0.54 |
0.15 | 0.01 |
– | 0.39 |
0.15 | ||||||||||||||||||||||||
| (1) | Segmented credit information by geographic area is based upon the country of ultimate risk. |
| (2) | Excludes provision for credit losses on other assets. |
| (3) | Aggregate Net Loans and Acceptances balances are net of allowance for credit losses on performing loans and impaired loans (excluding those related to off-balance sheet instruments). |
| BMO Financial Group 207th Annual Report 2024 | 123 |
| ($ millions) | Canada | United States | Other countries | Total | ||||||||||||||||||||||||||||
| For the year ended October 31 | 2024 |
2023 | 2024 |
2023 | 2024 |
2023 | 2024 |
2023 | ||||||||||||||||||||||||
| Consumer |
||||||||||||||||||||||||||||||||
| Residential mortgages
|
38 |
18 | 10 |
1 | – |
– | 48 |
19 | ||||||||||||||||||||||||
| Consumer instalment and other personal
|
420 |
266 | 80 |
113 | – |
– | 500 |
379 | ||||||||||||||||||||||||
| Credit cards
|
496 |
314 | 108 |
52 | – |
– | 604 |
366 | ||||||||||||||||||||||||
| Total consumer
|
954 |
598 | 198 |
166 | – |
– | 1,152 |
764 | ||||||||||||||||||||||||
| Business and Government |
||||||||||||||||||||||||||||||||
| Commercial real estate
|
29 |
30 | 143 |
30 | – |
– | 172 |
60 | ||||||||||||||||||||||||
| Construction
(non-real estate) |
16 |
13 | 49 |
24 | – |
– | 65 |
37 | ||||||||||||||||||||||||
| Retail trade
|
(4 |
) |
18 | 106 |
95 | – |
– | 102 |
113 | |||||||||||||||||||||||
| Wholesale trade
|
23 |
15 | 229 |
16 | – |
– | 252 |
31 | ||||||||||||||||||||||||
| Agriculture
|
8 |
5 | 8 |
(55 | ) | – |
– | 16 |
(50 | ) | ||||||||||||||||||||||
| Communications
|
6 |
1 | 2 |
– | – |
– | 8 |
1 | ||||||||||||||||||||||||
| Financing products
|
– |
– | – |
– | – |
– | – |
– | ||||||||||||||||||||||||
| Manufacturing
|
50 |
12 | 315 |
25 | – |
– | 365 |
37 | ||||||||||||||||||||||||
| Mining
|
37 |
(1 | ) | – |
– | – |
(5 | ) | 37 |
(6 | ) | |||||||||||||||||||||
| Oil and gas
|
1 |
(11 | ) | (7 |
) |
1 | – |
– | (6 |
) |
(10 | ) | ||||||||||||||||||||
| Transportation
|
71 |
9 | 188 |
60 | – |
– | 259 |
69 | ||||||||||||||||||||||||
| Utilities
|
– |
– | 1 |
– | – |
– | 1 |
– | ||||||||||||||||||||||||
| Forest products
|
1 |
1 | – |
1 | – |
– | 1 |
2 | ||||||||||||||||||||||||
| Service industries
|
95 |
48 | 354 |
44 | 1 |
– | 450 |
92 | ||||||||||||||||||||||||
| Financial
|
1 |
1 | 63 |
13 | 62 |
– | 126 |
14 | ||||||||||||||||||||||||
| Government
|
– |
– | – |
– | – |
– | – |
– | ||||||||||||||||||||||||
| Other
|
53 |
30 | 13 |
(4 | ) | – |
– | 66 |
26 | |||||||||||||||||||||||
| Total business and government
|
387 |
171 | 1,464 |
250 | 63 |
(5 | ) | 1,914 |
416 | |||||||||||||||||||||||
| Total provision for credit losses on impaired loans
|
1,341 |
769 | 1,662 |
416 | 63 |
(5 | ) | 3,066 |
1,180 | |||||||||||||||||||||||
| Provision for credit losses on performing loans
|
296 |
138 | 378 |
865 | 21 |
(5 | ) | 695 |
998 | |||||||||||||||||||||||
| Total provision for credit losses
|
1,637 |
907 | 2,040 |
1,281 | 84 |
(10 | ) | 3,761 |
2,178 | |||||||||||||||||||||||
| Performance Ratios (%)
|
||||||||||||||||||||||||||||||||
| Total
PCL-to-average |
0.44 |
0.25 | 0.75 |
0.51 | 0.73 |
(0.09 | ) | 0.57 |
0.35 | |||||||||||||||||||||||
| PCL on impaired loans-to-average net loans and acceptances
|
||||||||||||||||||||||||||||||||
| Consumer
|
0.41 |
0.27 | 0.36 |
0.34 | 0.00 |
– | 0.40 |
0.28 | ||||||||||||||||||||||||
| Business and government
|
0.27 |
0.12 | 0.67 |
0.12 | 0.55 |
(0.04 | ) | 0.51 |
0.12 | |||||||||||||||||||||||
| Total PCL on impaired
loans-to-average |
0.36 |
0.21 | 0.61 |
0.17 | 0.55 |
(0.04 | ) | 0.47 |
0.19 | |||||||||||||||||||||||
| (1) | Segmented credit information by geographic area is based upon the country of ultimate risk.
|
2024 |
2023 | |||||||||||||||
| ($ millions, except as noted) | Average balance |
Average (%)
rate paid |
Average balance |
Average rate paid (%) |
||||||||||||
| Deposits Booked in Canada |
||||||||||||||||
| Payable on demand – interest bearing
|
62,464 |
4.58 |
52,270 | 4.08 | ||||||||||||
| Payable on demand –
non-interest bearing |
64,555 |
– |
71,789 | – | ||||||||||||
| Payable after notice
|
135,487 |
3.59 |
125,664 | 3.08 | ||||||||||||
| Payable on a fixed date
|
329,317 |
4.55 |
292,597 | 4.11 | ||||||||||||
| Total deposits booked in Canada
|
591,823 |
3.84 |
542,320 | 3.33 | ||||||||||||
| Deposits Booked in the United States |
||||||||||||||||
| Payable on demand – interest bearing
|
10,577 |
5.00 |
17,837 | 3.30 | ||||||||||||
| Payable on demand –
non-interest bearing |
10,244 |
– |
26,656 | – | ||||||||||||
| Payable after notice
|
195,017 |
2.19 |
164,149 | 1.74 | ||||||||||||
| Payable on a fixed date
|
93,339 |
4.97 |
71,644 | 4.43 | ||||||||||||
| Total deposits booked in the United States
|
309,177 |
3.05 |
280,286 | 2.36 | ||||||||||||
| Deposits Booked in Other Countries |
||||||||||||||||
| Payable on demand – interest bearing
|
106 |
2.64 |
183 | 2.46 | ||||||||||||
| Payable on demand –
non-interest bearing |
6 |
– |
44 | – | ||||||||||||
| Payable after notice
|
2,202 |
5.20 |
2,161 | 4.27 | ||||||||||||
| Payable on a fixed date
|
45,642 |
5.07 |
41,259 | 4.35 | ||||||||||||
| Total deposits booked in other countries
|
47,956 |
5.07 |
43,647 | 4.34 | ||||||||||||
| Total average deposits |
948,956 |
3.64 |
866,253 | 3.06 | ||||||||||||
| (1) | As at October 31, 2024 and 2023: deposits by foreign depositors in our Canadian bank offices amounted to $123,141 million and $114,104 million, respectively.
|
| (2) | Average deposits payable on a fixed date included $26 million, $44,501 million and $18,427 million of federal funds purchased, commercial paper issued and other deposit liabilities, respectively, as at October 31, 2024 ($88 million, $44,520 million and $17,664 million, respectively, as at October 31, 2023).
|
124 |
BMO Financial Group 207th A nnu al Report 2024 |
| BMO Financial Group 207th Annual Report 2024 | 125 |
126 |
BMO Financial Group 207th Annual Report 2024 |
 |
 |
|||
Darryl White |
Tayfun Tuzun |
Toronto, Canada | ||
| Chief Executive Officer | Chief Financial Officer | December 5, 2024 |
| BMO Financial Group 207th Annual Report 2024 | 127 |
128 |
BMO Financial Group 207th Annual Report 2024 |
| BMO Financial Group 207th Annual Report 2024 | 129 |
130 |
BMO Financial Group 207th Annual Report 2024 |
| BMO Financial Group 207th Annual Report 2024 | 131 |

132 |
BMO Financial Group 207th Annual Report 2024 |
| BMO Financial Group 207th Annual Report 2024 | 133 |
For the Year Ended October 31 (Canadian $ in millions, except as noted) |
2024 |
2023 |
||||||
Interest, Dividend and Fee Income |
||||||||
Loans |
$ |
40,069 |
$ |
34,310 |
||||
Securities (Notes 3 and 10) (1)
|
15,038 |
11,392 |
||||||
Securities borrowed or purchased under resale agreements |
6,843 |
5,859 |
||||||
Deposits with banks |
4,035 |
4,013 |
||||||
65,985 |
55,574 |
|||||||
Interest Expense |
||||||||
Deposits |
34,580 |
26,547 |
||||||
Securities sold but not yet purchased and securities lent or sold under repurchase agreements |
8,907 |
7,299 |
||||||
Subordinated debt |
456 |
430 |
||||||
Other liabilities (Note 14)
|
2,574 |
2,617 |
||||||
46,517 |
36,893 |
|||||||
Net Interest Income |
19,468 |
18,681 |
||||||
Non-Interest Revenue |
||||||||
Securities commissions and fees |
1,106 |
1,025 |
||||||
Deposit and payment service charges |
1,626 |
1,517 |
||||||
Trading revenues (losses) (Notes 10 and 18)
|
2,377 |
(216 |
) |
|||||
Lending fees |
1,464 |
1,548 |
||||||
Card fees |
847 |
700 |
||||||
Investment management and custodial fees |
2,056 |
1,851 |
||||||
Mutual fund revenues |
1,324 |
1,244 |
||||||
Underwriting and advisory fees |
1,399 |
1,107 |
||||||
Securities gains, other than trading (Note 3)
|
200 |
180 |
||||||
Foreign exchange gains, other than trading |
263 |
234 |
||||||
Insurance service results (Note 15)
|
340 |
389 |
||||||
Insurance investment results (Note 15)
|
105 |
171 |
||||||
Share of profit in associates and joint ventures |
207 |
185 |
||||||
Other revenues |
13 |
643 |
||||||
13,327 |
10,578 |
|||||||
Total Revenue |
32,795 |
29,259 |
||||||
Provision for Credit Losses (Notes 4 and 10)
|
3,761 |
2,178 |
||||||
Non-Interest Expense |
||||||||
Employee compensation (Notes 21 and 22)
|
10,872 |
11,460 |
||||||
Premises and equipment (Note 9)
|
4,117 |
4,870 |
||||||
Amortization of intangible assets (Note 11)
|
1,112 |
1,008 |
||||||
Advertising and business development |
837 |
812 |
||||||
Communications |
388 |
367 |
||||||
Professional fees |
583 |
863 |
||||||
Association, clearing and annual regulator fees |
321 |
272 |
||||||
Other |
1,269 |
1,482 |
||||||
19,499 |
21,134 |
|||||||
Income Before Provision for Income Taxes |
9,535 |
5,947 |
||||||
Provision for income taxes (Note 23)
|
2,208 |
1,510 |
||||||
Net Income |
$ |
7,327 |
$ |
4,437 |
||||
Attributable to: |
||||||||
Bank shareholders |
$ |
7,318 |
$ |
4,425 |
||||
Non-controlling interest in subsidiaries |
9 |
12 |
||||||
Net Income |
$ |
7,327 |
$ |
4,437 |
||||
Earnings Per Common Share (Canadian $) (Note 24)
|
||||||||
Basic |
$ |
9.52 |
$ |
5.77 |
||||
Diluted |
9.51 |
5.76 |
||||||
Dividends per common share |
6.12 |
5.80 |
||||||
| (1) | Includes interest income on securities measured at fair value through other comprehensive income (FVOCI) and amortized cost, calculated using the effective interest rate method, of $7,826 million for the year ended October 31, 2024 ($6,027 million in 2023). |
|
|
 |
|
Darryl White |
Jan Babiak |
|
| Chief Executive Officer | Chair, Audit and Conduct Review Committee |
134 |
BMO Financial Group 207th Annual Report 2024 |
For the Year Ended October 31 (Canadian $ in millions) |
2024 |
2023 |
||||||
Net Income |
$ |
7,327 |
$ |
4,437 |
||||
Other Comprehensive Income, net of taxes (Note 23)
|
||||||||
Items that will subsequently be reclassified to net income |
||||||||
Net change in unrealized gains (losses) on fair value through OCI debt securities |
||||||||
Unrealized gains (losses) on fair value through OCI debt securities arising during the year |
217 |
(74 |
) |
|||||
Reclassification to earnings of (gains) during the year |
(83 |
) |
(31 |
) |
||||
134 |
(105 |
) |
||||||
Net change in unrealized gains (losses) on derivatives designated as cash flow hedges |
||||||||
Gains (losses) on derivatives designated as cash flow hedges arising during the year (Note 8)
|
2,512 |
(1,292 |
) |
|||||
Reclassification to earnings/goodwill of losses on derivatives designated as cash flow hedges during the year (Note 10)
|
1,417 |
973 |
||||||
3,929 |
(319 |
) |
||||||
Net gains on translation of net foreign operations |
||||||||
Unrealized gains on translation of net foreign operations |
287 |
1,399 |
||||||
Unrealized (losses) on hedges of net foreign operations |
(100 |
) |
(373 |
) |
||||
187 |
1,026 |
|||||||
Items that will not be subsequently reclassified to net income |
||||||||
Net unrealized gains on fair value through OCI equity securities arising during the year |
9 |
– |
||||||
Net (losses) on remeasurement of pension and other employee future benefit plans (Note 22)
|
(69 |
) |
(1 |
) |
||||
Net (losses) on remeasurement of own credit risk on financial liabilities designated at fair value |
(633 |
) |
(291 |
) |
||||
(693 |
) |
(292 |
) |
|||||
Total Other Comprehensive Income, net of taxes (Note 23)
|
3,557 |
310 |
||||||
Total Comprehensive Income |
$ |
10,884 |
$ |
4,747 |
||||
Attributable to: |
||||||||
Bank shareholders |
$ |
10,875 |
$ |
4,735 |
||||
Non-controlling interest in subsidiaries |
9 |
12 |
||||||
Total Comprehensive Income |
$ |
10,884 |
$ |
4,747 |
||||
BMO Financial Group 207th Annual Report 2024 |
135 |
As at October 31 (Canadian $ in millions) |
2024 |
2023 |
||||||
Assets |
||||||||
Cash and Cash Equivalents (Note 2)
|
$ |
65,098 |
$ |
77,934 |
||||
Interest Bearing Deposits with Banks (Note 2)
|
3,640 |
4,109 |
||||||
Securities (Notes 3 and 10)
|
||||||||
Trading |
168,926 |
123,718 |
||||||
Fair value through profit or loss |
19,064 |
16,733 |
||||||
Fair value through other comprehensive income |
93,702 |
62,819 |
||||||
Debt securities at amortized cost |
115,188 |
116,814 |
||||||
396,880 |
320,084 |
|||||||
Securities Borrowed or Purchased Under Resale Agreements (Note 4)
|
110,907 |
115,662 |
||||||
Loans (Notes 4, 6 and 10)
|
||||||||
Residential mortgages |
191,080 |
177,250 |
||||||
Consumer instalment and other personal |
92,687 |
104,042 |
||||||
Credit cards |
13,612 |
12,294 |
||||||
Business and government |
384,993 |
366,886 |
||||||
682,372 |
660,472 |
|||||||
Allowance for credit losses (Note 4)
|
(4,356 |
) |
(3,807 |
) |
||||
678,016 |
656,665 |
|||||||
Other Assets |
||||||||
Derivative instruments (Note 8)
|
47,253 |
39,976 |
||||||
Customers’ liability under acceptances (Note 12)
|
359 |
8,111 |
||||||
Premises and equipment (Note 9)
|
6,249 |
6,241 |
||||||
Goodwill (Notes 10 and 11)
|
16,774 |
16,728 |
||||||
Intangible assets (Notes 10 and 11)
|
4,925 |
5,216 |
||||||
Current tax assets |
2,219 |
2,052 |
||||||
Deferred tax assets (Note 23)
|
3,024 |
3,420 |
||||||
Receivable from brokers, dealers and clients |
31,916 |
53,002 |
||||||
Other (Note 12)
|
42,387 |
37,806 |
||||||
155,106 |
172,552 |
|||||||
Total Assets |
$ |
1,409,647 |
$ |
1,347,006 |
||||
Liabilities and Equity |
||||||||
Deposits (Note 13)
|
$ |
982,440 |
$ |
910,879 |
||||
Other Liabilities |
||||||||
Derivative instruments (Note 8)
|
58,303 |
50,193 |
||||||
Acceptances (Note 14)
|
359 |
8,111 |
||||||
Securities sold but not yet purchased (Note 14)
|
35,030 |
43,774 |
||||||
Securities lent or sold under repurchase agreements (Note 6)
|
110,791 |
106,108 |
||||||
Securitization and structured entities’ liabilities (Notes 6 and 7)
|
40,164 |
27,094 |
||||||
Insurance-related liabilities (Note 15)
|
18,770 |
14,458 |
||||||
Payable to brokers, dealers and clients |
34,407 |
53,754 |
||||||
Other (Note 14)
|
36,720 |
48,284 |
||||||
334,544 |
351,776 |
|||||||
Subordinated Debt (Note 16)
|
8,377 |
8,228 |
||||||
Total Liabilities |
$ |
1,325,361 |
$ |
1,270,883 |
||||
Equity |
||||||||
Preferred shares and other equity instruments (Note 17)
|
8,087 |
6,958 |
||||||
Common shares (Note 17)
|
23,921 |
22,941 |
||||||
Contributed surplus |
354 |
328 |
||||||
Retained earnings |
46,469 |
44,006 |
||||||
Accumulated other comprehensive income |
5,419 |
1,862 |
||||||
Total shareholders’ equity |
84,250 |
76,095 |
||||||
Non-controlling interest in subsidiaries (Note 17)
|
36 |
28 |
||||||
Total Equity |
84,286 |
76,123 |
||||||
Total Liabilities and Equity |
$ |
1,409,647 |
$ |
1,347,006 |
||||
136 |
BMO Financial Group 207th Annual Report 2024 |
For the Year Ended October 31 (Canadian $ in millions) |
2024 |
2023 |
||||||
Preferred Shares and Other Equity Instruments (Note 17)
|
||||||||
Balance at beginning of year |
$ |
6,958 |
$ |
6,308 |
||||
Issued during the year |
2,379 |
650 |
||||||
Redeemed during the year |
(1,250 |
) |
– |
|||||
Balance at End of Year |
8,087 |
6,958 |
||||||
Common Shares (Note 17)
|
||||||||
Balance at beginning of year |
22,941 |
17,744 |
||||||
Issued under the Shareholder Dividend Reinvestment and Share Purchase Plan |
905 |
1,609 |
||||||
Issued under the Stock Option Plan |
74 |
61 |
||||||
Treasury shares sold |
1 |
14 |
||||||
Issued to align capital position with increased regulatory requirements as announced by OSFI (Note 17)
|
– |
3,360 |
||||||
Issued for acquisitions (Notes 10 and 17)
|
– |
153 |
||||||
Balance at End of Year |
23,921 |
22,941 |
||||||
Contributed Surplus |
||||||||
Balance at beginning of year |
328 |
317 |
||||||
Stock option expense, net of options exercised (Note 21)
|
15 |
11 |
||||||
Net premium (discount) on sale of treasury shares |
11 |
(2 |
) |
|||||
Other |
– |
2 |
||||||
Balance at End of Year |
354 |
328 |
||||||
Retained Earnings |
||||||||
Balance at beginning of year |
44,006 |
45,117 |
||||||
Impact from accounting policy changes (Note 1)
|
– |
(974 |
) |
|||||
Net income attributable to bank shareholders |
7,318 |
4,425 |
||||||
Dividends on preferred shares and distributions payable on other equity instruments (Note 17)
|
(386 |
) |
(331 |
) |
||||
Dividends on common shares (Note 17)
|
(4,458 |
) |
(4,148 |
) |
||||
Equity issue expense |
(11 |
) |
(73 |
) |
||||
Net discount on sale of treasury shares |
– |
(10 |
) |
|||||
Balance at End of Year |
46,469 |
44,006 |
||||||
Accumulated Other Comprehensive (Loss) on Fair Value through OCI Securities, net of taxes |
||||||||
Balance at beginning of year |
(464 |
) |
(359 |
) |
||||
Unrealized gains (losses) on fair value through OCI debt securities arising during the year |
217 |
(74 |
) |
|||||
Unrealized gains on fair value through OCI equity securities arising during the year |
9 |
– |
||||||
Reclassification to earnings of (gains) during the year |
(83 |
) |
(31 |
) |
||||
Balance at End of Year |
(321 |
) |
(464 |
) |
||||
Accumulated Other Comprehensive (Loss) on Cash Flow Hedges, net of taxes |
||||||||
Balance at beginning of year |
(5,448 |
) |
(5,129 |
) |
||||
Gains (losses) on derivatives designated as cash flow hedges arising during the year (Note 8)
|
2,512 |
(1,292 |
) |
|||||
Reclassification to earnings/goodwill of losses on derivatives designated as cash flow hedges during the year (Note 10)
|
1,417 |
973 |
||||||
Balance at End of Year |
(1,519 |
) |
(5,448 |
) |
||||
Accumulated Other Comprehensive Income on Translation of Net Foreign Operations, net of taxes |
||||||||
Balance at beginning of year |
6,194 |
5,168 |
||||||
Unrealized gains on translation of net foreign operations |
287 |
1,399 |
||||||
Unrealized (losses) on hedges of net foreign operations |
(100 |
) |
(373 |
) |
||||
Balance at End of Year |
6,381 |
6,194 |
||||||
Accumulated Other Comprehensive Income on Pension and Other Employee Future Benefit Plans, net of taxes |
||||||||
Balance at beginning of year |
943 |
944 |
||||||
(Losses) on remeasurement of pension and other employee future benefit plans (Note 22)
|
(69 |
) |
(1 |
) |
||||
Balance at End of Year |
874 |
943 |
||||||
| Accumulated Other Comprehensive Income on Own Cr edit Risk on Financial Liabilities Designated at Fair Value, net of taxes |
||||||||
Balance at beginning of year |
637 |
928 |
||||||
(Losses) on remeasurement of own credit risk on financial liabilities designated at fair value |
(633 |
) |
(291 |
) |
||||
Balance at End of Year |
4 |
637 |
||||||
Total Accumulated Other Comprehensive Income |
5,419 |
1,862 |
||||||
Total Shareholders’ Equity |
84,250 |
76,095 |
||||||
Non-Controlling Interest in Subsidiaries (Note 17)
|
||||||||
Balance at beginning of year |
28 |
– |
||||||
Acquisition (Note 10)
|
– |
16 |
||||||
Net income attributable to non-controlling interest in subsidiaries |
9 |
12 |
||||||
Dividends to non-controlling interest in subsidiaries |
(3 |
) |
– |
|||||
Other |
2 |
– |
||||||
Balance at End of Year |
36 |
28 |
||||||
Total Equity |
$ |
84,286 |
$ |
76,123 |
||||
BMO Financial Group 207th Annual Report 2024 |
137 |
For the Year Ended October 31 (Canadian $ in millions) |
2024 |
2023 |
||||||
Cash Flows Provided by Operating Activities |
||||||||
Net Income |
$ |
7,327 |
$ |
4,437 |
||||
Adjustments to determine net cash flows provided by operating activities: |
||||||||
Securities (gains), other than trading (Note 3)
|
(200 |
) |
(180 |
) |
||||
Depreciation of premises and equipment (Note 9)
|
970 |
1,022 |
||||||
Depreciation of other assets |
28 |
62 |
||||||
Amortization of intangible assets (Note 11)
|
1,112 |
1,008 |
||||||
Provision for credit losses (Note 4)
|
3,761 |
2,178 |
||||||
Deferred taxes (Note 23)
|
153 |
(708 |
) |
|||||
Share of (profit) in associates and joint ventures |
(207 |
) |
(185 |
) |
||||
Changes in operating assets and liabilities: |
||||||||
Trading securities |
(42,700 |
) |
(13,290 |
) |
||||
Derivative assets |
(85 |
) |
14,373 |
|||||
Derivative liabilities |
2,123 |
(14,924 |
) |
|||||
Current income taxes |
257 |
(990 |
) |
|||||
Accrued interest receivable and payable |
785 |
1,956 |
||||||
Insurance-related liabilities |
4,312 |
3,257 |
||||||
Brokers, dealers and clients receivable and payable |
1,529 |
405 |
||||||
Other items and accruals, net |
(7,099 |
) |
4,028 |
|||||
Deposits |
68,441 |
32,721 |
||||||
Loans |
(24,636 |
) |
(25,094 |
) |
||||
Securities sold but not yet purchased |
(8,786 |
) |
5,652 |
|||||
Securities lent or sold under repurchase agreements |
3,766 |
(5,130 |
) |
|||||
Securities borrowed or purchased under resale agreements |
5,480 |
(885 |
) |
|||||
Securitization and structured entities’ liabilities |
12,699 |
(122 |
) |
|||||
Net Cash Provided by Operating Activities |
29,030 |
9,591 |
||||||
Cash Flows Provided by (Used in) Financing Activities |
||||||||
Liabilities of subsidiaries |
(12,071 |
) |
2,068 |
|||||
Proceeds from issuance of covered bonds (Note 13)
|
– |
8,027 |
||||||
Redemption/buyback of covered bonds (Note 13)
|
(2,327 |
) |
(10,743 |
) |
||||
Proceeds from issuance of subordinated debt (Note 16)
|
1,000 |
1,150 |
||||||
Repayment of subordinated debt (Note 16)
|
(1,000 |
) |
(1,179 |
) |
||||
Proceeds from issuance of preferred shares, net of issuance costs (Note 17)
|
2,368 |
648 |
||||||
Redemption of preferred shares (Note 17)
|
(1,250 |
) |
– |
|||||
Net proceeds from issuance of common shares (Note 17)
|
67 |
3,339 |
||||||
Net sale of treasury shares (Note 17)
|
1 |
14 |
||||||
Cash dividends and distributions paid |
(3,840 |
) |
(2,703 |
) |
||||
Cash dividends paid to non-controlling interest |
(3 |
) |
– |
|||||
Repayment of lease liabilities |
(357 |
) |
(353 |
) |
||||
Net Cash Provided by (Used in) Financing Activities |
(17,412 |
) |
268 |
|||||
Cash Flows (Used in) Investing Activities |
||||||||
Interest bearing deposits with banks |
515 |
1,680 |
||||||
Purchases of securities, other than trading |
(86,980 |
) |
(50,149 |
) |
||||
Maturities of securities, other than trading |
27,323 |
20,905 |
||||||
Proceeds from sales of securities, other than trading |
36,177 |
23,186 |
||||||
Net purchases of premises and equipment and software (Notes 9 and 11)
|
(1,564 |
) |
(1,677 |
) |
||||
Acquisitions (Note 10) (1)
|
– |
(15,102 |
) |
|||||
Net Cash (Used in) Investing Activities |
(24,529 |
) |
(21,157 |
) |
||||
Effect of Exchange Rate Changes on Cash and Cash Equivalents |
75 |
1,766 |
||||||
Net (decrease) in Cash and Cash Equivalents |
(12,836 |
) |
(9,532 |
) |
||||
Cash and Cash Equivalents at Beginning of Year |
77,934 |
87,466 |
||||||
Cash and Cash Equivalents at End of Year (Note 2)
|
$ |
65,098 |
$ |
77,934 |
||||
Supplemental Disclosure of Cash Flow Information |
||||||||
Net cash provided by operating activities includes: |
||||||||
Interest paid in the year (2)
|
$ |
45,092 |
$ |
33,747 |
||||
Income taxes paid in the year |
2,450 |
2,591 |
||||||
Interest received in the year |
63,108 |
52,112 |
||||||
Dividends received in the year |
2,481 |
2,349 |
||||||
| (1) | This amount is net of cash and cash equivalents of $3,646 million acquired as part of acquisitions during the year ended October 31, 2023. To mitigate changes in the Canadian dollar equivalent of the Bank of the West purchase price on closing, we entered into forward contracts, which qualified for hedge accounting. |
| (2) | Includes dividends paid on securities sold but not yet purchased. |
138 |
BMO Financial Group 207th Annual Report 2024 |
Note |
Topic |
Page |
||||||
| 1 | 139 | |||||||
| 2 | 145 | |||||||
| 3 | 146 | |||||||
| 4 | 148 | |||||||
| 5 | 155 | |||||||
| 6 | 156 | |||||||
| 7 | 157 | |||||||
| 8 | 160 | |||||||
| 9 | 169 | |||||||
| 10 | 170 | |||||||
| 11 | 172 | |||||||
| 12 | 173 | |||||||
| 13 | 174 | |||||||
| 14 | 175 | |||||||
| 15 | 176 | |||||||
Note |
Topic |
Page |
||||||||
| 16 | 178 | |||||||||
| 17 | 179 | |||||||||
| 18 | 182 | |||||||||
| 19 | 188 | |||||||||
| 20 | 189 | |||||||||
| 21 | 190 | |||||||||
| 22 | 192 | |||||||||
| 23 | 196 | |||||||||
| 24 | 199 | |||||||||
| 25 | 199 | |||||||||
| 26 | 202 | |||||||||
| 27 | 205 | |||||||||
| 28 | 205 | |||||||||
BMO Financial Group 207th Annual Report 2024 |
139 |
140 |
BMO Financial Group 207th Annual Report 2024 |
| (Canadian $ in millions) | 2023 | |||
| Non-derivative assets(1)
|
$ | 44,370 | ||
| Non-derivative liabilities (1)
|
4,584 | |||
| Derivative notional amounts (2) (3)
|
1,779,140 | |||
| Authorized and committed loan commitments (4) (5) (6)
|
55,548 | |||
| (1) | All amounts presented based on contractual amounts outstanding at October 31, 2023, with the exception of securities, recorded in non-derivative assets, presented based on carrying value. |
| (2) | Notional amounts represent the amount to which a rate or price is applied in order to calculate the amount of cash that must be exchanged under the contract. Notional amounts do not represent assets or liabilities and therefore are not recorded in our Consolidated Balance Sheet. |
| (3) | Includes certain cross-currency swap positions where both the pay and receive legs referenced a CDOR or BA rate. For those derivatives, the table above includes the notional amounts for both the pay and receive legs in the relevant columns aligning with the CDOR or BA rate exposure. |
| (4) | Excludes personal lines of credit and credit cards that are unconditionally cancellable at our discretion. A large majority of these commitments expire without being drawn upon. As a result, the total contractual amounts may not be representative of the funding likely to be required for these commitments. |
| (5) | Includes loan commitments where our customers have the option to draw from their facility in multiple currencies. Amounts drawn will be subject to prevailing IBORs for the foreign currency, including those that are in scope of IBOR reform. |
| (6) | Commitments include backstop liquidity facilities provided by the bank to external parties. |
BMO Financial Group 207th Annual Report 2024 |
141 |
142 |
BMO Financial Group 207th Annual Report 2024 |
BMO Financial Group 207th Annual Report 2024 |
143 |
| (Canadian $ in millions) | November 1, 2022 previously reported |
IFRS 17 impacts |
IAS 40 accounting policy change impacts |
November 1, 2022 restated |
||||||||||||||
Assets |
||||||||||||||||||
Other Assets |
||||||||||||||||||
| Deferred tax assets | $ | 1,175 | $ | 418 | $ | (51 | ) | $ | 1,542 | |||||||||
| Other | ||||||||||||||||||
Insurance-related assets |
2,575 | 657 | 183 | 3,415 | ||||||||||||||
Total Assets |
$ | 3,750 | $ | 1,075 | $ | 132 | $ | 4,957 | ||||||||||
Liabilities |
||||||||||||||||||
Other Liabilities |
||||||||||||||||||
| Insurance-related liabilities | $ | 11,201 | $ | 2,181 | $ | – | $ | 13,382 | ||||||||||
| Other | ||||||||||||||||||
Deferred tax liabilities |
102 | – | – | 102 | ||||||||||||||
Total Liabilities |
$ | 11,303 | $ | 2,181 | $ | – | $ | 13,484 | ||||||||||
144 |
BMO Financial Group 207th Annual Report 2024 |
(Canadian $ in millions) |
2024 |
2023 |
||||||
Cash and deposits with banks (1)
|
$ |
62,823 |
$ |
75,528 |
||||
Cheques and other items in transit, net |
2,275 |
2,406 |
||||||
Total cash and cash equivalents |
$ |
65,098 |
$ |
77,934 |
||||
(1) |
Includes deposits with the Bank of Canada, the U.S. Federal Reserve and other central banks. |
BMO Financial Group 207th Annual Report 2024 |
145 |
146 |
BMO Financial Group 207th Annual Report 2024 |
| (Canadian $ in millions, except as noted) | Term to maturity |
2024 |
2023 | |||||||||||||||||||||||||||||
Within 1 year |
1 to 3 years |
3 to 5 years |
5 to 10 years |
Over 10 years |
No maturity |
Total |
Total | |||||||||||||||||||||||||
Trading Securities |
||||||||||||||||||||||||||||||||
Issued or guaranteed by: |
||||||||||||||||||||||||||||||||
Canadian federal government |
$ |
620 |
$ |
1,353 |
$ |
1,933 |
$ |
1,664 |
$ |
4,466 |
$ |
– |
$ |
10,036 |
$ | 11,370 | ||||||||||||||||
Canadian provincial and municipal governments |
1,983 |
460 |
760 |
944 |
3,438 |
– |
7,585 |
7,170 | ||||||||||||||||||||||||
U.S. federal government |
896 |
8,123 |
1,933 |
5,709 |
7,587 |
– |
24,248 |
20,132 | ||||||||||||||||||||||||
U.S. states, municipalities and agencies |
4 |
52 |
35 |
269 |
205 |
– |
565 |
279 | ||||||||||||||||||||||||
Other governments |
719 |
1,206 |
1,185 |
569 |
170 |
– |
3,849 |
2,540 | ||||||||||||||||||||||||
NHA MBS, U.S. agency MBS and CMO (1) |
427 |
451 |
898 |
1,089 |
38,130 |
– |
40,995 |
21,517 | ||||||||||||||||||||||||
Corporate debt |
1,590 |
3,283 |
4,234 |
3,936 |
2,147 |
– |
15,190 |
11,933 | ||||||||||||||||||||||||
Trading loans |
– |
66 |
195 |
214 |
– |
– |
475 |
450 | ||||||||||||||||||||||||
Corporate equity |
– |
– |
– |
– |
– |
65,983 |
65,983 |
48,327 | ||||||||||||||||||||||||
Total trading securities |
6,239 |
14,994 |
11,173 |
14,394 |
56,143 |
65,983 |
168,926 |
123,718 | ||||||||||||||||||||||||
FVTPL Securities |
||||||||||||||||||||||||||||||||
Issued or guaranteed by: |
||||||||||||||||||||||||||||||||
Canadian federal government |
276 |
7 |
– |
11 |
109 |
– |
403 |
216 | ||||||||||||||||||||||||
Canadian provincial and municipal governments |
2 |
10 |
34 |
113 |
1,419 |
– |
1,578 |
1,166 | ||||||||||||||||||||||||
U.S. federal government |
5 |
– |
– |
– |
1,522 |
– |
1,527 |
2,088 | ||||||||||||||||||||||||
Other governments |
25 |
– |
– |
– |
– |
– |
25 |
48 | ||||||||||||||||||||||||
NHA MBS, U.S. agency MBS and CMO (1) |
– |
– |
13 |
8 |
– |
– |
21 |
19 | ||||||||||||||||||||||||
Corporate debt |
143 |
270 |
355 |
1,012 |
7,000 |
– |
8,780 |
7,362 | ||||||||||||||||||||||||
Corporate equity |
– |
– |
– |
– |
– |
6,730 |
6,730 |
5,834 | ||||||||||||||||||||||||
Total FVTPL securities |
451 |
287 |
402 |
1,144 |
10,050 |
6,730 |
19,064 |
16,733 | ||||||||||||||||||||||||
FVOCI Securities |
||||||||||||||||||||||||||||||||
Issued or guaranteed by: |
||||||||||||||||||||||||||||||||
Canadian federal government |
||||||||||||||||||||||||||||||||
Amortized cost |
12,552 |
5,951 |
10,703 |
4,686 |
– |
– |
33,892 |
20,579 | ||||||||||||||||||||||||
Fair value |
12,571 |
5,975 |
10,861 |
4,770 |
– |
– |
34,177 |
20,100 | ||||||||||||||||||||||||
Yield (%) |
3.48 |
2.95 |
3.55 |
2.93 |
– |
– |
3.33 |
3.05 | ||||||||||||||||||||||||
Canadian provincial and municipal governments |
||||||||||||||||||||||||||||||||
Amortized cost |
665 |
496 |
2,265 |
2,496 |
17 |
– |
5,939 |
5,281 | ||||||||||||||||||||||||
Fair value |
666 |
496 |
2,286 |
2,533 |
15 |
– |
5,996 |
5,055 | ||||||||||||||||||||||||
Yield (%) |
3.29 |
3.08 |
4.01 |
3.45 |
4.19 |
– |
3.61 |
3.23 | ||||||||||||||||||||||||
U.S. federal government |
||||||||||||||||||||||||||||||||
Amortized cost |
1,423 |
1,750 |
4,344 |
9,516 |
– |
– |
17,033 |
6,245 | ||||||||||||||||||||||||
Fair value |
1,422 |
1,743 |
4,283 |
9,517 |
– |
– |
16,965 |
5,880 | ||||||||||||||||||||||||
Yield (%) |
4.00 |
4.00 |
3.83 |
4.19 |
– |
– |
4.06 |
3.77 | ||||||||||||||||||||||||
U.S. states, municipalities and agencies |
||||||||||||||||||||||||||||||||
Amortized cost |
423 |
652 |
714 |
2,789 |
547 |
– |
5,125 |
5,486 | ||||||||||||||||||||||||
Fair value |
420 |
640 |
702 |
2,766 |
540 |
– |
5,068 |
5,301 | ||||||||||||||||||||||||
Yield (%) |
2.22 |
2.56 |
3.36 |
4.59 |
5.32 |
– |
4.04 |
4.22 | ||||||||||||||||||||||||
Other governments |
||||||||||||||||||||||||||||||||
Amortized cost |
3,912 |
616 |
1,115 |
– |
– |
– |
5,643 |
7,064 | ||||||||||||||||||||||||
Fair value |
3,918 |
614 |
1,124 |
– |
– |
– |
5,656 |
6,969 | ||||||||||||||||||||||||
Yield (%) |
2.87 |
3.42 |
4.00 |
– |
– |
– |
3.15 |
3.11 | ||||||||||||||||||||||||
NHA MBS, U.S. agency MBS and CMO (1) |
||||||||||||||||||||||||||||||||
Amortized cost |
58 |
1,381 |
7,390 |
4,396 |
8,345 |
– |
21,570 |
16,421 | ||||||||||||||||||||||||
Fair value |
58 |
1,373 |
7,360 |
4,356 |
8,146 |
– |
21,293 |
15,765 | ||||||||||||||||||||||||
Yield (%) |
0.85 |
2.79 |
4.44 |
3.66 |
3.81 |
– |
3.92 |
4.76 | ||||||||||||||||||||||||
Corporate debt |
||||||||||||||||||||||||||||||||
Amortized cost |
1,748 |
581 |
492 |
1,473 |
97 |
– |
4,391 |
3,676 | ||||||||||||||||||||||||
Fair value |
1,733 |
579 |
497 |
1,470 |
91 |
– |
4,370 |
3,589 | ||||||||||||||||||||||||
Yield (%) |
2.35 |
4.24 |
3.45 |
2.00 |
5.32 |
– |
2.67 |
5.43 | ||||||||||||||||||||||||
Corporate equity |
||||||||||||||||||||||||||||||||
Cost |
– |
– |
– |
– |
– |
135 |
135 |
129 | ||||||||||||||||||||||||
Fair value |
– |
– |
– |
– |
– |
177 |
177 |
160 | ||||||||||||||||||||||||
Total cost or amortized cost |
20,781 |
11,427 |
27,023 |
25,356 |
9,006 |
135 |
93,728 |
64,881 | ||||||||||||||||||||||||
Total fair value |
20,788 |
11,420 |
27,113 |
25,412 |
8,792 |
177 |
93,702 |
62,819 | ||||||||||||||||||||||||
Yield (%) |
3.27 |
3.16 |
3.89 |
3.71 |
3.92 |
– |
3.61 |
3.80 | ||||||||||||||||||||||||
Amortized Cost Securities |
||||||||||||||||||||||||||||||||
Issued or guaranteed by: |
||||||||||||||||||||||||||||||||
Canadian federal government |
||||||||||||||||||||||||||||||||
Amortized cost |
1,056 |
1,276 |
97 |
36 |
– |
– |
2,465 |
4,908 | ||||||||||||||||||||||||
Fair value |
1,014 |
1,259 |
96 |
34 |
– |
– |
2,403 |
4,905 | ||||||||||||||||||||||||
Yield (%) |
1.79 |
1.72 |
2.71 |
2.83 |
– |
– |
1.81 |
1.83 | ||||||||||||||||||||||||
Canadian provincial and municipal governments |
||||||||||||||||||||||||||||||||
Amortized cost |
1,699 |
1,523 |
952 |
314 |
– |
– |
4,488 |
4,613 | ||||||||||||||||||||||||
Fair value |
1,621 |
1,392 |
890 |
313 |
– |
– |
4,216 |
4,605 | ||||||||||||||||||||||||
Yield (%) |
1.90 |
2.52 |
2.73 |
3.20 |
– |
– |
2.38 |
2.26 | ||||||||||||||||||||||||
U.S. federal government |
||||||||||||||||||||||||||||||||
Amortized cost |
13,237 |
15,145 |
14,670 |
8,587 |
3,782 |
– |
55,421 |
56,878 | ||||||||||||||||||||||||
Fair value |
13,023 |
14,521 |
13,444 |
7,421 |
2,910 |
– |
51,319 |
51,063 | ||||||||||||||||||||||||
Yield (%) |
1.40 |
1.30 |
1.58 |
1.56 |
2.04 |
– |
1.49 |
1.50 | ||||||||||||||||||||||||
U.S. states, municipalities and agencies |
||||||||||||||||||||||||||||||||
Amortized cost |
– |
– |
– |
182 |
– |
– |
182 |
190 | ||||||||||||||||||||||||
Fair value |
– |
– |
– |
180 |
– |
– |
180 |
179 | ||||||||||||||||||||||||
Yield (%) |
– |
– |
– |
4.65 |
– |
– |
4.65 |
4.66 | ||||||||||||||||||||||||
Other governments |
||||||||||||||||||||||||||||||||
Amortized cost |
289 |
378 |
14 |
– |
– |
– |
681 |
948 | ||||||||||||||||||||||||
Fair value |
283 |
378 |
14 |
– |
– |
– |
675 |
779 | ||||||||||||||||||||||||
Yield (%) |
0.91 |
2.51 |
0.86 |
– |
– |
– |
1.80 |
1.82 | ||||||||||||||||||||||||
NHA MBS, U.S. agency MBS and CMO (1) |
||||||||||||||||||||||||||||||||
Amortized cost |
971 |
3,280 |
2,179 |
1,502 |
34,841 |
– |
42,773 |
47,590 | ||||||||||||||||||||||||
Fair value |
934 |
3,148 |
2,072 |
1,348 |
31,117 |
– |
38,619 |
41,134 | ||||||||||||||||||||||||
Yield (%) |
1.13 |
1.64 |
2.08 |
1.99 |
2.77 |
– |
2.58 |
2.61 | ||||||||||||||||||||||||
Corporate debt |
||||||||||||||||||||||||||||||||
Amortized cost |
335 |
1,034 |
102 |
42 |
7,665 |
– |
9,178 |
1,687 | ||||||||||||||||||||||||
Fair value |
331 |
972 |
105 |
40 |
7,601 |
– |
9,049 |
1,506 | ||||||||||||||||||||||||
Yield (%) |
1.55 |
2.49 |
2.68 |
1.02 |
5.03 |
– |
4.57 |
1.80 | ||||||||||||||||||||||||
Total carrying value |
17,587 |
22,636 |
18,014 |
10,663 |
46,288 |
– |
115,188 |
116,814 | ||||||||||||||||||||||||
Total fair value |
17,206 |
21,670 |
16,621 |
9,336 |
41,628 |
– |
106,461 |
104,171 | ||||||||||||||||||||||||
Yield (%) |
1.45 |
1.53 |
1.72 |
1.72 |
3.09 |
– |
2.19 |
2.01 | ||||||||||||||||||||||||
Total carrying value of securities |
45,065 |
49,337 |
56,702 |
51,613 |
121,273 |
72,890 |
396,880 |
320,084 | ||||||||||||||||||||||||
Total by Currency |
||||||||||||||||||||||||||||||||
Canadian dollar |
21,661 |
14,764 |
17,213 |
12,539 |
17,759 |
27,434 |
111,370 |
98,301 | ||||||||||||||||||||||||
U.S. dollar |
19,843 |
34,105 |
38,834 |
38,760 |
103,301 |
43,715 |
278,558 |
215,990 | ||||||||||||||||||||||||
Other currencies |
3,561 |
468 |
655 |
314 |
213 |
1,741 |
6,952 |
5,793 | ||||||||||||||||||||||||
Total securities |
$ |
45,065 |
$ |
49,337 |
$ |
56,702 |
$ |
51,613 |
$ |
121,273 |
$ |
72,890 |
$ |
396,880 |
$ | 320,084 | ||||||||||||||||
(1) |
These amounts are either supported by insured mortgages or issued by U.S. agencies and government-sponsored enterprises. NHA refers to the National Housing Act, MBS refers to mortgage-backed securities and CMO refers to collateralized mortgage obligations. |
(2) |
The carrying values of securities that are part of fair value hedging relationships are adjusted for related gains (losses) on hedge contracts. |
BMO Financial Group 207th Annual Report 2024 |
147 |
(Canadian $ in millions) |
2024 |
2023 |
||||||||||||||||||||||||||||||
Cost or amortized cost |
Gross unrealized gains |
Gross unrealized losses |
Fair value |
Cost or amortized cost |
Gross unrealized gains |
Gross unrealized losses |
Fair value |
|||||||||||||||||||||||||
Issued or guaranteed by: |
||||||||||||||||||||||||||||||||
Canadian federal government |
$ |
33,892 |
$ |
303 |
$ |
(18 |
) |
$ |
34,177 |
$ | 20,579 | $ | 14 | $ | (493 | ) | $ | 20,100 | ||||||||||||||
Canadian provincial and municipal governments |
5,939 |
82 |
(25 |
) |
5,996 |
5,281 | 2 | (228 | ) | 5,055 | ||||||||||||||||||||||
U.S. federal government |
17,033 |
100 |
(168 |
) |
16,965 |
6,245 | – | (365 | ) | 5,880 | ||||||||||||||||||||||
U.S. states, municipalities and agencies |
5,125 |
24 |
(81 |
) |
5,068 |
5,486 | 5 | (190 | ) | 5,301 | ||||||||||||||||||||||
Other governments |
5,643 |
20 |
(7 |
) |
5,656 |
7,064 | 13 | (108 | ) | 6,969 | ||||||||||||||||||||||
NHA MBS, U.S. agency MBS and CMO |
21,570 |
58 |
(335 |
) |
21,293 |
16,421 | 12 | (668 | ) | 15,765 | ||||||||||||||||||||||
Corporate debt |
4,391 |
31 |
(52 |
) |
4,370 |
3,676 | 3 | (90 | ) | 3,589 | ||||||||||||||||||||||
Corporate equity |
135 |
42 |
– |
177 |
129 | 31 | – | 160 | ||||||||||||||||||||||||
Total |
$ |
93,728 |
$ |
660 |
$ |
(686 |
) |
$ |
93,702 |
$ | 64,881 | $ | 80 | $ | (2,142 | ) | $ | 62,819 | ||||||||||||||
(Canadian $ in millions) |
2024 |
2023 |
||||||
FVTPL securities |
$ |
161 |
$ | 66 | ||||
FVOCI securities |
3,874 |
2,517 | ||||||
Amortized cost securities |
3,952 |
3,510 | ||||||
Total |
$ |
7,987 |
$ | 6,093 | ||||
(Canadian $ in millions) |
2024 |
2023 |
||||||
FVTPL securities |
$ |
87 |
$ | 144 | ||||
FVOCI securities – realized gains (1)
|
114 |
36 | ||||||
Impairment on FVOCI and amortized cost securities |
(1 |
) |
– | |||||
Securities gains, other than trading |
$ |
200 |
$ | 180 | ||||
| (1) | Gains are net of (losses) on hedge contracts. |
(Canadian $ in millions) |
2024 |
2023 |
||||||
Interest and dividend income |
$ |
515 |
$ | 454 | ||||
Gains (losses) from securities designated at FVTPL (1)
|
1,270 |
(282 | ) | |||||
Realized gains from FVOCI securities |
1 |
– | ||||||
Total interest and dividend income and gains held in our Insurance business |
$ |
1,786 |
$ | 172 | ||||
(1) |
Gains (losses) on these securities may be offset by certain (losses) gains from changes in insurance-related liabilities, as described above under Securities Designated at FVTPL. |
148 |
BMO Financial Group 207th Annual Report 2024 |
| BMO Financial Group 207th Annual Report 2024 | 149 |
150 |
BMO Financial Group 207th Annual Report 2024 |
(Canadian $ in millions) |
2024 |
2023 |
||||||||||||||||||||||||||||||
Stage 1 |
Stage 2 |
Stage 3 |
Total |
Stage 1 |
Stage 2 |
Stage 3 (1) |
Total |
|||||||||||||||||||||||||
Loans: Residential mortgages |
||||||||||||||||||||||||||||||||
Balance as at beginning of year |
$ |
73 |
$ |
151 |
$ |
10 |
$ |
234 |
$ |
59 |
$ |
67 |
$ |
16 |
$ |
142 |
||||||||||||||||
Transfer to Stage 1 |
132 |
(130 |
) |
(2 |
) |
– |
92 |
(92 |
) |
– |
– |
|||||||||||||||||||||
Transfer to Stage 2 |
(26 |
) |
42 |
(16 |
) |
– |
(18 |
) |
27 |
(9 |
) |
– |
||||||||||||||||||||
Transfer to Stage 3 |
(1 |
) |
(29 |
) |
30 |
– |
(1 |
) |
(12 |
) |
13 |
– |
||||||||||||||||||||
Net remeasurement of loss allowance |
(142 |
) |
170 |
36 |
64 |
(94 |
) |
106 |
15 |
27 |
||||||||||||||||||||||
Loan originations |
24 |
– |
– |
24 |
26 |
– |
– |
26 |
||||||||||||||||||||||||
Loan purchases |
– |
– |
– |
– |
31 |
– |
– |
31 |
||||||||||||||||||||||||
Derecognitions and maturities |
(3 |
) |
(13 |
) |
– |
(16 |
) |
(4 |
) |
(9 |
) |
– |
(13 |
) |
||||||||||||||||||
Model changes |
(1 |
) |
(5 |
) |
– |
(6 |
) |
(19 |
) |
63 |
– |
44 |
||||||||||||||||||||
Total PCL (2)
|
(17 |
) |
35 |
48 |
66 |
13 |
83 |
19 |
115 |
|||||||||||||||||||||||
Write-offs (3)
|
– |
– |
(5 |
) |
(5 |
) |
– |
– |
(10 |
) |
(10 |
) |
||||||||||||||||||||
Recoveries of previous write-offs |
– |
– |
7 |
7 |
– |
– |
7 |
7 |
||||||||||||||||||||||||
Foreign exchange and other |
– |
– |
(41 |
) |
(41 |
) |
1 |
1 |
(22 |
) |
(20 |
) |
||||||||||||||||||||
Balance as at end of year |
$ |
56 |
$ |
186 |
$ |
19 |
$ |
261 |
$ |
73 |
$ |
151 |
$ |
10 |
$ |
234 |
||||||||||||||||
Loans: Consumer instalment and other personal |
||||||||||||||||||||||||||||||||
Balance as at beginning of year |
$ |
220 |
$ |
434 |
$ |
152 |
$ |
806 |
$ |
111 |
$ |
304 |
$ |
102 |
$ |
517 |
||||||||||||||||
Transfer to Stage 1 |
301 |
(283 |
) |
(18 |
) |
– |
265 |
(254 |
) |
(11 |
) |
– |
||||||||||||||||||||
Transfer to Stage 2 |
(44 |
) |
91 |
(47 |
) |
– |
(52 |
) |
93 |
(41 |
) |
– |
||||||||||||||||||||
Transfer to Stage 3 |
(7 |
) |
(133 |
) |
140 |
– |
(18 |
) |
(104 |
) |
122 |
– |
||||||||||||||||||||
Net remeasurement of loss allowance |
(237 |
) |
355 |
437 |
555 |
(264 |
) |
438 |
309 |
483 |
||||||||||||||||||||||
Loan originations |
54 |
– |
– |
54 |
58 |
6 |
– |
64 |
||||||||||||||||||||||||
Loan purchases |
– |
– |
– |
– |
179 |
– |
– |
179 |
||||||||||||||||||||||||
Derecognitions and maturities |
(16 |
) |
(38 |
) |
(12 |
) |
(66 |
) |
(34 |
) |
(43 |
) |
– |
(77 |
) |
|||||||||||||||||
Model changes |
15 |
46 |
– |
61 |
(26 |
) |
(8 |
) |
– |
(34 |
) |
|||||||||||||||||||||
Total PCL (2)
|
66 |
38 |
500 |
604 |
108 |
128 |
379 |
615 |
||||||||||||||||||||||||
Write-offs (3)
|
– |
– |
(623 |
) |
(623 |
) |
– |
– |
(371 |
) |
(371 |
) |
||||||||||||||||||||
Recoveries of previous write-offs |
– |
– |
195 |
195 |
– |
– |
74 |
74 |
||||||||||||||||||||||||
Foreign exchange and other |
(89 |
) |
(1 |
) |
(49 |
) |
(139 |
) |
1 |
2 |
(32 |
) |
(29 |
) |
||||||||||||||||||
Balance as at end of year |
$ |
197 |
$ |
471 |
$ |
175 |
$ |
843 |
$ |
220 |
$ |
434 |
$ |
152 |
$ |
806 |
||||||||||||||||
Loans: Credit cards |
||||||||||||||||||||||||||||||||
Balance as at beginning of year |
$ |
188 |
$ |
308 |
$ |
– |
$ |
496 |
$ |
115 |
$ |
250 |
$ |
– |
$ |
365 |
||||||||||||||||
Transfer to Stage 1 |
226 |
(226 |
) |
– |
– |
172 |
(172 |
) |
– |
– |
||||||||||||||||||||||
Transfer to Stage 2 |
(64 |
) |
64 |
– |
– |
(45 |
) |
45 |
– |
– |
||||||||||||||||||||||
Transfer to Stage 3 |
(6 |
) |
(290 |
) |
296 |
– |
(3 |
) |
(147 |
) |
150 |
– |
||||||||||||||||||||
Net remeasurement of loss allowance |
(182 |
) |
633 |
308 |
759 |
(146 |
) |
366 |
216 |
436 |
||||||||||||||||||||||
Loan originations |
76 |
– |
– |
76 |
77 |
1 |
– |
78 |
||||||||||||||||||||||||
Loan purchases |
– |
– |
– |
– |
25 |
– |
– |
25 |
||||||||||||||||||||||||
Derecognitions and maturities |
(8 |
) |
(27 |
) |
– |
(35 |
) |
(7 |
) |
(36 |
) |
– |
(43 |
) |
||||||||||||||||||
Model changes |
4 |
9 |
– |
13 |
– |
– |
– |
– |
||||||||||||||||||||||||
Total PCL (2)
|
46 |
163 |
604 |
813 |
73 |
57 |
366 |
496 |
||||||||||||||||||||||||
Write-offs (3)
|
– |
– |
(720 |
) |
(720 |
) |
– |
– |
(436 |
) |
(436 |
) |
||||||||||||||||||||
Recoveries of previous write-offs |
– |
– |
171 |
171 |
– |
– |
103 |
103 |
||||||||||||||||||||||||
Foreign exchange and other |
(1 |
) |
1 |
(55 |
) |
(55 |
) |
– |
1 |
(33 |
) |
(32 |
) |
|||||||||||||||||||
Balance as at end of year |
$ |
233 |
$ |
472 |
$ |
– |
$ |
705 |
$ |
188 |
$ |
308 |
$ |
– |
$ |
496 |
||||||||||||||||
Loans: Business and government |
||||||||||||||||||||||||||||||||
Balance as at beginning of year |
$ |
1,043 |
$ |
1,155 |
$ |
533 |
$ |
2,731 |
$ |
746 |
$ |
789 |
$ |
439 |
$ |
1,974 |
||||||||||||||||
Transfer to Stage 1 |
601 |
(575 |
) |
(26 |
) |
– |
306 |
(291 |
) |
(15 |
) |
– |
||||||||||||||||||||
Transfer to Stage 2 |
(278 |
) |
394 |
(116 |
) |
– |
(173 |
) |
236 |
(63 |
) |
– |
||||||||||||||||||||
Transfer to Stage 3 |
(9 |
) |
(310 |
) |
319 |
– |
(25 |
) |
(161 |
) |
186 |
– |
||||||||||||||||||||
Net remeasurement of loss allowance |
(599 |
) |
1,189 |
1,748 |
2,338 |
(446 |
) |
735 |
308 |
597 |
||||||||||||||||||||||
Loan originations |
278 |
8 |
– |
286 |
276 |
4 |
– |
280 |
||||||||||||||||||||||||
Loan purchases |
– |
– |
– |
– |
470 |
– |
– |
470 |
||||||||||||||||||||||||
Derecognitions and maturities |
(147 |
) |
(308 |
) |
(11 |
) |
(466 |
) |
(126 |
) |
(193 |
) |
– |
(319 |
) |
|||||||||||||||||
Model changes |
53 |
57 |
– |
110 |
(17 |
) |
(51 |
) |
– |
(68 |
) |
|||||||||||||||||||||
Total PCL (2)
|
(101 |
) |
455 |
1,914 |
2,268 |
265 |
279 |
416 |
960 |
|||||||||||||||||||||||
Write-offs (3)
|
– |
– |
(1,802 |
) |
(1,802 |
) |
– |
– |
(372 |
) |
(372 |
) |
||||||||||||||||||||
Recoveries of previous write-offs |
– |
– |
194 |
194 |
– |
– |
81 |
81 |
||||||||||||||||||||||||
Foreign exchange and other |
(50 |
) |
88 |
(302 |
) |
(264 |
) |
32 |
87 |
(31 |
) |
88 |
||||||||||||||||||||
Balance as at end of year |
$ |
892 |
$ |
1,698 |
$ |
537 |
$ |
3,127 |
$ |
1,043 |
$ |
1,155 |
$ |
533 |
$ |
2,731 |
||||||||||||||||
Total as at end of year |
$ |
1,378 |
$ |
2,827 |
$ |
731 |
$ |
4,936 |
$ |
1,524 |
$ |
2,048 |
$ |
695 |
$ |
4,267 |
||||||||||||||||
Comprising: Loans |
$ |
1,143 |
$ |
2,560 |
$ |
653 |
$ |
4,356 |
$ |
1,264 |
$ |
1,859 |
$ |
684 |
$ |
3,807 |
||||||||||||||||
Other credit instruments (4)
|
235 |
267 |
78 |
580 |
260 |
189 |
11 |
460 |
||||||||||||||||||||||||
| (1) | Includes changes in allowance for purchased credit impaired (PCI) loans. |
| (2) | Excludes PCL on other assets of $10 million for the year ended October 31, 2024 ($(8) million for the year ended October 31, 2023). |
| (3) | Generally, we continue to seek recovery on amounts that were written off during the year, unless the loan is sold, we no longer have the right to collect or we have exhausted all reasonable efforts to collect. |
| (4) | Other credit instruments, including off-balance sheet items, are recorded in other liabilities in our Consolidated Balance Sheet. |
BMO Financial Group 207th Annual Report 2024 |
151 |
(Canadian $ in millions) |
2024 |
2023 |
||||||||||||||||||||||||||||||
Stage 1 |
Stage 2 |
Stage 3 |
Total |
Stage 1 (1) |
Stage 2 |
Stage 3 |
Total |
|||||||||||||||||||||||||
Loans: Residential mortgages |
||||||||||||||||||||||||||||||||
Exceptionally low |
$ |
1 |
$ |
– |
$ |
– |
$ |
1 |
$ |
2 |
$ |
– |
$ |
– |
$ |
2 |
||||||||||||||||
Very low |
86,730 |
5,631 |
– |
92,361 |
85,423 |
171 |
– |
85,594 |
||||||||||||||||||||||||
Low |
52,111 |
15,080 |
– |
67,191 |
51,366 |
10,820 |
– |
62,186 |
||||||||||||||||||||||||
Medium |
7,402 |
5,329 |
– |
12,731 |
5,289 |
5,434 |
– |
10,723 |
||||||||||||||||||||||||
High |
268 |
2,622 |
– |
2,890 |
282 |
2,015 |
– |
2,297 |
||||||||||||||||||||||||
Not rated (4)
|
14,207 |
1,042 |
– |
15,249 |
15,906 |
118 |
– |
16,024 |
||||||||||||||||||||||||
Impaired |
– |
– |
657 |
657 |
– |
– |
424 |
424 |
||||||||||||||||||||||||
Gross residential mortgages |
160,719 |
29,704 |
657 |
191,080 |
158,268 |
18,558 |
424 |
177,250 |
||||||||||||||||||||||||
ACL |
56 |
185 |
10 |
251 |
73 |
146 |
5 |
224 |
||||||||||||||||||||||||
Carrying amount |
160,663 |
29,519 |
647 |
190,829 |
158,195 |
18,412 |
419 |
177,026 |
||||||||||||||||||||||||
Loans: Consumer instalment and other personal |
||||||||||||||||||||||||||||||||
Exceptionally low |
9,162 |
145 |
– |
9,307 |
1,547 |
4 |
– |
1,551 |
||||||||||||||||||||||||
Very low |
20,466 |
903 |
– |
21,369 |
37,924 |
180 |
– |
38,104 |
||||||||||||||||||||||||
Low |
26,125 |
4,575 |
– |
30,700 |
21,406 |
1,052 |
– |
22,458 |
||||||||||||||||||||||||
Medium |
7,405 |
5,526 |
– |
12,931 |
7,971 |
5,686 |
– |
13,657 |
||||||||||||||||||||||||
High |
789 |
2,017 |
– |
2,806 |
759 |
2,127 |
– |
2,886 |
||||||||||||||||||||||||
Not rated (4)
|
14,522 |
475 |
– |
14,997 |
24,426 |
411 |
– |
24,837 |
||||||||||||||||||||||||
Impaired |
– |
– |
577 |
577 |
– |
– |
549 |
549 |
||||||||||||||||||||||||
Gross consumer instalment and other personal |
78,469 |
13,641 |
577 |
92,687 |
94,033 |
9,460 |
549 |
104,042 |
||||||||||||||||||||||||
ACL |
183 |
447 |
168 |
798 |
208 |
415 |
152 |
775 |
||||||||||||||||||||||||
Carrying amount |
78,286 |
13,194 |
409 |
91,889 |
93,825 |
9,045 |
397 |
103,267 |
||||||||||||||||||||||||
Loans: Credit cards (5)
|
||||||||||||||||||||||||||||||||
Exceptionally low |
1,660 |
– |
– |
1,660 |
1,605 |
– |
– |
1,605 |
||||||||||||||||||||||||
Very low |
2,166 |
1 |
– |
2,167 |
1,946 |
1 |
– |
1,947 |
||||||||||||||||||||||||
Low |
2,110 |
60 |
– |
2,170 |
1,884 |
70 |
– |
1,954 |
||||||||||||||||||||||||
Medium |
4,544 |
824 |
– |
5,368 |
3,860 |
890 |
– |
4,750 |
||||||||||||||||||||||||
High |
746 |
922 |
– |
1,668 |
533 |
763 |
– |
1,296 |
||||||||||||||||||||||||
Not rated (4)
|
430 |
149 |
– |
579 |
651 |
91 |
– |
742 |
||||||||||||||||||||||||
Impaired |
– |
– |
– |
– |
– |
– |
– |
– |
||||||||||||||||||||||||
Gross credit cards |
11,656 |
1,956 |
– |
13,612 |
10,479 |
1,815 |
– |
12,294 |
||||||||||||||||||||||||
ACL |
161 |
421 |
– |
582 |
134 |
267 |
– |
401 |
||||||||||||||||||||||||
Carrying amount |
11,495 |
1,535 |
– |
13,030 |
10,345 |
1,548 |
– |
11,893 |
||||||||||||||||||||||||
Loans: Business and government (6)
|
||||||||||||||||||||||||||||||||
Acceptable |
||||||||||||||||||||||||||||||||
Investment grade |
191,742 |
3,437 |
– |
195,179 |
202,731 |
3,886 |
– |
206,617 |
||||||||||||||||||||||||
Sub-investment grade |
147,713 |
15,078 |
– |
162,791 |
126,535 |
26,260 |
– |
152,795 |
||||||||||||||||||||||||
Watchlist |
238 |
22,535 |
– |
22,773 |
1,078 |
11,520 |
– |
12,598 |
||||||||||||||||||||||||
Impaired |
– |
– |
4,609 |
4,609 |
– |
– |
2,987 |
2,987 |
||||||||||||||||||||||||
Gross business and government |
339,693 |
41,050 |
4,609 |
385,352 |
330,344 |
41,666 |
2,987 |
374,997 |
||||||||||||||||||||||||
ACL |
743 |
1,507 |
475 |
2,725 |
849 |
1,031 |
527 |
2,407 |
||||||||||||||||||||||||
Carrying amount |
338,950 |
39,543 |
4,134 |
382,627 |
329,495 |
40,635 |
2,460 |
372,590 |
||||||||||||||||||||||||
Total gross loans and acceptances |
590,537 |
86,351 |
5,843 |
682,731 |
593,124 |
71,499 |
3,960 |
668,583 |
||||||||||||||||||||||||
Total net loans and acceptances |
589,394 |
83,791 |
5,190 |
678,375 |
591,860 |
69,640 |
3,276 |
664,776 |
||||||||||||||||||||||||
Commitments and financial guarantee contracts |
||||||||||||||||||||||||||||||||
Acceptable |
||||||||||||||||||||||||||||||||
Investment grade |
198,132 |
787 |
– |
198,919 |
195,149 |
1,721 |
– |
196,870 |
||||||||||||||||||||||||
Sub-investment grade |
68,177 |
6,647 |
– |
74,824 |
54,148 |
14,158 |
– |
68,306 |
||||||||||||||||||||||||
Watchlist |
59 |
8,765 |
– |
8,824 |
254 |
4,137 |
– |
4,391 |
||||||||||||||||||||||||
Impaired |
– |
– |
1,373 |
1,373 |
– |
– |
687 |
687 |
||||||||||||||||||||||||
Gross commitments and financial guarantee contracts |
266,368 |
16,199 |
1,373 |
283,940 |
249,551 |
20,016 |
687 |
270,254 |
||||||||||||||||||||||||
ACL |
235 |
267 |
78 |
580 |
260 |
189 |
11 |
460 |
||||||||||||||||||||||||
Carrying amount (7) (8)
|
$ |
266,133 |
$ |
15,932 |
$ |
1,295 |
$ |
283,360 |
$ |
249,291 |
$ |
19,827 |
$ |
676 |
$ |
269,794 |
||||||||||||||||
| (1) | Includes $163 million ($1,676 million as at October 31, 2023) of residential mortgages and $12,431 million ($5,720 million as at October 31, 2023) of business and government loans that are classified and measured at FVTPL. |
(2) |
Includes Bank of the West PCI loans. |
| ( 3 ) |
92% of Stage 3 loans were either fully or partially collateralized as at October 31, 2024 (93% as at October 31, 2023). |
(4) |
Includes purchased portfolios and certain cases where an internal risk rating is not assigned. Alternative credit risk assessments, rating methodologies, policies and tools are used to manage credit risk for these portfolios .
|
| (5) | Credit card loans are immediately written off when principal or interest payments are 180 days past due, and as a result are not reported as impaired in Stage 3. |
| (6) | Includes customers’ liability under acceptances. |
| (7) | Represents the total contractual amounts of undrawn credit facilities and other off-balance sheet exposures, excluding personal lines of credit and credit cards that are unconditionally cancellable at our discretion. |
| (8) | Certain commercial borrower commitments are conditional and may include recourse to counterparties. |
152 |
BMO Financial Group 207th Annual Report 2024 |
(Canadian $ in millions) |
2024 |
2023 |
||||||||||||||||||||||||||||||
Gross amount |
ACL on impaired loans |
ACL on performing loans |
Net amount |
Gross amount |
ACL on impaired loans (1) |
ACL on performing loans |
Net amount |
|||||||||||||||||||||||||
By geographic region (3)
|
||||||||||||||||||||||||||||||||
Canada |
$ |
392,398 |
$ |
461 |
$ |
1,531 |
$ |
390,406 |
$ | 365,455 | $ | 457 | $ | 1,272 | $ | 363,726 | ||||||||||||||||
United States |
277,718 |
192 |
2,141 |
275,385 |
283,355 | 227 | 1,833 | 281,295 | ||||||||||||||||||||||||
Other countries |
12,256 |
– |
31 |
12,225 |
11,662 | – | 18 | 11,644 | ||||||||||||||||||||||||
Total |
$ |
682,372 |
$ |
653 |
$ |
3,703 |
$ |
678,016 |
$ | 660,472 | $ | 684 | $ | 3,123 | $ | 656,665 | ||||||||||||||||
| (1) | Excludes ACL on impaired loans of $78 million for other credit instruments, which is included in other liabilities ($11 million as at October 31, 2023). |
| (2) | Excludes ACL on performing loans of $502 million for other credit instruments, which is included in other liabilities ($449 million as at October 31, 2023). |
| (3) | Geographic region is based upon the country of ultimate risk. |
(Canadian $ in millions) |
2024 |
2023 |
||||||||||||||||||||||
Gross impaired amount |
ACL on impaired loans |
Net impaired amount |
Gross impaired amount |
ACL on impaired loans (1) |
Net impaired amount |
|||||||||||||||||||
Residential mortgages |
$ |
657 |
$ |
10 |
$ |
647 |
$ | 424 | $ | 5 | $ | 419 | ||||||||||||
Consumer instalment and other personal |
577 |
168 |
409 |
549 | 152 | 397 | ||||||||||||||||||
Business and government (2)
|
4,609 |
475 |
4,134 |
2,987 | 527 | 2,460 | ||||||||||||||||||
Total |
$ |
5,843 |
$ |
653 |
$ |
5,190 |
$ | 3,960 | $ | 684 | $ | 3,276 | ||||||||||||
By geographic region (3)
|
||||||||||||||||||||||||
Canada |
$ |
2,513 |
$ |
461 |
$ |
2,052 |
$ | 1,629 | $ | 457 | $ | 1,172 | ||||||||||||
United States |
3,327 |
192 |
3,135 |
2,331 | 227 | 2,104 | ||||||||||||||||||
Other countries |
3 |
– |
3 |
– | – | – | ||||||||||||||||||
Total |
$ |
5,843 |
$ |
653 |
$ |
5,190 |
$ | 3,960 | $ | 684 | $ | 3,276 | ||||||||||||
| (1) | Excludes ACL on impaired loans of $78 million for other credit instruments, which is included in other liabilities ($11 million as at October 31, 2023). |
(2) |
Includes customers’ liability under acceptances. |
(3) |
Geographic region is based upon the country of ultimate risk. |
BMO Financial Group 207th Annual Report 2024 |
153 |
(Canadian $ in millions) |
2024 |
2023 |
||||||||||||||||||||||
30 to 89 days |
90 days or more |
Total |
30 to 89 days |
90 days or more (1) |
Total |
|||||||||||||||||||
Residential mortgages |
$ |
696 |
$ |
15 |
$ |
711 |
$ | 707 | $ | 9 | $ | 716 | ||||||||||||
Credit cards, consumer instalment and other personal |
734 |
173 |
907 |
1,003 | 129 | 1,132 | ||||||||||||||||||
Business and government |
689 |
16 |
705 |
826 | 18 | 844 | ||||||||||||||||||
Total |
$ |
2,119 |
$ |
204 |
$ |
2,323 |
$ | 2,536 | $ | 156 | $ | 2,692 | ||||||||||||
| (1) | Fully secured loans with amounts between 90 and 180 days past due that we have not classified as impaired totalled $16 million as at October 31, 2024 ($10 million as at October 31, 2023). |
As at October 31, 2024 |
||||||||||||||||||||||||||||||||
Scenarios |
||||||||||||||||||||||||||||||||
All figures are average annual values |
Upside |
Base |
Downside |
Severe downside |
||||||||||||||||||||||||||||
First 12 months |
Remaining horizon |
First 12 months |
Remaining horizon |
First 12 months |
Remaining horizon |
First 12 months |
Remaining horizon |
|||||||||||||||||||||||||
Real GDP growth rates (2)
|
||||||||||||||||||||||||||||||||
Canada |
4.6 %
|
2.6 %
|
1.8 %
|
1.9 %
|
(2.3) %
|
1.3 %
|
(3.6) %
|
1.2 %
|
||||||||||||||||||||||||
United States |
4.3 %
|
2.4 %
|
1.9 %
|
1.9 %
|
(2.1) %
|
1.4 %
|
(3.4) %
|
1.3 %
|
||||||||||||||||||||||||
Corporate BBB 10-year spread |
||||||||||||||||||||||||||||||||
Canada |
1.3 %
|
1.8 %
|
1.9 %
|
2.0 %
|
3.6 %
|
3.0 %
|
4.2 %
|
3.5 %
|
||||||||||||||||||||||||
United States |
0.9 %
|
1.6 %
|
1.6 %
|
2.0 %
|
3.4 %
|
3.1 %
|
4.6 %
|
3.6 %
|
||||||||||||||||||||||||
Unemployment rates |
||||||||||||||||||||||||||||||||
Canada |
5.3 %
|
4.8 %
|
7.0 %
|
6.8 %
|
8.8 %
|
9.4 %
|
9.8 %
|
10.5 % |
||||||||||||||||||||||||
United States |
3.4 %
|
3.0 %
|
4.7 %
|
4.4 %
|
6.7 %
|
7.3 %
|
7.6 %
|
8.4 % |
||||||||||||||||||||||||
Housing Price Index (2)
|
||||||||||||||||||||||||||||||||
Canada (3)
|
5.9 %
|
5.4 %
|
1.6 %
|
3.0 %
|
(10.9) %
|
(1.0) %
|
(19.0) %
|
(5.0) %
|
||||||||||||||||||||||||
United States (4)
|
5.9 % |
4.0 %
|
2.8 %
|
2.6 %
|
(9.6) %
|
(1.0) %
|
(19.3) %
|
(4.3) %
|
||||||||||||||||||||||||
(1) |
The remaining forecast period is two years. |
(2) |
Real gross domestic product (GDP) and housing price index are averages of quarterly year-over-year growth rates. |
(3) |
In Canada, we use the Housing Price Index Benchmark Composite. |
(4) |
In the United States, we use the National Case-Shiller House Price Index. |
154 |
BMO Financial Group 207th Annual Report 2024 |
| As at October 31, 2023 | ||||||||||||||||||||||||||||||||
| Scenarios | ||||||||||||||||||||||||||||||||
| All figures are average annual values | Upside | Base | Severe downside | |||||||||||||||||||||||||||||
| First 12 months |
Remaining horizon (1) |
First 12 months |
Remaining horizon (1) |
First 12 months |
Remaining horizon (1) |
|||||||||||||||||||||||||||
| Real GDP growth rates (2)
|
||||||||||||||||||||||||||||||||
| Canada |
3.2 % |
2.6 % |
0.4% | 1.9% | (3.9)% | 1.2% | ||||||||||||||||||||||||||
| United States |
4.1 % |
2.5% | 1.4% | 2.0% | (3.5)% | 1.4% | ||||||||||||||||||||||||||
| Corporate BBB 10-year spread |
||||||||||||||||||||||||||||||||
| Canada |
1.7 % |
1.8% | 2.4% | 2.0% | 4.2% | 3.5% | ||||||||||||||||||||||||||
| United States |
1.4 % |
1.7% | 2.2% | 2.1% | 4.6% | 3.5% | ||||||||||||||||||||||||||
| Unemployment rates |
||||||||||||||||||||||||||||||||
| Canada |
4.2 % |
3.7% | 5.9% | 5.7% | 9.3% | 10.1% | ||||||||||||||||||||||||||
| United States |
2.9 % |
2.5% | 4.2% | 4.1% | 7.5% | 8.3% | ||||||||||||||||||||||||||
| Housing Price Index (2)
|
||||||||||||||||||||||||||||||||
| Canada (3)
|
9.9 % |
6.9% | 5.5% | 4.5% | (20.2)% | (5.0)% | ||||||||||||||||||||||||||
| United States (4)
|
2.7 % |
3.7% | (0.5)% | 2.3% | (19.2)% | (4.3)% | ||||||||||||||||||||||||||
| (1) | The remaining forecast period is two years. |
| (2) | Real gross domestic product (GDP) and housing price index are averages of quarterly year-over-year growth rates. |
| (3) | In Canada, we use the Housing Price Index Benchmark Composite. |
| (4) | In the United States, we use the National Case-Shiller House Price Index. |
BMO Financial Group 207th Annual Report 2024 |
155 |
(Canadian $ in millions) |
2024 |
2023 |
||||||||||||||
Carrying value |
Fair value |
Carrying value (1) |
Fair value |
|||||||||||||
| Assets |
||||||||||||||||
| Trading securities (2)
|
$ |
106 |
$ |
– |
$ |
277 |
$ |
– |
||||||||
| Loans |
9,277 |
– |
7,317 |
– |
||||||||||||
| Other related assets (3)
|
6,952 |
– |
8,430 |
– |
||||||||||||
| Total |
$ |
16,335 |
$ |
16,118 |
$ |
16,024 |
$ |
15,266 |
||||||||
| Associated liabilities (4)
|
$ |
15,790 |
$ |
15,598 |
$ |
14,937 |
$ |
14,244 |
||||||||
| (1) | Carrying value of loans is net of ACL , where applicable. |
| (2) | Trading securities represent CMO issued by third-party sponsored vehicles, where we do not substantially transfer all of the risks and rewards of ownership to third-party investors. |
| (3) | Other related assets represent payments received on account of mortgages pledged under securitization programs that have not yet been applied against the associated liabilities. The payments received are held in permitted instruments on behalf of the investors in the securitization vehicles until principal payments are required to be made on the associated liabilities. In order to compare all assets supporting the associated liabilities, this amount is added to the carrying value of the securitized assets in the table above. |
| (4) | Associated liabilities are recognized in securitization and structured entities’ liabilities in our Consolidated Balance Sheet. |
156 |
BMO Financial Group 207th Annual Report 2024 |
BMO Financial Group 207th Annual Report 2024 |
157 |
(Canadian $ in millions) |
2024 |
2023 |
||||||||||||||
Carrying value |
Fair value |
Carrying value |
Fair value |
|||||||||||||
| Assets |
||||||||||||||||
| Credit cards |
$ |
10,964 |
$ |
10,964 |
$ |
9,506 |
$ |
9,506 |
||||||||
| Consumer instalment and other personal (2)
|
3,732 |
3,728 |
4,695 |
4,670 |
||||||||||||
| Total |
$ |
14,696 |
$ |
14,692 |
$ |
14,201 |
$ |
14,176 |
||||||||
| Associated liabilities (3)
|
$ |
9,151 |
$ |
9,146 |
$ |
10,376 |
$ |
10,177 |
||||||||
| (1) | Carrying value of loans is net of ACL. |
| (2) | Includes real estate lines of credit and auto loans. |
| (3) | Associated liabilities are recognized in securitization and structured entities’ liabilities in our Consolidated Balance Sheet. |
(Canadian $ in millions) |
2024 |
2023 |
||||||||||||||||||||||
|
Customer securitization vehicles |
Capital vehicles |
Other securitization vehicles |
Customer securitization vehicles (1) |
Capital vehicles |
Other securitization vehicles |
|||||||||||||||||||
| Interests recorded in our Consolidated Balance Sheet |
|
|||||||||||||||||||||||
| Financial Assets |
||||||||||||||||||||||||
| Cash and cash equivalents |
$ |
107 |
$ |
5,536 |
$ |
– |
$ |
184 |
$ |
5,182 |
$ |
– |
||||||||||||
| Trading securities |
170 |
– |
21,485 |
518 |
– |
3,346 |
||||||||||||||||||
| FVTPL securities |
40 |
– |
– |
23 |
– |
– |
||||||||||||||||||
| FVOCI securities |
1,484 |
– |
– |
1,393 |
– |
– |
||||||||||||||||||
| Derivatives |
1 |
– |
– |
23 |
– |
– |
||||||||||||||||||
| Other |
8 |
– |
169 |
9 |
– |
100 |
||||||||||||||||||
| Total |
$ |
1,810 |
$ |
5,536 |
$ |
21,654 |
$ |
2,150 |
$ |
5,182 |
$ |
3,446 |
||||||||||||
| Financial Liabilities |
||||||||||||||||||||||||
| Deposits |
$ |
107 |
$ |
5,536 |
$ |
– |
$ |
184 |
$ |
5,182 |
$ |
– |
||||||||||||
| Derivatives |
3 |
– |
– |
– |
– |
– |
||||||||||||||||||
| Other |
– |
87 |
– |
– |
79 |
– |
||||||||||||||||||
| Total |
$ |
110 |
$ |
5,623 |
$ |
– |
$ |
184 |
$ |
5,261 |
$ |
– |
||||||||||||
| Maximum exposure to loss (2)
|
$ |
20,998 |
$ |
1 |
$ |
21,654 |
$ |
21,740 |
$ |
1 |
$ |
3,446 |
||||||||||||
| Total assets of the entities |
$ |
12,956 |
$ |
5,624 |
$ |
87,611 |
$ |
13,936 |
$ |
5,260 |
$ |
30,877 |
||||||||||||
| (1) | Securities held that are issued by our Canadian and U.S. customer securitization vehicles comprise |
| (2) | Maximum exposure to loss represents securities held, undrawn liquidity facilities, any remaining unfunded committed amounts to the BMO funded vehicle, derivative assets and other assets. |
158 |
BMO Financial Group 207th Annual Report 2024 |
BMO Financial Group 207th Annual Report 2024 |
159 |
• |
Interest rate swaps – counterparties generally exchange fixed and floating rate interest payments based on a notional value in a single currency. |
• |
Cross-currency swaps – counterparties exchange fixed rate interest payments and principal amounts in different currencies. |
• |
Cross-currency interest rate swaps – counterparties exchange fixed and/or floating rate interest payments and principal amounts in different currencies. |
• |
Commodity swaps – counterparties generally exchange fixed and floating rate payments based on a notional value of a single commodity. |
• |
Equity swaps – counterparties exchange the return on an equity security or a group of equity securities for the return based on a fixed or floating interest rate or the return on another equity security or group of equity securities. |
• |
Credit default swaps – one counterparty pays the other a fee in exchange for that other counterparty agreeing to make a payment if a credit event occurs, such as bankruptcy or failure to pay. |
• |
Total return swaps – one counterparty agrees to pay or receive from the other cash amounts based on changes in the value of a reference asset or group of assets, including returns such as interest earned on these assets, in exchange for amounts that are based on prevailing market funding rates. |
160 |
BMO Financial Group 207th Annual Report 2024 |
BMO Financial Group 207th Annual Report 2024 |
161 |
(Canadian $ in millions) |
2024 |
2023 |
||||||||||||||||||||||
Gross assets |
Gross liabilities |
Net |
Gross assets |
Gross liabilities |
Net |
|||||||||||||||||||
Trading |
||||||||||||||||||||||||
Interest Rate Contracts |
||||||||||||||||||||||||
Swaps |
$ |
3,203 |
$ |
(5,707 |
) |
$ |
(2,504 |
) |
$ |
4,193 |
$ |
(9,393 |
) |
$ |
(5,200 |
) |
||||||||
Forward rate agreements |
477 |
(281 |
) |
196 |
360 |
(84 |
) |
276 |
||||||||||||||||
Purchased options |
2,574 |
– |
2,574 |
3,221 |
– |
3,221 |
||||||||||||||||||
Written options |
– |
(2,341 |
) |
(2,341 |
) |
– |
(3,129 |
) |
(3,129 |
) |
||||||||||||||
Futures |
21 |
(10 |
) |
11 |
6 |
(21 |
) |
(15 |
) |
|||||||||||||||
Foreign Exchange Contracts (1)
|
||||||||||||||||||||||||
Cross-currency swaps |
1,989 |
(1,378 |
) |
611 |
1,887 |
(1,397 |
) |
490 |
||||||||||||||||
Cross-currency interest rate swaps |
9,777 |
(10,867 |
) |
(1,090 |
) |
10,340 |
(10,081 |
) |
259 |
|||||||||||||||
Forward foreign exchange contracts |
8,150 |
(6,096 |
) |
2,054 |
6,685 |
(5,469 |
) |
1,216 |
||||||||||||||||
Purchased options |
657 |
– |
657 |
575 |
– |
575 |
||||||||||||||||||
Written options |
– |
(528 |
) |
(528 |
) |
– |
(448 |
) |
(448 |
) |
||||||||||||||
Commodity Contracts |
||||||||||||||||||||||||
Swaps |
1,023 |
(1,097 |
) |
(74 |
) |
1,029 |
(743 |
) |
286 |
|||||||||||||||
Purchased options |
644 |
– |
644 |
850 |
– |
850 |
||||||||||||||||||
Written options |
– |
(607 |
) |
(607 |
) |
– |
(787 |
) |
(787 |
) |
||||||||||||||
Futures |
160 |
(117 |
) |
43 |
143 |
(127 |
) |
16 |
||||||||||||||||
Equity Contracts |
14,194 |
(25,673 |
) |
(11,479 |
) |
4,690 |
(11,460 |
) |
(6,770 |
) |
||||||||||||||
Credit Contracts |
||||||||||||||||||||||||
Purchased |
1 |
(10 |
) |
(9 |
) |
13 |
(18 |
) |
(5 |
) |
||||||||||||||
Written |
9 |
(1 |
) |
8 |
12 |
(9 |
) |
3 |
||||||||||||||||
Total fair value – trading derivatives |
$ |
42,879 |
$ |
(54,713 |
) |
$ |
(11,834 |
) |
$ |
34,004 |
$ |
(43,166 |
) |
$ |
(9,162 |
) |
||||||||
Hedging |
||||||||||||||||||||||||
Interest Rate Contracts (2)
|
||||||||||||||||||||||||
Cash flow hedges – swaps |
$ |
2,148 |
$ |
(915 |
) |
$ |
1,233 |
$ |
693 |
$ |
(3,784 |
) |
$ |
(3,091 |
) |
|||||||||
Fair value hedges – swaps |
1,464 |
(1,589 |
) |
(125 |
) |
4,877 |
(1,390 |
) |
3,487 |
|||||||||||||||
Total swaps |
3,612 |
(2,504 |
) |
1,108 |
5,570 |
(5,174 |
) |
396 |
||||||||||||||||
Foreign Exchange Contracts |
||||||||||||||||||||||||
Cash flow hedges |
699 |
(1,080 |
) |
(381 |
) |
333 |
(1,801 |
) |
(1,468 |
) |
||||||||||||||
Fair value hedges |
– |
(2 |
) |
(2 |
) |
69 |
(1 |
) |
68 |
|||||||||||||||
Net investment hedges |
– |
(4 |
) |
(4 |
) |
– |
(8 |
) |
(8 |
) |
||||||||||||||
Total foreign exchange contracts |
699 |
(1,086 |
) |
(387 |
) |
402 |
(1,810 |
) |
(1,408 |
) |
||||||||||||||
Equity Contracts |
||||||||||||||||||||||||
Cash flow hedges |
63 |
– |
63 |
– |
(43 |
) |
(43 |
) |
||||||||||||||||
Total equity contracts |
63 |
– |
63 |
– |
(43 |
) |
(43 |
) |
||||||||||||||||
Total fair value – hedging derivatives (3)
|
4,374 |
(3,590 |
) |
784 |
5,972 |
(7,027 |
) |
(1,055 |
) |
|||||||||||||||
Total fair value – trading and hedging derivatives |
47,253 |
(58,303 |
) |
(11,050 |
) |
39,976 |
(50,193 |
) |
(10,217 |
) |
||||||||||||||
Less: impact of master netting agreements |
(31,576 |
) |
31,576 |
– |
(26,674 |
) |
26,674 |
– |
||||||||||||||||
Total |
$ |
15,677 |
$ |
(26,727 |
) |
$ |
(11,050 |
) |
$ |
13,302 |
$ |
(23,519 |
) |
$ |
(10,217 |
) |
||||||||
| (1) | Gold contracts are included in foreign exchange contracts. |
| (2) | Includes the fair value of bond futures in fair value hedges rounded down to $nil million as at October 31, 2024 ($nil million as at October 31, 2023). |
| (3) | The fair values of hedging derivatives wholly or partially offset the changes in fair values of the related on-balance sheet financial instruments. |
162 |
BMO Financial Group 207th Annual Report 2024 |
(Canadian $ in millions) |
2024 |
2023 |
||||||||||||||||||||||
Exchange-traded |
Over-the-counter |
Total |
Exchange-traded |
Over-the-counter |
Total |
|||||||||||||||||||
| Interest Rate Contracts |
||||||||||||||||||||||||
| Swaps |
$ |
– |
$ |
16,390,827 |
$ |
16,390,827 |
$ |
– |
$ |
9,254,984 |
$ |
9,254,984 |
||||||||||||
| Forward rate agreements |
– |
3,414,449 |
3,414,449 |
– |
132,653 |
132,653 |
||||||||||||||||||
| Purchased options |
136,796 |
253,694 |
390,490 |
37,264 |
130,000 |
167,264 |
||||||||||||||||||
| Written options |
26,468 |
255,721 |
282,189 |
38,256 |
118,524 |
156,780 |
||||||||||||||||||
| Futures |
1,735,442 |
– |
1,735,442 |
1,367,959 |
– |
1,367,959 |
||||||||||||||||||
| Total interest rate contracts |
1,898,706 |
20,314,691 |
22,213,397 |
1,443,479 |
9,636,161 |
11,079,640 |
||||||||||||||||||
| Foreign Exchange Contracts (1)
|
||||||||||||||||||||||||
| Cross-currency swaps |
– |
64,100 |
64,100 |
– |
54,169 |
54,169 |
||||||||||||||||||
| Cross-currency interest rate swaps |
– |
891,272 |
891,272 |
– |
677,765 |
677,765 |
||||||||||||||||||
| Forward foreign exchange contracts |
– |
679,250 |
679,250 |
– |
563,716 |
563,716 |
||||||||||||||||||
| Purchased options |
3,572 |
76,576 |
80,148 |
1,851 |
51,143 |
52,994 |
||||||||||||||||||
| Written options |
3,248 |
88,210 |
91,458 |
2,282 |
55,370 |
57,652 |
||||||||||||||||||
| Futures |
1,751 |
– |
1,751 |
4,035 |
– |
4,035 |
||||||||||||||||||
| Total foreign exchange contracts |
8,571 |
1,799,408 |
1,807,979 |
8,168 |
1,402,163 |
1,410,331 |
||||||||||||||||||
| Commodity Contracts |
||||||||||||||||||||||||
| Swaps |
– |
20,328 |
20,328 |
– |
18,574 |
18,574 |
||||||||||||||||||
| Purchased options |
43,931 |
5,495 |
49,426 |
30,397 |
5,319 |
35,716 |
||||||||||||||||||
| Written options |
45,440 |
4,268 |
49,708 |
31,351 |
4,218 |
35,569 |
||||||||||||||||||
| Futures |
36,071 |
– |
36,071 |
35,285 |
– |
35,285 |
||||||||||||||||||
| Total commodity contracts |
125,442 |
30,091 |
155,533 |
97,033 |
28,111 |
125,144 |
||||||||||||||||||
| Equity Contracts |
333,126 |
138,034 |
471,160 |
189,112 |
115,689 |
304,801 |
||||||||||||||||||
| Credit Contracts |
||||||||||||||||||||||||
| Purchased |
– |
23,350 |
23,350 |
– |
16,927 |
16,927 |
||||||||||||||||||
| Written |
– |
16,211 |
16,211 |
– |
10,010 |
10,010 |
||||||||||||||||||
| Total credit contracts |
– |
39,561 |
39,561 |
– |
26,937 |
26,937 |
||||||||||||||||||
| Total |
$ |
2,365,845 |
$ |
22,321,785 |
$ |
24,687,630 |
$ |
1,737,792 |
$ |
11,209,061 |
$ |
12,946,853 |
||||||||||||
| (1) | Gold contracts are included in foreign exchange contracts. |
BMO Financial Group 207th Annual Report 2024 |
163 |
(Canadian $ in millions, except as noted) |
Remaining term to maturity |
2024 |
2023 |
|||||||||||||||||||||||||||
Within 1 year |
1 to 3 years |
3 to 5 years |
5 to 10 years |
Over 10 years |
Total |
Total |
||||||||||||||||||||||||
| Cash Flow Hedges |
||||||||||||||||||||||||||||||
| Interest rate risk – Interest rate swaps |
||||||||||||||||||||||||||||||
| Notional amount (1)
|
$ |
62,887 |
$ |
99,368 |
$ |
64,333 |
$ |
34,402 |
$ |
5,882 |
$ |
266,872 |
$ |
186,679 |
||||||||||||||||
| Average fixed interest rate |
4.59% |
3.38% |
3.54% |
3.63% |
3.79% |
3.75% |
4.20% |
|||||||||||||||||||||||
| Foreign exchange risk – Cross-currency swaps and foreign exchange forwards (2)
|
||||||||||||||||||||||||||||||
| CAD-USD pair |
Notional amount |
4,256 |
21,186 |
14,229 |
1,011 |
251 |
40,933 |
43,622 |
||||||||||||||||||||||
Average fixed interest rate |
1.96% |
3.38% |
3.24% |
1.75% |
3.02% |
3.14% |
2.77% |
|||||||||||||||||||||||
Average exchange rate: CAD-USD
|
1.2589 |
1.3197 |
1.3532 |
1.3266 |
1.3122 |
1.3252 |
1.3218 |
|||||||||||||||||||||||
| CAD-EUR pair |
Notional amount |
717 |
13,171 |
3,310 |
– |
201 |
17,399 |
16,386 |
||||||||||||||||||||||
Average fixed interest rate |
5.40% |
3.44% |
3.21% |
– |
2.97% |
3.47% |
3.15% |
|||||||||||||||||||||||
Average exchange rate: CAD-EUR
|
1.4345 |
1.4177 |
1.4711 |
– |
1.4870 |
1.4293 |
1.4352 |
|||||||||||||||||||||||
| Other currency pairs (3)
|
Notional amount |
923 |
6,548 |
2,219 |
237 |
– |
9,927 |
9,787 |
||||||||||||||||||||||
Average fixed interest rate |
2.54% |
2.98% |
4.22% |
4.83% |
– |
3.26% |
2.99% |
|||||||||||||||||||||||
Average exchange rate: CAD-Non USD/EUR |
1.4539 |
1.6847 |
1.2748 |
0.3257 |
– |
1.5391 |
1.5221 |
|||||||||||||||||||||||
| Equity price risk – Total return swap (4)
|
||||||||||||||||||||||||||||||
| Notional amount |
20 |
460 |
– |
– |
– |
480 |
451 |
|||||||||||||||||||||||
| Fair Value Hedges |
||||||||||||||||||||||||||||||
| Interest rate risk – Interest rate swaps |
||||||||||||||||||||||||||||||
| Notional amount (5)
|
51,525 |
42,933 |
56,909 |
33,010 |
3,901 |
188,278 |
169,368 |
|||||||||||||||||||||||
| Average fixed interest rate |
4.53% |
3.94% |
3.71% |
3.74% |
3.80% |
3.99% |
3.91% |
|||||||||||||||||||||||
| Interest rate risk – Bond futures (exchange-traded derivatives)
|
||||||||||||||||||||||||||||||
| Notional amount |
1,479 |
– |
– |
– |
– |
1,479 |
2,825 |
|||||||||||||||||||||||
| Average price in dollars |
108 |
– |
– |
– |
– |
108 |
105 |
|||||||||||||||||||||||
| Foreign exchange risk – Cross-currency swaps (6)
|
||||||||||||||||||||||||||||||
| USD-EUR pair |
Notional amount |
21 |
– |
– |
– |
– |
21 |
21 |
||||||||||||||||||||||
Average fixed interest rate |
3.25% |
– |
– |
– |
– |
3.25% |
3.25% |
|||||||||||||||||||||||
Average exchange rate: USD-EUR
|
0.9706 |
– |
– |
– |
– |
0.9706 |
0.9706 |
|||||||||||||||||||||||
| USD-JPY pair |
Notional amount |
– |
– |
– |
– |
– |
– |
476 |
||||||||||||||||||||||
Average fixed interest rate |
– |
– |
– |
– |
– |
– |
(0.08)% |
|||||||||||||||||||||||
Average exchange rate: USD-JPY
|
– |
– |
– |
– |
– |
– |
0.0076 |
|||||||||||||||||||||||
| Net Investment Hedges |
||||||||||||||||||||||||||||||
| Foreign exchange risk – Cross-currency swaps and foreign exchange forwards |
||||||||||||||||||||||||||||||
| CAD-CNH pair |
Notional amount |
677 |
– |
– |
– |
– |
677 |
650 |
||||||||||||||||||||||
| Foreign exchange risk – Deposit liabilities |
||||||||||||||||||||||||||||||
| USD denominated deposit – carrying amount |
16,053 |
– |
– |
– |
– |
16,053 |
13,154 |
|||||||||||||||||||||||
| GBP denominated deposit – carrying amount |
300 |
– |
– |
– |
– |
300 |
157 |
|||||||||||||||||||||||
| (1) | The notional amount of interest rate swaps maturing after June 28, 2024 which referenced CDOR was $21,718 million as at October 31, 2023 .There are no derivatives referencing CDOR as at October 31, 2024. |
| (2) | Under certain hedge strategies using cross-currency swaps, a CAD leg is inserted to create two swaps designated as separate hedges (for example, a EUR-USD cross-currency swap split into EUR-CAD and CAD-USD cross-currency swaps). The relevant notional amount is grossed up in this table, as the cross-currency swaps are disclosed by CAD-foreign currency pair. |
| (3) | Includes CAD-AUD, CAD-CHF, CAD-CNH, CAD-GBP, CAD-HKD, CAD-JPY or CAD-NOK cross-currency swaps, where applicable. The notional amount of cross-currency swaps maturing after June 28, 2024 as at October 31, 2023. which referenced CDOR was $nil million |
| (4) | The notional amount of total return swaps maturing after June 28, 2024 which referenced CDOR was $451 million October 31, 2023 . |
| (5) | The notional amount of interest rate swaps maturing after June 28, 2024 which referenced CDOR was $22,328 million October 31, 2023 . |
| (6) | The notional amount of cross-currency swaps maturing after June 28, 2024 which referenced CDOR was $nil million October 31, 2023 . |
164 |
BMO Financial Group 207th Annual Report 2024 |
(Canadian $ in millions) |
2024 |
|||||||||||||||||||||||
|
Carrying amount of hedging instruments |
Hedge ineffectiveness |
|||||||||||||||||||||||
Asset |
Liability |
Gains (losses) on hedging derivatives used to calculate hedge ineffectiveness |
Gains (losses) on hypothetical derivatives used to calculate hedge ineffectiveness |
Ineffectiveness recorded in non-interest
revenue – other |
||||||||||||||||||||
Cash Flow Hedges |
||||||||||||||||||||||||
Interest rate risk – Interest rate swaps |
$ |
2,148 |
$ |
(915 |
) |
$ |
3,552 |
$ |
(3,615 |
) |
$ |
(12 |
) |
|||||||||||
Foreign exchange risk – Cross-currency swaps and foreign exchange forwards |
699 |
(1,080 |
) |
(251 |
) |
251 |
– |
|||||||||||||||||
Equity price risk – Total return swaps |
63 |
– |
165 |
(165 |
) |
– |
||||||||||||||||||
2,910 |
(1,995 |
) |
3,466 |
(3,529 |
) |
(12 |
) |
|||||||||||||||||
Net Investment Hedges |
||||||||||||||||||||||||
Foreign exchange risk – Cross-currency swaps and foreign exchange forwards |
– |
(4 |
) |
(23 |
) |
19 |
(4 |
) |
||||||||||||||||
Foreign exchange risk – Deposit liabilities |
– |
(16,353 |
) |
(119 |
) |
119 |
– |
|||||||||||||||||
Total |
$ |
2,910 |
$ |
(18,352 |
) |
$ |
3,324 |
$ |
(3,391 |
) |
$ |
(16 |
) |
|||||||||||
2023 |
||||||||||||||||||||||||
|
Carrying amount of hedging instruments (1) |
Hedge ineffectiveness |
|||||||||||||||||||||||
Asset |
Liability |
Gains (losses) on hedging derivatives used to calculate hedge ineffectiveness (2) |
Gains (losses) on hypothetical derivatives used to calculate hedge ineffectiveness (2) |
Ineffectiveness recorded in non-interest
revenue – other |
||||||||||||||||||||
Cash Flow Hedges |
||||||||||||||||||||||||
Interest rate risk – Interest rate swaps |
$ |
693 |
$ |
(3,784 |
) |
$ |
(1,543 |
) |
$ |
1,511 |
$ |
– |
||||||||||||
Foreign exchange risk – Cross-currency swaps and foreign exchange forwards (3)
|
333 |
(1,801 |
) |
(245 |
) |
245 |
– |
|||||||||||||||||
Equity price risk – Total return swaps |
– |
(43 |
) |
(80 |
) |
80 |
– |
|||||||||||||||||
1,026 |
(5,628 |
) |
(1,868 |
) |
1,836 |
– |
||||||||||||||||||
Net Investment Hedges |
||||||||||||||||||||||||
Foreign exchange risk – Cross-currency swaps and foreign exchange forwards |
– |
(8 |
) |
23 |
(22 |
) |
1 |
|||||||||||||||||
Foreign exchange risk – Deposit liabilities |
– |
(13,311 |
) |
(485 |
) |
485 |
– |
|||||||||||||||||
Total |
$ |
1,026 |
$ |
(18,947 |
) |
$ |
(2,330 |
) |
$ |
2,299 |
$ |
1 |
||||||||||||
(1) |
Represents unrealized gains (losses) recorded as part of derivative instruments in assets and liabilities, respectively, in our Consolidated Balance Sheet. |
(2) |
Represents life to date amounts. |
(3) |
Includes derivatives entered into in relation to our acquisition of Bank of the West and its subsidiaries, which were settled upon completion of the transaction. Refer to Note 10 for further details. |
BMO Financial Group 207th Annual Report 2024 |
165 |
(Canadian $ in millions) |
2024 |
|||||||||||||||||||||||||||
Balance in cash flow hedge AOCI / net foreign operations AOCI |
||||||||||||||||||||||||||||
Balance October 31, 2023 |
Gains / (losses) recognized in OCI |
Amount reclassified to net income as the hedged item affects net income |
Balance October 31, 2024 |
Active hedges |
Discontinued hedges |
|||||||||||||||||||||||
Cash Flow Hedges |
||||||||||||||||||||||||||||
Interest rate risk |
$ |
(8,015 |
) |
$ |
3,564 |
$ |
1,971 |
$ |
(2,480 |
) |
$ |
1,695 |
$ |
(4,175 |
) |
|||||||||||||
Foreign exchange risk |
610 |
(251 |
) |
(2 |
) |
357 |
357 |
– |
||||||||||||||||||||
Equity price risk |
(72 |
) |
165 |
(16 |
) |
77 |
77 |
– |
||||||||||||||||||||
(7,477 |
) |
3,478 |
1,953 |
(2,046 |
) |
2,129 |
(4,175 |
) |
||||||||||||||||||||
Net Investment Hedges |
||||||||||||||||||||||||||||
Foreign exchange risk |
(2,186 |
) |
(138 |
) |
– |
(2,324 |
) |
(2,324 |
) |
– |
||||||||||||||||||
Total |
$ |
(9,663 |
) |
$ |
3,340 |
$ |
1,953 |
$ |
(4,370 |
) |
$ |
(195 |
) |
$ |
(4,175 |
) |
||||||||||||
2023 |
||||||||||||||||||||||||||||
Balance in cash flow hedge AOCI / net foreign operations AOCI |
||||||||||||||||||||||||||||
Balance October 31, 2022 |
Gains / (losses) recognized in OCI |
Amount reclassified to net income/goodwill as the hedged item affects net income/goodwill |
Balance October 31, 2023 (1) (2) |
Active hedges |
Discontinued hedges |
|||||||||||||||||||||||
Cash Flow Hedges |
||||||||||||||||||||||||||||
Interest rate risk |
$ |
(8,204 |
) |
$ |
(1,543 |
) |
$ |
1,732 |
$ |
(8,015 |
) |
$ |
(2,720 |
) |
$ |
(5,295 |
) |
|||||||||||
Foreign exchange risk (3)
|
1,223 |
(245 |
) |
(368 |
) |
610 |
610 |
– |
||||||||||||||||||||
Equity price risk |
33 |
(80 |
) |
(25 |
) |
(72 |
) |
(72 |
) |
– |
||||||||||||||||||
(6,948 |
) |
(1,868 |
) |
1,339 |
(7,477 |
) |
(2,182 |
) |
(5,295 |
) |
||||||||||||||||||
Net Investment Hedges |
||||||||||||||||||||||||||||
Foreign exchange risk |
(1,723 |
) |
(463 |
) |
– |
(2,186 |
) |
(2,186 |
) |
– |
||||||||||||||||||
Total |
$ |
(8,671 |
) |
$ |
(2,331 |
) |
$ |
1,339 |
$ |
(9,663 |
) |
$ |
(4,368 |
) |
$ |
(5,295 |
) |
|||||||||||
| (1) | Tax balance related to cash flow hedges accumulated other comprehensive income was $527 |
| (2) | Tax balance related to net investment hedges accumulated other comprehensive income was $593 |
| (3) | On closing our acquisition of Bank of the West on February 1, 2023, we settled the foreign exchange forward contracts entered to mitigate foreign exch an ge risk of the purchase price of Bank of the West and reclassified an
after-tax gain of $269 million to goodwill. Refer to Note 10 for further details. |
(Canadian $ in millions) |
2024 |
|||||||||||||||||||||||||||||||||||
Carrying amount of hedging derivatives |
Hedge ineffectiveness |
Accumulated amount of fair value hedge gains (losses) on hedged items |
||||||||||||||||||||||||||||||||||
Asset |
Liability |
Gains (losses) on hedging derivatives used to calculate hedge ineffectiveness |
Gains (losses) on hedged item used to calculate hedge ineffectiveness |
Ineffectiveness recorded in non-interest
revenue – other |
Carrying amount of the hedged item |
Active hedges |
Discontinued hedges |
|||||||||||||||||||||||||||||
| Fair Value Hedge (3)
|
||||||||||||||||||||||||||||||||||||
| Interest rate swaps |
$ |
1,464 |
$ |
(1,589 |
) |
$ |
– |
$ |
– |
$ |
– |
$ |
– |
$ |
– |
$ |
– |
|||||||||||||||||||
| Cross-currency swaps |
– |
(2 |
) |
– |
– |
– |
– |
– |
– |
|||||||||||||||||||||||||||
| Securities and loans |
– |
– |
(3,266 |
) |
3,117 |
(149 |
) |
118,397 |
741 |
(1,293 |
) | |||||||||||||||||||||||||
| Deposits, subordinated debt and other liabilities |
– |
– |
1,234 |
(1,217 |
) |
17 |
(65,156 |
) |
(214 |
) |
930 |
|||||||||||||||||||||||||
| Total |
$ |
1,464 |
$ |
(1,591 |
) |
$ |
(2,032 |
) |
$ |
1,900 |
$ |
(132 |
) |
$ |
53,241 |
$ |
527 |
$ |
(363 |
) | ||||||||||||||||
(1) |
Represents the unrealized gains (losses) within derivative instruments in assets and liabilities, respectively, in our Consolidated Balance Sheet. |
(2) |
Represents the carrying value in our Consolidated Balance Sheet and includes amortized cost, before ACL, plus fair value hedge adjustments, except for FVOCI securities that are carried at fair value. |
(3) |
Includes the fair value of bond futures rounded down to $nil million as at October 31, 2024. |
166 |
BMO Financial Group 207th Annual Report 2024 |
2023 |
||||||||||||||||||||||||||||||||||||
Carrying amount of hedging derivatives (1) |
Hedge ineffectiveness |
Accumulated amount of fair value hedge gains (losses) on hedged items |
||||||||||||||||||||||||||||||||||
Asset |
Liability |
Gains (losses) on hedging derivatives used to calculate hedge ineffectiveness |
Gains (losses) on hedged item used to calculate hedge ineffectiveness |
Ineffectiveness recorded in non-interest
revenue – other |
Carrying amount of the hedged item (2) |
Active hedges |
Discontinued hedges |
|||||||||||||||||||||||||||||
| Fair Value Hedge (3)
|
||||||||||||||||||||||||||||||||||||
| Interest rate swaps |
$ |
4,877 |
$ |
(1,390 |
) |
$ |
– |
$ |
– |
$ |
– |
$ |
– |
$ |
– |
$ |
– |
|||||||||||||||||||
| Cross-currency swaps |
69 |
(1 |
) |
– |
– |
– |
– |
– |
– |
|||||||||||||||||||||||||||
| Securities and loans |
– |
– |
4,071 |
(3,955 |
) |
116 |
87,043 |
(4,373 |
) |
(404 |
) | |||||||||||||||||||||||||
| Deposits, subordinated debt and other liabilities |
– |
– |
(1,078 |
) |
1,139 |
61 |
(77,358 |
) |
1,015 |
1,867 |
||||||||||||||||||||||||||
| Total |
$ |
4,946 |
$ |
(1,391 |
) |
$ |
2,993 |
$ |
(2,816 |
) |
$ |
177 |
$ |
9,685 |
$ |
(3,358 |
) |
$ |
1,463 |
|||||||||||||||||
| (1) | Represents the unrealized gains (losses) within derivative instruments in assets and liabilities, respectively, in our Consolidated Balance Sheet. |
| (2) | Represents the carrying value in our Consolidated Balance Sheet and includes amortized cost, before ACL, plus fair value hedge adjustments, except for FVOCI securities that are carried at fair value. |
| (3) | Includes the fair value of bond futures rounded down to $nil million as at October 31, 2023. |
BMO Financial Group 207th Annual Report 2024 |
167 |
(Canadian $ in millions) |
2024 |
2023 |
||||||||||||||||||||||
Replacement cost |
Credit risk equivalent |
Risk-weighted
assets |
Replacement cost (1) |
Credit risk equivalent (1) |
Risk-weighted
assets |
|||||||||||||||||||
| Interest Rate Contracts |
||||||||||||||||||||||||
| Over-the-counter |
||||||||||||||||||||||||
| Swaps |
$ |
2,404 |
$ |
7,797 |
$ |
1,125 |
$ |
1,265 |
$ |
5,133 |
$ |
1,006 |
||||||||||||
| Forward rate agreements |
650 |
2,696 |
600 |
571 |
2,219 |
471 |
||||||||||||||||||
| Purchased options |
42 |
338 |
188 |
45 |
174 |
61 |
||||||||||||||||||
| Written options |
2 |
211 |
78 |
1 |
140 |
77 |
||||||||||||||||||
3,098 |
11,042 |
1,991 |
1,882 |
7,666 |
1,615 |
|||||||||||||||||||
| Exchange-traded |
||||||||||||||||||||||||
| Futures |
122 |
279 |
6 |
171 |
296 |
6 |
||||||||||||||||||
| Purchased options |
8 |
19 |
– |
3 |
4 |
– |
||||||||||||||||||
| Written options |
– |
1 |
– |
– |
– |
– |
||||||||||||||||||
130 |
299 |
6 |
174 |
300 |
6 |
|||||||||||||||||||
| Total interest rate contracts |
3,228 |
11,341 |
1,997 |
2,056 |
7,966 |
1,621 |
||||||||||||||||||
| Foreign Exchange Contracts (2)
|
||||||||||||||||||||||||
| Over-the-counter |
||||||||||||||||||||||||
| Swaps |
1,559 |
7,218 |
825 |
1,921 |
6,517 |
1,313 |
||||||||||||||||||
| Forward foreign exchange contracts |
2,709 |
9,643 |
1,764 |
2,300 |
9,296 |
1,908 |
||||||||||||||||||
| Purchased options |
142 |
447 |
142 |
149 |
448 |
129 |
||||||||||||||||||
| Written options |
1 |
119 |
27 |
2 |
118 |
39 |
||||||||||||||||||
4,411 |
17,427 |
2,758 |
4,372 |
16,379 |
3,389 |
|||||||||||||||||||
| Exchange-traded |
||||||||||||||||||||||||
| Futures |
– |
1 |
– |
– |
– |
– |
||||||||||||||||||
| Purchased options |
– |
3 |
– |
3 |
8 |
– |
||||||||||||||||||
| Written options |
– |
– |
– |
– |
– |
– |
||||||||||||||||||
– |
4 |
– |
3 |
8 |
– |
|||||||||||||||||||
| Total foreign exchange contracts |
4,411 |
17,431 |
2,758 |
4,375 |
16,387 |
3,389 |
||||||||||||||||||
| Commodity Contracts |
||||||||||||||||||||||||
| Over-the-counter |
||||||||||||||||||||||||
| Swaps |
993 |
4,256 |
1,035 |
468 |
1,957 |
683 |
||||||||||||||||||
| Purchased options |
155 |
484 |
182 |
4 |
280 |
110 |
||||||||||||||||||
| Written options |
10 |
246 |
86 |
47 |
331 |
106 |
||||||||||||||||||
1,158 |
4,986 |
1,303 |
519 |
2,568 |
899 |
|||||||||||||||||||
| Exchange-traded |
||||||||||||||||||||||||
| Futures |
176 |
594 |
12 |
243 |
869 |
17 |
||||||||||||||||||
| Purchased options |
179 |
319 |
6 |
329 |
535 |
11 |
||||||||||||||||||
| Written options |
– |
73 |
1 |
3 |
83 |
2 |
||||||||||||||||||
355 |
986 |
19 |
575 |
1,487 |
30 |
|||||||||||||||||||
| Total commodity contracts |
1,513 |
5,972 |
1,322 |
1,094 |
4,055 |
929 |
||||||||||||||||||
| Equity Contracts |
||||||||||||||||||||||||
| Over-the-counter |
199 |
8,625 |
1,645 |
684 |
8,274 |
2,123 |
||||||||||||||||||
| Exchange-traded |
675 |
2,899 |
58 |
1,640 |
4,635 |
93 |
||||||||||||||||||
| Total equity contracts |
874 |
11,524 |
1,703 |
2,324 |
12,909 |
2,216 |
||||||||||||||||||
| Credit Contracts |
103 |
309 |
39 |
446 |
1,093 |
81 |
||||||||||||||||||
| Total |
$ |
10,129 |
$ |
46,577 |
$ |
7,819 |
$ |
10,295 |
$ |
42,410 |
$ |
8,236 |
||||||||||||
| (1) | Replacement cost and credit risk equivalent are presented after the impact of master netting agreements and calculated using the Standardized Approach for Counterparty Credit Risk (SA-CCR) in accordance with the CAR Guideline issued by OSFI. The table therefore excludes loan commitment derivatives. |
| (2) | Gold contracts are included in foreign exchange contracts. |
168 |
BMO Finan cia l Group 207th Annual Report 2024 |
(Canadian $ in millions) |
Term to maturity |
2024 |
2023 |
|||||||||||||||||||||||||||||
Within 1 year |
1 to 3 years |
3 to 5 years |
5 to 10 years |
Over 10 years |
Total notional amounts |
Total notional amounts |
||||||||||||||||||||||||||
Interest Rate Contracts |
||||||||||||||||||||||||||||||||
Swaps |
$ |
8,085,307 |
$ |
3,515,046 |
$ |
2,371,050 |
$ |
2,013,819 |
$ |
860,755 |
$ |
16,845,977 |
$ |
9,611,030 |
||||||||||||||||||
Forward rate agreements, futures and options |
4,016,550 |
1,652,656 |
127,962 |
23,015 |
3,866 |
5,824,049 |
1,827,482 |
|||||||||||||||||||||||||
Total interest rate contracts |
12,101,857 |
5,167,702 |
2,499,012 |
2,036,834 |
864,621 |
22,670,026 |
11,438,512 |
|||||||||||||||||||||||||
Foreign Exchange Contracts (1)
|
||||||||||||||||||||||||||||||||
Swaps |
222,003 |
359,299 |
211,093 |
149,931 |
59,997 |
1,002,323 |
780,954 |
|||||||||||||||||||||||||
Forward foreign exchange contracts |
651,037 |
21,566 |
2,334 |
1,854 |
3,136 |
679,927 |
564,366 |
|||||||||||||||||||||||||
Futures |
1,735 |
16 |
– |
– |
– |
1,751 |
4,035 |
|||||||||||||||||||||||||
Options |
152,864 |
17,904 |
838 |
– |
– |
171,606 |
110,646 |
|||||||||||||||||||||||||
Total foreign exchange contracts |
1,027,639 |
398,785 |
214,265 |
151,785 |
63,133 |
1,855,607 |
1,460,001 |
|||||||||||||||||||||||||
Commodity Contracts |
||||||||||||||||||||||||||||||||
Swaps |
13,781 |
5,593 |
597 |
357 |
– |
20,328 |
18,574 |
|||||||||||||||||||||||||
Futures |
20,226 |
14,393 |
1,292 |
160 |
– |
36,071 |
35,285 |
|||||||||||||||||||||||||
Options |
47,556 |
51,286 |
193 |
99 |
– |
99,134 |
71,285 |
|||||||||||||||||||||||||
Total commodity contracts |
81,563 |
71,272 |
2,082 |
616 |
– |
155,533 |
125,144 |
|||||||||||||||||||||||||
Equity Contracts |
394,847 |
61,511 |
12,809 |
1,738 |
735 |
471,640 |
305,252 |
|||||||||||||||||||||||||
Credit Contracts |
1,233 |
5,273 |
23,239 |
8,511 |
1,305 |
39,561 |
26,937 |
|||||||||||||||||||||||||
Total notional amount |
$ |
13,607,139 |
$ |
5,704,543 |
$ |
2,751,407 |
$ |
2,199,484 |
$ |
929,794 |
$ |
25,192,367 |
$ |
13,355,846 |
||||||||||||||||||
(1) |
Gold contracts are included in foreign exchange contracts. |
Buildings |
10 to 40 years |
|||
Computer equipment and operating system software |
5 to 7 years |
|||
Other equipment |
10 years |
|||
Leasehold improvements |
Lease term to a maximum of 10 years |
BMO Financial Group 207th Annual Report 2024 |
169 |
(Canadian $ in millions) |
||||||||||||||||||||||||||||
Land |
Buildings |
Computer equipment |
Other equipment |
Leasehold improvements |
Right-of-use assets |
Total |
||||||||||||||||||||||
Cost |
||||||||||||||||||||||||||||
Balance at October 31, 2022 |
$ |
119 |
$ |
1,688 |
$ |
2,671 |
$ |
945 |
$ |
2,054 |
$ |
3,435 |
$ |
10,912 |
||||||||||||||
Additions/lease modifications |
13 |
91 |
280 |
125 |
413 |
406 |
1,328 |
|||||||||||||||||||||
Acquisitions |
213 |
276 |
63 |
12 |
25 |
523 |
1,112 |
|||||||||||||||||||||
Disposals |
(28 |
) |
(26 |
) |
(109 |
) |
(30 |
) |
(97 |
) |
(60 |
) |
(350 |
) |
||||||||||||||
Foreign exchange and other |
6 |
18 |
18 |
8 |
18 |
53 |
121 |
|||||||||||||||||||||
Balance at October 31, 2023 |
323 |
2,047 |
2,923 |
1,060 |
2,413 |
4,357 |
13,123 |
|||||||||||||||||||||
Additions/lease modifications |
– |
81 |
270 |
117 |
352 |
171 |
991 |
|||||||||||||||||||||
Disposals |
(7 |
) |
(41 |
) |
(22 |
) |
(11 |
) |
(26 |
) |
– |
(107 |
) |
|||||||||||||||
Fully depreciated assets |
– |
(32 |
) |
(694 |
) |
(257 |
) |
(71 |
) |
(96 |
) |
(1,150 |
) |
|||||||||||||||
Foreign exchange and other |
1 |
4 |
3 |
2 |
7 |
12 |
29 |
|||||||||||||||||||||
Balance at October 31, 2024 |
$ |
317 |
$ |
2,059 |
$ |
2,480 |
$ |
911 |
$ |
2,675 |
$ |
4,444 |
$ |
12,886 |
||||||||||||||
Accumulated Depreciation and Impairment |
||||||||||||||||||||||||||||
Balance at October 31, 2022 |
$ |
– |
$ |
1,188 |
$ |
2,007 |
$ |
667 |
$ |
1,270 |
$ |
939 |
$ |
6,071 |
||||||||||||||
Disposals |
– |
(25 |
) |
(106 |
) |
(29 |
) |
(94 |
) |
(50 |
) |
(304 |
) |
|||||||||||||||
Depreciation |
– |
70 |
306 |
65 |
169 |
412 |
1,022 |
|||||||||||||||||||||
Foreign exchange and other (1) |
– |
5 |
21 |
1 |
11 |
55 |
93 |
|||||||||||||||||||||
Balance at October 31, 2023 |
– |
1,238 |
2,228 |
704 |
1,356 |
1,356 |
6,882 |
|||||||||||||||||||||
Disposals |
– |
(29 |
) |
(12 |
) |
(8 |
) |
(21 |
) |
– |
(70 |
) |
||||||||||||||||
Depreciation |
– |
64 |
261 |
76 |
167 |
402 |
970 |
|||||||||||||||||||||
Fully depreciated assets |
– |
(32 |
) |
(694 |
) |
(257 |
) |
(71 |
) |
(96 |
) |
(1,150 |
) |
|||||||||||||||
Foreign exchange and other (1) |
– |
1 |
(4 |
) |
(6 |
) |
5 |
9 |
5 |
|||||||||||||||||||
Balance at October 31, 2024 |
$ |
– |
$ |
1,242 |
$ |
1,779 |
$ |
509 |
$ |
1,436 |
$ |
1,671 |
$ |
6,637 |
||||||||||||||
Net Carrying Value |
||||||||||||||||||||||||||||
Balance at October 31, 2024 |
$ |
317 |
$ |
817 |
$ |
701 |
$ |
402 |
$ |
1,239 |
$ |
2,773 |
$ |
6,249 |
||||||||||||||
Balance at October 31, 2023 |
323 |
809 |
695 |
356 |
1,057 |
3,001 |
6,241 |
|||||||||||||||||||||
(1) |
Includes impairment charges. |
| (Canadian $ in millions) | June 1, 2023 | |||||||||||||||||
Securities |
$ 668 | |||||||||||||||||
Goodwill and intangible assets |
384 | |||||||||||||||||
Other assets |
141 | |||||||||||||||||
Total assets |
1,193 | |||||||||||||||||
Deferred revenue (1)
|
916 | |||||||||||||||||
Other liabilities |
64 | |||||||||||||||||
Total liabilities |
980 | |||||||||||||||||
Purchase price |
$ 213 | |||||||||||||||||
(1) |
Deferred revenue reflects our obligation to fulfill the redemption of miles that were outstanding at the acquisition date and is included in other liabilities in our Consolidated Balance Sheet. |
170 |
BMO Financial Group 207th Annual Report 2024 |
(Canadian $ in millions) |
February 1, 2023 |
|||
Purchase consideration |
$ |
18,382 |
||
Impact of forward contracts (1)
|
(269 |
) |
||
Net purchase consideration |
18,113 |
|||
Fair value of identifiable assets acquired |
||||
Securities |
28,437 |
|||
Loans |
||||
Residential mortgages |
11,912 |
|||
Consumer instalment and other personal |
20,268 |
|||
Credit cards |
885 |
|||
Business and government |
43,418 |
|||
Total loans |
76,483 |
|||
Other assets (2)
|
9,152 |
|||
Intangible assets |
2,883 |
|||
Total fair value of identifiable assets acquired |
116,955 |
|||
Fair value of identifiable liabilities assumed |
||||
Deposits |
91,711 |
|||
Other liabilities (2)
|
17,697 |
|||
Total fair value of identifiable liabilities assumed |
109,408 |
|||
Non-controlling interest |
16 |
|||
Goodwill |
10,582 |
|||
Net purchase consideration |
$ |
18,113 |
||
| (1) | To mitigate changes in the Canadian dollar equivalent of the purchase price between our announcement of the acquisition and its closing, we entered into forward contracts, which qualified for hedge accounting. Changes in the fair value of these forward contracts of $ 269 million (after-tax) were accounted for as a reduction of the Canadian dollar equivalent of the purchase price. |
| (2) | The net deferred tax asset recorded in the opening balance sheet was $1,273 million. |
BMO Financial Group 207th Annual Report 2024 |
171 |
(Canadian $ in millions) |
December 1, 2022 |
|||
Goodwill and intangible assets |
$ |
145 |
||
Other assets |
85 |
|||
Total assets |
230 |
|||
Liabilities |
35 |
|||
Purchase price |
$ |
195 |
||
| The | purchase price allocation for Radicle has been completed. |
(Canadian $ in millions) |
Personal and Commercial Banking |
BMO Wealth Management |
BMO Capital Markets |
Total |
||||||||||||||||||||||||||||||||||||||||
Canadian P&C |
U.S. P&C |
Total |
Wealth and Asset Management |
Insurance |
Total |
|||||||||||||||||||||||||||||||||||||||
Balance at October 31, 2022 |
$ | 97 | $ | 3,929 | $ | 4,026 | $ | 822 | $ | 2 | $ | 824 | $ | 435 | $ | 5,285 | ||||||||||||||||||||||||||||
Acquisitions (1)
|
233 | 10,345 | 10,578 | 237 | – | 237 | 85 | 10,900 | ||||||||||||||||||||||||||||||||||||
Foreign exchange and other |
– | 515 | 515 | 20 | – | 20 | 8 | 543 | ||||||||||||||||||||||||||||||||||||
Balance at October 31, 2023 |
330 | 14,789 | 15,119 | 1,079 | 2 | 1,081 | 528 | 16,728 | ||||||||||||||||||||||||||||||||||||
Foreign exchange and other |
– |
43 |
43 |
2 |
– |
2 |
1 |
46 |
||||||||||||||||||||||||||||||||||||
Balance at October 31, 2024 |
$ |
330 |
$ |
14,832 |
$ |
15,162 |
$ |
1,081 |
$ |
2 |
$ |
1,083 |
$ |
529 |
$ |
16,774 |
||||||||||||||||||||||||||||
| (1) | Refer to Note 10 for further information. |
172 |
BMO Financial Group 207th Annual Report 2024 |
(Canadian $ in millions) |
Customer relationships |
Core deposits |
Software – amortizing |
Software under development |
Other |
Total |
||||||||||||||||||
Cost |
||||||||||||||||||||||||
Balance at October 31, 2022 |
$ |
521 |
$ |
978 |
$ |
6,237 |
$ |
259 |
$ |
322 |
$ |
8,317 |
||||||||||||
Additions |
– |
– |
58 |
739 |
33 |
830 |
||||||||||||||||||
Acquisitions (1)
|
311 |
2,453 |
103 |
– |
227 |
3,094 |
||||||||||||||||||
Transfers |
– |
– |
672 |
(672 |
) |
– |
– |
|||||||||||||||||
Fully amortized intangibles |
– |
– |
(29 |
) |
– |
(21 |
) |
(50 |
) |
|||||||||||||||
Foreign exchange and other |
18 |
122 |
30 |
(2 |
) |
11 |
179 |
|||||||||||||||||
Balance at October 31, 2023 |
850 |
3,553 |
7,071 |
324 |
572 |
12,370 |
||||||||||||||||||
Additions |
– |
– |
22 |
782 |
48 |
852 |
||||||||||||||||||
Transfers |
– |
– |
688 |
(688 |
) |
– |
– |
|||||||||||||||||
Fully amortized intangibles |
– |
– |
(1,696 |
) |
– |
(33 |
) |
(1,729 |
) |
|||||||||||||||
Foreign exchange and other |
2 |
10 |
11 |
(1 |
) |
1 |
23 |
|||||||||||||||||
Balance at October 31, 2024 |
$ |
852 |
$ |
3,563 |
$ |
6,096 |
$ |
417 |
$ |
588 |
$ |
11,516 |
||||||||||||
Accumulated Amortization |
||||||||||||||||||||||||
Balance at October 31, 2022 |
$ |
435 |
$ |
978 |
$ |
4,422 |
$ |
– |
$ |
289 |
$ |
6,124 |
||||||||||||
Amortization |
44 |
291 |
646 |
– |
27 |
1,008 |
||||||||||||||||||
Write-downs |
– |
– |
9 |
– |
– |
9 |
||||||||||||||||||
Fully amortized intangibles |
– |
– |
(29 |
) |
– |
(21 |
) |
(50 |
) |
|||||||||||||||
Foreign exchange and other |
8 |
26 |
25 |
– |
4 |
63 |
||||||||||||||||||
Balance at October 31, 2023 |
487 |
1,295 |
5,073 |
– |
299 |
7,154 |
||||||||||||||||||
Amortization |
62 |
342 |
676 |
– |
32 |
1,112 |
||||||||||||||||||
Write-downs |
4 |
– |
22 |
– |
– |
26 |
||||||||||||||||||
Fully amortized intangibles |
– |
– |
(1,696 |
) |
– |
(33 |
) |
(1,729 |
) |
|||||||||||||||
Foreign exchange and other |
3 |
10 |
15 |
– |
– |
28 |
||||||||||||||||||
Balance at October 31, 2024 |
$ |
556 |
$ |
1,647 |
$ |
4,090 |
$ |
– |
$ |
298 |
$ |
6,591 |
||||||||||||
Net Carrying Value |
||||||||||||||||||||||||
Balance at October 31, 2024 |
$ |
296 |
$ |
1,916 |
$ |
2,006 |
$ |
417 |
$ |
290 |
$ |
4,925 |
||||||||||||
Balance at October 31, 2023 |
363 |
2,258 |
1,998 |
324 |
273 |
5,216 |
||||||||||||||||||
| (1) | Refer to Note 10 for further information. |
(2) |
Includes internally generated software of $5,466 million in cost and $3,653 million in accumulated amortization as at October 31, 2024 ($6,172 million in cost and $4,420 million in accumulated amortization as at October 31, 2023). |
BMO Financial Group 207th Annual Report 2024 |
173 |
(Canadian $ in millions) |
2024 |
2023 |
||||||
Accounts receivable, prepaid expenses and other items |
$ |
3,832 |
$ |
5,806 |
||||
Accrued interest receivable |
4,463 |
4,097 |
||||||
Bank owned life insurance policies |
6,350 |
6,306 |
||||||
Leased vehicles, net of accumulated amortization |
67 |
124 |
||||||
Cash collateral |
9,419 |
9,939 |
||||||
Investments in associates and joint ventures |
1,727 |
1,461 |
||||||
Insurance-related assets (1)
|
5,748 |
4,066 |
||||||
Other employee future benefits assets (Note 22)
|
44 |
81 |
||||||
Pension asset (Note 22)
|
1,252 |
1,225 |
||||||
Precious metals (2)
|
9,485 |
4,701 |
||||||
Total |
$ |
42,387 |
$ |
37,806 |
||||
| (1) | Includes $1,363 million of investment properties ($1,326 million as at October 31, 2023) carried at fair value. These investment properties support our insurance contract liabilities. The fair value is determined by external independent property valuers and categorized as Level 3 (refer to Note 18 for further information on fair value levels) using models with unobservable market inputs. |
| (2) | Precious metals are recorded at fair value based on quoted prices in active markets.
Changes in fair value
are recorded in our Consolidated Statement of Income in non-interest revenue, trading revenues (losses). |
Payable on demand |
||||||||||||||||||||||||
(Canadian $ in millions) |
Interest bearing |
Non-interest
bearing |
Payable after notice |
Payable on a fixed date |
2024 |
2023 |
||||||||||||||||||
Amortized cost deposits by: |
||||||||||||||||||||||||
Banks (4)
|
$ |
4,302 |
$ |
1,945 |
$ |
1,584 |
$ |
24,715 |
$ |
32,546 |
$ |
29,080 |
||||||||||||
Business and government |
70,630 |
41,740 |
209,747 |
252,902 |
575,019 |
548,068 |
||||||||||||||||||
Individuals |
3,567 |
34,675 |
140,742 |
141,783 |
320,767 |
297,886 |
||||||||||||||||||
Total amortized cost deposits |
78,499 |
78,360 |
352,073 |
419,400 |
928,332 |
875,034 |
||||||||||||||||||
Deposits at FVTPL |
– |
– |
– |
54,108 |
54,108 |
35,845 |
||||||||||||||||||
Total (5)
|
$ |
78,499 |
$ |
78,360 |
$ |
352,073 |
$ |
473,508 |
$ |
982,440 |
$ |
910,879 |
||||||||||||
Booked in: |
||||||||||||||||||||||||
Canada |
$ |
66,676 |
$ |
66,417 |
$ |
148,164 |
$ |
336,884 |
$ |
618,141 |
$ |
564,412 |
||||||||||||
United States |
11,753 |
11,942 |
201,844 |
88,527 |
314,066 |
301,064 |
||||||||||||||||||
Other countries |
70 |
1 |
2,065 |
48,097 |
50,233 |
45,403 |
||||||||||||||||||
Total |
$ |
78,499 |
$ |
78,360 |
$ |
352,073 |
$ |
473,508 |
$ |
982,440 |
$ |
910,879 |
||||||||||||
| (1) | Includes $44,617 million of non-interest bearing deposits as at October 31, 2024 ($49,515 million as at October 31, 2023). |
| (2) | Includes $65,986 million of senior unsecured debt as at October 31, 2024 subject to the Bank Recapitalization (Bail-In) regime ($63,925 million as at October 31, 2023). The Bail-In regime provides certain statutory powers to the Canada Deposit Insurance Corporation, including the ability to convert specified eligible shares and liabilities into common shares if the bank becomes non-viable. |
| (3) | We have unencumbered liquid assets of $396,338 million as at October 31, 2024 to support these and other deposit liabilities ($360,213 million as at October 31, 2023). |
| (4) | Includes regulated and central banks. |
| (5) | Included in deposits as at October 31, 2024 and 2023 are $521,160 million and $492,404 million, respectively, of deposits denominated in U.S. dollars, and $54,397 million and $55,705 million, respectively, of deposits denominated in other foreign currencies. |
• |
Various investment instruments purchased by our customers to earn interest over a fixed period, such as retail and small business term deposits, wholesale funding and guaranteed investment certificates. Deposits totalling $29,136 million as at October 31, 2024 ($30,852 million as at October 31, 2023) can be redeemed early, either fully or partially, by customers without penalty. These are classified as payable on a fixed date, based on their remaining contractual maturities. |
• |
Commercial paper, which totalled $51,500 million as at October 31, 2024 ($52,884 million as at October 31, 2023). |
• |
Covered bonds, which totalled $26,957 million as at October 31, 2024 ($28,400 million as at October 31, 2023). |
174 |
BMO Financial Group 207th Annual Report 2024 |
(Canadian $ in millions) |
Canada |
United States |
Other |
Total |
||||||||||||
| As at October 31, 2024 |
$ |
285,555 |
$ |
77,313 |
$ |
48,086 |
$ |
410,954 |
||||||||
| As at October 31, 2023 |
269,262 |
73,226 |
43,106 |
385,594 |
||||||||||||
(Canadian $ in millions) |
Less than 3 months |
3 to 6 months |
6 to 12 months |
Over 12 months |
Total |
|||||||||||||||
| As at October 31, 2024 |
$ |
63,442 |
$ |
33,704 |
$ |
62,674 |
$ |
125,735 |
$ |
285,555 |
||||||||||
| As at October 31, 2023 |
55,070 |
38,509 |
61,370 |
114,313 |
269,262 |
|||||||||||||||
(Canadian $ in millions) |
Fair value |
Notional amount due at contractual maturity |
Difference between fair value and amount due at contractual maturity |
Change in fair value - gains (losses) recorded in the Consolidated Statement of Income |
Change in fair value - (losses) due to own credit risk recorded in OCI (before tax) |
Cumulative change in fair value - gains due to own credit risk recognized in AOCI (before tax) |
||||||||||||||||||
| As at October 31, 2024 |
$ |
54,108 |
$ |
56,300 |
$ |
(2,192 |
) |
$ |
(4,815 |
) |
$ |
(841 |
) |
$ |
24 |
|||||||||
| As at October 31, 2023 |
35,845 |
42,973 |
(7,128 |
) |
1,692 |
(379 |
) |
865 |
||||||||||||||||
(1) |
Change in fair value may be offset by related change in fair value on hedge contracts. |
BMO Financial Group 207th Annual Report 2024 |
175 |
(Canadian $ in millions) |
2024 |
2023 |
||||||
| Accounts payable, accrued expenses and other items |
$ |
11,311 |
$ |
11,999 |
||||
| Accrued interest payable |
6,468 |
5,299 |
||||||
| ACL on off-balance sheet items |
580 |
460 |
||||||
| Cash collateral |
6,414 |
6,406 |
||||||
| Credit card loyalty rewards |
1,465 |
1,432 |
||||||
| Current tax liabilities |
470 |
44 |
||||||
| Deferred tax liabilities (Note 23)
|
1 |
16 |
||||||
| Lease liabilities |
3,326 |
3,506 |
||||||
| Liabilities of subsidiaries |
5,633 |
18,120 |
||||||
| Other employee future benefits liability (Note 22)
|
863 |
823 |
||||||
| Pension liability (Note 22)
|
189 |
179 |
||||||
| Total |
$ |
36,720 |
$ |
48,284 |
||||
(Canadian $ in millions) |
2024 |
2023 |
||||||
| Insurance revenue |
$ |
1,767 |
$ |
1,587 |
||||
| Insurance service expenses |
(1,330 |
) |
(1,080 |
) | ||||
| Net expenses from reinsurance contracts |
(97 |
) |
(118 |
) | ||||
| Insurance service results |
$ |
340 |
$ |
389 |
||||
(Canadian $ in millions) |
2024 |
2023 |
||||||
| Investment return |
$ |
2,320 |
$ |
285 |
||||
| Insurance finance (expense) from insurance and reinsurance contracts held |
(2,098 |
) |
(127 |
) | ||||
| Movement in investment contract liabilities |
(117 |
) |
13 |
|||||
| Insurance investment results |
$ |
105 |
$ |
171 |
||||
176 |
BMO Financial Group 207th Annual Report 2024 |
(Canadian $ in millions) |
2024 |
2023 |
||||||||||||||||||||||
Liabilities for remaining coverage |
Liabilities for incurred claims |
Total |
Liabilities for remaining coverage |
Liabilities for incurred claims |
Total |
|||||||||||||||||||
Insurance contract liabilities, beginning of year |
$ |
13,114 |
$ |
235 |
$ |
13,349 |
$ |
11,850 |
$ |
267 |
$ |
12,117 |
||||||||||||
Insurance service results |
(1,448 |
) |
1,101 |
(347 |
) |
(1,403 |
) |
979 |
(424 |
) |
||||||||||||||
Net finance expenses from insurance contracts |
2,206 |
– |
2,206 |
179 |
– |
179 |
||||||||||||||||||
Total cash flows |
3,176 |
(1,136 |
) |
2,040 |
2,488 |
(1,013 |
) |
1,475 |
||||||||||||||||
Other changes in the net carrying amount of the insurance contract |
(1 |
) |
1 |
– |
– |
2 |
2 |
|||||||||||||||||
Insurance contract liabilities, end of year (1)
|
$ |
17,047 |
$ |
201 |
$ |
17,248 |
$ |
13,114 |
$ |
235 |
$ |
13,349 |
||||||||||||
| (1) | The liabilities for incurred claims relating to insurance contracts in our creditor and reinsurance business were $115 million as at October 31, 2024 and $131 million as at October 31, 2023. |
Portfolio duration: |
2024 |
2023 |
||||||
1 year |
4.16% |
6.10% |
||||||
3 years |
4.17% |
5.83% |
||||||
5 years |
4.35% |
5.69% |
||||||
10 years |
4.82% |
5.82% |
||||||
20 years |
5.15% |
5.85% |
||||||
30 years |
4.98% |
5.81% |
||||||
Ultimate |
5.00% |
5.00% |
||||||
(Canadian $ in millions) |
Fair value |
Notional amount due at contractual maturity |
Difference between fair value and amount due at contractual maturity |
Change in fair value - gains (losses) recorded in the Consolidated Statement of Income |
Change in fair value - (losses) due to own credit risk recorded in OCI (before tax) |
Cumulative change in fair value - gains (losses) due to own credit risk recognized in AOCI (before tax) |
||||||||||||||||||
As at October 31, 2024 |
$ |
796 |
$ |
1,336 |
$ |
(540 |
) |
$ |
(86 |
) |
$ (34 |
) |
$ |
(26 |
) |
|||||||||
As at October 31, 2023 |
708 |
1,397 |
(689 |
) |
42 |
(15 |
) |
8 |
||||||||||||||||
BMO Financial Group 207th Annual Report 2024 |
177 |
(Canadian $ in millions, except as noted) |
Face value |
Maturity date |
Interest rate (%) |
Reset premium (%) |
Redeemable at our option (2) |
2024 Total |
2023 Total |
|||||||||||||||||||
Debentures Series 20 |
$ 150 |
December 2025 to 2040 | 8.25 |
na |
Not redeemable | $ |
147 |
$ |
147 |
|||||||||||||||||
3.803% Subordinated Notes due 2032 (1)
|
US$1,250 |
December 2032 | 3.80 |
1.43 |
(3) |
December 2027 | 1,602 |
1,510 |
||||||||||||||||||
Series J Medium-Term Notes, First Tranche (1)
|
$1,000 |
September 2029 | 2.88 |
na |
(4) |
September 2024 |
|
– |
999 |
|||||||||||||||||
Series J Medium-Term Notes, Second Tranche (1)
|
$1,250 |
June 2030 | 2.08 |
na |
(4) |
June 2025 | 1,237 |
1,248 |
||||||||||||||||||
Series K Medium-Term Notes, First Tranche (1)
|
$1,000 |
July 2031 | 1.93 |
na |
(4) |
July 2026 | 992 |
988 |
||||||||||||||||||
3.088% Subordinated Notes due 2037 (1)
|
US$1,250 |
January 2037 | 3.09 |
1.40 |
(6) |
January 2032 | 1,466 |
1,439 |
||||||||||||||||||
Series L Medium-Term Notes, First Tranche (1)
|
$ 750 |
October 2032 | 6.53 |
2.70 |
(7) |
October 2027 | 732 |
749 |
||||||||||||||||||
Series M Medium-Term Notes, First Tranche (1)
|
$1,150 |
September 2033 | 6.03 |
2.02 |
(7) |
September 2028 | 1,202 |
1,148 |
||||||||||||||||||
Series M Medium-Term Notes, Second Tranche (1)
|
$1,000 | July 2034 | 4.98 | 1.63 | (7) |
July 2029 | (8) |
999 |
– | |||||||||||||||||
Total (
9 ) |
$ |
8,377 |
$ |
8,228 |
||||||||||||||||||||||
| (1) | These notes include a NVCC provision, which is necessary for notes issued after a certain date to qualify as regulatory capital under Basel III. As such, they are convertible into a variable number of our common shares if OSFI announces that the bank is, or is about to become, non-viable or if a federal or provincial government in Canada publicly announces that the bank has accepted or agreed to accept a capital injection, or equivalent support, to avoid non-viability. In such an event, each note is convertible into common shares pursuant to an automatic conversion formula with a multiplier and a conversion price based on the greater of: (i) a floor price of $5.00 and (ii) the current market price of our common shares based on the volume weighted-average trading price of our common shares on the TSX. The number of common shares issued is determined by dividing the par value of the note (including accrued and unpaid interest on such note) by the conversion price and then applying the multiplier. |
| (2) | Redeemable at par with accrued and unpaid interest to and excluding the redemption date. |
| (3) | Interest rate will reset at a rate equal to the 5-year mid-swap rate plus the reset premium noted. |
| (4) | Interest rate will reset at a rate determined in accordance with the terms and conditions of the applicable subordinated notes. |
| (5) | All $1,000 million 2.88% Series J Medium-Term Notes (NVCC ), First Tranche were redeemed on September 17, 2024 for 100% of the principal amount, plus accrued interest to, but excluding, the redemption date. |
| (6) | Interest rate will reset at a rate equal to the 5-year U.S. treasury bill rate plus the reset premium noted. |
| (7) | Interest rate will reset at a rate equal to the Canadian Overnight Repo Rate Average (CORRA) plus the reset premium noted. |
| (8) | On July 3, 2024, we issued $1,000 million of unsecured subordinated debt through our Canadian Medium-Term Note program. These notes are redeemable at par on July 3, 2029 together with accrued and unpaid interest to, but excluding, the redemption date. |
(9) |
Certain amounts of subordinated debt were issued at a premium or discount and include fair value hedge adjustments, which together decreased their carrying value as at October 31, 2024 by $400 million (decreased by $539 million in 2023). Refer to Note 8 for further details on hedge adjustments. The carrying value is also adjusted for our subordinated debt holdings, held for market-making purposes. |
178 |
BMO Financial Group 207th Annual Report 2024 |
| (Canadian $ in millions, except as noted) | 2024 |
2023 | ||||||||||||||||||||||
|
Number of shares |
Amount |
Dividends declared per share |
Number of shares |
Amount | Dividends declared per share |
|||||||||||||||||||
Preferred Shares – Classified as Equity |
||||||||||||||||||||||||
Class B – Series 27 (1)
|
– |
$ |
– |
$ |
0.48 |
20,000,000 | $ | 500 | $ | 0.96 | ||||||||||||||
Class B – Series 29 (2)
|
– |
– |
0.68 |
16,000,000 | 400 | 0.91 | ||||||||||||||||||
Class B – Series 31 (3)
|
12,000,000 |
300 |
0.96 |
12,000,000 | 300 | 0.96 | ||||||||||||||||||
Class B – Series 33 |
8,000,000 |
200 |
0.76 |
8,000,000 | 200 | 0.76 | ||||||||||||||||||
Class B – Series 44 |
16,000,000 |
400 |
1.70 |
16,000,000 | 400 | 1.21 | ||||||||||||||||||
Class B – Series 46 (1)
|
– |
– |
0.64 |
14,000,000 | 350 | 1.28 | ||||||||||||||||||
Class B – Series 50 |
500,000 |
500 |
73.73 |
500,000 | 500 | 73.73 | ||||||||||||||||||
Class B – Series 52 |
650,000 |
650 |
70.57 |
650,000 | 650 | 57.52 | ||||||||||||||||||
Preferred Shares – Classified as Equity |
$ |
2,050 |
$ | 3,300 | ||||||||||||||||||||
Other Equity Instruments |
||||||||||||||||||||||||
4.800% Additional Tier 1 Capital Notes (AT1 Notes) |
$ |
658 |
$ | 658 | ||||||||||||||||||||
4.300% Series 1 LRCNs |
1,250 |
1,250 | ||||||||||||||||||||||
5.625% Series 2 LRCNs |
750 |
750 | ||||||||||||||||||||||
7.325% Series 3 LRCNs |
1,000 |
1,000 | ||||||||||||||||||||||
7.700% Series 4 LRCNs (4)
|
1,356 |
– | ||||||||||||||||||||||
7.300% Series 5 LRCNs (5)
|
1,023 |
– | ||||||||||||||||||||||
Other Equity Instruments |
$ |
6,037 |
$ | 3,658 | ||||||||||||||||||||
| Preferred Shares and Other Equity Instruments |
$ |
8,087 |
$ | 6,958 | ||||||||||||||||||||
Common Shares |
||||||||||||||||||||||||
Balance at beginning of year |
720,909,161 |
$ |
22,941 |
677,106,878 | $ | 17,744 | ||||||||||||||||||
Issued under the Shareholder Dividend Reinvestment and Share Purchase Plan |
7,790,724 |
905 |
13,482,314 | 1,609 | ||||||||||||||||||||
Issued under the Stock Option Plan and other stock-based compensation plans (Note 21)
|
811,652 |
74 |
724,853 | 61 | ||||||||||||||||||||
Treasury shares sold |
18,339 |
1 |
101,178 | 14 | ||||||||||||||||||||
Issued to align capital position with increased regulatory requirements as announced by OSFI |
– |
– |
28,331,227 | 3,360 | ||||||||||||||||||||
Issued for acquisitions (Note 10)
|
– |
– |
1,162,711 | 153 | ||||||||||||||||||||
Balance at End of Year (6)
|
729,529,876 |
$ |
23,921 |
$ |
6.12 |
720,909,161 | $ | 22,941 |
$ |
5.80 | ||||||||||||||
| (1) | Series 27 and Series 46 were redeemed and final dividends were paid on May 25, 2024. |
| (2) | Series 29 was redeemed and final dividends were paid on August 25, 2024. |
| (3) | Series 31 was redeemed and final dividends were paid on November 25, 2024. |
| (4) | On March 8, 2024, we issued Series 4 LRCNs for US$1,000 million. |
| (5) | On July 17, 2024, we issued Series 5 LRCNs for US$750 million. |
| (6) | Common shares are net of 55,172 treasury shares as at October 31, 2024 (73,511 treasury shares as at October 31, 2023). |
| (Canadian $, except as noted) | ||||||||||||||||||||
| Redemption amount | Non-cumulative dividend (1) |
Reset premium | Date redeemable / convertible | Convertible to | ||||||||||||||||
Class B – Series 31 |
25.00 |
$ 0.240688 |
(2) |
2.22% | November 25, 2024 | (3) |
Class B – Series 32 | |||||||||||||
Class B – Series 33 |
25.00 |
$ 0.190875 |
(2) |
2.71% | August 25, 2025 | (4) (5) |
Class B – Series 34 | (6) (7) |
||||||||||||
Class B – Series 44 |
25.00 |
$ 0.426000 |
(2) |
2.68% | November 25, 2028 | (4) (5) |
Class B – Series 45 | (6) (7) |
||||||||||||
Class B – Series 50 |
1,000.00 | $36.865000 | (2) |
4.25% | November 26, 2027 | (4) |
Not convertible | (7) |
||||||||||||
Class B – Series 52 |
1,000.00 | $35.285000 | (2) |
4.25% | May 26, 2028 | (4) |
Not convertible | (7) |
||||||||||||
| (1) | Non-cumulative dividends are payable quarterly as and when declared by the Board of Directors, except for Class B – Series 50 and 52 preferred shares, which are payable semi-annually. |
| (2) | The dividend rate will reset on the date redeemable and every five years thereafter at a rate equal to the 5-year Government of Canada bond yield plus the reset premium noted. If converted to a floating rate series, the rate will be set as, and when declared, at the 3-month Government of Canada treasury bill yield plus the reset premium noted. |
| (3) | Series 31 was redeemed and final dividends were paid on November 25, 2024. |
(4) |
Redeemable on the date noted and every five years thereafter. |
| (5) | Convertible on the date noted and every five years thereafter if not redeemed. If converted, the shares will become floating rate preferred shares. |
| (6) | If converted, the holders have the option to convert back to the original preferred shares on subsequent redemption dates. |
| (7) | The shares issued include a NVCC provision, which is necessary for the shares to qualify as regulatory capital under Basel III. Refer to the Non-Viability Contingent Capital paragraph below for details. |
BMO Financial Group 207th Annual Report 2024 |
179 |
(Canadian $ in millions, except as noted) |
2024 |
2023 |
||||||||||||||||
Face value |
Interest rate (%) |
Redeemable at our option |
Convertible to |
Total |
Total |
|||||||||||||
4.800% AT1 Notes |
US$ 500 |
6.709 (1)
|
(2)
|
Variable number of common shares (3)
|
$ |
658 |
$ |
658 |
||||||||||
4.300% Series 1 LRCNs |
$1,250 |
4.300 (4)
|
(2)
|
Variable number of common shares (3) (4)
|
1,250 |
1,250 |
||||||||||||
5.625% Series 2 LRCNs |
$ 750 |
5.625 (4)
|
(2)
|
Variable number of common shares (3) (4)
|
750 |
750 |
||||||||||||
7.325% Series 3 LRCNs |
$1,000 |
7.325 (4)
|
(2)
|
Variable number of common shares (3) (4)
|
1,000 |
1,000 |
||||||||||||
7.700% Series 4 LRCNs |
US$1,000 |
7.700 (4)
|
(2)
|
Variable number of common shares (3) (4)
|
1,356 |
– |
||||||||||||
7.300% Series 5 LRCNs |
US$ 750 |
7.300 (4)
|
(2)
|
Variable number of common shares (3) (4)
|
1,023 |
– |
||||||||||||
Total |
$ |
6,037 |
$ |
3,658 |
||||||||||||||
| (1) | Non-cumulative interest is payable semi-annually in arrears, at the bank’s discretion. The notes had an initial interest rate of 4.800% and reset on August 25, 2024 to 6.709%. |
| (2) | The notes are redeemable at a redemption price equal to 100% of the principal amount plus any accrued and unpaid interest, in whole or in part, at our option on any interest payment date on or after the first interest reset date or following certain regulatory or tax events. The bank may, at any time, purchase the notes at any price in the open market. |
| (3) | The notes issued include a NVCC provision, which is necessary for the notes to qualify as regulatory capital under Basel III. Refer to the Non-Viability Contingent Capital paragraph below for details. |
(4) |
Non-deferrable interest is payable semi-annually on the Series 1, Series 2 and Series 3 LRCNs and quarterly on the Series 4 and Series 5 LRCNs, at the bank’s discretion. Non-payment of interest will result in a recourse event, with the noteholders’ sole remedy being their proportionate share of trust assets, which comprise our NVCC Preferred Shares Series 48 for Series 1 LRCNs, Preferred Shares Series 49 for Series 2 LRCNs, Preferred Shares Series 51 for Series 3 LRCNs, Preferred Shares Series 53 for Series 4 LRCNs and Preferred Shares Series 54 for Series 5 LRCNs. In such an event, the delivery of the trust assets will represent the full and complete extinguishment of our obligations under the LRCNs. In circumstances under which NVCC, including the Preferred Shares Series 48, Preferred Shares Series 49, Preferred Shares Series 51, Preferred Shares Series 53 and Preferred Shares Series 54 for Series 1, Series 2, Series 3, Series 4 and Series 5 LRCNs, respectively, would be converted into common shares of the bank (as described below), the LRCNs would be redeemed, with the noteholders’ sole remedy being their proportionate share of trust assets, which comprise common shares of the bank received by the trust on conversion. |
180 |
BMO Financial Group 207th Annual Report 2024 |
BMO Financial Group 207th Annual Report 2024 |
181 |
182 |
BMO Financial Group 207th Annual Report 2024 |
• |
For fixed rate, fixed maturity deposits, we discount the remaining contractual cash flows related to these deposits, adjusted for expected redemptions, at market interest rates currently offered for deposits with similar terms and risk profiles. The fair value of our senior note liabilities and covered bonds is determined by referring to current market prices for similar instruments or using valuation techniques, such as discounted cash flow models that use market interest rate yield curves and funding spreads. |
• |
For fixed rate deposits with no defined maturities, we consider fair value to equal carrying value, since carrying value is equivalent to the amount payable on the reporting date. |
• |
For floating rate deposits, changes in interest rates have minimal impact on fair value, since deposits reprice to market frequently. On that basis, fair value is considered to equal carrying value. |
| BMO Financial Group 207th Annual Report 2024 | 183 |
(Canadian $ in millions) |
2024 |
2023 |
||||||||||||||
Carrying value |
Fair value |
Carrying value |
Fair value (6) |
|||||||||||||
Securities (1)
|
||||||||||||||||
Amortized cost |
$ |
115,188 |
$ |
106,461 |
$ |
116,814 |
$ |
104,171 |
||||||||
Loans (1) (2)
|
||||||||||||||||
Residential mortgages |
190,666 |
188,848 |
175,350 |
167,863 |
||||||||||||
Consumer instalment and other personal |
91,889 |
91,513 |
103,267 |
101,023 |
||||||||||||
Credit cards |
13,030 |
13,030 |
11,893 |
11,893 |
||||||||||||
Business and government |
369,776 |
370,101 |
358,712 |
357,027 |
||||||||||||
665,361 |
663,492 |
649,222 |
637,806 |
|||||||||||||
Deposits (3)
|
928,332 |
928,689 |
875,034 |
871,776 |
||||||||||||
Securitization and structured entities’ liabilities (4)
|
21,850 |
21,653 |
24,631 |
23,739 |
||||||||||||
Other liabilities (5)
|
2,929 |
2,669 |
4,160 |
3,287 |
||||||||||||
Subordinated debt |
8,377 |
8,543 |
8,228 |
7,849 |
||||||||||||
| (1) | Carrying value is net of ACL. |
| (2) | Excludes $163 million of residential mortgages classified as FVTPL, $12,431 million of business and government loans classified as FVTPL and $61 million of business and government loans classified as FVOCI ($1,676 million, $5,720 million and $58 million, respectively, as at October 31, 2023). |
| (3) | Excludes $45,222 million of structured note liabilities, $6,032 million of money market deposits, $1,047 million of embedded options related to structured deposits carried at amortized cost and $1,807 million of metals deposits measured at fair value ($35,300 million, $nil million, $341 million and $204 million, respectively, as at October 31, 2023). |
| (4) | Excludes $18,314 million of securitization and structured entities’ liabilities classified as FVTPL ($2,463 million as at October 31, 2023). |
| (5) | Other liabilities include certain investment contract liabilities in our insurance business measured at amortized cost, as well as certain other liabilities of subsidiaries. |
| (6) | If financial instruments not carried at fair value were categorized based on the fair value hierarchy, all of these financial instruments would be categorized as Level 2, except for amortized cost securities, which would have $106,389 million categorized as Level 2 104,171 million as at October 31, 2023) and $72 million categorized as Level 3 (
$ ($nil million as at October 31, 2023). |
184 |
BMO Financial Group 207th Annual Report 2024 |
(Canadian $ in millions) |
2024 |
2023 |
||||||||||||||||||||||||||||||
Valued using quoted market prices |
Valued using models (with observable inputs) |
Valued using models (without observable inputs) |
Total |
Valued using quoted market prices |
Valued using models (with observable inputs) |
Valued using models (without observable inputs) |
Total |
|||||||||||||||||||||||||
Trading Securities |
||||||||||||||||||||||||||||||||
Issued or guaranteed by: |
||||||||||||||||||||||||||||||||
Canadian federal government |
$ |
1,272 |
$ |
8,764 |
$ |
– |
$ |
10,036 |
$ |
1,176 |
$ |
10,194 |
$ |
– |
$ |
11,370 |
||||||||||||||||
Canadian provincial and municipal governments |
– |
7,585 |
– |
7,585 |
– |
7,170 |
– |
7,170 |
||||||||||||||||||||||||
U.S. federal government |
2,688 |
21,560 |
– |
24,248 |
3,593 |
16,539 |
– |
20,132 |
||||||||||||||||||||||||
U.S. states, municipalities and agencies |
– |
565 |
– |
565 |
– |
279 |
– |
279 |
||||||||||||||||||||||||
Other governments |
92 |
3,757 |
– |
3,849 |
20 |
2,520 |
– |
2,540 |
||||||||||||||||||||||||
NHA MBS, and U.S. agency MBS and CMO |
– |
40,995 |
– |
40,995 |
– |
21,517 |
– |
21,517 |
||||||||||||||||||||||||
Corporate debt |
– |
15,190 |
– |
15,190 |
– |
11,933 |
– |
11,933 |
||||||||||||||||||||||||
Trading loans |
– |
475 |
– |
475 |
– |
450 |
– |
450 |
||||||||||||||||||||||||
Corporate equity |
65,559 |
420 |
4 |
65,983 |
48,094 |
196 |
37 |
48,327 |
||||||||||||||||||||||||
69,611 |
99,311 |
4 |
168,926 |
52,883 |
70,798 |
37 |
123,718 |
|||||||||||||||||||||||||
FVTPL Securities |
||||||||||||||||||||||||||||||||
Issued or guaranteed by: |
||||||||||||||||||||||||||||||||
Canadian federal government |
166 |
237 |
– |
403 |
4 |
212 |
– |
216 |
||||||||||||||||||||||||
Canadian provincial and municipal governments |
– |
1,578 |
– |
1,578 |
– |
1,166 |
– |
1,166 |
||||||||||||||||||||||||
U.S. federal government |
– |
1,527 |
– |
1,527 |
2 |
2,086 |
– |
2,088 |
||||||||||||||||||||||||
Other governments |
– |
25 |
– |
25 |
– |
48 |
– |
48 |
||||||||||||||||||||||||
NHA MBS, and U.S. agency MBS and CMO |
– |
21 |
– |
21 |
– |
19 |
– |
19 |
||||||||||||||||||||||||
Corporate debt |
– |
8,745 |
35 |
8,780 |
– |
7,335 |
27 |
7,362 |
||||||||||||||||||||||||
Corporate equity |
921 |
910 |
4,899 |
6,730 |
821 |
805 |
4,208 |
5,834 |
||||||||||||||||||||||||
1,087 |
13,043 |
4,934 |
19,064 |
827 |
11,671 |
4,235 |
16,733 |
|||||||||||||||||||||||||
FVOCI Securities |
||||||||||||||||||||||||||||||||
Issued or guaranteed by: |
||||||||||||||||||||||||||||||||
Canadian federal government |
3,212 |
30,965 |
– |
34,177 |
633 |
19,467 |
– |
20,100 |
||||||||||||||||||||||||
Canadian provincial and municipal governments |
– |
5,996 |
– |
5,996 |
– |
5,055 |
– |
5,055 |
||||||||||||||||||||||||
U.S. federal government |
25 |
16,940 |
– |
16,965 |
– |
5,880 |
– |
5,880 |
||||||||||||||||||||||||
U.S. states, municipalities and agencies |
– |
5,068 |
– |
5,068 |
– |
5,301 |
– |
5,301 |
||||||||||||||||||||||||
Other governments |
– |
5,656 |
– |
5,656 |
– |
6,969 |
– |
6,969 |
||||||||||||||||||||||||
NHA MBS, and U.S. agency MBS and CMO |
– |
21,293 |
– |
21,293 |
– |
15,765 |
– |
15,765 |
||||||||||||||||||||||||
Corporate debt |
– |
4,370 |
– |
4,370 |
– |
3,589 |
– |
3,589 |
||||||||||||||||||||||||
Corporate equity |
– |
– |
177 |
177 |
– |
– |
160 |
160 |
||||||||||||||||||||||||
3,237 |
90,288 |
177 |
93,702 |
633 |
62,026 |
160 |
62,819 |
|||||||||||||||||||||||||
Loans |
||||||||||||||||||||||||||||||||
Residential mortgages |
– |
163 |
– |
163 |
– |
1,676 |
– |
1,676 |
||||||||||||||||||||||||
Business and government loans |
– |
12,190 |
302 |
12,492 |
– |
5,592 |
186 |
5,778 |
||||||||||||||||||||||||
– |
12,353 |
302 |
12,655 |
– |
7,268 |
186 |
7,454 |
|||||||||||||||||||||||||
Other Assets (1)
|
11,236 |
– |
1,717 |
12,953 |
6,020 |
33 |
1,723 |
7,776 |
||||||||||||||||||||||||
Fair Value Liabilities (2)
|
||||||||||||||||||||||||||||||||
Deposits (3)
|
– |
54,108 |
– |
54,108 |
– |
35,845 |
– |
35,845 |
||||||||||||||||||||||||
Securities sold but not yet purchased |
10,631 |
24,399 |
– |
35,030 |
12,217 |
31,557 |
– |
43,774 |
||||||||||||||||||||||||
Other liabilities (4)
|
1,754 |
19,110 |
– |
20,864 |
1,479 |
3,046 |
5 |
4,530 |
||||||||||||||||||||||||
12,385 |
97,617 |
– |
110,002 |
13,696 |
70,448 |
5 |
84,149 |
|||||||||||||||||||||||||
Derivative Assets |
||||||||||||||||||||||||||||||||
Interest rate contracts |
36 |
9,851 |
– |
9,887 |
21 |
13,329 |
– |
13,350 |
||||||||||||||||||||||||
Foreign exchange contracts |
4 |
21,258 |
10 |
21,272 |
28 |
19,861 |
– |
19,889 |
||||||||||||||||||||||||
Commodity contracts |
169 |
1,656 |
2 |
1,827 |
668 |
1,349 |
5 |
2,022 |
||||||||||||||||||||||||
Equity contracts |
539 |
13,718 |
– |
14,257 |
58 |
4,632 |
– |
4,690 |
||||||||||||||||||||||||
Credit default swaps |
– |
10 |
– |
10 |
– |
25 |
– |
25 |
||||||||||||||||||||||||
748 |
46,493 |
12 |
47,253 |
775 |
39,196 |
5 |
39,976 |
|||||||||||||||||||||||||
Derivative Liabilities |
||||||||||||||||||||||||||||||||
Interest rate contracts |
32 |
10,811 |
– |
10,843 |
52 |
17,749 |
– |
17,801 |
||||||||||||||||||||||||
Foreign exchange contracts |
– |
19,955 |
– |
19,955 |
1 |
19,204 |
– |
19,205 |
||||||||||||||||||||||||
Commodity contracts |
96 |
1,721 |
4 |
1,821 |
589 |
1,067 |
1 |
1,657 |
||||||||||||||||||||||||
Equity contracts |
75 |
25,596 |
2 |
25,673 |
160 |
11,335 |
8 |
11,503 |
||||||||||||||||||||||||
Credit default swaps |
– |
10 |
1 |
11 |
– |
25 |
2 |
27 |
||||||||||||||||||||||||
$ |
203 |
$ |
58,093 |
$ |
7 |
$ |
58,303 |
$ |
802 |
$ |
49,380 |
$ |
11 |
$ |
50,193 |
|||||||||||||||||
| (1) | Other assets include precious metals, segregated fund assets and investment properties in our insurance business, carbon credits, certain receivables and other items measured at fair value. |
| (2) | Interest expense for liabilities carried at fair value is $2,774 million for the year ended October 31, 2024 ($2,274 million for the year ended October 31, 2023). Interest expense for liabilities carried at amortized cost is $43,743 million for the year ended October 31, 2024 ($34,619 million for the year ended October 31, 2023). |
| (3) | Deposits include structured note liabilities
, money market and metals deposits designated at FVTPL and certain embedded options related to structured deposits carried at amortized cost.
|
| (4) | Other liabilities include
certain investment contract liabilities and segregated fund liabilities in our insurance business, as well as certain securitization and structured entities’ liabilities measured at FVTPL.
|
BMO Financial Group 207th Annual Report 2024 |
185 |
(Canadian $ in millions except as noted) |
2024 |
|||||||||||||||||||||||||||
|
Reporting line in fair value hierarchy table |
Fair value of assets |
Valuation techniques |
S ignificantunobservable inputs |
Range of input values (1) |
Changes in fair value from using reasonably possible alternatives (2) |
|||||||||||||||||||||||
Low |
High |
|||||||||||||||||||||||||||
Private equity |
Corporate equity |
$ |
4,899 |
Net asset value |
Net asset value |
na |
na |
na |
||||||||||||||||||||
EV/EBITDA |
Multiple |
5 |
21 |
(18)/18 |
||||||||||||||||||||||||
Investment properties |
Other assets |
1,363 |
Income approach |
Capitalization rate |
2% |
8% |
(118)/151 |
|||||||||||||||||||||
2023 |
||||||||||||||||||||||||||||
Private equity |
Corporate equity |
$ |
4,208 |
Net asset value |
Net asset value |
na |
na |
na |
||||||||||||||||||||
EV/EBITDA |
Multiple |
3 | 23 | (13)/13 |
||||||||||||||||||||||||
Investment properties |
Other assets |
1,326 |
Income approach |
Capitalization rate |
1% |
9% |
(124)/174 |
|||||||||||||||||||||
| (1) | The low and high input values represent the lowest and highest actual level of inputs used to value a group of financial instruments in a particular product category. These value ranges do not reflect the level of input uncertainty but are affected by the specific underlying instruments within each product category. The value ranges will therefore vary from period to period based on the characteristics of the underlying instruments held at each balance sheet date. |
| (2) | Net asset values are provided by fund managers and therefore have no other reasonably possible alternative assumptions. Sensitivity of private equity investments is determined by adjusting the price multiples based on the range of multiples of comparable companies. Sensitivity of investment properties is determined by adjusting the
capitalization rate. |
186 |
BMO Financial Group 207th Annual Report 2024 |
Change in fair value |
Movements |
Transfers |
||||||||||||||||||||||||||||||||||||||
For the year ended October 31, 2024 (Canadian $ in millions) |
Balance October 31, 2023 |
Included in earnings |
Included in other comprehensive income |
Purchases/ Issuances |
Sales |
Maturities /Settlement |
Transfers into Level 3 |
Transfers out of Level 3 |
Fair value as at October 31, 2024 |
Change in unrealized gains (losses) recorded in income for instruments still held |
||||||||||||||||||||||||||||||
Trading Securities |
||||||||||||||||||||||||||||||||||||||||
NHA MBS and U.S. agency MBS and CMO |
$ |
– |
$ |
– |
$ |
– |
$ |
41 |
$ |
(41 |
) |
$ |
– |
$ |
– |
$ |
– |
$ |
– |
$ |
– |
|||||||||||||||||||
Corporate equity |
37 |
– |
– |
4 |
– |
– |
– |
(37 |
) |
4 |
– |
|||||||||||||||||||||||||||||
Total trading securities |
37 |
– |
– |
45 |
(41 |
) |
– |
– |
(37 |
) |
4 |
– |
||||||||||||||||||||||||||||
FVTPL Securities |
||||||||||||||||||||||||||||||||||||||||
Corporate debt |
27 |
(10 |
) |
– |
18 |
– |
– |
– |
– |
35 |
(10 |
) |
||||||||||||||||||||||||||||
Corporate equity |
4,208 |
(162 |
) |
11 |
1,068 |
(240 |
) |
(1 |
) |
16 |
(1 |
) |
4,899 |
57 |
||||||||||||||||||||||||||
Total FVTPL securities |
4,235 |
(172 |
) |
11 |
1,086 |
(240 |
) |
(1 |
) |
16 |
(1 |
) |
4,934 |
47 |
||||||||||||||||||||||||||
FVOCI Securities |
||||||||||||||||||||||||||||||||||||||||
Corporate equity |
160 |
– |
13 |
4 |
– |
– |
– |
– |
177 |
na |
||||||||||||||||||||||||||||||
Total FVOCI securities |
160 |
– |
13 |
4 |
– |
– |
– |
– |
177 |
na |
||||||||||||||||||||||||||||||
Business and Government Loans |
186 |
– |
– |
89 |
– |
(171 |
) |
198 |
– |
302 |
– |
|||||||||||||||||||||||||||||
Other Assets |
1,723 |
30 |
– |
86 |
(21 |
) |
(101 |
) |
– |
– |
1,717 |
47 |
||||||||||||||||||||||||||||
Derivative Assets |
||||||||||||||||||||||||||||||||||||||||
Foreign exchange contracts |
– |
– |
– |
10 |
– |
– |
– |
– |
10 |
– |
||||||||||||||||||||||||||||||
Commodity contracts |
5 |
(3 |
) |
– |
– |
– |
– |
– |
– |
2 |
(3 |
) |
||||||||||||||||||||||||||||
Equity contracts |
– |
– |
– |
– |
– |
– |
13 |
(13 |
) |
– |
– |
|||||||||||||||||||||||||||||
Total derivative assets |
5 |
(3 |
) |
– |
10 |
– |
– |
13 |
(13 |
) |
12 |
(3 |
) |
|||||||||||||||||||||||||||
Other Liabilities |
5 |
– |
– |
8 |
– |
(13 |
) |
– |
– |
– |
– |
|||||||||||||||||||||||||||||
Derivative Liabilities |
||||||||||||||||||||||||||||||||||||||||
Foreign exchange contracts |
– |
– |
– |
– |
– |
– |
– |
– |
– |
– |
||||||||||||||||||||||||||||||
Commodity contracts |
1 |
3 |
– |
– |
– |
– |
– |
– |
4 |
3 |
||||||||||||||||||||||||||||||
Equity contracts |
8 |
1 |
– |
– |
– |
– |
2 |
(9 |
) |
2 |
1 |
|||||||||||||||||||||||||||||
Credit default swaps |
2 |
(2 |
) |
– |
– |
– |
– |
1 |
– |
1 |
(1 |
) |
||||||||||||||||||||||||||||
Total derivative liabilities |
11 |
2 |
– |
– |
– |
– |
3 |
(9 |
) |
7 |
3 |
|||||||||||||||||||||||||||||
Change in fair value |
Movements |
Transfers |
||||||||||||||||||||||||||||||||||||||
For the year ended October 31, 2023 (Canadian $ in millions) |
Balance October 31, 2022 |
Included in earnings |
Included in other comprehensive income (1) |
Purchases/ Issuances (3) |
Sales |
Maturities/ Settlement |
Transfers into Level 3 |
Transfers out of Level 3 |
Fair value as at October 31, 2023 |
Change in unrealized gains (losses) recorded in income for instruments still held (2) |
||||||||||||||||||||||||||||||
Trading Securities |
||||||||||||||||||||||||||||||||||||||||
NHA MBS and U.S. agency MBS and CMO |
$ |
– |
$ |
– |
$ |
– |
$ |
– |
$ |
– |
$ |
– |
$ |
– |
$ |
– |
$ |
– |
$ |
– |
||||||||||||||||||||
Corporate equity |
– |
– |
– |
– |
– |
– |
37 |
– |
37 |
– |
||||||||||||||||||||||||||||||
Total trading securities |
– |
– |
– |
– |
– |
– |
37 |
– |
37 |
– |
||||||||||||||||||||||||||||||
FVTPL Securities |
||||||||||||||||||||||||||||||||||||||||
Corporate debt |
8 |
– |
– |
19 |
– |
– |
– |
– |
27 |
1 |
||||||||||||||||||||||||||||||
Corporate equity |
4,044 |
(233 |
) |
45 |
2,784 |
(349 |
) |
(1 |
) |
15 |
(2,097 |
) |
4,208 |
(39 |
) |
|||||||||||||||||||||||||
Total FVTPL securities |
4,052 |
(233 |
) |
45 |
2,803 |
(349 |
) |
(1 |
) |
15 |
(2,097 |
) |
4,235 |
(38 |
) |
|||||||||||||||||||||||||
FVOCI Securities |
||||||||||||||||||||||||||||||||||||||||
Corporate equity |
153 |
– |
1 |
7 |
(1 |
) |
– |
– |
– |
160 |
na |
|||||||||||||||||||||||||||||
Total FVOCI securities |
153 |
– |
1 |
7 |
(1 |
) |
(1 |
) |
– |
– |
160 |
na |
||||||||||||||||||||||||||||
Business and Government Loans |
20 |
– |
4 |
259 |
– |
(97 |
) |
– |
– |
186 |
– |
|||||||||||||||||||||||||||||
Other Assets |
1,233 |
40 |
– |
461 |
– |
(11 |
) |
– |
– |
1,723 |
40 |
|||||||||||||||||||||||||||||
Derivative Assets |
||||||||||||||||||||||||||||||||||||||||
Foreign exchange contracts |
26 |
(17 |
) |
– |
– |
– |
(9 |
) |
– |
– |
– |
9 |
||||||||||||||||||||||||||||
Commodity contracts |
– |
(8 |
) |
– |
13 |
– |
– |
– |
– |
5 |
(8 |
) |
||||||||||||||||||||||||||||
Equity contracts |
– |
2 |
– |
– |
– |
– |
1 |
(3 |
) |
– |
2 |
|||||||||||||||||||||||||||||
Total derivative assets |
26 |
(23 |
) |
– |
13 |
– |
(9 |
) |
1 |
(3 |
) |
5 |
3 |
|||||||||||||||||||||||||||
Other Liabilities |
2 |
(1 |
) |
– |
11 |
(4 |
) |
– |
– |
(3 |
) |
5 |
(1 |
) |
||||||||||||||||||||||||||
Derivative Liabilities |
||||||||||||||||||||||||||||||||||||||||
Foreign exchange contracts |
– |
12 |
– |
– |
– |
(12 |
) |
– |
– |
– |
(38 |
) |
||||||||||||||||||||||||||||
Commodity contracts |
– |
1 |
– |
– |
– |
– |
– |
– |
1 |
1 |
||||||||||||||||||||||||||||||
Equity contracts |
– |
– |
– |
– |
– |
– |
8 |
– |
8 |
– |
||||||||||||||||||||||||||||||
Credit default swaps |
2 |
– |
– |
– |
– |
– |
– |
– |
2 |
– |
||||||||||||||||||||||||||||||
Total derivative liabilities |
2 |
13 |
– |
– |
– |
(12 |
) |
8 |
– |
11 |
(37 |
) |
||||||||||||||||||||||||||||
| (1) | Foreign exchange translation on assets and liabilities held by foreign operations is included
our Consolidated Statement of Comprehensive Income as part of net gains on translation of net foreign operations.
|
| (2) | Changes in unrealized gains (losses) on trading and FVTPL securities still held on October 31, 2024 and 2023 are included in earnings for the year. |
| (3) | FVTPL securities include $969 million of Federal Home Loan Bank (FHLB) and Federal Reserve Bank equity and $587 million of investments in LIHTC entities, acquired as a result of our acquisition of Bank of the West
in 2023 .
|
| BMO Financial Group 207th Annual Report 2024 | 187 |
(Canadian $ in millions) |
2024 |
2023 |
||||||
Interest rates |
$ |
1,003 |
$ |
770 |
||||
Foreign exchange |
579 |
638 |
||||||
Equities |
759 |
610 |
||||||
Commodities |
150 |
192 |
||||||
Other (1)
|
55 |
(1,526 |
) |
|||||
Total trading-related revenue |
$ |
2,546 |
$ |
684 |
||||
Reported as: |
||||||||
Net interest income |
169 |
900 |
||||||
Non-interest revenue – trading revenues (losses) (1)
|
2,377 |
(216 |
) |
|||||
Total trading-related revenue |
$ |
2,546 |
$ |
684 |
||||
(1) |
Includes management of fair value changes on the purchase of Bank of the West in 2023. Refer to Note 10 for further information. |
(Canadian $ in millions) |
2024 |
|||||||||||||||||||||||||||
Amounts not offset in the balance sheet |
||||||||||||||||||||||||||||
|
Gross amounts |
Amounts offset in the balance sheet |
Net amounts presented in the balance sheet |
Impact of master netting agreements |
Securities received/pledged as collateral |
Cash collateral |
Net amount |
||||||||||||||||||||||
Financial Assets |
||||||||||||||||||||||||||||
Securities borrowed or purchased under resale agreements |
$ |
135,282 |
$ |
24,375 |
$ |
110,907 |
$ |
5,738 |
$ |
103,814 |
$ |
72 |
$ |
1,283 |
||||||||||||||
Derivative instruments |
47,662 |
409 |
47,253 |
31,576 |
2,294 |
3,802 |
9,581 |
|||||||||||||||||||||
$ |
182,944 |
$ |
24,784 |
$ |
158,160 |
$ |
37,314 |
$ |
106,108 |
$ |
3,874 |
$ |
10,864 |
|||||||||||||||
Financial Liabilities |
||||||||||||||||||||||||||||
Derivative instruments |
$ |
58,712 |
$ |
409 |
$ |
58,303 |
$ |
31,576 |
$ |
10,866 |
$ |
7,378 |
$ |
8,483 |
||||||||||||||
Securities lent or sold under repurchase agreements |
135,166 |
24,375 |
110,791 |
5,738 |
104,266 |
258 |
529 |
|||||||||||||||||||||
$ |
193,878 |
$ |
24,784 |
$ |
169,094 |
$ |
37,314 |
$ |
115,132 |
$ |
7,636 |
$ |
9,012 |
|||||||||||||||
2023 |
||||||||||||||||||||||||||||
Financial Assets |
||||||||||||||||||||||||||||
Securities borrowed or purchased under resale agreements |
$ |
118,128 |
$ |
2,466 |
$ |
115,662 |
$ |
11,386 |
$ |
102,852 |
$ |
25 |
$ |
1,399 |
||||||||||||||
Derivative instruments |
40,513 |
537 |
39,976 |
26,674 |
3,266 |
4,569 |
5,467 |
|||||||||||||||||||||
$ |
158,641 |
$ |
3,003 |
$ |
155,638 |
$ |
38,060 |
$ |
106,118 |
$ |
4,594 |
$ |
6,866 |
|||||||||||||||
Financial Liabilities |
||||||||||||||||||||||||||||
Derivative instruments |
$ |
50,730 |
$ |
537 |
$ |
50,193 |
$ |
26,674 |
$ |
7,837 |
$ |
7,186 |
$ |
8,496 |
||||||||||||||
Securities lent or sold under repurchase agreements |
108,574 |
2,466 |
106,108 |
11,386 |
94,291 |
106 |
325 |
|||||||||||||||||||||
$ |
159,304 |
$ |
3,003 |
$ |
156,301 |
$ |
38,060 |
$ |
102,128 |
$ |
7,292 |
$ |
8,821 |
|||||||||||||||
| (1) | Financial assets received/pledged as collateral are disclosed at fair value and limited to the net balance sheet exposure (i.e. any over-collateralization is excluded from the table). |
| (2) | Certain amounts of collateral are restricted from being sold or re pledged e xcept in the event of default or the occurrence of other predetermined events. |
| (3) | Not intended to represent our actual exposure to credit risk. |
188 |
BMO Financial Group 207th Annual Report 2024 |
• |
Regulatory capital ratios are calculated by dividing CET1 Capital, Tier 1 Capital, Total Capital and TLAC by their respective risk-weighted assets. |
• |
The Leverage Ratio is defined as Tier 1 Capital divided by leverage exposures, which consist of on-balance sheet items and specified off-balance sheet items, net of specified adjustments. The TLAC Leverage Ratio is defined as TLAC divided by leverage exposures. |
(Canadian $ in millions, except as noted) |
2024 |
2023 |
||||||
CET1 Capital |
$ |
57,054 |
$ |
52,914 |
||||
Tier 1 Capital |
64,735 |
59,785 |
||||||
Total Capital |
73,911 |
68,718 |
||||||
TLAC |
123,288 |
114,402 |
||||||
Risk-Weighted Assets |
420,838 |
424,197 |
||||||
Leverage Exposures |
1,484,962 |
1,413,036 |
||||||
CET1 Ratio |
13.6% |
12.5% |
||||||
Tier 1 Capital Ratio |
15.4% |
14.1% |
||||||
Total Capital Ratio |
17.6% |
16.2% |
||||||
TLAC Ratio |
29.3% |
27.0% |
||||||
Leverage Ratio |
4.4% |
4.2% |
||||||
TLAC Leverage Ratio |
8.3% |
8.1% |
||||||
| (1) | Calculated in accordance with OSFI’s CAR Guideline, Leverage Requirements Guideline and TLAC Guideline, as applicable. |
BMO Financial Group 207th Annual Report 2024 |
189 |
(Canadian $, except as noted) |
2024 |
2023 |
||||||||||||||
Number of stock options |
Weighted-average
exercise price |
Number of stock options |
Weighted-average
exercise price |
|||||||||||||
Outstanding at beginning of year |
6,312,576 |
$ |
105.26 |
5,976,870 |
$ |
98.12 |
||||||||||
Granted |
1,113,853 |
118.50 |
1,322,817 |
122.31 |
||||||||||||
Exercised |
(811,652 |
) |
82.74 |
(724,853 |
) |
76.12 |
||||||||||
Forfeited/expired/cancelled |
(60,285 |
) |
122.22 |
(262,258 |
) |
109.19 |
||||||||||
Outstanding at end of year |
6,554,492 |
110.14 |
6,312,576 |
105.26 |
||||||||||||
Exercisable at end of year |
2,856,460 |
95.27 |
2,759,935 |
89.99 |
||||||||||||
Available for grant |
9,565,914 |
10,619,482 |
||||||||||||||
(Canadian $, except as noted) |
2024 |
|||||||||||||||||||
Options outstanding |
Options exercisable |
|||||||||||||||||||
Range of exercise prices |
Number of stock options |
Weighted- average remaining contractual life (years) |
Weighted-average
exercise price |
Number of stock options |
Weighted-average
exercise price |
|||||||||||||||
$70.01 to $80.00 |
332,980 |
0.9 |
$ |
77.42 |
332,980 |
$ |
77.42 |
|||||||||||||
$80.01 to $90.00 |
563,982 |
4.1 |
89.90 |
563,982 |
89.90 |
|||||||||||||||
$90.01 to $100.00 |
1,185,672 |
5.0 |
97.07 |
749,448 |
97.03 |
|||||||||||||||
$100.01 to $120.00 |
2,281,462 |
6.7 |
109.43 |
1,195,574 |
101.19 |
|||||||||||||||
$120.01 and over |
2,190,396 |
7.7 |
128.14 |
14,476 |
135.58 |
|||||||||||||||
(Canadian $ in millions, except as noted) |
2024 |
2023 |
||||||
Unrecognized compensation cost for non-vested stock option awards |
$ |
12 |
$ |
14 |
||||
Cash proceeds from stock options exercised |
67 |
55 |
||||||
Weighted-average share price for stock options exercised (in dollars) |
120.40 |
123.01 |
||||||
2024 |
2023 |
|||||
Expected dividend yield |
4.5% |
4.5% – 4.6% |
||||
Expected share price volatility |
17.4 % – 17.6% |
20.9% |
||||
Risk-free rate of return |
3.3 % – 3.4% |
3.2% |
||||
Expected period until exercise (in years) |
6.5 – 7.0 |
6.5 – 7.0 |
||||
190 |
BMO Financial Group 207th Annual Report 2024 |
BMO Financial Group 207th Annual Report 2024 |
191 |
• |
monitoring surplus-at-risk, |
• |
stress testing and scenario analyses to evaluate the volatility of the plans’ financial positions and any potential impact on the bank; |
• |
hedging of foreign currency and interest rate risk exposures within policy limits; |
• |
controls related to asset mix allocations, geographic allocations, portfolio duration, credit quality of debt securities, sector guidelines, issuer/counterparty limits and others; and |
• |
ongoing monitoring of exposures, performance and risk levels. |
192 |
BMO Financial Group 207th Annual Report 2024 |
(Canadian $ in millions) |
Pension benefit plans |
Other employee future benefit plans |
||||||||||||||
2024 |
2023 |
2024 |
2023 |
|||||||||||||
Defined benefit obligation |
$ |
8,365 |
$ |
7,513 |
$ |
954 |
$ |
880 |
||||||||
Fair value of plan assets |
9,431 |
8,559 |
245 |
138 |
||||||||||||
Net surplus (deficit) |
1,066 |
1,046 |
(709 |
) |
(742 |
) |
||||||||||
Effect of asset ceiling |
(3 |
) |
– |
(110 |
) |
– |
||||||||||
Net surplus (deficit), net of the effect of the asset ceiling |
$ |
1,063 |
$ |
1,046 |
$ |
(819 |
) |
$ |
(742 |
) |
||||||
Net surplus (deficit) comprises : |
||||||||||||||||
Funded or partially funded plans |
1,223 |
1,209 |
44 |
81 |
||||||||||||
Unfunded plans |
(160 |
) |
(163 |
) |
(863 |
) |
(823 |
) |
||||||||
Net surplus (deficit), net of the effect of the asset ceiling |
$ |
1,063 |
$ |
1,046 |
$ |
(819 |
) |
$ |
(742 |
) |
||||||
(Canadian $ in millions) |
Pension benefit plans |
Other employee future benefit plans |
||||||||||||||
2024 |
2023 |
2024 |
2023 |
|||||||||||||
Annual benefits expense |
||||||||||||||||
Current service cost |
$ |
153 |
$ |
163 |
$ |
5 |
$ |
6 |
||||||||
Net interest (income) expense (1)
|
(61 |
) |
(64 |
) |
40 |
42 |
||||||||||
Impact of plan amendments |
– |
(1 |
) |
(84 |
) |
(51 |
) |
|||||||||
Administrative expenses |
11 |
10 |
– |
– |
||||||||||||
Remeasurement of other long-term benefits |
– |
– |
5 |
9 |
||||||||||||
Benefits expense |
$ |
103 |
$ |
108 |
$ |
(34 |
) |
$ |
6 |
|||||||
Government pension plans expense (2)
|
375 |
361 |
– |
– |
||||||||||||
Defined contribution expense |
290 |
271 |
– |
– |
||||||||||||
Total annual pension and other employee future benefit expenses (recovery) recognized in our Consolidated Statement of Income |
$ |
768 |
$ |
740 |
$ |
(34 |
) |
$ |
6 |
|||||||
| (1) | Net interest (income) expense is increased by million for other employee future benefit plans for 2024 ($nil million and $nil million, respectively, for 2023) as a result of assets written down through other comprehensive income due to the asset ceiling. |
(2) |
Includes Canada Pension Plan, Quebec Pension Plan and U.S. Federal Insurance Contribution Act |
BMO Financial Group 207th Annual Report 2024 |
193 |
Pension benefit plans |
Other employee future benefit plans |
|||||||||||||||
2024 |
2023 |
2024 |
2023 |
|||||||||||||
Defined Benefit Expenses |
||||||||||||||||
Discount rate at beginning of year (1) (2)
|
5.8% |
5.5% |
5.7% |
5.5% |
||||||||||||
Rate of compensation increase |
2.1% |
2.3% |
na |
na |
||||||||||||
Assumed overall health care cost trend rate |
na |
na |
4.8% |
(4)
|
4.7% |
(3) |
||||||||||
Defined Benefit Obligation |
||||||||||||||||
Discount rate at end of year |
4.9% |
5.8% |
4.8% |
5.7% |
||||||||||||
Rate of compensation increase |
2.1% |
2.1% |
na |
na |
||||||||||||
Assumed overall health care cost trend rate |
na |
na |
4.8% |
(3)
|
4.8% |
(4) |
||||||||||
| (1) | The pension benefit current service cost was calculated using a separate discount rate of 5.6% and 5.4% for 2024 and 2023, respectively. |
| (2) | The other employee future benefit plans current service cost was calculated using a separate discount rate of 5.7% and 5.5% for 2024 and 2023, respectively. |
| (3) | Trending to 4.00% in 2041 and remaining at that level thereafter. |
| (4) | Trending to 4.03% in 2040 and remaining at that level thereafter. |
(Years) |
Canada |
United States |
||||||||||||||
2024 |
2023 |
2024 |
2023 |
|||||||||||||
Life expectancy for those currently age 65 |
||||||||||||||||
Males |
24.0
|
23.9 |
22.0 |
21.9 |
||||||||||||
Females |
24.3 |
24.3 |
23.3 |
23.3 |
||||||||||||
Life expectancy at age 65 for those currently age 45 |
||||||||||||||||
Males |
24.9 |
24.8 |
23.2 |
23.1 |
||||||||||||
Females |
25.2 |
25.2 |
24.5 |
24.5 |
||||||||||||
194 |
BMO Financial Group 207th Annual Report 2024 |
(Canadian $ in millions, except as noted) |
Pension benefit plans |
Other employee future benefit plans |
||||||||||||||
2024 |
2023 |
2024 |
2023 |
|||||||||||||
Defined benefit obligation |
||||||||||||||||
Defined benefit obligation at beginning of year |
$ |
7,513 |
$ |
7,082 |
$ |
880 |
$ |
928 |
||||||||
Acquisition of defined benefit obligation (1)
|
– |
563 |
– |
28 |
||||||||||||
Settlements (2) |
(147 |
) |
– |
– |
– |
|||||||||||
Current service cost |
153 |
163 |
5 |
6 |
||||||||||||
Interest cost |
418 |
393 |
49 |
50 |
||||||||||||
Impact of plan amendments |
– |
(1 |
) |
15 |
(51 |
) |
||||||||||
Benefits paid |
(481 |
) |
(449 |
) |
(59 |
) |
(58 |
) |
||||||||
Employee contributions |
20 |
20 |
6 |
6 |
||||||||||||
Actuarial (gains) losses due to: |
||||||||||||||||
Changes in demographic assumptions |
– |
– |
(12 |
) |
(2 |
) |
||||||||||
Changes in financial assumptions |
851 |
(349 |
) |
81 |
(19 |
) |
||||||||||
Plan member experience |
31 |
46 |
(11 |
) |
(10 |
) |
||||||||||
Foreign exchange and other |
7 |
45 |
– |
2 |
||||||||||||
Defined benefit obligation at end of year |
8,365 |
7,513 |
954 |
880 |
||||||||||||
Wholly or partially funded defined benefit obligation |
8,205 |
7,350 |
91 |
57 |
||||||||||||
Unfunded defined benefit obligation |
160 |
163 |
863 |
823 |
||||||||||||
Total defined benefit obligation |
8,365 |
7,513 |
954 |
880 |
||||||||||||
Fair value of plan assets |
||||||||||||||||
Fair value of plan assets at beginning of year |
8,559 |
8,261 |
138 |
147 |
||||||||||||
Acquisition of plan assets (1)
|
– |
487 |
– |
– |
||||||||||||
Settlements (2) |
(147 |
) |
– |
– |
– |
|||||||||||
Impact of plan amendments |
– |
– |
100 |
– |
||||||||||||
Interest income |
479 |
457 |
12 |
8 |
||||||||||||
Return on plan assets (excluding interest income) |
979 |
(300 |
) |
1 |
(12 |
) |
||||||||||
Employer contributions |
25 |
50 |
45 |
45 |
||||||||||||
Employee contributions |
20 |
20 |
6 |
6 |
||||||||||||
Benefits paid |
(481 |
) |
(449 |
) |
(59 |
) |
(58 |
) |
||||||||
Administrative expenses |
(12 |
) |
(10 |
) |
– |
– |
||||||||||
Foreign exchange and other |
9 |
43 |
2 |
2 |
||||||||||||
Fair value of plan assets at end of year |
9,431 |
8,559 |
245 |
138 |
||||||||||||
Effect of asset ceiling |
(3 |
) |
– |
(110 |
) |
– |
||||||||||
Net surplus (deficit), net of the effect of the asset ceiling |
$ |
1,063 |
$ |
1,046 |
$ |
(819 |
) |
$ |
(742 |
) |
||||||
Recorded in: |
||||||||||||||||
Other assets |
1,252 |
1,225 |
44 |
81 |
||||||||||||
Other liabilities |
(189 |
) |
(179 |
) |
(863 |
) |
(823 |
) |
||||||||
Net surplus (deficit), net of the effect of the asset ceiling |
$ |
1,063 |
$ |
1,046 |
$ |
(819 |
) |
$ |
(742 |
) |
||||||
Actuarial gains (losses) recognized in other comprehensive income |
||||||||||||||||
Net actuarial (losses) on plan assets |
979 |
(300 |
) |
1 |
(12 |
) |
||||||||||
Effect of asset ceiling |
(3 |
) |
– |
(107 |
) |
– |
||||||||||
Actuarial gains (losses) on defined benefit obligation due to: |
||||||||||||||||
Changes in demographic assumptions |
– |
– |
15 |
14 |
||||||||||||
Changes in financial assumptions |
(851 |
) |
349 |
(74 |
) |
17 |
||||||||||
Plan member experience |
(31 |
) |
(46 |
) |
6 |
9 |
||||||||||
Foreign exchange and other |
(3 |
) |
(8 |
) |
– |
– |
||||||||||
Actuarial gains (losses) recognized in other comprehensive income for the year |
$ |
91 |
$ |
(5 |
) |
$ |
(159 |
) |
$ |
28 |
||||||
(1) |
Relates to the defined benefit plan included in our acquisition of Bank of the West in fiscal 2023. Refer to Note 10 for further information. |
(2) |
We completed a buyout of our UK pension plan in the fourth quarter of 2024 whereby we transferred our defined benefit obligations and an equal amount of plan assets to a third-party insurer, who has assumed the responsibility of administering payments to the plan members. We do not have any further involvement in the plan. There was no pre-tax impact from this transfer. Deferred tax assets and liabilities related to the pension plan were reduced to $nil. |
(Canadian $ in millions) |
2024 |
2023 |
||||||||||||||||||||||||||||||||||||||
Target range |
% of total |
Quoted |
Unquoted |
Total |
Target range |
% of total |
Quoted |
Unquoted |
Total |
|||||||||||||||||||||||||||||||
Equities |
15 – 40 % |
22% |
$ |
1,060 |
$ |
852 |
$ |
1,912 |
15 – 40% |
20% |
$ |
925 |
$ |
663 |
$ |
1,588 |
||||||||||||||||||||||||
Fixed income investments |
40 – 55% |
49% |
96 |
4,467 |
4,563 |
40 – 60% |
49% |
168 |
3,855 |
4,023 |
||||||||||||||||||||||||||||||
Alternative strategies |
10 – 35% |
29% |
– |
2,681 |
2,681 |
10 – 40% |
31% |
– |
2,537 |
2,537 |
||||||||||||||||||||||||||||||
100% |
$ |
1,156 |
$ |
8,000 |
$ |
9,156 |
100% |
$ |
1,093 |
$ |
7,055 |
$ |
8,148 |
|||||||||||||||||||||||||||
BMO Financial Group 207th Annual Report 2024 |
195 |
| (Canadian $ in millions, except as noted) | Defined benefit obligation | |||||||||
| Pension benefit plans | Other employee future benefit plans | |||||||||
Discount rate (%)
|
4.9 | 4.8 | ||||||||
Impact of: 1% increase ($)
|
$ (839 | ) | $ (73 | ) | ||||||
1% decrease ($)
|
1,037 | 86 | ||||||||
Rate of compensation increase (%)
|
2.1 | na | ||||||||
Impact of: 0.25% increase ($)
|
$ 37 | na | ||||||||
0.25% decrease ($)
|
(36 | ) | na | |||||||
Mortality |
||||||||||
Impact of: 1 year shorter life expectancy ($)
|
$ 154 | $ 20 | ||||||||
1 year longer life expectancy ($)
|
(157 | ) | (20 | ) | ||||||
Assumed overall health care cost trend rate (%)
|
na | 4.8 | (1) |
|||||||
Impact of: 1% increase ($)
|
na | $ 29 | ||||||||
1% decrease ($)
|
na | (29 | ) | |||||||
| (1) | Trending to 4.00% in 2041 and remaining at that level thereafter. |
(Years) |
2024 |
2023 |
||||||||||||||
Canadian pension plans |
13.0 |
12.1 |
||||||||||||||
U.S. pension plans |
7.5 |
7.2 |
||||||||||||||
Canadian other employee future benefit plans |
11.7 |
11.2 |
||||||||||||||
(Canadian $ in millions) |
Pension benefit plans |
Other employee future benefit plans |
||||||||||||||||
2024 |
2023 |
2024 |
2023 |
|||||||||||||||
Net contributions (refund) to defined benefit plans |
$ |
(25 |
) |
$ |
7 |
$ |
– |
$ |
– |
|||||||||
Contributions to defined contribution plans |
290 |
271 |
– |
– |
||||||||||||||
Benefits paid directly to pensioners |
50 |
43 |
45 |
45 |
||||||||||||||
$ |
315 |
$ |
321 |
$ |
45 |
$ |
45 |
|||||||||||
196 |
BMO Financial Group 207th Annual Report 2024 |
(Canadian $ in millions) |
2024 |
2023 |
||||||
Consolidated Statement of Income |
||||||||
Current |
||||||||
Provision for income taxes for the current period |
$ |
2,055 |
$ |
2,220 |
||||
Adjustments for prior periods |
– |
(2 |
) |
|||||
Deferred |
||||||||
Origination and reversal of temporary differences |
150 |
(687 |
) |
|||||
Effect of changes in tax rates |
3 |
(21 |
) |
|||||
2,208 |
1,510 |
|||||||
Other Comprehensive Income and Equity |
||||||||
Income tax expense (recovery) related to: |
||||||||
Unrealized gains (losses) on FVOCI debt securities |
79 |
(35 |
) |
|||||
Reclassification to earnings of (gains) on FVOCI debt securities |
(31 |
) |
(11 |
) |
||||
Gains (losses) on derivatives designated as cash flow hedges |
966 |
(576 |
) |
|||||
Reclassification to earnings/goodwill of losses on derivatives designated as cash flow hedges |
536 |
366 |
||||||
Unrealized (losses) on hedges of net foreign operations |
(38 |
) |
(90 |
) |
||||
Unrealized gains on FVOCI equity securities |
3 |
– |
||||||
(Losses) on remeasurement of pension and other employee future benefit plans |
1 |
24 |
||||||
(Losses) on remeasurement of own credit risk on financial liabilities designated at fair value |
(242 |
) |
(103
|
) |
||||
Share-based compensation |
(4 |
) |
4 |
|||||
1,270 |
(421 |
) |
||||||
Total provision for income taxes |
$ |
3,478 |
$ |
1,089 |
||||
|
Components of Total Provision for Income Taxes (Canadian $ in millions) |
2024 |
2023 |
||||||
Canada: Current taxes |
||||||||
Federal |
$ |
813 |
$ |
509 |
||||
Provincial |
453 |
278 |
||||||
1,266 |
787 |
|||||||
Canada: Deferred taxes |
||||||||
Federal |
133 |
(475 |
) |
|||||
Provincial |
74 |
(261 |
) |
|||||
207 |
(736 |
) |
||||||
Total Canadian |
1,473 |
51 |
||||||
Foreign: Current taxes |
1,764 |
933 |
||||||
Deferred taxes |
241 |
105 |
||||||
Total foreign |
2,005 |
1,038 |
||||||
Total provision for income taxes |
$ |
3,478 |
$ |
1,089 |
||||
BMO Financial Group 207th Annual Report 2024 |
197 |
(Canadian $ in millions, except as noted) |
2024 |
2023 |
||||||||||||||
Combined Canadian federal and provincial income taxes at the statutory tax rate |
$ |
2,651 |
27.8 |
% |
$ |
1,654 |
27.8 |
% |
||||||||
Increase (decrease) resulting from: |
||||||||||||||||
Tax-exempt income from securities |
(45 |
) |
(0.5 |
) |
(265 |
) |
(4.5 |
) |
||||||||
Foreign operations subject to different tax rates |
(365 |
) |
(3.8 |
) |
(233 |
) |
(4.0 |
) |
||||||||
Change in tax rate for deferred taxes |
3 |
– |
– |
– |
||||||||||||
Income attributable to investments in associates and joint ventures |
(36 |
) |
(0.3 |
) |
(31 |
) |
(0.5 |
) |
||||||||
Net impact of certain Canadian tax measures |
– |
– |
371 |
6.3 |
||||||||||||
Other |
– |
– |
14 |
0.3 |
||||||||||||
Provision for income taxes in our Consolidated Statement of Income and effective tax rate |
$ |
2,208 |
23.2 |
% |
$ |
1,510 |
25.4 |
% |
||||||||
(Canadian $ in millions) |
||||||||||||||||||||||||
Deferred Tax Asset (Liability) |
Net asset, November 1, 2023 |
Benefit (expense) to income statement |
Benefit (expense) to equity |
Translation and other |
Net asset, October 31, 2024 |
|||||||||||||||||||
Allowance for credit losses |
$ |
893 |
$ |
449 |
$ |
– |
$ |
1 |
$ |
1,343 |
||||||||||||||
Employee future benefits |
264 |
3 |
15 |
– |
282 |
|||||||||||||||||||
Deferred compensation benefits |
783 |
(35 |
) |
– |
1 |
749 |
||||||||||||||||||
Other comprehensive income |
522 |
– |
(298 |
) |
– |
224 |
||||||||||||||||||
Premises and equipment |
(343 |
) |
(136 |
) |
– |
(1 |
) |
(480 |
) |
|||||||||||||||
Pension benefits |
(395 |
) |
73 |
(16 |
) |
– |
(338 |
) |
||||||||||||||||
Goodwill and intangible assets |
(913 |
) |
107 |
– |
1 |
(805 |
) |
|||||||||||||||||
Securities |
987 |
(119 |
) |
– |
(1 |
) |
867 |
|||||||||||||||||
Other |
1,606 |
(495 |
) (1)
|
4 |
66 |
1,181 |
||||||||||||||||||
Net deferred tax assets (liabilities) |
$ |
3,404 |
$ |
(153 |
) |
$ |
(295 |
) |
$ |
67 |
$ |
3,023 |
||||||||||||
Comprising |
||||||||||||||||||||||||
Deferred tax assets |
$ |
3,420 |
$ |
3,024 |
||||||||||||||||||||
Deferred tax liabilities |
(16 |
) |
(1 |
) |
||||||||||||||||||||
Net deferred tax assets (liabilities) |
$ |
3,404 |
$ |
3,023 |
||||||||||||||||||||
(Canadian $ in millions) |
||||||||||||||||||||||||
Deferred Tax Asset (Liability) |
Net asset, November 1, 2022 |
Bank of the West acquisition |
Benefit (expense) to income statement |
Benefit (expense) to equity |
Translation and other |
Net asset, October 31, 2023 |
||||||||||||||||||
Allowance for credit losses |
$ |
605 |
$ |
96 |
$ |
182 |
$ |
– |
$ |
10 |
$ |
893 |
||||||||||||
Employee future benefits |
256 |
– |
21 |
(14 |
) |
1 |
264 |
|||||||||||||||||
Deferred compensation benefits |
708 |
115 |
(50 |
) |
– |
10 |
783 |
|||||||||||||||||
Other comprehensive income |
573 |
– |
– |
(51 |
) |
– |
522 |
|||||||||||||||||
Premises and equipment |
(511 |
) |
(179 |
) |
359 |
– |
(12 |
) |
(343 |
) |
||||||||||||||
Pension benefits |
(370 |
) |
25 |
(41 |
) |
(9 |
) |
– |
(395 |
) |
||||||||||||||
Goodwill and intangible assets |
(244 |
) |
(767 |
) |
134 |
– |
(36 |
) |
(913 |
) |
||||||||||||||
Securities |
142 |
1,086 |
(286 |
) |
– |
45 |
987 |
|||||||||||||||||
Other |
281 |
897 |
(2) |
389 |
(3) |
(3 |
) |
42 |
1,606 |
|||||||||||||||
Net deferred tax assets (liabilities) |
$ |
1,440 |
$ |
1,273 |
$ |
708 |
$ |
(77 |
) |
$ |
60 |
$ |
3,404 |
|||||||||||
Comprising |
||||||||||||||||||||||||
Deferred tax assets |
$ |
1,542 |
$ |
3,420 |
||||||||||||||||||||
Deferred tax liabilities |
(102 |
) |
(16 |
) |
||||||||||||||||||||
Net deferred tax assets (liabilities) |
$ |
1,440 |
$ |
3,404 |
||||||||||||||||||||
| (1) | Includes the tax impact of the legal provision reversal recorded in relation to the lawsuit described in Note 25. |
| (2) | Includes the tax impact of deferred revenue and purchase accounting adjustments in connection with our acquisition of Bank of the West. |
(3) |
Includes the tax impact of interest rate swaps and securities we purchased to mitigate the impact of changes in interest rates in our acquisition of Bank of the West (refer to Note 10 for additional details) and the tax impact of leasing assets. |
198 |
BMO Financial Group 207th Annual Report 2024 |
|
Basic Earnings Per Common Share (Canadian $ in millions, except as noted) |
2024 |
2023 |
||||||
Net income attributable to bank shareholders |
$ |
7,318 |
$ |
4,425 |
||||
Dividends on preferred shares and distributions on other equity instruments |
(386 |
) |
(331 |
) |
||||
Net income available to common shareholders |
$ |
6,932 |
$ |
4,094 |
||||
Weighted-average number of common shares outstanding (in thousands)
|
727,738 |
709,364 |
||||||
Basic earnings per common share (Canadian $)
|
$ |
9.52 |
$ |
5.77 |
||||
|
Diluted Earnings Per Common Share (Canadian $ in millions, except as noted) |
2024 |
2023 |
||||||
Net income available to common shareholders |
$ |
6,932 |
$ |
4,094 |
||||
Weighted-average number of common shares outstanding (in thousands)
|
727,738 |
709,364 |
||||||
Effect of dilutive instruments |
||||||||
Stock options potentially exercisable (1)
|
3,556 |
4,440 |
||||||
Common shares potentially repurchased |
(2,759 |
) |
(3,289 |
) |
||||
Weighted-average number of diluted common shares outstanding (in thousands)
|
728,535 |
710,515 |
||||||
Diluted earnings per common share (Canadian $)
|
$ |
9.51 |
$ |
5.76 |
||||
| (1) | In computing diluted earnings per common share, we excluded average stock options outstanding of 3,220,995 with a weighted-average exercise price of $130.33 for the year ended October 31, 2024 (2,204,402 with a weighted-average exercise price of $135.69 for the year ended October 31, 2023), as the average share price in each of the two years did not exceed the exercise price. |
BMO Financial Group 207th Annual Report 2024 |
199 |
(Canadian $ in millions) |
2024 |
2023 |
||||||
Financial Guarantees |
||||||||
Standby letters of credit |
$ |
30,523 |
$ |
29,656 |
||||
Credit default swaps (1)
|
16,211 |
10,010 |
||||||
Other Credit Instruments |
||||||||
Backstop liquidity facilities |
18,224 |
18,805 |
||||||
Documentary and commercial letters of credit |
1,893 |
1,763 |
||||||
Commitments to extend credit (2)
|
230,689 |
218,094 |
||||||
Other commitments (3)
|
10,093 |
9,947 |
||||||
Total |
$ |
307,633 |
$ |
288,275 |
||||
| (1) | The fair value of the related derivatives included in our Consolidated Balance Sheet was $8 million as at October 31, 2024 ($3 million as at October 31, 2023). |
| (2) | Commitments to extend credit exclude personal lines of credit and credit cards that are unconditionally cancellable at our discretion. |
| (3) | Other commitments include $4,511 million as at October 31, 2024 ($5,611 million as at October 31, 2023) of underwriting commitments that are extended but not yet accepted by the borrower. |
200 |
BMO Financial Group 207th Annual Report 2024 |
(Canadian $ in millions) |
2024 |
2023 |
||||||
Bank Assets |
||||||||
Cash and due from banks |
$ |
80 |
$ | 125 | ||||
Securities (1)
|
139,553 |
114,407 | ||||||
Loans |
71,419 |
94,442 | ||||||
Other assets |
10,314 |
10,596 | ||||||
221,366 |
219,570 | |||||||
Third-party Assets (2)
|
||||||||
Collateral received and available for sale or re-pledging
|
195,071 |
191,148 | ||||||
Less: Collateral not sold or re-pledged
|
(45,087 |
) |
(46,331 | ) | ||||
149,984 |
144,817 | |||||||
Total pledged assets and collateral |
$ |
371,350 |
$ | 364,387 | ||||
| (Canadian $ in millions) | 2024 |
2023 | ||||||
Uses of pledged assets and collateral |
||||||||
Clearing systems, payment systems and depositories |
$ |
26,203 |
$ | 18,096 | ||||
Foreign governments and central banks |
46 |
89 | ||||||
Obligations related to securities sold short |
35,030 |
43,774 | ||||||
Obligations related to securities sold under repurchase agreements |
97,878 |
92,549 | ||||||
Securities borrowing and lending (3)
|
99,405 |
87,136 | ||||||
Derivatives transactions |
19,224 |
14,983 | ||||||
Securitization |
23,739 |
27,058 | ||||||
Covered bonds |
27,235 |
29,802 | ||||||
Other (4)
|
42,590 |
50,900 | ||||||
Total pledged assets and collateral |
$ |
371,350 |
$ | 364,387 | ||||
| (1) | Includes NHA MBS of $5,492 million, which are included in loans in our Consolidated Balance Sheet ($4,481 million as at October 31, 2023). |
| (2) | Includes on-balance sheet securities borrowed or purchased under resale agreements and off-balance sheet collateral received. |
| (3) | Includes off-balance sheet securities borrowing and lending. |
| (4) | Includes $21,235 million of assets that have been pledged supporting FHLB activity ($41,510 million as at October 31, 2023). |
BMO Financial Group 207th Annual Report 2024 |
201 |
(Canadian $ in millions) |
2024 |
2023 |
||||||||||||||||||||||
Restructuring and severance |
Legal |
Total |
Restructuring and severance |
Legal |
Total |
|||||||||||||||||||
Balance at beginning of year |
$ |
335 |
$ |
1,243 |
$ |
1,578 |
$ |
109 |
$ |
1,168 |
$ |
1,277 |
||||||||||||
Additional provisions/increase in provisions |
101 |
67 |
168 |
388 |
188 |
576 |
||||||||||||||||||
Provisions utilized |
(210 |
) |
(19 |
) |
(229 |
) |
(142 |
) |
(116 |
) |
(258 |
) |
||||||||||||
Amounts reversed |
(59 |
) |
(1,196 |
) |
(1,255 |
) |
(27 |
) |
(11 |
) |
(38 |
) |
||||||||||||
Foreign exchange and other |
(3 |
) |
– |
(3 |
) |
7 |
14 |
21 |
||||||||||||||||
Balance at end of year |
$ |
164 |
$ |
95 |
$ |
259 |
$ |
335 |
$ |
1,243 |
$ |
1,578 |
||||||||||||
202 |
BMO Financial Group 207th Annual Report 2024 |
BMO Financial Group 207th Annual Report 2024 |
203 |
(Canadian $ in millions) |
Canadian P&C |
U.S. P&C |
BMO WM |
BMO CM |
Corporate Services |
2024 Total |
||||||||||||||||||
Net interest income (2)
|
$ |
8,852 |
$ |
8,162 |
$ |
1,313 |
$ |
1,731 |
$ |
(590 |
) |
$ |
19,468 |
|||||||||||
Non-interest revenue |
2,587 |
1,602 |
4,333 |
4,785 |
20 |
13,327 |
||||||||||||||||||
Total Revenue |
11,439 |
9,764 |
5,646 |
6,516 |
(570 |
) |
32,795 |
|||||||||||||||||
Provision for credit losses on impaired loans |
1,326 |
1,274 |
26 |
367 |
73 |
3,066 |
||||||||||||||||||
Provision for (recovery of) credit losses on performing loans |
333 |
389 |
5 |
2 |
(34 |
) |
695 |
|||||||||||||||||
Total provision for credit losses |
1,659 |
1,663 |
31 |
369 |
39 |
3,761 |
||||||||||||||||||
Depreciation and amortization |
590 |
957 |
264 |
299 |
– |
2,110 |
||||||||||||||||||
Non-interest expense |
4,415 |
4,941 |
3,704 |
3,979 |
350 |
17,389 |
||||||||||||||||||
Income (loss) before taxes and non-controlling interest in subsidiaries |
4,775 |
2,203 |
1,647 |
1,869 |
(959 |
) |
9,535 |
|||||||||||||||||
Provision for (recovery of) income taxes |
1,318 |
374 |
399 |
377 |
(260 |
) |
2,208 |
|||||||||||||||||
Reported net income (loss) |
$ |
3,457 |
$ |
1,829 |
$ |
1,248 |
$ |
1,492 |
$ |
(699 |
) |
$ |
7,327 |
|||||||||||
Non-controlling interest in subsidiaries |
$ |
– |
$ |
2 |
$ |
– |
$ |
– |
$ |
7 |
$ |
9 |
||||||||||||
Net income (loss) attributable to bank shareholders |
$ |
3,457 |
$ |
1,827 |
$ |
1,248 |
$ |
1,492 |
$ |
(706 |
) |
$ |
7,318 |
|||||||||||
Average assets (3)
|
$ |
327,883 |
$ |
236,341 |
$ |
64,674 |
$ |
468,963 |
$ |
271,554 |
$ |
1,369,415 |
||||||||||||
|
Canadian P&C |
U.S. P&C |
BMO WM |
BMO CM |
Corporate Services (1) |
2023 Total |
|||||||||||||||||||
Net interest income (2)
|
$ |
8,043 |
$ |
7,607 |
$ |
1,380 |
$ |
2,490 |
$ |
(839 |
) |
$ |
18,681 |
|||||||||||
Non-interest revenue |
2,516 |
1,573 |
4,031 |
3,902 |
(1,444 |
) |
10,578 |
|||||||||||||||||
Total Revenue |
10,559 |
9,180 |
5,411 |
6,392 |
(2,283 |
) |
29,259 |
|||||||||||||||||
Provision for credit losses on impaired loans |
724 |
364 |
5 |
9 |
78 |
1,180 |
||||||||||||||||||
Provision for credit losses on performing loans |
185 |
142 |
13 |
9 |
649 |
998 |
||||||||||||||||||
Total provision for credit losses |
909 |
506 |
18 |
18 |
727 |
2,178 |
||||||||||||||||||
Depreciation and amortization |
573 |
891 |
288 |
340 |
– |
2,092 |
||||||||||||||||||
Non-interest expense |
4,150 |
4,553 |
3,590 |
3,938 |
2,811 |
19,042 |
||||||||||||||||||
Income (loss) before taxes and non-controlling interest in subsidiaries |
4,927 |
3,230 |
1,515 |
2,096 |
(5,821 |
) |
5,947 |
|||||||||||||||||
Provision for (recovery of) income taxes |
1,354 |
741 |
369 |
471 |
(1,425 |
) |
1,510 |
|||||||||||||||||
Reported net income (loss) |
$ |
3,573 |
$ |
2,489 |
$ |
1,146 |
$ |
1,625 |
$ |
(4,396 |
) |
$ |
4,437 |
|||||||||||
Non-controlling interest in subsidiaries |
$ | – | $ | 6 | $ | – | $ | – | $ | 6 | $ | 12 | ||||||||||||
Net income (loss) attributable to bank shareholders |
$ |
3,573 |
$ |
2,483 |
$ |
1,146 |
$ |
1,625 |
$ |
(4,402 |
) |
$ |
4,425 |
|||||||||||
Average assets (3)
|
$ |
310,323 |
$ |
211,864 |
$ |
60,092 |
$ |
466,030 |
$ |
251,215 |
$ |
1,299,524 |
||||||||||||
(1) |
Corporate Services includes T&O. |
(2) |
Operating groups report on a teb – see Basis of Presentation section. |
(3) |
Included within average assets are average earning assets, which comprise 2024 are $1,237,245 million, including $319,795 million for Canadian P&C, $215,987 million for U.S. P&C and $701,463 million for all other operating segments, including Corporate Services (2023 – Total: $1,145,870 million, Canadian P&C: $296,164 million, U.S. P&C: $195,363 million and all other operating segments: $654,343 million). |
(Canadian $ in millions) |
2024 |
|||||||||||||||||||||||
Canada |
United States |
Other countries |
Total |
|||||||||||||||||||||
Total Revenue |
$ |
16,107 |
$ |
14,465 |
$ |
2,223 |
$ |
32,795 |
||||||||||||||||
Income before taxes |
4,434 |
3,547 |
1,554 |
9,535 |
||||||||||||||||||||
Reported net income |
3,199 |
2,865 |
1,263 |
7,327 |
||||||||||||||||||||
Average Assets |
692,750 |
613,098 |
63,567 |
1,369,415 |
||||||||||||||||||||
2023 |
||||||||||||||||||||||||
Total Revenue |
$ |
15,087 |
$ |
11,836 |
$ |
2,336 |
$ |
29,259 |
||||||||||||||||
Income (loss) before taxes |
4,635 |
(176 |
) |
1,488 |
5,947 |
|||||||||||||||||||
Reported net income |
3,194 |
29 |
1,214 |
4,437 |
||||||||||||||||||||
Average Assets |
665,025 |
572,434 |
62,065 |
1,299,524 |
||||||||||||||||||||
204 |
BMO Financial Group 207th Annual Report 2024 |
| Significant subsidiaries (1) (2) | Head or principal office |
Book value of shares owned by the bank (Canadian $ in millions) |
||||||
AIR MILES Loyalty Inc. |
Toronto, Canada | $ | 157 |
|||||
Bank of Montreal (China) Co. Ltd. |
Beijing, China | 501 |
||||||
B ank of Montreal Europe Public Limited Company
|
Dublin, Ireland | 1,319 |
||||||
Bank of Montreal Holding Inc. and subsidiaries, including: |
Toronto, Canada | 35,530 | ||||||
Bank of Montreal Mortgage Corporation |
Calgary, Canada | |||||||
BMO Mortgage Corp. |
Vancouver, Canada | |||||||
BMO Investments Inc. |
Toronto, Canada | |||||||
BMO Investments Limited |
Hamilton, Bermuda | |||||||
BMO Reinsurance Limited |
St. Michael, Barbados | |||||||
BMO InvestorLine Inc. |
Toronto, Canada | |||||||
BMO Nesbitt Burns Inc. |
Toronto, Canada | |||||||
BMO Private Equity (Canada) Inc. |
Toronto, Canada | |||||||
BMO Capital Markets Limited |
London, England | 361 | ||||||
BMO Capital Partners Inc. |
Toronto, Canada | 936 | ||||||
BMO Financial Corp. and subsidiaries, including: |
Chicago, United States | 54,698 | ||||||
BMO Bank National Association |
Chicago, United States | |||||||
BMO Capital Markets Corp. |
New York, United States | |||||||
BMO Japan Securities Ltd. |
Tokyo, Japan | 6 | ||||||
BMO Life Insurance Company and subsidiaries, including: |
Toronto, Canada | 1,246 | ||||||
BMO Life Holdings (Canada), ULC |
Halifax, Canada | |||||||
BMO Life Assurance Company |
Toronto, Canada | |||||||
BMO Trust Company |
Toronto, Canada | 543 | ||||||
| (1) | Each subsidiary is incorporated or organized under the laws of the state or country in which the principal office is situated, except for BMO Financial Corp. and BMO Capital Markets Corp., which are incorporated under the laws of the state of Delaware, United States. |
| (2) | Unless otherwise noted, the bank, either directly or indirectly through its subsidiaries, owns 100% of the outstanding voting shares of each subsidiary. |
• |
Assets pledged as security for various liabilities we incur. Refer to Note 25 for details. |
• |
Assets of our consolidated SEs that are held for the benefit of the note holders. Refer to Note 7 for details. |
• |
Assets held by our insurance subsidiaries. Refer to Note 15 for details. |
• |
Regulatory and statutory requirements that reflect capital and liquidity requirements. |
• |
Funds required to be held with certain central banks, regulatory bodies and counterparties. Refer to Note 2 for details. |
(Canadian $ in millions) |
2024 |
2023 |
||||||
Base salary and incentives |
$ |
20 |
$ | 22 | ||||
Post-employment benefits |
2 |
2 | ||||||
Share-based payments (1)
|
37 |
49 | ||||||
Total key management personnel compensation |
$ |
59 |
$ | 73 | ||||
| (1) | Amounts included in share-based payments are the fair values of awards granted in the year. |
BMO Financial Group 207th Annual Report 2024 |
205 |
(Canadian $ in millions) |
Joint ventures |
Associates |
||||||||||||||
2024 |
2023 |
2024 |
2023 |
|||||||||||||
Carrying amount |
$ 907 |
$ 679 |
$ 820 |
$ 782 |
||||||||||||
Share of net income |
93 |
61 |
114 |
124 |
||||||||||||
(Canadian $ in millions) |
2024 |
2023 |
||||||||||||||
Loans (1) (2)
|
$ 1,864 |
$ 1,525 |
||||||||||||||
Deposits |
241 |
265 |
||||||||||||||
Fees paid for services received |
66 |
58 |
||||||||||||||
Guarantees and commitments |
210 |
98 |
||||||||||||||
(1) |
Includes customers’ liability under acceptances. |
(2) |
We had no ACL on impaired loans related to these amounts as at October 31, 2024 and 2023. |
206 |
BMO Financial Group 207th Annual Report 2024 |
Exhibit 99.4
|
|
||||||
| KPMG LLP Bay Adelaide Centre 333 Bay Street, Suite 4600 Toronto, ON M5H 2S5 Canada Tel 416-777-8500 Fax 416-777-8818 |
CONSENT OF INDEPENDENT REGISTERED PUBLIC ACCOUNTING FIRM
To the Board of Directors of Bank of Montreal:
We consent to the use of:
| i) | our report of independent registered public accounting firm dated December 5, 2024 to the Shareholders and the Board of Directors of Bank of Montreal (the “Bank”) on the consolidated financial statements of the Bank, which comprise the consolidated balance sheets as of October 31, 2024 and 2023, the related consolidated statements of income, comprehensive income, changes in equity and cash flows for the years then ended, and the related notes, and |
| ii) | our report of independent registered public accounting firm dated December 5, 2024 to the Shareholders and the Board of Directors of the Bank on the effectiveness of internal control over financial reporting as of October 31, 2024 |
each of which is included in this Annual Report on Form 40-F of the Bank for the fiscal year ended October 31, 2024.
We also consent to the incorporation by reference of the above-mentioned reports and to the reference to our firm under the heading “Experts”, in the following Registration Statements of the Bank:
| 1. | Registration Statement – Form F-3 – File No. 333-264388 |
| 2. | Registration Statement – Form F-3 – File No. 333-214934 |
We also consent to the incorporation by reference of the above-mentioned reports in the following Registration Statements of the Bank:
| 1. | Registration Statement – Form S-8 – File No. 333-276007 |
| 2. | Registration Statement – Form S-8 – File No. 333-237522 |
| 3. | Registration Statement – Form S-8 – File No. 333-207739 |
| 4. | Registration Statement – Form S-8 – File No. 333-191591 |
| 5. | Registration Statement – Form S-8 – File No. 333-180968 |
| 6. | Registration Statement – Form S-8 – File No. 333-177579 |
| 7. | Registration Statement – Form S-8 – File No. 333-177568 |
| 8. | Registration Statement – Form S-8 – File No. 333-176479 |
| 9. | Registration Statement – Form S-8 – File No. 333-175413 |
| 10. | Registration Statement – Form S-8 – File No. 333-175412 |
| 11. | Registration Statement – Form S-8 – File No. 333-113096 |
| 12. | Registration Statement – Form S-8 – File No. 333-14260 |
| 13. | Registration Statement – Form S-8 – File No. 33-92112 |
/s/ KPMG LLP
Chartered Professional Accountants, Licensed Public Accountants
Toronto, Canada
December 5, 2024
© 2024 KPMG LLP, an Ontario limited liability partnership and a member firm of the KPMG global organization of independent member firms affiliated with
KPMG International Limited, a private English company limited by guarantee. All rights reserved.
Exhibit 99.5
Certifications
Pursuant to Rule 13a-14(a) or 15d-14(a) under the Securities Exchange Act of 1934, as adopted pursuant to Section 302 of the Sarbanes-Oxley Act of 2002
I, Darryl White, Chief Executive Officer of Bank of Montreal, certify that:
1. I have reviewed this annual report on Form 40-F (the “report”) of Bank of Montreal (the “issuer”);
2. Based on my knowledge, this report does not contain any untrue statement of a material fact or omit to state a material fact necessary to make the statements made, in light of the circumstances under which such statements were made, not misleading with respect to the period covered by this report;
3. Based on my knowledge, the financial statements, and other financial information included in this report, fairly present in all material respects the financial condition, results of operations and cash flows of the issuer as of, and for, the periods presented in this report;
4. The issuer’s other certifying officer and I are responsible for establishing and maintaining disclosure controls and procedures (as defined in Exchange Act Rules 13a-15(e) and 15d-15(e)) and internal control over financial reporting (as defined in Exchange Act Rules 13a-15(f) and 15d-15(f)) for the issuer and have:
(a) Designed such disclosure controls and procedures, or caused such disclosure controls and procedures to be designed under our supervision, to ensure that material information relating to the issuer, including its consolidated subsidiaries, is made known to us by others within those entities, particularly during the period in which this report is being prepared;
(b) Designed such internal control over financial reporting, or caused such internal control over financial reporting to be designed under our supervision, to provide reasonable assurance regarding the reliability of financial reporting and the preparation of financial statements for external purposes in accordance with generally accepted accounting principles;
(c) Evaluated the effectiveness of the issuer’s disclosure controls and procedures and presented in this report our conclusions about the effectiveness of the disclosure controls and procedures, as of the end of the period covered by this report based on such evaluation; and
(d) Disclosed in this report any change in the issuer’s internal control over financial reporting that occurred during the period covered by the annual report that has materially affected, or is reasonably likely to materially affect, the issuer’s internal control over financial reporting; and
5. The issuer’s other certifying officer and I have disclosed, based on our most recent evaluation of internal control over financial reporting, to the issuer’s auditors and the audit committee of the issuer’s board of directors (or persons performing the equivalent functions):
(a) All significant deficiencies and material weaknesses in the design or operation of internal control over financial reporting which are reasonably likely to adversely affect the issuer’s ability to record, process, summarize and report financial information; and
(b) Any fraud, whether or not material, that involves management or other employees who have a significant role in the issuer’s internal control over financial reporting.
Date: December 5, 2024
| /s/ Darryl White |
| Darryl White |
| Chief Executive Officer |
Exhibit 99.6
Certifications
Pursuant to Rule 13a-14(a) or 15d-14(a) under the Securities Exchange Act of 1934, as adopted pursuant to Section 302 of the Sarbanes-Oxley Act of 2002
I, Tayfun Tuzun, Chief Financial Officer of Bank of Montreal, certify that:
1. I have reviewed this annual report on Form 40-F (the “report”) of Bank of Montreal (the “issuer”);
2. Based on my knowledge, this report does not contain any untrue statement of a material fact or omit to state a material fact necessary to make the statements made, in light of the circumstances under which such statements were made, not misleading with respect to the period covered by this report;
3. Based on my knowledge, the financial statements, and other financial information included in this report, fairly present in all material respects the financial condition, results of operations and cash flows of the issuer as of, and for, the periods presented in this report;
4. The issuer’s other certifying officer and I are responsible for establishing and maintaining disclosure controls and procedures (as defined in Exchange Act Rules 13a-15(e) and 15d-15(e)) and internal control over financial reporting (as defined in Exchange Act Rules 13a-15(f) and 15d-15(f)) for the issuer and have:
(a) Designed such disclosure controls and procedures, or caused such disclosure controls and procedures to be designed under our supervision, to ensure that material information relating to the issuer, including its consolidated subsidiaries, is made known to us by others within those entities, particularly during the period in which this report is being prepared;
(b) Designed such internal control over financial reporting, or caused such internal control over financial reporting to be designed under our supervision, to provide reasonable assurance regarding the reliability of financial reporting and the preparation of financial statements for external purposes in accordance with generally accepted accounting principles;
(c) Evaluated the effectiveness of the issuer’s disclosure controls and procedures and presented in this report our conclusions about the effectiveness of the disclosure controls and procedures, as of the end of the period covered by this report based on such evaluation; and
(d) Disclosed in this report any change in the issuer’s internal control over financial reporting that occurred during the period covered by the annual report that has materially affected, or is reasonably likely to materially affect, the issuer’s internal control over financial reporting; and
5. The issuer’s other certifying officer and I have disclosed, based on our most recent evaluation of internal control over financial reporting, to the issuer’s auditors and the audit committee of the issuer’s board of directors (or persons performing the equivalent functions):
(a) All significant deficiencies and material weaknesses in the design or operation of internal control over financial reporting which are reasonably likely to adversely affect the issuer’s ability to record, process, summarize and report financial information; and
(b) Any fraud, whether or not material, that involves management or other employees who have a significant role in the issuer’s internal control over financial reporting.
Date: December 5, 2024
| /s/ Tayfun Tuzun |
| Tayfun Tuzun |
| Chief Financial Officer |
Exhibit 99.7
Certifications
Pursuant to Rule 13(a) or 15(d) under the Securities Exchange Act of 1934, as adopted pursuant to Section 906 of the Sarbanes-Oxley Act of 2002
Pursuant to 18 U.S.C. 1350, the undersigned officers of Bank of Montreal (the “Bank”), hereby certify that, to his knowledge, (a) the annual report on Form 40-F for the period ended October 31, 2024 (the “Report”) fully complies with the requirements of Section 13(a) or 15(d), as applicable, of the Securities Exchange Act of 1934 and (b) the information contained in the Report fairly presents, in all material respects, the financial condition and results of operations of the Bank.
| Date: December 5, 2024 | /s/ Darryl White |
|||
| Darryl White Chief Executive Officer |
||||
| Date: December 5, 2024 | /s/ Tayfun Tuzun |
|||
| Tayfun Tuzun | ||||
| Chief Financial Officer |
||||