UNITED STATES
SECURITIES AND EXCHANGE COMMISSION
WASHINGTON, D.C. 20549
FORM 8-K
CURRENT REPORT
Pursuant to Section 13 or 15(d)
of the Securities Exchange Act of 1934
Date of Report (Date of earliest event reported): October 21, 2024
NUCOR CORPORATION
(Exact name of Registrant as Specified in Its Charter)
| Delaware | 1-4119 | 13-1860817 | ||
| (State or Other Jurisdiction of Incorporation) |
(Commission File Number) |
(IRS Employer Identification No.) |
| 1915 Rexford Road, Charlotte, NC |
28211 | |
| (Address of Principal Executive Offices) | (Zip Code) |
Registrant’s Telephone Number, Including Area Code: (704) 366-7000
Not Applicable
(Former Name or Former Address, if Changed Since Last Report)
Check the appropriate box below if the Form 8-K filing is intended to simultaneously satisfy the filing obligation of the registrant under any of the following provisions:
| ☐ | Written communications pursuant to Rule 425 under the Securities Act (17 CFR 230.425) |
| ☐ | Soliciting material pursuant to Rule 14a-12 under the Exchange Act (17 CFR 240.14a-12) |
| ☐ | Pre-commencement communications pursuant to Rule 14d-2(b) under the Exchange Act (17 CFR 240.14d-2(b)) |
| ☐ | Pre-commencement communications pursuant to Rule 13e-4(c) under the Exchange Act (17 CFR 240.13e-4(c)) |
Securities registered pursuant to Section 12(b) of the Act:
| Title of each class |
Trading |
Name of each exchange on which registered |
||
| Common Stock, par value $0.40 per share | NUE | New York Stock Exchange |
Indicate by check mark whether the registrant is an emerging growth company as defined in Rule 405 of the Securities Act of 1933 (§ 230.405 of this chapter) or Rule 12b-2 of the Securities Exchange Act of 1934 (§ 240.12b-2 of this chapter).
Emerging growth company ☐
If an emerging growth company, indicate by check mark if the registrant has elected not to use the extended transition period for complying with any new or revised financial accounting standards provided pursuant to Section 13(a) of the Exchange Act. ☐
| Item 2.02. | Results of Operations and Financial Condition. |
On October 21, 2024, Nucor Corporation issued a news release reporting its financial results for the quarter ended September 28, 2024. A copy of the news release is furnished as Exhibit 99.1 and incorporated herein by reference.
| Item 7.01. | Regulation FD Disclosure. |
On October 21, 2024, Nucor Corporation, in conjunction with the issuance of the aforementioned news release, posted an investor presentation to its Investor Relations website. A copy of the investor presentation is furnished as Exhibit 99.2 and incorporated herein by reference.
| Item 9.01. | Financial Statements and Exhibits. |
| (d) | Exhibits |
| 99.1 | News Release of Nucor Corporation dated October 21, 2024 | |
| 99.2 | Investor Presentation dated October 21, 2024 | |
| 104 | Cover Page from this Current Report on Form 8-K, formatted in Inline XBRL | |
The information contained in this Current Report on Form 8-K, including the exhibits attached hereto, is being furnished and shall not be deemed to be “filed” for the purposes of Section 18 of the Securities Exchange Act of 1934, as amended (the “Exchange Act”), or otherwise subject to the liabilities of that Section. Furthermore, the information contained in this Current Report on Form 8-K shall not be deemed to be incorporated by reference into any registration statement or other document filed pursuant to the Securities Act of 1933, as amended, or the Exchange Act, except as shall be expressly set forth by specific reference in any such registration statement or other document.
1
SIGNATURES
Pursuant to the requirements of the Securities Exchange Act of 1934, the registrant has duly caused this report to be signed on its behalf by the undersigned hereunto duly authorized.
| NUCOR CORPORATION | ||||||
| Date: October 21, 2024 | By: | /s/ Stephen D. Laxton |
||||
| Stephen D. Laxton | ||||||
| Chief Financial Officer, Treasurer and Executive Vice President |
||||||
2
Exhibit 99.1
| News Release |

|
Nucor Reports Results for the Third Quarter of 2024
Third Quarter of 2024 Highlights
| • | Consolidated net earnings attributable to Nucor stockholders of $249.9 million, or $1.05 per diluted share. |
| • | Adjusted net earnings attributable to Nucor stockholders of $353.0 million, or $1.49 per diluted share. |
| • | Net sales of $7.44 billion. |
| • | Net earnings before noncontrolling interests of $302.8 million; EBITDA of $869.0 million. |
CHARLOTTE, N.C. – October 21, 2024 - Nucor Corporation (NYSE: NUE) today announced consolidated net earnings attributable to Nucor stockholders of $249.9 million, or $1.05 per diluted share, for the third quarter of 2024. Excluding non-cash impairment charges taken during the quarter, Nucor’s third quarter of 2024 adjusted net earnings attributable to Nucor stockholders were $353.0 million, or $1.49 per diluted share. By comparison, Nucor reported consolidated net earnings attributable to Nucor stockholders of $645.2 million, or $2.68 per diluted share, for the second quarter of 2024 and $1.14 billion, or $4.57 per diluted share, for the third quarter of 2023.
Reflected in the third quarter of 2024 losses and impairments of assets are non-cash charges of $83.0 million, or $0.27 per diluted share, and $40.0 million, or $0.17 per diluted share, related to the impairment of certain non-current assets in the raw materials and steel products segments, respectively.
In the first nine months of 2024, Nucor reported consolidated net earnings attributable to Nucor stockholders of $1.74 billion, or $7.22 per diluted share, compared with consolidated net earnings attributable to Nucor stockholders of $3.74 billion, or $14.83 per diluted share, in the first nine months of 2023.
“Thank you to our Nucor teammates for continuing to set new records for safety performance while generating over $1.30 billion of cash from operations for the quarter,” said Leon Topalian, Nucor’s Chair, President and Chief Executive Officer. “Nucor’s market leadership, product diversity, and strong balance sheet enable us to provide meaningful returns to shareholders and execute our growth strategy even in the face of market uncertainty.”
Selected Segment Data
Earnings (loss) before income taxes and noncontrolling interests by segment for the third quarter and first nine months of 2024 and 2023 were as follows (in thousands):
| Three Months (13 Weeks) Ended | Nine Months (39 Weeks) Ended | |||||||||||||||
| September 28, 2024 | September 30, 2023 | September 28, 2024 | September 30, 2023 | |||||||||||||
| Steel mills |
$ | 309,123 | $ | 882,614 | $ | 2,056,689 | $ | 3,124,549 | ||||||||
| Steel products |
313,972 | 806,731 | 1,266,922 | 2,788,322 | ||||||||||||
| Raw materials |
(66,332 | ) | 71,367 | (17,355 | ) | 267,918 | ||||||||||
| Corporate/eliminations |
(168,490 | ) | (212,630 | ) | (794,479 | ) | (986,141 | ) | ||||||||
|
|
|
|
|
|
|
|
|
|||||||||
| $ | 388,273 | $ | 1,548,082 | $ | 2,511,777 | $ | 5,194,648 | |||||||||
|
|
|
|
|
|
|
|
|
|||||||||
Page 1 of 10
Nucor Executive Offices: 1915 Rexford Road, Charlotte, North Carolina 28211
Phone 704-366-7000 Fax 704-362-4208 www.nucor.com
| News Release |
|
Nucor Reports Results for the Third Quarter of 2024 (Continued)
Financial Review
Nucor’s consolidated net sales decreased 8% to $7.44 billion in the third quarter of 2024 compared with $8.08 billion in the second quarter of 2024 and decreased 15% compared with $8.78 billion in the third quarter of 2023. Average sales price per ton in the third quarter of 2024 decreased 6% compared with the second quarter of 2024 and decreased 15% compared with the third quarter of 2023. A total of approximately 6,196,000 tons were shipped to outside customers in the third quarter of 2024, a 1% decrease compared with both the second quarter of 2024 and the third quarter of 2023. Total steel mill shipments in the third quarter of 2024 decreased 3% compared with the second quarter of 2024 and were comparable to the third quarter of 2023. Steel mill shipments to internal customers represented 19% of total steel mill shipments in the third quarter of 2024, compared with 21% in the second quarter of 2024 and 20% in the third quarter of 2023. Downstream steel product shipments to outside customers in the third quarter of 2024 decreased 6% compared with the second quarter of 2024 and decreased 11% compared with the third quarter of 2023.
In the first nine months of 2024, Nucor’s consolidated net sales of $23.66 billion decreased 12% compared with consolidated net sales of $27.01 billion in the first nine months of 2023. Total tons shipped to outside customers in the first nine months of 2024 were approximately 18,709,000 tons, a decrease of 3% compared with the first nine months of 2023, and the average sales price per ton in the first nine months of 2024 decreased 10% compared with the first nine months of 2023.
The average scrap and scrap substitute cost per gross ton used in the third quarter of 2024 was $378, a 5% decrease compared to $396 in the second quarter of 2024 and a 9% decrease compared to $415 in the third quarter of 2023. The average scrap and scrap substitute cost per gross ton used in the first nine months of 2024 was $399, a 7% decrease compared to $429 in the first nine months of 2023.
Pre-operating and start-up costs related to the Company’s growth projects were approximately $168 million, or $0.54 per diluted share, in the third quarter of 2024, compared with approximately $137 million, or $0.43 per diluted share, in the second quarter of 2024 and approximately $101 million, or $0.31 per diluted share, in the third quarter of 2023.
In the first nine months of 2024, pre-operating and start-up costs related to the Company’s growth projects were approximately $430 million, or $1.36 per diluted share, compared with approximately $273 million, or $0.83 per diluted share, in the first nine months of 2023.
Overall operating rates at the Company’s steel mills were 75% in both the third quarter and second quarter of 2024 and 77% in the third quarter of 2023. Operating rates in the first nine months of 2024 decreased to 77% as compared to 80% in the first nine months of 2023.
Page 2 of 10
Nucor Executive Offices: 1915 Rexford Road, Charlotte, North Carolina 28211
Phone 704-366-7000 Fax 704-362-4208 www.nucor.com
| News Release |
|
Nucor Reports Results for the Third Quarter of 2024 (Continued)
Financial Strength
At the end of the third quarter of 2024, we had $4.86 billion in cash and cash equivalents and short-term investments on hand. The Company’s $1.75 billion revolving credit facility remains undrawn and does not expire until November 2026. Nucor continues to have the strongest credit ratings in the North American steel sector (A-/A-/Baa1) with stable outlooks at Standard & Poor’s and Fitch Ratings and a positive outlook at Moody’s.
Commitment to Returning Capital to Stockholders
Nucor repurchased approximately 2.5 million shares of its common stock during the third quarter of 2024 at an average price of $156.07 per share (approximately 11.0 million shares year-to-date at an average price of $172.36 per share). Nucor has returned approximately $2.29 billion to stockholders in the form of share repurchases and dividend payments during the first nine months of 2024. As of September 28, 2024, Nucor had approximately $1.42 billion remaining authorized and available for repurchases under its share repurchase program. This share repurchase authorization is discretionary and has no scheduled expiration date.
On September 12, 2024, Nucor’s Board of Directors declared a cash dividend of $0.54 per share. This cash dividend is payable on November 8, 2024, to stockholders of record as of September 27, 2024, and is Nucor’s 206th consecutive quarterly cash dividend.
Third Quarter of 2024 Analysis
The largest driver for the decrease in earnings in the third quarter of 2024 as compared to the second quarter of 2024 is the decreased earnings of the steel mills segment, due primarily to lower average selling prices. The steel products segment’s earnings decreased in the third quarter of 2024 as compared to the second quarter of 2024 due to lower average selling prices and lower volumes. Earnings in the raw materials segment are lower in the third quarter of 2024 as compared to the second quarter of 2024 due primarily to the non-cash impairment charge taken in the third quarter of 2024.
Fourth Quarter of 2024 Outlook
We expect consolidated net earnings attributable to Nucor stockholders in the fourth quarter of 2024 to decrease compared to earnings per diluted share of $1.05 reported for the third quarter of 2024. The largest driver for the expected decrease in earnings in the fourth quarter of 2024 is the decreased earnings of the steel mills segment caused by lower average selling prices and decreased volumes. We expect earnings in the steel products segment to decrease in the fourth quarter of 2024 as compared to the third quarter of 2024 due to lower average selling prices and decreased volumes. The earnings of the raw materials segment are expected to increase in the fourth quarter of 2024 as compared to the third quarter of 2024 (excluding the impairment charge taken during the third quarter of 2024).
Page 3 of 10
Nucor Executive Offices: 1915 Rexford Road, Charlotte, North Carolina 28211
Phone 704-366-7000 Fax 704-362-4208 www.nucor.com
| News Release |
|
Nucor Reports Results for the Third Quarter of 2024 (Continued)
Earnings Conference Call
You are invited to listen to the live broadcast of Nucor’s conference call during which management will discuss Nucor’s third quarter results on October 22, 2024, at 10:00 a.m. Eastern Time. The call can be accessed via webcast from the Investor Relations section of Nucor’s website (nucor.com/investors). A presentation with supplemental information to accompany the call has been posted to Nucor’s Investor Relations website. A playback of the webcast will be posted to the same site within one day of the live event.
About Nucor
Nucor and its affiliates are manufacturers of steel and steel products, with operating facilities in the United States, Canada and Mexico. Products produced include: carbon and alloy steel — in bars, beams, sheet and plate; hollow structural section tubing; electrical conduit; steel racking; steel piling; steel joists and joist girders; steel deck; fabricated concrete reinforcing steel; cold finished steel; precision castings; steel fasteners; metal building systems; insulated metal panels; overhead doors; steel grating; wire and wire mesh; and utility structures. Nucor, through The David J. Joseph Company and its affiliates, also brokers ferrous and nonferrous metals, pig iron and hot briquetted iron / direct reduced iron; supplies ferro-alloys; and processes ferrous and nonferrous scrap. Nucor is North America’s largest recycler.
Non-GAAP Financial Measures
The Company uses certain non-GAAP (Generally Accepted Accounting Principles) financial measures in this news release, including EBITDA, adjusted net earnings attributable to Nucor stockholders and adjusted earnings per diluted share. Generally, a non-GAAP financial measure is a numerical measure of a company’s performance or financial position that either excludes or includes amounts that are not normally excluded or included in the most directly comparable financial measure calculated and presented in accordance with GAAP.
We define EBITDA as net earnings before noncontrolling interests, adding back the following items: interest (income) expense, net; provision for income taxes; losses and impairments of assets; depreciation; and amortization. We define adjusted net earnings attributable to Nucor stockholders as net earnings attributable to Nucor stockholders adding back losses and impairments of assets, net of tax. We define adjusted earnings per diluted share as earnings per diluted share adding back the per diluted share impact of losses and impairments of assets, net of tax. Please note that other companies might define their non-GAAP financial measures differently than we do.
Management presents the non-GAAP financial measures of EBITDA, adjusted net earnings attributable to Nucor stockholders and adjusted earnings per diluted share in this news release because it considers them to be important supplemental measures of performance. Management believes that these non-GAAP financial measures provide additional insight for analysts and investors evaluating the Company’s financial and operational performance by providing a consistent basis of comparison across periods.
Page 4 of 10
Nucor Executive Offices: 1915 Rexford Road, Charlotte, North Carolina 28211
Phone 704-366-7000 Fax 704-362-4208 www.nucor.com
| News Release |
|
Nucor Reports Results for the Third Quarter of 2024 (Continued)
Forward-Looking Statements
Certain statements contained in this news release are “forward-looking statements” that involve risks and uncertainties which we expect will or may occur in the future and may impact our business, financial condition and results of operations. The words “anticipate,” “believe,” “expect,” “intend,” “project,” “may,” “will,” “should,” “could” and similar expressions are intended to identify those forward-looking statements. These forward-looking statements reflect the Company’s best judgment based on current information, and, although we base these statements on circumstances that we believe to be reasonable when made, there can be no assurance that future events will not affect the accuracy of such forward-looking information. As such, the forward-looking statements are not guarantees of future performance, and actual results may vary materially from the projected results and expectations discussed in this news release. Factors that might cause the Company’s actual results to differ materially from those anticipated in forward-looking statements include, but are not limited to: (1) competitive pressure on sales and pricing, including pressure from imports and substitute materials; (2) U.S. and foreign trade policies affecting steel imports or exports; (3) the sensitivity of the results of our operations to general market conditions, and in particular, prevailing market steel prices and changes in the supply and cost of raw materials, including pig iron, iron ore and scrap steel; (4) the availability and cost of electricity and natural gas, which could negatively affect our cost of steel production or result in a delay or cancellation of existing or future drilling within our natural gas drilling programs; (5) critical equipment failures and business interruptions; (6) market demand for steel products, which, in the case of many of our products, is driven by the level of nonresidential construction activity in the United States; (7) impairment in the recorded value of inventory, equity investments, fixed assets, goodwill or other long-lived assets; (8) uncertainties and volatility surrounding the global economy, including excess world capacity for steel production, inflation and interest rate changes; (9) fluctuations in currency conversion rates; (10) significant changes in laws or government regulations affecting environmental compliance, including legislation and regulations that result in greater regulation of greenhouse gas emissions that could increase our energy costs, capital expenditures and operating costs or cause one or more of our permits to be revoked or make it more difficult to obtain permit modifications; (11) the cyclical nature of the steel industry; (12) capital investments and their impact on our performance; (13) our safety performance; (14) our ability to integrate businesses we acquire; and (15) the impact of any pandemic or public health situation. These and other factors are discussed in Nucor’s regulatory filings with the United States Securities and Exchange Commission, including those in “Item 1A. Risk Factors” of Nucor’s Annual Report on Form 10-K for the year ended December 31, 2023. The forward-looking statements contained in this news release speak only as of this date, and Nucor does not assume any obligation to update them, except as may be required by applicable law.
Contact Information
For Investor/Analyst Inquiries – Jack Sullivan, 704-264-8942, or Paul Donnelly, 704-264-8807
For Media Inquiries - Katherine Miller, 704-353-9015
Page 5 of 10
Nucor Executive Offices: 1915 Rexford Road, Charlotte, North Carolina 28211
Phone 704-366-7000 Fax 704-362-4208 www.nucor.com
| News Release |
|
Nucor Reports Results for the Third Quarter of 2024 (Continued)
Tonnage Data
(In thousands)
| Three Months (13 Weeks) Ended | Nine Months (39 Weeks) Ended | |||||||||||||||||||||||
| September 28, 2024 |
September 30, 2023 |
Percent Change |
September 28, 2024 |
September 30, 2023 |
Percent Change |
|||||||||||||||||||
| Steel mills total shipments: |
||||||||||||||||||||||||
| Sheet |
2,837 | 2,723 | 4 | % | 8,680 | 8,328 | 4 | % | ||||||||||||||||
| Bars |
1,926 | 2,001 | -4 | % | 5,843 | 6,292 | -7 | % | ||||||||||||||||
| Structural |
493 | 530 | -7 | % | 1,555 | 1,571 | -1 | % | ||||||||||||||||
| Plate |
435 | 460 | -5 | % | 1,295 | 1,434 | -10 | % | ||||||||||||||||
| Other |
28 | 32 | -13 | % | 103 | 135 | -24 | % | ||||||||||||||||
|
|
|
|
|
|
|
|
|
|
|
|
|
|||||||||||||
| 5,719 | 5,746 | — | 17,476 | 17,760 | -2 | % | ||||||||||||||||||
|
|
|
|
|
|
|
|
|
|
|
|
|
|||||||||||||
| Sales tons to outside customers: |
||||||||||||||||||||||||
| Steel mills |
4,607 | 4,578 | 1 | % | 13,900 | 14,156 | -2 | % | ||||||||||||||||
| Joist |
90 | 127 | -29 | % | 292 | 404 | -28 | % | ||||||||||||||||
| Deck |
79 | 104 | -24 | % | 242 | 310 | -22 | % | ||||||||||||||||
| Rebar fabrication products |
278 | 307 | -9 | % | 781 | 918 | -15 | % | ||||||||||||||||
| Tubular products |
213 | 223 | -4 | % | 635 | 737 | -14 | % | ||||||||||||||||
| Building systems |
60 | 71 | -15 | % | 181 | 185 | -2 | % | ||||||||||||||||
| Other steel products |
291 | 309 | -6 | % | 919 | 921 | — | |||||||||||||||||
| Raw materials |
578 | 521 | 11 | % | 1,759 | 1,640 | 7 | % | ||||||||||||||||
|
|
|
|
|
|
|
|
|
|
|
|
|
|||||||||||||
| 6,196 | 6,240 | -1 | % | 18,709 | 19,271 | -3 | % | |||||||||||||||||
|
|
|
|
|
|
|
|
|
|
|
|
|
|||||||||||||
Page 6 of 10
Nucor Executive Offices: 1915 Rexford Road, Charlotte, North Carolina 28211
Phone 704-366-7000 Fax 704-362-4208 www.nucor.com
| News Release |
|
Nucor Reports Results for the Third Quarter of 2024 (Continued)
Condensed Consolidated Statements of Earnings (Unaudited)
(In thousands, except per share data)
| Three Months (13 Weeks) Ended | Nine Months (39 Weeks) Ended | |||||||||||||||
| September 28, 2024 |
September 30, 2023 |
September 28, 2024 |
September 30, 2023 |
|||||||||||||
| Net sales |
$ | 7,444,160 | $ | 8,775,734 | $ | 23,658,415 | $ | 27,008,970 | ||||||||
|
|
|
|
|
|
|
|
|
|||||||||
| Costs, expenses and other: |
||||||||||||||||
| Cost of products sold |
6,686,226 | 6,854,934 | 20,183,246 | 20,588,294 | ||||||||||||
| Marketing, administrative and other expenses |
244,657 | 385,768 | 883,132 | 1,229,051 | ||||||||||||
| Equity in (earnings) losses of unconsolidated affiliates |
(5,278 | ) | 1,083 | (24,079 | ) | (3,671 | ) | |||||||||
| Losses and impairments of assets |
123,000 | — | 137,150 | — | ||||||||||||
| Interest expense (income), net |
7,282 | (14,133 | ) | (32,811 | ) | 648 | ||||||||||
|
|
|
|
|
|
|
|
|
|||||||||
| 7,055,887 | 7,227,652 | 21,146,638 | 21,814,322 | |||||||||||||
|
|
|
|
|
|
|
|
|
|||||||||
| Earnings before income taxes and noncontrolling interests |
388,273 | 1,548,082 | 2,511,777 | 5,194,648 | ||||||||||||
| Provision for income taxes |
85,448 | 326,827 | 537,847 | 1,154,689 | ||||||||||||
|
|
|
|
|
|
|
|
|
|||||||||
| Net earnings before noncontrolling interests |
302,825 | 1,221,255 | 1,973,930 | 4,039,959 | ||||||||||||
| Earnings attributable to noncontrolling interests |
52,915 | 79,749 | 233,962 | 300,557 | ||||||||||||
|
|
|
|
|
|
|
|
|
|||||||||
| Net earnings attributable to Nucor stockholders |
$ | 249,910 | $ | 1,141,506 | $ | 1,739,968 | $ | 3,739,402 | ||||||||
|
|
|
|
|
|
|
|
|
|||||||||
| Net earnings per share: |
||||||||||||||||
| Basic |
$ | 1.05 | $ | 4.58 | $ | 7.23 | $ | 14.86 | ||||||||
| Diluted |
$ | 1.05 | $ | 4.57 | $ | 7.22 | $ | 14.83 | ||||||||
| Average shares outstanding: |
||||||||||||||||
| Basic |
236,462 | 248,504 | 239,701 | 250,752 | ||||||||||||
| Diluted |
236,768 | 248,916 | 239,800 | 251,179 | ||||||||||||
Page 7 of 10
Nucor Executive Offices: 1915 Rexford Road, Charlotte, North Carolina 28211
Phone 704-366-7000 Fax 704-362-4208 www.nucor.com
| News Release |
|
Nucor Reports Results for the Third Quarter of 2024 (Continued)
Condensed Consolidated Balance Sheets (Unaudited)
(In thousands)
| September 28, 2024 | December 31, 2023 | |||||||
| ASSETS |
||||||||
| Current assets: |
||||||||
| Cash and cash equivalents |
$ | 4,262,799 | $ | 6,383,298 | ||||
| Short-term investments |
595,650 | 747,479 | ||||||
| Accounts receivable, net |
2,949,190 | 2,953,311 | ||||||
| Inventories, net |
5,126,493 | 5,577,758 | ||||||
| Other current assets |
587,085 | 724,012 | ||||||
|
|
|
|
|
|||||
| Total current assets |
13,521,217 | 16,385,858 | ||||||
| Property, plant and equipment, net |
12,580,243 | 11,049,767 | ||||||
| Restricted cash and cash equivalents |
— | 3,494 | ||||||
| Goodwill |
4,273,610 | 3,968,847 | ||||||
| Other intangible assets, net |
3,194,261 | 3,108,015 | ||||||
| Other assets |
776,860 | 824,518 | ||||||
|
|
|
|
|
|||||
| Total assets |
$ | 34,346,191 | $ | 35,340,499 | ||||
|
|
|
|
|
|||||
| LIABILITIES |
||||||||
| Current liabilities: |
||||||||
| Short-term debt |
$ | 213,751 | $ | 119,211 | ||||
| Current portion of long-term debt and finance lease obligations |
1,040,380 | 74,102 | ||||||
| Accounts payable |
1,902,927 | 2,020,289 | ||||||
| Salaries, wages and related accruals |
974,568 | 1,326,390 | ||||||
| Accrued expenses and other current liabilities |
1,085,160 | 1,054,517 | ||||||
|
|
|
|
|
|||||
| Total current liabilities |
5,216,786 | 4,594,509 | ||||||
| Long-term debt and finance lease obligations due after one year |
5,684,936 | 6,648,873 | ||||||
| Deferred credits and other liabilities |
1,887,928 | 1,973,363 | ||||||
|
|
|
|
|
|||||
| Total liabilities |
12,789,650 | 13,216,745 | ||||||
|
|
|
|
|
|||||
| Commitments and contingencies |
||||||||
| EQUITY |
||||||||
| Nucor stockholders’ equity: |
||||||||
| Common stock |
152,061 | 152,061 | ||||||
| Additional paid-in capital |
2,207,928 | 2,176,243 | ||||||
| Retained earnings |
30,113,666 | 28,762,045 | ||||||
| Accumulated other comprehensive loss, net of income taxes |
(168,233 | ) | (162,072 | ) | ||||
| Treasury stock |
(11,832,564 | ) | (9,987,643 | ) | ||||
|
|
|
|
|
|||||
| Total Nucor stockholders’ equity |
20,472,858 | 20,940,634 | ||||||
| Noncontrolling interests |
1,083,683 | 1,183,120 | ||||||
|
|
|
|
|
|||||
| Total equity |
21,556,541 | 22,123,754 | ||||||
|
|
|
|
|
|||||
| Total liabilities and equity |
$ | 34,346,191 | $ | 35,340,499 | ||||
|
|
|
|
|
|||||
Page 8 of 10
Nucor Executive Offices: 1915 Rexford Road, Charlotte, North Carolina 28211
Phone 704-366-7000 Fax 704-362-4208 www.nucor.com
| News Release |
|
Nucor Reports Results for the Third Quarter of 2024 (Continued)
Condensed Consolidated Statements of Cash Flows (Unaudited)
(In thousands)
| Nine Months (39 Weeks) Ended | ||||||||
| September 28, 2024 | September 30, 2023 | |||||||
| Operating activities: |
||||||||
| Net earnings before noncontrolling interests |
$ | 1,973,930 | $ | 4,039,959 | ||||
| Adjustments: |
||||||||
| Depreciation |
808,791 | 681,153 | ||||||
| Amortization |
189,146 | 175,701 | ||||||
| Loss on assets |
137,150 | — | ||||||
| Stock-based compensation |
114,280 | 101,107 | ||||||
| Deferred income taxes |
(92,468 | ) | (25,750 | ) | ||||
| Distributions from affiliates |
7,997 | 18,621 | ||||||
| Equity in earnings of unconsolidated affiliates |
(24,079 | ) | (3,671 | ) | ||||
| Changes in assets and liabilities (exclusive of acquisitions and dispositions): |
||||||||
| Accounts receivable |
46,823 | 171,621 | ||||||
| Inventories |
496,048 | 209,056 | ||||||
| Accounts payable |
(206,730 | ) | 164,479 | |||||
| Federal income taxes |
16,535 | 240,667 | ||||||
| Salaries, wages and related accruals |
(313,770 | ) | (347,026 | ) | ||||
| Other operating activities |
91,979 | 165,692 | ||||||
|
|
|
|
|
|||||
| Cash provided by operating activities |
3,245,632 | 5,591,609 | ||||||
|
|
|
|
|
|||||
| Investing activities: |
||||||||
| Capital expenditures |
(2,293,859 | ) | (1,496,248 | ) | ||||
| Investment in and advances to affiliates |
(79 | ) | (35,106 | ) | ||||
| Sale of business |
1,438 | — | ||||||
| Disposition of plant and equipment |
11,834 | 8,617 | ||||||
| Acquisitions (net of cash acquired) |
(672,193 | ) | — | |||||
| Purchases of investments |
(1,036,908 | ) | (1,200,136 | ) | ||||
| Proceeds from the sale of investments |
1,209,944 | 917,332 | ||||||
| Other investing activities |
9,607 | (35,001 | ) | |||||
|
|
|
|
|
|||||
| Cash used in investing activities |
(2,770,216 | ) | (1,840,542 | ) | ||||
|
|
|
|
|
|||||
| Financing activities: |
||||||||
| Net change in short-term debt |
94,540 | (13,142 | ) | |||||
| Repayment of long-term debt |
(5,000 | ) | (7,500 | ) | ||||
| Proceeds from exercise of stock options |
3,357 | 10,350 | ||||||
| Payment of tax withholdings on certain stock-based compensation |
(50,213 | ) | (44,456 | ) | ||||
| Distributions to noncontrolling interests |
(333,399 | ) | (412,404 | ) | ||||
| Cash dividends |
(393,837 | ) | (387,996 | ) | ||||
| Acquisition of treasury stock |
(1,901,574 | ) | (1,376,757 | ) | ||||
| Other financing activities |
(10,724 | ) | (12,437 | ) | ||||
|
|
|
|
|
|||||
| Cash used in financing activities |
(2,596,850 | ) | (2,244,342 | ) | ||||
|
|
|
|
|
|||||
| Effect of exchange rate changes on cash |
(2,559 | ) | 837 | |||||
|
|
|
|
|
|||||
| (Decrease) Increase in cash and cash equivalents and restricted cash and cash equivalents |
(2,123,993 | ) | 1,507,562 | |||||
| Cash and cash equivalents and restricted cash and cash equivalents - beginning of year |
6,386,792 | 4,361,220 | ||||||
|
|
|
|
|
|||||
| Cash and cash equivalents and restricted cash and cash equivalents - end of nine months |
$ | 4,262,799 | $ | 5,868,782 | ||||
|
|
|
|
|
|||||
| Non-cash investing activity: |
||||||||
| Change in accrued plant and equipment purchases |
$ | 70,077 | $ | 40,126 | ||||
|
|
|
|
|
|||||
Page 9 of 10
Nucor Executive Offices: 1915 Rexford Road, Charlotte, North Carolina 28211
Phone 704-366-7000 Fax 704-362-4208 www.nucor.com
| News Release |
|
Nucor Reports Results for the Third Quarter of 2024 (Continued)
Non-GAAP Financial Measures
Reconciliation of EBITDA (Unaudited)
(In thousands)
| Three Months (13 Weeks) Ended | 9 Months (39 Weeks) Ended | |||||||||||||||
| September 28, 2024 |
September 30, 2023 |
September 28, 2024 |
September 30, 2023 |
|||||||||||||
| Net earnings before noncontrolling interests |
$ | 302,825 | $ | 1,221,255 | $ | 1,973,930 | $ | 4,039,959 | ||||||||
| Depreciation |
281,165 | 232,317 | 808,791 | 681,153 | ||||||||||||
| Amortization |
69,296 | 58,470 | 189,146 | 175,701 | ||||||||||||
| Losses and impairments of assets |
123,000 | — | 137,150 | — | ||||||||||||
| Interest (income) expense, net |
7,282 | (14,133 | ) | (32,811 | ) | 648 | ||||||||||
| Provision for income taxes |
85,448 | 326,827 | 537,847 | 1,154,689 | ||||||||||||
|
|
|
|
|
|
|
|
|
|||||||||
| EBITDA |
$ | 869,016 | $ | 1,824,736 | $ | 3,614,053 | $ | 6,052,150 | ||||||||
|
|
|
|
|
|
|
|
|
|||||||||
Reconciliation of Adjusted net earnings attributable to Nucor stockholders (Unaudited)
(In thousands, except per share data)
| Three Months (13 Weeks) Ended September 28, 2024 | ||||||||
| Diluted EPS | ||||||||
| Net earnings attributable to Nucor stockholders |
$ | 249,910 | $ | 1.05 | ||||
| Losses and impairments of assets, net of tax |
103,080 | 0.44 | ||||||
|
|
|
|
|
|||||
| Adjusted net earnings attributable to Nucor stockholders |
$ | 352,990 | $ | 1.49 | ||||
|
|
|
|
|
|||||
Page 10 of 10
Nucor Executive Offices: 1915 Rexford Road, Charlotte, North Carolina 28211
Phone 704-366-7000 Fax 704-362-4208 www.nucor.com

Exhibit 99.2 THIRD QUARTER 2024 EARNINGS CALL LEON TOPALIAN Chair, President and CEO STEVE LAXTON Executive Vice President and CFO October 22, 2024

FORWARD-LOOKING STATEMENTS Certain statements made in this presentation may constitute forward-looking statements within the meaning of the Private Securities Litigation Reform Act of 1995. These statements involve risks and uncertainties. The words “anticipate,” “believe,” “expect,” “intend,” “may,” “project,” “will,” “should,” “could” and similar expressions are intended to identify forward-looking statements. These forward-looking statements reflect the Company’s best judgment based on current information, and although we base these statements on circumstances that we believe to be reasonable when made, there can be no assurance that future events will not affect the accuracy of such forward-looking information. The Company does not undertake any obligation to update these statements. The forward-looking statements are not guarantees of future performance, and actual results may vary materially from the projected results and expectations discussed in this presentation. Factors that might cause the Company’s actual results to differ materially from those anticipated in forward- looking statements include, but are not limited to: (1) competitive pressure on sales and pricing, including pressure from imports and substitute materials; (2) U.S. and foreign trade policies affecting steel imports or exports; (3) the sensitivity of the results of our operations to general market conditions, and in particular, prevailing market steel prices and changes in the supply and cost of raw materials, including pig iron, iron ore and scrap steel; (4) the availability and cost of electricity and natural gas, which could negatively affect our cost of steel production or result in a delay or cancellation of existing or future drilling within our natural gas drilling programs; (5) critical equipment failures and business interruptions; (6) market demand for steel products, which, in the case of many of our products, is driven by the level of nonresidential construction activity in the United States; (7) impairment in the recorded value of inventory, equity investments, fixed assets, goodwill or other long- lived assets; (8) uncertainties and volatility surrounding the global economy, including excess world capacity for steel production, inflation and interest rate changes; (9) fluctuations in currency conversion rates; (10) significant changes in laws or government regulations affecting environmental compliance, including legislation and regulations that result in greater regulation of greenhouse gas emissions that could increase our energy costs, capital expenditures and operating costs or cause one or more of our permits to be revoked or make it more difficult to obtain permit modifications; (11) the cyclical nature of the steel industry; (12) capital investments and their impact on our performance; (13) our safety performance; (14) our ability to integrate businesses we acquire; (15) the impact of the COVID-19 pandemic, any variants of the virus, and any other similar public health situation; and (16) the risks discussed in “Item 1A. Risk Factors” of the Company’s Annual Report on Form 10-K for the year ended December 31, 2023 and elsewhere therein and in the other reports we file with the U.S. Securities and Exchange Commission. 2
NON-GAAP FINANCIAL MEASURES The Company uses certain non-GAAP (Generally Accepted Accounting Principles) financial measures in this news release, including EBITDA and Free Cash Flow (FCF). Generally, a non-GAAP financial measure is a numerical measure of a company’s performance or financial position that either excludes or includes amounts that are not normally excluded or included in the most directly comparable financial measure calculated and presented in accordance with GAAP. We define EBITDA as net earnings before noncontrolling interests adding back the following items: interest expense, net; provision for income taxes; depreciation; amortization; and losses and impairments of assets. We define Free Cash Flow (FCF) as Cash Provided by Operating Activities less Capital Expenditures. Please note that other companies might define their non-GAAP financial measures differently than we do. Management presents the non-GAAP financial measures of EBITDA and FCF in this news release because it considers them to be an important supplemental measure of performance. Management believes that these non-GAAP financial measures provide additional insight for analysts and investors evaluating the Company’s financial and operational performance by providing a consistent basis of comparison across periods. Non-GAAP financial measures have limitations as an analytical tool. Investors are encouraged to review the reconciliation of non-GAAP financial measures to their most directly comparable GAAP financial measures provided in this presentation, including in the accompanying tables located in the Appendix. 3
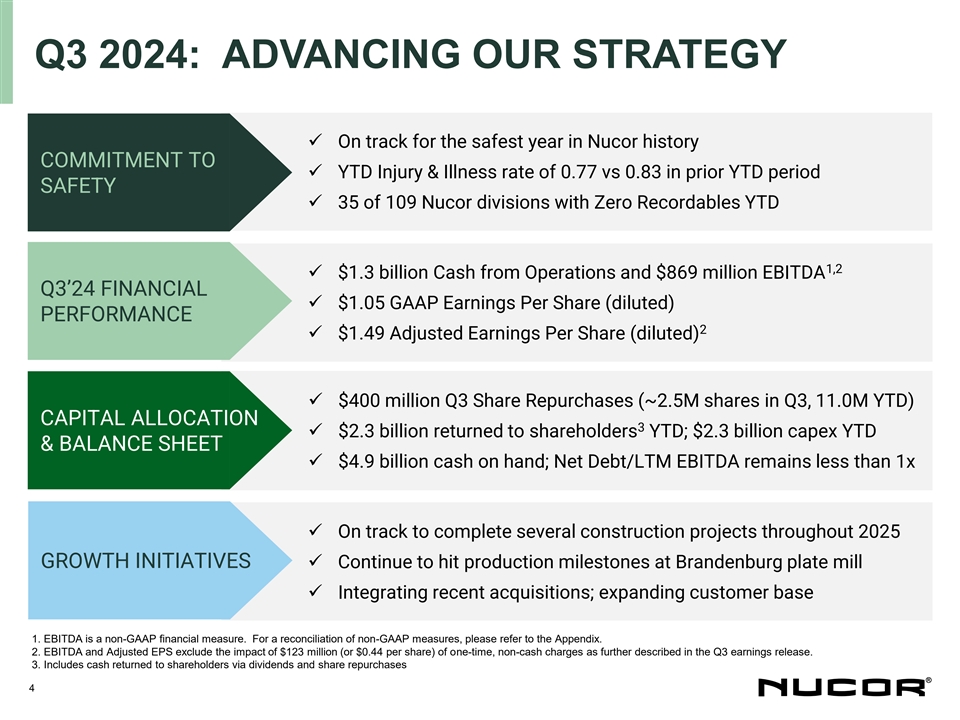
Q3 2024: ADVANCING OUR STRATEGY ✓ On track for the safest year in Nucor history COMMITMENT TO ✓ YTD Injury & Illness rate of 0.77 vs 0.83 in prior YTD period SAFETY ✓ 35 of 109 Nucor divisions with Zero Recordables YTD 1,2 ✓ $1.3 billion Cash from Operations and $869 million EBITDA Q3’24 FINANCIAL ✓ $1.05 GAAP Earnings Per Share (diluted) PERFORMANCE 2 ✓ $1.49 Adjusted Earnings Per Share (diluted) ✓ $400 million Q3 Share Repurchases (~2.5M shares in Q3, 11.0M YTD) CAPITAL ALLOCATION 3 ✓ $2.3 billion returned to shareholders YTD; $2.3 billion capex YTD & BALANCE SHEET ✓ $4.9 billion cash on hand; Net Debt/LTM EBITDA remains less than 1x ✓ On track to complete several construction projects throughout 2025 GROWTH INITIATIVES✓ Continue to hit production milestones at Brandenburg plate mill ✓ Integrating recent acquisitions; expanding customer base 1. EBITDA is a non-GAAP financial measure. For a reconciliation of non-GAAP measures, please refer to the Appendix. 2. EBITDA and Adjusted EPS exclude the impact of $123 million (or $0.44 per share) of one-time, non-cash charges as further described in the Q3 earnings release. 3. Includes cash returned to shareholders via dividends and share repurchases 4
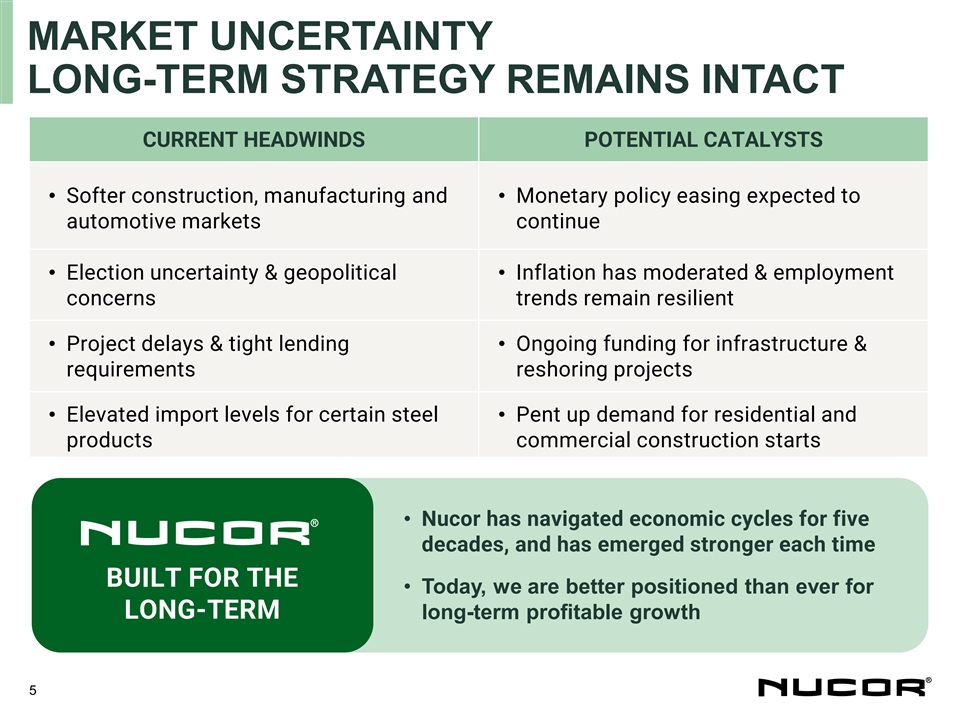
MARKET UNCERTAINTY LONG-TERM STRATEGY REMAINS INTACT CURRENT HEADWINDS POTENTIAL CATALYSTS • Softer construction, manufacturing and • Monetary policy easing expected to automotive markets continue • Election uncertainty & geopolitical • Inflation has moderated & employment concerns trends remain resilient • Project delays & tight lending • Ongoing funding for infrastructure & requirements reshoring projects • Elevated import levels for certain steel • Pent up demand for residential and products commercial construction starts • Nucor has navigated economic cycles for five decades, and has emerged stronger each time BUILT FOR THE • Today, we are better positioned than ever for LONG-TERM long-term profitable growth 5
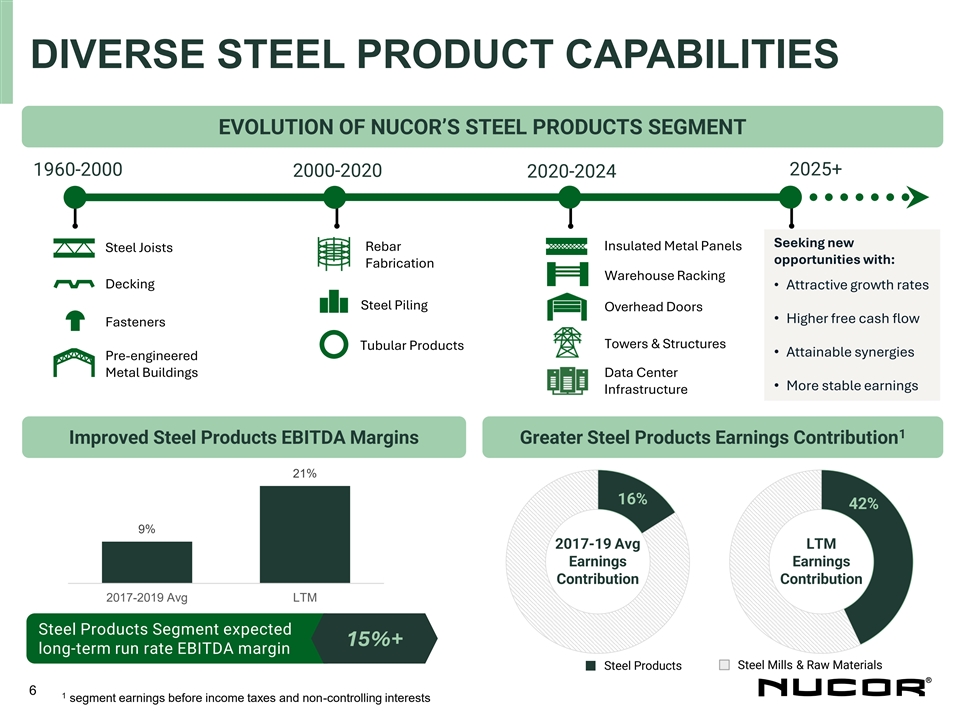
DIVERSE STEEL PRODUCT CAPABILITIES EVOLUTION OF NUCOR’S STEEL PRODUCTS SEGMENT 1960-2000 2025+ 2000-2020 2020-2024 Seeking new Rebar Insulated Metal Panels Steel Joists opportunities with: Fabrication Warehouse Racking Decking • Attractive growth rates Steel Piling Overhead Doors • Higher free cash flow Fasteners Towers & Structures Tubular Products • Attainable synergies Pre-engineered Metal Buildings Data Center • More stable earnings Infrastructure 1 Improved Steel Products EBITDA Margins Greater Steel Products Earnings Contribution 21% 16% 42% 9% 2017-19 Avg LTM Earnings Earnings Contribution Contribution 2017-2019 Avg LTM Steel Products Segment expected 15%+ long-term run rate EBITDA margin Steel Mills & Raw Materials Steel Products 6 1 segment earnings before income taxes and non-controlling interests
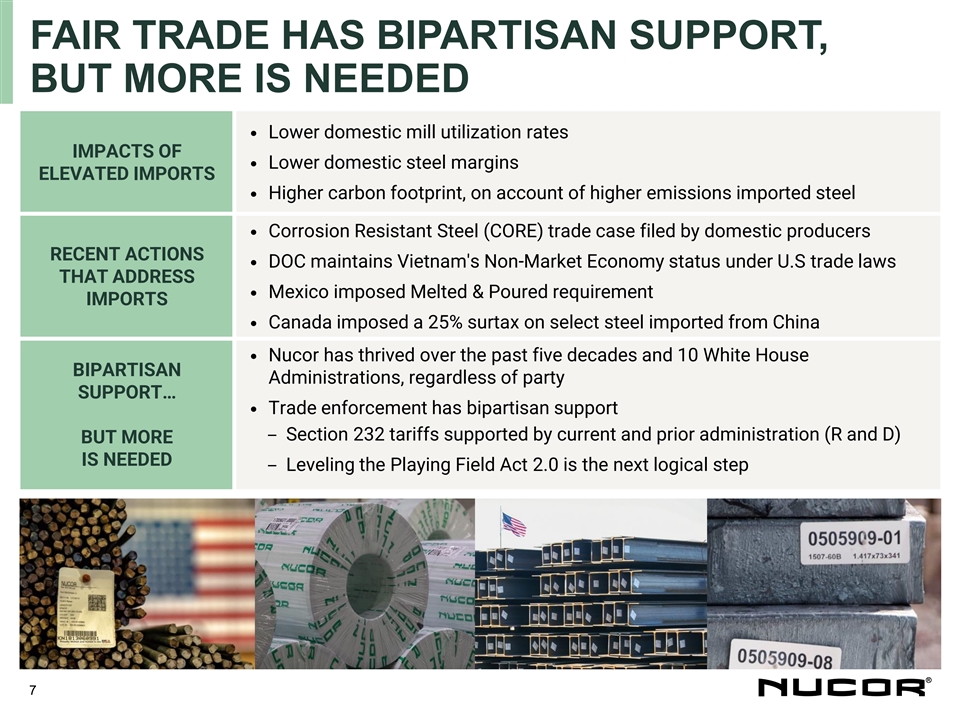
FAIR TRADE HAS BIPARTISAN SUPPORT, BUT MORE IS NEEDED • Lower domestic mill utilization rates IMPACTS OF • Lower domestic steel margins ELEVATED IMPORTS • Higher carbon footprint, on account of higher emissions imported steel • Corrosion Resistant Steel (CORE) trade case filed by domestic producers RECENT ACTIONS • DOC maintains Vietnam's Non-Market Economy status under U.S trade laws THAT ADDRESS • Mexico imposed Melted & Poured requirement IMPORTS • Canada imposed a 25% surtax on select steel imported from China • Nucor has thrived over the past five decades and 10 White House BIPARTISAN Administrations, regardless of party SUPPORT… • Trade enforcement has bipartisan support ‒ Section 232 tariffs supported by current and prior administration (R and D) BUT MORE IS NEEDED ‒ Leveling the Playing Field Act 2.0 is the next logical step 7

CONSOLIDATED FINANCIAL RESULTS ($ in billions except per share data) 1 1 Diluted EPS EBITDA 2023 2023 2024 2024 $14.83 $7.66 Adj for $0.44 non-cash $6.05 impairment $7.22 $4.57 $3.61 $1.49 $1.82 $1.05 $0.87 Q3 YTD Q3 YTD Q3 YTD Q3 YTD 2 Capital Expenditures Cash Returned to Shareholders 2023 2024 2023 2024 $2.30 $2.29 $1.76 $1.50 $0.82 $0.63 $0.53 $0.44 Q3 YTD Q3 YTD Q3 YTD Q3 YTD (1) EBITDA and Adjusted EPS exclude the impact of $123 million (or $0.44 per share) of pre-tax, non-cash charges as further described in the Q3 earnings release. EBITDA is a non-GAAP financial measure. For a reconciliation of non-GAAP measures, please refer to the Appendix 8 (2) Cash Returned to Shareholders include dividends and share repurchases
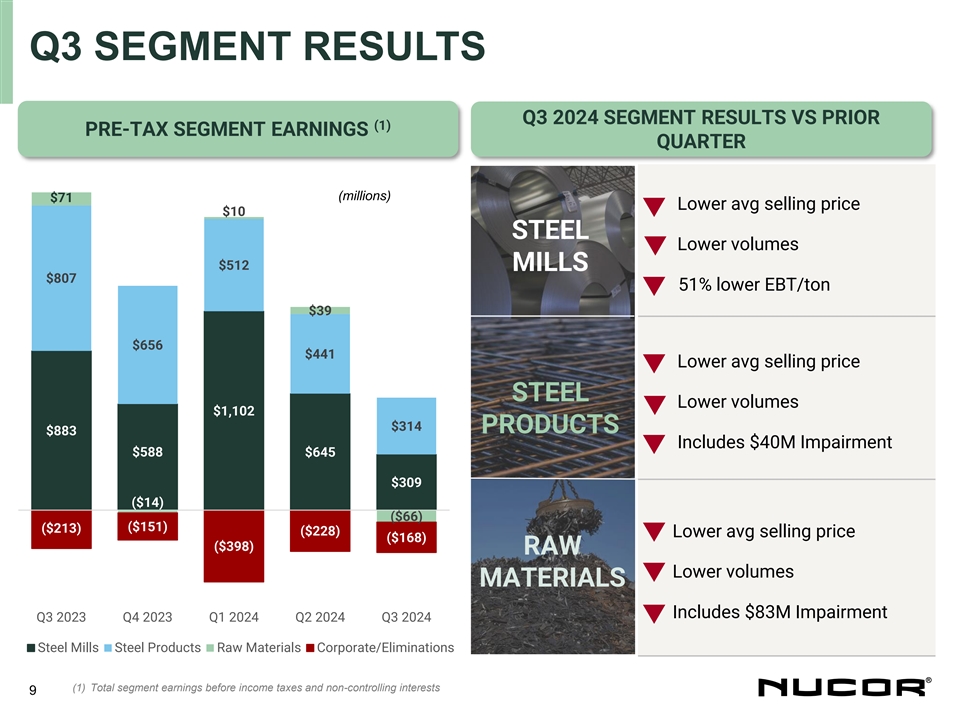
Q3 SEGMENT RESULTS Q3 2024 SEGMENT RESULTS VS PRIOR (1) PRE-TAX SEGMENT EARNINGS QUARTER (millions) $71 • Lower avg selling price $10 STEEL • Lower volumes $512 MILLS $807 • 51% lower EBT/ton $39 $656 $441 • Lower avg selling price STEEL • Lower volumes $1,102 $314 PRODUCTS $883 • Includes $40M Impairment $588 $645 $309 ($14) ($66) ($151) ($213) ($228) • Lower avg selling price ($168) ($398) RAW • Lower volumes MATERIALS • Includes $83M Impairment Q3 2023 Q4 2023 Q1 2024 Q2 2024 Q3 2024 Steel Mills Steel Products Raw Materials Corporate/Eliminations (1) Total segment earnings before income taxes and non-controlling interests 9

Q4 2024 OUTLOOK IMPACT ON Q4 SEGMENT EXPECTATIONS FOR Q4 vs Q3 EARNINGS VS Q3 • Lower average selling prices and lower Steel Mills volumes • Lower average selling prices and lower Steel Products volumes • Stable volumes and pricing, lower operating Raw Materials costs • Intercompany eliminations expected to be Corp / Eliminations lower (a net positive to earnings) Consolidated • Lower consolidated earnings vs Q3 Earnings Other Metrics Steel Mills • Expected to be slightly lower on a per ton basis in Q4 Conversion Costs • Expected to be a source of cash in Q4 Working Capital 10

BALANCED CAPITAL ALLOCATION DRIVES LONG-TERM SHAREHOLDER VALUE BALANCED CAPITAL ALLOCATION GROWING SHAREHOLDER VALUE Jan. 2017 – Sep. 2024 Jan. 2017 – Sep. 2024 Total Shareholder Return 300% 19% Cash to Shareholders 200% ~$34 Bn 44% Capital Expenditures 100% since 2017 0% Acquisitions 37% -100% Increased Earnings Power $8,000 $140 35% 33% Ave ROE ’20-’23 $120 30% $6,000 $100 25% $4,000 $80 18% Ave ROE 20% ’17-’19 $60 15% $2,000 $40 10% $20 5% $0 $millions $millions 2017 2018 2019 2020 2021 2022 2023 2024 $- 0% LTM 2017 2018 2019 2020 2021 2022 2023 2024 Acquisitions Capital Expenditures YTD Book Value per Share Accumulated Dividend Cash to Shareholders Free Cash Flow Average ROE% (rt axis) 11

APPENDIX 12
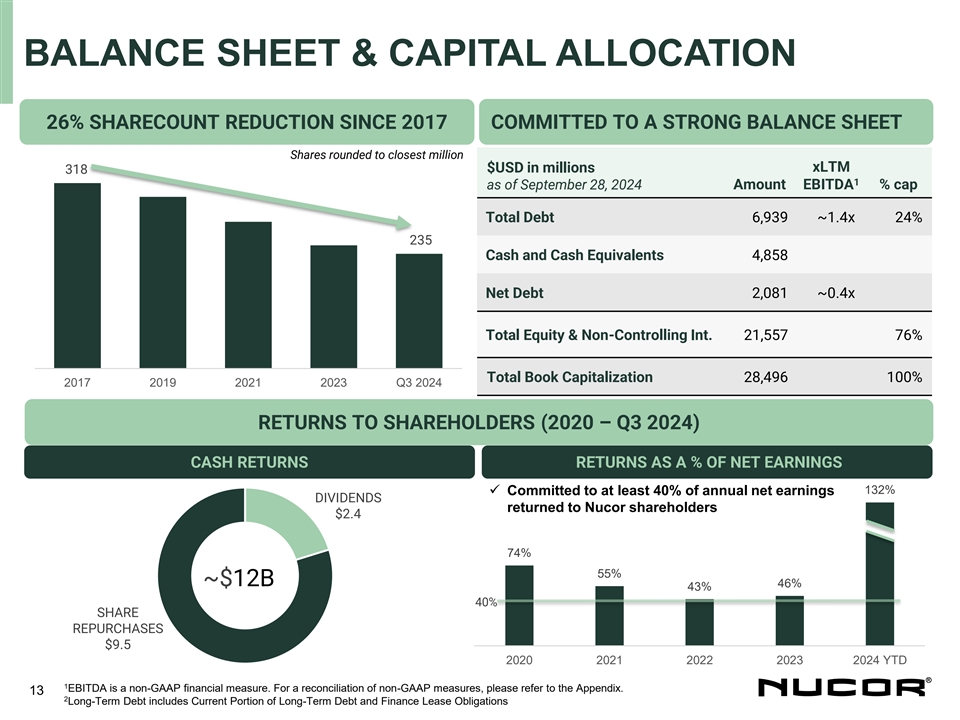
BALANCE SHEET & CAPITAL ALLOCATION 26% SHARECOUNT REDUCTION SINCE 2017 COMMITTED TO A STRONG BALANCE SHEET Shares rounded to closest million xLTM $USD in millions 318 1 as of September 28, 2024 Amount EBITDA % cap Total Debt 6,939 ~1.4x 24% 235 Cash and Cash Equivalents 4,858 Net Debt 2,081 ~0.4x Total Equity & Non-Controlling Int. 21,557 76% Total Book Capitalization 28,496 100% 2017 2019 2021 2023 Q3 2024 RETURNS TO SHAREHOLDERS (2020 – Q3 2024) CASH RETURNS RETURNS AS A % OF NET EARNINGS 132% ✓ Committed to at least 40% of annual net earnings DIVIDENDS returned to Nucor shareholders $2.4 74% 55% ~$12B 46% 43% 40% SHARE REPURCHASES $9.5 2020 2021 2022 2023 2024 YTD 1 EBITDA is a non-GAAP financial measure. For a reconciliation of non-GAAP measures, please refer to the Appendix. 13 2 Long-Term Debt includes Current Portion of Long-Term Debt and Finance Lease Obligations

CAPEX PLAN FUNDED WITH ROBUST OPERATING CASHFLOW AND HEALTHY BALANCE SHEET $3,000 FCF Line = Operating Cashflow minus Capex Annual Annual Annual Cash Period Operating (1) Capex FCF Balance Cashflow $2,500 2017 – 2019 $2.1B $1.0B $1.1B $1.4B (average) $2,000 2021 – 2023 $7.8B $1.9B $5.9B $4.9B (average) $1,500 LTM Q3 ’24 $4.8B $3.0B $1.8B $4.9B $1,000 Operating $500 Cashflow $0 -$500 Capex -$1,000 -$1,500 2017 2018 2019 2020 2021 2022 2023 ’24 YTD $millions QUARTERLY CAPEX QUARTERLY OPERATING CASH FLOW QUARTERLY FCF (1) Represents average year-end cash, cash equivalents and short-term investments during multi-year periods. For LTM period, represents balance at end of Q3 ‘24. 14
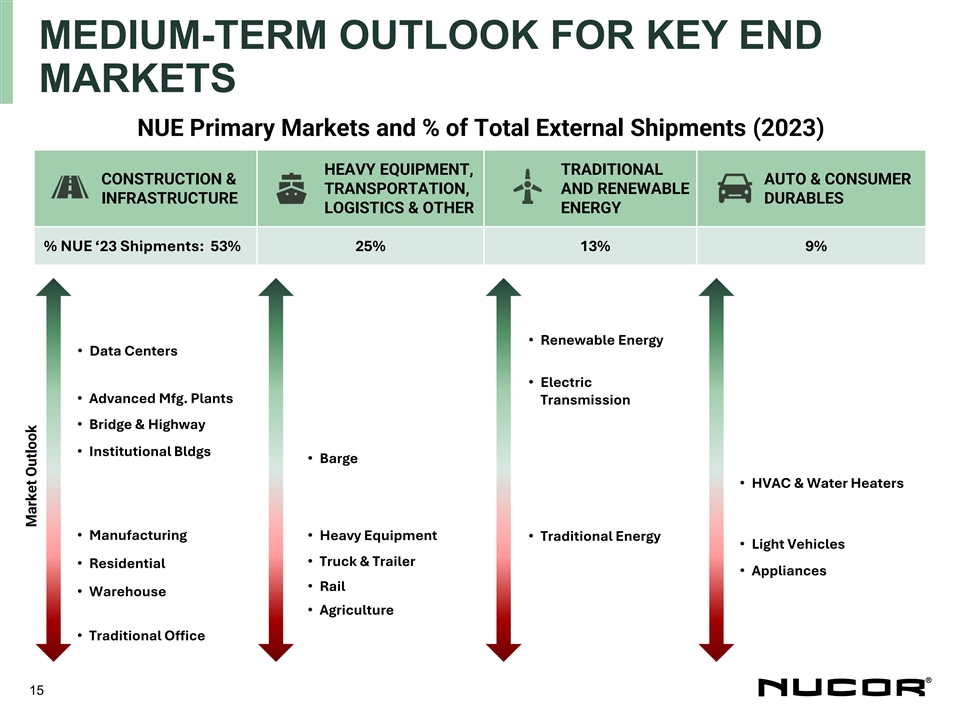
MEDIUM-TERM OUTLOOK FOR KEY END MARKETS NUE Primary Markets and % of Total External Shipments (2023) HEAVY EQUIPMENT, TRADITIONAL CONSTRUCTION & AUTO & CONSUMER TRANSPORTATION, AND RENEWABLE INFRASTRUCTURE DURABLES LOGISTICS & OTHER ENERGY % NUE ‘23 Shipments: 53% 25% 13% 9% • Renewable Energy • Data Centers • Electric • Advanced Mfg. Plants Transmission • Bridge & Highway • Institutional Bldgs • Barge • HVAC & Water Heaters • Manufacturing • Heavy Equipment • Traditional Energy • Light Vehicles • Truck & Trailer • Residential • Appliances • Rail • Warehouse • Agriculture • Traditional Office 15 Market Outlook

SEGMENT RESULTS: STEEL MILLS AND STEEL PRODUCTS STEEL MILLS $s in millions, tons in thousands % Change Versus Prior Shipments Q3 ‘24 Q2 ’24 Q3 ’23 Prior Qtr. Q3 2024 vs. Q2 2024 Year Sheet 2,837 2,869 2,723 -1% 4% • Lower pricing was the primary driver of Bars 1,926 2,005 2,001 -4% -4% 52% lower earnings in the segment, Structural 493 512 530 -4% -7% compared to Q2 Plate 435 448 460 -3% -5% • Lower shipments across the group Other Steel 28 33 32 -15% -13% compared to prior quarter Total Shipments 5,719 5,867 5,746 -3% 0% 1 EBT $309 $645 $883 -52% -65% 1 EBT /Ton $54 $110 $154 -51% -65% STEEL PRODUCTS $s in millions, tons in thousands % Change Versus Prior Shipments Q3 ‘24 Q2 ’24 Q3 ’23 Prior Qtr. Q3 2024 vs. Q2 2024 Year Tubular 213 214 223 0% -4% • Joist & Deck 169 185 231 -9% -27% Pricing was down primarily in Joist & Rebar Fabrication 278 265 307 5% -9% Deck and Tubular Products Building Systems 60 66 71 -9% -15% • Overall lower shipments Other 291 344 309 -15% -6% Total Shipments 1,011 1,074 1,141 -6% -11% 1 EBT $314 $441 $807 -29% -61% Exclude Impairment Charge $40 1 Adj. EBT $354 $441 $807 -20% -56% 1 Adj. EBT /Ton $350 $411 $707 -15% -50% 16 1 EBT refers to Earnings (loss) before income taxes and noncontrolling interests as disclosed in relevant Nucor quarterly earnings news release

SEGMENT RESULTS: RAW MATERIALS RAW MATERIALS $s in millions, tons in thousands % Change Versus Q3 2024 vs. Q2 2024 Prior Production Q3 ‘24 Q2 ’24 Q3 ’23 Prior Qtr. Year DRI 835 987 1,005 -15% -17% Scrap Processing 993 1,037 993 -4% 0% • Lower volumes and selling prices 1 Total Production 1,828 2,024 1,997 -10% -8% 2 EBT -$66 $39 $71 -269% -193% Exclude Impairment Charge $83 2 Adj. EBT $17 $39 $71 -56% -76% 1 Total production excluding scrap brokerage activities. 2 EBT refers to Earnings (loss) before income taxes and noncontrolling interests as disclosed in relevant 17 Nucor quarterly earnings news release

QUARTERLY SALES AND EARNINGS DATA SALES TONS (THOUSANDS) TO OUTSIDE CUSTOMERS EARNINGS (LOSS) STEEL STEEL PRODUCTS BEFORE INCOME TAXES COMP. SALES OTHER TOTAL PRICE TOTAL STEEL STEEL REBAR TUBULAR BLDG STEEL STEEL RAW TOTAL NET SALES PER $ PER YEAR SHEET BARS BEAM* PLATE STEEL JOISTS DECK FAB PRODS SYSTEMS PRODS PRODS MATLS TONS ($ 000’S) TON ($) ($ 000’S) TON 2024 Q1 2,517 1,344 431 384 4,676 99 81 238 208 55 284 965 583 6,224 $8,137,083 $1,307 $1,111,220 $188 Q2 2,348 1,445 407 417 4,617 103 82 265 214 66 344 1,074 598 6,289 $8,077,172 $1,284 $831,237 $139 Q3 2,394 1,402 406 405 4,607 90 79 278 213 60 291 1,011 578 6,196 $7,444,160 $1,201 $335,358 $57 Q4 YEAR 2023 Q1 2,384 1,550 440 430 4,804 135 99 279 275 51 302 1,141 498 6,443 $8,709,980 $1,352 $1,501,697 $244 Q2 2,404 1,481 399 490 4,774 142 107 332 239 63 310 1,193 621 6,588 $9,523,256 $1,446 $1,924,061 $306 Q3 2,305 1,408 439 426 4,578 127 104 307 223 71 309 1,141 521 6,240 $8,775,734 $1,406 $1,468,333 $247 Q4 2,239 1,402 414 341 4,396 106 91 251 212 63 288 1,011 527 5,934 $7,704,531 $1,298 $990,676 $175 YEAR 9,332 5,841 1,692 1,687 18,552 510 401 1,169 949 248 1,209 4,486 2,167 25,205 $34,713,501 $1,377 $5,884,767 $245 18 *Beam includes all structural steel
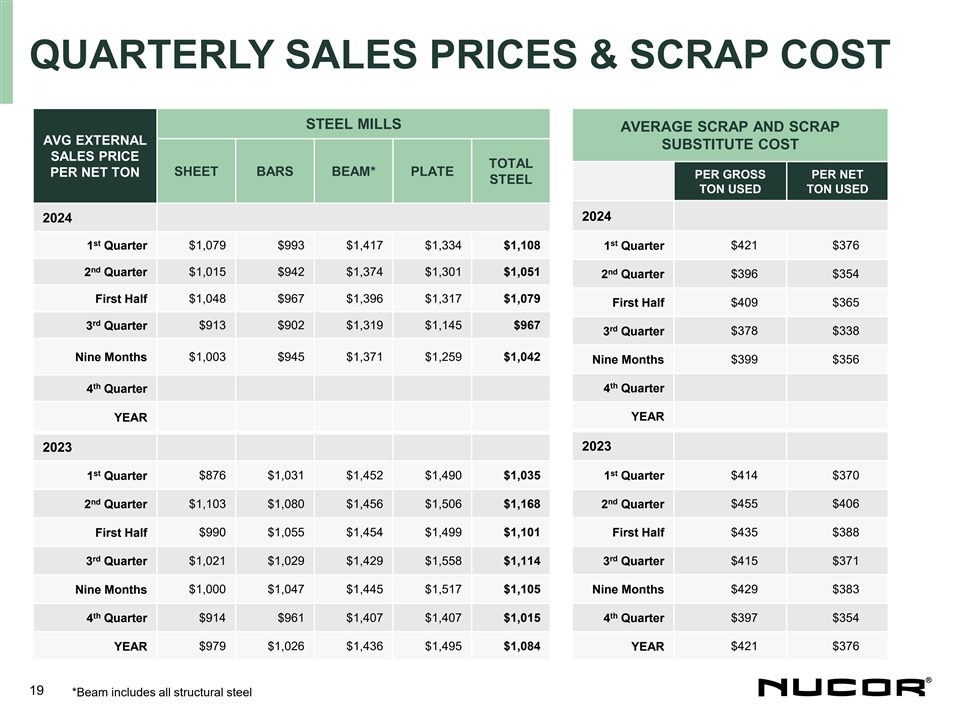
QUARTERLY SALES PRICES & SCRAP COST STEEL MILLS AVERAGE SCRAP AND SCRAP AVG EXTERNAL SUBSTITUTE COST SALES PRICE TOTAL SHEET BARS BEAM* PLATE PER NET TON PER GROSS PER NET STEEL TON USED TON USED 2024 2024 st st 1 Quarter $1,079 $993 $1,417 $1,334 $1,108 $421 $376 1 Quarter nd nd 2 Quarter $1,015 $942 $1,374 $1,301 $1,051 2 Quarter $396 $354 First Half $1,048 $967 $1,396 $1,317 $1,079 First Half $409 $365 rd 3 Quarter $913 $902 $1,319 $1,145 $967 rd $378 $338 3 Quarter Nine Months $1,003 $945 $1,371 $1,259 $1,042 Nine Months $399 $356 th th 4 Quarter 4 Quarter YEAR YEAR 2023 2023 st st 1 Quarter $876 $1,031 $1,452 $1,490 $1,035 1 Quarter $414 $370 nd nd 2 Quarter $1,103 $1,080 $1,456 $1,506 $1,168 2 Quarter $455 $406 $990 $1,055 $1,454 $1,499 $1,101 $435 $388 First Half First Half rd rd 3 Quarter $1,021 $1,029 $1,429 $1,558 $1,114 3 Quarter $415 $371 Nine Months $1,000 $1,047 $1,445 $1,517 $1,105 Nine Months $429 $383 th th 4 Quarter $914 $961 $1,407 $1,407 $1,015 4 Quarter $397 $354 YEAR $979 $1,026 $1,436 $1,495 $1,084 YEAR $421 $376 19 *Beam includes all structural steel
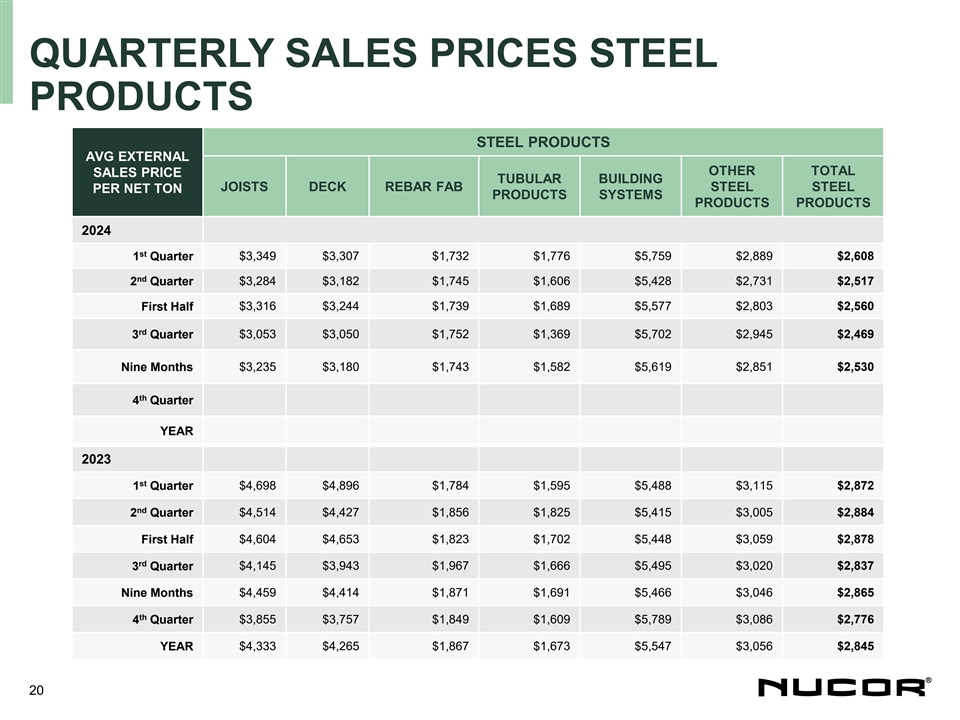
QUARTERLY SALES PRICES STEEL PRODUCTS STEEL PRODUCTS AVG EXTERNAL OTHER TOTAL SALES PRICE TUBULAR BUILDING JOISTS DECK REBAR FAB STEEL STEEL PER NET TON PRODUCTS SYSTEMS PRODUCTS PRODUCTS 2024 st 1 Quarter $3,349 $3,307 $1,732 $1,776 $5,759 $2,889 $2,608 nd 2 Quarter $3,284 $3,182 $1,745 $1,606 $5,428 $2,731 $2,517 First Half $3,316 $3,244 $1,739 $1,689 $5,577 $2,803 $2,560 rd 3 Quarter $3,053 $3,050 $1,752 $1,369 $5,702 $2,945 $2,469 $3,235 $3,180 $1,743 $1,582 $5,619 $2,851 $2,530 Nine Months th 4 Quarter YEAR 2023 st $4,698 $4,896 $1,784 $1,595 $5,488 $3,115 $2,872 1 Quarter nd $4,514 $4,427 $1,856 $1,825 $5,415 $3,005 $2,884 2 Quarter First Half $4,604 $4,653 $1,823 $1,702 $5,448 $3,059 $2,878 rd 3 Quarter $4,145 $3,943 $1,967 $1,666 $5,495 $3,020 $2,837 Nine Months $4,459 $4,414 $1,871 $1,691 $5,466 $3,046 $2,865 th 4 Quarter $3,855 $3,757 $1,849 $1,609 $5,789 $3,086 $2,776 YEAR $4,333 $4,265 $1,867 $1,673 $5,547 $3,056 $2,845 20
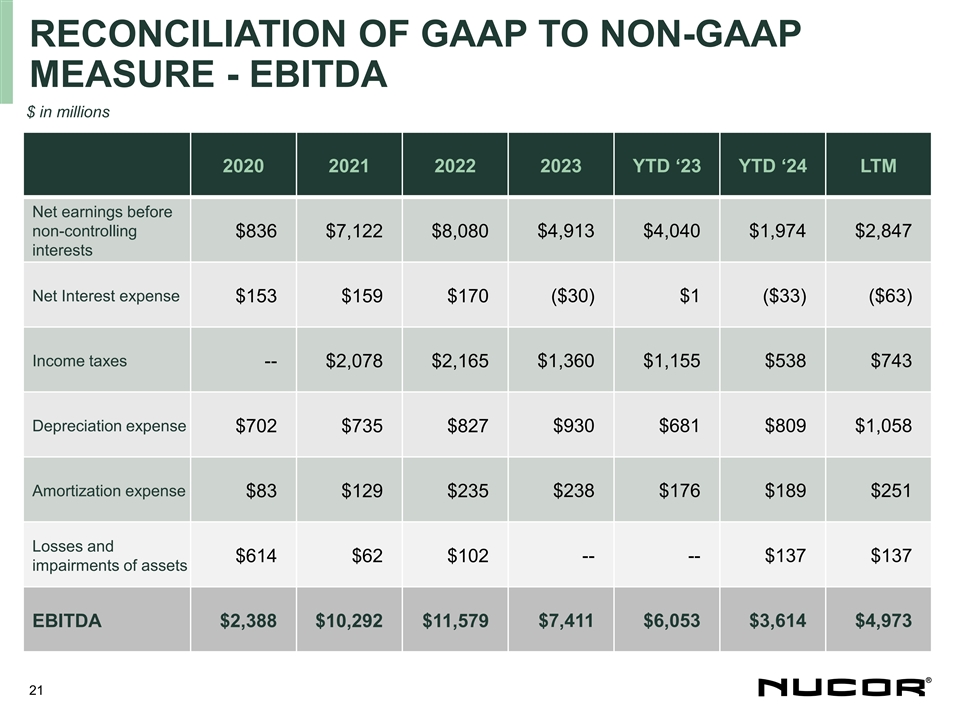
RECONCILIATION OF GAAP TO NON-GAAP MEASURE - EBITDA $ in millions 2020 2021 2022 2023 YTD ‘23 YTD ‘24 LTM Net earnings before non-controlling $836 $7,122 $8,080 $4,913 $4,040 $1,974 $2,847 interests Net Interest expense $153 $159 $170 ($30) $1 ($33) ($63) Income taxes -- $2,078 $2,165 $1,360 $1,155 $538 $743 Depreciation expense $702 $735 $827 $930 $681 $809 $1,058 Amortization expense $83 $129 $235 $238 $176 $189 $251 Losses and $614 $62 $102 -- -- $137 $137 impairments of assets $7,411 $6,053 $3,614 $4,973 EBITDA $2,388 $10,292 $11,579 21
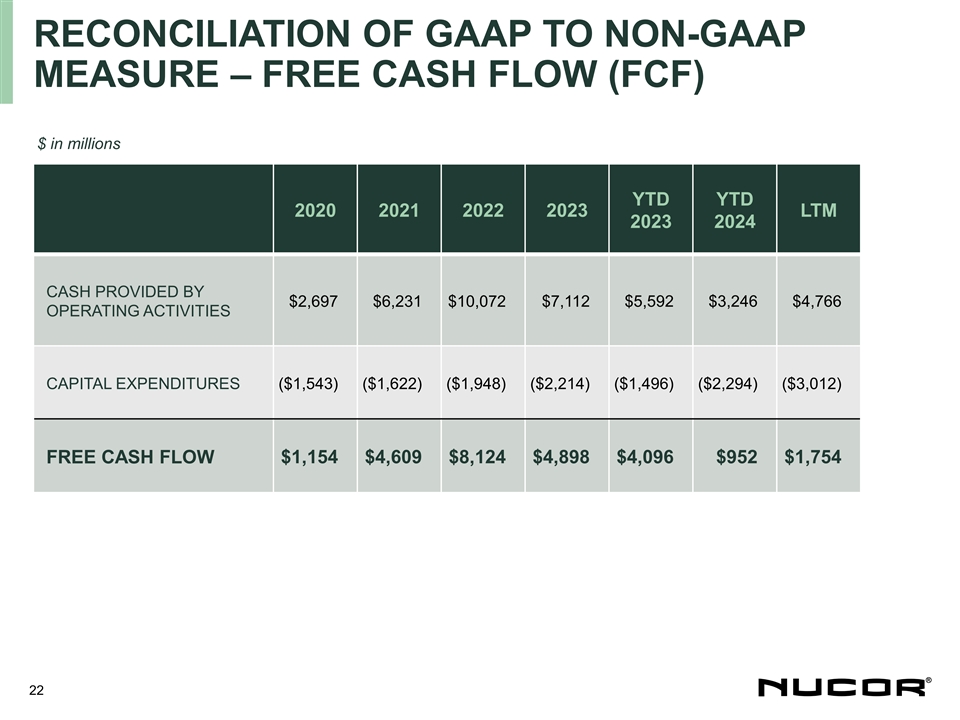
RECONCILIATION OF GAAP TO NON-GAAP MEASURE – FREE CASH FLOW (FCF) $ in millions YTD YTD 2020 2021 2022 2023 LTM 2023 2024 CASH PROVIDED BY $2,697 $6,231 $10,072 $7,112 $5,592 $3,246 $4,766 OPERATING ACTIVITIES CAPITAL EXPENDITURES ($1,543) ($1,622) ($1,948) ($2,214) ($1,496) ($2,294) ($3,012) FREE CASH FLOW $1,154 $4,609 $8,124 $4,898 $4,096 $952 $1,754 22