UNITED STATES
SECURITIES AND EXCHANGE COMMISSION
Washington, D.C. 20549
FORM 8-K
CURRENT REPORT
Pursuant to Section 13 or 15(d) of the Securities Exchange Act of 1934
Date of Report (Date of earliest event reported) October 18, 2024
SIMMONS FIRST NATIONAL CORPORATION
(Exact name of registrant as specified in its charter)
| Arkansas | 0-6253 | 71-0407808 | ||
|
(State or other jurisdiction of incorporation) |
(Commission File Number) | (I.R.S. Employer Identification No.) | ||
| 501 Main Street, Pine Bluff, Arkansas | 71601 | |||
| (Address of principal executive offices) | (Zip Code) | |||
(870) 541-1000
(Registrant’s telephone number, including area code)
Not Applicable
(Former name or former address, if changed since last report.)
Check the appropriate box below if the Form 8-K filing is intended to simultaneously satisfy the filing obligation of the registrant under any of the following provisions (see General Instruction A.2. below):
☐ Written communications pursuant to Rule 425 under the Securities Act (17 CFR 230.425)
☐ Soliciting material pursuant to Rule 14a-12 under the Exchange Act (17 CFR 240.14a-12)
☐ Pre-commencement communications pursuant to Rule 14d-2(b) under the Exchange Act (17 CFR 240.14d-2(b))
☐ Pre-commencement communications pursuant to Rule 13e-4(c) under the Exchange Act (17 CFR 240.13e-4(c))
Securities registered pursuant to Section 12(b) of the Act:
|
Title of each class
|
Trading Symbol(s)
|
Name of each exchange on which registered
|
||
|
Common stock, par value $0.01 per share
|
SFNC
|
The Nasdaq Global Select Market
|
Indicate by check mark whether the registrant is an emerging growth company as defined in Rule 405 of the Securities Act of 1933 (17 CFR §230.405) or Rule 12b-2 of the Securities Exchange Act of 1934 (17 CFR §240.12b-2). Emerging growth company ☐
If an emerging growth company, indicate by check mark if the registrant has elected not to use the extended transition period for complying with any new or revised financial accounting standards provided pursuant to Section 13(a) of the Exchange Act. ☐
| Item 2.02 | Results of Operations and Financial Condition. |
On October 18, 2024, the Registrant issued a press release, a copy of which is attached hereto as Exhibit 99.1 and is incorporated herein by reference.
The information provided pursuant to this Item 2.02, including Exhibit 99.1, is being furnished and shall not be deemed “filed” for purposes of Section 18 of the Securities Exchange Act of 1934 (“Exchange Act”) or otherwise subject to the liabilities under that Section and shall not be deemed to be incorporated by reference into any filing of the Registrant under the Securities Act of 1933 (“Securities Act”) or the Exchange Act, except as shall be expressly set forth by specific reference in such filing.
| Item 7.01 | Regulation FD Disclosure. |
On October 18, 2024, the Registrant issued an investor presentation, a copy of which is attached hereto as Exhibit 99.2 and is incorporated herein by reference.
The information provided pursuant to this Item 7.01, including Exhibit 99.2, is being furnished and shall not be deemed “filed” for purposes of Section 18 of the Exchange Act or otherwise subject to the liabilities under that Section and shall not be deemed to be incorporated by reference into any filing of the Registrant under the Securities Act or the Exchange Act, except as shall be expressly set forth by specific reference in such filing.
| Item 9.01 | Financial Statements and Exhibits. |
| Exhibit 99.1 | Press Release dated October 18, 2024 | |
| Exhibit 99.2 | Investor Presentation issued on October 18, 2024 | |
| Exhibit 104 | Cover Page Interactive Data File (embedded within the Inline XBRL Document) |
SIGNATURE
Pursuant to the requirements of the Securities Exchange Act of 1934, the registrant has duly caused this report to be signed on its behalf by the undersigned hereunto duly authorized.
| SIMMONS FIRST NATIONAL CORPORATION | ||||
| /s/ C. Daniel Hobbs | ||||
| Date: October 18, 2024 | C. Daniel Hobbs, Executive Vice President and | |||
| Chief Financial Officer | ||||
Exhibit 99.1

October 18, 2024
Simmons First National Corporation Reports Third Quarter 2024 Results
Bob Fehlman, Simmons’ Chief Executive Officer, commented on third quarter 2024 results:
Simmons’ third quarter results were highlighted by positive underlying trends across the board. Net interest income increased 10 percent annualized on a linked quarter basis as loan yields continued to increase, while deposit costs were unchanged from second quarter 2024 levels and appear to have peaked.
We also were proactive in responding to favorable market conditions when opportunities presented themselves. During the quarter, we decided to sell certain lower yielding bonds in our securities portfolio to hasten the pace of our ongoing balance sheet optimization strategy. While the loss on the sale of these securities weighed on reported results, on an adjusted basis total revenue, noninterest income and pre-provision net revenue posted solid growth on a linked quarter basis. Equally important, credit trends remained steady in the quarter and our allowance for credit losses on loans ended the quarter at 1.35 percent.
As we enter the final quarter of 2024, we believe our strong capital and liquidity positions combined with the liability sensitivity position of our balance sheet will provide tailwinds as we navigate an uncertain macroeconomic environment.
| FINANCIAL HIGHLIGHTS |
3Q24 | 2Q24 | 3Q23 | 3Q24 Highlights |
||||||||||
| BALANCE SHEET (in millions) |
Comparisons reflect 3Q24 vs 2Q24
• Net income of $24.7 million and diluted EPS of $0.20
• Adjusted earnings1 of $46.0 million and adjusted diluted EPS1 of $0.37
• Total revenue of $174.8 million and PPNR1 of $37.6 million
• Adjusted total revenue1 of $203.2 million and adjusted PPNR1 of $66.4 million
• Net interest margin of 2.74%, up 5 bps
• Cost of deposits unchanged from 2Q24 levels at 2.79%
• Provision for credit losses on loans exceeded net charge-offs in the quarter by $2.8 million
• NCO ratio 22 bps in 3Q24; 9 bps of NCO ratio associated with run-off portfolio
• ACL ratio ends the quarter at 1.35%
• EA ratio 12.94%; TCE ratio1 up 31 bps to 8.15%
• Book value per share up 2%; tangible book value per share1 up 4% |
|||||||||||||
| Total loans |
$ | 17,336 | $ | 17,192 | $ | 16,772 | ||||||||
| Total investment securities |
6,350 | 6,571 | 7,101 | |||||||||||
| Total deposits |
21,935 | 21,841 | 22,231 | |||||||||||
| Total assets |
27,269 | 27,369 | 27,564 | |||||||||||
| Total shareholders’ equity |
3,529 | 3,459 | 3,286 | |||||||||||
| ASSET QUALITY |
||||||||||||||
| Net charge-off ratio (NCO ratio) |
0.22 | % | 0.19 | % | 0.28 | % | ||||||||
| Nonperforming loan ratio |
0.59 | 0.60 | 0.49 | |||||||||||
| Nonperforming assets to total assets |
0.38 | 0.39 | 0.32 | |||||||||||
| Allowance for credit losses to loans (ACL) |
1.35 | 1.34 | 1.30 | |||||||||||
| Nonperforming loan coverage ratio |
229 | 223 | 267 | |||||||||||
| PERFORMANCE MEASURES (in millions) |
||||||||||||||
| Total revenue |
$ | 174.8 | $ | 197.2 | $ | 196.2 | ||||||||
| Adjusted total revenue1 |
203.2 | 197.2 | 196.2 | |||||||||||
| Pre-provision net revenue1 (PPNR) |
37.6 | 57.9 | 64.2 | |||||||||||
| Adjusted pre-provision net revenue1 |
66.4 | 59.4 | 66.3 | |||||||||||
| Provision for credit losses |
12.1 | 11.1 | 7.7 | |||||||||||
| PER SHARE DATA |
||||||||||||||
| Diluted earnings |
$ | 0.20 | $ | 0.32 | $ | 0.37 | ||||||||
| Adjusted diluted earnings1 |
0.37 | 0.33 | 0.39 | |||||||||||
| Book value |
28.11 | 27.56 | 26.26 | |||||||||||
| Tangible book value1 |
16.78 | 16.20 | 14.77 | |||||||||||
| CAPITAL RATIOS |
||||||||||||||
| Equity to assets (EA ratio) |
12.94 | % | 12.64 | % | 11.92 | % | ||||||||
| Tangible common equity (TCE) ratio1 |
8.15 | 7.84 | 7.07 | |||||||||||
| Common equity tier 1 (CET1) ratio |
12.06 | 12.00 | 12.02 | |||||||||||
| Total risk-based capital ratio |
14.25 | 14.17 | 14.27 | |||||||||||
| LIQUIDITY ($ in millions) |
||||||||||||||
| Loan to deposit ratio |
79.03 | % | 78.72 | % | 75.44 | % | ||||||||
| Borrowed funds to total liabilities |
6.16 | 7.38 | 7.37 | |||||||||||
| Uninsured, non-collateralized deposits (UCD) |
$ | 4,659 | $ | 4,408 | $ | 4,631 | ||||||||
| Additional liquidity sources |
11,174 | 11,120 | 11,447 | |||||||||||
| Coverage ratio of UCD |
2.4 | x | 2.5 | x | 2.5 | x | ||||||||
Simmons First National Corporation (NASDAQ: SFNC) (Simmons or Company) today reported net income of $24.7 million for the third quarter of 2024, compared to $40.8 million in the second quarter of 2024 and $47.2 million in the third quarter of 2023. Diluted earnings per share were $0.20 for the third quarter of 2024, compared to $0.32 in the second quarter of 2024 and $0.37 in the third quarter of 2023. Adjusted earnings1 for the third quarter of 2024 were $46.0 million, compared to $41.9 million in the second quarter of 2024 and $48.8 million in the third quarter of 2023. Adjusted diluted earnings per share1 for the third quarter of 2024 were $0.37, compared to $0.33 in the second quarter of 2024 and $0.39 in the third quarter of 2023.
During the third quarter of 2024, given prevailing market conditions, we executed a strategic decision to sell approximately $252 million of available-for-sale (AFS) investment securities with a weighted average yield of approximately 1.29 percent, resulting in an after-tax loss of $21.0 million. The proceeds from the sale were used to pay off higher rate wholesale funding consisting of Federal Home Loan Bank advances. The table below summarizes the impact of this transaction, along with the impact of certain other items consisting primarily of branch right sizing, early retirement, and termination of vendor and software services. They are also described in further detail in the “Reconciliation of Non-GAAP Financial Measures” tables contained in this press release.
Impact of Certain Items on Earnings and Diluted EPS
| $ in millions, except per share data |
3Q24 | 2Q24 | 3Q23 | |||||||||
| Net income |
$ | 24.7 | $ | 40.8 | $ | 47.2 | ||||||
| FDIC special assessment |
— | 0.3 | — | |||||||||
| Branch right sizing, net |
0.4 | 0.5 | 0.5 | |||||||||
| Early retirement program |
— | 0.1 | 1.6 | |||||||||
| Termination of vendor and software services |
— | 0.6 | — | |||||||||
| Loss on sale of AFS investment securities |
28.4 | — | — | |||||||||
|
|
|
|
|
|
|
|||||||
| Total pre-tax impact |
28.8 | 1.5 | 2.1 | |||||||||
| Tax effect2 |
(7.5 | ) | (0.4 | ) | (0.5 | ) | ||||||
|
|
|
|
|
|
|
|||||||
| Total impact on earnings |
21.3 | 1.1 | 1.6 | |||||||||
|
|
|
|
|
|
|
|||||||
| Adjusted earnings1 |
$ | 46.0 | $ | 41.9 | $ | 48.8 | ||||||
|
|
|
|
|
|
|
|||||||
| Diluted EPS |
$ | 0.20 | $ | 0.32 | $ | 0.37 | ||||||
| FDIC special assessment |
— | — | — | |||||||||
| Branch right sizing, net |
— | — | 0.01 | |||||||||
| Early retirement program |
— | — | 0.01 | |||||||||
| Termination of vendor and software contracts |
— | 0.01 | — | |||||||||
| Loss on sale of AFS investment securities |
0.23 | — | — | |||||||||
|
|
|
|
|
|
|
|||||||
| Total pre-tax impact |
0.23 | 0.01 | 0.02 | |||||||||
| Tax effect2 |
(0.6 | ) | — | — | ||||||||
|
|
|
|
|
|
|
|||||||
| Total impact on earnings |
0.17 | 0.01 | 0.02 | |||||||||
|
|
|
|
|
|
|
|||||||
| Adjusted Diluted EPS1 |
$ | 0.37 | $ | 0.33 | $ | 0.39 | ||||||
|
|
|
|
|
|
|
|||||||
Net Interest Income
Net interest income for the third quarter of 2024 totaled $157.7 million, compared to $153.9 million in the second quarter of 2024 and $153.4 million in the third quarter of 2023. Interest income totaled $334.3 million in the third quarter of 2024, compared to $329.1 million in the second quarter of 2024 and $310.3 million in the third quarter of 2023. The increase in interest income was primarily driven by an increase in total loans, coupled with an increase in the rate earned on loans. Interest expense totaled $176.6 million in the third quarter of 2024, up $1.3 million on a linked quarter basis primarily due to an increase in other borrowings costs, offset in part by a decrease in the interest expense on interest bearing deposits. Included in net interest income is accretion recognized on loans, which totaled $1.5 million in the third quarter of 2024, $1.6 million in the second quarter of 2024 and $2.1 million in the third quarter of 2023.
The yield on loans on a fully taxable equivalent (FTE) basis for the third quarter of 2024 was 6.44 percent, up 5 basis points from the 6.39 percent for the second quarter of 2024 and up 36 basis points from the 6.08 percent for the third quarter of 2023. Cost of deposits for the third quarter of 2024 was 2.79 percent, unchanged from second quarter 2024 levels. The net interest margin on an FTE basis for the third quarter of 2024 was 2.74 percent, compared to 2.69 percent for the second quarter of 2024 and 2.61 percent for the third quarter of 2023. The 5 basis point increase in the net interest margin on a linked quarter basis included an estimated 3 basis point benefit from the strategic sale of AFS investment securities.
| Select Yield/Rates |
3Q24 | 2Q24 | 1Q24 | 4Q23 | 3Q23 | |||||||||||||||
| Loan yield (FTE)2 |
6.44 | % | 6.39 | % | 6.24 | % | 6.20 | % | 6.08 | % | ||||||||||
| Investment securities yield (FTE)2 |
3.63 | 3.68 | 3.76 | 3.67 | 3.08 | |||||||||||||||
| Cost of interest bearing deposits |
3.52 | 3.53 | 3.48 | 3.31 | 3.06 | |||||||||||||||
| Cost of deposits |
2.79 | 2.79 | 2.75 | 2.58 | 2.37 | |||||||||||||||
| Cost of borrowed funds |
5.79 | 5.84 | 5.85 | 5.79 | 5.60 | |||||||||||||||
| Net interest spread (FTE)2 |
1.95 | 1.92 | 1.89 | 1.93 | 1.87 | |||||||||||||||
| Net interest margin (FTE)2 |
2.74 | 2.69 | 2.66 | 2.68 | 2.61 | |||||||||||||||
Noninterest Income
Noninterest income for the third quarter of 2024 was $17.1 million, compared to $43.3 million in the second quarter of 2024 and $42.8 million in the third quarter of 2023. Included in the third quarter of 2024 was a $28.4 million pre-tax loss on the strategic sale of AFS investment securities. Excluding this item, adjusted noninterest income1 was $45.5 million in the third quarter of 2024, compared to $43.3 million in the second quarter of 2024 and $42.8 million in the third quarter of 2023. The increase in adjusted noninterest income on a linked quarter basis was primarily due to an increase in other noninterest income reflecting gains on the sale of other real estate owned.
| Noninterest Income $ in millions |
3Q24 | 2Q24 | 1Q24 | 4Q23 | 3Q23 | |||||||||||||||
| Service charges on deposit accounts |
$ | 12.7 | $ | 12.3 | $ | 12.0 | $ | 12.8 | $ | 12.4 | ||||||||||
| Wealth management fees |
8.2 | 8.3 | 7.5 | 7.7 | 7.7 | |||||||||||||||
| Debit and credit card fees |
8.1 | 8.2 | 8.2 | 7.8 | 7.7 | |||||||||||||||
| Mortgage lending income |
2.0 | 2.0 | 2.3 | 1.6 | 2.2 | |||||||||||||||
| Other service charges and fees |
2.4 | 2.4 | 2.2 | 2.3 | 2.2 | |||||||||||||||
| Bank owned life insurance |
3.8 | 3.9 | 3.8 | 3.1 | 3.1 | |||||||||||||||
| Gain (loss) on sale of securities |
(28.4 | ) | — | — | (20.2 | ) | — | |||||||||||||
| Other income |
8.3 | 6.4 | 7.2 | 6.9 | 7.4 | |||||||||||||||
|
|
|
|
|
|
|
|
|
|
|
|||||||||||
| Total noninterest income |
$ | 17.1 | $ | 43.3 | $ | 43.2 | $ | 22.0 | $ | 42.8 | ||||||||||
|
|
|
|
|
|
|
|
|
|
|
|||||||||||
| Adjusted noninterest income1 |
$ | 45.5 | $ | 43.3 | $ | 43.2 | $ | 42.2 | $ | 42.8 | ||||||||||
Noninterest Expense
Noninterest expense for the third quarter of 2024 was $137.2 million, compared to $139.4 million in the second quarter of 2024 and $132.0 million in the third quarter of 2023. Included in noninterest expense are certain items consisting of branch right sizing, early retirement, and termination of vendor and software services, amongst others. Collectively, these items totaled $0.4 million in the third quarter of 2024, $1.5 million in the second quarter of 2024 and $2.1 million in the third quarter of 2023. Excluding these items (which are described in the “Reconciliation of Non-GAAP Financial Measures” tables below), adjusted noninterest expense1 was $136.8 million in the third quarter of 2024, $137.8 million in the second quarter of 2024 and $129.9 million in the third quarter of 2023. The decrease in noninterest expense and adjusted noninterest expense on a linked quarter basis was primarily attributable to a decline in salaries and employee benefits reflecting incentive compensation accrual adjustments.
| Noninterest Expense $ in millions |
3Q24 | 2Q24 | 1Q24 | 4Q23 | 3Q23 | |||||||||||||||
| Salaries and employee benefits |
$ | 69.2 | $ | 70.7 | $ | 72.7 | $ | 67.0 | $ | 67.4 | ||||||||||
| Occupancy expense, net |
12.2 | 11.9 | 12.3 | 11.7 | 12.0 | |||||||||||||||
| Furniture and equipment |
5.6 | 5.6 | 5.1 | 5.4 | 5.1 | |||||||||||||||
| Deposit insurance |
5.6 | 5.4 | 5.5 | 4.7 | 4.7 | |||||||||||||||
| Other real estate and foreclosure expense |
0.1 | 0.1 | 0.2 | 0.2 | 0.2 | |||||||||||||||
| FDIC special assessment |
— | 0.3 | 1.6 | 10.5 | — | |||||||||||||||
| Other operating expenses |
44.5 | 45.4 | 42.5 | 48.6 | 42.6 | |||||||||||||||
|
|
|
|
|
|
|
|
|
|
|
|||||||||||
| Total noninterest expense |
$ | 137.2 | $ | 139.4 | $ | 139.9 | $ | 148.1 | $ | 132.0 | ||||||||||
|
|
|
|
|
|
|
|
|
|
|
|||||||||||
| Adjusted salaries and employee benefits1 |
$ | 69.2 | $ | 70.6 | $ | 72.4 | $ | 66.0 | $ | 65.8 | ||||||||||
| Adjusted other operating expenses1 |
44.4 | 44.3 | 42.4 | 44.9 | 42.1 | |||||||||||||||
| Adjusted noninterest expense1 |
136.8 | 137.8 | 137.9 | 132.7 | 129.9 | |||||||||||||||
| Efficiency ratio |
75.70 | % | 68.38 | % | 69.41 | % | 80.46 | % | 65.11 | % | ||||||||||
| Adjusted efficiency ratio1 |
63.38 | 65.68 | 66.42 | 62.91 | 61.94 | |||||||||||||||
| Full-time equivalent employees |
2,972 | 2,961 | 2,989 | 3,007 | 3,005 |
Loans and Unfunded Loan Commitments
Total loans at the end of the third quarter of 2024 were $17.3 billion, up $564.2 million, or 3 percent, compared to $16.8 billion at the end of the third quarter of 2023. Total loans on a linked quarter basis increased $143.6 million, or 3 percent on an annualized basis. Unfunded loan commitments at the end of the third quarter of 2024 were $3.7 billion, down slightly from second quarter 2024 levels. The commercial loan pipeline ended the third quarter of 2024 at $1.2 billion, compared to $1.0 billion at the end of the second quarter of 2024 and $877 million at the end of the third quarter of 2023. The rate on ready to close commercial loans at the end of the third quarter of 2024 was 8.31 percent.
| Loans and Unfunded Loan Commitments $ in millions |
3Q24 | 2Q24 | 1Q24 | 4Q23 | 3Q23 | |||||||||||||||
| Total loans |
$ | 17,336 | $ | 17,192 | $ | 17,002 | $ | 16,846 | $ | 16,772 | ||||||||||
| Unfunded loan commitments |
3,681 | 3,746 | 3,875 | 3,880 | 4,049 | |||||||||||||||
Deposits
Total deposits at the end of the third quarter of 2024 were $21.9 billion, compared to $21.8 billion at the end of the second quarter of 2024 and $22.2 billion at the end of the third quarter of 2023. The increase in total deposits on a linked quarter basis was primarily attributable to an increase in public funds and brokered deposits. During the third quarter of 2024, the brokered deposit market reflected more favorable pricing opportunities compared to other wholesale funding options. As a result, while the utilization of brokered deposits increased during the third quarter of 2024, other borrowings totaled $1.0 billion, down $300.5 million on a linked quarter basis. The loan to deposit ratio at the end of the third quarter of 2024 was 79 percent, unchanged from second quarter 2024 levels.
| Deposits $ in millions |
3Q24 | 2Q24 | 1Q24 | 4Q23 | 3Q23 | |||||||||||||||
| Noninterest bearing deposits |
$ | 4,522 | $ | 4,624 | $ | 4,698 | $ | 4,801 | $ | 4,991 | ||||||||||
| Interest bearing transaction accounts |
10,038 | 10,092 | 10,316 | 10,277 | 9,875 | |||||||||||||||
| Time deposits |
4,014 | 4,185 | 4,314 | 4,266 | 4,103 | |||||||||||||||
| Brokered deposits |
3,361 | 2,940 | 3,025 | 2,901 | 3,262 | |||||||||||||||
|
|
|
|
|
|
|
|
|
|
|
|||||||||||
| Total deposits |
$ | 21,935 | $ | 21,841 | $ | 22,353 | $ | 22,245 | $ | 22,231 | ||||||||||
|
|
|
|
|
|
|
|
|
|
|
|||||||||||
| Noninterest bearing deposits to total deposits |
21 | % | 21 | % | 21 | % | 22 | % | 22 | % | ||||||||||
| Total loans to total deposits |
79 | 79 | 76 | 76 | 75 | |||||||||||||||
Asset Quality
Provision for credit losses totaled $12.1 million for the third quarter of 2024, compared to $11.1 for the second quarter of 2024 and $7.7 million for the third quarter of 2023. Provision for credit losses on loans exceeded net charge-offs by $2.8 million during the third quarter of 2024. The allowance for credit losses on loans at the end of the third quarter of 2024 was $233.2 million, compared to $230.4 million at the end of the second quarter of 2024 and $218.5 million at the end of the third quarter of 2023. The increase in allowance for credit losses on loans on a linked quarter and year-over-year basis reflected normalization of the credit environment from historical lows, as well as changes in the macroeconomic conditions and increased activity in the loan portfolio. The allowance for credit losses on loans as a percentage of total loans was 1.35 percent at the end of the third quarter of 2024, compared to 1.34 percent at the end of the second quarter of 2024 and 1.30 percent at the end of the third quarter of 2023.
Net charge-offs as a percentage of average loans for the third quarter of 2024 were 22 basis points, compared to 19 basis points in the second quarter of 2024 and 28 basis points in the third quarter of 2023. Net charge-offs in the third quarter of 2024 included $3.5 million of charge-offs associated with the run-off portfolio, which consists of an acquired asset-based lending portfolio and a small ticket equipment finance portfolio. Net charge-offs from the run-off portfolio accounted for 9 basis points of total net charge-offs during the third quarter of 2024 and 16 basis points of total net charge-offs during the second quarter of 2024.
Total nonperforming loans at the end of the third quarter of 2024 were $101.7 million, compared to $103.4 million at the end of the second quarter of 2024 and $81.9 million at the end of the third quarter of 2023. The decrease in nonperforming loans on a linked quarter basis reflected $5 million of payoffs from the run-off portfolio and the previously noted charge-offs associated with this portfolio. The nonperforming loan coverage ratio ended the third quarter of 2024 at 229 percent, compared to 223 percent at the end of the second quarter of 2024 and 267 percent at the end of the third quarter of 2023. Total nonperforming assets as a percentage of total assets were 38 basis points at the end of the third quarter of 2024, compared to 39 basis points at the end of the second quarter of 2024 and 32 basis points at the end of the third quarter of 2023.
| Asset Quality $ in millions |
3Q24 | 2Q24 | 1Q24 | 4Q23 | 3Q23 | |||||||||||||||
| Allowance for credit losses on loans to total loans |
1.35 | % | 1.34 | % | 1.34 | % | 1.34 | % | 1.30 | % | ||||||||||
| Allowance for credit losses on loans to nonperforming loans |
229 | 223 | 212 | 267 | 267 | |||||||||||||||
| Nonperforming loans to total loans |
0.59 | 0.60 | 0.63 | 0.50 | 0.49 | |||||||||||||||
| Net charge-off ratio (annualized) |
0.22 | 0.19 | 0.19 | 0.11 | 0.28 | |||||||||||||||
| Net charge-off ratio YTD (annualized) |
0.20 | 0.19 | 0.19 | 0.12 | 0.12 | |||||||||||||||
| Total nonperforming loans |
$ | 101.7 | $ | 103.4 | $ | 107.3 | $ | 84.5 | $ | 81.9 | ||||||||||
| Total other nonperforming assets |
2.6 | 3.4 | 5.0 | 5.8 | 5.2 | |||||||||||||||
|
|
|
|
|
|
|
|
|
|
|
|||||||||||
| Total nonperforming assets |
$ | 104.3 | $ | 106.8 | $ | 112.3 | $ | 90.3 | $ | 87.1 | ||||||||||
|
|
|
|
|
|
|
|
|
|
|
|||||||||||
| Reserve for unfunded commitments |
$ | 25.6 | $ | 25.6 | $ | 25.6 | $ | 25.6 | $ | 25.6 | ||||||||||
Capital
Total stockholders’ equity at the end of the third quarter of 2024 was $3.5 billion, compared to $3.3 billion at the end of the third quarter of 2023. On a linked quarter basis, total stockholders’ equity increased $70.0 million, primarily as a result of a $69.6 million recapture of accumulated other comprehensive income principally associated with mark-to-market adjustment on AFS investment securities. Book value per share at the end of the third quarter of 2024 was $28.11, up 2 percent on a linked quarter basis and up 7 percent compared to the end of the third quarter of 2023. Tangible book value per share1 at the end of the third quarter of 2024 was $16.78, up 4 percent on a linked quarter basis and up 14 percent compared to the end of the third quarter of 2023.
Total stockholders’ equity as a percentage of total assets at September 30, 2024 was 12.9 percent, up from 12.6 percent reported at the end of the second quarter of 2024 and up from 11.9 percent reported at the end of the third quarter of 2023. Tangible common equity as a percentage of tangible assets1 was 8.2 percent, up from 7.8 percent reported at the end of the second quarter of 2024 and up from 7.1 percent reported at the end of the third quarter of 2023. Each of the regulatory capital ratios for Simmons and its lead subsidiary, Simmons Bank, continue to significantly exceed “well-capitalized” guidelines.
| Select Capital Ratios |
3Q24 | 2Q24 | 1Q24 | 4Q23 | 3Q23 | |||||||||||||||
| Stockholders’ equity to total assets |
12.9 | % | 12.6 | % | 12.6 | % | 12.5 | % | 11.9 | % | ||||||||||
| Tangible common equity to tangible assets1 |
8.2 | 7.8 | 7.8 | 7.7 | 7.1 | |||||||||||||||
| Common equity tier 1 (CET1) ratio |
12.1 | 12.0 | 12.0 | 12.1 | 12.0 | |||||||||||||||
| Tier 1 leverage ratio |
9.6 | 9.5 | 9.4 | 9.4 | 9.3 | |||||||||||||||
| Tier 1 risk-based capital ratio |
12.1 | 12.0 | 12.0 | 12.1 | 12.0 | |||||||||||||||
| Total risk-based capital ratio |
14.3 | 14.2 | 14.4 | 14.4 | 14.3 | |||||||||||||||
Share Repurchase Program
During the third quarter of 2024, Simmons did not repurchase shares under its stock repurchase program that was authorized in January 2024 (2024 Program), which replaced its former repurchase program that was authorized in January 2022. Remaining authorization under the 2024 Program as of September 30, 2024, was approximately $175 million. The timing, pricing and amount of any repurchases under the 2024 Program will be determined by Simmons’ management at its discretion based on a variety of factors including, but not limited to, market conditions, trading volume and market price of Simmons’ common stock, Simmons’ capital needs, Simmons’ working capital and investment requirements, other corporate considerations, economic conditions, and legal requirements. The 2024 Program does not obligate Simmons to repurchase any common stock and may be modified, discontinued or suspended at any time without prior notice.
| (1) | Non-GAAP measurement. See “Non-GAAP Financial Measures” and “Reconciliation of Non-GAAP Financial Measures” below |
| (2) | FTE – fully taxable equivalent basis using an effective tax rate of 26.135% |
Conference Call
Management will conduct a live conference call to review this information beginning at 9:00 a.m. Central Time today, Friday, October 18, 2024. Interested persons can listen to this call by dialing toll-free 1-844-481-2779 (North America only) and asking for the Simmons First National Corporation conference call, conference ID 10193072. In addition, the call will be available live or in recorded version on Simmons’ website at simmonsbank.com for at least 60 days following the date of the call.
Simmons First National Corporation
Simmons First National Corporation (NASDAQ: SFNC) is a Mid-South based financial holding company that has paid cash dividends to its shareholders for 115 consecutive years. Its principal subsidiary, Simmons Bank, operates 234 branches in Arkansas, Kansas, Missouri, Oklahoma, Tennessee and Texas. Founded in 1903, Simmons Bank offers comprehensive financial solutions delivered with a client-centric approach. In 2024, Simmons Bank was recognized by U.S. News & World Report as one of the 2024-2025 Best Companies to Work For in the South and by Forbes as one of America’s Best-In-State Banks 2024 in Tennessee and America’s Best-In-State Banks 2024 in Missouri. Additional information about Simmons Bank can be found on our website at simmonsbank.com, by following @Simmons_Bank on X (formerly Twitter) or by visiting our newsroom.
Non-GAAP Financial Measures
This press release contains financial information determined by methods other than in accordance with U.S. generally accepted accounting principles (GAAP). The Company’s management uses these non-GAAP financial measures in their analysis of the Company’s performance. These measures adjust GAAP performance measures to, among other things, include the tax benefit associated with revenue items that are tax-exempt, as well as exclude from net income (including on a per share diluted basis), pre-tax, pre-provision earnings, net charge-offs, income available to common shareholders, non-interest income, and non-interest expense certain income and expense items attributable to, for example, merger activity (primarily including merger-related expenses), gains and/or losses on sale of branches, net branch right-sizing initiatives, FDIC special assessment charges and gain/loss on the sale of AFS investment securities. The Company has updated its calculation of certain non-GAAP financial measures to exclude the impact of gains or losses on the sale of AFS investment securities in light of the impact of the Company’s strategic AFS investment securities transactions during the fourth quarter of 2023 and has presented past periods on a comparable basis.
In addition, the Company also presents certain figures based on tangible common stockholders’ equity, tangible assets and tangible book value, which exclude goodwill and other intangible assets. The Company further presents certain figures that are exclusive of the impact of deposits and/or loans acquired through acquisitions, mortgage warehouse loans, and/or energy loans, or gains and/or losses on the sale of securities. The Company’s management believes that these non-GAAP financial measures are useful to investors because they, among other things, present the results of the Company’s ongoing operations without the effect of mergers or other items not central to the Company’s ongoing business, as well as normalize for tax effects and certain other effects. Management, therefore, believes presentations of these non-GAAP financial measures provide useful supplemental information that is essential to a proper understanding of the operating results of the Company’s ongoing businesses, and management uses these non-GAAP financial measures to assess the performance of the Company’s ongoing businesses as related to prior financial periods. These non-GAAP disclosures should not be viewed as a substitute for operating results determined in accordance with GAAP, nor are they necessarily comparable to non-GAAP performance measures that may be presented by other companies. Where non-GAAP financial measures are used, the comparable GAAP financial measure, as well as the reconciliation to the comparable GAAP financial measure, can be found in the tables of this release.
Forward-Looking Statements
Certain statements in this press release may not be based on historical facts and should be considered “forward-looking statements” within the meaning of the Private Securities Litigation Reform Act of 1995. These forward-looking statements, including, without limitation, statements made in Mr. Fehlman’s quote, may be identified by reference to future periods or by the use of forward-looking terminology, such as “believe,” “budget,” “expect,” “foresee,” “anticipate,” “intend,” “indicate,” “target,” “estimate,” “plan,” “project,” “continue,” “contemplate,”
“positions,” “prospects,” “predict,” or “potential,” by future conditional verbs such as “will,” “would,” “should,” “could,” “might” or “may,” or by variations of such words or by similar expressions. These forward-looking statements include, without limitation, statements relating to Simmons’ future growth, business strategies, lending capacity and lending activity, loan demand, revenue, assets, asset quality, profitability, dividends, net interest margin, non-interest revenue, share repurchase program, acquisition strategy, digital banking initiatives, the Company’s ability to recruit and retain key employees, the adequacy of the allowance for credit losses, and future economic conditions and interest rates. Any forward-looking statement speaks only as of the date of this press release, and Simmons undertakes no obligation to update these forward-looking statements to reflect events or circumstances that occur after the date of this press release. By nature, forward-looking statements are based on various assumptions and involve inherent risk and uncertainties. Various factors, including, but not limited to, changes in economic conditions, changes in credit quality, changes in interest rates and related governmental policies, changes in loan demand, changes in deposit flows, changes in real estate values, changes in the assumptions used in making the forward-looking statements, changes in the securities markets generally or the price of Simmons’ common stock specifically, changes in information technology affecting the financial industry, and changes in customer behaviors, including consumer spending, borrowing, and saving habits; general economic and market conditions; changes in governmental administrations; market disruptions including pandemics or significant health hazards, severe weather conditions, natural disasters, terrorist activities, financial crises, political crises, war and other military conflicts (including the ongoing military conflicts between Russia and Ukraine and between Israel and Hamas) or other major events, or the prospect of these events; the soundness of other financial institutions and any indirect exposure related to the closings of other financial institutions and their impact on the broader market through other customers, suppliers and partners, or that the conditions which resulted in the liquidity concerns experienced by closed financial institutions may also adversely impact, directly or indirectly, other financial institutions and market participants with which the Company has commercial or deposit relationships; increased inflation; the loss of key employees; increased competition in the markets in which the Company operates and from non-bank financial institutions; increased unemployment; labor shortages; claims, damages, and fines related to litigation or government actions; changes in accounting principles relating to loan loss recognition (current expected credit losses); the Company’s ability to manage and successfully integrate its mergers and acquisitions and to fully realize cost savings and other benefits associated with acquisitions; increased delinquency and foreclosure rates on commercial real estate loans; cyber threats, attacks or events; reliance on third parties for key services; government legislation; and other factors, many of which are beyond the control of the Company, could cause actual results to differ materially from those projected in or contemplated by the forward-looking statements. Additional information on factors that might affect the Company’s financial results is included in the Company’s Form 10-K for the year ended December 31, 2023, and other reports that the Company has filed with or furnished to the U.S. Securities and Exchange Commission (the SEC), all of which are available from the SEC on its website, www.sec.gov. In addition, there can be no guarantee that the board of directors (Board) of Simmons will approve a quarterly dividend in future quarters, and the timing, payment, and amount of future dividends (if any) is subject to, among other things, the discretion of the Board and may differ significantly from past dividends.
FOR MORE INFORMATION CONTACT:
Ed Bilek, EVP, Director of Investor and Media Relations
ed.bilek@simmonsbank.com or 205.612.3378 (cell)
| Simmons First National Corporation | SFNC | |
| Consolidated End of Period Balance Sheets | ||
| For the Quarters Ended | ||
| (Unaudited) |
| Sep 30 2024 |
Jun 30 2024 |
Mar 31 2024 |
Dec 31 2023 |
Sep 30 2023 |
||||||||||||||||
| ($ in thousands) | ||||||||||||||||||||
| ASSETS |
||||||||||||||||||||
| Cash and noninterest bearing balances due from banks |
$ | 398,321 | $ | 320,021 | $ | 380,324 | $ | 345,258 | $ | 181,822 | ||||||||||
| Interest bearing balances due from banks and federal funds sold |
205,081 | 254,312 | 222,979 | 268,834 | 423,826 | |||||||||||||||
|
|
|
|
|
|
|
|
|
|
|
|||||||||||
| Cash and cash equivalents |
603,402 | 574,333 | 603,303 | 614,092 | 605,648 | |||||||||||||||
| Interest bearing balances due from banks - time |
100 | 100 | 100 | 100 | 100 | |||||||||||||||
| Investment securities - held-to-maturity |
3,658,700 | 3,685,450 | 3,707,258 | 3,726,288 | 3,742,292 | |||||||||||||||
| Investment securities - available-for-sale |
2,691,094 | 2,885,904 | 3,027,558 | 3,152,153 | 3,358,421 | |||||||||||||||
| Mortgage loans held for sale |
8,270 | 13,053 | 11,899 | 9,373 | 11,690 | |||||||||||||||
| Loans: |
||||||||||||||||||||
| Loans |
17,336,040 | 17,192,437 | 17,001,760 | 16,845,670 | 16,771,888 | |||||||||||||||
| Allowance for credit losses on loans |
(233,223 | ) | (230,389 | ) | (227,367 | ) | (225,231 | ) | (218,547 | ) | ||||||||||
|
|
|
|
|
|
|
|
|
|
|
|||||||||||
| Net loans |
17,102,817 | 16,962,048 | 16,774,393 | 16,620,439 | 16,553,341 | |||||||||||||||
| Premises and equipment |
584,366 | 581,893 | 576,466 | 570,678 | 567,167 | |||||||||||||||
| Foreclosed assets and other real estate owned |
1,299 | 2,209 | 3,511 | 4,073 | 3,809 | |||||||||||||||
| Interest receivable |
125,700 | 126,625 | 122,781 | 122,430 | 110,361 | |||||||||||||||
| Bank owned life insurance |
508,781 | 505,023 | 503,348 | 500,559 | 497,465 | |||||||||||||||
| Goodwill |
1,320,799 | 1,320,799 | 1,320,799 | 1,320,799 | 1,320,799 | |||||||||||||||
| Other intangible assets |
101,093 | 104,943 | 108,795 | 112,645 | 116,660 | |||||||||||||||
| Other assets |
562,983 | 606,692 | 611,964 | 592,045 | 676,572 | |||||||||||||||
|
|
|
|
|
|
|
|
|
|
|
|||||||||||
| Total assets |
$ | 27,269,404 | $ | 27,369,072 | $ | 27,372,175 | $ | 27,345,674 | $ | 27,564,325 | ||||||||||
|
|
|
|
|
|
|
|
|
|
|
|||||||||||
| LIABILITIES AND STOCKHOLDERS’ EQUITY |
||||||||||||||||||||
| Deposits: |
||||||||||||||||||||
| Noninterest bearing transaction accounts |
$ | 4,521,715 | $ | 4,624,186 | $ | 4,697,539 | $ | 4,800,880 | $ | 4,991,034 | ||||||||||
| Interest bearing transaction accounts and savings deposits |
10,863,945 | 10,925,179 | 11,071,762 | 10,997,425 | 10,571,807 | |||||||||||||||
| Time deposits |
6,549,774 | 6,291,518 | 6,583,703 | 6,446,673 | 6,668,370 | |||||||||||||||
|
|
|
|
|
|
|
|
|
|
|
|||||||||||
| Total deposits |
21,935,434 | 21,840,883 | 22,353,004 | 22,244,978 | 22,231,211 | |||||||||||||||
| Federal funds purchased and securities sold under agreements to repurchase |
51,071 | 52,705 | 58,760 | 67,969 | 74,482 | |||||||||||||||
| Other borrowings |
1,045,878 | 1,346,378 | 871,874 | 972,366 | 1,347,855 | |||||||||||||||
| Subordinated notes and debentures |
366,255 | 366,217 | 366,179 | 366,141 | 366,103 | |||||||||||||||
| Accrued interest and other liabilities |
341,933 | 304,020 | 283,232 | 267,732 | 259,119 | |||||||||||||||
|
|
|
|
|
|
|
|
|
|
|
|||||||||||
| Total liabilities |
23,740,571 | 23,910,203 | 23,933,049 | 23,919,186 | 24,278,770 | |||||||||||||||
|
|
|
|
|
|
|
|
|
|
|
|||||||||||
| Stockholders’ equity: |
||||||||||||||||||||
| Common stock |
1,256 | 1,255 | 1,254 | 1,252 | 1,251 | |||||||||||||||
| Surplus |
2,508,438 | 2,506,469 | 2,503,673 | 2,499,930 | 2,497,874 | |||||||||||||||
| Undivided profits |
1,355,000 | 1,356,626 | 1,342,215 | 1,329,681 | 1,330,810 | |||||||||||||||
| Accumulated other comprehensive (loss) income |
(335,861 | ) | (405,481 | ) | (408,016 | ) | (404,375 | ) | (544,380 | ) | ||||||||||
|
|
|
|
|
|
|
|
|
|
|
|||||||||||
| Total stockholders’ equity |
3,528,833 | 3,458,869 | 3,439,126 | 3,426,488 | 3,285,555 | |||||||||||||||
|
|
|
|
|
|
|
|
|
|
|
|||||||||||
| Total liabilities and stockholders’ equity |
$ | 27,269,404 | $ | 27,369,072 | $ | 27,372,175 | $ | 27,345,674 | $ | 27,564,325 | ||||||||||
|
|
|
|
|
|
|
|
|
|
|
|||||||||||
Page 1
| Simmons First National Corporation | SFNC | |
| Consolidated Statements of Income - Quarter-to-Date | ||
| For the Quarters Ended | ||
| (Unaudited) |
| Sep 30 2024 |
Jun 30 2024 |
Mar 31 2024 |
Dec 31 2023 |
Sep 30 2023 |
||||||||||||||||
| ($ in thousands, except per share data) | ||||||||||||||||||||
| INTEREST INCOME |
||||||||||||||||||||
| Loans (including fees) |
$ | 277,939 | $ | 270,937 | $ | 261,490 | $ | 261,505 | $ | 255,901 | ||||||||||
| Interest bearing balances due from banks and federal funds sold |
2,921 | 2,964 | 3,010 | 3,115 | 3,569 | |||||||||||||||
| Investment securities |
53,220 | 55,050 | 58,001 | 58,755 | 50,638 | |||||||||||||||
| Mortgage loans held for sale |
209 | 194 | 148 | 143 | 178 | |||||||||||||||
|
|
|
|
|
|
|
|
|
|
|
|||||||||||
| TOTAL INTEREST INCOME |
334,289 | 329,145 | 322,649 | 323,518 | 310,286 | |||||||||||||||
|
|
|
|
|
|
|
|
|
|
|
|||||||||||
| INTEREST EXPENSE |
||||||||||||||||||||
| Time deposits |
73,937 | 73,946 | 73,241 | 72,458 | 68,062 | |||||||||||||||
| Other deposits |
78,307 | 79,087 | 78,692 | 71,412 | 65,095 | |||||||||||||||
| Federal funds purchased and securities sold under agreements to repurchase |
138 | 156 | 189 | 232 | 277 | |||||||||||||||
| Other borrowings |
17,067 | 15,025 | 11,649 | 16,607 | 16,450 | |||||||||||||||
| Subordinated notes and debentures |
7,128 | 7,026 | 6,972 | 7,181 | 6,969 | |||||||||||||||
|
|
|
|
|
|
|
|
|
|
|
|||||||||||
| TOTAL INTEREST EXPENSE |
176,577 | 175,240 | 170,743 | 167,890 | 156,853 | |||||||||||||||
|
|
|
|
|
|
|
|
|
|
|
|||||||||||
| NET INTEREST INCOME |
157,712 | 153,905 | 151,906 | 155,628 | 153,433 | |||||||||||||||
|
|
|
|
|
|
|
|
|
|
|
|||||||||||
| PROVISION FOR CREDIT LOSSES |
||||||||||||||||||||
| Provision for credit losses on loans |
12,148 | 11,099 | 10,206 | 11,225 | 20,222 | |||||||||||||||
| Provision for credit losses on unfunded commitments |
— | — | — | — | (11,300 | ) | ||||||||||||||
| Provision for credit losses on investment securities - AFS |
— | — | — | (1,196 | ) | (1,200 | ) | |||||||||||||
| Provision for credit losses on investment securities - HTM |
— | — | — | — | — | |||||||||||||||
|
|
|
|
|
|
|
|
|
|
|
|||||||||||
| TOTAL PROVISION FOR CREDIT LOSSES |
12,148 | 11,099 | 10,206 | 10,029 | 7,722 | |||||||||||||||
|
|
|
|
|
|
|
|
|
|
|
|||||||||||
| NET INTEREST INCOME AFTER PROVISION FOR CREDIT LOSSES |
145,564 | 142,806 | 141,700 | 145,599 | 145,711 | |||||||||||||||
|
|
|
|
|
|
|
|
|
|
|
|||||||||||
| NONINTEREST INCOME |
||||||||||||||||||||
| Service charges on deposit accounts |
12,713 | 12,252 | 11,955 | 12,782 | 12,429 | |||||||||||||||
| Debit and credit card fees |
8,144 | 8,162 | 8,246 | 7,822 | 7,712 | |||||||||||||||
| Wealth management fees |
8,226 | 8,274 | 7,478 | 7,679 | 7,719 | |||||||||||||||
| Mortgage lending income |
1,956 | 1,973 | 2,320 | 1,603 | 2,157 | |||||||||||||||
| Bank owned life insurance income |
3,757 | 3,876 | 3,814 | 3,094 | 3,095 | |||||||||||||||
| Other service charges and fees (includes insurance income) |
2,381 | 2,352 | 2,199 | 2,346 | 2,232 | |||||||||||||||
| Gain (loss) on sale of securities |
(28,393 | ) | — | — | (20,218 | ) | — | |||||||||||||
| Other income |
8,346 | 6,410 | 7,172 | 6,866 | 7,433 | |||||||||||||||
|
|
|
|
|
|
|
|
|
|
|
|||||||||||
| TOTAL NONINTEREST INCOME |
17,130 | 43,299 | 43,184 | 21,974 | 42,777 | |||||||||||||||
|
|
|
|
|
|
|
|
|
|
|
|||||||||||
| NONINTEREST EXPENSE |
||||||||||||||||||||
| Salaries and employee benefits |
69,167 | 70,716 | 72,653 | 66,982 | 67,374 | |||||||||||||||
| Occupancy expense, net |
12,216 | 11,864 | 12,258 | 11,733 | 12,020 | |||||||||||||||
| Furniture and equipment expense |
5,612 | 5,623 | 5,141 | 5,445 | 5,117 | |||||||||||||||
| Other real estate and foreclosure expense |
87 | 117 | 179 | 189 | 228 | |||||||||||||||
| Deposit insurance |
5,571 | 5,682 | 7,135 | 15,220 | 4,672 | |||||||||||||||
| Merger-related costs |
— | — | — | — | 5 | |||||||||||||||
| Other operating expenses |
44,540 | 45,352 | 42,513 | 48,570 | 42,582 | |||||||||||||||
|
|
|
|
|
|
|
|
|
|
|
|||||||||||
| TOTAL NONINTEREST EXPENSE |
137,193 | 139,354 | 139,879 | 148,139 | 131,998 | |||||||||||||||
|
|
|
|
|
|
|
|
|
|
|
|||||||||||
| NET INCOME BEFORE INCOME TAXES |
25,501 | 46,751 | 45,005 | 19,434 | 56,490 | |||||||||||||||
| Provision for income taxes |
761 | 5,988 | 6,134 | (4,473 | ) | 9,243 | ||||||||||||||
|
|
|
|
|
|
|
|
|
|
|
|||||||||||
| NET INCOME |
$ | 24,740 | $ | 40,763 | $ | 38,871 | $ | 23,907 | $ | 47,247 | ||||||||||
|
|
|
|
|
|
|
|
|
|
|
|||||||||||
| BASIC EARNINGS PER SHARE |
$ | 0.20 | $ | 0.32 | $ | 0.31 | $ | 0.19 | $ | 0.38 | ||||||||||
|
|
|
|
|
|
|
|
|
|
|
|||||||||||
| DILUTED EARNINGS PER SHARE |
$ | 0.20 | $ | 0.32 | $ | 0.31 | $ | 0.19 | $ | 0.37 | ||||||||||
|
|
|
|
|
|
|
|
|
|
|
|||||||||||
Page 2
| Simmons First National Corporation | SFNC | |
| Consolidated Risk-Based Capital | ||
| For the Quarters Ended | ||
| (Unaudited) |
| Sep 30 | Jun 30 | Mar 31 | Dec 31 | Sep 30 | ||||||||||||||||
| 2024 | 2024 | 2024 | 2023 | 2023 | ||||||||||||||||
| ($ in thousands) | ||||||||||||||||||||
| Tier 1 capital |
||||||||||||||||||||
| Stockholders’ equity |
$ | 3,528,833 | $ | 3,458,869 | $ | 3,439,126 | $ | 3,426,488 | $ | 3,285,555 | ||||||||||
| CECL transition provision (1) |
30,873 | 30,873 | 30,873 | 61,746 | 61,746 | |||||||||||||||
| Disallowed intangible assets, net of deferred tax |
(1,388,549 | ) | (1,391,969 | ) | (1,394,672 | ) | (1,398,810 | ) | (1,402,682 | ) | ||||||||||
| Unrealized loss (gain) on AFS securities |
335,861 | 405,481 | 408,016 | 404,375 | 544,380 | |||||||||||||||
|
|
|
|
|
|
|
|
|
|
|
|||||||||||
| Total Tier 1 capital |
2,507,018 | 2,503,254 | 2,483,343 | 2,493,799 | 2,488,999 | |||||||||||||||
|
|
|
|
|
|
|
|
|
|
|
|||||||||||
| Tier 2 capital |
||||||||||||||||||||
| Subordinated notes and debentures |
366,255 | 366,217 | 366,179 | 366,141 | 366,103 | |||||||||||||||
| Subordinated debt phase out |
(132,000 | ) | (132,000 | ) | (66,000 | ) | (66,000 | ) | (66,000 | ) | ||||||||||
| Qualifying allowance for loan losses and reserve for unfunded commitments |
220,517 | 217,684 | 214,660 | 170,977 | 165,490 | |||||||||||||||
|
|
|
|
|
|
|
|
|
|
|
|||||||||||
| Total Tier 2 capital |
454,772 | 451,901 | 514,839 | 471,118 | 465,593 | |||||||||||||||
|
|
|
|
|
|
|
|
|
|
|
|||||||||||
| Total risk-based capital |
$ | 2,961,790 | $ | 2,955,155 | $ | 2,998,182 | $ | 2,964,917 | $ | 2,954,592 | ||||||||||
|
|
|
|
|
|
|
|
|
|
|
|||||||||||
| Risk weighted assets |
$ | 20,790,941 | $ | 20,856,194 | $ | 20,782,094 | $ | 20,599,238 | $ | 20,703,669 | ||||||||||
|
|
|
|
|
|
|
|
|
|
|
|||||||||||
| Adjusted average assets for leverage ratio |
$ | 26,198,178 | $ | 26,371,545 | $ | 26,312,873 | $ | 26,552,988 | $ | 26,733,658 | ||||||||||
|
|
|
|
|
|
|
|
|
|
|
|||||||||||
| Ratios at end of quarter |
||||||||||||||||||||
| Equity to assets |
12.94 | % | 12.64 | % | 12.56 | % | 12.53 | % | 11.92 | % | ||||||||||
| Tangible common equity to tangible assets (2) |
8.15 | % | 7.84 | % | 7.75 | % | 7.69 | % | 7.07 | % | ||||||||||
| Common equity Tier 1 ratio (CET1) |
12.06 | % | 12.00 | % | 11.95 | % | 12.11 | % | 12.02 | % | ||||||||||
| Tier 1 leverage ratio |
9.57 | % | 9.49 | % | 9.44 | % | 9.39 | % | 9.31 | % | ||||||||||
| Tier 1 risk-based capital ratio |
12.06 | % | 12.00 | % | 11.95 | % | 12.11 | % | 12.02 | % | ||||||||||
| Total risk-based capital ratio |
14.25 | % | 14.17 | % | 14.43 | % | 14.39 | % | 14.27 | % | ||||||||||
| (1) | The Company has elected to use the CECL transition provision allowed for in the year of adopting ASC 326. |
| (2) | Calculations of tangible common equity to tangible assets and the reconciliations to GAAP are included in the schedules accompanying this release. |
Page 3
| Simmons First National Corporation | SFNC | |
| Consolidated Investment Securities | ||
| For the Quarters Ended | ||
| (Unaudited) |
| Sep 30 2024 |
Jun 30 2024 |
Mar 31 2024 |
Dec 31 2023 |
Sep 30 2023 |
||||||||||||||||
| ($ in thousands) | ||||||||||||||||||||
| Investment Securities - End of Period |
||||||||||||||||||||
|
Held-to-Maturity |
||||||||||||||||||||
| U.S. Government agencies |
$ | 455,179 | $ | 454,488 | $ | 453,805 | $ | 453,121 | $ | 452,428 | ||||||||||
| Mortgage-backed securities |
1,093,070 | 1,119,741 | 1,142,352 | 1,161,694 | 1,178,324 | |||||||||||||||
| State and political subdivisions |
1,857,283 | 1,857,409 | 1,855,642 | 1,856,674 | 1,857,652 | |||||||||||||||
| Other securities |
253,168 | 253,812 | 255,459 | 254,799 | 253,888 | |||||||||||||||
|
|
|
|
|
|
|
|
|
|
|
|||||||||||
| Total held-to-maturity (net of credit losses) |
3,658,700 | 3,685,450 | 3,707,258 | 3,726,288 | 3,742,292 | |||||||||||||||
|
|
|
|
|
|
|
|
|
|
|
|||||||||||
|
Available-for-Sale |
||||||||||||||||||||
| U.S. Treasury |
$ | 1,290 | $ | 1,275 | $ | 1,964 | $ | 2,254 | $ | 2,224 | ||||||||||
| U.S. Government agencies |
58,397 | 66,563 | 69,801 | 72,502 | 172,759 | |||||||||||||||
| Mortgage-backed securities |
1,510,402 | 1,730,842 | 1,845,364 | 1,940,307 | 2,157,092 | |||||||||||||||
| State and political subdivisions |
898,178 | 864,190 | 874,849 | 902,793 | 790,344 | |||||||||||||||
| Other securities |
222,827 | 223,034 | 235,580 | 234,297 | 236,002 | |||||||||||||||
|
|
|
|
|
|
|
|
|
|
|
|||||||||||
| Total available-for-sale (net of credit losses) |
2,691,094 | 2,885,904 | 3,027,558 | 3,152,153 | 3,358,421 | |||||||||||||||
|
|
|
|
|
|
|
|
|
|
|
|||||||||||
| Total investment securities (net of credit losses) |
$ | 6,349,794 | $ | 6,571,354 | $ | 6,734,816 | $ | 6,878,441 | $ | 7,100,713 | ||||||||||
|
|
|
|
|
|
|
|
|
|
|
|||||||||||
| Fair value - HTM investment securities |
$ | 3,109,610 | $ | 3,005,524 | $ | 3,049,281 | $ | 3,135,370 | $ | 2,848,211 | ||||||||||
|
|
|
|
|
|
|
|
|
|
|
|||||||||||
Page 4
| Simmons First National Corporation | SFNC | |
| Consolidated Loans | ||
| For the Quarters Ended | ||
| (Unaudited) |
| Sep 30 2024 |
Jun 30 2024 |
Mar 31 2024 |
Dec 31 2023 |
Sep 30 2023 |
||||||||||||||||
| ($ in thousands) | ||||||||||||||||||||
| Loan Portfolio - End of Period |
||||||||||||||||||||
| Consumer: |
||||||||||||||||||||
| Credit cards |
$ | 177,696 | $ | 178,354 | $ | 182,742 | $ | 191,204 | $ | 191,550 | ||||||||||
| Other consumer |
113,896 | 130,278 | 124,531 | 127,462 | 112,832 | |||||||||||||||
|
|
|
|
|
|
|
|
|
|
|
|||||||||||
| Total consumer |
291,592 | 308,632 | 307,273 | 318,666 | 304,382 | |||||||||||||||
| Real Estate: |
||||||||||||||||||||
| Construction |
2,796,378 | 3,056,703 | 3,331,739 | 3,144,220 | 3,022,321 | |||||||||||||||
| Single-family residential |
2,724,648 | 2,666,201 | 2,624,738 | 2,641,556 | 2,657,879 | |||||||||||||||
| Other commercial real estate |
7,992,437 | 7,760,266 | 7,508,049 | 7,552,410 | 7,565,008 | |||||||||||||||
|
|
|
|
|
|
|
|
|
|
|
|||||||||||
| Total real estate |
13,513,463 | 13,483,170 | 13,464,526 | 13,338,186 | 13,245,208 | |||||||||||||||
| Commercial: |
||||||||||||||||||||
| Commercial |
2,467,384 | 2,484,474 | 2,499,311 | 2,490,176 | 2,477,077 | |||||||||||||||
| Agricultural |
314,340 | 285,181 | 226,642 | 232,710 | 296,912 | |||||||||||||||
|
|
|
|
|
|
|
|
|
|
|
|||||||||||
| Total commercial |
2,781,724 | 2,769,655 | 2,725,953 | 2,722,886 | 2,773,989 | |||||||||||||||
| Other |
749,261 | 630,980 | 504,008 | 465,932 | 448,309 | |||||||||||||||
|
|
|
|
|
|
|
|
|
|
|
|||||||||||
| Total loans |
$ | 17,336,040 | $ | 17,192,437 | $ | 17,001,760 | $ | 16,845,670 | $ | 16,771,888 | ||||||||||
|
|
|
|
|
|
|
|
|
|
|
|||||||||||
Page 5
| Simmons First National Corporation | SFNC | |
| Consolidated Allowance and Asset Quality | ||
| For the Quarters Ended | ||
| (Unaudited) |
| Sep 30 | Jun 30 | Mar 31 | Dec 31 | Sep 30 | ||||||||||||||||
| 2024 | 2024 | 2024 | 2023 | 2023 | ||||||||||||||||
| ($ in thousands) | ||||||||||||||||||||
| Allowance for Credit Losses on Loans |
||||||||||||||||||||
| Beginning balance |
$ | 230,389 | $ | 227,367 | $ | 225,231 | $ | 218,547 | $ | 209,966 | ||||||||||
| Loans charged off: |
||||||||||||||||||||
| Credit cards |
1,744 | 1,418 | 1,646 | 1,500 | 1,318 | |||||||||||||||
| Other consumer |
524 | 550 | 732 | 767 | 633 | |||||||||||||||
| Real estate |
159 | 123 | 2,857 | 1,023 | 9,723 | |||||||||||||||
| Commercial |
8,235 | 7,243 | 4,593 | 3,105 | 1,219 | |||||||||||||||
|
|
|
|
|
|
|
|
|
|
|
|||||||||||
| Total loans charged off |
10,662 | 9,334 | 9,828 | 6,395 | 12,893 | |||||||||||||||
| Recoveries of loans previously charged off: |
||||||||||||||||||||
| Credit cards |
231 | 221 | 248 | 242 | 234 | |||||||||||||||
| Other consumer |
275 | 509 | 333 | 518 | 344 | |||||||||||||||
| Real estate |
403 | 72 | 735 | 785 | 429 | |||||||||||||||
| Commercial |
439 | 455 | 442 | 309 | 245 | |||||||||||||||
|
|
|
|
|
|
|
|
|
|
|
|||||||||||
| Total recoveries |
1,348 | 1,257 | 1,758 | 1,854 | 1,252 | |||||||||||||||
|
|
|
|
|
|
|
|
|
|
|
|||||||||||
| Net loans charged off |
9,314 | 8,077 | 8,070 | 4,541 | 11,641 | |||||||||||||||
| Provision for credit losses on loans |
12,148 | 11,099 | 10,206 | 11,225 | 20,222 | |||||||||||||||
|
|
|
|
|
|
|
|
|
|
|
|||||||||||
| Balance, end of quarter |
$ | 233,223 | $ | 230,389 | $ | 227,367 | $ | 225,231 | $ | 218,547 | ||||||||||
|
|
|
|
|
|
|
|
|
|
|
|||||||||||
| Nonperforming assets |
||||||||||||||||||||
| Nonperforming loans: |
||||||||||||||||||||
| Nonaccrual loans |
$ | 100,865 | $ | 102,891 | $ | 105,788 | $ | 83,325 | $ | 81,135 | ||||||||||
| Loans past due 90 days or more |
830 | 558 | 1,527 | 1,147 | 806 | |||||||||||||||
|
|
|
|
|
|
|
|
|
|
|
|||||||||||
| Total nonperforming loans |
101,695 | 103,449 | 107,315 | 84,472 | 81,941 | |||||||||||||||
|
|
|
|
|
|
|
|
|
|
|
|||||||||||
| Other nonperforming assets: |
||||||||||||||||||||
| Foreclosed assets and other real estate owned |
1,299 | 2,209 | 3,511 | 4,073 | 3,809 | |||||||||||||||
| Other nonperforming assets |
1,311 | 1,167 | 1,491 | 1,726 | 1,417 | |||||||||||||||
|
|
|
|
|
|
|
|
|
|
|
|||||||||||
| Total other nonperforming assets |
2,610 | 3,376 | 5,002 | 5,799 | 5,226 | |||||||||||||||
|
|
|
|
|
|
|
|
|
|
|
|||||||||||
| Total nonperforming assets |
$ | 104,305 | $ | 106,825 | $ | 112,317 | $ | 90,271 | $ | 87,167 | ||||||||||
|
|
|
|
|
|
|
|
|
|
|
|||||||||||
| Ratios |
||||||||||||||||||||
| Allowance for credit losses on loans to total loans |
1.35 | % | 1.34 | % | 1.34 | % | 1.34 | % | 1.30 | % | ||||||||||
| Allowance for credit losses to nonperforming loans |
229 | % | 223 | % | 212 | % | 267 | % | 267 | % | ||||||||||
| Nonperforming loans to total loans |
0.59 | % | 0.60 | % | 0.63 | % | 0.50 | % | 0.49 | % | ||||||||||
| Nonperforming assets to total assets |
0.38 | % | 0.39 | % | 0.41 | % | 0.33 | % | 0.32 | % | ||||||||||
| Annualized net charge offs to average loans (QTD) |
0.22 | % | 0.19 | % | 0.19 | % | 0.11 | % | 0.28 | % | ||||||||||
| Annualized net charge offs to average loans (YTD) |
0.20 | % | 0.19 | % | 0.19 | % | 0.12 | % | 0.12 | % | ||||||||||
| Annualized net credit card charge offs to average credit card loans (QTD) |
3.23 | % | 2.50 | % | 2.88 | % | 2.49 | % | 2.19 | % | ||||||||||
Page 6
| Simmons First National Corporation | SFNC | |
| Consolidated - Average Balance Sheet and Net Interest Income Analysis | ||
| For the Quarters Ended | ||
| (Unaudited) |
| Three Months Ended Sep 2024 |
Three Months Ended Jun 2024 |
Three Months Ended Sep 2023 |
||||||||||||||||||||||||||||||||||
| Average Balance |
Income/ Expense |
Yield/ Rate |
Average Balance |
Income/ Expense |
Yield/ Rate |
Average Balance |
Income/ Expense |
Yield/ Rate |
||||||||||||||||||||||||||||
| ($ in thousands) | ||||||||||||||||||||||||||||||||||||
| ASSETS |
||||||||||||||||||||||||||||||||||||
| Earning assets: |
||||||||||||||||||||||||||||||||||||
| Interest bearing balances due from banks and federal funds sold |
$ | 204,505 | $ | 2,921 | 5.68 | % | $ | 214,777 | $ | 2,964 | 5.55 | % | $ | 331,444 | $ | 3,569 | 4.27 | % | ||||||||||||||||||
| Investment securities - taxable |
3,826,934 | 37,473 | 3.90 | % | 4,035,508 | 39,283 | 3.92 | % | 4,638,486 | 34,734 | 2.97 | % | ||||||||||||||||||||||||
| Investment securities - non-taxable (FTE) |
2,617,532 | 21,318 | 3.24 | % | 2,597,005 | 21,429 | 3.32 | % | 2,617,152 | 21,563 | 3.27 | % | ||||||||||||||||||||||||
| Mortgage loans held for sale |
12,425 | 209 | 6.69 | % | 10,328 | 194 | 7.55 | % | 9,542 | 178 | 7.40 | % | ||||||||||||||||||||||||
| Loans - including fees (FTE) |
17,208,162 | 278,766 | 6.44 | % | 17,101,799 | 271,851 | 6.39 | % | 16,758,597 | 256,757 | 6.08 | % | ||||||||||||||||||||||||
|
|
|
|
|
|
|
|
|
|
|
|
|
|
|
|
|
|
|
|||||||||||||||||||
| Total interest earning assets (FTE) |
23,869,558 | 340,687 | 5.68 | % | 23,959,417 | 335,721 | 5.64 | % | 24,355,221 | 316,801 | 5.16 | % | ||||||||||||||||||||||||
| Non-earning assets |
3,346,882 | 3,345,860 | 3,239,390 | |||||||||||||||||||||||||||||||||
|
|
|
|
|
|
|
|||||||||||||||||||||||||||||||
| Total assets |
$ | 27,216,440 | $ | 27,305,277 | $ | 27,594,611 | ||||||||||||||||||||||||||||||
|
|
|
|
|
|
|
|||||||||||||||||||||||||||||||
| LIABILITIES AND STOCKHOLDERS’ EQUITY |
|
|||||||||||||||||||||||||||||||||||
| Interest bearing liabilities: |
||||||||||||||||||||||||||||||||||||
| Interest bearing transaction and savings accounts |
$ | 10,826,514 | $ | 78,307 | 2.88 | % | $ | 10,973,462 | $ | 79,087 | 2.90 | % | $ | 10,682,767 | $ | 65,095 | 2.42 | % | ||||||||||||||||||
| Time deposits |
6,355,801 | 73,937 | 4.63 | % | 6,447,259 | 73,946 | 4.61 | % | 6,558,110 | 68,062 | 4.12 | % | ||||||||||||||||||||||||
|
|
|
|
|
|
|
|
|
|
|
|
|
|
|
|
|
|
|
|||||||||||||||||||
| Total interest bearing deposits |
17,182,315 | 152,244 | 3.52 | % | 17,420,721 | 153,033 | 3.53 | % | 17,240,877 | 133,157 | 3.06 | % | ||||||||||||||||||||||||
| Federal funds purchased and securities sold under agreement to repurchase |
51,830 | 138 | 1.06 | % | 50,558 | 156 | 1.24 | % | 89,769 | 277 | 1.22 | % | ||||||||||||||||||||||||
| Other borrowings |
1,252,435 | 17,067 | 5.42 | % | 1,111,734 | 15,025 | 5.44 | % | 1,222,557 | 16,450 | 5.34 | % | ||||||||||||||||||||||||
| Subordinated notes and debentures |
366,236 | 7,128 | 7.74 | % | 366,198 | 7,026 | 7.72 | % | 366,085 | 6,969 | 7.55 | % | ||||||||||||||||||||||||
|
|
|
|
|
|
|
|
|
|
|
|
|
|
|
|
|
|
|
|||||||||||||||||||
| Total interest bearing liabilities |
18,852,816 | 176,577 | 3.73 | % | 18,949,211 | 175,240 | 3.72 | % | 18,919,288 | 156,853 | 3.29 | % | ||||||||||||||||||||||||
|
|
|
|
|
|
|
|
|
|
|
|
|
|||||||||||||||||||||||||
| Noninterest bearing liabilities: |
||||||||||||||||||||||||||||||||||||
| Noninterest bearing deposits |
4,535,105 | 4,624,819 | 5,032,631 | |||||||||||||||||||||||||||||||||
| Other liabilities |
323,378 | 280,092 | 271,014 | |||||||||||||||||||||||||||||||||
|
|
|
|
|
|
|
|||||||||||||||||||||||||||||||
| Total liabilities |
23,711,299 | 23,854,122 | 24,222,933 | |||||||||||||||||||||||||||||||||
| Stockholders’ equity |
3,505,141 | 3,451,155 | 3,371,678 | |||||||||||||||||||||||||||||||||
|
|
|
|
|
|
|
|||||||||||||||||||||||||||||||
| Total liabilities and stockholders’ equity |
$ | 27,216,440 | $ | 27,305,277 | $ | 27,594,611 | ||||||||||||||||||||||||||||||
|
|
|
|
|
|
|
|||||||||||||||||||||||||||||||
| Net interest income (FTE) |
$ | 164,110 | $ | 160,481 | $ | 159,948 | ||||||||||||||||||||||||||||||
|
|
|
|
|
|
|
|||||||||||||||||||||||||||||||
| Net interest spread (FTE) |
1.95 | % | 1.92 | % | 1.87 | % | ||||||||||||||||||||||||||||||
|
|
|
|
|
|
|
|||||||||||||||||||||||||||||||
| Net interest margin (FTE) |
2.74 | % | 2.69 | % | 2.61 | % | ||||||||||||||||||||||||||||||
|
|
|
|
|
|
|
|||||||||||||||||||||||||||||||
Page 7
| Simmons First National Corporation | SFNC | |
| Consolidated - Selected Financial Data | ||
| For the Quarters Ended | ||
| (Unaudited) |
| Sep 30 | Jun 30 | Mar 31 | Dec 31 | Sep 30 | ||||||||||||||||
| 2024 | 2024 | 2024 | 2023 | 2023 | ||||||||||||||||
| ($ in thousands, except share data) | ||||||||||||||||||||
|
QUARTER-TO-DATE |
||||||||||||||||||||
| Financial Highlights - As Reported |
||||||||||||||||||||
| Net Income |
$ | 24,740 | $ | 40,763 | $ | 38,871 | $ | 23,907 | $ | 47,247 | ||||||||||
| Diluted earnings per share |
0.20 | 0.32 | 0.31 | 0.19 | 0.37 | |||||||||||||||
| Return on average assets |
0.36 | % | 0.60 | % | 0.57 | % | 0.35 | % | 0.68 | % | ||||||||||
| Return on average common equity |
2.81 | % | 4.75 | % | 4.54 | % | 2.84 | % | 5.56 | % | ||||||||||
| Return on tangible common equity (non-GAAP) (1) |
5.27 | % | 8.67 | % | 8.33 | % | 5.61 | % | 10.33 | % | ||||||||||
| Net interest margin (FTE) |
2.74 | % | 2.69 | % | 2.66 | % | 2.68 | % | 2.61 | % | ||||||||||
| Efficiency ratio (2) |
75.70 | % | 68.38 | % | 69.41 | % | 80.46 | % | 65.11 | % | ||||||||||
| FTE adjustment |
6,398 | 6,576 | 6,422 | 6,511 | 6,515 | |||||||||||||||
| Average diluted shares outstanding |
125,999,269 | 125,758,166 | 125,661,950 | 125,609,265 | 126,283,609 | |||||||||||||||
| Shares repurchased under plan |
— | — | — | — | 1,128,962 | |||||||||||||||
| Average price of shares repurchased |
— | — | — | — | 17.69 | |||||||||||||||
| Cash dividends declared per common share |
0.210 | 0.210 | 0.210 | 0.200 | 0.200 | |||||||||||||||
| Accretable yield on acquired loans |
1,496 | 1,569 | 1,123 | 1,762 | 2,146 | |||||||||||||||
| Financial Highlights - Adjusted (non-GAAP) (1) |
||||||||||||||||||||
| Adjusted earnings |
$ | 46,005 | $ | 41,897 | $ | 40,351 | $ | 50,215 | $ | 48,804 | ||||||||||
| Adjusted diluted earnings per share |
0.37 | 0.33 | 0.32 | 0.40 | 0.39 | |||||||||||||||
| Adjusted return on average assets |
0.67 | % | 0.62 | % | 0.60 | % | 0.73 | % | 0.70 | % | ||||||||||
| Adjusted return on average common equity |
5.22 | % | 4.88 | % | 4.71 | % | 5.97 | % | 5.74 | % | ||||||||||
| Adjusted return on tangible common equity |
9.34 | % | 8.89 | % | 8.62 | % | 11.10 | % | 10.64 | % | ||||||||||
| Adjusted efficiency ratio (2) |
63.38 | % | 65.68 | % | 66.42 | % | 62.91 | % | 61.94 | % | ||||||||||
|
YEAR-TO-DATE |
||||||||||||||||||||
| Financial Highlights - GAAP |
||||||||||||||||||||
| Net Income |
$ | 104,374 | $ | 79,634 | $ | 38,871 | $ | 175,057 | $ | 151,150 | ||||||||||
| Diluted earnings per share |
0.83 | 0.63 | 0.31 | 1.38 | 1.19 | |||||||||||||||
| Return on average assets |
0.51 | % | 0.59 | % | 0.57 | % | 0.64 | % | 0.73 | % | ||||||||||
| Return on average common equity |
4.02 | % | 4.64 | % | 4.54 | % | 5.21 | % | 6.00 | % | ||||||||||
| Return on tangible common equity (non-GAAP) (1) |
7.39 | % | 8.50 | % | 8.33 | % | 9.76 | % | 11.14 | % | ||||||||||
| Net interest margin (FTE) |
2.70 | % | 2.68 | % | 2.66 | % | 2.78 | % | 2.82 | % | ||||||||||
| Efficiency ratio (2) |
71.00 | % | 68.90 | % | 69.41 | % | 67.75 | % | 64.13 | % | ||||||||||
| FTE adjustment |
19,396 | 12,998 | 6,422 | 25,443 | 18,932 | |||||||||||||||
| Average diluted shares outstanding |
125,910,260 | 125,693,536 | 125,661,950 | 126,775,704 | 127,099,727 | |||||||||||||||
| Cash dividends declared per common share |
0.630 | 0.420 | 0.210 | 0.800 | 0.600 | |||||||||||||||
| Financial Highlights - Adjusted (non-GAAP) (1) |
||||||||||||||||||||
| Adjusted earnings |
$ | 128,253 | $ | 82,248 | $ | 40,351 | $ | 207,716 | $ | 157,501 | ||||||||||
| Adjusted diluted earnings per share |
1.02 | 0.65 | 0.32 | 1.64 | 1.24 | |||||||||||||||
| Adjusted return on average assets |
0.63 | % | 0.61 | % | 0.60 | % | 0.75 | % | 0.76 | % | ||||||||||
| Adjusted return on average common equity |
4.94 | % | 4.80 | % | 4.71 | % | 6.18 | % | 6.25 | % | ||||||||||
| Adjusted return on tangible common equity |
8.96 | % | 8.76 | % | 8.62 | % | 11.46 | % | 11.58 | % | ||||||||||
| Adjusted efficiency ratio (2) |
65.14 | % | 66.05 | % | 66.42 | % | 61.32 | % | 60.81 | % | ||||||||||
| END OF PERIOD |
||||||||||||||||||||
| Book value per share |
$ | 28.11 | $ | 27.56 | $ | 27.42 | $ | 27.37 | $ | 26.26 | ||||||||||
| Tangible book value per share |
16.78 | 16.20 | 16.02 | 15.92 | 14.77 | |||||||||||||||
| Shares outstanding |
125,554,598 | 125,487,520 | 125,419,618 | 125,184,119 | 125,133,281 | |||||||||||||||
| Full-time equivalent employees |
2,972 | 2,961 | 2,989 | 3,007 | 3,005 | |||||||||||||||
| Total number of financial centers |
234 | 234 | 233 | 234 | 232 | |||||||||||||||
| (1) | Non-GAAP measurement that management believes aids in the understanding and discussion of results. Reconciliations to GAAP are included in the schedules accompanying this release. |
| (2) | Efficiency ratio is noninterest expense as a percent of net interest income (fully taxable equivalent) and noninterest revenues. Adjusted efficiency ratio is noninterest expense before foreclosed property expense, amortization of intangibles and certain adjusting items as a percent of net interest income (fully taxable equivalent) and noninterest revenues, excluding gains and losses from securities transactions and certain adjusting items, and is a non-GAAP measurement. |
Page 8
| Simmons First National Corporation |
SFNC |
|
| Reconciliation Of Non-GAAP Financial Measures - Adjusted Earnings - Quarter-to-Date |
||
| For the Quarters Ended |
||
| (Unaudited) |
| Sep 30 | Jun 30 | Mar 31 | Dec 31 | Sep 30 | ||||||||||||||||
| 2024 | 2024 | 2024 | 2023 | 2023 | ||||||||||||||||
| (in thousands, except per share data) | ||||||||||||||||||||
|
QUARTER-TO-DATE |
||||||||||||||||||||
| Net income |
$ | 24,740 | $ | 40,763 | $ | 38,871 | $ | 23,907 | $ | 47,247 | ||||||||||
| Certain items (non-GAAP) |
||||||||||||||||||||
| FDIC Deposit Insurance special assessment |
— | 283 | 1,549 | 10,521 | — | |||||||||||||||
| Merger related costs |
— | — | — | — | 5 | |||||||||||||||
| Early retirement program |
(1 | ) | 118 | 219 | 1,032 | 1,557 | ||||||||||||||
| Termination of vendor and software services |
(13 | ) | 615 | — | — | — | ||||||||||||||
| Loss (gain) on sale of securities |
28,393 | — | — | 20,218 | — | |||||||||||||||
| Branch right sizing (net) |
410 | 519 | 236 | 3,846 | 547 | |||||||||||||||
| Tax effect of certain items (1) |
(7,524 | ) | (401 | ) | (524 | ) | (9,309 | ) | (552 | ) | ||||||||||
|
|
|
|
|
|
|
|
|
|
|
|||||||||||
| Certain items, net of tax |
21,265 | 1,134 | 1,480 | 26,308 | 1,557 | |||||||||||||||
|
|
|
|
|
|
|
|
|
|
|
|||||||||||
| Adjusted earnings (non-GAAP) |
$ | 46,005 | $ | 41,897 | $ | 40,351 | $ | 50,215 | $ | 48,804 | ||||||||||
|
|
|
|
|
|
|
|
|
|
|
|||||||||||
| Diluted earnings per share |
$ | 0.20 | $ | 0.32 | $ | 0.31 | $ | 0.19 | $ | 0.37 | ||||||||||
| Certain items (non-GAAP) |
||||||||||||||||||||
| FDIC Deposit Insurance special assessment |
— | — | 0.01 | 0.08 | — | |||||||||||||||
| Early retirement program |
— | — | — | 0.01 | 0.01 | |||||||||||||||
| Termination of vendor and software services |
— | 0.01 | — | — | — | |||||||||||||||
| Loss (gain) on sale of securities |
0.23 | — | — | 0.16 | — | |||||||||||||||
| Branch right sizing (net) |
— | — | — | 0.03 | 0.01 | |||||||||||||||
| Tax effect of certain items (1) |
(0.06 | ) | — | — | (0.07 | ) | — | |||||||||||||
|
|
|
|
|
|
|
|
|
|
|
|||||||||||
| Certain items, net of tax |
0.17 | 0.01 | 0.01 | 0.21 | 0.02 | |||||||||||||||
|
|
|
|
|
|
|
|
|
|
|
|||||||||||
| Adjusted diluted earnings per share (non-GAAP) |
$ | 0.37 | $ | 0.33 | $ | 0.32 | $ | 0.40 | $ | 0.39 | ||||||||||
|
|
|
|
|
|
|
|
|
|
|
|||||||||||
| (1) | Effective tax rate of 26.135%. |
| Reconciliation of Certain Noninterest Income and Expense Items (non-GAAP) | ||||||||||||||||||||
|
QUARTER-TO-DATE |
||||||||||||||||||||
| Noninterest income |
$ | 17,130 | $ | 43,299 | $ | 43,184 | $ | 21,974 | $ | 42,777 | ||||||||||
| Certain noninterest income items |
||||||||||||||||||||
| Loss (gain) on sale of securities |
28,393 | — | — | 20,218 | — | |||||||||||||||
|
|
|
|
|
|
|
|
|
|
|
|||||||||||
| Adjusted noninterest income (non-GAAP) |
$ | 45,523 | $ | 43,299 | $ | 43,184 | $ | 42,192 | $ | 42,777 | ||||||||||
|
|
|
|
|
|
|
|
|
|
|
|||||||||||
| Noninterest expense |
$ | 137,193 | $ | 139,354 | $ | 139,879 | $ | 148,139 | $ | 131,998 | ||||||||||
| Certain noninterest expense items |
||||||||||||||||||||
| Merger related costs |
— | — | — | — | (5 | ) | ||||||||||||||
| Early retirement program |
1 | (118 | ) | (219 | ) | (1,032 | ) | (1,557 | ) | |||||||||||
| FDIC Deposit Insurance special assessment |
— | (283 | ) | (1,549 | ) | (10,521 | ) | — | ||||||||||||
| Termination of vendor and software services |
13 | (615 | ) | — | — | — | ||||||||||||||
| Branch right sizing expense |
(410 | ) | (519 | ) | (236 | ) | (3,846 | ) | (547 | ) | ||||||||||
|
|
|
|
|
|
|
|
|
|
|
|||||||||||
| Adjusted noninterest expense (non-GAAP) |
$ | 136,797 | $ | 137,819 | $ | 137,875 | $ | 132,740 | $ | 129,889 | ||||||||||
|
|
|
|
|
|
|
|
|
|
|
|||||||||||
| Salaries and employee benefits |
$ | 69,167 | $ | 70,716 | $ | 72,653 | $ | 66,982 | $ | 67,374 | ||||||||||
| Certain salaries and employee benefits items |
||||||||||||||||||||
| Early retirement program |
1 | (118 | ) | (219 | ) | (1,032 | ) | (1,557 | ) | |||||||||||
| Other |
(1 | ) | 1 | — | 2 | — | ||||||||||||||
|
|
|
|
|
|
|
|
|
|
|
|||||||||||
| Adjusted salaries and employee benefits (non-GAAP) |
$ | 69,167 | $ | 70,599 | $ | 72,434 | $ | 65,952 | $ | 65,817 | ||||||||||
|
|
|
|
|
|
|
|
|
|
|
|||||||||||
| Other operating expenses |
$ | 44,540 | $ | 45,352 | $ | 42,513 | $ | 48,570 | $ | 42,582 | ||||||||||
| Certain other operating expenses items |
||||||||||||||||||||
| Termination of vendor and software services |
13 | (615 | ) | — | — | — | ||||||||||||||
| Branch right sizing expense |
(184 | ) | (392 | ) | (83 | ) | (3,708 | ) | (466 | ) | ||||||||||
|
|
|
|
|
|
|
|
|
|
|
|||||||||||
| Adjusted other operating expenses (non-GAAP) |
$ | 44,369 | $ | 44,345 | $ | 42,430 | $ | 44,862 | $ | 42,116 | ||||||||||
|
|
|
|
|
|
|
|
|
|
|
|||||||||||
Page 9
| Simmons First National Corporation |
SFNC |
|
| Reconciliation Of Non-GAAP Financial Measures - Adjusted Earnings - Year-to-Date |
||
| For the Quarters Ended |
||
| (Unaudited) |
| Sep 30 | Jun 30 | Mar 31 | Dec 31 | Sep 30 | ||||||||||||||||
| 2024 | 2024 | 2024 | 2023 | 2023 | ||||||||||||||||
| (in thousands, except per share data) | ||||||||||||||||||||
|
YEAR-TO-DATE |
||||||||||||||||||||
| Net income |
$ | 104,374 | $ | 79,634 | $ | 38,871 | $ | 175,057 | $ | 151,150 | ||||||||||
| Certain items (non-GAAP) |
||||||||||||||||||||
| FDIC Deposit Insurance special assessment |
1,832 | 1,832 | 1,549 | 10,521 | — | |||||||||||||||
| Merger related costs |
— | — | — | 1,420 | 1,420 | |||||||||||||||
| Early retirement program |
336 | 337 | 219 | 6,198 | 5,166 | |||||||||||||||
| Termination of vendor and software services |
602 | 615 | — | — | — | |||||||||||||||
| Loss (gain) on sale of securities |
28,393 | — | — | 20,609 | 391 | |||||||||||||||
| Branch right sizing (net) |
1,165 | 755 | 236 | 5,467 | 1,621 | |||||||||||||||
| Tax effect of certain items (1) |
(8,449 | ) | (925 | ) | (524 | ) | (11,556 | ) | (2,247 | ) | ||||||||||
|
|
|
|
|
|
|
|
|
|
|
|||||||||||
| Certain items, net of tax |
23,879 | 2,614 | 1,480 | 32,659 | 6,351 | |||||||||||||||
|
|
|
|
|
|
|
|
|
|
|
|||||||||||
| Adjusted earnings (non-GAAP) |
$ | 128,253 | $ | 82,248 | $ | 40,351 | $ | 207,716 | $ | 157,501 | ||||||||||
|
|
|
|
|
|
|
|
|
|
|
|||||||||||
| Diluted earnings per share |
$ | 0.83 | $ | 0.63 | $ | 0.31 | $ | 1.38 | $ | 1.19 | ||||||||||
| Certain items (non-GAAP) |
||||||||||||||||||||
| FDIC Deposit Insurance special assessment |
0.02 | 0.02 | 0.01 | 0.08 | — | |||||||||||||||
| Merger related costs |
— | — | — | 0.01 | 0.01 | |||||||||||||||
| Early retirement program |
— | — | — | 0.05 | 0.04 | |||||||||||||||
| Loss (gain) on sale of securities |
0.23 | — | — | 0.17 | — | |||||||||||||||
| Branch right sizing (net) |
0.01 | 0.01 | — | 0.04 | 0.02 | |||||||||||||||
| Tax effect of certain items (1) |
(0.07 | ) | (0.01 | ) | — | (0.09 | ) | (0.02 | ) | |||||||||||
|
|
|
|
|
|
|
|
|
|
|
|||||||||||
| Certain items, net of tax |
0.19 | 0.02 | 0.01 | 0.26 | 0.05 | |||||||||||||||
|
|
|
|
|
|
|
|
|
|
|
|||||||||||
| Adjusted diluted earnings per share (non-GAAP) |
$ | 1.02 | $ | 0.65 | $ | 0.32 | $ | 1.64 | $ | 1.24 | ||||||||||
|
|
|
|
|
|
|
|
|
|
|
|||||||||||
| (1) | Effective tax rate of 26.135%. |
| Reconciliation of Certain Noninterest Income and Expense Items (non-GAAP) | ||||||||||||||||||||
|
YEAR-TO-DATE |
||||||||||||||||||||
| Noninterest income |
$ | 103,613 | $ | 86,483 | $ | 43,184 | $ | 155,566 | $ | 133,592 | ||||||||||
| Certain noninterest income items |
||||||||||||||||||||
| Loss (gain) on sale of securities |
28,393 | — | — | 20,609 | 391 | |||||||||||||||
|
|
|
|
|
|
|
|
|
|
|
|||||||||||
| Adjusted noninterest income (non-GAAP) |
$ | 132,006 | $ | 86,483 | $ | 43,184 | $ | 176,175 | $ | 133,983 | ||||||||||
|
|
|
|
|
|
|
|
|
|
|
|||||||||||
| Noninterest expense |
$ | 416,426 | $ | 279,233 | $ | 139,879 | $ | 563,061 | $ | 414,922 | ||||||||||
| Certain noninterest expense items |
||||||||||||||||||||
| Merger related costs |
— | — | — | (1,420 | ) | (1,420 | ) | |||||||||||||
| Early retirement program |
(336 | ) | (337 | ) | (219 | ) | (6,198 | ) | (5,166 | ) | ||||||||||
| FDIC Deposit Insurance special assessment |
(1,832 | ) | (1,832 | ) | (1,549 | ) | (10,521 | ) | — | |||||||||||
| Termination of vendor and software services |
(602 | ) | (615 | ) | — | — | — | |||||||||||||
| Branch right sizing expense |
(1,165 | ) | (755 | ) | (236 | ) | (5,467 | ) | (1,621 | ) | ||||||||||
|
|
|
|
|
|
|
|
|
|
|
|||||||||||
| Adjusted noninterest expense (non-GAAP) |
$ | 412,491 | $ | 275,694 | $ | 137,875 | $ | 539,455 | $ | 406,715 | ||||||||||
|
|
|
|
|
|
|
|
|
|
|
|||||||||||
| Salaries and employee benefits |
$ | 212,536 | $ | 143,369 | $ | 72,653 | $ | 286,117 | $ | 219,135 | ||||||||||
| Certain salaries and employee benefits items |
||||||||||||||||||||
| Early retirement program |
(336 | ) | (337 | ) | (219 | ) | (6,198 | ) | (5,166 | ) | ||||||||||
| Other |
— | 1 | — | 2 | — | |||||||||||||||
|
|
|
|
|
|
|
|
|
|
|
|||||||||||
| Adjusted salaries and employee benefits (non-GAAP) |
$ | 212,200 | $ | 143,033 | $ | 72,434 | $ | 279,921 | $ | 213,969 | ||||||||||
|
|
|
|
|
|
|
|
|
|
|
|||||||||||
| Other operating expenses |
$ | 132,405 | $ | 87,865 | $ | 42,513 | $ | 177,164 | $ | 128,594 | ||||||||||
| Certain other operating expenses items |
||||||||||||||||||||
| Termination of vendor and software services |
(602 | ) | (615 | ) | — | — | — | |||||||||||||
| Branch right sizing expense |
(659 | ) | (475 | ) | (83 | ) | (4,937 | ) | (1,229 | ) | ||||||||||
|
|
|
|
|
|
|
|
|
|
|
|||||||||||
| Adjusted other operating expenses (non-GAAP) |
$ | 131,144 | $ | 86,775 | $ | 42,430 | $ | 172,227 | $ | 127,365 | ||||||||||
|
|
|
|
|
|
|
|
|
|
|
|||||||||||
Page 10
| Simmons First National Corporation | SFNC | |
| Reconciliation Of Non-GAAP Financial Measures - End of Period | ||
| For the Quarters Ended | ||
| (Unaudited) |
| Sep 30 | Jun 30 | Mar 31 | Dec 31 | Sep 30 | ||||||||||||||||
| 2024 | 2024 | 2024 | 2023 | 2023 | ||||||||||||||||
| ($ in thousands, except per share data) | ||||||||||||||||||||
| Calculation of Tangible Common Equity and the Ratio of Tangible Common Equity to Tangible Assets |
|
|||||||||||||||||||
| Total common stockholders’ equity |
$ | 3,528,833 | $ | 3,458,869 | $ | 3,439,126 | $ | 3,426,488 | $ | 3,285,555 | ||||||||||
| Intangible assets: |
||||||||||||||||||||
| Goodwill |
(1,320,799 | ) | (1,320,799 | ) | (1,320,799 | ) | (1,320,799 | ) | (1,320,799 | ) | ||||||||||
| Other intangible assets |
(101,093 | ) | (104,943 | ) | (108,795 | ) | (112,645 | ) | (116,660 | ) | ||||||||||
|
|
|
|
|
|
|
|
|
|
|
|||||||||||
| Total intangibles |
(1,421,892 | ) | (1,425,742 | ) | (1,429,594 | ) | (1,433,444 | ) | (1,437,459 | ) | ||||||||||
|
|
|
|
|
|
|
|
|
|
|
|||||||||||
| Tangible common stockholders’ equity |
$ | 2,106,941 | $ | 2,033,127 | $ | 2,009,532 | $ | 1,993,044 | $ | 1,848,096 | ||||||||||
|
|
|
|
|
|
|
|
|
|
|
|||||||||||
| Total assets |
$ | 27,269,404 | $ | 27,369,072 | $ | 27,372,175 | $ | 27,345,674 | $ | 27,564,325 | ||||||||||
| Intangible assets: |
||||||||||||||||||||
| Goodwill |
(1,320,799 | ) | (1,320,799 | ) | (1,320,799 | ) | (1,320,799 | ) | (1,320,799 | ) | ||||||||||
| Other intangible assets |
(101,093 | ) | (104,943 | ) | (108,795 | ) | (112,645 | ) | (116,660 | ) | ||||||||||
|
|
|
|
|
|
|
|
|
|
|
|||||||||||
| Total intangibles |
(1,421,892 | ) | (1,425,742 | ) | (1,429,594 | ) | (1,433,444 | ) | (1,437,459 | ) | ||||||||||
|
|
|
|
|
|
|
|
|
|
|
|||||||||||
| Tangible assets |
$ | 25,847,512 | $ | 25,943,330 | $ | 25,942,581 | $ | 25,912,230 | $ | 26,126,866 | ||||||||||
|
|
|
|
|
|
|
|
|
|
|
|||||||||||
| Ratio of common equity to assets |
12.94 | % | 12.64 | % | 12.56 | % | 12.53 | % | 11.92 | % | ||||||||||
|
|
|
|
|
|
|
|
|
|
|
|||||||||||
| Ratio of tangible common equity to tangible assets |
8.15 | % | 7.84 | % | 7.75 | % | 7.69 | % | 7.07 | % | ||||||||||
|
|
|
|
|
|
|
|
|
|
|
|||||||||||
| Calculation of Tangible Book Value per Share |
||||||||||||||||||||
| Total common stockholders’ equity |
$ | 3,528,833 | $ | 3,458,869 | $ | 3,439,126 | $ | 3,426,488 | $ | 3,285,555 | ||||||||||
| Intangible assets: |
||||||||||||||||||||
| Goodwill |
(1,320,799 | ) | (1,320,799 | ) | (1,320,799 | ) | (1,320,799 | ) | (1,320,799 | ) | ||||||||||
| Other intangible assets |
(101,093 | ) | (104,943 | ) | (108,795 | ) | (112,645 | ) | (116,660 | ) | ||||||||||
|
|
|
|
|
|
|
|
|
|
|
|||||||||||
| Total intangibles |
(1,421,892 | ) | (1,425,742 | ) | (1,429,594 | ) | (1,433,444 | ) | (1,437,459 | ) | ||||||||||
|
|
|
|
|
|
|
|
|
|
|
|||||||||||
| Tangible common stockholders’ equity |
$ | 2,106,941 | $ | 2,033,127 | $ | 2,009,532 | $ | 1,993,044 | $ | 1,848,096 | ||||||||||
|
|
|
|
|
|
|
|
|
|
|
|||||||||||
| Shares of common stock outstanding |
125,554,598 | 125,487,520 | 125,419,618 | 125,184,119 | 125,133,281 | |||||||||||||||
|
|
|
|
|
|
|
|
|
|
|
|||||||||||
| Book value per common share |
$ | 28.11 | $ | 27.56 | $ | 27.42 | $ | 27.37 | $ | 26.26 | ||||||||||
|
|
|
|
|
|
|
|
|
|
|
|||||||||||
| Tangible book value per common share |
$ | 16.78 | $ | 16.20 | $ | 16.02 | $ | 15.92 | $ | 14.77 | ||||||||||
|
|
|
|
|
|
|
|
|
|
|
|||||||||||
| Calculation of Coverage Ratio of Uninsured, Non-Collateralized Deposits |
|
|||||||||||||||||||
| Uninsured deposits at Simmons Bank |
$ | 8,355,496 | $ | 8,186,903 | $ | 8,413,514 | $ | 8,328,444 | $ | 8,143,200 | ||||||||||
| Less: Collateralized deposits (excluding portion that is FDIC insured) |
2,710,167 | 2,835,424 | 2,995,241 | 2,846,716 | 2,835,405 | |||||||||||||||
| Less: Intercompany eliminations |
986,626 | 943,979 | 775,461 | 728,480 | 676,840 | |||||||||||||||
|
|
|
|
|
|
|
|
|
|
|
|||||||||||
| Total uninsured, non-collateralized deposits |
$ | 4,658,703 | $ | 4,407,500 | $ | 4,642,812 | $ | 4,753,248 | $ | 4,630,955 | ||||||||||
|
|
|
|
|
|
|
|
|
|
|
|||||||||||
| FHLB borrowing availability |
$ | 4,955,000 | $ | 4,910,000 | $ | 5,326,000 | $ | 5,401,000 | $ | 5,372,000 | ||||||||||
| Unpledged securities |
4,110,000 | 4,145,000 | 4,122,000 | 3,817,000 | 4,124,000 | |||||||||||||||
| Fed funds lines, Fed discount window and |
||||||||||||||||||||
| Bank Term Funding Program (1) |
2,109,000 | 2,065,000 | 2,009,000 | 1,998,000 | 1,951,000 | |||||||||||||||
|
|
|
|
|
|
|
|
|
|
|
|||||||||||
| Additional liquidity sources |
$ | 11,174,000 | $ | 11,120,000 | $ | 11,457,000 | $ | 11,216,000 | $ | 11,447,000 | ||||||||||
|
|
|
|
|
|
|
|
|
|
|
|||||||||||
| Uninsured, non-collateralized deposit coverage ratio |
2.4 | 2.5 | 2.5 | 2.4 | 2.5 | |||||||||||||||
|
|
|
|
|
|
|
|
|
|
|
|||||||||||
| (1) The Bank Term Funding Program closed for new loans on March 11, 2024. At no time did Simmons borrow funds under this program. |
|
|||||||||||||||||||
| Calculation of Net Charge Off Ratio | ||||||||||||||||||||
| Net charge offs |
$ | 9,314 | $ | 8,077 | $ | 8,070 | ||||||||||||||
| Less: Net charge offs from run-off portfolio (1) |
3,500 | 6,700 | 4,500 | |||||||||||||||||
|
|
|
|
|
|
|
|||||||||||||||
| Net charge offs excluding run-off portfolio |
$ | 5,814 | $ | 1,377 | $ | 3,570 | ||||||||||||||
|
|
|
|
|
|
|
|||||||||||||||
| Average total loans |
$ | 17,208,162 | $ | 17,101,799 | $ | 16,900,496 | ||||||||||||||
|
|
|
|
|
|
|
|||||||||||||||
| Annualized net charge offs to average loans (NCO ratio) |
0.22 | % | 0.19 | % | 0.19 | % | ||||||||||||||
|
|
|
|
|
|
|
|||||||||||||||
| NCO ratio, excluding net charge offs associated with run-off portfolio (annualized) |
0.13 | % | 0.03 | % | 0.08 | % | ||||||||||||||
|
|
|
|
|
|
|
|||||||||||||||
| (1) | Run-off portfolio consists of asset based lending and small equipment finance portfolios obtained in acquisitions. |
Page 11
| Simmons First National Corporation | SFNC | |
| Reconciliation Of Non-GAAP Financial Measures - Quarter-to-Date | ||
| For the Quarters Ended | ||
| (Unaudited) |
| Sep 30 | Jun 30 | Mar 31 | Dec 31 | Sep 30 | ||||||||||||||||
| 2024 | 2024 | 2024 | 2023 | 2023 | ||||||||||||||||
| ($ in thousands) | ||||||||||||||||||||
| Calculation of Adjusted Return on Average Assets |
||||||||||||||||||||
| Net income |
$ | 24,740 | $ | 40,763 | $ | 38,871 | $ | 23,907 | $ | 47,247 | ||||||||||
| Certain items (non-GAAP) |
||||||||||||||||||||
| FDIC Deposit Insurance special assessment |
— | 283 | 1,549 | 10,521 | — | |||||||||||||||
| Merger related costs |
— | — | — | — | 5 | |||||||||||||||
| Early retirement program |
(1 | ) | 118 | 219 | 1,032 | 1,557 | ||||||||||||||
| Termination of vendor and software services |
(13 | ) | 615 | — | — | — | ||||||||||||||
| Loss (gain) on sale of securities |
28,393 | — | — | 20,218 | — | |||||||||||||||
| Branch right sizing (net) |
410 | 519 | 236 | 3,846 | 547 | |||||||||||||||
| Tax effect of certain items (2) |
(7,524 | ) | (401 | ) | (524 | ) | (9,309 | ) | (552 | ) | ||||||||||
|
|
|
|
|
|
|
|
|
|
|
|||||||||||
| Adjusted earnings (non-GAAP) |
$ | 46,005 | $ | 41,897 | $ | 40,351 | $ | 50,215 | $ | 48,804 | ||||||||||
|
|
|
|
|
|
|
|
|
|
|
|||||||||||
| Average total assets |
$ | 27,216,440 | $ | 27,305,277 | $ | 27,259,399 | $ | 27,370,811 | $ | 27,594,611 | ||||||||||
|
|
|
|
|
|
|
|
|
|
|
|||||||||||
| Return on average assets |
0.36 | % | 0.60 | % | 0.57 | % | 0.35 | % | 0.68 | % | ||||||||||
|
|
|
|
|
|
|
|
|
|
|
|||||||||||
| Adjusted return on average assets (non-GAAP) |
0.67 | % | 0.62 | % | 0.60 | % | 0.73 | % | 0.70 | % | ||||||||||
|
|
|
|
|
|
|
|
|
|
|
|||||||||||
| Calculation of Return on Tangible Common Equity |
||||||||||||||||||||
| Net income available to common stockholders |
$ | 24,740 | $ | 40,763 | $ | 38,871 | $ | 23,907 | $ | 47,247 | ||||||||||
| Amortization of intangibles, net of taxes |
2,845 | 2,845 | 2,844 | 2,965 | 3,027 | |||||||||||||||
|
|
|
|
|
|
|
|
|
|
|
|||||||||||
| Total income available to common stockholders |
$ | 27,585 | $ | 43,608 | $ | 41,715 | $ | 26,872 | $ | 50,274 | ||||||||||
|
|
|
|
|
|
|
|
|
|
|
|||||||||||
| Certain items (non-GAAP) |
||||||||||||||||||||
| FDIC Deposit Insurance special assessment |
$ | — | $ | 283 | $ | 1,549 | $ | 10,521 | $ | — | ||||||||||
| Merger related costs |
— | — | — | — | 5 | |||||||||||||||
| Early retirement program |
(1 | ) | 118 | 219 | 1,032 | 1,557 | ||||||||||||||
| Termination of vendor and software services |
(13 | ) | 615 | — | — | — | ||||||||||||||
| Loss (gain) on sale of securities |
28,393 | — | — | 20,218 | — | |||||||||||||||
| Branch right sizing (net) |
410 | 519 | 236 | 3,846 | 547 | |||||||||||||||
| Tax effect of certain items (2) |
(7,524 | ) | (401 | ) | (524 | ) | (9,309 | ) | (552 | ) | ||||||||||
|
|
|
|
|
|
|
|
|
|
|
|||||||||||
| Adjusted earnings (non-GAAP) |
46,005 | 41,897 | 40,351 | 50,215 | 48,804 | |||||||||||||||
| Amortization of intangibles, net of taxes |
2,845 | 2,845 | 2,844 | 2,965 | 3,027 | |||||||||||||||
|
|
|
|
|
|
|
|
|
|
|
|||||||||||
| Total adjusted earnings available to common stockholders (non-GAAP) |
$ | 48,850 | $ | 44,742 | $ | 43,195 | $ | 53,180 | $ | 51,831 | ||||||||||
|
|
|
|
|
|
|
|
|
|
|
|||||||||||
| Average common stockholders’ equity |
$ | 3,505,141 | $ | 3,451,155 | $ | 3,447,021 | $ | 3,336,247 | $ | 3,371,678 | ||||||||||
| Average intangible assets: |
||||||||||||||||||||
| Goodwill |
(1,320,799 | ) | (1,320,799 | ) | (1,320,799 | ) | (1,320,799 | ) | (1,320,799 | ) | ||||||||||
| Other intangibles |
(103,438 | ) | (107,173 | ) | (111,023 | ) | (114,861 | ) | (119,125 | ) | ||||||||||
|
|
|
|
|
|
|
|
|
|
|
|||||||||||
| Total average intangibles |
(1,424,237 | ) | (1,427,972 | ) | (1,431,822 | ) | (1,435,660 | ) | (1,439,924 | ) | ||||||||||
|
|
|
|
|
|
|
|
|
|
|
|||||||||||
| Average tangible common stockholders’ equity (non-GAAP) |
$ | 2,080,904 | $ | 2,023,183 | $ | 2,015,199 | $ | 1,900,587 | $ | 1,931,754 | ||||||||||
|
|
|
|
|
|
|
|
|
|
|
|||||||||||
| Return on average common equity |
2.81 | % | 4.75 | % | 4.54 | % | 2.84 | % | 5.56 | % | ||||||||||
|
|
|
|
|
|
|
|
|
|
|
|||||||||||
| Return on tangible common equity |
5.27 | % | 8.67 | % | 8.33 | % | 5.61 | % | 10.33 | % | ||||||||||
|
|
|
|
|
|
|
|
|
|
|
|||||||||||
| Adjusted return on average common equity (non-GAAP) |
5.22 | % | 4.88 | % | 4.71 | % | 5.97 | % | 5.74 | % | ||||||||||
|
|
|
|
|
|
|
|
|
|
|
|||||||||||
| Adjusted return on tangible common equity (non-GAAP) |
9.34 | % | 8.89 | % | 8.62 | % | 11.10 | % | 10.64 | % | ||||||||||
|
|
|
|
|
|
|
|
|
|
|
|||||||||||
| Calculation of Efficiency Ratio and Adjusted Efficiency Ratio (1) |
||||||||||||||||||||
| Noninterest expense (efficiency ratio numerator) |
$ | 137,193 | $ | 139,354 | $ | 139,879 | $ | 148,139 | $ | 131,998 | ||||||||||
| Certain noninterest expense items (non-GAAP) |
||||||||||||||||||||
| Merger related costs |
— | — | — | — | (5 | ) | ||||||||||||||
| Early retirement program |
1 | (118 | ) | (219 | ) | (1,032 | ) | (1,557 | ) | |||||||||||
| FDIC Deposit Insurance special assessment |
— | (283 | ) | (1,549 | ) | (10,521 | ) | — | ||||||||||||
| Termination of vendor and software services |
13 | (615 | ) | — | — | — | ||||||||||||||
| Branch right sizing expense |
(410 | ) | (519 | ) | (236 | ) | (3,846 | ) | (547 | ) | ||||||||||
| Other real estate and foreclosure expense adjustment |
(87 | ) | (117 | ) | (179 | ) | (189 | ) | (228 | ) | ||||||||||
| Amortization of intangibles adjustment |
(3,851 | ) | (3,852 | ) | (3,850 | ) | (4,015 | ) | (4,097 | ) | ||||||||||
|
|
|
|
|
|
|
|
|
|
|
|||||||||||
| Adjusted efficiency ratio numerator |
$ | 132,859 | $ | 133,850 | $ | 133,846 | $ | 128,536 | $ | 125,564 | ||||||||||
|
|
|
|
|
|
|
|
|
|
|
|||||||||||
| Net interest income |
$ | 157,712 | $ | 153,905 | $ | 151,906 | $ | 155,628 | $ | 153,433 | ||||||||||
| Noninterest income |
17,130 | 43,299 | 43,184 | 21,974 | 42,777 | |||||||||||||||
| Fully tax-equivalent adjustment (effective tax rate of 26.135%) |
6,398 | 6,576 | 6,422 | 6,511 | 6,515 | |||||||||||||||
|
|
|
|
|
|
|
|
|
|
|
|||||||||||
| Efficiency ratio denominator |
181,240 | 203,780 | 201,512 | 184,113 | 202,725 | |||||||||||||||
| Certain noninterest income items (non-GAAP) |
||||||||||||||||||||
| (Gain) loss on sale of securities |
28,393 | — | — | 20,218 | — | |||||||||||||||
|
|
|
|
|
|
|
|
|
|
|
|||||||||||
| Adjusted efficiency ratio denominator |
$ | 209,633 | $ | 203,780 | $ | 201,512 | $ | 204,331 | $ | 202,725 | ||||||||||
|
|
|
|
|
|
|
|
|
|
|
|||||||||||
| Efficiency ratio (1) |
75.70 | % | 68.38 | % | 69.41 | % | 80.46 | % | 65.11 | % | ||||||||||
|
|
|
|
|
|
|
|
|
|
|
|||||||||||
| Adjusted efficiency ratio (non-GAAP) (1) |
63.38 | % | 65.68 | % | 66.42 | % | 62.91 | % | 61.94 | % | ||||||||||
|
|
|
|
|
|
|
|
|
|
|
|||||||||||
| (1) | Efficiency ratio is noninterest expense as a percent of net interest income (fully taxable equivalent) and noninterest revenues. Adjusted efficiency ratio is noninterest expense before foreclosed property expense, amortization of intangibles and certain adjusting items as a percent of net interest income (fully taxable equivalent) and noninterest revenues, excluding gains and losses from securities transactions and certain adjusting items, and is a non-GAAP measurement. |
| (2) | Effective tax rate of 26.135%. |
Page 12
| Simmons First National Corporation | SFNC | |
| Reconciliation Of Non-GAAP Financial Measures - Quarter-to-Date (continued) | ||
| For the Quarters Ended | ||
| (Unaudited) |
| Sep 30 | Jun 30 | Mar 31 | Dec 31 | Sep 30 | ||||||||||||||||
| 2024 | 2024 | 2024 | 2023 | 2023 | ||||||||||||||||
| ($ in thousands) | ||||||||||||||||||||
| Calculation of Total Revenue and Adjusted Total Revenue |
||||||||||||||||||||
| Net interest income |
$ | 157,712 | $ | 153,905 | $ | 151,906 | $ | 155,628 | $ | 153,433 | ||||||||||
| Noninterest income |
17,130 | 43,299 | 43,184 | 21,974 | 42,777 | |||||||||||||||
|
|
|
|
|
|
|
|
|
|
|
|||||||||||
| Total revenue |
174,842 | 197,204 | 195,090 | 177,602 | 196,210 | |||||||||||||||
| Certain items, pre-tax (non-GAAP) |
||||||||||||||||||||
| Less: Gain (loss) on sale of securities |
(28,393 | ) | — | — | (20,218 | ) | — | |||||||||||||
|
|
|
|
|
|
|
|
|
|
|
|||||||||||
| Adjusted total revenue |
$ | 203,235 | $ | 197,204 | $ | 195,090 | $ | 197,820 | $ | 196,210 | ||||||||||
|
|
|
|
|
|
|
|
|
|
|
|||||||||||
| Calculation of Pre-Provision Net Revenue (PPNR) |
||||||||||||||||||||
| Net interest income |
$ | 157,712 | $ | 153,905 | $ | 151,906 | $ | 155,628 | $ | 153,433 | ||||||||||
| Noninterest income |
17,130 | 43,299 | 43,184 | 21,974 | 42,777 | |||||||||||||||
|
|
|
|
|
|
|
|
|
|
|
|||||||||||
| Total revenue |
174,842 | 197,204 | 195,090 | 177,602 | 196,210 | |||||||||||||||
| Less: Noninterest expense |
137,193 | 139,354 | 139,879 | 148,139 | 131,998 | |||||||||||||||
|
|
|
|
|
|
|
|
|
|
|
|||||||||||
| Pre-Provision Net Revenue (PPNR) |
$ | 37,649 | $ | 57,850 | $ | 55,211 | $ | 29,463 | $ | 64,212 | ||||||||||
|
|
|
|
|
|
|
|
|
|
|
|||||||||||
| Calculation of Adjusted Pre-Provision Net Revenue |
||||||||||||||||||||
| Pre-Provision Net Revenue (PPNR) |
$ | 37,649 | $ | 57,850 | $ | 55,211 | $ | 29,463 | $ | 64,212 | ||||||||||
| Certain items, pre-tax (non-GAAP) |
||||||||||||||||||||
| Plus: Loss (gain) on sale of securities |
28,393 | — | — | 20,218 | — | |||||||||||||||
| Plus: FDIC Deposit Insurance special assessment |
— | 283 | 1,549 | 10,521 | — | |||||||||||||||
| Plus: Merger related costs |
— | — | — | — | 5 | |||||||||||||||
| Plus: Early retirement program costs |
(1 | ) | 118 | 219 | 1,032 | 1,557 | ||||||||||||||
| Plus: Termination of vendor and software services |
(13 | ) | 615 | — | — | — | ||||||||||||||
| Plus: Branch right sizing costs (net) |
410 | 519 | 236 | 3,846 | 547 | |||||||||||||||
|
|
|
|
|
|
|
|
|
|
|
|||||||||||
| Adjusted Pre-Provision Net Revenue |
$ | 66,438 | $ | 59,385 | $ | 57,215 | $ | 65,080 | $ | 66,321 | ||||||||||
|
|
|
|
|
|
|
|
|
|
|
|||||||||||
Page 13
| Simmons First National Corporation |
SFNC | |
| Reconciliation Of Non-GAAP Financial Measures - Year-to-Date |
||
| For the Quarters Ended |
||
| (Unaudited) |
||
| Sep 30 | Jun 30 | Mar 31 | Dec 31 | Sep 30 | ||||||||||||||||
| 2024 | 2024 | 2024 | 2023 | 2023 | ||||||||||||||||
| ($ in thousands) | ||||||||||||||||||||
| Calculation of Adjusted Return on Average Assets |
||||||||||||||||||||
| Net income |
$ | 104,374 | $ | 79,634 | $ | 38,871 | $ | 175,057 | $ | 151,150 | ||||||||||
| Certain items (non-GAAP) |
||||||||||||||||||||
| FDIC Deposit Insurance special assessment |
1,832 | 1,832 | 1,549 | 10,521 | — | |||||||||||||||
| Merger related costs |
— | — | — | 1,420 | 1,420 | |||||||||||||||
| Early retirement program |
336 | 337 | 219 | 6,198 | 5,166 | |||||||||||||||
| Termination of vendor and software services |
602 | 615 | — | — | — | |||||||||||||||
| Loss (gain) on sale of securities |
28,393 | — | — | 20,609 | 391 | |||||||||||||||
| Branch right sizing (net) |
1,165 | 755 | 236 | 5,467 | 1,621 | |||||||||||||||
| Tax effect of certain items (2) |
(8,449 | ) | (925 | ) | (524 | ) | (11,556 | ) | (2,247 | ) | ||||||||||
|
|
|
|
|
|
|
|
|
|
|
|||||||||||
| Adjusted earnings (non-GAAP) |
$ | 128,253 | $ | 82,248 | $ | 40,351 | $ | 207,716 | $ | 157,501 | ||||||||||
|
|
|
|
|
|
|
|
|
|
|
|||||||||||
| Average total assets |
$ | 27,260,212 | $ | 27,282,338 | $ | 27,259,399 | $ | 27,554,859 | $ | 27,616,882 | ||||||||||
|
|
|
|
|
|
|
|
|
|
|
|||||||||||
| Return on average assets |
0.51 | % | 0.59 | % | 0.57 | % | 0.64 | % | 0.73 | % | ||||||||||
|
|
|
|
|
|
|
|
|
|
|
|||||||||||
| Adjusted return on average assets (non-GAAP) |
0.63 | % | 0.61 | % | 0.60 | % | 0.75 | % | 0.76 | % | ||||||||||
|
|
|
|
|
|
|
|
|
|
|
|||||||||||
| Calculation of Return on Tangible Common Equity |
||||||||||||||||||||
| Net income available to common stockholders |
$ | 104,374 | $ | 79,634 | $ | 38,871 | $ | 175,057 | $ | 151,150 | ||||||||||
| Amortization of intangibles, net of taxes |
8,534 | 5,689 | 2,844 | 12,044 | 9,079 | |||||||||||||||
|
|
|
|
|
|
|
|
|
|
|
|||||||||||
| Total income available to common stockholders |
$ | 112,908 | $ | 85,323 | $ | 41,715 | $ | 187,101 | $ | 160,229 | ||||||||||
|
|
|
|
|
|
|
|
|
|
|
|||||||||||
| Certain items (non-GAAP) |
||||||||||||||||||||
| FDIC Deposit Insurance special assessment |
$ | 1,832 | $ | 1,832 | $ | 1,549 | $ | 10,521 | $ | — | ||||||||||
| Merger related costs |
— | — | — | 1,420 | 1,420 | |||||||||||||||
| Early retirement program |
336 | 337 | 219 | 6,198 | 5,166 | |||||||||||||||
| Termination of vendor and software services |
602 | 615 | — | — | — | |||||||||||||||
| Loss (gain) on sale of securities |
28,393 | — | — | 20,609 | 391 | |||||||||||||||
| Branch right sizing (net) |
1,165 | 755 | 236 | 5,467 | 1,621 | |||||||||||||||
| Tax effect of certain items (2) |
(8,449 | ) | (925 | ) | (524 | ) | (11,556 | ) | (2,247 | ) | ||||||||||
|
|
|
|
|
|
|
|
|
|
|
|||||||||||
| Adjusted earnings (non-GAAP) |
128,253 | 82,248 | 40,351 | 207,716 | 157,501 | |||||||||||||||
| Amortization of intangibles, net of taxes |
8,534 | 5,689 | 2,844 | 12,044 | 9,079 | |||||||||||||||
|
|
|
|
|
|
|
|
|
|
|
|||||||||||
| Total adjusted earnings available to common stockholders (non-GAAP) |
$ | 136,787 | $ | 87,937 | $ | 43,195 | $ | 219,760 | $ | 166,580 | ||||||||||
|
|
|
|
|
|
|
|
|
|
|
|||||||||||
| Average common stockholders’ equity |
$ | 3,467,908 | $ | 3,449,089 | $ | 3,447,021 | $ | 3,359,312 | $ | 3,367,088 | ||||||||||
| Average intangible assets: |
||||||||||||||||||||
| Goodwill |
(1,320,799 | ) | (1,320,799 | ) | (1,320,799 | ) | (1,320,510 | ) | (1,320,412 | ) | ||||||||||
| Other intangibles |
(107,197 | ) | (109,098 | ) | (111,023 | ) | (121,098 | ) | (123,200 | ) | ||||||||||
|
|
|
|
|
|
|
|
|
|
|
|||||||||||
| Total average intangibles |
(1,427,996 | ) | (1,429,897 | ) | (1,431,822 | ) | (1,441,608 | ) | (1,443,612 | ) | ||||||||||
|
|
|
|
|
|
|
|
|
|
|
|||||||||||
| Average tangible common stockholders’ equity (non-GAAP) |
$ | 2,039,912 | $ | 2,019,192 | $ | 2,015,199 | $ | 1,917,704 | $ | 1,923,476 | ||||||||||
|
|
|
|
|
|
|
|
|
|
|
|||||||||||
| Return on average common equity |
4.02 | % | 4.64 | % | 4.54 | % | 5.21 | % | 6.00 | % | ||||||||||
|
|
|
|
|
|
|
|
|
|
|
|||||||||||
| Return on tangible common equity |
7.39 | % | 8.50 | % | 8.33 | % | 9.76 | % | 11.14 | % | ||||||||||
|
|
|
|
|
|
|
|
|
|
|
|||||||||||
| Adjusted return on average common equity (non-GAAP) |
4.94 | % | 4.80 | % | 4.71 | % | 6.18 | % | 6.25 | % | ||||||||||
|
|
|
|
|
|
|
|
|
|
|
|||||||||||
| Adjusted return on tangible common equity (non-GAAP) |
8.96 | % | 8.76 | % | 8.62 | % | 11.46 | % | 11.58 | % | ||||||||||
|
|
|
|
|
|
|
|
|
|
|
|||||||||||
| Calculation of Efficiency Ratio and Adjusted Efficiency Ratio (1) |
||||||||||||||||||||
| Noninterest expense (efficiency ratio numerator) |
$ | 416,426 | $ | 279,233 | $ | 139,879 | $ | 563,061 | $ | 414,922 | ||||||||||
| Certain noninterest expense items (non-GAAP) |
||||||||||||||||||||
| Merger related costs |
— | — | — | (1,420 | ) | (1,420 | ) | |||||||||||||
| Early retirement program |
(336 | ) | (337 | ) | (219 | ) | (6,198 | ) | (5,166 | ) | ||||||||||
| FDIC Deposit Insurance special assessment |
(1,832 | ) | (1,832 | ) | (1,549 | ) | (10,521 | ) | — | |||||||||||
| Termination of vendor and software services |
(602 | ) | (615 | ) | — | — | — | |||||||||||||
| Branch right sizing expense |
(1,165 | ) | (755 | ) | (236 | ) | (5,467 | ) | (1,621 | ) | ||||||||||
| Other real estate and foreclosure expense adjustment |
(383 | ) | (296 | ) | (179 | ) | (892 | ) | (703 | ) | ||||||||||
| Amortization of intangibles adjustment |
(11,553 | ) | (7,702 | ) | (3,850 | ) | (16,306 | ) | (12,291 | ) | ||||||||||
|
|
|
|
|
|
|
|
|
|
|
|||||||||||
| Adjusted efficiency ratio numerator |
$ | 400,555 | $ | 267,696 | $ | 133,846 | $ | 522,257 | $ | 393,721 | ||||||||||
|
|
|
|
|
|
|
|
|
|
|
|||||||||||
| Net interest income |
$ | 463,523 | $ | 305,811 | $ | 151,906 | $ | 650,126 | $ | 494,498 | ||||||||||
| Noninterest income |
103,613 | 86,483 | 43,184 | 155,566 | 133,592 | |||||||||||||||
| Fully tax-equivalent adjustment (effective tax rate of 26.135%) |
19,396 | 12,998 | 6,422 | 25,443 | 18,932 | |||||||||||||||
|
|
|
|
|
|
|
|
|
|
|
|||||||||||
| Efficiency ratio denominator |
586,532 | 405,292 | 201,512 | 831,135 | 647,022 | |||||||||||||||
| Certain noninterest income items (non-GAAP) |
||||||||||||||||||||
| (Gain) loss on sale of securities |
28,393 | — | — | 20,609 | 391 | |||||||||||||||
|
|
|
|
|
|
|
|
|
|
|
|||||||||||
| Adjusted efficiency ratio denominator |
$ | 614,925 | $ | 405,292 | $ | 201,512 | $ | 851,744 | $ | 647,413 | ||||||||||
|
|
|
|
|
|
|
|
|
|
|
|||||||||||
| Efficiency ratio (1) |
71.00 | % | 68.90 | % | 69.41 | % | 67.75 | % | 64.13 | % | ||||||||||
|
|
|
|
|
|
|
|
|
|
|
|||||||||||
| Adjusted efficiency ratio (non-GAAP) (1) |
65.14 | % | 66.05 | % | 66.42 | % | 61.32 | % | 60.81 | % | ||||||||||
|
|
|
|
|
|
|
|
|
|
|
|||||||||||
| (1) | Efficiency ratio is noninterest expense as a percent of net interest income (fully taxable equivalent) and noninterest revenues. Adjusted efficiency ratio is noninterest expense before foreclosed property expense, amortization of intangibles and certain adjusting items as a percent of net interest income (fully taxable equivalent) and noninterest revenues, excluding gains and losses from securities transactions and certain adjusting items, and is a non-GAAP measurement. |
| (2) | Effective tax rate of 26.135%. |
Page 14
Exhibit 99.2

SS Simmons first national corporation Nasdaq: SFNC 3rd Quarter 2024 Earnings Presentation Contents 3 Company Profile 4 3Q24 Financial Highlights 11 Deposits, Securities, Liquidity, Interest Rate Sensitivity and Capital 18 Loan Portfolio 24 Credit Quality 28 Appendix Simmons bank
2 Forward-Looking Statements and Non-GAAP Financial Measures Forward-Looking Statements. Certain statements by Simmons First National Corporation (the “Company”, which where appropriate includes the Company’s wholly-owned banking subsidiary, Simmons Bank) contained in this presentation may not be based on historical facts and should be considered “forward-looking statements” within the meaning of the Private Securities Litigation Reform Act of 1995. These forward-looking statements may be identified by reference to a future period(s) or by the use of forward-looking terminology, such as “anticipate,” “believe,” “continue,” “estimate,” “expect,” “foresee,“ “indicate,” “plan,” “potential,” “project,” “target,” “may,” “might,” “will,” “would,” “could,“ “should,” “likely” or “intend,” future or conditional verb tenses, and variations or negatives of such terms or by similar expressions. These forward-looking statements include, without limitation, statements relating to the Company’s future growth; business strategies; product development; revenue; expenses (including interest expense and non-interest expenses); assets; loan demand (including loan growth, loan capacity, and other lending activity); deposit levels; asset quality; profitability; earnings; critical accounting policies; accretion; net interest margin; noninterest income; the Company’s common stock repurchase program; adequacy of the allowance for credit losses; income tax deductions; credit quality; level of credit losses from lending commitments; net interest revenue; interest rate sensitivity (including, among other things, the potential impact of rising rates); loan loss experience; liquidity; capital resources; future economic conditions and market risk; interest rates; the expected expenses and cost savings associated with branch closures; the Company’s ability to recruit and retain key employees; increases in, and cash flows associated with, the Company’s securities portfolio; legal and regulatory limitations and compliance and competition; anticipated loan principal reductions; plans for investments in and cash flows from securities; the estimated annual impact of securities sales; estimated earn back periods; projections regarding loan repricing, securities investments and maturities thereof; estimates of future swap income set forth on slide 8; the interest rate sensitivity estimates and projections noted on slide 15; and dividends. Readers are cautioned not to place undue reliance on the forward-looking statements contained in this presentation in that actual results could differ materially from those indicated in or implied by such forward-looking statements due to a variety of factors. These factors include, but are not limited to, changes in the Company’s operating or expansion strategy; the availability of and costs associated with obtaining adequate and timely sources of liquidity; the ability to maintain credit quality; changes in general market and economic conditions; increased unemployment; labor shortages; possible adverse rulings, judgments, settlements and other outcomes of pending or future litigation; the ability of the Company to collect amounts due under loan agreements; changes in consumer preferences and loan demand; the effectiveness of the Company’s interest rate risk management strategies; laws and regulations affecting financial institutions in general or relating to taxes; the effect of pending or future legislation; changes in governmental administrations; the ability of the Company to repurchase its common stock on favorable terms; the ability of the Company to successfully manage and implement its acquisition strategy and integrate acquired institutions; difficulties and delays in integrating an acquired business or fully realizing cost savings and other benefits of mergers and acquisitions; changes in interest rates, deposit flows, real estate values, and capital markets; increased inflation; customer acceptance of the Company’s products and services; changes or disruptions in technology and IT systems (including cyber threats, attacks and events); changes in accounting principles relating to loan loss recognition (current expected credit losses, or CECL); the benefits associated with the Company’s early retirement program; political crises, war, and other military conflicts (including the ongoing military conflicts between Russia and Ukraine and between Israel and Hamas) or other major events, or the prospect of these events; increased competition in the markets in which the Company operates and from non-bank financial institutions; changes in governmental policies; loss of key employees; the soundness of other financial institutions and any indirect exposure related to the closings of other financial institutions and their impact on the broader market through other customers, suppliers and partners, or that the conditions which resulted in the liquidity concerns experienced by closed financial institutions may also adversely impact, directly or indirectly, other financial institutions and market participants with which the Company has commercial or deposit relationships; increased delinquency and foreclosure rates on commercial real estate loans; and other risk factors. Other relevant risk factors may be detailed from time to time in the Company’s press releases and filings with the U.S. Securities and Exchange Commission, including, without limitation, the Company’s Form 10-K for the year ended December 31, 2023. In addition, there can be no guarantee that the board of directors (“Board”) of the Company will approve a quarterly dividend in future quarters, and the timing, payment, and amount of future dividends (if any) is subject to, among other things, the discretion of the Board and may differ significantly from past dividends. Any forward-looking statement speaks only as of the date of this presentation, and the Company undertakes no obligation to update these forward-looking statements to reflect events or circumstances that occur after the date of this presentation. Annualized, pro forma, projected and estimated numbers are used for illustrative purpose only, are not forecasts and may not reflect actual results. Non-GAAP Financial Measures. This presentation contains financial information determined by methods other than in accordance with U.S. generally accepted accounting principles (“GAAP”). The Company’s management uses these non-GAAP financial measures in their analysis of the Company’s performance and capital adequacy. These measures adjust GAAP performance measures to, among other things, include the tax benefit associated with revenue items that are tax-exempt, as well as exclude from net income (including on a per share diluted basis), pre-tax, pre-provision earnings, net charge-offs, income available to common shareholders, non-interest income, and non-interest expense certain income and expense items attributable to, for example, merger activity (primarily including merger-related expenses), gains and/or losses on sale of branches, net branch right-sizing initiatives, FDIC special assessment charges and gain/loss on the sale of AFS investment securities. The Company has updated its calculation of certain non-GAAP financial measures to exclude the impact of gains or losses on the sale of AFS investment securities in light of the impact of the Company’s strategic AFS investment securities transactions during the fourth quarter of 2023, and has presented past periods on a comparable basis. In addition, the Company also presents certain figures based on tangible common stockholders’ equity, tangible assets and tangible book value, which exclude goodwill and other intangible assets, and presents certain other figures to include the effect that accumulated other comprehensive income could have on the Company’s capital levels . The Company further presents certain figures that are exclusive of the impact of deposits and/or loans acquired through acquisitions, mortgage warehouse loans, and/or energy loans, or gains and/or losses on the sale of securities. The Company’s management believes that these non-GAAP financial measures are useful to investors because they, among other things, present the results of the Company’s ongoing operations without the effect of mergers or other items not central to the Company’s ongoing business, present the Company’s capital inclusive of the potential impact of AOCI (primarily comprised of unrealized losses on securities), as well as normalize for tax effects and certain other effects. Management, therefore, believes presentations of these non-GAAP financial measures provide useful supplemental information that is essential to a proper understanding of the operating results of the Company’s ongoing businesses, and management uses these non-GAAP financial measures to assess the performance of the Company’s ongoing businesses as related to prior financial periods. These non-GAAP disclosures should not be viewed as a substitute for operating results determined in accordance with GAAP, nor are they necessarily comparable to non-GAAP performance measures that may be presented by other companies. Where non-GAAP financial measures are used, the comparable GAAP financial measure, as well as the reconciliation to the comparable GAAP financial measure, can be found in the appendix to this presentation.
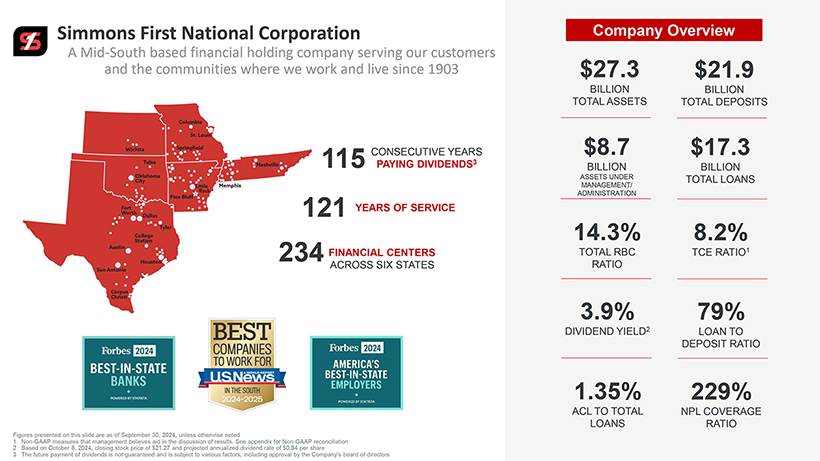
Simmons First National Corporation A Mid-South based financial holding company serving our customers and the communities where we work and live since 1903 115 CONSECUTIVE YEARS PAYING DIVIDENDS3 121 YEARS OF SERVICE 234 FINANCIAL CENTERS ACROSS SIX STATES Figures presented on this slide are as of September 30, 2024, unless otherwise noted 1 Non-GAAP measures that management believes aid in the discussion of results. See appendix for Non-GAAP reconciliation 2 Based on October 8, 2024, closing stock price of $21.27 and projected annualized dividend rate of $0.84 per share 3 The future payment of dividends is not guaranteed and is subject to various factors, including approval by the Company’s board of directors Company Overview $27.3 BILLION TOTAL ASSETS $21.9 BILLION TOTAL DEPOSITS 115 CONSECUTIVE YEARS PAYING DIVIDENDS3 $8.7 BILLION ASSETS UNDER MANAGEMENT/ ADMINISTRATION $17.3 BILLION TOTAL LOANS 121 YEARS OF SERVICE 234 FINANCIAL CENTERS ACROSS SIX STATES 14.3% TOTAL RBC RATIO 8.2% TCE RATIO1 3.9% DIVIDEND YIELD2 79% LOAN TO DEPOSIT RATIO 1.35% ACL TO TOTAL LOANS 229% NPL COVERAGE RATIO Forbes 2024 best-in-state banks powered by statista Best companies to work for u.s.news a world report in the south 2024-2025 Forbes 2024 america’s best-in-state employers powered by statista

3Q24 Financial Highlights Simmons first national corporation Simmons bank 4
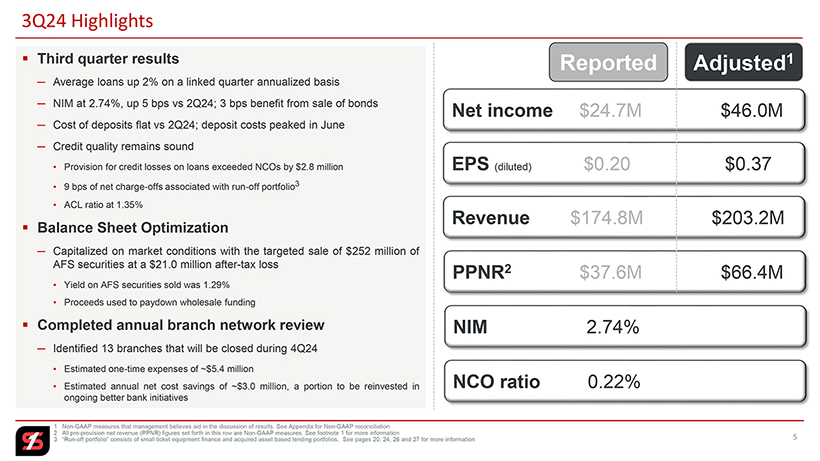
5 PPNR2 $37.6M $66.4M Revenue $174.8M $203.2M EPS (diluted) $0.20 $0.37 Net income $24.7M $46.0M 5 3Q24 Highlights 1 Non-GAAP measures that management believes aid in the discussion of results. See Appendix for Non-GAAP reconciliation 2 All pre-provision net revenue (PPNR) figures set forth in this row are Non-GAAP measures. See footnote 1 for more information 3 “Run-off portfolio” consists of small ticket equipment finance and acquired asset based lending portfolios. See pages 20, 24, 26 and 27 for more information â–ª Third quarter results Reported Adjusted1 — Average loans up 2% on a linked quarter annualized basis — NIM at 2.74%, up 5 bps vs 2Q24; 3 bps benefit from sale of bonds — Cost of deposits flat vs 2Q24; deposit costs peaked in June — Credit quality remains sound • Provision for credit losses on loans exceeded NCOs by $2.8 million • 9 bps of net charge-offs associated with run-off portfolio3 • ACL ratio at 1.35% â–ª Balance Sheet Optimization — Capitalized on market conditions with the targeted sale of $252 million of AFS securities at a $21.0 million after-tax loss • Yield on AFS securities sold was 1.29% • Proceeds used to paydown wholesale funding â–ª Completed annual branch network review — Identified 13 branches that will be closed during 4Q24 • Estimated one-time expenses of ~$5.4 million • Estimated annual net cost savings of ~$3.0 million, a portion to be reinvested in ongoing better bank initiatives NIM 2.74% NCO ratio 0.22% 1 Non-GAAP measures that management believes aid in the discussion of results. See Appendix for Non-GAAP reconciliation 2 All pre-provision net revenue (PPNR) figures set forth in this row are Non-GAAP measures. See footnote 1 for more information 3 “Run-off portfolio” consists of small ticket equipment finance and acquired asset based lending portfolios. See pages 20, 24, 26 and 27 for more information
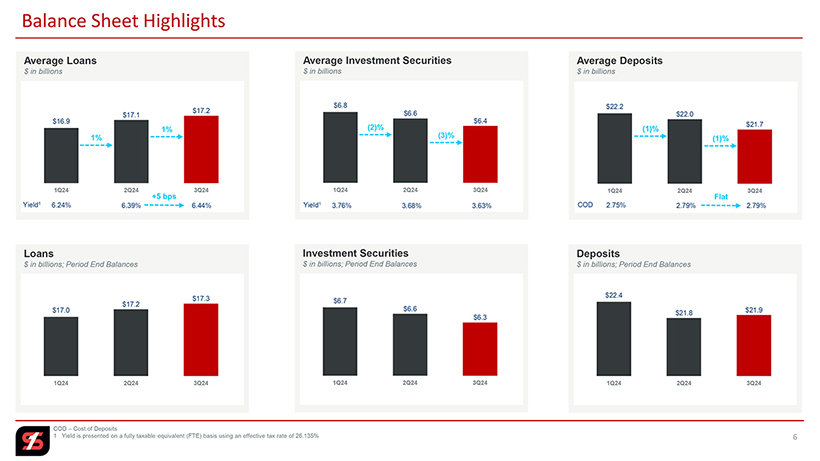
6 Balance Sheet Highlights COD – Cost of Deposits 1 Yield is presented on a fully taxable equivalent (FTE) basis using an effective
tax rate of 26.135%
Loans $ in billions; Period End Balances Investment Securities $ in billions; Period End Balances Deposits $ in billions; Period End Balances
Average Loans $ in billions Average Investment Securities $ in billions Average Deposits $ in billions
(3)% 6.24% 6.39% 6.44% Yield1 1% 1% 3.76% 3.68% 3.63% Yield1 (2)% 2.75% 2.79% 2.79% COD (1)% (1)% +5 bps Flat$17.0 $17.2 $17.3 1Q24 2Q24 3Q24 $6.7 $6.6 $6.3 1Q24 2Q24 3Q24 $22.4
$21.8 $21.9 1Q24 2Q24 3Q24 $16.9 $17.1 $17.2 1Q24 2Q24 3Q24 $6.8 $6.6 $6.4 1Q24 2Q24 3Q24 $22.2 $22.0 $21.7 1Q24 2Q24 3Q24 COD – Cost of Deposits 1 Yield is presented on a fully taxable equivalent (FTE) basis using an effective tax rate of
26.135%
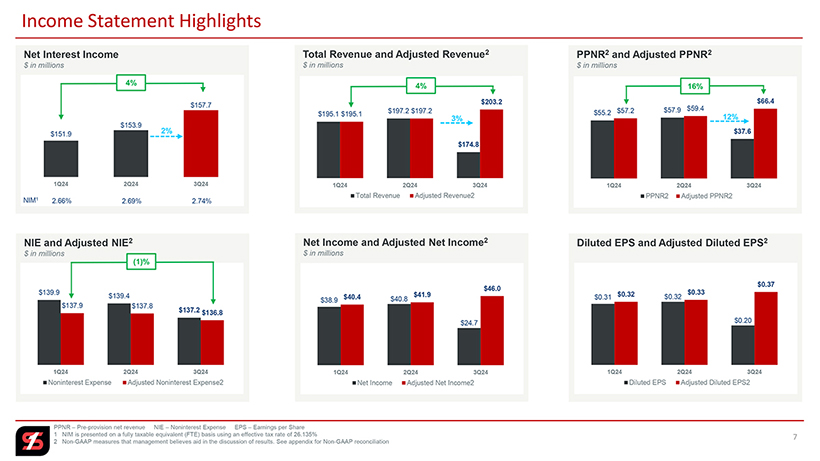
Income Statement Highlights 7 $151.9 $153.9 $157.7 1Q24 2Q24 3Q24 $38.9 $40.8 $24.7 $40.4 $41.9 $46.0 1Q24 2Q24 3Q24 Net Income Adjusted Net Income2 $195.1 $197.2 $174.8 $195.1 $197.2 $203.2 1Q24 2Q24 3Q24 Total Revenue Adjusted Revenue2 $55.2 $57.9 $37.6 $57.2 $59.4 $66.4 1Q24 2Q24 3Q24 PPNR2 Adjusted PPNR2 $139.9 $139.4 $137.2 $137.9 $137.8 $136.8 1Q24 2Q24 3Q24 Noninterest Expense Adjusted Noninterest Expense2 $0.31 $0.32 $0.20 $0.32 $0.33 $0.37 1Q24 2Q24 3Q24 Diluted EPS Adjusted Diluted EPS2 (1)% PPNR – Pre-provision net revenue NIE – Noninterest Expense EPS – Earnings per Share 1 NIM is presented on a fully taxable equivalent (FTE) basis using an effective tax rate of 26.135% 2 Non-GAAP measures that management believes aid in the discussion of results. See appendix for Non-GAAP reconciliation
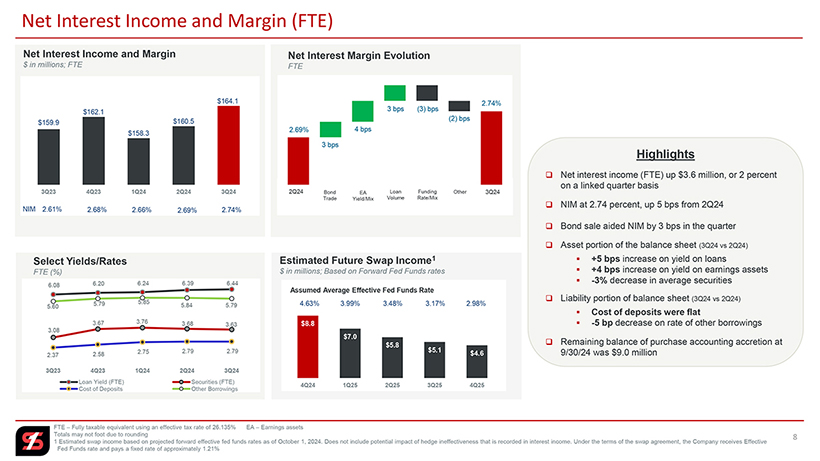
Net Interest Income and Margin (FTE) 8 $159.9 $162.1 $158.3 $160.5 $164.1 3Q23 4Q23 1Q24 2Q24 3Q24 6.08 6.20 6.24 6.39 6.44 3.08 3.67 3.76 3.68 3.63 2.37 2.58 2.75 2.79 2.79 5.60 5.79 5.85 5.84 5.79 3Q23 4Q23 1Q24 2Q24 3Q24 Loan Yield (FTE) Securities (FTE) Cost of Deposits Other Borrowings $8.8 $7.0 $5.8 $5.1 $4.6 4Q24 1Q25 2Q25 3Q25 4Q25 Other â‘ Net interest income (FTE) up $3.6 million, or 2 percent on a linked quarter basis â‘ NIM at 2.74 percent, up 5 bps from 2Q24 â‘ Bond sale aided NIM by 3 bps in the quarter â‘ Asset portion of the balance sheet (3Q24 vs 2Q24) â–ª +5 bps increase on yield on loans â–ª +4 bps increase on yield on earnings assets â–ª -3% decrease in average securities â‘ Liability portion of balance sheet (3Q24 vs 2Q24) â–ª Cost of deposits were flat â–ª -5 bp decrease on rate of other borrowings â‘ Remaining balance of purchase accounting accretion at 9/30/24 was $9.0 million FTE – Fully taxable equivalent using an effective tax rate of 26.135% EA – Earnings assets Totals may not foot due to rounding 1 Estimated swap income based on projected forward effective fed funds rates as of October 1, 2024. Does not include potential impact of hedge ineffectiveness that is recorded in interest income. Under the terms of the swap agreement, the Company receives Effective Fed Funds rate and pays a fixed rate of approximately 1.21% Net Interest Margin Evolution Estimated Future Swap Income1 $ in millions; Based on Forward Fed Funds rates Highlights â‘ Net interest income (FTE) up $3.6 million, or 2 percent on a linked quarter basis â‘ NIM at 2.74 percent, up 5 bps from 2Q24 â‘ Bond sale aided NIM by 3 bps in the quarter â‘ Asset portion of the balance sheet (3Q24 vs 2Q24) â–ª +5 bps increase on yield on loans â–ª +4 bps increase on yield on earnings assets â–ª -3% decrease in average securities â‘ Liability portion of balance sheet (3Q24 vs 2Q24)â–ª Cost of deposits were flatâ–ª -5 bp decrease on rate of other borrowings â‘ Remaining balance of purchase accounting accretion at 9/30/24 was $9.0 million
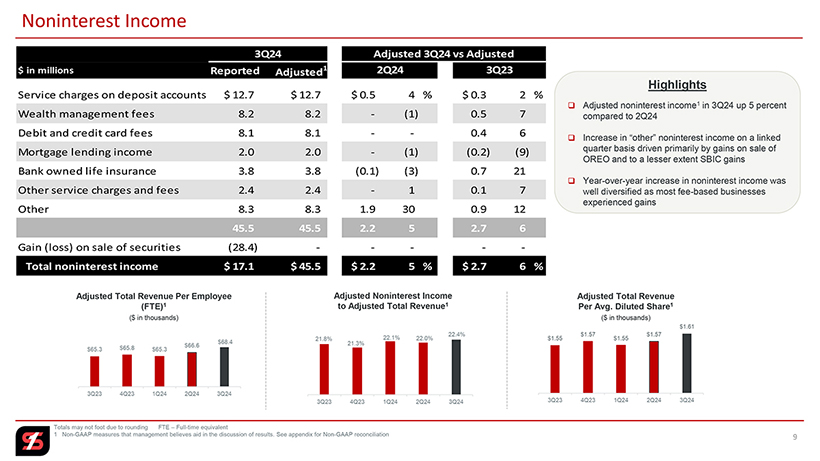
Noninterest Income 3Q24 $ in millions Reported Adjusted1 Service charges on deposit accounts $ 12.7 $ 12.7 Wealth management fees 8.2 8.2 Debit and credit card fees 8.1 8.1 Mortgage lending income 2.0 2.0 Bank owned life insurance 3.8 3.8 Other service charges and fees 2.4 2.4 Other 8.3 8.3 45.5 45.5 Gain (loss) on sale of securities (28.4)— Total noninterest income $ 17.1 $ 45.5 Adjusted 3Q24 vs Adjusted 2Q24 Adjusted 3Q24 vs Adjusted 3Q23 $ 0.5 4 % $ 0.3 2 % —(1) 0.5 7 — 0.4 6 —(1) (0.2) (9) (0.1) (3) 0.7 21 —1 0.1 7 1.9 30 0.9 12 2.2 5 2.7 6 — — $ 2.2 5 % $ 2.7 6 % Adjusted Total Revenue Per Employee (FTE)1 ($ in thousands) $65.3 $65.8 $65.3 $66.6 $68.4 3Q23 4Q23 1Q24 2Q24 3Q24 Adjusted Noninterest Income to Adjusted Total Revenue1 21.8% 21.3% 22.1% 22.0% 22.4% 3Q23 4Q23 1Q24 2Q24 3Q24 Adjusted Total Revenue Per Avg. Diluted Share1 ($ in thousands) $1.55 $1.57 $1.55 $1.57 $1.61 3Q23 4Q23 1Q24 2Q24 3Q24 Totals may not foot due to rounding FTE – Full-time equivalent 1 Non-GAAP measures that management believes aid in the discussion of results. See appendix for Non-GAAP reconciliation 9
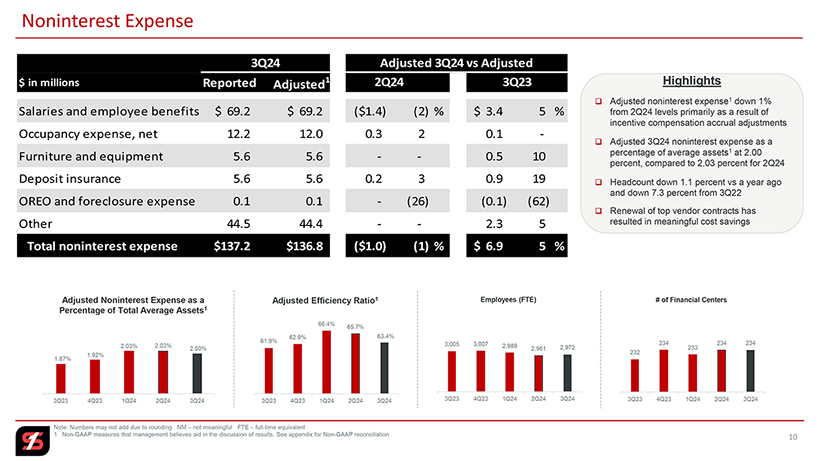
$ in millions Reported Adjusted1 Salaries and employee benefits $ 69.2 $ 69.2 ($1.4) (2) % $ 3.4 5 % Occupancy expense, net 12.2 12.0 0.3 2 0.1—Furniture and equipment 5.6 5.6 — 0.5 10 Deposit insurance 5.6 5.6 0.2 3 0.9 19 OREO and foreclosure expense 0.1 0.1—(26) (0.1) (62) Other 44.5 44.4 — 2.3 5 Total noninterest expense $137.2 $136.8 ($1.0) (1) % $ 6.9 5 % 3Q24 Adjusted 3Q24 vs Adjusted 2Q24 3Q23 3,005 3,007 2,989 2,961 2,972 3Q23 4Q23 1Q24 2Q24 3Q24 Employees (FTE) 61.9% 62.9% 66.4% 65.7% 63.4% 3Q23 4Q23 1Q24 2Q24 3Q24 Adjusted Efficiency Ratio1 1.87% 1.92% 2.03% 2.03% 2.00% 3Q23 4Q23 1Q24 2Q24 3Q24 Adjusted Noninterest Expense as a Percentage of Total Average Assets1 10 Noninterest Expense Note: Numbers may not add due to rounding NM – not meaningful FTE – full-time equivalent 1 Non-GAAP measures that management believes aid in the discussion of results. See appendix for Non-GAAP reconciliation 232 234 233 234 234 3Q23 4Q23 1Q24 2Q24 3Q24 # of Financial Centers Highlights â‘ Adjusted noninterest expense1 down 1% from 2Q24 levels primarily as a result of incentive compensation accrual adjustments â‘ Adjusted 3Q24 noninterest expense as a percentage of average assets1 at 2.00 percent, compared to 2.03 percent for 2Q24 â‘ Headcount down 1.1 percent vs a year ago and down 7.3 percent from 3Q22 â‘ Renewal of top vendor contracts has resulted in meaningful cost savings 10

Deposits, Securities, Liquidity, Interest Rate Sensitivity and Capital simmons first national corporation
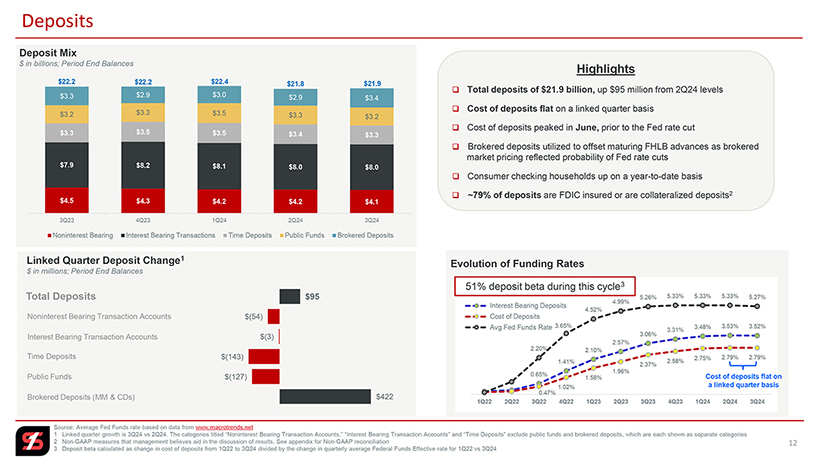
Deposits Deposit Mix $ in billions; Period End Balances $22.2 $22.2 $22.4 $21.8 $21.9 $3.3 $2.9 $3.0 $2.9 $3.4 $3.2 $3.3 $3.5 $3.3 $3.2 $3.3 $3.5 $3.5 $3.4 $3.3 $7.9 $8.2 $8.1 $8.0 $8.0 $4.5 $4.3 $4.2 $4.2 $4.1 3Q23 4Q23 1Q24 2Q24 3Q24 Noninterest Bearing Interest Bearing Transactions Time Deposits Public Funds Brokered Deposits Highlights Total deposits of $21.9 billion, up $95 million from 2Q24 levels Cost of deposits flat on a linked quarter basis Cost of deposits peaked in June, prior to the Fed rate cut Brokered deposits utilized to offset maturing FHLB advances as brokered market pricing reflected probability of Fed rate cuts Consumer checking households up on a year-to-date basis ~79% of deposits are FDIC insured or are collateralized deposits2 Linked Quarter Deposit Change1 $ in millions; Period End Balances Total Deposits $95 Noninterest Bearing Transaction Accounts $(54) Interest Bearing Transaction Accounts $(3) Time Deposits $(143) Public Funds $(127) Brokered Deposits (MM & CDs) $422 Evolution of Funding Rates 51% deposit beta during this cycle3 5.26% 5.33% 5.33% 5.33% 5.27% 4.99% Interest Bearing Deposits 4.52% Cost of Deposits Avg Fed Funds Rate 3.65% 3.48% 3.53% 3.52% 3.31% 3.06% 2.57% 2.20% 2.10% 2.75% 2.79% 2.79% 1.41% 2.58% 2.37% 1.96% 0.65% Cost of deposits flat on 1.58% 1.02% a linked quarter basis 0.47% 1Q22 2Q22 3Q22 4Q22 1Q23 2Q23 3Q23 4Q23 1Q24 2Q24 3Q24 Source: Average Fed Funds rate based on data from www.macrotrends.net 1 Linked quarter growth is 3Q24 vs 2Q24. The categories titled “Noninterest Bearing Transaction Accounts,” “Interest Bearing Transaction Accounts” and “Time Deposits” exclude public funds and brokered deposits, which are each shown as separate categories 2 Non-GAAP measures that management believes aid in the discussion of results. See appendix for Non-GAAP reconciliation 12 3 Deposit beta calculated as change in cost of deposits from 1Q22 to 3Q24 divided by the change in quarterly average Federal Funds Effective rate for 1Q22 vs 3Q24
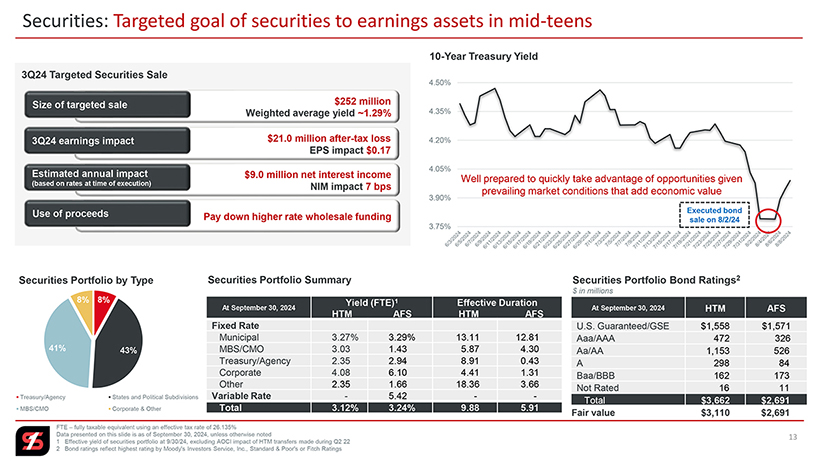
Securities: Targeted goal of securities to earnings assets in mid-teens 3Q24 Targeted Securities Sale Size of targeted sale $252 million Weighted average yield ~1.29% 3Q24 earnings impact $21.0 million after-tax loss EPS impact $0.17 Estimated annual impact $9.0 million net interest income (based on rates at time of execution) NIM impact 7 bps Use of proceeds Pay down higher rate wholesale funding 10-Year Treasury Yield 4.50% 4.35% 4.20% 4.05% Well prepared to quickly take advantage of opportunities given prevailing market conditions that add economic value 3.90% Executed bond 3.75% sale on 8/2/24 Securities Portfolio by Type 8% 8% 41% 43% Treasury/Agency States and Political Subdivisions MBS/CMO Corporate & Other Securities Portfolio Summary Securities Portfolio Bond Ratings2 $ in millions Yield (FTE)1 Effective Duration At September 30, 2024 At September 30, 2024 HTM AFS HTM AFS HTM AFS Fixed Rate U.S. Guaranteed/GSE $1,558 $1,571 Municipal 3.27% 3.29% 13.11 12.81 Aaa/AAA 472 326 MBS/CMO 3.03 1.43 5.87 4.30 Aa/AA 1,153 526 Treasury/Agency 2.35 2.94 8.91 0.43 A 298 84 Corporate 4.08 6.10 4.41 1.31 Baa/BBB 162 173 Other 2.35 1.66 18.36 3.66 Not Rated 16 11 Variable Rate—5.42 — Total $3,662 $2,691 Total 3.12% 3.24% 9.88 5.91 Fair value $3,110 $2,691 FTE – fully taxable equivalent using an effective tax rate of 26.135% Data presented on this slide is as of September 30, 2024, unless otherwise noted 1 Effective yield of securities portfolio at 9/30/24, excluding AOCI impact of HTM transfers made during Q2 22 2 Bond ratings reflect highest rating by Moody’s Investors Service, Inc., Standard & Poor’s or Fitch Ratings6/3/2024 6/5/2024 6/7/2024 6/9/2024 6/11 2024 6/13/2024 6/15/2024 6/17/2024 6/19/2024 6/21/2024 6/23/2024 6/25/2024 6/27/2024 6/29/2024 7/1/2024 7/3/2024 7/5/2024 7/7/2024/7/9/2024 7/11/2024 7/13/2024 7/15/2024 7/17/2024 7/19/2024 7/21/2024 7/23/2024 7/25/2024 7/27/2024 7/29/2024 7/31/2024 8/2/2024 8/4/2024 8/6/2024 8/8/2024 13
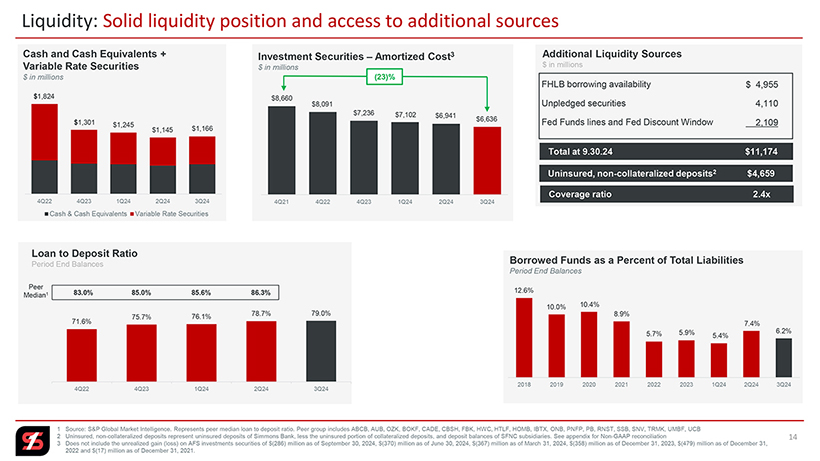
Liquidity: Solid liquidity position and access to additional sources Cash and Cash Equivalents + Variable Rate Securities $ in millions $1,824 $1,301 $1,245 $1,166 $1,145 4Q22 4Q23 1Q24 2Q24 3Q24 Cash & Cash Equivalents Variable Rate Securities Investment Securities – Amortized Cost3 $ in millions (23)% $8,660 $8,091 $7,236 $7,102 $6,941 $6,636 4Q21 4Q22 4Q23 1Q24 2Q24 3Q24 Additional Liquidity Sources $ in millions FHLB borrowing availability $ 4,955 Unpledged securities 4,110 Fed Funds lines and Fed Discount Window 2,109 Total at 9.30.24 $11,174 Uninsured, non-collateralized deposits2 $4,659 Coverage ratio 2.4x Loan to Deposit Ratio Period End Balances Peer 83.0% 85.0% 85.6% 86.3% Median1 78.7% 79.0% 75.7% 76.1% 71.6% 4Q22 4Q23 1Q24 2Q24 3Q24 Borrowed Funds as a Percent of Total Liabilities Period End Balances 12.6% 10.0% 10.4% 8.9% 7.4% 5.7% 5.9% 6.2% 5.4% 2018 2019 2020 2021 2022 2023 1Q24 2Q24 3Q24 1 Source: S&P Global Market Intelligence. Represents peer median loan to deposit ratio. Peer group includes ABCB, AUB, OZK, BOKF, CADE, CBSH, FBK, HWC, HTLF, HOMB, IBTX, ONB, PNFP, PB, RNST, SSB, SNV, TRMK, UMBF, UCB 2 Uninsured, non-collateralized deposits represent uninsured deposits of Simmons Bank, less the uninsured portion of collateralized deposits, and deposit balances of SFNC subsidiaries. See appendix for Non-GAAP reconciliation 14 3 Does not include the unrealized gain (loss) on AFS investments securities of $(286) million as of September 30, 2024, $(370) million as of June 30, 2024, $(367) million as of March 31, 2024, $(358) million as of December 31, 2023, $(479) million as of December 31, 2022 and $(17) million as of December 31, 2021.
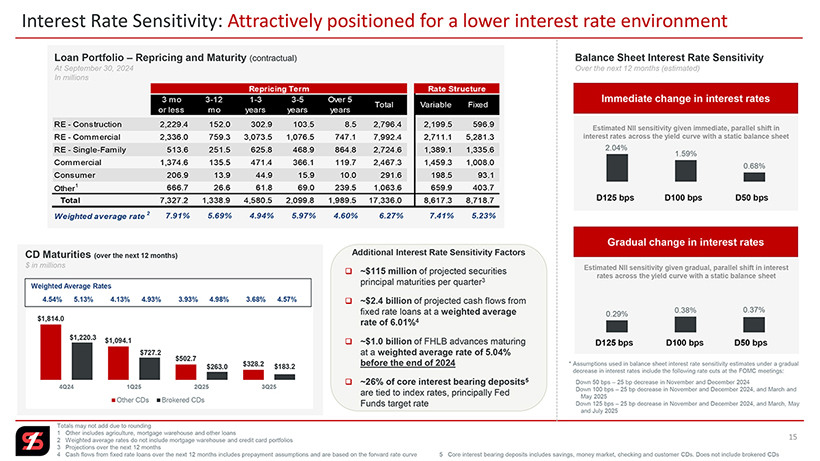
Interest Rate Sensitivity: Attractively positioned for a lower interest rate environment Loan Portfolio – Repricing and Maturity (contractual) At September 30, 2024 In millions Repricing Term Rate Structure 3 mo 3-12 1-3 3-5 Over 5 Total Variable Fixed or less mo years years years RE—Construction 2,229.4 152.0 302.9 103.5 8.5 2,796.4 2,199.5 596.9 RE—Commercial 2,336.0 759.3 3,073.5 1,076.5 747.1 7,992.4 2,711.1 5,281.3 RE—Single-Family 513.6 251.5 625.8 468.9 864.8 2,724.6 1,389.1 1,335.6 Commercial 1,374.6 135.5 471.4 366.1 119.7 2,467.3 1,459.3 1,008.0 Consumer 206.9 13.9 44.9 15.9 10.0 291.6 198.5 93.1 Other1 666.7 26.6 61.8 69.0 239.5 1,063.6 659.9 403.7 Total 7,327.2 1,338.9 4,580.5 2,099.8 1,989.5 17,336.0 8,617.3 8,718.7 Weighted average rate 2 7.91% 5.69% 4.94% 5.97% 4.60% 6.27% 7.41% 5.23% CD Maturities (over the next 12 months) $ in millions Weighted Average Rates 4.54% 5.13% 4.13% 4.93% 3.93% 4.98% 3.68% 4.57% $1,814.0 $1,220.3 $1,094.1 $727.2 $502.7 $263.0 $328.2 $183.2 4Q24 1Q25 2Q25 3Q25 Other CDs Brokered CDs Additional Interest Rate Sensitivity Factors ~$115 million of projected securities principal maturities per quarter3 ~$2.4 billion of projected cash flows from fixed rate loans at a weighted average rate of 6.01%4 ~$1.0 billion of FHLB advances maturing at a weighted average rate of 5.04% before the end of 2024 ~26% of core interest bearing deposits5 are tied to index rates, principally Fed Funds target rate Balance Sheet Interest Rate Sensitivity Over the next 12 months (estimated) Immediate change in interest rates Estimated NII sensitivity given immediate, parallel shift in interest rates across the yield curve with a static balance sheet 2.04% 1.59% 0.68% D125 bps D100 bps D50 bps Gradual change in interest rates Estimated NII sensitivity given gradual, parallel shift in interest rates across the yield curve with a static balance sheet 0.38% 0.37% 0.29% D125 bps D100 bps D50 bps * Assumptions used in balance sheet interest rate sensitivity estimates under a gradual decrease in interest rates include the following rate cuts at the FOMC meetings: Down 50 bps – 25 bp decrease in November and December 2024 Down 100 bps – 25 bp decrease in November and December 2024, and March and May 2025 Down 125 bps – 25 bp decrease in November and December 2024, and March, May and July 2025 Totals may not add due to rounding 1 Other includes agriculture, mortgage warehouse and other loans 2 Weighted average rates do not include mortgage warehouse and credit card portfolios 15 3 Projections over the next 12 months 4 Cash flows from fixed rate loans over the next 12 months includes prepayment assumptions and are based on the forward rate curve 5 Core interest bearing deposits includes savings, money market, checking and customer CDs. Does not include brokered CDs
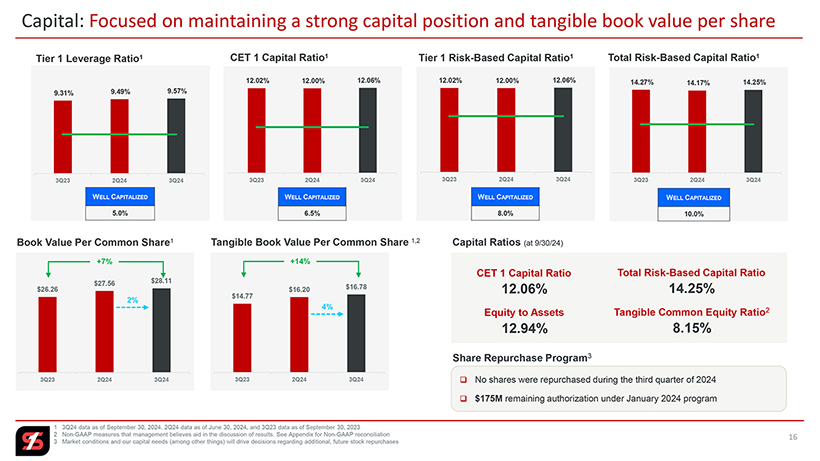
Capital: Focused on maintaining a strong capital position and tangible book value per share Tier 1 Leverage Ratio1 CET 1 Capital Ratio1 Tier 1 Risk-Based Capital Ratio1 Total Risk-Based Capital Ratio1 12.02% 12.00% 12.06% 12.02% 12.00% 12.06% 14.27% 14.17% 14.25% 9.31% 9.49% 9.57% 3Q23 2Q24 3Q24 3Q23 2Q24 3Q24 3Q23 2Q24 3Q24 3Q23 2Q24 3Q24 WELL CAPITALIZED WELL CAPITALIZED WELL CAPITALIZED WELL CAPITALIZED 5.0% 6.5% 8.0% 10.0% Book Value Per Common Share1 Tangible Book Value Per Common Share 1,2 +7% +14% $27.56 $28.11 $16.78 $26.26 $16.20 $14.77 2% 4% 3Q23 2Q24 3Q24 3Q23 2Q24 3Q24 Capital Ratios (at 9/30/24) CET 1 Capital Ratio Total Risk-Based Capital Ratio 12.06% 14.25% Equity to Assets Tangible Common Equity Ratio2 12.94% 8.15% Share Repurchase Program3 No shares were repurchased during the third quarter of 2024 $175M remaining authorization under January 2024 program 1 3Q24 data as of September 30, 2024, 2Q24 data as of June 30, 2024, and 3Q23 data as of September 30, 2023 2 Non-GAAP measures that management believes aid in the discussion of results. See Appendix for Non-GAAP reconciliation 3 Market conditions and our capital needs (among other things) will drive decisions regarding additional, future stock repurchases
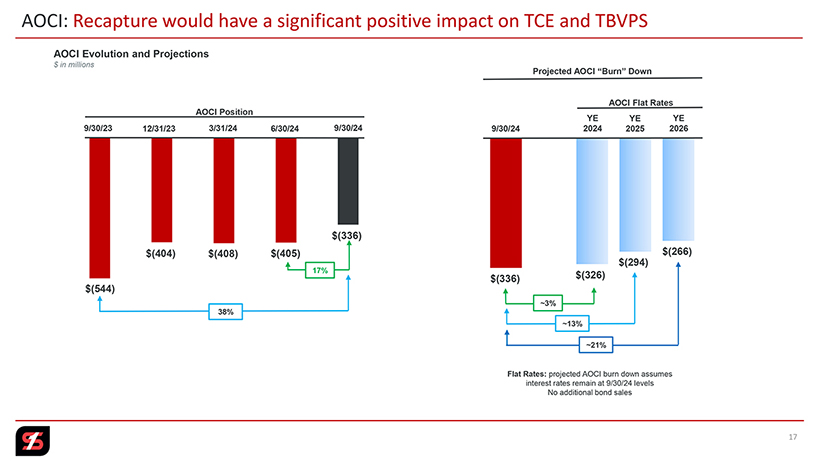
AOCI: Recapture would have a significant positive impact on TCE and TBVPS AOCI Evolution and Projections $ in millions AOCI Position 9/30/23 12/31/23 3/31/24 6/30/24 9/30/24 $(336) $(404) $(408) $(405) 17% $(544) 38% Projected AOCI “Burn” Down AOCI Flat Rates YE YE YE 9/30/24 2024 2025 2026 $(266) $(294) $(336) $(326) ~3% ~13% ~21% Flat Rates: projected AOCI burn down assumes interest rates remain at 9/30/24 levels No additional bond sales

Loan Portfolio simmons first national corporation
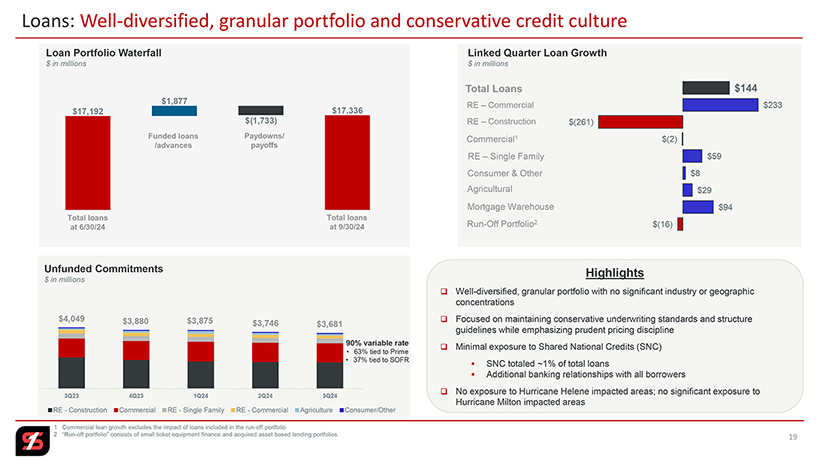
Loans: Well-diversified, granular portfolio and conservative credit culture Loan Portfolio Waterfall $ in millions Funded loans Paydowns/ /advances payoffs Total loans Total loans at 6/30/24 at 9/30/24 $17,192 $1,877 $(1,733) $17,336 Unfunded Commitments $ in millions $4,049 $3,880 $3,875 $3,746 $3,681 90% variable rate • 63% tied to Prime • 37% tied to SOFR 3Q23 4Q23 1Q24 2Q24 3Q24 RE—Construction Commercial RE—Single Family RE—Commercial Agriculture Consumer/Other Linked Quarter Loan Growth $ in millions Total Loans $144 RE – Commercial $233 RE – Construction $(261) Commercial1 $(2) RE – Single Family $59 Consumer & Other $8 Agricultural $29 Mortgage Warehouse $94 Run-Off Portfolio2 $(16) Highlights Well-diversified, granular portfolio with no significant industry or geographic concentrations Focused on maintaining conservative underwriting standards and structure guidelines while emphasizing prudent pricing discipline Minimal exposure to Shared National Credits (SNC) SNC totaled ~1% of total loans Additional banking relationships with all borrowers No exposure to Hurricane Helene impacted areas; no significant exposure to Hurricane Milton impacted areas 1 Commercial loan growth excludes the impact of loans included in the run-off portfolio 2 “Run-off portfolio” consists of small ticket equipment finance and acquired asset based lending portfolios 19
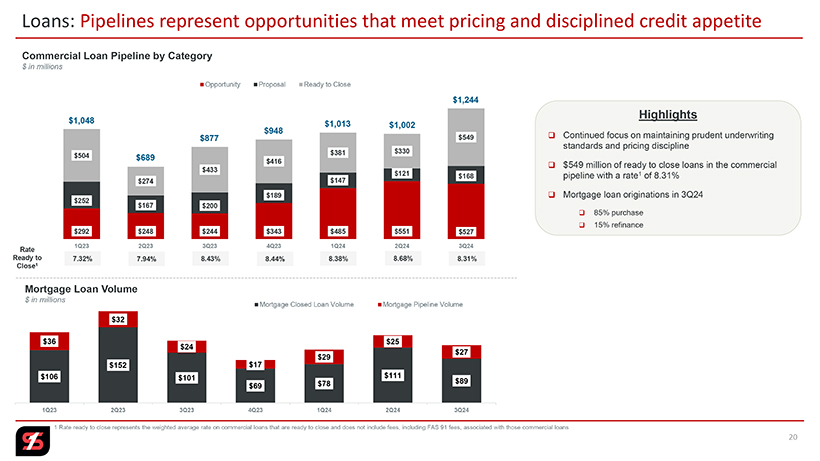
Loans: Pipelines represent opportunities that meet pricing and disciplined credit appetite Commercial Loan Pipeline by Category $ in millions Opportunity Proposal Ready to Close $1,244 $1,048 $1,013 $1,002 $877 $948 $549 $381 $330 $504 $689 $416 $433 $121 $168 $274 $147 $189 $252 $167 $200 $292 $248 $244 $343 $485 $551 $527 1Q23 2Q23 3Q23 4Q23 1Q24 2Q24 3Q24 Rate Ready to 7.32% 7.94% 8.43% 8.44% 8.38% 8.68% 8.31% Close1 Mortgage Loan Volume $ in millions Mortgage Closed Loan Volume Mortgage Pipeline Volume $32 $36 $25 $24 $27 $29 $152 $17 $106 $101 $111 $78 $89 $69 1Q23 2Q23 3Q23 4Q23 1Q24 2Q24 3Q24 Highlights Continued focus on maintaining prudent underwriting standards and pricing discipline $549 million of ready to close loans in the commercial pipeline with a rate1 of 8.31% Mortgage loan originations in 3Q24 85% purchase 15% refinance 1 Rate ready to close represents the weighted average rate on commercial loans that are ready to close and does not include fees, including FAS 91 fees, associated with those commercial loans 20
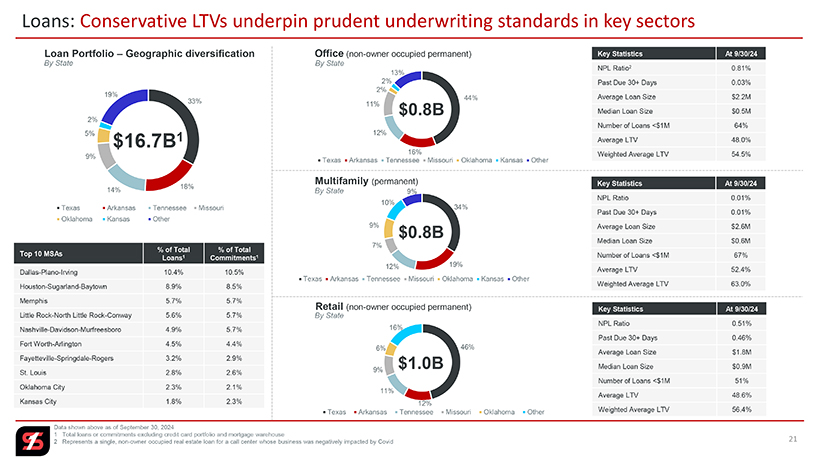
Loans: Conservative LTVs underpin prudent underwriting standards in key sectors Loan Portfolio – Geographic diversification Office (non-owner occupied permanent) Key Statistics At 9/30/24 By State By State NPL Ratio2 0.81% 13% 2% Past Due 30+ Days 0.03% 2% 19% Average Loan Size $2.2M 44% 33% 11% $0.8B Median Loan Size $0.5M 2% Number of Loans <$1M 64% 5% 1 12% $16.7B Average LTV 48.0% 16% Weighted Average LTV 54.5% 9% Texas Arkansas Tennessee Missouri Oklahoma Kansas Other Multifamily (permanent) Key Statistics At 9/30/24 18% 14% By State 9% NPL Ratio 0.01% 10% Texas Arkansas Tennessee Missouri 34% Past Due 30+ Days 0.01% Oklahoma Kansas Other 9% $0.8B Average Loan Size $2.6M Median Loan Size $0.6M 7% % of Total % of Total Top 10 MSAs Number of Loans <$1M 67% Loans1 Commitments1 12% 19% Dallas-Plano-Irving 10.4% 10.5% Average LTV 52.4% Texas Arkansas Tennessee Missouri Oklahoma Kansas Other Houston-Sugarland-Baytown 8.9% 8.5% Weighted Average LTV 63.0% Memphis 5.7% 5.7% Retail (non-owner occupied permanent) Key Statistics At 9/30/24 Little Rock-North Little Rock-Conway 5.6% 5.7% By State NPL Ratio 0.51% Nashville-Davidson-Murfreesboro 4.9% 5.7% 16% Fort Worth-Arlington 4.5% 4.4% Past Due 30+ Days 0.46% 6% 46% Fayetteville-Springdale-Rogers 3.2% 2.9% Average Loan Size $1.8M $1.0B Median Loan Size $0.9M St. Louis 2.8% 2.6% 9% Oklahoma City 2.3% 2.1% Number of Loans <$1M 51% 11% Kansas City 1.8% 2.3% Average LTV 48.6% 12% Weighted Average LTV 56.4% Texas Arkansas Tennessee Missouri Oklahoma Other Data shown above as of September 30, 2024 1 Total loans or commitments excluding credit card portfolio and mortgage warehouse 2 Represents a single, non-owner occupied real estate loan for a call center whose business was negatively impacted by Covid 21
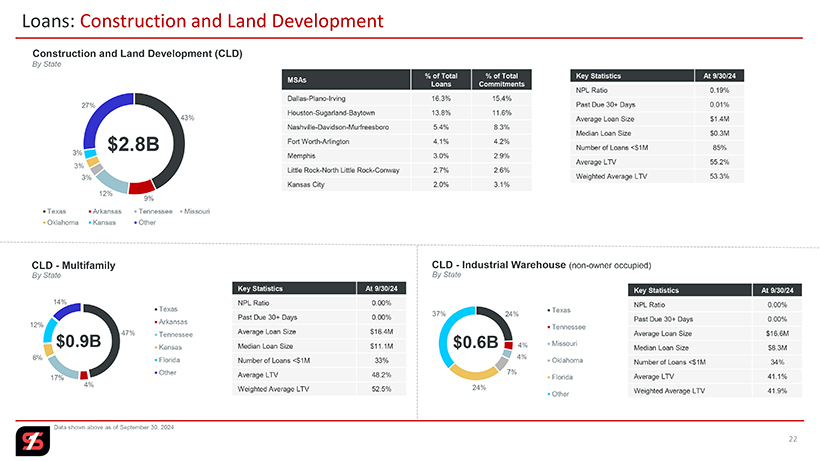
Loans: Construction and Land Development Construction and Land Development (CLD) By State % of Total % of Total Key Statistics At 9/30/24 MSAs Loans Commitments NPL Ratio 0.19% Dallas-Plano-Irving 16.3% 15.4% Past Due 30+ Days 0.01% 27% Houston-Sugarland-Baytown 13.8% 11.6% 43% Average Loan Size $1.4M Nashville-Davidson-Murfreesboro 5.4% 8.3% Median Loan Size $0.3M $2.8B Fort Worth-Arlington 4.1% 4.2% Number of Loans <$1M 85% 3% Memphis 3.0% 2.9% Average LTV 55.2% 3% Little Rock-North Little Rock-Conway 2.7% 2.6% Weighted Average LTV 53.3% 3% Kansas City 2.0% 3.1% 12% 9% Texas Arkansas Tennessee Missouri Oklahoma Kansas Other CLD—Multifamily CLD—Industrial Warehouse (non-owner occupied) By State By State Key Statistics At 9/30/24 Key Statistics At 9/30/24 14% NPL Ratio 0.00% NPL Ratio 0.00% Texas Texas 37% 24% Past Due 30+ Days 0.00% Past Due 30+ Days 0.00% Arkansas 12% Tennessee 47% Tennessee Average Loan Size $16.4M Average Loan Size $16.6M $0.9B Median Loan Size $11.1M $0.6B 4% Missouri Kansas Median Loan Size $8.3M 6% 4% Florida Number of Loans <$1M 33% Oklahoma Number of Loans <$1M 34% Other Average LTV 48.2% 7% 17% Florida Average LTV 41.1% 4% 24% Weighted Average LTV 52.5% Weighted Average LTV 41.9% Other Data shown above as of September 30, 2024 22
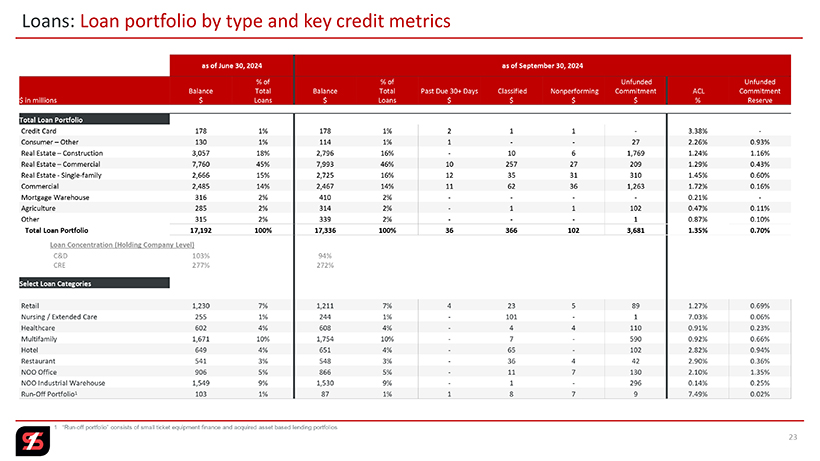
Loans: Loan portfolio by type and key credit metrics as of June 30, 2024 as of September 30, 2024 % of % of Unfunded Unfunded Balance Total Balance Total Past Due 30+ Days Classified Nonperforming Commitment ACL Commitment $ in millions $ Loans $ Loans $ $ $ $ % Reserve Total Loan Portfolio Credit Card 178 1% 178 1% 2 1 1—3.38% -Consumer – Other 130 1% 114 1% 1 — 27 2.26% 0.93% Real Estate – Construction 3,057 18% 2,796 16%—10 6 1,769 1.24% 1.16% Real Estate – Commercial 7,760 45% 7,993 46% 10 257 27 209 1.29% 0.43% Real Estate—Single-family 2,666 15% 2,725 16% 12 35 31 310 1.45% 0.60% Commercial 2,485 14% 2,467 14% 11 62 36 1,263 1.72% 0.16% Mortgage Warehouse 316 2% 410 2% — — 0.21% -Agriculture 285 2% 314 2%—1 1 102 0.47% 0.11% Other 315 2% 339 2% ——1 0.87% 0.10% Total Loan Portfolio 17,192 100% 17,336 100% 36 366 102 3,681 1.35% 0.70% Loan Concentration (Holding Company Level) C&D 103% 94% CRE 277% 272% Select Loan Categories Retail 1,230 7% 1,211 7% 4 23 5 89 1.27% 0.69% Nursing / Extended Care 255 1% 244 1%—101—1 7.03% 0.06% Healthcare 602 4% 608 4%—4 4 110 0.91% 0.23% Multifamily 1,671 10% 1,754 10%—7—590 0.92% 0.66% Hotel 649 4% 651 4%—65—102 2.82% 0.94% Restaurant 541 3% 548 3%—36 4 42 2.90% 0.36% NOO Office 906 5% 866 5%—11 7 130 2.10% 1.35% NOO Industrial Warehouse 1,549 9% 1,530 9%—1—296 0.14% 0.25% Run-Off Portfolio1 103 1% 87 1% 1 8 7 9 7.49% 0.02% 1 “Run-off portfolio” consists of small ticket equipment finance and acquired asset based lending portfolios 23

Simmons first national corporation Credit Quality
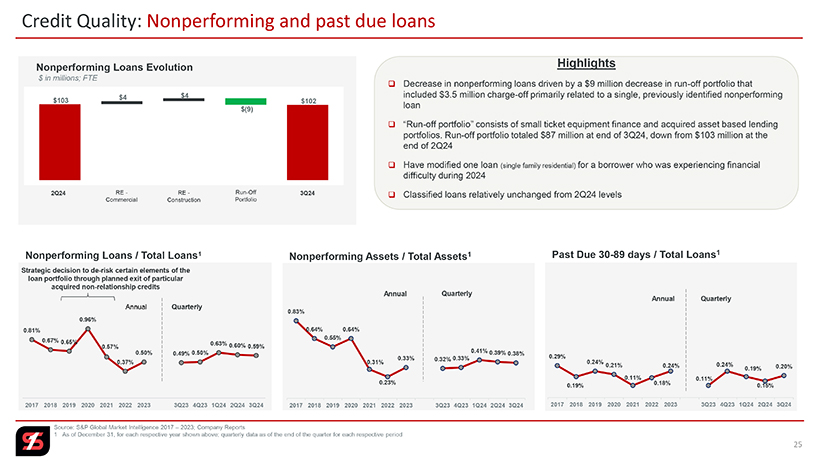
Credit Quality: Nonperforming and past due loans Nonperforming Loans Evolution Highlights $ in millions; FTE Decrease in nonperforming loans driven by a $9 million decrease in run-off portfolio that included $3.5 million charge-off primarily related to a single, previously identified nonperforming loan “Run-off portfolio” consists of small ticket equipment finance and acquired asset based lending portfolios. Run-off portfolio totaled $87 million at end of 3Q24, down from $103 million at the end of 2Q24 Have modified one loan (single family residential) for a borrower who was experiencing financial difficulty during 2024 2Q24 RE—RE—Run-Off 3Q24 Classified loans relatively unchanged from 2Q24 levels Commercial Construction Portfolio Nonperforming Loans / Total Loans1 Nonperforming Assets / Total Assets1 Past Due 30-89 days / Total Loans1 Strategic decision to de-risk certain elements of the loan portfolio through planned exit of particular acquired non-relationship credits Annual Quarterly Annual Quarterly Annual Quarterly 0.83% 0.96% 0.81% 0.64% 0.64% 0.55% 0.67% 0.65% 0.63% 0.60% 0.57% 0.59% 0.50% 0.50% 0.41% 0.39% 0.49% 0.38% 0.33% 0.33% 0.29% 0.32% 0.37% 0.31% 0.24% 0.21% 0.24% 0.24% 0.20% 0.19% 0.11% 0.11% 0.23% 0.18% 0.19% 0.15% 2017 2018 2019 2020 2021 2022 2023 3Q23 4Q23 1Q24 2Q24 3Q24 2017 2018 2019 2020 2021 2022 2023 3Q23 4Q23 1Q24 2Q24 3Q24 2017 2018 2019 2020 2021 2022 2023 3Q23 4Q23 1Q24 2Q24 3Q24 Source: S&P Global Market Intelligence 2017 – 2023; Company Reports 1 As of December 31, for each respective year shown above; quarterly data as of the end of the quarter for each respective period 25
Credit Quality: Loan loss provision and net charge-offs Net Charge-Offs to Average Loans1 Highlights Annual Quarterly Provision for credit losses on loans exceeded net charge-offs by $2.8 million during 3Q24 NCO ratio of 22 bps in 3Q24; 9 bps associated with run-off portfolio and 3 bps associated 0.45% with credit card portfolio 0.31% 0.24% 0.28% 0.21% 0.19% 0.22% 0.19% 9 bps of NCO ACL to total loans ended 3Q24 at 1.35%, up 1 bp from 2Q24 levels 0.12% 0.09% ratio associated 0.13% with run-off 0.11% portfolio 2017 2018 2019 2020 2021 2022 2023 3Q23 4Q23 1Q24 2Q24 3Q24 Loan Loss Provision and Net Charge-Offs $ in millions Credit Card Portfolio Net Charge-Off Ratio1 $20.2 Annual Quarterly 3.23% 2.88% 2.49% 2.15% 2.19% $11.6 $12.1 1.61% 1.64% 1.86% 2.50% $11.2 $11.1 1.60% $10.2 1.40% 1.44% $8.1 $9.3 $8.1 $3.5 million of $4.5 net charge-offs associated with 2017 2018 2019 2020 2021 2022 2023 3Q23 4Q23 1Q24 2Q24 3Q24 run-off portfolio 3Q23 4Q23 1Q24 2Q24 3Q24 Key Credit Metrics: Average FICO Scores 751 Provision for credit losses on loans Net Charge-Offs Balance Weighted Average FICO Score 744 Line Utilization 18% Source: S&P Global Market Intelligence 2017 – 2023 1 Net charge-offs to average loans for the full-year for each respective year shown above; quarterly annualized data for each respective quarter 26
ACL: Reflects current economic forecast and composition of loan portfolio ACL / Loans (%) and ACL ($)1 $ in millions Allowance for Credit Losses on Loans and Loan Coverage $250 1.85% 2.00% 1.52% 1.71% ACL / $225 1.80% ACL $200 1.60% Loans 1.34% 1.34% 1.35% $ in millions 1.34% $175 1.22% 1.40% $150 1.20% ACL as of 6/30/23 $ 210.0 1.25% $125 1.00% $100 0.80% 3Q23 Provision 20.2 $75 0.60% 3Q23 Net Charge-Offs (11.7) $50 0.40% ACL as of 9/30/23 $ 218.5 1.30% $25 $220 $238 $205 $197 $225 $227 $230 $233 0.20% $0 0.00% 4Q23 Provision 11.2 1/1/20 CECL 2020 2021 2022 2023 1Q24 2Q24 3Q24 Adoption 4Q23 Net Charge-Offs (4.5) ACL as of 12/31/23 $ 225.2 1.34% ACL METHODOLOGY AS OF 9/30/24: Moody’s September 2024 scenarios with management’s weighting: 1Q24 Provision 10.2 Baseline (75%) / S1 (15%) / S3 (10%) 1Q24 Net Charge-Offs (8.0) Total credit coverage / total commitments: 1.23% ACL as of 3/31/24 $ 227.4 1.34% 2Q24 Provision 11.1 Reserve for Unfunded Commitments 2Q24 Net Charge-Offs (8.1) As of As of As of As of As of $ in millions 9/30/23 12/31/23 3/31/24 6/30/24 9/30/24 ACL as of 6/30/24 $ 230.4 1.34% Unfunded Commitments $4,049 $3,880 $3,875 $3,746 $3,681 3Q24 Provision 12.1 3Q24 Net Charge-Offs (9.3) Reserve for Unfunded Commitments $25.6 $25.6 $25.6 $25.6 $25.6 Provision for Unfunded Commitments $(11.3) — — ACL as of 9/30/24 $ 233.2 1.35% Reserve / Unfunded Balance 0.63% 0.66% 0.66% 0.68% 0.70% Note: Numbers may not add due to rounding ACL – Allowance for Credit Losses on Loans 1 As of December 31, for each respective year shown above; quarterly data as of the end of the quarter for each respective period 27

Simmons first national corporation Appendix
Select Balance Sheet and Other Data 3Q24 vs 2Q24 3Q24 vs 3Q23 $ in millions, except per share data 3Q24 2Q24 3Q23 $ Change % Change $ Change % Change Period End Balances Total loans $17,336.0 $17,192.4 $16,771.9 $143.6 1 % $564.2 3 % Investment securities 6,349.8 6,571.4 7,100.7 (221.6) (3) (750.9) (11) Total assets 27,269.4 27,369.1 27,564.3 (99.7)— (294.9) (1) Total deposits 21,935.4 21,840.9 22,231.2 94.6— (295.8) (1) Borrowed funds 1,463.2 1,765.3 1,788.4 (302.1) (17) (325.2) (18) Total stockholders’ equity 3,528.8 3,458.9 3,285.6 70.0 2 243.3 7 Average Balances Total loans $17,208.2 $17,101.8 $16,758.6 $106.4 1 % $449.6 3 % Investment securities 6,444.5 6,632.5 7,255.6 (188.0) (3) (811.2) (11) Total assets 27,216.4 27,305.3 27,594.6 (88.8)— (378.2) (1) Total deposits 21,717.4 22,045.5 22,273.5 (328.1) (1) (556.1) (2) Borrowed funds 1,670.5 1,528.5 1,678.4 142.0 9 (7.9)— Total stockholders’ equity 3,505.1 3,451.2 3,371.7 54.0 2 133.5 4 Select Other Data Equity to assets 12.94 % 12.64 % 11.92 % Tangible common equity to tangible assets1 8.15 7.84 7.07 Book value per share $28.11 $27.56 $26.26 $0.55 2 % $1.85 7 % Tangible book value per share1 16.78 16.20 14.77 0.58 4 2.01 14 Allowance for credit losses to total loans 1.35 % 1.34 % 1.30 % Nonperforming loan coverage ratio 229 223 267 1 Non-GAAP measures that management believes aid in the discussion of results. See appendix for Non-GAAP reconciliation 29
Income Summary 3Q24 Adjusted 3Q24 vs Adjusted $ in millions, except per share data Reported Adjusted1 2Q24 3Q23 Net interest income $157.7 $157.7 $3.8 2 % $4.3 3 % Noninterest income 17.1 45.5 2.2 5 2.7 6 Total revenue 174.8 203.2 6.0 3 7.0 4 Noninterest expense 137.2 136.8 (1.0) (1) 6.9 5 Pre-provision net revenue2 37.6 66.4 7.1 12 0.1— Provision for credit losses on loans 12.1 12.1 1.0 9 4.4 NM Provision for income taxes 0.8 8.3 1.9 30 (1.5) (15) Earnings $ 24.7 $ 46.0 $ 4.1 10 % $(2.8) (6) % Diluted EPS $ 0.20 $ 0.37 $0.04 12 % $(0.02) (5) % Totals may not foot due to rounding NM – Not meaningful 1 Non-GAAP measures that management believes aid in the discussion of results. See appendix for Non-GAAP reconciliation 30 2 All pre-provision net revenue (PPNR) figures set forth in this row are Non-GAAP measures. See footnote 1 for more information
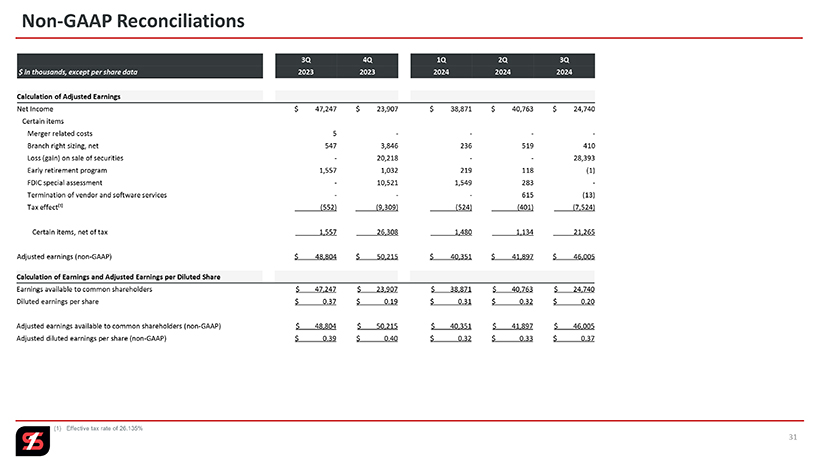
Non-GAAP Reconciliations 3Q 4Q 1Q 2Q 3Q $ in thousands, except per share data 2023 2023 2024 2024 2024 Calculation of Adjusted Earnings Net Income $ 47,247 $ 23,907 $ 38,871 $ 40,763 $ 24,740 Certain items Merger related costs 5 — —Branch right sizing, net 547 3,846 236 519 410 Loss (gain) on sale of securities—20,218 — 28,393 Early retirement program 1,557 1,032 219 118 (1) FDIC special assessment—10,521 1,549 283 -Termination of vendor and software services ——615 (13) Tax effect⽹⾠(552) (9,309) (524) (401) (7,524) Certain items, net of tax 1,557 26,308 1,480 1,134 21,265 Adjusted earnings (non-GAAP) $ 48,804 $ 50,215 $ 40,351 $ 41,897 $ 46,005 Calculation of Earnings and Adjusted Earnings per Diluted Share Earnings available to common shareholders $ 47,247 $ 23,907 $ 38,871 $ 40,763 $ 24,740 Diluted earnings per share $ 0.37 $ 0.19 $ 0.31 $ 0.32 $ 0.20 Adjusted earnings available to common shareholders (non-GAAP) $ 48,804 $ 50,215 $ 40,351 $ 41,897 $ 46,005 Adjusted diluted earnings per share (non-GAAP) $ 0.39 $ 0.40 $ 0.32 $ 0.33 $ 0.37 (1) Effective tax rate of 26.135% 31
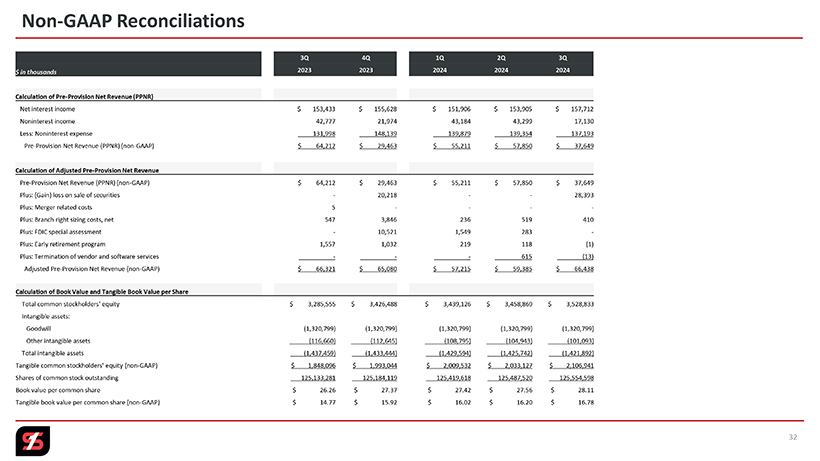
Non-GAAP Reconciliations 3Q 4Q 1Q 2Q 3Q $ in thousands 2023 2023 2024 2024 2024 Calculation of Pre-Provision Net Revenue (PPNR) Net interest income $ 153,433 $ 155,628 $ 151,906 $ 153,905 $ 157,712 Noninterest income 42,777 21,974 43,184 43,299 17,130 Less: Noninterest expense 131,998 148,139 139,879 139,354 137,193 Pre-Provision Net Revenue (PPNR) (non-GAAP) $ 64,212 $ 29,463 $ 55,211 $ 57,850 $ 37,649 Calculation of Adjusted Pre-Provision Net Revenue Pre-Provision Net Revenue (PPNR) (non-GAAP) $ 64,212 $ 29,463 $ 55,211 $ 57,850 $ 37,649 Plus: (Gain) loss on sale of securities—20,218 — 28,393 Plus: Merger related costs 5 — —Plus: Branch right sizing costs, net 547 3,846 236 519 410 Plus: FDIC special assessment—10,521 1,549 283 -Plus: Early retirement program 1,557 1,032 219 118 (1) Plus: Termination of vendor and software services — — — 615 (13) Adjusted Pre-Provision Net Revenue (non-GAAP) $ 66,321 $ 65,080 $ 57,215 $ 59,385 $ 66,438 Calculation of Book Value and Tangible Book Value per Share Total common stockholders’ equity $ 3,285,555 $ 3,426,488 $ 3,439,126 $ 3,458,869 $ 3,528,833 Intangible assets: Goodwill (1,320,799) (1,320,799) (1,320,799) (1,320,799) (1,320,799) Other intangible assets (116,660) (112,645) (108,795) (104,943) (101,093) Total intangible assets (1,437,459) (1,433,444) (1,429,594) (1,425,742) (1,421,892) Tangible common stockholders’ equity (non-GAAP) $ 1,848,096 $ 1,993,044 $ 2,009,532 $ 2,033,127 $ 2,106,941 Shares of common stock outstanding 125,133,281 125,184,119 125,419,618 125,487,520 125,554,598 Book value per common share $ 26.26 $ 27.37 $ 27.42 $ 27.56 $ 28.11 Tangible book value per common share (non-GAAP) $ 14.77 $ 15.92 $ 16.02 $ 16.20 $ 16.78 32
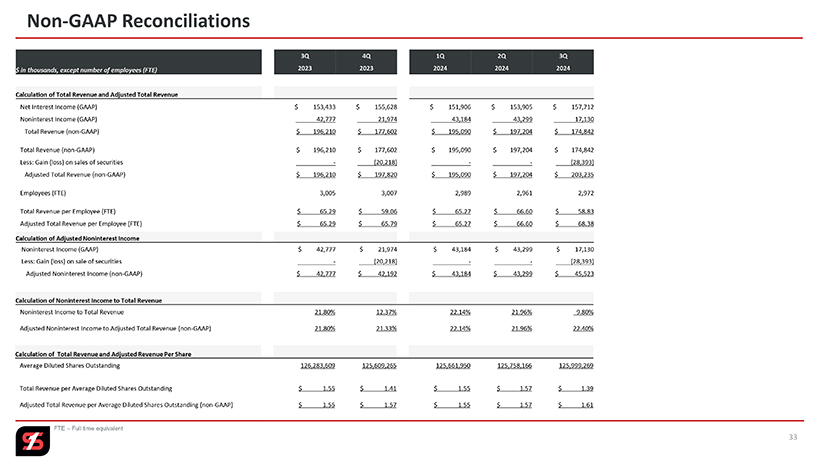
Non-GAAP Reconciliations 3Q 4Q 1Q 2Q 3Q $ in thousands, except number of employees (FTE) 2023 2023 2024 2024 2024 Calculation of Total Revenue and Adjusted Total Revenue Net Interest Income (GAAP) $ 153,433 $ 155,628 $ 151,906 $ 153,905 $ 157,712 Noninterest Income (GAAP) 42,777 21,974 43,184 43,299 17,130 Total Revenue (non-GAAP) $ 196,210 $ 177,602 $ 195,090 $ 197,204 $ 174,842 Total Revenue (non-GAAP) $ 196,210 $ 177,602 $ 195,090 $ 197,204 $ 174,842 Less: Gain (loss) on sales of securities — (20,218) — — (28,393) Adjusted Total Revenue (non-GAAP) $ 196,210 $ 197,820 $ 195,090 $ 197,204 $ 203,235 Employees (FTE) 3,005 3,007 2,989 2,961 2,972 Total Revenue per Employee (FTE) $ 65.29 $ 59.06 $ 65.27 $ 66.60 $ 58.83 Adjusted Total Revenue per Employee (FTE) $ 65.29 $ 65.79 $ 65.27 $ 66.60 $ 68.38 Calculation of Adjusted Noninterest Income Noninterest Income (GAAP) $ 42,777 $ 21,974 $ 43,184 $ 43,299 $ 17,130 Less: Gain (loss) on sale of securities — (20,218) — — (28,393) Adjusted Noninterest Income (non-GAAP) $ 42,777 $ 42,192 $ 43,184 $ 43,299 $ 45,523 Calculation of Noninterest Income to Total Revenue Noninterest Income to Total Revenue 21.80% 12.37% 22.14% 21.96% 9.80% Adjusted Noninterest Income to Adjusted Total Revenue (non-GAAP) 21.80% 21.33% 22.14% 21.96% 22.40% Calculation of Total Revenue and Adjusted Revenue Per Share Average Diluted Shares Outstanding 126,283,609 125,609,265 125,661,950 125,758,166 125,999,269 Total Revenue per Average Diluted Shares Outstanding $ 1.55 $ 1.41 $ 1.55 $ 1.57 $ 1.39 Adjusted Total Revenue per Average Diluted Shares Outstanding (non-GAAP) $ 1.55 $ 1.57 $ 1.55 $ 1.57 $ 1.61 FTE – Full time equivalent 33
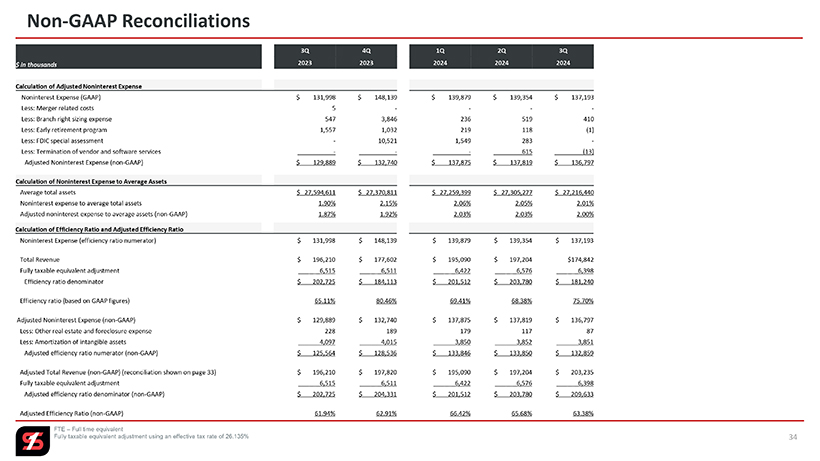
Non-GAAP Reconciliations 3Q 4Q 1Q 2Q 3Q $ in thousands 2023 2023 2024 2024 2024 Calculation of Adjusted Noninterest Expense Noninterest Expense (GAAP) $ 131,998 $ 148,139 $ 139,879 $ 139,354 $ 137,193 Less: Merger related costs 5 — —Less: Branch right sizing expense 547 3,846 236 519 410 Less: Early retirement program 1,557 1,032 219 118 (1) Less: FDIC special assessment—10,521 1,549 283 -Less: Termination of vendor and software services — — — 615 (13) Adjusted Noninterest Expense (non-GAAP) $ 129,889 $ 132,740 $ 137,875 $ 137,819 $ 136,797 Calculation of Noninterest Expense to Average Assets Average total assets $ 27,594,611 $ 27,370,811 $ 27,259,399 $ 27,305,277 $ 27,216,440 Noninterest expense to average total assets 1.90% 2.15% 2.06% 2.05% 2.01% Adjusted noninterest expense to average assets (non-GAAP) 1.87% 1.92% 2.03% 2.03% 2.00% Calculation of Efficiency Ratio and Adjusted Efficiency Ratio Noninterest Expense (efficiency ratio numerator) $ 131,998 $ 148,139 $ 139,879 $ 139,354 $ 137,193 Total Revenue $ 196,210 $ 177,602 $ 195,090 $ 197,204 $174,842 Fully taxable equivalent adjustment ___ _ _6,515 ___ _ _6,511 ___ _ _6,422 ___ _ _6,576 ___ _ _6,398 Efficiency ratio denominator $ 202,725 $ 184,113 $ 201,512 $ 203,780 $ 181,240 Efficiency ratio (based on GAAP figures) 65.11% 80.46% 69.41% 68.38% 75.70% Adjusted Noninterest Expense (non-GAAP) $ 129,889 $ 132,740 $ 137,875 $ 137,819 $ 136,797 Less: Other real estate and foreclosure expense 228 189 179 117 87 Less: Amortization of intangible assets ___ __ 4,097 ___ __ 4,015 ___ __ 3,850 ___ __ 3,852 ___ __ 3,851 Adjusted efficiency ratio numerator (non-GAAP) $ 125,564 $ 128,536 $ 133,846 $ 133,850 $ 132,859 Adjusted Total Revenue (non-GAAP) (reconciliation shown on page 33) $ 196,210 $ 197,820 $ 195,090 $ 197,204 $ 203,235 Fully taxable equivalent adjustment ___ _ _6,515 ___ _ _6,511 ___ _ _6,422 ___ _ _6,576 ___ _ _6,398 Adjusted efficiency ratio denominator (non-GAAP) $ 202,725 $ 204,331 $ 201,512 $ 203,780 $ 209,633 Adjusted Efficiency Ratio (non-GAAP) 61.94% 62.91% 66.42% 65.68% 63.38% FTE – Full time equivalent Fully taxable equivalent adjustment using an effective tax rate of 26.135% 34
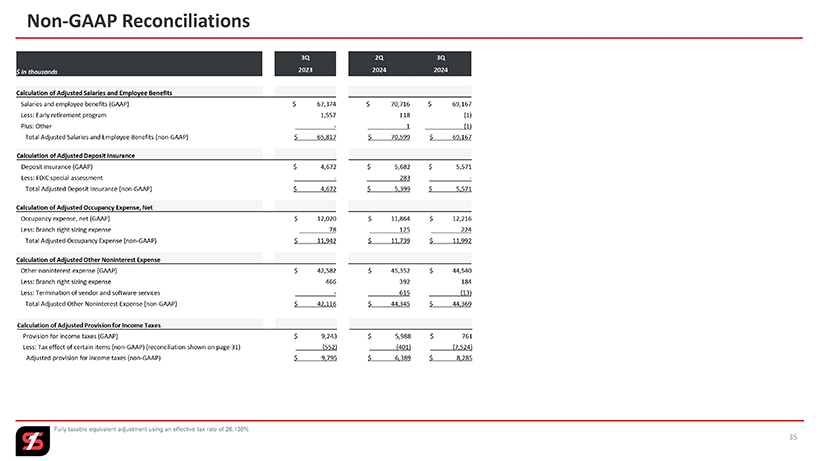
Non-GAAP Reconciliations 3Q 2Q 3Q $ in thousands 2023 2024 2024 Calculation of Adjusted Salaries and Employee Benefits Salaries and employee benefits (GAAP) $ 67,374 $ 70,716 $ 69,167 Less: Early retirement program 1,557 118 (1) Plus: Other — 1 (1) Total Adjusted Salaries and Employee Benefits (non-GAAP) $ 65,817 $ 70,599 $ 69,167 Calculation of Adjusted Deposit Insurance Deposit insurance (GAAP) $ 4,672 $ 5,682 $ 5,571 Less: FDIC special assessment — 283 -Total Adjusted Deposit Insurance (non-GAAP) $ 4,672 $ 5,399 $ 5,571 Calculation of Adjusted Occupancy Expense, Net Occupancy expense, net (GAAP) $ 12,020 $ 11,864 $ 12,216 Less: Branch right sizing expense 78 125 224 Total Adjusted Occupancy Expense (non-GAAP) $ 11,942 $ 11,739 $ 11,992 Calculation of Adjusted Other Noninterest Expense Other noninterest expense (GAAP) $ 42,582 $ 45,352 $ 44,540 Less: Branch right sizing expense 466 392 184 Less: Termination of vendor and software services — 615 (13) Total Adjusted Other Noninterest Expense (non-GAAP) $ 42,116 $ 44,345 $ 44,369 Calculation of Adjusted Provision for Income Taxes Provision for income taxes (GAAP) $ 9,243 $ 5,988 $ 761 Less: Tax effect of certain items (non-GAAP) (reconciliation shown on page 31) (552) (401) (7,524) Adjusted provision for income taxes (non-GAAP) $ 9,795 $ 6,389 $ 8,285 Fully taxable equivalent adjustment using an effective tax rate of 26.135% 35
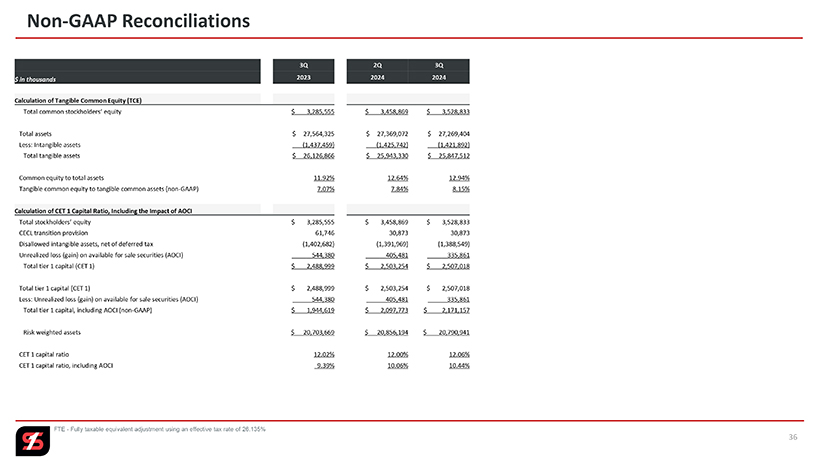
Non-GAAP Reconciliations 3Q 2Q 3Q $ in thousands 2023 2024 2024 Calculation of Tangible Common Equity (TCE) Total common stockholders’ equity $ 3,285,555 $ 3,458,869 $ 3,528,833 Total assets $ 27,564,325 $ 27,369,072 $ 27,269,404 Less: Intangible assets (1,437,459) (1,425,742) (1,421,892) Total tangible assets $ 26,126,866 $ 25,943,330 $ 25,847,512 Common equity to total assets 11.92% 12.64% 12.94% Tangible common equity to tangible common assets (non-GAAP) 7.07% 7.84% 8.15% Calculation of CET 1 Capital Ratio, Including the Impact of AOCI Total stockholders’ equity $ 3,285,555 $ 3,458,869 $ 3,528,833 CECL transition provision 61,746 30,873 30,873 Disallowed intangible assets, net of deferred tax (1,402,682) (1,391,969) (1,388,549) Unrealized loss (gain) on available for sale securities (AOCI) ____ _ 544,380 ____ _ 405,481 ____ _ 335,861 Total tier 1 capital (CET 1) $ 2,488,999 $ 2,503,254 $ 2,507,018 Total tier 1 capital (CET 1) $ 2,488,999 $ 2,503,254 $ 2,507,018 Less: Unrealized loss (gain) on available for sale securities (AOCI) 544,380 405,481 335,861 Total tier 1 capital, including AOCI (non-GAAP) $ 1,944,619 $ 2,097,773 $ 2,171,157 Risk weighted assets $ 20,703,669 $ 20,856,194 $ 20,790,941 CET 1 capital ratio 12.02% 12.00% 12.06% CET 1 capital ratio, including AOCI 9.39% 10.06% 10.44% FTE—Fully taxable equivalent adjustment using an effective tax rate of 26.135% 36
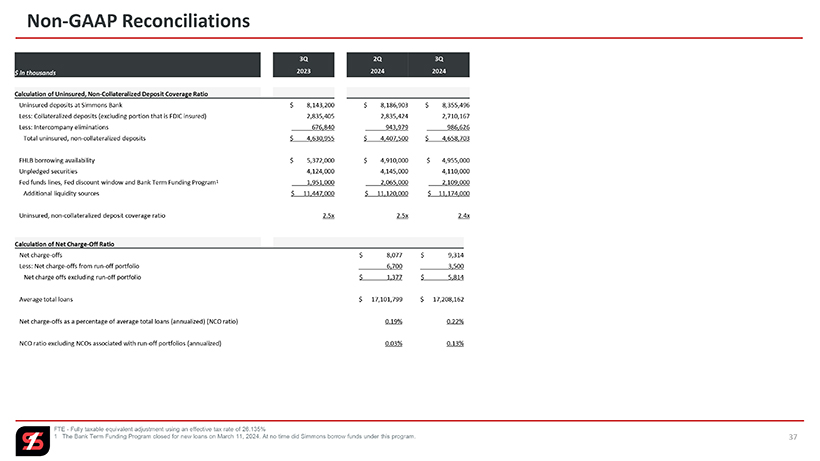
Non-GAAP Reconciliations 3Q 2Q 3Q $ in thousands 2023 2024 2024 Calculation of Uninsured, Non-Collateralized Deposit Coverage Ratio Uninsured deposits at Simmons Bank $ 8,143,200 $ 8,186,903 $ 8,355,496 Less: Collateralized deposits (excluding portion that is FDIC insured) 2,835,405 2,835,424 2,710,167 Less: Intercompany eliminations ______676,840 ______943,979 ______986,626 Total uninsured, non-collateralized deposits $ 4,630,955 $ 4,407,500 $ 4,658,703 FHLB borrowing availability $ 5,372,000 $ 4,910,000 $ 4,955,000 Unpledged securities 4,124,000 4,145,000 4,110,000 Fed funds lines, Fed discount window and Bank Term Funding Program1 1,951,000 2,065,000 2,109,000 Additional liquidity sources $ 11,447,000 $ 11,120,000 $ 11,174,000 Uninsured, non-collateralized deposit coverage ratio 2.5x 2.5x 2.4x Calculation of Net Charge-Off Ratio Net charge-offs $ 8,077 $ 9,314 Less: Net charge-offs from run-off portfolio ______ 6,700 ______ 3,500 Net charge offs excluding run-off portfolio $ 1,377 $ 5,814 Average total loans $ 17,101,799 $ 17,208,162 Net charge-offs as a percentage of average total loans (annualized) (NCO ratio) 0.19% 0.22% NCO ratio excluding NCOs associated with run-off portfolios (annualized) 0.03% 0.13% FTE—Fully taxable equivalent adjustment using an effective tax rate of 26.135% 1 The Bank Term Funding Program closed for new loans on March 11, 2024. At no time did Simmons borrow funds under this program. 37

Simmons first national corporation Nasdaq: SFNC 3rd Quarter 2024 Earnings Presentation Contents 3 Company Profile 4 3Q24 Financial Highlights 11 Deposits, Securities, Liquidity, Interest Rate Sensitivity and Capital 18 Loan Portfolio 24 Credit Quality 28 Appendix