UNITED STATES
SECURITIES AND EXCHANGE COMMISSION
Washington, D.C. 20549
FORM 8-K
CURRENT REPORT
Pursuant to Section 13 or 15(d)
of the Securities Exchange Act of 1934
October 18, 2024
(Date of report; date of earliest event reported)
Commission file number: 1-3754
ALLY FINANCIAL INC.
(Exact name of registrant as specified in its charter)
| Delaware | 38-0572512 | |
| (State or other jurisdiction of incorporation or organization) |
(I.R.S. Employer Identification No.) |
Ally Detroit Center
500 Woodward Ave.
Floor 10, Detroit, Michigan
48226
(Address of principal executive offices)
(Zip Code)
(866) 710-4623
(Registrant’s telephone number, including area code)
Check the appropriate box below if the Form 8-K filing is intended to simultaneously satisfy the filing obligation of the registrant under any of the following provisions (see General Instruction A.2. below):
| ☐ | Written communications pursuant to Rule 425 under the Securities Act (17 CFR 230.425) |
| ☐ | Soliciting material pursuant to Rule 14a-12 under the Exchange Act (17 CFR 240.14a-12) |
| ☐ | Pre-commencement communications pursuant to Rule 14d-2(b) under the Exchange Act (17 CFR 240.14d-2(b)) |
| ☐ | Pre-commencement communications pursuant to Rule 13e-4(c) under the Exchange Act (17 CFR 240.13e-4(c)) |
Securities registered pursuant to Section 12(b) of the Act (listed on the New York Stock Exchange):
Title of each class |
Trading |
Name of each exchange |
||
| Common Stock, par value $0.01 per share | ALLY | New York Stock Exchange |
Indicate by check mark whether the registrant is an emerging growth company as defined in Rule 405 of the Securities Act of 1933 (§230.405 of this chapter) or Rule 12b-2 of the Securities Exchange Act of 1934 (§240.12b-2 of this chapter).
Emerging growth company ☐
If an emerging growth company, indicate by check mark if the registrant has elected not to use the extended transition period for complying with any new or revised financial accounting standards provided pursuant to Section 13(a) of the Exchange Act. ☐
| Item 2.02 | Results of Operation and Financial Condition. |
On October 18, 2024, Ally Financial Inc. issued a press release announcing preliminary operating results for the third quarter ended September 30, 2024. The press release is attached hereto and incorporated by reference as Exhibit 99.1. Charts furnished to securities analysts are attached hereto and incorporated by reference as Exhibit 99.2. In addition, supplemental financial data furnished to securities analysts is attached hereto and incorporated by reference as Exhibit 99.3.
| Item 9.01 | Financial Statements and Exhibits. |
Exhibit No. |
Description |
|
| 99.1 | Press Release, Dated October 18, 2024 | |
| 99.2 | Charts Furnished to Securities Analysts | |
| 99.3 | Supplemental Financial Data Furnished to Securities Analysts | |
| 104 | The cover page from this Current Report on Form 8-K, formatted in Inline XBRL | |
SIGNATURES
Pursuant to the requirements of the Securities Exchange Act of 1934, the registrant has duly caused this report to be signed on its behalf by the undersigned hereunto duly authorized.
| ALLY FINANCIAL INC. | ||||||
| (Registrant) | ||||||
| Dated: October 18, 2024 | /s/ David J. DeBrunner |
|||||
| David J. DeBrunner | ||||||
| Vice President, Controller, and Chief Accounting Officer | ||||||
Exhibit 99.1
News release: IMMEDIATE RELEASE

Ally Financial Reports Third Quarter 2024 Financial Results
| $1.06 | 11.0% | $233 million | $2.1 billion | |||
| GAAP EPS | RETURN ON COMMON EQUITY | PRE-TAX INCOME | GAAP TOTAL NET REVENUE | |||
| $0.95 | 13.1% | $188 million | $2.1 billion | |||
| ADJUSTED EPS1 | CORE ROTCE1 | CORE PRE-TAX INCOME1 | ADJUSTED TOTAL NET REVENUE1 | |||
|
FINANCIAL HIGHLIGHTS
OPERATIONAL HIGHLIGHTS
CEO COMMENTS
|
• GAAP EPS of $1.06 and Adjusted EPS of $0.95, up $0.18 and $0.12 year over year, respectively
• Pre-tax income of $233 million, up $5 million year over year. Core pre-tax income of $188 million, down $138 million year over year
• CET1 of 9.8% up 20 bps quarter over quarter; $4.2 billion of excess CET1 above minimum requirement of 7.1%
• NIM ex. OID1 of 3.25% is down 5 bps quarter over quarter; well positioned for expansion over the medium term
• $124 million tax benefit including $179 million of lease EV tax credits recognized in the quarter
• $9.4 billion of consumer auto origination volume sourced from 3.6 million consumer auto applications
• Retail auto originated yield1 of 10.54% with 43% of volume within highest credit quality tier
• Insurance written premiums of $384 million, up 15% year over year; record since IPO
• $141 billion of retail deposits, 92% FDIC insured
• 62 consecutive quarters of retail deposit customer growth, up 57 thousand in 3Q; 3.3 million customers
• 1.3 million active credit cardholders; balanced approach to growth
• Corporate Finance HFI portfolio of $10.3 billion; continued strength in returns and credit performance
“I’m proud of the way our team continued to serve our 11 million customers amid an evolving operating environment - a testament to our “Do It Right” culture,” said Chief Executive Officer, Michael Rhodes. “I’m pleased with the way we are executing across the organization, originating business with compelling risk adjusted returns and being disciplined in deploying capital.
The challenges of managing through a unique environment are reflected in our results this quarter. However, I expect underlying trends in Dealer Financial Services, Deposits, and Corporate Finance to position us to win in the marketplace and grow shareholder value.
In Auto, a robust network of 22 thousand dealers resulted in decisioning 3.6 million consumer applications and $9.4 billion of consumer auto originations with strong risk adjusted yields. Retail Auto net charge-offs of 2.24% are elevated, but we are confident the curtailment actions we’ve taken will drive losses lower over time. And a record $384 million of written premiums reflect continued momentum in our Insurance business.
At Ally Bank, 92% of our $141 billion retail deposits are FDIC insured. Our commitment to build a better bank is evidenced by 62 consecutive quarters of retail deposit customer growth, now totaling 3.3 million customers. Deposits remain a source of strength and our naturally liability sensitive balance sheet positions us well for margin expansion over the medium-term.
Corporate Finance delivered another impressive quarter with $95 million of pre-tax income and 33% return-on-equity. Credit performance in the Corporate Finance portfolio has been particularly strong, with no losses on a year-to-date basis.
As we look ahead, we are encouraged about the opportunity in our core franchises. Our team remains focused on what we can control, executing on our long-term strategic priorities, and delivering value for our customers, communities, and shareholders.” |
| Third Quarter 2024 Financial Results | ||||
| Increase / (Decrease) vs. | ||||||||||||||||||||
| ($ millions except per share data) | 3Q 24 | 2Q 24 | 3Q 23 | 2Q 24 | 3Q 23 | |||||||||||||||
| GAAP Net Income Attributable to Common Shareholders |
$ | 330 | $ | 266 | $ | 269 | 24 % | 23 % | ||||||||||||
| Core Net Income Attributable to Common Shareholders1 |
$ | 295 | $ | 299 | $ | 252 | (2) % | 17 % | ||||||||||||
| GAAP Earnings per Common Share |
$ | 1.06 | $ | 0.86 | $ | 0.88 | 24 % | 21 % | ||||||||||||
| Adjusted EPS1 |
$ | 0.95 | $ | 0.97 | $ | 0.83 | (2) % | 15 % | ||||||||||||
| Return on GAAP Shareholder’s Equity |
11.0 | % | 9.3 | % | 9.9 | % | 19 % | 11 % | ||||||||||||
| Core ROTCE1 |
13.1 | % | 14.0 | % | 12.9 | % | (7) % | 2 % | ||||||||||||
| GAAP Common Shareholder’s Equity per Share |
$ | 40.70 | $ | 37.84 | $ | 34.81 | 8 % | 17 % | ||||||||||||
| Adjusted Tangible Book Value per Share1 |
$ | 36.43 | $ | 33.51 | $ | 29.79 | 9 % | 22 % | ||||||||||||
| GAAP Total Net Revenue |
$ | 2,103 | $ | 2,000 | $ | 1,968 | 5 % | 7 % | ||||||||||||
| Adjusted Total Net Revenue1 |
$ | 2,058 | $ | 2,042 | $ | 2,036 | 1 % | 1 % | ||||||||||||
| 1 | The following are non-GAAP financial measures which Ally believes are important to the reader of the Consolidated Financial Statements, but which are supplemental to and not a substitute for GAAP measures: Adjusted Earnings per Share (Adjusted EPS), Adjusted Total Net Revenue, Core Pre-Tax Income, Core Net Income Attributable to Common Shareholders, Core OID, Core Return on Tangible Common Equity (Core ROTCE), Estimated Retail Auto Originated Yield, Tangible Common Equity, Net Financing Revenue (excluding Core OID) and Adjusted Tangible Book Value per Share (Adjusted TBVPS). These measures are used by management and we believe are useful to investors in assessing the company’s operating performance and capital. Refer to the Definitions of Non-GAAP Financial Measures and Other Key Terms, and Reconciliation to GAAP later in this release. |

| Discussion of Third Quarter 2024 Results | ||||
|
Net income attributable to common shareholders was $330 million in the quarter, compared to $269 million in the third quarter of 2023. The increase was driven by the income tax benefit associated with EV lease originations and higher adjusted other revenue in the current quarter, which was partially offset by higher provision expense and lower net financing revenue.
Net financing revenue was $1.5 billion, down $45 million year over year primarily driven by lower average earning assets and higher funding costs.
Net interest margin (“NIM”) of 3.22% decreased 2 bps year over year. Excluding Core OIDA , NIM of 3.25% was down 1 bp year over year.
Other revenue increased $180 million year over year to $615 million, including a $59 million increase in fair value of equity securities in the quarter compared to a $56 million decrease in the third quarter of 2023. Adjusted other revenueA , excluding the change in fair value of equity securities, of $556 million increased $65 million year over year driven by momentum within Insurance and diversified fee revenue from SmartAuction and Passthrough platforms.
Provision for credit losses increased $137 million year over year to $645 million, reflecting higher net charge-offs and a 15 bps increase in the retail auto reserve rate in the third quarter.
Noninterest expense decreased $7 million year over year, reflecting disciplined expense management.
A tax benefit of $124 million resulted in an effective tax rate of (53%) in the quarter driven by strong EV lease originations. |
||||
| A | Represents a non-GAAP financial measure. Refer to the Definitions of Non-GAAP Financial Measures and Other Key Terms and Reconciliation to GAAP later in this press release. |
| Third Quarter 2024 Financial Results | ||||
| Increase/(Decrease) vs. | ||||||||||||||||||||||||
| ($ millions except per share data) | 3Q 24 | 2Q 24 | 3Q 23 | 2Q 24 | 3Q 23 | |||||||||||||||||||
| (a) Net Financing Revenue |
$ | 1,488 | $ | 1,495 | $ | 1,533 | $ | (7) | $ | (45) | ||||||||||||||
| Core OID1 |
14 | 14 | 12 | 1 | 2 | |||||||||||||||||||
| Net Financing Revenue (excluding Core OID)1 |
1,502 | 1,509 | 1,545 | (6) | (43) | |||||||||||||||||||
| (b) Other Revenue |
615 | 505 | 435 | 110 | 180 | |||||||||||||||||||
| Change in Fair Value of Equity Securities2 |
(59) | 28 | 56 | (87) | (115) | |||||||||||||||||||
| Adjusted Other Revenue1 |
556 | 533 | 491 | 23 | 65 | |||||||||||||||||||
| (c) Provision for Credit Losses |
645 | 457 | 508 | 188 | 137 | |||||||||||||||||||
| (d) Noninterest Expense |
1,225 | 1,286 | 1,232 | (61) | (7) | |||||||||||||||||||
| Repositioning3 |
- | - | (30) | - | 30 | |||||||||||||||||||
| Noninterest Expense (excluding Repositioning)1 |
1,225 | 1,286 | 1,202 | (61) | 23 | |||||||||||||||||||
| Pre-Tax Income (a+b-c-d) |
$ | 233 | $ | 257 | $ | 228 | $ | (24) | $ | 5 |
|
|
|
|||||||||||
| Income Tax Expense (Benefit) |
(124) | (37) | (68) | (87) | (56) | |||||||||||||||||||
| Net Income (Loss) from Discontinued Operations |
- | - | - | - | - | |||||||||||||||||||
| Net Income |
$ | 357 | $ | 294 | $ | 296 | $ | 63 | $ | 61 |
|
|
|
|||||||||||
| Preferred Dividends |
27 | 28 | 27 | (1) | - | |||||||||||||||||||
| Net Income Attributable to Common Shareholders |
$ | 330 | $ | 266 | $ | 269 | $ | 64 | $ | 61 |
|
|
|
|||||||||||
| GAAP EPS (diluted) |
$ | 1.06 | $ | 0.86 | $ | 0.88 | $ | 0.20 | $ | 0.18 |
|
|
|
|||||||||||
| Core OID, Net of Tax1 |
0.04 | 0.04 | 0.03 | 0.00 | 0.00 | |||||||||||||||||||
| Change in Fair Value of Equity Securities, Net of Tax3 |
(0.15) | 0.07 | 0.14 | (0.22) | (0.29) | |||||||||||||||||||
| Repositioning, Discontinued Ops., and Other, Net of Tax3 |
- | - | 0.08 | - | (0.08) | |||||||||||||||||||
| Significant Discrete Tax Items |
- | - | (0.31) | - | 0.31 | |||||||||||||||||||
| Adjusted EPS1 |
$ | 0.95 | $ | 0.97 | $ | 0.83 | $ | (0.02) | $ | 0.12 |
|
|
|
|||||||||||
| (1) | Represents a non-GAAP financial measure. Refer to the Definitions of Non-GAAP Financial Measures and Other Key Terms and Reconciliation to GAAP later in this press release. |
| (2) | Impacts the Insurance, Corporate Finance and Corporate and Other segments. The change reflects fair value adjustments to equity securities that are reported at fair value. Management believes the change in fair value of equity securities should be removed from select financial measures because it enables the reader to better understand the business’s ongoing ability to generate revenue and income. |
| (3) | Contains non-GAAP financial measures and other financial measures. See pages 5 and 6 for definitions. |
2
| Pre-Tax Income by Segment | ||||
| Increase/(Decrease) vs. | ||||||||||||||||||||
| ($ millions) | 3Q 24 | 2Q 24 | 3Q 23 | 2Q 24 | 3Q 23 | |||||||||||||||
| Automotive Finance |
$ | 175 | $ | 407 | $ | 377 | $ | (232) | $ | (202) | ||||||||||
| Insurance |
102 | (42) | (16) | 144 | 118 | |||||||||||||||
| Dealer Financial Services |
$ | 277 | $ | 365 | $ | 361 | $ | (88) | $ | (84) | ||||||||||
| Corporate Finance |
95 | 98 | 84 | (3) | 11 | |||||||||||||||
| Mortgage Finance |
27 | 27 | 26 | - | 1 | |||||||||||||||
| Corporate and Other |
(166) | (233) | (243) | 67 | 77 | |||||||||||||||
| Pre-Tax Income from Continuing Operations |
$ | 233 | $ | 257 | $ | 228 | $ | (24) | $ | 5 | ||||||||||
| Core OID1 |
14 | 14 | 12 | 1 | 2 | |||||||||||||||
| Change in Fair Value of Equity Securities2,3 |
(59) | 28 | 56 | (87) | (115) | |||||||||||||||
| Repositioning and Other3 |
- | - | 30 | - | (30) | |||||||||||||||
| Core Pre-Tax Income1 |
$ | 188 | $ | 299 | $ | 326 | $ | (111) | $ | (138) | ||||||||||
| (1) | Represents a non-GAAP financial measure. Refer to the Definitions of Non-GAAP Financial Measures and Other Key Terms and Reconciliation to GAAP later in this press release. |
| (2) | Change in fair value of equity securities primarily impacts the Insurance, Corporate Finance, and Corporate and Other segments. Reflects equity fair value adjustments which requires change in the fair value of equity securities to be recognized in current period net income. |
| (3) | Contains non-GAAP financial measures and other financial measures. See pages 5 and 6 for definitions. |
| Discussion of Segment Results | ||||
|
Auto Finance Pre-tax income of $175 million was down $202 million year over year, primarily driven by higher retail net charge-offs and loss reserves.
Net financing revenue of $1,285 million was down $75 million year over year, driven by elevated funding costs. Ally’s retail auto portfolio yield, excluding the impact from hedges, increased 83 bps year over year to 8.99% as the portfolio seasons and reflects higher originated yields from recent periods.
Provision for credit losses of $579 million was up $135 million year over year, driven by higher retail auto net charge-offs and a 15 bps quarter over quarter increase in the retail auto coverage rate. The retail auto net charge-off rate was 2.24%.
Noninterest expense of $616 million was down $2 million year over year.
Consumer auto originations of $9.4 billion included $5.9 billion of used retail volume, or 63% of total originations, $2.5 billion of new retail volume, and $1.0 billion of lease. Estimated retail auto originated yieldB was 10.54% in the quarter with 43% of originations in the highest credit quality tier.
End-of-period auto earning assets of $115.6 billion decreased $0.8 billion year over year. End-of-period consumer auto earning assets of $91.7 billion decreased $3.6 billion year over year, driven by retail auto loan sales in recent periods. End-of-period commercial earning assets of $23.8 billion were up $2.8 billion year over year, driven by higher new vehicle inventory.
Insurance Pre-tax income of $102 million was up $118 million year over year. Results reflect a $103 million increase in the change in fair value of equity securities year over year. Core pre-tax incomeC of $46 million increased $15 million year over year, which was supported by $362 million of earned premiums in the quarter.
Insurance losses of $135 million, up $28 million year over year, are reflective of P&C portfolio growth and higher GAP losses driven by normalization in used vehicle values.
Written premiums of $384 million, up 15% year over year, were driven by growth in both P&C and F&I premiums.
Total investment income, excluding the change in fair value of equity securitiesD, was $50 million, up $5 million year over year driven by higher realized investment gains.
|
||||
BEstimated Retail Auto Originated Yield is a forward-looking non-GAAP financial measure determined by calculating the estimated average annualized yield for loans originated during the period. Refer to the Definitions of Non-GAAP Financial Measures and Other Key Terms and Reconciliation to GAAP later in this press release.
CRepresents a non-GAAP financial measure. Refer to the Definitions of Non-GAAP Financial Measures and Other Key Terms and Reconciliation to GAAP later in this press release.
DChange in the fair value of equity securities to be recognized in current period net income. Refer to the Definitions of Non-GAAP Financial Measures and Other Key Terms and Reconciliation to GAAP later in this press release.
3
| Discussion of Segment Results | ||||
|
Corporate Finance Pre-tax income of $95 million was up $11 million year over year driven by higher other revenue and net financing revenue.
Net financing revenue of $101 million was up $4 million year over year, primarily driven by higher income spreads and fees from loan payoffs. Other revenue of $37 million was up $13 million year over year driven by record syndication income during the quarter.
Provision expense of $11 million was up $6 million year over year primarily driven by a recovery in the prior year quarter.
The held-for-investment loan portfolio of $10.3 billion is effectively all first lien. Loans secured by commercial real estate of $1.6B continue to perform well.
Mortgage Finance Pre-tax income of $27 million was up $1 million year over year.
Net financing revenue of $52 million was down $1 million year over year, while other revenue of $6 million was up $2 million year over year.
Direct-to-consumer originations totaled $256 million in the quarter, predominantly held-for-sale.
Existing Ally Bank deposit customers accounted for more than 70% of the quarter’s direct-to-consumer origination volume, continuing to highlight the strong customer value proposition. |
||||
| Capital, Liquidity & Deposits | ||||
|
Capital Ally paid a $0.30 per share quarterly common dividend, which was unchanged year over year. Ally’s Board of Directors approved a $0.30 per share common dividend for the fourth quarter of 2024. Ally did not repurchase any shares on the open market during the quarter.
Ally’s common equity tier 1 (CET1) capital ratio was 9.8%, and risk weighed assets (RWA) of $156.2 billion were down $1.2 billion quarter over quarter.
Liquidity & Funding Cash and cash equivalentsE totaled $7.9 billion, up from $6.7 billion at the end of the second quarter. Highly liquid securities were $20.8 billion and unused pledged borrowing capacity at the FHLB and FRB was $12.5 billion and $26.7 billion, respectively. Total current available liquidityF was $67.9 billion, equal to 6.1x uninsured deposit balances.
Deposits represented 89% of Ally’s funding portfolio.
Deposits Retail deposits of $141.4 billion were up $1.3 billion year over year, and down $0.6 billion quarter over quarter. Total deposits were $152.0 billion and Ally maintained an industry-leading customer retentionG rate.
The average retail portfolio deposit rate was 4.18%, up 18 bps year over year and down 1 bp quarter over quarter. Ally Bank continues to demonstrate strong customer acquisition with 57 thousand net new deposit customers, now totaling 3.3 million, up 9% year over year. Millennials and younger customers continue to comprise the largest generation segment of new customers, accounting for 74% of new customers in the quarter. Approximately 10% of deposit customers maintained an Ally Invest, Ally Home or Ally Credit Card relationship.
|
||||
ECash & cash equivalents may include the restricted cash accumulation for retained notes maturing within the following 30 days and returned to Ally on the distribution date. See page 18 of the Financial Supplement for more details.
FTotal liquidity includes cash & cash equivalents, highly liquid securities and current unused borrowing capacity at the FHLB, and FRB Discount Window. See page 18 of the Financial Supplement for more details.
GSee definitions of non-GAAP financial measures and other key terms later in this document for more details.
4
| Definitions of Non-GAAP Financial Measures and Other Key Terms | ||||
Ally believes the non-GAAP financial measures defined here are important to the reader of the Consolidated Financial Statements, but these are supplemental to and not a substitute for GAAP measures. See Reconciliation to GAAP below for calculation methodology and details regarding each measure.
Adjusted earnings per share (Adjusted EPS) is a non-GAAP financial measure that adjusts GAAP EPS for revenue and expense items that are typically strategic in nature or that management otherwise does not view as reflecting the operating performance of the company. Management believes Adjusted EPS can help the reader better understand the operating performance of the core businesses and their ability to generate earnings. In the numerator of Adjusted EPS, GAAP net income attributable to common shareholders is adjusted for the following items: (1) excludes discontinued operations, net of tax, as Ally is primarily a domestic company and sales of international businesses and other discontinued operations in the past have significantly impacted GAAP EPS, (2) adds back the tax-effected non-cash Core OID, (3) adjusts for tax-effected repositioning and other which are primarily related to the extinguishment of high-cost legacy debt, strategic activities and significant other one-time items, (4) change in fair value of equity securities, (5) excludes significant discrete tax items that do not relate to the operating performance of the core businesses, and adjusts for preferred stock capital actions that have been taken by the company to normalize its capital structure, as applicable for respective periods. See page 6 for calculation methodology and details.
Core Return on Tangible Common Equity (Core ROTCE) is a non-GAAP financial measure that management believes is helpful for readers to better understand the ongoing ability of the company to generate returns on its equity base that supports core operations. For purposes of this calculation, tangible common equity is adjusted for Core OID balance and net DTA. Ally’s Core net income attributable to common shareholders for purposes of calculating Core ROTCE is based on the actual effective tax rate for the period adjusted for significant discrete tax items including tax reserve releases, which aligns with the methodology used in calculating adjusted earnings per share.
| (1) | In the numerator of Core ROTCE, GAAP net income attributable to common shareholders is adjusted for discontinued operations net of tax, tax-effected Core OID, tax-effected repositioning and other which are primarily related to the extinguishment of high-cost legacy debt, strategic activities and significant other one-time items, change in fair value of equity securities, significant discrete tax items, and preferred stock capital actions, as applicable for respective periods. |
| (2) | In the denominator, GAAP shareholder’s equity is adjusted for goodwill and identifiable intangibles net of DTL, Core OID balance, and net DTA. |
Adjusted Efficiency Ratio is a non-GAAP financial measure that management believes is helpful to readers in comparing the efficiency of its core banking and lending businesses with those of its peers. In the numerator of Adjusted Efficiency Ratio, total noninterest expense is adjusted for Rep and warrant expense, Insurance segment expense, and repositioning and other which are primarily related to the extinguishment of high-cost legacy debt, strategic activities and significant other one-time items, as applicable for respective periods. In the denominator, total net revenue is adjusted for Core OID and Insurance segment revenue. See Reconciliation to GAAP on page 7 for calculation methodology and details.
Adjusted Tangible Book Value per Share (Adjusted TBVPS) is a non-GAAP financial measure that reflects the book value of equity attributable to shareholders even if Core OID balance were accelerated immediately through the financial statements. As a result, management believes Adjusted TBVPS provides the reader with an assessment of value that is more conservative than GAAP common shareholder’s equity per share. Adjusted TBVPS generally adjusts common equity for: (1) goodwill and identifiable intangibles, net of DTLs, and (2) tax-effected Core OID balance to reduce tangible common equity in the event the corresponding discounted bonds are redeemed/tendered, as applicable for respective periods.
Core Net Income Attributable to Common Shareholders is a non-GAAP financial measure that serves as the numerator in the calculations of Adjusted EPS and Core ROTCE and that, like those measures, is believed by management to help the reader better understand the operating performance of the core businesses and their ability to generate earnings. Core Net Income Attributable to Common Shareholders adjusts GAAP net income attributable to common shareholders for discontinued operations net of tax, tax-effected Core OID expense, tax-effected repositioning and other primarily related to the extinguishment of high-cost legacy debt and strategic activities and significant other, preferred stock capital actions, significant discrete tax items and tax-effected changes in equity investments measured at fair value, as applicable for respective periods. See Reconciliation to GAAP on page 6 for calculation methodology and details.
Core Original Issue Discount (Core OID) Amortization Expense is a non-GAAP financial measure for OID, and is believed by management to help the reader better understand the activity removed from: Core pre-tax income (loss), Core net income (loss) attributable to common shareholders, Adjusted EPS, Core ROTCE, Adjusted efficiency ratio, Adjusted total net revenue, and Net financing revenue (excluding Core OID). Core OID is primarily related to bond exchange OID which excludes international operations and future issuances. See page 7 for calculation methodology and details.
Core Outstanding Original Issue Discount Balance (Core OID balance) is a non-GAAP financial measure for outstanding OID and is believed by management to help the reader better understand the balance removed from Core ROTCE and Adjusted TBVPS. Core OID balance is primarily related to bond exchange OID which excludes international operations and future issuances. See page 7 for calculation methodology and details.
Core Pre-Tax Income is a non-GAAP financial measure that adjusts pre-tax income from continuing operations by excluding (1) Core OID, and (2) change in fair value of equity securities (change in fair value of equity securities impacts the Insurance and Corporate Finance segments), and (3) Repositioning and other which are primarily related to the extinguishment of high-cost legacy debt, strategic activities and significant other one-time items, as applicable for respective periods or businesses. Management believes core pre-tax income can help the reader better understand the operating performance of the core businesses and their ability to generate earnings. See the Pre-Tax Income by Segment Table on page 3 for calculation methodology and details.
Tangible Common Equity is a non-GAAP financial measure that is defined as common stockholders’ equity less goodwill and identifiable intangible assets, net of deferred tax liabilities. Ally considers various measures when evaluating capital adequacy, including Tangible Common Equity. Ally believes that Tangible Common Equity is important because we believe readers may assess our capital adequacy using this measure. Additionally, presentation of this measure allows readers to compare certain aspects of our capital adequacy on the same basis to other companies in the industry. For purposes of calculating Core Return on Tangible Common Equity (Core ROTCE), Tangible Common Equity is further adjusted for Core OID balance and net deferred tax asset. See page 6 for calculation methodology & details.
Net Interest Margin (excluding Core OID) is calculated using a non-GAAP measure that adjusts net interest margin by excluding Core OID. The Core OID balance is primarily related to bond exchange OID which excludes international operations and future issuances. Management believes net interest margin ex. Core OID is a helpful financial metric because it enables the reader to better understand the business’ profitability and margins.
Net Financing Revenue (excluding Core OID) is calculated using a non-GAAP measure that adjusts net financing revenue by excluding Core OID. The Core OID balance is primarily related to bond exchange OID which excludes international operations and future issuances. Management believes net financing revenue ex. Core OID is a helpful financial metric because it enables the reader to better understand the business’ ability to generate revenue.
Adjusted Other Revenue is a non-GAAP financial measure that adjusts GAAP other revenue for OID expenses, repositioning, and change in fair value of equity securities. Management believes adjusted other revenue is a helpful financial metric because it enables the reader better understand the business’ ability to generate other revenue.
Adjusted Total Net Revenue is a non-GAAP financial measure that management believes is helpful for readers to understand the ongoing ability of the company to generate revenue. For purposes of this calculation, GAAP net financing revenue is adjusted by excluding Core OID to calculate net financing revenue ex. core OID. GAAP other revenue is adjusted for OID expenses, repositioning, and change in fair value of equity securities to calculate adjusted other revenue. Adjusted total net revenue is calculated by adding net financing revenue ex. core OID to adjusted other revenue.
Adjusted Noninterest Expense is a non-GAAP financial measure that adjusts GAAP noninterest expense for repositioning items. Management believes adjusted noninterest expense is a helpful financial metric because it enables the reader to better understand the business’ expenses excluding nonrecurring items.
Adjusted Provision for Credit Losses is a non-GAAP financial measure that adjusts GAAP provision for credit losses for repositioning items. Management believes adjusted provision for credit losses is a helpful financial metric because it enables the reader to better understand the business’s expenses excluding nonrecurring items.
Estimated Retail Auto Originated Yield is a financial measure determined by calculating the estimated average annualized yield for loans originated during the period. At this time there currently is no comparable GAAP financial measure for Estimated Retail Auto Originated Yield and therefore this forecasted estimate of yield at the time of origination cannot be quantitatively reconciled to comparable GAAP information.
Net Charge-Off Ratios are annualized net charge-offs divided by average outstanding finance receivables and loans excluding loans measured at fair value and loans held-for-sale.
Accelerated issuance expense (Accelerated OID) is the recognition of issuance expenses related to calls of redeemable debt.
Customer retention rate is the annualized 3-month rolling average of 1 minus the monthly attrition rate; excludes escheatment.
Repositioning is primarily related to the extinguishment of high-cost legacy debt, strategic activities, restructuring, and significant other one-time items.
Corporate and Other primarily consists of activity related to centralized corporate treasury activities such as management of the cash and corporate investment securities and loan portfolios, short- and long-term debt, retail and brokered deposit liabilities, derivative instruments, the amortization of the discount associated with new debt issuances and bond exchanges, and the residual impacts of our corporate FTP and treasury ALM activities. Corporate and Other also includes certain equity investments, the management of our legacy mortgage portfolio, and reclassifications and eliminations between the reportable operating segments. Subsequent to June 1, 2016, the revenue and expense activity associated with Ally Invest was included within the Corporate and Other segment. Subsequent to October 1, 2019, the revenue and expense activity associated with Ally Lending was included within the Corporate and Other segment. Ally Lending was moved to Assets of Operations Held for Sale on December 31, 2023. The sale of Ally Lending closed on March 1, 2024. Subsequent to December 1, 2021, the revenue and expense activity associated with Ally Credit Card was included within the Corporate and Other segment.
5
Change in fair value of equity securities impacts the Insurance, Corporate Finance and Corporate and Other segments. The change reflects fair value adjustments to equity securities that are reported at fair value. Management believes the change in fair value of equity securities should be removed from select financial measures because it enables the reader to better understand the business’ ongoing ability to generate revenue and income.
Estimated impact of CECL on regulatory capital per final rule issued by U.S. banking agencies - In December 2018, the FRB and other U.S. banking agencies approved a final rule to address the impact of CECL on regulatory capital by allowing BHCs and banks, including Ally, the option to phase in the day-one impact of CECL over a three-year period. In March 2020, the FRB and other U.S. banking agencies issued an interim final rule that became effective on March 31, 2020 and provided an alternative option for banks to temporarily delay the impacts of CECL, relative to the incurred loss methodology for estimating the allowance for loan losses, on regulatory capital. A final rule that was largely unchanged from the March 2020 interim final rule was issued by the FRB and other U.S. banking agencies in August 2020, and became effective in September 2020. For regulatory capital purposes, these rules permitted us to delay recognizing the estimated impact of CECL on regulatory capital until after a two-year deferral period, which for us extended through December 31, 2021. Beginning on January 1, 2022, we are required to phase in 25% of the previously deferred estimated capital impact of CECL, with an additional 25% to be phased in at the beginning of each subsequent year until fully phased in by the first quarter of 2025. Under these rules, firms that adopt CECL and elect the five-year transition will calculate the estimated impact of CECL on regulatory capital as the day-one impact of adoption plus 25% of the subsequent change in allowance during the two-year deferral period, which according to the final rule approximates the impact of CECL relative to an incurred loss model. We adopted this transition option during the first quarter of 2020, and beginning January 1, 2022, are phasing in the regulatory capital impacts of CECL based on this five-year transition period.
| Reconciliation to GAAP | ||||
| Adjusted Earnings per Share |
||||||||||||||||
| Numerator ($ millions) | 3Q 24 | 2Q 24 | 3Q 23 | |||||||||||||
| GAAP Net Income Attributable to Common Shareholders |
$ | 330 | $ | 266 | $ | 269 | ||||||||||
| Discontinued Operations, Net of Tax |
- | - | - | |||||||||||||
| Core OID |
14 | 14 | 12 | |||||||||||||
| Repositioning and Other |
- | - | 30 | |||||||||||||
| Change in the Fair Value of Equity Securities |
(59 | ) | 28 | 56 | ||||||||||||
| Tax on: Core OID, Repo, & Change in Fair Value of Equity Securities (21% tax rate) |
9 | (9 | ) | (21 | ) | |||||||||||
| Significant Discrete Tax Items |
- | - | (94 | ) | ||||||||||||
| Core Net Income Attributable to Common Shareholders |
[a] | $ | 295 | $ | 299 | $ | 252 | |||||||||
| Denominator |
||||||||||||||||
| Weighted-Average Common Shares Outstanding - (Diluted, thousands) |
[b] | 311,044 | 309,886 | 305,693 | ||||||||||||
| Adjusted EPS |
[a] ÷ [b] | $ | 0.95 | $ | 0.97 | $ | 0.83 | |||||||||
| Core Return on Tangible Common Equity (ROTCE) | ||||||||||||||||
| Numerator ($ millions) | 3Q 24 | 2Q 24 | 3Q 23 | |||||||||||||
| GAAP Net Income Attributable to Common Shareholders |
$ | 330 | $ | 266 | $ | 269 | ||||||||||
| Discontinued Operations, Net of Tax |
- | - | - | |||||||||||||
| Core OID |
14 | 14 | 12 | |||||||||||||
| Repositioning and Other |
- | - | 30 | |||||||||||||
| Change in Fair Value of Equity Securities |
(59 | ) | 28 | 56 | ||||||||||||
| Tax on: Core OID, Repo, & Change in Fair Value of Equity Securities (21% tax rate) |
9 | (9 | ) | (21 | ) | |||||||||||
| Significant Discrete Tax Items |
- | - | (94 | ) | ||||||||||||
| Core Net Income Attributable to Common Shareholders |
[a] | $ | 295 | $ | 299 | $ | 252 | |||||||||
| Denominator (Average, $ millions) |
||||||||||||||||
| GAAP Shareholder’s Equity |
$ | 14,288 | $ | 13,754 | $ | 13,179 | ||||||||||
| Preferred Equity |
(2,324 | ) | (2,324 | ) | (2,324 | ) | ||||||||||
| GAAP Common Shareholder’s Equity |
$ | 11,964 | 11,430 | $ | 10,855 | |||||||||||
| Goodwill & Identifiable Intangibles, Net of Deferred Tax Liabilities (DTLs) |
(710 | ) | (717 | ) | (883 | ) | ||||||||||
| Tangible Common Equity |
$ | 11,254 | $ | 10,713 | $ | 9,972 | ||||||||||
| Core OID Balance |
(759 | ) | (773 | ) | (812 | ) | ||||||||||
| Net Deferred Tax Asset (DTA) |
(1,463 | ) | (1,388 | ) | (1,310 | ) | ||||||||||
| Normalized Common Equity | [b] | $ | 9,033 | $ | 8,553 | $ | 7,850 | |||||||||
| Core Return on Tangible Common Equity |
[a] ÷ [b] | 13.1 | % | 14.0 | % | 12.9 | % | |||||||||
6
|
Adjusted Tangible Book Value per Share |
||||||||||||||
| Numerator ($ millions) | 3Q 24 | 2Q 24 | 3Q 23 | |||||||||||
| GAAP Shareholder’s Equity |
$ | 14,725 | $ | 13,851 | $ | 12,825 | ||||||||
| Preferred Equity |
(2,324 | ) | (2,324 | ) | (2,324 | ) | ||||||||
| GAAP Common Shareholder’s Equity |
$ | 12,401 | $ | 11,527 | $ | 10,501 | ||||||||
| Goodwill and Identifiable Intangible Assets, Net of DTLs |
(707 | ) | (713 | ) | (879 | ) | ||||||||
| Tangible Common Equity |
11,694 | 10,814 | 9,622 | |||||||||||
| Tax-effected Core OID Balance (21% tax rate) |
(594 | ) | (605 | ) | (636 | ) | ||||||||
| Adjusted Tangible Book Value |
[a] |
$ | 11,101 | $ | 10,209 | $ | 8,986 | |||||||
| Denominator |
||||||||||||||
| Issued Shares Outstanding (period-end, thousands) |
[b] |
304,715 | 304,656 | 301,630 | ||||||||||
| Metric |
||||||||||||||
| GAAP Common Shareholder’s Equity per Share |
$ | 40.70 | $ | 37.84 | $ | 34.81 | ||||||||
| Goodwill and Identifiable Intangible Assets, Net of DTLs per Share |
(2.32 | ) | (2.34 | ) | (2.91 | ) | ||||||||
| Tangible Common Equity per Share |
$ | 38.38 | $ | 35.50 | $ | 31.90 | ||||||||
| Tax-effected Core OID Balance (21% tax rate) per Share |
(1.95 | ) | (1.99 | ) | (2.11 | ) | ||||||||
| Adjusted Tangible Book Value per Share |
[a] ÷ [b] |
$ | 36.43 | $ | 33.51 | $ | 29.79 | |||||||
| Adjusted Efficiency Ratio |
|
|||||||||||||
| Numerator ($ millions) | 3Q 24 | 2Q 24 | 3Q 23 | |||||||||||
| GAAP Noninterest Expense |
$ | 1,225 | $ | 1,286 | $ | 1,232 | ||||||||
| Insurance Expense |
(366 | ) | (410 | ) | (338 | ) | ||||||||
| Repositioning and Other |
- | - | (30 | ) | ||||||||||
| Adjusted Noninterest Expense for Adjusted Efficiency Ratio |
[a] |
$ | 859 | $ | 876 | $ | 864 | |||||||
| Denominator ($ millions) | ||||||||||||||
| Total Net Revenue |
$ | 2,103 | $ | 2,000 | $ | 1,968 | ||||||||
| Core OID |
14 | 14 | 12 | |||||||||||
| Insurance Revenue |
(468 | ) | (368 | ) | (322 | ) | ||||||||
| Adjusted Net Revenue for Adjusted Efficiency Ratio |
[b] |
$ | 1,649 | $ | 1,646 | $ | 1,658 | |||||||
| Adjusted Efficiency Ratio |
[a] ÷ [b] |
52.1 | % | 53.2 | % | 52.1 | % | |||||||
| Original Issue Discount Amortization Expense ($ millions) |
|
|||||||||||||
| 3Q 24 | 2Q 24 | 3Q 23 | ||||||||||||
| GAAP Original Issue Discount Amortization Expense |
$ | 17 | $ | 17 | $ | 15 | ||||||||
| Other OID |
(3 | ) | (3 | ) | (3 | ) | ||||||||
| Core Original Issue Discount (Core OID) Amortization Expense |
$ | 14 | $ | 14 | $ | 12 | ||||||||
| Outstanding Original Issue Discount Balance ($ millions) |
|
|||||||||||||
| 3Q 24 | 2Q 24 | 3Q 23 | ||||||||||||
| GAAP Outstanding Original Issue Discount Balance |
$ | (780 | ) | $ | (797 | ) | $ | (847 | ) | |||||
| Other Outstanding OID Balance |
29 | 31 | 42 | |||||||||||
| Core Outstanding Original Issue Discount Balance (Core OID Balance) |
$ | (751 | ) | $ | (766 | ) | $ | (806 | ) | |||||
7
|
($ millions) |
||||||||||||||||
| Net Financing Revenue (Excluding Core OID) | 3Q 24 | 2Q 24 | 3Q 23 | |||||||||||||
| GAAP Net Financing Revenue |
[w] | $ | 1,488 | $ | 1,495 | $ | 1,533 | |||||||||
| Core OID |
14 | 14 | 12 | |||||||||||||
| Net Financing Revenue (Excluding Core OID) |
[a] | $ | 1,502 | $ | 1,509 | $ | 1,545 | |||||||||
| Adjusted Other Revenue | 3Q 24 | 2Q 24 | 3Q 23 | |||||||||||||
| GAAP Other Revenue |
[x] | $ | 615 | $ | 505 | $ | 435 | |||||||||
| Change in Fair Value of Equity Securities |
(59 | ) | 28 | 56 | ||||||||||||
| Adjusted Other Revenue |
[b] | $ | 556 | $ | 533 | $ | 491 | |||||||||
| Adjusted Total Net Revenue | 3Q 24 | 2Q 24 | 3Q 23 | |||||||||||||
| Adjusted Total Net Revenue |
[a]+[b] | $ | 2,058 | $ | 2,042 | $ | 2,036 | |||||||||
| Adjusted Provision for Credit Losses | 3Q 24 | 2Q 24 | 3Q 23 | |||||||||||||
| GAAP Provision for Credit Losses |
[y] | $ | 645 | $ | 457 | $ | 508 | |||||||||
| Adjusted Provision for Credit Losses |
[c] | $ | 645 | $ | 457 | $ | 508 | |||||||||
| Adjusted NIE (Excluding Repositioning) | 3Q 24 | 2Q 24 | 3Q 23 | |||||||||||||
| GAAP Noninterest Expense |
[z] | $ | 1,225 | $ | 1,286 | $ | 1,232 | |||||||||
| Repositioning |
- | - | (30 | ) | ||||||||||||
| Adjusted NIE (Excluding Repositioning) |
[d] | $ | 1,225 | $ | 1,286 | $ | 1,202 | |||||||||
| Core Pre-Tax Income | 3Q 24 | 2Q 24 | 3Q 23 | |||||||||||||
| Pre-Tax Income |
[w]+[x]-[y]-[z] | $ | 233 | $ | 257 | $ | 228 | |||||||||
| Core Pre-Tax Income |
[a]+[b]-[c]-[d] | $ | 188 | $ | 299 | $ | 326 | |||||||||
| Insurance Non-GAAP Walk to Core Pre-Tax Income |
|
|||||||||||||||||||||||
| 3Q 2024 | 3Q 2023 | |||||||||||||||||||||||
| ($ millions)
Insurance |
GAAP | |
Change in the fair value of equity securities |
|
|
Non-GAAP1 |
|
GAAP | |
Change in the fair value of equity securities |
|
|
Non-GAAP1 |
|
||||||||||
| Premiums, Service Revenue Earned and Other |
$ | 362 | $ | - | $ | 362 | $ | 324 | $ | - | $ | 324 | ||||||||||||
| Losses and Loss Adjustment Expenses |
135 | - | 135 | 107 | - | 107 | ||||||||||||||||||
| Acquisition and Underwriting Expenses |
231 | - | 231 | 231 | - | 231 | ||||||||||||||||||
| Investment Income and Other |
106 | (56 | ) | 50 | (2 | ) | 46 | 44 | ||||||||||||||||
| Pre-Tax Income from Continuing Operations |
$ | 102 | $ | (56 | ) | $ | 46 | $ | (16 | ) | $ | 46 | $ | 30 | ||||||||||
1Non-GAAP line items walk to Core Pre-Tax Income, a non-GAAP financial measure that adjusts Pre-Tax Income.
8
| Additional Financial Information | ||||
For additional financial information, the third quarter 2024 earnings presentation and financial supplement are available in the Events & Presentations section of Ally’s Investor Relations Website at http://www.ally.com/about/investor/events-presentations/.
About Ally Financial Inc.
Ally Financial Inc. (NYSE: ALLY) is a financial services company with the nation’s largest all-digital bank and an industry-leading auto financing business, driven by a mission to “Do It Right” and be a relentless ally for customers and communities. The company serves approximately 11 million customers through a full range of online banking services (including deposits, mortgage, and credit card products) and securities brokerage and investment advisory services. The company also includes a robust corporate finance business that offers capital for equity sponsors and middle-market companies, as well as auto financing and insurance offerings. For more information, please visit www.ally.com.
For more information and disclosures about Ally, visit https://www.ally.com/#disclosures.
For further images and news on Ally, please visit http://media.ally.com.
Forward-Looking Statements
This earnings release and related communications should be read in conjunction with the financial statements, notes, and other information contained in our Annual Reports on Form 10-K, Quarterly Reports on Form 10-Q, and Current Reports on Form 8-K. This information is preliminary and based on company and third-party data available at the time of the release or related communication.
This earnings release and related communications contain forward-looking statements within the meaning of the Private Securities Litigation Reform Act of 1995. These statements can be identified by the fact that they do not relate strictly to historical or current facts—such as statements about the outlook for financial and operating metrics and performance and future capital allocation and actions. Forward-looking statements often use words such as “believe,” “expect,” “anticipate,” “intend,” “pursue,” “seek,” “continue,” “estimate,” “project,” “outlook,” “forecast,” “potential,” “target,” “objective,” “trend,” “plan,” “goal,” “initiative,” “priorities,” or other words of comparable meaning or future-tense or conditional verbs such as “may,” “will,” “should,” “would,” or “could.” Forward-looking statements convey our expectations, intentions, or forecasts about future events, circumstances, or results. All forward-looking statements, by their nature, are subject to assumptions, risks, and uncertainties, which may change over time and many of which are beyond our control. You should not rely on any forward-looking statement as a prediction or guarantee about the future.
Actual future objectives, strategies, plans, prospects, performance, conditions, or results may differ materially from those set forth in any forward looking statement. Some of the factors that may cause actual results or other future events or circumstances to differ from those in forward looking statements are described in our Annual Report on Form 10-K for the year ended December 31, 2023, our subsequent Quarterly Reports on Form 10-Q or Current Reports on Form 8-K, or other applicable documents that are filed or furnished with the U.S. Securities and Exchange Commission (collectively, our “SEC filings”). Any forward-looking statement made by us or on our behalf speaks only as of the date that it was made. We do not undertake to update any forward-looking statement to reflect the impact of events, circumstances, or results that arise after the date that the statement was made, except as required by applicable securities laws. You, however, should consult further disclosures (including disclosures of a forward-looking nature) that we may make in any subsequent SEC filings.
This earnings release and related communications contain specifically identified non-GAAP financial measures, which supplement the results that are reported according to generally accepted accounting principles (“GAAP”). These non-GAAP financial measures may be useful to investors but should not be viewed in isolation from, or as a substitute for, GAAP results. Differences between non-GAAP financial measures and comparable GAAP financial measures are reconciled in the release.
Unless the context otherwise requires, the following definitions apply. The term “loans” means the following consumer and commercial products associated with our direct and indirect financing activities: loans, retail installment sales contracts, lines of credit, and other financing products excluding operating leases. The term “operating leases” means consumer- and commercial-vehicle lease agreements where Ally is the lessor and the lessee is generally not obligated to acquire ownership of the vehicle at lease-end or compensate Ally for the vehicle’s residual value. The terms “lend,” “finance,” and “originate” mean our direct extension or origination of loans, our purchase or acquisition of loans, or our purchase of operating leases as applicable. The term “consumer” means all consumer products associated with our loan and operating-lease activities and all commercial retail installment sales contracts. The term “commercial” means all commercial products associated with our loan activities, other than commercial retail installment sales contracts. The term “partnerships” means business arrangements rather than partnerships as defined by law.
| Contacts: | ||
| Sean Leary | Peter Gilchrist | |
| Ally Investor Relations | Ally Communications (Media) | |
| 704-444-4830 | 704-644-6299 | |
| sean.leary@ally.com | peter.gilchrist@ally.com |
9

Exhibit 99.2 Ally Financial Inc. 3Q 2024 Earnings Review October 18, 2024 Contact Ally Investor Relations at (866) 710-4623 or investor.relations@ally.com

3Q 2024 Preliminary Results Forward-Looking Statements and Additional Information This presentation and related communications should be read in conjunction with the financial statements, notes, and other information contained in our Annual Reports on Form 10-K, Quarterly Reports on Form 10-Q, and Current Reports on Form 8-K. This information is preliminary and based on company and third-party data available at the time of the presentation or related communication. This presentation and related communications contain forward-looking statements within the meaning of the Private Securities Litigation Reform Act of 1995. These statements can be identified by the fact that they do not relate strictly to historical or current facts—such as statements about the outlook for financial and operating metrics and performance and future capital allocation and actions. Forward-looking statements often use words such as “believe,” “expect,” “anticipate,” “intend,” “pursue,” “seek,” “continue,” “estimate,” “project,” “outlook,” “forecast,” “potential,” “target,” “objective,” “trend,” “plan,” “goal,” “initiative,” “priorities,” or other words of comparable meaning or future-tense or conditional verbs such as “may,” “will,” “should,” “would,” or “could.” Forward-looking statements convey our expectations, intentions, or forecasts about future events, circumstances, or results. All forward-looking statements, by their nature, are subject to assumptions, risks, and uncertainties, which may change over time and many of which are beyond our control. You should not rely on any forward-looking statement as a prediction or guarantee about the future. Actual future objectives, strategies, plans, prospects, performance, conditions, or results may differ materially from those set forth in any forward-looking statement. Some of the factors that may cause actual results or other future events or circumstances to differ from those in forward-looking statements are described in our Annual Report on Form 10-K for the year ended December 31, 2023, our subsequent Quarterly Reports on Form 10-Q or Current Reports on Form 8-K, or other applicable documents that are filed or furnished with the U.S. Securities and Exchange Commission (collectively, our “SEC filings”). Any forward-looking statement made by us or on our behalf speaks only as of the date that it was made. We do not undertake to update any forward-looking statement to reflect the impact of events, circumstances, or results that arise after the date that the statement was made, except as required by applicable securities laws. You, however, should consult further disclosures (including disclosures of a forward-looking nature) that we may make in any subsequent SEC filings. This presentation and related communications contain specifically identified non-GAAP financial measures, which supplement the results that are reported according to U.S. generally accepted accounting principles (“GAAP”). These non-GAAP financial measures may be useful to investors but should not be viewed in isolation from, or as a substitute for, GAAP results. Differences between non-GAAP financial measures and comparable GAAP financial measures are reconciled in the presentation. Unless the context otherwise requires, the following definitions apply. The term “loans” means the following consumer and commercial products associated with our direct and indirect financing activities: loans, retail installment sales contracts, lines of credit, and other financing products excluding operating leases. The term “operating leases” means consumer- and commercial-vehicle lease agreements where Ally is the lessor and the lessee is generally not obligated to acquire ownership of the vehicle at lease-end or compensate Ally for the vehicle’s residual value. The terms “lend,” “finance,” and “originate” mean our direct extension or origination of loans, our purchase or acquisition of loans, or our purchase of operating leases, as applicable. The term “consumer” means all consumer products associated with our loan and operating-lease activities and all commercial retail installment sales contracts. The term “commercial” means all commercial products associated with our loan activities, other than commercial retail installment sales contracts. The term “partnerships” means business arrangements rather than partnerships as defined by law. 2
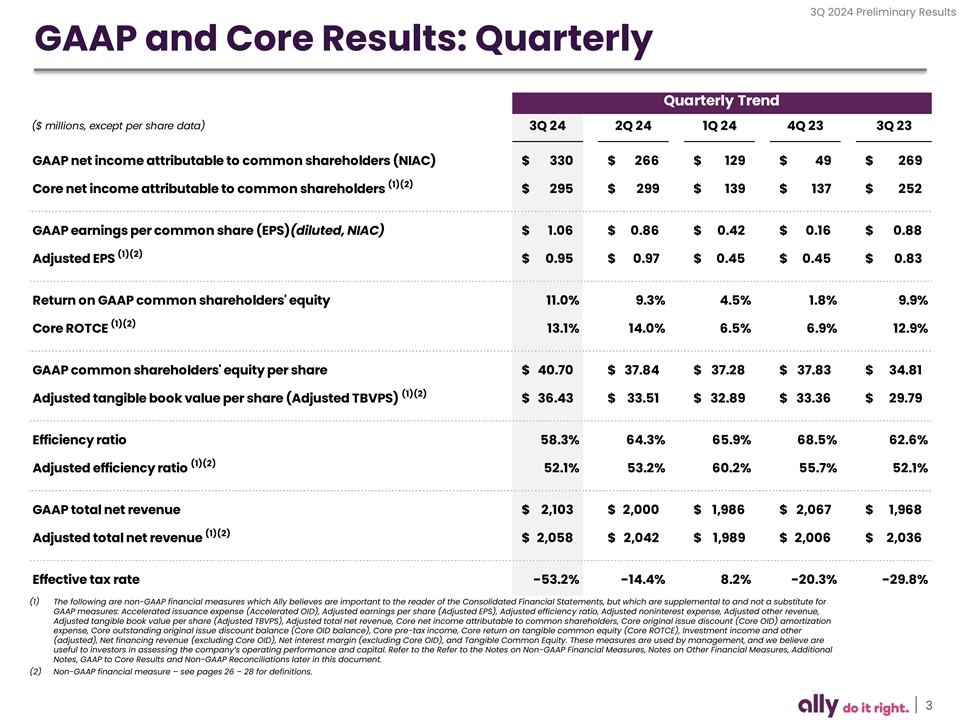
3Q 2024 Preliminary Results GAAP and Core Results: Quarterly Quarterly Trend ($ millions, except per share data) 3Q 24 2Q 24 1Q 24 4Q 23 3Q 23 GAAP net income attributable to common shareholders (NIAC) $ 330 $ 266 $ 1 29 $ 49 $ 269 (1)(2) Core net income attributable to common shareholders $ 295 $ 2 99 $ 1 39 $ 137 $ 252 GAAP earnings per common share (EPS)(diluted, NIAC) $ 1 .06 $ 0.86 $ 0.42 $ 0 .16 $ 0.88 (1)(2) Adjusted EPS $ 0 .95 $ 0.97 $ 0.45 $ 0.45 $ 0 .83 Return on GAAP common shareholders' equity 11.0% 9.3% 4.5% 1.8% 9.9% (1)(2) Core ROTCE 13.1% 14.0% 6.5% 6.9% 12.9% GAAP common shareholders' equity per share $ 4 0.70 $ 37.84 $ 37.28 $ 37.83 $ 3 4.81 (1)(2) Adjusted tangible book value per share (Adjusted TBVPS) $ 36.43 $ 33.51 $ 32.89 $ 33.36 $ 2 9.79 Efficiency ratio 58.3% 64.3% 65.9% 68.5% 62.6% (1)(2) Adjusted efficiency ratio 52.1% 53.2% 60.2% 55.7% 52.1% GAAP total net revenue $ 2,103 $ 2,000 $ 1 ,986 $ 2,067 $ 1 ,968 (1)(2) Adjusted total net revenue $ 2,058 $ 2 ,042 $ 1,989 $ 2,006 $ 2 ,036 Effective tax rate -53.2% -14.4% 8.2% -20.3% -29.8% (1) The following are non-GAAP financial measures which Ally believes are important to the reader of the Consolidated Financial Statements, but which are supplemental to and not a substitute for GAAP measures: Accelerated issuance expense (Accelerated OID), Adjusted earnings per share (Adjusted EPS), Adjusted efficiency ratio, Adjusted noninterest expense, Adjusted other revenue, Adjusted tangible book value per share (Adjusted TBVPS), Adjusted total net revenue, Core net income attributable to common shareholders, Core original issue discount (Core OID) amortization expense, Core outstanding original issue discount balance (Core OID balance), Core pre-tax income, Core return on tangible common equity (Core ROTCE), Investment income and other (adjusted), Net financing revenue (excluding Core OID), Net interest margin (excluding Core OID), and Tangible Common Equity. These measures are used by management, and we believe are useful to investors in assessing the company’s operating performance and capital. Refer to the Refer to the Notes on Non-GAAP Financial Measures, Notes on Other Financial Measures, Additional Notes, GAAP to Core Results and Non-GAAP Reconciliations later in this document. (2) Non-GAAP financial measure – see pages 26 – 28 for definitions. 3
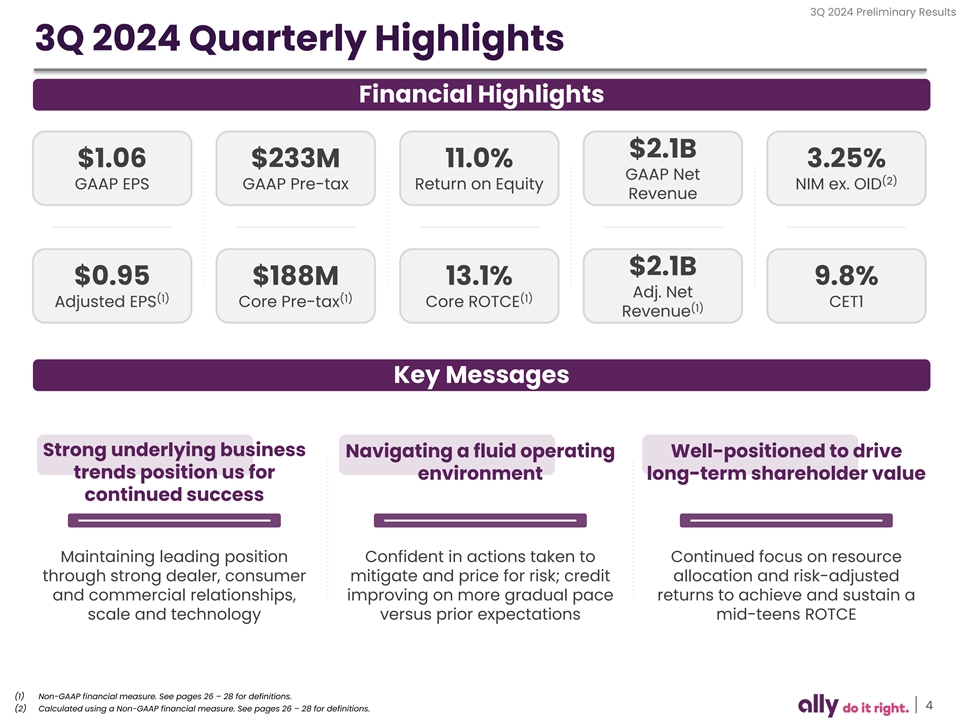
3Q 2024 Preliminary Results 3Q 2024 Quarterly Highlights Financial Highlights $2.1B $1.06 $233M 11.0% 3.25% GAAP Net (2) GAAP EPS GAAP Pre-tax Return on Equity NIM ex. OID Revenue $2.1B $0.95 $188M 13.1% 9.8% Adj. Net (1) (1) (1) Adjusted EPS Core Pre-tax Core ROTCE CET1 (1) Revenue Key Messages Strong underlying business Navigating a fluid operating Well-positioned to drive trends position us for environment long-term shareholder value continued success Maintaining leading position Confident in actions taken to Continued focus on resource through strong dealer, consumer mitigate and price for risk; credit allocation and risk-adjusted and commercial relationships, improving on more gradual pace returns to achieve and sustain a scale and technology versus prior expectations mid-teens ROTCE (1) Non-GAAP financial measure. See pages 26 – 28 for definitions. 4 (2) Calculated using a Non-GAAP financial measure. See pages 26 – 28 for definitions.
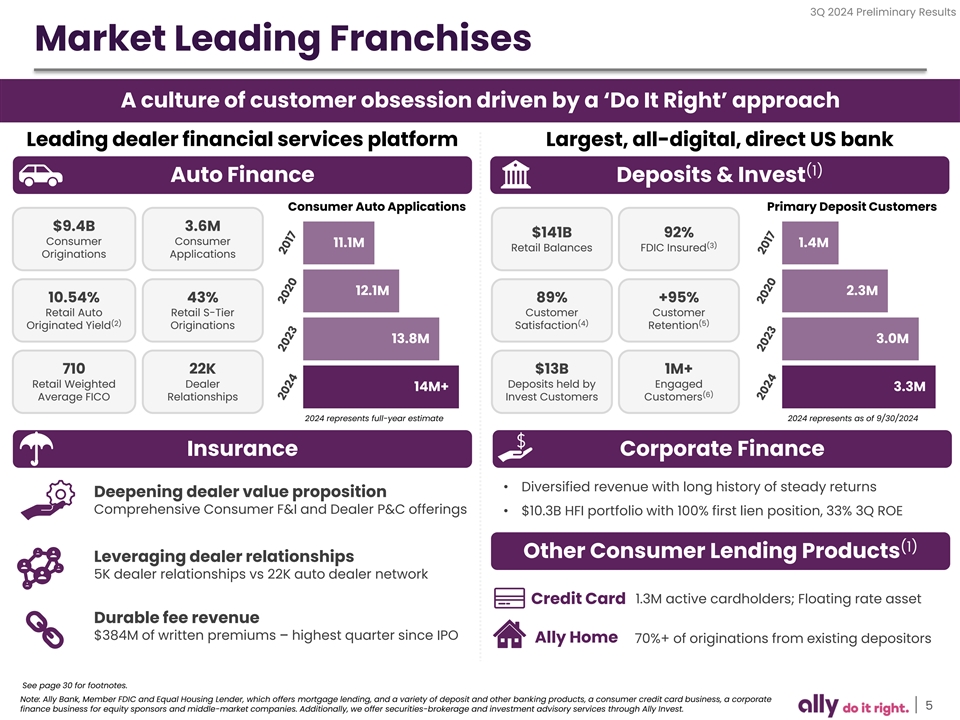
3Q 2024 Preliminary Results Market Leading Franchises A culture of customer obsession driven by a ‘Do It Right’ approach Leading dealer financial services platform Largest, all-digital, direct US bank (1) Auto Finance Deposits & Invest Consumer Auto Applications Primary Deposit Customers $9.4B 3.6M $141B 92% Consumer Consumer 11.1M (3) 1.4M Retail Balances FDIC Insured Originations Applications 12.1M 2.3M 10.54% 43% 89% +95% Retail Auto Retail S-Tier Customer Customer (2) (4) (5) Originated Yield Originations Satisfaction Retention 13.8M 3.0M 710 22K $13B 1M+ Retail Weighted Dealer Deposits held by Engaged 14M+ 3.3M (6) Average FICO Relationships Invest Customers Customers 2024 represents full-year estimate 2024 represents as of 9/30/2024 Insurance Corporate Finance • Diversified revenue with long history of steady returns Deepening dealer value proposition Comprehensive Consumer F&I and Dealer P&C offerings • $10.3B HFI portfolio with 100% first lien position, 33% 3Q ROE (1) Other Consumer Lending Products Leveraging dealer relationships 5K dealer relationships vs 22K auto dealer network Credit Card 1.3M active cardholders; Floating rate asset Durable fee revenue $384M of written premiums – highest quarter since IPO Ally Home 70%+ of originations from existing depositors See page 30 for footnotes. Note: Ally Bank, Member FDIC and Equal Housing Lender, which offers mortgage lending, and a variety of deposit and other banking products, a consumer credit card business, a corporate 5 finance business for equity sponsors and middle-market companies. Additionally, we offer securities-brokerage and investment advisory services through Ally Invest.
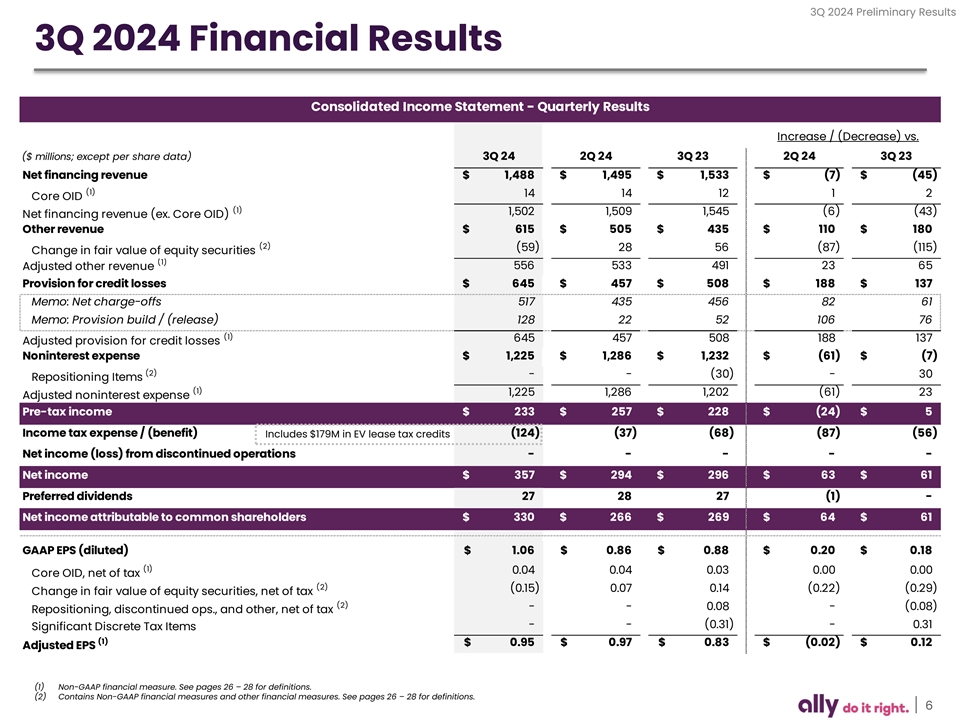
3Q 2024 Preliminary Results 3Q 2024 Financial Results Consolidated Income Statement - Quarterly Results Increase / (Decrease) vs. ($ millions; except per share data) 3Q 24 2Q 24 3Q 23 2Q 24 3Q 23 Net financing revenue $ 1,488 $ 1,495 $ 1,533 $ (7) $ (45) (1) 14 14 12 1 2 Core OID (1) 1,502 1,509 1,545 (6) (43) Net financing revenue (ex. Core OID) Other revenue $ 615 $ 505 $ 435 $ 110 $ 180 (2) (59) 28 56 ( 87) (115) Change in fair value of equity securities (1) 556 5 33 491 23 65 Adjusted other revenue Provision for credit losses $ 645 $ 457 $ 508 $ 188 $ 137 Memo: Net charge-offs 517 435 456 82 61 Memo: Provision build / (release) 128 22 52 106 76 (1) 645 457 508 1 88 137 Adjusted provision for credit losses Noninterest expense $ 1 ,225 $ 1,286 $ 1,232 $ (61) $ (7) (2) - - (30) - 30 Repositioning Items (1) 1,225 1 ,286 1 ,202 (61) 23 Adjusted noninterest expense Pre-tax income $ 233 $ 257 $ 228 $ (24) $ 5 Income tax expense / (benefit) Includes $179M in EV lease tax credits (124) (37) (68) (87) ( 56) Net income (loss) from discontinued operations - - - - - Net income $ 357 $ 294 $ 296 $ 63 $ 61 Preferred dividends 27 28 27 (1) - Net income attributable to common shareholders $ 330 $ 266 $ 269 $ 64 $ 61 GAAP EPS (diluted) $ 1 .06 $ 0 .86 $ 0 .88 $ 0.20 $ 0.18 (1) 0.04 0.04 0.03 0.00 0.00 Core OID, net of tax (2) (0.15) 0.07 0.14 ( 0.22) (0.29) Change in fair value of equity securities, net of tax (2) - - 0.08 - ( 0.08) Repositioning, discontinued ops., and other, net of tax - - (0.31) - 0.31 Significant Discrete Tax Items (1) $ 0 .95 $ 0 .97 $ 0.83 $ (0.02) $ 0 .12 Adjusted EPS (1) Non-GAAP financial measure. See pages 26 – 28 for definitions. (2) Contains Non-GAAP financial measures and other financial measures. See pages 26 – 28 for definitions. 6
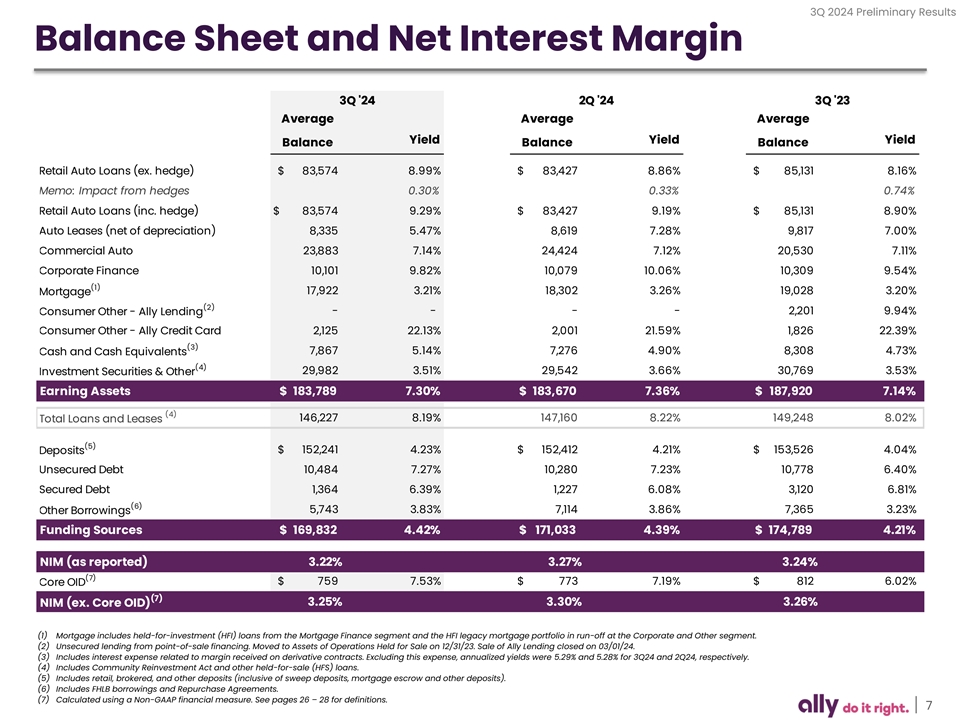
3Q 2024 Preliminary Results Balance Sheet and Net Interest Margin 3Q '24 2Q '24 3Q '23 Average Average Average Yield Yield Yield Balance Balance Balance Retail Auto Loans (ex. hedge) $ 83,574 8.99% $ 83,427 8.86% $ 85,131 8.16% Memo: Impact from hedges 0.30% 0.33% 0.74% Retail Auto Loans (inc. hedge) $ 83,574 9.29% $ 83,427 9.19% $ 8 5,131 8.90% Auto Leases (net of depreciation) 8,335 5.47% 8,619 7.28% 9,817 7.00% Commercial Auto 23,883 7.14% 2 4,424 7.12% 2 0,530 7.11% Corporate Finance 10,101 9.82% 10,079 10.06% 1 0,309 9.54% (1) 17,922 3.21% 18,302 3.26% 1 9,028 3.20% Mortgage (2) - - - - 2 ,201 9.94% Consumer Other - Ally Lending Consumer Other - Ally Credit Card 2,125 22.13% 2,001 21.59% 1,826 22.39% (3) 7,867 5.14% 7 ,276 4.90% 8,308 4.73% Cash and Cash Equivalents (4) 2 9,982 3.51% 29,542 3.66% 3 0,769 3.53% Investment Securities & Other Earning Assets $ 183,789 7.30% $ 183,670 7.36% $ 187,920 7.14% (4) 146,227 8.19% 147,160 8.22% 149,248 8.02% Total Loans and Leases (5) $ 152,241 4.23% $ 152,412 4.21% $ 153,526 4.04% Deposits Unsecured Debt 10,484 7.27% 1 0,280 7.23% 10,778 6.40% Secured Debt 1,364 6.39% 1,227 6.08% 3,120 6.81% (6) 5,743 3.83% 7,114 3.86% 7,365 3.23% Other Borrowings Funding Sources $ 169,832 4.42% $ 1 71,033 4.39% $ 174,789 4.21% NIM (as reported) 3.22% 3.27% 3.24% (7) $ 759 7.53% $ 773 7.19% $ 812 6.02% Core OID (7) NIM (ex. Core OID) 3.25% 3.30% 3.26% (1) Mortgage includes held-for-investment (HFI) loans from the Mortgage Finance segment and the HFI legacy mortgage portfolio in run-off at the Corporate and Other segment. (2) Unsecured lending from point-of-sale financing. Moved to Assets of Operations Held for Sale on 12/31/23. Sale of Ally Lending closed on 03/01/24. (3) Includes interest expense related to margin received on derivative contracts. Excluding this expense, annualized yields were 5.29% and 5.28% for 3Q24 and 2Q24, respectively. (4) Includes Community Reinvestment Act and other held-for-sale (HFS) loans. (5) Includes retail, brokered, and other deposits (inclusive of sweep deposits, mortgage escrow and other deposits). (6) Includes FHLB borrowings and Repurchase Agreements. (7) Calculated using a Non-GAAP financial measure. See pages 26 – 28 for definitions. 7
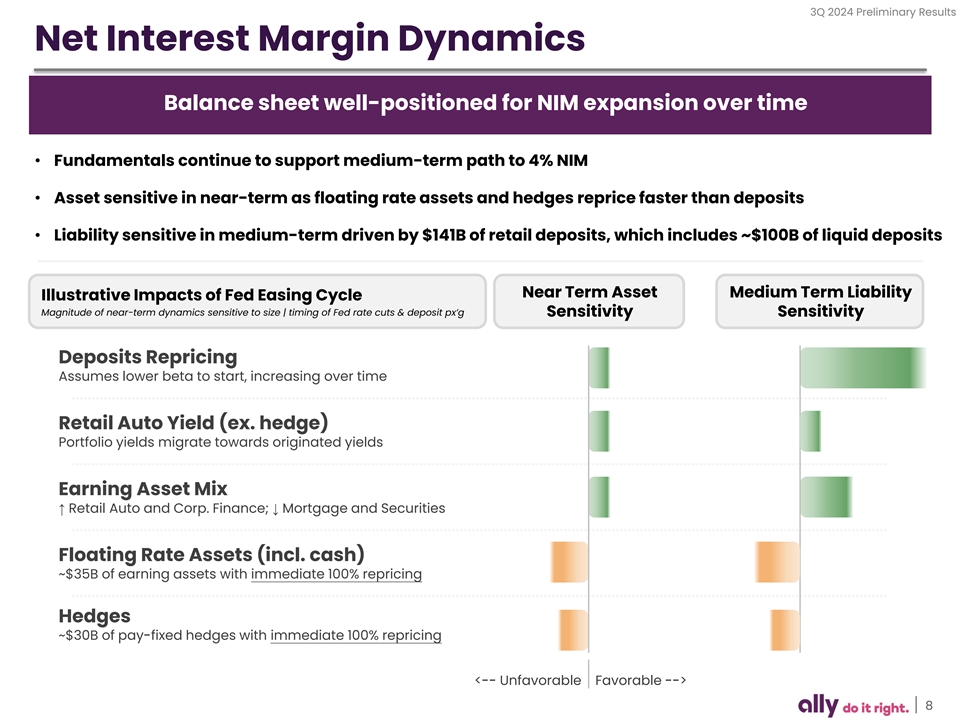
3Q 2024 Preliminary Results Net Interest Margin Dynamics Balance sheet well-positioned for NIM expansion over time • Fundamentals continue to support medium-term path to 4% NIM • Asset sensitive in near-term as floating rate assets and hedges reprice faster than deposits • Liability sensitive in medium-term driven by $141B of retail deposits, which includes ~$100B of liquid deposits Near Term Asset Medium Term Liability Illustrative Impacts of Fed Easing Cycle Magnitude of near-term dynamics sensitive to size | timing of Fed rate cuts & deposit px’g Sensitivity Sensitivity Deposits Repricing Assumes lower beta to start, increasing over time Retail Auto Yield (ex. hedge) Portfolio yields migrate towards originated yields Earning Asset Mix ↑ Retail Auto and Corp. Finance; ↓ Mortgage and Securities Floating Rate Assets (incl. cash) ~$35B of earning assets with immediate 100% repricing Hedges ~$30B of pay-fixed hedges with immediate 100% repricing <-- Unfavorable Favorable --> 8
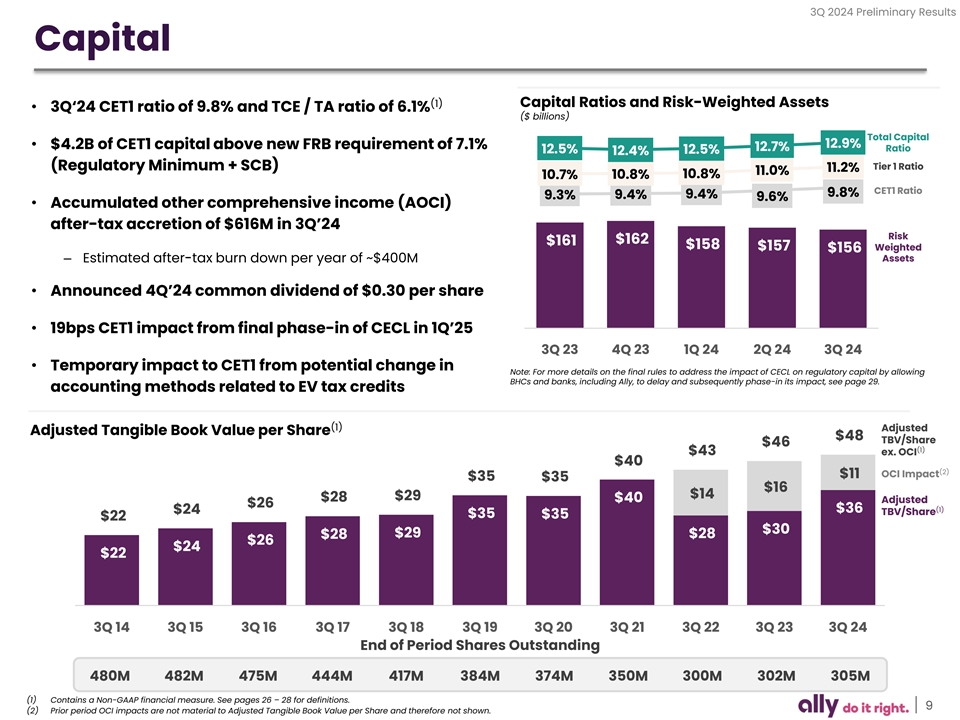
3Q 2024 Preliminary Results Capital Capital Ratios and Risk-Weighted Assets (1) • 3Q‘24 CET1 ratio of 9.8% and TCE / TA ratio of 6.1% ($ billions) Total Capital 12.9% • $4.2B of CET1 capital above new FRB requirement of 7.1% 12.7% Ratio 12.5% 12.5% 12.4% Tier 1 Ratio (Regulatory Minimum + SCB) 11.2% 11.0% 10.8% 10.8% 10.7% CET1 Ratio 9.8% 9.4% 9.4% 9.3% 9.6% • Accumulated other comprehensive income (AOCI) after-tax accretion of $616M in 3Q’24 Risk $162 $161 $158 $157 Weighted $156 Assets – Estimated after-tax burn down per year of ~$400M • Announced 4Q’24 common dividend of $0.30 per share • 19bps CET1 impact from final phase-in of CECL in 1Q’25 3Q 23 4Q 23 1Q 24 2Q 24 3Q 24 • Temporary impact to CET1 from potential change in Note: For more details on the final rules to address the impact of CECL on regulatory capital by allowing BHCs and banks, including Ally, to delay and subsequently phase-in its impact, see page 29. accounting methods related to EV tax credits (1) Adjusted Adjusted Tangible Book Value per Share $48 TBV/Share $46 (1) $43 ex. OCI $40 (2) OCI Impact $11 $35 $35 $16 $14 $28 $29 $40 Adjusted $26 (1) $36 $24 TBV/Share $35 $35 $22 $30 $29 $28 $28 $26 $24 $22 3Q 14 3Q 15 3Q 16 3Q 17 3Q 18 3Q 19 3Q 20 3Q 21 3Q 22 3Q 23 3Q 24 End of Period Shares Outstanding 480M 482M 475M 444M 417M 384M 374M 350M 300M 302M 305M (1) Contains a Non-GAAP financial measure. See pages 26 – 28 for definitions. 9 (2) Prior period OCI impacts are not material to Adjusted Tangible Book Value per Share and therefore not shown.
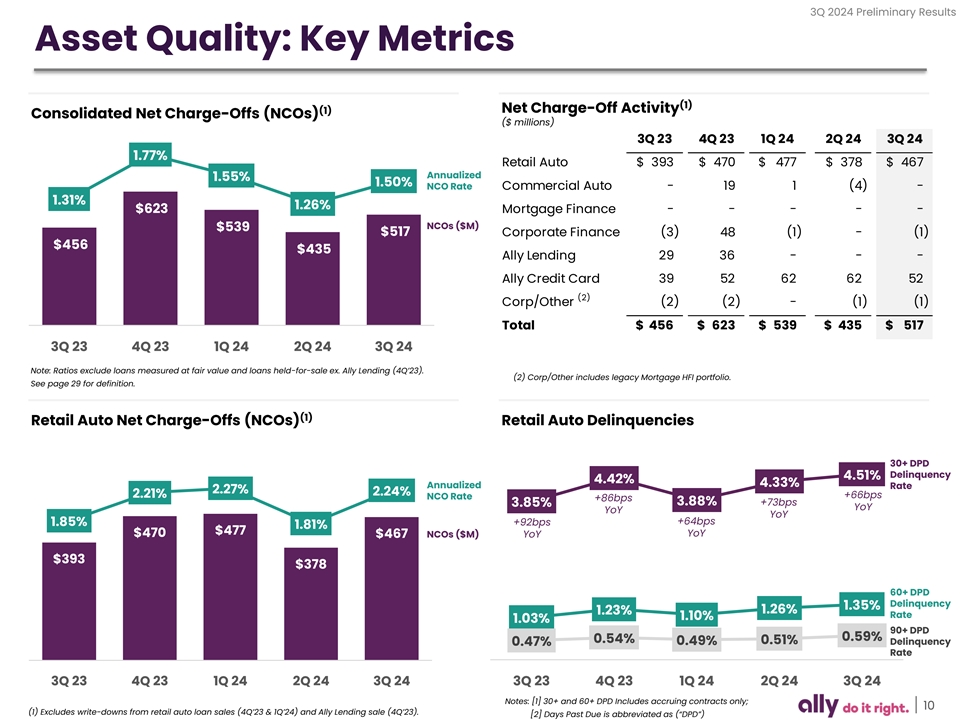
3Q 2024 Preliminary Results Asset Quality: Key Metrics (1) Net Charge-Off Activity (1) Consolidated Net Charge-Offs (NCOs) ($ millions) 3Q 23 4Q 23 1Q 24 2Q 24 3Q 24 1.77% Retail Auto $ 393 $ 470 $ 477 $ 378 $ 467 Annualized 1.55% 1.50% NCO Rate Commercial Auto - 19 1 (4) - 1.31% 1.26% $623 Mortgage Finance - - - - - NCOs ($M) $539 $517 Corporate Finance (3) 48 (1) - (1) $456 $435 Ally Lending 29 36 - - - Ally Credit Card 39 52 62 62 52 (2) Corp/Other (2) (2) - (1) (1) Total $ 456 $ 623 $ 539 $ 435 $ 517 3Q 23 4Q 23 1Q 24 2Q 24 3Q 24 Note: Ratios exclude loans measured at fair value and loans held-for-sale ex. Ally Lending (4Q’23). (2) Corp/Other includes legacy Mortgage HFI portfolio. See page 29 for definition. (1) Retail Auto Net Charge-Offs (NCOs) Retail Auto Delinquencies 30+ DPD Delinquency 4.51% 4.42% 4.33% Annualized Rate 2.27% 2.24% 2.21% +66bps NCO Rate +86bps 3.88% +73bps 3.85% YoY YoY YoY +92bps +64bps 1.85% 1.81% $477 $470 NCOs ($M) YoY YoY $467 $393 $378 60+ DPD Delinquency 1.35% 1.26% 1.23% Rate 1.10% 1.03% 90+ DPD 0.59% 0.54% 0.51% 0.49% Delinquency 0.47% Rate 3Q 23 4Q 23 1Q 24 2Q 24 3Q 24 3Q 23 4Q 23 1Q 24 2Q 24 3Q 24 Notes: [1] 30+ and 60+ DPD Includes accruing contracts only; 10 (1) Excludes write-downs from retail auto loan sales (4Q’23 & 1Q’24) and Ally Lending sale (4Q’23). Notes: [2] Days Past Due is abbreviated as (“DPD”)
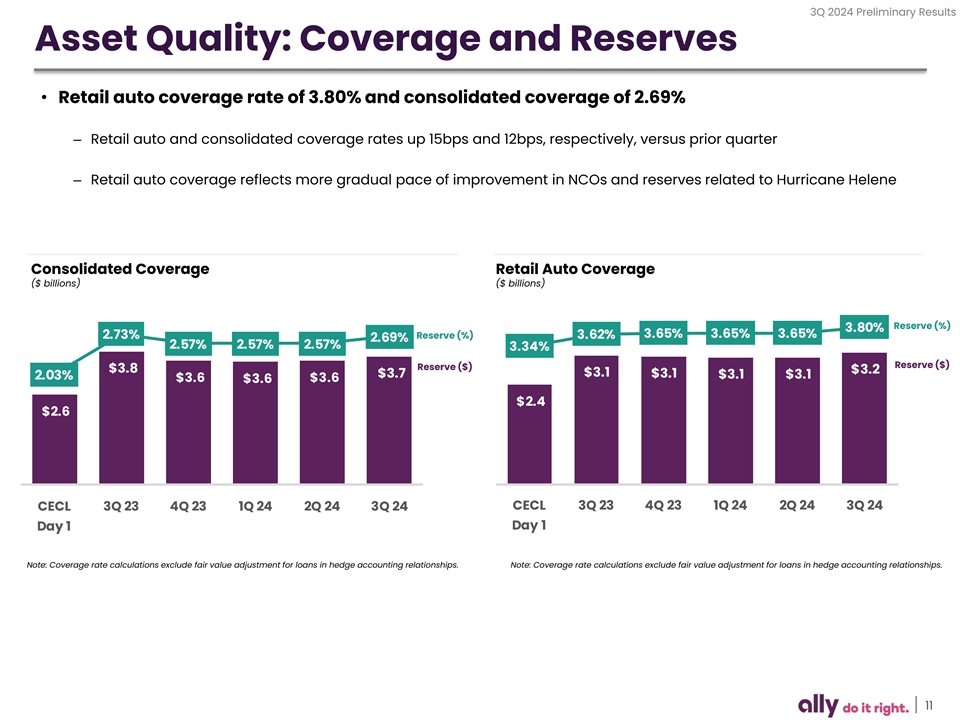
3Q 2024 Preliminary Results Asset Quality: Coverage and Reserves • Retail auto coverage rate of 3.80% and consolidated coverage of 2.69% – Retail auto and consolidated coverage rates up 15bps and 12bps, respectively, versus prior quarter – Retail auto coverage reflects more gradual pace of improvement in NCOs and reserves related to Hurricane Helene Consolidated Coverage Retail Auto Coverage ($ billions) ($ billions) Reserve (%) 3.80% 2. 3% Reserve (%) 3.62% 3.65% 3.65% 3.65% 2.69% 2.5 % 2.5 % 2.5 % 3.34% Reserve ($) Reserve ($) $3.8 $3.2 $3. $3.1 $3.1 $3.1 $3.1 2.03% $3.6 $3.6 $3.6 $2.4 $2.6 CECL 3Q 23 4Q 23 1Q 24 2Q 24 3Q 24 CECL 3Q 23 4Q 23 1Q 24 2Q 24 3Q 24 Day 1 Day 1 Note: Coverage rate calculations exclude fair value adjustment for loans in hedge accounting relationships. Note: Coverage rate calculations exclude fair value adjustment for loans in hedge accounting relationships. 11
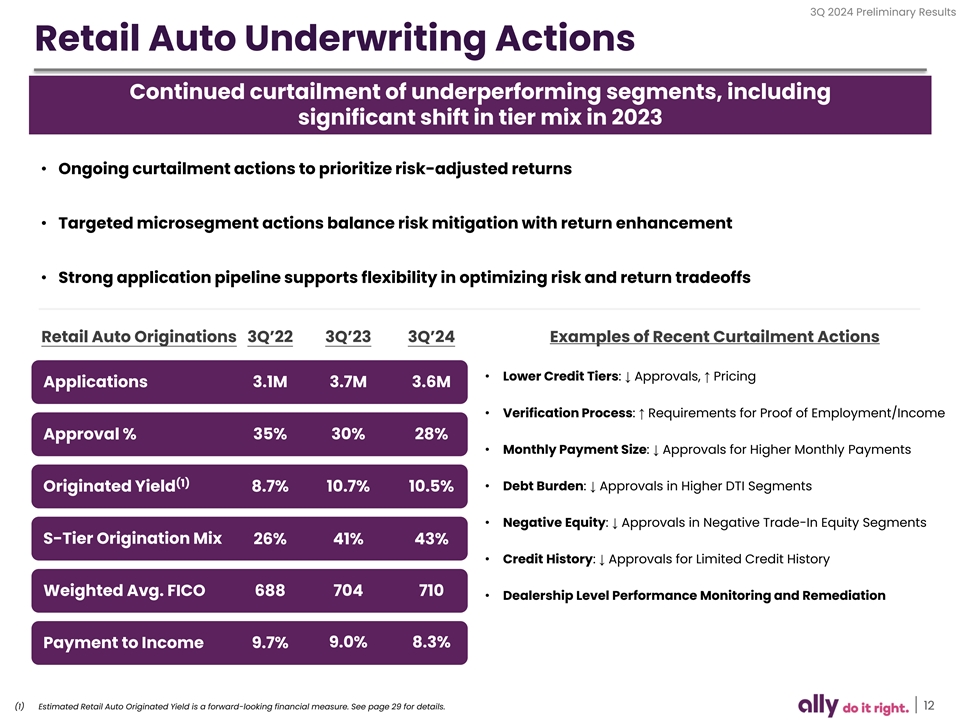
3Q 2024 Preliminary Results Retail Auto Underwriting Actions Continued curtailment of underperforming segments, including significant shift in tier mix in 2023 • Ongoing curtailment actions to prioritize risk-adjusted returns • Targeted microsegment actions balance risk mitigation with return enhancement • Strong application pipeline supports flexibility in optimizing risk and return tradeoffs Retail Auto Originations 3Q’22 3Q’23 3Q’24 Examples of Recent Curtailment Actions • Lower Credit Tiers: ↓ Approvals, ↑ Pricing Applications 3.1M 3.7M 3.6M • Verification Process: ↑ Requirements for Proof of Employment/Income Approval % 35% 30% 28% • Monthly Payment Size: ↓ Approvals for Higher Monthly Payments (1) • Debt Burden: ↓ Approvals in Higher DTI Segments Originated Yield 8.7% 10.7% 10.5% • Negative Equity: ↓ Approvals in Negative Trade-In Equity Segments S-Tier Origination Mix 26% 41% 43% • Credit History: ↓ Approvals for Limited Credit History Weighted Avg. FICO 688 704 710 • Dealership Level Performance Monitoring and Remediation Payment to Income 9.7% 9.0% 8.3% (1) Estimated Retail Auto Originated Yield is a forward-looking financial measure. See page 29 for details. 12
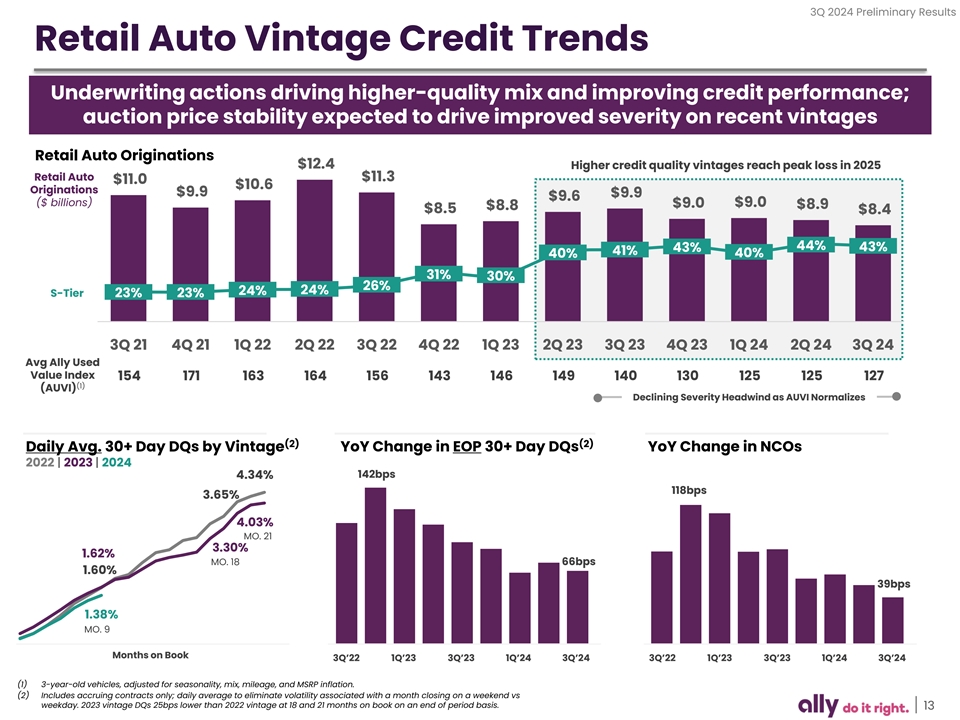
3Q 2024 Preliminary Results Retail Auto Vintage Credit Trends Underwriting actions driving higher-quality mix and improving credit performance; auction price stability expected to drive improved severity on recent vintages Retail Auto Originations $12.4 Higher credit quality vintages reach peak loss in 2025 Retail Auto $11.3 $11.0 $10.6 Originations $9.9 $9.9 $9.6 ($ billions) $9.0 $9.0 $8.9 $8.8 $8.5 $8.4 44% 43% 43% 41% 40% 40% 31% 30% 26% 24% 24% S-Tier 23% 23% 3Q 21 4Q 21 1Q 22 2Q 22 3Q 22 4Q 22 1Q 23 2Q 23 3Q 23 4Q 23 1Q 24 2Q 24 3Q 24 Avg Ally Used Value Index 154 171 163 164 156 143 146 149 140 130 125 125 127 (1) (AUVI) Declining Severity Headwind as AUVI Normalizes (2) (2) Daily Avg. 30+ Day DQs by Vintage YoY Change in EOP 30+ Day DQs YoY Change in NCOs 2022 | 2023 | 2024 4.34% 142bps 118bps 3.65% 4.03% MO. 21 3.30% 1.62% MO. 18 66bps 1.60% 39bps 1.38% MO. 9 Months on Book 3Q’22 1Q’23 3Q’23 1Q’24 3Q’24 3Q’22 1Q’23 3Q’23 1Q’24 3Q’24 (1) 3-year-old vehicles, adjusted for seasonality, mix, mileage, and MSRP inflation. (2) Includes accruing contracts only; daily average to eliminate volatility associated with a month closing on a weekend vs weekday. 2023 vintage DQs 25bps lower than 2022 vintage at 18 and 21 months on book on an end of period basis. 13
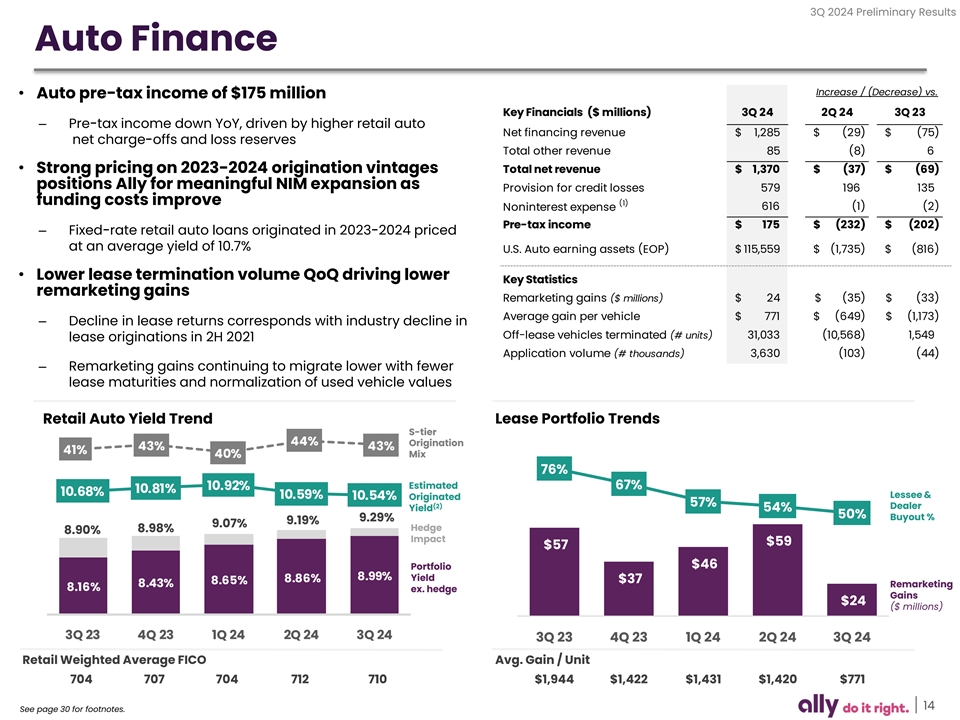
3Q 2024 Preliminary Results Auto Finance Increase / (Decrease) vs. • Auto pre-tax income of $175 million Key Financials ($ millions) 3Q 24 2Q 24 3Q 23 – Pre-tax income down YoY, driven by higher retail auto Net financing revenue $ 1,285 $ (29) $ (75) net charge-offs and loss reserves Total other revenue 85 ( 8) 6 • Strong pricing on 2023-2024 origination vintages Total net revenue $ 1,370 $ ( 37) $ (69) positions Ally for meaningful NIM expansion as Provision for credit losses 579 1 96 1 35 funding costs improve (1) Noninterest expense 6 16 ( 1) (2) Pre-tax income $ 175 $ (232) $ (202) – Fixed-rate retail auto loans originated in 2023-2024 priced at an average yield of 10.7% U.S. Auto earning assets (EOP) $ 115,559 $ (1,735) $ (816) • Lower lease termination volume QoQ driving lower Key Statistics remarketing gains Remarketing gains ($ millions) $ 24 $ ( 35) $ ( 33) Average gain per vehicle $ 771 $ ( 649) $ ( 1,173) – Decline in lease returns corresponds with industry decline in Off-lease vehicles terminated (# units) 31,033 ( 10,568) 1,549 lease originations in 2H 2021 Application volume (# thousands) 3,630 ( 103) ( 44) – Remarketing gains continuing to migrate lower with fewer lease maturities and normalization of used vehicle values Retail Auto Yield Trend Lease Portfolio Trends S-tier 44% Origination 43% 43% 41% Mix 40% 76% Estimated 67% 10.92% 10.81% 10.68% 10.59% Lessee & 10.54% Originated 57% (2) Dealer Yield 54% 50% Buyout % 9.29% 9.19% 9.07% Hedge 8.98% 8.90% Impact $59 $57 $46 Portfolio 8.99% Yield 8.86% 8.65% $37 8.43% Remarketing 8.16% ex. hedge Gains $24 ($ millions) 3Q 23 4Q 23 1Q 24 2Q 24 3Q 24 3Q 23 4Q 23 1Q 24 2Q 24 3Q 24 Retail Weighted Average FICO Avg. Gain / Unit 704 707 704 712 710 $1,944 $1,422 $1,431 $1,420 $771 14 See page 30 for footnotes.
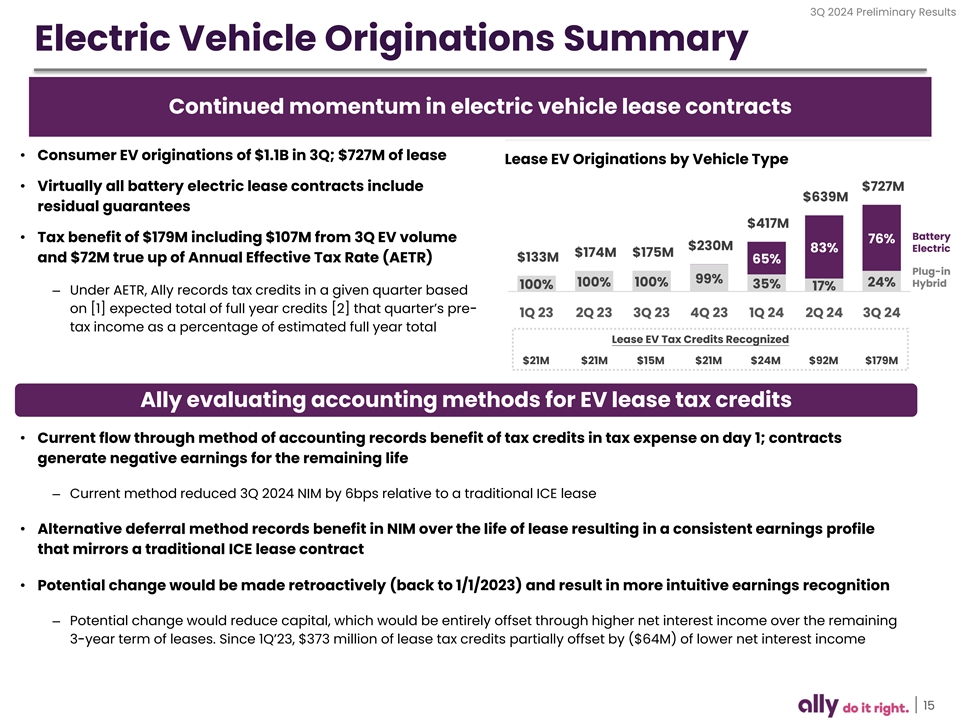
3Q 2024 Preliminary Results Electric Vehicle Originations Summary Continued momentum in electric vehicle lease contracts • Consumer EV originations of $1.1B in 3Q; $727M of lease Lease EV Originations by Vehicle Type • Virtually all battery electric lease contracts include $727M $639M residual guarantees $417M Battery • Tax benefit of $179M including $107M from 3Q EV volume 76% $230M 83% Electric $174M $175M $133M and $72M true up of Annual Effective Tax Rate (AETR) 65% Plug-in 99% 100% 100% 24% Hybrid 100% 35% 17% – Under AETR, Ally records tax credits in a given quarter based on [1] expected total of full year credits [2] that quarter’s pre- 1Q 23 2Q 23 3Q 23 4Q 23 1Q 24 2Q 24 3Q 24 tax income as a percentage of estimated full year total Lease EV Tax Credits Recognized $21M $21M $15M $21M $24M $92M $179M Ally evaluating accounting methods for EV lease tax credits • Current flow through method of accounting records benefit of tax credits in tax expense on day 1; contracts generate negative earnings for the remaining life – Current method reduced 3Q 2024 NIM by 6bps relative to a traditional ICE lease • Alternative deferral method records benefit in NIM over the life of lease resulting in a consistent earnings profile that mirrors a traditional ICE lease contract • Potential change would be made retroactively (back to 1/1/2023) and result in more intuitive earnings recognition – Potential change would reduce capital, which would be entirely offset through higher net interest income over the remaining 3-year term of leases. Since 1Q’23, $373 million of lease tax credits partially offset by ($64M) of lower net interest income 15
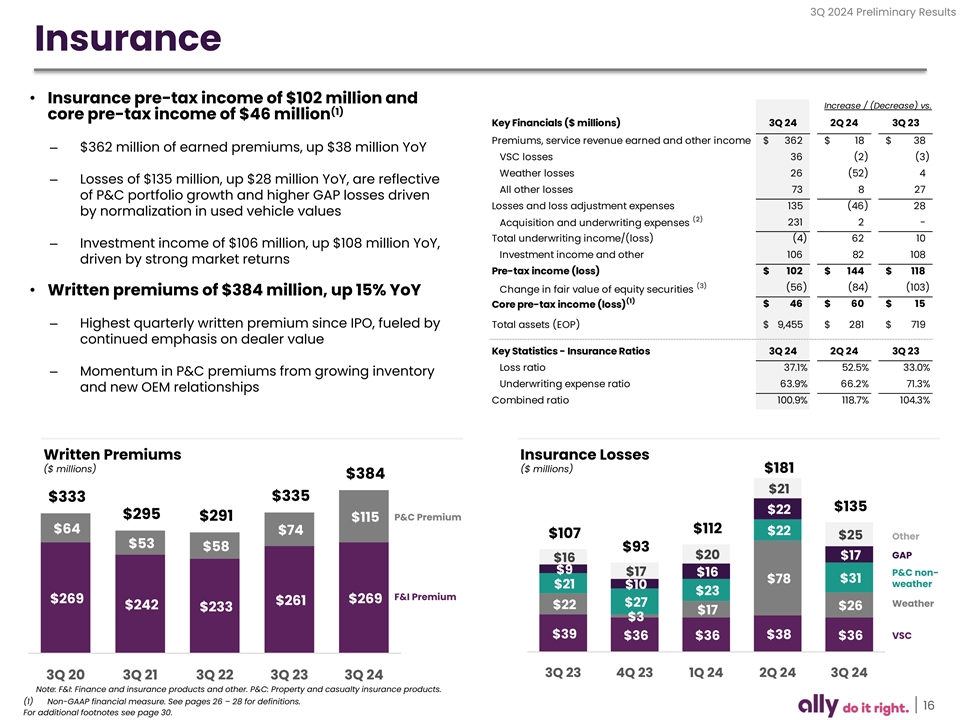
3Q 2024 Preliminary Results Insurance • Insurance pre-tax income of $102 million and Increase / (Decrease) vs. (1) core pre-tax income of $46 million Key Financials ($ millions) 3Q 24 2Q 24 3Q 23 Premiums, service revenue earned and other income $ 362 $ 18 $ 38 – $362 million of earned premiums, up $38 million YoY VSC losses 36 (2) (3) Weather losses 26 ( 52) 4 – Losses of $135 million, up $28 million YoY, are reflective All other losses 73 8 27 of P&C portfolio growth and higher GAP losses driven Losses and loss adjustment expenses 135 (46) 28 by normalization in used vehicle values (2) 231 2 - Acquisition and underwriting expenses Total underwriting income/(loss) (4) 62 10 – Investment income of $106 million, up $108 million YoY, Investment income and other 106 82 108 driven by strong market returns Pre-tax income (loss) $ 102 $ 144 $ 118 (3) (56) (84) (103) Change in fair value of equity securities • Written premiums of $384 million, up 15% YoY (1) $ 46 $ 60 $ 15 Core pre-tax income (loss) – Highest quarterly written premium since IPO, fueled by Total assets (EOP) $ 9,455 $ 281 $ 719 continued emphasis on dealer value Key Statistics - Insurance Ratios 3Q 24 2Q 24 3Q 23 Loss ratio 37.1% 52.5% 33.0% – Momentum in P&C premiums from growing inventory Underwriting expense ratio 63.9% 66.2% 71.3% and new OEM relationships Combined ratio 100.9% 118.7% 104.3% Written Premiums Insurance Losses ($ millions) ($ millions) $181 $384 $21 $335 $333 $135 $22 $295 $291 P&C Premium $115 $64 $112 $74 $22 $107 $25 Other $53 $58 $93 GAP $20 $17 $16 $9 $17 P&C non- $16 $31 $78 weather $21 $10 $23 F&I Premium $269 $269 $261 $27 Weather $242 $22 $26 $233 $17 $3 $39 $38 VSC $36 $36 $36 3Q 23 4Q 23 1Q 24 2Q 24 3Q 24 3Q 20 3Q 21 3Q 22 3Q 23 3Q 24 Note: F&I: Finance and insurance products and other. P&C: Property and casualty insurance products. (1) Non-GAAP financial measure. See pages 26 – 28 for definitions. 16 For additional footnotes see page 30.
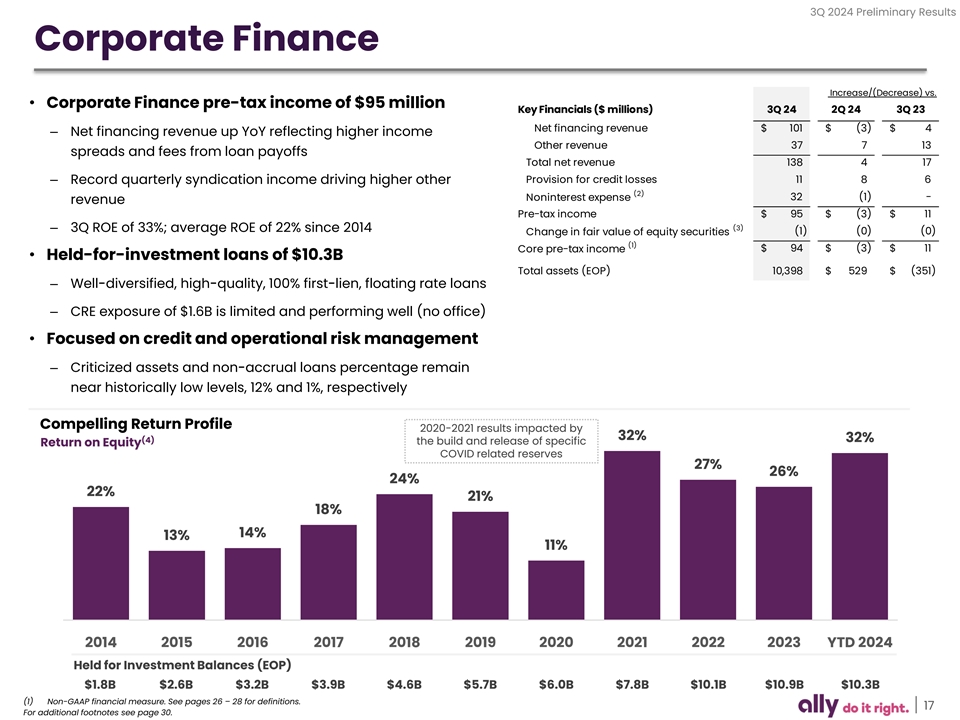
3Q 2024 Preliminary Results Corporate Finance Increase/(Decrease) vs. • Corporate Finance pre-tax income of $95 million Key Financials ($ millions) 3Q 24 2Q 24 3Q 23 Net financing revenue $ 101 $ ( 3) $ 4 – Net financing revenue up YoY reflecting higher income Other revenue 37 7 13 spreads and fees from loan payoffs Total net revenue 138 4 17 Provision for credit losses 11 8 6 – Record quarterly syndication income driving higher other (2) 32 (1) - Noninterest expense revenue Pre-tax income $ 95 $ (3) $ 11 (3) – 3Q ROE of 33%; average ROE of 22% since 2014 (1) (0) (0) Change in fair value of equity securities (1) Core pre-tax income $ 94 $ ( 3) $ 11 • Held-for-investment loans of $10.3B Total assets (EOP) 10,398 $ 529 $ (351) – Well-diversified, high-quality, 100% first-lien, floating rate loans – CRE exposure of $1.6B is limited and performing well (no office) • Focused on credit and operational risk management – Criticized assets and non-accrual loans percentage remain near historically low levels, 12% and 1%, respectively Compelling Return Profile 2020-2021 results impacted by 32% (4) 32% the build and release of specific Return on Equity COVID related reserves 27% 26% 24% 22% 21% 18% 14% 13% 11% 2014 2015 2016 2017 2018 2019 2020 2021 2022 2023 YTD 2024 Held for Investment Balances (EOP) $1.8B $2.6B $3.2B $3.9B $4.6B $5.7B $6.0B $7.8B $10.1B $10.9B $10.3B (1) Non-GAAP financial measure. See pages 26 – 28 for definitions. 17 For additional footnotes see page 30.
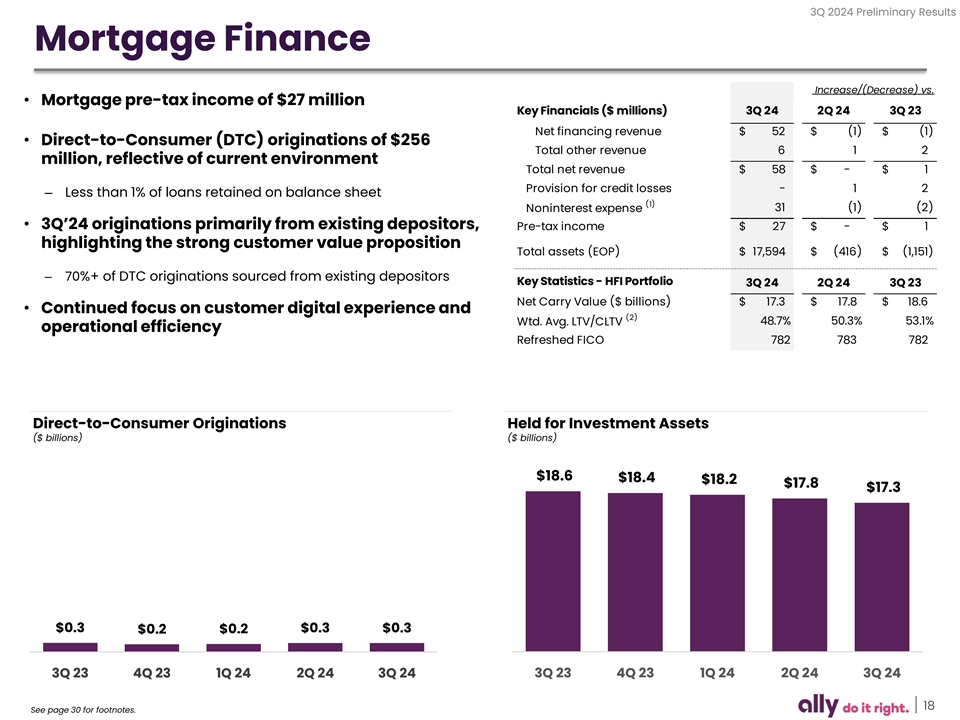
3Q 2024 Preliminary Results Mortgage Finance Increase/(Decrease) vs. • Mortgage pre-tax income of $27 million Key Financials ($ millions) 3Q 24 2Q 24 3Q 23 Net financing revenue $ 52 $ ( 1) $ (1) • Direct-to-Consumer (DTC) originations of $256 Total other revenue 6 1 2 million, reflective of current environment Total net revenue $ 58 $ - $ 1 Provision for credit losses - 1 2 – Less than 1% of loans retained on balance sheet (1) Noninterest expense 31 (1) (2) • 3Q’24 originations primarily from existing depositors, Pre-tax income $ 27 $ - $ 1 highlighting the strong customer value proposition Total assets (EOP) $ 17,594 $ (416) $ (1,151) – 70%+ of DTC originations sourced from existing depositors Key Statistics - HFI Portfolio 3Q 24 2Q 24 3Q 23 Net Carry Value ($ billions) $ 17.3 $ 17.8 $ 18.6 • Continued focus on customer digital experience and (2) Wtd. Avg. LTV/CLTV 48.7% 50.3% 53.1% operational efficiency Refreshed FICO 782 783 782 Direct-to-Consumer Originations Held for Investment Assets ($ billions) ($ billions) $18.6 $18.4 $18.2 $17.8 $17.3 $0.3 $0.2 $0.2 $0.3 $0.3 3Q 23 4Q 23 1Q 24 2Q 24 3Q 24 3Q 23 4Q 23 1Q 24 2Q 24 3Q 24 18 See page 30 for footnotes.
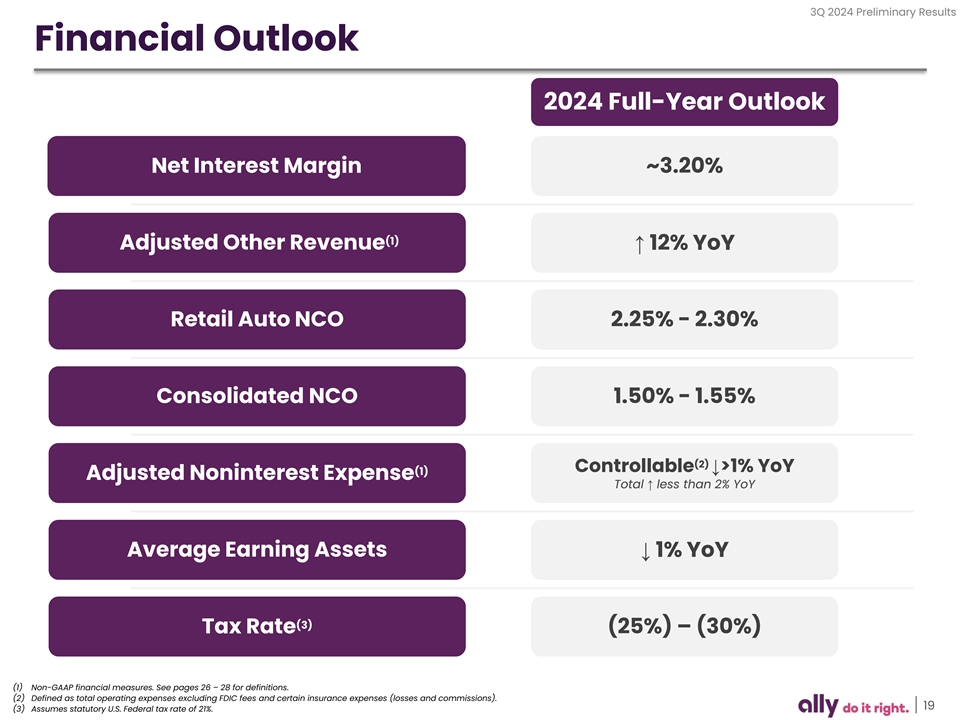
3Q 2024 Preliminary Results Financial Outlook 2024 Full-Year Outlook Net Interest Margin ~3.20% (1) Adjusted Other Revenue ↑ 12% YoY Retail Auto NCO 2.25% - 2.30% Consolidated NCO 1.50% - 1.55% (2) Controllable↓>1% YoY (1) Adjusted Noninterest Expense Total ↑ less than 2% YoY Average Earning Assets↓ 1% YoY (3) Tax Rate (25%) – (30%) (1) Non-GAAP financial measures. See pages 26 – 28 for definitions. (2) Defined as total operating expenses excluding FDIC fees and certain insurance expenses (losses and commissions). 19 (3) Assumes statutory U.S. Federal tax rate of 21%.
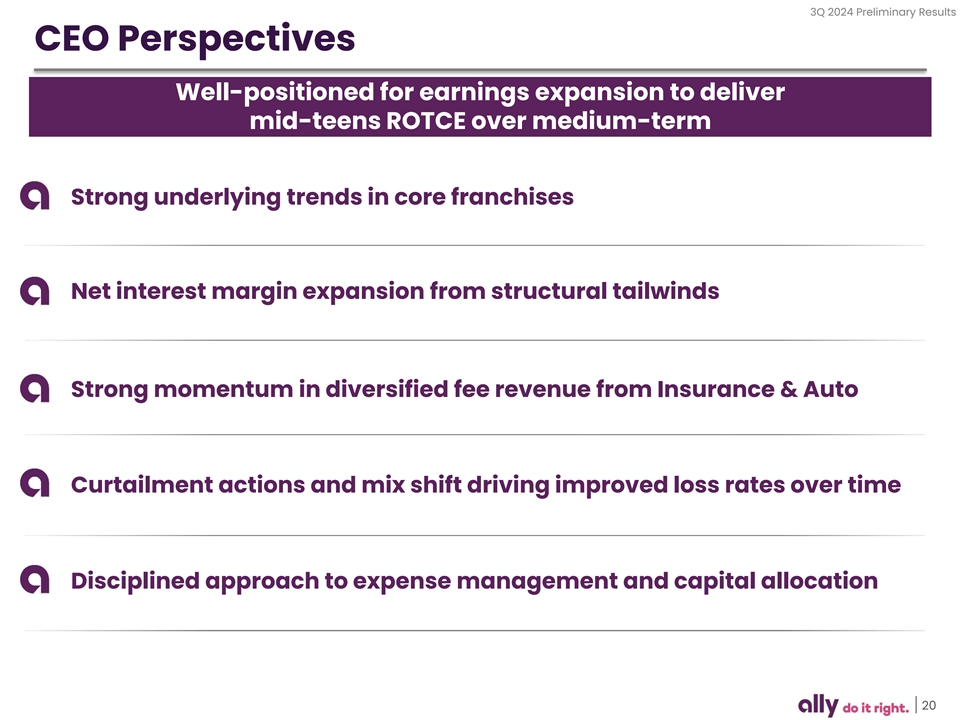
3Q 2024 Preliminary Results CEO Perspectives Well-positioned for earnings expansion to deliver mid-teens ROTCE over medium-term Strong underlying trends in core franchises Net interest margin expansion from structural tailwinds Strong momentum in diversified fee revenue from Insurance & Auto Curtailment actions and mix shift driving improved loss rates over time Disciplined approach to expense management and capital allocation 20

Supplemental
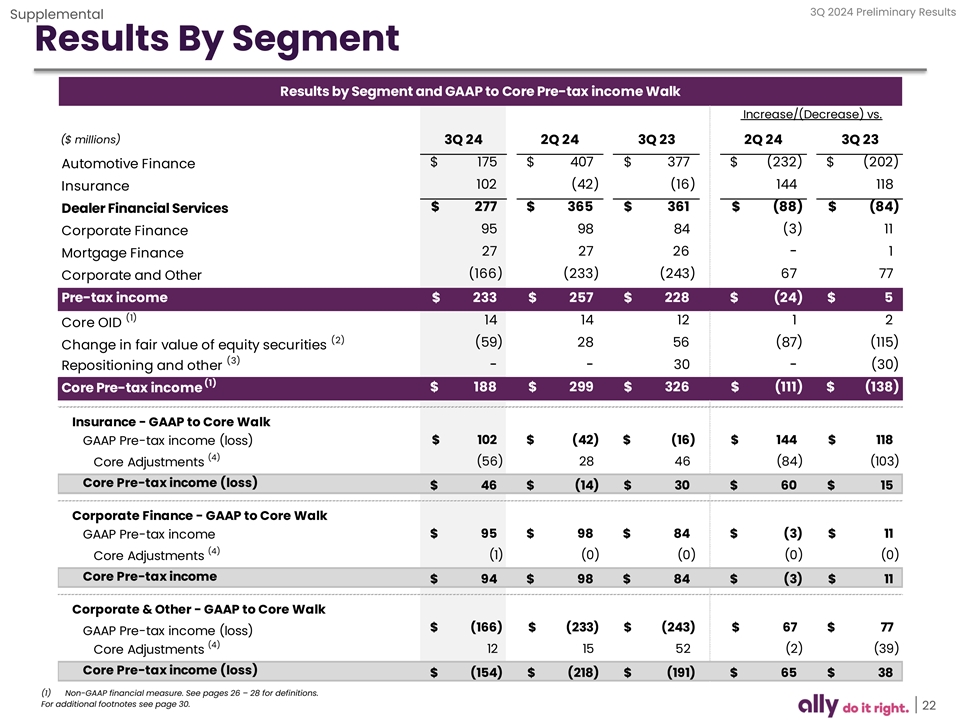
3Q 2024 Preliminary Results Supplemental Results By Segment Results by Segment and GAAP to Core Pre-tax income Walk Increase/(Decrease) vs. ($ millions) 3Q 24 2Q 24 3Q 23 2Q 24 3Q 23 $ 1 75 $ 4 07 $ 3 77 $ (232) $ (202) Automotive Finance 1 02 ( 42) ( 16) 144 118 Insurance $ 277 $ 365 $ 3 61 $ (88) $ ( 84) Dealer Financial Services 95 98 84 ( 3) 11 Corporate Finance 27 27 26 - 1 Mortgage Finance (166) (233) (243) 67 77 Corporate and Other Pre-tax income $ 2 33 $ 257 $ 228 $ ( 24) $ 5 (1) 14 14 12 1 2 Core OID (2) (59) 28 56 (87) (115) Change in fair value of equity securities (3) - - 30 - ( 30) Repositioning and other (1) Core Pre-tax income $ 188 $ 299 $ 3 26 $ (111) $ ( 138) Insurance - GAAP to Core Walk $ 1 02 $ (42) $ ( 16) $ 144 $ 118 GAAP Pre-tax income (loss) (4) (56) 28 46 (84) (103) Core Adjustments Core Pre-tax income (loss) $ 46 $ (14) $ 30 $ 60 $ 15 Corporate Finance - GAAP to Core Walk GAAP Pre-tax income $ 95 $ 98 $ 84 $ ( 3) $ 11 (4) Core Adjustments (1) (0) (0) (0) (0) Core Pre-tax income $ 94 $ 98 $ 84 $ ( 3) $ 11 Corporate & Other - GAAP to Core Walk $ ( 166) $ ( 233) $ (243) $ 67 $ 77 GAAP Pre-tax income (loss) (4) 12 15 52 (2) (39) Core Adjustments Core Pre-tax income (loss) $ (154) $ (218) $ ( 191) $ 65 $ 38 (1) Non-GAAP financial measure. See pages 26 – 28 for definitions. For additional footnotes see page 30. 22
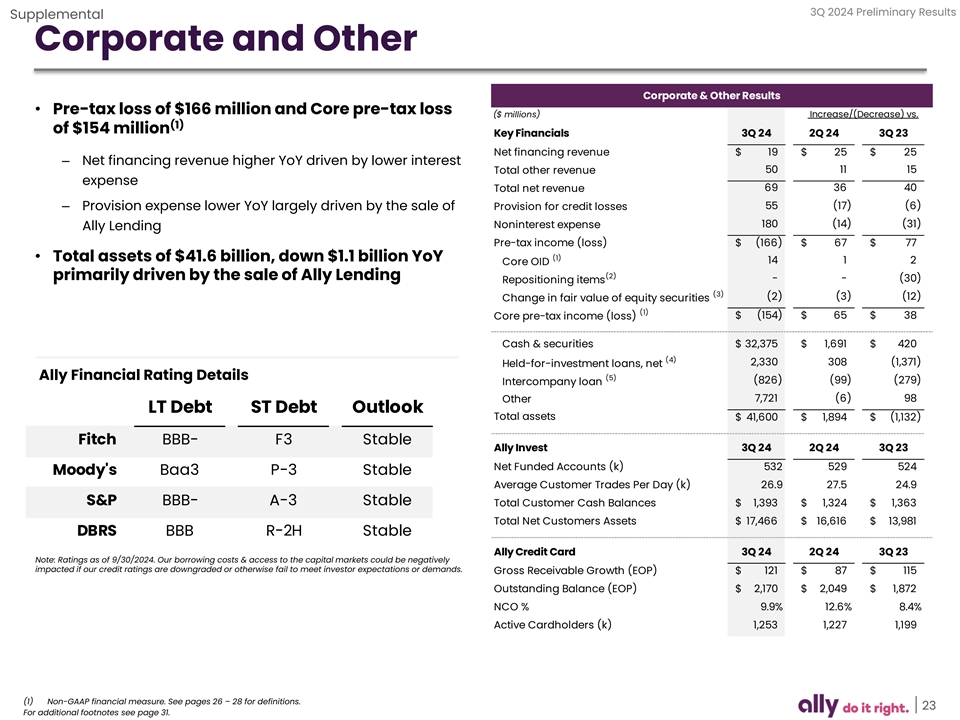
3Q 2024 Preliminary Results Supplemental Corporate and Other Corporate & Other Results • Pre-tax loss of $166 million and Core pre-tax loss ($ millions) Increase/(Decrease) vs. (1) of $154 million Key Financials 3Q 24 2Q 24 3Q 23 Net financing revenue $ 19 $ 25 $ 25 – Net financing revenue higher YoY driven by lower interest 50 11 15 Total other revenue expense Total net revenue 69 36 40 55 (17) (6) – Provision expense lower YoY largely driven by the sale of Provision for credit losses Noninterest expense 180 (14) (31) Ally Lending Pre-tax income (loss) $ ( 166) $ 67 $ 77 (1) • Total assets of $41.6 billion, down $1.1 billion YoY 14 1 2 Core OID (2) primarily driven by the sale of Ally Lending - - (30) Repositioning items (3) (2) (3) (12) Change in fair value of equity securities (1) $ (154) $ 65 $ 38 Core pre-tax income (loss) Cash & securities $ 32,375 $ 1,691 $ 420 (4) 2,330 308 (1,371) Held-for-investment loans, net Ally Financial Rating Details (5) (826) (99) (279) Intercompany loan Other 7 ,721 (6) 98 LT Debt ST Debt Outlook Total assets $ 41,600 $ 1,894 $ ( 1,132) Fitch BBB- F3 Stable Ally Invest 3Q 24 2Q 24 3Q 23 Net Funded Accounts (k) 532 529 524 Moody's Baa3 P-3 Stable Average Customer Trades Per Day (k) 26.9 27.5 24.9 S&P BBB- A-3 Stable Total Customer Cash Balances $ 1,393 $ 1,324 $ 1,363 Total Net Customers Assets $ 17,466 $ 16,616 $ 13,981 DBRS BBB R-2H Stable Ally Credit Card 3Q 24 2Q 24 3Q 23 Note: Ratings as of 9/30/2024. Our borrowing costs & access to the capital markets could be negatively impacted if our credit ratings are downgraded or otherwise fail to meet investor expectations or demands. Gross Receivable Growth (EOP) $ 121 $ 87 $ 115 Outstanding Balance (EOP) $ 2,170 $ 2,049 $ 1,872 NCO % 9.9% 12.6% 8.4% Active Cardholders (k) 1,253 1 ,227 1,199 (1) Non-GAAP financial measure. See pages 26 – 28 for definitions. 23 For additional footnotes see page 31.
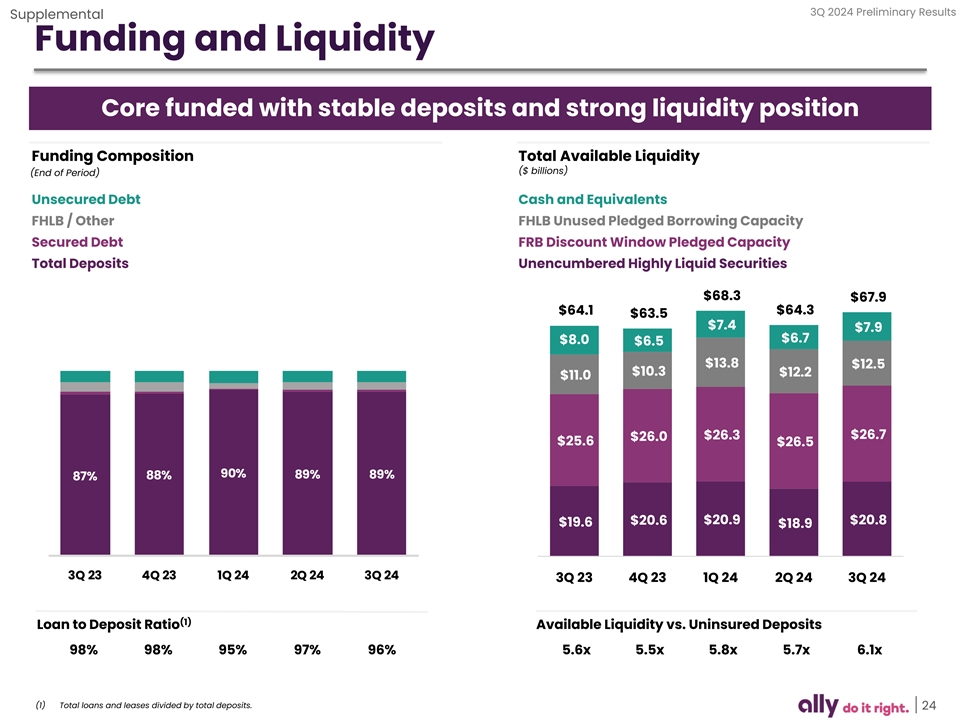
3Q 2024 Preliminary Results Supplemental Funding and Liquidity Core funded with stable deposits and strong liquidity position Funding Composition Total Available Liquidity ($ billions) (End of Period) Unsecured Debt Cash and Equivalents FHLB / Other FHLB Unused Pledged Borrowing Capacity Secured Debt FRB Discount Window Pledged Capacity Total Deposits Unencumbered Highly Liquid Securities $68.3 $67.9 $64.1 $64.3 $63.5 $7.4 $7.9 $6.7 $8.0 $6.5 $13.8 $12.5 $10.3 $12.2 $11.0 $26.7 $26.3 $26.0 $25.6 $26.5 90% 89% 89% 88% 8 % $20.9 $20.6 $20.8 $19.6 $18.9 3Q 23 4Q 23 1Q 24 2Q 24 3Q 24 3Q 23 4Q 23 1Q 24 2Q 24 3Q 24 (1) Loan to Deposit Ratio Available Liquidity vs. Uninsured Deposits 98% 98% 95% 97% 96% 5.6x 5.5x 5.8x 5.7x 6.1x (1) Total loans and leases divided by total deposits. 24
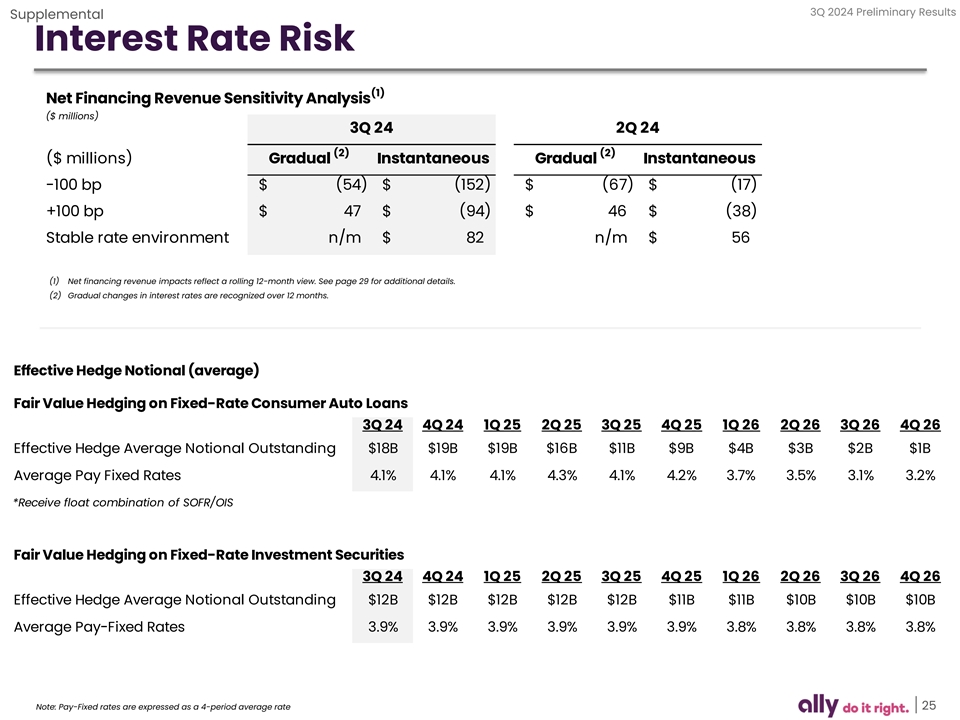
3Q 2024 Preliminary Results Supplemental Interest Rate Risk (1) Net Financing Revenue Sensitivity Analysis ($ millions) 3Q 24 2Q 24 (2) (2) ($ millions) Gradual Instantaneous Gradual Instantaneous -100 bp $ (54) $ (152) $ (67) $ ( 17) +100 bp $ 47 $ (94) $ 46 $ (38) Stable rate environment n/m $ 82 n/m $ 56 (1) Net financing revenue impacts reflect a rolling 12-month view. See page 29 for additional details. (2) Gradual changes in interest rates are recognized over 12 months. Effective Hedge Notional (average) Fair Value Hedging on Fixed-Rate Consumer Auto Loans 3Q 24 4Q 24 1Q 25 2Q 25 3Q 25 4Q 25 1Q 26 2Q 26 3Q 26 4Q 26 Effective Hedge Average Notional Outstanding $18B $19B $19B $16B $11B $9B $4B $3B $2B $1B Average Pay Fixed Rates 4.1% 4.1% 4.1% 4.3% 4.1% 4.2% 3.7% 3.5% 3.1% 3.2% *Receive float combination of SOFR/OIS Fair Value Hedging on Fixed-Rate Investment Securities 3Q 24 4Q 24 1Q 25 2Q 25 3Q 25 4Q 25 1Q 26 2Q 26 3Q 26 4Q 26 Effective Hedge Average Notional Outstanding $12B $12B $12B $12B $12B $11B $11B $10B $10B $10B Average Pay-Fixed Rates 3.9% 3.9% 3.9% 3.9% 3.9% 3.9% 3.8% 3.8% 3.8% 3.8% 25 Note: Pay-Fixed rates are expressed as a 4-period average rate
3Q 2024 Preliminary Results Supplemental Notes on Non-GAAP Financial Measures The following are non-GAAP financial measures which Ally believes are important to the reader of the Consolidated Financial Statements, but which are supplemental to and not a substitute for GAAP measures: Accelerated issuance expense (Accelerated OID), Adjusted earnings per share (Adjusted EPS), Adjusted efficiency ratio, Adjusted noninterest expense, Adjusted other revenue, Adjusted provision for Credit Losses, Adjusted tangible book value per share (Adjusted TBVPS), Adjusted total net revenue, Core net income attributable to common shareholders, Core original issue discount (Core OID) amortization expense, Core outstanding original issue discount balance (Core OID balance), Core pre-tax income, Core return on tangible common equity (Core ROTCE), Investment income and other (adjusted), Net financing revenue (excluding Core OID), Net interest margin (excluding Core OID), and Tangible Common Equity. These measures are used by management, and we believe are useful to investors in assessing the company’s operating performance and ccal apita culati l. Fo on r methodology, refer to the Reconciliation to GAAP later in this document. 1) Accelerated issuance expense (Accelerated OID) is the recognition of issuance expenses related to calls of redeemable debt. 2) Adjusted earnings per share (Adjusted EPS) is a non-GAAP financial measure that adjusts GAAP EPS for revenue and expense items that are typically strategic in nature or that management otherwise does not view as reflecting the operating performance of the company. Management believes Adjusted EPS can help the reader better understand the operating performance of the core businesses and their ability to generate earnings. In the numerator of Adjusted EPS, GAAP net income attributable to common shareholders is adjusted for the following items: (1) excludes discontinued operations, net of tax, as Ally is primarily a domestic company and sales of international businesses and other discontinued operations in the past have significantly impacted GAAP EPS, (2) adds back the tax-effected non-cash Core OID, (3) adjusts for tax-effected repositioning and other which are primarily related to the extinguishment of high-cost legacy debt, strategic activities and significant other one- time items, (4) change in fair value of equity securities, (5) excludes significant discrete tax items that do not relate to the operating performance of the core businesses, and adjusts for preferred stock capital actions that have been taken by the company to normalize its capital structure, as applicable for respective periods. See page 32 for calculation methodology and details. 3) Adjusted efficiency ratio is a non-GAAP financial measure that management believes is helpful to readers in comparing the efficiency of its core banking and lending businesses with those of its peers. See page 35 for calculation details. (1) In the numerator of Adjusted efficiency ratio, total noninterest expense is adjusted for Rep and warrant expense, Insurance segment expense, and repositioning and other which are primarily related to the extinguishment of high-cost legacy debt, strategic activities, restructuring and significant other one-time items, as applicable for respective periods. (2) In the denominator, total net revenue is adjusted for Core OID and Insurance segment revenue. See page 16 for the combined ratio for the Insurance segment which management uses as a primary measure of underwriting profitability for the Insurance segment. 4) Adjusted noninterest expense is a non-GAAP financial measure that adjusts GAAP noninterest expense for repositioning items. Management believes adjusted noninterest expense is a helpful financial metric because it enables the reader better understand the business' expenses excluding nonrecurring items. See page 36 for calculation methodology and details. 5) Adjusted other revenue is a non-GAAP financial measure that adjusts GAAP other revenue for OID expenses, repositioning, and change in fair value of equity securities. Management believes adjusted other revenue is a helpful financial metric because it enables the reader to better understand the business' ability to generate other revenue. See page 36 for calculation methodology and details. 6) Adjusted provision for credit losses is a non-GAAP financial measure that adjusts GAAP provision for credit losses for repositioning items. Management believes adjusted provision for credit losses is a helpful financial metric because it enables the reader to better understand the business’ expenses excluding nonrecurring items. See page 36 for calculation methodology and details. 26
3Q 2024 Preliminary Results Supplemental Notes on Non-GAAP Financial Measures 7) Adjusted tangible book value per share (Adjusted TBVPS) is a non-GAAP financial measure that reflects the book value of equity attributable to shareholders even if Core OID balance were accelerated immediately through the financial statements. As a result, management believes Adjusted TBVPS provides the reader with an assessment of value that is more conservative than GAAP common shareholder’s equity per share. Adjusted TBVPS generally adjusts common equity for: (1) goodwill and identifiable intangibles, net of DTLs and (2) tax-effected Core OID balance to reduce tangible common equity in the event the corresponding discounted bonds are redeemed/tendered. Note: In December 2017, tax-effected Core OID balance was adjusted from a statutory U.S. Federal tax rate of 35% to 21% (“rate”) as a result of changes to U.S. tax law. The adjustment conservatively increased the tax-effected Core OID balance and consequently reduced Adjusted TBVPS as any acceleration of the non-cash charge in future periods would flow through the financial statements at a 21% rate versus a previously modeled 35% rate. See page 34 for calculation methodology and details. 8) Adjusted total net revenue is a non-GAAP financial measure that management believes is helpful for readers to understand the ongoing ability of the company to generate revenue. For purposes of this calculation, GAAP net financing revenue is adjusted by excluding Core OID to calculate net financing revenue ex. core OID. GAAP other revenue is adjusted for OID expenses, repositioning, and change in fair value of equity securities to calculate adjusted other revenue. Adjusted total net revenue is calculated by adding net financing revenue ex. core OID to adjusted other revenue. See pages 36 for calculation methodology and details. 9) Core net income attributable to common shareholders is a non-GAAP financial measure that serves as the numerator in the calculations of Adjusted EPS and Core ROTCE and that, like those measures, is believed by management to help the reader better understand the operating performance of the core businesses and their ability to generate earnings. Core net income attributable to common shareholders adjusts GAAP net income attributable to common shareholders for discontinued operations net of tax, tax-effected Core OID expense, tax-effected repositioning and other primarily related to the extinguishment of high-cost legacy debt and strategic activities and significant other, preferred stock capital actions, significant discrete tax items and tax-effected changes in equity investments measured at fair value, as applicable for respective periods. See pages 32 – 33 for calculation methodology and details. 10) Core original issue discount (Core OID) amortization expense is a non-GAAP financial measure for OID and is believed by management to help the reader better understand the activity removed from: Core pre-tax income (loss), Core net income (loss) attributable to common shareholders, Adjusted EPS, Core ROTCE, Adjusted efficiency ratio, Adjusted total net revenue, and Net financing revenue (excluding Core OID). Core OID is primarily related to bond exchange OID which excludes international operations and future issuances. Core OID for all periods shown is applied to the pre-tax income of the Corporate and Other segment. See page 36 for calculation methodology and details. 11) Core outstanding original issue discount balance (Core OID balance) is a non-GAAP financial measure for outstanding OID and is believed by management to help the reader better understand the balance removed from Core ROTCE and Adjusted TBVPS. Core OID balance is primarily related to bond exchange OID which excludes international operations and future issuances. See page 36 for calculation methodology and details. 12) Core pre-tax income is a non-GAAP financial measure that adjusts pre-tax income from continuing operations by excluding (1) Core OID, and (2) change in fair value of equity securities (change in fair value of equity securities impacts the Insurance and Corporate Finance segments), and (3) Repositioning and other which are primarily related to the extinguishment of high-cost legacy debt, strategic activities and significant other one-time items, as applicable for respective periods or businesses. Management believes core pre-tax income can help the reader better understand the operating performance of the core businesses and their ability to generate earnings. See page 22 for calculation methodology and details. 27
3Q 2024 Preliminary Results Supplemental Notes on Non-GAAP Financial Measures 13) Core return on tangible common equity (Core ROTCE) is a non-GAAP financial measure that management believes is helpful for readers to better understand the ongoing ability of the company to generate returns on its equity base that supports core operations. For purposes of this calculation, tangible common equity is adjusted for Core OID balance and net DTA. Ally’s Core net income attributable to common shareholders for purposes of calculating Core ROTCE is based on the actual effective tax rate for the period adjusted for significant discrete tax items including tax reserve releases, which aligns with the methodology used in calculating adjusted earnings per share. See page 33 for calculation details. (1) In the numerator of Core ROTCE, GAAP net income attributable to common shareholders is adjusted for discontinued operations net of tax, tax-effected Core OID, tax-effected repositioning and other which are primarily related to the extinguishment of high-cost legacy debt, strategic activities and significant other one- time items, change in fair value of equity securities, significant discrete tax items, and preferred stock capital actions, as applicable for respective periods. (2) In the denominator, GAAP shareholder’s equity is adjusted for goodwill and identifiable intangibles net of DTL, Core OID balance, and net DTA. 14) Investment income and other (adjusted) is a non-GAAP financial measure that adjusts GAAP investment income and other for repositioning, and the change in fair value of equity securities. Management believes investment income and other (adjusted) is a helpful financial metric because it enables the reader to better understand the business' ability to generate investment income. 15) Net financing revenue excluding core OID is calculated using a non-GAAP measure that adjusts net financing revenue by excluding Core OID. The Core OID balance is primarily related to bond exchange OID which excludes international operations and future issuances. Management believes net financing revenue ex. Core OID is a helpful financial metric because it enables the reader to better understand the business' ability to generate revenue. See pages 36 for calculation methodology and details. 16) Net interest margin excluding core OID is calculated using a non-GAAP measure that adjusts net interest margin by excluding Core OID. The Core OID balance is primarily related to bond exchange OID which excludes international operations and future issuances. Management believes net interest margin ex. Core OID is a helpful financial metric because it enables the reader to better understand the business' profitability and margins. See page 7 for calculation methodology and details. 17) Tangible Common Equity is a non-GAAP financial measure that is defined as common stockholders’ equity less goodwill and identifiable intangible assets, net of deferred tax liabilities. Ally considers various measures when evaluating capital adequacy, including tangible common equity. Ally believes that tangible common equity is important because we believe readers may assess our capital adequacy using this measure. Additionally, presentation of this measure allows readers to compare certain aspects of our capital adequacy on the same basis to other companies in the industry. For purposes of calculating Core return on tangible common equity (Core ROTCE), tangible common equity is further adjusted for Core OID balance and net deferred tax asset. See pages 34 for calculation methodology and details. 28
3Q 2024 Preliminary Results Supplemental Notes on Other Financial Measures 1) Change in fair value of equity securities impacts the Insurance, Corporate Finance and Corporate and Other segments. The change reflects fair value adjustments to equity securities that are reported at fair value. Management believes the change in fair value of equity securities should be removed from select financial measures because it enables the reader to better understand the business’ ongoing ability to generate revenue and income. 2) Estimated impact of CECL on regulatory capital per final rule issued by U.S. banking agencies - In December 2018, the FRB and other U.S. banking agencies approved a final rule to address the impact of CECL on regulatory capital by allowing BHCs and banks, including Ally, the option to phase in the day-one impact of CECL over a three-year period. In March 2020, the FRB and other U.S. banking agencies issued an interim final rule that became effective on March 31, 2020 and provided an alternative option for banks to temporarily delay the impacts of CECL, relative to the incurred loss methodology for estimating the allowance for loan losses, on regulatory capital. A final rule that was largely unchanged from the March 2020 interim final rule was issued by the FRB and other U.S. banking agencies in August 2020, and became effective in September 2020. For regulatory capital purposes, these rules permitted us to delay recognizing the estimated impact of CECL on regulatory capital until after a two-year deferral period, which for us extended through December 31, 2021. Beginning on January 1, 2022, we are required to phase in 25% of the previously deferred estimated capital impact of CECL, with an additional 25% to be phased in at the beginning of each subsequent year until fully phased in by the first quarter of 2025. Under these rules, firms that adopt CECL and elect the five-year transition will calculate the estimated impact of CECL on regulatory capital as the day-one impact of adoption plus 25% of the subsequent change in allowance during the two-year deferral period, which according to the final rule approximates the impact of CECL relative to an incurred loss model. We adopted this transition option during the first quarter of 2020, and beginning January 1, 2022 are phasing in the regulatory capital impacts of CECL based on this five-year transition period. 3) Estimated retail auto originated yield is a financial measure determined by calculating the estimated average annualized yield for loans originated during the period. At this time there currently is no comparable GAAP financial measure for Estimated Retail Auto Originated Yield and therefore this forecasted estimate of yield at the time of origination cannot be quantitatively reconciled to comparable GAAP information. 4) Interest rate risk modeling – We prepare our forward-looking baseline forecasts of net financing revenue taking into consideration anticipated future business growth, asset/liability positioning, and interest rates based on the implied forward curve. The analysis is highly dependent upon a variety of assumptions including the repricing characteristics of retail deposits with both contractual and non-contractual maturities. We continually monitor industry and competitive repricing activity along with other market factors when contemplating deposit pricing actions. Please see our SEC filings for more details. 5) Net charge-off ratios are calculated as annualized net charge-offs divided by average outstanding finance receivables and loans excluding loans measured at fair value and loans held-for-sale. 6) Repositioning is primarily related to the extinguishment of high-cost legacy debt, strategic activities, restructuring, amounts related to nonrecurring business transactions or pending transactions, and significant other one-time items. 7) U.S. consumer auto originations New Retail – standard and subvented rate new vehicle loans; Lease – new vehicle lease originations; Used – used vehicle loans Nonprime – originations with a FICO® score of less than 620 29
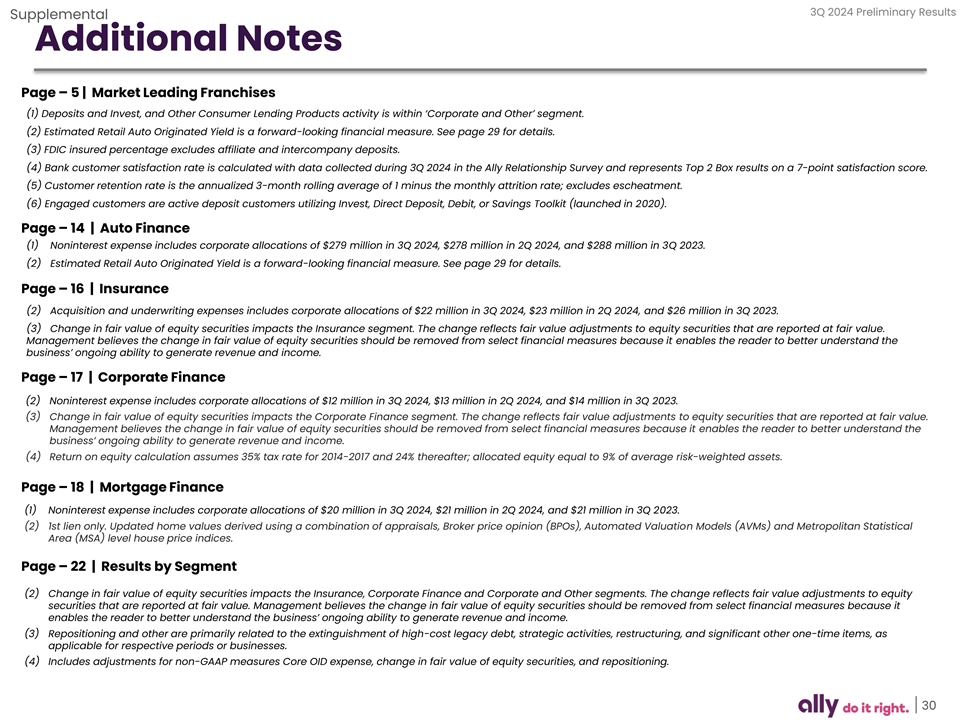
3Q 2024 Preliminary Results Supplemental Additional Notes Page – 5 | Market Leading Franchises (1) Deposits and Invest, and Other Consumer Lending Products activity is within ‘Corporate and Other’ segment. (2) Estimated Retail Auto Originated Yield is a forward-looking financial measure. See page 29 for details. (3) FDIC insured percentage excludes affiliate and intercompany deposits. (4) Bank customer satisfaction rate is calculated with data collected during 3Q 2024 in the Ally Relationship Survey and represents Top 2 Box results on a 7-point satisfaction score. (5) Customer retention rate is the annualized 3-month rolling average of 1 minus the monthly attrition rate; excludes escheatment. (6) Engaged customers are active deposit customers utilizing Invest, Direct Deposit, Debit, or Savings Toolkit (launched in 2020). Page – 14 | Auto Finance (1) Noninterest expense includes corporate allocations of $279 million in 3Q 2024, $278 million in 2Q 2024, and $288 million in 3Q 2023. (2) Estimated Retail Auto Originated Yield is a forward-looking financial measure. See page 29 for details. Page – 16 | Insurance (2) Acquisition and underwriting expenses includes corporate allocations of $22 million in 3Q 2024, $23 million in 2Q 2024, and $26 million in 3Q 2023. (3) Change in fair value of equity securities impacts the Insurance segment. The change reflects fair value adjustments to equity securities that are reported at fair value. Management believes the change in fair value of equity securities should be removed from select financial measures because it enables the reader to better understand the business’ ongoing ability to generate revenue and income. Page – 17 | Corporate Finance (2) Noninterest expense includes corporate allocations of $12 million in 3Q 2024, $13 million in 2Q 2024, and $14 million in 3Q 2023. (3) Change in fair value of equity securities impacts the Corporate Finance segment. The change reflects fair value adjustments to equity securities that are reported at fair value. Management believes the change in fair value of equity securities should be removed from select financial measures because it enables the reader to better understand the business’ ongoing ability to generate revenue and income. (4) Return on equity calculation assumes 35% tax rate for 2014-2017 and 24% thereafter; allocated equity equal to 9% of average risk-weighted assets. Page – 18 | Mortgage Finance (1) Noninterest expense includes corporate allocations of $20 million in 3Q 2024, $21 million in 2Q 2024, and $21 million in 3Q 2023. (2) 1st lien only. Updated home values derived using a combination of appraisals, Broker price opinion (BPOs), Automated Valuation Models (AVMs) and Metropolitan Statistical Area (MSA) level house price indices. Page – 22 | Results by Segment (2) Change in fair value of equity securities impacts the Insurance, Corporate Finance and Corporate and Other segments. The change reflects fair value adjustments to equity securities that are reported at fair value. Management believes the change in fair value of equity securities should be removed from select financial measures because it enables the reader to better understand the business’ ongoing ability to generate revenue and income. (3) Repositioning and other are primarily related to the extinguishment of high-cost legacy debt, strategic activities, restructuring, and significant other one-time items, as applicable for respective periods or businesses. (4) Includes adjustments for non-GAAP measures Core OID expense, change in fair value of equity securities, and repositioning. 30

3Q 2024 Preliminary Results Supplemental Additional Notes Page – 23 | Corporate and Other (2) Repositioning and other are primarily related to the extinguishment of high-cost legacy debt, strategic activities, restructuring, and significant other one-time items, as applicable for respective periods or businesses. (3) Change in fair value of equity securities impacts the Corporate and Other segments. The change reflects fair value adjustments to equity securities that are reported at fair value. Management believes the change in fair value of equity securities should be removed from select financial measures because it enables the reader to better understand the business’ ongoing ability to generate revenue and income. (4) HFI legacy mortgage portfolio and HFI Ally Credit Card portfolio 3Q 2024 and 2Q 2024, and includes HFI Ally Lending in 3Q 2023. (5) Intercompany loan related to activity between Insurance and Corporate for liquidity purposes from the wind down of the Demand Notes program. Includes loans held-for-sale. 31
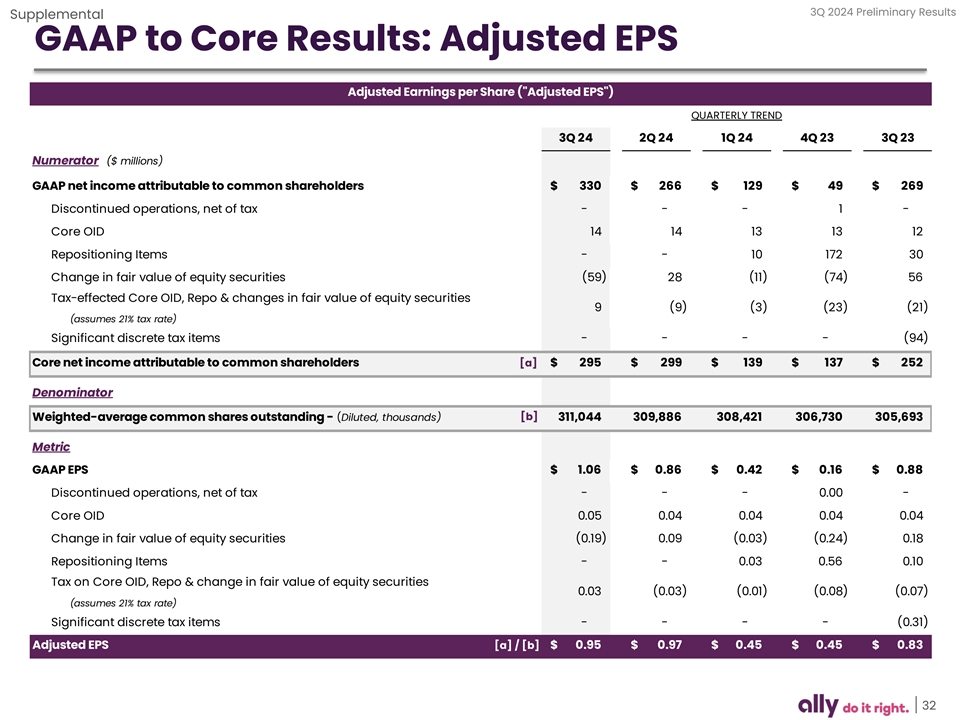
3Q 2024 Preliminary Results Supplemental GAAP to Core Results: Adjusted EPS Adjusted Earnings per Share ( Adjusted EPS ) QUARTERLY TREND 3Q 24 2Q 24 1Q 24 4Q 23 3Q 23 Numerator ($ millions) GAAP net income attributable to common shareholders $ 330 $ 266 $ 129 $ 49 $ 269 Discontinued operations, net of tax - - - 1 - Core OID 14 14 13 13 12 Repositioning Items - - 10 172 30 Change in fair value of equity securities (59) 28 (11) (74) 56 Tax-effected Core OID, Repo & changes in fair value of equity securities 9 (9) (3) (23) (21) (assumes 21% tax rate) Significant discrete tax items - - - - (94) Core net income attributable to common shareholders [a] $ 295 $ 299 $ 139 $ 137 $ 2 52 Denominator [b] Weighted-average common shares outstanding - (Diluted, thousands) 311,044 309,886 308,421 306,730 305,693 Metric GAAP EPS $ 1.06 $ 0.86 $ 0.42 $ 0.16 $ 0.88 Discontinued operations, net of tax - - - 0.00 - Core OID 0.05 0.04 0.04 0.04 0.04 Change in fair value of equity securities (0.19) 0.09 (0.03) ( 0.24) 0.18 Repositioning Items - - 0.03 0.56 0.10 Tax on Core OID, Repo & change in fair value of equity securities 0.03 (0.03) (0.01) ( 0.08) (0.07) (assumes 21% tax rate) Significant discrete tax items - - - - (0.31) Adjusted EPS [a] / [b] $ 0.95 $ 0 .97 $ 0.45 $ 0 .45 $ 0.83 32
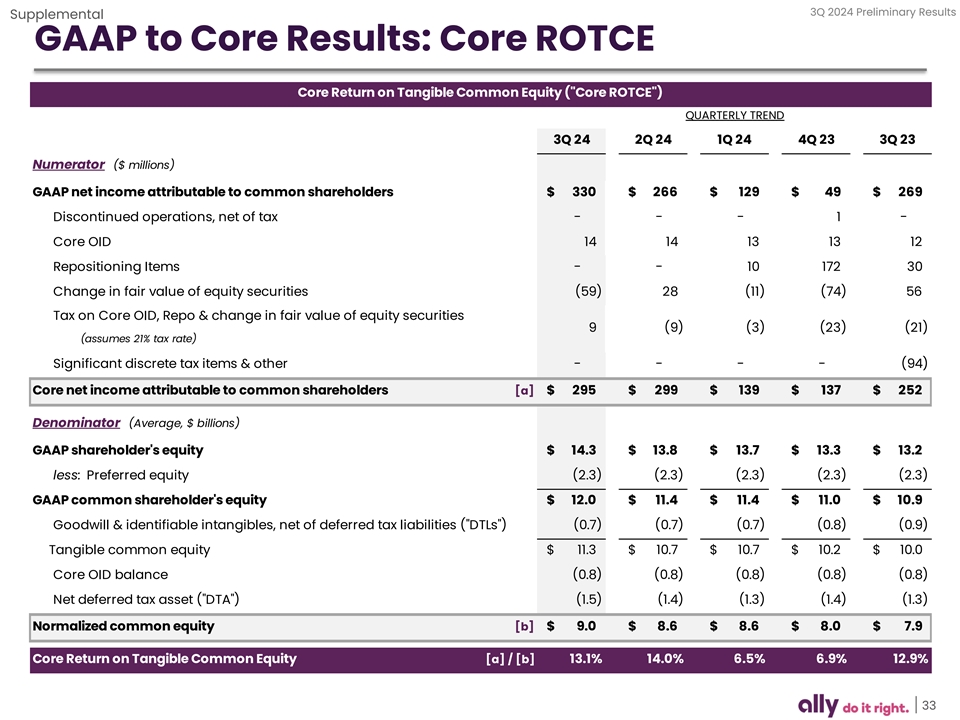
3Q 2024 Preliminary Results Supplemental GAAP to Core Results: Core ROTCE Core Return on Tangible Common Equity ( Core ROTCE ) QUARTERLY TREND 3Q 24 2Q 24 1Q 24 4Q 23 3Q 23 Numerator ($ millions) GAAP net income attributable to common shareholders $ 330 $ 266 $ 129 $ 49 $ 269 Discontinued operations, net of tax - - - 1 - Core OID 14 14 13 13 12 Repositioning Items - - 10 172 30 Change in fair value of equity securities (59) 28 (11) (74) 56 Tax on Core OID, Repo & change in fair value of equity securities 9 (9) (3) (23) (21) (assumes 21% tax rate) Significant discrete tax items & other - - - - (94) Core net income attributable to common shareholders [a] $ 295 $ 2 99 $ 1 39 $ 137 $ 252 Denominator (Average, $ billions) GAAP shareholder's equity $ 14.3 $ 13.8 $ 1 3.7 $ 13.3 $ 13.2 less: Preferred equity (2.3) (2.3) (2.3) (2.3) (2.3) GAAP common shareholder's equity $ 12.0 $ 11.4 $ 11.4 $ 11.0 $ 10.9 Goodwill & identifiable intangibles, net of deferred tax liabilities ( DTLs ) (0.7) (0.7) (0.7) (0.8) (0.9) Tangible common equity $ 11.3 $ 1 0.7 $ 10.7 $ 10.2 $ 10.0 Core OID balance (0.8) (0.8) (0.8) (0.8) (0.8) Net deferred tax asset ( DTA ) (1.5) (1.4) (1.3) (1.4) (1.3) Normalized common equity [b] $ 9.0 $ 8 .6 $ 8.6 $ 8.0 $ 7. 9 Core Return on Tangible Common Equity [a] / [b] 13.1% 14.0% 6.5% 6.9% 12.9% 33
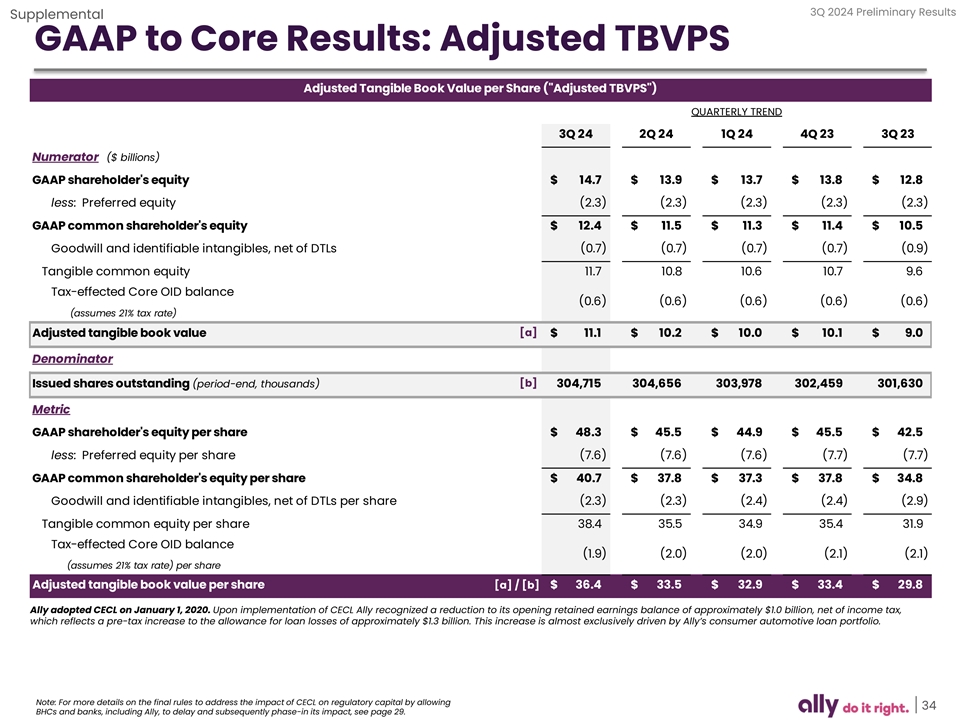
3Q 2024 Preliminary Results Supplemental GAAP to Core Results: Adjusted TBVPS Adjusted Tangible Book Value per Share ( Adjusted TBVPS ) QUARTERLY TREND 3Q 24 2Q 24 1Q 24 4Q 23 3Q 23 Numerator ($ billions) GAAP shareholder's equity $ 14.7 $ 13.9 $ 13.7 $ 13.8 $ 12.8 less: Preferred equity (2.3) (2.3) (2.3) (2.3) (2.3) GAAP common shareholder's equity $ 12.4 $ 11.5 $ 11.3 $ 11.4 $ 10.5 Goodwill and identifiable intangibles, net of DTLs (0.7) (0.7) (0.7) (0.7) (0.9) Tangible common equity 1 1.7 10.8 10.6 1 0.7 9.6 Tax-effected Core OID balance ( 0.6) ( 0.6) (0.6) (0.6) ( 0.6) (assumes 21% tax rate) [a] Adjusted tangible book value $ 11.1 $ 10.2 $ 10.0 $ 10.1 $ 9.0 Denominator [b] Issued shares outstanding (period-end, thousands) 304,715 304,656 303,978 302,459 301,630 Metric GAAP shareholder's equity per share $ 48.3 $ 45.5 $ 44.9 $ 45.5 $ 42.5 less: Preferred equity per share (7.6) (7.6) (7.6) (7.7) (7.7) GAAP common shareholder's equity per share $ 40.7 $ 3 7.8 $ 37.3 $ 37.8 $ 34.8 Goodwill and identifiable intangibles, net of DTLs per share (2.3) (2.3) (2.4) (2.4) (2.9) Tangible common equity per share 38.4 35.5 34.9 35.4 31.9 Tax-effected Core OID balance (1.9) (2.0) (2.0) (2.1) (2.1) (assumes 21% tax rate) per share Adjusted tangible book value per share [a] / [b] $ 36.4 $ 33.5 $ 3 2.9 $ 33.4 $ 29.8 Ally adopted CECL on January 1, 2020. Upon implementation of CECL Ally recognized a reduction to its opening retained earnings balance of approximately $1.0 billion, net of income tax, which reflects a pre-tax increase to the allowance for loan losses of approximately $1.3 billion. This increase is almost exclusively driven by Ally’s consumer automotive loan portfolio. Note: For more details on the final rules to address the impact of CECL on regulatory capital by allowing 34 BHCs and banks, including Ally, to delay and subsequently phase-in its impact, see page 29.
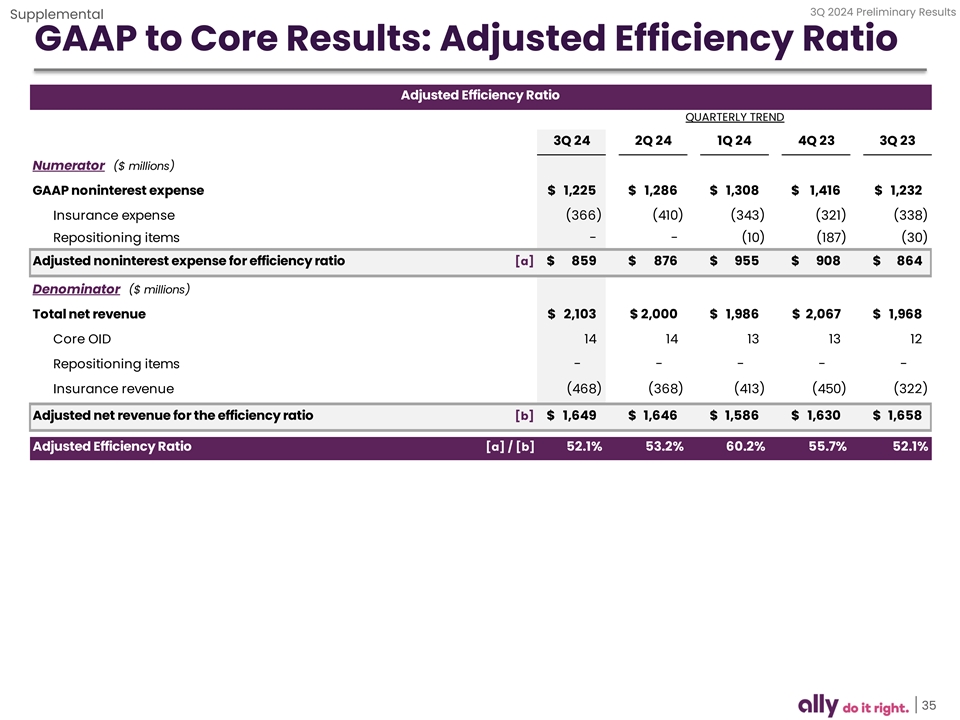
3Q 2024 Preliminary Results Supplemental GAAP to Core Results: Adjusted Efficiency Ratio Adjusted Efficiency Ratio QUARTERLY TREND 3Q 24 2Q 24 1Q 24 4Q 23 3Q 23 Numerator ($ millions) GAAP noninterest expense $ 1,225 $ 1,286 $ 1,308 $ 1,416 $ 1 ,232 Insurance expense (366) (410) ( 343) (321) (338) Repositioning items - - ( 10) (187) ( 30) Adjusted noninterest expense for efficiency ratio [a] $ 859 $ 876 $ 955 $ 908 $ 864 Denominator ($ millions) Total net revenue $ 2 ,103 $ 2 ,000 $ 1,986 $ 2 ,067 $ 1 ,968 Core OID 14 14 13 13 12 Repositioning items - - - - - Insurance revenue (468) ( 368) (413) ( 450) (322) Adjusted net revenue for the efficiency ratio [b] $ 1 ,649 $ 1,646 $ 1,586 $ 1 ,630 $ 1,658 Adjusted Efficiency Ratio [a] / [b] 52.1% 53.2% 60.2% 55.7% 52.1% 35
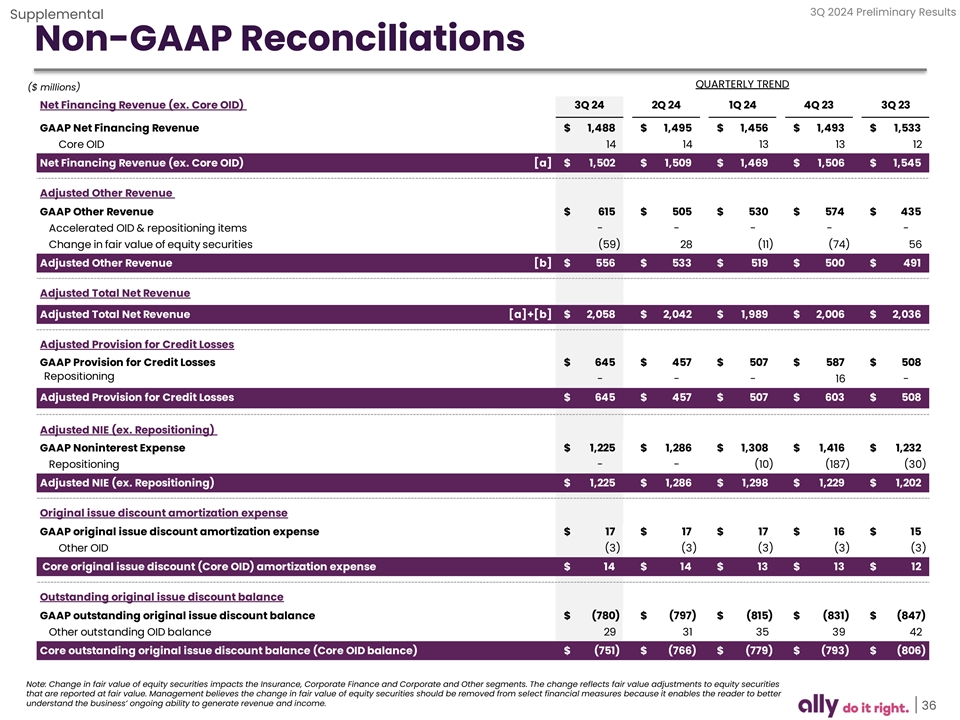
3Q 2024 Preliminary Results Supplemental Non-GAAP Reconciliations QUARTERLY TREND ($ millions) Net Financing Revenue (ex. Core OID) 3Q 24 2Q 24 1Q 24 4Q 23 3Q 23 GAAP Net Financing Revenue $ 1,488 $ 1,495 $ 1,456 $ 1,493 $ 1,533 Core OID 14 14 13 13 12 Net Financing Revenue (ex. Core OID) [a] $ 1,502 $ 1,509 $ 1,469 $ 1 ,506 $ 1,545 Adjusted Other Revenue GAAP Other Revenue $ 615 $ 5 05 $ 530 $ 574 $ 435 Accelerated OID & repositioning items - - - - - Change in fair value of equity securities (59) 28 ( 11) (74) 56 Adjusted Other Revenue [b] $ 556 $ 533 $ 519 $ 500 $ 491 Adjusted Total Net Revenue Adjusted Total Net Revenue [a]+[b] $ 2,058 $ 2,042 $ 1,989 $ 2,006 $ 2,036 Adjusted Provision for Credit Losses GAAP Provision for Credit Losses $ 645 $ 4 57 $ 507 $ 587 $ 5 08 Repositioning - - - 16 - Adjusted Provision for Credit Losses $ 645 $ 457 $ 507 $ 603 $ 5 08 Adjusted NIE (ex. Repositioning) GAAP Noninterest Expense $ 1,225 $ 1,286 $ 1,308 $ 1,416 $ 1,232 Repositioning - - (10) (187) (30) Adjusted NIE (ex. Repositioning) $ 1,225 $ 1,286 $ 1,298 $ 1,229 $ 1,202 Original issue discount amortization expense GAAP original issue discount amortization expense $ 17 $ 17 $ 17 $ 16 $ 15 Other OID (3) (3) ( 3) ( 3) (3) Core original issue discount (Core OID) amortization expense $ 14 $ 14 $ 13 $ 13 $ 12 Outstanding original issue discount balance GAAP outstanding original issue discount balance $ (780) $ (797) $ ( 815) $ ( 831) $ ( 847) Other outstanding OID balance 29 31 35 39 42 Core outstanding original issue discount balance (Core OID balance) $ (751) $ (766) $ (779) $ (793) $ (806) Note: Change in fair value of equity securities impacts the Insurance, Corporate Finance and Corporate and Other segments. The change reflects fair value adjustments to equity securities that are reported at fair value. Management believes the change in fair value of equity securities should be removed from select financial measures because it enables the reader to better understand the business’ ongoing ability to generate revenue and income. 36
Exhibit 99.3

THIRD QUARTER 2024
FINANCIAL SUPPLEMENT
| ALLY FINANCIAL INC. FORWARD-LOOKING STATEMENTS AND ADDITIONAL INFORMATION |

|
This document and related communications should be read in conjunction with the financial statements, notes, and other information contained in our Annual Reports on Form 10-K, Quarterly Reports on Form 10-Q, and Current Reports on Form 8-K. This information is preliminary and based on company and third-party data available at the time of the presentation or related communication.
This document and related communications contain forward-looking statements within the meaning of the Private Securities Litigation Reform Act of 1995. These statements can be identified by the fact that they do not relate strictly to historical or current facts—such as statements about the outlook for financial and operating metrics, and future capital allocation and actions. Forward-looking statements often use words such as “believe,” “expect,” “anticipate,” “intend,” “pursue,” “seek,” “continue,” “estimate,” “project,” “outlook,” “forecast,” “potential,” “target,” “objective,” “trend,” “plan,” “goal,” “initiative,” “priorities,” or other words of comparable meaning or future-tense or conditional verbs such as “may,” “will,” “should,” “would,” or “could.” Forward-looking statements convey our expectations, intentions, or forecasts about future events, circumstances, or results. All forward-looking statements, by their nature, are subject to assumptions, risks, and uncertainties, which may change over time and many of which are beyond our control. You should not rely on any forward-looking statement as a prediction or guarantee about the future. Actual future objectives, strategies, plans, prospects, performance, conditions, or results may differ materially from those set forth in any forward-looking statement. Some of the factors that may cause actual results or other future events or circumstances to differ from those in forward-looking statements are described in our Annual Report on Form 10-K for the year ended December 31, 2023, our subsequent Quarterly Reports on Form 10-Q or Current Reports on Form 8-K, or other applicable documents that are filed or furnished with the U.S. Securities and Exchange Commission (collectively, our “SEC filings”). Any forward-looking statement made by us or on our behalf speaks only as of the date that it was made. We do not undertake to update any forward-looking statement to reflect the impact of events, circumstances, or results that arise after the date that the statement was made, except as required by applicable securities laws. You, however, should consult further disclosures (including disclosures of a forward-looking nature) that we may make in any subsequent SEC filings.
This document and related communications contain specifically identified non-GAAP financial measures, which supplement the results that are reported according to U.S. generally accepted accounting principles (“GAAP”). These non-GAAP financial measures may be useful to investors but should not be viewed in isolation from, or as a substitute for, GAAP results. Differences between non-GAAP financial measures and comparable GAAP financial measures are reconciled in the presentation.
Unless the context otherwise requires, the following definitions apply. The term “loans” means the following consumer and commercial products associated with our direct and indirect financing activities: loans, retail installment sales contracts, lines of credit, and other financing products excluding operating leases. The term “operating leases” means consumer- and commercial-vehicle lease agreements where Ally is the lessor and the lessee is generally not obligated to acquire ownership of the vehicle at lease-end or compensate Ally for the vehicle’s residual value. The terms “lend,” “finance,” and “originate” mean our direct extension or origination of loans, our purchase or acquisition of loans, or our purchase of operating leases, as applicable. The term “consumer” means all consumer products associated with our loan and operating-lease activities and all commercial retail installment sales contracts. The term “commercial” means all commercial products associated with our loan activities, other than commercial retail installment sales contracts. The term “partnerships” means business arrangements rather than partnerships as defined by law.
| 2 |
| ALLY FINANCIAL INC. TABLE OF CONTENTS |
|
| Page(s) | ||||
| Consolidated Results |
||||
| Consolidated Financial Highlights |
4 | |||
| Consolidated Income Statement |
5 | |||
| Consolidated Period-End Balance Sheet |
6 | |||
| Consolidated Average Balance Sheet |
7 | |||
| Segment Detail |
||||
| Segment Highlights |
8 | |||
| Automotive Finance |
9-10 | |||
| Insurance |
11 | |||
| Mortgage Finance |
12 | |||
| Corporate Finance |
13 | |||
| Corporate and Other |
14 | |||
| Credit Related Information |
15-16 | |||
| Supplemental Detail |
||||
| Capital |
17 | |||
| Liquidity and Deposits |
18 | |||
| Net Interest Margin |
19 | |||
| Ally Bank Consumer Mortgage HFI Portfolios |
20 | |||
| Earnings Per Share Related Information |
21 | |||
| Adjusted Tangible Book Per Share Related Information |
22 | |||
| Core ROTCE Related Information |
23 | |||
| Adjusted Efficiency Ratio Related Information |
24 | |||
| 3 |
| ALLY FINANCIAL INC. CONSOLIDATED FINANCIAL HIGHLIGHTS |
|
($ in millions, shares in thousands)
| QUARTERLY TRENDS | CHANGE VS. | |||||||||||||||||||||||||||
| Selected Income Statement Data |
3Q 24 | 2Q 24 | 1Q 24 | 4Q 23 | 3Q 23 | 2Q 24 | 3Q 23 | |||||||||||||||||||||
| Net financing revenue |
$ | 1,488 | $ | 1,495 | $ | 1,456 | $ | 1,493 | $ | 1,533 | $ | (7 | ) | $ | (45 | ) | ||||||||||||
| Core OID (1) |
14 | 14 | 13 | 13 | 12 | 1 | 2 | |||||||||||||||||||||
| Net financing revenue (excluding Core OID) (1) |
1,502 | 1,509 | 1,469 | 1,506 | 1,545 | (6 | ) | (43 | ) | |||||||||||||||||||
| Other revenue |
615 | 505 | 530 | 574 | 435 | 110 | 180 | |||||||||||||||||||||
| Change in fair value of equity securities (2) |
(59 | ) | 28 | (11 | ) | (74 | ) | 56 | (87 | ) | (115 | ) | ||||||||||||||||
| Adjusted other revenue (1) |
556 | 533 | 519 | 500 | 491 | 23 | 65 | |||||||||||||||||||||
| Provision for credit losses |
645 | 457 | 507 | 587 | 508 | 188 | 137 | |||||||||||||||||||||
| Repositioning |
- | - | - | 16 | - | - | - | |||||||||||||||||||||
| Adjusted provision for credit losses (1) |
645 | 457 | 507 | 603 | 508 | 188 | 137 | |||||||||||||||||||||
| Total noninterest expense (3) |
1,225 | 1,286 | 1,308 | 1,416 | 1,232 | (61 | ) | (7 | ) | |||||||||||||||||||
| Repositioning |
- | - | (10 | ) | (187 | ) | (30 | ) | - | 30 | ||||||||||||||||||
| Noninterest expense (ex. Repositioning) (1) |
1,225 | 1,286 | 1,298 | 1,229 | 1,202 | (61 | ) | 23 | ||||||||||||||||||||
|
|
|
|
|
|
|
|
|
|
|
|
|
|
|
|
|
|
|
|
|
|
||||||||
| Pre-tax income from continuing operations |
233 | 257 | 171 | 64 | 228 | (24 | ) | 5 | ||||||||||||||||||||
| Income tax expense (benefit) |
(124 | ) | (37 | ) | 14 | (13 | ) | (68 | ) | (87 | ) | (56 | ) | |||||||||||||||
| (Loss) from discontinued operations, net of tax |
- | - | - | (1 | ) | - | - | - | ||||||||||||||||||||
|
|
|
|
|
|
|
|
|
|
|
|
|
|
|
|
|
|
|
|
|
|
||||||||
| Net Income |
357 | 294 | 157 | 76 | 296 | 63 | 61 | |||||||||||||||||||||
| Preferred Dividends |
27 | 28 | 28 | 27 | 27 | (1 | ) | - | ||||||||||||||||||||
|
|
|
|
|
|
|
|
|
|
|
|
|
|
|
|
|
|
|
|
|
|
||||||||
| Net income attributable to common shareholders |
$ | 330 | $ | 266 | $ | 129 | $ | 49 | $ | 269 | $ | 64 | $ | 61 | ||||||||||||||
|
|
|
|
|
|
|
|
|
|
|
|
|
|
|
|
|
|
|
|
|
|
||||||||
| Selected Balance Sheet Data (Period-End) |
||||||||||||||||||||||||||||
| Total assets |
$ | 192,981 | $ | 192,531 | $ | 192,877 | $ | 196,392 | $ | 195,704 | $ | 450 | $ | (2,723 | ) | |||||||||||||
| Consumer loans |
103,095 | 103,585 | 103,809 | 104,977 | 108,343 | (490 | ) | (5,248 | ) | |||||||||||||||||||
| Commercial loans |
34,406 | 35,198 | 34,151 | 34,462 | 31,917 | (792 | ) | 2,489 | ||||||||||||||||||||
| Allowance for loan losses |
(3,700 | ) | (3,572 | ) | (3,550 | ) | (3,587 | ) | (3,837 | ) | (128 | ) | 137 | |||||||||||||||
| Deposits |
151,950 | 152,154 | 155,084 | 154,666 | 152,835 | (204 | ) | (885 | ) | |||||||||||||||||||
| Total equity |
14,725 | 13,851 | 13,657 | 13,766 | 12,825 | 874 | 1,900 | |||||||||||||||||||||
| Common Share Count |
||||||||||||||||||||||||||||
| Weighted average basic |
307,312 | 306,774 | 306,003 | 304,506 | 304,134 | 538 | 3,179 | |||||||||||||||||||||
| Weighted average diluted |
311,044 | 309,886 | 308,421 | 306,730 | 305,693 | 1,158 | 5,350 | |||||||||||||||||||||
| Issued shares outstanding (period-end) |
304,715 | 304,656 | 303,978 | 302,459 | 301,630 | 59 | 3,085 | |||||||||||||||||||||
| Per Common Share Data |
||||||||||||||||||||||||||||
| Earnings per share (basic) |
$ | 1.07 | $ | 0.87 | $ | 0.42 | $ | 0.16 | $ | 0.88 | $ | 0.21 | $ | 0.19 | ||||||||||||||
| Earnings per share (diluted) |
1.06 | 0.86 | 0.42 | 0.16 | 0.88 | 0.20 | 0.18 | |||||||||||||||||||||
| Adjusted earnings per share (1) |
0.95 | 0.97 | 0.45 | 0.45 | 0.83 | (0.02 | ) | 0.12 | ||||||||||||||||||||
| Book value per share |
40.70 | 37.84 | 37.28 | 37.83 | 34.81 | 2.86 | 5.88 | |||||||||||||||||||||
| Tangible book value per share |
38.38 | 35.50 | 34.91 | 35.43 | 31.90 | 2.88 | 6.48 | |||||||||||||||||||||
| Adjusted tangible book value per share (1) |
36.43 | 33.51 | 32.89 | 33.36 | 29.79 | 2.92 | 6.64 | |||||||||||||||||||||
| Select Financial Ratios |
||||||||||||||||||||||||||||
| Net interest margin |
3.22% | 3.27% | 3.13% | 3.17% | 3.24% | |||||||||||||||||||||||
| Net interest margin (ex. Core OID) (1) |
3.25% | 3.30% | 3.16% | 3.20% | 3.26% | |||||||||||||||||||||||
| Cost of funds |
4.42% | 4.39% | 4.44% | 4.35% | 4.21% | |||||||||||||||||||||||
| Cost of funds (ex. Core OID) (1) |
4.36% | 4.34% | 4.38% | 4.29% | 4.15% | |||||||||||||||||||||||
| Efficiency Ratio |
58.3% | 64.3% | 65.9% | 68.5% | 62.6% | |||||||||||||||||||||||
| Adjusted efficiency ratio (1) |
52.1% | 53.2% | 60.2% | 55.7% | 52.1% | |||||||||||||||||||||||
| Return on average assets |
0.7% | 0.6% | 0.3% | 0.1% | 0.5% | |||||||||||||||||||||||
| Return on average total equity |
9.2% | 7.7% | 3.8% | 1.5% | 8.2% | |||||||||||||||||||||||
| Return on average tangible common equity |
11.7% | 9.9% | 4.8% | 1.9% | 10.8% | |||||||||||||||||||||||
| Core ROTCE (1) |
13.1% | 14.0% | 6.5% | 6.9% | 12.9% | |||||||||||||||||||||||
| Capital Ratios (4) |
||||||||||||||||||||||||||||
| Common Equity Tier 1 (CET1) capital ratio |
9.8% | 9.6% | 9.4% | 9.4% | 9.3% | |||||||||||||||||||||||
| Tier 1 capital ratio |
11.2% | 11.0% | 10.8% | 10.8% | 10.7% | |||||||||||||||||||||||
| Total capital ratio |
12.9% | 12.7% | 12.5% | 12.4% | 12.5% | |||||||||||||||||||||||
| Tier 1 leverage ratio |
9.0% | 8.8% | 8.6% | 8.7% | 8.6% | |||||||||||||||||||||||
(1) Represents a non-GAAP financial measure. For more details refer to pages 21-27.
(2) For more details refer to pages 25-27.
(3) Including but not limited to employee related expenses, commissions and provision for losses and loss adjustment expense related to the insurance business, information technology expenses, servicing expenses, facilities expenses, marketing expenses, and other professional and legal expenses.
(4) For more details on the final rules to address the impact of CECL on regulatory capital by allowing BHCs and banks, including Ally, to delay and subsequently phase-in its impact, see page 26.
Note: Numbers may not foot due to rounding
| 4 |
| ALLY FINANCIAL INC. CONSOLIDATED INCOME STATEMENT |
|
($ in millions)
| QUARTERLY TRENDS | CHANGE VS. | |||||||||||||||||||||||||||
| 3Q 24 | 2Q 24 | 1Q 24 | 4Q 23 | 3Q 23 | 2Q 24 | 3Q 23 | ||||||||||||||||||||||
| Financing revenue and other interest income |
||||||||||||||||||||||||||||
| Interest and fees on finance receivables and loans |
$ | 2,889 | $ | 2,845 | $ | 2,827 | $ | 2,887 | $ | 2,837 | $ | 44 | $ | 52 | ||||||||||||||
| Interest on loans held-for-sale |
5 | 7 | 36 | 5 | 7 | (2 | ) | (2 | ) | |||||||||||||||||||
| Total interest and dividends on investment securities |
253 | 255 | 255 | 260 | 256 | (2 | ) | (3 | ) | |||||||||||||||||||
| Interest-bearing cash |
102 | 88 | 97 | 90 | 99 | 14 | 3 | |||||||||||||||||||||
| Other earning assets |
9 | 10 | 11 | 10 | 11 | (1 | ) | (2 | ) | |||||||||||||||||||
| Operating leases |
316 | 333 | 356 | 371 | 385 | (17 | ) | (69 | ) | |||||||||||||||||||
|
|
|
|
|
|
|
|
|
|
|
|
|
|
|
|
|
|
|
|
|
|
||||||||
| Total financing revenue and other interest income |
3,574 | 3,538 | 3,582 | 3,623 | 3,595 | 36 | (21 | ) | ||||||||||||||||||||
| Interest expense |
||||||||||||||||||||||||||||
| Interest on deposits |
1,616 | 1,594 | 1,651 | 1,621 | 1,563 | 22 | 53 | |||||||||||||||||||||
| Interest on short-term borrowings |
13 | 27 | 23 | 37 | 13 | (14 | ) | - | ||||||||||||||||||||
| Interest on long-term debt |
256 | 244 | 248 | 248 | 274 | 12 | (18 | ) | ||||||||||||||||||||
| Interest on other |
- | 1 | - | 2 | - | (1 | ) | - | ||||||||||||||||||||
|
|
|
|
|
|
|
|
|
|
|
|
|
|
|
|
|
|
|
|
|
|
||||||||
| Total interest expense |
1,885 | 1,866 | 1,922 | 1,908 | 1,850 | 19 | 35 | |||||||||||||||||||||
| Depreciation expense on operating lease assets |
201 | 177 | 204 | 222 | 212 | 24 | (11 | ) | ||||||||||||||||||||
|
|
|
|
|
|
|
|
|
|
|
|
|
|
|
|
|
|
|
|
|
|
||||||||
| Net financing revenue |
$ | 1,488 | $ | 1,495 | $ | 1,456 | $ | 1,493 | $ | 1,533 | $ | (7 | ) | $ | (45 | ) | ||||||||||||
| Other revenue |
||||||||||||||||||||||||||||
| Insurance premiums and service revenue earned |
359 | 341 | 345 | 335 | 320 | 18 | 39 | |||||||||||||||||||||
| Gain on mortgage and automotive loans, net |
6 | 6 | 6 | 3 | 4 | - | 2 | |||||||||||||||||||||
| Other gain / (loss) on investments, net |
74 | (7 | ) | 29 | 85 | (41 | ) | 81 | 115 | |||||||||||||||||||
| Other income, net of losses |
176 | 165 | 150 | 151 | 152 | 11 | 24 | |||||||||||||||||||||
|
|
|
|
|
|
|
|
|
|
|
|
|
|
|
|
|
|
|
|
|
|
||||||||
| Total other revenue |
615 | 505 | 530 | 574 | 435 | 110 | 180 | |||||||||||||||||||||
| Total net revenue |
2,103 | 2,000 | 1,986 | 2,067 | 1,968 | 103 | 135 | |||||||||||||||||||||
| Provision for loan losses |
645 | 457 | 507 | 587 | 508 | 188 | 137 | |||||||||||||||||||||
| Noninterest expense |
||||||||||||||||||||||||||||
| Compensation and benefits expense |
435 | 442 | 519 | 453 | 463 | (7 | ) | (28 | ) | |||||||||||||||||||
| Insurance losses and loss adjustment expenses |
135 | 181 | 112 | 93 | 107 | (46 | ) | 28 | ||||||||||||||||||||
| Goodwill impairment |
- | - | - | 149 | - | - | - | |||||||||||||||||||||
| Other operating expenses |
655 | 663 | 677 | 721 | 662 | (8 | ) | (7 | ) | |||||||||||||||||||
|
|
|
|
|
|
|
|
|
|
|
|
|
|
|
|
|
|
|
|
|
|
||||||||
| Total noninterest expense |
1,225 | 1,286 | 1,308 | 1,416 | 1,232 | (61 | ) | (7 | ) | |||||||||||||||||||
| Pre-tax income from continuing operations |
$ | 233 | $ | 257 | $ | 171 | $ | 64 | $ | 228 | $ | (24 | ) | $ | 5 | |||||||||||||
| Income tax (benefit) / expense from continuing operations |
(124 | ) | (37 | ) | 14 | (13 | ) | (68 | ) | (87 | ) | (56 | ) | |||||||||||||||
|
|
|
|
|
|
|
|
|
|
|
|
|
|
|
|
|
|
|
|
|
|
||||||||
| Net income from continuing operations |
357 | 294 | 157 | 77 | 296 | 63 | 61 | |||||||||||||||||||||
| Loss from discontinued operations, net of tax |
- | - | - | (1 | ) | - | - | - | ||||||||||||||||||||
|
|
|
|
|
|
|
|
|
|
|
|
|
|
|
|
|
|
|
|
|
|
||||||||
| Net income |
$ | 357 | $ | 294 | $ | 157 | $ | 76 | $ | 296 | $ | 63 | $ | 61 | ||||||||||||||
|
|
|
|
|
|
|
|
|
|
|
|
|
|
|
|
|
|
|
|
|
|
||||||||
| Preferred Dividends |
27 | 28 | 28 | 27 | 27 | (1 | ) | - | ||||||||||||||||||||
|
|
|
|
|
|
|
|
|
|
|
|
|
|
|
|
|
|
|
|
|
|
||||||||
| Net income available to common shareholders |
$ | 330 | $ | 266 | $ | 129 | $ | 49 | $ | 269 | $ | 64 | $ | 61 | ||||||||||||||
|
|
|
|
|
|
|
|
|
|
|
|
|
|
|
|
|
|
|
|
|
|
||||||||
| Core pre-tax Income walk |
||||||||||||||||||||||||||||
| Net financing revenue |
$ | 1,488 | $ | 1,495 | $ | 1,456 | $ | 1,493 | $ | 1,533 | $ | (7 | ) | $ | (45 | ) | ||||||||||||
| Other revenue |
615 | 505 | 530 | 574 | 435 | 110 | 180 | |||||||||||||||||||||
| Provision for credit losses |
645 | 457 | 507 | 587 | 508 | 188 | 137 | |||||||||||||||||||||
| Total noninterest expense |
1,225 | 1,286 | 1,308 | 1,416 | 1,232 | (61 | ) | (7 | ) | |||||||||||||||||||
|
|
|
|
|
|
|
|
|
|
|
|
|
|
|
|
|
|
|
|
|
|
||||||||
| Pre-tax income from continuing operations |
$ | 233 | $ | 257 | $ | 171 | $ | 64 | $ | 228 | $ | (24 | ) | $ | 5 | |||||||||||||
| Core OID (1) |
14 | 14 | 13 | 13 | 12 | 1 | 2 | |||||||||||||||||||||
| Change in the fair value of equity securities (2) |
(59 | ) | 28 | (11 | ) | (74 | ) | 56 | (87 | ) | (115 | ) | ||||||||||||||||
| Repositioning (2) |
- | - | 10 | 172 | 30 | - | (30 | ) | ||||||||||||||||||||
|
|
|
|
|
|
|
|
|
|
|
|
|
|
|
|
|
|
|
|
|
|
||||||||
| Core pre-tax income (1) |
$ | 188 | $ | 299 | $ | 183 | $ | 174 | $ | 326 | $ | (111 | ) | $ | (138 | ) | ||||||||||||
|
|
|
|
|
|
|
|
|
|
|
|
|
|
|
|
|
|
|
|
|
|
||||||||
(1) Represents a non-GAAP financial measure. For more details refer to pages 25-27.
(2) For more details refer to pages 25-27.
Note: Numbers may not foot due to rounding
| 5 |
| ALLY FINANCIAL INC. CONSOLIDATED PERIOD-END BALANCE SHEET |
|
($ in millions)
| QUARTERLY TRENDS | CHANGE VS. | |||||||||||||||||||||||||||
| 3Q 24 | 2Q 24 | 1Q 24 | 4Q 23 | 3Q 23 | 2Q 24 | 3Q 23 | ||||||||||||||||||||||
| Assets | ||||||||||||||||||||||||||||
| Cash and cash equivalents |
||||||||||||||||||||||||||||
| Noninterest-bearing |
$ | 544 | $ | 536 | $ | 589 | $ | 638 | $ | 603 | $ | 8 | $ | (59 | ) | |||||||||||||
| Interest-bearing |
8,072 | 6,833 | 7,564 | 6,307 | 7,912 | 1,239 | 160 | |||||||||||||||||||||
|
|
|
|
|
|
|
|
|
|
|
|
|
|
|
|
|
|
|
|
|
|
||||||||
| Total cash and cash equivalents |
8,616 | 7,369 | 8,153 | 6,945 | 8,515 | 1,247 | 101 | |||||||||||||||||||||
| Investment securities (1) |
29,223 | 28,602 | 29,127 | 29,905 | 28,532 | 621 | 691 | |||||||||||||||||||||
| Loans held-for-sale, net |
306 | 316 | 358 | 400 | 289 | (10 | ) | 17 | ||||||||||||||||||||
| Finance receivables and loans, net |
137,501 | 138,783 | 137,960 | 139,439 | 140,260 | (1,282 | ) | (2,759 | ) | |||||||||||||||||||
| Allowance for loan losses |
(3,700 | ) | (3,572 | ) | (3,550 | ) | (3,587 | ) | (3,837 | ) | (128 | ) | 137 | |||||||||||||||
|
|
|
|
|
|
|
|
|
|
|
|
|
|
|
|
|
|
|
|
|
|
||||||||
| Total finance receivables and loans, net |
133,801 | 135,211 | 134,410 | 135,852 | 136,423 | (1,410 | ) | (2,622 | ) | |||||||||||||||||||
| Investment in operating leases, net |
8,318 | 8,374 | 8,731 | 9,171 | 9,569 | (56 | ) | (1,251 | ) | |||||||||||||||||||
| Premiums receivables and other insurance assets |
2,810 | 2,806 | 2,750 | 2,749 | 2,775 | 4 | 35 | |||||||||||||||||||||
| Other assets |
9,907 | 9,853 | 9,348 | 9,395 | 9,601 | 54 | 306 | |||||||||||||||||||||
| Assets of operations held-for-sale (2) |
- | - | - | 1,975 | - | - | - | |||||||||||||||||||||
|
|
|
|
|
|
|
|
|
|
|
|
|
|
|
|
|
|
|
|
|
|
||||||||
| Total assets |
$ | 192,981 | $ | 192,531 | $ | 192,877 | $ | 196,392 | $ | 195,704 | $ | 450 | $ | (2,723 | ) | |||||||||||||
|
|
|
|
|
|
|
|
|
|
|
|
|
|
|
|
|
|
|
|
|
|
||||||||
| Liabilities |
||||||||||||||||||||||||||||
| Deposit liabilities |
||||||||||||||||||||||||||||
| Noninterest-bearing |
$ | 174 | $ | 156 | $ | 137 | $ | 139 | $ | 188 | $ | 18 | $ | (14 | ) | |||||||||||||
| Interest-bearing |
151,776 | 151,998 | 154,947 | 154,527 | 152,647 | (222 | ) | (871 | ) | |||||||||||||||||||
|
|
|
|
|
|
|
|
|
|
|
|
|
|
|
|
|
|
|
|
|
|
||||||||
| Total deposit liabilities |
151,950 | 152,154 | 155,084 | 154,666 | 152,835 | (204 | ) | (885 | ) | |||||||||||||||||||
| Short-term borrowings |
1,771 | 3,122 | - | 3,297 | 2,410 | (1,351 | ) | (639 | ) | |||||||||||||||||||
| Long-term debt |
16,807 | 15,979 | 17,011 | 17,570 | 20,096 | 828 | (3,289 | ) | ||||||||||||||||||||
| Interest payable |
1,425 | 1,148 | 1,118 | 858 | 1,437 | 277 | (12 | ) | ||||||||||||||||||||
| Unearned insurance premiums and service revenue |
3,534 | 3,496 | 3,480 | 3,492 | 3,494 | 38 | 40 | |||||||||||||||||||||
| Accrued expense and other liabilities |
2,769 | 2,781 | 2,527 | 2,726 | 2,607 | (12 | ) | 162 | ||||||||||||||||||||
| Liabilities of operations held-for-sale |
- | - | - | 17 | - | - | - | |||||||||||||||||||||
|
|
|
|
|
|
|
|
|
|
|
|
|
|
|
|
|
|
|
|
|
|
||||||||
| Total liabilities |
$ | 178,256 | $ | 178,680 | $ | 179,220 | $ | 182,626 | $ | 182,879 | $ | (424 | ) | $ | (4,623 | ) | ||||||||||||
| Equity |
||||||||||||||||||||||||||||
| Common stock and paid-in capital (3) |
$ | 15,199 | $ | 15,176 | $ | 15,134 | $ | 15,104 | $ | 15,069 | $ | 23 | $ | 130 | ||||||||||||||
| Preferred stock |
2,324 | 2,324 | 2,324 | 2,324 | 2,324 | - | - | |||||||||||||||||||||
| Retained earnings |
595 | 360 | 188 | 154 | 197 | 235 | 398 | |||||||||||||||||||||
| Accumulated other comprehensive loss |
(3,393 | ) | (4,009 | ) | (3,989 | ) | (3,816 | ) | (4,765 | ) | 616 | 1,372 | ||||||||||||||||
|
|
|
|
|
|
|
|
|
|
|
|
|
|
|
|
|
|
|
|
|
|
||||||||
| Total equity |
14,725 | 13,851 | 13,657 | 13,766 | 12,825 | 874 | 1,900 | |||||||||||||||||||||
|
|
|
|
|
|
|
|
|
|
|
|
|
|
|
|
|
|
|
|
|
|
||||||||
| Total liabilities and equity |
$ | 192,981 | $ | 192,531 | $ | 192,877 | $ | 196,392 | $ | 195,704 | $ | 450 | $ | (2,723 | ) | |||||||||||||
|
|
|
|
|
|
|
|
|
|
|
|
|
|
|
|
|
|
|
|
|
|
||||||||
(1) Includes Held-to-maturity securities.
(2) Unsecured lending from point-of-sale financing. Moved to Assets of Operations Held-For-Sale (HFS) on 12/31/23. Sale of Ally Lending closed on 03/01/24.
(3) Includes Treasury stock.
Note: Numbers may not foot due to rounding
| 6 |
| ALLY FINANCIAL INC. CONSOLIDATED AVERAGE BALANCE SHEET (1) |
|
($ in millions)
| QUARTERLY TRENDS | CHANGE VS. | |||||||||||||||||||||||||||
| 3Q 24 | 2Q 24 | 1Q 24 | 4Q 23 | 3Q 23 | 2Q 24 | 3Q 23 | ||||||||||||||||||||||
| Assets |
||||||||||||||||||||||||||||
| Interest-bearing cash and cash equivalents |
$ | 7,867 | $ | 7,276 | $ | 7,709 | $ | 7,571 | $ | 8,308 | $ | 591 | $ | (441 | ) | |||||||||||||
| Investment securities and other earning assets |
29,695 | 29,233 | 29,939 | 29,407 | 30,364 | 462 | (669 | ) | ||||||||||||||||||||
| Loans held-for-sale, net |
267 | 220 | 382 | 237 | 278 | 47 | (11 | ) | ||||||||||||||||||||
| Total finance receivables and loans, net (2) (5) |
137,625 | 138,322 | 139,945 | 140,326 | 139,153 | (697 | ) | (1,528 | ) | |||||||||||||||||||
| Investment in operating leases, net |
8,335 | 8,619 | 8,955 | 9,415 | 9,817 | (284 | ) | (1,482 | ) | |||||||||||||||||||
|
|
|
|
|
|
|
|
|
|
|
|
|
|
|
|
|
|
|
|
|
|
||||||||
| Total interest earning assets |
183,789 | 183,670 | 186,930 | 186,956 | 187,920 | 119 | (4,131 | ) | ||||||||||||||||||||
| Noninterest-bearing cash and cash equivalents |
266 | 360 | 309 | 257 | 335 | (94 | ) | (69 | ) | |||||||||||||||||||
| Other assets |
11,614 | 11,622 | 11,443 | 11,644 | 10,925 | (8 | ) | 689 | ||||||||||||||||||||
| Allowance for loan losses |
(3,584 | ) | (3,557 | ) | (3,589 | ) | (3,801 | ) | (3,820 | ) | (27 | ) | 236 | |||||||||||||||
|
|
|
|
|
|
|
|
|
|
|
|
|
|
|
|
|
|
|
|
|
|
||||||||
| Total assets |
$ | 192,085 | $ | 192,095 | $ | 195,093 | $ | 195,056 | $ | 195,360 | $ | (10 | ) | $ | (3,275 | ) | ||||||||||||
|
|
|
|
|
|
|
|
|
|
|
|
|
|
|
|
|
|
|
|
|
|
||||||||
| Liabilities |
||||||||||||||||||||||||||||
| Interest-bearing deposit liabilities |
||||||||||||||||||||||||||||
| Retail deposit liabilities |
$ | 141,286 | $ | 142,949 | $ | 143,491 | $ | 140,117 | $ | 139,372 | $ | (1,663 | ) | $ | 1,914 | |||||||||||||
| Other interest-bearing deposit liabilities (3) |
10,789 | 9,316 | 11,712 | 13,391 | 13,973 | 1,473 | (3,184 | ) | ||||||||||||||||||||
|
|
|
|
|
|
|
|
|
|
|
|
|
|
|
|
|
|
|
|
|
|
||||||||
| Total Interest-bearing deposit liabilities |
152,075 | 152,265 | 155,203 | 153,508 | 153,345 | (190 | ) | (1,270 | ) | |||||||||||||||||||
| Short-term borrowings |
994 | 2,254 | 1,726 | 2,714 | 948 | (1,260 | ) | 46 | ||||||||||||||||||||
| Long-term debt (4) |
16,597 | 16,367 | 17,309 | 17,933 | 20,315 | 230 | (3,718 | ) | ||||||||||||||||||||
|
|
|
|
|
|
|
|
|
|
|
|
|
|
|
|
|
|
|
|
|
|
||||||||
| Total interest-bearing liabilities (4) |
169,666 | 170,886 | 174,238 | 174,155 | 174,608 | (1,220 | ) | (4,942 | ) | |||||||||||||||||||
| Noninterest-bearing deposit liabilities |
166 | 147 | 149 | 164 | 181 | 19 | (15 | ) | ||||||||||||||||||||
| Other liabilities |
7,619 | 7,231 | 7,021 | 7,826 | 6,503 | 388 | 1,116 | |||||||||||||||||||||
|
|
|
|
|
|
|
|
|
|
|
|
|
|
|
|
|
|
|
|
|
|
||||||||
| Total liabilities |
$ | 177,451 | $ | 178,264 | $ | 181,408 | $ | 182,145 | $ | 181,292 | $ | (813 | ) | $ | (3,841 | ) | ||||||||||||
| Equity |
||||||||||||||||||||||||||||
| Total equity |
$ | 14,634 | $ | 13,831 | $ | 13,685 | $ | 12,911 | $ | 14,068 | $ | 803 | $ | 566 | ||||||||||||||
|
|
|
|
|
|
|
|
|
|
|
|
|
|
|
|
|
|
|
|
|
|
||||||||
| Total liabilities and equity |
$ | 192,085 | $ | 192,095 | $ | 195,093 | $ | 195,056 | $ | 195,360 | $ | (10 | ) | $ | (3,275 | ) | ||||||||||||
|
|
|
|
|
|
|
|
|
|
|
|
|
|
|
|
|
|
|
|
|
|
||||||||
(1) Average balances are calculated using a combination of monthly and daily average methodologies.
(2) Nonperforming finance receivables and loans are included in the average balances net of unearned income, unamortized premiums and discounts, and deferred fees and costs.
(3) Includes brokered (inclusive of sweep deposits) and other deposits.
(4) Includes average Core OID balance of $759 million in 3Q24, $773 million in 2Q24, $786 million in 1Q24, $799 million in 4Q23, and $812 million in 3Q23.
(5) Includes the effects of finance receivables and loans, net that were transferred to loans held-for-sale, net and subsequently transferred to assets of operations held-for-sale as of December 31, 2023.
Note: Numbers may not foot due to rounding
| 7 |
| ALLY FINANCIAL INC. SEGMENT HIGHLIGHTS |
|
($ in millions)
| QUARTERLY TRENDS | CHANGE VS. | |||||||||||||||||||||||||||
| 3Q 24 | 2Q 24 | 1Q 24 | 4Q 23 | 3Q 23 | 2Q 24 | 3Q 23 | ||||||||||||||||||||||
| Pre-tax Income / (Loss) |
||||||||||||||||||||||||||||
| Automotive Finance |
$ | 175 | $ | 407 | $ | 322 | $ | 294 | $ | 377 | $ | (232 | ) | $ | (202 | ) | ||||||||||||
| Insurance |
102 | (42 | ) | 70 | 129 | (16 | ) | 144 | 118 | |||||||||||||||||||
|
|
|
|
|
|
|
|
|
|
|
|
|
|
|
|
|
|
|
|
|
|
||||||||
| Dealer Financial Services |
277 | 365 | 392 | 423 | 361 | (88 | ) | (84 | ) | |||||||||||||||||||
| Corporate Finance |
95 | 98 | 90 | 79 | 84 | (3 | ) | 11 | ||||||||||||||||||||
| Mortgage Finance |
27 | 27 | 25 | 24 | 26 | - | 1 | |||||||||||||||||||||
| Corporate and Other (1) |
(166 | ) | (233 | ) | (336 | ) | (462 | ) | (243 | ) | 67 | 77 | ||||||||||||||||
|
|
|
|
|
|
|
|
|
|
|
|
|
|
|
|
|
|
|
|
|
|
||||||||
| Pre-tax income from continuing operations |
$ | 233 | $ | 257 | $ | 171 | $ | 64 | $ | 228 | $ | (24 | ) | $ | 5 | |||||||||||||
| Core OID (2) (4) |
14 | 14 | 13 | 13 | 12 | 1 | 2 | |||||||||||||||||||||
| Change in the fair value of equity securities (3) |
(59 | ) | 28 | (11 | ) | (74 | ) | 56 | (87 | ) | (115 | ) | ||||||||||||||||
| Repositioning (4) |
- | - | 10 | 172 | 30 | - | (30 | ) | ||||||||||||||||||||
|
|
|
|
|
|
|
|
|
|
|
|
|
|
|
|
|
|
|
|
|
|
||||||||
| Core pre-tax income (4) |
$ | 188 | $ | 299 | $ | 183 | $ | 174 | $ | 326 | $ | (111 | ) | $ | (138 | ) | ||||||||||||
|
|
|
|
|
|
|
|
|
|
|
|
|
|
|
|
|
|
|
|
|
|
||||||||
(1) Corporate and Other includes the impact of centralized asset and liability management, corporate overhead allocation activities, the legacy mortgage portfolio, Ally Invest activity, Ally Lending activity and the Credit Card portfolio. The sale of Ally Lending closed on 03/01/24.
(2) Core OID for all periods shown are applied to the pre-tax income of the Corporate and Other segment.
(3) For more details refer to pages 25-27.
(4) Represents a non-GAAP measure. For more details refer to pages 25-27.
Note: Numbers may not foot due to rounding
| 8 |
| ALLY FINANCIAL INC. AUTOMOTIVE FINANCE - CONDENSED FINANCIAL STATEMENTS |
|
($ in millions)
| QUARTERLY TRENDS | CHANGE VS. | |||||||||||||||||||||||||||
| Income Statement |
3Q 24 | 2Q 24 | 1Q 24 | 4Q 23 | 3Q 23 | 2Q 24 | 3Q 23 | |||||||||||||||||||||
| Net financing revenue |
||||||||||||||||||||||||||||
| Consumer |
$ | 1,889 | $ | 1,837 | $ | 1,808 | $ | 1,799 | $ | 1,748 | $ | 52 | $ | 141 | ||||||||||||||
| Commercial |
432 | 435 | 411 | 394 | 364 | (3 | ) | 68 | ||||||||||||||||||||
| Loans held-for-sale |
- | 1 | 1 | 1 | 2 | (1 | ) | (2 | ) | |||||||||||||||||||
| Operating leases |
316 | 333 | 356 | 371 | 385 | (17 | ) | (69 | ) | |||||||||||||||||||
|
|
|
|
|
|
|
|
|
|
|
|
|
|
|
|
|
|
|
|
|
|
||||||||
| Total financing revenue and other interest income |
2,637 | 2,606 | 2,576 | 2,565 | 2,499 | 31 | 138 | |||||||||||||||||||||
| Interest expense |
1,151 | 1,115 | 1,058 | 1,013 | 927 | 36 | 224 | |||||||||||||||||||||
| Depreciation expense on operating lease assets: |
||||||||||||||||||||||||||||
| Depreciation expense on operating lease assets (ex. remarketing) |
225 | 236 | 249 | 260 | 268 | (11 | ) | (43 | ) | |||||||||||||||||||
| Remarketing gains, net of repo valuation |
(24 | ) | (59 | ) | (46 | ) | (37 | ) | (57 | ) | 35 | 33 | ||||||||||||||||
|
|
|
|
|
|
|
|
|
|
|
|
|
|
|
|
|
|
|
|
|
|
||||||||
| Total depreciation expense on operating lease assets |
201 | 177 | 204 | 222 | 212 | 24 | (11 | ) | ||||||||||||||||||||
|
|
|
|
|
|
|
|
|
|
|
|
|
|
|
|
|
|
|
|
|
|
||||||||
| Net financing revenue |
1,285 | 1,314 | 1,314 | 1,330 | 1,360 | (29 | ) | (75 | ) | |||||||||||||||||||
| Other revenue |
||||||||||||||||||||||||||||
| Total other revenue |
85 | 93 | 97 | 82 | 79 | (8 | ) | 6 | ||||||||||||||||||||
|
|
|
|
|
|
|
|
|
|
|
|
|
|
|
|
|
|
|
|
|
|
||||||||
| Total net revenue |
1,370 | 1,407 | 1,411 | 1,412 | 1,439 | (37 | ) | (69 | ) | |||||||||||||||||||
|
|
|
|
|
|
|
|
|
|
|
|
|
|
|
|
|
|
|
|
|
|
||||||||
| Provision for credit losses |
579 | 383 | 448 | 492 | 444 | 196 | 135 | |||||||||||||||||||||
| Noninterest expense |
||||||||||||||||||||||||||||
| Compensation and benefits |
165 | 160 | 178 | 163 | 164 | 5 | 1 | |||||||||||||||||||||
| Other operating expenses |
451 | 457 | 463 | 463 | 454 | (6 | ) | (3 | ) | |||||||||||||||||||
|
|
|
|
|
|
|
|
|
|
|
|
|
|
|
|
|
|
|
|
|
|
||||||||
| Total noninterest expense |
616 | 617 | 641 | 626 | 618 | (1 | ) | (2 | ) | |||||||||||||||||||
|
|
|
|
|
|
|
|
|
|
|
|
|
|
|
|
|
|
|
|
|
|
||||||||
| Pre-tax Income |
$ | 175 | $ | 407 | $ | 322 | $ | 294 | $ | 377 | $ | (232 | ) | $ | (202 | ) | ||||||||||||
|
|
|
|
|
|
|
|
|
|
|
|
|
|
|
|
|
|
|
|
|
|
||||||||
| Memo: Net lease revenue |
||||||||||||||||||||||||||||
| Operating lease revenue |
$ | 316 | $ | 333 | $ | 356 | $ | 371 | $ | 385 | $ | (17 | ) | $ | (69 | ) | ||||||||||||
| Depreciation expense on operating lease assets (ex. remarketing) |
225 | 236 | 249 | 260 | 268 | (11 | ) | (43 | ) | |||||||||||||||||||
| Remarketing gains, net of repo valuation |
(24 | ) | (59 | ) | (46 | ) | (37 | ) | (57 | ) | 35 | 33 | ||||||||||||||||
|
|
|
|
|
|
|
|
|
|
|
|
|
|
|
|
|
|
|
|
|
|
||||||||
| Total depreciation expense on operating lease assets |
201 | 177 | 204 | 222 | 212 | 24 | (11 | ) | ||||||||||||||||||||
|
|
|
|
|
|
|
|
|
|
|
|
|
|
|
|
|
|
|
|
|
|
||||||||
| Net lease revenue |
$ | 115 | $ | 156 | $ | 152 | $ | 149 | $ | 173 | $ | (41 | ) | $ | (58 | ) | ||||||||||||
|
|
|
|
|
|
|
|
|
|
|
|
|
|
|
|
|
|
|
|
|
|
||||||||
| Balance Sheet (Period-End) |
||||||||||||||||||||||||||||
| Loans held-for-sale, net |
$ | 3 | $ | 6 | $ | 5 | $ | 13 | $ | 21 | $ | (3 | ) | $ | (18 | ) | ||||||||||||
| Consumer loans |
83,396 | 83,694 | 83,587 | 84,414 | 85,728 | (298 | ) | (2,332 | ) | |||||||||||||||||||
| Commercial loans |
23,842 | 25,220 | 23,765 | 23,334 | 21,057 | (1,378 | ) | 2,785 | ||||||||||||||||||||
| Allowance for loan losses |
(3,204 | ) | (3,092 | ) | (3,083 | ) | (3,117 | ) | (3,153 | ) | (112 | ) | (51 | ) | ||||||||||||||
|
|
|
|
|
|
|
|
|
|
|
|
|
|
|
|
|
|
|
|
|
|
||||||||
| Total finance receivables and loans, net |
104,034 | 105,822 | 104,269 | 104,631 | 103,632 | (1,788 | ) | 402 | ||||||||||||||||||||
| Investment in operating leases, net |
8,318 | 8,374 | 8,731 | 9,171 | 9,569 | (56 | ) | (1,251 | ) | |||||||||||||||||||
| Other assets |
1,579 | 1,570 | 1,608 | 1,572 | 1,520 | 9 | 59 | |||||||||||||||||||||
|
|
|
|
|
|
|
|
|
|
|
|
|
|
|
|
|
|
|
|
|
|
||||||||
| Total assets |
$ | 113,934 | $ | 115,772 | $ | 114,613 | $ | 115,387 | $ | 114,742 | $ | (1,838 | ) | $ | (808 | ) | ||||||||||||
|
|
|
|
|
|
|
|
|
|
|
|
|
|
|
|
|
|
|
|
|
|
||||||||
Note: Numbers may not foot due to rounding
| 9 |
| ALLY FINANCIAL INC. AUTOMOTIVE FINANCE - KEY STATISTICS |
|
| QUARTERLY TRENDS | CHANGE VS. | |||||||||||||||||||||||||||
| 3Q 24 | 2Q 24 | 1Q 24 | 4Q 23 | 3Q 23 | 2Q 24 | 3Q 23 | ||||||||||||||||||||||
| U.S. Consumer Originations (1) ($ in billions) |
||||||||||||||||||||||||||||
| Retail standard - new vehicle GM |
$ | 0.9 | $ | 1.1 | $ | 1.0 | $ | 1.1 | $ | 1.1 | $ | (0.2 | ) | $ | (0.2 | ) | ||||||||||||
| Retail standard - new vehicle Stellantis |
0.6 | 0.7 | 0.6 | 0.7 | 0.7 | (0.1 | ) | (0.1 | ) | |||||||||||||||||||
| Retail standard - new vehicle Other |
1.0 | 1.0 | 0.9 | 1.0 | 1.1 | 0.0 | (0.1 | ) | ||||||||||||||||||||
| Used vehicle |
5.9 | 6.1 | 6.6 | 6.2 | 6.9 | (0.2 | ) | (1.0 | ) | |||||||||||||||||||
| Lease |
1.0 | 0.9 | 0.7 | 0.6 | 0.7 | 0.1 | 0.3 | |||||||||||||||||||||
|
|
|
|
|
|
|
|
|
|
|
|
|
|
|
|
|
|
|
|
|
|
||||||||
| Total originations |
$ | 9.4 | $ | 9.8 | $ | 9.8 | $ | 9.6 | $ | 10.6 | $ | (0.4 | ) | $ | (1.2 | ) | ||||||||||||
| U.S. Consumer Originations - FICO Score |
||||||||||||||||||||||||||||
| Super prime (760-999) |
$ | 2.6 | $ | 2.7 | $ | 2.4 | $ | 2.4 | $ | 2.5 | $ | (0.1 | ) | $ | 0.1 | |||||||||||||
| High prime (720-759) |
1.4 | 1.4 | 1.4 | 1.4 | 1.5 | - | (0.1 | ) | ||||||||||||||||||||
| Prime (660-719) |
2.6 | 2.8 | 2.8 | 2.7 | 3.1 | (0.2 | ) | (0.5 | ) | |||||||||||||||||||
| Prime/Near (620-659) |
1.5 | 1.6 | 1.7 | 1.5 | 1.8 | (0.1 | ) | (0.3 | ) | |||||||||||||||||||
| Non-Prime (540-619) |
0.6 | 0.6 | 0.7 | 0.6 | 0.7 | - | (0.1 | ) | ||||||||||||||||||||
| Sub-Prime (0-539) |
0.1 | 0.1 | 0.2 | 0.2 | 0.2 | 0.0 | (0.1 | ) | ||||||||||||||||||||
| No FICO (Primarily CSG) |
0.5 | 0.6 | 0.7 | 0.8 | 0.8 | (0.1 | ) | (0.3 | ) | |||||||||||||||||||
|
|
|
|
|
|
|
|
|
|
|
|
|
|
|
|
|
|
|
|
|
|
||||||||
| Total originations |
$ | 9.4 | $ | 9.8 | $ | 9.8 | $ | 9.6 | $ | 10.6 | $ | (0.4 | ) | $ | (1.2 | ) | ||||||||||||
| U.S. Consumer Retail Originations - Average FICO |
||||||||||||||||||||||||||||
| New vehicle |
716 | 714 | 712 | 718 | 712 | 2 | 4 | |||||||||||||||||||||
| Used vehicle |
707 | 710 | 702 | 703 | 701 | (3 | ) | 6 | ||||||||||||||||||||
| Total retail originations |
710 | 712 | 704 | 707 | 704 | (2 | ) | 6 | ||||||||||||||||||||
| U.S. Market |
||||||||||||||||||||||||||||
| New light vehicle sales (SAAR - units in millions) |
15.6 | 15.7 | 15.5 | 15.6 | 15.6 | (0.1 | ) | - | ||||||||||||||||||||
| New light vehicle sales (quarterly - units in millions) |
3.9 | 4.1 | 3.7 | 3.9 | 4.0 | (0.2 | ) | (0.1 | ) | |||||||||||||||||||
| Dealer Engagement |
||||||||||||||||||||||||||||
| Total Active DFS Dealers (2) |
21,656 | 21,825 | 21,787 | 21,829 | 22,323 | (169 | ) | (667 | ) | |||||||||||||||||||
| Total Application Volume (000s) |
3,630 | 3,733 | 3,764 | 3,322 | 3,674 | (103 | ) | (44 | ) | |||||||||||||||||||
| Ally U.S. Commercial Outstandings EOP ($ in billions) |
||||||||||||||||||||||||||||
| Floorplan outstandings |
$ | 17.5 | $ | 18.7 | $ | 17.3 | $ | 17.0 | $ | 14.9 | $ | (1.2 | ) | $ | 2.6 | |||||||||||||
| Dealer loans and other |
6.3 | 6.6 | 6.4 | 6.3 | 6.1 | (0.2 | ) | 0.2 | ||||||||||||||||||||
|
|
|
|
|
|
|
|
|
|
|
|
|
|
|
|
|
|
|
|
|
|
||||||||
| Total Commercial outstandings |
$ | 23.8 | $ | 25.2 | $ | 23.8 | $ | 23.3 | $ | 21.1 | $ | (1.4 | ) | $ | 2.8 | |||||||||||||
| U.S. Off-Lease Remarketing |
||||||||||||||||||||||||||||
| Off-lease vehicles terminated - on-balance sheet (# in units) |
31,033 | 41,601 | 31,926 | 26,237 | 29,484 | (10,568 | ) | 1,549 | ||||||||||||||||||||
| Average gain per vehicle |
$ | 771 | $ | 1,420 | $ | 1,431 | $ | 1,422 | $ | 1,944 | $ | (649 | ) | $ | (1,173 | ) | ||||||||||||
| Total gain ($ in millions) |
$ | 24 | $ | 59 | $ | 46 | $ | 37 | $ | 57 | $ | (35 | ) | $ | (33 | ) | ||||||||||||
(1) Some standard rate loan originations contain manufacturer sponsored cash back rebate incentives. Some lease originations contain rate subvention. While Ally may jointly develop marketing programs for these originations, Ally does not have exclusive rights to such originations under operating agreements with manufacturers.
(2) A dealer is considered to have an active relationship with us if we provided automotive financing, remarketing, or insurance services during the three months ended September 30,2024.
Note: Numbers may not foot due to rounding
| 10 |
| ALLY FINANCIAL INC. INSURANCE - CONDENSED FINANCIAL STATEMENTS AND KEY STATISTICS |
|
| ($ in millions) | QUARTERLY TRENDS | CHANGE VS. | ||||||||||||||||||||||||||
| Income Statement (GAAP View) |
3Q 24 | 2Q 24 | 1Q 24 | 4Q 23 | 3Q 23 | 2Q 24 | 3Q 23 | |||||||||||||||||||||
| Net financing revenue |
||||||||||||||||||||||||||||
| Total interest and fees on finance receivables and loans(1) |
$ | 4 | $ | 4 | $ | 3 | $ | 3 | $ | 2 | $ | - | $ | 2 | ||||||||||||||
| Interest and dividends on investment securities |
31 | 32 | 31 | 34 | 32 | (1 | ) | (1 | ) | |||||||||||||||||||
| Interest bearing cash |
8 | 5 | 5 | 5 | 3 | 3 | 5 | |||||||||||||||||||||
|
|
|
|
|
|
|
|
|
|
|
|
|
|
|
|
|
|
|
|
|
|
||||||||
| Total financing revenue and other interest revenue |
43 | 41 | 39 | 42 | 37 | 2 | 6 | |||||||||||||||||||||
| Interest expense |
12 | 11 | 10 | 9 | 8 | 1 | 4 | |||||||||||||||||||||
|
|
|
|
|
|
|
|
|
|
|
|
|
|
|
|
|
|
|
|
|
|
||||||||
| Net financing revenue |
31 | 30 | 29 | 33 | 29 | 1 | 2 | |||||||||||||||||||||
| Other revenue |
||||||||||||||||||||||||||||
| Insurance premiums and service revenue earned |
359 | 341 | 345 | 335 | 320 | 18 | 39 | |||||||||||||||||||||
| Other gain / (loss) on investments, net |
75 | (6 | ) | 35 | 78 | (31 | ) | 81 | 106 | |||||||||||||||||||
| Other income, net of losses |
3 | 3 | 4 | 4 | 4 | - | (1 | ) | ||||||||||||||||||||
|
|
|
|
|
|
|
|
|
|
|
|
|
|
|
|
|
|
|
|
|
|
||||||||
| Total other revenue |
437 | 338 | 384 | 417 | 293 | 99 | 144 | |||||||||||||||||||||
|
|
|
|
|
|
|
|
|
|
|
|
|
|
|
|
|
|
|
|
|
|
||||||||
| Total net revenue |
468 | 368 | 413 | 450 | 322 | 100 | 146 | |||||||||||||||||||||
| Noninterest expense |
||||||||||||||||||||||||||||
| Compensation and benefits expense |
27 | 26 | 28 | 27 | 26 | 1 | 1 | |||||||||||||||||||||
| Insurance losses and loss adjustment expenses |
135 | 181 | 112 | 93 | 107 | (46 | ) | 28 | ||||||||||||||||||||
| Other operating expenses |
204 | 203 | 203 | 201 | 205 | 1 | (1 | ) | ||||||||||||||||||||
|
|
|
|
|
|
|
|
|
|
|
|
|
|
|
|
|
|
|
|
|
|
||||||||
| Total noninterest expense |
366 | 410 | 343 | 321 | 338 | (44 | ) | 28 | ||||||||||||||||||||
|
|
|
|
|
|
|
|
|
|
|
|
|
|
|
|
|
|
|
|
|
|
||||||||
| Pre-tax income (loss) |
$ | 102 | $ | (42 | ) | $ | 70 | $ | 129 | $ | (16 | ) | $ | 144 | $ | 118 | ||||||||||||
|
|
|
|
|
|
|
|
|
|
|
|
|
|
|
|
|
|
|
|
|
|
||||||||
| Memo: Income Statement (Managerial View) |
||||||||||||||||||||||||||||
| Insurance premiums and other income |
||||||||||||||||||||||||||||
| Insurance premiums and service revenue earned |
$ | 359 | $ | 341 | $ | 345 | $ | 335 | $ | 320 | $ | 18 | $ | 39 | ||||||||||||||
| Investment income and other (adjusted) (2) |
50 | 52 | 47 | 44 | 44 | (2 | ) | 5 | ||||||||||||||||||||
| Other income |
3 | 3 | 4 | 4 | 4 | - | (1 | ) | ||||||||||||||||||||
|
|
|
|
|
|
|
|
|
|
|
|
|
|
|
|
|
|
|
|
|
|
||||||||
| Total insurance premiums and other income |
412 | 396 | 396 | 383 | 368 | 16 | 43 | |||||||||||||||||||||
| Expense |
||||||||||||||||||||||||||||
| Insurance losses and loss adjustment expenses |
135 | 181 | 112 | 93 | 107 | (46 | ) | 28 | ||||||||||||||||||||
| Acquisition and underwriting expenses |
||||||||||||||||||||||||||||
| Compensation and benefit expense |
27 | 26 | 28 | 27 | 26 | 1 | 1 | |||||||||||||||||||||
| Insurance commission expense |
164 | 162 | 161 | 161 | 160 | 2 | 4 | |||||||||||||||||||||
| Other expense |
40 | 41 | 42 | 40 | 45 | (1 | ) | (5 | ) | |||||||||||||||||||
|
|
|
|
|
|
|
|
|
|
|
|
|
|
|
|
|
|
|
|
|
|
||||||||
| Total acquistion and underwriting expense |
231 | 229 | 231 | 228 | 231 | 2 | - | |||||||||||||||||||||
|
|
|
|
|
|
|
|
|
|
|
|
|
|
|
|
|
|
|
|
|
|
||||||||
| Total expense |
366 | 410 | 343 | 321 | 338 | (44 | ) | 28 | ||||||||||||||||||||
|
|
|
|
|
|
|
|
|
|
|
|
|
|
|
|
|
|
|
|
|
|
||||||||
| Core pre-tax (loss) / income (2) |
46 | (14 | ) | 53 | 62 | 30 | 60 | 15 | ||||||||||||||||||||
| Change in the fair value of equity securities (3) |
56 | (28 | ) | 17 | 67 | (46 | ) | 84 | 103 | |||||||||||||||||||
|
|
|
|
|
|
|
|
|
|
|
|
|
|
|
|
|
|
|
|
|
|
||||||||
| Income (loss) before income tax expense |
$ | 102 | $ | (42 | ) | $ | 70 | $ | 129 | $ | (16 | ) | $ | 144 | $ | 118 | ||||||||||||
|
|
|
|
|
|
|
|
|
|
|
|
|
|
|
|
|
|
|
|
|
|
||||||||
| Balance Sheet (Period-End) |
||||||||||||||||||||||||||||
| Cash and investment securities |
$ | 5,461 | $ | 5,285 | $ | 5,285 | $ | 5,333 | $ | 5,086 | $ | 176 | $ | 375 | ||||||||||||||
| Intercompany loans(1) |
826 | 727 | 719 | 619 | 547 | 99 | 279 | |||||||||||||||||||||
| Premiums receivable and other insurance assets |
2,829 | 2,824 | 2,768 | 2,767 | 2,791 | 5 | 38 | |||||||||||||||||||||
| Other assets |
339 | 338 | 328 | 362 | 312 | 1 | 27 | |||||||||||||||||||||
|
|
|
|
|
|
|
|
|
|
|
|
|
|
|
|
|
|
|
|
|
|
||||||||
| Total assets |
$ | 9,455 | $ | 9,174 | $ | 9,100 | $ | 9,081 | $ | 8,736 | $ | 281 | $ | 719 | ||||||||||||||
|
|
|
|
|
|
|
|
|
|
|
|
|
|
|
|
|
|
|
|
|
|
||||||||
| Key Statistics |
||||||||||||||||||||||||||||
| Total written premiums and revenue (4) |
$ | 384 | $ | 344 | $ | 354 | $ | 333 | $ | 335 | $ | 40 | $ | 49 | ||||||||||||||
| Loss ratio (5) |
37.1% | 52.5% | 32.2% | 27.6% | 33.0% | |||||||||||||||||||||||
| Underwriting expense ratio (6) |
63.9% | 66.2% | 66.4% | 67.2% | 71.3% | |||||||||||||||||||||||
|
|
|
|
|
|
|
|
|
|
|
|
|
|
|
|
||||||||||||||
| Combined ratio |
100.9% | 118.7% | 98.6% | 94.8% | 104.3% | |||||||||||||||||||||||
(1) Intercompany activity represents excess liquidity placed with corporate segment.
(2) Represents a non-GAAP financial measure. For more details refer to pages 25-27.
(3) For more details refer to pages 25-27.
(4) Written premiums are net of ceded premium for reinsurance.
(5) Loss ratio is calculated as Insurance losses and loss adjustment expenses divided by Insurance premiums and service revenue earned and Other Income, net of losses.
(6) Underwriting expense ratio is calculated as Compensation and benefits expense and Other operating expenses divided by Insurance premiums and service revenue earned and Other income, net of losses.
Note: Numbers may not foot due to rounding
| 11 |
| ALLY FINANCIAL INC. MORTGAGE FINANCE - CONDENSED FINANCIAL STATEMENTS |
|
($ in millions)
| QUARTERLY TRENDS | CHANGE VS. | |||||||||||||||||||||||||||
| Income Statement |
3Q 24 | 2Q 24 | 1Q 24 | 4Q 23 | 3Q 23 | 2Q 24 | 3Q 23 | |||||||||||||||||||||
| Net financing revenue |
||||||||||||||||||||||||||||
| Total financing revenue and other interest income |
$ | 141 | $ | 145 | $ | 146 | $ | 147 | $ | 149 | $ | (4 | ) | $ | (8 | ) | ||||||||||||
| Interest expense |
89 | 92 | 94 | 96 | 96 | (3 | ) | (7 | ) | |||||||||||||||||||
|
|
|
|
|
|
|
|
|
|
|
|
|
|
|
|
|
|
|
|
|
|
||||||||
| Net financing revenue |
52 | 53 | 52 | 51 | 53 | (1 | ) | (1 | ) | |||||||||||||||||||
| Gain on mortgage loans, net |
6 | 5 | 6 | 3 | 4 | 1 | 2 | |||||||||||||||||||||
| Total other revenue |
6 | 5 | 6 | 3 | 4 | 1 | 2 | |||||||||||||||||||||
|
|
|
|
|
|
|
|
|
|
|
|
|
|
|
|
|
|
|
|
|
|
||||||||
| Total net revenue |
58 | 58 | 58 | 54 | 57 | - | 1 | |||||||||||||||||||||
|
|
|
|
|
|
|
|
|
|
|
|
|
|
|
|
|
|
|
|
|
|
||||||||
| Provision for loan losses |
- | (1 | ) | - | - | (2 | ) | 1 | 2 | |||||||||||||||||||
| Noninterest expense |
||||||||||||||||||||||||||||
| Compensation and benefits expense |
4 | 5 | 5 | 4 | 5 | (1 | ) | (1 | ) | |||||||||||||||||||
| Other operating expense |
27 | 27 | 28 | 26 | 28 | - | (1 | ) | ||||||||||||||||||||
|
|
|
|
|
|
|
|
|
|
|
|
|
|
|
|
|
|
|
|
|
|
||||||||
| Total noninterest expense |
31 | 32 | 33 | 30 | 33 | (1 | ) | (2 | ) | |||||||||||||||||||
|
|
|
|
|
|
|
|
|
|
|
|
|
|
|
|
|
|
|
|
|
|
||||||||
| Pre-tax Income |
$ | 27 | $ | 27 | $ | 25 | $ | 24 | $ | 26 | $ | - | $ | 1 | ||||||||||||||
|
|
|
|
|
|
|
|
|
|
|
|
|
|
|
|
|
|
|
|
|
|
||||||||
| Balance Sheet (Period-End) |
||||||||||||||||||||||||||||
| Finance receivables and loans, net: |
||||||||||||||||||||||||||||
| Consumer loans |
$ | 17,309 | $ | 17,803 | $ | 18,227 | $ | 18,442 | $ | 18,657 | $ | (494 | ) | $ | (1,348 | ) | ||||||||||||
| Allowance for loan losses |
(17 | ) | (17 | ) | (18 | ) | (18 | ) | (19 | ) | - | 2 | ||||||||||||||||
|
|
|
|
|
|
|
|
|
|
|
|
|
|
|
|
|
|
|
|
|
|
||||||||
| Total finance receivables and loans, net |
17,292 | 17,786 | 18,209 | 18,424 | 18,638 | (494 | ) | (1,346 | ) | |||||||||||||||||||
| Loans held for sale, net |
238 | 157 | 27 | 25 | 29 | 81 | 209 | |||||||||||||||||||||
| Other assets |
64 | 67 | 67 | 63 | 78 | (3 | ) | (14 | ) | |||||||||||||||||||
|
|
|
|
|
|
|
|
|
|
|
|
|
|
|
|
|
|
|
|
|
|
||||||||
| Total assets |
$ | 17,594 | $ | 18,010 | $ | 18,303 | $ | 18,512 | $ | 18,745 | $ | (416 | ) | $ | (1,151 | ) | ||||||||||||
|
|
|
|
|
|
|
|
|
|
|
|
|
|
|
|
|
|
|
|
|
|
||||||||
Note: Numbers may not foot due to rounding
| 12 |
| ALLY FINANCIAL INC. CORPORATE FINANCE - CONDENSED FINANCIAL STATEMENTS |
|
($ in millions)
| QUARTERLY TRENDS | CHANGE VS. | |||||||||||||||||||||||||||
| Income Statement |
3Q 24 | 2Q 24 | 1Q 24 | 4Q 23 | 3Q 23 | 2Q 24 | 3Q 23 | |||||||||||||||||||||
| Net financing revenue |
||||||||||||||||||||||||||||
| Total financing revenue and other interest income |
$ | 248 | $ | 252 | $ | 269 | $ | 264 | $ | 248 | $ | (4 | ) | $ | - | |||||||||||||
| Interest expense |
147 | 148 | 158 | 159 | 151 | (1 | ) | (4 | ) | |||||||||||||||||||
|
|
|
|
|
|
|
|
|
|
|
|
|
|
|
|
|
|
|
|
|
|
||||||||
| Net financing revenue |
101 | 104 | 111 | 105 | 97 | (3 | ) | 4 | ||||||||||||||||||||
| Total other revenue |
37 | 30 | 23 | 23 | 24 | 7 | 13 | |||||||||||||||||||||
|
|
|
|
|
|
|
|
|
|
|
|
|
|
|
|
|
|
|
|
|
|
||||||||
| Total net revenue |
138 | 134 | 134 | 128 | 121 | 4 | 17 | |||||||||||||||||||||
| Provision for loan losses |
11 | 3 | (1 | ) | 17 | 5 | 8 | 6 | ||||||||||||||||||||
| Noninterest expense |
||||||||||||||||||||||||||||
| Compensation and benefits expense |
17 | 17 | 27 | 17 | 16 | - | 1 | |||||||||||||||||||||
| Other operating expense |
15 | 16 | 18 | 15 | 16 | (1 | ) | (1 | ) | |||||||||||||||||||
|
|
|
|
|
|
|
|
|
|
|
|
|
|
|
|
|
|
|
|
|
|
||||||||
| Total noninterest expense |
32 | 33 | 45 | 32 | 32 | (1 | ) | - | ||||||||||||||||||||
|
|
|
|
|
|
|
|
|
|
|
|
|
|
|
|
|
|
|
|
|
|
||||||||
| Pre-tax income |
$ | 95 | $ | 98 | $ | 90 | $ | 79 | $ | 84 | $ | (3 | ) | $ | 11 | |||||||||||||
|
|
|
|
|
|
|
|
|
|
|
|
|
|
|
|
|
|
|
|
|
|
||||||||
| Change in the fair value of equity securities (1) |
(1 | ) | (0 | ) | 0 | 0 | (0 | ) | (0 | ) | (0 | ) | ||||||||||||||||
|
|
|
|
|
|
|
|
|
|
|
|
|
|
|
|
|
|
|
|
|
|
||||||||
| Core pre-tax income (2) |
$ | 94 | $ | 98 | $ | 90 | $ | 79 | $ | 84 | $ | (3 | ) | $ | 11 | |||||||||||||
|
|
|
|
|
|
|
|
|
|
|
|
|
|
|
|
|
|
|
|
|
|
||||||||
| Balance Sheet (Period-End) |
||||||||||||||||||||||||||||
| Equity securities |
$ | 3 | $ | 2 | $ | 5 | $ | 6 | $ | 6 | $ | 1 | $ | (3 | ) | |||||||||||||
| Loans held for sale, net |
65 | 101 | 213 | 253 | 81 | (36 | ) | (16 | ) | |||||||||||||||||||
| Commercial loans |
10,300 | 9,737 | 10,144 | 10,905 | 10,637 | 563 | (337 | ) | ||||||||||||||||||||
| Allowance for loan losses |
(167 | ) | (156 | ) | (152 | ) | (153 | ) | (185 | ) | (11 | ) | 18 | |||||||||||||||
|
|
|
|
|
|
|
|
|
|
|
|
|
|
|
|
|
|
|
|
|
|
||||||||
| Total finance receivables and loans, net |
10,133 | 9,581 | 9,992 | 10,752 | 10,452 | 552 | (319 | ) | ||||||||||||||||||||
| Other assets |
197 | 185 | 200 | 201 | 210 | 12 | (13 | ) | ||||||||||||||||||||
|
|
|
|
|
|
|
|
|
|
|
|
|
|
|
|
|
|
|
|
|
|
||||||||
| Total assets |
$ | 10,398 | $ | 9,869 | $ | 10,410 | $ | 11,212 | $ | 10,749 | $ | 529 | $ | (351 | ) | |||||||||||||
|
|
|
|
|
|
|
|
|
|
|
|
|
|
|
|
|
|
|
|
|
|
||||||||
(1) For more details refer to pages 25-27.
(2) Represents a non-GAAP financial measure. For more details refer to pages 25-27.
Note: Numbers may not foot due to rounding
| 13 |
| ALLY FINANCIAL INC. CORPORATE AND OTHER - CONDENSED FINANCIAL STATEMENTS |
|
($ in millions)
| QUARTERLY TRENDS | CHANGE VS. | |||||||||||||||||||||||||||
| Income Statement |
3Q 24 | 2Q 24 | 1Q 24 | 4Q 23 | 3Q 23 | 2Q 24 | 3Q 23 | |||||||||||||||||||||
| Net financing revenue |
||||||||||||||||||||||||||||
| Total financing revenue and other interest income |
$ | 505 | $ | 494 | $ | 552 | $ | 605 | $ | 662 | $ | 11 | $ | (157 | ) | |||||||||||||
| Interest expense |
486 | 500 | 602 | 631 | 668 | (14 | ) | (182 | ) | |||||||||||||||||||
|
|
|
|
|
|
|
|
|
|
|
|
|
|
|
|
|
|
|
|
|
|
||||||||
| Net financing revenue |
19 | (6 | ) | (50 | ) | (26 | ) | (6 | ) | 25 | 25 | |||||||||||||||||
| Other revenue |
||||||||||||||||||||||||||||
| Other gain/(loss) on investments, net |
(2 | ) | (1 | ) | (6 | ) | 8 | (11 | ) | (1 | ) | 9 | ||||||||||||||||
| Other income, net of losses (1) |
52 | 40 | 26 | 41 | 46 | 12 | 6 | |||||||||||||||||||||
|
|
|
|
|
|
|
|
|
|
|
|
|
|
|
|
|
|
|
|
|
|
||||||||
| Total other revenue |
50 | 39 | 20 | 49 | 35 | 11 | 15 | |||||||||||||||||||||
|
|
|
|
|
|
|
|
|
|
|
|
|
|
|
|
|
|
|
|
|
|
||||||||
| Total net revenue |
69 | 33 | (30 | ) | 23 | 29 | 36 | 40 | ||||||||||||||||||||
| Provision for loan losses |
55 | 72 | 60 | 78 | 61 | (17 | ) | (6 | ) | |||||||||||||||||||
| Noninterest expense |
||||||||||||||||||||||||||||
| Compensation and benefits expense |
222 | 234 | 281 | 242 | 252 | (12 | ) | (30 | ) | |||||||||||||||||||
| Goodwill impairment |
- | - | - | 149 | - | - | - | |||||||||||||||||||||
| Other operating expense (2) |
(42 | ) | (40 | ) | (35 | ) | 16 | (41 | ) | (2 | ) | (1 | ) | |||||||||||||||
|
|
|
|
|
|
|
|
|
|
|
|
|
|
|
|
|
|
|
|
|
|
||||||||
| Total noninterest expense |
180 | 194 | 246 | 407 | 211 | (14 | ) | (31 | ) | |||||||||||||||||||
|
|
|
|
|
|
|
|
|
|
|
|
|
|
|
|
|
|
|
|
|
|
||||||||
| Pre-tax (loss) income |
$ | (166 | ) | $ | (233 | ) | $ | (336 | ) | $ | (462 | ) | $ | (243 | ) | $ | 67 | $ | 77 | |||||||||
|
|
|
|
|
|
|
|
|
|
|
|
|
|
|
|
|
|
|
|
|
|
||||||||
| Change in the fair value of equity securities (3) |
(2 | ) | 1 | 6 | (7 | ) | 10 | (3 | ) | (12 | ) | |||||||||||||||||
| Core OID (4) |
14 | 14 | 13 | 13 | 12 | 1 | 2 | |||||||||||||||||||||
| Repositioning (3) |
- | - | 10 | 172 | 30 | - | (30 | ) | ||||||||||||||||||||
|
|
|
|
|
|
|
|
|
|
|
|
|
|
|
|
|
|
|
|
|
|
||||||||
| Core pre-tax (loss) income (4) |
$ | (154 | ) | $ | (218 | ) | $ | (307 | ) | $ | (284 | ) | $ | (191 | ) | $ | 65 | $ | 38 | |||||||||
|
|
|
|
|
|
|
|
|
|
|
|
|
|
|
|
|
|
|
|
|
|
||||||||
| Balance Sheet (Period-End) |
$ | 32,375 | $ | 30,684 | $ | 31,990 | $ | 31,511 | $ | 31,955 | $ | 1,691 | $ | 420 | ||||||||||||||
| Cash, trading and investment securities |
||||||||||||||||||||||||||||
| Loans held-for-sale, net |
- | 52 | 113 | 109 | 158 | (52 | ) | (158 | ) | |||||||||||||||||||
| Consumer loans |
2,390 | 2,088 | 1,995 | 2,121 | 3,958 | 302 | (1,568 | ) | ||||||||||||||||||||
| Commercial loans |
252 | 241 | 242 | 223 | 223 | 11 | 29 | |||||||||||||||||||||
| Intercompany loans(5) |
(826 | ) | (727 | ) | (719 | ) | (619 | ) | (547 | ) | (99 | ) | (279 | ) | ||||||||||||||
| Allowance for loan losses |
(312 | ) | (307 | ) | (297 | ) | (299 | ) | (480 | ) | (5 | ) | 168 | |||||||||||||||
|
|
|
|
|
|
|
|
|
|
|
|
|
|
|
|
|
|
|
|
|
|
||||||||
| Total finance receivables and loans, net |
1,504 | 1,295 | 1,221 | 1,426 | 3,154 | 209 | (1,650 | ) | ||||||||||||||||||||
| Other assets |
7,721 | 7,675 | 7,127 | 7,179 | 7,465 | 46 | 256 | |||||||||||||||||||||
| Assets of operations held-for-sale (6) |
- | - | - | 1,975 | - | - | - | |||||||||||||||||||||
|
|
|
|
|
|
|
|
|
|
|
|
|
|
|
|
|
|
|
|
|
|
||||||||
| Total assets |
$ | 41,600 | $ | 39,706 | $ | 40,451 | $ | 42,200 | $ | 42,732 | $ | 1,894 | $ | (1,132 | ) | |||||||||||||
|
|
|
|
|
|
|
|
|
|
|
|
|
|
|
|
|
|
|
|
|
|
||||||||
| Core OID Amortization Schedule (4) |
2024 | 2025 | 2026 | 2027 | 2028 & After | |||||||||||||||||||||||
| Remaining Core OID amortization expense |
$ | 15 | $ | 66 | $ | 77 | $ | 89 | Avg = $126/yr | |||||||||||||||||||
(1) Includes the impact of centralized asset and liability management, corporate overhead allocation activities, the legacy mortgage portfolio, Ally Invest activity, and Ally Lending activity.
(2) Other operating expenses includes corporate overhead allocated to the other business segments. Amounts of corporate overhead allocated were $333 million for 3Q24, $335 million for 2Q24, $346 million for 1Q24, $342 million for 4Q23, and $348 million for 3Q23. The receiving business segment records the allocation of corporate overhead expense within other operating expenses.
(3) For more details refer to pages 25-27.
(4) Represents a non-GAAP financial measure. For more details refer to pages 25-27.
(5) Intercompany loans related to activity between Insurance and Corporate and Other for liquidity purposes.
(6) Unsecured lending from point-of-sale financing. Moved to Assets of Operations Held-For-Sale (HFS) on 12/31/23. Sale of Ally Lending closed on 03/01/24.
Note: Numbers may not foot due to rounding
| 14 |
| ALLY FINANCIAL INC. CREDIT RELATED INFORMATION |
|
($ in millions)
| QUARTERLY TRENDS | CHANGE VS. | |||||||||||||||||||||||||||
| Asset Quality - Consolidated (1) |
3Q 24 | 2Q 24 | 1Q 24 | 4Q 23 | 3Q 23 | 2Q 24 | 3Q 23 | |||||||||||||||||||||
| Ending loan balance |
$ | 137,501 | $ | 138,783 | $ | 137,960 | $ | 139,439 | $ | 140,260 | $ | (1,282) | $ | (2,759) | ||||||||||||||
| 30+ Accruing DPD |
$ | 3,871 | $ | 3,737 | $ | 3,347 | $ | 3,856 | $ | 3,459 | $ | 134 | $ | 412 | ||||||||||||||
| 30+ Accruing DPD % |
2.82% | 2.69% | 2.43% | 2.76% | 2.47% | |||||||||||||||||||||||
| 60+ Accruing DPD |
$ | 1,165 | $ | 1,087 | $ | 948 | $ | 1,077 | $ | 934 | $ | 78 | $ | 231 | ||||||||||||||
| 60+ Accruing DPD % |
0.85% | 0.78% | 0.69% | 0.77% | 0.67% | |||||||||||||||||||||||
| Non-performing loans (NPLs) |
$ | 1,266 | $ | 1,215 | $ | 1,252 | $ | 1,394 | $ | 1,500 | $ | 51 | $ | (234) | ||||||||||||||
| Net charge-offs (NCOs) |
$ | 517 | $ | 435 | $ | 539 | $ | 623 | $ | 456 | $ | 82 | $ | 61 | ||||||||||||||
| Net charge-off rate (2) |
1.50% | 1.26% | 1.55% | 1.77% | 1.31% | |||||||||||||||||||||||
| Provision for loan losses |
$ | 645 | $ | 457 | $ | 507 | $ | 587 | $ | 508 | $ | 188 | $ | 137 | ||||||||||||||
| Allowance for loan losses (ALLL) |
$ | 3,700 | $ | 3,572 | $ | 3,550 | $ | 3,587 | $ | 3,837 | $ | 128 | $ | (137) | ||||||||||||||
| ALLL as % of Loans (3) (4) |
2.69% | 2.57% | 2.57% | 2.57% | 2.73% | |||||||||||||||||||||||
| ALLL as % of NPLs (3) |
292% | 294% | 284% | 257% | 256% | |||||||||||||||||||||||
| ALLL as % of NCOs (3) |
179% | 205% | 165% | 144% | 211% | |||||||||||||||||||||||
| U.S. Auto Delinquencies - HFI Retail Contract $‘s (5) |
||||||||||||||||||||||||||||
| 30+ Delinquent contract $ |
$ | 3,760 | $ | 3,620 | $ | 3,239 | $ | 3,730 | $ | 3,290 | $ | 140 | $ | 470 | ||||||||||||||
| % of retail contract $ outstanding |
4.51% | 4.33% | 3.88% | 4.42% | 3.85% | |||||||||||||||||||||||
| 60+ Delinquent contract $ |
$ | 1,129 | $ | 1,049 | $ | 915 | $ | 1,037 | $ | 878 | $ | 80 | $ | 251 | ||||||||||||||
| % of retail contract $ outstanding |
1.35% | 1.26% | 1.10% | 1.23% | 1.03% | |||||||||||||||||||||||
| U.S. Auto Annualized Net Charge-Offs - HFI Retail Contract $‘s |
||||||||||||||||||||||||||||
| Net charge-offs |
$ | 467 | $ | 378 | $ | 477 | $ | 470 | $ | 393 | $ | 89 | $ | 74 | ||||||||||||||
| % of avg. HFI assets (2) |
2.24% | 1.81% | 2.27% | 2.21% | 1.85% | |||||||||||||||||||||||
| U.S. Auto Annualized Net Charge-Offs - HFI Commercial Contract $‘s |
||||||||||||||||||||||||||||
| Net charge-offs |
$ | 0 | $ | (4) | $ | 1 | $ | 19 | $ | (0) | $ | 4 | $ | 0 | ||||||||||||||
| % of avg. HFI assets (2) |
(0.01)% | (0.07)% | 0.02% | 0.34% | -% | |||||||||||||||||||||||
(1) Loans within this table are classified as held-for-investment recorded at amortized cost as these loans are included in our allowance for loan losses.
(2) Net charge-off ratios are calculated as annualized net charge-offs divided by average outstanding finance recievables and loans excluding loans measured at fair value, conditional repurchase loans and loans held-for-sale during the year for each loan category.
(3) Excludes provision for credit losses related to our reserve for unfunded commitments.
(4) ALLL coverage ratios are based on the allowance for loan losses related to loans held-for-investment excluding those loans held at fair value as a percentage of the unpaid principal balance, net of premiums and discounts.
(5) Auto delinquency metrics include accruing contracts only.
Note: Numbers may not foot due to rounding
| 15 |
| ALLY FINANCIAL INC. CREDIT RELATED INFORMATION, CONTINUED |
|
($ in millions)
| Automotive Finance (1) |
QUARTERLY TRENDS | CHANGE VS. | ||||||||||||||||||||||||||
| Consumer | 3Q 24 | 2Q 24 | 1Q 24 | 4Q 23 | 3Q 23 | 2Q 24 | 3Q 23 | |||||||||||||||||||||
| Allowance for loan losses |
$ | 3,166 | $ | 3,055 | $ | 3,050 | $ | 3,083 | $ | 3,104 | $ | 111 | $ | 62 | ||||||||||||||
| Total consumer loans (2) |
$ | 83,424 | $ | 83,528 | $ | 83,406 | $ | 84,320 | $ | 85,370 | $ | (104) | $ | (1,946) | ||||||||||||||
| Coverage ratio (3) |
3.80% | 3.65% | 3.65% | 3.65% | 3.62% | |||||||||||||||||||||||
| Commercial |
||||||||||||||||||||||||||||
| Allowance for loan losses |
$ | 38 | $ | 37 | $ | 33 | $ | 34 | $ | 49 | $ | 1 | $ | (11) | ||||||||||||||
| Total commercial loans (4) |
$ | 23,854 | $ | 25,220 | $ | 23,765 | $ | 23,334 | $ | 21,057 | $ | (1,366) | $ | 2,797 | ||||||||||||||
| Coverage ratio |
0.16% | 0.15% | 0.14% | 0.15% | 0.23% | |||||||||||||||||||||||
| Mortgage (1) |
||||||||||||||||||||||||||||
| Consumer |
||||||||||||||||||||||||||||
| Mortgage Finance |
||||||||||||||||||||||||||||
| Allowance for loan losses |
$ | 17 | $ | 17 | $ | 18 | $ | 18 | $ | 19 | $ | - | $ | (2) | ||||||||||||||
| Total consumer loans |
$ | 17,309 | $ | 17,803 | $ | 18,227 | $ | 18,442 | $ | 18,657 | $ | (494) | $ | (1,348) | ||||||||||||||
| Coverage ratio |
0.10% | 0.09% | 0.10% | 0.10% | 0.10% | |||||||||||||||||||||||
| Mortgage - Legacy |
||||||||||||||||||||||||||||
| Allowance for loan losses |
$ | 2 | $ | 2 | $ | 3 | $ | 3 | $ | 3 | $ | - | $ | (1) | ||||||||||||||
| Total consumer loans |
$ | 192 | $ | 205 | $ | 214 | $ | 225 | $ | 238 | $ | (13) | $ | (46) | ||||||||||||||
| Coverage ratio |
1.14% | 1.15% | 1.26% | 1.32% | 1.29% | |||||||||||||||||||||||
| Total Mortgage |
||||||||||||||||||||||||||||
| Allowance for loan losses |
$ | 19 | $ | 19 | $ | 21 | $ | 21 | $ | 22 | $ | - | $ | (3) | ||||||||||||||
| Total consumer loans |
$ | 17,501 | $ | 18,008 | $ | 18,441 | $ | 18,667 | $ | 18,895 | $ | (507) | $ | (1,394) | ||||||||||||||
| Coverage ratio |
0.11% | 0.11% | 0.11% | 0.11% | 0.11% | |||||||||||||||||||||||
| Consumer Other - Ally Lending (1) (5) |
||||||||||||||||||||||||||||
| Allowance for loan losses |
$ | - | $ | - | $ | - | $ | - | $ | 202 | $ | - | $ | (202) | ||||||||||||||
| Total consumer loans |
$ | - | $ | - | $ | - | $ | - | $ | 2,206 | $ | - | $ | (2,206) | ||||||||||||||
| Coverage ratio |
-% | -% | -% | -% | 9.16% | |||||||||||||||||||||||
| Consumer Other - Ally Credit Card (1) |
||||||||||||||||||||||||||||
| Allowance for loan losses |
$ | 307 | $ | 302 | $ | 291 | $ | 293 | 272 | $ | 5 | $ | 35 | |||||||||||||||
| Total consumer loans |
$ | 2,170 | $ | 2,049 | $ | 1,962 | $ | 1,990 | 1,872 | $ | 121 | $ | 298 | |||||||||||||||
| Coverage ratio |
14.14% | 14.73% | 14.85% | 14.72% | 14.55% | |||||||||||||||||||||||
| Corporate Finance (1) |
||||||||||||||||||||||||||||
| Allowance for loan losses |
$ | 167 | $ | 156 | $ | 152 | $ | 153 | $ | 185 | $ | 11 | $ | (18) | ||||||||||||||
| Total commercial loans |
$ | 10,300 | $ | 9,737 | $ | 10,144 | $ | 10,905 | $ | 10,636 | $ | 563 | $ | (336) | ||||||||||||||
| Coverage ratio |
1.62% | 1.60% | 1.50% | 1.40% | 1.74 % | |||||||||||||||||||||||
| Corporate and Other (1) |
||||||||||||||||||||||||||||
| Allowance for loan losses |
$ | 3 | $ | 3 | $ | 3 | $ | 3 | $ | 3 | $ | - | $ | - | ||||||||||||||
| Total commercial loans |
$ | 252 | $ | 241 | $ | 242 | $ | 223 | $ | 224 | $ | 11 | $ | 28 | ||||||||||||||
| Coverage ratio |
1.36% | 1.36% | 1.36% | 1.36% | 1.36% | |||||||||||||||||||||||
(1) ALLL coverage ratios are based on the domestic allowance as a percentage of finance receivables and loans reported at their gross carrying value, which includes the principal amount outstanding, net of unearned income, unamortized deferred fees reduced by costs on originated loans, unamortized premiums and discounts on purchased loans, unamortized basis adjustments arising from the designation of finance receivables and loans as the hedged item in qualifying fair value hedge relationships, and cumulative principal charge-offs. Excludes loans held at fair value.
(2) Includes $28M of fair value adjustment for loans in hedge accounting relationships in 3Q24, ($166M) in 2Q24, ($181M) in 1Q24, ($93M) in 4Q23 and ($358M) in 3Q23.
(3) Excludes $28M of fair value adjustment for loans in hedge accounting relationships in 3Q24, ($166M) in 2Q24, ($181M) in 1Q24, ($93M) in 4Q23 and ($358M) in 3Q23.
(4) Commercial Auto loans include Insurance advances.
(5) Unsecured consumer lending from point-of-sale financing.
Note: Numbers may not foot due to rounding
| 16 |
| ALLY FINANCIAL INC. CAPITAL |
|
($ in billions)
| QUARTERLY TRENDS | CHANGE VS. | |||||||||||||||||||||||||||
| Capital |
3Q 24 | 2Q 24 | 1Q 24 | 4Q 23 | 3Q 23 | 2Q 24 | 3Q 23 | |||||||||||||||||||||
| Risk-weighted assets |
$ | 156.2 | $ | 157.5 | $ | 158.3 | $ | 161.6 | $ | 161.1 | $ | (1.3 | ) | $ | (4.9 | ) | ||||||||||||
| Common Equity Tier 1 (CET1) capital ratio |
9.8% | 9.6% | 9.4% | 9.4% | 9.3% | |||||||||||||||||||||||
| Tier 1 capital ratio |
11.2% | 11.0% | 10.8% | 10.8% | 10.7% | |||||||||||||||||||||||
| Total capital ratio |
12.9% | 12.7% | 12.5% | 12.4% | 12.5% | |||||||||||||||||||||||
| Tangible common equity / Tangible assets (1)(2) |
6.1% | 5.6% | 5.5% | 5.5% | 4.9% | |||||||||||||||||||||||
| Tangible common equity / Risk-weighted assets (1) |
7.5% | 6.9% | 6.7% | 6.6% | 6.0% | |||||||||||||||||||||||
| Shareholders’ equity |
$ | 14.7 | $ | 13.9 | $ | 13.7 | $ | 13.8 | $ | 12.8 | $ | 0.8 | $ | 1.9 | ||||||||||||||
| add: CECL phase-in adjustment |
0.3 | 0.3 | 0.3 | 0.6 | 0.6 | - | (0.3 | ) | ||||||||||||||||||||
| less: Certain AOCI items and other adjustments |
2.6 | 3.3 | 3.3 | 3.1 | 3.9 | (0.7 | ) | (1.3 | ) | |||||||||||||||||||
| Preferred equity |
(2.3 | ) | (2.3 | ) | (2.3 | ) | (2.3 | ) | (2.3 | ) | - | - | ||||||||||||||||
|
|
|
|
|
|
|
|
|
|
|
|
|
|
|
|
|
|
|
|
|
|
||||||||
| Common Equity Tier 1 capital |
$ | 15.3 | $ | 15.1 | $ | 14.9 | $ | 15.1 | $ | 15.0 | $ | 0.2 | $ | 0.3 | ||||||||||||||
|
|
|
|
|
|
|
|
|
|
|
|
|
|
|
|
|
|
|
|
|
|
||||||||
| Common Equity Tier 1 capital |
$ | 15.3 | $ | 15.1 | $ | 14.9 | $ | 15.1 | $ | 15.0 | $ | 0.2 | $ | 0.3 | ||||||||||||||
| add: Preferred equity |
2.3 | 2.3 | 2.3 | 2.3 | 2.3 | - | - | |||||||||||||||||||||
| less: Other adjustments |
(0.1 | ) | (0.1 | ) | (0.1 | ) | (0.1 | ) | (0.1 | ) | - | - | ||||||||||||||||
|
|
|
|
|
|
|
|
|
|
|
|
|
|
|
|
|
|
|
|
|
|
||||||||
| Tier 1 capital |
$ | 17.6 | $ | 17.4 | $ | 17.2 | $ | 17.4 | $ | 17.3 | $ | 0.2 | $ | 0.3 | ||||||||||||||
|
|
|
|
|
|
|
|
|
|
|
|
|
|
|
|
|
|
|
|
|
|
||||||||
| Tier 1 capital |
$ | 17.6 | $ | 17.4 | $ | 17.2 | $ | 17.4 | $ | 17.3 | $ | 0.2 | $ | 0.3 | ||||||||||||||
| add: Qualifying subordinated debt |
0.7 | 0.7 | 0.7 | 0.7 | 0.9 | - | (0.2 | ) | ||||||||||||||||||||
| Allowance for loan and lease losses includible in Tier 2 capital and other adjustments |
1.9 | 1.9 | 1.9 | 2.0 | 2.0 | - | (0.1 | ) | ||||||||||||||||||||
|
|
|
|
|
|
|
|
|
|
|
|
|
|
|
|
|
|
|
|
|
|
||||||||
| Total capital |
$ | 20.2 | $ | 20.0 | $ | 19.8 | $ | 20.1 | $ | 20.1 | $ | 0.2 | $ | 0.1 | ||||||||||||||
|
|
|
|
|
|
|
|
|
|
|
|
|
|
|
|
|
|
|
|
|
|
||||||||
| Total shareholders’ equity |
$ | 14.7 | $ | 13.9 | $ | 13.7 | $ | 13.8 | $ | 12.8 | $ | 0.8 | $ | 1.9 | ||||||||||||||
| less: Preferred equity |
(2.3 | ) | (2.3 | ) | (2.3 | ) | (2.3 | ) | (2.3 | ) | - | - | ||||||||||||||||
| Goodwill and intangible assets, net of deferred tax liabilities |
(0.7 | ) | (0.7 | ) | (0.7 | ) | (0.7 | ) | (0.9 | ) | - | 0.2 | ||||||||||||||||
|
|
|
|
|
|
|
|
|
|
|
|
|
|
|
|
|
|
|
|
|
|
||||||||
| Tangible common equity (1) |
$ | 11.7 | $ | 10.8 | $ | 10.6 | $ | 10.7 | $ | 9.6 | $ | 0.9 | $ | 2.1 | ||||||||||||||
|
|
|
|
|
|
|
|
|
|
|
|
|
|
|
|
|
|
|
|
|
|
||||||||
| Total assets |
$ | 193.0 | $ | 192.5 | $ | 192.9 | $ | 196.4 | $ | 195.7 | $ | 0.5 | $ | (2.7 | ) | |||||||||||||
| less: Goodwill and intangible assets, net of deferred tax liabilities |
(0.7 | ) | (0.7 | ) | (0.7 | ) | (0.7 | ) | (0.9 | ) | - | 0.2 | ||||||||||||||||
|
|
|
|
|
|
|
|
|
|
|
|
|
|
|
|
|
|
|
|
|
|
||||||||
| Tangible assets (2) |
$ | 192.3 | $ | 191.8 | $ | 192.2 | $ | 195.7 | $ | 194.8 | $ | 0.5 | $ | (2.5 | ) | |||||||||||||
|
|
|
|
|
|
|
|
|
|
|
|
|
|
|
|
|
|
|
|
|
|
||||||||
Note: Numbers may not foot due to rounding
(1) Represents a non-GAAP financial measure. For more details refer to pages 25-27.
(2) Ally defines tangible assets as total assets less goodwill and intangible assets, net of deferred tax liabilities.
For more details on the final rules to address the impact of CECL on regulatory capital by allowing BHCs and banks, including Ally, to delay and subsequently phase-in its impact, see page 26.
| 17 |
| ALLY FINANCIAL INC. LIQUIDITY AND DEPOSITS |
|
| QUARTERLY TRENDS | CHANGE VS. | |||||||||||||||||||||||||||
| Consolidated Available Liquidity ($ in billions) |
3Q 24 | 2Q 24 | 1Q 24 | 4Q 23 | 3Q 23 | 2Q 24 | 3Q 23 | |||||||||||||||||||||
| Liquid cash and cash equivalents (1) |
$ | 7.9 | $ | 6.7 | $ | 7.4 | $ | 6.5 | $ | 8.0 | $ | 1.2 | $ | (0.1) | ||||||||||||||
| Highly liquid securities (2) |
20.8 | 18.9 | 20.9 | 20.6 | 19.6 | 2.0 | 1.3 | |||||||||||||||||||||
|
|
|
|
|
|
|
|
|
|
|
|
|
|
|
|
|
|
|
|
|
|
||||||||
| Subtotal |
$ | 28.8 | $ | 25.6 | $ | 28.3 | $ | 27.1 | $ | 27.6 | $ | 3.2 | $ | 1.2 | ||||||||||||||
|
|
|
|
|
|
|
|
|
|
|
|
|
|
|
|
|
|
|
|
|
|
||||||||
| FHLB Unused Pledged Borrowing Capacity |
12.5 | 12.2 | 13.8 | 10.3 | 11.0 | 0.3 | 1.5 | |||||||||||||||||||||
| FRB Discount Window Unused Pledged Capacity |
26.7 | 26.5 | 26.3 | 26.0 | 25.6 | 0.2 | 1.1 | |||||||||||||||||||||
|
|
|
|
|
|
|
|
|
|
|
|
|
|
|
|
|
|
|
|
|
|
||||||||
| Total unused pledged capacity |
$ | 39.2 | $ | 38.8 | $ | 40.0 | $ | 36.4 | $ | 36.6 | $ | 0.4 | $ | 2.6 | ||||||||||||||
|
|
|
|
|
|
|
|
|
|
|
|
|
|
|
|
|
|
|
|
|
|
||||||||
| Total current available liquidity |
$ | 67.9 | $ | 64.3 | $ | 68.3 | $ | 63.5 | $ | 64.1 | $ | 3.6 | $ | 3.8 | ||||||||||||||
|
|
|
|
|
|
|
|
|
|
|
|
|
|
|
|
|
|
|
|
|
|
||||||||
| Unsecured Long-Term Debt Maturity Profile |
2024 | 2025 | 2026 | 2027 | 2028 | 2029 & After | ||||||||||||||||||||||
| Consolidated remaining maturities (3) |
$ | - | $ | 2.3 | $ | - | $ | 1.5 | $ | 0.8 | $ | 5.3 | ||||||||||||||||
| Ally Bank Deposits |
||||||||||||||||||||||||||||
| Key Deposit Statistics |
||||||||||||||||||||||||||||
| Average retail CD maturity (months) |
18.4 | 18.7 | 18.6 | 19.0 | 19.1 | (0.3 | ) | (0.7 | ) | |||||||||||||||||||
| Average retail deposit rate |
4.18% | 4.18% | 4.25% | 4.15% | 4.00% | |||||||||||||||||||||||
| End of Period Deposit Levels ($ in millions) |
||||||||||||||||||||||||||||
| Retail |
$ | 141,449 | $ | 142,075 | $ | 145,147 | $ | 142,265 | $ | 140,100 | $ | (626 | ) | $ | 1,349 | |||||||||||||
| Brokered & other |
10,501 | 10,079 | 9,937 | 12,401 | 12,735 | 422 | (2,234 | ) | ||||||||||||||||||||
|
|
|
|
|
|
|
|
|
|
|
|
|
|
|
|
|
|
|
|
|
|
||||||||
| Total deposits |
$ | 151,950 | $ | 152,154 | $ | 155,084 | $ | 154,666 | $ | 152,835 | $ | (204) | $ | (885 | ) | |||||||||||||
|
|
|
|
|
|
|
|
|
|
|
|
|
|
|
|
|
|
|
|
|
|
||||||||
| Deposit Mix |
||||||||||||||||||||||||||||
| Retail CD |
27% | 26% | 27% | 29% | 28% | |||||||||||||||||||||||
| MMA/OSA/Checking |
66% | 67% | 67% | 63% | 64% | |||||||||||||||||||||||
| Brokered & other |
7% | 7% | 6% | 8% | 8% | |||||||||||||||||||||||
(1) May include the restricted cash accumulation for retained notes maturing within the following 30 days and returned to Ally on the distribution date
(2) Includes unencumbered UST, Agency MBS, and highly liquid Corporates
(3) Excludes retail notes; as of 9/30/2024. Reflects notional value of outstanding bond. Excludes total GAAP OID and capitalized transaction costs.
Note: Numbers may not foot due to rounding
| 18 |
| ALLY FINANCIAL INC. NET INTEREST MARGIN |
|
($ in millions)
| QUARTERLY TRENDS | CHANGE VS. | |||||||||||||||||||||||||||
| Average Balance Details |
3Q 24 | 2Q 24 | 1Q 24 | 4Q 23 | 3Q 23 | 2Q 24 | 3Q 23 | |||||||||||||||||||||
| Retail Auto Loans |
$ | 83,574 | $ | 83,427 | $ | 84,056 | $ | 84,711 | $ | 85,131 | $ | 147 | $ | (1,557 | ) | |||||||||||||
| Auto Lease (net of dep) |
8,335 | 8,619 | 8,955 | 9,415 | 9,817 | (284 | ) | (1,482 | ) | |||||||||||||||||||
| Dealer Floorplan |
17,535 | 18,003 | 16,833 | 15,693 | 14,507 | (468 | ) | 3,028 | ||||||||||||||||||||
| Other Dealer Loans |
6,348 | 6,421 | 6,339 | 6,115 | 6,023 | (73 | ) | 325 | ||||||||||||||||||||
| Corporate Finance |
10,101 | 10,079 | 10,937 | 10,787 | 10,309 | 22 | (208 | ) | ||||||||||||||||||||
| Mortgage(1) |
17,922 | 18,302 | 18,578 | 18,788 | 19,028 | (380 | ) | (1,106 | ) | |||||||||||||||||||
| Consumer Other - Ally Lending (2) |
- | - | 1,274 | 2,167 | 2,201 | - | (2,201 | ) | ||||||||||||||||||||
| Consumer Other - Ally Credit Card |
2,125 | 2,001 | 1,975 | 1,925 | 1,826 | 124 | 299 | |||||||||||||||||||||
| Cash and Cash Equivalents |
7,867 | 7,276 | 7,709 | 7,571 | 8,308 | 591 | (441 | ) | ||||||||||||||||||||
| Investment Securities and Other |
29,982 | 29,542 | 30,274 | 29,784 | 30,769 | 440 | (787 | ) | ||||||||||||||||||||
|
|
|
|
|
|
|
|
|
|
|
|
|
|
|
|
|
|
|
|
|
|
||||||||
| Total Earning Assets |
$ | 183,789 | $ | 183,670 | $ | 186,930 | $ | 186,956 | $ | 187,920 | $ | 119 | $ | (4,131 | ) | |||||||||||||
| Interest Revenue |
3,373 | 3,361 | 3,378 | 3,401 | 3,383 | 12 | (10 | ) | ||||||||||||||||||||
| Unsecured Debt (ex. Core OID balance) (3) |
$ | 11,243 | $ | 11,053 | $ | 11,290 | $ | 10,595 | $ | 11,590 | $ | 190 | $ | (347 | ) | |||||||||||||
| Secured Debt |
1,364 | 1,227 | 1,409 | 2,279 | 3,120 | 137 | (1,756 | ) | ||||||||||||||||||||
| Deposits (4) |
152,241 | 152,412 | 155,352 | 153,672 | 153,526 | (171 | ) | (1,285 | ) | |||||||||||||||||||
| Other Borrowings |
5,743 | 7,114 | 7,122 | 8,572 | 7,365 | (1,371 | ) | (1,622 | ) | |||||||||||||||||||
|
|
|
|
|
|
|
|
|
|
|
|
|
|
|
|
|
|
|
|
|
|
||||||||
| Total Funding Sources (ex. Core OID balance) (3) |
$ | 170,591 | $ | 171,806 | $ | 175,173 | $ | 175,118 | $ | 175,601 | $ | (1,215) | $ | (5,010 | ) | |||||||||||||
| Interest Expense (ex. Core OID) (3) |
1,871 | 1,852 | 1,909 | 1,895 | 1,838 | 19 | 33 | |||||||||||||||||||||
| Net Financing Revenue (ex. Core OID) (3) |
$ | 1,502 | $ | 1,509 | $ | 1,469 | $ | 1,506 | $ | 1,545 | $ | (7 | ) | $ | (43 | ) | ||||||||||||
| Net Interest Margin (yield details) |
||||||||||||||||||||||||||||
| Retail Auto Loan |
9.29% | 9.19% | 9.07% | 8.98% | 8.90% | 0.10% | 0.39% | |||||||||||||||||||||
| Retail Auto Loan (excl. hedge impact) |
8.99% | 8.86% | 8.65% | 8.43% | 8.16% | 0.13% | 0.83% | |||||||||||||||||||||
| Auto Lease (net of dep) |
5.47% | 7.28% | 6.85% | 6.24% | 7.00% | (1.81)% | (1.53)% | |||||||||||||||||||||
| Dealer Floorplan |
7.68% | 7.64% | 7.69% | 7.84% | 7.88% | 0.04% | (0.20)% | |||||||||||||||||||||
| Other Dealer Loans |
5.65% | 5.67% | 5.61% | 5.35% | 5.25% | (0.02)% | 0.40% | |||||||||||||||||||||
| Corporate Finance |
9.82% | 10.06% | 9.88% | 9.70% | 9.54% | (0.24)% | 0.28% | |||||||||||||||||||||
| Mortgage |
3.21% | 3.26% | 3.25% | 3.21% | 3.20% | (0.05)% | 0.01% | |||||||||||||||||||||
| Consumer Other - Ally Lending |
- | - | 8.77% | 9.86% | 9.94% | - | (9.94)% | |||||||||||||||||||||
| Consumer Other - Ally Credit Card |
22.13% | 21.59% | 21.61% | 22.02% | 22.39% | 0.54% | (0.26)% | |||||||||||||||||||||
| Cash and Cash Equivalents (5) |
5.14% | 4.90% | 5.04% | 4.72% | 4.73% | 0.24% | 0.41% | |||||||||||||||||||||
| Investment Securities and Other |
3.51% | 3.66% | 3.60% | 3.66% | 3.53% | (0.15)% | (0.02)% | |||||||||||||||||||||
|
|
|
|
|
|
|
|
|
|
|
|
|
|
|
|
|
|
|
|
|
|
||||||||
| Total Earning Assets |
7.30% | 7.36% | 7.27% | 7.22% | 7.14% | (0.06)% | 0.16% | |||||||||||||||||||||
| Unsecured Debt (ex. Core OID & Core OID balance) (3) |
6.27% | 6.22% | 6.19% | 6.08% | 5.55% | 0.05% | 0.72% | |||||||||||||||||||||
| Secured Debt |
6.39% | 6.08% | 5.74% | 5.15% | 6.81% | 0.31% | (0.42)% | |||||||||||||||||||||
| Deposits (4) |
4.23% | 4.21% | 4.28% | 4.19% | 4.04% | 0.02% | 0.19% | |||||||||||||||||||||
| Other Borrowings (6) |
3.83% | 3.86% | 3.63% | 3.79% | 3.23% | (0.03)% | 0.60% | |||||||||||||||||||||
|
|
|
|
|
|
|
|
|
|
|
|
|
|
|
|
|
|
|
|
|
|
||||||||
| Total Funding Sources (ex. Core OID & Core OID balance) (3) |
4.36% | 4.34% | 4.38% | 4.29% | 4.15% | 0.02% | 0.21% | |||||||||||||||||||||
| NIM (as reported) |
3.22% | 3.27% | 3.13% | 3.17% | 3.24% | (0.05)% | (0.02)% | |||||||||||||||||||||
| NIM (ex. Core OID & Core OID balance) (3) |
3.25% | 3.30% | 3.16% | 3.20% | 3.26% | (0.05)% | (0.01)% | |||||||||||||||||||||
(1) Mortgage includes held-for-investment (HFI) loans from the Mortgage Finance segment and the HFI legacy mortgage portfolio in run-off at the Corporate and Other segment.
(2) Unsecured lending from point-of-sale financing. Sale of Ally Lending closed on 03/01/24.
(3) Represents a non-GAAP financial measure. Excludes Core OID from interest expense and Core OID balance from Unsecured Debt. For more details refer to pages 25-27.
(4) Includes retail, brokered, and other deposits. Other includes sweep deposits and other deposits.
(5) Includes interest expense related to margin received on derivative contracts. Excluding this expense, annualized yields were 5.29% and 5.28% for 3Q24 and 2Q24, respectively.
(6) Includes FHLB Borrowings, Repurchase Agreements and other.
Note: Numbers may not foot due to rounding
| 19 |
| ALLY FINANCIAL INC. ALLY BANK CONSUMER MORTGAGE HFI PORTFOLIOS (PERIOD-END) |
|
($ in billions)
| QUARTERLY TRENDS | ||||||||||||||||||||
| Mortgage Finance HFI Portfolio |
3Q 24 | 2Q 24 | 1Q 24 | 4Q 23 | 3Q 23 | |||||||||||||||
| Loan Value |
||||||||||||||||||||
| Gross carry value |
$ | 17.3 | $ | 17.8 | $ | 18.2 | $ | 18.4 | $ | 18.7 | ||||||||||
| Net carry value |
$ | 17.3 | $ | 17.8 | $ | 18.2 | $ | 18.4 | $ | 18.6 | ||||||||||
| Estimated Pool Characteristics |
||||||||||||||||||||
| % Second lien |
0.0% | 0.0% | 0.0% | 0.0% | 0.0% | |||||||||||||||
| % Interest only |
0.0% | 0.0% | 0.0% | 0.0% | 0.0% | |||||||||||||||
| % 30+ Day delinquent(1)(2) |
0.5% | 0.5% | 0.4% | 0.5% | 0.5% | |||||||||||||||
| % Low/No documentation |
0.0% | 0.0% | 0.0% | 0.0% | 0.0% | |||||||||||||||
| % Non-primary residence |
4.0% | 4.1% | 4.1% | 4.1% | 4.1% | |||||||||||||||
| Refreshed FICO(3) |
782 | 783 | 781 | 782 | 782 | |||||||||||||||
| Wtd. Avg. LTV/CLTV (4) |
48.7% | 50.3% | 50.7% | 52.2% | 53.1% | |||||||||||||||
| Corporate Other Legacy Mortgage HFI Portfolio |
||||||||||||||||||||
| Loan Value |
||||||||||||||||||||
| Gross carry value |
$ | 0.2 | $ | 0.2 | $ | 0.2 | $ | 0.2 | $ | 0.2 | ||||||||||
| Net carry value |
$ | 0.2 | $ | 0.2 | $ | 0.2 | $ | 0.2 | $ | 0.2 | ||||||||||
| Estimated Pool Characteristics |
||||||||||||||||||||
| % Second lien |
12.6% | 12.5% | 12.5% | 12.5% | 12.4% | |||||||||||||||
| % Interest only |
0.2% | 0.2% | 0.2% | 0.2% | 0.2% | |||||||||||||||
| % 30+ Day delinquent(1)(2) |
5.4% | 6.1% | 7.0% | 7.0% | 6.7% | |||||||||||||||
| % Low/No documentation |
26.0% | 26.0% | 25.8% | 25.5% | 25.2% | |||||||||||||||
| % Non-primary residence |
3.2% | 3.0% | 3.1% | 3.1% | 3.2% | |||||||||||||||
| Refreshed FICO(3) |
742 | 742 | 739 | 742 | 743 | |||||||||||||||
| Wtd. Avg. LTV/CLTV (4) |
44.0% | 44.6% | 45.0% | 46.9% | 47.3% | |||||||||||||||
1) MBA Delinquency buckets were used for First Lien products and OTS Delinquency buckets were used for all others.
2) %30+Day Delinquency bucket excludes loans which are current but are in bankruptcy.
3) Refreshed FICO includes the entire Bank HFI portfolio, inclusive of SBO. Previously, SBO loans had been excluded from our reporting.
4) 1st lien only. Updated home values derived using a combination of appraisals, BPOs, AVMs and MSA level house price indices.
Note: Numbers may not foot due to rounding
| 20 |
| ALLY FINANCIAL INC. EARNINGS PER SHARE RELATED INFORMATION |
|
($ in millions, shares in thousands)
| QUARTERLY TRENDS | CHANGE VS. | |||||||||||||||||||||||||||||||
| Earnings Per Share Data |
3Q 24 | 2Q 24 | 1Q 24 | 4Q 23 | 3Q 23 | 2Q 24 | 3Q 23 | |||||||||||||||||||||||||
| GAAP net income attributable to common shareholders |
$ | 330 | $ | 266 | $ | 129 | $ | 49 | $ | 269 | $ | 64 | $ | 61 | ||||||||||||||||||
| Weighted-average common shares outstanding - basic |
307,312 | 306,774 | 306,003 | 304,506 | 304,134 | 538 | 3,179 | |||||||||||||||||||||||||
| Weighted-average common shares outstanding - diluted |
311,044 | 309,886 | 308,421 | 306,730 | 305,693 | 1,158 | 5,350 | |||||||||||||||||||||||||
| Issued shares outstanding (period-end) |
304,715 | 304,656 | 303,978 | 302,459 | 301,630 | 59 | 3,085 | |||||||||||||||||||||||||
|
|
|
|
|
|
|
|
|
|
|
|
|
|
|
|
|
|
|
|
|
|
||||||||||||
| Net income per share - basic |
$ | 1.07 | $ | 0.87 | $ | 0.42 | $ | 0.16 | $ | 0.88 | $ | 0.21 | $ | 0.19 | ||||||||||||||||||
|
|
|
|
|
|
|
|
|
|
|
|
|
|
|
|
|
|
|
|
|
|
||||||||||||
| Net income per share - diluted |
$ | 1.06 | $ | 0.86 | $ | 0.42 | $ | 0.16 | $ | 0.88 | $ | 0.20 | $ | 0.18 | ||||||||||||||||||
|
|
|
|
|
|
|
|
|
|
|
|
|
|
|
|
|
|
|
|
|
|
||||||||||||
| Adjusted Earnings per Share (“Adjusted EPS”) (2) |
||||||||||||||||||||||||||||||||
| Numerator |
||||||||||||||||||||||||||||||||
| GAAP net income attributable to common shareholders |
$ | 330 | $ | 266 | $ | 129 | $ | 49 | $ | 269 | $ | 64 | $ | 61 | ||||||||||||||||||
| Discontinued operations, net of tax |
- | - | - | 1 | - | - | - | |||||||||||||||||||||||||
| Core OID (1) |
14 | 14 | 13 | 13 | 12 | 1 | 2 | |||||||||||||||||||||||||
| Change in the fair value of equity securities (3) |
(59 | ) | 28 | (11 | ) | (74 | ) | 56 | (87 | ) | (115 | ) | ||||||||||||||||||||
| Core OID, repositioning & change in the fair value of equity securities tax (tax rate 21%) |
9 | (9 | ) | (3 | ) | (23 | ) | (21 | ) | 18 | 30 | |||||||||||||||||||||
| Repositioning (3) |
- | - | 10 | 172 | 30 | - | (30 | ) | ||||||||||||||||||||||||
| Significant discrete tax items |
- | - | - | - | (94 | ) | - | 94 | ||||||||||||||||||||||||
|
|
|
|
|
|
|
|
|
|
|
|
|
|
|
|
|
|
|
|
|
|
||||||||||||
| Core net income attributable to common shareholders (1) |
$ | 295 | $ | 299 | $ | 139 | $ | 137 | $ | 252 | $ | (5 | ) | $ | 43 | |||||||||||||||||
| Denominator |
||||||||||||||||||||||||||||||||
| Weighted-average common shares outstanding - diluted |
311,044 | 309,886 | 308,421 | 306,730 | 305,693 | 1,158 | 5,350 | |||||||||||||||||||||||||
| Adjusted EPS (2) |
$ | 0.95 | $ | 0.97 | $ | 0.45 | $ | 0.45 | $ | 0.83 | $ | (0.02 | ) | $ | 0.12 | |||||||||||||||||
| GAAP original issue discount amortization expense |
$ | 17 | $ | 17 | $ | 17 | $ | 16 | $ | 15 | $ | 0 | $ | 2 | ||||||||||||||||||
| Other OID |
(3 | ) | (3 | ) | (3 | ) | (3 | ) | (3 | ) | 0 | (0 | ) | |||||||||||||||||||
|
|
|
|
|
|
|
|
|
|
|
|
|
|
|
|
|
|
|
|
|
|
||||||||||||
| Core original issue discount (Core OID) amortization expense (1) |
$ | 14 | $ | 14 | $ | 13 | $ | 13 | $ | 12 | $ | 1 | $ | 2 | ||||||||||||||||||
|
|
|
|
|
|
|
|
|
|
|
|
|
|
|
|
|
|
|
|
|
|
||||||||||||
| GAAP outstanding original issue discount balance |
$ | (780 | ) | $ | (797 | ) | $ | (815 | ) | $ | (831 | ) | $ | (847 | ) | $ | 16 | $ | 67 | |||||||||||||
| Other outstanding OID balance |
29 | 31 | 35 | 39 | 42 | (2 | ) | (13 | ) | |||||||||||||||||||||||
|
|
|
|
|
|
|
|
|
|
|
|
|
|
|
|
|
|
|
|
|
|
||||||||||||
| Core outstanding original issue discount balance (Core OID balance) (1) |
$ | (751 | ) | $ | (766 | ) | $ | (779 | ) | $ | (793 | ) | $ | (806 | ) | $ | 14 | $ | 54 | |||||||||||||
|
|
|
|
|
|
|
|
|
|
|
|
|
|
|
|
|
|
|
|
|
|
||||||||||||
| GAAP Net Financing Revenue |
[A | ] | $ | 1,488 | $ | 1,495 | $ | 1,456 | $ | 1,493 | $ | 1,533 | $ | (7 | ) | $ | (45 | ) | ||||||||||||||
| Core OID (1) |
14 | 14 | 13 | 13 | 12 | 1 | 2 | |||||||||||||||||||||||||
|
|
|
|
|
|
|
|
|
|
|
|
|
|
|
|
|
|
|
|
|
|
||||||||||||
| Net Financing Revenue (ex. Core OID) (1) |
[B | ] | $ | 1,502 | $ | 1,509 | $ | 1,469 | $ | 1,506 | $ | 1,545 | $ | (6 | ) | $ | (43 | ) | ||||||||||||||
|
|
|
|
|
|
|
|
|
|
|
|
|
|
|
|
|
|
|
|
|
|
||||||||||||
| GAAP Other Revenue |
[C | ] | $ | 615 | $ | 505 | $ | 530 | $ | 574 | $ | 435 | $ | 110 | $ | 180 | ||||||||||||||||
| Change in the fair value of equity securities (3) |
(59 | ) | 28 | (11 | ) | (74 | ) | 56 | (87 | ) | (115 | ) | ||||||||||||||||||||
|
|
|
|
|
|
|
|
|
|
|
|
|
|
|
|
|
|
|
|
|
|
||||||||||||
| Adjusted Other Revenue (1) |
[D | ] | $ | 556 | $ | 533 | $ | 519 | $ | 500 | $ | 491 | $ | 23 | $ | 65 | ||||||||||||||||
|
|
|
|
|
|
|
|
|
|
|
|
|
|
|
|
|
|
|
|
|
|
||||||||||||
| GAAP Provision Expense |
$ | 645 | $ | 457 | $ | 507 | $ | 587 | $ | 508 | $ | 188 | $ | 137 | ||||||||||||||||||
| Repositioning |
- | - | - | 16 | - | - | - | |||||||||||||||||||||||||
|
|
|
|
|
|
|
|
|
|
|
|
|
|
|
|
|
|
|
|
|
|
||||||||||||
| Adjusted Provision (ex. Repositioning) (1) |
$ | 645 | $ | 457 | $ | 507 | $ | 603 | $ | 508 | $ | 188 | $ | 137 | ||||||||||||||||||
|
|
|
|
|
|
|
|
|
|
|
|
|
|
|
|
|
|
|
|
|
|
||||||||||||
| GAAP Noninterest Expense |
[E | ] | $ | 1,225 | $ | 1,286 | $ | 1,308 | $ | 1,416 | $ | 1,232 | $ | (61 | ) | $ | (7 | ) | ||||||||||||||
| Repositioning and other |
- | - | (10 | ) | (187 | ) | (30 | ) | - | 30 | ||||||||||||||||||||||
|
|
|
|
|
|
|
|
|
|
|
|
|
|
|
|
|
|
|
|
|
|
||||||||||||
| Adjusted Noninterest Expense (1) |
[F | ] | $ | 1,225 | $ | 1,286 | $ | 1,298 | $ | 1,229 | $ | 1,202 | $ | (61 | ) | $ | 23 | |||||||||||||||
|
|
|
|
|
|
|
|
|
|
|
|
|
|
|
|
|
|
|
|
|
|
||||||||||||
(1) Represents a non-GAAP financial measure. For more details refer to pages 25-27.
(2) Adjusted earnings per share (Adjusted EPS) is a non-GAAP financial measure that adjusts GAAP EPS for revenue and expense items that are typically strategic in nature or that management otherwise does not view as reflecting the operating performance of the company. Management believes Adjusted EPS can help the reader better understand the operating performance of the core businesses and their ability to generate earnings. In the numerator of Adjusted EPS, GAAP net income attributable to common shareholders is adjusted for the following items: (1) excludes discontinued operations, net of tax, as Ally is primarily a domestic company and sales of international businesses and other discontinued operations in the past have significantly impacted GAAP EPS, (2) adds back the tax-effected non-cash Core OID, (3) adjusts for tax-effected repositioning and other which are primarily related to the extinguishment of high cost legacy debt, strategic activities and significant other one-time items, (4) change in fair value of equity securities, (5) excludes significant discrete tax items that do not relate to the operating performance of the core businesses, and adjusts for preferred stock capital actions that have been taken by the company to normalize its capital structure, as applicable for respective periods. See pages 25-27 for details.
(3) For more details refer to pages 25-27. Note: Numbers may not foot due to rounding
| 21 |
| ALLY FINANCIAL INC. ADJUSTED TANGIBLE BOOK PER SHARE RELATED INFORMATION |
|
($ in millions, shares in thousands)
| QUARTERLY TRENDS | CHANGE VS. | |||||||||||||||||||||||||||
| Adjusted Tangible Book Value Per Share (“Adjusted TBVPS”) Information |
3Q 24 | 2Q 24 | 1Q 24 | 4Q 23 | 3Q 23 | 2Q 24 | 3Q 23 | |||||||||||||||||||||
| Numerator |
||||||||||||||||||||||||||||
| GAAP shareholder’s equity |
$ | 14,725 | $ | 13,851 | $ | 13,657 | $ | 13,766 | $ | 12,825 | $ | 874 | $ | 1,900 | ||||||||||||||
| Preferred equity |
(2,324 | ) | (2,324 | ) | (2,324 | ) | (2,324 | ) | (2,324 | ) | - | - | ||||||||||||||||
|
|
|
|
|
|
|
|
|
|
|
|
|
|
|
|
|
|
|
|
|
|
||||||||
| GAAP common shareholder’s equity |
$ | 12,401 | $ | 11,527 | $ | 11,333 | $ | 11,442 | $ | 10,501 | $ | 874 | $ | 1,900 | ||||||||||||||
| Goodwill and identifiable intangibles, net of DTLs |
(707 | ) | (713 | ) | (720 | ) | (727 | ) | (879 | ) | 6 | 172 | ||||||||||||||||
|
|
|
|
|
|
|
|
|
|
|
|
|
|
|
|
|
|
|
|
|
|
||||||||
| Tangible common equity (1) |
11,694 | 10,814 | 10,613 | 10,715 | 9,622 | 880 | 2,072 | |||||||||||||||||||||
| Tax-effected Core OID balance (21% tax rate) (1) |
(594 | ) | (605 | ) | (616 | ) | (626 | ) | (636 | ) | 11 | 43 | ||||||||||||||||
|
|
|
|
|
|
|
|
|
|
|
|
|
|
|
|
|
|
|
|
|
|
||||||||
| Adjusted tangible book value (2) |
$ | 11,101 | $ | 10,209 | $ | 9,997 | $ | 10,089 | $ | 8,986 | $ | 892 | $ | 2,115 | ||||||||||||||
|
|
|
|
|
|
|
|
|
|
|
|
|
|
|
|
|
|
|
|
|
|
||||||||
| Denominator |
||||||||||||||||||||||||||||
| Issued shares outstanding (period-end, thousands) |
304,715 | 304,656 | 303,978 | 302,459 | 301,630 | 59 | 3,085 | |||||||||||||||||||||
| GAAP shareholder’s equity per share |
$ | 48.32 | $ | 45.46 | $ | 44.93 | $ | 45.51 | $ | 42.52 | $ | 2.86 | $ | 5.80 | ||||||||||||||
| Preferred equity per share |
(7.63 | ) | (7.63 | ) | (7.65 | ) | (7.68 | ) | (7.70 | ) | - | 0.08 | ||||||||||||||||
| GAAP common shareholder’s equity per share |
$ | 40.70 | $ | 37.84 | $ | 37.28 | $ | 37.83 | $ | 34.81 | $ | 2.86 | $ | 5.88 | ||||||||||||||
| Goodwill and identifiable intangibles, net of DTLs per share |
(2.32 | ) | (2.34 | ) | (2.37 | ) | (2.40 | ) | (2.91 | ) | 0.02 | 0.59 | ||||||||||||||||
|
|
|
|
|
|
|
|
|
|
|
|
|
|
|
|
|
|
|
|
|
|
||||||||
| Tangible common equity per share (1) |
38.38 | 35.50 | 34.91 | 35.43 | 31.90 | 2.88 | 6.48 | |||||||||||||||||||||
| Tax-effected Core OID balance (21% tax rate) per share (1) |
(1.95 | ) | (1.99 | ) | (2.03 | ) | (2.07 | ) | (2.11 | ) | 0.04 | 0.16 | ||||||||||||||||
|
|
|
|
|
|
|
|
|
|
|
|
|
|
|
|
|
|
|
|
|
|
||||||||
| Adjusted tangible book value per share (2) |
$ | 36.43 | $ | 33.51 | $ | 32.89 | $ | 33.36 | $ | 29.79 | $ | 2.92 | $ | 6.64 | ||||||||||||||
|
|
|
|
|
|
|
|
|
|
|
|
|
|
|
|
|
|
|
|
|
|
||||||||
(1) Represents a non-GAAP financial measure. For more details refer to pages 25-27.
(2) Adjusted tangible book value per share (Adjusted TBVPS) is a non-GAAP financial measure that reflects the book value of equity attributable to shareholders even if Core OID balance were accelerated immediately through the financial statements. As a result, management believes Adjusted TBVPS provides the reader with an assessment of value that is more conservative than GAAP common shareholder’s equity per share. Adjusted TBVPS generally adjusts common equity for (1) goodwill and identifiable intangibles, net of DTLs, and (2) tax-effected Core OID balance to reduce tangible common equity in the event the corresponding discounted bonds are redeemed/tendered and (3) Series G discount which reduces tangible common equity as the company has normalized its capital structure, as applicable for respective periods.
Note: Numbers may not foot due to rounding
| 22 |
| ALLY FINANCIAL INC. CORE ROTCE RELATED INFORMATION |
|
($ in millions) unless noted otherwise
| QUARTERLY TRENDS | CHANGE VS. | |||||||||||||||||||||||||||
| Core Return on Tangible Common Equity (“Core ROTCE”) |
3Q 24 | 2Q 24 | 1Q 24 | 4Q 23 | 3Q 23 | 2Q 24 | 3Q 23 | |||||||||||||||||||||
| Numerator |
||||||||||||||||||||||||||||
| GAAP net income attributable to common shareholders |
$ | 330 | $ | 266 | $ | 129 | $ | 49 | $ | 269 | $ | 64 | $ | 61 | ||||||||||||||
| Discontinued operations, net of tax |
- | - | - | 1 | - | - | - | |||||||||||||||||||||
| Core OID (2) |
14 | 14 | 13 | 13 | 12 | 1 | 2 | |||||||||||||||||||||
| Change in the fair value of equity securities (2) |
(59 | ) | 28 | (11 | ) | (74 | ) | 56 | (87 | ) | (115 | ) | ||||||||||||||||
| Core OID, repositioning & change in the fair value of equity securities tax (tax rate 21%) |
9 | (9 | ) | (3 | ) | (23 | ) | (21 | ) | 18 | 30 | |||||||||||||||||
| Repositioning (2) |
- | - | 10 | 172 | 30 | - | (30 | ) | ||||||||||||||||||||
| Significant discrete tax items |
- | - | - | - | (94 | ) | - | 94 | ||||||||||||||||||||
|
|
|
|
|
|
|
|
|
|
|
|
|
|
|
|
|
|
|
|
|
|
||||||||
| Core net income attributable to common shareholders (1) |
$ | 295 | $ | 299 | $ | 139 | $ | 137 | $ | 252 | $ | (5 | ) | $ | 43 | |||||||||||||
| Denominator (average, $ millions) |
||||||||||||||||||||||||||||
| GAAP shareholder’s equity |
$ | 14,288 | $ | 13,754 | $ | 13,712 | $ | 13,296 | $ | 13,179 | $ | 534 | $ | 1,110 | ||||||||||||||
| Preferred equity |
(2,324 | ) | (2,324 | ) | (2,324 | ) | (2,324 | ) | (2,324 | ) | - | - | ||||||||||||||||
| Goodwill & identifiable intangibles, net of deferred tax liabilities (“DTLs”) |
(710 | ) | (717 | ) | (723 | ) | (803 | ) | (883 | ) | 7 | 173 | ||||||||||||||||
|
|
|
|
|
|
|
|
|
|
|
|
|
|
|
|
|
|
|
|
|
|
||||||||
| Tangible common equity (1) |
$ | 11,254 | $ | 10,713 | $ | 10,664 | $ | 10,169 | $ | 9,972 | $ | 541 | $ | 1,282 | ||||||||||||||
| Core OID balance |
(759 | ) | (773 | ) | (786 | ) | (799 | ) | (812 | ) | 14 | 53 | ||||||||||||||||
| Net deferred tax asset (“DTA”) |
(1,463 | ) | (1,388 | ) | (1,278 | ) | (1,378 | ) | (1,310 | ) | (74 | ) | (153 | ) | ||||||||||||||
|
|
|
|
|
|
|
|
|
|
|
|
|
|
|
|
|
|
|
|
|
|
||||||||
| Normalized common equity |
$ | 9,033 | $ | 8,553 | $ | 8,600 | $ | 7,992 | $ | 7,850 | $ | 480 | $ | 1,183 | ||||||||||||||
| Core Return on Tangible Common Equity (3) |
13.1% | 14.0% | 6.5% | 6.9% | 12.9% | |||||||||||||||||||||||
(1) Represents a non-GAAP measure. See pages 25-27 for methodology and detail.
(2) For more details see pages 25-27.
(3) Core return on tangible common equity (Core ROTCE) is a non-GAAP financial measure that management believes is helpful for readers to better understand the ongoing ability of the company to generate returns on its equity base that supports core operations. For purposes of this calculation, tangible common equity is adjusted for Core OID balance and net DTA. Ally’s Core net income attributable to common shareholders for purposes of calculating Core ROTCE is based on the actual effective tax rate for the period adjusted for significant discrete tax items including tax reserve releases, which aligns with the methodology used in calculating adjusted earnings per share.
| (1) | In the numerator of Core ROTCE, GAAP net income attributable to common shareholders is adjusted for discontinued operations net of tax, tax-effected Core OID, tax-effected repositioning and other which are primarily related to the extinguishment of high-cost legacy debt, strategic activities and significant other one-time items, change in fair value of equity securities, significant discrete tax items, and preferred stock capital actions, as applicable for respective periods. |
| (2) | In the denominator, GAAP shareholder’s equity is adjusted for goodwill and identifiable intangibles net of DTL, Core OID balance, and net DTA. |
Note: Numbers may not foot due to rounding
| 23 |
| ALLY FINANCIAL INC. ADJUSTED EFFICIENCY RATIO RELATED INFORMATION |
|
($ in millions)
| QUARTERLY TREND | CHANGE VS. | |||||||||||||||||||||||||||
| Adjusted Efficiency Ratio Calculation |
3Q 24 | 2Q 24 | 1Q 24 | 4Q 23 | 3Q 23 | 2Q 24 | 3Q 23 | |||||||||||||||||||||
| Numerator |
||||||||||||||||||||||||||||
| GAAP Noninterest Expense |
$ | 1,225 | $ | 1,286 | $ | 1,308 | $ | 1,416 | $ | 1,232 | $ | (61 | ) | $ | (7 | ) | ||||||||||||
| Insurance expense |
(366 | ) | (410 | ) | (343 | ) | (321 | ) | (338 | ) | 44 | (28 | ) | |||||||||||||||
| Repositioning (2) |
- | - | (10 | ) | (187 | ) | (30 | ) | - | 30 | ||||||||||||||||||
|
|
|
|
|
|
|
|
|
|
|
|
|
|
|
|
|
|
|
|
|
|
||||||||
| Adjusted noninterest expense for the efficiency ratio |
$ | 859 | $ | 876 | $ | 955 | $ | 908 | $ | 864 | $ | (17 | ) | $ | (5 | ) | ||||||||||||
| Denominator |
||||||||||||||||||||||||||||
| Total net revenue |
$ | 2,103 | $ | 2,000 | $ | 1,986 | $ | 2,067 | $ | 1,968 | $ | 103 | $ | 135 | ||||||||||||||
| Core OID (2) |
14 | 14 | 13 | 13 | 12 | 1 | 2 | |||||||||||||||||||||
| Insurance revenue |
(468 | ) | (368 | ) | (413 | ) | (450 | ) | (322 | ) | (100 | ) | (146 | ) | ||||||||||||||
|
|
|
|
|
|
|
|
|
|
|
|
|
|
|
|
|
|
|
|
|
|
||||||||
| Adjusted net revenue for the efficiency ratio |
$ | 1,649 | $ | 1,646 | $ | 1,586 | $ | 1,630 | $ | 1,658 | $ | 4 | $ | (9 | ) | |||||||||||||
| Adjusted Efficiency Ratio (1) |
52.1% | 53.2% | 60.2% | 55.7% | 52.1% | |||||||||||||||||||||||
|
|
|
|
|
|
|
|
|
|
|
|
|
|
|
|
||||||||||||||
(1) Adjusted efficiency ratio is a non-GAAP financial measure that management believes is helpful to readers in comparing the efficiency of its core banking and lending businesses with those of its peers. In the numerator of Adjusted efficiency ratio, total noninterest expense is adjusted for Insurance segment expense, Rep and warrant expense, and repositioning and other which is primarily related to the extinguishment of high cost legacy debt, strategic activities and significant one-time items, as applicable for respective periods. In the denominator, total net revenue is adjusted for Insurance segment revenue and Core OID. See page 11 for the combined ratio for the Insurance segment which management uses as a primary measure of underwriting profitability for the Insurance business.
(2) For more details see pages 25-27.
Note: Numbers may not foot due to rounding
| 24 |
| ALLY FINANCIAL INC. |
|
The following are non-GAAP financial measures which Ally believes are important to the reader of the Consolidated Financial Statements, but which are supplemental to and not a substitute for GAAP measures: Accelerated issuance expense (Accelerated OID), Adjusted earnings per share (Adjusted EPS), Adjusted efficiency ratio, Adjusted noninterest expense, Adjusted other revenue, Adjusted tangible book value per share (Adjusted TBVPS), Adjusted total net revenue, Core net income attributable to common shareholders, Core original issue discount (Core OID) amortization expense, Core outstanding original issue discount balance (Core OID balance), Core pre-tax income, Core return on tangible common equity (Core ROTCE), Investment income and other (adjusted), Net financing revenue (excluding Core OID), Net interest margin (excluding Core OID), and Tangible Common Equity. These measures are used by management and we believe are useful to investors in assessing the company’s operating performance and capital.
1) Accelerated issuance expense (Accelerated OID) is the recognition of issuance expenses related to calls of redeemable debt.
2) Adjusted earnings per share (Adjusted EPS) is a non-GAAP financial measure that adjusts GAAP EPS for revenue and expense items that are typically strategic in nature or that management otherwise does not view as reflecting the operating performance of the company. Management believes Adjusted EPS can help the reader better understand the operating performance of the core businesses and their ability to generate earnings. In the numerator of Adjusted EPS, GAAP net income attributable to common shareholders is adjusted for the following items: (1) excludes discontinued operations, net of tax, as Ally is primarily a domestic company and sales of international businesses and other discontinued operations in the past have significantly impacted GAAP EPS, (2) adds back the tax-effected non-cash Core OID, (3) adjusts for tax-effected repositioning and other which are primarily related to the extinguishment of high cost legacy debt, strategic activities and significant other one-time items, (4) change in fair value of equity securities, (5) excludes significant discrete tax items that do not relate to the operating performance of the core businesses, and adjusts for preferred stock capital actions that have been taken by the company to normalize its capital structure, as applicable for respective periods.
3) Adjusted efficiency ratio is a non-GAAP financial measure that management believes is helpful to readers in comparing the efficiency of its core banking and lending businesses with those of its peers.
| (1) | In the numerator of Adjusted efficiency ratio, total noninterest expense is adjusted for Rep and warrant expense, Insurance segment expense, and repositioning and other which are primarily related to the extinguishment of high-cost legacy debt, strategic activities and significant other one-time items, as applicable for respective periods. |
| (2) | In the denominator, total net revenue is adjusted for Core OID and Insurance segment revenue. |
4) Adjusted noninterest expense is a non-GAAP financial measure that adjusts GAAP noninterest expense for repositioning items. Management believes adjusted noninterest expense is a helpful financial metric because it enables the reader better understand the business’ expenses excluding nonrecurring items.
5) Adjusted other revenue is a non-GAAP financial measure that adjusts GAAP other revenue for OID expenses, repositioning, and change in fair value of equity securities. Management believes adjusted other revenue is a helpful financial metric because it enables the reader to better understand the business’ ability to generate other revenue.
6) Adjusted Provision for Credit Losses is a non-GAAP financial measure that adjusts GAAP provision for credit losses for repositioning items. Management believes adjusted provision for credit losses is a helpful financial metric because it enables the reader better understand the business’s expenses excluding nonrecurring items.
7) Adjusted tangible book value per share (Adjusted TBVPS) is a non-GAAP financial measure that reflects the book value of equity attributable to shareholders even if Core OID balance were accelerated immediately through the financial statements. As a result, management believes Adjusted TBVPS provides the reader with an assessment of value that is more conservative than GAAP common shareholder’s equity per share. Adjusted TBVPS generally adjusts common equity for: (1) goodwill and identifiable intangibles, net of DTLs, (2) tax-effected Core OID balance to reduce tangible common equity in the event the corresponding discounted bonds are redeemed/tendered, and (3) Series G discount which reduces tangible common equity as the company has normalized its capital structure, as applicable for respective periods. Note: In December 2017, tax-effected Core OID balance was adjusted from a statutory U.S. Federal tax rate of 35% to 21% (“rate”) as a result of changes to U.S. tax law. The adjustment conservatively increased the tax-effected Core OID balance and consequently reduced Adjusted TBVPS as any acceleration of the non-cash charge in future periods would flow through the financial statements at a 21% rate versus a previously modeled 35% rate.
8) Adjusted total net revenue is a non-GAAP financial measure that management believes is helpful for readers to understand the ongoing ability of the company to generate revenue. For purposes of this calculation, GAAP net financing revenue is adjusted by excluding Core OID to calculate net financing revenue ex. core OID. GAAP other revenue is adjusted for OID expenses, repositioning, and change in fair value of equity securities to calculate adjusted other revenue. Adjusted total net revenue is calculated by adding net financing revenue ex. core OID to adjusted other revenue.
9) Change in fair value of equity securities impacts the Insurance, Corporate Finance and Corporate and Other segments. The change reflects fair value adjustments to equity securities that are reported at fair value. Management believes the change in fair value of equity securities should be removed from select financial measures because it enables the reader to better understand the business’ ongoing ability to generate revenue and income.
| 25 |
| ALLY FINANCIAL INC. |
|
The following are non-GAAP financial measures which Ally believes are important to the reader of the Consolidated Financial Statements, but which are supplemental to and not a substitute for GAAP measures: Accelerated issuance expense (Accelerated OID), Adjusted earnings per share (Adjusted EPS), Adjusted efficiency ratio, Adjusted noninterest expense, Adjusted other revenue, Adjusted tangible book value per share (Adjusted TBVPS), Adjusted total net revenue, Core net income attributable to common shareholders, Core original issue discount (Core OID) amortization expense, Core outstanding original issue discount balance (Core OID balance), Core pre-tax income, Core return on tangible common equity (Core ROTCE), Investment income and other (adjusted), Net financing revenue (excluding Core OID), Net interest margin (excluding Core OID), and Tangible Common Equity. These measures are used by management and we believe are useful to investors in assessing the company’s operating performance and capital.
10) Core net income attributable to common shareholders is a non-GAAP financial measure that serves as the numerator in the calculations of Adjusted EPS and Core ROTCE and that, like those measures, is believed by management to help the reader better understand the operating performance of the core businesses and their ability to generate earnings. Core net income attributable to common shareholders adjusts GAAP net income attributable to common shareholders for discontinued operations net of tax, tax-effected Core OID expense, tax-effected repositioning and other primarily related to the extinguishment of high-cost legacy debt and strategic activities and significant other, preferred stock capital actions, significant discrete tax items and tax-effected changes in equity investments measured at fair value, as applicable for respective periods.
11) Core original issue discount (Core OID) amortization expense is a non-GAAP financial measure for OID and is believed by management to help the reader better understand the activity removed from: Core pre-tax income (loss), Core net income (loss) attributable to common shareholders, Adjusted EPS, Core ROTCE, Adjusted efficiency ratio, Adjusted total net revenue, and Net financing revenue (excluding Core OID). Core OID is primarily related to bond exchange OID which excludes international operations and future issuances. Core OID for all periods shown is applied to the pre-tax income of the Corporate and Other segment.
12) Core outstanding original issue discount balance (Core OID balance) is a non-GAAP financial measure for outstanding OID and is believed by management to help the reader better understand the balance removed from Core ROTCE and Adjusted TBVPS. Core OID balance is primarily related to bond exchange OID which excludes international operations and future issuances.
13) Core pre-tax income is a non-GAAP financial measure that adjusts pre-tax income from continuing operations by excluding (1) Core OID, and (2) change in fair value of equity securities (change in fair value of equity securities impacts the Insurance and Corporate Finance segments), and (3) Repositioning and other which are primarily related to the extinguishment of high cost legacy debt, strategic activities and significant other one-time items, as applicable for respective periods or businesses. Management believes core pre-tax income can help the reader better understand the operating performance of the core businesses and their ability to generate earnings.
14) Core return on tangible common equity (Core ROTCE) is a non-GAAP financial measure that management believes is helpful for readers to better understand the ongoing ability of the company to generate returns on its equity base that supports core operations. For purposes of this calculation, tangible common equity is adjusted for Core OID balance and net DTA. Ally’s Core net income attributable to common shareholders for purposes of calculating Core ROTCE is based on the actual effective tax rate for the period adjusted for significant discrete tax items including tax reserve releases, which aligns with the methodology used in calculating adjusted earnings per share.
| (1) | In the numerator of Core ROTCE, GAAP net income attributable to common shareholders is adjusted for discontinued operations net of tax, tax-effected Core OID, tax-effected repositioning and other which are primarily related to the extinguishment of high-cost legacy debt, strategic activities and significant other one-time items, change in fair value of equity securities, significant discrete tax items, and preferred stock capital actions, as applicable for respective periods. |
| (2) | In the denominator, GAAP shareholder’s equity is adjusted for goodwill and identifiable intangibles net of DTL, Core OID balance, and net DTA. |
15) Estimated impact of CECL on regulatory capital per final rule issued by U.S. banking agencies - In December 2018, the FRB and other U.S. banking agencies approved a final rule to address the impact of CECL on regulatory capital by allowing BHCs and banks, including Ally, the option to phase in the day-one impact of CECL over a three-year period. In March 2020, the FRB and other U.S. banking agencies issued an interim final rule that became effective on March 31, 2020 and provided an alternative option for banks to temporarily delay the impacts of CECL, relative to the incurred loss methodology for estimating the allowance for loan losses, on regulatory capital. A final rule that was largely unchanged from the March 2020 interim final rule was issued by the FRB and other U.S. banking agencies in August 2020, and became effective in September 2020. For regulatory capital purposes, these rules permitted us to delay recognizing the estimated impact of CECL on regulatory capital until after a two-year deferral period, which for us extended through December 31, 2021. Beginning on January 1, 2022, we are required to phase in 25% of the previously deferred estimated capital impact of CECL, with an additional 25% to be phased in at the beginning of each subsequent year until fully phased in by the first quarter of 2025. Under these rules, firms that adopt CECL and elect the five-year transition will calculate the estimated impact of CECL on regulatory capital as the day-one impact of adoption plus 25% of the subsequent change in allowance during the two-year deferral period, which according to the final rule approximates the impact of CECL relative to an incurred loss model. We adopted this transition option during the first quarter of 2020, and beginning January 1, 2022, are phasing in the regulatory capital impacts of CECL based on this five-year transition period.
16) Investment income and other (adjusted) is a non-GAAP financial measure that adjusts GAAP investment income and other for repositioning, and the change in fair value of equity securities. Management believes investment income and other (adjusted) is a helpful financial metric because it enables the reader to better understand the business’ ability to generate investment income.
| 26 |
| ALLY FINANCIAL INC. |
|
The following are non-GAAP financial measures which Ally believes are important to the reader of the Consolidated Financial Statements, but which are supplemental to and not a substitute for GAAP measures: Accelerated issuance expense (Accelerated OID), Adjusted earnings per share (Adjusted EPS), Adjusted efficiency ratio, Adjusted noninterest expense, Adjusted other revenue, Adjusted tangible book value per share (Adjusted TBVPS), Adjusted total net revenue, Core net income attributable to common shareholders, Core original issue discount (Core OID) amortization expense, Core outstanding original issue discount balance (Core OID balance), Core pre-tax income, Core return on tangible common equity (Core ROTCE), Investment income and other (adjusted), Net financing revenue (excluding Core OID), Net interest margin (excluding Core OID), and Tangible Common Equity. These measures are used by management and we believe are useful to investors in assessing the company’s operating performance and capital.
17) Net financing revenue excluding core OID is calculated using a non-GAAP measure that adjusts net financing revenue by excluding Core OID. The Core OID balance is primarily related to bond exchange OID which excludes international operations and future issuances. Management believes net financing revenue ex. Core OID is a helpful financial metric because it enables the reader to better understand the business’ ability to generate revenue.
18) Net interest margin excluding core OID is calculated using a non-GAAP measure that adjusts net interest margin by excluding Core OID. The Core OID balance is primarily related to bond exchange OID which excludes international operations and future issuances. Management believes net interest margin ex. Core OID is a helpful financial metric because it enables the reader to better understand the business’ profitability and margins.
19) Repositioning is primarily related to the extinguishment of high-cost legacy debt, strategic activities, restructuring, amounts related to nonrecurring business transactions or pending transactions, and significant other one-time items.
20) Tangible Common Equity is a non-GAAP financial measure that is defined as common stockholders’ equity less goodwill and identifiable intangible assets, net of deferred tax liabilities. Ally considers various measures when evaluating capital adequacy, including tangible common equity. Ally believes that tangible common equity is important because we believe readers may assess our capital adequacy using this measure. Additionally, presentation of this measure allows readers to compare certain aspects of our capital adequacy on the same basis to other companies in the industry. For purposes of calculating Core return on tangible common equity (Core ROTCE), tangible common equity is further adjusted for Core OID balance and net deferred tax asset.
| 27 |