UNITED STATES
SECURITIES AND EXCHANGE COMMISSION
Washington, D.C. 20549
FORM 8-K
CURRENT REPORT
Pursuant to Section 13 or 15(d)
of the Securities Exchange Act of 1934
Date of report (Date of earliest event reported): August 29, 2024
DULUTH HOLDINGS INC.
(Exact name of registrant as specified in its charter)
| Wisconsin | 001-37641 | 39-1564801 | ||
| (State or other jurisdiction of incorporation) |
(Commission File Number) |
(IRS Employer Identification No.) |
201 East Front Street
Mount Horeb, Wisconsin 53572
(Address of principal executive offices, including zip code)
(608) 424-1544
(Registrant’s telephone number, including area code)
Check the appropriate box below if the Form 8-K filing is intended to simultaneously satisfy the filing obligation of the registrant under any of the following provisions (see General Instruction A.2. below):
| ☐ | Written communications pursuant to Rule 425 under the Securities Act (17 CFR 230.425) |
| ☐ | Soliciting material pursuant to Rule 14a-12 under the Exchange Act (17 CFR 240.14a-12) |
| ☐ | Pre-commencement communications pursuant to Rule 14d-2(b) under the Exchange Act (17 CFR 240.14d-2(b)) |
| ☐ | Pre-commencement communications pursuant to Rule 13e-4(c) under the Exchange Act (17 CFR 240.13e-4(c)) |
Securities registered pursuant to Section 12(b) of the Act:
| Title of each class |
Trading Symbol(s) |
Name of each exchange on which registered |
||
| Class B Common Stock, No Par Value | DLTH | NASDAQ Global Select Market |
Indicate by check mark whether the registrant is an emerging growth company as defined in Rule 405 of the Securities Act of 1933 (§230.405 of this chapter) or Rule 12b-2 of the Securities Exchange Act of 1934 (§240.12b-2 of this chapter).
Emerging growth company ☐
If an emerging growth company, indicate by check mark if the registrant has elected not to use the extended transition period for complying with any new or revised financial accounting standards provided pursuant to Section 13(a) of the Exchange Act. ☐
| Item 2.02 | Results of Operations and Financial Condition. |
On August 29, 2024, Duluth Holdings Inc. (the “Company” or “Duluth Trading”) issued a press release (the “Earnings Press Release”) discussing, among other things, its financial results for its fiscal first quarter ended July 28, 2024. A copy of the Earnings Press Release is furnished as Exhibit 99.1 to this report.
| Item 7.01 | Regulation FD Disclosure. |
On August 29, 2024, the Company issued an Investor Presentation. A copy of the Investor Presentation is attached as Exhibit 99.2, and is incorporated by reference herein.
The information reported in this Form 8-K, including the exhibits, is not deemed “filed” for the purposes of Section 18 of the Securities Exchange Act of 1934, or otherwise subject to the liabilities of that section. Further, the information reported in this Form 8-K, including the exhibits, shall not be deemed to be incorporated by reference into the filings of the registrant under the Securities Act of 1933, except as shall be expressly set forth by specific reference in such filings.
Forward Looking Information
Certain matters discussed in this Current Report on Form 8-K and other oral and written statements by representatives of the Company including, but not limited to, the Company’s ability to meet its fiscal 2024 expectations (including its ability to achieve its projected net sales, adjusted EPS, and adjusted EBITDA) and its ability to execute on its growth strategies and its long-term growth targets, are forward-looking statements within the meaning of the Private Securities Litigation Reform Act of 1995. You can identify forward-looking statements by the use of words such as “may,” “might,” “will,” “should,” “expect,” “plan,” “anticipate,” “could,” “believe,” “estimate,” “project,” “target,” “predict,” “intend,” “future,” “budget,” “goals,” “potential,” “continue,” “design,” “objective,” “forecasted,” “would,” and other similar expressions. The forward-looking statements are not historical facts, and are based upon Duluth Trading’s current expectations, beliefs, estimates, and projections, and various assumptions, many of which, by their nature, are inherently uncertain and beyond Duluth Trading’s control. Duluth Trading’s expectations, beliefs and projections are expressed in good faith, and Duluth Trading believes there is a reasonable basis for them. However, there can be no assurance that management’s expectations, beliefs, estimates, and projections will result or be achieved and actual results may vary materially from what is expressed in or indicated by the forward-looking statements. Forward-looking statements are subject to risks and uncertainties that could cause actual performance or results to differ materially from those expressed in the forward-looking statements, including, among others, the risks, uncertainties, and factors set forth under Part 1, Item 1A “Risk Factors” in the Company’s Annual Report on Form 10-K filed with the SEC on March 22, 2024 and other factors as may be periodically described in Duluth Trading’s subsequent filings with the SEC. These risks and uncertainties include, but are not limited to, the following: the impact of inflation and measures to control inflation on our results of operations; the prolonged effects of economic uncertainties on store and website traffic and disruptions to our distribution network, supply chains and operations; our ability to maintain and enhance a strong brand and sub-brand image; adapting to declines in consumer confidence, inflation and decreases in consumer spending; disruptions in our e-commerce platform; effectively adapting to new challenges associated with our expansion into new geographic markets; our ability to meet customer delivery time expectations; natural disasters, unusually adverse weather conditions, boycotts, prolonged public health crises, epidemics or pandemics and unanticipated events; generating adequate cash from our existing stores and direct sales to support our growth; the impact of changes in corporate tax regulations and sales tax; identifying and responding to new and changing customer preferences; the success of the locations in which our stores are located; effectively relying on sources for merchandise located in foreign markets; transportation delays and interruptions, including port congestion; inability to timely and effectively obtain shipments of products from our suppliers and deliver merchandise to our customers; the inability to maintain the performance of a maturing store portfolio; our inability to deploy marketing tactics to strengthen brand awareness and attract new customers in a cost effective manner; our ability to successfully open new stores; competing effectively in an environment of intense competition; our ability to adapt to significant changes in sales due to the seasonality of our business; price reductions or inventory shortages resulting from failure to purchase the appropriate amount of inventory in advance of the season in which it will be sold; the potential for further increases in price and availability of raw materials; our dependence on third-party vendors to provide us with sufficient quantities of merchandise at acceptable prices; the susceptibility of the price and availability of our merchandise to international trade conditions; failure of our vendors and their manufacturing sources to use acceptable labor or other practices; our dependence upon key executive management or our inability to hire or retain the talent required for our business; increases in costs of fuel or other energy, transportation or utility costs and in the costs of labor and employment; failure of our information technology systems to support our current and growing business, before and after our planned upgrades; disruptions in our supply chain and fulfillment centers; our inability to protect our trademarks or other intellectual property rights; infringement on the intellectual property of third parties; acts of war, terrorism or civil unrest; the impact of governmental laws and regulations and the outcomes of legal proceedings; changes in U.S. and non-U.S. laws affecting the importation and taxation of goods, including imposition of unilateral tariffs on imported goods; our ability to secure the personal and/or financial information of our customers and employees; our ability to comply with the security standards for the credit card industry; our failure to maintain adequate (d) Exhibits.
internal controls over our financial and management systems; acquisition, disposition, and development risks; and other factors that may be disclosed in our SEC filings or otherwise. Forward-looking statements speak only as of the date the statements are made. Duluth Trading assumes no obligation to update forward-looking statements to reflect actual results, subsequent events or circumstances or other changes affecting forward-looking information except to the extent required by applicable securities laws.
| Item 9.01 | Financial Statements and Exhibits. |
The following exhibits are being furnished with this Current Report on Form 8-K.
| Exhibit |
Description |
|
| 99.1 | Earnings Press Release, dated August 29, 2024 | |
| 99.2 | Investor Presentation, dated August 29, 2024 | |
| 104 | Cover Page interactive data file (embedded with the inline XBRL document) | |
SIGNATURES
Pursuant to the requirements of the Securities Exchange Act of 1934, the registrant has duly caused this report to be signed on its behalf by the undersigned hereunto duly authorized.
| DULUTH HOLDINGS INC. | ||||||
| Date: August 29, 2024 | ||||||
| By: | /s/ Heena Agrawal |
|||||
| Name: | Heena Agrawal | |||||
| Title: | Senior Vice President and Chief Financial Officer | |||||
Exhibit 99.1

Duluth Holdings Inc. Announces Second Quarter 2024 Financial Results
Year-over-year net sales growth of 1.8% to $141.6 million
Benefiting from our product and sourcing initiatives, gross margin expands 90 basis points to 52.3%
Strong financial position with no debt and approximately $210 million of liquidity
Reaffirmed Fiscal 2024 outlook excluding restructuring expense and sales tax expense accrual
MOUNT HOREB, WI – August 29, 2024 – Duluth Holdings Inc. (dba, Duluth Trading Company) (“Duluth Trading” or the “Company”) (NASDAQ: DLTH), a lifestyle brand of men’s and women’s workwear, casual wear, outdoor apparel and accessories, today announced its financial results for the fiscal second quarter ended July 28, 2024.
Summary of the Second Quarter Ended July 28, 2024
| • | Net sales of 141.6 million increased 1.8% compared to the prior year second quarter |
| • | Net loss of $3.7 million and adjusted net loss1 of $0.6 million, compared to net loss of $2.0 million in the prior year second quarter. Adjusted net loss of $0.6 million excludes $1.6 million of restructuring expense and a $2.4 million non-recurring estimated sales tax expense accrual that is reflected in Selling, general and administrative expenses |
| • | EPS per diluted share of ($0.11); Adjusted EPS1 of ($0.02) |
| • | Adjusted EBITDA2 increased $2.0 million from the prior year to $10.6 million, representing 7.5% of net sales |
| 1 | See Reconciliation of net loss to adjusted net loss and adjusted net loss to adjusted EPS in the accompanying financial tables. |
| 2 | See Reconciliation of net loss to EBITDA and EBITDA to Adjusted EBITDA in the accompanying financial tables. |
Management Commentary
President and CEO, Sam Sato commented, “We are pleased to have returned to top-line growth in the second quarter, while also expanding our gross margin as we begin to see the benefits of our product development and sourcing initiatives. During the quarter we saw a trend line improvement in both traffic and transactions with healthy shopper conversion, fueling 1.8% year-over-year net sales growth. The quarter strength was highlighted by product innovation wins including Dry on the Fly, Armachillo and DuluthFlex Fire Hose Sweat Management.
1
| “We entered the third quarter with a strong lineup of newness such as Duluth Reserve, Bullpen 3D and Souped up Sweats and we expanded our Plus size assortment including our successful Adjustabust, a bonded zip-front bra with a sleek silhouette and criss-crossed back offering extra support and security. On August 10th we successfully hosted our second underwear trade-up event engaging with existing and new customers throughout our local store markets. The event generated a lot of buzz and resulted in a jump in traffic, higher overall sales, and 40% of trade ups from our female shoppers, which remains a key strategic growth opportunity for Duluth.”
Sato concluded, “From a longer-term structural update, we have successfully moved into phase two of our fulfillment center network plan to maximize productivity and capacity. The tremendous success we are seeing with our near fully automated fulfillment center in Adairsville, Georgia, which processed 58% of total company volume during the first of half of our fiscal year, allowed for the planned exit of our Dubuque fulfillment center this October. Importantly, we will begin to realize the SG&A benefits in Q4.” |

|
Operating Results for the Second Quarter Ended July 28, 2024
Net sales increased 1.8% to $141.6 million, compared to $139.1 million in the same period a year ago. Direct to-consumer net sales increased by 5.6% to $91.7 million primarily driven by higher site conversion compared to the prior year. Retail store net sales decreased by 4.4% to $49.9 million due to slower store traffic, partially offset by strong conversion rates.
Gross profit increased to $74.0 million, or 52.3% of net sales up 90 basis points, compared to $71.5 million, or 51.4% of net sales, in the corresponding prior year period driven by our sourcing initiative.
Selling, general and administrative expenses increased 4.6% to $76.3 million, compared to $72.9 million in the same period a year ago. The increase included the $2.4 million non-recurring estimated sales tax expense. Excluding this non-recurring expense, selling, general and administrative expenses increased $1.0 million to $73.9 million, representing 52.2% of net sales and leveraging 20 basis points compared to the prior year.
As part of the Company’s in-depth review of the retail portfolio strategy, fulfillment center network, and benchmarking to identify structural opportunities to improve operating margin, working capital, and asset efficiency, in the second quarter of 2024, the Company began phase two of the fulfillment center network plan to maximize productivity and capacity. As a result, the Company initiated a lease amendment for one of its legacy fulfillment centers to accelerate the lease expiration date from September 2030 to October 2024.
The Company expects to incur total restructuring expenses related to the lease amendment of $7.4 million during the second and third quarters of 2024, $1.6 million of which was recognized during the second quarter. The Company expects a total cash outlay of approximately $4.4 million related to this initiative, including $1.7 million to be paid in the current fiscal year.
Exiting the legacy facility is projected to reduce overhead expenses by approximately $1.2 million during the fourth quarter of the current fiscal year. The Company expects an expense reduction of approximately $5.0 million and cash savings of $4.0 million annually.
As previously mentioned, during the third quarter last year, the Company went live with a highly automated fulfillment center in Adairsville, Georgia which now processes 58% of all online orders and replenishment volume. The Adairsville facility has shortened delivery times while driving lower cost per unit to fulfill an order, which was 32% of the cost of the three legacy fulfillment centers over the first half of the year. The success and productivity from the critical Adairsville facility investment has allowed the Company to accelerate phase two of its overall fulfillment center network plan.
2
Balance Sheet and Liquidity
The Company ended the quarter with $9.8 million of cash and cash equivalents, net working capital of $79.8 million, no outstanding debt on the Duluth Trading $200 million revolving line of credit and $209.8 million of liquidity.
Fiscal 2024 Outlook
The Company reaffirmed its fiscal 2024 outlook, excluding restructuring expense and sales tax expense accrual:
| • | Net sales of approximately $640 million |
| • | Adjusted EPS1 of approximately ($0.22) per diluted share |
| • | Adjusted EBITDA2 of approximately $39 million |
| • | Capital expenditures, inclusive of software hosting implementation costs, of approximately $25 million |
| 1 | See Reconciliation of forecasted net loss to forecasted adjusted net loss and forecasted adjusted net loss to forecasted adjusted EPS in the accompanying financial tables. |
| 2 | See Reconciliation of forecasted net loss to forecasted EBITDA and forecasted EBITDA to forecasted Adjusted EBITDA in the accompanying financial tables. |
Conference Call Information
A conference call and audio webcast with analysts and investors will be held on Thursday, August 29, 2024 at 9:30 am Eastern Time, to discuss the results and answer questions.
| • | Live conference call: 844-875-6915 (domestic) or 412-317-6711 (international) |
| • | Conference call replay available through September 5, 2024: 877-344-7529 (domestic) or 412-317-0088 (international) |
| • | Replay access code: 5705373 |
| • | Live and archived webcast: ir.duluthtrading.com |
Investors can pre-register for the earnings conference call to expedite their entry into the call and avoid waiting for a live operator. To pre-register for the call, please visit https://dpregister.com/sreg/10191086/fd20abea22 and enter your contact information. You will then be issued a personalized phone number and pin to dial into the live conference call. Investors can pre-register any time prior to the start of the conference call.
About Duluth Trading
Duluth Trading is a lifestyle brand for the Modern, Self-Reliant American. Based in Mount Horeb, Wisconsin, we offer high quality, solution-based casual wear, workwear and accessories for men and women who lead a hands-on lifestyle and who value a job well-done. We provide our customers an engaging and entertaining experience. Our marketing incorporates humor and storytelling that conveys the uniqueness of our products in a distinctive, fun way, and are available through our content-rich website, catalogs, and “store like no other” retail locations. We are committed to outstanding customer service backed by our “No Bull Guarantee” - if it’s not right, we’ll fix it. Visit our website at http://www.duluthtrading.com.
3
Non-GAAP Measurements
Management believes that non-GAAP financial measures may be useful in certain instances to provide additional meaningful comparisons between current results and results in prior operating periods. Within this release, including the tables attached hereto, reference is made to adjusted earnings before interest, taxes, depreciation and amortization (EBITDA), adjusted net loss and adjusted earnings per share (EPS). See attached table “Reconciliation of Net Loss to EBITDA and EBITDA to Adjusted EBITDA,” for a reconciliation of net loss to EBITDA and EBITDA to Adjusted EBITDA for the three and six months ended July 28, 2024, versus the three and six months ended July 30, 2023 and attached table “Reconciliation of Net Loss to Adjusted Net Loss and Adjusted Net Loss to Adjusted EPS,” for a reconciliation of net loss to adjusted net loss and adjusted net loss to adjusted EPS for the three and six months ended July 28, 2024.
Adjusted EBITDA is a metric used by management and frequently used by the financial community, which provides insight into an organization’s operating trends and facilitates comparisons between peer companies, since interest, taxes, depreciation and amortization can differ greatly between organizations as a result of differing capital structures and tax strategies. Adjusted EBITDA excludes certain items that are unusual in nature or not comparable from period to period.
Adjusted Net Loss and Adjusted EPS is a metric used by management and frequently used by the financial community, which provides insight into the effectiveness of our business strategies and to compare our performance against that of peer companies. Adjusted Net Loss and Adjusted EPS excludes restructuring expenses and a one-time estimated sales tax accrual that are not comparable from period to period.
The Company provides this information to investors to assist in comparisons of past, present and future operating results and to assist in highlighting the results of on-going operations. While the Company’s management believes that non-GAAP measurements are useful supplemental information, such adjusted results are not intended to replace the Company’s GAAP financial results and should be read in conjunction with those GAAP results.
Forward-Looking Statements
This press release includes “forward-looking statements” within the meaning of the Private Securities Litigation Reform Act of 1995. All statements, other than statements of historical facts included in this press release, including statements concerning Duluth Trading’s plans, objectives, goals, beliefs, business strategies, future events, business conditions, its results of operations, financial position and its business outlook, business trends and certain other information herein, including statements under the heading “Fiscal 2024 Outlook” are forward-looking statements. You can identify forward-looking statements by the use of words such as “may,” ”might,” “will,” “should,” “expect,” “plan,” “anticipate,” “could,” “believe,” “estimate,” “project,” “target,” “predict,” “intend,” “future,” “budget,” “goals,” “potential,” “continue,” “design,” “objective,” “forecasted,” “would” and other similar expressions. The forward-looking statements are not historical facts, and are based upon Duluth Trading’s current expectations, beliefs, estimates, and projections, and various assumptions, many of which, by their nature, are inherently uncertain and beyond Duluth Trading’s control. Duluth Trading’s expectations, beliefs and projections are expressed in good faith, and Duluth Trading believes there is a reasonable basis for them. However, there can be no assurance that management’s expectations, beliefs, estimates, and projections will be achieved and actual results may vary materially from what is expressed in or indicated by the forward-looking statements. Forward-looking statements are subject to risks and uncertainties that could cause actual performance or results to differ materially from those expressed in the forward-looking statements, including, among others, the risks, uncertainties, and factors set forth under Part 1, Item 1A “Risk Factors” in the Company’s Annual Report on Form 10-K filed with the SEC on March 22, 2024 and other factors as may be periodically described in Duluth Trading’s subsequent filings with the SEC.
4
These risks and uncertainties include, but are not limited to, the following: the impact of inflation and measures to control inflation on our results of operations; the prolonged effects of economic uncertainties on store and website traffic and disruptions to our distribution network, supply chains and operations; our ability to maintain and enhance a strong brand and sub-brand image; adapting to declines in consumer confidence, inflation and decreases in consumer spending; disruptions in our e-commerce platform; effectively adapting to new challenges associated with our expansion into new geographic markets; our ability to meet customer delivery time expectations; natural disasters, unusually adverse weather conditions, boycotts, prolonged public health crises, epidemics or pandemics and unanticipated events; generating adequate cash from our existing stores and direct sales to support our growth; the impact of changes in corporate tax regulations and sales tax; identifying and responding to new and changing customer preferences; the success of the locations in which our stores are located; effectively relying on sources for merchandise located in foreign markets; transportation delays and interruptions, including port congestion; inability to timely and effectively obtain shipments of products from our suppliers and deliver merchandise to our customers; the inability to maintain the performance of a maturing store portfolio; our inability to deploy marketing tactics to strengthen brand awareness and attract new customers in a cost effective manner; our ability to successfully open new stores; competing effectively in an environment of intense competition; our ability to adapt to significant changes in sales due to the seasonality of our business; price reductions or inventory shortages resulting from failure to purchase the appropriate amount of inventory in advance of the season in which it will be sold; the potential for further increases in price and availability of raw materials; our dependence on third-party vendors to provide us with sufficient quantities of merchandise at acceptable prices; the susceptibility of the price and availability of our merchandise to international trade conditions; failure of our vendors and their manufacturing sources to use acceptable labor or other practices; our dependence upon key executive management or our inability to hire or retain the talent required for our business; increases in costs of fuel or other energy, transportation or utility costs and in the costs of labor and employment; failure of our information technology systems to support our current and growing business, before and after our planned upgrades; disruptions in our supply chain and fulfillment centers; our inability to protect our trademarks or other intellectual property rights; infringement on the intellectual property of third parties; acts of war, terrorism or civil unrest; the impact of governmental laws and regulations and the outcomes of legal proceedings; changes in U.S. and non-U.S. laws affecting the importation and taxation of goods, including imposition of unilateral tariffs on imported goods; our ability to secure the personal and/or financial information of our customers and employees; our ability to comply with the security standards for the credit card industry; our failure to maintain adequate internal controls over our financial and management systems; acquisition, disposition, and development risks; and other factors that may be disclosed in our SEC filings or otherwise. Forward-looking statements speak only as of the date the statements are made. Duluth Trading assumes no obligation to update forward-looking statements to reflect actual results, subsequent events or circumstances or other changes affecting forward-looking information except to the extent required by applicable securities laws.
Investor Contacts:
Tom Filandro
ICR, Inc.
(646) 277-1200
DuluthIR@icrinc.com
(Tables Follow)
***
5
DULUTH HOLDINGS INC.
Condensed Consolidated Balance Sheets
(Unaudited)
(Amounts in thousands)
| July 28, 2024 | January 28, 2024 | July 30, 2023 | ||||||||||
| ASSETS |
||||||||||||
| Current Assets: |
||||||||||||
| Cash and cash equivalents |
$ | 9,787 | $ | 32,157 | $ | 11,148 | ||||||
| Receivables |
8,318 | 5,955 | 5,758 | |||||||||
| Income tax receivable |
313 | 617 | 140 | |||||||||
| Inventory, net |
168,718 | 125,757 | 157,126 | |||||||||
| Prepaid expenses & other current assets |
19,722 | 16,488 | 17,665 | |||||||||
|
|
|
|
|
|
|
|||||||
| Total current assets |
206,858 | 180,974 | 191,837 | |||||||||
| Property and equipment, net |
121,148 | 132,718 | 125,970 | |||||||||
| Operating lease right-of-use assets |
107,799 | 121,430 | 126,132 | |||||||||
| Finance lease right-of-use assets, net |
34,646 | 40,315 | 45,742 | |||||||||
| Available-for-sale security |
4,877 | 4,986 | 5,254 | |||||||||
| Other assets, net |
8,961 | 9,020 | 7,853 | |||||||||
| Deferred tax assets |
4,306 | 1,010 | 353 | |||||||||
|
|
|
|
|
|
|
|||||||
| Total assets |
$ | 488,595 | $ | 490,453 | $ | 503,141 | ||||||
|
|
|
|
|
|
|
|||||||
| LIABILITIES AND SHAREHOLDERS’ EQUITY |
||||||||||||
| Current liabilities: |
||||||||||||
| Trade accounts payable |
$ | 77,600 | $ | 51,122 | $ | 59,259 | ||||||
| Accrued expenses and other current liabilities |
30,069 | 30,930 | 28,215 | |||||||||
| Current portion of operating lease liabilities |
16,027 | 16,401 | 15,993 | |||||||||
| Current portion of finance lease liabilities |
2,450 | 3,149 | 2,964 | |||||||||
| Current maturities of TRI long-term debt1 |
888 | 847 | 807 | |||||||||
|
|
|
|
|
|
|
|||||||
| Total current liabilities |
127,034 | 102,449 | 107,238 | |||||||||
| Operating lease liabilities, less current maturities |
92,275 | 106,413 | 110,999 | |||||||||
| Finance lease liabilities, less current maturities |
31,911 | 34,276 | 35,906 | |||||||||
| TRI long-term debt, less current maturities1 |
24,723 | 25,141 | 25,538 | |||||||||
|
|
|
|
|
|
|
|||||||
| Total liabilities |
275,943 | 268,279 | 279,681 | |||||||||
| Shareholders’ equity: |
||||||||||||
| Treasury stock |
(2,243 | ) | (1,738 | ) | (1,733 | ) | ||||||
| Capital stock |
106,169 | 103,579 | 101,415 | |||||||||
| Retained earnings |
112,199 | 123,816 | 127,299 | |||||||||
| Accumulated other comprehensive loss, net |
(436 | ) | (427 | ) | (295 | ) | ||||||
|
|
|
|
|
|
|
|||||||
| Total shareholders’ equity of Duluth Holdings Inc. |
215,689 | 225,230 | 226,686 | |||||||||
| Noncontrolling interest |
(3,037 | ) | (3,056 | ) | (3,226 | ) | ||||||
|
|
|
|
|
|
|
|||||||
| Total shareholders’ equity |
212,652 | 222,174 | 223,460 | |||||||||
|
|
|
|
|
|
|
|||||||
| Total liabilities and shareholders’ equity |
$ | 488,595 | $ | 490,453 | $ | 503,141 | ||||||
|
|
|
|
|
|
|
|||||||
| 1 | Represents debt of the variable interest entity, TRI Holdings, LLC, that is consolidated in accordance with ASC 810, Consolidation. Duluth Holdings Inc. is not the guarantor nor the obligor of this debt. |
6
DULUTH HOLDING INC.
Consolidated Statements of Operations
(Unaudited)
(Amounts in thousands, except per share figures)
| Three Months Ended | Six Months Ended | |||||||||||||||
| July 28, 2024 | July 30, 2023 | July 28, 2024 | July 30, 2023 | |||||||||||||
| Net sales |
$ | 141,619 | $ | 139,099 | $ | 258,303 | $ | 262,858 | ||||||||
| Cost of goods sold (excluding depreciation and amortization) |
67,623 | 67,616 | 122,683 | 125,724 | ||||||||||||
|
|
|
|
|
|
|
|
|
|||||||||
| Gross profit |
73,996 | 71,483 | 135,620 | 137,134 | ||||||||||||
| Selling, general and administrative expenses1 |
76,286 | 72,926 | 146,881 | 143,126 | ||||||||||||
| Restructuring expense |
1,596 | — | 1,596 | — | ||||||||||||
|
|
|
|
|
|
|
|
|
|||||||||
| Operating loss |
(3,886 | ) | (1,443 | ) | (12,857 | ) | (5,992 | ) | ||||||||
| Interest expense |
988 | 880 | 1,981 | 1,814 | ||||||||||||
| Other income, net |
145 | 109 | 161 | 257 | ||||||||||||
|
|
|
|
|
|
|
|
|
|||||||||
| Loss before income taxes |
(4,729 | ) | (2,214 | ) | (14,677 | ) | (7,549 | ) | ||||||||
| Income tax benefit |
(996 | ) | (202 | ) | (3,079 | ) | (1,660 | ) | ||||||||
|
|
|
|
|
|
|
|
|
|||||||||
| Net loss |
(3,733 | ) | (2,012 | ) | (11,598 | ) | (5,889 | ) | ||||||||
| Less: Net income (loss) attributable to noncontrolling interest |
11 | (8 | ) | 19 | (16 | ) | ||||||||||
|
|
|
|
|
|
|
|
|
|||||||||
| Net loss attributable to controlling interest |
$ | (3,744 | ) | $ | (2,004 | ) | $ | (11,617 | ) | $ | (5,873 | ) | ||||
|
|
|
|
|
|
|
|
|
|||||||||
| Basic earnings per share (Class A and Class B): |
||||||||||||||||
| Weighted average shares of common stock outstanding |
33,367 | 32,952 | 33,247 | 32,912 | ||||||||||||
|
|
|
|
|
|
|
|
|
|||||||||
| Net loss per share attributable to controlling interest |
$ | (0.11 | ) | $ | (0.06 | ) | $ | (0.35 | ) | $ | (0.18 | ) | ||||
|
|
|
|
|
|
|
|
|
|||||||||
| Diluted earnings per share (Class A and Class B): |
||||||||||||||||
| Weighted average shares and equivalents outstanding |
33,367 | 32,952 | 33,247 | 32,912 | ||||||||||||
|
|
|
|
|
|
|
|
|
|||||||||
| Net loss per share attributable to controlling interest |
$ | (0.11 | ) | $ | (0.06 | ) | $ | (0.35 | ) | $ | (0.18 | ) | ||||
|
|
|
|
|
|
|
|
|
|||||||||
| 1 | In conjunction with ongoing state sales tax audits the Company began a review of its sales tax positions. As a result of the review, the Company recorded an estimated sales tax expense accrual of $2.4M that is reflected in Selling, general and administrative expenses. |
7
DULUTH HOLDINGS INC.
Consolidated Statements of Cash Flows
(Unaudited)
(Amounts in thousands)
| Six Months Ended | ||||||||
| July 28, 2024 | July 30, 2023 | |||||||
| Cash flows from operating activities: |
||||||||
| Net loss |
$ | (11,598 | ) | $ | (5,889 | ) | ||
| Adjustments to reconcile net loss to net cash used in operating activities: |
||||||||
| Depreciation and amortization |
16,297 | 14,868 | ||||||
| Stock based compensation |
2,383 | 2,284 | ||||||
| Deferred income taxes |
(3,293 | ) | (1,553 | ) | ||||
| Loss on disposal of property and equipment |
77 | 16 | ||||||
| Changes in operating assets and liabilities: |
||||||||
| Receivables |
(2,363 | ) | 283 | |||||
| Income taxes receivable |
304 | (140 | ) | |||||
| Inventory |
(42,961 | ) | (2,204 | ) | ||||
| Prepaid expense & other current assets |
130 | (1,351 | ) | |||||
| Software hosting implementation costs, net |
(3,406 | ) | (370 | ) | ||||
| Trade accounts payable |
26,623 | 2,716 | ||||||
| Income taxes payable |
— | (1,761 | ) | |||||
| Accrued expenses and deferred rent obligations |
(591 | ) | (7,343 | ) | ||||
| Other assets |
(2 | ) | (20 | ) | ||||
| Noncash lease impacts |
1,348 | (785 | ) | |||||
|
|
|
|
|
|||||
| Net cash used in operating activities |
(17,052 | ) | (1,249 | ) | ||||
|
|
|
|
|
|||||
| Cash flows from investing activities: |
||||||||
| Purchases of property and equipment |
(3,183 | ) | (31,483 | ) | ||||
| Principal receipts from available-for-sale security |
97 | 88 | ||||||
|
|
|
|
|
|||||
| Net cash used in investing activities |
(3,086 | ) | (31,395 | ) | ||||
|
|
|
|
|
|||||
| Cash flows from financing activities: |
||||||||
| Proceeds from line of credit |
40,500 | 10,000 | ||||||
| Payments on line of credit |
(40,500 | ) | (10,000 | ) | ||||
| Payments on TRI long term debt |
(412 | ) | (373 | ) | ||||
| Payments on finance lease obligations |
(1,521 | ) | (1,397 | ) | ||||
| Payments of tax withholding on vested restricted shares |
(505 | ) | (274 | ) | ||||
| Other |
206 | 288 | ||||||
|
|
|
|
|
|||||
| Net cash used in financing activities |
(2,232 | ) | (1,756 | ) | ||||
|
|
|
|
|
|||||
| Decrease in cash and cash equivalents |
(22,370 | ) | (34,400 | ) | ||||
| Cash and cash equivalents at beginning of period |
32,157 | 45,548 | ||||||
|
|
|
|
|
|||||
| Cash and cash equivalents at end of period |
$ | 9,787 | $ | 11,148 | ||||
|
|
|
|
|
|||||
| Supplemental disclosure of cash flow information: |
||||||||
| Interest paid |
$ | 1,981 | $ | 1,814 | ||||
| Income taxes paid |
$ | 125 | $ | 1,795 | ||||
| Supplemental disclosure of non-cash information: |
||||||||
| Unpaid liability to acquire property and equipment |
$ | 1,459 | $ | 1,336 | ||||
8
DULUTH HOLDINGS INC.
Reconciliation of Net Loss to EBITDA and EBITDA to Adjusted EBITDA
For the Fiscal Quarter and Six Months Ended July 28, 2024 and July 30, 2023
(Unaudited)
(Amounts in thousands)
| Three Months Ended | Six Months Ended | |||||||||||||||
| July 28, 2024 | July 30, 2023 | July 28, 2024 | July 30, 2023 | |||||||||||||
| (in thousands) | ||||||||||||||||
| Net loss |
$ | (3,733 | ) | $ | (2,012 | ) | $ | (11,598 | ) | $ | (5,889 | ) | ||||
| Depreciation and amortization |
8,046 | 7,455 | 16,297 | 14,868 | ||||||||||||
| Amortization of internal-use software hosting subscription implementation costs |
1,292 | 1,150 | 2,462 | 2,420 | ||||||||||||
| Interest expense |
988 | 880 | 1,981 | 1,814 | ||||||||||||
| Income tax benefit |
(996 | ) | (202 | ) | (3,079 | ) | (1,660 | ) | ||||||||
|
|
|
|
|
|
|
|
|
|||||||||
| EBITDA |
$ | 5,597 | $ | 7,271 | $ | 6,063 | $ | 11,553 | ||||||||
| Stock based compensation |
1,011 | 1,294 | 2,383 | 2,284 | ||||||||||||
| Restructuring expense |
1,596 | — | 1,596 | — | ||||||||||||
| Sales tax expense accrual |
2,406 | — | 2,406 | — | ||||||||||||
|
|
|
|
|
|
|
|
|
|||||||||
| Adjusted EBITDA |
$ | 10,610 | $ | 8,565 | $ | 12,448 | $ | 13,837 | ||||||||
|
|
|
|
|
|
|
|
|
|||||||||
DULUTH HOLDINGS INC.
Reconciliation of Forecasted Net Loss to Forecasted EBITDA and Forecasted EBITDA to Forecasted Adjusted EBITDA
For the Fiscal Year Ending February 2, 2025
(Unaudited)
(Amounts in thousands)
| Forecasted | ||||
| Net loss |
$ | (14,800 | ) | |
| Depreciation and amortization |
33,200 | |||
| Amortization of internal-use software hosting subscription implementation costs |
5,000 | |||
| Interest expense |
5,450 | |||
| Income tax benefit |
(4,350 | ) | ||
|
|
|
|||
| EBITDA |
$ | 24,500 | ||
| Stock based compensation |
4,694 | |||
| Restructuring expense |
7,400 | |||
| Sales tax expense accrual |
2,406 | |||
|
|
|
|||
| Adjusted EBITDA |
$ | 39,000 | ||
|
|
|
|||
DULUTH HOLDINGS INC.
Reconciliation of Forecasted Net Loss to Forecasted Adjusted Net Loss and Forecasted Adjusted Net Loss to Forecasted Adjusted EPS
For the Fiscal Year Ending February 2, 2025
(Unaudited)
(Amounts in thousands)
| Forecasted | ||||||||
| (in thousands, except per share amounts) | Amount | Per share | ||||||
| Forecasted Net Loss |
$ | (14,800 | ) | $ | (0.45 | ) | ||
| Plus: Forecasted income tax benefit |
(4,350 | ) | (0.13 | ) | ||||
|
|
|
|
|
|||||
| Forecasted Net loss before income taxes |
$ | (19,150 | ) | $ | (0.58 | ) | ||
| Plus: Forecasted restructuring expenses |
7,400 | 0.22 | ||||||
| Plus: Sales tax expense accrual |
2,406 | 0.07 | ||||||
|
|
|
|
|
|||||
| Forecasted Adjusted loss before income taxes |
$ | (9,344 | ) | $ | (0.28 | ) | ||
| Forecasted Adjusted estimated income tax benefit |
(1,944 | ) | (0.06 | ) | ||||
|
|
|
|
|
|||||
| Forecasted Adjusted net loss |
$ | (7,400 | ) | $ | (0.22 | ) | ||
|
|
|
|
|
|||||
9
DULUTH HOLDINGS INC.
Reconciliation of Net Loss to Adjusted Net Loss and Adjusted Net Loss to Adjusted EPS
For the Fiscal Quarter and Six Months Ended July 28, 2024
(Unaudited)
(Amounts in thousands)
| Three Months Ended | Six Months Ended | |||||||||||||||
| July 28, 2024 | July 28, 2024 | |||||||||||||||
| (in thousands, except per share amounts) | Amount | Per share | Amount | Per share | ||||||||||||
| Net Loss |
$ | (3,733 | ) | $ | (0.11 | ) | $ | (11,598 | ) | $ | (0.35 | ) | ||||
| Plus: Income tax benefit |
(996 | ) | (0.03 | ) | (3,079 | ) | (0.09 | ) | ||||||||
|
|
|
|
|
|
|
|
|
|||||||||
| Net loss before income taxes |
$ | (4,729 | ) | $ | (0.14 | ) | $ | (14,677 | ) | $ | (0.44 | ) | ||||
| Plus: Restructuring expenses |
1,596 | 0.05 | 1,596 | 0.05 | ||||||||||||
| Plus: Sales tax expense accrual |
2,406 | 0.07 | 2,406 | 0.07 | ||||||||||||
|
|
|
|
|
|
|
|
|
|||||||||
| Adjusted loss before income taxes |
$ | (727 | ) | $ | (0.02 | ) | $ | (10,675 | ) | $ | (0.32 | ) | ||||
| Adjusted estimated income tax benefit |
(159 | ) | (0.00 | ) | (2,242 | ) | (0.07 | ) | ||||||||
|
|
|
|
|
|
|
|
|
|||||||||
| Adjusted net loss |
$ | (568 | ) | $ | (0.02 | ) | $ | (8,433 | ) | $ | (0.25 | ) | ||||
|
|
|
|
|
|
|
|
|
|||||||||
10

Exhibit 99.2 Investor Presentation Second Quarter 2024 August 29, 2024
Disclaimer Forward-Looking Statements This presentation dated August 29, 2024 includes “forward-looking statements” within the meaning of the Private Securities Litigation Reform Act of 1995. All statements, other than statements of historical facts included in this presentation, including statements concerning Duluth Holdings Inc.'s (dba Duluth Trading Company) (“Duluth Trading” or the “Company”) plans, objectives, goals, beliefs, business strategies, future events, business conditions, its results of operations, financial position and its business outlook, business trends and certain other information herein are forward-looking statements, including its ability to execute on its growth strategies. You can identify forward-looking statements by the use of words such as “may,” ”might,” “will,” “should,” “expect,” “plan,” “anticipate,” “could,” “believe,” “estimate,” “project,” “target,” “predict,” “intend,” “future,” “budget,” “goals,” “potential,” “continue,” “design,” “objective,” “would” and other similar expressions. The forward-looking statements are not historical facts, and are based upon Duluth Trading's current expectations, beliefs, estimates, and projections, and various assumptions, many of which, by their nature, are inherently uncertain and beyond Duluth Trading's control. Duluth Trading's expectations, beliefs and projections are expressed in good faith, and Duluth Trading believes there is a reasonable basis for them. However, there can be no assurance that management's expectations, beliefs, estimates, and projections will be achieved and actual results may vary materially from what is expressed in or indicated by the forward-looking statements. Forward-looking statements are subject to risks and uncertainties that could cause actual performance or results to differ materially from those expressed in the forward-looking statements, including, among others, the risks, uncertainties, and factors set forth under Part 1, Item 1A “Risk Factors” in Duluth Trading’s Annual Report on Form 10-K filed with the SEC on March 22, 2024, and other factors as may be periodically described in Duluth Trading’s subsequent filings with the SEC. Forward-looking statements speak only as of the date the statements are made. Duluth Trading assumes no obligation to update forward-looking statements to reflect actual results, subsequent events or circumstances or other changes affecting forward-looking information except to the extent required by applicable securities laws. Non-GAAP Measurements Management believes that non-GAAP financial measures may be useful in certain instances to provide additional meaningful comparisons between current results and results in prior operating periods. Within this presentation, reference is made to adjusted earnings before interest, taxes, depreciation and amortization (EBITDA) and Free Cash Flow. See Appendix Table “Adjusted EBITDA,” for a reconciliation of net income to EBITDA and EBITDA to Adjusted EBITDA and “Free Cash Flow” for a reconciliation of Net cash provided by operating activities to Free Cash Flow. Adjusted EBITDA is a metric used by management and frequently used by the financial community, which provides insight into an organization’s operating trends and facilitates comparisons between peer companies, since interest, taxes, depreciation and amortization can differ greatly between organizations as a result of differing capital structures and tax strategies. Adjusted EBITDA excludes certain items, such as stock-based compensation. Management believes Free Cash Flow is a useful measure of performance as an indication of an organization’s financial strength and provides additional perspective on the ability to efficiently use capital in executing growth strategies. Free Cash Flow is used to facilitate a comparison of operating performance on a consistent basis from period- to-period and the ability to generate cash. Free Cash Flow is defined as net cash provided by operating activities less purchase of property and equipment and capital contributions towards build-to-suit stores. The Company provides this information to investors to assist in comparisons of past, present and future operating results and to assist in highlighting the results of on-going operations. While the Company’s management believes that non-GAAP measurements are useful supplemental information, such adjusted results are not intended to replace the Company’s GAAP financial results and should be read in conjunction with those GAAP results. August 29, 2024 2

OUR GREATER PURPOSE “Celebrating the can-do spirit by enabling anyone who takes on life with their own two hands.” OUR MISSION STATEMENT “We build high-quality, solution-based products for work, play and every day. We craft our raw materials – unique brands, durable products, standout customer service, and a No Bull Guarantee – into industry-leading consumer experiences. Job done right means we never forget that “there’s gotta be a better way.”

Secret Sauce Better Brands A brood of sub-brands all bonded by the belief that you can accomplish anything that you put your own mind and own two hands to Better Innovation Long, colorful history of product innovation and solution-based design Better Marketing Distinctive marketing made to break through the clutter and drive buying Better Customer Experiences Outstanding and engaging customer experience August 29, 2024 5

FINANCIAL REVIEW
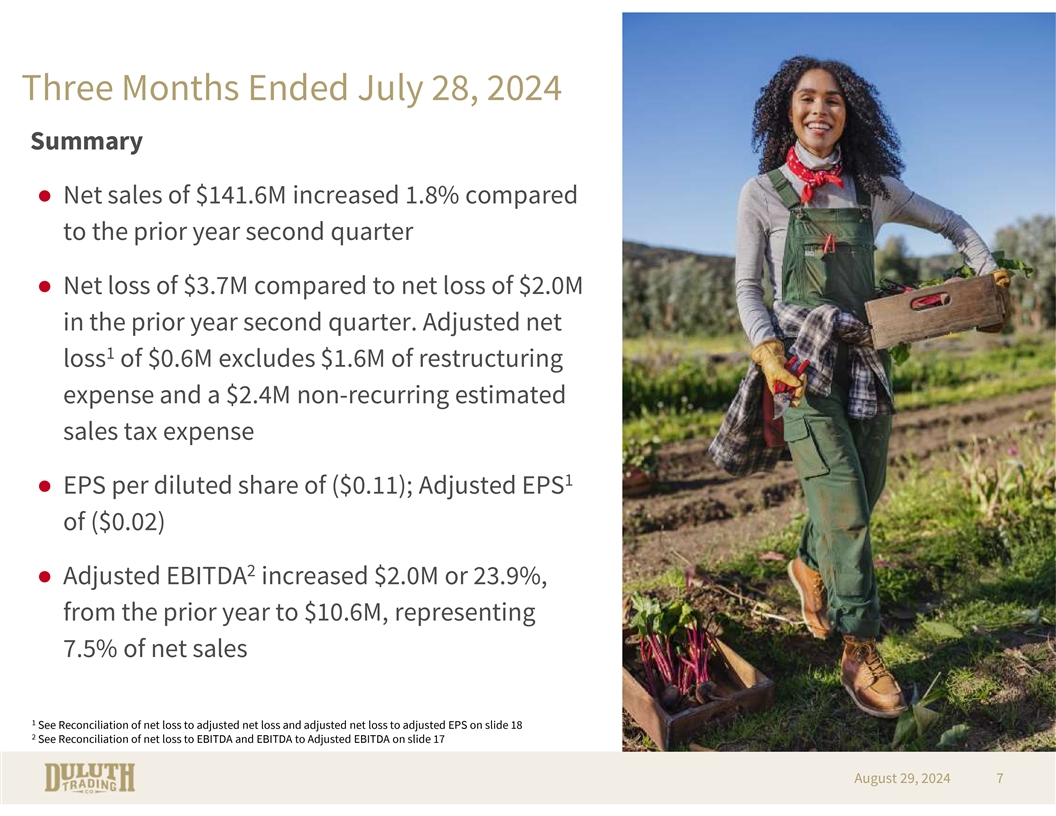
Three Months Ended July 28, 2024 Summary ● Net sales of $141.6M increased 1.8% compared to the prior year second quarter ● Net loss of $3.7M compared to net loss of $2.0M in the prior year second quarter. Adjusted net 1 loss of $0.6M excludes $1.6M of restructuring expense and a $2.4M non-recurring estimated sales tax expense 1 ● EPS per diluted share of ($0.11); Adjusted EPS of ($0.02) 2 ● Adjusted EBITDA increased $2.0M or 23.9%, from the prior year to $10.6M, representing 7.5% of net sales 1 See Reconciliation of net loss to adjusted net loss and adjusted net loss to adjusted EPS on slide 18 2 See Reconciliation of net loss to EBITDA and EBITDA to Adjusted EBITDA on slide 17 August 29, 2024 7
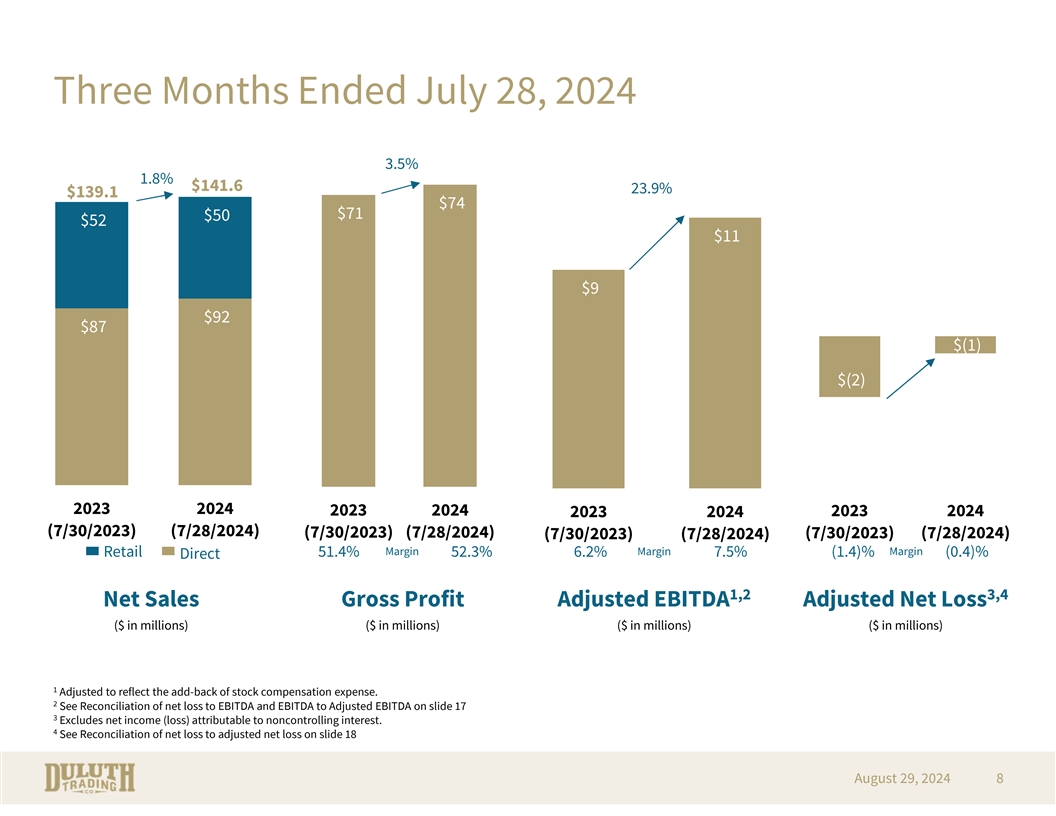
Three Months Ended July 28, 2024 3.5% 1.8% $141.6 23.9% $139.1 $74 $71 $50 $52 $11 $9 $92 $87 $(1) $(2) 2023 2024 2023 2024 2023 2024 2023 2024 (7/30/2023) (7/28/2024) (7/30/2023) (7/28/2024) (7/30/2023) (7/28/2024) (7/30/2023) (7/28/2024) Retail Direct 1,2 3,4 Net Sales Gross Profit Adjusted EBITDA Adjusted Net Loss ($ in millions) ($ in millions) ($ in millions) ($ in millions) 1 Adjusted to reflect the add-back of stock compensation expense. 2 See Reconciliation of net loss to EBITDA and EBITDA to Adjusted EBITDA on slide 17 3 Excludes net income (loss) attributable to noncontrolling interest. 4 See Reconciliation of net loss to adjusted net loss on slide 18 August 29, 2024 8
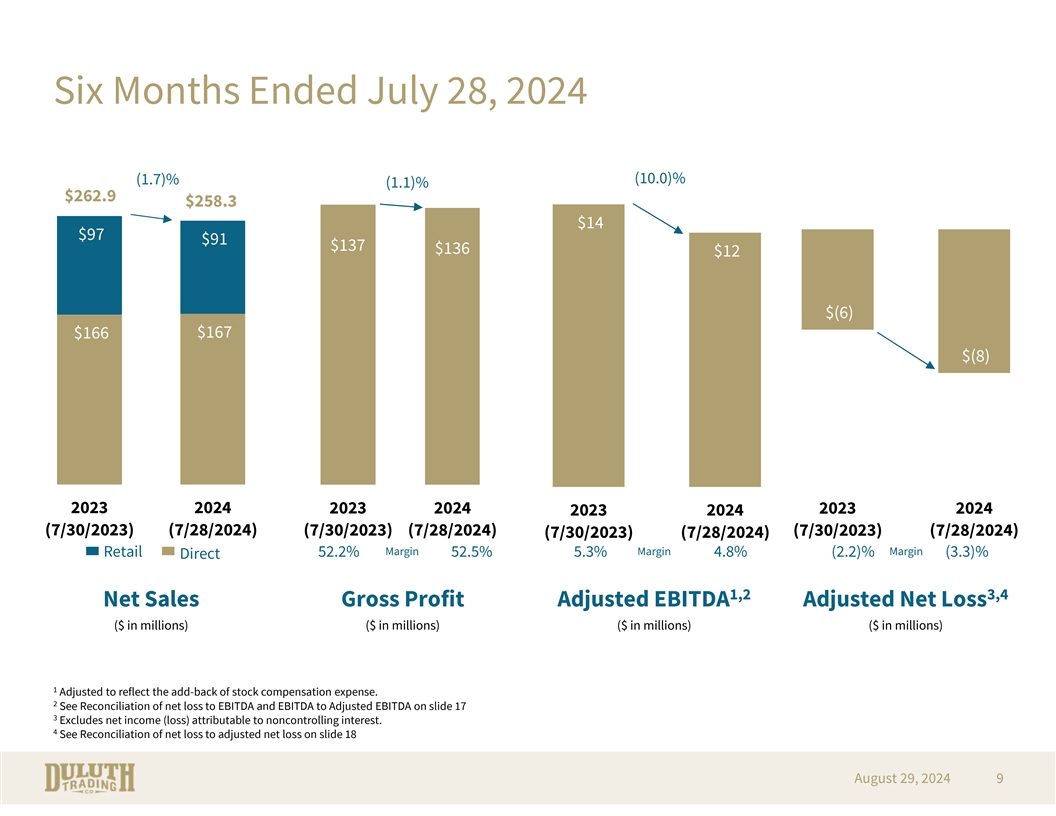
Six Months Ended July 28, 2024 (1.7)% (10.0)% (1.1)% $262.9 $258.3 $14 $97 $91 $137 $136 $12 $(6) $167 $166 $(8) 2023 2024 2023 2024 2023 2024 2023 2024 (7/30/2023) (7/28/2024) (7/30/2023) (7/28/2024) (7/30/2023) (7/28/2024) (7/30/2023) (7/28/2024) Retail Direct 1,2 3,4 Net Sales Gross Profit Adjusted EBITDA Adjusted Net Loss ($ in millions) ($ in millions) ($ in millions) ($ in millions) 1 Adjusted to reflect the add-back of stock compensation expense. 2 See Reconciliation of net loss to EBITDA and EBITDA to Adjusted EBITDA on slide 17 3 Excludes net income (loss) attributable to noncontrolling interest. 4 See Reconciliation of net loss to adjusted net loss on slide 18 August 29, 2024 9
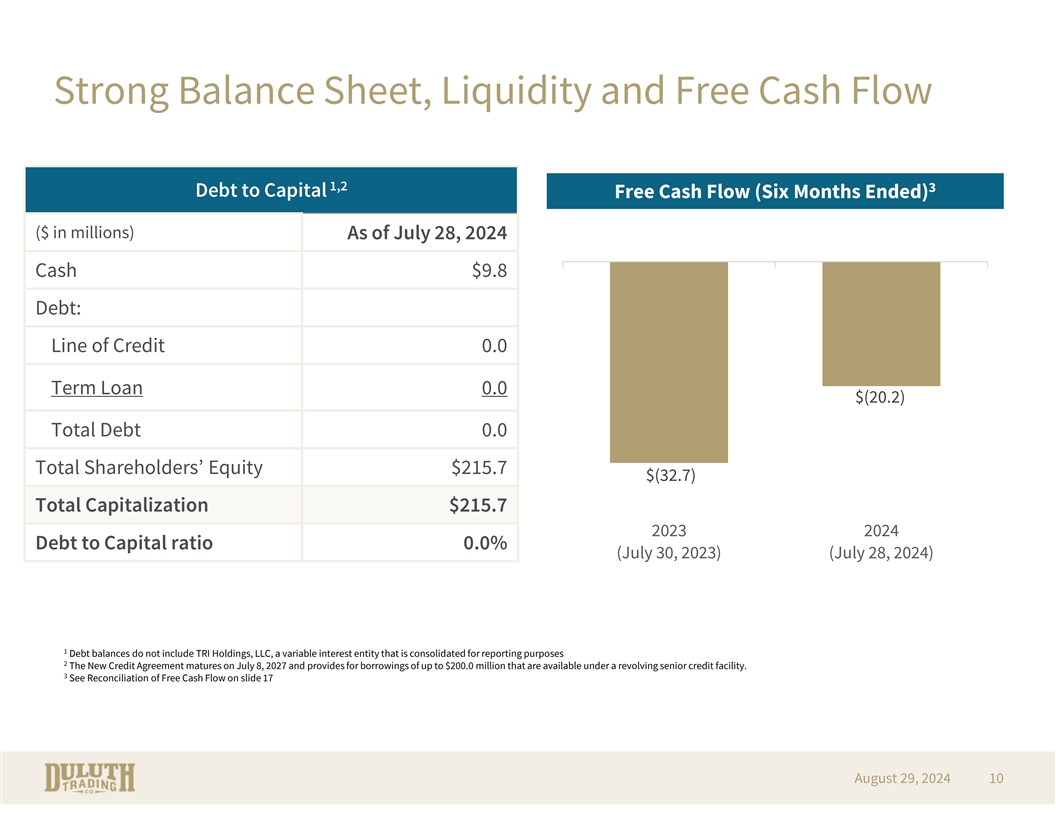
Strong Balance Sheet, Liquidity and Free Cash Flow 1,2 3 Debt to Capital Free Cash Flow (Six Months Ended) ($ in millions) As of July 28, 2024 Cash $9.8 Debt: Line of Credit 0.0 Term Loan 0.0 $(20.2) Total Debt 0.0 Total Shareholders’ Equity $215.7 $(32.7) Total Capitalization $215.7 2023 2024 Debt to Capital ratio 0.0% (July 30, 2023) (July 28, 2024) 1 Debt balances do not include TRI Holdings, LLC, a variable interest entity that is consolidated for reporting purposes 2 The New Credit Agreement matures on July 8, 2027 and provides for borrowings of up to $200.0 million that are available under a revolving senior credit facility. 3 See Reconciliation of Free Cash Flow on slide 17 August 29, 2024 10
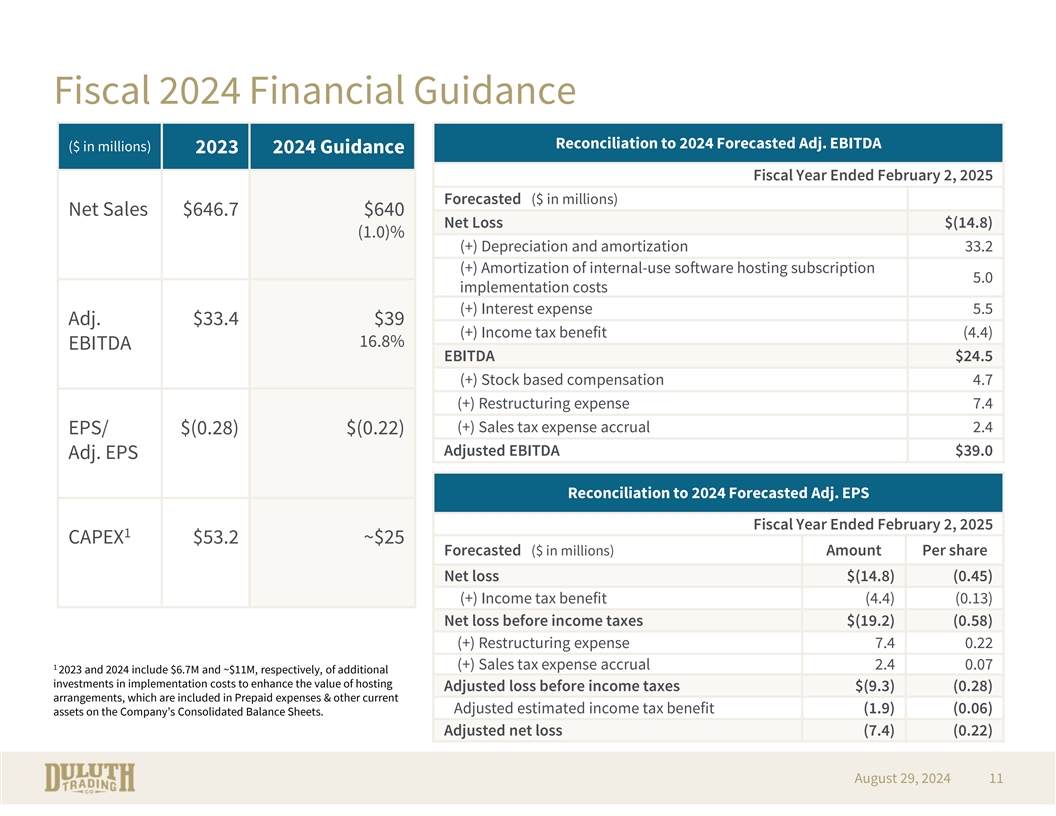
Fiscal 2024 Financial Guidance Reconciliation to 2024 Forecasted Adj. EBITDA ($ in millions) 2023 2024 Guidance Fiscal Year Ended February 2, 2025 Forecasted ($ in millions) Net Sales $646.7 $640 Net Loss $(14.8) (1.0)% (+) Depreciation and amortization 33.2 (+) Amortization of internal-use software hosting subscription 5.0 implementation costs (+) Interest expense 5.5 Adj. $33.4 $39 (+) Income tax benefit (4.4) 16.8% EBITDA EBITDA $24.5 (+) Stock based compensation 4.7 (+) Restructuring expense 7.4 (+) Sales tax expense accrual 2.4 EPS/ $(0.28) $(0.22) Adjusted EBITDA $39.0 Adj. EPS Reconciliation to 2024 Forecasted Adj. EPS Fiscal Year Ended February 2, 2025 1 CAPEX $53.2 ~$25 Forecasted ($ in millions) Amount Per share Net loss $(14.8) (0.45) (+) Income tax benefit (4.4) (0.13) Net loss before income taxes $(19.2) (0.58) (+) Restructuring expense 7.4 0.22 (+) Sales tax expense accrual 2.4 0.07 1 2023 and 2024 include $6.7M and ~$11M, respectively, of additional investments in implementation costs to enhance the value of hosting Adjusted loss before income taxes $(9.3) (0.28) arrangements, which are included in Prepaid expenses & other current Adjusted estimated income tax benefit (1.9) (0.06) assets on the Company’s Consolidated Balance Sheets. Adjusted net loss (7.4) (0.22) August 29, 2024 11
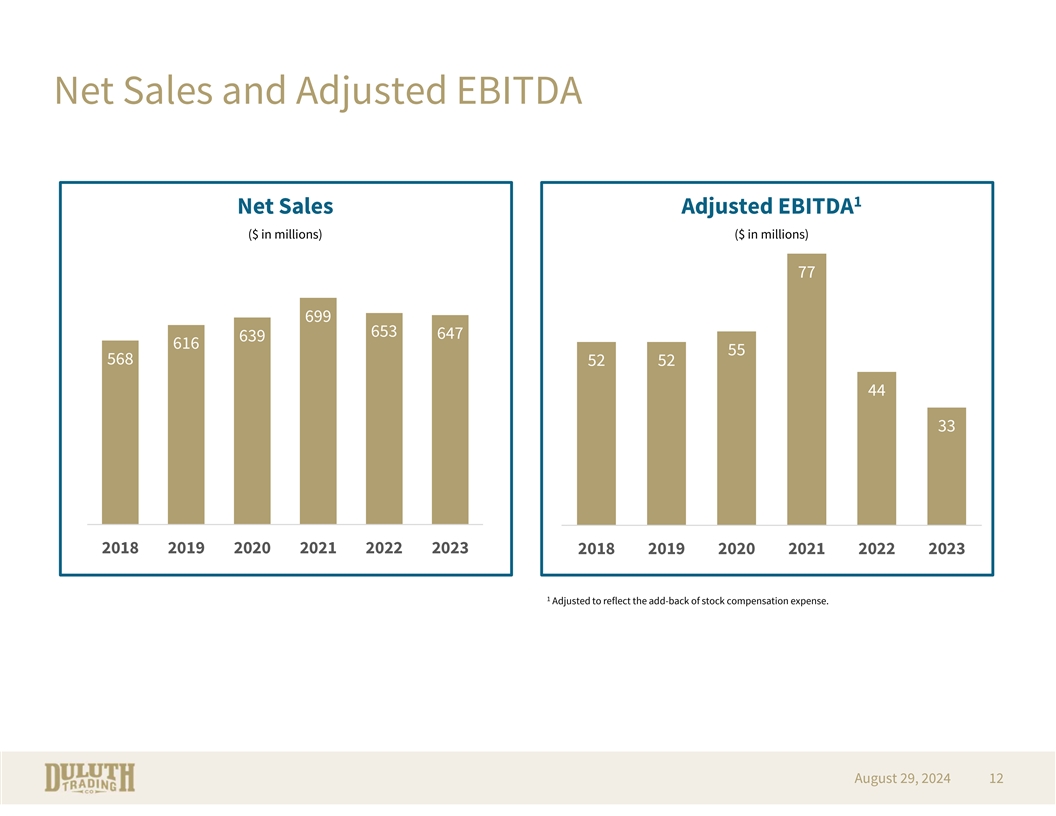
Net Sales and Adjusted EBITDA 1 Net Sales Adjusted EBITDA ($ in millions) ($ in millions) 77 699 653 647 639 616 55 568 52 52 44 33 2018 2019 2020 2021 2022 2023 2018 2019 2020 2021 2022 2023 1 Adjusted to reflect the add-back of stock compensation expense. August 29, 2024 12
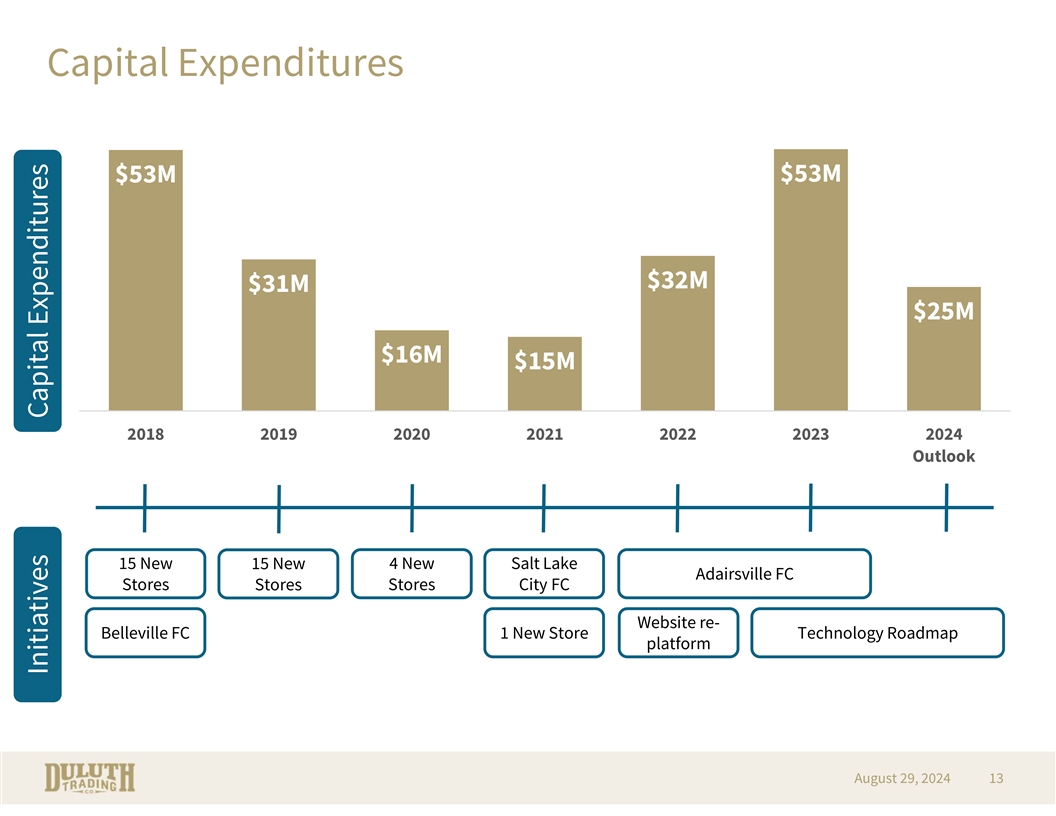
Capital Expenditures $53M $53M $32M $31M $25M $16M $15M 2018 2019 2020 2021 2022 2023 2024 Outlook 15 New 15 New 4 New Salt Lake Adairsville FC Stores Stores Stores City FC Website re- Belleville FC 1 New Store Technology Roadmap platform August 29, 2024 13 Initiatives Capital Expenditures

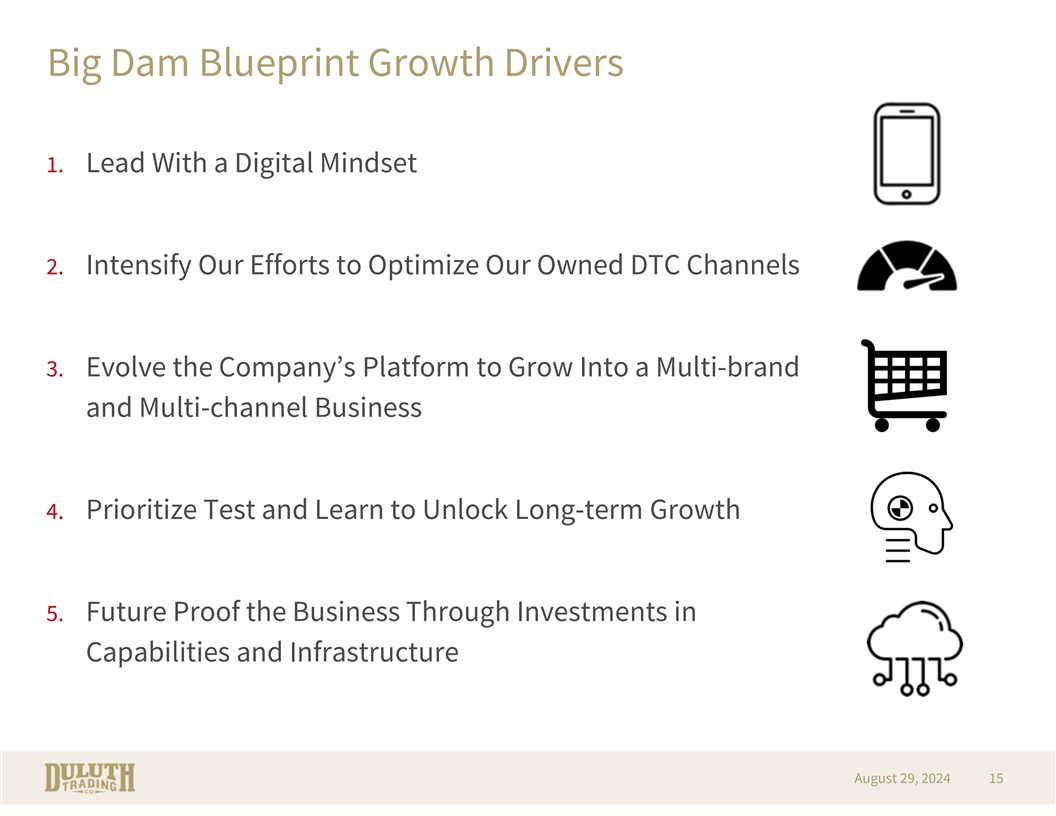
Big Dam Blueprint Growth Drivers 1. Lead With a Digital Mindset 2. Intensify Our Efforts to Optimize Our Owned DTC Channels 3. Evolve the Company’s Platform to Grow Into a Multi-brand and Multi-channel Business 4. Prioritize Test and Learn to Unlock Long-term Growth 5. Future Proof the Business Through Investments in Capabilities and Infrastructure August 29, 2024 15

THANK YOU
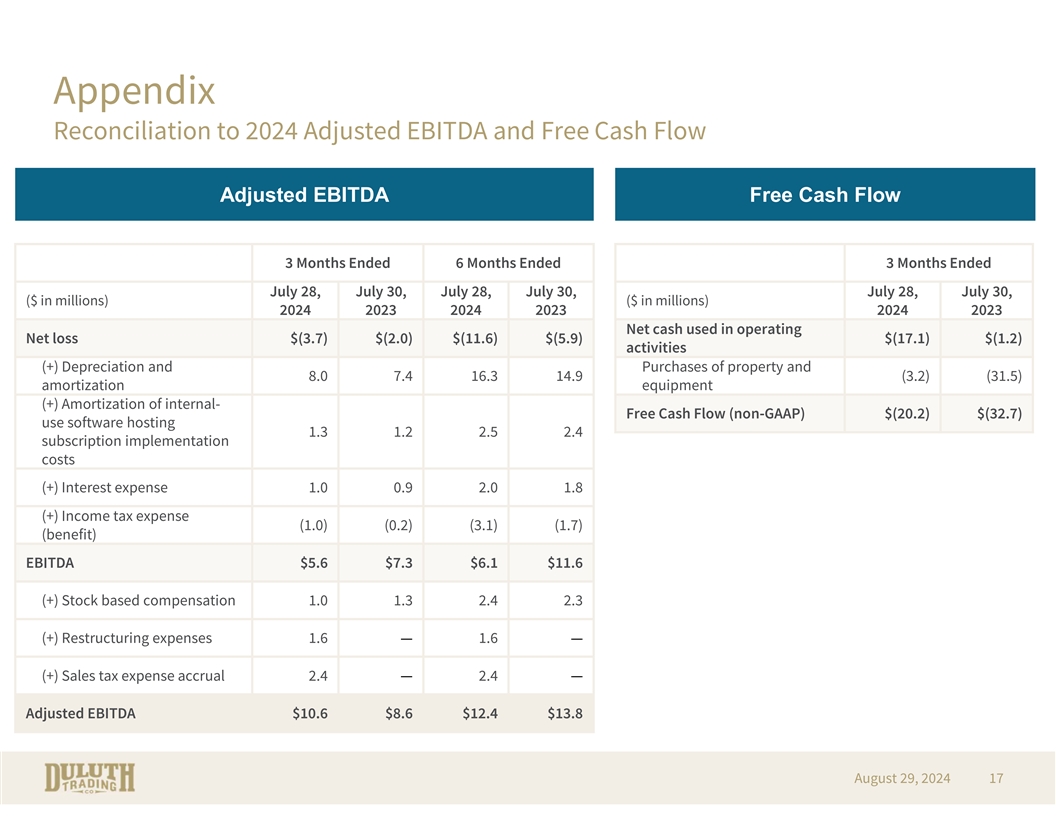
Appendix Reconciliation to 2024 Adjusted EBITDA and Free Cash Flow Adjusted EBITDA Free Cash Flow 3 Months Ended 6 Months Ended 3 Months Ended July 28, July 30, July 28, July 30, July 28, July 30, ($ in millions) ($ in millions) 2024 2023 2024 2023 2024 2023 Net cash used in operating Net loss $(3.7) $(2.0) $(11.6) $(5.9) $(17.1) $(1.2) activities (+) Depreciation and Purchases of property and 8.0 7.4 16.3 14.9 (3.2) (31.5) amortization equipment (+) Amortization of internal- Free Cash Flow (non-GAAP) $(20.2) $(32.7) use software hosting 1.3 1.2 2.5 2.4 subscription implementation costs (+) Interest expense 1.0 0.9 2.0 1.8 (+) Income tax expense (1.0) (0.2) (3.1) (1.7) (benefit) EBITDA $5.6 $7.3 $6.1 $11.6 (+) Stock based compensation 1.0 1.3 2.4 2.3 (+) Restructuring expenses 1.6 — 1.6 — (+) Sales tax expense accrual 2.4 — 2.4 — Adjusted EBITDA $10.6 $8.6 $12.4 $13.8 August 29, 2024 17
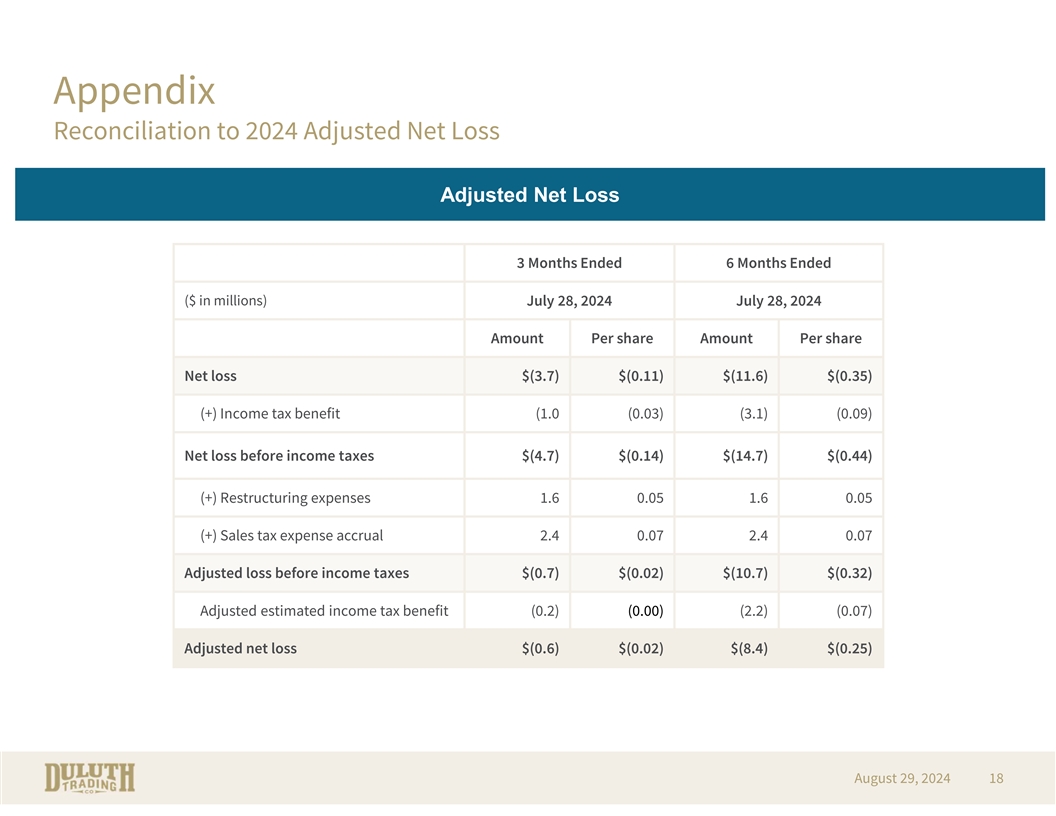
Appendix Reconciliation to 2024 Adjusted Net Loss Adjusted Net Loss 3 Months Ended 6 Months Ended ($ in millions) July 28, 2024 July 28, 2024 Amount Per share Amount Per share Net loss $(3.7) $(0.11) $(11.6) $(0.35) (+) Income tax benefit (1.0 (0.03) (3.1) (0.09) Net loss before income taxes $(4.7) $(0.14) $(14.7) $(0.44) (+) Restructuring expenses 1.6 0.05 1.6 0.05 (+) Sales tax expense accrual 2.4 0.07 2.4 0.07 Adjusted loss before income taxes $(0.7) $(0.02) $(10.7) $(0.32) Adjusted estimated income tax benefit (0.2) (0.00) (2.2) (0.07) Adjusted net loss $(0.6) $(0.02) $(8.4) $(0.25) August 29, 2024 18