UNITED STATES
SECURITIES AND EXCHANGE COMMISSION
WASHINGTON, D.C. 20549
FORM 8-K
CURRENT REPORT
Pursuant to Section 13 or 15(d)
of the Securities Exchange Act of 1934
Date of Report (Date of earliest event reported): August 6, 2024
Airbnb, Inc.
(Exact name of registrant as specified in its charter)
| Delaware | 001-39778 | 26-3051428 | ||
| (State or other jurisdiction of incorporation) |
(Commission File Number) |
(IRS Employer Identification No.) |
| 888 Brannan Street |
| San Francisco, California 94103 |
| (Address of principal executive offices) (Zip Code) |
Registrant’s telephone number, including area code: (415) 510-4027
Not applicable
(Former name or former address, if changed since last report)
Check the appropriate box below if the Form 8-K filing is intended to simultaneously satisfy the filing obligation of the registrant under any of the following provisions:
| ☐ | Written communications pursuant to Rule 425 under the Securities Act (17 CFR 230.425) |
| ☐ | Soliciting material pursuant to Rule 14a-12 under the Exchange Act (17 CFR 240.14a-12) |
| ☐ | Pre-commencement communications pursuant to Rule 14d-2(b) under the Exchange Act (17 CFR 240.14d-2(b)) |
| ☐ | Pre-commencement communications pursuant to Rule 13e-4(c) under the Exchange Act (17 CFR 240.13e-4(c)) |
Securities registered pursuant to Section 12(b) of the Act:
| Title of each class |
Trading Symbol(s) |
Name of each exchange on which registered |
||
| Class A common stock, $0.0001 par value per share | ABNB | The Nasdaq Stock Market |
Indicate by check mark whether the registrant is an emerging growth company as defined in Rule 405 of the Securities Act of 1933 (§230.405 of this chapter) or Rule 12b-2 of the Securities Exchange Act of 1934 (§240.12b-2 of this chapter).
Emerging growth company ☐
If an emerging growth company, indicate by check mark if the registrant has elected not to use the extended transition period for complying with any new or revised financial accounting standards provided pursuant to Section 13(a) of the Exchange Act. ☐
| Item 2.02. | Results of Operations and Financial Condition. |
On August 6, 2024, Airbnb, Inc. (the “Company”) issued a Shareholder Letter (the “Letter”) announcing its financial results for the second quarter ended June 30, 2024. In the Letter, the Company also announced that it would be holding a conference call on August 6, 2024 at 1:30 p.m. PT / 4:30 p.m. ET to discuss its financial results for the second quarter ended June 30, 2024. A copy of the Letter is furnished as Exhibit 99.1 to this Current Report on Form 8-K (“Form 8-K”) and is incorporated herein by reference.
The Company is making reference to non-GAAP financial information in both the Letter and the conference call. A reconciliation of these non-GAAP financial measures to their nearest GAAP equivalents is provided in the Letter.
The information furnished pursuant to Item 2.02 of this Form 8-K, including Exhibit 99.1 attached hereto, shall not be deemed “filed” for purposes of Section 18 of the Securities Exchange Act of 1934, as amended (the “Exchange Act”), or otherwise subject to the liabilities of that section, nor shall it be deemed incorporated by reference into any other filing under the Securities Act of 1933, as amended, or the Exchange Act, regardless of any general incorporation language in such filing, except as expressly set forth by specific reference in such filing.
| Item 9.01. | Financial Statements and Exhibits. |
(d) Exhibits.
| Exhibit No. |
Description |
|
| 99.1 | Shareholder Letter, dated August 6, 2024 | |
| 104.1 | Cover Page Interactive Data File (embedded within the Inline XBRL document) | |
SIGNATURES
Pursuant to the requirements of the Securities Exchange Act of 1934, as amended, the registrant has duly caused this report to be signed on its behalf by the undersigned hereunto duly authorized.
| AIRBNB, INC. | ||||||
| Date: August 6, 2024 |
By: | /s/ Elinor Mertz |
||||
| Elinor Mertz Chief Financial Officer |
||||||
Exhibit 99.1

Q2 2024 Shareholder Letter
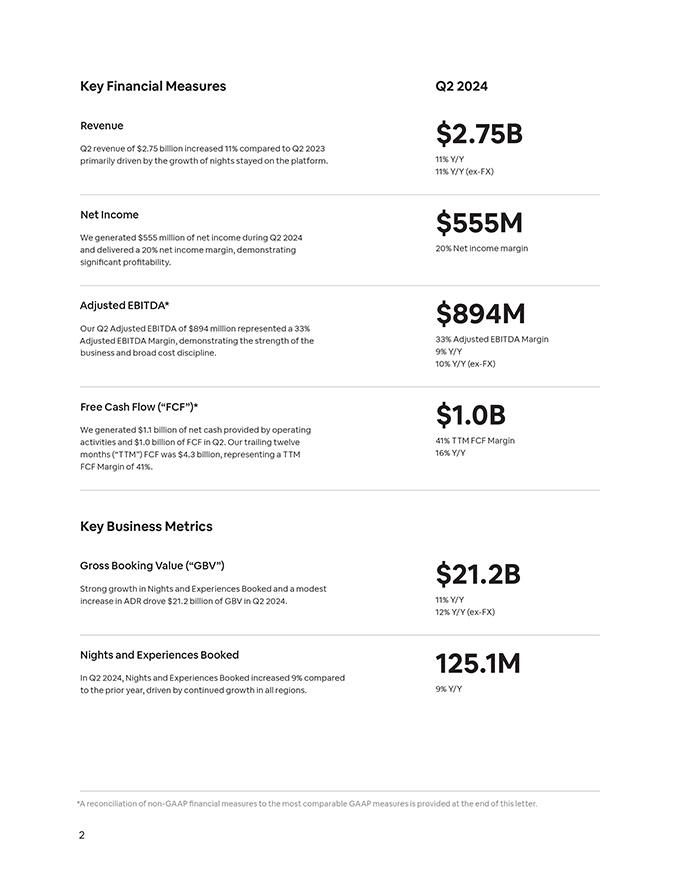
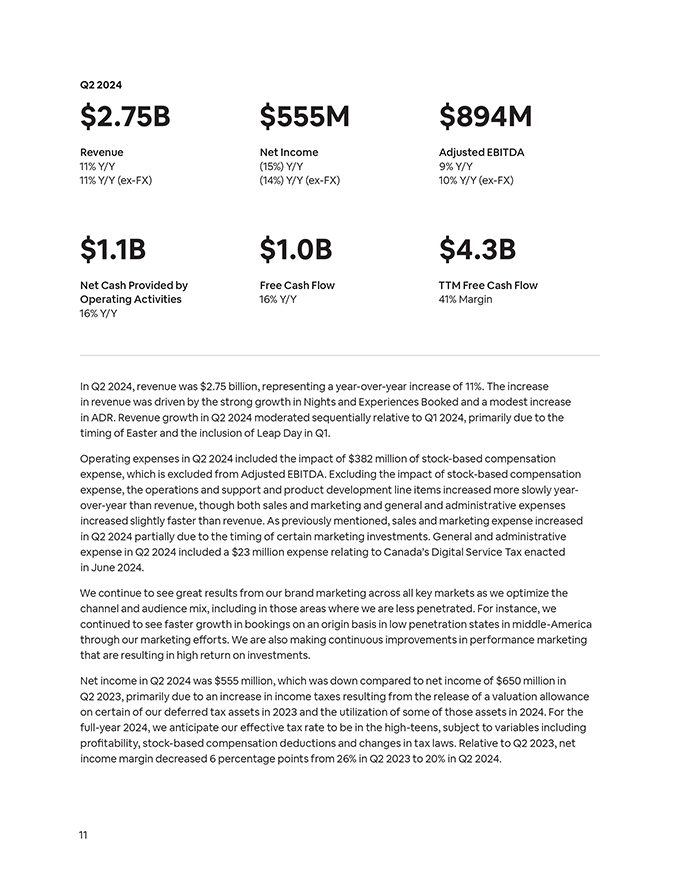
Key Financial Measures Revenue Q2 revenue of $2.75 billion increased 11% compared to Q2 2023 primarily driven by the growth of nights stayed on the platform. Q2 2024 $2.75B 11% Y/Y 11% Y/Y (ex-FX) Net Income We generated $555 million of net income during Q2 2024 and delivered a 20% net income margin, demonstrating significant profitability. Adjusted EBITDA* Our Q2 Adjusted EBITDA of $894 million represented a 33% Adjusted EBITDA Margin, demonstrating the strength of the business and broad cost discipline. Free Cash Flow (“FCF”)* We generated $1.1 billion of net cash provided by operating activities and $1.0 billion of FCF in Q2. Our trailing twelve months (“TTM”) FCF was $4.3 billion, representing a TTM FCF Margin of 41%. $555M 20% Net income margin $894M 33% Adjusted EBITDA Margin 9% Y/Y 10% Y/Y (ex-FX) $1.0B 41% TTM FCF Margin 16% Y/Y Key Business Metrics Gross Booking Value (“GBV”) Strong growth in Nights and Experiences Booked and a modest increase in ADR drove $21.2 billion of GBV in Q2 2024. $21.2B 11% Y/Y 12% Y/Y (ex-FX) Nights and Experiences Booked In Q2 2024, Nights and Experiences Booked increased 9% compared to the prior year, driven by continued growth in all regions. 125.1M 9% Y/Y *A reconciliation of non-GAAP financial measures to the most comparable GAAP measures is provided at the end of this letter. 2 Q2 2024 Shareholder Letter Q2 marked another strong quarter for Airbnb.
Revenue increased 11% year-over-year to $2.75 billion. Net income was $555 million, representing a net income margin of 20%. Adjusted EBITDA of $894 million increased 9% year-over-year and represented an Adjusted EBITDA Margin of 33%. We generated $1.0 billion of FCF during Q2 and $4.3 billion of FCF over the trailing twelve months—our highest ever. During the quarter, we made significant progress across each of our 2024 strategic priorities: • Making hosting mainstream: Last year, we shared our commitment to making hosting just as popular as traveling on Airbnb. We’ve been focused on raising awareness around the benefits of hosting and providing better tools for hosts. In Q2 2024, we surpassed 8 million active listings, driven by continued growth across all regions and market types. But we’re not just growing supply; we’re committed to ensuring it’s high quality. As part of this commitment, since we launched our updated hosting quality system in April 2023, we’ve removed over 200,000 listings that failed to meet our guests’ expectations to ensure we consistently deliver high-quality stays. • Perfecting the core service: We remain focused on making Airbnb more reliable, affordable, and an overall better service for hosts and guests. In recent years, we’ve rolled out hundreds of new features and upgrades to our platform. We’ve introduced major reliability initiatives like Guest Favorites, which make it easier for guests to find great listings, and since its launch, we’ve seen over 150 million nights booked at Guest Favorite listings. We’ve also made dozens of smaller changes that have led to improved usability and booking conversion. • Expanding beyond the core: We continue to drive growth by investing in under-penetrated markets. In Q2, growth of gross nights booked on an origin basis in our expansion markets significantly outperformed our core markets on average. We’re leveraging our global expansion playbook, which includes a more localized product and marketing approach, and will continue investing in less mature markets throughout 2024 and beyond. We’re also expanding Airbnb’s brand positioning beyond travel accommodations with the global roll out of Airbnb Icons, a new category of extraordinary experiences that we launched in May. This will be critical as we expand our offerings in the coming years. Q2 2024 Financial Results Here’s a snapshot of our Q2 2024 results • Q2 revenue was $2.75 billion, up 11% year-over-year. Revenue increased to $2.75 billion in Q2 2024 from $2.5 billion in Q2 2023, primarily driven by solid growth in Nights and Experiences Booked and a modest increase in Average Daily Rate (“ADR”). • Q2 net income was $555 million, representing a 20% net income margin. Net income decreased to $555 million in Q2 2024 from $650 million in Q2 2023 primarily due to an increase in income taxes resulting from the release of a valuation allowance on certain of our deferred tax assets in 2023 and the utilization of some of those assets in 2024. In Q2 2024, we delivered a net income margin of 20%, down from 26% in Q2 2023. 3 • Q2 Adjusted EBITDA was $894 million, up 9% year-over-year.
Adjusted EBITDA increased to $894 million in Q2 2024 from $819 million in Q2 2023, which demonstrates the continued strength of our business and discipline in managing our cost structure. Adjusted EBITDA Margin was 33% in Q2 2024, which was stable with Q2 2023.1 • Q2 Free Cash Flow was $1.0 billion, up 16% year-over-year. In Q2 2024, net cash provided by operating activities was $1.1 billion compared to $909 million in Q2 2023. The increase in year-over-year cash flow was driven by continued strong business performance. Our TTM FCF was $4.3 billion, representing a FCF Margin of 41%.2 • Q2 share repurchases of $749 million. Our strong cash flow enabled us to repurchase $749 million of our Class A common stock in Q2 2024. Share repurchases for the trailing twelve months totaled $2.75 billion and helped us to reduce our fully diluted share count from 686 million at the end of Q2 2023 to 673 million at the end of Q2 2024. We have a remaining authorization to purchase up to $5.25 billion of our Class A common stock as of June 30, 2024. Business Highlights Our strong quarter was driven by a number of positive business highlights: • Guests are increasingly booking on the Airbnb app. In Q2 2024, Nights and Experiences Booked increased 9% year-over-year, representing stable growth from Q1. With the growing reliance on smartphones for travel planning and booking, we optimized our mobile website to promote Airbnb app downloads. We believe our approach is working. In Q2 2024, we saw a 25% year-over-year increase in app downloads globally, with even stronger growth in the US. In addition, nights booked on our app during Q2 2024 increased 19% year-over-year and now comprises 55% of total nights booked, up from 50% in the prior-year period. In addition to our success with mobile downloads and bookings, we’re seeing continued growth of first-time bookers on our platform, with the highest level of growth seen in the youngest age demographic. • Guests are choosing Airbnb for special events. The week of July 4th represented our single highest week of revenue ever in North America, and we’re continuing to see more guests choose Airbnb for major holidays and events. In Europe, major sporting events are driving notable bookings growth. In anticipation of the Summer Olympic Games Paris 2024, nights booked in the Paris region for the dates of the event through Q2 were more than double what they were the same time a year ago. To help meet this increased demand, we focused on supply growth and saw active listings increase 37% year-over-year in the Paris region as of Q2 2024. Over the course of the Olympics, more than 400,000 guests are staying on Airbnb in the Paris region. And during the recent Euro Cup in Germany, cities hosting matches saw on average a more than 20% year-over-year increase in nights booked compared to the prior- year period, with certain cities seeing more than 50% growth. 1, 2 A reconciliation of non-GAAP financial measures to the most comparable GAAP measures is provided at the end of this letter. 4 • Supply quality is improving on Airbnb.
We’ve made huge strides with supply growth, but remain just as focused on supply quality. As we improve quality, we believe more people will try Airbnb, unlocking even more growth. We have two major initiatives underway to help us do this. First, we’re removing low-quality supply, including the removal of over 200,000 listings since we launched our updated hosting quality system in April 2023, which takes a more targeted and holistic approach to better evaluate listings. Second, we’re making it easier for guests to find the best places to stay. We launched Guest Favorites as well as top listing highlights, which show percentile ranking for the top 1%, 5%, and 10% of eligible homes. These new features make it easy for guests to find the highest-quality homes on Airbnb and over 150 million nights have already been booked at our Guest Favorite listings since launch. In Q2, we also saw active listings managed by Superhosts, some of our most high-quality hosts, increase 26% year-over-year. Results from our 2024 Summer Release On May 1, we introduced Icons–a new category of extraordinary experiences hosted by some of the greatest names in music, film, television, art, sports, and more. We’ve unveiled the first 12 Icons on Airbnb, including a stay at Team Riley Headquarters of Disney and Pixar’s Inside Out 2, and a night at the Musée d’Orsay in Paris to kick off the Summer Olympic Games Paris 2024. New Icons will launch throughout the year, and you can request to book them right in the app.3 Since our Summer Release, we’ve seen nearly 40 million views of Icons on our site. In addition, with more than 850 million social impressions, Icons are expanding Airbnb’s brand positioning beyond travel accommodations. This is key to our strategy as we prepare to roll out new offerings in the coming years. Our 2024 Summer Release also included significant improvements to group travel on Airbnb. More than 80% of bookings on Airbnb are group trips, so we introduced new features that make planning a trip with other people easier than ever:4 • Shared wishlists – let guests easily share their favorite homes with others on the trip, inviting them to add homes, write notes and vote on listings. In June, the number of bookings from shared wishlists was more than double what it was during the same period last year. • A new messages tab – allows everyone on a trip to message with the host in a group thread. We’ve seen quick adoption of group message threads since launch. • Trip invitations – make it easy for guests to invite others to join the trip, giving them access to all the reservation details they need. The number of trips with registered co-travelers in June more than doubled on a year-over-year basis. A registered account and/or profile are required before a traveler is added to a wishlist, booking, or messaging thread. Since launching these improvements, hundreds of thousands of people have created new accounts on Airbnb. 3 There is no cost to submit a request to book an Icon. See rules for terms, including age and geographic eligibility, and how data is used at airbnb.com/iconsrules. 4 Group trips are based on those with 2 or more people. 5 Results from our 2023 Winter Release Our 2023 Winter Release was largely focused on quality.
We introduced Guest Favorites–a collection of the most-loved homes on Airbnb based on ratings, reviews, and reliability data. Since launching in November 2023, we’ve had over 150 million nights booked for these listings. The Guest Favorites badge allows us to steer guests toward our highest-quality listings and help provide them with more consistent stays on Airbnb. Since launch, we’ve seen an increase in 5-star ratings and lower rates of trip issues reported by guests. These improvements were even more significant for first-time bookers. We also continue to make progress on host cancellations, which, although rare, are a significant pain point for guests. In Q2, the cancellation rates by hosts decreased over 30% from a year ago. Ongoing product improvements Twice a year, we launch our highly anticipated Summer and Winter Releases that include the most exciting updates and enhancements to the Airbnb experience. In addition to these bi-annual events, we’re continuously optimizing the platform to improve the experience for guests and hosts and drive business growth. Throughout the first half of the year, we’ve made dozens of changes that have led to improved usability and booking conversion. They include enhanced details on maps, clear indication of cancellation policies, simplified signup and login, and much more. We’ve made great progress, and we’ll never stop improving Airbnb. 6
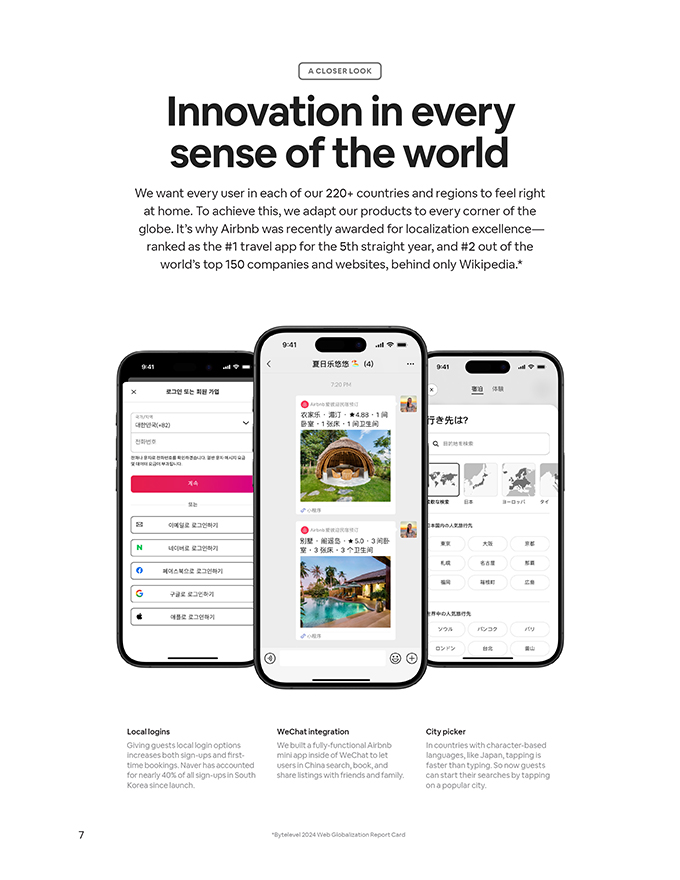
A CLOSER LOOK Innovation in every sense of the world We want every user in each of our 220+ countries and regions to feel right at home. To achieve this, we adapt our products to every corner of the globe. It’s why Airbnb was recently awarded for localization excellence—ranked as the #1 travel app for the 5th straight year, and #2 out of the world’s top 150 companies and websites, behind only Wikipedia.* Local logins WeChat integration City picker Giving guests local login options We built a fully-functional Airbnb In countries with character-based increases both sign-ups and first- mini app inside of WeChat to let languages, like Japan, tapping is time bookings. Naver has accounted users in China search, book, and faster than typing. So now guests for nearly 40% of all sign-ups in South share listings with friends and family. can start their searches by tapping Korea since launch. on a popular city. 7 *Bytelevel 2024 Web Globalization Report Card

A CLOSER LOOK The most extraordinary experiences on Earth Icons let you step into worlds you’ve only ever dreamed of—all over the world. These international experiences aren’t just making headlines, they’re inviting new audiences across the globe into the magic of Airbnb.* Janhvi Kapoor Musée d’Orsay Feid The experience and the never- A true ‘night at the museum’ The Colombian star’s world tour before-seen home of the evening, this remarkable created a world of traffic for Airbnb, Bollywood star has been shared Parisian experience generated with over 1.5 million views and almost 65k times, and viewed over 3 million views and nearly nearly 50k shares from reggaeton over 3 million times. 100k shares. lovers around the planet. 8 *There is no cost to submit a request. See full rules for terms, including age and geographic eligibility, and how data is used at airbnb.com/iconsrules
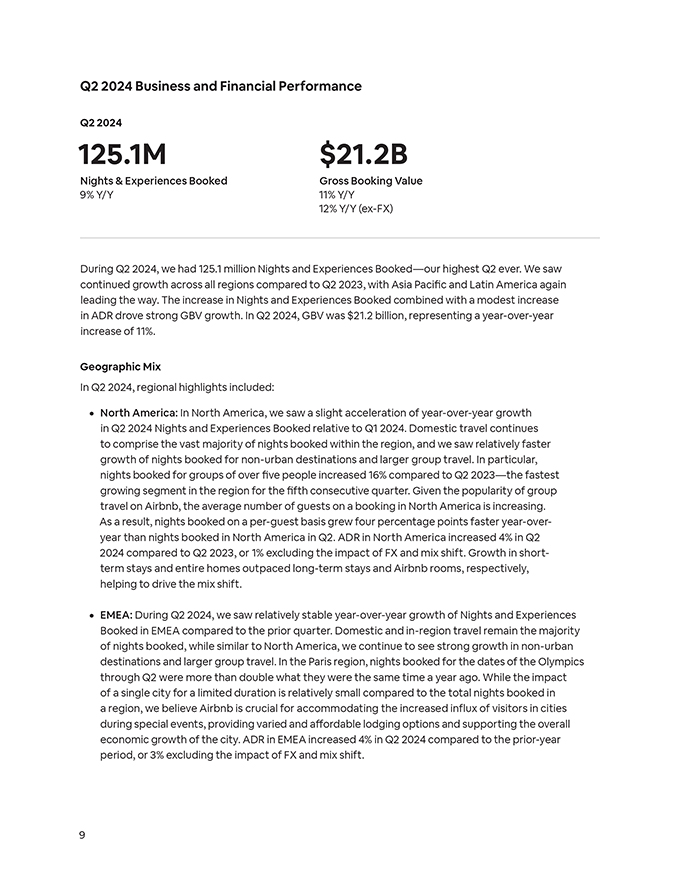
Q2 2024 Business and Financial Performance Q2 2024 125.1M $21.2B Nights & Experiences Booked Gross Booking Value 9% Y/Y 11% Y/Y 12% Y/Y (ex-FX) During Q2 2024, we had 125.1 million Nights and Experiences Booked—our highest Q2 ever. We saw continued growth across all regions compared to Q2 2023, with Asia Pacific and Latin America again leading the way. The increase in Nights and Experiences Booked combined with a modest increase in ADR drove strong GBV growth. In Q2 2024, GBV was $21.2 billion, representing a year-over-year increase of 11%. Geographic Mix In Q2 2024, regional highlights included: • North America: In North America, we saw a slight acceleration of year-over-year growth in Q2 2024 Nights and Experiences Booked relative to Q1 2024. Domestic travel continues to comprise the vast majority of nights booked within the region, and we saw relatively faster growth of nights booked for non-urban destinations and larger group travel. In particular, nights booked for groups of over five people increased 16% compared to Q2 2023—the fastest growing segment in the region for the fifth consecutive quarter. Given the popularity of group travel on Airbnb, the average number of guests on a booking in North America is increasing. As a result, nights booked on a per-guest basis grew four percentage points faster year-over-year than nights booked in North America in Q2. ADR in North America increased 4% in Q2 2024 compared to Q2 2023, or 1% excluding the impact of FX and mix shift. Growth in short-term stays and entire homes outpaced long-term stays and Airbnb rooms, respectively, helping to drive the mix shift. • EMEA: During Q2 2024, we saw relatively stable year-over-year growth of Nights and Experiences Booked in EMEA compared to the prior quarter. Domestic and in-region travel remain the majority of nights booked, while similar to North America, we continue to see strong growth in non-urban destinations and larger group travel. In the Paris region, nights booked for the dates of the Olympics through Q2 were more than double what they were the same time a year ago. While the impact of a single city for a limited duration is relatively small compared to the total nights booked in a region, we believe Airbnb is crucial for accommodating the increased influx of visitors in cities during special events, providing varied and affordable lodging options and supporting the overall economic growth of the city. ADR in EMEA increased 4% in Q2 2024 compared to the prior-year period, or 3% excluding the impact of FX and mix shift.
• Latin America: In Latin America, Nights and Experiences Booked grew 17% in Q2 2024 compared to Q2 2023. During the quarter, we saw continued strength in domestic travel with domestic gross nights booked in Latin America increasing 24% compared to the prior-year period. Consistent with recent quarters, we saw the highest year-over-year growth of active listings in Latin America and Asia Pacific—the two regions that also had the highest level of year-over-year growth of Nights and Experiences Booked. • Asia Pacific: In Asia Pacific, Nights and Experiences Booked increased 19% on a year-over-year basis. This region is generally reliant on cross-border travel and in Q2 2024, we saw cross-border travel to Asia Pacific grow 22% year-over-year. In addition, although the recovery has been and continues to be gradual, we are encouraged by the recovery of the outbound China business. Average Daily Rates ADR was $170 in Q2 2024, increasing 2% compared to Q2 2023. Excluding the impact of FX, ADR in Q2 2024 increased 3% and was higher across all regions, largely due to price appreciation and mix shift. 10
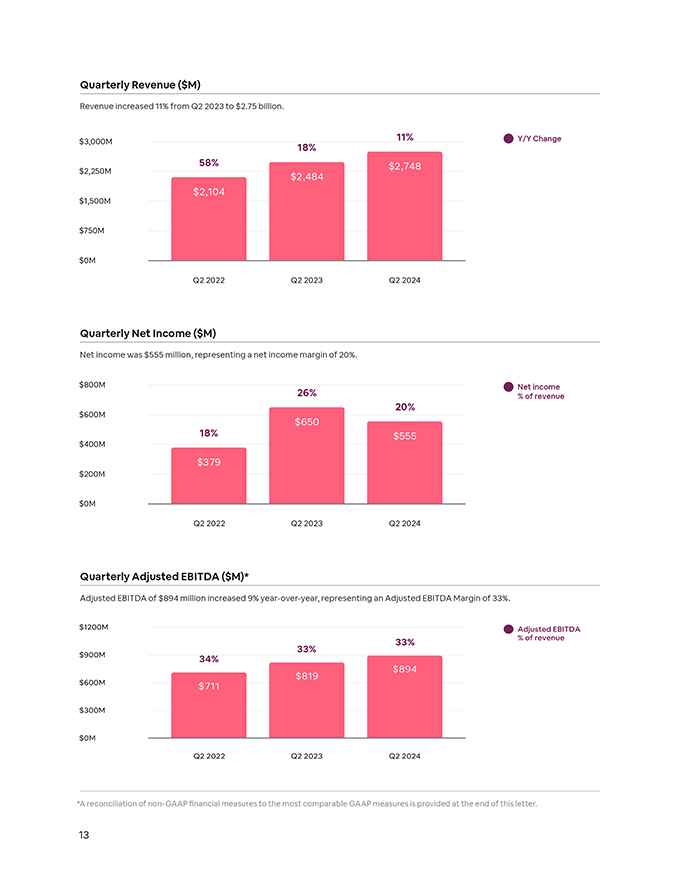
Quarterly Revenue ($M) Revenue increased 11% from Q2 2023 to $2.75 billion. $3,000M $2,250M $1,500M $750M $0M 58% $2,104 Q2 2022 18% $2,484 Q2 2023 11% $2,748 Q2 2024 Y/Y Change Quarterly Net Income ($M) Net income was $555 million, representing a net income margin of 20%. $800M $600M $400M $200M $0M 18% $379 Q2 2022 26% $650 Q2 2023 20% $555 Q2 2024 Net income % of revenue Quarterly Adjusted EBITDA ($M)* Adjusted EBITDA of $894 million increased 9% year-over-year, representing an Adjusted EBITDA Margin of 33%. $1200M $900M $600M $300M $0M 34% $711 Q2 2022 33% $819 Q2 2023 33% $894 Q2 2024 Adjusted EBITDA % of revenue *A reconciliation of non-GAAP financial measures to the most comparable GAAP measures is provided at the end of this letter. 13
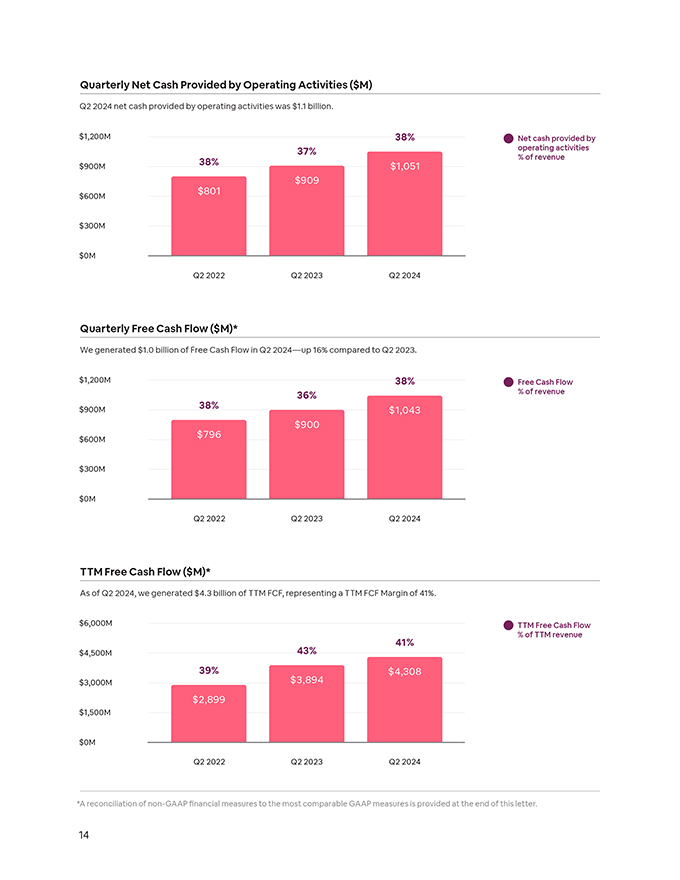
Quarterly Net Cash Provided by Operating Activities ($M) Q2 2024 net cash provided by operating activities was $1.1 billion.$1,200M $900M $600M $300M $0M 38% $801 Q2 2022 37% $909 Q2 2023 38% $1,051 Q2 2024 Net cash provided by operating activities % of revenue Quarterly Free Cash Flow ($M)* We generated $1.0 billion of Free Cash Flow in Q2 2024—up 16% compared to Q2 2023. $1,200M $900M $600M $300M $0M 38% $796 Q2 2022 36% $900 Q2 2023 38% $1,043 Q2 2024 Free Cash Flow % of revenue TTM Free Cash Flow ($M)* As of Q2 2024, we generated $4.3 billion of TTM FCF, representing a TTM FCF Margin of 41%. $6,000M $4,500M $3,000M $1,500M $0M 39% $2,899 Q2 2022 43% $3,894 Q2 2023 41% $4,308 Q2 2024 TTM Free Cash Flow % of TTM revenue *A reconciliation of non-GAAP financial measures to the most comparable GAAP measures is provided at the end of this letter. 14
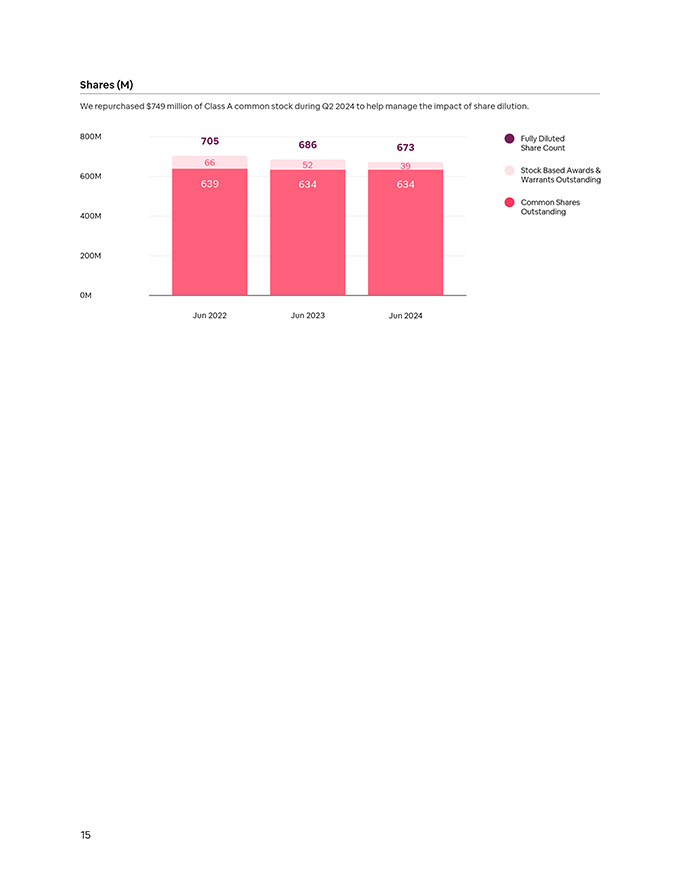
Shares (M) We repurchased $749 million of Class A common stock during Q2 2024 to help manage the impact of share dilution. 800M 705 Fully Diluted 686 673 Share Count 66 52 39 Stock Based Awards & 600M Warrants Outstanding 639 634 634 Common Shares Outstanding 400M 200M 0M Jun 2022 Jun 2023 Jun 2024
Balance Sheet and Cash Flows For the three months ended June 30, 2024, we reported $1.1 billion of net cash provided by operating activities and $1.0 billion of FCF, compared to $909 million and $900 million, respectively, for the three months ended June 30, 2023.6 As of June 30, 2024, we had $11.3 billion of cash and cash equivalents, short-term investments, and restricted cash. We also had $10.3 billion of funds held on behalf of guests as of June 30, 2024. Capital Allocation In February 2024, we announced a share repurchase authorization to purchase up to $6 billion of our Class A common stock. During Q2 2024, we repurchased $749 million of our Class A common stock under this authorization. The repurchase program continues to be executed as part of our broader capital allocation strategy which prioritizes investments in organic growth, strategic acquisitions where relevant, and return of capital to shareholders, in that order. Our strong balance sheet and significant cash flow generation provides us the opportunity to pursue all three capital allocation priorities. In addition to our share repurchase plan, we often use corporate cash to make required tax payments associated with the vesting of employee RSUs, and withhold a corresponding number of shares from employees, rather than selling employee shares on their behalf to cover related taxes. Since the inception of our share repurchases in Q3 2022, we have reduced our fully diluted share count by approximately 5% through a combination of share repurchases and cash used for employee tax obligations totaling $7 billion. Outlook In Q3 2024, we expect to deliver revenue of $3.67 billion to $3.73 billion, representing year-over-year growth of 8% to 10%, inclusive of a modest foreign exchange headwind. We anticipate that our implied take rate in Q3 2024 will be higher on a year-over-year basis, primarily due to the timing of bookings and cross-currency transaction fees, partially offset by investments in customer service aimed to enhance the guest and host experience, which impact contra-revenue. During Q3 2024, we expect a sequential moderation in the year-over-year growth of Nights and Experiences Booked relative to Q2 2024. Latin America and Asia Pacific continue to be our fastest growing regions. However, we are seeing shorter booking lead times globally and some signs of slowing demand from U.S. guests. Lastly, we expect ADR to increase modestly on a year-over- year basis in Q3 2024. In Q3 2024, we expect Adjusted EBITDA to approximate Q3 2023 on a nominal basis, but for Adjusted EBITDA Margin to decline relative to Q3 2023. Marketing expense is expected to grow faster than revenue on a year-over-year basis in Q3 2024, partially due to timing and investments in new growth markets. 6 A reconciliation of non-GAAP financial measures to the most comparable GAAP measures is provided at the end of this letter. 16
For the full-year 2024, consistent with our prior guidance, we expect to grow Adjusted EBITDA on a nominal basis and to deliver an Adjusted EBITDA Margin of at least 35%, providing us flexibility to invest in incremental growth opportunities over the course of the year. We also expect to continue to deliver a full-year 2024 Free Cash Flow margin several points above our EBITDA margin. Earnings Webcast Airbnb will host an audio webcast to discuss its second quarter results at 1:30 p.m. PT / 4:30 p.m. ET on August 6, 2024. The link to the webcast will be made available on the Investor Relations website at https://investors.airbnb.com. Interested parties can register for the call in advance by visiting https://registrations.events/direct/ Q4I663653. After registering, instructions will be shared on how to join the call. Investor Relations Contact: ir@airbnb.com Press Contact: contact.press@airbnb.com About Airbnb Airbnb was born in 2007 when two hosts welcomed three guests to their San Francisco home, and has since grown to over 5 million hosts who have welcomed over 1.5 billion guest arrivals in almost every country across the globe. Every day, hosts offer unique stays and experiences that make it possible for guests to connect with communities in a more authentic way. Forward-Looking Statements This letter contains forward-looking statements within the meaning of the Private Securities Litigation Reform Act of 1995. All statements other than statements of historical fact could be deemed forward-looking, including, but not limited to, statements regarding the future performance of Airbnb, Inc. and its consolidated subsidiaries (the “Company”), including its financial outlook for the third quarter of 2024 and the fiscal year 2024; the other expectations described under “Outlook” above; the Company’s expectations regarding travel trends and the travel industry generally; the Company’s strategic priorities and investments, including those in certain markets; the Company’s expectations with respect to the demand for bookings, and expectations with respect to increases in and the quality of active listings; the Company’s expectations regarding cross-border travel; the Company’s expectation of attracting and retaining more hosts; the growth of active listings; the Company’s expectations regarding international expansion; the Company’s expectations regarding long-term stays through its platform; the Company’s expectations regarding bookings around major holidays or events; the Company’s plans regarding guest service fees and cross-currency bookings and the impact on take rate; the Company’s expectations regarding its financial performance, including its revenue, implied take rate, Adjusted EBITDA, and Adjusted EBITDA Margin; the Company’s expectations regarding future operating performance, including Nights and Experiences Booked and GBV; the Company’s expectations regarding ADR; the Company’s 17
expectations regarding marketing spend; the Company’s expectations with respect to stock-based compensation expense; the Company’s share repurchase program; the Company’s expectations for product and services growth and enhancements, including the ongoing impact and results from platform enhancements or new features, including the Company’s 2023 Winter Release and 2024 Summer Release; the Company’s expectations regarding the success of offerings beyond accommodations, including Icons; and the Company’s business strategy, plans, and objectives for future operations. In some cases, forward-looking statements can be identified by terms such as “may,” “will,” “appears,” “should,” “expects,” “plans,” “anticipates,” “could,” “outlook,” “intends,” “target,” “projects,” “contemplates,” “believes,” “estimates,” “predicts,” “potential,” or “continue,” or the negative of these words or other similar terms or expressions that concern our expectations, strategy, plans, or intentions. Such statements are subject to a number of known and unknown risks, uncertainties, assumptions, and other factors that may cause the Company’s actual results, performance, or achievements to differ materially from results expressed or implied in this letter. Investors are cautioned not to place undue reliance on these statements, and reported results should not be considered as an indication of future performance. Risks that contribute to the uncertain nature of the forward-looking statements include, among others, the travel industry, travel trends, and the global economy generally; the Company’s ability to retain existing hosts and guests and add new hosts and guests; any decline or disruption in the travel and hospitality industries or economic downturn; the Company’s ability to compete successfully; changes to the laws and regulations that may limit the Company’s hosts’ ability and willingness to provide their listings, and/or result in significant fines, liabilities, and penalties to the Company; the effect of extensive regulation and oversight, litigation, and other proceedings related to the Company’s business in a variety of areas; the Company’s ability to maintain its brand and reputation, and effectively drive traffic to its platform; the effectiveness of the Company’s strategy and business initiatives; the Company’s operations in international markets; the Company’s level of indebtedness; the Company’s final closing procedures, final adjustments, and other developments that may arise in the course of audit and review procedures; and changes in political, business, and economic conditions; as well as other risks listed or described from time to time in the Company’s filings with the Securities and Exchange Commission (the “SEC”), including the Company’s Annual Report on Form 10-K for the fiscal year ended December 31, 2023, the Company’s Quarterly Report on Form 10-Q for the quarter ended June 30, 2024 and any subsequent filings, which are or will be on file with the SEC and available on the investor relations page of the Company’s website. All forward looking statements are based on information and estimates available to the Company at the time of this letter and are not guarantees of future performance. Except as required by law, the Company assumes no obligation to update any of the statements in this letter. The information that can be accessed through hyperlinks or website addresses included herein is deemed not to be incorporated in or part of this letter. Non-GAAP Financial Measures In addition to our results determined in accordance with generally accepted accounting principles in the United States (“GAAP”), we review financial measures that are not calculated and presented in accordance with GAAP (“non-GAAP financial measures”). We believe our non-GAAP financial measures are useful in evaluating our operating performance. We use the following non-GAAP financial information, collectively, to evaluate our ongoing operations and for internal planning and forecasting purposes. We believe that non-GAAP financial information, when taken collectively, may be helpful to investors because it provides 18
consistency and comparability with past financial performance, and assists in comparisons with other companies, some of which use similar non-GAAP financial information to supplement their GAAP results. The non-GAAP financial information is presented for supplemental informational purposes only, should not be considered a substitute for financial information presented in accordance with GAAP, and may be different from similarly titled non-GAAP measures used by other companies. A reconciliation of each non-GAAP financial measure to the most directly comparable financial measure stated in accordance with GAAP is provided below. Investors are encouraged to review the related GAAP financial measures and the reconciliation of these non-GAAP financial measures to their most directly comparable GAAP financial measures. Our non-GAAP financial measures include Adjusted EBITDA, Adjusted EBITDA Margin, Free Cash Flow, Free Cash Flow Margin, trailing twelve months (“TTM”) Free Cash Flow, TTM Free Cash Flow Margin, revenue change excluding the effect of changes in foreign exchange rates (“ex-FX”), net income ex-FX, and Adjusted EBITDA ex-FX. Adjusted EBITDA is defined as net income or loss adjusted for (i) provision for (benefit from) income taxes; (ii) other income (expense), net, and interest income; (iii) depreciation and amortization; (iv) stock-based compensation expense; (v) acquisition-related impacts consisting of gains (losses) recognized on changes in the fair value of contingent consideration arrangements; (vi) net changes to the reserves for lodging taxes for which management believes it is probable that we may be held jointly liable with hosts for collecting and remitting such taxes, and the applicability of withholding taxes on payments made to such hosts; and (vii) restructuring charges. The above items are excluded from our Adjusted EBITDA measure because these items are non-cash in nature, or because the amount and timing of these items is unpredictable, not driven by core results of operations and renders comparisons with prior periods and competitors less meaningful. Reconciliations of expected Adjusted EBITDA and Adjusted EBITDA Margins to corresponding net income (loss) and net income (loss) margins have not been provided because of the unpredictability of certain of the items excluded from Adjusted EBITDA and because we cannot determine their probable significance. We believe Adjusted EBITDA provides useful information to investors and others in understanding and evaluating our results of operations, as well as provides a useful measure for period-to-period comparisons of our business performance. Moreover, we have included Adjusted EBITDA in this letter because it is a key measurement used by our management internally to make operating decisions, including those related to operating expenses, evaluating performance, and performing strategic planning and annual budgeting. Adjusted EBITDA has limitations as a financial measure, should be considered as supplemental in nature, and is not meant as a substitute for the related financial information prepared in accordance with GAAP. These limitations include the following: Adjusted EBITDA does not reflect interest income and other income (expense), net, which include unrealized and realized gains and losses on foreign currency exchange, investments, and financial instruments; Adjusted EBITDA excludes certain recurring, non-cash charges, such as depreciation of property and equipment and amortization of intangible assets, and although these are non-cash charges, 19
the assets being depreciated and amortized may have to be replaced in the future, and Adjusted EBITDA does not reflect all cash requirements for such replacements or for new capital expenditure requirements; Adjusted EBITDA excludes stock-based compensation expense, which has been, and will continue to be for the foreseeable future, a significant recurring expense in our business and an important part of our compensation strategy; Adjusted EBITDA excludes acquisition-related impacts consisting of gains (losses) recognized on changes in the fair value of contingent consideration arrangements. The contingent consideration, which was in the form of equity, was valued as of the acquisition date and is marked-to-market at each reporting period based on factors including our stock price; Adjusted EBITDA does not reflect net changes to reserves for lodging taxes for which management believes it is probable that we may be held jointly liable with hosts for collecting and remitting such taxes and reserves, and the applicability of withholding taxes on payments made to such hosts; and Adjusted EBITDA does not reflect restructuring charges, which include impairment of operating lease right-of-use assets and leasehold improvements. Adjusted EBITDA Margin is defined as Adjusted EBITDA divided by revenue. Because of these limitations, you should consider Adjusted EBITDA and Adjusted EBITDA Margin alongside other financial performance measures, including net income (loss) and our other GAAP results. Free Cash Flow represents net cash provided by (used in) operating activities less purchases of property and equipment. We believe that Free Cash Flow is a meaningful indicator of liquidity that provides information to management and investors about the amount of cash generated from operations that, after purchases of property and equipment, can be used for strategic initiatives, including continuous investment in our business, growth through acquisitions, and strengthening our balance sheet. Our Free Cash Flow is impacted by the timing of GBV because we collect our service fees at the time of booking, which is generally before a stay or experience occurs. Funds held on behalf of our hosts and guests and amounts payable to our hosts and guests do not impact Free Cash Flow, except interest earned on these funds. Free Cash Flow Margin is defined as Free Cash Flow divided by revenue. We track our TTM Free Cash Flow to account for the timing difference in when we receive cash from service fees, which is at the time of booking. Free Cash Flow has limitations as an analytical tool and should not be considered in isolation or as a substitute for analysis of other GAAP financial measures, such as net cash provided by (used in) operating activities. Free Cash Flow does not reflect our ability to meet future contractual commitments and may be calculated differently by other companies in our industry, limiting its usefulness as a comparative measure. TTM Free Cash Flow Margin is defined as TTM Free Cash Flow divided by TTM revenue. In addition to the actual amount or percentage change, we disclose the amount or percentage change in our current period results for revenue, GBV, net income (loss), Adjusted EBITDA, and ADR from the corresponding prior period results by comparing results using constant currencies. We present constant currency amounts and change rate information to provide a framework for assessing how our revenue, GBV, net income (loss), Adjusted EBITDA, and ADR performed excluding the effect of changes in foreign exchange rates. We use the amounts and percentage change in constant currency revenues, GBV, net 20
income (loss), Adjusted EBITDA, and ADR for financial and operational decision-making and as a means to evaluate period-to-period comparisons. We believe the presentation of results on a constant currency basis in addition to the U.S. GAAP presentation helps improve the ability to understand our performance because it excludes the effects of foreign currency volatility that are not indicative of our core operating results. We calculate the percentage change in constant currency by determining the change in the current period over the prior comparable period where current period foreign currency amounts are translated using the exchange rates of the comparative period. Share Repurchases Share repurchases under our share repurchase programs may be made through a variety of methods, which may include open market purchases, privately negotiated transactions, block trades or accelerated share repurchase transactions, or by any combination of such methods. Any such repurchases will be made from time to time subject to market and economic conditions, applicable legal requirements and other relevant factors. Our share repurchase program does not obligate us to repurchase any specific number of shares and may be modified, suspended, or terminated at any time at our discretion. 21
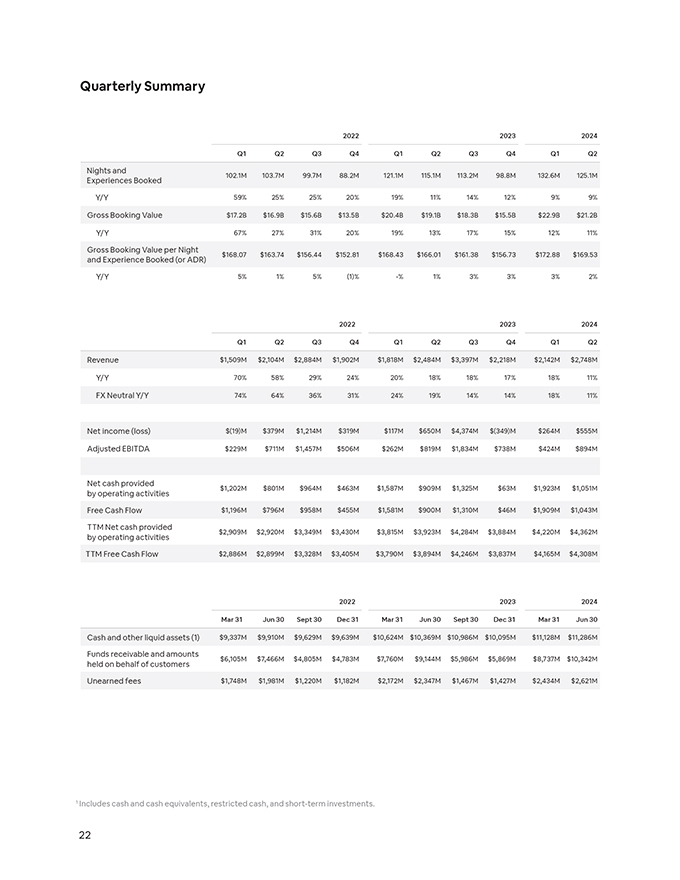
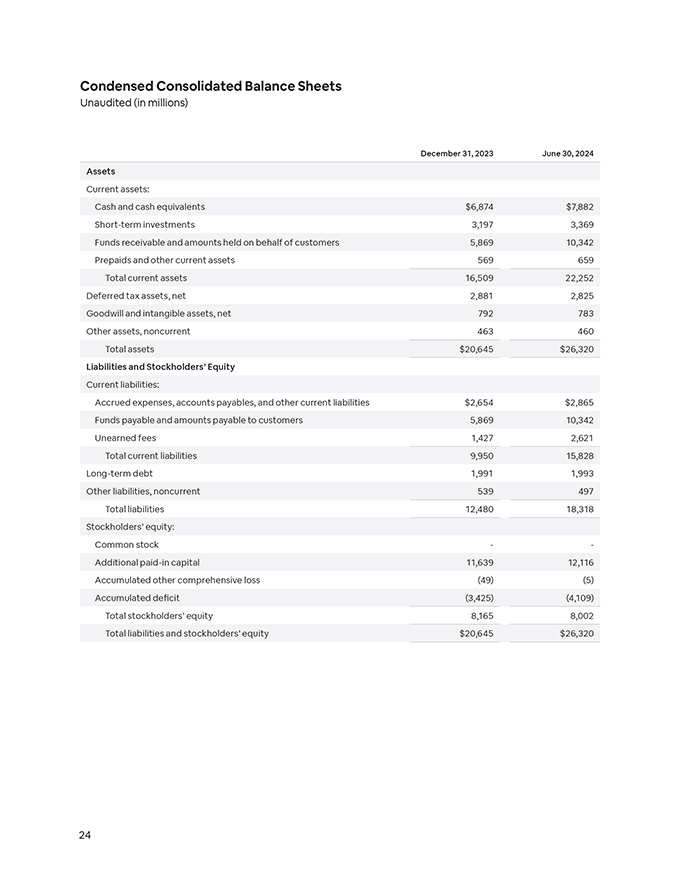
Quarterly Summary 2022 2023 2024 Q1 Q2 Q3 Q4 Q1 Q2 Q3 Q4 Q1 Q2 Nights and Experiences Booked 102.1M 103.7M 99.7M 88.2M 121.1M 115.1M 113.2M 98.8M 132.6M 125.1M Y/Y 59% 25% 25% 20% 19% 11% 14% 12% 9% 9% Gross Booking Value $17.2B $16.9B $15.6B $13.5B $20.4B $19.1B $18.3B $15.5B $22.9B $21.2B Y/Y 67% 27% 31% 20% 19% 13% 17% 15% 12% 11% Gross Booking Value per Night and Experience Booked (or ADR) $168.07 $163.74 $156.44 $152.81 $168.43 $166.01 $161.38 $156.73 $172.88 $169.53 Y/Y 5% 1% 5% (1)% -% 1% 3% 3% 3% 2% 2022 2023 2024 Q1 Q2 Q3 Q4 Q1 Q2 Q3 Q4 Q1 Q2 Revenue $1,509M $2,104M $2,884M $1,902M $1,818M $2,484M $3,397M $2,218M $2,142M $2,748M Y/Y 70% 58% 29% 24% 20% 18% 18% 17% 18% 11% FX Neutral Y/Y 74% 64% 36% 31% 24% 19% 14% 14% 18% 11% Net income (loss) $(19)M $379M $1,214M $319M $117M $650M $4,374M $(349)M $264M $555M Adjusted EBITDA $229M $711M $1,457M $506M $262M $819M $1,834M $738M $424M $894M Net cash provided by operating activities $1,202M $801M $964M $463M $1,587M $909M $1,325M $63M $1,923M $1,051M Free Cash Flow $1,196M $796M $958M $455M $1,581M $900M $1,310M $46M $1,909M $1,043M TTM Net cash provided by operating activities $2,909M $2,920M $3,349M $3,430M $3,815M $3,923M $4,284M $3,884M $4,220M $4,362M TTM Free Cash Flow $2,886M $2,899M $3,328M $3,405M $3,790M $3,894M $4,246M $3,837M $4,165M $4,308M 2022 2023 2024 Mar 31 Jun 30 Sept 30 Dec 31 Mar 31 Jun 30 Sept 30 Dec 31 Mar 31 Jun 30 Cash and other liquid assets (1) $9,337M $9,910M $9,629M $9,639M $10,624M $10,369M $10,986M $10,095M $11,128M $11,286M Funds receivable and amounts held on behalf of customers $6,105M $7,466M $4,805M $4,783M $7,760M $9,144M $5,986M $5,869M $8,737M $10,342M Unearned fees $1,748M $1,981M $1,220M $1,182M $2,172M $2,347M $1,467M $1,427M $2,434M $2,621M 1 Includes cash and cash equivalents, restricted cash, and short-term investments. 22 Condensed Consolidated Balance SheetsUnaudited (in millions) December 31, 2023 June 30, 2024 Assets Current assets: Cash and cash equivalents $6,874 $7,882 Short-term investments 3,197 3,369 Funds receivable and amounts held on behalf of customers 5,869 10,342 Prepaids and other current assets 569 659 Total current assets 16,509 22,252 Deferred tax assets, net 2,881 2,825 Goodwill and intangible assets, net 792 783 Other assets, noncurrent 463 460 Total assets $20,645 $26,320 Liabilities and Stockholders’ Equity Current liabilities: Accrued expenses, accounts payables, and other current liabilities $2,654 $2,865 Funds payable and amounts payable to customers 5,869 10,342 Unearned fees 1,427 2,621 Total current liabilities 9,950 15,828 Long-term debt 1,991 1,993 Other liabilities, noncurrent 539 497 Total liabilities 12,480 18,318 Stockholders’ equity: Common stock - - Additional paid-in capital 11,639 12,116 Accumulated other comprehensive loss (49) (5) Accumulated deficit (3,425) (4,109) Total stockholders’ equity 8,165 8,002 Total liabilities and stockholders’ equity $20,645 $26,320 24
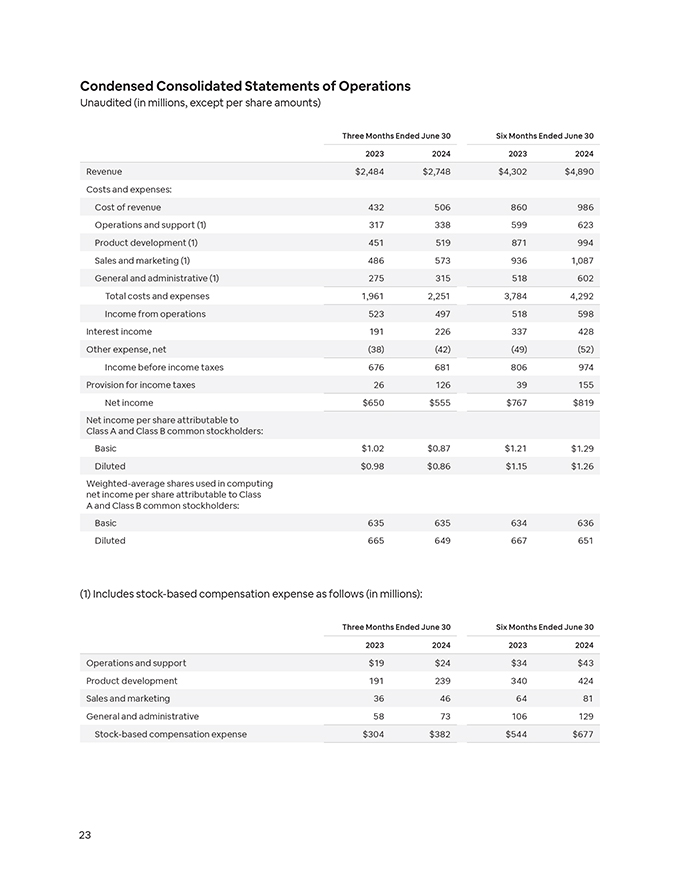
Condensed Consolidated Statements of Operations Unaudited (in millions, except per share amounts) Three Months Ended June 30 Six Months Ended June 30 2023 2024 2023 2024 Revenue $2,484 $2,748 $4,302 $4,890 Costs and expenses: Cost of revenue 432 506 860 986 Operations and support (1) 317 338 599 623 Product development (1) 451 519 871 994 Sales and marketing (1) 486 573 936 1,087 General and administrative (1) 275 315 518 602 Total costs and expenses 1,961 2,251 3,784 4,292 Income from operations 523 497 518 598 Interest income 191 226 337 428 Other expense, net (38) (42) (49) (52) Income before income taxes 676 681 806 974 Provision for income taxes 26 126 39 155 Net income $650 $555 $767 $819 Net income per share attributable to Class A and Class B common stockholders: Basic $1.02 $0.87 $1.21 $ 1. 2 9 Diluted $0.98 $0.86 $1.15 $1.26 Weighted-average shares used in computing net income per share attributable to Class A and Class B common stockholders: Basic 635 635 634 636 Diluted 665 649 667 651 (1) Includes stock-based compensation expense as follows (in millions): Three Months Ended June 30 Six Months Ended June 30 2023 2024 2023 2024 Operations and support $19 $24 $34 $43 Product development 191 239 340 424 Sales and marketing 36 46 64 81 General and administrative 58 73 106 129 Stock-based compensation expense $304 $382 $544 $677
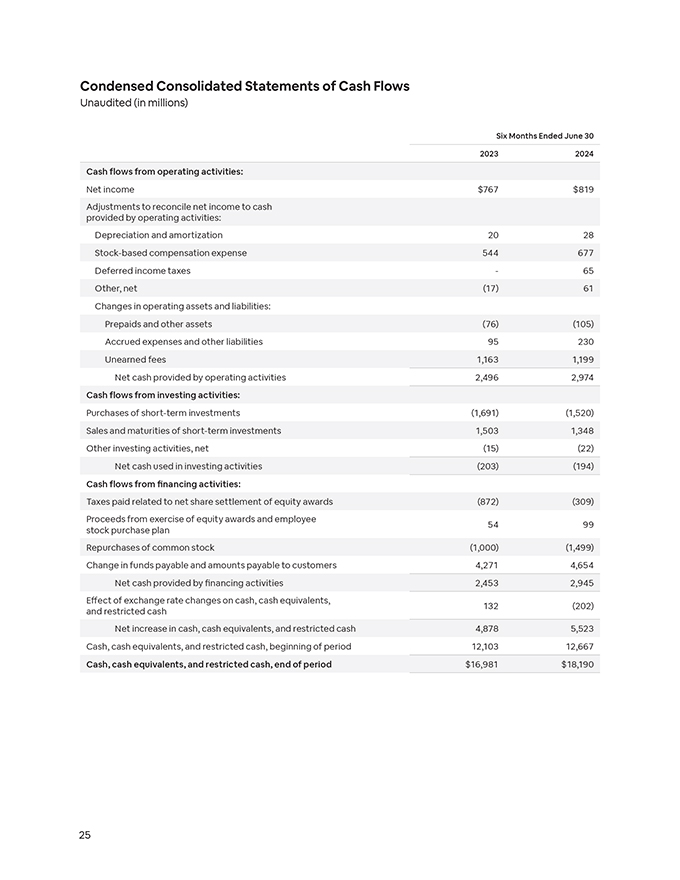
Condensed Consolidated Statements of Cash FlowsUnaudited (in millions) Six Months Ended June 30 2023 2024 Cash flows from operating activities: Net income $767 $819 Adjustments to reconcile net income to cash provided by operating activities: Depreciation and amortization 20 28 Stock-based compensation expense 544 677 Deferred income taxes - 65 Other, net (17) 61 Changes in operating assets and liabilities: Prepaids and other assets (76) (105) Accrued expenses and other liabilities 95 230 Unearned fees 1,163 1,199 Net cash provided by operating activities 2,496 2,974 Cash flows from investing activities: Purchases of short-term investments (1,691) (1,520) Sales and maturities of short-term investments 1,503 1,348 Other investing activities, net (15) (22) Net cash used in investing activities (203) (194) Cash flows from financing activities: Taxes paid related to net share settlement of equity awards (872) (309) Proceeds from exercise of equity awards and employee stock purchase plan 54 99 Repurchases of common stock (1,000) (1,499) Change in funds payable and amounts payable to customers 4,271 4,654 Net cash provided by financing activities 2,453 2,945 Effect of exchange rate changes on cash, cash equivalents, and restricted cash 132 (202) Net increase in cash, cash equivalents, and restricted cash 4,878 5,523 Cash, cash equivalents, and restricted cash, beginning of period 12,103 12,667 Cash, cash equivalents, and restricted cash, end of period $16,981 $18,190 25 Key Business Metrics Three Months Ended June 30 Six Months Ended June 30 2023 2024 2023 2024 Nights and Experiences Booked 115.1M 125.1M 236.2M 257.7M Gross Booking Value $19.1B $21.2B $39.5B $44.1B We track certain key business metrics to measure our performance, identify trends, formulate financial projections, and make strategic decisions.
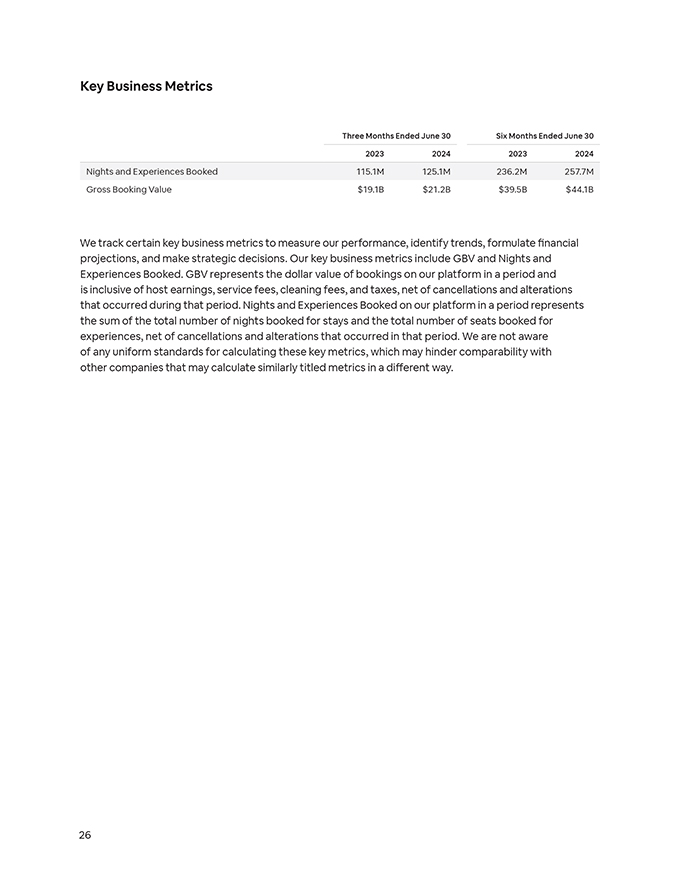
Our key business metrics include GBV and Nights and Experiences Booked. GBV represents the dollar value of bookings on our platform in a period and is inclusive of host earnings, service fees, cleaning fees, and taxes, net of cancellations and alterations that occurred during that period. Nights and Experiences Booked on our platform in a period represents the sum of the total number of nights booked for stays and the total number of seats booked for experiences, net of cancellations and alterations that occurred in that period. We are not aware of any uniform standards for calculating these key metrics, which may hinder comparability with other companies that may calculate similarly titled metrics in a different way. 26
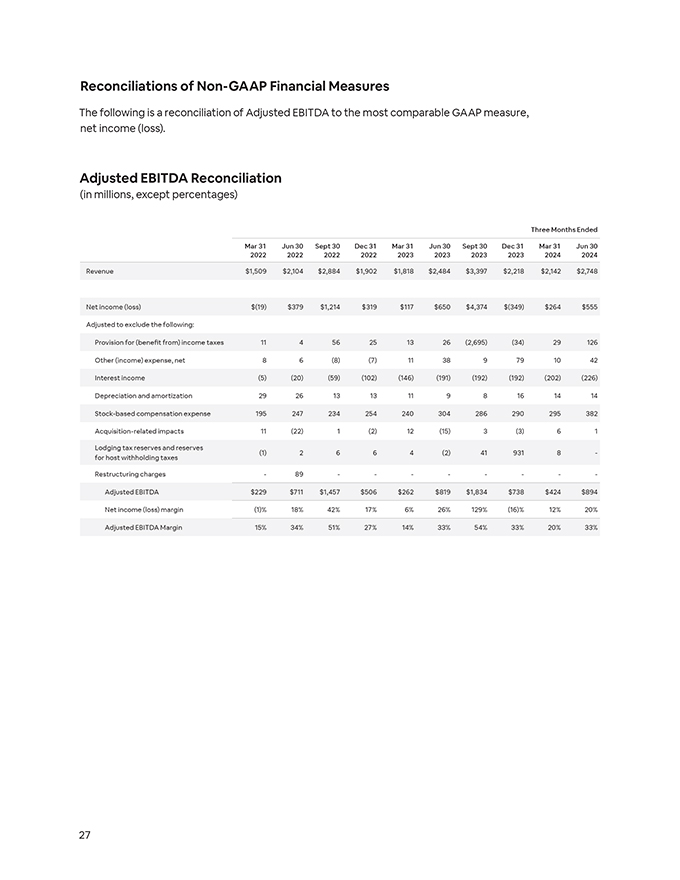
Reconciliations of Non-GAAP Financial Measures The following is a reconciliation of Adjusted EBITDA to the most comparable GAAP measure, net income (loss). Adjusted EBITDA Reconciliation (in millions, except percentages) Three Months Ended Mar 31 2022Jun 30 2022Sept 30 2022Dec 31 2022Mar 31 2023Jun 30 2023Sept 30 2023Dec 31 2023Mar 31 2024Jun 30 2024 Revenue$1,509$2,104$2,884$1,902$1,818$2,484$3,397$2,218$2,142$2,748 Net income (loss)$(19)$379$1,214$319$117$650$4,374$(349)$264$555 Adjusted to exclude the following: Provision for (benefit from) income taxes11456251326(2,695)(34)29126 Other (income) expense, net86(8)(7)11389791042 Interest income(5)(20)(59)(102)(146)(191)(192)(192)(202)(226) Depreciation and amortization292613131198161414 Stock-based compensation expense195247234254240304286290295382 Acquisition-related impacts11(22)1(2)12(15)3(3)61 Lodging tax reserves and reserves (1)2664(2)419318- for host withholding taxes Restructuring charges-89-------- Adjusted EBITDA$229$711$1,457$506$262$819$1,834$738$424$894 Net income (loss) margin(1)% 18%42%17%6%26%129%(16)%12%20% Adjusted EBITDA Margin15%34%51%27%14%33%54%33%20%33% 27
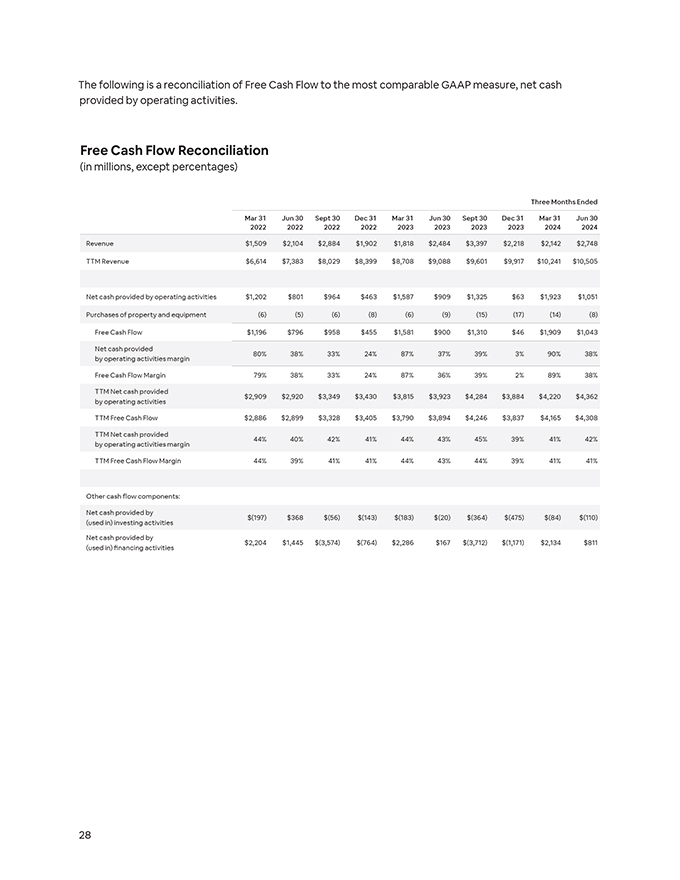
The following is a reconciliation of Free Cash Flow to the most comparable GAAP measure, net cash provided by operating activities. Free Cash Flow Reconciliation (in millions, except percentages) Three Months Ended Mar 31 2022Jun 30 2022Sept 30 2022Dec 31 2022Mar 31 2023Jun 30 2023Sept 30 2023Dec 31 2023Mar 31 2024Jun 30 2024 Revenue$1,509$2,104$2,884$1,902$1,818$2,484$3,397$2,218$2,142$2,748 TTM Revenue$6,614$7,383$8,029$8,399$8,708$9,088$9,601$9,917$10,241$10,505 Net cash provided by operating activities$1,202$801$964$463$1,587$909$1,325$63$1,923$1,051 Purchases of property and equipment(6)(5)(6)(8)(6)(9)(15)(17)(14)(8) Free Cash Flow$1,196$796$958$455$1,581$900$1,310$46$1,909$1,043 Net cash provided 80%38%33%24%87%37%39%3%90%38% by operating activities margin Free Cash Flow Margin79%38%33%24%87%36%39%2%89%38% TTM Net cash provided $2,909$2,920$3,349$3,430$3,815$3,923$4,284$3,884$4,220$4,362 by operating activities TTM Free Cash Flow$2,886$2,899$3,328$3,405$3,790$3,894$4,246$3,837$4,165$4,308 TTM Net cash provided 44%40%42%41%44%43%45%39%41%42% by operating activities margin TTM Free Cash Flow Margin44%39%41%41%44%43%44%39%41%41% Other cash flow components: Net cash provided by $(197)$368$(56)$(143)$(183)$(20)$(364)$(475)$(84)$(110) (used in) investing activities Net cash provided by $2,204$1,445$(3,574)$(764)$2,286$167$(3,712)$(1,171)$2,134$811 (used in) financing activities 28
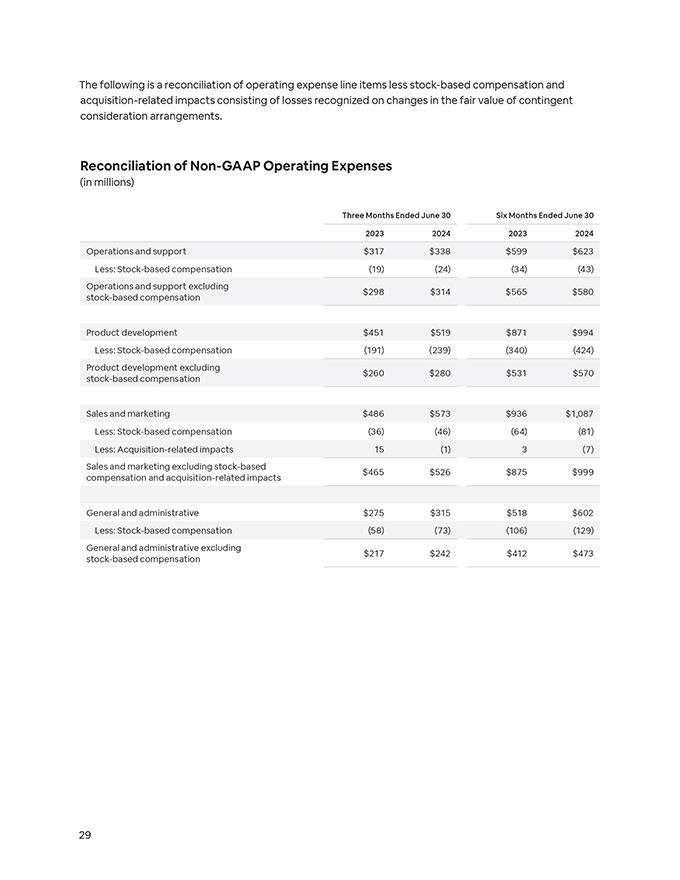
The following is a reconciliation of operating expense line items less stock-based compensation and acquisition-related impacts consisting of losses recognized on changes in the fair value of contingent consideration arrangements. Reconciliation of Non-GAAP Operating Expenses (in millions) Three Months Ended June 30 Six Months Ended June 30 2023202420232024 Operations and support$317$338$599$623 Less: Stock-based compensation(19)(24)(34)(43) Operations and support excluding$298$314$565$580 stock-based compensation Product development$451$519$871$994 Less: Stock-based compensation(191)(239)(340)(424) Product development excluding$260$280$531$570 stock-based compensation Sales and marketing$486$573$936$1,087 Less: Stock-based compensation(36)(46)(64)(81) Less: Acquisition-related impacts15(1)3(7) Sales and marketing excluding stock-based$465$526$875$999 compensation and acquisition-related impacts General and administrative$275$315$518$602 Less: Stock-based compensation(58)(73)(106)(129) General and administrative excluding$217$242$412$473 stock-based compensation 29

A PRINCIPLED APPROACH Balancing form, function, and feeling In everything we pursue at Airbnb, we consider the relationship between not just form and function, but also how you feel. At its best, great design is about how something looks, how something works, and ultimately, about how the experience can bring forth a sense of connection to people, places, and yourself. Explore the Musée d’Orsay and other Icon experiences at airbnb.com/icons

Cover image: Musée d’Orsay, an Icon on Airbnb