UNITED STATES SECURITIES AND EXCHANGE COMMISSION
Washington, D.C. 20549
Form 8-K
|
|
CURRENT REPORT PURSUANT TO SECTION 13 or 15(d) OF THE SECURITIES EXCHANGE ACT OF 1934 |
|
| Date of Report (Date of earliest event reported): July 15, 2024 |
||
The Goldman Sachs Group, Inc.
(Exact name of registrant as specified in its charter)
Commission File Number: 001-14965
| Delaware | 13-4019460 | |
| (State or other jurisdiction of incorporation) |
(IRS Employer Identification No.) |
|
| 200 West Street, New York, N.Y. | 10282 | |
| (Address of principal executive offices) | (Zip Code) | |
(212) 902-1000
(Registrant’s telephone number, including area code)
Check the appropriate box below if the Form 8-K filing is intended to simultaneously satisfy the filing obligation of the registrant under any of the following provisions:
☐ Written communications pursuant to Rule 425 under the Securities Act (17 CFR 230.425)
☐ Soliciting material pursuant to Rule 14a-12 under the Exchange Act (17 CFR 240.14a-12)
☐ Pre-commencement communications pursuant to Rule 14d-2(b) under the Exchange Act (17 CFR 240.14d-2(b))
☐ Pre-commencement communications pursuant to Rule 13e-4(c) under the Exchange Act (17 CFR 240.13e-4(c))
Securities registered pursuant to Section 12(b) of the Act:
| Title of each class | Trading Symbol |
Exchange on which registered |
||
| Common stock, par value $.01 per share | GS | NYSE | ||
| Depositary Shares, Each Representing 1/1,000th Interest in a Share of Floating Rate Non-Cumulative Preferred Stock, Series A | GS PrA | NYSE | ||
| Depositary Shares, Each Representing 1/1,000th Interest in a Share of Floating Rate Non-Cumulative Preferred Stock, Series C | GS PrC | NYSE | ||
| Depositary Shares, Each Representing 1/1,000th Interest in a Share of Floating Rate Non-Cumulative Preferred Stock, Series D | GS PrD | NYSE | ||
| 5.793% Fixed-to-Floating Rate Normal Automatic Preferred Enhanced Capital Securities of Goldman Sachs Capital II | GS/43PE | NYSE | ||
| Floating Rate Normal Automatic Preferred Enhanced Capital Securities of Goldman Sachs Capital III | GS/43PF | NYSE | ||
| Medium-Term Notes, Series F, Callable Fixed and Floating Rate Notes due March 2031 of GS Finance Corp. | GS/31B | NYSE | ||
| Medium-Term Notes, Series F, Callable Fixed and Floating Rate Notes due May 2031 of GS Finance Corp. | GS/31X | NYSE | ||
Indicate by check mark whether the registrant is an emerging growth company as defined in Rule 405 of the Securities Act of 1933 (17 CFR 230.405) or Rule 12b-2 of the Securities Exchange Act of 1934 (17 CFR 240.12b-2).
Emerging growth company ☐
If an emerging growth company, indicate by check mark if the registrant has elected not to use the extended transition period for complying with any new or revised financial accounting standards provided pursuant to Section 13(a) of the Exchange Act. ☐
Item 2.02 Results of Operations and Financial Condition.
On July 15, 2024, The Goldman Sachs Group, Inc. (Group Inc. and, together with its consolidated subsidiaries, the firm) reported its earnings for the second quarter ended June 30, 2024. A copy of Group Inc.’s press release containing this information is attached as Exhibit 99.1 to this Report on Form 8-K and is incorporated herein by reference.
Item 7.01 Regulation FD Disclosure.
On July 15, 2024, at 9:30 a.m. (ET), the firm will hold a conference call to discuss the firm’s financial results, outlook and related matters. A copy of the presentation for the conference call is attached as Exhibit 99.2 to this Report on Form 8-K.
Item 9.01 Financial Statements and Exhibits.
(d) Exhibits.
| 99.1 |
The quotation on page 1 of Exhibit 99.1 and the information under the caption “Quarterly Highlights” on the following page (Excluded Sections) shall not be deemed “filed” for purposes of Section 18 of the Securities Exchange Act of 1934 (Exchange Act) or otherwise subject to the liabilities under that Section and shall not be deemed to be incorporated by reference into any filing of Group Inc. under the Securities Act of 1933 or the Exchange Act. The information included in Exhibit 99.1, other than in the Excluded Sections, shall be deemed “filed” for purposes of the Exchange Act.
| 99.2 | Presentation of Group Inc. dated July 15, 2024, for the conference call on July 15, 2024. |
Exhibit 99.2 is being furnished pursuant to Item 7.01 of Form 8-K and the information included therein shall not be deemed “filed” for purposes of Section 18 of the Exchange Act or otherwise subject to the liabilities under that Section and shall not be deemed to be incorporated by reference into any filing of Group Inc. under the Securities Act of 1933 or the Exchange Act.
| 101 | Pursuant to Rule 406 of Regulation S-T, the cover page information is formatted in iXBRL (Inline eXtensible Business Reporting Language). |
| 104 | Cover Page Interactive Data File (formatted in iXBRL in Exhibit 101). |
SIGNATURE
Pursuant to the requirements of the Securities Exchange Act of 1934, the Registrant has duly caused this report to be signed on its behalf by the undersigned hereunto duly authorized.
| THE GOLDMAN SACHS GROUP, INC. |
||||||||||
| (Registrant) |
||||||||||
| Date: July 15, 2024 |
By: |
/s/ Denis P. Coleman III |
||||||||
| Name: Denis P. Coleman III |
||||||||||
| Title: Chief Financial Officer |
||||||||||
Exhibit 99.1

|
Second Quarter 2024
Earnings Results
Media Relations: Tony Fratto 212-902-5400 Investor Relations: Jehan Ilahi 212-902-0300
|
||
|
The Goldman Sachs Group, Inc. 200 West Street | New York, NY 10282
|
Second Quarter 2024 Earnings Results
Goldman Sachs Reports Second Quarter Earnings Per Common Share of $8.62 and Increases the Quarterly Dividend to $3.00 Per Common Share in the Third Quarter
|
“We are pleased with our solid second quarter results and our overall performance in the first half of the year, reflecting strong year-on-year growth in both Global Banking & Markets and Asset & Wealth Management. Our One Goldman Sachs operating approach is allowing us to bring the whole firm to our clients, deepening our relationships and serving them in an improving, but complex environment.” |
|
- David Solomon, Chairman and Chief Executive Officer
|
|
Financial Summary
|
|
|
|
|
|
|||||||||
|
Net Revenues
|
Net Earnings
|
EPS
|
||||||||||
|
2Q24 $12.73 billion
|
2Q24 $3.04 billion
|
2Q24 $8.62
|
||||||||||
|
2Q24 YTD $26.94 billion
|
2Q24 YTD $7.18 billion
|
2Q24 YTD $20.21
|
||||||||||
|
Annualized ROE1
|
Annualized ROTE1
|
Book Value Per Share
|
||||||||||
|
2Q24 10.9%
|
2Q24 11.6%
|
2Q24 $327.13
|
||||||||||
|
2Q24 YTD 12.8%
|
2Q24 YTD 13.8%
|
YTD Growth 4.3%
|
||||||||||
NEW YORK, July 15, 2024 – The Goldman Sachs Group, Inc. (NYSE: GS) today reported net revenues of $12.73 billion and net earnings of $3.04 billion for the second quarter ended June 30, 2024. Net revenues were $26.94 billion and net earnings were $7.18 billion for the first half of 2024.
Diluted earnings per common share (EPS) was $8.62 for the second quarter of 2024 compared with $3.08 for the second quarter of 2023 and $11.58 for the first quarter of 2024, and was $20.21 for the first half of 2024 compared with $11.91 for the first half of 2023.
Annualized return on average common shareholders’ equity (ROE)1 was 10.9% for the second quarter of 2024 and 12.8% for the first half of 2024. Annualized return on average tangible common shareholders’ equity (ROTE)1 was 11.6% for the second quarter of 2024 and 13.8% for the first half of 2024.
1
Goldman Sachs Reports
Second Quarter 2024 Earnings Results
Quarterly Highlights
| ◾ | Global Banking & Markets generated quarterly net revenues of $8.18 billion, driven by strong performance in Equities. Second highest quarterly net revenues in Equities financing and in Fixed Income, Currency and Commodities (FICC) financing. |
| ◾ | The firm ranked #1 in worldwide announced and completed mergers and acquisitions for the year-to-date.2 |
| ◾ | Asset & Wealth Management generated quarterly net revenues of $3.88 billion, including record quarterly Management and other fees. |
| ◾ | Assets under supervision3 increased $86 billion during the quarter to a record $2.93 trillion. |
| ◾ | Book value per common share increased by 1.9% during the quarter to $327.13. |
| ◾ | On July 12, 2024, the Board of Directors of The Goldman Sachs Group, Inc. approved a 9% increase in the quarterly dividend to $3.00 per common share beginning in the third quarter of 2024. |
Net Revenues
| Net revenues were $12.73 billion for the second quarter of 2024, 17% higher than the second quarter of 2023 and 10% lower than the first quarter of 2024. The increase compared with the second quarter of 2023 reflected higher net revenues in Global Banking & Markets and Asset & Wealth Management. |
|
Net Revenues
|
||
|
$12.73 billion
|
||||
2
Goldman Sachs Reports
Second Quarter 2024 Earnings Results
|
|
Global Banking & Markets |
|
| Net revenues in Global Banking & Markets were $8.18 billion for the second quarter of 2024, 14% higher than the second quarter of 2023 and 16% lower than the first quarter of 2024.
Investment banking fees were $1.73 billion, 21% higher than the second quarter of 2023, reflecting significantly higher net revenues in Debt underwriting, primarily driven by leveraged finance activity, higher net revenues in Equity underwriting, primarily from convertible and initial public offerings, and slightly higher net revenues in Advisory. The firm’s Investment banking fees backlog3 increased significantly compared with the end of the first quarter of 2024 and increased slightly compared with the end of 2023.
Net revenues in FICC were $3.18 billion, 17% higher than the second quarter of 2023, reflecting higher net revenues in FICC intermediation (due to significantly higher net revenues in interest rate products and currencies and higher net revenues in mortgages, partially offset by significantly lower net revenues in commodities and lower net revenues in credit products) and significantly higher net revenues in FICC financing (driven by mortgages and structured lending).
Net revenues in Equities were $3.17 billion, 7% higher than the second quarter of 2023, reflecting higher net revenues in Equities intermediation, driven by significantly higher net revenues in derivatives, partially offset by lower net revenues in cash products. Net revenues in Equities financing were slightly lower, reflecting significantly lower net revenues from portfolio financing, largely offset by significantly higher net revenues from prime financing.
Net revenues in Other were $102 million for the second quarter of 2024, compared with $81 million for the second quarter of 2023. |
Global Banking & Markets
|
|||
|
$8.18 billion
|
||||
| Advisory |
$ 688 million |
|||
| Equity underwriting |
$ 423 million |
|||
| Debt underwriting |
$ 622 million |
|||
| Investment banking fees |
$ 1.73 billion |
|||
|
FICC intermediation |
$ 2.33 billion |
|||
| FICC financing |
$ 850 million |
|||
| FICC |
$ 3.18 billion |
|||
|
Equities intermediation |
$ 1.79 billion |
|||
| Equities financing |
$ 1.38 billion |
|||
| Equities |
$ 3.17 billion |
|||
|
Other |
$ 102 million |
|||
|
|
Asset & Wealth Management |
|
| Net revenues in Asset & Wealth Management were $3.88 billion for the second quarter of 2024, 27% higher than the second quarter of 2023 and 2% higher than the first quarter of 2024. The increase compared with the second quarter of 2023 reflected net gains in Equity investments compared with net losses in the prior year period, higher Management and other fees and higher net revenues in Debt investments, partially offset by lower net revenues in Private banking and lending.
The increase in Equity investments net revenues primarily reflected net gains from real estate investments compared with significant net losses in the prior year period. The increase in Management and other fees primarily reflected the impact of higher average assets under supervision. Debt investments net revenues were higher, reflecting significantly lower net losses from real estate investments, partially offset by significantly lower net interest income due to a reduction in the Debt investments balance sheet. The decrease in Private banking and lending net revenues reflected the impact of the sale of the Marcus loans portfolio in 2023 (including a gain of approximately $100 million related to the sale of substantially all of the remaining Marcus loans portfolio in the second quarter of 2023). |
Asset & Wealth Management
|
|||
|
$3.88 billion
|
||||
|
Management and other fees |
$ 2.54 billion |
|||
| Incentive fees |
$ 46 million |
|||
| Private banking and lending |
$ 707 million |
|||
| Equity investments |
$ 292 million |
|||
| Debt investments |
$ 297 million |
|||
3
Goldman Sachs Reports
Second Quarter 2024 Earnings Results
|
|
Platform Solutions |
|
| Net revenues in Platform Solutions were $669 million for the second quarter of 2024, 2% higher than the second quarter of 2023 and 4% lower than the first quarter of 2024.
Consumer platforms net revenues were slightly higher compared with the second quarter of 2023, reflecting higher average credit card balances and higher average deposit balances, largely offset by the impact of the sale of GreenSky in the first quarter of 2024. Transaction banking and other net revenues were lower, reflecting lower average deposit balances. |
Platform Solutions
|
|||||
|
$669 million
|
||||||
|
Consumer platforms |
$599 million | |||||
| Transaction banking and other
|
$ 70 million
|
|||||
Provision for Credit Losses
| Provision for credit losses was $282 million for the second quarter of 2024, compared with $615 million for the second quarter of 2023 and $318 million for the first quarter of 2024. Provisions for the second quarter of 2024 reflected net provisions related to the credit card portfolio (driven by net charge-offs). Provisions for the second quarter of 2023 reflected net provisions related to the credit card and point-of-sale loan portfolios (driven by net charge-offs and growth) and wholesale loans (driven by impairments), partially offset by a reserve reduction related to the repayment of a term deposit with First Republic Bank. |
Provision for Credit Losses |
|||||
|
$282 million
|
||||||
Operating Expenses
| Operating expenses were $8.53 billion for the second quarter of 2024, essentially unchanged compared with both the second quarter of 2023 and the first quarter of 2024. The firm’s efficiency ratio3 was 63.8% for the first half of 2024, compared with 73.3% for the first half of 2023.
Operating expenses, compared with the second quarter of 2023, reflected decreases driven by an impairment of goodwill related to Consumer platforms in the prior year period and significantly lower impairments related to consolidated real estate investments (both in depreciation and amortization), offset by increases from higher compensation and benefits expenses (reflecting improved operating performance) and higher transaction based expenses.
Net provisions for litigation and regulatory proceedings were $104 million for the second quarter of 2024 compared with $19 million for the second quarter of 2023.
Headcount was essentially unchanged compared with the end of the first quarter of 2024. |
Operating Expenses |
|||||
|
$8.53 billion
|
||||||
|
YTD Efficiency Ratio |
||||||
|
63.8%
|
||||||
4
Goldman Sachs Reports
Second Quarter 2024 Earnings Results
Provision for Taxes
| The effective income tax rate for the first half of 2024 was 21.6%, up from 21.1% for the first quarter of 2024, primarily due to a decrease in the impact of permanent tax benefits. |
YTD Effective Tax Rate
|
|||
|
21.6%
|
||||
Other Matters
| ◾ On July 12, 2024, the Board of Directors of The Goldman Sachs Group, Inc. increased the quarterly dividend to $3.00 per common share from $2.75 per common share. The dividend will be paid on September 27, 2024 to common shareholders of record on August 30, 2024.
◾ During the quarter, the firm returned $4.43 billion of capital to common shareholders, including $3.50 billion of common share repurchases (8.0 million shares at an average cost of $437.57) and $929 million of common stock dividends.3
◾ Global core liquid assets3 averaged $424 billion for the second quarter of 2024, compared with an average of $423 billion for the first quarter of 2024. |
Declared Quarterly Dividend Per Common Share
|
|||
|
$3.00
|
||||
|
Common Share Repurchases
|
||||
|
8.0 million shares for $3.50 billion
|
||||
|
Average GCLA
|
||||
|
$424 billion
|
||||
5
Goldman Sachs Reports
Second Quarter 2024 Earnings Results
The Goldman Sachs Group, Inc. is a leading global financial institution that delivers a broad range of financial services to a large and diversified client base that includes corporations, financial institutions, governments and individuals. Founded in 1869, the firm is headquartered in New York and maintains offices in all major financial centers around the world.
|
|
Cautionary Note Regarding Forward-Looking Statements |
|
This press release contains “forward-looking statements” within the meaning of the safe harbor provisions of the U.S. Private Securities Litigation Reform Act of 1995. Forward-looking statements are not historical facts or statements of current conditions, but instead represent only the firm’s beliefs regarding future events, many of which, by their nature, are inherently uncertain and outside of the firm’s control. It is possible that the firm’s actual results, financial condition and liquidity may differ, possibly materially, from the anticipated results, financial condition and liquidity in these forward-looking statements. For information about some of the risks and important factors that could affect the firm’s future results, financial condition and liquidity, see “Risk Factors” in Part I, Item 1A of the firm’s Annual Report on Form 10-K for the year ended December 31, 2023.
Information regarding the firm’s assets under supervision, capital ratios, risk-weighted assets, supplementary leverage ratio, balance sheet data, global core liquid assets and VaR consists of preliminary estimates. These estimates are forward-looking statements and are subject to change, possibly materially, as the firm completes its financial statements.
Statements about the firm’s Investment banking fees backlog and future results also may constitute forward-looking statements. Such statements are subject to the risk that transactions may be modified or may not be completed at all, and related net revenues may not be realized or may be materially less than expected. Important factors that could have such a result include, for underwriting transactions, a decline or weakness in general economic conditions, an outbreak or worsening of hostilities, including those in Ukraine and the Middle East, volatility in the securities markets or an adverse development with respect to the issuer of the securities and, for financial advisory transactions, a decline in the securities markets, an inability to obtain adequate financing, an adverse development with respect to a party to the transaction or a failure to obtain a required regulatory approval. For information about other important factors that could adversely affect the firm’s Investment banking fees, see “Risk Factors” in Part I, Item 1A of the firm’s Annual Report on Form 10-K for the year ended December 31, 2023.
|
|
Conference Call |
|
A conference call to discuss the firm’s financial results, outlook and related matters will be held at 9:30 am (ET). The call will be open to the public. Members of the public who would like to listen to the conference call should dial 1-800-289-0459 (in the U.S.) or 1-323-794-2095 (outside the U.S.) passcode number 7042022. The number should be dialed at least 10 minutes prior to the start of the conference call. The conference call will also be accessible as an audio webcast through the Investor Relations section of the firm’s website, www.goldmansachs.com/investor-relations. There is no charge to access the call. For those unable to listen to the live broadcast, a replay will be available on the firm’s website beginning approximately three hours after the event. Please direct any questions regarding obtaining access to the conference call to Goldman Sachs Investor Relations, via e-mail, at gs-investor-relations@gs.com.
6
Goldman Sachs Reports
Second Quarter 2024 Earnings Results
The Goldman Sachs Group, Inc. and Subsidiaries
Segment Net Revenues (unaudited)
$ in millions
| THREE MONTHS ENDED | % CHANGE FROM | |||||||||||||||||||||
| JUNE 30, 2024 |
MARCH 31, 2024 |
JUNE 30, 2023 |
MARCH 31, 2024 |
JUNE 30, 2023 |
||||||||||||||||||
|
GLOBAL BANKING & MARKETS |
||||||||||||||||||||||
|
Advisory
|
|
$ 688
|
|
|
$ 1,011
|
|
|
$ 645
|
|
|
(32) %
|
|
|
7 %
|
|
|||||||
| Equity underwriting
|
|
423
|
|
|
370
|
|
|
338
|
|
|
14
|
|
|
25
|
|
|||||||
| Debt underwriting
|
|
622
|
|
|
699
|
|
|
448
|
|
|
(11)
|
|
|
39
|
|
|||||||
| Investment banking fees
|
|
1,733
|
|
|
2,080
|
|
|
1,431
|
|
|
(17)
|
|
|
21
|
|
|||||||
| FICC intermediation
|
|
2,330
|
|
|
3,471
|
|
|
2,089
|
|
|
(33)
|
|
|
12
|
|
|||||||
| FICC financing
|
|
850
|
|
|
852
|
|
|
622
|
|
|
–
|
|
|
37
|
|
|||||||
| FICC
|
|
3,180
|
|
|
4,323
|
|
|
2,711
|
|
|
(26)
|
|
|
17
|
|
|||||||
| Equities intermediation
|
|
1,786
|
|
|
1,989
|
|
|
1,533
|
|
|
(10)
|
|
|
17
|
|
|||||||
| Equities financing
|
|
1,383
|
|
|
1,322
|
|
|
1,433
|
|
|
5
|
|
|
(3)
|
|
|||||||
| Equities
|
|
3,169
|
|
|
3,311
|
|
|
2,966
|
|
|
(4)
|
|
|
7
|
|
|||||||
| Other
|
|
102
|
|
|
12
|
|
|
81
|
|
|
750
|
|
|
26
|
|
|||||||
|
Net revenues |
|
8,184
|
|
|
9,726 |
|
|
7,189 |
|
|
(16) |
|
|
14 |
|
|||||||
|
ASSET & WEALTH MANAGEMENT |
||||||||||||||||||||||
|
Management and other fees
|
|
2,536
|
|
|
2,452
|
|
|
2,354
|
|
|
3
|
|
|
8
|
|
|||||||
| Incentive fees
|
|
46
|
|
|
88
|
|
|
25
|
|
|
(48)
|
|
|
84
|
|
|||||||
| Private banking and lending
|
|
707
|
|
|
682
|
|
|
874
|
|
|
4
|
|
|
(19)
|
|
|||||||
| Equity investments
|
|
292
|
|
|
222
|
|
|
(403)
|
|
|
32
|
|
|
N.M.
|
|
|||||||
| Debt investments
|
|
297
|
|
|
345
|
|
|
197
|
|
|
(14)
|
|
|
51
|
|
|||||||
|
Net revenues |
|
3,878 |
|
|
3,789 |
|
|
3,047 |
|
|
2 |
|
|
27 |
|
|||||||
|
PLATFORM SOLUTIONS |
||||||||||||||||||||||
|
Consumer platforms
|
|
599
|
|
|
618
|
|
|
577
|
|
|
(3)
|
|
|
4
|
|
|||||||
| Transaction banking and other
|
|
70
|
|
|
80
|
|
|
82
|
|
|
(13)
|
|
|
(15)
|
|
|||||||
|
Net revenues |
|
669 |
|
|
698 |
|
|
659 |
|
|
(4) |
|
|
2 |
|
|||||||
|
Total net revenues
|
|
$ 12,731
|
|
|
$ 14,213
|
|
|
$ 10,895
|
|
|
(10) |
|
|
17 |
|
|||||||
|
Geographic Net Revenues (unaudited)3 |
||||||||||||||||||||||
| $ in millions | ||||||||||||||||||||||
| THREE MONTHS ENDED | ||||||||||||||||||||||
| JUNE 30, 2024 |
MARCH 31, 2024 |
JUNE 30, 2023 |
||||||||||||||||||||
|
Americas
|
|
$ 8,125
|
|
|
$ 9,181
|
|
|
$ 6,801
|
|
|||||||||||||
| EMEA
|
|
2,931
|
|
|
3,470
|
|
|
2,868
|
|
|||||||||||||
| Asia
|
|
1,675
|
|
|
1,562
|
|
|
1,226
|
|
|||||||||||||
|
Total net revenues |
|
$ 12,731 |
|
|
$ 14,213 |
|
|
$ 10,895 |
|
|||||||||||||
| Americas
|
|
64%
|
|
|
65%
|
|
|
63%
|
|
|||||||||||||
| EMEA
|
|
23%
|
|
|
24%
|
|
|
26%
|
|
|||||||||||||
| Asia
|
|
13%
|
|
|
11%
|
|
|
11%
|
|
|||||||||||||
|
Total
|
|
100%
|
|
|
100%
|
|
|
100%
|
|
|||||||||||||
7
Goldman Sachs Reports
Second Quarter 2024 Earnings Results
The Goldman Sachs Group, Inc. and Subsidiaries
Segment Net Revenues (unaudited)
$ in millions
| SIX MONTHS ENDED | % CHANGE FROM | |||||||||||||||
| JUNE 30, 2024 |
JUNE 30, 2023 |
JUNE 30, 2023 |
||||||||||||||
|
GLOBAL BANKING & MARKETS |
||||||||||||||||
|
Advisory
|
|
$ 1,699
|
|
|
$ 1,463
|
|
|
16 %
|
|
|||||||
| Equity underwriting |
793 | 593 | 34 | |||||||||||||
|
Debt underwriting |
1,321 | 954 | 38 | |||||||||||||
|
Investment banking fees |
3,813 | 3,010 | 27 | |||||||||||||
|
FICC intermediation |
5,801 | 5,369 | 8 | |||||||||||||
|
FICC financing |
1,702 | 1,273 | 34 | |||||||||||||
|
FICC |
7,503 | 6,642 | 13 | |||||||||||||
| Equities intermediation |
3,775 | 3,274 | 15 | |||||||||||||
|
Equities financing |
2,705 | 2,707 | – | |||||||||||||
|
Equities
|
|
6,480
|
|
|
5,981
|
|
|
8
|
|
|||||||
|
Other
|
|
114
|
|
|
–
|
|
|
N.M.
|
|
|||||||
|
Net revenues
|
|
17,910
|
|
|
15,633
|
|
|
15
|
|
|||||||
|
ASSET & WEALTH MANAGEMENT |
||||||||||||||||
|
Management and other fees |
4,988 | 4,636 | 8 | |||||||||||||
|
Incentive fees |
134 | 78 | 72 | |||||||||||||
|
Private banking and lending |
1,389 | 1,228 | 13 | |||||||||||||
|
Equity investments |
514 | (284) | N.M. | |||||||||||||
|
Debt investments
|
|
642
|
|
|
605
|
|
|
6
|
|
|||||||
|
Net revenues
|
|
7,667
|
|
|
6,263
|
|
|
22
|
|
|||||||
|
PLATFORM SOLUTIONS |
||||||||||||||||
|
Consumer platforms
|
|
1,217
|
|
|
1,067
|
|
|
14
|
|
|||||||
| Transaction banking and other
|
|
150
|
|
|
156
|
|
|
(4)
|
|
|||||||
|
Net revenues
|
|
1,367
|
|
|
1,223
|
|
|
12
|
|
|||||||
|
Total net revenues
|
|
$ 26,944
|
|
|
$ 23,119
|
|
|
17
|
|
|||||||
|
Geographic Net Revenues (unaudited)3 $ in millions
|
|
|||||||||||||||
| SIX MONTHS ENDED | ||||||||||||||||
| JUNE 30, 2024 |
JUNE 30, 2023 |
|||||||||||||||
| Americas |
$ 17,306 | $ 13,995 | ||||||||||||||
|
EMEA |
6,401 | 6,452 | ||||||||||||||
|
Asia
|
|
3,237
|
|
|
2,672
|
|
||||||||||
|
Total net revenues |
|
$ 26,944
|
|
|
$ 23,119
|
|
||||||||||
| Americas |
64% | 60% | ||||||||||||||
|
EMEA |
24% | 28% | ||||||||||||||
|
Asia
|
|
12%
|
|
|
12%
|
|
||||||||||
|
Total
|
|
100%
|
|
|
100%
|
|
||||||||||
8
Goldman Sachs Reports
Second Quarter 2024 Earnings Results
The Goldman Sachs Group, Inc. and Subsidiaries
Consolidated Statements of Earnings (unaudited)
In millions, except per share amounts and headcount
| THREE MONTHS ENDED | % CHANGE FROM | |||||||||||||||||||||||||
| JUNE 30, 2024 |
MARCH 31, 2024 |
JUNE 30, 2023 |
MARCH 31, 2024 |
JUNE 30, 2023 |
||||||||||||||||||||||
|
REVENUES |
||||||||||||||||||||||||||
|
Investment banking |
$ 1,733 | $ 2,085 | $ 1,432 | (17) % | 21 | % | ||||||||||||||||||||
|
Investment management |
2,533 | 2,491 | 2,356 | 2 | 8 | |||||||||||||||||||||
|
Commissions and fees |
1,051 | 1,077 | 893 | (2) | 18 | |||||||||||||||||||||
|
Market making |
4,225 | 5,992 | 4,351 | (29) | (3) | |||||||||||||||||||||
|
Other principal transactions
|
|
947
|
|
|
960
|
|
|
179
|
|
|
(1)
|
|
|
429
|
|
|||||||||||
|
Total non-interest revenues
|
|
10,489
|
|
|
12,605
|
|
|
9,211
|
|
|
(17)
|
|
|
14
|
|
|||||||||||
| Interest income
|
20,440 | 19,555 | 16,836 | 5 | 21 | |||||||||||||||||||||
| Interest expense
|
|
18,198
|
|
|
17,947
|
|
|
15,152
|
|
|
1
|
|
|
20
|
|
|||||||||||
|
Net interest income
|
|
2,242
|
|
|
1,608
|
|
|
1,684
|
|
|
39
|
|
|
33
|
|
|||||||||||
|
Total net revenues
|
|
12,731
|
|
|
14,213
|
|
|
10,895
|
|
|
(10)
|
|
|
17
|
|
|||||||||||
|
Provision for credit losses
|
|
282
|
|
|
318
|
|
|
615
|
|
|
(11)
|
|
|
(54)
|
|
|||||||||||
|
OPERATING EXPENSES
|
||||||||||||||||||||||||||
|
Compensation and benefits |
4,240 | 4,585 | 3,619 | (8) | 17 | |||||||||||||||||||||
|
Transaction based |
1,654 | 1,497 | 1,385 | 10 | 19 | |||||||||||||||||||||
|
Market development |
153 | 153 | 146 | – | 5 | |||||||||||||||||||||
|
Communications and technology |
500 | 470 | 482 | 6 | 4 | |||||||||||||||||||||
|
Depreciation and amortization |
646 | 627 | 1,594 | 3 | (59) | |||||||||||||||||||||
|
Occupancy |
244 | 247 | 253 | (1) | (4) | |||||||||||||||||||||
|
Professional fees |
393 | 384 | 392 | 2 | – | |||||||||||||||||||||
|
Other expenses
|
703 | 695 | 673 | 1 | 4 | |||||||||||||||||||||
|
Total operating expenses
|
|
8,533
|
|
|
8,658
|
|
|
8,544
|
|
|
(1)
|
|
|
–
|
|
|||||||||||
| Pre-tax earnings
|
3,916 | 5,237 | 1,736 | (25) | 126 | |||||||||||||||||||||
| Provision for taxes
|
873 | 1,105 | 520 | (21) | 68 | |||||||||||||||||||||
|
Net earnings
|
|
3,043
|
|
|
4,132
|
|
|
1,216
|
|
|
(26)
|
|
|
150
|
|
|||||||||||
| Preferred stock dividends
|
|
152
|
|
|
201
|
|
|
145
|
|
|
(24)
|
|
|
5
|
|
|||||||||||
|
Net earnings applicable to common shareholders
|
|
$ 2,891
|
|
|
$ 3,931
|
|
|
$ 1,071
|
|
|
(26)
|
|
|
170
|
|
|||||||||||
|
EARNINGS PER COMMON SHARE
|
||||||||||||||||||||||||||
|
Basic3 |
$ 8.73 | $ 11.67 | $ 3.09 | (25) % | 183 | % | ||||||||||||||||||||
|
Diluted |
$ 8.62 | $ 11.58 | $ 3.08 | (26) | 180 | |||||||||||||||||||||
|
AVERAGE COMMON SHARES
|
||||||||||||||||||||||||||
| Basic |
329.8 | 335.6 | 342.3 | (2) | (4) | |||||||||||||||||||||
|
Diluted |
335.5 | 339.5 | 347.2 | (1) | (3) | |||||||||||||||||||||
|
SELECTED DATA AT PERIOD-END
|
||||||||||||||||||||||||||
|
Common shareholders’ equity |
$ 106,710 | $ 107,343 | $ 105,790 | (1) | 1 | |||||||||||||||||||||
|
Basic shares3 |
326.2 | 334.3 | 342.0 | (2) | (5) | |||||||||||||||||||||
|
Book value per common share |
$ 327.13 | $ 321.10 | $ 309.33 | 2 | 6 | |||||||||||||||||||||
| Headcount
|
|
44,300
|
|
|
44,400
|
|
|
44,600
|
|
|
–
|
|
|
(1)
|
|
|||||||||||
9
Goldman Sachs Reports
Second Quarter 2024 Earnings Results
The Goldman Sachs Group, Inc. and Subsidiaries
Consolidated Statements of Earnings (unaudited)
In millions, except per share amounts
| SIX MONTHS ENDED | % CHANGE FROM | |||||||||||||||||||
| JUNE 30, 2024 |
JUNE 30, 2023 |
JUNE 30, 2023 |
||||||||||||||||||
|
REVENUES |
||||||||||||||||||||
|
Investment banking |
$ 3,818 | $ 3,010 | 27 % | |||||||||||||||||
|
Investment management |
5,024 | 4,645 | 8 | |||||||||||||||||
|
Commissions and fees |
2,128 | 1,981 | 7 | |||||||||||||||||
|
Market making |
10,217 | 9,784 | 4 | |||||||||||||||||
|
Other principal transactions |
1,907 | 234 | 715 | |||||||||||||||||
|
Total non-interest revenues |
|
23,094 |
|
|
19,654 |
|
|
18 |
|
|||||||||||
| Interest income |
39,995 | 31,774 | 26 | |||||||||||||||||
|
Interest expense |
36,145 | 28,309 | 28 | |||||||||||||||||
|
Net interest income |
|
3,850 |
|
|
3,465 |
|
|
11 |
|
|||||||||||
|
Total net revenues |
26,944 | 23,119 | 17 | |||||||||||||||||
|
|
|
|
||||||||||||||||||
|
Provision for credit losses |
600 | 444 | 35 | |||||||||||||||||
|
OPERATING EXPENSES |
||||||||||||||||||||
|
Compensation and benefits |
8,825 | 7,709 | 14 | |||||||||||||||||
|
Transaction based |
3,151 | 2,790 | 13 | |||||||||||||||||
|
Market development |
306 | 318 | (4) | |||||||||||||||||
|
Communications and technology |
970 | 948 | 2 | |||||||||||||||||
|
Depreciation and amortization |
1,273 | 2,564 | (50) | |||||||||||||||||
|
Occupancy |
491 | 518 | (5) | |||||||||||||||||
|
Professional fees |
777 | 775 | - | |||||||||||||||||
|
Other expenses |
1,398 | 1,324 | 6 | |||||||||||||||||
|
Total operating expenses |
|
17,191 |
|
|
16,946 |
|
|
1 |
|
|||||||||||
| Pre-tax earnings |
9,153 | 5,729 | 60 | |||||||||||||||||
|
Provision for taxes |
1,978 | 1,279 | 55 | |||||||||||||||||
|
Net earnings |
7,175 | 4,450 | 61 | |||||||||||||||||
|
Preferred stock dividends |
353 | 292 | 21 | |||||||||||||||||
|
Net earnings applicable to common shareholders |
$ 6,822 | $ 4,158 | 64 | |||||||||||||||||
|
EARNINGS PER COMMON SHARE |
||||||||||||||||||||
|
Basic3 |
$ 20.44 | $ 12.00 | 70 % | |||||||||||||||||
|
Diluted |
$ 20.21 | $ 11.91 | 70 | |||||||||||||||||
|
AVERAGE COMMON SHARES |
||||||||||||||||||||
|
Basic |
332.6 | 344.4 | (3) | |||||||||||||||||
|
Diluted
|
|
337.5
|
|
|
349.2
|
|
|
(3)
|
|
|||||||||||
10
Goldman Sachs Reports
Second Quarter 2024 Earnings Results
The Goldman Sachs Group, Inc. and Subsidiaries
Condensed Consolidated Balance Sheets (unaudited)3
$ in billions
| AS OF | ||||||||||||||||||||||
| JUNE 30, 2024 |
MARCH 31, 2024 |
|||||||||||||||||||||
| ASSETS
|
||||||||||||||||||||||
| Cash and cash equivalents |
$ 206 | $ 209 | ||||||||||||||||||||
|
Collateralized agreements |
403 | 447 | ||||||||||||||||||||
|
Customer and other receivables |
142 | 160 | ||||||||||||||||||||
|
Trading assets |
522 | 508 | ||||||||||||||||||||
|
Investments |
161 | 155 | ||||||||||||||||||||
|
Loans |
184 | 184 | ||||||||||||||||||||
|
Other assets |
35 | 35 | ||||||||||||||||||||
|
Total assets
|
|
$ 1,653
|
|
|
$ 1,698
|
|
||||||||||||||||
|
LIABILITIES AND SHAREHOLDERS’ EQUITY
|
||||||||||||||||||||||
| Deposits |
$ 433 | $ 441 | ||||||||||||||||||||
|
Collateralized financings |
325 | 349 | ||||||||||||||||||||
|
Customer and other payables |
243 | 257 | ||||||||||||||||||||
|
Trading liabilities |
200 | 201 | ||||||||||||||||||||
|
Unsecured short-term borrowings |
77 | 78 | ||||||||||||||||||||
|
Unsecured long-term borrowings |
235 | 234 | ||||||||||||||||||||
|
Other liabilities |
21 | 20 | ||||||||||||||||||||
|
Total liabilities
|
|
1,534
|
|
|
1,580
|
|
||||||||||||||||
| Shareholders’ equity |
119 | 118 | ||||||||||||||||||||
|
Total liabilities and shareholders’ equity |
|
$ 1,653
|
|
|
$ 1,698
|
|
||||||||||||||||
|
Capital Ratios and Supplementary Leverage Ratio (unaudited)3 $ in billions
|
|
|||||||||||||||||||||
| AS OF | ||||||||||||||||||||||
| JUNE 30, 2024 |
MARCH 31, 2024 |
|||||||||||||||||||||
|
Common equity tier 1 capital |
$ 100.8 | $ 101.7 | ||||||||||||||||||||
|
STANDARDIZED CAPITAL RULES
|
||||||||||||||||||||||
| Risk-weighted assets |
$ 679 | $ 695 | ||||||||||||||||||||
|
Common equity tier 1 capital ratio |
14.8% | 14.6% | ||||||||||||||||||||
|
ADVANCED CAPITAL RULES
|
||||||||||||||||||||||
| Risk-weighted assets |
$ 640 | $ 640 | ||||||||||||||||||||
|
Common equity tier 1 capital ratio |
15.7% | 15.9% | ||||||||||||||||||||
|
SUPPLEMENTARY LEVERAGE RATIO
|
||||||||||||||||||||||
| Supplementary leverage ratio
|
5.4% | 5.4% | ||||||||||||||||||||
|
Average Daily VaR (unaudited)3 $ in millions |
|
|||||||||||||||||||||
| THREE MONTHS ENDED | ||||||||||||||||||||||
| JUNE 30, 2024 |
MARCH 31, 2024 |
|||||||||||||||||||||
|
RISK CATEGORIES
|
||||||||||||||||||||||
|
Interest rates |
$ 81 | $ 86 | ||||||||||||||||||||
|
Equity prices |
33 | 29 | ||||||||||||||||||||
|
Currency rates |
30 | 18 | ||||||||||||||||||||
|
Commodity prices |
18 | 17 | ||||||||||||||||||||
| Diversification effect |
(71) | (63) | ||||||||||||||||||||
|
Total
|
|
$ 91
|
|
|
$ 87
|
|
||||||||||||||||
11
Goldman Sachs Reports
Second Quarter 2024 Earnings Results
The Goldman Sachs Group, Inc. and Subsidiaries
Assets Under Supervision (unaudited)3
$ in billions
| AS OF | ||||||||||||||||||||||||
| JUNE 30, 2024 |
MARCH 31, 2024 |
JUNE 30, 2023 |
||||||||||||||||||||||
|
ASSET CLASS
|
||||||||||||||||||||||||
| Alternative investments
|
|
$ 314
|
|
|
$ 296
|
|
|
$ 267
|
|
|||||||||||||||
| Equity
|
|
735
|
|
|
713
|
|
|
627
|
|
|||||||||||||||
| Fixed income
|
|
1,147
|
|
|
1,141
|
|
|
1,056
|
|
|||||||||||||||
|
Total long-term AUS
|
|
2,196
|
|
|
2,150
|
|
|
1,950
|
|
|||||||||||||||
| Liquidity products
|
|
738
|
|
|
698
|
|
|
764
|
|
|||||||||||||||
|
Total AUS
|
|
$ 2,934
|
|
|
$ 2,848
|
|
|
$ 2,714
|
|
|||||||||||||||
| THREE MONTHS ENDED | ||||||||||||||||||||||||
| JUNE 30, 2024 |
MARCH 31, 2024 |
JUNE 30, 2023 |
||||||||||||||||||||||
|
Beginning balance
|
$ 2,848 | $ 2,812 | $ 2,672 | |||||||||||||||||||||
| Net inflows / (outflows):
|
||||||||||||||||||||||||
| Alternative investments
|
18 | – | (1) | |||||||||||||||||||||
| Equity
|
|
6
|
|
|
1
|
|
|
(3)
|
|
|||||||||||||||
| Fixed income
|
|
7
|
|
|
23
|
|
|
12
|
|
|||||||||||||||
|
Total long-term AUS net inflows / (outflows)
|
|
31
|
|
|
24
|
|
|
8
|
|
|||||||||||||||
|
Liquidity products
|
|
40
|
|
|
(39)
|
|
|
4
|
|
|||||||||||||||
|
Total AUS net inflows / (outflows)
|
|
71
|
|
|
(15)
|
|
|
12
|
|
|||||||||||||||
| Acquisitions / (dispositions)
|
|
–
|
|
|
–
|
|
|
–
|
|
|||||||||||||||
| Net market appreciation / (depreciation)
|
|
15
|
|
|
51
|
|
|
30
|
|
|||||||||||||||
|
Ending balance
|
|
$ 2,934
|
|
|
$ 2,848
|
|
|
$ 2,714
|
|
|||||||||||||||
12
Goldman Sachs Reports
Second Quarter 2024 Earnings Results
|
Footnotes |
|
|
| 1. | Annualized ROE is calculated by dividing annualized net earnings applicable to common shareholders by average monthly common shareholders’ equity. Annualized ROTE is calculated by dividing annualized net earnings applicable to common shareholders by average monthly tangible common shareholders’ equity (tangible common shareholders’ equity is calculated as total shareholders’ equity less preferred stock, goodwill and identifiable intangible assets). Management believes that ROTE is meaningful because it measures the performance of businesses consistently, whether they were acquired or developed internally, and that tangible common shareholders’ equity is meaningful because it is a measure that the firm and investors use to assess capital adequacy. ROTE and tangible common shareholders’ equity are non-GAAP measures and may not be comparable to similar non-GAAP measures used by other companies. |
The table below presents a reconciliation of average common shareholders’ equity to average tangible common shareholders’ equity:
|
AVERAGE FOR THE |
||||||||||||||
| Unaudited, $ in millions
|
THREE MONTHS ENDED JUNE 30, 2024
|
SIX MONTHS ENDED
|
||||||||||||
|
Total shareholders’ equity
|
|
$ 118,842
|
|
|
$ 118,056
|
|
||||||||
| Preferred stock
|
|
(12,366)
|
|
|
(11,867)
|
|
||||||||
|
Common shareholders’ equity
|
|
106,476
|
|
|
106,189
|
|
||||||||
|
Goodwill |
|
(5,895)
|
|
|
(5,899)
|
|
||||||||
| Identifiable intangible assets
|
|
(1,006)
|
|
|
(1,071)
|
|
||||||||
|
Tangible common shareholders’ equity
|
|
$ 99,575
|
|
|
$ 99,219
|
|
||||||||
| 2. | Dealogic – January 1, 2024 through June 30, 2024. |
| 3. | For information about the following items, see the referenced sections in Part I, Item 2 “Management’s Discussion and Analysis of Financial Condition and Results of Operations” in the firm’s Quarterly Report on Form 10-Q for the period ended March 31, 2024: (i) Investment banking fees backlog – see “Results of Operations – Global Banking & Markets,” (ii) assets under supervision – see “Results of Operations – Asset & Wealth Management – Assets Under Supervision,” (iii) efficiency ratio – see “Results of Operations – Operating Expenses,” (iv) share repurchase program – see “Capital Management and Regulatory Capital – Capital Management,” (v) global core liquid assets – see “Risk Management – Liquidity Risk Management,” (vi) basic shares – see “Balance Sheet and Funding Sources – Balance Sheet Analysis and Metrics” and (vii) VaR – see “Risk Management – Market Risk Management.” |
For information about the following items, see the referenced sections in Part I, Item 1 “Financial Statements (Unaudited)” in the firm’s Quarterly Report on Form 10-Q for the period ended March 31, 2024: (i) risk-based capital ratios and the supplementary leverage ratio – see Note 20 “Regulation and Capital Adequacy,” (ii) geographic net revenues – see Note 25 “Business Segments” and (iii) unvested share-based awards that have non-forfeitable rights to dividends or dividend equivalents in calculating basic EPS – see Note 21 “Earnings Per Common Share.”
Represents a preliminary estimate for the second quarter of 2024 for the firm’s assets under supervision, capital ratios, risk-weighted assets, supplementary leverage ratio, balance sheet data, global core liquid assets and VaR. These may be revised in the firm’s Quarterly Report on Form 10-Q for the period ended June 30, 2024.
13

Exhibit 99.2 Second Quarter 2024 Earnings Results Presentation July 15, 2024
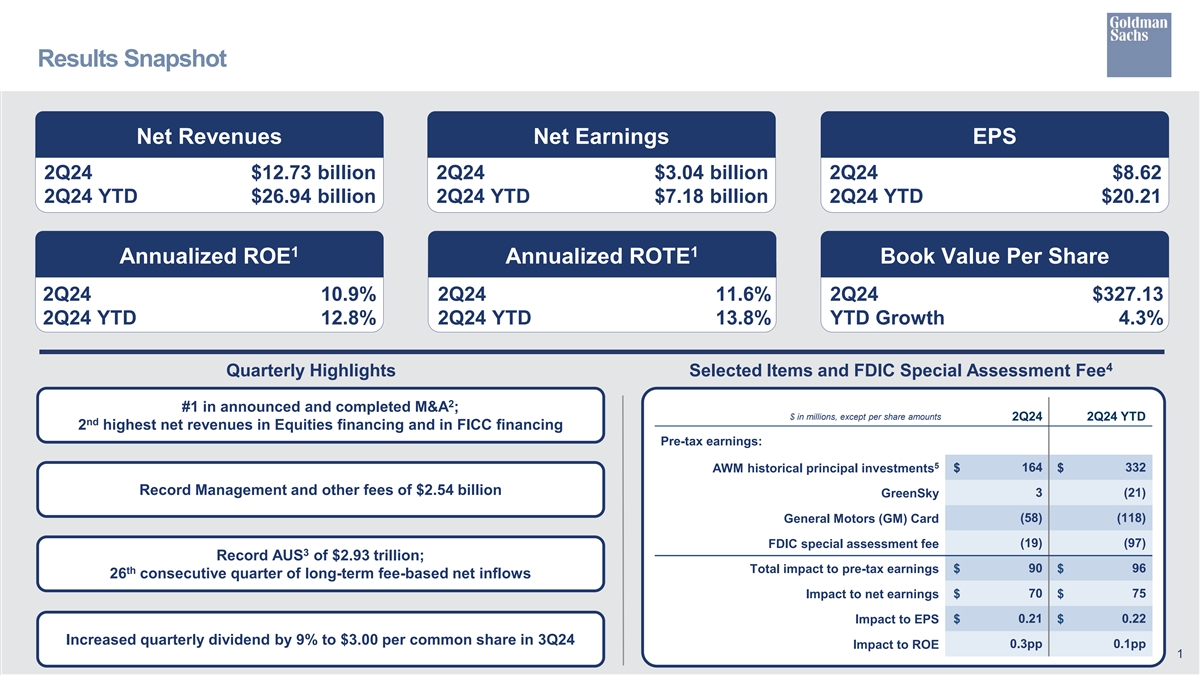
Results Snapshot Net Revenues Net Earnings EPS 2Q24 $12.73 billion 2Q24 $3.04 billion 2Q24 $8.62 2Q24 YTD $ 2 6 . 9 4 bi llion 2Q24 YTD $ 7 . 1 8 bi l l i on 2Q24 YTD $20. 21 1 1 Annualized ROE Annualized ROTE Book Value Per Share 2Q24 10.9% 2Q24 11.6% 2Q24 $327.13 2Q24 YTD 12.8% 2Q24 YTD 13.8% YTD Growth 4.3% 4 Quarterly Highlights Selected Items and FDIC Special Assessment Fee 2 #1 in announced and completed M&A ; $ in millions, except per share amounts 2Q24 2Q24 YTD nd 2 highest net revenues in Equities financing and in FICC financing Pre-tax earnings: 5 164 332 AWM historical principal investments $ $ Record Management and other fees of $2.54 billion GreenSky 3 (21) General Motors (GM) Card (58) (118) (19) (97) FDIC special assessment fee 3 Record AUS of $2.93 trillion; $ 90 $ 96 th Total impact to pre-tax earnings 26 consecutive quarter of long-term fee-based net inflows 70 75 Impact to net earnings $ $ 0.21 0.22 Impact to EPS $ $ Increased quarterly dividend by 9% to $3.00 per common share in 3Q24 Impact to ROE 0.3pp 0.1pp 1
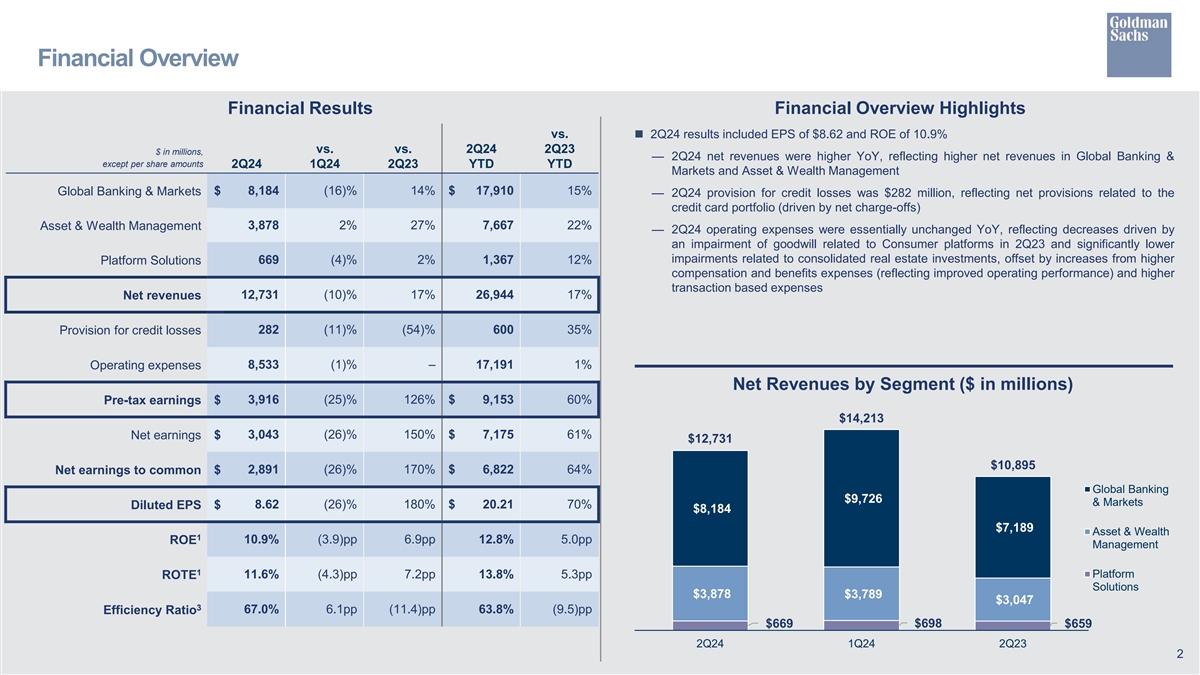
Financial Overview Financial Results Financial Overview Highlights vs.n 2Q24 results included EPS of $8.62 and ROE of 10.9% vs. vs. 2Q24 2Q23 $ in millions, — 2Q24 net revenues were higher YoY, reflecting higher net revenues in Global Banking & except per share amounts 2Q24 1Q24 2Q23 YTD YTD Markets and Asset & Wealth Management $ 8,184 (16)% 14% $ 17,910 15% Global Banking & Markets — 2Q24 provision for credit losses was $282 million, reflecting net provisions related to the credit card portfolio (driven by net charge-offs) Asset & Wealth Management 3,878 2% 27% 7,667 22% — 2Q24 operating expenses were essentially unchanged YoY, reflecting decreases driven by an impairment of goodwill related to Consumer platforms in 2Q23 and significantly lower impairments related to consolidated real estate investments, offset by increases from higher 669 (4)% 2% 1,367 12% Platform Solutions compensation and benefits expenses (reflecting improved operating performance) and higher transaction based expenses 12,731 (10)% 17% 26,944 17% Net revenues 282 (11)% (54)% 600 35% Provision for credit losses 8,533 (1)% – 17,191 1% Operating expenses Net Revenues by Segment ($ in millions) 3,916 (25)% 126% $ 9,153 60% Pre-tax earnings $ $14,213 $ 3,043 (26)% 150% $ 7,175 61% Net earnings $12,731 $10,895 $ 2,891 (26)% 170% $ 6,822 64% Net earnings to common Global Banking $9,726 & Markets Diluted EPS $ 8.62 (26)% 180% $ 20.21 70% $8,184 $7,189 Asset & Wealth 1 ROE 10.9% (3.9)pp 6.9pp 12.8% 5.0pp Management 1 Platform ROTE 11.6% (4.3)pp 7.2pp 13.8% 5.3pp Solutions $3,878 $3,789 $3,047 3 67.0% 6.1pp (11.4)pp 63.8% (9.5)pp Efficiency Ratio $669 $698 $659 2Q24 1Q24 2Q23 2
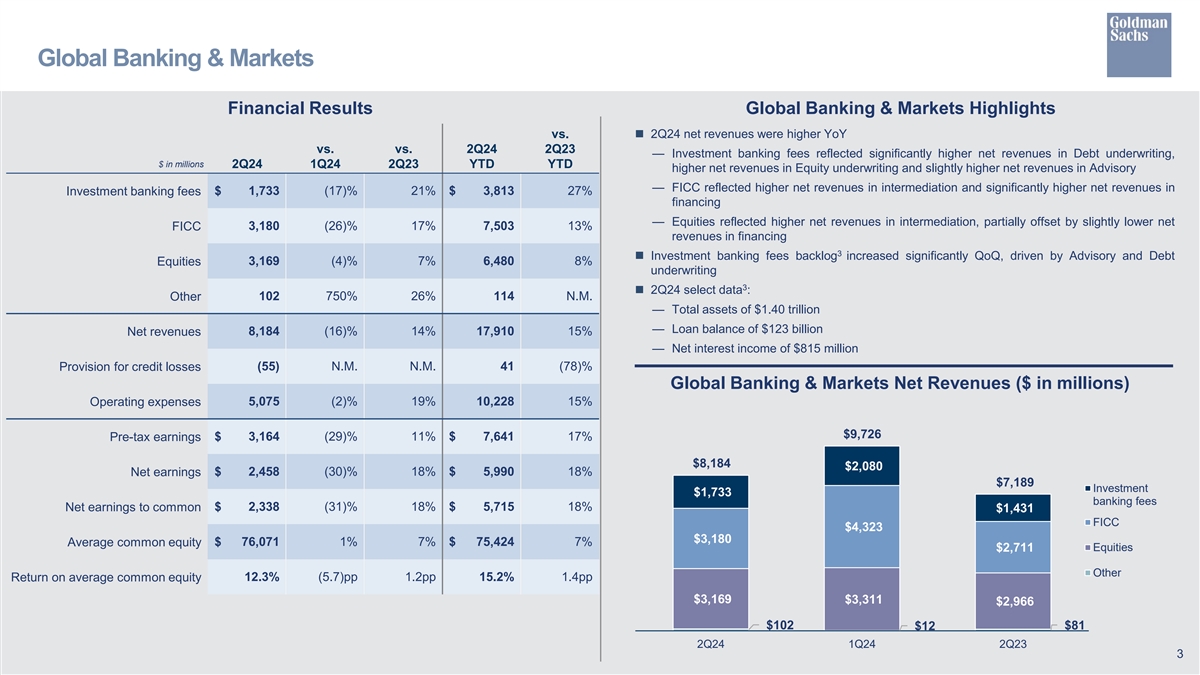
Global Banking & Markets Financial Results Global Banking & Markets Highlights vs.n 2Q24 net revenues were higher YoY vs. vs. 2Q24 2Q23 — Investment banking fees reflected significantly higher net revenues in Debt underwriting, $ in millions 2Q24 1Q24 2Q23 YTD YTD higher net revenues in Equity underwriting and slightly higher net revenues in Advisory — FICC reflected higher net revenues in intermediation and significantly higher net revenues in $ 1,733 (17)% 21% $ 3,813 27% Investment banking fees financing — Equities reflected higher net revenues in intermediation, partially offset by slightly lower net 3,180 (26)% 17% 7,503 13% FICC revenues in financing 3 n Investment banking fees backlog increased significantly QoQ, driven by Advisory and Debt 3,169 (4)% 7% 6,480 8% Equities underwriting 3 n 2Q24 select data : 102 750% 26% 114 N.M. Other — Total assets of $1.40 trillion — Loan balance of $123 billion 8,184 (16)% 14% 17,910 15% Net revenues — Net interest income of $815 million Provision for credit losses (55) N.M. N.M. 41 (78)% Global Banking & Markets Net Revenues ($ in millions) Operating expenses 5,075 (2)% 19% 10,228 15% $9,726 Pre-tax earnings $ 3,164 (29)% 11% $ 7,641 17% $8,184 $2,080 Net earnings $ 2,458 (30)% 18% $ 5,990 18% $7,189 Investment $1,733 banking fees Net earnings to common $ 2,338 (31)% 18% $ 5,715 18% $1,431 FICC $4,323 $3,180 Average common equity $ 76,071 1% 7% $ 75,424 7% Equities $2,711 Other Return on average common equity 12.3% (5.7)pp 1.2pp 15.2% 1.4pp $3,169 $3,311 $2,966 $102 $12 $81 2Q24 1Q24 2Q23 3
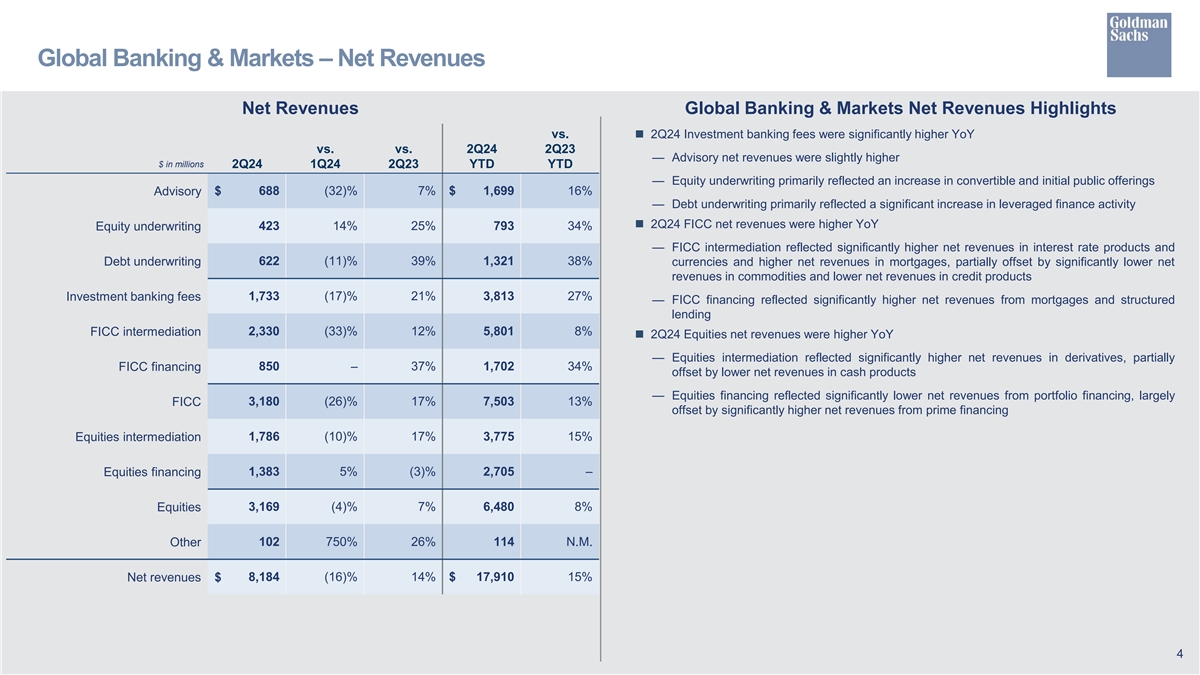
Global Banking & Markets – Net Revenues Net Revenues Global Banking & Markets Net Revenues Highlights vs.n 2Q24 Investment banking fees were significantly higher YoY vs. vs. 2Q24 2Q23 — Advisory net revenues were slightly higher $ in millions 2Q24 1Q24 2Q23 YTD YTD — Equity underwriting primarily reflected an increase in convertible and initial public offerings $ 688 (32)% 7% $ 1,699 16% Advisory — Debt underwriting primarily reflected a significant increase in leveraged finance activity n 2Q24 FICC net revenues were higher YoY 423 14% 25% 793 34% Equity underwriting — FICC intermediation reflected significantly higher net revenues in interest rate products and 622 (11)% 39% 1,321 38% Debt underwriting currencies and higher net revenues in mortgages, partially offset by significantly lower net revenues in commodities and lower net revenues in credit products 1,733 (17)% 21% 3,813 27% Investment banking fees — FICC financing reflected significantly higher net revenues from mortgages and structured lending 2,330 (33)% 12% 5,801 8% FICC intermediation n 2Q24 Equities net revenues were higher YoY — Equities intermediation reflected significantly higher net revenues in derivatives, partially FICC financing 850 – 37% 1,702 34% offset by lower net revenues in cash products — Equities financing reflected significantly lower net revenues from portfolio financing, largely FICC 3,180 (26)% 17% 7,503 13% offset by significantly higher net revenues from prime financing Equities intermediation 1,786 (10)% 17% 3,775 15% Equities financing 1,383 5% (3)% 2,705 – Equities 3,169 (4)% 7% 6,480 8% Other 102 750% 26% 114 N.M. Net revenues $ 8,184 (16)% 14% $ 17,910 15% 4
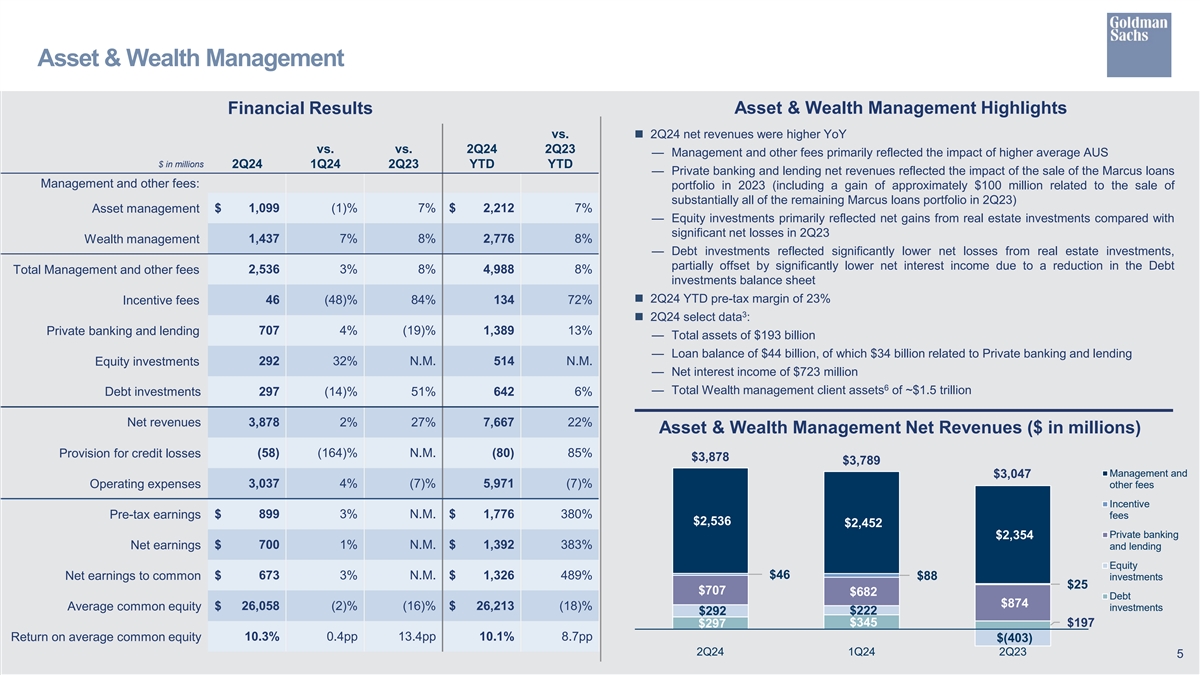
Asset & Wealth Management Financial Results Asset & Wealth Management Highlights vs.n 2Q24 net revenues were higher YoY vs. vs. 2Q24 2Q23 — Management and other fees primarily reflected the impact of higher average AUS $ in millions 2Q24 1Q24 2Q23 YTD YTD — Private banking and lending net revenues reflected the impact of the sale of the Marcus loans Management and other fees: portfolio in 2023 (including a gain of approximately $100 million related to the sale of substantially all of the remaining Marcus loans portfolio in 2Q23) Asset management $ 1,099 (1)% 7% $ 2,212 7% — Equity investments primarily reflected net gains from real estate investments compared with significant net losses in 2Q23 1,437 7% 8% 2,776 8% Wealth management — Debt investments reflected significantly lower net losses from real estate investments, partially offset by significantly lower net interest income due to a reduction in the Debt Total Management and other fees 2,536 3% 8% 4,988 8% investments balance sheet n 2Q24 YTD pre-tax margin of 23% 46 (48)% 84% 134 72% Incentive fees 3 n 2Q24 select data : Private banking and lending 707 4% (19)% 1,389 13% — Total assets of $193 billion — Loan balance of $44 billion, of which $34 billion related to Private banking and lending 292 32% N.M. 514 N.M. Equity investments — Net interest income of $723 million 6 — Total Wealth management client assets of ~$1.5 trillion Debt investments 297 (14)% 51% 642 6% Net revenues 3,878 2% 27% 7,667 22% Asset & Wealth Management Net Revenues ($ in millions) Provision for credit losses (58) (164)% N.M. (80) 85% $3,878 $3,789 Management and $3,047 3,037 4% (7)% 5,971 (7)% Operating expenses other fees Incentive Pre-tax earnings $ 899 3% N.M. $ 1,776 380% fees $2,536 $2,452 Private banking $2,354 $ 700 1% N.M. $ 1,392 383% Net earnings and lending Equity $46 Net earnings to common $ 673 3% N.M. $ 1,326 489% $88 investments $25 $707 $682 Debt $874 $ 26,058 (2)% (16)% $ 26,213 (18)% Average common equity investments $292 $222 $345 $297 $197 Return on average common equity 10.3% 0.4pp 13.4pp 10.1% 8.7pp $(403) 2Q24 1Q24 2Q23 5
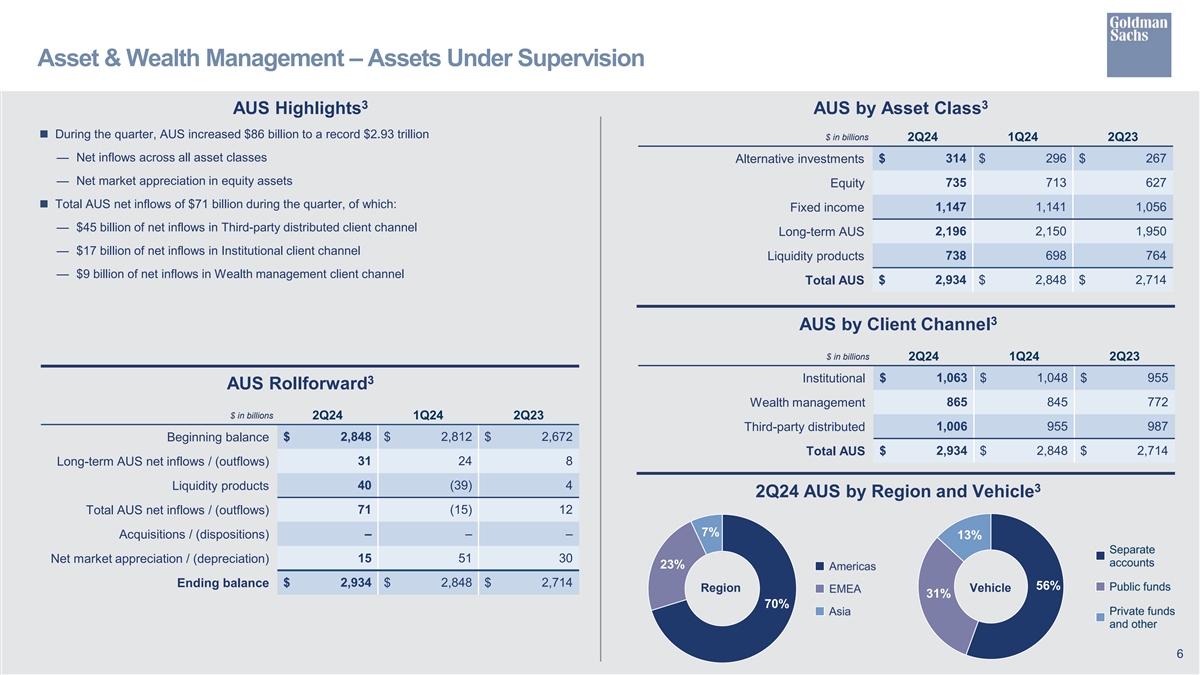
Asset & Wealth Management – Assets Under Supervision 3 3 AUS Highlights AUS by Asset Class n During the quarter, AUS increased $86 billion to a record $2.93 trillion $ in billions 2Q24 1Q24 2Q23 — Net inflows across all asset classes $ 314 $ 296 $ 267 Alternative investments — Net market appreciation in equity assets Equity 735 713 627 n Total AUS net inflows of $71 billion during the quarter, of which: Fixed income 1,147 1,141 1,056 — $45 billion of net inflows in Third-party distributed client channel Long-term AUS 2,196 2,150 1,950 — $17 billion of net inflows in Institutional client channel Liquidity products 738 698 764 — $9 billion of net inflows in Wealth management client channel 2,934 2,848 2,714 Total AUS $ $ $ 3 AUS by Client Channel $ in billions 2Q24 1Q24 2Q23 Institutional $ 1,063 $ 1,048 $ 955 3 AUS Rollforward 865 845 772 Wealth management $ in billions 2Q24 1Q24 2Q23 Third-party distributed 1,006 955 987 Beginning balance $ 2,848 $ 2,812 $ 2,672 Total AUS $ 2,934 $ 2,848 $ 2,714 31 24 8 Long-term AUS net inflows / (outflows) Liquidity products 40 (39) 4 3 2Q24 AUS by Region and Vehicle 71 (15) 12 Total AUS net inflows / (outflows) 7% Acquisitions / (dispositions) – – – 13% Net market appreciation / (depreciation) 15 51 30 23% Ending balance $ 2,934 $ 2,848 $ 2,714 56% Region Vehicle 31% 70% 6
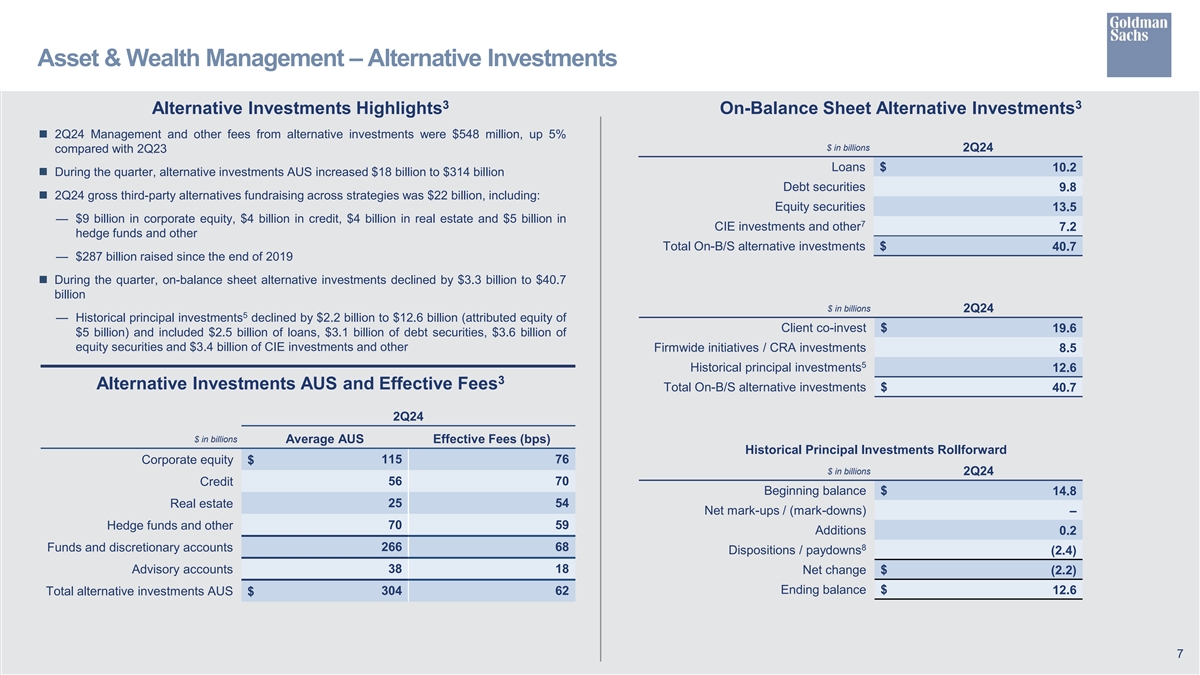
Asset & Wealth Management – Alternative Investments 3 3 Alternative Investments Highlights On-Balance Sheet Alternative Investments n 2Q24 Management and other fees from alternative investments were $548 million, up 5% $ in billions 2Q24 compared with 2Q23 Loans $ 10.2 n During the quarter, alternative investments AUS increased $18 billion to $314 billion Debt securities 9.8 n 2Q24 gross third-party alternatives fundraising across strategies was $22 billion, including: Equity securities 13.5 — $9 billion in corporate equity, $4 billion in credit, $4 billion in real estate and $5 billion in 7 CIE investments and other 7.2 hedge funds and other Total On-B/S alternative investments $ 40.7 — $287 billion raised since the end of 2019 n During the quarter, on-balance sheet alternative investments declined by $3.3 billion to $40.7 billion $ in billions 2Q24 5 — Historical principal investments declined by $2.2 billion to $12.6 billion (attributed equity of Client co-invest $ 19.6 $5 billion) and included $2.5 billion of loans, $3.1 billion of debt securities, $3.6 billion of equity securities and $3.4 billion of CIE investments and other Firmwide initiatives / CRA investments 8.5 5 Historical principal investments 12.6 3 Alternative Investments AUS and Effective Fees Total On-B/S alternative investments $ 40.7 2Q24 $ in billions Average AUS Effective Fees (bps) Historical Principal Investments Rollforward Corporate equity 115 76 $ $ in billions 2Q24 56 70 Credit Beginning balance $ 14.8 Real estate 25 54 Net mark-ups / (mark-downs) – Hedge funds and other 70 59 Additions 0.2 Funds and discretionary accounts 266 68 8 Dispositions / paydowns (2.4) Advisory accounts 38 18 Net change $ (2.2) Ending balance $ Total alternative investments AUS 304 62 12.6 $ 7
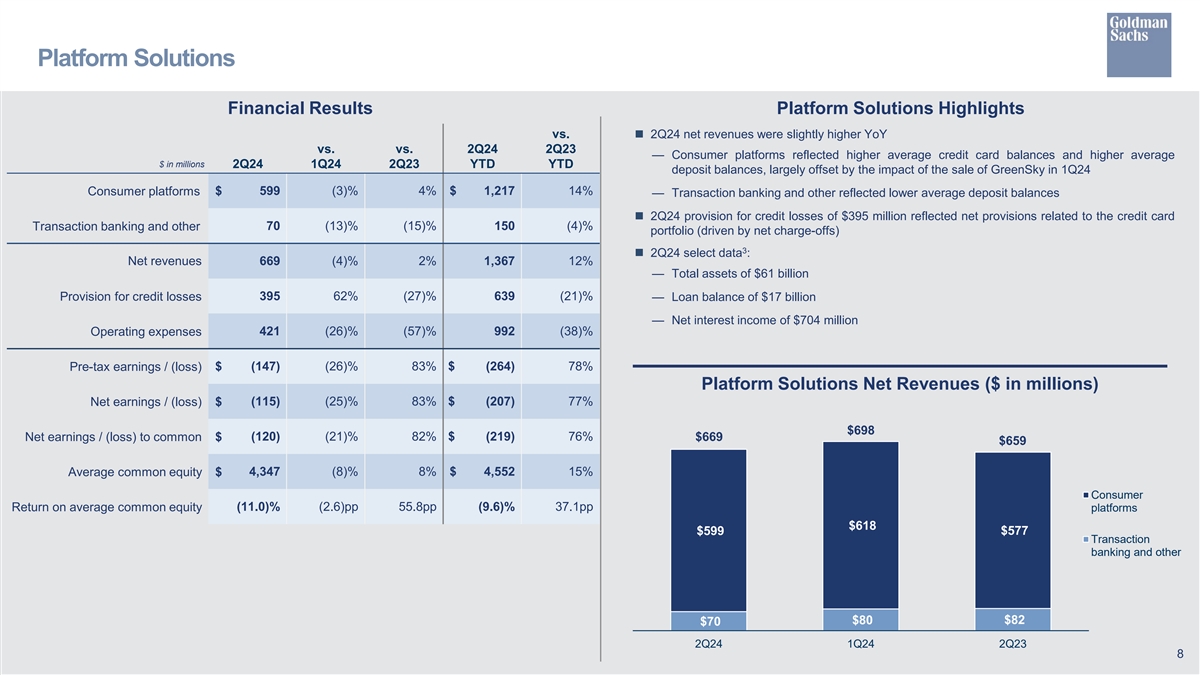
Platform Solutions Financial Results Platform Solutions Highlights vs.n 2Q24 net revenues were slightly higher YoY vs. vs. 2Q24 2Q23 — Consumer platforms reflected higher average credit card balances and higher average $ in millions 2Q24 1Q24 2Q23 YTD YTD deposit balances, largely offset by the impact of the sale of GreenSky in 1Q24 $ 599 (3)% 4% $ 1,217 14% Consumer platforms — Transaction banking and other reflected lower average deposit balances n 2Q24 provision for credit losses of $395 million reflected net provisions related to the credit card 70 (13)% (15)% 150 (4)% Transaction banking and other portfolio (driven by net charge-offs) 3 n 2Q24 select data : Net revenues 669 (4)% 2% 1,367 12% — Total assets of $61 billion 395 62% (27)% 639 (21)% Provision for credit losses — Loan balance of $17 billion — Net interest income of $704 million 421 (26)% (57)% 992 (38)% Operating expenses Pre-tax earnings / (loss) $ (147) (26)% 83% $ (264) 78% Platform Solutions Net Revenues ($ in millions) Net earnings / (loss) $ (115) (25)% 83% $ (207) 77% $698 Net earnings / (loss) to common $ (120) (21)% 82% $ (219) 76% $669 $659 Average common equity $ 4,347 (8)% 8% $ 4,552 15% Consumer Return on average common equity (11.0)% (2.6)pp 55.8pp (9.6)% 37.1pp platforms $618 $599 $577 Transaction banking and other $82 $80 $70 2Q24 1Q24 2Q23 8
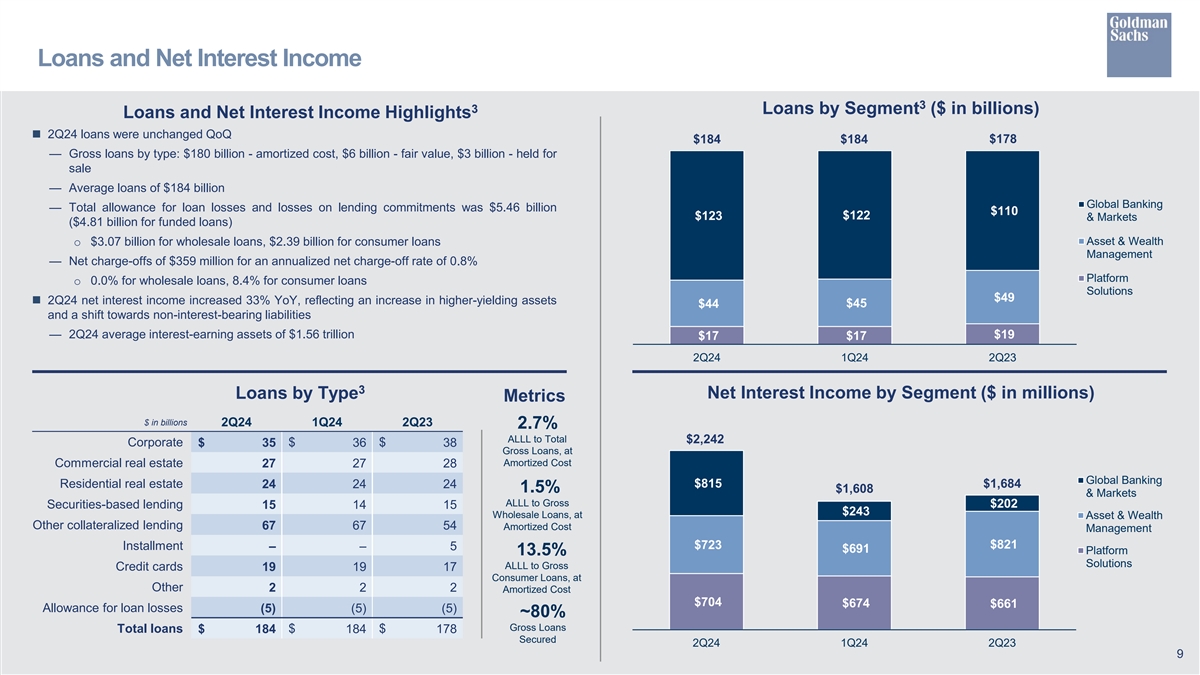
Loans and Net Interest Income 3 3 Loans by Segment ($ in billions) Loans and Net Interest Income Highlights n 2Q24 loans were unchanged QoQ $184 $184 $178 — Gross loans by type: $180 billion - amortized cost, $6 billion - fair value, $3 billion - held for sale — Average loans of $184 billion Global Banking — Total allowance for loan losses and losses on lending commitments was $5.46 billion $110 $123 $122 & Markets ($4.81 billion for funded loans) Asset & Wealth o $3.07 billion for wholesale loans, $2.39 billion for consumer loans Management — Net charge-offs of $359 million for an annualized net charge-off rate of 0.8% Platform o 0.0% for wholesale loans, 8.4% for consumer loans Solutions $49 n 2Q24 net interest income increased 33% YoY, reflecting an increase in higher-yielding assets $44 $45 and a shift towards non-interest-bearing liabilities — 2Q24 average interest-earning assets of $1.56 trillion $19 $17 $17 2Q24 1Q24 2Q23 3 Loans by Type Net Interest Income by Segment ($ in millions) Metrics $ in billions 2Q24 1Q24 2Q23 2.7% ALLL to Total $2,242 Corporate $ $ $ 35 36 38 Gross Loans, at Amortized Cost Commercial real estate 27 27 28 Global Banking Residential real estate $815 $1,684 24 24 24 1.5% $1,608 & Markets ALLL to Gross $202 Securities-based lending 15 14 15 $243 Wholesale Loans, at Asset & Wealth Other collateralized lending 67 67 54 Amortized Cost Management $723 $821 Installment – – 5 $691 13.5% Platform Solutions ALLL to Gross Credit cards 19 19 17 Consumer Loans, at Other 2 2 2 Amortized Cost $704 $674 $661 Allowance for loan losses (5) (5) (5) ~80% Gross Loans Total loans $ $ $ 184 184 178 Secured 2Q24 1Q24 2Q23 9
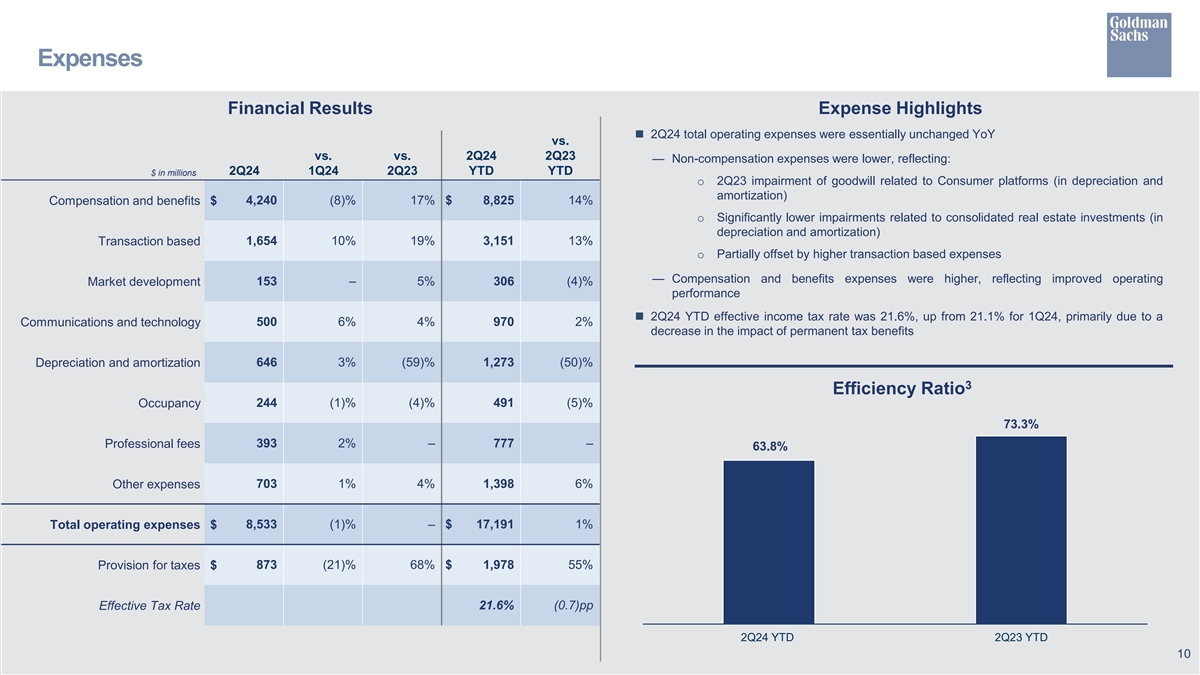
Expenses Financial Results Expense Highlights n 2Q24 total operating expenses were essentially unchanged YoY vs. vs. vs. 2Q24 2Q23 — Non-compensation expenses were lower, reflecting: 2Q24 1Q24 2Q23 YTD YTD $ in millions o 2Q23 impairment of goodwill related to Consumer platforms (in depreciation and amortization) Compensation and benefits $ 4,240 (8)% 17% $ 8,825 14% o Significantly lower impairments related to consolidated real estate investments (in depreciation and amortization) Transaction based 1,654 10% 19% 3,151 13% o Partially offset by higher transaction based expenses — Compensation and benefits expenses were higher, reflecting improved operating Market development 153 – 5% 306 (4)% performance n 2Q24 YTD effective income tax rate was 21.6%, up from 21.1% for 1Q24, primarily due to a Communications and technology 500 6% 4% 970 2% decrease in the impact of permanent tax benefits 646 3% (59)% 1,273 (50)% Depreciation and amortization 3 Efficiency Ratio Occupancy 244 (1)% (4)% 491 (5)% 73.3% Professional fees 393 2% – 777 – 63.8% Other expenses 703 1% 4% 1,398 6% Total operating expenses $ 8,533 (1)% – $ 17,191 1% 873 (21)% 68% $ 1,978 55% Provision for taxes $ Effective Tax Rate 21.6% (0.7)pp 2Q24 YTD 2Q23 YTD 10
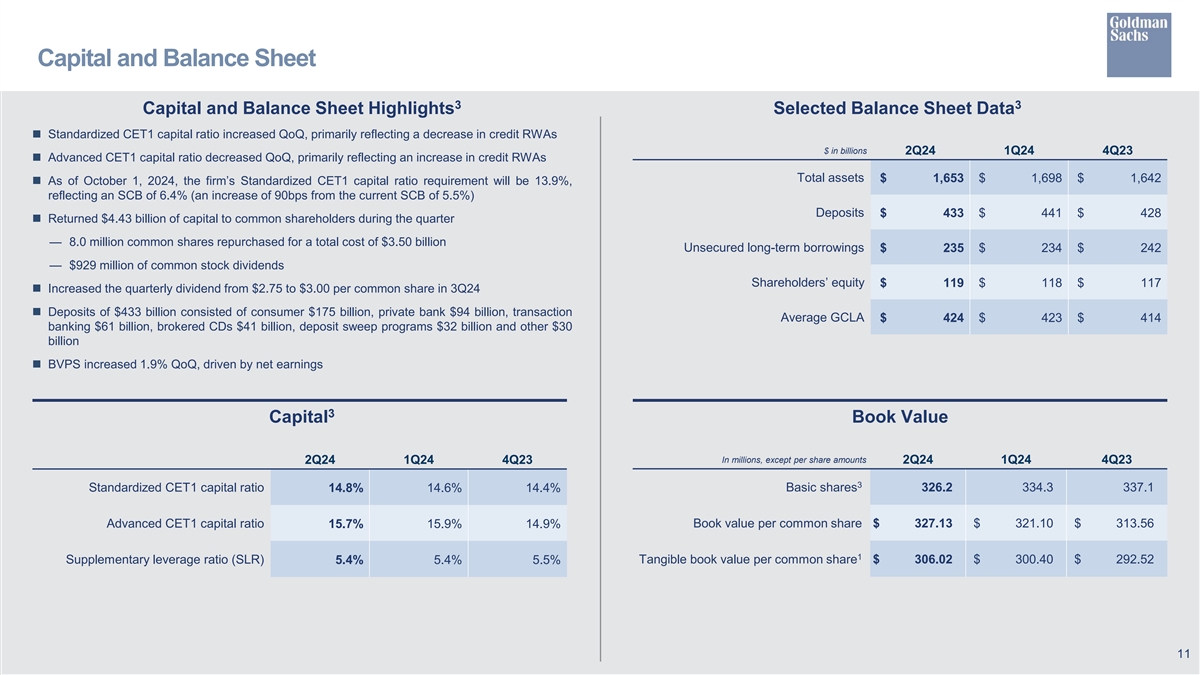
Capital and Balance Sheet 3 3 Capital and Balance Sheet Highlights Selected Balance Sheet Data n Standardized CET1 capital ratio increased QoQ, primarily reflecting a decrease in credit RWAs $ in billions 2Q24 1Q24 4Q23 n Advanced CET1 capital ratio decreased QoQ, primarily reflecting an increase in credit RWAs Total assets $ 1,653 $ 1,698 $ 1, 642 n As of October 1, 2024, the firm’s Standardized CET1 capital ratio requirement will be 13.9%, reflecting an SCB of 6.4% (an increase of 90bps from the current SCB of 5.5%) Deposits $ 433 $ 441 $ 428 n Returned $4.43 billion of capital to common shareholders during the quarter — 8.0 million common shares repurchased for a total cost of $3.50 billion Unsecured long-term borrowings $ 235 $ 234 $ 242 — $929 million of common stock dividends Shareholders’ equity $ 119 $ 118 $ 117 n Increased the quarterly dividend from $2.75 to $3.00 per common share in 3Q24 n Deposits of $433 billion consisted of consumer $175 billion, private bank $94 billion, transaction Average GCLA $ 424 $ 423 $ 414 banking $61 billion, brokered CDs $41 billion, deposit sweep programs $32 billion and other $30 billion n BVPS increased 1.9% QoQ, driven by net earnings 3 Capital Book Value In millions, except per share amounts 2Q24 1Q24 4Q23 2Q24 1Q24 4Q23 3 Standardized CET1 capital ratio Basic shares 326.2 334.3 337.1 14.8% 14.6% 14.4% Advanced CET1 capital ratio Book value per common share $ 327.13 $ 321.10 $ 313.56 15.7% 15.9% 14.9% 1 Supplementary leverage ratio (SLR) 5.4% 5.4% 5.5% Tangible book value per common share $ 306.02 $ 300.40 $ 292.52 11
Cautionary Note Regarding Forward-Looking Statements This presentation contains “forward-looking statements” within the meaning of the safe harbor provisions of the U.S. Private Securities Litigation Reform Act of 1995. Forward-looking statements are not historical facts or statements of current conditions, but instead represent only the firm’s beliefs regarding future events, many of which, by their nature, are inherently uncertain and outside of the firm’s control. It is possible that the firm’s actual results, financial condition and liquidity may differ, possibly materially, from the anticipated results, financial condition and liquidity in these forward-looking statements. For information about some of the risks and important factors that could affect the firm’s future results, financial condition and liquidity and the forward-looking statements below, see “Risk Factors” in Part I, Item 1A of the firm’s Annual Report on Form 10-K for the year ended December 31, 2023. Information regarding the firm’s assets under supervision, capital ratios, risk-weighted assets, supplementary leverage ratio, balance sheet data and global core liquid assets (GCLA) consists of preliminary estimates. These estimates are forward-looking statements and are subject to change, possibly materially, as the firm completes its financial statements. Statements regarding (i) estimated GDP growth or contraction, interest rate and inflation trends and volatility, (ii) the timing, profitability, benefits and other prospective aspects of business initiatives and the achievability of targets and goals, (iii) the future state of the firm’s liquidity and regulatory capital ratios (including the firm’s stress capital buffer and G-SIB buffer, and the potential impact of changes to U.S. regulatory capital rules), (iv) the firm’s prospective capital distributions (including dividends and repurchases), (v) the firm’s future effective income tax rate, (vi) the firm’s Investment banking fees backlog and future results, (vii) the firm’s planned 2024 benchmark debt issuances, (viii) the impact of Russia’s invasion of Ukraine and related sanctions and other developments and the impact of the conflict in the Middle East on the firm’s business, results and financial position, and (ix) the firm’s ability to sell, and the terms of any proposed or pending sale of, Asset & Wealth Management historical principal investments and the firm’s ability to transition the GM credit card are forward-looking statements. Statements regarding estimated GDP growth or contraction, interest rate and inflation trends and volatility are subject to the risk that actual GDP growth or contraction, interest rate and inflation trends and volatility may differ, possibly materially, due to, among other things, changes in general economic conditions and monetary and fiscal policy. Statements about the timing, profitability, benefits and other prospective aspects of business initiatives and the achievability of targets and goals are based on the firm’s current expectations regarding the firm’s ability to effectively implement these initiatives and achieve these targets and goals and may change, possibly materially, from what is currently expected. Statements about the future state of the firm’s liquidity and regulatory capital ratios (including the firm’s stress capital buffer and G-SIB buffer), as well as its prospective capital distributions (including dividends and repurchases), are subject to the risk that the firm’s actual liquidity, regulatory capital ratios and capital distributions may differ, possibly materially, from what is currently expected, including due to, among other things, potential future changes to regulatory capital rules, which may not be what the firm expects. Statements about the firm’s future effective income tax rate are subject to the risk that the firm’s future effective income tax rate may differ from the anticipated rate indicated, possibly materially, due to, among other things, changes in the tax rates applicable to the firm, the firm’s earnings mix or profitability, the entities in which the firm generates profits and the assumptions made in forecasting the firm’s expected tax rate, and potential future guidance from tax authorities. Statements about the firm’s Investment banking fees backlog and future advisory and capital market results are subject to the risk that advisory and capital market activity may not increase as the firm expects or that transactions may be modified or may not be completed at all, and related net revenues may not be realized or may be materially less than expected. Important factors that could have such a result include, for underwriting transactions, a decline or weakness in general economic conditions, an outbreak or worsening of hostilities, including those in Ukraine and the Middle East, volatility in the securities markets or an adverse development with respect to the issuer of the securities and, for financial advisory transactions, a decline in the securities markets, an inability to obtain adequate financing, an adverse development with respect to a party to the transaction or a failure to obtain a required regulatory approval. Statements regarding the firm’s planned 2024 benchmark debt issuances are subject to the risk that actual issuances may differ, possibly materially, due to changes in market conditions, business opportunities or the firm’s funding needs. Statements about the impact of Russia’s invasion of Ukraine and related sanctions and other developments and the impact of the conflict in the Middle East on the firm’s business, results and financial position are subject to the risks that hostilities may escalate and expand, that sanctions may increase and that the actual impact may differ, possibly materially, from what is currently expected. Statements about the proposed or pending sales of Asset & Wealth Management historical principal investments are subject to the risks that buyers may not bid on these assets or bid at levels, or with terms, that are unacceptable to the firm, and that the performance of these activities may deteriorate as a result of the proposed and pending sales, and statements about the process to transition the GM credit card are subject to the risk that a transaction may not close on the anticipated timeline or at all, including due to a failure to obtain requisite regulatory approvals. 12
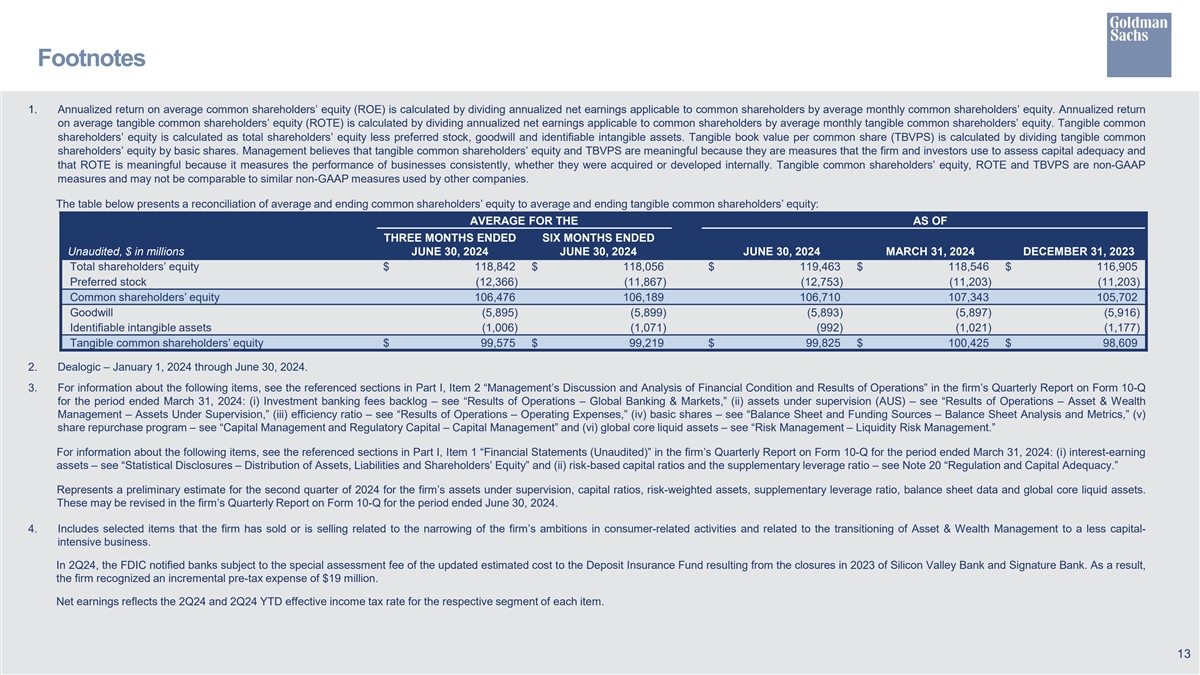
Footnotes 1. Annualized return on average common shareholders’ equity (ROE) is calculated by dividing annualized net earnings applicable to common shareholders by average monthly common shareholders’ equity. Annualized return on average tangible common shareholders’ equity (ROTE) is calculated by dividing annualized net earnings applicable to common shareholders by average monthly tangible common shareholders’ equity. Tangible common shareholders’ equity is calculated as total shareholders’ equity less preferred stock, goodwill and identifiable intangible assets. Tangible book value per common share (TBVPS) is calculated by dividing tangible common shareholders’ equity by basic shares. Management believes that tangible common shareholders’ equity and TBVPS are meaningful because they are measures that the firm and investors use to assess capital adequacy and that ROTE is meaningful because it measures the performance of businesses consistently, whether they were acquired or developed internally. Tangible common shareholders’ equity, ROTE and TBVPS are non-GAAP measures and may not be comparable to similar non-GAAP measures used by other companies. The table below presents a reconciliation of average and ending common shareholders’ equity to average and ending tangible common shareholders’ equity: AVERAGE FOR THE AS OF THREE MONTHS ENDED SIX MONTHS ENDED Unaudited, $ in millions JUNE 30, 2024 JUNE 30, 2024 JUNE 30, 2024 MARCH 31, 2024 DECEMBER 31, 2023 Total shareholders’ equity $ 118,842 $ 118,056 $ 119,463 $ 118,546 $ 116,905 Preferred stock (12,366) (11,867) (12,753) (11,203) (11,203) Common shareholders’ equity 106,476 106,189 106,710 107,343 105,702 Goodwill (5,895) (5,899) (5,893) (5,897) (5,916) Identifiable intangible assets (1,006) (1,071) (992) (1,021) (1,177) Tangible common shareholders’ equity $ 99,575 $ 99,219 $ 99,825 $ 100,425 $ 98,609 2. Dealogic – January 1, 2024 through June 30, 2024. 3. For information about the following items, see the referenced sections in Part I, Item 2 “Management’s Discussion and Analysis of Financial Condition and Results of Operations” in the firm’s Quarterly Report on Form 10-Q for the period ended March 31, 2024: (i) Investment banking fees backlog – see “Results of Operations – Global Banking & Markets,” (ii) assets under supervision (AUS) – see “Results of Operations – Asset & Wealth Management – Assets Under Supervision,” (iii) efficiency ratio – see “Results of Operations – Operating Expenses,” (iv) basic shares – see “Balance Sheet and Funding Sources – Balance Sheet Analysis and Metrics,” (v) share repurchase program – see “Capital Management and Regulatory Capital – Capital Management” and (vi) global core liquid assets – see “Risk Management – Liquidity Risk Management.” For information about the following items, see the referenced sections in Part I, Item 1 “Financial Statements (Unaudited)” in the firm’s Quarterly Report on Form 10-Q for the period ended March 31, 2024: (i) interest-earning assets – see “Statistical Disclosures – Distribution of Assets, Liabilities and Shareholders’ Equity” and (ii) risk-based capital ratios and the supplementary leverage ratio – see Note 20 “Regulation and Capital Adequacy.” Represents a preliminary estimate for the second quarter of 2024 for the firm’s assets under supervision, capital ratios, risk-weighted assets, supplementary leverage ratio, balance sheet data and global core liquid assets. These may be revised in the firm’s Quarterly Report on Form 10-Q for the period ended June 30, 2024. 4. Includes selected items that the firm has sold or is selling related to the narrowing of the firm’s ambitions in consumer-related activities and related to the transitioning of Asset & Wealth Management to a less capital- intensive business. In 2Q24, the FDIC notified banks subject to the special assessment fee of the updated estimated cost to the Deposit Insurance Fund resulting from the closures in 2023 of Silicon Valley Bank and Signature Bank. As a result, the firm recognized an incremental pre-tax expense of $19 million. Net earnings reflects the 2Q24 and 2Q24 YTD effective income tax rate for the respective segment of each item. 13
Footnotes - Continued 5. Includes consolidated investment entities (CIEs) and other legacy investments the firm intends to exit over the medium term (refers to a 3-5 year time horizon from year-end 2022). 6. Consists of AUS, brokerage assets and Marcus deposits. 7. Includes CIEs and other investments. CIEs are generally accounted for at historical cost less depreciation. Substantially all of the firm’s CIEs are engaged in commercial real estate investment activities. Assets held by CIEs of $4 billion as of June 30, 2024 were funded with liabilities of approximately $2 billion as of June 30, 2024. Substantially all such liabilities are nonrecourse, thereby reducing the firm’s equity at risk. 8. Includes approximately $0.2 billion of investments that were transferred from historical principal investments to client co-invest. 14