| ☐ | REGISTRATION STATEMENT PURSUANT TO SECTION 12(b) OR 12(g) OF THE SECURITIES EXCHANGE ACT OF 1934 |
| ☒ | ANNUAL REPORT PURSUANT TO SECTION 13 OR 15(d) OF THE SECURITIES EXCHANGE ACT OF 1934 |
| ☐ | TRANSITION REPORT PURSUANT TO SECTION 13 OR 15(d) OF THE SECURITIES EXCHANGE ACT OF 1934 |
| ☐ | SHELL COMPANY REPORT PURSUANT TO SECTION 13 OR 15(d) OF THE SECURITIES EXCHANGE ACT OF 1934 |
Japan |
13-1, Nihonbashi 1-chome
Chuo-ku, Tokyo 103-8645
Japan |
|
(Jurisdiction of incorporation or organization) |
(Address of principal executive offices) |
Title of Each Class |
Trading Symbol(s) |
Name of Each Exchange On Which Registered |
||
|
American Depositary Shares Common Stock *
|
NMR |
New York Stock Exchange |
| * | No t for trading, but only in connection with the registration of the American Depositary Shares, each representing one share of Common Stock. |
|
Large accelerated file r ☒ |
Accelerated filer ☐ |
Non-accelerated filer ☐ |
Emerging growth company ☐ |
| U.S. GAAP ☒
|
International Financial Reporting Standards as issued by the International Accounting Standards Board ☐
|
Other ☐ |
Page |
||||
PART I |
||||
Item 1. |
2 | |||
Item 2. |
2 | |||
Item 3. |
2 | |||
Item 4. |
21 | |||
Item 4A. |
55 | |||
Item 5. |
55 | |||
Item 6. |
92 | |||
Item 7. |
119 | |||
Item 8. |
119 | |||
Item 9. |
120 | |||
Item 10. |
120 | |||
Item 11. |
128 | |||
Item 12. |
143 | |||
PART II |
||||
Item 13. |
145 | |||
Item 14. |
145 | |||
Item 15. |
145 | |||
Item 16A. |
146 | |||
Item 16B. |
146 | |||
Item 16C. |
146 | |||
Item 16D. |
147 | |||
Item 16E. |
147 | |||
Item 16F. |
148 | |||
Item 16G. |
148 | |||
Item 16H. |
150 | |||
Item 16I. |
150 | |||
Item 16J. |
150 | |||
Item 16K. |
150 | |||
PART III |
||||
Item 17. |
152 | |||
Item 18. |
152 | |||
Item 19. |
152 | |||
F-1 |
||||
|
·
|
Risks Relating to the Business Environment |
1 |
Our business may be materially affected by financial markets, economic conditions and market fluctuations in Japan and elsewhere around the world, including the ones caused by geopolitical events |
| (1) | Governmental fiscal and monetary policy changes in Japan, or in any other countries or regions where we conduct business may affect our business, financial condition and results of operations |
| (2) | Extended market declines and decreases in market participants can reduce liquidity and lead to material losses |
| (3) | Natural disaster, terrorism, military dispute and infectious disease could adversely affect our business |
2 |
The financial services industry faces intense competition |
| (1) | Competition with other financial firms and financial services by non-financial companies is increasing |
| (2) | Increased consolidation, business alliance and cooperation in the financial services industry mean increased competition for us |
| (3) | Our global business continues to face intense competition and may require further revisions to its business model |
3 |
Event risk, including the ones caused by geopolitical events, may cause losses in our trading and investment assets as well as market and liquidity risk |
4 |
Sustainability factors including climate change and broader associated policy changes in each jurisdiction could adversely affect our business |
|
·
|
Risks Relating to Our Businesses |
5 |
Our business may incur losses due to various factors in the conduct of its operations |
| (1) | We may incur significant losses from our trading and investment activities |
| (2) | Holding large and concentrated positions of securities and other assets may expose us to significant losses |
| (3) | Our hedging strategies may not prevent losses |
| (4) | Our risk management policies and procedures may not be fully effective in managing risk |
| (5) | Market risk may increase other risks that we face |
| (6) | Our brokerage and asset management revenues may decline |
| (7) | Our investment banking revenues may decline |
6 |
We may be exposed to losses when third parties do not perform their obligations to us |
| (1) | Defaults by a large financial institution could adversely affect the financial markets generally and us specifically |
| (2) | There can be no assurance as to the accuracy of the information about our credit risk, or the sufficiency of the collateral we use in managing it |
| (3) | Our clients and counterparties may be unable to perform their obligations to us as a result of political or economic conditions |
7 |
We are exposed to model risk, i.e., risk of financial loss, incorrect decision making, or damage to our credibility arising from model errors or incorrect or inappropriate model application |
8 |
NHI is a holding company and depends on payments from its subsidiaries |
9 |
We may not be able to realize gains we expect, and may even suffer losses, on our investments in equity securities and non-trading debt securities |
10 |
We may face an outflow of clients’ assets due to losses incurred within cash reserve funds or debt securities we offer to clients |
|
·
|
Risks Relating to Our Financial Position |
11 |
We may have to recognize impairment losses with regard to the amount of goodwill, tangible and intangible assets recognized on our consolidated balance sheets |
12 |
Liquidity risk could impair our ability to fund operations and jeopardize our financial condition |
| (1) | We may be unable to access unsecured or secured funding |
| (2) | We may be unable to sell assets |
| (3) | Lowering of our credit ratings could impact our funding |
13 |
Equity investments in affiliates and other investees accounted for under the equity method in our consolidated financial statements may decline significantly over a period of time and result in us recognizing impairment losses |
|
·
|
Risks Relating to Legal, Compliance and Other Operational Issues |
14 |
Operational risk could adversely affect our business |
15 |
We identified a material weakness in our internal control over financial reporting and, despite our efforts to remediate, may identify further material weaknesses in the future |
16 |
Misconduct or fraud by an employee, director or officer, or any third party, could occur, and our reputation in the market and our relationships with clients could be harmed |
17 |
A failure to identify and appropriately address conflicts of interest could adversely affect our business |
18 |
Our business is subject to substantial legal, regulatory and reputational risks |
| (1) | Legal liability related to our business may occur and could adversely affect our business, financial condition and results of operations |
| (2) | Extensive regulation of our businesses limits our activities and may subject us to significant penalties and losses |
| (3) | Tightening of regulations applicable to the financial system and financial industry could adversely affect our business, financial condition and results of operations |
| (4) | Deferred tax assets may be impacted due to a change in business condition or in laws and regulations, resulting in an adverse effect on our operating results and financial condition |
| (5) | Defects in our anti-money laundering and counter-terrorism financing measures could have serious consequences such as, administrative penalties or punitive fines |
19 |
Unauthorized disclosure or misuse of personal information held by us may adversely affect our business |
20 |
System failure, information leakage and cost of maintaining sufficient cybersecurity could adversely affect our business, financial condition and results of operations |
21 |
Our business may be adversely affected if we are unable to hire, retain and develop qualified personnel |
|
·
|
Risks Related to Holding or Trading of our Shares and ADSs |
22 |
Because of daily price range limitations under Japanese stock exchange rules, you may not be able to sell your shares of the Company’s common stock at a particular price on any particular trading day, or at all |
23 |
Under Japan’s unit share system, holders of shares of the Company’s common stock constituting less than one unit are subject to transfer, voting and other restrictions |
24 |
As a holder of ADSs, you will have fewer rights than a shareholder has and you will have to act through the depositary to exercise these rights |
25 |
Rights of shareholders under Japanese law may be more limited than under the laws of other jurisdictions |
26 |
The Company’s shareholders of record on a record date may not receive the dividend they anticipate |
27 |
It may not be possible for investors to secure personal jurisdiction within the U.S. over the Company or the Company’s directors or executive officers, or to enforce against the Company or those persons judgments obtained in U.S. courts predicated upon the civil liability provisions of the federal securities laws of the U.S. |
|
·
|
Special Note Regarding Forward-looking Statements |
|
·
|
Risks Relating to the Business Environment |
1. |
Our business may be materially affected by financial markets, economic conditions and market fluctuations in Japan and elsewhere around the world, including the ones caused by geopolitical events |
2. |
The financial services industry faces intense competition |
3. |
Event risk, including the ones caused by geopolitical events, may cause losses in our trading and investment assets as well as market and liquidity risk |
| • | sudden and significant reductions in credit ratings with regard to financial instruments held by our trading and investment businesses by major rating agencies, |
| • | sudden changes in trading, tax, accounting, regulatory requirements, laws and other related rules which may make our trading strategy obsolete, less competitive or no longer viable, or |
| • | an unexpected failure in a corporate transaction in which we participate resulting in us not receiving the consideration we should have received, as well as bankruptcy, deliberate acts of fraud, and administrative penalty with respect to the issuers of our trading and investment assets. |
4. |
Sustainability factors including climate change and broader associated policy changes in each jurisdiction could adversely affect our business |
|
·
|
Risks Relating to Our Businesses |
5. |
Our business may incur losses due to various factors in the conduct of its operations. |
6. |
We may be exposed to losses when third parties do not perform their obligations to us |
7. |
We are exposed to model risk, i.e., risk of financial loss, incorrect decision making, or damage to our credibility arising from model errors or incorrect or inappropriate model application |
8. |
NHI is a holding company and depends on payments from its subsidiaries |
9. |
We may not be able to realize gains we expect, and may even suffer losses, on our investments in equity securities and non-trading debt securities |
10. |
We may face an outflow of clients’ assets due to losses incurred within cash reserve funds or debt securities we offer to clients |
|
·
|
Risks Relating to Our Financial Position |
11. |
We may have to recognize impairment losses with regard to the amount of goodwill, tangible and intangible assets recognized on our consolidated balance sheets |
12. |
Liquidity risk could impair our ability to fund operations and jeopardize our financial condition |
| • | We incur large trading losses, |
| • | The level of our business activity decreases due to a market downturn, |
| • | Regulatory authorities take significant action against us, or |
| • | Our credit rating is downgraded. |
13. |
Equity investments in affiliates and other investees accounted for under the equity method in our consolidated financial statements may decline significantly over a period of time and result in us recognizing impairment losses |
|
·
|
Risks Relating to Legal, Compliance and Other Operational Issues |
14. |
Operational risk could adversely affect our business |
15. |
We identified a material weakness in our internal control over financial reporting and, despite our efforts to remediate, may identify further material weaknesses in the future |
16. |
Misconduct or fraud by an employee, director or officer, or any third party, could occur, and our reputation in the market and our relationships with clients could be harmed |
17. |
A failure to identify and appropriately address conflicts of interest could adversely affect our business |
18. |
Our business is subject to substantial legal, regulatory and reputational risks |
19. |
Unauthorized disclosure or misuse of personal information held by us may adversely affect our business |
20. |
System failure, information leakage and cost of maintaining sufficient cybersecurity could adversely affect our business, financial condition and results of operations |
21. |
Our business may be adversely affected if we are unable to hire, retain and develop qualified personnel |
|
·
|
Risks Related to Holding or Trading of our Shares and ADSs |
22. |
Because of daily price range limitations under Japanese stock exchange rules, you may not be able to sell your shares of the Company’s common stock at a particular price on any particular trading day, or at all |
23. |
Under Japan’s unit share system, holders of shares of the Company’s common stock constituting less than one unit are subject to transfer, voting and other restrictions |
24. |
As a holder of ADSs, you will have fewer rights than a shareholder has and you will have to act through the depositary to exercise these rights |
25. |
Rights of shareholders under Japanese law may be more limited than under the laws of other jurisdictions |
26. |
The Company’s shareholders of record on a record date may not receive the dividend they anticipate |
27. |
It may not be possible for investors to secure personal jurisdiction within the U.S. over the Company or the Company’s directors or executive officers, or to enforce against the Company or those persons judgments obtained in U.S. courts predicated upon the civil liability provisions of the federal securities laws of the U.S. |
|
·
|
Special Note Regarding Forward-looking Statements |
|
* |
The Retail Division has been renamed the “Wealth Management Division”, effective April 1, 2024. |
|
Purpose We aspire to create a better world by harnessing the power of financial markets |
| • | the quality, range and prices of our products and services, |
| • | our ability to originate and develop innovative client solutions, |
| • | our ability to maintain and develop client relationships, |
| • | our ability to access and commit capital resources, |
| • | our ability to retain and attract qualified employees, and |
| • | our general reputation. |
| • | the monetary and fiscal policies of national governments and international economic organizations, |
| • | economic, political and social developments both within and between Japan, the U.S., Europe and other major industrialized and developing countries and regions, and |
| • | increasing digitalization beyond the traditional financial sector |
| (i) | significantly reduce the number of instruments in scope of full transparency by trading venues and investment firms to those instruments considered most liquid (Category 1 instruments), with only venues responsible for providing transparency on other non-equity instruments (Category 2 instruments) when these are traded on venue; and |
| (ii) | streamline pre-trade waivers and post-trade deferrals, as well as allowing venues to calibrate these themselves for Category 2 instruments (applying specified criteria). |
• |
Wealth Management Division |
| • | Investment Management Division |
| • | Wholesale Division |
| • | Risk Management and Compliance, etc. |
| • | Supporting the sustainability efforts of our clients and stakeholders through business activities as a leading financial institution |
| • | The Company’s efforts to continue being a sustainable corporate group |
| • | Risk that clients will not adequately respond to climate change, resulting in financial damage, decline in creditworthiness and inability to fulfil their contractual obligations |
| • | Risk that climate change causes market fluctuations and losses are incurred due to fluctuations in the market price of Nomura’s financial assets |
| • | Risk of reputational damage if Nomura and counterparties fail to respond appropriately to climate change |
| • | Risk of financial losses or reputational damage due to inadequate or failed internal processes and employee response to climate change |
| • | Risk of inadequate strategies or failed execution of strategies as compared with competitors, and risk of gap between strategies and resources |

| (1) | Absenteeism: The impact of absenteeism is measured by financial losses due to absence from work coursed by injury or illness, calculated by multiplying the average compensation of employees for such financial year by the number of employees and the utilization rate of sick leave. |
| (2) | Presenteeism: A condition in which individuals go to work despite being ill or experiencing symptoms of illness, with negative impacts on business execution and productivity. The figure is calculated based on responses to the SPQ (Single-Item Presenteeism Question, Tokyo University 1-Item Version). |
| (3) | Work Engagement: A positive, fulfilling, work-related state of mind. This is measured based on deviation from the results of the national average of annual stress assessment, which is an annual mandatory workplace program in Japan to screen for mental health issues in workers. |
Name |
Country/Region |
Ownership Interest |
||||
(%) |
||||||
Nomura Holdings, Inc. |
Japan | — | ||||
Nomura Securities Co., Ltd. (1)
|
Japan | 100 | ||||
Nomura Asset Management Co., Ltd. |
Japan | 100 | ||||
The Nomura Trust & Banking Co., Ltd. |
Japan | 100 | ||||
Nomura Babcock & Brown Co., Ltd. |
Japan | 100 | ||||
Nomura Capital Investment Co., Ltd. |
Japan | 100 | ||||
Nomura Investor Relations Co., Ltd. |
Japan | 100 | ||||
Nomura Fiduciary Research & Consulting Co., Ltd. |
Japan | 100 | ||||
Nomura Research & Advisory Co., Ltd. |
Japan | 100 | ||||
Nomura Business Services Co., Ltd. |
Japan | 100 | ||||
Nomura Properties, Inc. |
Japan | 100 | ||||
Nomura Institute of Capital Markets Research |
Japan | 100 | ||||
Nomura Healthcare Co., Ltd. (1)
|
Japan | 100 | ||||
Nomura Agri Planning & Advisory Co., Ltd. (1)
|
Japan | 100 | ||||
Nomura Financial Products & Services, Inc. |
Japan | 100 | ||||
Nomura Institute of Estate Planning |
Japan | 100 | ||||
Nomura Capital Partners Co., Ltd. |
Japan | 100 | ||||
Nomura Mezzanine Partners Co., Ltd. |
Japan | 100 | ||||
Corporate Design Partners Co., Ltd. |
Japan | 100 | ||||
Nomura Kagayaki Co., Ltd. |
Japan | 100 | ||||
Nomura IM Investment LLC |
Japan | 100 | ||||
Nomura Asia Pacific Holdings Co., Ltd. |
Japan | 100 | ||||
Nomura International (Hong Kong) Limited |
Hong Kong | 100 | ||||
Nomura Singapore Limited |
Singapore | 100 | ||||
Nomura Securities Singapore Pte. Ltd. |
Singapore | 100 | ||||
Nomura Australia Limited |
Australia | 100 | ||||
Nomura Asia Investment (Fixed Income) Pte. Ltd. |
Singapore | 100 | ||||
Name |
Country/Region |
Ownership Interest |
||||
(%) |
||||||
Nomura Asia Investment (Singapore) Pte. Ltd. |
Singapore | 100 | ||||
Nomura Financial Advisory and Securities (India) Private Limited |
India | 100 | ||||
Nomura Holding America Inc. |
U.S. | 100 | ||||
Nomura Securities International, Inc. |
U.S. | 100 | ||||
Nomura Corporate Research and Asset Management Inc. |
U.S. | 100 | ||||
Nomura America Mortgage Finance, LLC |
U.S. | 100 | ||||
Nomura Global Financial Products, Inc. |
U.S. | 100 | ||||
Instinet Incorporated |
U.S. | 100 | ||||
Nomura Europe Holdings plc |
U.K. | 100 | ||||
Nomura International plc |
U.K. | 100 | ||||
Nomura Bank International plc |
U.K. | 100 | ||||
Nomura Financial Products Europe GmbH |
Germany | 100 | ||||
Banque Nomura France |
France | 100 | ||||
Nomura Bank (Luxembourg) S.A. |
Luxemburg | 100 | ||||
Nomura Bank (Switzerland) Ltd. |
Switzerland | 100 | ||||
Nomura Europe Finance N.V. |
The Netherlands | 100 | ||||
Nomura European Investment Limited |
U.K. | 100 | ||||
Laser Digital Group Holdings AG |
Switzerland | 100 | ||||
Nomura Asia Investment (India Powai) Pte. Ltd. |
Singapore | 100 | ||||
Nomura Services India Private Limited |
India | 100 | ||||
Nomura International Funding Pte. Ltd. |
Singapore | 100 | ||||
Nomura Orient International Securities Co., Ltd. |
China | 51 | ||||
| (1) | Nomura Securities Co., Ltd. (“NSC”), Nomura Healthcare Co., Ltd. (“NHSA”) and Nomura Agri Planning & Advisory Co., Ltd. (“NAPA”), merged effective on May 1, 2024. NSC is a surviving entity and NHSA and NAPA are absorbed entities. |
Name |
Location |
Segment |
Nature of the plan |
Estimate of the amount of expenditures (Millions of yen) |
Amount of expenditures already paid (Millions of yen) |
Method of financing |
Date of start of the activity |
Estimated date of completion of the activity |
||||||||||||
NHI |
Tokyo |
Other |
Nihonbashi 1-Chome Naka Area Type 1 Urban Area Redevelopment Project |
149,200 | 17,233 | Own funds |
December 2021 |
March 2026 |
||||||||||||
|
1. |
Diluted net income attributable to NHI shareholders per share. |
Year ended March 31 (Trillions of yen) |
||||||||||||||||||||
2022 |
2023 |
% Change from previous year |
2024 |
% Change from previous year |
||||||||||||||||
Recurring revenue assets |
¥ | 19.6 | ¥ | 18.7 | (4.6 | )% | ¥ | 23.0 | 23.0 | % | ||||||||||
Year ended March 31 (Billions of yen) |
||||||||||||||||||||
2022 |
2023 |
% Change from previous year |
2024 |
% Change from previous year |
||||||||||||||||
Net inflows of recurring revenue assets |
¥ | 555.5 | ¥ | 333.7 | (39.9 | )% | ¥ | 317.4 | (4.9 | )% | ||||||||||
Year ended March 31 (Thousands) |
||||||||||||||||||||
2022 |
2023 |
% Change from previous year |
2024 |
% Change from previous year |
||||||||||||||||
Flow business clients |
1,505 | 1,446 | (3.9 | )% | 1,692 | 17.0 | % | |||||||||||||
Services for salaried employees |
3,357 | 3,489 | 3.9 | % | 3,627 | 4.0 | % | |||||||||||||
(Trillions of yen) |
||||||||||||||||||||
March 31, 2022 |
March 31, 2023 |
% Change from previous year |
March 31, 2024 |
% Change from previous year |
||||||||||||||||
The balance of assets under management |
¥ | 67.9 | ¥ | 67.3 | (0.9 | )% | ¥ | 89.0 | 32.2% | |||||||||||
Year ended March 31 (Billions of yen) |
||||||||||||||||||||
2022 |
2023 |
% Change from previous year |
2024 |
% Change from previous year |
||||||||||||||||
Net inflow |
¥ | 2,066 | ¥ | (760 | ) | — | % | ¥ | 3,760 | — % | ||||||||||
Year ended March 31 |
||||||||||||||||||||
2022 |
2023 |
% Change from previous year |
2024 |
% Change from previous year |
||||||||||||||||
Cost-to-income |
89 | % | 96 | % | 7 | % | 94 | % | (2 | )% | ||||||||||
Revenue/modified RWA |
7.0 | % | 6.5 | % | (0.5 | )% | 6.8 | % | 0.3 | % | ||||||||||
Millions of yen, except percentages |
||||||||||||||||||||
Year ended March 31 |
||||||||||||||||||||
2022 |
2023 |
% Change from previous year |
2024 |
% Change from previous year |
||||||||||||||||
Non-interest revenues: |
||||||||||||||||||||
Commissions |
¥ | 332,344 | ¥ | 279,857 | (15.8 | )% | ¥ | 364,095 | 30.1 | % | ||||||||||
Fees from investment banking |
149,603 | 113,208 | (24.3 | ) | 173,265 | 53.1 | ||||||||||||||
Asset management and portfolio service fees |
269,985 | 271,684 | 0.6 | 310,154 | 14.2 | |||||||||||||||
Net gain on trading |
368,799 | 563,269 | 52.7 | 491,611 | (12.7 | ) | ||||||||||||||
Gain on private equity and debt investments |
30,768 | 14,504 | (52.9 | ) | 11,877 | (18.1 | ) | |||||||||||||
Gain (loss) on investments in equity securities |
5,446 | (1,426 | ) | — | 9,612 | — | ||||||||||||||
Other |
152,832 | 130,940 | (14.3 | ) | 175,824 | 34.3 | ||||||||||||||
Total Non-interest revenues |
1,309,777 | 1,372,036 | 4.8 | 1,536,438 | 12.0 | |||||||||||||||
Net interest revenue |
54,113 | (36,459 | ) | — | 25,562 | — | ||||||||||||||
Net revenue |
1,363,890 | 1,335,577 | (2.1 | ) | 1,562,000 | 17.0 | ||||||||||||||
Non-interest expenses |
1,137,267 | 1,186,103 | 4.3 | 1,288,150 | 8.6 | |||||||||||||||
Income before income taxes |
226,623 | 149,474 | (34.0 | ) | 273,850 | 83.2 | ||||||||||||||
Income tax expense |
80,090 | 57,798 | (27.8 | ) | 96,630 | 67.2 | ||||||||||||||
Net income |
¥ | 146,533 | ¥ | 91,676 | (37.4 | )% | ¥ | 177,220 | 93.3 | % | ||||||||||
Less: Net income (loss) attributable to noncontrolling interests |
3,537 | (1,110 | ) | — | 11,357 | — | ||||||||||||||
Net income attributable to NHI shareholders |
¥ | 142,996 | ¥ | 92,786 | (35.1 | )% | ¥ | 165,863 | 78.8 | % | ||||||||||
Return on equity |
5.1 | % | 3.1 | % | 5.1 | % | ||||||||||||||
Millions of yen |
||||||||||||||||||||
Year ended March 31 |
||||||||||||||||||||
2022 |
2023 |
% Change from previous year |
2024 |
% Change from previous year |
||||||||||||||||
Non-interest revenue |
¥ | 324,642 | ¥ | 297,496 | (8.4 | )% | ¥ | 395,900 | 33.1 | % | ||||||||||
Net interest revenue |
3,343 | 2,695 | (19.4 | ) | 6,461 | 139.7 | ||||||||||||||
Net revenue |
327,985 | 300,191 | (8.5 | ) | 402,361 | 34.0 | ||||||||||||||
Non-interest expenses |
268,745 | 266,695 | (0.8 | ) | 279,682 | 4.9 | ||||||||||||||
Income before income taxes |
¥ | 59,240 | ¥ | 33,496 | (43.5 | )% | ¥ | 122,679 | 266.2 | % | ||||||||||
Millions of yen |
||||||||||||||||||||
Year ended March 31 |
||||||||||||||||||||
2022 |
2023 |
% Change from previous year |
2024 |
% Change from previous year |
||||||||||||||||
Commissions |
¥ | 138,525 | ¥ | 112,455 | (18.8 | )% | ¥ | 173,461 | 54.2 | % | ||||||||||
Brokerage commissions |
67,419 | 50,901 | (24.5 | ) | 80,239 | 57.6 | ||||||||||||||
Commissions for distribution of investment trusts |
43,537 | 30,183 | (30.7 | ) | 54,857 | 81.7 | ||||||||||||||
Other commissions |
27,569 | 31,371 | 13.8 | 38,365 | 22.3 | |||||||||||||||
Net gain on trading |
43,981 | 44,171 | 0.4 | 55,919 | 26.6 | |||||||||||||||
Fees from investment banking |
19,003 | 16,184 | (14.8 | ) | 23,066 | 42.5 | ||||||||||||||
Asset management fees |
109,300 | 108,085 | (1.1 | ) | 124,446 | 15.1 | ||||||||||||||
Others |
13,833 | 16,601 | 20.0 | 19,008 | 14.5 | |||||||||||||||
Non-interest revenues |
¥ | 324,642 | ¥ | 297,496 | (8.4 | )% | ¥ | 395,900 | 33.1 | % | ||||||||||
Trillions of yen |
||||||||||||||||||||
Year ended March 31, 2023 |
||||||||||||||||||||
|
Balance at beginning of year |
Gross inflows |
Gross outflows |
Market appreciation / (depreciation) |
Balance at end of year |
||||||||||||||||
Equities |
¥ | 77.5 | ¥ | 21.4 | ¥ | (18.6 | ) | ¥ | (2.3 | ) | ¥ | 78.0 | ||||||||
Debt securities |
17.7 | 15.5 | (22.9 | ) | 8.2 | 18.5 | ||||||||||||||
Equity investment trusts |
10.8 | 2.8 | (2.6 | ) | (0.8 | ) | 10.2 | |||||||||||||
Debt investment trusts |
7.5 | 0.1 | (0.7 | ) | (0.1 | ) | 6.8 | |||||||||||||
Overseas mutual funds |
1.3 | 0.1 | (0.1 | ) | (0.1 | ) | 1.2 | |||||||||||||
Others |
7.3 | 1.0 | (0.5 | ) | (0.3 | ) | 7.5 | |||||||||||||
Total |
¥ | 122.1 | ¥ | 40.9 | ¥ | (45.4 | ) | ¥ | 4.6 | ¥ | 122.2 | |||||||||
Trillions of yen |
||||||||||||||||||||
Year ended March 31, 2024 |
||||||||||||||||||||
|
Balance at beginning of year |
Gross inflows |
Gross outflows |
Market appreciation / (depreciation) |
Balance at end of year |
||||||||||||||||
Equities |
¥ | 78.0 | ¥ | 31.1 | ¥ | (27.0 | ) | ¥ | 20.4 | ¥ | 102.5 | |||||||||
Debt securities |
18.5 | 13.6 | (18.4 | ) | 6.4 | 20.1 | ||||||||||||||
Equity investment trusts |
10.2 | 3.8 | (3.6 | ) | 2.9 | 13.3 | ||||||||||||||
Debt investment trusts |
6.8 | 0.8 | (0.3 | ) | 0.0 | 7.3 | ||||||||||||||
Overseas mutual funds |
1.2 | 0.5 | (0.1 | ) | 0.2 | 1.8 | ||||||||||||||
Others |
7.5 | 1.8 | (0.8 | ) | 0.1 | 8.6 | ||||||||||||||
Total |
¥ | 122.2 | ¥ | 51.6 | ¥ | (50.2 | ) | ¥ | 30.0 | ¥ | 153.6 | |||||||||
Millions of yen |
||||||||||||||||||||
Year ended March 31 |
||||||||||||||||||||
2022 |
2023 |
% Change from previous year |
2024 |
% Change from previous year |
||||||||||||||||
Non-interest revenue |
¥ | 129,848 | ¥ | 120,096 | (7.5 | )% | ¥ | 149,575 | 24.5 | % | ||||||||||
Net interest revenue |
18,145 | 8,463 | (53.4 | ) | 4,568 | (46.0 | ) | |||||||||||||
Net revenue |
147,993 | 128,559 | (13.1 | ) | 154,143 | 19.9 | ||||||||||||||
Non-interest expenses |
76,478 | 85,064 | 11.2 | 93,945 | 10.4 | |||||||||||||||
Income before income taxes |
¥ | 71,515 | ¥ | 43,495 | (39.2 | )% | ¥ | 60,198 | 38.4 | % | ||||||||||
Millions of yen |
||||||||||||||||||||
Year ended March 31 |
||||||||||||||||||||
2022 |
2023 |
% Change from previous year |
2024 |
% Change from previous year |
||||||||||||||||
Business revenue (1)
|
¥ | 119,920 | ¥ | 120,664 | 0.6 | % | ¥ | 137,249 | 13.7 | % | ||||||||||
Investment gain/ loss (2)
|
28,073 | 7,895 | (71.9 | ) | 16,894 | 114.0 | ||||||||||||||
Net revenue |
¥ | 147,993 | ¥ | 128,559 | (13.1 | )% | ¥ | 154,143 | 19.9 | % | ||||||||||
| (1) | Consists of divisional revenue, other than investment gain/loss, including revenue generated by our asset management business (excluding gains and losses related to our investment in American Century Investments), revenues generated by Nomura Babcock & Brown Co., Ltd.’s aircraft leasing-related businesses and management fee revenues generated from our private equity and other investment businesses |
| (2) | Consists of divisional revenue attributable to investments (including fair value fluctuations, funding cost and dividends), including gains and losses related to our investment in American Century Investments, our investments held in our private equity and other investment businesses. |
Billions of yen |
||||||||||||||||||||
Year ended March 31, 2023 |
||||||||||||||||||||
|
Balance at beginning of year |
Gross inflows |
Gross outflows |
Market appreciation / (depreciation) |
Balance at end of year |
||||||||||||||||
Nomura Asset Management Co., Ltd . |
¥ | 69,592 | ¥ | 23,168 | ¥ | (24,762 | ) | ¥ | 1,094 | ¥ | 69,092 | |||||||||
Nomura Corporate Research and Asset Management Inc. etc |
3,867 | 1,040 | (1,074 | ) | 35 | 3,868 | ||||||||||||||
Combined total |
73,459 | 24,208 | (25,836 | ) | 1,129 | 72,960 | ||||||||||||||
Shared across group companies |
(5,546 | ) | (1,409 | ) | 1,382 | (115 | ) | (5,688 | ) | |||||||||||
Total |
¥ | 67,913 | ¥ | 22,799 | ¥ | (24,454 | ) | ¥ | 1,014 | ¥ | 67,272 | |||||||||
Billions of yen |
||||||||||||||||||||
Year ended March 31, 2024 |
||||||||||||||||||||
|
Balance at beginning of year |
Gross inflows |
Gross outflows |
Market appreciation / (depreciation) |
Balance at end of year |
||||||||||||||||
Nomura Asset Management Co., Ltd . |
¥ | 69,092 | ¥ | 31,019 | ¥ | (28,614 | ) | ¥ | 19,514 | ¥ | 91,011 | |||||||||
Nomura Corporate Research and Asset Management Inc. etc |
3,868 | 1,799 | (1,098 | ) | 1,019 | 5,588 | ||||||||||||||
Combined total |
72,960 | 32,818 | (29,712 | ) | 20,533 | 96,599 | ||||||||||||||
Shared across group companies |
(5,688 | ) | (2,061 | ) | 1,680 | (1,529 | ) | (7,598 | ) | |||||||||||
Total |
¥ | 67,272 | ¥ | 30,757 | ¥ | (28,032 | ) | ¥ | 19,004 | ¥ | 89,001 | |||||||||
March 31 |
||||||||||||
2022 |
2023 |
2024 |
||||||||||
Total of publicly offered investment trusts |
27 | % | 27 | % | 26 | % | ||||||
Equity investment trusts |
25 | % | 25 | % | 25 | % | ||||||
Debt investment trusts |
44 | % | 44 | % | 44 | % | ||||||
Millions of yen |
||||||||||||||||||||
Year ended March 31 |
||||||||||||||||||||
2022 |
2023 |
% Change from previous year |
2024 |
% Change from previous year |
||||||||||||||||
Non-interest revenue |
¥ | 617,227 | ¥ | 809,681 | 31.2 | % | ¥ | 875,664 | 8.1 | % | ||||||||||
Net interest revenue |
85,828 | (37,301 | ) | — | (9,517 | ) | — | |||||||||||||
Net revenue |
703,055 | 772,380 | 9.9 | 866,147 | 12.1 | |||||||||||||||
Non-interest expenses |
628,563 | 743,011 | 18.2 | 812,236 | 9.3 | |||||||||||||||
Income before income taxes |
¥ | 74,492 | ¥ | 29,369 | (60.6 | )% | ¥ | 53,911 | 83.6 | % | ||||||||||
Millions of yen |
||||||||||||||||||||
Year ended March 31 |
||||||||||||||||||||
2022 |
2023 |
% Change from previous year |
2024 |
% Change from previous year |
||||||||||||||||
Wholesale net revenue: |
||||||||||||||||||||
Global Markets net revenue |
¥ | 556,417 | ¥ | 656,298 | 18.0 | % | ¥ | 707,113 | 7.7 | % | ||||||||||
Investment Banking net revenue |
146,638 | 116,082 | (20.8 | ) | 159,034 | 37.0 | ||||||||||||||
Net revenue |
¥ | 703,055 | ¥ | 772,380 | 9.9 | % | ¥ | 866,147 | 12.1 | % | ||||||||||
Millions of yen, except per share data and percentages |
||||||||||||||||||||
Year ended March 31 |
||||||||||||||||||||
2020 |
2021 |
2022 |
2023 |
2024 |
||||||||||||||||
Statement of income data: |
||||||||||||||||||||
Revenue |
¥ | 1,952,482 | ¥ | 1,617,235 | ¥ | 1,593,999 | ¥ | 2,486,726 | ¥ | 4,157,294 | ||||||||||
Interest expense |
664,653 | 215,363 | 230,109 | 1,151,149 | 2,595,294 | |||||||||||||||
Net revenue |
1,287,829 | 1,401,872 | 1,363,890 | 1,335,577 | 1,562,000 | |||||||||||||||
Non-interest expenses |
1,039,568 | 1,171,201 | 1,137,267 | 1,186,103 | 1,288,150 | |||||||||||||||
Income before income taxes |
248,261 | 230,671 | 226,623 | 149,474 | 273,850 | |||||||||||||||
Income tax expense |
28,894 | 70,274 | 80,090 | 57,798 | 96,630 | |||||||||||||||
Net income |
¥ | 219,367 | ¥ | 160,397 | ¥ | 146,533 | ¥ | 91,676 | ¥ | 177,220 | ||||||||||
Less: Net income (loss) attributable to noncontrolling interests |
2,369 | 7,281 | 3,537 | (1,110 | ) | 11,357 | ||||||||||||||
Net income attributable to NHI shareholders |
¥ | 216,998 | ¥ | 153,116 | ¥ | 142,996 | ¥ | 92,786 | ¥ | 165,863 | ||||||||||
Balance sheet data (period end): |
||||||||||||||||||||
Total assets |
¥ | 43,999,815 | ¥ | 42,516,480 | ¥ | 43,412,156 | ¥ | 47,771,802 | ¥ | 55,147,203 | ||||||||||
Total NHI shareholders’ equity |
2,653,467 | 2,694,938 | 2,914,605 | 3,148,567 | 3,350,189 | |||||||||||||||
Total equity |
2,731,264 | 2,756,451 | 2,972,803 | 3,224,142 | 3,448,513 | |||||||||||||||
Common stock |
594,493 | 594,493 | 594,493 | 594,493 | 594,493 | |||||||||||||||
Per share data: |
||||||||||||||||||||
Net income attributable to NHI shareholders—basic |
¥ | 67.76 | ¥ | 50.11 | ¥ | 46.68 | ¥ | 30.86 | ¥ | 54.97 | ||||||||||
Net income attributable to NHI shareholders—diluted |
66.20 | 48.63 | 45.23 | 29.74 | 52.69 | |||||||||||||||
Total NHI shareholders’ equity (1)
|
873.26 | 879.79 | 965.80 | 1,048.24 | 1,127.72 | |||||||||||||||
Cash dividends (1)
|
20.00 | 35.00 | 22.00 | 17.00 | 23.00 | |||||||||||||||
Cash dividends in USD (2)
|
$ | 0.19 | $ | 0.32 | $ | 0.18 | $ | 0.13 | $ | 0.15 | ||||||||||
Weighted average number of shares outstanding (in thousands) (3)
|
3,202,370 | 3,055,526 | 3,063,524 | 3,006,744 | 3,017,128 | |||||||||||||||
Return on equity (4) : |
8.2 | % | 5.7 | % | 5.1 | % | 3.1 | % | 5.1 | % | ||||||||||
| (1) | Calculated using the number of shares outstanding at year end. |
| (2) | Calculated using the Japanese Yen—U.S. Dollar exchange rate as of the respective fiscal year end date, the noon buying rate in New York City for cable transfers in foreign currencies as certified for customs purposes by the Federal Reserve Bank of New York. |
| (3) | The number shown is used to calculate basic earnings per share. |
| (4) | Calculated as net income attributable to NHI shareholders divided by total NHI shareholders’ equity. |
Millions of yen |
||||||||||||
March 31, 2024 |
||||||||||||
Funded |
Unfunded |
Total |
||||||||||
Europe |
¥ | 16,707 | ¥ | 168,259 | ¥ | 184,966 | ||||||
Americas |
27,951 | 287,623 | 315,574 | |||||||||
Asia and Oceania |
21,616 | 29,870 | 51,486 | |||||||||
Total |
¥ | 66,274 | ¥ | 485,752 | ¥ | 552,026 | ||||||
Millions of yen |
||||
March 31, 2024 |
||||
Deferred tax assets |
||||
Depreciation, amortization and valuation of fixed assets |
¥ | 41,883 | ||
Investments in subsidiaries and affiliates |
7,364 | |||
Valuation of financial instruments |
136,834 | |||
Accrued pension and severance costs |
11,837 | |||
Other accrued expenses and provisions |
83,418 | |||
Operating losses |
477,358 | |||
Lease liabilities |
48,951 | |||
Other |
20,811 | |||
Gross deferred tax assets |
828,456 | |||
Less—Valuation allowances |
(595,668 | ) | ||
Total deferred tax assets |
232,788 | |||
Deferred tax liabilities |
||||
Investments in subsidiaries and affiliates |
109,611 | |||
Valuation of financial instruments |
111,175 | |||
Undistributed earnings of foreign subsidiaries |
2,257 | |||
Valuation of fixed assets |
22,945 | |||
Right-of-use |
43,443 | |||
Other |
4,404 | |||
Total deferred tax liabilities |
293,835 | |||
Net deferred tax assets (liabilities) |
¥ | (61,047 | ) | |
Billions of yen |
||||||||||||||||
|
Average for year ended March 31, 2023 |
March 31, 2023 |
Average for year ended March 31, 2024 |
March 31, 2024 |
|||||||||||||
Cash, cash equivalents and time deposits (1)
|
¥ | 3,155.5 | ¥ | 3,229.3 | ¥ | 3,741.8 | ¥ | 3,629.9 | ||||||||
Government debt securities |
4,073.8 | 3,984.0 | 4,029.4 | 4,348.6 | ||||||||||||
Others (2)
|
416.9 | 441.0 | 423.4 | 439.5 | ||||||||||||
Total liquidity portfolio |
¥ | 7,646.2 | ¥ | 7,654.3 | ¥ | 8,194.6 | ¥ | 8,418.0 | ||||||||
| (1) | Cash, cash equivalents, and time deposits include nostro balances and deposits with both central banks and market counterparties that are readily available to support the liquidity position of Nomura. |
| (2) | Others include other liquid financial assets such as money market funds and U.S. agency securities. |
Billions of yen |
||||||||||||||||
|
Average for year ended March 31, 2023 |
March 31, 2023 |
Average for year ended March 31, 2024 |
March 31, 2024 |
|||||||||||||
Japanese Yen |
¥ | 1,613.6 | ¥ | 1,852.0 | ¥ | 1,964.8 | ¥ | 1,702.3 | ||||||||
U.S. Dollar |
4,326.0 | 3,953.3 | 4,341.1 | 4,601.7 | ||||||||||||
Euro |
869.3 | 964.5 | 933.2 | 1,023.5 | ||||||||||||
British Pound |
505.7 | 522.4 | 549.4 | 659.8 | ||||||||||||
Others (1)
|
331.6 | 362.1 | 406.1 | 430.7 | ||||||||||||
Total liquidity portfolio |
¥ | 7,646.2 | ¥ | 7,654.3 | ¥ | 8,194.6 | ¥ | 8,418.0 | ||||||||
| (1) | Includes other currencies such as the Australian Dollar, the Canadian Dollar and the Swiss Franc. |
Billions of yen |
||||||||
March 31, 2023 |
March 31, 2024 |
|||||||
NHI and NSC (1)
|
¥ | 1,806.4 | ¥ | 1,495.2 | ||||
Major broker-dealer subsidiaries |
3,012.6 | 3,592.5 | ||||||
Bank subsidiaries (2)
|
1,178.6 | 1,319.9 | ||||||
Other affiliates |
1,656.7 | 2,010.4 | ||||||
Total liquidity portfolio |
¥ | 7,654.3 | ¥ | 8,418.0 | ||||
| (1) | NSC, a broker-dealer located in Japan, holds an account with the Bank of Japan (“BOJ”) and has direct access to the BOJ Lombard facility through which same day funding is available for our securities pool. Any liquidity surplus at NHI is lent to NSC via short-term intercompany loans, which can be unwound immediately when needed. |
| (2) | Includes Nomura Bank International plc (“NBI”), Nomura Singapore Limited and Nomura Bank Luxembourg S.A. |
Billions of yen |
||||||||
March 31, 2023 |
March 31, 2024 |
|||||||
Net liquidity value of other unencumbered assets |
¥ | 2,842.5 | ¥ | 3,175.6 | ||||
Liquidity portfolio |
7,654.3 | 8,418.0 | ||||||
Total |
¥ | 10,496.8 | ¥ | 11,593.6 | ||||
Billions of yen |
||||||||
March 31, 2023 |
March 31, 2024 |
|||||||
Short-term bank borrowings |
¥ | 203.3 | ¥ | 177.5 | ||||
Other loans |
256.8 | 356.0 | ||||||
Commercial paper |
300.0 | 224.8 | ||||||
Deposits at banking entities |
1,705.0 | 1,880.9 | ||||||
Certificates of deposit |
224.2 | 232.4 | ||||||
Debt securities maturing within one year |
721.9 | 1,089.8 | ||||||
Total short-term unsecured debt |
¥ | 3,411.2 | ¥ | 3,961.4 | ||||
Billions of yen |
||||||||
March 31, 2023 |
March 31, 2024 |
|||||||
Long-term deposits at banking entities |
¥ | 208.8 | ¥ | 243.0 | ||||
Long-term bank borrowings |
3,004.9 | 3,408.4 | ||||||
Other loans |
265.5 | 292.3 | ||||||
Debt securities (1)
|
5,291.5 | 6,311.2 | ||||||
Total long-term unsecured debt |
¥ | 8,770.7 | ¥ | 10,254.9 | ||||
| (1) | Excludes long-term debt securities issued by consolidated special purpose entities and similar entities that meet the definition of variable interest entities under Accounting Standard Codification (“ASC”) 810 “ Consolidation Long-term borrowings Transfers and Servicing. |
| • | Stressed scenario—To maintain adequate liquidity during a severe market-wide liquidity event without raising funds through unsecured financing or through the liquidation of assets for a year; and |
| • | Acute stress scenario—To maintain adequate liquidity during a severe market-wide liquidity event coupled with credit concerns regarding Nomura’s liquidity position, without raising funds through unsecured funding or through the liquidation of assets for 30 days. |
| • | No liquidation of assets; |
| • | No ability to issue additional unsecured funding; |
| • | Upcoming maturities of unsecured debt (maturities less than one year); |
| • | Potential buybacks of our outstanding debt; |
| • | Loss of secured funding lines particularly for less liquid assets; |
| • | Fluctuation of funding needs under normal business circumstances; |
| • | Cash deposits and free collateral roll-off in a stress event; |
| • | Widening of haircuts on outstanding repo funding; |
| • | Additional collateralization requirements of clearing banks and depositories; |
| • | Drawdown on loan commitments; |
| • | Loss of liquidity from market losses; |
| • | Assuming a two-notch downgrade of our credit ratings, the aggregate fair value of assets that we would be required to post as additional collateral in connection with our derivative contracts; and |
| • | Legal and regulatory requirements that can restrict the flow of funds between entities in the Nomura Group. |
Billions of yen |
||||||||
Year Ended March 31 |
||||||||
2023 |
2024 |
|||||||
Net cash provided by (used in) operating activities |
¥ | (694.8 | ) | ¥ | 132.6 | |||
Net income |
91.7 | 177.2 | ||||||
Trading assets and private equity and debt investments |
(1,623.0 | ) | (386.5 | ) | ||||
Trading liabilities |
467.3 | (411.8 | ) | |||||
Securities purchased under agreements to resell, net of securities sold under agreements to repurchase |
(590.4 | ) | 290.8 | |||||
Securities borrowed, net of securities loaned |
834.4 | (324.1 | ) | |||||
Other net operating cash flow reconciling items |
125.2 | 787.0 | ||||||
Net cash used in investing activities |
(233.2 | ) | (887.9 | ) | ||||
Net cash outflows from time deposits |
(59.4 | ) | (83.0 | ) | ||||
Net cash outflows from loans |
(299.8 | ) | (791.7 | ) | ||||
Net cash inflows from non-trading debt securities |
159.6 | 23.3 | ||||||
Other net investing cash outflows |
(33.6 | ) | (36.5 | ) | ||||
Net cash provided by financing activities |
1,283.9 | 1,012.9 | ||||||
Net cash inflows from long-term borrowings |
1,093.3 | 962.9 | ||||||
Net cash inflows / (outflows) from short-term borrowings |
(64.5 | ) | 98.0 | |||||
Net cash inflows from deposits received at banks |
328.9 | 107.5 | ||||||
Other net financing cash outflows |
(73.8 | ) | (155.5 | ) | ||||
Effect of exchange rate changes on cash, cash equivalents, restricted cash and restricted cash equivalents |
148.6 | 220.6 | ||||||
Net increase in cash, cash equivalents, restricted cash and restricted cash equivalents |
504.4 | 478.2 | ||||||
Cash, cash equivalents, restricted cash and restricted cash equivalents at beginning of the year |
3,316.4 | 3,820.9 | ||||||
Cash, cash equivalents, restricted cash and restricted cash equivalents at end of the year |
¥ | 3,820.9 | ¥ | 4,299.0 | ||||
Billions of yen, except ratios |
||||||||
March 31 |
||||||||
2023 |
2024 |
|||||||
NHI shareholders’ equity |
¥ | 3,148.6 | ¥ | 3,350.2 | ||||
Total assets |
47,771.8 | 55,147.2 | ||||||
Adjusted assets (1)
|
29,654.3 | 34,152.4 | ||||||
Leverage ratio (2)
|
15.2 x | 16.5 x | ||||||
Adjusted leverage ratio (3)
|
9.4 x | 10.2 x | ||||||
| (1) | Represents total assets less Securities purchased under agreements to resell Securities borrowed non-GAAP financial measure and is calculated as follows: |
| (2) | Equals total assets divided by NHI shareholders’ equity. |
| (3) | Equals adjusted assets divided by NHI shareholders’ equity. |
Billions of yen |
||||||||
March 31 |
||||||||
2023 |
2024 |
|||||||
Total assets |
¥ | 47,771.8 | ¥ | 55,147.2 | ||||
Less: |
||||||||
Securities purchased under agreements to resell |
13,834.5 | 15,621.1 | ||||||
Securities borrowed |
4,283.0 | 5,373.7 | ||||||
Adjusted assets |
¥ | 29,654.3 | ¥ | 34,152.4 | ||||
Fiscal year ended March 31, |
First Quarter |
Second Quarter |
Third Quarter |
Fourth Quarter |
Total |
|||||||||||||||
2019 |
¥ | — | ¥ | 3.00 | ¥ | — | ¥ | 3.00 | ¥ | 6.00 | ||||||||||
2020 |
— | 15.00 | — | 5.00 | 20.00 | |||||||||||||||
2021 |
— | 20.00 | — | 15.00 | 35.00 | |||||||||||||||
2022 |
— | 8.00 | — | 14.00 | 22.00 | |||||||||||||||
2023 |
— | 5.00 | — | 12.00 | 17.00 | |||||||||||||||
2024 |
— | 8.00 | — | 15.00 | 23.00 | |||||||||||||||
Billions of yen, except ratios |
||||||||
March 31 |
||||||||
2023 |
2024 |
|||||||
Common equity Tier 1 capital |
¥ | 2,828.8 | ¥ | 3,091.3 | ||||
Tier 1 capital |
3,203.7 | 3,467.8 | ||||||
Total capital |
3,204.1 | 3,468.3 | ||||||
Risk-Weighted Assets |
||||||||
Credit risk-weighted assets |
8,385.8 | 9,764.7 | ||||||
Market risk equivalent assets |
6,270.6 | 6,381.9 | ||||||
Operational risk equivalent assets |
2,667.5 | 2,828.9 | ||||||
Total risk-weighted assets |
¥ | 17,323.9 | ¥ | 18,975.5 | ||||
Consolidated Capital Adequacy Ratios |
||||||||
Common equity Tier 1 capital ratio |
16.32 | % | 16.29 | % | ||||
Tier 1 capital ratio |
18.49 | % | 18.27 | % | ||||
Consolidated capital adequacy ratio |
18.49 | % | 18.27 | % | ||||
Consolidated Leverage Ratio |
5.63 | % | 5.24 | % | ||||
External TLAC Ratios |
||||||||
Risk-weighted assets basis |
31.78 | % | 33.06 | % | ||||
Leverage ratio exposure measure basis |
10.63 | % | 10.42 | % | ||||
Nomura Holdings, Inc. |
Short-term Debt |
Long-term Debt |
||
S&P Global Ratings |
A-2 |
BBB+ | ||
Moody’s Investors Service |
— | Baa1 | ||
Fitch Ratings |
F1 | A- | ||
Rating and Investment Information, Inc. |
a-1 |
A | ||
Japan Credit Rating Agency, Ltd. |
— | AA- | ||
Nomura Securities Co., Ltd. |
Short-term Debt |
Long-term Debt |
||
S&P Global Ratings |
A-2 |
A- | ||
Moody’s Investors Service |
P-2 |
A3 | ||
Fitch Ratings |
F1 | A- | ||
Rating and Investment Information, Inc. |
a-1 |
A+ | ||
Japan Credit Rating Agency, Ltd. |
— | AA- | ||
| • | an obligation under a guarantee contract; |
| • | a retained or contingent interest in assets transferred to an off-balance sheet entity or similar arrangement that serves to provide credit, liquidity or market risk support to such entity; |
| • | any obligation, including a contingent obligation, under a contract that would be accounted for as a derivative instrument; or |
| • | any obligation, including a contingent obligation, arising out of a variable interest in an off-balance sheet entity that is held by, and material to, us, where such entity provides financing, liquidity, market risk or credit risk support to, or engages in leasing, hedging or research and development services with, us. |
| • | In connection with our banking and financing activities, we enter into various guarantee arrangements with counterparties in the form of standby letters of credit and other guarantees, which generally have fixed expiration dates. |
| • | In connection with our operating activities, we issue Japanese Yen and non-Japanese Yen denominated long-term borrowings which incur variable and fixed interest payments in accordance with our funding policy. |
| • | We lease office space, residential facilities for employees, motor vehicles, equipment and technology assets in the ordinary course of business both in Japan and overseas as lessee. These arrangements predominantly consist of operating leases. |
| • | Separately we sublease certain real estate and equipment through operating lease arrangements. |
| • | We lease certain equipment and facilities in Japan and overseas which are classified as finance lease agreements. |
| • | We have purchase obligations for goods and services which include payments for construction, advertising, and computer and telecommunications maintenance agreements. |
| • | In connection with our banking and financing activities, we enter into contractual commitments to extend credit, which generally have fixed expiration dates. |
| • | In connection with our investment banking activities, we enter into agreements with clients under which we commit to underwrite securities that may be issued by clients. |
| • | As a member of certain central clearing counterparties, Nomura is committed to provide liquidity facilities through entering into reverse repurchase transactions backed by government and government agency debt securities with those counterparties in a situation where a default of another clearing member occurs. |
| • | We have commitments to invest in interests in various partnerships and other entities and commitments to provide financing for investments related to those partnerships. |
Millions of yen |
||||||||||||||||||||
|
Total contractual amount |
Years to maturity |
|||||||||||||||||||
|
Less than 1 year |
1 to 3 years |
3 to 5 years |
More than 5 years |
|||||||||||||||||
Standby letters of credit and other guarantees |
¥ | 3,561,640 | ¥ | 3,517,487 | ¥ | 24,321 | ¥ | 16,976 | ¥ | 2,856 | ||||||||||
Long-term borrowings (1)
|
11,926,429 | 1,146,494 | 3,374,258 | 2,265,231 | 5,140,446 | |||||||||||||||
Contractual interest payments (2)
|
2,002,724 | 317,600 | 468,572 | 316,353 | 900,199 | |||||||||||||||
Operating lease commitments (3)
|
200,454 | 47,123 | 65,824 | 44,630 | 42,877 | |||||||||||||||
Purchase obligations (4)
|
94,478 | 16,124 | 74,189 | 3,049 | 1,116 | |||||||||||||||
Commitments to extend credit (5)
|
3,105,611 | 1,905,593 | 388,648 | 476,372 | 334,998 | |||||||||||||||
Commitments to invest |
31,989 | 2,305 | 3,698 | 461 | 25,525 | |||||||||||||||
Total |
¥ | 20,923,325 | ¥ | 6,952,726 | ¥ | 4,399,510 | ¥ | 3,123,072 | ¥ | 6,448,017 | ||||||||||
| (1) | The amounts disclosed within long-term borrowings exclude financial liabilities recognized within long-term borrowings as a result of transfers of financial assets that are accounted for as financings rather than sales in accordance with ASC 860. These are not borrowings issued for our own funding purposes and therefore do not represent actual contractual obligations by us to deliver cash. |
| (2) | The amounts represent estimated future interest payments related to long-time borrowings based on the period through to their maturity and applicable interest rates as of March 31, 2024. |
| (3) | The amounts of operating lease commitments are undiscounted future minimum lease payments. The amounts of finance lease contracts were immaterial. |
| (4) | The minimum contractual obligations under enforceable and legally binding contracts that specify all significant terms. Amounts exclude obligations that are already reflected on our consolidated balance sheets as liabilities or payables. Includes the commitment to purchase parts of the redeveloped real estate in Tokyo Nihonbashi district from the redevelopment association. |
| (5) | Contingent liquidity facilities to central clearing counterparties are included. |
Critical accounting policy |
Critical accounting estimates |
Key subjective assumptions or judgments by management |
Effect of changes in estimates and assumptions during year ended March 31, 2024 |
|||
|
Fair value of financial instruments Note 2
“Fair value measurements” |
Estimating fair value for financial instruments |
A significant portion of our financial instruments are carried at fair value. The fair values of these financial instruments may not only be measured at quoted prices but also impacted by other factors, including selection of valuation techniques/ models and other assumptions that require judgment. This may affect the amount and timing of unrealized gains or losses recognized in the consolidated statements of income for a particular financial instrument. |
See Note 2
“Fair value measurements” Level 3 financial assets (net of derivative liabilities) during the year increased from ¥868 billion as of March 2023 to ¥1,041 billion as of March 2024. Total level 3 financial assets to total financial assets carried at fair value on a recurring basis ratio was 6 % as of March 31, 2024 (5 % as of March 31, 2023.) |
Critical accounting policy |
Critical accounting estimates |
Key subjective assumptions or judgments by management |
Effect of changes in estimates and assumptions during year ended March 31, 2024 |
|||
|
Selection of appropriate valuation techniques • For financial instruments measured at fair values where quoted prices are available in active markets, we typically use quoted prices as level 1 inputs for determining the fair values of these financial instruments. • For financial instruments where such quoted prices are not available, fair values of these financial instruments are measured using level 2 or level 3 inputs. Significant judgment is involved in selection of appropriate valuation techniques and validation of assumptions applied in models because the estimated fair values measured could vary depending on which models and assumptions are used. When selecting valuation techniques, various factors such as the particular circumstances and markets where these financial instruments are traded, the availability of reliable inputs, maximizing the use of relevant observable inputs and minimizing the use of unobservable inputs are considered. Significance of level 3 inputs • Fair values are more judgmental when we use level 3 inputs, which are based on significant
non-market based unobservable inputs.• For these instruments, fair value is determined based on management’s judgment about the assumption that market participant would use in pricing the instruments, including perception of liquidity, economic environment and the risks affecting the specific instruments. |
See Note 2
“Fair Value measurement” |
|
Name (Date of Birth) |
Responsibilities and Status within Nomura/ Other Principal Business Activities |
Business Experience |
||||
|
Koji Nagai (Jan. 25, 1959) |
Director Chairman of the Board Directors Member of the Nomination Committee Member of the Compensation Committee Director and Chairman of Nomura Securities Co., Ltd. |
Apr. 1981 | Joined the Company | |||
| Apr. 2003 | Director of Nomura Securities Co., Ltd. | |||||
| Jun. 2003 | Executive Officer of Nomura Securities Co., Ltd. | |||||
| Apr. 2007 | Executive Officer (Executive Managing Director) of Nomura Securities Co., Ltd. | |||||
| Oct. 2008 | Senior Corporate Managing Director of Nomura Securities Co., Ltd. | |||||
| Apr. 2009 | Executive Officer and Executive Vice President of Nomura Securities Co., Ltd. | |||||
| Apr. 2011 |
Co-COO and Deputy President of Nomura Securities Co., Ltd. |
|||||
| Apr. 2012 |
Senior Managing Director of the Company Director, Representative Executive Officer and President of Nomura Securities Co., Ltd. |
|||||
| Aug. 2012 |
Representative Executive Officer & Group CEO of the Company Director, Representative Executive Officer and President of Nomura Securities Co., Ltd. |
|||||
| Jun. 2013 |
Director, Representative Executive Officer & Group CEO of the Company Director, Representative Executive Officer and President of Nomura Securities Co., Ltd. |
|||||
| Apr. 2017 |
Director, Representative Executive Officer, President & Group CEO of the Company Director and Chairman of Nomura Securities Co., Ltd. |
|||||
| Apr. 2020 |
Director and Chairman of the Company (Current) Director and Chairman of Nomura Securities Co., Ltd. (Current) |
|||||
|
Name (Date of Birth) |
Responsibilities and Status within Nomura/ Other Principal Business Activities |
Business Experience |
||||
|
Kentaro Okuda (Nov. 7, 1963) |
Director, Representative Executive Officer, President and Group CEO Representative Director and President of Nomura Securities Co., Ltd. |
Apr. 1987 | Joined the Company | |||
| Apr. 2010 | Senior Managing Director of Nomura Securities Co., Ltd. | |||||
| Apr. 2012 | Senior Corporate Managing Director of Nomura Securities Co., Ltd. | |||||
| Aug. 2012 |
Senior Corporate Managing Director of the Company Senior Corporate Managing Director of Nomura Securities Co., Ltd. |
|||||
| Apr. 2013 |
Senior Managing Director of the Company Senior Corporate Managing Director of Nomura Securities Co., Ltd. |
|||||
| Apr. 2015 |
Senior Managing Director of the Company Executive Vice President of Nomura Securities Co., Ltd. |
|||||
| Apr. 2016 |
Senior Managing Director of the Company Executive Officer and Executive Vice President of Nomura Securities Co., Ltd. |
|||||
| Apr. 2017 |
Senior Managing Director of the Company Executive Vice President of Nomura Securities Co., Ltd. |
|||||
| Apr. 2018 |
Executive Officer and Group
Co-COO of the CompanyDirector, Executive Officer and Deputy President of Nomura Securities Co., Ltd. |
|||||
| Apr. 2019 | Executive Officer, Deputy President and Group Co-COO of the Company |
|||||
| Apr. 2020 |
Representative Executive Officer, President & Group CEO of the Company Representative Director of Nomura Securities Co., Ltd. |
|||||
| Jun. 2020 |
Director, Representative Executive Officer, President & Group CEO of the Company Representative Director of Nomura Securities Co., Ltd. |
|||||
| Jun. 2021 |
Director, Representative Executive Officer, President & Group CEO of the Company (Current) Representative Director and President of Nomura Securities Co., Ltd. (Current) |
|||||
|
Name (Date of Birth) |
Responsibilities and Status within Nomura/ Other Principal Business Activities |
Business Experience |
||||
|
Yutaka Nakajima (Aug. 2, 1965) |
Director, Representative Executive Officer and Deputy President Representative Director and Deputy President of Nomura Securities Co., Ltd. |
Apr. 1988 | Joined the Company | |||
| Apr. 2011 | Senior Managing Director of Nomura Securities Co., Ltd. | |||||
| May. 2015 | Senior Managing Director of the Company | |||||
| Apr. 2016 |
Senior Managing Director of the Company Senior Corporate Managing Director of Nomura Securities Co., Ltd. |
|||||
| Apr. 2017 |
Senior Managing Director of the Company Executive Managing Director and Senior Corporate Managing Director of Nomura Securities Co., Ltd. |
|||||
| Apr. 2018 |
Senior Managing Director of the Company Executive Managing Director and Executive Vice President of Nomura Securities Co., Ltd. |
|||||
| Apr. 2019 |
Senior Managing Director of the Company Director and Executive Vice President of Nomura Securities Co., Ltd. |
|||||
| Apr. 2021 |
Senior Managing Director of the Company Representative Director and Deputy President of Nomura Securities Co., Ltd. |
|||||
| Apr. 2023 |
Representative Executive Officer and Deputy President of the Company Representative Director and Deputy President of Nomura Securities Co., Ltd. |
|||||
| Jun. 2023 |
Director, Representative Executive Officer and Deputy President of the Company (Current) Representative Director and Deputy President of Nomura Securities Co., Ltd. (Current) |
|||||
|
Name (Date of Birth) |
Responsibilities and Status within Nomura/ Other Principal Business Activities |
Business Experience |
||||
|
Shoji Ogawa (Aug. 9, 1964) |
Director Member of the Audit Committee (full-time) Member of the Board Risk Committee Corporate Auditor of Nomura Asia Pacific Holdings Co., Ltd Non-Executive Director of Nomura Holding America Inc.Non-Executive Director of Instinet Incorporated |
Apr. 1987 | Joined the Company | |||
| Apr. 2007 | Head of Investment Banking Strategic Planning Dept of Nomura Securities Co., Ltd. | |||||
| Oct. 2008 | Head of Capital Markets Dept. and Capital Solutions Dept. of Nomura Securities Co., Ltd. | |||||
| Jul. 2009 | Head of Capital Markets Dept. of Nomura Securities Co., Ltd. | |||||
| Apr. 2012 | Head of Investment Banking Strategic Planning Dept. of Nomura Securities Co., Ltd. | |||||
| Jul. 2013 |
Head of Office of Audit Committee of the Company Head of Office of Audit Committee of Nomura Securities Co., Ltd. |
|||||
| Aug. 2016 |
Head of Office of
Non-Executive Directors and Audit Committee of the CompanyHead of Office of
Non-Executive Directors and Audit Committee of Nomura Securities Co., Ltd. |
|||||
| Apr. 2017 |
Senior Managing Director and Group Internal Audit of the Company Senior Managing Director and Internal Audit of Nomura Securities Co., Ltd. |
|||||
| Apr. 2021 | Advisor of the Company | |||||
| Jun. 2021 | Director of the Company (Current) | |||||
|
Laura Simone Unger (Jan. 8, 1961) |
Outside Director Chairperson of the Board Risk Committee Independent Director of Nomura Holding America Inc. Independent Director of Nomura Securities International, Inc. Independent Director of Nomura Global Financial Products Inc. Independent Director of Instinet Holdings Incorporated |
Jan. 1988 | Enforcement Attorney of the U.S. Securities and Exchange Commission (SEC) | |||
| Oct. 1990 | Counsel of the U.S. Senate Committee on Banking, Housing, and Urban Affairs | |||||
| Nov. 1997 | Commissioner of the SEC | |||||
| Feb. 2001 | Acting Chairperson of the SEC | |||||
| Jul. 2002 | Regulatory Expert of CNBC | |||||
| May 2003 | Independent Consultant of JPMorgan Chase & Co. | |||||
| Aug. 2004 | Independent Director of CA Inc. | |||||
| Jan. 2010 | Special Advisor of Promontory Financial Group | |||||
| Dec. 2010 | Independent Director of CIT Group Inc. | |||||
| Nov. 2014 | Independent Director of Navient Corporation | |||||
| Jun. 2018 | Outside Director of the Company (Current) | |||||
|
Name (Date of Birth) |
Responsibilities and Status within Nomura/ Other Principal Business Activities |
Business Experience |
||||
|
Victor Chu (Jun. 20, 1957) |
Outside Director Member of the Audit Committee Chairman and Chief Executive Officer of First Eastern Investment Group Chair of Council, University College London Co-Chair, International Business Council of the World Economic ForumIndependent Director of Airbus SE |
Dec. 1982 | Solicitor of the Supreme Court, Hong Kong | |||
| Jan. 1988 | Chairman and Chief Executive Officer of First Eastern Investment Group (Current) | |||||
| Oct. 1988 | Director and Council Member of the Hong Kong Stock Exchange | |||||
| Jun. 1992 | Advisory Committee Member of the Securities and Futures Commission, Hong Kong | |||||
| Aug. 2003 | Foundation Board Member of the World Economic Forum | |||||
| Apr. 2018 | Independent Director of Airbus SE (Current) | |||||
| Jun. 2021 | Outside Director of the Company (Current) | |||||
|
J.Christopher Giancarlo (May 12, 1959) |
Outside Director Member of the Board Risk Committee Senior Counsel of Willkie Farr & Gallagher LLP Chair of the Board of Directors of Digital Dollar Project Independent Director of Digital Asset Holdings, LLC Independent Director of Nomura Securities International, Inc. Independent Director of Nomura Global Financial Products Inc. |
Sep. 1984 | Associate Attorney of Mudge Rose Guthrie Alexander & Ferdon | |||
| Oct. 1985 | Associate Attorney of Curtis, Mallet-Prevost, Colt & Mosle | |||||
| Jan. 1992 | Attorney, Founding Partner of Giancarlo & Gleiberman | |||||
| Sep. 1997 | Attorney, (Equity) Partner of Thelen Reid Brown Raysman & Steiner | |||||
| Apr. 2000 | Vice President and Legal Counsel of Fenics Software | |||||
| Apr. 2001 | Executive Vice President of GFI Group Inc. | |||||
| Jun. 2014 | Commissioner of the U.S. Commodity Futures Trading Commission | |||||
| Jan. 2017 | Chairman of the U.S. Commodity Futures Trading Commission | |||||
| Oct. 2019 | Independent Director of the American Financial Exchange | |||||
| Jan. 2020 | Senior Counsel of Willkie Farr & Gallagher LLP (Current) | |||||
| Jun. 2021 | Outside Director of the Company (Current) | |||||
|
Name (Date of Birth) |
Responsibilities and Status within Nomura/ Other Principal Business Activities |
Business Experience |
||||
|
Patricia Mosser (Feb. 14, 1956) |
Outside Director Member of the Board Risk Committee Senior Research Scholar* Director of the MPA Program in Economic Policy Management* Director of Central Banking and Financial Policy* *Positions at Columbia University, School of International and Public Affairs Independent Director of Nomura Holding America Inc. |
Jul. 1986 | Assistant Professor, Economics Department, Columbia University | |||
| Jan. 1991 | Economist and Vice President of the Federal Reserve Bank of New York (FRBNY) | |||||
| Nov. 2006 | Senior Vice President, FRBNY, Member of the FX Forum, Executive Meeting of East Asia and Pacific (EMEAP) Central Banks, Bank for International Settlements | |||||
| Jan. 2007 | Board Member of the American Economic Association’s Committee on the Status of Women in the Economics Profession | |||||
| Jun. 2007 | Member of the Markets Committee, Bank for International Settlements | |||||
| Jan 2009 | Acting Systemic Open Market Account Manager for the Federal Open Market Committee (FOMC) | |||||
| Oct. 2013 | Deputy Director of the Office of Financial Research (OFR), U.S. Treasury Department | |||||
| Oct. 2013 | Member of the Deputies Committee of the Financial Stability Oversight Council (FSOC) | |||||
| Jun. 2015 | Senior Research Scholar and Director of Central Banking and Financial Policy at Columbia University’s School of International and Public Affairs (Current) | |||||
| Jun. 2021 | Outside Director of the Company (Current) | |||||
|
Name (Date of Birth) |
Responsibilities and Status within Nomura/ Other Principal Business Activities |
Business Experience |
||||
|
Takahisa Takahara (Jul. 12, 1961) |
Outside Director Member of the Nomination Committee Member of the Compensation Committee Representative Director, President & CEO of Unicharm Corporation Outside Director of Sumitomo Corporation |
Apr. 1986 | Joined The Sanwa Bank, Ltd. (currently MUFG Bank, Ltd.) | |||
| Apr. 1991 | Joined Unicharm Corporation | |||||
| Jun. 1995 | Director of Unicharm Corporation | |||||
| Apr. 1996 | Director, General Manager of Procurement Division and Deputy General Manager of International Division of Unicharm Corporation | |||||
| Jun. 1997 | Senior Director of Unicharm Corporation | |||||
| Apr. 1998 | Senior Director, General Manager of Feminine Hygiene Business Division of Unicharm Corporation | |||||
| Oct. 2000 | Senior Director, Responsible for Management Strategy of Unicharm Corporation | |||||
| Jun. 2001 | Representative Director, President of Unicharm Corporation | |||||
| Jun. 2004 | Representative Director, President & CEO of Unicharm Corporation (Current) | |||||
| Jun. 2021 | Outside Director of the Company (Current) | |||||
|
Miyuki Ishiguro (Oct. 26, 1964) |
Outside Director Member of the Board Risk Committee Partner of Nagashima Ohno & Tsunematsu President of the Inter-Pacific Bar Association (IPBA) Outside Audit & Supervisory Board Member, Lasertec Corporation |
Apr. 1991 | Registered as an Attorney-at-Law |
|||
| Jan. 1999 | Partner of Tsunematsu Yanase & Sekine | |||||
| Jan. 2000 | Partner of Nagashima Ohno & Tsunematsu(Current) | |||||
| Oct. 2004 | Visiting Professor, Columbia Law School | |||||
| May. 2015 | Secretary General of the Inter-Pacific Bar Association (IPBA) | |||||
| Feb. 2016 | Council Member of the Radio Regulatory Council (Ministry of Internal Affairs and Communications) | |||||
| Apr. 2016 | Council Member of the Management Council of Hitotsubashi University | |||||
| Apr. 2018 | Vice President of the Tokyo Bar Association | |||||
| Jun. 2023 | Outside Director of the Company (Current) | |||||
| Apr. 2024 | President of the Inter-Pacific Bar Association (IPBA) (Current) | |||||
|
Name (Date of Birth) |
Responsibilities and Status within Nomura/ Other Principal Business Activities |
Business Experience |
||||
|
Masahiro Ishizuka (Apr. 21, 1960) |
Outside Director Chairman of the Audit Committee Director of Nomura Securities Co., Ltd. |
Oct. 1984 | Joined Deloitte Haskins and Sells International (*) | |||
| Apr. 1988 | Registered as a Certified Public Accountant | |||||
| Jun. 1997 | Partner of Tohmatsu & Co. (*) | |||||
| Jan. 1998 | Deloitte & Touche LLP based in New York | |||||
| Oct. 2004 | Head of Audit and Technology Dept. of Business Administrative Division, of Tohmatsu & Co. (*) | |||||
| Aug. 2010 | Vice Chairman of the Audit Standards Committee of the Japanese Institute of Certified Public Accountants | |||||
| Oct. 2010 | Head of Office of Manual, of Quality Administrative Division, of Deloitte Touche Tohmatsu LLC | |||||
| Nov. 2015 | The Board Member of Deloitte Tohmatsu LLC | |||||
| Jun. 2017 | Executive Officer, General Manager of the Reputation Quality Risk Management Division of Deloitte Tohmatsu LLC and Deloitte Touche Tohmatsu LLC | |||||
| Jun. 2022 | Ethics Officer of Deloitte Tohmatsu Group | |||||
| Jun. 2023 | Outside Director of the Company (Current) | |||||
| Apr. 2024 | Director of Nomura Securities Co., Ltd. (Current) | |||||
| *Each of the corporations is currently Deloitte Touche Tohmatsu LLC | ||||||
|
Taku Oshima (Jul. 14, 1956) |
Outside Director Chairman of the Nomination Committee Chairman of the Compensation Committee Chairman and Representative Director of NGK INSULATORS, LTD. Outside Director of Central Japan Railway Company Chairman of Aichi Employers’ Association Outside Director of Toho Gas |
Mar. 1980 | Joined NGK INSULATORS, LTD. | |||
| Jun. 2007 | Corporate Officer of NGK INSULATORS, LTD. | |||||
| Jun. 2011 | Corporate Executive Officer of NGK INSULATORS, LTD. | |||||
| Jun. 2014 | President and Representative Director of NGK INSULATORS, LTD. | |||||
| Apr. 2021 | Chairman and Representative Director of NGK INSULATORS, LTD. (Current) | |||||
| Jun. 2024 | Outside Director of the Company (Current) | |||||
|
Name (Date of Birth) |
Responsibilities and Status within Nomura/ Other Principal Business Activities |
Business Experience |
||||
|
Kentaro Okuda (Nov. 7, 1963) |
See “ Directors |
See “ Directors |
||||
|
Yutaka Nakajima (Aug. 2, 1965) |
See “ Directors |
See “ Directors |
||||
|
Toshiyasu Iiyama (Feb. 24, 1965) |
Executive Officer and Deputy President Chief of Staff Representative Director and Deputy President of Nomura Securities Co., Ltd. |
Apr. 1987 | Joined the Company | |||
| Apr. 2012 | Senior Managing Director of Nomura Securities Co., Ltd. | |||||
| Apr. 2015 |
Senior Managing Director of the Company Senior Managing Director of Nomura Securities Co., Ltd. |
|||||
| Apr. 2016 |
Senior Managing Director of the Company Senior Corporate Managing Director of Nomura Securities Co., Ltd. |
|||||
| Apr. 2018 |
Senior Managing Director of the Company Executive Officer and Executive Vice President of Nomura Securities Co., Ltd. |
|||||
| Apr. 2019 |
Senior Managing Director of the Company Executive Vice President of Nomura Securities Co., Ltd. |
|||||
| Apr. 2020 |
Senior Managing Director of the Company Representative Director and Deputy President of Nomura Securities Co., Ltd. |
|||||
| Apr. 2021 |
Executive Officer and Chief Health Officer of the Company Representative Director and Deputy President of Nomura Securities Co., Ltd. |
|||||
| Apr. 2023 |
Executive Officer, Deputy President and Chief of Staff of the Company (Current) Representative Director and Deputy President of Nomura Securities Co., Ltd. (Current) |
|||||
|
Name (Date of Birth) |
Responsibilities and Status within Nomura/ Other Principal Business Activities |
Business Experience |
||||
|
Takumi Kitamura (Nov. 26, 1966) |
Executive Officer Chief Financial Officer Chief Transformation Officer Director, Executive Vice President of Nomura Securities Co., Ltd. Director of Nomura Asia Pacific Holdings Co., Ltd |
Apr. 1990 | Joined the Company | |||
| Apr. 2016 |
Executive Officer and Chief Financial Officer of the Company Executive Officer and Financial Officer of Nomura Securities Co., Ltd. |
|||||
| Apr. 2019 |
Executive Officer and Chief Financial Officer of the Company Director and Senior Corporate Managing Director of Nomura Securities Co., Ltd. |
|||||
| Apr. 2021 |
Executive Officer and Chief Financial Officer of the Company Director, Executive Vice President of Nomura Securities Co., Ltd. |
|||||
| Oct. 2021 |
Executive Officer, Chief Financial Officer and Chief Administrative Officer of the Company Director, Executive Vice President of Nomura Securities Co., Ltd. |
|||||
| Apr. 2022 |
Executive Officer and Chief Financial Officer of the Company Director, Executive Vice President of Nomura Securities Co., Ltd. |
|||||
| Apr. 2024 |
Executive Officer, Chief Financial Officer and Chief Transformation Officer of the Company (Current) Director, Executive Vice President of Nomura Securities Co., Ltd. (Current) |
|||||
|
Sotaro Kato (Oct. 9, 1969) |
Executive Officer Chief Risk Officer Director and Senior Corporate Managing Director of Nomura Securities Co., Ltd. Director of Nomura Holding America Inc. |
Sep. 2002 | Joined the Company | |||
| Apr. 2020 |
Executive Officer and Chief Risk Officer of the Company (based in New York) (Current) Director and Senior Corporate Managing Director of Nomura Securities Co., Ltd. (Current) |
|||||
|
Yosuke Inaida (Oct. 6, 1967) |
Executive Officer Chief Compliance Officer Senior Corporate Managing Director of Nomura Securities Co., Ltd. Director of Nomura Asia Pacific Holdings Co., Ltd |
Apr. 1991 | Joined the Company | |||
| Apr. 2015 | Senior Managing Director of Nomura Securities Co., Ltd. | |||||
| Apr. 2020 | Senior Corporate Managing Director of Nomura Securities Co., Ltd. | |||||
| Apr. 2022 |
Executive Officer and Chief Compliance Officer of the Company (Current) Senior Corporate Managing Director of Nomura Securities Co., Ltd. (Current) |
|||||
|
Name (Date of Birth) |
Responsibilities and Status within Nomura/ Other Principal Business Activities |
Business Experience |
||||
|
Christopher Willcox (Feb. 25, 1968) |
Executive Officer Head of Wholesale |
May. 2014 | CEO of J.P. Morgan Asset Management Inc. | |||
| May. 2021 |
Director and
Co-CEO of Nomura Holding America Inc.Director, President and CEO of Nomura Securities International, Inc. Director, President and CEO of Nomura Global Financial Products Inc. |
|||||
| Apr. 2022 |
Director, President and CEO of Nomura Holding America Inc. Director, President and CEO of Nomura Securities International, Inc. Director, President and CEO of Nomura Global Financial Products Inc. |
|||||
| Oct. 2022 | Executive Officer and Head of Wholesale of the Company (based in New York) (Current) | |||||
Fixed Compensation |
Performance-linked Compensation |
|||
| Base salary | Annual Bonuses | Long-term Incentive Plan | ||
| • | Base salary is paid in cash and determined based on factors such as professional background, career history, responsibilities and compensation standards of related business fields. |
| • | With respect to the Group CEO, given the overall responsibility of business execution of the Nomura Group, the basic amount of the performance-linked compensation is calculated based on the level of achievement in actual value(s) against the target value(s) of key performance indicator(s) and performance metrics that form the basis for their calculation. In addition, qualitative evaluation competitor benchmarking is also reflected when determining final annual bonus amount. |
| • | With respect to Directors and other Executive Officers, the amount of annual bonus is determined with the annual bonus of Group CEO as standard baseline, taking into consideration roles and responsibilities, local remuneration regulations and compensation levels in each jurisdiction etc., in addition to a qualitative evaluation of individual performance. |
| • | Audit Committee members and Outside Directors are not bonus-eligible in order to maintain and ensure their independence from business execution. |
| • | In principle, certain portion of any annual bonus payment should be deferred. |
| • | Payments under long-term incentive plans are made when a certain degree of achievements are accomplished. Payments are made in stock-based compensation awards. |
| • | Fixed compensation—reflects the role, responsibilities and experience of the employee; and |
| • | Variable compensation—designed to incentivize performance, encourage the right behaviors and drive employee growth and development. For higher paid employees, a portion of variable compensation may be deferred, balancing short-term with our medium and long-term interests. |

Type of elements |
Item |
Actual for the fiscal year ended March 31, 2024. |
||
| Profit and loss | Net revenue | 1,562 billions of yen | ||
| Revenue cost coverage ratio (1)
|
82.5% | |||
| Income before income taxes | 274 billions of yen | |||
| Per share information | Earnings per Share (“EPS”) | 52.69 yen | ||
| Capital efficiency | ROE | 5.1% | ||
| Shareholder returns | Total Shareholder Return (“TSR”) (2)
|
196.3% |
| 1. | Ratio calculated by dividing Total non-interest expenses by Net revenue |
| 2. | The value obtained by dividing the total of fluctuations in the price of NHI shares and dividends in the current fiscal year by the NHI share price at the end of the previous business year. |
Type of award |
Key features |
|
Restricted Stock Units (“RSUs”) |
• Introduced as the main form of Deferred Compensation since the fiscal year ended March 31, 2018. • Settled in the Company’s common stock. • Graded vesting period is set as three years in principle. |
|
Notional Stock Units (“NSUs”) |
• Linked to the price of the Company’s common stock Cash-settled in local currency. • Graded vesting period is set as three years in principle. |
|
Performance Share Units (“PSUs”) |
• Introduced as the Long Term Incentive Plan since the fiscal year ended March 31, 2024. • The number of shares to be awarded will be determined by depended on the degree of achievement of the performance targets of the three fiscal years. • Performance evaluation period is set as more than three years in principle. |
|
|
Performance Indicators |
Composition ratio |
Change in the grant ratio |
Evaluation method |
|||
| ROE | 50% | 0%~150% | Calculated based on the actual (average) values for the three-year performance evaluation period |
|||
| TSR | 50% | 0%~150% | Calculated based on the actual value (absolute value) during the three-year performance evaluation period |
|||


| • | Alignment of interests with shareholders. |
| • | Medium-term incentives and retention by providing an opportunity for the economic value of Deferred Compensation at the time of grant to be increased by a rise in shares during a period of time from grant to vesting. |
| • | Promotion of cross-divisional collaboration and cooperation by providing a common goal of increasing corporate value over the medium to long term. |
Number of People (1)
|
Millions of yen |
|||||||||||||||||||||||
Year ended March 31, 2024 |
||||||||||||||||||||||||
Fixed compensation |
Performance-linked compensation |
Total |
||||||||||||||||||||||
Base salary (2,3)
|
Cash Bonuses |
NSU (4)
|
RSU (4)
|
|||||||||||||||||||||
Directors |
13 | ¥ | 389 | ¥ | 116 | ¥ | 221 | ¥ | — | ¥ | 726 | |||||||||||||
(Outside Directors included in above) |
10 | (217 | ) | (— | ) | (— | ) | (— | ) | (217 | ) | |||||||||||||
Executive Officers |
8 | 598 | 1,206 | 2,412 | 241 | 4,457 | ||||||||||||||||||
Total |
21 | ¥ | 987 | ¥ | 1,322 | ¥ | 2,633 | ¥ | 241 | ¥ | 5,183 | |||||||||||||
| (1) | Includes one Director retired in June 2023, and two Directors who were appointed in June 2023. There were eleven Directors and eight Executive Officers as of March 31, 2024. Compensation to Directors who were concurrently serving as Executive Officers is included within “Executive Officers.” |
| (2) | Includes other compensation (commuter pass allowance) of ¥0.27 million. |
| (3) | In addition to base salary, ¥16 million of corporate housing benefits, including housing allowance and related tax adjustments, were provided to Executive Officers. |
| (4) | Represents deferred stock-based compensation awards granted in prior years recognized as expense in the consolidated financial statement of income for the year ended March 31, 2024. The expense of NSUs are remeasured to fair value at each balance sheet date, while the amounts of RSUs are measured at fair value on the grant date. For more details, see Note 1 “Summary of accounting policies” in our consolidated financial statements. Furthermore, the expenses related to the Long-Term Incentive Plan, which was approved for implementation at the Compensation Committee on March 29, 2024, will be recognized for the performance evaluation period starting from the fiscal year ended March 2025 and are not included in the above figures. |
| (5) | Total compensation paid to Outside Directors for their services to subsidiaries of the Company was ¥76 million for the fiscal year ended March 31, 2024. |
Millions of yen |
||||||||||||||||||||||||
Fixed Remuneration |
Variable Compensation |
|||||||||||||||||||||||
Name |
Company |
Role |
Cash |
RSU |
Cash Bonuses |
Stock Based Compensation |
Total |
|||||||||||||||||
Koji Nagai |
Nomura | Chairman of the Board of Directors | ¥ | 91.2 | ¥ | 0.0 | ¥ | 116.0 | ¥ | 116.0 | ¥ | 323.2 | ||||||||||||
Kentaro Okuda (1)
|
Nomura |
Director, Representative Executive Officer (Group CEO) |
¥ | 102.0 | ¥ | 17.4 | ¥ | 183.7 | ¥ | 202.9 | ¥ | 506.0 | ||||||||||||
Yutaka Nakajima |
Nomura |
Director, Representative Executive Officer |
¥ | 75.6 | ¥ | 14.4 | ¥ | 106.3 | ¥ | 106.3 | ¥ | 302.6 | ||||||||||||
Toshiyasu Iiyama |
Nomura | Executive Officer | ¥ | 72.0 | ¥ | 14.4 | ¥ | 85.1 | ¥ | 85.1 | ¥ | 256.5 | ||||||||||||
Takumi Kitamura |
Nomura | Executive Officer | ¥ | 60.0 | ¥ | 13.2 | ¥ | 45.9 | ¥ | 45.9 | ¥ | 165.0 | ||||||||||||
Sotaro Kato |
Nomura | Executive Officer | ¥ | 54.0 | ¥ | 9.6 | ¥ | 38.2 | ¥ | 38.2 | ¥ | 140.0 | ||||||||||||
Yosuke Inaida |
Nomura | Executive Officer | ¥ | 54.0 | ¥ | 9.6 | ¥ | 35.7 | ¥ | 35.7 | ¥ | 135.0 | ||||||||||||
Toru Otsuka |
Nomura | Executive Officer | ¥ | 54.0 | ¥ | 9.6 | ¥ | 35.7 | ¥ | 35.7 | ¥ | 135.0 | ||||||||||||
Willcox, Christopher (2)
|
Nomura | Executive Officer | ¥ | 108.4 | ¥ | 9.6 | ¥ | 675.8 | ¥ | 940.6 | ¥ | 1,734.4 | ||||||||||||
| (Equivalent in ’000 USD) | $ | (750.0 | ) | $ | (66.9 | ) | $ | (4,675.8 | ) | $ | (6,507.3 | ) | $ | (12,000.0 | ) | |||||||||
| (1) | In addition to fixed compensation, ¥16 million of corporate housing costs, including housing allowance and related tax adjustments, were provided. |
| (2) | Since appointed as an Executive Officer in October 2022, the compensation for six months converted into millions of JPY were stated in the 20-F for the fiscal year ended March 2023 (1 USD = 135.44 yen basically). In the table above, the compensation for twelve months for the fiscal year ended March 2024 (1 USD = 144.54 yen basically) is stated. |
Date |
Summary of the discussion and the resolution |
Attendance records of the member |
||||
April 21, 2023 |
Discussion: | • Performance for the year ended March 31, 2023 and the compensation level of the group CEO. |
All members attended | |||
April 24, 2023 |
Discussion: | • The compensation level of the group CEO during the year end March 31, 2023. |
All members attended | |||
April 26, 2023 |
Resolution: |
• The bonus plan for the year ended March 31, 2023. • Amendment of policies governing compensation for Directors and Executive Officers. |
All members attended | |||
June 27, 2023 |
Resolution: |
• The appointment of the Director with the right to convoke the board of directors meetings. • The Director who reports the executions of the committee’s duties to the board of the directors meetings. • The Compensation Policy of Nomura Group and base salary of the Directors and Executive Officers. • Individual base salary of the Directors and Executive Officers. • Granting RSUs to the Directors and Executive Officers. |
All members attended | |||
| Reporting: | • Schedule for current fiscal year |
|||||
August 29, 2023 |
Discussion | • Review of policies governing pay for Directors and Executive Officers. |
All members attended | |||
September 27, 2023 |
Discussion: |
• Individual base salary of the Directors and Executive Officers. • Group CEO Pay levels. |
All members attended | |||
November 6, 2023 |
Resolution: | • Introduction of the U.S. SEC Clawback Regulations and the Company’s Response. |
All members attended | |||
December 5, 2023 |
Reporting: | • Compensation levels for executives in major competitive regions domestically and internationally. |
All members attended | |||
January 31, 2024 |
Discussion: | • Review of executive compensation levels and the determination method for executive compensation for the fiscal year ended March 2024. |
All members attended | |||
February 20, 2024 |
Discussion: | • Review of the method for determining executive compensation. |
All members attended | |||
March 29, 2024 |
Resolution: |
• The annual base salary of the next fiscal year. • Introduction of Long-Term Incentive Plans (LTI). |
All members attended | |||
| Discussion: | • Expected performance and compensation level outlook for the fiscal year ended March 2024. |
|||||
March 31, 2024 |
||||||||||||||||
Series of SARs |
Allotment Date |
Number of Shares under SARs (1)
|
Exercise Period of SARs |
Exercise Price per Share under SARs |
Paid-in Amount for SARs |
|||||||||||
Stock Acquisition Rights No.71 |
June 7, 2016 | 185,300 |
From April 20, 2019 to April 19, 2024 |
¥ | 1 | ¥ | 198 | |||||||||
Stock Acquisition Rights No.76 |
June 9, 2017 | 151,900 |
From April 20, 2019 to April 19, 2024 |
¥ | 1 | ¥ | 334 | |||||||||
Stock Acquisition Rights No.77 |
June 9, 2017 | 553,600 |
From April 20, 2020 to April 19, 2025 |
¥ | 1 | ¥ | 325 | |||||||||
Stock Acquisition Rights No.78 |
June 9, 2017 | 142,800 |
From April 20, 2021 to April 19, 2026 |
¥ | 1 | ¥ | 312 | |||||||||
Stock Acquisition Rights No.79 |
June 9, 2017 | 177,700 |
From April 20, 2022 to April 19, 2027 |
¥ | 1 | ¥ | 303 | |||||||||
Stock Acquisition Rights No.80 |
June 9, 2017 | 47,000 |
From April 20, 2023 to April 19, 2028 |
¥ | 1 | ¥ | 282 | |||||||||
Stock Acquisition Rights No.81 |
June 9, 2017 | 132,100 |
From April 20, 2024 to April 19, 2029 |
¥ | 1 | ¥ | 273 | |||||||||
Stock Acquisition Rights No.84 |
November 17, 2017 | 1,805,200 |
From November 17, 2019 to November 16, 2024 |
¥ | 684 | ¥ | 398 | |||||||||
Stock Acquisition Rights No.85 |
November 20, 2018 | 1,728,200 |
From November 20, 2020 to November 19, 2025 |
¥ | 573 | ¥ | 329 | |||||||||
| (1) | The number of NHI shares issuable under SARs is subject to adjustments under certain circumstances including stock splits. |
March 31, 2024 |
||||||||
Numbers of Holders |
||||||||
Series of SARs |
Number of Shares under SARs |
Directors and Executive Officers (excluding Outside Directors) |
||||||
Stock Acquisition Rights No.77 |
79,000 | 4 | ||||||
Stock Acquisition Rights No.78 |
2,800 | 1 | ||||||
Stock Acquisition Rights No.79 |
2,800 | 1 | ||||||
Stock Acquisition Rights No.80 |
2,800 | 1 | ||||||
March 31, |
||||||||||||
2022 |
2023 |
2024 |
||||||||||
Japan |
15,213 | 15,131 | 14,870 | |||||||||
Europe |
2,820 | 2,937 | 3,053 | |||||||||
Americas |
2,257 | 2,387 | 2,440 | |||||||||
Asia and Oceania |
6,295 | 6,320 | 6,487 | |||||||||
Total |
26,585 | 26,775 | 26,850 | |||||||||
Name |
Number of Shareholdings |
|||
Koji Nagai |
512,942 | |||
Kentaro Okuda |
439,490 | |||
Yutaka Nakajima |
658,392 | |||
Shoji Ogawa |
51,789 | |||
Laura Simone Unger |
(1,000ADR | ) (1) |
||
Victor Chu |
— |
|||
J.Christopher Giancarlo |
— |
|||
Patricia Mosser |
(100ADR | ) (1) |
||
Takahisa Takahara |
881 | |||
Miyuki Ishiguro |
— |
|||
Masahiro Ishizuka |
3,610 | |||
Taku Oshima |
— | |||
Total |
1,667,104 | |||
| (1) | ADRs are not included in the total. |
Name |
Number of Shareholdings |
|||
Kentaro Okuda |
See above |
(1) |
||
Yutaka Nakajima |
See above |
(1) |
||
Toshiyasu Iiyama |
188,929 | |||
Takumi Kitamura |
120,037 | |||
Sotaro Kato |
28,059 | |||
Yosuke Inaida |
192,308 | |||
Christopher Willcox |
4,894 | |||
Total |
534,227 | |||
| (1) | The number of shares owned by Executive Officers who are concurrently serving as Directors is not included in the total. |
| (1) | Financial instruments business prescribed in the Financial Instruments and Exchange Law; |
| (2) | Banking business prescribed in the Banking Law and trust business prescribed in the Trust Business Law; and |
| (3) | Any other financial services and any business incidental or related to such financial services. |
| (4) | Other than as prescribed in the items above, any other business ancillary or related to survey and research in connection with the economy, financial or capital markets, or infrastructure or undertaking the outsourcing thereof. |
| • | a dealer in securities, |
| • | a trader in securities that elects to use a mark-to-market |
| • | a tax-exempt organization, |
| • | a life insurance company, |
| • | a person that actually or constructively owns 10% or more of the combined voting power of our voting stock or of the total value of our stock, |
| • | a person that holds shares or ADSs as part of a straddle or a hedging, conversion, integrated or constructive sale transaction, |
| • | a person that purchases or sells shares or ADSs as part of a wash sale for tax purposes, or |
| • | a person whose functional currency is not the U.S. Dollar. |
| • | a citizen or resident of the U.S., |
| • | a corporation created or organized in or under the laws of the U.S. or any political subdivision thereof, |
| • | an estate whose income is subject to U.S. federal income tax regardless of its source, or |
| • | a trust if a U.S. court can exercise primary supervision over the trust’s administration and one or more U.S. persons are authorized to control all substantial decisions of the trust. |
| • | at least 75% of our gross income for the taxable year is passive income, or |
| • | at least 50% of the value, determined on the basis of a quarterly average, of our assets is attributable to assets that produce or are held for the production of passive income. |
| • | any gain you realize on the sale or other disposition of your shares or ADSs, and |
| • | any excess distribution that we make to you (generally, any distributions to you during a single taxable, other than distributions in the first taxable year that you hold the shares or ADSs, year that are greater than 125% of the average annual distributions received by you in respect of the shares or ADSs during the three preceding taxable years or, if shorter, your holding period for the shares or ADSs that preceded the taxable year in which you receive the distribution). |
| • | the gain or excess distribution will be allocated ratably over your holding period for the shares or ADSs, |
| • | the amount allocated to the taxable year in which you realized the gain or excess distribution, or to prior years before the first year in which we were a PFIC with respect to you, will be taxed as ordinary income, |
| • | the amount allocated to each other previous year will be taxed at the highest tax rate in effect for that year, and |
| • | the interest charge generally applicable to underpayments of tax will be imposed in respect of the tax attributable to each such year. |
| • | the overall tax consequences of the acquisition, ownership and disposition of shares or ADSs, including specifically the tax consequences under Japanese law, |
| • | the laws of the jurisdiction of which they are resident, and |
| • | any tax treaty between Japan and their country of residence. |
| • | First Line of Defense: All executives and employees of the front office for Financial Risk and all executives and employees for Non-Financial Risk are primarily responsible for risk management and assume the consequences associated with business execution and to provide evidence and justify that the risk arising from their business activities is in line with risk appetite. |
| • | Second Line of Defense: The department responsible for risk management supports and monitors management activities on the First Line of Defense and reports to the board and the senior management. In addition, the Second Line independently evaluates risk management governance established by the First Line. |
| • | Third Line of Defense: The Internal Audit function examines and evaluates the risk management from an independent standpoint, provides advice for improvement, and reports the examination and evaluation results to the Audit Committee. |

| • | Amendment and abolition of the Risk Appetite Statement |
| • | Change in risk management framework |
| • | Results of analysis and verification or future forecasts of risk environment |
| • | Execution state of the overall risk management and medium- to long-term risk strategies |
| • | Resource Allocation—At the beginning of each financial year, the EMB determines the allocation of management resources and financial resources such as risk-weighted asset and unsecured funding to business units and establishes usage limits for these resources; |
| • | Business Plan—At the beginning of each financial year, the EMB approves the business plan and budget of Nomura. Introduction of significant new businesses, changes to business plans, the budget and the allocation of management resources during the year are also approved by the EMB; and |
| • | Reporting—The EMB reports the status of its deliberations to the BoD. |
Risk Category |
Definition |
|
Financial Risk |
||
Market risk |
Risk of loss arising from fluctuations in values of financial assets or debts (including off-balance sheet items) due to fluctuations in market risk factors (interest rates, foreign exchange rates, prices of securities and others). |
|
Credit risk |
Risk of loss arising from an obligor’s default, insolvency or administrative proceeding which results in the obligor’s failure to meet its contractual obligations in accordance with agreed terms. It is also the risk of loss arising through a credit valuation adjustment (the “CVA”) associated with deterioration in the creditworthiness of a counterparty. | |
Model risk |
Risk of financial loss, incorrect decision making, or damage to the firm’s credibility arising from model errors or incorrect or inappropriate model application. | |
Non-financial Risk |
||
Operational risk |
Risk of financial loss or non-financial impact arising from inadequate or failed internal processes, people and systems, or from external events. Operational risk includes in its definition Compliance, Legal, IT and Cyber Security, Fraud, Third Party and other non-financial risks. |
|
Reputational risk |
Possible damage to Nomura’s reputation and associated risk to earnings, capital or liquidity arising from any association, action or inaction which could be perceived by stakeholders to be inappropriate, unethical or inconsistent with Nomura Group’s values and corporate philosophy. | |
Liquidity risk |
||
Liquidity risk |
Risk of loss arising from difficulty in securing the necessary funding or from a significantly higher cost of funding than normal levels due to deterioration of the Nomura Group’s creditworthiness or deterioration in market conditions. | |
Other Risks |
||
|
ESG: Environmental, Social and Governance |
ESG is a collective term for Environmental (E), Social (S) and Governance (G) factors. “Environmental” includes issues related to impacts on the natural environment, including climate change. “Social” includes interactions with stakeholders and communities, for example the approach to human rights, workplace related issues and engagement on social issues. “Governance” includes issues related to corporate governance, corporate behavior and the approach to transparent reporting. | |
Strategic risk |
Risk to current or anticipated earning, capital, liquidity, enterprise value, or the Nomura Group’s reputation arising from adverse business decisions, poor implementation of business decisions, or lack of responsiveness to change in the industry or external environment. | |

Billions of yen |
||||||||
As of |
||||||||
|
March 31, 2023 |
March 31, 2024 |
|||||||
Equity |
¥ | 3.3 | ¥ | 3.3 | ||||
Interest rate |
4.7 | 2.6 | ||||||
Foreign exchange |
1.4 | 2.1 | ||||||
Subtotal |
9.4 | 8.0 | ||||||
Less: Diversification Benefit |
(3.2 | ) | (2.5 | ) | ||||
VaR |
¥ | 6.2 | ¥ | 5.5 | ||||
Billions of yen |
||||||||
For the twelve months ended |
||||||||
|
March 31, 2023 |
March 31, 2024 |
|||||||
Maximum daily VaR (1)
|
¥ | 6.8 | ¥ | 6.8 | ||||
Average daily VaR (1)
|
4.8 | 5.6 | ||||||
Minimum daily VaR (1)
|
2.7 | 4.3 | ||||||
| (1) | Represents the maximum, average and minimum VaR based on all daily calculations for the fiscal year ended March 31, 2024. |
| • | Evaluation of likelihood that a counterparty defaults on its payments and obligations; |
| • | Assignment of internal ratings to all active counterparties; |
| • | Approval of extensions of credit and establishment of credit limits; |
| • | Measurement, monitoring and management of Nomura’s current and potential future credit exposures; |
| • | Setting credit terms in legal documentation; and |
| • | Use of appropriate credit risk mitigants including netting, collateral and hedging. |
| • | Establishing the amount of counterparty credit risk that Nomura is willing to take to an individual counterparty or counterparty group (setting of credit limits); |
| • | Determining the level of delegated authority for setting credit limits (including tenor); |
| • | The frequency of credit reviews (renewal of credit limits); |
| • | Reporting counterparty credit risk to senior management within Nomura; and |
| • | Reporting counterparty credit risk to stakeholders outside of Nomura. |
Billions of yen |
||||||||||||||||||||||||||||||||||||
Years to Maturity |
Cross- Maturity Netting (1)
|
Total Fair Value |
Collateral obtained |
Replacement cost (3)
|
||||||||||||||||||||||||||||||||
Credit Rating |
Less than 1 year |
1 to 3 years |
3 to 5 years |
5 to 7 years |
More than 7 years |
|||||||||||||||||||||||||||||||
(a) |
(b) |
(a)-(b) |
||||||||||||||||||||||||||||||||||
AAA |
¥ | 16 | ¥ | 13 | ¥ | 5 | ¥ | 12 | ¥ | 52 | ¥ | (85 | ) | ¥ | 13 | ¥ | 1 | ¥ | 12 | |||||||||||||||||
AA |
359 | 336 | 156 | 100 | 712 | (1,272 | ) | 391 | 103 | 288 | ||||||||||||||||||||||||||
A |
517 | 397 | 209 | 219 | 864 | (1,748 | ) | 458 | 168 | 290 | ||||||||||||||||||||||||||
BBB |
302 | 109 | 65 | 39 | 315 | (492 | ) | 338 | 157 | 181 | ||||||||||||||||||||||||||
BB and lower |
161 | 92 | 67 | 8 | 52 | (238 | ) | 142 | 568 | — | ||||||||||||||||||||||||||
Other (2)
|
63 | 82 | 104 | 128 | 831 | (1,246 | ) | (38 | ) | 90 | — | |||||||||||||||||||||||||
Sub-total |
¥ | 1,418 | ¥ | 1,029 | ¥ | 606 | ¥ | 506 | ¥ | 2,826 | ¥ | (5,081 | ) | ¥ | 1,304 | ¥ | 1,087 | ¥ | 771 | |||||||||||||||||
Listed |
587 | 38 | 13 | 5 | 0 | (423 | ) | 220 | 244 | — | ||||||||||||||||||||||||||
Total |
¥ | 2,005 | ¥ | 1,067 | ¥ | 619 | ¥ | 511 | ¥ | 2,826 | ¥ | (5,504 | ) | ¥ | 1,524 | ¥ | 1,331 | ¥ | 771 | |||||||||||||||||
| (1) | Represents netting of derivative liabilities against derivatives assets entered into with the same counterparty across different maturity bands. Derivative assets and derivative liabilities with the same counterparty in the same maturity band are net within the relevant maturity band. Cash collateral netting against net derivative assets in accordance with ASC 210-20 “Balance Sheet — Offsetting Derivatives and Hedging |
| (2) | “Other” comprises unrated counterparties and certain portfolio level valuation adjustments not allocated to specific counterparties. |
| (3) | Zero balances represent instances where total collateral received is in excess of the total fair value; therefore, Nomura’s credit exposure is zero. |
Top 10 Country (Region) Exposures (1)
|
Billions of yen |
|||
(As of March 31, 2024) |
||||
United States |
7,477 | |||
Japan |
2,635 | |||
United Kingdom |
1,105 | |||
Singapore |
301 | |||
Canada |
257 | |||
India |
249 | |||
South Korea |
223 | |||
Germany |
217 | |||
Luxembourg |
186 | |||
Hong Kong S.A.R |
169 | |||
| (1) | The table represents the Top 10 country (region) exposures as of March 31, 2024 based on country of risk, combining counterparty and inventory exposures |
| - | Counterparty exposures include cash and cash equivalents held at banks; the outstanding default fund and initial margin balances posted by Nomura to central clearing counterparties as legally required under its direct and affiliate clearing memberships; the aggregate marked-to-market |
| - | Inventory exposures are the market value of debt and equity securities, and equity and credit derivatives, using the net of long versus short positions. |
| • | Policy framework: Sets standards for managing operational risk and details how to monitor adherence to these standards. |
| • | Training and awareness: Action taken by the Operational Risk Management (“ORM”) to improve business understanding of operational risk. |
| • | Event Reporting: This process is used to identify and report any event which resulted in or had the potential to result in a loss or gain or other impact associated with inadequate or failed internal processes, people and systems, or from external events. |
• |
Risk and Control Self-Assessment (the “RCSA”): This process is used to identify the inherent risks the business faces, the key controls associated with those risks and relevant actions to mitigate the residual risks. Global ORM are responsible for developing the RCSA process and supporting the business in its implementation. |
• |
Key Risk Indicators (the “KRI”): KRIs are metrics used to monitor the business’ exposure to operational risk and trigger appropriate responses as thresholds are breached. |
• |
Scenario Analysis: The process used to assess and quantify potential high impact, low likelihood operational risk events. During the process actions may be identified to enhance the control environment. |
• |
Analysis and reporting: A key aspect of ORM’s role is to analyze, report, and challenge operational risk information provided by business units, and work with business units to develop action plans to mitigate risks. |
• |
Operational risk capital calculation: Calculate operational risk capital as required under applicable Basel regulations and local regulatory requirements. |
Business Line |
Description |
Beta Factor |
||||
Retail Banking |
Retail deposit and loan-related services |
12% |
||||
Commercial Banking |
Deposit and loan-related services except for Retail Banking business |
15% |
||||
Payment and Settlement |
Payment and settlement services for clients’ transactions |
18% |
||||
Retail Brokerage |
Securities-related services mainly for individuals |
12% |
||||
Trading and Sales |
Market-related business |
18% |
||||
Corporate Finance |
M&A, underwriting, secondary and private offerings, and other funding services for clients |
18% |
||||
Agency Services |
Agency services for clients such as custody |
15% |
||||
Asset Management |
Fund management services for clients |
12% |
||||
• |
Nomura calculates the required amount of operational risk capital for each business line by multiplying the allocated annual gross income amount by the appropriate Beta Factor defined above. The operational risk capital for any gross income amount not allocated to a specific business line is determined by multiplying such unallocated gross income amount by a fixed percentage of 18%. |
• |
The total operational risk capital for Nomura is calculated by aggregating the total amount of operational risk capital required for each business line and unallocated amount and by determining a three-year average. Where the aggregated amount for a given year is negative, then the total operational risk capital amount for that year will be calculated as zero. In any given year, negative amounts in any business line are offset against positive amounts in other business lines. However, negative unallocated amounts are not offset against positive amounts in other business lines and are calculated as zero. |
• |
Operational risk capital is calculated at the end of September and March each year. |
(1) |
Transaction committees are in place to provide formal governance over the review and decision-making process for individual transactions. The liability for non-compliance is also clarified. |
(2) |
The new product approval process allows business unit sponsors to submit applications for new products and obtain approval from relevant departments prior to execution of the new products. The process is designed to capture and assess risks across various risk classes as a result of the new product or business. |
• |
Sensitivity analysis is used to quantify the impact of a market move in one or two associated risk factors (for example, equity prices, equity volatilities) in order primarily to capture those risks which may not be readily identified by other risk models; |
• |
Scenario analysis is used to quantify the impact of a specified event across multiple asset classes and risk classes. This is a primary approach used in performing stress testing at the different hierarchical levels of the Nomura Group; |
• |
Nomura Group establishes several stress scenarios to validate risk appetite for capital and liquidity soundness, taking into account the business environment, business’s risk profile, economic environment and forecasts. |
• |
Group-wide stress to assess the capital adequacy of the Nomura Group under severe but plausible market scenarios is conducted on a quarterly basis at a minimum; and |
• |
Reverse stress testing, a process of considering the vulnerabilities of the firm and hence how it may react to situations where it becomes difficult to continue its business, and reviewing the results of that analysis, is conducted on an annual basis at a minimum. |
Type of Services: |
Amount of Fee (U.S. Dollars) |
|
Taxes and other governmental charges |
As applicable. The depositary may offset any taxes or governmental charges it is obligated to withhold, if applicable, against the proceeds from sale of the property received. |
|
Transfers of the Company’s shares to or from the name of the depositary (or its nominee) or the Custodian (or its nominee) in connection with deposits or withdrawals |
Such registration fees as may be in effect for the registration of transfers of the Company’s shares on the Company’s share register (or any entity that presently carries out the duties of registrar). |
|
Cable, telex and facsimile transmission expenses |
As applicable. |
|
Expenses incurred by the depositary in the conversion of foreign currency |
As applicable. |
|
Execution and delivery of Receipts in connection with deposits, stock splits or exercise of subscription rights |
$5.00 or less per 100 ADSs (or portion thereof). |
|
Surrender of Receipts in connection with a withdrawal or termination of the Deposit Agreement |
$5.00 or less per 100 ADSs (or portion thereof). |
|
Any cash distribution pursuant to the Deposit Agreement, including, but not limited to, cash distribution(s) made in connection with cash dividends; distributions in securities, property or subscription rights; and stock splits. |
$.02 or less per ADS (or portion thereof). Only the cash amounts net of this fee, if applicable, are distributed. |
|
Distribution by the depositary of securities (other than common shares of the Company) that accrued on the underlying shares to owners of the Receipts |
Treating for the purpose of this fee all such securities as if they were common shares of the Company, $5.00 or less per 100 ADSs (or portion thereof). |
|
General depositary services |
$.02 or less per ADS (or portion thereof), accruing on the last day of each calendar year, except where the fee for cash distribution described above was assessed during that calendar year. |
|
Any other charge payable by the depositary, any of the depositary’s agents, including the Custodian, or the agents of the depositary’s agents in connection with the servicing of the Company’s shares or other deposited securities |
As applicable. |
|
• |
The Company has performed a detailed review of the consolidated statements of cash flow in this annual report, in order to identify other related issues or improvements in both classification and presentation of cash flows matters; |
• |
The Company has released a comprehensive internal policy documentation and has provided training to relevant personnel specifically focusing on classification and presentation within the consolidated statement of cash flows; and |
• |
The Company has implemented a new annual control whereby senior finance and accounting policy personnel perform an in-depth comprehensive review of the consolidated statement of cash flows, including a review of underlying calculations and methodologies used as the basis of reported amounts, to evaluate compliance with applicable accounting requirements under ASC 230 “Statement of Cash Flows |
Millions of yen |
||||||||
Year ended March 31 |
||||||||
2023 |
2024 |
|||||||
Audit Fees |
¥ |
4,138 |
¥ |
4,282 |
||||
Audit-Related Fees |
224 |
261 |
||||||
Tax Fees |
330 |
294 |
||||||
All Other Fees |
264 |
51 |
||||||
Total |
¥ |
4,956 |
¥ |
4,888 |
||||
Month |
Total Number of Shares Purchased |
Average Price Paid per Share (in yen) |
Total Number of Shares Purchased as Part of Publicly Announced Program |
Maximum Number of Shares that May Yet Be Purchased Under the Program |
||||||||||||
April 1 to 30, 2023 |
902 |
¥ |
515 |
— |
— |
|||||||||||
May 1 to 31, 2023 |
1,547 |
493 |
— |
35,000,000 |
||||||||||||
June 1 to 30, 2023 |
2,001 |
531 |
— |
35,000,000 |
||||||||||||
July 1 to 31, 2023 |
2,333 |
549 |
— |
35,000,000 |
||||||||||||
August 1 to 31, 2023 |
17,294,762 |
547 |
17,292,000 |
17,708,000 |
||||||||||||
September 1 to 30, 2023 |
17,079,619 |
617 |
17,076,500 |
631,500 |
||||||||||||
October 1 to 31, 2023 |
1,520 |
593 |
— |
— |
||||||||||||
November 1 to 30, 2023 |
1,266 |
605 |
— |
— |
||||||||||||
December 1 to 31, 2023 |
2,066 |
620 |
— |
— |
||||||||||||
January 1 to 31, 2024 |
2,034 |
703 |
— |
— |
||||||||||||
February 1 to 28, 2024 |
18,466,880 |
843 |
18,464,500 |
106,535,500 |
||||||||||||
March 1 to 31, 2024 |
27,762,213 |
917 |
27,759,100 |
78,776,400 |
||||||||||||
Total |
80,617,143 |
¥ |
757 |
80,592,100 |
— |
|||||||||||
|
Corporate Governance Practices Followed by NYSE-listed U.S. Companies |
Corporate Governance Practices Followed by the Company |
|
A NYSE-listed U.S. company must have a majority of Directors meeting the independence requirements under Section 303A of the NYSE Listed Company Manual. |
Under the Companies Act, a company which adopts the Company with Three Board Committees structure is not required to have a majority of outside directors, but is required to have a majority of outside directors on each of the audit, nomination and compensation committees. The Company currently has eight outside directors among its twelve Directors. |
|
A NYSE-listed U.S. company must have an audit committee that satisfies the requirements under Section 303A of the NYSE Listed Company Manual, including those imposed by Rule 10A-3 under the U.S. Securities Exchange Act of 1934. The audit committee must be composed entirely of independent directors and have at least three members. |
The Company has an Audit Committee consisting of three Directors, two of whom are outside directors in compliance with the requirements under the Companies Act. All three Audit Committee members are independent directors under Rule 10A-3 under the U.S. Securities Exchange Act of 1934 with one member qualified as audit committee financial expert. |
|
A NYSE-listed U.S. company must have a nominating/corporate governance committee with responsibilities described under Section 303A of the NYSE Listed Company Manual. The nominating/corporate governance committee must be composed entirely of independent directors. |
The Company has a Nomination Committee in compliance with the requirements under the Companies Act, consisting of three Directors, two of whom are outside directors. Further, the Company appoints an outside director as the chairman of the Committee. |
|
A NYSE-listed U.S. company must have a compensation committee composed entirely of independent directors. Compensation committee members must satisfy the additional independence requirements under Section 303A.02(a)(ii) of the NYSE Listed Company Manual. A compensation committee must also have authority to retain or obtain the advice of compensation and other advisers, subject to prescribed independence criteria that the committee must consider prior to engaging any such adviser. |
The Company has a Compensation Committee in compliance with the requirements under the Companies Act, consisting of three Directors, two of whom are outside directors. Further, the Company appoints an outside director as the chairman of the Committee. |
|
A NYSE-listed U.S. company must generally obtain shareholder approval with respect to any equity compensation plan. |
Under the Companies Act, companies with three Board Committees are not required to obtain shareholder approval with respect to compensation of Directors and Executive Officers, including RSUs and PSUs. The Company’s Compensation Committee establishes policies, based on which individual compensation for Directors and Executive Officers is determined, and the Company’s Human Resources Committee establishes policies for determining compensation for officers and employees other than the Company’s Directors and Executive Officers. Additionally, under the Companies Act, shares granted in connection with RSUs and PSUs do not require shareholder approval unless offered at a favorable price. |
|
|
Corporate Governance Practices Followed by NYSE-listed U.S. Companies |
Corporate Governance Practices Followed by the Company |
|
A NYSE-listed U.S. company must adopt and disclose corporate governance guidelines. |
Under the Companies Act, the Company is not required to adopt and disclose corporate governance guidelines. However, in response to Japan’s Corporate Governance Code, which was incorporated into the Tokyo Stock Exchange’s Securities Listing Regulations, the Company has established and publicly disclosed the “Nomura Holdings Corporate Governance Guidelines.” |
|
The non-management directors of a NYSE-listed U.S. company must meet at regularly scheduled executive sessions without management. |
Under the Companies Act, outside directors of the Company are not required to meet at regularly scheduled executive sessions without management. However, in accordance with the “Nomura Holdings Corporate Governance Guidelines,” outside directors hold meetings consisting solely of outside directors in order to discuss matters such as the business and corporate governance of the Company. |
|
A NYSE-listed U.S. company must adopt and disclose a code of business conduct and ethics for directors, officers and employees, and promptly disclose any waivers of the code for directors or executive officers. |
Under the Companies Act, the Company is not required to adopt and disclose a code of business conduct and ethics for directors, officers or employees. However, the Company has adopted the “Nomura Group Code of Conduct”. Please see Item 16B of this annual report for further information regarding the “Nomura Group Code of Conduct.” |
|
|
Exhibit Number |
Description |
|
1.1 |
Articles of Incorporation of Nomura Holdings, Inc. (English translation) (filed on June 24, 2022 as an exhibit to the Annual Report on Form 20-F (File No. 001-15270) and incorporated herein by reference) |
|
1.2 |
Share Handling Regulations of Nomura Holdings, Inc. (English translation) (filed on June 28, 2023 as an exhibit to the Annual Report on Form 20-F (File No. 001-15270) and incorporated herein by reference) |
|
1.3 |
Regulations of the Board of Directors of Nomura Holdings, Inc. (English translation) (filed on June 24, 2022 as an exhibit to the Annual Report on Form 20-F (File No. 001-15270) and incorporated herein by reference) |
|
1.4 |
Regulations of the Nomination Committee of Nomura Holdings, Inc. (English translation) (filed on June 23, 2016 as an exhibit to the Annual Report on Form 20-F (File No. 001-15270) and incorporated herein by reference) |
|
1.5 |
Regulations of the Audit Committee of Nomura Holdings, Inc. (English translation) (filed on June 24, 2022 as an exhibit to the Annual Report on Form 20-F (File No. 001-15270) and incorporated herein by reference) |
|
1.6 |
Regulations of the Compensation Committee of Nomura Holdings, Inc. (English translation) (filed on June 27, 2012 as an exhibit to the Annual Report on Form 20-F (File No. 001-15270) and incorporated herein by reference) |
|
2.1 |
Form of Deposit Agreement among Nomura Holdings, Inc., The Bank of New York Mellon as depositary and all owners and holders from time to time of American Depositary Receipts, including the form of American Depositary Receipt (filed on June 11, 2024 as an exhibit to the Registration Statement on Form F-6 (File No. 333-280111) and incorporated herein by reference) |
|
2.2 |
Description of rights of each class of securities registered under Section 12 of the Securities Exchange Act of 1934 (filed on June 24, 2022 as an exhibit to the Annual Report on Form 20-F (File No. 001-15270) and incorporated herein by reference) |
|
4.1 |
Form of Limitation of Liability Agreement (1)
|
|
8.1 |
Subsidiaries of Nomura Holdings, Inc.—See Item 4.C. “ Organizational Structure |
|
11.1 |
Nomura Group Code of Conduct (English translation) |
|
11.2 |
Nomura Group Code of Ethics for Financial Professionals (English translation) (filed on June 30, 2020 as an exhibit to the Annual Report on Form 20-F (File No. 001-15270) and incorporated herein by reference) |
|
|
Exhibit
Number
|
Description |
|
| 11.3 | Rules on Trading, etc. of Nomura Holdings Stocks, etc. by Nomura Group’s Officers and Employees (English translation) |
|
| 11.4 | Nomura Group Personal Account Dealing Policy (English translation) |
|
| 12.1 | Certification of the principal executive officer required by 17 C.F.R. 240. 13a-14(a)
|
|
| 12.2 | Certification of the principal financial officer required by 17 C.F.R. 240. 13a-14(a)
|
|
| 13.1 | Certification of the chief executive officer required by 18 U.S.C. Section 1350 |
|
| 13.2 | Certification of the chief financial officer required by 18 U.S.C. Section 1350 |
|
| 15.1 | Consent of Ernst & Young ShinNihon LLC, an independent registered public accounting firm |
|
| 17.1 | Subsidiary Issuer of Registered Guaranteed Securities |
|
| 97.1 | Nomura Holdings, Inc. Compensation Recovery Policy |
|
| 101.INS | Inline XBRL Instance Document - the instance document does not appear in the Interactive Data File because its XBRL tags are embedded within the Inline XBRL document |
|
| 101.SCH | Inline XBRL Taxonomy Extension Schema Document |
|
| 101.CAL | Inline XBRL Taxonomy Extension Calculation Linkbase Document |
|
| 101.DEF | Inline XBRL Taxonomy Extension Definition Linkbase Document |
|
| 101.LAB | Inline XBRL Taxonomy Extension Label Linkbase Document |
|
| 101.PRE | Inline XBRL Taxonomy Extension Presentation Linkbase Document |
|
| 104 | The cover page for the Company’s Annual Report on Form 20-F for the year ended March 31, 2023, has been formatted in Inline XBRL |
|
(1) |
The Company has entered into Limitation of Liability Agreements substantially in the form of this exhibit with all of its outside directors and director Shoji Ogawa. |
Page |
||||
| Consolidated Financial Statements of Nomura Holdings, Inc.: |
||||
F-2 |
||||
F- 5
|
||||
F- 8
|
||||
F- 9
|
||||
F-1 0
|
||||
F-1 2
|
||||
F-1 4
|
||||
Fair value of less liquid financial instruments | ||
| Description of the Matter |
The Company holds financial instruments for trading, customer facilitation and investment purposes. As disclosed in Note 2 to the consolidated financial statements as of March 31, 2024, the Company had ¥1,296 billion and ¥812 billion of financial instrument assets and liabilities recorded at their fair value on a recurring basis, respectively, categorized within Level 3 of the fair value hierarchy. In determining the fair value of these financial instruments, the Company used valuation models and unobservable inputs which reflect its assumptions and specific data. These inputs are significant to the fair value of the financial instruments and are supported by little or no market activity as of March 31, 2024. The valuation techniques applied by management to determine the fair value of such instruments are described in Note 2 to the consolidated financial statements. Auditing the fair value of the Company’s Level 3 financial instruments was complex and highly judgmental due to the subjectivity of the judgments used and estimations made by management in determining the fair value for these financial instruments. In particular, to value certain financial instruments, management used a variety of valuation techniques which involved certain underlying valuation assumptions and significant unobservable inputs, including weighted average cost of capital, growth rates, volatilities, correlations, credit spreads, recovery rates, loss severities, prepayment rates, default probabilities and yields. | |
| How We Addressed the Matter in Our Audit |
We obtained an understanding, evaluated the design and tested the operating effectiveness of controls relating to the valuation models and significant unobservable inputs used in fair value measurement. This included the testing of model validation controls by various departments within the Company. Our audit procedures to evaluate the valuation techniques used by the Company included, among others, testing valuation models and significant unobservable inputs. For certain of these financial instruments, we independently developed fair value estimates for which we involved our valuation specialists to assist with the application of these procedures and compared them to the Company’s results, on a sample basis. We also agreed significant unobservable inputs and underlying data used in the Company’s valuation models to information available from third party sources and market data, where available. We evaluated subsequent transactions and considered whether they corroborate or contradict the Company’s year-end valuations. | |
Millions of yen |
||||||||
March 31 |
||||||||
2023 |
2024 |
|||||||
ASSETS |
||||||||
| Cash and cash deposits: |
||||||||
| Cash and cash equivalents |
¥ | 3,820,685 | ¥ | 4,239,359 | ||||
| Time deposits |
409,082 | 545,842 | ||||||
| Deposits with stock exchanges and other segregated cash |
291,480 | 369,770 | ||||||
| |
|
|
|
|||||
| Total cash and cash deposits |
4,521,247 | 5,154,971 | ||||||
| |
|
|
|
|||||
| Loans and receivables: |
||||||||
| Loans receivable (includes ¥1,650,115 and ¥2,074,585 at fair value option ) |
4,013,852 | 5,469,195 | ||||||
| Receivables from customers (includes ¥39,107 and ¥21,834 at fair value option ) |
379,911 | 453,937 | ||||||
| Receivables from other than customers |
819,263 | 928,632 | ||||||
| Allowance for credit losses |
(5,832 | ) | (18,047 | ) | ||||
| |
|
|
|
|||||
| Total loans and receivables |
5,207,194 | 6,833,717 | ||||||
| |
|
|
|
|||||
| Collateralized agreements: |
||||||||
| Securities purchased under agreements to resell (includes ¥303,499 and ¥466,440 at fair value option ) |
13,834,460 | 15,621,132 | ||||||
| Securities borrowed |
4,283,039 | 5,373,663 | ||||||
| |
|
|
|
|||||
| Total collateralized agreements |
18,117,499 | 20,994,795 | ||||||
| |
|
|
|
|||||
| Trading assets and private equity and debt investments: |
||||||||
| Trading assets (includes assets pledged of ¥5,656,626 and ¥6,892,311; includes ¥7,043 and ¥8,108 at fair value option ) |
17,509,934 | 19,539,742 | ||||||
| Private equity and debt investments (includes ¥18,033 and ¥22,807 at fair value option ) |
99,399 | 117,066 | ||||||
| |
|
|
|
|||||
| Total trading assets and private equity and debt investments |
17,609,333 | 19,656,808 | ||||||
| |
|
|
|
|||||
| Other assets: |
||||||||
| Office buildings, land, equipment and facilities (net of accumulated depreciation and amortization of ¥459,954 and ¥529,605) |
464,316 | 448,785 | ||||||
| Non-trading debt securities |
337,361 | 335,401 | ||||||
| Investments in equity securities (includes assets pledged of ¥953 and ¥247) |
97,660 | 105,088 | ||||||
| Investments in and advances to affiliated companies (includes assets pledged of ¥5,658 and ¥6,929 ; includes ¥ nil and ¥1,514 at fair value option ) |
402,485 | 462,017 | ||||||
| Other (includes ¥168,780 and ¥213,227 at fair value option ) |
1,014,707 | 1,155,621 | ||||||
| |
|
|
|
|||||
| Total other assets |
2,316,529 | 2,506,912 | ||||||
| |
|
|
|
|||||
| Total assets |
¥ | 47,771,802 | ¥ | 55,147,203 | ||||
| |
|
|
|
|||||
Millions of yen |
||||||||
March 31 |
||||||||
2023 |
2024 |
|||||||
LIABILITIES AND EQUITY |
||||||||
| Short-term borrowings (includes ¥476,212 and ¥650,122 at fair value option ) |
¥ | 1,008,541 | ¥ | 1,054,717 | ||||
| Payables and deposits: |
||||||||
| Payables to customers |
1,359,948 | 1,310,825 | ||||||
| Payables to other than customers |
1,799,585 | 2,823,100 | ||||||
| Deposits received at banks (includes ¥159,505 and ¥182,906 at fair value option ) |
2,137,936 | 2,356,202 | ||||||
| |
|
|
|
|||||
| Total payables and deposits |
5,297,469 | 6,490,127 | ||||||
| |
|
|
|
|||||
| Collateralized financing: |
||||||||
| Securities sold under agreements to repurchase (includes ¥666,985 and ¥916,090 at fair value option ) |
14,217,966 | 16,870,303 | ||||||
| Securities loaned (includes ¥82,136 and ¥62,102 at fair value option ) |
1,556,663 | 2,133,066 | ||||||
| Other secured borrowings |
334,319 | 393,206 | ||||||
| |
|
|
|
|||||
| Total collateralized financing |
16,108,948 | 19,396,575 | ||||||
| |
|
|
|
|||||
| Trading liabilities |
10,557,971 | 10,890,610 | ||||||
| Other liabilities (includes ¥34,984 and ¥61,052 at fair value option ) |
1,175,521 | 1,414,546 | ||||||
| Long-term borrowings (includes ¥4,957,581 and ¥6,145,018 at fair value option ) |
10,399,210 | 12,452,115 | ||||||
| |
|
|
|
|||||
| Total liabilities |
44,547,660 | 51,698,690 | ||||||
| |
|
|
|
|||||
| Commitments and contingencies (Note 19) |
||||||||
| Equity: |
||||||||
| Nomura Holdings, Inc. (“NHI”) shareholders’ equity: |
||||||||
| Common stock |
||||||||
| No par value shares; Authorized—6,000,000,000 shares Issued—3,233,562,601 and 3,163,562,601 sharesOutstanding—3,003,679,324 and 2,970,755,160 shares |
594,493 | 594,493 | ||||||
| Additional paid-in capital |
707,189 | 708,785 | ||||||
| Retained earnings |
1,647,005 | 1,705,725 | ||||||
| Accumulated other comprehensive income |
318,454 | 459,984 | ||||||
| |
|
|
|
|||||
| Total NHI shareholders’ equity before treasury stock |
3,267,141 | 3,468,987 | ||||||
| Common stock held in treasury, at cost—229,883,277 and 192,807,441 shares |
(118,574 | ) | (118,798 | ) | ||||
| |
|
|
|
|||||
| Total NHI shareholders’ equity |
3,148,567 | 3,350,189 | ||||||
| |
|
|
|
|||||
| Noncontrolling interests |
75,575 | 98,324 | ||||||
| Total equity |
3,224,142 | 3,448,513 | ||||||
| |
|
|
|
|||||
| Total liabilities and equity |
¥ | 47,771,802 | ¥ | 55,147,203 | ||||
| |
|
|
|
|||||
Billions of yen |
||||||||
March 31 |
||||||||
2023 |
2024 |
|||||||
| Cash and cash deposits |
¥ | 23 | ¥ | 73 | ||||
| Trading assets and private equity and debt investments |
1,044 | 1,296 | ||||||
| Other assets |
127 | 99 | ||||||
| |
|
|
|
|||||
| Total assets |
¥ | 1,194 | ¥ | 1,468 | ||||
| |
|
|
|
|||||
| Trading liabilities |
¥ | 0 | ¥ | 0 | ||||
| Other liabilities |
5 | 6 | ||||||
| Borrowings |
887 | 1,106 | ||||||
| |
|
|
|
|||||
| Total liabilities |
¥ | 892 | ¥ | 1,112 | ||||
| |
|
|
|
|||||
Millions of yen |
||||||||||||
Year ended March 31 |
||||||||||||
2022 |
2023 |
2024 |
||||||||||
| Revenue: |
||||||||||||
| Commissions |
¥ | 332,344 | ¥ | 279,857 | ¥ | 364,095 | ||||||
| Fees from investment banking |
149,603 | 113,208 | 173,265 | |||||||||
| Asset management and portfolio service fees |
269,985 | 271,684 | 310,154 | |||||||||
| Net gain on trading |
368,799 | 563,269 | 491,611 | |||||||||
| Gain on private equity and debt investments |
30,768 | 14,504 | 11,877 | |||||||||
| Interest and dividends |
284,222 | 1,114,690 | 2,620,856 | |||||||||
| Gain (loss) on investments in equity securities |
5,446 | (1,426 | ) | 9,612 | ||||||||
| Other |
152,832 | 130,940 | 175,824 | |||||||||
| |
|
|
|
|
|
|||||||
| Total revenue |
1,593,999 | 2,486,726 | 4,157,294 | |||||||||
| Interest expense |
230,109 | 1,151,149 | 2,595,294 | |||||||||
| |
|
|
|
|
|
|||||||
| Net revenue |
1,363,890 | 1,335,577 | 1,562,000 | |||||||||
| |
|
|
|
|
|
|||||||
| Non-interest expenses: |
||||||||||||
| Compensation and benefits |
529,506 | 605,787 | 673,523 | |||||||||
| Commissions and floor brokerage |
105,204 | 119,237 | 137,328 | |||||||||
| Information processing and communications |
184,319 | 209,537 | 217,126 | |||||||||
| Occupancy and related depreciation |
69,742 | 66,857 | 68,698 | |||||||||
| Business development expenses |
15,641 | 22,636 | 24,236 | |||||||||
| Other |
232,855 | 162,049 | 167,239 | |||||||||
| |
|
|
|
|
|
|||||||
| Total non-interest expenses |
1,137,267 | 1,186,103 | 1,288,150 | |||||||||
| |
|
|
|
|
|
|||||||
| Income before income taxes |
226,623 | 149,474 | 273,850 | |||||||||
| |
|
|
|
|
|
|||||||
| Income tax expense |
80,090 | 57,798 | 96,630 | |||||||||
| |
|
|
|
|
|
|||||||
| Net income |
¥ | 146,533 | ¥ | 91,676 | ¥ | 177,220 | ||||||
| |
|
|
|
|
|
|||||||
| Less: Net income (loss) attributable to noncontrolling interests |
3,537 | (1,110 | ) | 11,357 | ||||||||
| |
|
|
|
|
|
|||||||
| Net income attributable to NHI shareholders |
¥ | 142,996 | ¥ | 92,786 | ¥ | 165,863 | ||||||
| |
|
|
|
|
|
|||||||
Yen |
||||||||||||
| Per share of common stock: |
||||||||||||
| Basic — |
||||||||||||
| Net income attributable to NHI shareholders per share |
¥ | 46.68 | ¥ | 30.86 | ¥ | 54.97 | ||||||
| |
|
|
|
|
|
|||||||
| Diluted — |
||||||||||||
| Net income attributable to NHI shareholders per share |
¥ | 45.23 | ¥ | 29.74 | ¥ | 52.69 | ||||||
| |
|
|
|
|
|
|||||||
Millions of yen |
||||||||||||
Year ended March 31 |
||||||||||||
2022 |
2023 |
2024 |
||||||||||
| Net income |
¥ | 146,533 | ¥ | 91,676 | ¥ | 177,220 | ||||||
| Other comprehensive income (loss): |
||||||||||||
| Change in cumulative translation adjustments: |
||||||||||||
| Change in cumulative translation adjustments |
122,468 | 107,058 | 204,507 | |||||||||
| Deferred income taxes |
(946 | ) | (145 | ) | (1,161 | ) | ||||||
| |
|
|
|
|
|
|||||||
| Total |
121,522 | 106,913 | 203,346 | |||||||||
| |
|
|
|
|
|
|||||||
| Defined benefit pension plans: |
||||||||||||
| Pension liability adjustment |
(404 | ) | 16,422 | 18,475 | ||||||||
| Deferred income taxes |
78 | (4,793 | ) | (5,813 | ) | |||||||
| |
|
|
|
|
|
|||||||
| Total |
(326 | ) | 11,629 | 12,662 | ||||||||
| |
|
|
|
|
|
|||||||
| Own credit adjustments: |
||||||||||||
| Own credit adjustments |
60,777 | 95,047 | (91,001 | ) | ||||||||
| Deferred income taxes |
(12,930 | ) | (22,050 | ) | 18,565 | |||||||
| |
|
|
|
|
|
|||||||
| Total |
47,847 | 72,997 | (72,436 | ) | ||||||||
| |
|
|
|
|
|
|||||||
| Total other comprehensive income |
169,043 | 191,539 | 143,572 | |||||||||
| |
|
|
|
|
|
|||||||
| Comprehensive income |
315,576 | 283,215 | 320,792 | |||||||||
| Less: Comprehensive income (loss) attributable to noncontrolling interests |
6,463 | (52 | ) | 13,399 | ||||||||
| |
|
|
|
|
|
|||||||
| Comprehensive income attributable to NHI shareholders |
¥ | 309,113 | ¥ | 283,267 | ¥ | 307,393 | ||||||
| |
|
|
|
|
|
|||||||
Millions of yen |
||||||||||||
Year ended March 31 |
||||||||||||
2022 |
2023 |
2024 |
||||||||||
| Common stock |
||||||||||||
| Balance at beginning of year |
¥ | 594,493 | ¥ | 594,493 | ¥ | 594,493 | ||||||
| |
|
|
|
|
|
|||||||
| Balance at end of year |
594,493 | 594,493 | 594,493 | |||||||||
| |
|
|
|
|
|
|||||||
| Additional paid-in capital |
||||||||||||
| Balance at beginning of year |
696,122 | 697,507 | 707,189 | |||||||||
| Stock-based compensation awards |
1,421 | 9,411 | 1,609 | |||||||||
| Changes in ownership interests in subsidiaries |
— |
287 |
— |
| ||||||||
| Changes in an affiliated company’s interests |
(36 | ) | (16 | ) | (13 | ) | ||||||
| |
|
|
|
|
|
|||||||
| Balance at end of year |
697,507 | 707,189 | 708,785 | |||||||||
| |
|
|
|
|
|
|||||||
| Retained earnings |
||||||||||||
| Balance at beginning of year |
1,533,713 | 1,606,987 | 1,647,005 | |||||||||
| Net income attributable to NHI shareholders |
142,996 | 92,786 | 165,863 | |||||||||
| Cash dividends |
(67,007 | ) | (51,050 | ) | (68,674 | ) | ||||||
| L oss on sales of treasury stock |
(2,715 | ) | (1,718 | ) | (2,364 | ) | ||||||
| Cancellation of treasury stock |
— |
— |
(36,105 | ) | ||||||||
| |
|
|
|
|
|
|||||||
| Balance at end of year |
1,606,987 | 1,647,005 | 1,705,725 | |||||||||
| |
|
|
|
|
|
|||||||
| Accumulated other comprehensive income (loss) |
||||||||||||
| Cumulative translation adjustments |
||||||||||||
| Balance at beginning of year |
18,316 | 136,912 | 242,767 | |||||||||
| Net change during the year |
118,596 | 105,855 | 201,304 | |||||||||
| |
|
|
|
|
|
|||||||
| Balance at end of year |
136,912 | 242,767 | 444,071 | |||||||||
| |
|
|
|
|
|
|||||||
| Defined benefit pension plans |
||||||||||||
| Balance at beginning of year |
(43,477 | ) | (43,803 | ) | (32,174 | ) | ||||||
| Pension liability adjustment |
(326 | ) | 11,629 | 12,662 | ||||||||
| |
|
|
|
|
|
|||||||
| Balance at end of year |
(43,803 | ) | (32,174 | ) | (19,512 | ) | ||||||
| |
|
|
|
|
|
|||||||
| Own credit adjustments |
||||||||||||
| Balance at beginning of year |
(12,983 | ) | 34,864 | 107,861 | ||||||||
| Own credit adjustments |
47,847 | 72,997 | (72,436 | ) | ||||||||
| |
|
|
|
|
|
|||||||
| Balance at end of year |
34,864 | 107,861 | 35,425 | |||||||||
| |
|
|
|
|
|
|||||||
| Balance at end of year |
127,973 | 318,454 | 459,984 | |||||||||
| |
|
|
|
|
|
|||||||
Millions of yen |
||||||||||||
Year ended March 31 |
||||||||||||
2022 |
2023 |
2024 |
||||||||||
| Common stock held in treasury |
||||||||||||
| Balance at beginning of year |
(91,246 | ) | (112,355 | ) | (118,574 | ) | ||||||
| Repurchases of common stock |
(39,650 | ) | (24,728 | ) | (61,199 | ) | ||||||
| Sales of common stock |
0 | 0 | 0 | |||||||||
| Common stock issued to employees |
18,541 | 18,509 | 24,870 | |||||||||
| Cancellation of treasury stock |
— |
— |
36,105 | |||||||||
| |
|
|
|
|
|
|||||||
| Balance at end of year |
(112,355 | ) | (118,574 | ) | (118,798 | ) | ||||||
| |
|
|
|
|
|
|||||||
| Total NHI shareholders’ equity |
||||||||||||
| Balance at end of year |
2,914,605 | 3,148,567 | 3,350,189 | |||||||||
| |
|
|
|
|
|
|||||||
| Noncontrolling interests (1)
|
||||||||||||
| Balance at beginning of year |
61,513 | 58,198 | 75,575 | |||||||||
| Cash dividends |
(43,346 | ) | (3,868 | ) | (3,548 | ) | ||||||
| Net income (loss) attributable to noncontrolling interests |
3,537 | (1,110 | ) | 11,357 | ||||||||
| Accumulated other comprehensive income attributable to noncontrolling interests |
||||||||||||
| Cumulative translation adjustments |
2,926 | 1,058 | 2,042 | |||||||||
| Transaction between NHI group and noncontrolling interest holders, net |
42,881 | 25,956 | 11,855 | |||||||||
| Other net change in noncontrolling interests |
(9,313 | ) | (4,659 | ) | 1,043 | |||||||
| |
|
|
|
|
|
|||||||
| Balance at end of year |
58,198 | 75,575 | 98,324 | |||||||||
| |
|
|
|
|
|
|||||||
| Total equity |
||||||||||||
| Balance at end of year |
¥ | 2,972,803 | ¥ | 3,224,142 | ¥ | 3,448,513 | ||||||
| |
|
|
|
|
|
|||||||
| (1) | Certain reclassifications of previously reported amounts have been made to conform to the current period presentation. |
Millions of yen |
||||||||||||
Year ended March 31 |
||||||||||||
2022 |
2023 |
2024 |
||||||||||
| Cash flows from operating activities: |
||||||||||||
| Net income |
¥ |
146,533 |
¥ |
91,676 |
¥ |
177,220 |
||||||
| Adjustments to reconcile net income to net cash provided by (used in) operating activities: |
||||||||||||
| Depreciation and amortization |
59,524 |
61,424 |
61,340 |
|||||||||
| Provision for credit losses |
8,749 |
(4,047 |
) |
13,910 |
||||||||
| Stock-based compensation |
27,941 |
35,216 |
35,577 |
|||||||||
| (Gain) loss on investments in equity securities |
(5,446 |
) |
1,426 |
(9,612 |
) | |||||||
| Gain on investments in subsidiaries and affiliates |
(79,396 |
) |
(23,889 |
) |
(968 |
) | ||||||
| Equity in earnings of affiliates, net of dividends received |
(20,235 |
) |
(34,127 |
) |
(31,070 |
) | ||||||
| (Gain) loss on disposal of office buildings, land, equipment and facilities |
(3,490 |
) |
344 |
2,670 |
||||||||
| Deferred income taxes |
3,106 |
6,137 |
(312 |
) | ||||||||
| Changes in operating assets and liabilities: |
||||||||||||
| Deposits with stock exchanges and other segregated cash |
(18,408 |
) |
170,632 |
16,465 |
||||||||
| Trading assets and private equity and debt investments |
1,229,557 |
(1,623,037 |
) |
(386,474 |
) | |||||||
| Trading liabilities |
(284,747 |
) |
467,257 |
(411,843 |
) | |||||||
| Securities purchased under agreements to resell, net of securities sold under agreements to repurchase |
(2,220,493 |
) |
(590,424 |
) |
290,843 |
|||||||
| Securities borrowed, net of securities loaned |
595,116 |
834,438 |
(324,095 |
) | ||||||||
| Margin loans and receivables |
111,468 |
472,811 |
(276,058 |
) | ||||||||
| Payables |
(247,980 |
) |
(139,417 |
) |
709,839 |
|||||||
| Bonus accrual |
(1,865 |
) |
(3,319 |
) |
26,480 |
|||||||
| Accrued income taxes, net |
(37,639 |
) |
(42,603 |
) |
70,892 |
|||||||
| Other, net |
(125,127 |
) |
(375,318 |
) |
167,836 |
|||||||
| |
|
|
|
|
|
|||||||
| Net cash provided by (used in) operating activities |
(862,832 |
) |
(694,820 |
) |
132,640 |
|||||||
| |
|
|
|
|
|
|||||||
| Cash flows from investing activities: |
||||||||||||
| Payments for placements of time deposits |
(227,644 |
) |
(344,117 |
) |
(650,562 |
) | ||||||
| Proceeds from redemption or maturity of time deposits |
199,475 |
284,705 |
567,599 |
|||||||||
| Payments for purchases of office buildings, land, equipment and facilities |
(111,331 |
) |
(171,165 |
) |
(145,784 |
) | ||||||
| Proceeds from sales of office buildings, land, equipment and facilities |
94,985 |
63,648 |
111,954 |
|||||||||
| Payments for purchases of equity investments |
(3,142 |
) |
(4,471 |
) |
(14,716 |
) | ||||||
| Proceeds from sales of equity investments |
41,089 |
52,299 |
40,497 |
|||||||||
| Net cash outflows from loans receivable at banks |
(110,811 |
) |
(84,362 |
) |
(112,224 |
) | ||||||
| Payments for purchases or origination of other non-trading loans |
(5,695,122 |
) |
(4,702,061 |
) |
(4,286,507 |
) | ||||||
| Proceeds from sales or repayments of other non-trading loans |
5,172,221 |
4,486,651 |
3,606,974 |
|||||||||
| Net cash outflows from interbank money market loans |
(808 |
) |
(62 |
) |
— |
|||||||
| Payments for purchases of non-trading debt securities |
(106,390 |
) |
(45,910 |
) |
(112,438 |
) | ||||||
| Proceeds from sales or maturity of non-trading debt securities |
55,325 |
205,468 |
135,690 |
|||||||||
| Acquisitions, net of cash acquired |
— |
— |
(457 |
) | ||||||||
| Divestures, net of cash disposed of |
— |
16,950 |
— |
|||||||||
| Payments for purchases of investments in affiliated companies |
(5,674 |
) |
(25,119 |
) |
(29,778 |
) | ||||||
| Proceeds from sales of investments in affiliated companies |
109,111 |
43,299 |
900 |
|||||||||
| Other, net |
(4,466 |
) |
(8,978 |
) |
914 |
|||||||
| |
|
|
|
|
|
|||||||
| Net cash used in investing activities |
(593,182 |
) |
(233,225 |
) |
(887,938 |
) | ||||||
| |
|
|
|
|
|
|||||||
| Cash flows from financing activities: |
||||||||||||
| Proceeds from issuances of long-term borrowings |
3,894,613 |
2,208,422 |
3,064,698 |
|||||||||
| Payments for repurchases or maturity of long-term borrowings |
(2,656,233 |
) |
(1,115,171 |
) |
(2,101,758 |
) | ||||||
| Proceeds from issuances of short-term borrowings |
1,743,817 |
2,630,083 |
1,964,955 |
|||||||||
| Payments for repurchases or maturity of short-term borrowings |
(2,164,098 |
) |
(2,694,588 |
) |
(1,866,998 |
) | ||||||
| Net cash inflows (outflows) from interbank money market borrowings |
12,925 |
48,197 |
(88,288 |
) | ||||||||
| Net cash inflows (outflows) from other secured borrowings |
30,753 |
(52,915 |
) |
57,311 |
||||||||
| Net cash inflows from deposits received at banks |
372,575 |
328,867 |
107,532 |
|||||||||
| Payments for withholding taxes on stock-based compensation |
(10,816 |
) |
(9,060 |
) |
(12,669 |
) | ||||||
| Proceeds from sales of common stock |
11 |
4 |
953 |
|||||||||
| Payments for repurchases of common stock |
(39,650 |
) |
(24,728 |
) |
(61,029 |
) | ||||||
| Payments for cash dividends |
(70,714 |
) |
(57,262 |
) |
(60,164 |
) | ||||||
| Contributions from noncontrolling interests |
42,881 |
59,718 |
69,231 |
|||||||||
| Distributions to noncontrolling interests |
(43,346 |
) |
(37,630 |
) |
(60,924 |
) | ||||||
| |
|
|
|
|
|
|||||||
| Net cash provided by financing activities |
1,112,718 |
1,283,937 |
1,012,850 |
|||||||||
| |
|
|
|
|
|
|||||||
| Effect of exchange rate changes on cash, cash equivalents, restricted cash and restricted cash equivalents |
149,693 |
148,552 |
220,618 |
|||||||||
| |
|
|
|
|
|
|||||||
| Net increase (decrease) in cash, cash equivalents, restricted cash and restricted cash equivalents |
(193,603 |
) |
504,444 |
478,170 |
||||||||
| Cash, cash equivalents, restricted cash and restricted cash equivalents at beginning of year |
3,510,011 |
3,316,408 |
3,820,852 |
|||||||||
| |
|
|
|
|
|
|||||||
| Cash, cash equivalents, restricted cash and restricted cash equivalents at end of year |
¥ |
3,316,408 |
¥ |
3,820,852 |
¥ |
4,299,022 |
||||||
| |
|
|
|
|
|
|||||||
| Supplemental information: |
||||||||||||
| Cash paid during the year for— |
||||||||||||
| Interest |
¥ |
225,679 |
¥ |
1,098,815 |
¥ |
2,514,801 |
||||||
| |
|
|
|
|
|
|||||||
| Income tax payments, net |
¥ |
114,623 |
¥ |
94,263 |
¥ |
26,050 |
||||||
| |
|
|
|
|
|
|||||||
Millions of yen |
||||||||||||
Year ended March 31 |
||||||||||||
2022 |
2023 |
2024 |
||||||||||
| Cash and cash equivalents reported in Cash and cash equivalents |
¥ | 3,316,238 | ¥ | 3,820,685 | ¥ | 4,239,359 | ||||||
| Restricted cash and restricted cash equivalents reported in Deposits with stock exchanges and other segregated cash |
170 | 167 | 59,663 | |||||||||
| |
|
|
|
|
|
|||||||
| Total cash, cash equivalent, restricted cash and restricted cash equivalents |
¥ | 3,316,408 | ¥ | 3,820,852 | ¥ | 4,299,022 | ||||||
| |
|
|
|
|
|
|||||||
• |
The financial assets are originated or acquired with the intention to generate profit through sale in the short-term; |
• |
The financial assets are part of a portfolio of identified financial instruments that are managed together for the purposes of short-term profit or arbitrage profit-taking; or |
• |
The financial assets are derivative assets. |
• |
Fair value hedges non-trading debt securities, respectively. These derivatives are effective in reducing the risk associated with the exposure being hedged and they are highly correlated with changes in the fair value of the underlying hedged items, both at inception and throughout the life of the hedging relationship. Changes in fair value of the hedging derivatives are reported together with those of the hedged financial assets and liabilities through the consolidated statements of income within Interest expense Revenue — Other |
• |
Net investment hedges Revenue — Net gain on trading Accumulated other comprehensive income (loss) |
• |
Economic expense hedges |
Office buildings |
3 to 50 years |
|||
Equipment and facilities |
3 to 20 years |
|||
Software |
3 to 10 years |
| Pronouncement |
Summary of new guidance |
Adoption date and method of adoption |
Effect on these consolidated financial statements | |||
ASU 2022-02 “Financial instruments – Credit losses (Topic 326): Troubled debt restructurings and vintage disclosures” |
• Eliminates specific recognition and measurement guidance for troubled debt restructurings (“TDRs”). Single guidance to be applied to all modifications when determining whether a modification results in a new receivable or a continuation of an existing receivable. • Requires to use a discounted cash flow (“DCF”) or reconcilable method for measurement of current expected credit losses for modified receivables is removed; where a DCF method is used for the measurement, an effective interest rate (EIR) derived from the modified contractual terms should be applied. • Enhances disclosures by creditors for modifications of receivables from debtors experiencing financial difficulty in the form of principal forgiveness, an interest rate reduction, other-than-insignificant payment delay or term extension. |
Nomura has adopted the amendments prospectively from April 1, 2023. |
No material financial impact on initial adoption and since adoption. See Note 7. “ Financing receivables |
| Pronouncement |
Summary of new guidance |
Adoption date and method of adoption |
Effect on these consolidated financial statements | |||
| • Augments the current requirements for public business entity creditors to disclose current-period gross write-offs by year of origination (i.e., the vintage year) for financing receivables and net investments in leases. |
| Pronouncement |
Summary of new guidance |
Expected adoption date and method of adoption |
Effect on these consolidated financial statements | |||
ASU 2022-03 “Fair value measurement (Topic 820)” |
• Clarifies that a contractual sale restriction is an entity-specific characteristic and therefore should not be considered in the fair value measurement of an equity security. • Enhances disclosures for fair value of investments in equity securities subject to contractual sale restrictions, nature and remaining duration of the restrictions and circumstances that could cause a lapse in the restrictions. |
Nomura will adopt the amendments prospectively from April 1, 2024. |
No material financial impact expected. | |||
ASU 2023-07 “Segment Reporting (Topic 280): Improvements to Reportable Segment Disclosures” |
• Enhances segment reporting by introducing incremental interim and annual disclosure requirements for more disaggregated expense information about a public entity’s reportable segments and expanding frequency of existing segment disclosures. • Requires annual disclosures of information about the chief operating decision maker. • Clarifies circumstances where disclosure of more than one measure of a segment’s profit or loss are permitted. |
Nomura currently plans to adopt the amendments retrospectively from March 31, 2025. |
No material financial impact expected. | |||
ASU 2023-08 “Intangibles—Goodwill and Other—Crypto Assets (Subtopic 350-60): Accounting for and Disclosure of Crypto Assets” |
• Requires all in-scope crypto assets be subsequently measured at fair value at each reporting period through earnings.• Presentation of in-scope crypto assets in the financial statements to be shown separately from other intangible assets. |
Nomura currently plans to adopt the amendments based on a modified retrospective approach from April 1, 2025. |
No material financial impact expected. | |||
| Pronouncement |
Summary of new guidance |
Expected adoption date and method of adoption |
Effect on these consolidated financial statements | |||
| • Introduces new disclosure requirements for in-scope crypto assets applicable to all entities. |
||||||
ASU 2023-09 “Income Taxes (Topic 740): Improvements to Income Tax Disclosures” |
• Introduces incremental annual disclosures for disaggregated information about an entity’s effective tax rate reconciliation and information on income taxes paid. • Removes certain existing disclosure requirements in relation to unrecognized tax benefits and temporary differences for which a deferred tax liability is not recognized. |
Nomura currently plans to adopt the amendments prospectively from April 1, 2025. |
No material financial impact expected. | |||
Billions of yen |
||||||||||||||||||||
March 31, 2023 |
||||||||||||||||||||
Level 1 |
Level 2 |
Level 3 |
Counterparty and Cash Collateral Netting (1)
|
Balance as of March 31, 2023 |
||||||||||||||||
Assets: |
||||||||||||||||||||
Trading assets and private equity and debt investments (2)
|
||||||||||||||||||||
Equities (3)
|
¥ | 1,906 | ¥ | 1,111 | ¥ | 4 | ¥ | — | ¥ | 3,021 | ||||||||||
Private equity and debt investments (5)
|
25 | — | 52 | — | 77 | |||||||||||||||
Japanese government securities |
1,627 | — | — | — | 1,627 | |||||||||||||||
Japanese agency and municipal securities |
— | 157 | 2 | — | 159 | |||||||||||||||
Foreign government, agency and municipal securities |
3,566 | 2,221 | 8 | — | 5,795 | |||||||||||||||
Bank and corporate debt securities and loans for trading purposes |
— | 1,268 | 258 | — | 1,526 | |||||||||||||||
Commercial mortgage-backed securities (“CMBS”) |
— | — | 0 | — | 0 | |||||||||||||||
Residential mortgage-backed securities (“RMBS”) |
— | 3,402 | 8 | — | 3,410 | |||||||||||||||
Issued/Guaranteed by government sponsored entity |
— | 3,265 | — | — | 3,265 | |||||||||||||||
Other |
— | 137 | 8 | — | 145 | |||||||||||||||
Real estate-backed securities |
— | 58 | 95 | — | 153 | |||||||||||||||
Collateralized debt obligations (“CDOs”) and other (6)
|
— | 35 | 28 | — | 63 | |||||||||||||||
Investment trust funds and other |
307 | 3 | 2 | — | 312 | |||||||||||||||
Total trading assets and private equity and debt investments |
7,431 | 8,255 | 457 | — | 16,143 | |||||||||||||||
Derivative assets (7)
|
||||||||||||||||||||
Equity contracts |
2 | 1,052 | 11 | — | 1,065 | |||||||||||||||
Interest rate contracts |
73 | 12,593 | 133 | — | 12,799 | |||||||||||||||
Credit contracts |
8 | 232 | 36 | — | 276 | |||||||||||||||
Foreign exchange contracts |
0 | 4,171 | 49 | — | 4,220 | |||||||||||||||
Commodity contracts |
1 | 2 | — | — | 3 | |||||||||||||||
Netting |
— | — | — | (16,943 | ) | (16,943 | ) | |||||||||||||
Total derivative assets |
84 | 18,050 | 229 | (16,943 | ) | 1,420 | ||||||||||||||
Subtotal |
¥ | 7,515 | ¥ | 26,305 | ¥ | 686 | ¥ | (16,943 | ) | ¥ | 17,563 | |||||||||
Loans and receivables (8)
|
— | 1,498 | 191 | — | 1,689 | |||||||||||||||
Collateralized agreements (9)
|
— | 286 | 17 | — |
303 | |||||||||||||||
Other assets (2)
|
||||||||||||||||||||
Non-trading debt securities |
87 | 247 | 3 | — | 337 | |||||||||||||||
Other (3)(4)
|
188 | 164 | 196 | — | 548 | |||||||||||||||
Total |
¥ | 7,790 | ¥ | 28,500 | ¥ | 1,093 | ¥ | (16,943 | ) | ¥ | 20,440 | |||||||||
Liabilities: |
||||||||||||||||||||
Trading liabilities |
||||||||||||||||||||
Equities |
¥ | 2,068 | ¥ | 13 | ¥ | 1 | ¥ | — | ¥ | 2,082 | ||||||||||
Japanese government securities |
1,469 | — |
— | — | 1,469 | |||||||||||||||
Japanese agency and municipal securities |
— | 5 | — | — | 5 | |||||||||||||||
Foreign government, agency and municipal securities |
3,579 | 1,021 | 0 | — | 4,600 | |||||||||||||||
Bank and corporate debt securities |
— | 232 | 3 | — | 235 | |||||||||||||||
Residential mortgage-backed securities (“RMBS”) |
— | 0 | — | — | 0 | |||||||||||||||
Investment trust funds and other |
158 | — | 0 | — | 158 | |||||||||||||||
Total trading liabilities |
7,274 | 1,271 | 4 | — | 8,549 | |||||||||||||||
Derivative liabilities (7)
|
||||||||||||||||||||
Equity contracts |
3 | 1,602 | 5 | — | 1,610 | |||||||||||||||
Interest rate contracts |
45 | 12,080 | 122 | — | 12,247 | |||||||||||||||
Credit contracts |
14 | 276 | 68 | — | 358 | |||||||||||||||
Foreign exchange contracts |
0 | 4,090 | 30 | — | 4,120 | |||||||||||||||
Commodity contracts |
— | 3 | — | — | 3 | |||||||||||||||
Netting |
— | — | — | (16,329 | ) | (16,329 | ) | |||||||||||||
Total derivative liabilities |
62 | 18,051 | 225 | (16,329 | ) | 2,009 | ||||||||||||||
Subtotal |
¥ | 7,336 | ¥ | 19,322 | ¥ | 229 | ¥ | (16,329 | ) | ¥ | 10,558 | |||||||||
Short-term borrowings (11)
|
¥ — | ¥ | 446 | ¥ | 30 | ¥ | — | ¥ | 476 | |||||||||||
Payables and deposits (10)(12)
|
— | 142 | 17 | — | 159 | |||||||||||||||
Collateralized financing (9)
|
— | 749 | — | — | 749 | |||||||||||||||
Long-term borrowings (11)(13)(14)
|
27 | 4,437 | 493 | — | 4,957 | |||||||||||||||
Other liabilities (15)
|
108 | 175 | 21 | — | 304 | |||||||||||||||
Total |
¥ | 7,471 | ¥ | 25,271 | ¥ | 790 | ¥ | (16,329 | ) | ¥ | 17,203 | |||||||||
Billions of yen |
||||||||||||||||||||
March 31, 2024 |
||||||||||||||||||||
Level 1 |
Level 2 |
Level 3 |
Counterparty and Cash Collateral Netting (1)
|
Balance as of March 31, 2024 |
||||||||||||||||
Assets: |
||||||||||||||||||||
Trading assets and private equity and debt investments (2)
|
||||||||||||||||||||
Equities (3)
|
¥ | 2,931 | ¥ | 1,353 | ¥ | 8 | ¥ | — | ¥ | 4,292 | ||||||||||
Private equity and debt investments (5)
|
— | 3 | 80 | — | 83 | |||||||||||||||
Japanese government securities |
1,919 | — | — | — | 1,919 | |||||||||||||||
Japanese agency and municipal securities |
— | 182 | 0 | — | 182 | |||||||||||||||
Foreign government, agency and municipal securities |
3,677 | 2,450 | 3 | — | 6,130 | |||||||||||||||
Bank and corporate debt securities and loans for trading purposes |
— | 1,543 | 173 | — | 1,716 | |||||||||||||||
Commercial mortgage-backed securities (“CMBS”) |
— | 9 | 0 | — | 9 | |||||||||||||||
Residential mortgage-backed securities (“RMBS”) |
— | 3,071 | 35 | — | 3,106 | |||||||||||||||
Issued/Guaranteed by government sponsored entity |
— | 2,923 | — | — | 2,923 | |||||||||||||||
Other |
— | 148 | 35 | — | 183 | |||||||||||||||
Real estate-backed securities |
— | 37 | 122 | — | 159 | |||||||||||||||
Collateralized debt obligations (“CDOs”) and other (6)
|
— | 35 | 46 | — | 81 | |||||||||||||||
Investment trust funds and other |
393 | 1 | 3 | — | 397 | |||||||||||||||
Total trading assets and private equity and debt investments |
8,920 | 8,684 | 470 | — | 18,074 | |||||||||||||||
Derivative assets (7)
|
||||||||||||||||||||
Equity contracts |
2 | 3,228 | 9 | — | 3,239 | |||||||||||||||
Interest rate contracts |
17 | 12,766 | 146 | — | 12,929 | |||||||||||||||
Credit contracts |
1 | 236 | 47 | — | 284 | |||||||||||||||
Foreign exchange contracts |
1 | 4,836 | 47 | — | 4,884 | |||||||||||||||
Commodity contracts |
1 | 2 | — | — | 3 | |||||||||||||||
Netting |
— | — | — | (19,815 | ) |
(19,815 | ) |
|||||||||||||
Total derivative assets |
22 | 21,068 | 249 | (19,815 | ) | 1,524 | ||||||||||||||
Subtotal |
¥ | 8,942 | ¥ | 29,752 | ¥ | 719 | ¥ | (19,815 | ) | ¥ | 19,598 | |||||||||
Loans and receivables (8)
|
2 | 1,808 | 291 | — | 2,101 | |||||||||||||||
Collateralized agreements (9)
|
— | 454 | 12 | — | 466 | |||||||||||||||
Other assets (2)
|
||||||||||||||||||||
Non-trading debt securities |
112 | 202 | 21 | — | 335 | |||||||||||||||
Other (3)(4)
|
371 | 59 | 253 | — | 683 | |||||||||||||||
Total |
¥ | 9,427 | ¥ | 32,275 | ¥ | 1,296 | ¥ | (19,815 | ) | ¥ | 23,183 | |||||||||
Liabilities: |
||||||||||||||||||||
Trading liabilities |
||||||||||||||||||||
Equities |
¥ | 2,597 | ¥ | 28 | ¥ | 0 | ¥ | — | ¥ | 2,625 | ||||||||||
Japanese government securities |
2,098 | — | — | — | 2,098 | |||||||||||||||
Japanese agency and municipal securities |
— | 6 | — | — | 6 | |||||||||||||||
Foreign government, agency and municipal securities |
3,206 | 645 | — | — | 3,851 | |||||||||||||||
Bank and corporate debt securities |
— | 175 | 1 | — | 176 | |||||||||||||||
Residential mortgage-backed securities (“RMBS”) |
— | 0 | — | — | 0 | |||||||||||||||
Investment trust funds and other |
188 | — | 0 | — | 188 | |||||||||||||||
Total trading liabilities |
8,089 | 854 | 1 | — | 8,944 | |||||||||||||||
Derivative liabilities (7)
|
||||||||||||||||||||
Equity contracts |
3 | 3,820 | 4 | — | 3,827 | |||||||||||||||
Interest rate contracts |
18 | 12,102 | 114 | — | 12,234 | |||||||||||||||
Credit contracts |
0 | 290 | 93 | — | 383 | |||||||||||||||
Foreign exchange contracts |
0 | 4,620 | 44 | — | 4,664 | |||||||||||||||
Commodity contracts |
0 | 5 | — | — | 5 | |||||||||||||||
Netting |
— | — | — | (19,166 | ) | (19,166 | ) | |||||||||||||
Total derivative liabilities |
21 | 20,837 | 255 | (19,166 | ) | 1,947 | ||||||||||||||
Subtotal |
¥ | 8,110 | ¥ | 21,691 | ¥ | 256 | ¥ | (19,166 | ) | ¥ | 10,891 | |||||||||
Short-term borrowings (11)
|
¥ | — | ¥ | 628 | ¥ | 23 | ¥ | — | ¥ | 651 | ||||||||||
Payables and deposits (10)(12)
|
— | 168 | 15 | — | 183 | |||||||||||||||
Collateralized financing (9)
|
— | 978 | — | — | 978 | |||||||||||||||
Long-term borrowings (11)(13)(14)
|
22 | 5,627 | 474 | — | 6,123 | |||||||||||||||
Other liabilities (15)
|
283 | 66 | 44 | — | 393 | |||||||||||||||
Total |
¥ | 8,415 | ¥ | 29,158 | ¥ | 812 | ¥ | (19,166 | ) | ¥ | 19,219 | |||||||||
(1) |
Represents the amount offset under counterparty netting of derivative assets and liabilities as well as cash collateral netting against net derivatives assets or liabilities. |
| (2) | Investments that are carried at fair value using NAV per share as a practical expedient have not been classified in the fair value hierarchy. As of March 31, 2023 and March 31, 2024, the fair values of these investments which are included in Trading assets and private equity and debt investments Other assets—Others |
| (3) | Includes equity investments that would have been accounted for under the equity method had Nomura not chosen to elect the fair value option. |
| (4) | Includes equity investments which comprise listed and unlisted equity securities held for operating purposes in the amounts of ¥69,475 million and ¥28,185 million, respectively, as of March 31, 2023 and ¥78,708 million and ¥26,380 million, respectively, as of March 31, 2024. |
| (5) | Private equity and debt investments include minority private equity and venture capital equity investments and other junior debt investments such as mezzanine debt held for non-trading purposes, and post-IPO investments. These investments also include equity investments that would have been accounted for under the equity method had Nomura not chosen to elect the fair value option. |
| (6) | Includes collateralized loan obligations (“CLOs”) and asset-backed securities (“ABS”) such as those secured on credit card loans, auto loans and student loans. |
| (7) | Derivatives which contain multiple types of risk are classified based on the primary risk type of the instrument. |
| (8) | Includes loans and receivables for which the fair value option has been elected. |
| (9) | Includes collateralized agreements or collateralized financing for which the fair value option has been elected. |
| (10) | Includes deposits received at banks for which the fair value option has been elected. |
| (11) | Includes structured notes for which the fair value option has been elected. |
| (12) | Includes embedded derivatives bifurcated from deposits received at banks. Deposits are adjusted for fair value changes in corresponding embedded derivatives for presentation in the consolidated balance sheets. |
| (13) | Includes embedded derivatives bifurcated from issued structured notes. Structured notes are adjusted for fair value changes in corresponding embedded derivatives for presentation in the consolidated balance sheets |
| (14) | Includes liabilities recognized from secured financing transactions that are accounted for as financings rather than sales. Nomura elected the fair value option for these liabilities. |
| (15) | Includes loan commitments for which the fair value option has been elected. |
March 31, 2023 |
||||||||||||||||
Financial Instrument |
Fair value in billions of yen |
Valuation
technique
|
Significant
unobservable
valuation input |
Range of
valuation
inputs
(1)
|
Weighted
Average
(2)(3)
|
Impact of
increases in significant unobservable valuation inputs
(4)(5)
|
Interrelationships
between valuation inputs
(6)
|
|||||||||
Assets: |
||||||||||||||||
Trading assets and private equity and debt investments |
||||||||||||||||
Equities |
¥ | 4 | DCF | Liquidity discounts | 75.0% | 75.0% | Lower fair value | Not applicable | ||||||||
Private equity and debt investments |
52 |
DCF |
WACC
Growth rates
Credit spreads
Liquidity discounts
|
5.5 – 17.5%
– 2.0%
7.5 – 10.9%
5.0 – 30.0%
|
10.1%
0.7%
9.8%
17.1%
|
Lower fair value
Higher fair value
Lower fair value
Lower fair value
|
No predictable interrelationship |
|||||||||
| Market multiples | EV/EBITDA ratios | 2.0 – 11.7 x | 8.4 x | Higher fair value | No predictable interrelationship | |||||||||||
| PE Ratios | 11.3 – 24.3 x | 14.4 x | Higher fair value | |||||||||||||
| Liquidity discounts | 5.0 – 20.0% | 11.0% | Lower fair value | |||||||||||||
Foreign government, agency and municipal securities |
8 |
DCF |
Credit spreads
Recovery rates
|
– 1.7%
6.3 – 18.0%
|
0.7%
8.1%
|
Lower fair value
Higher fair value
|
No predictable interrelationship |
|||||||||
Bank and corporate debt securities and loans for trading purposes |
258 |
DCF |
Credit spreads
Recovery rates
|
– 21.8%
– 100.0%
|
5.7%
83.1%
|
Lower fair value
Higher fair value
|
No predictable interrelationship |
|||||||||
March 31, 2023 |
||||||||||||||||
Financial Instrument |
Fair value in billions of yen |
Valuation technique |
Significant unobservable valuation input |
Range of valuation inputs (1)
|
Weighted Average (2)(3)
|
Impact of increases in significant unobservable valuation inputs (4)(5)
|
Interrelationships between valuation inputs (6)
|
|||||||||
Residential mortgage backed securities (“RMBS”) |
8 |
DCF |
Yields
Prepayment rates
Loss severities
|
17.7 – 28.6%
12.0 – 15.0%
0.4 – 99.6%
|
24.3%
13.2%
20.3%
|
Lower fair value
Lower fair value
Lower fair value
|
No predictable interrelationship |
|||||||||
Real estate-backed securities |
95 |
DCF |
Loss severities |
1.3 – 70.0% |
9.2% |
Lower fair value |
Not applicable |
|||||||||
Collateralized debt obligations (“CDOs”) and other |
28 |
DCF |
Yields Prepayment rates Default probabilities Loss severities |
6.0 – 38.9% 18.0 – 20.0% 2.0% 50.0 – 100.0% |
13.9% 19.0% 2.0% 52.6% |
Lower fair value Lower fair value Lower fair value Lower fair value |
Change in default probabilities typically accompanied by directionally similar change in loss severities and opposite change in prepayment rates |
|||||||||
Investment trust funds and other |
2 |
DCF |
Liquidity discounts |
– 2.0% |
1.0% |
Lower fair value |
Not applicable |
|||||||||
Derivatives, net: |
||||||||||||||||
Equity contracts |
¥ | 6 | Option models |
Dividend yield Volatilities Correlations |
– 25.1% 15.4 – 108.6% (0.85) – 0.98 |
— — — |
Higher fair value Higher fair value Higher fair value |
No predictable interrelationship | ||||||||
Interest rate contracts |
11 |
DCF/ Option models |
Interest rates Volatilities Volatilities Correlations |
1.0 – 4.4% 10.7 – 14.1% 38.5 – 147.4 bp (1.00) – 1 .00
|
— — — — |
Higher fair value Higher fair value Higher fair value Higher fair value |
No predictable interrelationship |
|||||||||
Credit contracts |
(32) |
DCF/ Option models |
Credit spreads Recovery rates Volatilities Correlations |
0.1 – 348.3%
– 90.0% 55.5 – 61.1% 0.23 – 0.9 0
|
— — — — |
Higher fair value Higher fair value Higher fair value Higher fair value |
No predictable interrelationship | |||||||||
Foreign exchange contracts |
19 |
Option models |
Volatilities Correlations |
1.0 – 23.6 %0.18 – 0.74
|
— — |
Higher fair value Higher fair value |
No predictable interrelationship |
|||||||||
Loans and receivables |
191 |
DCF |
Credit spreads Recovery rates |
– 25.8% 22.1 – 100.0% |
7.1% 74.5% |
Lower fair value Higher fair value |
No predictable interrelationship |
|||||||||
Collateralized agreements |
17 |
DCF |
Repo rate |
2.8 – 6.0% |
3.4% |
Lower fair value |
Not applicable |
|||||||||
Other assets |
||||||||||||||||
Non-trading debt securities |
3 |
DCF |
Credit spreads |
% |
% |
Lower fair value |
Not applicable |
|||||||||
Other (7)
|
196 | DCF |
WACC Growth rates |
11.2% 3.0% |
11.2% 3.0% |
Lower fair value Higher fair value |
No predictable interrelationship | |||||||||
| Market multiples |
EV/EBITDA ratios
PE Ratios
Price/Book ratios
Liquidity discounts
|
4.0 – 5.4 x
7.4 – 30.8 x
0.3 – 1.6 x
25.0 – 30.0%
|
4.4 x
10.3 x
0.8 x
29.8%
|
Higher fair value
Higher fair value
Higher fair value
Lower fair value
|
Generally changes in multiples result in a corresponding similar directional change in a fair value measurement, assuming earnings levels remain constant. | |||||||||||
March 31, 2023 |
||||||||||||||||
Financial Instrument |
Fair value in billions of yen |
Valuation technique |
Significant unobservable valuation input |
Range of valuation inputs (1)
|
Weighted Average (2)(3)
|
Impact of increases in significant unobservable valuation inputs (4)(5)
|
Interrelationships between valuation inputs (6)
|
|||||||||
Liabilities: |
||||||||||||||||
Trading Liabilities |
||||||||||||||||
Bank and corporate debt securities |
3 |
DCF |
Recovery rates |
4.5 – 95.0% |
65.5% |
Higher fair value |
Not applicable |
|||||||||
Short-term borrowings |
30 |
DCF/ Option models |
Volatilities Correlations |
15.4 – 100.6% (0.80) – 0.95 |
— — |
Higher fair value Higher fair value |
No predictable interrelationship |
|||||||||
Payable and deposits |
17 | DCF/ Option models | Volatilities Correlations |
10.7 – 11.3% 0.40 – 0.98 |
— — |
Higher fair value Higher fair value |
No predictable interrelationship | |||||||||
Long-term borrowings |
493 |
DCF |
Loss severities |
– 30.0% |
9.0% |
Lower fair value |
Not applicable |
|||||||||
|
DCF/ Option models |
Volatilities Volatilities Correlations |
10.5 – 100.6% 51.9 – 63.6 bp (1.00) – 0.98 |
— — — |
Higher fair value
Higher fair value Higher fair value |
No predictable interrelationship | |||||||||||
Other liabilities |
21 | DCF | Recovery rates | 40.0 – 98.5% | 89.9% | Higher fair value | Not applicable | |||||||||
March 31, 2024 |
||||||||||||||||
Financial Instrument |
Fair value in billions of yen |
Valuation technique |
Significant unobservable valuation input |
Range of valuation inputs (1)
|
Weighted Average (2)(3)
|
Impact of increases in significant unobservable valuation inputs (4)(5)
|
Interrelationships between valuation inputs (6)
|
|||||||||
Assets: |
||||||||||||||||
Trading assets and private equity and debt investments |
||||||||||||||||
Equities |
¥ | 8 | DCF | Liquidity discounts |
75.0 % |
75.0% | Lower fair value | Not applicable | ||||||||
Private equity and debt investments |
80 |
DCF |
WACC Growth rates Credit spreads Liquidity discounts |
5.5 – 17.0% – 2.0% 7.9 – 11.0% 5.0 – 30.0% |
9.2% 0.6% 9.6% 15.2% |
Lower fair value Higher fair value Lower fair value Lower fair value |
No predictable interrelationship |
|||||||||
| Market multiples | EV/EBITDA ratios | 3.4 – 12 .0 x |
9.2 x | Higher fair value | No predictable interrelationship | |||||||||||
| PE Ratios | 11.9 – 28.7 x | 16.0 |
Higher fair value | |||||||||||||
| Liquidity discounts | 5.0 – 20.0% | 10.0% | Lower fair value | |||||||||||||
Foreign government, agency and municipal securities |
3 |
DCF |
Credit spreads Recovery rates |
– 1.3% 0.5 – 12.0% |
0.6% 1.7% |
Lower fair value Higher fair value |
No predictable interrelationship |
|||||||||
Bank and corporate debt securities and loans for trading purposes |
173 |
DCF |
Credit spreads Recovery rates |
– 29.2%
– 100.0%
|
6.6%
74.7%
|
Lower fair value
Higher fair value
|
No predictable interrelationship |
|||||||||
March 31, 2024 |
||||||||||||||||
Financial Instrument |
Fair value in billions of yen |
Valuation technique |
Significant unobservable valuation input |
Range of valuation inputs (1)
|
Weighted Average (2)(3)
|
Impact of increases in significant unobservable valuation inputs (4)(5)
|
Interrelationships between valuation inputs (6)
|
|||||||||
Residential mortgage backed securities (“RMBS”) |
35 |
DCF |
Yields
Prepayment rates
Loss severities
|
18.3 – 41.9 %12 –
.0
15 %.0
–
100 %.0
|
30.9%
13.4%
68.3%
|
Lower fair value
Lower fair value
Lower fair value
|
No predictable interrelationship |
|||||||||
Real estate-backed securities |
122 |
DCF |
Loss severities |
–
26.1 % |
3.5% |
Lower fair value |
Not applicable |
|||||||||
Collateralized debt obligations (“CDOs”) and other |
46 |
DCF |
Yields
Prepayment rates
Default probabilities Loss severities
Credit spreads
|
5.5 – 50.4%
20
.0 %2
.0 %
– 100
.0 %
– 0.1%
|
12.4%
20
.0 %2
.0 %37.6%
%
|
Lower fair value
Lower fair value
Lower fair value
Lower fair value
Lower fair value
|
Change in default probabilities typically accompanied by directionally similar change in loss severities and opposite change in prepayment rates |
|||||||||
Investment trust funds and other |
3 |
DCF |
Liquidity discounts |
– 3.9% |
2.7% |
Lower fair value |
Not applicable |
|||||||||
Derivatives, net: |
||||||||||||||||
Equity contracts |
¥ | 5 | Option models | Dividend yield Volatilities Correlations |
– 11.6%
4.4 – 140.8%
(0.95) – 0.99
|
—
—
—
|
Higher fair value
Higher fair value
Higher fair value
|
No predictable interrelationship | ||||||||
Interest rate contracts |
32 |
DCF/ Option models |
Interest rates Volatilities Volatilities Correlations |
0.6 – 4.5%
10.1 – 13.6%
24.3 – 401.5 bp
(1
.00 ) – 1.00
|
—
—
—
—
|
Higher fair value
Higher fair value
Higher fair value
Higher fair value
|
No predictable interrelationship |
|||||||||
Credit contracts |
(46) | DCF/ Option models | Credit spreads Recovery rates Volatilities Correlations |
– 21
.0 %15
.0 – 100.0 %35
.0 – 47.9%0.24 – 0.85
|
—
—
—
—
|
Higher fair value
Higher fair value
Higher fair value
Higher fair value
|
No predictable interrelationship | |||||||||
Foreign exchange contracts |
3 |
Option models |
Volatilities Correlations |
6.5 – 18.9%
0.21 – 0.7
0
|
—
—
|
Higher fair value
Higher fair value
|
No predictable interrelationship |
|||||||||
Loans and receivables |
291 |
DCF |
Credit spreads Recovery rates |
– 33.6%
42.1 – 100
.0 % |
8.1%
90.3%
|
Lower fair value
Higher fair value
|
No predictable interrelationship |
|||||||||
Collateralized agreements |
12 | DCF | Repo rate | 3.1% | 3.1% | Lower fair value | Not applicable | |||||||||
Other assets |
||||||||||||||||
Non-trading debt securities |
21 | DCF | Credit spreads | 4.8 – 6.3% | 5 .0 % |
Lower fair value | Not applicable | |||||||||
Other (7)
|
253 | DCF |
WACC
Growth rates
|
11.1%
3
.0 % |
11.1%
3
.0 % |
Lower fair value
Higher fair value
|
No predictable interrelationship | |||||||||
| Market multiples |
EV/EBITDA ratios PE Ratios
Price/Book ratios Liquidity discounts
|
4.2 – 6.9 x
7.9 – 35.9 x
0.4 – 1.5 x
25.0 – 30.0%
|
5.2 x
13.6 x
0.9 x
29.7%
|
Higher fair value Higher fair value Higher fair value Lower fair value | Generally changes in multiples result in a corresponding similar directional change in a fair value measurement, assuming earnings levels remain constant. | |||||||||||
March 31, 2024 |
||||||||||||||||
Financial Instrument |
Fair value in billions of yen |
Valuation technique |
Significant unobservable valuation input |
Range of valuation inputs (1)
|
Weighted Average (2)(3)
|
Impact of increases in significant unobservable valuation inputs (4)(5)
|
Interrelationships between valuation inputs (6)
|
|||||||||
Liabilities: |
||||||||||||||||
Short-term borrowings |
23 |
DCF/
option models
|
Volatilities Correlations |
5
.0 – 63.8%(0.83) – 0.97
|
—
—
|
Higher fair value Higher fair value |
No predictable interrelationship |
|||||||||
Payable and deposits |
15 |
DCF/
option models
|
Volatilities Correlations |
10.3– 11.0%
0.4
0 – 0.98 |
—
—
|
Higher fair value
Higher fair value
|
No predictable interrelationship | |||||||||
Long-term borrowings |
474 |
DCF |
Loss severities |
17.9 – 99.3% |
95.6% |
Lower fair value |
Not applicable |
|||||||||
|
DCF/
Option models
|
Volatilities | 5 .0 – 63.8% |
— | Higher fair value | No predictable interrelationship | |||||||||||
| Volatilities Correlations |
37.8 – 97.6 bp
(1
.00) – 0.98 |
—
—
|
Higher fair value Higher fair value | |||||||||||||
Other liabilities |
44 | DCF | Recovery rates | 40 .0 – 94.0 % |
85.5% | Higher fair value | Not applicable | |||||||||
| (1) | Range information is provided in percentages, coefficients and multiples and represents the highest and lowest level significant unobservable valuation input used to value that type of financial instrument. A wide dispersion in the range does not necessarily reflect increased uncertainty or subjectivity in the valuation input and is typically just a consequence of the different characteristics of the financial instruments themselves. |
| (2) | Weighted average information for non-derivatives is calculated by weighting each valuation input by the fair value of the financial instrument. |
| (3) | Nomura has not provided weighted average information for derivatives as unlike cash products the risk on such products is distinct from the balance sheet value and is subject to netting. |
| (4) | The above table only considers the impact of an increase in each significant unobservable valuation input on the fair value measurement of the financial instrument. However, a decrease in the significant unobservable valuation input would have the opposite effect on the fair value measurement of the financial instrument. For example, if an increase in a significant unobservable valuation input would result in a lower fair value measurement, a decrease in the significant unobservable valuation input would result in a higher fair value measurement. |
| (5) | The impact of an increase in the significant unobservable valuation input on the fair value measurement for a derivative assumes Nomura is long risk to the input (such as being long volatility). Where Nomura is short such risk, the impact of an increase would have a converse effect on the fair value measurement of the derivative. |
| (6) | Consideration of the interrelationships between significant unobservable valuation inputs is only relevant where more than one unobservable valuation input is used to determine the fair value measurement of the financial instrument. |
| (7) | Valuation techniques and unobservable valuation inputs in respect of equity securities reported within Other assets |
Billions of yen |
||||||||||||||||||||||||||||||||||||||||
Year ended March 31, 2023 |
||||||||||||||||||||||||||||||||||||||||
|
Balance as of April 1, 2022 |
Total gains (losses) recognized in net (1)
|
Total gains (losses) recognized in other comprehensive |
Purchases / issues (2)
|
Sales / redemptions (2)
|
Settlements |
Foreign exchange movements |
Transfers into Level 3 (4)(5)
|
Transfers out of Level 3 (5)
|
Balance as of March 31, 2023 |
|||||||||||||||||||||||||||||||
| Assets: |
||||||||||||||||||||||||||||||||||||||||
| Trading assets and private equity and debt investments |
||||||||||||||||||||||||||||||||||||||||
| Equities |
¥ | 14 | ¥ | (2 | ) | ¥ | — | ¥ | 11 | ¥ | (13 | ) | ¥ | — | ¥ | 1 | ¥ | 1 | ¥ | (8 | ) | ¥ | 4 | |||||||||||||||||
| Private equity and debt investments |
32 | 11 | — | 27 | (18 | ) | — | 0 | — | — | 52 | |||||||||||||||||||||||||||||
| Japanese agency and municipal securities |
2 | 0 | — | 0 | 0 | — | — | — | — | 2 | ||||||||||||||||||||||||||||||
| Foreign government, agency and municipal securities |
10 | 0 | — | 15 | (17 | ) | — | 0 | 1 | (1 | ) | 8 | ||||||||||||||||||||||||||||
| Bank and corporate debt securities and loans for trading purposes |
220 | (3 | ) | — | 273 | (266 | ) | — | 13 | 100 | (79 | ) | 258 | |||||||||||||||||||||||||||
| Commercial mortgage-backed securities (“CMBS”) |
7 | 0 | — | 0 | 0 | — | — | 0 | (7 | ) | 0 | |||||||||||||||||||||||||||||
| Residential mortgage-backed securities (“RMBS”) |
8 | (1 | ) | — | 3 | (12 | ) | — | 0 | 10 | 0 | 8 | ||||||||||||||||||||||||||||
| Real estate-backed securities |
79 | (10 | ) | — | 160 | (141 | ) | — | 7 | — | — | 95 | ||||||||||||||||||||||||||||
| Collateralized debt obligations (“CDOs”) and other |
26 | (6 | ) | — | 69 | (69 | ) | — | 2 | 10 | (4 | ) | 28 | |||||||||||||||||||||||||||
| Investment trust funds and other |
0 | 0 | — | 64 | (62 | ) | — | 0 | 0 | — | 2 | |||||||||||||||||||||||||||||
| |
|
|
|
|
|
|
|
|
|
|
|
|
|
|
|
|
|
|
|
|||||||||||||||||||||
| Total trading assets and private equity and debt investments |
398 | (11 | ) | — | 622 | (598 | ) | — | 23 | 122 | (99 | ) | 457 | |||||||||||||||||||||||||||
| |
|
|
|
|
|
|
|
|
|
|
|
|
|
|
|
|
|
|
|
|||||||||||||||||||||
| Derivatives, net (3)
|
||||||||||||||||||||||||||||||||||||||||
| Equity contracts |
10 | (4 | ) | — | — | — | (23 | ) | (4 | ) | 11 | 16 | 6 | |||||||||||||||||||||||||||
| Interest rate contracts |
(11 | ) | (6 | ) | — | — | — | 14 | 1 | 9 | 4 | 11 | ||||||||||||||||||||||||||||
| Credit contracts |
(33 | ) | 24 | — | — | — | (5 | ) | (3 | ) | 0 | (15 | ) | (32 | ) | |||||||||||||||||||||||||
| Foreign exchange contracts |
10 | 2 | — | — | — | 5 | 2 | 0 | 0 | 19 | ||||||||||||||||||||||||||||||
| |
|
|
|
|
|
|
|
|
|
|
|
|
|
|
|
|
|
|
|
|||||||||||||||||||||
| Total derivatives, net |
(24 | ) | 16 | — | — | — | (9 | ) | (4 | ) | 20 | 5 | 4 | |||||||||||||||||||||||||||
| |
|
|
|
|
|
|
|
|
|
|
|
|
|
|
|
|
|
|
|
|||||||||||||||||||||
| Subtotal |
¥ | 374 | ¥ | 5 | ¥ | — | ¥ | 622 | ¥ | (598 | ) | ¥ | (9 | ) | ¥ | 19 | ¥ | 142 | ¥ | (94 | ) | ¥ | 461 | |||||||||||||||||
| |
|
|
|
|
|
|
|
|
|
|
|
|
|
|
|
|
|
|
|
|||||||||||||||||||||
| Loans and receivables |
¥ | 205 | ¥ | 21 | ¥ | — | ¥ | 85 | ¥ | (123 | ) | ¥ | — | ¥ | 12 | ¥ | 65 | ¥ | (74 | ) | ¥ | 191 | ||||||||||||||||||
| Collateralized agreements |
16 | 0 | — | — | — | — | 1 | — | — | 17 | ||||||||||||||||||||||||||||||
| Other assets |
||||||||||||||||||||||||||||||||||||||||
| Non-trading debt securities |
— | 0 | — | 0 | — | — | 1 | 2 | — | 3 | ||||||||||||||||||||||||||||||
| Other |
197 | (12 | ) | 0 | 10 | (14 | ) | — | 14 | 1 | — | 196 | ||||||||||||||||||||||||||||
| |
|
|
|
|
|
|
|
|
|
|
|
|
|
|
|
|
|
|
|
|||||||||||||||||||||
| Total |
¥ | 792 | ¥ | 14 | ¥ | 0 | ¥ | 717 | ¥ | (735 | ) | ¥ | (9 | ) | ¥ | 47 | ¥ | 210 | ¥ | (168 | ) | ¥ | 868 | |||||||||||||||||
| |
|
|
|
|
|
|
|
|
|
|
|
|
|
|
|
|
|
|
|
|||||||||||||||||||||
| Liabilities: |
||||||||||||||||||||||||||||||||||||||||
| Trading liabilities |
||||||||||||||||||||||||||||||||||||||||
| Equities |
¥ | 0 | ¥ | (1 | ) | ¥ | — | ¥ | 0 | ¥ | (2 | ) | ¥ | — | ¥ | 0 | ¥ | 2 | ¥ | — | ¥ | 1 | ||||||||||||||||||
| Foreign government, agency and municipal securities |
0 | 0 | — | — | — | — | 0 | — | — | 0 | ||||||||||||||||||||||||||||||
| Bank and corporate debt securities |
3 | 0 | — | 2 | (6 | ) | — | 0 | 7 | (3 | ) | 3 | ||||||||||||||||||||||||||||
| Collateralized debt obligations (“CDOs”) and other |
0 | — | — | 1 | (1 | ) | — | 0 | — | — | — | |||||||||||||||||||||||||||||
| Investment trust funds and other |
0 | 0 | — | 0 | 0 | — | 0 | — | — | 0 | ||||||||||||||||||||||||||||||
| |
|
|
|
|
|
|
|
|
|
|
|
|
|
|
|
|
|
|
|
|||||||||||||||||||||
| Total trading liabilities |
¥ | 3 | ¥ | (1 | ) | ¥ | — | ¥ | 3 | ¥ | (9 | ) | ¥ | — | ¥ | 0 | ¥ | 9 | ¥ | (3 | ) | ¥ | 4 | |||||||||||||||||
| |
|
|
|
|
|
|
|
|
|
|
|
|
|
|
|
|
|
|
|
|||||||||||||||||||||
| Short-term borrowings |
58 | (4 | ) | 0 | 43 | (32 | ) | — | 0 | 10 | (53 | ) | 30 | |||||||||||||||||||||||||||
| Payables and deposits |
8 | 1 | 0 | 17 | 0 | — | — | 8 | (15 | ) | 17 | |||||||||||||||||||||||||||||
| Long-term borrowings |
479 | 4 | 7 | 238 | (152 | ) | — | 2 | 114 | (177 | ) | 493 | ||||||||||||||||||||||||||||
| Other liabilities |
32 | 16 | — | 5 | (2 | ) | — | 3 | 0 | (1 | ) | 21 | ||||||||||||||||||||||||||||
| |
|
|
|
|
|
|
|
|
|
|
|
|
|
|
|
|
|
|
|
|||||||||||||||||||||
| Total |
¥ | 580 | ¥ | 16 | ¥ | 7 | ¥ | 306 | ¥ | (195 | ) | ¥ | — | ¥ | 5 | ¥ | 141 | ¥ | (249) | ¥ | 565 | |||||||||||||||||||
| |
|
|
|
|
|
|
|
|
|
|
|
|
|
|
|
|
|
|
|
|||||||||||||||||||||
Billions of yen |
||||||||||||||||||||||||||||||||||||||||
Year ended March 31, 2024 |
||||||||||||||||||||||||||||||||||||||||
|
Balance as of April 1, 2023 |
Total gains (losses) recognized in net (1)
|
Total gains (losses) recognized in other comprehensive |
Purchases / issues (2)
|
Sales / redemptions (2)
|
Settlements |
Foreign exchange movements |
Transfers into Level 3 (4)(5)
|
Transfers out of Level 3 (5)
|
Balance as of March 31, 2024 |
|||||||||||||||||||||||||||||||
| Assets: |
||||||||||||||||||||||||||||||||||||||||
| Trading assets and private equity and debt investments |
||||||||||||||||||||||||||||||||||||||||
| Equities |
¥ | 4 | ¥ | 0 | ¥ | — | ¥ | 28 | ¥ | (21 | ) | ¥ | — | ¥ | 1 | ¥ | 3 | ¥ | (7 | ) | ¥ | 8 | ||||||||||||||||||
| Private equity and debt investments |
52 | 12 | — | 18 | (3 | ) | — | 1 | — | — | 80 | |||||||||||||||||||||||||||||
| Japanese agency and municipal securities |
2 | — | — | — | 0 | — | — | — | (2 | ) | 0 | |||||||||||||||||||||||||||||
| Foreign government, agency and municipal securities |
8 | 1 | — | 5 | (8 | ) | — | 0 | 3 | (6 | ) | 3 | ||||||||||||||||||||||||||||
| Bank and corporate debt securities and loans for trading purposes |
258 | (2 | ) | — | 322 | (410 | ) | — | 23 | 45 | (63 | ) | 173 | |||||||||||||||||||||||||||
| Commercial mortgage-backed securities (“CMBS”) |
0 | 0 | — | 0 | 0 | — | — | — | — | 0 | ||||||||||||||||||||||||||||||
| Residential mortgage-backed securities (“RMBS”) |
8 | 0 | — | 34 | (8 | ) | — | 1 | — | 0 | 35 | |||||||||||||||||||||||||||||
| Real estate-backed securities |
95 | (1 | ) | — | 241 | (227 | ) | — | 14 | — | — | 122 | ||||||||||||||||||||||||||||
| Collateralized debt obligations (“CDOs”) and other |
28 | (2 | ) | — | 124 | (102 | ) | — | 2 | 0 | (4 | ) | 46 | |||||||||||||||||||||||||||
| Investment trust funds and other |
2 | 0 | — | 48 | (47 | ) | — | 0 | — | 0 | 3 | |||||||||||||||||||||||||||||
| |
|
|
|
|
|
|
|
|
|
|
|
|
|
|
|
|
|
|
|
|||||||||||||||||||||
| Total trading assets and private equity and debt investments |
457 | 8 | — | 820 | (826 | ) | — | 42 | 51 | (82 | ) | 470 | ||||||||||||||||||||||||||||
| |
|
|
|
|
|
|
|
|
|
|
|
|
|
|
|
|
|
|
|
|||||||||||||||||||||
| Derivatives, net (3)
|
||||||||||||||||||||||||||||||||||||||||
| Equity contracts |
6 | (1 | ) | — | — | — | (4 | ) | 1 | 4 | (1 | ) | 5 | |||||||||||||||||||||||||||
| Interest rate contracts |
11 | (5 | ) | — | — | — | (5 | ) | 3 | (21 | ) | 49 | 32 | |||||||||||||||||||||||||||
| Credit contracts |
(32 | ) |
(3 | ) | — | — | — | 6 | (4 | ) |
(5 | ) | (8 | ) | (46 | ) | ||||||||||||||||||||||||
| Foreign exchange contracts |
19 | (12 | ) | — | — | — | (5 | ) | 3 | 1 | (3 | ) | 3 | |||||||||||||||||||||||||||
| |
|
|
|
|
|
|
|
|
|
|
|
|
|
|
|
|
|
|
|
|||||||||||||||||||||
| Total derivatives, net |
4 | (21 | ) | — | — | — | (8 | ) | 3 | (21 | ) |
37 | (6 | ) | ||||||||||||||||||||||||||
| |
|
|
|
|
|
|
|
|
|
|
|
|
|
|
|
|
|
|
|
|||||||||||||||||||||
| Subtotal |
¥ | 461 | ¥ | (13 | ) | ¥ | — | ¥ | 820 | ¥ | (826 | ) |
¥ | (8 | ) |
¥ | 45 | ¥ | 30 | ¥ | (45 | ) |
¥ | 464 | ||||||||||||||||
| |
|
|
|
|
|
|
|
|
|
|
|
|
|
|
|
|
|
|
|
|||||||||||||||||||||
| Loans and receivables |
¥ | 191 | ¥ | 23 | ¥ | — | ¥ | 142 | ¥ | (118 | ) | ¥ | — | ¥ | 28 | ¥ | 69 | ¥ | (44 | ) | ¥ | 291 | ||||||||||||||||||
| Collateralized agreements |
17 | 1 | — | — | (8 | ) | — | 2 | — | — | 12 | |||||||||||||||||||||||||||||
| Other assets |
||||||||||||||||||||||||||||||||||||||||
| Non-trading debt securities |
3 | 1 | — | 1 | (4 | ) | — | 0 | 20 | — | 21 | |||||||||||||||||||||||||||||
| Other |
196 | 27 | 0 | 12 | (6 | ) | — | 23 | — | 1 | 253 | |||||||||||||||||||||||||||||
| |
|
|
|
|
|
|
|
|
|
|
|
|
|
|
|
|
|
|
|
|||||||||||||||||||||
| Total |
¥ | 868 | ¥ | 39 | ¥ | 0 | ¥ | 975 | ¥ | (962 | ) | ¥ | (8 | ) | ¥ | 98 | ¥ | 119 | ¥ | (88 | ) | ¥ | 1,041 | |||||||||||||||||
| |
|
|
|
|
|
|
|
|
|
|
|
|
|
|
|
|
|
|
|
|||||||||||||||||||||
| Liabilities: |
||||||||||||||||||||||||||||||||||||||||
| Trading liabilities |
||||||||||||||||||||||||||||||||||||||||
| Equities |
¥ | 1 | ¥ | (1 | ) | ¥ | — | ¥ | 7 | ¥ | (8 | ) | ¥ | — | ¥ | 0 | ¥ | 0 | ¥ | (1 | ) | ¥ | 0 | |||||||||||||||||
| Foreign government, agency and municipal securities |
0 | 0 | — | — | — | — | 0 | — | — | — | ||||||||||||||||||||||||||||||
| Bank and corporate debt securities |
3 | 2 | — | 5 | (6 | ) | — | 0 | 3 | (2 | ) | 1 | ||||||||||||||||||||||||||||
| Collateralized debt obligations (“CDOs”) and other |
— | — | — | 0 | 0 | — | — | — | — | — | ||||||||||||||||||||||||||||||
| Investment trust funds and other |
0 | 0 | — | — | 0 | — | 0 | — | — | 0 | ||||||||||||||||||||||||||||||
| |
|
|
|
|
|
|
|
|
|
|
|
|
|
|
|
|
|
|
|
|||||||||||||||||||||
| Total trading liabilities |
¥ | 4 | ¥ | 1 | ¥ | — | ¥ | 12 | ¥ | (14 | ) | ¥ | — | ¥ | 0 | ¥ | 3 | ¥ | (3 | ) | ¥ | 1 | ||||||||||||||||||
| |
|
|
|
|
|
|
|
|
|
|
|
|
|
|
|
|
|
|
|
|||||||||||||||||||||
| Short-term borrowings |
30 | (1 | ) | 0 | 59 | (59 | ) | — | 2 | 5 | (15 | ) | 23 | |||||||||||||||||||||||||||
| Payables and deposits |
17 | 0 | 0 | 3 | — | — | 1 | 4 | (10 | ) | 15 | |||||||||||||||||||||||||||||
| Long-term borrowings |
493 | (40 | ) | (2 | ) | 285 | (276 | ) | — | 7 | 55 | (132 | ) | 474 | ||||||||||||||||||||||||||
| Other liabilities |
21 | 6 | — | 29 | (3 | ) | — | 3 | 0 | 0 | 44 | |||||||||||||||||||||||||||||
| |
|
|
|
|
|
|
|
|
|
|
|
|
|
|
|
|
|
|
|
|||||||||||||||||||||
| Total |
¥ | 565 | ¥ | (34 | ) |
¥ | (2 | ) |
¥ | 388 | ¥ | (352 | ) | ¥ | — | ¥ | 13 | ¥ | 67 | ¥ | (160 | ) | ¥ | 557 | ||||||||||||||||
| |
|
|
|
|
|
|
|
|
|
|
|
|
|
|
|
|
|
|
|
|||||||||||||||||||||
| (1) | Includes gains and losses reported primarily within Net gain on trading, Gain on private equity and debt investments, Gain (loss) on investments in equity securities, Revenue —Other Non-interest expenses—Other, Interest and dividends Interest expense |
| (2) | Amounts reported in Purchases / issues Sales / redemptions |
| (3) | Derivatives which contain multiple types of risk are classified based on the primary risk type of the instrument. |
| (4) | Amounts of gains and losses on these transfers which were recognized in the period when the Transfers into Level 3 |
| (5) | Transfers into Level 3 Transfers out of Level 3 Quantitative and qualitative information regarding significant unobservable valuation inputs” |
Billions of yen |
||||||||
March 31 |
||||||||
2023 |
2024 |
|||||||
Unrealized gains / (losses) (1)
|
||||||||
| Assets: |
||||||||
| Trading assets and private equity and debt investments |
||||||||
| Equities |
¥ | (2 | ) | ¥ | 0 | |||
| Private equity and debt investments |
9 | 11 | ||||||
| Japanese agency and municipal securities |
0 | — | ||||||
| Foreign government, agency and municipal securities |
(1 | ) | 1 | |||||
| Bank and corporate debt securities and loans for trading purposes |
13 | (7 | ) | |||||
| Commercial mortgage-backed securities (“CMBS”) |
0 | 0 | ||||||
| Residential mortgage-backed securities (“RMBS”) |
0 | 1 | ||||||
| Real estate-backed securities |
2 | 1 | ||||||
| Collateralized debt obligations (“CDOs”) and other |
(6 | ) | (4 | ) | ||||
| Investment trust funds and other |
0 | 0 | ||||||
| |
|
|
|
|||||
| Total trading assets and private equity and debt investments |
15 | 3 | ||||||
| |
|
|
|
|||||
| Derivatives, net (2)
|
||||||||
| Equity contracts |
7 | 1 | ||||||
| Interest rate contracts |
(8 | ) | (39 | ) | ||||
| Credit contracts |
1 | 8 | ||||||
| Foreign exchange contracts |
0 | (14 | ) | |||||
| |
|
|
|
|||||
| Total derivatives, net |
0 | (44 | ) | |||||
| |
|
|
|
|||||
| Subtotal |
¥ | 15 | ¥ | (41 | ) | |||
| |
|
|
|
|||||
| Loans and receivables |
14 | 22 | ||||||
| Collateralized agreements |
0 | 0 | ||||||
| Other assets |
||||||||
| Non-Trading debt Securities |
0 | 1 | ||||||
| Other |
(7 | ) | 9 | |||||
| |
|
|
|
|||||
| |
¥ | 22 | ¥ | (9 | ) | |||
| |
|
|
|
|
|
|
|
|
| Liabilities: |
||||||||
| Trading liabilities |
||||||||
| Equities |
¥ | 0 | ¥ | — | ||||
| Foreign government, agency and municipal securities |
0 | 0 | ||||||
Billions of yen |
||||||||
March 31 |
||||||||
2023 |
2024 |
|||||||
Unrealized gains / (losses) (1)
|
||||||||
| Bank and corporate debt securities |
0 | 1 | ||||||
| |
|
|
|
|||||
| Total trading liabilities |
¥ | 0 | ¥ | 1 | ||||
| |
|
|
|
|||||
| Short-term borrowings (3)
|
(3 | ) | 0 | |||||
| Payables and deposits (3)
|
1 | 0 | ||||||
| Long-term borrowings (3)
|
22 | (21 | ) | |||||
| Other liabilities |
0 | 3 | ||||||
| |
|
|
|
|||||
| |
¥ | 20 | ¥ | (17 | ) | |||
| |
|
|
|
|||||
| (1) | Includes gains and losses reported within Net gain on trading, Gain on private equity and debt investments Gain(loss) on investments in equity securities, Revenue — Other Non-interest expenses— Other, Interest and dividends Interest expense |
| (2) | Derivatives which contain multiple types of risk are classified based on the primary risk type of the instrument. |
| (3) | Includes unrealized gains and losses of ¥7 billion and ¥(1) Other comprehensive income (loss) fo |
Billions of yen |
||||||||||||||||
March 31, 2023 |
||||||||||||||||
Fair value |
Unfunded commitments (1)
|
Redemption frequency (if currently eligible) (2)
|
Redemption notice (3)
|
|||||||||||||
| Hedge funds |
¥ | 12 | ¥ | 1 | Monthly |
-30 days |
||||||||||
| Venture capital funds |
11 | 9 | — | — | ||||||||||||
| Private equity funds |
24 | 10 | — | — | ||||||||||||
| Real estate funds |
3 | 1 | — | — | ||||||||||||
| |
|
|
|
|||||||||||||
| Total |
¥ | 50 | ¥ | 21 | ||||||||||||
| |
|
|
|
|||||||||||||
Billions of yen |
||||||||||||||||
March 31, 2024 |
||||||||||||||||
Fair value |
Unfunded commitments (1)
|
Redemption frequency (if currently eligible) (2)
|
Redemption notice (3)
|
|||||||||||||
| Hedge funds |
¥ | 10 | ¥ | 3 | Monthly |
e day-30 days |
||||||||||
| Venture capital funds |
15 | 6 | — | — | ||||||||||||
| Private equity funds |
33 | 13 | — | — | ||||||||||||
| Real estate funds |
4 | 0 | — | — | ||||||||||||
| |
|
|
|
|||||||||||||
| Total |
¥ | 62 | ¥ | 22 | ||||||||||||
| |
|
|
|
|||||||||||||
| (1) | The contractual amount of any unfunded commitments Nomura is required to make to the entities in which the investment is held. |
| (2) | The frequency with which Nomura is permitted to redeem investments. |
| (3) | The range in prior notice period for redemption. |
• |
Equity method investments reported within Trading assets and private equity and debt investments Other assets |
| • | Certain loans receivables and receivables from customers reported within Loans and Receivables which are risk managed on a fair value basis and undrawn loan commitments related to such loans receivable expected to be funded. Nomura elects the fair value option to mitigate volatility through earnings caused by the difference in measurement basis that otherwise would arise between loans and the derivatives used to risk manage those instruments. |
• |
Reverse repurchase and repurchase agreements reported within Collateralized agreements Collateralized financing |
• |
All structured notes issued on or after April 1, 2008 reported within Short-term borrowings Long-term borrowings |
• |
Certain structured deposit issuances reported within Deposits received at banks. |
• |
Financial liabilities reported within Long-term borrowings |
| the transferred financial assets, they remain on the consolidated balance sheets and continue to be carried at fair value, with changes in fair value recognized through earnings. |
• |
Financial reinsurance contracts reported within Other assets |
Billions of yen |
||||||||||||
Year ended March 31 |
||||||||||||
2022 |
2023 |
2024 |
||||||||||
Gains/(Losses) (1)
|
||||||||||||
| Assets: |
||||||||||||
| Trading assets and private equity and debt investments (2)
|
||||||||||||
| Trading assets |
¥ | 1 | ¥ | (1 | ) | ¥ | 0 | |||||
| Private equity and debt investments |
6 | 2 | 2 | |||||||||
| Loans and receivables |
39 | 35 | 54 | |||||||||
| Collateralized agreements (3)
|
(1 | ) | 0 | 6 | ||||||||
| Other assets (2)
|
(3 | ) | (12 | ) | 22 | |||||||
| |
|
|
|
|
|
|||||||
| Total |
¥ | 42 | ¥ | 24 | ¥ | 84 | ||||||
| |
|
|
|
|
|
|||||||
| Liabilities: |
||||||||||||
| Short-term borrowings (4)
|
¥ | 60 | ¥ | 208 | ¥ | 13 | ||||||
| Payables and deposits |
4 | 7 | 8 | |||||||||
| Collateralized financing (3)
|
3 | (5 | ) | (17 | ) | |||||||
| Long-term borrowings (4)(5)
|
275 | 298 | (110 | ) | ||||||||
| Other liabilities (6)
|
4 | 7 | (1 | ) | ||||||||
| |
|
|
|
|
|
|||||||
| Total |
¥ | 346 | ¥ | 515 | ¥ | (107 | ) | |||||
| |
|
|
|
|
|
|||||||
| (1) | Includes gains and losses reported primarily within Revenue – Net gain on trading Revenue —Other |
| (2) | Includes equity investments that would have been accounted for under the equity method had Nomura not chosen to elect the fair value option. |
| (3) | Includes reverse repurchase and repurchase agreements. |
| (4) | Includes structured notes and other financial liabilities. |
| (5) | Includes secured financing transactions arising from transfers of financial assets which did not meet the criteria for sales accounting. |
| (6) | Includes unfunded written loan commitments. |
Billions of yen |
||||||||
Year ended March 31 |
||||||||
2023 |
2024 |
|||||||
| Changes recognized as a credit (debit) to other comprehensive income |
¥ | 95 | ¥ | (82 | ) | |||
| Credit (debit) amounts reclassified to earnings |
0 | 0 | ||||||
| Cumulative credit balance recognized in accumulated other comprehensive income |
145 | 56 | ||||||
Billions of yen |
||||||||||||||||||||
March 31, 2023 |
||||||||||||||||||||
Japan |
U.S. |
EU & U.K. |
Other |
Total (1)
|
||||||||||||||||
| Government, agency and municipal securities |
¥ | 1,786 | ¥ | 2,561 | ¥ | 2,309 | ¥ | 925 | ¥ | 7,581 | ||||||||||
Billions of yen |
||||||||||||||||||||
March 31, 2024 |
||||||||||||||||||||
Japan |
U.S. |
EU & U.K. |
Other |
Total (1)
|
||||||||||||||||
| Government, agency and municipal securities |
¥ | 2,101 | ¥ | 3,139 | ¥ | 1,469 | ¥ | 1,522 | ¥ | 8,231 | ||||||||||
| (1) | Other than above, there were ¥324 billion and ¥248 billion of government, agency and municipal securities reported within Other assets — Non-trading debt securities |
Billions of yen |
||||||||||||||||||||
March 31, 2023 (1)
|
||||||||||||||||||||
Fair value by level |
||||||||||||||||||||
|
Carrying value |
Fair value |
Level 1 |
Level 2 |
Level 3 |
||||||||||||||||
Assets: |
||||||||||||||||||||
Cash and cash equivalents |
¥ | 3,821 | ¥ | 3,821 | ¥ | 3,821 | ¥ | — | ¥ | — | ||||||||||
Time deposits |
409 | 409 | — | 409 | — | |||||||||||||||
Deposits with stock exchanges and other segregated cash |
291 | 291 | — | 291 | — | |||||||||||||||
Loans receivable (2)
|
4,010 | 4,009 | — | 2,855 | 1,154 | |||||||||||||||
Securities purchased under agreements to resell |
13,834 | 13,834 | — | 13,817 | 17 | |||||||||||||||
Securities borrowed |
4,283 | 4,283 | — | 4,283 | — | |||||||||||||||
Total |
¥ | 26,648 | ¥ | 26,647 | ¥ | 3,821 | ¥ | 21,655 | ¥ | 1,171 | ||||||||||
Liabilities: |
||||||||||||||||||||
Short-term borrowings |
¥ | 1,009 | ¥ | 1,009 | ¥ | — | ¥ | 978 | ¥ | 31 | ||||||||||
Deposits received at banks |
2,138 | 2,138 | — | 2,121 | 17 | |||||||||||||||
Securities sold under agreements to repurchase |
14,218 | 14,218 | — | 14,218 | — | |||||||||||||||
Securities loaned |
1,557 | 1,557 | — | 1,557 | — | |||||||||||||||
Other secured borrowings |
334 | 334 | — | 334 | — | |||||||||||||||
Long-term borrowings |
10,399 | 10,350 | 27 | 9,795 | 528 | |||||||||||||||
Total |
¥ | 29,655 | ¥ | 29,606 | ¥ | 27 | ¥ | 29,003 | ¥ | 576 | ||||||||||
Billions of yen |
||||||||||||||||||||
March 31, 2024 (1)
|
||||||||||||||||||||
Fair value by level |
||||||||||||||||||||
Carrying value |
Fair value |
Level 1 |
Level 2 |
Level 3 |
||||||||||||||||
Assets: |
||||||||||||||||||||
Cash and cash equivalents |
¥ | 4,239 | ¥ | 4,239 | ¥ | 4,239 | ¥ | — | ¥ | — | ||||||||||
Time deposits |
546 | 546 | — | 546 | — | |||||||||||||||
Deposits with stock exchanges and other segregated cash |
370 | 370 | — | 370 | — | |||||||||||||||
Loans receivable (2)
|
5,467 | 5,464 | — | 4,057 | 1,407 | |||||||||||||||
Securities purchased under agreements to resell |
15,621 | 15,621 | — | 15,609 | 12 | |||||||||||||||
Securities borrowed |
5,374 | 5,374 | — | 5,374 | — | |||||||||||||||
Total |
¥ | 31,617 | ¥ | 31,614 | ¥ | 4,239 | ¥ | 25,956 | ¥ | 1,419 | ||||||||||
Liabilities: |
||||||||||||||||||||
Short-term borrowings |
¥ | 1,055 | ¥ | 1,055 | ¥ | — | ¥ | 1,032 | ¥ | 23 | ||||||||||
Deposits received at banks |
2,356 | 2,356 | — | 2,341 | 15 | |||||||||||||||
Securities sold under agreements to repurchase |
16,870 | 16,870 | — | 16,870 | — | |||||||||||||||
Securities loaned |
2,133 | 2,133 | — | 2,133 | — | |||||||||||||||
Other secured borrowings |
393 | 393 | — | 393 | — | |||||||||||||||
Long-term borrowings |
12,452 | 12,478 | 22 | 11,953 | 503 | |||||||||||||||
Total |
¥ | 35,259 | ¥ | 35,285 | ¥ | 22 | ¥ | 34,722 | ¥ | 541 | ||||||||||
| (1) | Includes financial instruments which are carried at fair value on a recurring basis. |
| (2) | Carrying values are shown after deducting relevant allowances for credit losses. |
Billions of yen |
||||||||||||||||
March 31, 2023 |
||||||||||||||||
|
Gross fair value of derivative assets |
Impact of master netting agreements |
Impact of collateral |
Net exposure to credit risk |
|||||||||||||
Financial institutions |
¥ | 15,296 | ¥ |
(12,885 ) |
¥ | (1,855) | ¥ | 556 | ||||||||
Billions of yen |
||||||||||||||||
March 31, 2024 |
||||||||||||||||
|
Gross fair value of derivative assets |
Impact of master netting agreements |
Impact of collateral |
Net exposure to credit risk |
|||||||||||||
Financial institutions |
¥ | 17,644 | ¥ | (14,853) |
¥ | (2,173) |
¥ | 618 | ||||||||
Billions of yen |
||||||||||||
March 31, 2023 |
||||||||||||
|
Derivative assets |
Derivative liabilities |
|||||||||||
Total notional (1)
|
Fair value |
Fair value (1)
|
||||||||||
Derivatives used for trading and non-trading purposes(2) : |
||||||||||||
Equity contracts |
¥ | 39,203 | ¥ | 1,065 | ¥ | 1,610 | ||||||
Interest rate contracts |
3,423,357 | 12,799 | 12,065 | |||||||||
Credit contracts |
35,007 | 276 | 358 | |||||||||
Foreign exchange contracts |
337,616 | 4,219 | 4,120 | |||||||||
Commodity contracts |
257 | 3 | 3 | |||||||||
Total |
¥ | 3,835,440 | ¥ | 18,362 | ¥ | 18,156 | ||||||
Derivatives designated as formal fair value or net investment accounting hedges: |
||||||||||||
Interest rate contracts |
¥ | 2,828 | ¥ | 0 | ¥ | 180 | ||||||
Foreign exchange contracts |
164 | 1 | 0 | |||||||||
Total |
¥ | 2,992 | ¥ | 1 | ¥ | 180 | ||||||
Total derivatives |
¥ | 3,838,432 | ¥ | 18,363 | ¥ | 18,336 | ||||||
Billions of yen |
||||||||||||
March 31, 2024 |
||||||||||||
Derivative assets |
Derivative liabilities |
|||||||||||
Total notional (1)
|
Fair value |
Fair value (1)
|
||||||||||
Derivatives used for trading and non-trading purposes(2) : |
||||||||||||
Equity contracts |
¥ | 78,829 | ¥ | 3,239 | ¥ | 3,827 | ||||||
Interest rate contracts |
3,810,866 | 12,929 | 12,014 | |||||||||
Credit contracts |
42,965 | 284 | 383 | |||||||||
Foreign exchange contracts |
420,052 | 4,881 | 4,664 | |||||||||
Commodity contracts |
325 | 3 | 5 | |||||||||
Total |
¥ | 4,353,037 | ¥ | 21,336 | ¥ | 20,893 | ||||||
Derivatives designated as formal fair value or net investment accounting hedges: |
||||||||||||
Interest rate contracts |
¥ | 3,291 | ¥ | 0 | ¥ | 219 | ||||||
Foreign exchange contracts |
190 | 3 | — | |||||||||
Total |
¥ | 3,481 | ¥ | 3 | ¥ | 219 | ||||||
Total derivatives |
¥ | 4,356,518 | ¥ | 21,339 | ¥ | 21,112 | ||||||
(1) |
Includes the amount of embedded derivatives bifurcated in accordance with ASC 815. |
(2) |
The amounts reported include derivatives used for non-trading purposes other than those designated as formal fair value or net investment accounting hedges. These amounts have not been separately presented since such amounts were not significant as of March 31, 2023 and March 31, 2024. |
Billions of yen |
Billions of yen |
|||||||||||||||
March 31, 2023 |
March 31, 2024 |
|||||||||||||||
|
Derivative assets |
Derivative liabilities (1)
|
Derivative assets |
Derivative liabilities (1)
|
|||||||||||||
| Equity contracts |
||||||||||||||||
| OTC settled bilaterally |
¥ | 649 | ¥ | 880 | ¥ | 2,397 | ¥ | 2,609 | ||||||||
| Exchange-traded |
416 | 730 | 842 | 1,218 | ||||||||||||
| Interest rate contracts |
||||||||||||||||
| OTC settled bilaterally |
11,535 | 10,976 | 11,575 | 10,889 | ||||||||||||
| OTC centrally-cleared |
1,191 | 1,226 | 1,339 | 1,329 | ||||||||||||
| Exchange-traded |
73 | 45 | 15 | 16 | ||||||||||||
| Credit contracts |
||||||||||||||||
| OTC settled bilaterally |
182 | 252 | 240 | 341 | ||||||||||||
| OTC centrally-cleared |
86 | 92 | 43 | 41 | ||||||||||||
| Exchange-traded |
8 | 14 | 1 | 1 | ||||||||||||
| Foreign exchange contracts |
||||||||||||||||
| OTC settled bilaterally |
4,220 | 4,120 | 4,884 | 4,664 | ||||||||||||
| Commodity contracts |
||||||||||||||||
| OTC settled bilaterally |
2 | 3 | 3 | 5 | ||||||||||||
| Exchange-traded |
1 | — | 0 | 0 | ||||||||||||
| |
|
|
|
|
|
|
|
|||||||||
| Total gross derivative balances (2)
|
¥ | 18,363 | ¥ | 18,338 | ¥ | 21,339 | ¥ | 21,113 | ||||||||
| Less: Amounts offset in the consolidated balance sheets (3)
|
(16,943 | ) | (16,329 | ) | (19,815 | ) |
(19,166 | ) | ||||||||
| |
|
|
|
|
|
|
|
|||||||||
| (4)
|
¥ | 1,420 | ¥ | 2,009 | ¥ | 1,524 | ¥ | 1,947 | ||||||||
| |
|
|
|
|
|
|
|
|||||||||
| Less: Additional amounts not offset in the consolidated balance sheets (5)
|
||||||||||||||||
| Financial instruments and non-cash collateral |
¥ | (394 | ) | ¥ | (315 | ) | ¥ | (567 | ) | ¥ | (394 | ) | ||||
| |
|
|
|
|
|
|
|
|||||||||
| Net amount |
¥ | 1,026 | ¥ | 1,694 | ¥ | 957 | ¥ | 1,553 | ||||||||
| |
|
|
|
|
|
|
|
|||||||||
| (1) | Includes the amount of embedded derivatives bifurcated in accordance with ASC 815. |
| (2) | Includes all gross derivative asset and liability balances irrespective of whether they are transacted under a master netting agreement or whether Nomura has obtained sufficient evidence of enforceability of the master netting agreement. As of March 31, 2023, the gross balance of derivative assets and derivative liabilities which are not documented under master netting agreements or are documented under master netting agreements for which Nomura has not yet obtained sufficient evidence of enforceability was ¥479 billion and ¥753 billion, respectively. As of March 31, 2024, the gross balance of such derivative assets and derivative liabilities was ¥402 billion and ¥730 billion, respectively. |
| (3) | Represents amounts offset through counterparty offsetting of derivative assets and liabilities as well as cash collateral offsetting against net derivatives under master netting and similar agreements for which Nomura has obtained sufficient evidence of enforceability in accordance with ASC 210-20 and ASC 815. As of March 31, 2023, Nomura offset a total of ¥1,591 billion of cash collateral receivables against net derivative liabilities and ¥2,205 billion of cash collateral payables against net derivative assets. As of March 31, 2024, Nomura offset a total of ¥1,902 billion of cash collateral receivables against net derivative liabilities and ¥2,551 billion of cash collateral payables against net derivative assets. |
| (4) | Net derivative assets and net derivative liabilities are generally reported within Trading assets and private equity and debt investments — Trading assets Trading liabilities Short-term borrowings Long-term borrowings |
| (5) | Represents amounts which are not permitted to be offset on the consolidated balance sheets in accordance with ASC 210-20 and ASC 815 but which provide Nomura with a legally enforceable right of offset in the event of counterparty default. Amounts relating to derivative and collateral agreements where Nomura has not yet obtained sufficient evidence of enforceability of such offsetting rights are excluded. As of March 31, 2023, a total of ¥298 billion of cash collateral receivables and ¥673 billion of cash collateral payables, including amounts reported in the table, have not been offset against net derivatives. As of March 31, 2024, a total of ¥240 billion of cash collateral receivables and ¥938 billion of cash collateral payables, including amounts reported in the table, have not been offset against net derivatives. |
Billions of yen |
||||||||||||
Year ended March 31 |
||||||||||||
2022 |
2023 |
2024 |
||||||||||
| Derivatives used for trading and non-trading purposes(1) : |
||||||||||||
| Equity contracts |
¥ | (36 | ) | ¥ | 88 | ¥ | (194 | ) | ||||
| Interest rate contracts |
198 | 76 | 468 | |||||||||
| Credit contracts |
(118 | ) | 45 | 12 | ||||||||
| Foreign exchange contracts |
27 | 434 | 142 | |||||||||
| Commodity contracts |
87 | (4 | ) | 27 | ||||||||
| |
|
|
|
|
|
|||||||
| Total |
¥ | 158 | ¥ | 639 | ¥ | 455 | ||||||
| |
|
|
|
|
|
|||||||
(1) Includes |
net gains (losses) on derivatives used for non-trading purposes which are not designated as fair value or net investment hedges. For the year ended March 31, 2022, 2023 and 2024, net gains (losses) for these non-trading derivatives were not significant. |
Billions of yen |
||||||||||||||||||||||||
| Balance sheet line item in which the hedged item is included: |
Carrying amount of the hedged liabilities |
Cumulative gains of fair value hedging adjustment included in the carrying amount of the hedged liabilities |
Cumulative amount of fair value hedging adjustment remaining for the liabilities which hedge accounting has been discontinued |
|||||||||||||||||||||
| |
|
|
|
|
|
|||||||||||||||||||
March 31, 2023 |
March 31, 2024 |
March 31, 2023 |
March 31, 2024 |
March 31, 2023 |
March 31, 2024 |
|||||||||||||||||||
| |
¥ | 2,659 | ¥ | 3,087 | ¥ | 168 | ¥ | 201 | ¥ | 2 | ¥ | 3 | ||||||||||||
| |
|
|
|
|
|
|
|
|
|
|
|
|||||||||||||
| Total |
¥ | 2,659 | ¥ | 3,087 | ¥ | 168 | ¥ | 201 | ¥ | 2 | ¥ | 3 | ||||||||||||
| |
|
|
|
|
|
|
|
|
|
|
|
|||||||||||||
Billions of yen |
||||||||||||
Year ended March 31 |
||||||||||||
2022 |
2023 |
2024 |
||||||||||
| Derivatives designated as hedging instruments: |
||||||||||||
| Interest rate contracts |
¥ | 85 | ¥ | 92 | ¥ | (39 | ) | |||||
| |
|
|
|
|
|
|||||||
| Total |
¥ | 85 | ¥ | 92 | ¥ | (39 | ) | |||||
| |
|
|
|
|
|
|||||||
Billions of yen |
||||||||||||
Year ended March 31 |
||||||||||||
2022 |
2023 |
2024 |
||||||||||
| Hedged items : |
||||||||||||
| Long-term borrowings |
¥ | (85 | ) | ¥ | (92 | ) | ¥ | 39 | ||||
| |
|
|
|
|
|
|||||||
| Total |
¥ | (85 | ) | ¥ | (92 | ) | ¥ | 39 | ||||
| |
|
|
|
|
|
|||||||
Billions of yen |
||||||||||||
Year ended March 31 |
||||||||||||
2022 |
2023 |
2024 |
||||||||||
| Hedging instruments: |
||||||||||||
| Foreign exchange contracts |
¥ | 7 | ¥ | 3 | ¥ | 3 | ||||||
| |
|
|
|
|
|
|||||||
| Total |
¥ | 7 | ¥ | 3 | ¥ | 3 | ||||||
| |
|
|
|
|
|
|||||||
Billions of yen |
||||||||||||||||||||||||||||
March 31, 2023 |
||||||||||||||||||||||||||||
Carrying value (1)
(Asset) / Liability |
Maximum potential payout/Notional |
Notional |
||||||||||||||||||||||||||
Years to maturity |
Purchased credit protection |
|||||||||||||||||||||||||||
Total |
Less than 1 year |
1 to 3 years |
3 to 5 years |
More than 5 years |
||||||||||||||||||||||||
| Single-name credit default swaps |
¥ | (29 | ) | ¥ | 8,121 | ¥ | 1,263 | ¥ | 3,095 | ¥ | 2,579 | ¥ | 1,184 | ¥ | 5,708 | |||||||||||||
| Credit default swap indices |
(47 | ) | 6,839 | 1,339 | 2,601 | 2,284 | 615 | 3,886 | ||||||||||||||||||||
| Other credit risk related portfolio products |
38 | 624 | 166 | 216 | 210 | 32 | 341 | |||||||||||||||||||||
| Credit-risk related options and swaptions |
0 | 51 | — | — | 37 | 14 | 51 | |||||||||||||||||||||
| |
|
|
|
|
|
|
|
|
|
|
|
|
|
|||||||||||||||
| Total |
¥ | (38 | ) | ¥ | 15,635 | ¥ | 2,768 | ¥ | 5,912 | ¥ | 5,110 | ¥ | 1,845 | ¥ | 9,986 | |||||||||||||
| |
|
|
|
|
|
|
|
|
|
|
|
|
|
|||||||||||||||
Billions of yen |
||||||||||||||||||||||||||||
March 31, 2024 |
||||||||||||||||||||||||||||
Carrying value (1)
(Asset) /Liability |
Maximum potential payout/Notional |
Notional |
||||||||||||||||||||||||||
Years to maturity |
Purchased credit protection |
|||||||||||||||||||||||||||
Total |
Less than 1 year |
1 to 3 years |
3 to 5 years |
More than 5 years |
||||||||||||||||||||||||
| Single-name credit default swaps |
¥ | (138 | ) | ¥ | 9,746 | ¥ | 1,849 | ¥ | 3,125 | ¥ | 3,251 | ¥ | 1,521 | ¥ | 6,994 | |||||||||||||
| Credit default swap indices |
(126 | ) | 9,223 | 2,271 | 2,558 | 3,232 | 1,162 | 6,040 | ||||||||||||||||||||
| Other credit risk related portfolio products |
19 | 1,011 | 142 | 256 | 580 | 33 | 755 | |||||||||||||||||||||
| Credit-risk related options and swaptions |
0 | 49 | — | — | 20 | 29 | 10 | |||||||||||||||||||||
| |
|
|
|
|
|
|
|
|
|
|
|
|
|
|||||||||||||||
| Total |
¥ | (245 | ) | ¥ | 20,029 | ¥ | 4,262 | ¥ | 5,939 | ¥ | 7,083 | ¥ | 2,745 | ¥ | 13,799 | |||||||||||||
| |
|
|
|
|
|
|
|
|
|
|
|
|
|
|||||||||||||||
| (1) | Carrying value amounts are shown on a gross basis prior to cash collateral or counterparty offsetting. Asset balances represent positive fair value amounts caused by tightening of credit spreads of underlyings since inception of the credit derivatives. |
Billions of yen |
||||||||||||||||||||||||||||
March 31, 2023 |
||||||||||||||||||||||||||||
Maximum potential payout/Notional |
||||||||||||||||||||||||||||
AAA |
AA |
A |
BBB |
BB |
Other (1)
|
Total |
||||||||||||||||||||||
Single-name credit default swaps |
¥ | 227 | ¥ | 1,405 | ¥ | 2,378 | ¥ | 2,530 | ¥ | 781 | ¥ | 800 | ¥ | 8,121 | ||||||||||||||
Credit default swap indices |
185 | 180 | 2,924 | 2,844 | 299 | 407 | 6,839 | |||||||||||||||||||||
Other credit risk-related portfolio products |
— | — | 21 | 325 | 53 | 225 | 624 | |||||||||||||||||||||
Credit risk-related options and swaptions |
— | — | — | 29 | 22 | — | 51 | |||||||||||||||||||||
Total |
¥ | 412 | ¥ | 1,585 | ¥ | 5,323 | ¥ | 5,728 | ¥ | 1,155 | ¥ | 1,432 | ¥ | 15,635 | ||||||||||||||
Billions of yen |
||||||||||||||||||||||||||||
March 31, 2024 |
||||||||||||||||||||||||||||
Maximum potential payout/Notional |
||||||||||||||||||||||||||||
AAA |
AA |
A |
BBB |
BB |
Other (1)
|
Total |
||||||||||||||||||||||
Single-name credit default swaps |
¥ | 156 | ¥ | 1,485 | ¥ | 2,938 | ¥ | 3,489 | ¥ | 925 | ¥ | 753 | ¥ | 9,746 | ||||||||||||||
Credit default swap indices |
38 | 40 | 3,257 | 5,251 | 265 | 372 | 9,223 | |||||||||||||||||||||
Other credit risk-related portfolio products |
— | — | 19 | 631 | 18 | 343 | 1,011 | |||||||||||||||||||||
Credit risk-related options and swaptions |
— | — | 16 | 16 | 17 | — | 49 | |||||||||||||||||||||
Total |
¥ | 194 | ¥ | 1,525 | ¥ | 6,230 | ¥ | 9,387 | ¥ | 1,225 | ¥ | 1,468 | ¥ | 20,029 | ||||||||||||||
| (1) | Other includes credit derivatives where the credit rating of the underlying reference asset is below investment grade or where a credit rating is unavailable. |
Millions of yen |
||||||||
March 31 |
||||||||
2023 |
2024 |
|||||||
Gross cash proceeds received at transfer dates |
¥ | 69,535 | ¥ | 69,383 |
||||
Fair value of transferred securities at transfer dates |
¥ | 69,405 | ¥ | 69,253 |
||||
Fair value of transferred securities at reporting dates |
¥ | 59,199 | ¥ | 54,627 |
||||
Gross derivative liabilities arising from the transactions at reporting dates (1)
|
¥ | 10,119 | ¥ |
14,434 |
||||
| (1) | Amounts presented on a gross basis, before the application of counterparty offsetting are included in Trading liabilities ¥
s as of March 31, 2023 and March 31, 2024 respectively as disclosed in Note 3 “ Derivative instruments and hedging activities |
Millions of yen |
||||||||||||
Year ended March 31 |
||||||||||||
2022 |
2023 |
2024 |
||||||||||
Commissions |
¥ | 332,344 | ¥ | 279,857 | ¥ | 364,095 | ||||||
Fees from investment banking |
149,603 | 113,208 | 173,265 | |||||||||
Asset management and portfolio service fees |
269,985 | 271,684 | 310,154 | |||||||||
Other revenue |
38,863 | 43,190 | 48,971 | |||||||||
Total |
¥ | 790,795 | ¥ | 707,939 | ¥ | 896,485 | ||||||
Millions of yen |
||||||||||||
Year ended March 31 |
||||||||||||
2022 |
2023 |
2024 |
||||||||||
Brokerage commissions |
¥ | 236,353 | ¥ | 190,778 | ¥ | 242,687 | ||||||
Commissions for distribution of investment trust |
43,695 | 30,268 | 56,241 | |||||||||
Other commissions |
52,296 | 58,811 | 65,167 | |||||||||
Total |
¥ | 332,344 | ¥ | 279,857 | ¥ | 364,095 | ||||||
Millions of yen |
||||||||||||
Year ended March 31 |
||||||||||||
2022 |
2023 |
2024 |
||||||||||
Equity underwriting and distribution fees |
¥ | 33,113 | ¥ | 18,862 | ¥ | 45,478 | ||||||
Debt underwriting and distribution fees |
29,812 | 21,145 | 27,456 | |||||||||
Financial advisory fees |
64,240 | 53,946 | 61,560 | |||||||||
Other fees |
22,438 | 19,255 | 38,771 | |||||||||
Total |
¥ | 149,603 | ¥ | 113,208 | ¥ | 173,265 | ||||||
Millions of yen |
||||||||||||
Year ended March 31 |
||||||||||||
2022 |
2023 |
2024 |
||||||||||
Asset management fees |
¥ | 171,056 | ¥ | 171,327 | ¥ | 193,468 | ||||||
Administration fees |
79,572 | 76,157 | 88,201 | |||||||||
Custodial fees |
19,357 | 24,200 | 28,485 | |||||||||
Total |
¥ | 269,985 | ¥ | 271,684 | ¥ | 310,154 | ||||||
|
Type of service provided to customers |
Overview of key services provided |
Key revenue recognition policies, assumptions and judgments |
||
| Trade execution, clearing services and distribution of fund units |
• Buying and selling of securities on behalf of customers • Distribution of fund units • Clearing of securities and derivatives on behalf of customers |
• Trade execution and clearing commissions recognized at a point in time, namely trade date. • Distribution fees are recognized at a point in time when the fund units have been sold to third party investors. • Commissions recognized net of soft dollar credits provided to customers where Nomura is acting as agent in providing investment research and
|
|
Type of service provided to customers |
Overview of key services provided |
Key revenue recognition policies, assumptions and judgments |
||
similar services to the customer. |
||||
Financial advisory services |
• Provision of financial advice to customers in connection with a specific forecasted transaction or transactions such as mergers and acquisitions • Provision of financial advice not in connection with a specific forecasted transaction or transactions such as general corporate intelligence and similar research • Issuance of fairness opinions • Structuring complex financial instruments for customers |
• Fees contingent on the success of an underlying transaction are variable consideration recognized when the underlying transaction has been completed since only at such point is it probable that a significant reversal of revenue will not occur. • Retainer and milestone fees are recognized either over the period to which they relate or are deferred until consummation of the underlying transaction depending on whether the underlying performance obligation is satisfied at a point in time or over time. • Judgment is required to make this determination with factors influencing this determination including, but not limited to, whether the fee is in connection with an engagement designed to achieve a specific transaction or outcome for the customer (such as the purchase or sale of a business), the nature and extent of benefit to be provided to the customer prior to, and in addition to such specific transaction or outcome and the fee structure for the engagement. • Retainer and milestone fees recognized over time are |
||
| Type of service provided to customers |
Overview of key services provided |
Key revenue recognition policies, assumptions and judgments | ||
| normally recognized on a straight-line basis over the term of the contract based on time elapsed. | ||||
Underwriting and syndication services |
• Underwriting of debt, equity and other financial instruments on behalf of customers • Distributing securities on behalf of issuers • Arranging loan financing for customers • Syndicating loan financing on behalf of customer |
• Underwriting and syndication fees are recognized at a point in time when the underlying transaction is complete. • Commitment fees where draw down of the facility is deemed remote are recognized on a straight-line basis over the life of the facility based on time elapsed. • Underwriting and syndication costs are recognized either as a reduction of revenue or on a gross basis depending on whether Nomura is acting as principal or agent for such amounts. | ||
Asset management services |
• Management of funds, investment trusts and other investment vehicles • Provision of investment advisory services • Provision of custodial and administrative services to customers |
• Management fees earned by Nomura in connection with managing a fund, investment trust or other vehicle generally are recognized on a straight-line basis over the term of the contract based on time elapsed. • Performance-based fees are variable consideration recognized when the performance metric has been determined since only at such point is it probable that a significant reversal of revenue will not occur. • Custodial and administrative fees are recognized on a straight-line basis over time based on time elapsed. | ||
Millions of yen |
||||||||
March 31, 2023 |
March 31, 2024 |
|||||||
| Customer contract receivables |
¥ | 85,100 | ¥ | 101,668 | ||||
| Contract liabilities (1)
|
5,226 | 6,073 | ||||||
| (1) | Contract liabilities primarily rise from investment advisory services and are recognized over the term of the contract based on time elapsed. |
Billions of yen |
||||||||||||||||
March 31, 2023 |
||||||||||||||||
Assets |
Liabilities |
|||||||||||||||
|
Reverse repurchase agreements |
Securities borrowing transactions |
Repurchase agreements |
Securities lending transactions |
|||||||||||||
Total gross balance (1)
|
¥ | 35,030 | ¥ | 4,280 | ¥ | 35,414 | ¥ | 1,825 | ||||||||
Less: Amounts offset in the consolidated balance sheets (2)
|
(21,196 | ) | — |
(21,196 | ) | — |
||||||||||
Total net amounts as reported on the face of the consolidated balance sheets (3)
|
¥ | 13,834 | ¥ | 4,280 | ¥ | 14,218 | ¥ | 1,825 | ||||||||
Less: Additional amounts not offset in the consolidated balance sheets (4)
|
||||||||||||||||
Financial instruments and non-cash collateral |
(11,938 | ) | (2,690 | ) | (11,550 | ) | (1,617 | ) | ||||||||
Cash collateral |
(14 | ) | — | (1 | ) | — |
||||||||||
Net amount |
¥ | 1,882 | ¥ | 1,590 | ¥ | 2,667 | ¥ | 208 | ||||||||
Billions of yen |
||||||||||||||||
March 31, 2024 |
||||||||||||||||
Assets |
Liabilities |
|||||||||||||||
|
Reverse repurchase agreements |
Securities borrowing transactions |
Repurchase agreements |
Securities lending transactions |
|||||||||||||
Total gross balance (1)
|
¥ | 41,288 | ¥ | 5,371 | ¥ | 42,537 | ¥ | 2,465 | ||||||||
Less: Amounts offset in the consolidated balance sheets (2)
|
(25,667 | ) |
— | (25,667 | ) | — | ||||||||||
Total net amounts as reported on the face of the consolidated balance sheets (3)
|
¥ | 15,621 | ¥ | 5,371 | ¥ | 16,870 | ¥ | 2,465 | ||||||||
Less: Additional amounts not offset in the consolidated balance sheets (4)
|
||||||||||||||||
Financial instruments and non-cash collateral |
(13,228 | ) | (3,572 | ) |
(13,817 | ) |
(2,324 | ) |
||||||||
Cash collateral |
(9 | ) | — | (2 | ) | — | ||||||||||
Net amount |
¥ | 2,384 | ¥ | 1,799 | ¥ | 3,051 | ¥ | 141 | ||||||||
| (1) | Include all recognized balances irrespective of whether they are transacted under a master netting agreement or whether Nomura has obtained sufficient evidence of enforceability of the master netting agreement. Amounts include transactions carried at fair value through election of the fair value option. As of March 31, 2023, the gross balance of reverse repurchase agreements and repurchase agreements which were not transacted under master netting agreements or are documented under master netting agreements for which Nomura has not yet obtained sufficient evidence of enforceability amounted to ¥883 billion and ¥2,394 billion, respectively. As of March 31, 2023, the gross balance of securities borrowing transactions and securities lending transactions which were not transacted under master netting agreements or are documented under master netting agreements for which Nomura has not yet obtained sufficient evidence of enforceability amounted to ¥1,449 billion and ¥137 billion, respectively. As of March 31, 2024, the gross balance of reverse repurchase agreements and repurchase agreements which were not transacted under master netting agreements or are documented under master netting agreements for which Nomura has not yet obtained sufficient evidence of enforceability amounted to ¥1,161 billion and ¥2,574 billion, respectively. As of March 31, 202 4 , the gross balance of securities borrowing transactions and securities lending transactions which were not transacted under master netting agreements or are documented under master netting agreements for which Nomura has not yet obtained sufficient evidence of enforceability amounted to ¥1,512 billion and ¥69 billion, respectively. |
| (2) | Represent amounts offset through counterparty netting under master netting or similar agreements for which Nomura has obtained sufficient evidence of enforceability in accordance with ASC 210-20. Amounts offset include transactions carried at fair value through election of the fair value option. |
| (3) | Reverse repurchase agreements and securities borrowing transactions are reported within Collateralized agreements — Securities purchased under agreements to resell Collateralized agreements — Securities borrowed Collateralized financing — Securities sold under agreements to repurchase Collateralized financing — Securities loaned Other liabilities |
| (4) | Represent amounts which are not permitted to be offset on the face of the consolidated balance sheets in accordance with ASC 210-20 but which provide Nomura with the right of offset in the event of counterparty |
default. Amounts relating to agreements where Nomura has not yet obtained sufficient evidence of enforceability of such offsetting rights are excluded. |
Billions of yen |
||||||||||||||||||||||||
March 31, 2023 |
||||||||||||||||||||||||
Overnight and open (1)
|
Up to 30 days |
30 - 90 days |
90 days - 1 year |
Greater than 1 year |
Total |
|||||||||||||||||||
Repurchase agreements |
¥ | 14,017 | ¥ | 16,597 | ¥ | 2,663 | ¥ | 1,357 | ¥ | 780 | ¥ | 35,414 | ||||||||||||
Securities lending transactions |
1,002 | 243 | 55 | 498 | 27 | 1,825 | ||||||||||||||||||
Total gross recognized liabilities (2)
|
¥ | 15,019 | ¥ | 16,840 | ¥ | 2,718 | ¥ | 1,855 | ¥ | 807 | ¥ | 37,239 | ||||||||||||
Billions of yen |
||||||||||||||||||||||||
March 31, 2024 |
||||||||||||||||||||||||
|
Overnight and open (1)
|
Up to 30 days |
30 - 90 days |
90 days - 1 year |
Greater than 1 year |
Total |
|||||||||||||||||||
Repurchase agreements |
¥ | 18,513 | ¥ | 17,317 | ¥ | 3,747 | ¥ | 2,024 | ¥ | 936 | ¥ | 42,537 | ||||||||||||
Securities lending transactions |
1,337 | 299 | 43 | 786 | — | 2,465 | ||||||||||||||||||
Total gross recognized liabilities (2)
|
¥ | 19,850 | ¥ | 17,616 | ¥ | 3,790 | ¥ | 2,810 | ¥ | 936 | ¥ | 45,002 | ||||||||||||
| (1) | Open transactions do not have an explicit contractual maturity date and are terminable on demand by Nomura or the counterparty. |
| (2) | Repurchase agreements and securities lending transactions are reported within Collateralized financing — Securities sold under agreements to repurchase Collateralized financing — Securities loaned Other liabilities |
Billions of yen |
||||||||||||
March 31, 2023 |
||||||||||||
|
Repurchase agreements |
Securities lending transactions |
Total |
||||||||||
| Equities and convertible securities |
¥ | 251 | ¥ | 1,598 | ¥ | 1,849 | ||||||
| Japanese government, agency and municipal securities |
1,651 | 0 | 1,651 | |||||||||
| Foreign government, agency and municipal securities |
28,039 | 74 | 28,113 | |||||||||
| Bank and corporate debt securities |
2,639 | 128 | 2,767 | |||||||||
| Commercial mortgage-backed securities (“CMBS”) |
— | — | — | |||||||||
| Residential mortgage-backed securities (“RMBS”) (1)
|
2,657 | — | 2,657 | |||||||||
| Collateralized debt obligations (“CDOs”) and other |
168 | — | 168 | |||||||||
| Investment trust funds and other |
9 | 25 | 34 | |||||||||
| |
|
|
|
|
|
|||||||
| Total gross recognized liabilities (2)
|
¥ | 35,414 | ¥ | 1,825 | ¥ | 37,239 | ||||||
| |
|
|
|
|
|
|||||||
Billions of yen |
||||||||||||
March 31, 2024 |
||||||||||||
|
Repurchase agreements |
Securities lending transactions |
Total |
||||||||||
| Equities and convertible securities |
¥ | 234 | ¥ | 2,228 | ¥ | 2,462 | ||||||
| Japanese government, agency and municipal securities |
2,506 | 0 | 2,506 | |||||||||
| Foreign government, agency and municipal securities |
31,355 | 72 | 31,427 | |||||||||
| Bank and corporate debt securities |
3,636 | 94 | 3,730 | |||||||||
| Commercial mortgage-backed securities (“CMBS”) |
17 | — | 17 | |||||||||
| Residential mortgage-backed securities (“RMBS”) (1)
|
4,598 | — | 4,598 | |||||||||
| Collateralized debt obligations (“CDOs”) and other |
190 | — | 190 | |||||||||
| Investment trust funds and other |
1 | 71 | 72 | |||||||||
| |
|
|
|
|
|
|||||||
| Total gross recognized liabilities (2)
|
¥ | 42,537 | ¥ | 2,465 | ¥ | 45,002 | ||||||
| |
|
|
|
|
|
|||||||
| (1) | Includes ¥2,080 billion of U.S. government sponsored agency mortgage pass through securities and collateralized mortgage obligations as of March 31, 2023. Includes ¥ 3,842 billion of U.S. government sponsored agency mortgage pass through securities and collateralized mortgage obligations as of March 31, 2024. |
| (2) | Repurchase agreements and securities lending transactions are reported within Collateralized financing — Securities sold under agreements to repurchase Collateralized financing — Securities loaned Other liabilities |
Billions of yen |
||||||||
March 31 |
||||||||
2023 |
2024 |
|||||||
| The fair value of collateral received |
¥ | 53,857 | ¥ | 62,456 | ||||
| The portion of the above received that has been sold (as reported as short sales within Trading liabilities |
38,417 | 45,389 | ||||||
Millions of yen |
||||||||
March 31 |
||||||||
2023 |
2024 |
|||||||
| Trading assets: |
||||||||
| Equities and convertible securities |
¥ | 194,486 | ¥ | 212,165 | ||||
| Government and government agency securities |
1,017,843 | 1,238,863 | ||||||
| Bank and corporate debt securities |
55,532 | 151,454 | ||||||
| Residential mortgage-backed securities (“RMBS”) |
2,527,124 | 2,360,053 | ||||||
| Collateralized debt obligations (“CDOs”) and other (1)
|
12,383 | 12,959 | ||||||
| Investment trust funds and other |
10,411 | 570 | ||||||
| |
|
|
|
|||||
| ¥ | 3,817,779 | ¥ | 3,976,064 | |||||
| |
|
|
|
|||||
| Non-trading debt securities(2)
|
106,319 | 94,421 | ||||||
| Investments in and advances to affiliated companies (3)
|
¥ | 14,023 | ¥ | 14,976 | ||||
| (1) | Includes collateralized loan obligations (“CLOs”) and asset-backed securities (“ABSs”) such as those secured on credit card loans, auto loans and student loans. |
| (2) | Non-trading debt securities are primarily Japanese municipal securities issued by prefectures or ordinance-designated city. |
| (3) | Investments in and advances to affiliated companies comprise shares in Nomura Research Institute, Ltd. |
Millions of yen |
||||||||
March 31 |
||||||||
2023 |
2024 |
|||||||
Loans and receivables |
¥ | 354,508 | ¥ | 409,145 | ||||
Trading assets and private equity and debt investments |
1,397,669 | 1,818,795 | ||||||
Office buildings, land, equipment and facilities |
3,323 | 7,591 | ||||||
Non-trading debt securities |
107,852 | 94,471 | ||||||
Investments in and advances to affiliated companies |
3 | 2 | ||||||
Other |
773 | 1,084 | ||||||
| ¥ | 1,864,128 | ¥ | 2,331,088 | |||||
Billions of yen |
||||||||||||||||||||||||
March 31, 2023 |
||||||||||||||||||||||||
Level 1 |
Level 2 |
Level 3 |
Total |
Investment grade |
Other |
|||||||||||||||||||
Government, agency and municipal securities |
¥ | — | ¥ | 161 | ¥ | — |
¥ | 161 | ¥ | 161 | ¥ | — |
||||||||||||
Bank and corporate debt securities |
— | — |
— | — |
— |
— | ||||||||||||||||||
CMBS and RMBS |
— |
— | 7 | 7 | 2 | 5 | ||||||||||||||||||
Total |
¥ | — |
¥ | 161 | ¥ | 7 | ¥ | 168 | ¥ | 163 | ¥ | 5 | ||||||||||||
Billions of yen |
||||||||||||||||||||||||
March 31, 2024 |
||||||||||||||||||||||||
Level 1 |
Level 2 |
Level 3 |
Total |
Investment grade |
Other |
|||||||||||||||||||
Government, agency and municipal securities |
¥ | — | ¥ | 152 | ¥ | — | ¥ | 152 | ¥ | 152 | ¥ | — | ||||||||||||
Bank and corporate debt securities |
— | — | — | — | — | — | ||||||||||||||||||
CMBS and RMBS |
— | — | 8 | 8 | 2 | 6 | ||||||||||||||||||
Total |
¥ | — | ¥ | 152 | ¥ | 8 | ¥ | 160 | ¥ | 154 | ¥ | 6 | ||||||||||||
Billions of yen |
||||||||
March 31 |
||||||||
2023 |
2024 |
|||||||
| Assets |
||||||||
| Trading assets |
||||||||
| Japanese government securities |
¥ | 1 | ¥ | 1 | ||||
| Loans for trading purposes |
25 | 69 | ||||||
| Loans receivable |
328 | 539 | ||||||
| |
|
|
|
|||||
| Total |
¥ | 354 | ¥ | 609 | ||||
| |
|
|
|
|||||
| Liabilities |
||||||||
| Long-term borrowings |
¥ | 354 | ¥ | 609 | ||||
| |
|
|
|
|||||
Billions of yen |
||||||||
March 31 |
||||||||
2023 |
2024 |
|||||||
| Consolidated VIE assets |
||||||||
| Cash and cash equivalents |
¥ | 23 | ¥ | 73 | ||||
| Trading assets |
||||||||
| Equities |
491 | 539 | ||||||
| Debt securities |
491 | 613 | ||||||
| CMBS and RMBS |
27 | 94 | ||||||
| Derivatives |
0 | 1 | ||||||
| Private equity and debt investments |
35 | 49 | ||||||
| Office buildings, land, equipment and facilities |
49 | 15 | ||||||
| Other |
78 | 84 | ||||||
| |
|
|
|
|||||
| Total |
¥ | 1,194 | ¥ | 1,468 | ||||
| |
|
|
|
|||||
| Consolidated VIE liabilities |
||||||||
| Trading liabilities |
||||||||
| Derivatives |
0 | 0 | ||||||
| Borrowings |
||||||||
| Short-term borrowings |
94 | 220 | ||||||
| Long-term borrowings |
793 | 886 | ||||||
| Other |
5 | 6 | ||||||
| |
|
|
|
|||||
| Total |
¥ | 892 | ¥ | 1,112 | ||||
| |
|
|
|
|||||
Billions of yen |
||||||||||||
March 31, 2023 |
||||||||||||
Carrying amount of variable interests |
Maximum exposure to loss to unconsolidated VIEs |
|||||||||||
Assets |
Liabilities |
|||||||||||
Trading assets and liabilities |
||||||||||||
Equities |
¥ | 18 | ¥ | — | ¥ | 18 | ||||||
Debt securities |
64 | — | 64 | |||||||||
CMBS and RMBS |
3,376 | — | 3,376 | |||||||||
Investment trust funds and other |
164 | — | 164 | |||||||||
Private equity and debt investments |
21 | — | 21 | |||||||||
Loans |
936 | — | 936 | |||||||||
Other |
3 | — | 3 | |||||||||
Commitments to extend credit and other guarantees |
— | — | 196 | |||||||||
Total |
¥ | 4,582 | ¥ | — | ¥ | 4,778 | ||||||
Billions of yen |
||||||||||||
March 31, 2024 |
||||||||||||
Carrying amount of variable interests |
Maximum exposure to loss to unconsolidated VIEs |
|||||||||||
Assets |
Liabilities |
|||||||||||
Trading assets and liabilities |
||||||||||||
Equities |
¥ | 26 | ¥ | — | ¥ | 26 | ||||||
Debt securities |
83 | — | 83 | |||||||||
CMBS and RMBS |
2,996 | — | 2,996 | |||||||||
Investment trust funds and other |
147 | — | 147 | |||||||||
Private equity and debt investments |
23 | — | 23 | |||||||||
Loans |
1,512 | — | 1,512 | |||||||||
Other |
22 | — | 22 | |||||||||
Commitments to extend credit and other guarantees |
— | — | 224 | |||||||||
Total |
¥ | 4,809 | ¥ | — | ¥ | 5,033 | ||||||
Millions of yen |
||||||||||||
March 31, 2023 |
||||||||||||
|
Carried at amortized cost |
Carried at fair value (1)
|
Total |
||||||||||
| Loans receivables |
||||||||||||
| Loans at banks |
¥ | 802,595 | ¥ | — | ¥ | 802,595 | ||||||
| Short-term secured margin loans |
457,273 | — | 457,273 | |||||||||
| Inter-bank money market loans |
— | — | — | |||||||||
| Corporate loans |
1,103,869 | 1,650,115 | 2,753,984 | |||||||||
| |
|
|
|
|
|
|||||||
| Total loans receivables |
¥ | 2,363,737 | ¥ | 1,650,115 | ¥ | 4,013,852 | ||||||
| |
|
|
|
|
|
|||||||
| Advances to affiliated companies |
4,000 | — | 4,000 | |||||||||
| |
|
|
|
|
|
|||||||
| Total |
¥ | 2,367,737 | ¥ | 1,650,115 | ¥ | 4,017,852 | ||||||
| |
|
|
|
|
|
|||||||
Millions of yen |
||||||||||||
March 31, 2024 |
||||||||||||
|
Carried at amortized cost |
Carried at fair value (1)
|
Total |
||||||||||
| Loans receivables |
||||||||||||
| Loans at banks |
¥ | 915,962 | ¥ | — | ¥ | 915,962 | ||||||
| Short-term secured margin loans |
608,332 | — | 608,332 | |||||||||
| Inter-bank money market loans |
— | — | — | |||||||||
| Corporate loans |
1,870,316 | 2,074,585 | 3,944,901 | |||||||||
| |
|
|
|
|
|
|||||||
| Total loans receivables |
¥ | 3,394,610 | ¥ | 2,074,585 | ¥ | 5,469,195 | ||||||
| |
|
|
|
|
|
|||||||
| Advances to affiliated companies |
8,066 | 1,514 | 9,580 | |||||||||
| |
|
|
|
|
|
|||||||
| Total |
¥ | 3,402,676 | ¥ | 2,076,099 | ¥ | 5,478,775 | ||||||
| |
|
|
|
|
|
|||||||
| (1) | Includes loans receivable and loan commitments carried at fair value through election of the fair value option. |
• |
Loans receivable; |
• |
Written unfunded loan commitments and other off-balance sheet financial instruments; |
• |
Cash deposits; |
• |
Collateralized agreements such as reverse repos and securities borrowing transactions; |
• |
Customer contract assets and receivables; and |
• |
Other receivables including margin receivables, security deposits, default fund contributions to central clearing counterparties, reinsurance benefits, and net investments in finance leases. |
| Financial instrument |
Methodology to determine current expected credit losses | |
Loans, written loan commitments, other off-balance sheet financial instruments and certain deposits |
• Full loss rate model developed by Nomura’s Risk department • Measures expected credit losses based on probability of default (“PD”), Loss Given Default (“LGD”) and Exposure at Default (“EAD”) inputs. • PD inputs incorporate forward-looking scenarios used by Nomura for internal risk management and capital purposes. • Immediate reversion method used for periods beyond which reasonable and supportable forecast is not available. • For financial instruments which have defaulted or are probable of defaulting, expected credit losses measured using discounted cash flow analyses or, where the financial instrument is collateral dependent, based on any shortfall of fair value of the underlying collateral. | |
Collateralized agreements, short-term secured margin loans and cash prime brokerage loans |
• For reverse repos and short-term secured margin loans and cash prime brokerage loans where frequent margining is required and the counterparty has ability to replenish margin, as permitted by a practical expedient provided by ASC 326 expected credit losses are limited to difference between carrying value of the reverse repo or margin loan and fair value of underlying collateral. • Securities borrowing transactions typically have very short expected lives and are collateralized and therefore expected credit losses are generally determined qualitatively to be insignificant based on historical experience and consistent monitoring of collateral. | |
Customer contract assets and receivables |
• Expected credit losses typically based on aging analysis where loss rates are applied to the carrying value based on historical experience, the current economic climate and specific information about the ability of the client to pay. | |
Millions of yen |
||||||||||||||||||||||||
Year ended March 31, 2022 |
||||||||||||||||||||||||
|
Allowances for current expected credit losses against loans |
Allowances against receivables other than loans (1)
|
Total allowances for current expected credit losses |
||||||||||||||||||||||
|
Loans at banks |
Short-term secured margin loans |
Corporate loans |
Subtotal |
|||||||||||||||||||||
| Opening balance |
1,282 | — | 47,985 | 49,267 | 4,517 | 53,784 | ||||||||||||||||||
| Provision for credit losses (2)
|
1,161 | — | 11,079 | 12,240 | 113 | 12,353 | ||||||||||||||||||
| Write-offs |
— | — | — | — | (1,231 | ) | (1,231 | ) | ||||||||||||||||
| Other (4)(5)
|
(9 | ) | — | 3,289 | 3,280 | (1,840 | ) | 1,440 | ||||||||||||||||
| |
|
|
|
|
|
|
|
|
|
|
|
|||||||||||||
| Ending balance |
¥ | 2,434 | ¥ | — | ¥ | 62,353 | ¥ | 64,787 | ¥ | 1,559 | ¥ | 66,346 | ||||||||||||
| |
|
|
|
|
|
|
|
|
|
|
|
|||||||||||||
Millions of yen |
||||||||||||||||||||||||
Year ended March 31, 2023 |
||||||||||||||||||||||||
Allowances for current expected credit losses against loans |
Allowances against receivables other than loans (1)
|
Total allowances for current expected credit losses |
||||||||||||||||||||||
Loans at banks |
Short-term secured margin loans |
Corporate loans |
Subtotal |
|||||||||||||||||||||
| Opening balance |
2,434 | — |
62,353 | 64,787 | 1,559 | 66,346 | ||||||||||||||||||
| Provision for credit losses |
672 | — |
898 | 1,570 | 4 | 1,574 | ||||||||||||||||||
| Write-offs(3) |
(1,523 | ) | — |
(61,604 | ) | (63,127 | ) | — |
(63,127 | ) | ||||||||||||||
| Other (4)(5)
|
(457 | ) | — |
1,283 | 826 | 213 | 1,039 | |||||||||||||||||
| |
|
|
|
|
|
|
|
|
|
|
|
|||||||||||||
| Ending balance |
¥ | 1,126 | ¥ | — |
¥ | 2,930 | ¥ | 4,056 | ¥ | 1,776 | ¥ | 5,832 | ||||||||||||
| |
|
|
|
|
|
|
|
|
|
|
|
|||||||||||||
Millions of yen |
||||||||||||||||||||||||
Year ended March 31, 2024 |
||||||||||||||||||||||||
|
Allowances for current expected credit losses against loans |
Allowances against receivables other than loans (1)
|
Total allowances for current expected credit losses |
||||||||||||||||||||||
|
Loans at banks |
Short-term secured margin loans |
Corporate loans |
Subtotal |
|||||||||||||||||||||
| Opening balance |
1,126 | — | 2.930 | 4,056 | 1,776 | 5,832 | ||||||||||||||||||
| Provision for credit losses (2)
|
(341 | ) | — | 371 | 30 | 13,608 | 13,638 | |||||||||||||||||
| Write-offs |
— | — | (1,908 | ) | (1,908 | ) | — | (1,908 | ) | |||||||||||||||
| Other (5)
|
— | — | 238 | 238 | 247 | 485 | ||||||||||||||||||
| |
|
|
|
|
|
|
|
|
|
|
|
|||||||||||||
| Ending balance |
¥ | 785 | ¥ | — | ¥ | 1,631 | ¥ | 2,416 | ¥ | 15,631 | ¥ | 18,047 | ||||||||||||
| |
|
|
|
|
|
|
|
|
|
|
|
|||||||||||||
| (1) | Includes amounts recognized against collateralized agreements, customer contract assets and receivables and other receivables. |
| (2) | Following default by a U.S. client in connection with the U.S. Prime Brokerage Event in March 2021, an additional provision for credit losses of ¥9,289 million was recognized during the year ended March 31, 2022. A provision for credit losses in connection with settlement failures with a broker cou n terparty was recognized during the year ended March 31, 2024. |
| (3) | Includes ¥59,025 million of write-offs in connection with the U.S. Prime Brokerage Event during the year ended March 31, 2023. |
| (4) | Includes a reduction in allowances for current expected credit losses of million in connection with the U.S. Prime Brokerage Event during the years ended March 31, 2022 and 2023
respectively . |
| (5) | Primarily includes recoveries and foreign exchange movements. The amounts of recoveries for the year ended March 31, 2022 and 2023 and 2024 were not significant. |
| Millions of yen | ||||||||||||||||||||||||||||||||
| March 31, 2023 | ||||||||||||||||||||||||||||||||
| 2023 | 2022 | 2021 | 2020 | 2019 | 2018 or earlier |
Revolving | Total | |||||||||||||||||||||||||
Secured loans at banks: |
||||||||||||||||||||||||||||||||
AAA-BBB |
¥ | 104,543 | ¥ | 152,888 | ¥ | 5,960 | ¥ | 8,050 | ¥ | 14,817 | ¥ | 16,047 | ¥ | — | ¥ | 302,305 | ||||||||||||||||
BB-CCC |
117,680 | 199,696 | — | 1,642 | 415 | 2,395 | — | 321,828 | ||||||||||||||||||||||||
CC-D |
— | — | — | — | — | — | — | — | ||||||||||||||||||||||||
Others (1)
|
55,842 | 45,404 | — | — | — | — | — | 101,246 | ||||||||||||||||||||||||
Total secured loans at banks |
¥ | 278,065 | ¥ | 397,988 | ¥ | 5,960 | ¥ | 9,692 | ¥ | 15,232 | ¥ | 18,442 | ¥ | — | ¥ | 725,379 | ||||||||||||||||
Unsecured loans at banks: |
||||||||||||||||||||||||||||||||
AAA-BBB |
¥ | 4,673 | ¥ | 9,297 | ¥ | 9,169 | ¥ | 9,513 | ¥ | 11,036 | ¥ | 25,806 | ¥ | — | ¥ | 69,494 | ||||||||||||||||
BB-CCC |
— | — | 1,000 | 3,370 | 1,692 | 1,660 | — | 7,722 | ||||||||||||||||||||||||
CC-D |
— | — | — | — | — | — | — | — | ||||||||||||||||||||||||
Others |
— | — | — | — | — | — | — | — | ||||||||||||||||||||||||
Total unsecured loans at banks |
¥ | 4,673 | ¥ | 9,297 | ¥ | 10,169 | ¥ | 12,883 | ¥ | 12,728 | ¥ | 27,466 | ¥ | — | ¥ | 77,216 | ||||||||||||||||
Short-term secured margin loans: |
||||||||||||||||||||||||||||||||
AAA-BBB |
¥ | — | ¥ | — | ¥ | — | ¥ | — | ¥ | — | ¥ | — | ¥ | — | ¥ | — | ||||||||||||||||
BB-CCC |
— | — | — | — | — | — | — | — | ||||||||||||||||||||||||
CC-D |
— | — | — | — | — | — | — | — | ||||||||||||||||||||||||
Others (1)
|
217,767 | 2,081 | — | — | — | — | 237,425 | 457,273 | ||||||||||||||||||||||||
Total short-term secured margin loans |
¥ | 217,767 | ¥ | 2,081 | ¥ | — | ¥ | — | ¥ | — | ¥ | — | ¥ | 237,425 | ¥ | 457,273 | ||||||||||||||||
Secured corporate loans: |
||||||||||||||||||||||||||||||||
AAA-BBB |
¥ | 9,132 | ¥ | 433,330 | ¥ | 184,579 | ¥ | 169,393 | ¥ | 20,423 | ¥ | — | ¥ | 10,392 | ¥ | 827,249 | ||||||||||||||||
BB-CCC |
598 | 8,242 | 7,322 | 14,954 | 23,811 | 20,791 | 69,260 | 144,978 | ||||||||||||||||||||||||
CC-D |
— | — | — | — | — | — | — | — | ||||||||||||||||||||||||
Others (1)
|
1,550 | 458 | — | — | 2 | — | 119 | 2,129 | ||||||||||||||||||||||||
Total secured corporate loans |
¥ | 11,280 | ¥ | 442,030 | ¥ | 191,901 | ¥ | 184,347 | ¥ | 44,236 | ¥ | 20,791 | ¥ | 79,771 | ¥ | 974,356 | ||||||||||||||||
Unsecured corporate loans: |
||||||||||||||||||||||||||||||||
AAA-BBB |
¥ | — | ¥ | — | ¥ | — | ¥ | — | ¥ | — | ¥ | — | ¥ | — | ¥ | — | ||||||||||||||||
BB-CCC |
— | — | — | — | — | — | — | — | ||||||||||||||||||||||||
CC-D |
— | — | — | — | 2,184 | — | — | 2,184 | ||||||||||||||||||||||||
Others |
200 | 3 | 472 | 166 | — | 126,488 | — | 127,329 | ||||||||||||||||||||||||
Total unsecured corporate loans |
¥ | 200 | ¥ | 3 | ¥ | 472 | ¥ | 166 | ¥ | 2,184 | ¥ | 126,488 | ¥ | — | ¥ | 129,513 | ||||||||||||||||
Advances to affiliated companies |
||||||||||||||||||||||||||||||||
AAA-BBB |
¥ | — | ¥ | 3,000 | ¥ | 1,000 | ¥ | — | ¥ | — | ¥ | — | ¥ | — | ¥ | 4,000 | ||||||||||||||||
BB-CCC |
— | — | — | — | — | — | — | — | ||||||||||||||||||||||||
CC-D |
— | — | — | — | — | — | — | — | ||||||||||||||||||||||||
Others |
— | — | — | — | — | — | — | — | ||||||||||||||||||||||||
Total advances to affiliated companies |
¥ | — | ¥ | 3,000 | ¥ | 1,000 | ¥ | — | ¥ | — | ¥ | — | ¥ | — | ¥ | 4,000 | ||||||||||||||||
Total |
¥ | 511,985 | ¥ | 854,399 | ¥ | 209,502 | ¥ | 207,088 | ¥ | 74,380 | ¥ | 193,187 | ¥ | 317,196 | ¥ | 2,367,737 | ||||||||||||||||
| (1) | Relate s to collateralized exposures where a specified ratio of LTV is maintained. |
Millions of yen |
||||||||||||||||||||||||||||||||
March 31, 2024 |
||||||||||||||||||||||||||||||||
2024 |
2023 |
2022 |
2021 |
2020 |
2019 or earlier |
Revolving |
Total |
|||||||||||||||||||||||||
| Secured loans at banks: |
||||||||||||||||||||||||||||||||
| AAA-BBB |
¥ | 122,946 | ¥ | 213,785 | ¥ | 12,000 | ¥ | 5,660 | ¥ | 2,650 | ¥ | 27,115 | ¥ | — | ¥ | 384,156 | ||||||||||||||||
| BB-CCC |
108,558 | 215,226 | 5,086 | — | 995 | 283 | — | 330,148 | ||||||||||||||||||||||||
| CC-D |
— | — | — | — | — | — | — | — | ||||||||||||||||||||||||
| Others (1)
|
— | 139,104 | — | — | — | — | — | 139,104 | ||||||||||||||||||||||||
| |
|
|
|
|
|
|
|
|
|
|
|
|
|
|
|
|||||||||||||||||
| Total secured loans at banks |
¥ | 231,504 | ¥ | 568,115 | ¥ | 17,086 | ¥ | 5,660 | ¥ | 3,645 | ¥ | 27,398 | ¥ | — | ¥ | 853,408 | ||||||||||||||||
| |
|
|
|
|
|
|
|
|
|
|
|
|
|
|
|
|||||||||||||||||
| Unsecured loans at banks: |
||||||||||||||||||||||||||||||||
| AAA-BBB |
¥ | 4,075 | ¥ | 9,904 | ¥ | 2,844 | ¥ | 8,449 | ¥ | 6,352 | ¥ | 25,099 | ¥ | — | ¥ | 56,723 | ||||||||||||||||
| BB-CCC |
900 | 756 | — | 1,000 | 875 | 2,300 | — | 5,831 | ||||||||||||||||||||||||
| CC-D |
— | — | — | — | — | — | — | — | ||||||||||||||||||||||||
| Others |
— | — | — | — | — | — | — | — | ||||||||||||||||||||||||
| |
|
|
|
|
|
|
|
|
|
|
|
|
|
|
|
|||||||||||||||||
| Total unsecured loans at banks |
¥ | 4,975 | ¥ | 10,660 | ¥ | 2,844 | ¥ | 9,449 | ¥ | 7,227 | ¥ | 27,399 | ¥ | — | ¥ | 62,554 | ||||||||||||||||
| |
|
|
|
|
|
|
|
|
|
|
|
|
|
|
|
|||||||||||||||||
| Short-term secured margin loans: |
||||||||||||||||||||||||||||||||
| AAA-BBB |
¥ | — | ¥ | — | ¥ | — | ¥ | — | ¥ | — | ¥ | — | ¥ | — | ¥ | — | ||||||||||||||||
| BB-CCC |
— | — | — | — | — | — | — | — | ||||||||||||||||||||||||
| CC-D |
— | — | — | — | — | — | — | — | ||||||||||||||||||||||||
| Others (1)
|
285,209 | 19,038 | — | — | — | — | 304,085 | 608,332 | ||||||||||||||||||||||||
| |
|
|
|
|
|
|
|
|
|
|
|
|
|
|
|
|||||||||||||||||
| Total short-term secured margin loans |
¥ | 285,209 | ¥ | 19,038 | ¥ | — | ¥ | — | ¥ | — | ¥ | — | ¥ | 304,085 | ¥ | 608,332 | ||||||||||||||||
| |
|
|
|
|
|
|
|
|
|
|
|
|
|
|
|
|||||||||||||||||
| Secured corporate loans: |
||||||||||||||||||||||||||||||||
| AAA-BBB |
¥ | 32,362 | ¥ | 217,440 | ¥ | 177,557 | ¥ | 113,559 | ¥ | 84,442 | ¥ | 103,995 | ¥ | 685,608 | ¥ | 1,414,963 | ||||||||||||||||
| BB-CCC |
— | 25,759 | 17,018 | 12,591 | 32,187 | 8,204 | 161,371 | 257,130 | ||||||||||||||||||||||||
| CC-D |
— | — | — | — | — | — | — | — | ||||||||||||||||||||||||
| Others (1)
|
8,203 | 302 | — | — | — | — | 252 | 8,757 | ||||||||||||||||||||||||
| |
|
|
|
|
|
|
|
|
|
|
|
|
|
|
|
|||||||||||||||||
| Total secured corporate loans |
¥ | 40,565 | ¥ | 243,501 | ¥ | 194,575 | ¥ | 126,150 | ¥ | 116,629 | ¥ | 112,199 | ¥ | 847,231 | ¥ | 1,680,850 | ||||||||||||||||
| |
|
|
|
|
|
|
|
|
|
|
|
|
|
|
|
|||||||||||||||||
| Unsecured corporate loans: |
||||||||||||||||||||||||||||||||
| AAA-BBB |
¥ | — | ¥ | — | ¥ | — | ¥ | — | ¥ | — | ¥ | — | ¥ | — | ¥ | — | ||||||||||||||||
| BB-CCC |
36,329 | 8,376 | — | — | — | — | — | 44,705 | ||||||||||||||||||||||||
| CC-D |
— | — | — | — | — | — | — | — | ||||||||||||||||||||||||
| Others |
150 | 122 | — | 537 | — | 143,952 | — | 144,761 | ||||||||||||||||||||||||
| |
|
|
|
|
|
|
|
|
|
|
|
|
|
|
|
|||||||||||||||||
| Total unsecured corporate loans |
¥ | 36,479 | ¥ | 8,498 | ¥ | — | ¥ | 537 | ¥ | — | ¥ | 143,952 | ¥ | — | ¥ | 189,466 | ||||||||||||||||
| |
|
|
|
|
|
|
|
|
|
|
|
|
|
|
|
|||||||||||||||||
| Advances to affiliated companies |
||||||||||||||||||||||||||||||||
| AAA-BBB |
¥ | — | ¥ | 4,066 | ¥ | 3,000 | ¥ | 1,000 | ¥ | — | ¥ | — | ¥ | — | ¥ | 8,066 | ||||||||||||||||
| BB-CCC |
— | — | — | — | — | — | — | — | ||||||||||||||||||||||||
| CC-D |
— | — | — | — | — | — | — | — | ||||||||||||||||||||||||
| Others |
— | — | — | — | — | — | — | — | ||||||||||||||||||||||||
| |
|
|
|
|
|
|
|
|
|
|
|
|
|
|
|
|||||||||||||||||
| Total advances to affiliated companies |
¥ | — | ¥ | 4,066 | ¥ | 3,000 | ¥ | 1,000 | ¥ | — | ¥ | — | ¥ | — | ¥ | 8,066 | ||||||||||||||||
| |
|
|
|
|
|
|
|
|
|
|
|
|
|
|
|
|||||||||||||||||
| Total |
¥ | 598,732 | ¥ | 853,878 | ¥ | 217,505 | ¥ | 142,796 | ¥ |
127,501 | ¥ | 310,948 | ¥ | 1,151,316 | ¥ | 3,402,676 | ||||||||||||||||
| |
|
|
|
|
|
|
|
|
|
|
|
|
|
|
|
|||||||||||||||||
(1) |
Relate s to collateralized exposures where a specified ratio of LTV is maintained. |
(2) |
The amounts of write offs for the year ended March 31, 2024 were not significant. |
Rating Range |
Definition |
|
AAA |
Highest credit quality category. An obligor or facility has extremely strong capacity to meet its financial commitments. ‘AAA range’ is the highest credit rating assigned by Nomura. Extremely low probability of default. |
|
AA |
Very high credit quality category. An obligor or facility has very strong capacity to meet its financial commitments. Very low probability of default but higher that of ‘AAA range.’ |
|
A |
High credit quality category. An obligor or facility has strong capacity to meet its financial commitments but is somewhat more susceptible to the adverse effects of changes in circumstances and economic conditions than those in higher-rated categories. Low probability of default but higher than that of ‘AA range.’ |
|
BBB |
Good credit quality category. An obligor or facility has adequate capacity to meet its financial commitments. However, adverse economic conditions or changes in circumstances are more likely to lead to a weakened capacity to meet its financial commitments. Medium probability of default but higher than that of ‘A range.’ |
|
BB |
Speculative credit quality category. An obligor or facility is less vulnerable in the near term than other lower-ratings. However, it faces major ongoing uncertainties and exposure to adverse business, financial, or economic conditions which could lead to the inadequate capacity to meet its financial commitments. Medium to high probability of default but higher than that of ‘BBB range.’ |
|
B |
Highly speculative credit quality category. An obligor or facility is more vulnerable than those rated ‘BB range’, but the obligor currently has the capacity to meet its financial commitments. Adverse business, financial, or economic conditions will likely impair the issuer’s or obligor’s capacity or willingness to meet its financial commitments. High probability of default—higher than that of ‘BB range.’ |
|
CCC |
Substantial credit risk. An obligor or facility is currently vulnerable, and is dependent upon favorable business, financial, and economic conditions to meet its financial commitments. Strong probability of default – higher than that of ‘B range.’ |
|
CC |
An obligor or facility is currently highly vulnerable to insolvency or is under distressed debt restructuring. Due to insolvency concern or payment failure, a termination notice and close out is initiated. It also includes a solvent obligor past due on financial obligations by more than 3 months. The obligor continues to be a going-concern. |
|
C |
An obligor or facility is imminent to file for bankruptcy (i.e. Chapter 11 or equivalent) in the near-term. The going-concern status is about to cease; unless for an extraordinary turnaround event. |
|
D |
An Obligor or facility has filed for bankruptcy, administration, receivership, liquidation or other winding up or cessation of business of an obligor or other similar situations. D range includes sale of assets (i.e. loans) at a material loss of more than 30%, or the obligor is externally rated ‘D’ by any Designated External Rating Agencies. |
|
Millions of yen |
||||||||||||||||||||||||
March 31 |
||||||||||||||||||||||||
2023 |
2024 |
|||||||||||||||||||||||
Cost |
Accumulated depreciation |
Net carrying amount |
Cost |
Accumulated depreciation |
Net carrying amount |
|||||||||||||||||||
Real estate (1)
|
¥ | 21 | ¥ | — | ¥ | 21 | ¥ | 21 | ¥ | — | ¥ | 21 | ||||||||||||
Aircraft |
49,472 | (741 | ) | 48,731 | 13,259 | (184 | ) | 13,075 | ||||||||||||||||
Total |
¥ | 49,493 | ¥ | (741 | ) | ¥ | 48,752 | ¥ | 13,280 | ¥ | (184 | ) |
¥ | 13,096 | ||||||||||
| (1) | Cost, accumulated depreciation and net carrying amounts include amounts relating to real estate u s ed by Nomura. |
Millions of yen |
||||
March 31, 2024 |
||||
Minimum lease payments to be received |
||||
Years of receipt |
||||
Less than 1 year |
¥ | 1,198 | ||
1 to 2 years |
1,198 | |||
2 to 3 years |
1,198 | |||
3 to 4 years |
1,198 | |||
4 to 5 years |
1,198 | |||
More than 5 years |
6,876 | |||
Total |
¥ | 12,866 | ||
Millions of yen |
||||||||||||
Year ended March 31 |
||||||||||||
2022 |
2023 |
2024 |
||||||||||
Lease expense: |
||||||||||||
Operating lease costs |
¥ | 47,643 | ¥ | 47,268 | ¥ | 48,125 | ||||||
Other income and expenses: |
||||||||||||
Gross sublease income |
¥ | 3,464 | ¥ | 1,658 | ¥ | 1,997 | ||||||
Millions of yen |
||||||||||||
Year ended March 31 |
||||||||||||
2022 |
2023 |
2024 |
||||||||||
Cash flows for operating leases |
¥ | 46,565 | ¥ | 44,689 | ¥ | 49,339 | ||||||
ROU assets recognized in connection with new operating leases |
¥ | 32,208 | ¥ | 36,032 | ¥ | 29,374 | ||||||
Millions of yen |
||||
March 31, 2024 |
||||
Operating leases |
||||
Years of payment |
||||
Less than 1 year |
¥ | 47,123 | ||
1 to 2 years |
38,059 | |||
2 to 3 years |
27,765 | |||
3 to 4 years |
23,404 | |||
4 to 5 years |
21,226 | |||
More than 5 years |
42,877 | |||
Total undiscounted lease payments |
¥ | 200,454 | ||
Less: Impact of discounting |
(10,640 | ) |
||
as reported in the consolidated balance sheets |
¥ | 189,814 | ||
Year ended March 31 |
||||
2023 |
2024 |
|||
Operating leases |
Operating leases |
|||
Weighted-average discount rate used to measure lease liabilities |
1.5% | 2.9% | ||
Weighted-average remaining lease term |
6.5 years | 6.9 years | ||
Millions of yen |
||||||||
March 31 |
||||||||
2023 |
2024 |
|||||||
Land |
¥ | 38,752 | ¥ | 42,914 | ||||
Office buildings |
56,802 | 54,657 | ||||||
Equipment and facilities |
71,981 | 38,110 | ||||||
Software |
117,780 | 130,280 | ||||||
Construction in progress |
8,008 | 16,094 | ||||||
assets |
170,993 | 166,730 | ||||||
Total |
¥ | 464,316 | ¥ | 448,785 | ||||
Millions of yen |
||||||||
March 31 |
||||||||
2023 |
2024 |
|||||||
| Other assets — Other: |
||||||||
| Securities received as collateral |
¥ | 268,591 | ¥ | 332,363 | ||||
| Goodwill and other intangible assets |
36,194 | 38,387 | ||||||
| Net deferred tax assets (1)
|
22,645 | 24,254 | ||||||
| Investments in equity securities for other than operating purposes (2)
|
249,865 | 299,638 | ||||||
| Deposit receivables (4)
|
298,705 | 316,570 | ||||||
| Prepaid expenses |
19,727 | 22,811 | ||||||
| Other |
118,980 | 121,598 | ||||||
| |
|
|
|
|||||
| Total |
¥ | 1,014,707 | ¥ | 1,155,621 | ||||
| |
|
|
|
|||||
| Other liabilities: |
||||||||
| Obligation to return securities received as collateral |
¥ | 268,591 | ¥ | 332,363 | ||||
| Accrued income taxes |
42,254 | 81,585 | ||||||
| Net deferred tax liabilities (1)
|
|
|
93,834
|
|
|
|
85,301
|
|
| Other accrued expenses and provisions (3)
|
479,491 | 596,684 | ||||||
| |
193,883 | 189,814 | ||||||
| Other |
97,468 | 128,799 | ||||||
| |
|
|
|
|||||
| Total |
¥ | 1,175,521 | ¥ | 1,414,546 | ||||
| |
|
|
|
|||||
(1) |
Net deferred tax assets are deferred tax assets offset by deferred tax liabilities which relate to the same tax-paying component within a particular tax jurisdiction. Net deferred tax liabilities are deferred tax liabilities offset by deferred tax assets which relate to the same tax-paying component within a particular tax jurisdiction. See Note 14 “Income taxes” for further information. |
| ( 2 ) |
Includes equity securities held for other than trading or operating purposes. These investments comprise listed equity securities and unlisted equity securities of ¥13,174 million and ¥236,691 million respectively, as of March 31, 2023, and ¥6,410 million and ¥293,228 million respectively, as of March 31, 2024. These securities are generally carried at fair value, with changes in fair value recognized and reported within Revenue — Other |
( 3 ) |
Includes a liability of ¥42,459 million and ¥21,177 million as of March 31, 2023 and 2024 respectively, in respect of all outstanding and unsettled investigations, lawsuits and other legal proceedings where loss is considered probable and the amount of such loss can be reasonably estimated. See Note 19 “Commitments, contingencies and guarantees |
| ( 4 ) |
Includes Japan Securities Clearing Corporation’s clearing fund. |
Millions of yen |
||||||||||||||||||||||||||||||||||||
Year ended March 31, 2023 |
||||||||||||||||||||||||||||||||||||
Beginning of year |
Changes during year |
End of year |
||||||||||||||||||||||||||||||||||
|
Gross carrying amount |
Accumulated Impairment |
Net carrying amount |
Acquisition |
Impairment |
Other (1)
|
Gross carrying amount |
Accumulated Impairment |
Net carrying amount |
||||||||||||||||||||||||||||
| Wholesale |
¥ | 106,554 | ¥ | (92,814 | ) | ¥ | 13,740 | ¥ | 2,289 | ¥ | — | ¥ | 1,191 | ¥ | 110,034 | ¥ | (92,814 | ) | ¥ | 17,220 | ||||||||||||||||
| Other |
667 | — | 667 | — | — | (249 | ) | 418 | — | 418 | ||||||||||||||||||||||||||
| |
|
|
|
|
|
|
|
|
|
|
|
|
|
|
|
|
|
|||||||||||||||||||
| Total |
¥ | 107,221 | ¥ | (92,814 | ) | ¥ | 14,407 | ¥ | 2,289 | ¥ | — | ¥ | 942 | ¥ | 110,452 | ¥ | (92,814 | ) | ¥ | 17,638 | ||||||||||||||||
| |
|
|
|
|
|
|
|
|
|
|
|
|
|
|
|
|
|
|||||||||||||||||||
Millions of yen |
||||||||||||||||||||||||||||||||||||
Year ended March 31, 2024 |
||||||||||||||||||||||||||||||||||||
Beginning of year |
Changes during year |
End of year |
||||||||||||||||||||||||||||||||||
Gross carrying amount |
Accumulated Impairment |
Net carrying amount |
Acquisition |
Impairment |
Other (1)
|
Gross carrying amount |
Accumulated Impairment |
Net carrying amount |
||||||||||||||||||||||||||||
| Wholesale |
¥ | 110,034 | ¥ | (92,814 | ) | ¥ | 17,220 | ¥ | — | ¥ | (723 | ) | ¥ | 2,345 | ¥ | 112,379 | ¥ | (93,537 | ) | ¥ | 18,842 | |||||||||||||||
| Other |
418 | — | 418 | — | — | — | 418 | — | 418 | |||||||||||||||||||||||||||
| |
|
|
|
|
|
|
|
|
|
|
|
|
|
|
|
|
|
|||||||||||||||||||
| Total |
¥ | 110,452 | ¥ | (92,814 | ) |
¥ | 17,638 | ¥ | — | ¥ | (723 | ) |
¥ | 2,345 | ¥ | 112,797 | ¥ | (93,537 | ) |
¥ | 19,260 | |||||||||||||||
| |
|
|
|
|
|
|
|
|
|
|
|
|
|
|
|
|
|
|||||||||||||||||||
(1) |
Includes currency translation adjustments. |
Millions of yen |
||||||||||||||||||||||||
March 31, 2023 |
March 31, 2024 |
|||||||||||||||||||||||
Gross carrying amount |
Accumulated amortization |
Net carrying amount |
Gross carrying amount |
Accumulated amortization |
Net carrying amount |
|||||||||||||||||||
| Client relationships |
¥ | 74,550 | ¥ | (66,465 | ) | ¥ | 8,085 | ¥ | 82,155 | ¥ | (75,237 |
) | ¥ | 6,918 | ||||||||||
| Other |
2,239 | (1,836 | ) | 403 | 3,275 | (2,338 |
) | 937 | ||||||||||||||||
| |
|
|
|
|
|
|
|
|
|
|
|
|||||||||||||
| Total |
¥ | 76,789 | ¥ | (68,301 | ) | ¥ | 8,488 | ¥ | 85,430 | ¥ | (77,575 |
) | ¥ | 7,855 | ||||||||||
| |
|
|
|
|
|
|
|
|
|
|
|
|||||||||||||
Millions of yen |
||||
| Year ending March 31 |
Estimated amortization expense |
|||
| 2025 |
¥ | 976 | ||
| 2026 |
143 | |||
| 2027 |
91 | |||
| 2028 |
91 | |||
| 2029 |
91 | |||
Millions of yen |
||||||||
March 31 |
||||||||
2023 |
2024 |
|||||||
| Balance at beginning of year |
¥ | 14,240 | ¥ | 14,196 | ||||
| Provision for the year |
453 | 1,354 | ||||||
| Settled during the year |
(497 | ) | (38 | ) | ||||
| |
|
|
|
|||||
| Balance at end of year |
¥ | 14,196 | ¥ | 15,512 | ||||
| |
|
|
|
|||||
Millions of yen |
||||||||
March 31 |
||||||||
2023 |
2024 |
|||||||
| Short-term borrowings (1) : |
||||||||
| Commercial paper |
¥ | 299,993 | ¥ | 224,801 | ||||
| Bank borrowings |
176,708 | 81,692 | ||||||
| Other |
531,840 | 748,224 | ||||||
| |
|
|
|
|||||
| Total |
¥ | 1,008,541 | ¥ | 1,054,717 | ||||
| |
|
|
|
|||||
| Long-term borrowings: |
||||||||
| Long-term borrowings from banks and other financial institutions (2)
|
¥ | 3,502,383 | ¥ | 4,074,720 | ||||
| Bonds and notes issued (3) : |
||||||||
| Fixed-rate obligations: |
||||||||
| Japanese Yen denominated |
872,588 | 1,252,324 | ||||||
| Non-Japanese Yen denominated |
3,042,649 | 4,116,627 | ||||||
| Floating-rate obligations: |
||||||||
| Japanese Yen denominated |
893,832 | 546,628 | ||||||
| Non-Japanese Yen denominated |
409,160 | 571,108 | ||||||
| Index / Equity-linked obligations: |
||||||||
| Japanese Yen denominated |
918,693 | 946,400 | ||||||
| Non-Japanese Yen denominated |
346,292 | 418,622 | ||||||
| |
|
|
|
|||||
| 6,483,214 | 7,851,709 | |||||||
| |
|
|
|
|||||
| Subtotal |
9,985,597 | 11,926,429 | ||||||
| |
|
|
|
|||||
| Trading balances of secured borrowings |
413,613 | 525,686 | ||||||
| |
|
|
|
|||||
| Total |
¥ | 10,399,210 | ¥ | 12,452,115 | ||||
| |
|
|
|
|||||
| (1) | Includes secured borrowings of ¥97,481 million and ¥144,920 million as of March 31, 2023 and March 31, 2024 respectively. |
| (2) | Includes secured borrowings of ¥84,999 million and ¥187,692 million as of March 31, 2023 and March 31, 2024 respectively. |
| (3) | Includes secured borrowings of ¥742,267 million and ¥903,662 million as of March 31, 2023 and March 31, 2024 respectively. |
Millions of yen |
||||||||
March 31 |
||||||||
2023 |
2024 |
|||||||
| Debt issued by the Company |
¥ | 4,154,579 | ¥ | 4,243,445 | ||||
| Debt issued by subsidiaries — (1) |
2,026,071 | 5,156,514 | ||||||
| Debt issued by subsidiaries — (1)
|
4,218,560 | 3,052,156 | ||||||
| |
|
|
|
|||||
| Total |
¥ | 10,399,210 | ¥ | 12,452,115 | ||||
| |
|
|
|
|||||
| (1) | Includes trading balances of secured borrowings. |
March 31 |
||||||||
2023 |
2024 |
|||||||
| Short-term borrowings |
1.23 | % | 1.97 | % | ||||
| Long-term borrowings |
2.09 | % | 3.09 | % | ||||
| Fixed-rate obligations |
2.40 | % | 3.73 | % | ||||
| Floating-rate obligations |
2.08 | % | 2.90 | % | ||||
| Index / Equity-linked obligations |
1.09 | % | 1.05 | % | ||||
| Year ending March 31 |
Millions of yen |
|||
| 2025 |
¥ | 1,146,494 | ||
| 2026 |
2,148,270 | |||
| 2027 |
1,225,988 | |||
| 2028 |
942,368 | |||
| 2029 |
1,322,863 | |||
| 2030 and thereafter |
5,140,446 | |||
| |
|
|||
| Subtotal |
11,926,429 | |||
| |
|
|||
| Trading balances of secured borrowings |
525,686 | |||
| |
|
|||
| Total |
¥ | 12,452,115 | ||
| |
|
|||
Millions of yen except per share data presented in yen |
||||||||||||
Year ended March 31 |
||||||||||||
2022 |
2023 |
2024 |
||||||||||
| Basic— |
||||||||||||
| Net income attributable to NHI shareholders |
¥ | 142,996 | ¥ | 92,786 | ¥ | 165,863 | ||||||
| |
|
|
|
|
|
|||||||
| Weighted average number of NHI shares outstanding |
3,063,524,091 | 3,006,744,201 | 3,017,128,412 | |||||||||
| |
|
|
|
|
|
|||||||
| Net income attributable to NHI shareholders per share |
¥ | 46.68 | ¥ | 30.86 | ¥ | 54.97 | ||||||
| |
|
|
|
|
|
|||||||
| Diluted— |
||||||||||||
| Net income attributable to NHI shareholders |
¥ | 142,861 | ¥ | 92,606 | ¥ | 165,701 | ||||||
| |
|
|
|
|
|
|||||||
| Weighted average number of NHI shares outstanding |
3,158,708,013 | 3,114,313,612 | 3,144,540,974 | |||||||||
| |
|
|
|
|
|
|||||||
| Net income attributable to NHI shareholders per share |
¥ | 45.23 | ¥ | 29.74 | ¥ | 52.69 | ||||||
| |
|
|
|
|
|
|||||||
Millions of yen |
||||||||||||
Year ended March 31 |
||||||||||||
2022 |
2023 |
2024 |
||||||||||
| Service cost |
¥ | 6,452 | ¥ | 6,398 | ¥ | 6,028 | ||||||
| Interest cost |
2,042 | 2,432 | 3,484 | |||||||||
| Expected return on plan assets |
(6,055 | ) | (5,968 | ) | (5,658 | ) | ||||||
| Amortization of net actuarial losses |
3,955 | 3,818 | 3,021 | |||||||||
| Amortization of prior service cost |
(1,599 | ) | (1,607 | ) | (1,603 | ) | ||||||
| |
|
|
|
|
|
|||||||
| |
¥ | 4,795 | ¥ | 5,073 | ¥ | 5,272 | ||||||
| |
|
|
|
|
|
|||||||
Millions of yen |
||||||||
As of or for the year ended March 31 |
||||||||
2023 |
2024 |
|||||||
Change in projected benefit obligation: |
||||||||
Projected benefit obligation at beginning of year |
¥ | 293,039 | ¥ | 265,143 | ||||
Service cost |
6,398 | 6,028 | ||||||
Interest cost |
2,432 | 3,484 | ||||||
Actuarial gain |
(22,749 | ) | (14,049 | ) |
||||
Benefits paid |
(13,893 | ) | (15,156 | ) | ||||
Acquisition, divestitures and other |
(84 | ) | (11 | ) | ||||
Projected benefit obligation at end of year |
¥ | 265,143 | ¥ | 245,439 | ||||
Change in plan assets: |
||||||||
Fair value of plan assets at beginning of year |
¥ | 231,461 | ¥ | 219,462 | ||||
Actual return on plan assets |
(2,416 | ) | 10,219 | |||||
Employer contributions |
820 | 848 | ||||||
Benefits paid |
(10,403 | ) | (10,660 | ) | ||||
Fair value of plan assets at end of year |
¥ | 219,462 | ¥ | 219,869 | ||||
Funded status at end of year |
(45,681 | ) | (25,570 | ) | ||||
Amounts recognized in the consolidated balance sheets |
¥ | (45,681 | ) | ¥ | (25,570 | ) | ||
Millions of yen |
||||||||
March 31 |
||||||||
2023 |
2024 |
|||||||
Plans with ABO in excess of plan assets: |
||||||||
PBO |
¥ | 47,672 | ¥ | 45,899 | ||||
ABO |
47,672 | 45,899 | ||||||
Fair value of plan assets |
— | — | ||||||
Plans with PBO in excess of plan assets: |
||||||||
PBO |
¥ | 47,672 | ¥ | 45,899 | ||||
ABO |
47,672 | 45,899 | ||||||
Fair value of plan assets |
— | — | ||||||
Millions of yen |
||||
For the year ended March 31, 2024 |
||||
Net actuarial loss |
¥ | 43,239 | ||
Net prior service cost |
(4,904 | ) |
||
Total |
¥ | 38,335 | ||
Millions of yen |
||||
For the year ending March 31, 2025 |
||||
Net actuarial loss |
¥ | 1,650 | ||
Net prior service cost |
(504 | ) |
||
Total |
¥ | 1,146 | ||
March 31 |
||||||||
2023 |
2024 |
|||||||
Discount rate |
1.3 | % | 1.6 | % | ||||
Rate of increase in compensation levels |
0.4 | % | 0.5 | % | ||||
Interest crediting rate |
2.8 | % | 2.8 | % | ||||
Year ended March 31 |
||||||||||||
2022 |
2023 |
2024 |
||||||||||
Discount rate |
0.7 | % | 0.8 | % | 1.3 | % | ||||||
Rate of increase in compensation levels |
0.3 | % | 0.3 | % | 0.4 | % | ||||||
Expected long-term rate of return on plan assets |
2.6 | % | 2.6 | % | 2.6 | % | ||||||
Interest crediting rate |
2.9 | % | 2.9 | % | 2.8 | % | ||||||
Millions of yen |
||||||||||||||||
March 31, 2023 |
||||||||||||||||
Level 1 |
Level 2 |
Level 3 |
Balance as of March 31, 2023 |
|||||||||||||
Pension plan assets: |
||||||||||||||||
Private equity and pooled investments (1)
|
¥ | — | ¥ | 1,718 | ¥ | 23,078 | ¥ | 24,796 | ||||||||
Japanese government securities |
21,704 | — | — | 21,704 | ||||||||||||
Investment trust funds and other (2)(3)
|
— | 19,918 | 26,328 | 46,246 | ||||||||||||
Life insurance company general accounts |
— | 74,033 | — | 74,033 | ||||||||||||
Other assets |
— | 24,334 | — | 24,334 | ||||||||||||
Total |
¥ | 21,704 | ¥ | 120,003 | ¥ | 49,406 | ¥ | 191,113 | ||||||||
Millions of yen |
||||||||||||||||
March 31, 2024 |
||||||||||||||||
Level 1 |
Level 2 |
Level 3 |
Balance as of March 31, 2024 |
|||||||||||||
Pension plan assets: |
||||||||||||||||
Private equity and pooled investments (1)
|
¥ | — | ¥ | 905 | ¥ | 16,321 | ¥ | 17,226 | ||||||||
Japanese government securities |
14,411 | — | — | 14,411 | ||||||||||||
Investment trust funds and other (2)(3)
|
— | 16,773 | 27,022 | 43,795 | ||||||||||||
Life insurance company general accounts |
— | 74,529 | — | 74,529 | ||||||||||||
Other assets |
— | 31,196 | — | 31,196 | ||||||||||||
Total |
¥ | 14,411 | ¥ | 123,403 | ¥ | 43,343 | ¥ | 181,157 | ||||||||
| (1) | Includes corporate type equity investments. |
| (2) | Includes primarily debt investment funds. Hedge funds and real estate funds are also included. |
| (3) | Certain assets that are measured at fair value using net asset value per share as a practical expedient have not been classified in the fair value hierarchy. As of March 31, 2023 and 2024, the fair values of these assets were ¥28,349 million and ¥38,712 million, respectively. |
Millions of yen |
||||||||||||||||
Year ended March 31, 2023 |
||||||||||||||||
Balance as of April 1, 2022 |
Unrealized and realized gains / (loss) |
Purchases / sales and other settlement |
Balance as of March 31, 2023 |
|||||||||||||
Private equity and pooled investments |
¥ | 29,081 | ¥ | (1,990 | ) | ¥ | (4,013 | ) | ¥ | 23,078 | ||||||
Investment trust funds and other |
27,575 | 2,211 | (3,458 | ) | 26,328 | |||||||||||
Total |
¥ | 56,656 | ¥ | 221 | ¥ | (7,471 | ) | ¥ | 49,406 | |||||||
Millions of yen |
||||||||||||||||
Year ended March 31, 2024 |
||||||||||||||||
|
Balance as of April 1, 2023 |
Unrealized and realized gains / (loss) |
Purchases / sales and other settlement |
Balance as of March 31, 2024 |
|||||||||||||
Private equity and pooled investments |
¥ | 23,078 | ¥ | (316 | ) | ¥ | (6,441 | ) | ¥ | 16,321 | ||||||
Investment trust funds and other |
26,328 | 2,627 | (1,933 | ) | 27,022 | |||||||||||
Total |
¥ | 49,406 | ¥ | 2,311 | ¥ | (8,374 | ) | ¥ | 43,343 | |||||||
Year ending March 31 |
Millions of yen |
|||
2025 |
¥ | 17,302 | ||
2026 |
15,534 | |||
2027 |
14,747 | |||
2028 |
15,304 | |||
2029 |
13,913 | |||
2030-2034 |
57,231 | |||
Outstanding (number of Nomura shares) |
Weighted-average grant date fair value per share |
Weighted-average remaining life until expiry (years) |
||||||||||
Outstanding as of March 31, 2023 |
158,759,875 | ¥ | 451 | 1.0 | ||||||||
Granted |
84,295,700 | 466 | ||||||||||
Forfeited |
(12,039,400 | ) | 460 | |||||||||
Delivered |
(69,433,175 | ) |
451 | |||||||||
Outstanding as of March 31, 2024 |
161,583,000 | ¥ | 459 | 1.0 | ||||||||
Outstanding (number of Nomura shares) |
Weighted-average grant date fair value per share |
Weighted-average remaining life until expiry (years) |
||||||||||
Outstanding as of March 31, 2023 |
4,023,000 | ¥ | 490 | 1.9 | ||||||||
Granted |
— | — | ||||||||||
Exercised |
(2,143,100 | ) |
470 | |||||||||
Forfeited |
(6,600 | ) | 465 | |||||||||
Expired |
(482,900 | ) | 559 | |||||||||
Outstanding as of March 31, 2024 |
1,390,400 | ¥ | 495 | 1.6 | ||||||||
Exercisable as of March 31, 2024 |
1,258,300 | ¥ | 505 | 1.3 | ||||||||
NSUs |
CSUs |
|||||||||||||||
Outstanding (number of units) |
Stock price |
Outstanding (number of units) |
Stock price |
|||||||||||||
Outstanding as of March 31, 2023 |
20,596,542 | ¥ | 484 | 12,595,287 | ¥ | 509 | ||||||||||
Granted |
15,678,023 | 529 |
(1) |
2,808,971 | 484 | |||||||||||
Vested |
(13,443,712 | ) |
556 |
(2) |
(5,976,711 | ) |
532 |
(2) |
||||||||
Forfeited |
(339,642 | ) | (224,157 | ) | ||||||||||||
Outstanding as of March 31, 2024 |
22,491,211 | ¥ | 949 |
(3) |
9,203,390 | ¥ | 612 |
(3) |
||||||||
| (1) | Weighted-average price of the Company’s common stock used to determine number of awards granted. |
| (2) | Weighted-average price of the Company’s common stock used to determine the final cash settlement amount of the awards. |
| (3) | The price of the Company’s common stock used to remeasure the fair value of the remaining outstanding unvested awards as of March 31, 2024. |
Millions of yen |
||||||||||||
Year ended March 31 |
||||||||||||
2022 |
2023 |
2024 |
||||||||||
Current: |
||||||||||||
Domestic |
¥ | 69,661 | ¥ | 35,107 | ¥ | 74,117 | ||||||
Foreign |
7,323 | 16,554 | 22,825 | |||||||||
Subtotal |
76,984 | 51,661 | 96,942 | |||||||||
Deferred: |
||||||||||||
Domestic |
1,561 | 14,356 | 2,566 | |||||||||
Foreign |
1,545 | (8,219 | ) | (2,878 | ) |
|||||||
Subtotal |
3,106 | 6,137 | (312 | ) | ||||||||
Total |
¥ | 80,090 | ¥ | 57,798 | ¥ | 96,630 | ||||||
Year ended March 31 |
||||||||||||
2022 |
2023 |
2024 |
||||||||||
Nomura’s effective statutory tax rate |
31.0 | % | 31.0 | % | 31.0 | % | ||||||
Impact of: |
||||||||||||
Changes in deferred tax valuation allowances (
1 ) |
18.0 | 11.3 | 3.9 | |||||||||
Additional taxable income |
1.0 | 0.7 | 0.2 | |||||||||
Non-deductible expenses |
5.1 | 7.8 | 6.0 | |||||||||
Non-taxable income |
(2.9 | ) | (4.7 | ) | (2.5 | ) | ||||||
Dividends from foreign subsidiaries |
0.0 | 0.1 | 0.0 | |||||||||
Tax effect of undistributed earnings of foreign subsidiaries |
0.1 | 0.3 | (0.2 | ) | ||||||||
Different tax rate applicable to income (loss) of foreign subsidiaries |
0.0 | (0.9 | ) | (0.2 | ) | |||||||
Effect of changes in foreign tax laws (
1 ) |
(14.4 | ) | (1.9 | ) | 0.0 | |||||||
Tax benefit recognized on the outside basis differences for investment in subsidiaries and affiliates |
0.0 | (2.3 | ) | (0.0 | ) |
|||||||
Other |
(2.6 | ) | (2.7 | ) | (2.9 | ) | ||||||
Effective tax rate |
35.3 | % | 38.7 | % | 35.3 | % | ||||||
| (1) | The U.K. Finance Act 2021, enacted on June 10, 2021, increases the headline U.K. corporation tax rate from 19% to 25% on April 1, 2023. Deferred tax assets and liabilities as of the balance sheet date are calculated by reference to the most appropriate enacted rates as of March 31, 2022. As a result of the change in closing deferred tax rate, Nomura recognized a movement in Effect of changes in foreign tax laws of ¥36 billion (which decreased Nomura’s effective tax rate by 16.0%), which was offset by a movement in Changes in deferred tax valuation allowances of ¥36 billion (which increased Nomura’s effective tax rate by 16.0% ) during the year ended March 31, 2022. |
Millions of yen |
||||||||
March 31 |
||||||||
2023 |
2024 |
|||||||
Deferred tax assets |
||||||||
Depreciation, amortization and valuation of fixed assets |
¥ | 38,596 | ¥ | 41,883 | ||||
Investments in subsidiaries and affiliates |
7,458 | 7,364 | ||||||
Valuation of financial instruments |
123,841 | 136,834 | ||||||
Accrued pension and severance costs |
17,308 | 11,837 | ||||||
Other accrued expenses and provisions |
74,043 | 83,418 | ||||||
Operating losses |
414,084 | 477,358 | ||||||
Lease liabilities |
48,329 | 48,951 | ||||||
Other |
19,645 | 20,811 | ||||||
Gross deferred tax assets |
743,304 | 828,456 | ||||||
Less — |
(515,068 | ) | (595,668 | ) |
||||
Total deferred tax assets |
228,236 | 232,788 | ||||||
Deferred tax liabilities |
||||||||
Investments in subsidiaries and affiliates |
100,335 | 109,611 | ||||||
Valuation of financial instruments |
118,314 | 111,175 | ||||||
Undistributed earnings of foreign subsidiaries |
2,936 | 2,257 | ||||||
Valuation of fixed assets |
22,540 | 22,945 | ||||||
Right-of-use |
47,775 | 43,443 | ||||||
Other |
7,524 | 4,404 | ||||||
Total deferred tax liabilities |
299,424 | 293,835 | ||||||
Net deferred tax assets (liabilities) |
¥ | (71,188 | ) | ¥ | (61,047 | ) | ||
Millions of yen |
||||||||||||
Year ended March 31 |
||||||||||||
2022 |
2023 |
2024 |
||||||||||
Balance at beginning of year |
¥ | 428,014 | ¥ | 466,145 | ¥ | 515,068 | ||||||
Net change during the year |
38,131 |
(1) |
48,923 |
(2) |
80,600 |
(3) |
||||||
Balance at end of year |
¥ | 466,145 | ¥ | 515,068 | ¥ | 595,668 | ||||||
| (1) | Primarily includes an increase of ¥51,706 million of valuation allowances of certain foreign subsidiaries primarily due to an increase in operating loss carryforwards, and a reduction of ¥13,575 million of valuation allowances related to Japanese subsidiaries and the Company primarily due to a decrease of operating loss carryforwards. In total, ¥38,131 million of allowances increased. |
| (2) | Primarily includes an increase of ¥53,851 million of valuation allowances of certain foreign subsidiaries primarily due to an increase in operating loss carryforwards, and a reduction of ¥4,928 million of valuation allowances related to Japanese subsidiaries and the Company primarily due to a decrease of valuation allowances of Investments in subsidiaries and affiliates. In total, ¥48,923 million of allowances increased. |
| (3) | Primarily includes an increase of ¥83,838 million of valuation allowances of certain foreign subsidiaries primarily due to an increase in operating loss carryforwards, and a reduction of ¥3,238 million of valuation allowances related to Japanese subsidiaries and the Company primarily due to a utilization of loss carryforwards . In total, ¥80,600 million of allowances increased. |
| Jurisdiction |
Fiscal year ended March 31, |
|||
| Japan |
2019 |
(1) | ||
| United Kingdom |
2016 |
(2) | ||
| United States |
2021 |
|||
| (1) | The earliest year in which Nomura remains subject to examination for transfer pricing issues is the fiscal year ended March 31, 2018. |
(2) |
The earliest year in which Nomura remains subject to examination for transfer pricing issues is the fiscal year ended March 31, 2016. |
Millions of yen |
||||||||||||||||||||
For the year ended March 31, 2022 |
||||||||||||||||||||
Balance at beginning of year |
Other comprehensive income (loss) before reclassifications |
Reclassifications out of accumulated other comprehensive income (loss) |
Net change during the year |
Balance at end of year |
||||||||||||||||
| Cumulative translation adjustments |
¥ |
18,316 |
¥ |
118,574 |
¥ |
22 |
¥ |
118,596 |
¥ |
136,912 |
||||||||||
| Pension liability adjustment (1)
|
(43,477 |
) |
(2,156 |
) |
1,830 |
(326 |
) |
(43,803 |
) | |||||||||||
| Own credit adjustments (2)
|
(12,983 |
) |
46,816 |
1,031 |
47,847 |
34,864 |
||||||||||||||
| |
|
|
|
|
|
|
|
|
|
|||||||||||
| Total |
¥ |
(38,144 |
) |
¥ |
163,234 |
¥ |
2,883 |
¥ |
166,117 |
¥ |
127,973 |
|||||||||
| |
|
|
|
|
|
|
|
|
|
|||||||||||
Millions of yen |
||||||||||||||||||||
For the year ended March 31, 2023 |
||||||||||||||||||||
|
Balance at beginning of year |
Other comprehensive income (loss) before reclassifications |
Reclassifications out of accumulated other comprehensive income (loss) |
Net change during the year |
Balance at end of year |
||||||||||||||||
| Cumulative translation adjustments |
¥ | 136,912 | ¥ | 109,801 | ¥ | (3,946 | ) | ¥ | 105,855 | ¥ | 242,767 | |||||||||
| Pension liability adjustment (1)
|
(43,803 | ) | 8,615 | 3,014 | 11,629 | (32,174 | ) | |||||||||||||
| Own credit adjustments (2)
|
34,864 | 73,193 | (196 | ) | 72,997 | 107,861 | ||||||||||||||
| |
|
|
|
|
|
|
|
|
|
|||||||||||
| Total |
¥ | 127,973 | ¥ | 191,609 | ¥ | (1,128 | ) | ¥ | 190,481 | ¥ | 318,454 | |||||||||
| |
|
|
|
|
|
|
|
|
|
|||||||||||
Millions of yen |
||||||||||||||||||||
For the year ended March 31, 2024 |
||||||||||||||||||||
|
Balance at beginning of year |
Other comprehensive income (loss) before reclassifications |
Reclassifications out of accumulated other comprehensive income (loss) |
Net change during the year |
Balance at end of year |
||||||||||||||||
| Cumulative translation adjustments |
¥ | 242,767 | ¥ | 201,662 | ¥ | (358 | ) | ¥ | 201,304 | ¥ | 444,071 | |||||||||
| Pension liability adjustment (1)
|
(32,174 | ) | 11,220 | 1,442 | 12,662 | (19,512 | ) | |||||||||||||
| Own credit adjustments (2)
|
107,861 | (71,965 | ) | (471 | ) | (72,436 | ) |
35,425 | ||||||||||||
| |
|
|
|
|
|
|
|
|
|
|||||||||||
| Total |
¥ | 318,454 | ¥ | 140,917 | ¥ | 613 | ¥ | 141,530 | ¥ | 459,984 | ||||||||||
| |
|
|
|
|
|
|
|
|
|
|||||||||||
| (1) | See Note 12 “ Employee benefit plans |
| (2) | See Note 2 “ Fair value measurements |
Millions of yen | ||||||||||||||
For the year ended March 31 | ||||||||||||||
2022 |
2023 |
2024 |
Affected line items in consolidated statements of income | |||||||||||
Reclassifications out of accumulated other comprehensive income (loss) |
Reclassifications out of accumulated other comprehensive income (loss) |
Reclassifications out of accumulated other comprehensive income (loss) |
||||||||||||
| Cumulative translation adjustments: |
||||||||||||||
¥ |
(21 |
) |
¥ |
4,033 |
¥ |
358 |
Revenue—Other / Non-interest expenses—Other | |||||||
(1 |
) |
(87 |
) |
— |
Income tax expense | |||||||||
| |
|
|
|
|
|
|||||||||
(22 |
) |
3,946 |
358 |
Net income (loss) | ||||||||||
| |
|
|
|
|
|
|||||||||
— |
— |
— |
Net income attributable to noncontrolling interests | |||||||||||
| |
|
|
|
|
|
|||||||||
¥ |
(22 |
) |
¥ |
3,946 |
¥ |
358 |
Net income (loss) attributable to NHI shareholders | |||||||
| |
|
|
|
|
|
|||||||||
Millions of yen | ||||||||||||||
For the year ended March 31 | ||||||||||||||
2022 |
2023 |
2024 |
Affected line items in consolidated statements of income | |||||||||||
Reclassifications out of accumulated other comprehensive income (loss) |
Reclassifications out of accumulated other comprehensive income (loss) |
Reclassifications out of accumulated other comprehensive income (loss) |
||||||||||||
| Pension liability adjustment: |
||||||||||||||
¥ |
(2,585 |
) |
¥ |
(3,372 |
) |
¥ |
(1,737 |
) |
Non-interest expenses—Compensation and benefits / Revenue—Other | |||||
755 |
358 |
295 |
Income tax expense | |||||||||||
| |
|
|
|
|
|
|||||||||
(1,830 |
) |
(3,014 |
) |
(1,442 |
) |
Net income (loss) | ||||||||
| |
|
|
|
|
|
|||||||||
— |
— |
— |
Net income attributable to noncontrolling interests | |||||||||||
| |
|
|
|
|
|
|||||||||
¥ |
(1,830 |
) |
¥ |
(3,014 |
) |
¥ |
(1,442 |
) |
Net income (loss) attributable to NHI shareholders | |||||
| |
|
|
|
|
|
|||||||||
Millions of yen | ||||||||||||||
For the year ended March 31 | ||||||||||||||
2022 |
2023 |
2024 |
Affected line items in consolidated statements of income | |||||||||||
Reclassifications out of accumulated other comprehensive income (loss) |
Reclassifications out of accumulated other comprehensive income (loss) |
Reclassifications out of accumulated other comprehensive income (loss) |
||||||||||||
| Own credit adjustments: |
||||||||||||||
¥ |
(1,161 |
) |
¥ |
334 |
¥ |
597 |
Revenue—Net gain on trading | |||||||
130 |
(138 |
) |
(126 |
) |
Income tax expense | |||||||||
| |
|
|
|
|
|
|||||||||
(1,031 |
) |
196 |
471 |
Net income (loss) | ||||||||||
| |
|
|
|
|
|
|||||||||
— |
— |
— |
Net income attributable to noncontrolling interests | |||||||||||
| |
|
|
|
|
|
|||||||||
¥ |
(1,031 |
) |
¥ |
196 |
¥ |
471 |
Net income (loss) attributable to NHI shareholders | |||||||
| |
|
|
|
|
|
|
|
|
|
|
|
|
|
|
Number of Shares |
||||||||||||
Year ended March 31 |
||||||||||||
2022 |
2023 |
2024 |
||||||||||
| Common stock outstanding at beginning of year |
3,063,155,434 | 3,017,804,012 | 3,003,679,324 | |||||||||
| Decrease of common stock by cancellation of treasury stock |
— | — | (70,000,000 | ) | ||||||||
| Common stock held in treasury: |
||||||||||||
| Repurchases of common stock |
(80,020,237 | ) | (50,016,744 | ) | (80,617,143 | ) | ||||||
| Sales of common stock |
345 | 296 | 534 | |||||||||
| Common stock issued to employees |
34,682,592 | 35,900,087 | 47,695,273 | |||||||||
| Cancellation of treasury stock |
— | — | 70,000,000 | |||||||||
| Other net change in treasury stock |
(14,122 | ) | (8,327 | ) | (2,828 | ) | ||||||
| |
|
|
|
|
|
|||||||
| Common stock outstanding at end of year |
3,017,804,012 | 3,003,679,324 | 2,970,755,160 | |||||||||
| |
|
|
|
|
|
|||||||
Millions of yen |
||||||||
March 31 |
||||||||
2023 |
2024 |
|||||||
| Total assets |
¥ | 3,135,710 | ¥ | 3,370,063 | ||||
| Total liabilities |
2,006,590 | 2,204,376 | ||||||
Millions of yen |
||||||||||||
Year ended March 31 |
||||||||||||
2022 |
2023 |
2024 |
||||||||||
| Net revenues |
¥ | 1,041,000 | ¥ | 1,079,609 | ¥ | 1,187,696 | ||||||
| Non-interest expenses |
786,391 | 838,005 | 937,551 | |||||||||
| Net income attributable to affiliated companies |
179,706 | 179,073 | 176,705 | |||||||||
Millions of yen |
||||||||
March 31 |
||||||||
2023 |
2024 |
|||||||
| Investments in affiliated companies |
¥ | 398,485 | ¥ | 452,437 | ||||
| Advances to affiliated companies |
4,000 | 9,580 | ||||||
| Other receivables from affiliated companies (1)
|
25,415 | 24,782 | ||||||
| Other payables to affiliated companies (2)
|
31,074 | 29,546 | ||||||
| (1) | Includes ROU assets of ¥23,311 million and ¥ 23,157 million as of March 31, 2023 and 2024, respectively. |
| (2) | Includes operating lease liabilities of ¥23,311 million and ¥23,157 million as of March 31, 2023 and 2024, respec tively. |
Millions of yen |
||||||||||||
Year ended March 31 |
||||||||||||
2022 |
2023 |
2024 |
||||||||||
| Revenues |
¥ | 2,660 | ¥ | 2,795 | ¥ |
2,172 | ||||||
| Non-interest expenses |
50,004 | 50,966 | 53,177 | |||||||||
| Purchase of software, securities and tangible assets |
12,760 | 19,602 | 15,367 | |||||||||
Millions of yen |
||||||||
March 31 |
||||||||
2023 |
2024 |
|||||||
| Carrying amount |
¥ | 363,792 | ¥ | 394,091 | ||||
| Fair value |
593,883 | 844,412 | ||||||
Millions of yen |
||||||||||||
Year ended March 31 |
||||||||||||
2022 |
2023 |
2024 |
||||||||||
| Equity in earnings of equity-method investees (1)
|
¥ | 32,083 | ¥ | 47,480 | ¥ | 45,687 | ||||||
| Dividends from equity-method investees |
11,848 | 13,354 | 14,617 | |||||||||
| (1) | Equity in earnings of equity-method investees is reported within Revenue—Other |
Millions of yen |
||||||||
March 31, 2023 |
March 31, 2024 |
|||||||
| Commitments to extend credit |
||||||||
| Liquidity facilities to central clearing counterparties |
¥ | 1,623,897 | ¥ | 1,724,901 | ||||
| Other commitments to extend credit |
1,010,332 | 1,380,710 | ||||||
| |
|
|
|
|||||
| Total |
¥ | 2,634,229 | ¥ | 3,105,611 | ||||
| |
|
|
|
|||||
| Commitments to invest |
¥ | 21,994 | ¥ | 31,989 | ||||
Millions of yen |
||||||||||||||||||||
Total contractual amount |
Years to maturity |
|||||||||||||||||||
Less than 1 year |
1 to 3 years |
3 to 5 years |
More than 5 years |
|||||||||||||||||
| Commitments to extend credit |
||||||||||||||||||||
| Liquidity facilities to central clearing counterparties |
¥ | 1,724,901 | ¥ | 1,724,901 | ¥ | — | ¥ | — | ¥ | — | ||||||||||
| Other commitments to extend credit |
1,380,710 | 180,692 | 388,648 | 476,372 | 334,998 | |||||||||||||||
| |
|
|
|
|
|
|
|
|
|
| ||||||||||
| Total |
¥ | 3,105,611 | ¥ | 1,905,593 | ¥ | 388,648 | ¥ | 476,372 | ¥ | 334,998 | ||||||||||
| |
|
|
|
|
|
|
|
|
|
|||||||||||
| Commitments to invest |
¥ | 31,989 | ¥ | 2,305 | ¥ | 3,698 | ¥ | 461 | ¥ | 25,525 | ||||||||||
Millions of yen |
||||||||||||||||||||||||||||
Total |
Years of payment |
|||||||||||||||||||||||||||
Less than 1 year |
1 to 2 years |
2 to 3 years |
3 to 4 years |
4 to 5 years |
More than 5 years |
|||||||||||||||||||||||
| Purchase obligations |
¥ | 94,478 | ¥ | 16,124 | ¥ | 8,134 | ¥ | 66,054 | ¥ | 1,923 | ¥ | 1,127 | ¥ | 1,116 | ||||||||||||||
Millions of yen |
||||||||||||||||
March 31 |
||||||||||||||||
2023 |
2024 |
|||||||||||||||
Carrying value |
Maximum potential payout / Notional total |
Carrying value |
Maximum potential payout / Notional total |
|||||||||||||
| Derivative contracts (1)(2)
|
¥ | 8,983,145 | ¥ | 514,420,432 | ¥ | 11,286,872 | ¥ | 613,663,415 | ||||||||
| Standby letters of credit and other guarantees (3)
|
— | 1,544,159 | — | 3,561,640 | ||||||||||||
| (1) | Credit derivatives are disclosed in Note 3 “ Derivative instruments and hedging activities |
| (2) | Derivative contracts primarily consist of equity, interest rate and foreign exchange contracts. |
| (3) | Primarily related to a certain sponsored repo program where Nomura guarantees to a third party clearing house in relation to its clients’ payment obligations. Our credit exposures under this guarantee is minimized by obtaining collateral from clients at amount approximately the maximum potential payout under the guarantee. |
Millions of yen |
||||||||||||||||||||||||
Carrying value |
Maximum potential payout/Notional |
|||||||||||||||||||||||
Total |
Years to Maturity |
|||||||||||||||||||||||
Less than 1 year |
1 to 3 years |
3 to 5 years |
More than 5 years |
|||||||||||||||||||||
| Derivative contracts |
¥ | 11,286,872 | ¥ | 613,663,415 | ¥ | 137,188,347 | ¥ | 236,495,377 | ¥ | 53,281,097 | ¥ | 186,698,594 | ||||||||||||
| Standby letters of credit and other guarantees |
— | 3,561,640 | 3,517,487 | 24,321 | 16,976 | 2,856 | ||||||||||||||||||
Millions of yen |
||||||||||||||||||||
Retail |
Investment Management |
Wholesale (1)(2)
(3)
|
Other (Incl. elimination) |
Total |
||||||||||||||||
Year ended March 31, 2022 |
||||||||||||||||||||
Non-interest revenue |
¥ | 324,642 | ¥ | 129,848 | ¥ | 617,227 | ¥ | 232,437 | ¥ | 1,304,154 | ||||||||||
Net interest revenue |
3,343 | 18,145 | 85,828 | (53,203 | ) | 54,113 | ||||||||||||||
Net revenue |
327,985 | 147,993 | 703,055 | 179,234 | 1,358,267 | |||||||||||||||
Non-interest expenses |
268,745 | 76,478 | 628,563 | 163,481 | 1,137,267 | |||||||||||||||
Income before income taxes |
¥ | 59,240 | ¥ | 71,515 | ¥ | 74,492 | ¥ | 15,753 | ¥ | 221,000 | ||||||||||
Year ended March 31, 2023 |
||||||||||||||||||||
Non-interest revenue |
¥ | 297,496 | ¥ | 120,096 | ¥ | 809,681 | ¥ | 175,034 | ¥ | 1,402,307 | ||||||||||
Net interest revenue |
2,695 | 8,463 | (37,301 | ) | (10,316 | ) | (36,459 | ) | ||||||||||||
Net revenue |
300,191 | 128,559 | 772,380 | 164,718 | 1,365,848 | |||||||||||||||
Non-interest expenses |
266,695 | 85,064 | 743,011 | 91,333 | 1,186,103 | |||||||||||||||
Income before income taxes |
¥ | 33,496 | ¥ | 43,495 | ¥ | 29,369 | ¥ | 73,385 | ¥ | 179,745 | ||||||||||
Year ended March 31, 2024 |
||||||||||||||||||||
Non-interest revenue |
¥ | 395,900 | ¥ | 149,575 | ¥ | 875,664 | ¥ | 125,640 | ¥ | 1,546,779 | ||||||||||
Net interest revenue |
6,461 | 4,568 | (9,517 | ) | 24,050 | 25,562 | ||||||||||||||
Net revenue |
402,361 | 154,143 | 866,147 | 149,690 | 1,572,341 | |||||||||||||||
Non-interest expenses |
279,682 | 93,945 | 812,236 | 102,287 | 1,288,150 | |||||||||||||||
Income before income taxes |
¥ | 122,679 | ¥ | 60,198 | ¥ | 53,911 | ¥ | 47,403 | ¥ | 284,191 | ||||||||||
| (1) | Non-interest revenueNon-interest expenseNet gain on trading Non-interest expenses—Other |
| (2) | Non-interest revenue and Non-interest expense for the year ended March 31, 2022 include gains of ¥14,696 million, as the recoverable amount for a part of the claim related to the loss arising from the U.S. PrimeNet gain on trading Non-interest expenses— Other |
| (3) | Non-interest revenue and Non-interest expense for the year ended March 31, 2023 include gains of million, as the recoverable amount for a part of the claim related to the loss arising from the U.S. Prime Brokerage Event was reasonably estimated and collected. The gains are reported within 9,954 Net gain on trading in the amount of ¥million and in (2,071Non-interest expenses—Other in the amount of ¥) million in the consolidated statements of income. |
Millions of yen |
||||||||||||
Year ended March 31 |
||||||||||||
2022 |
2023 |
2024 |
||||||||||
Net gain (loss) related to economic hedging transactions |
¥ | (9,937 | ) | ¥ | (4,846 | ) | ¥ | 2,021 | ||||
Realized gain on investments in equity securities held for operating purposes |
1,355 | 28,385 | 21,027 | |||||||||
Equity in earnings of affiliates |
36,790 | 47,744 | 46,420 | |||||||||
Corporate items (1)
|
(91,073 | ) | (12,590 | ) | (11,997 | ) |
||||||
Other (2)(3)(4)
|
78,618 | 14,692 | (10,068 | ) | ||||||||
Total |
¥ | 15,753 | ¥ | 73,385 | ¥ | 47,403 | ||||||
(1) |
Income before income taxes for the year ended March 31, 2022 includes a loss of approximately ¥62.0 billion related to legacy transactions in the U.S. from before the global financial crisis (2007 – 2008) that was recognized including legal expenses as well as certain transactions intended to mitigate future losses. |
(2) |
Income before income taxes for the year ended March 31, 2022 includes a gain of approximately ¥79.0 billion from the partial sale of Nomura’s investment in the ordinary shares of Nomura Research Institute, Ltd. |
(3) |
Income before income taxes for the year ended March 31, 2023 includes a gain of approximately ¥28.0 billion from the sale of Nomura Research Institute, Ltd. ordinary shares. |
| (4) | Includes the impact of Nomura’s own creditworthiness. |
Millions of yen |
||||||||||||
Year ended March 31 |
||||||||||||
2022 |
2023 |
2024 |
||||||||||
Net revenue |
¥ | 1,358,267 | ¥ | 1,365,848 | ¥ | 1,572,341 | ||||||
Unrealized gain (loss) on investments in equity securities held for operating purposes |
5,623 | (30,271 | ) | (10,341 | ) | |||||||
Consolidated net revenue |
¥ | 1,363,890 | ¥ | 1,335,577 | ¥ | 1,562,000 | ||||||
Non-interest expenses |
¥ | 1,137,267 | ¥ | 1,186,103 | ¥ | 1,288,150 | ||||||
Unrealized gain (loss) on investments in equity securities held for operating purposes |
— | — | — | |||||||||
Consolidated non-interest expenses |
¥ | 1,137,267 | ¥ | 1,186,103 | ¥ | 1,288,150 | ||||||
Income before income taxes |
¥ | 221,000 | ¥ | 179,745 | ¥ | 284,191 | ||||||
Unrealized gain (loss) on investments in equity securities held for operating purposes |
5,623 | (30,271 | ) | (10,341 | ) |
|||||||
Consolidated income before income taxes |
¥ | 226,623 | ¥ | 149,474 | ¥ | 273,850 | ||||||
| (1) | Includes a reversal of unrealized gain (loss) on investments in equity securities held for operating purposes that were sold in the years ended March 31, 2022, 2023 and 2024. |
Millions of yen |
||||||||||||
Year ended March 31 |
||||||||||||
2022 (2)
|
2023 (3)
|
2024 |
||||||||||
Net revenue (1)(3) : |
||||||||||||
Americas |
¥ | 289,571 | ¥ | 290,036 | ¥ | 453,069 | ||||||
Europe |
131,393 | 163,977 | 269,292 | |||||||||
Asia and Oceania |
85,081 | 68,817 | 56,684 | |||||||||
Subtotal |
506,045 | 522,830 | 779,045 | |||||||||
Japan |
857,845 | 812,747 | 782,955 | |||||||||
Consolidated |
¥ | 1,363,890 | ¥ | 1,335,577 | ¥ | 1,562,000 | ||||||
Income (loss) before income taxes (3) : |
||||||||||||
Americas |
¥ | (40,950 | ) | ¥ | (51,743 | ) | ¥ | 14,650 | ||||
Europe |
(21,774 | ) | 9,206 | (33,064 | ) |
|||||||
Asia and Oceania |
28,586 | 31,003 | 23,795 | |||||||||
Subtotal |
(34,138 | ) | (11,534 | ) | 5,381 | |||||||
Japan |
260,761 | 161,008 | 268,469 | |||||||||
Consolidated |
¥ | 226,623 | ¥ | 149,474 | ¥ | 273,850 | ||||||
| (1) | There is no revenue derived from transactions with a single major external customer. |
| (2) | Includes losses arising from the U.S. Prime Brokerage Event. |
| (3) | Includes gains from the estimated recoverable amounts and collected amounts for a part of the claim related to the loss arising from the U.S. Prime Brokerage Event. |
Millions of yen |
||||||||||||
Year ended March 31 |
||||||||||||
2022 |
2023 |
2024 |
||||||||||
Long-lived assets: |
||||||||||||
Americas |
¥ | 103,045 | ¥ | 114,946 | ¥ | 121,633 | ||||||
Europe |
53,643 | 53,161 | 62,063 | |||||||||
Asia and Oceania |
23,600 | 23,839 | 33,820 | |||||||||
Subtotal |
180,288 | 191,946 | 217,516 | |||||||||
Japan |
269,135 | 308,941 | 270,924 | |||||||||
Consolidated |
¥ | 449,423 | ¥ | 500,887 | ¥ | 488,440 | ||||||
|
Exhibit
Number
|
Description |
|
| 1.1 | ||
| 1.2 | ||
| 1.3 | ||
| 1.4 | ||
| 1.5 | ||
| 1.6 | ||
| 2.1 | ||
| 2.2 | ||
| 4.1 | ||
| 8.1 | ||
| 11.1 | ||
| 11.2 | ||
| 11.3 | ||
| 11.4 | ||
| 12.1 | ||
| 12.2 | ||
| 13.1 | ||
| 13.2 | ||
| 15.1 | ||
| 17.1 | ||
| 97.1 | ||
| 101.INS | Inline XBRL Instance Document - the instance document does not appear in the Interactive Data File because its XBRL tags are embedded within the Inline XBRL document |
|
| 101.SCH | Inline XBRL Taxonomy Extension Schema Document |
|
| 101.CAL | Inline XBRL Taxonomy Extension Calculation Linkbase Document |
|
| 101.DEF | Inline XBRL Taxonomy Extension Definition Linkbase Document |
|
| 101.LAB | Inline XBRL Taxonomy Extension Label Linkbase Document |
|
| 101.PRE | Inline XBRL Taxonomy Extension Presentation Linkbase Document |
|
| 104 | The cover page for the Company’s Annual Report on Form 20-F for the year ended March 31, 2023, has been formatted in Inline XBRL |
|
(1) |
The Company has entered into Limitation of Liability Agreements substantially in the form of this exhibit with all of its outside directors and director Shoji Ogawa. |
NOMURA HOLDINGS, INC. |
||||
By: |
/s/ KENTARO OKUDA |
|||
Name: |
Kentaro Okuda |
|||
Title: |
Representative Executive Officer, President and Group Chief Executive Officer |
|||
Exhibit 4.1
(Translation)
LIMITATION OF LIABILITY AGREEMENT
NOMURA HOLDINGS, INC. (hereinafter, the “Company”) and (hereinafter, the “Director”) hereby agree to enter into this limitation of liability agreement (hereinafter, the “Agreement”) in accordance with Article 427, Paragraph 1 of the Companies Act and Article 33, Paragraph 2 of the Articles of Incorporation of the Company.
Article 1
On or after the date that this Agreement is entered into, in the event that the Director, in good faith and without gross negligence in performing his or her duties as a director of the Company, incurs liability to compensate the Company under Article 423, Paragraph 1 of the Companies Act (hereinafter, the “Relevant Liability”), the Company shall limit the Director’s Relevant Liability to the higher of ¥20 million or the total sum of any of the following items:
| (1) | the total amount of remuneration, bonus or other consideration received, or economic benefit accrued by, the Director while in office as a director of the Company for the performance of his or her duties as a director, in the fiscal year in which the facts causing the Relevant Liability arose; or in any prior fiscal year, whichever is the highest amount, multiplied by two (2); |
| (2) | the total amount of retirement bonus or other economic benefit of a similar nature received by the Director from the Company divided by the number of years served as a director (hereinafter, “Years of Service”), or two (2) where the Years of Service is less than two (2) years, multiplied by 2 (two); or |
| (3) | depending on the classification in items (a) and (b) below, each amount set forth below: |
| (a) | In the event that, following his or her appointment to office, the Director exercises Company share options (only in cases listed in the items in Article 238, Paragraph 3 of the Companies Act, excluding those which may have been received by the Director from the Company as compensation for the execution of duty) if any (hereinafter, the “Relevant Share Options”): the amount calculated by multiplying (i) the current per share price of the Company’s share at the time of exercise of the Relevant Share Options, less the amount per share that is the purpose of the Relevant Share Option out of the aggregate sum of the amount provided for in Article 236, Paragraph 1, Item 2 of the Companies Act and the paid-in price as provided for in Article 238, Paragraph 1, Item 3 of the Companies Act (if the amount so calculated is zero or less, then zero), by (ii) the number of shares of the Company delivered to the Director upon exercise of the Relevant Share Options; or |
| (b) | In the event that, following his or her appointment to office, the Director transfers Relevant Share Options: the amount calculated by multiplying the transfer price of Relevant Share Options less the paid-in price as provided for in Article 238, Paragraph 1, Item 3 of the Companies Act, by the number of the Relevant Share Options. |
Article 2
The Company may request the Director to provide any information necessary for determining whether or not a Relevant Liability exists and the amount up to which any such Relevant Liability may be limited.
Article 3
| 1. | In the event that a limitation of the Director’s Relevant Liability is applied pursuant to Article 1 of this Agreement, the Director shall not receive any amount of retirement bonus or other economic benefit of a similar nature from the Company, or exercise or transfer Relevant Share Options without the approval of the general meeting of shareholders of the Company. |
| 2. | In the event that the Director possesses share option certificates representing Relevant Share Options where a limitation of the Director’s Relevant Liability has been applied pursuant to Article 1 of this Agreement, the Director shall be required to deposit such share option certificates with the Company without delay and shall not be permitted to demand the return of the such certificate until after the approval of the general meeting of shareholders of the Company has been obtained for such transfer. |
Article 4
| 1. | This Agreement shall become effective on the date that it is entered into and shall continue to be in effect until the Director loses the position of director of the Company. Further, even if the loss of the position of director of the Company is a formality due to the expiration of a term of office or other reason, when there is an immediate reappointment and acceptance of office of director of the Company, and the position of director of the Company continues to be held, this Agreement shall continue to be in effect, and the same shall apply thereafter. |
| 2. | In the event that the Director becomes an executive director or manager of the Company, or otherwise becomes an employee of the Company, this Agreement shall be of no effect from such time onwards. |
| 3. | Even if this Agreement is terminated, regarding acts that the Director carried out as a director of the Company during the effective term of this Agreement, this Agreement shall apply. |
Article 5
Any matters not covered under this Agreement shall be resolved through mutual consultation between the Company and the Director.
IN WITNESS WHEREOF, the parties hereto have executed this Agreement in duplicate by placing their signatures or affixing their names and seals thereon, with each party retaining a counterpart hereof.
[DATE]
| NOMURA HOLDINGS, INC. |
||
|
|
||
| DIRECTOR |
||
|
|
||
| Exhibit 11.1 (Translation)
|
CODE OF CONDUCT CODE OF CONDUCT CODE of CONDUCT | NOMURA NOMURA CODE of CONDUCT

|
CODE of CONDUCT CODE of CONDUCT

|
Message Introduction Clients Our People Society Nomura Group Corporate Philosophy Purpose We aspire to create a better world by harnessing the power of financial markets Management Vision Achieve sustainable growth by helping resolve social issues Values Entrepreneurial Leadership With passion and courage, we continually innovate to meet the needs of our stakeholders Teamwork To build our values and “Deliver Together”, we promote diversity and collaboration across divisions and regions Integrity Personal integrity is paramount to us. We act honestly, fairly and openly 01 CODE of CONDUCT 02 NOMURA

|
Message Introduction Clients Our People Society Message from the Group CEO Working with pride and integrity Kentaro Okuda President and Group CEO Nomura’s management vision is to achieve sustainable growth by helping resolve social issues. We recognize that raising our corporate value is closely linked to ensuring sustainable growth of society as a whole. Our business relies on trust. When one of us does something to undermine it, we lose credibility with our clients and stakeholders and the entire group is adversely impacted. The Code of Conduct serves as our guide for ethical decision-making and proper conduct as we work to build trust and commit to doing the right thing all the time. A critical part of this is to care for others, speak up when something is not right, and create a psychologically safe workplace that supports everyone. Nurturing diversity and respect for each other are essential to such an environment. We all have a responsibility as members of Nomura Group to do more than just comply with rules and regulations. We must all work together to build a firm where our people conduct themselves with integrity at all times and take pride in everything we do. NOMURA 03 CODE of CONDUCT 04 NOMURA
|
Message Introduction Clients Our People Society CODE of CONDUCT | Table of Contents 05 CODE of CONDUCT Message from the Group CEO -> 03 Introduction What does the Code Mean? -> 07 How do We implement the Code? -> 09 Five questions to ask when in doubt -> 11 Our Code of Conduct -> 13 Key points Conduct for Clients -> 15 Conduct for Our People -> 29 Conduct for Society ->45 The following notes are inserted for easy reference: Good Example For Reference Q&A 06 NOMURA
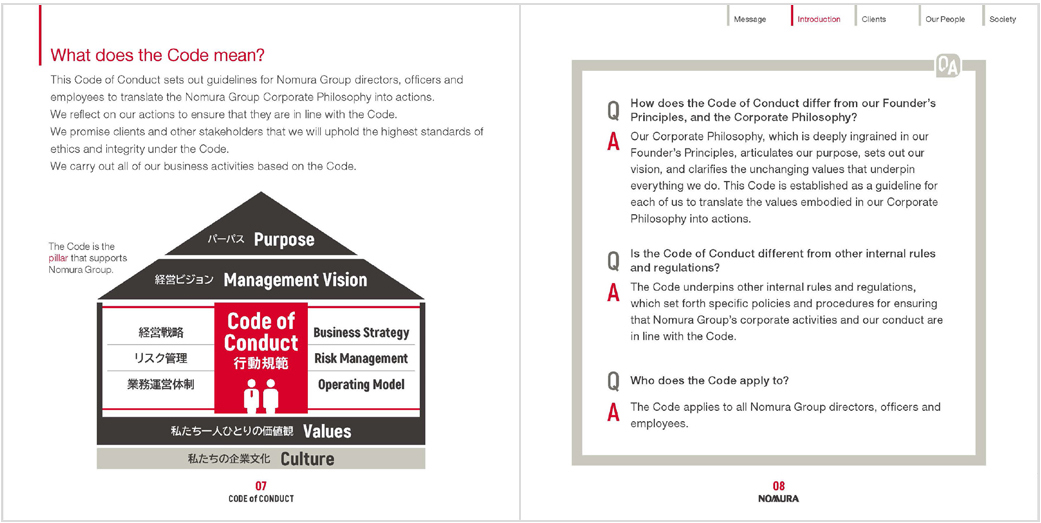
|
Message Introduction Clients Our People Society What does the Code mean? This Code of Conduct sets out guidelines for Nomura Group directors, officers and employees to translate the Nomura Group Corporate Philosophy into actions. We reflect on our actions to ensure that they are in line with the Code. We promise clients and other stakeholders that we will uphold the highest standards of ethics and integrity under the Code. We carry out all of our business activities based on the Code. The Code is the pillar that supports Nomura Group. Purpose Management Vision Code of Conduct Business Strategy Risk Management Operating Model Values Culture 07 CODE of CONDUCT QA Q How does the Code of Conduct differ from our Founder’s Principles, and the Corporate Philosophy? A Our Corporate Philosophy, which is deeply ingrained in our Founder’s Principles, articulates our purpose, sets out our vision, and clarifies the unchanging values that underpin everything we do. This Code is established as a guideline for each of us to translate the values embodied in our Corporate Philosophy into actions. Q Is the Code of Conduct different from other internal rules and regulations? A The Code underpins other internal rules and regulations, which set forth specific policies and procedures from ensuring that Nomura Group’s corporate activities and our conduct are in line with the Code. Q Who does the Code apply to? A The Code applies to all Nomura Group directors, officers and employees. 08 NOMURA
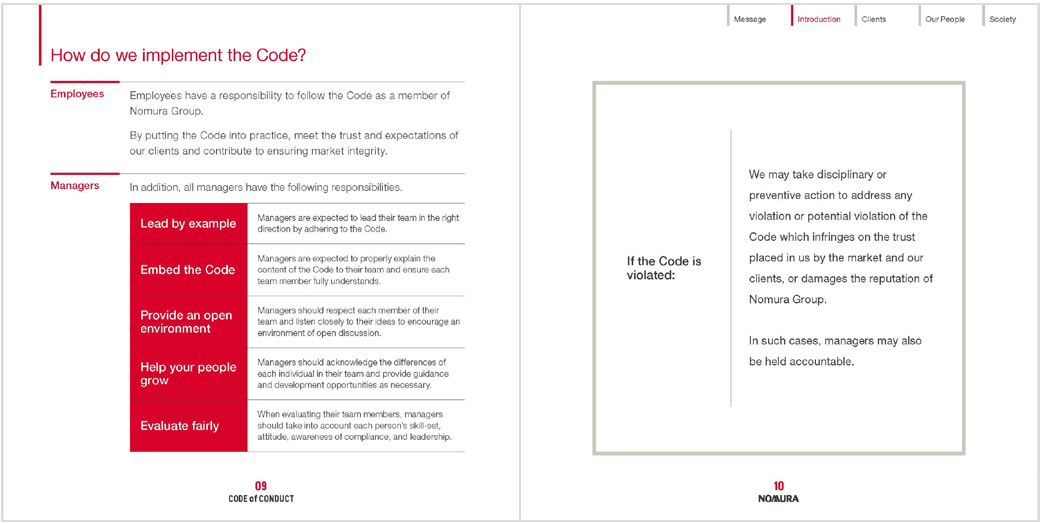
|
Message Introduction Clients Our People Society How do we implement the Code? Employees Employees have a responsibility to follow the Code as a member of Nomura Group. By putting the Code into practice, meet the trust and expectations of our clients and contribute to ensuring market integrity. Managers In addition, all managers have the following responsibilities. Lead by example Managers are expected to lead their team in the right direction by adhering to the Code. Embed the Code Managers are expected to properly explain the content of the Code to their team and ensure each team member fully understands. Provide an open environment Managers should respect each member of their team and listen closely to their ideas to encourage an environment of open discussion. Help your people grow Managers should acknowledge the differences of each individual in their team and provide guidance and development opportunities as necessary. Evaluate fairly When evaluating their team members, managers should take into account each person’s skill-set, attitude awareness of compliance, and leadership. 09 CODE of CONDUCT If the Code is violated: We may take disciplinary or preventive action to address any violation or potential violation of the Code which infringes on the trust placed in us by the market and our clients, or damages the reputation of Nomura Group. In such cases, managers may also be held accountable. 10 NOMURA

|
Message Introduction Clients Our People Society Five questions to ask when in doubt If you are unsure how to act, go back to the basics and ask yourself the following questions. Would you be comfortable if it were made public? YES Did you check relevant rules and regulations? YES Is it in the best interests of the client? YES Is the integrity of the market protected? YES Do you feel comfortable telling your family and friends? YES If in doubt, talk to your manager or compliance officer. 11 CODE of CONDUCT Q What should I do if the answer is NO? A Do not proceed. Check what the problems are and make improvements until you are able to answer YES to all the questions. If you are still unsure, consult with your manager or compliance officer. Q What should I do if conflicts of interest occur between the client and the firm? A The best interests for the client should be prioritized while observing the Code of Conduct. When unsure, you should confirm if you can answer “yes” to all five “Nomura 5 YES” questions. 12 NOMURA
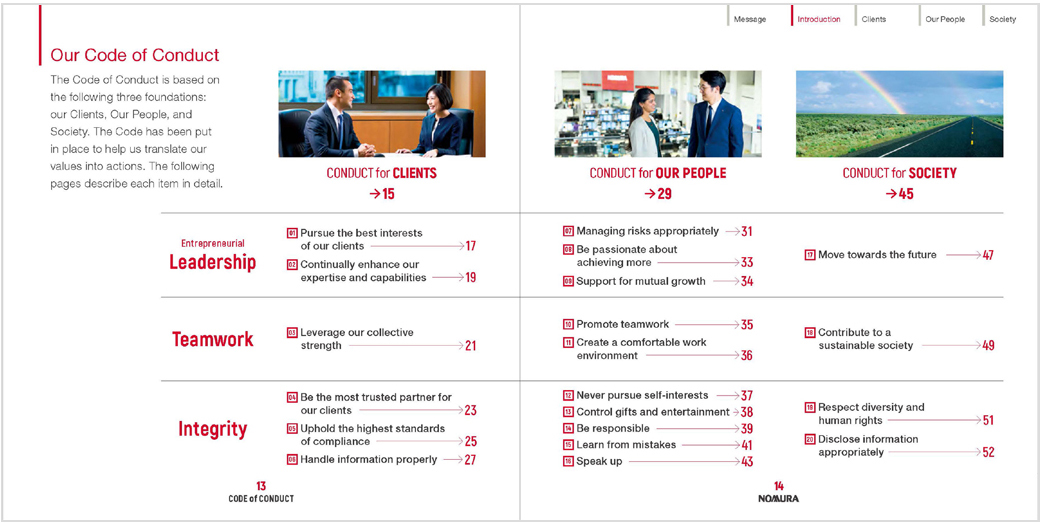
|
Message Introduction Clients Our People Society Our Code of Conduct The Code of Conduct is based on the following three foundations: our Clients, Our People, and Society. The Code has been put in place to help us translate our values into actions. The following pages describe each item in detail. CONDUCT for CLIENTS -> 15 Entrepreneurial Leadership Pursue the best interests of our clients 17 Continually enhance our expertise and capabilities 19 Teamwork Leverage our collective strength 21 Integrity Be the most trusted partner for our clients 23 Uphold the highest standards of compliance 25 Handle information properly 27 13 CODE of CONDUCT CONDUCT for OUR PEOPLE ->29 Managing risks appropriately 31 Be passionate about achieving more 33 Support for mutual growth 34 Promote teamwork 35 Create a comfortable work environment 36 Never pursue self-interests 37 Control gifts and entertainment 38 Be responsible 39 Learn from mistakes 41 Speak up 43 CONDUCT for SOCIETY -> 45 Move towards the future 47 Contribute to a sustainable society 49 Respect diversity and human rights 51 Disclose information appropriately 52 14 NOMURA

|
Message Introduction Clients Our People Society 15 CODE of CONDUCT We always place our clients at the heart of everything we do. To continue to be the most trusted partner for our clients, we collaborate with our team members and provide high quality services. CONDUCT for CLIENTS Pursue the best interests of our clients -> 17 Continually enhance our expertise and capabilities ->19 Leverage our collective strength ->21 Be the most trusted partner for our clients ->23 Uphold the highest standards of compliance ->25 Handle information properly ->27 16 NOMURA

|
Message Introduction Clients Our People Society CONDUCT for CLIENTS 01 Pursue the best interests of our clients We strive to meet our clients’ expectations by understanding their needs and proposing suitable products and services. 17 CODE of CONDUCT To pursue the best interests or our clients: We serve clients with respect, and understand their needs and interests We provide thorough explanation considering the client’s understanding and experience We strive to provide proposals that exceed client expectations Whether or not you have opportunities to directly serve our clients, always keep in mind how our businesses can affect them What does the best interests or our clients actually mean? Acting in the best interests of our clients means providing the optimal financial solution to meet our clients’ needs while also observing the Code of Conduct. Best interests does not necessarily mean maximizing economic interests, but rather developing and providing products and services from the client’s perspective, Furthermore, pursuing the best interests of the client also means to advise when you think something they asked you is not in their best interests. 18 NOMURA

|
Message Introduction Clients Our People Society CONDUCT for CLIENTS To serve our clients with expertise: We stay on top of the latest trends in financial and capital markets around the world We enhance our ability to identify risks our clients are exposed to We build our knowledge of both financial and other fields 02 Continually enhance our expertise and capabilities We take pride and responsibility as financial professionals to enhance our expertise and capabilities in providing the best services to our clients. We properly assess the risks of our clients and take appropriate actions as necessary. “Tail risk” There have been many cases where unexpected events have resulted in severe losses. These include events that you thought would never occur because they had not occurred in the past, or those that very rarely occur. Itis important to recognize there are certain types of risks (tail risk) that can cause significant loss when they become apparent. 19 CODE of CONDUCT 20 NOMURA
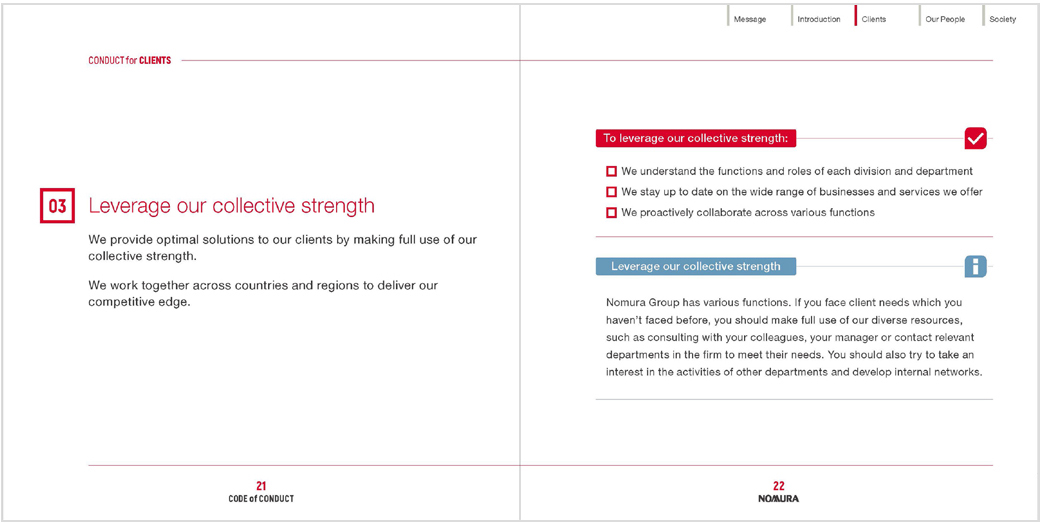
|
Message Introduction Clients Our People Society CONDUCT for CLIENTS 03 Leverage our collective strength We provide optimal solutions to our clients by making full use of our collective strength. We work together across countries and regions to deliver our competitive edge. Leverage our collective strength Nomura Group has various functions. If you face client needs which you haven’t faced before, you should make full use of our diverse resources, such as consulting with your colleagues, your manager or contact relevant departments in the firm to meet their needs. You should also try to take an interest in the activities of other departments and develop internal networks. To leverage our collective strength: We understand the functions and roles of each division and department We stay up to date on the wide range of businesses and services we offer We proactively collaborate across various functions 21 CODE of CONDUCT 22 NOMURA

|
Message Introduction Clients Our People Society CONDUCT for CLIENTS To continue to be the most trusted partner for our clients: We will propose products and services appropriate for each client We will provide information in accordance with the client’s investment experience We will improve the quality of our operations and avoid causing inconvenience to our clients due to errors in administrative procedures We will keep our clients informed and remain direct and prompt even in difficult communications We will let clients know our concerns if something they propose will not be beneficial for them What does “for the client” mean? Just because it is not against the law does not mean we can do anything that our clients request. Activities that undermine market integrity, and behavior that deviates from social norms are ultimately not beneficial for our clients. You should not be driven by immediate profits and should ask yourself if your actions will help build long-term relationships of trust with clients. Then, you should go back to “Nomura 5 YES” and check if what you are about to do is appropriate. 04 Be the most trusted partner for our clients We will always place our clients at the heart of everything we do, deal with them with integrity, and build long-term relationships of trust. 23 CODE of CONDUCT 24 NOMURA
|
Message Introduction Clients Our People Society CONDUCT for CLIENTS 05 Uphold the highest standards of compliance We strictly comply with applicable laws and regulations. In addition, we work with the highest level of compliance awareness to protect our clients and ensure market integrity. The following are examples of acts that are strictly prohibited Insider Trading If someone enters into a transaction using material non-public information (“MNPI”) not known to others, that person will have an unfair advantage over other investors we are committed to protecting market integrity. The use of MNPI for the benefit of a specific investor is unfair. Market Manipulation If transactions intended to artificially change or peg prices are executed, investor decisions will be adversely affected and this will impede the fair operation of the markets. Such conduct undermines market integrity and will lead to a loss of investor trust in the market. Given our role as a gatekeeper for capital markets, we do not tolerate such activities and work to prevent them. We must also act in accordance with principles of fair dealing and good faith. Money Laundering If proper client verification is not carried out prior to a transaction and fraudulent activities occur, we will be unable to prevent proceeds of financial crime from entering into capital markets and terrorism funding. Organized Crime If we fail to prevent transactions with criminal organizations or their members, this can result in financing their illegal activities. Such conduct undermines the development of a sound economy. This will enable organized crime and allow terrorists to expand their sources of funding. We must maintain robust controls to prevent these activities. Violation of the Duty of Explanation Clients may make wrong investment decisions if we fail to properly explain the nature and risks of financial products and services. Conflict of Interest As a global investment bank, we act as an intermediary between the markets and our clients. We manage potential conflicts of interest appropriately to censure our clients’ interests are not adversely affected. We work to protect our clients’ interests at all times. We act with integrity towards all our clients. 25 CODE of CONDUCT 26 NOMURA

|
Message Introduction Clients Our People Society CONDUCT for CLIENTS 06 Handle information properly We strictly manage entrusted client information and only use it in accordance with our client’s understanding. We strictly control and manage material non-public information to protect market integrity, and will never use it improperly. We properly manage internal information to protect the credibility of Nomura Group. Handling of Nomura Group information Details regarding Nomura’s business operations and other company information must not be shared with outside parties, including former employees. If you receive requests for client information from outside parties, promptly report to your manager. If you are contacted by the media, do not respond based on your own judgment. Promptly contact your regional Corporate Communications Department and follow their instructions. Q I believe it will benefit our clients if we promptly communicate information that is to their advantage. If it’s not prohibited by law such as insider information, there’s no issue, right? A We must always consider market integrity and fairness. Please talk to your manager or contact Compliance if you are not sure. 27 CODE of CONDUCT 28 NOMURA

|
Message Introduction Clients Our People Society We adapt to change. We are disciplined in everything we do. We strive to become better, and be the most trusted partners for our clients. CONDUCT for OUR PEOPLE 07 Managing risks appropriately -> 31 08 Be passionate about achieving more -> 33 09 Support for mutual growth -> 34 10 Promote teamwork -> 35 11 Create a comfortable work environment -> 36 12 Never pursue self-interests -> 37 13 Control gifts and entertainment -> 38 14 Be responsible -> 39 15 Learn from mistakes -> 41 18 Speak up -> 43 29 CODE of CONDUCT 30 NOMURA

|
Message Introduction Clients Our People Society 07 Managing risks appropriately We will deepen our knowledge and understanding on risks, properly recognize and evaluate them, and actively engage in risk management. We will assume appropriate risks to pursue the improvement of Nomura Group’s corporate value and provide the highest quality of services to our clients. Each employee is accountable and will work together to prepare for all possible contingencies, Managing risk appropriately: We understand we are accountable, have ownership in risk management and will be proactive in mind and action without leaving things to others In order to maintain trust from all of our stakeholders, we will not only comply with the rules and regulations concerning risk management but also take appropriate actions with integrity, based on understandings of the purpose and background of the rules, and with the highest expertise and ethical standards required of financial institutions We acknowledge we may underestimate risks or take wrong actions. In case we recognize any risk management concerns or issues, we have a responsibility to proactively and promptly escalate concerns to our managers and relevant departments, even when net directly involved in the business We will strive to create a psychologically safe workplace, respecting each other’s opinions and do not treat in disadvantageous manners. As an organization we will recognize risks correctly and make appropriate decisions Q What kind of risks are there and what actions are required? A These are the major risks that require action. Managing risks inherent to our business Appropriate management is required on risks such as “market risk” which is the possibility of incurring losses from market volatility affecting interest rates, currency rates and stock, and “credit risk”, which is the possibility of the firm incurring default losses due to failure of a counterparty (borrower) to honor its contractual obligations, such as derivative investment and financing transactions. Unavoidable risks Among “operational risks’, risks that cannot be completely prevented in business operations, such as human error, and risks caused by external factors, such as natural disasters and third party failures, are included, Efforts to minimize these risks is crucial. Prohibited risks Among operational risks, risks that violate laws and regulations, and adversely affect market fairness, soundness and client protection are included. Efforts are required to eliminate these risks. 31 CODE of CONDUCT 32 NOMURA

|
Message Introduction Clients Our People Society CONDUCT for OUR PEOPLE 08 Be passionate about achieving more We do not shy away from change and always move forward believing in our potential. To keep growing: We listen and respect others’ views and cultivate our own mindsets We actively improve processes and utilize new technologies We always strive to develop our skills Q I want to try something new, but I am worried about making mistakes. A Nomura supports people who take on challenges. Challenges help us learn and provide critical opportunities for growth. Share your ideas with your manager. Managers should motivate their team and support them in taking on new challenges. 09 Support for mutual growth We strive to develop talent to ensure all of our people can realize their full potential through mutual support. To support for mutual growth: We help our colleagues grow and maximize their potential by focusing on their individual needs Between guidance and harassment Providing guidance in an appropriate manner at work does not constitute power harassment. Managers are accountable for creating an inclusive environment for the development of their team through various approaches. 33 CODE of CONDUCT 34 NOMURA

|
Message Introduction Clients Our People Society CONDUCT for OUR PEOPLE 10 Promote teamwork We respect diversity and work together as a team. To maximize teamwork: We strive to maximize our full potential We communicate effectively and get to know each other better We fully share information, knowledge, expertise, and concerns within the team We share the same goals and work together to achieve them 11 Create a comfortable work environment We respect each other and foster a positive environment where everyone can contribute and have an active role. We hold ourselves to a higher standard and do not engage in behavior that can be perceived as harassment. To create a comfortable work environment: We accept flexible working styles Managers should be sensitive to the needs of their team members We are open to each other’s values, viewpoints and ideas that are different from our own to create an open environment in which everyone feels comfortable expressing their views We think of others and consider the impact of what we say or do 35 CODE of CONDUCT 36 NOMURA

|
Message Introduction Clients Our People Society CONDUCT for OUR PEOPLE 12 Never pursue self-interests We do not use information obtained in the course of our business or take advantage of our position at Nomura to gain any improper personal benefit. When trading securities using our personal account, we comply with applicable laws and regulations as well as rules set by Nomura Group companies. 37 CODE of CONDUCT 13 Control gifts and entertainment We do not offer or accept cash (including facilitation payments), cash equivalents, inappropriate gifts or excessive business entertainment from public officials and business counterparts. Q A client offered me a gift certificate. Can I accept it? A You must not accept cash or cash equivalents from clients. However there may be exceptional circumstances where you may be allowed to accept. Please refer to internal guidelines for details. 38 NOMURA

|
Message Introduction Clients Our People Society CONDUCT for OUR PEOPLE 14 Be responsible We show humility and commit to be accountable to our clients, our people and to society. 39 CODE of CONDUCT Our behavior: We are humble in how we interact with others and strive to establish good relationships We are considerate of others and mindful of the impact of our words and actions We maintain personal integrity at all times and never commit acts that are considered sociality unacceptable To be responsible Be mindful of the fact that your action or words may be observed by others and could be taken as a representation of the firm. You should always exercise common sense and act responsibly. Social media is a convenient communication tool. However, disseminating inappropriate information and opinions my undermine the trust of clients with the firm. Keep in mind that regardless of whether you have identified yourself, the individual poster or the firm can be identified in many cases and significantly damage Nomura Group’s credibility and brand. Always exercise common sense and follow internal guidelines and other regulations when using social media. 40 NOMURA

|
Message Introduction Clients Our People Society CONDUCT for OUR PEOPLE 15 Learn from mistakes We recognize our past mistakes and work to never repeat them. We learn from others’ mistakes and use them as an opportunity to reexamine ourselves. 41 CODE of CONDUCT Always remember Nomura Group has caused several scandals in the past. We know how easy it is to lose society’s trust and how difficult it is to restore it. We have also learned a lot from our past mistakes. Every year on August 3*, we all take time to reflect on the lessons learned and renew our pledge to never repeat our past mistakes. * Nomura Founding Principles and Corporate Ethics Day 42 NOMURA
|
Message Introduction Clients Our People Society CONDUCT for OUR PEOPLE 16 Speak up We will promptly report any violation including suspicious behavior of the Code of Conduct to our managers, compliance or where appropriate, to the Compliance Hotline of relevant companies within the Group. 43 CODE of CONDUCT We speak up: To help protect our clients, our people and the firm When we see something suspicious When we see misconduct To create an open environment where everyone feels comfortable voicing their concerns and seriously listen to those who speak up We will respond with integrity to those who escalated their concerns and protect them from any retaliation Compliance Hotline We have established the Compliance Hotline as a Whistleblowing System to enable employees to anonymously escalate issues or concerns. All information received through the Hotline is treated as strictly confidential. We carefully investigate all reports, and take corrective actions as necessary. You will not be subject to any adverse treatment for reports made in good faith. The information you provide may help us detect and correct misconduct early, and make Nomura a better firm. Don’t hesitate to speak up. 44 NOMURA

|
Message Introduction Clients Our People Society CONDUCT for SOCIETY 45 CODE of CONDUCT We have a responsibility to the communities where we live and work. We will proactively contribute to the creation of a better world. CONDUCT for SOCIETY Move towards the future 47 Contribute to a sustainable society 49 Respect diversity and human rights 51 Disclose information appropriately 52 46 NOMURA
|
Message Introduction Clients Our People Society CONDUCT for SOCIETY 17 Move towards the future We play an important role in providing flow of funds and helping create innovation that contribute to building a sustainable society. We continue to actively address environmental and social issues, such as climate change and social inequality. We aspire to create a better world together with our stakeholders, and commit to build a robust operation platform to drive sustainability. 47 CODE of CONDUCT To ensure flow of funds help resolve social issues: We carefully listen to our clients and stakeholders We strive to resolve social issues through our collective strength We extensively use technology and data to provide products and services our clients needs Q What exactly does Nomura Group mean by creation of “a better world”? A We believe that we can realize “a better world” by constantly making efforts to develop and provide high quality products and services. For example, when we develop new products, we consider whether they will contribute to the sustainable development of society and capital markets, and whether they will meet our clients’ needs. We believe that a better world will be created through our commitment in help solving social issues. 48 NOMURA

|
Message Introduction Clients Our People Society CONDUCT for SOCIETY 18 Contribute to a sustainable society We respect cultures and customs of all countries and regions, and always act responsibly toward the environment and society. We continue to actively engage in a wide range of social contribution activities for a sustainable world. 49 CODE of CONDUCT What each of us can do now to contribute to society: We perceive and make efforts to address climate change and other impacts on our natural environment, by using resources effectively, and reducing power consumption Provide opportunities for a wide range of people to improve knowledge on finance, economy, and building assets, and contribute to the formation of a sound capital market. Nomura’s view on Sustainability* We promote initiatives to globally expand our business and strengthen our corporate governance to achieve consistent growth. In developing and providing financial products and services, we recognize that protecting the global environment and implementing diverse initiatives are essential to maintaining development of both the economy and society. Improving our corporate value and promoting sustainable growth of the entire society share the same roadmap. It is essential for each of our people to have a common view on sustainability. *Sustainability: Economic and business development cannot be conducted without considering the environment and society. An integrated approach to pursuit profit and to maintain a long-term perspective to ensure a sustainable environment and society. 50 NOMURA

|
Message Introduction Clients Our People Society CONDUCT for SOCIETY 19 Respect diversity and human rights We promote equal opportunity and do not discriminate on grounds such as nationality, race, sex, gender identity, sexual orientation, creed, social status, or existence of or nonexistence of disability. We respect differences in values and are always sincere. 51 CODE of CONDUCT 20 Disclose information appropriately We retain accurate records and proactively ensure the fair, timely and appropriate disclosure of Nomura Group information including financial statements. This will enable us to be properly evaluated and trusted by society. To disclose information properly: We never falsify, intentionally conceal or maliciously destroy operational and financial information and retain it for a specified period 52 NOMURA

|
Nomura Group CODE of CONDUCT ©NOMURA HOLDINGS, INC. ALL RIGHTS RESERVED. April 2024 CODE of CONDUCT
Exhibit 11.3
| [Nomura Holdings, Inc.] | [Translation] |
Rules on Trading, etc., of Nomura Holdings Stocks, etc. by Nomura Group’s Officers and Employees
Chapter I General Provisions
(Purpose)
| Article 1 | These Rules shall apply to the administration of Corporate Confidential Information on Nomura Holdings Inc. (Hereinafter referred to as “NHI”) and the trading of Nomura Holdings Stocks, etc. (Hereinafter referred to “NHI shares, etc.”) on the accounts of Nomura Group’s Officers and Employees. The purpose of the Rules is to set out the basic issues concerning the trading of NHI shares, etc., to prevent inappropriate transactions in NHI shares etc., and to ensure robust asset formation by Nomura Group’s Officers and Employees and to contribute to the correct business operations of the Nomura Group. |
(Definitions)
| Article 2 | As used in these Rules, “Nomura Group” refers to the companies stated in Article 2 of the Regulations of Nomura Group Management Structure. |
2. As used in these Rules, the term “Officer” means Directors, Executive Officers, Senior Managing Directors, Principle Managing Directors (excluding Principle Managing Directors who are employees.), SMD, Corporate Auditors, and other equivalent persons.
3. As used in these Rules, the term “Employee(s)” means the employees of each Nomura Group company and other persons who are in a delegated or employment relationship with each Nomura Group company.
4. As used in these Rules, the term “Corporate Confidential Information” means information that falls under the category of Corporate Confidential Information as stated in Article 1 (4) (14) of the Cabinet Office Ordinance on Financial Instruments Business, as amended.
5. As used in these Rules, the term “NHI shares, etc.” means the shares and warrants issued by Nomura Holdings, Inc. (excluding stock options as defined in paragraph 6) and related equity instruments (including foreign currency-denominated securities of a similar nature) and corporate bonds, Listed Investment Securities (ETN), and related products thereto (including foreign currency-denominated securities of a similar nature) issued by Nomura Holdings, Inc. and subsidiaries of Nomura Holdings, Inc.(excluding listed subsidiaries)
6. As used in these Rules, the term “stock option” means share options issued by Nomura Holdings, Inc. to Nomura Group’s officers and employees.
7. As used in these Rules, the term “Open Window Period” means a period within 10 business days counting from the day following the date on which Nomura Holdings, Inc. announces its financial results (This includes semi-annual results and quarterly results. The same shall apply hereinafter)
8. As used in these rules, the term “NHI Screening Directors” means a person who conducts an examination as to allow the trading of NHI shares, etc., and who is the Chief Financial Officer (CFO), the Director in charge of Legal and the Internal Administration Supervisor of Nomura Holdings, Inc.
(Compliance with Laws and Regulations)
| Article 3 | When Nomura Group’s Officers and Employees trade NHI shares, etc., they must comply with the Financial Instruments and Exchange Act and other laws and regulations, as well as the rules of the Japan Securities Dealers Association, stock exchanges and internal rules. |
| [Nomura Holdings, Inc.] | [Translation] |
Chapter II Control of Corporate Confidential Information in relation to NHI
(Managing Corporate Confidential Information)
| Article 4 | If an employee of Nomura Group acquires Corporate Confidential Information in relation to Nomura Holdings, Inc., they shall immediately report this to their Department Head (For Nomura Asset Management, they shall report it to the Corporate Information Management Officer). |
2. Each Nomura Group company is required to assign a person who is responsible for managing of Corporate Confidential Information in relation to Nomura Holdings, Inc. (Hereinafter referred to as “Information Manager”). The Department Head who has received the report set forth in the preceding paragraph shall report it to the Information Manager.
3. Notwithstanding the preceding two paragraphs, the overseas subsidiaries of Nomura Group shall make the report to the persons specified in each region.
4. Information Manager and persons designated in each region as set forth in the preceding paragraphs shall report the possession by the relevant employee of Corporate Confidential Information to the Compliance Administration Supervisor
5. If a Nomura Group Officer acquires a Corporate Confidential Information related to Nomura Holdings, Inc., they must report this to the Compliance Administration Supervisor
Chapter III Principles Pertaining to Trading of NHI shares, etc. by Nomura Group Officers and Employees
(Trading of NHI shares, etc. by Officers)
| Article 5 | Officers of Nomura Group shall not, in principle trade NHI shares, etc. However, this shall not apply to the cases specified in the following point: |
(1) Purchase of NHI shares through Nomura Group Board of Directors Stock Ownership Plan
(2) Trading of NHI shares, etc. executed after obtaining approvals from NHI Screening Directors during Open Window Period
2. Details of the approval application procedure noted in point (2) of the preceding paragraph shall be determined separately by each Nomura Group company.
3. Trading of NHI shares, etc. by Officers is allowed only if they place a market order for a purchase/sale before the market opens or a sale order based on a VWAP target transaction on the business day following the day on which the approval set forth in point (2) of paragraph 1 has been obtained.
4. Notwithstanding the preceding paragraph, trading of NHI shares, etc. by officers of overseas subsidiaries after obtaining the approval set forth in point (2) of paragraph 1 shall be executed in accordance with the methods prescribed in each region.
(Trading of NHI shares, etc. by Employees)
| Article 6 | Whenever Employees of Nomura Group trade in NHI shares, etc., they shall obtain prior approval from a specified approver, which is designated in advance in each company. |
2. Employees of Nomura Group shall not trade NHI shares, etc. during the period from the day following the end of Nomura Holding’s quarterly results periods until the day on which the relevant financial results are announced (Hereinafter referred to as “Blackout Period”).
| [Nomura Holdings, Inc.] | [Translation] |
(Trading of NHI shares, etc. by Employees of Nomura Insider Departments)
| Article 7 | Employees of departments that are expected to handle Corporate Confidential Information of Nomura Holdings, Inc. on a regular basis (Hereinafter referred to as “Nomura Insider Departments”) may trade NHI shares, etc. only during the Open Window Period. |
2. The scope of Nomura Insider Departments noted in the preceding paragraph and procedures, etc. for actual trading shall be separately prescribed by each Nomura Group company.
(Holding Period)
| Article 8 | In principle, Nomura Group’s Officers and Employees shall not sell NHI shares, etc. for a period of six months from the date of purchase. |
2. Notwithstanding the preceding paragraph, the holding period restriction shall not be applied with respect to the sale of NHI shares, etc. which were acquired through Nomura Group Board of Directors Stock Ownership Plan and Nomura Group Employees Stock Ownership Plan, acquired through the cumulative stock investment and acquired through the exercise of stock options.
(Transaction Account)
| Article 9 | When Officers and Employees of Nomura Group in Japan (This includes persons who concurrently serve as Officers or Employees of overseas subsidiaries and persons who are seconded to overseas subsidiaries, etc.) want to trade NHI shares, etc. (This includes the sale of NHI shares acquired through the exercise of stock options. The same shall apply hereinafter in this Article.), the transaction shall be carried out in a Nomura Securities Co. Ltd transaction account. However, this shall not apply to cases where the Compliance Administration Supervisor specifically approves. |
2. Each region separately specifies a transaction account for Officers and Employees of overseas subsidiaries (excluding those who concurrently serve as officers and employees of Nomura Group in Japan and persons who are seconded from Nomura Group Company in Japan)
(Maintenance of Internal Rules, etc.)
| Article 10 | Each Nomura Group Company shall, pursuant to these Rules, maintain internal rules that provide for the matters listed in the following points related to the trading of NHI shares, etc. Internal rules that provide for the matters listed in the following points shall be established: |
(1) Matters concerning the principle of prohibition of trading of NHI shares, etc. by officers
(2) Matters related to specific procedures, etc. for cases where officers may exceptionally trade NHI shares, etc.
(3) Matters concerning the prohibition period for trading of NHI shares, etc. by employees
(4) Matters concerning the approval procedures, etc. for trading of NHI shares, etc. by employees
(5) Matters concerning the holding period of NHI shares, etc. for officers and employees
(6) Matters concerning the scope of Nomura Insider Department, the trading of NHI shares, etc. by Nomura Insider Department employee is limited to during the Open Window Period, the procedures etc. pertaining to the trade of NHI shares, etc. by Nomura Insider Department employee in cases where a Nomura Insider Department is to be established
2. With regard to overseas subsidiaries, internal rules set forth in the preceding paragraph may be maintained for each region.
3. Each Nomura Group company shall report to Group Compliance Department Head in advance when establishing, revising or abolishing the internal rules in Paragraph 1.
| [Nomura Holdings, Inc.] | [Translation] |
4. Each Nomura Group company shall not establish any internal rules that contradict or conflict with the contents of these Rules.
Chapter IV Applicability of Secondment and Concurrent Service
(Trade of NHI shares, etc. etc. by seconded employees within Nomura Group)
| Article 11 | Where a person (excluding employees belonging to Nomura Insider Departments as defined in Article 7) is seconded from one company in Nomura Group to another company, etc. in Nomura Group as an officer or employee carries out trades in NHI shares, etc., the procedures of the seconded company shall apply. |
2. Notwithstanding the provisions of the preceding paragraph, where a person seconded from Nomura Securities Co., Ltd. to another Nomura Group company, etc. as an officer or employee carries out trades in NHI shares, etc., both procedures for the seconded company and Nomura Securities Co., Ltd., shall apply.
(Trade of NHI shares, etc. by employees seconded to companies outside Nomura Group)
| Article 12 | Persons seconded from a single company within Nomura Group to a company, etc. outside Nomura Group as an officer or employee are to comply with the internal rules of the seconded company. |
(Trade of NHI shares, etc. by Nomura Group Officers who concurrently hold positions within Nomura Group)
| Article 13 | When officers engaged in the business of multiple companies within Nomura Group trade NHI shares, etc., they shall follow the procedures of each company (excluding companies that are part-time.) in accordance with their position. |
Chapter V Other Provisions
(In cases not provided for in these Rules)
| Article 14 | Matters not provided for in these Rules shall be subject to any separate provisions of the respective companies. |
(Outside Director or Outside Auditor)
| Article 15 | These Rules shall not apply to Outside Directors or Outside Auditors who are not full-time employees of Nomura Group companies (excluding Nomura Holdings, Inc. and Nomura Securities Co., Ltd.) |
(Others)
| Article 16 | Among the companies in Nomura Group, listed companies and continuous disclosure companies with minority shareholders as well as their subsidiaries, etc. may be excluded from the application of this Rues with respect to their independence. |
| [Nomura Holdings, Inc.] | [Translation] |
Supplementary Provisions
Article 1 These Rules shall enter into force on 1 January 2002.
| Date of Amendment | ||||
| August 1, 2002 | June 26, 2003 | April 1, 2006 | ||
| May 1, 2006 | July 1, 2006 | January 17, 2007 | ||
| June 1, 2007 | 11 23, 2009 | February 1, 2010 | ||
| April 2, 2010 | July 1, 2010 | September 30, 2010 | ||
| October 1, 2010 | December 1, 2010 | December 13, 2010 | ||
| April 1, 2011 | June 28, 2011 | July 1, 2011 | ||
| August 1, 2012 | December 1, 2012 | September 6, 2013 | ||
| April 1, 2014 | February 1, 2017 | April 1, 2017 | ||
| May 1, 2019 | ||||
Exhibit 11.4

NOMURA Nomura Group Personal Account Dealing Policy January 2020 STRICTLY PRIVATE AND CONFIDENTIAL Copyright©2024 Nomura This document is the sole property of Nomura. No part of this document may be reproduced in any form or by any means — electronic, mechanical, photocopying, recording or otherwise — without the prior written permission of Nomura.
NOMURA Table of Contents 1. Purpose 1 2. Scope 1 3. Definitions 1 4. Principles 2 4.1 NHI Stock 2 4.2 Material Non-Public Information 2 4.3 Restrictions on Personnel who are considered “Private” or “Above he Wall (REI)” 2 4.4 Restricted List 2 4.5 Conflicts of Interest 2 4.6 Front Running 2 4.7 Prohibited Restrictions on Transactions Which Nomura Has Been Involved 2 5. Policy Standards 3 5.1 Account Disclosures 3 5.2 Designated/Approved Broker 3 5.3 Pre-Trade Approval 3 5.4 Holding Period 4 5.5 Reporting of Trades 4 5.6 Exempted Products 4 5.7 Exempted Accounts 4 5.8 Expatriate and Seconded Personnel 4 5.9 Monitoring 4 5.10 Affirmation 5 5.11 Violations of the Standard 5 6. Affirmation 5 6.1 Ownership 5 6.2 Review 5 6.3 Establishment, Amendment and Abolishment 5 6.4 Deviation to Policy 5 7. Effective Date 5 Version Control 6

NOMURA 1. Purpose The Nomura Group provides clients with financial services globally through a variety of Nomura Group companies based on our philosophy of “putting clients at the heart of everything we do”. With respect to their investment activities in pursuit of personal account formation, all Senior Management , Employees and Contractors of Nomura Group (collectively, “Personnel”) must understand the firm’s mission, not pursue short-term profit but keep the long-term view and contribute to the fairness and soundness of the capital market. This Personal Account Dealing Policy (the “Group Policy”) sets out the principles and the minimum standards that each Nomura Company within the Nomura Group must follow to maintain appropriate controls for personal account dealing in line with Nomura Group’s risk appetite. 2. Scope This Group Policy applies to all subsidiaries of the Nomura Group excluding its investee companies. Each Nomura Group company may further supplement this Group Policy with additional policy requirements and/or clarify the scope of the application of this Group Policy to their company. This Group Policy applies to accounts in the name of Nomura Group’s Personnel and their family. Applicable family account and contractors are defined in relevant Nomura Group local policies in a risk based approach. 3. Definitions “Nomura Group” means Nomura Holdings, Inc. and its consolidated domestic and foreign subsidiaries (excluding its private investee companies). “Material non-public information (MNPI)”, “Watch List”,” Private” and “Public”: The definitions can be found in the document entitled “Nomura Group Chinese Walls Policy”. “Restricted List” is a list used by the Nomura Group whenever securities laws, regulations or firm policy prohibits or restricts the Nomura Group and its Personnel from engaging in certain types of solicitation, trading or research activities. . “Personal Account” is defined as any account at any broker-dealer, bank or other entity through which covered trade instruments may be executed or held. 1
NOMURA 4. Principles All transactions executed through Personal Accounts should follow the below principles. Personnel are prohibited from trading in securities or derivatives that is against standards of conduct contained in internal policies, procedures and guideline, including the Code of Ethics of the Nomura Group. Personnel must understand the Principles related to Personal Account Dealing and comply with the Group Policy, relevant Nomura Group local policies as well as applicable rules and regulations. 4.1 NHI Stock Transactions in Nomura Holdings, Inc. stock must follow the regulations set out in the document entitled “Regulations On Tradings Stocks, Etc. Of Nomura Holdings, Inc. By Officers And Employees Of Nomura Group*. Please refer to the regulations prior to executing transactions in NHI stock. 4.2 Material Non-Public Information Personnel are prohibited from entering into transactions in the possession of material non-public information (MNPI) in breach of applicable rules and regulation. 4.3 Restrictions on Personnel who are considered “Private” or “Above the Wall (REI)” Personnel who are considered “Private” or “Above the Wall (REI)” are prohibited from trading single name securities or any derivatives or instruments with single stock as underling security, or narrow-based ETFs. “Private” or “Above the Wall (REI)” personnel are allowed to sell the pre-existing securities, subject to at least Compliance pre-trade approval. 4.4 Restricted List Personnel are prohibited from trading in Personal Accounts any names that are on the firm’s accessible restricted list if these are applicable for Personal Account Dealing. 4.5 Conflicts of Interest Personnel are prohibited from trading in Personal Accounts that conflicts with duties owed to the Nomura Group, its clients or customers. 4.6 Front Running Personnel are prohibited from trading in securities or derivatives of companies on the basis of an impending research publication or a pending client or firm order. 4.7 Prohibited Restrictions on Transactions Which Nomura Has Been Involved Personnel are prohibited from trading in the following transactions. 2
NOMURA Subscribing for any listed shares or bonds via placement or public offering that is advised, managed, or underwritten by Nomura Group ; and Nomura OTC structured products. 5. Policy Standards All Nomura Group companies must have in place policies and procedures to ensure that the following Global Personal Account Dealing Policy standards are met; 5.1 Account Disclosures Personnel are required to disclose personal securities trading accounts within 30 days after joining the firm. 5.2 Designated /Approved Broker Personnel are required to maintain their Personal Accounts at one or more of the Designated /Approved Brokers, which are determined at relevant Nomura Group local policies. The following types of accounts are exempted from Designated / Approved Broker requirement. All the other policy requirements, e.g. pre-trade approval, must be complied with. Employee stock option accounts from previous employers Individual retirement accounts, and certain high interest savings accounts (regionally dependent) which have tax benefits Inheritance accounts whereby employee is receiving a benefit or acting as executioner of deceased relative’s last will and testament. Accounts with holding of delisted securities only which are not able to be transferred to other brokerage accounts For reasons other than the above, accounts which are not able to be transferred to Designated/Approved brokerage are exempted from this requirement subject to each Nomura Group Compliance’s approval. 5.3 Pre-Trade Approval Personnel are subject to their relevant Nomura Group local policies that, at a minimum, include pre-trade approval by a designated person that each Nomura Group company stipulates. 3
NOMURA 5.4 Holding Period Personnel are subject to their relevant Nomura Group local policies that, at a minimum, include a holding period consistent with local market standard. 5.5 Reporting of Trades Personnel are responsible for ensuring that their trades in a Personal Account are reported to their respective Nomura Group companies. This may include ensuring their broker is electronically reporting the trades or providing paper statements to the Compliance department. If the broker does not provide, Personnel are responsible for providing those statements to the Compliance department. Personal Accounts, which are opened at Nomura Securities Co., Ltd. by Personnel, are excluded from this requirement. 5.6 Exempted Products The Exempted products are highly liquid, less dependent to single name or are not securities hence, these products are exempted from the Group Policy. The Exempted Products are determined at relevant Nomura Group local policies as local regulatory requirements are varied. Regional Compliance should consult with NHI Group Compliance prior to updating their exempted product lists. 5.7 Exempted Accounts The following accounts are exempted from the Group policy. Local policy may have additional requirements for these or similar accounts: Discretionary Account Accounts which only trade Exempt Products 5.8 Expatriate and Seconded Personnel Expatriate and Seconded Personnel are subject to both the home country/company’s policy and local policy. 5.9 Monitoring Compliance will conduct various monitoring against the requirements of the Policy. This may include contract note reconciliation amongst other monitoring activities. It includes monitoring of possible insider dealing by Personnel through their personal account trading by Watch list. 4
5.10 Affirmation Personnel must affirm at least annually that they have fully disclosed their personal accounts in accordance with their relevant Nomura local policies. 5.11 Violations of the Standard Personnel who violate this standard either unknowingly or intentionally, may be subject to an inquiry and/or disciplinary action, including, but not limited to, possible suspension or termination of employment/contract. 6. Administration 6.1 Ownership This Group Policy is owned by the NHI Group Compliance Department (GCD). GCD should confirm that all applicable Nomura entities are compliant with this Group Policy Periodically. 6.2 Review This Group Policy must be reviewed and where necessary revised at least annually by Head of NHI Group Compliance Department to ensure it continues to meet internal and external requirements. 6.3 Establishment, Amendment and Abolishment The establishment, amendment and abolition of this Policy are subject to the prior approval of the NHI Executive Management Board. 6.4 Deviation to Policy If there is any deviation from this Group Policy in relevant Nomura Group local policies, Nomura Group Company must seek approval from Chief Compliance Officer for either a temporary exemption or permanent exemption. 7. Effective Date This version of the Policy is effective from 14” of January 2020. 5

NOMURA Version Control Version Date Description Author 1.0 January 2020 Creation of document NHI Group Compliance Department 6
Exhibit 12.1
Certification
I, Kentaro Okuda, certify that:
1. I have reviewed this annual report on Form 20-F of Nomura Holdings, Inc.;
2. Based on my knowledge, this report does not contain any untrue statement of a material fact or omit to state a material fact necessary to make the statements made, in light of the circumstances under which such statements were made, not misleading with respect to the period covered by this report;
3. Based on my knowledge, the financial statements, and other financial information included in this report, fairly present in all material respects the financial condition, results of operations and cash flows of the company as of, and for, the periods presented in this report;
4. The company’s other certifying officer and I are responsible for establishing and maintaining disclosure controls and procedures (as defined in Exchange Act Rules 13a-15(e) and 15d-15(e)) and internal control over financial reporting (as defined in Exchange Act Rules 13a-15(f) and 15d-15(f)) for the company and have:
a) Designed such disclosure controls and procedures, or caused such disclosure controls and procedures to be designed under our supervision, to ensure that material information relating to the company, including its consolidated subsidiaries, is made known to us by others within those entities, particularly during the period in which this report is being prepared;
b) Designed such internal control over financial reporting, or caused such internal control over financial reporting to be designed under our supervision, to provide reasonable assurance regarding the reliability of financial reporting and the preparation of financial statements for external purposes in accordance with generally accepted accounting principles;
c) Evaluated the effectiveness of the company’s disclosure controls and procedures and presented in this report our conclusions about the effectiveness of the disclosure controls and procedures, as of the end of the period covered by this report based on such evaluation; and
d) Disclosed in this report any change in the company’s internal control over financial reporting that occurred during the period covered by the annual report that has materially affected, or is reasonably likely to materially affect, the company’s internal control over financial reporting; and
5. The company’s other certifying officer and I have disclosed, based on our most recent evaluation of internal control over financial reporting, to the company’s auditors and the audit committee of the company’s board of directors (or persons performing the equivalent functions):
a) All significant deficiencies and material weaknesses in the design or operation of internal control over financial reporting which are reasonably likely to adversely affect the company’s ability to record, process, summarize and report financial information; and
b) Any fraud, whether or not material, that involves management or other employees who have a significant role in the company’s internal control over financial reporting.
| Date: June 26, 2024 |
| /s/ Kentaro Okuda |
| Kentaro Okuda |
| Representative Executive Officer, President and Group Chief Executive Officer |
Exhibit 12.2
Certification
I, Takumi Kitamura, certify that:
1. I have reviewed this annual report on Form 20-F of Nomura Holdings, Inc.;
2. Based on my knowledge, this report does not contain any untrue statement of a material fact or omit to state a material fact necessary to make the statements made, in light of the circumstances under which such statements were made, not misleading with respect to the period covered by this report;
3. Based on my knowledge, the financial statements, and other financial information included in this report, fairly present in all material respects the financial condition, results of operations and cash flows of the company as of, and for, the periods presented in this report;
4. The company’s other certifying officer and I are responsible for establishing and maintaining disclosure controls and procedures (as defined in Exchange Act Rules 13a-15(e) and 15d-15(e)) and internal control over financial reporting (as defined in Exchange Act Rules 13a-15(f) and 15d-15(f)) for the company and have:
a) Designed such disclosure controls and procedures, or caused such disclosure controls and procedures to be designed under our supervision, to ensure that material information relating to the company, including its consolidated subsidiaries, is made known to us by others within those entities, particularly during the period in which this report is being prepared;
b) Designed such internal control over financial reporting, or caused such internal control over financial reporting to be designed under our supervision, to provide reasonable assurance regarding the reliability of financial reporting and the preparation of financial statements for external purposes in accordance with generally accepted accounting principles;
c) Evaluated the effectiveness of the company’s disclosure controls and procedures and presented in this report our conclusions about the effectiveness of the disclosure controls and procedures, as of the end of the period covered by this report based on such evaluation; and
d) Disclosed in this report any change in the company’s internal control over financial reporting that occurred during the period covered by the annual report that has materially affected, or is reasonably likely to materially affect, the company’s internal control over financial reporting; and
5. The company’s other certifying officer and I have disclosed, based on our most recent evaluation of internal control over financial reporting, to the company’s auditors and the audit committee of the company’s board of directors (or persons performing the equivalent functions):
a) All significant deficiencies and material weaknesses in the design or operation of internal control over financial reporting which are reasonably likely to adversely affect the company’s ability to record, process, summarize and report financial information; and
b) Any fraud, whether or not material, that involves management or other employees who have a significant role in the company’s internal control over financial reporting.
| Date: June 26, 2024 |
| /s/ Takumi Kitamura |
| Takumi Kitamura |
| Chief Financial Officer |
Exhibit 13.1
Certification
Pursuant to 18 U.S.C. §1350, the undersigned officer of Nomura Holdings, Inc. (the “Company”) hereby certifies, to such officer’s knowledge, that the Company’s annual report on Form 20-F for the year ended March 31, 2024 (the “Report”) fully complies with the requirements of Section 13(a) or 15(d), as applicable, of the Securities Exchange Act of 1934 and that the information contained in the Report fairly presents, in all material respects, the financial condition and results of operations of the Company.
Date: June 26, 2024
| /s/ Kentaro Okuda |
| Kentaro Okuda |
| Representative Executive Officer, |
| President and Group Chief Executive Officer |
Exhibit 13.2
Certification
Pursuant to 18 U.S.C. §1350, the undersigned officer of Nomura Holdings, Inc. (the “Company”) hereby certifies, to such officer’s knowledge, that the Company’s annual report on Form 20-F for the year ended March 31, 2024 (the “Report”) fully complies with the requirements of Section 13(a) or 15(d), as applicable, of the Securities Exchange Act of 1934 and that the information contained in the Report fairly presents, in all material respects, the financial condition and results of operations of the Company.
Date: June 26, 2024
| /s/ Takumi Kitamura |
| Takumi Kitamura |
| Chief Financial Officer |
Exhibit 15.1
Consent of Independent Registered Public Accounting Firm
We consent to the incorporation by reference in the Registration Statements (Form F-3 No. 333-261756 and No. 333-273353 and Form S-8 No. 333-228585, No. 333-228586, No. 333-231683, No. 333-239996, No. 333-256408, No. 333-265160, No. 333-272157, and No. 333-279645) and related Prospectuses of Nomura Holdings, Inc. of our reports dated June 26, 2024, with respect to the consolidated financial statements of Nomura Holdings, Inc. and the effectiveness of internal control over financial reporting of Nomura Holdings, Inc., included in this Annual Report (Form 20-F) for the year ended March 31, 2024.
/s/ Ernst & Young ShinNihon LLC
Tokyo, Japan
June 26, 2024
Exhibit 17.1
Subsidiary Issuer of Registered Guaranteed Securities
Nomura Holdings, Inc. (“NHI”) fully and unconditionally guarantees certain securities issued by its indirect, wholly owned finance subsidiary, Nomura America Finance LLC (“NAFL”). The securities issued by NAFL and guaranteed by NHI that are subject to Section 13(a) or 15(d) of the Securities Exchange Act of 1934 are as follows:
| • | Senior Global Medium-Term Notes, Series A, Callable Leveraged Steepener Notes due November 24, 2025 |
| • | Senior Global Medium-Term Notes, Series A, Callable Leveraged Steepener Notes due December 31, 2033 |
| • | Senior Global Medium-Term Notes, Series A, Callable Leveraged Steepener Notes due February 28, 2034 |
| • | Senior Global Medium-Term Notes, Series A, Callable Leveraged Steepener Notes due May 30, 2034 |
| • | Senior Global Medium-Term Notes, Series A, Callable Contingent Coupon Trigger Notes Linked to Russell 2000® Index due July 16, 2024 |
| • | Senior Global Medium-Term Notes, Series A, Callable Leveraged Steepener Notes due July 29, 2034 |
| • | Senior Global Medium-Term Notes, Series A, CPI-Linked Notes due December 24, 2024 |
| • | Senior Global Medium-Term Notes, Series A, Callable Leveraged Steepener Notes due December 24, 2034 |
| • | Senior Global Medium-Term Notes, Series A, Contingent Coupon Trigger Notes Linked to Russell 2000® Index due February 18, 2025 |
| • | Senior Global Medium-Term Notes, Series A, 3.00% Fixed to Floating Rate Notes due August 21, 2025 |
| • | Senior Global Medium-Term Notes, Series A, Autocallable Contingent Coupon Barrier Notes Linked to the Least Performing of the Equity Securities of Apple Inc., Cisco Systems, Inc. and International Business Machines Corporation due May 13, 2025 |
| • | Senior Global Medium-Term Notes, Series A, Autocallable Contingent Coupon Barrier Notes Linked to the Least Performing of the Equity Securities of Apple Inc., Cisco Systems, Inc. and Dell Technologies Inc. due May 13, 2025 |
| • | Senior Global Medium-Term Notes, Series A, Market-Linked Notes Linked to the Common Stock of Arista Networks, Inc. due June 20, 2025 |
Exhibit 97.1
Nomura Holdings, Inc.
Compensation Recovery Policy
Article 1. (Purpose)
This Nomura Holdings, Inc. (“NHI”) Compensation Recovery Policy (this “Recovery Policy”), in addition to the Nomura Group compensation policy for all the employees and statutory officers (“Basic Policy”), Compensation Policy for Directors and Executive Officers of Nomura Holdings, Inc. (“Policy for Statutory Officers”) and the compensation policy for Nomura Group officers and employees, including senior managing directors of NHI and directors of subsidiaries of NHI but excluding Directors and Executive Officers of NHI (“Employee Policy”), establishes the policy to recover erroneously awarded Compensation received by current or former Officers. This Recovery Policy is designed to comply with Section 10D of the U.S. Securities Exchange Act of 1934, as amended (the “Exchange Act”), Rule 10D-1 thereunder, and Section 303A.14 of the New York Stock Exchange Listed Company Manual (“Section 303A.14”), and will be interpreted and applied accordingly. Capitalized terms used in this Recovery Policy are defined as provided herein.
Article 2. (Definitions)
| 1. | “Compensation” means any compensation that is granted, earned, or vested based wholly or in part upon the attainment of a Financial Reporting Measure. |
| 2. | “Covered Event” means where NHI is required to prepare an accounting restatement due to the material noncompliance of NHI with any financial reporting requirement under the securities laws, including any accounting restatement to correct an error in previously issued financial statements that is material to the previously issued financial statements, or that would result in a material misstatement if the error were corrected in the current period or left uncorrected in the current period. |
| 3. | “Financial Reporting Measure” means (a) any measure that is determined and presented in accordance with the accounting principles used in preparing NHI’s financial statements, and any measures that are derived wholly or in part from such measures and (b) NHI’s stock price or the total shareholder return of NHI. A measure, however, need not be presented with the financial statements or included in a filing with the U.S. Securities and Exchange Commission (“SEC”) to constitute a Financial Reporting Measure. |
| 4. | “Officers” means any person who is or was an “executive officer” of NHI, as determined pursuant to Section 303A.14. |
| 5. | “Restatement Date” means the earlier to occur of: (i) the date NHI’s Board of Directors concludes, or reasonably should have concluded, that the Covered Event has occurred; or (ii) the date a court, regulator, or other legally authorized body directs NHI to prepare any accounting restatement as described in the definition of the Covered Event. |
Article 3. (Scope)
| 1. | This Recovery Policy shall apply to Compensation received by a current or former Officer (a “Covered Person”) on or after October 2, 2023: |
| (1) | after beginning service as an Officer; |
| (2) | who served as an Officer at any time during the performance period for the Compensation; |
| (3) | while NHI has a class of securities listed on a national securities exchange or a national securities association registered with the SEC; and |
| (4) | during the three completed fiscal years immediately preceding the Restatement Date (or such longer period as required under Section 303A.14 in the event NHI changes its fiscal year). |
| 2. | Compensation is deemed received in NHI’s fiscal period during which the Financial Reporting Measure specified in the Compensation award is attained, even if the payment or grant of the Compensation occurs after the end of that period. |
Article 4. (Recovery)
| 1. | Upon the occurrence of a Covered Event, NHI shall recover the following amount from a Covered Person: the amount of Compensation received that exceeds the amount of Compensation that otherwise would have been received had it been determined based on the restated Financial Reporting Measures, computed without regard to any taxes paid on such Compensation. |
| 2. | If the amount of the Compensation received by a Covered Person was based on NHI’s stock price or total stockholder return and is not subject to mathematical recalculation directly from the information in the accounting restatement described in the Covered Event, the amount to be recovered shall be based on a reasonable estimate of the effect of the accounting restatement on the stock price or total stockholder return upon which the Compensation was received. NHI shall obtain and maintain all documentation of the determination of such reasonable estimate and provide such documentation to the NYSE when required. |
| 3. | Recoupment of Compensation pursuant to this Recovery Policy shall be made on a “no fault” without regard to whether any misconduct occurred or whether any Covered Person has responsibility for the noncompliance that resulted in the Covered Event. |
| 4. | NHI must recover the amount in accordance with Paragraph 1 above except to the extent the majority of the independent directors of NHI has made a determination that recovery would be impracticable for any of the following reasons: |
| (1) | The direct expense paid to a third party to assist in enforcing this Recovery Policy would exceed the amount to be recovered, provided that before concluding that it would be impracticable to recover any Compensation based on the exception contemplated under this Article 4 Paragraph 4(1), NHI shall make a reasonable attempt to recover such Compensation, and shall document such reasonable attempt(s) to recover and provide that documentation to the NYSE when required. |
| (2) | Recovery would violate an applicable home country law adopted prior to November 28, 2022, provided that before concluding that it would be impracticable to recover any amount of Compensation based on the exception contemplated under this Article 4 Paragraph 4(2), NHI shall engage legal counsel experienced and qualified to practice law in the applicable jurisdiction (if such counsel is acceptable to the NYSE) to render an opinion that recovery would result in a violation of law and shall provide such opinion to the NYSE; or |
| (3) | Recovery would likely cause an otherwise tax-qualified, broad-based retirement plan of NHI to fail to meet the requirements of 26 U.S.C. 401(a)(13) or 26 U.S.C. 411(a) and regulations thereunder. |
| 5. | Any right of recovery under this Recovery Policy is in addition to, and not in lieu of, any other remedies or rights of recovery that may be available to NHI pursuant to the terms of any award agreement and any other legal remedies available to NHI. |
Article 5. (Method of Recovery)
| 1. | To recover the erroneously awarded compensation in accordance with Article 4, NHI may or may cause its subsidiaries to (a) cancel any unvested portion of the Compensation previously awarded; (b) forfeit any vested but unpaid portion of the Compensation previously awarded; (c) require the Covered Person to repay any amount equivalent to the Compensation subject to recoupment; (d) seek recovery of any gain realized on or since the vesting, exercise, settlement, sale, transfer, or other disposition of any share-based awards; (e) offset the recouped amount from any compensation otherwise owed by NHI to the Covered Person (including, without limitation, any severance otherwise payable by NHI to the Covered Person); use any other remedial and recovery method authorized by applicable law or contract. |
| 2. | NHI will determine, in its sole discretion, the terms on which and the process by which erroneously awarded compensation must be recovered. Any sums owed to NHI under this Recovery Policy may be deducted from relevant individual’s salary or any outstanding payments due from NHI or its subsidiaries in accordance with applicable laws and as authorized by contract. |
Article 6. (No Indemnification)
Neither NHI nor any of its subsidiaries or affiliates shall indemnify any Covered Person against the loss of any Compensation recovered under this Recovery Policy. Further, neither NHI nor any of its subsidiaries or affiliates shall pay or reimburse any Covered Person for any insurance policy entered into by a Covered Person that provides for full or partial coverage of any recoupment obligation under this Recovery Policy.
Article 7. (Disclosure)
| 1. | NHI shall disclose this Recovery Policy and its amendments in accordance with applicable laws. |
| 2. | If the Covered Event has occurred that require recovery of Compensation pursuant to this Recovery Policy, NHI shall disclose the matters as required in accordance with applicable laws. |
Article 8. (Committee)
The Human Resources Committee of NHI shall be responsible for the management, operation, interpretation and administration of this Recovery Policy to the extent permitted by applicable laws. Furthermore, the Compensation Committee of NHI shall determine matters with respect to Compensation of Officers who are statutory officers of NHI under Japanese law. The Compensation Committee and the Human Resources Committee of NHI shall have the discretion to interpret the terms of this Recovery Policy and make determinations under it, and any action taken by each committee pursuant to this Recovery Policy shall be within the absolute discretion of such committee. Any interpretations or determinations made by each committee or its delegate shall be final and binding on all affected individuals.
Article 9. (Amendments)
Any amendments or termination of this Recovery Policy, which may only be made to the extent permitted under the rules of the NYSE, shall be made by resolution of the Compensation Committee of NHI.
Established: December 1, 2023