UNITED STATES
SECURITIES AND EXCHANGE COMMISSION
Washington, D.C. 20549
FORM 6-K
REPORT OF FOREIGN PRIVATE ISSUER
PURSUANT TO SECTION 13A-16 OR 15D-16
UNDER THE SECURITIES EXCHANGE ACT OF 1934
For the month of May 2024
Commission File Number: 001-42020
MAREX GROUP PLC
(Translation of registrant’s name into English)
155 Bishopsgate
London EC2M 3TQ
United Kingdom
(Address of Principal Executive Office)
Indicate by check mark whether the registrant files or will file annual reports under cover of Form 20-F or Form 40-F.
Form 20-F ☒ Form 40-F ☐
EXPLANATORY NOTE
Earnings Results
On May 16, 2024, Marex Group plc (the “Company”) issued a press release titled “Marex Group plc Full Year 2023 Results and Q1 2024 Update.” A copy of the press release is furnished as Exhibit 99.1 herewith.
UK Annual Report to Shareholders
On May 16, 2024, the Company published its UK Annual Report 2023 to Shareholders. The UK Annual Report 2023 to Shareholders is furnished as Exhibit 99.2 herewith.
EXHIBIT INDEX
The following exhibits are furnished as part of this Form 6-K:
| Exhibit No. |
Description | |
| 99.1 | Press release dated May 16, 2024 titled “Marex Group plc Full Year 2023 Results and Q1 2024 Update” | |
| 99.2 | UK Annual Report 2023 to Shareholders | |
SIGNATURES
Pursuant to the requirements of the Securities Exchange Act of 1934, as amended, the registrant has duly caused this report to be signed on its behalf by the undersigned, thereunto duly authorized.
| Marex Group plc | ||||||
| Date: May 16, 2024 | By: | /s/ Robert Irvin |
||||
| Robert Irvin | ||||||
| Chief Financial Officer | ||||||
Exhibit 99.1
Press Release
Marex Group plc Announces Full Year 2023 Results and Q1 2024 Update
| • | Transformational year thanks to successful organic growth and the benefit of acquisitions |
| • | First quarter profit at the top end of range for preliminary results shows continued strong performance |
| • | Positive momentum continued into the second quarter with good performance in April |
NEW YORK, May 16, 2024 (GLOBE NEWSWIRE) — Marex Group plc (‘Marex’ or the ‘Group’), a diversified global financial services platform, announces strong results for the twelve months ended December 31, 2023, and a positive update for the first three months ended March 31, 2024.
Ian Lowitt, Group Chief Executive Officer, commented:
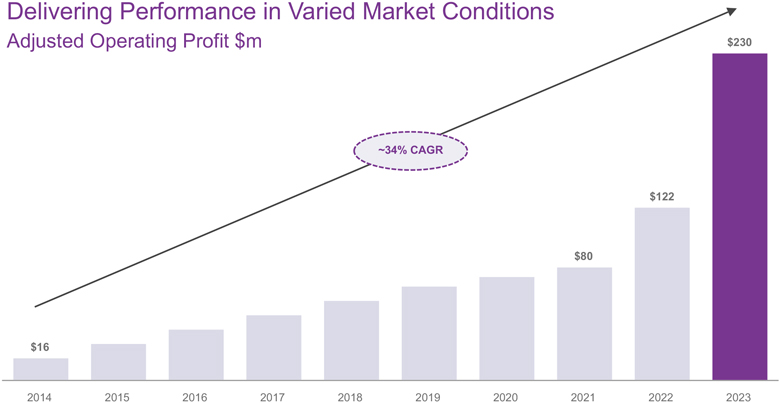
“2023 was another exceptional year where we transformed the scale and scope of the firm and maintained our record of delivering sequential growth over each of the last nine years, with an Adjusted Operating Profit compound annual growth of 34%. We continued to deliver on our strategy to expand our capabilities and our geographic reach, providing our growing client base with essential market connectivity, liquidity and hedging solutions.
We also delivered strong performance in the first quarter of 2024, reflecting the strength and scalability of the diversified global platform we have built. We are pleased to report profit at the top end of the range of the preliminary results in our IPO registration statement and significantly higher than the fourth quarter of 2023. We are delighted to have successfully launched our IPO in April and are grateful for the strong investor engagement and support. As we look to the second quarter, we have seen continued positive momentum.
The outlook for Marex remains positive. We have strong momentum in our core businesses bolstered by supportive macro-economic conditions. We continue to consider potential inorganic growth opportunities that will supplement our strong organic growth initiatives, which are proceeding well. We expect to continue to deliver sustainable growth and build an even more diversified and resilient business.”
Financial Highlights:
| 12 months ended Dec 31, 2023 |
12 months ended Dec 31, 2022 |
% Change2 |
3 months ended Mar 31, 2024 (unaudited) |
3 months ended Dec 31, 2023 (unaudited) |
% Change2 | |||||||||||||||||||
| $m |
||||||||||||||||||||||||
| Reported |
||||||||||||||||||||||||
| Revenue |
1,245 | 711 | 75% | 366 | 326 | 12% | ||||||||||||||||||
| Profit before tax |
197 | 122 | 62% | 59 | 29 | 104% | ||||||||||||||||||
| Profit before tax Margin (%) |
16% | 17% | (1ppt) | 16% | 9% | 7ppt | ||||||||||||||||||
| Profit after tax |
141 | 98 | 44% | 44 | 18 | 141% | ||||||||||||||||||
| Return on Equity (%) |
19% | 17% | 2ppt | 23% | 9% | 14ppt | ||||||||||||||||||
| Adjusted1 |
||||||||||||||||||||||||
| Operating Profit1 |
230 | 122 | 89% | 68 | 53 | 29% | ||||||||||||||||||
| Operating Profit Margin (%)1 |
18% | 17% | 1ppt | 19% | 16% | 3ppt | ||||||||||||||||||
| Operating Profit after tax Attributable to Common Equity1 |
163 | 93 | 75% | 49 | 39 | 26% | ||||||||||||||||||
| Return on Operating Profit after tax Attributable to Common Equity (%)1 |
26% | 18% | 8ppt | 29% | 23% | 6ppt | ||||||||||||||||||
| 1. | These are non-IFRS financial measures. See Appendix 1 “Non-IFRS Financial Measures and Key Performance Indicators” for additional information and for a reconciliation of each such IFRS measure to its most directly comparable non-IFRS measure. |
| 2. | % change is calculated on numbers presented to the nearest tenth of a million. |
For this quarterly update we are providing a comparison to the fourth quarter 2023, the most recent quarter. There are no comparable numbers from the first quarter in 2023 because as a private company we were not required to do a substantive close. We started this process from June 2023 in preparation for our US listing. Therefore, we will provide comparisons for the first half of 2023 as well as the third and fourth quarter.
1
Full Year 2023 Highlights:
| • | We have delivered on our strategy to grow our capabilities, our geographic reach, and our clients, through organic growth and selective acquisitions, benefiting from the integration of the ED&F Man Capital Markets division and completing the acquisition of Cowen’s prime broking business in December 2023. |
| • | Our diversified and resilient business delivered increased client activity as we benefited from organic and inorganic growth. |
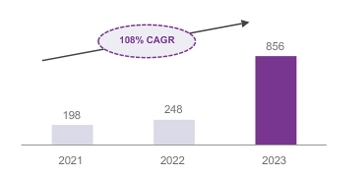
| ○ | Total trades executed were up 122% to 129 million and contracts cleared were up 245% to 856 million in 2023. |
| ○ | Average client balances were up 45% to $13.2 billion at December 31, 2023, from $9.1 billion at the end of 2022. |
| • | Results benefited from a supportive macro-economic environment, characterised by high interest rates. |
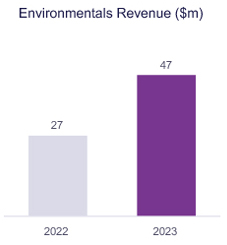
| • | Marex’s environmentals business generated strong revenue growth, up 74% to $47 million in 2023, as we continue to help our clients to navigate the energy transition. |
| • | We continue to invest in our proprietary technology portal Neon, which delivers a high-quality user experience to clients and now has approximately 16,000 users. |
| • | Successful issuance of €300 million in unsecured 5-year senior notes, further strengthening our liquidity. Through retained earnings we also strengthened the balance sheet and capital position to support continued growth. |
| • | Investment grade credit ratings affirmed by S&P Global and Fitch. |
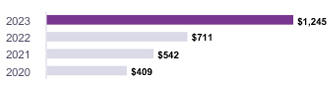
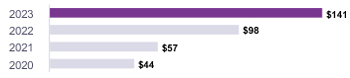
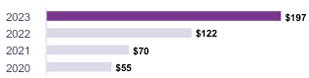
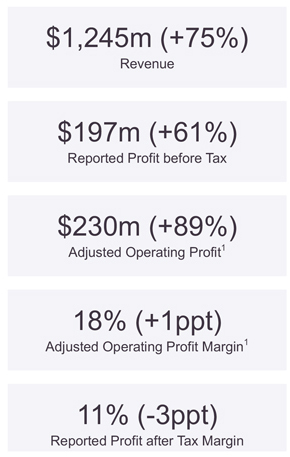
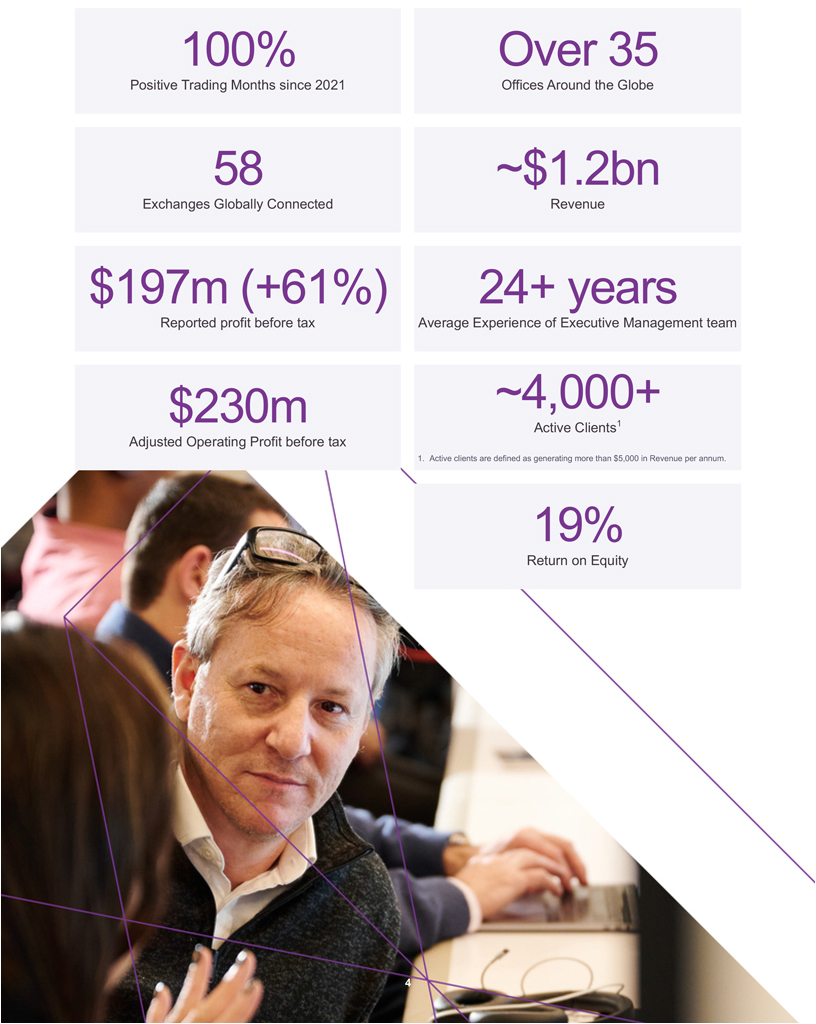
Performance was strong across the Group. Revenue rose 75% to $1,245 million and Reported Profit before tax was up 62% to $197 million and Adjusted Operating Profit rose 89% to $230 million. This was driven by performance across our segments as follows:
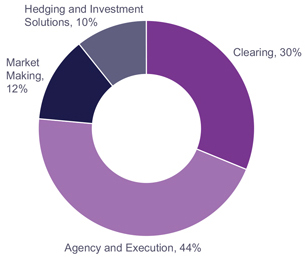
| • | Clearing provides connectivity between clients, exchanges and clearing houses across four principal asset classes: metals, agriculture, energy and financial products. Revenue for the twelve months ended December 31, 2023 was $373.6 million, up 87% from $200 million in 2022. This includes $236.2 million in net commission income, up 63% from the year before. |
| • | Agency and Execution acts as an agent matching buyers and sellers thereby facilitating access to market liquidity in energy and financial securities. Revenue for the twelve months ended December 31, 2023 was $541.5 million, up 135% from $230.7 million in 2022, reflecting positive conditions in the energy markets and the benefits of acquisitions that increased our capabilities in financial securities. |
| • | Market Making operates within four principal markets: metals, agriculture, energy and financial securities. Revenue for the twelve months ended December 31, 2023 of $153.9 million, down 11% from $172.6 million in 2022 reflecting a return to more normalised levels of volatility following exceptionally high levels in 2022, and higher costs of liquidity. |
| • | Hedging and Investment Solutions provides high-quality bespoke hedging and investment solutions to our clients. Revenue for the twelve months ended December 31, 2023 was $128.1 million, up by 28% from $100 million the year earlier. |
| • | Corporate revenue is primarily net interest income on house cash balances placed at banks and exchanges. Revenue for the twelve months ended December 31, 2023 was $47.5 million, up 509% from $7.8 million in 2022. |
First Quarter Year 2024 Highlights:
| • | Strong start to the year with increased client activity on our platform and the full benefit of the Cowen acquisition which was completed in December 2023: |
| ○ | Contracts cleared were 264 million, up 16% from Q4 2023. |
| • | All four segments saw a solid first quarter with a particularly strong performance from Hedging and Investment Solutions. |
| • | Recently acquired Cowen prime brokerage and outsourced trading business performing well, with good progress made onboarding new clients. |
| • | Prudent approach to capital and liquidity management, with significant headroom maintained above regulatory requirements. |
| • | Supportive market conditions and strong business performance continue into the second quarter. Well positioned, building on our expanded global footprint and client-centric growth strategy. |
First quarter performance continued to improve across the Group as compared to the fourth quarter of 2023. We generated $365.8 million in revenue for the three months ended March 31, 2024, up 12% from the three months ended December 31, 2023, driven by performance across our segments as follows:
2
First Quarter Year 2024 Highlights (continued):
| • | Clearing saw revenue for the three months ended March 31, 2024 of $100.7 million, up 22% from $82.7 million in the fourth quarter of 2023. Revenue in Q1 included $69.5 million in commission income, as well as $30.2 million net interest income reflecting average balances for the period of $13.2 billion, up from $12.7 billion in Q4 2023. |
| • | Agency and Execution saw revenue for the three months ended March 31, 2024 at $168.1 million, up 6% from $157.9 million in Q4 2023. Revenue in the first quarter consisted of $73.2 million from energy and $94.9 million from financial securities. |
| • | Market Making benefited from relatively benign conditions in the first quarter, with 94% positive trading days. Revenue
for the three months ended March 31, 2024 rose 8% to $41.8 million from $38.8 million in Q4 2023, consisting of |
| • | Hedging and Investment Solutions delivered strong performance in the first quarter, with good demand from clients in both parts of the business. Revenue for the three months ended March 31, 2024 was $41.3 million, up 24% from $33.2 million in Q4 2023, consisting of $19.5 million from hedging solutions and $21.8 million from financial products. |
| • | Corporate revenue for the three months ended March 31, 2024 was $13.9 million up 8% from $12.9 million in Q4 2023. |
As at March 31, 2024, the Group’s balance sheet was broadly in line with December 31, 2023. Total assets increased 2% to $18.0 billion.
The following table presents summary consolidated financial and other data as of the dates and for the periods indicated:
| 12 months ended Dec 31, 2023 |
12 months ended Dec 31, 2022 |
% Change |
3 months ended Mar 31, 2024 (unaudited) |
3 months ended Dec 31, 2023 (unaudited) |
% Change |
|||||||||||||||||||
| $m |
||||||||||||||||||||||||
| Revenue |
1,244.6 | 711.1 | 75.0% | 365.8 | 325.5 | 12.4% | ||||||||||||||||||
| Front Office Costs |
(690.4) | (400.0) | 72.6% | (210.1) | (186.0) | 13.0% | ||||||||||||||||||
| Control & Support Costs |
(294.2) | (168.6) | 74.5% | (80.6) | (79.3) | 1.6% | ||||||||||||||||||
| Provision for Credit Losses |
(7.1) | (9.5) | (25.3)% | 0.3 | (2.4) | (112.5)% | ||||||||||||||||||
| Depreciation & Amortisation |
(27.1) | (13.8) | 96.4% | (7.8) | (6.1) | 27.9% | ||||||||||||||||||
| Other income and share of results of associates |
4.2 | 2.5 | 68.0% | 0.1 | 0.9 | (88.9)% | ||||||||||||||||||
|
|
|
|
|
|
|
|
|
|
|
|
|
|||||||||||||
| Adjusted Operating Profit |
230.0 | 121.7 | 89.0% | 67.7 | 52.6 | 28.7% | ||||||||||||||||||
| Non-Operating adjustments |
(33.5) | (0.1) | n.m. | (8.8) | (23.8) | (63.0)% | ||||||||||||||||||
|
|
|
|
|
|
|
|
|
|
|
|
|
|||||||||||||
| Reported Profit before tax |
196.5 | 121.6 | 61.6% | 58.9 | 28.8 | 104.5% | ||||||||||||||||||
| Tax |
(55.2) | (23.4) | 135.9% | (15.3) | (10.7) | 43.0% | ||||||||||||||||||
|
|
|
|
|
|
|
|
|
|
|
|
|
|||||||||||||
| Reported Profit after tax |
141.3 | 98.2 | 43.9% | 43.6 | 18.1 | 140.9% | ||||||||||||||||||
|
|
|
|
|
|
|
|
|
|
|
|
|
|||||||||||||
Front office costs represent staff, systems and infrastructure costs associated with running our revenue generating operations. Control and Support costs primarily reflect staff and property-related costs, along with professional fees and other administrative expenses associated with the support functions.
Conference Call Information:
Marex’s management will host a conference call to discuss its financial results today, May 16, 2024, at 9am Eastern Time. A live webcast of the call can be accessed from Marex’s Investor Relations website. An archived version will be available on the website after the call. To participate in the Conference Call, please register at the link here https://edge.media-server.com/mmc/p/t4uh5at8.
About Marex plc:
Marex is a diversified global financial services platform providing essential liquidity, market access and infrastructure services to clients across energy, commodities and financial markets.
3
About Marex plc (continued)
The Group provides comprehensive breadth and depth of coverage across four core services: Clearing, Agency and Execution, Market Making and Hedging and Investment Solutions. It has a leading franchise in many major metals, energy and agricultural products, executing around 129 million trades and clearing 856 million contracts in 2023. The Group provides access to the world’s major commodity markets, covering a broad range of clients that include some of the largest commodity producers, consumers and traders, banks, hedge funds and asset managers.
Headquartered in London with more than 35 offices worldwide, the Group has over 2,000 employees across Europe, Asia and the Americas. For more information visit www.marex.com.
Forward looking statements:
This press release contains forward-looking statements within the meaning of the Private Securities Litigation Reform Act of 1995. All statements contained in this press release that do not relate to matters of historical fact should be considered forward-looking statements, including expected financial results, expected growth and business plans. In some cases, these forward-looking statements can be identified by words or phrases such as “may,” “will,” “expect,” “anticipate,” “aim,” “estimate,” “intend,” “plan,” “believe,” “potential,” “continue,” “is/are likely to” or other similar expressions.
These forward-looking statements are subject to risks, uncertainties and assumptions, some of which are beyond our control. In addition, these forward-looking statements reflect our current views with respect to future events and are not a guarantee of future performance. Actual outcomes may differ materially from the information contained in the forward-looking statements as a result of a number of factors, including, without limitation: subdued commodity market activity or pricing levels; the effects of geopolitical events, terrorism and wars, such as the effect of Russia’s military action in Ukraine, on market volatility, global macroeconomic conditions and commodity prices; changes in interest rate levels; the risk of our clients and their related financial institutions defaulting on their obligations to us; regulatory, reputational and financial risks as a result of our international operations; software or systems failure, loss or disruption of data or data security failures; an inability to adequately hedge our positions and limitations on our ability to modify contracts and the contractual protections that may be available to us in OTC derivatives transactions; market volatility, reputational risk and regulatory uncertainty related to commodity markets, equities, fixed income, foreign exchange and cryptocurrency; the impact of climate change and the transition to a lower carbon economy on supply chains and the size of the market for certain of our energy products; the impact of changes in judgments, estimates and assumptions made by management in the application of our accounting policies on our reported financial condition and results of operations; lack of sufficient financial liquidity; if we fail to comply with applicable law and regulation, we may be subject to enforcement or other action, forced to cease providing certain services or obliged to change the scope or nature of our operations; significant costs, including adverse impacts on our business, financial condition and results of operations, and expenses associated with compliance with relevant regulations; and if we fail to remediate the material weaknesses we identified in our internal control over financial reporting or prevent material weaknesses in the future, the accuracy and timing of our financial statements may be impacted, which could result in material misstatements in our financial statements or failure to meet our reporting obligations and subject us to potential delisting, regulatory investments or civil or criminal sanctions, and other risks discussed under the caption “Risk Factors” in our final prospectus filed pursuant to 424(b)(4) with the Securities and Exchange Commission (the “SEC”) on April 26, 2024 and our other reports filed with the SEC.
The forward-looking statements made in this press release relate only to events or information as of the date on which the statements are made in this press release. Except as required by law, we undertake no obligation to update or revise publicly any forward-looking statements, whether as a result of new information, future events or otherwise, after the date on which the statements are made or to reflect the occurrence of unanticipated events.
In addition, statements that “we believe” and similar statements reflect our beliefs and opinions on the relevant subject. These statements are based upon information available to us as of the date of this press release, and while we believe such information forms a reasonable basis for such statements, such information may be limited or incomplete, and our statements should not be read to indicate that we have conducted an exhaustive inquiry into, or review of, all potentially available relevant information. These statements are inherently uncertain, and investors are cautioned not to unduly rely upon these statements.
4
| Appendix 1 – Supplementary Financial Information
Statutory Condensed Consolidated Income |
12 months | 12 months | 3 months ended Mar |
3 months ended Dec |
||||||||||||
| ended Dec | ended Dec | 31, 2024 | 31, 2023 | |||||||||||||
| 31, 2023 | 31, 2022 | (unaudited) | (unaudited) | |||||||||||||
| $m | $m | $m | $m | |||||||||||||
| Commission and fee income |
1,342.4 | 651.0 | 400.6 | 318.6 | ||||||||||||
| Commission and fee expense |
(637.5) | (299.2) | (181.7) | (137.2) | ||||||||||||
| Net commission income |
704.9 | 351.8 | 218.9 | 181.4 | ||||||||||||
| Net trading income |
411.4 | 325.3 | 106.2 | 111.5 | ||||||||||||
| Interest income |
591.8 | 194.4 | 163.2 | 144.5 | ||||||||||||
| Interest expense |
(470.2) | (165.0) | (127.6) | (114.4) | ||||||||||||
| Net interest income |
121.6 | 29.4 | 35.6 | 30.1 | ||||||||||||
| Net physical commodities income |
6.7 | 4.6 | 5.1 | 2.5 | ||||||||||||
| Revenue |
1,244.6 | 711.1 | 365.8 | 325.5 | ||||||||||||
| Expenses: |
||||||||||||||||
| Compensation and benefits |
(770.3) | (438.6) | (229.9) | (206.9) | ||||||||||||
| Depreciation and amortisation |
(27.1) | (13.8) | (7.8) | (6.1) | ||||||||||||
| Impairment of goodwill |
(10.7) | (53.9) | — | (10.7) | ||||||||||||
| Other expenses |
(237.4) | (147.8) | (69.6) | (71.5) | ||||||||||||
| Provision for credit losses |
(7.1) | (9.5) | 0.3 | (2.4) | ||||||||||||
| Bargain purchase gain on acquisitions |
0.3 | 71.6 | — | — | ||||||||||||
| Other income |
3.4 | 2.8 | 0.1 | 0.9 | ||||||||||||
| Share of results of associates and joint ventures . |
0.8 | (0.3) | — | — | ||||||||||||
| Profit before tax |
196.5 | 121.6 | 58.9 | 28.8 | ||||||||||||
| Tax |
(55.2) | (23.4) | (15.3) | (10.7) | ||||||||||||
| Profit after tax |
141.3 | 98.2 | 43.6 | 18.1 | ||||||||||||
| Attributable to: |
||||||||||||||||
| Ordinary shareholders of the Company |
128.0 | 91.6 | 40.3 | 14.8 | ||||||||||||
| Other equity holders |
13.3 | 6.6 | 3.3 | 3.3 | ||||||||||||
5
Appendix 1 – Supplementary Financial Information (continued)
Revenue
| Agency | Hedging and | |||||||||||||||||||||||||||||||||||
| and | Market | Investments | ||||||||||||||||||||||||||||||||||
| Clearing | Execution | Making | Solutions | Corporate | Total | |||||||||||||||||||||||||||||||
| 12 months ended December 31, 2023 | $m | $m | $m | $m | $m | $m | ||||||||||||||||||||||||||||||
| Net commission income/(expense) |
236.2 | 473.4 | (4.7) | — | — | 704.9 | ||||||||||||||||||||||||||||||
| Net trading income/(expense) |
1.2 | 62.1 | 182.8 | 165.7 | (0.4) | 411.4 | ||||||||||||||||||||||||||||||
| Net interest income/(expense) |
136.2 | 6.0 | (30.9) | (37.6) | 47.9 | 121.6 | ||||||||||||||||||||||||||||||
| Net physical commodities income |
— | — | 6.7 | — | — | 6.7 | ||||||||||||||||||||||||||||||
| Revenue |
373.6 | 541.5 | 153.9 | 128.1 | 47.5 | 1,244.6 | ||||||||||||||||||||||||||||||
| Agency | Hedging and | |||||||||||||||||||||||||||||||||||
| and | Market | Investments | ||||||||||||||||||||||||||||||||||
| Clearing | Execution | Making | Solutions | Corporate | Total | |||||||||||||||||||||||||||||||
| 12 months ended December 31, 2022 | $m | $m | $m | $m | $m | $m | ||||||||||||||||||||||||||||||
| Net commission income/(expense) |
144.7 | 207.1 | — | — | — | 351.8 | ||||||||||||||||||||||||||||||
| Net trading income/(expense) |
— | 18.4 | 179.1 | 128.2 | (0.4) | 325.3 | ||||||||||||||||||||||||||||||
| Net interest income/(expense) |
55.3 | 5.2 | (11.1) | (28.2) | 8.2 | 29.4 | ||||||||||||||||||||||||||||||
| Net physical commodities income |
— | — | 4.6 | — | — | 4.6 | ||||||||||||||||||||||||||||||
| Revenue |
200.0 | 230.7 | 172.6 | 100.0 | 7.8 | 711.1 | ||||||||||||||||||||||||||||||
| Agency | Hedging and | |||||||||||||||||||||||||||||||||||
| and | Market | Investments | ||||||||||||||||||||||||||||||||||
| 3 months ended March 31, 2024 (Unaudited) |
Clearing |
Execution | Making | Solutions | Corporate | Total | ||||||||||||||||||||||||||||||
|
$m |
$m | $m | $m | $m | $m | |||||||||||||||||||||||||||||||
| Net commission income/(expense) |
69.5 | 150.5 | (1.1) | — | — | 218.9 | ||||||||||||||||||||||||||||||
| Net trading income |
1.0 | 9.1 | 44.2 | 51.9 | — | 106.2 | ||||||||||||||||||||||||||||||
| Net interest income/(expense) |
30.2 | 8.0 | (5.9) | (10.6) | 13.9 | 35.6 | ||||||||||||||||||||||||||||||
| Net physical commodities income |
— | 0.5 | 4.6 | — | — | 5.1 | ||||||||||||||||||||||||||||||
| Revenue |
100.7 | 168.1 | 41.8 | 41.3 | 13.9 | 365.8 | ||||||||||||||||||||||||||||||
6
Appendix 1 – Supplementary Financial Information (continued)
Revenue (continued)
| Agency | Hedging and | |||||||||||||||||||||||
| and | Market | Investments | ||||||||||||||||||||||
| 3 months ended December 31, 2023 (Unaudited) |
Clearing |
Execution | Making | Solutions | Corporate | Total | ||||||||||||||||||
|
$m |
$m | $m | $m | $m | $m | |||||||||||||||||||
| Net commission income/(expense) |
52.6 | 131.2 | (2.4) | — | — | 181.4 | ||||||||||||||||||
| Net trading income |
0.4 | 23.2 | 45.7 | 42.3 | (0.2) | 111.5 | ||||||||||||||||||
| Net interest income/(expense) |
29.6 | 3.5 | (7.0) | (9.1) | 13.1 | 30.1 | ||||||||||||||||||
| Net physical commodities income |
— | — | 2.5 | — | — | 2.5 | ||||||||||||||||||
|
|
|
|||||||||||||||||||||||
| Revenue |
82.7 | 157.9 | 38.8 | 33.2 | 12.9 | 325.5 | ||||||||||||||||||
|
|
|
|||||||||||||||||||||||
Reconciliation of Adjusted Operating Profit and Adjusted Operating Profit After Tax Attributable to Common Equity to Reported Profit before tax per the income statement:
| 3 months | 3 months | |||||||||||||||
| 12 months | 12 months | ended Mar | ended Dec | |||||||||||||
| ended Dec | ended Dec | 31, 2024 | 31, 2023 | |||||||||||||
| 31, 2023 | 31, 2022 | (unaudited) | (unaudited) | |||||||||||||
| Profit Before Tax |
196.5 | 121.6 | 58.9 | 28.8 | ||||||||||||
| Goodwill impairment charges(a) |
10.7 | 53.9 | — | 10.7 | ||||||||||||
| Bargain purchase gains(b) |
(0.3) | (71.6) | — | — | ||||||||||||
| Acquisition costs(c) |
1.8 | 11.5 | 0.2 | 1.2 | ||||||||||||
| Amortisation of acquired brands and customer lists(d) |
2.1 | 1.7 | 0.8 | 0.8 | ||||||||||||
| Activities relating to shareholders(e) |
3.1 | 0.5 | 2.4 | 2.2 | ||||||||||||
| Owner fees(f) |
6.0 | 3.4 | 1.7 | 1.0 | ||||||||||||
| IPO preparation costs(g) |
10.1 | 0.7 | 3.7 | 7.9 | ||||||||||||
|
|
|
|
|
|
|
|||||||||||
| Adjusted Operating Profit |
230.0 | 121.7 | 67.7 | 52.6 | ||||||||||||
| Adjusted Operating Tax |
(57.3) | (23.9) | (16.3) | (11.4) | ||||||||||||
|
|
|
|||||||||||||||
| Adjusted Operating Profit after tax |
172.7 | 97.8 | 51.4 | 41.2 | ||||||||||||
| Profit attributable to AT1 note holders(h) |
(10.1) | (5.1) | (2.5) | (2.5) | ||||||||||||
|
|
|
|||||||||||||||
| Adjusted Operating Profit after tax Attributable to Common Equity |
162.6 | 92.7 | 48.9 | 38.7 | ||||||||||||
|
|
|
|||||||||||||||
7
Appendix 1 – Supplementary Financial Information (continued)
(a) Goodwill impairment charges in 2023 relates to the impairment recognised for goodwill relating to the Volatility Performance Fund S.A. CGU (‘VPF’) largely due to declining projected revenue. Goodwill impairment changes in 2022 relates to the impairment charge recognised for the OTC Energy CGU largely due to declining budgeted performance and macroeconomic factors, such as high inflation and interest rates.
(b) Bargain purchase gains relate to a gain of $0.3 million (2022: $71.6 million), recognised as a result of the acquisition of ED&F Man Capital Markets’ US and UK businesses in 2022.
(c) Acquisition costs are costs, such as legal fees incurred in relation to the business acquisitions of ED&F Man Capital Markets business, the OTCex group and Cowen’s Prime Services and Outsourced Trading business.
(d) This represents the amortisation charge for the year/period of acquired brands and customers lists.
(e) Activities in relation to shareholders primarily consist of dividend-like contributions made to participants within certain of our share-based payments schemes. In prior years, this balance was presented as part of amortisation of acquired brands and customer lists. Given the increase of the balance in 2023, this has been reclassified out of the line item and is now presented separately.
(f) Owner fees relate to management services to parties associated with the ultimate controlling party based on a percentage of our EBITDA in each year, presented in the income statement within other expenses. Owner fees are excluded from operating expenses as they do not form part of the operation of the business and ceased to be incurred after the completion of our offering.
(g) IPO preparation costs related to consulting, legal and audit fees, presented in the income statement within other expenses.
(h) Profit attributable to AT1 note holders includes the coupons on the AT1 which are accounted for as dividends and the tax benefit of the coupons.
Non-IFRS Financial Measures and Key Performance Indicators
Certain parts of this press release contain non-IFRS financial measures, including Adjusted Operating Profit, Adjusted Operating Profit Margin, Adjusted Operating Profit After Tax Attributable to Common Equity and Return on Adjusted Operating Profit After Tax Attributable to Common Equity. These non-IFRS financial measures are presented for supplemental informational purposes only and should not be considered a substitute for profit after tax, profit margin, return on equity or any other financial information presented in accordance with IFRS and may be different from similarly titled non-IFRS measures used by other companies.
We define Adjusted Operating Profit as profit after tax adjusted for (i) tax, (ii) goodwill impairment charges, (iii) acquisition costs, (iv) bargain purchase gains, (v) owner fees, (vi) amortisation of acquired brands and customer lists, (vii) activities in relation to shareholders and (viii) initial public offering (“IPO”) preparation costs. Adjusted Operating Profit is the primary measure used by our management to evaluate and understand our underlying operations and business trends, forecast future results and determine future capital investment allocations. Adjusted Operating Profit is the measure used by our executive board to assess the financial performance of our business in relation to our trading performance. The most directly comparable IFRS measure is profit after tax. We believe Adjusted Operating Profit is a useful measure as it allows management to monitor our ongoing core operations and provides useful information to investors and analysts regarding the net results of the business. The core operations represent the primary trading operations of the business.
We define Adjusted Operating Profit Margin as Adjusted Operating Profit (as defined above) divided by revenue. We believe that Adjusted Operating Profit Margin is a useful measure as it allows management to assess the profitability of our business in relation to revenue. The most directly comparable IFRS measure is profit margin, which is profit after tax divided by revenue.
8
Appendix 1 – Supplementary Financial Information (continued)
We define Adjusted Operating Profit After Tax Attributable to Common Equity as adjusted operating profit adjusting for (i) the tax effect of the adjusting items to calculate adjusted operating profit, (ii) the tax effect from the coupons on the additional tier one capital and (iii) the profit attributable to the holders of the Additional Tier 1 capital. We define common equity as being the equity belonging to the holder of the Group’s share capital. The most directly comparable IFRS measure is profit after tax.
We define the Return on Adjusted Operating Profit After Tax Attributable to Common Equity as the Adjusted Operating Profit After Tax Attributable to Common Equity, divided by the average common equity for the period. Common equity is the total equity and deducting the Additional Tier 1 capital, the average being a two point average from the beginning and end of the period. The most directly comparable IFRS measure for Adjusted Operating Profit After Tax Attributable to Common Equity is profit after tax.
We believe that these non-IFRS financial measures provide useful information to both management and investors by excluding certain items that management believes are not indicative of our ongoing operations. Our management uses these non-IFRS measures to evaluate our business strategies and to facilitate operating performance comparisons from period to period. We believe that these non-IFRS measures provide useful information to investors because they improve the comparability of our financial results between periods and provide for greater transparency of key measures used to evaluate our performance. In addition, we believe Adjusted Operating Profit, Adjusted Operating Profit Margin, Adjusted Operating Profit After Tax Attributable to Common Equity and Return on Adjusted Operating Profit After Tax Attributable to Common Equity are measures commonly used by investors to evaluate companies in the financial services industry. However, they are not presentations made in accordance with IFRS, and the use of the terms Adjusted Operating Profit, Adjusted Operating Profit Margin, Adjusted Operating Profit After Tax Attributable to Common Equity and Return on Adjusted Operating Profit After Tax Attributable to Common Equity may vary from others in our industry. Adjusted Operating Profit, Adjusted Operating Profit Margin, Adjusted Operating Profit After Tax Attributable to Common Equity and Return on Adjusted Operating Profit After Tax Attributable to Common Equity are frequently used by securities analysts, investors and other interested parties in their evaluation of companies comparable to us, many of which present related performance measures when reporting their results.
Adjusted Operating Profit, Adjusted Operating Profit Margin, Adjusted Operating Profit After Tax Attributable to Common Equity and Return on Adjusted Operating Profit After Tax Attributable to Common Equity are used by different companies for differing purposes and are often calculated in different ways that reflect the circumstances of those companies. In addition, certain judgments and estimates are inherent in our process to calculate such non-IFRS measures. You should exercise caution in comparing Adjusted Operating Profit, Adjusted Operating Profit Margin, Adjusted Operating Profit After Tax Attributable to Common Equity and Return on Adjusted Operating Profit After Tax Attributable to Common Equity as reported by us to Adjusted Operating Profit, Adjusted Operating Profit Margin, Adjusted Operating Profit After Tax Attributable to Common Equity, and Return on Adjusted Operating Profit After Tax Attributable to Common Equity as reported by other companies.
Adjusted Operating Profit, Adjusted Operating Profit Margin, Adjusted Operating Profit After Tax Attributable to Common Equity and Return on Adjusted Operating Profit After Tax Attributable to Common Equity have limitations as analytical tools, and you should not consider them in isolation or as substitutes for analysis of our results as reported under IFRS. Some of these limitations are:
| • | they do not reflect costs incurred in relation to the acquisitions that we have undertaken; |
| • | they do not reflect impairment of goodwill; |
| • | other companies in our industry may calculate these measures differently than we do, limiting their usefulness as comparative measures; and |
| • | the adjustments made in calculating these non-IFRS measures are those that management considers to be not representative of our core operations and, therefore, are subjective in nature. |
Accordingly, prospective investors should not place undue reliance on Adjusted Operating Profit, Adjusted Operating Profit Margin, Adjusted Operating Profit After Tax Attributable to Common Equity and Return on Adjusted Operating Profit After Tax Attributable to Common Equity.
We also use key performance indicators (“KPIs”) such as Average Balances, Trades Executed, and Contracts Cleared to assess the performance of our business and believe that these KPIs provide useful information to both management and investors by showing the growth of our business across the periods presented.
9
Appendix 1 – Supplementary Financial Information (continued)
Our management uses these KPIs to evaluate our business strategies and to facilitate operating performance comparisons from period to period. We define certain terms used in this release as follows:
“Average balances” means the average amount of segregated and non-segregated client balances that generate interest income for us over a given period, calculated by taking the balances at the end of each quarter for the last five quarters.
“Trades executed” means the total number of trades executed on our platform in a given year.
“Contracts cleared” means the total number of contracts cleared in a given year.
10
Appendix 2 – Trading Volumes
| Marex Volumes | Market Volumes |
Marex Volumes | Market Volumes |
|||||||||||||||||||||||||||||
| (million contracts) |
12 months ended Dec 31, 2023 (Unaudited) |
12 months ended Dec 31, 2022 (Unaudited) |
Growth%1 | 2023 vs 20221 |
3 months ended Mar 31, 2024 (Unaudited) |
3 months ended Dec 31, 2023 (Unaudited) |
Growth%1 | Q1 24 vs Q4 231 |
||||||||||||||||||||||||
| Clearing |
855.5 | 247.8 | 245 | % | 4 | % | 263.5 | 228.1 | 16 | % | 4 | % | ||||||||||||||||||||
| Agency & Execution |
||||||||||||||||||||||||||||||||
| Energy |
44.7 | 30.9 | 45 | % | 13 | % | 14.9 | 13.6 | 10 | % | 9 | % | ||||||||||||||||||||
| Securities |
239.5 | 57.7 | 315 | % | 4 | % | 75.5 | 64.7 | 17 | % | 1 | % | ||||||||||||||||||||
| Market Making |
||||||||||||||||||||||||||||||||
| Agriculture |
28.1 | 24.1 | 17 | % | 16 | % | 8.9 | 7.1 | 25 | % | 8 | % | ||||||||||||||||||||
| Metals |
25.3 | 21.5 | 18 | % | 18 | % | 6.8 | 6.8 | — | % | 10 | % | ||||||||||||||||||||
| Energy |
2.1 | 2.0 | 1 | % | 13 | % | 0.5 | 0.6 | (10 | )% | 9 | % | ||||||||||||||||||||
| 1. | % change is calculated on unrounded numbers. |
Enquiries please contact:
Marex
Nicola Ratchford / Robert Coates
+44 (0) 7786548889 / +44 7880 486329 | nratchford@marex.com / RCoates@marex.com
FTI Consulting US / UK
+1 (919) 609-9423 / +44 (0) 7776 111 222 | marex@fticonsulting.com Marex is a diversified global financial services
11
Exhibit 99.2
Diversified Resilient. . Dynamic. Marex Group plc Annual report 2023

platform, providing essential liquidity, market
access and infrastructure services to clients in
the energy, commodities and financial markets.
We have over 35 offices, access to 58 exchanges,
and a client-focussed technology platform.
| 1 | ||||
| 2 | ||||
| 3 | ||||
| 6 | ||||
| 8 | ||||
| 10 | ||||
| 18 | ||||
| 19 | ||||
| 21 | ||||
| 22 | ||||
| 24 | ||||
| 27 | ||||
| 33 | ||||
| 41 | ||||
| 61 | ||||
| 67 | ||||
| 77 | ||||
| 81 | ||||
| 86 | ||||
| 90 | ||||
| 94 | ||||
| 101 | ||||
| 103 | ||||
| Consolidated Statement of the Changes in Equity and Movements in Reserves |
105 | |||
| 106 | ||||
| 108 | ||||
| 179 | ||||
| Company Statement of the Changes in Equity and Movements in Reserves |
180 | |||
| 181 | ||||
| 182 | ||||
| Marex Group plc Annual Report 2023 | Strategic Report | Corporate Governance | Financial Statements | |||
|
|
|
|
|
|||
Our diversified and resilient business
model delivered double digit growth in
Adjusted Operating Profit before tax
over the past nine years in a variety of
market conditions
We have delivered on our strategy to
grow our capabilities, our geographic
reach, and our clients, through organic
growth and selective acquisitions
Recent acquisitions have dramatically
transformed our scale and scope and
extended our geographic footprint
Successful issuance of €300 million
in unsecured 5-year senior notes,
funding our recent growth
Investment grade credit ratings
affirmed by S&P Global and Fitch
Strong financial performance driven
by client activity on our platform
About Marex
Marex is a diversified and global financial services platform. We are agile and entrepreneurial. Our teams are dedicated to providing excellent service to our clients across the globe, underpinned by our strong balance sheet, credit rating and robust risk controls. At the heart of our firm is our ability to connect clients to global markets for commodities, financial products and energy.


1. Marex’s KPIs include non-statutory alternative performance measures (‘APMs’) as defined by the European Securities and Markets Authority (‘ESMA’). We provide these to offer additional insights into the Group’s financial results. Where a non-statutory financial measure of performance is used, a reconciliation to the most directly related statutory measure is provided in note 6 to the financial statements.
1
| Marex Group plc Annual Report 2023 | Strategic Report | Corporate Governance | Financial Statements | |||
|
|
|
|
|
|||
Marex’s diversified and scalable platform offers
liquidity, market access and hedging services
to clients across a broad range of asset classes.
We offer essential specialist services to
market participants.
Our values
| Integrity
We pride ourselves on our honesty and high ethical standards. We apply these values when working with all our clients, colleagues and other stakeholders. |
Respect
Our people and our clients are at the heart of our business. We always act respectfully and treat people fairly in everything we do. |
Developing our people
Our people are the basis of our competitive advantage. We look to ‘grow our own’ and make Marex the place ambitious, hardworking and talented people choose to build their career. |
||
| Adaptable and nimble
We are proactive. We embrace change as markets evolve to constantly increase our efficiency and create innovative solutions for our clients. |
Collaborative
By working together across the organisation, we foster teamwork, can better respond to challenges and successfully deliver for our clients. |
|||

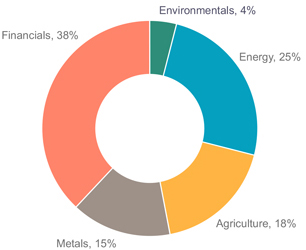
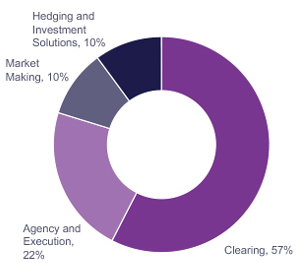
| Revenue by asset class1 | Revenue by service segment1 | |
|
|
|
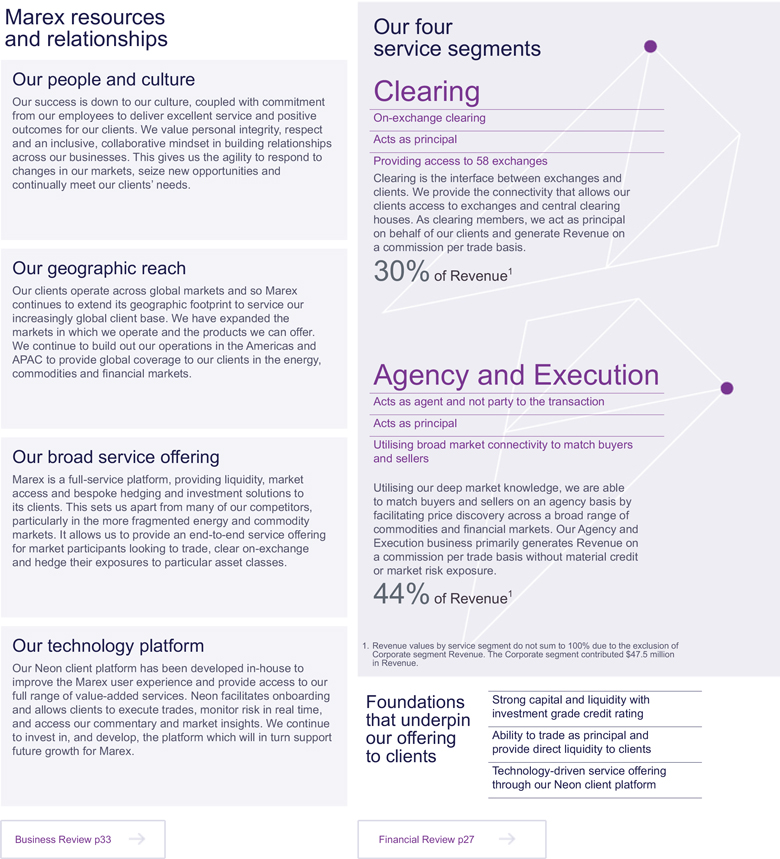
| 1. | Revenue pie charts are for the 12 months ended 31 December 2023. Revenue values by service segment do not sum to 100% due to the exclusion of Corporate segment Revenue. The Corporate segment contributed $47.5 million in Revenue. |
2
| Marex Group plc Annual Report 2023 | Strategic Report | Corporate Governance | Financial Statements | |||
|
|
|
|
|
|||
At a Glance
| Marex Group plc Annual Report 2023 | Strategic Report | Corporate Governance | Financial Statements | |||
|
|
|
|
|
|||
Our Value Chain
Marex Occupies a Central Position in the Value Chain Our scalable business model allows us to
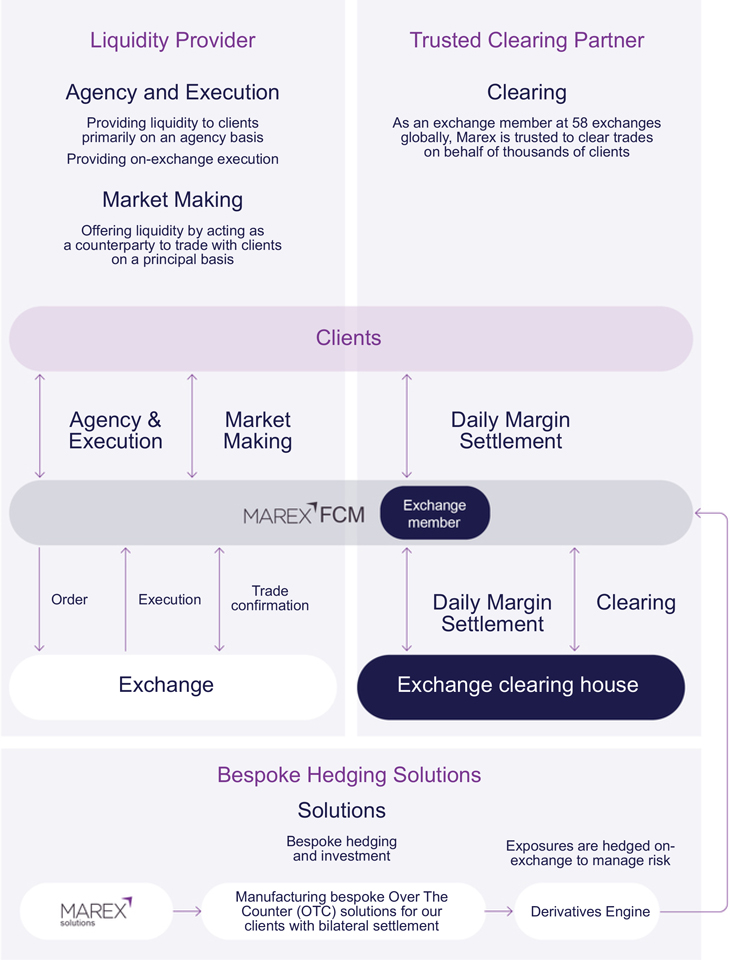
5
| Marex Group plc Annual Report 2023 | Strategic Report | Corporate Governance | Financial Statements | |||
|
|
|
|
|
|||
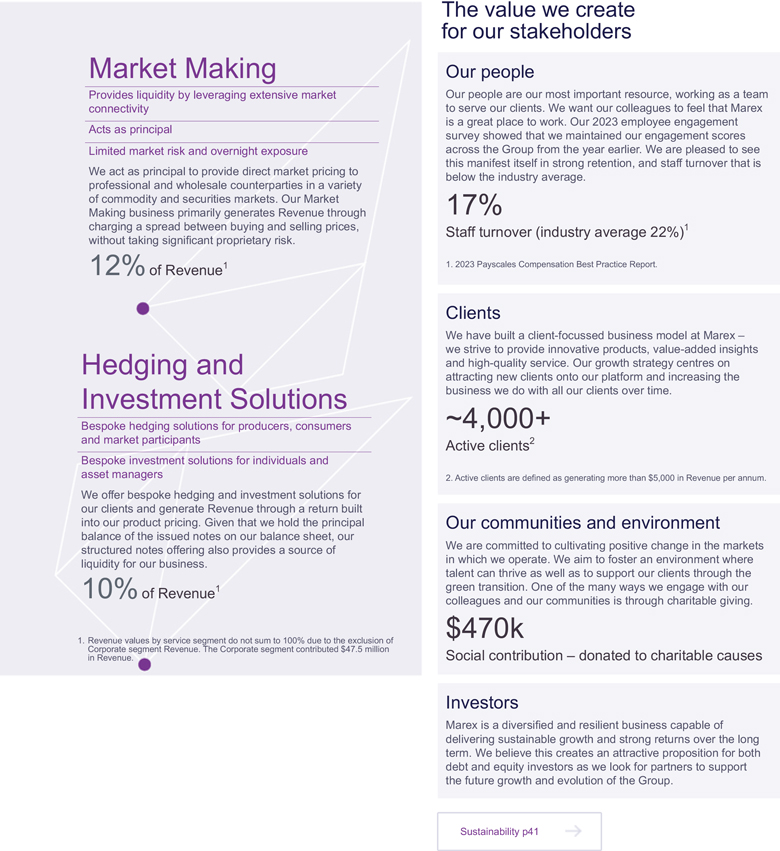
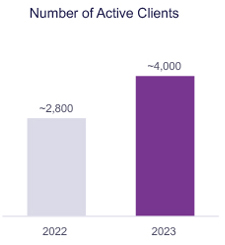
Market Making Provides liquidity by leveraging extensive market connectivity Acts as principal Limited market risk and overnight exposure We act as principal to provide direct market pricing to professional and wholesale counterparties in a variety of commodity and securities markets. Our Market Making business primarily generates Revenue through charging a spread between buying and selling prices, without taking significant proprietary risk. of Revenue1 12% Hedging and Investment Solutions Bespoke hedging solutions for producers, consumers and market participants Bespoke investment solutions for individuals and asset managers We offer bespoke hedging and investment solutions for our clients and generate Revenue through a return built into our product pricing. Given that we hold the principal balance of the issued notes on our balance sheet, our structured notes offering also provides a source of liquidity for our business. of Revenue1 10% 1. Revenue values by service segment do not sum to 100% due to the exclusion of Corporate segment Revenue. The Corporate segment contributed $47.5 million in Revenue. The value we create for our stakeholders Our people Our people are our most important resource, working as a team to serve our clients. We want our colleagues to feel that Marex is a great place to work. Our 2023 employee engagement survey showed that we maintained our engagement scores across the Group from the year earlier. We are pleased to see this manifest itself in strong retention, and staff turnover that is below the industry average. 17% Staff turnover (industry average 22%)1 1. 2023 Payscales Compensation Best Practice Report. Clients We have built a client-focussed business model at Marex – we strive to provide innovative products, value-added insights and high-quality service. Our growth strategy centres on attracting new clients onto our platform and increasing the business we do with all our clients over time. ~4,000+ Active clients2 2. Active clients are defined as generating more than $5,000 in Revenue per annum. Our communities and environment We are committed to cultivating positive change in the markets in which we operate. We aim to foster an environment where talent can thrive as well as to support our clients through the green transition. One of the many ways we engage with our colleagues and our communities is through charitable giving. $470k Social contribution – donated to charitable causes Investors Marex is a diversified and resilient business capable of delivering sustainable growth and strong returns over the long term. We believe this creates an attractive proposition for both debt and equity investors as we look for partners to support the future growth and evolution of the Group.
7
| Marex Group plc Annual Report 2023 | Strategic Report | Corporate Governance | Financial Statements | |||
|
|
|
|
|
|||
Marex aims to deliver high-quality, sustainable
growth by expanding our product offering and
global reach, to deepen our client relationships.
Our growth strategy is to build a diversified global platform and increase our capabilities as we look to connect clients to global markets. We continually look to expand our product coverage and geographic footprint, allowing us to bring more clients onto our platform and deepen relationships with existing clients. We have developed a scalable platform, and our people are focussed on delivering high-quality service to our clients, to differentiate us from our competitors. As our platform grows, we will continue to supplement the numerous organic growth opportunities that we see in the markets we operate in with selective, value-accretive acquisitions to accelerate our development.
As our platform grows, we have expanded into adjacent products and regions, organically and through acquisition, in the following ways:
| – | Firstly, by increasing the number of clients we service on our platform by continually developing new client relations and deepening the relationships we have with existing clients by leveraging our full-service offering. |
| – | Secondly, by extending our geographic coverage by building out our presence in the Americas, APAC and also the Middle East. |
| – | Thirdly, by expanding our product offering by adding adjacent asset classes. Most notably this includes building full service capabilities in renewables and environmentals, to support our clients in the transition to a lower carbon economy, and by increasing our coverage of the financial securities markets in both Clearing and Agency & Execution, diversifying away from the commodities markets which were historically the focus of the Group. |
Successful execution of this strategy over the last five years has created a business with a track record of delivering sustainable growth across both strong and weak macroeconomic environments.
8
| Marex Group plc Annual Report 2023 | Strategic Report | Corporate Governance | Financial Statements | |||
|
|
|
|
|
|||
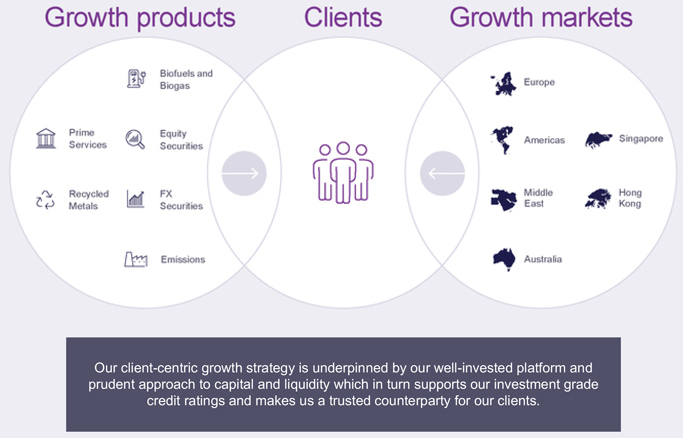
Products
Focusing on our four core services, we look to expand our product coverage into adjacent markets or asset classes to increase our relevance to a broader client base.
Clients
We provide services that are essential for our clients to run their businesses effectively. We look to add new clients to our platform and deepen relationships with our existing clients through cross-selling.
Geography
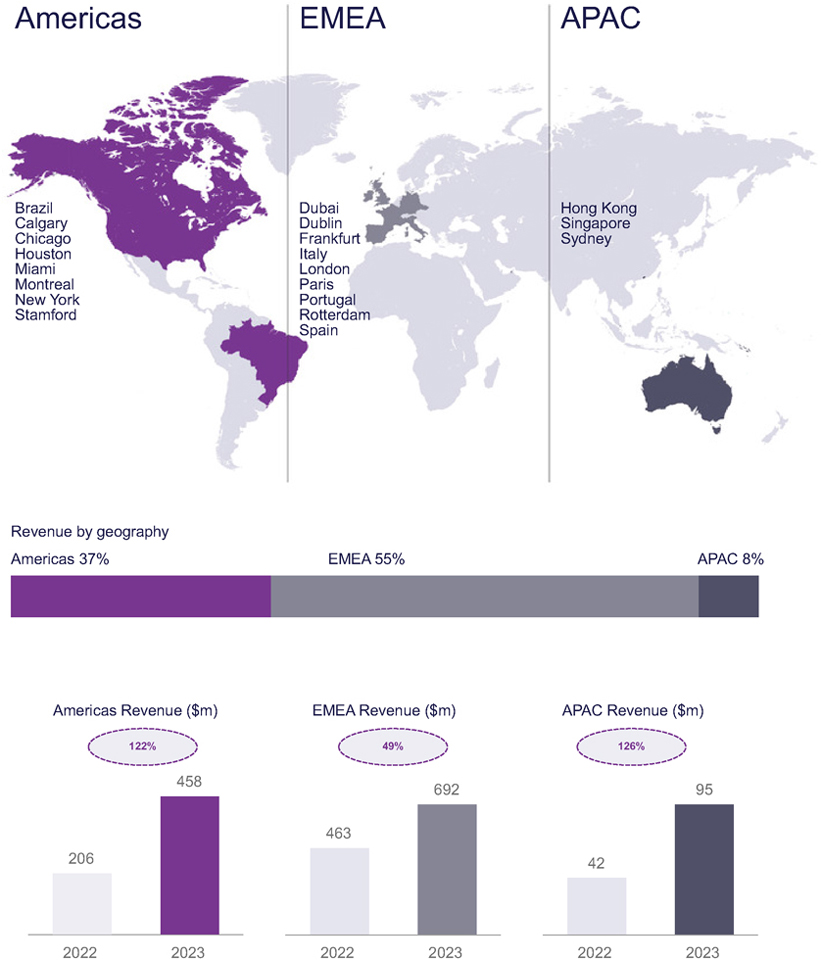
We have an extensive global presence across 17 countries and are actively increasing our presence in the Middle East, the Americas and Asia Pacific, which are growth markets for us.
Recent progress
Over the last few years, we have gradually built out our product offering and expanded the asset classes we cover through both organic and inorganic investments. The acquisition of ED&F Man Capital Markets increased our capabilities in clearing, as well as financial securities in agency and execution. Acquiring OTCex also bolstered our broking capabilities in financial markets. In late 2023, we acquired Cowen’s prime and outsourced trading businesses, creating opportunities to provide additional services to our growing asset manager client base.
Recent progress
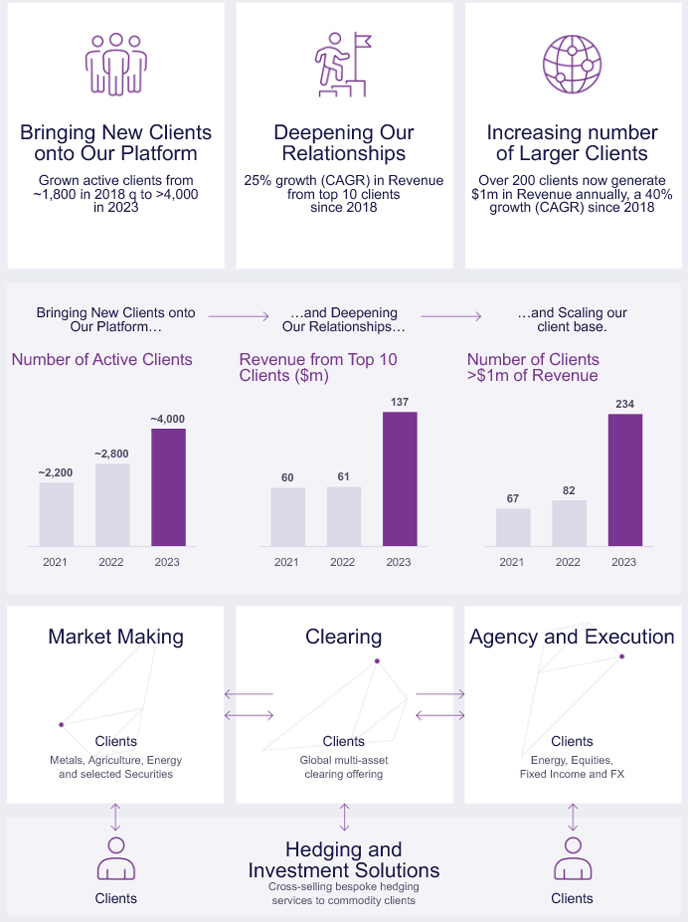
We have been highly successful in bringing new clients to our platform, with the total number of active clients exceeding 4,000 at the end of 2023, while increasing average balances from less than $1 billion in 2018 to $13.2 billion at the end of 2023. We have also increased the amount of business we do with our largest clients, increasing our share of wallet, seeing an increase in the number of clients that generate over $1 million of Revenue from 43 in 2018 to 234 in 2023, with Revenue generated from our Top 10 clients increasing to $137 million in 2023.
Recent progress
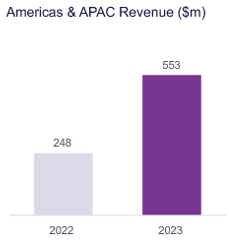
By expanding our global footprint we have seen the Revenue generated from the Americas and APAC regions grow from $248 million in 2022 to $553 million in 2023. In fact, Revenue from these regions now accounts for 45% of the Group’s total Revenue. We have achieved our extensive global presence through both organic growth and strategic acquisitions. For example, the acquisition of ED&F Man Capital Markets has significantly increased our U.S. and Middle East capabilities while our acquisition of Cowen’s prime brokerage business enabled us to diversify our product offering in financial securities in the U.S.
Looking ahead
We see opportunities to develop in Market Making in certain commodities and also to develop further in Clearing in the Americas. There is also a significant opportunity to develop more environmental products, particularly ‘green’ contracts, pairing carbon certificates with underlying commodities.
Looking ahead
We continue to add clients through organic and inorganic growth and increase Revenue generated from our smaller clients. There is a significant opportunity to cross-sell additional services to existing clients, especially for those clients who are newer to our platform.
Looking ahead
We see opportunities for growth in the securities and commodities markets in the United States and in the broader Americas region. In Asia Pacific we seek to capitalise on numerous structural growth opportunities and recent new exchange memberships on SGX and ASX. In the Middle East we see opportunities to expand in energy and environmentals, metals and financial securities.
9
| Marex Group plc Annual Report 2023 | Strategic Report | Corporate Governance | Financial Statements | |||
|
|
|
|
|
|||
Unlocking Opportunities
Through Diversification
At Marex, we believe that diversity in our operations and services
is the key to unlocking opportunities, mitigating risk, and ensuring
our resilience in an ever-evolving market landscape.
Diversified
The combination of our global footprint and broad range of products and services means we have a scalable platform that can serve the evolving needs of our clients. New services include prime brokerage and outsourced trading, and we have bolstered our renewable metals offering and extended our range of financial products.
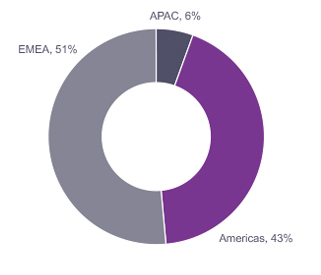
Our geographic expansion has also yielded benefits. We have seen significant Revenue growth in the U.S. and have expanded activities in APAC and in the Middle East. The Americas now account for 37% of Revenue and 43% of our Adjusted Operating Profit.
| Adjusted Operating Profit by service segment1 | Adjusted Operating Profit by geography1 | |
|
|
| 1. | Adjusted Operating Profit pie charts are for the 12 months ended 31 December 2023. Adjusted Operating Profit values by service segment do not sum to 100% due to exclusion of Corporate segment. Adjusted Operating Profit is a non-IFRS measure. Please see note 6 for a reconciliation to the nearest IFRS measure. |
10
| Marex Group plc Annual Report 2023 | Strategic Report | Corporate Governance | Financial Statements | |||
|
|
|
|
|
|||

“Expanding our business in the Americas has been an essential part of Marex’s strategy. We now offer services across financial, energy, metals and agricultural markets that position us extremely well to grow our client franchise, not just in the region, but also globally.” Ram Vittal. CEO, North America Key Highlights: Revenue in the Americas has grown from $142 million in 2021 to $458 million in 2023 – CAGR of 80%. Financial markets makes up the largest Revenue driver in the Americas with 43% of Revenue coming from Agency and Execution. Marex is a top 10 Futures Commission Merchant (FCM) by average segregated funds, competing with the largest global banks.
| Marex Group plc Annual Report 2023 | Strategic Report | Corporate Governance | Financial Statements | |||
|
|
|
|
|
|||
Strategy in action
Consistent Performance Through
Our Resilient Approach
Our diversified platform, combined with our prudent approach to capital
and funding, means we are resilient in the face of market volatility,
demonstrated by our consistent performance.
Resilient
Our track record is a testament to our resilience. Our risk management procedures are central to this resilience, with a prudent risk tolerance delivering consistent profitability with limited market risk.
This has resulted in improving positive trading weeks and months since 2021, and no single negative month since 2021.
This is the result of our diligent risk assessment, proactive measures, and prudent financial management.
Investment in our business model means we are well positioned to capture structural growth within the services that we provide, off-setting any cyclical headwinds, whilst still managing our risk to a reasonable level.
12
| Marex Group plc Annual Report 2023 | Strategic Report | Corporate Governance | Financial Statements | |||
|
|
|
|
|
|||
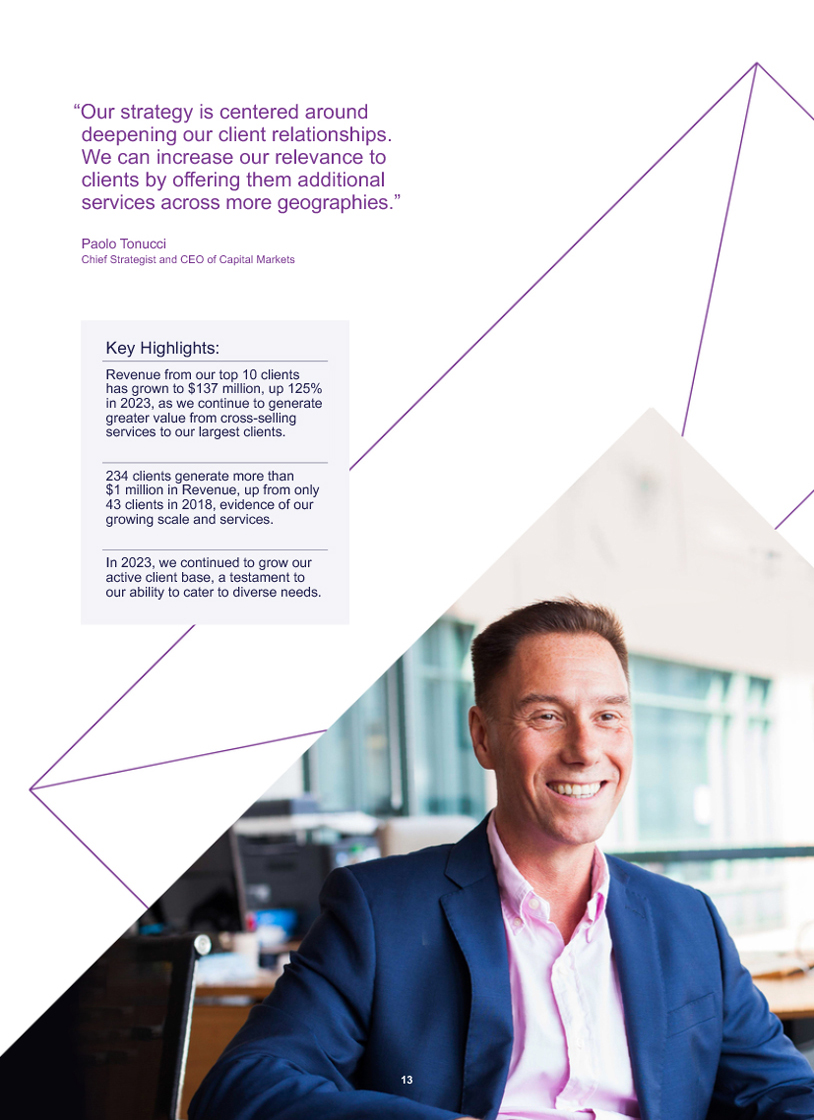
“Our strategy is centered around deepening our client relationships. We can increase our relevance to clients by offering them additional services across more geographies.” Paolo Tonucci Chief Strategist and CEO of Capital Markets Key Highlights: Revenue from our top 10 clients has grown to $137 million, up 125% in 2023, as we continue to generate greater value from cross-selling services to our largest clients. 234 clients generate more than $1 million in Revenue, up from only 43 clients in 2018, evidence of our growing scale and services. In 2023, we continued to grow our active client base, a testament to our ability to cater to diverse needs.
| Marex Group plc Annual Report 2023 | Strategic Report | Corporate Governance | Financial Statements | |||
|
|
|
|
|
|||
Strategy in action
Embracing Change Through
Our Dynamic Spirit
Change creates opportunity. Our proactive approach and
agile culture ensures that we can adapt as markets evolve
to meet our clients’ needs.
Dynamic
Marex embodies dynamism and is ready to embrace innovation and proactively adapt to shifts in the financial landscape. This means we are able not just to withstand market volatility, but also to benefit from it.
We see that volatility has become the norm, driven by macro-economic events and exacerbated by geopolitical events.
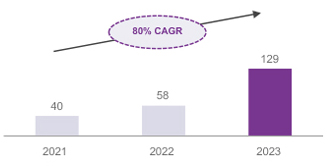
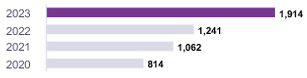
Our trading volumes tell a story of our dynamic nature, with total contracts cleared and trades executed growing 245% and 122% respectively in 2023. We are quick to respond to market demands, adjusting our strategies to seize new opportunities while staying ahead in a competitive environment.
This includes developing new products in our Environmentals business, where we see great opportunity to support our clients as they navigate the green transition.
| Contracts Cleared (m) | Trades Executed (m) | |
|
|
14
| Marex Group plc Annual Report 2023 | Strategic Report | Corporate Governance | Financial Statements | |||
|
|
|
|
|
|||

“We are consistently exploring new ways to support our clients as they navigate their journey to net-zero. This includes investments in expanding our green product coverage further into recycled metals and carbon certificates.” Bastien Declercq Head of Environmentals and CEO of CSC Commodities Key Highlights: Revenue from environmental products up 75% to $47 million in 2023, representing 4% of our total Revenue. We sell over 50 environmental products and services, to support our clients as they transition to a low carbon economy. In 2023, we added to our recycled metals offering by acquiring Global Metals Network (GMN) in Hong Kong.
| Marex Group plc Annual Report 2023 | Strategic Report | Corporate Governance | Financial Statements | |||
|
|
|
|
|
|||
Case Studies
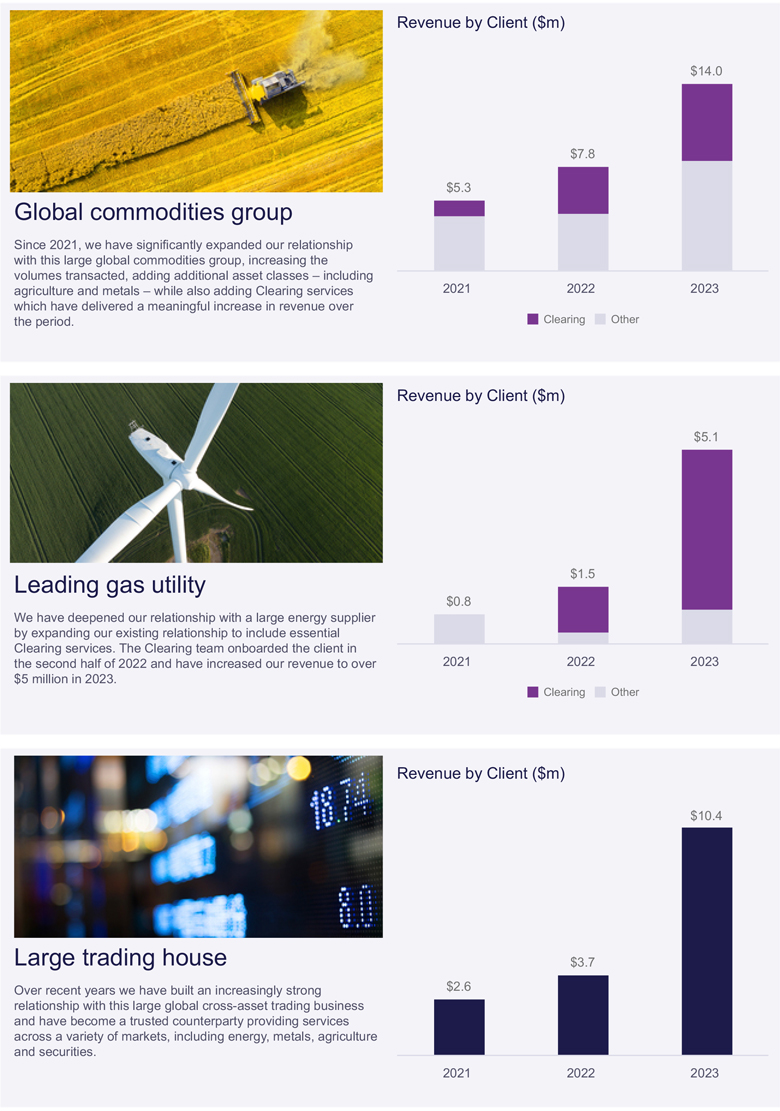
Global commodities group Since 2021, we have significantly expanded our relationship with this large global commodities group, increasing the volumes transacted, adding additional asset classes – including agriculture and metals – while also adding Clearing services which have delivered a meaningful increase in revenue over the period. Leading gas utility. We have deepened our relationship with a large energy supplier by expanding our existing relationship to include essential Clearing services. The Clearing team on boarded the client in the second half of 2022 and have increased our revenue to over $5 million in 2023. Large trading house Over recent years we have built an increasingly strong relationship with this large global cross-asset trading business and have become a trusted counterparty providing services across a variety of markets, including energy, metals, agriculture and securities.
16
| Marex Group plc Annual Report 2023 | Strategic Report | Corporate Governance | Financial Statements | |||
|
|
|
|
|
|||
Clients
Deepening Client Relationships Through Maximising Cross-Selling The Board uses key performance indicators (‘KPIs’) to monitor our performance and track progress against our growth strategy.
17
| Marex Group plc Annual Report 2023 | Strategic Report | Corporate Governance | Financial Statements | |||
|
|
|
|
|
|||
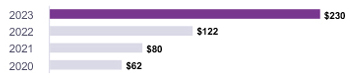
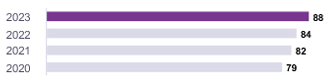
| Revenue ($m) | Reported profit after tax ($m) | |
| Revenue as reported in the audited Income Statement. This metric tracks the Group’s top-line growth. |
Profit after tax as reported in the audited Income Statement. |
|
|
|
|
|
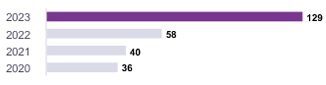
| Reported profit before tax ($m) | Adjusted Operating Profit ($m) | |
| Profit before tax as reported in the audited Income Statement. |
Adjusted Operating Profit (before tax) is a measure of the underlying profitability of the Group and excludes items that are considered to be non-operating, such as exceptional items. |
|
|
|
|
|
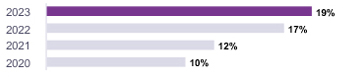
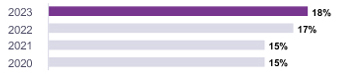
| Reported return on equity (%) | Adjusted Operating Profit Margin (%) | |
| The annual return the Group produces on its equity capital base, calculated as reported profit after tax divided by average total equity. |
Adjusted Operating Profit Margin is calculated as Adjusted Operating Profit divided by Revenue. This metric tracks the underlying relative profitability of the Group. |
|
|
|
|
|
| Total capital ratio (%) | Positive trading days (%) | |
| Indicates the financial strength of the business. The Group’s total capital resources as a percentage of total risk exposure calculated under the UK Investment Firms Prudential Regime (‘IFPR’) (came into force from January 2022). |
The proportion of positive trading days is a measure of the effectiveness of the Group’s risk management and of the profitability of our Market Making operations. |
|
|
|
|
|
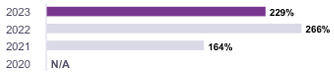
| Number of trades executed (m) | Average number of employees
|
|
|
The number of trades (in millions) executed on behalf of our clients tracks the Group’s growth over time. |
Average full time equivalent (‘FTE’) headcount is an indication of the size of the Group and tracks our growth over time. |
|
|
|
|
|
Marex’s KPIs include non-statutory APMs as defined by ESMA. We provide these to offer additional insights into the Group’s financial results. Where a non-statutory financial measure of performance is used, a reconciliation to the most directly related statutory measure is provided in note 6 to the consolidated financial statements.
18
| Marex Group plc Annual Report 2023 | Strategic Report | Corporate Governance | Financial Statements | |||
|
|
|
|
|
|||
Marex operates in an attractive market environment,
with a large addressable market and declining
competitive intensity, both of which support future
growth.
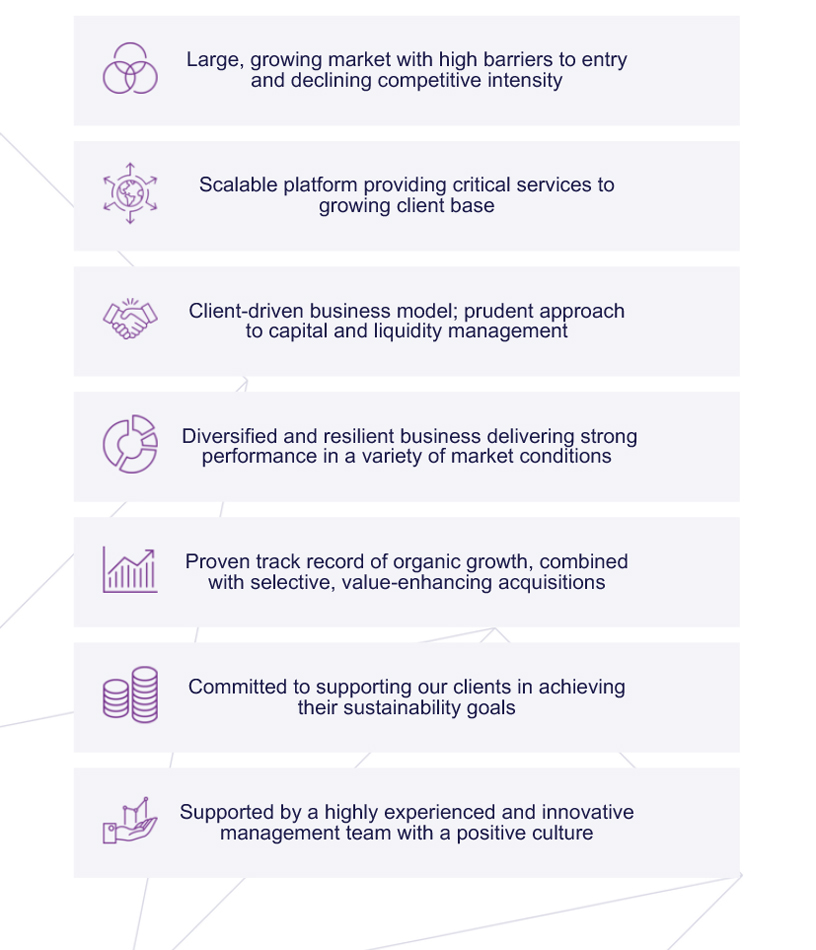
| Attractive market backdrop
Marex is well positioned within an attractive market environment, which supports future growth. The markets are large, growing and highly fragmented and characterised by declining competitive intensity. We remain nimble and entrepreneurial, focussed on providing excellent service to our clients, but we also have impressive scale and significant capital. This, combined with our investment grade credit rating, allows us to leverage our global footprint and broad asset class coverage to increase our market share.
These market dynamics have supported Marex’s ability to consistently deliver double digit growth, both in Revenue and Adjusted Operating Profit in recent years.
We anticipate these market dynamics will continue to be supportive for future growth. |
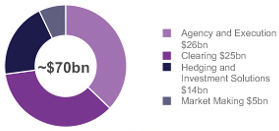
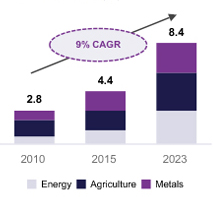
Large addressable market
We estimate our serviceable addressable market (‘SAM’) for our services to be around $70 billion per annum in Revenue terms. With a market share of only c. 2%, we see material opportunity to grow Revenues and gain market share in a growing market.
To increase our share, we are expanding our geographic footprint and asset class coverage, to better meet our clients’ needs.
Market growth
The energy, agriculture and metals markets that we service are large, established markets and asset classes. Our analysis suggests that the commodities market has delivered a compound annual growth rate of 9% since 2010. While the growth rate in any given year can be impacted by external events, which can impact volatility or the risk appetite of market participants and cause market conditions to evolve, we anticipate that market volumes in these core markets will continue to increase gradually. |
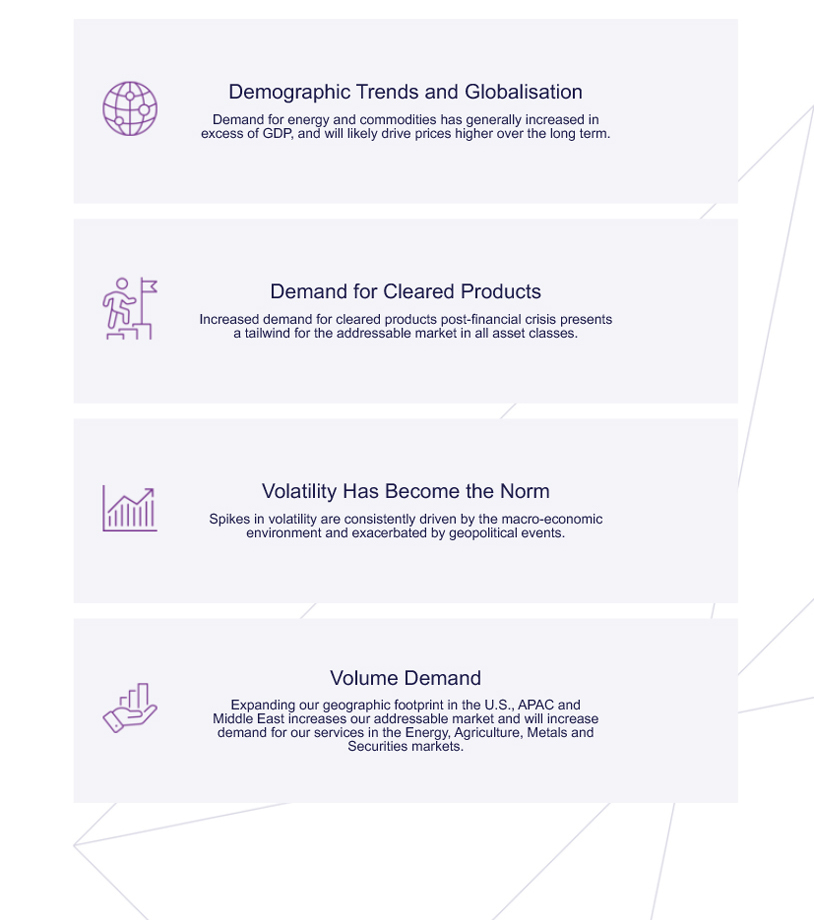
The consistent volume growth over the long term has resulted from demographic trends and globalisation, with the demand for energy and commodities steadily increasing.
In addition, increased demand for cleared products after the financial crisis presents a tailwind for the addressable markets in all asset classes.
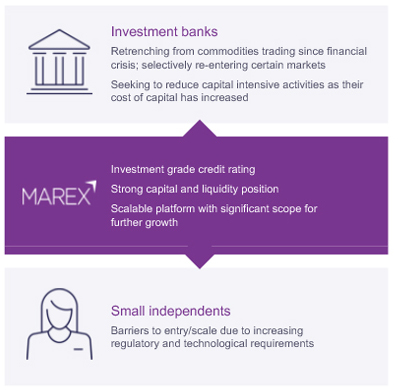
This market is characterised by declining competitive intensity, with investment and commercial banks retrenching from both commodities trading as well as reducing capital intensive activities such as clearing. Smaller competitors are less able to take advantage of these opportunities given the regulatory complexity and technology investments that are required to be successful in this market. So we see material opportunity to continue gaining market share from both our larger, and smaller, competitors. |
||
| Declining competitive intensity and barriers to entry | Large serviceable addressable market |
|||
|
Large serviceable addressable market refers to revenue opportunities.
Exchange-traded energy and commodity derivatives volumes (bn)
Volumes relates to derivative contracts. |
|||
19
| Marex Group plc Annual Report 2023 | Strategic Report | Corporate Governance | Financial Statements | |||
|
|
|
|
|
|||
Our Market Drivers
Our Core Markets Exhibit Strong Growth Well-invested scalable platform, underpinned by a highly experienced management team with a clear strategy.
20
| Marex Group plc Annual Report 2023 | Strategic Report | Corporate Governance | Financial Statements | |||
|
|
|
|
|
|||
2023 – a banner year for Marex as we reap
the benefits of our growth strategy

|
||||
| I am delighted to present my first report to shareholders since I was appointed Chair of the Marex Board in October. I would like to pay tribute to my predecessor, Carla Stent, who stepped down at the end of September after nine years in the role. Carla made a huge contribution in overseeing our governance arrangements and in supporting and guiding our management team as they grew the business into what it is today.
2023 proved to be a banner year for Marex as we reaped the benefits of the strategic steps implemented over the past several years. Against a background of continuing economic uncertainty and geopolitical turmoil, we grew our business across the board, delivering record results in almost |
every segment. Revenue increased by 75% to $1.2 billion while Adjusted Operating Profit before tax rose nearly 89% to $230 million. Our Adjusted Operating Profit margin grew to 18% and our reported return on equity stood at 19%.
Segments
Growth in profits was driven primarily by our Clearing, and Agency and Execution businesses. Marex’s Clearing business benefited from a full year of commission income from ED&F Man Capital Markets (‘ED&F Man’) and from additional net interest income arising from higher interest rates on larger client balances. This interest income is an integral feature of our Clearing business which requires us to hold large amounts of cash on behalf of our clients. Marex is now a major player in the clearing business globally and one of the largest non-bank futures commission merchants. In the fourth quarter of 2023, we ranked in the top five clearers by volume on the |
Chicago Mercantile Exchange (‘CME’), and in the top three on both the London Metal Exchange (‘LME’) and the Intercontinental Exchange (‘ICE’).
Our Agency and Execution business also grew strongly. A major turnaround in our Energy OTC business which connects market participants in oil, gas, power markets, environmentals and biofuel, led to a substantial increase in Revenue and profit, while a full year of Revenue from ED&F Man and contributions from the OTCex businesses acquired in February 2023 drove a significant increase in our capital markets Revenues. We intend our capital markets businesses in Agency and Execution to be a significant area of growth in the future as we expand them by product and geography, further diversifying our Revenues and reducing our dependence on commodity and energy markets. |
||
22
| Marex Group plc Annual Report 2023 | Strategic Report | Corporate Governance | Financial Statements | |||
|
|
|
|
|
|||
In December 2023, we completed the acquisition of the prime brokerage and outsourced trading businesses of Cowen, which have now been rebranded under the Marex name. This acquisition will create opportunities to provide additional services to a new set of clients.
Despite a decrease in market volatility and a changing mix of business, our Market Making Revenues marginally declined to $153.9 million in 2023. Although the Adjusted Operating Profit dropped (50%) year-on-year this represents a strong performance, as Revenues in 2022 had been boosted by the extraordinary volatility sparked by the Russian invasion of Ukraine. Many of our competitors saw considerable declines in their market making and trading businesses.
Our Hedging and Investment Solutions business (Marex Solutions), which enables clients to hedge positions in commodities, foreign exchange and rates, and also creates structured investment products which are distributed to investors via third parties, was able to grow Revenue organically by more than 28%. Marex Solutions is not just a significant contributor to our profits but is also an important source of funding for the Group as when we issue structured notes, the buyers of those notes lend money to the Group in exchange for an enhanced return.
People
The organic growth and acquisitions which have enabled us to deliver these exceptional results have also resulted in a significant increase in our headcount which now stands at more than 2,000, up from around 1,600 at the end of 2022. Management has worked hard to ensure that these businesses and individuals are integrated into Marex’s systems and culture and that all our employees understand our values and how we do business.
It is essential that, as we grow, we ensure that we understand and manage the risks which are an integral part of our business and that we maintain open, transparent and constructive relationships with the many regulators to whom we are accountable in the territories where we operate. To this end, we have invested heavily in our Control and Support functions to ensure that they keep pace with our growth, and we will continue to do so.
A prudent approach to managing our balance sheet underpins our strategy and we ensure that Marex holds sufficient surplus capital and liquidity to satisfy our regulators and to support our investment grade credit ratings. These ratings help Marex to be seen as a trusted counterparty for our clients. We continue to diversify our funding sources and, in February 2023, we successfully completed our inaugural public senior bond issuance, raising €300 million. This bond issuance further strengthens the Group’s liquidity position, diversifies its funding sources and extends its debt maturity profile.
In our Environmentals business, we continue to expand our capabilities as we help our clients transition to a lower-carbon economy. To support this, in July we acquired Global Metals Network, a recycled metals market maker in Hong Kong. We also acquired Eagle Commodities which offers carbon certificates alongside traditional energy products. Thanks to our range of services, we are well placed to help clients meet their regulatory requirements and switch to environmental products.
These efforts are one element of our broader People & Planet plan, which underpins our sustainability objective to cultivate positive change in the markets in which we operate. Elsewhere within Marex, we have made great strides towards meeting our climate-related reporting requirements, bringing in an advisor on our Climate Related Financial Disclosures (‘CFD’) reporting and also implementing Environmental Social and Governance (‘ESG’) carbon emission reporting software. These actions will help us meet compliance requirements and establish a baseline for a credible transition pathway to net-zero.
Governance/Leadership
In addition to Carla Stent, we also said goodbye last year to Stanley, Lord Fink, who stepped down after 13 years on the Board. Stanley was there from the beginning and we all benefited from his years of accumulated experience and wisdom.
In further Board changes, Sarah Ing stepped up to become Senior Independent Director and remains Chair of the Audit Committee. We also welcomed Linda Myers and Madelyn Antoncic, both of whom joined the Board in January 2024. Linda and Madelyn are both proven leaders with outstanding credentials in their respective fields of corporate law, and markets and risk management. In March 2024, Linda became Chair of the Remuneration Committee taking over from Jeremy Isaacs who has performed this role for the past seven years.
I am extremely grateful to our Non-Executive Directors and Committee Chairs for the support they give our management team as we strive for best in class governance, and I thank them for their efforts.
On the executive side, Rob Irvin joined us in March 2023 as Chief Financial Officer, and Graham Francis in July as Chief Operating Officer. Paolo Tonucci relinquished the role of Chief Financial Officer and stepped down from the board in May in order to concentrate full time on his new roles as Chief Executive of Capital Markets and Chief Strategist. Rob Irvin was appointed to the Board in May 2023.
I would like to thank our executive team, led with distinction by Ian Lowitt, for the enormous amount of hard work they have put in during 2023 and over the previous years, which has resulted in the impressive performance detailed in this report.
Future
The next few years will be exciting ones for Marex as we continue to build the business. We believe there will be many opportunities to grow our share of existing markets as well as to expand into adjacent areas as larger competitors retrench and leave the field. We expect to pursue these opportunities both organically and through acquisition. In parallel, we will continue to forge a distinctive Marex culture and identity as we evolve from our roots as a commodities-focussed broker and market maker into a diversified global financial services platform with market access and infrastructure at the heart of our offering. We view the future with excitement and confidence.
Robert Pickering
Chair
22 April 2024
23
| Marex Group plc Annual Report 2023 | Strategic Report | Corporate Governance | Financial Statements | |||
|
|
|
|
|
|||
Chief Executive Officer’s Review
2023 – an exceptional year in Marex’s
growth strategy

I am pleased to report that 2023 was another exceptional year when we transformed the scale and scope of the Firm. We continued to deliver on our strategy to grow our capabilities, our geographic reach, and our client base. We continued to invest in our platform and our people, and our Revenue grew 75% to $1.2 billion and our Adjusted Operating Profit was up 89% to $230 million.
The strength of our 2023 performance further demonstrates our ability to successfully navigate challenging periods in global markets. We have now increased Adjusted Operating Profit in each of the past nine years, a 34% CAGR since 2014. This sustained high performance is further confirmation of the strength of our organisation and the demand for our
services. Building on this momentum, we see a significant opportunity to capture additional market share across a total serviceable addressable market in Revenue terms exceeding $70 billion.
Macro conditions were broadly supportive through the year, with higher interest rates globally acting as a tailwind. While commodity markets showed less extreme volatility than the previous year, conditions were positive, and our business remained resilient.
We continued to add clients to our global platform in 2023, steadily increasing the amount of business we are doing with them, maintaining a strong level of organic growth. Revenue has been driven by a combination of client-driven organic growth, supplemented by selective acquisitions.
Our scalable platform has continued to demonstrate its ability to process a significant increase in levels of client activity on the platform this year, with total
trades executed up 80% (CAGR) since 2021 to 129 million trades. As we build scale in the business, so we also see an improvement in returns, with reported return on equity of 19%, up from 17% in 2022.
We have posted these record results while maintaining a strong capital and liquidity position that underpins our investment grade credit rating.
The steps we have taken to diversify the business have created a resilient business and scalable platform that continues to serve the evolving needs of our clients. Nowhere has this been more evident than in Clearing, where we have grown to become a global cross-asset clearer. Owing to the depth of our clearing proposition, we have attracted new clients and extended support for existing customers, delivering a 245% increase in contracts cleared, to 856 million in 2023. This growth has a demonstrable impact on bottom line.
24
| Marex Group plc Annual Report 2023 | Strategic Report | Corporate Governance | Financial Statements | |||
|
|
|
|
|
|||
During the year, we joined the top 10 largest futures commission merchants (‘FCMs’) by client assets in the U.S., and we also maintained a top five market share in many of the largest exchanges.
In Q4 2022, we acquired ED&F Man Capital Markets across the UK, U.S., Middle East and Australia, which significantly expanded both our product coverage and international presence, creating a more competitive and internationally diversified Firm. Throughout 2023, the integration of the business has been successful, reflective of the highly complementary nature of the service offering in Clearing and Agency and Execution.
We also took some important steps in 2023 to integrate our trading and reporting systems, which will improve our operating efficiency. We will also review our operations to reduce complexity, such as rationalising our legal entity structure, ensuring we remain agile.
I would like to take this opportunity to thank everyone at Marex for their hard work and dedication throughout the year. It is due to this effort that we continue to provide such a high-quality service to our clients.
Delivering on our growth strategy
Our growth strategy is to extend the breadth of our product offering, while expanding our international reach to bring more clients onto our platform. We have continued to diversify our business through both organic and inorganic investment with a view to creating sustainable earnings growth that ensures Marex is resilient regardless of market conditions.
The strategic investments we have made in recent years have allowed us to cross-sell additional services to our existing clients, whilst also attracting new ones. We now have over 4,000 active clients, up from around 2,800 a year ago, to whom we provide our services. The mix of organic and inorganic growth over a long period has created a very competitive franchise that can cater to both blue-chip and boutique clients.
We remain particularly excited about the opportunities in expanding into environmental and renewable products, and we have continued to invest in these areas. We see robust demand from our clients for this, with Revenue from our Environmentals business up 75% compared to 2022.
In addition, our acquisition of Global Metals Network, the recycled metals market maker based in Hong Kong, builds on our ambition to become a leading provider of environmental commodities while also accelerating our geographic expansion.
Given our presence in the metals, agriculture and energy markets, we see a compelling opportunity to become a leading market maker of best in class carbon credits, offering execution and clearing services in the various credit markets. We anticipate that over time green versions of contracts will operate alongside current energy and commodities contracts, providing an attractive growth opportunity.
We also acquired Cowen’s prime and outsourced trading businesses during 2023, bolstering our provision of essential market infrastructure connecting clients to markets, whilst also creating opportunities to provide additional services to a new set of clients. Through the acquisition we added clients, and a business that is geographically and strategically aligned with Marex’s growth ambitions.
The acquisitions we have made have materially enhanced the skills and capabilities we need to grow organically. We have a track record in improving the performance of the businesses we acquire, through business rationalisation and creating Revenue synergies.
Our geographic expansion has also yielded widespread benefits. Our enlarged U.S. franchise delivered strong Revenue growth in both the legacy Marex business and from the ED&F Capital Markets acquisition. In the year, the Americas region contributed 43% of Group Adjusted Operating Profit.
In the APAC region, where we are investing in our clearing offering, Revenue rose 126% year-on-year.
In the Middle East, we are increasing our coverage of the energy and financial securities markets. This is still a relatively modest part of the Group, but our Revenue is growing each month. We now have over 40 employees in the region to service our growing client base.
These operations complement our Capital Markets business, which continues to benefit from increased volumes. Collectively they give us a global reach for our agency and execution, and clearing services.
Crucially, Marex is benefiting from increased scale that geographic expansion is creating. As we build our business, there are more opportunities for cross-selling, and our margins and returns are improving. We are continuing to onboard numerous clients each year as we extend our reach across geographies and services.
We recognise that while our strength is in commodities, our clients are looking for support in other markets. This has informed our strategy to expand into financial markets to meet this need.
Marex is also benefiting from the structural opportunities provided by the unusual combination of high barriers to entry and declining competitive intensity. Regulatory and capital requirements, along with an increasing need for technology investment mean that larger banks are selectively reducing services they offer in our space. This gives us further confidence going forward.
Prudent approach to capital and liquidity
Our robust balance sheet supports this growth. We hold high-quality liquid assets to underpin the activity on the Marex platform.
We increased our total assets by 13% to $17.8 billion as at 31 December 2023. There was significant growth in our capital base; with total equity up 14% to $775.7 million at year end. This increase reflected $141.3 million in profit after tax partly offset by the payment of dividends and AT1 coupon in the period.
We continue to grow and diversify our funding sources, with total liquid resources of $1,369.8 million and liquidity headroom of $738.8 million as at 31 December 2023.
In February 2023 Marex raised €300 million of unsecured nominal fixed rate 5-year senior notes. The notes, which received an investment grade credit rating, support our expansion – both our organic growth and our M&A activity.
Our ability to manage risk and monitor client positions has in the past allowed us to navigate market turbulence and support our clients during challenging periods.
25
| Marex Group plc Annual Report 2023 | Strategic Report | Corporate Governance | Financial Statements | |||
|
|
|
|
|
|||
Chief Executive Officer’s Review (continued)
People
Our people are central to our success. That’s why we’ve taken steps this year to make Marex an even more attractive place to work.
This year we onboarded over 800 new colleagues and have established new initiatives to support career development, including enhancing our induction processes.
We rolled out official corporate titles to everyone across the business. The move gives us more uniform structure across geographies and means individuals can now see a more transparent path to develop their careers at Marex.
We launched a new Diversity, Equity and Inclusion (‘DE&I’) steering committee. This committee was instrumental in driving various initiatives forward this year, including the appointment of 20 DE&I champions to act as advocates for DE&I across the globe.
We also introduced a mentoring pilot for female talent to foster greater representation. More than 40 mentees partnered with individuals from the management executive team in the first stage of the pilot. We also held four events that we marked globally – International Women’s Day, Pride, Pink October, and Movember.
Wellness events for colleagues, including lunchtime yoga and exercise classes, are also held regularly. And we continue to support our colleagues’ charitable fundraising, contributing $470k in charitable matched giving in 2023.
To support our growing scale, we strengthened our executive team this year. Rob Irvin joined us from HSBC as Chief Financial Officer and Graham Francis joined us from TP ICAP as Chief Operating Officer, both bringing strong financial experience. I look forward to continuing to work with them both in delivering on Marex’s strategic priorities.
This is an exciting time for Marex. I’d like to thank all our teams for their hard work to deliver our initiatives and provide the standards our clients expect.
Awards
It is always pleasing to be recognised for our expertise and excellent service. This year Marex won several awards. The Energy Risk Awards named Marex commodity broker of the year and base metals house of the year, while Global Investor FOW International named Marex Non-Bank FCM of the Year and Client Clearing Provider of the Year. The British Legal Awards also nominated our in-house legal team for legal department of the year.
Positive outlook
Marex is well positioned for future growth following another year of expansion and strategic development. We see clear opportunities to continue adding to our product coverage, ensuring our global clients can access the services they require across a comprehensive range of asset classes.
We remain focussed on extending our geographic footprint so we can provide more clients with essential services. As a Firm, we are nimble and have numerous growth initiatives identified across our four core service areas so we can grow our business, irrespective of changes in the external environment.
Our scalable platform means we can achieve continued structural growth that will offset the impact of any cyclical headwinds.
In 2023 we’ve built on our strategy to create a diversified and resilient business. We are well positioned going into 2024, and I’m confident about the year ahead.
Our success is down to the people at Marex. Across the Group, our colleagues are working hard to give our clients excellent service and provide the structure we need to deliver for our clients and our investors.
Ian Lowitt
Chief Executive Officer
22 April 2024
26
| Marex Group plc Annual Report 2023 | Strategic Report | Corporate Governance | Financial Statements | |||
|
|
|
|
|
|||
2023 was a great year for Marex. We delivered
strong underlying organic Revenue and profit growth
while also successfully embedding and accelerating
our transformative ED&F Man acquisition.
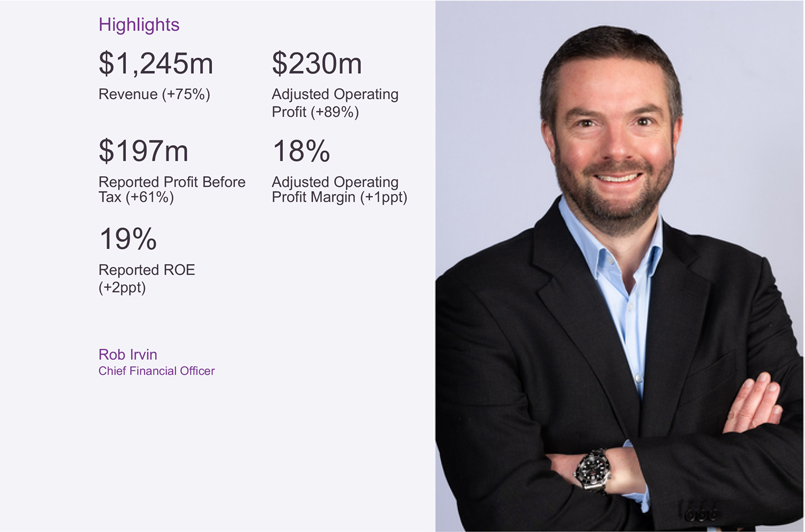
Our reported results are prepared in accordance with IFRS, as detailed in the notes to the financial statements starting on page 108. We also present alternative performance measures (non-GAAP financial measures) such as Adjusted Operating Profit which is used to compare period-on-period performance, as it excludes one-off income statement items to enhance comparability between periods. The results of our businesses and regions are presented on an adjusted basis below, which is consistent with how we manage and assess performance.
Revenue
The Group delivered strong performance in 2023 with Revenue growth of 75% to $1,244.6 million from $711.1 million in 2022. This performance was driven by organic growth in the underlying business, additional net interest income due to elevated interest rates, and the acquisitions, most notably ED&F Man Capital in Q4 2022.
Revenue increased across all segments except for Market Making and was primarily driven by an increase in Revenue from our Agency and Execution and Clearing businesses, which benefited from an increased number of clients on our platform as a result of both organic and inorganic growth. The reduction in Market Marketing Revenue reflects lower levels of volatility and client activity compared to the exceptional conditions seen in the prior period.
27
| Marex Group plc Annual Report 2023 | Strategic Report | Corporate Governance | Financial Statements | |||
|
|
|
|
|
|||
Financial Review (continued)
| 2023 | 2022 | |||||||||||
| $m | $m | Change | ||||||||||
| Revenue |
1,244.6 | 711.1 | 75% | |||||||||
| – Net commission income |
704.9 | 351.8 | 100% | |||||||||
| – Net trading Income |
411.4 | 325.3 | 26% | |||||||||
| – Net interest income |
121.6 | 29.4 | 314% | |||||||||
| – Net physical commodities income |
6.7 | 4.6 | 46% | |||||||||
Net commission income and Net trading Income increased year-on-year due to higher activity levels in our core metals, agriculture and energy markets which benefits Clearing, Agency and Execution and Market Making volumes. Net interest income increased significantly primarily due to higher average balances and higher interest rates during the period.
Net commission income increased by 100% to $704.9 million for the year ended 31 December 2023 from $351.8 million for the year ended 31 December 2022. The increase reflected increased customer activity in Agency and Execution, as well as in our Clearing business.
Net trading income rose by 26% to $411.4 million for the year ended 31 December 2023 from $325.3 million for the year ended 31 December 2022. The increase was primarily led by growth in Agency and Execution, driven by our Financial Securities business, as well as a significant increase in Hedging and Investment Solutions reflecting increased demand. In Market Making, the net trading income increase was more muted. We experienced strong acquisition driven growth in financial securities products, however, this was partly offset by lower net trading income from the metals, agriculture and energy markets, which decreased reflecting lower levels of volatility and client activity due to a return to more normal levels following the exceptional conditions seen in the first half of 2022.
Net interest income increased by 314% to $121.6 million for the year ended 31 December 2023 from $29.4 million for the year ended 31 December 2022. This growth reflects the benefit of both higher interest rates and increased average balances, partly offset by higher funding costs as market rates and spreads increased.
During 2023, the average Fed Funds rate increased to 5.0% for the year ended 31 December 2023 from 1.7% in 2022. In addition to the rise in interest rates, we experienced increases in our total average balances (including segregated and non-segregated client balances), which increased to $13.2 billion as of 31 December 2023 from $9.1 billion as of 31 December 2022. Average balances grew due to a combination of increased activity levels within our core businesses, higher margin requirements at exchanges in the first half of 2023, as well as the full year impact of the acquisition of ED&F Man Capital Markets.
Net physical commodities income increased by 46% to $6.7 million for the year ended 31 December 2023 from $4.6 million for the year ended 31 December 2022. This increase was primarily due to a 10% increase in sales volumes resulting from the acquisition of GMN.
Summary Income Statement
The table below shows the Group income statement on an adjusted basis, including Adjusted Operating Profit (before tax), which is the key measure of financial performance (and an alternative performance measure) utilised by the Board to monitor the underlying performance of the business.
| 2023 | 2022 | |||||||||||
| $m | $m | Change | ||||||||||
| Revenue |
1,244.6 | 711.1 | 75% | |||||||||
| Front office costs1 |
(690.4) | (400.0) | 73% | |||||||||
| Control and support costs1 |
(294.2) | (168.6) | 74% | |||||||||
| Provision for credit losses |
(7.1) | (9.5) | (25% | ) | ||||||||
| Depreciation and amortisation |
(27.1) | (13.8) | 96% | |||||||||
| Other Income and share of results of associates |
4.2 | 2.5 | 68% | |||||||||
| Adjusted Operating Profit |
230.0 | 121.7 | 89% | |||||||||
|
Non-operating adjustments |
(33.5) | (0.1) | 33,400% | |||||||||
| Reported Profit Before Tax |
196.5 | 121.6 | 62% | |||||||||
| Tax |
(55.2) | (23.4) | 136% | |||||||||
| Reported Profit After Tax |
141.3 | 98.20 | +44% | |||||||||
| Reported return on equity (‘ROE’) |
19% | 17% | 200bps | |||||||||
| Adjusted Operating Profit Margin |
18% | 17% | 140bps | |||||||||
Front office costs represent staff, systems and infrastructure costs associated with running our revenue generating operations. These costs increased 73% to $690.4 million in 2023, largely reflecting the increase in front office headcount during the year as part of consolidating recent acquisitions. This is evident in the increase in front office average FTE by 48% in the year to 1,028.
Control and Support costs primarily reflect staff and property-related costs, along with professional fees and other administrative expenses associated with the support functions. These costs increased 74% to $294.2 million in 2023, primarily reflecting increased headcount in our Finance, Risk and Compliance functions, to ensure we continually invest in our systems and processes to support future sustainable growth, as well as integrating additional Control & Support employees as part of recent acquisitions. Total control and support average FTE grew 62% to 886 at the end of 2023. As a result of the revenue and cost trends noted above, Adjusted Operating Profit increased 89% to $230 million for 2023 and Adjusted Operating Profit Margins improved to 18%, up from 17% in the prior year.
| 1. | Front Office and Control & Support costs exclude Allocations. |
28
| Marex Group plc Annual Report 2023 | Strategic Report | Corporate Governance | Financial Statements | |||
|
|
|
|
|
|||
|
|
||||||
The Group’s effective tax rate increased year-on-year to 28.1% in 2023 (2022: 19%). Our effective tax rate increased due to the change in the headline U.K. Corporation rate tax from 19% to 25% on 1 April 2023, as well as the changing geographic mix of our profits.
| 2023 | 2022 | |||||||||||
| Annual average full time equivalent (‘FTE’) headcount |
No. | No. | Change | |||||||||
| Front Office |
1,028 | 695 | 48% | |||||||||
| Control and Support |
886 | 546 | 62% | |||||||||
| Total |
1,914 | 1,241 | 54% | |||||||||
| Percentage of Front office employees |
54% | 56% | ||||||||||
Reconciliation to reported results
On a reported basis, Profit before tax increased 62% year-on-year to $196.5 million in 2023 from $121.6 million in 2022. This includes the impact of non-operating items; goodwill impairment in the Volatility Performance fund cash generating unit (‘CGU’), IPO preparation costs, acquisition costs, activities in relation to shareholders, and fees payable to private equity ownership. In the prior year items also included the impact of non-operating items: the bargain purchase (‘negative goodwill’) associated with the purchase of ED&F Man Capital Markets and the goodwill impairment in the Energy CGU.
| 2023 | 2022 | |||||||
| $m | $m | |||||||
| Adjusted Operating Profit |
230.0 | 121.7 | ||||||
| Goodwill impairment charges |
(10.7 | ) | (53.9 | ) | ||||
| Acquisition costs |
(1.8 | ) | (11.5 | ) | ||||
| ED&F Man Capital Markets – bargain purchase gain |
0.3 | 71.6 | ||||||
| Owner fees |
(6.0 | ) | (3.4 | ) | ||||
| Amortisation of acquired brands and customer lists |
(2.1 | ) | (1.7 | ) | ||||
| Activities in relation to shareholders |
(3.1 | ) | (0.5 | ) | ||||
| IPO preparation costs |
(10.1 | ) | (0.7 | ) | ||||
| Profit before tax (reported) |
196.5 | 121.6 | ||||||
| Tax |
(55.2 | ) | (23.4 | ) | ||||
| Profit after tax (reported) |
141.3 | 98.2 | ||||||
Segmental performance
We report our results in five segments, which consist of our four core segments: Clearing, Agency and Execution, Market Making, Hedging and Investment Solutions, and our Corporate segment. In prior years, we did not separately report on the Corporate segment and during 2023 we changed our approach to include Corporate as a separately reportable segment. The prior year’s segment information has been restated accordingly.
The following tables show the split of Revenue and Adjusted Operating Profit by segment for 2023 compared to 2022:
| 2023 | 2022 | |||||||||||
| Restated2 | ||||||||||||
| Revenue |
$m | $m | Change | |||||||||
| Clearing |
373.6 | 200.0 | 87% | |||||||||
| Agency and Execution |
541.5 | 230.7 | 135% | |||||||||
| Market Making |
153.9 | 172.6 | (11% | ) | ||||||||
| Hedging and Investment Solutions |
128.1 | 100.0 | 28% | |||||||||
| Corporate |
47.5 | 7.8 | 509% | |||||||||
| Total |
1,244.6 | 711.1 | 75% | |||||||||
| 2023 | 2022 | |||||||||||
| Restated2 | ||||||||||||
| Adjusted Operating Profit |
$m | $m | Change | |||||||||
| Clearing |
185.0 | 77.5 | 139% | |||||||||
| Agency and Execution |
71.9 | 23.4 | 207% | |||||||||
| Market Making |
33.3 | 66.5 | (50% | ) | ||||||||
| Hedging and Investment Solutions |
33.8 | 27.8 | 22% | |||||||||
| Corporate |
(94.0 | ) | (73.5 | ) | 28% | |||||||
| Total |
230.0 | 121.7 | 89% | |||||||||
| 2. | Please see note 6 for further information. |
29
| Marex Group plc Annual Report 2023 | Strategic Report | Corporate Governance | Financial Statements | |||
|
|
|
|
|
|||
Financial Review (continued)
The Group delivered another year of strong financial performance in 2023, with Adjusted Operating Profit increasing 89% in the year to $230.0 million. On a segmental basis, this performance was primarily driven by our Clearing and Agency and Execution segments which benefited from the transformative acquisition of ED&F Man completed at the end of 2022, which resulted in higher client assets at a time of rising interest rates, as well as an increased numbers of clients on our platform and increased levels of client activity. Our Hedging and Investment Solutions segment continued to see strong client demand, benefiting from market movements and growth in distribution capabilities.
For more details on performance in each of our segments, see the Business Review starting on page 33.
Balance sheet
The Group’s equity base increased during the year, with total equity increasing by 14% to $775.7 million as a result of strong profitability during the year with Profit after tax of $141.3 million in 2023 (2022: $98.2 million).
Total assets and total liabilities have grown significantly during 2023 as a result of higher levels of client activity, which led to an increase in client-related balances. Our balance sheet continues to consist of high-quality liquid assets which underpin client activity on our platform. Total assets increased from $15.7 billion at December 2022 to $17.8 billion at December 2023. This increase is largely due to growth in Securities and Cash and Liquid assets, partly offset by lower reverse repurchase agreements.
Securities balances increased to $4.0 billion, up $1.7 billion from the December 2022 position, due to growth in stock borrowing and equity instruments, driven by client activity and optimisation of recent acquisitions in the Agency and Execution business.
Cash and Liquid Assets increased by $836.1 million to $4.5 billion, primarily reflecting liquidity generated from our structured notes program, as well as well as underlying customer growth.
Goodwill and Intangible assets increased from $181.1 million to $219.6 million, mainly as a result of a $30.4m increase in intangible assets, driven by acquisitions and the recognition of customer relationships as well as capitalised software costs which more than offset amortisation of intangible assets during the year. Goodwill increased by $8.1 million to $163.6 million, primarily as a result of the OTCex acquisition, partly offset by an impairment charge taken on our Volatility Performance fund during the year.
| 2023 | 2022 | |||||||||||
| $m | $m | Change | ||||||||||
| Cash & Liquid Assets |
4,465.9 | 3,629.8 | 23% | |||||||||
| Trade Receivables |
4,789.8 | 4,685.2 | 2% | |||||||||
| Reverse Repo Agreements |
3,199.8 | 4,346.0 | (26% | ) | ||||||||
| Securities |
4,022.7 | 2,304.6 | 75% | |||||||||
| Derivative Instruments |
794.1 | 480.8 | 65% | |||||||||
| Other Assets |
258.2 | 116.4 | 122% | |||||||||
| Goodwill and Intangibles |
219.6 | 181.1 | 21% | |||||||||
| Total Assets |
17,750.1 | 15,743.9 | 13% | |||||||||
| Trade Payables |
6,785.9 | 6,647.6 | 2% | |||||||||
| Repurchase Agreements |
3,118.9 | 4,381.4 | (29% | ) | ||||||||
| Securities |
4,248.1 | 2,383.7 | 78% | |||||||||
| Debt Securities |
2,216.3 | 1,308.7 | 69% | |||||||||
| Derivative Instruments |
540.7 | 294.3 | 84% | |||||||||
| Other Liabilities |
64.5 | 50.5 | 28% | |||||||||
| Total Liabilities |
16,974.4 | 15,066.2 | 13% | |||||||||
| Total Equity |
775.7 | 677.7 | 14% | |||||||||
| * | Certain 2022 balances have been restated (refer to note 39 for more detail). |
30
| Marex Group plc Annual Report 2023 | Strategic Report | Corporate Governance | Financial Statements | |||
|
|
|
|
|
|||
|
|
||||||
Liquidity
| 2023 | 2022 | |||||||
| $m | $m | |||||||
| Total available liquid resources |
1,369.8 | 797.6 | ||||||
| Liquidity headroom |
738.8 | 530.3 | ||||||
A prudent approach to capital and liquidity and commitment to maintaining an investment grade credit rating are core principles which underpin the successful delivery of our growth strategy.
Group liquidity resources consist of cash and high-quality liquid assets that can be quickly converted to meet immediate and short-term obligations. The resources include non-segregated cash and unencumbered securities guaranteed by the U.S. Government. The Group also includes any undrawn portion of its committed revolving credit facility (‘RCF’) in its liquidity resources.
Liquidity headroom is based on the Group’s Liquid Asset Threshold Requirement, which is prepared according to the principles of the UK Investment Firms Prudential Regime (IFPR). The requirement includes a liquidity stress impact from three scenarios based on Systemic (Market Conditions), Idiosyncratic (i.e. Group specific) and Combined (mixture of both Systemic and Idiosyncratic). Assumptions are made on various factors such as Variation Margin requirements and Initial Margin call requirements, as well as the ability to draw down on the RCF to give a total headroom over and above a Board approved Trigger and Limit for each factor.
The Group maintains a $150 million unsecured RCF with the four participant banks: Bank of China Limited, London Branch; Barclays Bank plc; HSBC Bank plc; and Industrial and Commercial Bank of China Limited, London Branch. The RCF was refinanced on 30 June 2023 and has a renewal date of 30 June 2026. The facility remained undrawn as at 31 December 2023.
Facilities held by operating subsidiaries, and which are only available to that relevant subsidiary, have been excluded from these figures as they are not available to the entire Group.
The Group ended 2023 with $1,369.8 million of liquid resources, including the undrawn portion of the RCF, compared with $797.6 million at the end of 2022.
In February 2023, the Group successfully completed its inaugural public senior bond issuance, raising €300 million of additional liquidity. The bonds have an annual coupon of 8.375%, mature in February 2028 and have been rated BBB- by both S&P and Fitch. The latest issuance further strengthens the Group’s liquidity position, diversifies its funding sources and extends its debt maturity profile.
Regulatory capital
The Group is subject to consolidated supervision by the UK Financial Conduct Authority and has regulated subsidiaries in jurisdictions both inside and outside of the UK.
The Group is regulated as a MIFIDPRU investment firm under IFPR. The minimum capital requirement as at 31 December 2023 was determined by the Own Funds Threshold Requirement (‘OFTR’) set via an assessment of the Group’s capital adequacy and risk assessment conducted annually.
The Group and its subsidiaries are in compliance with their regulatory requirements and are appropriately capitalised relative to the minimum requirements as set by the relevant competent authority. The Group maintained a capital surplus over its regulatory requirements at all times.
Maintaining a prudent approach to capital and liquidity in order to maintain an investment grade credit rating are core principles which underpin the successful delivery of our growth strategy. The Group manages its capital structure in order to comply with regulatory requirements, ensuring its capital base is more than adequate to cover the risks inherent in the business and to maximise shareholder value through the strategic deployment of capital to support the Group’s growth and strategic development. The Group performs business model assessment, business and capital forecasting, stress testing and recovery planning at least annually.
31
| Marex Group plc Annual Report 2023 | Strategic Report | Corporate Governance | Financial Statements | |||
|
|
|
|
|
|||
Financial Review (continued)
The following table (unaudited) summarises the Group’s capital position at the year end:
| 2023 | 2022 | |||||||
| $m | $m | |||||||
| Core equity Tier 1 Capital1 |
437.7 | 383.3 | ||||||
| Additional Tier 1 Capital (net of issuance costs) |
97.6 | 97.6 | ||||||
| Tier 2 Capital |
3.1 | 4.1 | ||||||
| Total Capital resources |
538.4 | 485.0 | ||||||
| K-factor Requirement |
184.8 | 165.3 | ||||||
| Own Funds Requirement2 |
235.1 | 182.6 | ||||||
| Total Capital ratio3 |
229% | 266% | ||||||
| 1. | Total capital resources include audited results for the financial year |
| 2. | Own Funds Requirement presented as Own Funds Threshold Requirement (‘OFTR’) |
| 3. | The ratio expresses the Group’s total capital as a percentage of Own Funds Requirement |
At 31 December 2023, the Group had a total capital ratio of 229% (2022: 266%), representing significant capital headroom to minimum requirements. The decrease in the total capital ratio resulted from higher Own Funds Threshold Requirement following the acquisitions in 2022 and 2023, mainly ED&F Man Capital Markets and OTCex. The higher Own Funds Requirement was offset by the increase in total capital resources due to strong profitability in the period.
The K-factor requirement reflects assessment of market, credit and operational risk for the Group’s operations as defined by the IFPR regulations and consists of: K-NPR (‘Net Position Risk’); K-TCD (‘Trading Counterparty Default’); K-CMH (‘Client Money Held’); K-COH (‘Client Orders Handled’); and K-DTF (‘Daily Trading Flow’). K-NPR is the market risk arising from the open positions held by the Group at the end of day. K-TCD measures the counterparty risk in the trading book exposure when dealing on own account. K-CMH, K-COH and K-DTF are calculated based on the daily average client money held, daily average notional of client orders, and daily average notional of transactions executed in the Group’s name.
32
| Marex Group plc Annual Report 2023 | Strategic Report | Corporate Governance | Financial Statements | |||
|
|
|
|
|
|||

Marex provides Clearing services across the full range of energy, commodity and financial markets. We act as principal for our clients and provide direct access to over 58 exchanges globally.
Our Neon client portal compliments these Clearing capabilities with near real-time updates on transactions and exposures, allowing our clients to efficiently manage their accounts and risk.
Our Clearing business performed exceptionally well in 2023, benefiting from higher levels of client activity on our platform, with the total number of contracts cleared up 245% to 856 million in 2023, from 248 million in 2022. This significant increase reflects a combination of factors, including increased number of clients we provide clearing services to, in part due to the benefit of the ED&F Man Capital Markets acquisition which closed in the final quarter of 2022, as well as a change in mix towards financial securities and higher volume clients.
Revenue increased 87% to $373.6 million in 2023, up from $200 million in 2022, driven by a combination of Net commission income increasing 63% to $236.2 million, as a result of the both higher average balances and higher interest rates in 2023 compared to 2022. Average balances increased to $13.2 billion in 2023, from $9.1 billion in 2022, as a result of increasing client numbers and activity, and balances added through the ED&F Man Capital Markets acquisition.
33
| Marex Group plc Annual Report 2023 | Strategic Report | Corporate Governance | Financial Statements | |||
|
|
|
|
|
|||
Business Review (continued)
Adjusted Operating Profit increased by 139% in 2023 to $185.0 million, from $77.5 million, while Adjusted Operating Profit Margin increased to 50% in 2023, from 39% in 2022, an indicator of a remarkable year.
We continue to onboard new clients which supports our organic growth. Marex is an attractive alternative to traditional investment banks for many of our clients, who are increasingly turning to us given our reputation for leading customer service and as a safe and reliable alternative.
The combination of our global cross asset class offering and commitment to client service is being recognised in the market, with our teams winning its fourth consecutive Futures & Options Weekly award. While well established in our core geographies, we are seeking to replicate this award-winning model in new territories. Notable expansions in 2023 included the successful launch of clearing services in Australia with our new membership of ASX, Singapore with direct member of SGX and in the Middle East, leveraging our new presence in Dubai.

Portfolio
Portfolio provides access to all clearing accounts, updated throughout the day across transactions, balances and performance. Viewable on any desktop or mobile device.
| 2023 | 2022 | Change | ||||||||||
| Revenue ($m) |
373.6 | 200.0 | 87% | |||||||||
| Net commission income |
236.2 | 144.7 | 63% | |||||||||
| Net interest income |
136.2 | 55.3 | 146% | |||||||||
| Net trading income |
1.2 | — | n.m. | |||||||||
| Adjusted Operating Profit ($m) |
185.0 | 77.5 | 139% | |||||||||
| Adjusted Operating Profit Margin |
50% | 39% | ||||||||||
| Contracts cleared (m) |
856 | 248 | 245% | |||||||||
| Front office headcount (No.) |
275 | 260 | 6% | |||||||||
|
Our priorities |
||||
| Work closely with our clients to maximise service quality and manage credit risk through periods of volatility | ||||
| Continue to bring new clients onto our platform and cross-sell clearing services to our existing clients | ||||
| Leverage our expanded global operating footprint to expand our client base, particularly in Asia, Australia and the Middle East
|
||||

34
| Marex Group plc Annual Report 2023 | Strategic Report | Corporate Governance | Financial Statements | |||
|
|
|
|
|
|||
|
|
Agency and Execution provides essential liquidity and execution services to our clients primarily in the energy and financial securities markets.
We act on an agency basis and matched principal basis, connecting buyers and sellers in often illiquid markets to facilitate price discovery and so they can transact directly. In addition, we provide execution services where we execute transactions on a regulated exchange on behalf of our clients and then pass the transaction to the relevant counterparty or clearing house to settle.
This business segment is primarily commission-driven and has a lower risk profile, both market and credit risk, and therefore a lower capital requirement compared to Market Making or Clearing.
Revenue increased substantially year-on-year to $541.5 million in 2023 compared to $230.7 million in 2022, reflecting the positive market conditions in the energy markets, investments we have made and the benefit of recent acquisitions significantly increasing our capabilities in financial securities.
Adjusted Operating Profit increased year-on-year to $71.9 million from $23.4 million in 2022. This is principally due to improved market conditions in the energy markets, an increase in the underlying financial securities business, as well the benefit of recent acquisitions. As a result, Adjusted Operating Profit Margin for the segment increased to 13% for 2023, up from 10% in 2022.
Securities
Our presence in the financial markets is growing as we integrate and optimise recent acquisitions, allowing Marex to diversify its asset class coverage away from traditional commodity markets. The key drivers of our agency and execution revenues in financial securities are equity derivatives, primarily index options and fixed income, including corporate and government bonds. Revenue increased significantly, up 261% to $319.8 million during 2023, primarily as a result of the benefit of the ED&F Man Capital Markets and OTCex acquisitions which completed in the final quarter of 2022 and first quarter of 2023 respectively. In combination, these strategic investments significantly expanded our geographic operating footprint in the U.S. and continental Europe, giving us a presence in the Middle East.
The acquisition of the legacy Cowen Prime Services business, which completed in December 2023, creates an additional growth opportunity for us which is highly complementary to our existing operations in the financial securities markets and will allow us to further increase our market share with small and mid-sized asset managers. |
|||
35
| Marex Group plc Annual Report 2023 | Strategic Report | Corporate Governance | Financial Statements | |||
|
|
|
|
|
|||
Business Review (continued)
Energy
Our energy division provides essential liquidity to clients by connecting buyers and sellers in the opaque OTC energy markets to facilitate price discovery. We have leading positions in many of the markets we operate in, including key gas and power markets in Europe; environmental, petrochemical and crude markets in North America; and fuel oil, LPG (liquefied petroleum gas) and mid-distillates globally.
We achieve this through the breadth and depth of the service we offer to customers, including market intelligence for each product we transact in, based on the extensive knowledge and experience of our teams.
Revenue increased 57% year-on-year to $219.8 million in 2023, compared to $140.4 million in 2022. While client activity in many energy markets improved as a result of reduced margin requirements, the significant increase in revenues was also driven by the strategic reorganisation and initiatives put in place by the new management team appointed in January 2022.

Neon
Our Neon platform combines trading, risk, market data and insights on the global commodities markets. Providing access to liquidity across both listed and OTC markets, complemented by our leading research and market commentary – all in one platform.
| 2023 | 2022 | Change | ||||||||||
| Revenue ($m) |
541.5 | 230.7 | 135% | |||||||||
| Energy |
219.8 | 140.4 | 57% | |||||||||
| Securities |
319.8 | 88.7 | 261% | |||||||||
| Other Revenues |
1.9 | 1.6 | 19% | |||||||||
| Adjusted Operating Profit ($m) |
71.9 | 23.4 | 207% | |||||||||
| Adjusted Operating Profit Margin |
13% | 10% | ||||||||||
| Front office headcount (No.) |
677 | 417 | 62% | |||||||||

36
| Marex Group plc Annual Report 2023 | Strategic Report | Corporate Governance | Financial Statements | |||
|
|
|
|
|
|||
|
|
Our Market Making business provides direct liquidity to our clients across a variety of products, primarily in the energy, metals and agriculture markets.
This ability to make prices and trade as principal in a wide variety of energy and commodity markets differentiates us from many of our peers.
Marex has a long and successful heritage in the commodity markets that it operates in, having been a Category 1 member of the London Metal Exchange for over 15 years, for example, and some of its front office teams have decades of experience in their chosen product areas. This results in strong market positions in our core markets which makes Marex a ‘go-to counterparty’ in the energy and commodity markets and provides an excellent platform to cross-sell additional services, such as clearing, to our large and growing client base.
Revenue decreased slightly in 2023, down 11% year-on-year to $153.9 million. This reflects a return to more normalised levels of volatility in the year, most notably in our metals and energy markets, compared to the exceptional levels of volatility and trading activity in the prior year. |
37
| Marex Group plc Annual Report 2023 | Strategic Report | Corporate Governance | Financial Statements | |||
|
|
|
|
|
|||
Business Review (continued)
| We continue to see growing demand for our
Adjusted Operating Profit decreased by 50% in |
2023 | 2022 | Change | |||||||||||||||||||
| Revenue ($m) |
153.9 | 172.6 | (11% | ) | ||||||||||||||||||
|
Metals |
69.3 | 88.7 | (22% | ) | ||||||||||||||||||
|
Agriculture |
27.5 | 20.3 | 35% | |||||||||||||||||||
|
Energy |
31.6 | 52.1 | (39% | ) | ||||||||||||||||||
|
Securities |
25.5 | 11.5 | 122% | |||||||||||||||||||
|
Adjusted Operating Profit ($m) |
33.3 | 66.5 | (50% | ) | ||||||||||||||||||
|
Adjusted Operating Profit Margin |
22% | 39% | ||||||||||||||||||||
|
Front office headcount (No.) |
99 | 93 | 6% | |||||||||||||||||||
|
|
||||||||||||||||||||||
|
Crude & Metals
Our Neon platform combines trading, risk, market data and insights on the global commodities markets. For example, in metals and crude oil markets we provide both electronic and voice trading capabilities in one seamless portal. |
Our priorities
|
|
||||
|
Continue to support our clients through this period of elevated market volatility |
||||||
|
Enhancing coverage and connectivity of our renewables product offering |
||||||
|
Opportunities to expand our Market Making capabilities in U.S. and Middle East |
||||||
|
Leveraging our Neon client platform to enhance client experience and increase trading volumes
|
||||||
|
|
||||||
38
| Marex Group plc Annual Report 2023 | Strategic Report | Corporate Governance | Financial Statements | |||
|
|
|
|
|
|||

|
Our Hedging and Investment Solutions business provides high-quality bespoke hedging and investment solutions to our clients.
Tailored commodity hedging solutions allow producers and consumers of commodities to hedge their exposure to movements in energy and commodity prices, as well as exchange rates, across a variety of different time horizons.
Our financial products offering allows investors to gain exposure to a particular market or asset class, for example equity indices, in a cost effective manner through a structured product.
The business performed well during 2023, particularly given the backdrop of volatile market conditions and subdued investor appetite, delivering 28% Revenue growth to $128.1 million.
Demand for our commodity hedging services increased during the year, with the moderation in market volatility to more normal levels impacting demand, offset by the continued expansion of our distribution network, particularly in the U.S., leading to an increase in the number of active clients on our platform.
Performance in the financial products area of the business was particularly strong with a recovery in investor sentiment and equity market performance supporting a significant increase in structured notes issuance during the year.
The structured notes portfolio consisted of 2,749 notes with an average maturity of 15 months and a total value of $1,850.4 million at the end of 2023 compared to a total value of $1,155.9 million in 2022 with an average maturity of 17 months.
As a result of increased Revenues during the year, notably in our financial products area, Adjusted Operating Profit increased by 22% to $33.8 million, but margins declined slightly to 26% as we continue to invest in our infrastructure and distribution network to support the next leg of our growth. |
39
| Marex Group plc Annual Report 2023 | Strategic Report | Corporate Governance | Financial Statements | |||
|
|
|
|
|
|||
Business Review (continued)
| The business is well positioned to continue to |
2023 | 2022 | Change | |||||||||||||||||||
| Revenue ($m) |
128.1 | 100.0 | 28% | |||||||||||||||||||
|
Hedging solutions |
62.0 | 52.4 | 18% | |||||||||||||||||||
|
Financial products |
66.1 | 47.6 | 39% | |||||||||||||||||||
|
Adjusted Operating Profit ($m) |
33.8 | 27.8 | 22% | |||||||||||||||||||
|
Adjusted Operating Profit Margin |
26% | 28% | ||||||||||||||||||||
|
Headcount (No.) |
144 | 97 | 48% | |||||||||||||||||||
|
Our priorities
|
|
|||||
|
Further build out our distribution network in the U.S. and APAC
|
||||||
|
Exploring commodities hedging opportunities in South America
|
||||||
|
Continuing to invest in our cutting-edge derivatives engine and client portal to further enhance our competitive advantage
|
| Financial Products
Our structured notes program provides our asset management clients the ability to gain access and tailored exposure to a broad range of markets, whilst also being an important source of liquidity for the group.
|

|
|||
|
Hedging Solutions
Through our bespoke hedging solutions, we help commodity producers to hedge their risk, against any commodity, across any time horizon, versus any underlying currency, at an attractive price. |

|
|||
40
| Marex Group plc Annual Report 2023 | Strategic Report | Corporate Governance | Financial Statements | |||
|
|
|
|
|
|||
Taking action to support the low carbon transition

As Chair of Marex’s Sustainability Committee I am focussed on bringing together internal and external expertise to deliver our People & Planet strategy and to advance towards our long-term goal to achieve net-zero by 2050.
Marex is committed to cultivating positive change in the markets in which we operate to support the transition to a low-carbon economy, build resilience, and secure the long-term success of the business.
As climate, nature and other sustainability risks climb to the top of the corporate agenda, we are working in partnership with clients, colleagues and wider stakeholders to both manage these risks and unlock opportunities.
With our experienced position in the global energy, commodities and financial markets, we can facilitate connections and provide environmental products and services that help our clients build the low-carbon, more sustainable, economy of the future.
We are also committed to cultivating positive change within our own business and within our industry. We are working to foster an inclusive environment where talent can thrive, and we seek to grow awareness of opportunities in our industry to broaden our talent pool.
This activity is underpinned by strong governance, policies, and procedures to manage risks and opportunities.
We see significant opportunity to support our clients through the green transition. We are investing in this opportunity by growing our team, by acquiring businesses, and through innovative partnerships.
We have built a diversified environmental business that offers a broad range of services, from originating our own carbon certificates from Indonesian mangrove forests, to connecting buyers to sellers in renewable energy in North America and Europe, to transacting in recycled metals.
We believe that this work to support our clients on their path to decarbonisation will create the most impact towards cultivating positive change.
However, we are also determined to play our direct part by reducing our own carbon emissions to net-zero by 2050 or sooner.
We recognise the need to continually evolve our sustainability strategy and build our capabilities to manage our sustainability programmes and disclosures. In 2023, we have invested in sustainability data management tool and team resources to help us deliver our People & Planet sustainability strategy in the years ahead.
The following pages provide further detail on Marex Group’s sustainability strategy and activities over 2023. For more detail our separate Sustainability Report is also available on the Group website.
Rob Irvin
Chief Financial Officer
41
| Marex Group plc Annual Report 2023 | Strategic Report | Corporate Governance | Financial Statements | |||
|
|
|
|
|
|||
Sustainability (continued)
Sustainability highlights 2023
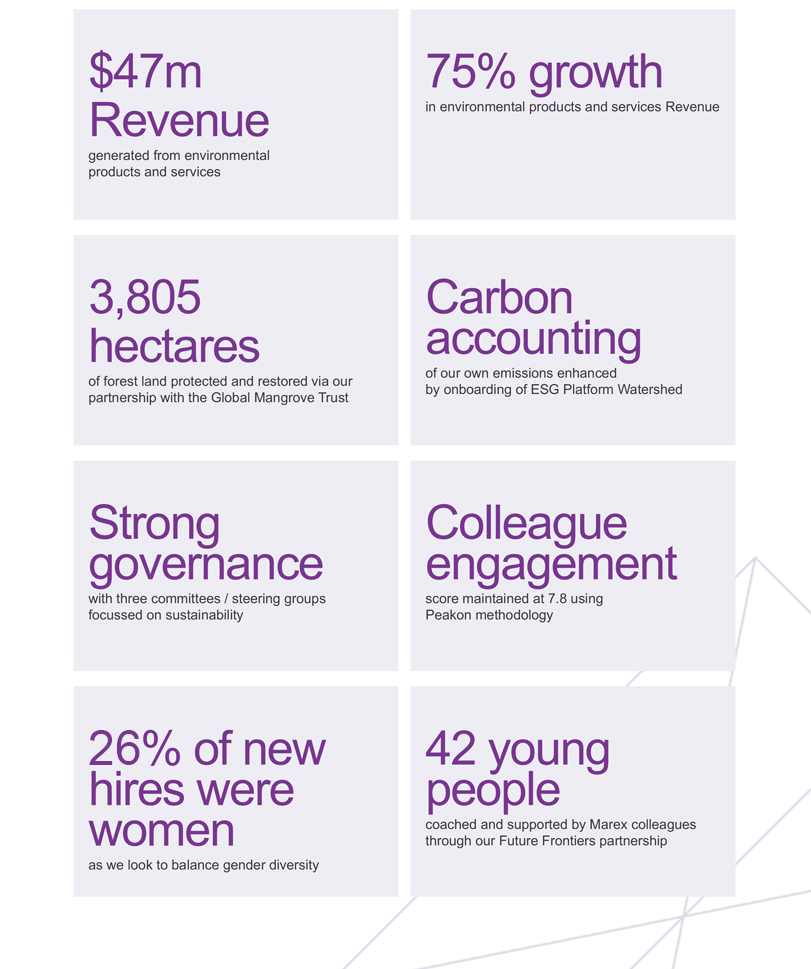
42
| Marex Group plc Annual Report 2023 | Strategic Report | Corporate Governance | Financial Statements | |||
|
|
|
|
|
|||
Our Sustainability Strategy
Marex is committed to cultivating positive change in the markets in
which we operate to support the transition to a low-carbon economy,
build resilience, and secure the long-term success of the business.
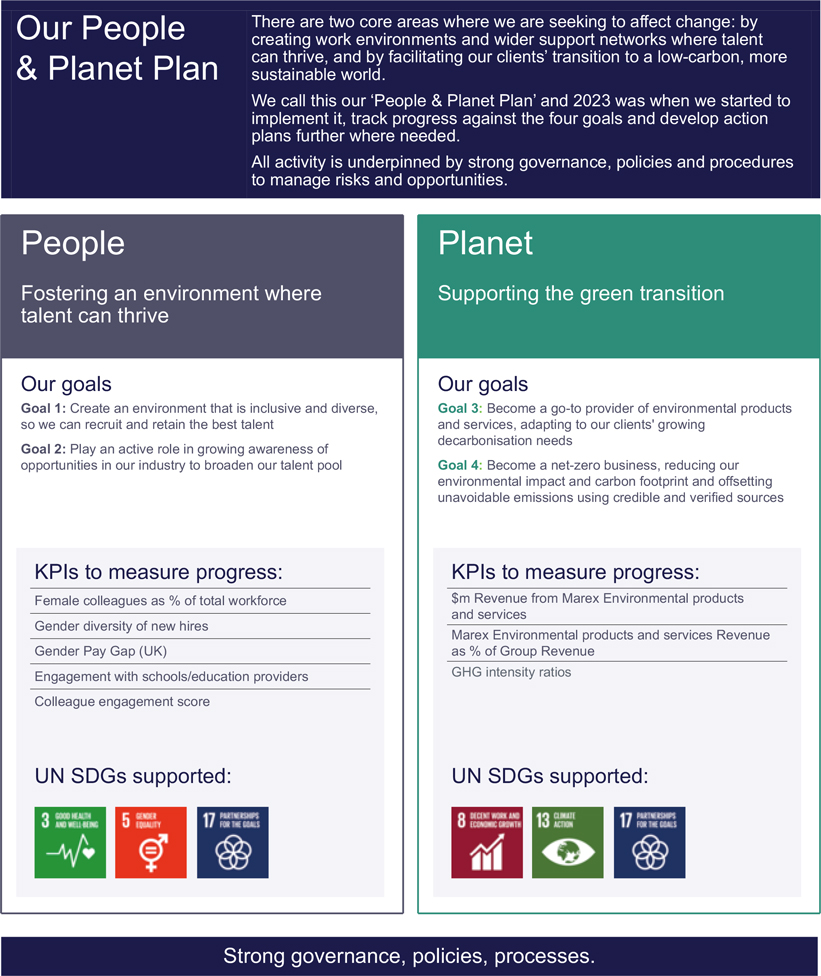
43
| Marex Group plc Annual Report 2023 | Strategic Report | Corporate Governance | Financial Statements | |||
|
|
|
|
|
|||
Sustainability (continued)
Evolution of Our People & Planet Plan
We have worked with sustainability experts to develop the People &
Planet Plan and ensure it takes account of stakeholders’ views about
our priority issues, our Group strategy, and external sustainability
frameworks such as the UN’s Sustainable Development Goals (‘SDGs’).
In 2024 our sustainability strategy will continue to evolve taking account of emerging stakeholder views, the needs of our corporate strategy, and to ensure progress can be tracked.
Our contribution to the UN Sustainable Development Goals
| UN SDG | Objective | How Marex is contributing | ||

|
Ensure healthy lives and promote wellbeing for all at all ages | Marex treats employee welbeing as a key priority. We offer a suite of wellbeing services to provide comprehensive support for both physical and mental health. | ||

|
Promote gender equality and empower all women and girls | Marex is committed to promoting opportunities for women within Marex and the commodities and financial services industry more broadly. We do this through supporting our internal female talent pipeline, mentoring schemes, working to remove any bias from recruitment processes, and working with schools and partners to demystify the industry and attract more females to consider careers at Marex.
Beyond our organisation, Marex contributes to various initiatives to support women around the world. One example is our partnership with The Global Mangrove Trust, which directly supports gender diversity by creating jobs and livelihoods for women in rural communities in South East Asia. |
||

|
Promote sustained, inclusive and sustainable economic growth, full and productive employment and decent work for all | Employing more than 2,000 people worldwide, Marex is an important contributor to the UK and global economies. We believe that inclusivity in a workplace helps us attract the most talented people – regardless of gender, race, religion, disability, culture or sexual orientation. | ||

|
Take urgent action to combat climate change and its impacts | Our pivotal position in the global energy and commodity markets provides an opportunity to assist the transition to a low-carbon and environmentally sustainable economy. We provide environmental products, services and expertise that enable clients to lower environmental impact, and create new, cleaner business models.
A key sustainability goal for Marex is to become net-zero by 2050 and to establish a transition plan to achieve this. We maintained carbon neutrality in 2023 through offsetting Scope 1 & 2 GHG emissions using OxCarbon verified carbon credits from mangrove forest carbon sequestration schemes where we are an active partner.
This carbon offset initiative, a partnership with OxCarbon, The Global Mangrove Trust and Kumi Analytics, is also available to the whole market as a high-quality and verifiable way to offset hard-to-abate emissions. |
||

|
Strengthen the means of implementation and revitalise the Global Partnership for Sustainable Development | With our experienced position in the global commodities sector, we can connect key players and act as a change intermediary, from the growers and energy generators to the manufacturers, corporations and institutions. By brokering connections, we can help to build new, lower-impact, cleaner markets and harness our expertise to create a low-carbon economy. | ||
44
| Marex Group plc Annual Report 2023 | Strategic Report | Corporate Governance | Financial Statements | |||
|
|
|
|
|
|||
| Responding to climate-related risks and opportunities
Climate-related Financial Disclosures (‘CFD’)
Marex is committed to aligning its risk management and reporting with the recommendations, and required Companies Act disclosures of the Climate-related Financial Disclosures (also known as ‘TCFD aligned’ and based on the work undertaken by the Task Force) ensuring that our strategy takes account of the climate-related risks and opportunities identified by the CFD framework.
We have used the CFD framework over each of 2022 and 2023 to gain a better understanding of our climate-related risks and opportunities and in 2023, Marex has undertaken an in-depth piece of work to further evolve and improve its TCFD aligned reporting. Marex’s 2023 CFD Statement can be found starting on page 61 of the Strategic Report. |

|
|||
| Our approach to taxation
Marex recognises taxation as an important social consequence of doing profitable business in a jurisdiction, and our commitment to paying the right amount of tax in the right jurisdiction and at the right time reflects this. Taxation, both direct and indirect, is an important part of Marex’s contribution to the societies in which it operates. As such, Marex is committed to complying with tax laws in a responsible manner and to having open relationships with tax authorities wherever it operates. Marex’s tax risk appetite is low. |
Marex is committed to transparency of the taxes it pays. In 2023, Marex had an effective tax rate of 28.1% (compared to the blended UK corporation tax rate of 23.5% for 2023) and made total worldwide corporation tax cash payments of $55.9 million (2022: $18.0 million). |
“Marex recognises taxation as an important social consequence of doing profitable business in a jurisdiction, and our commitment to paying the right amount of tax in the right jurisdiction and at the right time reflects this.” |
||
45
| Marex Group plc Annual Report 2023 | Strategic Report | Corporate Governance | Financial Statements | |||
|
|
|
|
|
|||
Sustainability (continued)
People
| Like any business, people are at the core of our strategy. Our People pillar is focussed around two goals that ensure we build a team of talented people to drive our ambition for change across the business.
Goal 1 addresses our intent to develop a diverse colleague population with a culture that values every person on their individual merits, regardless of gender, age, race, religion, disability, culture or sexual orientation.
Goal 2 speaks to the importance of making our sector visible and appealing to people from all walks of life as they consider their professional future. |
Goal 1:
Create an environment that is inclusive and diverse so we can recruit and retain the best talent. |
We know that diversity brings a broader perspective which enhances problem-solving and innovation. This breadth of thinking helps us to develop more innovative solutions for our clients, and in turn helps to develop a culture that attracts the brightest talent, so we are committed to nurturing diversity and opportunity in all areas of our business. This will help us to create an environment that respects and benefits from wider experience, helping to retain and attract talented individuals as well as driving forward our business and the green transition. |

46
| Marex Group plc Annual Report 2023 | Strategic Report | Corporate Governance | Financial Statements | |||
|
|
|
|
|
|||
| Goal 1 in action
Diversity, Equity and Inclusion (‘DE&I’) Champions
In 2023, we created a network of DE&I Champions across the business to encourage active colleague involvement and to support Marex’s efforts to be more inclusive and champion the interests of all colleagues. The role of the Champions is to work collaboratively with each other across the business worldwide, to propose and implement a 12-month plan that supports our overall DE&I goals and objectives.
The Champions network is supported by our newly established DE&I Steering Group which is responsible for setting our DE&I agenda and goals, and supporting a range of DE&I initiatives including support for International Women’s Day, Pride, Pink October and Movember in 2023. |
|
Pink October
Globally, we raised almost $10,000 for breast cancer charities. Teams held awareness initiatives throughout the month, and hundreds of Marex colleagues took part in the #WearItPink initiative.
In the U.S., our DE&I Champions organised ‘pink breakfasts’ throughout the offices which raised over $2,000 for the breast cancer charity Susan G. Komen.
Our APAC region Champions organised a bake sale and sold pink merchandise, including polo shirts and ribbons. |
This raised over $2,000 for the Breast Cancer Foundation in Hong Kong and Singapore.
In the UK, the Champions held a pink-themed breakfast and sold pink socks and ribbons across the office. They also ran a bake-off judged by our senior leadership team and arranged a bra donation drive.
In total, the UK raised over £3,000 for Breast Cancer Now. |
|||||
| The 12-month plan includes initiatives to raise awareness, educate colleagues and celebrate diversity. Progress is reported quarterly to the Steering Group. |
|
|||||||
|
Movember
In total, Marex raised over $5,000 for the cause. Movember is an annual event that encourages people to grow moustaches during the month of November to raise awareness about men’s health issues. The campaign aims to address this critical agenda globally, funding groundbreaking projects, and advocating for better treatment and support for men in need. |
Throughout our offices globally, we encouraged those who wanted to participate to grow a moustache. We also used the month to raise awareness among our colleagues about the importance of men’s physical and mental health. We did this through a talk by James Martin, long-serving Movember Ambassador and Co-Founder and Mental Health and Well-being Director at Walking the Walk, which supports organisations in helping people take ownership for their own wellbeing. James discussed prostate and testicular cancer, as well as mental health and suicide prevention.
|

|
||||||
|
|
||||||||
47
| Marex Group plc Annual Report 2023 | Strategic Report | Corporate Governance | Financial Statements | |||
|
|
|
|
|
|||
Sustainability (continued)
People (continued)
Supporting career
progression for women and
increasing the diversity of
our colleague population.
A 12 month pilot mentoring programme for women leaders at Marex was launched in August 2023. The scheme is sponsored by our CEO who also mentors three colleagues. Pilots have run in all regions with the goal to increase women’s career opportunities at Marex. We have around 40 colleagues currently benefiting from the programme. Following evaluation in June 2024, we expect to offer the scheme on an ongoing basis.
Across our operations we are working hard to ensure that our job descriptions and recruitment advertising are gender neutral, and in the U.S. we are taking efforts to publish salary bands with all job roles. We constantly review the effectiveness of these approaches to attract more women into our business and will apply them in other operating countries where appropriate.
In the UK, we are working on our senior hire processes to help us to attract women into senior roles at Marex. Our colleague population is currently 23% women which is an increase of 2 percentage points against 2022.
During 2023, 26% of new hires were women. This is an issue on which we will continue to focus in 2024 as we work towards better representation for women at all levels of the business.
We continue to focus on ways to enhance diversity in all its forms across our workplace and how we can measure progress where possible.
Gender Pay Gap
In line with UK statutory requirements, Marex publishes Gender Pay Gap information for Marex Financial, the entity that employs the majority of our colleagues in the UK.
The figures for 2023 report the narrowing of the hourly fixed pay and bonus pay gaps in 2023 compared to 2022. Mean and median pay gaps in 2023 were 21% and 23% respectively (2022: 30% and 31%) and mean and median bonus pay gaps were 69% and 44% (2022: 81% and 54%).
The growth in the number of top-quartile roles held by women at Marex Financial has contributed to this narrowing. However, as we consolidate acquisitions into Marex Financial, we expect that in 2024 these pay gaps may widen again closer to the levels we have seen in 2022 and earlier years.
Marex’s gender pay gap is driven primarily by under-representation of women in the top-quartile of the higher paid and higher bonus-paying roles in the Group, typically front-office roles. Therefore, it is positive that in 2023 the percentage of women in top-quartile roles rose to 18% from 15% in 2022, which has contributed to the reduction in the mean and median pay gaps. While this is welcome, as mentioned above, we expect that the 2024 pay gap will widen due to the inclusion of pay data from additional companies that are being consolidated into Marex Financial. These acquired companies have a higher percentage of men working in their front-office roles.
The 2023 bonus mean and median pay gaps have been affected by the introduction of the Deferred Bonus Plan reflecting up to a 60% deferral of variable pay. This therefore results in a significant proportion of the variable pay awarded to the senior roles for calendar 2022 being awarded in shares which vest on a three-year cycle and are not captured in the bonus ‘pay’ for the 2023 Gender Pay Gap purposes. As the value of the shares on vesting will be included in future years’ calculations, we anticipate that the mean and median bonus pay gaps will begin to widen from the 2023 levels.
Marex’s gender pay gap is a function of the relative under-representation of women in the highest compensated roles in Marex Financial.
We remain committed to addressing these pay gaps by seeking to increase the proportion of women in more senior roles. We do this through the initiatives outlined in this report spanning every stage of the employment cycle from talent identification to, recruitment, training and development, mentoring and return-to-work initiatives.
|
Supporting International Women’s Day & Pride – inspiring and engaging our colleagues
International Women’s Day (‘IWD’) is a global day celebrating the social, economic, cultural, and political achievements of women and is recognised annually on 8th March.
To mark our support for IWD and celebrate success of female role models, we invited Kate Richardson-Walsh OBE (Olympic Gold and Bronze Medal-winning GB field hockey player) to talk to our teams. Kate guided the GB team through tough times, a revolution of personnel and culture, and on to Olympic glory. With lessons in leadership, team building, and vision, Kate shared insight into how an all-female team can work together to defy expectations.
To celebrate Pride month 2023, Marex invited Gareth Thomas, a former Welsh and British & Irish Lions professional rugby player, to speak about the power of authenticity and allies, while sharing his own journey in a male-dominated environment. |

|
|||
48
| Marex Group plc Annual Report 2023 | Strategic Report | Corporate Governance | Financial Statements | |||
|
|
|
|
|
|||
| Corporate titles | Gender distribution by corporate title |
|
||||||||||||||||||||||||||||||||||||||||||||
| Marex is committed to developing our people and providing an environment where employees can fulfil their full potential, advance their careers, and receive recognition for taking on increased responsibility.
The introduction of corporate titles in 2023 provides a consistent framework to facilitate a fair and consistent promotion process at all levels.
In 2023, we have a global baseline of gender distribution by corporate title (see table opposite) and we will continue to conduct fair and transparent performance and talent reviews to encourage career progression. |
Female | |
% of Female Total |
|
Male | |
% of Male Total |
|
Total | |
% Female of Overall Total |
|
||||||||||||||||||||||||||||||||||
|
Managing Director |
10 | 2% | 81 | 5% | 91 | 11% | ||||||||||||||||||||||||||||||||||||||||
|
Executive Director |
28 | 6% | 156 | 10% | 184 | 15% | ||||||||||||||||||||||||||||||||||||||||
|
Director |
61 | 13% | 408 | 25% | 469 | 13% | ||||||||||||||||||||||||||||||||||||||||
|
Vice President |
134 | 29% | 481 | 30% | 615 | 22% | ||||||||||||||||||||||||||||||||||||||||
|
Associate |
164 | 35% | 345 | 21% | 509 | 32% | ||||||||||||||||||||||||||||||||||||||||
|
Analyst |
68 | 14% | 118 | 7% | 186 | 37% | ||||||||||||||||||||||||||||||||||||||||
|
Not applicable*
|
|
4
|
|
|
1%
|
|
|
16
|
|
|
1%
|
|
|
20
|
|
|
20%
|
|
||||||||||||||||||||||||||||
|
Total
|
|
469
|
|
|
100%
|
|
|
1,605
|
|
|
100%
|
|
|
2,074
|
|
|||||||||||||||||||||||||||||||
|
Total % of female vs male employees
|
|
23%
|
|
|
77%
|
|
||||||||||||||||||||||||||||||||||||||||
| *Not applicable – non-corporate roles, e.g. interns. |
|
|||||||||||||||||||||||||||||||||||||||||||||
| Fostering the wellbeing of all our people
Worklife Central is a service that provides Marex colleagues globally with a comprehensive programme of tailored, expert-led resources to support parents, carers and professionals in their work and home lives. Worklife Central offers informal, friendly and confidential support groups which connect professionals who may be facing similar personal situations, experiences or challenges so they can support each other. The support groups available include neurodiverse professionals, menopause, single parents, new dads, carers, parents of LGBTQ+ children and many more.
To date, 185 colleagues have registered for the programme and have sought advice on topics including careers, wellbeing, families and inclusion. |
Engaging our people
We are pleased to see our Peakon colleague engagement score this year is consistent with last year, with an overall score of 7.8, and a participation rate in our colleague survey of 81%. The score represents satisfaction level at work with a score range from 0 – 10 where 10 is high. We saw strong results in the Peakon Key Drivers of ‘Goal Setting’, ‘Management Support’, ‘Meaningful Work’ and ‘Peer Relationships’. Our ‘Workload’ score, which measures colleagues’ perception around workload levels, declined versus last year reflecting a year of change and growth. We will continue to invest in systems and processes to improve efficiencies and the ‘Workload’ scoring. Further plans aim to raise our engagement score in 2024. |
Respectful workplace
Respect at work is an essential part of maintaining and continuing to improve a positive, inclusive culture and a healthy working environment where colleagues feel valued and can be comfortable at work. This in turn improves morale, wellbeing, collaboration and engagement, influencing success. Marex has an expectation of all colleagues to be respectful at work to create an open, fair and inclusive workplace. To this end, in 2023, 118 of our colleagues attended our ‘Working With Respect’ workshops across 14 workshops, and this will be offered to teams globally throughout 2024.
Outcomes of the workshop include:
– Understanding of the benefits of a positive culture based on dignity and respect
– Understanding of how respect and inclusion relate to behaviours |
||

|
– Discussing the importance of perception and not ‘crossing the line’
– Knowing their responsibilities in making Marex a great place to work
– Being reminded of how this links to day-to-day work and our other policies
– Having the opportunity to ask questions and discuss scenarios and cases from the industry |
|||
49
| Marex Group plc Annual Report 2023 | Strategic Report | Corporate Governance | Financial Statements | |||
|
|
|
|
|
|||
Sustainability (continued)
People (continued)
| Goal 2:
Play an active role in growing awareness of opportunities in our industry to broaden our talent pool.
|
|
The workforce in our sector lacks diversity so we are committed to an outreach programme that helps to break down established stereotypes and inspires young people from all walks of life to explore career opportunities in the sector. In engaging with these initiatives, we aim to attract the brightest and best to Marex, and to enhance the recruitment pool of the wider industry. For those who join us, we are committed to providing exciting career development opportunities.
|
|
Future Frontiers evaluate their impact using an indicator defined as ‘career readiness’. This is calculated using the Student Career Readiness Index (SCRI), a validated national scale. The programme outcome showed a significant increase in career readiness amongst participating pupils.
The graph (right) shows the positive impact on student readiness for career transition (as measured by SCRI) after 20 students from Drayton Manor School in London completed their coaching sessions with Marex staff in 2023. |
| Goal 2 in action
Outreach partnership with Future Frontiers, helping young people to pursue the career they choose
Marex’s partnership with Future Frontiers aims to combat the effect that disadvantaged socio-economic background can have on life opportunities. In 2023 the partnership supported 42 young people through the Future Frontiers Coaching Programme supporting them to pursue the career they want. |
The partnership offers skills-based volunteering for Marex colleagues that gives them the opportunity to positively impact career outcomes for young people. In addition to the positive benefits for the participants, Marex colleagues taking part benefit from development of communication and coaching skills, alongside practical experience of a diverse range of social experience and perspectives. | |
|
Benefits of Future Frontiers coaching programmes
(Source: Future Frontiers 2023 Impact Report)
|
||
| Increase in pupil career and transition readiness
(Source: Future Frontiers Impact Report 2023)
|
||
50
| Marex Group plc Annual Report 2023 | Strategic Report | Corporate Governance | Financial Statements | |||
|
|
|
|
|
|||
Student feedback

“My coach showed me all the paths I can take to get to my chosen career. They showed me which subjects I need to focus on as well as encouraging me to work harder. Thank you for helping me to explore my options and career paths I can take.”

“My coach helped me realise that I can go into a career that matches my interests as I didn’t think that job existed before, I’ll try my best in lessons to achieve my goals.”

‘90% of the young people coached agree they are clearer on how to achieve their ambitions’
Training and development
Marex is committed to promoting an environment of training, learning and continuing personal and professional development for all employees. We recognise that this is essential to providing a high-quality working environment which meets the needs and expectations of our clients, stakeholders, regulators and employees. To that end, the Group supports and pays for employees’ training where this is appropriate to their role, subject to business needs, operational and budgetary considerations.
The Group’s approach to identifying the training and development needs for employees is focussed on ensuring relevant skills in specific job areas. In 2023, we piloted the Marex Manager Development Programme to provide the tools and resources to be an effective people manager, and this will be scaled out. In 2024, we have invested in a Learning Management System to provide more learning and development opportunities for everyone as we grow as a Firm. This will be branded as the Marex Academy and we aim to launch in Q2 2024. The system will also provide data to track how many colleagues have benefited from training during each year.
Graduate training programme to attract young people into our business
Our new Graduate Programme established in late 2023 will help to develop the talent pipeline with a goal of attracting early career talent. The Full Time Graduate Programme is a two-year experiential journey designed to support 25 graduates in connecting their personal interests and strengths to Marex’s values and purpose.
The programme begins with a comprehensive two-week induction to learn about financial markets, our purpose, business and strategic priorities – all while gaining insights into the day-to-day life of an analyst at Marex. Following the induction, the graduate joins their team whilst remaining connected with their peers through ongoing training and professional development. The programme is designed to fast-track their understanding of Marex, the industry and help them grow their skills and expertise with the objective of retaining them after the programme has concluded. We look forward to welcoming the first graduates on the scheme in 2024.
To monitor progress against our goals and maintain transparency, we have identified the following KPIs:
| Key Performance Indicator |
2023 | 2022 | ||||
| Female colleagues – % total global workforce |
23% | 21% | ||||
| Gender diversity of new hires |
26% | Not reported | ||||
| female new | ||||||
| hires
|
||||||
| Engagement with schools/education providers |
UK: | UK: | ||||
| 25 Marex | 14 Marex | |||||
| volunteers | volunteers | |||||
| 42 students | 13 students | |||||
| coached | coached | |||||
| 2 schools
|
2 schools | |||||
| UK businesses mean gender pay gap |
21%
|
30% | ||||
| Employee Engagement – Peakon Satisfaction Score |
7.8 / 10
|
7.8 / 10
|
||||
51
| Marex Group plc Annual Report 2023 | Strategic Report | Corporate Governance | Financial Statements | |||
|
|
|
|
|
|||
Sustainability (continued)
Planet
| Our ability to connect clients to markets combined with our long experience in energy and commodities puts us at the intersection of the capital flow into markets that support the transition to net-zero. We use this position to act as an enabler of the green transition for our clients by introducing new environmental products, and guiding clients through the opportunities and risks of the transition.
Simultaneously, we are working to reduce our own environmental impact by improving the efficiency of our operations and aim to create a detailed transition plan to reach net-zero by 2050.
|
|
Goal 3:
Become a go-to provider of environmental products and services, adapting to our clients’ growing decarbonisation needs. |
The global economy is transitioning rapidly to a lower-carbon future. Supply and demand for energy, metals and other commodities is being shaped by international efforts to reduce GHG emissions and improve resource efficiency.
Many of our clients, whether in energy, shipping, metals, or finance, look to Marex for the solutions that allow them to manage risks and re-allocate capital away from high-carbon activities and towards the low-carbon future.
At Marex we use our experience, market knowledge, global reach, and balance sheet strength to drive global growth in environmental products and services. |
|||
| Our sustainability strategy is therefore focussed on two major ‘Planet’ goals: supporting clients in the green transition and becoming a net-zero business by 2050 or sooner.
|

52
| Marex Group plc Annual Report 2023 | Strategic Report | Corporate Governance | Financial Statements | |||
|
|
|
|
|
|||
Goal 3 in action
We have over 50 environmental products and services covering our clients’ carbon management, clean energy, and recycled metals needs.
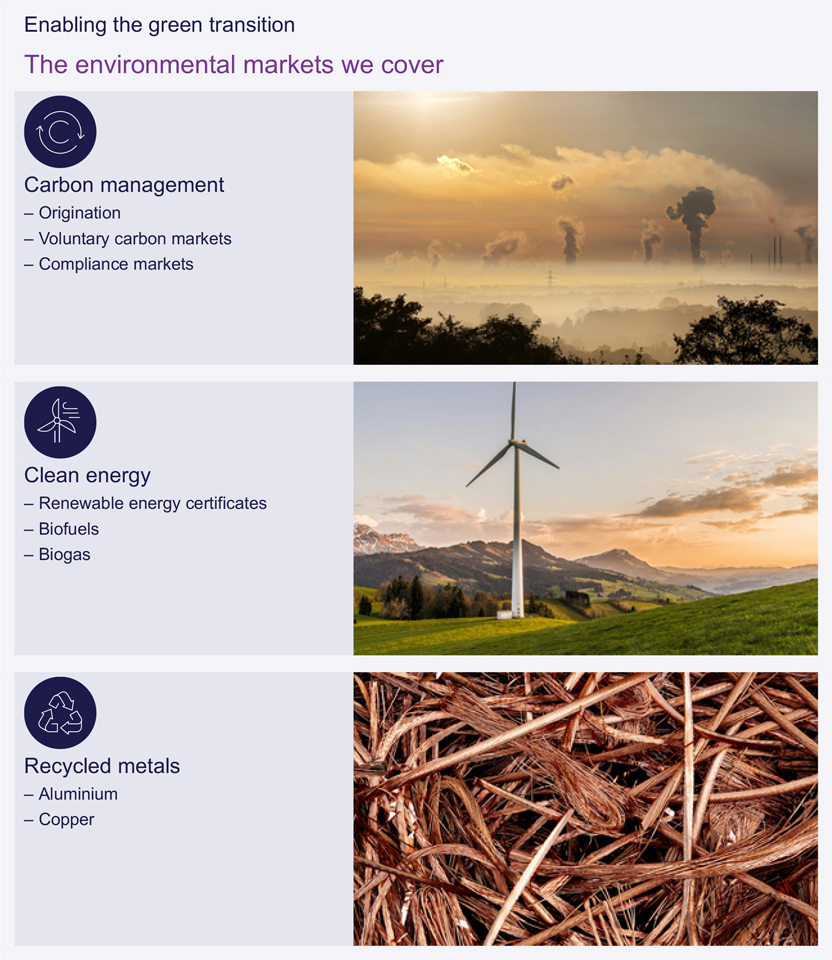
53
| Marex Group plc Annual Report 2023 | Strategic Report | Corporate Governance | Financial Statements | |||
|
|
|
|
|
|||
Sustainability (continued)
Planet (continued)

Carbon management
We focus on providing our clients with access at scale to carbon offsets in both the voluntary and compliance markets. We provide a fully integrated Voluntary Carbon Market (VCM) service from origination of nature-based credits through to clearing, broking, trading, and retirement. In the compliance market we provide clearing and delivery of carbon allowance certificates for all companies in the scope of various EU, UK, U.S., Canadian and other regulated emissions trading schemes.

Clean energy
Our global network of offices provides solutions to global clean-energy challenges. Working across our U.S., European and Asian offices we can provide access, liquidity, and finance to enable cross-border solutions that make the green transition happen on the ground.
Our Market Making division, CSC Commodities, provides clients with the environmental products and solutions that are the fast-growing counterparts to traditional commodities: biogas and emissions now trade alongside energy products, biofuels are making agriculture more sustainable, and recycled metals are in demand alongside virgin metals.
We also provide liquidity and access to the renewable energy market globally through our Agency and Execution services. In the U.S., our Renewable Energy Credit (‘REC’) desk provides innovative products that meet both generators’ and buyers’ needs.
|
|
||||
| Voluntary carbon market | ||||
| Offsets at scale | ||||
| A sovereign wealth-fund in the Middle East sought externally verifiable carbon credits to offset GHG emissions related to the construction of a city-scale infrastructure project. Using our market experience and access, we sourced and fully managed a package of voluntary offsets ranging from wind turbine, natural gas leakage reduction, hydro, and cook stove schemes. Sourced from across the world to meet the client’s scale and verification needs this ongoing programme will enable the project to offset millions of tonnes of carbon. | ||||
|
|
||||
|
|
||||
| U.S. Renewable Energy Credit (‘REC’) market |
||||
| REC services for utilities and load-serving entities (‘LSEs’) |
||||
| Utilities and LSEs utilise our aggregation model to acquire substantial volume of compliance RECs for states’ mandates. Marex purchases the requested number of RECs from multiple generators and bundles these RECs to deliver to the appropriate compliance buyers under one contract. Buyers can leave Good-Til-Cancelled (‘GTC’) tickets with Marex for several weeks or months at a time with moving price targets. This model provides renewable energy generators with liquidity for their immediate delivery RECs, and the monetisation of these RECs allows generators to finance both existing and new projects. We saw revenue from this model grow significantly in 2023 as more buyers used our model for longer periods of time and in greater REC blocks.
|
||||
|
|
||||
54
| Marex Group plc Annual Report 2023 | Strategic Report | Corporate Governance | Financial Statements | |||
|
|
|
|
|
|||

Recycled metals
The demand for recycled metals is surging as the world decarbonises. There is growing demand for recycled copper to build the electrified power and transport systems for the low-carbon economy whilst keeping emissions and environmental impact lower than using virgin metal.
In 2023 we acquired Global Metal Networks (‘GMN’), a Hong Kong based recycled metals business, to add to our global connections in the physical copper and aluminium markets and increase access to Asian customers. Combining GMN with our existing metals teams, London Metal Exchange (‘LME’) presence, risk management solutions, and balance sheet strength positions us as an enabler and price risk manager for global consumers and producers of recycled aluminium and copper.
| Future opportunities for Environmental products and services
In 2024 we expect to continue to innovate in the carbon management, clean energy and recycled metals markets. We are exploring new products and services in areas such as refrigerants, physical biofuel blending, and hydrogen where clients are seeking solutions to help manage the green transition.
|

|
||||
| Recycled metals | ||||
| Innovative funding to recycle metals at scale | ||||
| The decommissioning of a UK coal-fired power plant provided an opportunity to support the extraction and recycling of valuable materials from the site. We used our balance sheet to provide liquidity and pre-financing to help fund the extraction of the materials, and our Recycled Metals business provided risk management and distribution. Our approach creates value by enabling the costly extraction of the material and integrating it back into the supply chain where clients acquire recycled materials for their production needs to reduce their carbon footprint. | ||||
|
|
||||
55
| Marex Group plc Annual Report 2023 | Strategic Report | Corporate Governance | Financial Statements | |||
|
|
|
|
|
|||
Sustainability (continued)
Planet (continued)

Carbon offset origination and verification
We are committed to maintaining a strong position in the voluntary carbon markets so we can best serve client needs in this area. As well as providing carbon credit products and solutions we are also active in carbon offset origination and verification through our partnerships with leading organisations globally.
Our partners
In 2023, we continued to partner with The Global Mangrove Trust, OxCarbon (a not-for-profit spin-out from the University of Oxford), Kumi Analytics and other key stakeholders to develop scalable, verifiable carbon offset methodologies using satellite technology, while preserving and restoring mangrove forests in South East Asia, which have a number of highly beneficial environmental and social impacts.
Our project
The long-term commitment we have made to the 001 – OxC / The Global Mangrove Trust restoration & conservation project in North Sumatra, Indonesia, saw us continue to invest in 2023, directly contributing to one of the most effective eco-systems for capturing and storing carbon. This is also creating direct employment through the monitoring, patrolling, and administering of the project, and further support for local livelihoods through social programmes that drive entrepreneurship skills.
The expected annual carbon reduction from this project far exceeds Marex’s operational footprint, demonstrating how, through commitment to innovation, we seek to maximise the impact that Marex can have. We used offsets from this project to offset Marex’s Scope 1 & 2 GHG emissions in 2022, and we have done so again in 2023. The Global Mangrove Trust project provides Marex, our clients and the wider market with an inventory of high-quality carbon offsets, verified and issued under the OxCarbon Principles Standard.
56
| Marex Group plc Annual Report 2023 | Strategic Report | Corporate Governance | Financial Statements | |||
|
|
|
|
|
|||
The Global Mangrove Trust restoration
and conservation project North Sumatra –another year of progress
| |
2023 highlights
|
|
||
| Original conservation area of 2,305 hectares extended by 1,500 hectares to approximately 3,805 hectares
|
||||
| 56,125 mangrove trees planted covering 22 hectares
|
||||
| Direct employment created for 4 staff at partner organisations
|
||||
| Indirect employment created for 39 local people
|
||||
| 15 upskilling workshops delivered to 135 local people, 66% female
|
||||
|
|

001 – OxC scheme locations

|
How it works |
||||||||
| This is the inaugural blue carbon conservation project launched under the OxCarbon Standard by YAGASU and The Global Mangrove Trust with support from Marex.
The project – known as 001- OxC – is focussed on both the restoration and conservation of coastal mangrove eco-systems, with livelihood generation and social programmes integral to the conservation approach.
The social programmes are designed to help local communities develop livelihoods that are dependent on the existence and health of the mangroves to encourage conservation and create permanence for the project.
Community programmes provide workshops on silvofishery (prawn and fish farming) and artisan crafts, e.g. mangrove-based products, to promote livelihoods that are not reliant on forest clearing.
|
Local communities benefit from direct, well paid, employment opportunities in forestry conservation, planting, monitoring, and patrolling the mangrove forests.
Kumi Analytics provides verification of the health and progress of the forest through its OxCarbon certified Kumi Analytics Carbon Sequestration Assessment Tool (‘KACSAT’) that uses satellites, AI and on-the-ground monitoring. |
|||||||
|
|
||||||||
57
| Marex Group plc Annual Report 2023 | Strategic Report | Corporate Governance | Financial Statements | |||
|
|
|
|
|
|||
Sustainability (continued)
Planet (continued)
Measurement:
In 2023, we delivered a wide range of carbon management, clean energy, and recycled metals environmental products and services to clients, introduced new products to meet emerging needs, and attracted new clients with our environmental offer. We use the following metrics to track progress in this area.
| Key Performance Indicator |
2023 | 2022 | ||
| Revenue from environmental products and services ($m) |
46.7 | 26.7 | ||
| Revenue from environmental products and markets (% of total Revenue) |
4% | 4% | ||

58
| Marex Group plc Annual Report 2023 | Strategic Report | Corporate Governance | Financial Statements | |||
|
|
|
|
|
|||
|
Goal 4:
Become a net-zero business, reducing our environmental impact and carbon footprint and offsetting unavoidable emissions using credible and verified sources. |
Over 2023, we have continued to build the capabilities and systems that will allow us to transition to a net-zero business by 2050 or sooner.
At the heart of this is high-quality data and in 2023 we introduced an ESG platform, Watershed, into the business to automate the collection, storage, and reporting of emissions data. This project is enabling us to continue to develop more accurate measurement of Scope 1, 2 & 3 GHG emissions across all operations, including recently acquired companies.
As an acquisitive and fast-growing business, we use intensity ratios rather than absolute carbon emissions KPIs to track our progress.
|
In 2023, we used our improved emissions data to re-baseline our Scope 1 & 2 intensity ratio per full time employee (‘FTE’) on a Total and UK basis (see table below).
The increase in our global emissions stems from ongoing international expansion, particularly relating to the acquisition of the ED&F Man Capital Markets business at the end of 2022 which brought with it a New York and Chicago office.
In 2024, we will use the Watershed platform to further improve the quality of our Scope 3 data, help identify emissions hot spots, prioritise actions to reduce emissions, and establish a transition plan that will achieve our goal to reach net-zero by 2050, or sooner.
As part of our transition plan, our future objective is to drive down our GHG emissions as much as possible and offset residual emissions using carbon offsets.
However, in the near term, we remain committed to offsetting 100% of our Scope 1&2 emissions to achieve carbon neutrality. To ensure that these offsets are credible and verifiable they are purchased from the 001 – OxC – The Global Mangrove Trust restoration and conservation project in North Sumatra. Marex has helped establish this project and, working in partnership with OxCarbon and Kumi Analytics, we are using it to develop a credible, verifiable carbon sequestration methodology using remote, satellite-based verification.
In our own operations, we continue to focus on decarbonisation in three areas: Energy, Waste and Travel.
Planet – Measurement
In 2023, we used our new ESG platform, Watershed, to measure our Scope 1&2 emissions to include a greater proportion of actual data rather than estimates. Using this data we have established Total and UK based intensity ratios as a new baseline to measure our progress against in coming years:
| 2023 | 2022 | |||||||
| Total intensity ratio – Scope 1&2 (tCO2e per FTE) |
0.76 | 0.55 | ||||||
| UK intensity ratio – Scope 1&2 (tCO2e per FTE) |
0.59 | 0.54 | ||||||
|
Energy
We continue to implement the recommendations from our UK Energy Savings Opportunities Scheme (‘ESOS’) report, for example by rolling out LED lighting across all offices. The majority of our office estate is leased and when we sign a lease on a new building, or renew an existing lease, we put sustainability at the forefront of our considerations. As a result, we have 100% renewable electricity use at our Bishopsgate HQ in the City of London, and our Asia Square office in Singapore has a U.S. Green Building Council LEED Platinum certification and the largest photovoltaic installation (224 kWh peak) in the City’s Central Business District. |
Waste
We work to establish a reduce, reuse, recycle waste hierarchy at all our sites. For example, we encourage all staff to minimise paper waste at source through a managed printing software (Papercut) that tracks usage. We support reuse through our choices in office fit-out and refurbishment. In our London office a refurbishment project in 2023 used recycled carpet and for kitchen flooring an alternative to linoleum made from recycled cocoa beans. |
Travel
We have introduced a new travel booking and management system (Navan) to accurately track and report travel-related carbon emissions including flights, hotels, trains, rental car and taxis. With this granular data we will be better able to identify emissions hotspots and travel trends by location, department, or route, and then take action to cut emissions where possible. As a fast-growing global business, we will always have a requirement to travel, but this data provides us with the insights to minimise travel where possible, and choose the most sustainable option when travel is required. |
||||||
|
|
|
|
||||||
59
| Marex Group plc Annual Report 2023 | Strategic Report | Corporate Governance | Financial Statements | |||
|
|
|
|
|
|||
Sustainability (continued)
Looking ahead
We are determined to use our experienced position in the
commodities and financial markets, our deep relationships,
and our track-record of innovation to cultivate positive
change and support the transition to a low-carbon economy
in the years ahead.
By developing new environmental products and services we aim to provide clients with the carbon management, clean energy, and recycled metals solutions they need to meet their sustainability goals. The hydrogen, refrigerants and biofuels markets are all areas of potential, and we will continue to explore opportunities in these areas in 2024, as well as our existing product areas.
We are also focussed on measuring and managing our direct impact on the environment and in 2023 we established the systems and quality of data that will allow us to develop a detailed transition plan to achieve net-zero by 2050.
People are at the heart of Marex’s success, and we will invest further in initiatives that promote diversity, create opportunity and offer all colleagues personal and professional development opportunities.
We have introduced an enhanced graduate scheme for 2024 to help bring more talent into our industry and will continue our work with partners to bring opportunities in the financial sector to the attention of those from diverse backgrounds.
Through these actions we will continue to endeavour to make a positive impact on the environment and the communities in which we operate, while building our own resilience to secure the long-term success of the business.
“We are also focussed on measuring and managing our direct impact on the environment, and in 2023 we established the systems and quality of data that will allow us to develop a detailed transition plan to achieve net-zero by 2050.”
60
| Marex Group plc Annual Report 2023 | Strategic Report | Corporate Governance | Financial Statements | |||
|
|
|
|
|
|||
Climate-related Financial Disclosure (‘CFD’) Statement
In accordance with the Companies (Strategic Report) (Climate-Related Financial Disclosure) Regulations 2022, Sections 414C, 414CA and 414CB of the Companies Act 2006 (the Act), the Board provides its climate-related financial disclosures for the Group for the year ended 31 December 2023.
This is the Group’s first year of reporting in respect of these provisions in the Act, and the Group aims to make further progress during the year ending 31 December 2024 in relation to:
Governance
| – | Enhance governance processes for reviewing and updating climate-related metrics and targets. |
Risk
| – | Improve and enhance our Enterprise-Wide Risk Management Framework (‘EWRM’). We will formalise the taxonomy of climate-related risks into our Risk Classification Model. This will allow climate-related risks to be explicitly assessed and further embedded into our risk processes. |
Strategy
| – | Further develop plans and associated approach for conducting scenario analysis in the future years. |
| – | Consider, develop and document a process to identify and assess the impact of climate-related risks and opportunities on financial and strategic planning. |
Metrics and targets
| – | Consider and develop the approach to address significant Scope 3 emissions and work with stakeholders in the value chain to calculate a Scope 3 emissions baseline. |
| – | Continue to develop a transition plan to net-zero by 2050 or sooner. |
| – | Continue to develop operational emissions reduction targets and develop short- and long-term targets. |
The Board considered the non-binding guidance on the ‘Mandatory climate-related financial disclosures by publicly quoted companies, large private companies and LLPs’ issued by the Department for Business, Energy & Industrial Strategy, as well as the recommended guidance by the Task Force on Climate-related disclosures (‘TCFD’), when developing its disclosures.
Climate-Related Financial Disclosure Index
We have outlined the requirements of the Act and identified the sections within this Statement that provide the corresponding information:
| Reference |
Requirement of s414CB (2A) of the Act | Sections disclosing the corresponding information | ||
| a | A description of the company’s governance arrangements in relation to assessing and managing climate-related risks and opportunities. | Governance (page 62) ® | ||
| b | A description of how the company identifies, assesses, and manages climate-related risks and opportunities. | Risk Management (page 63) ® | ||
| c | A description of how processes for identifying, assessing, and managing climate-related risks are integrated into the company’s overall risk management process. | Risk Management (page 63) ® | ||
| d | A description of: (i) the principal climate-related risks and opportunities arising in connection with the company’s operations; and (ii) the time periods by reference to which those risks and opportunities are assessed. |
Strategy (page 64) ® | ||
| e | A description of the actual and potential impacts of the principal climate-related risks and opportunities on the company’s business model and strategy. | Strategy (page 64) ® | ||
| f | An analysis of the resilience of the company’s business model and strategy, taking into consideration different climate-related scenarios. | Strategy (page 65) ® | ||
| g | A description of the targets used by the company to manage climate-related risks and to realise climate-related opportunities and of performance against those targets. | Metrics & Targets (page 65) ® | ||
| h | A description of the KPIs used to assess progress against targets used to manage climate-related risks and realise climate-related opportunities and of the calculations on which those KPIs are based. | Metrics & Targets (page 65) ® | ||
61
| Marex Group plc Annual Report 2023 | Strategic Report | Corporate Governance | Financial Statements | |||
|
|
|
|
|
|||
Climate-related Financial Disclosure Statement (continued)
Our approach to climate change
Climate change presents both challenges and opportunities to the Group’s business model and products, as well as to colleagues and clients, and these are embedded into our growth strategy and mission. We provide liquidity to and match counterparties across key energy markets, including crude oil, residual fuel oil, middle distillates, naphtha and gasoline, as part of our Agency and Execution and Market Making businesses. Changes in laws, regulations, policies, social attitudes, client preferences, market dynamics and technological developments and innovations relating to climate change and the transition to a lower-carbon economy have decreased the demand, and therefore the size, of the markets for certain energy products where we have historically had significant market shares (such as fuel oil). However, such changes have also created opportunities for us to capture market share in new energy products (such as renewables). The development and creation of new energy products are less predictable (such as wind power), which may lead to increased levels of volatility. We have a significant presence in the global agricultural markets, with established teams in London, New York and Chicago that broker and trade agricultural products, including coffee, cocoa, dairy, forestry, grains and oil seeds, livestock and sugar. As a result, the physical impacts of climate change and climate change driven severe weather events have had, and are expected to continue to have a direct impact on trading volumes in certain products. For example, activity levels in the cocoa, coffee, sugar and grain commodity markets have been impacted by severe weather exacerbated by climate change. In particular, drought has impacted the volume of grain production in Ukraine in recent years, which in turn has reduced volumes of grain and other impacted commodities have led to an increase in hedging activity by market participants and increased our revenue. In the coming years, we want to increase this support and help businesses and governments achieve their net-zero ambitions. This is a challenge to business as usual, but one that opens up new opportunities and markets, while building a brighter future. We are committed to supporting our customers through the transition to net-zero; accelerating the shift in the market and in our clients’ organisations; and adapting to new environmental regulations. We also recognise the value ESG and climate-related risks and opportunities play in assessing risk both in our business and beyond.
Governance
The role of the Board is stewardship of the Group with the long-term sustainable success of the Company, the creation of shareholder value and contribution to wider society as the fundamental objectives.
The Board recognises its duty to respond to climate change and assumes the role of supervising the Group’s sustainability strategies and initiatives. The Board acknowledges the need to understand and assess climate-related risks and opportunities and the inherent uncertainty therein. In May 2023, the Board received its annual update from the CEO and Chair which set out progress made to date in relation to sustainability matters including the Group’s people and planet commitments such as the build out of the commercial renewables business and initiatives to reduce the Group’s operational emissions.
The Board also considered and approved the Group’s third Sustainability Report which had been enhanced to provide a more insightful view of the year. In addition, the Board also received an update on the Group’s Environmentals business as well as conducting a review of external climate-related disclosures in the Group’s Annual Report and Accounts. The members of the Board Audit and Compliance Committee also received an update on Climate-related Financial Disclosure requirements from the CFO and the Group’s external auditor.
The Board is committed to developing its breadth of knowledge and in January 2024, appointed two new independent non-executive directors, both have diverse experience and a deep understanding of ESG matters, which will further support the Board in engaging in effective discussions to tackle the important social issue of climate change.
ESG Governance Structure
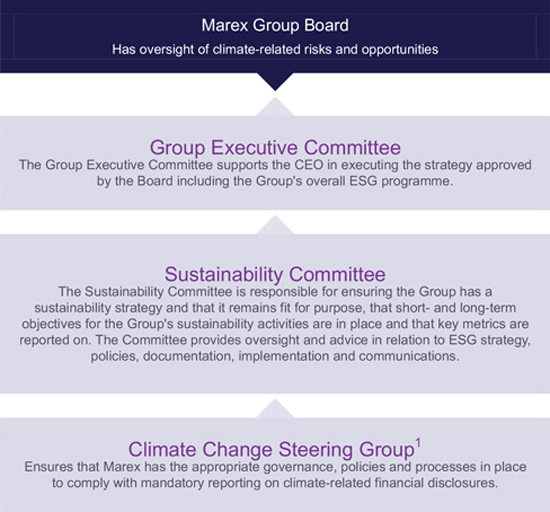
1. Formerly the Task Force on Climate-related Financial Disclosures (TCFD) Steering Group.
62
| Marex Group plc Annual Report 2023 | Strategic Report | Corporate Governance | Financial Statements | |||
|
|
|
|
|
|||
Management’s role in assessing and managing climate-related risks and opportunities
The CEO is responsible for the day-to-day management of the Group, to implement the strategy and objectives in line with culture, values and ethical and regulatory standards.
The Group has established a Sustainability Committee as a sub-committee of the Group Executive Committee chaired by the Chief Financial Officer (an Executive Director of the Group). It has membership drawn from senior executives in key businesses and core functions including Risk, Operations, Front Office, Technology, HR and Corporate Affairs, being the representatives best placed to deploy positive change across Marex, driving strategic execution down through the business units.
The primary role of the Sustainability Committee is to ensure that the Group has an appropriate sustainability strategy that remains fit for purpose, maintaining short- and long-term objectives for the Group’s sustainability activities. The Sustainability Committee monitors Marex’s progress against climate-related actions on a quarterly basis, and updates are provided to the Group Executive Committee by the Chair of the Sustainability Committee as appropriate. The Sustainability Committee met four times in 2023 and has appointed external ESG advisors and consultants as the Group’s interim ‘Chief Sustainability Officers’ to assist in accelerating the promotion of the sustainability strategy across the Group.
A dedicated Climate Change Steering Group (‘CCSG’) has been established to focus on implementing the mandatory Climate-related Financial Disclosures, including Climate-related Financial Disclosures (‘CFD’). The role and purpose of the CCSG is to ensure that Marex has the appropriate governance, policies and processes in place to comply with mandatory reporting on Climate-related Financial Disclosures. The CCSG also discusses and proposes measures to support the climate strategy set by the Sustainability Committee for the Group to meet its obligations with regards to climate change, including leading on the process of disclosures, related climate change programmes and remedial activity.
The Steering Group is also responsible for assessing progress against climate targets and KPIs set by the Sustainability Committee, adherence to voluntary disclosure regimes and improving reporting and communication. This Group includes senior representatives from Finance, Risk, Procurement and Corporate Affairs and is a sub-group of the Sustainability Committee. The CCSG convenes and reports to the Sustainability Committee on a monthly basis.
The implementation of climate-related products to track risks and utilise climate opportunities across the business is managed at business segment level, namely, Market Making, Clearing, Agency and Execution, Hedging and Investment Solutions and Corporate.
As part of ongoing considerations for climate-related activities, management launched a new group-wide travel booking platform in early 2024 which will centralise spend and emissions reporting.
Risk management
Processes for identifying and assessing climate-related risk
Risk management and internal control are fundamental to achieving the Group’s aim of delivering long-term sustainable growth and shareholder value.
Principal and emerging risks are informed both ‘top down’ by the Board and the Sustainability Committee and ‘bottom up’ from the business, including the outcomes of climate screening workshops (part of the climate scenario process described in later sections) which identified the key areas of potential vulnerability to physical or transition risk over the medium to long term.
Climate-related risks and their significance are also considered in the ICARA stress testing and scenario analysis that we perform at least annually for the evaluation of our risk profile in terms of capital and liquidity needs.
The Group maintains a group-wide risk register which captures operational risks per individual entity and business division across all jurisdictions. This group-wide register is maintained by the Operational risk team which is part of the Group’s second line of defense. Business owners evaluate the inherent impact, in terms of risk severity and likelihood, control effectiveness and risk trends. Impact on business continuity, revenue, litigation outcomes, applicable fines and other factors are all quantifiable indicators that affect the risk assessment.
In evaluating market and credit risk, climate-related risk drivers are also being implicitly considered: for example, price volatility of carbon certificates due to changing expectations of regulatory landscape, or volatility of commodity prices due to extreme weather forecasts.
When evaluating clients to understand our counterparty risk exposure, one of the measures we take into consideration is their exposure to event risk (which includes potential litigation and environmental risk).
Overall, our analysis indicated that due to the longer-term material impact of climate-related risks and opportunities, climate-related risk remains a ‘principal risk’ as described in the EWRM section of this report.
Processes for managing climate-related risks and opportunities
One of the most material climate-related risks and opportunities for Marex lies in the longer-term diversification of our revenue stream – thus our goal to become a market leader in sustainable products and to facilitate our clients’ transitions to net-zero can be seen as both a strategic plan and a risk mitigant. The Sustainability Committee meets regularly to oversee the execution of this strategy.
Marex also conducts horizon scanning to monitor current and emerging environmental regulations across the industry and business sectors, and therefore is able to identify any new and emerging requirements as they arise. We evaluate compliance regularly and consider how these regulations may impact Marex. Horizon scanning is performed by the Group’s Legal department.
Other climate-related risks are considered within the overall risk management framework, for instance through regular monitoring of client concentrations including their exposures to physical climate risks (e.g. droughts) and escalation of potential impacts to the Chief Risk Officer (‘CRO’) or Risk Committee where appropriate.
Integration of climate-related risk processes into overall risk management
As mentioned previously, Climate-related Risk is noted as a principal risk in the EWRM section of this report.
In 2023 Marex continued to expand its existing suite of risk identification and management tools (e.g. Business Change Risk Assessment) to embed considerations of climate-related risks and opportunities into the overall risk management process.
As part of our plans to continuously improve and enhance Marex’s EWRM, for 2024 we intend to formalise the taxonomy of climate-related risks into our Risk Classification Model. This will allow climate-related risks to be explicitly assessed and further embedded into our risk processes.
63
| Marex Group plc Annual Report 2023 | Strategic Report | Corporate Governance | Financial Statements | |||
|
|
|
|
|
|||
Climate-related Financial Disclosure Statement (continued)
Strategy
Identification of the climate-related risks and opportunities
With the global economy transitioning towards a low-carbon future, Marex is committed to cultivating a positive change in the markets in which we operate to support the transition to a low-carbon economy, build resilience, and secure the long-term success of the business. Diversification of revenue streams represents the Group’s biggest risk and opportunity with respect to climate change.
We continuously assess our business strategy and the service we offer to our clients so that we can plan for the transition to a low-carbon world and address emerging risks and opportunities.
In order to assess the Group’s risks and opportunities, through the initial screening workshops we engaged with internal stakeholders to understand the Group’s views about the most significant climate-related risks and opportunities facing the Group. This work then informed subsequent qualitative climate scenario analysis covering risks and opportunities. Following this work, the ‘People and Planet Plan’ was created and approved by the Marex Board in May 2023. As our business grows and evolves, we recognise that Marex will need to continuously evolve our approach to materiality for climate-related issues.
Timeframes
Marex operates according to a short-term timeframe of 0–3 years reflected by a financial planning cycle of 3 years. This reflects the nature of the business being market-driven providing essential liquidity, market access and infrastructure services to clients in the energy, commodities and financial markets. We recognise that the world is moving to a long-term ambition of net-zero by 2050 or earlier. The Group is committed to becoming net-zero by 2050 or earlier. The outcomes of the previous climate screening workshops identified the key areas of potential vulnerability to physical or transition risk over the medium to long-term and climate change remains a ‘principal risk’ as described in the EWRM given the longer-term material impact of climate-related risks and opportunities. The Group’s initial assessment of medium and long term is based on its qualitative scenario analysis. The Group’s initial timeframe for medium-term is 3-6 years or to 2030. The Group’s initial assessment of long-term is from 6-26 years or to 2050. The Group will look to further define and embed medium and long-term as part of our future scenario analysis.
Risks
Physical climate impacts such as increased frequency and severity of droughts, flooding and other extreme weather events could dramatically change the way agricultural companies operate, potentially forcing some of Marex’s agricultural clients out of business. In this scenario new clients would likely require Marex’s services as informed by the Group’s qualitative scenario analysis.
Transitional risk stems from legal and policy risks from the physical impact of climate change driving more stringent regulations with respect to climate change. An additional risk is the availability of key raw materials and the impact on supply chains. For transitional risk, as some of Marex’s revenue comes from fossil fuel and oil trades this represents a risk should we see the scaling back of this industry to meet net-zero targets. Should this risk arise there are also opportunities for Marex as trends shift to a low-carbon economy. Marex is focussed on its strategy to help its clients transition to a low-carbon and environmentally sustainable economy. Refer to Sustainability section pages 41-60 for further detail.
Opportunities
Marex is committed to supporting the goal of transitioning towards net-zero GHG by 2050 or sooner, in line with global efforts to limit warming to 1.5°C. Whilst the fossil fuel industry shrinks, Marex will leverage its pivotal position in the global energy and commodity markets, by assisting our clients in the transition to a low-carbon and environmentally sustainable economy as outlined in the introduction to this section. Diversification of revenue streams is a key opportunity for the Group.
While there is a risk of the fossil fuel industry shrinking, there are potential opportunities for Marex to increase Revenues from green trades. Marex is taking positive steps to respond to the trend towards decarbonising economies through helping clients reduce or offset their emissions, and secure renewable guarantees of origin for gas and power, in turn helping to accelerate the shift in the market whilst also adapting to new regulatory changes across the climate agenda internationally. Refer to the Sustainability section on pages 41 to 60.
We have deliberately placed ourselves at the heart of this environmental commodities growth because it is the right thing to do for our clients, our own future, and the planet. As such, we provide environmental products, services and expertise that enable clients to lower their environmental impact, create new, cleaner business models and adapt to the evolving sustainability regulations and new reporting requirements.
We have embedded an ESG criteria assessment as part of our new business approval process, as well as the due diligence process we perform on all acquisitions. This systematic assessment is performed based on a standardised questionnaire established as a primary review. This assessment is then shared with all control and support functions for their review and approval.
The implementation of products and strategies to utilise climate opportunities across the business are managed at business segment level, namely Market Making, Clearing, Agency and Execution, Hedging and Investment Solutions and Corporate. The Group has a hiring pipeline and a budget for the next 2 years, and is strategically thinking over the next 5 years for the product and services pipeline.
We have established over 50 products under the Marex Environmental brand covering fast-growing markets in carbon offsets, renewable energy certificates, bio fuels and recycled metals. As we introduce new products to meet emerging trends, our environmental offer has enabled us to attract new clients. Key performance data evidencing growth over the last year in these opportunities can be found on page 58. For example, in 2023, we saw strong growth in biofuel broking in the U.S. and European markets and we built on our strong recycled metals expertise with Tangent Trading and presence on the London Metal Exchange (‘LME’) through the acquisition of Global Metals Network in Hong Kong.
In addition to offering a broad range of Environmental products, Marex is also taking action to combat the impacts of climate change by investing in innovation to drive significant change. In 2023, we continued to partner with The Global Mangrove Trust, OxCarbon (a not-for-profit spinout from the University of Oxford), Oxford University’s Smith School of Enterprise and the Environment, Kumi Analytics and other key stakeholders to develop scalable, verifiable carbon offset methodologies using satellite technology, while preserving and restoring mangrove forests in South East Asia, which have a number of highly beneficial environmental and social impacts. The expected annual carbon reduction from this project exceeds Marex’s operational footprint, demonstrating how, through commitment to innovation, we seek to maximise the impact that Marex can have. We used offsets from this project to offset Marex’s 2023 Scope 1 & 2 GHG emissions, and plan to do this also in 2024. The Global Mangrove Trust project provides Marex and Marex’s clients with an inventory of high-quality carbon offsets, verified under the OxCarbon Principles Standard. In 2023, Marex expanded the project to cover approximately 3,805 hectares (from the original 2,305) as well as accelerating the tree-planting programme.
64
| Marex Group plc Annual Report 2023 | Strategic Report | Corporate Governance | Financial Statements | |||
|
|
|
|
|
|||
Over the next 5 years, this is expected to result in approximately 100k tons CO2e of OxCarbon Credits (‘OxCs’) annually, increasing to 150k tonnes CO2e per annum in the 5-10 year forward as the new trees move towards maturity. In addition, Marex is engaging with key clients and potential investment partners about the possibility of financing further expansions of this concept to a further 20k – 50k hectares.
Assessing the resilience of our strategy to different climate-related scenarios
As mentioned previously, in 2022 Marex conducted inaugural scenario analysis with the help of a third party expert to inform the climate-change risk management process using scenarios based on the Network for Greening the Financial System (‘NGFS’) global climate model scenarios, in order to assess Marex’s climate change exposure up to 2050.
NGFS global climate model scenarios have been considered in order to align our climate change related risks and opportunities assessment with businesses’ and governments’ net-zero commitment.
The qualitative scenarios adopted include pathways to >3°C warming and <2°C warming. These scenarios were selected as they were based on the quantitative NGFS climate scenarios. In our qualitative scenario analysis, we combined physical and transition impacts of the key climate scenarios provided by NGFS under two representative temperature pathways: below 2°C and above 3°C (‘hot house world’).
Some below 2°C warming scenarios, including 1.5°C scenario ‘net-zero 2050’, assume stringent carbon mandates and regulations, while above 3°C warming scenarios assume delayed or no policy action. The scenarios also make a range of assumptions such as emission price introduction, energy mix evolution, progress in technology, and shifts in behaviour from companies and consumers.
We identified climate change related risks and climate change related opportunities that we have assessed as material to our business.
This scenario analysis identified that the biggest risk to Marex in a <2°C world is from the retraction of its primary market, fossil fuel trading, and a failure to realise the opportunities in trading in carbon credits or other green products.
As a part of its growth strategy, Marex plans to continue to diversify its revenues across green trades, protecting against this worst case. In a >3°C world, Marex’s most significant risks are of litigation and market risks in the supply chain as a result of physical climate change.
It is key that Marex works with sectors that facilitate the transition and adaptation, to limit impacts to revenues.
Whilst the scenarios adopted are underpinned by quantitative data, the scenario analysis is qualitative in nature, providing a platform on which to focus more quantitatively in the future years.
Metrics and targets
Targets used to manage climate-related risks and opportunities and performance against targets
We are committed to cultivating positive change in the markets in which we operate to support the transition to a low-carbon economy, build resilience, and secure the long-term success of the business. Our sustainability strategy aims to build resilience and secure the long-term success of the business, underpinned by strong governance, policies and processes.
During 2023, the Group outlined the following ambitions to support our clients through the green transition:
| – | become a go-to provider of Environmental products and services, adapting to our clients growing decarbonisation needs; |
| – | become a net-zero business, reducing our environmental impact and carbon footprint and offsetting unavoidable emissions using credible and verified sources. |
The Group currently does not have any targets set however, during 2024 the Group will continue to develop operational emissions reduction targets and develop short- and long-term targets.
We are committed to cultivating positive change in the markets in which we operate to support the transition to a low-carbon economy, build resilience, and secure the long-term success of the business. Marex remains committed to improving energy efficiency across the Group and aims to become net-zero by 2050 or earlier. In 2021, Marex set a target of achieving carbon neutral status by the end of 2022 which was maintained during 2023. Marex achieves its carbon neutrality by offsetting its global absolute Scope 1 & 2 emissions against retiring offsets from our Global Mangrove Trust project. This was performed in April 2024. Moving forwards we will seek to further drive down our operational emissions, as well as increasing visibility of our supply chain emissions.
In 2024, we plan to develop short-term (within the next 0–3 years in line with our planning timeframes) and long-term carbon reduction targets, referring to CFD guidance on characteristics of effective climate-related metrics and targets. We are in the process of undertaking a deeper analysis of our GHG inventory to inform these targets. Our global footprint has increased significantly following recent acquisitions and we will set our targets accordingly.
Metrics used to assess climate-related risks and opportunities
Marex’s internal metrics include absolute Scope 1 & 2 GHG emissions, and absolute energy use and revenue from Marex’s environmental products and services. The GHG emissions metrics and targets from our operations are consistent with a reduction required to keep global warming to less than 2°C by 2050 and prevent the most damaging effects of climate change according to the latest climate science. The Group has disclosed its UK and Global Scope 1 & 2 emissions for the first time in 2024 using the Group’s new ESG platform. In our UK head office we use 100% clean energy sources.
The follow are key metrics for the Group:
| – | $46.7 million (2022: $26.7 million) Revenue from Marex environmental products and services |
| – | Revenues from environmental products and markets (% of total Revenue) was 4% (2022: 4%) |
| – | The Group’s global intensity ratio is 0.76 (2022: 0.55). This metric primarily increased due to the Group’s acquisitions and increased property footprint. |
Other climate-related risks are assessed using the relevant metrics according to the risk management framework, for example the potential impact of commodity price volatility on client risk would be assessed in terms of client margin exposure.
65
| Marex Group plc Annual Report 2023 | Strategic Report | Corporate Governance | Financial Statements | |||
|
|
|
|
|
|||
Climate-related Financial Disclosure Statement (continued)
Disclosure of Scope 1, Scope 2, & Scope 3 GHG emissions and related risks
Marex is committed to becoming a net-zero business in line with government guidelines of 2050 or earlier.
Marex is committed to improving the quality of our carbon emissions reporting and during 2023, the Group onboarded an external carbon accounting platform so as to strengthen our reporting going forward. During 2023, the quality of our reporting improved as a result of obtaining actual data for the majority of our real estate footprint
(c. 80%). Our KPIs with respect to climate-related financial disclosures are our Scope 1 & 2 emissions. Reporting of our energy consumption and Scope 1 and 2 is included within our Streamlined Energy and Carbon Reporting (‘SECR’) table below. We also explain the sources of data, methodology and assumptions considered for the GHG emissions below.
The Group’s Scope 1 & 2 GHG emissions were reviewed by the Climate Change Steering Group, the Sustainability Committee and the Audit and Compliance Committee.
Our strategy to address Scope 3 emissions is developing. We are working with our ESG Platform to engage with customers, suppliers and other stakeholders in the value chain to develop a Scope 3 emissions baseline, focussing on key categories upstream and downstream. The Group aims to use the ESG platform to inform our Scope 3 emissions. Additionally, in February 2024 the Group onboarded a new travel management system which will calculate the carbon emissions associated with the Group’s business travel.
| Year ended 31 December 2023 |
Year ended 31 December 2022 |
|||||||||||||||||||||||
| Restated | Restated | Restated | ||||||||||||||||||||||
| UK | Global (Excluding UK) |
Total | UK | Global (Excluding UK) |
Total | |||||||||||||||||||
| Emissions (market-based) |
||||||||||||||||||||||||
| Emissions from the combustion of gas (tCO2e) (Scope 1) |
3 | 18 | 21 | — | 13 | 13 | ||||||||||||||||||
| Emissions from purchase of electricity (tCO2e) (Scope 2) |
8 | 1,016 | 1,024 | 3 | 435 | 437 | ||||||||||||||||||
| Total gross emissions based on the above (tCO2e) |
11 | 1,034 | 1,045 | 3 | 448 | 451 | ||||||||||||||||||
| Emissions (location-based) |
||||||||||||||||||||||||
| Emissions from the combustion of gas (tCO2e) (Scope 1) |
3 | 18 | 21 | — | 13 | 13 | ||||||||||||||||||
| Emissions from purchase of electricity (tCO2e) (Scope 2) |
583 | 1,031 | 1,613 | 454 | 432 | 885 | ||||||||||||||||||
| Total gross emissions based on the above (tCO2e) |
586 | 1,049 | 1,634 | 454 | 445 | 899 | ||||||||||||||||||
| Intensity ratio tCO2e (gross Scope 1, 2) per full time equivalent |
0.59 | 0.91 | 0.76 | 0.54 | 0.55 | 0.55 | ||||||||||||||||||
| Energy consumption used to calculate Scope 1 emissions (kWh) |
11,509 | 96,090 | 107,599 | 1,065 | 71,911 | 72,976 | ||||||||||||||||||
| Energy consumption used to calculate Scope 2 emissions (kWh) |
2,811,718 | 2,899,618 | 5,711,336 | 2,344,442 | 1,180,178 | 3,524,620 | ||||||||||||||||||
| Total energy consumption based on above (kWh)1 |
2,823,227 | 2,995,708 | 5,818,935 | 2,345,507 | 1,252,089 | 3,597,596 | ||||||||||||||||||
The above GHG emissions cover all material sources for which Marex Group plc is responsible. Emissions were calculated following the GHG Reporting Protocol (Corporate Standard) using the Watershed platform. Responsibility for emissions sources was determined using the operational control approach. All emissions sources required under The Companies (Directors’ Report) and Limited Liability Partnerships (Energy and Carbon Report) Regulations 2018 are included. Actual energy usage data was collected in the form of invoices, service charges and spreadsheets held by Marex Group plc. Estimated data is based on building square-footage for all facilities, and was combined with emissions factors from the U.S. EPA, Ecoinvent, TCR and other data sources to calculate GHG emissions. Electricity emissions factors are chosen based on geography to reflect the emissions intensities of the facilities’ local grid.
66
| Marex Group plc Annual Report 2023 | Strategic Report | Corporate Governance | Financial Statements | |||
|
|
|
|
|
|||
Our enterprise-wide risk management framework and
internal control environment are designed to address
those risks that can undermine our business model
and ability to execute our strategy.
Risk management is a key consideration for delivering against our strategic priorities, whilst ensuring our long-term sustainability and effective corporate governance. Our Group’s business strategy and risk appetite are linked and form the driver for decision-making across the Group so that boundaries are set to support the execution of our strategy, the effective management of capital and the efficient use of liquidity.
To ensure effective risk management practices permeate throughout the business, we have a comprehensive risk management governance structure in place, that articulates the control mechanisms to identify, measure, assess, monitor, control, and report on our underlying top and emerging risks. This governance structure is articulated within our Enterprise-Wide Risk Management (‘EWRM’) framework and policy which are enabled by our people, our processes and systems and sets the foundations and organisational structure for implementing and reviewing risk management practices and activities across the Group.
Risk appetite
Our comfort in risk taking is set by the Board and Group Risk Committee which defines the risk boundaries in which the business and management operate.
Our risk appetite is underpinned by a series of measures that track the current and stressed performance of the business against a series of risk appetite statements.
Regular monitoring of our risk appetite measures helps us to alert management in case there are any changes to the Group risk profile so that appropriate actions can be promptly taken to return to within acceptable risk levels.
In line with our EWRM framework and policy, this approach allows the Board, its sub-committees and executive management to discuss and measure the nature and extent of the risks faced by the Group while executing our strategy.
Stress and scenario analysis
As part of the risk management process and in alignment with UK regulatory requirements set by the Financial Conduct Authority, we carry out regular stress tests and scenario analysis on the amount, type and distribution of financial and capital resources to address the key risks we are exposed to.
Within these assessments we not only look at capital and liquidity resources required to cover for the level of risk we may be exposed to, but we also take into consideration the level of harm to those that might be affected by our operations such as our clients and the markets we operate in.
We use these extreme but plausible risk scenarios to better understand how resilient our business should be during a moment of crisis or large-scale events that could materialise and, if necessary, to re-calibrate our risk appetite.
67
| Marex Group plc Annual Report 2023 | Strategic Report | Corporate Governance | Financial Statements | |||
|
|
|
|
|
|||
Managing our risk (continued)
Our Enterprise Wide Risk Management framework
Our EWRM framework is an overarching document that applies to the Group. It describes the methodology for managing our risks. The Board has ultimate responsibility for ensuring that the Group operates with an appropriate risk governance framework. It maintains oversight over subsidiaries and is cognisant of the local regulatory responsibilities applicable to boards of local operations.
Subsidiaries may develop their own risk frameworks and policies for their specific business, however in their development they are consistent with and do not conflict with the principles of the Group EWRM framework and all other relevant Group policies.
This structure ensures that all separate legal entities are treated collectively for the purposes of risk identification, assessment, communication, and reporting, so the Group has a holistic view of risk.
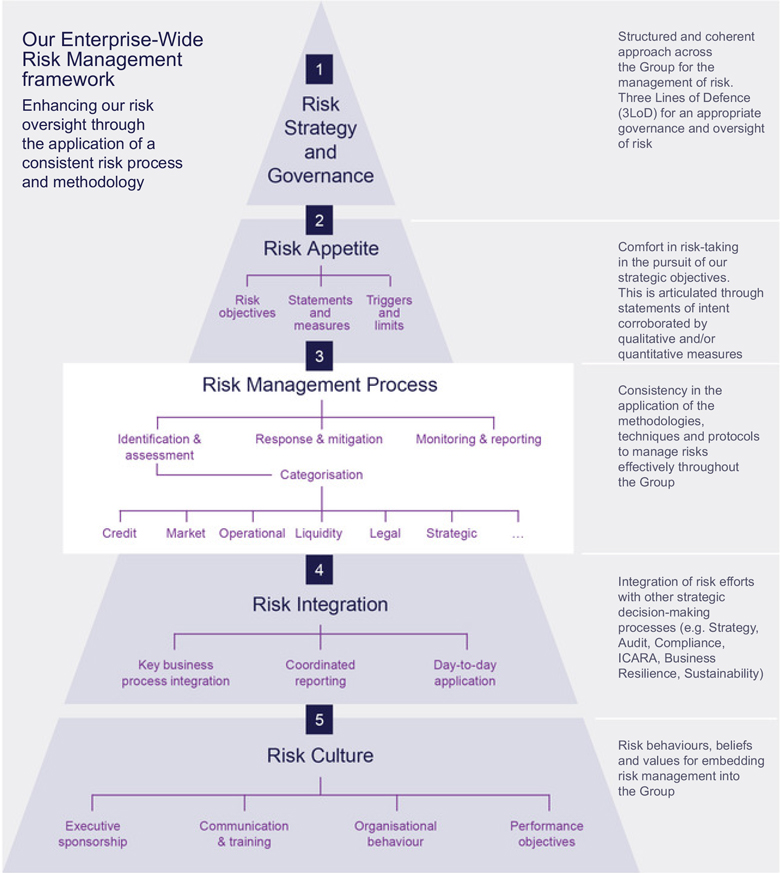
68
| Marex Group plc Annual Report 2023 | Strategic Report | Corporate Governance | Financial Statements | |||
|
|
|
|
|
|||
|
|
||||||

|
Risk strategy and governance |
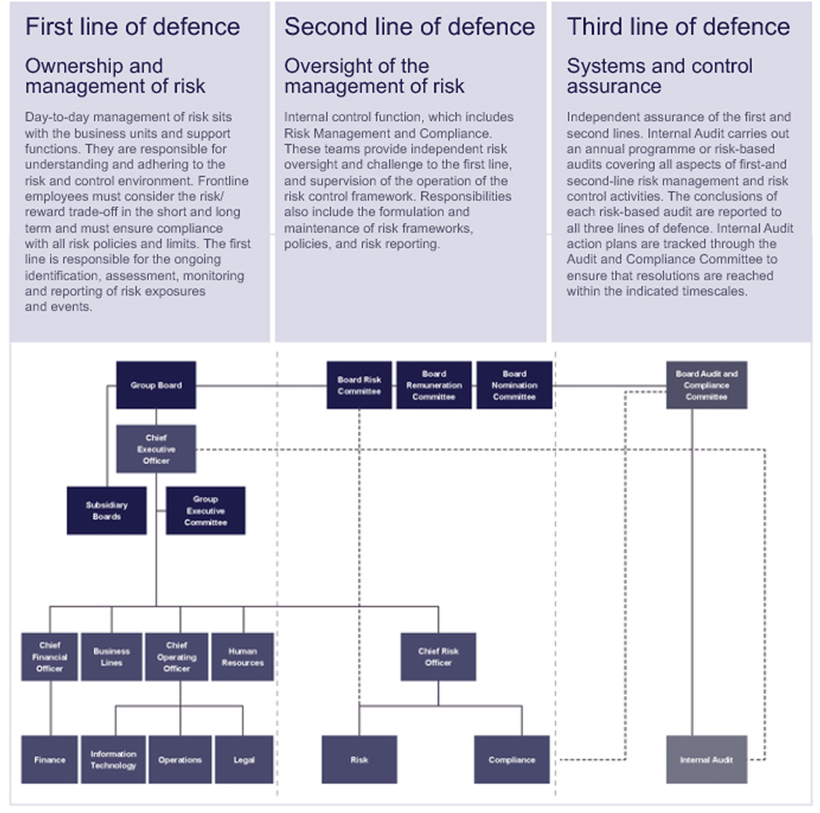
Our robust governance and assurance structure facilitates the escalation and reporting of risk – bottom-up, by business units to the various Committees and Board – whilst also ensuring effective channels to cascade risk approved policies and information – top-down, from the Board to the business units.
Business units are accountable for identification, management, and escalation of risk in their area, supported by Risk Management and Internal Audit for guidance, oversight and supervision.

|
Risk appetite |
Our group-wide business strategy is aligned with the Group’s risk appetite to guide the Group’s business activity and management’s risk-taking decisions. This approach ensures structures exist to respond to any material risks in line with the boundaries set by the Board.
Our Group risk appetite statements are further articulated and translated into risk triggers, limits, and exposures which are reviewed by management on a regular basis to ensure the business operates within an acceptable level of risk exposure.
69
| Marex Group plc Annual Report 2023 | Strategic Report | Corporate Governance | Financial Statements | |||
|
|
|
|
|
|||
|
|
||||||
Managing our risk (continued)
A high-level summary of the key risk roles and responsibilities is included in the table below:
| Role |
Responsibilities | |
| Board of Directors |
Sets risk appetite and reviews and challenges risk strategies, risk management and control framework, key risk limits and high-level risk policies. Oversees business plan and risk management strategy. |
|
| Group Executive Committee |
Considers decisions relating to risk and initiates appropriate actions following Board, Risk Committee and Audit and Compliance Committee meetings. Reviews and challenges the overall risk profile and capital position of the business and ensures appropriate actions are taken to ensure risks are managed within the parameters and appetite set by the Board. |
|
| Chief Risk Officer |
Enables efficient and effective governance of significant risks and related opportunities to the Group. As a member of the Executive Committee, guides the Committee and Board on the formulation of risk appetite, strategies, policies, delegated authorities, and limit structures for the management of risks. |
|
| Chief Operating Officer |
Supports the establishment of a risk-aware culture and the implementation of the EWRM framework, embedding its principles within all policies, frameworks and procedures under their remit. | |
| Risk Committee |
Provides advice to the Board on the Group’s current risk exposures and future risk strategies (including the strategy for capital and liquidity management), the embedding and maintenance throughout the Group of a supportive culture in relation to the management of risk and the establishment of prescriptive rules and procedures in relation to risk. Oversight of risk when approving and monitoring limits on risk exposures and concentration across the business. Focus is on risks to which the Group is exposed to considering risk appetite. |
|
| Audit and Compliance Committee |
Monitors the operational effectiveness of policies and internal control systems. Approves, monitors, and challenges the frequency, scope and performance of Risk Management considering risk exposures. |
|
| Remuneration Committee |
Recommends to the Board the Group policies, practices and procedures related to employee remuneration, ensuring they encourage responsible business conduct, are consistent with, and promote sound and effective, risk management, promote risk awareness and prudent risk-taking. | |

|
Risk management process |
Our risk management process aims to provide a consistent methodology to the Group to effectively manage the risks we face.
To support this, we have a defined Risk Classification Model (‘RCM’) that provides a common risk language, and a consistent basis for the identification of risk. This approach allows us to have a common frame of reference when we communicate risk information while we continue our efforts to standardise reporting across the Group and across our regions. This categorisation model forms an integral part of the EWRM framework and is effectively linked to our risk appetite methodology.
The key steps as part of this component are:
| 1. | Identification and assessment: The Group identifies and assesses material risks to which it may be exposed in the process of delivering its business strategy. This risk assessment forms the basis of identifying where it may be appropriate to implement risk controls across the business. |
| 2. | Measurement & control: Key risks identified in the RCM are consistently analysed and measured in accordance with approved policies and processes. The specific measure of risk is dependent upon the risk and multiple measures may be used to provide a comprehensive view given potential shortcomings in individual methodologies. Key business controls and procedures are implemented to |
| mitigate the risks highlighted by the risk assessment. |
| 3. | Reporting: An important part of the risk management remit is regular and appropriate reporting and communication of risk. In line with the governance structure in place, periodic reporting and risk analysis is presented to the relevant governing bodies as well as the relevant risk-takers, including the Board; Risk Committee; Executive Board; and senior management. Specific details on calibration and implementation of individual measures and controls are detailed within the relevant policies and procedures for the control and business area. |
The flow of information and communication across the Group relating to the management of risk and the effectiveness of the control framework within the risk governance structure is an important component of the framework. There is regular reporting on the performance and effectiveness of risk metrics and formalised management information relating to the risks inherent in the business. The escalation procedures for raising significant issues with managers and supervisors are clear and well embedded across the Group.
Reporting requirements include monitoring the ongoing adequacy and effectiveness of the control framework, taking account of the trends and frequency of breaches of the control framework recorded on the risk register. Inherent risks and mitigating controls are assessed during the Risk and Control Self-Assessment (‘RCSA’) process.

|
Risk integration |
We recognise that for risk management to be effective, it needs to be coordinated and embedded across the Group. We continuously strive to integrate our risk management efforts with other relevant strategic decision-making processes. As an example of this, our Risk department interacts, liaises, and is coordinated with the activities undertaken by Compliance, Internal Audit, Strategy and Planning, Business Resilience, and Sustainability teams to inform and challenge the ICARA processes.
Risk management also plays a crucial role when acquiring and integrating a new company into Group activities. We have a structured process in place to ensure that acquisition and integration activities are executed in a controlled and structured manner and inherent risks of the target company are understood and managed.

|
Risk culture |
Measured risk-taking, and effective risk management are fundamental to our core values – the tone from the top in relation to the organisational culture and attitude to risk informs the behaviour of our colleagues towards risk-taking activities.
We believe that risk management is the responsibility of all employees and this is why we have reflected risk into our appraisal and remuneration processes.
70
| Marex Group plc Annual Report 2023 | Strategic Report | Corporate Governance | Financial Statements | |||
|
|
|
|
|
|||
|
|
||||||
Group risks in 2023
Over the course of the year the Board, informed by the Risk Committee, and the Audit and Compliance Committee have periodically reviewed the Group principal and emerging risks and our ongoing focus remained on enhancing our internal control environment to meet the needs of our growing business.
We have also continued to strengthen our capabilities for identifying and assessing climate-related risks which will be reviewed by our relevant stakeholders supported by the Sustainability Committee together with the Climate Change (formerly TCFD) Steering Group.
Key changes in the year
The Group’s most significant risks are monitored regularly to ensure that the risk profile is in line with that expected from our Board as articulated in our risk appetite statements.
During the year we have enhanced our Group EWRM framework and improved our risk management processes. A revised Group EWRM framework together with a refreshed risk classification model were implemented to keep momentum on our risk management and integration efforts and at the same time provide an appropriate and common frame of reference to continue to classify and consistently report our risks in line with our strategy and the business environment we operate in.
Our key risks in 2023
|
|
Risk heightened in 2023 |
|
|
|
Risk remained flat since 2022 |
|
|
|
Risk decreased in 2023 |
|
Financial
| Risk |
Trend | Mitigation | Owner | |||
| Credit
We operate and deal with a range of clients from institutional investors and financial services firms to energy distributors, commodity producers and other corporate hedging clients. Where any of our client, counterparty, or distributor fails to perform its contractual obligations we may incur a loss. |

|
We control credit risk using a structured framework for the creation, use and monitoring of credit risk models. In addition, Group Risk Management supports business decision-making and the proactive identification of any new risks. | Group Management | |||
| Market
In trading businesses, changes in the values of trading portfolios generate profits or losses. Market Risk manages and limits the market risk exposures which give rise to changes in value of the trading portfolio. Such changes are due to changes in the prices of market instruments, including spot prices, volatilities, interest rates, etc. |
|
Through our Market Risk team we monitor the sensitivity of the portfolio to movements of market-driven risk factors. Key risk measures in place to control the portfolio are VaR, greek sensitivities and portfolio stress testing.
Market Risk limits are set at levels to support business growth within a controlled Risk environment. The Market Risk Management Framework is open and transparent. |
Group Management | |||
| Liquidity
Due to the nature of our business, we may be subject to potential losses for not having sufficient financial resources to meet our financial obligations as they fall due, or we can secure such resources only at excessive cost. |
|
We operate extensive liquidity management processes and perform regular stress tests and scenario analysis on the amount, type, and distribution of financial and capital resources to address the key risks we are exposed to. Policies and stress tests are performed at both Group and at a material operating entity basis. | Group Management | |||
71
| Marex Group plc Annual Report 2023 | Strategic Report | Corporate Governance | Financial Statements | |||
|
|
|
|
|
|||
|
|
||||||
Managing our risk (continued)
Operational
| Risk |
Trend | Mitigation | Owner | |||||
| Technology and cyber
We rely on a wide range of technology solutions, both built in-house and by leading providers. We have two risks that could arise in relation to our technology approach, the first being in relation to technology failure, where our systems and platforms become unavailable for a period of time driven by the infrastructure not being configured correctly or fit for purpose in line with the size and complexity of the business, and the second being, cyber risk driven by advances in the sophistication of techniques used in cyber-attacks. Both of these risks are heightened as we continue to grow the business, and as we acquire more assets, Marex becomes more susceptible to failure in our core platforms and systems, and a target of a cyber-attack. |

|
We continually focus on our long-term technology needs and requirements through the implementation of our technology strategy. In addition to this, we have built an operational resilience and business continuity approach, to ensure that our technology remains available, and resilient. Our security infrastructure is robust, and we aim to stay up to date with our platforms, applications and systems to continuously improve our security posture and programs.
Our suite of policies is ISO27001 aligned, and we run a Cyber assessment framework based on the National Institute of Standards and Technology (NIST). We perform comprehensive due diligence on acquired entities to understand their security posture and security enhancements are made where necessary before integrating into the Marex IT infrastructure. |
Group Management | |||||
| Third Party and supplier management
Multiple acquisitions in rapid succession coupled with business growth and expansion increases our exposure and ability to manage third party suppliers. |
|
Recognising the increased risk exposure towards the supplier population mainly driven by acquisitions, we continued to focus our effort on strengthening our supplier management capabilities for the appropriate oversight and management of third parties. Having established a Supplier Management function we are designing a Supplier Management Policy and Framework that integrates and enhances risk management activities, by implementing an enhanced structure to enable us to better control and manage this increased supplier base. | Group Management | |||||
| Complexity related to the integration of new businesses, and delivery of strategic change programs
With the continued growth and business expansion, our ability to integrate new businesses may be adversely affected by the increasing complexity and volume of these acquisitions stressed by capacity constraints within our key control and support functions. |
|
We continue to focus on investing and strengthening our change management capabilities to better integrate new businesses and deliver strategic initiatives while managing change in an efficient and effective way. We are implementing an improved change structure to control and manage this increasing portfolio of work so that it continues to deliver the planned outcomes.
When acquiring new businesses, we perform due diligence assessment and drive our integration plan in a consistent manner so that acquisition and integration activities are executed within a controlled and structured process while enhancing our control framework. |
Group Management | |||||
72
| Marex Group plc Annual Report 2023 | Strategic Report | Corporate Governance | Financial Statements | |||
|
|
|
|
|
|||
|
|
||||||
Strategic and business
| Risk |
Trend | Mitigation | Owner | |||||
| Acquisition and market expansion
As part of Marex’s growth ambitions, acquisitions form one part of our strategy to expand into new markets and territories, extend our portfolio, gain or boost long-run competitive advantage, acquire new technologies and skill sets. A clear strategic vision on which assets we acquire, when we acquire, and how, is critical. We recognise that a failure to take due care and consideration into our acquisition approach and framework may lead to undue pressure on our capital and liquidity resources and have a detrimental impact on our strategy. |

|
Our strategic acquisitions are aimed at extending the breadth of our product offering while expanding our international reach to bring more clients into our platform. We do so with a prudent approach to capital and liquidity, always aiming at diversifying our business. We adopt a clear valuation model, aligned with our strategic initiatives, which supports our acquisitions targets.
Before acquiring any new business, we perform extensive initial due diligence assessments to identify, and potentially manage, any material risks while evaluating the viability of the purchase. |
Group Management | |||||
| Climate-related risk
In the global shifts towards a more sustainable economy, we may fail to anticipate and adequately respond to physical and transition threats and opportunities, which may lead to a decline in revenues and/or market share, as well as regulatory and financial impact to the Group. Failure to articulate and manage our exposure to Climate-related risks may compromise our reputation and profitability, not meeting our stakeholder and investors’ expectations. |
New risk |
We are expanding our offerings to make Marex the go-to place for access to environmental products and markets and continue to mature our approach to measuring and monitoring our impact with quantifiable sustainability metrics and clear targets.
We strive to align our sustainability approach with global leading practices and continue to seek advice from external subject matters resources to respond to new sustainability developments. |
Sustainability Committee | |||||
| Health and safety
While performing our business activities our employees, visitors, other parties or the environment may be adversely affected. |

|
We take health and safety seriously and recognise that the control of all health and safety matters from our work activities is not only an essential feature of our efficient operations but also a civil and statutory obligation.
We are committed to provide a safe and healthy workplace for all our employees and it is our objective to continually improve our overall health and safety performance. We have a Health and safety global Programme in place which is regularly overseen by our Health and Safety Committee and review our Health and Safety policy on a regular basis taking into consideration changing operational procedures, changing legislation and new knowledge. |
Health and Safety Committee | |||||
73
| Marex Group plc Annual Report 2023 | Strategic Report | Corporate Governance | Financial Statements | |||
|
|
|
|
|
|||
|
|
||||||
Managing our risk (continued)
Compliance
| Risk |
Trend | Mitigation | Owner | |||||
| Evolving regulatory landscape
Adding on new business types, with new regulatory requirements from new jurisdictional regulators in complex business units from both organic and inorganic growth has added to the overall regulatory risk we face as a business. |

|
We closely monitor the evolution of the regulatory landscape so that we can respond to changes in a timely manner. Our teams regularly scan upcoming regulations to understand if the introduction of changes would limit or restrict the way we run and operate our business.
We also work with regulators and financial exchanges around the world to promptly respond to consultations with a view on collaboration so that regulations can be shaped effectively. |
Group Management | |||||
| Financial Crime and Sanctions
We consider financial crime risk as the risk of facilitating illegal activity committed or furthered through Marex by internal or external parties, in relation to the following: money laundering, fraud, bribery and corruption, tax evasion, terrorist financing, proliferation financing and violation of sanctions. |

|
We have adopted a holistic approach to the management of financial crime and sanctions risk and implemented a group-wide Financial Crime Policy that is imposed through a structured financial crime and sanctions prevention framework.
Our risk-based approach is aligned to the Financial Action Task Force (‘FATF’) recommendations and relevant regulatory requirements.
Marex understands that its business model, sectors, and geographies in which it operates introduce inherent sanctions and financial crime risks. Additionally, the global sanctions landscape continues to evolve at pace bringing new complexities for compliance.
We are constantly strengthening our financial crime and sanctions prevention framework to adapt to these new and evolving threats and vulnerabilities, and to ensure the control environment remains sustainably designed and operates effectively. |
Financial Crime Committee | |||||
Looking ahead – our emerging risks
Geopolitical and macro-economics
Russia – Ukraine conflict
As Russia’s invasion of Ukraine continued throughout the year, the impact on global supply chains has stabilised, with financial market prices remaining marginally volatile. NATO is expanding the Alliance and continues to act as a buffer against Russia, whilst other political and economic efforts are also being used.
We continue to monitor the geopolitical landscape and assess our risk profile accordingly. While high commodity prices were one of the risks already identified as potentially disruptive to the recovery, the prolongation of the conflict intensifies uncertainty in the global economy.
Israel – Palestinian conflict
After the attack by Hamas on Israel on 7 October, we have followed our local business continuity plan and confirmed the safety of our people based in Israel. In these uncertain times, we continue to monitor the local situation as well as the wider geopolitical evolution to ensure that safety and security of our people are maintained; and at the same time that Marex continues to provide the essential infrastructure for all our clients and the required credit and liquidity in times of stressed markets.
A potential global recession and the escalation of geopolitical tensions, among others, are all potential drivers for further volatility ahead.
Evolving technologies and increased cyber threat
The pace of technological innovation keeps transforming. Emerging technologies (such as the introduction of AI) are introducing efficiencies in workplace processes, however, the introduction of potentially disruptive technologies can have a detrimental impact on our business.
This pace of change, coupled with major incidents occurring across financial markets throughout the year such as the collapse of several crypto assets, failure of FTX exchange, ransomware attack on Ion Markets, and the failure of different U.S. regional banks, all renewed the focus of organisations around their resilience capabilities towards disruptive events and is challenging their cybersecurity strategies.
Movement to screens
As more industries are disrupted across the world there is a risk that more transaction volume moves from voice to screens in the most liquid products, or even over entire exchanges. We continue to look at and evolve our business model entering new markets, enabling capacity on less liquid segments and invest further to enhance our technology capabilities.
74
| Marex Group plc Annual Report 2023 | Strategic Report | Corporate Governance | Financial Statements | |||
|
|
|
|
|
|||
|
|
||||||
Section 172 – Companies Act 2006 statement
The directors of a company must act in a way they consider, in good faith, would be most likely to promote the success of the company for the benefit of its members as a whole, and in doing so have regard (amongst other matters) to the requirements of Section 172 (1) (a) to (f) of the Companies Act 2006 as set out below. The Directors recognise the importance of stakeholder engagement and its contribution to the success of the Company and their interests are taken into consideration by the Directors during Board discussions and decision-making. This report sets out how the Directors have met these responsibilities during the financial year.
(a) The likely consequences of any decision in the long term
The Group Board held its annual ‘Strategy Day’ in January 2023. At this meeting, the overarching strategy of the Group was reviewed and the 2023 budget and capital plan were approved. The discussions on strategy included diversification and growth, with a focus on the Americas and Asia-Pacific regions. The meeting also focussed on potential corporate restructuring to simplify the Group and facilitate the development in overseas jurisdictions; and simplifying the requirements of the unregulated business in both the UK and overseas. The Board also discussed the organisation of the U.S. business and the opportunities available to cross-sell products. The Directors continue to identify opportunities for innovation, creativity and ambition, and to evolve and diversify the Group in line with agreed risk appetite and long-term strategy. This was particularly evidenced in 2023 by a number of strategic acquisitions which have expanded the size of the Group, its employees and locations, and have both added to, and enhanced, its product set.
(b) The interests of the company’s employees
The Directors continued to support the annual employee engagement survey, which was undertaken in July. The number of respondents increased year-on-year by approximately 50% to 1,416 (2022: 926) reflecting the growth of the Group. The overall scores were mostly consistent with the previous year, which suggests the Group’s strengths have been preserved throughout significant change. Management, supported by the Board, will continue to focus on building a strong Group with increasingly satisfied employees, and on maintaining high levels of engagement following the recent acquisitions. Further details of the Group Board’s approach to remuneration, to leadership and how this cascades through the business to the workforce and employee engagement, can be found in the Corporate Governance Report.
(c) The need to foster the company’s business relationships with suppliers, customers and others
The Group Board is key in supporting appropriate behaviours in how the Group conducts business and in promoting the maintenance of good business relationships. The Directors are committed to supplier relationships of a high standard; and as such, all suppliers are required to meet the Marex Supplier Code of Conduct and abide by both relevant national and international standards, including those set out by the International Labour Organization, the UK Bribery Act 2010 and the UK Equality Act 2010. The Group’s Modern Slavery and Human Trafficking Statement sets out the commitment of the Directors to corporate responsibility and to maintaining a culture within which ethical behaviour is promoted, in addition to setting out the steps taken to minimise the risk of modern slavery existing in the Group’s business or supply chains. The Group Board recognises its financial regulators across the globe as key relationships, and the Directors are committed to regular open dialogue and compliance with regulatory requirements.
(d) The impact of the company’s operations on the community and the environment
The Group Board acknowledges its responsibility to foster a positive impact on the community and the environment. The Directors continue to support the Group’s focus on ESG, which includes activities in biofuels, renewable energy certificates, emissions futures and options, and environmental consulting services; and the Group has also launched a bespoke renewables desk. The Directors remain committed to the Group’s carbon sequestration project with Oxford University spin-off OxCarbon and The Global Mangrove Trust; and the Group continues to be committed to ESG positive initiatives. Further detail of the Group’s approach can be found in the Sustainability Report. In addition, supported by the Directors, the Group’s approach to taxation is one of transparency and disclosure, paying its fair share of tax, ensuring a cooperative approach to working with tax authorities, with no aggressive tax planning, and alignment with best market practices.
(e) The desirability of the company maintaining a reputation for high standards of business conduct
The Directors understand the importance of promoting the Group’s cultural values, ensuring they are understood by all and are embedded into the fabric of the Group, its actions, how it conducts business, and how it supports appropriate behaviours. These are as follows:
Integrity: We pride ourselves on our honesty and high ethical standards. We apply these values when working with all our clients, colleagues and other stakeholders.
Respect: Our people and our clients are at the heart of our business. We always act respectfully and treat people fairly in everything we do.
Developing our people: Our people are the basis of our competitive advantage. We look to ‘grow our own’ and make Marex the place ambitious, hardworking and talented people choose to build their careers.
Adaptable and nimble: We are proactive. We embrace change as markets evolve to constantly increase our efficiency and we create innovative solutions for our clients.
Collaborative: By working together across the organisation, we foster teamwork, can better respond to challenges and successfully deliver for our clients.
(f) The need to act fairly as between members of the company
All shareholders are treated equally and provided with information in a consistent manner. For further information see the Corporate Governance Report.
The Directors, in preparing this Strategic Report, have complied with s.414C of the Companies Act 2006.
I T Lowitt
Director
22 April 2024
75

| Corporate Governance |
||||||
|
|
|
|
77 |
|
||
|
|
|
81 |
|
|||
| 86 | ||||||
| 90 | ||||||
| Marex Group plc Annual Report 2023 | Strategic Report | Corporate Governance | Financial Statements | |||
|
|
|
|
|
|||
|
|

|

|
||
|
|

|

|
||

|

|

|

|
Board Committee Membership
| Board Member | Audit and Compliance |
Risk | Remuneration | Nomination | ||||||
| 1 |
Robert Pickering¹ | – | – | X | X (Chair) | |||||
| 2 |
Sarah Ing | X (Chair) | X | X | X | |||||
| 3 |
Konstantin Graf von Schweinitz | X | X (Chair) | X | X | |||||
| 4 |
Linda Myers2 | X | – | X (Chair) | – | |||||
| 5 |
Madelyn Antoncic3 | X | X | X | X | |||||
| 6 |
Jeremy Isaacs4 | – | – | X | X | |||||
| 7 |
Roger Nagioff | – | X | – | – | |||||
| 8 |
Joe Cohen | – | – | X | X | |||||
| 9 |
Ian Lowitt5 | – | – | – | – | |||||
| 10 |
Rob Irvin5 6 | – | – | – | – | |||||
| 1. | Robert Pickering was appointed Chair of the Board on 1 October 2023 and consequently stepped down as a member of the Audit and Compliance Committee on the same date. |
| 2. | Linda Myers was appointed as a member of the Board and as a member of the Audit and Compliance, and Remuneration Committees on 1 January 2024; and was appointed as Chair of the Remuneration Committee on 14 March 2024. |
| 3. | Madelyn Antoncic was appointed as a member of the Board and as a member of the Audit and Compliance, Risk, Remuneration, and Nomination Committees on 8 January 2024. |
| 4. | Jeremy Isaacs stepped down as Chair of the Remuneration Committee on 14 March 2024, remaining a member. |
| 5. | All Board Committee members are Non-Executive Directors and Executive Directors attend as required. |
| 6. | Rob Irvin was appointed as a member of the Board on 26 May 2023. |
77
| Marex Group plc Annual Report 2023 | Strategic Report | Corporate Governance | Financial Statements | |||
|
|
|
|
|
|||
Board of Directors (continued)
| 1 | Robert |
| Pickering |
Chair of the Group
Board
Date of Appointment
13 September 2021
Nationality
British
Committee Membership

Contribution to the Board and relevant experience
Robert Pickering is an experienced Non-Executive Director in financial services. He joined the Group in September 2021, becoming Senior Independent Director in March 2022, and was appointed Chair of the Board in October 2023. Previously he served on the Board at Itau BBA, the investment banking arm of Itau Unibanco, the largest private sector bank in Brazil. He began his long career in the City at Cazenove, where he spent 23 years building its financial advisory practice and growing its wealth management division, becoming its first Chief Executive at the age of 41. Robert negotiated and led Cazenove’s highly successful joint venture with JPMorgan in 2004. Since leaving Cazenove in 2008, he has focussed on a portfolio career, acting as an advisor to private individuals and boards, mainly in financial services. Robert’s extensive experience on various boards has included a myriad of corporate transactions including IPOs, mergers, fund raisings and private equity. Robert holds an MA in Law from the University of Oxford.
| 2 | Sarah |
| Ing |
Senior Independent Non-Executive Director
Date of Appointment
22 July 2021
Nationality
British
Committee Membership

Contribution to the Board and relevant experience
Sarah Ing joined the Group as an Independent Non-Executive Director in July 2021, and was appointed Chair of the Audit and Compliance Committee in March 2022 and as the Senior Independent Non-Executive Director in October 2023. She is an experienced non-executive director in the financial services sector and has over 30 years’ experience in accountancy, investment banking and fund management. Previously, Sarah founded and ran a hedge fund investment management business and was also a top-rated equity research analyst covering the general financials sector. Sarah is also an Independent Non-Executive Director and Committee Chair at CMC Markets plc, XPS Pensions Group plc and City of London Investment Group plc. She is a chartered accountant and has a BSc Hons in Botany from Durham University.
| 3 | Konstantin Graf |
| von Schweinitz |
Independent Non-
Executive Director
Date of Appointment
7 September 2021
Nationality
German
Committee Membership

Contribution to the Board and relevant experience
Konstantin Graf von Schweinitz joined the Group as an Independent Non-Executive Director in September 2021 and was appointed Chair of the Risk Committee in August 2022. Konstantin is an experienced banker, non-executive board director and advisor, with over 35 years’ experience in capital markets, investment banking, private banking and asset management. His current roles include acting as Independent Chair of SG Kleinwort Hambros Bank and as a Non-Executive Director at Egerton Capital. Konstantin previously held a variety of executive roles at Dresdner Group, including Head of Risk Management for investment banking. He has a BA and an MA in History and Economics from the University of Oxford.
| 4 | Linda |
| Myers |
Independent Non-
Executive Director
Date of Appointment
1 January 2024
Nationality
American
Committee Membership

Contribution to the Board and relevant experience
Linda Myers joined the Group as an Independent Non-Executive Director in January 2024 and became Chair of the Remuneration Committee in March 2024. Linda has had an extensive career practicing corporate law, having been a Senior Partner at international law firm Kirkland & Ellis LLP until 2022. At Kirkland & Ellis, Linda served on its global management committee from 2010 to 2020 and focused her practice on debt financing transactions for a range of public and private companies. As well as chairing the committee responsible for all of the firm’s policies, she was a member of two committees that were responsible for compensation. Linda has a strong track-record of supporting diversity goals, having established a number of diversity-focused task forces and initiatives at Kirkland & Ellis. Linda also sits on the boards of the National Philanthropic Trust, Gibraltar Industries and LCI Industries.

78
| Marex Group plc Annual Report 2023 | Strategic Report | Corporate Governance | Financial Statements | |||
|
|
|
|
|
|||
| 5 | Madelyn |
| Antoncic |
Independent Non-Executive Director
Date of Appointment
8 January 2024
Nationality
American
Committee Membership

Contribution to the Board and relevant experience
Madelyn Antoncic joined the Group as an Independent Non-Executive Director in January 2024. Madelyn, a PhD. Economist and former World Bank Vice-President and Treasurer, is currently Senior Fellow at New York University, Development Research Institute. At the World Bank, from 2011 to 2015, Madelyn was responsible for overseeing every aspect of managing the bank’s and other official-sector institutions’ assets, as well as the bank’s capital, annual funding program, collateral and cash management, and daily cash payments and disbursements. She is a former Economist at the Federal Reserve Bank of New York; was Senior Advisor to the United Nations Conference on Trade and Development on Sustainable Development Goal Reporting; and has held senior positions at Goldman Sachs, Barclays, Lehman Brothers, and Principal Global Investors. Her experience spans global markets across numerous asset classes in senior market and risk roles, and she is renowned for her leadership in financial innovation and risk management. Madelyn also sits on the boards of ACWA Power and Weill Cornell Medicine; and is a Member of the UK’s Foreign, Commonwealth and Development Office Research Advisory Panel.
| 6 | Jeremy |
| Isaacs CBE |
Non-Executive Director
Date of Appointment
15 February 2010
Nationality
British
Committee Membership

Contribution to the Board and relevant experience
Jeremy Isaacs represents the investor, JRJ Group, on the Marex Board. Jeremy is a Founding Partner of JRJ Group and has four decades of financial services industry and investment experience. At JRJ Group, Jeremy is closely involved with the implementation and guidance of fund strategy, as well as the development and execution of portfolio company strategy. Jeremy is also central to the development and maintenance of JRJ Group’s extensive financial industry relationships with senior personnel across the institutional landscape, as well as with regulators and governments. Prior to establishing JRJ Group in late 2008, Jeremy was the Chief Executive Officer of Lehman Brothers in Europe, the Middle East, and Asia. Before joining Lehman Brothers, he led the European equity derivatives trading business of Goldman Sachs.
| 7 | Roger |
| Nagioff |
Non-Executive Director
Date of Appointment
15 February 2010
Nationality
British
Committee Membership

Contribution to the Board and relevant experience
Roger Nagioff represents the investor, JRJ Group, on the Marex Board. Roger is a Founding Partner of JRJ Group and has over 35 years of operating and investing experience in the financial services and real estate industries. Prior to co-founding JRJ Group, he served in various senior executive positions within Lehman Brothers, holding leadership roles in a number of business lines in Europe and the United States. Roger was Global Head of Fixed Income at Lehman Brothers, succeeding to the role from his previous position as Chief Operating Officer for Europe, and before that, as Co-Head of Global Equities. Roger holds a BA in law.
| 8 | Joe |
| Cohen |
Non-Executive Director
Date of Appointment
7 July 2010
Nationality
British
Committee Membership

Contribution to the Board and relevant experience
Joe Cohen represents the investor, Trilantic Europe, on the Marex Board. Joe is one of the three Founding Partners of Trilantic Europe, and prior to that he spent 21 years at Lehman Brothers, 13 of which were at Lehman Brothers Merchant Banking, where he was European Co-Head. Joe was also a member of the Lehman Brothers Investment Management Division’s European Operating Committee. Prior to that, Joe was a member of Lehman Brothers’ Corporate Finance team based in Paris, New York and London. He is also currently a Non-Executive Director of Verian (formerly Kantar Public). Joe holds a BSc in Economics from the London School of Economics.
79
| Marex Group plc Annual Report 2023 | Strategic Report | Corporate Governance | Financial Statements | |||
|
|
|
|
|
|||
Board of Directors (continued)
| 9 | Ian |
| Lowitt |
CEO
Date of Appointment
1 November 2012
Nationality
American
Contribution to the Board and relevant experience
Ian Lowitt was appointed as a Director in November 2012 and became Chief Executive Officer in January 2016. He was previously at Barclays Bank where, after the acquisition of Lehman Brothers, he managed integration of the businesses and support functions, and served as the COO of Barclays Wealth America. Prior to Barclays, Ian spent 14 years at Lehman Brothers, latterly as Chief Financial Officer, and before that was Co-Chief Administrative Officer for the firm, responsible for Systems, Operations, Finance Risk and Expense Management. Prior to this role, he was the Head of Strategy, Global Treasurer and Head of Tax; and European Chief Administrative Officer. Ian has an MSc in Economics, and an MA in Economics, Philosophy and Politics from the University of Oxford, which he attended as a Rhodes Scholar, and a BSc and an MSc in Electrical Engineering from the University of Witwatersrand in Johannesburg.
| 10 | Rob |
| Irvin |
Chief Financial Officer
Date of Appointment
26 May 2023
Nationality
British
Contribution to the Board and relevant experience
Rob Irvin became Chief Financial Officer at Marex in April 2023. Rob was previously at HSBC for over 10 years where he undertook various senior finance leadership roles. He was latterly the CFO of their Global Private Bank & Wealth business, focusing on implementation of structural change and execution of strategy, and prior to that as CFO of Global Banking, driving business change to raise capital efficiency and improve shareholder returns. Before HSBC, he was an assistant director in transaction services at Deloitte LLP, focusing on both financial and operational due diligence on major capital markets transactions. Rob is a chartered accountant, and has a BA (Hons) in Economics and Social History from the University of York.
80
| Marex Group plc Annual Report 2023 | Strategic Report | Corporate Governance | Financial Statements | |||
|
|
|
|
|
|||
Wates Principles: How we comply
For the year ended 31 December 2023, under the Companies (Miscellaneous Reporting) Regulations 2018, the Group applied The Wates Corporate Governance Principles for Large Private Companies (the ‘Wates Principles’), published by the Financial Reporting Council.
The Group Board is the ultimate governing body of the Marex Group and plays a pivotal role in ensuring effective governance is in place to establish a sound risk management culture and environment, along with promoting and embedding the Group’s cultural values.
The Wates Principles provide a framework in which the Group can demonstrate its high corporate governance standards.
The Group’s reporting against the Wates Principles is detailed below.
Principle 1: Purpose and leadership
The Group has a clearly defined purpose which is outlined in the principles that determine its competitive advantage. The role of the Group Board is stewardship of the Group with long-term sustainable success and creation of shareholder value as fundamental objectives. The Group Board is responsible for determining the strategic objectives and policies required to deliver such long-term value within a framework of rewards, incentives and prudent and effective controls, which enables risk to be assessed and managed. The Group Board is accountable for effective and prudent management, including the segregation of duties and the identification and management of conflicts of interest, to ensure that the influence of third parties does not compromise or override independent judgement.
The Group Board is also responsible for investigating all major deficiencies in performance and major deviations from strategic and financial objectives and risk strategy, ensuring that the necessary financial and human resources are in place for the Group to meet its objectives, and overseeing the conduct of management.
The Group continues to transform in terms of scale and complexity, and in parallel with that growth, its culture continues to evolve. The Group defines culture as the spine which connects employees into a unified community, with a common set of values, practices and behaviours, which defines it and separates it from peers.
Culture and conduct remain key priorities for the Group, and the numerous initiatives undertaken to embed its cultural values are validated by Internal Audit as part of every assignment it undertakes. The Group Board and executive management have continued their robust oversight of conduct and culture-related matters throughout the year, with regular presentations, discussion and challenge at meetings of the Group Board and Board sub-committees.
The Group Board understands its role in setting ‘the tone from the top’ and ‘leading by example’ and cascades this throughout the business through ongoing dialogue with the workforce and other stakeholders. Employee engagement surveys are undertaken annually and responses from the 2023 exercise were positive, showing stable results across all measures versus the previous year, against a backdrop of significant change throughout the Group. Participants again provided insightful comments and feedback to management, further demonstrating their engagement and enabling actions to be taken by senior management and enhancements to be introduced where appropriate. Further details of actions taken from the employee engagement survey can be found in the Strategic Report. The CEO, CFO and Chief Strategist also conduct regular ‘Town Halls’ disseminating information and updates to each region and enabling employees to participate in direct ‘Q&A’ sessions with management.
Principle 2: Board composition
The Group Board is structured to bring a broad balance of skills, knowledge and experience to the Group.
The Group has a separate Chair and Chief Executive Officer, which maintains a balance of responsibilities, accountability and decision-making. Formal statements setting out the distinct and separate roles of the Chair and Chief Executive Officer are also in place.
The Group Board currently comprises:
| – | the Independent Non-Executive Chair; |
| – | four Independent Non-Executive Directors (one of whom is the Senior Independent Director); |
| – | two Executive Directors (Chief Executive Officer and Chief Financial Officer); and |
| – | three Non-Executive Directors (representing the majority shareholders). |
The Non-Executive Directors combine broad experience with objective judgement and provide challenge to the executive. Each Director receives a comprehensive induction upon joining the Group Board, is expected to commit sufficient time to meet the expectations of their role, and receives continued support and training (facilitated by the Chair and Company Secretary) to enable them to carry out their duties effectively.
Group Board activity review
The Group Board holds six scheduled meetings each year, together with ad hoc meetings as required for specific subjects of focus or urgent matters. The first Board meeting each year is an offsite full day strategy meeting. The Risk Committee and the Audit and Compliance Committee both meet at least four times each year and ad hoc as required. The Remuneration Committee and the Nomination Committee both meet at least once a year and ad hoc as required.
81
| Marex Group plc Annual Report 2023 | Strategic Report | Corporate Governance | Financial Statements | |||
|
|
|
|
|
|||
Wates Principles: How we comply (continued)
Attendance by members for Group Board and Board Committee meetings in 2023 was as set out below:1
|
Audit and |
||||||||||||||||||||
| Compliance | Risk | Remuneration | Nomination | |||||||||||||||||
| Group Board | Committee | Committee | Committee | Committee | ||||||||||||||||
| Robert Pickering2 |
6/6 | 5/5 | – | 3/3 | 1/1 | |||||||||||||||
| Sarah Ing |
6/6 | 8/8 | 5/5 | 3/3 | – | |||||||||||||||
| Konstantin Graf von Schweinitz |
6/6 | 8/8 | 5/5 | 3/3 | – | |||||||||||||||
| Jeremy Isaacs |
6/6 | – | – | 3/3 | 1/1 | |||||||||||||||
| Roger Nagioff |
5/6 | – | 5/5 | – | – | |||||||||||||||
| Joe Cohen |
6/6 | – | – | 2/3 | 1/1 | |||||||||||||||
| Ian Lowitt |
6/6 | – | – | – | – | |||||||||||||||
| Rob Irvin3 |
3/3 | – | – | – | – | |||||||||||||||
| Paolo Tonucci4 |
3/3 | – | – | – | – | |||||||||||||||
| Carla Stent5 |
5/5 | – | 4/4 | 3/3 | 1/1 | |||||||||||||||
| Lord Fink6 |
4/5 | – | 0/4 | – | – | |||||||||||||||
| 1. | The above table does not include ad hoc Group Board meetings (of which three were held during the year), however additional meetings of the Board Committees have been included. Attendance by standing attendees is not included (for example the Chair attends all Audit and Compliance Committee and Risk Committee meetings and the CEO is present at the majority of Board Committee meetings). The Mergers and Acquisitions Committee membership is selected on a transaction-by-transaction basis and is not included in the above analysis. |
| 2. | Robert Pickering stepped down as a member of the Audit and Compliance Committee on 1 October 2023. |
| 3. | Rob Irvin was appointed as a Director on 26 May 2023. |
| 4. | Paolo Tonucci resigned as a Director on 26 May 2023. |
| 5. | Carla Stent resigned as a Director on 30 September 2023. |
| 6. | Lord Fink resigned as a Director on 30 September 2023. |
In 2023, Robert Pickering was appointed as Chair of the Board, following the departure of Carla Stent, and Sarah Ing was appointed as Senior Independent Director.
The Group Board continues to look to overcome the lack of diversity in its membership, which is symptomatic of the financial services industry as a whole, and in January 2024, Linda Myers and Madelyn Antoncic were appointed as directors. The Group is fully committed to promoting diversity and inclusion and this will remain a key focus.
The Group Board regularly assesses the independence of each of the Non-Executive Directors and has determined that Robert Pickering, Sarah Ing, Konstantin Graf von Schweinitz, Linda Myers and Madelyn Antoncic are independent.
None of the Non-Executive Directors, nor their immediate families, have received additional remuneration from the Group, apart from management fees paid to JRJ in accordance with the Shareholders’ Agreement. The accuracy of the JRJ fees is reviewed annually by Internal Audit on behalf of the Audit and Compliance Committee. A full Register of Directors’ Interests is presented to the Group Board annually for approval and any interim changes are reviewed and approved at the next available Board meeting. At the commencement of each Group Board meeting, the Directors are also invited by the Chair to advise of any conflicts or potential conflicts in respect of items on that meeting’s agenda. Where the Group Board believes that a potential conflict of interest could affect, or could appear to affect, any Director’s judgement, appropriate procedures will be considered, including recusal of the Director from the relevant part of the meeting.
An evaluation of the performance of the Group Board, its committees, and the Chair is generally carried out annually. In July 2023, the latest evaluation was undertaken and was conducted by Robert Pickering (in his previous role as Senior Independent Director) by way of individual meetings held with each director. The results were presented to the Board and were positive across all areas: Board composition, structure and size; Board culture and behaviours; Board meeting process; support for the Board; Board committees; and the Chair. Overall, there were no particular concerns and the Board was considered to be working well, however certain suggestions were subsequently actioned. These included the appointment of two additional independent non-executive directors (one to act as Remuneration Committee Chair), refinement to the format of the Board Strategy Day, and further enhancements to the quality of Board and Board Committee papers. To support the ongoing professional development of the Group Board members, during the year Directors received training in areas such as the FCA Consumer Duty and Senior Managers & Certification Regime.
82
| Marex Group plc Annual Report 2023 | Strategic Report | Corporate Governance | Financial Statements | |||
|
|
|
|
|
|||
Principle 3: Director responsibilities
The Group’s governance arrangements, including the Group Board Terms of Reference, Delegation of Authority and Matters Reserved, and all Board Committee Terms of Reference, are assessed annually by the Company Secretary and the Chair to ensure that these are robust and effective, and that lines of accountability and responsibility are clear. Any required enhancements are recommended to the Group Board as appropriate.
The governance structure takes into account the specific governance requirements or guidelines issued by applicable regulators. As good practice, governance arrangements are applied at Group level and an FCA-approved modification of entity-level governance and risk management regulatory requirements is in place, given that these are achieved robustly by the Group Board committees. All participants in Board and Board Committee meetings are also careful to consider the capacity within which decisions are taken and are cognisant of the specific legal entity involved in the matter.
The Company Secretary advises the Group Board on matters of corporate governance, and attends all meetings of the Group Board and (where possible) its Committees, and ensures that correct procedures are followed. All members of the Group Board, Subsidiary Boards and Board Committees have access to the services of the Company Secretary. The quality of management information presented to the Group Board continues to evolve and improve and the Directors fully utilise the digital board paper solution implemented by the Company Secretary.
The Group Board meets every two calendar months or more frequently as determined by the Chair.
Principle 4: Opportunity
and risk
Details on how the Group Board considers the long-term strategy and future opportunities for innovation is contained in the Section 172 report.
The Group Board has delegated authority to the Risk Committee for oversight and management of key risks and maintaining the Group’s risk profile within the risk appetite set by the Group Board. The Risk Committee meets on a quarterly basis and ad hoc as required, focussing on the key risks faced by the Group, including market, credit and operational risk. The Risk Committee oversees and challenges day-to-day risk management and oversight arrangements of senior management; assesses the current risk exposures of the Group, drawing on appropriate qualitative and quantitative metrics; reviews the Group’s current risk exposures and advises the Group Board of any risk exposures of concern; and develops metrics to be used to monitor the Group’s risk management performance and periodically review the methodologies and tools used in assessing and monitoring the Group’s risk exposures.
In 2023 the Risk Committee reviewed, and recommended to the appropriate subsidiary boards for approval, the Internal Capital Adequacy and Risk Assessment (‘ICARA’) which will be revised on an annual basis or following material changes. Amongst other mechanisms, the ICARA allows the Board to monitor the activities of the Group and its results against targeted financial resilience and liquidity. The Group Board reviews the forecasted financing requirements, financing capacity and options required to deliver the targeted financial resilience levels, allowing for Group strategy to be set.
83
| Marex Group plc Annual Report 2023 | Strategic Report | Corporate Governance | Financial Statements | |||
|
|
|
|
|
|||
2023 Board activities timeline
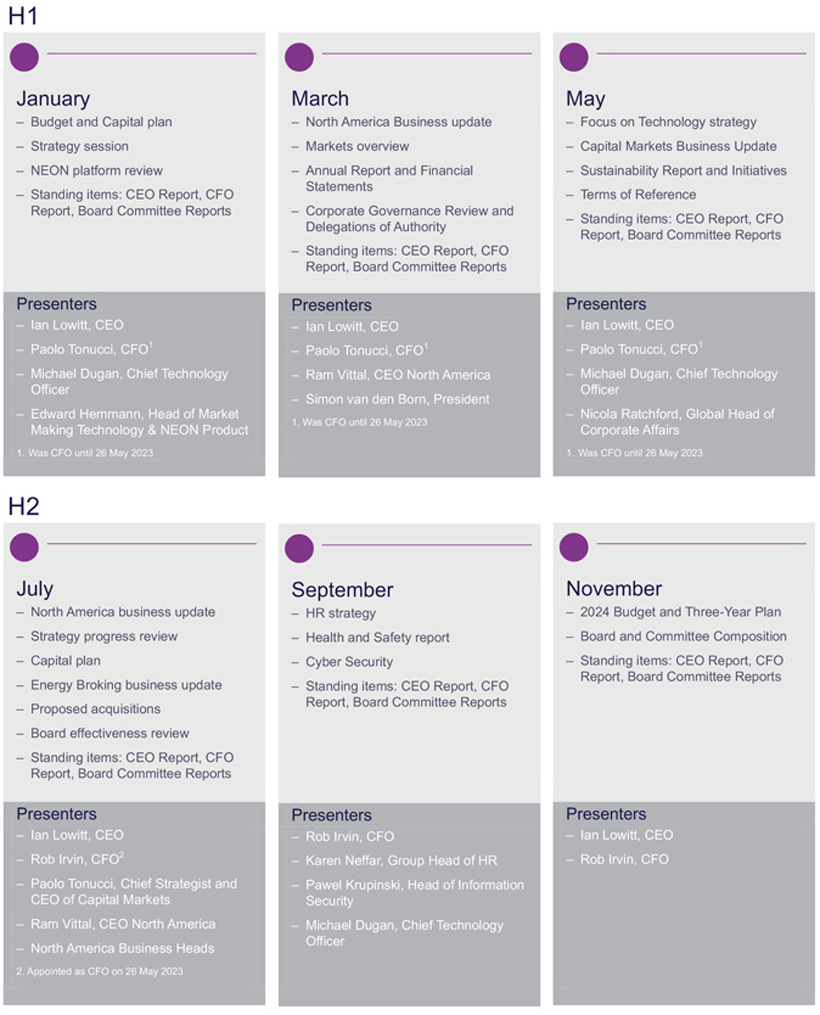
84
| Marex Group plc Annual Report 2023 | Strategic Report | Corporate Governance | Financial Statements | |||
|
|
|
|
|
|||
Wates Principles: How we comply (continued)
Principle 5: Remuneration
The Remuneration Committee reviews and approves the annual remuneration and discretionary bonus awards for ‘Material Risk Takers’ and ensures that remuneration is designed to promote the long-term success of the Company, is transparent, and is aligned with behaviour, conduct and the Group’s cultural values. In 2023, the Remuneration Committee also approved the Material Risk Taker population and the compensation structures in place to allow the Group to comply with the deferred variable pay requirements of the FCA Investment Firms Prudential Regime.
The Remuneration Committee comprises Non-Executive Directors in order to ensure independence and appropriate consideration of shareholder interests.
The Group prepares a Gender Pay Gap Report annually and in 2023 results indicated alignment with the Financial Services industry as a whole. The Group’s mid- to long-term aim remains to increase female numbers, particularly in senior roles, as analysis continues to show that fewer women in senior positions, and not unequal pay, is the driver of the Group’s gender pay gap. There is no pay gap between genders for matched roles.
Principle 6: Stakeholder relationships and engagement
During the course of the year, the Group engaged with a broad range of stakeholders, allowing more meaningful relationships to be built and the understanding of their expectations to be enhanced. These stakeholders include clients, employees, the environment, regulators, suppliers, shareholders and investors.
Clients
The Group’s clients are everything, which is why superior execution and superb client service is central to its business. The Group Board and management are always looking for new ways to strengthen client offerings, and the acquisition in 2023 of the HPC/OTCex Group, Eagle Energy Brokers LLC, Global Metals Network Limited, Cowen International Limited (since renamed Marex Prime Services Limited) and Pinnacle Fuel LLC has increased the size of the Group and further diversified both its product set and geographical reach. The Group believes that the breadth, depth and quality of services provided differentiates it from peers. Every day the Group’s brokers and market makers are interacting with their clients, and management is also engaging more frequently with senior executives of clients, as even deeper relationships are cultivated.
Employees
The Group invests in its employees and helps them develop their careers, believing them to be the basis of its competitive advantage. The Group looks to make its business the rewarding place that ambitious, hardworking and talented people choose to build their careers. The Group is committed to offering equality of opportunity to all, regardless of gender. Management frequently engages with employees through formal and informal channels. These include face-to-face dialogues between employees and line managers and regular ‘Town Halls’ hosted by the Chief Executive Officer together with other senior managers such as the Chief Financial Officer, and Chief Strategist. In 2023, the Group continued its employee survey programme and made subsequent enhancements based on the feedback received. The Group Board Chair acts as whistleblowers’ champion and mandatory refresher training on whistleblowing was undertaken by employees during the year.
The environment
The Group recognises its role in promoting and supporting environmental sustainability initiatives and continues to sponsor a multi-year Research Programme at the Smith School of Enterprise and the Environment at the University of Oxford. The Group Board has further strengthened its commitment to sustainability throughout 2023, and the Group’s annual Sustainability Report sets out its commitment to improve the environment in which its clients, employees, their communities and those with whom it interacts with, live and work.
The Group’s Sustainability Committee continues to meet regularly to further develop ESG positive initiatives and the Group Board remains committed to serving clients, communities and investors by being a responsible business.
Regulators
The Group is subject to an extensive supervisory and regulatory framework across each of the countries in which it operates. Changes in this regulatory framework could have a significant effect on business, clients and costs, as well as on the financial and economic environment. Management therefore maintains a constant and open dialogue with the Group’s regulators around the world. As a UK-headquartered group, the most frequent interaction is with the Financial Conduct Authority, and is centralised through the Compliance function. Regular discussions also take place between the FCA, executive management and Board Directors. In addition, the Group continues to have close dialogue with: the Commodity Futures Trading Commission; the Financial Industry Regulatory Authority and the Securities and Exchange Commission in the United States; the Central Bank of Ireland; Hong Kong
Securities and Futures Commission; Monetary Authority of Singapore; Australian Securities and Investments Commission; Dubai Financial Services Authority; and the Autorité des Marchés Financiers and Autorité de Contrôle Prudentiel et de Résolution in France.
Suppliers
The Group has long-term relationships with a broad range of suppliers around the world. Strong business relationships are essential for the Group, and for the key subsidiaries for which payment practices and performance reporting is required, the average time taken to make payments under qualifying contracts in 2023 was 22 days. The Group, as a leader in its field, takes great pride in being a good corporate citizen and always strives to set the highest standards of ethical conduct and corporate social responsibility.
Shareholders and investors
Being privately held, the Group maintains a balance between delivering value for shareholders and investors, but also developing its business as a global financial services platform. The Group’s key shareholders are represented by Directors on the Group Board, and between Board meetings there is regular communication between the CEO, Chair and shareholder representatives. The Group has a small amount of ordinary non-voting shares held by current and former management and staff, each of whom retains the right to receive any dividends paid, and also has external investors in its public debt issuances. The Group website is regularly updated to provide shareholders, investors and other stakeholders with the latest news and developments, including copies of the latest financial statements of the Group and key subsidiaries.
85
| Marex Group plc Annual Report 2023 | Strategic Report | Corporate Governance | Financial Statements | |||
|
|
|
|
|
|||
Audit and Compliance Committee

|
Members
– Sarah Ing (Chair) – Konstantin Graf von Schweinitz – Linda Myers (appointed 1 January 2024) – Madelyn Antoncic (appointed 8 January 2024) – Robert Pickering (up to 30 September 2023)
Standing attendees1
– Ian Lowitt (CEO) – Rob Irvin (CFO) – Paolo Tonucci (Chief Strategist and CEO of Capital Markets) – Dean Shoosmith (CRO) – Nigel Grace (Head of Finance) – Adam Hooker (Global Head of Risk) – Ann Marie Bull (Group Head of Compliance) – Claudio Picotti (Group Head of Internal Audit) – Graham Francis (Group Chief Operating Officer) – Ram Vittal (CEO, Marex North America)
1. Except in the regular private sessions with Internal Audit and external auditors (held without the executives present), or where there is a conflict of interest
|
|
Focus for 2024
Key priorities for the Audit and Compliance Committee in 2024 include: – Monitor ongoing effectiveness of the FCA Consumer Duty requirements. – Review appropriate integration of acquisitions. – Continued oversight of internal audit. – Continued monitoring and review of the operation of financial crime systems and controls, onboarding processes and procedures, and continued enhancements to the financial crime control framework. – Continued oversight and monitoring of client money controls. |
|
Activities during the year
Activities of the Audit and Compliance Committee during 2023 included:
Compliance
Reviewing key regulatory and exchange interactions, initiatives and compliance; reviewing Compliance assurance reports; and reviewing the Group’s annual whistleblowing report.
FCA Consumer Duty
Monitoring effective implementation of the FCA Consumer Duty requirements; reviewing metrics and key performance indicators; and considering the format and content for the first annual board report.
Client assets (‘CASS’)
Reviewing client asset reports and CASS policy content.
Financial crime
Reviewing the Money Laundering Reporting Officer’s Annual Report; approving the financial crime Risk Appetite Statement; approving amendments to the Gifts and Hospitality policy; and reviewing the financial crime assurance plan.
|
Internal audit
Monitoring progress against plan; reviewing reports and monitoring actions taken as a result of recommendations; approving the Internal Audit charter; reviewing the strategic plan; and monitoring adequacy of resourcing.
External audit
Reviewing and recommending the 2022 Annual Report to the Board for approval; reviewing the external auditor’s 2022 management letter and management’s response to observations; reviewing the 2023 year end audit plan including risk assessment, significant risks, approach to materiality and acquisitions; and approving audit fees.
Finance and tax
Approving the Group Tax strategy for 2023/2024; and receiving quarterly Finance updates from the CFO.
Data privacy
Monitoring and reviewing the Group’s privacy framework and risk appetite metrics.
Other matters
Monitoring the acquisition integration process; approving the Group’s operational resilience self-assessment; and receiving training on the FCA Consumer Duty from external counsel.
|
|
|
The role of the Audit and Compliance Committee is to assist the Board in ensuring the independence and effectiveness of the internal and external audit functions, the integrity of the financial and narrative statements, the effectiveness of internal financial controls, and regulatory compliance through monitoring and review. |
The responsibilities of the Audit and Compliance Committee include the following:
– Monitoring the integrity of the financial statements of the Company, including reviewing and approving statements to be included in the Annual Report.
– Reviewing the Company’s internal financial controls (including the systems to identify, manage and monitor financial risks).
– Reviewing the Company’s procedures, systems, and controls for detecting and preventing financial crime.
– Overseeing the proper and independent discharge of the Group Compliance function and compliance with legal and regulatory requirements.
– Monitoring and reviewing the effectiveness of the Company’s Internal Audit function in the context of the Company’s overall risk management system.
– Overseeing the Company’s relations with the external auditor and assessing external auditor independence.
– Monitoring the proper discharge of the client money operational oversight function. |
86
| Marex Group plc Annual Report 2023 | Strategic Report | Corporate Governance | Financial Statements | |||
|
|
|
|
|
|||
Risk Committee
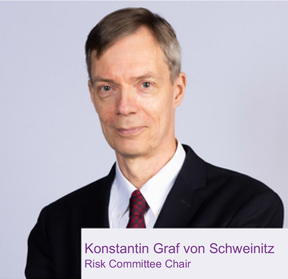
|
Members
– Konstantin Graf von Schweinitz (Chair) – Madelyn Antoncic (appointed 8 January 2024) – Sarah Ing – Roger Nagioff – Carla Stent (up to 30 September 2023) – Lord Fink (up to 30 September 2023)
Standing attendees1
– Ian Lowitt (CEO) – Rob Irvin (CFO) – Dean Shoosmith (CRO) – Paolo Tonucci (Chief Strategist and CEO of Capital Markets) – Simon van den Born (President) – Nigel Grace (Head of Finance) – Adam Hooker (Global Head of Risk) – Ann Marie Bull (Group Head of Compliance) – Deana Herley (Group Risk COO) – Ram Vittal (CEO, Marex North America)
1. Except where there is a conflict of interest
|
|
Focus for 2024
Key priorities for the Risk Committee in 2024 include: – Ensure appropriate coverage of risk by the Group on a global basis, particularly given the increase in size of non-UK businesses. – Monitoring the integration of acquisitions and any required enhancements to risk frameworks. – Continued focus on the Solutions business. – Monitoring geopolitical events and the associated key risks to the Group. – Continued and enhanced focus on cyber security risks. |
|
Activities during the year
Activities of the Risk Committee during 2023 included:
Capital and liquidity
Reviewing and monitoring liquidity risk and regulatory capital; monitoring impacts of geopolitical events on market volatility; monitoring interest rate risks on investments and management of residual balances; considering ICARA requirements and ultimately recommending that document to the respective subsidiary Boards for approval.
Operational risk
Reviewing organisational complexity and senior management accountability; reviewing key operational risks based on Risk Control Self-Assessments; monitoring inherent risk in change management, particularly integration of new acquisitions; and reviewing critical systems adequacy.
Treasury risk management
Reviewing specific Treasury risks, focusing on Group liquidity monitoring, intraday liquidity management, counterparty cash limits and client asset regulation, and liquid asset investment strategy.
|
Acquisitions
Reviewing key acquisition risks, with particular focus on the OTCex/HPC group and Marex Prime Services Limited.
Business change
Reviewing new products and services escalated to the committee and reviewing decisions of the Business Change Approval Committee.
Solutions
Reviewing the liquidity stress tests and recommendations; considering credit limit increases; and noting decisions of the focused sub-committee (Structured Product Governance Committee).
Other matters
Reviewing and monitoring risk appetite, country risk, clearing risk, credit portfolios, market risk, client defaults, emerging risks, cyber risk, and the Group’s ransomware strategy.
|
|
|
The role of the Risk Committee is to oversee and provide advice to the Board on the Group’s current risk exposures and future risk strategies, the embedding and maintenance throughout the Group of a supportive culture in relation to the management of risk and the establishment of prescriptive rules and procedures in relation to risk. |
The responsibilities of the Risk Committee include:
– Overseeing and challenging the day-to-day risk management, internal control systems, and oversight arrangements of senior management.
– Assessing the risk exposures of the Group, drawing on appropriate qualitative and quantitative metrics.
– Reviewing risk exposures, management, mitigation and in particular any risk exposures of concern.
– Having primary oversight of the ICARA process.
– Overseeing the approval and monitoring of appropriate limits on exposures and concentrations.
– Advising the Board on risk appetites, tolerance, and future risk strategy.
– Reviewing risk appetite statements, trigger limits and capacities. |
87
| Marex Group plc Annual Report 2023 | Strategic Report | Corporate Governance | Financial Statements | |||
|
|
|
|
|
|||
Remuneration Committee
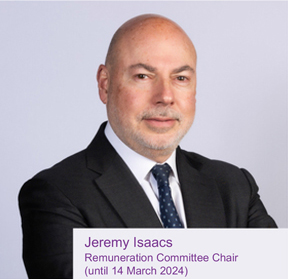
|
Members
– Jeremy Isaacs (Chair)1 – Linda Myers1 (appointed 1 January 2024) – Madelyn Antoncic (appointed 8 January 2024) – Joe Cohen – Sarah Ing – Robert Pickering – Konstantin Graf von Schweinitz – Carla Stent (up to 30 September 2023)
Standing attendees2
– Ian Lowitt (CEO) – Karen Neffar (Group Head of HR) – Sarah Lewis (Global Head of Reward)
1. On 14 March 2024, Linda Myers received FCA regulatory approval for her position as Chair of the Remuneration Committee, taking over from Jeremy Isaacs who remains a member of the Committee.
2. Except where there is a conflict of interest
|
|
Focus for 2024
Key priorities for the Remuneration Committee in 2024 include: – Review and approve compensation proposals for the Group’s ‘Material Risk Takers’ and the compensation pool for the Control and Support division. – Review the Material Risk Takers framework and approve the designated roles for 2024 – Consider Executive Director performance against the set scorecard targets and accordingly approve appropriate compensation for 2023. – Set appropriate Executive Director performance measures for 2024. – Approve the 2023 Deferred Bonus Plan grant and 2021 and 2022 Deferred Bonus Plan vestings. – Review the Group’s Remuneration Policy. – Consider a 2024 Retention Long Term Incentive Plan for employees and associated performance measures. – Consider appropriate future employee incentive plans. |
| Activities during the year
Activities of the Remuneration Committee during 2023 included:
Annual compensation approvals
Assessing the reasonableness of base salary, variable and total compensation proposals for senior management and other relevant staff against the current market environment; and reviewing bonus ranges and associated control metrics, including a gender assessment.
Executive Director 2022 remuneration approval
Reviewing 2022 performance of the Executive Directors, including evolution of their roles, consideration of performance scorecards, and ultimately approving remuneration proposals.
Executive Director 2023 performance measurement
Considering and formulating metrics to measure the 2023 performance of Executive Directors including detailed strategic, financial performance, and risk targets.
|
Deferred compensation
Approving first tranche vesting of the 2021 Deferred Bonus Plan; approving the 2022 Deferred Bonus Plan grant; and approving the appropriate share price methodology.
Long Term Incentive Plan
Reviewing and approving the performance measures and rules of the 2022 Long Term Incentive Plan for senior management.
Employee share sales
Approving a proposal to offer employees the opportunity to sell shares back to the Company.
Gender Pay Gap
Reviewing and approving the gender pay gap report for Marex Financial including measures to progress the Group’s diversity, equity and inclusion initiatives.
Material Risk Takers
Reviewing and approving Material Risk Takers’ designated roles for 2023. |
|
| The role of the Remuneration Committee is to determine the remuneration policy and practices of the Company for executive directors and design and determine remuneration for the chair of the Board, executive directors and senior management, having regard to statutory and regulatory requirements. | The responsibilities of the Remuneration Committee include:
– Determining remuneration policy.
– Setting remuneration for the Chair of the Board, Executive Directors, and senior management, including pension rights and compensation payments.
– Advising on and determining all formulae and targets for performance-related schemes and the methods for assessing whether performance conditions are met and the eligibility of Executive Directors for annual bonuses.
– Reviewing and approving all aspects of any share option scheme, share incentive scheme or other long-term incentive plan.
– Ensuring that potential conflicts of interest are managed and that no Director or senior executive is involved in any decisions as to their own remuneration.
– Reviewing gender pay gap reporting and associated actions. |
|
88
| Marex Group plc Annual Report 2023 | Strategic Report | Corporate Governance | Financial Statements | |||
|
|
|
|
|
|||
Nomination Committee
|
Members
– Robert Pickering (Chair) (from 30 September 2023) – Madelyn Antoncic (appointed 8 January 2024) – Joe Cohen – Sarah Ing (appointed 30 November 2023) – Jeremy Isaacs – Konstantin Graf von Schweinitz (appointed 30 November 2023) – Carla Stent (up until 30 September 2023)
Standing attendees1
– Ian Lowitt (CEO) – Karen Neffar (Group Head of HR)
1. Except where there is a conflict of interest
|
|
Focus for 2024
Key priorities for the Nomination Committee in 2024 include:
– Further development of succession planning for senior management across the Group. – Ensuring continuation of actions to improve diversity and inclusion across the Group, particularly at more senior levels. – Continue to evaluate the skills, experience and knowledge of the Board in the context of current requirements and future challenges. |
| Activities during the year
Activities of the Nomination Committee during 2023 included:
Appointment of a new independent non-executive director as Remuneration Committee Chair
Leading the search for a new independent non-executive director to act as Chair of the Remuneration Committee, appointing an external executive search agency to partner in the process, considering the balance of skills, knowledge experience and diversity on the board, and ultimately recommending to the Board the appointment of Linda Myers.
Appointment of a further new independent non-executive director
Considering the appointment of an additional independent non-executive director and conducting an interview process in the closing months of the year, leading to a recommendation to the Board to appoint Madelyn Antoncic. |
Talent and succession planning
Considering succession and talent planning for senior executives, undertaking a comprehensive review with the assistance of an external facilitator, and analysing the pipeline of talent, high potential employees and future possible successors to key management roles; and reviewing areas for further enhancement to management feedback tools, psychometric testing and the appraisal processes.
Diversity, Equity and Inclusion
Reviewing and revising the Group’s Diversity, Equity and Inclusion policy to make reference to the enhancements made in this area such as new steering groups in place, ‘sponsor’ and ‘champion’ structures, alignment to goals and objectives set by the DE&I Steering Group, and to revise language around protected characteristics.
Committee Composition
Proposing revisions to composition of the Committee following the departure of Carla Stent, adding Sarah Ing and Konstantin Graf von Schweinitz.
|
|
| The role of the Nomination Committee is to ensure there is a formal, rigorous and transparent procedure for the appointment of new directors, to lead the process for board appointments and ensuring plans are in place for succession to the Board and senior management positions, overseeing the development of a diverse pipeline for succession. | The responsibilities of the Nomination Committee include:
– Evaluating the skills, experience and knowledge of the Board.
– Identifying, nominating and recommending, for the approval of the Board, candidates to fill Board vacancies.
– Approving the Company’s policy on boardroom diversity and inclusion.
– Overseeing the development of a diverse pipeline for orderly succession for appointments to both the Board and senior management. |
|
89
| Marex Group plc Annual Report 2023 | Strategic Report | Corporate Governance | Financial Statements | |||
|
|
|
|
|
|||
The Directors present their report and audited consolidated financial statements of Marex Group plc and its subsidiaries (collectively ‘Marex’, or the ‘Group’) and the standalone financial statements for Marex Group plc (the ‘Company’) for the year ended 31 December 2023.
Results
The audited financial statements of the Group and the Company are shown on pages 101 to 187.
The profit before tax attributable to the owners of the Group for the year ended 31 December 2023 amounts to $196.5 million (2022: $121.6 million). Further information on the performance of the Group is given in the Financial Review section of the Strategic Report.
The financial statements are prepared in U.S. dollars as this is the currency in which most of the Group’s transactions are denominated.
Dividends
Dividends of $45.0m were paid to ordinary shareholders during the year (2022: $nil).
Restatements
During the preparation of these financial statements, the Group voluntarily decided to change certain accounting policies in accordance with IAS 8 Accounting policies, Changes in Accounting Estimates and Errors, including the presentation of its consolidated income statement to provide more detailed information to investors and align better its financial reporting to that of a public entity and the presentation of income from physical commodities trading in the consolidated income statement. Furthermore, the Group is correcting some errors identified in the statement of financial position and in the income and cash flow statements included in the financial statements as of and for the year ended 31 December 2022 such as the reclassification of debt securities and borrowings between current and non-current, and the reclassification of software from property, plant and equipment to intangible assets. The details of the voluntary accounting policy changes and correction of errors are outlined in the accounting policies and note 39.
Directors
The Directors who have held office during the year and at the date of this report were as follows:
| R M Pickering (Chair)
S L Ing
K N Graf von Schweinitz |
||
|
L K Myers
M Antoncic
J M Isaacs CBE
R B Nagioff
J C Cohen
I T Lowitt (CEO) |
(appointed 1 January 2024)
(appointed 8 January 2024) |
|
|
C R J Irvin (CFO)
Lord S Fink
C R Stent
P R Tonucci |
(appointed 26 May 2023)
(resigned 30 September 2023)
(resigned 30 September 2023)
(resigned 26 May 2023 ) |
Indemnity of Directors
Each Director is indemnified out of the assets of the Group against all costs, charges, losses and liabilities incurred by them in the proper exercise of their duties. Directors who have resigned during the year also benefit from the same indemnity arrangement. The Directors are also covered by an insurance policy.
Directors’ statement as to disclosure of information to the auditor
Each of the persons who is a Director at the date of approval of this report, confirms that:
| – | so far as the Director is aware, there is no relevant audit information of which the Group’s auditor are unaware; and |
| – | they have taken all the steps that they ought to have taken as a Director in order to make themselves aware of any relevant audit information and to establish that the Group’s auditor are aware of that information. |
This confirmation is given and should be interpreted in accordance with the provisions of s.418 of the Companies Act 2006.
90
| Marex Group plc Annual Report 2023 | Strategic Report | Corporate Governance | Financial Statements | |||
|
|
|
|
|
|||
Charitable and political contributions
Marex budgets to spend $100,000 per annum to support employees in their charitable fundraising activities. It does this by donating 50% of the sum raised by each employee to the chosen charities. In order to ensure that the fund can be accessed by as many employees as possible, donations from the Company are capped at $4,000 per fundraising event. The total charitable donations from this programme were $470,419 during the year ended 31 December 2023 (2022: $235,731). No contributions were made for political purposes during the year (2022: $nil).
Foreign exchange
The following foreign exchange rates have been used in the preparation of these financial statements:
| 2023 | 2022 | |||||||||||||||
| Average | Year end | Average | Year end | |||||||||||||
| rate | rate | rate | rate | |||||||||||||
| GBP / USD |
1.2438 | 1.2731 | 1.2372 | 1.2099 | ||||||||||||
| EUR / USD |
1.0816 | 1.1037 | 1.0538 | 1.0704 | ||||||||||||
Going concern
The Group’s business activities and financial position, the factors likely to affect its future development and performance, its objectives and policies in managing the financial risks to which it is exposed and its capital, are discussed in the Financial review. The Group’s regulatory capital resources, significant developments in 2023 and anticipated future developments are detailed in the liquidity and regulatory capital section on pages 22 and 23. This section also describes the Group’s funding and liquidity profile, including changes in key metrics and the build up of liquidity reserves. As detailed in note 3(e) of the accounting policies, it is concluded that the Group and Company have adequate resources to continue to operate for the foreseeable future and for at least twelve months from the date of signing of the statements of financial position and confirm that the Group and Company can operate as a going concern. It is for this reason that the Directors continue to prepare the financial statements on a going concern basis.
Events after the reporting period
Events since the statement of financial position date are disclosed in note 36.
Overseas branches
As at 31 December 2023, the Group had branches in Canada, Germany, Spain, Portugal, Italy, Dubai, Australia, Israel, Switzerland, Gibraltar and the U.S.
Financial risk management
Financial risk management objectives are included in the Strategic Report.
Future developments
Future developments are included in the Chief Executive Officer’s Review.
Research and development
The Group produces commodity research across energy, agricultural, base metals and ferrous metals markets, and has developed key partnerships in this field.
Engagement with employees
The Group places considerable value on the involvement of its employees and has continued to keep them informed on matters affecting them as employees and on the various factors affecting the performance of the Group and the Company. This is achieved through formal and informal meetings and the Group website. Further statements regarding actions taken by the Group during the financial year in regard to its employees are set out in the Strategic Report.
Disabled persons
Applications for employment by disabled persons are always fully considered, bearing in mind the respective aptitudes and abilities of the applicant concerned. In the event of members of staff becoming disabled, every effort is made to ensure that their employment with the Group continues and that appropriate training is arranged. It is the policy of the Group that the training, career development and promotion of a disabled person should, as far as possible, be identical to that of a person who does not suffer from a disability.
91
| Marex Group plc Annual Report 2023 | Strategic Report | Corporate Governance | Financial Statements | |||
|
|
|
|
|
|||
Group Directors’ Report (continued)
Suppliers, customers and others
In accordance with the Reporting on Payment Practices and Performance Regulations 2017, the Group submits biannual reports on payment practices and performance to the Department for Business, Energy and Industrial Strategy. Strong business relationships are essential for the Group and, for the key subsidiaries for which reporting is required, the average time taken to make payments under qualifying contracts was 22 days. Further statements regarding how the Directors have regard to the need to foster the Group’s relationships with suppliers, customers and others, and the effect of that regard on the principal decisions taken by the Company during the financial year are contained in the Strategic Report.
Streamlined energy carbon reporting
Streamlined energy carbon reporting is provided in the Sustainability section of the Strategic Report.
Corporate governance arrangements
In 2023, the Group followed The Wates Corporate Governance Principles for Large Private Companies and reporting against that framework is contained in the Corporate Governance Report.
Directors’ responsibilities statement
The Directors are responsible for preparing the Annual Report and Financial Statements in accordance with applicable law and regulations. Company law requires the Directors to prepare financial statements for each financial year. Under that law the Directors have elected to prepare the financial statements in accordance with International Financial Reporting Standards (‘IFRSs’) as issued by the International Accounting Standards Board (‘IASB’). In accordance with company law, the Directors must not approve the financial statements unless they are satisfied that they give a true and fair view of the state of affairs of the Group and Company and of the profit or loss of the Group and Company for that period.
In preparing these financial statements, International Accounting Standard (‘IAS’) 1 requires directors to:
| – | properly select and apply accounting policies; |
| – | present information, including accounting policies, in a manner that provides relevant, reliable, comparable and understandable information; |
| – | provide additional disclosures when compliance with the specific requirements in IFRSs is insufficient to enable users to understand the impact of particular transactions, other events and conditions on the Group and Company’s financial position and financial performance; and |
| – | make an assessment of the Group and Company’s ability to continue as a going concern. |
The Directors are responsible for keeping adequate accounting records that are sufficient to show and explain the Group and Company’s transactions and disclose with reasonable accuracy at any time the financial position of the Group and Company and enable them to ensure that the financial statements comply with the Companies Act 2006. They are also responsible for safeguarding the assets of the Group and Company and, hence, for taking reasonable steps for the prevention and detection of fraud and other irregularities.
The Directors are responsible for the maintenance and integrity of the corporate and financial information included on the Company’s website. Legislation in the United Kingdom governing the preparation and dissemination of financial statements may differ from legislation in other jurisdictions.
Auditor
The auditor, Deloitte LLP, has expressed its willingness to continue in office as auditor and a resolution to reappoint them will be proposed at the Company’s forthcoming Annual General Meeting.
Approved by the Board and signed on its behalf by:
I T Lowitt
Director
22 April 2024
92
| Financial Statements | ||||||
| 94 | ||||||
| 101 | ||||||
| 103 | ||||||
| Consolidated Statement of the Changes in Equity and Movements in Reserves |
105 | |||||
| 106 | ||||||
| 108 | ||||||
| 179 | ||||||
| Company Statement of the Changes in Equity and Movements in Reserves |
180 | |||||
| 181 | ||||||
| 182 | ||||||
| Marex Group plc Annual Report 2023 | Strategic Report | Corporate Governance | Financial Statements | |||
|
|
|
|
|
|||
Independent Auditor’s Report to the Members of Marex Group plc
Report on the audit of the financial statements
1. Opinion
In our opinion:
| – | the financial statements of Marex Group plc (the ‘Parent Company’) and its subsidiaries (the ‘Group’) give a true and fair view of the state of the Group’s and of the Parent Company’s affairs as at 31 December 2023 and of the Group’s profit for the year then ended; |
| – | the Group financial statements have been properly prepared in accordance with United Kingdom adopted international accounting standards and International Financial Reporting Standards (IFRSs) as issued by the International Accounting Standards Board (IASB); |
| – | the Parent Company financial statements have been properly prepared in accordance with United Kingdom adopted international accounting standards and as applied in accordance with the provisions of the Companies Act 2006; and |
| – | the financial statements have been prepared in accordance with the requirements of the Companies Act 2006. |
We have audited the financial statements which comprise:
| – | the consolidated income statement; |
| – | the consolidated statement of comprehensive income; |
| – | the consolidated and Company statement of financial position; |
| – | the consolidated and Company statement of changes in equity and movements in reserves; |
| – | the consolidated and Company statement of cash flows; and |
| – | the related notes 1 to 39 and A to J. |
The financial reporting framework that has been applied in the preparation of the Group financial statements is applicable law, United Kingdom adopted international accounting standards and IFRSs as issued by the IASB. The financial reporting framework that has been applied in the preparation of the Parent Company financial statements is applicable law and United Kingdom adopted international accounting standards and as applied in accordance with the provisions of the Companies Act 2006.
2. Basis for opinion
We conducted our audit in accordance with International Standards on Auditing (UK) (ISAs (UK)) and applicable law. Our responsibilities under those standards are further described in the auditor’s responsibilities for the audit of the financial statements section of our report.
We are independent of the Group and the Parent Company in accordance with the ethical requirements that are relevant to our audit of the financial statements in the UK, including the Financial Reporting Council’s (the ‘FRC’s’) Ethical Standard as applied to listed entities, and we have fulfilled our other ethical responsibilities in accordance with these requirements.
We believe that the audit evidence we have obtained is sufficient and appropriate to provide a basis for our opinion.
3. Summary of our audit approach
| Key audit matters |
The key audit matter that we identified in the current year was:
– Goodwill impairment – Volatility Performance Fund (‘VPF’) Cash Generating Unit (‘CGU’) |
|
| Materiality |
The materiality that we used for the Group financial statements was $10.0m which was determined on the basis of 5% of profit before tax. | |
| Scoping |
Our Group audit scope focused primarily on two subsidiaries subject to full scope audits and 24 subsidiaries subject to specified audit procedures. In aggregate, these subsidiaries represent 98% of the Group’s total assets, 99% of the Group’s total liabilities, 91% of the Group’s revenue and 80% of the Group’s expenses. | |
| Significant changes in our approach |
Following the group legal entity reorganisation we have concluded that two subsidiaries are in scope for full scope audits, a decrease from prior year. We have increased the number of subsidiaries subject to specified audit procedures. In the previous year we have determined our materiality on the basis of normalised profit before tax. In the current year, materiality was determined on the basis of profit before tax. We no longer consider ‘Accounting for acquisitions’ a key audit matter due to lack of complexity or judgement within current year acquisitions. | |
4. Conclusions relating to going concern
In auditing the financial statements, we have concluded that the directors’ use of the going concern basis of accounting in the preparation of the financial statements is appropriate.
Our evaluation of the directors’ assessment of the Group’s and Parent Company’s ability to continue to adopt the going concern basis of accounting included:
| – | using our knowledge of the Group and Parent company, the financial services industry, the financial services regulatory environment and the general economic environment, including macro-economic pressures affecting the Group’s operations, to identify inherent risks in the business model and how such risks might affect the financial resources or ability to continue operations over the going concern period; |
| – | making inquiries of Group management about the assumptions, used in their going concern models, and assessing the reasonableness of those assumptions and historical forecasting accuracy; |
94
| Marex Group plc Annual Report 2023 | Strategic Report | Corporate Governance | Financial Statements | |||
|
|
|
|
|
|||
Independent Auditor’s Report to the Members of Marex Group plc (continued)
| – | evaluating the Group’s strategic plans in light of the changing macro-economic environment, short and longer term financial budgets, funding, and funding plans, and involving our regulatory specialist to assess liquidity and capital adequacy plans including internal stress tests; |
| – | evaluating the Group’s operational resilience by inspecting the crisis management and business continuity plans in place and the Group’s readiness to respond to catastrophic events; |
| – | reviewing regulatory correspondence to assess whether there are any matters that may impact the going concern assessment; and |
| – | evaluating the Group’s disclosures on going concern against the requirements of IAS 1, Presentation of Financial Statements. |
Based on the work we have performed, we have not identified any material uncertainties relating to events or conditions that, individually or collectively, may cast significant doubt on the Group’s and Parent Company’s ability to continue as a going concern for a period of at least twelve months from when the financial statements are authorised for issue.
Our responsibilities and the responsibilities of the directors with respect to going concern are described in the relevant sections of this report.
5. Key audit matters
Key audit matters are those matters that, in our professional judgement, were of most significance in our audit of the financial statements of the current period and include the most significant assessed risks of material misstatement (whether or not due to fraud) that we identified. These matters included those which had the greatest effect on: the overall audit strategy; the allocation of resources in the audit; and directing the efforts of the engagement team.
These matters were addressed in the context of our audit of the financial statements as a whole, and in forming our opinion thereon, and we do not provide a separate opinion on these matters.
5.1 Goodwill impairment – Volatility Performance Fund (‘VPF’) cash generating unit (‘CGU’)
| Key audit matter description |
As required by IAS 36 Impairment of Assets, goodwill is reviewed for impairment at least annually. The Group performed its annual impairment test as at 1 October 2023. Determining whether goodwill is impaired requires an estimation of the recoverable amount of the respective CGU, using the higher of the value in use or fair value less costs to sell, which requires management to make significant estimates and assumptions related to the revenue growth rate, costs growth rate, long-term growth rate and discount rate assumptions. Changes to these assumptions could have a significant impact on the fair value, value in use or the amount of any goodwill impairment charge. Based on the value in use of which the carrying value exceeded the recoverable amount, an impairment of $10.7m was recognised on the VPF CGU.
We identified goodwill impairment for the VPF CGU as a key audit matter because of the significant estimates and assumptions management makes to estimate the recoverable amount of the VPF CGU and the difference between the recoverable amount and the carrying value. This required a high degree of auditor judgment and an increased extent of effort, including the involvement of our valuation specialists, when performing audit procedures to evaluate the reasonableness of management’s estimates and assumptions related to the revenue growth rate, costs growth rate, long-term growth rate and discount rate. |
|
| How the scope of our audit responded to the key audit matter |
We performed the following audit procedures, amongst others, related to the revenue growth rates, cost growth rate, long-term growth rate, and discount rates used by management to estimate the recoverable amount of the VPF CGU:
– We evaluated management’s ability to accurately forecast revenue growth rates and costs growth rates by performing a look-back analysis and comparing actual results to management’s historical forecasts;
– We evaluated the reasonableness of management’s forecast revenue growth rates and costs growth rates by comparing the forecasts to:
– Historical revenues and costs;
– Internal communications to management and the Board of Directors; and
– Forecast information included in external communications of certain peer companies.
With the assistance of our valuation specialists, we evaluated the reasonableness of the long-term growth rate and discount rate by:
– Testing the source information underlying the determination of the long-term growth rate and discount rate and the mathematical accuracy of the calculation; and
– Developing a range of independent estimates and comparing those to the long-term growth rate and discount rate selected by management.
– Considered whether events or transactions that occurred after the balance sheet date, but before the reporting date, affect the conclusions reached on the carrying values of the assets and associated disclosures. |
|
| Key observations |
We concur with management’s conclusion to recognise a $10.7m impairment with respect to the VPF CGU and concluded that the disclosures are reasonable. | |
95
| Marex Group plc Annual Report 2023 | Strategic Report | Corporate Governance | Financial Statements | |||
|
|
|
|
|
|||
Independent Auditor’s Report to the Members of Marex Group plc (continued)
6. Our application of materiality
6.1 Materiality
We define materiality as the magnitude of misstatement in the financial statements that makes it probable that the economic decisions of a reasonably knowledgeable person would be changed or influenced. We use materiality both in planning the scope of our audit work and in evaluating the results of our work.
Based on our professional judgement, we determined materiality for the financial statements as a whole as follows:
| Group financial statements | Parent Company financial statements | |||
| Materiality |
$10.0m (2022: $5.7m) | $6m (2022: $2.9m) | ||
| Basis for determining materiality |
5% of profit before tax (2022: 5% of the normalised profit before tax) | 3% of net assets | ||
| Rationale for the benchmark applied |
In determining the Group materiality, we considered a number of factors, including the needs and interests of the users of the Group financial statements. Profit before tax is considered to be the key metric for the users of the financial statements. | Parent Company materiality equates to 3% of net assets, which is capped at 60% of the Group’s materiality (2022: 50% of Group’s materiality). | ||
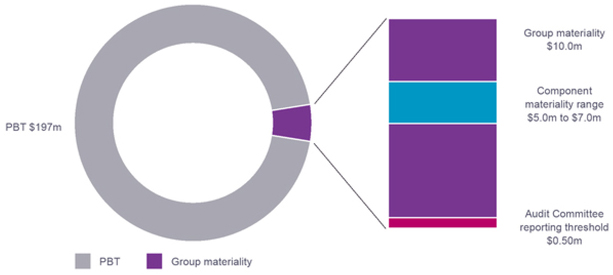
96
| Marex Group plc Annual Report 2023 | Strategic Report | Corporate Governance | Financial Statements | |||
|
|
|
|
|
|||
Independent Auditor’s Report to the Members of Marex Group plc (continued)
6.2 Performance materiality
We set performance materiality at a level lower than materiality to reduce the probability that, in aggregate, uncorrected and undetected misstatements exceed the materiality for the financial statements as a whole.
| Group financial statements | Parent Company financial statements | |||
| Performance materiality |
65% (2022: 70%) of Group materiality | 65% (2022: 70%) of Parent Company materiality | ||
| Basis and rationale for determining performance materiality |
In determining performance materiality, we considered the following factors:
– The quality of the control environment and whether we were able to rely on controls;
– Degree of centralisation and commonality of controls and processes;
– The nature, volume and size of uncorrected misstatements arising in the previous audit; and management’s willingness to correct misstatements in the current period. |
|||
6.3 Error reporting threshold
We agreed with the Audit Committee that we would report to the Committee all audit differences in excess of $500k (2022: $287k), for Group and $300k (2022: $144k) for Parent Company, as well as differences below that threshold that, in our view, warranted reporting on qualitative grounds. We also report to the Audit Committee on disclosure matters that we identified when assessing the overall presentation of the financial statements.
7. An overview of the scope of our audit
7.1 Identification and scoping of components
Our Group audit scope focused primarily on 2 locations, the UK and the USA (2022: 2 locations, the UK and the USA) with 2 subsidiaries (2022: 14 subsidiaries) subject to full scope audits and 24 subsidiaries (2022: 19 subsidiaries) subject to specified audit procedures. In aggregate, these subsidiaries represent the principal business units within each of the Group’s operating segments. This change reflects the reorganisation of the group’s legal entities.
These subsidiaries account for 98% (2022: 99%) of the Group’s total assets, 99% (2022: 99%) of the Group’s total liabilities, 91% (2022: 99%) of the Group’s revenue and 80% (2022: 99%) of the Group’s expenses.
The subsidiaries were selected based on their quantitative contribution to the Group and qualitative risk factors. Our audits of each of the subsidiaries were performed using lower levels of materiality based on their size relative to the Group. The materiality for each subsidiary audit ranged from $5.0m to $7.0m (2022: $1.6m to $3.6m). We tested the Group’s consolidation process and carried out analytical procedures to confirm that there were no significant risks of material misstatement in the aggregated financial information of the remaining subsidiaries not subject to full scope audits or specified audit procedures.
7.2 Our consideration of the control environment
We obtained an understanding of relevant business controls. The Group uses a number of different IT systems across components, and we worked with our IT specialists to test the General IT controls for relevant systems. We relied on controls in limited areas and further improvements are required in order for us to adopt a wider controls-reliant approach across the Group.
7.3 Our consideration of climate-related risks
In planning our audit, we have considered the potential impact of climate change on the Group’s business and its financial statements. The Group continues to develop its assessment of and response to the potential impacts of environmental, social and governance (‘ESG’) related risks, including climate change, as outlined in the Strategic Report starting on page 41 (Sustainability section).
We held discussions with management to understand the process for identifying climate-related risks, the consideration of mitigating actions and the impact on the Group’s financial statements which can be found in the Climate-related Financial Disclosures Statement section of the Strategic report. Management do not expect any material climate change related financial impact on their business. We performed our own qualitative risk assessment of the potential impact of climate change on the Group’s account balances and classes of transactions based on our understanding of the nature of the Group’s underlying operations through inquiries of management and review of the minutes and regulatory correspondence.
We read the climate-related disclosures included in the Strategic report section in the annual report and considered whether they are materially consistent with the financial statements and our knowledge obtained in the audit.
7.4 Working with other auditors
The Group audit team maintained dialogue with all component auditors in the UK and the USA, throughout all phases of the audit and received written reports from component auditors setting out the results of their audit procedures. Physical and virtual site visits were undertaken by the Senior Statutory Auditor that involved discussing and challenging the audit approach with the component teams and any findings arising from their work, meeting with local management, attending planning and closing meetings and reviewing relevant audit working papers on risk areas.
The Group engagement team interacted regularly with the component teams during various stages of the audit and were responsible for the scope and direction of the audit process. The Group audit team performed a remote file review of the work performed by all component auditors.
97
| Marex Group plc Annual Report 2023 | Strategic Report | Corporate Governance | Financial Statements | |||
|
|
|
|
|
|||
Independent Auditor’s Report to the Members of Marex Group plc (continued)
8. Other information
The other information comprises the information included in the annual report including the Strategic report, Corporate governance section and Directors’ report other than the financial statements and our auditor’s report thereon. The directors are responsible for the other information contained within the annual report.
Our opinion on the financial statements does not cover the other information and, except to the extent otherwise explicitly stated in our report, we do not express any form of assurance conclusion thereon.
Our responsibility is to read the other information and, in doing so, consider whether the other information is materially inconsistent with the financial statements or our knowledge obtained in the course of the audit, or otherwise appears to be materially misstated.
If we identify such material inconsistencies or apparent material misstatements, we are required to determine whether this gives rise to a material misstatement in the financial statements themselves. If, based on the work we have performed, we conclude that there is a material misstatement of this other information, we are required to report that fact.
We have nothing to report in this regard.
9. Responsibilities of directors
As explained more fully in the directors’ responsibilities statement, the directors are responsible for the preparation of the financial statements and for being satisfied that they give a true and fair view, and for such internal control as the directors determine is necessary to enable the preparation of financial statements that are free from material misstatement, whether due to fraud or error.
In preparing the financial statements, the directors are responsible for assessing the Group’s and the Parent Company’s ability to continue as a going concern, disclosing as applicable, matters related to going concern and using the going concern basis of accounting unless the directors either intend to liquidate the Group or the Parent Company or to cease operations, or have no realistic alternative but to do so.
10. Auditor’s responsibilities for the audit of the financial statements
Our objectives are to obtain reasonable assurance about whether the financial statements as a whole are free from material misstatement, whether due to fraud or error, and to issue an auditor’s report that includes our opinion. Reasonable assurance is a high level of assurance, but is not a guarantee that an audit conducted in accordance with ISAs (UK) will always detect a material misstatement when it exists. Misstatements can arise from fraud or error and are considered material if, individually or in the aggregate, they could reasonably be expected to influence the economic decisions of users taken on the basis of these financial statements.
A further description of our responsibilities for the audit of the financial statements is located on the FRC’s website at: www.frc.org.uk/auditorsresponsibilities. This description forms part of our auditor’s report.
11. Extent to which the audit was considered capable of detecting irregularities, including fraud
Irregularities, including fraud, are instances of non-compliance with laws and regulations. We design procedures in line with our responsibilities, outlined above, to detect material misstatements in respect of irregularities, including fraud. The extent to which our procedures are capable of detecting irregularities, including fraud is detailed below.
11.1 Identifying and assessing potential risks related to irregularities
In identifying and assessing risks of material misstatement in respect of irregularities, including fraud and non-compliance with laws and regulations, we considered the following:
| – | The nature of the industry and sector, control environment and business performance including the design of the Group’s remuneration policies, key drivers for directors’ remuneration, bonus levels and performance targets; |
| – | Results of our enquiries of the directors, management, internal audit and the audit committee about their own identification and assessment of the risks of irregularities including those that are specific to the group’s sector; |
| – | Any matters we identified having obtained and reviewed the Group’s documentation of their policies and procedures relating to: |
| – | identifying, evaluating and complying with laws and regulations and whether they were aware of any instances of non-compliance; |
| – | detecting and responding to the risks of fraud and whether they have knowledge of any actual, suspected or alleged fraud; |
| – | the internal controls established to mitigate risks of fraud or non-compliance with laws and regulations; |
| – | The matters discussed among the audit engagement team including significant component audit teams and relevant internal specialists, including fraud, regulatory, tax, financial instruments, valuations and IT specialists regarding how and where fraud might occur in the financial statements and any potential indicators of fraud. |
As a result of these procedures, we considered the opportunities and incentives that may exist within the organisation for fraud and identified the greatest potential for fraud in the impairment of goodwill of the VPF CGU. In common with all audits under ISAs (UK), we are also required to perform specific procedures to respond to the risk of management override.
We also obtained an understanding of the legal and regulatory frameworks that the Group operates in, focusing on provisions of those laws and regulations that had a direct effect on the determination of material amounts and disclosures in the financial statements. The key laws and regulations we considered in this context included the UK Companies Act, FCA regulations, and tax legislation.
In addition, we considered provisions of other laws and regulations that do not have a direct effect on the financial statements but compliance with which may be fundamental to the Group’s ability to operate or to avoid a material penalty.
98
| Marex Group plc Annual Report 2023 | Strategic Report | Corporate Governance | Financial Statements | |||
|
|
|
|
|
|||
Independent Auditor’s Report to the Members of Marex Group plc (continued)
11.2 Audit response to risks identified
As a result of performing the above, we identified Goodwill impairment – VPF CGU as a key audit matter related to the potential risk of fraud. The key audit matters section of our report explains the matter in more detail and also describes the specific procedures we performed in response to that key audit matter.
In addition to the above, our procedures to respond to risks identified included the following:
| – | Reviewing the financial statement disclosures and testing to supporting documentation to assess compliance with provisions of relevant laws and regulations described as having a direct effect on the financial statements; |
| – | Enquiring of management, the audit committee and in-house and external legal counsel concerning actual and potential litigation and claims; |
| – | Performing analytical procedures to identify any unusual or unexpected relationships that may indicate risks of material misstatement due to fraud; |
| – | Reading minutes of meetings of those charged with governance, reviewing internal audit reports and reviewing correspondence with HMRC and regulators, including the FCA; and |
| – | In addressing the risk of fraud through management override of controls, testing the appropriateness of journal entries and other adjustments; assessing whether the judgements made in making accounting estimates are indicative of a potential bias; and evaluating the business rationale of any significant transactions that are unusual or outside the normal course of business. |
We also communicated relevant identified laws and regulations and potential fraud risks to all engagement team members including internal specialists and significant component audit teams, and remained alert to any indications of fraud or non-compliance with laws and regulations throughout the audit.
99
| Marex Group plc Annual Report 2023 | Strategic Report | Corporate Governance | Financial Statements | |||
|
|
|
|
|
|||
Independent Auditor’s Report to the Members of Marex Group plc (continued)
Report on other legal and regulatory requirements
12. Opinions on other matters prescribed by the Companies Act 2006
In our opinion, based on the work undertaken in the course of the audit:
| – | the information given in the Strategic report and the Directors’ report for the financial year for which the financial statements are prepared is consistent with the financial statements; and |
| – | the Strategic report and the Directors’ report have been prepared in accordance with applicable legal requirements. |
In the light of the knowledge and understanding of the Group and the Parent Company and their environment obtained in the course of the audit, we have not identified any material misstatements in the Strategic report or the Directors’ report.
13. Matters on which we are required to report by exception
13.1 Adequacy of explanations received and accounting records
Under the Companies Act 2006 we are required to report to you if, in our opinion:
| – | we have not received all the information and explanations we require for our audit; or |
| – | adequate accounting records have not been kept by the Parent Company, or returns adequate for our audit have not been received from branches not visited by us; or |
| – | the Parent Company financial statements are not in agreement with the accounting records and returns. |
We have nothing to report in respect of these matters.
13.2 Directors’ remuneration
Under the Companies Act 2006 we are also required to report if in our opinion certain disclosures of directors’ remuneration have not been made.
We have nothing to report in respect of this matter.
14. Use of our report
This report is made solely to the Company’s members, as a body, in accordance with Chapter 3 of Part 16 of the Companies Act 2006. Our audit work has been undertaken so that we might state to the Company’s members those matters we are required to state to them in an auditor’s report and for no other purpose. To the fullest extent permitted by law, we do not accept or assume responsibility to anyone other than the Company and the Company’s members as a body, for our audit work, for this report, or for the opinions we have formed.
David Roberts, FCA (Senior statutory auditor)
For and on behalf of Deloitte LLP
London, United Kingdom
22 April 2024
100
| Marex Group plc Annual Report 2023 | Strategic Report | Corporate Governance | Financial Statements | |||
|
|
|
|
|
|||
For the Year Ended 31 December 2023
| 2023 | 2022 | |||||||||||
| Notes | $m | $m | ||||||||||
| Restated | ||||||||||||
| Commission and fee income |
1,342.4 | 651.0 | ||||||||||
| Commission and fee expense |
(637.5 | ) | (299.2 | ) | ||||||||
| Net commission income |
5 | 704.9 | 351.8 | |||||||||
| Net trading income |
5 | 411.4 | 325.3 | |||||||||
| Interest income |
8 | 591.8 | 194.4 | |||||||||
| Interest expense |
8 | (470.2 | ) | (165.0 | ) | |||||||
| Net interest income |
8 | 121.6 | 29.4 | |||||||||
| Net physical commodities income |
5 | 6.7 | 4.6 | |||||||||
| Revenue |
5 | 1,244.6 | 711.1 | |||||||||
| Expenses: |
||||||||||||
| Compensation and benefits |
9 | (770.3 | ) | (438.6 | ) | |||||||
| Depreciation and amortisation |
14, 15 | (27.1 | ) | (13.8 | ) | |||||||
| Other expenses |
10 | (237.4 | ) | (147.8 | ) | |||||||
| Impairment of goodwill |
13 | (10.7 | ) | (53.9 | ) | |||||||
| Provision for credit losses |
(7.1 | ) | (9.5 | ) | ||||||||
| Bargain purchase gain on acquisitions |
18 | 0.3 | 71.6 | |||||||||
| Other income |
3.4 | 2.8 | ||||||||||
| Share of results in associates and joint ventures |
0.8 | (0.3 | ) | |||||||||
| Profit before tax |
196.5 | 121.6 | ||||||||||
| Tax |
11 | (55.2 | ) | (23.4 | ) | |||||||
| Profit after tax |
141.3 | 98.2 | ||||||||||
| Attributable to: |
||||||||||||
| Ordinary shareholders of the Company |
128.0 | 91.6 | ||||||||||
| Other equity holders¹ |
13.3 | 6.6 | ||||||||||
| Earnings per share |
||||||||||||
| Basic (dollars per share) |
35 | 1.17 | 0.84 | |||||||||
| Diluted (dollars per share) |
35 | 1.09 | 0.80 | |||||||||
| 1. | Other equity holders relate to holders of AT1 securities. |
The notes on pages 108 to 187 form part of these financial statements. Refer to note 3(c) and note 39 for the 2022 Group balances that have been restated.
101
| Marex Group plc Annual Report 2023 | Strategic Report | Corporate Governance | Financial Statements | |||
|
|
|
|
|
|||
Consolidated Statement of Other Comprehensive Income
For the Year Ended 31 December 2023
| 2023 | 2022 | |||||||||||
| Notes | $m | $m | ||||||||||
| Restated | ||||||||||||
| Profit after tax |
141.3 | 98.2 | ||||||||||
| Other comprehensive income |
||||||||||||
| Items that may be reclassified subsequently to profit and loss: |
||||||||||||
| Gain on cash flow hedge reserve |
1.2 | 2.7 | ||||||||||
| Deferred tax on cash flow hedge reserve |
11(a) | (0.3 | ) | (0.5 | ) | |||||||
| Currency translation adjustments |
1.8 | — | ||||||||||
| Items that will not be recycled to profit and loss: |
||||||||||||
| Change in fair value of financial liabilities designated at FVTPL due to own credit risk |
(6.4 | ) | (4.0 | ) | ||||||||
| Deferred tax on change in fair value of financial liabilities designated at FVTPL due to own credit risk |
11(a) | 1.7 | 1.2 | |||||||||
| Loss on revaluation of investments |
16 | — | (0.6 | ) | ||||||||
| Deferred tax on revaluation of investments |
11(a) | (0.3 | ) | 0.3 | ||||||||
| Other comprehensive loss, net of tax |
(2.3 | ) | (0.9 | ) | ||||||||
| Total comprehensive income |
139.0 | 97.3 | ||||||||||
| Attributable to: |
||||||||||||
| Ordinary shareholders of the Company |
125.7 | 90.7 | ||||||||||
| Other equity holders |
13.3 | 6.6 | ||||||||||
All operations are continuing for the current and prior year.
The notes on pages 108 to 187 form part of these financial statements. Refer to note 3(c) and note 39 for the 2022 Group balances that have been restated.
102
| Marex Group plc Annual Report 2023 | Strategic Report | Corporate Governance | Financial Statements | |||
|
|
|
|
|
|||
Consolidated Statement of Financial Position
As at 31 December 2023
| Registration Number 05613060 |
31 December
2023 |
31 December
2022 |
1 December
2022 |
|||||||||||||
| Notes | $m | $m | $m | |||||||||||||
| Restated | Restated | |||||||||||||||
| Assets |
||||||||||||||||
| Non-current assets |
||||||||||||||||
| Goodwill |
13 | 163.6 | 155.5 | 208.9 | ||||||||||||
| Intangible assets |
14 | 56.0 | 25.6 | 17.5 | ||||||||||||
| Property, plant and equipment |
15 | 16.6 | 11.8 | 7.9 | ||||||||||||
| Right-of-use asset |
32 | 40.6 | 33.7 | 17.0 | ||||||||||||
| Investments |
16 | 16.2 | 16.4 | 8.9 | ||||||||||||
| Investment in associate |
17 | — | 5.6 | 5.9 | ||||||||||||
| Deferred tax |
24 | 21.4 | 7.6 | 4.0 | ||||||||||||
| Treasury instruments (unpledged) |
19(a) | 60.8 | — | 69.0 | ||||||||||||
| Treasury instruments (pledged as collateral) |
19(b) | 300.4 | 133.5 | 799.7 | ||||||||||||
| Financial institution notes |
— | — | 1.0 | |||||||||||||
| Total non-current assets |
675.6 | 389.7 | 1,139.8 | |||||||||||||
| Current assets |
||||||||||||||||
| Corporate income tax receivable |
0.1 | 5.5 | 10.3 | |||||||||||||
| Trade and other receivables |
21 | 4,789.8 | 4,685.2 | 2,018.8 | ||||||||||||
| Inventory |
20 | 163.4 | 35.8 | 80.1 | ||||||||||||
| Equity instruments |
33(b) | 1,521.3 | 410.0 | 8.1 | ||||||||||||
| Derivative instruments |
23 | 794.1 | 480.8 | 496.5 | ||||||||||||
| Stock borrowing |
33(b) | 2,501.4 | 1,894.6 | — | ||||||||||||
| Treasury instruments (unpledged) |
19(a) | 558.5 | 247.6 | 38.2 | ||||||||||||
| Treasury instruments (pledged as collateral) |
19(b) | 2,062.6 | 2,338.6 | 616.5 | ||||||||||||
| Reverse repurchase agreements |
19(d) | 3,199.8 | 4,346.0 | 144.3 | ||||||||||||
| Cash and cash equivalents |
1,483.5 | 910.1 | 712.0 | |||||||||||||
| Total current assets |
17,074.5 | 15,354.2 | 4,124.8 | |||||||||||||
| Total assets |
17,750.1 | 15,743.9 | 5,264.6 | |||||||||||||
The notes on pages 108 to 187 form part of these financial statements. Refer to note 3(c) and note 39 for the 2022 Group balances that have been restated.
103
| Marex Group plc Annual Report 2023 | Strategic Report | Corporate Governance | Financial Statements | |||
|
|
|
|
|
|||
Consolidated Statement of Financial Position (continued)
As at 31 December 2023
Registration Number 05613060
| 31 December
2023 |
31 December
2022 |
1 December
2022 |
||||||||||||||
| Notes | $m | $m | $m | |||||||||||||
| Restated | Restated | |||||||||||||||
| Liabilities |
||||||||||||||||
| Current liabilities |
||||||||||||||||
| Repurchase agreements |
19(d) | 3,118.9 | 4,381.4 | 140.4 | ||||||||||||
| Trade and other payables |
25 | 6,785.9 | 6,647.6 | 3,291.2 | ||||||||||||
| Stock lending |
33(b) | 2,323.3 | 1,396.9 | — | ||||||||||||
| Short securities |
33(b) | 1,924.8 | 986.8 | — | ||||||||||||
| Short-term borrowings |
22(a)(b)(c) | — | 12.9 | — | ||||||||||||
| Lease liability |
32 | 13.2 | 6.8 | 6.0 | ||||||||||||
| Derivative instruments |
23 | 540.7 | 294.3 | 199.4 | ||||||||||||
| Corporation tax |
7.6 | 8.9 | 2.1 | |||||||||||||
| Debt securities |
33(b) | 1,308.4 | 823.7 | 990.1 | ||||||||||||
| Provisions |
26 | 0.4 | 2.6 | 0.9 | ||||||||||||
| Total current liabilities |
16,023.2 | 14,561.9 | 4,630.1 | |||||||||||||
| Non-current liabilities |
||||||||||||||||
| Lease liability |
32 | 39.4 | 32.1 | 17.0 | ||||||||||||
| Long-term borrowings |
22(a)(b)(c) | — | 135.8 | — | ||||||||||||
| Debt securities |
33(b) | 907.9 | 336.3 | 136.6 | ||||||||||||
| Deferred tax liability |
24 | 3.7 | 0.1 | 3.2 | ||||||||||||
| Total non-current liabilities |
951.0 | 504.3 | 156.8 | |||||||||||||
| Total liabilities |
16,974.2 | 15,066.2 | 4,786.9 | |||||||||||||
| Total net assets |
775.9 | 677.7 | 477.7 | |||||||||||||
| Equity |
||||||||||||||||
| Share capital |
28 | 0.1 | 0.1 | 0.1 | ||||||||||||
| Share premium |
134.3 | 134.3 | 134.3 | |||||||||||||
| Additional Tier 1 capital (AT1) |
30 | 97.6 | 97.6 | — | ||||||||||||
| Retained earnings |
555.3 | 455.3 | 346.6 | |||||||||||||
| Own shares |
29 | (9.8 | ) | (7.9 | ) | — | ||||||||||
| Other reserves |
31 | (1.6 | ) | (1.7 | ) | (3.3 | ) | |||||||||
| Total equity |
775.9 | 677.7 | 477.7 | |||||||||||||
The notes on pages 108 to 187 form part of these financial statements. Refer to notes 3(c) and 39 for the 2022 Group balances that have been restated.
The financial statements on pages 101 to 187 were approved and authorised for issue by the Board of Directors on 22 April 2024 and are signed on its behalf by:
I T Lowitt
Director
22 April 2024
104
| Marex Group plc Annual Report 2023 | Strategic Report | Corporate Governance | Financial Statements | |||
|
|
|
|
|
|||
Consolidated Statement of the Changes in Equity and Movements in Reserves
For the Year Ended 31 December 2023
| Share capital |
Share premium |
Additional (AT1) capital |
Retained earnings |
Own shares |
Other reserves |
Total | ||||||||||||||||||||||
| $m | $m | $m | $m | $m | $m | $m | ||||||||||||||||||||||
| At 1 January 2022 |
0.1 | 134.3 | — | 346.6 | — | (3.3 | ) | 477.7 | ||||||||||||||||||||
| Profit for the period |
— | — | 6.6 | 91.6 | — | — | 98.2 | |||||||||||||||||||||
| Gain on cash flow hedge |
— | — | — | — | 2.7 | 2.7 | ||||||||||||||||||||||
| Deferred tax on cash flow hedge |
— | — | — | — | — | (0.5 | ) | (0.5 | ) | |||||||||||||||||||
| Change in fair value due to own credit risk |
— | — | — | — | — | (4.0 | ) | (4.0 | ) | |||||||||||||||||||
| Deferred tax on change in fair value of financial liabilities designated at FVTPL due to own credit risk |
— | — | — | — | — | 1.2 | 1.2 | |||||||||||||||||||||
| Loss on revaluation of investments |
— | — | — | — | — | (0.6 | ) | (0.6 | ) | |||||||||||||||||||
|
Deferred tax on revaluation of investments |
— | — | — | — | — | 0.3 | 0.3 | |||||||||||||||||||||
| Total comprehensive income for the period |
— | — | 6.6 | 91.6 | — | (0.9 | ) | 97.3 | ||||||||||||||||||||
| Additional (AT1) capital |
— | — | 97.6 | — | — | — | 97.6 | |||||||||||||||||||||
| AT1 dividends paid |
— | — | (6.6 | ) | — | — | — | (6.6 | ) | |||||||||||||||||||
| Repurchase of own shares |
— | — | — | — | (7.9 | ) | — | (7.9 | ) | |||||||||||||||||||
| Share-based payments |
— | — | — | 17.8 | — | — | 17.8 | |||||||||||||||||||||
| Other movements |
— | — | — | (0.7 | ) | — | 2.5 | 1.8 | ||||||||||||||||||||
| At 31 December 2022 and 1 January 2023 |
0.1 | 134.3 | 97.6 | 455.3 | (7.9 | ) | (1.7 | ) | 677.7 | |||||||||||||||||||
| Profit for the period |
— | — | 13.3 | 128.0 | — | — | 141.3 | |||||||||||||||||||||
| Gain on cash flow hedge |
— | — | — | — | — | 1.2 | 1.2 | |||||||||||||||||||||
| Deferred tax on cash flow hedge |
— | — | — | — | — | (0.3 | ) | (0.3 | ) | |||||||||||||||||||
| Change in fair value due to own credit risk |
— | — | — | — | — | (6.4 | ) | (6.4 | ) | |||||||||||||||||||
| Deferred tax on change in fair value of financial liabilities designated at FVTPL due to own credit risk |
— | — | — | — | — | 1.7 | 1.7 | |||||||||||||||||||||
| Deferred tax on revaluation of investments |
— | — | — | — | — | (0.3 | ) | (0.3 | ) | |||||||||||||||||||
|
Currency translations adjustments |
— | — | — | — | — | 1.8 | 1.8 | |||||||||||||||||||||
| Total comprehensive income for the period |
— | — | 13.3 | 128.0 | — | (2.3 | ) | 139.0 | ||||||||||||||||||||
| AT1 dividends paid |
— | — | (13.3 | ) | — | — | — | (13.3 | ) | |||||||||||||||||||
| Ordinary dividends paid |
— | — | — | (45.0 | ) | — | — | (45.0 | ) | |||||||||||||||||||
| Repurchase of own shares |
— | — | — | — | (3.1 | ) | — | (3.1 | ) | |||||||||||||||||||
| Share-based payments |
— | — | — | 20.3 | — | — | 20.3 | |||||||||||||||||||||
| Deferred tax on share-based payments |
— | — | — | — | — | 2.4 | 2.4 | |||||||||||||||||||||
| Share settlement (share-based payments) |
— | — | — | (1.2 | ) | 1.2 | — | — | ||||||||||||||||||||
| Other movements |
— | — | — | (2.1 | ) | — | — | (2.1 | ) | |||||||||||||||||||
| At 31 December 2023 |
0.1 | 134.3 | 97.6 | 555.3 | (9.8 | ) | (1.6 | ) | 775.9 | |||||||||||||||||||
105
| Marex Group plc Annual Report 2023 | Strategic Report | Corporate Governance | Financial Statements | |||
|
|
|
|
|
|||
Consolidated Statement of Cash Flows
For the Year Ended 31 December 2023
| 2023 | 2022 | |||||||||||
| Notes | $m | $m | ||||||||||
| Restated | ||||||||||||
| Profit before tax |
196.5 | 121.6 | ||||||||||
| Adjustments for: |
||||||||||||
| Amortisation of intangible assets |
14 | 6.7 | 5.5 | |||||||||
| Loss on disposal of intangibles |
14 | 0.1 | 0.6 | |||||||||
| Depreciation of property, plant and equipment |
15 | 5.5 | 2.8 | |||||||||
| Depreciation of right-of-use asset |
32 | 9.7 | 5.5 | |||||||||
| Impairment of right-of-use asset |
32 | 5.2 | — | |||||||||
| Bargain purchase gain on acquisitions |
18 | (0.3 | ) | (71.6 | ) | |||||||
| Impairment of goodwill |
13 | 10.7 | 53.9 | |||||||||
| (Decrease) / increase in provisions |
26 | (2.2 | ) | 1.7 | ||||||||
| Provision for credit losses |
7.1 | 9.5 | ||||||||||
| Share of results in associates and joint ventures |
17 | (0.8 | ) | 0.3 | ||||||||
| Lease liability foreign exchange revaluation |
32 | (0.1 | ) | (1.3 | ) | |||||||
| Movement in fair value of derivative instruments |
(66.9 | ) | 111.1 | |||||||||
| Other revaluations |
(9.1 | ) | 9.3 | |||||||||
| Other non-cash movements |
(0.5 | ) | — | |||||||||
| Share-based compensation expense |
9 | 20.3 | 16.7 | |||||||||
| Operating cash flow before changes in working capital |
181.9 | 265.6 | ||||||||||
| Working capital adjustments: |
||||||||||||
| Decrease in trade and other receivables |
777.6 | 3,141.1 | ||||||||||
| Increase in trade and other payables |
(709.5 | ) | (2,873.8 | ) | ||||||||
| Increase in treasury instruments |
(262.6 | ) | (494.0 | ) | ||||||||
| Increase in equity instruments |
(173.3 | ) | (402.3 | ) | ||||||||
| Increase in debt securities2 |
1,049.8 | 83.3 | ||||||||||
| Increase in financial institution notes |
— | 1.0 | ||||||||||
| Net repayment of borrowings |
(148.7 | ) | (49.9 | ) | ||||||||
| (Decrease) / increase in inventory |
(127.6 | ) | 44.3 | |||||||||
| (Decrease) / increase in net repurchase agreements |
(116.3 | ) | 39.2 | |||||||||
| Increase in net stock borrowing and lending |
319.6 | 489.1 | ||||||||||
| Cash flow from operating activities |
790.9 | 243.6 | ||||||||||
| Corporation tax paid |
(55.9 | ) | (18.0 | ) | ||||||||
| Net cash flow from operating activities |
735.0 | 225.6 | ||||||||||
During 2023, interest received was $595.0m (2022: $159.2m), interest paid was $470.2m (2022: $161.1m) and dividends received were $nil (2022: $nil).
The notes on pages 108 to 187 form part of these financial statements. Refer to notes 3(c) and 39 for 2022 Group balances that have been restated.
106
| Marex Group plc Annual Report 2023 | Strategic Report | Corporate Governance | Financial Statements | |||
|
|
|
|
|
|||
Consolidated Statement of Cash Flows (continued)
For the Year Ended 31 December 2023
| 2023 | 2022 | |||||||||||
| Notes | $m | $m | ||||||||||
| Restated | ||||||||||||
| Investing activities |
||||||||||||
| Redemption of investment in associate |
17 | 6.4 | — | |||||||||
| Acquisition of businesses, net of cash acquired |
18 | (90.3 | ) | (36.9 | ) | |||||||
| Payment of contingent consideration |
(1.6 | ) | — | |||||||||
| Purchase of intangible assets |
14 | (3.1 | ) | (5.8 | ) | |||||||
| Purchase of property, plant and equipment |
15 | (9.0 | ) | (3.6 | ) | |||||||
| Net cash used in investing activities |
(97.6 | ) | (46.3 | ) | ||||||||
| Financing activities |
||||||||||||
| Proceeds from issuance of Additional Tier 1 capital (AT1) |
30 | — | 100.0 | |||||||||
| Issuance costs of Additional Tier 1 capital (AT1) |
30 | — | (2.4 | ) | ||||||||
| Repayment of Tier 2 debt securities |
— | (50.0 | ) | |||||||||
| Purchase of own shares |
29 | (3.1 | ) | (7.9 | ) | |||||||
| Dividends paid |
30,12 | (58.3 | ) | (6.6 | ) | |||||||
| Payment of lease liabilities |
32 | (11.4 | ) | (6.6 | ) | |||||||
| Net cash (used in) / from financing activities |
(72.8 | ) | 26.5 | |||||||||
| Net increase in cash and cash equivalents |
564.6 | 205.8 | ||||||||||
| Cash and cash equivalents |
||||||||||||
| Cash and cash equivalents at 1 January |
910.1 | 712.0 | ||||||||||
| Increase in cash |
564.6 | 205.8 | ||||||||||
| Effect of foreign exchange rate changes |
8.8 | (7.7 | ) | |||||||||
| Cash and cash equivalents at 31 December1 |
1,483.5 | 910.1 | ||||||||||
| 1. | Cash and cash equivalents includes restricted cash of $197.7m at 31 December 2023 (2022: $120.1m). |
| 2. | Included in the movement in debt securities is the movement of EMTN notes. |
The notes on pages 108 to 187 form part of these financial statements. Refer to notes 3(c) and 39 for 2022 Group balances that have been restated.
107
| Marex Group plc Annual Report 2023 | Strategic Report | Corporate Governance | Financial Statements | |||
|
|
|
|
|
|||
Notes to the Consolidated Financial Statements
For the Year Ended 31 December 2023
| 1 | General Information |
Marex Group plc (the ‘Company’) is incorporated in England and Wales under the Companies Act. The address of the registered office is 155 Bishopsgate, London, EC2M 3TQ, United Kingdom. The principal activities of the Group and the nature of the Group’s operations are set out in notes 5 and 6 and in the Strategic Report.
The consolidated financial statements of the Group have been prepared in accordance with International Financial Reporting Standards (‘IFRSs’) as issued by the International Accounting Standards Board (‘IASB’).
The consolidated financial statements of the Group are presented in US dollars (‘USD” or ‘$’), which is also the Company’s functional currency. All amounts have been rounded to the nearest tenth of a million (‘m’), except where otherwise indicated.
| 2 | Adoption of New and Revised Standards |
(a) New and amended IFRS Accounting Standards that are effective for the current year
The Group applied for the first time certain standards and amendments, which are effective for annual periods beginning on or after 1 January 2023 (unless otherwise stated). The Group has not early adopted any other standard, interpretation or amendment that has been issued but is not yet effective.
IFRS 17 Insurance Contracts
IFRS 17 Insurance Contracts is a comprehensive new accounting standard for insurance contracts covering recognition and measurement, presentation and disclosure. IFRS 17 replaces IFRS 4 Insurance Contracts. IFRS 17 applies to all types of insurance contracts (i.e. life, non-life, direct insurance and re-insurance), regardless of the type of entities that issue them, as well as to certain guarantees and financial instruments with discretionary participation features; a few scope exceptions will apply.
The new standard had no impact on the Group’s consolidated financial statements.
Definition of Accounting Estimates – Amendments to IAS 8
The Group has adopted the amendments to IAS 8 for the first time in the current year. Under the new definition, accounting estimates are ‘monetary amounts in financial statements that are subject to measurement uncertainty’. The definition of change in accounting estimates was deleted.
This amendment had no impact on the Group’s consolidated financial statements.
Disclosure of Accounting Policies – Amendments to IAS 1
The Group has adopted the amendments to IAS 1 for the first time in the current year. The amendments change the requirements in IAS 1 with regard to disclosure of accounting policies. The amendments replace all instances of the term ‘significant accounting policies’ with ‘material accounting policy information’. The accounting policy information is material if, when considered together with other information included in an entity’s financial statements, it can reasonably be expected to influence decisions that the primary users of general purpose financial statements make on the basis of those financial statements.
The supporting paragraphs in IAS 1 are also amended to clarify that accounting policy information that relates to immaterial transactions, other events or conditions is immaterial and need not be disclosed. Accounting policy information may be material because of the nature of the related transactions, other events or conditions, even if the amounts are immaterial. However, not all accounting policy information relating to material transactions, other events or conditions is itself material.
The Group has revised the accounting policies information in accordance with the amendments.
Deferred Tax Related to Assets and Liabilities Arising from a Single Transaction – Amendments to IAS 12
The Group has adopted the amendments to IAS 12 Income Tax for the first time in the current year. The amendments introduce a further exception from the initial recognition exemption. Under the amendments, an entity does not apply the initial recognition exemption for transactions that give rise to equal taxable and deductible temporary differences. Depending on the applicable tax law, equal taxable and deductible temporary differences may arise on initial recognition of an asset and liability in a transaction that is not a business combination and affects neither accounting profit nor taxable profit.
Following the amendments to IAS 12, an entity is required to recognise the related deferred tax asset and liability, with the recognition of any deferred tax asset being subject to the recoverability criteria in IAS 12.
This amendment had no impact on the Group’s consolidated financial statements.
108
| Marex Group plc Annual Report 2023 | Strategic Report | Corporate Governance | Financial Statements | |||
|
|
|
|
|
|||
| 2 | Adoption of New and Revised Standards (continued) |
International Tax Reform – Pillar Two Model Rules – Amendments to IAS 12
The Group has adopted the amendments to IAS 12 for the first time in the current year. The IASB amended the scope of IAS 12 to clarify that the Standard applies to income taxes arising from tax law enacted or substantively enacted to implement the Pillar Two model rules published by the Organisation for Economic Co-operation and Development (‘OECD’).
The amendments introduce a mandatory temporary exception to the accounting requirements for deferred taxes in IAS 12, so that an entity would neither recognise or disclose information about deferred tax assets and liabilities related to Pillar Two income taxes.
Following the amendments, the Group is required to disclose that it has applied the exception and to disclose separately its current tax expense (income) related to Pillar Two income taxes (see note 11).
(b) New and revised IFRSs in issue, but not yet effective
At the date of authorisation of these financial statements, the Group has not applied the following revised IFRS Accounting Standards that have been issued and adopted by the IFRS UK Endorsement Board but are not yet effective in the UK.
Amendments to IFRS 16 Leases – Lease Liability in a Sale and Leaseback
The amendments to IFRS 16 add subsequent measurement requirements for sale and leaseback transactions that satisfy the requirements in IFRS 15 Revenue from Contracts with Customers to be accounted for as a sale. The amendments require the seller-lessee to determine ‘lease payments’ or ‘revised lease payments’ such that the seller-lessee does not recognise a gain or loss that relates to the right-of-use retained by the seller-lessee, after the commencement date.
The amendments do not affect the gain or loss recognised by the seller-lessee relating to the partial or full termination of a lease. Without these new requirements, a seller-lessee may have recognised a gain on the right-of-use it retains solely because of a remeasurement of the lease liability (for example, following a lease modification or change in the lease term) applying the general requirements in IFRS 16. This could have been particularly the case in a leaseback that includes variable lease payments that are not dependent on an index or rate.
As part of the amendments, the IASB amended an illustrative example in IFRS 16 and added a new example to illustrate the subsequent measurement of a right-of-use asset and lease liability in a sale and leaseback transaction with variable lease payments that do not depend on an index or rate. The illustrative examples also clarify that the liability that arises from a sale and leaseback transaction that qualifies as a sale applying IFRS 15 is a lease liability.
The amendments are effective for annual reporting periods beginning on or after 1 January 2024. Earlier application is permitted. If a seller-lessee applies the amendments for an earlier period, it is required to disclose that fact.
A seller-lessee applies the amendments retrospectively in accordance with IAS 8 to sale and leaseback transactions entered into after the date of initial application, which is defined as the beginning of the annual reporting period in which the entity first applied IFRS 16.
The Directors do not expect that these amendments will have a material impact on the Group’s financial statements in future periods.
Amendments to IAS 1 Presentation of Financial Statements – Classification of Liabilities as Current or Non-Current
The amendments to IAS 1 published in January 2020 affect only the presentation of liabilities as current or non-current in the statement of financial position and not the amount or timing of recognition of any asset, liability, income or expense, or the information disclosed about those items.
The amendments clarify that the classification of liabilities as current or non-current is based on rights that are in existence at the end of the reporting period, specify that classification is unaffected by expectations about whether an entity will exercise its right to defer settlement of a liability, explain that rights are in existence if covenants are complied with at the end of the reporting period, and introduce a definition of ‘settlement’ to make clear that settlement refers to the transfer to the counterparty of cash, equity instruments, other assets or services.
The amendments are applied retrospectively for annual periods beginning on or after 1 January 2024, with early application permitted. The IASB has aligned the effective date with the 2022 amendments to IAS 1. If an entity applies the 2020 amendments for an earlier period, it is also required to apply the 2022 amendments early.
The Directors anticipate that the application of these amendments may have an impact on the Group’s consolidated financial statements in future periods.
109
| Marex Group plc Annual Report 2023 | Strategic Report | Corporate Governance | Financial Statements | |||
|
|
|
|
|
|||
Notes to the Consolidated Financial Statements (continued)
For the Year Ended 31 December 2023
| 2 | Adoption of New and Revised Standards (continued) |
Amendments to IAS 1 Presentation of Financial Statements – Non-current Liabilities with Covenants
The amendments to IAS 1 issued in October 2022 specify that only covenants that an entity is required to comply with on or before the end of the reporting period affect the entity’s right to defer settlement of a liability for at least 12 months after the reporting date (and therefore must be considered in assessing the classification of the liability as current or non-current). Such covenants affect whether the right exists at the end of the reporting period, even if compliance with the covenant is assessed only after the reporting date (e.g. a covenant based on the entity’s financial position at the reporting date that is assessed for compliance only after the reporting date).
The IASB also specifies that the right to defer settlement of a liability for at least 12 months after the reporting date is not affected if an entity only has to comply with a covenant after the reporting period. However, if the entity’s right to defer settlement of a liability is subject to the entity complying with covenants within 12 months after the reporting period, an entity discloses information that enables users of financial statements to understand the risk of the liabilities becoming repayable within 12 months after the reporting period. This would include information about the covenants (including the nature of the covenants and when the entity is required to comply with them), the carrying amount of related liabilities and facts and circumstances, if any, that indicate that the entity may have difficulties complying with the covenants.
The amendments are applied retrospectively for annual reporting periods beginning on or after 1 January 2024. Earlier application of the amendments is permitted. If an entity applies the amendments for an earlier period, it is also required to apply the 2020 amendments to IAS 1 early.
The Directors do not expect that these amendments will have a material impact on the Group’s financial statements in future periods.
Amendments to IAS 7 Statement of Cash Flows and IFRS 7 Financial Instruments: Disclosures – Supplier Finance Arrangements
The amendments add a disclosure objective to IAS 7 stating that an entity is required to disclose information about its supplier finance arrangements that enables users of financial statements to assess the effects of those arrangements on the entity’s liabilities and cash flows. In addition, IFRS 7 was amended to add supplier finance arrangements as an example within the requirements to disclose information about an entity’s exposure to concentration of liquidity risk.
The amendments, which contain specific transition reliefs for the first annual reporting period in which an entity applies the amendments, are applicable for annual reporting periods beginning on or after 1 January 2024. Although earlier application is permitted.
The Directors do not expect that these amendments will have a material impact on the Group’s financial statements in future periods.
Amendments to IAS 21 The Effects of Changes in Foreign Exchange Rates
The amendments to IAS 21 sets out the requirements to help entities to assess exchangeability between two currencies, and to determine the spot exchange rate, when exchangeability is lacking. An entity is impacted by the amendments when it has a transaction or an operation in a foreign currency that is not exchangeable into another currency at a measurement date for a specified purpose.
When a currency is not exchangeable into another currency, the spot exchange rate needs to be estimated. The objective in estimating the spot exchange rate at a measurement date is to determine the rate at which an orderly exchange transaction would take place at that date between market participants under prevailing economic conditions.
The amendments are applicable for annual reporting periods beginning on or after 1 January 2025. Although earlier adoption is permitted.
The Directors do not expect these amendments will have a material impact on the Group’s financial statements in future periods.
| 3 | Material Accounting Policy Information |
The Group is required to disclose material accounting policy information. Accounting policy information is material if it can reasonably be expected to influence decisions that the primary users of financial statements make on the basis of those financial statements when considered together with other information included in the financial statements. The Group considers an accounting policy as material if the information relates to material transactions, other events or conditions or involves a high degree of uncertainty and has a material impact on the financial statements.
(a) Basis of accounting
The consolidated financial statements of the Group and the standalone financial statements of Marex Group plc have been prepared in accordance with IFRSs as issued by the IASB as well as interpretations issued by the IFRS Interpretations Committee (‘IFRIC’) as endorsed by the UK Endorsement Board (‘UKEB’).
The Company has taken the exemption in section 408(3) of the Companies Act 2006 not to present a standalone income statement, standalone statement of comprehensive income and related notes that form part of the Company financial statements.
The financial statements have been prepared on the historical cost basis, except for the revaluation of certain assets and liabilities that are measured at fair value less costs of sale at the end of each reporting period, as explained in the accounting policies below.
The principal accounting policies adopted are set out below.
110
| Marex Group plc Annual Report 2023 | Strategic Report | Corporate Governance | Financial Statements | |||
|
|
|
|
|
|||
| 3 | Material Accounting Policy Information (continued) |
(b) Basis of consolidation
The consolidated financial statements include the financial statements of the Company and entities controlled by the Company (its subsidiaries) made up to 31 December each year. Control is achieved when the Company:
| – | has the power over the investee; |
| – | is exposed, or has rights, to variable return from its involvement with the investee; and |
| – | has the ability to use its power to affect its returns. |
The Company reassesses whether or not it controls an investee if the facts and circumstances indicate that there are changes to one or more of the three elements of control listed above.
Consolidation of a subsidiary begins when the Company obtains control over the subsidiary and ceases when the Company loses control of the subsidiary. Specifically, the results of subsidiaries acquired or disposed of during the year are included in the consolidated income statement from the date the Company gains control until the date when the Company ceases to control the subsidiary.
Where necessary, adjustments are made to the financial statements of subsidiaries to bring the accounting policies used into line with the Group’s accounting policies. All intragroup assets and liabilities, equity, income, expenses and cash flows relating to transactions between the members of the Group are eliminated on consolidation.
(c) Restatement
During the preparation of these financial statements, the Group voluntarily decided to change certain accounting policies in accordance with IAS 8 Accounting Policies, Changes in Accounting Estimates and Errors, including the presentation of its consolidated income statements to provide more detailed information to the investors and align better its financial reporting to that of a public entity and the presentation of income from physical commodities trading in the consolidated income statement. Furthermore, the Group is correcting some errors identified in the statement of financial position and in the income and cash flow statements included in the financial statements as of and for the year ended 31 December 2022, such as the reclassification of debt securities and borrowings between current and non-current, and the reclassification of software from property, plant and equipment to intangible assets. The details of the voluntary accounting policy changes and correction of errors are outlined in the accounting policies and note 39.
(d) Current versus non-current classification
The Group presents assets and liabilities in the statement of financial position based on current/non-current classification. An asset is current when it is:
| – | expected to be realised or intended to be sold or consumed in the normal operating cycle; |
| – | held primarily for the purpose of trading; and |
| – | expected to be realised within 12 months after the reporting period. |
All other assets are classified as non-current.
A liability is current when:
| – | it is expected to be settled in the normal operating cycle; |
| – | it is held primarily for the purpose of trading; and |
| – | it is due to be settled within 12 months after the reporting period, or the Group does not have an unconditional right to defer settlement of the liability for at least 12 months after the reporting period.. |
The terms of the liability that could, at the option of the counterparty, result in its settlement by the issue of equity instruments do not affect its classification.
The Group classifies all other liabilities as non-current. Deferred tax assets and liabilities are classified as non-current assets and liabilities.
(e) Going concern
The Directors have assessed the going concern assumptions during the preparation of the Group’s consolidated financial statements. The Group believes that no events or conditions, including those related to recent macro-economic events give rise to doubt about the ability of the Group to continue operating for a period of at least 12 months from the date the financial statements were approved and authorised for issuance. This conclusion is drawn based on the knowledge of the Group, and the estimated economic outlook and identified risks, which have been modelled to be included within several stress tests. The results of the stress tests highlighted that the Group has sufficient liquidity and capital to satisfy its regulatory requirements. The Group has sufficient cash and undrawn balances in its credit facilities. Therefore, the Group expects that it will be able to meet contractual and expected maturities and covenants. Consequently, it has been concluded that it is reasonable to continue to adopt the going concern basis of accounting in preparing these consolidated financial statements.
111
| Marex Group plc Annual Report 2023 | Strategic Report | Corporate Governance | Financial Statements | |||
|
|
|
|
|
|||
Notes to the Consolidated Financial Statements (continued)
For the Year Ended 31 December 2023
| 3 | Material Accounting Policy Information (continued) |
(f) Business combinations
Acquisitions of businesses are accounted for using the acquisition method. The consideration transferred in a business combination is measured at fair value, which is calculated as the sum of the acquisition-date fair values of assets transferred by the Group, liabilities incurred by the Group to the former owners of the acquiree and the equity interest issued by the Group in exchange for control of the acquiree. Acquisition-related costs are recognised in the income statement as incurred and presented within other expenses.
At the acquisition date, the identifiable assets acquired, and the liabilities assumed are recognised at their fair values at the acquisition date, except that:
| – | deferred tax assets or liabilities and assets or liabilities related to employee benefit arrangements are recognised and measured in accordance with IAS 12 Income Taxes and IAS 19 Employee Benefits respectively; |
| – | liabilities or equity instruments related to share-based payment arrangements of the acquiree or share-based payment arrangements of the Group entered into to replace share-based arrangements of the acquiree are measured in accordance with IFRS 2 at the acquisition date; and |
| – | assets (or disposal groups) that are classified as held for sale in accordance with IFRS 5 Non-current Assets held for Sale and Discontinued Operations are measured in accordance with IFRS 5. |
Goodwill arises on business combinations and represents the excess of the sum of the consideration transferred, the amount of any non-controlling interests in the acquiree, and the fair value of the acquirer’s previously held equity interest in the acquiree (if any) over the fair value of the Group’s share of the identifiable assets, liabilities and contingent liabilities acquired. Where the fair value of the Group’s share of the identifiable assets, liabilities and contingent liabilities of the acquired business is greater than the cost of acquisition, the excess is recognised immediately in the income statement as a bargain purchase gain.
When the consideration transferred by the Group in a business combination includes a contingent consideration arrangement, the contingent consideration is measured at its acquisition date fair value. Subsequent accounting for changes in the fair value of the contingent consideration depends on its classification. Contingent consideration that is classified as equity is not subsequently remeasured and its settlement is accounted for within equity. Other contingent consideration is remeasured to fair value at subsequent reporting dates with changes in fair value recognised in the income statement.
Goodwill has an indefinite useful economic life and is measured at cost less any accumulated impairment losses. It is tested for impairment annually and whenever there is an indicator of impairment. Where the carrying value exceeds the higher of the value in use or fair value less cost to sell, an impairment loss is recognised in the income statement.
(g) Revenue recognition
The Group’s Revenue consists of:
Net commission and fee income
Sales and brokerage commissions are generated by internal brokers and introducing broker dealers when customers trade exchange traded derivatives, over-the-counter (‘OTC’) traded derivatives, treasury instruments and equity securities.
The Group is responsible for executing and clearing its customers’ purchases and sales and as such it acts as principal and commission income is recognised on a gross basis.
Commissions charged to customers on exchange traded derivatives and over-the-counter traded derivatives are recognised at a point in time on the trade date when a client order is cleared or executed (i.e. when the performance obligation is satisfied). Commissions charged to customers on traded securities are sales-based commissions that are recognised at a point in time on the trade date. Sales based commissions are typically a fixed fee per security transaction and in certain instances, are based on a percentage of the transaction value.
Commission charged to customers on clearing transactions recoup clearing fees and other fee expenses incurred. Clearing fees earned represent the recharge of transaction-based fees charged by the various exchanges and clearing organisations at which the Group or one of its clearing brokers is a member for the purpose of executing and/or clearing trades through them. Clearing fees incurred are generally passed through to clients’ accounts and are reported gross as the Group maintains control over the clearing and execution services provided, maintains relationships with the exchanges or clearing brokers, and has ultimate discretion in whether the fees incurred are passed through to the clients and the rates at which they are passed through. As clearing fees charged are transactional based, they are recognised at a point in time on the trade date along with the related commission income when the client order is cleared or executed.
In connection with the execution and clearing of trades, the Group is required to pay fees to the executing brokers, exchanges, clearing organisations and banks. These fees are based on transaction volumes and recognised as commission and fee expense on the trade date. The Group also pays commissions to third party introducing brokers (individuals or organisations) that maintain relationships with clients and introduce them to the Group. Introducing brokers accept orders from clients whilst the Group provides the accounts, transaction, margining and reporting services, including money and securities from clients. Introducing brokers’ commissions are determined monthly and presented in commission and fee expense in the income statement and settled quarterly. Commission and fee expenses are generally passed through to clients’ accounts. No other costs related to the generation of commission income are included within commission and fee expense.
112
| Marex Group plc Annual Report 2023 | Strategic Report | Corporate Governance | Financial Statements | |||
|
|
|
|
|
|||
| 3 | Material Accounting Policy Information (continued) |
(g) Revenue recognition (continued)
Net trading income
Net trading income includes realised and unrealised gains and losses derived from market making activities in OTC derivatives, exchange traded derivatives, equities, fixed income and foreign exchange. Net trading income also includes gains and losses generated from transactions in over-the-counter derivatives, equities, fixed income and foreign exchange executed with clients and other counterparties. The Group enters into these transactions on its own account.
In certain transactions, the transaction price of the financial instrument differs from the fair value calculated using valuation models.
This difference is called day 1 profit or loss and is recognised immediately in the income statement in net trading income only when:
| – | the fair value determined using valuation models is based only on observable inputs; |
| – | the fair value determined using valuation models is based on both observable and unobservable inputs but the impact of the unobservable inputs in the fair value is insignificant. |
In all other cases, the financial instrument is initially recognised at the transaction price and the recognition of day 1 profit or loss is deferred and amortised through the term of the deal or to the date when unobservable inputs become observable (if sooner) unless specific factors relevant to the trade require a specific recognition pattern.
Net interest income
Interest income includes mainly the interest earned on the cash and financial instruments balances held on behalf of our clients as well as on our own cash balances, and interest earned in secured financing transactions. Interest income is calculated using the effective interest rate (‘EIR’) method. The effective interest rate is the rate that exactly discounts the estimated future cash payments or receipts over the expected life of the financial instrument to the gross carrying amount of the financial asset (before adjusting for expected credit losses) or to the amortised cost of the financial liability.
Interest expense includes interest paid to our clients on their balances and paid to our counterparties in secured financing transactions, debt securities issued and borrowings. Interest expense is calculated using the effective interest method as defined above. The interest expense component of the Group’s structured notes which are financial liabilities designated at fair value through profit and loss are also presented in gross interest expense recognised on a market interest rate basis.
Net physical commodities income
The Group enters into contracts to purchase physical commodities for the purpose of selling in the near future (90 days on average) to generate a profit from the fluctuations in prices. In accordance with IFRS 9, these contracts are recognised and measured at fair value, with the resulting fair value gains and losses included in net physical commodities income. Contracts to purchase and sell physical commodities are provisionally priced at the date that an initial invoice is issued. Provisionally priced contracts are contracts where the price of the contract is subject to adjustments resulting from these contracts being priced against a future quoted price after settlement of the underlying commodity. Provisionally priced payables and receivables are measured initially and subsequently at their fair value through profit and loss until settlement and are presented within trade payables in the trade and other payables and trade debtors in the trade and other receivables line item in the statement of financial position.
(h) Tax
The tax expense represents the sum of the tax currently payable and deferred tax.
Current tax
The current tax payable is based on taxable profit for the year. Taxable profit differs from profit before tax as reported in the income statement because it excludes items of income or expense that are taxable or deductible in other years and it further excludes items that are never taxable or deductible. The Group’s liability for current tax is calculated using tax rates that have been enacted or substantively enacted by the balance sheet date.
A provision is recognised for those matters for which the tax determination is uncertain but it is considered probable that there will be a future outflow of funds to a tax authority. The provisions are measured at the best estimate of the amount expected to become payable. The assessment is based on the judgement of tax professionals within the Company supported by previous experience in respect of such activities and in certain cases based on specialist independent tax advice.
Deferred tax
Deferred tax is the tax expected to be payable or recoverable on differences between the carrying amounts of assets and liabilities in the financial statements and the corresponding tax bases used in the computation of taxable profit, and is accounted for using the balance sheet liability method. Deferred tax liabilities are generally recognised for all taxable temporary differences and deferred tax assets are recognised to the extent that it is probable that future taxable profits will be available against which deductible temporary differences can be utilised. Such assets and liabilities are not recognised if the temporary difference arises from the initial recognition of goodwill or from the initial recognition (other than in a business combination) of other assets and liabilities in a transaction that affects neither the taxable profit nor the accounting profit.
113
| Marex Group plc Annual Report 2023 | Strategic Report | Corporate Governance | Financial Statements | |||
|
|
|
|
|
|||
Notes to the Consolidated Financial Statements (continued)
For the Year Ended 31 December 2023
| 3 | Material Accounting Policy Information (continued) |
(h) Tax (continued)
Deferred tax liabilities are recognised for taxable temporary differences arising on investments in subsidiaries and associates, and interests in joint ventures, except where the Group is able to control the reversal of the temporary difference and it is probable that the temporary difference will not reverse in the foreseeable future. Deferred tax assets arising from deductible temporary differences associated with such investments and interests are only recognised to the extent that it is probable that there will be sufficient taxable profits against which to utilise the benefits of the temporary differences and they are expected to reverse in the foreseeable future.
The carrying amount of deferred tax assets is reviewed at each balance sheet date and reduced to the extent that it is no longer probable that sufficient taxable profits will be available to allow all or part of the asset to be recovered.
Deferred tax is calculated at the tax rates that are expected to apply in the period when the liability is settled or the asset is realised based on tax laws and rates that have been enacted or substantively enacted at the balance sheet date.
The measurement of deferred tax liabilities and assets reflects the tax consequences that would follow from the manner in which the Group expects, at the end of the reporting period, to recover or settle the carrying amount of its assets and liabilities.
Deferred tax assets and liabilities are offset when there is a legally enforceable right to set off current tax assets against current tax liabilities and when they relate to income taxes levied by the same tax authority and the Group intends to settle its current tax assets and liabilities on a net basis or to realise the asset and settle the liability simultaneously.
Current tax and deferred tax for the year
Current and deferred tax are recognised in profit and loss, except when they relate to items that are recognised in other comprehensive income or directly in equity, in which case, the current and deferred tax are also recognised in other comprehensive income or directly in equity respectively, with the exception of the coupon on AT1 securities in respect of which the coupon is charged to equity but the related tax relief is taken to the income statement tax expense. Where current tax or deferred tax arises from the initial accounting for a business combination, the tax effect is included in the accounting for the business combination.
In determining whether uncertain tax positions exist, the Group assesses whether it is probable that a tax authority will accept the uncertain tax treatment applied or proposed to be applied in its income tax filings. The Group assesses for each uncertain tax treatment whether it should be considered independently or whether some tax treatments should be considered together based on what the Group believes provides a better prediction of the resolution of the uncertainty. The Group measures tax uncertainties using its best estimate of likely outcomes for which it relies on estimates and assumptions and may involve judgements about future events. Corporate activity as well as day to day operations may give rise to tax uncertainties. The Group has determined, with the benefit of opinions from external tax advisors and legal counsel, where appropriate, that it has provided for all tax liabilities that are probable to arise from such activities. New information may become available that causes the Group to change its judgement regarding the adequacy of existing tax liabilities. Such changes could result in incremental tax liabilities which could have a material effect on cash flows, financial condition and results of operations. Where the final tax outcome of these matters is different from the amounts that were originally estimated such differences will impact the income tax and deferred tax provisions in the period in which such determination is made.
(i) Impairment of non-financial assets
Impairment tests on goodwill and intangible assets with indefinite useful lives (trademarks) are undertaken annually and whenever there is an indicator of impairment. Other non-financial assets are subject to impairment tests whenever events or changes in circumstances indicate that their carrying amount may not be recoverable.
The impairment test is carried out on the asset’s cash generating unit (i.e. the smallest group of assets in which the asset belongs for which management measures separately identifiable cash flows). Where the asset does not generate cash flows that are independent from other assets, the Group estimates the recoverable amount of the cash generating unit to which the asset belongs. When a reasonable and consistent basis of allocation can be identified, corporate assets are also allocated to individual cash generating units, or otherwise, they are allocated to the smallest group of cash generating units for which a reasonable and consistent allocation can be identified.
The recoverable amount is the higher of fair value less costs of disposal and value in use. In assessing value in use, the estimated future cash flows are discounted to their present value using a pre-tax discount rate that reflects current market assessments of the time value of money and risks specific to the asset for which the estimates of future cash flows have not been adjusted.
Where the carrying value of an asset exceeds its recoverable amount an impairment loss is recognised in the income statement.
An impairment loss in respect of goodwill is not reversed. For non-financial assets other than goodwill, an impairment loss is reversed only to the extent that the asset’s carrying amount does not exceed the carrying amount that would have been determined, net of depreciation or amortisation, if no impairment loss had been recognised.
(j) Financial instruments
Initial recognition and measurement
Financial assets and financial liabilities are recognised in the Group’s statement of financial position when the Group becomes a party to the contractual provisions of the instrument.
114
| Marex Group plc Annual Report 2023 | Strategic Report | Corporate Governance | Financial Statements | |||
|
|
|
|
|
|||
| 3 | Material Accounting Policy Information (continued) |
(j) Financial instruments (continued)
Financial assets and financial liabilities are initially measured at fair value. Transaction costs that are directly attributable to the acquisition or issue of financial assets and financial liabilities (other than financial assets and financial liabilities at fair value through profit and loss) are added to or deducted from the fair value of the financial assets or financial liabilities, as appropriate, on initial recognition. Transaction costs directly attributable to the acquisition of financial assets or financial liabilities at fair value through profit and loss are recognised immediately in profit and loss.
Financial assets
All regular way purchases or sales of financial assets are recognised and derecognised on a trade date basis. Regular way purchases or sales are purchases or sales of financial assets that require delivery of assets within the timeframe established by regulation or convention in the marketplace.
All recognised financial assets are subsequently measured in their entirety at either amortised cost or fair value, depending on the classification of the financial assets.
Financial assets that meet both of the following conditions and have not been designated as at fair value through profit and loss (‘FVTPL’) are measured at amortised cost:
| – | the financial asset is held within a business model whose objective is to hold financial assets in order to collect contractual cash flows; and |
| – | the contractual terms of the financial asset give rise on specified dates to cash flows that are solely payments of principal and interest on the principal amount outstanding. |
Financial assets that meet both of the following conditions and have not been designated as at FVTPL are measured at fair value through other comprehensive income (‘FVTOCI’):
| – | the financial asset is held within a business model whose objective is achieved by both collecting contractual cash flows and selling the financial assets; and |
| – | the contractual terms of the financial asset give rise on specified dates to cash flows that are solely payments of principal and interest on the principal amount outstanding. |
All financial assets not classified as measured at amortised cost or FVTOCI as described above are measured at FVTPL. This includes all derivative financial assets.
The Group may make the following irrevocable election and/or designation at initial recognition of a financial asset:
| – | the Group may irrevocably elect to present subsequent changes in fair value of an equity investment in other comprehensive income if certain criteria are met; and |
| – | the Group may irrevocably designate a debt investment that meets the amortised cost or FVTOCI criteria as measured at FVTPL if doing so eliminates or significantly reduces an accounting mismatch. |
The following accounting policies apply to the subsequent measurement of financial assets.
Amortised cost and effective interest rate method
The effective interest rate method is a method of calculating the amortised cost of a debt instrument and of allocating interest income over the relevant period.
For financial instruments other than purchased or originated credit-impaired financial assets, the effective interest rate is the rate that exactly discounts estimated future cash receipts (including all fees and points paid or received that form an integral part of the effective interest rate, transaction costs and other premiums or discounts) excluding expected credit losses, through the expected life of the debt instrument, or, where appropriate, a shorter period, to the gross carrying amount of the debt instrument on initial recognition.
The amortised cost of a financial asset is the amount at which the financial asset is measured at initial recognition minus the principal repayments, plus the cumulative amortisation using the EIR method of any difference between that initial amount and the maturity amount, adjusted for any loss allowance. On the contrary, the gross carrying amount of a financial asset is the amortised cost of a financial asset before adjusting for any loss allowance.
Interest income is recognised using the EIR method for debt instruments measured subsequently at amortised cost and at FVTOCI. For financial instruments other than purchased or originated credit-impaired financial assets, interest income is calculated by applying the EIR to the gross carrying amount of a financial asset, except for financial assets that have subsequently become credit-impaired. For financial assets that have subsequently become credit-impaired interest income is recognised by applying the EIR to the amortised cost of the financial asset.
Investments in debt instruments classified as amortised cost
Debt instruments classified as amortised cost are subsequently measured using the EIR method and are subject to impairment. Gains and losses are recognised in the income statement when the asset is derecognised, modified or impaired. The Group’s financial assets held at amortised cost include US treasury and agency bonds (classified as treasury instruments on the statement of financial position) and trade receivables.
115
| Marex Group plc Annual Report 2023 | Strategic Report | Corporate Governance | Financial Statements | |||
|
|
|
|
|
|||
Notes to the Consolidated Financial Statements (continued)
For the Year Ended 31 December 2023
| 3 | Material Accounting Policy Information (continued) |
(j) Financial instruments (continued)
Investments in equity designated as at FVTOCI
On initial recognition, the Group made an irrevocable election (on an instrument-by-instrument basis) to designate investments in equity instruments as at FVTOCI. Designation at FVTOCI is not permitted if the equity investment is held for trading or if it is contingent consideration recognised by an acquirer in a business combination to which IFRS 3 Business Combinations (“IFRS 3”) applies.
A financial asset is held for trading if:
| – | it has been acquired principally for the purpose of selling it in the near term; or |
| – | on initial recognition it is part of a portfolio of identified financial instruments that the Group manages together and has evidence of a recent actual pattern of short-term profit taking; or |
| – | it is a derivative (except for a derivative that is a financial guarantee contract or a designated and effective hedging instrument). |
Investments in equity instruments at FVTOCI are initially measured at fair value plus transaction costs and are presented as investments in the statement of financial position. Subsequently, they are measured at fair value with gains and losses arising from changes in fair value recognised in other comprehensive income and accumulated in the revaluation reserve. The cumulative gain or loss will not be reclassified to profit and loss on disposal of the equity investments; instead it will be transferred to retained earnings. The Group has designated all investments in equity instruments that are not held for trading as at FVTOCI on initial application of IFRS 9.
Financial assets at FVTPL
Financial assets that do not meet the criteria for being measured at amortised cost or FVTOCI are measured at FVTPL. Specifically:
| – | investments in equity instruments are classified as at FVTPL, unless the Group designates an equity investment that is neither held for trading nor a contingent consideration arising from a business combination as at FVTOCI on initial recognition; and |
| – | debt instruments that do not meet the amortised cost criteria or the FVTOCI criteria are classified as at FVTPL. |
Impairment of financial assets
The Group recognises a loss allowance for expected credit losses (‘ECL’) on investments in debt instruments that are measured at amortised cost or at FVTOCI. No impairment loss is recognised for investments in equity instruments. The amount of ECL is updated at each reporting date to reflect changes in credit risk since initial recognition of the respective financial instrument.
The Group always recognises lifetime ECL for trade receivables. ECL are a probability-weighted estimate of credit losses based on both quantitative and qualitative information and analysis, based on the Group’s historical experience and informed credit assessment and forward-looking expectation.
For all other financial instruments, the Group recognises lifetime ECL when there has been a significant increase in credit risk since initial recognition. If, on the other hand, the credit risk on the financial instrument has not increased significantly since initial recognition, the Group measures the loss allowance for that financial instrument at an amount equal to 12-month ECL. The assessment of whether lifetime ECL should be recognised is based on significant increases in the likelihood or risk of a default occurring since initial recognition instead of on evidence of a financial asset being credit-impaired at the reporting date or an actual default occurring. Lifetime ECL represents the ECL that will result from all possible default events over the expected life of a financial instrument. In contrast, 12-month ECL represents the portion of lifetime ECL that is expected to result from default events on a financial instrument that is possible within 12 months after the reporting date.
Simplified approach
The Group adopts a simplified approach for trade debtors whereby allowances are always equal to lifetime ECL. The ECL on trade debtors are estimated using a provision matrix by reference to historical credit losses experience adjusted for current and expected future economic conditions. When a trade debtor balance is more than 180 days past due, the Group further performs a qualitative review of the debtor analysing factors such as the debtor’s current financial position, past due days, cash collection history and internal credit ratings to determine whether the Group has reasonable and supportable information to apply a higher credit loss rate adjusted by forward-looking information.
Significant increases in credit risk
In assessing whether the credit risk on a financial instrument has increased significantly since initial recognition, the Group compares the risk of a default occurring on the financial instrument at the reporting date with the risk of a default occurring on the financial instrument as at the date of initial recognition. In making this assessment, the Group considers both quantitative and qualitative information that is reasonable and supportable, including historical experience and forward-looking information that is available without undue cost or effort.
In particular, the following information is taken into account when assessing whether credit risk has increased significantly since initial recognition:
| – | an actual or expected significant deterioration in the financial instrument’s external (if available) or internal credit rating; and |
| – | significant deterioration in external market indicators of credit risk for a particular financial instrument. |
116
| Marex Group plc Annual Report 2023 | Strategic Report | Corporate Governance | Financial Statements | |||
|
|
|
|
|
|||
| 3 | Material Accounting Policy Information (continued) |
(j) Financial instruments (continued)
The Group assumes that the credit risk on a financial instrument has not increased significantly since initial recognition if the financial instrument is determined to have low credit risk, based on all of the following: (i) the financial instrument has a low risk of default in accordance with either internal or external credit ratings; (ii) the borrower has a strong capacity to meet its contractual cash flow obligations in the near term; and (iii) adverse changes in economic and business conditions in the long term may, but will not necessarily, reduce the ability of the borrower to fulfil its contractual cash flow obligations. The Group regularly monitors the effectiveness of the criteria used to identify whether there has been a significant increase in credit risk and revises them as appropriate to ensure that each criterion is capable of identifying a significant increase in credit risk before the amount becomes past due.
Definition of default
The Group considers the following as constituting an event of default for internal credit risk management purposes as historical experience indicates that receivables and other assets that meet either of the following criteria are generally not recoverable:
| – | when there is a breach of financial covenants by the counterparty; or |
| – | information developed internally or obtained from external sources indicates that the debtor is unlikely to pay its creditors, including the Group, in full (without taking into account any collateral held by the Group) or partially. |
Credit-impaired financial assets
A financial asset is credit-impaired when one or more events that have a detrimental impact on the estimated future cash flows of that financial asset have occurred. Evidence that a financial asset is credit-impaired includes observable data about the following events:
| – | significant financial difficulty of the issuer or the borrower; |
| – | a breach of contract, such as default or past due event; |
| – | it is becoming probable that the borrower will enter bankruptcy or other financial reorganisation; or |
| – | the disappearance of an active market for that financial asset because of financial difficulties. |
Write-off policy
The Group writes off a financial asset when there is information indicating that the counterparty is in severe financial difficulty and there is no reasonable expectation of recovery, e.g. when the counterparty has been placed under liquidation or has entered into bankruptcy proceedings. Financial assets written off may still be subject to enforcement activities under the Group’s recovery procedures, taking into account legal advice where appropriate. Any recoveries made are recognised in profit and loss.
Measurement and recognition of expected credit losses
At the reporting date, an allowance is required for the 12-month (Stage 1) ECL. If the credit risk has significantly increased since initial recognition (Stage 2), or if the financial instrument is credit-impaired (Stage 3), an allowance (or provision) should be recognised for the lifetime ECL.
The measurement of ECL is a function of the probability of default, loss given default (i.e. the magnitude of the loss if there is a default) and the exposure at default. The assessment of the probability of default and loss given default is based on historical data adjusted by forward-looking information as described above. As for the exposure at default, for financial assets, this is represented by the assets’ gross carrying amount at the reporting date, less any collateral held.
For financial assets, the ECL is estimated as the difference between all contractual cash flows that are due to the Group in accordance with the contract and all the cash flows that the Group expects to receive, discounted at the original effective interest rate.
The grouping is regularly reviewed by management to ensure the constituents of each group continue to share similar credit risk characteristics.
Where lifetime ECL is measured on a collective basis to cater for cases where evidence of significant increases in credit risk at the individual instrument level may not yet be available, the financial instruments are grouped on the following basis:
| – | nature of financial instruments; and |
| – | external credit ratings where available. |
If the Group has measured the loss allowance for a financial instrument at an amount equal to lifetime ECL in the previous reporting period, but determines at the current reporting date that the conditions for lifetime ECL are no longer met, the Group measures the loss allowance at an amount equal to 12-month ECL at the current reporting date.
The Group recognises an impairment gain or loss in profit and loss for all financial instruments with a corresponding adjustment to their carrying amount through a loss allowance account, except for investments in debt instruments that are measured at FVTOCI, for which the loss allowance is recognised in other comprehensive income and accumulated in the revaluation reserve, and does not reduce the carrying amount of the financial asset in the statement of financial position.
Presentation of impairment
Loss allowances for financial assets measured at amortised cost are deducted from the gross carrying amount of the assets. Provision for credit losses related to trade and other receivables, including settlement balances and deposits paid for securities borrowed are presented on the face of the income statement.
117
| Marex Group plc Annual Report 2023 | Strategic Report | Corporate Governance | Financial Statements | |||
|
|
|
|
|
|||
Notes to the Consolidated Financial Statements (continued)
For the Year Ended 31 December 2023
| 3 | Material Accounting Policy Information (continued) |
(j) Financial instruments (continued)
Derecognition of financial assets
The Group derecognises a financial asset only when the contractual rights to the cash flows from the asset expire, or when it transfers the financial asset and substantially all the risks and rewards of ownership of the asset to another entity. If the Group neither transfers nor retains substantially all the risks and rewards of ownership and continues to control the transferred asset, the Group recognises its retained interest in the asset and an associated liability for amounts it may have to pay. If the Group retains substantially all the risks and rewards of ownership of a transferred financial asset, the Group continues to recognise the financial asset and also recognises a collateralised borrowing for the proceeds received.
On derecognition of a financial asset measured at amortised cost, the difference between the asset’s carrying amount and the sum of the consideration received and receivable is recognised in the income statement. In addition, on derecognition of an investment in a debt instrument classified as at FVTOCI, the cumulative gain or loss previously accumulated in the revaluation reserve is reclassified to the income statement. In contrast, on derecognition of an investment in equity instrument which the Group has elected on initial recognition to measure at FVTOCI, the cumulative gain or loss previously accumulated in the revaluation reserve is not reclassified to the income statement but is transferred to retained earnings.
Financial liabilities
All financial liabilities are measured subsequently at amortised cost using the effective interest rate method or at FVTPL.
Financial liabilities that arise when a transfer of a financial asset does not qualify for derecognition or when the continuing involvement approach applies and financial guarantee contracts issued by the Group, are measured in accordance with the specific accounting policies set out below.
Financial liabilities at FVTPL
Financial liabilities are classified as at FVTPL when the financial liability is (i) contingent consideration recognised by an acquirer in a business combination to which IFRS 3 applies, (ii) held for trading or (iii) designated as at FVTPL.
A financial liability is classified as held for trading if:
| – | it has been acquired principally for the purpose of repurchasing it in the near term; or |
| – | on initial recognition it is part of a portfolio of identified financial instruments that the Group manages together and has a recent actual pattern of short-term profit-taking; or |
| – | it is a derivative, except for a derivative that is a financial guarantee contract or a designated and effective hedging instrument. |
A financial liability other than a financial liability held for trading or contingent consideration of an acquirer in a business combination may be designated as at FVTPL upon initial recognition if:
| – | such designation eliminates or significantly reduces a measurement or recognition inconsistency that would otherwise arise; or |
| – | the financial liability forms part of a group of financial assets or financial liabilities or both, which is managed and its performance is evaluated on a fair value basis, in accordance with the Group’s documented risk management or investment strategy, and information about the grouping is provided internally on that basis; or |
| – | it forms part of a contract containing one or more embedded derivatives, and IFRS 9 permits the entire combined contact to be designated at FVTPL. |
Financial liabilities at FVTPL are measured at fair value, with any gains or losses arising on changes in fair value recognised in the income statement to the extent that they are not part of a designated hedging relationship. The interest expense on structured notes designated at FVTPL is recognised in interest expense based on the implied variable market interest rate.
In respect of financial liabilities that are designated as at FVTPL (i.e. structured notes issued), the amount of change in the fair value of the financial liability that is attributable to changes in the credit risk of that liability is recognised in other comprehensive income, unless the recognition of the effects of changes in the liability’s credit risk in other comprehensive income would create or enlarge an accounting mismatch in the income statement. The remaining amount of change in the fair value of the liability is recognised in the income statement. Changes in the fair value attributable to a financial liability’s credit risk that are recognised in other comprehensive income are not subsequently reclassified to the income statement. Instead, they are transferred to retained earnings upon derecognition of the financial liability.
Financial liabilities measured at amortised cost
Financial liabilities that are not (i) contingent consideration of an acquirer in a business combination, (ii) held-for-trading, or (iii) designated at FVTPL, are measured subsequently at amortised cost using the effective interest rate method.
Derecognition of financial liabilities
A financial liability is derecognised when the obligation under the liability is discharged, cancelled or expired. The difference between the carrying amount of the financial liability derecognised and the consideration paid and payable is recognised in the income statement.
118
| Marex Group plc Annual Report 2023 | Strategic Report | Corporate Governance | Financial Statements | |||
|
|
|
|
|
|||
| 3 | Material Accounting Policy Information (continued) |
(j) Financial instruments (continued)
When the Group exchanges with the existing lender one debt instrument into another one with substantially different terms, such exchange is accounted for as an extinguishment of the original financial liability and the recognition of a new financial liability. Similarly the Group accounts for substantial modification of terms of an existing liability or part of it as an extinguishment of the original financial liability and the recognition of a new liability. The terms are substantially different if the discounted present value of the cash flows under the new terms, including any fees paid net of any fees received and discounted using the original effective rate, is at least 10% different from the discounted present value of the remaining cash flows of the original financial liability. If the modification is not substantial, the difference between: (i) the carrying amount of the liability before the modification; and (ii) the present value of the cash flows after modification should be recognised in the income statement as the modification gain or loss.
Offsetting of financial assets and liabilities
Financial assets and liabilities are offset and the net amount is reported in the statement of financial position if there is a currently enforceable legal right to offset the recognised amounts and there is an intention and ability to settle on a net basis, or to realise the assets and liabilities simultaneously.
Derivative instruments
The Group uses derivative financial instruments, such as forward currency contracts, OTC precious and base metal contracts, agriculture contracts, energy contracts and equities. Such derivative financial instruments are initially recognised at fair value on the date on which a derivative contract is entered into and are subsequently remeasured at fair value. Derivatives are carried as financial assets when the fair value is positive and as financial liabilities when the fair value is negative.
The Group utilises the services of a Prime Broker to enter into derivative contracts that are used to hedge its structured notes issuance business. The agreement provides for net settlement of daily margin calls and in addition, should there be a default event, this would also be settled on a net basis. On this basis the Group has determined that the balance representing cash held at the Prime Broker and various derivative instruments should be shown within ‘Derivative Assets’ in the statement of financial position.
Issued debt and equity instruments
The Group applies IAS 32 Financial Instruments: Presentation to determine whether an instrument is either a financial liability (debt) or equity. Issued financial instruments or their components are classified as liabilities if the contractual arrangement results in the Group having an unconditional obligation to either deliver cash or another financial asset, or a variable number of equity shares, to the holder of the instrument. If this is not the case, the instrument is generally an equity instrument and the proceeds included in equity, net of transaction costs. Dividends and other returns to equity holders are recognised (other than for AT1 securities) when approved for payment by the Board of Directors and treated as a deduction from equity. Distributions paid to holders of AT1 securities are shown as dividends and are treated as a deduction from equity.
Debt securities are the Group’s issued debt instruments which are comprised of hybrid financial instruments and vanilla debt instrument. Structured notes issued are hybrid financial instruments and are composed of debt components and embedded derivatives and are designated as FVTPL. Changes in fair value are recognised within net trading income except for changes related to the Group’s own credit risk which are recognised in other comprehensive income and interest related to the hybrid debt securities is presented within interest expense. Vanilla debt instruments are presented within debt securities in line with their maturity profile and have no other embedded or linked instruments. The Group presents the hedged interest expense related to vanilla debt instruments through interest expense.
(k) Inventories
The Group applies the broker-dealer exemption to its inventories stated in paragraph 3 of IAS 2, Inventories. The Group has physical holdings of commodities held for trading purposes. These are measured at fair value less costs to sell and relate to the recycled metals trading division.
The Group holds cryptocurrencies, both for its own account in order to generate a return, and to complement its cryptocurrency client offerings. The Group does not act as a custodian for crypto and, other than in limited circumstances, does not allow clients to provide crypto as security for client activity. The Group holds these cryptocurrencies in either a hot wallet at Fireblocks (kept online) or in cold storage at a crypto custodian (kept offline). The Group classifies cryptocurrency holdings as inventories on the statement of financial position measured at fair value less costs to sell.
The Group has holdings of carbon emission certificates held for trading purposes. These are held at fair value less costs to sell. The cost of inventories including the changes in their fair value is recognised in the income statement within the line Net trading income.
(l) Physical commodity contracts
The Group trades in physical commodity contracts for the purposes of trading. As such, these contracts meet the definition of a derivative financial instrument and therefore where outstanding at year end are recorded at fair value on the statement of financial position with changes in fair value reflected within net physical commodities income.
119
| Marex Group plc Annual Report 2023 | Strategic Report | Corporate Governance | Financial Statements | |||
|
|
|
|
|
|||
Notes to the Consolidated Financial Statements (continued)
For the Year Ended 31 December 2023
| 3 | Material Accounting Policy Information (continued) |
(m) Hedge accounting
Fair value hedge accounting
The Group manages the fixed interest rate risk on its vanilla debt instruments through interest rate and cross currency swaps as hedging instruments. The change in the fair value of the hedging instrument is recognised in the income statement as interest income and/or expense. The change in the fair value of the hedged item attributable to the risk hedged is recorded as part of the carrying value of the hedged item and is also recognised in the income statement as interest expense. If the hedged item is derecognised, the unamortised fair value is recognised immediately in the income statement.
For fair value hedges related to items carried at amortised cost, any adjustment to the carrying value is amortised through the income statement over the remaining term of the hedge using the EIR method. The EIR amortisation may begin as soon as an adjustment exists and no later than when the hedged item ceases to be adjusted for changes in its fair value attributable to the risk being hedged.
(n) Reverse repurchase agreements, repurchase agreements, stock borrowing and stock lending (securities financing transactions)
The Group enters into debt securities purchased under agreements to resell, debt securities sold under agreements to repurchase, stock (equities) borrowed transactions, and stock (equities) loaned transactions primarily to meet counterparty needs under matched book principal strategies.
These transactions are accounted for as collateralised financing transactions and are recorded at their amortised cost. In connection with these agreements and transactions, it is the Group’s policy to receive or pledge cash or securities to collateralise such agreements and transactions in accordance with contractual arrangements. The Group monitors the fair value of its collateral on a daily basis, and the Group may require counterparties, or may be required by counterparties, to deposit additional collateral or return collateral pledged. Interest income and interest expense is recognised over the life of the arrangements and is recorded in the income statement as applicable. The carrying amounts of these transactions approximate fair value due to their short-term nature and the level of collateralisation.
The securities are included on the statement of financial position as the Group retains substantially all of the risks and rewards of ownership. Consideration received is accounted for as a financial liability at amortised cost, unless it is designated at fair value through profit and loss. The difference between the consideration received and the fixed price in the future is treated as interest and recognised over the life of the agreements using the effective interest rate method.
Non-cash collateral
As part of our prime brokerage service business, the Group may receive or pay collateral different from cash. This collateral is governed by the terms of business and the Group is able to repledge or sell the collateral to the prime brokers. As such the non-cash collateral is not recorded on the Group’s balance sheet but remains on the counterparty’s statement of financial position. The Group monitors the fair value of its collateral on a daily basis, and the Group may require its counterparties, or may be required by counterparties, to deposit additional collateral or return collateral pledged. Interest income and expense is recognised over the life of the arrangements and is recorded within the income statement as applicable.
(o) Cash and cash equivalents
The Group considers cash held at banks and all highly liquid investments not held for trading purposes, with original or acquired maturities of 90 days or less, including certificates of deposit, to be cash and cash equivalents. Cash and cash equivalents not deposited with or pledged to broker-dealers, clearing organisations, counterparties or segregated under federal or other regulations is recognised on the statement of financial position.
Pursuant to the requirements of the Commodity Exchange Act and Commission Regulation 30.7 of the U.S. Commodity Futures Trading Commission (‘CFTC’) in the U.S. the Markets in Financial Instruments Implementing Directive 2006/73/EC underpinning the Client Asset (‘CASS’) rules in the Financial Conduct Authority (‘FCA’) handbook in the U.K. and the Securities & Futures Act in Singapore, funds deposited by clients relating to futures and options on futures contracts in regulated commodities must be carried in separate accounts, which are designated as segregated or secured client accounts. Additionally, in accordance with rule 15c3-3 of the Securities Exchange Act of 1934, the Group maintains separate accounts for the exclusive benefit of securities clients and proprietary accounts of broker dealers. Rule 15c3-3 requires the Group to maintain special reserve bank accounts for the exclusive benefit of securities clients and the proprietary accounts of broker dealers. The deposits in segregated client accounts and the special reserve bank accounts are not commingled with Group funds. Under the FCA’s rules certain categories of clients may choose to opt-out of segregation.
120
| Marex Group plc Annual Report 2023 | Strategic Report | Corporate Governance | Financial Statements | |||
|
|
|
|
|
|||
| 3 | Material Accounting Policy Information (continued) |
(p) Share-based payments
Equity-settled share-based payments to employees and others providing similar services are measured at the fair value of the equity instruments at the grant date. The fair value excludes the effect of non-market-based vesting conditions. Details regarding the determination of the fair value of equity-settled share-based transactions are set out in note 38.
The fair value determined at the grant date of the equity-settled share-based payments is expensed on a straight-line basis over the vesting period, based on the Group’s estimate of the number of equity instruments that will eventually vest. At each reporting date, the Group revises its estimate of the number of equity instruments expected to vest as a result of the effect of non-market-based vesting conditions. The impact of the revision on the original estimates, if any, is recognised in profit and loss such that the cumulative expense reflects the revised estimate, with a corresponding adjustment to reserves.
For cash-settled share-based payments, a liability is recognised for the goods or services acquired, measured initially at the fair value of the liability. At each reporting date until the liability is settled, and at the date of settlement, the fair value of the liability is remeasured, with any changes in fair value recognised in the income statement for the year.
| 4 | Critical accounting judgements and key sources of estimation uncertainty |
In the application of the Group’s accounting policies, the Directors are required to make judgements, estimates and assumptions that affect the reported carrying amounts of assets, liabilities, income and expenses. The estimates and associated assumptions are based on historical experience and other factors that are considered to be relevant and reasonable under the circumstances.
Estimates and assumptions are reviewed on an ongoing basis and revisions to accounting estimates are recognised in the period an estimate is revised. The following critical accounting judgement has been applied in the preparation of these financial statements:
Probability of a liquidity event
The Group has issued growth shares, growth share options, nil cost options and warrants under previous share based payment awards for which redemption or exercise is contingent upon the occurrence of a liquidity event (defined as a sale, initial public offering or liquidation). Management have reviewed the IFRS considerations necessary to assess whether as at 31 December 2023, a liquidity event was probable. The assessment considered factors such as the progress of the planned initial public offering, previous historical experience with planned liquidity events and external factors impacting the occurrence of a liquidity event. Considering the high level of uncertainty around the number of factors that are outside of the control of the Group and senior management, Management have concluded that a liquidity event was not probable at the period end date.
Key sources of estimation uncertainty are as follows:
Impairment of goodwill
Determining whether goodwill is impaired requires an estimation of the recoverable amount of the cash generating unit to which goodwill has been allocated, which is the higher of the value in use or fair value less costs of disposal. The value in use calculation requires the Group to estimate both the future revenue from the cash generating unit and a suitable discount rate in order to calculate the present value.
A number of factors, many of which the Group has no ability to control, could cause actual results to differ from the estimates and assumptions employed. These factors include:
| – | a prolonged global or regional economic downturn; |
| – | a significant decrease in the demand for the Group’s services; |
| – | a significant adverse change in legal factors or in the business climate; |
| – | an adverse action or assessment by a regulator; and |
| – | successful efforts by our competitors to gain market share in our markets. |
Where the actual future revenues are less than expected, or changes in facts and circumstances which result in a downward revision of future cash flows or an upward revision of the discount rate, a material impairment loss or a further impairment loss may arise.
The key sources of estimation uncertainty in the assessment of goodwill impairment are the assumptions around the discount rates, revenue growth rates and terminal growth rates. The value in use calculation uses the cash flows inferred from budgets or achieved during the period and applies the assumptions above to create a discounted cash flow model. The cash flows do not include restructuring activities that the Group is not yet committed to or significant future investments that will enhance the performance of the assets of the cash generating unit being tested. The recoverable amount is sensitive to the discount rate used as well as the growth rates both growth and terminal. These estimates are most relevant to the testing of goodwill for impairment. The key assumptions used to determine the recoverable amount for the different CGUs, including a sensitivity analysis, are disclosed and further explained in note 13.
121
| Marex Group plc Annual Report 2023 | Strategic Report | Corporate Governance | Financial Statements | |||
|
|
|
|
|
|||
Notes to the Consolidated Financial Statements (continued)
For the Year Ended 31 December 2023
| 5 | Revenue |
Revenues within the scope of IFRS 15 are presented as commission and fee income in the income statement.
Revenues that are not within the scope of IFRS 15 are presented within net trading income, net interest income and net physical commodities income in the income statement.
The below disaggregation shows the revenue by each of the five operating segments. The substantial majority of the Group’s performance obligations for revenues from contracts with clients are satisfied at a point in time. Revenue recognised over time is not material.
| Clearing | Agency and Execution |
Market Making |
Hedging and Investment Solutions |
Corporate | Total | |||||||||||||||||||
| 31 December 2023 |
$m | $m | $m | $m | $m | $m | ||||||||||||||||||
| Commission and fee income |
825.1 | 506.8 | 10.5 | — | — | 1,342.4 | ||||||||||||||||||
| Commission and fee expense |
(588.9 | ) | (33.4 | ) | (15.2 | ) | — | — | (637.5 | ) | ||||||||||||||
| Net commission income/(expense) |
236.2 | 473.4 | (4.7 | ) | — | — | 704.9 | |||||||||||||||||
| Net trading income/(expense) |
1.2 | 62.1 | 182.8 | 165.7 | (0.4 | )1 | 411.4 | |||||||||||||||||
| Interest income/(expense) |
232.9 | 8.7 | (3.9 | ) | — | (116.1 | ) | 121.6 | ||||||||||||||||
| Inter-segmental funding allocations |
(96.7 | ) | (2.7 | ) | (27.0 | ) | (37.6 | ) | 164.0 | — | ||||||||||||||
| Net interest income/(expense) |
136.2 | 6.0 | (30.9 | ) | (37.6 | ) | 47.9 | 121.6 | ||||||||||||||||
| Net physical commodities income |
— | — | 6.7 | — | — | 6.7 | ||||||||||||||||||
| Revenue |
373.6 | 541.5 | 153.9 | 128.1 | 47.5 | 1,244.6 | ||||||||||||||||||
| Clearing | Agency and Execution |
Market Making |
Hedging and Investment Solutions |
Corporate | Total | |||||||||||||||||||
| 31 December 2022 (Restated2) |
$m | $m | $m | $m | $m | $m | ||||||||||||||||||
| Commission and fee income |
424.7 | 220.7 | 5.6 | — | — | 651.0 | ||||||||||||||||||
| Commission and fee expense |
(280.0 | ) | (13.6 | ) | (5.6 | ) | — | — | (299.2 | ) | ||||||||||||||
| Net commission income/(expense) |
144.7 | 207.1 | — | — | — | 351.8 | ||||||||||||||||||
| Net trading income/(expense) |
— | 18.4 | 179.1 | 128.2 | (0.4 | ) | 325.3 | |||||||||||||||||
| Interest income/(expense) |
70.6 | 6.1 | (1.4 | ) | — | (45.9 | ) | 29.4 | ||||||||||||||||
| Inter-segmental funding allocations |
(15.3 | ) | (0.9 | ) | (9.7 | ) | (28.2 | ) | 54.1 | — | ||||||||||||||
| Net interest income/(expense) |
55.3 | 5.2 | (11.1 | ) | (28.2 | ) | 8.2 | 29.4 | ||||||||||||||||
| Net physical commodities income |
— | — | 4.6 | — | — | 4.6 | ||||||||||||||||||
| Revenue |
200.0 | 230.7 | 172.6 | 100.0 | 7.8 | 711.1 | ||||||||||||||||||
| 1. | Fair value movement.. |
| 2. | The Group changed its reporting segments during 2023; as such segment information for the comparative periods have been restated. Refer to note 6 segmental analysis for further detail. |
Clearing provides connectivity between clients, exchanges and clearing houses across four principal markets: metals, agriculture, energy and financial products.
Agency and Execution provides services primarily across two core markets: energy and financial securities. Revenue for 2023 can be split as follows: energy $219.8m (2022: $140.4m) and financial securities $319.8m (2022: $88.7m).
Market Making operates within four principal markets: metals, agriculture, energy and financial securities. Revenue for 2023 can be split as follows: metals $69.3m (2022: $88.7m), agriculture $27.5m (2022: $20.3m), energy $31.6m (2022: $52.1m) and financial securities $25.5m (2022: $11.5m).
Hedging and Investment Solutions provides high quality bespoke hedging and investment solutions across two core markets: hedging solutions and financial products. Revenue for 2023 can be split as follows: hedging solutions $62.0m (2022: $52.4m) and financial products $66.1m (2022: $47.6m).
Corporate net interest income is derived through earning interest on house cash balances placed at banks and exchanges. Income for 2023 was $47.5m (2022: $7.8m).
Contract assets
There were no assets that meet the definition of a contract asset as at 31 December 2023 (2022: $nil).
122
| Marex Group plc Annual Report 2023 | Strategic Report | Corporate Governance | Financial Statements | |||
|
|
|
|
|
|||
| 6 | Segmental Analysis |
Operating segments information is presented in a manner consistent with the internal reporting provided to the Chief Operating Decision Maker (‘CODM’). The CODM, who is responsible for allocating resources and assessing performance, has been identified as the Group’s Executive Committee. The CODM regularly reviews the Group’s operating results in order to assess performance and to allocate resources. The accounting policies of the operating segments are the same as the Group’s accounting policies.
Adjusted operating profit/(loss) is the segments performance measure and excludes income and expenses that are not considered directly related to the performance of our segments as detailed in the reconciliation below.
During 2023, the Group changed its internal reporting. Previously the Group did not include a Corporate segment as a separately reportable segment. The Group’s Executive Committee responsible for allocating resources and assessing performance now receives information which incorporates a Corporate segment. The Corporate segment represents the central functions of the Group grouping together the income and costs relating to finance, treasury, tax, IT, risk, compliance, legal, marketing, human resources and executive management. Also, as part of the changes in internal reporting, there were some minor reallocation of desks between the segments. The prior year’s segment information has been restated accordingly.
For management purposes, the Group is organised into the following operating segments, based on the services provided, as follows:
| – | Clearing – the interface between exchanges and clients. The Group provides the connectivity that allows its clients access to exchanges and central clearing houses. As clearing members, the Group acts as principal on behalf of its clients and generates revenue on a commission per trade basis. The Group provides clearing services across four principal markets: metals, agricultural products, energy and financial securities markets across different geographies. |
| – | Agency and Execution – The Group matches buyers and sellers on an agency basis by facilitating price discovery primarily across energy and financial securities markets. The Agency and Execution segment primarily generates revenue on a commission per trade basis without material credit or market risk exposure. In addition to listed products that trade directly on exchanges, many of the Group’s markets are traded on an OTC basis. |
| – | Market Making – The Group acts as principal to provide direct market pricing to professional and wholesale counterparties, primarily metals, agriculture, energy and financial securities markets. The Market Making segment primarily generates revenue through charging a spread between buying and selling prices, without taking significant proprietary risk. The Market Making operations are diversified across geographies and asset classes. |
| – | Hedging and Investment Solutions – The Group offers bespoke hedging and investment solutions to its clients and generates revenue through a return built into the product pricing. Tailored hedging solutions allow producers and consumers of commodities to hedge their exposure to movements in market prices, as well as exchange rates, across a variety of different time horizons. |
| – | The Corporate segment includes the Group’s control and support functions: finance, treasury, IT, risk, compliance, legal, human resources and executive management to support the operating segments. Corporate manages the resources of the Group, makes investment decisions and provides operational support to the business segments. Corporate manages the Group’s funding requirements, interest expense is incurred through debt securities issuance, which is charged to other segments thorough inter-segmental funding allocations to reflect their consumption of these resources. Interest Income is derived from interest on in-house cash balances. The adjusted operating loss includes the expenses related to costs of the functions that are not recovered from the operating segments and corporate costs. |
Segment information for the year ended 31 December 2023:
| Clearing | Agency and Execution |
Market Making |
Hedging and Investment Solutions |
Corporate | Total | |||||||||||||||||||
| $m | $m | $m | $m | $m | $m | |||||||||||||||||||
| Net commission income/(expense) |
236.2 | 473.4 | (4.7 | ) | — | — | 704.9 | |||||||||||||||||
| Net trading income/(expense) |
1.2 | 62.1 | 182.8 | 165.7 | (0.4 | ) | 411.4 | |||||||||||||||||
| Interest income/(expense) |
232.9 | 8.7 | (3.9 | ) | — | (116.1 | ) | 121.6 | ||||||||||||||||
| Inter-segmental funding allocations1 |
(96.7 | ) | (2.7 | ) | (27.0 | ) | (37.6 | ) | 164.0 | — | ||||||||||||||
| Net interest income/(expense) |
136.2 | 6.0 | (30.9 | ) | (37.6 | ) | 47.9 | 121.6 | ||||||||||||||||
| Net physical commodities income |
— | — | 6.7 | — | — | 6.7 | ||||||||||||||||||
| Revenue |
373.6 | 541.5 | 153.9 | 128.1 | 47.5 | 1,244.6 | ||||||||||||||||||
| Adjusted operating profit/(loss) |
185.0 | 71.9 | 33.3 | 33.8 | (94.0 | ) | 230.0 | |||||||||||||||||
| Other segment information |
||||||||||||||||||||||||
| Depreciation and amortisation |
(0.3 | ) | (0.8 | ) | (0.3 | ) | (0.3 | ) | (25.4 | ) | (27.1 | ) | ||||||||||||
| Compensation and benefits |
(88.2 | ) | (368.1 | ) | (72.7 | ) | (51.0 | ) | (190.3 | ) | (770.3 | ) | ||||||||||||
| 1. | The Inter-segmental funding allocation represents the interest costs borne by the Group, excluding interest earned centrally on house cash balances, which is subsequently recharged to the business segments. The recharge is based on the funding requirements of each business. |
123
| Marex Group plc Annual Report 2023 | Strategic Report | Corporate Governance | Financial Statements | |||
|
|
|
|
|
|||
Notes to the Consolidated Financial Statements (continued)
For the Year Ended 31 December 2023
| 6 | Segmental Analysis (continued) |
Segment information for the year ended 31 December 2022:
| Clearing | Agency and Execution |
Market Making |
Hedging and Investment Solutions |
Corporate | Total | |||||||||||||||||||||||||||||||||||||||
| $m | $m | $m | $m | $m | $m | |||||||||||||||||||||||||||||||||||||||
| Restated | Restated | Restated | Restated | Restated | Restated | |||||||||||||||||||||||||||||||||||||||
| Net commission income/(expense) |
144.7 | 207.1 | — | — | — | 351.8 | ||||||||||||||||||||||||||||||||||||||
| Net trading income/(expense) |
— | 18.4 | 179.1 | 128.2 | (0.4 | ) | 325.3 | |||||||||||||||||||||||||||||||||||||
| Interest income/(expense) |
70.6 | 6.1 | (1.4 | ) | — | (45.9 | ) | 29.4 | ||||||||||||||||||||||||||||||||||||
| Inter-segmental funding allocations |
(15.3 | ) | (0.9 | ) | (9.7 | ) | (28.2 | ) | 54.1 | — | ||||||||||||||||||||||||||||||||||
| Net interest income/(expense) |
55.3 | 5.2 | (11.1 | ) | (28.2 | ) | 8.2 | 29.4 | ||||||||||||||||||||||||||||||||||||
| Net physical commodities income |
— | — | 4.6 | — | — | 4.6 | ||||||||||||||||||||||||||||||||||||||
| Revenue |
200.0 | 230.7 | 172.6 | 100.0 | 7.8 | 711.1 | ||||||||||||||||||||||||||||||||||||||
| Adjusted operating profit/(loss) |
77.5 | 23.4 | 66.5 | 27.8 | (73.5 | ) | 121.7 | |||||||||||||||||||||||||||||||||||||
| Other segment information |
||||||||||||||||||||||||||||||||||||||||||||
| Depreciation and amortisation |
(0.3 | ) | (0.2 | ) | (0.3 | ) | (0.1 | ) | (12.9 | ) | (13.8 | ) | ||||||||||||||||||||||||||||||||
| Compensation and benefits |
(55.8 | ) | (162.3 | ) | (75.3 | ) | (40.9 | ) | (104.3 | ) | (438.6 | ) | ||||||||||||||||||||||||||||||||
The goodwill impairment of $53.9m during 2022 was incurred in the Energy business within the Agency and Execution segment.
Reconciliation of total segments adjusted operating profit to the Group’s profit before tax per the income statement:
| 2023 | 2022 | |||||||
| $m | $m | |||||||
| Total segments adjusted operating profit |
230.0 | 121.7 | ||||||
| Goodwill impairment charges(a) |
(10.7 | ) | (53.9 | ) | ||||
| Acquisition costs(b) |
(1.8 | ) | (11.5 | ) | ||||
| ED&F Capital Markets – bargain purchase gain(c) |
0.3 | 71.6 | ||||||
| Owner fees(d) |
(6.0 | ) | (3.4 | ) | ||||
| Amortisation of acquired brands and customer lists(e) |
(2.1 | ) | (1.7 | ) | ||||
| Activities in relation to shareholders(f) |
(3.1 | ) | (0.5 | ) | ||||
| IPO preparation costs(g) |
(10.1 | ) | (0.7 | ) | ||||
| Profit before tax (as reported) |
196.5 | 121.6 | ||||||
| (a) | 2023 relates to the impairment charge recognised for Volatility Performance Fund S.A. CGU (‘VPF’) largely due to declining projected revenue. 2022 relates to the impairment charge recognised for the OTC Energy CGU largely due to declining budgeted performance and macroeconomic factors, such as high inflation and interest rates. See note 13 for further details. |
| (b) | Costs such as legal fees, incurred in relation to the business acquisitions of ED&F Man Capital Markets division, OTCex SA Group and Cowen’s Prime Services and Outsourced Trading business. |
| (c) | A bargain purchase gain was recognised as a result of the ED&F Man Capital Markets division acquisition. See note 18. |
| (d) | Owner fees relate to management services to parties associated with the ultimate controlling party based on a percentage of the Group’s profitability. These fees will no longer apply once the Group is listed. |
| (e) | This represents the amortisation charge for the year of acquired brands and customers lists. |
| (f) | Primarily comprise of dividend like contributions made to participants within the share-based payments schemes. In prior years, this balance was presented as part of amortisation of acquired brands and customer lists. Given the increase of the balance in 2023, it has been reclassified out of the line item and now presented separately. |
| (g) | This represents IPO related costs, which include consulting, legal and audit fees. |
124
| Marex Group plc Annual Report 2023 | Strategic Report | Corporate Governance | Financial Statements | |||
|
|
|
|
|
|||
| 6 | Segmental Analysis (continued) |
The Group’s Revenue and non-current assets by subsidiary company’s country of domicile is as follows. In presenting geographical information, revenue is based on the geographic location of the legal entity where the customers’ revenue is recorded. Non-current assets are based on the geographic location of the legal entity where the assets are recorded.
| Revenue | Non-current assets | |||||||||||||||||||
| 2023 | 2022 | 2023 | 2022 | |||||||||||||||||
| $m | $m | $m | $m | |||||||||||||||||
| United Kingdom |
607.2 | 414.4 | 234.7 | 194.5 | ||||||||||||||||
| United States |
422.0 | 238.1 | 46.3 | 47.1 | ||||||||||||||||
| Rest of the world |
215.4 | 58.6 | 12.0 | 7.0 | ||||||||||||||||
| Total |
1,244.6 | 711.1 | 293.0 | 248.6 | ||||||||||||||||
The balances in Rest of the world mainly consist of those from countries in Europe and the Asia Pacific region, none of which are individually material for separate disclosure.
Non-current assets for this purpose consist of goodwill, intangible assets, property, plant and equipment, right-of-use assets, investments, and investment in associate.
| 7 | Auditor’s Remuneration |
The analysis of the auditor’s remuneration is as follows:
| 2023 | 2022 | |||||||
| $m | $m | |||||||
| Fees payable to the auditor of the Group and their associates for the audit of the annual accounts |
||||||||
| Audit of the Group’s annual accounts |
1.6 | 0.9 | ||||||
| Audit of the Company’s subsidiaries |
5.4 | 1.8 | ||||||
| Audit of the Group’s financial statements for the three years 2023, 2022 and 2021 under PCAOB standards for inclusion in an SEC registration |
3.7 | 0.3 | ||||||
| Total audit fees payable to the Group’s auditor and their associates |
10.7 | 3.0 | ||||||
| Fees payable to other auditors for the audit of the Group’s annual accounts |
— | 0.4 | ||||||
| Fees payable to other auditors for the audit of subsidiaries’ financial statements |
0.7 | 0.6 | ||||||
| Total audit fees |
11.4 | 4.0 | ||||||
| 2023 | 2022 | |||||||
| $m | $m | |||||||
| Fees payable to the auditors of the Group and their associates for other services comprise: |
||||||||
| Audit-related assurance services |
0.2 | 0.1 | ||||||
| Total non-audit fee |
0.2 | 0.1 | ||||||
Audit fees for the Company for the year ended 31 December 2023 and the prior year were paid by another group undertaking.
125
| Marex Group plc Annual Report 2023 | Strategic Report | Corporate Governance | Financial Statements | |||
|
|
|
|
|
|||
Notes to the Consolidated Financial Statements (continued)
For the Year Ended 31 December 2023
| 8 | Interest income and expense |
| 2023 | 2022 | |||||||
| $m | $m | |||||||
| Interest income |
||||||||
| Financial institutions (1) |
242.0 | 106.1 | ||||||
| Exchanges (2) |
235.0 | 27.2 | ||||||
| Securities (3) |
97.5 | 51.0 | ||||||
| Clients (4) |
17.3 | 10.1 | ||||||
| 591.8 | 194.4 | |||||||
| Interest expense |
||||||||
| Clients (5) |
(194.8 | ) | (19.9 | ) | ||||
| Borrowings and debt issued (6) |
(179.8 | ) | (59.7 | ) | ||||
| Exchanges (7) |
(26.1 | ) | (28.9 | ) | ||||
| Securities (8) |
(67.1 | ) | (55.5 | ) | ||||
| Lease interest expense |
(2.4 | ) | (1.0 | ) | ||||
| (470.2 | ) | (165.0 | ) | |||||
| Net interest income |
121.6 | 29.4 | ||||||
| 1. | Interest income from financial institutions includes interest earned from banks from cash and cash equivalents on client money (see note 34) and the Group’s own cash and cash equivalents. |
| 2. | Interest income from deposits placed at exchanges, clearing houses, and intermediary brokers placed at these counterparties to facilitate transactional activity. Interest income is calculated using a deposit rate linked to the benchmark interest rates. |
| 3. | Securities interest income arises from securities purchased under agreements to resell, repurchase and stock borrowing activities. |
| 4. | Interest income from clients is the result of credit lines offered to clients. |
| 5. | Interest expense includes interest paid to clients on cash deposited with the Group by clients. |
| 6. | Interest expense from debt securities includes the interest component on structured notes and the coupons for the EMTN issuance. Interest expense from EMTN notes was $33.4m (2022: $nil) and interest expense on structured notes was $142.2m (2022: $55.1m). Structured notes are measured at fair value through profit or loss. |
| 7. | Interest expense from balances placed at exchanges, clearing houses, and intermediary brokers placed at these counterparties to facilitate transactional activity. Interest expense is calculated using an internal deposit rate linked to the benchmark interest rates. |
| 8. | Securities interest expense arises from securities sold under agreements to repurchase and stock lending activities. |
| 9 | Compensation and benefits |
| 2023 | 2022 | |||||||
| Number | Number | |||||||
| Front Office |
1,028 | 695 | ||||||
| Control and Support |
886 | 546 | ||||||
| Average monthly number of staff |
1,914 | 1,241 | ||||||
| 2023 | 2022 | |||||||
| $m | $m | |||||||
| Wages and salaries |
680.0 | 382.5 | ||||||
| Share-based compensation expense |
20.3 | 16.7 | ||||||
| Employer’s national insurance contributions and similar taxes |
43.2 | 26.7 | ||||||
| Short-term monetary benefits |
15.6 | 7.3 | ||||||
| Defined contribution pension cost |
8.9 | 3.8 | ||||||
| Apprenticeship levy |
0.7 | 0.4 | ||||||
| Redundancy payments |
1.6 | 1.2 | ||||||
| Total staff costs |
770.3 | 438.6 | ||||||
As at 31 December 2023, there were contributions totaling $1.6m (2022: $1.2m) payable to the defined contribution pension scheme by the Group.
126
| Marex Group plc Annual Report 2023 | Strategic Report | Corporate Governance | Financial Statements | |||
|
|
|
|
|
|||
| 10 | Other expenses |
| 2023 | 2022 | |||||||
| $m | $m | |||||||
| Professional fees |
61.4 | 44.1 | ||||||
| Non-trading technology and support |
45.8 | 36.7 | ||||||
| Trading systems and market data |
54.6 | 25.2 | ||||||
| Occupancy and equipment rental |
23.0 | 11.8 | ||||||
| Travel and business development |
20.6 | 10.2 | ||||||
| Communications |
7.4 | 8.1 | ||||||
| Bank costs |
5.4 | 4.1 | ||||||
| Owner fees |
6.0 | 3.4 | ||||||
| VAT (irrecoverable) |
2.7 | 1.7 | ||||||
| Other |
10.5 | 2.5 | ||||||
| 237.4 | 147.8 | |||||||
| 11 | Tax |
(a) Tax expense
| 2023 | 2022 | |||||||||||
| Notes | $m | $m | ||||||||||
| Current tax |
||||||||||||
| UK corporation tax on profit for the year |
38.9 | 19.0 | ||||||||||
| Foreign corporation tax on profit for the year |
23.1 | 4.8 | ||||||||||
| Total UK and Foreign corporation tax |
62.0 | 23.8 | ||||||||||
| Adjustment in respect of prior years: |
||||||||||||
| UK corporation tax |
0.9 | 0.8 | ||||||||||
| Foreign corporation tax |
1.0 | (0.1 | ) | |||||||||
| Total adjustments in respect of prior years |
1.9 | 0.7 | ||||||||||
| 63.9 | 24.5 | |||||||||||
| Deferred tax |
||||||||||||
| Origination and reversal of temporary differences |
(9.3 | ) | (1.0 | ) | ||||||||
| Adjustment in respect of prior years – other |
0.6 | (0.1 | ) | |||||||||
| 24 | (8.7 | ) | (1.1 | ) | ||||||||
| Tax expense for the year |
11(b) | 55.2 | 23.4 | |||||||||
| Deferred tax charge relating to items recognised in OCI |
||||||||||||
| Items that may be reclassified subsequently to profit and loss |
0.3 | 0.5 | ||||||||||
| Items that will not be recycled to profit and loss |
(1.4 | ) | (1.5 | ) | ||||||||
| (1.1 | ) | (1.0 | ) | |||||||||
| Deferred tax expense relating to items recognised in Equity |
(2.4 | ) | — | |||||||||
127
| Marex Group plc Annual Report 2023 | Strategic Report | Corporate Governance | Financial Statements | |||
|
|
|
|
|
|||
Notes to the Consolidated Financial Statements (continued)
For the Year Ended 31 December 2023
| 11 | Tax (continued) |
(b) Reconciliation between tax expense and profit before tax
The Group’s reconciliation between the tax expense and profit before tax is based on its domestic UK tax rate. The tax assessed for the year is higher (2022: higher) than the standard rate of corporation tax in the UK of 23.50% (2022: 19.0%). This is driven by material non-deductible acquisition and IPO preparation expenses incurred during the year, non-deductible goodwill adjustments and prior year adjustments booked in respect of 2022 tax returns filed during the year. This is offset by deductions taken in respect of the Group’s AT1 securities issuance in June 2022. Under IAS12, whilst the coupon on the AT1 is taken to equity, the related tax relief is recognised in profit and loss which generates a material tax reconciling item. The headline rate of UK corporation tax increased from 19% to 25% on 1 April 2023 which results in a blended effective rate of 23.50% for the year and 25% for future periods.
The Group’s future tax expense will be sensitive to the geographic mix of profits earned, the tax rates in force and changes to the tax rules in the jurisdictions in which the Group operates. In particular, the Group is closely monitoring developments in relation to Pillar Two of the OECD Base Erosion and Profit Shifting Project around a global minimum tax rate of 15%. In December 2021, the OECD released the Pillar Two model rules, also referred to as the ‘Global Anti-Base Erosion’ or ‘GLOBE’ rules. Several jurisdictions in which the Group operates have adopted the OECD rules including the UK and France who have both transposed the rules into their respective tax legislation effective for years beginning on or after 31 December 2023. The Group is expected to meet the criteria to be subject to these rules. The Group currently has trading operations in the following low tax jurisdictions with an IAS 12 Effective Tax Rate (‘ETR’) below 15%: Ireland and the UAE. Ireland and the UAE are both subject to tax at a headline rate of less than 15% however in 2023 these operations did not form a material part of the overall Group revenue. As such, at this time and as currently drafted, it is not expected that the rules will have a material impact on the Group, although there will be an additional compliance burden at Group level as a result of their introduction
The Group has applied the exception to recognising and disclosing information about deferred tax assets and liabilities related to Pillar Two income taxes.
| 2023 | 2022 | |||||||
| $m | $m | |||||||
| Profit before tax |
196.5 | 121.6 | ||||||
| Expected tax expense based on the standard rate of corporation tax in the UK of 23.50% (2022: 19.00%) |
46.2 | 23.1 | ||||||
| Explained by: |
||||||||
| Effect of overseas tax rates |
0.7 | 1.0 | ||||||
| Income not subject to tax |
(0.7 | ) | (0.2 | ) | ||||
| Expenses not deductible for tax purposes |
4.7 | 4.2 | ||||||
| Non (taxable)/deductible goodwill adjustments |
2.5 | (2.3 | ) | |||||
| Movements in deferred tax not recognised |
2.9 | (1.0 | ) | |||||
| Deductible payments on AT1 securities |
(3.1 | ) | (1.3 | ) | ||||
| Tax rate change |
(0.5 | ) | (0.8 | ) | ||||
| Prior year adjustments |
2.5 | 0.7 | ||||||
| Tax expense for the year |
55.2 | 23.4 | ||||||
| 12 | Dividends Paid and Proposed |
Dividends of $45.0m were paid to ordinary shareholders during the year ended 31 December 2023 (2022: $nil). Dividends per weighted number of shares amount to $0.22 (2022: $nil). No dividend has been proposed at the year end (2022: $nil).
Refer to note 30 for dividends paid to holders of Additional Tier 1 securities.
128
| Marex Group plc Annual Report 2023 | Strategic Report | Corporate Governance | Financial Statements | |||
|
|
|
|
|
|||
| 13 | Goodwill |
| 2023 | 2022 | |||||||
| $m | $m | |||||||
| Cost |
||||||||
| At 1 January |
220.4 | 219.9 | ||||||
| Additions during the year |
18.8 | 0.5 | ||||||
| Cost at 31 December |
239.2 | 220.4 | ||||||
| Impairment losses at 1 January |
(64.9 | ) | (11.0 | ) | ||||
| Impairment of Energy CGU |
— | (53.9 | ) | |||||
| Impairment of Volatility Performance Fund S.A. CGU |
(10.7 | ) | — | |||||
| Net book value at 31 December |
163.6 | 155.5 | ||||||
(a) Goodwill impairment testing
For the purpose of impairment testing, goodwill has been allocated to the CGUs which represent the level at which goodwill is monitored and managed:
| 2023 | 2022 | |||||||
| $m | $m | |||||||
| Group goodwill by CGU: |
||||||||
| Energy |
83.7 | 78.4 | ||||||
| CSC Commodities UK Limited |
20.6 | 20.6 | ||||||
| Agriculture |
11.4 | 11.4 | ||||||
| Volatility Performance Fund S.A. |
— | 10.7 | ||||||
| Rosenthal Collins Group |
10.5 | 10.5 | ||||||
| Volcap Trading Partners Limited |
7.8 | 7.8 | ||||||
| X-Change Financial Access LLC |
6.1 | 6.1 | ||||||
| Recycled Metals |
4.6 | 4.2 | ||||||
| ProTrader |
3.3 | 3.3 | ||||||
| Marex Spectron Europe Limited |
2.0 | 2.0 | ||||||
| Arfinco S.A. |
0.5 | 0.5 | ||||||
| OTCex SA Group |
12.5 | — | ||||||
| Cowen’s Prime Services and Outsourced Trading Business |
0.6 | — | ||||||
| As at 31 December |
163.6 | 155.5 | ||||||
The Group performed the annual impairment test as at 1 October 2023 and 30 September 2022. Between annual tests the Group reviews each CGU for impairment triggers that could adversely impact the valuation of the CGU and, if necessary, undertakes additional impairment testing. In assessing whether an impairment is required, the carrying value of the CGU is compared with the recoverable amount, which is determined by calculating both the fair value less cost of disposal (‘FVLCD’) and the value in use (‘VIU’). The higher of these two amounts is compared with the carrying value of the CGU. If either the VIU or the FVLCD is higher than the carrying value, no impairment is necessary.
During the year the acquisition of OTCex Group companies (HPC SA, OTCex Hong Kong, OTCex LLC) and Cowen’s Prime Services and Outsourced Trading business generated goodwill amounting to $12.5m and $0.6m, respectively.
During 2023, the Group renamed the former CGU, Tangent Trading Holdings Limited, to Recycled Metals. This accommodated the acquisition of Global Metals Network Limited (‘GMN’), the recycled metals market maker based in Hong Kong. The increase in goodwill of $0.4m associated with the Recycled Metals CGU relates solely to the acquisition of GMN.
The Group recorded additional goodwill of $5.3m during 2023 within the Energy CGU related to the initial purchase price allocation for the acquisition of Eagle Energy Brokers LLC (‘Eagle’).
An impairment of goodwill was recorded during the year. The impairment charge was recognised against Volatility Performance Fund S.A. CGU (‘VPF’). VPF’s projected future net revenues as well as the growth assumptions were based upon the most recent performance. Notwithstanding a good overall performance in 2022, 2023 proved to be a particularly challenging year for VPF, ultimately resulting in a loss. The recoverable amount of VPF of $6.4m based on its VIU was determined to be lower than its carrying value of $17.1m and an impairment charge of $10.7m was recognised due to the combination of projected performance and macro-economic factors.
As at 31 December 2023, the review of the indicators of impairment did not require any further testing.
129
| Marex Group plc Annual Report 2023 | Strategic Report | Corporate Governance | Financial Statements | |||
|
|
|
|
|
|||
Notes to the Consolidated Financial Statements (continued)
For the Year Ended 31 December 2023
| 13 | Goodwill (continued) |
(b) Key assumptions
| – | The fair value less cost of disposal is determined by applying a price earnings multiple to the post-tax earnings of each CGU arising in the period and for the effect of any organisational changes to the CGU. The price earnings multiples applied are derived from comparable peer companies. |
| – | Comparable peers are those against whom our stakeholders evaluate our performance, whilst the price earnings multiples are obtained from third party market data providers. The provision of data from third party data sources, such as Bloomberg, would suggest that this data and therefore any valuation conducted using this data would contain only observable market data. However, management applies a level of judgement in the application of this data and in determining the price earnings multiple. |
| – | In assessing the VIU, a discounted cash flow model is used covering a 5 year projected period, which drives the valuation of the CGUs. VIU was calculated using post-tax discount rates and post-tax cash flows. An equivalent pre-tax discount rate was determined. Future projections are based on the most recent financial projections considered by the Board of Directors as at the valuation date which are used to project post-tax cash flows for the next 5 years. After this period a steady cash flow is used to derive a terminal value for the CGU. |
| – | The stable terminal growth rate of all CGUs was expected to be 2% and has been used to approximate an inflationary increase. |
| – | Discount rates represent the current market assessment of the risks specific to each CGU, taking into consideration the time value of money and individual risks of the underlying assets that have not been incorporated in the cash flow estimates. The discount rate calculation is based on the market assessment of the weighted average cost of capital derived from observable inputs at the valuation date. |
The following inputs represent key assumptions for each CGU in 2023:
| CGU: |
Valuation discount rate |
Breakeven discount rate |
Valuation revenue growth rate |
Breakeven revenue growth rate |
Breakeven terminal value growth rate |
|||||||||||||||
| Energy |
12.9% | 35.5% | 0.8% | (8.9% | ) | (52.3% | ) | |||||||||||||
| CSC Commodities UK Limited |
12.9% | 16.7% | 3.2% | 1.0% | (2.1% | ) | ||||||||||||||
| Agriculture |
12.9% | 43.2% | 2.4% | (10.2% | ) | (157.2% | ) | |||||||||||||
| Volatility Performance Fund S.A. |
9.7% | 4.9% | 3.2% | 8.7% | 5.8% | |||||||||||||||
| Rosenthal Collins Group |
11.1% | 150.8% | 1.2% | 0.2% | n.m.1 | |||||||||||||||
| Volcap Trading Partners Limited |
12.9% | 42.2% | 3.2% | (11.6% | ) | (132.3% | ) | |||||||||||||
| X-Change Financial Access LLC |
11.0% | 17.6% | 2.0% | (0.5% | ) | (4.9% | ) | |||||||||||||
| Recycled Metals |
12.9% | 14.1% | 3.2% | 3.4% | 0.7% | |||||||||||||||
| ProTrader |
13.0% | 345.5% | 1.8% | (3.1% | ) | n.m. | 1 | |||||||||||||
| Marex Spectron Europe Limited |
9.0% | 19.8% | 3.2% | 2.5% | (15.5% | ) | ||||||||||||||
| Arfinco S.A. |
9.7% | 12.0% | 2.4% | 1.3% | (0.1% | ) | ||||||||||||||
| OTCex SA Group |
10.3% | 11.4% | 3.2% | 3.1% | 1.0% | |||||||||||||||
| Cowen’s Prime Services and |
||||||||||||||||||||
| Outsourced Trading Business |
10.5% | 19.8% | 3.3% | 0.9% | (11.0% | ) | ||||||||||||||
| 1. | not meaningful |
The other assumption for the VIU calculation is that total direct costs are expected to grow by 3.2% over the 5 year projected period for all CGUs, with the exception of Cowen’s Prime Services and Outsourced Trading Business and OTCex SA Group, where total direct costs are expected to grow by only 1.1% and 2.2%, respectively; driven by inflation in the near term.
130
| Marex Group plc Annual Report 2023 | Strategic Report | Corporate Governance | Financial Statements | |||
|
|
|
|
|
|||
| 13 | Goodwill (continued) |
The following inputs represent key assumptions for each CGU in 2022:
| CGU: |
Valuation discount rate |
Breakeven discount rate |
Valuation revenue growth rate |
Breakeven revenue growth rate |
Breakeven terminal value growth rate |
|||||||||||||||
| Energy2 |
14.6% | n.m. | 0.8% | n.m. | n.m. | |||||||||||||||
| CSC Commodities UK Limited |
14.5% | 24.6% | 4.7% | (1.5% | ) | (12.0% | ) | |||||||||||||
| Agriculture |
14.5% | 49.3% | 2.4% | (14.3% | ) | (1115.5% | ) | |||||||||||||
| Volatility Performance Fund S.A. |
9.9% | 13.4% | 5.0% | 2.9% | (3.3% | ) | ||||||||||||||
| Rosenthal Collins Group (‘RCG’) |
11.1% | 15.3% | 4.0% | 1.8% | (2.6% | ) | ||||||||||||||
| Volcap Trading Partners Limited |
14.5% | 31.6% | 3.2% | (6.3% | ) | (30.5% | ) | |||||||||||||
| X-Change Financial Access LLC |
11.6% | 34.5% | 2.0% | (2.7% | ) | (34.0% | ) | |||||||||||||
| Recycled Metals |
14.5% | 35.7% | 2.7% | (7.0% | ) | (49.4% | ) | |||||||||||||
| ProTrader |
14.3% | 27.1% | 7.9% | 3.8% | (18.4% | ) | ||||||||||||||
| Marex Spectron Europe Limited |
11.6% | 13.4% | 6.0% | 5.0% | (0.2% | ) | ||||||||||||||
| Arfinco S.A. |
13.9% | 26.7% | 3.2% | (9.4% | ) | (14.1% | ) | |||||||||||||
| 2. | In 2022 an impairment charge of $53.9m was recognised in relation to the Energy CGU. As a result the breakeven rates have not been considered relevant and therefore have not been disclosed. |
The impact on future cash flows resulting from falling growth rates does not reflect any management actions that would be taken.
| 14 | Intangible Assets |
| Customer Relationships1 |
Brands | Software (Restated2) |
Total (Restated2) |
|||||||||||||
| $m | $m | $m | $m | |||||||||||||
| Cost |
||||||||||||||||
| At 1 January 2022 |
14.3 | 0.9 | 19.4 | 34.6 | ||||||||||||
| Additions on acquisitions |
3.2 | 0.1 | 1.1 | 4.4 | ||||||||||||
| Additions |
— | — | 5.8 | 5.8 | ||||||||||||
| Disposals |
— | (0.7 | ) | — | (0.7 | ) | ||||||||||
| At 31 December 2022 |
17.5 | 0.3 | 26.3 | 44.1 | ||||||||||||
| Additions on acquisitions |
32.1 | 1.8 | 0.2 | 34.1 | ||||||||||||
| Additions |
— | — | 3.1 | 3.1 | ||||||||||||
| Disposals |
— | — | (0.1 | ) | (0.1 | ) | ||||||||||
| At 31 December 2023 |
49.6 | 2.1 | 29.5 | 81.2 | ||||||||||||
| Impairment losses and amortisation |
||||||||||||||||
| At 1 January 2022 |
1.7 | 0.1 | 11.3 | 13.1 | ||||||||||||
| Amortisation charge |
1.6 | 0.1 | 3.8 | 5.5 | ||||||||||||
| Disposals |
— | (0.1 | ) | — | (0.1 | ) | ||||||||||
| At 31 December 2022 |
3.3 | 0.1 | 15.1 | 18.5 | ||||||||||||
| Amortisation charge |
2.1 | — | 4.6 | 6.7 | ||||||||||||
| Disposals |
— | — | — | — | ||||||||||||
| At 31 December 2023 |
5.4 | 0.1 | 19.7 | 25.2 | ||||||||||||
| Net book value |
||||||||||||||||
| At 31 December 2023 |
44.2 | 2.0 | 9.8 | 56.0 | ||||||||||||
| At 31 December 2022 |
14.2 | 0.2 | 11.2 | 25.6 | ||||||||||||
| 1. | Customer relationships, with a net book value of $44.2m (2022: $14.2m), mainly relate to the acquisitions of RCG $2.0m (2022: $2.4m), Volcap $4.2m (2022: $4.8m), XFA $3.5m (2022: $4.0m), Eagle Commodities $5.2m (2022: $nil), Cowen’s Prime Service and Outsourced Trading Business $24.4m (2022: $nil) and GMN $2.6m (2022: $nil). The remaining amortisation periods are 5.25 years for RCG, 7.75 years for Volcap, 7 years for XFA, 9.4 years for Eagle Commodities, 10 years for Cowen’s Prime Service and Outsourced Trading Business and 9.4 years for GMN. |
| 2. | As at 31 December 2022, the Group presented within property, plant and equipment an amount of software ($4.0m) as the Group considered the software was integral to the operation of the hardware. The software is separable from hardware and can reside on any infrastructure delivering full functionality, hence it should be presented as intangible assets and the prior period has been restated for this balance. |
131
| Marex Group plc Annual Report 2023 | Strategic Report | Corporate Governance | Financial Statements | |||
|
|
|
|
|
|||
Notes to the Consolidated Financial Statements (continued)
For the Year Ended 31 December 2023
| 15 | Property, Plant and Equipment |
| Leasehold improvements |
Computer equipment & other hardware |
Furniture, fixtures and fittings |
Total (Restated1) |
|||||||||||||
| $m | $m | $m | $m | |||||||||||||
| Cost |
||||||||||||||||
| At 1 January 2022 |
7.5 | 22.3 | 4.6 | 34.4 | ||||||||||||
| Additions on acquisitions |
5.3 | 0.6 | 1.2 | 7.1 | ||||||||||||
| Additions |
1.1 | 2.2 | 0.3 | 3.6 | ||||||||||||
| At 31 December 2022 |
13.9 | 25.1 | 6.1 | 45.1 | ||||||||||||
| Additions on acquisitions |
0.5 | 0.2 | 0.6 | 1.3 | ||||||||||||
| Additions |
3.7 | 3.5 | 1.8 | 9.0 | ||||||||||||
| At 31 December 2023 |
18.1 | 28.8 | 8.5 | 55.4 | ||||||||||||
| Depreciation |
||||||||||||||||
| At 1 January 2022 |
6.3 | 20.2 | 4.0 | 30.5 | ||||||||||||
| Charge for the year |
0.5 | 2.1 | 0.2 | 2.8 | ||||||||||||
| At 31 December 2022 |
6.8 | 22.3 | 4.2 | 33.3 | ||||||||||||
| Charge for the year |
1.5 | 2.4 | 1.6 | 5.5 | ||||||||||||
| At 31 December 2023 |
8.3 | 24.7 | 5.8 | 38.8 | ||||||||||||
| Net book value |
||||||||||||||||
| At 31 December 2023 |
9.8 | 4.1 | 2.7 | 16.6 | ||||||||||||
| At 31 December 2022 |
7.1 | 2.8 | 1.9 | 11.8 | ||||||||||||
| 1. | As at 31 December 2022, the Group presented as property, plant and equipment an amount of software ($4.0m) as the Group considered the software was integral to the operation of the hardware. The software is separable from hardware and can reside on any infrastructure delivering full functionality, hence it should be presented as intangible assets and the prior period has been restated for this balance. |
Property, plant and equipment is measured at cost less accumulated depreciation and impairment. Depreciation of property, plant and equipment begins when they are available for use (i.e. when they are in the location and condition necessary for them to be capable of operating in the manner intended by management). Depreciation is calculated on a straight-line basis over an asset’s estimated useful life. The estimated useful economic lives of the Group’s property, plant and equipment are:
| Leasehold improvements |
over the remaining length of the lease or 5 years straight-line, where appropriate |
|
| Computer equipment and other hardware |
2 to 5 years straight-line | |
| Furniture, fixtures and fittings |
2 to 5 years straight-line | |
| 16 | Investments |
(a) Investments
| 2023 | 2022 | |||||||
| $m | $m | |||||||
| Cost |
||||||||
| At 1 January |
16.4 | 8.9 | ||||||
| Additions |
0.2 | 8.1 | ||||||
| Revaluation of investments held at FVTOCI |
— | (0.6 | ) | |||||
| Change in value of investments held at FVTPL |
(0.4 | ) | — | |||||
| At 31 December |
16.2 | 16.4 | ||||||
| Listed investments |
10.7 | 10.5 | ||||||
| Unlisted investments |
5.5 | 5.9 | ||||||
| At 31 December |
16.2 | 16.4 | ||||||
132
| Marex Group plc Annual Report 2023 | Strategic Report | Corporate Governance | Financial Statements | |||
|
|
|
|
|
|||
| 16 | Investments (continued) |
(a) Investments (continued)
Investments comprise shares and seats held in clearing houses which are deemed relevant to the Group’s trading activities and are classified as FVTOCI financial assets and recorded at fair value, with changes in fair value reported in equity within the revaluation reserve. The fair value for these investments are based on valuations as disclosed in note 33.
(b) Group subsidiaries and undertakings
The subsidiaries of the Company as at 31 December 2023 are as follows:
Subsidiaries held directly
| Name / Registered office |
Country of incorporation/ of business |
Class | Proportion of ownership interest |
Nature of business | ||||
| CSC Commodities UK Limited 155 Bishopsgate, London, EC2M 3TQ1 |
England and Wales | Ordinary Shares | 100% | Services company | ||||
| Marex European Holdings Limited Suite 401, Q House, Furze Road, Sandyford Business Park, Sandyford, Dublin 18 |
Ireland | Ordinary Shares | 100% | Holding company | ||||
| Marex Financial 155 Bishopsgate, London, EC2M 3TQ2 |
England and Wales | Ordinary Shares | 100% | Commodities and financial instruments broker and clearer | ||||
| Marex France SAS 42 rue Washington, 75008 Paris |
France | Ordinary Shares | 100% | Alternative Investment Fund manager | ||||
| Marex Hong Kong Limited 17/F One Island East, Taikoo Place, 18 Westlands Road, Quarry Bay |
Hong Kong | Ordinary Shares | 100% | Futures and options broking | ||||
| Marex North America Holdings Inc. 3411 Silverside Road, Tatnall Building #104, Wilmington, New Castle, Delaware, DE19810 |
United States of America | Ordinary Shares | 100% | Holding company | ||||
| Marex Prime Services Limited 155 Bishopsgate, London, EC2M 3TQ |
England and Wales | Ordinary Shares | 100% | Commodity broker | ||||
| Marex Spectron Europe Limited Suite 401, Q House, Furze Road, Sandyford Business Park, Sandyford, Dublin 183 |
Ireland | Ordinary Shares | 100% | Energy broking | ||||
| Marex Spectron International Limited 155 Bishopsgate, London, EC2M 3TQ4 |
England and Wales | Ordinary Shares | 100% | Energy OTC broking | ||||
| Spectron Services Limited 155 Bishopsgate, London, EC2M 3TQ |
England and Wales | Ordinary Shares | 100% | Services and holding company | ||||
| Tangent Trading Holdings Limited, 155 Bishopsgate, London, EC2M 3TQ |
England and Wales | Ordinary Shares | 100% | Holding company | ||||
| Volatility Performance Fund S.A. 30 Boulevard Royal, 2449 |
Luxembourg | Ordinary Shares | 100% | Fund vehicle | ||||
Branches
| 1. | CSC Commodities UK Limited operates branches in the following countries: |
| – | United States of America – 80 State Street, Albany, New York, NY12207-2543 |
| – | Gibraltar – 28 Irish Town |
| 2. | Marex Financial operates a branch in the following country: |
| – | Israel – 7 Rival Street, Tel-Aviv-Yafo, Israel, 6777840 |
| 3. | Marex Spectron Europe Limited operates branches in the following countries: |
| – | Germany – Hauptstr. 39-41, 63486 Bruchkoebel, Germany |
| – | Spain – Calle Eloy Gonzalo 27, Madrid 28010, Spain |
| 4. | Marex Spectron International Limited operates branches in the following countries: |
| – | Canada (Alberta) – Suite 400, 4th Floor, 110-9th Avenue SW, Calgary, Alberta |
| – | Canada (Québec) – 1250 boulevard René-Lévesque West, 39th Floor. Montréal, Québec, H3B4W8 |
| – | United States of America – 10th Floor, 140 East 45th Street, New York 10017 |
133
| Marex Group plc Annual Report 2023 | Strategic Report | Corporate Governance | Financial Statements | |||
|
|
|
|
|
|||
Notes to the Consolidated Financial Statements (continued)
For the Year Ended 31 December 2023
| 16 | Investments (continued) |
(b) Group subsidiaries and undertakings (continued)
Subsidiaries held indirectly
| Name / Registered office |
Country of incorporation/ of business |
Class | Proportion of ownership interest |
Nature of business | ||||
| Arfinco S.A. 4 Impasse des Gendarmes, 78000, Versailles |
France | Ordinary Shares | 100% | Broker | ||||
| Carlton Commodities 2004 LLP 155 Bishopsgate, London, EC2M 3TQ |
England and Wales | Partnership Interest | N/A | Commodity and option trading | ||||
| Eagle Energy Brokers LLC Brandywine Plaza, 1521 Concord Pike, Suite 201, Wilmington, DE 19803 |
United States of America | Membership Interest | 100% | Energy Broking | ||||
| Eagle Commodities Brokers Limited 155 Bishopsgate, London, EC2M 3TQ |
England and Wales | Ordinary Shares | 100% | Energy Broking | ||||
| Global Metals Network Limited 12/F 239 Hennessy Road, Wanchai, Hong Kong |
Hong Kong | Ordinary Shares | 100% | Recycled Metals Trading | ||||
| HPC Investment Partners France SA 42 Rue Washington, 75008, Paris |
France | Ordinary Shares | 94.594% | Investment Company | ||||
| HPC Investment Services Limited 155 Bishopsgate, London, EC2M 3TQ |
England and Wales | Ordinary Shares | 100% | Investment Company | ||||
| HPC OTCex Asia Pte Ltd 8 Marina View, 33-06 Asia, Tower 1, Singapore, 018960 |
Singapore | Ordinary Shares | 100% | Management Consultancy Services | ||||
| HPC Tel Aviv Ltd 22 Rothschild Blvd., Tel Aviv – Yafo, 6688218, Israel |
Israel | Ordinary Shares | 100% | Investment Management Services | ||||
| Marex Australia Pty Limited Suite 2, Level 13, 88 Philip Street, Sydney, NSW 2000 |
Australia | Ordinary Shares | 100% | Broker and clearer | ||||
| Marex Brazil Participações Ltda. Avenida Selma Parada (Bailarina), 505, nº 802 e 804, Jardim Madalena, CEP 13091-605, Cidade de Campinas, Estado de São Paulo |
Brazil | Ordinary Shares | 100% | Service company | ||||
| Marex Capital Markets Inc. 600 Mamaroneck Avenue, #400, Harrison, NY10528 |
United States of America | Ordinary Shares | 100% | Broker dealer | ||||
| Marex Client Services Inc.5 140 East 45th Street, 10th Floor, New York, NY10017 |
United States of America | Ordinary Shares | 100% | Margin financing | ||||
| Marex Derivative Products Inc.5 3411 Silverside Road, Tatnall Building #104, Wilmington, New Castle, Delaware, DE19810 |
United States of America | Ordinary Shares | 100% | Swap dealer | ||||
| Marex Fund S.A. SICAV-RAIF 30 boulevard Royal, 2449 |
Luxembourg | Ordinary Shares | 100% | Fund vehicle | ||||
| Marex HK Asia Limited Level 54, Hopewell Centre, 183 Queen’s Road East, Hong Kong |
Hong Kong | Ordinary Shares | 100% | Energy Broking | ||||
| Marex Holdings Limited5 Clarendon House, 2 Church Street, Hamilton, HM 11 |
Bermuda | Ordinary Shares | 100% | Holding company | ||||
| Marex International Holdings Limited5 155 Bishopsgate, London, EC2M 3TQ |
England and Wales | Ordinary Shares | 100% | Holding company | ||||
| Marex MENA Limited5 Unit OT 09-33, Level 9, Central Park Offices, Dubai International Financial Centre, United Arab Emirates |
Dubai International Finance Centre | Ordinary Shares | 100% | Investment company | ||||
| Marex Netherlands B.V. Weteringschans 165 C, 1017 XD Amsterdam |
Netherlands | Ordinary Shares | 100% | Environmental product trading | ||||
134
| Marex Group plc Annual Report 2023 | Strategic Report | Corporate Governance | Financial Statements | |||
|
|
|
|
|
|||
| 16 | Investments (continued) |
(b) Group subsidiaries and undertakings (continued)
Subsidiaries held indirectly (continued)
| Name / Registered office |
Country of incorporation/ of business |
Class | Proportion of ownership interest |
Nature of business | ||||
| Marex North America LLC Brandywine Plaza, 1521 Concord Pike, Suite 201, |
United States of America | Membership Interest | 100% | Commodities and financial instruments broker and clearer | ||||
| Marex North America Securities, LLC 3411 Silverside Road, Tatnall Building #104, |
United States of America | Membership Interest | 100% | Broker dealer | ||||
| Marex Professional Trading Services Inc.5 Brandywine Plaza, 1521 Concord Pike, Suite 201, |
United States of America | Ordinary Shares | 100% | Market Making and Foreign exchange trading | ||||
| Marex SA 42 Rue Washington, 75008, Paris, France |
France | Ordinary Shares | 100% | Investment Company | ||||
| Marex Services Inc.5 3411 Silverside Road, Tatnall Building #104, |
United States of America | Ordinary Shares | 100% | Holding and services company | ||||
| Marex Services Limited5 155 Bishopsgate, London, EC2M 3TQ |
England and Wales | Ordinary Shares | 100% | Dormant | ||||
| Marex Spectron Asia Pte. Ltd. 8 Marina View, 33-06 Asia Tower 1, |
Singapore | Ordinary Shares | 100% | Freight broking | ||||
| Marex Spectron USA LLC Brandywine Plaza, 1521 Concord Pike, Suite 201, |
United States of America | Membership interest | 100% | OTC Derivatives | ||||
| Marex Trading International Limited 155 Bishopsgate, London, EC2M 3TQ |
England and Wales | Ordinary Shares | 100% | Trade facilitation | ||||
| Marex US Holdings Inc.5 Brandywine Plaza, 1521 Concord Pike, Suite 201, |
United States of America | Ordinary Shares | 100% | Holding company | ||||
| OTCex Hong Kong Limited Unit 1-3, 31/F, Dah Sing Financial Centre, 248 |
Hong Kong | Ordinary Shares | 100% | Broker Dealer | ||||
| OTCex LLC 608 Fifth Avenue, Suite 602, NY 10020, |
United States of America | Ordinary Shares | 100% | Broker Dealer | ||||
| Spectron Energy (Asia) Pte Ltd. 8 Marina View, 33-06 Asia Tower 1, |
Singapore | Ordinary Shares | 100% | Energy broking | ||||
| Spectron Energy Inc. Brandywine Plaza, 1521 Concord Pike, Suite 201, |
United States of America | Ordinary Shares | 100% | Energy broking | ||||
| Starsupply Petroleum Europe B.V. 20th Floor, Hofpoort Building, Hofplein 20, |
Netherlands | Ordinary Shares | 100% | Physical oil brokerage | ||||
| Tangent Trading Limited 155 Bishopsgate, London, EC2M 3TQ |
England and Wales | Ordinary Shares | 100% | Recycled metals trading | ||||
| Volcap Trading Partners Limited 155 Bishopsgate, London, EC2M 3TQ |
England and Wales | Ordinary Shares | 100% | Broker and Structured note distributor | ||||
| Volcap Trading Partners France SAS 12 Rue Vivienne Lot 3, 75002 Paris |
France | Ordinary Shares | 100% | Dormant | ||||
| X-Change Financial Access, LLC 350 S Northwest Hwy, Suite 300, Park Ridge, |
United States of America | Membership interest | 100% | Trade execution | ||||
| Xeram CEEMA Limited5 5 Pindou, 4, Egkomi, Nicosia, 2409 |
Cyprus | Ordinary Shares | 100% | Dormant | ||||
135
| Marex Group plc Annual Report 2023 | Strategic Report | Corporate Governance | Financial Statements | |||
|
|
|
|
|
|||
Notes to the Consolidated Financial Statements (continued)
For the Year Ended 31 December 2023
| 16 | Investments (continued) |
(b) Group subsidiaries and undertakings (continued)
Year end
All subsidiaries have a financial year end of 31 December with the exception of Carlton Commodities 2004 LLP and Volatility Performance Fund S.A. which both have a year end of 31 March.
Other Related Entities
| Name |
Country of incorporation | Class | Nature of business | |||||
| Intertrust Employee Benefit Trustee Limited, 44 Esplanade, St Helier, Jersey, JE4 9WG |
Jersey | Ordinary Shares | Trustee of the Employee Benefit Trust |
|||||
| 17 | Investment in an Associate |
During the year the Group redeemed its investment in Cambridge Machines Gemini Fund Limited (the ‘Fund’). The Fund assesses investment opportunities in the global futures markets using Bayesian statistical methods. The Fund was incorporated in the Isle of Man and is a private entity that is not listed on any public exchanges. The Group’s interest in the Fund was accounted for using the equity method and was not consolidated as the Group did not have control over the Fund because the shares the Group held did not have voting rights. The following table illustrates the summarised financial information of the Group’s investment in the Fund:
| 2023 | 2022 | |||||||
| $m | $m | |||||||
| At 1 January |
5.6 | 5.9 | ||||||
| Profit / (loss) recognised in income statement |
0.8 | (0.3) | ||||||
| Proceeds from redemption of shares |
(6.4) | — | ||||||
| Net gains/losses from divestment |
— | — | ||||||
| At 31 December |
— | 5.6 | ||||||
| Share of | Share of | |||||||
| net assets | net assets | |||||||
| $m | $m | |||||||
| Current assets |
— | 10.4 | ||||||
| Current liabilities |
— | (0.3) | ||||||
| Equity |
— | 10.1 | ||||||
| Share in equity |
—% | 55.8% | ||||||
| Carrying amount of the investment |
— | 5.6 | ||||||
Prior to the redemption the Group’s percentage share in equity was subject to dilution depending on share subscriptions by other investors.
136
| Marex Group plc Annual Report 2023 | Strategic Report | Corporate Governance | Financial Statements | |||
|
|
|
|
|
|||
| 18 | Business Combinations |
(a) Acquisition of OTCex SA Group companies
On 1 February 2023, the Group acquired 100% of the share capital of the entities engaged in voice brokerage within OTCex SA Group companies (HPC SA, OTCex Hong Kong, OTCex LLC). The acquisition of the three companies was accounted for as a single acquisition under IFRS 3. The acquisition expanded the capabilities and geographical reach of the capital markets business.
| FX rate | ||||||||
| $m | ||||||||
| Cash consideration (€54.8m) |
1.0864 €/$ | 59.6 | ||||||
| Contingent consideration |
3.7 | |||||||
| Total consideration |
63.3 | |||||||
| Fair value of identifiable net assets: |
||||||||
| Property, plant and equipment |
1.3 | |||||||
| Intangible assets |
1.7 | |||||||
| Right-of-use assets |
6.3 | |||||||
| Cash and cash equivalents |
29.8 | |||||||
| Trade and other receivables |
70.2 | |||||||
| Trade and other payables |
(51.7 | ) | ||||||
| Lease liabilities |
(6.3 | ) | ||||||
| Taxes |
(0.3 | ) | ||||||
| Deferred tax liability |
(0.2 | ) | ||||||
| Total fair value of identifiable assets and liabilities |
50.8 | |||||||
| Goodwill |
12.5 | |||||||
Intangible assets
Intangible assets acquired as part of the transaction consists of the HPC ($1.0m) and OTCex ($0.7m) brands.
Trade and other receivables
Trade and other receivables consist of trade receivables of $58.9m and other debtors of $11.3m. The fair value of trade receivables approximates to their book value. Gross contractual amounts of trade receivables are $58.9m.
Contribution to the Group’s results
OTCex contributed $139.6m revenue and a profit before tax of $0.3m to the Group’s results for the period between the date of acquisition and the reporting date. If the acquisition of OTCex had been completed on the first day of the financial year, Group revenue for the year would have increased by $151.2m and Group profit before tax would have increased by $0.1m.
Consideration
The consideration paid is split between the net asset value of the acquisition balance sheets of the entities being purchased of $48.9m (€45.0m), a premium $10.7m (€9.8m) and contingent consideration. As the contingent consideration is calculated as a specific percentage of earnings of the acquired business for the four-year period following the acquisition date, it is not possible to estimate a range as the contingent consideration is based upon earnings which could be uncapped as the earnings of the business are not capped. The fair value of the contingent consideration was $5.0m (€4.6m) at the acquisition date. This represented the Group’s estimate of the present value of the cash outflows and based on the best estimate of the profit levels of the acquired business after combination. At year end, the deferred contingent consideration credit was revalued downwards by $1.3m (€1.2m) to $3.7m (€3.4m) as a result of the post acquisition performance of the acquired entities not meeting the required hurdle rate in the first year. This reduction in the contingent consideration liability has been recognised as a reduction in the value of goodwill associated with the transaction.
Acquisition-related costs
Acquisition-related costs (included in other expenses) amounted to $0.6m.
Goodwill
The goodwill recognised on acquisition relates to expected growth and revenue synergies with the Group’s existing product and service offerings. The total amount of goodwill that is expected to be deductible for tax purposes is $1.8m.
137
| Marex Group plc Annual Report 2023 | Strategic Report | Corporate Governance | Financial Statements | |||
|
|
|
|
|
|||
Notes to the Consolidated Financial Statements (continued)
For the Year Ended 31 December 2023
| 18 | Business Combinations (continued) |
(b) Acquisition of Global Metals Network Limited
On 1 July 2023, the Group acquired all of the share capital in Global Metals Network Limited (‘GMN’) from two private individuals for the consideration noted below. GMN is a recycled metals market maker and was purchased to augment the Group’s current recycled metals strategy and to support our clients as they transition towards a low-carbon economy.
| $m | ||||
| Cash consideration |
3.4 | |||
| Total consideration |
3.4 | |||
| Fair value of identifiable net assets: |
||||
| Cash and cash equivalents |
1.9 | |||
| Trade and other receivables |
2.3 | |||
| Intangible assets |
2.6 | |||
| Deferred tax liability |
(0.4 | ) | ||
| Trade and other payables |
(3.4 | ) | ||
| Total fair value of identifiable assets and liabilities |
3.0 | |||
| Goodwill |
0.4 | |||
Trade and other receivables
The fair value of trade receivables approximates to their book value.
Intangible assets
The customer list intangible assets relates to new customer relationships introduced to the Group. In addition to the new customers, the purchase brings in a well-known market maker with knowledge and expertise in the global recycled metals market.
Trade and other payables
The trade and other payables relate to trade creditors and accrued expenses.
Contribution to the Group’s results
GMN contributed $1.4m revenue and a loss before tax of $0.5m to the Group’s results for the period between the date of acquisition and the reporting date. If the acquisition of the business and assets had been completed on the first day of the financial year, Group revenue for the year would have increased by $2.5m and Group profit before tax would have decreased by $0.7m. GMN incurred costs of $0.3m as a result of the acquisition during the period ended 31 December 2023.
(c) Acquisition of Eagle Energy Brokers LLC
On 1August 2023, the Group acquired all of the share capital in Eagle Energy Brokers LLC (which owns 100% of the share capital of Eagle Commodities Limited) from two private owners. Eagle Energy Brokers LLC (‘Eagle’) was purchased to augment the existing OTC energy business.
| $m | ||||
| Cash consideration |
10.7 | |||
| Total consideration |
10.7 | |||
| Fair value of identifiable net assets: |
||||
| Cash and cash equivalents |
1.1 | |||
| Trade and other receivables |
2.0 | |||
| Intangible assets |
5.2 | |||
| Trade and other payables |
(1.5 | ) | ||
| Deferred tax liability |
(1.4 | ) | ||
| Total fair value of identifiable assets and liabilities |
5.4 | |||
| Goodwill |
5.3 | |||
Trade and other receivables
The fair value of trade receivables approximates to their book value. Gross contractual amounts of trade receivables are $2.0m.
138
| Marex Group plc Annual Report 2023 | Strategic Report | Corporate Governance | Financial Statements | |||
|
|
|
|
|
|||
| 18 | Business Combinations (continued) |
(c) Acquisition of Eagle Energy Brokers LLC (continued)
Intangible assets
The customer list intangible assets acquired consists of over 150 clients ranging from oil majors, trading houses, banks and hedge funds between the commodities and environmental businesses leading to significant ongoing revenue streams. The Group expects to benefit significantly from the acquisition of these new customer relationships while seeking synergies with other parts of the Group’s business.
Contribution to the Group’s results
Eagle contributed $5.8m revenue and a profit before tax of $0.8m to the Group’s results for the period between the date of acquisition and the reporting date. If the acquisition of the entity had been completed on the first day of the financial year, Group revenue for the year would have increased by $12.1m and Group profit before tax would have decreased by $0.1m.
Goodwill
The goodwill recognised on acquisition related to expected growth and revenue synergies with the Group’s existing product and service offerings.
(d) Acquisition of Cowen’s Prime Services and Outsourced Trading business
On 1 December 2023, the Group acquired the business and entities related to Cowen’s prime services and outsourced trading business (‘Cowen’) from Toronto-Dominion Bank. The transaction was structured as an acquisition of trading assets in Hong Kong and the US, and all of the issued share capital of Cowen International Limited being purchased by the Company and its subsidiaries. The Group acquired this business to augment the capital markets business line, adding a significant number of new clients, and increasing its client offering to prime services.
| $m | ||||
| Cash consideration |
106.3 | |||
| Consideration receivable Toronto-Dominion |
(14.1 | ) | ||
| Total consideration |
92.2 | |||
| Fair value of identifiable net assets: |
||||
| Intangible assets |
24.4 | |||
| Trade and other receivables |
800.7 | |||
| Derivative instruments – asset |
14.0 | |||
| Cash and cash equivalents |
56.6 | |||
| Trade and other payables |
(790.1 | ) | ||
| Derivative instruments – liability |
(14.0 | ) | ||
| Total fair value of identifiable assets and liabilities |
91.6 | |||
| Goodwill |
0.6 | |||
Trade and other Receivables
Trade and other receivables represent cash amounts due from brokers and customers. The book value of amounts receivable from brokers and customers approximates fair value and is the best estimate of the contractual cash flows to be collected.
Contribution to the Group’s results
The business and the assets acquired from Cowen contributed $6.2m to Group revenue and $1.2m of profit before tax for the period between the date of acquisition and the reporting date. If the acquisition of the business and assets had been completed on the first day of the financial year, the Group’s revenue for the year would have increased by $112.9m and the profit before tax would have increased by $8.0m.
Acquisition-related costs
Costs directly related to the acquisition (included in other expenses) consists mainly of legal expenses totalling $1.1m.
139
| Marex Group plc Annual Report 2023 | Strategic Report | Corporate Governance | Financial Statements | |||
|
|
|
|
|
|||
Notes to the Consolidated Financial Statements (continued)
For the Year Ended 31 December 2023
| 18 | Business Combinations (continued) |
(d) Acquisition of Cowen’s Prime Services and Outsourced Trading business (continued)
Provisional accounting
The Group’s preliminary estimates of the fair values of the assets acquired, liabilities assumed and contingent consideration are based on information that was available at the date of the acquisition and the Group is continuing to evaluate the underlying inputs and assumptions used in its valuations. Accordingly, these preliminary estimates are subject to change during the measurement period, which is up to one year from the date of acquisition.
The preliminary consideration for the acquisition consisted of the fixed premium of $25.0m and the net asset value of $81.3m totalling $106.3m. The net asset value was based upon the closing balance sheet dated 31 October 2023, for a transaction that completed on 1 December 2023, and as such the Group purchased additional assets of $2.4m owing to increases in balances due from customers, in the normal course of business during November 2023, for which additional consideration is required to be paid to Toronto-Dominion.
As per the share and asset sale and purchase agreement, the legal mechanism to true up to the final net asset value is that 120 days after the completion date (31 March 2024) both the buyer and seller agree on a completion balance sheet as at 1 December 2023 detailing the assets and liabilities that were purchased as a part of the acquisition.
As a part of this exercise, a balance of $16.5m of amounts due from customers, has been noted as having been overstated from the opening net asset value. As per the share and asset sale and purchase agreement, the shortfall has been recorded as a receivable from Toronto-Dominion Bank.
The net receivable from Toronto-Dominion taking both factors above into consideration is therefore estimated to be $14.1m.
(e) Acquisition of ED&F Man Capital Markets Hong Kong Limited
On 8 February 2023, the Group acquired all of the issued share capital of ED&F Man Capital Markets Hong Kong Limited for the consideration noted below.
| $m | ||||
| Cash consideration |
1.9 | |||
| Total consideration |
1.9 | |||
| Recognised amounts of identifiable net assets: |
||||
| Cash and cash equivalents |
2.2 | |||
| Trade and other receivables |
0.1 | |||
| Right-of-use asset |
0.6 | |||
| Trade and other payables |
(0.2 | ) | ||
| Lease liabilities |
(0.5 | ) | ||
| Total fair value of identifiable assets and liabilities |
2.2 | |||
| Bargain purchase gain |
0.3 | |||
Trade and other receivables
The fair value of trade and other receivables approximates to their book value.
Acquisition-related costs
Acquisition-related costs (included in other expenses) amount to $0.1m.
Bargain purchase gain
A bargain purchase gain of $0.3m was recognised as a result of the acquisition. The transaction resulted in a gain due to the discount applied to the purchase; the gain has been recognised within the Group’s income statement. The transaction resulted in a gain due to the desire of the seller to exit the capital markets business segment and raise capital to meet financial obligations. The lack of other companies that could acquire the business allowed Marex to obtain an acquisition price that was at a material discount to the tangible net asset value of the acquired businesses.
140
| Marex Group plc Annual Report 2023 | Strategic Report | Corporate Governance | Financial Statements | |||
|
|
|
|
|
|||
| 18 | Business Combinations (continued) |
Acquisitions in 2022
(f) Acquisition of Arfinco SA
On 1 February 2022, the Group, through Spectron Services Limited, a wholly owned subsidiary, acquired all of the issued share capital of Arfinco SA (‘Arfinco’) for the consideration noted below. Arfinco has developed a broad offering in trade execution services for commodities futures and options.
| FX rate | ||||||||
| $m | ||||||||
| Cash consideration (€2.9m) |
1.1271 $/€ | 3.3 | ||||||
| Total consideration |
3.3 | |||||||
| Recognised amounts of identifiable net assets: |
||||||||
| Tangible fixed assets |
— | |||||||
| Intangible assets |
2.0 | |||||||
| Other assets |
0.8 | |||||||
| Cash and cash equivalents |
0.6 | |||||||
| Trade and other receivables |
0.4 | |||||||
| Trade and other payables |
(0.5 | ) | ||||||
| Deferred tax liability |
(0.5 | ) | ||||||
| Total fair value of identifiable assets and liabilities |
2.8 | |||||||
| Goodwill |
0.5 | |||||||
Identifiable net assets
On 1 February 2022, the valuation of the customer relationships of Arfinco was $1.9m and the valuation of the Arfinco brand $0.1m. These were calculated by an independent valuation specialist. They were both calculated using the excess earnings method.
Receivables
The fair value of the receivables approximates to their book value.
Acquisition-related costs
Acquisition-related costs (included in other expenses) amount to $0.2m.
Contribution to Group’s results
Arfinco SA contributed $1.6m revenue and $0.2m to the Group’s profit for the period between the date of acquisition and the reporting date. If the acquisition of the business and assets had been completed on the first day of the financial year, Group revenue for the year would have increased by $0.2m and Group profit would have increased by $13,000.
Goodwill
The goodwill recognised on acquisition related to expected growth and revenue synergies with the Group’s existing offering in trade execution services for commodities futures and options and the valuation of Arfinco’s workforce which cannot be separately recognised as an intangible asset.
141
| Marex Group plc Annual Report 2023 | Strategic Report | Corporate Governance | Financial Statements | |||
|
|
|
|
|
|||
Notes to the Consolidated Financial Statements (continued)
For the Year Ended 31 December 2023
| 18 | Business Combinations (continued) |
(g) Acquisition of the business and selected assets of ED&F Man Capital Markets Limited
In August 2022, the Group signed a share and asset purchase agreement to acquire certain businesses of ED&F Man Capital Markets. Each acquisition was completed on different dates as approvals from competency regulatory bodies in different jurisdictions were obtained.
On 1 October 2022, the Group, through Marex Financial, a wholly owned subsidiary, acquired the business clients (clearing, metals, FF&O and FX), certain staff and selected assets of ED&F Man Capital Markets Limited, which is a limited liability company incorporated in England and Wales.
| $m | ||||
| Cash consideration |
43.9 | |||
| Total consideration |
43.9 | |||
| Recognised amounts of identifiable net assets: |
||||
| Tangible fixed assets |
0.3 | |||
| Right-of-use assets |
0.1 | |||
| Cash and cash equivalents |
149.9 | |||
| Trade and other receivables |
4.2 | |||
| Prepayments and accrued income |
3.9 | |||
| Other debtors |
8.4 | |||
| Margins with brokers, exchanges and clearing houses |
115.4 | |||
| Receivable secured on default funds |
60.0 | |||
| Lease liabilities |
(0.1 | ) | ||
| Margins due to brokers, exchanges and clearing houses |
(2.5 | ) | ||
| Trade and other payables |
(283.6 | ) | ||
| Total fair value of identifiable assets and liabilities |
56.0 | |||
| Bargain purchase gain |
12.1 | |||
Trade and other receivables and margins with brokers, exchanges and clearing houses
The fair value of the trade and other receivables approximates to their book value. The gross contractual amounts of trade receivables are $4,4m. The best estimate at the acquisition date of the contractual cash flows not expected to be collected is $0.2m. For Margins with brokers, exchanges and clearing houses, the best estimate at the acquisition date of the contractual cash flows the Group expects to receive back is the same as the gross contractual amount.
Acquisition-related costs
Acquisition-related costs (included in other expenses) amounted to $3.8m.
Contribution to Group’s results
The business and assets acquired from ED&F Man Capital Markets Limited contributed $33.1m revenue and $12.8m to the Group’s profit for the period between the date of acquisition and the reporting date. If the acquisition of the business and assets had been completed on the first day of the financial year, Group revenue for the year would have increased by $84.5m and Group profit would have increased by $3.4m.
Bargain purchase gain
A bargain purchase gain of $12.1m was recognised as a result of the acquisition. The transaction resulted in a gain due to the discount applied of $12.1m to the tangible net assets acquired and has been recognised within the Group’s consolidated income statement. The transaction resulted in a gain due to the desire of the seller to exit the capital markets business segment and raise capital to meet financial obligations. The lack of other companies that could acquire the business allowed Marex to obtain an acquisition price that was at a material discount to the tangible net asset value of the acquired businesses.
142
| Marex Group plc Annual Report 2023 | Strategic Report | Corporate Governance | Financial Statements | |||
|
|
|
|
|
|||
| 18 | Business Combinations (continued) |
(h) Acquisition of ED&F Man Capital Markets Australia Pty Ltd
On 11 November 2022, the Group, through Spectron Services Limited, a wholly owned subsidiary, acquired all of the issued share capital of ED&F Man Capital Markets Australia Pty Ltd (renamed Marex Australia Pty Ltd) for the consideration noted below. Marex Australia Pty Ltd is a limited liability company incorporated in Australia, and operates as a broker and executes commodity futures, financial futures and other fixed income securities transactions for the accounts of its customers on a give-up basis.
| $m | ||||
| Cash consideration |
1.4 | |||
| Total consideration |
1.4 | |||
| Recognised amounts of identifiable net assets: |
||||
| Tangible fixed assets |
0.2 | |||
| Right-of-use assets |
0.3 | |||
| Cash and cash equivalents |
1.5 | |||
| Trade and other receivables |
0.5 | |||
| Trade and other payables |
(0.8 | ) | ||
| Lease liabilities |
(0.3 | ) | ||
| Total fair value of identifiable assets and liabilities |
1.4 | |||
Trade and other Receivables
The fair value of the receivables approximates to their book value. The gross contractual amount of trade receivables is $0.5m. The best estimate at the acquisition date of contractual cash flows not expected to be collected is $10,000.
Acquisition-related costs
No acquisition-related costs were allocated to this acquisition given the size of the acquired entity.
Contribution to Group’s results
Marex Australia Pty Ltd contributed $0.4m revenue and ($0.5m) of loss to the Group’s profit for the period between the date of acquisition and the reporting date. If the acquisition of Marex Australia Pty Ltd had been completed on the first day of the financial year, Group revenue for the year would have been $2.0m more and Group profit would have been $4.3m less.
143
| Marex Group plc Annual Report 2023 | Strategic Report | Corporate Governance | Financial Statements | |||
|
|
|
|
|
|||
Notes to the Consolidated Financial Statements (continued)
For the Year Ended 31 December 2023
| 18 | Business Combinations (continued) |
(i) Acquisition of ED&F Man Capital Markets Holdings Limited and
ED&F Man Capital Markets US Holdings Inc
On 1 December 2022, the Group acquired the entire share capital of ED&F Man Capital Markets US Holdings Inc. (renamed Marex US Holdings Inc) together with its subsidiaries. Marex US Holdings Inc. is a company incorporated in the United States. On 1 December 2022, the Group acquired the entire share capital of ED&F Man Capital Markets Holdings Limited (renamed Marex Holdings Limited) together with its subsidiaries. Marex Holdings Limited is a limited liability company incorporated in Bermuda. These entities were acquired for a consideration of $183.0m. The ED&F Man Capital Markets acquisition enhances Marex’s client offering and capabilities to serve clients. The acquisition creates a leading franchise in the US.
| $m | ||||
| Cash consideration |
183.0 | |||
| Total consideration |
183.0 | |||
| Recognised amounts of identifiable net assets: |
||||
| Tangible fixed assets |
6.4 | |||
|
Right-of-use-assets |
15.1 | |||
| Intangible assets |
2.4 | |||
| Cash and cash equivalents |
44.7 | |||
| Trade receivables |
2,178.8 | |||
| Margins with brokers, exchanges and clearing houses |
3,341.4 | |||
| Investments |
7.9 | |||
| Prepayments and accrued income |
7.1 | |||
| Marketable securities |
702.3 | |||
| Derivative financial instruments |
15.4 | |||
| Securities purchased under agreements to resell |
8,420.7 | |||
| Other debtors |
86.0 | |||
| Deferred tax asset |
5.0 | |||
| Trade and other payables |
(4,360.0 | ) | ||
| Lease liabilities |
(15.1 | ) | ||
| External loans |
(198.6 | ) | ||
| Other creditors |
(1,582.0 | ) | ||
| Derivative financial instruments |
(15.4 | ) | ||
| Securities sold under agreements to repurchase |
(8,420.8 | ) | ||
| Total fair value of identifiable assets and liabilities |
241.3 | |||
| Bargain purchase gain |
58.3 | |||
Trade receivables and margins with brokers, exchanges and clearing houses
The fair value of the receivables approximates to their book value. The gross contractual amounts of trade receivables are $2,179.3m. The best estimate at the acquisition date of the contractual cash flows not expected to be collected is $0.5m. For Margins with brokers, exchanges and clearing houses, the best estimate at the acquisition date of the contractual cash flows the Group expects to receive back is the same as the gross contractual amount.
Acquisition-related costs
Acquisition-related costs amount to $2.4m.
Contribution to Group’s results
The acquired entities contributed $78.4m revenue and $3.0m to the Group’s profit for the period between the date of acquisition and the reporting date. If the acquisition had been completed on the first day of the financial year, Group revenue for the year would have increased by $505.6m and Group profit would have increased by $25.8m.
Bargain purchase gain
A bargain purchase gain of $58.3m was recognised as a result of the acquisitions. The transaction resulted in a gain due to the discount applied to the purchase, an adjustment required by IFRS 3; the gain has been recognised in the Group’s consolidated income statement. The transaction resulted in a gain due to the desire of the seller to exit the capital markets business segment and raise capital to meet financial obligations. The lack of other companies that could acquire the business allowed Marex to obtain an acquisition price that was at a material discount to the tangible net asset value of the acquired businesses.
144
| Marex Group plc Annual Report 2023 | Strategic Report | Corporate Governance | Financial Statements | |||
|
|
|
|
|
|||
| 18 | Business Combinations (continued) |
(j) Acquisition of ED&F Man Capital Markets MENA Limited
On 1 December 2022, the Group acquired all of the issued share capital of ED&F Man Capital Markets MENA Limited (renamed Marex MENA Limited) for $5.3m. Marex MENA Limited is a limited liability company incorporated in the Dubai International Financial Centre and is engaged in advising on financial products, dealing in investments as principal, dealing in investments as agent and arranging deals in investments.
| $m | ||||
| Cash consideration |
5.3 | |||
| Total consideration |
5.3 | |||
| Recognised amounts of identifiable net assets: |
||||
| Tangible fixed assets |
0.2 | |||
| Right-of-use assets |
0.2 | |||
| Cash and cash equivalents |
3.5 | |||
| Trade receivables |
1.4 | |||
| Prepayments and accrued income |
2.8 | |||
| Other debtors |
0.1 | |||
| Due from exchanges, clearing houses and other counterparties |
1.2 | |||
| Trade and other payables |
(2.6 | ) | ||
| Lease liabilities |
(0.3 | ) | ||
| Total fair value of identifiable assets and liabilities |
6.5 | |||
| Bargain purchase gain |
1.2 | |||
Trade receivables and margins with brokers, exchanges and clearing houses
The fair value of the trade receivables approximates to their book value. The gross contractual amounts of trade receivables are $1.5m. The best estimate at the acquisition date of the contractual cash flows not expected to be collected is $0.1m.
Acquisition-related costs
No acquisition-related costs were allocated to this acquisition given the size of the acquired entity.
Contribution to Group’s results
Marex MENA Limited contributed $3.7m revenue and $0.3m to the Group’s profit for the period between the date of acquisition and the reporting date. If the acquisition of Marex MENA Limited had been completed on the first day of the financial year, Group revenue for the year would have increased by $15.1m and Group profit would have increased by $1.9m.
Bargain purchase gain
A bargain purchase gain of $1.2m was recognised as a result of the acquisition of Marex MENA Limited, and this has been recognised in the Group’s consolidated income statement. The transaction resulted in a gain due to the discount applied to the purchase totalling $1.2m. The transaction resulted in a gain due to the desire of the seller to exit the capital markets business segment and raise capital to meet financial obligations. The lack of other companies that could acquire the business allowed Marex to obtain an acquisition price that was at a material discount to the tangible net asset value of the acquired businesses.
145
| Marex Group plc Annual Report 2023 | Strategic Report | Corporate Governance | Financial Statements | |||
|
|
|
|
|
|||
Notes to the Consolidated Financial Statements (continued)
For the Year Ended 31 December 2023
| 19 | Treasury Instruments – Unpledged and Pledged |
(a) Unpledged
As at 31 December 2023, the Group held $619.3m US Treasuries which were unpledged (2022: $247.6m). These US Treasuries will fully mature by 30 June 2027.
(b) Pledged as collateral
Treasury instruments pledged as collateral comprise US Treasuries and agency bonds which will fully mature by 30 June 2027. At year end, the Group has pledged $2,363.0m (2022: $2,472.1m) US Treasuries to counterparties as collateral for securities purchased under agreements to resell, and securities segregated under Federal and other regulations. Financial instruments which have been pledged in this way are held under certain terms and conditions set out in specific agreements with each counterparty. In these agreements it is generally stated that whilst the US Treasury is pledged at the counterparty the Group cannot sell or transfer the financial instrument or have any third party rights associated with the financial instrument whereby it can be used as security towards any further financing activities.
| 2023 | 2022 | |||||||
| $m | $m | |||||||
| Treasury instruments (non-current) |
300.4 | 133.5 | ||||||
| Treasury Instruments (current) |
2,062.6 | 2,338.6 | ||||||
| 2,363.0 | 2,472.1 | |||||||
(c) Unpledged and pledged non-current/current analysis
| 2023 | 2022 | |||||||
| $m | $m | |||||||
| Treasury instruments (non-current) |
361.2 | 133.5 | ||||||
| Treasury instruments (current) |
2,621.1 | 2,586.2 | ||||||
| 2,982.3 | 2,719.7 | |||||||
(d) Repurchase agreements
| 2023 | 2022 | |||||||
| $m | $m | |||||||
| Reverse repurchase agreements |
3,199.8 | 4,346.0 | ||||||
| Repurchase agreements |
(3,118.9 | ) | (4,381.4 | ) | ||||
| 80.9 | (35.4 | ) | ||||||
As at 31 December 2023, reverse repurchase agreements and repurchase agreements were carried out at average interest rates of 5.38% and 5.42% respectively. The allowance for credit losses on reverse repurchase agreements was $nil at 31 December 2023 (2022: $nil).
146
| Marex Group plc Annual Report 2023 | Strategic Report | Corporate Governance | Financial Statements | |||
|
|
|
|
|
|||
| 20 | Inventory |
| 2023 | 2022 | |||||||
| $m | $m | |||||||
| Cryptocurrency – Trading |
121.0 | 1.5 | ||||||
| Carbon emission certificates – Trading |
23.5 | 26.0 | ||||||
| Recyclable scrap metals |
18.9 | 8.3 | ||||||
| Total inventories at fair value less cost to sell |
163.4 | 35.8 | ||||||
The Group economically hedges its exposure to cryptocurrencies and hence the Group’s net exposure to market risk has not been material to our operations for the periods presented. As at 31 December 2023, the Group’s overall net market risk exposure to cryptocurrencies was $1.8m (2022: $0.4m). The fair values of cryptocurrencies held as assets are determined based on quoted market prices and are classified as a level 1 valuation.
Emissions inventory are certificates which are held to trade, the fair value for which is based on quoted market prices. Recyclable scrap metals are those where the Group has title over and is in transit from the supplier to the customer. The vast majority of recyclable scrap metals consist of non-ferrous and comprise various grades of copper (including brass), aluminium and lead.
All inventories are held at fair value less cost to sell. The fair value movements charged to profit and loss are as follows:
| Fair value | ||||||||||||
| Cost | movement | Inventory | ||||||||||
| 2023 | 2023 | 2023 | ||||||||||
| $m | $m | $m | ||||||||||
| Ethereum, USD Coin and other cryptocurrencies |
114.1 | 6.9 | 121.0 | |||||||||
| EUA emissions |
26.9 | (3.4 | ) | 23.5 | ||||||||
| Recyclable scrap metal |
18.4 | 0.5 | 18.9 | |||||||||
| 159.4 | 4.0 | 163.4 | ||||||||||
| Fair value | ||||||||||||
| Cost | movement | Inventory | ||||||||||
| 2022 | 2022 | 2022 | ||||||||||
| $m | $m | $m | ||||||||||
| Ethereum, USD Coin and other cryptocurrencies |
5.8 | (4.3 | ) | 1.5 | ||||||||
| EUA emissions |
24.6 | 1.4 | 26.0 | |||||||||
| Recyclable scrap metal |
8.3 | — | 8.3 | |||||||||
| 38.7 | (2.9 | ) | 35.8 | |||||||||
147
| Marex Group plc Annual Report 2023 | Strategic Report | Corporate Governance | Financial Statements | |||
|
|
|
|
|
|||
Notes to the Consolidated Financial Statements (continued)
For the Year Ended 31 December 2023
| 21 | Trade and Other Receivables |
| 2023 | 2022 | |||||||
| $m | $m | |||||||
| Amounts due from exchanges, clearing houses and other counterparties |
3,459.6 | 4,046.7 | ||||||
| Trade debtors |
823.8 | 141.1 | ||||||
| Default funds and deposits |
273.2 | 352.7 | ||||||
| Loans receivable |
8.0 | 18.2 | ||||||
| Other tax and social security taxes |
10.8 | 7.3 | ||||||
| Other debtors |
194.2 | 103.5 | ||||||
| Prepayments |
20.2 | 15.7 | ||||||
| 4,789.8 | 4,685.2 | |||||||
Included in the amounts due from exchanges, clearing houses and other counterparties are segregated balances of $1,699.5m (2022: $2,474.3m) and non-segregated balances of $1,760.1m (2022: $1,572.4m).
Other debtors includes amounts related to sign-on bonuses of $39.5m (2022: $22.2m).
The Group recognises lifetime ECL allowance for trade debtors of $1.1m and $0.4m as at 31 December 2023 and 2022, respectively, using a provision matrix under the simplified approach. Further to this, the Group has recorded within amounts due from exchanges, clearing houses and other counterparties, an ECL allowance of $19.6m as at 31 December 2023 (2022: $13.9m), based on individual assessment, to reflect the credit losses associated with certain counterparties. The Directors consider that the carrying amounts of trade and other receivables are not materially different to their fair value.
(a) Ageing of trade debtors and other Receivables
The provision matrix for trade debtors is as follows.
| Less than 30 | 31 to 60 | 61 to | 91 to | More than | ||||||||||||||||||||||||
| 2023 |
Current | days | days | 90 days | 120 days | 120 days | Total | |||||||||||||||||||||
| Expected credit loss rate |
0.17% | 0.17% | 0.17% | 0.17% | 0.17% | 0.17% | ||||||||||||||||||||||
| Trade debtors $m |
660.5 | 120.6 | 22.7 | 5.2 | 3.1 | 10.6 | 822.7 | |||||||||||||||||||||
| Trade debtors lifetime ECL $m |
0.9 | 0.2 | — | — | — | — | 1.1 | |||||||||||||||||||||
| Less than 30 | 31 to 60 | 61 to | 91 to | More than | ||||||||||||||||||||||||
| 2022 |
Current | days | days | 90 days | 120 days | 120 days | Total | |||||||||||||||||||||
| Expected credit loss rate |
0.12% | 0.12% | 0.12% | 0.12% | 0.12% | 2.02% | ||||||||||||||||||||||
| Trade debtors $m |
68.8 | 52.4 | 4.3 | 2.4 | 3.2 | 10.4 | 141.5 | |||||||||||||||||||||
| Trade debtors lifetime ECL $m |
0.1 | 0.1 | — | — | — | 0.2 | 0.4 | |||||||||||||||||||||
148
| Marex Group plc Annual Report 2023 | Strategic Report | Corporate Governance | Financial Statements | |||
|
|
|
|
|
|||
| 21 | Trade and Other Receivables (continued) |
(a) Ageing of trade debtors and other Receivables (continued)
Below we present the ageing of the Group’s other receivables different from trade debtors, excluding other tax and social security taxes and prepayments.
| Less than | 31 to 60 | 61 to | 91 to | More than | ||||||||||||||||||||||||
| 2023 ($m) |
Current | 30 days | days | 90 days | 120 days | 120 days | Total | |||||||||||||||||||||
| Amounts due from exchanges, clearing houses and other counterparties |
3,432.2 | 6.2 | 2.7 | 1.4 | — | 17.1 | 3,459.6 | |||||||||||||||||||||
| Default funds and deposits |
273.2 | — | — | — | — | — | 273.2 | |||||||||||||||||||||
| Loans receivable |
1.1 | 2.7 | 0.1 | 0.9 | 1.6 | 1.6 | 8.0 | |||||||||||||||||||||
| Other debtors |
160.8 | 0.2 | 2.1 | 0.4 | — | 30.7 | 194.2 | |||||||||||||||||||||
|
|
|
|
||||||||||||||||||||||||||
| 3,935.0 | ||||||||||||||||||||||||||||
| Corresponding allowance for loan losses ECL |
19.6 | |||||||||||||||||||||||||||
| 61 to | 91 to | |||||||||||||||||||||||||||
| Less than | 31 to 60 | 90 | 120 | More than | ||||||||||||||||||||||||
| 2022 ($m) |
Current | 30 days | days | days | days | 120 days | Total | |||||||||||||||||||||
| Amounts due from exchanges, clearing houses and other counterparties |
4,032.8 | — | — | — | 13.9 | — | 4,046.7 | |||||||||||||||||||||
| Default funds and deposits |
352.7 | — | — | — | — | — | 352.7 | |||||||||||||||||||||
| Loans receivable |
13.0 | 5.3 | — | — | — | — | 18.3 | |||||||||||||||||||||
| Other debtors |
103.5 | — | — | — | — | — | 103.5 | |||||||||||||||||||||
|
|
|
|
||||||||||||||||||||||||||
| 4,521.2 | ||||||||||||||||||||||||||||
| Corresponding allowance for loan losses ECL |
13.9 | |||||||||||||||||||||||||||
(b) Reconciliation of the movement in impairment allowance
| 2023 | 2022 | |||||||||
|
|
$m | $m | ||||||||
| At 1 January |
14.3 | 5.8 | ||||||||
| Bad debts written off |
(0.5 | ) | (1.1 | ) | ||||||
| Released to the income statement |
(2.0 | ) | (0.9 | ) | ||||||
| Charged to the income statement |
9.1 | 10.5 | ||||||||
| At 31 December |
20.9 | 14.3 | ||||||||
The $20.9m (2022: $14.3m) in the table above also comprises $0.2m (2022: $nil) ECL for cash and cash equivalents.
149
| Marex Group plc Annual Report 2023 | Strategic Report | Corporate Governance | Financial Statements | |||
|
|
|
|
|
|||
Notes to the Consolidated Financial Statements (continued)
For the Year Ended 31 December 2023
| 22 | Borrowings |
(a) Loans
| 2023 | 2022 | |||||||
| $m | $m | |||||||
| Short-term borrowings |
— | 12.9 | ||||||
| Long-term borrowings |
— | 135.8 | ||||||
| Total borrowings |
— | 148.7 | ||||||
| 2023 | 2022 | |||||||
| $m | $m | |||||||
| At 1 January |
148.7 | — | ||||||
| Additions during the year |
— | 198.6 | ||||||
| Repayments |
(148.7 | ) | (59.9 | ) | ||||
| Additional draws |
— | 10.0 | ||||||
| Total borrowings |
— | 148.7 | ||||||
(b) Secured credit agreements
The Group, through its regulated subsidiary, Marex Capital Markets Inc. (‘MCMI’) has a $125.0m (2022: $125.0m) uncommitted securities financing facility arranged by a leading financial institution. There was no outstanding borrowing as at 31 December 2023 (2022: $8m).
In the ordinary course of its broker-dealer activities, MCMI has appointed The Bank of New York Mellon to act as its clearing agent (‘Clearing Agent’) for the purpose of clearing and settling transactions in securities maintained in the Federal Reserve/Treasury book entry system for receiving and delivering Federal Reserve Board (FRB) Securities (‘MCMI Clearing Agreement’). Under the terms of the MCMI Clearing Agreement, the Clearing Agent may finance, on an overnight basis, failed deliveries of FRB securities and/or the position in FRB Securities collateralised on FRB Securities, subject to certain haircuts. There was no outstanding borrowing as at 31 December 2023 (2022: $nil).
In 2022, MCMI had access to a $85.0m five-year secured credit agreement with PGIM Private Capital, a division of PGIM Inc. The subsidiary repaid the loan and early termination costs in full during February 2023 (2022: $85.5m outstanding).
(c) Subordinated facility
The Group, through its subsidiary MCMI previously had a $55.0m facility as at 31 December 2022. The borrowing was subordinated to the claims of general creditors, was covered by agreements approved by FINRA (a US regulatory body), and was included by MCMI for the purposes of computing net capital under the SEC’s Uniform Net Capital Rule. The borrowing was repaid in full and terminated during March 2023 (31 December 2022: $55.0m).
(d) Revolving credit facilities
On 30 June 2023, the Group refinanced its syndicated revolving credit facility (RCF) on improved terms and conditions with HSBC Bank plc. The new RCF is unsecured and committed up to $150.0m (31 December 2022: $120.0m) with a renewal date of 30 June 2026. As at 31 December 2023 the facility was undrawn (2022: previous facility was undrawn). The RCF contains certain financial and other covenants.
Interest on the amount utilised is calculated at a currency risk free rate plus a spread of 210 basis points plus a utilisation fee payable dependent on the percentage of utilisation. The maximum utilisation fee payable is 50 basis points. Interest on the unutilised portion is charged at a fixed percentage rate of 74 basis points (2022: 88 basis points).
The Group, through its regulated subsidiary, MCMI, has access to a $100.0m 364-day (2022: $160.0m) unsecured committed revolving credit facility arranged by a leading financial institution. This facility was renewed and reduced from $160m to $100m in May 2023. Interest on the amount utilised is calculated as the US prime rate less 25 basis points. There was no outstanding borrowing under this facility as at 31 December 2023 (2022: $nil). The credit facility agreement contains certain financial and other covenants.
(e) Uncommitted credit facilities
In accordance with local regulatory requirements and to maintain additional access to liquidity in the local time-zone, through its regulated subsidiary, Marex Australia Pty Ltd (‘MAPL’), the Group has access to an AUD 38.0m unsecured and uncommitted overdraft facility provided by a leading financial institution (‘MAPL Facility’). The MAPL Facility contains customary provisions, undertakings and other covenants. There was no outstanding borrowing under this facility as at 31 December 2023 (2022: $nil).
150
| Marex Group plc Annual Report 2023 | Strategic Report | Corporate Governance | Financial Statements | |||
|
|
|
|
|
|||
| 23 | Derivative Instruments |
Derivative assets and derivative liabilities comprise the following:
| 2023 | 2022 | |||||||
| Financial assets |
$m | $m | ||||||
| Held for trading derivatives carried at fair value through profit and loss that are not designated in hedge accounting relationships: |
||||||||
| Synthetic equity swap |
177.1 | 125.3 | ||||||
| Agriculture forward contracts |
123.8 | 142.8 | ||||||
| Agriculture option contracts |
48.1 | 30.4 | ||||||
| Energy forward contracts |
63.3 | 35.9 | ||||||
| Energy option contracts |
5.5 | 0.6 | ||||||
| Foreign currency forward contracts |
143.3 | 66.6 | ||||||
| Foreign currency option contracts |
13.4 | 3.8 | ||||||
| Precious metal forward contracts |
0.1 | 0.9 | ||||||
| Precious metal option contracts |
— | 0.1 | ||||||
| Credit forward |
2.8 | 0.8 | ||||||
| Metals forward |
11.5 | 9.7 | ||||||
| Equity option |
163.0 | 55.1 | ||||||
| Equity forward |
0.3 | 0.2 | ||||||
| Crypto forward |
0.1 | — | ||||||
| Rates forward |
11.8 | 5.1 | ||||||
| Rates option |
0.1 | — | ||||||
| Held for trading derivatives that are designated in hedge accounting relationships: |
||||||||
| Foreign currency forward contracts |
3.1 | 3.5 | ||||||
| Interest rate swaps |
23.8 | — | ||||||
| Cross currency swaps |
3.0 | — | ||||||
| 794.1 | 480.8 | |||||||
| 2023 | 2022 | |||||||
| Financial liabilities |
$m | $m | ||||||
| Held for trading derivatives carried at fair value through profit and loss that are not designated in hedge accounting relationships: |
||||||||
| Agriculture forward contracts |
106.4 | 113.4 | ||||||
| Agriculture option contracts |
25.1 | 16.3 | ||||||
| Energy forward contracts |
49.1 | 18.8 | ||||||
| Energy option contracts |
7.8 | 0.2 | ||||||
| Foreign currency forward contracts |
89.0 | 52.3 | ||||||
| Foreign currency option contracts |
14.5 | 3.2 | ||||||
| Precious metal forward contracts |
2.6 | 29.8 | ||||||
| Precious metal option contracts |
— | 0.1 | ||||||
| Credit forward |
1.7 | 3.2 | ||||||
| Interest rate forward contracts |
12.9 | 9.1 | ||||||
| Interest rate options contracts |
0.2 | — | ||||||
| Crypto forward |
14.9 | 0.9 | ||||||
| Crypto option |
19.3 | — | ||||||
| Equity option contracts |
167.4 | 28.4 | ||||||
| Metals forward |
5.6 | 5.5 | ||||||
| Equity forward |
24.0 | 11.5 | ||||||
| Held for trading derivatives that are designated in hedge accounting relationships: |
||||||||
| Foreign currency forward contracts |
0.2 | 1.6 | ||||||
| 540.7 | 294.3 | |||||||
151
| Marex Group plc Annual Report 2023 | Strategic Report | Corporate Governance | Financial Statements | |||
|
|
|
|
|
|||
Notes to the Consolidated Financial Statements (continued)
For the Year Ended 31 December 2023
| 24 | Deferred Tax |
| 2023 |
At 1 January | Credited/ to the income statement |
Recognised on acquisition |
Credited to other comprehensive income & equity |
At 31 December |
|||||||||||||||
| $m | $m | $m | $m | $m | ||||||||||||||||
| Acquired Intangibles |
0.5 | 0.2 | (1.8 | ) | — | (1.1 | ) | |||||||||||||
| Compensation |
1.9 | (1.8 | ) | — | — | 0.1 | ||||||||||||||
| Depreciation in excess of capital allowances |
(3.0 | ) | 1.2 | — | — | (1.8 | ) | |||||||||||||
| Lease accounting |
0.3 | 1.5 | — | — | 1.8 | |||||||||||||||
| Other short-term timing differences |
2.4 | 3.6 | 0.2 | — | 6.2 | |||||||||||||||
| Prepayments |
(0.2 | ) | 0.2 | — | — | — | ||||||||||||||
| Revaluation of investments, cash flow hedges and liabilities designated at FVTPL |
(0.3 | ) | (0.1 | ) | — | 1.1 | 0.7 | |||||||||||||
| Share-based payments |
4.7 | 5.1 | (0.4 | ) | 2.4 | 11.8 | ||||||||||||||
| Tax losses |
1.2 | (1.2 | ) | — | — | — | ||||||||||||||
| 7.5 | 8.7 | (2.0 | ) | 3.5 | 17.7 | |||||||||||||||
| 2022 |
At 1 January | Credited/ (expensed) to the income statement |
Recognised on acquisition |
Credited to other comprehensive income & equity |
At 31 December |
|||||||||||||||
| $m | $m | $m | $m | $m | ||||||||||||||||
| Acquired Intangibles |
(1.8 | ) | (1.6 | ) | 3.9 | — | 0.5 | |||||||||||||
| Compensation |
(1.2 | ) | 1.8 | 1.3 | — | 1.9 | ||||||||||||||
| Depreciation in excess of capital allowances |
(0.2 | ) | (1.2 | ) | (1.6 | ) | — | (3.0 | ) | |||||||||||
| Lease accounting |
0.5 | 0.2 | (0.4 | ) | — | 0.3 | ||||||||||||||
| Other short-term timing differences |
0.7 | (0.1 | ) | 1.8 | — | 2.4 | ||||||||||||||
| Prepayments |
— | — | (0.2 | ) | — | (0.2 | ) | |||||||||||||
| Revaluation of investments, cash flow hedges and liabilities designated at FVTPL |
(0.9 | ) | (0.1 | ) | (0.3 | ) | 1.0 | (0.3 | ) | |||||||||||
| Share-based payments |
— | 4.7 | — | — | 4.7 | |||||||||||||||
| Tax losses |
3.8 | (2.6 | ) | — | — | 1.2 | ||||||||||||||
| 0.9 | 1.1 | 4.5 | 1.0 | 7.5 | ||||||||||||||||
| 2023 | 2022 | |||||||
| $m | $m | |||||||
| Deferred tax asset |
21.4 | 7.6 | ||||||
| Deferred tax liability |
(3.7 | ) | (0.1 | ) | ||||
| 31 December |
17.7 | 7.5 | ||||||
Business Combinations
The recognition of Marex’s deferred tax assets is dependent on the availability of sufficient taxable profits when the timing differences reverse. The acquisitions of the OTCex SA Group, Global Metals Network Limited, Eagle Energy Brokers LLC and Cowen’s Prime Services and Outsourced Trading business have not changed the probability of the availability of sufficient future taxable profits and therefore, the probability of realising any pre-acquisition deferred tax assets has not changed. As such, no additional disclosure is made.
Offset
Deferred tax assets and liabilities are offset where the Group has a legally enforceable right to do so. Deferred tax balances have been measured using the tax rates that are expected to apply when the asset is realised or the liability is settled based upon the tax rates that have been enacted or substantially enacted by the balance sheet date.
The Finance Act 2021, enacted on 10 June 2021, increased the headline rate of UK corporation tax from 19% to 25% from 1 April 2023. Therefore, UK deferred tax assets and liabilities have been recognised at 25%. Non-UK deferred tax assets and liabilities are recognised at the relevant jurisdiction’s prevailing tax rate to the extent the Group expects to receive future benefit from them.
152
| Marex Group plc Annual Report 2023 | Strategic Report | Corporate Governance | Financial Statements | |||
|
|
|
|
|
|||
| 24 | Deferred Tax (continued) |
Unrecognised deferred tax assets
The Group has unrecognised deferred tax assets in respect of the following:
| – | Tax losses of $27.5m (2022: $14.2m) relate to losses with no expiry date. The increase in these unrecognised losses compared to the prior period is primarily driven by tax losses incurred during the year in France and Australia. These assets are not recognised on the basis of insufficient evidence concerning profits being available against which deferred tax assets could be utilised. |
| 25 | Trade and Other Payables |
| 2023 | 2022 | |||||||
| $m | $m | |||||||
| Trade payables |
5,908.5 | 6,189.7 | ||||||
| Amounts due to exchanges, clearing houses and other counterparties |
432.4 | 180.0 | ||||||
| Other tax and social security taxes |
9.9 | 5.5 | ||||||
| Other creditors |
21.7 | 11.9 | ||||||
| Accruals |
412.9 | 259.5 | ||||||
| Deferred income |
0.5 | 1.0 | ||||||
| 6,785.9 | 6,647.6 | |||||||
Included in trade payables and amounts due to exchanges, clearing houses and other counterparties are segregated balances of $3,820.2m (2022: $4,715.5m) and non-segregated balances of $2,520.7m (2022: $1,654.2m).
The Directors consider that the carrying amount of trade and other payables is not materially different to their fair value.
| 26 | Provisions |
| Onerous contracts |
Leasehold dilapidation |
Total | ||||||||||
| $m | $m | $m | ||||||||||
| At 1 January 2022 |
— | 0.9 | 0.9 | |||||||||
| Movement in the year: |
||||||||||||
| Provision on acquisition |
3.7 | 0.3 | 4.0 | |||||||||
| Decrease during the year |
(1.8 | ) | (0.5 | ) | (2.3 | ) | ||||||
| 1.9 | (0.2 | ) | 1.7 | |||||||||
| At 31 December 2022 |
1.9 | 0.7 | 2.6 | |||||||||
| Movement in the year: |
||||||||||||
| Provision on acquisition |
— | 0.1 | 0.1 | |||||||||
| Decrease during the year |
(1.9 | ) | (0.4 | ) | (2.3 | ) | ||||||
| (1.9 | ) | (0.3 | ) | (2.2 | ) | |||||||
| At 31 December 2023 |
— | 0.4 | 0.4 | |||||||||
(a) Leasehold dilapidation
The Leasehold dilapidation provision relates to the estimated cost of returning a leasehold property to its original state at the end of the lease in accordance with the lease terms. The main uncertainty relates to estimating the cost that will be incurred at the end of the lease. As the Group exits leases the costs of reinstatement are booked against the provision and as the Group enters new leases estimates are made during the lease of the expected end of lease dilapidation costs.
(b) Onerous contracts
A provision for onerous contracts was made as a result of the acquisition of certain assets and liabilities of ED&F Man Capital Markets Limited on 1 October 2022. The provision related to various IT and office contracts where the Group cancelled these contracts as the related service was not required. The provision has been fully utilised in 2023.
153
| Marex Group plc Annual Report 2023 | Strategic Report | Corporate Governance | Financial Statements | |||
|
|
|
|
|
|||
Notes to the Consolidated Financial Statements (continued)
For the Year Ended 31 December 2023
| 27 | Contingent Liabilities |
From time to time, the Group’s subsidiaries are engaged in litigation in relation to a variety of matters. In addition, the Group is required to provide information to regulators and other government agencies as part of informal and formal enquiries or market reviews.
The Group’s reputation may also be damaged by any involvement or the involvement of any of its employees or former employees in any regulatory investigation and by any allegations or findings, even where the associated fine or penalty is not material.
As outlined above, in respect of legal matters or disputes for which a provision has not been made, notwithstanding the uncertainties that are inherent in the outcome of such matters, there are no individual matters which are considered to pose a significant risk of material adverse financial impact on the Group’s results or net assets.
| 28 | Share Capital |
| Group and Company | ||||||||||||||||
| Issued and fully paid | Issued and fully paid | |||||||||||||||
| 2023 | 2023 | 2022 | 2022 | |||||||||||||
| Number | $‘000 | Number | $‘000 | |||||||||||||
| Ordinary Shares of $0.000165 each |
106,491,588 | 18 | 106,491,588 | 18 | ||||||||||||
| Non-voting Ordinary Shares of $0.000165 each |
3,986,376 | 1 | 3,986,376 | 1 | ||||||||||||
| Deferred Shares of £0.000469 each |
107,491,490 | 69 | 107,462,989 | 69 | ||||||||||||
| Growth Shares of $0.000165 each |
24,892,848 | 4 | 24,992,848 | 4 | ||||||||||||
| 242,862,302 | 92 | 242,933,801 | 92 | |||||||||||||
There is no authorised share capital for any class of share. There are no shares issued but not fully paid.
On 6 November 2023, the Employee Benefit Trust acquired the beneficial interests in 100,000 Growth shares of $0.000165 each from an ex-employee. Subsequently, on 14 December 2023, the 100,000 Growth shares of $0.000165 each were redenominated from USD to GBP using the exchange rate USD/GBP $1.23/£1, such that the new denomination of the Growth shares became £0.000133668. The 100,000 Growth shares of £0.000133668 were then consolidated into 28,501 Growth shares of £0.000469 each. The 28,501 Growth shares of £0.000469 each were then re-designated as 28,501 Deferred shares of £0.000469 each.
On 21 December 2022, 2,304,155 Growth shares of $0.000165 each were redenominated from USD to GBP using the exchange rate USD/GBP $1.22/£1, such that the new denomination of the Growth shares became £0.000135246. The 2,304,155 Growth shares of £0.000135246 were then consolidated into 664,451 Growth shares of £0.000469 each. The 664,451 Growth shares of £0.000469 each were then re-designated as 664,451 Deferred shares of £0.000469 each.
| Group and Company | ||||||||||||||||||||
|
Ordinary Shares Number |
Non-voting Ordinary Shares Number |
Deferred Shares Number |
Growth Shares Number |
Total Number |
||||||||||||||||
| At 1 January 2023 |
106,491,588 | 3,986,376 | 107,462,989 | 24,992,848 | 242,933,801 | |||||||||||||||
| Movement during year |
— | — | 28,501 | (100,000 | ) | (71,499 | ) | |||||||||||||
| At 31 December 2023 |
106,491,588 | 3,986,376 | 107,491,490 | 24,892,848 | 242,862,302 | |||||||||||||||
| Group and Company | ||||||||||||||||||||
|
Ordinary Shares Number |
Non-voting Ordinary Shares Number |
Deferred Shares Number |
Growth Shares Number |
Total Number |
||||||||||||||||
| At 1 January 2022 |
106,491,588 | 3,986,376 | 106,798,538 | 27,297,003 | 244,573,505 | |||||||||||||||
| Movement during year |
— | — | 664,451 | (2,304,155 | ) | (1,639,704 | ) | |||||||||||||
| At 31 December 2022 |
106,491,588 | 3,986,376 | 107,462,989 | 24,992,848 | 242,933,801 | |||||||||||||||
154
| Marex Group plc Annual Report 2023 | Strategic Report | Corporate Governance | Financial Statements | |||
|
|
|
|
|
|||
| 28 | Share Capital (continued) |
The rights of the shares are as follows:
| Class of share |
Rights | |
| Ordinary Shares |
Full voting rights and right to participate in ordinary dividends ranking pari passu with non-voting ordinary shares. In the event of a winding up, entitled to a return of capital ranking pari passu with non-voting ordinary shares and no right of redemption. | |
|
Non-voting Ordinary Shares |
As per ordinary shares, other than having no voting rights. | |
| Deferred Shares |
No voting rights, no right to participate in dividends or distributions and no right to redemption. On a return of capital on a winding up or otherwise, the assets of the Company available for distribution to its members shall be applied in paying a sum equal to £1 to the holders of the deferred shares pro rata according to the number of deferred shares held by them (rounded to the nearest £0.01, but such that the total paid in aggregate to all the holders shall in no event exceed £1). The deferred shares were created on 12 February 2010 by a reorganisation of share capital, undertaken to facilitate the Company’s acquisition by Amphitryon Limited and Ocean Ring Jersey Co Limited. | |
| Growth Shares |
The growth shares were issued in several series as part of a share-based remuneration scheme. On a liquidity event, such as an initial public offering or a sale, the growth shares entitle the holder thereof to a return if the proceeds exceed some specific level, set for each series thereby diluting existing ordinary shareholders. The holders of growth shares have no voting rights, no rights to participate in dividends, no entitlements to participate in a winding up and cannot impact the timing of a liquidity event. The growth shares do not expire and may be redeemed immediately prior to a liquidity event in cash or converted into a number of non-voting ordinary shares, equivalent in value to the redemption price. The growth shares permit the holders to elect for cash or equity settlement of the award, though in the absence of an election by the holder, the default settlement is through the issuance of non-voting ordinary shares. The Directors believe the growth shares will be settled in equity owing to factors such as the uncertain timing of settlement and the potential adverse tax consequences that arise for the holder in the event of cash settlement. As at the reporting date, the Directors do not believe a liquidity event to be probable. | |
| 29 | Own Shares |
As at 31 December 2023, the Group (through the Employee Benefit Trust) held 2,024,308 (2022: 1,901,586) non-voting ordinary shares purchased at a total cost of $9.8m (2022: $7.9m). This amount is shown as a debit balance within total equity. The movement in 2023 consists of non-voting ordinary shares purchased at a cost of $3.1m and the vesting of non-voting ordinary shares to the value of $1.2m under the Deferred Bonus Plan.
| 30 | Additional Capital (AT1 securities) |
The Group has $97.6m of AT1 securities (2022: $97.6m) which are perpetual securities with no fixed maturity and are structured to qualify as AT1 instruments under prevailing capital rules applicable. In 2023, there was no new issuance of AT1 securities. In 2022 there was one issuance in the form of Fixed Rate Resetting Perpetual Subordinated Contingent Convertible Notes of $100.0m ($97.6m, net of issuance costs of $2.4m). There were no redemptions in 2023 (2022: no redemptions).
Interest on the securities, at a fixed rate of 13.25% per annum, is payable semi-annually in arrears in equal instalments on 30 June and 30 December in each year, commencing on 30 December 2022. On the first reset date on 30 December 2027, in the event that the securities are not redeemed, interest will be reset to the five-year semi-annual US treasury securities yield plus a margin of 10.158% per annum. The interest payment is fully discretionary and non-cumulative, and conditional upon the Group being solvent at the time of payment, having sufficient distributable reserves and not being required by the regulatory authorities to cancel an interest payment.
Distributions amounting to $13.3m were made in 2023 (2022: $6.6m) on the AT1 securities.
The securities are perpetual securities with no fixed redemption date. The Group may, in its sole and full discretion, subject to regulatory approval, redeem all (but not some only) of the securities on any day falling in the period commencing on (and including) 30 June 2027 and ending on (and including) the first reset date or on any interest payment date thereafter at the prevailing principal amount together with accrued but unpaid interest. In addition, the securities are redeemable at the option of the Group for certain regulatory or tax reasons, subject to regulatory approval.
155
| Marex Group plc Annual Report 2023 | Strategic Report | Corporate Governance | Financial Statements | |||
|
|
|
|
|
|||
Notes to the Consolidated Financial Statements (continued)
For the Year Ended 31 December 2023
| 30 | Additional Capital (AT1 securities) (continued) |
The securities, which do not carry voting rights, rank pari passu with holders of Tier 1 instruments (excluding the Company’s Ordinary shares). They rank ahead of the holders of ordinary share capital of the Company but junior to the claims of senior creditors of the Group.
All AT1 securities will be converted into ordinary shares, at a pre-determined price, should the Group’s Investment Firms Prudential Regime CET1 Ratio fall to less than 64%.
| 31 | Other Reserve |
The following describes the nature and purpose of the reserves within other reserves:
| Reserves |
Description | |
| Revaluation reserve |
Cumulative unrealised gains on investments in exchanges that are held at FVTOCI and recognised in equity as well as changes in own credit risk. | |
| Cash flow hedge reserve |
Cumulative unrealised gains and losses on hedging instruments deemed effective cash flow hedges. | |
| Currency translation reserve |
On consolidation, the results of overseas operations are translated into USD at rates approximating to those prevailing when the transactions took place. All assets and liabilities of overseas operations, including goodwill arising on the acquisition of those operations, are translated at the rates ruling at the prevailing date. | |
| 32 | Leases |
| Right-of-use asset | ||||||||
| 2023 | 2022 | |||||||
| $‘000 | $‘000 | |||||||
| As at 1 January |
33.7 | 17.0 | ||||||
| Additions during the year |
22.8 | 22.4 | ||||||
| Adjustment to initial recognition of right-of-use asset |
(1.0 | ) | (0.2 | ) | ||||
| Depreciation charged to income statement |
(9.7 | ) | (5.5 | ) | ||||
| Impairment of right-of-use asset |
(5.2 | ) | — | |||||
| As at 31 December |
40.6 | 33.7 | ||||||
| Lease liability | ||||||||
| 2023 | 2022 | |||||||
| $‘000 | $‘000 | |||||||
| As at 1 January |
38.9 | 23.0 | ||||||
| Additions during the year |
22.8 | 22.8 | ||||||
| Interest expense charged to income statement |
2.5 | 1.0 | ||||||
| Payment of lease liabilities |
(11.4 | ) | (6.6 | ) | ||||
| Foreign exchange revaluation |
(0.1 | ) | (1.2 | ) | ||||
| Lease incentive |
(0.1 | ) | (0.1 | ) | ||||
| As at 31 December |
52.6 | 38.9 | ||||||
| Lease liability | ||||||||
| 2023 | 2022 | |||||||
| $m | $m | |||||||
| Current liability |
13.2 | 6.8 | ||||||
|
Non-current liability |
39.4 | 32.1 | ||||||
| As at 31 December |
52.6 | 38.9 | ||||||
Right-of-use assets relate to leasehold buildings. Other operating lease expenses, including service charges, utilities, property insurance and maintenance, amounted to $8.7m (2022: $5.5m). Operating lease expenses for short-term leases amounted to $2.2m (2022: $0.5m).
In 2023, the Group impaired the right-of-use asset for 425 Financial Place, Chicago recognising an impairment of $2.8m and Rue des Capucines, Paris recognising an impairment of $2.0m (2022: no impairments).
156
| Marex Group plc Annual Report 2023 | Strategic Report | Corporate Governance | Financial Statements | |||
|
|
|
|
|
|||
| 32 | Leases (continued) |
The weighted average incremental borrowing rate applied to lease liabilities recognised in the statement of financial position as at 31 December 2023 is 5.16% (2022: 5.0%).
The Group has the following leases that have the option of extension at the end of the lease term:
| – | Greenway Plaza, Houston – five years; |
| – | Asia Square Towers, Singapore – three years; |
| – | Fourth floor, Bishopsgate, London lease has an option of a renewal (term unspecified); |
| – | 45th street, New York – five years; |
| – | Montreal – five years; |
| – | Milton Park, Alpharetta, Georgia – five years; |
| – | Embarcadero Center, San Francisco – five years; |
| – | Crescent Court, Dallas, Texas – five years. |
The maturities of the undiscounted lease liabilities as at 31 December are as follows:
| Lease liability | ||||||||
| 2023 | 2022 | |||||||
| $m | $m | |||||||
| 1 year |
13.8 | 8.7 | ||||||
| 1 to 5 years |
31.5 | 24.5 | ||||||
| More than 5 years |
12.5 | 7.6 | ||||||
| 57.8 | 40.8 | |||||||
| Less: Future interest expense |
(5.2 | ) | (1.9 | ) | ||||
| 52.6 | 38.9 | |||||||
| 33 | Financial Instruments |
(a) Capital risk management
For the purpose of the Group’s capital management, capital includes issued share capital, AT1 capital, share premium and all other equity reserves attributable to the equity holders of the Company as disclosed in notes 28, 30 and 31. The primary objective of the Group’s capital management is to maximise shareholder value.
In order to achieve this overall objective, the Group’s capital management, amongst other things, aims to ensure that it meets the financial covenants attached to the interest-bearing borrowings that define capital structure requirements. Breaches in meeting the financial covenants would permit the banks to immediately call in any loans and borrowings that the Group might have withdrawn at that point in time. There have been no breaches in the financial covenants of any interest-bearing loans and borrowings in the current or prior year.
Many of the Group’s material operating subsidiaries are subject to regulatory restrictions and minimum capital requirements. As at 31 December 2023, each of these subsidiaries had net capital in excess of the requisite minimum requirements. These requirements are designed to ensure institutions have an adequate capital base to support the nature and scale of their operations. Management of regulatory capital forms an important part of the Group’s risk governance structure. A robust programme of regular monitoring and review takes place to ensure each regulated entity is in adherence to local rules and has capital in excess of external and internal limits. Regular submissions are made and constantly maintained with internal limits assessed against the Group’s risk appetite, as determined by the Board. One of those regulated entities is MCMI, regulated in the United States by both the Commodity Futures Trading Commission (‘CFTC’) and the Securities and Exchange Commission (‘SEC’). As a regulated Futures Commission Merchant (‘FCM’) and Broker Dealer, MCMI is subject to the SEC’s Uniform Net Capital Rule (Rule 15c3-1) and the CFTC’s minimum financial requirements for FCMs and introducing brokers (Regulation 1.17), which require the maintenance of minimum net capital. Advances to affiliates, repayment of subordinated liabilities, dividend payments, and other equity withdrawals are subject to certain limitations and other provisions of the capital rules of the SEC and other regulators. Specifically, MCMI is required to hold sufficient regulatory capital to support its activities and regulatory approval must be obtained prior to the repayment of 10% or more of excess net capital. As at 31 December 2023, MCMI had $664.2m (2022: $321.8m) of capital, of which the subordinated borrowing by the Group was $345m (2022: $279.6m) and of which excess net capital was $280.9m (2022: $127.6m). Owing to the local requirement to obtain regulatory approval for payments of amounts in excess of 10% of the excess net capital, or $28.1m (2022:12.7m), MCMI’s ability to transfer the remaining $316.9m (2022: $266.8m) of capital to its parent is restricted.
No changes were made in objectives, policies or processes for managing capital during the year.
157
| Marex Group plc Annual Report 2023 | Strategic Report | Corporate Governance | Financial Statements | |||
|
|
|
|
|
|||
Notes to the Consolidated Financial Statements (continued)
For the Year Ended 31 December 2023
| 33 | Financial Instruments (continued) |
(b) Categories of financial instruments
Below is an analysis of the Group and Company’s financial assets and liabilities as at 31 December.
| FVTPL | FVTOCI | Amortised cost | Total | |||||||||||||
| 2023 Financial assets |
$m | $m | $m | $m | ||||||||||||
| Investments |
— | 16.2 | — | 16.2 | ||||||||||||
| Treasury instruments1 |
— | — | 2,982.3 | 2,982.3 | ||||||||||||
| Equity instruments |
1,521.3 | — | — | 1,521.3 | ||||||||||||
| Derivative instruments |
791.0 | 2 | 3.1 | 3 | — | 794.1 | ||||||||||
| Stock borrowing |
— | — | 2,501.4 | 2,501.4 | ||||||||||||
| Reverse repurchase agreements |
— | — | 3,199.8 | 3,199.8 | ||||||||||||
| Amounts due from exchanges, clearing houses and other counterparties |
— | — | 3,459.6 | 3,459.6 | ||||||||||||
| Trade debtors |
— | — | 823.8 | 823.8 | ||||||||||||
| Default funds and deposits |
— | — | 273.2 | 273.2 | ||||||||||||
| Loans receivable |
— | — | 8.0 | 8.0 | ||||||||||||
| Other debtors4 |
5.6 | — | 149.1 | 154.7 | ||||||||||||
| Cash and cash equivalents |
— | — | 1,483.5 | 1,483.5 | ||||||||||||
| 2,317.9 | 19.3 | 14,880.7 | 17,217.9 | |||||||||||||
| FVTPL | FVTOCI | Amortised cost | Total | |||||||||||||
| 2022 Financial assets |
$m | $m | $m | $m | ||||||||||||
| Investments |
— | 16.4 | — | 16.4 | ||||||||||||
| Treasury instruments1 |
— | — | 2,719.7 | 2,719.7 | ||||||||||||
| Equity Instruments |
410.0 | — | — | 410.0 | ||||||||||||
| Derivative instruments |
477.3 | 3.5 | 480.8 | |||||||||||||
| Stock Borrowing |
1,894.6 | 1,894.6 | ||||||||||||||
| Reverse repurchase agreements |
— | — | 4,346.0 | 4,346.0 | ||||||||||||
| Amounts due from exchanges, clearing houses and other counterparties |
— | — | 4,046.7 | 4,046.7 | ||||||||||||
| Trade debtors |
— | — | 141.1 | 141.1 | ||||||||||||
| Default funds and deposits |
— | — | 352.7 | 352.7 | ||||||||||||
| Loans receivable |
— | — | 18.2 | 18.2 | ||||||||||||
| Other debtors (restated)4 |
4.5 | — | 76.8 | 81.3 | ||||||||||||
| Cash and cash equivalents |
— | — | 910.1 | 910.1 | ||||||||||||
| 891.8 | 19.9 | 14,505.9 | 15,417.6 | |||||||||||||
| 1. | The fair value of the treasury instruments, which are Level 1 instruments as they are all quoted instruments, held at amortised cost at 31 December 2023 was $2,972.48m (2022: $2,655.5m). The fair values of other assets and liabilities at amortised cost are consistent with the carrying amount. |
| 2. | The Group manages the fixed interest risk on its vanilla debt instrument through interest rate and cross currency swaps as hedging instruments. Refer to note 33 (f). |
| 3. | The $3.1m (2022: $3.5m) are hedging derivatives at FVTOCI due to being designated in a cash flow hedging relationship. |
| 4. | $39.5m (2022: $22.2m (restated)) of the other debtors balance relates to sign-on bonuses (note 21) and are not included in the table above as they are not a financial asset. |
158
| Marex Group plc Annual Report 2023 | Strategic Report | Corporate Governance | Financial Statements | |||
|
|
|
|
|
|||
| 33 | Financial Instruments (continued) |
(b) Categories of financial instruments (continued)
| FVTPL | FVTOCI | Amortised cost | Total | |||||||||||||
| 2023 Financial liabilities |
$m | $m | $m | $m | ||||||||||||
| Repurchase agreements |
— | — | 3,118.9 | 3,118.9 | ||||||||||||
| Derivative instruments1 |
540.5 | 0.2 | 1 | — | 540.7 | |||||||||||
| Short securities |
1,924.8 | — | — | 1,924.8 | ||||||||||||
| Amounts due to exchanges, clearing houses and other counterparties |
— | — | 432.4 | 432.4 | ||||||||||||
| Trade payables |
5.6 | — | 5,902.9 | 5,908.5 | ||||||||||||
| Other creditors |
— | — | 21.7 | 21.7 | ||||||||||||
| Stock lending |
— | — | 2,323.3 | 2,323.3 | ||||||||||||
| Long-term borrowings |
— | — | — | — | ||||||||||||
| Debt securities2 |
1,857.9 | — | 358.4 | 2,216.3 | ||||||||||||
| Lease liability |
— | — | 52.6 | 52.6 | ||||||||||||
| 4,328.8 | 0.2 | 12,210.2 | 16,539.2 | |||||||||||||
| FVTPL | FVTOCI | Amortised cost | Total | |||||||||||||
| 2022 Financial liabilities |
$m | $m | $m | $m | ||||||||||||
| Repurchase agreements |
— | — | 4,381.4 | 4,381.4 | ||||||||||||
| Derivative instruments1 |
292.7 | 1.6 | 1 | — | 294.3 | |||||||||||
| Short securities |
986.8 | — | — | 986.8 | ||||||||||||
| Amounts due to exchanges, clearing houses and other counterparties |
— | — | 180.0 | 180.0 | ||||||||||||
| Trade payables |
4.5 | — | 6,185.2 | 6,189.7 | ||||||||||||
| Other creditors |
— | — | 11.9 | 11.9 | ||||||||||||
| Stock lending |
— | — | 1,396.9 | 1,396.9 | ||||||||||||
| Short-term borrowings |
— | — | 12.9 | 12.9 | ||||||||||||
| Long-term borrowings |
— | — | 135.8 | 135.8 | ||||||||||||
| Debt securities |
1,160.0 | — | — | 1,160.0 | ||||||||||||
| Lease liability |
— | — | 38.9 | 38.9 | ||||||||||||
| 2,444.0 | 1.6 | 12,343.0 | 14,788.6 | |||||||||||||
| 1. | The $0.2m (2022: $1.6m) are hedging derivatives at FVTOCI but designated in a cash flow hedging relationship (note 33(f)). |
| 2. | Debt securities includes EMTN measured at amortised cost for which we apply fair value hedge accounting. |
159
| Marex Group plc Annual Report 2023 | Strategic Report | Corporate Governance | Financial Statements | |||
|
|
|
|
|
|||
Notes to the Consolidated Financial Statements (continued)
For the Year Ended 31 December 2023
| 33 | Financial Instruments (continued) |
| (c) | Equity instruments |
Equity instruments are purchased primarily to facilitate the stock lending and borrowing business, which is part of the agency and execution business segment and to facilitate counterparty requirements. Additionally, some equity instruments are purchased for the Group’s own account to hedge the economic exposure arising from the non-host derivative component of the Group’s issued debt securities.
| (d) | Financial instruments subject to offsetting, enforceable master netting arrangements and similar agreements |
As a member of the London Metal Exchange (‘LME’), the Group is subject to the settlement and margining rules of LME Clear. The majority of products transacted by the Group are LME forward contracts. LME forwards that are in-the-money do not settle in cash until the maturity (‘prompt’) date, while the Group is required to post margin to cover loss-making contracts daily. In accordance with the LME Clear rules, the Group is able to utilise forward profits to satisfy daily margin requirements which are set-off against loss-making contracts. Consequently, trade payables and amounts due from exchanges, clearing houses and other counterparties are presented on a net basis in the statement of financial position. The balance of trade receivables includes offsetting of LME forwards against any cash collateral held with the LME.
The Group nets certain repurchase and reverse repurchase agreements with the same counterparty where the conditions of offsetting are met, including the existence of master netting agreements between the relevant subsidiary and its counterparties.
The effect of offsetting is disclosed below:
| Gross amount |
Amounts set-off |
Net amount |
Non-cash collateral rec’d/ (pledged) |
Cash collateral rec’d/ (pledged) |
Net amount | |||||||||||||||||||
| 2023 |
$m | $m | $m | $m | $m | $m | ||||||||||||||||||
| Financial assets |
||||||||||||||||||||||||
| Amounts due from exchanges, clearing houses and other counterparties |
3,812.2 | (352.6 | ) | 3,459.6 | — | — | 3,459.6 | |||||||||||||||||
| Reverse repurchase agreements |
19,094.6 | (15,894.8 | ) | 3,199.8 | (3,086.6 | ) | 113.2 | |||||||||||||||||
| Derivative instruments |
833.6 | (39.5 | ) | 794.1 | — | (184.5 | ) | 609.6 | ||||||||||||||||
| Financial liabilities |
||||||||||||||||||||||||
| Trade payables |
6,261.1 | (352.6 | ) | 5,908.5 | — | — | 5,908.5 | |||||||||||||||||
| Repurchase agreements |
19,013.7 | (15,894.8 | ) | 3,118.9 | (3,096.2 | ) | — | 22.7 | ||||||||||||||||
| Derivative instruments |
580.2 | (39.5 | ) | 540.7 | — | (128.5 | ) | 412.2 | ||||||||||||||||
| Gross amount |
Amounts set-off |
Net amount |
Non-cash collateral rec’d/ (pledged) |
Cash collateral rec’d/ (pledged) |
Net amount | |||||||||||||||||||
| 2022 |
$m | $m | $m | $m | $m | $m | ||||||||||||||||||
| Financial assets |
||||||||||||||||||||||||
| Amounts due from exchanges, clearing houses and other counterparties |
4,833.1 | (786.4 | ) | 4,046.7 | — | — | 4,046.7 | |||||||||||||||||
| Reverse repurchase agreements |
8,743.1 | (4,397.1 | ) | 4,346.0 | (4,162.0 | ) | 184.0 | |||||||||||||||||
| Derivative Instruments |
496.2 | (15.4 | ) | 480.8 | — | (263.0 | ) | 217.8 | ||||||||||||||||
| Financial liabilities |
||||||||||||||||||||||||
| Trade payables |
6,976.2 | (786.4 | ) | 6,189.8 | — | — | 6,189.8 | |||||||||||||||||
| Repurchase agreements |
8,778.5 | (4,397.1 | ) | 4,381.4 | (4,252.5 | ) | — | 128.9 | ||||||||||||||||
| Derivative Instruments |
309.7 | (15.4 | ) | 294.3 | — | (102.8 | ) | 191.5 | ||||||||||||||||
160
| Marex Group plc Annual Report 2023 | Strategic Report | Corporate Governance | Financial Statements | |||
|
|
|
|
|
|||
| 33 | Financial Instruments (continued) |
(e) Debt securities
Financial Products Programs
In 2018 and September 2021, we launched our Structured Notes Program and Public Offer Program (together, the ‘Financial Products Programs’), respectively, which are at the core of our Financial Products business. The Financial Products business is part of our Hedging and Investment solutions segment and provides our clients with structured investment products (the ‘Structured Notes’) and represents a way to diversify our sources of funding and to reduce the utilisation of our revolving credit facilities. The Financial Products business allows investors to build their own Structured Notes across numerous asset classes, including commodities, equities, foreign exchange and fixed income products.
Under the Structured Notes Program, the Company and Marex Financial (a subsidiary) may issue warrants, certificates or notes, including auto callable, fixed, stability and capital linked notes with varied terms. As at 31 December 2023, the Group had $1,850.4m (2022: $1,155.9m) of debt securities issued under the Structured Notes Program with an average expected maturity of 15 months (2022: 17 months) however some of those debt securities issued include early redemption clauses exercised at the election of the investor if the underlying conditions are met. The average imputed interest rate of the notes was 7.8% (2022: 3.8%). These notes are designated at fair value through profit and loss.
Under the Public Offer Program, Marex Financial may issue warrants, certificates or notes, including auto callable, fixed, stability and capital linked notes with varied terms. No notes (2022: no notes) were outstanding under the Public Offer Program.
Tier 2 Program
Under the Tier 2 Program, Marex Financial may issue subordinated notes including fixed or floating rate, zero coupon, share or index linked notes with varied terms that qualify as Tier 2 Capital.
The Tier 2 Program has been approved by the Vienna Stock Exchange and the Tier 2 Notes are listed on the Vienna Multilateral Trading Facility. As at 31 December 2023, the Group had $7.4m (2022: $4.1m) of debt securities issued under the Tier 2 Program with an average maturity of 26 months (2022: 40 months) and an average interest rate of SOFR plus 643 basis points (2022: SOFR plus 643 basis points).
EMTN Program
In October 2022, the Company entered into a Euro Medium Term Note (‘EMTN’) Program under which it may, from time to time, issue tranches of notes of varying terms (EMTN Notes). The maximum aggregate principal amount of EMTN Notes outstanding at any time during the duration of the EMTN Program is $750.0m (or the equivalent in other currencies). The EMTN Notes constitute direct, unconditional, unsubordinated and unsecured obligations of the Company. The EMTN Notes rank at least pari passu with all other outstanding unsecured and unsubordinated obligations of the Company. The EMTN Program also contains certain customary events of default and optional redemption, and the Company has provided certain customary undertakings, such as restricting the creation of security over the Company’s and the Company’s subsidiaries’ assets. The EMTN Program and the EMTN Notes are listed on the Vienna Multilateral Trading Facility of the Vienna Stock Exchange. In February 2023, the Company issued senior fixed rate notes due 2 February 2028 in the amount of €300m for net proceeds of $325.6m at an interest rate of 8.38%. As at 31 December 2023, the Group had $358.5m (2022: $nil) of debt securities issued under the EMTN Program with an average maturity of 49 months (2022: nil) and an average interest rate of 8.38% (2022: nil). These EMTN notes are designated in a fair value hedging relationship for interest rate risk.
In addition to the above debt programs, the Group issued Additional Tier 1 (AT1) securities which are accounted for as equity instruments and disclosed in note 30.
(f) Financial risk management objectives
The Group’s activities expose it to a number of financial risks including credit risk, market risk and liquidity risk.
The Group manages these risks through various control mechanisms and its approach to risk management is both prudent and evolving.
Overall responsibility for risk management rests with the Board. Dedicated resources within the Risk Department control and manage the exposures of the Group’s own positions, the positions of its clients and its exposures to its counterparties, within the risk appetite set by the Board.
Credit risk
The maximum credit risk exposure relating to financial assets is represented by the gross carrying value as at the balance sheet date. Credit risk in the Group principally arises from cash and cash equivalents deposited with third party institutions, exposures from transactions and balances with exchanges and clearing houses, and exposures resulting from transactions and balances relating to customers and counterparties, some of which have been granted credit lines.
The Group only makes treasury deposits with banks and financial institutions that have received approval from the Group’s Executive Credit and Risk Committee (or their authorised delegates). These deposits are also subject to counterparty limits with respect to concentration and maturity.
The Group’s exposure to customer and counterparty transactions and balances is managed through the Group’s credit policies and, where appropriate, the use of initial and variation margin credit limits, in conjunction with position limits for all customers and counterparties. These exposures are monitored both intraday and overnight. The limits are set by the Group’s Executive Credit and Risk Committee (or their authorised delegates) through a formalised process.
161
| Marex Group plc Annual Report 2023 | Strategic Report | Corporate Governance | Financial Statements | |||
|
|
|
|
|
|||
Notes to the Consolidated Financial Statements (continued)
For the Year Ended 31 December 2023
| 33 | Financial Instruments (continued) |
(f) Financial risk management objectives (continued)
Credit quality
The table below reflects the Credit quality of financial assets and does not take into account collateral held.
| 2023 | 2022 | |||||||
| $m | $m | |||||||
| AA and above |
8,604.5 | 8,446.5 | ||||||
| AA- |
1,920.8 | 1,519.7 | ||||||
| A+ |
488.9 | 191.6 | ||||||
| A |
11.7 | — | ||||||
| A- |
162.0 | 2,851.8 | ||||||
| BBB+ |
57.0 | 8.4 | ||||||
| Lower and unrated |
5,973.0 | 2,411.6 | ||||||
| 17,217.9 | 15,429.6 | |||||||
The Group has received collateral in respect of its derivative assets during the year ended 31 December 2023 amounting to $184.5m (2022: $218.7m). Collateral was recognised in amounts due to exchanges, clearing houses and other counterparties.
Market risk
The Group’s activities expose it to financial risks primarily generated through financial (interest rate, equity and foreign exchange markets) and commodity market price exposures. The Group’s Market Making and Hedging and Investment Solutions businesses generate market risk as the Group acts as principal.
Market risk sensitivity
The Group manages market risk exposure using appropriate risk management techniques within predefined and independently monitored parameters and limits. The Group uses a range of tools to monitor and limit market risk exposures. These include Value-at-Risk (‘VaR’), sensitivity limits and stress testing. VaR, risk sensitivity limits and stress testing have been implemented to provide oversight and control over the Market Making and Hedging and Investment Solutions segments and to ensure that trading is conducted within the pre-set risk appetite from the Board.
The Group is not yet required to calculate an Economic VaR for capital purposes. Continuous development of the Group’s VaR framework and risk sensitivities will ensure a more consistent method of risk management for all desks. This continues to be developed.
Market risk management in the Market Making segment
VaR, risk sensitivity limits and stress testing are used to assess market risk associated with the Metals, Agriculture and CSC business, with equities and acquired businesses within the Capital Markets business in the Market Making segment. Those parts of the Capital Markets business within Market Making which exhibit market risk are the acquired businesses in 2023, the Equity Market Making desk and the Volatility Performance Fund.
Value at Risk
VaR is a technique that estimates the potential losses that could occur on risk positions as a result of movements in market rates and prices over a specified time horizon and to a given level of confidence.
The VaR model used by the Group for the Metals, Agriculture and CSC business is based upon the Monte Carlo simulation technique. This model derives plausible future scenarios from past series of recorded market rates and prices, taking account of inter-relationships between different markets and rates, including interest rates and foreign exchange rates. The model also incorporates the effect of option features on the underlying exposures.
The Monte Carlo simulation model used by the Group incorporates the following features:
| – | 5,000 simulations using a variance covariance matrix; |
| – | simulations generated using geometric Brownian motion; |
| – | an exceptional decay factor is applied across an estimation period of 250 days; and |
| – | VaR is calculated to a one-day, 99.75% one-tail confidence level. |
162
| Marex Group plc Annual Report 2023 | Strategic Report | Corporate Governance | Financial Statements | |||
|
|
|
|
|
|||
| 33 | Financial Instruments (continued) |
(f) Financial risk management objectives (continued)
The Group validates VaR by comparing to alternative risk measures, for example, scenario analysis and exchange initial margins as well as the back testing of calculated results against actual profit and loss.
Although a valuable guide to risk, VaR should always be viewed in the context of its limitations, for example:
| – | the use of both Monte Carlo and historical simulation as a proxy for estimating future events may not encompass all potential events, particularly those which are extreme in nature; |
| – | the use of a one-day holding period assumes that all positions can be liquidated or hedged in one-day. This may not fully reflect the market risk arising at times of severe liquidity stress, when a one-day holding period may be insufficient to liquidate or hedge all positions fully; |
| – | the use of a 99.75% confidence level, by definition, does not take into account losses that might occur beyond this level of confidence; |
| – | the VaR, disclosed below, is calculated on the basis of exposures outstanding at the close of business and, therefore, does not necessarily reflect intraday exposure; and |
| – | VaR is unlikely to reflect loss potential on exposures that only arise under significant market moves. |
The Group recognises these limitations by augmenting its VaR limits with other position and sensitivity limit structures. The Group also applies a wide range of stress testing, both on individual portfolios and on the Group’s consolidated positions.
For the Metals, Agriculture and CSC business, the VaR as at 31 December 2023 was $2.2m (2022: $1.5m) and the average monthly VaR for the year ended 31 December 2023 was $2.2m (2022: $2.0m).
The VaR model used by the Group for the acquired businesses in the US during 2023 uses historical simulation with a 3-year lookback period. The mandates cover individual desks and overall consolidated positions. The VaR for the acquired Capital Markets businesses as at 31 December 2023 was $0.4m and the average monthly VaR for the year ended 31 December 2023 was $0.4m.
In the remaining Capital Markets businesses market risk primarily derives from exposure to equities within the Volatility Performance Fund) and Equity Market Making desks.
The Volatility Performance Fund provides market making services to clients as well as seeking profitable market opportunities, primarily on equity indices with some additional small exposures to a limited set of commodity underlyers. The risks on the books are managed both by risk sensitivity analysis and stress testing to remain within the agreed limits. The stress exposure for the Volatility Performance Fund as at 31 December 2023 was $0.1m and as at 31 December 2022 was $0.7m.
The Equity Market Making business offers market making services on UK equities and investment trusts catering to retail stockbrokers, wealth managers and institutional investors. Risk is systematically monitored and regulated through limits based on net-delta at the stock, book and overall portfolio levels, with triggers in place for monitoring gross long/short exposures. Additionally, a VaR (1 day 99.75%) limit is implemented as well to oversee and manage the desk activities. The VaR at 31 December 2023 was $0.1m (2022: 0.1m).
Market risk management in the Hedging and Investment Solutions segment
The Hedging and Investment Solutions segment offers bespoke hedging solutions in the form of customised OTC derivatives and includes the structured notes issuance program. The market risk profile of the business is managed via risk sensitivities according to the prevailing risk factors of issued products and hedges. This is monitored and controlled daily on a net risk profile for each desk and supported by additional stress concentration and scenario-based analyses. Sensitivity analysis measures the impact of individual market factor movements on specific instruments or portfolios, including the key risks per asset class as follows:
| – | Commodity risk |
| – | Equity risk |
| – | Foreign exchange risk |
| – | Interest rate risk |
| – | Credit spread risk |
| – | Crypto currency market risk |
Risk sensitivity limits together with scenario stresses are used to manage the market risk for the Hedging and Investment Solutions segment given the inherent complexity of its products. The products traded within this segment gives rise to a number of different market risk exposures, commonly known as the “greeks”, e.g. delta, gamma, vega. Within each asset class, and in aggregate across the segment, the market risks are captured, measured, monitored and limited within the risk limits agreed with the Market Risk function.
The net market risk exposure to customised OTC derivatives, which includes structured notes issuance, within Hedging and Investment Solutions, including hedges, using the delta measure for the years ending 31 December, 2023 and 2022 were $0.1m and $2.0m respectively. Risks on other asset classes are small.
Sensitivity measures are used to monitor the market risk positions within each risk type, and granular risk limits are set for each desk with consideration for market liquidity, customer demand and capital constraints among other factors.
Risk sensitivity calculations are made using a dedicated Risk Engine, whose models have been independently validated by a third party. They are calculated by altering a risk factor and repricing all products to observe the profit and loss impact of the change.
163
| Marex Group plc Annual Report 2023 | Strategic Report | Corporate Governance | Financial Statements | |||
|
|
|
|
|
|||
Notes to the Consolidated Financial Statements (continued)
For the Year Ended 31 December 2023
| 33 | Financial Instruments (continued) |
(f) Financial risk management objectives (continued)
The Group issues products on cryptocurrencies, primarily Bitcoin and Ethereum. There are residual exposures in four other cryptocurrencies, driven from two structured notes previously issued. The exposures to cryptocurrencies are detailed in note 20.
Foreign currency risk
The Group’s policy is to minimise volatility as a result of foreign currency exposure. As such, management monitors currency exposure on a daily basis and buys or sells currency to minimise the exposure, in addition to the hedging of material future-dated GBP commitments through the use of derivative instruments. It is the policy of the Group to enter into foreign exchange forward contracts (for terms not exceeding fourteen months) to hedge the exchange rate risk from these specific future-dated GBP commitments and designate them in cash flow hedge relationships. The Group’s sensitivity to FX is immaterial as all our non-USD exposure is materially hedged.
Cash flow hedge
The associated gains and losses on derivatives that are used to hedge GBP commitments are recognised in other comprehensive income and will be recycled when the anticipated commitments take place and included in the initial cost of the hedged commitments.
The following table details the foreign currency forward contracts, held within derivatives on the statement of financial position, that are designated in cash flow hedging relationships:
| 2023 | ||||||||||||||||
| Average | ||||||||||||||||
| forward rates | Foreign currency | Notional value | Fair value assets | |||||||||||||
| Outstanding contracts |
($/£) | $m | £m | $m | ||||||||||||
| Derivative assets designated as cash flow hedges |
||||||||||||||||
| Less than 3 months |
1.2293 | 28.9 | 23.5 | 1.3 | ||||||||||||
| 3 to 6 months |
1.2301 | 14.7 | 12.0 | 0.6 | ||||||||||||
| 6 to 12 months |
1.2303 | 29.4 | 23.9 | 1.2 | ||||||||||||
| 73.0 | 59.4 | 3.1 | ||||||||||||||
| 2023 | ||||||||||||||||
| Average | ||||||||||||||||
| forward rates | Foreign currency | Notional value | Fair value liabilities | |||||||||||||
| Outstanding contracts |
($/£) | $m | £m | $m | ||||||||||||
| Derivative liabilities designated as cash flow hedges |
||||||||||||||||
| Less than 3 months |
1.2912 | 3.9 | 3.0 | (0.1 | ) | |||||||||||
| 3 to 6 months |
1.2986 | 3.9 | 3.0 | — | ||||||||||||
| 6 to 12 months |
1.2856 | 7.7 | 6.0 | (0.1 | ) | |||||||||||
| 15.5 | 12.0 | (0.2 | ) | |||||||||||||
| 2022 | ||||||||||||||||
| Average | ||||||||||||||||
| forward rates | Foreign currency | Notional value | Fair value assets | |||||||||||||
| Outstanding contracts |
($/£) | $m | $m | $m | ||||||||||||
| Derivative assets designated as cash flow hedges |
||||||||||||||||
| Less than 3 months |
1.1357 | 19.5 | 17.2 | 1.3 | ||||||||||||
| 3 to 6 months |
1.1357 | 19.5 | 17.2 | 1.3 | ||||||||||||
| 6 to 12 months |
1.1513 | 16.5 | 14.3 | 0.9 | ||||||||||||
| 55.5 | 48.7 | 3.5 | ||||||||||||||
| 2022 | ||||||||||||||||
| Average | ||||||||||||||||
| forward rates | Foreign currency | Notional value | Fair value liabilities | |||||||||||||
| Outstanding contracts |
($/£) | $m | $m | $m | ||||||||||||
| Derivative liabilities designated as cash flow hedges |
||||||||||||||||
| Less than 3 months |
1.3407 | 16.1 | 12.0 | (1.6 | ) | |||||||||||
| 16.1 | 12.0 | (1.6 | ) | |||||||||||||
164
| Marex Group plc Annual Report 2023 | Strategic Report | Corporate Governance | Financial Statements | |||
|
|
|
|
|
|||
| 33 | Financial Instruments (continued) |
(f) Financial risk management objectives (continued)
As at 31 December 2023, the aggregate amount of gains/(losses) under foreign exchange forward contracts deferred in the cash flow hedge reserve relating to the exposure on these anticipated future commitments is a gain of $2.9m (2022: $2.1m gain, 2021 $0.6m gain). It is anticipated that these commitments will become due monthly over the course of the next twelve months, at which time the amount deferred in equity will be recycled to profit and loss.
As at 31 December 2023 no ineffectiveness (2022 and 2021: $nil) has been recognised in profit and loss arising from the hedging of these future dated GBP commitments.
Interest rate risk
The Group is exposed to interest rate risk based on the difference between the interest rates earned on investments (interest-earning assets such as cash posted to exchanges or deposited with banks and/or invested in highly liquid securities), and the interest rates paid on client balances and group-wide debt financing (interest-bearing liabilities). These interest-earning assets and interest-bearing liabilities are not part of our fair value trading portfolio and as such the exposure they create to interest rate risk is measured using a sensitivity analysis. Interest rate risk created by other financial assets and financial liabilities measured at fair value and within our trading portfolio is measured by VaR.
The exposure to interest rate fluctuations is, however, limited through the offset that exists between the interest-earning assets and interest-bearing liabilities. The sensitivity is variable to the extent that investments are linked to client balances and, in addition, many of the balances have limited sensitivity as both the assets and liabilities are exposed to similar reference rates. Since the return paid on client liabilities is generally reset to prevailing market interest rates on an overnight basis, the Group is only exposed for the time it takes to reset any of our fixed-rate investments which typically have maturities of less than three months, with the exception of certain U.S. Treasuries, which have a maturity of up to two years.
The interest rate movements are monitored for potential impact to net interest income (‘NII’) continuously. The Group is sensitive to movements in short term rates, as changes to the rate will require a rebalancing of any fixed rate exposure. The Group considers that short term rates include rates that reference periods between overnight and three months on the basis that these are the most common fixing periods for interest rate products. The interest rate exposure is managed using a variety of instruments and are exposed to material changes in the short term rates as these are likely to reflect fixing periods during which floating rate exposure is effectively fixed until the next fixing date is reached. Analysis of recent changes to short term rates suggest that movements are usually within a 100bps range; this is based on a review of Fed Funds rate moves over a rolling three month period between January 2022 and September 2023 and as such, the Group has considered a movement of 100bps to be an extreme scenario over a three month period.
The Group has modelled the interest rate sensitivity to include the impact of rate movements on the income earned on average investment balances offset with expenses paid on interest bearing liabilities and debt funding. This reflects the proportion of client assets which are interest bearing and the average balances of our debt funding. The sensitivity analysis has been determined based on the exposure at the reporting date and does not include effects that may arise from increased margin calls at exchanges, changes in client behaviour or related management actions.
It is estimated, that as at 31 December 2023, if the relevant short term interest rates had been 100bps higher, NII on interest-bearing financial assets and financial liabilities for the year ended 31 December 2023 would increase by $38m (2022: $33m). If the short-term interest rates had been 100bps lower, NII for interest-bearing financial assets and financial liabilities for the year ended 31 December 2023 would decrease by $38m (2022: $33m). This impact relates solely to NII and does not include the impact of compensation or taxes which would reduce the impact on profit after tax.
Fair value hedge
At 31 December 2023, the Group had an interest rate swap and a cross currency swap agreement in place with a notional amount of €300m whereby the Group receives SOFR + 6.1% and $327.3m in return for €300m and paying fixed 8.375%. The interest rate swap and cross currency swap are being used to hedge the exposure to changes in the fair value of the fixed rate 8.375% senior debt issuance.
There is an economic relationship between the hedged item and the hedging instrument as the terms of the interest rate swap match the terms of the fixed rate loan (i.e. notional amount, maturity, payment and reset dates). The Group has established a hedge ratio of 1:1 for the hedging relationships as the underlying risk of the interest rate swap is identical to the hedged risk component. To test the hedge effectiveness, the Group uses the hypothetical derivative method and compares the changes in the fair value of the hedging instrument against the changes in the fair value of the hedged item attributable to the hedged risk.
Hedge ineffectiveness can arise from:
| – | different interest rate curve applied to discount the hedged item and hedging instrument; |
| – | differences in timing of cash flows of the hedged item and hedging instrument; |
| – | the counterparties’ credit risk differently impacting the fair value movements of the hedging instrument and hedged item. |
165
| Marex Group plc Annual Report 2023 | Strategic Report | Corporate Governance | Financial Statements | |||
|
|
|
|
|
|||
Notes to the Consolidated Financial Statements (continued)
For the Year Ended 31 December 2023
| 33 | Financial Instruments (continued) |
(f) Financial risk management objectives (continued)
The impact of the hedging instrument on the statement of financial position as at 31 December 2023 is as follows:
| Change in fair value | ||||||||||||||||
| used for measuring | ||||||||||||||||
| Line item in the statement of | ineffectiveness for | |||||||||||||||
| Notional Amount | Carrying Amount | financial position | the period | |||||||||||||
| $m | $m | $m | ||||||||||||||
| Interest rate swap |
331.1 | 23.8 | Derivative instruments | 3.4 | ||||||||||||
| Cross currency swap |
327.3 | 3.0 | Derivative instruments | – | ||||||||||||
| Fixed rate borrowing |
329.8 | 358.4 | Debt securities | -3.4 | ||||||||||||
Concentration risk
To mitigate the concentration of credit risk exposure to a particular single customer, counterparty or group of affiliated customers or counterparties, the Group monitors these exposures carefully and ensures that these remain within pre-defined limits. Large exposure limits are determined in accordance with appropriate regulatory rules.
Further concentration risk controls are in place to limit exposure to clients or counterparties within single countries of origin and operation through specific country credit risk limits as set by the Board Risk Committee.
The largest concentration of cash balances as at 31 December 2023 was 46% (2022: 65%) to a UK-based, AA rated global banking group (2022: UK-based, AA- rated global banking group).
The largest concentration of exposures to exchanges, clearing houses and other counterparties as at 31 December 2023 was 38% to ICE (2022: 44%) and 38% to the CME (2022: 26%).
The largest concentration of exposures to treasury instruments is to the United States Government as 97% (2022: 100%) of the instruments are issued by the US Government or a US Government sponsored enterprise.
Liquidity risk
The Group defines liquidity risk as the failure to meet its day-to-day capital and cash flow requirements. Liquidity risk is assessed and managed under the Individual Capital and Risk Assessment (ICARA) and Liquidity Risk Framework. To mitigate liquidity risk, the Group has implemented robust cash management policies and procedures that monitor liquidity daily to ensure that the Group has sufficient resources to meet its margin requirement at clearing houses and third party brokers. In the event of a liquidity issue arising, the Group has recourse to existing global cash resources, after which it could draw down on $250m (2022: $280m) of committed revolving credit facilities (note 22(d)). The Group has access to a further $125m (2022: $210m) secured borrowings (note 22(b)). The effect of the callable features within the structured note program is monitored and dynamically updated to reflect any changes to expected cashflows as part of the overall Group liquidity requirements. Short term liquidity requirements are monitored and subject to limits reflecting the Groups liquidity resources.
There are strict guidelines followed in relation to products and tenor into which excess liquidity can be invested. Excess liquidity is invested in highly liquid instruments, such as cash deposits with financial institutions for a period of less than 3 months and US Treasuries with a maturity of up to 2 years.
The financial liabilities are based upon rates set on a daily basis, apart from the financing of the warrant positions and the credit facility where the rates are set for the term of the loan. For assets not marked-to-market, there is no material difference between the carrying value and fair value.
Liquidity risk exposures
The following table details the Group’s available committed financing facilities including committed credit agreements:
| Secured borrowings and committed revolving credit facilities: |
2023 | 2022 | ||||||||||
| $m | $m | |||||||||||
| Amount used |
23(a | ) | — | 148.7 | ||||||||
| Amount unused |
23(d | ) | 250.0 | 280.0 | ||||||||
| 250.0 | 428.7 | |||||||||||
166
| Marex Group plc Annual Report 2023 | Strategic Report | Corporate Governance | Financial Statements | |||
|
|
|
|
|
|||
| 33 | Financial Instruments (continued) |
(f) Financial risk management objectives (continued)
Liquidity risk (continued)
The following table details the Group’s contractual maturity for non-derivative financial liabilities. Debt securities are presented discounted based on the first call dates. Lease liabilities are undiscounted and contractual.
| Less than 3 | 3 to 12 | 1 to 5 | More than 5 | |||||||||||||||||||||
| On demand | months | months | years | years | Total | |||||||||||||||||||
| 2023 |
$m | $m | $m | $m | $m | $m | ||||||||||||||||||
| Repurchase agreements |
— | 3,118.9 | — | — | — | 3,118.9 | ||||||||||||||||||
| Short securities |
1.3 | 1,923.5 | — | — | — | 1,924.8 | ||||||||||||||||||
| Amounts due to exchanges, clearing houses and other counterparties |
432.4 | — | — | — | — | 432.4 | ||||||||||||||||||
| Trade payables |
5,725.2 | 183.3 | — | — | — | 5,908.5 | ||||||||||||||||||
| Other creditors |
8.9 | 10.7 | 2.1 | — | — | 21.7 | ||||||||||||||||||
| Stock lending |
— | 2,323.3 | — | — | — | 2,323.3 | ||||||||||||||||||
| Short-term borrowings |
— | — | — | — | — | — | ||||||||||||||||||
| Debt securities |
— | 440.2 | 868.2 | 889.4 | 18.5 | 2,216.3 | ||||||||||||||||||
| Lease liabilities |
— | 3.4 | 10.4 | 31.5 | 12.5 | 57.8 | ||||||||||||||||||
| 6,167.8 | 8,003.3 | 880.7 | 920.9 | 31.0 | 16,003.7 | |||||||||||||||||||
| Less than 3 | 3 to 12 | 1 to 5 | More than 5 | |||||||||||||||||||||
| On demand | months | months | years | years | Total | |||||||||||||||||||
| 2022 |
$m | $m | $m | $m | $m | $m | ||||||||||||||||||
| Repurchase agreements |
1,874.5 | 2,500.4 | 6.5 | — | — | 4,381.4 | ||||||||||||||||||
| Short securities |
676.8 | 310.0 | — | — | — | 986.8 | ||||||||||||||||||
| Amounts due to exchanges, clearing houses and other counterparties |
180.0 | — | — | — | — | 180.0 | ||||||||||||||||||
| Trade payables |
5,652.9 | 160.8 | 376.0 | — | — | 6,189.7 | ||||||||||||||||||
| Other creditors |
5.6 | 5.2 | 1.1 | — | — | 11.9 | ||||||||||||||||||
| Stock lending |
1,004.0 | 392.9 | — | — | — | 1,396.9 | ||||||||||||||||||
| Short term borrowings |
— | 12.9 | — | — | — | 12.9 | ||||||||||||||||||
| Long term borrowings |
— | — | — | 135.8 | 135.8 | |||||||||||||||||||
| Debt securities (restated) |
— | 199.9 | 623.8 | 314.6 | 21.7 | 1,160.0 | ||||||||||||||||||
| Lease liabilities |
— | 2.2 | 6.5 | 24.5 | 7.6 | 40.8 | ||||||||||||||||||
| 9,393.8 | 3,584.3 | 1,013.9 | 474.9 | 29.3 | 14,496.2 | |||||||||||||||||||
Amounts due to exchanges, clearing houses and other counterparties, trade payables and other creditors are aggregated on the statement of financial position in trade and other payables and disaggregated in note 25.
Debt securities maturity profile has been restated, please refer to note 3(c) and note 39 for further information.
167
| Marex Group plc Annual Report 2023 | Strategic Report | Corporate Governance | Financial Statements | |||
|
|
|
|
|
|||
Notes to the Consolidated Financial Statements (continued)
For the Year Ended 31 December 2023
| 33 | Financial Instruments (continued) |
(f) Financial risk management objectives (continued)
Liquidity risk (continued)
Shown below is the Group’s contractual maturity for non-derivative financial assets:
| Less than 3 | 3 to 12 | 1 to 5 | More than 5 | |||||||||||||||||||||
| On demand | months | months | years | years | Total | |||||||||||||||||||
| 2023 |
$m | $m | $m | $m | $m | $m | ||||||||||||||||||
| Treasury instruments |
— | 2,757.8 | 104.8 | 119.7 | — | 2,982.3 | ||||||||||||||||||
| Equity instruments |
1,511.9 | 9.4 | — | — | — | 1,521.3 | ||||||||||||||||||
| Stock borrowing |
2,501.4 | — | — | — | — | 2,501.4 | ||||||||||||||||||
| Repurchase agreements |
— | 3,199.8 | — | — | — | 3,199.8 | ||||||||||||||||||
| Amounts due from exchanges, clearing houses and other counterparties |
3,297.2 | — | — | — | — | 3,297.2 | ||||||||||||||||||
| Trade debtors |
468.2 | 206.7 | 11.8 | 1.1 | — | 687.8 | ||||||||||||||||||
| Default funds and deposits |
17.3 | 121.5 | 134.3 | 0.1 | — | 273.2 | ||||||||||||||||||
| Loans receivable |
— | 7.7 | 0.4 | — | — | 8.1 | ||||||||||||||||||
| Other debtors |
142.2 | 11.3 | 0.5 | 0.1 | 0.6 | 154.7 | ||||||||||||||||||
| Cash and cash equivalents |
1,483.5 | — | — | — | — | 1,483.5 | ||||||||||||||||||
| 9,421.7 | 6,314.2 | 251.8 | 121.0 | 0.6 | 16,109.3 | |||||||||||||||||||
| Less than 3 | 3 to 12 | 1 to 5 | More than 5 | |||||||||||||||||||||
| On demand | months | months | years | years | Total | |||||||||||||||||||
| 2022 |
$m | $m | $m | $m | $m | $m | ||||||||||||||||||
| Treasury instruments |
— | 2,497.8 | 221.9 | — | — | 2,719.7 | ||||||||||||||||||
| Equity instruments |
410.0 | — | — | — | — | 410.0 | ||||||||||||||||||
| Financial institution notes |
1,894.6 | — | — | — | — | 1,894.6 | ||||||||||||||||||
| Repurchase agreements |
2,004.3 | 2,335.2 | 6.5 | — | — | 4,346.0 | ||||||||||||||||||
| Amounts due from exchanges, clearing houses and other counterparties |
565.3 | 3,409.0 | 48.2 | 24.2 | — | 4,046.7 | ||||||||||||||||||
| Trade debtors |
25.1 | 107.4 | 8.6 | — | — | 141.1 | ||||||||||||||||||
| Default funds and deposits |
192.3 | 160.4 | — | — | — | 352.7 | ||||||||||||||||||
| Loans receivable |
— | 17.9 | — | 0.3 | — | 18.2 | ||||||||||||||||||
| Other debtors |
5.3 | 67.3 | 6.7 | 14.0 | — | 93.3 | ||||||||||||||||||
| Cash and cash equivalents |
910.1 | — | — | — | — | 910.1 | ||||||||||||||||||
| 6,007.0 | 8,595.0 | 291.9 | 38.5 | — | 14,932.4 | |||||||||||||||||||
168
| Marex Group plc Annual Report 2023 | Strategic Report | Corporate Governance | Financial Statements | |||
|
|
|
|
|
|||
| 33 | Financial Instruments (continued) |
(f) Financial risk management objectives (continued)
Liquidity risk (continued)
Both assets and liabilities are included to understand the Group’s liquidity risk management, as the liquidity is managed on a net asset and liability basis. Amounts due from exchanges, clearing houses and other counterparties, trade debtors, default funds and deposits, loans receivable and other debtors are aggregated on the statement of financial position in trade and other receivables and disaggregated in note 21.
The following table details the Group’s contractual maturity for derivative financial assets and derivative financial liabilities as at 31 December 2023:
| Less than 3 | 3 to 12 | 1 to 5 | ||||||||||||||||||||||
| 2023 |
On demand | months | months | years | 5 + years | Total | ||||||||||||||||||
| Derivative instruments |
$m | $m | $m | $m | $m | $m | ||||||||||||||||||
| Assets |
— | 255.3 | 139.9 | 396.5 | 2.4 | 794.1 | ||||||||||||||||||
| Liabilities |
— | (248.9 | ) | (109.0 | ) | (181.0 | ) | (1.8 | ) | (540.7 | ) | |||||||||||||
| — | 6.4 | 30.9 | 215.5 | 0.6 | 253.4 | |||||||||||||||||||
The following table details the Group’s contractual maturity for derivative financial assets and derivative financial liabilities as at 31 December 2022:
| Less than 3 | 3 to 12 | 1 to 5 | ||||||||||||||||||||||
| 2022 |
On demand | months | months | years | 5 + years | Total | ||||||||||||||||||
| Derivative instruments |
$m | $m | $m | $m | $m | $m | ||||||||||||||||||
| Assets (restated) |
— | 128.4 | 154.5 | 197.5 | 0.4 | 480.8 | ||||||||||||||||||
| Liabilities (restated) |
— | (134.1 | ) | (124.9 | ) | (35.2 | ) | (0.1 | ) | (294.3 | ) | |||||||||||||
| — | (5.7 | ) | 29.6 | 162.3 | 0.3 | 186.5 | ||||||||||||||||||
Certain derivative assets and liabilities do not meet the offsetting criteria in IAS 32, but the entity has the right of offset in the case of default, insolvency or bankruptcy. Consequently, the gross amount of derivative assets of $794.1m (2022: $480.8m) and the gross amount of derivative liabilities of $540.7m (2022: $294.3m) are presented separately in the Group’s statement of financial position.
Fair value measurement
The information set out below provides information about how the Group determines fair values of various financial assets and financial liabilities.
Management assessed that the fair values of treasury instruments, stock borrowing, reverse repurchase agreements, amounts due from exchanges, clearing houses and other counterparties, cash and short term deposits, trade receivables, repurchase agreements, stock lending and trade and other payables, approximate their carrying value amounts largely due to the short-term maturities of these instruments.
The following methods and assumptions were used to estimate the Level 2 fair values:
| – | The fair values of the debt securities takes the price quotations at the reporting date and compares them against internal quantitative models that require the use of multiple market inputs including commodities prices, interest and foreign exchange rates to generate a continuous yield or pricing curves and volatility factors, which are used to value the position. |
| – | The fair value of non-listed investments relates to the Group’s holding of seats and membership of the exchanges and is based upon the latest trading price. |
| – | Where the inventory is related to scrap metals, the valuation is based on the quoted price discounted by location and grade of metal. Where there is an active market for the Group’s inventory, then quoted market price will be used to value the inventory position. |
| – | The Group enters into derivative financial instruments with various counterparties, principally financial institutions with investment grade credit ratings. Interest rate swaps, foreign exchange forward contracts and commodity forward contracts are valued using valuation techniques, which employ the use of market observable inputs. The most frequently applied valuation techniques include forward pricing and swap models using present value calculations. The models incorporate various inputs including the credit quality of counterparties, foreign exchange spot and forward rates curves of the underlying commodity. Some derivative contracts are fully cash collateralised, thereby eliminating both counterparty risk and the Group’s own non-performance risk. |
Level 3 fair value measurements are those derived from valuation techniques that include inputs for the asset or liability that are not based on observable market data. Some of the Group’s derivative financial instruments are priced using quantitative models that require the use of multiple market inputs including commodity prices, interest and foreign exchange rates to generate continuous yield or pricing curves and volatility factors in addition to unobservable inputs, which are used to value the position and therefore qualify as Level 3 financial assets.
169
| Marex Group plc Annual Report 2023 | Strategic Report | Corporate Governance | Financial Statements | |||
|
|
|
|
|
|||
Notes to the Consolidated Financial Statements (continued)
For the Year Ended 31 December 2023
| 33 | Financial Instruments (continued) |
(f) Financial risk management objectives (continued)
Own credit
Under IFRS 9, changes in fair value related to own credit risk for other financial liabilities designated at fair value through profit and loss are recognised in other comprehensive income. The changes in own credit risk recognised in other comprehensive income are subsequently transferred within equity to retained earnings in the same period as the sales fee income is deemed earned. The Group determines its own credit spread regularly based on a model using observable market inputs. Management estimates the own credit spread through using market observable credit spreads and paid credit spreads for public distributed products of the Group. The estimated own credit sensitivity to a 1 basis point move in credit spread is $0.2m (2022: $0.2m). Hence an increase in own credit spread of 1 basis point will lead to a charge of $0.2m (2022: $0.2m) recognised in other comprehensive income.
The following table shows an analysis of assets and liabilities recorded at fair value shown in accordance with the fair value hierarchy as at 31 December 2023 and 2022.
| Level 1 | Level 2 | Level 3 | Total | |||||||||||||
| 2023 |
$m | $m | $m | $m | ||||||||||||
| Financial assets – FVTPL: |
||||||||||||||||
| Equity instruments |
1,521.3 | — | — | 1,521.3 | ||||||||||||
| Derivative instruments |
1.1 | 789.1 | 0.8 | 791.0 | ||||||||||||
| Trade debtors |
5.6 | — | — | 5.6 | ||||||||||||
| Inventory |
144.5 | 18.9 | — | 163.4 | ||||||||||||
| Financial assets – FVTOCI: |
||||||||||||||||
| Investments |
5.5 | 10.7 | — | 16.2 | ||||||||||||
| Derivative instruments |
— | 3.1 | — | 3.1 | ||||||||||||
| Financial liabilities – FVTOCI: |
||||||||||||||||
| Derivative instruments |
— | (0.2 | ) | — | (0.2 | ) | ||||||||||
| Financial liabilities – FVTPL: |
||||||||||||||||
| Derivative instruments |
(2.2 | ) | (535.3 | ) | (3.0 | ) | (540.5 | ) | ||||||||
| Trade payables |
(5.6 | ) | — | — | (5.6 | ) | ||||||||||
| Short securities |
(1,924.8 | ) | — | — | (1,924.8 | ) | ||||||||||
| Debt securities |
— | (1,854.9 | ) | (3.0 | ) | (1,857.9 | ) | |||||||||
| (254.6 | ) | (1,568.6 | ) | (5.2 | ) | (1,828.4 | ) | |||||||||
| Level 1 | Level 2 | Level 3 | Total | |||||||||||||
| 2022 |
$m | $m | $m | $m | ||||||||||||
| Financial assets – FVTPL: |
||||||||||||||||
| Equity instruments |
410.0 | — | — | 410.0 | ||||||||||||
| Derivative instruments |
— | 474.7 | 2.6 | 477.3 | ||||||||||||
| Trade Debtors |
4.5 | — | — | 4.5 | ||||||||||||
| Inventory |
27.5 | 8.3 | — | 35.8 | ||||||||||||
| Financial assets – FVTOCI: |
||||||||||||||||
| Investments |
4.9 | 11.5 | — | 16.4 | ||||||||||||
| Derivative instruments |
— | 3.5 | — | 3.5 | ||||||||||||
| Financial liabilities – FVTOCI: |
||||||||||||||||
| Derivative instruments |
— | (1.6 | ) | — | (1.6 | ) | ||||||||||
| Financial liabilities – FVTPL: |
||||||||||||||||
| Derivative instruments |
— | (287.9 | ) | (4.8 | ) | (292.7 | ) | |||||||||
| Trade Payables |
(4.5 | ) | — | — | (4.5 | ) | ||||||||||
| Short securities |
(986.8 | ) | — | — | (986.8 | ) | ||||||||||
| Debt securities |
— | (1,160.0 | ) | — | (1,160.0 | ) | ||||||||||
| (544.4 | ) | (951.5 | ) | (2.2 | ) | (1,498.1 | ) | |||||||||
The above table has been restated to add trade debtors, trade payables and short securities line items.
The following table summarises the movements in the Level 3 balances during the year.
Asset and liability transfers between Level 2 and Level 3 are primarily due to either an increase or decrease in observable market activity related to an input or a change in the significance of the unobservable input, with assets and liabilities classified as Level 3 if an unobservable input is deemed significant. There were no transfers between any other levels during the year (2022: no transfers).
170
| Marex Group plc Annual Report 2023 | Strategic Report | Corporate Governance | Financial Statements | |||
|
|
|
|
|
|||
| 33 | Financial Instruments (continued) |
(f) Financial risk management objectives (continued)
Reconciliation of Level 3 fair value measurements of financial assets
| 2023 | 2022 | |||||||
| $m | $m | |||||||
| Balance at 1 January |
2.6 | 1.4 | ||||||
| Purchases |
— | 0.9 | ||||||
| Settlements |
(2.4 | ) | (0.6 | ) | ||||
| Total gains or losses in the period recognised in the income statement: |
||||||||
| Market Making revenue |
0.6 | 0.9 | ||||||
| Balance at 31 December |
0.8 | 2.6 | ||||||
Reconciliation of Level 3 fair value measurements of financial liabilities
| 2023 | 2022 | |||||||
| $m | $m | |||||||
| Balance at 1 January |
4.8 | 2.4 | ||||||
| Purchases |
0.6 | 1.6 | ||||||
| Settlements |
(0.7 | ) | (0.1 | ) | ||||
| Total gains or losses in the period recognised in the income statement: |
||||||||
| Market Making revenue |
2.9 | 0.9 | ||||||
| Transfers out of Level 3 |
(4.0 | ) | — | |||||
| Transfers into Level 3 |
2.4 | — | ||||||
| Balance at 31 December |
6.0 | 4.8 | ||||||
The Group’s management believes, based on the valuation approach used for the calculation of fair values and the related controls, that the Level 3 fair values are appropriate. The impact of reasonably possible alternative assumptions from the unobservable input parameters shows no significant impact on the Group’s profit, comprehensive income or shareholders’ equity. The Group deems the total amount of Level 3 financial assets and liabilities to be immaterial and therefore any sensitivities calculated on these balances are also deemed to be immaterial. The Group defers day 1 gains/losses when the initial fair value of a financial instrument held at fair value through profit and loss relies on unobservable inputs. At 31 December 2023, the Group held a deferred day 1 gains/losses balance of $3.1m (2022 $2.3m).
| 34 | Client Money (segregated) |
As required by the UK FCA’s Client Assets Sourcebook (‘CASS’) rules and the CFTC’s client money rules, the Group maintains certain balances on behalf of clients with banks, exchanges, clearing houses and brokers in segregated accounts. Segregated assets governed by the UK FCA’s CASS rules and the related liabilities to clients, whose recourse is limited to segregated accounts, are not included in the Group’s statement of financial position where the Group is not beneficially entitled thereto and does not share any of the risks or rewards of the assets. Excess Group cash placed in US segregated accounts to satisfy US regulations and securities held in US segregated accounts are recognised on the Group’s statement of financial position.
| 2023 | 2022 | |||||||
| $m | $m | |||||||
| Segregated assets at banks (not recognised) |
4,116.4 | 4,447.4 | ||||||
| Segregated assets at exchanges, clearing houses and other counterparties (not recognised) |
2,084.6 | 3,442.8 | ||||||
| Segregated assets at exchanges, clearing houses and other counterparties (recognised) |
4,415.6 | 5,059.4 | ||||||
| 10,616.6 | 12,949.6 | |||||||
As at 31 December 2023, $197.7m (2022: $120.1m) of excess Group cash placed in segregated accounts to satisfy US regulations has been recorded within cash and cash equivalents and client liabilities within Trade and other payables in the statement of financial position.
171
| Marex Group plc Annual Report 2023 | Strategic Report | Corporate Governance | Financial Statements | |||
|
|
|
|
|
|||
Notes to the Consolidated Financial Statements (continued)
For the Year Ended 31 December 2023
| 35 | Earnings Per Share |
Basic earnings per share is calculated by dividing the profit attributable to the ordinary equity holders of the Group for the year by the weighted average number of ordinary shares and non-voting ordinary shares outstanding during the year.
Diluted EPS is calculated by dividing the profit attributable to ordinary equity holders of the Group (after adjusting for the impact of AT1 securities dividends) by the weighted average number of ordinary shares that would be issued on conversion of all the dilutive potential ordinary shares into ordinary shares.
The following table reflects the income and share data used in the basic and diluted EPS calculations:
| 2023 | 2022 | |||||||
| Profit before tax ($m) |
196.5 | 121.6 | ||||||
| Tax ($m) |
(55.2 | ) | (23.4 | ) | ||||
| Profit after tax ($m) |
141.3 | 98.2 | ||||||
| AT1 dividends paid ($m) |
(13.3 | ) | (6.6 | ) | ||||
| Profit attributable to shareholders of the Group ($m) |
128.0 | 91.6 | ||||||
| Weighted average number of Ordinary shares during the year |
109,083,693 | 109,146,580 | ||||||
| Basic earnings per share ($) |
1.17 | 0.84 | ||||||
| Weighted average number of Ordinary shares for basic EPS |
109,083,693 | 109,146,580 | ||||||
| Effect of dilution from: |
||||||||
| Share schemes |
8,621,240 | 5,835,142 | ||||||
| Weighted average number of Ordinary shares adjusted for the effect of dilution |
117,704,933 | 114,981,722 | ||||||
| Diluted earnings per share ($) |
1.09 | 0.80 | ||||||
There have been no other transactions involving ordinary shares or potential ordinary shares between the reporting date and the date of authorisation of these financial statements. The 2022 number for Share schemes and weighted average number of ordinary shares adjusted for the effect of dilution has been restated.
| 36 | Events after Balance Sheet Date |
(a) Disposal of Marex North America LLC
On 3 January 2024 the Group disposed of one of its regulated subsidiaries in the United States, Marex North America LLC (‘MNA’), to an external buyer for proceeds of $127.5m, constituting $125m for the net assets of the business and a premium of $2.5m.
Prior to the disposal, during 2023, the business of MNA was transferred to another affiliate, Marex Capital Markets Inc. The entity being disposed of qualified as a disposal group under IFRS 5. However, as the only asset that the entity held at the balance sheet date was a receivable related to intragroup debt, which eliminates on consolidation, the entity was not disclosed as a disposal group.
(b) Purchase of Pinnacle Fuel LLC
On 4 January 2024 the Group acquired Pinnacle Fuel LLC (‘Pinnacle’) from Empire Holding LLC for a consideration of $4.01m including a $4m premium and $0.01m of net assets. Pinnacle is a physical oil trading business and has been purchased by MNA Holdings LLC in order to facilitate the back-to-back oil trading business.
The initial accounting for the acquisition of net identifiable assets has only been provisionally determined. At the date of finalisation of these consolidated financial statements, the necessary market valuation and other calculations had not been finalised.
(c) Interim dividend
On 6 February 2024 the Company paid an interim dividend of $44.1m to ordinary shareholders.
(d) Initial public offering
On 15 April 2024, the Group launched its initial public offering of ordinary shares with a total of 15.4 million ordinary shares being offered. A registration statement relating to these securities has been filed with the U.S. Securities and Exchange Commission but, as of the date hereof, has not yet become effective. The securities on offer cannot be sold nor offers accepted until the registration statement becomes effective.
172
| Marex Group plc Annual Report 2023 | Strategic Report | Corporate Governance | Financial Statements | |||
|
|
|
|
|
|||
| 37 | Related Party Transactions |
(a) Parent and ultimate controlling party
In these financial statements Group comprises the Company and its subsidiaries. Subsidiaries refers to the entities controlled by the Company as disclosed in note 16(c).
The immediate parent and ultimate controlling party of the Company is Amphitryon Limited, a company incorporated in Jersey, Channel Islands.
(b) Key management personnel
The remuneration paid to key management personnel for their services to the Group was as follows:
| 2023 | 2022 | |||||||
| $m | $m | |||||||
| Aggregate wages and salaries |
46.5 | 47.3 | ||||||
| Short-term monetary benefits |
0.2 | 0.2 | ||||||
| Defined contribution pension cost |
0.1 | 0.1 | ||||||
| Management Incentive Plan |
16.5 | 12.9 | ||||||
| 63.3 | 60.5 | |||||||
The remuneration of the highest paid Director for their services to the Group was $4.3m (2022: $7.3m). No pension contributions were made on their behalf whilst they were a Director of the Group (2022: $nil).
The salaries, fees, bonuses and benefits in kind paid to Directors were $10.4m (2022: $13.1m). The amounts awarded to Directors under the deferred bonus plan were $3.1m (2022: $2.4m). The defined pension contribution for Directors was less than $0.1m (2022: $nil). One Director (2022: no Director) is a member of the main UK pension plan. Dividends paid to Directors were $0.1m (2022: $nil).
(c) Key management personnel transactions
In May 2023 the Company offered all current and former employees the opportunity to sell some or all of the beneficial interest held in non-voting ordinary shares to the Employee Benefit Trust. Pursuant to that offer, in June 2023 the beneficial interest in 208,754 non-voting ordinary shares was acquired at market value from key management personnel.
(d) Transactions with entities having significant influence over the Group
Balances and transactions between the Company and its subsidiaries which are related parties have been eliminated on consolidation and are not disclosed in this note.
On 20 October 2020, the Company entered into a Shareholders’ Agreement with Amphitryon Limited, Ocean Ring Jersey Co. Limited and Ocean Trade Lux Co S.Á.R.L. (the ‘2020 Shareholders’ Agreement’). Pursuant to the terms of the 2020 Shareholders’ Agreement, the Group pays a management fee of 2.5% of EBITDA each year to a party associated with the ultimate parent company for services provided. For the year ending 31 December 2023 the Group paid $6.1m (2022: $3.4m), recorded within other expenses. As at 31 December 2023, there was $1.1m outstanding (2022: $1.0m) recorded within trade and other payables.
There were no other transactions during the period or assets and liabilities outstanding as at 31 December 2023 (2022: $nil) with other related parties.
173
| Marex Group plc Annual Report 2023 | Strategic Report | Corporate Governance | Financial Statements | |||
|
|
|
|
|
|||
Notes to the Consolidated Financial Statements (continued)
For the Year Ended 31 December 2023
| 38 | Share-based payments |
Share-based payment
The Group operates three equity-settled share-based remuneration schemes for Executive Directors and senior management. All are United Kingdom tax authority unapproved schemes. The cost of the service is calculated by reference to the fair value of shares at the grant date, the number of shares expected to vest under the schemes and the probability that the performance and the service conditions will be met. The fair values of the shares were calculated by applying an estimated price-earnings multiple to the earnings per share of the Group, which prior to grant was approved at the Remuneration Committee. The cost of the service is recognised in the income statement over the period that the employee provides service and there is a shared understanding of the terms and conditions of the arrangement. The employee to whom these awards were granted must not depart from the Group, and such an action would require a forfeiture of some or all of the award depending on the conditions under which the employee were to leave.
Deferred Bonus Plan
Members of the scheme are awarded a fixed number of non-voting ordinary shares vesting in three equal tranches over the three years following the date of grant. As the awards are based on the employees’ annual performance, the grant date is deemed to be the beginning of the year for which the bonus had been awarded.
Retention Long Term Incentive Plan
Members of the scheme are awarded a variable number of non-voting ordinary shares three years after the grant date. The number of shares awarded is determined by reference to a hurdle return on equity of the Group and to growth targets for the profit after tax of the Group over the three-year period.
Annual Long Term Incentive Plan
Members of the scheme are awarded a variable number of non-voting ordinary shares three years after the grant date. The number of shares awarded is determined by reference to financial underpins; the first is a hurdle return on equity of the Group and the second underpin is growth targets for the adjusted operating profit before tax over the three year period.
The charge for the year arising from share-based payment schemes was as follows:
| 2023 | 2022 | |||||||
| $m | $m | |||||||
| Deferred Bonus Plan |
13.8 | 6.7 | ||||||
| Retention Long Term Incentive Plan |
4.5 | 10.0 | ||||||
| Annual Long Term Incentive Plan |
2.0 | — | ||||||
| Total equity-settled share-based payments |
20.3 | 16.7 | ||||||
Movement on share awards
| 2023 | 2022 | |||||||
| Number | Number | |||||||
| Outstanding at the beginning of the year |
5,835,142 | 844,760 | * | |||||
| Granted during the year |
3,067,596 | 5,073,560 | * | |||||
| Vested during the year |
(281,498 | ) | — | |||||
| Forfeited during the year |
— | (83,178 | ) | |||||
| Outstanding at the end of the year |
8,621,240 | 5,835,142 | ||||||
| Weighted average fair value of awards granted ($) |
6.8 | 6.1 | ||||||
*Restated
For the purposes of the above disclosure the fair value of the awards granted during 2023 is assumed to be the final price approved by the Remuneration Committee.
Previous share-based payment schemes
In addition to the three equity-settled share-based remuneration schemes currently active and outlined above, previously the Group had other equity and cash settled share-based remuneration plans under which no more awards are being granted. However, there are certain instruments issued and outstanding under those plans as at 31 December 2023. The terms and the instruments are outlined below.
174
| Marex Group plc Annual Report 2023 | Strategic Report | Corporate Governance | Financial Statements | |||
|
|
|
|
|
|||
| 38 | Share-based payments (continued) |
Growth shares and nil cost options
The Group offered multiple series of growth shares and some nil cost options to employees (some of whom are now former employees), including Directors and senior managers during the period between 2010 and 2020.
As an equity settled scheme the nil cost options are not recognised as they are contingent on a liquidity event which is not yet considered probable.
The growth shares series granted in 2010, 2011 and 2015 were fully vested prior to 1 January 2021 and, accordingly, 10.8 million growth shares were issued. Those growth shares remain subject to a bad leavers provision, under which they will be converted into deferred shares if the employee who leaves is categorised as a bad leaver.
The 2016, 2019 and 2020 series will only vest on the occurrence of a liquidity event, which is defined as a sale, initial public offering, or liquidation. Refer to note 28 – Share capital for a description of the rights of the Growth shares.
Growth options
The Group granted growth options to current and former employees under the series 2010 growth options scheme. The series 2010 growth options are exercisable upon the occurrence of a liquidity event, and will entitle the holder to a cash payment equal to the value of the 2010 growth share series. Alternatively the Group Board may determine that holders of the options instead be offered the right for their 2010 growth options to be converted into 2010 Growth Shares, but the choice of settlement will remain with the holder. All growth options were fully vested prior to 1 January 2021. At 31 December 2023, there were 185,894 (2022: 185,894) growth options outstanding. A liability commensurate with the growth share value will be recorded at fair value with the remeasurement being recognised in the income statement. Upon the liquidity event becoming probable, an amount equal to the value of the growth shares will be recognised which, as at 31 December 2023, is not material.
Warrants
The Group granted warrants to certain Directors and senior managers in 2010 and 2019, giving the holders of the warrants the right to purchase in aggregate 1,143,453 non-voting ordinary shares for a fixed price per share. The warrants granted were fully vested prior to 1 January 2021. The warrants can be exercised upon the occurrence of a liquidity event. They are accounted for as an equity instrument.
| 39 | Restatement |
Restatement of previously issued financial statements
During the preparation of these financial statements, the Group voluntarily decided to change certain accounting policies in accordance with IAS 8 Accounting Policies, Changes in Accounting Estimates and Errors, including the presentation of its consolidated income statement to provide more detailed information to investors and align better its financial reporting to that of a public entity, and the presentation of income from physical commodities trading in the consolidated income statement. Furthermore, the Group corrected some errors identified in the statement of financial position and in the income and cash flow statements included in the already issued statutory financial statements as at and for the year ended 31 December 2022. The details of these voluntary accounting policies changes and correction of errors are as follows.
Restatement of the consolidated income statement
Change in accounting policies
Change of presentation of the income statement
As a privately owned group, historically the Group has presented revenue and expenses in its income statement at an aggregated level. For the year ended 31 December 2022, the Group decided to present within revenue all the income derived from the ordinary activities of the Group and disaggregate them in the income statement to provide the users of the financial statements with a presentation which is more reflective of the manner in which the business is managed and to provide additional clarity regarding the Group’s performance. In connection with this, commissions and fees paid to exchanges and clearing houses and all interest income and interest expense incurred as part of the ordinary activities of the Group, are now presented within revenue. Similarly, a more granular presentation has been adopted for the Group’s expenses. This will provide more reliable and relevant information for the users of its financial statements. This change has been applied retrospectively for comparative purposes and only impacts the presentation of the income statement and has no impact on profit after tax. The changes do not impact the consolidated statement of financial position or the statement of comprehensive income and changes in equity. The impact in the consolidated statement of cash flows is described in the section below.
175
| Marex Group plc Annual Report 2023 | Strategic Report | Corporate Governance | Financial Statements | |||
|
|
|
|
|
|||
Notes to the Consolidated Financial Statements (continued)
For the Year Ended 31 December 2023
| 39 | Restatement (continued) |
Restatement of the consolidated income statement (continued)
Presentation of income from physical commodities trading
For the year ended 31 December 2022, the Group retrospectively adopted a voluntary change in accounting policy, with respect to the presentation of revenue and associated costs from the sale of physical commodities, which in previous issued financial statements were presented on a gross basis within revenue and operating costs, respectively, in the income statement. To align the presentation in the income statement to the manner in which the physical commodities trading business is managed, the Group decided to change its accounting policy for all revenue arising from fair valuing forward contracts to buy and sell physical commodities to be presented on a net basis, with no gross revenue and gross cost of sales presented upon physical settlement of the forward contracts. This will provide more reliable and more relevant information for the users of its financial statements. As restated, net physical commodities income is $4.6m. As reported, $338.3m was presented within revenue and $333.7m within operating expenses. This retrospective change in accounting policy does not impact the consolidated statement of financial position, statements of comprehensive income, of cash flows or of changes in equity.
In aggregate, considering the above changes in accounting policies in the income statement, revenue as restated is $711.1m. Previously, revenue was $1,344.4m. All other changes resulted in a disaggregation of line items into a nature-based presentation to provide better information or present them separately as required by IFRS.
| 2022 | ||||
| $m | ||||
| Revenue as originally presented |
1,344.4 | |||
| plus: interest income |
106.2 | |||
| minus: interest expense |
(106.6 | ) | ||
| minus: commission and fee expense |
(299.2 | ) | ||
| minus: cost of sales of physical commodities |
(333.7 | ) | ||
| Revenue as restated |
711.1 | |||
Correction of errors
Presentation of interest income calculated using the effective interest method
The Group did not present separately in the income statement the interest income calculated using the effective interest method as required by IAS 1. As restated, interest income is $194.4m. As reported, $88.2m of interest income was presented within revenue and $106.2m as finance income. The error did not impact profit after tax. The correction of this error does not impact the consolidated statement of financial position, the statements of comprehensive income, cash flows or of changes in equity.
Presentation of impairment for credit losses
The Group did not present separately in the income statement the impairment for credit losses as required by IAS 1. As restated, impairment for credit losses is $9.5m and was previously presented as part of operating expenses. The error did not impact profit after tax. The correction of this error does not impact the consolidated statement of financial position, the statements of comprehensive income, cash flows or of changes in equity.
176
| Marex Group plc Annual Report 2023 | Strategic Report | Corporate Governance | Financial Statements | |||
|
|
|
|
|
|||
| 39 | Restatement (continued) |
Restatement of the consolidated statement of financial position
Correction of errors
Reclassification of software from property, plant and equipment to intangible assets
The Group presented within property, plant and equipment an amount of software ($4.0m) in the statement of financial position as the Group considered the software was integral to the operation of the hardware. The software is separable from hardware and can reside on any infrastructure delivering full functionality, hence it should be presented as intangible assets. The correction of this error does not impact the consolidated income statement, the statements of comprehensive income, cash flows or of changes in equity.
Reclassification of borrowings between current and non-current liabilities
For the year ended 31 December 2022, the Group presented as short-term borrowings an amount of $135.8m in the statement of financial position where the contractual maturity was due in more than 12 months after the reporting date. The early voluntary repayment of those borrowings after 31 December 2022 represents a non-adjusting subsequent event and hence they should have been presented as non-current liabilities as at 31 December 2022. The correction of this error does not impact the consolidated income statement, statements of comprehensive income, cash flows or of changes in equity.
The impact of the correction of these two reclassification errors in the statement of financial position is as follows:
| As reported | Adjustment | As restated | ||||||||||
| 31 December 2022 |
$m | $m | $m | |||||||||
| Intangible assets |
21.4 | 4.0 | 25.4 | |||||||||
| Property, plant and equipment |
15.8 | (4.0 | ) | 11.8 | ||||||||
| Short term borrowings |
148.7 | (135.8 | ) | 12.9 | ||||||||
| Long term borrowings |
— | 135.8 | 135.8 | |||||||||
| Total current liabilities |
14,309.0 | (135.8 | ) | 14,173.2 | ||||||||
| Total non-current liabilities |
757.2 | 135.8 | 893.0 | |||||||||
Presentation of debt securities in issue
In connection with the preparation of our consolidated financial statements, we identified an error related to the classification of current and non-current debt securities liabilities, specifically related to structured notes issued.
Historically the Group classified the structured notes in line with the expected maturities of the instruments, however some structured notes are linked to the performance of underlying securities issued by third parties and include early redemption clauses, granting the investors the right to call them if the price of the underlying securities is higher than a specified threshold at certain dates. As the performance of the underlying securities is beyond the control of the Group, we do not have an unconditional right to defer settlement of the liability for at least 12 months after the period end. Therefore they need to be classified as non-current liabilities as required by International Accounting Standard 1, Presentation of Financial Statements.
The impact of the correction of this error is presented below. Total liabilities remain unchanged for all periods presented. The error did not impact the income statement, the statements of comprehensive income, cash flows or changes in equity.
| 31 December 2022 | 1 January 2022 | |||||||||||||||||||||||
| As reported | Adjustment | As restated | As reported | Adjustment | As restated | |||||||||||||||||||
| Debt securities – current |
435.0 | 388.7 | 823.7 | 463.6 | 526.5 | 990.1 | ||||||||||||||||||
| Total current liabilities |
14,173.2 | 388.7 | 14,561.9 | 4,103.6 | 526.5 | 4,630.1 | ||||||||||||||||||
| Debt securities – non-current |
725.0 | (388.7 | ) | 336.3 | 663.1 | (526.5 | ) | 136.6 | ||||||||||||||||
| Total non-current liabilities |
893 | (388.7 | ) | 504.3 | 683.3 | (526.5 | ) | 156.8 | ||||||||||||||||
177
| Marex Group plc Annual Report 2023 | Strategic Report | Corporate Governance | Financial Statements | |||
|
|
|
|
|
|||
Notes to the Consolidated Financial Statements (continued)
For the Year Ended 31 December 2023
| 39 | Restatement (continued) |
Restatement of the consolidated statement of cash flows
Impact of change of presentation of the income statement and correction of errors in the cash flow statement
Following the changes in the presentation of the income statement, the Group aligned its cash flow statement and corrected some errors in the classification of certain cash flows.
| – | Cash flows related to interest received (2022: $68.6m) and paid (2022: $18.7m) are now presented as part of operating activities. Previously, interest received was considered an investing activity and interest paid a financing activity. |
| – | Increase in fair value of derivative instruments (2022; $111.1m) is presented as a reconciling item between profit before tax and net cash flows from operating activities. Previously, they were presented as working capital adjustments within operating activities. |
| – | Increase in debt securities – structured notes (2022: $83.3m) and net repayment of borrowings (2022: $49.9m) are now presented as operating activities. Previously they were presented as financing activities. |
| – | Increase in equity instruments (2022: $402.3m) and investment in convertible bond (2022: $0.4m) are now presented as operating activities. Previously they were presented as investing activities. Investment in convertible bond is now also presented aggregated within increase in equity instruments. |
| – | The effect of foreign exchange rates (2022: ($7.7m)) in cash and cash equivalents is now presented separately. Previously, it was presented as part of the reconciling items between profit before tax and net cash flows from operating activities. |
| – | Proceeds from the issuance of the AT1 capital instrument (2022: $100.0m) and its issuance cost (2022: ($2.4m)) are now presented gross. Previously they were presented net. |
| – | Treasury instruments are now presented aggregated (2022: $494.0m) instead of separately to aggregate cash flows on the same type of instruments. |
The impact of the change in presentation of the income statement and correction of the above errors in the statement of cash flows is as follows:
| 31 December 2022 |
As reported | Adjustment | As restated | |||||||||
| $m | $m | $m | ||||||||||
| Operating cash flows before changes in working capital |
63.2 | 202.4 | 265.6 | |||||||||
| Cash flows from operating activities |
554.9 | (317.9 | ) | 237.0 | ||||||||
| Net cash from operating activities |
536.9 | (317.9 | ) | 219.0 | ||||||||
| Net cash used in investing activities |
(380.0 | ) | 333.7 | (46.3 | ) | |||||||
| Net cash from / (used in) financing activities |
41.2 | (8.1 | ) | 33.1 | ||||||||
| Effect of foreign exchange rate changes |
— | (7.7 | ) | (7.7 | ) | |||||||
178
| Marex Group plc Annual Report 2023 | Strategic Report | Corporate Governance | Financial Statements | |||
|
|
|
|
|
|||
Company Financial Statements
Company Statement of Financial Position
As at 31 December 2023
| 2023 | 2022 | |||||||||||
| notes | $m | $m | ||||||||||
| Assets |
||||||||||||
| Non-current assets |
||||||||||||
| Investments |
(B) | 3.8 | 3.7 | |||||||||
| Investments in subsidiaries |
(C) | 633.3 | 502.7 | |||||||||
| Deferred tax |
(E) | 2.1 | 0.2 | |||||||||
| Subordinated loans due from group undertakings |
(F) | 59.8 | 352.6 | |||||||||
| Total non-current assets |
699.0 | 859.2 | ||||||||||
| Current assets |
||||||||||||
| Trade and other receivables |
(D) | 1,184.3 | 5.5 | |||||||||
| Derivative instruments |
(G) | 43.7 | 0.2 | |||||||||
| Corporation tax |
— | 0.1 | ||||||||||
| Cash and cash equivalents |
10.9 | — | ||||||||||
| Total current assets |
1,238.9 | 5.8 | ||||||||||
| Total assets |
1,937.9 | 865.0 | ||||||||||
| Liabilities |
||||||||||||
| Current liabilities |
||||||||||||
| Derivative instruments |
(G) | 29.1 | 2.9 | |||||||||
| Debt securities |
(I) | 530.0 | — | |||||||||
| Trade and other payables |
(H) | 190.6 | 363.2 | |||||||||
| Total current liabilities |
749.7 | 366.1 | ||||||||||
| Non-current liabilities |
||||||||||||
| Debt securities |
(I) | 708.0 | 59.4 | |||||||||
| Deferred tax liability |
(E) | — | 0.1 | |||||||||
| Total non-current liabilities |
708.0 | 59.5 | ||||||||||
| Total liabilities |
1,457.7 | 425.6 | ||||||||||
| Total net assets |
480.2 | 439.4 | ||||||||||
| Equity |
||||||||||||
| Share capital |
28 | 0.1 | 0.1 | |||||||||
| Share premium |
134.3 | 134.3 | ||||||||||
| Additional Tier 1 capital (AT1) |
30 | 97.6 | 97.6 | |||||||||
| Retained earnings |
264.2 | 215.3 | ||||||||||
| Own shares |
29 | (9.8 | ) | (7.9 | ) | |||||||
| Other reserve |
31 | (6.2 | ) | — | ||||||||
| Total equity |
480.2 | 439.4 | ||||||||||
The Company reported a retained profit for the year ended 31 December 2023 of $90.2m (2022: $15.2m retained loss).
179
| Marex Group plc Annual Report 2023 | Strategic Report | Corporate Governance | Financial Statements | |||
|
|
|
|
|
|||
Company Financial Statements (continued)
Company Statement of Changes in Equity and Movements in Reserves
For the Year Ended 31 December 2023
| Additional | ||||||||||||||||||||||||||||
| Share | Share | Retained | (AT1) | Own | Other | |||||||||||||||||||||||
| capital | premium | earnings | capital | shares | reserve | Total | ||||||||||||||||||||||
| $m | $m | $m | $m | $m | $m | $m | ||||||||||||||||||||||
| At 1 January 2022 |
0.1 | 134.3 | 212.7 | 6.6 | — | 0.1 | 353.8 | |||||||||||||||||||||
| Loss for the period |
— | — | (15.2 | ) | — | — | — | (15.2 | ) | |||||||||||||||||||
| Loss on revaluation of investments |
— | — | — | — | — | (0.3 | ) | (0.3 | ) | |||||||||||||||||||
| Deferred tax on revaluation of investments |
— | — | — | — | — | 0.2 | 0.2 | |||||||||||||||||||||
| Total comprehensive income for the period |
— | — | (15.2 | ) | — | — | (0.1 | ) | (15.3 | ) | ||||||||||||||||||
| Additional (AT1) capital |
— | — | — | 97.6 | — | — | 97.6 | |||||||||||||||||||||
| AT1 dividends paid |
— | — | — | (6.6 | ) | — | — | (6.6 | ) | |||||||||||||||||||
| Own Shares |
— | — | — | — | (7.9 | ) | — | (7.9 | ) | |||||||||||||||||||
| Share-based payments |
— | — | 17.8 | — | — | — | 17.8 | |||||||||||||||||||||
| At 31 December 2022 and 1 January 2023 |
0.1 | 134.3 | 215.3 | 97.6 | (7.9 | ) | — | 439.4 | ||||||||||||||||||||
| Profit for the period |
— | — | 90.2 | — | — | — | 90.2 | |||||||||||||||||||||
| Gain on revaluation of investments |
— | — | — | — | — | 0.1 | 0.1 | |||||||||||||||||||||
| Change in fair value due to own credit risk |
— | — | — | — | — | (8.2 | ) | (8.2 | ) | |||||||||||||||||||
| Deferred tax on
change in fair value of financial liabilities designated at FVTPL due |
— | — | — | — | — | 1.9 | 1.9 | |||||||||||||||||||||
| Total comprehensive income for the period |
— | — | 90.2 | — | — | (6.2 | ) | 84.0 | ||||||||||||||||||||
| AT1 dividends paid |
— | — | (13.3 | ) | — | — | — | (13.3 | ) | |||||||||||||||||||
| Dividends paid |
— | — | (45.0 | ) | — | — | — | (45.0 | ) | |||||||||||||||||||
| Own Shares |
— | — | — | — | (3.1 | ) | — | (3.1 | ) | |||||||||||||||||||
| Share-based payments |
— | — | 20.3 | — | — | — | 20.3 | |||||||||||||||||||||
| Share settlement of share-based payments |
— | — | (1.2 | ) | — | 1.2 | — | — | ||||||||||||||||||||
| Other movements |
— | — | (2.1 | ) | — | — | — | (2.1 | ) | |||||||||||||||||||
| At 31 December 2023 |
0.1 | 134.3 | 264.2 | 97.6 | (9.8 | ) | (6.2 | ) | 480.2 | |||||||||||||||||||
180
| Marex Group plc Annual Report 2023 | Strategic Report | Corporate Governance | Financial Statements | |||
|
|
|
|
|
|||
Company Financial Statements (continued)
Company Statement of Cash Flows
For the Year Ended 31 December 2023
| 2023 | 2022 | |||||||
| $m | $m | |||||||
| Restated | ||||||||
| Profit / (loss) before tax |
91.1 | (13.3 | ) | |||||
| Adjustment to reconcile profit / (loss) before tax to net cash flows: |
||||||||
| Impairment of investments in subsidiaries |
8.2 | 32.3 | ||||||
| Bargain purchase gain on acquisitions |
(0.9 | ) | — | |||||
| (Increase) / decrease in fair value of derivative instruments |
(17.3 | ) | 2.7 | |||||
| Share-based payments |
20.3 | 16.7 | ||||||
| Other revaluations |
(2.1 | ) | — | |||||
| Operating cash flows before changes in working capital |
99.3 | 38.4 | ||||||
| Working capital adjustments: |
||||||||
| (Increase) / decrease in trade and other receivables |
(1,127.9 | ) | 2.5 | |||||
| (Decrease) / increase in trade and other payables |
(172.6 | ) | 51.8 | |||||
| Increase in equity instruments |
(188.8 | ) | (118.1 | ) | ||||
| Increase in debt securities |
1,170.4 | 59.4 | ||||||
| Cash (outflow) / inflow from operating activities |
(219.6 | ) | 34.0 | |||||
| Corporation tax paid |
(0.9 | ) | (3.6 | ) | ||||
| Net cash (outflow) / inflow from operating activities |
(220.5 | ) | 30.4 | |||||
| Investing activities |
||||||||
| Decrease / (increase) in subordinated loan receivable |
292.8 | (63.5 | ) | |||||
| Net cash inflow / (outflow) from investing activities |
292.8 | (63.5 | ) | |||||
| Financing activities |
||||||||
| Proceeds from issuance of Additional Tier 1 capital (AT1) |
— | 100.0 | ||||||
| Issuance costs of Additional Tier 1 capital (AT1) |
— | (2.4 | ) | |||||
| Repayment of Tier 2 debt securities |
— | (50.0 | ) | |||||
| Purchase of own shares |
(3.1 | ) | (7.9 | ) | ||||
| Dividends paid |
(58.3 | ) | (6.6 | ) | ||||
| Net cash (outflow) / inflow from financing activities |
(61.4 | ) | 33.1 | |||||
| Net increase in cash and cash equivalents |
10.9 | — | ||||||
| Cash and cash equivalents |
||||||||
| Cash at banks and on hand and short-term deposits at 1 January |
— | — | ||||||
| Increase in cash |
10.9 | — | ||||||
| Cash and cash equivalents at 31 December |
10.9 | — | ||||||
181
| Marex Group plc Annual Report 2023 | Strategic Report | Corporate Governance | Financial Statements | |||
|
|
|
|
|
|||
Company Financial Statements (continued)
Notes to the Company Financial Statements
For the Year Ended 31 December 2023
(A) Company income statement
As permitted by section 408 of the Companies Act 2006, the Company has elected not to present its income statement for the year. The Company reported a retained profit for the year ended 31 December 2023 of $90.2m (2022: $15.2m retained loss).
(B) Investments
| 2023 | 2022 | |||||||
| $m | $m | |||||||
| Cost |
||||||||
| At 1 January |
3.7 | 3.9 | ||||||
| Revaluation |
0.1 | (0.2 | ) | |||||
| At 31 December |
3.8 | 3.7 | ||||||
| Listed investments |
2.0 | 2.1 | ||||||
| Unlisted investments |
1.8 | 1.6 | ||||||
| At 31 December |
3.8 | 3.7 | ||||||
Investments comprise shares and seats held in clearing houses which are deemed relevant to the Group’s trading activities and are classified as FVTOCI financial assets and recorded at fair value, with changes in fair value reported in equity. The fair value for these investments are based on valuations as disclosed in note 33.
(C) Investments in subsidiaries
| 2023 | 2022 | |||||||
| $m | $m | |||||||
| Cost |
||||||||
| At 1 January |
502.7 | 416.8 | ||||||
| Additions |
191.4 | 118.2 | ||||||
| Disposals |
(52.6 | ) | — | |||||
| Impairment of investment |
(8.2 | ) | (32.3 | ) | ||||
| At 31 December |
633.3 | 502.7 | ||||||
(D) Trade and other receivables
| 2023 | 2022 | |||||||
| $m | $m | |||||||
| Amounts due from group undertakings |
1,164.3 | — | ||||||
| Trade debtors |
— | 1.4 | ||||||
| Other tax and social security taxes |
0.8 | 1.7 | ||||||
| Other debtors |
16.5 | 1.2 | ||||||
| Prepayments |
2.7 | 1.2 | ||||||
| 1,184.3 | 5.5 | |||||||
(i) Ageing of trade debtors
The amount of trade debtors as at 31 December 2023 was $nil (2022: $1.4m, ageing is between 61 to 90 days and with no ECL provision).
The ageing of the Company’s other receivables different from trade receivables, excluding other tax and social security taxes and prepayments as at 31 December 2023 relates to Other debtors ($16.5m) and is all Current, with a $nil corresponding allowance for loan losses ECL (2022: $1.2m, ageing is More than 120 days, $nil corresponding allowance for loan losses ECL).
(ii) Reconciliation of the movement in impairment allowance
There was no impairment allowance in 2023 and 2022.
182
| Marex Group plc Annual Report 2023 | Strategic Report | Corporate Governance | Financial Statements | |||
|
|
|
|
|
|||
Company Financial Statements (continued)
Notes to the Company Financial Statements
For the Year Ended 31 December 2023
(E) Deferred tax
| Credited/ | Credited to | |||||||||||||||||||
| (expensed) | other | |||||||||||||||||||
| to the | Recognised | comprehensive | ||||||||||||||||||
| income | on | income & | At 31 | |||||||||||||||||
| 2023 |
At 1 January | statement | acquisition | equity | December | |||||||||||||||
| $m | $m | $m | $m | $m | ||||||||||||||||
| Other short-term timing differences |
(0.1 | ) | 0.1 | — | — | — | ||||||||||||||
| Revaluation of investments, cash flow hedges and liabilities designated at FVTPL |
0.2 | — | — | 1.9 | 2.1 | |||||||||||||||
| 0.1 | 0.1 | — | 1.9 | 2.1 | ||||||||||||||||
| Credited/ | Credited to | |||||||||||||||||||
| (expensed) | other | |||||||||||||||||||
| to the | Recognised | comprehensive | ||||||||||||||||||
| income | on | income & | At 31 | |||||||||||||||||
| 2022 |
At 1 January | statement | acquisition | equity | December | |||||||||||||||
| $m | $m | $m | $m | $m | ||||||||||||||||
| Other short-term timing differences |
— | (0.1 | ) | — | — | (0.1 | ) | |||||||||||||
| Revaluation of investments, cash flow hedges and liabilities designated at FVTPL |
— | — | — | 0.2 | 0.2 | |||||||||||||||
| — | (0.1 | ) | — | 0.2 | 0.1 | |||||||||||||||
| 2023 | 2022 | |||||||
| $m | $m | |||||||
| Deferred tax asset |
2.1 | 0.2 | ||||||
| Deferred tax liability |
— | (0.1 | ) | |||||
| 31 December |
2.1 | 0.1 | ||||||
(F) Subordinated loans due from group undertakings
| 2023 | 2022 | |||||||
| $m | $m | |||||||
| Marex North America LLC1 |
— | 303.0 | ||||||
| Marex Financial2 |
49.6 | 49.6 | ||||||
| Marex Australia Pty Ltd3 |
10.2 | — | ||||||
| 59.8 | 352.6 | |||||||
| 1. | The revolving subordinated loan agreement with Marex North America LLC was renewed during the year ended 31 December 2023 with the approval of the CME. The facility had a drawing termination date of 31 January 2024, maturity date of 31 January 2027 and total credit line of $355.0m (2022: $355.0m). Upon approval of the respective designated self-regulatory organisation (DSRO), CME and NFA, loan prepayments were made during 2023, reducing the outstanding loan balance to $125m by October 2023. The subordinated borrowings of $125.0m (2022: $303.0m) were unsecured and carried interest at SOFR plus 4.00% for the year (2022: SOFR plus 4.00%). The subordinated borrowings qualified as equity capital as defined by the CFTC regulation 1.17d. As at 22 December 2023, the Company sold, transferred and assigned to Marex Services Inc (‘MSI’) all of the MNA loan interests which MSI simultaneously assigned, transferred and contributed said interests to MNA Holdco LLC (‘MNAH’). |
| 2. | The Company extended a subordinated loan of $49.6m to its subsidiary, Marex Financial. The facility has a maturity date of 1 June 2031 with an optional call date of 1 June 2026 and total credit line of $49.6m. The subordinated borrowings of $49.6m are unsecured and carry interest at a fixed rate of 8%.The subordinated borrowings qualify as Tier 2 equity capital under Prudential regulations (Prudential Regulation Authority or ‘PRA’). |
| 3. | The Company extended an unsecured subordinated loan facility of AUD35m ($23.8m) to its subsidiary, Marex Australia Pty Ltd, and has a maturity date of 14 November 2025. Borrowings under the facility amounted to AUD15m ($10.2m) and carry interest at one-month BBSW plus 6.30% per annum. The subordinated borrowings comply with the ASX Clear (Futures) Pty operating rules. |
183
| Marex Group plc Annual Report 2023 | Strategic Report | Corporate Governance | Financial Statements | |||
|
|
|
|
|
|||
Company Financial Statements (continued)
Notes to the Company Financial Statements
For the Year Ended 31 December 2023
(G) Derivative instruments
Derivative assets and derivative liabilities comprise the following:
| 2023 | 2022 | |||||||
| Financial assets |
$m | $m | ||||||
| Held for trading derivatives carried at fair value through profit and loss that are not designated in hedge accounting relationships: |
||||||||
| Energy option contracts |
0.3 | — | ||||||
| Foreign currency option contracts |
0.3 | — | ||||||
| Precious metal option contracts |
1.8 | — | ||||||
| Credit forward |
1.4 | — | ||||||
| Equity option |
11.8 | 0.2 | ||||||
| Crypto option |
1.3 | — | ||||||
| Held for trading derivatives that are designated in hedge accounting relationships: |
||||||||
| Interest rate swaps |
23.8 | — | ||||||
| Cross currency swaps |
3.0 | — | ||||||
| 43.7 | 0.2 | |||||||
| 2023 | 2022 | |||||||
| Financial liabilities |
$m | $m | ||||||
| Held for trading derivatives carried at fair value through profit and loss that are not designated in hedge accounting relationships: |
||||||||
| Agriculture option contracts |
0.3 | — | ||||||
| Energy option contracts |
0.2 | 0.5 | ||||||
| Precious metal option contracts |
0.1 | — | ||||||
| Credit forward |
2.3 | 0.5 | ||||||
| Crypto forward |
0.9 | — | ||||||
| Crypto option |
0.2 | — | ||||||
| Equity option contracts |
25.1 | 1.9 | ||||||
| 29.1 | 2.9 | |||||||
(H) Trade and other payables
| 2023 | 2022 | |||||||
| $m | $m | |||||||
| Amounts due to group undertakings |
136.1 | 353.7 | ||||||
| Amounts due to exchanges, clearing houses and other counterparties |
32.4 | — | ||||||
| Other creditors |
— | 2.1 | ||||||
| Accruals |
22.1 | 7.4 | ||||||
| 190.6 | 363.2 | |||||||
Amounts due to group undertakings arise mainly due to cash received in order to facilitate another intercompany loan. The Directors consider that the carrying amount of trade and other payables is not materially different to their fair value.
184
| Marex Group plc Annual Report 2023 | Strategic Report | Corporate Governance | Financial Statements | |||
|
|
|
|
|
|||
Company Financial Statements (continued)
Notes to the Company Financial Statements
For the Year Ended 31 December 2023
(I) Financial instruments
Categories of financial instruments
| FVTPL | FVTOCI | Amortised cost | Total | |||||||||||||
| Financial assets - 2023 |
$m | $m | $m | $m | ||||||||||||
| Investments |
— | 3.8 | — | 3.8 | ||||||||||||
| Amounts due from group undertakings |
— | — | 1,164.3 | 1,164.3 | ||||||||||||
| Subordinated loans due from group undertakings |
— | — | 59.8 | 59.8 | ||||||||||||
| Derivative instruments |
43.7 | — | — | 43.7 | ||||||||||||
| Other debtors |
— | — | 16.5 | 16.5 | ||||||||||||
| Cash and cash equivalents |
— | — | 10.9 | 10.9 | ||||||||||||
| 43.7 | 3.8 | 1,251.5 | 1,299.0 | |||||||||||||
| FVTPL | FVTOCI | Amortised cost | Total | |||||||||||||
| Financial assets - 2022 |
$m | $m | $m | $m | ||||||||||||
| Investments |
— | 3.7 | — | 3.7 | ||||||||||||
| Subordinated loans due from group undertakings |
— | — | 352.6 | 352.6 | ||||||||||||
| Derivative instruments |
0.2 | — | — | 0.2 | ||||||||||||
| Trade debtors |
— | — | 1.4 | 1.4 | ||||||||||||
| Other debtors |
— | — | 1.2 | 1.2 | ||||||||||||
| 0.2 | 3.7 | 355.2 | 359.1 | |||||||||||||
| FVTPL | Amortised cost | Total | ||||||||||||||
| Financial liabilities - 2023 |
$m | $m | $m | |||||||||||||
| Amounts due to group undertakings |
— | 136.1 | 136.1 | |||||||||||||
| Amounts due to exchanges, clearing houses and other counterparties |
— | 32.4 | 32.4 | |||||||||||||
| Derivatives instruments |
29.1 | — | 29.1 | |||||||||||||
| Debt securities |
879.6 | 358.4 | 1,238.0 | |||||||||||||
| 908.7 | 526.9 | 1,435.6 | ||||||||||||||
| FVTPL | Amortised cost | Total | ||||||||||||||
| Financial liabilities - 2022 |
$m | $m | $m | |||||||||||||
| Amounts due to group undertakings |
— | 353.7 | 353.7 | |||||||||||||
| Derivatives instruments |
2.9 | — | 2.9 | |||||||||||||
| Other creditors |
— | 2.1 | 2.1 | |||||||||||||
| Debt securities |
59.4 | — | 59.4 | |||||||||||||
| 62.3 | 355.8 | 418.1 | ||||||||||||||
The table below reflects the credit quality of financial assets and does not take into account collateral held.
| 2023 | 2022 | |||||||||||||||
| $m | $m | |||||||||||||||
| AA- |
10.8 | — | ||||||||||||||
| A+ |
2.1 | — | ||||||||||||||
| Lower and unrated |
1,286.1 | 359.1 | ||||||||||||||
| 1,299.0 | 359.1 | |||||||||||||||
185
| Marex Group plc Annual Report 2023 | Strategic Report | Corporate Governance | Financial Statements | |||
|
|
|
|
|
|||
Company Financial Statements (continued)
Notes to the Company Financial Statements
For the Year Ended 31 December 2023
(I) Financial instruments (continued)
The following table details the Group’s contractual maturity for non-derivative financial liabilities. Debt securities are presented discounted based on the first call dates.
| Less than 3 | 3 to 12 | 1 to 5 | More than 5 | |||||||||||||||||||||
| On demand | months | months | years | years | Total | |||||||||||||||||||
| 2023 |
$m | $m | $m | $m | $m | $m | ||||||||||||||||||
| Amounts due to group undertakings |
136.1 | — | — | — | — | 136.1 | ||||||||||||||||||
| Amounts due to exchanges, clearing houses and other counterparties |
32.4 | — | — | — | — | 32.4 | ||||||||||||||||||
| Debt securities |
— | 172.2 | 357.8 | 689.5 | 18.5 | 1,238.0 | ||||||||||||||||||
| 168.5 | 172.2 | 357.8 | 689.5 | 18.5 | 1,406.5 | |||||||||||||||||||
| Less than 3 | 3 to 12 | 1 to 5 | More than 5 | |||||||||||||||||||||
| On demand | months | months | years | years | Total | |||||||||||||||||||
| 2022 |
$m | $m | $m | $m | $m | $m | ||||||||||||||||||
| Amounts due to group undertakings |
353.7 | — | — | — | — | 353.7 | ||||||||||||||||||
| Other creditors |
— | 2.1 | — | — | — | 2.1 | ||||||||||||||||||
| Debt securities |
— | — | — | 59.4 | — | 59.4 | ||||||||||||||||||
| 353.7 | 2.1 | — | 59.4 | — | 415.2 | |||||||||||||||||||
| Shown below is the Company’s contractual maturity for non-derivative financial assets: |
|
|||||||||||||||||||||||
| Less than 3 | 3 to 12 | 1 to 5 | ||||||||||||||||||||||
| On demand | months | months | years | Total | ||||||||||||||||||||
| 2023 |
$m | $m | $m | $m | $m | |||||||||||||||||||
| Cash and cash equivalents |
10.9 | — | — | — | 10.9 | |||||||||||||||||||
| Other debtors |
16.5 | — | — | — | 16.5 | |||||||||||||||||||
| Amounts due from group undertakings |
|
1,164.3 | — | — | — | 1,164.3 | ||||||||||||||||||
| Subordinated loans due from group undertakings |
— | — | — | 59.8 | 59.8 | |||||||||||||||||||
| 1,191.7 | — | — | 59.8 | 1,251.5 | ||||||||||||||||||||
| Less than 3 | 3 to 12 | 1 to 5 | ||||||||||||||||||||||
| On demand | months | months | years | Total | ||||||||||||||||||||
| 2022 |
$m | $m | $m | $m | $m | |||||||||||||||||||
| Subordinated loans due from group undertakings |
— | — | — | 352.6 | 352.6 | |||||||||||||||||||
| Other debtors |
1.2 | — | — | — | 1.2 | |||||||||||||||||||
| 1.2 | — | — | 352.6 | 353.8 | ||||||||||||||||||||
The following table shows an analysis of assets and liabilities recorded at fair value shown in accordance with the fair value hierarchy as at 31 December 2023 and 2022.
| Level 1 | Level 2 | Level 3 | Total | |||||||||||||
| 2023 |
$m | $m | $m | $m | ||||||||||||
| Financial assets – FVTPL: |
||||||||||||||||
| Derivative instruments |
— | 43.6 | 0.1 | 43.7 | ||||||||||||
| Financial assets – FVTOCI: |
||||||||||||||||
| Investments |
2.0 | 1.8 | — | 3.8 | ||||||||||||
| Financial liabilities – FVTPL: |
||||||||||||||||
| Derivative instruments |
— | (29.1 | ) | — | (29.1 | ) | ||||||||||
| Debt securities |
— | (878.9 | ) | (0.7 | ) | (879.6 | ) | |||||||||
| 2.0 | (862.6 | ) | (0.6 | ) | (861.2 | ) | ||||||||||
186
| Marex Group plc Annual Report 2023 | Strategic Report | Corporate Governance | Financial Statements | |||
|
|
|
|
|
|||
Company Financial Statements (continued)
Notes to the Company Financial Statements
For the Year Ended 31 December 2023
(I) Financial instruments (continued)
| Level 1 | Level 2 | Level 3 | Total | |||||||||||||
| 2022 |
$m | $m | $m | $m | ||||||||||||
| Financial assets – FVTPL: |
||||||||||||||||
| Derivative instruments |
— | 0.2 | — | 0.2 | ||||||||||||
| Financial assets – FVTOCI: |
||||||||||||||||
| Investments |
2.1 | 1.6 | — | 3.7 | ||||||||||||
| Financial liabilities – FVTPL: |
||||||||||||||||
| Derivative instruments |
— | (2.9 | ) | — | (2.9 | ) | ||||||||||
| Debt securities |
— | (59.4 | ) | — | (59.4 | ) | ||||||||||
| 2.1 | (60.5 | ) | — | (58.4 | ) | |||||||||||
The following table summarises the movements in the Level 3 balances during the year.
Asset and liability transfers between Level 2 and Level 3 are primarily due to either an increase or decrease in observable market activity related to an input or a change in the significance of the unobservable input, with assets and liabilities classified as Level 3 if an unobservable input is deemed significant. There were no transfers between any levels during the year (2022: no transfers).
Reconciliation of Level 3 fair value measurements of financial assets
| 2023 | 2022 | |||||||
| $m | $m | |||||||
| Balance at 1 January |
— | — | ||||||
| Market Making revenue |
0.1 | — | ||||||
| Balance at 31 December |
0.1 | — | ||||||
Reconciliation of Level 3 fair value measurements of financial liabilities
| 2023 | 2022 | |||||||
| $m | $m | |||||||
| Balance at 1 January |
— | — | ||||||
| Purchases |
0.7 | — | ||||||
| Balance at 31 December |
0.7 | — | ||||||
(J) Restatement
Restatement of the statement of cash flows
During the preparation of these financial statements, the Company voluntarily decided to change certain accounting policies in accordance with IAS 8 Accounting Policies, Changes in Accounting Estimates and Errors, including the presentation of cash flow statement to align presentation of certain items with Group’s income statement. The Company corrected some errors in the classification of certain cash flows compared to the previously issued financial statements.
| – | Increase in fair value of derivative instruments (2022: $2.7m) is presented as a reconciling item between profit before tax and net cash flows from operating activities. Previously, it was presented as working capital adjustments within operating activities. |
| – | Increase in debt securities (2022: $59.4m) is now presented as operating activities. Previously it was presented as financing activities. |
| – | Increase in equity instruments (2022: $118.1m) is now presented as operating activities. Previously it was presented as investing activities. |
| – | Proceeds from the issuance of the AT1 capital instrument (2022: $100.0m) and its issuance cost (2022: ($2.4m)) are now presented gross. Previously they were presented net. |
The impact of the correction of the above errors in the statement of cash flows is as follows:
| As reported | Adjustment | As restated | ||||||||||
| 31 December 2022 |
$m | $m | $m | |||||||||
| Operating cash flows before changes in working capital |
15.6 | 22.8 | 38.4 | |||||||||
| Cash inflow from operating activities |
70.2 | (36.2 | ) | 34.0 | ||||||||
| Net cash inflow from operating activities |
68.5 | (38.1 | ) | 30.4 | ||||||||
| Net cash outflow from investing activities |
(154.9 | ) | 91.4 | (63.5 | ) | |||||||
| Net cash inflow from financing activities |
86.4 | (53.3 | ) | 33.1 | ||||||||
187
| Marex Group plc Annual Report 2023 | Strategic Report | Corporate Governance | Financial Statements | |||
|
|
|
|
|
|||
Glossary
Adjusted Operating Profit APM based on profit after tax adjusted for i/ tax, ii/ goodwill impairment charges, iii/ acquisition costs, iv/ bargain purchase gains, v/ owner fees, vi/ amortisation of acquired brands and customer lists, vii/ activities in relation to shareholders and viii/ initial public offering (‘IPO’) preparation costs
Adjusted Operating Profit Margin APM calculated as Adjusted Operating Profit divided by Revenue
APAC Asia Pacific region
APM Alternative Performance Measure, i.e. non IFRS financial measure used by management
AT1 Additional Tier 1 Capital
Board The Board of Directors of Marex Group plc
BPS Basis points (1 bp = 0.01%)
CAGR Compound Annual Growth Rate
CASS FCA Client Asset Sourcebook
CEO Chief Executive Officer
CFD Climate-related financial disclosures
CFO Chief Financial Officer
CFTC Commodity Futures Trading Commission
CGU Cash Generating Unit
CME Chicago Mercantile Exchange
CO2e Carbon dioxide equivalent
CODM Chief Operating Decision Maker
Company Marex Group plc
CRO Chief Risk Officer
CRR Capital Requirements Regulation
ECL Expected credit loss
EIR Effective interest rate
EMEA Europe, Middle East, and Africa region
EPS Earnings per share
ESG Environmental, Social, and Governance
ESMA European Securities and Markets Authority
EU European Union
EU ETS European Union Emissions Trading Scheme
EUA European Union Allowance
EWRM Enterprise-Wide Risk Management Framework
FCA Financial Conduct Authority
FIA Futures Industry Association
FRC Financial Reporting Council
FVLCD Fair value less cost of disposal
FVTOCI Fair value through other comprehensive income
FVTPL Fair value through profit and loss
GHG Greenhouse Gas (emissions)
Gross Revenue or simply revenue; statutory revenue
Group Marex Group plc and its subsidiaries
HK Hong Kong
IAS International Accounting Standards
IASB International Accounting Standards Board
ICARA Internal Capital Adequacy and Risk Assessment
ICE Intercontinental Exchange
IFPR Investment Firms Prudential Regime
IFRS International Financial Reporting Standards
KPI Key Performance Indicator
kWh Kilowatt hour
LME London Metal Exchange
LSE London Stock Exchange
M&A Mergers and Acquisitions
MCM ED&F Man Capital Markets division
MiFiD II Markets in Financial Instruments Directive
MLRO Money Laundering Reporting Officer
NFA National Futures Association
NII Net interest income
Non-operating items for the purpose of calculating APMs certain items are excluded such as: goodwill impairment charges, acquisition costs, bargain purchase gains, owner fees, amortisation of acquired brands and customer lists and IPO costs
OCI Other comprehensive income
OECD Organisation for Economic Co-operation and Development
OFTR Own Funds Threshold Requirement
OTC Over the counter
PAT Profit after tax
PBT Profit before tax
PCAOB Public Company Accounting Oversight Board
Pillar 1 Minimum capital requirements under CRD IV
Pillar 3 Disclosure requirements under CRD IV
RCF Revolving Credit Facility
REPO Repurchase agreement (a form of short-term borrowing)
R-LTIP Retention Long-Term Incentive Plan
ROE Return on Equity
ROTE Return on Tangible Equity
SEC Securities and Exchange Commission
SECR Streamlined Energy and Carbon Reporting
TCFD Task Force on Climate-related Financial Disclosures
Tier 1 capital Primary source of regulatory capital
Tier 2 debt Secondary source of regulatory capital
Total capital ratio expresses the Group’s capital as a percentage of total risk exposure
Total risk exposure calculated in accordance with article 92(3) of CRR (Pillar 1 divided by 8%)
UK United Kingdom
UKEB UK Endorsement Board
US United States of America
VaR Value at Risk
VER Voluntary Emission Reduction
VIU Value in use
188
Company Information
| Country of Incorporation |
England and Wales | |
| Legal Form |
Public limited company | |
| Directors |
R M Pickering | |
| S L Ing | ||
| K N Graf von Schweinitz | ||
| L Myers | ||
| M Antoncic | ||
| J M Isaacs CBE | ||
| R B Nagioff | ||
| J C Cohen | ||
| I T Lowitt | ||
| R Irvin | ||
| Company Secretary |
S Linsley | |
| Registered Office |
155 Bishopsgate, London, EC2M 3TQ | |
| Auditor |
Deloitte LLP | |
| 2 New Street Square, London, EC4A 3BZ | ||
| Bankers |
HSBC Bank plc | |
| 8 Canada Square, London, E14 5HQ | ||
| BMO Harris Bank N.A. | ||
| 111 W. Monroe St. Chicago, Illinois 60603 | ||
| Barclays Bank plc | ||
| 1 Churchill Place, London, E14 5HP | ||
| Lloyds Bank plc | ||
| 25 Gresham Street, London, EC2V 7HN | ||
| ICBC (London) plc | ||
| 81 King William Street, London, EC4N 7BG | ||