UNITED STATES
SECURITIES AND EXCHANGE COMMISSION
Washington, D.C. 20549
Form 6-K
Report of Foreign Private Issuer
Pursuant to Rule 13a-16 or 15d-16 under
the Securities Exchange Act of 1934
For the month of May 2024
Commission File No. 000-54189
MITSUBISHI UFJ FINANCIAL GROUP, INC.
(Translation of registrant’s name into English)
7-1, Marunouchi 2-chome, Chiyoda-ku
Tokyo 100-8330, Japan
(Address of principal executive office)
Indicate by check mark whether the registrant files or
will file annual reports under cover of Form 20-F or Form 40-F.
Form 20-F X Form 40-F
Indicate by check mark if the registrant is submitting the Form 6-K
in paper as permitted by Regulation S-T Rule 101(b)(1):
Indicate by check mark if the registrant is submitting the Form 6-K
in paper as permitted by Regulation S-T Rule 101(b)(7):
THIS REPORT ON FORM 6-K SHALL BE DEEMED TO BE INCORPORATED BY REFERENCE IN THE REGISTRATION STATEMENT ON FORM F-3 (NO. 333-273681) OF MITSUBISHI UFJ FINANCIAL GROUP, INC. AND TO BE A PART THEREOF FROM THE DATE ON WHICH THIS REPORT IS FURNISHED TO THE U.S. SECURITIES AND EXCHANGE COMMISSION TO THE EXTENT NOT SUPERSEDED BY DOCUMENTS OR REPORTS SUBSEQUENTLY FILED WITH OR FURNISHED TO THE U.S. SECURITIES AND EXCHANGE COMMISSION.
SIGNATURES
Pursuant to the requirements of the Securities Exchange Act of 1934, the registrant has duly caused this report to be signed on its behalf by the undersigned, thereunto duly authorized.
Date: May 15, 2024
| Mitsubishi UFJ Financial Group, Inc. | ||
| By: | /s/ Toshinao Endo |
|
| Name: | Toshinao Endo | |
| Title: | Managing Director, Head of Documentation & Corporate Secretary Department, | |
| Corporate Administration Division |
||

Consolidated Summary Report
<under Japanese GAAP>
for the fiscal year ended March 31, 2024
May 15, 2024
| Company name: |
Mitsubishi UFJ Financial Group, Inc. |
|
| Stock exchange listings: |
Tokyo, Nagoya, New York |
|
| Code number: |
8306 |
|
| URL |
https://www.mufg.jp/ |
|
| Representative: |
Hironori Kamezawa, President & Group CEO |
|
| For inquiry: |
Masahisa Takahashi, Managing Director, Head of Financial Accounting and Reporting, Financial Accounting Office, Financial Planning Division |
|
| TEL 050-3613-1179 |
||
| General meeting of shareholders: |
June 27, 2024 |
|
| Dividend payment date: |
June 28, 2024 |
|
| Securities report issuing date: |
June 25, 2024 |
|
| Trading accounts: |
Established |
|
| Supplemental information for financial statements: |
Available |
|
| Investor meeting presentation: |
Scheduled (for investors and analysts) |
(Amounts of less than one million yen are rounded down.)
1. Consolidated Financial Data for the Fiscal Year ended March 31, 2024
| (1) | Results of Operations |
| (% represents the change from the previous fiscal year) | ||||||||||||||||||||||||
| Ordinary Income | Ordinary Profits | Profits Attributable to Owners of Parent |
||||||||||||||||||||||
| million yen | % | million yen | % | million yen | % | |||||||||||||||||||
| Fiscal year ended |
||||||||||||||||||||||||
| March 31, 2024 |
11,890,350 | 28.1 | 2,127,958 | 108.5 | 1,490,781 | 33.5 | ||||||||||||||||||
| March 31, 2023 |
9,281,027 | 52.8 | 1,020,728 | (33.6 | ) | 1,116,496 | (1.3 | ) | ||||||||||||||||
| (*) | Comprehensive income |
March 31, 2024: 3,316,519 million yen 186.2%; March 31, 2023: 1,158,800 million yen 45.3%
| Basic earnings per share |
Diluted earnings per share |
Net Income to Net Assets Attributable to MUFG shareholders |
Ordinary Profits to Total Assets |
Ordinary Profits to Ordinary Income |
||||||||||||||||
| yen | yen | % | % | % | ||||||||||||||||
| Fiscal year ended |
||||||||||||||||||||
| March 31, 2024 |
124.65 | 124.33 | 8.1 | 0.5 | 17.9 | |||||||||||||||
| March 31, 2023 |
90.73 | 90.41 | 6.5 | 0.3 | 11.0 | |||||||||||||||
(Reference) Income from investment in affiliates (Equity method)
March 31, 2024: 531,803 million yen; March 31, 2023: 425,829 million yen
| (2) | Financial Conditions |
| Total Assets | Total Net Assets | Equity-to-asset ratio (*) |
Total Net Assets per Common Stock |
|||||||||||||
| million yen | million yen | % | yen | |||||||||||||
| As of |
||||||||||||||||
| March 31, 2024 |
403,703,147 | 20,746,978 | 4.9 | 1,670.45 | ||||||||||||
| March 31, 2023 |
386,799,477 | 18,272,857 | 4.5 | 1,433.12 | ||||||||||||
(Reference) Shareholders’ equity as of March 31, 2024: 19,587,974 million yen; March 31, 2023: 17,231,291 million yen
| (*) | “Equity-to-asset ratio” is computed under the formula shown below |
| (Total net assets - Subscription right to share - Non-controlling interests) / Total assets |
| (3) | Cash Flows |
| Cash Flows from Operating Activities |
Cash Flows from Investing Activities |
Cash Flows from Financing Activities |
Cash and Cash Equivalents at the end of the period |
|||||||||||||
| million yen | million yen | million yen | million yen | |||||||||||||
| Fiscal year ended |
||||||||||||||||
| March 31, 2024 |
(9,844,860 | ) | 3,986,415 | 8,307 | 109,870,502 | |||||||||||
| March 31, 2023 |
13,431,773 | (10,675,096 | ) | (977,138 | ) | 113,630,172 | ||||||||||
2. Dividends on Common Stock
| Dividends per Share | Total dividends |
Dividend payout ratio (Consolidated) |
Dividend on net assets ratio (Consolidated) |
|||||||||||||||||||||||||||||
| 1st quarter-end |
2nd quarter-end |
3rd quarter-end |
Fiscal year-end |
Total | ||||||||||||||||||||||||||||
| yen | yen | yen | yen | yen | million yen | % | % | |||||||||||||||||||||||||
| Fiscal year |
||||||||||||||||||||||||||||||||
| ended March 31, 2023 |
— | 16.00 | — | 16.00 | 32.00 | 389,991 | 35.3 | 2.3 | ||||||||||||||||||||||||
| ended March 31, 2024 |
— | 20.50 | — | 20.50 | 41.00 | 488,038 | 32.9 | 2.6 | ||||||||||||||||||||||||
| ending March 31, 2024 (Forecast) |
— | 25.00 | — | 25.00 | 50.00 | 39.1 | ||||||||||||||||||||||||||
| (*) | Revision of forecasts for dividends on the presentation date of this Consolidated Summary Report: None |
3. Earnings Target for the Fiscal Year ending March 31, 2025 (Consolidated)
MUFG has set an earnings target of 1,500.0 billion yen of profits attributable to owners of parent for the fiscal year ending March 31, 2025. MUFG is engaged in financial service businesses such as banking business, trust banking business, securities business and credit card/loan businesses. Because there are various uncertainties caused by economic situation, market environments and other factors in these businesses, MUFG discloses a target of its profits attributable to owners of parent instead of a forecast of its performance.
ø Notes
| (1) | Changes in significant subsidiaries during the period (Changes in specified subsidiaries accompanying change in scope of consolidation): No |
| (2) | Changes in accounting policies, changes in accounting estimates and restatements |
(A) Changes in accounting policies due to revision of accounting standards: No
(B) Changes in accounting policies due to reasons other than (A): No
(C) Changes in accounting estimates: No
(D) Restatements: No
| (3) | Number of common stocks outstanding at the end of the period |
| (A) Total stocks outstanding including treasury stocks: |
March 31, 2024 | 12,337,710,920 shares | ||||
| March 31, 2023 | 12,687,710,920 shares | |||||
| (B) Treasury stocks: |
March 31, 2024 | 611,522,914 shares | ||||
| March 31, 2023 | 664,065,483 shares | |||||
| (C) Average outstanding stocks: |
Fiscal year ended March 31, 2024 | 11,959,977,563 shares | ||||
| Fiscal year ended March 31, 2023 | 12,305,714,018 shares |
* This “Consolidated Summary Report” (“Tanshin”) is outside the scope of the external auditor’s audit procedure.
* Notes for using forecasted information etc.
| 1. | This financial summary report contains forward-looking statements regarding estimations, forecasts, targets and plans in relation to the results of operations, financial conditions and other overall management of the company and/or the group as a whole (the “forward-looking statements”). The forward-looking statements are made based upon, among other things, the company’s current estimations, perceptions and evaluations. In addition, in order for the company to adopt such estimations, forecasts, targets and plans regarding future events, certain assumptions have been made. Accordingly, due to various risks and uncertainties, the statements and assumptions are inherently not guarantees of future performance, may be considered differently from alternative perspectives and may result in material differences from the actual result. For the main factors that may affect the current forecasts, please see Consolidated Summary Report, Annual Securities Report, Disclosure Book, Annual Report, and other current disclosures that the company has announced. |
| 2. | The financial information included in this financial summary report is prepared and presented in accordance with accounting principles generally accepted in Japan (“Japanese GAAP”). Differences exist between Japanese GAAP and the accounting principles generally accepted in the United States (“U.S. GAAP”) in certain material respects. Such differences have resulted in the past, and are expected to continue to result for this period and future periods, in amounts for certain financial statement line items under U.S. GAAP to differ significantly from the amounts under Japanese GAAP. For example, differences in consolidation basis or accounting for business combinations, including but not limited to amortization and impairment of goodwill, could result in significant differences in our reported financial results between Japanese GAAP and U.S. GAAP. Readers should consult their own professional advisors for an understanding of the differences between Japanese GAAP and U.S. GAAP and how those differences might affect our reported financial results. We will publish U.S. GAAP financial results in a separate disclosure document when such information becomes available. |
Mitsubishi UFJ Financial Group, Inc.
(Appendix)
Contents of Appendix
| 1. Results of Operations and Financial Condition |
2 | |||
| (1) Analysis of results of operations |
2 | |||
| (2) Analysis of financial condition |
3 | |||
| 2. Basic Views on Selection of Accounting Standards |
3 | |||
| 3. Consolidated Financial Statements and Notes |
4 | |||
| (1) Consolidated Balance Sheets |
4 | |||
| (2) Consolidated Statements of Income and Consolidated Statements of Comprehensive Income |
6 | |||
| (3) Consolidated Statements of Changes in Net Assets |
9 | |||
| (4) Consolidated Statements of Cash Flows |
11 | |||
| Notes to the Consolidated Financial Statements |
13 | |||
| Notes on Going-Concern Assumption |
||||
| Changes in Presentation of Financial Information |
||||
| Additional Information |
||||
| Segment Information |
||||
| Per Share Information Subsequent Events |
Supplemental Information:
“Selected Financial Information under Japanese GAAP For the Fiscal Year Ended March 31, 2024”
| (*) | The following is the schedule of internet conference and explanation for investors and analysts. You can confirm those contents over the internet. |
| Internet Conference: | May 15, 2024 (Wednesday) | |
| Explanation for investors and analysts: | May 17, 2024 (Friday) | |
1
Mitsubishi UFJ Financial Group, Inc.
1. Results of Operations and Financial Condition
(1) Analysis of results of operations
(Results of operations for the fiscal year ended March 31, 2024)
Consolidated gross profits for the fiscal year ended March 31, 2024 increased 229.5 billion yen from the previous fiscal year to 4,732.5 billion yen. This was due to an increase in net fees and commissions mainly from overseas business and an increase in net other operating profits resulting from decrease of net losses on debt securities through rebalancing the bond portfolio, partially offset by an decrease in net interest income due to the absence of gains on investment trusts cancellation included in the previous year and the impact of the sale of MUFG Union Bank, N.A. General and administrative expenses decreased 19.9 billion yen from the previous fiscal year to 2,888.7 billion yen, mainly due to the impact of the sale of MUFG Union Bank, N.A. As a result, net operating profits increased 249.4 billion yen from the previous fiscal year to 1,843.7 billion yen.
Total credit costs decreased 176.9 billion yen from the previous fiscal year to 497.9 billion yen, mainly due to the absence of valuation losses on loans held by MUFG Union Bank, N.A., included in the previous fiscal year. Other non-recurring gains improved 491.5 billion yen from the previous fiscal year, mainly due to the absence of valuation losses on bonds held by MUFG Union Bank, N.A., included in the previous fiscal year. As a result, ordinary profits for the fiscal year ended March 31, 2024 increased 1,107.2 billion yen from the previous fiscal year to 2,127.9 billion yen. Net extraordinary losses decreased 627.0 billion yen from the previous fiscal year, mainly due to the absence of gains on the sale of MUFG Union Bank, N.A., included in the previous fiscal year. As a result, profits attributable to owners of parent for the fiscal year ended March 31, 2024 was 1,490.7 billion yen, an increase of 374.2 billion yen from the previous fiscal year.
| (in billions of Japanese yen) | For the fiscal year ended March 31, 2024 |
For the fiscal year ended March 31, 2023 |
Increase (Decrease) |
|||||||||
| Gross profits before credit costs for trust accounts |
4,732.5 | 4,503.0 | 229.5 | |||||||||
| General and administrative expenses |
2,888.7 | 2,908.7 | (19.9 | ) | ||||||||
| Net operating profits before credit costs for trust accounts and provision for general allowance for credit losses |
1,843.7 | 1,594.2 | 249.4 | |||||||||
| Total credit costs |
(497.9 | ) | (674.8 | ) | 176.9 | |||||||
| Net gains (losses) on equity securities |
371.2 | 288.0 | 83.2 | |||||||||
| Equity in earnings of equity method investees |
531.8 | 425.8 | 105.9 | |||||||||
| Other non-recurring gains (losses) |
(120.9 | ) | (612.5 | ) | 491.5 | |||||||
| Ordinary profits |
2,127.9 | 1,020.7 | 1,107.2 | |||||||||
| Net extraordinary gains (losses) |
(77.8 | ) | 549.1 | (627.0 | ) | |||||||
| Total taxes |
478.3 | 369.6 | 108.7 | |||||||||
| Profits attributable to non-controlling interests |
80.9 | 83.8 | (2.8 | ) | ||||||||
| Profits attributable to owners of parent |
1,490.7 | 1,116.4 | 374.2 | |||||||||
2
Mitsubishi UFJ Financial Group, Inc.
(2) Analysis of financial condition
Total assets as of March 31, 2024 increased 16,903.6 billion yen from March 31, 2023 to 403,703.1 billion yen, and total net assets as of March 31, 2024 increased 2,474.1 billion yen from March 31, 2023 to 20,746.9 billion yen. The increase in total net assets was mainly due to an increase of Retained earnings and Foreign currency translation adjustments, etc.
With regard to major items of assets, loans and bills discounted as of March 31, 2024 increased 7,679.3 billion yen from March 31, 2023 to 116,825.6 billion yen and securities as of March 31, 2024 increased 131.6 billion yen from March 31, 2023 to 86,878.5 billion yen. With regard to major items of liabilities, deposits as of March 31, 2024 increased 10,425.5 billion yen from March 31, 2023 to 224,035.0 billion yen.
2. Basic Views on Selection of Accounting Standards
MUFG group, currently adopting Japanese GAAP, is preparing for its future adoption of IFRS by considering the development of its infrastructures and organizations within the group, and the timing of adoption.
3
Mitsubishi UFJ Financial Group, Inc.
3. Consolidated Financial Statements and Notes
(1) Consolidated Balance Sheets
| (in millions of yen) | As of March 31, 2023 |
As of March 31, 2024 |
||||||
| Assets: |
||||||||
| Cash and due from banks |
113,630,172 | 109,875,097 | ||||||
| Call loans and bills bought |
618,223 | 720,879 | ||||||
| Receivables under resale agreements |
14,000,846 | 18,367,908 | ||||||
| Receivables under securities borrowing transactions |
4,549,792 | 5,010,399 | ||||||
| Monetary claims bought |
7,325,185 | 7,786,978 | ||||||
| Trading assets |
18,013,184 | 20,886,546 | ||||||
| Money held in trust |
1,287,020 | 1,270,815 | ||||||
| Securities |
86,746,900 | 86,878,589 | ||||||
| Loans and bills discounted |
109,146,272 | 116,825,660 | ||||||
| Foreign exchanges |
2,300,198 | 2,496,308 | ||||||
| Other assets |
15,195,896 | 17,912,498 | ||||||
| Tangible fixed assets |
1,220,172 | 1,229,007 | ||||||
| Buildings |
286,879 | 281,807 | ||||||
| Land |
629,782 | 625,557 | ||||||
| Lease assets |
12,390 | 15,517 | ||||||
| Construction in progress |
34,649 | 29,264 | ||||||
| Other tangible fixed assets |
256,469 | 276,860 | ||||||
| Intangible fixed assets |
1,358,124 | 1,671,372 | ||||||
| Software |
555,235 | 611,287 | ||||||
| Goodwill |
252,009 | 405,629 | ||||||
| Lease assets |
17 | 26 | ||||||
| Other intangible fixed assets |
550,862 | 654,429 | ||||||
| Net defined benefit assets |
1,325,434 | 1,982,502 | ||||||
| Deferred tax assets |
322,021 | 156,673 | ||||||
| Customers’ liabilities for acceptances and guarantees |
11,005,758 | 12,167,164 | ||||||
| Allowance for credit losses |
(1,245,727 | ) | (1,535,253 | ) | ||||
|
|
|
|
|
|||||
| Total assets |
386,799,477 | 403,703,147 | ||||||
|
|
|
|
|
|||||
4
Mitsubishi UFJ Financial Group, Inc.
| (in millions of yen) | As of March 31, 2023 |
As of March 31, 2024 |
||||||
| Liabilities: |
||||||||
| Deposits |
213,609,501 | 224,035,035 | ||||||
| Negotiable certificates of deposit |
13,632,559 | 16,555,451 | ||||||
| Call money and bills sold |
3,449,234 | 5,125,583 | ||||||
| Payables under repurchase agreements |
39,982,955 | 35,482,072 | ||||||
| Payables under securities lending transactions |
1,171,947 | 1,047,194 | ||||||
| Commercial papers |
2,220,723 | 3,105,779 | ||||||
| Trading liabilities |
14,716,820 | 16,729,760 | ||||||
| Borrowed money |
24,856,340 | 25,955,961 | ||||||
| Foreign exchanges |
2,570,412 | 3,465,919 | ||||||
| Short-term bonds payable |
1,047,499 | 1,211,769 | ||||||
| Bonds payable |
15,708,720 | 16,303,298 | ||||||
| Due to trust accounts |
11,689,414 | 7,387,495 | ||||||
| Other liabilities |
12,132,972 | 13,312,715 | ||||||
| Reserve for bonuses |
196,850 | 243,372 | ||||||
| Reserve for bonuses to directors |
3,639 | 2,629 | ||||||
| Reserve for stocks payment |
9,304 | 13,331 | ||||||
| Net defined benefit liabilities |
86,445 | 102,155 | ||||||
| Reserve for retirement benefits to directors |
830 | 822 | ||||||
| Reserve for loyalty award credits |
17,962 | 17,809 | ||||||
| Reserve for contingent losses |
164,891 | 133,860 | ||||||
| Reserves under special laws |
4,659 | 5,058 | ||||||
| Deferred tax liabilities |
157,651 | 465,295 | ||||||
| Deferred tax liabilities for land revaluation |
89,525 | 86,631 | ||||||
| Acceptances and guarantees |
11,005,758 | 12,167,164 | ||||||
|
|
|
|
|
|||||
| Total liabilities |
368,526,620 | 382,956,169 | ||||||
|
|
|
|
|
|||||
| Net assets: |
||||||||
| Capital stock |
2,141,513 | 2,141,513 | ||||||
| Capital surplus |
349,661 | 83,623 | ||||||
| Retained earnings |
12,739,228 | 13,791,608 | ||||||
| Treasury stock |
(481,091 | ) | (613,823 | ) | ||||
|
|
|
|
|
|||||
| Total shareholders’ equity |
14,749,310 | 15,402,921 | ||||||
|
|
|
|
|
|||||
| Net unrealized gains (losses) on available-for-sale securities |
800,955 | 1,534,094 | ||||||
| Net deferred gains (losses) on hedging instruments |
(387,079 | ) | (687,476 | ) | ||||
| Land revaluation excess |
135,526 | 133,967 | ||||||
| Foreign currency translation adjustments |
1,792,840 | 2,762,818 | ||||||
| Remeasurements of defined benefit plans |
140,485 | 507,085 | ||||||
| Debt value adjustments of foreign subsidiaries and affiliates |
(747 | ) | (65,435 | ) | ||||
|
|
|
|
|
|||||
| Total accumulated other comprehensive income |
2,481,980 | 4,185,052 | ||||||
|
|
|
|
|
|||||
| Subscription rights to shares |
— | 0 | ||||||
| Non-controlling interests |
1,041,565 | 1,159,003 | ||||||
|
|
|
|
|
|||||
| Total net assets |
18,272,857 | 20,746,978 | ||||||
|
|
|
|
|
|||||
| Total liabilities and net assets |
386,799,477 | 403,703,147 | ||||||
|
|
|
|
|
|||||
5
Mitsubishi UFJ Financial Group, Inc.
(2) Consolidated Statements of Income and Consolidated Statements of Comprehensive Income
Consolidated Statements of Income
| (in millions of yen) | For the fiscal year ended March 31, 2023 |
For the fiscal year ended March 31, 2024 |
||||||
| Ordinary income |
9,281,027 | 11,890,350 | ||||||
| Interest income |
5,298,944 | 7,468,679 | ||||||
| Interest on loans and bills discounted |
2,810,147 | 3,969,660 | ||||||
| Interest and dividends on securities |
1,452,461 | 1,372,086 | ||||||
| Interest on call loans and bills bought |
19,104 | 31,822 | ||||||
| Interest on receivables under resale agreements |
111,940 | 421,537 | ||||||
| Interest on receivables under securities borrowing transactions |
43,509 | 125,323 | ||||||
| Interest on deposits |
364,406 | 709,392 | ||||||
| Other interest income |
497,373 | 838,856 | ||||||
| Trust fees |
140,637 | 139,363 | ||||||
| Fees and commissions |
1,883,428 | 2,047,232 | ||||||
| Trading income |
373,347 | 368,172 | ||||||
| Other operating income |
631,365 | 679,329 | ||||||
| Other ordinary income |
953,304 | 1,187,572 | ||||||
| Gains on loans written-off |
96,569 | 101,726 | ||||||
| Others |
856,735 | 1,085,846 | ||||||
| Ordinary expenses |
8,260,299 | 9,762,391 | ||||||
| Interest expenses |
2,372,735 | 5,011,105 | ||||||
| Interest on deposits |
887,987 | 1,929,404 | ||||||
| Interest on negotiable certificates of deposit |
283,076 | 681,823 | ||||||
| Interest on call money and bills sold |
3,173 | 1,718 | ||||||
| Interest on payables under repurchase agreements |
454,200 | 1,065,167 | ||||||
| Interest on payables under securities lending transactions |
2,193 | 22,801 | ||||||
| Interest on commercial papers |
78,041 | 164,313 | ||||||
| Interest on borrowed money |
61,677 | 114,617 | ||||||
| Interest on short-term bonds payable |
135 | 362 | ||||||
| Interest on bonds payable |
355,003 | 470,099 | ||||||
| Other interest expenses |
247,246 | 560,796 | ||||||
| Fees and commissions |
328,660 | 365,940 | ||||||
| Trading expenses |
284 | — | ||||||
| Other operating expenses |
1,622,838 | 593,515 | ||||||
| General and administrative expenses |
2,969,325 | 2,920,875 | ||||||
| Other ordinary expenses |
966,453 | 870,954 | ||||||
| Provision for allowance for credit losses |
225,416 | 377,978 | ||||||
| Others |
741,037 | 492,975 | ||||||
|
|
|
|
|
|||||
| Ordinary profits |
1,020,728 | 2,127,958 | ||||||
|
|
|
|
|
|||||
6
Mitsubishi UFJ Financial Group, Inc.
| (in millions of yen) | For the fiscal year ended March 31, 2023 |
For the fiscal year ended March 31, 2024 |
||||||
| Extraordinary gains |
715,667 | 19,738 | ||||||
| Gains on disposition of fixed assets |
16,157 | 19,621 | ||||||
| Gains on change in equity |
— | 117 | ||||||
| Gains on sales of shares of subsidiaries |
699,509 | — | ||||||
| Extraordinary losses |
166,472 | 97,593 | ||||||
| Losses on disposition of fixed assets |
17,076 | 15,027 | ||||||
| Losses on impairment of fixed assets |
18,167 | 31,108 | ||||||
| Provision for reserve for contingent liabilities from financial instruments transactions |
2 | 399 | ||||||
| Losses on change in equity |
23,711 | 50,964 | ||||||
| Losses on sales of shares of subsidiaries |
— | 93 | ||||||
| Losses on pension buyout |
78,111 | — | ||||||
| Losses on sales of shares of affiliates |
29,401 | — | ||||||
|
|
|
|
|
|||||
| Profits before income taxes |
1,569,923 | 2,050,104 | ||||||
|
|
|
|
|
|||||
| Income taxes-current |
436,968 | 411,857 | ||||||
| Income taxes-deferred |
(67,361 | ) | 66,485 | |||||
|
|
|
|
|
|||||
| Total taxes |
369,607 | 478,342 | ||||||
|
|
|
|
|
|||||
| Profits |
1,200,316 | 1,571,761 | ||||||
|
|
|
|
|
|||||
| Profits attributable to non-controlling interests |
83,820 | 80,979 | ||||||
|
|
|
|
|
|||||
| Profits attributable to owners of parent |
1,116,496 | 1,490,781 | ||||||
|
|
|
|
|
|||||
7
Mitsubishi UFJ Financial Group, Inc.
Consolidated Statements of Comprehensive Income
| (in millions of yen) | For the fiscal year ended March 31, 2023 |
For the fiscal year ended March 31, 2024 |
||||||
| Profits |
1,200,316 | 1,571,761 | ||||||
| Other comprehensive income |
||||||||
| Net unrealized gains (losses) on available-for-sale securities |
(676,883 | ) | 706,097 | |||||
| Net deferred gains (losses) on hedging instruments |
(315,870 | ) | (297,162 | ) | ||||
| Foreign currency translation adjustments |
701,427 | 587,606 | ||||||
| Remeasurements of defined benefit plans |
(54,790 | ) | 369,769 | |||||
| Share of other comprehensive income of associates accounted for using equity method |
304,600 | 378,446 | ||||||
|
|
|
|
|
|||||
| Total other comprehensive income |
(41,515 | ) | 1,744,757 | |||||
|
|
|
|
|
|||||
| Comprehensive income |
1,158,800 | 3,316,519 | ||||||
|
|
|
|
|
|||||
| (Comprehensive income attributable to) |
||||||||
| Comprehensive income attributable to owners of parent |
1,038,465 | 3,195,413 | ||||||
| Comprehensive income attributable to non-controlling interests |
120,335 | 121,106 | ||||||
8
Mitsubishi UFJ Financial Group, Inc.
(3) Consolidated Statements of Changes in Net Assets
For the fiscal year ended March 31, 2023
| (in millions of yen) | ||||||||||||||||||||||||||||
| Shareholders’ equity | Accumulated other comprehensive income |
|||||||||||||||||||||||||||
| Capital stock | Capital surplus | Retained earnings |
Treasury stock | Total shareholders’ equity |
Net unrealized gains (losses) on available-for- sale securities |
Net deferred gains (losses) on hedging instruments |
||||||||||||||||||||||
| Balance at the beginning of the period |
2,141,513 | 770,277 | 11,998,157 | (451,288 | ) | 14,458,659 | 1,615,060 | (81,145 | ) | |||||||||||||||||||
| Cumulative effects of changes in accounting policies |
— | — | ||||||||||||||||||||||||||
| Restated balance |
2,141,513 | 770,277 | 11,998,157 | (451,288 | ) | 14,458,659 | 1,615,060 | (81,145 | ) | |||||||||||||||||||
| Changes during the period |
||||||||||||||||||||||||||||
| Cash dividends |
(380,528 | ) | (380,528 | ) | ||||||||||||||||||||||||
| Profits attributable to owners of parent |
1,116,496 | 1,116,496 | ||||||||||||||||||||||||||
| Repurchase of treasury stock |
(450,018 | ) | (450,018 | ) | ||||||||||||||||||||||||
| Disposal of treasury stock |
0 | 2,118 | 2,118 | |||||||||||||||||||||||||
| Retirement of treasury stock |
(418,097 | ) | 418,097 | — | ||||||||||||||||||||||||
| Reversal of land revaluation excess |
5,102 | 5,102 | ||||||||||||||||||||||||||
| Changes in subsidiaries’ equity |
1,510 | 1,510 | ||||||||||||||||||||||||||
| Change from transaction under common control involving overseas subsidiary |
(4,028 | ) | (4,028 | ) | ||||||||||||||||||||||||
| Net changes of items other than shareholders’ equity |
(814,104 | ) | (305,933 | ) | ||||||||||||||||||||||||
| Total changes during the period |
— | (420,616 | ) | 741,070 | (29,802 | ) | 290,651 | (814,104 | ) | (305,933 | ) | |||||||||||||||||
| Balance at the end of the period |
2,141,513 | 349,661 | 12,739,228 | (481,091 | ) | 14,749,310 | 800,955 | (387,079 | ) | |||||||||||||||||||
| (in millions of yen) | ||||||||||||||||||||||||||||
| Accumulated other comprehensive income | Non- controlling interests |
Total net assets | ||||||||||||||||||||||||||
| Land revaluation excess |
Foreign currency translation adjustments |
Remeasurements of defined benefit plans |
Debt value adjustments of foreign subsidiaries and affiliates |
Total accumulated other comprehensive income |
||||||||||||||||||||||||
| Balance at the beginning of the period |
140,628 | 734,588 | 193,865 | (37,883 | ) | 2,565,114 | 964,471 | 17,988,245 | ||||||||||||||||||||
| Cumulative effects of changes in accounting policies |
— | — | ||||||||||||||||||||||||||
| Restated balance |
140,628 | 734,588 | 193,865 | (37,883 | ) | 2,565,114 | 964,471 | 17,988,245 | ||||||||||||||||||||
| Changes during the period |
||||||||||||||||||||||||||||
| Cash dividends |
(380,528 | ) | ||||||||||||||||||||||||||
| Profits attributable to owners of parent |
1,116,496 | |||||||||||||||||||||||||||
| Repurchase of treasury stock |
(450,018 | ) | ||||||||||||||||||||||||||
| Disposal of treasury stock |
2,118 | |||||||||||||||||||||||||||
| Retirement of treasury stock |
— | |||||||||||||||||||||||||||
| Reversal of land revaluation excess |
5,102 | |||||||||||||||||||||||||||
| Changes in subsidiaries’ equity |
1,510 | |||||||||||||||||||||||||||
| Change from transaction under common control involving overseas subsidiary |
(4,028 | ) | ||||||||||||||||||||||||||
| Net changes of items other than shareholders’ equity |
(5,102 | ) | 1,058,251 | (53,380 | ) | 37,136 | (83,133 | ) | 77,094 | (6,039 | ) | |||||||||||||||||
| Total changes during the period |
(5,102 | ) | 1,058,251 | (53,380 | ) | 37,136 | (83,133 | ) | 77,094 | 284,612 | ||||||||||||||||||
| Balance at the end of the period |
135,526 | 1,792,840 | 140,485 | (747 | ) | 2,481,980 | 1,041,565 | 18,272,857 | ||||||||||||||||||||
9
Mitsubishi UFJ Financial Group, Inc.
For the fiscal year ended March 31, 2024
| (in millions of yen) | ||||||||||||||||||||||||||||
| Shareholders’ equity | Accumulated other comprehensive income |
|||||||||||||||||||||||||||
| Capital stock | Capital surplus | Retained earnings |
Treasury stock |
Total shareholders’ equity |
Net unrealized gains (losses) on available-for-sale securities |
Net deferred gains (losses) on hedging instruments |
||||||||||||||||||||||
| Balance at the beginning of the period |
2,141,513 | 349,661 | 12,739,228 | (481,091 | ) | 14,749,310 | 800,955 | (387,079 | ) | |||||||||||||||||||
| Changes during the period |
||||||||||||||||||||||||||||
| Cash dividends |
(439,960 | ) | (439,960 | ) | ||||||||||||||||||||||||
| Profits attributable to owners of parent |
1,490,781 | 1,490,781 | ||||||||||||||||||||||||||
| Repurchase of treasury stock |
(400,036 | ) | (400,036 | ) | ||||||||||||||||||||||||
| Disposal of treasury stock |
211 | 2,295 | 2,506 | |||||||||||||||||||||||||
| Retirement of treasury stock |
(265,009 | ) | 265,009 | — | ||||||||||||||||||||||||
| Reversal of land revaluation excess |
1,559 | 1,559 | ||||||||||||||||||||||||||
| Changes in subsidiaries’ equity |
(1,239 | ) | (1,239 | ) | ||||||||||||||||||||||||
| Net changes of items other than shareholders’ equity |
733,139 | (300,397 | ) | |||||||||||||||||||||||||
| Total changes during the period |
— | (266,037 | ) | 1,052,380 | (132,731 | ) | 653,610 | 733,139 | (300,397 | ) | ||||||||||||||||||
| Balance at the end of the period |
2,141,513 | 83,623 | 13,791,608 | (613,823 | ) | 15,402,921 | 1,534,094 | (687,476 | ) | |||||||||||||||||||
| (in millions of yen) | ||||||||||||||||||||||||||||||||
| Accumulated other comprehensive income | Subscription rights to shares |
Non-controlling interests |
Total net assets |
|||||||||||||||||||||||||||||
| Land revaluation excess |
Foreign currency translation adjustments |
Remeasurements of defined benefit plans |
Debt value adjustments of foreign subsidiaries and affiliates |
Total accumulated other comprehensive income |
||||||||||||||||||||||||||||
| Balance at the beginning of the period |
135,526 | 1,792,840 | 140,485 | (747 | ) | 2,481,980 | — | 1,041,565 | 18,272,857 | |||||||||||||||||||||||
| Changes during the period |
||||||||||||||||||||||||||||||||
| Cash dividends |
(439,960 | ) | ||||||||||||||||||||||||||||||
| Profits attributable to owners of parent |
1,490,781 | |||||||||||||||||||||||||||||||
| Repurchase of treasury stock |
(400,036 | ) | ||||||||||||||||||||||||||||||
| Disposal of treasury stock |
2,506 | |||||||||||||||||||||||||||||||
| Retirement of treasury stock |
— | |||||||||||||||||||||||||||||||
| Reversal of land revaluation excess |
1,559 | |||||||||||||||||||||||||||||||
| Changes in subsidiaries’ equity |
(1,239 | ) | ||||||||||||||||||||||||||||||
| Net changes of items other than shareholders’ equity |
(1,559 | ) | 969,978 | 366,600 | (64,688 | ) | 1,703,072 | 0 | 117,437 | 1,820,510 | ||||||||||||||||||||||
| Total changes during the period |
(1,559 | ) | 969,978 | 366,600 | (64,688 | ) | 1,703,072 | 0 | 117,437 | 2,474,121 | ||||||||||||||||||||||
| Balance at the end of the period |
133,967 | 2,762,818 | 507,085 | (65,435 | ) | 4,185,052 | 0 | 1,159,003 | 20,746,978 | |||||||||||||||||||||||
10
Mitsubishi UFJ Financial Group, Inc.
(4) Consolidated Statements of Cash Flows
| (in millions of yen) | For the fiscal year ended March 31, 2023 |
For the fiscal year ended March 31, 2024 |
||||||
| Cash flows from operating activities: |
||||||||
| Profits before income taxes |
1,569,923 | 2,050,104 | ||||||
| Depreciation and amortization |
314,708 | 340,137 | ||||||
| Impairment losses |
18,167 | 31,108 | ||||||
| Amortization of goodwill |
19,928 | 22,230 | ||||||
| Equity in losses (gains) of equity method investees |
(425,829 | ) | (531,803 | ) | ||||
| Losses on pension buyout |
78,111 | — | ||||||
| Increase (decrease) in allowance for credit losses |
(32,780 | ) | 224,881 | |||||
| Increase (decrease) in reserve for bonuses |
71,053 | 34,279 | ||||||
| Increase (decrease) in reserve for bonuses to directors |
1,727 | (1,239 | ) | |||||
| Increase (decrease) in reserve for stocks payment |
866 | 4,027 | ||||||
| Decrease (increase) in net defined benefit assets |
(53,774 | ) | (481,644 | ) | ||||
| Increase (decrease) in net defined benefit liabilities |
123 | 7,404 | ||||||
| Increase (decrease) in reserve for retirement benefits to directors |
17 | (7 | ) | |||||
| Increase (decrease) in reserve for loyalty award credits |
(213 | ) | (1,077 | ) | ||||
| Increase (decrease) in reserve for contingent losses |
(64,789 | ) | (32,296 | ) | ||||
| Interest income recognized on statement of income |
(5,298,944 | ) | (7,468,679 | ) | ||||
| Interest expenses recognized on statement of income |
2,372,735 | 5,011,105 | ||||||
| Losses (gains) on securities |
481,930 | 79,574 | ||||||
| Losses (gains) on money held in trust |
6,088 | 76,366 | ||||||
| Foreign exchange losses (gains) |
(2,255,057 | ) | (4,994,338 | ) | ||||
| Losses (gains) on sales of fixed assets |
918 | (4,594 | ) | |||||
| Net decrease (increase) in trading assets |
(42,347 | ) | (2,288,718 | ) | ||||
| Net increase (decrease) in trading liabilities |
2,219,838 | 1,387,039 | ||||||
| Adjustment of unsettled trading accounts |
(651,611 | ) | (206,076 | ) | ||||
| Net decrease (increase) in loans and bills discounted |
(4,211,367 | ) | (6,763,304 | ) | ||||
| Net increase (decrease) in deposits |
7,118,314 | 9,410,399 | ||||||
| Net increase (decrease) in negotiable certificates of deposit |
2,869,240 | 2,903,887 | ||||||
| Net increase (decrease) in borrowed money (excluding subordinated borrowings) |
(6,264,775 | ) | 920,095 | |||||
| Net decrease (increase) in call loans and bills bought and others |
(1,804,036 | ) | (4,059,830 | ) | ||||
| Net decrease (increase) in receivables under securities borrowing transactions |
153,662 | (281,434 | ) | |||||
| Net increase (decrease) in call money and bills sold and others |
12,597,828 | (3,720,809 | ) | |||||
| Net increase (decrease) in commercial papers |
179,650 | 885,347 | ||||||
| Net increase (decrease) in payables under securities lending transactions |
83,926 | (125,534 | ) | |||||
| Net decrease (increase) in foreign exchanges (assets) |
(3,533 | ) | (170,240 | ) | ||||
| Net increase (decrease) in foreign exchanges (liabilities) |
389,405 | 895,169 | ||||||
| Net increase (decrease) in short-term bonds payable |
(269,304 | ) | 164,270 | |||||
| Net increase (decrease) in issuance and redemption of unsubordinated bonds payable |
2,595,987 | (295,231 | ) | |||||
| Net increase (decrease) in due to trust accounts |
(1,121,708 | ) | (4,301,919 | ) | ||||
| Interest income (cash basis) |
4,923,477 | 7,250,761 | ||||||
| Interest expenses (cash basis) |
(2,098,922 | ) | (4,851,903 | ) | ||||
| Others |
440,666 | (435,455 | ) | |||||
|
|
|
|
|
|||||
| Sub-total |
13,909,305 | (9,317,949 | ) | |||||
|
|
|
|
|
|||||
| Income taxes |
(549,466 | ) | (607,135 | ) | ||||
| Refund of income taxes |
71,934 | 80,225 | ||||||
|
|
|
|
|
|||||
| Net cash provided by (used in) operating activities |
13,431,773 | (9,844,860 | ) | |||||
|
|
|
|
|
|||||
11
Mitsubishi UFJ Financial Group, Inc.
| (in millions of yen) | For the fiscal year ended March 31, 2023 |
For the fiscal year ended March 31, 2024 |
||||||
| Cash flows from investing activities: |
||||||||
| Purchases of securities |
(103,993,341 | ) | (92,819,270 | ) | ||||
| Proceeds from sales of securities |
58,441,528 | 64,100,921 | ||||||
| Proceeds from redemption of securities |
36,986,139 | 33,333,232 | ||||||
| Payments for increase in money held in trust |
(1,040,424 | ) | (1,378,121 | ) | ||||
| Proceeds from decrease in money held in trust |
1,075,874 | 1,333,026 | ||||||
| Purchases of tangible fixed assets |
(118,147 | ) | (129,650 | ) | ||||
| Purchases of intangible fixed assets |
(283,478 | ) | (333,157 | ) | ||||
| Proceeds from sales of tangible fixed assets |
46,360 | 78,282 | ||||||
| Proceeds from sales of intangible fixed assets |
180 | 568 | ||||||
| Proceeds from transfer of businesses |
— | 5,070 | ||||||
| Payments for acquisition of subsidiaries’ equity affecting the scope of consolidation |
— | (205,797 | ) | |||||
| Payments for sales of subsidiaries’ equity affecting the scope of consolidation |
(1,784,755 | ) | — | |||||
| Proceeds from sales of subsidiaries’ equity affecting the scope of consolidation |
— | 4,406 | ||||||
| Others |
(5,032 | ) | (3,092 | ) | ||||
|
|
|
|
|
|||||
| Net cash provided by (used in) investing activities |
(10,675,096 | ) | 3,986,415 | |||||
|
|
|
|
|
|||||
| Cash flows from financing activities: |
||||||||
| Proceeds from subordinated borrowings |
29,000 | 123,000 | ||||||
| Repayments of subordinated borrowings |
(28,000 | ) | (68,000 | ) | ||||
| Proceeds from issuance of subordinated bonds payable and bonds with warrants |
670,246 | 992,021 | ||||||
| Payments for redemption of subordinated bonds payable and bonds with warrants |
(787,754 | ) | (155,290 | ) | ||||
| Proceeds from issuance of common stock to non-controlling shareholders |
227 | 945 | ||||||
| Repayments to non-controlling shareholders |
— | (216 | ) | |||||
| Dividends paid by MUFG |
(380,447 | ) | (439,755 | ) | ||||
| Dividends paid by subsidiaries to non-controlling shareholders |
(32,050 | ) | (44,946 | ) | ||||
| Purchases of treasury stock |
(450,153 | ) | (400,156 | ) | ||||
| Proceeds from sales of treasury stock |
2,237 | 2,297 | ||||||
| Payments for purchases of subsidiaries’ equity not affecting the scope of consolidation |
(444 | ) | (1,592 | ) | ||||
|
|
|
|
|
|||||
| Net cash provided by (used in) financing activities |
(977,138 | ) | 8,307 | |||||
|
|
|
|
|
|||||
| Effect of foreign exchange rate changes on cash and cash equivalents |
1,089,328 | 2,090,467 | ||||||
|
|
|
|
|
|||||
| Net increase (decrease) in cash and cash equivalents |
2,868,867 | (3,759,669 | ) | |||||
|
|
|
|
|
|||||
| Cash and cash equivalents at the beginning of the period |
110,763,205 | 113,630,172 | ||||||
|
|
|
|
|
|||||
| Increase in cash and cash equivalents resulting from inclusion of subsidiaries in consolidation |
— | 4,595 | ||||||
| Decrease in cash and cash equivalents resulting from exclusion of subsidiaries from consolidation |
(1,900 | ) | — | |||||
|
|
|
|
|
|||||
| Cash and cash equivalents at the end of the period |
113,630,172 | 109,875,097 | ||||||
|
|
|
|
|
|||||
12
Mitsubishi UFJ Financial Group, Inc.
Notes to the Consolidated Financial Statements
(Notes on Going-Concern Assumption)
None.
(Changes in Presentation of Financial Information)
“Refund of income taxes”, which was previously presented separately from “Income taxes”, on a disaggregated basis for the fiscal year ended March 31, 2023, is included in “Income taxes” on a net basis from the fiscal year ended March 31, 2024 due to the decreased significance in the recorded amount. In order to reflect this change in presentation, the consolidated financial statements for the fiscal year ended March 31, 2023 have been reclassified.
As a result, “Income taxes” of ¥493,256 million and “Refund of income taxes” of ¥(56,288) million previously presented in the consolidated statement of income for the fiscal year ended March 31, 2023 have been aggregated on a net basis and reclassified into “Income taxes” of ¥436,968 million.
(Additional Information)
(Information that is relevant to readers’ understanding of the consolidated financial statements regarding the calculation of allowance for credit losses)
The process of calculating the allowance for credit losses for the Bank and its domestic consolidated subsidiaries, our principal domestic consolidated banking subsidiaries, involves various estimates such as determination of borrower credit ratings which are based on evaluation and classification of borrowers’ debt-service capacity, assessment of the value of collateral provided by borrowers, estimation of future cash flows when applying the cash flow estimation method, and adjustments for future loss projections and other factors to the loss rates calculated based on historical credit loss experience.
Among these, internal credit ratings are assigned to counterparties based on qualitative factors such as the current and expected future business environment of the industry to which they belong as well as their management and funding risks in addition to quantitative financial evaluations through an analysis of their financial results. In particular, those determination of internal credit ratings for these counterparties may be highly dependent on our assessment of the prospects of improvements in their operating results and their ability to continue as going concerns.
MUFG Bank, Ltd. (“the Bank”), our principal consolidated domestic banking subsidiary, applies the cash flow estimation method when providing for allowance for credit losses for loans to substantially bankrupt borrowers and borrowers requiring special attention and caution in cases where it is possible to reasonably estimate the cash flows related to the collection of loan principal and receipt of interest payments. The estimation of such future cash flows is based on a borrower-specific assessment regarding the collectability of loans, including past collection experience, evaluation of the borrower’s restructuring plans, the financial condition and operating results of the borrower, and the economic environment of the industry to which the borrower belongs. In this regard, the estimation of future cash flows may be highly dependent on estimation of borrowers’ future performance and business sustainability. Estimates are subject to a high degree of uncertainly especially when made in connection with assessments regarding the collectability of loans to substantially bankrupt borrowers with respect to which objective information is not reasonably available.
In addition, when calculating allowance for credit losses, the Bank determines loss rates primarily by calculating a rate of loss based on a historical average of the credit loss rate or a historical average of the default probability derived from actual credit loss experience or actual bankruptcy experience and making necessary adjustments based on future projections and other factors.
The Bank makes such adjustments based on future projections and other factors to the loss rate calculated based on historical loss experience, when and to the extent such adjustments are deemed appropriate by, for example, considering any additional expected loss amount not reflected in such loss rate calculated based on historical loss experience, especially in light of the Russia-Ukraine situation. The amount of impact of these adjustments as of the end of the current fiscal year is 42,492 million yen (69,569 million yen as of March 31, 2023). Given that actual loss information after the expansion of COVID-19 has been accumulated and the impact of COVID-19 is reflected in the loss rates calculated based on historical loss experience, starting in the second quarter of the fiscal year ended March 31, 2024, no adjustments are made based on future projections that take into account the rate of increase in the credit loss rate or the default probability in a recent period.
13
Mitsubishi UFJ Financial Group, Inc.
In addition, certain overseas subsidiaries which apply Generally Accepted Accounting Principles in the United States (“U.S. GAAP”) have adopted Accounting Standards Codification (“ASC”) Topic 326, “Financial Instruments—Credit losses,” and provide for allowance for credit losses by estimating credit losses currently expected for the remaining term of the relevant contracts. Expected credit losses are calculated using a quantitative model that reflects economic forecast scenarios based on macroeconomic variables. The calculation process includes determination of macroeconomic variables used in multiple economic forecast scenarios and the weightings applied to each economic forecast scenario. Expected credit losses are adjusted for qualitative factors to compensate for expected credit losses that are not reflected in a quantitative model.
Significant assumptions used in our calculation of allowance for credit losses, including those described above, are subject to uncertainty. In particular, certain counterparties’ prospects of improvements in their operating results and expectations as to their ability to continue as going concerns, and adjustments to the rate of loss calculated based on actual experience for future projections and other factors, as well as determination of the macroeconomic variables used in, and the weightings applied to, multiple economic forecast scenarios, and adjustments there to for qualitative factors, by certain subsidiaries which apply U.S. GAAP, are based on estimation relating to the economic environment, including changes in economic conditions, commodity prices and monetary policy in each country as well as geopolitical situations, with respect to which objective data are not readily available.
In particular, future developments concerning the Russia-Ukraine situation are subject to significant uncertainty. Accordingly, we make certain assumptions, including that the current Russia-Ukraine situation continues for a while. The recorded allowance represents our best estimate made in a manner designed to ensure objectivity and rationality.
These assumptions change to reflect the Russia-Ukraine situation, and changes in the assumptions may result in an increase or decrease in the allowance for credit losses in the following fiscal year.
14
Mitsubishi UFJ Financial Group, Inc.
(Provisional closing of accounts of a significant equity-method affiliate)
Morgan Stanley, a significant equity-method affiliate of MUFG, closes its financial accounts based on a fiscal year-end of December 31 and, previously, the equity method of accounting was applied to Morgan Stanley’s consolidated financial statements as of the end of Morgan Stanley’s fiscal year. However, from the perspective of providing financial information in a more timely manner, MUFG has decided to make modifications so that, effective from the fiscal year ended March 31, 2024, the equity method of accounting is to applied to Morgan Stanley based on a provisional closing of accounts implemented as of March 31, which is the end of MUFG’s fiscal year.
Accordingly, for the fiscal year ended March 31, 2024, the equity method of accounting has been applied to Morgan Stanley’s consolidated financial statements for the fifteen-month period from January 1, 2023 to March 31, 2024 based on a provisional closing of accounts, and the impact of implementation of such provisional closing of accounts has been reflected in MUFG’s consolidated financial statements from the beginning of the fiscal year ended March 31, 2024.
For the period from January 1, 2023 to March 31, 2023, equity in earnings of the equity method investees related to Morgan Stanley is 106,161 million yen, losses on change in equity related to Morgan Stanley is 22,058 million yen, and share of other comprehensive income of associates accounted for using equity method related to Morgan Stanley included in other comprehensive income is 406,491 million yen.
(Provisional closing of accounts of a significant subsidiary planned for the fiscal year ending March 31, 2025)
Bank of Ayudhya Public Company Limited(“Krungsri”), a significant subsidiary of MUFG, closes its financial accounts based on a fiscal year-end of December 31, and is consolidated based on its consolidated financial statements as of the December 31 fiscal year-end.
However, from the perspective of providing financial information in a more timely manner, MUFG has decided to consolidate Krungsri based on a provisional closing of accounts of Krungsri to be implemented as of March 31, which is MUFG’s fiscal year-end, effective from the beginning of the fiscal year ending March 31, 2025.
Accordingly, for the fiscal year ending March 31, 2025, Krungsri’s financial results for the 15-month period from January 1, 2024 to March 31, 2025 are expected to be reflected in MUFG’s consolidated financial statements.
15
Mitsubishi UFJ Financial Group, Inc.
(Segment Information)
| 1. | Information on net revenue, operating profit (loss), and fixed assets for each reporting segment |
For the Fiscal Year Ended March 31, 2024
| (in millions of yen) | ||||||||||||||||||||||||||||||||||||||||
| Digital Service Business Group |
Retail & Commercial Banking Business Group |
Japanese Corporate & Investment Banking Business Group |
Global Commercial Banking Business Group |
Asset Management & Investor Services Business Group |
Global Corporate & Investment Banking Business Group |
Total of Customer Business |
Global Markets Business Group |
Other | Total | |||||||||||||||||||||||||||||||
| Net revenue |
782,544 | 709,398 | 1,013,680 | 684,992 | 432,311 | 863,065 | 4,485,994 | 323,387 | (37,592 | ) | 4,771,789 | |||||||||||||||||||||||||||||
| Operating expenses |
536,613 | 463,978 | 343,839 | 382,862 | 307,305 | 361,391 | 2,395,990 | 300,033 | 232,871 | 2,928,896 | ||||||||||||||||||||||||||||||
| Operating profit (loss) |
245,931 | 245,419 | 669,841 | 302,130 | 125,005 | 501,674 | 2,090,003 | 23,353 | (270,463 | ) | 1,842,893 | |||||||||||||||||||||||||||||
| Fixed assets at period end |
186,829 | 228,577 | 169,234 | 1,636 | 21,246 | 170,905 | 778,429 | 114,297 | 502,246 | 1,394,973 | ||||||||||||||||||||||||||||||
(Notes)
| 1. | “Net revenue” in the above table is used in lieu of net sales generally used by Japanese non-financial companies. |
| 2. | “Net revenue” includes net interest income, trust fees, net fees and commissions, net trading profit, and net other operating profit. |
| 3. | “Operating expenses” includes personnel expenses and premise expenses. |
| 4. | “Fixed assets at period end” for each reporting segment in the above table represent those related to the Bank and Mitsubishi UFJ Trust and Banking Corporation. Those fixed assets and consolidation adjustments related to MUFG and its other consolidated subsidiaries, which are not allocated to reporting segments, were ¥1,505,407 million. With respect to such fixed assets not allocated to reporting segments, certain related expenses are allocated to each reporting segment on a reasonable basis. |
| 2. | Reconciliation of the total operating profit in each of the above tables to the ordinary profit in the consolidated statement of income for the corresponding fiscal year period |
| Operating profit |
For the fiscal year ended March 31, 2024 |
|||
| Total operating profit of reporting segments |
1,842,893 | |||
| Operating profit of consolidated subsidiaries excluded from reporting segments |
(373 | ) | ||
| Provision for general allowance for credit losses |
(6,723 | ) | ||
| Credit related expenses |
(592,913 | ) | ||
| Gains on loans written-off |
101,726 | |||
| Net gains on equity securities and other securities |
371,274 | |||
| Equity in earnings of equity method investees |
531,803 | |||
| Others |
(119,727 | ) | ||
|
|
|
|||
| Ordinary profit in the consolidated statement of income |
2,127,958 | |||
|
|
|
|||
16
Mitsubishi UFJ Financial Group, Inc.
(Per Share Information)
| For the fiscal year ended March 31, 2024 |
||||
| Total equity per common share |
¥ | 1,670.44 | ||
| Basic earnings per common share |
¥ | 124.64 | ||
| Diluted earnings per common share |
¥ | 124.32 | ||
(Notes)
| 1. | The bases for the calculation of basic earnings per common share and diluted earnings per common share for the periods indicated were as follows: |
| For the fiscal year ended March 31, 2024 |
||||
| Basic earnings per common share |
||||
| Profits attributable to owners of parent |
million yen | 1,490,781 | ||
| Profits not attributable to common shareholders |
million yen | — | ||
| Profits attributable to common shareholders of parent |
million yen | 1,490,781 | ||
| Average number of common shares during the period |
thousand shares | 11,959,977 | ||
| Diluted earnings per common share |
||||
| Adjustment to profits attributable to owners of parent |
million yen | (3,807) | ||
| Adjustment related to dilutive shares of consolidated subsidiaries and others |
million yen | (3,807) | ||
| Increase in common shares |
thousand shares | — | ||
| Description of antidilutive securities which were not included in the calculation of diluted earnings per share |
Share subscription rights issued by equity method affiliates: Morgan Stanley Stock options and others - 0 million units as of March 31, 2024 |
|||
| 2. | The bases for the calculation of total equity per common share for the period indicated were as follows: |
| As of March 31, 2024 |
||||
| Total equity |
million yen | 20,746,978 | ||
| Deductions from total equity: |
million yen | 1,159,004 | ||
| Subscription rights to shares |
million yen | 0 | ||
| Non-controlling interests |
million yen | 1,159,003 | ||
| Total equity attributable to common shares |
million yen | 19,587,974 | ||
| Number of common shares at period end used for the calculation of total equity per common share |
thousand shares | 11,726,188 |
17
Mitsubishi UFJ Financial Group, Inc.
(Subsequent Events)
None.
18
Selected Financial Information
under Japanese GAAP
For the Fiscal Year Ended March 31, 2024
| Mitsubishi UFJ Financial Group, Inc. |

|
Mitsubishi UFJ Financial Group, Inc.
[Contents]
| 1. Financial Results |
[ MUFG Consolidated ]*1[ BK and TB Combined ]*2*3*4 [ BK Consolidated ][ BK Non-consolidated ] [ TB Consolidated ][ TB Non-consolidated ] |
1 | ||
| 2. Average Interest Rate Spread |
[ BK Non-consolidated ][ TB Non-consolidated ] [ BK and TB Combined ] | 7 | ||
| 3. Notional Principal by the Remaining Life of the Interest Rate Swaps for Hedge-Accounting |
[ MUFG Consolidated ] [ BK Consolidated ] [ TB Consolidated ] | 8 | ||
| 4. Securities |
[ MUFG Consolidated ] [ BK Non-consolidated ] [ TB Non-consolidated ] |
9 | ||
| 5. ROE |
[ MUFG Consolidated ] | 12 | ||
| 6. Risk-Adjusted Capital Ratio |
[ MUFG Consolidated ][ BK Consolidated ][ TB Consolidated ] [ BK Non-consolidated ][ TB Non-consolidated ] |
13 | ||
| 7. Loans to Be Disclosed under the Banking Act and the Financial Reconstruction Act (the “FRA”) |
[ MUFG Consolidated ][ BK and TB Combined including Trust Account ] [ BK Non-consolidated ][ TB Non-consolidated ] [ TB Non-consolidated : Trust Account ] |
14 | ||
| 8. Progress in Disposition of Problem Assets |
[ BK Non-consolidated ] [ TB Non-consolidated including Trust Account ] |
20 | ||
| 9. Loans Classified by Type of Industry |
[ BK and TB Combined including Trust Accounts ] [ BK Non-consolidated ][ TB Non-consolidated ] [ TB Non-consolidated : Trust Accounts ] |
22 | ||
| 10 Domestic Consumer Loans, Domestic Loans to Small/Medium-Sized Companies and Proprietors |
[ BK Non-consolidated ] [ TB Non-consolidated including Trust Account ] |
26 | ||
| 11. Overseas Loans |
[ BK Consolidated excl. KS, BDI ]*5*6 | 27 | ||
| 12. Loans and Deposits |
[ BK and TB Combined ] [ BK Non-consolidated ][ TB Non-consolidated ] |
28 | ||
| 13. Domestic Deposits |
[ BK and TB Combined ] [ BK Non-consolidated ][ TB Non-consolidated ] |
29 | ||
| 14. Status of Deferred Tax Assets |
[ BK Non-consolidated ][ TB Non-consolidated ] | 30 | ||
| 15. Retirement Benefits |
[ MUFG Consolidated ] [ BK Non-consolidated ][ TB Non-consolidated ] |
32 | ||
| (Reference) 1. Financial Statements |
[ BK Non-consolidated ][ TB Non-consolidated ] | 35 | ||
| (*1) | “MUFG” means Mitsubishi UFJ Financial Group, Inc. |
| (*2) | “BK” means MUFG Bank, Ltd. |
| (*3) | “TB” means Mitsubishi UFJ Trust and Banking Corporation. |
| (*4) | “BK and TB Combined” means simple sum of “BK” and “TB” without consolidation processes. |
| (*5) | “KS” means Bank of Ayudhya Public Company Limited. |
| (*6) | “BDI” means PT Bank Danamon Indonesia, Tbk. |
Mitsubishi UFJ Financial Group, Inc.
1. Financial Results
MUFG Consolidated
| (in millions of yen) | ||||||||||||
| For the fiscal year ended | Increase | |||||||||||
| March 31, 2024 (A) |
March 31, 2023 (B) |
(Decrease) (A) - (B) |
||||||||||
| Gross profits |
4,732,524 | 4,503,008 | 229,515 | |||||||||
| Gross profits before credit costs for trust accounts |
4,732,519 | 4,503,008 | 229,510 | |||||||||
| Net interest income |
2,457,882 | 2,907,511 | (449,629 | ) | ||||||||
| Trust fees |
139,363 | 140,637 | (1,274 | ) | ||||||||
| Credit costs for trust accounts (1) |
4 | — | 4 | |||||||||
| Net fees and commissions |
1,681,291 | 1,554,767 | 126,524 | |||||||||
| Net trading profits |
368,172 | 372,093 | (3,920 | ) | ||||||||
| Net other operating profits |
85,813 | (472,001 | ) | 557,815 | ||||||||
| Net gains (losses) on debt securities |
(450,755 | ) | (884,618 | ) | 433,862 | |||||||
| General and administrative expenses |
2,888,747 | 2,908,709 | (19,962 | ) | ||||||||
| Amortization of goodwill |
22,230 | 19,928 | 2,302 | |||||||||
| Net operating profits before credit costs for trust accounts, provision for general allowance for credit losses and amortization of goodwill |
1,866,003 | 1,614,227 | 251,775 | |||||||||
| Net operating profits before credit costs for trust accounts and provision for general allowance for credit losses |
1,843,772 | 1,594,299 | 249,472 | |||||||||
| Provision for general allowance for credit losses (2) |
(6,723 | ) | (36,608 | ) | 29,884 | |||||||
| Net operating profits*1 |
1,837,053 | 1,557,691 | 279,361 | |||||||||
| Net non-recurring gains (losses) |
290,905 | (536,963 | ) | 827,868 | ||||||||
| Credit costs (3) |
(592,913 | ) | (746,353 | ) | 153,439 | |||||||
| Losses on loan write-offs*2 |
(193,119 | ) | (547,783 | ) | 354,663 | |||||||
| Provision for specific allowance for credit losses |
(387,362 | ) | (197,561 | ) | (189,801 | ) | ||||||
| Other credit costs |
(12,432 | ) | (1,009 | ) | (11,422 | ) | ||||||
| Reversal of allowance for credit losses (4) |
— | — | — | |||||||||
| Reversal of reserve for contingent losses included in credit costs (5) |
— | 11,550 | (11,550 | ) | ||||||||
| Gains on loans written-off (6) |
101,726 | 96,569 | 5,156 | |||||||||
| Net gains (losses) on equity securities |
371,274 | 288,000 | 83,274 | |||||||||
| Gains on sales of equity securities |
452,125 | 332,747 | 119,377 | |||||||||
| Losses on sales of equity securities |
(70,673 | ) | (28,796 | ) | (41,877 | ) | ||||||
| Losses on write-down of equity securities |
(10,177 | ) | (15,950 | ) | 5,773 | |||||||
| Equity in earnings of equity method investees |
531,803 | 425,829 | 105,973 | |||||||||
| Other non-recurring gains (losses)*2 |
(120,985 | ) | (612,559 | ) | 491,574 | |||||||
|
|
|
|
|
|
|
|||||||
| Ordinary profits |
2,127,958 | 1,020,728 | 1,107,230 | |||||||||
|
|
|
|
|
|
|
|||||||
| Net extraordinary gains (losses) |
(77,854 | ) | 549,195 | (627,049 | ) | |||||||
| Net gains (losses) on disposition of fixed assets |
4,594 | (918 | ) | 5,513 | ||||||||
| Losses on impairment of fixed assets |
(31,108 | ) | (18,167 | ) | (12,940 | ) | ||||||
| Net gains (losses) sales of shares of subsidiaries*3 |
(93 | ) | 699,509 | (699,603 | ) | |||||||
| Net gains (losses) on change in equity |
(50,847 | ) | (23,711 | ) | (27,135 | ) | ||||||
| Net gains (losses) on sales of shares of affiliates |
— | (29,401 | ) | 29,401 | ||||||||
| Losses on pension buyout |
— | (78,111 | ) | 78,111 | ||||||||
| Profits before income taxes |
2,050,104 | 1,569,923 | 480,180 | |||||||||
| Income taxes-current |
411,857 | 436,968 | (25,111 | ) | ||||||||
| Income taxes-deferred |
66,485 | (67,361 | ) | 133,847 | ||||||||
| Total taxes |
478,342 | 369,607 | 108,735 | |||||||||
| Profits |
1,571,761 | 1,200,316 | 371,444 | |||||||||
| Profits attributable to non-controlling interests |
80,979 | 83,820 | (2,840 | ) | ||||||||
|
|
|
|
|
|
|
|||||||
| Profits attributable to owners of parent |
1,490,781 | 1,116,496 | 374,285 | |||||||||
|
|
|
|
|
|
|
|||||||
| Note: |
||||||||||||
| *1. Net operating profits = Banking subsidiaries’ net operating profits + Other consolidated entities’ gross profits - Other consolidated entities’ general and administrative expenses - Other consolidated entities’ provision for general allowance for credit losses - Amortization of goodwill - Inter-company transactions |
|
|||||||||||
| *2. In connection with the planned sale of the shares in MUFG Union Bank, N.A. (“MUB”), an aggregate of ¥952,590 million of losses were recognized for the fiscal year ended March 31, 2023, primarily in accordance with Accounting Standards Codification (“ASC”) Topic 326, “Financial Instruments—Credit losses,” and ASC Topic 310, “Receivables.” These losses consist mainly of ¥555,421 million of valuation losses related to securities held for sale, which are included in Other non-recurring gains (losses), and ¥400,511 million of valuation losses related to loans held for sale, which are included in Losses on loan write-offs. |
|
|||||||||||
| *3. “Net gains (losses) sales of shares of subsidiaries” for the fiscal year ended March 31, 2023, includes ¥699,509 million of gains on sales of shares of subsidiaries resulting from the sale of the shares in MUB. |
|
|||||||||||
| (Reference) |
||||||||||||
| Total credit costs (1)+(2)+(3)+(4)+(5)+(6) |
(497,907 | ) | (674,842 | ) | 176,935 | |||||||
| Number of consolidated subsidiaries |
253 | 246 | 7 | |||||||||
| Number of affiliated companies accounted for under the equity method |
51 | 46 | 5 | |||||||||
1
Mitsubishi UFJ Financial Group, Inc.
BK and TB Combined
| (in millions of yen) | ||||||||||||
| For the fiscal year ended | Increase | |||||||||||
| March 31, 2024 (A) |
March 31, 2023 (B) |
(Decrease) (A) - (B) |
||||||||||
| Gross profits |
2,565,957 | 2,150,510 | 415,447 | |||||||||
| Gross profits before credit costs for trust accounts |
2,565,953 | 2,150,510 | 415,443 | |||||||||
| Domestic gross profits |
1,179,786 | 1,129,899 | 49,887 | |||||||||
| Net interest income |
772,653 | 734,884 | 37,768 | |||||||||
| Trust fees |
120,757 | 111,924 | 8,833 | |||||||||
| Credit costs for trust accounts (1) |
4 | — | 4 | |||||||||
| Net fees and commissions |
375,410 | 358,002 | 17,407 | |||||||||
| Net trading profits |
(6,719 | ) | (9,246 | ) | 2,527 | |||||||
| Net other operating profits |
(82,315 | ) | (65,666 | ) | (16,649 | ) | ||||||
| Net gains (losses) on debt securities |
(104,859 | ) | (102,278 | ) | (2,581 | ) | ||||||
| Non-domestic gross profits |
1,386,170 | 1,020,610 | 365,559 | |||||||||
| Net interest income |
844,261 | 1,119,761 | (275,500 | ) | ||||||||
| Net fees and commissions |
389,191 | 266,557 | 122,633 | |||||||||
| Net trading profits |
102,432 | 65,846 | 36,586 | |||||||||
| Net other operating profits |
50,285 | (431,555 | ) | 481,841 | ||||||||
| Net gains (losses) on debt securities |
(345,043 | ) | (780,359 | ) | 435,316 | |||||||
| General and administrative expenses |
1,520,862 | 1,350,891 | 169,971 | |||||||||
| Personnel expenses |
641,143 | 476,225 | 164,917 | |||||||||
| Non-personnel expenses |
809,960 | 800,355 | 9,605 | |||||||||
| Taxes |
69,759 | 74,311 | (4,552 | ) | ||||||||
| Net operating profits before credit costs for trust accounts and provision for general allowance for credit losses |
1,045,090 | 799,618 | 245,471 | |||||||||
| Provision for general allowance for credit losses (2) |
5,767 | (40,374 | ) | 46,142 | ||||||||
| Net operating profits |
1,050,862 | 759,243 | 291,619 | |||||||||
| Net non-recurring gains (losses) |
29,492 | 315,640 | (286,148 | ) | ||||||||
| Credit costs (3) |
(283,016 | ) | (88,696 | ) | (194,319 | ) | ||||||
| Reversal of allowance for credit losses (4) |
85 | — | 85 | |||||||||
| Reversal of reserve for contingent losses included in credit costs (5) |
— | 9,798 | (9,798 | ) | ||||||||
| Gains on loans written-off (6) |
26,723 | 20,450 | 6,272 | |||||||||
| Net gains (losses) on equity securities |
363,467 | 286,114 | 77,353 | |||||||||
| Gains on sales of equity securities |
442,142 | 322,193 | 119,948 | |||||||||
| Losses on sales of equity securities |
(71,983 | ) | (27,596 | ) | (44,386 | ) | ||||||
| Losses on write-down of equity securities |
(6,691 | ) | (8,482 | ) | 1,790 | |||||||
| Other non-recurring gains (losses) |
(77,768 | ) | 87,973 | (165,742 | ) | |||||||
|
|
|
|
|
|
|
|||||||
| Ordinary profits |
1,080,354 | 1,074,883 | 5,470 | |||||||||
|
|
|
|
|
|
|
|||||||
| Net extraordinary gains (losses) |
(10,463 | ) | 330,501 | (340,965 | ) | |||||||
| Net gains (losses) on disposition of fixed assets |
657 | (2,278 | ) | 2,935 | ||||||||
| Losses on impairment of fixed assets |
(20,405 | ) | (10,125 | ) | (10,280 | ) | ||||||
| Gains on sales of shares of subsidiaries* |
4,863 | 415,106 | (410,243 | ) | ||||||||
| Gains on extinguishment of tie-in shares |
4,319 | — | 4,319 | |||||||||
| Gains on negative goodwill |
— | 11,040 | (11,040 | ) | ||||||||
| Losses on sales of shares of affiliates |
— | (5,248 | ) | 5,248 | ||||||||
| Losses on pension buyout |
— | (78,111 | ) | 78,111 | ||||||||
| Income before income taxes |
1,069,891 | 1,405,385 | (335,494 | ) | ||||||||
| Income taxes-current |
257,985 | 290,586 | (32,601 | ) | ||||||||
| Income taxes-deferred |
(50,158 | ) | (25,200 | ) | (24,957 | ) | ||||||
| Total taxes |
207,826 | 265,385 | (57,558 | ) | ||||||||
|
|
|
|
|
|
|
|||||||
| Net income |
862,064 | 1,139,999 | (277,935 | ) | ||||||||
|
|
|
|
|
|
|
|||||||
| Note: * “Gains on sales of shares of subsidiaries” for the fiscal year ended March 31, 2023, is related to a transaction with MUFG Americas Holdings Corporation (“MUAH”).
|
|
|||||||||||
| (Reference) |
||||||||||||
| Total credit costs (1)+(2)+(3)+(4)+(5)+(6) |
(250,434 | ) | (98,822 | ) | (151,612 | ) | ||||||
| Credit costs for trust accounts |
4 | — | 4 | |||||||||
| Provision for general allowance for credit losses |
5,853 | (40,374 | ) | 46,228 | ||||||||
| Provision for special allowance for credit losses |
(237,335 | ) | (67,550 | ) | (169,784 | ) | ||||||
| Allowance for credit to specific foreign borrowers |
10,752 | 5,188 | 5,564 | |||||||||
| Losses on loans write-offs |
(30,782 | ) | (15,419 | ) | (15,362 | ) | ||||||
| Provision for contingent losses included in credit costs |
(12,763 | ) | 9,614 | (22,378 | ) | |||||||
| Gains on loans written-off |
26,723 | 20,450 | 6,272 | |||||||||
| Losses on sales of other loans, etc. |
(12,887 | ) | (10,731 | ) | (2,155 | ) | ||||||
| Net operating profits before credit costs for trust accounts and provision for general allowance for credit losses, excluding net gains (losses) on debt securities |
1,494,992 | 1,682,255 | (187,263 | ) | ||||||||
| Net operating profits before credit costs for trust accounts and provision for general allowance for credit losses, excluding net gains (losses) on debt securities and investment trusts cancellation |
1,396,187 | 1,126,493 | 269,693 | |||||||||
2
Mitsubishi UFJ Financial Group, Inc.
BK Consolidated
| (in millions of yen) | ||||||||||||
| For the fiscal year ended | Increase | |||||||||||
| March 31, 2024 (A) |
March 31, 2023 (B) |
(Decrease) (A) - (B) |
||||||||||
| Gross profits |
3,360,598 | 3,240,353 | 120,245 | |||||||||
| Net interest income |
2,145,049 | 2,388,320 | (243,270 | ) | ||||||||
| Trust fees |
— | 12,258 | (12,258 | ) | ||||||||
| Net fees and commissions |
914,290 | 894,410 | 19,880 | |||||||||
| Net trading profits |
192,345 | 130,570 | 61,775 | |||||||||
| Net other operating profits |
108,912 | (185,205 | ) | 294,118 | ||||||||
| Net gains (losses) on debt securities |
(375,997 | ) | (590,505 | ) | 214,507 | |||||||
| General and administrative expenses |
1,895,166 | 2,004,252 | (109,086 | ) | ||||||||
| Amortization of goodwill |
8,479 | 7,551 | 928 | |||||||||
| Net operating profits before provision for general allowance for credit losses and amortization of goodwill |
1,473,911 | 1,243,652 | 230,259 | |||||||||
| Net operating profits before provision for general allowance for credit losses |
1,465,432 | 1,236,100 | 229,331 | |||||||||
| Provision for general allowance for credit losses (1) |
1,284 | (34,640 | ) | 35,924 | ||||||||
| Net operating profits*1 |
1,466,716 | 1,201,460 | 265,256 | |||||||||
| Net non-recurring gains (losses) |
(116,439 | ) | (914,490 | ) | 798,051 | |||||||
| Credit costs (2) |
(478,742 | ) | (646,764 | ) | 168,022 | |||||||
| Losses on loan write-offs*2 |
(96,866 | ) | (465,102 | ) | 368,235 | |||||||
| Provision for specific allowance for credit losses |
(369,443 | ) | (180,652 | ) | (188,791 | ) | ||||||
| Other credit costs |
(12,432 | ) | (1,009 | ) | (11,422 | ) | ||||||
| Reversal of allowance for credit losses (3) |
— | — | — | |||||||||
| Reversal of reserve for contingent losses included in credit costs (4) |
— | 11,551 | (11,551 | ) | ||||||||
| Gains on loans written-off (5) |
75,872 | 71,721 | 4,150 | |||||||||
| Net gains (losses) on equity securities |
285,362 | 218,639 | 66,723 | |||||||||
| Gains on sales of equity securities |
363,056 | 259,129 | 103,926 | |||||||||
| Losses on sales of equity securities |
(70,881 | ) | (27,516 | ) | (43,364 | ) | ||||||
| Losses on write-down of equity securities |
(6,812 | ) | (12,974 | ) | 6,161 | |||||||
| Equity in earnings of equity method investees |
39,203 | 36,824 | 2,378 | |||||||||
| Other non-recurring gains (losses)*2 |
(38,135 | ) | (606,463 | ) | 568,327 | |||||||
|
|
|
|
|
|
|
|||||||
| Ordinary profits |
1,350,277 | 286,969 | 1,063,307 | |||||||||
|
|
|
|
|
|
|
|||||||
| Net extraordinary gains (losses) |
(21,686 | ) | 584,103 | (605,789 | ) | |||||||
| Net gains (losses) on disposition of fixed assets |
2,373 | (384 | ) | 2,757 | ||||||||
| Losses on impairment of fixed assets |
(24,059 | ) | (6,925 | ) | (17,134 | ) | ||||||
| Gains on sales of shares of subsidiaries*3 |
— | 699,509 | (699,509 | ) | ||||||||
| Net gains (losses) on sales of shares of affiliates |
— | (29,985 | ) | 29,985 | ||||||||
| Losses on pension buyout |
— | (78,111 | ) | 78,111 | ||||||||
| Profits before income taxes |
1,328,591 | 871,073 | 457,517 | |||||||||
| Income taxes-current |
328,101 | 347,320 | (19,219 | ) | ||||||||
| Income taxes-deferred |
26,974 | (94,318 | ) | 121,292 | ||||||||
| Total taxes |
355,075 | 253,001 | 102,073 | |||||||||
| Profits |
973,515 | 618,071 | 355,444 | |||||||||
| Profits attributable to non-controlling interests |
28,787 | 16,037 | 12,749 | |||||||||
|
|
|
|
|
|
|
|||||||
| Profits attributable to owners of parent |
944,728 | 602,034 | 342,694 | |||||||||
|
|
|
|
|
|
|
|||||||
| Note: | ||||||||||||
| *1. Net operating profits = Net operating profits of BK + Other consolidated entities’ gross profits - Other consolidated entities’ general and administrative expenses - Other consolidated entities’ provision for general allowance for credit losses - Amortization of goodwill - Inter-company transactions |
|
|||||||||||
| *2. In connection with the planned sale of the shares in MUB, an aggregate of ¥952,590 million of losses were recognized for the fiscal year ended March 31, 2023, primarily in accordance with ASC Topic 326, “Financial Instruments—Credit losses,” and ASC Topic 310, “Receivables.” These losses consist mainly of ¥555,421 million of valuation losses related to securities held for sale, which are included in Other non-recurring gains (losses), and ¥400,511 million of valuation losses related to loans held for sale, which are included in Losses on loan write-offs. |
|
|||||||||||
| *3. “Gains on sales of shares of subsidiaries” for the fiscal year ended March 31, 2023, includes ¥699,509 million of gains on sales of shares of subsidiaries resulting from the sale of the shares in MUB. |
|
|||||||||||
| (Reference) |
||||||||||||
| Total credit costs (1)+(2)+(3)+(4)+(5) |
(401,585 | ) | (598,131 | ) | 196,546 | |||||||
| Number of consolidated subsidiaries |
113 | 108 | 5 | |||||||||
| Number of affiliated companies accounted for under the equity method |
44 | 42 | 2 | |||||||||
3
Mitsubishi UFJ Financial Group, Inc.
BK Non-consolidated
| (in millions of yen) | ||||||||||||
| For the fiscal year ended | Increase | |||||||||||
| March 31, 2024 (A) |
March 31, 2023 (B) |
(Decrease) (A) - (B) |
||||||||||
| Gross profits |
2,283,668 | 1,844,033 | 439,634 | |||||||||
| Domestic gross profits |
896,600 | 843,285 | 53,315 | |||||||||
| Net interest income |
717,094 | 675,384 | 41,709 | |||||||||
| Net fees and commissions |
268,500 | 253,364 | 15,136 | |||||||||
| Net trading profits |
2,917 | 3,005 | (87 | ) | ||||||||
| Net other operating profits |
(91,911 | ) | (88,469 | ) | (3,442 | ) | ||||||
| Net gains (losses) on debt securities |
(91,668 | ) | (97,938 | ) | 6,270 | |||||||
| Non-domestic gross profits |
1,387,067 | 1,000,748 | 386,318 | |||||||||
| Net interest income |
778,723 | 808,355 | (29,631 | ) | ||||||||
| Net fees and commissions |
387,188 | 265,590 | 121,598 | |||||||||
| Net trading profits |
106,654 | 75,756 | 30,898 | |||||||||
| Net other operating profits |
114,500 | (148,953 | ) | 263,454 | ||||||||
| Net gains (losses) on debt securities |
(284,229 | ) | (493,067 | ) | 208,837 | |||||||
| General and administrative expenses |
1,309,067 | 1,153,573 | 155,493 | |||||||||
| Personnel expenses |
571,241 | 413,043 | 158,198 | |||||||||
| Non-personnel expenses |
676,244 | 674,889 | 1,355 | |||||||||
| Amortization of goodwill |
3,830 | 2,451 | 1,379 | |||||||||
| Taxes |
61,580 | 65,641 | (4,061 | ) | ||||||||
| Net operating profits before provision for general allowance for credit losses and amortization of goodwill |
978,432 | 692,911 | 285,520 | |||||||||
| Net operating profits before provision for general allowance for credit losses |
974,601 | 690,460 | 284,141 | |||||||||
| Provision for general allowance for credit losses (1) |
5,767 | (40,334 | ) | 46,102 | ||||||||
| Net operating profits |
980,368 | 650,125 | 330,243 | |||||||||
| Net non-recurring gains (losses) |
19,402 | 253,619 | (234,217 | ) | ||||||||
| Credit costs (2) |
(282,760 | ) | (88,507 | ) | (194,253 | ) | ||||||
| Reversal of allowance for credit losses (3) |
— | — | — | |||||||||
| Reversal of reserve for contingent losses included in credit costs (4) |
— | 9,798 | (9,798 | ) | ||||||||
| Gains on loans written-off (5) |
26,722 | 20,450 | 6,271 | |||||||||
| Net gains (losses) on equity securities |
286,136 | 224,294 | 61,842 | |||||||||
| Gains on sales of equity securities |
360,191 | 256,280 | 103,910 | |||||||||
| Losses on sales of equity securities |
(69,862 | ) | (25,697 | ) | (44,165 | ) | ||||||
| Losses on write-down of equity securities |
(4,191 | ) | (6,289 | ) | 2,097 | |||||||
| Other non-recurring gains (losses) |
(10,696 | ) | 87,583 | (98,279 | ) | |||||||
|
|
|
|
|
|
|
|||||||
| Ordinary profits |
999,771 | 903,744 | 96,026 | |||||||||
|
|
|
|
|
|
|
|||||||
| Net extraordinary gains (losses) |
(5,010 | ) | 335,850 | (340,860 | ) | |||||||
| Net gains (losses) on disposition of fixed assets |
303 | (1,893 | ) | 2,196 | ||||||||
| Losses on impairment of fixed assets |
(14,496 | ) | (5,043 | ) | (9,453 | ) | ||||||
| Gains on sales of shares of subsidiaries* |
4,863 | 415,106 | (410,243 | ) | ||||||||
| Gains on extinguishment of tie-in shares |
4,319 | — | 4,319 | |||||||||
| Gains on negative goodwill |
— | 11,040 | (11,040 | ) | ||||||||
| Losses on sales of shares of affiliates |
— | (5,248 | ) | 5,248 | ||||||||
| Losses on pension buyout |
— | (78,111 | ) | 78,111 | ||||||||
| Income before income taxes |
994,760 | 1,239,594 | (244,834 | ) | ||||||||
| Income taxes-current |
244,385 | 254,747 | (10,362 | ) | ||||||||
| Income taxes-deferred |
(53,885 | ) | (30,607 | ) | (23,278 | ) | ||||||
| Total taxes |
190,499 | 224,140 | (33,640 | ) | ||||||||
|
|
|
|
|
|
|
|||||||
| Net income |
804,260 | 1,015,454 | (211,193 | ) | ||||||||
|
|
|
|
|
|
|
|||||||
| Note: |
||||||||||||
| * “Gains on sales of shares of subsidiaries” for the fiscal year ended March 31, 2023, is related to a transaction with MUAH. |
|
|||||||||||
| (Reference) |
||||||||||||
| Total credit costs (1)+(2)+(3)+(4)+(5) |
(250,270 | ) | (98,592 | ) | (151,677 | ) | ||||||
| Provision for general allowance for credit losses |
5,767 | (40,334 | ) | 46,102 | ||||||||
| Provision for special allowance for credit losses |
(237,335 | ) | (67,544 | ) | (169,791 | ) | ||||||
| Allowance for credit to specific foreign borrowers |
10,752 | 5,188 | 5,564 | |||||||||
| Losses on loans write-off |
(30,782 | ) | (15,419 | ) | (15,362 | ) | ||||||
| Provision for contingent losses included in credit costs |
(12,508 | ) | 9,798 | (22,307 | ) | |||||||
| Gains on loans written-off |
26,722 | 20,450 | 6,271 | |||||||||
| Losses on sales of other loans, etc. |
(12,887 | ) | (10,731 | ) | (2,155 | ) | ||||||
| Net operating profits before provision for general allowance for credit losses, excluding net gains (losses) on debt securities |
1,350,498 | 1,281,465 | 69,033 | |||||||||
| Net operating profits before provision for general allowance for credit losses, excluding net gains (losses) on debt securities and investment trusts cancellation |
1,333,729 | 974,269 | 359,459 | |||||||||
4
Mitsubishi UFJ Financial Group, Inc.
TB Consolidated
| (in millions of yen) | ||||||||||||
| For the fiscal year ended | Increase | |||||||||||
| March 31, 2024 (A) |
March 31, 2023 (B) |
(Decrease) (A) - (B) |
||||||||||
| Gross profits |
591,268 | 549,851 | 41,417 | |||||||||
| Gross profits before credit costs for trust accounts |
591,264 | 549,851 | 41,413 | |||||||||
| Trust fees |
139,740 | 128,802 | 10,938 | |||||||||
| Trust fees before credit costs for trust accounts |
139,736 | 128,802 | 10,933 | |||||||||
| Money trusts fees (Jointly operated designated money trusts before credit costs for trust account) |
16,537 | 15,035 | 1,501 | |||||||||
| Other trust fees |
123,198 | 113,766 | 9,432 | |||||||||
| Credit costs for trust accounts (1) |
4 | — | 4 | |||||||||
| Net interest income |
130,455 | 352,384 | (221,929 | ) | ||||||||
| Net fees and commissions |
367,843 | 324,161 | 43,682 | |||||||||
| Net trading profits |
(11,307 | ) | (20,155 | ) | 8,848 | |||||||
| Net other operating profits |
(35,463 | ) | (235,340 | ) | 199,877 | |||||||
| Net gains (losses) on debt securities |
(74,029 | ) | (291,736 | ) | 217,707 | |||||||
| General and administrative expenses |
459,133 | 399,994 | 59,139 | |||||||||
| Amortization of goodwill |
13,747 | 12,403 | 1,344 | |||||||||
| Net operating profits before credit costs for trust accounts, provision for general allowance for credit losses and amortization of goodwill |
145,877 | 162,260 | (16,382 | ) | ||||||||
| Net operating profits before credit costs for trust accounts and provision for general allowance for credit losses |
132,130 | 149,856 | (17,726 | ) | ||||||||
| Provision for general allowance for credit losses (2) |
— | (95 | ) | 95 | ||||||||
| Net operating profits* |
132,134 | 149,761 | (17,626 | ) | ||||||||
| Net non-recurring gains (losses) |
8,362 | 55,481 | (47,119 | ) | ||||||||
| Credit costs (3) |
(10 | ) | 26 | (37 | ) | |||||||
| Losses on loan write-offs |
(10 | ) | (0 | ) | (10 | ) | ||||||
| Provision for specific allowance for credit losses |
— | 26 | (26 | ) | ||||||||
| Other credit costs |
— | — | — | |||||||||
| Reversal of allowance for credit losses (4) |
75 | — | 75 | |||||||||
| Reversal of reserve for contingent losses included in credit costs (5) |
— | — | — | |||||||||
| Gains on loans written-off (6) |
6 | 16 | (9 | ) | ||||||||
| Net gains (losses) on equity securities |
77,666 | 61,721 | 15,945 | |||||||||
| Gains on sales of equity securities |
81,967 | 65,912 | 16,055 | |||||||||
| Losses on sales of equity securities |
(2,120 | ) | (1,913 | ) | (206 | ) | ||||||
| Losses on write-down of equity securities |
(2,180 | ) | (2,277 | ) | 96 | |||||||
| Equity in earnings of equity method investees |
2,676 | 1,695 | 980 | |||||||||
| Other non-recurring gains (losses) |
(72,051 | ) | (7,978 | ) | (64,073 | ) | ||||||
|
|
|
|
|
|
|
|||||||
| Ordinary profits |
140,496 | 205,242 | (64,745 | ) | ||||||||
|
|
|
|
|
|
|
|||||||
| Net extraordinary gains (losses) |
(3,796 | ) | (5,733 | ) | 1,937 | |||||||
| Net gains (losses) on disposition of fixed assets |
2,214 | (328 | ) | 2,542 | ||||||||
| Losses on impairment of fixed assets |
(6,033 | ) | (5,404 | ) | (628 | ) | ||||||
| Profits before income taxes |
136,700 | 199,508 | (62,808 | ) | ||||||||
| Income taxes-current |
37,459 | 55,066 | (17,606 | ) | ||||||||
| Income taxes-deferred |
1,712 | 3,845 | (2,132 | ) | ||||||||
| Total taxes |
39,172 | 58,912 | (19,739 | ) | ||||||||
| Profits |
97,527 | 140,596 | (43,068 | ) | ||||||||
| Profits attributable to non-controlling interests |
571 | 524 | 46 | |||||||||
|
|
|
|
|
|
|
|||||||
| Profits attributable to owners of parent |
96,956 | 140,072 | (43,115 | ) | ||||||||
|
|
|
|
|
|
|
|||||||
| Note: | ||||||||||||
| * Net operating profits = Net operating profits of TB + Other consolidated entities’ gross profits - Other consolidated entities’ general and administrative expenses - Other consolidated entities’ provision for general allowance for credit losses - Amortization of goodwill - Inter-company transactions |
|
|||||||||||
| (Reference) |
||||||||||||
| Total credit costs (1)+(2)+(3)+(4)+(5)+(6) |
76 | (52 | ) | 128 | ||||||||
| Number of consolidated subsidiaries |
109 | 105 | 4 | |||||||||
| Number of affiliated companies accounted for under the equity method |
5 | 4 | 1 | |||||||||
|
TB Consolidated (combined operating results of TB and transferred entities to MUAH in the United States) TB transferred the interests in its subsidiaries in the United States to MUAH in United States which are owned by BK and MUFG.
The combined operating results of TB and transferred entities are as follows (the operating results of transferred entities are prepared for managerial accounting purpose): |
|
|||||||||||
| Net operating profits before credit costs for trust accounts and provision for general allowance for credit losses |
134,546 | 152,632 | (18,085 | ) | ||||||||
| Profits attributable to owners of parent |
98,679 | 141,988 | (43,309 | ) | ||||||||
| Number of the entities transferred to MUAH |
4 | 4 | — | |||||||||
5
Mitsubishi UFJ Financial Group, Inc.
TB Non-consolidated
| (in millions of yen) | ||||||||||||
| For the fiscal year ended | Increase | |||||||||||
| March 31, 2024 (A) |
March 31, 2023 (B) |
(Decrease) (A) - (B) |
||||||||||
| Gross profits |
282,289 | 306,476 | (24,186 | ) | ||||||||
| Gross profits before credit costs for trust accounts |
282,284 | 306,476 | (24,191 | ) | ||||||||
| Domestic gross profits |
283,186 | 286,614 | (3,427 | ) | ||||||||
| Trust fees |
120,757 | 111,924 | 8,833 | |||||||||
| Trust fees before credit costs for trust accounts |
120,753 | 111,924 | 8,828 | |||||||||
| Money trusts fees (Jointly operated designated money trusts before credit costs for trust account) |
16,537 | 15,035 | 1,501 | |||||||||
| Other trust fees |
104,216 | 96,889 | 7,326 | |||||||||
| Credit costs for trust accounts (1) |
4 | — | 4 | |||||||||
| Net interest income |
55,558 | 59,499 | (3,940 | ) | ||||||||
| Net fees and commissions |
106,909 | 104,638 | 2,271 | |||||||||
| Net trading profits |
(9,637 | ) | (12,252 | ) | 2,615 | |||||||
| Net other operating profits |
9,596 | 22,803 | (13,206 | ) | ||||||||
| Net gains (losses) on debt securities |
(13,191 | ) | (4,339 | ) | (8,851 | ) | ||||||
| Non-domestic gross profits |
(896 | ) | 19,862 | (20,759 | ) | |||||||
| Net interest income |
65,538 | 311,406 | (245,868 | ) | ||||||||
| Net fees and commissions |
2,002 | 967 | 1,034 | |||||||||
| Net trading profits |
(4,222 | ) | (9,910 | ) | 5,687 | |||||||
| Net other operating profits |
(64,214 | ) | (282,601 | ) | 218,386 | |||||||
| Net gains (losses) on debt securities |
(60,813 | ) | (287,291 | ) | 226,478 | |||||||
| General and administrative expenses |
211,795 | 197,317 | 14,477 | |||||||||
| Personnel expenses |
69,901 | 63,182 | 6,719 | |||||||||
| Non-personnel expenses |
133,715 | 125,465 | 8,249 | |||||||||
| Taxes |
8,178 | 8,670 | (491 | ) | ||||||||
| Net operating profits before credit costs for trust accounts and provision for general allowance for credit losses |
70,489 | 109,158 | (38,669 | ) | ||||||||
| Provision for general allowance for credit losses (2) |
— | (40 | ) | 40 | ||||||||
| Net operating profits |
70,493 | 109,118 | (38,624 | ) | ||||||||
| Net non-recurring gains (losses) |
10,089 | 62,020 | (51,930 | ) | ||||||||
| Credit costs (3) |
(255 | ) | (189 | ) | (65 | ) | ||||||
| Reversal of allowance for credit losses (4) |
85 | — | 85 | |||||||||
| Reversal of reserve for contingent losses included in credit costs (5) |
— | — | — | |||||||||
| Gains on loans written-off (6) |
1 | 0 | 0 | |||||||||
| Net gains (losses) on equity securities |
77,330 | 61,819 | 15,511 | |||||||||
| Gains on sales of equity securities |
81,950 | 65,912 | 16,038 | |||||||||
| Losses on sales of equity securities |
(2,120 | ) | (1,899 | ) | (221 | ) | ||||||
| Losses on write-down of equity securities |
(2,499 | ) | (2,193 | ) | (306 | ) | ||||||
| Other non-recurring gains (losses) |
(67,071 | ) | 390 | (67,462 | ) | |||||||
|
|
|
|
|
|
|
|||||||
| Ordinary profits |
80,583 | 171,138 | (90,555 | ) | ||||||||
|
|
|
|
|
|
|
|||||||
| Net extraordinary gains (losses) |
(5,453 | ) | (5,348 | ) | (104 | ) | ||||||
| Net gains (losses) on disposition of fixed assets |
354 | (385 | ) | 739 | ||||||||
| Losses on impairment of fixed assets |
(5,908 | ) | (5,081 | ) | (826 | ) | ||||||
| Income before income taxes |
75,130 | 165,790 | (90,659 | ) | ||||||||
| Income taxes-current |
13,599 | 35,838 | (22,238 | ) | ||||||||
| Income taxes-deferred |
3,727 | 5,406 | (1,679 | ) | ||||||||
| Total taxes |
17,326 | 41,244 | (23,917 | ) | ||||||||
|
|
|
|
|
|
|
|||||||
| Net income |
57,803 | 124,545 | (66,742 | ) | ||||||||
|
|
|
|
|
|
|
|||||||
| (Reference) |
||||||||||||
| Total credit costs (1)+(2)+(3)+(4)+(5)+(6) |
(164 | ) | (229 | ) | 65 | |||||||
| Credit costs for trust accounts |
4 | — | 4 | |||||||||
| Provision for general allowance for credit losses |
85 | (40 | ) | 125 | ||||||||
| Provision for special allowance for credit losses |
0 | (6 | ) | 6 | ||||||||
| Allowance for credit to specific foreign borrowers |
— | — | — | |||||||||
| Losses on loans write-offs |
(0 | ) | — | (0 | ) | |||||||
| Provision for contingent losses included in credit costs |
(255 | ) | (183 | ) | (71 | ) | ||||||
| Gains on loans written-off |
1 | 0 | 0 | |||||||||
| Losses on sales of other loans, etc. |
— | — | — | |||||||||
| Net operating profits before credit costs for trust accounts and provision for general allowance for credit losses, excluding net gains (losses) on debt securities |
144,493 | 400,790 | (256,296 | ) | ||||||||
| Net operating profits before credit costs for trust accounts and provision for general allowance for credit losses, excluding net gains (losses) on debt securities and investment trusts cancellation |
62,458 | 152,223 | (89,765 | ) | ||||||||
6
Mitsubishi UFJ Financial Group, Inc.
2. Average Interest Rate Spread
BK Non-consolidated
| (percentage per annum) | ||||||||||||
| (Domestic business segment) | For the fiscal year ended March 31, 2024 (A) |
Increase (Decrease) (A) - (B) |
For the fiscal year ended March 31, 2023 (B) |
|||||||||
| Total average interest rate on interest-earning assets (a) |
0.52 | 0.03 | 0.49 | |||||||||
| Average interest rate on loans and bills discounted (b) |
0.81 | 0.05 | 0.75 | |||||||||
| Average interest rate on securities |
0.52 | 0.03 | 0.49 | |||||||||
| Total average interest rate on interest-bearing liabilities (c) |
||||||||||||
| <including general and administrative expenses> |
0.32 | (0.00 | ) | 0.32 | ||||||||
| Average interest rate on deposits and NCD (d) |
0.00 | 0.00 | 0.00 | |||||||||
| Average interest rate on other liabilities |
0.17 | 0.06 | 0.11 | |||||||||
| Overall interest rate spread (a)-(c) |
0.19 | 0.03 | 0.16 | |||||||||
| Interest rate spread (b)-(d) |
0.81 | 0.05 | 0.75 | |||||||||
| (After excluding loans to the Japanese government and governmental organizations) |
||||||||||||
| Average interest rate on loans and bills discounted (e) |
0.83 | 0.05 | 0.77 | |||||||||
| Interest rate spread (e)-(d) |
0.83 | 0.05 | 0.77 | |||||||||
| TB Non-consolidated |
||||||||||||
| (percentage per annum) | ||||||||||||
| (Domestic business segment) | For the fiscal year ended March 31, 2024 (A) |
Increase (Decrease) (A) - (B) |
For the fiscal year ended March 31, 2023 (B) |
|||||||||
| Total average interest rate on interest-earning assets (a) |
0.69 | 0.03 | 0.66 | |||||||||
| Average interest rate on loans and bills discounted (b) |
0.56 | 0.16 | 0.39 | |||||||||
| Average interest rate on securities |
2.66 | 0.35 | 2.31 | |||||||||
| Total average interest rate on interest-bearing liabilities (c) |
0.20 | 0.04 | 0.16 | |||||||||
| Average interest rate on deposits and NCD (d) |
0.02 | 0.00 | 0.01 | |||||||||
| Overall interest rate spread (a)-(c) |
0.49 | (0.00 | ) | 0.50 | ||||||||
| Interest rate spread (b)-(d) |
0.54 | 0.16 | 0.37 | |||||||||
| (After excluding loans to the Japanese government and governmental organizations) |
||||||||||||
| Average interest rate on loans and bills discounted (e) |
0.72 | (0.02 | ) | 0.75 | ||||||||
| Interest rate spread (e)-(d) |
0.69 | (0.03 | ) | 0.73 | ||||||||
| (Reference) |
||||||||||||
| BK and TB Combined |
||||||||||||
| (percentage per annum) | ||||||||||||
| (Domestic business segment) | For the fiscal year ended March 31, 2024 (A) |
Increase (Decrease) (A) - (B) |
For the fiscal year ended March 31, 2023 (B) |
|||||||||
| Average interest rate on loans and bills discounted (a) |
0.80 | 0.06 | 0.74 | |||||||||
| Average interest rate on deposits and NCD (b) |
0.00 | 0.00 | 0.00 | |||||||||
| Interest rate spread (a)-(b) |
0.80 | 0.05 | 0.74 | |||||||||
| (After excluding loans to the Japanese government and governmental organizations) |
||||||||||||
| Average interest rate on loans and bills discounted (c) |
0.83 | 0.05 | 0.77 | |||||||||
| Interest rate spread (c)-(b) |
0.82 | 0.05 | 0.77 | |||||||||
7
Mitsubishi UFJ Financial Group, Inc.
3. Notional Principal by the Remaining Life of the Interest Rate Swaps for Hedge-Accounting
MUFG Consolidated
| (in billions of yen) | ||||||||||||||||
| As of March 31, 2024 | ||||||||||||||||
| within 1 year | 1 year to 5 years | over 5 years | Total | |||||||||||||
|
Receive-fix/pay-floater |
3,836.9 | 27,047.4 | 10,212.0 | 41,096.4 | ||||||||||||
| Receive-floater/pay-fix |
1,415.2 | 1,795.8 | 4,789.8 | 8,000.9 | ||||||||||||
| Receive-floater/pay-floater |
— | — | — | — | ||||||||||||
|
Receive-fix/pay-fix |
— | — | — | — | ||||||||||||
|
|
|
|
|
|
|
|
|
|||||||||
| Total |
5,252.2 | 28,843.3 | 15,001.8 | 49,097.4 | ||||||||||||
|
|
|
|
|
|
|
|
|
|||||||||
|
BK Consolidated
|
|
|||||||||||||||
| (in billions of yen) | ||||||||||||||||
| As of March 31, 2024 | ||||||||||||||||
| within 1 year | 1 year to 5 years | over 5 years | Total | |||||||||||||
|
Receive-fix/pay-floater |
3,540.2 | 26,049.4 | 10,038.5 | 39,628.1 | ||||||||||||
| Receive-floater/pay-fix |
1,188.7 | 321.7 | 3,536.1 | 5,046.6 | ||||||||||||
| Receive-floater/pay-floater |
— | — | — | — | ||||||||||||
|
Receive-fix/pay-fix |
— | — | — | — | ||||||||||||
|
|
|
|
|
|
|
|
|
|||||||||
| Total |
4,728.9 | 26,371.1 | 13,574.6 | 44,674.7 | ||||||||||||
|
|
|
|
|
|
|
|
|
|||||||||
|
TB Consolidated
|
|
|||||||||||||||
| (in billions of yen) | ||||||||||||||||
| As of March 31, 2024 | ||||||||||||||||
| within 1 year | 1 year to 5 years | over 5 years | Total | |||||||||||||
|
Receive-fix/pay-floater |
296.7 | 843.1 | 142.3 | 1,282.2 | ||||||||||||
| Receive-floater/pay-fix |
216.4 | 1,395.9 | 1,215.0 | 2,827.5 | ||||||||||||
| Receive-floater/pay-floater |
— | — | — | — | ||||||||||||
|
Receive-fix/pay-fix |
— | — | — | — | ||||||||||||
|
|
|
|
|
|
|
|
|
|||||||||
| Total |
513.1 | 2,239.1 | 1,357.3 | 4,109.7 | ||||||||||||
|
|
|
|
|
|
|
|
|
|||||||||
8
Mitsubishi UFJ Financial Group, Inc.
4. Securities
MUFG Consolidated
The tables include negotiable certificates of deposit in “Cash and due from banks”, securitized products in “Monetary claims bought” and others in addition to “Securities”.
Fair Value Information on Securities
| (in millions of yen) | ||||||||||||||||||||||||||||||||
| As of March 31, 2024 | As of March 31, 2023 | |||||||||||||||||||||||||||||||
| Amount on consolidated balance sheet |
Unrealized gains (losses) |
Gains | Losses | Amount on consolidated balance sheet |
Unrealized gains (losses) |
Gains | Losses | |||||||||||||||||||||||||
| Debt securities being held to maturity |
24,843,961 | (286,447 | ) | 13,719 | 300,167 | 21,520,080 | (133,925 | ) | 49,237 | 183,163 | ||||||||||||||||||||||
| Domestic bonds |
17,310,411 | (107,223 | ) | 6,886 | 114,109 | 15,052,012 | 8,012 | 35,612 | 27,599 | |||||||||||||||||||||||
| Government bonds |
14,643,055 | (90,759 | ) | 4,592 | 95,351 | 13,513,972 | 12,778 | 32,129 | 19,351 | |||||||||||||||||||||||
| Municipal bonds |
1,999,181 | (14,279 | ) | 2,047 | 16,327 | 1,144,825 | (5,334 | ) | 2,473 | 7,808 | ||||||||||||||||||||||
| Short-term corporate bonds |
— | — | — | — | — | — | — | — | ||||||||||||||||||||||||
| Corporate bonds |
668,174 | (2,184 | ) | 245 | 2,430 | 393,214 | 568 | 1,009 | 440 | |||||||||||||||||||||||
| Other |
7,533,549 | (179,224 | ) | 6,832 | 186,057 | 6,468,068 | (141,938 | ) | 13,625 | 155,563 | ||||||||||||||||||||||
| Foreign bonds |
4,952,083 | (176,384 | ) | 3,151 | 179,536 | 3,913,345 | (92,148 | ) | 13,606 | 105,754 | ||||||||||||||||||||||
| Other |
2,581,465 | (2,839 | ) | 3,681 | 6,520 | 2,554,723 | (49,790 | ) | 18 | 49,809 | ||||||||||||||||||||||
| (in millions of yen) | ||||||||||||||||||||||||||||||||
| As of March 31, 2024 | As of March 31, 2023 | |||||||||||||||||||||||||||||||
| Amount on consolidated balance sheet |
Unrealized gains (losses) |
Gains | Losses | Amount on consolidated balance sheet |
Unrealized gains (losses) |
Gains | Losses | |||||||||||||||||||||||||
| Available-for-sale securities |
61,736,341 | 2,725,841 | 4,178,443 | 1,452,602 | 65,121,075 | 1,420,165 | 3,056,638 | 1,636,472 | ||||||||||||||||||||||||
| Domestic equity securities |
5,101,691 | 3,758,884 | 3,765,175 | 6,291 | 4,271,923 | 2,720,728 | 2,745,235 | 24,506 | ||||||||||||||||||||||||
| Domestic bonds |
25,074,644 | (129,949 | ) | 9,488 | 139,438 | 29,751,905 | (120,020 | ) | 22,256 | 142,277 | ||||||||||||||||||||||
| Government bonds |
21,365,241 | (70,791 | ) | 3,631 | 74,423 | 23,518,832 | (86,365 | ) | 9,112 | 95,477 | ||||||||||||||||||||||
| Municipal bonds |
1,045,990 | (9,573 | ) | 226 | 9,799 | 2,759,940 | (13,808 | ) | 2,062 | 15,871 | ||||||||||||||||||||||
| Short-term corporate bonds |
— | — | — | — | — | — | — | — | ||||||||||||||||||||||||
| Corporate bonds |
2,663,412 | (49,584 | ) | 5,630 | 55,215 | 3,473,132 | (19,846 | ) | 11,081 | 30,928 | ||||||||||||||||||||||
| Other |
31,560,005 | (903,093 | ) | 403,779 | 1,306,872 | 31,097,247 | (1,180,541 | ) | 289,146 | 1,469,688 | ||||||||||||||||||||||
| Foreign equity securities |
709,565 | 12,752 | 47,829 | 35,076 | 408,377 | (65,604 | ) | 23,090 | 88,695 | |||||||||||||||||||||||
| Foreign bonds |
20,990,483 | (997,307 | ) | 69,045 | 1,066,353 | 21,710,161 | (1,116,208 | ) | 61,205 | 1,177,413 | ||||||||||||||||||||||
| Other |
9,859,956 | 81,461 | 286,904 | 205,442 | 8,978,707 | 1,271 | 204,850 | 203,579 | ||||||||||||||||||||||||
|
Redemption schedule of Available-for-sale securities with maturities and debt securities being held to maturity
|
|
|||||||||||||||||||||||||||||||
| (in millions of yen) | ||||||||||||||||||||||||||||||||
| As of March 31, 2024 | As of March 31, 2023 | |||||||||||||||||||||||||||||||
| within 1 year |
1 year to 5 years |
5 years to 10 years |
over 10 years |
within 1 year |
1 year to 5 years |
5 years to 10 years |
over 10 years |
|||||||||||||||||||||||||
| Domestic bonds |
23,237,264 | 11,328,117 | 6,018,587 | 1,801,087 | 21,506,334 | 14,905,051 | 5,983,826 | 2,408,704 | ||||||||||||||||||||||||
| Government bonds |
22,398,893 | 8,721,368 | 4,279,478 | 608,555 | 20,839,280 | 11,024,384 | 4,063,028 | 1,106,111 | ||||||||||||||||||||||||
| Municipal bonds |
343,811 | 1,317,183 | 1,384,177 | — | 294,616 | 2,076,089 | 1,534,060 | — | ||||||||||||||||||||||||
| Short-term corporate bonds |
— | — | — | — | — | — | — | — | ||||||||||||||||||||||||
| Corporate bonds |
494,559 | 1,289,564 | 354,931 | 1,192,532 | 372,438 | 1,804,578 | 386,737 | 1,302,593 | ||||||||||||||||||||||||
| Other |
4,976,257 | 11,792,107 | 5,810,612 | 12,124,762 | 4,583,721 | 12,560,637 | 6,276,327 | 10,762,201 | ||||||||||||||||||||||||
| Foreign equity securities |
12,113 | 20,079 | — | — | 6,690 | 27,734 | — | — | ||||||||||||||||||||||||
| Foreign bonds |
3,741,605 | 8,640,847 | 3,955,393 | 9,604,622 | 3,759,532 | 9,126,577 | 4,383,117 | 8,354,116 | ||||||||||||||||||||||||
| Other |
1,222,537 | 3,131,181 | 1,855,218 | 2,520,139 | 818,601 | 3,411,810 | 1,928,496 | 2,408,084 | ||||||||||||||||||||||||
| Total |
28,213,521 | 23,120,225 | 11,829,199 | 13,925,850 | 26,091,159 | 27,471,175 | 12,295,440 | 13,170,906 | ||||||||||||||||||||||||
9
Mitsubishi UFJ Financial Group, Inc.
BK Non-consolidated
The tables include negotiable certificates of deposit in “Cash and due from banks”, securitized products in “Monetary claims bought” and others in addition to “Securities”.
Fair Value Information on Securities
| (in millions of yen) | ||||||||||||||||||||||||||||||||
| As of March 31, 2024 | As of March 31, 2023 | |||||||||||||||||||||||||||||||
| Amount on balance sheet |
Unrealized gains (losses) |
Gains | Losses | Amount on balance sheet |
Unrealized gains (losses) |
Gains | Losses | |||||||||||||||||||||||||
| Debt securities being held to maturity |
22,209,137 | (260,977 | ) | 10,038 | 271,015 | 19,047,385 | (78,497 | ) | 49,199 | 127,696 | ||||||||||||||||||||||
| Stocks of subsidiaries and affiliates |
685,292 | 563,814 | 572,794 | 8,979 | 610,147 | 482,330 | 482,914 | 584 | ||||||||||||||||||||||||
| (in millions of yen) | ||||||||||||||||||||||||||||||||
| As of March 31, 2024 | As of March 31, 2023 | |||||||||||||||||||||||||||||||
| Amount on balance sheet |
Unrealized gains (losses) |
Gains | Losses | Amount on balance sheet |
Unrealized gains (losses) |
Gains | Losses | |||||||||||||||||||||||||
| Available-for-sale securities |
45,454,390 | 2,491,997 | 3,340,687 | 848,693 | 50,631,570 | 1,276,158 | 2,374,166 | 1,098,007 | ||||||||||||||||||||||||
| Domestic equity securities |
4,310,320 | 3,134,194 | 3,138,838 | 4,643 | 3,566,081 | 2,212,225 | 2,232,823 | 20,598 | ||||||||||||||||||||||||
| Domestic bonds |
23,310,014 | (71,482 | ) | 7,994 | 79,477 | 28,013,980 | (79,159 | ) | 21,133 | 100,292 | ||||||||||||||||||||||
| Other |
17,834,055 | (570,714 | ) | 193,854 | 764,571 | 19,051,508 | (856,907 | ) | 120,209 | 977,117 | ||||||||||||||||||||||
| Foreign equity securities |
669,182 | 1,235 | 36,309 | 35,076 | 367,745 | (73,953 | ) | 15,072 | 89,026 | |||||||||||||||||||||||
| Foreign bonds |
10,234,364 | (554,058 | ) | 43,155 | 597,214 | 12,565,104 | (672,998 | ) | 48,517 | 721,516 | ||||||||||||||||||||||
| Other |
6,930,507 | (17,891 | ) | 114,390 | 132,281 | 6,118,658 | (109,954 | ) | 56,619 | 166,573 | ||||||||||||||||||||||
|
Redemption schedule of Available-for-sale securities with maturities and debt securities being held to maturity
|
|
|||||||||||||||||||||||||||||||
| (in millions of yen) | ||||||||||||||||||||||||||||||||
| As of March 31, 2024 | As of March 31, 2023 | |||||||||||||||||||||||||||||||
| within 1 year |
1 year to 5 years |
5 years to 10 years |
over 10 years |
within 1 year |
1 year to 5 years |
5 years to 10 years |
over 10 years |
|||||||||||||||||||||||||
| Domestic bonds |
23,194,822 | 10,452,409 | 5,689,499 | 1,283,696 | 21,479,460 | 14,127,226 | 5,612,956 | 1,846,349 | ||||||||||||||||||||||||
| Government bonds |
22,382,849 | 8,019,918 | 4,045,541 | 207,081 | 20,827,187 | 10,418,215 | 3,819,123 | 670,500 | ||||||||||||||||||||||||
| Municipal bonds |
342,305 | 1,218,778 | 1,291,205 | — | 292,101 | 2,002,924 | 1,413,467 | — | ||||||||||||||||||||||||
| Short-term corporate bonds |
— | — | — | — | — | — | — | — | ||||||||||||||||||||||||
| Corporate bonds |
469,666 | 1,213,712 | 352,752 | 1,076,614 | 360,171 | 1,706,086 | 380,365 | 1,175,849 | ||||||||||||||||||||||||
| Other |
3,543,953 | 6,204,463 | 2,326,644 | 8,099,827 | 2,668,272 | 9,065,937 | 2,182,686 | 7,468,702 | ||||||||||||||||||||||||
| Foreign equity securities |
12,113 | 20,079 | — | — | 6,690 | 27,734 | — | — | ||||||||||||||||||||||||
| Foreign bonds |
2,695,045 | 3,350,904 | 1,869,018 | 6,839,540 | 2,180,275 | 5,989,003 | 1,525,102 | 6,370,025 | ||||||||||||||||||||||||
| Other |
836,793 | 2,833,480 | 457,625 | 1,260,286 | 481,305 | 3,049,198 | 657,584 | 1,098,677 | ||||||||||||||||||||||||
| Total |
26,738,775 | 16,656,873 | 8,016,143 | 9,383,523 | 24,147,732 | 23,193,164 | 7,795,642 | 9,315,052 | ||||||||||||||||||||||||
10
Mitsubishi UFJ Financial Group, Inc.
TB Non-consolidated
The tables include securitized products in “Monetary claims bought” in addition to “Securities”.
Fair Value Information on Securities
| (in millions of yen) | ||||||||||||||||||||||||||||||||
| As of March 31, 2024 | As of March 31, 2023 | |||||||||||||||||||||||||||||||
| Amount on balance sheet |
Unrealized gains (losses) |
Gains | Losses | Amount on balance sheet |
Unrealized gains (losses) |
Gains | Losses | |||||||||||||||||||||||||
| Debt securities being held to maturity |
2,634,823 | (25,470 | ) | 3,681 | 29,151 | 2,472,695 | (55,428 | ) | 38 | 55,466 | ||||||||||||||||||||||
| Stocks of subsidiaries and affiliates |
15,136 | (1,477 | ) | — | 1,477 | 11,636 | (758 | ) | — | 758 | ||||||||||||||||||||||
| (in millions of yen) | ||||||||||||||||||||||||||||||||
| As of March 31, 2024 | As of March 31, 2023 | |||||||||||||||||||||||||||||||
| Amount on balance sheet |
Unrealized gains (losses) |
Gains | Losses | Amount on balance sheet |
Unrealized gains (losses) |
Gains | Losses | |||||||||||||||||||||||||
| Available-for-sale securities |
12,453,511 | 348,078 | 806,876 | 458,797 | 10,871,284 | 208,580 | 626,109 | 417,529 | ||||||||||||||||||||||||
| Domestic equity securities |
858,572 | 619,081 | 619,850 | 769 | 745,387 | 467,925 | 472,431 | 4,506 | ||||||||||||||||||||||||
| Domestic bonds |
1,746,579 | (58,581 | ) | 1,493 | 60,074 | 1,705,587 | (40,984 | ) | 1,114 | 42,098 | ||||||||||||||||||||||
| Other |
9,848,360 | (212,421 | ) | 185,532 | 397,953 | 8,420,308 | (218,360 | ) | 152,563 | 370,923 | ||||||||||||||||||||||
| Foreign equity securities |
126 | 77 | 77 | — | 81 | 63 | 63 | — | ||||||||||||||||||||||||
| Foreign bonds |
7,819,817 | (306,146 | ) | 20,037 | 326,183 | 6,367,896 | (334,590 | ) | 9,436 | 344,026 | ||||||||||||||||||||||
| Other |
2,028,416 | 93,647 | 165,417 | 71,769 | 2,052,330 | 116,165 | 143,062 | 26,897 | ||||||||||||||||||||||||
|
Redemption schedule of Available-for-sale securities with maturities and debt securities being held to maturity
|
|
|||||||||||||||||||||||||||||||
| (in millions of yen) | ||||||||||||||||||||||||||||||||
| As of March 31, 2024 | As of March 31, 2023 | |||||||||||||||||||||||||||||||
| within 1 year |
1 year to 5 years |
5 years to 10 years |
over 10 years |
within 1 year |
1 year to 5 years |
5 years to 10 years |
over 10 years |
|||||||||||||||||||||||||
| Domestic bonds |
26,386 | 873,712 | 329,088 | 517,391 | 14,781 | 759,692 | 368,758 | 562,355 | ||||||||||||||||||||||||
| Government bonds |
— | 699,455 | 233,937 | 401,473 | — | 588,036 | 243,905 | 435,611 | ||||||||||||||||||||||||
| Municipal bonds |
1,505 | 98,405 | 92,972 | — | 2,515 | 73,164 | 120,593 | — | ||||||||||||||||||||||||
| Short-term corporate bonds |
— | — | — | — | — | — | — | — | ||||||||||||||||||||||||
| Corporate bonds |
24,880 | 75,851 | 2,179 | 115,917 | 12,266 | 98,491 | 4,260 | 126,743 | ||||||||||||||||||||||||
| Other |
248,926 | 3,702,030 | 2,851,138 | 4,019,724 | 1,039,868 | 1,450,370 | 3,517,807 | 3,293,498 | ||||||||||||||||||||||||
| Foreign equity securities |
— | — | — | — | — | — | — | — | ||||||||||||||||||||||||
| Foreign bonds |
242,784 | 3,445,064 | 2,767,252 | 3,999,539 | 1,006,548 | 1,268,451 | 3,424,962 | 3,140,629 | ||||||||||||||||||||||||
| Other |
6,142 | 256,966 | 83,886 | 20,184 | 33,320 | 181,918 | 92,844 | 152,868 | ||||||||||||||||||||||||
| Total |
275,312 | 4,575,742 | 3,180,227 | 4,537,116 | 1,054,649 | 2,210,062 | 3,886,565 | 3,855,853 | ||||||||||||||||||||||||
11
Mitsubishi UFJ Financial Group, Inc.
5. ROE
MUFG Consolidated
| (%) | ||||||||||||
| For the fiscal year ended March 31, 2024 (A) |
Increase (Decrease) (A) - (B) |
For the fiscal year ended March 31, 2023 (B) |
||||||||||
| ROE (MUFG basis) *1 |
8.59 | 1.55 | 7.03 | |||||||||
| ROE (JPX basis) *2 |
8.10 | 1.58 | 6.52 | |||||||||
Note:
| *1 | ROE (MUFG basis) is computed as follows: |
| Profits attributable to owners of parent |
× |
100 |
|
|
| {(Total shareholders’ equity at the beginning of the period + Foreign currency translation adjustments at the beginning of the period) + (Total shareholders’ equity at the end of the period + Foreign currency translation adjustments at the end of the period)} / 2 |
||||
| *2 | Japan Exchange Group |
12
Mitsubishi UFJ Financial Group, Inc.
6. Risk-Adjusted Capital Ratio
MUFG Consolidated
| (in billions of yen) | (in billions of yen) | |||||||||||||||
| As of March 31, 2024 Preliminary (A) |
Increase (Decrease) (A) - (B) |
As of March 31, 2023 (B) |
As of September 30, 2023 |
|||||||||||||
| (1) Total capital ratio (4)/(7) |
17.82 | % | 3.91 | % | 13.91 | % | 14.02 | % | ||||||||
| (2) Tier 1 capital ratio (5)/(7) |
15.72 | % | 3.67 | % | 12.04 | % | 12.13 | % | ||||||||
| (3) Common Equity Tier 1 capital ratio (6)/(7) |
13.53 | % | 2.76 | % | 10.76 | % | 10.61 | % | ||||||||
| (4) Total capital |
19,817.8 | 2,651.7 | 17,166.1 | 18,734.8 | ||||||||||||
| (5) Tier 1 capital |
17,479.7 | 2,616.0 | 14,863.7 | 16,212.7 | ||||||||||||
| (6) Common Equity Tier 1 capital |
15,041.3 | 1,760.4 | 13,280.8 | 14,176.5 | ||||||||||||
| (7) Risk weighted assets |
111,160.1 | (12,203.2 | ) | 123,363.3 | 133,561.4 | |||||||||||
| (8) Required Capital (7)×8% |
8,892.8 | (976.2 | ) | 9,869.0 | 10,684.9 | |||||||||||
| BK Consolidated | ||||||||||||||||
| (in billions of yen) | (in billions of yen) | |||||||||||||||
| As of March 31, 2024 Preliminary (A) |
Increase (Decrease) (A) - (B) |
As of March 31, 2023 (B) |
As of September 30, 2023 |
|||||||||||||
| (1) Total capital ratio (4)/(7) |
18.11 | % | 5.53 | % | 12.58 | % | 12.70 | % | ||||||||
| (2) Tier 1 capital ratio (5)/(7) |
16.11 | % | 5.06 | % | 11.04 | % | 11.17 | % | ||||||||
| (3) Common Equity Tier 1 capital ratio (6)/(7) |
13.80 | % | 3.90 | % | 9.89 | % | 9.78 | % | ||||||||
| (4) Total capital |
15,915.0 | 1,707.2 | 14,207.8 | 15,609.5 | ||||||||||||
| (5) Tier 1 capital |
14,153.6 | 1,684.3 | 12,469.2 | 13,729.1 | ||||||||||||
| (6) Common Equity Tier 1 capital |
12,126.4 | 954.2 | 11,172.1 | 12,029.5 | ||||||||||||
| (7) Risk weighted assets |
87,833.0 | (25,037.4 | ) | 112,870.4 | 122,878.2 | |||||||||||
| (8) Required Capital (7)×8% |
7,026.6 | (2,002.9 | ) | 9,029.6 | 9,830.2 | |||||||||||
| TB Consolidated | ||||||||||||||||
| (in billions of yen) | (in billions of yen) | |||||||||||||||
| As of March 31, 2024 Preliminary (A) |
Increase (Decrease) (A) - (B) |
As of March 31, 2023 (B) |
As of September 30, 2023 |
|||||||||||||
| (1) Total capital ratio (4)/(7) |
20.42 | % | (0.24 | )% | 20.67 | % | 19.89 | % | ||||||||
| (2) Tier 1 capital ratio (5)/(7) |
17.83 | % | (0.10 | )% | 17.93 | % | 17.27 | % | ||||||||
| (3) Common Equity Tier 1 capital ratio (6)/(7) |
15.56 | % | (0.85 | )% | 16.41 | % | 15.50 | % | ||||||||
| (4) Total capital |
2,121.6 | 80.1 | 2,041.5 | 2,174.4 | ||||||||||||
| (5) Tier 1 capital |
1,852.1 | 81.2 | 1,770.9 | 1,888.6 | ||||||||||||
| (6) Common Equity Tier 1 capital |
1,616.4 | (4.4 | ) | 1,620.8 | 1,694.5 | |||||||||||
| (7) Risk weighted assets |
10,387.4 | 512.1 | 9,875.3 | 10,930.8 | ||||||||||||
| (8) Required Capital (7)×8% |
830.9 | 40.9 | 790.0 | 874.4 | ||||||||||||
| BK Non-consolidated | ||||||||||||||||
| (in billions of yen) | (in billions of yen) | |||||||||||||||
| As of March 31, 2024 Preliminary (A) |
Increase (Decrease) (A) - (B) |
As of March 31, 2023 (B) |
As of September 30, 2023 |
|||||||||||||
| (1) Total capital ratio (4)/(7) |
16.29 | % | 5.57 | % | 10.71 | % | 10.68 | % | ||||||||
| (2) Tier 1 capital ratio (5)/(7) |
14.38 | % | 5.08 | % | 9.30 | % | 9.25 | % | ||||||||
| (3) Common Equity Tier 1 capital ratio (6)/(7) |
11.77 | % | 3.66 | % | 8.11 | % | 7.80 | % | ||||||||
| (4) Total capital |
12,279.1 | 1,163.8 | 11,115.3 | 12,108.8 | ||||||||||||
| (5) Tier 1 capital |
10,839.0 | 1,194.9 | 9,644.1 | 10,489.5 | ||||||||||||
| (6) Common Equity Tier 1 capital |
8,872.4 | 462.1 | 8,410.2 | 8,844.5 | ||||||||||||
| (7) Risk weighted assets |
75,363.3 | (28,324.4 | ) | 103,687.7 | 113,281.9 | |||||||||||
| (8) Required Capital (7)×8% |
6,029.0 | (2,265.9 | ) | 8,295.0 | 9,062.5 | |||||||||||
| TB Non-consolidated | ||||||||||||||||
| (in billions of yen) | (in billions of yen) | |||||||||||||||
| As of March 31, 2024 Preliminary (A) |
Increase (Decrease) (A) - (B) |
As of March 31, 2023 (B) |
As of September 30, 2023 |
|||||||||||||
| (1) Total capital ratio (4)/(7) |
19.03 | % | (0.56 | )% | 19.60 | % | 18.61 | % | ||||||||
| (2) Tier 1 capital ratio (5)/(7) |
16.72 | % | (0.39 | )% | 17.11 | % | 16.21 | % | ||||||||
| (3) Common Equity Tier 1 capital ratio (6)/(7) |
14.71 | % | (1.03 | )% | 15.74 | % | 14.58 | % | ||||||||
| (4) Total capital |
2,209.6 | 78.6 | 2,131.0 | 2,210.1 | ||||||||||||
| (5) Tier 1 capital |
1,941.1 | 79.9 | 1,861.1 | 1,925.2 | ||||||||||||
| (6) Common Equity Tier 1 capital |
1,707.6 | (4.0 | ) | 1,711.6 | 1,731.7 | |||||||||||
| (7) Risk weighted assets |
11,605.9 | 734.7 | 10,871.2 | 11,873.8 | ||||||||||||
| (8) Required Capital (7)×8% |
928.4 | 58.7 | 869.6 | 949.9 | ||||||||||||
| Note: | Risk-adjusted capital ratio of MUFG is computed in accordance with the Notification of the Financial Services Agency No.20, 2006. |
| Risk-adjusted capital ratio of BK and TB are computed in accordance with the Notification of the Financial Services Agency No.19, 2006. |
13
Mitsubishi UFJ Financial Group, Inc.
7. Loans to Be Disclosed under the Banking Act and the Financial Reconstruction Act (the “FRA”)
MUFG Consolidated
(1) Loans to Be Disclosed under the Banking Act and the FRA (after write-offs)
| (in millions of yen) | ||||||||||||||||||||||||
| As of March 31, 2024 |
As of March 31, 2023 |
Increase (Decrease) |
||||||||||||||||||||||
| Bankrupt or De facto Bankrupt |
239,004 | 198,312 | 40,692 | |||||||||||||||||||||
| Doubtful |
1,134,503 | 746,207 | 388,296 | |||||||||||||||||||||
| Special Attention |
634,023 | 618,892 | 15,131 | |||||||||||||||||||||
| Accruing loans contractually past due 3 months or more |
|
26,869 | 23,679 | 3,189 | ||||||||||||||||||||
| Restructured loans |
607,154 | 595,212 | 11,942 | |||||||||||||||||||||
| Subtotal (A) |
2,007,531 | 1,563,411 | 444,120 | |||||||||||||||||||||
| Normal(B) |
130,602,373 | 121,766,210 | 8,836,163 | |||||||||||||||||||||
| Total loans (C=A+B) |
132,609,905 | 123,329,622 | 9,280,283 | |||||||||||||||||||||
| Non-performing loans ratio (A)/(C) |
1.51 | % | 1.26 | % | 0.24 | % | ||||||||||||||||||
| Write-offs |
217,701 | 216,625 | 1,075 | |||||||||||||||||||||
| (2) Allowance for Credit Losses | ||||||||||||||||||||||||
| (in millions of yen) | ||||||||||||||||||||||||
| As of March 31, 2024 |
Coverage ratio (D)/(A) |
As of March 31, 2023 |
Coverage ratio (D)/(A) |
Increase (Decrease) |
Coverage ratio (D)/(A) |
|||||||||||||||||||
| Allowance for credit losses (D) |
1,535,253 | 76.47 | % | 1,245,727 | 79.68 | % | 289,526 | (3.20 | )% | |||||||||||||||
| General allowance for credit losses |
848,536 | 799,536 | 49,000 | |||||||||||||||||||||
| Specific allowance for credit losses |
665,305 | 414,026 | 251,279 | |||||||||||||||||||||
| Allowance for credit to specific foreign borrowers |
21,412 | 32,165 | (10,752 | ) | ||||||||||||||||||||
| (3) Classification of Loans to Be Disclosed under the Banking Act and the FRA (excluding Normal Loans) |
|
|||||||||||||||||||||||
| (in millions of yen) | ||||||||||||||||||||||||
| Classified by Geographic Area | As of March 31, 2024 |
As of March 31, 2023 |
Increase (Decrease) |
|||||||||||||||||||||
| Domestic |
813,702 | 935,849 | (122,147 | ) | ||||||||||||||||||||
| Overseas |
1,193,829 | 627,561 | 566,268 | |||||||||||||||||||||
| Asia |
420,715 | 370,222 | 50,492 | |||||||||||||||||||||
| Indonesia |
50,117 | 40,496 | 9,620 | |||||||||||||||||||||
| Singapore |
12,752 | 25,067 | (12,314 | ) | ||||||||||||||||||||
| Thailand |
280,757 | 231,386 | 49,370 | |||||||||||||||||||||
| Other |
77,088 | 73,272 | 3,816 | |||||||||||||||||||||
| Americas |
601,518 | 102,130 | 499,388 | |||||||||||||||||||||
| Europe, Middle East and Other |
171,595 | 155,209 | 16,386 | |||||||||||||||||||||
| Total |
2,007,531 | 1,563,411 | 444,120 | |||||||||||||||||||||
| (in millions of yen) | ||||||||||||||||||||||||
| Classified by Industry | As of March 31, 2024 |
As of March 31, 2023 |
Increase (Decrease) |
|||||||||||||||||||||
| Domestic |
813,702 | 935,849 | (122,147 | ) | ||||||||||||||||||||
| Manufacturing |
283,777 | 355,468 | (71,691 | ) | ||||||||||||||||||||
| Construction |
8,226 | 8,467 | (241 | ) | ||||||||||||||||||||
| Wholesale and retail |
87,732 | 90,725 | (2,992 | ) | ||||||||||||||||||||
| Finance and insurance |
14,109 | 8,119 | 5,990 | |||||||||||||||||||||
| Real estate, goods rental and leasing |
37,388 | 36,097 | 1,291 | |||||||||||||||||||||
| Services |
80,749 | 99,295 | (18,545 | ) | ||||||||||||||||||||
| Other industries |
48,708 | 77,598 | (28,889 | ) | ||||||||||||||||||||
| Consumer |
253,008 | 260,078 | (7,069 | ) | ||||||||||||||||||||
| Overseas |
1,193,829 | 627,561 | 566,268 | |||||||||||||||||||||
| Financial institutions |
3,104 | 2,601 | 502 | |||||||||||||||||||||
| Commercial and industrial |
1,021,074 | 502,318 | 518,755 | |||||||||||||||||||||
| Other |
169,650 | 122,640 | 47,009 | |||||||||||||||||||||
| Total |
2,007,531 | 1,563,411 | 444,120 | |||||||||||||||||||||
14
Mitsubishi UFJ Financial Group, Inc.
BK and TB Combined including Trust Account
“Trust account” represents trust account with contracts indemnifying the principal amounts.
(1) Loans to Be Disclosed under the Banking Act and the FRA (after write-offs)
| (in millions of yen) | ||||||||||||||||||||||||
| As of March 31, 2024 |
As of March 31, 2023 |
Increase (Decrease) |
||||||||||||||||||||||
| Bankrupt or De facto Bankrupt |
77,265 | 74,448 | 2,817 | |||||||||||||||||||||
| Doubtful |
904,052 | 546,567 | 357,484 | |||||||||||||||||||||
| Special Attention |
478,331 | 464,199 | 14,131 | |||||||||||||||||||||
| Accruing loans contractually past due 3 months or more |
|
19,163 | 17,167 | 1,996 | ||||||||||||||||||||
| Restructured loans |
459,167 | 447,032 | 12,135 | |||||||||||||||||||||
| Subtotal (A) |
1,459,649 | 1,085,215 | 374,433 | |||||||||||||||||||||
| Normal(B) |
116,726,530 | 109,665,679 | 7,060,850 | |||||||||||||||||||||
| Total loans (C=A+B) |
118,186,179 | 110,750,895 | 7,435,283 | |||||||||||||||||||||
| Non-performing loans ratio (A)/(C) |
1.23 | % | 0.97 | % | 0.25 | % | ||||||||||||||||||
| Write-offs |
181,926 | 182,181 | (254 | ) | ||||||||||||||||||||
| (2) Status of Coverage of Loans to Be Disclosed under the Banking Act and the FRA (excluding Normal Loans) |
|
|||||||||||||||||||||||
| (in millions of yen) | ||||||||||||||||||||||||
| As of March 31, 2024 |
Coverage ratio [(D)+(E)]/(A) |
As of March 31, 2023 |
Coverage ratio [(D)+(E)]/(A) |
Increase (Decrease) |
Coverage ratio [(D)+(E)]/(A) |
|||||||||||||||||||
| Covered amount |
1,042,471 | 71.41 | % | 805,937 | 74.26 | % | 236,534 | (2.84 | )% | |||||||||||||||
| Allowance for credit losses(D) |
609,945 | 333,135 | 276,809 | |||||||||||||||||||||
| Collateral, guarantees, etc.(E) |
432,525 | 472,801 | (40,275 | ) | ||||||||||||||||||||
| (3) Coverage Ratio |
|
|||||||||||||||||||||||
| (in millions of yen) | ||||||||||||||||||||||||
| Category | Loan amount (A) |
Allowance for credit losses (D) |
Covered by collateral and/ or guarantees (E) |
Allowance coverage ratio for unsecured portion (D) / [(A) - (E)] |
Coverage ratio [(D)+(E)]/(A) |
|||||||||||||||||||
| Bankrupt or De facto Bankrupt |
77,265 | 5,358 | 71,907 | 100.00 | % | |||||||||||||||||||
| [74,448 | ] | [5,000 | ] | [69,448 | ] | [100.00 | %] | |||||||||||||||||
| Doubtful |
904,052 | 441,031 | 161,324 | 66.62 | % | |||||||||||||||||||
| [546,567 | ] | [224,271 | ] | [215,061 | ] | [80.38 | %] | |||||||||||||||||
| Special Attention |
478,331 | 163,555 | 199,294 | 75.85 | % | |||||||||||||||||||
| [464,199 | ] | [103,864 | ] | [188,292 | ] | [62.93 | %] | |||||||||||||||||
| Total |
1,459,649 | 609,945 | 432,525 | 71.41 | % | |||||||||||||||||||
| [1,085,215 | ] | [333,135 | ] | [472,801 | ] | [74.26 | %] | |||||||||||||||||
| Note: The upper figures are as of March 31, 2024. The lower figures with brackets are as of March 31, 2023.
(4) Classification of Loans to Be Disclosed under the Banking Act and the FRA (excluding Normal Loans) |
|
|||||||||||||||||||||||
| (in millions of yen) | ||||||||||||||||||||||||
| Classified by Geographic Area | As of March 31, 2024 |
As of March 31, 2023 |
Increase (Decrease) |
|||||||||||||||||||||
| Domestic |
621,995 | 750,949 | (128,954 | ) | ||||||||||||||||||||
| Overseas |
837,654 | 334,266 | 503,388 | |||||||||||||||||||||
| Asia |
89,421 | 97,915 | (8,493 | ) | ||||||||||||||||||||
| Indonesia |
— | — | — | |||||||||||||||||||||
| Singapore |
12,752 | 25,067 | (12,314 | ) | ||||||||||||||||||||
| Thailand |
— | — | — | |||||||||||||||||||||
| Other |
76,669 | 72,847 | 3,821 | |||||||||||||||||||||
| Americas |
601,518 | 102,130 | 499,388 | |||||||||||||||||||||
| Europe, Middle East and Other |
146,713 | 134,220 | 12,492 | |||||||||||||||||||||
| Total |
1,459,649 | 1,085,215 | 374,433 | |||||||||||||||||||||
| (in millions of yen) | ||||||||||||||||||||||||
| Classified by Industry | As of March 31, 2024 |
As of March 31, 2023 |
Increase (Decrease) |
|||||||||||||||||||||
| Domestic |
621,995 | 750,949 | (128,954 | ) | ||||||||||||||||||||
| Manufacturing |
282,469 | 354,298 | (71,828 | ) | ||||||||||||||||||||
| Construction |
8,050 | 8,326 | (275 | ) | ||||||||||||||||||||
| Wholesale and retail |
85,689 | 88,785 | (3,096 | ) | ||||||||||||||||||||
| Finance and insurance |
14,088 | 8,097 | 5,990 | |||||||||||||||||||||
| Real estate |
22,960 | 22,638 | 321 | |||||||||||||||||||||
| Goods rental and leasing |
14,393 | 13,438 | 954 | |||||||||||||||||||||
| Services |
80,619 | 99,205 | (18,586 | ) | ||||||||||||||||||||
| Other industries |
47,998 | 77,283 | (29,284 | ) | ||||||||||||||||||||
| Consumer |
65,724 | 78,875 | (13,150 | ) | ||||||||||||||||||||
| Overseas |
837,654 | 334,266 | 503,388 | |||||||||||||||||||||
| Financial institutions |
2,611 | 2,331 | 280 | |||||||||||||||||||||
| Commercial and industrial |
834,942 | 325,729 | 509,213 | |||||||||||||||||||||
| Other |
99 | 6,204 | (6,105 | ) | ||||||||||||||||||||
| Total |
1,459,649 | 1,085,215 | 374,433 | |||||||||||||||||||||
15
Mitsubishi UFJ Financial Group, Inc.
BK Non-consolidated
(1) Loans to Be Disclosed under the Banking Act and the FRA (after write-offs)
| (in millions of yen) | ||||||||||||||||||||||||
| As of March 31, 2024 |
As of March 31, 2023 |
Increase (Decrease) |
||||||||||||||||||||||
| Bankrupt or De facto Bankrupt |
77,210 | 74,313 | 2,896 | |||||||||||||||||||||
| Doubtful |
902,706 | 544,648 | 358,058 | |||||||||||||||||||||
| Special Attention |
478,331 | 464,199 | 14,131 | |||||||||||||||||||||
| Accruing loans contractually past due 3 months or more |
|
19,163 | 17,167 | 1,996 | ||||||||||||||||||||
| Restructured loans |
459,167 | 447,032 | 12,135 | |||||||||||||||||||||
| Subtotal (A) |
1,458,248 | 1,083,162 | 375,086 | |||||||||||||||||||||
| Normal(B) |
114,178,105 | 107,103,161 | 7,074,943 | |||||||||||||||||||||
| Total loans (C=A+B) |
115,636,353 | 108,186,323 | 7,450,030 | |||||||||||||||||||||
| Non-performing loans ratio (A)/(C) |
1.26 | % | 1.00 | % | 0.25 | % | ||||||||||||||||||
| Write-offs |
181,894 | 182,148 | (254 | ) | ||||||||||||||||||||
| (2) Status of Coverage of Loans to Be Disclosed under the Banking Act and the FRA (excluding Normal Loans) |
|
|||||||||||||||||||||||
| (in millions of yen) | ||||||||||||||||||||||||
| As of March 31, 2024 |
Coverage ratio [(D)+(E)]/(A) |
As of March 31, 2023 |
Coverage ratio [(D)+(E)]/(A) |
Increase (Decrease) |
Coverage ratio [(D)+(E)]/(A) |
|||||||||||||||||||
| Covered amount |
1,041,070 | 71.39 | % | 803,883 | 74.21 | % | 237,187 | (2.82 | )% | |||||||||||||||
| Allowance for credit losses(D) |
609,945 | 333,135 | 276,809 | |||||||||||||||||||||
| Collateral, guarantees, etc.(E) |
431,124 | 470,747 | (39,622 | ) | ||||||||||||||||||||
(3) Coverage Ratio
| (in millions of yen) | ||||||||||||||||||||||||
| Category | Loan amount (A) |
Allowance for credit losses (D) |
Covered by collateral and/ or guarantees (E) |
Allowance coverage ratio for unsecured portion (D) / [(A) - (E)] |
Coverage ratio [(D)+(E)]/(A) |
|||||||||||||||||||
| Bankrupt or De facto Bankrupt |
77,210 | 5,358 | 71,852 | 100.00 | % | 100.00 | % | |||||||||||||||||
| [74,313 | ] | [5,000 | ] | [69,313 | ] | [100.00 | %] | [100.00 | %] | |||||||||||||||
| Doubtful |
902,706 | 441,031 | 159,978 | 59.37 | % | 66.57 | % | |||||||||||||||||
| [544,648 | ] | [224,271 | ] | [213,141 | ] | [67.65 | %] | [80.31 | %] | |||||||||||||||
| Special Attention |
478,331 | 163,555 | 199,294 | 58.61 | % | 75.85 | % | |||||||||||||||||
| [464,199 | ] | [103,864 | ] | [188,292 | ] | [37.64 | %] | [62.93 | %] | |||||||||||||||
| Total |
1,458,248 | 609,945 | 431,124 | 59.38 | % | 71.39 | % | |||||||||||||||||
| [1,083,162 | ] | [333,135 | ] | [470,747 | ] | [54.39 | %] | [74.21 | %] | |||||||||||||||
Note: The upper figures are as of March 31, 2024. The lower figures with brackets are as of March 31, 2023.
| (4) Classification of Loans to Be Disclosed under the Banking Act and the FRA (excluding Normal Loans) |
|
|||||||||||||||||||||||
| (in millions of yen) | ||||||||||||||||||||||||
| Classified by Geographic Area | As of March 31, 2024 |
As of March 31, 2023 |
Increase (Decrease) |
|||||||||||||||||||||
| Domestic |
620,594 | 748,895 | (128,301 | ) | ||||||||||||||||||||
| Overseas |
837,654 | 334,266 | 503,388 | |||||||||||||||||||||
| Asia |
89,421 | 97,915 | (8,493 | ) | ||||||||||||||||||||
| Indonesia |
— | — | — | |||||||||||||||||||||
| Singapore |
12,752 | 25,067 | (12,314 | ) | ||||||||||||||||||||
| Thailand |
— | — | — | |||||||||||||||||||||
| Other |
76,669 | 72,847 | 3,821 | |||||||||||||||||||||
| Americas |
601,518 | 102,130 | 499,388 | |||||||||||||||||||||
| Europe, Middle East and Other |
146,713 | 134,220 | 12,492 | |||||||||||||||||||||
|
|
|
|
|
|
|
|||||||||||||||||||
| Total |
1,458,248 | 1,083,162 | 375,086 | |||||||||||||||||||||
|
|
|
|
|
|
|
|||||||||||||||||||
| (in millions of yen) | ||||||||||||||||||||||||
| Classified by Industry | As of March 31, 2024 |
As of March 31, 2023 |
Increase (Decrease) |
|||||||||||||||||||||
| Domestic |
620,594 | 748,895 | (128,301 | ) | ||||||||||||||||||||
| Manufacturing |
282,469 | 354,298 | (71,828 | ) | ||||||||||||||||||||
| Construction |
8,050 | 8,326 | (275 | ) | ||||||||||||||||||||
| Wholesale and retail |
85,689 | 88,785 | (3,096 | ) | ||||||||||||||||||||
| Finance and insurance |
14,088 | 8,097 | 5,990 | |||||||||||||||||||||
| Real estate |
22,960 | 22,638 | 321 | |||||||||||||||||||||
| Goods rental and leasing |
14,393 | 13,438 | 954 | |||||||||||||||||||||
| Services |
80,619 | 99,205 | (18,586 | ) | ||||||||||||||||||||
| Other industries |
47,998 | 77,283 | (29,284 | ) | ||||||||||||||||||||
| Consumer |
64,323 | 76,821 | (12,498 | ) | ||||||||||||||||||||
| Overseas |
837,654 | 334,266 | 503,388 | |||||||||||||||||||||
| Financial institutions |
2,611 | 2,331 | 280 | |||||||||||||||||||||
| Commercial and industrial |
834,942 | 325,729 | 509,213 | |||||||||||||||||||||
| Other |
99 | 6,204 | (6,105 | ) | ||||||||||||||||||||
|
|
|
|
|
|
|
|||||||||||||||||||
| Total |
1,458,248 | 1,083,162 | 375,086 | |||||||||||||||||||||
|
|
|
|
|
|
|
|||||||||||||||||||
16
Mitsubishi UFJ Financial Group, Inc.
TB Non-consolidated
(1) Loans to Be Disclosed under the Banking Act and the FRA (after write-offs)
| (in millions of yen) | ||||||||||||||||||||||||
| As of March 31, 2024 |
As of March 31, 2023 |
Increase (Decrease) |
||||||||||||||||||||||
| Bankrupt or De facto Bankrupt |
54 | 134 | (79 | ) | ||||||||||||||||||||
| Doubtful |
1,346 | 1,919 | (573 | ) | ||||||||||||||||||||
| Special Attention |
— | — | — | |||||||||||||||||||||
| Accruing loans contractually past due 3 months or more |
|
— | — | — | ||||||||||||||||||||
| Restructured loans |
— | — | — | |||||||||||||||||||||
| Subtotal (A) |
1,401 | 2,053 | (652 | ) | ||||||||||||||||||||
| Normal(B) |
2,545,305 | 2,558,578 | (13,273 | ) | ||||||||||||||||||||
| Total loans (C=A+B) |
2,546,706 | 2,560,632 | (13,926 | ) | ||||||||||||||||||||
| Non-performing loans ratio (A)/(C) |
0.05 | % | 0.08 | % | (0.03 | )% | ||||||||||||||||||
| Write-offs |
31 | 32 | (0 | ) | ||||||||||||||||||||
(2) Status of Coverage of Loans to Be Disclosed under the Banking Act and the FRA (excluding Normal Loans)
| (in millions of yen) | ||||||||||||||||||||||||
| As of March 31, 2024 |
Coverage ratio [(D)+(E)]/(A) |
As of March 31, 2023 |
Coverage ratio [(D)+(E)]/(A) |
Increase (Decrease) |
Coverage ratio [(D)+(E)]/(A) |
|||||||||||||||||||
| Covered amount |
1,401 | 100.00 | % | 2,053 | 100.00 | % | (652 | ) | — | |||||||||||||||
| Allowance for credit losses(D) |
— | — | — | |||||||||||||||||||||
| Collateral, guarantees, etc.(E) |
1,401 | 2,053 | (652 | ) | ||||||||||||||||||||
(3) Coverage Ratio
| (in millions of yen) | ||||||||||||||||||||||||
| Category | Loan amount (A) |
Allowance for credit losses (D) |
Covered by collateral and/ or guarantees (E) |
Allowance coverage ratio for unsecured portion (D) / [(A) - (E)] |
Coverage ratio [(D)+(E)]/(A) |
|||||||||||||||||||
| Bankrupt or De facto Bankrupt |
54 | — | 54 | — | 100.00 | % | ||||||||||||||||||
| [134 | ] | [— | ] | [134 | ] | [— | ] | [100.00 | %] | |||||||||||||||
| Doubtful |
1,346 | — | 1,346 | — | 100.00 | % | ||||||||||||||||||
| [1,919 | ] | [— | ] | [1,919 | ] | [— | ] | [100.00 | %] | |||||||||||||||
| Special Attention |
— | — | — | — | — | |||||||||||||||||||
| [— | ] | [— | ] | [— | ] | [— | ] | [— | ] | |||||||||||||||
| Total |
1,401 | — | 1,401 | — | 100.00 | % | ||||||||||||||||||
| [2,053 | ] | [— | ] | [2,053 | ] | [— | ] | [100.00 | %] | |||||||||||||||
Note: The upper figures are as of March 31, 2024. The lower figures with brackets are as of March 31, 2023.
(4) Classification of Loans to Be Disclosed under the Banking Act and the FRA (excluding Normal Loans)
| (in millions of yen) | ||||||||||||||||||||||||
| Classified by Geographic Area | As of March 31, 2024 |
As of March 31, 2023 |
Increase (Decrease) |
|||||||||||||||||||||
| Domestic |
1,401 | 2,053 | (652 | ) | ||||||||||||||||||||
| Overseas |
— | — | — | |||||||||||||||||||||
| Asia |
— | — | — | |||||||||||||||||||||
| Indonesia |
— | — | — | |||||||||||||||||||||
| Singapore |
— | — | — | |||||||||||||||||||||
| Thailand |
— | — | — | |||||||||||||||||||||
| Other |
— | — | — | |||||||||||||||||||||
| Americas |
— | — | — | |||||||||||||||||||||
| Europe, Middle East and Other |
— | — | — | |||||||||||||||||||||
|
|
|
|
|
|
|
|||||||||||||||||||
| Total |
1,401 | 2,053 | (652 | ) | ||||||||||||||||||||
|
|
|
|
|
|
|
|||||||||||||||||||
| (in millions of yen) | ||||||||||||||||||||||||
| Classified by Industry | As of March 31, 2024 |
As of March 31, 2023 |
Increase (Decrease) |
|||||||||||||||||||||
| Domestic |
1,401 | 2,053 | (652 | ) | ||||||||||||||||||||
| Manufacturing |
— | — | — | |||||||||||||||||||||
| Construction |
— | — | — | |||||||||||||||||||||
| Wholesale and retail |
— | — | — | |||||||||||||||||||||
| Finance and insurance |
— | — | — | |||||||||||||||||||||
| Real estate |
— | — | — | |||||||||||||||||||||
| Goods rental and leasing |
— | — | — | |||||||||||||||||||||
| Services |
— | — | — | |||||||||||||||||||||
| Other industries |
— | — | — | |||||||||||||||||||||
| Consumer |
1,401 | 2,053 | (652 | ) | ||||||||||||||||||||
| Overseas |
— | — | — | |||||||||||||||||||||
| Financial institutions |
— | — | — | |||||||||||||||||||||
| Commercial and industrial |
— | — | — | |||||||||||||||||||||
| Other |
— | — | — | |||||||||||||||||||||
|
|
|
|
|
|
|
|||||||||||||||||||
| Total |
1,401 | 2,053 | (652 | ) | ||||||||||||||||||||
|
|
|
|
|
|
|
|||||||||||||||||||
17
Mitsubishi UFJ Financial Group, Inc.
TB Non-consolidated: Trust Account
“Trust account” represents trust account with contracts indemnifying the principal amounts.
(1) Loans to Be Disclosed under the Banking Act and the FRA (after write-offs)
| (in millions of yen) | ||||||||||||||||||||||||
| As of March 31, 2024 |
As of March 31, 2023 |
Increase (Decrease) |
||||||||||||||||||||||
| Bankrupt or De facto Bankrupt |
— | — | — | |||||||||||||||||||||
| Doubtful |
— | — | — | |||||||||||||||||||||
| Special Attention |
— | — | — | |||||||||||||||||||||
| Accruing loans contractually past due 3 months or more |
|
— | — | — | ||||||||||||||||||||
| Restructured loans |
— | — | — | |||||||||||||||||||||
| Subtotal (A) |
— | — | — | |||||||||||||||||||||
| Normal(B) |
3,119 | 3,939 | (820 | ) | ||||||||||||||||||||
| Total loans (C=A+B) |
3,119 | 3,939 | (820 | ) | ||||||||||||||||||||
| Non-performing loans ratio (A)/(C) |
— | — | — | |||||||||||||||||||||
| Write-offs |
— | — | — | |||||||||||||||||||||
(2) Status of Coverage of Loans to Be Disclosed under the Banking Act and the FRA (excluding Normal Loans)
| (in millions of yen) | ||||||||||||||||||||||||
| As of March 31, 2024 |
Coverage ratio [(D)+(E)]/(A) |
As of March 31, 2023 |
Coverage ratio [(D)+(E)]/(A) |
Increase (Decrease) |
Coverage ratio [(D)+(E)]/(A) |
|||||||||||||||||||
| Covered amount |
— | — | — | — | — | — | ||||||||||||||||||
| Allowance for credit losses(D) |
— | — | — | |||||||||||||||||||||
| Collateral, guarantees, etc.(E) |
— | — | — | |||||||||||||||||||||
(3) Coverage Ratio
| (in millions of yen) | ||||||||||||||||||||||||
| Category | Loan amount (A) |
Allowance for credit losses (D) |
Covered by collateral and/or guarantees (E) |
Allowance coverage ratio for unsecured portion (D) / [(A) - (E)] |
Coverage ratio [(D)+(E)]/(A) |
|||||||||||||||||||
| Bankrupt or De facto Bankrupt |
— | — | — | — | — | |||||||||||||||||||
| [— | ] | [— | ] | [— | ] | [— | ] | [— | ] | |||||||||||||||
| Doubtful |
— | — | — | — | — | |||||||||||||||||||
| [— | ] | [— | ] | [— | ] | [— | ] | [— | ] | |||||||||||||||
| Special Attention |
— | — | — | — | — | |||||||||||||||||||
| [— | ] | [— | ] | [— | ] | [— | ] | [— | ] | |||||||||||||||
| Total |
— | — | — | — | — | |||||||||||||||||||
| [— | ] | [— | ] | [— | ] | [— | ] | [— | ] | |||||||||||||||
Note: The upper figures are as of March 31, 2024. The lower figures with brackets are as of March 31, 2023.
(4) Classification of Loans to Be Disclosed under the Banking Act and the FRA (excluding Normal Loans)
| (in millions of yen) | ||||||||||||||||||||||||
| Classified by Industry | As of March 31, 2024 |
As of March 31, 2023 |
Increase (Decrease) |
|||||||||||||||||||||
| Domestic |
— | — | — | |||||||||||||||||||||
| Manufacturing |
— | — | — | |||||||||||||||||||||
| Construction |
— | — | — | |||||||||||||||||||||
| Wholesale and retail |
— | — | — | |||||||||||||||||||||
| Finance and insurance |
— | — | — | |||||||||||||||||||||
| Real estate |
— | — | — | |||||||||||||||||||||
| Goods rental and leasing |
— | — | — | |||||||||||||||||||||
| Services |
— | — | — | |||||||||||||||||||||
| Other industries |
— | — | — | |||||||||||||||||||||
| Consumer |
— | — | — | |||||||||||||||||||||
|
|
|
|
|
|
|
|||||||||||||||||||
| Total |
— | — | — | |||||||||||||||||||||
|
|
|
|
|
|
|
|||||||||||||||||||
18
Mitsubishi UFJ Financial Group, Inc.
Overview of Self-Assessment, Status of Coverage, and Loans to Be Disclosed under the Banking Act and the FRA
BK and TB Combined
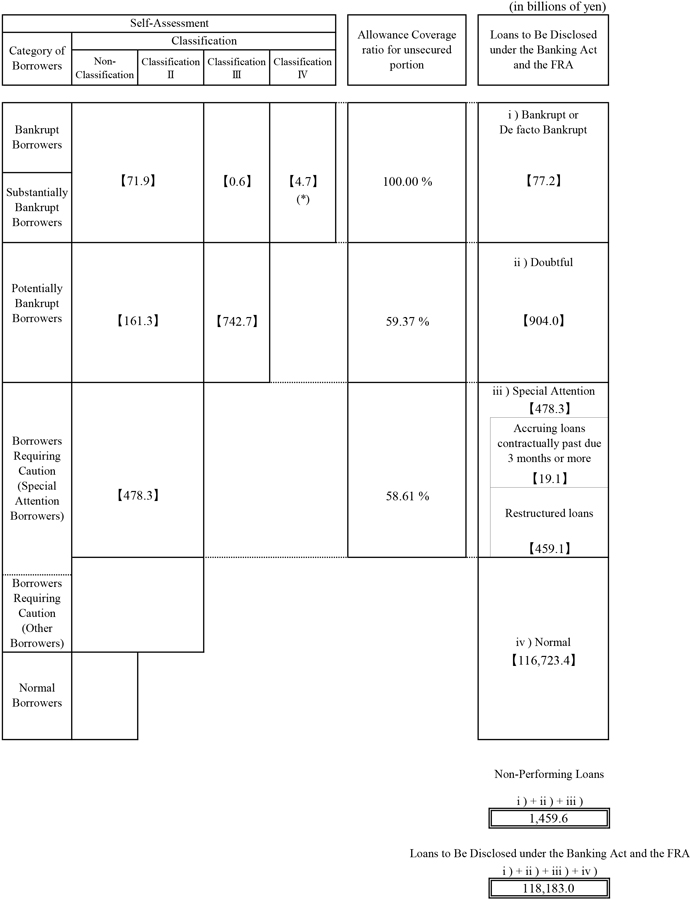
| (*) | “Customers’ liabilities for acceptances and guarantees” in Classification IV are fully reserved. |
19
Mitsubishi UFJ Financial Group, Inc.
8. Progress in Disposition of Problem Assets
BK Non-consolidated
(1) Bankrupt or De facto Bankrupt and Doubtful Assets Based on the “FRA”
| (in millions of yen) | ||||||||||||||||||||
| As of March 31, 2021 |
As of March 31, 2022 |
As of March 31, 2023 (A) |
As of March 31, 2024 (B) |
(B) - (A) | ||||||||||||||||
| Assets newly categorized during fiscal 2020 |
274,842 | 182,845 | 135,476 | 55,413 | (80,063 | ) | ||||||||||||||
| Assets newly categorized during fiscal 2021 |
321,978 | 110,451 | 68,032 | (42,419 | ) | |||||||||||||||
| Assets newly categorized during fiscal 2022 |
240,324 | 114,818 | (125,505 | ) | ||||||||||||||||
| Assets newly categorized during fiscal 2023 |
642,712 | |||||||||||||||||||
(2) Progress in Disposition of Problem Assets
| (in millions of yen) | ||||||||||||||||||||
| For the Fiscal Year Ended March 31, 2024 | ||||||||||||||||||||
| Bankrupt or De facto Bankrupt |
Doubtful | |||||||||||||||||||
| Liquidation |
4,565 | |||||||||||||||||||
| Reconstructive treatment |
26,811 | |||||||||||||||||||
| Upgrade due to reconstructive treatment |
— | |||||||||||||||||||
| Loan sold to secondary market |
3,202 | |||||||||||||||||||
| Write-offs |
29,129 | |||||||||||||||||||
| Others |
218,047 | |||||||||||||||||||
| Collection / Repayment |
63,471 | |||||||||||||||||||
| Upgrade |
154,575 | |||||||||||||||||||
|
|
|
|
|
|
|
|||||||||||||||
| Total |
281,757 | 38,463 | 243,293 | |||||||||||||||||
|
|
|
|
|
|
|
|||||||||||||||
| Amount in process for disposition |
60,722 | |||||||||||||||||||
| Note: | The process for disposition consists of legal liquidation, quasi-legal liquidation, company splits to good companies and bad companies, partial direct write-offs of retail exposure to individuals and small/medium-sized companies, and trusts to The Resolution and Collection Corporation mainly for the purpose of revitalization of companies, which are scheduled to be off-balanced before their maturities. |
20
Mitsubishi UFJ Financial Group, Inc.
TB Non-consolidated including Trust Account
“Trust account” represents trust account with contracts indemnifying the principal amounts.
(1) Bankrupt or De facto Bankrupt and Doubtful Assets Based on the “FRA”
| (in millions of yen) | ||||||||||||||||||||
| As of March 31, 2021 |
As of March 31, 2022 |
As of March 31, 2023 (A) |
As of March 31, 2024 (B) |
(B) - (A) | ||||||||||||||||
| Assets newly categorized during fiscal 2020 |
706 | 272 | 124 | 92 | (32 | ) | ||||||||||||||
| Assets newly categorized during fiscal 2021 |
635 | 272 | 204 | (68 | ) | |||||||||||||||
| Assets newly categorized during fiscal 2022 |
986 | 262 | (724 | ) | ||||||||||||||||
| Assets newly categorized during fiscal 2023 |
410 | |||||||||||||||||||
(2) Progress in Disposition of Problem Assets
| (in millions of yen) | ||||||||||||||||||||
| For the Fiscal Year Ended March 31, 2024 | ||||||||||||||||||||
| Bankrupt or De facto Bankrupt |
Doubtful | |||||||||||||||||||
| Liquidation |
— | |||||||||||||||||||
| Reconstructive treatment |
— | |||||||||||||||||||
| Upgrade due to reconstructive treatment |
— | |||||||||||||||||||
| Loan sold to secondary market |
— | |||||||||||||||||||
| Write-offs |
— | |||||||||||||||||||
| Others |
1,700 | |||||||||||||||||||
| Collection / Repayment |
171 | |||||||||||||||||||
| Upgrade |
1,528 | |||||||||||||||||||
|
|
|
|
|
|
|
|||||||||||||||
| Total |
1,700 | 110 | 1,590 | |||||||||||||||||
|
|
|
|
|
|
|
|||||||||||||||
| Amount in process for disposition |
82 | |||||||||||||||||||
| Note: | The process for disposition consists of legal liquidation, quasi-legal liquidation, company splits to good companies and bad companies, partial direct write-offs of retail exposure to individuals and small/medium-sized companies, and trusts to The Resolution and Collection Corporation mainly for the purpose of revitalization of companies, which are scheduled to be off-balanced before their maturities. |
21
Mitsubishi UFJ Financial Group, Inc.
9. Loans Classified by Type of Industry
BK and TB Combined including Trust Accounts
Loans Classified by Type of Industry
| (in millions of yen) | ||||||||||||
| As
of March 31, 2024 (A) |
Increase (Decrease) (A) - (B) |
As
of March 31, 2023 (B) |
||||||||||
| Domestic offices (excluding loans booked at offshore markets) |
71,342,802 | 1,934,308 | 69,408,494 | |||||||||
|
|
|
|
|
|
|
|||||||
| Manufacturing |
11,600,570 | (68,837 | ) | 11,669,407 | ||||||||
| Agriculture, forestry, fishery, mining, quarrying of stone and gravel |
93,187 | (73,317 | ) | 166,504 | ||||||||
| Construction |
927,249 | 94,429 | 832,820 | |||||||||
| Utilities |
2,654,904 | 133,894 | 2,521,010 | |||||||||
| Communication and information services |
1,250,823 | 153,917 | 1,096,905 | |||||||||
| Transport and postal activities |
2,185,557 | (124,575 | ) | 2,310,132 | ||||||||
| Wholesale and retail |
6,541,625 | 45,525 | 6,496,100 | |||||||||
| Finance and insurance |
9,555,080 | 509,920 | 9,045,159 | |||||||||
| Real estate |
10,777,110 | 685,655 | 10,091,455 | |||||||||
| Goods rental and leasing |
2,596,865 | 23,369 | 2,573,496 | |||||||||
| Services |
2,735,505 | 61,764 | 2,673,741 | |||||||||
| Municipal government |
1,542,281 | 83,296 | 1,458,985 | |||||||||
| Other industries (including loans to the Japanese government) |
18,882,044 | 409,265 | 18,472,778 | |||||||||
| Overseas offices and loans booked at offshore markets |
35,892,376 | 4,623,144 | 31,269,232 | |||||||||
| Governments |
314,663 | 21,493 | 293,170 | |||||||||
| Financial Institutions |
13,507,038 | 2,487,590 | 11,019,448 | |||||||||
| Other |
22,070,674 | 2,114,061 | 19,956,613 | |||||||||
|
|
|
|
|
|
|
|||||||
| Total |
107,235,179 | 6,557,452 | 100,677,726 | |||||||||
|
|
|
|
|
|
|
|||||||
22
Mitsubishi UFJ Financial Group, Inc.
BK Non-consolidated
Loans Classified by Type of Industry
| (in millions of yen) | ||||||||||||
| As
of March 31, 2024 (A) |
Increase (Decrease) (A) - (B) |
As
of March 31, 2023 (B) |
||||||||||
| Domestic offices (excluding loans booked at offshore markets) |
68,651,467 | 1,987,481 | 66,663,986 | |||||||||
|
|
|
|
|
|
|
|||||||
| Manufacturing |
11,599,170 | (68,837 | ) | 11,668,007 | ||||||||
| Agriculture, forestry, fishery, mining, quarrying of stone and gravel |
93,187 | (73,317 | ) | 166,504 | ||||||||
| Construction |
927,249 | 94,429 | 832,820 | |||||||||
| Utilities |
2,654,904 | 133,894 | 2,521,010 | |||||||||
| Communication and information services |
1,241,789 | 157,911 | 1,083,878 | |||||||||
| Transport and postal activities |
2,170,557 | (124,575 | ) | 2,295,132 | ||||||||
| Wholesale and retail |
6,541,625 | 45,525 | 6,496,100 | |||||||||
| Finance and insurance |
8,096,830 | 371,804 | 7,725,026 | |||||||||
| Real estate |
10,747,746 | 686,032 | 10,061,714 | |||||||||
| Goods rental and leasing |
2,596,865 | 23,369 | 2,573,496 | |||||||||
| Services |
2,734,980 | 61,973 | 2,673,007 | |||||||||
| Municipal government |
1,542,020 | 83,326 | 1,458,694 | |||||||||
| Other industries (including loans to the Japanese government) |
17,704,545 | 595,947 | 17,108,598 | |||||||||
| Overseas offices and loans booked at offshore markets |
34,793,516 | 4,329,753 | 30,463,763 | |||||||||
| Governments |
314,663 | 21,493 | 293,170 | |||||||||
| Financial Institutions |
12,408,212 | 2,194,208 | 10,214,003 | |||||||||
| Other |
22,070,640 | 2,114,051 | 19,956,588 | |||||||||
|
|
|
|
|
|
|
|||||||
| Total |
103,444,984 | 6,317,234 | 97,127,749 | |||||||||
|
|
|
|
|
|
|
|||||||
23
Mitsubishi UFJ Financial Group, Inc.
TB Non-consolidated
Loans Classified by Type of Industry
| (in millions of yen) | ||||||||||||
| As
of March 31, 2024 (A) |
Increase (Decrease) (A) - (B) |
As
of March 31, 2023 (B) |
||||||||||
| Domestic offices (excluding loans booked at offshore markets) |
1,121,366 | (345,267 | ) | 1,466,633 | ||||||||
|
|
|
|
|
|
|
|||||||
| Manufacturing |
— | — | — | |||||||||
| Agriculture, forestry, fishery, mining, quarrying of stone and gravel |
— | — | — | |||||||||
| Construction |
— | — | — | |||||||||
| Utilities |
— | — | — | |||||||||
| Communication and information services |
9,034 | (3,993 | ) | 13,027 | ||||||||
| Transport and postal activities |
— | — | — | |||||||||
| Wholesale and retail |
— | — | — | |||||||||
| Finance and insurance |
207,951 | (184,423 | ) | 392,374 | ||||||||
| Real estate |
3,529 | (62 | ) | 3,591 | ||||||||
| Goods rental and leasing |
— | — | — | |||||||||
| Services |
525 | (208 | ) | 734 | ||||||||
| Municipal government |
— | — | — | |||||||||
| Other industries (including loans to the Japanese government) |
900,326 | (156,579 | ) | 1,056,905 | ||||||||
| Overseas offices and loans booked at offshore markets |
1,098,859 | 293,390 | 805,468 | |||||||||
| Governments |
— | — | — | |||||||||
| Financial Institutions |
1,098,826 | 293,381 | 805,444 | |||||||||
| Other |
33 | 9 | 24 | |||||||||
|
|
|
|
|
|
|
|||||||
| Total |
2,220,225 | (51,876 | ) | 2,272,102 | ||||||||
|
|
|
|
|
|
|
|||||||
24
Mitsubishi UFJ Financial Group, Inc.
TB Non-consolidated: Trust Accounts
Loans Classified by Type of Industry
| (in millions of yen) | ||||||||||||
| As
of March 31, 2024 (A) |
Increase (Decrease) (A) - (B) |
As
of March 31, 2023 (B) |
||||||||||
| Domestic offices (excluding loans booked at offshore markets) |
1,569,969 | 292,094 | 1,277,875 | |||||||||
|
|
|
|
|
|
|
|||||||
| Manufacturing |
1,400 | — | 1,400 | |||||||||
| Agriculture, forestry, fishery, mining, quarrying of stone and gravel |
— | — | — | |||||||||
| Construction |
— | — | — | |||||||||
| Utilities |
— | — | — | |||||||||
| Communication and information services |
— | — | — | |||||||||
| Transport and postal activities |
15,000 | — | 15,000 | |||||||||
| Wholesale and retail |
— | — | — | |||||||||
| Finance and insurance |
1,250,299 | 322,539 | 927,759 | |||||||||
| Real estate |
25,835 | (313 | ) | 26,149 | ||||||||
| Goods rental and leasing |
— | — | — | |||||||||
| Services |
— | — | — | |||||||||
| Municipal government |
261 | (29 | ) | 291 | ||||||||
| Other industries (including loans to the Japanese government) |
277,173 | (30,101 | ) | 307,275 | ||||||||
| Overseas offices and loans booked at offshore markets |
— | — | — | |||||||||
| Governments |
— | — | — | |||||||||
| Financial Institutions |
— | — | — | |||||||||
| Other |
— | — | — | |||||||||
|
|
|
|
|
|
|
|||||||
| Total |
1,569,969 | 292,094 | 1,277,875 | |||||||||
|
|
|
|
|
|
|
|||||||
25
Mitsubishi UFJ Financial Group, Inc.
10 Domestic Consumer Loans, Domestic Loans to Small/Medium-Sized Companies and Proprietors
BK and TB Combined including Trust Accounts
| (1) | Domestic Consumer Loans |
| (in millions of yen) | ||||||||||||
| As of March 31, 2024 (A) |
Increase (Decrease) (A) - (B) |
As of March 31, 2023 (B) |
||||||||||
| Total domestic consumer loans |
14,954,731 | (370,182 | ) | 15,324,914 | ||||||||
| Housing loans |
14,236,251 | (396,106 | ) | 14,632,358 | ||||||||
| Residential purpose |
12,559,404 | (343,551 | ) | 12,902,955 | ||||||||
| Other |
718,480 | 25,924 | 692,556 | |||||||||
| (2) | Domestic Loans to Small/Medium-Sized Companies and Proprietors |
| (in millions of yen) | ||||||||||||
| As of March 31, 2024 (A) |
Increase (Decrease) (A) - (B) |
As of March 31, 2023 (B) |
||||||||||
| Outstanding amount |
41,020,108 | 701,705 | 40,318,403 | |||||||||
| % to total domestic loans |
57.49 | % | (0.59 | )% | 58.08 | % | ||||||
BK Non-consolidated
(1) Domestic Consumer Loans
| (in millions of yen) | ||||||||||||
| As
of March 31, 2024 (A) |
Increase (Decrease) (A) - (B) |
As
of March 31, 2023 (B) |
||||||||||
| Total domestic consumer loans |
14,315,262 | (294,078 | ) | 14,609,341 | ||||||||
| Housing loans |
13,597,362 | (320,319 | ) | 13,917,682 | ||||||||
| Residential purpose |
11,920,862 | (267,821 | ) | 12,188,683 | ||||||||
| Other |
717,899 | 26,241 | 691,658 | |||||||||
(2) Domestic Loans to Small/Medium-Sized Companies and Proprietors
| (in millions of yen) | ||||||||||||
| As
of March 31, 2024 (A) |
Increase (Decrease) (A) - (B) |
As
of March 31, 2023 (B) |
||||||||||
| Outstanding amount |
39,981,453 | 849,743 | 39,131,710 | |||||||||
| % to total domestic loans |
58.23 | % | (0.46 | )% | 58.69 | % | ||||||
TB Non-consolidated
(1) Domestic Consumer Loans
| (in millions of yen) | ||||||||||||
| As of March 31, 2024 (A) |
Increase (Decrease) (A) - (B) |
As
of March 31, 2023 (B) |
||||||||||
| Total domestic consumer loans |
636,906 | (75,633 | ) | 712,539 | ||||||||
| Housing loans |
636,325 | (75,316 | ) | 711,642 | ||||||||
| Residential purpose |
635,984 | (75,266 | ) | 711,251 | ||||||||
| Other |
580 | (317 | ) | 897 | ||||||||
(2) Domestic Loans to Small/Medium-Sized Companies and Proprietors
| (in millions of yen) | ||||||||||||
| As of March 31, 2024 (A) |
Increase (Decrease) (A) - (B) |
As
of March 31, 2023 (B) |
||||||||||
| Outstanding amount |
785,824 | (123,841 | ) | 909,665 | ||||||||
| % to total domestic loans |
70.07 | % | 8.05 | % | 62.02 | % | ||||||
TB Non-consolidated: Trust Accounts
(1) Domestic Consumer Loans
| (in millions of yen) | ||||||||||||
| As of March 31, 2024 (A) |
Increase (Decrease) (A) - (B) |
As
of March 31, 2023 (B) |
||||||||||
| Total domestic consumer loans |
2,563 | (470 | ) | 3,033 | ||||||||
| Housing loans |
2,563 | (470 | ) | 3,033 | ||||||||
| Residential purpose |
2,557 | (462 | ) | 3,020 | ||||||||
| Other |
— | — | — | |||||||||
(2) Domestic Loans to Small/Medium-Sized Companies and Proprietors
| (in millions of yen) | ||||||||||||
| As of March 31, 2024 (A) |
Increase (Decrease) (A) - (B) |
As
of March 31, 2023 (B) |
||||||||||
| Outstanding amount |
252,831 | (24,196 | ) | 277,027 | ||||||||
| % to total domestic loans |
16.10 | % | (5.57 | )% | 21.67 | % | ||||||
26
Mitsubishi UFJ Financial Group, Inc.
11. Overseas Loans
BK Consolidated excl. KS, BDI
| (in millions of yen) | ||||||||||||
| As of March 31, 2024 (A) |
Increase (Decrease) (A) - (B) |
As of March 31, 2023 (B) |
||||||||||
| Americas |
15,567,526 | 2,338,859 | 13,228,667 | |||||||||
| United States |
13,474,068 | 2,214,653 | 11,259,415 | |||||||||
| Canada |
749,349 | (20,842 | ) | 770,191 | ||||||||
| Brazil |
453,903 | 6,586 | 447,316 | |||||||||
| Mexico |
331,932 | 23,172 | 308,760 | |||||||||
| Others |
558,272 | 115,289 | 442,983 | |||||||||
| Asia/Oceania |
12,101,999 | 884,253 | 11,217,745 | |||||||||
| Hong Kong |
2,072,004 | 18,167 | 2,053,836 | |||||||||
| Australia |
1,724,953 | 194,938 | 1,530,014 | |||||||||
| China |
1,523,829 | (79,741 | ) | 1,603,570 | ||||||||
| Singapore |
1,457,176 | 46,357 | 1,410,819 | |||||||||
| India |
1,358,270 | 398,749 | 959,521 | |||||||||
| Indonesia |
1,108,536 | 307,488 | 801,047 | |||||||||
| Malaysia |
741,780 | (16,607 | ) | 758,388 | ||||||||
| Korea |
602,093 | 89,275 | 512,817 | |||||||||
| New Zealand |
424,736 | 47,044 | 377,691 | |||||||||
| Taiwan |
415,172 | (139,800 | ) | 554,973 | ||||||||
| Philippines |
275,854 | 72,271 | 203,582 | |||||||||
| Others |
397,591 | (53,890 | ) | 451,482 | ||||||||
| EMEA |
9,546,849 | 383,902 | 9,162,946 | |||||||||
| United Kingdom |
2,009,259 | (285,302 | ) | 2,294,561 | ||||||||
| Netherlands |
1,133,891 | 147,199 | 986,691 | |||||||||
| Germany |
794,459 | (21,984 | ) | 816,444 | ||||||||
| France |
731,430 | 122,420 | 609,009 | |||||||||
| Luxembourg |
592,202 | (1,244 | ) | 593,447 | ||||||||
| Ireland |
442,328 | 133,407 | 308,921 | |||||||||
| Qatar |
254,562 | 113,009 | 141,553 | |||||||||
| Switzerland |
234,648 | 32,335 | 202,313 | |||||||||
| Italy |
229,058 | 31,694 | 197,364 | |||||||||
| Saudi Arabia |
221,374 | (59,555 | ) | 280,929 | ||||||||
| Turkey |
203,900 | (13,078 | ) | 216,978 | ||||||||
| Spain |
202,333 | 25,944 | 176,389 | |||||||||
| Mauritius |
156,852 | 39,257 | 117,595 | |||||||||
| United Arab Emirates |
153,111 | (76,221 | ) | 229,333 | ||||||||
| Belgium |
145,207 | (7,349 | ) | 152,556 | ||||||||
| Russia |
109,794 | (31,417 | ) | 141,212 | ||||||||
| Sweden |
107,463 | 65,457 | 42,005 | |||||||||
| Others |
1,824,968 | 169,331 | 1,655,637 | |||||||||
|
|
|
|
|
|
|
|||||||
| Total |
37,216,375 | 3,607,015 | 33,609,359 | |||||||||
|
|
|
|
|
|
|
|||||||
KS and BDI have the following loan balances in the consolidated financial statements.
| (in millions of yen) | ||||||||||||
| As of March 31, 2024 (A) |
Increase (Decrease) (A) - (B) |
As of March 31, 2023 (B) |
||||||||||
| KS |
6,336,261 | 658,448 | 5,677,812 | |||||||||
| BDI |
1,416,667 | 334,819 | 1,081,848 | |||||||||
27
Mitsubishi UFJ Financial Group, Inc.
12. Loans and Deposits
BK and TB Combined
| (in millions of yen) | ||||||||||||
| As of March 31, 2024 (A) |
Increase (Decrease) (A) - (B) |
As of March 31, 2023 (B) |
||||||||||
| Deposits (ending balance) |
212,813,930 | 9,465,288 | 203,348,641 | |||||||||
| Deposits (average balance) |
210,432,802 | 10,086,470 | 200,346,332 | |||||||||
| Loans (ending balance) |
105,665,210 | 6,265,358 | 99,399,851 | |||||||||
| Loans (average balance) |
106,241,940 | 6,497,630 | 99,744,310 | |||||||||
| BK Non-consolidated | ||||||||||||
| (in millions of yen) | ||||||||||||
| As of March 31, 2024 (A) |
Increase (Decrease) (A) - (B) |
As of March 31, 2023 (B) |
||||||||||
| Deposits (ending balance) |
200,064,588 | 7,792,298 | 192,272,289 | |||||||||
| Deposits (average balance) |
198,236,443 | 9,201,655 | 189,034,788 | |||||||||
| Loans (ending balance) |
103,444,984 | 6,317,234 | 97,127,749 | |||||||||
| Loans (average balance) |
103,937,886 | 6,800,750 | 97,137,135 | |||||||||
| TB Non-consolidated | ||||||||||||
| (in millions of yen) | ||||||||||||
| As of March 31, 2024 (A) |
Increase (Decrease) (A) - (B) |
As of March 31, 2023 (B) |
||||||||||
| Deposits (ending balance) |
12,749,342 | 1,672,990 | 11,076,351 | |||||||||
| Deposits (average balance) |
12,196,358 | 884,814 | 11,311,544 | |||||||||
| Loans (ending balance) |
2,220,225 | (51,876 | ) | 2,272,102 | ||||||||
| Loans (average balance) |
2,304,054 | (303,120 | ) | 2,607,174 | ||||||||
28
Mitsubishi UFJ Financial Group, Inc.
13. Domestic Deposits
BK and TB Combined
| (in millions of yen) | ||||||||||||
| As of March 31, 2024 (A) |
Increase (Decrease) (A) - (B) |
As
of March 31, 2023 (B) |
||||||||||
| Individuals |
92,726,562 | 1,871,939 | 90,854,622 | |||||||||
| Corporations and others |
83,551,151 | 1,405,588 | 82,145,562 | |||||||||
| Domestic deposits |
176,277,713 | 3,277,528 | 173,000,185 | |||||||||
| Note: Amounts do not include negotiable certificates of deposit and JOM accounts. | ||||||||||||
| BK Non-consolidated | ||||||||||||
| (in millions of yen) | ||||||||||||
| As of March 31, 2024 (A) |
Increase (Decrease) (A) - (B) |
As of March 31, 2023 (B) |
||||||||||
| Individuals |
86,762,670 | 2,044,123 | 84,718,547 | |||||||||
| Corporations and others |
79,083,251 | 274,403 | 78,808,847 | |||||||||
| Domestic deposits |
165,845,921 | 2,318,526 | 163,527,394 | |||||||||
| Note: Amounts do not include negotiable certificates of deposit and JOM accounts. | ||||||||||||
| TB Non-consolidated | ||||||||||||
| (in millions of yen) | ||||||||||||
| As of March 31, 2024 (A) |
Increase (Decrease) (A) - (B) |
As of March 31, 2023 (B) |
||||||||||
| Individuals |
5,963,892 | (172,183 | ) | 6,136,075 | ||||||||
| Corporations and others |
4,467,899 | 1,131,185 | 3,336,714 | |||||||||
| Domestic deposits |
10,431,792 | 959,002 | 9,472,790 | |||||||||
| Note: Amounts do not include negotiable certificates of deposit and JOM accounts. | ||||||||||||
29
Mitsubishi UFJ Financial Group, Inc.
14. Status of Deferred Tax Assets
BK Non-consolidated
(1) Tax Effects of the Items Comprising Net Deferred Tax Assets
| (in billions of yen) | ||||||||||||
| As of March 31, 2024 (A) |
Increase (Decrease) (A) - (B) |
As
of March 31, 2023 (B) |
||||||||||
| Deferred tax assets |
1,221.6 | 165.1 | 1,056.5 | |||||||||
| Allowance for credit losses |
300.8 | 54.3 | 246.5 | |||||||||
| Write-down on investment securities |
357.0 | (9.0 | ) | 366.0 | ||||||||
| Unrealized losses on Available-for-sale securities |
133.7 | (23.6 | ) | 157.4 | ||||||||
| Reserve for retirement benefits |
75.1 | (6.7 | ) | 81.9 | ||||||||
| Reserve for contingent losses |
22.3 | 0.5 | 21.8 | |||||||||
| Depreciation and Impairment losses |
85.0 | 1.5 | 83.5 | |||||||||
| Devaluation on land upon merger |
20.2 | (1.3 | ) | 21.5 | ||||||||
| Net deferred losses on hedging instruments |
360.7 | 146.6 | 214.0 | |||||||||
| Other |
250.3 | (8.0 | ) | 258.3 | ||||||||
| Valuation allowance |
(384.0 | ) | 10.7 | (394.7 | ) | |||||||
| Deferred tax liabilities |
955.6 | 297.7 | 657.9 | |||||||||
| Unrealized gains on Available-for-sale securities |
747.9 | 303.0 | 444.8 | |||||||||
| Revaluation gains on securities upon merger |
44.4 | (2.7 | ) | 47.1 | ||||||||
| Gains on securities contributed to employees’ retirement benefits trust |
42.6 | (2.4 | ) | 45.1 | ||||||||
| Other |
120.6 | (0.0 | ) | 120.7 | ||||||||
| Net deferred tax assets |
265.9 | (132.6 | ) | 398.6 | ||||||||
(2) Net operating profits before provision for general allowance for credit losses and Taxable Income
| (in billions of yen) | ||||||||||||||||||||||||
| FY2018 | FY2019 | FY2020 | FY2021 | FY2022 | FY2023 | |||||||||||||||||||
| Net operating profits before provision for general allowance for credit losses |
388.4 | 395.2 | 388.0 | 374.4 | 690.4 | 974.6 | ||||||||||||||||||
| Total credit costs |
128.5 | 11.8 | (223.3 | ) | (234.0 | ) | (98.5 | ) | (244.3 | ) | ||||||||||||||
| Income before income taxes |
767.2 | (535.9 | ) | 205.5 | 286.1 | 1,239.5 | 994.7 | |||||||||||||||||
| Reconciliation to taxable income |
(500.2 | ) | 844.6 | 98.5 | 343.3 | (453.8 | ) | (57.6 | ) | |||||||||||||||
| Taxable income |
267.0 | 308.7 | 304.1 | 629.5 | 785.7 | 937.1 | ||||||||||||||||||
(3) Classification Based on Prior Year Operating Results as Provided in the ASBJ Guidance No.26
We are classified as “2” because we are considered to be a company showing stable financial performance.
30
Mitsubishi UFJ Financial Group, Inc.
TB Non-consolidated
(1) Tax Effects of the Items Comprising Net Deferred Tax Assets
| (in billions of yen) | ||||||||||||
| As of March 31, 2024 (A) |
Increase (Decrease) (A) - (B) |
As of March 31, 2023 (B) |
||||||||||
| Deferred tax assets |
73.4 | 7.9 | 65.4 | |||||||||
| Gains on securities related to employees’ retirement benefits trust |
52.2 | 16.0 | 36.2 | |||||||||
| Depreciation and Impairment losses |
10.1 | 0.4 | 9.6 | |||||||||
| Write-down on investment securities |
7.7 | (0.6 | ) | 8.3 | ||||||||
| Group tax sharing transactions |
6.3 | (4.4 | ) | 10.8 | ||||||||
| Reserve for contingent losses |
2.1 | (0.8 | ) | 3.0 | ||||||||
| Other |
18.2 | (3.7 | ) | 21.9 | ||||||||
| Valuation allowance |
(23.4 | ) | 1.1 | (24.6 | ) | |||||||
| Deferred tax liabilities |
263.1 | 53.5 | 209.6 | |||||||||
| Reserve for retirement benefits |
114.4 | 10.8 | 103.6 | |||||||||
| Unrealized gains on Available-for-sale securities |
99.2 | 45.3 | 53.8 | |||||||||
| Net deferred gains on hedging instruments |
35.0 | (3.7 | ) | 38.7 | ||||||||
| Other |
14.4 | 1.0 | 13.3 | |||||||||
| Net deferred tax assets |
(189.7 | ) | (45.6 | ) | (144.1 | ) | ||||||
(2) Net operating profits before credit costs for trust accounts and provision for general allowance for credit losses and Taxable Income
| (in billions of yen) | ||||||||||||||||||||||||
| FY2018 | FY2019 | FY2020 | FY2021 | FY2022 | FY2023 | |||||||||||||||||||
| Net operating profits before credit costs for trust accounts and provision for general allowance for credit losses |
144.5 | 142.3 | 132.3 | 176.4 | 109.1 | 70.4 | ||||||||||||||||||
| Total credit costs |
1.3 | 0.8 | 0.0 | 0.1 | (0.2 | ) | (0.1 | ) | ||||||||||||||||
| Income before income taxes |
127.9 | 148.6 | 129.4 | 210.6 | 165.7 | 75.1 | ||||||||||||||||||
| Reconciliation to taxable income |
(79.2 | ) | (39.3 | ) | (26.5 | ) | (37.4 | ) | (49.7 | ) | (18.9 | ) | ||||||||||||
| Taxable income |
48.7 | 109.3 | 102.9 | 173.1 | 116.0 | 56.2 | ||||||||||||||||||
(3) Classification Based on Prior Year Operating Results as Provided in the ASBJ Guidance No.26
We are classified as “2” because we are considered to be a company showing stable financial performance.
31
Mitsubishi UFJ Financial Group, Inc.
15. Retirement Benefits
MUFG Consolidated
(1) Benefit obligation
| (in millions of yen) | ||||||||||||
| As of March 31, 2024 (A) |
Increase (Decrease) (A) - (B) |
As of March 31, 2023 (B) |
||||||||||
| Projected benefit obligation (reserve type) (A) |
1,579,494 | (107,222 | ) | 1,686,716 | ||||||||
| Projected benefit obligation (non-reserve type) (B) |
100,291 | 15,802 | 84,488 | |||||||||
| Fair value of plan assets (C) |
3,560,132 | 549,937 | 3,010,195 | |||||||||
| Net amount recorded on the Consolidated Balance Sheet (A) + (B) - (C) |
(1,880,346 | ) | (641,356 | ) | (1,238,989 | ) | ||||||
| Net defined benefit liability |
102,155 | 15,710 | 86,445 | |||||||||
| Net defined benefit asset |
(1,982,502 | ) | (657,067 | ) | (1,325,434 | ) | ||||||
(2) Net periodic cost of retirement benefits
| (in millions of yen) | ||||||||||||
| For the fiscal
year ended March 31, 2024 (A) |
Increase (Decrease) (A) - (B) |
For the fiscal
year ended March 31, 2023 (B) |
||||||||||
| Net periodic cost of retirement benefits regarding defined benefit pension plans |
(31,364 | ) | (41,525 | ) | 10,161 | |||||||
| Service cost |
49,234 | (10,914 | ) | 60,149 | ||||||||
| Interest cost |
29,799 | (5,884 | ) | 35,683 | ||||||||
| Expected return on plan assets |
(94,319 | ) | 37,578 | (131,898 | ) | |||||||
| Amortization of unrecognized prior service cost |
99 | 3,023 | (2,924 | ) | ||||||||
| Amortization of unrecognized net actuarial loss |
(40,711 | ) | 3,977 | (44,688 | ) | |||||||
| Losses on pension buyout |
— | (78,111 | ) | 78,111 | ||||||||
| Other |
24,533 | 8,805 | 15,728 | |||||||||
(3) Assumptions used in calculation of projected benefit obligation
| As of March 31, 2024 | ||||||||
| Discount rates |
Domestic consolidated subsidiaries | 0.22%~1.83 | % | |||||
| Overseas consolidated subsidiaries | 1.92%~9.63 | % | ||||||
| Expected return |
Domestic consolidated subsidiaries | 1.50%~3.60 | % | |||||
| Overseas consolidated subsidiaries | 3.10%~9.63 | % | ||||||
32
Mitsubishi UFJ Financial Group, Inc.
BK Non-consolidated
(1) Benefit obligation
| (in millions of yen) | ||||||||||||
| As of March 31, 2024 (A) |
Increase (Decrease) (A) - (B) |
As of March 31, 2023 (B) |
||||||||||
| Projected benefit obligation (A) |
1,211,731 | (64,137 | ) | 1,275,869 | ||||||||
| Discount rates |
(1.4% ~ 1.8 | %) | (1.1% ~ 1.4 | %) | ||||||||
| Fair value of plan assets (B) |
2,466,312 | 371,135 | 2,095,176 | |||||||||
| Prepaid pension cost (C) |
730,933 | 85,164 | 645,769 | |||||||||
| Reserve for retirement benefits (D) |
20,421 | 5,976 | 14,444 | |||||||||
| Total amount unrecognized (A) - (B) + (C) - (D) |
(544,069 | ) | (356,085 | ) | (187,983 | ) | ||||||
| Unrecognized net actuarial loss |
(543,866 | ) | (356,231 | ) | (187,634 | ) | ||||||
| Unrecognized prior service cost |
(202 | ) | 146 | (348 | ) | |||||||
(2) Net periodic cost
| (in millions of yen) | ||||||||||||
| For the fiscal year ended March 31, 2024 (A) |
Increase (Decrease) (A) - (B) |
For the fiscal year ended March 31, 2023 (B) |
||||||||||
| Net periodic cost of retirement benefits |
(14,505 | ) | (48,503 | ) | 33,998 | |||||||
| Service cost |
32,344 | 1,434 | 30,910 | |||||||||
| Interest cost |
21,882 | 3,112 | 18,769 | |||||||||
| Expected return on plan assets |
(62,992 | ) | 1,989 | (64,982 | ) | |||||||
| Amortization of unrecognized prior service cost |
(194 | ) | 234 | (428 | ) | |||||||
| Amortization of unrecognized net actuarial loss |
(38,463 | ) | 11,359 | (49,822 | ) | |||||||
| Losses on pension buyout |
— | (78,111 | ) | 78,111 | ||||||||
| Other |
32,917 | 11,478 | 21,438 | |||||||||
33
Mitsubishi UFJ Financial Group, Inc.
TB Non-consolidated
(1) Benefit obligation
| (in millions of yen) | ||||||||||||
| As of March 31, 2024 (A) |
Increase (Decrease) (A) - (B) |
As of March 31, 2023 (B) |
||||||||||
| Projected benefit obligation (A) |
279,110 | (18,434 | ) | 297,544 | ||||||||
| Discount rates |
(1.3% ~ 1.7%) | (1% ~ 1.3%) | ||||||||||
| Fair value of plan assets (B) |
940,088 | 185,461 | 754,626 | |||||||||
| Prepaid pension cost (C) |
492,768 | 35,335 | 457,432 | |||||||||
| Reserve for retirement benefits (D) |
— | — | — | |||||||||
| Total amount unrecognized (A) - (B) + (C) - (D) |
(168,209 | ) | (168,560 | ) | 350 | |||||||
| Unrecognized net actuarial loss |
(169,325 | ) | (168,338 | ) | (986 | ) | ||||||
| Unrecognized prior service cost |
1,115 | (221 | ) | 1,337 | ||||||||
(2) Net periodic cost
| (in millions of yen) | ||||||||||||
| For the fiscal year ended March 31, 2024 (A) |
Increase (Decrease) (A) - (B) |
For the fiscal year ended March 31, 2023 (B) |
||||||||||
| Net periodic cost of retirement benefits |
(18,653 | ) | 2,106 | (20,760 | ) | |||||||
| Service cost |
4,831 | (773 | ) | 5,604 | ||||||||
| Interest cost |
3,668 | 986 | 2,682 | |||||||||
| Expected return on plan assets |
(27,465 | ) | 637 | (28,103 | ) | |||||||
| Amortization of unrecognized prior service cost |
221 | — | 221 | |||||||||
| Amortization of unrecognized net actuarial loss |
(393 | ) | 1,228 | (1,622 | ) | |||||||
| Other |
484 | 27 | 457 | |||||||||
34
Mitsubishi UFJ Financial Group, Inc.
(Reference)
1. Financial Statements
BK Non-consolidated
(1) Non-consolidated Balance Sheets (selected items)
| (in millions of yen) | As of March 31, 2023 |
As of March 31, 2024 |
||||||
| Assets: |
||||||||
| Cash and due from banks |
90,898,274 | 89,284,902 | ||||||
| Call loans |
750,795 | 1,266,925 | ||||||
| Receivables under resale agreements |
1,326,697 | 1,241,358 | ||||||
| Monetary claims bought |
4,326,066 | 4,730,143 | ||||||
| Trading assets |
6,306,376 | 6,263,383 | ||||||
| Money held in trust |
45,161 | 37,178 | ||||||
| Securities |
72,253,876 | 69,957,384 | ||||||
| Loans and bills discounted |
97,127,749 | 103,444,984 | ||||||
| Foreign exchanges |
1,726,923 | 2,030,007 | ||||||
| Other assets |
8,923,802 | 10,604,231 | ||||||
| Tangible fixed assets |
699,817 | 688,751 | ||||||
| Intangible fixed assets |
454,137 | 493,516 | ||||||
| Prepaid pension costs |
645,769 | 730,933 | ||||||
| Deferred tax assets |
398,626 | 265,948 | ||||||
| Customers’ liabilities for acceptances and guarantees |
8,661,518 | 9,335,180 | ||||||
| Allowance for credit losses |
(641,107 | ) | (841,518 | ) | ||||
|
|
|
|
|
|||||
| Total assets |
293,904,485 | 299,533,310 | ||||||
|
|
|
|
|
|||||
35
Mitsubishi UFJ Financial Group, Inc.
| (in millions of yen) | As of March 31, 2023 |
As of March 31, 2024 |
||||||
| Liabilities: |
||||||||
| Deposits |
192,272,289 | 200,064,588 | ||||||
| Negotiable certificates of deposit |
8,792,227 | 10,912,738 | ||||||
| Call money |
23,449 | 683,360 | ||||||
| Payables under repurchase agreements |
25,271,176 | 14,790,983 | ||||||
| Payables under securities lending transactions |
181,473 | — | ||||||
| Commercial papers |
1,834,968 | 2,807,589 | ||||||
| Trading liabilities |
2,835,605 | 3,355,951 | ||||||
| Borrowed money |
33,356,232 | 34,810,924 | ||||||
| Foreign exchanges |
2,779,176 | 3,719,588 | ||||||
| Bonds payable |
1,284,731 | 1,250,571 | ||||||
| Other liabilities |
7,564,963 | 8,105,838 | ||||||
| Reserve for bonuses |
71,830 | 85,950 | ||||||
| Reserve for bonuses to directors |
148 | 148 | ||||||
| Reserve for stocks payment |
3,705 | 4,597 | ||||||
| Reserve for retirement benefits |
14,444 | 20,421 | ||||||
| Reserve for loyalty award credits |
1,174 | — | ||||||
| Reserve for contingent losses |
71,357 | 73,000 | ||||||
| Deferred tax liabilities for land revaluation |
85,736 | 82,942 | ||||||
| Acceptances and guarantees |
8,661,518 | 9,335,180 | ||||||
|
|
|
|
|
|||||
| Total liabilities |
285,106,212 | 290,104,373 | ||||||
|
|
|
|
|
|||||
| Net assets: |
||||||||
| Capital stock |
1,711,958 | 1,711,958 | ||||||
| Capital surplus |
3,878,275 | 3,878,275 | ||||||
| Capital reserve |
1,711,958 | 1,711,958 | ||||||
| Other capital surplus |
2,166,317 | 2,166,317 | ||||||
| Retained earnings |
3,306,434 | 3,637,579 | ||||||
| Revenue reserve |
190,044 | 190,044 | ||||||
| Other retained earnings |
3,116,389 | 3,447,534 | ||||||
| Funds for retirement benefits |
2,432 | 2,432 | ||||||
| Reserve for investment promotion taxation |
260 | 260 | ||||||
| Other reserve |
718,196 | 718,196 | ||||||
| Earned surplus brought forward |
2,395,500 | 2,726,645 | ||||||
|
|
|
|
|
|||||
| Treasury stock |
(645,700 | ) | (645,700 | ) | ||||
|
|
|
|
|
|||||
| Total shareholders’ equity |
8,250,967 | 8,582,112 | ||||||
| Net unrealized gains (losses) on available-for-sale securities |
854,922 | 1,499,245 | ||||||
| Net deferred gains (losses) on hedging instruments |
(476,124 | ) | (814,862 | ) | ||||
| Land revaluation excess |
168,507 | 162,441 | ||||||
|
|
|
|
|
|||||
| Total valuation and translation adjustments |
547,305 | 846,824 | ||||||
|
|
|
|
|
|||||
| Total net assets |
8,798,272 | 9,428,937 | ||||||
|
|
|
|
|
|||||
| Total liabilities and net assets |
293,904,485 | 299,533,310 | ||||||
|
|
|
|
|
|||||
36
Mitsubishi UFJ Financial Group, Inc.
BK Non-consolidated
(2) Non-consolidated Statements of Income (selected items)
| (in millions of yen) | For the fiscal year ended March 31, 2023 |
For the fiscal year ended March 31, 2024 |
||||||
| Ordinary income |
4,799,567 | 6,807,405 | ||||||
| Interest income |
3,202,838 | 4,942,626 | ||||||
| Interest on loans and bills discounted |
1,826,196 | 3,086,665 | ||||||
| Interest and dividends on securities |
834,551 | 887,669 | ||||||
| Fees and commissions |
681,922 | 807,090 | ||||||
| Trading income |
80,369 | 110,789 | ||||||
| Other operating income |
494,359 | 491,974 | ||||||
| Other ordinary income |
340,078 | 454,925 | ||||||
| Ordinary expenses |
3,895,822 | 5,807,634 | ||||||
| Interest expenses |
1,701,450 | 3,446,842 | ||||||
| Interest on deposits |
745,390 | 1,675,678 | ||||||
| Fees and commissions |
162,966 | 151,400 | ||||||
| Trading expenses |
1,607 | 1,217 | ||||||
| Other operating expenses |
664,590 | 469,385 | ||||||
| General and administrative expenses |
1,174,267 | 1,339,058 | ||||||
| Other ordinary expenses |
190,940 | 399,730 | ||||||
|
|
|
|
|
|||||
| Ordinary profits |
903,744 | 999,771 | ||||||
|
|
|
|
|
|||||
| Extraordinary gains |
437,287 | 20,745 | ||||||
| Extraordinary losses |
101,436 | 25,755 | ||||||
|
|
|
|
|
|||||
| Income before income taxes |
1,239,594 | 994,760 | ||||||
|
|
|
|
|
|||||
| Income taxes - current |
254,747 | 244,385 | ||||||
| Income taxes - deferred |
(30,607 | ) | (53,885 | ) | ||||
|
|
|
|
|
|||||
| Total taxes |
224,140 | 190,499 | ||||||
|
|
|
|
|
|||||
| Net income |
1,015,454 | 804,260 | ||||||
|
|
|
|
|
|||||
37
Mitsubishi UFJ Financial Group, Inc.
TB Non-consolidated
(1) Non-consolidated Balance Sheets (selected items)
| (in millions of yen) | As of March 31, 2023 |
As of March 31, 2024 |
||||||
| Assets: |
||||||||
| Cash and due from banks |
13,673,282 | 13,589,516 | ||||||
| Call loans |
230,000 | 320,000 | ||||||
| Receivables under resale agreements |
77,370 | 81,636 | ||||||
| Receivables under securities borrowing transactions |
106,180 | 151,538 | ||||||
| Monetary claims bought |
124,086 | 15 | ||||||
| Trading assets |
78,114 | 70,459 | ||||||
| Money held in trust |
157,275 | 14,824 | ||||||
| Securities |
14,117,360 | 16,050,790 | ||||||
| Loans and bills discounted |
2,272,102 | 2,220,225 | ||||||
| Foreign exchanges |
248,948 | 281,805 | ||||||
| Other assets |
1,352,617 | 2,124,530 | ||||||
| Tangible fixed assets |
125,644 | 125,067 | ||||||
| Intangible fixed assets |
91,894 | 91,078 | ||||||
| Prepaid pension costs |
457,432 | 492,768 | ||||||
| Customers’ liabilities for acceptances and guarantees |
36,751 | 39,201 | ||||||
| Allowance for credit losses |
(1,045 | ) | (966 | ) | ||||
|
|
|
|
|
|||||
| Total assets |
33,148,018 | 35,652,492 | ||||||
|
|
|
|
|
|||||
38
Mitsubishi UFJ Financial Group, Inc.
| (in millions of yen) | As of March 31, 2023 |
As of March 31, 2024 |
||||||
| Liabilities: |
||||||||
| Deposits |
11,076,351 | 12,749,342 | ||||||
| Negotiable certificates of deposit |
4,675,417 | 5,385,777 | ||||||
| Call money |
5,165 | 1,493,171 | ||||||
| Payables under repurchase agreements |
5,281,893 | 6,191,612 | ||||||
| Payables under securities lending transactions |
4,041 | — | ||||||
| Commercial papers |
368,100 | 234,941 | ||||||
| Trading liabilities |
189,453 | 218,314 | ||||||
| Borrowed money |
1,679,724 | 2,087,312 | ||||||
| Foreign exchanges |
378,171 | 367,658 | ||||||
| Short-term bonds payable |
120,999 | 230,987 | ||||||
| Bonds payable |
30,000 | 30,000 | ||||||
| Due to trust accounts |
6,207,882 | 3,199,300 | ||||||
| Other liabilities |
846,818 | 1,038,897 | ||||||
| Reserve for bonuses |
5,163 | 5,571 | ||||||
| Reserve for bonuses to directors |
98 | 102 | ||||||
| Reserve for stocks payment |
2,855 | 3,891 | ||||||
| Reserve for contingent losses |
9,820 | 7,100 | ||||||
| Deferred tax liabilities |
144,164 | 189,776 | ||||||
| Deferred tax liabilities for land revaluation |
3,789 | 3,689 | ||||||
| Acceptances and guarantees |
36,751 | 39,201 | ||||||
|
|
|
|
|
|||||
| Total liabilities |
31,066,664 | 33,476,650 | ||||||
|
|
|
|
|
|||||
| Net assets: |
||||||||
| Capital stock |
324,279 | 324,279 | ||||||
| Capital surplus |
455,970 | 455,970 | ||||||
| Capital reserve |
250,619 | 250,619 | ||||||
| Other capital surplus |
205,351 | 205,351 | ||||||
| Retained earnings |
1,368,530 | 1,358,924 | ||||||
| Revenue reserve |
73,714 | 73,714 | ||||||
| Other retained earnings |
1,294,816 | 1,285,210 | ||||||
| Funds for retirement benefits |
710 | 710 | ||||||
| Reserve for investment promotion taxation |
227 | 281 | ||||||
| Other reserve |
138,495 | 138,495 | ||||||
| Earned surplus brought forward |
1,155,383 | 1,145,723 | ||||||
| Treasury stock |
(299,999 | ) | (299,999 | ) | ||||
|
|
|
|
|
|||||
| Total shareholders’ equity |
1,848,780 | 1,839,173 | ||||||
|
|
|
|
|
|||||
| Net unrealized gains (losses) on available-for-sale securities |
144,937 | 250,557 | ||||||
| Net deferred gains (losses) on hedging instruments |
87,817 | 85,588 | ||||||
| Land revaluation excess |
(182 | ) | 523 | |||||
|
|
|
|
|
|||||
| Total valuation and translation adjustments |
232,573 | 336,668 | ||||||
|
|
|
|
|
|||||
| Total net assets |
2,081,353 | 2,175,842 | ||||||
|
|
|
|
|
|||||
| Total liabilities and net assets |
33,148,018 | 35,652,492 | ||||||
|
|
|
|
|
|||||
39
Mitsubishi UFJ Financial Group, Inc.
TB Non-consolidated
(2) Non-consolidated Statements of Income (selected items)
| (in millions of yen) | For the fiscal year ended March 31, 2023 |
For the fiscal year ended March 31, 2024 |
||||||
| Ordinary income |
1,167,912 | 1,436,971 | ||||||
| Trust fees |
111,924 | 120,757 | ||||||
| Interest income |
761,508 | 1,005,801 | ||||||
| Interest on loans and bills discounted |
34,139 | 74,186 | ||||||
| Interest and dividends on securities |
627,380 | 697,894 | ||||||
| Fees and commissions |
154,590 | 163,247 | ||||||
| Trading income |
45 | 24 | ||||||
| Other operating income |
66,866 | 58,754 | ||||||
| Other ordinary income |
72,976 | 88,386 | ||||||
| Ordinary expenses |
996,773 | 1,356,388 | ||||||
| Interest expenses |
390,707 | 884,979 | ||||||
| Interest on deposits |
44,937 | 107,503 | ||||||
| Fees and commissions |
48,985 | 54,335 | ||||||
| Trading expenses |
22,207 | 13,884 | ||||||
| Other operating expenses |
326,663 | 113,372 | ||||||
| General and administrative expenses |
196,504 | 212,235 | ||||||
| Other ordinary expenses |
11,704 | 77,581 | ||||||
|
|
|
|
|
|||||
| Ordinary profits |
171,138 | 80,583 | ||||||
|
|
|
|
|
|||||
| Extraordinary gains |
764 | 2,177 | ||||||
| Extraordinary losses |
6,113 | 7,630 | ||||||
|
|
|
|
|
|||||
| Income before income taxes |
165,790 | 75,130 | ||||||
|
|
|
|
|
|||||
| Income taxes - current |
35,838 | 13,599 | ||||||
| Income taxes - deferred |
5,406 | 3,727 | ||||||
|
|
|
|
|
|||||
| Total taxes |
41,244 | 17,326 | ||||||
|
|
|
|
|
|||||
| Net income |
124,545 | 57,803 | ||||||
|
|
|
|
|
|||||
40
Mitsubishi UFJ Financial Group, Inc.
TB Non-consolidated
(3) Statements of Trust Assets and Liabilities
Including trust assets under service-shared co-trusteeship
| (in millions of yen) | As of March 31, 2023 |
As of March 31, 2024 |
||||||
| Assets: |
||||||||
| Loans and bills discounted |
1,277,875 | 1,569,969 | ||||||
| Securities |
70,547,100 | 80,134,164 | ||||||
| Beneficiary rights to the trust |
118,934,755 | 145,116,404 | ||||||
| Securities held in custody accounts |
2,933,178 | 3,886,180 | ||||||
| Monetary claims |
32,819,251 | 34,138,163 | ||||||
| Tangible fixed assets |
20,879,125 | 22,750,084 | ||||||
| Intangible fixed assets |
165,299 | 186,122 | ||||||
| Other claims |
3,189,442 | 3,312,930 | ||||||
| Call loans |
3,673,857 | 4,455,397 | ||||||
| Due from banking account |
10,620,708 | 6,170,680 | ||||||
| Cash and due from banks |
6,927,037 | 6,181,323 | ||||||
|
|
|
|
|
|||||
| Total |
271,967,632 | 307,901,420 | ||||||
|
|
|
|
|
|||||
| Liabilities: |
||||||||
| Money trusts |
33,565,350 | 37,371,516 | ||||||
| Pension trusts |
12,233,123 | 12,760,480 | ||||||
| Property formation benefit trusts |
6,273 | 5,738 | ||||||
| Investment trusts |
122,338,610 | 145,025,458 | ||||||
| Money entrusted other than money trusts |
6,153,057 | 7,167,100 | ||||||
| Securities trusts |
5,361,672 | 6,145,365 | ||||||
| Monetary claim trusts |
28,813,961 | 29,767,810 | ||||||
| Equipment trusts |
166,695 | 226,799 | ||||||
| Land and fixtures trusts |
18,626 | 18,425 | ||||||
| Composite trusts |
63,310,260 | 69,412,725 | ||||||
|
|
|
|
|
|||||
| Total |
271,967,632 | 307,901,420 | ||||||
|
|
|
|
|
|||||
| Note: | 1. | The table shown above includes master trust assets under the service-shared co-trusteeship between TB and The Master Trust Bank of Japan, Ltd. | ||
| 2. | Trust assets and liabilities under a declaration of trust excluded from above table are 280,332 millions of yen as of March 31, 2023 and 26,247 millions of yen as of March 31, 2024. |
Detailed information for “Money trust” with contracts indemnifying the principal amounts
(including trusts for which beneficiary interests are re-entrusted)
| (in millions of yen) | As of March 31, 2023 |
As of March 31, 2024 |
||||||
| Assets: |
||||||||
| Loans and bills discounted |
3,939 | 3,119 | ||||||
| Other |
6,405,078 | 3,289,438 | ||||||
|
|
|
|
|
|||||
| Total |
6,409,018 | 3,292,557 | ||||||
|
|
|
|
|
|||||
| Liabilities: |
||||||||
| Principal |
6,408,838 | 3,292,449 | ||||||
| Allowance for bad debts |
11 | 9 | ||||||
| Other |
168 | 99 | ||||||
|
|
|
|
|
|||||
| Total |
6,409,018 | 3,292,557 | ||||||
|
|
|
|
|
|||||
41
Mitsubishi UFJ Financial Group, Inc.
TB Non-consolidated
(4) Major Items
| (in millions of yen) | As of March 31, 2023 |
As of March 31, 2024 |
||||||
| Total funds |
61,556,516 | 68,272,855 | ||||||
|
|
|
|
|
|||||
| Deposits |
11,076,351 | 12,749,342 | ||||||
| Negotiable certificates of deposit |
4,675,417 | 5,385,777 | ||||||
| Money trusts |
33,565,350 | 37,371,516 | ||||||
| Pension trusts |
12,233,123 | 12,760,480 | ||||||
| Property formation benefit trusts |
6,273 | 5,738 | ||||||
|
|
|
|
|
|||||
| Loans and bills discounted |
3,549,977 | 3,790,194 | ||||||
|
|
|
|
|
|||||
| Banking account |
2,272,102 | 2,220,225 | ||||||
| Trust account |
1,277,875 | 1,569,969 | ||||||
|
|
|
|
|
|||||
| Investment securities |
84,664,460 | 96,184,954 | ||||||
|
|
|
|
|
|||||
| Note: | The table shown above includes master trust assets under the service-shared co-trusteeship between TB and The Master Trust Bank of Japan, Ltd. |
42