UNITED STATES
SECURITIES AND EXCHANGE COMMISSION
WASHINGTON, D.C. 20549
Form 6-K
REPORT OF FOREIGN PRIVATE ISSUER
PURSUANT TO RULE 13a-16 OR 15d-16
OF THE SECURITIES EXCHANGE ACT OF 1934
For the month of May 2024
Commission File Number 1-14840
AMDOCS LIMITED
Hirzel House, Smith Street,
St. Peter Port, Island of Guernsey, GY1 2NG
Amdocs, Inc.
625 Maryville Centre Drive, Suite 200, Saint Louis, Missouri 63141
(Address of principal executive offices)
Indicate by check mark whether the registrant files or will file annual reports under cover of Form 20-F or Form 40-F:
FORM 20-F ☒ FORM 40-F ☐
On May 8, 2024 Amdocs Limited (“Amdocs”) issued a press release announcing financial results for the quarter ended March 31, 2024. A copy of the press release and the accompanying presentation are furnished as Exhibits 99.1 and 99.2 to this Report of Foreign Private Issuer on Form 6-K.
The information in this Form 6-K (including Exhibits 99.1 and 99.2) shall not be deemed “filed” for purposes of Section 18 of the Securities Exchange Act of 1934 (the “Exchange Act”) or otherwise subject to the liabilities of that section, nor shall it be deemed incorporated by reference in any filing under the Securities Act of 1933 or the Exchange Act.
EXHIBIT INDEX
| EXHIBIT |
DESCRIPTION |
|
| 99.1 | Amdocs Limited Press Release Announcing Q2 Earnings, dated May 8, 2024 | |
| 99.2 | Fiscal Q2 2024 Earnings Presentation | |
SIGNATURES
Pursuant to the requirements of the Securities Exchange Act of 1934, the registrant has duly caused this report to be signed on its behalf by the undersigned, thereunto duly authorized.
| AMDOCS LIMITED | ||
| By: | /s/ Matthew E. Smith | |
| Matthew E. Smith | ||
| Secretary and Authorized Signatory | ||
Date: May 8, 2024
Exhibit 99.1

Amdocs Limited Reports Second Quarter Fiscal 2024 Results
Record Quarterly Revenue of $1.25 Billion, up 1.8% YoY as Reported and 2% YoY in Constant Currency(1)
Record 12-Month Backlog of $4.23 Billion, up ~3% YoY
Updates Fiscal 2024 Outlook:
Expects Revenue Growth of 1.6%-3.6% YoY as Reported and 1.7%-3.7% YoY in Constant Currency(1)
On-track to Deliver Accelerated Profitability in Fiscal 2024
Expects GAAP Diluted EPS Growth of 7.0%–13.0% and
Non-GAAP Diluted EPS Growth of 7.0%-11.0%
Second Quarter Fiscal 2024 Highlights
(All comparisons are against the prior year)
| • | Record revenue of $1,246 million, up 1.8% as reported and up 2.0% in constant currency(1); revenue was slightly above the midpoint of $1,225-$1,265 million guidance range and includes an unfavorable impact from foreign currency movements of approximately $2 million relative to the second quarter of fiscal 2023 |
| • | GAAP diluted EPS of $1.01, including a restructuring charge of 24 cents per share, without which GAAP diluted EPS would have been at the midpoint of the guidance range of $1.21-$1.29 |
| • | Non-GAAP diluted EPS of $1.56, at the midpoint of the guidance range of $1.53-$1.59 |
| • | GAAP operating income of $156 million; GAAP operating margin of 12.5%, down 240 basis points as compared to last year’s second fiscal quarter and down 230 basis points sequentially, primarily reflecting restructuring charges of $33 million recorded in the second fiscal quarter |
| (1) | Revenue on a constant currency basis assumes exchange rates in the current period were unchanged from the prior period |
| (2) | Please refer to the Selected Financial Metrics tables below (figures may not sum because of rounding) |
| (3) | Expected total shareholder return assumes Non-GAAP EPS growth plus dividend yield |
| • | Non-GAAP operating income of $229 million; non-GAAP operating margin of 18.4%, up 60 basis points as compared to last year’s second fiscal quarter and up 30 basis points sequentially, reflecting a continued focus on operational excellence |
| • | Managed services revenue of $720 million, equivalent to approximately 58% of total revenue |
| • | Free cash flow of $113 million, comprised of cash flow from operations of $133 million, less $20 million in net capital expenditures and other(2), including $7 million of restructuring payments |
| • | Repurchased $115 million of ordinary shares during the second fiscal quarter |
| • | Record twelve-month backlog of $4.23 billion, up approximately 3% as compared to last year’s second fiscal quarter and up approximately $20 million sequentially |
JERSEY CITY, NJ – May 8, 2024 – Amdocs Limited (NASDAQ: DOX), a leading provider of software and services to communications and media companies, today reported operating results for the three months ended March 31, 2024.
“I am pleased to report solid results for the second fiscal quarter, including record revenue, improved profitability, and healthy sales momentum as we delivered the market-leading innovation our customers need to support cloud migration, 5G monetization, digital modernization, and network automation. During Q2, we strengthened our relationships at several North American operators, and expanded our international footprint with several major network and digital modernizations wins, including Colt in the UK, a large Southeast Asian operator, and J:COM in Japan. I am very happy to report that we just signed a significant 5-year deal at AT&T, which expands our activities in the cloud domain, as well as extends our engagement with AT&T in the consumer domain,” said Shuky Sheffer, president and chief executive officer of Amdocs Management Limited.
“Second quarter operating profitability improved significantly on a sequential and year-over-year basis, reflecting our long-term commitment to operational excellence and the ongoing adoption of automation, artificial intelligence, and other sophisticated tools to drive internal efficiency. Among other highlights, we expanded our long-standing managed services relationship with Rogers in Canada to support its recent merger with Shaw under an extended multi-year agreement, and we expanded and extended our multi-year partnership with a major Southeast Asian service provider to include full cloud managed services and operations,” said Tamar Rapaport-Dagim, chief financial officer & chief operating officer of Amdocs Management Limited.
Sheffer concluded, “We continue to operate within a challenging environment of macro uncertainty and industry pressure. As the preferred technology partner for modernization, we continue to see healthy market demand for Amdocs’ innovative products and services around our strategic pillars, supporting double-digit revenue growth in cloud. I am also encouraged by our progress advancing multiple Gen AI development engagements in collaboration with key partners such as Nvidia, Microsoft and AWS, and several flagship customers. Looking to the fiscal second half, we expect sequential revenue growth based on our record 12-month backlog and an attractive pipeline of opportunities, albeit at a more moderate rate than we initially anticipated. Altogether, we now expect constant currency(1) revenue growth of 1.7% to 3.7% year-over-year in fiscal 2024. Moreover, our accelerated profitability improvement is tracking in line with our initial targets, and we are positioned to deliver double-digit expected total shareholder returns(3) for the fourth year running.”
Revenue
(All comparisons are against the prior year period)
| In millions Three months ended |
||||
| March 31, 2024 | ||||
| Actual | Guidance | |||
| Revenue |
$1,246 | $1,225 - $1,265 | ||
| Revenue Growth, as reported |
1.8% | |||
| Revenue Growth, constant currency (1) |
2.0% | |||
| • | Revenue for the second fiscal quarter of 2024 was slightly above the midpoint of Amdocs’ guidance, and includes immaterial impact from foreign currency movement compared to our guidance assumptions |
| • | Revenue for the second fiscal quarter includes an impact from foreign currency movements of approximately $2 million relative to the first quarter of fiscal 2024 |
Net Income and Earnings Per Share
| ` | In thousands, expect per share data Three months ended March 31, |
|||||||
| 2024 | 2023 | |||||||
| GAAP Measures |
||||||||
| Net Income |
$ | 119,425 | $ | 150,309 | ||||
| Net Income attributable to Amdocs Limited |
$ | 118,502 | $ | 149,603 | ||||
| Diluted earnings per share |
$ | 1.01 | $ | 1.23 | ||||
| Non-GAAP Measures |
||||||||
| Non-GAAP Net Income |
$ | 183,620 | $ | 179,298 | ||||
| Non-GAAP Net Income attributable to Amdocs Limited |
$ | 182,697 | $ | 178,592 | ||||
| Non-GAAP Diluted earnings per share |
$ | 1.56 | $ | 1.47 | ||||
| • | Non-GAAP net income excludes amortization of purchased intangible assets and other acquisition-related costs, changes in certain acquisition related liabilities measured at fair value, equity-based compensation expenses, and other, net of related tax effects, in all the periods presented, and in the three months ended March 31, 2024, also excludes restructuring charges net of related tax effects |
For further details of the reconciliation of selected financial metrics from GAAP to Non-GAAP, please refer to the tables below.
Capital Allocation
| • | Quarterly Cash Dividend Program: On May 8, 2024, the Board approved the Company’s next quarterly cash dividend payment of $0.479 per share, and set June 28, 2024 as the record date for determining the shareholders entitled to receive the dividend, which will be payable on July 26, 2024 |
| • | Share Repurchase Activity: Repurchased $115 million of ordinary shares during the second quarter of fiscal 2024 |
Twelve-month Backlog
Twelve-month backlog was a record $4.23 billion at the end of the second quarter of fiscal 2024, up approximately 3% as compared to last year’s second fiscal quarter. Twelve-month backlog includes anticipated revenue related to contracts, estimated revenue from managed services contracts, letters of intent, maintenance and estimated on-going support activities.
Third Quarter Fiscal 2024 Outlook
| In millions, expect per share data |
||||
| Q3 - 2024 | ||||
| Revenue |
$ | 1,235-$1,275 | ||
| GAAP Diluted earnings per share |
$ | 1.24-$1.32 | ||
| Non-GAAP Diluted earnings per share |
$ | 1.57-$1.63 | ||
| • | Third quarter revenue guidance assumes immaterial sequential impact from foreign currency fluctuations as compared to the second quarter of fiscal 2024 |
| • | Third quarter non-GAAP diluted EPS guidance excludes equity-based compensation expense of approximately $0.18-$0.20 per share, amortization of purchased intangible assets and other acquisition-related costs of approximately $0.11 per share, changes in certain acquisitions related liabilities measured at fair value, and other, net of related tax effects |
| • | GAAP diluted EPS guidance does not include the impact of future expected restructuring charges |
Full Year Fiscal 2024 Outlook
| FY 2024 - Year-over - Year growth | ||||
| Current guidance | Previous guidance | |||
| Revenue Growth, as reported |
1.6%-3.6% | 1.1%-5.1% | ||
| Revenue Growth, constant currency (1) |
1.7%-3.7% | 1.2%-5.2% | ||
| GAAP Diluted earnings per share |
7.0%-13.0% | 13.0%-19.5% | ||
| Non-GAAP Diluted earnings per share |
7.0%-11.0% | 8.0%-12.0% | ||
| FY 2024, in millions | ||||||||
| Current guidance | Previous guidance | |||||||
| Free Cash Flow (2) |
$ | 700 | $ | 750 | ||||
| • | Full year fiscal 2024 revenue guidance incorporates an expected unfavorable impact from foreign currency fluctuations of approximately 0.1% year-over-year, consistent with our previous assumption |
| • | Non-GAAP diluted earnings per share growth excludes equity-based compensation expense of approximately $0.73-$0.77 per share, amortization of purchased intangible assets and other acquisition-related costs of approximately $0.46 per share, restructuring charges of $0.24 per share, changes in certain acquisitions related liabilities measured at fair value, and other, net of related tax effects |
| • | GAAP diluted EPS guidance does not include the impact of future expected restructuring charges |
| • | Non-GAAP operating margin is anticipated to be within a range of 18.1% to 18.7% for the full year fiscal 2024 |
| • | Non-GAAP operating margin is comprised of GAAP operating margin, excluding amortization on purchased intangible assets and other, equity-based compensation expense, restructuring charges, and changes in certain acquisitions related liabilities measured at fair value |
| • | Non-GAAP effective tax rate is anticipated to be within a range of 13% to 17% for the full year fiscal 2024 |
| • | Free cash flow(2) is comprised of cash flow from operations, less net capital expenditures and other, and excludes payments related to restructuring charges |
The forward looking statements regarding our third fiscal quarter 2024 and full year fiscal 2024 guidance take into consideration the Company’s current expectations regarding macro and industry specific risks and various uncertainties and certain assumptions that we will discuss on our earnings conference call.
However, we note that market dynamics continue to shift rapidly and we cannot predict all possible outcomes, including those resulting from certain geopolitical events (including the recent attacks in Israel and evolving conflict), the current inflationary environment, global or regional events, such as the COVID-19 pandemic and the prevailing level of macro-economic, business and operational uncertainty, which have created, and continue to create, a significant amount of uncertainty, or from current and potential customer consolidation or their other strategic corporate activities.
Conference Call and Earnings Webcast Presentation Details
Amdocs will host a conference call and earnings webcast presentation on May 8, 2024 at 5:00 p.m. Eastern Time to discuss the Company’s second quarter of fiscal 2024 results. To participate in the call, please register here to receive the dial-in numbers and unique access PIN. The conference call and webcast will also be carried live on the Internet and may be accessed via the Amdocs website at https://investors.amdocs.com. Presentation slides will be available shortly before the webcast.
Non-GAAP Financial Measures This release includes non-GAAP diluted earnings per share and other non-GAAP financial measures, including free cash flow, revenue on a constant currency(1) basis, non-GAAP cost of revenue, non-GAAP research and development, non-GAAP selling, general and administrative, non-GAAP operating income, non-GAAP operating margin, non-GAAP interest and other expenses, net, non-GAAP income taxes, non-GAAP effective tax rate, non-GAAP net income, non-GAAP net income attributable to Amdocs Limited and non-GAAP diluted earnings per share growth. These other non-GAAP measures exclude the following items:
| • | amortization of purchased intangible assets and other acquisition-related costs; |
| • | changes in certain acquisition-related liabilities measured at fair value; |
| • | restructuring and unusual charges or benefits; |
| • | equity-based compensation expense; |
| • | other; and |
| • | tax effects related to the above. |
Free cash flow equals cash generated by operating activities less net capital expenditures and other. These non-GAAP financial measures are not in accordance with, or an alternative for, generally accepted accounting principles and may be different from non-GAAP financial measures used by other companies. In addition, these non-GAAP financial measures are not based on any comprehensive set of accounting rules or principles. Amdocs believes that non-GAAP financial measures have limitations in that they do not reflect all of the amounts associated with Amdocs’ results of operations as determined in accordance with GAAP and that these measures should only be used to evaluate Amdocs’ results of operations in conjunction with the corresponding GAAP measures.
Amdocs believes that the presentation of non-GAAP diluted earnings per share and other financial measures, including free cash flow(2), revenue on a constant currency(1) basis, non-GAAP cost of revenue, non-GAAP research and development, non-GAAP selling, general and administrative, non-GAAP operating income, non-GAAP operating margin, non-GAAP interest and other expenses, net, non-GAAP income taxes, non-GAAP effective tax rate, non-GAAP net income, non-GAAP net income attributable to Amdocs Limited and non-GAAP diluted earnings per share growth when shown in conjunction with the corresponding GAAP measures, provides useful information to investors and management regarding financial and business trends relating to its financial condition and results of operations, as well as the net amount of cash generated by its business operations after taking into account capital spending required to maintain or expand the business.
For its internal budgeting process and in monitoring the results of the business, Amdocs’ management uses financial statements that do not include amortization of purchased intangible assets and other acquisition-related costs, changes in certain acquisition-related liabilities measured at fair value, restructuring and unusual charges or benefits, equity-based compensation expense, other and related tax effects. Amdocs’ management also uses the foregoing non-GAAP financial measures, in addition to the corresponding GAAP measures, in reviewing the financial results of Amdocs. In addition, Amdocs believes that significant groups of investors exclude these items in reviewing its results and those of its competitors, because the amounts of the items between companies can vary greatly depending on the assumptions used by an individual company in determining the amounts of the items.
Amdocs further believes that, where the adjustments used in calculating non-GAAP diluted earnings per share are based on specific, identified amounts that impact different line items in the Consolidated Statements of Income (including cost of revenue, research and development, selling, general and administrative, operating income, interest and other expenses, net, income taxes and net income), it is useful to investors to understand how these specific line items in the Consolidated Statements of Income are affected by these adjustments. Please refer to the Reconciliation of Selected Financial Metrics from GAAP to Non-GAAP tables below.
Supporting Resources
| • | Keep up with Amdocs news by visiting the Company’s website |
| • | Subscribe to Amdocs’ RSS Feed and follow us on Twitter, Facebook, LinkedIn and YouTube |
About Amdocs
Amdocs helps those who build the future to make it amazing. With our market-leading portfolio of software products and services, we unlock our customers’ innovative potential, empowering them to provide next-generation communication and media experiences for both the individual end user and large enterprise customers. Our approximately 29,000 employees around the globe are here to accelerate service providers’ migration to the cloud, enable them to differentiate in the 5G era, and digitalize and automate their operations. Listed on the NASDAQ Global Select Market, Amdocs had revenue of $4.89 billion in fiscal 2023.
For more information, visit Amdocs at www.amdocs.com.
This press release includes information that constitutes forward-looking statements made pursuant to the safe harbor provision of the Private Securities Litigation Reform Act of 1995, including statements about Amdocs’ growth and business results in future quarters and years. Although we believe the expectations reflected in such forward-looking statements are based upon reasonable assumptions, we can give no assurance that our expectations will be obtained or that any deviations will not be material. Such statements involve risks and uncertainties that may cause future results to differ from those anticipated. These risks include, but are not limited to, the effects of general macroeconomic conditions, prevailing level of macroeconomic, business and operational uncertainty, including as a result of geopolitical events or other global or regional events such as the October 7, 2023 attacks in Israel and evolving conflict and the COVID-19 pandemic, as well as the current inflationary environment, and the effects of these conditions on the Company’s customers’ businesses and levels of business activity, including the effect of the current economic uncertainty and industry pressure on the spending decisions of the Company’s customers. Amdocs’ ability to grow in the business markets that it serves, Amdocs’ ability to successfully integrate acquired businesses, adverse effects of market competition, rapid technological shifts that may render the Company’s products and services obsolete, potential loss of a major customer, our ability to develop long-term relationships with our customers, our ability to successfully and effectively implement artificial intelligence and Generative AI in the Company’s offerings and operations, and risks associated with operating businesses in the international market. Amdocs may elect to update these forward-looking statements at some point in the future; however, Amdocs specifically disclaims any obligation to do so. These and other risks are discussed at greater length in Amdocs’ filings with the Securities and Exchange Commission, including in our Annual Report on Form 20-F for the fiscal year ended September 30, 2023 filed on December 13, 2023 and our Form 6-K furnished for the first quarter of fiscal 2024 on February 20, 2024.
Contact:
Matthew Smith
Head of Investor Relations
Amdocs 314-212-8328
E-mail: dox_info@amdocs.com
AMDOCS LIMITED
Consolidated Statements of Income
(In thousands, except per share data)
| Three months ended March 31, |
Six months ended March 31, |
|||||||||||||||
| 2024 | 2023 | 2024 | 2023 | |||||||||||||
| Revenue |
$ | 1,245,849 | $ | 1,223,304 | $ | 2,491,048 | $ | 2,409,024 | ||||||||
| Operating expenses: |
||||||||||||||||
| Cost of revenue |
801,996 | 795,485 | 1,614,740 | 1,552,334 | ||||||||||||
| Research and development |
91,154 | 89,274 | 180,361 | 185,000 | ||||||||||||
| Selling, general and administrative |
147,609 | 143,328 | 290,113 | 286,550 | ||||||||||||
| Amortization of purchased intangible assets and other |
16,198 | 12,940 | 32,608 | 28,253 | ||||||||||||
| Restructuring charges |
33,160 | — | 33,160 | 24,536 | ||||||||||||
|
|
|
|
|
|
|
|
|
|||||||||
| 1,090,117 | 1,041,027 | 2,150,982 | 2,076,673 | |||||||||||||
|
|
|
|
|
|
|
|
|
|||||||||
| Operating income |
155,732 | 182,277 | 340,066 | 332,351 | ||||||||||||
| Interest and other expense, net |
(11,650 | ) | (2,938 | ) | (21,428 | ) | (7,901 | ) | ||||||||
|
|
|
|
|
|
|
|
|
|||||||||
| Income before income taxes |
144,082 | 179,339 | 318,638 | 324,450 | ||||||||||||
| Income taxes |
24,657 | 29,030 | 50,491 | 44,269 | ||||||||||||
|
|
|
|
|
|
|
|
|
|||||||||
| Net income |
$ | 119,425 | $ | 150,309 | $ | 268,147 | $ | 280,181 | ||||||||
|
|
|
|
|
|
|
|
|
|||||||||
| Net income attributable to noncontrolling interests |
923 | 706 | 1,680 | 911 | ||||||||||||
|
|
|
|
|
|
|
|
|
|||||||||
| Net income attributable to Amdocs Limited |
$ | 118,502 | $ | 149,603 | $ | 266,467 | $ | 279,270 | ||||||||
|
|
|
|
|
|
|
|
|
|||||||||
| Basic earnings per share attributable to Amdocs Limited |
$ | 1.02 | $ | 1.24 | $ | 2.28 | $ | 2.32 | ||||||||
|
|
|
|
|
|
|
|
|
|||||||||
| Diluted earnings per share attributable to Amdocs Limited |
$ | 1.01 | $ | 1.23 | $ | 2.27 | $ | 2.30 | ||||||||
|
|
|
|
|
|
|
|
|
|||||||||
| Cash dividends declared per ordinary share |
$ | 0.479 | $ | 0.435 | $ | 0.914 | $ | 0.830 | ||||||||
|
|
|
|
|
|
|
|
|
|||||||||
| Basic weighted average number of shares outstanding |
116,404 | 120,516 | 116,623 | 120,585 | ||||||||||||
|
|
|
|
|
|
|
|
|
|||||||||
| Diluted weighted average number of shares outstanding |
117,125 | 121,359 | 117,331 | 121,430 | ||||||||||||
|
|
|
|
|
|
|
|
|
|||||||||
AMDOCS LIMITED
Selected Financial Metrics
(In thousands, except per share data)
| Three months ended March 31, |
Six months ended March 31, |
|||||||||||||||
| 2024 | 2023 | 2024 | 2023 | |||||||||||||
| Revenue |
$ | 1,245,849 | $ | 1,223,304 | $ | 2,491,048 | $ | 2,409,024 | ||||||||
| Non-GAAP operating income |
229,434 | 217,737 | 454,675 | 427,275 | ||||||||||||
| Non-GAAP net income |
183,620 | 179,298 | 367,453 | 355,840 | ||||||||||||
| Non-GAAP net income attributable to Amdocs Limited |
182,697 | 178,592 | 365,773 | 354,929 | ||||||||||||
| Non-GAAP diluted earnings per share |
$ | 1.56 | $ | 1.47 | $ | 3.12 | $ | 2.92 | ||||||||
| Diluted weighted average number of shares outstanding |
117,125 | 121,359 | 117,331 | 121,430 | ||||||||||||
Free Cash Flows
(In thousands)
| Three months ended March 31, |
Six months ended March 31, |
|||||||||||||||
| 2024 | 2023 | 2024 | 2023 | |||||||||||||
| Net Cash Provided by Operating Activities |
$ | 132,657 | $ | 294,476 | $ | 315,044 | $ | 377,702 | ||||||||
| Purchases of property and equipment, net (a) |
(19,603 | ) | (35,119 | ) | (63,346 | ) | (68,822 | ) | ||||||||
|
|
|
|
|
|
|
|
|
|||||||||
| Free Cash Flow |
$ | 113,054 | $ | 259,357 | $ | 251,698 | $ | 308,880 | ||||||||
| (a) | The amounts under “Purchase of property and equipment, net”, include immaterial proceeds from sale of property and equipment for the six months ended March 31, 2024, and $255 for the six months ended March 31, 2023. |
AMDOCS LIMITED
Reconciliation of Selected Financial Metrics from GAAP to Non-GAAP
(In thousands)
| Three Months Ended March 31, 2024 | ||||||||||||||||||||||||||||||||
| GAAP | Amortization of purchased intangible assets and other |
Equity based compensation expense |
Changes in certain acquisitions related liabilities measured at fair value |
Restructuring charges |
Other | Tax effect |
Non-GAAP | |||||||||||||||||||||||||
| Operating expenses: |
||||||||||||||||||||||||||||||||
| Cost of revenue |
$ | 801,996 | $ | — | $ | (13,248 | ) | $ | 2,001 | $ | — | $ | — | $ | — | $ | 790,749 | |||||||||||||||
| Research and development |
91,154 | (2,256 | ) | 88,898 | ||||||||||||||||||||||||||||
| Selling, general and administrative |
147,609 | (10,841 | ) | 136,768 | ||||||||||||||||||||||||||||
| Amortization of purchased intangible assets and other |
16,198 | (16,198 | ) | — | ||||||||||||||||||||||||||||
| Restructuring charges |
33,160 | (33,160 | ) | — | ||||||||||||||||||||||||||||
|
|
|
|
|
|
|
|
|
|
|
|
|
|
|
|
|
|||||||||||||||||
| Total operating expenses |
1,090,117 | (16,198 | ) | (26,345 | ) | 2,001 | (33,160 | ) | — | — | 1,016,415 | |||||||||||||||||||||
|
|
|
|
|
|
|
|
|
|
|
|
|
|
|
|
|
|||||||||||||||||
| Operating income |
155,732 | 16,198 | 26,345 | (2,001 | ) | 33,160 | — | — | 229,434 | |||||||||||||||||||||||
| Interest and other expense, net |
(11,650 | ) | 4,004 | (7,646 | ) | |||||||||||||||||||||||||||
| Income taxes |
24,657 | 13,511 | 38,168 | |||||||||||||||||||||||||||||
|
|
|
|
|
|
|
|
|
|
|
|
|
|
|
|
|
|||||||||||||||||
| Net income |
119,425 | 16,198 | 26,345 | (2,001 | ) | 33,160 | 4,004 | (13,511 | ) | 183,620 | ||||||||||||||||||||||
|
|
|
|
|
|
|
|
|
|
|
|
|
|
|
|
|
|||||||||||||||||
| Net income attributable to noncontrolling interests |
923 | 923 | ||||||||||||||||||||||||||||||
|
|
|
|
|
|
|
|
|
|
|
|
|
|
|
|
|
|||||||||||||||||
| Net income attributable to Amdocs Limited |
$ | 118,502 | $ | 16,198 | $ | 26,345 | $ | (2,001 | ) | $ | 33,160 | $ | 4,004 | $ | (13,511 | ) | $ | 182,697 | ||||||||||||||
|
|
|
|
|
|
|
|
|
|
|
|
|
|
|
|
|
|||||||||||||||||
| Three Months Ended March 31, 2023 | ||||||||||||||||||||||||
| GAAP | Amortization of purchased intangible assets and other |
Equity based compensation expense |
Changes in certain acquisitions related liabilities measured at fair value |
Tax effect |
Non-GAAP | |||||||||||||||||||
| Operating expenses: |
||||||||||||||||||||||||
| Cost of revenue |
$ | 795,485 | $ | — | $ | (10,061 | ) | $ | (1,159 | ) | $ | — | $ | 784,265 | ||||||||||
| Research and development |
89,274 | (1,703 | ) | 87,571 | ||||||||||||||||||||
| Selling, general and administrative |
143,328 | (9,597 | ) | 133,731 | ||||||||||||||||||||
| Amortization of purchased intangible assets and other |
12,940 | (12,940 | ) | — | ||||||||||||||||||||
|
|
|
|
|
|
|
|
|
|
|
|
|
|||||||||||||
| Total operating expenses |
1,041,027 | (12,940 | ) | (21,361 | ) | (1,159 | ) | — | 1,005,567 | |||||||||||||||
|
|
|
|
|
|
|
|
|
|
|
|
|
|||||||||||||
| Operating income |
182,277 | 12,940 | 21,361 | 1,159 | — | 217,737 | ||||||||||||||||||
| Interest and other expense, net |
(2,938 | ) | (2,938 | ) | ||||||||||||||||||||
| Income taxes |
29,030 | — | — | 6,471 | 35,501 | |||||||||||||||||||
|
|
|
|
|
|
|
|
|
|
|
|
|
|||||||||||||
| Net income |
150,309 | 12,940 | 21,361 | 1,159 | (6,471 | ) | 179,298 | |||||||||||||||||
|
|
|
|
|
|
|
|
|
|
|
|
|
|||||||||||||
| Net income attributable to noncontrolling interests |
706 | 706 | ||||||||||||||||||||||
|
|
|
|
|
|
|
|
|
|
|
|
|
|||||||||||||
| Net income attributable to Amdocs Limited |
$ | 149,603 | $ | 12,940 | $ | 21,361 | $ | 1,159 | $ | (6,471 | ) | $ | 178,592 | |||||||||||
|
|
|
|
|
|
|
|
|
|
|
|
|
|||||||||||||
AMDOCS LIMITED
Reconciliation of Selected Financial Metrics from GAAP to Non-GAAP
(In thousands)
| Six Months Ended March 31, 2024 | ||||||||||||||||||||||||||||||||
| GAAP | Amortization of purchased intangible assets and other |
Equity based compensation expense |
Changes in certain acquisitions related liabilities measured at fair value |
Restructuring charges |
Other | Tax effect |
Non-GAAP | |||||||||||||||||||||||||
| Operating expenses: |
||||||||||||||||||||||||||||||||
| Cost of revenue |
$ | 1,614,740 | $ | — | $ | (26,775 | ) | $ | 3,584 | $ | — | $ | — | $ | — | $ | 1,591,549 | |||||||||||||||
| Research and development |
180,361 | (4,123 | ) | 176,238 | ||||||||||||||||||||||||||||
| Selling, general and administrative |
290,113 | (21,527 | ) | 268,586 | ||||||||||||||||||||||||||||
| Amortization of purchased intangible assets and other |
32,608 | (32,608 | ) | — | ||||||||||||||||||||||||||||
| Restructuring charges |
33,160 | (33,160 | ) | — | ||||||||||||||||||||||||||||
|
|
|
|
|
|
|
|
|
|
|
|
|
|
|
|
|
|||||||||||||||||
| Total operating expenses |
2,150,982 | (32,608 | ) | (52,425 | ) | 3,584 | (33,160 | ) | — | 2,036,373 | ||||||||||||||||||||||
|
|
|
|
|
|
|
|
|
|
|
|
|
|
|
|
|
|||||||||||||||||
| Operating income |
340,066 | 32,608 | 52,425 | (3,584 | ) | 33,160 | — | 454,675 | ||||||||||||||||||||||||
| Interest and other expense, net |
(21,428 | ) | 5,538 | (15,890 | ) | |||||||||||||||||||||||||||
| Income taxes |
50,491 | 20,841 | 71,332 | |||||||||||||||||||||||||||||
|
|
|
|
|
|
|
|
|
|
|
|
|
|
|
|
|
|||||||||||||||||
| Net income |
268,147 | 32,608 | 52,425 | (3,584 | ) | 33,160 | 5,538 | (20,841 | ) | 367,453 | ||||||||||||||||||||||
|
|
|
|
|
|
|
|
|
|
|
|
|
|
|
|
|
|||||||||||||||||
| Net income attributable to noncontrolling interests |
1,680 | 1,680 | ||||||||||||||||||||||||||||||
|
|
|
|
|
|
|
|
|
|
|
|
|
|
|
|
|
|||||||||||||||||
| Net income attributable to Amdocs Limited |
$ | 266,467 | $ | 32,608 | $ | 52,425 | $ | (3,584 | ) | $ | 33,160 | $ | 5,538 | $ | (20,841 | ) | $ | 365,773 | ||||||||||||||
|
|
|
|
|
|
|
|
|
|
|
|
|
|
|
|
|
|||||||||||||||||
| Six Months Ended March 31, 2023 | ||||||||||||||||||||||||||||
| GAAP | Amortization of purchased intangible assets and other |
Equity based compensation expense |
Changes in certain acquisitions related liabilities measured at fair value |
Restructuring charges |
Tax effect |
Non-GAAP | ||||||||||||||||||||||
| Operating expenses: |
||||||||||||||||||||||||||||
| Cost of revenue |
$ | 1,552,334 | $ | — | $ | (18,716 | ) | $ | (1,284 | ) | $ | — | $ | — | $ | 1,532,334 | ||||||||||||
| Research and development |
185,000 | (3,187 | ) | 181,813 | ||||||||||||||||||||||||
| Selling, general and administrative |
286,550 | (18,948 | ) | 267,602 | ||||||||||||||||||||||||
| Amortization of purchased intangible assets and other |
28,253 | (28,253 | ) | — | ||||||||||||||||||||||||
| Restructuring charges |
24,536 | (24,536 | ) | — | ||||||||||||||||||||||||
|
|
|
|
|
|
|
|
|
|
|
|
|
|
|
|||||||||||||||
| Total operating expenses |
2,076,673 | (28,253 | ) | (40,851 | ) | (1,284 | ) | (24,536 | ) | — | 1,981,749 | |||||||||||||||||
|
|
|
|
|
|
|
|
|
|
|
|
|
|
|
|||||||||||||||
| Operating income |
332,351 | 28,253 | 40,851 | 1,284 | 24,536 | — | 427,275 | |||||||||||||||||||||
| Interest and other expense, net |
(7,901 | ) | (7,901 | ) | ||||||||||||||||||||||||
| Income taxes |
44,269 | 19,265 | 63,534 | |||||||||||||||||||||||||
|
|
|
|
|
|
|
|
|
|
|
|
|
|
|
|||||||||||||||
| Net income |
280,181 | 28,253 | 40,851 | 1,284 | 24,536 | (19,265 | ) | 355,840 | ||||||||||||||||||||
|
|
|
|
|
|
|
|
|
|
|
|
|
|
|
|||||||||||||||
| Net income attributable to noncontrolling interests |
911 | 911 | ||||||||||||||||||||||||||
|
|
|
|
|
|
|
|
|
|
|
|
|
|
|
|||||||||||||||
| Net income attributable to Amdocs Limited |
$ | 279,270 | $ | 28,253 | $ | 40,851 | $ | 1,284 | $ | 24,536 | $ | (19,265 | ) | $ | 354,929 | |||||||||||||
|
|
|
|
|
|
|
|
|
|
|
|
|
|
|
|||||||||||||||
AMDOCS LIMITED
Condensed Consolidated Balance Sheets
(In thousands)
| As of | ||||||||
| March 31, 2024 |
September 30, 2023 |
|||||||
| ASSETS |
||||||||
| Current assets: |
||||||||
| Cash and cash equivalents |
$ | 342,915 | $ | 520,080 | ||||
| Short-term interest-bearing investments |
201,441 | 222,451 | ||||||
| Accounts receivable, net, including unbilled of $329,753 and $211,498, respectively |
1,039,440 | 944,477 | ||||||
| Prepaid expenses and other current assets |
223,180 | 224,622 | ||||||
|
|
|
|
|
|||||
| Total current assets |
1,806,976 | 1,911,630 | ||||||
| Property and equipment, net |
766,123 | 790,923 | ||||||
| Lease assets |
162,745 | 160,938 | ||||||
| Goodwill and other intangible assets, net |
3,023,854 | 2,930,580 | ||||||
| Other noncurrent assets |
644,946 | 631,582 | ||||||
|
|
|
|
|
|||||
| Total assets |
$ | 6,404,644 | $ | 6,425,653 | ||||
|
|
|
|
|
|||||
| LIABILITIES AND SHAREHOLDERS’ EQUITY |
||||||||
| Current liabilities |
||||||||
| Accounts payable, accruals and other |
$ | 1,202,517 | $ | 1,142,781 | ||||
| Lease liabilities |
39,514 | 39,960 | ||||||
| Deferred revenue |
127,441 | 170,634 | ||||||
|
|
|
|
|
|||||
| Total current liabilities |
1,369,472 | 1,353,375 | ||||||
| Lease liabilities |
117,777 | 121,654 | ||||||
| Long-term debt, net of unamortized debt issuance costs |
645,991 | 645,696 | ||||||
| Other noncurrent liabilities |
683,883 | 737,996 | ||||||
| Total Amdocs Limited Shareholders’ equity |
3,544,412 | 3,523,759 | ||||||
| Noncontrolling interests |
43,109 | 43,173 | ||||||
|
|
|
|
|
|||||
| Total equity |
3,587,521 | 3,566,932 | ||||||
|
|
|
|
|
|||||
| Total liabilities and equity |
$ | 6,404,644 | $ | 6,425,653 | ||||
|
|
|
|
|
|||||
AMDOCS LIMITED
Consolidated Statements of Cash Flows
(In thousands)
| Six months ended March 31, |
||||||||
| 2024 | 2023 | |||||||
| Cash Flow from Operating Activities: |
||||||||
| Net income |
$ | 268,147 | $ | 280,181 | ||||
| Reconciliation of net income to net cash provided by operating activities: |
||||||||
| Depreciation, amortization and impairment |
97,851 | 103,086 | ||||||
| Amortization of debt issuance cost |
296 | 287 | ||||||
| Equity-based compensation expense |
52,425 | 40,851 | ||||||
| Deferred income taxes |
559 | (27,357 | ) | |||||
| Loss from short-term interest-bearing investments |
4,640 | 1,625 | ||||||
| Net changes in operating assets and liabilities, net of amounts acquired: |
||||||||
| Accounts receivable, net |
(71,288 | ) | (53,485 | ) | ||||
| Prepaid expenses and other current assets |
19,305 | (20,416 | ) | |||||
| Other noncurrent assets |
(14,493 | ) | (245 | ) | ||||
| Lease assets and liabilities, net |
(6,130 | ) | (3,928 | ) | ||||
| Accounts payable, accrued expenses and accrued personnel |
70,073 | (38,602 | ) | |||||
| Deferred revenue |
(48,528 | ) | 81,959 | |||||
| Income taxes payable, net |
(62,228 | ) | (11,245 | ) | ||||
| Other noncurrent liabilities |
4,415 | 24,991 | ||||||
|
|
|
|
|
|||||
| Net cash provided by operating activities |
315,044 | 377,702 | ||||||
|
|
|
|
|
|||||
| Cash Flow from Investing Activities: |
||||||||
| Purchase of property and equipment, net (a) |
(63,346 | ) | (68,822 | ) | ||||
| Proceeds from sale of short-term interest-bearing investments |
31,141 | 10,360 | ||||||
| Purchase of short-term interest-bearing investments |
(9,061 | ) | — | |||||
| Net cash paid for business acquisitions |
(87,129 | ) | — | |||||
| Other |
(391 | ) | (2,593 | ) | ||||
|
|
|
|
|
|||||
| Net cash used in investing activities |
(128,786 | ) | (61,055 | ) | ||||
|
|
|
|
|
|||||
| Cash Flow from Financing Activities: |
||||||||
| Repurchase of shares |
(273,941 | ) | (205,637 | ) | ||||
| Proceeds from employee stock option exercises |
16,061 | 34,840 | ||||||
| Payments of dividends |
(101,736 | ) | (95,370 | ) | ||||
| Distribution to noncontrolling interests |
(1,744 | ) | — | |||||
| Payment of contingent consideration from a business acquisition |
(2,063 | ) | (453 | ) | ||||
|
|
|
|
|
|||||
| Net cash used in financing activities |
(363,423 | ) | (266,620 | ) | ||||
|
|
|
|
|
|||||
| Net (decrease) increase in cash and cash equivalents |
(177,165 | ) | 50,027 | |||||
| Cash and cash equivalents at beginning of period |
520,080 | 573,377 | ||||||
|
|
|
|
|
|||||
| Cash and cash equivalents at end of period |
$ | 342,915 | $ | 623,404 | ||||
|
|
|
|
|
|||||
AMDOCS LIMITED
Supplementary Information
(In millions)
| Three months ended | ||||||||||||||||||||
| March 31, 2024 |
December 31, 2023 |
September 30, 2023 |
June 30, 2023 |
March 31, 2023 |
||||||||||||||||
| North America |
$ | 823.2 | $ | 838.1 | $ | 834.4 | $ | 830.9 | $ | 829.0 | ||||||||||
| Europe |
184.8 | 181.4 | 175.5 | 187.3 | 171.7 | |||||||||||||||
| Rest of the World |
237.8 | 225.7 | 232.6 | 217.8 | 222.6 | |||||||||||||||
|
|
|
|
|
|
|
|
|
|
|
|||||||||||
| Total Revenue |
$ | 1,245.8 | $ | 1,245.2 | $ | 1,242.6 | $ | 1,236.0 | $ | 1,223.3 | ||||||||||
|
|
|
|
|
|
|
|
|
|
|
|||||||||||
|
|
|
|
|
|
|
|
|
|
|
|||||||||||
| Three months ended | ||||||||||||||||||||
| March 31, 2024 |
December 31, 2023 |
September 30, 2023 |
June 30, 2023 |
March 31, 2023 |
||||||||||||||||
| Managed Services Revenue |
$ | 720.3 | $ | 722.5 | $ | 718.1 | $ | 719.8 | $ | 718.9 | ||||||||||
|
|
|
|
|
|
|
|
|
|
|
|||||||||||
| as of | ||||||||||||||||||||
| March 31, 2024 |
December 31, 2023 |
September 30, 2023 |
June 30, 2023 |
March 31, 2023 |
||||||||||||||||
| 12-Month Backlog |
$ | 4,230 | $ | 4,210 | $ | 4,150 | $ | 4,140 | $ | 4,110 | ||||||||||
|
|
|
|
|
|
|
|
|
|
|
|||||||||||
# # #
Exhibit 99.2

Amdocs Limited NASDAQ: DOX Fiscal Q2 2024 Earnings Presentation May 8, 2024 Shuky Sheffer President & CEO Tamar Rapaport-Dagim CFO & COO
The information contained herein in this presentation or delivered or to be delivered to you during this presentation does not constitute an offer, expressed or implied, or a recommendation to do any transaction in Amdocs Limited securities or in any securities of its affiliates or subsidiaries. This presentation and the comments made by members of Amdocs management in conjunction with it can be found on the Investor Relations section of our website, and, as always, a copy of today’s prepared remarks will also be posted immediately following the conclusion of this call. This presentation includes information that constitutes forward-looking statements made pursuant to the safe harbor provision of the Private Securities Litigation Reform Act of 1995, including statements about Amdocs’ growth and business results in future quarters and years. Although we believe the expectations reflected in such forward-looking statements are based upon reasonable assumptions, we can give no assurance that our expectations will be obtained or that any deviations will not be material. Such statements involve risks and uncertainties that may cause future results to differ from those anticipated. These risks include, but are not limited to, the effects of general macroeconomic conditions, prevailing level of macroeconomic, business and operational uncertainty, including as a result of geopolitical events or other global or regional events such as the October 7, 2023 attacks in Israel and evolving conflict and the COVID-19 pandemic, as well as the current inflationary environment, and the effects of these conditions on the Company’s customers’ businesses and levels of business activity, including the effect of the current economic uncertainty and industry pressure on the spending decisions of the Company’s customers. Amdocs’ ability to grow in the business markets that it serves, Amdocs’ ability to successfully integrate acquired businesses, adverse effects of market competition, rapid technological shifts that may render the Company’s products and services obsolete, potential loss of a major customer, our ability to develop long-term relationships with our customers, our ability to successfully and effectively implement artificial intelligence and Generative AI in the Company’s offerings and operations, and risks associated with operating businesses in the international market. Amdocs may elect to update these forward-looking statements at some point in the future; however, Amdocs specifically disclaims any obligation to do so. These and other risks are discussed at greater length in Amdocs’ filings with the Securities and Exchange Commission, including in our Annual Report on Form 20-F for the fiscal year ended September 30, 2023 filed on December 13, 2023, and our Form 6-K furnished for the first quarter of fiscal 2024 on February 20, 2024. This presentation includes non-GAAP financial measures, including non-GAAP operating margin, free cash flow, revenue on a constant currency basis, non-GAAP net income, non-GAAP net income attributable to Amdocs Limited, and non-GAAP earnings per share. Free cash flow equals cash generated by operating activities less net capital expenditures and other. While in prior years Amdocs used normalized free cash flow, a measure of our operating performance, is further adjusted to exclude net capital expenditures related to the new campus development, payments for non-recurring and unusual charges (such as capital gains tax to be paid in relation to the divestiture of OpenMarket), and payments of acquisition related liabilities, Amdocs is no longer reporting normalized free cash flow. Normalized free cash flow is not comparable to free cash flow. These non-GAAP financial measures are not in accordance with, or an alternative for, generally accepted accounting principles and may be different from non-GAAP financial measures used by other companies. In addition, these non-GAAP financial measures are not based on any comprehensive set of accounting rules or principles. Amdocs believes that non-GAAP financial measures have limitations in that they do not reflect all of the amounts associated with Amdocs’ results of operations as determined in accordance with GAAP and that these measures should only be used to evaluate Amdocs’ results of operations in conjunction with the corresponding GAAP measures. Please refer to the appendix for a reconciliation of these metrics to the most comparable GAAP provision. This presentation also includes pro forma metrics which exclude the financial impact of OpenMarket (divested on December 31, 2020) from fiscal year 2021. Please also review the information contained in Amdocs’ press release dated May 8, 2024 with respect to earnings for fiscal Q2 2024. The press release contains additional information regarding Amdocs’ outlook for fiscal year 2024 and certain non-GAAP metrics and their reconciliations. 2 Information Security Level 0 – Public. © 2024 – Proprietary & Confidential Information of Amdocs

Today’s speakers President & Chief Executive Officer Chief Financial Officer & Chief Operating Officer 3 Information Security Level 0 – Public. © 2024 – Proprietary & Confidential Information of Amdocs

Earnings call agenda 1 Strategy & business performance update Shuky Sheffer, President & Chief Executive Officer 2 Financial review &outlook Tamar Rapaport-Dagim, Chief Financial Officer & Chief Operating Officer 3 Q&A

President & Chief Executive Officer Strategy and business performance update
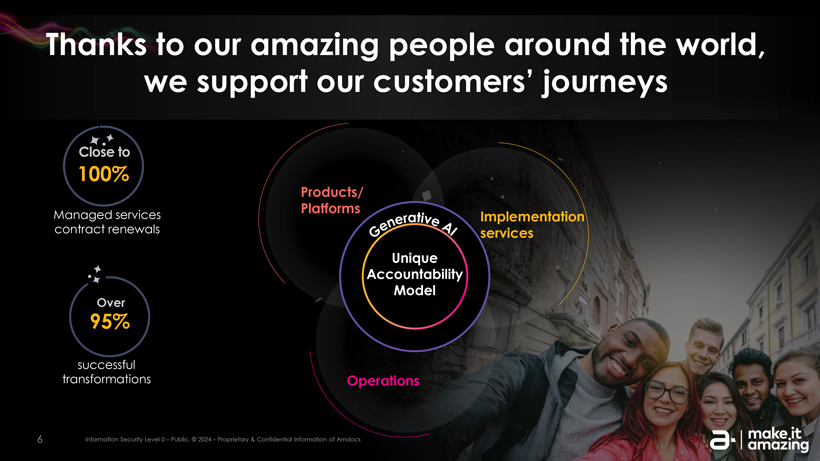
Thanks to our amazing people around the world, we support our customers’ journeys Close to 100% Products/ Managed services Platforms contract renewals Implementation services Unique Accountability Over Model 95% successful transformations Operations 6 Information Security Level 0 – Public. © 2024 – Proprietary & Confidential Information of Amdocs
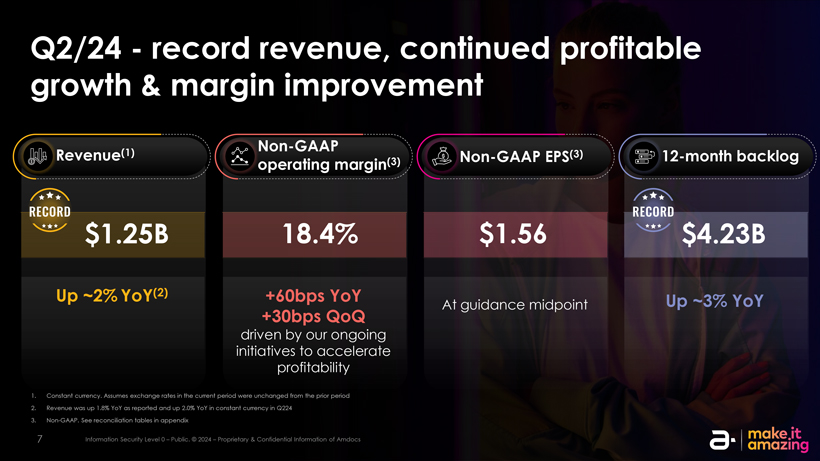
Q2/24—record revenue, continued profitable growth & margin improvement (1) Non-GAAP Revenue Non-GAAP EPS(3) 12-month backlog operating margin(3) $1.25B 18.4% $1.56 $4.23B Up ~2% YoY(2) +60bps YoY At guidance midpoint Up ~3% YoY +30bps QoQ driven by our ongoing initiatives to accelerate profitability 1. Constant currency. Assumes exchange rates in the current period were unchanged from the prior period 2. Revenue was up 1.8% YoY as reported and up 2.0% YoY in constant currency in Q224 3. Non-GAAP. See reconciliation tables in appendix 7 Information Security Level 0 – Public. © 2024 – Proprietary & Confidential Information of Amdocs
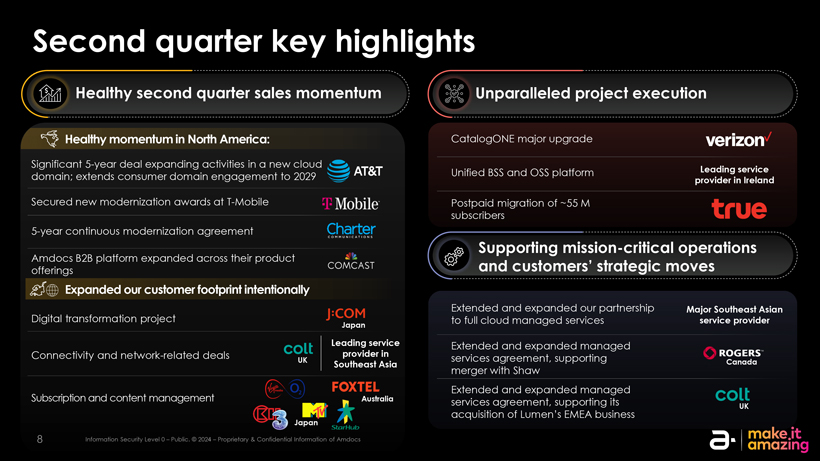
Second quarter key highlights Healthy second quarter sales momentum Unparalleled project execution Healthy momentum in North America: CatalogONE major upgrade Significant 5-year deal expanding activities in a new cloud Unified BSS and OSS platform Leading service domain; extends consumer domain engagement to 2029 provider in Ireland Secured new modernization awards at T-Mobile Postpaid migration of ~55 M subscribers 5-year continuous modernization agreement Supporting mission-critical operations Amdocs B2B platform expanded across their product and customers’ strategic moves offerings Expanded our customer footprint intentionally Extended and expanded our partnership Major Southeast Asian Digital transformation project to full cloud managed services service provider Japan Leading service Extended and expanded managed Connectivity and network-related deals provider in services agreement, supporting UK Southeast Asia Canada merger with Shaw Extended and expanded managed Subscription and content management Australia services agreement, supporting its UK Japan acquisition of Lumen’s EMEA business 8 Information Security Level 0 – Public. © 2024 – Proprietary & Confidential Information of Amdocs
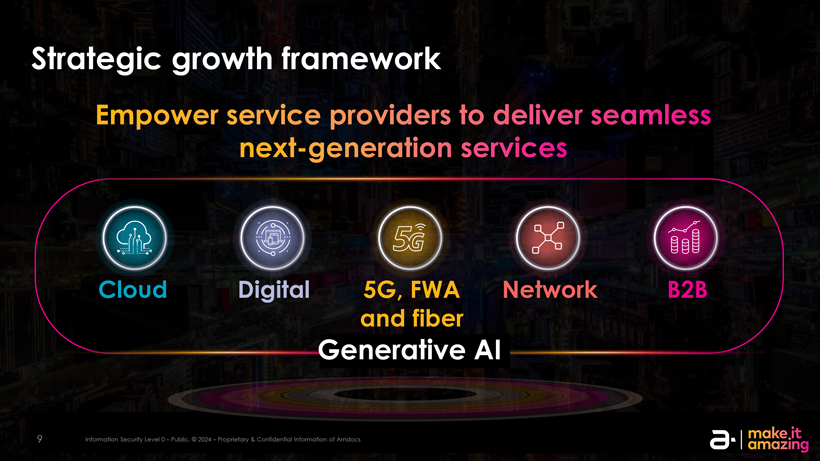
Strategic growth framework Cloud Digital 5G, FWA Network B2B and fiber Generative AI 9 Information Security Level 0 – Public. © 2024 – Proprietary & Confidential Information of Amdocs
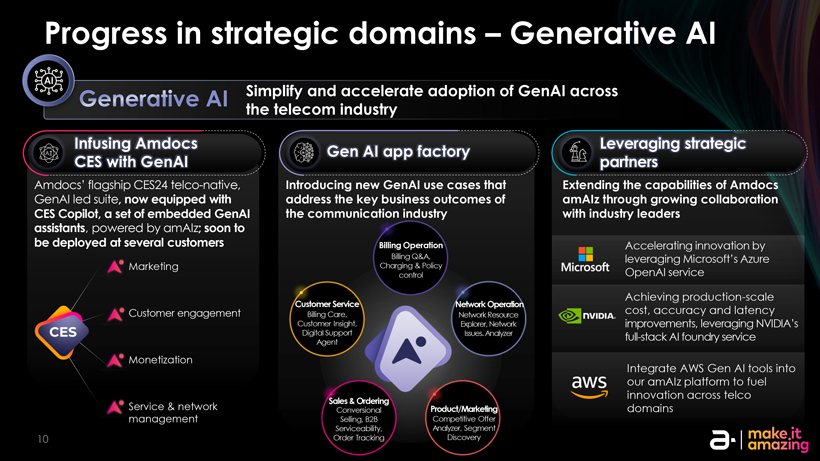
Progress in strategic domains – Generative AI Simplify and accelerate adoption of GenAI across the telecom industry Infusing Amdocs Leveraging strategic Gen AI app factory CES with GenAI partners Amdocs’ flagship CES24 telco-native, Introducing new GenAI use cases that Extending the capabilities of Amdocs GenAI led suite, now equipped with address the key business outcomes of amAIz through growing collaboration CES Copilot, a set of embedded GenAI the communication industry with industry leaders assistants, powered by amAIz; soon to be deployed at several customers Billing Operation Accelerating innovation by Billing Q&A, leveraging Microsoft’s Azure Marketing Charging & Policy control OpenAI service Achieving production-scale Customer Service Network Operation Customer engagement Billing Care, Network Resource cost, accuracy and latency Customer Insight, Explorer, Network improvements, leveraging NVIDIA’s Digital Support Issues. Analyzer full-stack AI foundry service Agent Monetization Integrate AWS Gen AI tools into our amAIz platform to fuel innovation across telco Sales & Ordering Service & network Conversional Product/Marketing domains management Selling, B2B Competitive Offer Serviceability, Analyzer, Segment 10 Order Tracking Discovery
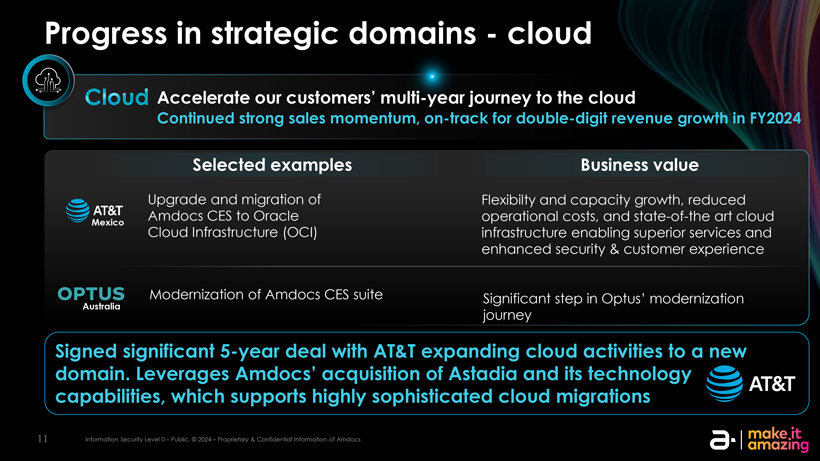
Progress in strategic domains—cloud Accelerate our customers’ journey to the cloud Continued strong sales momentum, on-track for double-digit revenue growth in FY2024 Selected examples Business value Upgrade and migration of Flexibilty and capacity growth, reduced Amdocs CES to Oracle operational costs, and state-of-the art cloud Mexico Cloud Infrastructure (OCI) infrastructure enabling superior services and enhanced security & customer experience Modernization of Amdocs CES suite Significant step in Optus’ modernization Australia journey Signed significant 5-year deal with AT&T expanding cloud activities to a new domain. Leverages Amdocs’ acquisition of Astadia and its technology capabilities, which supports highly sophisticated cloud migrations 11 Information Security Level 0 – Public. © 2024 – Proprietary & Confidential Information of Amdocs
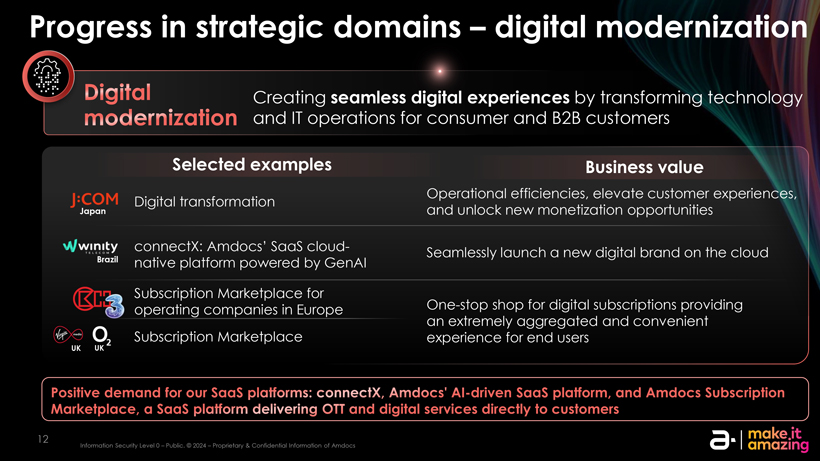
Progress in strategic domains – digital modernization Creating seamless digital experiences by transforming technology and IT operations for consumer and B2B customers Selected examples Business value Operational efficiencies, elevate customer experiences, Digital transformation Japan and unlock new monetization opportunities connectX: Amdocs’ SaaS cloud- Seamlessly launch a new digital brand on the cloud Brazil native platform powered by GenAI Subscription Marketplace for operating companies in Europe One-stop shop for digital subscriptions providing an extremely aggregated and convenient Subscription Marketplace experience for end users UK UK 12 Information Security Level 0 – Public. © 2024 – Proprietary & Confidential Information of Amdocs
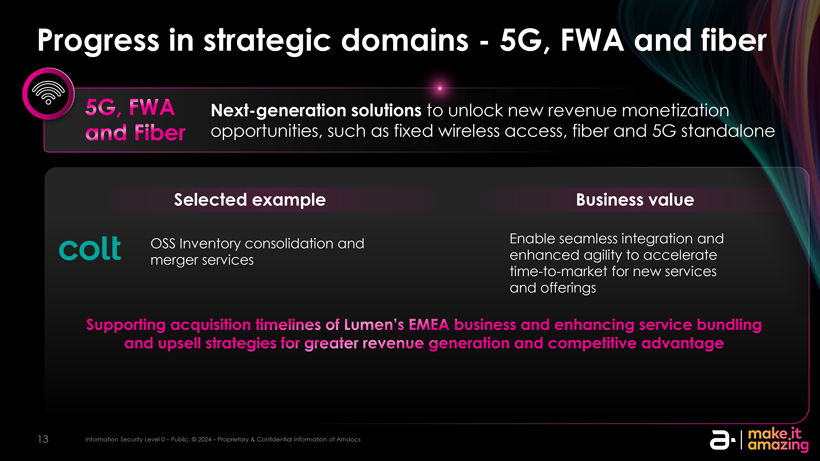
Progress in strategic domains—5G, FWA and fiber Next-generation solutions to unlock new revenue monetization opportunities, such as fixed wireless access, fiber and 5G standalone Selected example Business value OSS Inventory consolidation and Enable seamless integration and merger services enhanced agility to accelerate time-to-market for new services and offerings 13 Information Security Level 0 – Public. © 2024 – Proprietary & Confidential Information of Amdocs
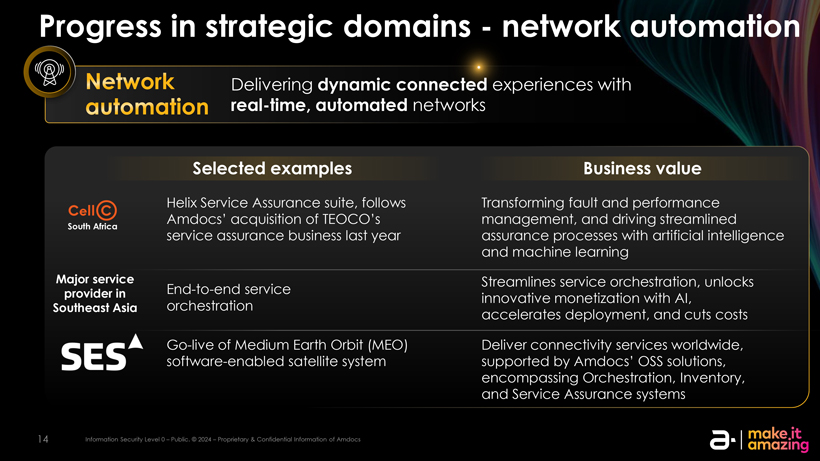
Progress in strategic domains—network automation Delivering dynamic connected experiences with real-time, automated networks Selected examples Business value Helix Service Assurance suite, follows Transforming fault and performance Amdocs’ acquisition of TEOCO’s management, and driving streamlined South Africa service assurance business last year assurance processes with artificial intelligence and machine learning Major service Streamlines service orchestration, unlocks provider in End-to-end service innovative monetization with AI, Southeast Asia orchestration accelerates deployment, and cuts costs Go-live of Medium Earth Orbit (MEO) Deliver connectivity services worldwide, software-enabled satellite system supported by Amdocs’ OSS solutions, encompassing Orchestration, Inventory, and Service Assurance systems 14 Information Security Level 0 – Public. © 2024 – Proprietary & Confidential Information of Amdocs
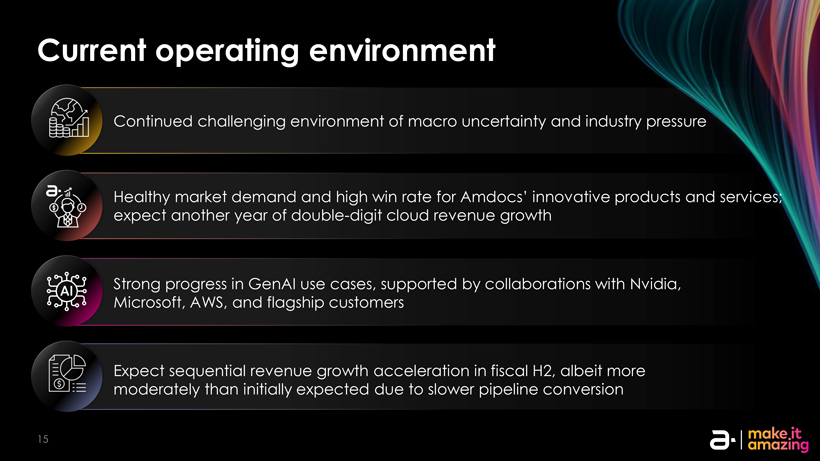
Current operating environment Continued challenging environment of macro uncertainty and industry pressure Healthy market demand and high win rate for Amdocs’ innovative products and services; expect another year of double-digit cloud revenue growth Strong progress in GenAI use cases, supported by collaborations with Nvidia, Microsoft, AWS, and flagship customers Expect sequential revenue growth acceleration in fiscal H2, albeit more moderately than initially expected due to slower pipeline conversion 15
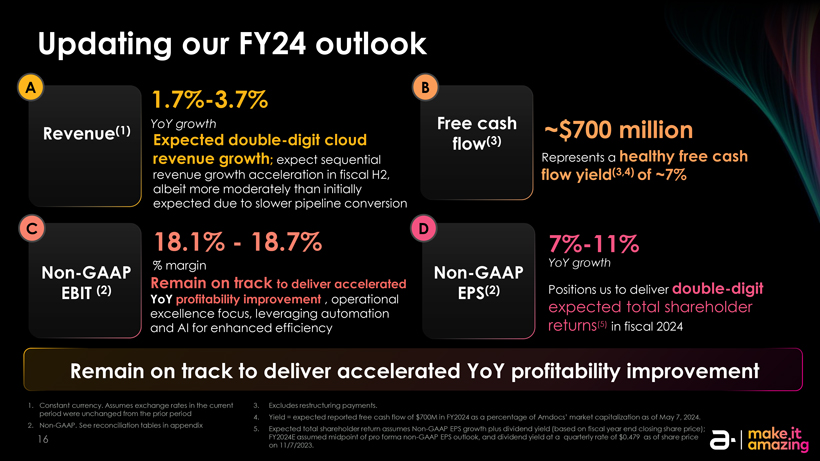
Updating our FY24 outlook A 1.7%-3.7% B YoY growth Free cash Revenue(1) Expected double-digit cloud flow(3) revenue growth; expect sequential Represents a revenue growth acceleration in fiscal H2, albeit more moderately than initially expected due to slower pipeline conversion C 18.1%—18.7% D 7%-11% % margin YoY growth Non-GAAP Non-GAAP Remain on track to deliver accelerated Positions us to deliver double-digit EBIT (2) EPS(2) YoY profitability improvement , operational expected total shareholder excellence focus, leveraging automation and AI for enhanced efficiency returns(5) in fiscal 2024 Remain on track to deliver accelerated YoY profitability improvement 1. Constant currency. Assumes exchange rates in the current 3. Excludes restructuring payments. period were unchanged from the prior period 4. Yield = expected reported free cash flow of $700M in FY2024 as a percentage of Amdocs’ market capitalization as of May 7, 2024. 2. Non-GAAP. See reconciliation tables in appendix 5. Expected total shareholder return assumes Non-GAAP EPS growth plus dividend yield (based on fiscal year end closing share price); 16 FY2024E assumed midpoint of pro forma non-GAAP EPS outlook, and dividend yield at a quarterly rate of $0.479 as of share price on 11/7/2023.

Chief Financial Officer & Chief Operating Officer Financial review & outlook
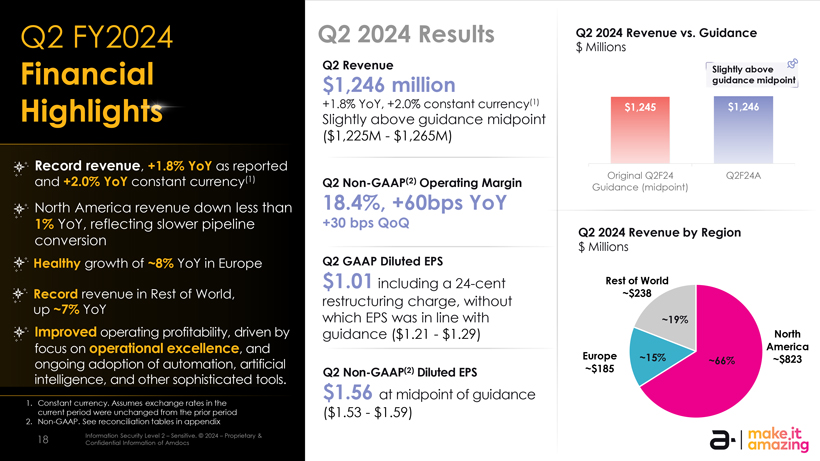
Q2 FY2024 Q2 2024 Results Q2 2024 Revenue vs. Guidance $ Millions Q2 Revenue Slightly above Financial $1,246 million guidance midpoint Highligh +1.8% YoY, +2.0% constant currency(1) $1,245 $1,246 Slightly above guidance midpoint ($1,225M—$1,265M) Record revenue, +1.8% YoY as reported (1) Original Q2F24 Q2F24A and +2.0% YoY constant currency Q2 Non-GAAP(2) Operating Margin Guidance (midpoint) North America revenue down less than 18.4%, +60bps YoY 1% YoY, reflecting slower pipeline +30 bps QoQ Q2 2024 Revenue by Region conversion $ Millions Healthy growth of ~8% YoY in Europe Q2 GAAP Diluted EPS $1.01 including a 24-cent Rest of World Record revenue in Rest of World, ~$238 restructuring charge, without up ~7% YoY which EPS was in line with ~19% Improved operating profitability, driven by guidance ($1.21—$1.29) North focus on operational excellence, and America Europe ~15% ~66% ~$823 ongoing adoption of automation, artificial ~$185 Q2 Non-GAAP(2) Diluted EPS intelligence, and other sophisticated tools. $1.56 at midpoint of guidance 1. Constant currency. Assumes exchange rates in the current period were unchanged from the prior period ($1.53—$1.59) 2. Non-GAAP. See reconciliation tables in appendix 18 Information Security Level 2 – Sensitive. © 2024 – Proprietary & Confidential Information of Amdocs
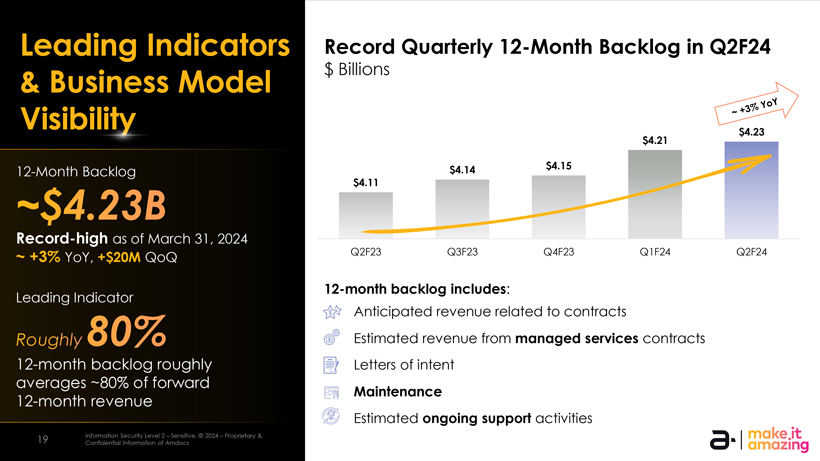
Leading Indicators Record Quarterly 12-Month Backlog in Q2F24 $ Billions & Business Model 12-month backlog growth has accelerated Visibility year-over-year over the past several quarters $4.23 $4.21 (1) 12-Month Backlog $4.14 $4.15 (1) $4.11 (1 Record-high as of March 31, 2024 ~ +3% YoY, +$20M QoQ Q2F23 Q3F23 Q4F23 Q1F24 Q2F24 12-month backlog includes: Leading Indicator Anticipated revenue related to contracts Estimated revenue from managed services contracts 12-month backlog roughly Letters of intent averages ~80% of forward Maintenance 12-month revenue Estimated ongoing support activities 19 Information Security Level 2 – Sensitive. © 2024 – Proprietary & Confidential Information of Amdocs
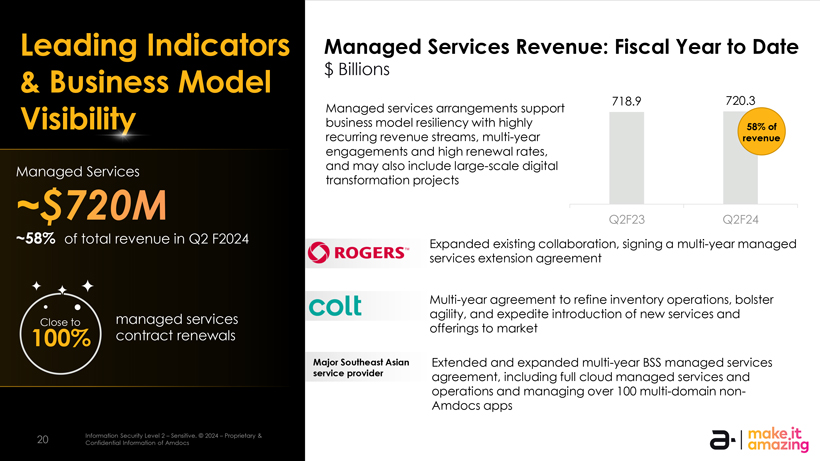
Leading Indicators Managed Services Revenue: Fiscal Year to Date & Business Model $ Billions 718.9 720.3 Managed services arrangements support Visibility business model resiliency with highly 58% of recurring revenue streams, multi-year revenue engagements and high renewal rates, Managed Services and may also include large-scale digital transformation projects Q2F23 Q2F24 ~58% of total revenue in Q2 F2024 Expanded existing collaboration, signing a multi-year managed services extension agreement Multi-year agreement to refine inventory operations, bolster managed services agility, and expedite introduction of new services and Close to offerings to market 100% contract renewals Major Southeast Asian Extended and expanded multi-year BSS managed services service provider agreement, including full cloud managed services and operations and managing over 100 multi-domain non-Amdocs apps 20 Information Security Level 2 – Sensitive. © 2024 – Proprietary & Confidential Information of Amdocs
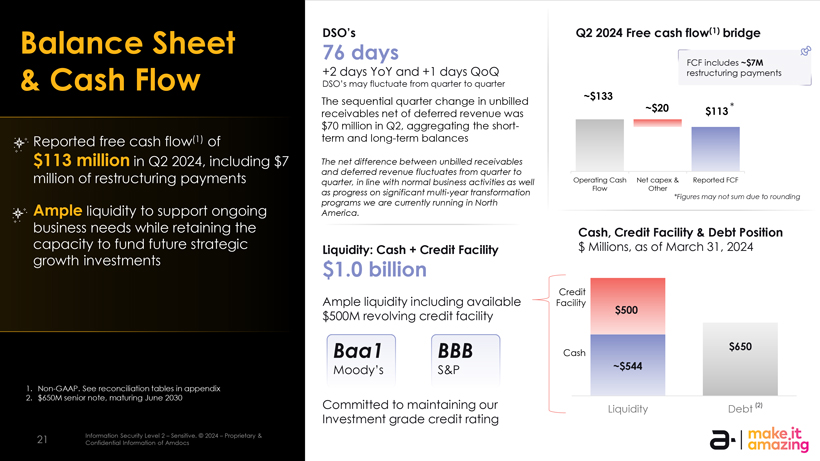
Balance Sheet DSO’s Q2 2024 Free cash flow(1) bridge 76 days FCF includes ~$7M +2 days YoY and +1 days QoQ restructuring payments & Cash Flow DSO’s may fluctuate from quarter to quarter ~$133 The sequential quarter change in unbilled ~$20 $113 * receivables net of deferred revenue was $70 million in Q2, aggregating the short- Reported free cash flow(1) of term and long-term balances $113 million in Q2 2024, including $7 The net difference between unbilled receivables and deferred revenue fluctuates from quarter to million of restructuring payments quarter, in line with normal business activities as well Operating Cash Net capex & Reported FCF as progress on significant multi-year transformation Flow Other *Figures may not sum due to rounding Ample programs we are currently running in North liquidity to support ongoing America. business needs while retaining the Cash, Credit Facility & Debt Position capacity to fund future strategic Liquidity: Cash + Credit Facility $ Millions, as of March 31, 2024 growth investments $1.0 billion Credit Ample liquidity including available Facility $500 $500M revolving credit facility $650 Baa1 BBB Cash Moody’s S&P ~$544 1. Non-GAAP. See reconciliation tables in appendix 2. $650M senior note, maturing June 2030 Committed to maintaining our Liquidity Debt $0 (2) Investment grade credit rating 21 Information Security Level 2 – Sensitive. © 2024 – Proprietary & Confidential Information of Amdocs
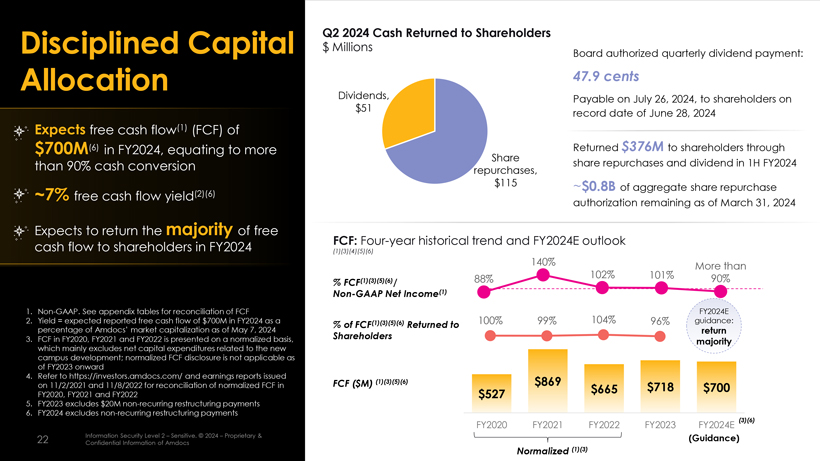
Q2 2024 Cash Returned to Shareholders Disciplined Capital $ Millions Board authorized quarterly dividend payment: Allocation 47.9 cents Dividends, Payable on July 26, 2024, to shareholders on $51 record date of June 28, 2024 Expects free cash flow(1) (FCF) of $700M(6) in FY2024, equating to more Returned $376M to shareholders through Share than 90% cash conversion share repurchases and dividend in 1H FY2024 repurchases, $115 ~$0.8B of aggregate share repurchase ~7% free cash flow yield(2)(6) authorization remaining as of March 31, 2024 Expects to return the majority of free cash flow to shareholders in FY2024 FCF: Four-year historical trend and FY2024E outlook (1)(3)(4)(5)(6) 140% More than 88% 102% 101% 90% % FCF(1)(3)(5)(6)/ Non-GAAP Net Income(1) 1. Non-GAAP. See appendix tables for reconciliation of FCF FY2024E 2. Yield = expected reported free cash flow of $700M in FY2024 as a (1)(3)(5)(6) 100% 99% 104% 96% guidance: % of FCF Returned to percentage of Amdocs’ market capitalization as of May 7, 2024 return 3. FCF in FY2020, FY2021 and FY2022 is presented on a normalized basis, Shareholders majority which mainly excludes net capital expenditures related to the new campus development; normalized FCF disclosure is not applicable as of FY2023 onward 4. Refer to https://investors.amdocs.com/ and earnings reports issued on 11/2/2021 and 11/8/2022 for reconciliation of normalized FCF in FCF ($M) (1)(3)(5)(6) $869 $718 $700 $665 FY2020, FY2021 and FY2022 $527 5. FY2023 excludes $20M non-recurring restructuring payments 6. FY2024 excludes non-recurring restructuring payments FY2020 FY2021 FY2022 FY2023 FY2024E (3)(6) 22 Information Security Level 2 – Sensitive. © 2024 – Proprietary & (Guidance) Confidential Information of Amdocs Normalized (1)(3)
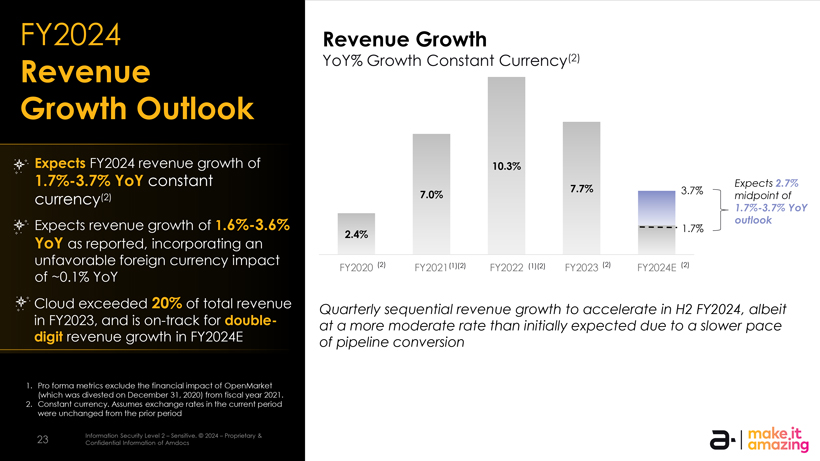
FY2024 Revenue Growth Revenue YoY% Growth Constant Currency(2) Growth Outlook Expects FY2024 revenue growth of 10.3% 1.7%-3.7% YoY constant Expects 2.7% 7.7% 3.7% currency(2) 7.0% midpoint of 1.7%-3.7% YoY Expects revenue growth of 1.6%-3.6% outlook 1.7% 2.4% YoY as reported, incorporating an unfavorable foreign currency impact (2) (1)(2) (1)(2) (2) (2) FY2020 FY2021 FY2022 FY2023 FY2024E of ~0.1% YoY Cloud exceeded 20% of total revenue Quarterly sequential revenue growth to accelerate in H2 FY2024, albeit in FY2023, and is on-track for double- at a more moderate rate than initially expected due to a slower pace digit revenue growth in FY2024E of pipeline conversion 1. Pro forma metrics exclude the financial impact of OpenMarket (which was divested on December 31, 2020) from fiscal year 2021. 2. Constant currency. Assumes exchange rates in the current period were unchanged from the prior period 23 Information Security Level 2 – Sensitive. © 2024 – Proprietary & Confidential Information of Amdocs
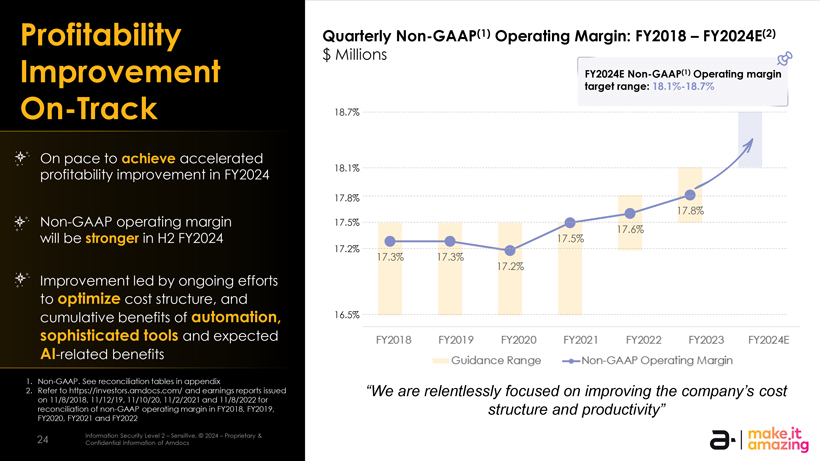
Profitability Quarterly Non-GAAP(1) Operating Margin: FY2018 – FY2024E(2) $ Millions Improvement FY2024E Non-GAAP(1) Operating margin target range: 18.1%-18.7% On-Track 18.7% On pace to achieve accelerated profitability improvement in FY2024 18.1% 17.8% 17.8% Non-GAAP operating margin 17.5% 17.6% will be stronger in H2 FY2024 17.5% 17.2% 17.3% 17.3% 17.2% Improvement led by ongoing efforts to optimize cost structure, and cumulative benefits of automation, 16.5% sophisticated tools and expected AI-related benefits 1. Non-GAAP. See reconciliation tables in appendix 2. Refer to https://investors.amdocs.com/ and earnings reports issued “We are relentlessly focused on improving the company’s cost on 11/8/2018, 11/12/19, 11/10/20, 11/2/2021 and 11/8/2022 for reconciliation of non-GAAP operating margin in FY2018, FY2019, structure and productivity” FY2020, FY2021 and FY2022 24 Information Security Level 2 – Sensitive. © 2024 – Proprietary & Confidential Information of Amdocs
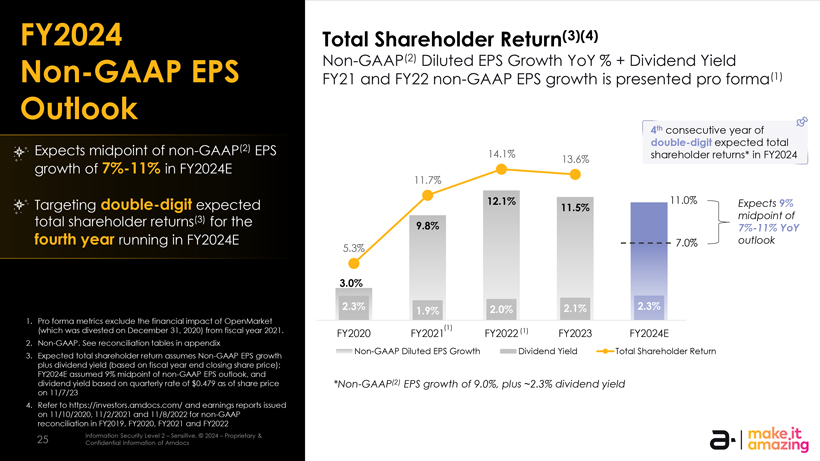
FY2024 Total Shareholder Return(3)(4) Non-GAAP(2) Diluted EPS Growth YoY % + Dividend Yield Non-GAAP EPS FY21 and FY22 non-GAAP EPS growth is presented pro forma(1) Outlook 4th consecutive year of double-digit expected total Expects midpoint of non-GAAP(2) EPS 14.1% shareholder returns* in FY2024 13.6% growth of 7%-11% in FY2024E 11.7% Targeting double-digit expected 12.1% 11.0% Expects 9% 11.5% total shareholder returns(3) for the 9.8% midpoint of 7%-11% YoY fourth year running in FY2024E 7.0% outlook 5.3% 3.0% 2.3% 1.9% 2.0% 2.1% 2.3% 1. Pro forma metrics exclude the financial impact of OpenMarket (which was divested on December 31, 2020) from fiscal year 2021. (1) (1) FY2020 FY2021 FY2022 FY2023 FY2024E 2. Non-GAAP. See reconciliation tables in appendix Non-GAAP Diluted EPS Growth Dividend Yield Total Shareholder Return 3. Expected total shareholder return assumes Non-GAAP EPS growth plus dividend yield (based on fiscal year end closing share price); FY2024E assumed 9% midpoint of non-GAAP EPS outlook, and dividend yield based on quarterly rate of $0.479 as of share price *Non-GAAP(2) EPS growth of 9.0%, plus ~2.3% dividend yield on 11/7/23 4. Refer to https://investors.amdocs.com/ and earnings reports issued on 11/10/2020, 11/2/2021 and 11/8/2022 for non-GAAP reconciliation in FY2019, FY2020, FY2021 and FY2022 25 Information Security Level 2 – Sensitive. © 2024 – Proprietary & Confidential Information of Amdocs

Committed to ESG TM Forum Moonshot Catalyst Hosted ‘Elevating Women in Included in the S&P Global winner for our AI-based Gen AI,’ at MWC, a Sustainability Yearbook Carbon Footprint Catalog, roundtable with visionary 2024 developed with Vodafone women leaders discussing Germany, AWS, Carbon the gender gap in GenAI Footprint, and Snowflake and exploring collaborative opportunities for women in tech and society ECOVADIS: Awarded with a Gold Medal (95th percentile) 4th year running 26 Information Security Level 0 – Public. © 2024 – Proprietary & Confidential Information of Amdocs

Q&A

Appendix Outlook & Reconciliation Tables
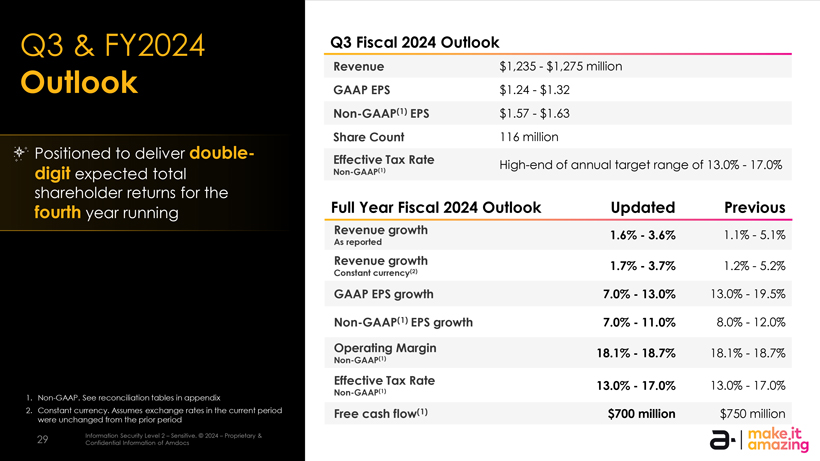
Q3 & FY2024 Q3 Fiscal 2024 Outlook Outlook Revenue $1,235—$1,275 million GAAP EPS $1.24—$1.32 Non-GAAP(1) EPS $1.57—$1.63 Share Count 116 million Positioned to deliver double- Effective Tax Rate High-end of annual target range of 13.0%—17.0% digit expected total Non-GAAP(1) shareholder returns for the fourth year running Full Year Fiscal 2024 Outlook Updated Previous Revenue growth 1.6%—3.6% 1.1%—5.1% As reported Revenue growth 1.7%—3.7% 1.2%—5.2% Constant currency(2) GAAP EPS growth 7.0%—13.0% 13.0%—19.5% Non-GAAP(1) EPS growth 7.0%—11.0% 8.0%—12.0% Operating Margin 18.1%—18.7% 18.1%—18.7% Non-GAAP(1) Effective Tax Rate 13.0%—17.0% 13.0%—17.0% 1. Non-GAAP. See reconciliation tables in appendix Non-GAAP(1) 2. Constant currency. Assumes exchange rates in the current period Free cash flow(1) $700 million $750 million were unchanged from the prior period 29 Information Security Level 2 – Sensitive. © 2024 – Proprietary & Confidential Information of Amdocs
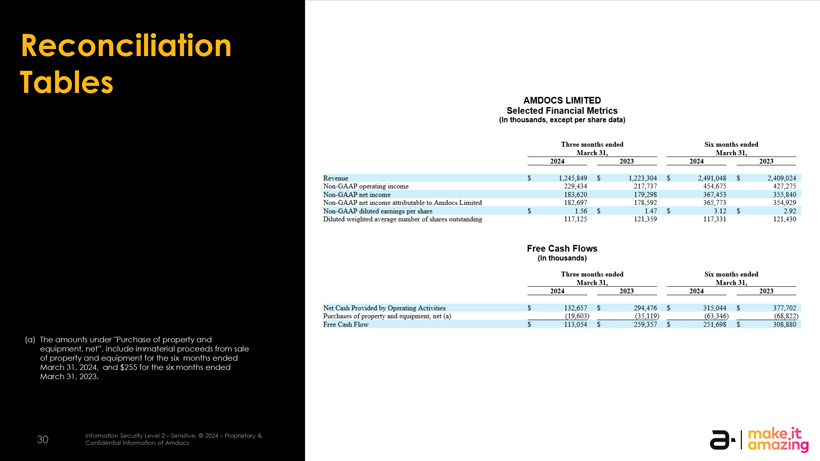
AMDOCS LIMITED Selected Financial Metrics (In thousands, except per share data) Three months ended Six mouths ended _March 31,_ _March 31,_ 2024 2023 2024 2023 Revenue S 1,245,849 S 1,223,304 S 2,491,0+8 S 2,409,024 Non-GAAP operating income 229,434 217,737 454,675 427,275 Non-GAAP net income 183,620 179,298 367,453 355,840 Non-GAAP net income attributable to Amdocs Limited 182,697 178,592 365,773 354,929 Non-GAAP diluted earnings per share S 1.56 S 1.47 S 3.12 S 2.92 Diluted weighted average number of shares outstanding 117,125 121,359 117.331 121.430 Free Cash Flows (In thousands) Three months ended Six mouths ended _March 31,_ _March 31,_ 2024 2023 2024 2023 Net Cash Provided by Operating Activities S 132.657 S 294.476 S 315.044 S 377.702 Purchases of property and equipment, net (a) _(19,603) _(35,119) _(63,346) _(68,822) Free Cash Flaw 5 113,054 S 259,357 S 251,698 $ 308,880 I make.it O I amazing
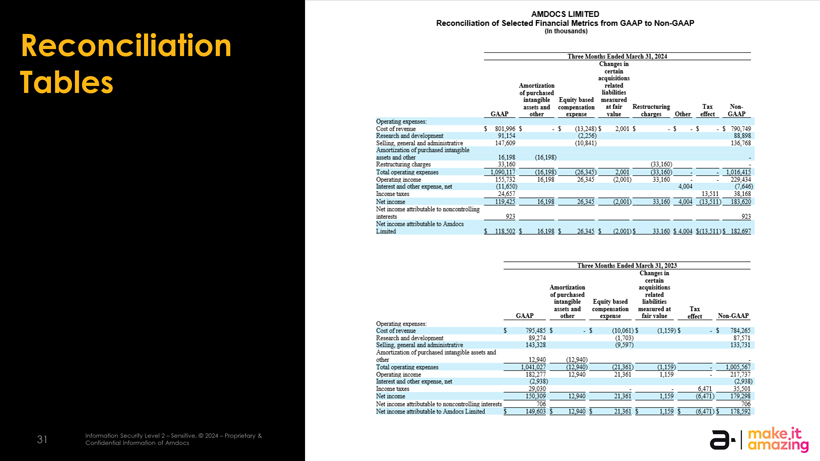
Reconciliation Tables AMDOCS LIMITED Reconciliation of Selected Financial Metrics from GAAP to Non-GAAP {Iri thousands] Three Months Ended March 31,2054 Changes in certain acquisitions Amortization related of purchased liabilities intangible- Equity based measured assets and compensation at fair Restructuring Tax Non- GAAP other expense value__charges Qthei1 effect GAAP Opera ting expenses: Cost erf revenue S B01399r5 5—5 (13,248)5 2,001 5 -5-5 -J 790,749 Research and development 91,154 58,S9S Selling, general and administrative 147,609 (10,341) 136,768 Amortization of purchased brinogtble assets and otter “ 16,198 (16,193) Re stntchiring charges 33,160 (33.153) Total operatmg eposes 1,090,11”. (16,1&3> (26,345) IvOl— LP 16,415 Operating income \ 55,732 16:1 93 26,345 (2,001) 33,160 — 229,434 Interest and other expense, net (11,650) 4,004 (7=646) Income taxes 24,657______13,511 3S,1pS Net income 119.42: 16,133 263*5 (2,001) 33»lff) 4004 (13,511) 153,620 Net income attributable to noncontrollin^ interests “ _923_______923 Net income attributable to Amdocs Limited 5 115.502 S 16.193 5 26.345 S (2.001)5 33.160 S 4.004 5(13.511)5 152.697 _Three Months Ended March 31, 202-3_ Changes in certain Amortization acquisitions of purchased related intangible Equity based liabilities assets and compensation measured at Tax GAAP__other__eipense__fair value__effect__Ncn-GAAJ Operating expenses: Costofrerame 5 795,485 $—5 (10,061)5 {1159)5—5 734=265 Research and development S9,274 G,™3) 37.571 Selling, general and administrative 143,323 (9,597) 133,731 Amortization of purchased intangible assets and other “ “ _12,940 (12,940)____- Total operating expenses 1,041,027 (12,940) (21,361) (1,159)_- LZZ:.:*’ Operating income 1S2,277 12,940 21,361 1159— 217,737 Interest and other expense, net (2,938) (2,938) Income taxes ” _29,030 __: _: tffil 35,501 Net income 150,309- 12,940 _21,361 _1159 ff:4?l) L’P.lrl Net income attributable to noncontrollin? interests_”?Qfr _ _ _ _ _706 Net income attributable to Amdocs Limited $ 149,603 5 12,940 5 21,361 5 L159 5 (€,471) S 175,592 a. I make.it I amazing o -I Information Security Level 2—Sensitive. © 2024—Proprietary & 31 Confidential Information of Amdocs
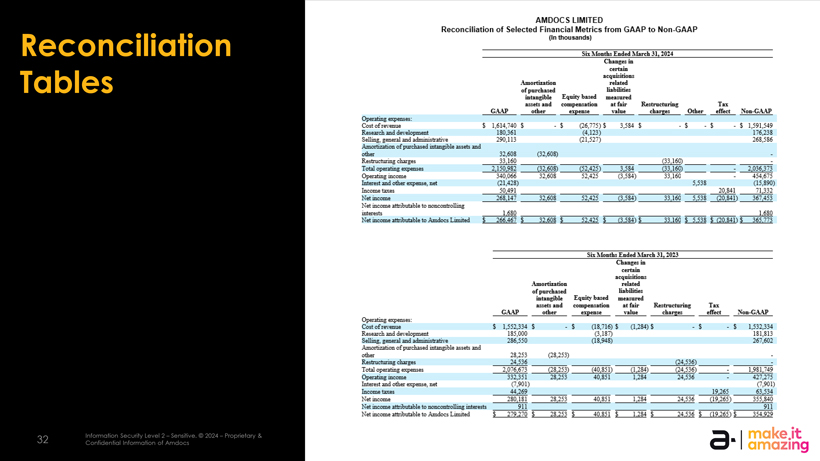
Reconciliation Tables o/-j Information Security Level 2—Sensith^ © 2024—Proprietary & 32 Confidential Information of1 Amdocs AMDOCS LIMITED Reconciliation of Selected Financial Metrics from GAAP to Non-GAAP (In thousands| jjji Mouths Ended March 31,20M Changes in certain acquisitions Atnortiza tio n related of purchased liabilitiEs iatangibl* Equity- based measured asjeta and cam pens at ion at fail1 Reatructuring Tai GAAJ other e^peme- value charges Other effect rfon- GAAP Cos: of revenue t ],614:740 t —t (26,775)$ 3,584 $ —$ —$ —$ 1,591,549 RErearcl and development 180,361 (4,131) 176^233 Collin; jji.tjI anrl aji-m-aratiia. 290,113 (21,527) 2SS:5BS Arn-ortisftion efpurolia^ed rrrtanerole irsetr and other “ 32,608 (32,608) Restructuring charEeE _33.160 _ _ _ _(33.160)_ _ _- Total opanttnE EKnenseE 1250.932 (52.603) (52,425) 3.384 (33.160)__; 2J36.373 Opsretmgfnuisi; f-v,056 -:2.60S 52,425 <3,5B4) 33,160 —454,675 Intarf and otter EKpaati irt (21,428) 5,538 (15,890) Income taxes 50.491 ______20.B41 71.332 NetiULome 268.147 32.608 52,425 (3,584)_33.160 5,538 00.841) 367.453 Net income attributable to nonrontrollinE hitererts _1.680 _______1.680 NetiriMmieattnTjutibl*toArnr^lxmHBd t 266.467 $ 32.608 t 52.425 $ G.5B4) t_33.160 $ 5.538 $ ;20.E41) $ 265.773 Sii Manths Endsd Mirth 31, MX3 CLaugEE in certain acquisitions .Amortization related of pu] cbaied liabilitlES intangible Equity” based measured a&reta and couapeiLratiou at fail’ Kju true hiring Tar GAAP other EipensE value cbafEfri effect Npn-GAAP â–¡piiituig Expenses: Cost of revenue $ 1.552,334$ -$ (18,716)$ (1,284) $ -$ —$ 1,532,334 REiEarcl and development 185,000 (3.1ST) 181,813 SellmE, general and adr^uranvi 286,550 (18,948) 267,602 ^T^nrht^itinn nfpiit!”—• â–¡Lt^JLSL^ls LiiiS“Li â– IJld other ~ 28,253 [28,253)—Rr^tructumia; charges _24,556 _ _ _ _(24.536)_ _ I :j] oparibxE expense- 2.3’6.f’i C3.:;.;) (40.351) â– 1.234)_(24.536)_- 1,981.749 Opaatirjg mccma 332,351 28,253 40,851 1,284 24,536 —427,275 Interest and other expense-, net :”.S01) (7,901) Incornetaies 44,269 _____19,265 _63,534 Netrncome 230.IS] 28.253 40.351 1.234 _24.536 (19.265) 3:5.8-0 Net income attributable tc nencouhollins ictErerts _SI ] _ _ _ _ _ _911 Netinr^attntutarJttoAmiociiiroited | 279.270 t 23.253 I 40.351 $ 1.284 |_24.536 $ (19.265 U 354.929 make.it amazing

Thank you!