UNITED STATES
SECURITIES AND EXCHANGE COMMISSION
Washington D.C. 20549
FORM 8-K
CURRENT REPORT
Pursuant to section 13 or 15(d)
of The Securities Exchange Act of 1934
Date of Report (Date of earliest event reported)
May 8, 2024
Civista Bancshares, Inc.
(Exact name of Registrant as specified in its charter)
| Ohio | 001-36192 | 34-1558688 | ||
| (State or other jurisdiction of incorporation or organization) |
(Commission File Number) |
( IRS Employer Identification No.) |
100 East Water Street, P.O. Box 5016, Sandusky, Ohio 44870
(Address of principle executive offices)
Registrant’s telephone number, including area code: (419) 625-4121
N/A
(Former name or former address, if changed since last report)
Check the appropriate box below if the Form 8-K filing is intended to simultaneously satisfy the filing obligation of the registrant under any of the following provisions:
| ☐ | Written communications pursuant to Rule 425 under the Securities Act (17 CFR 230.425) |
| ☐ | Soliciting material pursuant to Rule 14a-12 under the Exchange Act (17 CFR 240.14a-12) |
| ☐ | Pre-commencement communications pursuant to Rule 14d-2(b) under the Exchange Act (17 CFR 240.14d-2(b)) |
| ☐ | Pre-commencement communications pursuant to Rule 13e-4(c) under the Exchange Act (17 CFR 240.13e-4(c)) |
Indicate by check mark whether the registrant is an emerging growth company as defined in Rule 405 of the Securities Act of 1933 (§230.405 of this chapter) or Rule 12b-2 of the Securities Act of 1934 (§240.12b-2 of this chapter)
Securities registered pursuant to Section 12(b) of the Act:
| Title of each class |
Trading |
Name of each exchange on which registered |
||
| Common | CIVB | NASDAQ Capital Market |
Emerging growth company ☐
If an emerging growth company, indicate by check mark if the registrant has elected not to use the extended transition period for complying with any new or revised financial accounting standards provided pursuant to Section 13(a) of the Exchange Act. ☐
Item 7.01 Regulation FD Disclosure
On May 8th, 9th, and 10th management of Civista Bancshares, Inc. (“Civista”), including Dennis G. Shaffer, President and Chief Executive Officer and Richard J. Dutton, Senior Vice President, will meet with several investors while attending D.A. Davidson’s 26th Annual Financial Institutions Conference in Colorado Springs, Colorado. A copy of the investor presentation is included as Exhibit 99.1 to this Current Report on Form 8-K and is incorporated herein by reference.
The information in this Current Report on Form 8-K is being furnished under Item 7.01 and shall not be deemed “filed” for the purposes of Section 18 of the Securities Exchange Act of 1934 (the “Exchange Act”), or otherwise subject to the liabilities of such section, nor shall such information be deemed incorporated by reference in any filing under the Securities Act of 1933 or the Exchange Act, except as shall be expressly set forth by specific reference in such a filing.
Civista Bancshares, Inc. is a $3.9 billion financial holding company headquartered in Sandusky, Ohio. Its primary subsidiary, Civista Bank, was founded in 1884 and provides full-service banking, commercial lending, mortgage, and wealth management services. Today, Civista Bank operates 43 locations across Ohio, Southeastern Indiana, and Northern Kentucky. Civista Bank also offers commercial equipment leasing services for businesses nationwide through its subsidiary, Vision Financial Group, Inc. (VFG), centered in Pittsburgh, Pennsylvania. Civista Bancshares’ common shares are traded on the NASDAQ Capital Market under the symbol “CIVB”. Learn more at www.civb.com.
Item 9.01 Financial Statements and Exhibits
(d) Exhibit 99.1 Investor presentation
Exhibit 104 Cover Page Interactive File-the cover page interactive data file does not appear in the Interactive Data File because its XBRL tags are embedded within the Inline XBRL document.
SIGNATURE
Pursuant to the requirements of the Securities Exchange Act of 1934, the registrant has duly caused this report to be signed on its behalf by the undersigned thereunto duly authorized.
| Civista Bancshares, Inc. |
||||||
| (Registrant) | ||||||
| Date: May 8, 2024 | /s/ Todd A. Michel |
|||||
| Todd A. Michel, | ||||||
| Senior Vice President and Controller | ||||||
Exhibit 99.1 Investor Presentation First Quarter 2024 Dennis G. Shaffer ‐Chief Executive Officer & President Richard J. Dutton ‐Senior Vice President, Chief Operating Officer NASDAQ: CIVB 1

Forward‐Looking Statements. This presentation may contain “forward‐looking statements” within the meaning of Section 21E of the Securities Exchange Act of 1934, as amended. Forward‐looking statements express management’s current expectations, estimates or projections of future events, results or long‐term goals, and are generally identifiable by the use of words such as “believe,” “expect,” “anticipate,” “plan,” “intend,” “estimate,” “may,”“will,”“would,”“could,”“should”orothersimilarexpressions.Allstatementsinthismaterialspeakonlyasof the date they are made, and we undertake no obligation to update any statement except to the extent required by law. Forward‐looking statements are not guarantees of performance and are inherently subject to known and unknown risks, uncertainties and assumptions that are difficult to predict and could cause actual results or performancetodiffermateriallyfromthoseexpressedinorimpliedbytheforward‐lookingstatements. Factorsthat could cause actual results or performance to differ from those discussed in the forward‐looking statements include the risks identified from time to time in our public filings with the SEC, including those risks identified in “Item 1A. Risk Factors” of Part I of the Company’s Annual Report on Form 10‐K for the fiscal year ended December 31, 2023, as supplemented by any additional risks identified in the Company’s subsequent Form 10‐Qs. These risks and uncertainties should be considered in evaluating forward‐looking statements and undue reliance should not be placed onsuchstatements. Use of Non‐GAAP Financial Measures. This presentation contains certain financial information determined by methods other than in accordance with accounting principals generally accepted in the United States (“GAAP”). Thesenon‐GAAPfinancialmeasuresinclude“TangibleBookValueperShare”,“TangibleCommonEquitytoTangible Assets” and “Efficiency Ratio”. TheCompanybelievesthatthesenon‐GAAP financial measures provide both management and investors a more complete understanding of the Company’s profitability. These non‐GAAP financial measures are supplemental and are not a substitute for any analysis based on GAAP Measures. Not all companiesusethesamecalculationofthesemeasures;thereforethispresentationmaynotbecomparabletoother similarly titled measures as presented by other companies. Reconciliations of these non‐GAAP measures are provided intheAppendix sectionofthispresentation. SourcesofInformation: CompanyManagement andS&PGlobal MarketIntelligence 2

Contact Information Ø Civista Bancshares, Inc.’s common shares are traded on the NASDAQ Capital Market under the symbol “CIVB.” Ø Additional information can be found at: Ø www.civb.com Ø Dennis G Shaffer Ø Chief Executive Officer & President Ø dgshaffer@civista.bank Ø Telephone: 888.645.4121 3

Who We Are 4

Who We Are Ø Bank founded and headquartered in 1884 in Sandusky, Ohio th Ø 10 Largest Publicly Traded Commercial Bank Headquartered in Ohio Ø 537 Employees Ø Community Banking Focused Operations in 14 Ohio, 2 Indiana and 1 Kentucky Counties – 41 Branches & 2 Loan Production Offices – Operations in the 5 largest Ohio MSAs Ø Civista Leasing and Finance (CLF) is a national equipment leasing and finance operation with equipment leased in all 50 states Ø Full‐Service Banking Organization with Diversified Revenue Streams – Commercial Banking – Retail Banking – Wealth Management – Private Banking – Mortgage Banking – Equipment Leasing 5

Who We Are Ø Northwest Ohio Ø Sandusky/Norwalk/Port Clinton, Ohio Ø 7 Locations Ø 9 Locations Ø $157 million in loans Ø $460 million in loans Ø $179 million in Ø $1,480 million in deposits deposits Ø #1 deposit market share in Sandusky, Ø 17% deposit market Ohio with ~53% share Ø Civista Leasing & Ø Cleveland/Akron, Ø Columbus & West Central, Finance Ohio Ohio Ø $57 million in Ø 3 Locations Ø 6 Locations financing leases Ø $897 million in Ø $579 million in loans Ø $54 million in loans commercial loans Ø $231 million in deposits Ø $144 million in Ø $25 million in deposits Ø 27% deposit market share in operating leases the rural markets Ø Southeastern Indiana/Cincinnati, Ohio Ø North Central, Ohio Ø Greater Dayton, Ohio Ø 9 Locations Ø 6 Locations Ø 3 Locations Ø $532 million in loans Ø $41 million in loans Ø $117 million in loans Ø $591 million in deposits Ø $222 million in deposits Ø $134 million in Ø ~44% deposit market share deposits Ø ~39% deposit market share 6 Deposit market share information as of June 30, 2023.
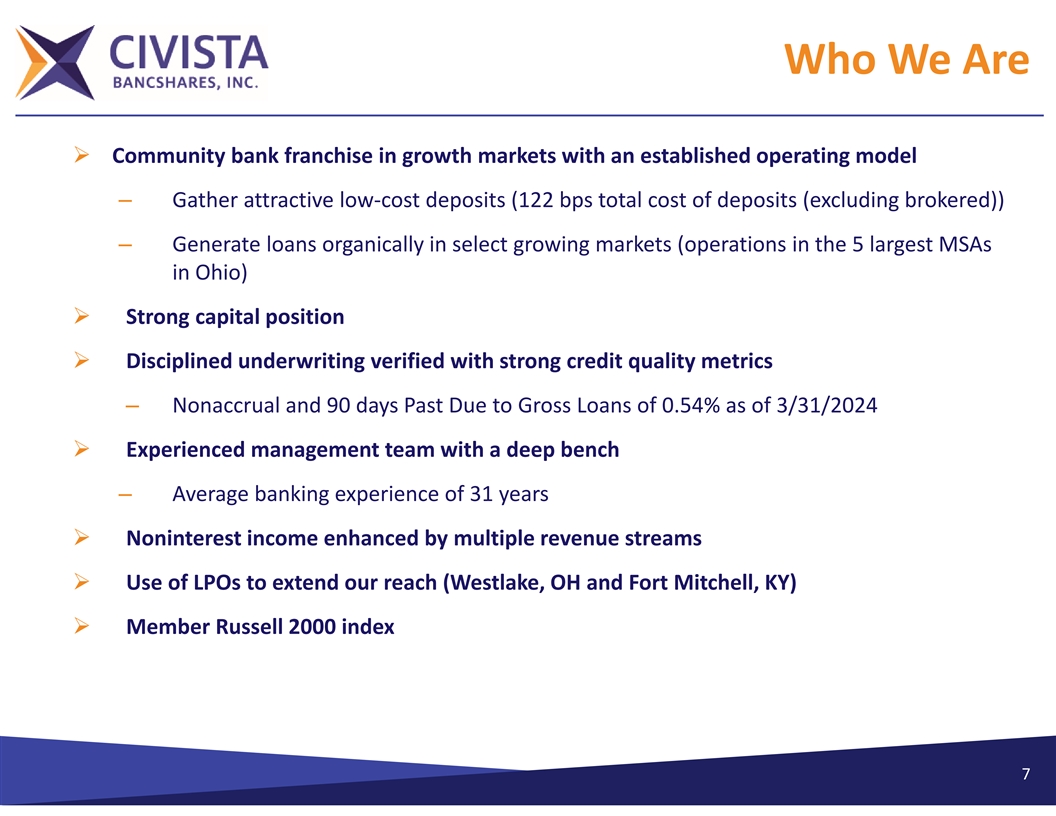
Who We Are Ø Community bank franchise in growth markets with an established operating model – Gather attractive low‐cost deposits (122 bps total cost of deposits (excluding brokered)) – Generate loans organically in select growing markets (operations in the 5 largest MSAs in Ohio) Ø Strong capital position Ø Disciplined underwriting verified with strong credit quality metrics – Nonaccrual and 90 days Past Due to Gross Loans of 0.54% as of 3/31/2024 Ø Experienced management team with a deep bench – Average banking experience of 31 years Ø Noninterest income enhanced by multiple revenue streams Ø Use of LPOs to extend our reach (Westlake, OH and Fort Mitchell, KY) Ø Member Russell 2000 index 7

Who We Are 8

Who We Are 9

Current Events 10

Deposits Ø 13.1%* or $392.3 million of deposits uninsured at March 31, 2024 Ø Cash and unpledged securities of $452 million at March 31, 2024 Ø Deposits, excluding tax program and brokered deposits, increased 1.25% from December 31, 2023 to March 31, 2024 Ø Excluding $315 million of public deposits, Civista had no deposit concentrations at March 31, 2024 Ø “Civista’s deposit franchise is one of our most valuable characteristics and contributes significantly to our peer leading net interest margin and profitability” 11 *Excluding Civista owned and tax program related deposit accounts

Liquidity Ø Strong on‐balance sheet liquidity – $452 million of cash and unpledged securities at March 31, 2024 Ø Ready access to off‐balance sheet funding – Immediate access to $1.3 billion in funding from FHLB, Federal Reserve and CDARS/IntraFi Ø Civista has not and does not anticipate using the Federal Reserve’s Bank Term Funding program 12
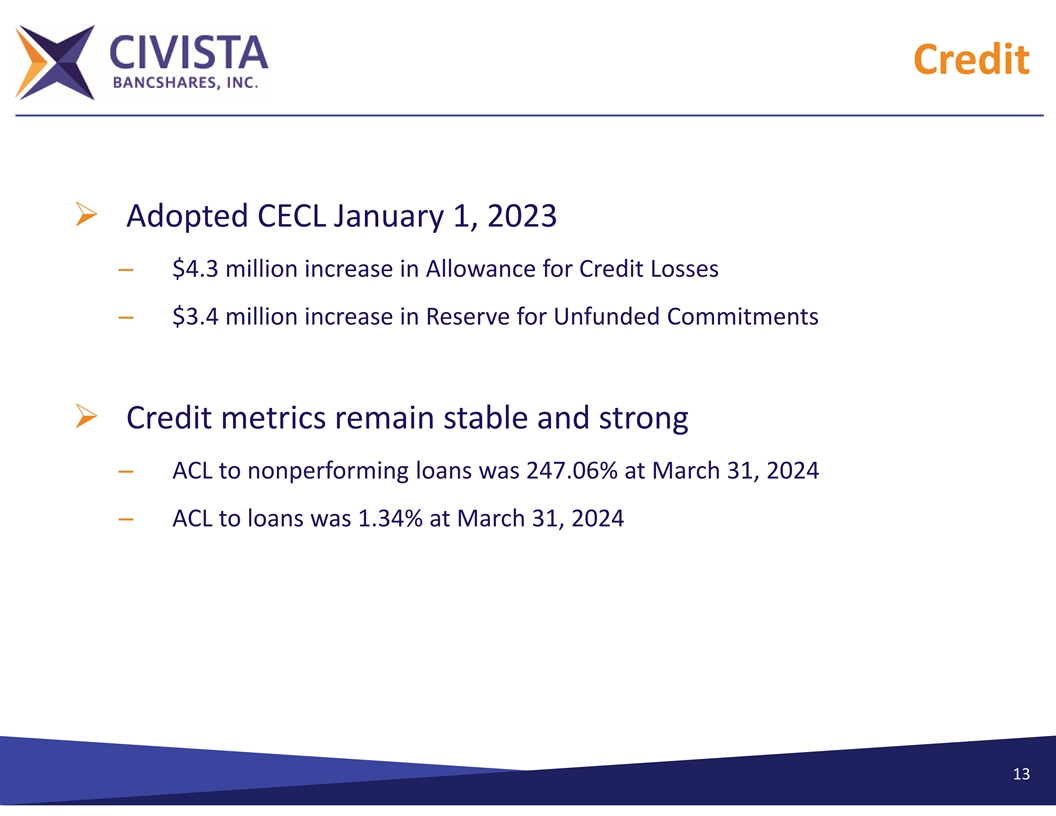
Credit Ø Adopted CECL January 1, 2023 – $4.3 million increase in Allowance for Credit Losses – $3.4 million increase in Reserve for Unfunded Commitments Ø Credit metrics remain stable and strong – ACL to nonperforming loans was 247.06% at March 31, 2024 – ACL to loans was 1.34% at March 31, 2024 13
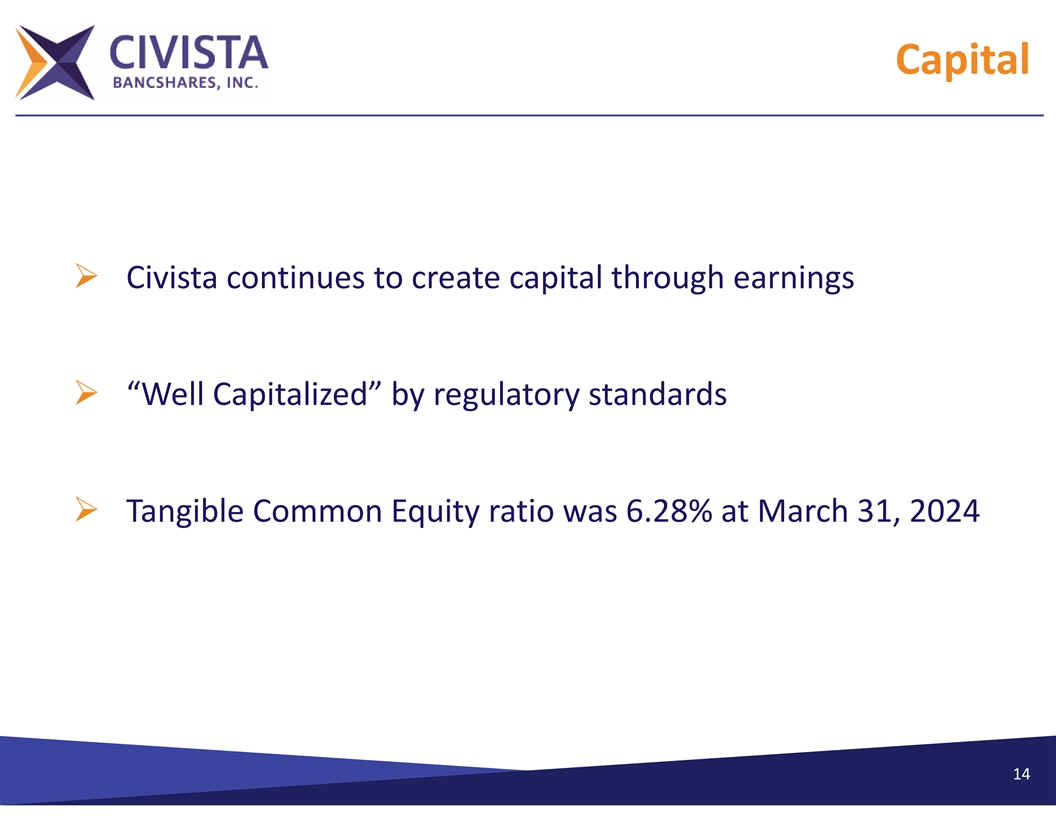
Capital Ø Civista continues to create capital through earnings Ø “Well Capitalized” by regulatory standards Ø Tangible Common Equity ratio was 6.28% at March 31, 2024 14

Strategic Initiatives Ø Revenue Improvement Ø Low/Lower Cost Funding – Ohio Homebuyer Plus Program – Identified opportunities for increased service charges • Launched May 6, 2024 • Treasury Management Fees • Potential for up to $100 million in deposits • Retail – Wealth Management Cash – Leasing Syndication Desk Balances Ø Expense Reduction • Adding ~ $70 million in deposits to balance sheet – Routing overflow calls to our retail staff – Other – Analyze branch network • Public Fund Operating Accounts • Loan Customers with low/no deposit – Manage/reduce overtime and balances staffing 15
Financial Trends 16

Financial Trends Financial Highlights ($s in thousands, except per share data) March 31, March 31, 2024 2023 % Change Balance Sheet $3,880,258 $3,685,672 5.28% Assets 1 2,898,139 2,681,180 8.09% Gross Loans (excluding HFS) 2,980,695 2,843,516 4.82% Deposits March 31, March 31, 2024 2023 % Change Performance Analysis $6,360 $12,888 (50.65%) Net Income Available to Common 2 0.66% 1.47% (55.08%) ROAA 2 6.89% 15.32% (55.05%) ROAE Market Data $241,881 $266,171 Market Capitalization ($mm) 3 102.9% 125.3% Price / Tangible Book Value 6.6x 5.9x Price/LTM diluted EPS 1. March 31, 2024 includes $235 thousand of PPP loans; March 31, 2023 includes $464 thousand of PPP loans 17 2. Presented on an annualized basis 3. Non‐GAAP reconciliation on page 39

Financial Trends 1 Total Assets ($ in millions) $3,880 $3,616 $3,538 $3,012 $2,763 $2,310 2019 2020 2021 2022 2023 2024 Q1 18 1. 2022 includes the addition of $316 million in assets due to Comunibanc Corp acquisition.

Financial Trends 1 Total Gross Loans and Leases ($ in millions) $2,898 $2,861 $2,547 $2,057 $1,998 $1,709 2019 2020 2021 2022 2023 2024 Q1 19 1. 2020 includes $217.3 million of PPP loans. 2021 includes $43.2 million of PPP loans. 2022 includes $819 thousand of PPP loans as well as $169 million due to the Comunibanc Corp acquisition.

FinancialTrends Loan Mix ($ in millions) Ø Total Gross Loans: $2.9billion 20

FinancialTrends CRE Non Owner Concentrations ($ in millions) 21

FinancialTrends Civista Leasing and Equipment Financing ($ in millions) Ø 2024 YTD Production • YTD Funded: $23.2 million • Sold: $12.6 million • Net Production: $10.6 million Ø Average Yield on Total Portfolio: 8.59% Ø Average Yield on Q1 Originations: 9.95% Industry Concentrations: v Propane, Recycling/Waste Management, Environmental, Additive Manufacturing (3‐D Printing), Construction, Non‐destructive testing 22

Financial Trends NonaccrualNP & As 90 & da 90+PD ys Pas t/ Due Asse /ts Gross Loans Loan Loan Loss Loss Re Resse errvve ess // Gr Gross oss Loans Loans 0.54% 0.53% 0.53% 1.34% 1.30% 1.28% 1.22% 0.41% 1.08% 0.36% 0.86% 0.27% 2019 2020 2021 2022 2023 Q1 2024 2019 2020 2021 2022 2023 Q1 2024 1 Reserves / NPLs Net Chargeoff Ratio 0.01% 496.10% 0.00% 0.00% 343.05% ‐0.01% ‐0.01% 261.45% 245.66% 247.06% 161.95% ‐0.04% 2019 2020 2021 2022 2023 Q1 2024 2019 2020 2021 2022 2023 2024 1. LTM basis 23

Financial Trends 1 Total Deposits ($ in millions) $2,985 $2,981 $2,620 $2,417 $2,189 $1,679 2019 2020 2021 2022 2023 2024 Q1 24 1. 2022 includes the addition of $271 million in deposits due to the Comunibanc Corp acquisition.

Financial Trends Deposit Mix Ø Total Deposits: $3.0 billion Ø Loan/Deposit Ratio: 98.3% Cost of Cost of Year Deposits Funding 2019 0.48% 0.68% 2020 0.33% 0.43% 2021 0.17% 0.24% 2022 0.15% 0.39% 2023 1.19% 1.72% 2024 2.14% 2.54% 25

Financial Trends Ø Total Cost of Deposits (%) 2.14% 2.00% 1.79% 1.64% 1.34% 1.10% 0.93% 0.93% 0.71% 0.71% 0.48% 0.33% 0.29% 0.27% 0.22% 0.22% 0.21% 0.17% 2019Y 2020Y 2021Y 2022Y 2023Y 2024Q1 CIVB Peer Median Peer Top Quartile Yield on Loans (%) 6.25% 6.20% 5.90% 5.86% 5.50% 5.42% 5.42% 5.27% 5.27% 5.09% 5.09% 4.91% 4.79% 4.69% 4.65% 4.61% 4.42% 4.44% 2019Y 2020Y 2021Y 2022Y 2023Y 2024Q1 CIVB Peer Median Peer Top Quartile 2024 Peer data as of 3/31/2024 or the latest available date. 26 Note: Comparable peers include public banks $1‐$4B in Ohio and +/‐40% CIVB’s asset size in contiguous states.

Financial Trends Net Interest Margin 4.31% 3.81% 3.80% 3.75% 3.74% 3.70% 3.70% 3.70% 3.66% 3.50% 3.47% 3.47% 3.45% 3.39% 3.31% 3.32% 3.22% 3.03% 2019Y 2020Y 2021Y 2022Y 2023Y 2024Q1 CIVB Peer Median Peer Top Quartile 2024 peer data as of 3/31/2024, or the latest available date. 27 Note: Comparable peers include public banks $1‐$4B in Ohio and +/‐40% CIVB’s asset size in contiguous states.

Financial Trends Non‐Interest Income and Expense Ø Fee income platformØ Disciplined approach to controlling non‐interest expense – Routing overflow calls to our retail staff – Service charges on deposit accounts were $1.4 million YTD 2024 and $1.8 million YTD 2023 – Manage/reduce overtime and staffing Ø Mortgage Banking Ø Continued focus on review of branch network – Gain on sale of loans and leases, YTD 2024 and 2023 was $863 Ø Revenue Improvement thousand and $631 thousand, respectively – Service Charges Ø Wealth Management – Leasing Syndication Desk – $1.3 million YTD 2024 and $1.2 million YTD 2023 • Facilitate higher gains on sales of leases and loans Ø Lease Revenue and Residual Income Ø Identified efficiencies in operations – $1.7 million YTD 2024 and $2.0 million YTD 2023 – Robotic Process Automation Ø Interchange Income – Chat GPT – $1.4 million YTD 2024 and $1.4 million YTD 2023 1 Non‐Interest Expense and Efficiency Ratio 28 1. 2021 efficiency ratio is adjusted for nonrecurring items; 2022 efficiency ratio is adjusted for merger related expenses. Page40 and 41 show Non‐GAAP reconciliations

Financial Trends Capital Management Ø November 2021 issued $75 million in 3.25% subordinated debt Ø Authorized $13.5 million stock repurchase plan in April 2024 Ø During 2023, 84,230 shares, 0.54% of the shares outstanding on December 31, 2023, have been repurchased for $1.5 million at a weighted average price of $17.77 (118% of TBV) Ø Increased the quarterly common dividend to $0.16 per share in the third quarter 2023 ($s in thousands, except per share data) For the Years Ended December 31, 2019 2020 2021 2022 2023 2024 Q1 Total Equity $330,126 $350,108 $355,212 $334,835 $372,002 $369,659 1 11.01% 9.88% 9.25% 5.83% 6.36% 6.28% TCE / TA 2 10.64% 9.57% 11.61% 12.47% 12.50% 10.36% ROAE 1. TCE Non‐GAAP reconciliation on page 39 29 2. LTM basis

Providing Shareholder Value 30

Providing Shareholder Value Net Income & Earnings Per Share (Available to Common) (LTM ‐$ in thousands) 1. Q1 2024 presented on LTM basis 31

Providing Shareholder Value 1,2,3 Total Shareholders’ Equity & Return on Tangible Equity ($ in thousands) 1. LTM basis 2. Non‐GAAP reconciliation on page 39 32 3. The change in the AOCI impact of unrealized losses on the investment portfolio from 12/31/21 to 12/31/22 was $67.4 million

Providing Shareholder Value 1,2 Tangible Book Value per Share $18.11 $16.68 $15.10 $14.95 $14.68 $12.61 2019 2020 2021 2022 2023 2024 1. Non‐GAAP reconciliation on page 39 33 2. The change in the AOCI impact of unrealized losses on the investment portfolio on TBV/share from 12/31/21 to 12/31/22 was$4.29

Why Civista? 34

Why Civista? Experienced Acquirer & Organic Growth Model Ø Completed 6 acquisitions since 2007, including the acquisition of Comunibanc Corp, which closed July 1, 2022 and acquisition of Vision Financial Group, which closed October 3, 2022 Ø On June 27, 2022, opened de novo branch in Gahanna, Ohio, located in Franklin County (Columbus MSA) Ø Expanded commercial loan growth in Columbus, Cleveland, Akron, Dayton, Toledo and Cincinnati markets Ø Since year‐end 2018, loan portfolios in these markets have increased from $645 million to $1.5 billion through March 31, 2024 Ø Low cost, locally generated deposit base 35

Why Civista? Compelling Investment Opportunity Ø Community bank franchise poised for acquisitions and strong core deposit franchise Ø Strong capital position Ø Strong credit culture and asset quality Ø Experienced acquirer Ø Continued strong NIM Ø Experienced management team with an average of 31 years in banking Ø Strategically positioned in attractive Ohio lending markets funded by low‐cost deposits with operations in the 5 largest Ohio MSAs Ø Demonstrated strong profitability from 2019 to Q1 2024 – Net Income CAGR: 2.2% – TBV / Share CAGR:0.4% – EPS CAGR: 3.5% 36

Additional Information 37

Operating Results ($s in thousands, except per share data) Q1 LTM 2019 2020 2021 2022 2023 2024 Net Interest Income $85,100 $89,727 $95,425 $110,204 $125,496 $121,267 Provision for Loan Losses 1,035 10,112 830 1,752 4,435 5,808 Noninterest Income 22,443 28,182 31,452 29,077 37,163 34,601 Noninterest Expense 66,947 70,665 78,484 90,493 107,611 107,667 Net Income/(Loss) 33,878 32,192 40,546 39,427 42,964 36,436 Net Income Available to Common Shareholders $33,231 $32,192 $40,546 $39,427 $42,964 $36,436 Diluted Earnings/(Loss) per Common Share $2.01 $2.00 $2.63 $2.60 $2.73 $2.33 Return on Average Assets (ROAA) 1.51% 1.17% 1.34% 1.22% 1.16% 0.99% Return on Average Equity (ROAE) 10.64% 9.57% 11.61% 12.46% 12.50% 10.36% 38

Non‐GAAP Reconciliation ($s in thousands, except per share data) As of and for the Years Ended December 31, Q1 2019 2020 2021 2022 2023 2024 Tangible Common Equity $ 330,126 $ 350,108 $ 355,212 $ 334,835 $ 372,002 $ 369,659 Total Shareholder's Equity - GAAP 85,156 84,926 84,432 136,454 135,028 134,618 Less: Goodwill and intangible assets Tangible common equity $ 244,970 $ 265,182 $ 270,780 $ 198,381 $ 236,974 $ 235,041 Total Shares Outstanding 16,687,542 15,898,032 14,954,200 15,728,234 15,695,424 15,727,013 Tangible book value per share $ 14.68 $ 16.68 $ 18.11 $ 12.61 $ 15.10 $ 14.95 Tangible Assets Total Assets - GAAP $ 2,309,557 $ 2,768,862 $ 3,011,983 $ 3,537,830 $ 3,861,418 $ 3,880,258 84,926 85,156 84,432 136,454 135,028 134,618 Less: Goodwill and intangible assets Tangible assets $ 2,224,401 $ 2,683,936 $ 2,927,551 $ 3,401,376 $ 3,726,390 $ 3,745,640 Tangible common equity to tangible assets 11.01% 9.88% 9.25% 5.83% 6.36% 6.28% 1 $ 33,231 $ 32,192 $ 40,546 $ 39,427 $ 42,964 $ 36,436 Net Income 1 13.57% 12.14% 14.97% 19.87% 18.13% 15.50% Return on Tangible Common Equity 39 1. LTM basis

Non‐GAAP Reconciliation ($s in thousands) 2021 Adjusted Efficiency ratio Noninterest expense - GAAP $ 78,484 FHLB prepayment penalty (3,717) Adjusted noninterest expense 74,767 Net interest income - GAAP 95,425 Noninterest Income - GAAP 31,452 Gain on sale of Visa B shares (1,785) Adjusted Non-interest Income 29,667 Adjusted total revenue $ 125,092 Adjusted Efficiency ratio 59.8% 40

Non‐GAAP Reconciliation ($s in thousands) YTD 2022 Adjusted Efficiency ratio Noninterest expense - GAAP $ 90,493 Acquisition and integration expense (3,757) Adjusted noninterest expense 86,736 Net interest income - GAAP 110,204 Effect of tax-exempt income 2,092 Adjusted net interest income 112,296 Noninterest Income - GAAP 29,076 Adjusted total revenue $ 141,372 61.4% Adjusted Efficiency ratio 41

Thank You 42