UNITED STATES
SECURITIES AND EXCHANGE COMMISSION
Washington, D.C. 20549
FORM 8-K
CURRENT REPORT
Pursuant to Section 13 or 15(d)
of The Securities Exchange Act of 1934
Date of Report (Date of earliest event reported): May 2, 2024
Block, Inc.
(Exact name of registrant as specified in its charter)
| Delaware | 001-37622 | 80-0429876 | ||
| (State or other jurisdiction of incorporation) |
(Commission File Number) | (IRS Employer Identification No.) |
1955 Broadway, Suite 600
Oakland, CA 946121
(Address of principal executive offices, including zip code)
(415) 375-3176
(Registrant’s telephone number, including area code)
Not Applicable
(Former name or former address, if changed since last report)
Check the appropriate box below if the Form 8-K filing is intended to simultaneously satisfy the filing obligation of the registrant under any of the following provisions (see General Instruction A.2. below):
☐ Written communications pursuant to Rule 425 under the Securities Act (17 CFR 230.425)
☐ Soliciting material pursuant to Rule 14a-12 under the Exchange Act (17 CFR 240.14a-12)
☐ Pre-commencement communications pursuant to Rule 14d-2(b) under the Exchange Act (17 CFR 240.14d-2(b))
☐ Pre-commencement communications pursuant to Rule 13e-4(c) under the Exchange Act (17 CFR 240.13e-4(c))
Securities registered pursuant to Section 12(b) of the Act:
| Title of each class | Trading Symbol(s) |
Name of each exchange on which registered
|
||
| Class A Common Stock, $0.0000001 par value per share |
SQ | New York Stock Exchange | ||
Indicate by check mark whether the registrant is an emerging growth company as defined in Rule 405 of the Securities Act of 1933 (§230.405 of this chapter) or Rule 12b-2 of the Securities Exchange Act of 1934 (§240.12b-2 of this chapter).
Emerging growth company ☐
If an emerging growth company, indicate by check mark if the registrant has elected not to use the extended transition period for complying with any new or revised financial accounting standards provided pursuant to Section 13(a) of the Exchange Act. ☐
1 We have adopted a distributed work model and, therefore, have no formal headquarters. This address represents our “principal executive office,” which we are required to identify under Securities and Exchange Commission rules.
| Item 2.02 | Results of Operations and Financial Condition. |
On May 2, 2024, Block, Inc. (the “Company”) issued a Shareholder Letter (the “Letter”) announcing its financial results for the first quarter ended March 31, 2024. In the Letter, the Company also announced that it would be holding a conference call and earnings webcast on May 2, 2024 at 2:00 p.m. Pacific Time to discuss its financial results for the first quarter ended March 31, 2024. The Letter is furnished as Exhibit 99.1 to this Current Report on Form 8-K (this “Report”).
The Company is making reference to non-GAAP financial information in both the Letter and the conference call. A reconciliation of these non-GAAP financial measures to their nearest GAAP equivalents is provided in the Letter.
The information furnished pursuant to Item 2.02 on this Report, including Exhibit 99.1 attached hereto, shall not be deemed “filed” for purposes of Section 18 of the Securities Exchange Act of 1934, as amended (the “Exchange Act”), or otherwise subject to the liabilities of that section, nor shall it be deemed incorporated by reference into any other filing under the Securities Act of 1933, as amended, or the Exchange Act, except as expressly set forth by specific reference in such a filing.
| Item 9.01 | Financial Statements and Exhibits. |
(d) Exhibits
Exhibit |
Description |
|
| 99.1 | ||
| 104 | Cover Page Interactive Data File, formatted in inline XBRL. |
|
SIGNATURES
Pursuant to the requirements of the Securities Exchange Act of 1934, the registrant has duly caused this report to be signed on its behalf by the undersigned hereunto duly authorized.
| BLOCK, INC. | ||||||
| Date: May 2, 2024 | By: | /s/ Chrysty Esperanza |
||||
|
Chrysty Esperanza Chief Legal Officer and Corporate Secretary |
||||||
Exhibit 99.1

May 2, 2024
To Our Shareholders
| “Why the hell are you all spending so much time on bitcoin?”
We get this question a lot. We’ll use this quarter’s letter to answer it.
First, some facts. Less than 3% of company resources are dedicated to bitcoin-related projects. All of which have been more than fully covered by the profits from our bitcoin exchange, which is Cash App’s fourth largest gross profit stream.
But why spend time on bitcoin at all? We believe the world needs an open protocol for money, one that’s not owned or controlled by any single entity. We believe bitcoin is the best and only candidate to be that protocol, and to ultimately become the native currency of the internet.
How does this benefit Block? An open protocol for money helps us serve more people around the world faster. We could build an amazing product experience once and ship it globally to any market in the world, without needing to customize for hundreds of different payment schemes. This creates the opportunity to accelerate our growth potential and improve our cost structure at the same time. It truly levels the playing field for a company like ours, and for everyone in the world.
Why bitcoin versus all the other “cryptos?” Satoshi designed bitcoin to solve a very specific problem around payments, which the world has since found to be immensely valuable. The majority of other projects are either solving different problems or attempting to be a speculative trading asset. We benefit from an open protocol for money, and that’s what we’re focused on building upon.
In 2018, Block became the first publicly listed company to offer a bitcoin product. Our strategy since then follows 3 core directives:
• Make it accessible.
• Make it more secure.
• Make it usable every day.
To make bitcoin more accessible, we started with the greatest need: “how do I get bitcoin?” We built a simple platform right into Cash App where one can buy, hold, withdraw, or sell bitcoin. It was a hit. Since launch, Cash App has had over 21 million actives use bitcoin. Cash App bitcoin products generated 3.3% and 4.2% of Block’s gross profit in 2022 and 2023, with only 0.7% of related expenses. |
|
|
BLOCK Q1 2024 2 |
| We went on to build ecosystem features to help people get bitcoin. 1.6 million Cash App Card actives have used our Bitcoin Round Ups feature to automatically convert spare change from everyday transactions into bitcoin. Our Paid in Bitcoin feature allows customers to convert a percentage of their direct deposits into bitcoin with zero fees or price spreads, yet another reason for people to direct their paychecks into Cash App. We just launched a similar feature named “Bitcoin Conversions” for Square sellers wishing to convert up to 10% of their daily sales into bitcoin.
We’re doing a few things to make bitcoin more secure. First, we recognize that holding bitcoin safely can make people feel anxious, especially if one doesn’t want to keep their bitcoin on an exchange. That’s why we built and launched Bitkey to over 90 countries: a globally available, non-custodial wallet that combines intuitive software, robust hardware, and advanced security measures. Bitkey makes bitcoin easy to use and hard to lose. It comes integrated with Cash App and Coinbase, allowing customers to easily buy and transfer bitcoin directly to their Bitkey.
We also want to help secure the bitcoin network by building bitcoin mining hardware. We’re introducing an entirely new 3 nanometer ASIC mining chip, in addition to an entire mining rig system. Why? We’ve heard from countless miners globally about their desire for reliable, flexible, and US-based mining hardware and software. This contributes to the health and security of the bitcoin network by further decentralizing both the supply of mining hardware and the distribution of hashrate, the computing power devoted to mining bitcoin.
With a standalone mining chip, we will represent the only large, well-capitalized mining hardware vendor with such a solution. We believe this will help unlock mining system innovation and support the much-needed development of new mining system form factors and use cases. With the full mining rig system, we’ll build on our product and software development expertise, system engineering competency, supply chain experience, and aftermarket support capability (with tens of millions of devices shipped) to build something miners can depend on. This is a massive market and opportunity we’re very excited about.
And finally, we want to make bitcoin more usable everyday. Our greatest contribution thus far to this goal has been investing in the Spiral team, a group of open-source developers who work every day to make bitcoin more than an investment. Spiral has been directly behind the Lightning Development Kit, the Bitcoin Development Kit, the Bitcoin Design Community, and has provided grants to over 50 developers in more than 20 countries, leading to a dozen foundational open source bitcoin projects. The team has also been the inspiration for our Bitkey and mining hardware projects and has helped us think deeply about how finance technology shifts over time. |
|
|
BLOCK Q1 2024 3 |
| Global remittance, an $860 billion industry, is a use case that’s more urgently in need of better solutions today than everyday payments. This is why we created TBD, to solve cross-border funds flow without the need for going through a centralized exchange. TBD has created a protocol for on- and off-ramps from fiat to digital currencies that would allow anyone without a bank (~1.4 billion people) and with access to a mobile phone to participate in the larger global economy. We’ll discuss TBD in a future shareholder letter as we launch our first remittance product later this year.
Ultimately, making bitcoin more usable every day means seeing bitcoin as a medium of exchange for the internet, thus solving for the original problem Satoshi stated in the bitcoin white paper:
“Commerce on the Internet has come to rely almost exclusively on financial institutions serving as trusted third parties to process electronic payments.
...What is needed is an electronic payment system based on cryptographic proof instead of trust, allowing any two willing parties to transact directly with each other without the need for a trusted third party.”
The internet will have a native currency; it’s just a matter of time. Artificial Intelligence systems and agents will have to transact, and the most efficient way to do so will be a common protocol for money movement. Creative endeavors will rely heavily on micropayments, something that’s been discussed since the dawn of the internet, and finally being realized at scale with things like “zaps” (transferring small amounts of bitcoin via lightning) on the NOSTR protocol. Commerce will be less constrained by national borders, flowing freely around the world without gatekeepers or rent seekers.
This won’t happen overnight. The existing and emerging financial systems will operate in parallel for some time. There’s an opportunity to build cohesive and regulatory-compliant connections between these two worlds. This is where we’ve always flourished: at the intersection of regulations and innovative technology that can bring more people into the economy.
Recognizing the interconnectedness of the bitcoin ecosystem, we understand that our advancements foster collective growth, and the progress of others, in turn, benefits us. This synergy is pivotal; as the bitcoin ecosystem flourishes, so does Block. We were the first to recognize this potential and have reaped the benefits, but as others join, the advantages compound. The rising tide of bitcoin’s growth lifts all boats, and our proactive contributions have positioned us at the forefront of this wave. |
|
|
BLOCK Q1 2024 4 |
| We also believe in investing in the overall asset of the ecosystem, and holding bitcoin in our treasury. Going forward, each month we will be investing 10% of our gross profit from bitcoin products into bitcoin purchases. We were one of the first public companies to put bitcoin on our balance sheet: we invested $220 million into bitcoin, and that investment has grown by approximately 160% to $573 million as of the end of the first quarter. We’re open sourcing our treasury blueprint so other companies can do the same: https://block.xyz/documents/bitcoin-blueprint.pdf
Historically and moving forward, our investment in bitcoin transcends technology; it is an investment in a future where economic empowerment is the norm. This commitment drives our business into new territories, unlocking novel opportunities for our customers, and securing enduring value for you, our shareholders.
Jack Dorsey |
|
|
BLOCK Q1 2024 5 |
Q1’24 Highlights
|
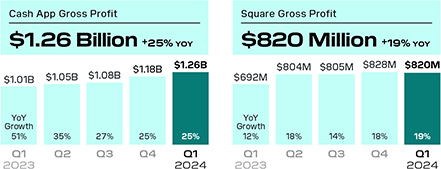
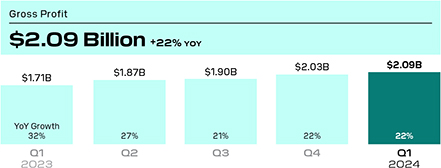
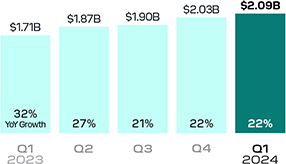
In the first quarter of 2024, gross profit grew 22% year over year to $2.09 billion. Cash App generated gross profit of $1.26 billion, up 25% year over year, and Square generated gross profit of $820 million, up 19% year over year. |
|
|
|
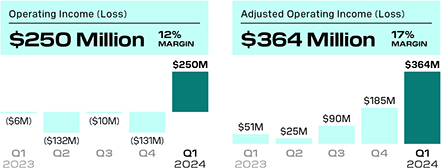
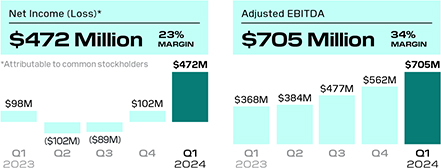
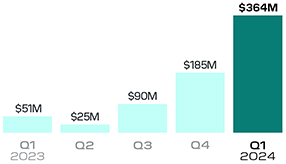
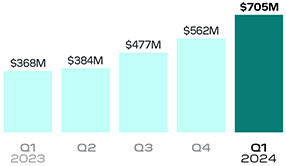
We delivered improvement across all profitability measures in the first quarter of 2024. Operating income was $250 million while Adjusted Operating Income was $364 million. Net income attributable to common stockholders was $472 million and Adjusted EBITDA was $705 million, up 91% year over year. |
|
Margins above are all calculated as a percent of gross profit. In the first quarter of 2024, total net revenue was $5.96 billion, up 19% year over year, and, excluding bitcoin revenue, revenue was $3.23 billion, up 14% year over year.
*We have revised the 2023 quarterly net income and EPS results in this letter and in our Q4 2023 letter from amounts previously reported to correctly reflect the impact of the remeasurement of bitcoin investment in each period, pursuant to the Company’s early adoption of ASU No. 2023-08, Accounting for and Disclosure of Crypto Assets (“ASU 2023-08”), in 2023, using the modified retrospective approach.
In the fourth quarter of 2023, we began reporting the financial results of our BNPL platform fully within Cash App, rather than allocating 50% of revenue and gross profit to each of Square and Cash App. The prior period segment financial information in this letter has been revised to conform to the updated segment reporting.
In the first quarter of 2024, net income included a remeasurement gain on our bitcoin investment of $233 million. Reconciliations of non-GAAP financial measures used in this letter to their nearest GAAP equivalents are provided at the end of this letter. Please see these reconciliations for a description of certain items that affected operating income (loss) and net income (loss) in the first quarter of 2024.
|
|
BLOCK Q1 2024 6 |
|
A transacting active is a Cash App account that has at least one financial transaction using any product or service within Cash App during a specified period. A transacting active for a specific Cash App product has at least one financial transaction using that product during the specified period and is referred to as an active. Examples of transactions include sending or receiving a peer-to-peer payment, transferring money into or out of Cash App, making a purchase using Cash App Card, earning a dividend on a stock investment, and paying back a loan, among others. Certain of these accounts may share an alias identifier with one or more other transacting active accounts. This could represent, among other things, one customer with multiple accounts or multiple customers sharing one alias identifier (for example, families).
A paycheck deposit active is a Cash App account that receives ACH inflows during a specified period, but excludes tax refunds and ACH transfers. There are certain features that a paycheck deposit active gets access to if they deposit a certain amount of money each month, such as free overdraft coverage and a 4.5% yield on their Cash App Savings account, among other benefits. |
| Cash App
Cash App, with its bank partners, is focused on a three-part strategy, introduced last quarter: banking our base, moving upmarket by serving families, and building the next-generation social bank. Our primary focus in the near term is banking our base by driving paycheck deposit adoption and increasing inflows per active.
We are committed to earning our customers’ trust.
· We are working to provide elevated card management tools for Cash App Card customers, which increases the card’s utility and is critical for building trust with our customers. In March, we allowed customers to stop charges from select merchants directly in the app, a frequently requested feature via our support channels.
· Over time, we expect to grow upmarket with families and can do so by offering an increasingly robust set of oversight controls to promote safety. In the first quarter, we redesigned the interface for Families so parents can more easily understand their teen’s balance, pay them, set up a recurring allowance, or modify controls and limits for their teen’s account.
We believe our financial services offerings are uniquely connected and differentiated from traditional banks.
· Cash App Taxes offers a free tax filing service. We can help our customers with their taxes and also introduce them to our direct deposit offering: More than 40% of Cash App Taxes actives chose to receive their refund directly into Cash App during this tax season, an increase from the prior year. |
|
24M Cash App Card monthly actives, which increased 16% year over year.
We are launching products and features across financial services that provide customers with a differentiated experience beyond traditional banks. |
|
|
BLOCK Q1 2024 7 |
| · | In the fourth quarter, we launched free overdraft coverage up to a certain amount for eligible customers, helping our customers save money and easing their day-to-day cash flow needs. This is a key feature that can drive direct deposit adoption, given the engagement we’ve seen since launch. |
| · | We believe that bringing a yield to Cash App’s savings product will continue to drive engagement, which we’ve seen by growth in the number of accounts utilizing it and increasing balances: Since launching in January, eligible actives have deposited more than $1 billion into their Savings accounts. |
We continued to integrate Afterpay into Cash App because we believe that commerce tools enhance the value of our entire financial services offering.
| · | BNPL GMV was $6.98 billion in the first quarter, up 25% year over year. Acquisition was strong across customers and merchants, with growth in the quarter driven by Single Use Payments (“SUP”) and Gift Cards. |
| · | We see advantages to distributing BNPL through Cash App Card. Over the past few months, we have been testing an Afterpay installment product using Cash App Card. This allows customers to convert certain purchases into a short-term loan and access BNPL anywhere they use their Cash App Card for a small fee. While early, we have seen strong adoption based on eligible customers. |
|
|
BLOCK Q1 2024 8 |
Square
Square is focused on four priorities: a rock-solid and flexible platform, providing a “local” experience to sellers of all sizes, growing with AI, and banking on Square.
We continued to strengthen our platform with features that we believe improve our ability to serve our sellers.
| · | A key priority is improving platform resilience, and in the first quarter we launched the full global expansion of offline payments to all Square hardware devices. Sellers in every one of our markets can now accept payments even if they are having connectivity issues. |
| · | As we work toward a single app for all sellers, we have evolved the onboarding experience for quick-service restaurants, reducing friction while creating a more tailored product experience for these sellers. Early results show an improvement in feature discovery, which we believe will increase the ability of sellers to find and use more of our products. As we learn more, we plan to update the onboarding flows for other verticals. |
| · | We recently introduced new features that improve the onboarding experience for Square Appointments, our point-of-sale booking platform used by sellers across services industries such as health and beauty. We are using AI to automate the previously manual task of uploading details about their various service offerings to Square Appointments, saving sellers time. |
|
|
BLOCK Q1 2024 9 |
| · | We serve many mixed-use sellers who don’t fit neatly into one vertical. For example, we may serve a retailer who primarily sells grocery items but also has a deli that serves fresh food. Ahead of our convergence to a single app, we continued to improve the connectivity of our software across verticals to better serve these mixed-use sellers. Retail sellers who also have a food and drink component can now send orders to Square Kitchen Display System (“KDS”) directly from their Retail Point of Sale, improving their buyer experience and showing the power of shared technology across verticals. |
We are evolving our go-to-market strategies and focusing on improving product velocity to deliver enhanced local experiences to sellers.
| · | We rolled out contracts in the second half of 2023 and saw the number of U.S. sales wins with contracts attached more than double from December to March. While still early, we are seeing encouraging improvements in early cohort retention when contracts are deployed. |
| · | Expanded franchise capabilities have been an unlock for Square to serve larger sellers. Since launch in the third quarter of 2023, we’ve expanded relationships with growing multi-location franchises, including Greek fast-casual restaurant chain Taziki’s Mediterranean Cafe, and signed new sellers, including innovative dessert concept JARS. |
| · | In the first quarter, we enhanced our Square Loyalty Promotions offering: Sellers choose what type of promotion, such as a holiday special, to launch, and our AI-enabled loyalty tool leverages traffic data, transaction patterns, and other inputs to create an offer that optimizes for business goals like increasing foot traffic during slow hours or selling specific items. |

Square KDS is a kitchen display system that connects with Square for Restaurants, Square for Retail, Square Point of Sale, Square Online, and our online ordering and delivery platforms. To help multi-vertical sellers customize their Square experience, in the first quarter we began enabling mixed-use retail businesses that also sell made-to-order foods to send orders to a Kitchen Display System directly from their Retail Point-of-Sale.
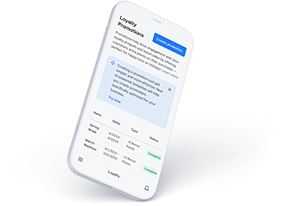
Our AI-enhanced Square Loyalty Promotions offering leverages traffic data and transaction patterns to help our sellers choose which type of promotion they want to launch.
|
|
BLOCK Q1 2024 10 |
We were able to bring new banking products to market quickly by leveraging existing Cash App infrastructure, as we have focused on creating more connections between our ecosystems.
| · | We launched Paper Cash Deposits in the first quarter, which allows sellers using Square Checking to deposit cash into their checking account at more than 70,000 retail locations across the U.S. This product has consistently been requested by sellers who accept cash and want to use Square for more of their banking needs. |
| · | In April, we began allowing sellers to instantly convert a portion of their sales into bitcoin through Cash App for a lower cost than buying bitcoin through an exchange. |
|
|
BLOCK Q1 2024 11 |
Reconciliations of non-GAAP metrics used in this letter to their nearest GAAP equivalents are provided at the end of this letter.
Bitcoin gross profit was $80 million in the first quarter of 2024. The total sale amount of bitcoin sold to customers, which we recognize as bitcoin revenue, was $2.73 billion. Bitcoin gross profit was 3% of bitcoin revenue.
Margins are calculated as a percent of gross profit.
Rule of 40 is the sum of our gross profit growth and Adjusted Operating Income margin as a percent of gross profit.
Financial Discussion
We outperformed our gross profit and profitability guidance in the first quarter of 2024. Gross profit grew 22% year over year to $2.09 billion. Cash App sustained strong gross profit growth of 25% year over year in the first quarter driven primarily by inflows per active and monetization rate, with strong performance across Cash App Card, our BNPL platform, our Bitcoin products, and Cash App Borrow. Square gross profit grew 19% year over year in the first quarter, an improvement from the fourth quarter, behind notable strength in our banking products and international markets.
We continued to drive strong profitability and delivered operating income of $250 million and Adjusted Operating Income of $364 million. Operating income margin was 12% and Adjusted Operating Income margin was 17%, as we achieved meaningful margin expansion during the quarter. We remained below our 12,000 people cap at the end of the quarter. We believe we can continue to drive profitability by leveraging our scale to improve our cost structure across a range of different expense areas, and utilizing AI and automation.
At the same time, we are also investing behind key initiatives that we believe will drive sustainable long-term growth. In Square, we are investing in our sales team to drive growth with larger sellers while increasing product velocity to enhance our ability to serve sellers across our business. For Cash App, we’re prioritizing initiatives, with our bank partners, that drive more customers toward a primary banking relationship.
Our focus is on continued execution to reach our Rule of 40 target in 2026. While we recognize there is more work to do, we are excited about the momentum across the business and believe we are setting the foundation for ongoing profitable growth at scale.
|
GROSS PROFIT
|
|
|
BLOCK Q1 2024 12 |
In the first quarter of 2024, gross profit included $18 million of amortization of acquired technology assets.
GPV includes Square GPV and Cash App Business GPV. Square GPV is defined as the total dollar amount of all card payments processed by sellers using Square, net of refunds, and ACH transfers. Cash App Business GPV comprises Cash App activity related to peer-to-peer transactions received by business accounts and peer-to-peer payments sent from a credit card. GPV does not include transactions from our BNPL platform because GPV is related only to transaction-based revenue and not to subscription and services-based revenue. Revenue from our BNPL platform includes fees generated from consumer receivables, late fees, and certain affiliate and advertising fees from the platform.
BLOCK TOTAL REVENUE AND GROSS PROFIT
In the first quarter of 2024, total net revenue was $5.96 billion, up 19% year over year. Excluding bitcoin revenue, revenue was $3.23 billion, up 14% year over year. Gross profit was $2.09 billion, up 22% year over year.
Transaction-based revenue was $1.51 billion in the first quarter of 2024, up 6% year over year, and transaction-based gross profit was $638 million, up 6% year over year. We processed $54.43 billion in GPV in the first quarter of 2024, up 6% year over year. Transaction-based gross profit as a percentage of GPV was 1.17%, down 1 basis point year over year and up 4 basis points quarter over quarter.
Subscription and services-based revenue was $1.68 billion in the first quarter of 2024, up 23% year over year, and subscription and services-based gross profit was $1.41 billion, up 28% year over year.
In the fourth quarter of 2023, we began reporting the financial results of our BNPL platform fully within Cash App, rather than allocating 50% of revenue and gross profit to each of Square and Cash App. The prior period segment financial information in this letter has been revised to conform to the updated segment reporting.
|
|
BLOCK Q1 2024 13 |
Inflows per transacting active refers to total inflows in the quarter divided by monthly actives for the last month of the quarter.
Inflows refers to funds entering the Cash App ecosystem. Inflows does not include the movement of funds when funds remain in the Cash App ecosystem or when funds leave the Cash App ecosystem, or inflows related to the Afterpay or Verse apps. Inflows from Verse actives were not material to overall inflows.
Eligible customers have the option to purchase online
Gift Cards from a variety of leading retailers and then spread the cost into 4 payments with Afterpay.
CASH APP REVENUE AND GROSS PROFIT
In the first quarter of 2024, Cash App generated $4.17 billion of revenue and $1.26 billion of gross profit, up 23% and 25% year over year, respectively. Excluding bitcoin revenue, Cash App revenue was $1.44 billion, up 18% year over year. Cash App generated $1.33 billion of subscription and services-based revenue, up 23% year over year. Strength in Cash App gross profit was driven by growth in Cash App Card, our BNPL platform, our Bitcoin products, and Cash App Borrow.
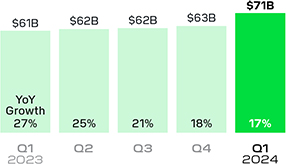
In March, Cash App had 57 million monthly transacting actives, up 6% year over year. In the first quarter of 2024, overall inflows were $71 billion, up 17% year over year and 12% quarter over quarter. Inflows per transacting active were $1,255, up 11% year over year from strength in financial services products and 10% quarter over quarter, reflecting tax refund seasonality. Monetization rate was 1.48%, up 7 basis points year over year and down 1 basis point quarter over quarter.
Our top strategic priority continues to be increasing engagement of banking products with our existing Cash App transacting actives. We continued to see strong usage of Cash App Card as the number of Cash App Card monthly actives increased to 24 million in March and spend per monthly active also grew on a year-over-year basis. During the quarter, Cash App Card transaction fees surpassed Instant Deposit as Cash App’s largest contributor to gross profit. Paycheck deposit actives as of March grew quarter over quarter.
BNPL GMV was $6.98 billion, up 25% year over year. Growth was driven by Single Use Payments (“SUP”), which enables customers to BNPL at both in-network and out-of-network merchants from within the Afterpay app, and Gift Cards. Cash App Pay also continued to grow, with volume up more than 40% on a quarter-over-quarter basis.
| CASH APP INFLOWS FRAMEWORK |
|
|
|
57M Actives |
|
|
| X | ||
|
$1,255 Inflows per Active |
|
|
| X | ||
|
1.48% Monetization Rate |
|
We calculate monetization rate by dividing Cash App gross profit, excluding contributions from our BNPL platform, by Cash App inflows.
| CASH APP INFLOWS |
|
|
|
|
BLOCK Q1 2024 14 |
Bitcoin revenue is the total sale amount of bitcoin sold to customers. Bitcoin costs are the total amount we pay to purchase bitcoin in order to facilitate customers’ access to bitcoin. In future quarters, bitcoin revenue and gross profit may fluctuate as a result of changes in customer demand or the market price of bitcoin.
Cash App generated $80 million of bitcoin gross profit in the first quarter of 2024, up 59% year over year. The total sale amount of bitcoin sold to customers, which we recognize as bitcoin revenue, was $2.73 billion, up 26% year over year. The year-over-year increase in bitcoin revenue and gross profit was driven by a few factors, including a pricing change made in the prior quarter, as well as a benefit from the price appreciation of our bitcoin inventory and an increase in the average market price of bitcoin during the quarter.
In the first quarter of 2024, Cash App generated $109 million of transaction-based revenue, down 19% year over year. Cash App Business GPV was $3.96 billion, down 19% year over year. Cash App Business GPV comprises Cash App activity related to peer-to-peer transactions received by business accounts and peer-to-peer payments sent from a credit card.
|
|
BLOCK Q1 2024 15 |
Services verticals include professional services, beauty and personal care, health care and fitness, and home and repair.
SQUARE REVENUE AND GROSS PROFIT
In the first quarter of 2024, Square generated $1.73 billion of revenue and $820 million of gross profit, up 11% and 19% year over year, respectively. Square generated $1.40 billion of transaction-based revenue in the first quarter of 2024, up 9% year over year, and $296 million of subscription and services-based revenue, up 29% year over year. Growth in Square gross profit was driven primarily by our banking products and international markets.
Square GPV was $50.46 billion, up 9% year over year on both a reported and constant currency basis. Square GPV in our U.S. market grew 6% year over year, and Square GPV in our international markets grew 23% year over year, or 26% year over year on a constant currency basis. On a year-over-year basis, food and drink GPV was up 14%, GPV from services verticals was up 7%, and retail GPV was up 4%. During the quarter, Square saw a higher percentage of GPV with custom pricing on a year-over-year basis, as we intend to drive incremental growth with larger sellers through our go-to-market and product strategies.
Throughout the first quarter, we saw weather-related impacts to our U.S. volume and pockets of continued same-store-growth weakness, most notably in our retail vertical. Card-present GPV was up 12% year over year, while card-not-present GPV was up 3% year over year. Within card-not-present volumes, GPV growth from online channels was up 10% year over year. We continued to experience softness in a portion of our card-not-present volume related to manual keyed entry or “MKE” transactions, and we remain focused on shifting to more software-enabled payments volume. We achieved positive growth in acquisition, or gross profit from new sellers, and churn of existing sellers remained consistent with prior periods.
| SQUARE GROSS PROFIT BY PRODUCT AREA |
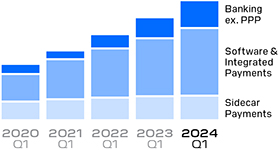
PERCENT OF TOTAL SQUARE GROSS PROFIT EX PPP
| Q1’20 |
Q1’21 |
Q1’22 |
Q1’23 |
Q1’24 |
||||||
| 17% |
11% | 16% | 20% | 23% | Banking ex. PPP | |||||
| 53% |
61% | 62% | 60% | 59% | Software & Integrated Payments | |||||
| 34% |
30% | 27% | 23% | 20% | Sidecar Payments | |||||
Hardware gross profit losses are not presented for any period. Percentages are of Square gross profit excluding contributions from PPP loan forgiveness for each period.
| SQUARE GROSS PAYMENT VOLUME |
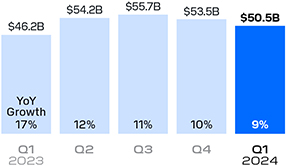
Square GPV is defined as the total dollar amount of all card payments processed by sellers using Square, net of refunds, and ACH transfers.
|
|
BLOCK Q1 2024 16 |
Software solutions are a key part of our strategic priority to help sellers save time and grow their businesses, and we remain focused on cross-selling more solutions to sellers. Software and integrated payments gross profit grew 17% year over year in the first quarter of 2024, while gross profit from our vertical point-of-sale solutions, including Square Appointments, Square for Restaurants, and Square for Retail, was up 24% year over year.
Gross profit from our banking products, which primarily include Square Loans, Instant Transfer, and Square Debit Card, grew 36% year over year. Strength in banking gross profit was driven by continued strong demand for loans and healthy repayment trends. We continue to find incremental opportunities to deliver lending solutions to our customers while maintaining underwriting discipline. Square Loans facilitated approximately 129,000 loans totaling $1.32 billion in originations, up 17% year over year.
International gross profit was up 38% year over year in the first quarter as we observed healthy growth in payments volumes across each of our international markets. We’ve also seen strength in our banking products internationally, most notably the recent launch of our merchant cash advance product in Japan.
Hardware revenue in the first quarter of 2024 was $32 million, down 15% year over year, and gross loss was $18 million as we use hardware as an acquisition tool.
| SQUARE GPV MIX BY SELLER SIZE |
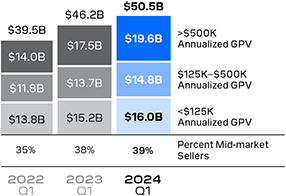
We determine seller size based on annualized GPV during the applicable quarter. A mid-market seller generates more than $500,000 in annualized GPV.
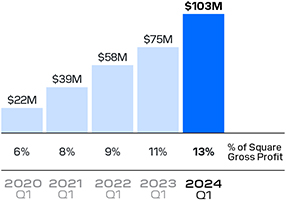
| GROSS PROFIT IN MARKETS OUTSIDE THE U.S. |
|
|
BLOCK Q1 2024 17 |
In the first quarter of 2024, operating expenses included $43 million of amortization of customer and other acquired intangible assets.
We discuss Cash App marketing expenses because a large portion is generated by our peer-to-peer service, which we offer free to our Cash App customers, and we consider it to be a marketing tool to encourage the use of Cash App. In the fourth quarter of 2023, we began reporting BNPL platform marketing expenses within Cash App. The year-over-year growth rate for Cash App marketing expenses presented in this letter reflect the new reporting classification for all historical periods.
CORPORATE AND OTHER REVENUE AND GROSS PROFIT
Corporate and Other generated $54 million in revenue and $16 million in gross profit in the first quarter of 2024. Corporate and Other was comprised primarily of TIDAL and intersegment eliminations between Cash App and Square in the first quarter of 2024.
OPERATING EXPENSES
In 2023, we sharpened our focus on identifying areas where we could be more cost efficient while driving growth. In the first quarter of 2024, we continued to make progress on these goals.
In the first quarter of 2024, operating expenses were $1.84 billion on a GAAP basis and $1.41 billion on a non-GAAP basis, up 7% and 3% year over year, respectively.
Product development expenses were $721 million on a GAAP basis and $461 million on a non-GAAP basis in the first quarter of 2024, up 15% and 16% year over year, respectively. The increase was driven primarily by personnel costs related to our engineering team, as we continue to develop and diversify our products, as well as by software and cloud computing infrastructure fees.
Sales and marketing expenses were $444 million on a GAAP basis and $412 million on a non-GAAP basis in the first quarter of 2024, down 11% and 12% year over year, respectively.
| · | Cash App marketing expenses were down 18% year over year, driven primarily by a decrease in advertising costs as we have continued to focus on expense discipline, and a $27 million release of chargeback losses related to prior periods, which were partially offset by an increase in peer-to-peer processing costs. |
| · | Other sales and marketing expenses were up 2% year over year. Other sales and marketing expenses primarily include expenses related to Square and TIDAL. |
|
|
BLOCK Q1 2024 18 |
As bitcoin is considered an indefinite-lived intangible asset, and upon adoption of Accounting Standards Update No. 2023-08, Accounting for and Disclosure of Crypto Assets, we remeasure our bitcoin at fair value at each reporting date with changes recognized in net income.
General and administrative expenses were $471 million on a GAAP basis and $358 million on a non-GAAP basis in the first quarter of 2024, up 9% and down 1% year over year, respectively. On a GAAP basis, the increase was driven by a $32 million charge related to certain purchase considerations related to the TIDAL acquisition that had been previously withheld for post-acquisition activities.
Transaction, loan, and consumer receivables losses were $166 million in the first quarter of 2024, up 30% year over year. The increase was driven primarily by growth in Cash App Borrow volumes, and partially offset by a release of previously established risk loss provisions related to prior periods. In the first quarter, loss rates for Square GPV, Square Loans, and Cash App Borrow remained consistent with historical ranges, and losses on BNPL consumer receivables were less than 1% of GMV, also consistent with historical ranges.
In the fourth quarter of 2020 and first quarter of 2021, we invested $50 million and $170 million, respectively, in bitcoin. As of March 31, 2024, we held approximately 8,038 bitcoins for investment purposes with a fair value of $573 million based on observable market prices, which is included within “Other non-current assets” on the condensed consolidated balance sheets. In the first quarter of 2024, other income, net, included a remeasurement gain on our bitcoin investment of $233 million.
|
|
BLOCK Q1 2024 19 |
EARNINGS
In the first quarter of 2024, operating income was $250 million, compared to a loss of $6 million in the first quarter of 2023. Adjusted Operating Income was $364 million, compared to $51 million in the first quarter of 2023. Adjusted Operating Income benefitted from approximately $52 million in non-recurring items, including a $38 million release of chargeback losses related to prior periods, with $27 million related to peer-to-peer transactions losses in sales and marketing expenses and $11 million in transaction, loan, and consumer receivable losses, and a $13 million indirect tax reserve release in general and administrative expenses.
The year-over-year improvement in operating income (loss) and Adjusted Operating Income was driven by gross profit growth across our Cash App and Square ecosystems.
|
OPERATING INCOME (LOSS)
|
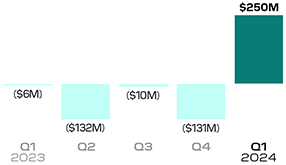
Please see the reconciliations at the end of this letter for a description of certain items that affected operating income (loss) in the first quarter of 2024.
|
ADJUSTED OPERATING INCOME (LOSS)
|
|
|
BLOCK Q1 2024 20 |
Net income attributable to common stockholders was $472 million in the first quarter of 2024. Net income per share attributable to common stockholders was $0.77 on a basic and $0.74 on a diluted basis, based on 616 million weighted-average basic and 637 million weighted-average diluted shares outstanding during the first quarter of 2024, representing a $0.61 and $0.58 increase year over year, respectively.
Adjusted EBITDA was $705 million in the first quarter of 2024, compared to $368 million in the first quarter of 2023.
The year-over-year improvement in net income attributable to common stockholders and Adjusted EBITDA was driven by gross profit growth across our Cash App and Square ecosystems and, on a GAAP net income basis, a $233 million gain from the remeasurement of our bitcoin investment.
In the first quarter of 2024, Adjusted Net Income Per Share (Adjusted EPS) was $0.85 on a diluted basis based on 637 million weighted-average diluted shares outstanding during the first quarter of 2024, representing a $0.42 increase year over year.
| NET INCOME (LOSS) ATTRIBUTABLE TO COMMON STOCKHOLDERS |
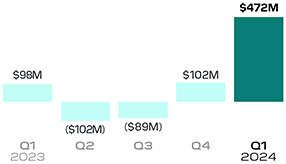
Please see the reconciliations at the end of this letter for a description of certain items that affected net income (loss) in the first quarter of 2024.
| ADJUSTED EBITDA |
|
|
BLOCK Q1 2024 21 |
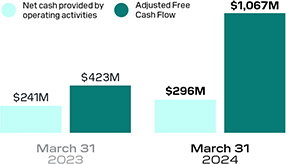
Adjusted Free Cash Flow is a non-GAAP financial measure that represents our net cash provided by operating activities adjusted for changes in settlements receivable; changes in customers payable; changes in settlements payable; the purchase of property and equipment; payments for originations of consumer receivables; proceeds from principal repayments and sales of consumer receivables; and sales, principal payments, and forgiveness of PPP loans. We present Adjusted Free Cash Flow because we use it to understand the cash generated by our business and make strategic decisions related to our balance sheet, and because we are focused on growing our Adjusted Free Cash Flow generation over time. It is not intended to represent amounts available for discretionary purposes.
BALANCE SHEET/CASH FLOW
We ended the first quarter of 2024 with $8.0 billion in available liquidity, with $7.2 billion in cash, cash equivalents, restricted cash, and investments in marketable debt securities, as well as $775 million available to be withdrawn from our revolving credit facility subject to compliance with our covenants. Additionally, we had $600 million available to be withdrawn under our warehouse funding facilities, to support funding of growth in our consumer receivables related to our BNPL platform.
In October 2023, our board of directors authorized the repurchase of up to $1 billion of our Class A common stock. In the first quarter of 2024, we repurchased 3.6 million shares of our Class A common stock for an aggregate amount of $252 million. As of March 31, 2024, $591 million remained available and authorized for repurchases.
In the first quarter of 2024, Adjusted EBITDA contributed positively to our overall liquidity. Overall liquidity was also positively impacted by a refund of a $350 million deposit held by a processor to meet requirements related to processing volumes in the fourth quarter of 2023.
Net cash provided by operating activities was $296 million for the twelve months ended March 31, 2024, compared to $241 million for the twelve months ended March 31, 2023. Adjusted Free Cash Flow was $1.07 billion for the twelve months ended March 31, 2024, compared to $423 million for the twelve months ended March 31, 2023.
| CASH FLOW (TWELVE MONTHS ENDED) |
|
|
BLOCK Q1 2024 22 |
Guidance
| Q2 2024 OUTLOOK | Q2 2024 | |
|
|
|
|
| Gross Profit |
$2.165B to $2.185B | |
| YoY Growth |
16% to 17% | |
| Adjusted EBITDA1 |
$670M to $690M | |
| % Margin |
31% to 32% | |
| Adjusted Operating Income1 |
$305M to $325M | |
| % Margin |
14% to 15% | |
|
|
|
|
In the second quarter of 2024, we expect our share-based compensation expense to remain relatively stable year over year on a dollar basis.
| 2024 OUTLOOK | Current 2024 | Previous 2024 | ||
|
|
|
|
||
| Gross Profit |
$8.78B | $8.65B | ||
| YoY Growth |
17% | 15% | ||
| Adjusted EBITDA1 |
$2.76B | $2.63B | ||
| % Margin |
31% | 30% | ||
| Adjusted Operating Income1 |
$1.30B | $1.15B | ||
| % Margin |
15% | 13% | ||
| Rule of 40 |
32% | 29% | ||
|
|
|
|
||
We are raising our full-year outlook to reflect outperformance in the first quarter and our improved expectations for the remainder of the year. For the full year, we expect gross profit of at least $8.78 billion, or 17% growth year over year. For Adjusted Operating Income, we expect at least $1.30 billion, or 15% margin for the full year. We remain focused on achieving Rule of 40 in 2026, which we calculate as gross profit growth plus Adjusted Operating Income margin. Our updated guidance for the full year equates to a Rule of 32, an increase compared to our prior guidance of at least Rule of 29 and an improvement compared to the prior year. Our outlook does not assume any additional macroeconomic deterioration, which could impact results.
On a GAAP basis, we expect to recognize approximately $58 million in expenses related to amortization of intangible assets in the second quarter and $53 million in each of the third and fourth quarters, based on the intangible assets as of March 31, 2024. These amounts may be affected by fluctuations in foreign exchange rates in future periods.
Margins are calculated as a percent of gross profit.
1. We have not provided the forward-looking GAAP equivalents for certain forward-looking non-GAAP metrics, including Adjusted EBITDA and Adjusted Operating Income (Loss), or GAAP reconciliations of any of the aforementioned, as a result of the uncertainty regarding, and the potential variability of, reconciling items such as share-based compensation expense. Accordingly, the Company has relied upon the exception in item 10(e)(1)(i)(B) of Regulation S-K to exclude such reconciliations, as the reconciliations of these non-GAAP guidance metrics to their corresponding GAAP equivalents are not available without unreasonable effort. However, it is important to note that material changes to reconciling items could have a significant effect on future GAAP results. We have provided reconciliations of other historical GAAP to non-GAAP metrics in tables at the end of this letter.
|
|
BLOCK Q1 2024 23 |
MEDIA CONTACT
press@block.xyz
INVESTOR RELATIONS CONTACT
ir@block.xyz
Earnings
Webcast
Block (NYSE:SQ) will host a conference call and earnings webcast at 2:00 p.m. Pacific time/5:00 p.m. Eastern time, May 2, to discuss these financial results. To register to participate in the conference call, or to listen to the live audio webcast, please visit the Events & Presentations section of Block’s Investor Relations website at investors.block.xyz. A replay will be available on the same website following the call.
We will release financial results for the second quarter of 2024 on August 1, 2024, after the market closes, and will also host a conference call and earnings webcast at 2:00 p.m. Pacific time/5:00 p.m. Eastern time on the same day to discuss those financial results.

|

|
|
| Jack Dorsey | Amrita Ahuja | |
|
|
BLOCK Q1 2024 24 |

|
Southern Grist Brewing Company is a Nashville, TN based taproom and restaurant that has two locations and a 9,900-square-foot production facility. They use Square for Restaurants, Square Register, Square Marketing, and Square Payroll, which have helped them enable multiple revenue streams while saving them 10 hours a week managing their team of more than 60 employees.
|
“Square is one of the pillars of our business. It’s taken us through constant growth and expansion hurdles and played a major role in keeping our customers spending money with Southern Grist. ”
Kevin Antoon
Co-founder and CEO of Southern Grist Brewing Company
|
|
BLOCK Q1 2024 25 |

SAFE HARBOR STATEMENT
This letter contains “forward-looking statements” within the meaning of the Safe Harbor provisions of the U.S. Private Securities Litigation Reform Act of 1995. All statements other than statements of historical fact could be deemed forward-looking, including, but not limited to, statements regarding the future performance of Block, Inc. and its consolidated subsidiaries (the Company); the Company’s strategies, including expected impact of such strategies on our customers, actives, and sellers as well as our business and financial performance, expected financial results, guidance, and general business outlook for current and future periods; the Company’s integration of Afterpay, and its impacts on the Company’s business and financial results; future profitability and growth in the Company’s businesses and products and the Company’s ability to drive such profitability and growth; the Company’s expectations regarding scale, economics, and the demand for or benefits from its products, product features, and services; the Company’s product development plans; the ability of the Company’s products to attract and retain customers, particularly in new or different markets or demographics; trends in the Company’s markets and the continuation of such trends; the Company’s expectations and intentions regarding future expenses, including future transaction and loan losses and the Company’s estimated reserves for such losses; the Company’s bitcoin investments and strategy as well as the potential financial impact and volatility; and management’s statements related to business strategy, plans, investments, opportunities, and objectives for future operations. In some cases, forward-looking statements can be identified by terms such as “may,” “will,” “appears,” “should,” “expects,” “plans,” “anticipates,” “could,” “intends,” “target,” “projects,” “contemplates,” “believes,” “estimates,” “predicts,” “potential,” or “continue,” or the negative of these words or other similar terms or expressions that concern our expectations, strategy, plans, or intentions.
Such statements are subject to a number of known and unknown risks, uncertainties, assumptions, and other factors that may cause the Company’s actual results, performance, or achievements to differ materially from results expressed or implied in this letter. Investors are cautioned not to place undue reliance on these statements, and reported results should not be considered as an indication of future performance.
Risks that contribute to the uncertain nature of the forward-looking statements include, among others, a continued or prolonged economic downturn in the United States and in other countries around the world; the Company’s investments in its business and ability to maintain profitability; the Company’s efforts to expand its product portfolio and market reach; the Company’s ability to develop products and services to address the rapidly evolving market for payments and financial services; the Company’s ability to deal with the substantial and increasingly intense competition in its industry; acquisitions, strategic investments, entries into new businesses, joint ventures, divestitures, and other transactions that the Company may undertake; the integration of Afterpay; the Company’s ability to ensure the integration of its services with a variety of operating systems and the interoperability of its technology with that of third parties; the Company’s ability to retain existing customers, attract new customers, and increase sales to all customers; the Company’s dependence on payment card networks and acquiring processors; the effect of extensive regulation and oversight related to the Company’s business in a variety of areas; risks related to the banking ecosystem, including through our bank partnerships, and FDIC and other regulatory obligations; the effect of management changes and business initiatives; the liabilities and loss potential associated with new products, product features, and services; litigation, including intellectual property claims, government investigations or inquiries, and regulatory matters or disputes; adoption of the Company’s products and services in international markets; changes in political, business, and economic conditions; as well as other risks listed or described from time to time in the Company’s filings with the Securities and Exchange Commission (the SEC), including the Company’s Annual Report on Form 10-K for the fiscal year ended December 31, 2023, which are on file with the SEC and available on the Investor Relations page of the Company’s website. Additional information will also be set forth in the Company’s Quarterly Report on Form 10-Q for the quarter ended March 31, 2024. All forward-looking statements represent management’s current expectations and predictions regarding trends affecting the Company’s business and industry and are based on information and estimates available to the Company at the time of this letter and are not guarantees of future performance. Except as required by law, the Company assumes no obligation to update any of the statements in this letter.
|
|
BLOCK Q1 2024 27 |
KEY OPERATING METRICS AND
NON-GAAP FINANCIAL MEASURES
To supplement our financial information presented in accordance with generally accepted accounting principles in the United States (GAAP), from period to period, we consider and present certain operating and financial measures that we consider key metrics or are not prepared in accordance with GAAP, including Gross Payment Volume (GPV), Gross Merchandise Value (GMV), Adjusted EBITDA, Adjusted EBITDA margin, Adjusted Net Income (Loss), Diluted Adjusted Net Income (Loss) Per Share (Adjusted EPS), Adjusted Operating Income (Loss), Adjusted Operating Income (Loss) margin, Adjusted Free Cash Flow, constant currency, and non-GAAP operating expenses as well as other measures defined in this letter such as measures excluding bitcoin revenue, and measures excluding PPP loan forgiveness gross profit. We believe these metrics and measures are useful to facilitate period-to-period comparisons of our business and to facilitate comparisons of our performance to that of other payments solution providers.
We define GPV as the total dollar amount of all card payments processed by sellers using Square, net of refunds, and ACH transfers. Additionally, GPV includes Cash App Business GPV, which comprises Cash App activity related to peer-to-peer transactions received by business accounts, and peer-to-peer payments sent from a credit card. GPV does not include transactions from our BNPL platform.
We define GMV as the total order value processed on our BNPL platform.
Adjusted EBITDA, Adjusted EBITDA margin, Adjusted Net Income (Loss), and Diluted Adjusted Net Income (Loss) Per Share (Adjusted EPS) are non-GAAP financial measures that represent our net income (loss) and net income (loss) per share, adjusted to eliminate the effect of share-based compensation expenses; amortization of intangible assets; gain or loss on revaluation of equity investments; bitcoin impairment losses; amortization of debt discount and issuance costs; and the gain or loss on the disposal of property and equipment, as applicable. Adjusted Operating Income (Loss) is a non-GAAP financial measure that represents our operating income (loss), adjusted to eliminate the effect of amortization of acquired technology assets; acquisition-related and integration costs; restructuring and other charges; goodwill impairment; bitcoin impairment losses; amortization of customer and other acquired intangible assets; and acquisition-related share-based acceleration costs. We also exclude from these measures certain acquisition-related and integration costs associated with business combinations, and various other costs that are not reflective of our core operating performance. We exclude amortization of intangible assets arising from business combinations because the amount of such expenses in any specific period may not directly correlate to the underlying performance of our ongoing business operations. Acquisition-related costs include amounts paid to redeem acquirees’ unvested stock-based compensation awards; charges associated with holdback liabilities; and legal, accounting, and due diligence costs. Integration costs include advisory and other professional services or consulting fees necessary to integrate acquired businesses. Other costs that are not reflective of our core business operating expenses may include contingent losses, impairment charges, and certain litigation and regulatory charges. We also add back the impact of the acquired deferred revenue and deferred cost adjustment, which was written down to fair value in purchase accounting. Additionally, for purposes of calculating diluted Adjusted EPS, we add back cash interest expense on convertible senior notes, as if converted at the beginning of the period, if the impact is dilutive. In addition to the items above, Adjusted EBITDA is a non-GAAP financial measure that also excludes depreciation and amortization, interest income and expense, other income and expense, and provision or benefit from income taxes, as applicable. Adjusted Operating Income (Loss) margin is calculated as Adjusted Operating Income (Loss) divided by gross profit. Adjusted EBITDA margin is calculated as Adjusted EBITDA divided by gross profit. To calculate the diluted Adjusted EPS, we adjust the weighted-average number of shares of common stock outstanding for the dilutive effect of all potential shares of common stock. In periods when we recorded an Adjusted Net Loss, the diluted Adjusted EPS is the same as basic Adjusted EPS because the effects of potentially dilutive items were anti-dilutive given the Adjusted Net Loss position.
|
|
BLOCK Q1 2024 28 |
KEY OPERATING METRICS AND
NON-GAAP FINANCIAL MEASURES
Adjusted Free Cash Flow is a non-GAAP financial measure that represents our net cash provided by operating activities adjusted for changes in settlements receivable; changes in customers payable; changes in settlements payable; the purchase of property and equipment; payments for originations of consumer receivables; proceeds from principal repayments and sales of consumer receivables; and sales, principal payments, and forgiveness of PPP loans. We present Adjusted Free Cash Flow because we use it to understand the cash generated by our business and make strategic decisions related to our balance sheet, and because we are focused on growing our Adjusted Free Cash Flow generation over time. It is not intended to represent amounts available for discretionary purposes.
Constant currency growth is calculated by assuming international results in a given period and the comparative prior period are translated from local currencies to the U.S. dollar at rates consistent with the monthly average rates in the comparative prior period. We discuss growth on a constant currency basis because a portion of our business operates in markets outside the U.S. and is subject to changes in foreign exchange rates.
Non-GAAP operating expenses is a non-GAAP financial measure that represents operating expenses adjusted to remove the impact of share-based compensation, depreciation and amortization, bitcoin impairment losses, loss on disposal of property and equipment, and acquisition-related integration and other costs.
We have included Adjusted EBITDA, Adjusted EBITDA margin, Adjusted Operating Income (Loss), Adjusted Operating Income (Loss) margin, Adjusted Net Income, Adjusted EPS, and non-GAAP operating expenses because they are key measures used by our management to evaluate our operating performance, generate future operating plans, and make strategic decisions, including those relating to operating expenses and the allocation of internal resources. Accordingly, we believe that Adjusted EBITDA, Adjusted EBITDA margin, Adjusted Operating Income (Loss), Adjusted Operating Income (Loss) margin, Adjusted Net Income, Adjusted EPS, and non-GAAP operating expenses provide useful information to investors and others in understanding and evaluating our operating results in the same manner as our management and board of directors. In addition, they provide useful measures for period-to-period comparisons of our business, as they remove the effect of certain non-cash items and certain variable charges that do not vary with our operations. We have included measures excluding our BNPL platform because we believe these measures are useful in understanding the ongoing results of our operations. We have included measures excluding bitcoin revenue because our role is to facilitate customers’ access to bitcoin. When customers buy bitcoin through Cash App, we only apply a small margin to the market cost of bitcoin, which tends to be volatile and outside our control. Therefore, we believe deducting bitcoin revenue or gross profit better reflects the economic benefits as well as our performance from these transactions. We have included measures excluding PPP loan forgiveness gross profit because we believe these measures are useful to facilitate comparisons of our business without PPP loan forgiveness.
Adjusted EBITDA, Adjusted EBITDA margin, Adjusted Net Income, Adjusted Operating Income (Loss), Adjusted Operating Income (Loss) margin, Adjusted EPS, and non-GAAP operating expenses, as well as other measures defined in the shareholder letter, such as measures excluding our BNPL platform, bitcoin revenue, and PPP loan forgiveness gross profit, have limitations as financial measures, should be considered as supplemental in nature, and are not meant as substitutes for the related financial information prepared in accordance with GAAP.
We believe that the aforementioned metrics and measures provide useful information about our operating results, enhance the overall understanding of our past performance and future prospects, and provide useful measures for period-to-period comparisons of our business, as they remove the effect of certain variable amounts, or they remove amounts that were not repeated across periods and therefore make comparisons more difficult. Our management uses these measures to evaluate our operating performance, generate future operating plans, and make strategic decisions, including those relating to operating expenses and the allocation of internal resources.
These non-GAAP financial measures should not be considered in isolation from, or as a substitute for, financial information prepared in accordance with GAAP. These non-GAAP financial measures are not based on any standardized methodology prescribed by GAAP. Other companies, including companies in our industry, may calculate the non-GAAP financial measures differently or not at all, which reduces their usefulness as comparative measures.
|
|
BLOCK Q1 2024 29 |
Condensed Consolidated
Statements of Operations
UNAUDITED
In thousands, except per share data
| THREE MONTHS ENDED | ||||||||
| Mar. 31, 2024 | Mar. 31, 2023 | |||||||
| Revenue: |
||||||||
| Transaction-based revenue |
$ | 1,511,209 | $ | 1,422,705 | ||||
| Subscription and services-based revenue |
1,682,294 | 1,366,224 | ||||||
| Hardware revenue |
32,501 | 37,451 | ||||||
| Bitcoin revenue |
2,731,124 | 2,163,751 | ||||||
|
|
|
|
||||||
| Total net revenue |
5,957,128 | 4,990,131 | ||||||
|
|
|
|
||||||
| Cost of revenue: |
||||||||
| Transaction-based costs |
873,165 | 820,787 | ||||||
| Subscription and services-based costs |
269,668 | 264,092 | ||||||
| Hardware costs |
50,785 | 58,785 | ||||||
| Bitcoin costs |
2,651,010 | 2,113,375 | ||||||
| Amortization of acquired technology assets |
18,027 | 18,508 | ||||||
|
|
|
|
||||||
| Total cost of revenue |
3,862,655 | 3,275,547 | ||||||
|
|
|
|
||||||
| Gross profit |
2,094,473 | 1,714,584 | ||||||
|
|
|
|
||||||
| Operating expenses: |
||||||||
| Product development |
720,574 | 626,937 | ||||||
| Sales and marketing |
443,885 | 496,011 | ||||||
| General and administrative |
471,260 | 432,825 | ||||||
| Transaction, loan, and consumer receivable losses |
165,729 | 127,896 | ||||||
| Amortization of customer and other acquired intangible assets |
43,282 | 37,087 | ||||||
|
|
|
|
||||||
| Total operating expenses |
1,844,730 | 1,720,756 | ||||||
|
|
|
|
||||||
| Operating income (loss) |
249,743 | (6,172) | ||||||
|
|
|
|
||||||
| Interest income, net |
(18,745) | (3,161) | ||||||
| Other income, net |
(237,824) | (77,717) | ||||||
|
|
|
|
||||||
| Income before income tax |
506,312 | 74,706 | ||||||
|
|
|
|
||||||
| Provision (benefit) for income taxes |
35,492 | (21,122) | ||||||
|
|
|
|
||||||
| Net income |
470,820 | 95,828 | ||||||
| Less: Net loss attributable to noncontrolling interests |
(1,185) | (2,488) | ||||||
|
|
|
|
||||||
| Net income attributable to common stockholders |
$ | 472,005 | $ | 98,316 | ||||
|
|
|
|
||||||
| Net income per share attributable to common stockholders: |
||||||||
| Basic |
$ | 0.77 | $ | 0.16 | ||||
|
|
|
|
||||||
| Diluted |
$ | 0.74 | $ | 0.16 | ||||
|
|
|
|
||||||
| Weighted-average shares used to compute net income per share attributable to common stockholders: |
||||||||
| Basic |
616,401 | 602,234 | ||||||
|
|
|
|
||||||
| Diluted |
637,360 | 623,579 | ||||||
|
|
|
|
||||||
|
|
BLOCK Q1 2024 30 |
Condensed Consolidated
Balance Sheets
In thousands, except per share data
| Mar. 31, 2024 | Dec 31, 2023 | |||||||
| UNAUDITED | ||||||||
| Assets |
||||||||
| Current assets: |
||||||||
| Cash and cash equivalents |
$ | 5,753,436 | $ | 4,996,465 | ||||
| Investments in short-term debt securities |
573,390 | 851,901 | ||||||
| Settlements receivable |
3,714,810 | 3,226,294 | ||||||
| Customer funds |
4,046,346 | 3,170,430 | ||||||
| Consumer receivables, net |
1,914,278 | 2,444,695 | ||||||
| Loans held for sale |
892,068 | 775,424 | ||||||
| Safeguarding asset related to bitcoin held for other parties |
1,681,111 | 1,038,585 | ||||||
| Other current assets |
1,962,865 | 2,353,488 | ||||||
|
|
|
|
||||||
| Total current assets |
20,538,304 | 18,857,282 | ||||||
|
|
|
|
||||||
| Goodwill |
11,721,329 | 11,919,720 | ||||||
| Acquired intangible assets, net |
1,673,618 | 1,761,521 | ||||||
| Other non-current assets |
1,679,579 | 1,531,370 | ||||||
|
|
|
|
||||||
| Total assets |
$ | 35,612,830 | $ | 34,069,893 | ||||
|
|
|
|
||||||
| Liabilities and Stockholders’ Equity |
||||||||
| Current liabilities: |
||||||||
| Customers payable |
$ | 8,137,147 | $ | 6,795,340 | ||||
| Accrued expenses and other current liabilities |
1,275,321 | 1,334,669 | ||||||
| Current portion of long-term debt (Note 12) |
997,197 | — | ||||||
| Warehouse funding facilities, current |
410,426 | 753,035 | ||||||
| Safeguarding obligation liability related to bitcoin held for other parties |
1,681,111 | 1,038,585 | ||||||
|
|
|
|
||||||
| Total current liabilities |
12,501,202 | 9,921,629 | ||||||
|
|
|
|
||||||
| Warehouse funding facilities, non-current |
543,751 | 854,882 | ||||||
| Long-term debt (Note 12) |
3,125,456 | 4,120,091 | ||||||
| Other non-current liabilities |
475,225 | 480,455 | ||||||
|
|
|
|
||||||
| Total liabilities |
16,645,634 | 15,377,057 | ||||||
|
|
|
|
||||||
| Commitments and contingencies (Note 17) |
||||||||
| Stockholders’ equity: |
||||||||
| Preferred stock, $0.0000001 par value: 100,000 shares authorized at March 31, 2024 and December 31, 2023. None issued and outstanding at March 31, 2024 and December 31, 2023. |
— | — | ||||||
| Class A common stock, $0.0000001 par value: 1,000,000 shares authorized at March 31, 2024 and December 31, 2023; 556,563 and 555,306 issued and outstanding at March 31, 2024 and December 31, 2023, respectively. |
— | — | ||||||
| Class B common stock, $0.0000001 par value: 500,000 shares authorized at March 31, 2024 and December 31, 2023; 60,501 and 60,515 issued and outstanding at March 31, 2024 and December 31, 2023, respectively. |
— | — | ||||||
| Additional paid-in capital |
19,687,428 | 19,601,992 | ||||||
| Accumulated other comprehensive loss |
(660,203) | (378,307) | ||||||
| Accumulated deficit |
(56,424) | (528,429) | ||||||
|
|
|
|
||||||
| Total stockholders’ equity attributable to common stockholders |
18,970,801 | 18,695,256 | ||||||
| Noncontrolling interests |
(3,605) | (2,420) | ||||||
|
|
|
|
||||||
| Total stockholders’ equity |
18,967,196 | 18,692,836 | ||||||
| Total liabilities and stockholders’ equity |
$ | 35,612,830 | $ | 34,069,893 | ||||
|
|
|
|
||||||
|
|
BLOCK Q1 2024 31 |
Condensed Consolidated
Statements of Cash Flows
UNAUDITED
In thousands
| THREE MONTHS ENDED | ||||||||
| Mar. 31, 2024 | Mar. 31, 2023 | |||||||
| Cash flows from operating activities: |
||||||||
| Net income |
$ | 470,820 | $ | 95,828 | ||||
| Adjustments to reconcile net income to net cash provided by operating activities: |
||||||||
| Depreciation and amortization |
97,640 | 93,173 | ||||||
| Amortization of discounts and premiums and other non-cash adjustments |
(266,991) | (85,314) | ||||||
| Non-cash lease expense |
14,512 | 24,333 | ||||||
| Share-based compensation |
311,168 | 279,592 | ||||||
| Loss on revaluation of equity investments |
1,111 | 14,885 | ||||||
| Bitcoin remeasurement |
(233,404) | (96,088) | ||||||
| Transaction, loan, and consumer receivable losses |
165,729 | 127,896 | ||||||
| Change in deferred income taxes |
(7,984) | 1,353 | ||||||
| Changes in operating assets and liabilities: |
||||||||
| Settlements receivable |
(542,070) | 452,868 | ||||||
| Purchases and originations of loans |
(3,010,609) | (1,834,442) | ||||||
| Proceeds from payments and forgiveness of loans |
2,824,953 | 1,753,515 | ||||||
| Customers payable |
465,891 | (418,948) | ||||||
| Settlements payable |
(7,341) | (64,528) | ||||||
| Other assets and liabilities |
205,970 | (49,722) | ||||||
|
|
|
|
||||||
| Net cash provided by operating activities |
489,395 | 294,401 | ||||||
|
|
|
|
||||||
| Cash flows from investing activities: |
||||||||
| Purchases of marketable debt securities |
(184,048) | (56,761) | ||||||
| Proceeds from maturities of marketable debt securities |
204,737 | 273,771 | ||||||
| Proceeds from sale of marketable debt securities |
327,128 | 15,697 | ||||||
| Payments for originations of consumer receivables |
(6,095,104) | (4,911,509) | ||||||
| Proceeds from principal repayments and sales of consumer receivables |
6,824,596 | 5,339,800 | ||||||
| Purchases of property and equipment |
(31,998) | (32,253) | ||||||
| Purchases of other investments |
(2,924) | (4,821) | ||||||
|
|
|
|
||||||
| Net cash provided by investing activities |
1,042,387 | 623,924 | ||||||
|
|
|
|
||||||
| Cash flows from financing activities: |
||||||||
| Repayments of Paycheck Protection Program Liquidity Facility advances |
— | (5,077) | ||||||
| Proceeds from warehouse facilities borrowings |
160,587 | 47,975 | ||||||
| Repayments of warehouse facilities borrowings |
(790,592) | (692,556) | ||||||
| Proceeds from the exercise of stock options and purchases under the employee stock purchase plan |
19,943 | 6,825 | ||||||
| Net increase in interest-bearing deposits |
18,650 | 13,601 | ||||||
| Repurchases of common stock |
(252,095) | — | ||||||
| Change in customer funds, restricted from use in the Company’s operations |
875,916 | 620,149 | ||||||
|
|
|
|
||||||
| Net cash provided by (used in) financing activities |
32,409 | (9,083) | ||||||
|
|
|
|
||||||
| Effect of foreign exchange rate on cash and cash equivalents |
(41,755) | 1,033 | ||||||
|
|
|
|
||||||
| Net increase in cash, cash equivalents, restricted cash, and customer funds |
1,522,436 | 910,275 | ||||||
| Cash, cash equivalents, restricted cash, and customer funds, beginning of the period |
9,009,087 | 8,435,906 | ||||||
|
|
|
|
||||||
| Cash, cash equivalents, restricted cash, and customer funds, end of the period |
$ | 10,531,523 | $ | 9,346,181 | ||||
|
|
|
|
||||||
|
|
BLOCK Q1 2024 32 |
Reportable Segment Disclosures
Information on the reportable segments revenue and segment operating profit are
as follows (in thousands):
| THREE MONTHS ENDED | ||||||||||||||||
| Mar. 31, 2024 | ||||||||||||||||
| Cash App | Square | Corporate and Other (i) |
Total | |||||||||||||
| Revenue: |
||||||||||||||||
| Transaction-based revenue |
$ | 109,220 | $ | 1,401,989 | $ | — | $ | 1,511,209 | ||||||||
| Subscription and services-based revenue |
1,332,560 | 296,218 | 53,516 | 1,682,294 | ||||||||||||
| Hardware revenue |
— | 31,830 | 671 | 32,501 | ||||||||||||
| Bitcoin revenue |
2,731,124 | — | — | 2,731,124 | ||||||||||||
|
|
|
|
|
|
|
|
|
|
||||||||
| Segment revenue |
$ | 4,172,904 | $ | 1,730,037 | $ | 54,187 | $ | 5,957,128 | ||||||||
|
|
|
|
|
|
|
|
|
|
||||||||
| Segment gross profit (ii) |
$ | 1,258,527 | $ | 820,272 | $ | 15,674 | $ | 2,094,473 | ||||||||
|
|
|
|
|
|
|
|
|
|
||||||||
| THREE MONTHS ENDED | ||||||||||||||||
| Mar. 31, 2023 | ||||||||||||||||
| Cash App | Square | Corporate and Other (i) |
Total | |||||||||||||
| Revenue: |
||||||||||||||||
| Transaction-based revenue |
$ | 134,663 | $ | 1,288,042 | $ | — | $ | 1,422,705 | ||||||||
| Subscription and services-based revenue |
1,085,748 | 229,884 | 50,592 | 1,366,224 | ||||||||||||
| Hardware revenue |
— | 37,451 | — | 37,451 | ||||||||||||
| Bitcoin revenue |
2,163,751 | — | — | 2,163,751 | ||||||||||||
|
|
|
|
|
|
|
|
|
|
||||||||
| Segment revenue |
$ | 3,384,162 | $ | 1,555,377 | $ | 50,592 | $ | 4,990,131 | ||||||||
|
|
|
|
|
|
|
|
|
|
||||||||
| Segment gross profit (ii) |
$ | 1,009,953 | $ | 691,562 | $ | 13,069 | $ | 1,714,584 | ||||||||
|
|
|
|
|
|
|
|
|
|
||||||||
Operating Segment Disclosures
A reconciliation of total segment gross profit to the Company’s income (loss)
before applicable income taxes is as follows (in thousands):
| THREE MONTHS ENDED | ||||||||
| Mar. 31, 2024 | Mar. 31, 2023 | |||||||
| Total segment gross profit |
$ | 2,094,473 | $ | 1,714,584 | ||||
| Less: Product development |
720,574 | 626,937 | ||||||
| Less: Sales and marketing |
443,885 | 496,011 | ||||||
| Less: General and administrative |
471,260 | 432,825 | ||||||
| Less: Transaction, loan, and consumer receivable losses |
165,729 | 127,896 | ||||||
| Less: Amortization of customer and other intangible assets |
43,282 | 37,087 | ||||||
| Less: Interest income, net |
(18,745) | (3,161) | ||||||
| Less: Other income, net |
(237,824) | (77,717) | ||||||
|
|
|
|
||||||
| Income before applicable income taxes |
$ | 506,312 | $ | 74,706 | ||||
|
|
|
|
||||||
(i) Corporate and other represents results related to products and services that are not assigned to a specific reportable segment, and intersegment eliminations.
(ii) Segment gross profit for Cash App for the three months ended March 31, 2024 and March 31, 2023 included $13.7 million and $14.4 million of amortization of acquired technology assets expense, respectively. Segment gross profit for Square for the three months ended March 31, 2024 and March 31, 2023 included $2.5 million and $2.7 million of amortization of acquired technology assets expense, respectively. Amortization of acquired technology assets expense included in Corporate and Other was immaterial for the three months ended March 31, 2024 and March 31, 2023.
|
|
BLOCK Q1 2024 33 |
Key Operating Metrics and
Non-GAAP Financial Measures
UNAUDITED
In thousands, except GPV and per share data
| THREE MONTHS ENDED | ||||||||
| Mar. 31, 2024 | Mar. 31, 2023 | |||||||
| Gross Payment Volume (GPV) (in millions) |
$ | 54,426 | $ | 51,117 | ||||
| Adjusted Operating Income (in thousands) |
$ | 364,264 | $ | 50,974 | ||||
| Adjusted EBITDA (in thousands) |
$ | 705,074 | $ | 368,367 | ||||
| Adjusted Net Income Per Share: |
||||||||
| Basic |
$ | 0.88 | $ | 0.45 | ||||
| Diluted |
$ | 0.85 | $ | 0.43 | ||||
| THREE MONTHS ENDED | ||||||||
| Mar. 31, 2024 | Mar. 31, 2023 | |||||||
| Square GPV (in millions) |
$ | 50,465 | $ | 46,220 | ||||
| Cash App GPV (in millions) |
3,961 | 4,897 | ||||||
|
|
|
|
||||||
| Total GPV |
$ | 54,426 | $ | 51,117 | ||||
|
|
|
|
||||||
Adjusted EBITDA
UNAUDITED
In thousands
| THREE MONTHS ENDED | ||||||||||||||||||||
| Mar. 31, 2024 | Mar. 31, 2023 | June 30, 2023 | Sept. 30, 2023 | Dec. 31, 2023 | ||||||||||||||||
| Net income (loss) attributable to common stockholders |
$ | 472,005 | $ | 98,316 | $ | (102,042) | $ | (88,738) | $ | 102,236 | ||||||||||
| Net loss attributable to noncontrolling interests |
(1,185) | (2,488) | (3,336) | (4,806) | (20,266) | |||||||||||||||
|
|
|
|
|
|
|
|
|
|
||||||||||||
| Net income (loss) |
470,820 | 95,828 | (105,378) | (93,544) | 81,970 | |||||||||||||||
| Share-based compensation expense |
304,531 | 279,591 | 319,248 | 345,690 | 331,568 | |||||||||||||||
| Restructuring share-based compensation expense |
6,637 | — | — | — | — | |||||||||||||||
| Depreciation and amortization |
97,640 | 93,173 | 94,545 | 115,518 | 105,324 | |||||||||||||||
| Acquisition-related and integration costs |
32,512 | 1,479 | 1,434 | 3,391 | 5,118 | |||||||||||||||
| Restructuring and other charges |
14,063 | 72 | 100,915 | 21,421 | 117,174 | |||||||||||||||
| Goodwill impairment |
— | — | — | — | 132,313 | |||||||||||||||
| Interest income, net |
(18,745) | (3,161) | (3,944) | (21,415) | (18,701) | |||||||||||||||
| Other expense (income), net (i) |
(237,824) | (77,717) | (14,635) | 23,912 | (134,035) | |||||||||||||||
| Provision (benefit) for income taxes |
35,492 | (21,122) | (8,150) | 81,139 | (59,886) | |||||||||||||||
| Loss (gain) on disposal of property and equipment |
(71) | 191 | 343 | 1,355 | 1,297 | |||||||||||||||
| Acquired deferred revenue and cost adjustment |
19 | 33 | 24 | 21 | 21 | |||||||||||||||
|
|
|
|
|
|
|
|
|
|
||||||||||||
| Adjusted EBITDA |
$ | 705,074 | $ | 368,367 | $ | 384,402 | $ | 477,488 | $ | 562,163 | ||||||||||
|
|
|
|
|
|
|
|
|
|
||||||||||||
(i) Includes the loss (gain) from the remeasurement of the Company’s bitcoin investment.
|
|
BLOCK Q1 2024 34 |
Adjusted Operating
Income (Loss)
UNAUDITED
In thousands
| THREE MONTHS ENDED | ||||||||||||||||||||
| Mar. 31, 2024 | Mar. 31, 2023 | June 30, 2023 | Sept. 30, 2023 | Dec. 31, 2023 | ||||||||||||||||
| Operating income (loss) |
$ | 249,743 | $ | (6,172) | $ | (132,107) | $ | (9,908) | $ | (130,652) | ||||||||||
| Amortization of acquired technology assets |
18,027 | 18,508 | 18,392 | 17,880 | 18,049 | |||||||||||||||
| Acquisition-related and integration costs |
32,512 | 1,479 | 1,434 | 3,391 | 5,118 | |||||||||||||||
| Restructuring and other charges |
14,063 | 72 | 100,915 | 21,421 | 117,174 | |||||||||||||||
| Restructuring share-based compensation |
6,637 | — | — | — | — | |||||||||||||||
| Goodwill impairment |
— | — | — | — | 132,313 | |||||||||||||||
| Amortization of customer and other acquired intangible assets |
43,282 | 37,087 | 36,865 | 56,965 | 43,127 | |||||||||||||||
|
|
|
|
|
|
|
|
|
|
||||||||||||
| Adjusted Operating Income |
$ | 364,264 | $ | 50,974 | $ | 25,499 | $ | 89,749 | $ | 185,129 | ||||||||||
|
|
|
|
|
|
|
|
|
|
||||||||||||
Key Metric Margins
UNAUDITED
In thousands, except for percentages
| THREE MONTHS ENDED |
||||
| Mar. 31, 2024 | ||||
| Gross profit |
$ | 2,094,473 | ||
| Gross profit change (%) YoY |
22 % | |||
| Operating income (loss) |
249,743 | |||
| Operating income (loss) margin (%) of gross profit |
12 % | |||
| Net income (loss) attributable to common stockholders |
472,005 | |||
| Net income margin (%) of gross profit |
23 % | |||
| Adjusted Operating Income |
364,264 | |||
| Adjusted Operating Income margin (%) of gross profit |
17 % | |||
| Adjusted EBITDA |
705,074 | |||
| Adjusted EBITDA margin (%) of gross profit |
34 % | |||
|
|
||||
|
|
BLOCK Q1 2024 35 |
Adjusted Free Cash Flow
UNAUDITED
In thousands
| TWELVE MONTHS ENDED (i) | ||||||||
| Mar. 31, 2024 | Mar. 31, 2023 | |||||||
| Net cash provided by operating activities |
$ | 295,955 | $ | 240,881 | ||||
| Consumer receivables cash flows included within investing activities in the GAAP statement of cash flows: |
||||||||
| Payments for originations of consumer receivables |
(25,152,382) | (21,326,912) | ||||||
| Proceeds from principal repayments and sales of consumer receivables |
25,726,447 | 21,588,716 | ||||||
| Less: Purchase of property and equipment |
(150,896) | (161,881) | ||||||
| Reversal of: |
||||||||
| Changes in settlements receivable |
2,103,467 | 825,828 | ||||||
| Changes in customers payable |
(2,141,417) | (505,439) | ||||||
| Changes in settlements payable |
396,849 | (133,006) | ||||||
| Sales, principal payments and forgiveness of PPP loans |
(10,901) | (104,918) | ||||||
|
|
|
|
||||||
| Adjusted Free Cash Flow |
$ | 1,067,122 | $ | 423,269 | ||||
|
|
|
|
||||||
| Net cash used in investing activities |
$ | 1,101,664 | $ | 719,007 | ||||
| Net cash provided by (used in) financing activities |
$ | (198,645) | $ | 1,057,053 | ||||
|
|
|
|
||||||
(i) The twelve months ended information presented in this table is comprised of financial data from the years ended December 31, 2023 and 2022, excluding first quarter of 2023 and 2022, and including first quarter of 2024 and 2023, amounts, respectively.
|
|
BLOCK Q1 2024 36 |
Select Financial Results
Excluding Bitcoin and PPP
UNAUDITED
In thousands
| THREE MONTHS ENDED | ||||||||||||||||||||
| Mar. 31, 2024 | Mar. 31, 2023 | |||||||||||||||||||
| Bitcoin revenue |
$ | 2,731,124 | $ | 2,163,751 | ||||||||||||||||
| Bitcoin costs |
2,651,010 | 2,113,375 | ||||||||||||||||||
|
|
|
|
||||||||||||||||||
| Bitcoin gross profit |
$ | 80,114 | $ | 50,376 | ||||||||||||||||
|
|
|
|
||||||||||||||||||
| THREE MONTHS ENDED | ||||||||||||||||||||
| Mar. 31, 2024 | Mar. 31, 2023 | |||||||||||||||||||
| Total net revenue (GAAP) |
$ | 5,957,128 | $ | 4,990,131 | ||||||||||||||||
| Less: Bitcoin revenue |
2,731,124 | 2,163,751 | ||||||||||||||||||
|
|
|
|
||||||||||||||||||
| Total net revenue, excluding Bitcoin |
$ | 3,226,004 | $ | 2,826,380 | ||||||||||||||||
|
|
|
|
||||||||||||||||||
| THREE MONTHS ENDED | ||||||||||||||||||||
| Mar. 31, 2024 | Mar. 31, 2023 | |||||||||||||||||||
| Cash App revenue (GAAP) |
$ | 4,172,904 | $ | 3,384,162 | ||||||||||||||||
| Less: Bitcoin contribution to Cash App revenue |
2,731,124 | 2,163,751 | ||||||||||||||||||
|
|
|
|
||||||||||||||||||
| Total Cash App revenue, excluding Bitcoin |
$ | 1,441,780 | $ | 1,220,411 | ||||||||||||||||
|
|
|
|
||||||||||||||||||
| THREE MONTHS ENDED | ||||||||||||||||||||
| Mar. 31, 2024 | Mar. 31, 2023 | Mar. 31, 2022 | Mar. 31, 2021 | Mar. 31, 2020 | ||||||||||||||||
| Square gross profit (GAAP) |
$ | 820,272 | $ | 691,562 | $ | 615,080 | $ | 468,016 | $ | 355,769 | ||||||||||
| Less: gross profit from Paycheck Protection Program (PPP) loan forgiveness |
182 | 693 | 51,454 | 9,400 | — | |||||||||||||||
|
|
|
|
|
|
|
|
|
|
||||||||||||
| Square gross profit excluding PPP loan forgiveness $ |
820,090 | $ | 690,869 | $ | 563,626 | $ | 458,616 | $ | 355,769 | |||||||||||
|
|
|
|
|
|
|
|
|
|
||||||||||||
| THREE MONTHS ENDED | ||||||||||||||||||||
| Mar. 31, 2024 | Mar. 31, 2023 | Mar. 31, 2022 | Mar. 31, 2021 | Mar. 31, 2020 | ||||||||||||||||
| Square gross profit from Banking |
$ | 190,363 | $ | 140,328 | $ | 142,191 | $ | 60,289 | $ | 60,208 | ||||||||||
| Less: gross profit from PPP loan forgiveness |
182 | 693 | 51,454 | 9,400 | — | |||||||||||||||
|
|
|
|
|
|
|
|
|
|
||||||||||||
| Square banking gross profit excluding PPP loan forgiveness |
$ | 190,181 | $ | 139,635 | $ | 90,737 | $ | 50,889 | $ | 60,208 | ||||||||||
|
|
|
|
|
|
|
|
|
|
||||||||||||
|
|
BLOCK Q1 2024 37 |
Adjusted Net Income and
Adjusted EPS
UNAUDITED
In thousands, except per share data
| THREE MONTHS ENDED | ||||||||
| Mar. 31, 2024 | Mar. 31, 2023 | |||||||
| Net income attributable to common stockholders |
$ | 472,005 | $ | 98,316 | ||||
| Net loss attributable to noncontrolling interests |
(1,185) | (2,488) | ||||||
|
|
|
|
||||||
| Net income |
470,820 | 95,828 | ||||||
| Share-based compensation expense |
304,531 | 279,591 | ||||||
| Restructuring share-based compensation expense |
6,637 | — | ||||||
| Acquisition-related and integration costs |
32,512 | 1,479 | ||||||
| Restructuring and other charges |
14,063 | 72 | ||||||
| Amortization of intangible assets |
61,309 | 55,595 | ||||||
| Amortization of debt discount and issuance costs |
3,071 | 2,949 | ||||||
| Loss on revaluation of equity investments |
1,111 | 14,885 | ||||||
| Bitcoin remeasurement |
(233,404) | (96,088) | ||||||
| Loss (gain) on disposal of property and equipment |
(71) | 191 | ||||||
| Acquired deferred revenue and cost adjustment |
19 | 33 | ||||||
| Tax effect of non-GAAP net income adjustments |
(118,336) | (84,607) | ||||||
|
|
|
|
||||||
| Adjusted Net Income - basic |
$ | 542,262 | $ | 269,928 | ||||
| Cash interest expense on convertible notes |
673 | 1,236 | ||||||
|
|
|
|
||||||
| Adjusted Net Income - diluted |
$ | 542,935 | $ | 271,164 | ||||
|
|
|
|
||||||
| Weighted-average shares used to compute net income per share attributable to common stockholders: |
||||||||
| Basic |
616,401 | 602,234 | ||||||
|
|
|
|
||||||
| Diluted |
637,360 | 623,579 | ||||||
|
|
|
|
||||||
| Net income per share attributable to common stockholders: |
||||||||
| Basic |
$ | 0.77 | $ | 0.16 | ||||
|
|
|
|
||||||
| Diluted |
$ | 0.74 | $ | 0.16 | ||||
|
|
|
|
||||||
| Weighted-average shares used to compute Adjusted Net Income Per Share: |
||||||||
| Basic |
616,401 | 602,234 | ||||||
|
|
|
|
||||||
| Diluted |
637,360 | 627,423 | ||||||
|
|
|
|
||||||
| Adjusted Net Income Per Share: |
||||||||
| Basic |
$ | 0.88 | $ | 0.45 | ||||
|
|
|
|
||||||
| Diluted |
$ | 0.85 | $ | 0.43 | ||||
|
|
|
|
||||||
|
|
BLOCK Q1 2024 38 |
Non-GAAP Operating Expenses
UNAUDITED
In thousands
| THREE MONTHS ENDED | ||||||||
| Mar. 31, 2024 | Mar. 31, 2023 | |||||||
| Operating expenses |
$ | (1,844,730) | $ | (1,720,756) | ||||
| Share-based compensation |
304,358 | 279,449 | ||||||
| Restructuring share-based compensation |
6,637 | — | ||||||
| Depreciation and amortization |
79,135 | 73,951 | ||||||
| Loss (gain) on disposal of property and equipment |
(71) | 191 | ||||||
| Acquisition-related and integration costs |
32,512 | 1,479 | ||||||
| Restructuring and other charges |
14,063 | 72 | ||||||
|
|
|
|
||||||
| Non-GAAP operating expenses |
$ | (1,408,096) | $ | (1,365,614) | ||||
|
|
|
|
||||||
| THREE MONTHS ENDED | ||||||||
| Mar. 31, 2024 | Mar. 31, 2023 | |||||||
| Product development |
$ | (720,574) | $ | (626,937) | ||||
| Share-based compensation |
217,450 | 197,857 | ||||||
| Restructuring share-based compensation |
4,504 | — | ||||||
| Depreciation and amortization |
37,101 | 30,537 | ||||||
| Loss on disposal of property and equipment |
45 | 324 | ||||||
|
|
|
|
||||||
| Non-GAAP product development |
$ | (461,474) | $ | (398,219) | ||||
|
|
|
|
||||||
| THREE MONTHS ENDED | ||||||||
| Mar. 31, 2024 | Mar. 31, 2023 | |||||||
| Sales and marketing |
$ | (443,885) | $ | (496,011) | ||||
| Share-based compensation |
30,290 | 29,365 | ||||||
| Restructuring share-based compensation |
1,078 | — | ||||||
| Depreciation and amortization |
1,006 | 1,458 | ||||||
| Gain on disposal of property and equipment |
(8) | — | ||||||
|
|
|
|
||||||
| Non-GAAP sales and marketing |
$ | (411,519) | $ | (465,188) | ||||
|
|
|
|
||||||
| THREE MONTHS ENDED | ||||||||
| Mar. 31, 2024 | Mar. 31, 2023 | |||||||
| General and administrative |
$ | (471,260) | $ | (432,825) | ||||
| Share-based compensation |
56,618 | 52,227 | ||||||
| Restructuring share-based compensation |
1,055 | — | ||||||
| Depreciation and amortization |
9,456 | 16,879 | ||||||
| Gain on disposal of property and equipment |
(108) | (133) | ||||||
| Acquisition-related and integration costs |
32,512 | 1,479 | ||||||
| Restructuring and other charges |
14,063 | 72 | ||||||
|
|
|
|
||||||
| Non-GAAP general and administrative |
$ | (357,664) | $ | (362,301) | ||||
|
|
|
|
||||||
|
Depreciation and Amortization by Function UNAUDITED In thousands
|
||||||||
| THREE MONTHS ENDED | ||||||||
| Mar. 31, 2024 | Mar. 31, 2023 | |||||||
| Cost of revenue |
$ | 18,505 | $ | 19,222 | ||||
| Product development |
37,101 | 30,537 | ||||||
| Sales and marketing |
1,006 | 1,458 | ||||||
| General and administrative |
9,456 | 16,879 | ||||||
| Amortization of acquired customer assets |
31,572 | 25,077 | ||||||
|
|
|
|
||||||
| Total depreciation and amortization |
$ | 97,640 | $ | 93,173 | ||||
|
|
|
|
||||||
|
|
BLOCK Q1 2024 39 |