UNITED STATES
SECURITIES AND EXCHANGE COMMISSION
WASHINGTON, D.C. 20549
Form 6-K
REPORT OF FOREIGN PRIVATE ISSUER
PURSUANT TO RULE 13a-16 OR 15d-16
UNDER THE SECURITIES EXCHANGE ACT OF 1934
For the month of May 2024
Commission File Number: 1-9059
Barrick Gold Corporation
(Registrant’s name)
Brookfield Place, TD Canada Trust Tower, Suite 3700
161 Bay Street, P.O. Box 212
Toronto, Ontario M5J 2S1 Canada
(Address of principal executive offices)
Indicate by check mark whether the registrant files or will file annual reports under cover of Form 20-F or Form 40-F.
Form 20-F ☐ Form 40-F ☒
INCORPORATION BY REFERENCE
Exhibit 99.1 to this report on Form 6-K is furnished, not filed, and will not be incorporated by reference into any registration statement.
Exhibit 99.2 to this report on Form 6-K is hereby incorporated by reference into the Registration Statements on Form F-3 (File No. 333-206417), Form S-8 (File Nos. 333-121500, 333-131715, 333-135769, 333-224560) and Form F-10 (File No. 333-271603).
SIGNATURES
Pursuant to the requirements of the Securities Exchange Act of 1934, the registrant has duly caused this report to be signed on its behalf by the undersigned, thereunto duly authorized.
| BARRICK GOLD CORPORATION | ||||||
| Date: May 1, 2024 | By: | /s/ Poupak Bahamin |
||||
| Name: | Poupak Bahamin | |||||
| Title: | General Counsel | |||||
EXHIBIT INDEX
Exhibit 99.1
BARRICK TO RAMP UP PRODUCTION
AS IT REMAINS ON TRACK TO ACHIEVE 2024 TARGETS
| TORONTO – MAY 1, 2024 ALL AMOUNTS EXPRESSED IN U.S. DOLLARS
Barrick Gold Corporation (NYSE:GOLD)(TSX:ABX) today reported its first quarter results which were in line with guidance and position the Company well to meet its full year targets. Gold production is expected to ramp up steadily during the year, supported by the completion of the Pueblo Viejo plant expansion and the resumption of operations at the Porgera mine. Additionally, copper production is also on track to meet the full year’s guidance.
Reporting its Q1 results, Barrick said lower production and the consequent higher costs reflected the delayed ramp up at Pueblo Viejo following reconstruction of the conveyor, which has now been completed, in addition to planned maintenance at Nevada Gold Mines (NGM) and mine sequencing at other sites. In the meantime, the Company was progressing its four major organic growth projects: the ramp up of the Goldrush gold mine in Nevada; the Pueblo Viejo expansion; the Super Pit project at the Lumwana copper mine in Zambia; and the development of the giant copper-gold mine at Reko Diq in Pakistan. Brownfields growth continues to support Barrick’s unique reserve replacement record and greenfields exploration is expanding its portfolio across the world.
Financial results for the quarter show a year-over-year 143% increase in net earnings per share, a 36% rise in adjusted net earnings1, and a 7% increase to $907 million in attributable EBITDA2, with the operations delivering $760 million in operating cash flow for the quarter. The quarterly dividend was maintained at $0.10 per share. |
|
CONTINUED ON PAGE 3

Key Performance Indicators
Financial and Operating Highlights
| Financial Results | Q1 2024 | Q4 2023 | Q1 2023 | |||||||||
| Realized gold price3,4 | 2,075 | 1,986 | 1,902 | |||||||||
| ($ per ounce) |
||||||||||||
| Realized copper price3,4 | 3.86 | 3.78 | 4.20 | |||||||||
| ($ per pound) |
||||||||||||
| Net earnings5 | 295 | 479 | 120 | |||||||||
| ($ millions) |
||||||||||||
| Adjusted net earnings1 | 333 | 466 | 247 | |||||||||
| ($ millions) |
||||||||||||
| Attributable EBITDA2 | 907 | 1,068 | 851 | |||||||||
| ($ millions) |
||||||||||||
| Net cash provided by operating activities ($ millions) | 760 | 997 | 776 | |||||||||
| Free cash flow6 | 32 | 136 | 88 | |||||||||
| ($ millions) |
||||||||||||
| Net earnings per share | 0.17 | 0.27 | 0.07 | |||||||||
| ($) |
||||||||||||
| Adjusted net earnings per share1 ($) |
0.19 | 0.27 | 0.14 | |||||||||
| Attributable capital expenditures7 ($ millions) |
572 | 660 | 526 | |||||||||
| Operating Results | Q1 2024 | Q4 2023 | Q1 2023 | |||||||||
| Gold | ||||||||||||
| Production3 | 940 | 1,054 | 952 | |||||||||
| (thousands of ounces) | ||||||||||||
| Cost of sales | 1,425 | 1,359 | 1,378 | |||||||||
| (Barrick’s share)3,8 ($ per ounce) | ||||||||||||
| Total cash costs3,9 | 1,051 | 982 | 986 | |||||||||
| ($ per ounce) | ||||||||||||
| All-in sustaining costs3,9 | 1,474 | 1,364 | 1,370 | |||||||||
| ($ per ounce) | ||||||||||||
| Copper | ||||||||||||
| Production3,10 | 40 | 51 | 40 | |||||||||
| (thousands of tonnes) | ||||||||||||
| Cost of sales | 3.20 | 2.92 | 3.22 | |||||||||
| (Barrick’s share)3,11 ($ per pound) | ||||||||||||
| C1 cash costs3,12 | 2.40 | 2.17 | 2.71 | |||||||||
| ($ per pound) | ||||||||||||
| All-in sustaining costs3,12 | 3.59 | 3.12 | 3.40 | |||||||||
| ($ per pound) | ||||||||||||
| Financial Position | As at 3/31/24 |
As at 12/31/23 |
As at 3/31/23 |
|||||||||
| Debt (current and long-term) | 4,725 | 4,726 | 4,777 | |||||||||
| ($ millions) | ||||||||||||
| Cash and equivalents | 3,942 | 4,148 | 4,377 | |||||||||
| ($ millions) | ||||||||||||
| Debt, net of cash | 783 | 578 | 400 | |||||||||
| ($ millions) | ||||||||||||
Best Assets
| ∎ | Barrick on track to achieve 2024 targets as Pueblo Viejo and Porgera ramp up |
| ∎ | Another strong performance from Loulo-Gounkoto and Veladero in Q1 |
| ∎ | Costs expected to track lower through the year on steadily increasing production |
| ∎ | Pueblo Viejo completes conveyor rebuild, plant ramping up in Q2 |
| ∎ | Porgera produces first gold, with plant ramp-up on track to reach capacity in 2024 |
| ∎ | Another significant contribution from the copper portfolio with increasing production forecast through the year |
| ∎ | Reko Diq and Lumwana feasibility studies on track for completion by year end with long-lead orders expected to commence in Q3 |
| ∎ | Focus shifts to Fourmile on the back of Goldrush success and exploration expands beyond brownfields targets |
| ∎ | Brownfields growth continues as engine for organic reserve replacement with encouraging drilling results at NGM, Loulo and Kibali |
| ∎ | Greenfield exploration, complemented by strategic partnerships, grows portfolio in the most prospective belts |
Leader in Sustainability
| ∎ | Continued focus on safety, refining our ‘Journey to Zero’ program with Group-wide rollout of Fatal Risk Standards |
| ∎ | Differentiated and holistic approach to sustainability reinforced in Sustainability Report to be published in May 2024 |
| ∎ | Commissioned 50% of the 200-megawatt solar facility in Nevada — an initiative supported by U.S. government incentives of over $100 million, including incentives for U.S.-manufactured solar cells |
Delivering Value
| ∎ | Barrick’s focus on gold and copper production growth amplifies profitability in rising commodity market |
| ∎ | Operating cash flow of $760 million for the quarter |
| ∎ | Net earnings per share of $0.17 and adjusted net earnings per share1 of $0.19 for the quarter |
| ∎ | $0.10 per share dividend declared |
| BARRICK FIRST QUARTER 2024 | 2 | PRESS RELEASE |
CONTINUED FROM PAGE 1
Operational highlights for the quarter also included the accelerated ramp-up of Goldrush in Nevada after its final permitting (Record of Decision) late last year. At the nearby Fourmile project — a potentially world-class asset 100% owned by Barrick — drilling for a prefeasibility study has started to drive it up the value curve. Exploration has identified open-ended high-grade upside at Turquoise Ridge in Nevada, already Barrick’s highest-grade mine, and at Kibali in the Democratic Republic of Congo, geologists have discovered a significant high-grade trend similar to the KCD deposit on which the mine was built.
Commenting on the results, president and chief executive Mark Bristow said Barrick’s ability to grow its gold and copper production from its peerless asset base would amplify its profitability in the rising commodity markets.
“Our focus on exploration has placed Barrick in the unique position of more than replacing the reserves we mine year after year. Our key organic projects, such as the development of Reko Diq, the extension of Pueblo Viejo’s Tier One13 life by more than 20 years and the transformation of Lumwana into one of the world’s major copper mines will secure Barrick’s production profile well into the future,” he said.
Barrick’s holistic sustainability strategy remains foundational to all aspects of its business and continues to deliver real value to stakeholders. Bristow noted that among many other
things, the Company had increased its water re-use and recycle rate to 84% last quarter, commissioned the first stage of a 100-megawatt solar array at NGM and had a 16-megawatt solar array permitted at Kibali. Power purchase agreements by NGM have avoided 75% of its emissions. On the biodiversity front, Barrick has a 730-hectare rehabilitation plan for its operating sites for 2024 and also aims to relocate 72 more white rhinos to the Garamba National Park in the Democratic Republic of Congo, in conjunction with the Institut Congolais pour la Conservation de la Nature (ICCN) and African Parks.
Q1 2024 Results Presentation
Webinar and Conference Call
Mark Bristow will host a live presentation of the results today at 11:00 AM ET, with an interactive webinar linked to a conference call. Participants will be able to ask questions.
Go to the webinar
US/Canada (toll-free), 1 844 763 8274
UK (toll), +44 20 3795 9972
International (toll), +1 647 484 8814
The Q1 presentation materials will be available on Barrick’s website at www.barrick.com and the webinar will remain on the website for later viewing.
BARRICK DECLARES Q1 DIVIDEND
Barrick today announced the declaration of a dividend of $0.10 per share for Q1 2024.
The dividend is consistent with the Company’s Performance Dividend Policy announced at the start of 2022.
The Q1 2024 dividend will be paid on June 17, 2024 to shareholders of record at the close of business on May 31, 2024.
“The continued strength of our balance sheet and our global asset base provide us with the ability to maintain the distribution of a robust dividend to our shareholders, whilst still ensuring Barrick has adequate liquidity to invest in growing our business,” said senior executive vice-president and chief financial officer Graham Shuttleworth.
| BARRICK FIRST QUARTER 2024 | 3 | PRESS RELEASE |
The Super Pit expansion project will transform Lumwana into one of the world’s largest copper mines.
WORLD-CLASS COPPER PROJECTS SET TO DELIVER
INTO RISING PRICE AND DEMAND MARKET
The copper industry has traditionally suffered from underinvestment while the search for new resources to boost production has accelerated. The long lead times needed to turn discoveries into mines mean that supply is unable to meet the growing global demand, driven by the worldwide transition to renewable energy.
Foreseeing the emergence of the metal’s critical importance to the greening of the global grid, Barrick made the expansion of its copper portfolio a strategic priority at the time of the merger with Randgold five years ago. A thorough review of its global assets highlighted two significant opportunities: the Lumwana mine in Zambia; and the dormant Reko Diq project in Pakistan.
The new Barrick team restructured and re-engineered the struggling Lumwana operation back to health and then embarked on a Super Pit expansion project which will transform Lumwana into one of the world’s largest copper mines, with a projected annual production of around 240,000 tonnes per year over a life of more than 30 years.14 It is a key component of the Zambian government’s drive to revive the country’s copper industry.
At the same time, Barrick revisited the Reko Diq project in Pakistan, which hosts one of the world’s largest undeveloped copper-gold deposits. Stalled at the feasibility stage almost a decade ago, Barrick revitalized the project through a reconstituted ownership structure based on its trademark partnership model. The Company owns 50% and will operate the mine, a number of Pakistani state-owned enterprises hold 25% and, at Barrick’s insistence, the remaining 25% is held by the government of the Balochistan province to ensure that the province and its people will receive a substantial economic benefit from the mine.
Both projects are on track for first production in 2028 when they will lift Barrick into the upper tier of copper miners and stand alongside its peerless gold asset portfolio as a major
contributor. It is worth noting that some analysts predict that gold and copper both appear to be entering a new commodity super cycle where demand outstrips supply, leading to high prices for years to come.
President and chief executive Mark Bristow said Reko Diq was a prime example of Barrick’s ability to recognize and realize value. “This is undoubtedly one of the best undeveloped copper-gold deposits in the world, with a truly unique combination of large scale, low strip and high-grade orebodies. Barrick has a long record of success in seeing projects of this magnitude through from construction to operation, and we also bring to Reko Diq our expertise in successfully partnering with host countries for the benefit of all stakeholders in developing jurisdictions globally,” he said.
“There is also an enormous opportunity here to further unlock value, not only at Reko Diq but also in the wider region, which is underexplored and highly prospective.”
Regarding Lumwana, Bristow said that well before the completion of its expansion program, the revived mine had already contributed almost $3 billion to the Zambian economy since 2019 in the form of royalties, taxes, salaries and the procurement of goods and services from local businesses.
As at its other operations, Barrick has also promoted the development of a sustainable local economy around the mine. Among other things, it has launched a Business Accelerator Program designed to build the commercial capacity of the contractors in its supply chain, equipping them to grow and diversify their businesses.
| BARRICK FIRST QUARTER 2024 | 4 | PRESS RELEASE |
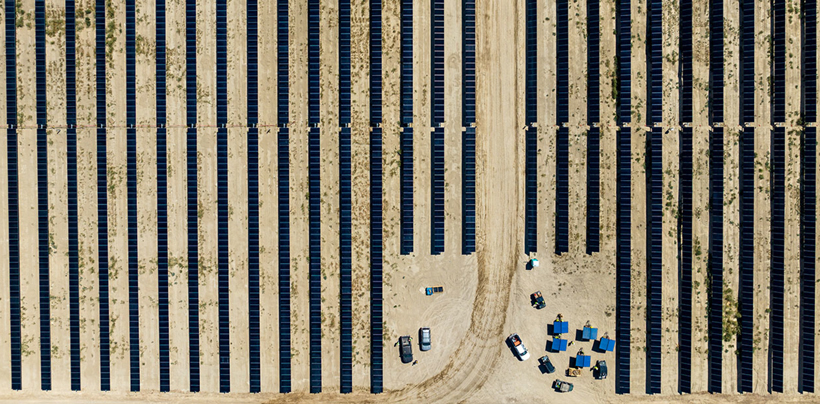
The TS Solar Power facility at Nevada Gold Mines.
POWER-BASED STRATEGIES AND TECHNOLOGY
DRIVE EFFICIENCIES, CUT COSTS
Barrick’s group-wide transition to clean energy is making steady progress with the commissioning of 50% of the TS Solar Power facility at NGM in April marking another major milestone on our greenhouse gas (GHG) emissions reduction roadmap.
With 100 megawatts of energy-producing capacity in this first phase, the solar facility began transmitting power to NGM’s operations in April.
When the second and final stage is completed in the second quarter of 2024, adding another 100 megawatts of power, the solar array will have the capacity to produce between 15% to 20% of NGM’s annual power demand — reducing NGM’s annual GHG emissions by 8% and Barrick’s overall GHG emissions by 5% against a 2018 baseline. The U.S. government provided an important economic incentive for the development of this renewable project via a $35 million tax benefit (Barrick’s share).
NGM has committed to a 20% carbon reduction by 2025 which will be achieved through the TS Solar facility and the modification of NGM’s TS Power Plant providing the ability to use cleaner burning natural gas as a fuel source.
Up next at NGM is the development of an additional solar power facility with a battery energy storage system (BESS) to serve as a secondary power source, mitigating the impacts of power grid disruption, and enhancing renewable energy consumption during off-peak hours. The project has been awarded $95 million in funding from the U.S. Department of Energy following a highly-competitive process that evaluated potential clean energy projects on mine land across the country.
At Loulo-Gounkoto in Mali, the use of solar energy is also increasing with a 72-megawatt solar power facility and 38-megwatt BESS now connected to the complex’s micro-grid. Solar power accounted for 28% of the total energy blend used in the first quarter of 2024, which is up from 14% in 2023 and 9% in 2022. Energy costs were down $6 million in the first quarter with this shift to solar away from heavy fuel oil.
In the Democratic Republic of Congo, Kibali’s three hydropower stations provided most of the mine’s power last year. At an average cost of $0.04 per kilowatt-hour, the hydropower blend is 90% cheaper than diesel fuel. The current expansion of the mine’s solar plant will increase the renewable energy use from 81% to 85%, with the mine running solely on renewal power during the six-month rainy season.
In Argentina, the Libertadores powerline is supplying renewable power to Veladero from neighboring Chile’s national grid, reducing GHG emissions and adding cost efficiencies. 2023 was the powerline’s first full year of operation — and it’s one reason Veladero exceeded its production guidance and beat its guidance on costs last year. A solar plant project at Pueblo Viejo in the Dominican Republic is also underway.
Barrick is targeting an overall 30% reduction in GHG emissions by 2030 (against our 2018 baseline) with the goal of achieving net-zero emissions by 2050.
| BARRICK FIRST QUARTER 2024 | 5 | PRESS RELEASE |
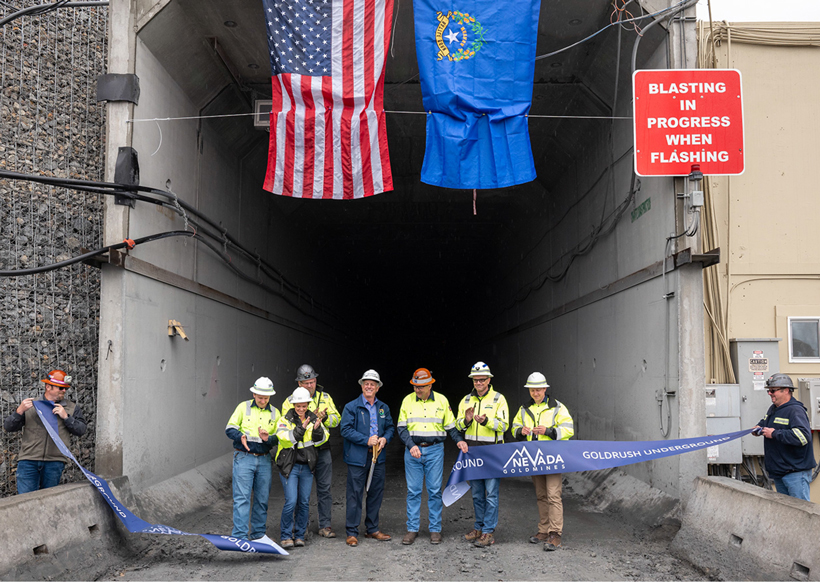
NEVADA GOLD MINES CELEBRATES
OFFICIAL OPENING OF GOLDRUSH
The Goldrush Project is officially on track to produce 130,000 ounces15 of gold this year and will further enhance the value Nevada Gold Mines (NGM) brings to the state through taxes, employment and meaningful support for communities, said Barrick President and CEO, Mark Bristow, at the project’s opening ceremony attended by Governor Joe Lombardo and local stakeholders.
Barrick, which owns 61.5% of the project through the NGM joint venture with Newmont (38.5%), is developing and will operate the mine, scheduled to reach commercial production by 2026 and growing to approximately 400,000 ounces per annum15 by 2028 (100% basis). The 24-year underground mine is expected to provide 500 jobs during its construction and employment for 570 people once operational.
More than $300 million of a $1 billion capital budget (100% basis) has been spent on the project, which is expected to generate substantial tax revenue for the state both in the form of net proceeds from minerals tax and the gold and silver
excise tax, earmarked for education. in Nevada under the new mine tax framework.
Speaking at the ribbon-cutting ceremony, Bristow thanked the bi-partisan federal delegation and the governor for their active and unwavering commitment that was instrumental in obtaining the record of decision, as well as our community stakeholders for supporting the project through the permitting process. “We recognize that we have been entrusted with a tremendous economic and environmental responsibility and we look forward to sharing the benefits of this new mine with Nevada and its people,” he said.
| BARRICK FIRST QUARTER 2024 | 6 | PRESS RELEASE |
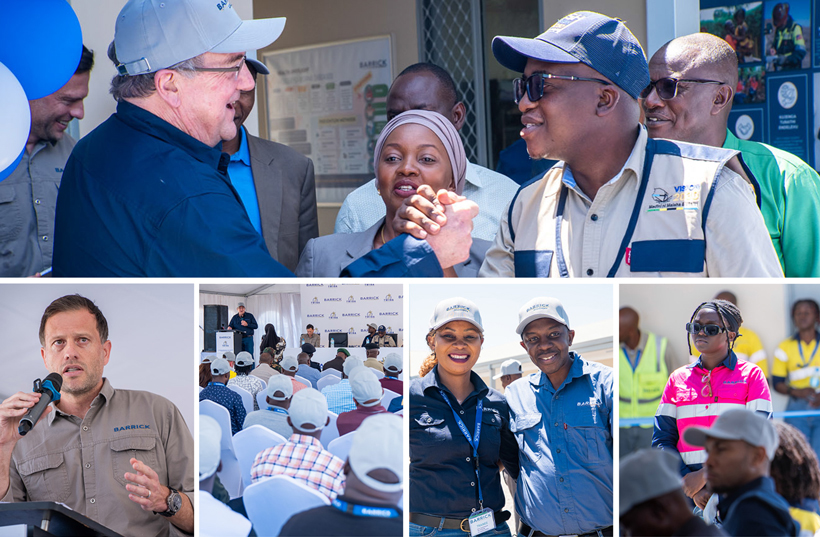
Mark Bristow greets the Honourable Anthony Mavunde, Tanaznia’s Minister of Minerals, at the opening of the Barrick Academy (pictured at top).
BARRICK OPENS ACADEMY AT CLOSED BUZWAGI MINE
Barrick has officially opened its world-class training academy at the old Buzwagi mine, in line with its mine closure objective of leaving a positive legacy after mining has finished.
The Barrick Academy is designed to offer tailor-made training programs aimed at developing Barrick’s frontline managers to grow both as individuals and as leaders in their fields, while equipping them with the skills to manage their teams more effectively and to improve performance.
The Academy will be training more than 2,000 foremen, supervisors and superintendents from the Africa and Middle East region in the next 24 months. Looking ahead, we are also gearing up to include our contractors and expand the curriculum to cover wider disciplines, including financial leadership, advanced computer literacy and safety courses.
The opening of the Barrick Academy follows the construction of an airport terminal at Buzwagi’s Kahama airstrip in January this year, which has paved the way for a scheduled airline service that can serve more than 200 passengers at a time. It is expected to be a major catalyst for economic growth in the region.
According to Barrick’s chief operating officer for the Africa and Middle East region, Sebastiaan Bock, the airport terminal and
Academy form part of Barrick’s plan to turn Buzwagi into a Special Economic Zone. A feasibility study commissioned in 2021 showed that the creation of the Special Economic Zone (SEZ) had the potential to replace the mine as the region’s economic driver and could sustainably create 3,000 jobs annually, generate more than $150,000 each year from service levies for the local municipality and deliver approximately $4.5 million in employment taxes a year. The Government of Tanzania approved the conversion of the mine into a SEZ through a Government Notice that was issued in February this year. A number of investors have started the process of setting up manufacturing industries inside this area.
“How we close our mines is just as important to us as how we build and operate them. Our Buzwagi mine was a significant economic powerhouse in the region for nearly 15 years before it poured its last gold in 2021. From our perspective, however, that is not the end of the story for Buzwagi as we transform it into an alternative productive asset that will serve the community for decades to come,” Bock said.
| BARRICK FIRST QUARTER 2024 | 7 | PRESS RELEASE |
2024 Operating and Capital Expenditure Guidance
GOLD PRODUCTION AND COSTS
| 2024 forecast attributable production (000s oz) |
2024 forecast cost of sales8 ($/oz) |
2024 forecast total cash costs9 ($/oz) |
2024 forecast all-in sustaining costs9 ($/ oz) |
|||||||||||||
| Carlin (61.5%) |
800 - 880 | 1,270 - 1,370 | 1,030 - 1,110 | 1,430 - 1,530 | ||||||||||||
| Cortez (61.5%)16 |
380 - 420 | 1,460 - 1,560 | 1,040 - 1,120 | 1,390 - 1,490 | ||||||||||||
| Turquoise Ridge (61.5%) |
330 - 360 | 1,230 - 1,330 | 850 - 930 | 1,090 - 1,190 | ||||||||||||
| Phoenix (61.5%) |
120 - 140 | 1,640 - 1,740 | 810 - 890 | 1,100 - 1,200 | ||||||||||||
| Nevada Gold Mines (61.5%) |
1,650 - 1,800 | 1,340 - 1,440 | 980 - 1,060 | 1,350 - 1,450 | ||||||||||||
| Hemlo |
140 - 160 | 1,470 - 1,570 | 1,210 - 1,290 | 1,600 - 1,700 | ||||||||||||
| North America | 1,750 - 1,950 | 1,350 - 1,450 | 1,000 - 1,080 | 1,370 - 1,470 | ||||||||||||
| Pueblo Viejo (60%) |
420 - 490 | 1,340 - 1,440 | 830 - 910 | 1,100 - 1,200 | ||||||||||||
| Veladero (50%) |
210 - 240 | 1,340 - 1,440 | 1,010 - 1,090 | 1,490 - 1,590 | ||||||||||||
| Porgera (47.5%)17 |
50 - 70 | 1,670 - 1,770 | 1,220 - 1,300 | 1,900 - 2,000 | ||||||||||||
| Latin America & Asia Pacific | 700 - 800 | 1,370 - 1,470 | 920 - 1,000 | 1,290 - 1,390 | ||||||||||||
| Loulo-Gounkoto (80%) |
510 - 560 | 1,190 - 1,290 | 780 - 860 | 1,150 - 1,250 | ||||||||||||
| Kibali (45%) |
320 - 360 | 1,140 - 1,240 | 740 - 820 | 950 - 1,050 | ||||||||||||
| North Mara (84%) |
230 - 260 | 1,250 - 1,350 | 970 - 1,050 | 1,270 - 1,370 | ||||||||||||
| Bulyanhulu (84%) |
160 - 190 | 1,370 - 1,470 | 990 - 1,070 | 1,380 - 1,480 | ||||||||||||
| Tongon (89.7%) |
160 - 190 | 1,520 - 1,620 | 1,200 - 1,280 | 1,440 - 1,540 | ||||||||||||
| Africa & Middle East | 1,400 - 1,550 | 1,250 - 1,350 | 880 - 960 | 1,180 - 1,280 | ||||||||||||
| Total Attributable to Barrick18,19,20 | 3,900 - 4,300 | 1,320 - 1,420 | 940 - 1,020 | 1,320 - 1,420 | ||||||||||||
| COPPER PRODUCTION AND COSTS | ||||||||||||||||
| 2024 forecast attributable production (000s tonnes)10 |
2024 forecast cost of sales11 ($/lb) |
2024 forecast C1 cash costs12 ($/lb) |
2024 forecast all-in sustaining costs12 ($/ lb) |
|||||||||||||
| Lumwana |
120 - 140 | 2.50 - 2.80 | 1.85 - 2.15 | 3.30 - 3.60 | ||||||||||||
| Zaldívar (50%) |
35 - 40 | 3.70 - 4.00 | 2.80 - 3.10 | 3.40 - 3.70 | ||||||||||||
| Jabal Sayid (50%) |
25 - 30 | 1.75 - 2.05 | 1.40 - 1.70 | 1.70 - 2.00 | ||||||||||||
| Total Attributable to Barrick20 | 180 - 210 | 2.65 - 2.95 | 2.00 - 2.30 | 3.10 - 3.40 | ||||||||||||
| ATTRIBUTABLE CAPITAL EXPENDITURES21 | ||||||||
| ($ millions) | ||||||||
| Attributable minesite sustaining7,21 |
1,550 - 1,750 | |||||||
| Attributable project7,21 |
950 - 1,150 | |||||||
| Total attributable capital expenditures21 |
2,500 - 2,900 | |||||||
2024 OUTLOOK ASSUMPTIONS AND ECONOMIC SENSITIVITY ANALYSIS
| 2024 guidance assumption |
Hypothetical change | Impact on EBITDA2 (millions) |
Impact on TCC and AISC9,12 |
|||||
| Gold price sensitivity | $1,900/oz | +/- $100/oz | +/-$550 | +/-$5/oz | ||||
| Copper price sensitivity | $3.50/lb | +/- $0.25/lb | +/- $110 | +/-$0.01/lb | ||||
| BARRICK FIRST QUARTER 2024 | 8 | PRESS RELEASE |
Production and Cost Summary - Gold
| For the three months ended | ||||||||||||||||||||
| 3/31/24 | 12/31/23 | % Change | 3/31/23 | % Change | ||||||||||||||||
| Nevada Gold Mines LLC (61.5%)a | ||||||||||||||||||||
| Gold produced (000s oz attributable basis) |
420 | 513 | (18)% | 416 | 1 % | |||||||||||||||
| Gold produced (000s oz 100% basis) |
683 | 833 | (18)% | 676 | 1 % | |||||||||||||||
| Cost of sales ($/oz) |
1,431 | 1,331 | 8 % | 1,461 | (2)% | |||||||||||||||
| Total cash costs ($/oz)b |
1,081 | 968 | 12 % | 1,074 | 1 % | |||||||||||||||
| All-in sustaining costs ($/oz)b |
1,536 | 1,366 | 12 % | 1,436 | 7 % | |||||||||||||||
| Carlin (61.5%) |
|
|||||||||||||||||||
| Gold produced (000s oz attributable basis) |
205 | 224 | (8)% | 166 | 23 % | |||||||||||||||
| Gold produced (000s oz 100% basis) |
334 | 363 | (8)% | 270 | 23 % | |||||||||||||||
| Cost of sales ($/oz) |
1,371 | 1,219 | 12 % | 1,449 | (5)% | |||||||||||||||
| Total cash costs ($/oz)b |
1,127 | 1,006 | 12 % | 1,215 | (7)% | |||||||||||||||
| All-in sustaining costs ($/oz)b |
1,687 | 1,506 | 12 % | 1,689 | 0 % | |||||||||||||||
| Cortez (61.5%)c |
|
|||||||||||||||||||
| Gold produced (000s oz attributable basis) |
119 | 162 | (27)% | 140 | (15)% | |||||||||||||||
| Gold produced (000s oz 100% basis) |
194 | 263 | (27)% | 226 | (15)% | |||||||||||||||
| Cost of sales ($/oz) |
1,329 | 1,353 | (2)% | 1,324 | 0 % | |||||||||||||||
| Total cash costs ($/oz)b |
946 | 909 | 4 % | 913 | 4 % | |||||||||||||||
| All-in sustaining costs ($/oz)b |
1,341 | 1,309 | 2 % | 1,233 | 9 % | |||||||||||||||
| Turquoise Ridge (61.5%) |
|
|||||||||||||||||||
| Gold produced (000s oz attributable basis) |
62 | 84 | (26)% | 81 | (23)% | |||||||||||||||
| Gold produced (000s oz 100% basis) |
101 | 137 | (26)% | 131 | (23)% | |||||||||||||||
| Cost of sales ($/oz) |
1,733 | 1,419 | 22 % | 1,412 | 23 % | |||||||||||||||
| Total cash costs ($/oz)b |
1,359 | 1,046 | 30 % | 1,034 | 31 % | |||||||||||||||
| All-in sustaining costs ($/oz)b |
1,655 | 1,257 | 32 % | 1,271 | 30 % | |||||||||||||||
| Phoenix (61.5%) |
|
|||||||||||||||||||
| Gold produced (000s oz attributable basis) |
34 | 41 | (17)% | 27 | 26 % | |||||||||||||||
| Gold produced (000s oz 100% basis) |
54 | 67 | (17)% | 45 | 26 % | |||||||||||||||
| Cost of sales ($/oz) |
1,595 | 1,576 | 1 % | 2,380 | (33)% | |||||||||||||||
| Total cash costs ($/oz)b |
767 | 787 | (3)% | 1,198 | (36)% | |||||||||||||||
| All-in sustaining costs ($/oz)b |
944 | 981 | (4)% | 1,365 | (31)% | |||||||||||||||
| Long Canyon (61.5%)d |
||||||||||||||||||||
| Gold produced (000s oz attributable basis) |
— | 2 | (100)% | 2 | (100)% | |||||||||||||||
| Gold produced (000s oz 100% basis) |
— | 3 | (100)% | 4 | (100)% | |||||||||||||||
| Cost of sales ($/oz) |
— | 2,193 | (100)% | 1,621 | (100)% | |||||||||||||||
| Total cash costs ($/oz)b |
— | 990 | (100)% | 579 | (100)% | |||||||||||||||
| All-in sustaining costs ($/oz)b |
— | 1,074 | (100)% | 629 | (100)% | |||||||||||||||
| Pueblo Viejo (60%) |
|
|||||||||||||||||||
| Gold produced (000s oz attributable basis) |
81 | 90 | (10)% | 89 | (9)% | |||||||||||||||
| Gold produced (000s oz 100% basis) |
134 | 151 | (10)% | 149 | (9)% | |||||||||||||||
| Cost of sales ($/oz) |
1,527 | 1,588 | (4)% | 1,241 | 23 % | |||||||||||||||
| Total cash costs ($/oz)b |
1,013 | 1,070 | (5)% | 714 | 42 % | |||||||||||||||
| All-in sustaining costs ($/oz)b |
1,334 | 1,428 | (7)% | 1,073 | 24 % | |||||||||||||||
| BARRICK FIRST QUARTER 2024 | 9 | PRESS RELEASE |
Production and Cost Summary - Gold (continued)
| For the three months ended | ||||||||||||||||||||||||
| 3/31/24 | 12/31/23 | % Change | 3/31/23 | % Change | ||||||||||||||||||||
| Loulo-Gounkoto (80%) |
||||||||||||||||||||||||
| Gold produced (000s oz attributable basis) |
141 | 127 | 11 % | 137 | 3 % | |||||||||||||||||||
| Gold produced (000s oz 100% basis) |
176 | 159 | 11 % | 172 | 3 % | |||||||||||||||||||
| Cost of sales ($/oz) |
1,177 | 1,296 | (9)% | 1,275 | (8)% | |||||||||||||||||||
| Total cash costs ($/oz)b |
794 | 924 | (14)% | 855 | (7)% | |||||||||||||||||||
| All-in sustaining costs ($/oz)b |
1,092 | 1,168 | (7)% | 1,190 | (8)% | |||||||||||||||||||
| Kibali (45%) |
||||||||||||||||||||||||
| Gold produced (000s oz attributable basis) |
76 | 93 | (18)% | 64 | 19 % | |||||||||||||||||||
| Gold produced (000s oz 100% basis) |
168 | 206 | (18)% | 141 | 19 % | |||||||||||||||||||
| Cost of sales ($/oz) |
1,200 | 1,141 | 5 % | 1,367 | (12)% | |||||||||||||||||||
| Total cash costs ($/oz)b |
802 | 737 | 9 % | 987 | (19)% | |||||||||||||||||||
| All-in sustaining costs ($/oz)b |
1,048 | 819 | 28 % | 1,177 | (11)% | |||||||||||||||||||
| Veladero (50%) |
||||||||||||||||||||||||
| Gold produced (000s oz attributable basis) |
57 | 55 | 4 % | 43 | 33 % | |||||||||||||||||||
| Gold produced (000s oz 100% basis) |
115 | 110 | 4 % | 86 | 33 % | |||||||||||||||||||
| Cost of sales ($/oz) |
1,322 | 1,378 | (4)% | 1,587 | (17)% | |||||||||||||||||||
| Total cash costs ($/oz)b |
961 | 1,021 | (6)% | 1,035 | (7)% | |||||||||||||||||||
| All-in sustaining costs ($/oz)b |
1,664 | 1,403 | 19 % | 1,761 | (6)% | |||||||||||||||||||
| Porgera (24.5%)e |
||||||||||||||||||||||||
| Gold produced (000s oz attributable basis) |
4 | — | — % | — | — % | |||||||||||||||||||
| Gold produced (000s oz 100% basis) |
14 | — | — % | — | — % | |||||||||||||||||||
| Cost of sales ($/oz) |
— | — | — % | — | — % | |||||||||||||||||||
| Total cash costs ($/oz)b |
— | — | — % | — | — % | |||||||||||||||||||
| All-in sustaining costs ($/oz)b |
— | — | — % | — | — % | |||||||||||||||||||
| Tongon (89.7%) |
||||||||||||||||||||||||
| Gold produced (000s oz attributable basis) |
36 | 42 | (14)% | 50 | (28)% | |||||||||||||||||||
| Gold produced (000s oz 100% basis) |
40 | 47 | (14)% | 55 | (28)% | |||||||||||||||||||
| Cost of sales ($/oz) |
1,887 | 1,489 | 27 % | 1,453 | 30 % | |||||||||||||||||||
| Total cash costs ($/oz)b |
1,630 | 1,184 | 38 % | 1,182 | 38 % | |||||||||||||||||||
| All-in sustaining costs ($/oz)b |
1,773 | 1,586 | 12 % | 1,284 | 38 % | |||||||||||||||||||
| Hemlo |
||||||||||||||||||||||||
| Gold produced (000s oz) |
37 | 34 | 9 % | 41 | (10)% | |||||||||||||||||||
| Cost of sales ($/oz) |
1,715 | 1,618 | 6 % | 1,486 | 15 % | |||||||||||||||||||
| Total cash costs ($/oz)b |
1,476 | 1,407 | 5 % | 1,291 | 14 % | |||||||||||||||||||
| All-in sustaining costs ($/oz)b |
1,754 | 1,671 | 5 % | 1,609 | 9 % | |||||||||||||||||||
| North Mara (84%) |
||||||||||||||||||||||||
| Gold produced (000s oz attributable basis) |
46 | 59 | (22)% | 68 | (32)% | |||||||||||||||||||
| Gold produced (000s oz 100% basis) |
55 | 71 | (22)% | 81 | (32)% | |||||||||||||||||||
| Cost of sales ($/oz) |
1,678 | 1,420 | 18 % | 987 | 70 % | |||||||||||||||||||
| Total cash costs ($/oz)b |
1,339 | 1,103 | 21 % | 759 | 76 % | |||||||||||||||||||
| All-in sustaining costs ($/oz)b |
1,753 | 1,449 | 21 % | 1,137 | 54 % | |||||||||||||||||||
| BARRICK FIRST QUARTER 2024 | 10 | PRESS RELEASE |
Production and Cost Summary - Gold (continued)
| For the three months ended | ||||||||||||||||||||||||
| 3/31/24 | 12/31/23 | % Change | 3/31/23 | % Change | ||||||||||||||||||||
| Bulyanhulu (84%) |
||||||||||||||||||||||||
| Gold produced (000s oz attributable basis) |
42 | 41 | 2 % | 44 | (5)% | |||||||||||||||||||
| Gold produced (000s oz 100% basis) |
50 | 48 | 2 % | 53 | (5)% | |||||||||||||||||||
| Cost of sales ($/oz) |
1,479 | 1,413 | 5 % | 1,358 | 9 % | |||||||||||||||||||
| Total cash costs ($/oz)b |
1,044 | 1,002 | 4 % | 982 | 6 % | |||||||||||||||||||
| All-in sustaining costs ($/oz)b |
1,485 | 1,376 | 8 % | 1,332 | 11 % | |||||||||||||||||||
| Total Attributable to Barrickf |
||||||||||||||||||||||||
| Gold produced (000s oz) |
940 | 1,054 | (11)% | 952 | (1)% | |||||||||||||||||||
| Cost of sales ($/oz)g |
1,425 | 1,359 | 5 % | 1,378 | 3 % | |||||||||||||||||||
| Total cash costs ($/oz)b |
1,051 | 982 | 7 % | 986 | 7 % | |||||||||||||||||||
| All-in sustaining costs ($/oz)b |
1,474 | 1,364 | 8 % | 1,370 | 8 % | |||||||||||||||||||
| a. | These results represent our 61.5% interest in Carlin, Cortez, Turquoise Ridge, Phoenix and Long Canyon until it transitioned to care and maintenance at the end of 2023, as previously reported. |
| b. | Further information on these non-GAAP financial performance measures, including detailed reconciliations, is included in the endnotes to this press release. |
| c. | Includes Goldrush. |
| d. | Starting in the first quarter of 2024, we have ceased to include production or non-GAAP cost metrics for Long Canyon as it was placed on care and maintenance at the end of 2023, as previously reported. |
| e. | As Porgera was placed on care and maintenance from April 25, 2020 until December 22, 2023, no operating data or per ounce data has been provided from the third quarter of 2020 to the fourth quarter of 2023. On December 22, 2023, we completed the Commencement Agreement, pursuant to which the PNG government and BNL, the 95% owner and operator of the Porgera joint venture, agreed on a partnership for the future ownership and operation of the mine. Ownership of Porgera is now held in a new joint venture owned 51% by PNG stakeholders and 49% by a Barrick affiliate, PJL. PJL is jointly owned on a 50/50 basis by Barrick and Zijin Mining Group and therefore Barrick now holds a 24.5% ownership interest in the Porgera joint venture. Barrick holds a 23.5% interest in the economic benefits of the mine under the economic benefit sharing arrangement agreed with the PNG government whereby Barrick and Zijin Mining Group together share 47% of the overall economic benefits derived from the mine accumulated over time, and the PNG stakeholders share the remaining 53%. In the first quarter of 2024, Porgera had gold production but did not have any gold sales. |
| f. | Excludes Pierina, which was producing incidental ounces until December 31, 2023 while in closure. It also excludes Long Canyon which is producing residual ounces from the leach pad while in care and maintenance. |
| g. | Gold cost of sales per ounce is calculated as cost of sales across our gold operations (excluding sites in closure or care and maintenance) divided by ounces sold (both on an attributable basis using Barrick’s ownership share). |
| BARRICK FIRST QUARTER 2024 | 11 | PRESS RELEASE |
Production and Cost Summary - Copper
| For the three months ended | ||||||||||||||||||||||||
| 3/31/24 | 12/31/23 | % Change | 3/31/23 | % Change | ||||||||||||||||||||
| Lumwana |
||||||||||||||||||||||||
| Copper production (thousands of tonnes)a |
22 | 33 | (33)% | 22 | 0 % | |||||||||||||||||||
| Cost of sales ($/lb) |
3.41 | 2.95 | 16 % | 3.56 | (4)% | |||||||||||||||||||
| C1 cash costs ($/lb)b |
2.52 | 2.14 | 18 % | 3.09 | (18)% | |||||||||||||||||||
| All-in sustaining costs ($/lb)b |
4.33 | 3.38 | 28 % | 3.98 | 9 % | |||||||||||||||||||
| Zaldívar (50%) |
||||||||||||||||||||||||
| Copper production (thousands of tonnes attributable basis)a |
9 | 10 | (10)% | 10 | (10)% | |||||||||||||||||||
| Copper production (thousands of tonnes 100% basis)a |
19 | 20 | (10)% | 20 | (10)% | |||||||||||||||||||
| Cost of sales ($/lb) |
3.97 | 3.85 | 3 % | 3.73 | 6 % | |||||||||||||||||||
| C1 cash costs ($/lb)b |
2.95 | 2.93 | 1 % | 2.86 | 3 % | |||||||||||||||||||
| All-in sustaining costs ($/lb)b |
3.27 | 3.51 | (7)% | 3.22 | 2 % | |||||||||||||||||||
| Jabal Sayid (50%) |
||||||||||||||||||||||||
| Copper production (thousands of tonnes attributable basis)a |
9 | 8 | 13 % | 8 | 13 % | |||||||||||||||||||
| Copper production (thousands of tonnes 100% basis)a |
17 | 16 | 13 % | 17 | 13 % | |||||||||||||||||||
| Cost of sales ($/lb) |
1.61 | 1.59 | 1 % | 1.53 | 5 % | |||||||||||||||||||
| C1 cash costs ($/lb)b |
1.35 | 1.32 | 2 % | 1.39 | (3)% | |||||||||||||||||||
| All-in sustaining costs ($/lb)b |
1.55 | 1.50 | 3 % | 1.61 | (4)% | |||||||||||||||||||
| Total Attributable to Barrick |
||||||||||||||||||||||||
| Copper production (thousands of tonnes)a |
40 | 51 | (22)% | 40 | 0 % | |||||||||||||||||||
| Cost of sales ($/lb)c |
3.20 | 2.92 | 10 % | 3.22 | (1)% | |||||||||||||||||||
| C1 cash costs ($/lb)b |
2.40 | 2.17 | 11 % | 2.71 | (11)% | |||||||||||||||||||
| All-in sustaining costs ($/lb)b |
3.59 | 3.12 | 15 % | 3.40 | 6 % | |||||||||||||||||||
| a. | Starting in 2024, we have presented our copper production and sales quantities in tonnes rather than pounds (1 tonne is equivalent to 2,204.6 pounds). Production and sales amounts for prior periods have been restated for comparative purposes. Our copper cost metrics are still reported on a per pound basis. |
| b. | Further information on these non-GAAP financial performance measures, including detailed reconciliations, is included in the endnotes to this press release. |
| c. | Copper cost of sales per pound is calculated as cost of sales across our copper operations divided by pounds sold (both on an attributable basis using Barrick’s ownership share). |
| BARRICK FIRST QUARTER 2024 | 12 | PRESS RELEASE |
Financial and Operating Highlights
| For the three months ended | ||||||||||||||||||||||||
| 3/31/24 | 12/31/23 | % Change | 3/31/23 | % Change | ||||||||||||||||||||
| Financial Results ($ millions) |
||||||||||||||||||||||||
| Revenues |
2,747 | 3,059 | (10)% | 2,643 | 4 % | |||||||||||||||||||
| Cost of sales |
1,936 | 2,139 | (9)% | 1,941 | 0 % | |||||||||||||||||||
| Net earningsa |
295 | 479 | (38)% | 120 | 146 % | |||||||||||||||||||
| Adjusted net earningsb |
333 | 466 | (29)% | 247 | 35 % | |||||||||||||||||||
| Attributable EBITDAb |
907 | 1,068 | (15)% | 851 | 7 % | |||||||||||||||||||
| Attributable EBITDA marginc |
41 % | 42 % | (2)% | 39 % | 5 % | |||||||||||||||||||
| Minesite sustaining capital expendituresb,d |
550 | 569 | (3)% | 454 | 21 % | |||||||||||||||||||
| Project capital expendituresb,d |
165 | 278 | (41)% | 226 | (27)% | |||||||||||||||||||
| Total consolidated capital expendituresd,e |
728 | 861 | (15)% | 688 | 6 % | |||||||||||||||||||
| Net cash provided by operating activities |
760 | 997 | (24)% | 776 | (2)% | |||||||||||||||||||
| Net cash provided by operating activities marginf |
28 % | 33 % | (15)% | 29 % | (3)% | |||||||||||||||||||
| Free cash flowb |
32 | 136 | (76)% | 88 | (64)% | |||||||||||||||||||
| Net earnings per share (basic and diluted) |
0.17 | 0.27 | (37)% | 0.07 | 143 % | |||||||||||||||||||
| Adjusted net earnings (basic)b per share |
0.19 | 0.27 | (30)% | 0.14 | 36 % | |||||||||||||||||||
| Weighted average diluted common shares (millions of shares) |
1,756 | 1,756 | 0 % | 1,755 | 0 % | |||||||||||||||||||
| Operating Results |
||||||||||||||||||||||||
| Gold production (thousands of ounces)g |
940 | 1,054 | (11)% | 952 | (1)% | |||||||||||||||||||
| Gold sold (thousands of ounces)g |
910 | 1,042 | (13)% | 954 | (5)% | |||||||||||||||||||
| Market gold price ($/oz) |
2,070 | 1,971 | 5 % | 1,890 | 10 % | |||||||||||||||||||
| Realized gold priceb,g ($/oz) |
2,075 | 1,986 | 4 % | 1,902 | 9 % | |||||||||||||||||||
| Gold cost of sales (Barrick’s share)g,h ($/oz) |
1,425 | 1,359 | 5 % | 1,378 | 3 % | |||||||||||||||||||
| Gold total cash costsb,g ($/oz) |
1,051 | 982 | 7 % | 986 | 7 % | |||||||||||||||||||
| Gold all-in sustaining costsb,g ($/oz) |
1,474 | 1,364 | 8 % | 1,370 | 8 % | |||||||||||||||||||
| Copper production (thousands of tonnes)g,i |
40 | 51 | (22)% | 40 | 0 % | |||||||||||||||||||
| Copper sold (thousands of tonnes)g,i |
39 | 53 | (26)% | 40 | (3)% | |||||||||||||||||||
| Market copper price ($/lb) |
3.83 | 3.70 | 4 % | 4.05 | (5)% | |||||||||||||||||||
| Realized copper priceb,g ($/lb) |
3.86 | 3.78 | 2 % | 4.20 | (8)% | |||||||||||||||||||
| Copper cost of sales (Barrick’s share)g,j ($/lb) |
3.20 | 2.92 | 10 % | 3.22 | (1)% | |||||||||||||||||||
| Copper C1 cash costsb,g ($/lb) |
2.40 | 2.17 | 11 % | 2.71 | (11)% | |||||||||||||||||||
| Copper all-in sustaining costsb,g ($/lb) |
3.59 | 3.12 | 15 % | 3.40 | 6 % | |||||||||||||||||||
| As at 3/31/24 |
As at 12/31/23 |
% Change | As at 3/31/23 |
% Change | ||||||||||||||||||||
| Financial Position ($ millions) |
||||||||||||||||||||||||
| Debt (current and long-term) |
4,725 | 4,726 | 0 % | 4,777 | (1)% | |||||||||||||||||||
| Cash and equivalents |
3,942 | 4,148 | (5)% | 4,377 | (10)% | |||||||||||||||||||
| Debt, net of cash |
783 | 578 | 35 % | 400 | 96 % | |||||||||||||||||||
| a. | Net earnings represents net earnings attributable to the equity holders of the Company. |
| b. | Further information on these non-GAAP financial performance measures, including detailed reconciliations, is included in the endnotes to this press release. |
| c. | Represents adjusted EBITDA divided by revenue. |
| d. | Amounts presented on a consolidated cash basis. Project capital expenditures are included in our calculation of all-in costs, but not included in our calculation of all-in sustaining costs. |
| e. | Total consolidated capital expenditures also includes capitalized interest of $13 million for the three month period ended March 31, 2024 (December 31, 2023: $14 million and March 31, 2023: $8 million). |
| f. | Represents net cash provided by operating activities divided by revenue. |
| g. | On an attributable basis. |
| h. | Gold cost of sales per ounce is calculated as cost of sales across our gold operations (excluding sites in closure or care and maintenance) divided by ounces sold (both on an attributable basis using Barrick’s ownership share). |
| i. | Starting in 2024, we have presented our copper production and sales quantities in tonnes rather than pounds (1 tonne is equivalent to 2,204.6 pounds). Production and sales amounts for prior periods have been restated for comparative purposes. Our copper cost metrics are still reported on a per pound basis. |
| j. | Copper cost of sales per pound is calculated as cost of sales across our copper operations divided by pounds sold (both on an attributable basis using Barrick’s ownership share). |
| BARRICK FIRST QUARTER 2024 | 13 | PRESS RELEASE |
Consolidated Statements of Income
| Barrick Gold Corporation (in millions of United States dollars, except per share data) (Unaudited) |
Three months ended March 31, |
|||||||
| 2024 | 2023 | |||||||
| Revenue (notes 4 and 5) |
$2,747 | $2,643 | ||||||
| Costs and expenses (income) |
||||||||
| Cost of sales (notes 4 and 6) |
1,936 | 1,941 | ||||||
| General and administrative expenses |
28 | 39 | ||||||
| Exploration, evaluation and project expenses |
95 | 71 | ||||||
| Impairment charges (note 8b) |
17 | 1 | ||||||
| Loss on currency translation |
12 | 38 | ||||||
| Closed mine rehabilitation |
(2 | ) | 22 | |||||
| Income from equity investees (note 11) |
(48 | ) | (53 | ) | ||||
| Other expense (note 8a) |
17 | 52 | ||||||
| Income before finance costs and income taxes |
$692 | $532 | ||||||
| Finance costs, net |
(31 | ) | (58 | ) | ||||
| Income before income taxes |
$661 | $474 | ||||||
| Income tax expense (note 9) |
(174 | ) | (205 | ) | ||||
| Net income |
$487 | $269 | ||||||
| Attributable to: |
||||||||
| Equity holders of Barrick Gold Corporation |
$295 | $120 | ||||||
| Non-controlling interests (note 14) |
$192 | $149 | ||||||
| Earnings per share data attributable to the equity holders of Barrick Gold Corporation (note 7) |
||||||||
| Net income |
||||||||
| Basic |
$0.17 | $0.07 | ||||||
| Diluted |
$0.17 | $0.07 | ||||||
The notes to these unaudited condensed interim financial statements, which are contained in the First Quarter Report 2024 available on our website, are an integral part of these consolidated financial statements.
| BARRICK FIRST QUARTER 2024 | 14 | PRESS RELEASE |
Consolidated Statements of Comprehensive Income
| Barrick Gold Corporation (in millions of United States dollars) (Unaudited) |
Three months ended March 31, |
|||||||
| 2024 | 2023 | |||||||
| Net income | $487 | $269 | ||||||
| Other comprehensive income (loss), net of taxes | ||||||||
| Items that may be reclassified subsequently to profit or loss: | ||||||||
| Unrealized gains on derivatives designated as cash flow hedges, net of tax $nil and $nil | 1 | — | ||||||
| Currency translation adjustments, net of tax $nil and $nil | — | (3 | ) | |||||
| Items that will not be reclassified to profit or loss: | ||||||||
| Net change on equity investments, net of tax $nil and $nil | 1 | — | ||||||
| Total other comprehensive income (loss) | 2 | (3 | ) | |||||
| Total comprehensive income | $489 | $266 | ||||||
| Attributable to: | ||||||||
| Equity holders of Barrick Gold Corporation | $297 | $117 | ||||||
| Non-controlling interests | $192 | $149 | ||||||
The notes to these unaudited condensed interim financial statements, which are contained in the First Quarter Report 2024 available on our website, are an integral part of these consolidated financial statements.
| BARRICK FIRST QUARTER 2024 | 15 | PRESS RELEASE |
Consolidated Statements of Cash Flow
| Barrick Gold Corporation (in millions of United States dollars) (Unaudited) |
Three months ended March 31, |
|||||||
| 2024 | 2023 | |||||||
| OPERATING ACTIVITIES | ||||||||
| Net income | $487 | $269 | ||||||
| Adjustments for the following items: | ||||||||
| Depreciation |
474 | 495 | ||||||
| Finance costs, net |
31 | 58 | ||||||
| Impairment charges (note 8b) |
17 | 1 | ||||||
| Income tax expense (note 9) |
174 | 205 | ||||||
| Income from equity investees (note 11) |
(48 | ) | (53 | ) | ||||
| Gain on sale of non-current assets |
(1 | ) | (3 | ) | ||||
| Loss on currency translation |
12 | 38 | ||||||
| Change in working capital (note 10) | (241 | ) | (191 | ) | ||||
| Other operating activities (note 10) | (70 | ) | 37 | |||||
| Operating cash flows before interest and income taxes | 835 | 856 | ||||||
| Interest paid | (27 | ) | (23 | ) | ||||
| Interest received | 68 | 49 | ||||||
| Income taxes paid1 | (116 | ) | (106 | ) | ||||
| Net cash provided by operating activities | 760 | 776 | ||||||
| INVESTING ACTIVITIES | ||||||||
| Property, plant and equipment | ||||||||
| Capital expenditures (note 4) |
(728 | ) | (688 | ) | ||||
| Sales proceeds |
— | 3 | ||||||
| Funding of equity method investments (note 11) | (44 | ) | — | |||||
| Dividends received from equity method investments (note 11) | 47 | 67 | ||||||
| Shareholder loan repayments from equity method investments | 45 | — | ||||||
| Net cash used in investing activities | (680 | ) | (618 | ) | ||||
| FINANCING ACTIVITIES | ||||||||
| Lease repayments | (3 | ) | (4 | ) | ||||
| Dividends | (175 | ) | (175 | ) | ||||
| Funding from non-controlling interests (note 14) | 22 | — | ||||||
| Disbursements to non-controlling interests (note 14) | (121 | ) | (62 | ) | ||||
| Pueblo Viejo JV partner shareholder loan | (7 | ) | 20 | |||||
| Net cash used in financing activities | (284 | ) | (221 | ) | ||||
| Effect of exchange rate changes on cash and equivalents | (2 | ) | — | |||||
| Net decrease in cash and equivalents | (206 | ) | (63 | ) | ||||
| Cash and equivalents at the beginning of period | 4,148 | 4,440 | ||||||
| Cash and equivalents at the end of period | $3,942 | $4,377 | ||||||
| 1 | Income taxes paid excludes $17 million (2023: $28 million) for the three months ended March 31, 2024 of income taxes payable that were settled against offsetting value added tax (“VAT”) receivables. |
The notes to these unaudited condensed interim financial statements, which are contained in the First Quarter Report 2024 available on our website, are an integral part of these consolidated financial statements.
| BARRICK FIRST QUARTER 2024 | 16 | PRESS RELEASE |
Consolidated Balance Sheets
| Barrick Gold Corporation (in millions of United States dollars) (Unaudited) |
As at March 31, 2024 |
As at December 31, 2023 |
||||||
| ASSETS | ||||||||
| Current assets | ||||||||
| Cash and equivalents |
$3,942 | $4,148 | ||||||
| Accounts receivable |
654 | 693 | ||||||
| Inventories |
1,805 | 1,782 | ||||||
| Other current assets |
880 | 815 | ||||||
| Total current assets | $7,281 | $7,438 | ||||||
| Non-current assets | ||||||||
| Non-current portion of inventory |
2,684 | 2,738 | ||||||
| Equity in investees (note 11) |
4,178 | 4,133 | ||||||
| Property, plant and equipment |
26,648 | 26,416 | ||||||
| Intangible assets |
148 | 149 | ||||||
| Goodwill |
3,581 | 3,581 | ||||||
| Other assets |
1,323 | 1,356 | ||||||
| Total assets | $45,843 | $45,811 | ||||||
| LIABILITIES AND EQUITY | ||||||||
| Current liabilities | ||||||||
| Accounts payable |
$1,360 | $1,503 | ||||||
| Debt |
12 | 11 | ||||||
| Current income tax liabilities |
317 | 303 | ||||||
| Other current liabilities |
506 | 539 | ||||||
| Total current liabilities | $2,195 | $2,356 | ||||||
| Non-current liabilities | ||||||||
| Debt |
4,713 | 4,715 | ||||||
| Provisions |
2,008 | 2,058 | ||||||
| Deferred income tax liabilities |
3,472 | 3,439 | ||||||
| Other liabilities |
1,238 | 1,241 | ||||||
| Total liabilities | $13,626 | $13,809 | ||||||
| Equity | ||||||||
| Capital stock (note 13) |
$28,118 | $28,117 | ||||||
| Deficit |
(6,594 | ) | (6,713 | ) | ||||
| Accumulated other comprehensive income |
26 | 24 | ||||||
| Other |
1,913 | 1,913 | ||||||
| Total equity attributable to Barrick Gold Corporation shareholders | $23,463 | $23,341 | ||||||
| Non-controlling interests (note 14) |
8,754 | 8,661 | ||||||
| Total equity | $32,217 | $32,002 | ||||||
| Contingencies and commitments (notes 4 and 15) | ||||||||
| Total liabilities and equity | $45,843 | $45,811 | ||||||
The notes to these unaudited condensed interim financial statements, which are contained in the First Quarter Report 2024 available on our website, are an integral part of these consolidated financial statements.
| BARRICK FIRST QUARTER 2024 | 17 | PRESS RELEASE |
Consolidated Statements of Changes in Equity
| Barrick Gold Corporation | Attributable to equity holders of the company | |||||||||||||||||||||||||||||||
| (in millions of United States dollars) (Unaudited) |
Common Shares (in thousands) |
Capital stock |
Retained earnings (deficit) |
Accumulated other comprehensive income (loss)1 |
Other2 | Total equity attributable to shareholders |
Non- controlling interests |
Total equity |
||||||||||||||||||||||||
| At January 1, 2024 | 1,755,570 | $28,117 | ($6,713 | ) | $24 | $1,913 | $23,341 | $8,661 | $32,002 | |||||||||||||||||||||||
| Net income |
— | — | 295 | — | — | 295 | 192 | 487 | ||||||||||||||||||||||||
| Total other comprehensive income |
— | — | — | 2 | — | 2 | — | 2 | ||||||||||||||||||||||||
| Total comprehensive income |
— | — | 295 | 2 | — | 297 | 192 | 489 | ||||||||||||||||||||||||
| Transactions with owners |
||||||||||||||||||||||||||||||||
| Dividends |
— | — | (175 | ) | — | — | (175 | ) | — | (175 | ) | |||||||||||||||||||||
| Funding from non-controlling interests (note 14) |
— | — | — | — | — | — | 22 | 22 | ||||||||||||||||||||||||
| Disbursements to non-controlling interests (note 14) |
— | — | — | — | — | — | (121 | ) | (121 | ) | ||||||||||||||||||||||
| Dividend reinvestment plan (note 13) |
66 | 1 | (1 | ) | — | — | — | — | — | |||||||||||||||||||||||
| Total transactions with owners |
66 | 1 | (176 | ) | — | — | (175 | ) | (99 | ) | (274 | ) | ||||||||||||||||||||
| At March 31, 2024 | 1,755,636 | $28,118 | ($6,594 | ) | $26 | $1,913 | $23,463 | $8,754 | $32,217 | |||||||||||||||||||||||
| At January 1, 2023 | 1,755,350 | $28,114 | ($7,282 | ) | $26 | $1,913 | $22,771 | $8,518 | $31,289 | |||||||||||||||||||||||
| Net income |
— | — | 120 | — | — | 120 | 149 | 269 | ||||||||||||||||||||||||
| Total other comprehensive loss |
— | — | — | (3 | ) | — | (3 | ) | — | (3 | ) | |||||||||||||||||||||
| Total comprehensive income (loss) |
— | — | 120 | (3 | ) | — | 117 | 149 | 266 | |||||||||||||||||||||||
| Transactions with owners |
||||||||||||||||||||||||||||||||
| Dividends |
— | — | (175 | ) | — | — | (175 | ) | — | (175 | ) | |||||||||||||||||||||
| Disbursements to non-controlling interests |
— | — | — | — | — | — | (62 | ) | (62 | ) | ||||||||||||||||||||||
| Dividend reinvestment plan |
58 | 1 | (1 | ) | — | — | — | — | — | |||||||||||||||||||||||
| Total transactions with owners |
58 | 1 | (176 | ) | — | — | (175 | ) | (62 | ) | (237 | ) | ||||||||||||||||||||
| At March 31, 2023 | 1,755,408 | $28,115 | ($7,338 | ) | $23 | $1,913 | $22,713 | $8,605 | $31,318 | |||||||||||||||||||||||
| 1 | Includes cumulative translation losses at March 31, 2024: $95 million (December 31, 2023: $95 million; March 31, 2023: $95 million). |
| 2 | Includes additional paid-in capital as at March 31, 2024: $1,875 million (December 31, 2023: $1,875 million; March 31, 2023: $1,875 million). |
The notes to these unaudited condensed interim financial statements, which are contained in the First Quarter Report 2024 available on our website, are an integral part of these consolidated financial statements.
| BARRICK FIRST QUARTER 2024 | 18 | PRESS RELEASE |
Technical Information
The scientific and technical information contained in this press release has been reviewed and approved by Craig Fiddes, SME-RM, Lead, Resource Modeling, Nevada Gold Mines; Richard Peattie, MPhil, FAusIMM, Mineral Resources Manager: Africa and Middle East; Simon Bottoms, CGeol, MGeol, FGS, FAusIMM, Mineral Resource Management and Evaluation Executive (in this capacity, Mr. Bottoms is also responsible on an interim basis for scientific and technical information relating to the Latin America and Asia Pacific region); John Steele, CIM, Metallurgy, Engineering and Capital Projects Executive; and Joel Holliday, FAusIMM, Executive Vice-President, Exploration—each a “Qualified Person” as defined in National Instrument 43-101 - Standards of Disclosure for Mineral Projects.
All mineral reserve and mineral resource estimates are estimated in accordance with National Instrument 43-101 - Standards of Disclosure for Mineral Projects. Unless otherwise noted, such mineral reserve and mineral resource estimates are as of December 31, 2023.
Endnotes
Endnote 1
“Adjusted net earnings” and “adjusted net earnings per share” are non-GAAP financial performance measures. Adjusted net earnings excludes the following from net earnings: impairment charges (reversals) related to intangibles, goodwill, property, plant and equipment, and investments; acquisition/disposition gains/losses; foreign currency translation gains/losses; significant tax adjustments; other items that are not indicative of the underlying operating performance of our core mining business; and tax effect and non-controlling interest of the above items. Management uses this measure internally to evaluate our underlying operating performance for the reporting periods presented and to assist with the planning and forecasting of future operating results. Management believes that adjusted net earnings is a useful measure of our performance because impairment charges, acquisition/disposition gains/losses and significant tax adjustments do not reflect the underlying operating performance of our core mining business and are not necessarily indicative of future operating results. Adjusted net earnings and adjusted net earnings per share are intended to provide additional information only and does not have any standardized definition under IFRS Accounting Standards as issued by the International Accounting Standards Board (“IFRS”) and should not be considered in isolation or as a substitute for measures of performance prepared in accordance with IFRS. The measures are not necessarily indicative of operating profit or cash flow from operations as determined under IFRS. Other companies may calculate these measures differently. The following table reconciles these non-GAAP financial measures to the most directly comparable IFRS measure. Further details on these non-GAAP financial performance measures are provided in the MD&A accompanying Barrick’s financial statements filed from time to time on SEDAR+ at www.sedarplus.ca and on EDGAR at www.sec.gov.
Reconciliation of Net Earnings to Net Earnings per Share, Adjusted Net Earnings and Adjusted Net Earnings per Share
| ($ millions, except per share amounts in dollars) |
For the three months ended | |||||||||||
| 3/31/24 |
12/31/23 | 3/31/23 | ||||||||||
| Net earnings attributable to equity holders of the Company |
295 | 479 | 120 | |||||||||
| Impairment charges related to intangibles, goodwill, property, plant and equipment, and investmentsa |
17 | 289 | 1 | |||||||||
| Acquisition/disposition gainsb |
(1 | ) | (354 | ) | (3 | ) | ||||||
| Loss on currency translation |
12 | 37 | 38 | |||||||||
| Significant tax adjustmentsc |
29 | 120 | 48 | |||||||||
| Other (income) expense adjustmentsd |
(9 | ) | 41 | 63 | ||||||||
|
Non-controlling intereste |
(4 | ) | (89 | ) | (6 | ) | ||||||
| Tax effecte |
(6 | ) | (57 | ) | (14 | ) | ||||||
| Adjusted net earnings |
333 | 466 | 247 | |||||||||
| Net earnings per sharef |
0.17 | 0.27 | 0.07 | |||||||||
| Adjusted net earnings per sharef |
0.19 | 0.27 | 0.14 | |||||||||
| a. | For the three month period ended March 31, 2024, net impairment charges were mainly related to miscellaneous property, plant and equipment assets. For the three month period ended December 31, 2023, net impairment charges mainly related to a long-lived asset impairment at Long Canyon. |
| b. | For the three month period ended December 31, 2023, acquisition/disposition gains mainly related to a gain on the reopening of the Porgera mine as the conditions for the reopening were completed on December 22, 2023. |
| c. | For the three month period ended March 31, 2024, significant tax adjustments were mainly related to the de-recognition of deferred tax assets and the remeasurement of deferred tax balances. Significant tax adjustments for the three month period ended December 31, 2023 related to foreign currency translation gains and losses on tax balances; the impact of prior year adjustments; and the recognition and derecognition of deferred tax assets. |
| d. | For the three month periods ended March 31, 2024 and December 31, 2023, other (income) expense adjustments mainly related to changes in the discount rate assumptions on our closed mine rehabilitation provision. The three month period ended December 31, 2023 was further impacted by care and maintenance expenses at Porgera. Other (income) expense adjustments for the three month period ended March 31, 2023 mainly related to the $30 million commitment we made towards the expansion of education infrastructure in Tanzania, per our community investment obligations under the Twiga partnership. |
| e. | Non-controlling interest and tax effect for the three month period ended March 31, 2024 primarily relates to net impairment charges. |
| f. | Calculated using weighted average number of shares outstanding under the basic method of earnings per share. |
Endnote 2
EBITDA is a non-GAAP financial performance measure, which excludes the following from net earnings: income tax expense; finance costs; finance income; and depreciation. Management believes that EBITDA is a valuable indicator of our ability to generate liquidity by producing operating cash flow to fund working capital needs, service debt obligations, and fund capital expenditures. Management uses EBITDA for this purpose. Adjusted EBITDA removes the effect of impairment charges;
| BARRICK FIRST QUARTER 2024 | 19 | PRESS RELEASE |
acquisition/disposition gains/losses; foreign currency translation gains/losses; and other expense adjustments. We also remove the impact of the income tax expense, finance costs, finance income and depreciation incurred in our equity method accounted investments. We believe these items provide a greater level of consistency with the adjusting items included in our adjusted net earnings reconciliation, with the exception that these amounts are adjusted to remove any impact on finance costs/income, income tax expense and/or depreciation as they do not affect EBITDA. We believe this additional information will assist analysts, investors and other stakeholders of Barrick in better understanding our ability to generate liquidity from our full business, including equity method investments, by excluding these amounts from the calculation as they are not indicative of the performance of our core mining business and not necessarily reflective of the underlying operating results for the periods presented. In the third quarter of 2023 we introduced attributable EBITDA, which removes the non-controlling interest portion from our adjusted EBITDA measure. Prior periods have been presented to allow for comparability. We believe this additional information will assist analysts, investors and other stakeholders of Barrick in better understanding our ability to generate liquidity from our attributable business and which is aligned with how we present our forward looking guidance on gold ounces and copper pounds produced. EBITDA, adjusted EBITDA, and attributable EBITDA are intended to provide additional information only and do not have any standardized definition under IFRS and should not be considered in isolation or as a substitute for measures of performance prepared in accordance with IFRS. Other companies may calculate EBITDA, adjusted EBITDA, and attributable EBITDA differently. Further details on these non-GAAP financial performance measures are provided in the MD&A accompanying Barrick’s financial statements filed from time to time on SEDAR+ at www.sedarplus.ca and on EDGAR at www.sec.gov.
Reconciliation of Net Earnings to EBITDA, Adjusted EBITDA and Attributable EBITDA
| ($ millions) |
For the three months ended | |||||||||||
|
|
3/31/24 |
12/31/23 | 3/31/23 | |||||||||
| Net earnings |
487 | 597 | 269 | |||||||||
| Income tax expense |
174 | 174 | 205 | |||||||||
| Finance costs, neta |
10 | (7 | ) | 37 | ||||||||
| Depreciation |
474 | 564 | 495 | |||||||||
| EBITDA |
1,145 | 1,328 | 1,006 | |||||||||
| Impairment charges of non-current assetsb |
17 | 289 | 1 | |||||||||
| Acquisition/disposition gainsc |
(1 | ) | (354 | ) | (3 | ) | ||||||
| Loss on currency translation |
12 | 37 | 38 | |||||||||
| Other (income) expense adjustmentsd |
(9 | ) | 41 | 63 | ||||||||
| Income tax expense, net finance costsa, and depreciation from equity investees |
102 | 118 | 78 | |||||||||
| Adjusted EBITDA |
1,266 | 1,459 | 1,183 | |||||||||
|
Non-controlling Interests |
(359 | ) | (391 | ) | (332 | ) | ||||||
| Attributable EBITDA |
907 | 1,068 | 851 | |||||||||
| Revenues - as adjustede |
2,222 | 2,514 | 2,188 | |||||||||
| Attributable EBITDA marginf |
41 | % | 42 | % | 39 | % | ||||||
| a. | Finance costs exclude accretion. |
| b. | For the three month period ended March 31, 2024, net impairment charges were mainly related to miscellaneous property, plant and equipment assets. For the three month period ended December 31, 2023, net impairment charges mainly related to a long-lived asset impairment at Long Canyon. |
| c. | For the three month period ended December 31, 2023, acquisition/disposition gains mainly related to a gain on the reopening of the Porgera mine as the conditions for the reopening were completed on December 22, 2023. |
| d. | For the three month periods ended March 31, 2024 and December 31, 2023, other (income) expense adjustments mainly related to changes in the discount rate assumptions on our closed mine rehabilitation provision. The three month period ended December 31, 2023 was further impacted by care and maintenance expenses at Porgera. Other (income) expense adjustments for the three month period ended March 31, 2023 mainly related to the $30 million commitment we made towards the expansion of education infrastructure in Tanzania, per our community investment obligations under the Twiga partnership. |
| e. | Refer to Reconciliation of Sales to Realized Price per ounce/pound on page 67 of Barrick’s Q1 2024 MD&A. |
| f. | Represents attributable EBITDA divided by revenues - as adjusted. |
Endnote 3
On an attributable basis.
Endnote 4
“Realized price” is a non-GAAP financial performance measure which excludes from sales: treatment and refining charges; and cumulative catch-up adjustment to revenue relating to our streaming arrangements. We believe this provides investors and analysts with a more accurate measure with which to compare to market gold and copper prices and to assess our gold and copper sales performance. For those reasons, management believes that this measure provides a more accurate reflection of our company’s past performance and is a better indicator of its expected performance in future periods. The realized price measure is intended to provide additional information, and does not have any standardized definition under IFRS and should not be considered in isolation or as a substitute for measures of performance prepared in accordance with IFRS. The measure is not necessarily indicative of sales as determined under IFRS. Other companies may calculate this measure differently. The following table reconciles realized prices to the most directly comparable IFRS measure. Further details on these non-GAAP financial performance measures are provided in the MD&A accompanying Barrick’s financial statements filed from time to time on SEDAR+ at www.sedarplus.ca and on EDGAR at www.sec.gov.
| BARRICK FIRST QUARTER 2024 | 20 | PRESS RELEASE |
Reconciliation of Sales to Realized Price per ounce/pound
| ($ millions, except per ounce/pound information in dollars) | Gold | Copper | ||||||||||||||||||||||
| For the three months ended | ||||||||||||||||||||||||
| 3/31/24 | 12/31/23 | 3/31/23 | 3/31/24 | 12/31/23 | 3/31/23 | |||||||||||||||||||
| Sales |
2,528 | 2,767 | 2,411 | 163 | 226 | 171 | ||||||||||||||||||
| Sales applicable to non-controlling interests |
(795 | ) | (872 | ) | (723 | ) | 0 | 0 | 0 | |||||||||||||||
| Sales applicable to equity method investmentsa,b |
151 | 183 | 126 | 136 | 168 | 160 | ||||||||||||||||||
| Sales applicable to sites in closure or care and maintenancec |
(2 | ) | (2 | ) | (7 | ) | 0 | 0 | 0 | |||||||||||||||
| Treatment and refinement charges |
7 | 8 | 7 | 34 | 51 | 43 | ||||||||||||||||||
| Otherd |
0 | (15 | ) | 0 | 0 | 0 | 0 | |||||||||||||||||
| Revenues – as adjusted |
1,889 | 2,069 | 1,814 | 333 | 445 | 374 | ||||||||||||||||||
| Ounces/pounds sold (000s ounces/millions pounds)e |
910 | 1,042 | 954 | 86 | 117 | 89 | ||||||||||||||||||
| Realized gold/copper price per ounce/poundd |
2,075 | 1,986 | 1,902 | 3.86 | 3.78 | 4.20 | ||||||||||||||||||
| a. | Represents sales of $151 million, for the three month period ended March 31, 2024 (December 31, 2023: $183 million and March 31, 2023: $126 million) applicable to our 45% equity method investment in Kibali for gold. Represents sales of $80 million for the three month period ended March 31, 2024 (December 31, 2023: $98 million and March 31, 2023: $98 million) applicable to our 50% equity method investment in Zaldívar and $62 million (December 31, 2023: $77 million and March 31, 2023: $69 million), applicable to our 50% equity method investment in Jabal Sayid for copper. |
| b. | Sales applicable to equity method investments are net of treatment and refinement charges. |
| c. | On an attributable basis. Excludes Pierina, which was producing incidental ounces until December 31, 2023 while in closure. It also excludes Long Canyon which is producing residual ounces from the leach pad while in care and maintenance. |
| d. | Represents a cumulative catch-up adjustment to revenue relating to our streaming arrangements. Refer to note 2e of the 2023 Annual Financial Statements for more information. |
| e. | Realized price per ounce/pound may not calculate based on amounts presented in this table due to rounding. |
Endnote 5
Net earnings represents net earnings attributable to the equity holders of the Company.
Endnote 6
“Free cash flow” is a non-GAAP financial measure that deducts capital expenditures from net cash provided by operating activities. Management believes this to be a useful indicator of our ability to operate without reliance on additional borrowing or usage of existing cash. Free cash flow is intended to provide additional information only and does not have any standardized definition under IFRS, and should not be considered in isolation or as a substitute for measures of performance prepared in accordance with IFRS. The measure is not necessarily indicative of operating profit or cash flow from operations as determined under IFRS. Other companies may calculate this measure differently. Further details on this non-GAAP financial performance measure are provided in the MD&A accompanying Barrick’s financial statements filed from time to time on SEDAR+ at www.sedarplus.ca and on EDGAR at www.sec.gov. The following table reconciles this non-GAAP financial measure to the most directly comparable IFRS measure.
Reconciliation of Net Cash Provided by Operating Activities to Free Cash Flow
| ($ millions) | For the three months ended | |||||||||||
| 3/31/24 | 12/31/23 | 3/31/23 | ||||||||||
| Net cash provided by operating activities |
760 | 997 | 776 | |||||||||
| Capital expenditures |
(728 | ) | (861 | ) | (688 | ) | ||||||
| Free cash flow |
32 | 136 | 88 | |||||||||
Endnote 7
These amounts are presented on the same basis as our guidance. Minesite sustaining capital expenditures and project capital expenditures are non-GAAP financial measures. Capital expenditures are classified into minesite sustaining capital expenditures or project capital expenditures depending on the nature of the expenditure. Minesite sustaining capital expenditures is the capital spending required to support current production levels. Project capital expenditures represent the capital spending at new projects and major, discrete projects at existing operations intended to increase net present value through higher production or longer mine life. Management believes this to be a useful indicator of the purpose of capital expenditures and this distinction is an input into the calculation of all-in sustaining costs per ounce and all-in costs per ounce. Classifying capital expenditures is intended to provide additional information only and does not have any standardized definition under IFRS, and should not be considered in isolation or as a substitute for measures of performance prepared in accordance with IFRS. Other companies may calculate these measures differently. The following table reconciles these non-GAAP financial performance measures to the most directly comparable IFRS measure.
| BARRICK FIRST QUARTER 2024 | 21 | PRESS RELEASE |
Reconciliation of the Classification of Capital Expenditures
| ($ millions) |
For the three months ended | |||||||||||
|
|
3/31/24 |
12/31/23 | 3/31/23 | |||||||||
| Minesite sustaining capital expenditures |
550 | 569 | 454 | |||||||||
| Project capital expenditures |
165 | 278 | 226 | |||||||||
| Capitalized interest |
13 | 14 | 8 | |||||||||
| Total consolidated capital expenditures |
728 | 861 | 688 | |||||||||
Endnote 8
Gold cost of sales per ounce is calculated as cost of sales across our gold operations (excluding sites in closure or care and maintenance) divided by ounces sold (both on an attributable basis using Barrick’s ownership share).
Endnote 9
“Total cash costs” per ounce, “All-in sustaining costs” per ounce and “All-in costs” per ounce are non-GAAP financial performance measures which are calculated based on the definition published by the World Gold Council (a market development organization for the gold industry comprised of and funded by gold mining companies from around the world, including Barrick, the “WGC”). The WGC is not a regulatory organization. Management uses these measures to monitor the performance of our gold mining operations and their ability to generate positive cash flow, both on an individual site basis and an overall company basis. “Total cash costs” per ounce start with our cost of sales related to gold production and removes depreciation, the noncontrolling interest of cost of sales and includes by-product credits. “All-in sustaining costs” per ounce start with “Total cash costs” per ounce and includes sustaining capital expenditures, sustaining leases, general and administrative costs, minesite exploration and evaluation costs and reclamation cost accretion and amortization. These additional costs reflect the expenditures made to maintain current production levels. “All-in costs” per ounce start with “All-in sustaining costs” and adds additional costs that reflect the varying costs of producing gold over the life-cycle of a mine, including: project capital expenditures (capital spending at new projects and major, discrete projects at existing operations intended to increase net present value through higher production or longer mine life) and other non-sustaining costs (primarily non-sustaining leases, exploration and evaluation costs, community relations costs and general and administrative costs that are not associated with current operations). These definitions recognize that there are different costs associated with the life-cycle of a mine, and that it is therefore appropriate to distinguish between sustaining and non-sustaining costs. Barrick believes that the use of “Total cash costs” per ounce, “All-in sustaining costs” per ounce and “All-in costs” per ounce will assist analysts, investors and other stakeholders of Barrick in understanding the costs associated with producing gold, understanding the economics of gold mining, assessing our operating performance and also our ability to generate free cash flow from current operations and to generate free cash flow on an overall company basis. “Total cash costs” per ounce, “All-in sustaining costs” per ounce and “All-in costs” per ounce are intended to provide additional information only and do not have standardized definitions under IFRS and should not be considered in isolation or as a substitute for measures of performance prepared in accordance with IFRS. These measures are not equivalent to net income or cash flow from operations as determined under IFRS. Although the WGC has published a standardized definition, other companies may calculate these measures differently. Further details on these non-GAAP financial performance measures are provided in the MD&A accompanying Barrick’s financial statements filed from time to time on SEDAR+ at www.sedarplus.ca and on EDGAR at www.sec.gov.
| BARRICK FIRST QUARTER 2024 | 22 | PRESS RELEASE |
| Reconciliation of Gold Cost of Sales to Total cash costs, All-in sustaining costs and All-in costs, including on a per ounce basis
|
|
|||||||||||||||
| ($ millions, except per ounce information in dollars) |
For the three months ended | |||||||||||||||
| Footnote | 3/31/24 |
12/31/23 | 3/31/23 | |||||||||||||
| Cost of sales applicable to gold production |
1,761 | 1,928 | 1,761 | |||||||||||||
| Depreciation |
(407 | ) | (471 | ) | (445 | ) | ||||||||||
| Cash cost of sales applicable to equity method investments |
56 | 65 | 63 | |||||||||||||
| By-product credits |
(56 | ) | (66 | ) | (61 | ) | ||||||||||
| Non-recurring items |
a | 0 | 0 | 0 | ||||||||||||
| Other |
b | 2 | 6 | 0 | ||||||||||||
|
Non-controlling interests |
c | (400 | ) | (432 | ) | (378 | ) | |||||||||
| Total cash costs |
956 | 1,030 | 940 | |||||||||||||
| General & administrative costs |
28 | 29 | 39 | |||||||||||||
| Minesite exploration and evaluation costs |
d | 13 | 4 | 11 | ||||||||||||
| Minesite sustaining capital expenditures |
e | 550 | 569 | 454 | ||||||||||||
| Sustaining leases |
6 | 7 | 7 | |||||||||||||
| Rehabilitation - accretion and amortization (operating sites) |
f | 17 | 20 | 14 | ||||||||||||
|
Non-controlling interest, copper operations and other |
g | (224 | ) | (230 | ) | (159 | ) | |||||||||
|
All-in sustaining costs |
1,346 | 1,429 | 1,306 | |||||||||||||
| Global exploration and evaluation and project expense |
d | 82 | 99 | 60 | ||||||||||||
| Community relations costs not related to current operations |
0 | 1 | 0 | |||||||||||||
| Project capital expenditures |
e | 165 | 278 | 226 | ||||||||||||
| Non-sustaining leases |
0 | 0 | 0 | |||||||||||||
| Rehabilitation - accretion and amortization (non-operating sites) |
f | 7 | 7 | 6 | ||||||||||||
|
Non-controlling interest and copper operations and other |
g | (92 | ) | (112 | ) | (88 | ) | |||||||||
|
All-in costs |
1,508 | 1,702 | 1,510 | |||||||||||||
| Ounces sold - attributable basis (000s ounces) |
h | 910 | 1,042 | 954 | ||||||||||||
| Cost of sales per ounce |
i,j | 1,425 | 1,359 | 1,378 | ||||||||||||
| Total cash costs per ounce |
j | 1,051 | 982 | 986 | ||||||||||||
| Total cash costs per ounce (on a co-product basis) |
j,k | 1,093 | 1,026 | 1,030 | ||||||||||||
| All-in sustaining costs per ounce |
j | 1,474 | 1,364 | 1,370 | ||||||||||||
|
All-in sustaining costs per ounce (on a co-product basis) |
j,k | 1,516 | 1,408 | 1,414 | ||||||||||||
| All-in costs per ounce |
j | 1,657 | 1,627 | 1,583 | ||||||||||||
|
All-in costs per ounce (on a co-product basis) |
j,k | 1,699 | 1,671 | 1,627 | ||||||||||||
| a. | Non-recurring items | |
| These costs are not indicative of our cost of production and have been excluded from the calculation of total cash costs. |
||
| b. | Other | |
| Other adjustments for the three month period ended March 31, 2024 include the removal of total cash costs and by-product credits associated with Pierina of $nil (December 31, 2023: $nil; March 31, 2023: $3 million), which was producing incidental ounces until December 31, 2023. |
||
| c. | Non-controlling interests | |
| Non-controlling interests include non-controlling interests related to gold production of $542 million for the three month period ended March 31, 2024 (December 31, 2023: $594 million and March 31, 2023: $529 million). Non-controlling interests include NGM, Pueblo Viejo, Loulo-Gounkoto, Tongon, North Mara and Bulyanhulu. Refer to Note 4 to the Financial Statements for further information. |
||
| d. | Exploration and evaluation costs | |
| Exploration, evaluation and project expenses are presented as minesite sustaining if it supports current mine operations and project if it relates to future projects. Refer to page 48 of Barrick’s Q1 2014 MD&A. |
||
| e. | Capital expenditures | |
| Capital expenditures are related to our gold sites only and are split between minesite sustaining and project capital expenditures. Project capital expenditures are capital spending at new projects and major, discrete projects at existing operations intended to increase net present value through higher production or longer mine life. Significant projects in the current year include the plant expansion project at Pueblo Viejo and the solar project at NGM. Refer to page 47 of Barrick’s Q1 2024 MD&A. |
||
| f. | Rehabilitation—accretion and amortization | |
| Includes depreciation on the assets related to rehabilitation provisions of our gold operations and accretion on the rehabilitation provision of our gold operations, split between operating and non-operating sites. |
||
| g. | Non-controlling interest and copper operations | |
| Removes general and administrative costs related to non-controlling interests and copper based on a percentage allocation of revenue. Also removes exploration, evaluation and project expenses, rehabilitation costs and capital expenditures incurred by our copper sites and the non-controlling interest of NGM, Pueblo Viejo, Loulo-Gounkoto, Tongon, North Mara and Bulyanhulu operating segments. It also includes capital expenditures applicable to our equity method investment in Kibali. Figures remove the impact of Pierina up until December 31, 2023. The impact is summarized as the following: |
||
| BARRICK FIRST QUARTER 2024 | 23 | PRESS RELEASE |
| ($ millions) |
For the three months ended | |||||||||||
| Non-controlling interest, copper operations and other |
3/31/24 | 12/31/23 | 3/31/23 | |||||||||
| General & administrative costs |
(4 | ) | 7 | (6 | ) | |||||||
| Minesite exploration and evaluation expenses |
(2 | ) | (2 | ) | (4 | ) | ||||||
| Rehabilitation - accretion and amortization (operating sites) |
(5 | ) | (6 | ) | (5 | ) | ||||||
| Minesite sustaining capital expenditures |
(213 | ) | (229 | ) | (144 | ) | ||||||
|
All-in sustaining costs total |
(224 | ) | (230 | ) | (159 | ) | ||||||
| Global exploration and evaluation and project expense |
(44 | ) | (40 | ) | (12 | ) | ||||||
| Project capital expenditures |
(48 | ) | (72 | ) | (76 | ) | ||||||
|
All-in costs total |
(92 | ) | (112 | ) | (88 | ) | ||||||
| h. | Ounces sold - attributable basis | |
| Excludes Pierina, which was producing incidental ounces until December 31, 2023 while in closure. It also excludes Long Canyon which is producing residual ounces from the leach pad while in care and maintenance. |
||
| i. | Cost of sales per ounce | |
| Figures remove the cost of sales impact of: Pierina of $nil for the three month period ended March 31, 2024 (December 31, 2023: $nil and March 31, 2023: $3 million), which was producing incidental ounces up until December 31, 2023. Gold cost of sales per ounce is calculated as cost of sales across our gold operations (excluding sites in closure or care and maintenance) divided by ounces sold (both on an attributable basis using Barrick’s ownership share). |
||
| j. | Per ounce figures | |
| Cost of sales per ounce, total cash costs per ounce, all-in sustaining costs per ounce and all-in costs per ounce may not calculate based on amounts presented in this table due to rounding. |
||
| k. | Co-product costs per ounce | |
| Total cash costs per ounce, all-in sustaining costs per ounce and all-in costs per ounce presented on a co-product basis removes the impact of by-product credits of our gold production (net of non-controlling interest) calculated as: |
||
| ($ millions) |
For the three months ended | |||||||||||
| 3/31/24 | 12/31/23 | 3/31/23 | ||||||||||
| By-product credits |
56 | 66 | 61 | |||||||||
|
Non-controlling interest |
(18 | ) | (20 | ) | (19 | ) | ||||||
|
By-product credits (net of non-controlling interest) |
38 | 46 | 42 | |||||||||
Endnote 10
Starting in 2024, we have presented our copper production and sales quantities in tonnes rather than pounds (1 tonne is equivalent to 2,204.6 pounds). Our copper cost metrics are still reported on a per pound basis.
Endnote 11
Copper cost of sales per pound is calculated as cost of sales across our copper operations divided by pounds sold (both on an attributable basis using Barrick’s ownership share).
Endnote 12
“C1 cash costs” per pound and “All-in sustaining costs” per pound are non-GAAP financial performance measures related to our copper mine operations. We believe that “C1 cash costs” per pound enables investors to better understand the performance of our copper operations in comparison to other copper producers who present results on a similar basis. “C1 cash costs” per pound excludes royalties and non-routine charges as they are not direct production costs. “All-in sustaining costs” per pound is similar to the gold all-in sustaining costs metric and management uses this to better evaluate the costs of copper production. We believe this measure enables investors to better understand the operating performance of our copper mines as this measure reflects all of the sustaining expenditures incurred in order to produce copper. “All-in sustaining costs” per pound includes C1 cash costs, sustaining capital expenditures, sustaining leases, general and administrative costs, minesite exploration and evaluation costs, royalties, reclamation cost accretion and amortization and writedowns taken on inventory to net realizable value. Further details on these non-GAAP financial performance measures are provided in the MD&A accompanying Barrick’s financial statements filed from time to time on SEDAR+ at www.sedarplus.ca and on EDGAR at www.sec.gov.
| BARRICK FIRST QUARTER 2024 | 24 | PRESS RELEASE |
Reconciliation of Copper Cost of Sales to C1 cash costs and All-in sustaining costs, including on a per pound basis
| ($ millions, except per pound information in dollars) |
For the three months ended | |||||||||||
|
3/31/24 |
12/31/23 | 3/31/23 | ||||||||||
| Cost of sales |
168 | 209 | 174 | |||||||||
| Depreciation/amortization |
(60 | ) | (86 | ) | (44 | ) | ||||||
| Treatment and refinement charges |
34 | 51 | 43 | |||||||||
| Cash cost of sales applicable to equity method investments |
82 | 103 | 87 | |||||||||
| Less: royalties |
(12 | ) | (16 | ) | (15 | ) | ||||||
| By-product credits |
(5 | ) | (5 | ) | (4 | ) | ||||||
| Other |
0 | 0 | 0 | |||||||||
| C1 cash costs |
207 | 256 | 241 | |||||||||
| General & administrative costs |
4 | 6 | 6 | |||||||||
| Rehabilitation - accretion and amortization |
2 | 2 | 2 | |||||||||
| Royalties |
12 | 16 | 15 | |||||||||
| Minesite exploration and evaluation costs |
0 | 0 | 2 | |||||||||
| Minesite sustaining capital expenditures |
83 | 84 | 33 | |||||||||
| Sustaining leases |
1 | 3 | 3 | |||||||||
|
All-in sustaining costs |
309 | 367 | 302 | |||||||||
| Tonnes sold - attributable basis (thousands of tonnes) |
39 | 53 | 40 | |||||||||
| Pounds sold - attributable basis (millions pounds) |
86 | 117 | 89 | |||||||||
| Cost of sales per pounda,b |
3.20 | 2.92 | 3.22 | |||||||||
| C1 cash costs per pounda |
2.40 | 2.17 | 2.71 | |||||||||
|
All-in sustaining costs per pounda |
3.59 | 3.12 | 3.40 | |||||||||
| a. | Cost of sales per pound, C1 cash costs per pound and all-in sustaining costs per pound may not calculate based on amounts presented in this table due to rounding. |
| b. | Copper cost of sales per pound is calculated as cost of sales across our copper operations divided by pounds sold (both on an attributable basis using Barrick’s ownership share). |
Endnote 13
A Tier One Gold Asset is an asset with a $1,300/oz reserve with potential for 5 million ounces to support a minimum 10-year life, annual production of at least 500,000 ounces of gold and with all-in sustaining costs per ounce in the lower half of the industry cost curve. Tier One Assets must be located in a world class geological district with potential for organic reserve growth and long-term geologically driven addition.
Endnote 14
Indicative copper production profile from Lumwana, which is conceptual in nature. Subject to change following completion of the pre-feasibility study.
Endnote 15
Refer to the Technical Report on the Cortez Complex, Lander and Eureka Counties, State of Nevada, USA, dated December 31, 2021, and filed on SEDAR+ at www.sedarplus.ca and EDGAR at www.sec.gov on March 18, 2022.
Endnote 16
Includes Goldrush.
Endnote 17
Porgera was placed on care and maintenance from April 25, 2020 until December 22, 2023. On December 22, 2023, the Porgera Project Commencement Agreement was completed and recommissioning of the mine commenced. As a result, Porgera is included in our 2024 guidance at 24.5%.
Endnote 18
Total cash costs and all-in sustaining costs per ounce include costs allocated to non-operating sites.
Endnote 19
Operating division guidance ranges reflect expectations at each individual operating division and may not add up to the company wide guidance range total. Guidance ranges exclude Pierina which is producing incidental ounces while in closure.
Endnote 20
Includes corporate administration costs.
Endnote 21
Attributable capital expenditures are presented on the same basis as guidance, which includes our 61.5% share of NGM, our 60% share of Pueblo Viejo, our 80% share of Loulo-Gounkoto, our 89.7% share of Tongon, our 84% share of North Mara and Bulyanhulu, our 50% share of Zaldívar and Jabal Sayid and, beginning in 2024, our 24.5% share of Porgera.
| BARRICK FIRST QUARTER 2024 | 25 | PRESS RELEASE |
Shares Listed
GOLD The New York Stock Exchange
ABX The Toronto Stock Exchange
Transfer Agents and Registrars
TSX Trust Company
301 – 100 Adelaide Street West
Toronto, Ontario M5H 4H1
Canada
or
Equiniti Trust Company, LLC
6201 – 15th Avenue
Brooklyn, New York 11219
USA
Telephone: 1 800 387 0825
Fax: 1 888 249 6189
Email: shareholderinquiries@tmx.com
Website: www.tsxtrust.com
Corporate Office
Barrick Gold Corporation
161 Bay Street, Suite 3700
Toronto, Ontario M5J 2S1
Canada
Telephone: +1 416 861 9911
Email: investor@barrick.com
Website: www.barrick.com
Enquiries
President and Chief Executive Officer
Mark Bristow
+1 647 205 7694
+44 7880 711 386
Senior Executive Vice-President and
Chief Financial Officer
Graham Shuttleworth
+1 647 262 2095
+44 7797 711 338
Investor and Media Relations
Kathy du Plessis
+44 207 557 7738
Email: barrick@dpapr.com
Cautionary Statement on Forward-Looking Information
Certain information contained or incorporated by reference in this press release, including any information as to our strategy, projects, plans or future financial or operating performance, constitutes “forward-looking statements”. All statements, other than statements of historical fact, are forward-looking statements. The words “believe”, “expect”, “strategy”, “target”, “plan”, “focus”, “scheduled”, “ramp up”, “commitment” “opportunities”, “foundation”, “guidance”, “project”, “expand”, “invest”, “continue”, “progress”, “develop”, “on track”, “estimate”, “growth”, “potential”, “future”, “extend”, “will”, “could”, “would”, “should”, “may” and similar expressions identify forward-looking statements. In particular, this press release contains forward-looking statements including, without limitation, with respect to: Barrick’s forward-looking production guidance; projected capital, operating and exploration expenditures; our ability to convert resources into reserves and replace reserves net of depletion from production; mine life and production rates and anticipated production growth from Barrick’s organic project pipeline and reserve replacement; Barrick’s global exploration strategy and planned exploration activities, including discoveries at Turqouise Ridge and Kibali; our ability to identify new Tier One assets and the potential for existing assets to attain Tier One status; Barrick’s copper strategy; our plans and expected completion and benefits of our growth projects; potential mineralization and metal or mineral recoveries; the completion of the TS Solar facility at Neveda Gold Mines; targeted first production for the Reko Diq project and the Lumwana Super Pit expansion project; projected annual production for the Lumwana Super Pit expansion project and the Goldrush project; the resumption
and ramp up of operations at the Porgera mine; our pipeline of high confidence projects at or near existing operations, including Fourmile; Barrick’s strategy, plans, targets and goals in respect of environmental and social governance issues, including local community relations, economic contributions and education, employment and procurement initiatives, climate change, including our GHG emissions reduction targets renewable energy initiatives, and biodiversity initiatives; the potential to transform Buzwagi into a Special Economic Zone; Barrick’s performance dividend policy; and expectations regarding future price assumptions, financial performance and other outlook or guidance.
Forward-looking statements are necessarily based upon a number of estimates and assumptions including material estimates and assumptions related to the factors set forth below that, while considered reasonable by the Company as at the date of this press release in light of management’s experience and perception of current conditions and expected developments, are inherently subject to significant business, economic and competitive uncertainties and contingencies. Known and unknown factors could cause actual results to differ materially from those projected in the forward-looking statements and undue reliance should not be placed on such statements and information. Such factors include, but are not limited to: fluctuations in the spot and forward price of gold, copper or certain other commodities (such as silver, diesel fuel, natural gas and electricity); risks associated with projects in the early stages of evaluation and for which additional engineering and other analysis is required; risks related to the possibility
| BARRICK FIRST QUARTER 2024 | 26 | PRESS RELEASE |
that future exploration results will not be consistent with the Company’s expectations, that quantities or grades of reserves will be diminished, and that resources may not be converted to reserves; risks associated with the fact that certain of the initiatives described in this press release are still in the early stages and may not materialize; changes in mineral production performance, exploitation and exploration successes; risks that exploration data may be incomplete and considerable additional work may be required to complete further evaluation, including but not limited to drilling, engineering and socioeconomic studies and investment; the speculative nature of mineral exploration and development; lack of certainty with respect to foreign legal systems, corruption and other factors that are inconsistent with the rule of law; changes in national and local government legislation, taxation, controls or regulations and/or changes in the administration of laws, policies and practices; the potential impact of proposed changes to Chilean law on the status of value added tax refunds received in Chile in connection with the development of the Pascua-Lama project; expropriation or nationalization of property and political or economic developments in Canada, the United States or other countries in which Barrick does or may carry on business in the future; risks relating to political instability in certain of the jurisdictions in which Barrick operates; timing of receipt of, or failure to comply with, necessary permits and approvals; non-renewal of key licenses by governmental authorities; failure to comply with environmental and health and safety laws and regulations; increased costs and physical and transition risks related to climate change, including extreme weather events, resource shortages, emerging policies and increased regulations relating to greenhouse gas emission levels, energy efficiency and reporting of risks; the Company’s ability to achieve its sustainability goals, including its climate-related goals and GHG emissions reduction targets, in particular its ability to achieve its Scope 3 emissions targets which require reliance on entities within Barrick’s value chain, but outside of the Company’s direct control, to achieve such targets within the specified time frames; contests over title to properties, particularly title to undeveloped properties, or over access to water, power and other required infrastructure; the liability associated with risks and hazards in the mining industry, and the ability to maintain insurance to cover such losses; damage to the Company’s reputation due to the actual or perceived occurrence of any number of events, including negative publicity with respect to the Company’s handling of environmental matters or dealings with community groups, whether true or not; risks related to operations near communities that may regard Barrick’s operations as being detrimental to them; litigation and legal and administrative proceedings; operating or technical difficulties in connection with mining or development activities, including geotechnical challenges, tailings dam and storage facilities failures, and disruptions in the maintenance or provision of required infrastructure and information technology systems; increased costs, delays, suspensions and technical challenges associated with the construction of capital projects; risks associated with working with partners in jointly controlled assets; risks related to disruption of supply routes which may cause delays in construction and mining activities, including disruptions in the supply of key mining inputs due to the invasion of Ukraine by Russia and conflicts in the Middle East; risk of loss due to acts of war, terrorism, sabotage and civil disturbances; risks associated with artisanal and illegal mining; risks associated with Barrick’s infrastructure, information
technology systems and the implementation of Barrick’s technological initiatives, including risks related to cyber-attacks, cybersecurity incidents, including those caused by computer viruses, malware, ransomware and other cyberattacks, or similar information technology system failures, delays and/or disruptions; the impact of global liquidity and credit availability on the timing of cash flows and the values of assets and liabilities based on projected future cash flows; the impact of inflation, including global inflationary pressures driven by ongoing global supply chain disruptions, global energy cost increases following the invasion of Ukraine by Russia and country-specific political and economic factors in Argentina; adverse changes in our credit ratings; fluctuations in the currency markets; changes in U.S. dollar interest rates; risks arising from holding derivative instruments (such as credit risk, market liquidity risk and mark-to-market risk); risks related to the demands placed on the Company’s management, the ability of management to implement its business strategy and enhanced political risk in certain jurisdictions; uncertainty whether some or all of Barrick’s targeted investments and projects will meet the Company’s capital allocation objectives and internal hurdle rate; whether benefits expected from recent transactions are realized; business opportunities that may be presented to, or pursued by, the Company; our ability to successfully integrate acquisitions or complete divestitures; risks related to competition in the mining industry; employee relations including loss of key employees; availability and increased costs associated with mining inputs and labor; risks associated with diseases, epidemics and pandemics, including the effects and potential effects of the global Covid-19 pandemic; risks related to the failure of internal controls; and risks related to the impairment of the Company’s goodwill and assets.
In addition, there are risks and hazards associated with the business of mineral exploration, development and mining, including environmental hazards, industrial accidents, unusual or unexpected formations, pressures, cave-ins, flooding and gold bullion, copper cathode or gold or copper concentrate losses (and the risk of inadequate insurance, or inability to obtain insurance, to cover these risks).
Many of these uncertainties and contingencies can affect our actual results and could cause actual results to differ materially from those expressed or implied in any forward-looking statements made by, or on behalf of, us. Readers are cautioned that forward-looking statements are not guarantees of future performance. All of the forward-looking statements made in this press release are qualified by these cautionary statements. Specific reference is made to the most recent Form 40-F/Annual Information Form on file with the SEC and Canadian provincial securities regulatory authorities for a more detailed discussion of some of the factors underlying forward-looking statements and the risks that may affect Barrick’s ability to achieve the expectations set forth in the forward-looking statements contained in this press release. We disclaim any intention or obligation to update or revise any forward-looking statements whether as a result of new information, future events or otherwise, except as required by applicable law.
| BARRICK FIRST QUARTER 2024 | 27 | PRESS RELEASE |
Exhibit 99.2

Management’s Discussion and Analysis (“MD&A”) Quarterly Report on the First Quarter of 2024
This portion of the Quarterly Report provides management’s discussion and analysis (“MD&A”) of the financial condition and results of operations, to enable a reader to assess material changes in financial condition and results of operations as at, and for the three month period ended March 31, 2024, in comparison to the corresponding prior-year periods. The MD&A is intended to help the reader understand Barrick Gold Corporation (“Barrick”, “we”, “our”, the “Company” or the “Group”), our operations, financial performance as well as our present and future business environment. This MD&A, which has been prepared as of April 30, 2024, is intended to supplement and complement the condensed unaudited interim consolidated financial statements and notes thereto, prepared in accordance with IFRS Accounting Standards as issued by the International Accounting Standards Board applicable to the preparation of interim financial statements, under International Accounting Standard 34, Interim Financial Reporting, for the three month period ended March 31, 2024 (collectively, the “Financial Statements”), which are included in this Quarterly Report on pages 74 to 78. You are encouraged to review the Financial Statements in conjunction with your review of this MD&A. This MD&A should be read in conjunction with both the annual audited consolidated
financial statements for the two years ended December 31, 2023, the related annual MD&A included in the 2023 Annual Report, and the most recent Form 40–F/Annual Information Form on file with the U.S. Securities and Exchange Commission (“SEC”) and Canadian provincial securities regulatory authorities. These documents and additional information relating to the Company are available on SEDAR+ at www.sedarplus.ca and EDGAR at www.sec.gov. Certain notes to the Financial Statements are specifically referred to in this MD&A and such notes are incorporated by reference herein. All dollar amounts in this MD&A are in millions of United States dollars (“$” or “US$”), unless otherwise specified.
For the purposes of preparing our MD&A, we consider the materiality of information. Information is considered material if: (i) such information results in, or would reasonably be expected to result in, a significant change in the market price or value of our shares; (ii) there is a substantial likelihood that a reasonable investor would consider it important in making an investment decision; or (iii) it would significantly alter the total mix of information available to investors. We evaluate materiality with reference to all relevant circumstances, including potential market sensitivity.
Abbreviations
| BAP |
Biodiversity Action Plans | |
| BNL |
Barrick Niugini Limited | |
| CDCs |
Community Development Committees | |
| CHUG |
Cortez Hills Underground | |
| CIL |
Carbon-in-leach | |
| Commencement Agreement |
Detailed Porgera Project Commencement Agreement between PNG and BNL | |
| DRC |
Democratic Republic of Congo | |
| E&S Committee |
Environmental and Social Oversight Committee | |
| ESG |
Environmental, Social and Governance | |
| ESG & Nominating Committee |
Environmental, Social, Governance & Nominating Committee | |
| ESIA |
Environmental and Social Impact Assessment | |
| G&A |
General and administrative | |
| GHG |
Greenhouse Gas | |
| GISTM |
Global Industry Standard for Tailings Management | |
| GoT |
Government of Tanzania | |
| IASB |
International Accounting Standards Board | |
| ICMM |
International Council on Mining and Metals | |
| IFRS |
IFRS Accounting Standards as issued by the International Accounting Standards Board | |
| ISSB |
International Sustainability Standards Board | |
| KCD |
Karagba, Chauffeur and Durba | |
| Ktpa |
Thousand tonnes per annum | |
| LTI |
Lost Time Injury | |
| LTIFR |
Lost Time Injury Frequency Rate | |
| Mtpa |
Million tonnes per annum | |
| MVA |
Megavolt-amperes | |
| MW |
Megawatt | |
| NGM |
Nevada Gold Mines | |
| NSR |
Net Smelter Return | |
| OECD |
Organisation for Economic Co-operation and Development | |
| PFS |
Prefeasibility Study | |
| PJL |
Porgera Jersey Limited | |
| PNG |
Papua New Guinea | |
| Randgold |
Randgold Resources Limited | |
| RC |
Reverse Circulation | |
| RIL |
Resin-in-leach | |
| ROD |
Record of Decision | |
| SDG |
Sustainable Development Goals | |
| TCFD |
Task Force for Climate-related Financial Disclosures | |
| TRIFR |
Total Recordable Injury Frequency Rate | |
| TRUG |
Turquoise Ridge Underground | |
| TSF |
Tailings Storage Facilities | |
| TW |
True Width | |
| VMS |
Volcanogenic Massive Sulphide | |
| VTEM |
Versatile Time Domain Electromagnetic | |
| WGC |
World Gold Council | |
| WTI |
West Texas Intermediate | |
| BARRICK FIRST QUARTER 2024 | 1 | MANAGEMENT’S DISCUSSION AND ANALYSIS |
Cautionary Statement on Forward-Looking Information
Certain information contained or incorporated by reference in this MD&A, including any information as to our strategy, projects, plans or future financial or operating performance, constitutes “forward-looking statements”. All statements, other than statements of historical fact, are forward-looking statements. The words “believe”, “expect”, “anticipated”, “vision”, “aim”, “on track”, “strategy”, “target”, “plan”, “opportunities”, “guidance”, “forecast”, “outlook”, “objective”, “intend”, “project”, “pursue”, “develop”, “progress”, “continue”, “committed”, “budget”, “estimate”, “potential”, “prospective”, “future”, “focus”, “during”, “ongoing”, “following”, “subject to”, “scheduled”, “may”, “will”, “can”, “could”, “would”, “should” and similar expressions identify forward-looking statements. In particular, this MD&A contains forward-looking statements including, without limitation, with respect to: Barrick’s forward-looking production guidance, including the anticipated increase in gold and copper production during the remainder of 2024; estimates of future cost of sales per ounce for gold and per pound for copper, total cash costs per ounce and C1 cash costs per pound, and all-in-sustaining costs per ounce/ pound; cash flow forecasts; projected capital, operating and exploration expenditures; the share buyback program and performance dividend policy, including the criteria for dividend payments; mine life and production rates; the resumption of operations at the Porgera mine and expected ramp up of mining and processing in 2024; our plans and expected completion and benefits of our growth and capital projects, including the Goldrush Project, Fourmile, Pueblo Viejo plant expansion and mine life extension project, including the anticipated ramp-up of the plant expansion during 2024, Veladero Phase 7 leach pad project, the Reko Diq project, solar power projects at NGM and Loulo-Gounkoto, Donlin Gold, the Jabal Sayid Lode 1 project and the development of the Lumwana Super Pit; expected timing for production for Goldrush, Reko Diq and the Lumwana Super Pit; the new mining code in Mali and the status of the establishment conventions for the Loulo-Gounkoto complex; capital expenditures related to upgrades and ongoing management initiatives; our ability to identify new Tier One assets and the potential for existing assets to attain Tier One status; Barrick’s global exploration strategy and planned exploration activities; our pipeline of high confidence projects at or near existing operations; potential mineralization and metal or mineral recoveries; our ability to convert resources into reserves; asset sales, joint ventures and partnerships; Barrick’s strategy, plans and targets in respect of environmental and social governance issues, including climate change, GHG emissions reduction targets, safety performance, responsible water use, TSF management, including Barrick’s conformance with the GISTM, community development, biodiversity and human rights initiatives; and expectations regarding future price assumptions, financial performance and other outlook or guidance.
Forward-looking statements are necessarily based upon a number of estimates and assumptions including material estimates and assumptions related to the factors set forth below that, while considered reasonable by the Company as at the date of this MD&A in light of management’s experience and perception of current conditions and expected developments, are inherently subject to significant business, economic and competitive uncertainties and contingencies. Known and unknown factors could cause actual results to differ materially from those projected in the forward-looking statements and undue reliance should not be placed on such statements and information. Such factors include, but are not limited to:
fluctuations in the spot and forward price of gold, copper or certain other commodities (such as silver, diesel fuel, natural gas and electricity); risks associated with projects in the early stages of evaluation and for which additional engineering and other analysis is required; risks related to the possibility that future exploration results will not be consistent with the Company’s expectations, that quantities or grades of reserves will be diminished, and that resources may not be converted to reserves; risks associated with the fact that certain of the initiatives described in this MD&A are still in the early stages and may not materialize; changes in mineral production performance, exploitation and exploration successes; risks that exploration data may be incomplete and considerable additional work may be required to complete further evaluation, including but not limited to drilling, engineering and socioeconomic studies and investment; the speculative nature of mineral exploration and development; lack of certainty with respect to foreign legal systems, corruption and other factors that are inconsistent with the rule of law; changes in national and local government legislation, taxation, controls or regulations and/or changes in the administration of laws, policies and practices, including the potential impact of proposed changes to Chilean law on the status of value-added tax (“VAT”) refunds received in Chile in connection with the development of the Pascua-Lama project; expropriation or nationalization of property and political or economic developments in Canada, the United States or other countries in which Barrick does or may carry on business in the future; risks relating to political instability in certain of the jurisdictions in which Barrick operates; timing of receipt of, or failure to comply with, necessary permits and approvals; non-renewal of key licenses by governmental authorities; failure to comply with environmental and health and safety laws and regulations; increased costs and physical and transition risks related to climate change, including extreme weather events, resource shortages, emerging policies and increased regulations related to greenhouse gas emission levels, energy efficiency and reporting of risks; the Company’s ability to achieve its sustainability goals, including its climate-related goals and GHG emissions reduction targets, in particular its ability to achieve its Scope 3 emissions targets which requires reliance on entities within Barrick’s value chain, but outside of the Company’s direct control, to achieve such targets within the specified time frames; contests over title to properties, particularly title to undeveloped properties, or over access to water, power and other required infrastructure; the liability associated with risks and hazards in the mining industry, and the ability to maintain insurance to cover such losses; damage to the Company’s reputation due to the actual or perceived occurrence of any number of events, including negative publicity with respect to the Company’s handling of environmental matters or dealings with community groups, whether true or not; risks related to operations near communities that may regard Barrick’s operations as being detrimental to them; litigation and legal and administrative proceedings; operating or technical difficulties in connection with mining or development activities, including geotechnical challenges, tailings dam and storage facilities failures, and disruptions in the maintenance or provision of required infrastructure and information technology systems; increased costs, delays, suspensions and technical challenges associated with the construction of capital projects; risks associated with working with partners in jointly controlled assets; risks related to disruption of supply routes which may cause delays in construction and mining
| BARRICK FIRST QUARTER 2024 | 2 | MANAGEMENT’S DISCUSSION AND ANALYSIS |
activities, including disruptions in the supply of key mining inputs due to the invasion of Ukraine by Russia and conflicts in the Middle East; risk of loss due to acts of war, terrorism, sabotage and civil disturbances; risks associated with artisanal and illegal mining; risks associated with Barrick’s infrastructure, information technology systems and the implementation of Barrick’s technological initiatives, including risks related to cybersecurity incidents, including those caused by computer viruses, malware, ransomware and other cyberattacks, or similar information technology system failures, delays and/or disruptions; the impact of global liquidity and credit availability on the timing of cash flows and the values of assets and liabilities based on projected future cash flows; the impact of inflation, including global inflationary pressures driven by ongoing global supply chain disruptions, global energy cost increases following the invasion of Ukraine by Russia and country-specific political and economic factors in Argentina; adverse changes in our credit ratings; fluctuations in the currency markets; changes in U.S. dollar interest rates; risks arising from holding derivative instruments (such as credit risk, market liquidity risk and mark-to-market risk); risks related to the demands placed on the Company’s management, the ability of management to implement its business strategy and enhanced political risk in certain jurisdictions; uncertainty whether some or all of Barrick’s targeted investments and projects will meet the Company’s capital allocation objectives and internal hurdle rate; whether benefits expected from recent transactions are realized; business opportunities that may be presented to, or pursued by, the Company; our ability to successfully integrate acquisitions or complete divestitures; risks related to competition in the mining industry; employee relations
including loss of key employees; availability and increased costs associated with mining inputs and labor; risks associated with diseases, epidemics and pandemics, including the effects and potential effects of the global Covid-19 pandemic; risks related to the failure of internal controls; and risks related to the impairment of the Company’s goodwill and assets.
In addition, there are risks and hazards associated with the business of mineral exploration, development and mining, including environmental hazards, industrial accidents, unusual or unexpected formations, pressures, cave-ins, flooding and gold bullion, copper cathode or gold or copper concentrate losses (and the risk of inadequate insurance, or inability to obtain insurance, to cover these risks).
Many of these uncertainties and contingencies can affect our actual results and could cause actual results to differ materially from those expressed or implied in any forward-looking statements made by, or on behalf of, us. Readers are cautioned that forward-looking statements are not guarantees of future performance. All of the forward-looking statements made in this MD&A are qualified by these cautionary statements. Specific reference is made to the most recent Form 40-F/Annual Information Form on file with the SEC and Canadian provincial securities regulatory authorities for a more detailed discussion of some of the factors underlying forward-looking statements and the risks that may affect Barrick’s ability to achieve the expectations set forth in the forward-looking statements contained in this MD&A. We disclaim any intention or obligation to update or revise any forward-looking statements whether as a result of new information, future events or otherwise, except as required by applicable law.
| BARRICK FIRST QUARTER 2024 | 3 | MANAGEMENT’S DISCUSSION AND ANALYSIS |
Use of Non-GAAP Financial Measures
We use the following non-GAAP financial measures in our MD&A:
| ∎ | “adjusted net earnings” |
| ∎ | “free cash flow” |
| ∎ | “EBITDA” |
| ∎ | “adjusted EBITDA” |
| ∎ | “attributable EBITDA” |
| ∎ | “minesite sustaining capital expenditures” |
| ∎ | “project capital expenditures” |
| ∎ | “total cash costs per ounce” |
| ∎ | “C1 cash costs per pound” |
| ∎ | “all-in sustaining costs per ounce/pound” |
| ∎ | “all-in costs per ounce” and |
| ∎ | “realized price” |
For a detailed description of each of the non-GAAP financial measures used in this MD&A and a detailed reconciliation to the most directly comparable measure under IFRS, please refer to the Non-GAAP Financial Measures section of this MD&A on pages 54 to 67. Each non-GAAP financial measure has been annotated with a reference to an endnote on page 68. The non-GAAP financial measures set out in this MD&A are intended to provide additional information to investors and do not have any standardized meaning under IFRS, and therefore may not be comparable to other issuers, and should not be considered in isolation or as a substitute for measures of performance prepared in accordance with IFRS.
| Index
|
| 5 |
Overview | |||
| 5 | Financial and Operating Highlights | |||
| 8 | Sustainability | |||
| 12 | Outlook | |||
| 14 | Production and Cost Summary | |||
| 16 |
Operating Performance | |||
| 17 | Nevada Gold Mines | |||
| 18 | Carlin | |||
| 20 | Cortez | |||
| 22 | Turquoise Ridge | |||
| 24 | Other Mine - Nevada Gold Mines | |||
| 25 | Pueblo Viejo | |||
| 27 | Loulo-Gounkoto | |||
| 29 | Kibali | |||
| 31 | North Mara | |||
| 33 | Bulyanhulu | |||
| 35 | Other Mines - Gold | |||
| 36 | Lumwana | |||
| 38 | Other Mines - Copper | |||
| 39 |
Growth Projects | |||
| 41 |
Exploration and Mineral Resource Management | |||
| 45 |
Review of Financial Results | |||
| 45 | Revenue | |||
| 46 | Production Costs | |||
| 47 | Capital Expenditures | |||
| 48 | General and Administrative Expenses | |||
| 48 | Exploration, Evaluation and Project Expenses | |||
| 48 | Finance Costs, Net | |||
| 48 | Additional Significant Statement of Income Items | |||
| 49 | Income Tax Expense | |||
| 50 |
Financial Condition Review | |||
| 50 | Balance Sheet Review | |||
| 50 | Shareholders’ Equity | |||
| 50 | Financial Position and Liquidity | |||
| 51 | Summary of Cash Inflow (Outflow) | |||
| 52 |
Commitments and Contingencies | |||
| 53 |
Review of Quarterly Results | |||
| 53 |
Internal Control over Financial Reporting and Disclosure Controls and Procedures | |||
| 54 |
IFRS Critical Accounting Policies and Accounting Estimates | |||
| 54 |
Non-GAAP Financial Measures | |||
| 68 |
Technical Information | |||
| 68 |
Endnotes | |||
| 74 |
Financial Statements | |||
| 79 |
Notes to Consolidated Financial Statements | |||
| BARRICK FIRST QUARTER 2024 | 4 | MANAGEMENT’S DISCUSSION AND ANALYSIS |
| OVERVIEW | OPERATING PERFORMANCE
|
GROWTH PROJECTS & EXPLORATION
|
REVIEW OF FINANCIAL RESULTS
|
OTHER INFORMATION & NON-GAAP RECONCILIATIONS |
FINANCIAL STATEMENTS |
|||||
Overview
Financial and Operating Highlights
| For the three months ended | ||||||||||||||||||||
| 3/31/24 | 12/31/23 | % Change | 3/31/23 | % Change | ||||||||||||||||
| Financial Results ($ millions) |
||||||||||||||||||||
| Revenues |
2,747 | 3,059 | (10)% | 2,643 | 4 % | |||||||||||||||
| Cost of sales |
1,936 | 2,139 | (9)% | 1,941 | 0 % | |||||||||||||||
| Net earningsa |
295 | 479 | (38)% | 120 | 146 % | |||||||||||||||
| Adjusted net earningsb |
333 | 466 | (29)% | 247 | 35 % | |||||||||||||||
| Attributable EBITDAb |
907 | 1,068 | (15)% | 851 | 7 % | |||||||||||||||
| Attributable EBITDA marginc |
41 % | 42 % | (2)% | 39 % | 5 % | |||||||||||||||
| Minesite sustaining capital expendituresb,d |
550 | 569 | (3)% | 454 | 21 % | |||||||||||||||
| Project capital expendituresb,d |
165 | 278 | (41)% | 226 | (27)% | |||||||||||||||
| Total consolidated capital expendituresd,e |
728 | 861 | (15)% | 688 | 6 % | |||||||||||||||
| Net cash provided by operating activities |
760 | 997 | (24)% | 776 | (2)% | |||||||||||||||
| Net cash provided by operating activities marginf |
28 % | 33 % | (15)% | 29 % | (3)% | |||||||||||||||
| Free cash flowb |
32 | 136 | (76)% | 88 | (64)% | |||||||||||||||
| Net earnings per share (basic and diluted) |
0.17 | 0.27 | (37)% | 0.07 | 143 % | |||||||||||||||
| Adjusted net earnings (basic)b per share |
0.19 | 0.27 | (30)% | 0.14 | 36 % | |||||||||||||||
| Weighted average diluted common shares (millions of shares) |
1,756 | 1,756 | 0 % | 1,755 | 0 % | |||||||||||||||
| Operating Results |
||||||||||||||||||||
| Gold production (thousands of ounces)g |
940 | 1,054 | (11)% | 952 | (1)% | |||||||||||||||
| Gold sold (thousands of ounces)g |
910 | 1,042 | (13)% | 954 | (5)% | |||||||||||||||
| Market gold price ($/oz) |
2,070 | 1,971 | 5 % | 1,890 | 10 % | |||||||||||||||
| Realized gold priceb,g ($/oz) |
2,075 | 1,986 | 4 % | 1,902 | 9 % | |||||||||||||||
| Gold cost of sales (Barrick’s share)g,h ($/oz) |
1,425 | 1,359 | 5 % | 1,378 | 3 % | |||||||||||||||
| Gold total cash costsb,g ($/oz) |
1,051 | 982 | 7 % | 986 | 7 % | |||||||||||||||
| Gold all-in sustaining costsb,g ($/oz) |
1,474 | 1,364 | 8 % | 1,370 | 8 % | |||||||||||||||
| Copper production (thousands of tonnes)g,i |
40 | 51 | (22)% | 40 | 0 % | |||||||||||||||
| Copper sold (thousands of tonnes)g,i |
39 | 53 | (26)% | 40 | (3)% | |||||||||||||||
| Market copper price ($/lb) |
3.83 | 3.70 | 4 % | 4.05 | (5)% | |||||||||||||||
| Realized copper priceb,g ($/lb) |
3.86 | 3.78 | 2 % | 4.20 | (8)% | |||||||||||||||
| Copper cost of sales (Barrick’s share)g,j ($/lb) |
3.20 | 2.92 | 10 % | 3.22 | (1)% | |||||||||||||||
| Copper C1 cash costsb,g ($/lb) |
2.40 | 2.17 | 11 % | 2.71 | (11)% | |||||||||||||||
| Copper all-in sustaining costsb,g ($/lb) |
3.59 | 3.12 | 15 % | 3.40 | 6 % | |||||||||||||||
| As at 3/31/24 |
As at 12/31/23 |
% Change | As at 3/31/23 | % Change | ||||||||||||||||
| Financial Position ($ millions) |
||||||||||||||||||||
| Debt (current and long-term) |
4,725 | 4,726 | 0 % | 4,777 | (1)% | |||||||||||||||
| Cash and equivalents |
3,942 | 4,148 | (5)% | 4,377 | (10)% | |||||||||||||||
| Debt, net of cash |
783 | 578 | 35 % | 400 | 96 % | |||||||||||||||
| a. | Net earnings represents net earnings attributable to the equity holders of the Company. |
| b. | Further information on these non-GAAP financial measures, including detailed reconciliations, is included on pages 54 to 67 of this MD&A. |
| c. | Represents adjusted EBITDA divided by revenue. |
| d. | Amounts presented on a consolidated cash basis. Project capital expenditures are included in our calculation of all-in costs, but not included in our calculation of all-in sustaining costs. |
| e. | Total consolidated capital expenditures also includes capitalized interest of $13 million for the three month period ended March 31, 2024 (December 31, 2023: $14 million and March 31, 2023: $8 million). |
| f. | Represents net cash provided by operating activities divided by revenue. |
| g. | On an attributable basis. |
| h. | Gold cost of sales per ounce is calculated as cost of sales across our gold operations (excluding sites in closure or care and maintenance) divided by ounces sold (both on an attributable basis using Barrick’s ownership share). |
| i. | Starting in 2024, we have presented our copper production and sales quantities in tonnes rather than pounds (1 tonne is equivalent to 2,204.6 pounds). Production and sales amounts for prior periods have been restated for comparative purposes. Our copper cost metrics are still reported on a per pound basis. |
| j. | Copper cost of sales per pound is calculated as cost of sales across our copper operations divided by pounds sold (both on an attributable basis using Barrick’s ownership share). |
| BARRICK FIRST QUARTER 2024 | 5 | MANAGEMENT’S DISCUSSION AND ANALYSIS |
| OVERVIEW | OPERATING PERFORMANCE
|
GROWTH PROJECTS & EXPLORATION
|
REVIEW OF FINANCIAL RESULTS
|
OTHER INFORMATION & NON-GAAP RECONCILIATIONS |
FINANCIAL STATEMENTS |
|||||
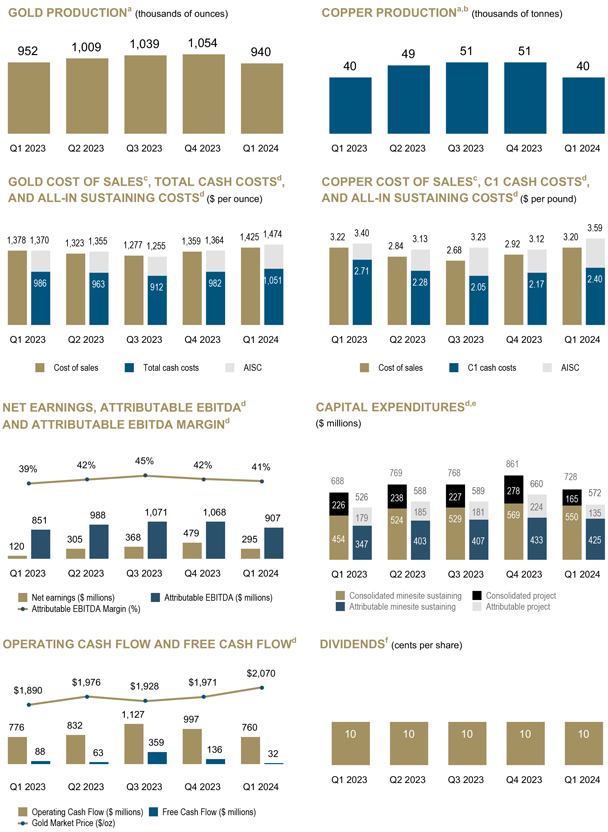
| a. | On an attributable basis. |
| b. | Starting in 2024, we have presented our copper production and sales quantities in tonnes rather than pounds (1 tonne is equivalent to 2,204.6 pounds). Production and sales amounts for prior periods have been restated for comparative purposes. Our copper cost metrics are still reported on a per pound basis. |
| c. | Gold cost of sales per ounce is calculated as cost of sales across our gold operations (excluding sites in closure or care and maintenance) divided by ounces sold (both on an attributable basis using Barrick’s ownership share). Copper cost of sales per pound is calculated as cost of sales across our copper operations divided by pounds sold (both on an attributable basis using Barrick’s ownership share). Refer to endnote 2 for further details. |
| d. | Further information on these non-GAAP financial measures, including detailed reconciliations, is included on pages 54 to 67 of this MD&A. |
| e. | Capital expenditures also includes capitalized interest. |
| f. | Dividend per share declared in respect of the stated period, inclusive of the performance dividend. |
| BARRICK FIRST QUARTER 2024 | 6 | MANAGEMENT’S DISCUSSION AND ANALYSIS |
| OVERVIEW | OPERATING PERFORMANCE
|
GROWTH PROJECTS & EXPLORATION
|
REVIEW OF FINANCIAL RESULTS
|
OTHER INFORMATION & NON-GAAP RECONCILIATIONS |
FINANCIAL STATEMENTS |
|||||
| Factors affecting net earnings and adjusted net earnings1 - three months ended March 31, 2024 versus December 31, 2023 Net earnings attributable to equity holders of Barrick (“net earnings”) for the three months ended March 31, 2024 were $295 million compared to $479 million in the prior quarter. This decrease was impacted by the following items, all of which occurred in the prior quarter: ∎ a gain of $352 million as the conditions for the reopening of the Porgera mine were completed on December 22, 2023; partially offset by; ∎ a long-lived asset impairment of $143 million (net of tax and non-controlling interests) at Long Canyon; and ∎ significant tax adjustments of $120 million related to deferred tax recoveries as a result of net impairment charges; foreign currency translation gains and losses on tax balances; the resolution of uncertain tax positions; the impact of prior year adjustments; the impact of nondeductible foreign exchange losses; and the recognition and derecognition of deferred tax assets. After adjusting for items that are not indicative of future operating earnings, adjusted net earnings1 of $333 million for the three months ended March 31, 2024 was $133 million lower than the prior quarter. The decrease was primarily due to lower gold sales volumes, mainly as Nevada Gold Mines carried out planned maintenance at the Sage autoclave at Turquoise Ridge, mined lower grade ores at Carlin and processed fewer open pit tonnes at Cortez with more waste mined during the quarter. Similarly, Kibali and North Mara processed lower grades, as per their mine plans. These impacts were partially offset by higher grades processed at Loulo-Gounkoto. This was combined with lower copper sales volumes driven by lower grades mined at Lumwana as per the mine plan, and higher gold cost of sales per ounce2 mainly due to the impact of the lower sales volumes. Adjusted net earnings1 were favorably impacted by higher realized gold and copper prices1. The realized gold and copper prices1 were $2,075 per ounce and $3.86 per pound, respectively, in the three months ended March 31, 2024, compared to $1,986 per ounce and $3.78 per pound, respectively, in the prior quarter.
Factors affecting net earnings and adjusted net earnings1 - three months ended March 31, 2024 versus March 31, 2023 Net earnings for the first quarter of 2024 were $295 million compared to $120 million in the same prior year period. This increase was mainly due to a higher realized gold price1, partially offset by lower gold sales volumes, higher gold cost of sales2, and a lower realized copper price1. The increase in net earnings was further impacted by the $30 million commitment we made towards the expansion of education infrastructure in Tanzania, per our community investment obligations under the Twiga partnership, occurring in the same prior year period. After adjusting for items that are not indicative of future operating earnings, adjusted net earnings1 of $333 million in the first quarter of 2024 were $86 million higher than the same prior year period. This increase was mainly due to a higher realized gold price1, partially offset by lower gold sales volumes, higher gold cost of sales2 and a lower realized copper price1, as described above. The realized gold and copper prices1 were $2,075 per ounce and $3.86 per pound, respectively, in the three months ended |
|
March 31, 2024 compared to $1,902 per ounce and $4.20 per pound, respectively, in the same prior year period. The decrease in gold sales volume was primarily due to lower throughput, grades processed and recovery at North Mara, less ore mined at the Crossroads open pit driven by the transition to Phase 6 at Cortez, and planned maintenance at the Sage autoclave at Turquoise Ridge. This was partially offset by higher production at Carlin, due to the conversion of the Goldstrike autoclave to a conventional CIL process and the planned maintenance shutdown that both occurred in the same prior year period. The increase in gold cost of sales per ounce2 was mainly due to lower grades processed and higher operating costs at North Mara, combined with lower recoveries and higher consumables and maintenance costs at Pueblo Viejo as we work on fine tuning the chemistry in the expanded processing plant. The significant adjusting items in the three months ended March 31, 2024 include: ∎ $29 million in significant tax adjustments. Refer to page 54 for a full list of reconciling items between net earnings and adjusted net earnings1 for the current and previous periods.
Factors affecting Operating Cash Flow and Free Cash Flow1 - three months ended March 31, 2024 versus December 31, 2023 In the three months ended March 31, 2024, we generated $760 million in operating cash flow, compared to $997 million in the prior quarter. The decrease of $237 million was primarily due to a lower gold and copper sales volumes, higher total cash costs/C1 cash costs per ounce/ pound1, partially offset by higher realized gold and copper prices1. Operating cash flow was further impacted by an unfavorable movement in working capital, mainly in accounts payable and other current assets (mainly VAT receivables), partially offset by a favorable movement in accounts receivable. This was partially offset by a decrease in interest paid as a result of the timing of semi-annual interest payments on our bonds, which primarily occur in Q2 and Q4. For the three months ended March 31, 2024, we recorded free cash flow1 of $32 million, compared to $136 million in the prior quarter, mainly reflecting lower operating cash flows as explained above, partially offset by lower capital expenditures. In the first quarter of 2024, capital expenditures on a cash basis were $728 million compared to $861 million in the prior quarter, due to a decrease in both project capital expenditures1 and minesite sustaining capital expenditures1. The decrease in project capital expenditures1 was mainly as commissioning of the solar substation and half of the array for the NGM TS Solar Project was completed in the prior quarter. This was combined with the Loulo-Gounkoto solar project being commissioned during the current quarter, and construction progress of the underground paste plant at North Mara. Minesite sustaining capital expenditures1 decreased primarily driven by a reduction in the number of new haul trucks commissioned at Cortez.
Factors affecting Operating Cash Flow and Free Cash Flow1 - three months ended March 31, 2024 versus March 31, 2023 In the first quarter of 2024, we generated $760 million in operating cash flow, compared to $776 million in the same prior year period. The decrease of $16 million was primarily |
Numerical annotations throughout the text of this document refer to the endnotes found starting on page 68.
| BARRICK FIRST QUARTER 2024 | 7 | MANAGEMENT’S DISCUSSION AND ANALYSIS |
| OVERVIEW | OPERATING PERFORMANCE
|
GROWTH PROJECTS & EXPLORATION
|
REVIEW OF FINANCIAL RESULTS
|
OTHER INFORMATION & NON-GAAP RECONCILIATIONS |
FINANCIAL STATEMENTS |
|||||
| due to an unfavorable movement in working capital, mainly in other current assets (mainly VAT receivables) and accounts payable, partially offset by a favorable movement in inventory and accounts receivable. Operating cash flow was further impacted by a higher realized gold price1, partially offset by lower gold sales volumes and higher total cash costs per pound1. In the first quarter of 2024, we generated free cash flow1 of $32 million compared to $88 million in the same prior year period. The decrease primarily reflects higher capital expenditures and to a lesser extent lower operating cash flows as explained above. In the first quarter of 2024, capital expenditures on a cash basis were $728 million compared to $688 million in the first quarter of 2023. The increase in capital expenditures of $40 million was due to an increase in minesite sustaining capital expenditures1, partially offset by a decrease in project capital expenditures1. Minesite sustaining capital expenditures1 increased compared to the same prior year period, mainly due to higher capitalized waste stripping at Lumwana and Carlin, combined with increased underground development and the purchase of Komatsu 930-E haul trucks at Carlin. The decrease in project capital expenditures1 is primarily due to lower expenditures at Loulo-Gounkoto due to the commissioning of the solar plant project during the current quarter, at Pueblo Viejo as the plant expansion project was substantially completed in the prior year, and at Lumwana resulting from the investment in the owner stripping fleet occurring in the prior year.
Sustainability Sustainability, including our license to operate, is entrenched in our DNA: our sustainability strategy is our business plan. Barrick’s vision for sustainability is underpinned by the knowledge that sustainability aspects are interconnected and must be tackled in conjunction with, and reference to, each other. We call this approach Holistic and Integrated Sustainability Management. We must tackle all sustainability aspects holistically and concurrently to make meaningful progress in any single aspect. Although we integrate our sustainability management, we discuss our sustainability strategy within four overarching pillars: (1) respecting human rights; (2) protecting the health and safety of our people and local communities; (3) sharing the benefits of our operations; and (4) managing our impacts on the environment. We implement this strategy by blending top-down accountability with bottom-up responsibility. This means we place the day-to-day ownership of sustainability, and the associated risks and opportunities, in the hands of individual sites. In the same way that each site must manage its geological, operational and technical capabilities to meet business objectives, it must also manage and identify programs, metrics, and targets that measure progress and deliver real value for the business and our stakeholders, including our host countries and local communities. The Group Sustainability Executive, supported by regional sustainability leads, provides oversight and direction over this site-level ownership, to ensure alignment with the strategic priorities of the overall business.
Governance The bedrock of our sustainability strategy is strong governance. Our most senior management-level body |
|
dedicated to sustainability is the E&S Committee, which connects site-level ownership of our sustainability strategy with the leadership of the Group. It is chaired by the President and Chief Executive Officer and includes: (1) regional Chief Operating Officers; (2) minesite General Managers; (3) Health, Safety, Environment and Closure Leads; (4) the Group Sustainability Executive; (5) in-house legal counsel; and (6) an independent sustainability consultant in an advisory role. The E&S Committee meets on a quarterly basis to review our performance across a range of key performance indicators, and to provide independent oversight and review of sustainability management. The President and Chief Executive Officer reviews the reports of the E&S Committee at every quarterly meeting of the Board’s ESG & Nominating Committee. The reports are reviewed to ensure the implementation of our sustainability policies and to drive performance of our environmental, health and safety, community relations and development, and human rights programs. This is supplemented by weekly meetings, at a minimum, between the Regional Sustainability Leads and the Group Sustainability Executive. These meetings examine the sustainability-related risks and opportunities facing the business in real time, as well as the progress and issues integrated into weekly Executive Committee review meetings. Incentive payments for senior leaders under Barrick’s Partnership Plan are tied to Sustainability performance. This comprises 10% weighting under the annual incentive program based on our annual safety and environment performance, and a 20% weighting under our Long-Term Company Scorecard linked to the assessment of our industry-first Sustainability Scorecard. As we strive for ongoing strong performance, the Sustainability Scorecard targets and metrics are updated annually. The results of the 2023 Sustainability Scorecard were published in the Annual Report in March 2024, and 2024 targets will be included in the 2023 Sustainability Report, to be published in May 2024. The E&S Committee tracks our progress against all metrics.
Human rights Our commitment to respect human rights is codified in our standalone Human Rights Policy and informed by the expectations of the United Nations Guiding Principles on Business and Human Rights, the Voluntary Principles on Security and Human Rights and the OECD Guidelines for Multinational Enterprises. This commitment is fulfilled on the ground via our Human Rights Program, the fundamental principles of which include: monitoring and reporting, due diligence, training, as well as disciplinary action and remedy. We continue to assess and manage security and human rights risks at all our operations and provide security and human rights training to private and public security forces across our sites. During 2023, independent human rights assessments were undertaken at the following sites: North Mara and Bulyanhulu in Tanzania; Jabal Sayid in Saudi Arabia; Loulo-Gounkoto in Mali; and Kibali in the DRC, and in the first quarter of 2024 at Reko Diq in Pakistan. In 2024, Barrick will carry out independent assessments and training at Tongon in Côte d’Ivoire, Pueblo Viejo in Dominican Republic, Lumwana in Zambia, |
| BARRICK FIRST QUARTER 2024 | 8 | MANAGEMENT’S DISCUSSION AND ANALYSIS |
| OVERVIEW | OPERATING PERFORMANCE
|
GROWTH PROJECTS & EXPLORATION
|
REVIEW OF FINANCIAL RESULTS
|
OTHER INFORMATION & NON-GAAP RECONCILIATIONS |
FINANCIAL STATEMENTS |
|||||
| and Porgera in Papua New Guinea, contingent upon the security situation in the country.
Safety We are committed to the safety, health and well-being of our people, their families and the communities in which we operate. Our safety vision is “Everyone to go home safe and healthy every day.” Our Management-Level Safety Committee continues to drive the implementation of the “Journey to Zero” initiative. The current priority is the roll out and training of the revised and standardized Fatal Risks and associated operating standards. We report our safety performance quarterly as part of both our E&S Committee meetings and our reports to the ESG & Nominating Committee. Our safety performance is a regular standing agenda item on our weekly Executive Committee review meeting. As disclosed as part of the Q4 2023 MD&A, regrettably, two fatal incidents occurred in early 2024 at North Mara and Kibali. As part of our Journey to Zero, we have identified four key elements in developing a culture that fosters a strong and effective focus on safety: (1) Leadership and Culture, (2) Zero Fatalities, (3) Risk Management, and (4) Prevention of Injuries. In terms of key performance indicators, for the first quarter of 2024, our LTIFR3 was 0.23, a 64% increase quarter on quarter, however a 4% decrease against the same period in 2023. Our TRIFR3 was 1.27, an 84% increase quarter on quarter, however a 22% decrease against the same period in 2023.
Social We regard our host communities and countries as important partners in our business. Our sustainability policies commit us to transparency in our relationships with host communities, government authorities, the public and other key stakeholders. Through these policies, we commit to conducting our business with integrity and with absolute opposition to corruption. We require our suppliers to operate ethically and responsibly as a condition of doing business with us.
Community and economic development Our commitment to social and economic development is set out in our overarching Sustainable Development and Social Performance policies. Mining has been identified as vital for the achievement of the United Nations SDGs, not only for its role in providing the minerals needed to enable the transition to a lower carbon intensive economy, but more importantly because of its ability to drive socio-economic development and build resilience. Creating long-term value and sharing economic benefits is at the heart of our approach to sustainability, as well as community development. This approach is encapsulated in three concepts: The primacy of partnership: this means that we invest in real partnerships with mutual responsibility. Partnerships include local communities, suppliers, government, and organizations, and this approach is epitomized through our CDCs with development initiatives and investments. Sharing the benefits: We hire and buy local wherever possible as this injects money into and keeps it in |
|
our local communities and host countries. By doing this, we build capacity, community resilience and create opportunity. We also invest in community development through our CDCs. Sharing the benefits also means paying our fair share of taxes, royalties and dividends and doing so transparently, primarily through the reporting mechanism of the Canadian Extractive Sector Transparency Measures Act. Our annual Tax Contribution Report sets out, in detail, our economic contributions to host governments with our 2023 report to be published in early May 2024. Engaging and listening to stakeholders: We develop tailored stakeholder engagement plans for every operation and the business as a whole. These plans guide and document how often we engage with various stakeholder groups and allow us to proactively deal with issues before they escalate into significant risks. Our community development spend during the first quarter was $10 million.
Environment We know the environment in which we work and our host communities are inextricably linked, and we apply a holistic and integrated approach to sustainability management. Being responsible stewards of the environment by applying the highest standards of environmental management, using natural resources and energy efficiently, recycling and reducing waste as well as working to protect biodiversity, we can deliver significant cost savings to our business, reduce future liabilities and help build stronger stakeholder relationships. Environmental matters such as how we use water, prevent incidents, manage tailings, respond to changing climate, and protect biodiversity are key areas of focus. We maintained our strong track record of stewardship and did not record any Class 14 environmental incidents in the first quarter.
Climate Change The ESG & Nominating Committee is responsible for overseeing Barrick’s policies, programs and performance relating to sustainability and the environment, including climate change. The Audit & Risk Committee assists the Board in overseeing the Group’s management of enterprise risks as well as the implementation of policies and standards for monitoring and mitigating such risks. Climate change is built into our formal risk management process, outputs of which are regularly reviewed by the Audit & Risk Committee. Barrick’s climate change strategy has three pillars: (1) identify, understand and mitigate the risks associated with climate change; (2) measure and reduce our GHG emissions across our operations and value chain; and (3) improve our disclosure on climate change. The three pillars of our climate change strategy do not focus solely on the development of emissions reduction targets, rather, we integrate and consider aspects of biodiversity protection, water management and community resilience in our approach. We are acutely aware of the impacts that climate change and extreme weather events have on our host communities and countries, particularly developing nations which are often the most vulnerable. As the world economy transitions to renewable power, it is imperative that developing nations are not left behind. As a responsible business, we have focused our efforts on building resilience |
| BARRICK FIRST QUARTER 2024 | 9 | MANAGEMENT’S DISCUSSION AND ANALYSIS |
| OVERVIEW | OPERATING PERFORMANCE
|
GROWTH PROJECTS & EXPLORATION
|
REVIEW OF FINANCIAL RESULTS
|
OTHER INFORMATION & NON-GAAP RECONCILIATIONS |
FINANCIAL STATEMENTS |
|||||
| in our host communities and countries, just as we do for our business. Our climate disclosure is based on the recommendations of the TCFD.
Identify, understand and mitigate the risks associated with climate change We identify and manage risks, build resilience to a changing climate and extreme weather events, as well as position ourselves for new opportunities. These factors continue to be incorporated into our formal risk assessment process. We have identified several risks and opportunities for our business including: physical impacts of extreme weather events; an increase in regulations that seek to address climate change; and an increase in global investment in innovation and low-carbon technologies. The risk assessment process includes scenario analysis, which is being rolled out to all sites with an initial focus on our Tier One Gold Assets5, to assess site-specific climate related risks and opportunities. The key findings and a summary of this asset-level physical and transitional risk assessment at Loulo-Gounkoto and Kibali were disclosed as part of our CDP (formerly known as the Carbon Disclosure Project) Climate Change and Water Security questionnaires, submitted to CDP in July 2023. In addition, climate scenario analysis and risk assessments were completed in 2023 for Carlin (physical risks) and NGM (transitional risks). These disclosures will be included in the 2023 Sustainability Report to be published in May 2024.
Measure and reduce the Group’s impact on climate change Mining is an energy-intensive business, and we understand the important link between energy use and GHG emissions. By measuring and effectively managing our energy use, we can reduce our GHG emissions, achieve more efficient production, and reduce our costs. We have climate champions at each site who are tasked with identifying roadmaps and assessing feasibility for our GHG emissions reductions and carbon offsets for hard-to-abate emissions. Any carbon offsets that we pursue must have appropriate socio-economic and/or biodiversity benefits. We have published an achievable emissions reduction roadmap and continue to assess further reduction opportunities across our operations. The detailed roadmap was first published in our 2021 Sustainability Report and includes committed capital projects and projects under investigation that rely on technological advances, with a progress summary contained in the 2022 Sustainability Report. We continue to progress our extensive work across our value chain in understanding our Scope 3 (indirect emissions associated with the value chain) emissions and implementing our engagement roadmap to enable our key suppliers to set meaningful and measurable reduction targets, in line with the commitments made through the ICMM Climate Position Paper. In November 2023, Barrick announced its Scope 3 emissions targets which it developed to promote awareness and action in its value chain and empower those actors to set their own net zero commitments, with short- and medium-term targets. These targets are both quantitative and qualitative and are focused on high emission areas in our value chain and are available on the Barrick website. |
|
Improve our disclosure on climate change Our disclosure on climate change, including in our Sustainability Report and on our website, is developed in line with the TCFD recommendations. Barrick continues to monitor the various regulatory climate disclosure standards being developed around the world, including the ISSB’s S2 Climate-related Disclosures standard. In addition, we complete the annual CDP Climate Change and Water Security questionnaires. This ensures our investor-relevant water use, emissions and climate data is widely available.
Emissions Barrick’s interim GHG emissions reduction target is for a minimum 30% reduction by 2030 against our 2018 baseline, while maintaining a steady production profile. The basis of this reduction is against a 2018 baseline of 7,541 kt CO2-e. Our GHG emissions reduction target is grounded in science and has a detailed pathway for achievement. Our target is not static and will be updated as we continue to identify and implement new GHG reduction opportunities. Ultimately, our vision is net zero GHG emissions by 2050, achieved primarily through GHG reductions, with some offsets for hard-to-abate emissions. Site-level plans to improve energy efficiency, integrate clean and renewable energy sources and reduce GHG emissions will also be strengthened. We plan to supplement our corporate emissions reduction targets with context-based site-specific emissions reduction targets. During the first quarter of 2024, the Group’s total Scope 1 and 2 (location-based) GHG emissions were 1,789 kt CO2-e.
Water Water is a vital and increasingly scarce global resource. Managing and using water responsibly is one of the most critical parts of our sustainability strategy. Our commitment to responsible water use is codified in our Environmental Policy and standalone Water Policy. Steady, reliable access to water is critical to the effective operation of our mines. Access to water is also a fundamental human right. Understanding the water stress in the regions in which we operate enables us to better understand the risks and manage our water resources through site-specific water balances, based on the ICMM Water Accounting Framework, aimed at minimizing our water withdrawal and maximizing water reuse and recycling within our operations. We include each mine’s water risks in its operational risk register. These risks are then aggregated and incorporated into the corporate risk register. Our identified water-related risks include: (1) managing excess water in regions with high rainfall; (2) maintaining access to water in arid areas and regions prone to water scarcity; and (3) regulatory risks related to permitting limits as well as municipal and national regulations for water use. We set an annual water recycling and reuse target of 80%. Our water recycling and reuse rate for the first quarter of 2024 was approximately 84%.
Tailings We are committed to having our TSFs meet global best practices for safety. Our TSFs are carefully engineered and regularly inspected, particularly those in regions with high rainfall and seismic events. |
| BARRICK FIRST QUARTER 2024 | 10 | MANAGEMENT’S DISCUSSION AND ANALYSIS |
| OVERVIEW | OPERATING PERFORMANCE
|
GROWTH PROJECTS & EXPLORATION
|
REVIEW OF FINANCIAL RESULTS
|
OTHER INFORMATION & NON-GAAP RECONCILIATIONS |
FINANCIAL STATEMENTS |
|||||
| We disclosed our conformance to the GISTM for all Extreme and Very High consequence facilities on the Barrick website on August 4, 2023, within the committed disclosure timeframe. All of our sites that are classified as Very High or Extreme consequence are in conformance with the GISTM. We continue to progress with our conformance for lower consequence facilities in accordance with the GISTM. Disclosures for lower consequence facilities will be completed by August 2025, also in accordance with the GISTM.
Biodiversity Biodiversity underpins many of the ecosystem services on which our mines and their surrounding communities |
|
depend. If improperly managed, mining and exploration activities have the potential to negatively affect biodiversity and ecosystem services. Protecting biodiversity and preventing nature loss is also critical and inextricably linked to the fight against climate change. We work to proactively manage our impact on biodiversity and strive to protect the ecosystems in which we operate. Wherever possible, we aim to achieve a net neutral biodiversity impact, particularly for ecologically sensitive environments. We continue to work to implement our BAPs. The BAPs outline our strategy to achieve no-net loss for all key biodiversity features and their associated management plans. |
| BARRICK FIRST QUARTER 2024 | 11 | MANAGEMENT’S DISCUSSION AND ANALYSIS |
| OVERVIEW | OPERATING PERFORMANCE
|
GROWTH PROJECTS & EXPLORATION
|
REVIEW OF FINANCIAL RESULTS
|
OTHER INFORMATION & NON-GAAP RECONCILIATIONS |
FINANCIAL STATEMENTS |
|||||
Full Year 2024 Outlook
We expect our 2024 gold production to be in the range of 3.9 to 4.3 million ounces. We expect stronger year-over-year performances from Pueblo Viejo and to a lesser extent Turquoise Ridge, together with stable delivery across the remaining Tier One Gold Assets1 with the exception of Cortez. Production at Cortez is expected to be lower in 2024 relative to 2023 due to lower oxide grades and tonnes at Crossroads partially offset by a higher contribution from Goldrush.
Across the four quarters of 2024, the Company’s gold production is expected to steadily increase throughout the year as the Pueblo Viejo plant expansion ramps up from Q2 and the Porgera mine restart continues in line with our plans. We therefore remain on track to achieve our full year gold production guidance.
Our 2024 gold cost guidance remains unchanged, including cost of sales of $1,320 to $1,420 per ounce2, total cash costs of $940 to $1,020 per ounce1 and all-in sustaining costs of $1,320 to $1,420 per ounce1. As the production increases with each quarter, we expect a corresponding reduction in our per ounce cost metrics based on the benefit of diluting the fixed costs over more ounces. These ranges were based on a gold price assumption of $1,900 per ounce and a WTI oil price assumption of $80 per barrel. We have previously disclosed a sensitivity of approximately $5 per ounce on our 2024 gold cost guidance metrics for every $100 per ounce change in the gold price. On the basis of this sensitivity, if the gold price were to average $2,100 per ounce for the 2024 year, all these cost guidance ranges would increase by $10 per ounce. Aside from this impact, we are on track to achieve our 2024 gold cost guidance metrics.
We expect 2024 copper production to be in the range of 180 to 210 thousand tonnes. Production in the second half of 2024 is expected to be materially stronger than the first half, mainly due to steadily increasing throughput at Lumwana as the new owner mining fleet is anticipated to be fully ramped up by the end of the second quarter of 2024. Likewise, our copper cost guidance metrics for 2024 remain unchanged, which are based on a copper price assumption of $3.50 per pound.
Further detail on our 2024 company guidance is provided below, inclusive of the key assumptions that were used as the basis for this guidance as released on February 14, 2024 and as qualified by the risks and uncertainties discussed above.
| Company Guidance |
2024 | |||
| ($ millions, except per ounce/pound data) |
Estimate | |||
| Gold production (millions of ounces) |
3.90 - 4.30 | |||
| Gold cost metrics |
||||
| Cost of sales - gold ($/oz) |
1,320 - 1,420 | |||
| Total cash costs ($/oz)a |
940 - 1,020 | |||
| Depreciation ($/oz) |
340 - 370 | |||
| All-in sustaining costs ($/oz)a |
1,320 - 1,420 | |||
| Copper production (thousands of tonnes)b |
180 - 210 | |||
| Copper cost metrics |
||||
| Cost of sales - copper ($/lb) |
2.65 - 2.95 | |||
| C1 cash costs ($/lb)a |
2.00 - 2.30 | |||
| Depreciation ($/lb) |
0.90 - 1.00 | |||
| All-in sustaining costs ($/lb)a |
3.10 - 3.40 | |||
| Exploration and project expenses |
400 - 440 | |||
| Exploration and evaluation |
180 - 200 | |||
| Project expenses |
220 - 240 | |||
| General and administrative expenses |
~180 | |||
| Corporate administration |
~130 | |||
| Share-based compensationc |
~50 | |||
| Other expense |
70 - 90 | |||
| Finance costs, net |
260 - 300 | |||
| Attributable capital expenditures: |
||||
| Attributable minesite sustaininga |
1,550 - 1,750 | |||
| Attributable projecta |
950 - 1,150 | |||
| Total attributable capital expenditures |
2,500 - 2,900 | |||
| Effective income tax rated |
26% - 30% | |||
| Key assumptions (used for guidance) |
||||
| Gold Price ($/oz) |
1,900 | |||
| Copper Price ($/lb) |
3.50 | |||
| Oil Price (WTI) ($/barrel) |
80 | |||
| AUD Exchange Rate (AUD:USD) |
0.75 | |||
| ARS Exchange Rate (USD:ARS) |
800 | |||
| CAD Exchange Rate (USD:CAD) |
1.30 | |||
| CLP Exchange Rate (USD:CLP) |
900 | |||
| EUR Exchange Rate (EUR:USD) |
1.10 | |||
| a. Further information on these non-GAAP financial measures, including detailed reconciliations, is included on pages 54 to 67 of this MD&A. b. Starting in 2024, we have presented our copper production and sales quantities in tonnes rather than pounds (1 tonne is equivalent to 2,204.6 pounds). Production and sales amounts for prior periods have been restated for comparative purposes. Our copper cost metrics are still reported on a per pound basis. c. Based on a one-month trailing average ending December 31, 2023 of US$17.61 per share. d. Based on key assumptions included in this table. |
| BARRICK FIRST QUARTER 2024 | 12 | MANAGEMENT’S DISCUSSION AND ANALYSIS |
| OVERVIEW | OPERATING PERFORMANCE
|
GROWTH PROJECTS & EXPLORATION
|
REVIEW OF FINANCIAL RESULTS
|
OTHER INFORMATION & NON-GAAP RECONCILIATIONS |
FINANCIAL STATEMENTS |
|||||
Operating Division Guidance
Our 2024 forecast gold and copper production, cost of salesa, total cash costsb, all-in sustaining costsb, and C1 cash costsb ranges by operating division are as follows:
| Operating Division
|
2024 forecast attributable production (000s ozs) |
2024 forecast cost of salesa ($/oz) |
2024 forecast total cash costsb ($/oz) |
2024 forecast all-in sustaining costsb ($/oz) |
||||||||||||
| Gold | ||||||||||||||||
| Carlin (61.5%) |
800 - 880 | 1,270 - 1,370 | 1,030 - 1,110 | 1,430 - 1,530 | ||||||||||||
| Cortez (61.5%)c |
380 - 420 | 1,460 - 1,560 | 1,040 - 1,120 | 1,390 - 1,490 | ||||||||||||
| Turquoise Ridge (61.5%) |
330 - 360 | 1,230 - 1,330 | 850 - 930 | 1,090 - 1,190 | ||||||||||||
| Phoenix (61.5%) |
120 - 140 | 1,640 - 1,740 | 810 - 890 | 1,100 - 1,200 | ||||||||||||
| Nevada Gold Mines (61.5%) |
1,650 - 1,800 | 1,340 - 1,440 | 980 - 1,060 | 1,350 - 1,450 | ||||||||||||
| Hemlo |
140 - 160 | 1,470 - 1,570 | 1,210 - 1,290 | 1,600 - 1,700 | ||||||||||||
| North America |
1,750 - 1,950 | 1,350 - 1,450 | 1,000 - 1,080 | 1,370 - 1,470 | ||||||||||||
| Pueblo Viejo (60%) |
420 - 490 | 1,340 - 1,440 | 830 - 910 | 1,100 - 1,200 | ||||||||||||
| Veladero (50%) |
210 - 240 | 1,340 - 1,440 | 1,010 - 1,090 | 1,490 - 1,590 | ||||||||||||
| Porgera (24.5%)d |
50 - 70 | 1,670 - 1,770 | 1,220 - 1,300 | 1,900 - 2,000 | ||||||||||||
| Latin America & Asia Pacific |
700 - 800 | 1,370 - 1,470 | 920 - 1,000 | 1,290 - 1,390 | ||||||||||||
| Loulo-Gounkoto (80%) |
510 - 560 | 1,190 - 1,290 | 780 - 860 | 1,150 - 1,250 | ||||||||||||
| Kibali (45%) |
320 - 360 | 1,140 - 1,240 | 740 - 820 | 950 - 1,050 | ||||||||||||
| North Mara (84%) |
230 - 260 | 1,250 - 1,350 | 970 - 1,050 | 1,270 - 1,370 | ||||||||||||
| Bulyanhulu (84%) |
160 - 190 | 1,370 - 1,470 | 990 - 1,070 | 1,380 - 1,480 | ||||||||||||
| Tongon (89.7%) |
160 - 190 | 1,520 - 1,620 | 1,200 - 1,280 | 1,440 - 1,540 | ||||||||||||
| Africa & Middle East |
1,400 - 1,550 | 1,250 - 1,350 | 880 - 960 | 1,180 - 1,280 | ||||||||||||
| Total Attributable to Barricke,f,g | 3,900 - 4,300 | 1,320 - 1,420 | 940 - 1,020 | 1,320 - 1,420 | ||||||||||||
| 2024 forecast attributable production (000s tonnes)h |
2024 forecast cost of salesa ($/lb) |
2024 forecast C1 cash costsb ($/lb) |
2024 forecast all-in sustaining costsb ($/lb) |
|||||||||||||
| Copper | ||||||||||||||||
| Lumwana |
120 - 140 | 2.50 - 2.80 | 1.85 - 2.15 | 3.30 - 3.60 | ||||||||||||
| Zaldívar (50%) |
35 - 40 | 3.70 - 4.00 | 2.80 - 3.10 | 3.40 - 3.70 | ||||||||||||
| Jabal Sayid (50%) |
25 - 30 | 1.75 - 2.05 | 1.40 - 1.70 | 1.70 - 2.00 | ||||||||||||
| Total Copperg | 180 - 210 | 2.65 - 2.95 | 2.00 - 2.30 | 3.10 - 3.40 | ||||||||||||
| a. | Gold cost of sales per ounce is calculated as cost of sales across our gold operations (excluding sites in closure or care and maintenance) divided by ounces sold (both on an attributable basis using Barrick’s ownership share). Copper cost of sales per pound is calculated as cost of sales across our copper operations divided by pounds sold (both on an attributable basis using Barrick’s ownership share). |
| b. | Further information on these non-GAAP financial measures, including detailed reconciliations, is included on pages 54 to 67 of this MD&A. |
| c. | Includes Goldrush. |
| d. | Porgera was placed on care and maintenance from April 25, 2020 until December 22, 2023. On December 22, 2023, the Porgera Project Commencement Agreement was completed and recommissioning of the mine commenced. As a result, Porgera is included in our 2024 guidance at 24.5%. |
| e. | Total cash costs and all-in sustaining costs per ounce include costs allocated to non-operating sites. |
| f. | Operating division guidance ranges reflect expectations at each individual operating division and may not add up to the company-wide guidance range total. |
| g. | Includes corporate administration costs. |
| h. | Starting in 2024, we have presented our copper production and sales quantities in tonnes rather than pounds (1 tonne is equivalent to 2,204.6 pounds). Production and sales amounts for prior periods have been restated for comparative purposes. Our copper cost metrics are still reported on a per pound basis. |
| BARRICK FIRST QUARTER 2024 | 13 | MANAGEMENT’S DISCUSSION AND ANALYSIS |
| OVERVIEW | OPERATING PERFORMANCE
|
GROWTH PROJECTS & EXPLORATION
|
REVIEW OF FINANCIAL RESULTS
|
OTHER INFORMATION & NON-GAAP RECONCILIATIONS |
FINANCIAL STATEMENTS |
|||||
Production and Cost Summary - Gold
| For the three months ended
|
||||||||||||||||
| 3/31/24 | 12/31/23 | % Change | 3/31/23 | % Change | ||||||||||||
| Nevada Gold Mines LLC (61.5%)a | ||||||||||||||||
| Gold produced (000s oz) |
420 | 513 | (18)% | 416 | 1 % | |||||||||||
| Cost of sales ($/oz) |
1,431 | 1,331 | 8 % | 1,461 | (2)% | |||||||||||
| Total cash costs ($/oz)b |
1,081 | 968 | 12 % | 1,074 | 1 % | |||||||||||
| All-in sustaining costs ($/oz)b |
1,536 | 1,366 | 12 % | 1,436 | 7 % | |||||||||||
| Carlin (61.5%) |
||||||||||||||||
| Gold produced (000s oz) |
205 | 224 | (8)% | 166 | 23 % | |||||||||||
| Cost of sales ($/oz) |
1,371 | 1,219 | 12 % | 1,449 | (5)% | |||||||||||
| Total cash costs ($/oz)b |
1,127 | 1,006 | 12 % | 1,215 | (7)% | |||||||||||
| All-in sustaining costs ($/oz)b |
1,687 | 1,506 | 12 % | 1,689 | 0 % | |||||||||||
| Cortez (61.5%)c |
||||||||||||||||
| Gold produced (000s oz) |
119 | 162 | (27)% | 140 | (15)% | |||||||||||
| Cost of sales ($/oz) |
1,329 | 1,353 | (2)% | 1,324 | 0 % | |||||||||||
| Total cash costs ($/oz)b |
946 | 909 | 4 % | 913 | 4 % | |||||||||||
| All-in sustaining costs ($/oz)b |
1,341 | 1,309 | 2 % | 1,233 | 9 % | |||||||||||
| Turquoise Ridge (61.5%) |
||||||||||||||||
| Gold produced (000s oz) |
62 | 84 | (26)% | 81 | (23)% | |||||||||||
| Cost of sales ($/oz) |
1,733 | 1,419 | 22 % | 1,412 | 23 % | |||||||||||
| Total cash costs ($/oz)b |
1,359 | 1,046 | 30 % | 1,034 | 31 % | |||||||||||
| All-in sustaining costs ($/oz)b |
1,655 | 1,257 | 32 % | 1,271 | 30 % | |||||||||||
| Phoenix (61.5%) |
||||||||||||||||
| Gold produced (000s oz) |
34 | 41 | (17)% | 27 | 26 % | |||||||||||
| Cost of sales ($/oz) |
1,595 | 1,576 | 1 % | 2,380 | (33)% | |||||||||||
| Total cash costs ($/oz)b |
767 | 787 | (3)% | 1,198 | (36)% | |||||||||||
| All-in sustaining costs ($/oz)b |
944 | 981 | (4)% | 1,365 | (31)% | |||||||||||
| Long Canyon (61.5%)d |
||||||||||||||||
| Gold produced (000s oz) |
— | 2 | (100)% | 2 | (100)% | |||||||||||
| Cost of sales ($/oz) |
— | 2,193 | (100)% | 1,621 | (100)% | |||||||||||
| Total cash costs ($/oz)b |
— | 990 | (100)% | 579 | (100)% | |||||||||||
| All-in sustaining costs ($/oz)b |
— | 1,074 | (100)% | 629 | (100)% | |||||||||||
| Pueblo Viejo (60%) | ||||||||||||||||
| Gold produced (000s oz) |
81 | 90 | (10)% | 89 | (9)% | |||||||||||
| Cost of sales ($/oz) |
1,527 | 1,588 | (4)% | 1,241 | 23 % | |||||||||||
| Total cash costs ($/oz)b |
1,013 | 1,070 | (5)% | 714 | 42 % | |||||||||||
| All-in sustaining costs ($/oz)b |
1,334 | 1,428 | (7)% | 1,073 | 24 % | |||||||||||
| Loulo-Gounkoto (80%) | ||||||||||||||||
| Gold produced (000s oz) |
141 | 127 | 11 % | 137 | 3 % | |||||||||||
| Cost of sales ($/oz) |
1,177 | 1,296 | (9)% | 1,275 | (8)% | |||||||||||
| Total cash costs ($/oz)b |
794 | 924 | (14)% | 855 | (7)% | |||||||||||
| All-in sustaining costs ($/oz)b |
1,092 | 1,168 | (7)% | 1,190 | (8)% | |||||||||||
| Kibali (45%) | ||||||||||||||||
| Gold produced (000s oz) |
76 | 93 | (18)% | 64 | 19 % | |||||||||||
| Cost of sales ($/oz) |
1,200 | 1,141 | 5 % | 1,367 | (12)% | |||||||||||
| Total cash costs ($/oz)b |
802 | 737 | 9 % | 987 | (19)% | |||||||||||
| All-in sustaining costs ($/oz)b |
1,048 | 819 | 28 % | 1,177 | (11)% | |||||||||||
| Veladero (50%) | ||||||||||||||||
| Gold produced (000s oz) |
57 | 55 | 4 % | 43 | 33 % | |||||||||||
| Cost of sales ($/oz) |
1,322 | 1,378 | (4)% | 1,587 | (17)% | |||||||||||
| Total cash costs ($/oz)b |
961 | 1,021 | (6)% | 1,035 | (7)% | |||||||||||
| All-in sustaining costs ($/oz)b |
1,664 | 1,403 | 19 % | 1,761 | (6)% | |||||||||||
| Porgera (24.5%)e | ||||||||||||||||
| Gold produced (000s oz) |
4 | — | — % | — | — % | |||||||||||
| Cost of sales ($/oz) |
— | — | — % | — | — % | |||||||||||
| Total cash costs ($/oz)b |
— | — | — % | — | — % | |||||||||||
| All-in sustaining costs ($/oz)b |
— | — | — % | — | — % | |||||||||||
| BARRICK FIRST QUARTER 2024 | 14 | MANAGEMENT’S DISCUSSION AND ANALYSIS |
| OVERVIEW | OPERATING PERFORMANCE
|
GROWTH PROJECTS & EXPLORATION
|
REVIEW OF FINANCIAL RESULTS
|
OTHER INFORMATION & NON-GAAP RECONCILIATIONS |
FINANCIAL STATEMENTS |
|||||
Production and Cost Summary - Gold (continued)
| For the three months ended
|
||||||||||||||||
| 3/31/24 | 12/31/23 | % Change | 3/31/23 | % Change | ||||||||||||
| Tongon (89.7%) | ||||||||||||||||
| Gold produced (000s oz) |
36 | 42 | (14)% | 50 | (28)% | |||||||||||
| Cost of sales ($/oz) |
1,887 | 1,489 | 27 % | 1,453 | 30 % | |||||||||||
| Total cash costs ($/oz)b |
1,630 | 1,184 | 38 % | 1,182 | 38 % | |||||||||||
| All-in sustaining costs ($/oz)b |
1,773 | 1,586 | 12 % | 1,284 | 38 % | |||||||||||
| Hemlo | ||||||||||||||||
| Gold produced (000s oz) |
37 | 34 | 9 % | 41 | (10)% | |||||||||||
| Cost of sales ($/oz) |
1,715 | 1,618 | 6 % | 1,486 | 15 % | |||||||||||
| Total cash costs ($/oz)b |
1,476 | 1,407 | 5 % | 1,291 | 14 % | |||||||||||
| All-in sustaining costs ($/oz)b |
1,754 | 1,671 | 5 % | 1,609 | 9 % | |||||||||||
| North Mara (84%) | ||||||||||||||||
| Gold produced (000s oz) |
46 | 59 | (22)% | 68 | (32)% | |||||||||||
| Cost of sales ($/oz) |
1,678 | 1,420 | 18 % | 987 | 70 % | |||||||||||
| Total cash costs ($/oz)b |
1,339 | 1,103 | 21 % | 759 | 76 % | |||||||||||
| All-in sustaining costs ($/oz)b |
1,753 | 1,449 | 21 % | 1,137 | 54 % | |||||||||||
| Bulyanhulu (84%) | ||||||||||||||||
| Gold produced (000s oz) |
42 | 41 | 2 % | 44 | (5)% | |||||||||||
| Cost of sales ($/oz) |
1,479 | 1,413 | 5 % | 1,358 | 9 % | |||||||||||
| Total cash costs ($/oz)b |
1,044 | 1,002 | 4 % | 982 | 6 % | |||||||||||
| All-in sustaining costs ($/oz)b |
1,485 | 1,376 | 8 % | 1,332 | 11 % | |||||||||||
| Total Attributable to Barrickf | ||||||||||||||||
| Gold produced (000s oz) |
940 | 1,054 | (11)% | 952 | (1)% | |||||||||||
| Cost of sales ($/oz)g |
1,425 | 1,359 | 5 % | 1,378 | 3 % | |||||||||||
| Total cash costs ($/oz)b |
1,051 | 982 | 7 % | 986 | 7 % | |||||||||||
| All-in sustaining costs ($/oz)b |
1,474 | 1,364 | 8 % | 1,370 | 8 % | |||||||||||
| a. | These results represent our 61.5% interest in Carlin, Cortez, Turquoise Ridge, Phoenix and Long Canyon until it transitioned to care and maintenance at the end of 2023, as previously reported. |
| b. | Further information on these non-GAAP financial measures, including detailed reconciliations, is included on pages 54 to 67 of this MD&A. |
| c. | Includes Goldrush. |
| d. | Starting in the first quarter of 2024, we have ceased to include production or non-GAAP cost metrics for Long Canyon as it was placed on care and maintenance at the end of 2023, as previously reported. |
| e. | As Porgera was placed on care and maintenance from April 25, 2020 until December 22, 2023, no operating data or per ounce data has been provided from the third quarter of 2020 to the fourth quarter of 2023. On December 22, 2023, we completed the Commencement Agreement, pursuant to which the PNG government and BNL, the 95% owner and operator of the Porgera joint venture, agreed on a partnership for the future ownership and operation of the mine. Ownership of Porgera is now held in a new joint venture owned 51% by PNG stakeholders and 49% by a Barrick affiliate, PJL. PJL is jointly owned on a 50/50 basis by Barrick and Zijin Mining Group and therefore Barrick now holds a 24.5% ownership interest in the Porgera joint venture. Barrick holds a 23.5% interest in the economic benefits of the mine under the economic benefit sharing arrangement agreed with the PNG government whereby Barrick and Zijin Mining Group together share 47% of the overall economic benefits derived from the mine accumulated over time, and the PNG stakeholders share the remaining 53%. In the first quarter of 2024, Porgera had gold production but did not have any gold sales. |
| f. | Excludes Pierina, which was producing incidental ounces until December 31, 2023 while in closure. It also excludes Long Canyon which is producing residual ounces from the leach pad while in care and maintenance. |
| g. | Gold cost of sales per ounce is calculated as cost of sales across our gold operations (excluding sites in closure or care and maintenance) divided by ounces sold (both on an attributable basis using Barrick’s ownership share). |
| BARRICK FIRST QUARTER 2024 | 15 | MANAGEMENT’S DISCUSSION AND ANALYSIS |
| OVERVIEW | OPERATING PERFORMANCE
|
GROWTH PROJECTS & EXPLORATION
|
REVIEW OF FINANCIAL RESULTS
|
OTHER INFORMATION & NON-GAAP RECONCILIATIONS |
FINANCIAL STATEMENTS |
|||||
Production and Cost Summary - Copper
| For the three months ended
|
||||||||||||||||
| 3/31/24 | 12/31/23 | % Change | 3/31/23 | % Change | ||||||||||||
| Lumwana | ||||||||||||||||
| Copper production (thousands of tonnes)a |
22 | 33 | (33)% | 22 | 0 % | |||||||||||
| Cost of sales ($/lb) |
3.41 | 2.95 | 16 % | 3.56 | (4)% | |||||||||||
| C1 cash costs ($/lb)b |
2.52 | 2.14 | 18 % | 3.09 | (18)% | |||||||||||
| All-in sustaining costs ($/lb)b |
4.33 | 3.38 | 28 % | 3.98 | 9 % | |||||||||||
| Zaldívar (50%) | ||||||||||||||||
| Copper production (thousands of tonnes)a |
9 | 10 | (10)% | 10 | (10)% | |||||||||||
| Cost of sales ($/lb) |
3.97 | 3.85 | 3 % | 3.73 | 6 % | |||||||||||
| C1 cash costs ($/lb)b |
2.95 | 2.93 | 1 % | 2.86 | 3 % | |||||||||||
| All-in sustaining costs ($/lb)b |
3.27 | 3.51 | (7)% | 3.22 | 2 % | |||||||||||
| Jabal Sayid (50%) | ||||||||||||||||
| Copper production (thousands of tonnes)a |
9 | 8 | 13 % | 8 | 13 % | |||||||||||
| Cost of sales ($/lb) |
1.61 | 1.59 | 1 % | 1.53 | 5 % | |||||||||||
| C1 cash costs ($/lb)b |
1.35 | 1.32 | 2 % | 1.39 | (3)% | |||||||||||
| All-in sustaining costs ($/lb)b |
1.55 | 1.50 | 3 % | 1.61 | (4)% | |||||||||||
| Total Copper | ||||||||||||||||
| Copper production (thousands of tonnes)a |
40 | 51 | (22)% | 40 | 0 % | |||||||||||
| Cost of sales ($/lb)c |
3.20 | 2.92 | 10 % | 3.22 | (1)% | |||||||||||
| C1 cash costs ($/lb)b |
2.40 | 2.17 | 11 % | 2.71 | (11)% | |||||||||||
| All-in sustaining costs ($/lb)b |
3.59 | 3.12 | 15 % | 3.40 | 6 % | |||||||||||
| a. | Starting in 2024, we have presented our copper production and sales quantities in tonnes rather than pounds (1 tonne is equivalent to 2,204.6 pounds). Production and sales amounts for prior periods have been restated for comparative purposes. Our copper cost metrics are still reported on a per pound basis. |
| b. | Further information on these non-GAAP financial measures, including detailed reconciliations, is included on pages 54 to 67 of this MD&A. |
| c. | Copper cost of sales per pound is calculated as cost of sales across our copper operations divided by pounds sold (both on an attributable basis using Barrick’s ownership share). |
Operating Performance
| Our presentation of reportable operating segments consists of eight gold mines (Carlin, Cortez, Turquoise Ridge, Pueblo Viejo, Loulo-Gounkoto, Kibali, North Mara and Bulyanhulu) and one copper mine (Lumwana). The remaining operating segments, including our remaining gold and copper mines, have been grouped into an “Other |
|
Mines” category and will not be reported on individually. Segment performance is evaluated based on a number of measures including operating income before tax, production levels and unit production costs. Certain costs are managed on a consolidated basis and are therefore not reflected in segment income. |
| BARRICK FIRST QUARTER 2024 | 16 | MANAGEMENT’S DISCUSSION AND ANALYSIS |
| OVERVIEW | OPERATING PERFORMANCE
|
GROWTH PROJECTS & EXPLORATION
|
REVIEW OF FINANCIAL RESULTS
|
OTHER INFORMATION & NON-GAAP RECONCILIATIONS |
FINANCIAL STATEMENTS |
|||||
Nevada Gold Mines (61.5%)a, Nevada, USA
Summary of Operating and Financial Data
| For the three months ended
|
||||||||||||||||
| 3/31/24 | 12/31/23 | % Change | 3/31/23 | % Change | ||||||||||||
| Total tonnes mined (000s) |
39,682 | 42,801 | (7)% | 36,501 | 9 % | |||||||||||
| Open pit ore |
5,196 | 7,430 | (30)% | 5,682 | (9)% | |||||||||||
| Open pit waste |
33,008 | 33,839 | (2)% | 29,572 | 12 % | |||||||||||
| Underground |
1,478 | 1,532 | (4)% | 1,247 | 19 % | |||||||||||
| Average grade (grams/tonne) |
||||||||||||||||
| Open pit mined |
0.93 | 0.98 | (5)% | 1.16 | (20)% | |||||||||||
| Underground mined |
8.28 | 9.24 | (10)% | 8.57 | (3)% | |||||||||||
| Processed |
2.51 | 2.08 | 21 % | 2.37 | 6 % | |||||||||||
| Ore tonnes processed (000s) |
6,779 | 9,155 | (26)% | 7,367 | (8)% | |||||||||||
| Oxide mill |
2,113 | 2,215 | (5)% | 2,725 | (22)% | |||||||||||
| Roaster |
1,394 | 1,425 | (2)% | 1,005 | 39 % | |||||||||||
| Autoclave |
1,067 | 1,153 | (7)% | 716 | 49 % | |||||||||||
| Heap leach |
2,205 | 4,362 | (49)% | 2,921 | (25)% | |||||||||||
| Recovery rateb |
82 % | 83 % | (1)% | 82 % | 0 % | |||||||||||
| Oxide Millb |
79 % | 82 % | (4)% | 76 % | 4 % | |||||||||||
| Roaster |
85 % | 85 % | 0 % | 85 % | 0 % | |||||||||||
| Autoclave |
81 % | 81 % | 0 % | 81 % | 0 % | |||||||||||
| Gold produced (000s oz) |
420 | 513 | (18)% | 416 | 1 % | |||||||||||
| Oxide mill |
85 | 126 | (33)% | 103 | (17)% | |||||||||||
| Roaster |
208 | 234 | (11)% | 182 | 14 % | |||||||||||
| Autoclave |
88 | 108 | (19)% | 82 | 7 % | |||||||||||
| Heap leach |
39 | 45 | (13)% | 49 | (20)% | |||||||||||
| Gold sold (000s oz) |
424 | 511 | (17)% | 411 | 3 % | |||||||||||
| Revenue ($ millions) |
917 | 1,047 | (12)% | 807 | 14 % | |||||||||||
| Cost of sales ($ millions) |
612 | 684 | (11)% | 606 | 1 % | |||||||||||
| Income ($ millions) |
296 | 355 | (17)% | 189 | 57 % | |||||||||||
| EBITDA ($ millions)c |
428 | 522 | (18)% | 329 | 30 % | |||||||||||
| EBITDA margind |
47 % | 50 % | (6)% | 41 % | 15 % | |||||||||||
| Capital expenditures ($ millions)e,f |
220 | 274 | (20)% | 169 | 30 % | |||||||||||
| Minesite sustainingc,e |
184 | 193 | (5)% | 137 | 34 % | |||||||||||
| Projectc,e |
34 | 77 | (56)% | 32 | 6 % | |||||||||||
| Cost of sales ($/oz) |
1,431 | 1,331 | 8 % | 1,461 | (2)% | |||||||||||
| Total cash costs ($/oz)c |
1,081 | 968 | 12 % | 1,074 | 1 % | |||||||||||
| All-in sustaining costs ($/oz)c |
1,536 | 1,366 | 12 % | 1,436 | 7 % | |||||||||||
| All-in costs ($/oz)c |
1,621 | 1,518 | 7 % | 1,514 | 7 % | |||||||||||
| a. | Barrick is the operator of NGM and owns 61.5%, with Newmont Corporation owning the remaining 38.5%. NGM is accounted for as a subsidiary with a 38.5% non-controlling interest. These results represent our 61.5% interest in Carlin, Cortez, Turquoise Ridge, Phoenix and Long Canyon until it transitioned to care and maintenance at the end of 2023, as previously reported. |
| b. | Excludes the Gold Quarry (Mill 5) concentrator. |
| c. | Further information on these non-GAAP financial measures, including detailed reconciliations, is included on pages 54 to 67 of this MD&A. |
| d. | Represents EBITDA divided by revenue. |
| e. | These amounts are presented on a cash basis. |
| f. | Includes capitalized interest. |
NGM includes Carlin, Cortez, Turquoise Ridge, Phoenix and non-mine site related activity such as the TS Solar Project. Barrick is the operator of the joint venture and owns 61.5%, with Newmont owning the remaining 38.5%. Refer to the following pages for a detailed discussion of each minesite’s results.
| BARRICK FIRST QUARTER 2024 | 17 | MANAGEMENT’S DISCUSSION AND ANALYSIS |
| OVERVIEW | OPERATING PERFORMANCE
|
GROWTH PROJECTS & EXPLORATION
|
REVIEW OF FINANCIAL RESULTS
|
OTHER INFORMATION & NON-GAAP RECONCILIATIONS |
FINANCIAL STATEMENTS |
|||||
Carlin (61.5%), Nevada, USA
Summary of Operating and Financial Data
| For the three months ended
|
||||||||||||||||
| 3/31/24 | 12/31/23 | % Change | 3/31/23 | % Change | ||||||||||||
| Total tonnes mined (000s) |
14,028 | 18,338 | (24)% | 14,357 | (2)% | |||||||||||
| Open pit ore |
590 | 739 | (20)% | 1,087 | (46)% | |||||||||||
| Open pit waste |
12,592 | 16,721 | (25)% | 12,554 | 0 % | |||||||||||
| Underground |
846 | 878 | (4)% | 716 | 18 % | |||||||||||
| Average grade (grams/tonne) |
||||||||||||||||
| Open pit mined |
1.94 | 2.05 | (5)% | 2.47 | (21)% | |||||||||||
| Underground mined |
7.51 | 8.32 | (10)% | 7.73 | (3)% | |||||||||||
| Processed |
4.03 | 4.60 | (12)% | 4.12 | (2)% | |||||||||||
| Ore tonnes processed (000s) |
1,869 | 1,840 | 2 % | 1,637 | 14 % | |||||||||||
| Oxide mill |
0 | 0 | 0 % | 377 | (100)% | |||||||||||
| Roasters |
1,220 | 1,232 | (1)% | 852 | 43 % | |||||||||||
| Autoclave |
649 | 564 | 15 % | 88 | 638 % | |||||||||||
| Heap leach |
0 | 44 | (100)% | 320 | (100) % | |||||||||||
| Recovery ratea |
81 % | 81 % | 0 % | 84 % | (4)% | |||||||||||
| Roasters |
83 % | 84 % | (1)% | 85 % | (2)% | |||||||||||
| Autoclave |
72 % | 67 % | 7 % | 72 % | 0 % | |||||||||||
| Gold produced (000s oz) |
205 | 224 | (8)% | 166 | 23 % | |||||||||||
| Oxide mill |
0 | 0 | 0 % | 4 | (100)% | |||||||||||
| Roasters |
169 | 187 | (10)% | 151 | 12 % | |||||||||||
| Autoclave |
30 | 29 | 3 % | 5 | 500 % | |||||||||||
| Heap leach |
6 | 8 | (25)% | 6 | 0 % | |||||||||||
| Gold sold (000s oz) |
207 | 220 | (6)% | 164 | 26 % | |||||||||||
| Revenue ($ millions) |
438 | 443 | (1)% | 314 | 39 % | |||||||||||
| Cost of sales ($ millions) |
288 | 272 | 6 % | 242 | 19 % | |||||||||||
| Income ($ millions) |
147 | 168 | (13)% | 66 | 123 % | |||||||||||
| EBITDA ($ millions)b |
198 | 215 | (8)% | 105 | 89 % | |||||||||||
| EBITDA marginc |
45 % | 49 % | (8)% | 33 % | 36 % | |||||||||||
| Capital expenditures ($ millions)d |
120 | 110 | 9 % | 72 | 67 % | |||||||||||
| Minesite sustainingb,d |
113 | 108 | 5 % | 72 | 57 % | |||||||||||
| Projectb,d |
7 | 2 | 250 % | 0 | 100 % | |||||||||||
| Cost of sales ($/oz) |
1,371 | 1,219 | 12 % | 1,449 | (5)% | |||||||||||
| Total cash costs ($/oz)b |
1,127 | 1,006 | 12 % | 1,215 | (7)% | |||||||||||
| All-in sustaining costs ($/oz)b |
1,687 | 1,506 | 12 % | 1,689 | 0 % | |||||||||||
| All-in costs ($/oz)b |
1,722 | 1,513 | 14 % | 1,689 | 2 % | |||||||||||
| a. | Excludes the Gold Quarry (Mill 5) concentrator. |
| b. | Further information on these non-GAAP financial measures, including detailed reconciliations, is included on pages 54 to 67 of this MD&A. |
| c. | Represents EBITDA divided by revenue. |
| d. | These amounts are presented on a cash basis. |
| Safety and Environment | ||||||||
| For the three months ended | ||||||||
| 3/31/24 | 12/31/23 | |||||||
| LTI |
3 | 0 | ||||||
| LTIFR3 |
1.30 | 0.00 | ||||||
| TRIFR3 |
5.18 | 2.09 | ||||||
| Class 14 environmental incidents |
0 | 0 | ||||||
Financial Results
Q1 2024 compared to Q4 2023
Carlin’s income for the first quarter of 2024 was 13% lower than the prior quarter primarily due to a higher cost of sales per ounce2 and lower sales volumes, partially offset by a higher realized gold price1.
Gold production in the first quarter of 2024 was 8% lower compared to the prior quarter primarily due to lower average grades processed at the roasters. This was mainly driven by a change in mix with more open pit ore tonnes and less underground tonnes processed compared to the prior quarter both driven by mine sequencing. This was partially offset by higher production at the Goldstrike autoclave on the back of improved flexibility which resulted in increased throughput. Notwithstanding the lower first
| BARRICK FIRST QUARTER 2024 | 18 | MANAGEMENT’S DISCUSSION AND ANALYSIS |
| OVERVIEW | OPERATING PERFORMANCE
|
GROWTH PROJECTS & EXPLORATION
|
REVIEW OF FINANCIAL RESULTS
|
OTHER INFORMATION & NON-GAAP RECONCILIATIONS |
FINANCIAL STATEMENTS |
|||||
| quarter production, Carlin delivered on plan and is on track to deliver on its planned 2024 production. Total tonnes mined were 24% lower compared to the prior quarter, primarily driven by open pit sequencing per the mine plan, combined with geotechnical constraints at the Gold Quarry open pit. Open pit waste tonnes mined decreased at both the Gold Quarry pit and the next phase of South Arturo. Open pit ore tonnes and grade mined were 20% and 5% lower, respectively, compared to the prior quarter, driven by a decrease in ore tonnes and grades at both Gold Quarry and South Arturo. At Gold Quarry, mining was slower than planned due to geotechnical constraints and working through historic underground workings. This was combined with lower tonnes mined at the Goldstar open pit as mining of phase 4 was substantially completed early in the third quarter of 2023, with only small ramp retreats occurring in the current quarter. Underground tonnes mined were 4% lower than the prior quarter, due to mine sequencing, while the average grade mined was slightly lower than the prior quarter. Cost of sales per ounce2 and total cash costs per ounce1 in the first quarter of 2024 were both 12% higher than the prior quarter, which reflected the 12% lower average grade processed. Given that cost per tonne processed was consistent with the prior quarter, this is unrelated to inflationary impacts. In the first quarter of 2024, all-in sustaining costs per ounce1 were 12% higher than the prior quarter, owing to higher total cash costs per ounce1, combined with higher minesite sustaining capital expenditures1. Capital expenditures in the first quarter of 2024 increased by 9% compared to prior quarter, primarily due to the purchase of Komatsu 930-E haul trucks. Project capital increased from the prior quarter as the Ren project moves forward with dewatering and detailed engineering.
Q1 2024 compared to Q1 2023 Carlin’s income for the three month period ended March 31, 2024 was 123% higher than the same prior year period due to higher sales volumes, a higher realized gold price1 and a lower cost of sales per ounce2. |
|
Gold production for the three month period ended March 31, 2024 was 23% higher compared to the same prior period, primarily due to the autoclave RIL to CIL conversion that took place in the first quarter of 2023, combined with the planned maintenance shutdown that occurred in the same prior year period. Total tonnes mined were 2% lower than the same prior year period, with lower tonnes mined at Goldstar as mining of phase 4 was substantially completed at the beginning of the third quarter of 2023. This was partially offset by waste stripping ramping up at the next phase of South Arturo, whereas there was no mining at South Arturo in the same prior year period. Average open pit mined grade decreased by 21% compared to the same prior year period, primarily due to mine sequencing and geotechnical constraints and working through historic underground workings at the Gold Quarry open pit. Underground tonnes mined were 18% higher while underground grade mined was slightly lower than the same prior year period, driven by a change in the mix of ore sources across the different underground operations, as per the mine plan. Cost of sales per ounce2 and total cash costs per ounce1 for the three month period ended March 31, 2024 were 5% and 7% lower, respectively, than the same prior year period, primarily due to the higher maintenance activity in the same prior year period which also impacted volumes. For the three month period ended March 31, 2024, all-in sustaining costs per ounce1 was in line with the same prior year period, mainly as lower total cash costs per ounce1 were offset with higher minesite sustaining capital expenditures1. Capital expenditures in the first quarter of 2024 were 67% higher compared with the same prior year period, mainly due to both higher minesite sustaining and project capital expenditures1. The increase in minesite sustaining capital expenditures1 is due to higher capitalized waste stripping and underground development as per the mine plan, combined with the purchase of Komatsu 930-E haul trucks. Project capital expenditures1 during the current quarter relates to dewatering and detailed engineering associated with the Ren project. |
| BARRICK FIRST QUARTER 2024 | 19 | MANAGEMENT’S DISCUSSION AND ANALYSIS |
| OVERVIEW | OPERATING PERFORMANCE
|
GROWTH PROJECTS & EXPLORATION
|
REVIEW OF FINANCIAL RESULTS
|
OTHER INFORMATION & NON-GAAP RECONCILIATIONS |
FINANCIAL STATEMENTS |
|||||
Cortez (61.5%)a, Nevada, USA
Summary of Operating and Financial Data
| For the three months ended | ||||||||||||||||
| 3/31/24 | 12/31/23 | % Change | 3/31/23 | % Change | ||||||||||||
| Total tonnes mined (000s) |
18,758 | 18,488 | 1 % | 15,326 | 22 % | |||||||||||
| Open pit ore |
1,823 | 3,547 | (49)% | 2,172 | (16)% | |||||||||||
| Open pit waste |
16,516 | 14,533 | 14 % | 12,856 | 28 % | |||||||||||
| Underground |
419 | 408 | 3 % | 298 | 41 % | |||||||||||
| Average grade (grams/tonne) |
||||||||||||||||
| Open pit mined |
0.77 | 0.77 | 0 % | 0.82 | (6)% | |||||||||||
| Underground mined |
8.75 | 9.85 | (11)% | 9.34 | (6)% | |||||||||||
| Processed |
1.84 | 1.54 | 19 % | 1.77 | 4 % | |||||||||||
| Ore tonnes processed (000s) |
2,022 | 3,965 | (49)% | 2,537 | (20)% | |||||||||||
| Oxide mill |
601 | 683 | (12)% | 564 | 7 % | |||||||||||
| Roasters |
174 | 193 | (10)% | 153 | 14 % | |||||||||||
| Heap leach |
1,247 | 3,089 | (60)% | 1,820 | (31)% | |||||||||||
| Recovery rate |
83 % | 84 % | (1)% | 83 % | 0 % | |||||||||||
| Oxide Mill |
79 % | 80 % | (1)% | 82 % | (4)% | |||||||||||
| Roasters |
90 % | 90 % | 0 % | 87 % | 3 % | |||||||||||
| Gold produced (000s oz) |
119 | 162 | (27)% | 140 | (15)% | |||||||||||
| Oxide Mill |
49 | 82 | (40)% | 69 | (29)% | |||||||||||
| Roasters |
38 | 46 | (17)% | 31 | 23 % | |||||||||||
| Heap leach |
32 | 34 | (6)% | 40 | (20)% | |||||||||||
| Gold sold (000s oz) |
121 | 164 | (26)% | 137 | (12)% | |||||||||||
| Revenue ($ millions) |
254 | 327 | (22)% | 262 | (3)% | |||||||||||
| Cost of sales ($ millions) |
160 | 222 | (28)% | 182 | (12)% | |||||||||||
| Income ($ millions) |
92 | 102 | (10)% | 78 | 18 % | |||||||||||
| EBITDA ($ millions)b |
138 | 175 | (21)% | 134 | 3 % | |||||||||||
| EBITDA marginc |
54 % | 54 % | 0 % | 51 % | 6 % | |||||||||||
| Capital expenditures ($ millions)d |
64 | 80 | (20)% | 56 | 14 % | |||||||||||
| Minesite sustainingb,d |
45 | 62 | (27)% | 41 | 10 % | |||||||||||
| Projectb,d |
19 | 18 | 6 % | 15 | 27 % | |||||||||||
| Cost of sales ($/oz) |
1,329 | 1,353 | (2)% | 1,324 | 0 % | |||||||||||
| Total cash costs ($/oz)b |
946 | 909 | 4 % | 913 | 4 % | |||||||||||
| All-in sustaining costs ($/oz)b |
1,341 | 1,309 | 2 % | 1,233 | 9 % | |||||||||||
| All-in costs ($/oz)b |
1,503 | 1,416 | 6 % | 1,340 | 12 % | |||||||||||
| a. | Includes Goldrush. |
| b. | Further information on these non-GAAP financial measures, including detailed reconciliations, is included on pages 54 to 67 of this MD&A. |
| c. | Represents EBITDA divided by revenue. |
| d. | These amounts are presented on a cash basis. |
| Safety and Environment | ||||||||
| For the three months ended | ||||||||
| 3/31/24 | 12/31/23 | |||||||
| LTI |
0 | 1 | ||||||
| LTIFR3 |
0.00 | 0.92 | ||||||
| TRIFR3 |
0.00 | 1.85 | ||||||
| Class 14 environmental incidents |
0 | 0 | ||||||
Financial Results
Q1 2024 compared to Q4 2023
Cortez’s income for the first quarter of 2024 was 10% lower than the prior quarter due to lower sales volumes, partially offset by a higher realized gold price1 and lower cost of sales per ounce2.
Gold production in the first quarter of 2024 was 27% lower than the prior quarter, resulting from a combination of less ore mined at the Crossroads open pit driven by the transition to Phase 6 which commenced in Q4 2023 as well as less oxide ore mined from the Cortez Hills underground in line with the mine sequence. This resulted in less oxide ore processed at the oxide mill and placed on the leach pad compared to the prior quarter. Overall refractory ounce production was also lower compared to the prior quarter driven by a decrease in overall grades mined from the undergrounds, as per the mine sequence.
| BARRICK FIRST QUARTER 2024 | 20 | MANAGEMENT’S DISCUSSION AND ANALYSIS |
| OVERVIEW | OPERATING PERFORMANCE
|
GROWTH PROJECTS & EXPLORATION
|
REVIEW OF FINANCIAL RESULTS
|
OTHER INFORMATION & NON-GAAP RECONCILIATIONS |
FINANCIAL STATEMENTS |
|||||
| As previously disclosed in our outlook for 2024, the lower production was primarily a function of the transition to Phase 6 at Crossroads. Cortez delivered on plan in the first quarter and is on track to deliver on its planned 2024 production. Total tonnes mined were largely in line with the prior quarter as mining in Crossroads was primarily in Phase 6 resulting in higher open pit waste tonnes mined and lower ore tonnes mined, with the average grade consistent with the prior quarter. Underground tonnes mined were 3% higher than the prior quarter, driven by improved productivity at both Goldrush and Cortez Hills undergrounds and the ramp-up at the Goldrush underground which is expected to progressively increase each quarter over 2024 following the receipt of the ROD late in Q4 2023. Underground grades mined were 11% lower than the prior quarter due to lower grades at Cortez Hills underground in line with the plan. Cost of sales per ounce2 in the first quarter of 2024 was 2% lower than the prior quarter due to decreased depreciation expense, partially offset by higher total cash costs per ounce1. Total cash costs per ounce1 was 4% higher than the prior quarter. This was notwithstanding a 26% decrease in sales volumes and primarily reflected a higher proportion of higher cost refractory ounces processed at the Carlin roasters in the sales mix partially offset by higher grades processed. In the first quarter of 2024, all-in sustaining costs per ounce1 were 2% higher than the prior quarter, driven by higher total cash costs per ounce1, slightly offset by lower minesite sustaining capital expenditures1 on a per ounce basis. Capital expenditures in the first quarter of 2024 were 20% lower than the prior quarter, primarily due to lower minesite sustaining expenditures1. Minesite sustaining capital expenditures1 were 27% lower compared to the prior quarter, mainly due to a reduction in the number of new haul trucks commissioned in the current quarter.
Q1 2024 compared to Q1 2023 Cortez’s income for the three month period ended March 31, 2024 was 18% higher than the same prior year period, primarily due to a higher realized gold price1, partially offset by a lower sales volume, with cost of sales per ounce2 in line with the same prior year period. |
|
Gold production for the three month period ended March 31, 2024 was 15% lower than the same prior year period, primarily driven by a combination of less ore mined at the Crossroads open pit driven by the transition to Phase 6 which commenced in Q4 2023 partially offset by higher oxide production from the Cortez Hills underground in line with the mine sequence. This was further offset by higher underground refractory production, both from Cortez Hills underground and Goldrush underground. Leach production was also lower driven by the leach cycle. Total tonnes mined were 22% higher compared to the same prior year period, driven by additional waste tonnes from Crossroads as it transitioned to waste stripping in Phase 6 in the fourth quarter of 2023, combined with improved underground performance and the continued ramp-up at Goldrush underground. Open pit ore tonnes and grade mined were 16% and 6% lower, respectively, compared to the same prior year period, driven by Crossroads as described above. Underground tonnes mined increased by 41% over the same prior year period, primarily driven by Cortez Hills underground and increased activity at Goldrush underground following the receipt of the ROD in Q4 2023. Cost of sales per ounce2 for the three month period ended March 31, 2024 was largely in line with the same prior year period, as higher total cash costs per ounce1 was largely offset by lower depreciation expense. Total cash costs per ounce1 was 4% higher reflecting a higher proportion of refractory ounces processed at the Carlin roasters. For the three month period ended March 31, 2024, all-in sustaining costs per ounce1 increased by 9% compared to the same prior year period, due to higher total cash costs per ounce1, combined with higher minesite sustaining capital expenditures1. Capital expenditures for the three month period ended March 31, 2024 increased by 14% from the same prior year period, due to higher minesite sustaining capital expenditures1 and project capital expenditures1. Minesite sustaining capital expenditures1 were 10% higher than the same prior year period resulting from higher capitalized waste stripping at Crossroads, combined with higher underground development. Project capital expenditures1 were 27% higher than the same prior year period due to increased activity at Goldrush. |
| BARRICK FIRST QUARTER 2024 | 21 | MANAGEMENT’S DISCUSSION AND ANALYSIS |
| OVERVIEW | OPERATING PERFORMANCE
|
GROWTH PROJECTS & EXPLORATION
|
REVIEW OF FINANCIAL RESULTS
|
OTHER INFORMATION & NON-GAAP RECONCILIATIONS |
FINANCIAL STATEMENTS |
|||||
Turquoise Ridge (61.5%), Nevada, USA
Summary of Operating and Financial Data
| For the three months ended | ||||||||||||||||
| 3/31/24 | 12/31/23 | % Change | 3/31/23 | % Change | ||||||||||||
| Total tonnes mined (000s) |
568 | 246 | 131 % | 233 | 144 % | |||||||||||
| Open pit waste |
355 | 0 | 0 % | 0 | 0 % | |||||||||||
| Underground |
213 | 246 | (13)% | 233 | (9)% | |||||||||||
| Average grade (grams/tonne) |
||||||||||||||||
| Underground mined |
10.28 | 11.08 | (7)% | 10.08 | 2 % | |||||||||||
| Processed |
4.32 | 4.48 | (4)% | 3.84 | 13 % | |||||||||||
| Ore tonnes processed (000s) |
480 | 671 | (28)% | 729 | (34)% | |||||||||||
| Oxide Mill |
62 | 82 | (24)% | 101 | (39)% | |||||||||||
| Autoclave |
418 | 589 | (29)% | 628 | (33)% | |||||||||||
| Recovery rate |
86 % | 87 % | (1)% | 83 % | 4 % | |||||||||||
| Oxide Mill |
85 % | 83 % | 2 % | 87 % | (2)% | |||||||||||
| Autoclave |
86 % | 87 % | (1)% | 82 % | 5 % | |||||||||||
| Gold produced (000s oz) |
62 | 84 | (26)% | 81 | (23)% | |||||||||||
| Oxide Mill |
3 | 4 | (25)% | 3 | 0 % | |||||||||||
| Autoclave |
58 | 79 | (27)% | 77 | (25)% | |||||||||||
| Heap leach |
1 | 1 | 0 % | 1 | 0 % | |||||||||||
| Gold sold (000s oz) |
62 | 86 | (28)% | 82 | (24)% | |||||||||||
| Revenue ($ millions) |
130 | 171 | (24)% | 156 | (17)% | |||||||||||
| Cost of sales ($ millions) |
107 | 121 | (12)% | 116 | (8)% | |||||||||||
| Income ($ millions) |
22 | 48 | (54)% | 40 | (45)% | |||||||||||
| EBITDA ($ millions)a |
45 | 79 | (43)% | 71 | (37)% | |||||||||||
| EBITDA marginb |
35 % | 46 % | (24)% | 46 % | (24)% | |||||||||||
| Capital expenditures ($ millions)c |
18 | 18 | 0 % | 21 | (14)% | |||||||||||
| Minesite sustaininga,c |
18 | 17 | 6 % | 18 | 0 % | |||||||||||
| Projecta,c |
0 | 1 | (100)% | 3 | (100)% | |||||||||||
| Cost of sales ($/oz) |
1,733 | 1,419 | 22 % | 1,412 | 23 % | |||||||||||
| Total cash costs ($/oz)a |
1,359 | 1,046 | 30 % | 1,034 | 31 % | |||||||||||
| All-in sustaining costs ($/oz)a |
1,655 | 1,257 | 32 % | 1,271 | 30 % | |||||||||||
| All-in costs ($/oz)a |
1,661 | 1,275 | 30 % | 1,306 | 27 % | |||||||||||
| a. | Further information on these non-GAAP financial measures, including detailed reconciliations, is included on pages 54 to 67 of this MD&A. |
| b. | Represents EBITDA divided by revenue. |
| c. | These amounts are presented on a cash basis. |
| Safety and Environment | ||||||||
| For the three months ended | ||||||||
| 3/31/24 | 12/31/23 | |||||||
| LTI |
2 | 1 | ||||||
| LTIFR3 |
3.23 | 1.54 | ||||||
| TRIFR3 |
8.09 | 1.54 | ||||||
| Class 14 environmental incidents |
0 | 0 | ||||||
Financial Results
Q1 2024 compared to Q4 2023
Turquoise Ridge’s income for the first quarter of 2024 was 54% lower than the prior quarter due to higher cost of sales per ounce2 combined with lower sales volumes, partially offset by a higher realized gold price1.
Gold production in the first quarter of 2024 was 26% lower than the prior quarter, mainly due to the planned Sage autoclave maintenance shutdown that took place during the first quarter of 2024.
Total tonnes mined were 131% higher than the prior quarter driven primarily by waste material mined from the open pit required for the construction of the Juniper
tailings dam raise. Production rates at the Turquoise Ridge underground were slightly lower than the prior quarter as we focused on backfill during the current quarter to set the mine up for further efficiency improvements over the remainder of the year. Grades mined decreased by 7% compared to the prior quarter as per the mine sequence at the Turquoise Ridge underground.
Cost of sales per ounce2 and total cash costs per ounce1 in the first quarter of 2024 were 22% and 30% higher, respectively, than the prior quarter, primarily due to the increased autoclave maintenance costs related to the planned shutdown combined with lower grades. All-in sustaining costs per ounce1 were 32% higher than the prior quarter, primarily reflecting higher total cash costs per ounce1 and higher minesite sustaining capital expenditures1 on a per ounce basis.
Capital expenditures in the first quarter of 2024 was in line with the prior quarter.
Q1 2024 compared to Q1 2023
Turquoise Ridge’s income for the first quarter of 2024 was 45% lower than the same prior year period due to a higher
| BARRICK FIRST QUARTER 2024 | 22 | MANAGEMENT’S DISCUSSION AND ANALYSIS |
| OVERVIEW | OPERATING PERFORMANCE
|
GROWTH PROJECTS & EXPLORATION
|
REVIEW OF FINANCIAL RESULTS
|
OTHER INFORMATION & NON-GAAP RECONCILIATIONS |
FINANCIAL STATEMENTS |
|||||
| cost of sales per ounce2 combined with lower sales volumes, partially offset by a higher realized gold price1. Gold production for the three month period ended March 31, 2024 was 23% lower than the same prior year period, primarily due to the planned Sage autoclave maintenance shutdown that took place during the first quarter of 2024, whereas in the prior year, the planned shutdown occurred in the second quarter of 2023. This was partially offset by higher grades processed and higher recoveries, which was positively impacted by improved carbon management. Total tonnes mined were 144% higher relative to the same prior year period, driven primarily by material mined from the open pit required for the construction of the Juniper tailings dam raise. Although underground efficiencies are up from the same prior year period, we focused on backfill during the current quarter, taking advantage of the planned downtime at the Sage autoclave to set the mine up for further efficiency improvements over |
|
the remainder of the year. Underground grades mined were 2% higher compared to the prior quarter as per the mine plan. Cost of sales per ounce2 and total cash costs per ounce1 for the three month period ended March 31, 2024 were 23% and 31% higher, respectively, than the same prior year period, primarily owing to increased autoclave maintenance costs related to the planned shutdown. All-in sustaining costs per ounce1 were 30% higher than the same prior year period, reflecting higher total cash costs per ounce1 and higher minesite sustaining capital expenditures1 on a per ounce basis. Capital expenditures for the three month period ended March 31, 2024 were 14% lower than the same prior year period primarily due to lower project capital expenditures1 as the Third Shaft was commissioned and substantially completed in the fourth quarter of 2022 with some minor spend that carried into the first quarter of 2023. |
| BARRICK FIRST QUARTER 2024 | 23 | MANAGEMENT’S DISCUSSION AND ANALYSIS |
| OVERVIEW | OPERATING PERFORMANCE
|
GROWTH PROJECTS & EXPLORATION
|
REVIEW OF FINANCIAL RESULTS
|
OTHER INFORMATION & NON-GAAP RECONCILIATIONS |
FINANCIAL STATEMENTS |
|||||
Other Mine - Nevada Gold Mines
| Summary of Operating and Financial Data
|
For the three months ended | |||||||||||||||||||||||||||||||||||||||
| 3/31/24 | 12/31/23 | |||||||||||||||||||||||||||||||||||||||
| Gold produced (000s oz) |
Cost of sales ($/oz) |
Total cash costs ($/oz)a |
All-in sustaining costs ($/ oz)a |
Capital Expend- ituresb |
Gold produced (000s oz) |
Cost of sales ($/oz) |
Total cash costs ($/oz)a |
All-in sustaining costs ($/oz)a |
Capital Expend- ituresb |
|||||||||||||||||||||||||||||||
| Phoenix (61.5%) |
34 | 1,595 | 767 | 944 | 4 | 41 | 1,576 | 787 | 981 | 5 | ||||||||||||||||||||||||||||||
| a. | Further information on these non-GAAP financial measures, including detailed reconciliations, is included on pages 54 to 67 of this MD&A. |
| b. | Includes both minesite sustaining and project capital expenditures1. These amounts are presented on a cash basis. |
Phoenix (61.5%)
Gold production for Phoenix in the first quarter of 2024 was 17% lower compared to the prior quarter, mainly driven by lower grades as mining in the prior quarter was primarily focused in the higher grade Fortitude pit, while mining in the current quarter included more ore from the Bonanza pit than the prior quarter, as per the mine plan. Lower recoveries related to ore chemistry also contributed to the lower ounces compared to the prior quarter.
Cost of sales per ounce2 in the first quarter of 2024 was 1% higher compared to the prior quarter due to increased depreciation, partially offset by lower total cash costs per ounce1. The decrease of 3% in total cash costs per ounce1 compared to the prior quarter was mainly due to the impact of lower processing costs as both electricity prices and power consumption were lower in the current quarter. In the first quarter of 2024, all-in sustaining costs per ounce1 decreased by 4% compared to the prior quarter due primarily to lower total cash costs per ounce1 and lower minesite sustaining capital expenditures1.
| BARRICK FIRST QUARTER 2024 | 24 | MANAGEMENT’S DISCUSSION AND ANALYSIS |
| OVERVIEW | OPERATING PERFORMANCE
|
GROWTH PROJECTS & EXPLORATION
|
REVIEW OF FINANCIAL RESULTS
|
OTHER INFORMATION & NON-GAAP RECONCILIATIONS |
FINANCIAL STATEMENTS |
|||||
Pueblo Viejo (60%)a, Dominican Republic
Summary of Operating and Financial Data
| For the three months ended | ||||||||||||||||||||
| 3/31/24 | 12/31/23 | % Change | 3/31/23 | % Change | ||||||||||||||||
| Open pit tonnes mined (000s) |
2,944 | 2,819 | 4 % | 5,651 | (48)% | |||||||||||||||
| Open pit ore |
1,235 | 1,902 | (35)% | 2,342 | (47)% | |||||||||||||||
| Open pit waste |
1,709 | 917 | 86 % | 3,309 | (48)% | |||||||||||||||
| Average grade (grams/tonne) |
||||||||||||||||||||
| Open pit mined |
2.09 | 2.19 | (5)% | 1.85 | 13 % | |||||||||||||||
| Processed |
2.33 | 2.64 | (12)% | 2.22 | 5 % | |||||||||||||||
| Autoclave ore tonnes processed (000s) |
1,382 | 1,345 | 3 % | 1,377 | 0 % | |||||||||||||||
| Recovery rate |
81 % | 79 % | 3 % | 89 % | (9)% | |||||||||||||||
| Gold produced (000s oz) |
81 | 90 | (10)% | 89 | (9)% | |||||||||||||||
| Gold sold (000s oz) |
82 | 89 | (8)% | 90 | (9)% | |||||||||||||||
| Revenue ($ millions) |
172 | 190 | (9)% | 175 | (2)% | |||||||||||||||
| Cost of sales ($ millions) |
125 | 141 | (11)% | 112 | 12 % | |||||||||||||||
| Income ($ millions) |
44 | 49 | (10)% | 61 | (28)% | |||||||||||||||
| EBITDA ($ millions)b |
81 | 89 | (9)% | 100 | (19)% | |||||||||||||||
| EBITDA marginc |
47 % | 47 % | 0 % | 57 % | (18)% | |||||||||||||||
| Capital expenditures ($ millions)d,e |
55 | 40 | 38 % | 68 | (19)% | |||||||||||||||
| Minesite sustainingb,d |
25 | 31 | (19)% | 31 | (19)% | |||||||||||||||
| Projectb,d |
20 | 9 | 122% | 37 | (46)% | |||||||||||||||
| Cost of sales ($/oz) |
1,527 | 1,588 | (4)% | 1,241 | 23 % | |||||||||||||||
| Total cash costs ($/oz)b |
1,013 | 1,070 | (5)% | 714 | 42 % | |||||||||||||||
| All-in sustaining costs ($/oz)b |
1,334 | 1,428 | (7)% | 1,073 | 24 % | |||||||||||||||
| All-in costs ($/oz)b |
1,571 | 1,532 | 3 % | 1,481 | 6 % | |||||||||||||||
| a. | Barrick is the operator of Pueblo Viejo and owns 60%, with Newmont Corporation owning the remaining 40%. Pueblo Viejo is accounted for as a subsidiary with a 40% non-controlling interest. The results in the table and the discussion that follows are based on our 60% share only. |
| b. | Further information on these non-GAAP financial measures, including detailed reconciliations, is included on pages 54 to 67 of this MD&A. |
| c. | Represents EBITDA divided by revenue. |
| d. | These amounts are presented on a cash basis. |
| e. | Starting in the first quarter of 2024, this amount includes capitalized interest. |
| Safety and Environment | ||||||||
| For the three months ended | ||||||||
| 3/31/24 | 12/31/23 | |||||||
| LTI |
0 | 0 | ||||||
| LTIFR3 |
0.00 | 0.00 | ||||||
| TRIFR3 |
0.81 | 0.73 | ||||||
| Class 14 environmental incidents |
0 | 0 | ||||||
Financial Results
Q1 2024 compared to Q4 2023
Pueblo Viejo’s income for the first quarter of 2024 was 10% lower than the prior quarter, mainly due to lower sales volume, partially offset by a lower cost of sales per ounce2, and a higher realized gold price1.
Gold production in the first quarter of 2024 was 10% lower than the prior quarter, mainly due to lower grades processed (in line with the planned mining and stockpile feed sequence), partially offset by higher throughput as result of the plant expansion ramp-up and higher recovery due to the increase in tonnes processed through the pressure oxidation circuit.
Cost of sales per ounce2 and total cash costs per ounce1 for the first quarter of 2024 were 4% and 5% lower, respectively, compared to the prior quarter, mainly driven by lower electricity costs and lower G&A expenses. For the first quarter of 2024, all-in sustaining costs per ounce1 were
7% lower than the prior quarter, mainly due to lower total cash costs per ounce1, and lower minesite sustaining capital expenditures1.
Capital expenditures for the first quarter of 2024 increased by 38% compared to the prior quarter, primarily due to higher project capital expenditures1 from higher spend on the new El Naranjo TSF. This was partially offset by lower minesite sustaining capital expenditures1 due to lower activity on the Llagal TSF.
Q1 2024 compared to Q1 2023
Pueblo Viejo’s income for the first quarter of 2024 was 28% lower than the same prior year period, driven by a higher costs of sales per ounce2 and lower sales volumes, partially offset by a higher realized gold price1.
Gold production for the three month period ended March 31, 2024 was 9% lower than the same prior year period due to lower recoveries caused by flotation coming online and ramping up, partially offset by higher grades processed. We expect to commence throughput ramp up for the expanded plant during the second quarter of 2024, with the conveyor stacker rebuild having been completed in April.
Cost of sales per ounce2 and total cash costs per ounce1 for the three month period ended March 31, 2024 were 23% and 42% higher, respectively, compared to the same prior year period. This was mainly due to the impact of lower recoveries, higher electricity consumption, higher
| BARRICK FIRST QUARTER 2024 | 25 | MANAGEMENT’S DISCUSSION AND ANALYSIS |
| OVERVIEW | OPERATING PERFORMANCE
|
GROWTH PROJECTS & EXPLORATION
|
REVIEW OF FINANCIAL RESULTS
|
OTHER INFORMATION & NON-GAAP RECONCILIATIONS |
FINANCIAL STATEMENTS |
|||||
| plant maintenance, and higher limestone costs as we continue to optimize processes within the expanded processing plant. For the three month period ended March 31, 2024, all-in sustaining costs per ounce1 were 24% higher than the same prior year period mainly due to higher total cash costs per ounce1, partially offset by lower minesite sustaining capital expenditures. Capital expenditures for the three month period ended March 31, 2024 decreased by 19% compared to the same prior year period, primarily due to lower project capital expenditures1 incurred on the plant expansion as the project was substantially completed in 2023, and lower minesite sustaining capital expenditures1 mainly due to lower activity on the Llagal TSF. |
|
|
| BARRICK FIRST QUARTER 2024 | 26 | MANAGEMENT’S DISCUSSION AND ANALYSIS |
| OVERVIEW | OPERATING PERFORMANCE
|
GROWTH PROJECTS & EXPLORATION
|
REVIEW OF FINANCIAL RESULTS
|
OTHER INFORMATION & NON-GAAP RECONCILIATIONS |
FINANCIAL STATEMENTS |
|||||
Loulo-Gounkoto (80%)a, Mali
Summary of Operating and Financial Data
| For the three months ended | ||||||||||||||||||||
| 3/31/24 | 12/31/23 | % Change | 3/31/23 | % Change | ||||||||||||||||
| Total tonnes mined (000s) | 7,692 | 5,846 | 32 % | 8,370 | (8)% | |||||||||||||||
| Open pit ore |
4 | 28 | (86)% | 125 | (97)% | |||||||||||||||
| Open pit waste |
6,721 | 4,872 | 38 % | 7,399 | (9)% | |||||||||||||||
| Underground |
967 | 946 | 2 % | 846 | 14 % | |||||||||||||||
| Average grade (grams/tonne) |
||||||||||||||||||||
| Open pit mined |
1.07 | 2.80 | (62)% | 2.22 | (52)% | |||||||||||||||
| Underground mined |
5.89 | 4.54 | 30 % | 5.62 | 5 % | |||||||||||||||
| Processed |
4.47 | 4.31 | 4 % | 4.69 | (5)% | |||||||||||||||
| Ore tonnes processed (000s) |
1,059 | 1,013 | 5 % | 1,006 | 5 % | |||||||||||||||
| Recovery rate |
93 % | 91 % | 2 % | 91 % | 2 % | |||||||||||||||
| Gold produced (000s oz) |
141 | 127 | 11 % | 137 | 3 % | |||||||||||||||
| Gold sold (000s oz) |
140 | 127 | 10 % | 134 | 4 % | |||||||||||||||
| Revenue ($ millions) |
289 | 256 | 13 % | 257 | 12 % | |||||||||||||||
| Cost of sales ($ millions) |
164 | 164 | 0 % | 171 | (4)% | |||||||||||||||
| Income ($ millions) |
116 | 82 | 41 % | 85 | 36 % | |||||||||||||||
| EBITDA ($ millions)b |
169 | 129 | 31 % | 141 | 20 % | |||||||||||||||
| EBITDA marginc |
58 % | 50 % | 16 % | 55 % | 5 % | |||||||||||||||
| Capital expenditures ($ millions)d |
59 | 75 | (21)% | 83 | (29)% | |||||||||||||||
| Minesite sustainingb,d |
40 | 30 | 33 % | 43 | (7)% | |||||||||||||||
| Projectb,d |
19 | 45 | (58)% | 40 | (53)% | |||||||||||||||
| Cost of sales ($/oz) |
1,177 | 1,296 | (9)% | 1,275 | (8)% | |||||||||||||||
| Total cash costs ($/oz)b |
794 | 924 | (14)% | 855 | (7)% | |||||||||||||||
| All-in sustaining costs ($/oz)b |
1,092 | 1,168 | (7)% | 1,190 | (8)% | |||||||||||||||
| All-in costs ($/oz)b |
1,229 | 1,521 | (19)% | 1,485 | (17)% | |||||||||||||||
| a. | Barrick owns 80% of Société des Mines de Loulo SA and Société des Mines de Gounkoto with the Republic of Mali owning 20%. Loulo-Gounkoto is accounted for as a subsidiary with a 20% non-controlling interest on the basis that Barrick controls the asset. The results in the table and the discussion that follows are based on our 80% share, inclusive of the impact of the purchase price allocation resulting from the merger with Randgold. |
| b. | Further information on these non-GAAP financial measures, including detailed reconciliations, is included on pages 54 to 67 of this MD&A. |
| c. | Represents EBITDA divided by revenue. |
| d. | These amounts are presented on a cash basis. |
Safety and Environment
| For the three months ended |
|
|||||||
| 3/31/24 | 12/31/23 | |||||||
| LTI | 1 | 0 | ||||||
| LTIFR3 | 0.20 | 0.00 | ||||||
| TRIFR3 | 0.61 | 0.00 | ||||||
| Class 14 environmental incidents | 0 | 0 | ||||||
Financial Results
Q1 2024 compared to Q4 2023
Loulo-Gounkoto’s income for the first quarter of 2024 was 41% higher than the prior quarter mainly due to higher sales volumes, a higher realized gold price1 and a lower cost of sales per ounce2.
Gold production for the first quarter of 2024 was higher than the prior quarter with higher grades processed, higher throughput and higher recovery, in line with the mine plan.
Cost of sales per ounce2 and total cash costs per ounce1 for the first quarter of 2024 were 9% and 14% lower, respectively, than the prior quarter, mainly due to the impact of higher grades processed, higher recovery and lower operating unit costs both in mining and in the processing plant. For the first quarter of 2024, all-in sustaining costs
per ounce1 were 7% lower than the prior quarter, mainly due to lower total cash costs per ounce1, partially offset by higher minesite sustaining capital expenditures1.
Capital expenditures for the first quarter of 2024 decreased by 21% compared to the prior quarter, mainly driven by lower project capital expenditures1, partially offset by higher minesite sustaining capital expenditures1. The decrease in project capital expenditures1 was mainly due to the commissioning of the solar plant expansion project during the current quarter. Higher minesite sustaining capital expenditures1 was primarily due to higher capitalized waste stripping at Gounkoto.
Q1 2024 compared to Q1 2023
Loulo-Gounkoto’s income for the first quarter of 2024 was 36% higher than the same prior year period, primarily due to a higher realized gold price1, higher sales volumes and a lower cost of sales per ounce2.
Gold production for the three month period ended March 31, 2024 was 3% higher due to increased throughput and recovery, partially offset by lower grades processed, in line with the mine plan.
Cost of sales per ounce2 and total cash costs per ounce1 for the first quarter of 2024 were 8% and 7% lower, respectively, than the same prior year period mainly due to
| BARRICK FIRST QUARTER 2024 | 27 | MANAGEMENT’S DISCUSSION AND ANALYSIS |
| OVERVIEW | OPERATING PERFORMANCE
|
GROWTH PROJECTS & EXPLORATION
|
REVIEW OF FINANCIAL RESULTS
|
OTHER INFORMATION & NON-GAAP RECONCILIATIONS |
FINANCIAL STATEMENTS |
|||||
the impact of lower operating unit costs both in mining and in the processing plant. For the first quarter of 2024, all-in sustaining costs per ounce1 decreased by 8% compared to the same prior year period, reflecting the decrease in total cash costs per ounce1 and lower minesite sustaining capital expenditures1.
Capital expenditures for the three month period ended March 31, 2024 decreased by 29% compared to the same prior year period, driven by both lower project and minesite sustaining capital expenditures1. The decrease in project capital expenditures1 was mainly driven by the commissioning of the solar plant expansion project. The decrease in minesite sustaining capital expenditures1 was primarily due to lower capitalized stripping.
Regulatory Matters
In August 2022, the Government of Mali announced that it would conduct an audit of the Malian gold mining industry, including the Loulo-Gounkoto complex. Barrick engaged with the government-appointed auditors and hosted the auditors at Loulo-Gounkoto for a site visit in November 2022. In April 2023, Barrick received a draft report
containing the auditors’ preliminary findings. During the second quarter of 2023, Barrick responded to the draft report to challenge the auditors’ findings, which Barrick believed to be legally and factually flawed and without merit. In February 2024, Barrick received the final audit report in relation to the Loulo-Gounkoto complex. The final report maintained most of the auditors’ findings from the draft and Barrick is engaging with the Government of Mali to challenge them.
In addition, a new mining code and a law requiring local content in the mining sector were adopted in Mali in August 2023 but are not currently being enforced, pending the adoption of implementing decrees. Under the new mining code, pre-existing mining titles remain subject to the legal and contractual regime under which they were issued for the remainder of their current term.
Refer to note 15 of the Financial Statements for information regarding ongoing discussions with the Government of Mali including with respect to the establishment conventions for the Loulo-Gounkoto complex and related matters.
| BARRICK FIRST QUARTER 2024 | 28 | MANAGEMENT’S DISCUSSION AND ANALYSIS |
| OVERVIEW | OPERATING PERFORMANCE
|
GROWTH PROJECTS & EXPLORATION
|
REVIEW OF FINANCIAL RESULTS
|
OTHER INFORMATION & NON-GAAP RECONCILIATIONS |
FINANCIAL STATEMENTS |
|||||
Kibali (45%)a, Democratic Republic of Congo
Summary of Operating and Financial Data
| For the three months ended | ||||||||||||||||||||
| 3/31/24 | 12/31/23 | % Change | 3/31/23 | % Change | ||||||||||||||||
| Total tonnes mined (000s) | 5,168 | 3,993 | 29 % | 4,902 | 5 % | |||||||||||||||
| Open pit ore |
605 | 619 | (2)% | 640 | (5)% | |||||||||||||||
| Open pit waste |
4,083 | 2,901 | 41 % | 3,882 | 5 % | |||||||||||||||
| Underground |
480 | 473 | 1 % | 380 | 26 % | |||||||||||||||
| Average grade (grams/tonne) |
||||||||||||||||||||
| Open pit mined |
1.42 | 1.63 | (13)% | 1.42 | 0 % | |||||||||||||||
| Underground mined |
5.05 | 5.28 | (4)% | 4.35 | 16 % | |||||||||||||||
| Processed |
2.85 | 3.50 | (19)% | 2.55 | 12 % | |||||||||||||||
| Ore tonnes processed (000s) |
925 | 911 | 2 % | 880 | 5 % | |||||||||||||||
| Recovery rate |
89 % | 90 % | (1)% | 88 % | 1 % | |||||||||||||||
| Gold produced (000s oz) |
76 | 93 | (18)% | 64 | 19 % | |||||||||||||||
| Gold sold (000s oz) |
72 | 92 | (22)% | 67 | 7 % | |||||||||||||||
| Revenue ($ millions) |
152 | 184 | (17)% | 127 | 20% | |||||||||||||||
| Cost of sales ($ millions) |
86 | 105 | (18)% | 91 | (5)% | |||||||||||||||
| Income ($ millions) |
64 | 78 | (18)% | 33 | 94 % | |||||||||||||||
| EBITDA ($ millions)b |
92 | 115 | (20)% | 58 | 59 % | |||||||||||||||
| EBITDA marginc |
61 % | 63 % | (3)% | 46 % | 33 % | |||||||||||||||
| Capital expenditures ($ millions)d |
24 | 20 | 20 % | 19 | 26 % | |||||||||||||||
| Minesite sustainingb,c |
15 | 5 | 200 % | 12 | 25 % | |||||||||||||||
| Projectb,c |
9 | 15 | (40)% | 7 | 29 % | |||||||||||||||
| Cost of sales ($/oz) |
1,200 | 1,141 | 5 % | 1,367 | (12)% | |||||||||||||||
| Total cash costs ($/oz)b |
802 | 737 | 9 % | 987 | (19)% | |||||||||||||||
| All-in sustaining costs ($/oz)b |
1,048 | 819 | 28 % | 1,177 | (11)% | |||||||||||||||
| All-in costs ($/oz)b |
1,165 | 988 | 18 % | 1,289 | (10)% | |||||||||||||||
| a. | Barrick owns 45% of Kibali Goldmines SA with the DRC and our joint venture partner, AngloGold Ashanti, owning 10% and 45%, respectively. The figures presented in this table and the discussion that follows are based on our 45% effective interest in Kibali Goldmines SA held through our 50% interest in Kibali (Jersey) Limited and its other subsidiaries (collectively “Kibali”), inclusive of the impact of the purchase price allocation resulting from the merger with Randgold. Kibali is accounted for as an equity method investment on the basis that the joint venture partners that have joint control have rights to the net assets of the joint venture. |
| b. | Further information on these non-GAAP financial measures, including detailed reconciliations, is included on pages 54 to 67 of this MD&A. |
| c. | Represents EBITDA divided by revenue. |
| d. | These amounts are presented on a cash basis. |
Safety and Environment
| For the three months ended |
|
|||||||
| 3/31/24 | 12/31/23 | |||||||
| LTI | 0 | 0 | ||||||
| LTIFR3 | 0.00 | 0.00 | ||||||
| TRIFR3 | 1.45 | 0.47 | ||||||
| Class 14 environmental incidents | 0 | 0 | ||||||
Unfortunately, on January 31, 2024, an incident occurred at Kibali which resulted in the tragic fatality of an employee. Please refer to page 8 for further details on our safety initiatives.
Financial Results
Q1 2024 compared to Q4 2023
Kibali’s income for the first quarter of 2024 was 18% lower than the prior quarter, mainly due to lower sales volumes and a higher cost of sales per ounce2, partially offset by a higher realized gold price1.
Gold production in the first quarter of 2024 was 18% lower than the prior quarter, mainly due to lower grades processed following the planned transition to waste
stripping in the Pamao and Gorumbwa open pits over the first half of the year, temporarily decreasing the open pit grades. This was combined with a decrease in underground grades mined mainly related to mine sequencing as per the mine plan. Waste stripping at the Ikamva open pit is progressing well, with the first ore projected in the second quarter of 2024 and the ongoing mining expected to increase the overall open pit grades mined in the second half of the year.
Cost of sales per ounce2 and total cash costs per ounce1 for the first quarter of 2024 were 5% and 9% higher, respectively, due to the impact of processing lower grades, partially offset by efficiency improvements from both the open pit and underground operations, and increased power costs resulting from less hydropower generation due to the dry season. For the first quarter of 2024, all-in sustaining costs per ounce1 was 28% higher compared to the prior quarter, mainly due to higher minesite sustaining capital expenditures1 and higher total cash costs per ounce2.
Capital expenditures for the three month period ended March 31, 2024 were 20% higher compared to the prior quarter, due to higher minesite sustaining capital expenditures1 relating to the timing of equipment rebuilds and purchases, in addition to the higher capitalized waste
| BARRICK FIRST QUARTER 2024 | 29 | MANAGEMENT’S DISCUSSION AND ANALYSIS |
| OVERVIEW | OPERATING PERFORMANCE
|
GROWTH PROJECTS & EXPLORATION
|
REVIEW OF FINANCIAL RESULTS
|
OTHER INFORMATION & NON-GAAP RECONCILIATIONS |
FINANCIAL STATEMENTS |
|||||
stripping, as discussed above. Project capital expenditures1 decreased due to the substantial completion of the reagent recovery plant and the Kalimva/Ikamva open pit project in 2023, with the project capital focus shifting to the solar project for 2024.
Q1 2024 compared to Q1 2023
Kibali’s income for the three month period ended March 31, 2024 was 94% higher than the same prior year period, driven by higher sales volumes, a higher realized gold price1 and a lower cost of sales per ounce2.
Gold production for the three month period ended March 31, 2024 was 19% higher than the same prior year period, mainly due to higher throughput, higher recoveries, and higher grades processed.
Cost of sales per ounce2 and total cash costs per ounce1 for the three month period ended March 31, 2024
were 12% and 19% lower, mainly due to the benefit of higher grades processed, and efficiency improvements from the underground operations. For the three month period ended March 31, 2024, all-in sustaining costs per ounce1 were 11% lower than the same prior year period, driven by lower total cash costs per ounce1, partially offset by higher minesite sustaining capital expenditures1.
Capital expenditures for the three month period ended March 31, 2024 were 26% higher than the same prior year period, mainly due to higher minesite sustaining capital expenditures1 resulting predominantly from higher capitalized waste stripping. Project capital expenditures1 also increased due to the ramp-up of expenditures related to the solar project.
| BARRICK FIRST QUARTER 2024 | 30 | MANAGEMENT’S DISCUSSION AND ANALYSIS |
| OVERVIEW | OPERATING PERFORMANCE
|
GROWTH PROJECTS & EXPLORATION
|
REVIEW OF FINANCIAL RESULTS
|
OTHER INFORMATION & NON-GAAP RECONCILIATIONS |
FINANCIAL STATEMENTS |
|||||
North Mara (84%)a, Tanzania
Summary of Operating and Financial Data
| For the three months ended | ||||||||||||||||||||
| 3/31/24 | 12/31/23 | % Change | 3/31/23 | % Change | ||||||||||||||||
| Total tonnes mined (000s) | 3,581 | 4,241 | (16)% | 3,525 | 2 % | |||||||||||||||
| Open pit ore |
374 | 406 | (8)% | 469 | (20)% | |||||||||||||||
| Open pit waste |
2,811 | 3,407 | (17)% | 2,691 | 4 % | |||||||||||||||
| Underground |
396 | 428 | (7)% | 365 | 8 % | |||||||||||||||
| Average grade (grams/tonne) |
||||||||||||||||||||
| Open pit mined |
1.68 | 1.84 | (9)% | 2.07 | (19)% | |||||||||||||||
| Underground mined |
2.77 | 3.17 | (13)% | 3.40 | (19)% | |||||||||||||||
| Processed |
2.43 | 2.85 | (15)% | 3.25 | (25)% | |||||||||||||||
| Ore tonnes processed (000s) |
651 | 719 | (9)% | 716 | (9)% | |||||||||||||||
| Recovery rate |
90 % | 91 % | (1)% | 92 % | (2)% | |||||||||||||||
| Gold produced (000s oz) |
46 | 59 | (22)% | 68 | (32)% | |||||||||||||||
| Gold sold (000s oz) |
46 | 61 | (25)% | 70 | (34)% | |||||||||||||||
| Revenue ($ millions) |
96 | 124 | (23)% | 133 | (28)% | |||||||||||||||
| Cost of sales ($ millions) |
77 | 86 | (10)% | 70 | 10 % | |||||||||||||||
| Income ($ millions) |
15 | 12 | 25 % | 47 | (68)% | |||||||||||||||
| EBITDA ($ millions)b |
30 | 30 | 0 % | 63 | (52)% | |||||||||||||||
| EBITDA marginc |
31 % | 24 % | 29 % | 47 % | (34)% | |||||||||||||||
| Capital expenditures ($ millions)d |
30 | 53 | (43)% | 35 | (14)% | |||||||||||||||
| Minesite sustainingb,d |
18 | 20 | (10)% | 25 | (28)% | |||||||||||||||
| Projectb,d |
12 | 33 | (64)% | 10 | 20 % | |||||||||||||||
| Cost of sales ($/oz) |
1,678 | 1,420 | 18 % | 987 | 70 % | |||||||||||||||
| Total cash costs ($/oz)b |
1,339 | 1,103 | 21 % | 759 | 76 % | |||||||||||||||
| All-in sustaining costs ($/oz)b |
1,753 | 1,449 | 21 % | 1,137 | 54 % | |||||||||||||||
| All-in costs ($/oz)b |
2,006 | 1,985 | 1 % | 1,278 | 57 % | |||||||||||||||
| a. | Barrick owns 84% of North Mara, with the GoT owning 16%. North Mara is accounted for as a subsidiary with a 16% non-controlling interest on the basis that Barrick controls the asset. The results in the table and the discussion that follows are based on our 84% share. |
| b. | Further information on these non-GAAP financial measures, including detailed reconciliations, is included on pages 54 to 67 of this MD&A. |
| c. | Represents EBITDA divided by revenue. |
| d. | These amounts are presented on a cash basis. |
Safety and Environment
| For the three months ended |
|
|||||||
| 3/31/24 | 12/31/23 | |||||||
| LTI | 0 | 0 | ||||||
| LTIFR3 | 0.00 | 0.00 | ||||||
| TRIFR3 | 0.70 | 0.36 | ||||||
| Class 14 environmental incidents | 0 | 0 | ||||||
Unfortunately, on January 9, 2024, an incident occurred at North Mara which resulted in the tragic fatality of an employee. Please refer to page 8 for further details on our safety initiatives.
Financial Results
Q1 2024 compared to Q4 2023
North Mara’s income for the first quarter of 2024 was 25% higher than the prior quarter mainly due to a higher realized gold price1, partially offset by lower sales volumes and a higher cost of sales per ounce2. In addition, the previous quarter was impacted by the transfer of a $15 million expense previously recognized in Bulyanhulu related to the expansion of education infrastructure in Tanzania per our community investment obligations under the Twiga partnership.
In the first quarter of 2024, production was 22% lower than the prior quarter with lower grades processed, lower throughput and lower recovery, in line with the mine plan.
Cost of sales per ounce2 and total cash costs per ounce1 were 18% and 21% higher, respectively, than the prior quarter due to lower grades processed, as well as lower throughput due to the temporary suspension of operations following the fatality in January and power supply interruptions. All-in sustaining costs per ounce1 in the first quarter of 2024 were 21% higher than the prior quarter, mainly due to higher total cash costs per ounce1, combined with higher minesite sustaining capital expenditures1 on a per ounce basis.
Capital expenditures in the first quarter of 2024 were 43% lower, than the prior quarter mainly due to lower project capital expenditures1 related to the ongoing construction of the underground paste plant which is on track for commissioning in the second half of 2024. This was combined with lower minesite sustaining capital expenditures1 primarily due to lower capitalized waste stripping costs.
Q1 2024 compared to Q1 2023
North Mara’s income for the three month period ending March 31, 2024 was 68% lower than the same prior year
| BARRICK FIRST QUARTER 2024 | 31 | MANAGEMENT’S DISCUSSION AND ANALYSIS |
| OVERVIEW | OPERATING PERFORMANCE
|
GROWTH PROJECTS & EXPLORATION
|
REVIEW OF FINANCIAL RESULTS
|
OTHER INFORMATION & NON-GAAP RECONCILIATIONS |
FINANCIAL STATEMENTS |
|||||
period, mainly driven by a higher cost of sales per ounce2 and lower sales volume, partially offset by a higher realized gold price1.
Gold production for the three month period ended March 31, 2024 was 32% lower due to lower throughput, lower grades processed and lower recovery, in line with our mine plan.
Cost of sales per ounce2 and total cash costs per ounce1 were 70% and 76% higher, respectively, compared to the same prior year period, mainly due to lower grades processed and higher operating costs. This was driven by higher cost stockpiled underground ore fed to the plant whilst mining lower grades from the open pit together with increased royalties resulting from the higher realized gold price1. This was coupled by lower capitalized waste
stripping compared to the same prior year period, related to the Gena open pit ramp up. All-in sustaining costs per ounce1 in the first quarter of 2024 was 54% higher than the same prior year period, mainly due to higher total cash cost per ounce1, combined with higher minesite sustaining capital expenditures1 on a per ounce basis.
For the three month period ending March 31, 2024, capital expenditures decreased by 14% compared to the same prior year period, mainly due to lower minesite sustaining capital expenditures1 resulting from decreased capitalized waste stripping, partially offset by the TSF Lift and Laboratory upgrade. This was partially offset by higher project capital expenditures1 related to the ongoing construction of the underground paste plant which is on track for commissioning in the second half of 2024.
| BARRICK FIRST QUARTER 2024 | 32 | MANAGEMENT’S DISCUSSION AND ANALYSIS |
| OVERVIEW | OPERATING PERFORMANCE
|
GROWTH PROJECTS & EXPLORATION
|
REVIEW OF FINANCIAL RESULTS
|
OTHER INFORMATION & NON-GAAP RECONCILIATIONS |
FINANCIAL STATEMENTS |
|||||
Bulyanhulu (84%)a, Tanzania
Summary of Operating and Financial Data
| For the three months ended | ||||||||||||||||||||
| 3/31/24 | 12/31/23 | % Change | 3/31/23 | % Change | ||||||||||||||||
| Underground tonnes mined (000s) |
304 | 300 | 1 % | 285 | 7 % | |||||||||||||||
| Average grade (grams/tonne) |
||||||||||||||||||||
| Underground mined |
5.86 | 5.88 | 0 % | 6.97 | (16)% | |||||||||||||||
| Processed |
5.77 | 5.88 | (2)% | 7.39 | (22)% | |||||||||||||||
| Ore tonnes processed (000s) |
238 | 222 | 7 % | 195 | 22 % | |||||||||||||||
| Recovery rate |
95 % | 96 % | (1)% | 95 % | 0 % | |||||||||||||||
| Gold produced (000s oz) |
42 | 41 | 2 % | 44 | (5)% | |||||||||||||||
| Gold sold (000s oz) |
40 | 41 | (2)% | 46 | (13)% | |||||||||||||||
| Revenue ($ millions) |
89 | 87 | 2 % | 93 | (4)% | |||||||||||||||
| Cost of sales ($ millions) |
60 | 59 | 2 % | 62 | (3) % | |||||||||||||||
| Income ($ millions) |
28 | 32 | (13)% | 17 | 65 % | |||||||||||||||
| EBITDA ($ millions)b |
41 | 45 | (9)% | 30 | 37 % | |||||||||||||||
| EBITDA marginc |
46% | 52% | (12)% | 32% | 44 % | |||||||||||||||
| Capital expenditures ($ millions)d |
26 | 28 | (7)% | 20 | 30 % | |||||||||||||||
| Minesite sustainingb,d |
18 | 15 | 20 % | 16 | 13 % | |||||||||||||||
| Projectb,d |
8 | 13 | (38)% | 4 | 100 % | |||||||||||||||
| Cost of sales ($/oz) |
1,479 | 1,413 | 5 % | 1,358 | 9 % | |||||||||||||||
| Total cash costs ($/oz)b |
1,044 | 1,002 | 4 % | 982 | 6 % | |||||||||||||||
| All-in sustaining costs ($/oz)b |
1,485 | 1,376 | 8 % | 1,332 | 11 % | |||||||||||||||
| All-in costs ($/oz)b |
1,695 | 1,692 | 0 % | 1,423 | 19 % | |||||||||||||||
| a. | Barrick owns 84% of Bulyanhulu, with the GoT owning 16%. Bulyanhulu is accounted for as a subsidiary with a 16% non-controlling interest on the basis that Barrick controls the asset. The results in the table and the discussion that follows are based on our 84% share. |
| b. | Further information on these non-GAAP financial measures, including detailed reconciliations, is included on pages 54 to 67 of this MD&A. |
| c. | Represents EBITDA divided by revenue. |
| d. | These amounts are presented on a cash basis. |
Safety and Environment
| For the three months ended |
|
|||||||
| 3/31/24 | 12/31/23 | |||||||
| LTI | 0 | 0 | ||||||
| LTIFR3 | 0.00 | 0.00 | ||||||
| TRIFR3 | 2.11 | 1.10 | ||||||
| Class 14 environmental incidents | 0 | 0 | ||||||
Financial Results
Q1 2024 compared to Q4 2023
Bulyanhulu’s income for the first quarter of 2024 was 13% lower than the prior quarter mainly due to a higher cost of sales per ounce2 and marginally lower sales volumes, partially offset by a higher realized gold price1. In addition, the previous quarter was impacted by the transfer to North Mara of a $15 million expense previously recognized in Bulyanhulu related to the expansion of education infrastructure in Tanzania per our community investment obligations under the Twiga partnership.
In the first quarter of 2024, gold production was 2% higher than the prior quarter, due to higher throughput slightly offset by lower grades processed and recovery, in line with the mine plan.
Cost of sales per ounce2 and total cash costs per ounce1 in the first quarter of 2024 were 5% and 4% higher, respectively, than the prior quarter, reflecting the lower grades processed and lower recovery, partially offset by lower processing plant costs. All-in sustaining costs per ounce1 in the first quarter of 2024 were 8% higher than the
prior quarter, due to higher total cash costs per ounce1 and higher minesite sustaining capital expenditures1 on a per ounce basis.
Capital expenditures in the first quarter of 2024 were 7% lower compared to the prior quarter, reflecting the lower project capital expenditures1 due to reduced drilling activity. This was partially offset by slightly higher minesite sustaining capital expenditures1 mainly driven by investments to improve efficiencies in the processing plant.
Q1 2024 compared to Q1 2023
Bulyanhulu’s income for the three month period ending March 31, 2024 was 65% higher than the same prior year period, mainly due to a higher realized gold price1, partially offset by lower sales volumes and a higher cost of sales per ounce2.
For the three month period ended March 31, 2024, gold production was 5% lower than the same prior year period driven by lower grades processed, in line with the mine plan, partially offset by higher throughput.
Cost of sales per ounce2 and total cash costs per ounce1 for the three month period ending March 31, 2024 were 9% and 6% higher, respectively, compared to the same prior year period, mainly due to the lower grades processed, lower capitalized underground costs and higher royalties due to the higher realized gold price1. This was partially offset by lower mining and lower processing costs resulting from cost optimization initiatives. All-in sustaining costs per ounce1 in the first quarter of 2024 were 11% higher than the same prior year period, mainly due to higher
| BARRICK FIRST QUARTER 2024 | 33 | MANAGEMENT’S DISCUSSION AND ANALYSIS |
| OVERVIEW | OPERATING PERFORMANCE
|
GROWTH PROJECTS & EXPLORATION
|
REVIEW OF FINANCIAL RESULTS
|
OTHER INFORMATION & NON-GAAP RECONCILIATIONS |
FINANCIAL STATEMENTS |
|||||
total cash costs per ounce1, and higher minesite sustaining capital expenditures1.
For the three month period ending March 31, 2024, capital expenditures were 30% higher than the same prior year period, mainly due to higher project capital expenditures1 related to the extension drilling of Reef 2 and Upper West, while minesite sustaining capital expenditures1 remained largely in line with the same prior year period.
| BARRICK FIRST QUARTER 2024 | 34 | MANAGEMENT’S DISCUSSION AND ANALYSIS |
| OVERVIEW | OPERATING PERFORMANCE
|
GROWTH PROJECTS & EXPLORATION
|
REVIEW OF FINANCIAL RESULTS
|
OTHER INFORMATION & NON-GAAP RECONCILIATIONS |
FINANCIAL STATEMENTS |
|||||
Other Mines - Gold
Summary of Operating and Financial Data
| For the three months ended | ||||||||||||||||||||||||||||||||||||||||
| 3/31/24 | 12/31/23 | |||||||||||||||||||||||||||||||||||||||
|
Gold produced (000s oz) |
Cost of sales ($/oz) |
Total cash costs ($/oz)a |
All-in sustaining costs ($/oz)a |
Capital Expend- ituresb |
Gold produced (000s oz) |
Cost of sales ($/oz) |
Total cash costs ($/oz)a |
All-in sustaining costs ($/oz)a |
Capital Expend- ituresb |
|||||||||||||||||||||||||||||||
| Veladero (50%) |
57 | 1,322 | 961 | 1,664 | 31 | 55 | 1,378 | 1,021 | 1,403 | 22 | ||||||||||||||||||||||||||||||
| Tongon (89.7%) |
36 | 1,887 | 1,630 | 1,773 | 2 | 42 | 1,489 | 1,184 | 1,586 | 13 | ||||||||||||||||||||||||||||||
| Hemlo |
37 | 1,715 | 1,476 | 1,754 | 10 | 34 | 1,618 | 1,407 | 1,671 | 8 | ||||||||||||||||||||||||||||||
| Porgerac (24.5%) |
4 | — | — | — | — | — | — | — | — | — | ||||||||||||||||||||||||||||||
| a. | Further information on these non-GAAP financial measures, including detailed reconciliations, is included on pages 54 to 67 of this MD&A. |
| b. | Includes both minesite sustaining and project capital expenditures1. These amounts are presented on a cash basis. |
| c. | As Porgera was placed on care and maintenance from April 25, 2020 until December 22, 2023, no operating data or per ounce data has been provided from the third quarter of 2020 to the fourth quarter of 2023. On December 22, 2023, we completed the Commencement Agreement, pursuant to which the PNG government and BNL, the 95% owner and operator of the Porgera joint venture, agreed on a partnership for the future ownership and operation of the mine. Ownership of Porgera is now held in a new joint venture owned 51% by PNG stakeholders and 49% by a Barrick affiliate, PJL. PJL is jointly owned on a 50/50 basis by Barrick and Zijin Mining Group and therefore Barrick now holds a 24.5% ownership interest in the Porgera joint venture. Barrick holds a 23.5% interest in the economic benefits of the mine under the economic benefit sharing arrangement agreed with the PNG government whereby Barrick and Zijin Mining Group together share 47% of the overall economic benefits derived from the mine accumulated over time, and the PNG stakeholders share the remaining 53%. In the first quarter of 2024, Porgera had gold production but did not have any gold sales. |
Veladero (50%), Argentina
Gold production for Veladero in the first quarter of 2024 was 4% higher than the prior quarter mainly due to an increase in recoverable ounces previously placed on the leach pad. Cost of sales per ounce2 and total cash costs per ounce1 in the first quarter of 2024 decreased by 4% and 6%, respectively, primarily driven by higher production and the impact of lower export duties. All-in sustaining costs per ounce1 in the first quarter of 2024 increased by 19% compared to the prior quarter, mainly due to higher minesite sustaining capital expenditures1 resulting from increased capitalized waste stripping, partially offset by lower total cash costs per ounce1.
Tongon (89.7%), Côte d’Ivoire
Gold production for Tongon in the first quarter of 2024 was 14% lower than the prior quarter mainly due to lower grades, in line with the mine plan. Cost of sales per ounce2 and total cash costs per ounce1 in the first quarter of 2024 were 27% and 38% higher, respectively, compared to the prior quarter, primarily driven by the impact of lower grades mined and processed, and higher open pit costs. All-in sustaining costs per ounce1 in the first quarter of 2024 increased by 12% compared to the prior quarter, primarily reflecting the higher total cash costs per ounce1, partially offset by lower minesite sustaining capital expenditures1.
Hemlo (100%), Ontario, Canada
Gold production in the first quarter of 2024 was 9% higher than the prior quarter primarily due to higher grades mined and processed as per the mine plan. Cost of sales per ounce2 and total cash costs per ounce1 in the first quarter of 2024 increased 6% and 5%, respectively, compared to the prior quarter, primarily due to higher underground mining costs which was driven by lower capitalized development. In the first quarter of 2024, all-in sustaining costs per ounce1 increased by 5% compared to the prior quarter, primarily reflecting higher total cash costs per ounce1 and higher minesite sustaining capital expenditures1 due to the timing of payments.
Porgera (24.5%), Papua New Guinea
At Porgera, significant ramp up progress was achieved during the quarter, with the first gold pour on February 23, 2024. Work on repairing the Hides Transmission Line was completed and the line has now been energized. Ramp-up of the plant and other equipment continues on schedule.
| BARRICK FIRST QUARTER 2024 | 35 | MANAGEMENT’S DISCUSSION AND ANALYSIS |
| OVERVIEW | OPERATING PERFORMANCE
|
GROWTH PROJECTS & EXPLORATION
|
REVIEW OF FINANCIAL RESULTS
|
OTHER INFORMATION & NON-GAAP RECONCILIATIONS |
FINANCIAL STATEMENTS |
|||||
Lumwana (100%), Zambia
Summary of Operating and Financial Data
| For the three months ended | ||||||||||||||||||||
| 3/31/24 | 12/31/23 | % Change | 3/31/23 | % Change | ||||||||||||||||
| Open pit tonnes mined (000s) |
29,571 | 32,081 | (8)% | 17,178 | 72 % | |||||||||||||||
| Open pit ore |
3,727 | 7,011 | (47)% | 4,568 | (18)% | |||||||||||||||
| Open pit waste |
25,844 | 25,070 | 3 % | 12,610 | 105 % | |||||||||||||||
| Average grade |
||||||||||||||||||||
| Open pit mined |
0.49 % | 0.60 % | (18)% | 0.38 % | 29 % | |||||||||||||||
| Processed |
0.41 % | 0.54 % | (24)% | 0.38 % | 8 % | |||||||||||||||
| Tonnes Processed (000s) |
6,022 | 7,090 | (15)% | 6,523 | (8)% | |||||||||||||||
| Recovery rate |
88 % | 87 % | 1 % | 87 % | 1 % | |||||||||||||||
| Copper produced (thousands of tonnes)a |
22 | 33 | (33)% | 22 | 0 % | |||||||||||||||
| Copper sold (thousands of tonnes)a |
22 | 32 | (31)% | 22 | 0 % | |||||||||||||||
| Revenue ($ millions) |
163 | 226 | (28)% | 171 | (5)% | |||||||||||||||
| Cost of sales ($ millions) |
168 | 207 | (19)% | 174 | (3)% | |||||||||||||||
| Income ($ millions) |
(7) | 17 | (141)% | (12) | 42 % | |||||||||||||||
| EBITDA ($ millions)b |
53 | 102 | (48)% | 32 | 66 % | |||||||||||||||
| EBITDA marginc |
33 % | 45 % | (27)% | 19 % | 74 % | |||||||||||||||
| Capital expenditures ($ millions)d |
87 | 81 | 7 % | 52 | 67 % | |||||||||||||||
| Minesite sustainingb,d |
75 | 68 | 10 % | 26 | 188 % | |||||||||||||||
| Projectb,d |
12 | 13 | (8)% | 26 | (54)% | |||||||||||||||
| Cost of sales ($/lb) |
3.41 | 2.95 | 16 % | 3.56 | (4)% | |||||||||||||||
| C1 cash costs ($/lb)b |
2.52 | 2.14 | 18 % | 3.09 | (18)% | |||||||||||||||
| All-in sustaining costs ($/lb)b |
4.33 | 3.38 | 28 % | 3.98 | 9 % | |||||||||||||||
| All-in costs ($/lb)b |
4.57 | 3.55 | 29 % | 4.51 | 1 % | |||||||||||||||
| a. | Starting in 2024, we have presented our copper production and sales quantities in tonnes rather than pounds (1 tonne is equivalent to 2,204.6 pounds). Production and sales amounts for prior periods have been restated for comparative purposes. Our copper cost metrics are still reported on a per pound basis. |
| b. | Further information on these non-GAAP financial measures, including detailed reconciliations, is included on pages 54 to 67 of this MD&A. |
| c. | Represents EBITDA divided by revenue. |
| d. | These amounts are presented on a cash basis. |
Safety and Environment
| For the three months ended |
|
|||||||
| 3/31/24 | 12/31/23 | |||||||
| LTI | 1 | 2 | ||||||
| LTIFR3 | 0.27 | 0.53 | ||||||
| TRIFR3 | 0.53 | 0.53 | ||||||
| Class 14 environmental incidents | 0 | 0 | ||||||
Financial Results
Q1 2024 compared to Q4 2023
Lumwana recorded a loss of $7 million in the first quarter of 2024, compared to income of $17 million in the prior quarter. This was due to lower sales volumes and a higher cost of sales per pound2, partially offset by a slightly higher realized copper price1.
Copper production in the first quarter of 2024 was 33% lower than the prior quarter due to lower throughput following a planned shutdown during the current quarter and lower grades processed. The lower grades were in line with the mine plan which is expected to open up higher grade zones from the second quarter of 2024 onwards in Chimiwongo East and South and the re-entry into Malundwe. The investment in the new fleet in addition to the ongoing efficiency improvement plan has resulted in another strong mining performance in the quarter.
Cost of sales per pound2 and C1 cash costs per pound1 were 16% and 18% higher, respectively, mainly due
to the lower grades processed, partially offset by improved mining efficiencies and lower G&A costs. In the first quarter of 2024, all-in sustaining costs per pound1 increased by 28% compared to the prior quarter, primarily driven by an increase in C1 cash costs per pound1 and minesite sustaining capital expenditures1.
Capital expenditures were 7% higher compared to the prior quarter due to an increase in minesite sustaining capital expenditures1, partially offset by a decrease in project capital expenditures1. Minesite sustaining capital expenditures1 were 10% higher mainly due to increased capitalized waste stripping. Project capital expenditures1 decreased by 8% reflecting the current phase of the expansion project.
Q1 2024 compared to Q1 2023
Lumwana recorded a loss of $7 million in the first quarter of 2024, compared to a loss of $12 million in the same prior year period, driven by a lower cost of sales per pound2, partially offset by a lower realized copper price1, while copper sales were consistent with the same prior year period.
Copper production for the three month period ended March 31, 2024 was in line with the the same prior year period, mainly due to higher grades processed, in line with the mine plan, partially offset by lower throughput following a planned shutdown during the current quarter.
| BARRICK FIRST QUARTER 2024 | 36 | MANAGEMENT’S DISCUSSION AND ANALYSIS |
| OVERVIEW | OPERATING PERFORMANCE
|
GROWTH PROJECTS & EXPLORATION
|
REVIEW OF FINANCIAL RESULTS
|
OTHER INFORMATION & NON-GAAP RECONCILIATIONS |
FINANCIAL STATEMENTS |
|||||
Cost of sales per pound2 and C1 cash costs per pound1 for the three month period ended March 31, 2024 were 4% and 18% lower, respectively, compared to the same prior year period, mainly as a result of improved mining efficiencies and lower G&A costs, combined with the impact of higher grade. The decrease in cost of sales per pound2 was partially offset by higher depreciation. For the three month period ended March 31, 2024, all-in sustaining costs per pound1 was 9% higher than the same prior year period mainly due to higher minesite sustaining capital expenditures1, partially offset by lower C1 cash costs per pound1.
Capital expenditures for the three month period ended March 31, 2024 were 67% higher than the same prior year period, mainly due to higher minesite capital expenditures1 resulting from the increase in waste stripping tonnes following the investment in the owner stripping fleet in 2023. This was partially offset by a decrease in project capital expenditures1 resulting from the investment in the owner stripping fleet occurring in the prior year, with the current year focusing on the feasibility study for the expansion project which is expected to ramp in the latter part of the year.
| BARRICK FIRST QUARTER 2024 | 37 | MANAGEMENT’S DISCUSSION AND ANALYSIS |
| OVERVIEW | OPERATING PERFORMANCE
|
GROWTH PROJECTS & EXPLORATION
|
REVIEW OF FINANCIAL RESULTS
|
OTHER INFORMATION & NON-GAAP RECONCILIATIONS |
FINANCIAL STATEMENTS |
|||||
Other Mines - Copper
Summary of Operating and Financial Data
| For the three months ended | ||||||||||||||||||||||||||||||||||||||||
| 3/31/24 | 12/31/23 | |||||||||||||||||||||||||||||||||||||||
|
Copper production (millions of pounds)a |
Cost of sales ($/lb) |
C1 cash costs ($/lb)b |
All-in sustaining costs ($/lb)b |
Capital Expend- ituresc |
Copper production (thousands of tonnes)a |
Cost of sales ($/lb) |
C1 cash costs ($/lb)b |
All-in sustaining costs ($/lb)b |
Capital Expend- ituresc |
|||||||||||||||||||||||||||||||
| Zaldívar (50%) | 9 | 3.97 | 2.95 | 3.27 | 9 | 10 | 3.85 | 2.93 | 3.51 | 16 | ||||||||||||||||||||||||||||||
| Jabal Sayid (50%) | 9 | 1.61 | 1.35 | 1.55 | 5 | 8 | 1.59 | 1.32 | 1.50 | 8 | ||||||||||||||||||||||||||||||
| a. | Starting in 2024, we have presented our copper production and sales quantities in tonnes rather than pounds (1 tonne is equivalent to 2,204.6 pounds). Production and sales amounts for prior periods have been restated for comparative purposes. Our copper cost metrics are still reported on a per pound basis. |
| b. | Further information on these non-GAAP financial measures, including detailed reconciliations, is included on pages 54 to 67 of this MD&A. |
| c. | Includes both minesite sustaining and project capital expenditures1. These amounts are presented on a cash basis. |
Zaldívar (50%), Chile
Copper production for Zaldívar in the first quarter of 2024 was 10% lower than the prior quarter driven by lower throughput. Cost of sales per pound2 and C1 cash costs per pound1 were 3% and 1% higher, respectively, than the prior quarter, mainly due to the impact of lower production. All-in sustaining costs per pound1 in the first quarter of 2024 was 7% lower compared to the prior quarter, due to lower minesite sustaining capital expenditures1. This investment, of which we are not the operator, continues to be a non-core part of our portfolio.
Jabal Sayid (50%), Saudi Arabia
Jabal Sayid’s copper production in the first quarter of 2024 was in line with the prior quarter. Cost of sales per pound2 and C1 cash costs per pound1 for the first quarter of 2024 increased by 1% and 2%, respectively, compared to the prior quarter, mainly due to higher mining and processing plant costs driven by a higher fuel price. All-in sustaining costs per pound1 in the first quarter of 2024 increased by 3% compared to the prior quarter, due to higher C1 cash costs per pound1, partially offset by lower minesite sustaining capital expenditures1.
| BARRICK FIRST QUARTER 2024 | 38 | MANAGEMENT’S DISCUSSION AND ANALYSIS |
| OVERVIEW | OPERATING PERFORMANCE
|
GROWTH PROJECTS & EXPLORATION
|
REVIEW OF FINANCIAL RESULTS
|
OTHER INFORMATION & NON-GAAP RECONCILIATIONS |
FINANCIAL STATEMENTS |
|||||
Growth Project Updates
Goldrush Project, Nevada, USA6
Goldrush, which is included within Cortez, is expected to be a long-life underground mine with anticipated annual production in excess of 400,000 ounces per annum (100% basis) by 2028.
In the first quarter of 2024, pilot hole drilling was completed for the installation of ventilation raise 1. Surface access in Horse Canyon along with water management infrastructure work in the Pine Valley district is currently on hold for sage grouse nesting season and will resume in July. Recruitment of experienced miners continues to ramp up.
As at March 31, 2024, project spend was $394 million on a 100% basis (including $12 million in the first quarter of 2024) inclusive of the exploration declines. This capital spent to date, together with the remaining expected pre-production capital, is still anticipated to be near the approximate $1 billion initial capital estimate for the Goldrush project (100% basis).
Fourmile, Nevada, USA
Fourmile is the wholly-owned Barrick asset in Nevada and has the potential to form a core component of Cortez in the future, one of Barrick’s Tier One Gold Assets5. The current focus is on exploration drilling with promising results to date which support the potential to significantly increase the modeled extents of the declared mineral resource within the two kilometers of prospective Wenban stratigraphy, as well as uplift the grade. A dedicated Barrick project development team and budget are targeting the extension of the existing mineral resources through the Sophia and Dorothy targets, while also assessing options for an independent exploration decline access. One such option that is being assessed is a surface portal from Rangefront North / Bullion Hill, which would decouple the development of the project from the existing Goldrush development but ultimately complement the current Goldrush multi-purpose development. Footwall development along the strike of the Fourmile orebodies would initially be used for the pre-feasibility drilling and then later be re-used for mine haulage. Barrick anticipates Fourmile will be contributed to the NGM joint venture if certain criteria are met following the completion of drilling and the requisite feasibility work. In 2024, we are planning to spend approximately $40 million on drilling, evaluation and modelling with a view to commence a pre-feasibility study at the end of 2024.
NGM TS Solar Project, Nevada, USA
The TS Solar project is a 200 MW photovoltaic solar farm located adjacent to NGM’s TS Power Plant and interconnected with the existing plant transmission infrastructure. Upon completion, the project will supply renewable energy to NGM’s operations and is expected to deliver a reduction of 254kt of CO2 equivalent emissions per annum, equating to an 8% decrease from NGM’s 2018 baseline.
In the first quarter of 2024, module wiring and inverter electrical terminations continued on plan. Transmission line relay upgrades and redundant communications were installed at the TS Solar substation and the utility-owned transmission substation. Direct and remote relay testing was completed in coordination with the local power utility to satisfy transmission network interconnection requirements. Access roadways within the
array were finished with gravel placement and completion of surface drainage grading. In April 2024, the TS Solar array achieved 100 MW commercial production and power is being transmitted to mine sites for consumption. The remaining 100 MW of the project is expected to begin transmitting power during the second quarter of 2024.
As at March 31, 2024, project spend was $292 million (including $9 million in the first quarter of 2024) out of an estimated capital cost of $290-$310 million (100% basis).
Donlin Gold, Alaska, USA
Over the past three years the focus of the Donlin Gold team has centered on building ore body knowledge around the controls on mineralization through detailed mapping and infill grid drilling. The tightly spaced drill grids focused on the deposit’s three main structural domains (ACMA, Lewis and Divide) and supported the classification of inferred and indicated resources in the current Donlin resource estimate, but have not yet defined a spacing that would support the declaration of measured resources, as per Barrick’s 2023 updated Mineral Reserves and Resources disclosures provided in Barrick’s fourth quarter 2023 MD&A. Trade-off studies and analysis on project assumptions, inputs, design components for optimization (mine engineering, metallurgy, hydrology, power, and infrastructure) were also conducted and will continue into 2024.
Donlin Gold, in collaboration with Calista Corporation (“Calista”) and The Kuskokwim Corporation (“TKC”), supported important initiatives in the Yukon- Kuskokwim (Y-K), including education, health, safety, cultural traditions, and environmental programs. Further, Donlin Gold collaborated with Calista and the village of Crooked Creek and engaged state officials, the U.S. Army Corps of Engineers, members of the U.S. congressional delegation, and with senior leadership from the U.S. Department of the Interior as part of ongoing outreach to emphasize the thoroughness of the project’s environmental review and permitting procedures, as well as on the strong partnership between Donlin Gold and the Native Alaskans who own the mineral resource and land.
The Donlin team continues to progress on the 2024 program with workstreams focused on continuing to move the Donlin Gold project up the value curve. Focus will continue to be on: optimizing the infrastructure, mine design, and flow sheet; mitigating the technical challenges; advancing the remaining project permitting; defending challenges to the existing permits; and exploring further partnership opportunities to unlock value for our Alaskan partners and communities.
Pueblo Viejo Expansion, Dominican Republic7
The Pueblo Viejo plant expansion and mine life extension project is designed to increase throughput to 14 million tonnes per annum and sustain gold production above 800,000 ounces per year (100% basis) going forward.
The process plant construction has been completed with the focus now on increasing production from the crushing and milling circuits and operational stability and recovery improvements in the flotation circuit. As previously disclosed, at the start of the fourth quarter of 2023 we experienced the structural failure of the crushed ore stockpile feed conveyor. The reconstruction work was completed in April 2024 which will allow the plant to
| BARRICK FIRST QUARTER 2024 | 39 | MANAGEMENT’S DISCUSSION AND ANALYSIS |
| OVERVIEW | OPERATING PERFORMANCE
|
GROWTH PROJECTS & EXPLORATION
|
REVIEW OF FINANCIAL RESULTS
|
OTHER INFORMATION & NON-GAAP RECONCILIATIONS |
FINANCIAL STATEMENTS |
|||||
commence throughput ramp up in the second quarter of the year.
The technical and social studies for additional tailings storage capacity (El Naranjo) continued to advance. Geotechnical drilling and site investigations are ongoing and continue to support the feasibility study, due for completion in the third quarter of 2024.
The development of a new town and housing complex to resettle the displaced families is progressing, with roads, houses, and infrastructure all starting in the quarter.
As at March 31, 2024, total project spend was $1,059 million (including $32 million in the first quarter of 2024) on a 100% basis. The estimated capital cost of the plant expansion and mine life extension project is approximately $2.1 billion (100% basis).
Veladero Phase 7 Leach Pad, Argentina
In November 2021, Minera Andina del Sol approved the Phase 7A leach pad construction project with Phase 7B subsequently approved in the third quarter of 2022. Construction on both phases includes sub-drainage and monitoring, leak collection and recirculation, impermeabilization, as well as pregnant leaching solution collection. Additionally, the north channel will be extended along the leach pad facility.
Construction of Phase 7A was completed on budget at a cost of $81 million (100% basis). Construction of Phase 7B began during the third quarter of 2023 and is scheduled for completion in 2024.
Overall for Phase 7, as at March 31, 2024, project spend was $131 million (including $19 million in the first quarter of 2024) out of an estimated capital cost of $160 million (100% basis).
Reko Diq Project, Pakistan8
Barrick has started a full update of the project’s 2010 feasibility study and 2011 expansion PFS. Once fully commissioned, the Reko Diq project is projected to deliver 260,000 tonnes of copper production per year during phase 1 expanding to more than 400,000 tonnes of copper during phase 2, which is based on an increased 45Mtpa process plant throughput in Phase 1 and 90Mtpa in Phase 2, as a result of the feasibility study grind size optimization. The Reko Diq feasibility study update is expected to be completed by the end of 2024, with 2028 targeted for first production.
During the first quarter of 2024, the project team continued to advance the feasibility study, with engineering consultants engaged to advance key areas and commence basic engineering. Feasibility studies on groundwater definition work in the Fan Sediments is demonstrating that is showing positive results. This system represents a small and isolated saline part of a much larger basin and there are no communities or community water sources located within the proposed bore field and its area of influence. Personnel continued to be recruited and mobilized for the project with the majority of new hires from Balochistan. The site works were advanced with a focus on early works infrastructure, with the related early works ESIA submitted during the quarter.
As at March 31, 2024, total spend on the feasibility update was $99 million (including $39 million in the first quarter of 2024) (100% basis). This amount is recorded in exploration, evaluation and project expense and excludes amounts relating to fixed asset purchases that were capitalized. For 2024, we expect to incur approximately $280 million (100% basis) in capital expenditure and approximately $100 million
in project expenses (100% basis). The project’s total capital estimates will be updated together with the completion of the feasibility study.
Loulo-Gounkoto Solar Project, Mali
This project entailed the design, supply and installation of a 40 MW (48 MW peak) photovoltaic solar farm with a 36 MVA battery energy storage system to complement the existing installed 20 MW plant. The completion of this project is projecting a reduction of 23 million liters of fuel in the power plant, which translates to savings of approximately 63kt of CO2 equivalent emissions per annum. The project was staged in two phases of solar and battery storage and has been completed 12 months ahead of schedule. The final battery energy storage system has been commissioned during the first quarter of 2024 and this marks the completion of the commissioning activities. The project schedule status is 100% complete (up from 99% as at December 31, 2023).
As at March 31, 2024, project spend was $73 million and the project finished below the original capital cost of approximately $90 million (100% basis).
Jabal Sayid Lode 1, Saudi Arabia
The scope of this project is to develop and mine a new orebody, located less than a kilometer from the existing lode at Jabal Sayid. The project design includes underground capital development as well as ventilation, paste plant and underground mining infrastructure upgrades where stoping commenced during the third quarter of 2023 with development currently ahead of schedule. The up-cast ventilation raise bore shaft is fully equipped and the reaming of the fresh air ventilation shaft has been completed. The reagent plant and direct flow reactor has been commissioned with optimization in progress. Civil and mechanical construction at the paste plant has been completed with electrical construction nearing completion. Commissioning of the paste plant is scheduled to commence during the second quarter of 2024. The project is 98% complete (up from 95% as at December 31, 2023)
As at March 31, 2024, project spend was $43 million (including $1 million in the first quarter of 2024) out of an estimated capital cost of approximately $43 million (100% basis) and there is no significant spend remaining.
Lumwana Super Pit Expansion, Zambia9
The Lumwana Super Pit Expansion is projected to deliver 240,000 tonnes of copper production per year, from a 50mtpa process plant expansion, with a mine life of more than 30 years. Following the successful transition in 2023 to the owner stripping model we have already seen the 20% planned cost and efficiency benefit which aligns well with the interim mine volumes and longer-term expansion strategy.
The second phase of resource conversion drilling in the Chimiwungo super-pit footprint is still in progress and the conversion drilling for the Malundwe footprint commenced during the first quarter of 2024. The comminution results from the conversion drilling received to date indicates similar properties to the current mined ore.
Flotation and comminution test work for the process plant expansion is 80% completed, which will provide inputs into the plant Feasibility Study design. Geotechnical site investigation drilling of the PFS project layout continued during the quarter, focusing on the large mechanical equipment locations.
| BARRICK FIRST QUARTER 2024 | 40 | MANAGEMENT’S DISCUSSION AND ANALYSIS |
| OVERVIEW | OPERATING PERFORMANCE
|
GROWTH PROJECTS & EXPLORATION
|
REVIEW OF FINANCIAL RESULTS
|
OTHER INFORMATION & NON-GAAP RECONCILIATIONS |
FINANCIAL STATEMENTS |
|||||
The PFS for the expansion project has been completed during the quarter and indicates increased confidence in the mine planning and capital spending.
The process plant feasibility study is progressing well and tracking at 20% completion. The process flow diagrams and process design criteria is currently being finalized with the support of the engineering consultant, Lycopodium. Value engineering studies on certain elements of the comminution circuit have been completed during the quarter, with design work started on the plant and scoping completed for the feasibility camp. The accelerated feasibility study is scheduled for completion towards the end of 2024, with pre-construction expected to start in 2025 and 2028 targeted for first production.
The PFS design for the TSF has been concluded and capital estimates were incorporated into the updated
financial models. The field work on the ESIA was completed during the current quarter and submission to the government is scheduled for the second quarter of 2024.
As at March 31, 2024, we have completed the PFS phase at a total cost of $37 million (including less than $1 million in the first quarter of 2024). Following this milestone, the feasibility study kicked off in 2024 with a total spend to date of $11 million out of an estimated budget of $38 million which will be treated as growth capital expenditure. For 2024, we expect to incur approximately $75 million in growth capital expenditure related to early works for the Lumwana Super Pit expansion. Total project capital cost is estimated to be approximately $2 billion, which will be updated upon completion of the feasibility study.
Exploration and Mineral Resource Management
The foundation of our exploration strategy is a deep organizational understanding that discovery through exploration is a long-term investment and the main value driver for the business. Our exploration strategy has multiple elements that all need to be in balance to deliver on Barrick’s business plan for growth and long-term sustainability.
First, we seek to deliver projects of a short- to medium-term nature that will drive improvements in mine plans. Second, we seek to make new discoveries that add to Barrick’s Tier One Gold Asset5 portfolio. Third, we work to optimize the value of our major undeveloped projects and finally, we seek to identify emerging opportunities early in their value chain and secure them by an earn-in or outright acquisition, where appropriate.
The following section summarizes the exploration results from the first quarter of 2024.
North America
Carlin, Nevada, USA10
Underground conversion drilling has commenced across all sites as planned for the first quarter, with step-out growth drilling expected to commence early in the second quarter in a few key project areas. Results reported below have been returned from 2023 drilling completed late in the previous quarter.
Results from step-out drilling from surface at the Horsham target intercepted a narrow zone of mineralization immediately hanging wall to the mine-scale West Bounding fault, with two narrow intercepts of 3.0 meters at 5.30 g/t Au and 3.0 meters at 3.93 g/t Au from HSX-23003. While narrow, these results confirm continuity of an open system in a roughly 300 meter gap, with high grade results to the southeast (HSC-23001: 32.6 meters at 32.88 g/t Au, previously reported in the second quarter of 2023) and the northwest (NTC-23008: 53.7 meters TW at 19.07 g/t Au, previously reported in the second quarter of 2023). Future step-out drilling is planned to confirm continuity of structures associated with high-grades ahead of potential underground development in this area.
Exploration drilling has commenced across the district at a number of high priority targets. Programs in progress include drill testing a new concept within the Little Boulder Basin located between Leeville and Goldstrike as well as targeting mineralized breccias on the poorly explored, eastern flank of the Western Spur, an uplifted fault-bounded block containing multiple deposits. Further
south, proximal to the giant Gold Quarry deposit, drilling is underway to test previously unexplored favorable host rocks at an intersection of significant district-scale ore-controlling faults.
Cortez, Nevada, USA11
Underground drilling was completed this quarter following-up from the previously reported CMX-23018 (33.2 meters at 18.42 g/t Au). Three drill holes stepped out between 80-100 metres along-strike of the 2023 result, expecting to confirm the continuity of the mineral-controlling El Rojo fault, as well as units of the ore-hosting Siluriun Roberts Mountain Formation. Results are expected to be returned early in the third quarter of 2024, but geological observations confirm the presence of the El Rojo fault, albeit with narrower lenses of the Roberts Mountain lithology than expected.
Turquoise Ridge, Nevada, USA
Step-out drilling began this quarter to target continuity of high-grade fault-and-fold features roughly 1 kilometer south of existing underground infrastructure at the southernmost end of the Turquoise Ridge underground mine (TRUG). TSM-24101 is targeting the continuity of the district-scale Getchell Fault Zone at depth, understood to control significant mineralization at depth within TRUG proper and near surface at the historic Getchell Open Pit. This hole will be followed-up with two additional holes in the second quarter of 2024.
At Twin Creeks, results were received from a core hole testing the emerging Nexus Anticline target northeast of the Mega Pit. Broad low grade anomalism was returned in the Comus stratigraphy. The newly recognized anticline appears to be analogous to the overturned anticline hosting the vast majority of mineralization in the Mega deposit to the west. Additional drilling has been motivated to target the intersection of the fold axis with a projection of the D Zone fault, an important ore controlling structure in the Mega Pit. Drilling was also completed along the projections of the Mega Feeder target zone north of Mega, and successfully confirmed low angle deformation, deeper host stratigraphy and alteration extending 1 kilometer north of previous drill holes. Assays are pending, and drilling is testing additional concepts south of Mega along the same deeper target horizon. Potential for a high-grade, feeder-type target beneath Mega and Vista deposits remains and continues to be a high priority exploration target concept within the district.
| BARRICK FIRST QUARTER 2024 | 41 | MANAGEMENT’S DISCUSSION AND ANALYSIS |
| OVERVIEW | OPERATING PERFORMANCE
|
GROWTH PROJECTS & EXPLORATION
|
REVIEW OF FINANCIAL RESULTS
|
OTHER INFORMATION & NON-GAAP RECONCILIATIONS |
FINANCIAL STATEMENTS |
|||||
Pearl String, Nevada, USA
Comprehensive analysis and peer review of all data led to the conclusion that limited opportunity remained for a significant discovery. The project was returned to the owner.
Hemlo, Canada12
Drilling continued at C-Zone Deep during the quarter aiming to de-risk resource ounces directly down plunge of current mining areas as well as successfully adding resources at the B-Zone Deep and D-zone. Significant intervals include 12.2 meters at 3.73 g/t Au in 90352321, 11.5 meters at 3.94 g/t Au in 90352322, 3.1 meters at 6.64 g/t Au in 90352335 (C-Zone Deep), 3.0 meters at 3.62 g/t Au in 4502307 (Lower B-Zone West), and 5.1 meters at 5.12 g/t Au in 7652332 (D-Zone).
Sturgeon, Ontario, Canada
An unseasonably warm winter prevented the completion of the planned framework diamond drilling from ice platforms. Permitting efforts are advancing.
Patris, Quebec, Canada
The drill-for-till and top of bedrock program was completed over the southern portion of the property targeted basal till beneath 10 to 45 meters of glacio-lacustrine and glacio-fluvial sediments. The program successfully sampled till in 94% of the 90 holes completed. In addition, several holes intersected altered intrusive rocks in subcrop. Analytical results from the program are anticipated in the second quarter.
Latin America & Asia-Pacific
Pueblo Viejo, Dominican Republic
At Pueblo Grande Norte, the framework drilling campaign was completed, with four more diamond holes drilled during the current quarter, for a total of eight holes. These holes confirmed the presence of permeable rocks containing strong disseminated sulphide typical in high-sulfidation systems. Four additional induced polarization lines were completed and a ground-magnetic survey is planned during the next quarter. A review of the geological model and targeting is ongoing, aiming to define the remnant potential of the area.
At Zambrana, to the southeast of the Moore pit, three additional diamond drillholes were completed. These holes confirmed and extended the previously reported zone of shallow oxide mineralization from surface to approximately 30 to 40 meters vertical depth (laboratory results pending).
At Pueblo Grande Sur, located several kilometers to the southeast of Zambrana, additional soil surveys and induced polarization geophysical surveys were completed. A review of the geological model is ongoing aiming to define the potential of the area.
Regional Exploration, Dominican Republic
During the quarter, an option agreement for a new high potential project, “La Jirafa,” was executed. La Jirafa is located in the prospective Los Ranchos Belt (host to Pueblo Viejo) and measures approximately 65 square kilometers. Early-stage geological mapping and sampling was completed during the quarter, confirming an emerging target. In 2024, detailed geological mapping, soil sampling and geophysical surveys are planned to define the geological model, potential and drill targets.
Veladero District, Argentina
Two priority targets are being tested at Veladero. Atahualpa, a gold porphyry target located in the Veladero trend, and Domo Fabiana, an epithermal target related to a series of dome systems.
At Atahualpa, 21 line-kilometers of induced polarization were completed along five east-west lines. A large, 3,200 by 600 meter chargeable anomaly of 20 to 45 millivolt per volt was identified, which coincides with gold porphyry evidence at surface, including banded quartz veinlets and a favorable alteration and geochemical footprint. Two drill-ready targets were defined, with drilling planned to start early in the second quarter.
At Domo Fabiana, rock chip samples defined a large epithermal geochemical footprint associated with favorable alteration and lithologies. A detailed talus sampling program was completed during the current quarter (laboratory results pending).
Following on from the definition of a mineral inventory after the first diamond drilling campaign at the Morro Escondido target, the metallurgical sampling program continues as part of the study to optimize the project economics. The exploration team is evaluating the geological extensions of the mineralization along the La Ortiga trend. A Controlled Source Audio Magneto Telluric (CSAMT) geophysical survey is planned for the second half of 2024 covering the large Ortiga Trend, from Cerro Lila in the north to the Julieta target area south of Morro Escondido.
Northern Chile
Generative work continues, aiming to secure a strong portfolio of district-scale projects that provide exploration optionality. Field-base validation is ongoing in the highest-ranked areas.
El Indio Camp, Chile
During 2024, geological reconnaissance work will continue on the El Indio Camp targets, particularly in the Sancarrón area, where a small drilling campaign is planned to test the extension of mineralized structures that were identified during 2023 field reconnaissance.
Peru
Four consolidated areas of interest in Peru are being advanced, with projects at various stages, from early stage reconnaissance work to drill-ready targets. In parallel, continuing the focus on building a high-quality portfolio across the country, generative work has been accelerated.
Following the definition of several drill-ready targets in Pataqueña, and the granting of drilling permits, preparation for the first framework diamond drilling campaign planned to commence in the second quarter of 2024 is in progress. Pataqueña is an intermediate sulfidation epithermal system in a promising structural setting. Outside the defined targets, district-scale work continues to assess further geological potential.
Following the positive results from early work in the Libelula District, detailed geological mapping and sampling, as well as induced-polarization and ground-magnetic surveys, are planned for the second quarter of 2024. The main objective is to have drill ready targets defined by the third quarter of the year. Fieldwork is also planned in the two additional areas secured along the “Pierina-Libelula Corridor”.
| BARRICK FIRST QUARTER 2024 | 42 | MANAGEMENT’S DISCUSSION AND ANALYSIS |
| OVERVIEW | OPERATING PERFORMANCE
|
GROWTH PROJECTS & EXPLORATION
|
REVIEW OF FINANCIAL RESULTS
|
OTHER INFORMATION & NON-GAAP RECONCILIATIONS |
FINANCIAL STATEMENTS |
|||||
Ecuador
Following Barrick’s successful participation in a public tender process (which was conducted by ENAMI EP, the state-owned mining company of Ecuador) and the signing of a commercial framework agreement with ENAMI EP, Barrick’s exploration team continues with prospecting work. The focus during the current quarter was the El Salto and Mirafruta Districts, both in the southern Jurassic Belt, which hosts the Mirador and Fruta del Norte deposits. At El Salto, two areas of interest have been defined, while, at Mirafruta, a copper and gold porphyry target is emerging.
Barrick continues to work with ENAMI EP on implementing the framework agreement.
Porgera, Papua New Guinea
Drilling of the Wangima target continued in the first quarter of 2024 and increased to four rigs operating, three underground and one on surface. This drill rate will continue to mid-year before ramping up further to fast track discovery along strike of the current open pit mining operation.
Japan Gold Strategic Alliance, Japan
In Japan, work progressed across the two Southern Kyushu Island projects (Mizobe and Ebino) whilst access to the Hakuryu project on Hokkaido Island and the Togi project on the central Honshu Island was not possible in the current quarter.
At Mizobe, a 12 square kilometer ground magnetic survey has been successfully completed across the volcano-sedimentary basin. The newly acquired data is presently undergoing processing, with initial findings revealing a pattern of structural blocks interpreted as sub-basins, delineated by northeast-oriented structures. Interpretation and integration of the data are scheduled for the second quarter aiming to define the geological model and exploring the potential of the system.
In the Ebino District, field mapping and ground magnetic surveys have commenced in the Masaki area, on a large area with favorable alteration and structural setting, six kilometers north of the Hishikari Mine. Planned work is expected to be completed by the third quarter, aiming to define exploration targets and mineral potential.
Asia Pacific
The exploration team continues its focus on reviewing and evaluating new exploration opportunities at different stages across the Asia Pacific region.
Africa and Middle East
Senegal, Exploration13
On the Bambadji joint venture, diamond drilling to test the depth extension of the Kabewest geological system intersected multiple zones of mineralization within a 350 meter thick package of altered breccias, returning significant intercepts: KBWDH022: 55.5 meters at 1.20 g/t Au (including 3.30 meters at 3.50 g/t) and 11.05 meters at 5.32 g/t Au (including 8.55 meters at 6.64 g/t). Mineralization is associated with strong sulphides and visible gold and remains open at depth. A new drill program is underway investigating the potential for extensions and dilation of the main high-grade breccia system to support a stand alone scale operation.
Along the BMSZ Corridor, deep drilling at Gefa returned an encouraging high-grade intersection, GFDT001: 10.8 meters at 3.63 g/t (including 5.80 meters at 5.10 g/t). This mineralization has similarities in style to the
nearby Gounkoto system and is still open at depth and laterally.
On the Bambadji South permit, the scout RC drilling over the strong auger anomalies at the Satadougou target returned several significant intersections in wide spaced drilling over nearly 2 kilometers strike: SATRC019: 6.0 meters at 4.71 g/t (including 3.00 meters at 8.82 g/t) from 56 meters, SATRC024: 7.0 meters at 2.21 g/t (including 2.00 meters at 6.26 g/t) SATRC025: 2.0 meters at 7.02 g/t and, SATRC031: 14.0 meters at 0.84 g/t (including 7.00 meters at 1.30 g/t). These initial shallow drill results have confirmed a new mineralized system over significant scale which remains open in all dimensions.
Loulo-Gounkoto, Mali14
At Yalea, the first holes targeting the potential for large scale extensions and/or repetitions of the main high grade Yalea system at depth were completed. Observations from the first hole confirm a wide altered system was intersected over 70 meters down hole width. Additionally a second hole intersected a wide zone of alteration and variable mineralization approximately 200 meters into the footwall of the main structure, YADH244: 4.65 meters at 4.21 g/t from 1695.95 meters and 27.25 meters at 1.82 g/t from 1708.15 meters (including 3.7 meters at 4.5 g/t). This zone may represent a sparsely tested mineralized structure with significant exploration potential. A third hole returned a stand out intersection on the main Yalea structure supporting the discovery potential: YADH248: 20.9 meters at 6.91 g/t from 1467.45 meters (including 9 meters at 13.91 g/t). Based on the initial results and observations, the design of the next step-out holes will be optimized to test for a large scale discovery.
At Barika, located south along the Yalea Domain Boundary, the initial drill program has confirmed the presence of a mineralized system of significant scale with the following intersections. BKRC001: 13.00 meters at 3.11 g/t Au (including 3.0 meters at 9.16 g/t), BKRC002: 18.00 meters at 1.66 g/t Au, BKRC004: 11.00 meters at 1.23 g/t Au. The system has been delineated over a 400 meter strike length and is open to the south and at depth. These results highlight the exploration potential of the major mineralized corridors of the Loulo district where several additional targets will be a focus in the coming quarters.
At Baboto, drilling resumed this quarter, with encouraging indications of system extensions at depth with high-grade mineralization intersected in hole BNRCDH344: 18.15 meters at 3.00 g/t Au, (including 7.5 meters at 4.56 g/t), associated with moderate-to-strong alteration and commonly observed Baboto-style brittle deformation and fine-disseminated sulphide. An expanded diamond drilling program has been designed to assess the resource potential and bring the target to a key decision point by the end of the third quarter of 2024.
At Gounkoto, drilling continued at MZ1 to assess the opportunity for significant underground extensions to mineralization. Results from GKDH522: 11.60 meters at 2.29 g/t Au, demonstrate the continuity of the shoot trend where further drilling is required to vector towards the higher-grade mineralization. Meanwhile a geological model review has been completed at MZ2/MZ3 and targets have been defined. A drilling program has been finalized to assess these opportunities in the second quarter of 2024.
| BARRICK FIRST QUARTER 2024 | 43 | MANAGEMENT’S DISCUSSION AND ANALYSIS |
| OVERVIEW | OPERATING PERFORMANCE
|
GROWTH PROJECTS & EXPLORATION
|
REVIEW OF FINANCIAL RESULTS
|
OTHER INFORMATION & NON-GAAP RECONCILIATIONS |
FINANCIAL STATEMENTS |
|||||
Tongon, Côte D’Ivoire15
As part of the strategy to deliver on the Koro A2 systems full potential, activities this quarter focused on investigating the southern extensions and parallel mineralized structures within the adjacent Korokaha North license. A drilling program confirmed multiple near-surface mineralized zones with encouraging results: KKHAC099: 6 meters at 2.2 g/t Au, KKHRC001: 10 meters at 2.16 g/t Au (including 4 meters at 3.29 g/t Au) and 5 meters at 1.52 g/t, KKHAC074: 5 meters at 27.15 g/t. A review is underway to design the optimal program to assess and to better constrain the mineralized system.
Aggressive testing of prioritized targets on the Senoufou Belt in the second quarter aims to deliver near-term life of mine extensions, meanwhile large scale auger programs are in progress to delineate further high quality targets.
Kibali, DRC16
At KCD NW, a follow-up drilling program of eight holes designed to define the geometry of the CS Domain Boundary mineralization near surface was completed this quarter. Geological observations and assay results received to date continue to support the economic potential of the western closure of the CS Domain Boundary to provide open pit resources to the mine. Significant intersections include DDD617: 5.2 meters at 8.85 g/t Au from 238.00 meters and 4.25 meters at 6.02 g/t Au from 354.7 meters. Upon receipt of the remaining assay results the open pit assessment will be completed to determine next steps.
At Agbarabo-Rhino-Airbo-Kombokolo, high grade results and encouraging observations from multiple drill holes this quarter have highlighted the potential of the 1.5 kilometer wide corridor to deliver a significant satellite deposit. Step-out drilling to test the down plunge continuity of multiple lenses have extended the Rhino mineralized system 300 meters down plunge. Meanwhile a near surface drilling program to test for additional open pit mineralization in the Agbarabo system returned high-grade results, validating preserved mineralization beneath the historic pit. Significant intersections include AGDD0004: 13.5 meters at 5.04 g/t Au from 37.5 meters and 16.65 meters at 11.57 g/t Au from 110.30 meters. At Airbo Hill (located between Rhino and Kombokolo), drilling identified a new mineralized lode which is open up and down plunge with a lateral extent of at least 100 meters. Significant intersections include SRRC0085: 43 meters at 3.69 g/t Au from 70.00 meters (including 13 meters at 7.00 g/t from 87.00 meters), SRRC0071: 40 meters at 1.40 g/t Au from 78.00 meters (including 3 meters at 6.76 g/t), SRRC0087: 13 meters at 6.68 g/t Au from 89.00 meters, (including 3 meters at 21.76 g/t).
At Oere, a program of follow-up drilling has commenced to test the continuity of the encouraging high grade mineralization reported in the fourth quarter of 2023 as well as framework drill holes along the rest of the KZ north structure to develop additional high impact targets. The two holes completed to date have confirmed the down dip and along strike continuity of the mineralization system over 200 and 400 meters respectively.
At Zambula, drilling has been completed, and a model update is in progress to assess the potential of the multi-kilometer scale system to provide significant open pit resources to the mine.
North Mara and Bulyanhulu, Tanzania17
At North Mara, diamond drilling at the Benno prospect commenced, aiming to establish the structural controls to the hydrothermal system identified during 2023 programs. Drilling to date has successfully intersected favorably altered rock packages and sulphide mineral assemblages, consistent with the surrounding RC drilling. At Tagota, geological model updates from mapping and re-logging generated five priority targets, increasing the overall prospectivity and opportunity for a satellite discovery within 15 kilometers of the plant. Significant intersections include TGRC048: 6 meters at 1.08 g/t Au from 27 meters and 11 meters at 1.36 g/t Au from 68 meters. At Gokona-Gena, eight targets close to existing infrastructure have been identified, each containing confirmed mineralization that remains open. Drill plans have been designed to test the highest-priority targets for near-term impact on the operation.
At Bulyanhulu, partial assay results received from the Ngula aircore drilling, have returned gold anomalism associated with sheared smoky quartz veins along Bulyanhulu Reef 1-style geological contacts, generating multiple targets within 10 kilometers of the plant. Follow-up RC drilling to test the targets is being planned for the dry season in the second quarter.
Expansion of the exploration portfolio continued during the quarter, with 16 additional permits totaling 606 square kilometers consolidated via option agreements. The consolidation aims to supply the exploration projects required to deliver the next generation of major discoveries in Tanzania.
Jabal Sayid, Kingdom of Saudi Arabia
At Jabal Sayid diamond drilling at Janob has defined a northwest orientation to the copper rich feeder style mineralization one-kilometer southwest of Lode 1. Stratigraphic drill holes and a grid geochemistry program are planned for the second quarter to constrain the position of the ore horizon extending from the main lodes. The intersection between the south trending ore horizon and northwest feeder will be targeted as the preferential site for massive sulphide mineralization.
At Umm ad Damar assay results from the framework drill program confirm the presence of a copper rich VMS system. Framework drilling has targeted depth extensions of mineralization outcropping on surface at four prospects: Umm Ad Damar North, Umm Ad Damar South, 4/6 Gossan and Jabal Sujarah. The license wide airborne VTEM Max geophysical survey, designed to detect evidence of massive sulphide mineralization, has been completed with final survey data pending. A grid air core and soil program is scheduled to commence in the second quarter, which in combination with the VTEM is designed to generate a pipeline of targets under thin soil and sediment cover.
Exploration during the first quarter of 2024 at Jabal Sayid South has constrained the extension of prospective stratigraphy continuing from the Jabal Sayid Mining License. Prospect scale mapping, sampling and airborne geophysics is underway to define targets for drill testing in the second quarter.
| BARRICK FIRST QUARTER 2024 | 44 | MANAGEMENT’S DISCUSSION AND ANALYSIS |
| OVERVIEW | OPERATING PERFORMANCE
|
GROWTH PROJECTS & EXPLORATION
|
REVIEW OF FINANCIAL RESULTS
|
OTHER INFORMATION & NON-GAAP RECONCILIATIONS |
FINANCIAL STATEMENTS |
|||||
Review of Financial Results
Revenue
| ($ millions, except per ounce/pound data in dollars) |
For the three months ended |
|||||||||||
| 3/31/24 | 12/31/23 | 3/31/23 | ||||||||||
| Gold |
||||||||||||
| 000s oz solda |
910 | 1,042 | 954 | |||||||||
| 000s oz produceda |
940 | 1,054 | 952 | |||||||||
| Market price ($/oz) |
2,070 | 1,971 | 1,890 | |||||||||
| Realized price ($/oz)b |
2,075 | 1,986 | 1,902 | |||||||||
| Revenue |
2,528 | 2,767 | 2,411 | |||||||||
| Copper |
||||||||||||
| 000s tonnes solda,c |
39 | 53 | 40 | |||||||||
| 000s tonnes produceda,c |
40 | 51 | 40 | |||||||||
| Market price ($/lb) |
3.83 | 3.70 | 4.05 | |||||||||
| Realized price ($/lb)b |
3.86 | 3.78 | 4.20 | |||||||||
| Revenue |
163 | 226 | 171 | |||||||||
| Other sales |
56 | 66 | 61 | |||||||||
| Total revenue |
2,747 | 3,059 | 2,643 | |||||||||
| a. | On an attributable basis. |
| b. | Further information on these non-GAAP financial measures, including detailed reconciliations, is included on pages 54 to 67 of this MD&A. |
| c. | Starting in 2024, we have presented our copper production and sales quantities in tonnes rather than pounds (1 tonne is equivalent to 2,204.6 pounds). Production and sales amounts for prior periods have been restated for comparative purposes. Our copper cost metrics are still reported on a per pound basis. |
Q1 2024 compared to Q4 2023
In the first quarter of 2024, gold revenues decreased by 9% compared to the fourth quarter of 2023, as lower sales volumes were partially offset by a higher realized gold price1. The average market price for the three month period ended March 31, 2024 was $2,070 per ounce, representing an all-time high quarterly average and a 5% increase versus the $1,971 per ounce average in the prior quarter. During the first quarter of 2024, the gold price ranged from $1,984 to an all-time nominal high price of $2,234 per ounce, and closed the quarter at $2,214 per ounce. Gold prices in the first quarter of 2024 continued to be volatile, impacted by economic and geopolitical concerns, expectations for benchmark interest rate cuts, and declining levels of inflation.
In the first quarter of 2024, gold production on an attributable basis was 114 thousand ounces lower than the prior quarter, mainly as Nevada Gold Mines carried out planned maintenance at the Sage autoclave at Turquoise Ridge, mined lower grade ores at Carlin and processed fewer open pit tonnes at Cortez with more waste mined during the quarter. Similarly, Kibali and North Mara processed lower grades, as per their mine plans. These impacts were partially offset by higher grades processed at Loulo-Gounkoto.
ATTRIBUTABLE GOLD PRODUCTION VARIANCE (000s oz)
Q1 2024 compared to Q4 2023
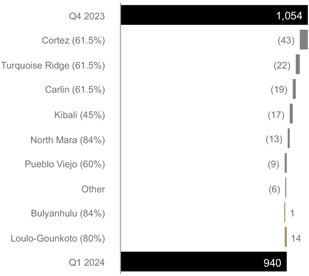
Copper revenues in the first quarter of 2024 decreased by 28% compared to the prior quarter, primarily due to lower sales volumes, partially offset by a higher realized copper price1. The average market price in the first quarter of 2024 was $3.83 per pound, representing an increase of 4% from the $3.70 per pound average in the prior quarter. The realized copper price1 in the first quarter of 2024 was slightly higher than the market copper price due to the impact of positive provisional pricing adjustments, consistent with the prior quarter. During the first quarter of 2024, the copper price traded in a range of $3.69 to $4.16 per pound, and closed the quarter at $3.96 per pound. Copper prices in the first quarter of 2024 were impacted by supply constraints and demand forecasts in China, which is the world’s largest consumer of copper.
Attributable copper production in the first quarter of 2024 was 11 thousand tonnes lower compared to the prior quarter driven by lower grades mined at Lumwana as per the mine plan.
Q1 2024 compared to Q1 2023
For the three month period ended March 31, 2024, gold revenues increased by 5% compared to the same prior year period, primarily due to a higher realized gold price1, partially offset by lower sales volumes. The average market price for the three month period ended March 31, 2024 was $2,070 per ounce versus $1,890 per ounce for the same prior year period.
| BARRICK FIRST QUARTER 2024 | 45 | MANAGEMENT’S DISCUSSION AND ANALYSIS |
| OVERVIEW | OPERATING PERFORMANCE
|
GROWTH PROJECTS & EXPLORATION
|
REVIEW OF FINANCIAL RESULTS
|
OTHER INFORMATION & NON-GAAP RECONCILIATIONS |
FINANCIAL STATEMENTS |
|||||
ATTRIBUTABLE GOLD PRODUCTION VARIANCE (000s oz)
Q1 2024 compared to Q1 2023
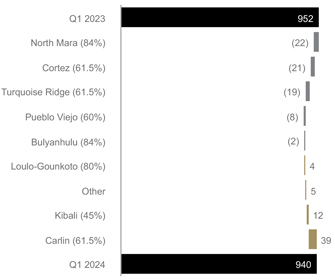
For the three month period ended March 31, 2024, attributable gold production was 12 thousand ounces lower than the same prior year period, primarily due to lower throughput, grades processed and recovery at North Mara, less ore mined at the Crossroads open pit driven by the transition to Phase 6 at Cortez, and planned maintenance at the Sage autoclave at Turquoise Ridge. This was partially offset by higher production at Carlin, due to the conversion of the Goldstrike autoclave to a conventional CIL process and the planned maintenance shutdown that both occurred in the same prior year period.
Copper revenues for the three month period ended March 31, 2024 decreased by 5% compared to the same prior year period, due to a lower realized copper price1, combined with lower sales volume. In the first quarter of 2024, the realized copper price1 was slightly higher than the market copper price due to the impact of positive provisional pricing adjustments, consistent with the same prior year period.
Attributable copper production for the three month period ended March 31, 2024 was in line with the same prior year period, with all sites consistent with the same prior year period.
Production Costs
| ($ millions, except per ounce/pound data in dollars) |
For the three months ended |
|||||||||||
| 3/31/24 | 12/31/23 | 3/31/23 | ||||||||||
| Gold |
||||||||||||
| Site operating costs |
1,257 | 1,355 | 1,208 | |||||||||
| Depreciation |
407 | 471 | 445 | |||||||||
| Royalty expense |
88 | 92 | 101 | |||||||||
| Community relations |
9 | 10 | 7 | |||||||||
| Cost of sales |
1,761 | 1,928 | 1,761 | |||||||||
| Cost of sales ($/oz)a |
1,425 | 1,359 | 1,378 | |||||||||
| Total cash costs ($/oz)b |
1,051 | 982 | 986 | |||||||||
| All-in sustaining costs ($/oz)b |
1,474 | 1,364 | 1,370 | |||||||||
| Copper |
||||||||||||
| Site operating costs |
95 | 105 | 115 | |||||||||
| Depreciation |
60 | 86 | 44 | |||||||||
| Royalty expense |
12 | 16 | 15 | |||||||||
| Community relations |
1 | 2 | 0 | |||||||||
| Cost of sales |
168 | 209 | 174 | |||||||||
| Cost of sales ($/lb)a |
3.20 | 2.92 | 3.22 | |||||||||
| C1 cash costs ($/lb)b |
2.40 | 2.17 | 2.71 | |||||||||
| All-in sustaining costs ($/lb)b |
3.59 | 3.12 | 3.40 | |||||||||
| a. | Gold cost of sales per ounce is calculated as cost of sales across our gold operations (excluding sites in closure or care and maintenance) divided by ounces sold (both on an attributable basis using Barrick’s ownership share). Copper cost of sales per pound is calculated as cost of sales across our copper operations divided by pounds sold (both on an attributable basis using Barrick’s ownership share). |
| b. | Further information on these non-GAAP financial measures, including detailed reconciliations, is included on pages 54 to 67 of this MD&A. |
Q1 2024 compared to Q4 2023
In the first quarter of 2024, gold cost of sales on a consolidated basis was 9% lower than the fourth quarter of 2023, mainly due to lower sales volume. Our 45% interest in Kibali is equity accounted, and therefore the mine’s cost of sales is excluded from our consolidated gold cost of sales. Our per ounce metrics, gold cost of sales2 and total cash costs1, includes our proportionate share of cost of sales at our equity method investees, and were 5% and 7% higher, respectively, than the prior quarter, mainly due to the impact of the lower sales volumes.
In the first quarter of 2024, gold all-in sustaining costs per ounce1, which also includes our proportionate share of equity method investees, increased by 8% compared to the prior quarter. This was primarily due to higher total cash costs per ounce1, as described above, combined with higher minesite sustaining capital expenditures1 on a per ounce basis.
In the first quarter of 2024, copper cost of sales on a consolidated basis was 20% lower than the prior quarter, due to lower sales volumes. Our 50% interests in Zaldívar and Jabal Sayid are equity accounted and therefore, we do not include their cost of sales in our consolidated copper cost of sales. Our per pound metrics, copper cost of sales2 and C1 cash costs1, include our proportionate share of cost of sales at our equity method investees. Copper cost of sales per pound2 and C1 cash costs per pound1 were 10% and 11% higher, respectively, compared to the prior period, primarily due to lower grades processed, partially offset by improved mining efficiencies and lower G&A costs at Lumwana.
| BARRICK FIRST QUARTER 2024 | 46 | MANAGEMENT’S DISCUSSION AND ANALYSIS |
| OVERVIEW | OPERATING PERFORMANCE
|
GROWTH PROJECTS & EXPLORATION
|
REVIEW OF FINANCIAL RESULTS
|
OTHER INFORMATION & NON-GAAP RECONCILIATIONS |
FINANCIAL STATEMENTS |
|||||
In the first quarter of 2024, copper all-in sustaining costs1 per pound, which also includes our proportionate share of equity method investees, was 15% higher than the prior quarter, primarily due to an increase in C1 cash costs per pound1, as discussed above, combined with an increase in minesite sustaining capital expenditures1 related to higher capitalized waste stripping at Lumwana.
Q1 2024 compared to Q1 2023
For the three month period ended March 31, 2024, gold cost of sales on a consolidated basis was in line with the same prior year period, as higher site operating costs were offset by lower depreciation. Our 45% interest in Kibali is equity accounted and therefore, the mine’s cost of sales is excluded from our consolidated gold cost of sales. Our per ounce metrics, gold cost of sales2 and total cash costs1, include our proportionate share of cost of sales at our equity method investees, and were 3% and 7% higher, respectively, compared to the same prior year period. This was mainly due to lower grades processed and higher operating costs at North Mara, combined with lower recoveries and higher consumables and maintenance costs at Pueblo Viejo as we work on fine tuning the chemistry in the expanded processing plant.
For the three month period ended March 31, 2024, gold all-in sustaining costs per ounce1 was 8% higher than the same prior year period, primarily due to higher total cash costs per ounce1, as described above, combined with higher minesite sustaining capital expenditures1.
For the three month period ended March 31, 2024, copper cost of sales on a consolidated basis was 3% lower than the same prior year period, primarily due to the impact of lower sales volumes, partially offset by higher depreciation expense. Our 50% interests in Zaldívar and Jabal Sayid are equity accounted and therefore, we do not include their cost of sales in our consolidated copper cost of sales. Our per pound metrics, copper cost of sales2 and C1 cash costs1, includes our proportionate share of cost of sales at our equity method investees. Copper cost of sales per pound2 and C1 cash costs1 were 1% and 11% lower, respectively, compared to the same prior year period, primarily due to the improved mining efficiencies and lower G&A costs, combined with the impact of higher grades processed at Lumwana. The decrease in cost of sales per pound2 was partially offset by higher depreciation at Lumwana.
For the three month period ended March 31, 2024, copper all-in sustaining costs per pound1 were 6% higher than the same prior year period, primarily reflecting higher minesite sustaining capital expenditures1 as result of the increase in waste stripping tonnes following the investment in the owner stripping fleet at Lumwana, partially offset by lower C1 cash costs per pound1, as discussed above.
Capital Expendituresa
| ($ millions) | For the three months ended |
|||||||||||
| 3/31/24 | 12/31/23 | 3/31/23 | ||||||||||
| Minesite sustainingb |
550 | 569 | 454 | |||||||||
| Project capital expendituresb,c |
165 | 278 | 226 | |||||||||
| Capitalized interest |
13 | 14 | 8 | |||||||||
| Total consolidated capital expenditures |
728 | 861 | 688 | |||||||||
| Attributable capital expendituresd |
572 | 660 | 526 | |||||||||
| a. | These amounts are presented on a cash basis. |
| b. | Further information on these non-GAAP financial measures, including detailed reconciliations, is included on pages 54 to 67 of this MD&A. |
| c. | Project capital expenditures1 are included in our calculation of all-in costs, but not included in our calculation of all-in sustaining costs. |
| d. | These amounts are presented on the same basis as our guidance. |
Q1 2024 compared to Q4 2023
In the first quarter of 2024, total consolidated capital expenditures on a cash basis decreased by 15% compared to the fourth quarter of 2023 due to a decrease in both project capital expenditures1 and minesite sustaining capital expenditures1. Project capital expenditures1 decreased by 41% compared to the prior quarter, mainly as commissioning of the solar substation and half of the array for the NGM TS Solar Project was completed in the prior quarter. This was combined with the Loulo-Gounkoto solar project being commissioned during the current quarter, and construction progress of the underground paste plant at North Mara. The decrease in minesite sustaining capital expenditures1 of 3% was primarily driven by a reduction in the number of new haul trucks commissioned at Cortez.
Q1 2024 compared to Q1 2023
For the three month period ended March 31, 2024, total consolidated capital expenditures on a cash basis increased by 6% compared to the same prior year period. This was mainly due to an increase in minesite sustaining capital expenditures1, partially offset by a decrease in project capital expenditures1. Minesite sustaining capital expenditures1 increased by 21% compared with the same prior year period mainly due to higher capitalized waste stripping at Lumwana and Carlin, combined with increased underground development and the purchase of Komatsu 930-E haul trucks at Carlin. Project capital expenditures1 decreased by 27% compared to the same prior year period, primarily due to lower expenditures at Loulo-Gounkoto due to the commissioning of the solar plant project during the current quarter, at Pueblo Viejo as the plant expansion project was substantially completed in the prior year, and at Lumwana resulting from the investment in the owner stripping fleet occurring in the prior year.
| BARRICK FIRST QUARTER 2024 | 47 | MANAGEMENT’S DISCUSSION AND ANALYSIS |
| OVERVIEW | OPERATING PERFORMANCE
|
GROWTH PROJECTS & EXPLORATION
|
REVIEW OF FINANCIAL RESULTS
|
OTHER INFORMATION & NON-GAAP RECONCILIATIONS |
FINANCIAL STATEMENTS |
|||||
General and Administrative Expenses
| ($ millions) | For the three months ended |
|||||||||||
| 3/31/24 | 12/31/23 | 3/31/23 | ||||||||||
| Corporate administration | 27 | 27 | 28 | |||||||||
| Share-based compensationa | 1 | 2 | 11 | |||||||||
| General & administrative expenses | 28 | 29 | 39 | |||||||||
| a. | Based on a US$15.63 share price as at March 31, 2024 (December 31, 2023: US$18.09 and March 31, 2023: US$18.27). |
Q1 2024 compared to Q4 2023
In the first quarter of 2024, general and administrative expenses was in line with the prior quarter.
Q1 2024 compared to Q1 2023
For the three month period ended March 31, 2024, general and administrative expenses decreased by $11 million compared to the same prior year period resulting from a lower share-based compensation expense due to a decrease in our share price during the current quarter compared to an increase in the same prior year period.
Exploration, Evaluation and Project Expenses
| ($ millions) | For the three months ended |
|||||||||||
| 3/31/24 | 12/31/23 | 3/31/23 | ||||||||||
| Global exploration and evaluation |
24 | 44 | 27 | |||||||||
| Project costs: |
||||||||||||
| Reko Diq |
39 | 25 | 5 | |||||||||
| Pascua-Lama |
5 | 6 | 8 | |||||||||
| Pueblo Viejo |
1 | 1 | 1 | |||||||||
| Lumwana |
0 | 11 | 7 | |||||||||
| Other |
12 | 8 | 11 | |||||||||
| Corporate development |
1 | 4 | 1 | |||||||||
| Global exploration and evaluation and project expense |
82 | 99 | 60 | |||||||||
| Minesite exploration and evaluation |
13 | 4 | 11 | |||||||||
| Total exploration, evaluation and project expenses |
95 | 103 | 71 | |||||||||
Q1 2024 compared to Q4 2023
Exploration, evaluation and project expenses for the first quarter of 2024 decreased by $8 million compared to the fourth quarter of 2023 driven by lower global exploration and evaluation costs across all regions, combined with lower project costs at Lumwana as the PFS work was largely completed in the prior quarter and the Feasibility Study will be capitalized. This was partially offset by higher project costs at Reko Diq as activity continues to ramp-up at the reconstituted project.
Q1 2024 compared to Q1 2023
Exploration, evaluation and project expenses for the three month period ended March 31, 2024 increased by $24 million compared to the same prior year period, driven by higher project costs at Reko Diq due to the ramp-up of activities at the reconstituted project, partially offset by lower project costs at Lumwana as explained above.
Finance Costs, Net
| ($ millions) | For the three months ended |
|||||||||||
| 3/31/24 | 12/31/23 | 3/31/23 | ||||||||||
| Interest expensea |
93 | 88 | 105 | |||||||||
| Accretion |
21 | 23 | 21 | |||||||||
| Interest capitalized |
(13 | ) | (15 | ) | (7 | ) | ||||||
| Other finance costs |
1 | 3 | 1 | |||||||||
| Finance income |
(71 | ) | (83 | ) | (62 | ) | ||||||
| Finance costs, net |
31 | 16 | 58 | |||||||||
| a. | For the three months ended March 31, 2024, interest expense includes approximately $8 million of non-cash interest expense relating to the streaming agreements with Royal Gold, Inc. (December 31, 2023: $7 million and March 31, 2023: $8 million). |
Q1 2024 compared to Q4 2023
In the first quarter of 2024, finance costs, net were $15 million higher than the prior quarter, mainly due to lower finance income.
Q1 2024 compared to Q1 2023
For the three month period ended March 31, 2024, finance costs, net decreased by $27 million compared to the same prior year period, primarily due to lower interest expense combined with higher finance income.
Additional Significant Statement of Income Items
| ($ millions) | For the three months ended |
|||||||||||
| 3/31/24 | 12/31/23 | 3/31/23 | ||||||||||
| Impairment charges |
17 | 289 | 1 | |||||||||
| Loss on currency translation |
12 | 37 | 38 | |||||||||
| Closed mine rehabilitation |
(2 | ) | 51 | 22 | ||||||||
| Other expense (income) |
17 | (323 | ) | 52 | ||||||||
Impairment Charges
Q1 2024 compared to Q4 2023
In the first quarter of 2024, net impairment charges were $17 million, compared to $289 million in the prior period. The impairment charges in the first quarter of 2024 relate to miscellaneous property, plant and equipment assets. The impairment charges in the prior quarter mainly related to a long-lived asset impairment of $280 million at Long Canyon, as we decided not to pursue the permitting associated with Phase 2 mining.
Q1 2024 compared to Q1 2023
For the three month period ended March 31, 2024, net impairment charges were $17 million, compared to $1 million in the same prior year period. The impairment charges in the first quarter of 2024 relate to miscellaneous property, plant and equipment assets. There were no significant impairment charges or reversals in the same prior year period.
Loss on Currency Translation
Q1 2024 compared to Q4 2023
Loss on currency translation in the first quarter of 2024 was $12 million compared to $37 million in the prior quarter. The loss in the current quarter mainly related to the devaluation of the Chilean peso and the Argentine peso, while the losses in the prior quarter mainly related to the significant devaluation of the Argentine peso. This currency fluctuation
| BARRICK FIRST QUARTER 2024 | 48 | MANAGEMENT’S DISCUSSION AND ANALYSIS |
| OVERVIEW | OPERATING PERFORMANCE
|
GROWTH PROJECTS & EXPLORATION
|
REVIEW OF FINANCIAL RESULTS
|
OTHER INFORMATION & NON-GAAP RECONCILIATIONS |
FINANCIAL STATEMENTS |
|||||
resulted in a revaluation of our local currency denominated value-added tax receivable and local currency denominated payable balances.
Q1 2024 compared to Q1 2023
Loss on currency translation in the first quarter of 2024 was $12 million compared to $38 million in the same prior year period. The loss in the current quarter mainly related to the devaluation of the Argentine peso and the Chilean peso. The losses in the same prior year period mainly related to the devaluation of the Zambian kwacha, resulting from high inflation levels and concerns regarding the restructuring of the country’s debt, which subsequently reversed in the second quarter of 2023 as a debt restructuring deal was made. These currency fluctuations resulted in a revaluation of our local currency denominated value-added tax receivable and local currency denominated payable balances.
Closed Mine Rehabilitation
Q1 2024 compared to Q4 2023
Closed mine rehabilitation gain in the first quarter of 2024 was $2 million compared to an expense of $51 million in the prior quarter, mainly due to a slight increase in the market real risk-free rate used to discount the closure provision in the current period, whereas the market real risk-free rate decreased in the prior quarter.
Q1 2024 compared to Q1 2023
Closed mine rehabilitation gain in the first quarter of 2024 was $2 million compared to an expense of $22 million in the same prior year period, mainly due to a slight increase in the market real risk-free rate used to discount the closure provision in the current period, whereas the market real risk-free rate decreased in the same prior year period.
Other Expense (Income)
Q1 2024 compared to Q4 2023
For the three months ended March 31, 2024, other expense was $17 million compared to other income of $323 million in the prior quarter. The change of $340 million mainly relates to a gain of $352 million in the prior quarter as the conditions for the reopening of the Porgera mine were completed on December 22, 2023.
Q1 2024 compared to Q1 2023
For the three months ended March 31, 2024, other expense was $17 million compared to $52 million in the same prior
year period. The decrease of $35 million mainly relates to the $30 million commitment we made towards the expansion of education infrastructure in Tanzania, per our community investment obligations under the Twiga partnership that occurred in the same prior year period.
Income Tax Expense
Income tax expense was $174 million in the first quarter of 2024. The unadjusted effective income tax rate in the first quarter of 2024 was 26% of income before income taxes.
The underlying effective income tax rate on ordinary income in the first quarter of 2024 was 22% after adjusting for the impact of foreign currency translation losses on deferred tax balances; the impact of the de-recognition of deferred tax assets; the impact of updates to the rehabilitation provision for our non-operating mines; the impact of non-deductible foreign exchange losses; and the impact of other expense adjustments.
We record deferred tax charges or credits if changes in facts or circumstances affect the estimated tax basis of assets and therefore, the expectations of our ability to realize deferred tax assets. The interpretation of tax regulations and legislation as well as their application to our business is complex and subject to change. We have significant amounts of deferred tax assets, including tax loss carry forwards, and also deferred tax liabilities. We also have significant amounts of unrecognized deferred tax assets (e.g. for tax losses in Canada). Potential changes in any of these amounts, as well as our ability to realize deferred tax assets, could significantly affect net income or cash flow in future periods. For further details on income tax expense, refer to note 9 of the Financial Statements.
Withholding Taxes
In the first quarter of 2024, we recorded $14 million of dividend withholding taxes related to the undistributed earnings of our subsidiaries in Peru and the United States.
OECD Pillar Two model rules
We have applied the exception available under the amendments to IAS 12 published by the IASB in May 2023 and are not recognizing or disclosing information about deferred tax assets and liabilities related to Pillar Two income taxes. We continue working on assessing our exposure to Pillar Two income taxes and based on the analysis performed to date, we do not expect the impact of Pillar Two provisions to be material to the Company.
| BARRICK FIRST QUARTER 2024 | 49 | MANAGEMENT’S DISCUSSION AND ANALYSIS |
| OVERVIEW | OPERATING PERFORMANCE
|
GROWTH PROJECTS & EXPLORATION
|
REVIEW OF FINANCIAL RESULTS
|
OTHER INFORMATION & NON-GAAP RECONCILIATIONS |
FINANCIAL STATEMENTS |
|||||
Financial Condition Review
Summary Balance Sheet and Key Financial Ratios
| ($ millions, except ratios and share amounts) | As at 3/31/24 | As at 12/31/23 | ||||||
| Total cash and equivalents |
3,942 | 4,148 | ||||||
| Current assets |
3,339 | 3,290 | ||||||
|
Non-current assets |
38,562 | 38,373 | ||||||
| Total Assets |
45,843 | 45,811 | ||||||
| Current liabilities excluding short-term debt |
2,183 | 2,345 | ||||||
| Non-current liabilities excluding long-term debta |
6,718 | 6,738 | ||||||
| Debt (current and long-term) |
4,725 | 4,726 | ||||||
| Total Liabilities |
13,626 | 13,809 | ||||||
| Total shareholders’ equity |
23,463 | 23,341 | ||||||
|
Non-controlling interests |
8,754 | 8,661 | ||||||
| Total Equity |
32,217 | 32,002 | ||||||
| Total common shares outstanding (millions of shares) |
1,756 | 1,756 | ||||||
| Debt, net of cash |
783 | 578 | ||||||
| Key Financial Ratios: |
||||||||
| Current ratiob |
3.32:1 | 3.16:1 | ||||||
|
Debt-to-equityc |
0.15:1 | 0.15:1 | ||||||
| a. | Non-current financial liabilities as at March 31, 2024 were $5,218 million (December 31, 2023: $5,221 million). |
| b. | Represents current assets divided by current liabilities (including short-term debt) as at March 31, 2024 and December 31, 2023. |
| c. | Represents debt divided by total shareholders’ equity (including minority interest) as at March 31, 2024 and December 31, 2023. |
Balance Sheet Review
Total assets were $45.8 billion as at March 31, 2024, slightly higher than total assets as at December 31, 2023.
Our asset base is primarily comprised of non-current assets such as property, plant and equipment and goodwill, reflecting the capital-intensive nature of the mining business and our history of growing through acquisitions. Other significant assets include production inventories, indirect taxes recoverable and receivable, concentrate sales receivable, other government and joint venture related receivables, as well as cash and equivalents.
Total liabilities at March 31, 2024 were $13.6 billion, slightly lower than total liabilities at December 31, 2023. Our liabilities are primarily comprised of debt, other non-current liabilities (such as provisions and deferred income tax liabilities), and accounts payable.
Shareholders’ Equity
| 4/23/2024 | Number of shares | |||
| Common shares |
1,755,636,101 | |||
| Stock options |
— | |||
Financial Position and Liquidity
We believe we have sufficient financial resources to meet our business requirements for the foreseeable future, including capital expenditures, working capital requirements, interest payments, environmental rehabilitation, securities buybacks and dividends.
Total cash and cash equivalents as at March 31, 2024 were $3.9 billion. Our capital structure comprises a mix of debt, non-controlling interest (primarily at NGM) and shareholders’ equity. As at March 31, 2024, our total debt was $4.7 billion (debt, net of cash and equivalents was $783 million) and our debt-to-equity ratio was 0.15:1. This compares to total debt as at December 31, 2023 of $4.7
billion (debt, net of cash and equivalents was $578 million), and a debt-to-equity ratio of 0.15:1.
Uses of cash for the remainder of 2024 include capital commitments of $338 million, and we expect to incur attributable minesite sustaining1 and project capital expenditures1 of approximately $1,900 to $2,300 million during the remainder of the year, based on our annual guidance range on page 12. For the remainder of 2024, we have contractual obligations and commitments of $744 million for supplies and consumables. In addition, we have $267 million in interest payments and other amounts as detailed in the table on page 52. We expect to fund these commitments through operating cash flow, which is our primary source of liquidity, as well as our existing cash balances as necessary. As previously disclosed, we have authorized a share buyback program, where we may purchase up to $1 billion of Barrick shares. As at March 31, 2024, we had not purchased any shares under this program in 2024.
We also have a performance dividend policy that will enhance the return to shareholders when the Company’s liquidity is strong. In addition to our base dividend, the amount of the performance dividend on a quarterly basis will be based on the amount of cash, net of debt, on our consolidated balance sheet at the end of each quarter as per the schedule below.
| BARRICK FIRST QUARTER 2024 | 50 | MANAGEMENT’S DISCUSSION AND ANALYSIS |
| OVERVIEW | OPERATING PERFORMANCE
|
GROWTH PROJECTS & EXPLORATION
|
REVIEW OF FINANCIAL RESULTS
|
OTHER INFORMATION & NON-GAAP RECONCILIATIONS |
FINANCIAL STATEMENTS |
|||||
| Performance Dividend Level |
Threshold Level |
Quarterly Base Dividend |
Quarterly Performance Dividend |
Quarterly Total Dividend |
||||
| Level I | Net cash <$0 |
$0.10 per share |
$0.00 per share |
$0.10 per share |
||||
| Level II | Net cash >$0 and <$0.5B |
$0.10 per share |
$0.05 per share |
$0.15 per share |
||||
| Level III | Net cash >$0.5B and <$1B |
$0.10 per share |
$0.10 per share |
$0.20 per share |
||||
| Level IV | Net cash >$1B |
$0.10 per share |
$0.15 per share |
$0.25 per share |
||||
The declaration and payment of dividends is at the discretion of the Board of Directors, and will depend on the company’s financial results, cash requirements, future prospects, the number of outstanding common shares, and other factors deemed relevant by the Board.
Our operating cash flow is dependent on the ability of our operations to deliver projected future cash flows. The market price of gold and to a lesser extent, copper, are the primary drivers of our operating cash flow. Other options to enhance liquidity include further portfolio optimization and the creation of new joint ventures and partnerships; issuance of equity securities in the public markets or to private investors, which could be undertaken for liquidity enhancement and/or in connection with establishing a strategic partnership; issuance of long-term debt securities in the public markets or to private investors (Moody’s and S&P currently rate Barrick’s outstanding long-term debt as investment grade, with ratings of A3 and BBB+, respectively); and drawing on the $3.0 billion available under our undrawn Credit Facility (subject to compliance with covenants and the making of certain representations and warranties, this facility is available for drawdown as a source of financing). The revolving Credit Facility incorporates sustainability-linked metrics and are made up of annual environmental and social performance targets directly influenced by Barrick’s actions, rather than based on external ratings. The performance targets include Scope 1 and Scope 2 GHG emissions intensity, water use efficiency (reuse and recycling rates), and TRIFR3. Barrick may incur positive or negative pricing adjustments on drawn credit spreads and standby fees based on its sustainability performance versus the targets that have been set. The key financial covenant in our undrawn Credit Facility requires Barrick to maintain a net debt to total capitalization ratio of less than 0.60:1. Barrick’s net debt to total capitalization ratio was 0.02:1 as at March 31, 2024 (0.02:1 as at December 31, 2023).
Summary of Cash Inflow (Outflow)
| ($ millions) | For the three months ended |
|||||||||||
| 3/31/24 | 12/31/23 | 3/31/23 | ||||||||||
| Net cash provided by operating activities | 760 | 997 | 776 | |||||||||
| Investing activities |
||||||||||||
| Capital expenditures |
(728 | ) | (861 | ) | (688 | ) | ||||||
| Funding of equity method investments | (44 | ) | 0 | 0 | ||||||||
| Dividends received from equity method investments | 47 | 114 | 67 | |||||||||
| Shareholder loan repayments from equity method investments | 45 | 7 | 0 | |||||||||
| Investment purchases |
0 | (26 | ) | 0 | ||||||||
| Other |
0 | 0 | 3 | |||||||||
| Total investing outflows |
(680 | ) | (766 | ) | (618 | ) | ||||||
| Net change in debta |
(3 | ) | (45 | ) | (4 | ) | ||||||
| Dividendsb |
(175 | ) | (176 | ) | (175 | ) | ||||||
| Net disbursements to non-controlling interests |
(99 | ) | (138 | ) | (62 | ) | ||||||
| Other |
(7 | ) | 17 | 20 | ||||||||
| Total financing outflows |
(284 | ) | (342 | ) | (221 | ) | ||||||
| Effect of exchange rate |
(2 | ) | (2 | ) | 0 | |||||||
| Decrease in cash and equivalents |
(206 | ) | (113 | ) | (63 | ) | ||||||
| a. | The difference between the net change in debt on a cash basis and the net change on the balance sheet is due to changes in non-cash charges, specifically the unwinding of discounts and amortization of debt issue costs. |
| b. | For the three months ended March 31, 2024, we declared and paid dividends per share in US dollars totaling $0.10 (December 31, 2023: declared and paid $0.10; March 31, 2023: declared and paid $0.10). |
Q1 2024 compared to Q4 2023
In the first quarter of 2024, we generated $760 million in operating cash flow, compared to $997 million in the prior quarter. The decrease of $237 million was primarily due to lower gold and copper sales volumes, higher total cash costs/C1 cash costs per ounce/pound1, partially offset by higher realized gold and copper prices1. Operating cash flow was further impacted by an unfavorable movement in working capital, mainly in accounts payable and other current assets (mainly VAT receivables), partially offset by a favorable movement in accounts receivable. This was partially offset by a decrease in interest paid as a result of the timing of semi-annual interest payments on our bonds, which primarily occur in Q2 and Q4.
Cash outflows from investing activities in the first quarter of 2024 were $680 million, compared to $766 million in the prior quarter. The decreased outflow of $86 million was primarily due to lower capital expenditures relating to the NGM TS Solar Project, Loulo-Gounkoto solar project, and underground paste plant at North Mara. This was partially offset by lower net distributions received from equity method investments, as lower dividends received from Kibali and funding made to Porgera was partially offset by higher shareholder loan repayments made by Kibali.
Net financing cash outflows for the first quarter of 2024 amounted to $284 million, compared to $342 million in the prior quarter. The decrease of $58 million is primarily due to the repurchase of approximately $43 million notional of debt securities occurring in the prior quarter, combined with lower net disbursements paid to non-controlling interests, primarily to Newmont in relation to their interest in NGM.
| BARRICK FIRST QUARTER 2024 | 51 | MANAGEMENT’S DISCUSSION AND ANALYSIS |
| OVERVIEW | OPERATING PERFORMANCE
|
GROWTH PROJECTS & EXPLORATION
|
REVIEW OF FINANCIAL RESULTS
|
OTHER INFORMATION & NON-GAAP RECONCILIATIONS |
FINANCIAL STATEMENTS |
|||||
Q1 2024 compared to Q1 2023
In the first quarter of 2024, we generated $760 million in operating cash flow, compared to $776 million in the same prior year period. The decrease of $16 million was primarily due to an unfavorable movement in working capital, mainly in other current assets (mainly VAT receivables) and accounts payable, partially offset by a favorable movement in inventory and accounts receivable. Operating cash flow was further impacted by a higher realized gold price1, partially offset by lower gold sales volumes and higher total cash costs per pound1.
Cash outflows from investing activities in the first quarter of 2024 were $680 million compared to $618 million in the same prior year period. The increase of $62 million was primarily due to higher capital expenditures mainly due
to higher capitalized waste stripping at Lumwana and Carlin, combined with increased underground development and the purchase of Komatsu 930-E haul trucks at Carlin. This was combined with the funding of equity method investments during the current quarter, in particular Porgera, partially offset by shareholder loan repayments made by equity method investments, in particular Kibali.
Net financing cash outflows for the first quarter of 2024 amounted to $284 million compared to $221 million in the same prior year period. The increase of $63 million is primarily due to higher net disbursements to non-controlling interests, primarily to Newmont in relation to their interest in NGM, combined with the repayment from Pueblo Viejo of the JV partner shareholder loan occurring in the same prior year period.
Commitments and Contingencies
Litigation and Claims
We are currently subject to various litigation proceedings as disclosed in note 15 to the Financial Statements, and we may be involved in disputes with other parties in the future that may result in litigation. If we are unable to resolve these disputes favorably, it may have a material adverse impact on our financial condition, cash flow and results of operations.
Contractual Obligations and Commitments
In the normal course of business, we enter into contracts that give rise to commitments for future minimum payments. The following table summarizes the remaining contractual maturities of our financial liabilities and operating and capital commitments shown on an undiscounted basis:
| ($ millions) | Payments due as at 3/31/24 | |||||||||||||||||||||||||||
| 2024 | 2025 | 2026 | 2027 | 2028 | 2029 and thereafter |
Total | ||||||||||||||||||||||
| Debta |
||||||||||||||||||||||||||||
| Repayment of principal |
0 | 12 | 47 | 0 | 0 | 4,631 | 4,690 | |||||||||||||||||||||
| Capital leases |
9 | 10 | 9 | 8 | 4 | 16 | 56 | |||||||||||||||||||||
| Interest |
267 | 285 | 282 | 279 | 278 | 2,938 | 4,329 | |||||||||||||||||||||
| Provisions for environmental rehabilitationb |
267 | 170 | 116 | 92 | 173 | 1,776 | 2,594 | |||||||||||||||||||||
| Restricted share units |
6 | 11 | 1 | 0 | 0 | 0 | 18 | |||||||||||||||||||||
| Pension benefits and other post-retirement benefits |
4 | 5 | 5 | 5 | 4 | 51 | 74 | |||||||||||||||||||||
| Purchase obligations for supplies and consumablesc |
744 | 266 | 199 | 193 | 181 | 213 | 1,796 | |||||||||||||||||||||
| Capital commitmentsd |
338 | 6 | 0 | 0 | 0 | 0 | 344 | |||||||||||||||||||||
| Social development costse |
27 | 14 | 11 | 3 | 3 | 57 | 115 | |||||||||||||||||||||
| Other obligationsf |
19 | 46 | 53 | 50 | 49 | 511 | 728 | |||||||||||||||||||||
| Total |
1,681 | 825 | 723 | 630 | 692 | 10,193 | 14,744 | |||||||||||||||||||||
| a. | Debt and Interest: Our debt obligations do not include any subjective acceleration clauses or other clauses that enable the holder of the debt to call for early repayment, except in the event that we breach any of the terms and conditions of the debt or for other customary events of default. We are not required to post any collateral under any debt obligations. Projected interest payments on variable rate debt were based on interest rates in effect at March 31, 2024. Interest is calculated on our long-term debt obligations using both fixed and variable rates. |
| b. | Provisions for environmental rehabilitation: Amounts presented in the table represent the undiscounted uninflated future payments for the expected cost of environmental rehabilitation. |
| c. | Purchase obligations for supplies and consumables: Includes commitments related to new purchase obligations to secure a supply of acid, tires and cyanide for our production process. |
| d. | Capital commitments: Purchase obligations for capital expenditures include only those items where binding commitments have been entered into. |
| e. | Social development costs: Includes a commitment of $14 million in 2029 and thereafter, related to the funding of a power transmission line in Argentina. |
| f. | Other obligations includes the Pueblo Viejo joint venture partner shareholder loan, the deposit on the Pascua-Lama silver sale agreement with Wheaton Precious Metals Corp., and minimum royalty payments. |
| BARRICK FIRST QUARTER 2024 | 52 | MANAGEMENT’S DISCUSSION AND ANALYSIS |
| OVERVIEW | OPERATING PERFORMANCE
|
GROWTH PROJECTS & EXPLORATION
|
REVIEW OF FINANCIAL RESULTS
|
OTHER INFORMATION & NON-GAAP RECONCILIATIONS |
FINANCIAL STATEMENTS |
|||||
Review of Quarterly Results
Quarterly Informationa
| ($ millions, except where indicated) | 2024 | 2023 | 2023 | 2023 | 2023 | 2022 | 2022 | 2022 | ||||||||||||||||||||||||
| Q1 | Q4 | Q3 | Q2 | Q1 | Q4 | Q3 | Q2 | |||||||||||||||||||||||||
| Revenues |
2,747 | 3,059 | 2,862 | 2,833 | 2,643 | 2,774 | 2,527 | 2,859 | ||||||||||||||||||||||||
| Realized price per ounce – goldb |
2,075 | 1,986 | 1,928 | 1,972 | 1,902 | 1,728 | 1,722 | 1,861 | ||||||||||||||||||||||||
| Realized price per pound – copperb |
3.86 | 3.78 | 3.78 | 3.70 | 4.20 | 3.81 | 3.24 | 3.72 | ||||||||||||||||||||||||
| Cost of sales |
1,936 | 2,139 | 1,915 | 1,937 | 1,941 | 2,093 | 1,815 | 1,850 | ||||||||||||||||||||||||
| Net earnings |
295 | 479 | 368 | 305 | 120 | (735 | ) | 241 | 488 | |||||||||||||||||||||||
| Per share (dollars)c |
0.17 | 0.27 | 0.21 | 0.17 | 0.07 | (0.42 | ) | 0.14 | 0.27 | |||||||||||||||||||||||
| Adjusted net earningsb |
333 | 466 | 418 | 336 | 247 | 220 | 224 | 419 | ||||||||||||||||||||||||
| Per share (dollars)b,c |
0.19 | 0.27 | 0.24 | 0.19 | 0.14 | 0.13 | 0.13 | 0.24 | ||||||||||||||||||||||||
| Operating cash flow |
760 | 997 | 1,127 | 832 | 776 | 795 | 758 | 924 | ||||||||||||||||||||||||
| Consolidated capital expendituresd |
728 | 861 | 768 | 769 | 688 | 891 | 792 | 755 | ||||||||||||||||||||||||
| Free cash flowb |
32 | 136 | 359 | 63 | 88 | (96 | ) | (34 | ) | 169 | ||||||||||||||||||||||
| a. | Sum of all the quarters may not add up to the annual total due to rounding. |
| b. | Further information on these non-GAAP financial measures, including detailed reconciliations, is included on pages 54 to 67 of this MD&A. |
| c. | Calculated using weighted average number of shares outstanding under the basic method of earnings per share. |
| d. | Amounts presented on a consolidated cash basis. |
Our recent financial results reflect our emphasis on cost discipline, an agile management structure that empowers our site based leadership teams and a portfolio of Tier One Gold Assets5. This, combined with ongoing strength in gold and copper prices, has resulted in strong operating cash flows over several quarters. The positive free cash flow1 generated, together with the proceeds from various divestitures, have allowed us to continue to reinvest in our business, strengthen our balance sheet and to increase returns to shareholders.
Net earnings has also been impacted by the following items in each quarter, which have been excluded from adjusted net earnings1. In the fourth quarter of 2023, we recorded a gain of $352 million as the conditions for the reopening of the Porgera mine were completed on December 22, 2023. In addition, we recorded a long-lived asset impairment of $143 million (net of tax and non-
controlling interests) at Long Canyon. In the first quarter of 2023, we recorded a loss on currency translation of $38 million, mainly related to the devaluation of the Zambian kwacha, and a $30 million commitment towards the expansion of education infrastructure in Tanzania per our community investment obligations under the Twiga partnership. In the fourth quarter of 2022, we recorded a goodwill impairment of $950 million (net of non-controlling interests) related to Loulo-Gounkoto, a non-current asset impairment of $318 million (net of tax) and a net realizable value impairment of leach pad inventory of $27 million (net of tax) at Veladero, and a non-current asset impairment of $42 million (net of tax and non-controlling interests) at Long Canyon. In addition, we recorded an impairment reversal of $120 million and a gain of $300 million following the completion of the transaction allowing for the reconstitution of the Reko Diq project.
Internal Control Over Financial Reporting and Disclosure Controls and Procedures
Management is responsible for establishing and maintaining adequate internal control over financial reporting and disclosure controls and procedures as defined in our 2023 annual MD&A.
Together, the internal control frameworks provide internal control over financial reporting and disclosure. Due to its inherent limitations, internal control over financial reporting and disclosure may not prevent or detect all misstatements. Further, the effectiveness of internal control is subject to the risk that controls may become inadequate because of changes in conditions, or that the degree of compliance with policies or procedures may change.
There were no changes in our internal controls over financial reporting during the three months ended March 31, 2024 that have materially affected, or are reasonably likely to materially affect, our internal controls over financial reporting.
Under the supervision and with the participation of management, including the President and Chief Executive Officer and Senior Executive Vice-President and Chief Financial Officer, management will continue to monitor and evaluate the design and effectiveness of its internal control over financial reporting and disclosure controls and procedures, and may make modifications from time to time as considered necessary.
| BARRICK FIRST QUARTER 2024 | 53 | MANAGEMENT’S DISCUSSION AND ANALYSIS |
| OVERVIEW | OPERATING PERFORMANCE
|
GROWTH PROJECTS & EXPLORATION
|
REVIEW OF FINANCIAL RESULTS
|
OTHER INFORMATION & NON-GAAP RECONCILIATIONS |
FINANCIAL STATEMENTS |
|||||
IFRS Critical Accounting Policies and Accounting Estimates
Management has discussed the development and selection of our critical accounting estimates with the Audit & Risk Committee of the Board of Directors, and the Audit & Risk Committee has reviewed the disclosure relating to such estimates in conjunction with its review of this MD&A. The accounting policies and methods we utilize determine how we report our financial condition and results of operations, and they may require management to make estimates or rely on assumptions about matters that are inherently uncertain. The consolidated financial statements have been prepared in accordance with IFRS, as modified by revaluation of certain financial assets, derivative contracts and post-retirement assets. Our significant accounting policies are disclosed in note 2 of the Financial Statements, including a summary of current and future changes in accounting policies.
Critical Accounting Estimates and Judgments
Certain accounting estimates have been identified as being “critical” to the presentation of our financial condition and results of operations because they require us to make subjective and/or complex judgments about matters that are inherently uncertain; or there is a reasonable likelihood that materially different amounts could be reported under different conditions or using different assumptions and estimates. Our significant accounting judgments, estimates and assumptions are disclosed in note 3 of the accompanying Financial Statements.
Non-GAAP Financial Measures
Adjusted Net Earnings and Adjusted Net Earnings per Share
Adjusted net earnings is a non-GAAP financial measure which excludes the following from net earnings:
| ∎ | Impairment charges (reversals) related to intangibles, goodwill, property, plant and equipment, and investments; |
| ∎ | Acquisition/disposition gains/losses; |
| ∎ | Foreign currency translation gains/losses; |
| ∎ | Significant tax adjustments; |
| ∎ | Other items that are not indicative of the underlying operating performance of our core mining business; and |
| ∎ | Tax effect and non-controlling interest of the above items. |
Management uses this measure internally to evaluate our underlying operating performance for the reporting periods presented and to assist with the planning and forecasting of future operating results. Management believes that adjusted net earnings is a useful measure of our performance because impairment charges, acquisition/ disposition gains/losses and significant tax adjustments do not reflect the underlying operating performance of our core mining business and are not necessarily indicative of future operating results. Furthermore, foreign currency translation gains/losses are not necessarily reflective of the underlying operating results for the reporting periods presented. The tax effect and non-controlling interest of the adjusting items are also excluded to reconcile the amounts to Barrick’s share on a post-tax basis, consistent with net earnings.
As noted, we use this measure for internal purposes. Management’s internal budgets and forecasts and public guidance do not reflect the types of items we adjust for. Consequently, the presentation of adjusted net earnings enables investors and analysts to better understand the underlying operating performance of our core mining business through the eyes of management. Management periodically evaluates the components of adjusted net earnings based on an internal assessment of performance measures that are useful for evaluating the operating performance of our business segments and a review of the non-GAAP financial measures used by mining industry analysts and other mining companies.
Adjusted net earnings is intended to provide additional information only and does not have any standardized definition under IFRS and should not be considered in isolation or as a substitute for measures of performance prepared in accordance with IFRS. The measures are not necessarily indicative of operating profit or cash flow from operations as determined under IFRS. Other companies may calculate these measures differently. The following table reconciles these non-GAAP financial measures to the most directly comparable IFRS measure.
| BARRICK FIRST QUARTER 2024 | 54 | MANAGEMENT’S DISCUSSION AND ANALYSIS |
| OVERVIEW | OPERATING PERFORMANCE
|
GROWTH PROJECTS & EXPLORATION
|
REVIEW OF FINANCIAL RESULTS
|
OTHER INFORMATION & NON-GAAP RECONCILIATIONS |
FINANCIAL STATEMENTS |
|||||
Reconciliation of Net Earnings to Net Earnings per Share, Adjusted Net Earnings and Adjusted Net Earnings per Share
| ($ millions, except per share amounts in dollars) | For the three months ended | |||||||||||
| 3/31/24 | 12/31/23 | 3/31/23 | ||||||||||
| Net earnings attributable to equity holders of the Company |
295 | 479 | 120 | |||||||||
| Impairment charges related to intangibles, goodwill, property, plant and equipment, and investmentsa |
17 | 289 | 1 | |||||||||
| Acquisition/disposition gainsb |
(1 | ) | (354 | ) | (3 | ) | ||||||
| Loss on currency translation |
12 | 37 | 38 | |||||||||
| Significant tax adjustmentsc |
29 | 120 | 48 | |||||||||
| Other (income) expense adjustmentsd |
(9 | ) | 41 | 63 | ||||||||
| Non-controlling intereste |
(4 | ) | (89 | ) | (6 | ) | ||||||
| Tax effecte |
(6 | ) | (57 | ) | (14 | ) | ||||||
| Adjusted net earnings |
333 | 466 | 247 | |||||||||
| Net earnings per sharef |
0.17 | 0.27 | 0.07 | |||||||||
| Adjusted net earnings per sharef |
0.19 | 0.27 | 0.14 | |||||||||
| a. | For the three month period ended March 31, 2024, net impairment charges were mainly related to miscellaneous property, plant and equipment assets. For the three month period ended December 31, 2023, net impairment charges mainly related to a long-lived asset impairment at Long Canyon. |
| b. | For the three month period ended December 31, 2023, acquisition/disposition gains mainly related to a gain on the reopening of the Porgera mine as the conditions for the reopening were completed on December 22, 2023. |
| c. | For the three month period ended March 31, 2024, significant tax adjustments were mainly related to the de-recognition of deferred tax assets and the remeasurement of deferred tax balances. Significant tax adjustments for the three month period ended December 31, 2023 related to foreign currency translation gains and losses on tax balances; the impact of prior year adjustments; and the recognition and derecognition of deferred tax assets. |
| d. | For the three month periods ended March 31, 2024 and December 31, 2023, other (income) expense adjustments mainly related to changes in the discount rate assumptions on our closed mine rehabilitation provision. The three month period ended December 31, 2023 was further impacted by care and maintenance expenses at Porgera. Other (income) expense adjustments for the three month period ended March 31, 2023 mainly related to the $30 million commitment we made towards the expansion of education infrastructure in Tanzania, per our community investment obligations under the Twiga partnership. |
| e. | Non-controlling interest and tax effect for the three month period ended March 31, 2024 primarily relates to net impairment charges. |
| f. | Calculated using weighted average number of shares outstanding under the basic method of earnings per share. |
Free Cash Flow
Free cash flow is a non-GAAP financial measure that deducts capital expenditures from net cash provided by operating activities. Management believes this to be a useful indicator of our ability to operate without reliance on additional borrowing or usage of existing cash.
Free cash flow is intended to provide additional information only and does not have any standardized definition under IFRS and should not be considered in
isolation or as a substitute for measures of performance prepared in accordance with IFRS. The measure is not necessarily indicative of operating profit or cash flow from operations as determined under IFRS. Other companies may calculate this measure differently. The following table reconciles this non-GAAP financial measure to the most directly comparable IFRS measure.
Reconciliation of Net Cash Provided by Operating Activities to Free Cash Flow
| ($ millions) |
For the three months ended | |||||||||||
| 3/31/24 | 12/31/23 | 3/31/23 | ||||||||||
| Net cash provided by operating activities |
760 | 997 | 776 | |||||||||
| Capital expenditures |
(728 | ) | (861 | ) | (688 | ) | ||||||
| Free cash flow |
32 | 136 | 88 | |||||||||
Capital Expenditures
Capital expenditures are classified into minesite sustaining capital expenditures or project capital expenditures depending on the nature of the expenditure. Minesite sustaining capital expenditures is the capital spending required to support current production levels. Project capital expenditures represent the capital spending at new projects and major, discrete projects at existing operations intended to increase net present value through higher production or longer mine life. Management believes this to be a useful indicator of the purpose of capital expenditures
and this distinction is an input into the calculation of all-in sustaining costs per ounce and all-in costs per ounce.
Classifying capital expenditures is intended to provide additional information only and does not have any standardized definition under IFRS, and should not be considered in isolation or as a substitute for measures of performance prepared in accordance with IFRS. Other companies may calculate these measures differently. The following table reconciles these non-GAAP financial measures to the most directly comparable IFRS measure.
| BARRICK FIRST QUARTER 2024 | 55 | MANAGEMENT’S DISCUSSION AND ANALYSIS |
| OVERVIEW | OPERATING PERFORMANCE
|
GROWTH PROJECTS & EXPLORATION
|
REVIEW OF FINANCIAL RESULTS
|
OTHER INFORMATION & NON-GAAP RECONCILIATIONS |
FINANCIAL STATEMENTS |
|||||
Reconciliation of the Classification of Capital Expenditures
| ($ millions) | For the three months ended | |||||||||||
| 3/31/24 | 12/31/23 | 3/31/23 | ||||||||||
| Minesite sustaining capital expenditures |
550 | 569 | 454 | |||||||||
| Project capital expenditures |
165 | 278 | 226 | |||||||||
| Capitalized interest |
13 | 14 | 8 | |||||||||
| Total consolidated capital expenditures |
728 | 861 | 688 | |||||||||
Total cash costs per ounce, All-in sustaining costs per ounce, All-in costs per ounce, C1 cash costs per pound and All-in sustaining costs per pound
Total cash costs per ounce, all-in sustaining costs per ounce and all-in costs per ounce are non-GAAP financial measures which are calculated based on the definition published by the WGC (a market development organization for the gold industry comprised of and funded by gold mining companies from around the world, including Barrick. The WGC is not a regulatory organization. Management uses these measures to monitor the performance of our gold mining operations and their ability to generate positive cash flow, both on an individual site basis and an overall company basis.
Total cash costs start with our cost of sales related to gold production and removes depreciation, the non-controlling interest of cost of sales and includes by-product credits. All-in sustaining costs start with total cash costs and includes sustaining capital expenditures, sustaining leases, general and administrative costs, minesite exploration and evaluation costs and reclamation cost accretion and amortization. These additional costs reflect the expenditures made to maintain current production levels.
All-in costs starts with all-in sustaining costs and adds additional costs that reflect the varying costs of producing gold over the life-cycle of a mine, including: project capital expenditures (capital spending at new projects and major, discrete projects at existing operations intended to increase net present value through higher production or longer mine life) and other non-sustaining costs (primarily non-sustaining leases, exploration and evaluation costs, community relations costs and general and administrative costs that are not associated with current operations). These definitions recognize that there are different costs associated with the life-cycle of a mine, and that it is therefore appropriate to distinguish between sustaining and non-sustaining costs.
We believe that our use of total cash costs, all-in sustaining costs and all-in costs will assist analysts, investors and other stakeholders of Barrick in understanding the costs associated with producing gold, understanding the economics of gold mining, assessing our operating performance and also our ability to generate free cash flow from current operations and to generate free cash flow on an overall company basis. Due to the capital-intensive nature of the industry and the long useful lives over which these items are depreciated, there can be a significant timing difference between net earnings
calculated in accordance with IFRS and the amount of free cash flow that is being generated by a mine and therefore we believe these measures are useful non-GAAP operating metrics and supplement our IFRS disclosures. These measures are not representative of all of our cash expenditures as they do not include income tax payments, interest costs or dividend payments. These measures do not include depreciation or amortization.
Total cash costs per ounce, all-in sustaining costs and all-in costs are intended to provide additional information only and do not have standardized definitions under IFRS and should not be considered in isolation or as a substitute for measures of performance prepared in accordance with IFRS. These measures are not equivalent to net income or cash flow from operations as determined under IFRS. Although the WGC has published a standardized definition, other companies may calculate these measures differently.
In addition to presenting these metrics on a by-product basis, we have calculated these metrics on a co-product basis. Our co-product metrics remove the impact of other metal sales that are produced as a by-product of our gold production from cost per ounce calculations but does not reflect a reduction in costs for costs associated with other metal sales.
C1 cash costs per pound and all-in sustaining costs per pound are non-GAAP financial measures related to our copper mine operations. We believe that C1 cash costs per pound enables investors to better understand the performance of our copper operations in comparison to other copper producers who present results on a similar basis. C1 cash costs per pound excludes royalties and non-routine charges as they are not direct production costs. All-in sustaining costs per pound is similar to the gold all-in sustaining costs metric and management uses this to better evaluate the costs of copper production. We believe this measure enables investors to better understand the operating performance of our copper mines as this measure reflects all of the sustaining expenditures incurred in order to produce copper. All-in sustaining costs per pound includes C1 cash costs, sustaining capital expenditures, sustaining leases, general and administrative costs, minesite exploration and evaluation costs, royalties, reclamation cost accretion and amortization and write-downs taken on inventory to net realizable value.
| BARRICK FIRST QUARTER 2024 | 56 | MANAGEMENT’S DISCUSSION AND ANALYSIS |
| OVERVIEW | OPERATING PERFORMANCE
|
GROWTH PROJECTS & EXPLORATION
|
REVIEW OF FINANCIAL RESULTS
|
OTHER INFORMATION & NON-GAAP RECONCILIATIONS |
FINANCIAL STATEMENTS |
|||||
Reconciliation of Gold Cost of Sales to Total cash costs, All-in sustaining costs and All-in costs, including on a per ounce basis
| ($ millions, except per ounce information in dollars) | For the three months ended | |||||||||||||||
| Footnote | 3/31/24 | 12/31/23 | 3/31/23 | |||||||||||||
| Cost of sales applicable to gold production |
1,761 | 1,928 | 1,761 | |||||||||||||
| Depreciation |
(407 | ) | (471 | ) | (445 | ) | ||||||||||
| Cash cost of sales applicable to equity method investments |
56 | 65 | 63 | |||||||||||||
| By-product credits |
(56 | ) | (66 | ) | (61 | ) | ||||||||||
| Non-recurring items |
a | 0 | 0 | 0 | ||||||||||||
| Other |
b | 2 | 6 | 0 | ||||||||||||
| Non-controlling interests |
c | (400 | ) | (432 | ) | (378 | ) | |||||||||
| Total cash costs | 956 | 1,030 | 940 | |||||||||||||
| General & administrative costs |
28 | 29 | 39 | |||||||||||||
| Minesite exploration and evaluation costs |
d | 13 | 4 | 11 | ||||||||||||
| Minesite sustaining capital expenditures |
e | 550 | 569 | 454 | ||||||||||||
| Sustaining leases |
6 | 7 | 7 | |||||||||||||
| Rehabilitation - accretion and amortization (operating sites) |
f | 17 | 20 | 14 | ||||||||||||
| Non-controlling interest, copper operations and other |
g | (224 | ) | (230 | ) | (159 | ) | |||||||||
| All-in sustaining costs | 1,346 | 1,429 | 1,306 | |||||||||||||
| Global exploration and evaluation and project expense |
d | 82 | 99 | 60 | ||||||||||||
| Community relations costs not related to current operations |
0 | 1 | 0 | |||||||||||||
| Project capital expenditures |
e | 165 | 278 | 226 | ||||||||||||
| Non-sustaining leases |
0 | 0 | 0 | |||||||||||||
| Rehabilitation - accretion and amortization (non-operating sites) |
f | 7 | 7 | 6 | ||||||||||||
| Non-controlling interest and copper operations and other |
g | (92 | ) | (112 | ) | (88 | ) | |||||||||
| All-in costs | 1,508 | 1,702 | 1,510 | |||||||||||||
| Ounces sold - attributable basis (000s ounces) | h | 910 | 1,042 | 954 | ||||||||||||
| Cost of sales per ounce | i,j | 1,425 | 1,359 | 1,378 | ||||||||||||
| Total cash costs per ounce | j | 1,051 | 982 | 986 | ||||||||||||
| Total cash costs per ounce (on a co-product basis) | j,k | 1,093 | 1,026 | 1,030 | ||||||||||||
| All-in sustaining costs per ounce | j | 1,474 | 1,364 | 1,370 | ||||||||||||
| All-in sustaining costs per ounce (on a co-product basis) | j,k | 1,516 | 1,408 | 1,414 | ||||||||||||
| All-in costs per ounce | j | 1,657 | 1,627 | 1,583 | ||||||||||||
| All-in costs per ounce (on a co-product basis) | j,k | 1,699 | 1,671 | 1,627 | ||||||||||||
| a. |
Non-recurring items These costs are not indicative of our cost of production and have been excluded from the calculation of total cash costs. |
|
| b. |
Other Other adjustments for the three month period ended March 31, 2024 include the removal of total cash costs and by-product credits associated with Pierina of $nil (December 31, 2023: $nil; March 31, 2023: $3 million), which was producing incidental ounces until December 31, 2023 while in closure. |
|
| c. |
Non-controlling interests Non-controlling interests include non-controlling interests related to gold production of $542 million for the three month period ended March 31, 2024 (December 31, 2023: $594 million and March 31, 2023: $529 million). Non-controlling interests include NGM, Pueblo Viejo, Loulo-Gounkoto, Tongon, North Mara and Bulyanhulu. Refer to Note 4 to the Financial Statements for further information. |
|
| d. |
Exploration and evaluation costs Exploration, evaluation and project expenses are presented as minesite sustaining if they support current mine operations and project if they relate to future projects. Refer to page 48 of this MD&A. |
|
| e. |
Capital expenditures Capital expenditures are related to our gold sites only and are split between minesite sustaining and project capital expenditures. Project capital expenditures are capital spending at new projects and major, discrete projects at existing operations intended to increase net present value through higher production or longer mine life. Significant projects in the current year include the plant expansion project at Pueblo Viejo and the solar project at NGM. Refer to page 47 of this MD&A. |
|
| f. |
Rehabilitation—accretion and amortization Includes depreciation on the assets related to rehabilitation provisions of our gold operations and accretion on the rehabilitation provision of our gold operations, split between operating and non-operating sites. |
|
| g. |
Non-controlling interest and copper operations Removes general and administrative costs related to non-controlling interests and copper based on a percentage allocation of revenue. Also removes exploration, evaluation and project expenses, rehabilitation costs and capital expenditures incurred by our copper sites and the non-controlling interest of NGM, Pueblo Viejo, Loulo-Gounkoto, Tongon, North Mara and Bulyanhulu operating segments. It also includes capital expenditures applicable to our equity method investment in Kibali. Figures remove the impact of Pierina up until December 31, 2023. The impact is summarized as the following: |
|
| BARRICK FIRST QUARTER 2024 | 57 | MANAGEMENT’S DISCUSSION AND ANALYSIS |
| OVERVIEW | OPERATING PERFORMANCE
|
GROWTH PROJECTS & EXPLORATION
|
REVIEW OF FINANCIAL RESULTS
|
OTHER INFORMATION & NON-GAAP RECONCILIATIONS |
FINANCIAL STATEMENTS |
|||||
| ($ millions) | For the three months ended | |||||||||||
| Non-controlling interest, copper operations and other | 3/31/24 | 12/31/23 | 3/31/23 | |||||||||
| General & administrative costs |
(4 | ) | 7 | (6 | ) | |||||||
| Minesite exploration and evaluation expenses |
(2 | ) | (2 | ) | (4 | ) | ||||||
| Rehabilitation - accretion and amortization (operating sites) |
(5 | ) | (6 | ) | (5 | ) | ||||||
| Minesite sustaining capital expenditures |
(213 | ) | (229 | ) | (144 | ) | ||||||
| All-in sustaining costs total |
(224 | ) | (230 | ) | (159 | ) | ||||||
| Global exploration and evaluation and project expense |
(44 | ) | (40 | ) | (12 | ) | ||||||
| Project capital expenditures |
(48 | ) | (72 | ) | (76 | ) | ||||||
| All-in costs total |
(92 | ) | (112 | ) | (88 | ) | ||||||
| h. | Ounces sold - attributable basis |
| Excludes Pierina, which was producing incidental ounces until December 31, 2023 while in closure. It also excludes Long Canyon which is producing residual ounces from the leach pad while in care and maintenance. |
| i. | Cost of sales per ounce |
| Figures remove the cost of sales impact of: Pierina of $nil for the three month period ended March 31, 2024 (December 31, 2023: $nil and March 31, 2023: $3 million), which was producing incidental ounces up until December 31, 2023 while in closure. Gold cost of sales per ounce is calculated as cost of sales across our gold operations (excluding sites in closure or care and maintenance) divided by ounces sold (both on an attributable basis using Barrick’s ownership share). |
| j. | Per ounce figures |
| Cost of sales per ounce, total cash costs per ounce, all-in sustaining costs per ounce and all-in costs per ounce may not calculate based on amounts presented in this table due to rounding. |
| k. | Co-product costs per ounce |
| Total cash costs per ounce, all-in sustaining costs per ounce and all-in costs per ounce presented on a co-product basis removes the impact of by-product credits of our gold production (net of non-controlling interest) calculated as: |
| ($ millions) | For the three months ended | |||||||||||
| 3/31/24 | 12/31/23 | 3/31/23 | ||||||||||
| By-product credits |
56 | 66 | 61 | |||||||||
| Non-controlling interest |
(18 | ) | (20 | ) | (19 | ) | ||||||
| By-product credits (net of non-controlling interest) |
38 | 46 | 42 | |||||||||
| BARRICK FIRST QUARTER 2024 | 58 | MANAGEMENT’S DISCUSSION AND ANALYSIS |
| OVERVIEW | OPERATING PERFORMANCE
|
GROWTH PROJECTS & EXPLORATION
|
REVIEW OF FINANCIAL RESULTS
|
OTHER INFORMATION & NON-GAAP RECONCILIATIONS |
FINANCIAL STATEMENTS |
|||||
Reconciliation of Gold Cost of Sales to Total cash costs, All-in sustaining costs and All-in costs, including on a per ounce basis, by operating segment
| ($ millions, except per ounce information in dollars) | For the three months ended 3/31/24 | |||||||||||||||||||||||||||||||
| Footnote | Carlin | Corteza | Turquoise Ridge |
Phoenix | Nevada Gold Minesb |
Hemlo | North America |
|||||||||||||||||||||||||
| Cost of sales applicable to gold production |
468 | 261 | 174 | 88 | 991 | 65 | 1,056 | |||||||||||||||||||||||||
| Depreciation |
(83 | ) | (75 | ) | (37 | ) | (18 | ) | (213 | ) | (9 | ) | (222 | ) | ||||||||||||||||||
| By-product credits |
(1 | ) | (1 | ) | 0 | (34 | ) | (36 | ) | 0 | (36 | ) | ||||||||||||||||||||
| Non-recurring items |
c | 0 | 0 | 0 | 0 | 0 | 0 | 0 | ||||||||||||||||||||||||
| Other |
d | (5 | ) | 0 | 0 | 6 | 1 | 0 | 1 | |||||||||||||||||||||||
|
Non-controlling interests |
(146 | ) | (71 | ) | (53 | ) | (15 | ) | (285 | ) | 0 | (285 | ) | |||||||||||||||||||
| Total cash costs |
233 | 114 | 84 | 27 | 458 | 56 | 514 | |||||||||||||||||||||||||
| General & administrative costs |
0 | 0 | 0 | 0 | 0 | 0 | 0 | |||||||||||||||||||||||||
| Minesite exploration and evaluation costs |
e | 3 | 1 | 1 | 1 | 6 | 0 | 6 | ||||||||||||||||||||||||
| Minesite sustaining capital expenditures |
f | 183 | 72 | 27 | 6 | 295 | 10 | 305 | ||||||||||||||||||||||||
| Sustaining capital leases |
0 | 0 | 0 | 1 | 1 | 0 | 1 | |||||||||||||||||||||||||
| Rehabilitation - accretion and amortization (operating sites) |
g | 3 | 4 | 1 | 1 | 9 | 0 | 9 | ||||||||||||||||||||||||
|
Non-controlling interests |
(73 | ) | (30 | ) | (11 | ) | (4 | ) | (120 | ) | 0 | (120 | ) | |||||||||||||||||||
| All-in sustaining costs |
349 | 161 | 102 | 32 | 649 | 66 | 715 | |||||||||||||||||||||||||
| Global exploration and evaluation and project expense |
e | 0 | 0 | 0 | 0 | 0 | 0 | 0 | ||||||||||||||||||||||||
| Project capital expenditures |
f | 12 | 31 | 0 | 0 | 56 | 0 | 56 | ||||||||||||||||||||||||
|
Non-controlling interests |
(5 | ) | (12 | ) | 0 | 0 | (22 | ) | 0 | (22 | ) | |||||||||||||||||||||
| All-in costs |
356 | 180 | 102 | 32 | 683 | 66 | 749 | |||||||||||||||||||||||||
| Ounces sold - attributable basis (000s ounces) | 207 | 121 | 62 | 34 | 424 | 38 | 462 | |||||||||||||||||||||||||
| Cost of sales per ounce | h,i | 1,371 | 1,329 | 1,733 | 1,595 | 1,431 | 1,715 | 1,454 | ||||||||||||||||||||||||
| Total cash costs per ounce | i | 1,127 | 946 | 1,359 | 767 | 1,081 | 1,476 | 1,114 | ||||||||||||||||||||||||
| Total cash costs per ounce (on a co-product basis) | i,j | 1,129 | 949 | 1,363 | 1,272 | 1,123 | 1,484 | 1,154 | ||||||||||||||||||||||||
| All-in sustaining costs per ounce | i | 1,687 | 1,341 | 1,655 | 944 | 1,536 | 1,754 | 1,554 | ||||||||||||||||||||||||
| All-in sustaining costs per ounce (on a co-product basis) | i,j | 1,689 | 1,344 | 1,659 | 1,449 | 1,578 | 1,762 | 1,594 | ||||||||||||||||||||||||
| All-in costs per ounce | i | 1,722 | 1,503 | 1,661 | 944 | 1,621 | 1,773 | 1,633 | ||||||||||||||||||||||||
| All-in costs per ounce (on a co-product basis) | i,j | 1,724 | 1,506 | 1,665 | 1,449 | 1,663 | 1,781 | 1,673 | ||||||||||||||||||||||||
| ($ millions, except per ounce information in dollars) | For the three months ended 3/31/24 |
|||||||||||||||||||||||||||||||
| Footnote |
Pueblo Viejo |
Veladero |
Porgerak | Latin America & Asia Pacific |
||||||||||||||||||||||||||||
| Cost of sales applicable to gold production |
210 | 45 | — | 255 | ||||||||||||||||||||||||||||
| Depreciation |
(62 | ) | (11 | ) | — | (73 | ) | |||||||||||||||||||||||||
| By-product credits |
(10 | ) | (1 | ) | — | (11 | ) | |||||||||||||||||||||||||
| Non-recurring items |
c | 0 | 0 | — | 0 | |||||||||||||||||||||||||||
| Other |
d | 0 | 0 | — | 0 | |||||||||||||||||||||||||||
|
Non-controlling interests |
(55 | ) | 0 | — | (55 | ) | ||||||||||||||||||||||||||
| Total cash costs |
83 | 33 | — | 116 | ||||||||||||||||||||||||||||
| General & administrative costs |
0 | 0 | — | 0 | ||||||||||||||||||||||||||||
| Minesite exploration and evaluation costs |
e | 0 | 3 | — | 3 | |||||||||||||||||||||||||||
| Minesite sustaining capital expenditures |
f | 42 | 21 | — | 63 | |||||||||||||||||||||||||||
| Sustaining capital leases |
0 | 0 | — | 0 | ||||||||||||||||||||||||||||
| Rehabilitation - accretion and amortization (operating sites) |
g | 1 | 0 | — | 1 | |||||||||||||||||||||||||||
|
Non-controlling interests |
(17 | ) | 0 | — | (17 | ) | ||||||||||||||||||||||||||
| All-in sustaining costs |
109 | 57 | — | 166 | ||||||||||||||||||||||||||||
| Global exploration and evaluation and project expense |
e | 0 | 0 | — | 0 | |||||||||||||||||||||||||||
| Project capital expenditures |
f | 33 | 10 | — | 43 | |||||||||||||||||||||||||||
|
Non-controlling interests |
(13 | ) | 0 | — | (13 | ) | ||||||||||||||||||||||||||
| All-in costs |
129 | 67 | — | 196 | ||||||||||||||||||||||||||||
| Ounces sold - attributable basis (000s ounces) |
82 | 33 | — | 115 | ||||||||||||||||||||||||||||
| Cost of sales per ounce |
h,i | 1,527 | 1,322 | — | 1,480 | |||||||||||||||||||||||||||
| Total cash costs per ounce |
i | 1,013 | 961 | — | 1,000 | |||||||||||||||||||||||||||
| Total cash costs per ounce (on a co-product basis) |
i,j | 1,075 | 1,000 | — | 1,055 | |||||||||||||||||||||||||||
| All-in sustaining costs per ounce |
i | 1,334 | 1,664 | — | 1,437 | |||||||||||||||||||||||||||
| All-in sustaining costs per ounce (on a co-product basis) |
i,j | 1,396 | 1,703 | — | 1,492 | |||||||||||||||||||||||||||
| All-in costs per ounce |
i | 1,571 | 1,953 | — | 1,690 | |||||||||||||||||||||||||||
| All-in costs per ounce (on a co-product basis) |
i,j | 1,633 | 1,992 | — | 1,745 | |||||||||||||||||||||||||||
| BARRICK FIRST QUARTER 2024 | 59 | MANAGEMENT’S DISCUSSION AND ANALYSIS |
| OVERVIEW | OPERATING PERFORMANCE
|
GROWTH PROJECTS & EXPLORATION
|
REVIEW OF FINANCIAL RESULTS
|
OTHER INFORMATION & NON-GAAP RECONCILIATIONS |
FINANCIAL STATEMENTS |
|||||
| ($ millions, except per ounce information in dollars) | For the three months ended 3/31/24 | |||||||||||||||||||||||||
| Footnote | Loulo- Gounkoto |
Kibali | North Mara | Tongon | Bulyanhulu | Africa & Middle East |
||||||||||||||||||||
| Cost of sales applicable to gold production |
206 | 86 | 92 | 73 | 71 | 528 | ||||||||||||||||||||
| Depreciation |
(67 | ) | (28 | ) | (18 | ) | (10 | ) | (15 | ) | (138 | ) | ||||||||||||||
| By-product credits |
0 | 0 | 0 | 0 | (6 | ) | (6 | ) | ||||||||||||||||||
| Non-recurring items |
c | 0 | 0 | 0 | 0 | 0 | 0 | |||||||||||||||||||
| Other |
d | 0 | 0 | 0 | 0 | 0 | 0 | |||||||||||||||||||
| Non-controlling interests |
(28 | ) | 0 | (12 | ) | (6 | ) | (8 | ) | (54 | ) | |||||||||||||||
| Total cash costs |
111 | 58 | 62 | 57 | 42 | 330 | ||||||||||||||||||||
| General & administrative costs |
0 | 0 | 0 | 0 | 0 | 0 | ||||||||||||||||||||
| Minesite exploration and evaluation costs |
e | 0 | 0 | 0 | 0 | 0 | 0 | |||||||||||||||||||
| Minesite sustaining capital expenditures |
f | 50 | 15 | 22 | 2 | 21 | 110 | |||||||||||||||||||
| Sustaining capital leases |
0 | 2 | 0 | 0 | 0 | 2 | ||||||||||||||||||||
| Rehabilitation - accretion and amortization (operating sites) |
g | 1 | 0 | 1 | 4 | 0 | 6 | |||||||||||||||||||
| Non-controlling interests |
(10 | ) | 0 | (4 | ) | (1 | ) | (3 | ) | (18 | ) | |||||||||||||||
| All-in sustaining costs |
152 | 75 | 81 | 62 | 60 | 430 | ||||||||||||||||||||
| Global exploration and evaluation and project expense |
e | 0 | 0 | 0 | 0 | 0 | 0 | |||||||||||||||||||
| Project capital expenditures |
f | 24 | 9 | 14 | 0 | 10 | 57 | |||||||||||||||||||
| Non-controlling interests |
(5 | ) | 0 | (2 | ) | 0 | (2 | ) | (9 | ) | ||||||||||||||||
| All-in costs |
171 | 84 | 93 | 62 | 68 | 478 | ||||||||||||||||||||
| Ounces sold - attributable basis (000s ounces) |
140 | 72 | 46 | 35 | 40 | 333 | ||||||||||||||||||||
| Cost of sales per ounce |
h,i | 1,177 | 1,200 | 1,678 | 1,887 | 1,479 | 1,362 | |||||||||||||||||||
| Total cash costs per ounce |
i | 794 | 802 | 1,339 | 1,630 | 1,044 | 989 | |||||||||||||||||||
| Total cash costs per ounce (on a co-product basis) |
i,j | 794 | 807 | 1,346 | 1,636 | 1,161 | 1,006 | |||||||||||||||||||
| All-in sustaining costs per ounce |
i | 1,092 | 1,048 | 1,753 | 1,773 | 1,485 | 1,293 | |||||||||||||||||||
| All-in sustaining costs per ounce (on a co-product basis) |
i,j | 1,092 | 1,053 | 1,760 | 1,779 | 1,602 | 1,310 | |||||||||||||||||||
| All-in costs per ounce |
i | 1,229 | 1,165 | 2,006 | 1,773 | 1,695 | 1,436 | |||||||||||||||||||
| All-in costs per ounce (on a co-product basis) |
i,j | 1,229 | 1,170 | 2,013 | 1,779 | 1,812 | 1,453 | |||||||||||||||||||
| ($ millions, except per ounce information in dollars) | For the three months ended 12/31/23 | |||||||||||||||||||||||||||||||||
| Footnote | Carlin | Corteza | Turquoise Ridge |
Long Canyonl |
Phoenix | Nevada Gold Minesb |
Hemlo | North America |
||||||||||||||||||||||||||
| Cost of sales applicable to gold production |
443 | 361 | 197 | 6 | 102 | 1,114 | 53 | 1,167 | ||||||||||||||||||||||||||
| Depreciation |
(77 | ) | (118 | ) | (51 | ) | (4 | ) | (21 | ) | (273 | ) | (7 | ) | (280 | ) | ||||||||||||||||||
| By-product credits |
0 | (1 | ) | (1 | ) | 0 | (38 | ) | (40 | ) | 0 | (40 | ) | |||||||||||||||||||||
| Non-recurring items |
c | 0 | 0 | 0 | 0 | 0 | 0 | 0 | 0 | |||||||||||||||||||||||||
| Other |
d | (6 | ) | 0 | 0 | 0 | 8 | 1 | 0 | 1 | ||||||||||||||||||||||||
| Non-controlling interests |
(139 | ) | (93 | ) | (55 | ) | 0 | (19 | ) | (307 | ) | 0 | (307 | ) | ||||||||||||||||||||
| Total cash costs |
221 | 149 | 90 | 2 | 32 | 495 | 46 | 541 | ||||||||||||||||||||||||||
| General & administrative costs |
0 | 0 | 0 | 0 | 0 | 0 | 0 | 0 | ||||||||||||||||||||||||||
| Minesite exploration and evaluation costs |
e | 2 | 1 | 1 | 0 | 0 | 5 | 0 | 5 | |||||||||||||||||||||||||
| Minesite sustaining capital expenditures |
f | 174 | 100 | 28 | 0 | 9 | 314 | 8 | 322 | |||||||||||||||||||||||||
| Sustaining capital leases |
0 | 0 | 0 | 0 | 1 | 1 | 0 | 1 | ||||||||||||||||||||||||||
| Rehabilitation - accretion and amortization (operating sites) |
g | 3 | 5 | 0 | 0 | 2 | 10 | 0 | 10 | |||||||||||||||||||||||||
| Non-controlling interests |
(70 | ) | (40 | ) | (11 | ) | 0 | (5 | ) | (128 | ) | 0 | (128 | ) | ||||||||||||||||||||
| All-in sustaining costs |
330 | 215 | 108 | 2 | 39 | 697 | 54 | 751 | ||||||||||||||||||||||||||
| Global exploration and evaluation and project expense |
e | 0 | 0 | 0 | 0 | 0 | 0 | 0 | 0 | |||||||||||||||||||||||||
| Project capital expenditures |
f | 3 | 29 | 2 | 0 | 0 | 126 | 0 | 126 | |||||||||||||||||||||||||
| Non-controlling interests |
(1 | ) | (11 | ) | (1 | ) | 0 | 0 | (49 | ) | 0 | (49 | ) | |||||||||||||||||||||
| All-in costs |
332 | 233 | 109 | 2 | 39 | 774 | 54 | 828 | ||||||||||||||||||||||||||
| Ounces sold - attributable basis (000s ounces) |
220 | 164 | 86 | 2 | 39 | 511 | 33 | 544 | ||||||||||||||||||||||||||
| Cost of sales per ounce |
h,i | 1,219 | 1,353 | 1,419 | 2,193 | 1,576 | 1,331 | 1,618 | 1,348 | |||||||||||||||||||||||||
| Total cash costs per ounce |
i | 1,006 | 909 | 1,046 | 990 | 787 | 968 | 1,407 | 995 | |||||||||||||||||||||||||
| Total cash costs per ounce (on a co-product basis) |
i,j | 1,008 | 911 | 1,053 | 992 | 1,258 | 1,007 | 1,413 | 1,032 | |||||||||||||||||||||||||
| All-in sustaining costs per ounce |
i | 1,506 | 1,309 | 1,257 | 1,074 | 981 | 1,366 | 1,671 | 1,385 | |||||||||||||||||||||||||
| All-in sustaining costs per ounce (on a co-product basis) |
i,j | 1,508 | 1,311 | 1,264 | 1,076 | 1,452 | 1,405 | 1,677 | 1,422 | |||||||||||||||||||||||||
| All-in costs per ounce |
i | 1,513 | 1,416 | 1,275 | 1,074 | 981 | 1,518 | 1,700 | 1,529 | |||||||||||||||||||||||||
| All-in costs per ounce (on a co-product basis) |
i,j | 1,515 | 1,418 | 1,282 | 1,076 | 1,452 | 1,557 | 1,706 | 1,566 | |||||||||||||||||||||||||
| BARRICK FIRST QUARTER 2024 | 60 | MANAGEMENT’S DISCUSSION AND ANALYSIS |
| OVERVIEW | OPERATING PERFORMANCE
|
GROWTH PROJECTS & EXPLORATION
|
REVIEW OF FINANCIAL RESULTS
|
OTHER INFORMATION & NON-GAAP RECONCILIATIONS |
FINANCIAL STATEMENTS |
|||||
| ($ millions, except per ounce information in dollars) | For the three months ended 12/31/23 | |||||||||||||
| Footnote | Pueblo Viejo | Veladero | Latin America & Asia Pacific | |||||||||||
| Cost of sales applicable to gold production | 235 | 64 | 299 | |||||||||||
| Depreciation |
(66 | ) | (14 | ) | (80 | ) | ||||||||
| By-product credits |
(11 | ) | (2 | ) | (13 | ) | ||||||||
| Non-recurring items |
c | 0 | 0 | 0 | ||||||||||
| Other |
d | 0 | 0 | 0 | ||||||||||
| Non-controlling interests |
(63 | ) | 0 | (63 | ) | |||||||||
| Total cash costs | 95 | 48 | 143 | |||||||||||
| General & administrative costs |
0 | 0 | 0 | |||||||||||
| Minesite exploration and evaluation costs |
e | 0 | 1 | 1 | ||||||||||
| Minesite sustaining capital expenditures |
f | 51 | 17 | 68 | ||||||||||
| Sustaining capital leases |
0 | 0 | 0 | |||||||||||
| Rehabilitation - accretion and amortization (operating sites) |
g | 2 | 0 | 2 | ||||||||||
| Non-controlling interests |
(21 | ) | 0 | (21 | ) | |||||||||
| All-in sustaining costs | 127 | 66 | 193 | |||||||||||
| Global exploration and evaluation and project expense |
e | 2 | 0 | 2 | ||||||||||
| Project capital expenditures |
f | 15 | 5 | 20 | ||||||||||
| Non-controlling interests |
(8 | ) | 0 | (8 | ) | |||||||||
| All-in costs | 136 | 71 | 207 | |||||||||||
| Ounces sold - attributable basis (000s ounces) | 89 | 46 | 135 | |||||||||||
| Cost of sales per ounce | h,i | 1,588 | 1,378 | 1,524 | ||||||||||
| Total cash costs per ounce | i | 1,070 | 1,021 | 1,049 | ||||||||||
| Total cash costs per ounce (on a co-product basis) |
i,j | 1,141 | 1,070 | 1,110 | ||||||||||
| All-in sustaining costs per ounce | i | 1,428 | 1,403 | 1,428 | ||||||||||
| All-in sustaining costs per ounce (on a co-product basis) |
i,j | 1,499 | 1,452 | 1,489 | ||||||||||
| All-in costs per ounce | i | 1,532 | 1,508 | 1,558 | ||||||||||
| All-in costs per ounce (on a co-product basis) | i,j | 1,603 | 1,557 | 1,619 | ||||||||||
| ($ millions, except per ounce information in dollars) | For the three months ended 12/31/23 | |||||||||||||||||||||||||
| Footnote | Loulo- Gounkoto |
Kibali | North Mara |
Tongon | Bulyanhulu | Africa & Middle East |
||||||||||||||||||||
| Cost of sales applicable to gold production | 205 | 105 | 103 | 70 | 69 | 552 | ||||||||||||||||||||
| Depreciation |
(59 | ) | (37 | ) | (22 | ) | (14 | ) | (15 | ) | (147 | ) | ||||||||||||||
| By-product credits |
0 | 0 | (1 | ) | 0 | (6 | ) | (7 | ) | |||||||||||||||||
| Non-recurring items |
c | 0 | 0 | 0 | 0 | 0 | 0 | |||||||||||||||||||
| Other |
d | 0 | 0 | 0 | 0 | 0 | 0 | |||||||||||||||||||
| Non-controlling interests |
(29 | ) | 0 | (12 | ) | (7 | ) | (7 | ) | (55 | ) | |||||||||||||||
| Total cash costs |
117 | 68 | 68 | 49 | 41 | 343 | ||||||||||||||||||||
| General & administrative costs |
0 | 0 | 0 | 0 | 0 | 0 | ||||||||||||||||||||
| Minesite exploration and evaluation costs |
e | 0 | 0 | 0 | 0 | 0 | 0 | |||||||||||||||||||
| Minesite sustaining capital expenditures |
f | 37 | 5 | 24 | 15 | 18 | 99 | |||||||||||||||||||
| Sustaining capital leases |
0 | 2 | 0 | 0 | 0 | 2 | ||||||||||||||||||||
| Rehabilitation - accretion and amortization (operating sites) |
g | 1 | 0 | 1 | 4 | 0 | 6 | |||||||||||||||||||
| Non-controlling interests |
(8 | ) | 0 | (4 | ) | (2 | ) | (2 | ) | (16 | ) | |||||||||||||||
| All-in sustaining costs | 147 | 75 | 89 | 66 | 57 | 434 | ||||||||||||||||||||
| Global exploration and evaluation and project expense |
e | 0 | 0 | 0 | 0 | 0 | 0 | |||||||||||||||||||
| Project capital expenditures |
f | 56 | 15 | 39 | 0 | 16 | 126 | |||||||||||||||||||
| Non-controlling interests |
(11 | ) | 0 | (6 | ) | 0 | (3 | ) | (20 | ) | ||||||||||||||||
| All-in costs | 192 | 90 | 122 | 66 | 70 | 540 | ||||||||||||||||||||
| Ounces sold - attributable basis (000s ounces) | 127 | 92 | 61 | 42 | 41 | 363 | ||||||||||||||||||||
| Cost of sales per ounce | h,i | 1,296 | 1,141 | 1,420 | 1,489 | 1,413 | 1,313 | |||||||||||||||||||
| Total cash costs per ounce | i | 924 | 737 | 1,103 | 1,184 | 1,002 | 945 | |||||||||||||||||||
| Total cash costs per ounce (on a co-product basis) | i,j | 925 | 742 | 1,119 | 1,190 | 1,112 | 962 | |||||||||||||||||||
| All-in sustaining costs per ounce | i | 1,168 | 819 | 1,449 | 1,586 | 1,376 | 1,198 | |||||||||||||||||||
| All-in sustaining costs per ounce (on a co-product basis) | i,j | 1,169 | 824 | 1,465 | 1,592 | 1,486 | 1,215 | |||||||||||||||||||
| All-in costs per ounce | i | 1,521 | 988 | 1,985 | 1,586 | 1,692 | 1,491 | |||||||||||||||||||
| All-in costs per ounce (on a co-product basis) | i,j | 1,522 | 993 | 2,001 | 1,592 | 1,802 | 1,508 | |||||||||||||||||||
| BARRICK FIRST QUARTER 2024 | 61 | MANAGEMENT’S DISCUSSION AND ANALYSIS |
| OVERVIEW | OPERATING PERFORMANCE
|
GROWTH PROJECTS & EXPLORATION
|
REVIEW OF FINANCIAL RESULTS
|
OTHER INFORMATION & NON-GAAP RECONCILIATIONS |
FINANCIAL STATEMENTS |
|||||
| ($ millions, except per ounce information in dollars) | For the three months ended 3/31/23 | |||||||||||||||||||||||||||||||||
| Footnote | Carlin | Corteza | Turquoise Ridge |
Long Canyonl |
Phoenix | Nevada Gold Minesb |
Hemlo | North America |
||||||||||||||||||||||||||
| Cost of sales applicable to gold production |
393 | 295 | 189 | 6 | 99 | 982 | 59 | 1,041 | ||||||||||||||||||||||||||
| Depreciation |
(63 | ) | (91 | ) | (50 | ) | (4 | ) | (19 | ) | (227 | ) | (8 | ) | (235 | ) | ||||||||||||||||||
| By-product credits |
(1 | ) | (1 | ) | (1 | ) | 0 | (38 | ) | (41 | ) | 0 | (41 | ) | ||||||||||||||||||||
| Non-recurring items |
c | 0 | 0 | 0 | 0 | 0 | 0 | 0 | 0 | |||||||||||||||||||||||||
| Other |
d | (5 | ) | 0 | 0 | 0 | 7 | 2 | 0 | 2 | ||||||||||||||||||||||||
| Non-controlling interests |
(125 | ) | (78 | ) | (53 | ) | (1 | ) | (18 | ) | (275 | ) | 0 | (275 | ) | |||||||||||||||||||
| Total cash costs | 199 | 125 | 85 | 1 | 31 | 441 | 51 | 492 | ||||||||||||||||||||||||||
| General & administrative costs |
0 | 0 | 0 | 0 | 0 | 0 | 0 | 0 | ||||||||||||||||||||||||||
| Minesite exploration and evaluation costs |
e | 8 | 0 | 1 | 0 | 0 | 10 | 0 | 10 | |||||||||||||||||||||||||
| Minesite sustaining capital expenditures |
f | 116 | 67 | 30 | 0 | 6 | 224 | 12 | 236 | |||||||||||||||||||||||||
| Sustaining capital leases |
0 | 0 | 0 | 0 | 0 | 0 | 1 | 1 | ||||||||||||||||||||||||||
| Rehabilitation - accretion and amortization (operating sites) |
g | 3 | 4 | 1 | 0 | 1 | 9 | 0 | 9 | |||||||||||||||||||||||||
| Non-controlling interests |
(49 | ) | (27 | ) | (13 | ) | 0 | (3 | ) | (94 | ) | 0 | (94 | ) | ||||||||||||||||||||
| All-in sustaining costs | 277 | 169 | 104 | 1 | 35 | 590 | 64 | 654 | ||||||||||||||||||||||||||
| Global exploration and evaluation and project expense |
e | 0 | 0 | 0 | 0 | 0 | 0 | 0 | 0 | |||||||||||||||||||||||||
| Project capital expenditures |
f | 0 | 24 | 5 | 0 | 0 | 53 | 0 | 53 | |||||||||||||||||||||||||
| Non-controlling interests |
0 | (9 | ) | (2 | ) | 0 | 0 | (20 | ) | 0 | (20 | ) | ||||||||||||||||||||||
| All-in costs | 277 | 184 | 107 | 1 | 35 | 623 | 64 | 687 | ||||||||||||||||||||||||||
| Ounces sold - attributable basis (000s ounces) |
164 | 137 | 82 | 2 | 26 | 411 | 40 | 451 | ||||||||||||||||||||||||||
| Cost of sales per ounce | h,i | 1,449 | 1,324 | 1,412 | 1,621 | 2,380 | 1,461 | 1,486 | 1,463 | |||||||||||||||||||||||||
| Total cash costs per ounce | i | 1,215 | 913 | 1,034 | 579 | 1,198 | 1,074 | 1,291 | 1,093 | |||||||||||||||||||||||||
| Total cash costs per ounce (on a co-product basis) |
i,j | 1,218 | 916 | 1,041 | 579 | 1,930 | 1,124 | 1,296 | 1,139 | |||||||||||||||||||||||||
| All-in sustaining costs per ounce | i | 1,689 | 1,233 | 1,271 | 629 | 1,365 | 1,436 | 1,609 | 1,451 | |||||||||||||||||||||||||
| All-in sustaining costs per ounce (on a co-product basis) |
i,j | 1,692 | 1,236 | 1,278 | 629 | 2,097 | 1,486 | 1,614 | 1,497 | |||||||||||||||||||||||||
| All-in costs per ounce | i | 1,689 | 1,340 | 1,306 | 629 | 1,365 | 1,514 | 1,610 | 1,522 | |||||||||||||||||||||||||
| All-in costs per ounce (on a co-product basis) |
i,j | 1,692 | 1,343 | 1,313 | 629 | 2,097 | 1,564 | 1,615 | 1,568 | |||||||||||||||||||||||||
| ($ millions, except per ounce information in dollars) | For the three months ended 3/31/23 | |||||||||||||||
| Footnote | Pueblo Viejo | Veladero | Latin America & Asia Pacific | |||||||||||||
| Cost of sales applicable to gold production |
184 | 70 | 254 | |||||||||||||
| Depreciation |
(64 | ) | (22 | ) | (86 | ) | ||||||||||
| By-product credits |
(12 | ) | (2 | ) | (14 | ) | ||||||||||
| Non-recurring items |
c | 0 | 0 | 0 | ||||||||||||
| Other |
d | 0 | 0 | 0 | ||||||||||||
| Non-controlling interests |
(44 | ) | 0 | (44 | ) | |||||||||||
| Total cash costs | 64 | 46 | 110 | |||||||||||||
| General & administrative costs |
0 | 0 | 0 | |||||||||||||
| Minesite exploration and evaluation costs |
e | 0 | 1 | 1 | ||||||||||||
| Minesite sustaining capital expenditures |
f | 52 | 30 | 82 | ||||||||||||
| Sustaining capital leases |
0 | 1 | 1 | |||||||||||||
| Rehabilitation - accretion and amortization (operating sites) |
g | 1 | 0 | 1 | ||||||||||||
| Non-controlling interests |
(21 | ) | 0 | (21 | ) | |||||||||||
| All-in sustaining costs | 96 | 78 | 174 | |||||||||||||
| Global exploration and evaluation and project expense |
e | 0 | 0 | 0 | ||||||||||||
| Project capital expenditures |
f | 61 | 6 | 67 | ||||||||||||
| Non-controlling interests |
(24 | ) | 0 | (24 | ) | |||||||||||
| All-in costs | 133 | 84 | 217 | |||||||||||||
| Ounces sold - attributable basis (000s ounces) | 90 | 44 | 134 | |||||||||||||
| Cost of sales per ounce | h,i | 1,241 | 1,587 | 1,377 | ||||||||||||
| Total cash costs per ounce | i | 714 | 1,035 | 819 | ||||||||||||
| Total cash costs per ounce (on a co-product basis) | i,j | 808 | 1,074 | 895 | ||||||||||||
| All-in sustaining costs per ounce | i | 1,073 | 1,761 | 1,304 | ||||||||||||
| All-in sustaining costs per ounce (on a co-product basis) |
i,j | 1,167 | 1,800 | 1,380 | ||||||||||||
| All-in costs per ounce | i | 1,481 | 1,910 | 1,661 | ||||||||||||
| All-in costs per ounce (on a co-product basis) | i,j | 1,575 | 1,949 | 1,737 | ||||||||||||
| BARRICK FIRST QUARTER 2024 | 62 | MANAGEMENT’S DISCUSSION AND ANALYSIS |
| OVERVIEW | OPERATING PERFORMANCE
|
GROWTH PROJECTS & EXPLORATION
|
REVIEW OF FINANCIAL RESULTS
|
OTHER INFORMATION & NON-GAAP RECONCILIATIONS |
FINANCIAL STATEMENTS |
|||||
| ($ millions, except per ounce information in dollars) | For the three months ended 3/31/23 | |||||||||||||||||||||||||
| Footnote | Loulo- Gounkoto |
Kibali | North Mara | Tongon | Bulyanhulu |
Africa & Middle East |
||||||||||||||||||||
| Cost of sales applicable to gold production |
215 | 91 | 83 | 83 | 74 | 546 | ||||||||||||||||||||
| Depreciation |
(71 | ) | (25 | ) | (19 | ) | (15 | ) | (16 | ) | (146 | ) | ||||||||||||||
| By-product credits |
0 | 0 | (1 | ) | 0 | (5 | ) | (6 | ) | |||||||||||||||||
| Non-recurring items |
c | 0 | 0 | 0 | 0 | 0 | 0 | |||||||||||||||||||
| Other |
d | 0 | 0 | 0 | 0 | 0 | 0 | |||||||||||||||||||
|
Non-controlling interests |
(29 | ) | 0 | (10 | ) | (7 | ) | (8 | ) | (54 | ) | |||||||||||||||
| Total cash costs |
115 | 66 | 53 | 61 | 45 | 340 | ||||||||||||||||||||
| General & administrative costs |
0 | 0 | 0 | 0 | 0 | 0 | ||||||||||||||||||||
| Minesite exploration and evaluation costs |
e | 0 | 0 | 0 | 0 | 0 | 0 | |||||||||||||||||||
| Minesite sustaining capital expenditures |
f | 55 | 12 | 30 | 4 | 19 | 120 | |||||||||||||||||||
| Sustaining capital leases |
1 | 0 | 0 | 0 | 0 | 1 | ||||||||||||||||||||
| Rehabilitation - accretion and amortization (operating sites) |
g | 0 | 0 | 1 | 1 | 0 | 2 | |||||||||||||||||||
|
Non-controlling interests |
(11 | ) | 0 | (5 | ) | 0 | (3 | ) | (19 | ) | ||||||||||||||||
| All-in sustaining costs |
160 | 78 | 79 | 66 | 61 | 444 | ||||||||||||||||||||
| Global exploration and evaluation and project expense |
e | 0 | 0 | 0 | 0 | 0 | 0 | |||||||||||||||||||
| Project capital expenditures |
f | 49 | 7 | 12 | 0 | 5 | 73 | |||||||||||||||||||
|
Non-controlling interests |
(10 | ) | 0 | (2 | ) | 0 | (1 | ) | (13 | ) | ||||||||||||||||
| All-in costs |
199 | 85 | 89 | 66 | 65 | 504 | ||||||||||||||||||||
| Ounces sold - attributable basis (000s ounces) |
134 | 67 | 70 | 52 | 46 | 369 | ||||||||||||||||||||
| Cost of sales per ounce |
h,i | 1,275 | 1,367 | 987 | 1,453 | 1,358 | 1,272 | |||||||||||||||||||
| Total cash costs per ounce |
i | 855 | 987 | 759 | 1,182 | 982 | 922 | |||||||||||||||||||
| Total cash costs per ounce (on a co-product basis) |
i,j | 855 | 993 | 765 | 1,185 | 1,070 | 936 | |||||||||||||||||||
| All-in sustaining costs per ounce |
i | 1,190 | 1,177 | 1,137 | 1,284 | 1,332 | 1,208 | |||||||||||||||||||
| All-in sustaining costs per ounce (on a co-product basis) | i,j | 1,190 | 1,183 | 1,143 | 1,287 | 1,420 | 1,222 | |||||||||||||||||||
| All-in costs per ounce |
i | 1,485 | 1,289 | 1,278 | 1,284 | 1,423 | 1,374 | |||||||||||||||||||
| All-in costs per ounce (on a co-product basis) |
i,j | 1,485 | 1,295 | 1,284 | 1,287 | 1,511 | 1,388 | |||||||||||||||||||
| a. | Includes Goldrush. |
| b. | These results represent our 61.5% interest in Carlin, Cortez, Turquoise Ridge, Phoenix and Long Canyon until it transitioned to care and maintenance at the end of 2023, as previously reported. |
| c. | Non-recurring items |
| These costs are not indicative of our cost of production and have been excluded from the calculation of total cash costs. |
| d. | Other |
| Other adjustments at Carlin include the removal of total cash costs and by-product credits associated with Emigrant starting the second quarter of 2022, which is producing incidental ounces. |
| e. | Exploration and evaluation costs |
| Exploration, evaluation and project expenses are presented as minesite sustaining if it supports current mine operations and project if it relates to future projects. Refer to page 48 of this MD&A. |
| f. | Capital expenditures |
| Capital expenditures are related to our gold sites only and are split between minesite sustaining and project capital expenditures. Project capital expenditures are capital spending at new projects and major, discrete projects at existing operations intended to increase net present value through higher production or longer mine life. Significant projects in the current year include the plant expansion project at Pueblo Viejo and the solar project at NGM. Refer to page 47 of this MD&A. |
| g. | Rehabilitation - accretion and amortization |
| Includes depreciation on the assets related to rehabilitation provisions of our gold operations and accretion on the rehabilitation provision of our gold operations, split between operating and non-operating sites. |
| h. | Cost of sales per ounce |
| Gold cost of sales per ounce is calculated as cost of sales across our gold operations (excluding sites in closure or care and maintenance) divided by ounces sold (both on an attributable basis using Barrick’s ownership share). |
| i. | Per ounce figures |
| Cost of sales per ounce, total cash costs per ounce, all-in sustaining costs per ounce and all-in costs per ounce may not calculate based on amounts presented in this table due to rounding. |
| j. | Co-product costs per ounce |
| Total cash costs per ounce, all-in sustaining costs per ounce and all-in costs per ounce presented on a co-product basis removes the impact of by-product credits of our gold production (net of non-controlling interest) calculated as: |
| BARRICK FIRST QUARTER 2024 | 63 | MANAGEMENT’S DISCUSSION AND ANALYSIS |
| OVERVIEW | OPERATING PERFORMANCE
|
GROWTH PROJECTS & EXPLORATION
|
REVIEW OF FINANCIAL RESULTS
|
OTHER INFORMATION & NON-GAAP RECONCILIATIONS |
FINANCIAL STATEMENTS |
|||||
| ($ millions) | For the three months ended 3/31/24 | |||||||||||||||||||||||||||
| Carlin | Corteza | Turquoise Ridge |
Phoenix | Nevada Gold Minesb |
Hemlo | Pueblo Viejo |
||||||||||||||||||||||
| By-product credits |
1 | 1 | 0 | 34 | 36 | 0 | 10 | |||||||||||||||||||||
| Non-controlling interest |
0 | 0 | 0 | (13 | ) | (13 | ) | 0 | (4 | ) | ||||||||||||||||||
| By-product credits (net of non-controlling interest) |
1 | 1 | 0 | 21 | 23 | 0 | 6 | |||||||||||||||||||||
| ($ millions) | For the three months ended 3/31/24 | |||||||||||||||||||||||||||
| Veladero | Porgerak | Loulo- Gounkoto |
Kibali | North Mara | Tongon | Bulyanhulu | ||||||||||||||||||||||
| By-product credits |
1 | — | 0 | 0 | 0 | 0 | 6 | |||||||||||||||||||||
| Non-controlling interest |
0 | — | 0 | 0 | 0 | 0 | (1 | ) | ||||||||||||||||||||
| By-product credits (net of non-controlling interest) |
1 | — | 0 | 0 | 0 | 0 | 5 | |||||||||||||||||||||
| ($ millions) | For the three months ended 12/31/23 | |||||||||||||||||||||||||||
| Carlin | Corteza | Turquoise Ridge |
Long Canyonl |
Phoenix | Nevada Gold Minesb |
Hemlo | ||||||||||||||||||||||
| By-product credits |
0 | 1 | 1 | 0 | 38 | 40 | 0 | |||||||||||||||||||||
| Non-controlling interest |
0 | 0 | (1 | ) | 0 | (14 | ) | (15 | ) | 0 | ||||||||||||||||||
| By-product credits (net of non-controlling interest) |
0 | 1 | 0 | 0 | 24 | 25 | 0 | |||||||||||||||||||||
| ($ millions) | For the three months ended 12/31/23 | |||||||||||||||||||||||||||
| Pueblo Viejo | Veladero | Loulo- Gounkoto |
Kibali | North Mara | Tongon | Bulyanhulu | ||||||||||||||||||||||
| By-product credits |
11 | 2 | 0 | 0 | 1 | 0 | 6 | |||||||||||||||||||||
| Non-controlling interest |
(5 | ) | 0 | 0 | 0 | 0 | 0 | (1 | ) | |||||||||||||||||||
| By-product credits (net of non-controlling interest) |
6 | 2 | 0 | 0 | 1 | 0 | 5 | |||||||||||||||||||||
| ($ millions) | For the three months ended 3/31/23 | |||||||||||||||||||||||||||
| Carlin | Corteza | Turquoise Ridge |
Long Canyonl |
Phoenix | Nevada Gold Minesb |
Hemlo | ||||||||||||||||||||||
| By-product credits |
1 | 1 | 1 | 0 | 38 | 41 | 0 | |||||||||||||||||||||
| Non-controlling interest |
0 | 0 | 0 | 0 | (14 | ) | (14 | ) | 0 | |||||||||||||||||||
| By-product credits (net of non-controlling interest) |
1 | 1 | 1 | 0 | 24 | 27 | 0 | |||||||||||||||||||||
| ($ millions) | For the three months ended 3/31/23 | |||||||||||||||||||||||||||
| Pueblo Viejo | Veladero | Loulo- Gounkoto |
Kibali | North Mara | Tongon | Bulyanhulu | ||||||||||||||||||||||
| By-product credits |
12 | 2 | 0 | 0 | 1 | 0 | 5 | |||||||||||||||||||||
| Non-controlling interest |
(4 | ) | 0 | 0 | 0 | 0 | 0 | (1 | ) | |||||||||||||||||||
| By-product credits (net of non-controlling interest) |
8 | 2 | 0 | 0 | 1 | 0 | 4 | |||||||||||||||||||||
|
|
||||||||||||||||||||||||||||
|
k. As Porgera was placed on care and maintenance from April 25, 2020 until December 22, 2023, no operating data or per ounce data has been provided from the third quarter of 2020 to the fourth quarter of 2023. On December 22, 2023, we completed the Commencement Agreement, pursuant to which the PNG government and BNL, the 95% owner and operator of the Porgera joint venture, agreed on a partnership for the future ownership and operation of the mine. Ownership of Porgera is now held in a new joint venture owned 51% by PNG stakeholders and 49% by a Barrick affiliate, PJL. PJL is jointly owned on a 50/50 basis by Barrick and Zijin Mining Group and therefore Barrick now holds a 24.5% ownership interest in the Porgera joint venture. Barrick holds a 23.5% interest in the economic benefits of the mine under the economic benefit sharing arrangement agreed with the PNG government whereby Barrick and Zijin Mining Group together share 47% of the overall economic benefits derived from the mine accumulated over time, and the PNG stakeholders share the remaining 53%. In the first quarter of 2024, Porgera had gold production but did not have any gold sales. |
|
|||||||||||||||||||||||||||
| l. Starting in the first quarter of 2024, we have ceased to include production or non-GAAP cost metrics for Long Canyon as it was placed on care and maintenance at the end of 2023, as previously reported. |
|
|||||||||||||||||||||||||||
| BARRICK FIRST QUARTER 2024 | 64 | MANAGEMENT’S DISCUSSION AND ANALYSIS |
| OVERVIEW | OPERATING PERFORMANCE
|
GROWTH PROJECTS & EXPLORATION
|
REVIEW OF FINANCIAL RESULTS
|
OTHER INFORMATION & NON-GAAP RECONCILIATIONS |
FINANCIAL STATEMENTS |
|||||
Reconciliation of Copper Cost of Sales to C1 cash costs and All-in sustaining costs, including on a per pound basis
| ($ millions, except per pound information in dollars) | For the three months ended | |||||||||||
| 3/31/24 | 12/31/23 | 3/31/23 | ||||||||||
| Cost of sales |
168 | 209 | 174 | |||||||||
| Depreciation/amortization |
(60 | ) | (86 | ) | (44 | ) | ||||||
| Treatment and refinement charges |
34 | 51 | 43 | |||||||||
| Cash cost of sales applicable to equity method investments |
82 | 103 | 87 | |||||||||
| Less: royalties |
(12 | ) | (16 | ) | (15 | ) | ||||||
| By-product credits |
(5 | ) | (5 | ) | (4 | ) | ||||||
| Other |
0 | 0 | 0 | |||||||||
| C1 cash costs |
207 | 256 | 241 | |||||||||
| General & administrative costs |
4 | 6 | 6 | |||||||||
| Rehabilitation - accretion and amortization |
2 | 2 | 2 | |||||||||
| Royalties |
12 | 16 | 15 | |||||||||
| Minesite exploration and evaluation costs |
0 | 0 | 2 | |||||||||
| Minesite sustaining capital expenditures |
83 | 84 | 33 | |||||||||
| Sustaining leases |
1 | 3 | 3 | |||||||||
| All-in sustaining costs |
309 | 367 | 302 | |||||||||
| Tonnes sold - attributable basis (thousands of tonnes) |
39 | 53 | 40 | |||||||||
| Pounds sold - attributable basis (millions pounds) |
86 | 117 | 89 | |||||||||
| Cost of sales per pounda,b |
3.20 | 2.92 | 3.22 | |||||||||
| C1 cash costs per pounda |
2.40 | 2.17 | 2.71 | |||||||||
| All-in sustaining costs per pounda |
3.59 | 3.12 | 3.40 | |||||||||
| a. | Cost of sales per pound, C1 cash costs per pound and all-in sustaining costs per pound may not calculate based on amounts presented in this table due to rounding. |
| b. | Copper cost of sales per pound is calculated as cost of sales across our copper operations divided by pounds sold (both on an attributable basis using Barrick’s ownership share). |
Reconciliation of Copper Cost of Sales to C1 cash costs and All-in sustaining costs, including on a per pound basis, by operating segment
| ($ millions, except per pound information in dollars) | For the three months ended | |||||||||||||||||||||||||||||||||||
| 3/31/24 | 12/31/23 | 3/31/23 | ||||||||||||||||||||||||||||||||||
| Zaldívar | Lumwana | Jabal Sayid |
Zaldívar | Lumwana | Jabal Sayid |
Zaldívar | Lumwana | Jabal Sayid |
||||||||||||||||||||||||||||
| Cost of sales |
82 | 168 | 26 | 101 | 206 | 34 | 87 | 174 | 26 | |||||||||||||||||||||||||||
| Depreciation/amortization |
(21 | ) | (60 | ) | (5 | ) | (24 | ) | (84 | ) | (8 | ) | (20 | ) | (44 | ) | (6 | ) | ||||||||||||||||||
| Treatment and refinement charges |
0 | 28 | 6 | 0 | 44 | 7 | 0 | 36 | 7 | |||||||||||||||||||||||||||
| Less: royalties |
0 | (12 | ) | 0 | 0 | (16 | ) | 0 | 0 | (15 | ) | 0 | ||||||||||||||||||||||||
| By-product credits |
0 | 0 | (5 | ) | 0 | 0 | (5 | ) | 0 | 0 | (4 | ) | ||||||||||||||||||||||||
| Other |
0 | 0 | 0 | 0 | 0 | 0 | 0 | 0 | 0 | |||||||||||||||||||||||||||
| C1 cash costs |
61 | 124 | 22 | 77 | 150 | 28 | 67 | 151 | 23 | |||||||||||||||||||||||||||
| Rehabilitation - accretion and amortization |
0 | 2 | 0 | 0 | 2 | 0 | 0 | 2 | 0 | |||||||||||||||||||||||||||
| Royalties |
0 | 12 | 0 | 0 | 16 | 0 | 0 | 15 | 0 | |||||||||||||||||||||||||||
| Minesite exploration and evaluation costs |
0 | 0 | 0 | 0 | 0 | 0 | 2 | 0 | 0 | |||||||||||||||||||||||||||
| Minesite sustaining capital expenditures |
5 | 75 | 3 | 13 | 68 | 3 | 5 | 26 | 2 | |||||||||||||||||||||||||||
| Sustaining leases |
1 | 0 | 0 | 2 | 0 | 1 | 0 | 1 | 2 | |||||||||||||||||||||||||||
| All-in sustaining costs |
67 | 213 | 25 | 92 | 236 | 32 | 74 | 195 | 27 | |||||||||||||||||||||||||||
| Tonnes sold - attributable basis (thousands of tonnes) |
9 | 22 | 8 | 12 | 32 | 9 | 10 | 22 | 8 | |||||||||||||||||||||||||||
| Pounds sold - attributable basis (millions pounds) |
21 | 49 | 16 | 26 | 70 | 21 | 23 | 49 | 17 | |||||||||||||||||||||||||||
| Cost of sales per pounda,b |
3.97 | 3.41 | 1.61 | 3.85 | 2.95 | 1.59 | 3.73 | 3.56 | 1.53 | |||||||||||||||||||||||||||
| C1 cash costs per pounda |
2.95 | 2.52 | 1.35 | 2.93 | 2.14 | 1.32 | 2.86 | 3.09 | 1.39 | |||||||||||||||||||||||||||
| All-in sustaining costs per pounda |
3.27 | 4.33 | 1.55 | 3.51 | 3.38 | 1.50 | 3.22 | 3.98 | 1.61 | |||||||||||||||||||||||||||
| a. | Cost of sales per pound, C1 cash costs per pound and all-in sustaining costs per pound may not calculate based on amounts presented in this table due to rounding. |
| b. | Copper cost of sales per pound is calculated as cost of sales across our copper operations divided by pounds sold (both on an attributable basis using Barrick’s ownership share). |
| BARRICK FIRST QUARTER 2024 | 65 | MANAGEMENT’S DISCUSSION AND ANALYSIS |
| OVERVIEW | OPERATING PERFORMANCE
|
GROWTH PROJECTS & EXPLORATION
|
REVIEW OF FINANCIAL RESULTS
|
OTHER INFORMATION & NON-GAAP RECONCILIATIONS |
FINANCIAL STATEMENTS |
|||||
| EBITDA, Adjusted EBITDA and Attributable EBITDA
EBITDA is a non-GAAP financial measure, which excludes the following from net earnings:
∎ Income tax expense; ∎ Finance costs; ∎ Finance income; and ∎ Depreciation.
Management believes that EBITDA is a valuable indicator of our ability to generate liquidity by producing operating cash flow to fund working capital needs, service debt obligations, and fund capital expenditures. Management uses EBITDA for this purpose. EBITDA is also frequently used by investors and analysts for valuation purposes whereby EBITDA is multiplied by a factor or “EBITDA multiple” that is based on an observed or inferred relationship between EBITDA and market values to determine the approximate total enterprise value of a company. Adjusted EBITDA removes the effect of impairment charges; acquisition/disposition gains/losses; foreign currency translation gains/losses; and other expense adjustments. We also remove the impact of income tax expense, finance costs, finance income and depreciation incurred in our equity method accounted investments. Attributable EBITDA further removes the non-controlling interest portion. We believe these items provide a greater level of consistency with the adjusting items |
|
included in our adjusted net earnings reconciliation, with the exception that these amounts are adjusted to remove any impact on finance costs/income, income tax expense and/or depreciation as they do not affect EBITDA. We believe this additional information will assist analysts, investors and other stakeholders of Barrick in better understanding our ability to generate liquidity from our attributable business, including equity method investments, by excluding these amounts from the calculation as they are not indicative of the performance of our core mining business and do not necessarily reflect the underlying operating results for the periods presented. Additionally, it is aligned with how we present our forward-looking guidance on gold ounces and copper pounds produced. EBITDA, adjusted EBITDA and attributable EBITDA are intended to provide additional information to investors and analysts and do not have any standardized definition under IFRS, and should not be considered in isolation or as a substitute for measures of performance prepared in accordance with IFRS. EBITDA, adjusted EBITDA and attributable EBITDA exclude the impact of cash costs of financing activities and taxes, and the effects of changes in operating working capital balances, and therefore are not necessarily indicative of operating profit or cash flow from operations as determined under IFRS. Other companies may calculate EBITDA, adjusted EBITDA and attributable EBITDA differently. |
Reconciliation of Net Earnings to EBITDA, Adjusted EBITDA and Attributable EBITDA
| ($ millions) | For the three months ended | |||||||||||
| 3/31/24 | 12/31/23 | 3/31/23 | ||||||||||
| Net earnings |
487 | 597 | 269 | |||||||||
| Income tax expense |
174 | 174 | 205 | |||||||||
| Finance costs, neta |
10 | (7) | 37 | |||||||||
| Depreciation |
474 | 564 | 495 | |||||||||
| EBITDA |
1,145 | 1,328 | 1,006 | |||||||||
| Impairment charges of non-current assetsb |
17 | 289 | 1 | |||||||||
| Acquisition/disposition gainsc |
(1) | (354) | (3) | |||||||||
| Loss on currency translation |
12 | 37 | 38 | |||||||||
| Other (income) expense adjustmentsd |
(9) | 41 | 63 | |||||||||
| Income tax expense, net finance costsa, and depreciation from equity investees |
102 | 118 | 78 | |||||||||
| Adjusted EBITDA |
1,266 | 1,459 | 1,183 | |||||||||
| Non-controlling Interests |
(359) | (391) | (332) | |||||||||
| Attributable EBITDA |
907 | 1,068 | 851 | |||||||||
| Revenues - as adjustede |
2,222 | 2,514 | 2,188 | |||||||||
| Attributable EBITDA marginf |
41 % | 42 % | 39 % | |||||||||
| a. | Finance costs exclude accretion. |
| b. | For the three month period ended March 31, 2024, net impairment charges were mainly related to miscellaneous property, plant and equipment assets. For the three month period ended December 31, 2023, net impairment charges mainly related to a long-lived asset impairment at Long Canyon. |
| c. | For the three month period ended December 31, 2023, acquisition/disposition gains mainly related to a gain on the reopening of the Porgera mine as the conditions for the reopening were completed on December 22, 2023. |
| d. | For the three month periods ended March 31, 2024 and December 31, 2023, other (income) expense adjustments mainly related to changes in the discount rate assumptions on our closed mine rehabilitation provision. The three month period ended December 31, 2023 was further impacted by care and maintenance expenses at Porgera. Other (income) expense adjustments for the three month period ended March 31, 2023 mainly related to the $30 million commitment we made towards the expansion of education infrastructure in Tanzania, per our community investment obligations under the Twiga partnership. |
| e. | Refer to Reconciliation of Sales to Realized Price per ounce/pound on page 67 of this MD&A. |
| f. | Represents attributable EBITDA divided by revenues - as adjusted. |
| BARRICK FIRST QUARTER 2024 | 66 | MANAGEMENT’S DISCUSSION AND ANALYSIS |
| OVERVIEW | OPERATING PERFORMANCE
|
GROWTH PROJECTS & EXPLORATION
|
REVIEW OF FINANCIAL RESULTS
|
OTHER INFORMATION & NON-GAAP RECONCILIATIONS |
FINANCIAL STATEMENTS |
|||||
Reconciliation of Income to EBITDA by operating site
| ($ millions) | For the three months ended 3/31/24 | |||||||||||||||||||||||||||||||||||||||
| Carlin (61.5%) |
Corteza (61.5%) |
Turquoise Ridge (61.5%) |
Nevada
Gold Minesb (61.5%) |
Pueblo Viejo (60%) |
Loulo- Gounkoto (80%) |
Kibali (45%) |
North Mara (84%) |
Bulyanhulu (84%) |
Lumwana (100%) |
|||||||||||||||||||||||||||||||
| Income |
147 | 92 | 22 | 296 | 44 | 116 | 64 | 15 | 28 | (7 | ) | |||||||||||||||||||||||||||||
| Depreciation |
51 | 46 | 23 | 132 | 37 | 53 | 28 | 15 | 13 | 60 | ||||||||||||||||||||||||||||||
| EBITDA |
198 | 138 | 45 | 428 | 81 | 169 | 92 | 30 | 41 | 53 | ||||||||||||||||||||||||||||||
| For the three months ended 12/31/23 | ||||||||||||||||||||||||||||||||||||||||
| Carlin (61.5%) |
Corteza (61.5%) |
Turquoise Ridge (61.5%) |
Nevada Gold Minesb (61.5%) |
Pueblo Viejo (60%) |
Loulo- Gounkoto (80%) |
Kibali (45%) |
North Mara (84%) |
Bulyanhulu (84%) |
Lumwana (100%) |
|||||||||||||||||||||||||||||||
| Income |
168 | 102 | 48 | 355 | 49 | 82 | 78 | 12 | 32 | 17 | ||||||||||||||||||||||||||||||
| Depreciation |
47 | 73 | 31 | 167 | 40 | 47 | 37 | 18 | 13 | 85 | ||||||||||||||||||||||||||||||
| EBITDA |
215 | 175 | 79 | 522 | 89 | 129 | 115 | 30 | 45 | 102 | ||||||||||||||||||||||||||||||
| For the three months ended 3/31/23 | ||||||||||||||||||||||||||||||||||||||||
| Carlin (61.5%) |
Corteza (61.5%) |
Turquoise Ridge (61.5%) |
Nevada Gold Minesb (61.5%) |
Pueblo Viejo (60%) |
Loulo- Gounkoto (80%) |
Kibali (45%) |
North Mara (84%) |
Bulyanhulu (84%) |
Lumwana (100%) |
|||||||||||||||||||||||||||||||
| Income |
66 | 78 | 40 | 189 | 61 | 85 | 33 | 47 | 17 | (12 | ) | |||||||||||||||||||||||||||||
| Depreciation |
39 | 56 | 31 | 140 | 39 | 56 | 25 | 16 | 13 | 44 | ||||||||||||||||||||||||||||||
| EBITDA |
105 | 134 | 71 | 329 | 100 | 141 | 58 | 63 | 30 | 32 | ||||||||||||||||||||||||||||||
| a. | Includes Goldrush. |
| b. | These results represent our 61.5% interest in Carlin, Cortez, Turquoise Ridge, Phoenix and Long Canyon until it transitioned to care and maintenance at the end of 2023, as previously reported. |
| Realized Price
Realized price is a non-GAAP financial measure which excludes from sales: ∎ Treatment and refining charges; and ∎ Cumulative catch-up adjustment to revenue relating to our streaming arrangements.
We believe this provides investors and analysts with a more accurate measure with which to compare to market gold and copper prices and to assess our gold and copper sales performance. For those reasons, management believes that this measure provides a more accurate reflection of our Company’s past performance and is a better indicator of its expected performance in future periods. |
|
The realized price measure is intended to provide additional information, and does not have any standardized definition under IFRS and should not be considered in isolation or as a substitute for measures of performance prepared in accordance with IFRS. The measure is not necessarily indicative of sales as determined under IFRS. Other companies may calculate this measure differently. The following table reconciles realized prices to the most directly comparable IFRS measure. |
Reconciliation of Sales to Realized Price per ounce/pound
| ($ millions, except per ounce/pound information in dollars) | Gold | Copper | ||||||||||||||||||||||
| For the three months ended | ||||||||||||||||||||||||
| 3/31/24 | 12/31/23 | 3/31/23 | 3/31/24 | 12/31/23 | 3/31/23 | |||||||||||||||||||
| Sales |
2,528 | 2,767 | 2,411 | 163 | 226 | 171 | ||||||||||||||||||
| Sales applicable to non-controlling interests |
(795 | ) | (872 | ) | (723 | ) | 0 | 0 | 0 | |||||||||||||||
| Sales applicable to equity method investmentsa,b |
151 | 183 | 126 | 136 | 168 | 160 | ||||||||||||||||||
| Sales applicable to sites in closure or care and maintenancec |
(2 | ) | (2 | ) | (7 | ) | 0 | 0 | 0 | |||||||||||||||
| Treatment and refinement charges |
7 | 8 | 7 | 34 | 51 | 43 | ||||||||||||||||||
| Otherd |
0 | (15 | ) | 0 | 0 | 0 | 0 | |||||||||||||||||
| Revenues – as adjusted |
1,889 | 2,069 | 1,814 | 333 | 445 | 374 | ||||||||||||||||||
| Ounces/pounds sold (000s ounces/millions pounds)c |
910 | 1,042 | 954 | 86 | 117 | 89 | ||||||||||||||||||
| Realized gold/copper price per ounce/pounde |
2,075 | 1,986 | 1,902 | 3.86 | 3.78 | 4.20 | ||||||||||||||||||
| a. | Represents sales of $151 million, for the three month period ended March 31, 2024 (December 31, 2023: $183 million and March 31, 2023: $126 million) applicable to our 45% equity method investment in Kibali for gold. Represents sales of $80 million for the three month period ended March 31, 2024 (December 31, 2023: $98 million and March 31, 2023: $98 million) applicable to our 50% equity method investment in Zaldívar and $62 million (December 31, 2023: $77 million and March 31, 2023: $69 million), applicable to our 50% equity method investment in Jabal Sayid for copper. |
| b. | Sales applicable to equity method investments are net of treatment and refinement charges. |
| c. | On an attributable basis. Excludes Pierina, which was producing incidental ounces until December 31, 2023 while in closure. It also excludes Long Canyon which is producing residual ounces from the leach pad while in care and maintenance. |
| d. | Represents a cumulative catch-up adjustment to revenue relating to our streaming arrangements. Refer to note 2e of the 2023 Annual Financial Statements for more information. |
| e. | Realized price per ounce/pound may not calculate based on amounts presented in this table due to rounding. |
| BARRICK FIRST QUARTER 2024 | 67 | MANAGEMENT’S DISCUSSION AND ANALYSIS |
| OVERVIEW | OPERATING PERFORMANCE
|
GROWTH PROJECTS & EXPLORATION
|
REVIEW OF FINANCIAL RESULTS
|
OTHER INFORMATION & NON-GAAP RECONCILIATIONS |
FINANCIAL STATEMENTS |
|||||
Technical Information
The scientific and technical information contained in this MD&A has been reviewed and approved by Craig Fiddes, SME-RM, Lead, Resource Modeling, Nevada Gold Mines; Richard Peattie, MPhil, FAusIMM, Mineral Resources Manager: Africa and Middle East; Simon Bottoms, CGeol, MGeol, FGS, FAusIMM, Mineral Resource Management and Evaluation Executive (in this capacity, Mr. Bottoms is also responsible on an interim basis for scientific and technical information relating to the Latin America and Asia Pacific region); John Steele, CIM, Metallurgy, Engineering and Capital Projects Executive; and Joel Holliday, FAusIMM, Executive Vice-President, Exploration – each a “Qualified Person” as defined in National Instrument 43-101 – Standards of Disclosure for Mineral Projects.
All mineral reserve and mineral resource estimates are estimated in accordance with National Instrument 43-101 – Standards of Disclosure for Mineral Projects. Unless otherwise noted, such mineral reserve and mineral resource estimates are as of December 31, 2023.
Endnotes
| 1 | Further information on these non-GAAP financial measures, including detailed reconciliations, is included on pages 54 to 67 of this MD&A. |
| 2 | Gold cost of sales per ounce is calculated as cost of sales across our gold operations (excluding sites in closure or care and maintenance) divided by ounces sold (both on an attributable basis using Barrick’s ownership share). Copper cost of sales per pound is calculated as cost of sales across our copper operations divided by pounds sold (both on an attributable basis using Barrick’s ownership share). References to attributable basis means our 100% share of Hemlo and Lumwana, our 61.5% share of NGM, our 60% share of Pueblo Viejo, our 80% share of Loulo-Gounkoto, our 89.7% share of Tongon, our 84% share of North Mara, and Bulyanhulu, our 50% share of Veladero, Zaldívar and Jabal Sayid, our 24.5% share of Porgera and our 45% share of Kibali. |
| 3 | Total reportable incident frequency rate (“TRIFR”) is a ratio calculated as follows: number of reportable injuries x 1,000,000 hours divided by the total number of hours worked. Reportable injuries include fatalities, lost time injuries, restricted duty injuries, and medically treated injuries. Lost time injury frequency rate (“LTIFR”) is a ratio calculated as follows: number of lost time injuries x 1,000,000 hours divided by the total number of hours worked. |
| 4 | Class 1 - High Significance is defined as an incident that causes significant negative impacts on human health or the environment or an incident that extends onto publicly accessible land and has the potential to cause significant adverse impact to surrounding communities, livestock or wildlife. |
| 5 | A Tier One Gold Asset is an asset with a $1,300/oz reserve with potential for 5 million ounces to support a minimum 10-year life, annual production of at least 500,000 ounces of gold and with all-in sustaining costs per ounce in the lower half of the industry cost curve. A Tier One Copper Asset is an asset with a $3.00/lb reserve with potential for 5 million tonnes or more of contained copper to support a minimum 20-year life, annual production of at least 200ktpa, with all-in sustaining costs per pound in the lower half of the industry cost curve. Tier One Assets must be located in a world class geological district with potential for organic reserve growth and long-term geologically driven addition. |
| 6 | Refer to the Technical Report on the Cortez Complex, Lander and Eureka Counties, State of Nevada, USA, dated December 31, 2021, and filed on SEDAR+ at www.sedarplus.ca and EDGAR at www.sec.gov on March 18, 2022. |
| 7 | See the Technical Report on the Pueblo Viejo mine, Dominican Republic, dated March 17, 2023, and filed on SEDAR+ at www.sedarplus.ca and EDGAR at www.sec.gov on March 17, 2023. |
| 8 | Indicative gold and copper recovered production profile from Reko Diq is conceptual in nature and subject to change following completion of the updated feasibility study. |
| 9 | Indicative copper production profile from Lumwana, which is conceptual in nature. Subject to change following completion of the pre-feasibility study. |
| 10 | Greater Leeville Significant Interceptsa |
| Drill Results from Q1 2024 | ||||||||||||||||||||||||||
| Drill Holeb | Azimuth | Dip | Interval (m) | Width (m)c | True Width (m)c | Ag (g/t) | ||||||||||||||||||||
| HSC-23001 |
129 | (26) | 250.5 - 283.2 | 32.6 | 32.88 | |||||||||||||||||||||
| HSC-23007 |
112 | (28) | 140.8 - 162.3 | 21.5 | 17.6 | 11.20 | ||||||||||||||||||||
| HSX-23003 |
101 | (27) | 776.6 - 779.7 | 3.0 | 5.30 | |||||||||||||||||||||
| 782.7 - 785.8 | 3.0 | 3.93 | ||||||||||||||||||||||||
| 875.5 - 878.7 | 3.2 | 15.72 | ||||||||||||||||||||||||
| NLC-23007 |
72 | (25) | 118.6 - 136.6 | 18.0 | 11.6 | 5.35 | ||||||||||||||||||||
| 166.7 - 177.7 | 11.0 | 10.3 | 4.80 | |||||||||||||||||||||||
| BARRICK FIRST QUARTER 2024 | 68 | MANAGEMENT’S DISCUSSION AND ANALYSIS |
| OVERVIEW | OPERATING PERFORMANCE
|
GROWTH PROJECTS & EXPLORATION
|
REVIEW OF FINANCIAL RESULTS
|
OTHER INFORMATION & NON-GAAP RECONCILIATIONS |
FINANCIAL STATEMENTS |
|||||
| 183.2 - 188.1 | 4.9 | 4.6 | 4.07 | |||||||||||||||||||||||
| 261.8 - 285.9 | 24.1 | 21.8 | 9.19 | |||||||||||||||||||||||
| NLX-23017 |
290 | (79) | 798.7 - 803.3 | 4.6 | 24.28 | |||||||||||||||||||||
| 866.9 - 881.0 | 14.2 | 8.67 | ||||||||||||||||||||||||
| 900.1 - 903.0 | 2.9 | 3.93 | ||||||||||||||||||||||||
| NTC-23008 |
94 | (22) | 15.2 - 22.6 | 7.3 | 4.7 | 8.24 | ||||||||||||||||||||
| 168.2 - 189 | 20.7 | 13.3 | 5.07 | |||||||||||||||||||||||
| 192 - 200.9 | 8.8 | 5.7 | 4.79 | |||||||||||||||||||||||
| 213.1 - 296.6 | 83.5 | 53.7 | 19.07 | |||||||||||||||||||||||
| a. | All intercepts calculated using a 3.4 g/t Au cutoff and are uncapped; minimum downhole intercept width is 3.0 meters; internal dilution is less than 20% total width. |
| b. | Carlin Trend drill hole nomenclature: Project area (CGX - Greater Leeville Exploration, HSC - Horsham Underground Core, HSX - Horshsam Exploration, NLC - North Leeville/Fallon Core, NLX - North Leeville/Fallon Growth, NTC - North Turf/Miramar Underground Core) followed by the year (23 for 2023) then hole number. |
| c. | True width for certain HSC and NLC drillholes has been estimated based on the latest geological and ore controls model and it is subject to refinement as additional data becomes available. True width of certain intercepts HSC, HSX and NLX drillholes is uncertain at this stage. |
The drilling results for Leeville contained in this MD&A have been prepared in accordance with National Instrument 43-101 – Standards of Disclosure for Mineral Projects. All drill hole assay information has been manually reviewed and approved by staff geologists and re-checked by the project manager. Sample preparation and analyses are conducted by an independent laboratory, ALS Minerals. Procedures are employed to ensure security of samples during their delivery from the drill rig to the laboratory. The quality assurance procedures, data verification and assay protocols used in connection with drilling and sampling on the Carlin Trend conform to industry accepted quality control methods.
| 11 | Cortez Hanson Significant Interceptsa |
| Drill Results from Q1 2024 | ||||||||||||||||||||
| Drill Holeb | Azimuth | Dip | Interval (m) | Width (m)c | Au (g/t) | |||||||||||||||
| CMX-23017 |
300 | (50) | 445 - 447.1 | 2.1 | 23.15 | |||||||||||||||
| CMX-23018 |
260 | (62) | 444.4 - 477.6 | 33.2 | 18.42 | |||||||||||||||
| a. | All intercepts calculated using a 3.42 g/t Au cutoff and are uncapped; minimum intercept width is 1.4 meters; internal dilution is less than 20% total width. |
| b. | Cortez drill hole nomenclature: Project (CMX - CHUG Minex) followed by the year (23 for 2023) then hole number. |
| c. | True width of intercepts are uncertain at this stage. |
The drilling results for Cortez contained in this MD&A have been prepared in accordance with National Instrument 43-101 –Standards of Disclosure for Mineral Projects. All drill hole assay information has been manually reviewed and approved by staff geologists and re-checked by the project manager. Sample preparation and analyses are conducted by an independent laboratory, ALS Minerals. Procedures are employed to ensure security of samples during their delivery from the drill rig to the laboratory. The quality assurance procedures, data verification and assay protocols used in connection with drilling and sampling at Cortez conform to industry accepted quality control methods.
| 12 | Hemlo Significant Interceptsa |
| Drill Results from Q1 2024 | ||||||||||||
| Drill Holeb | Azimuth | Dip | Interval (m) | Width (m)c | True Width (m)c | Au (g/t) | ||||||
| 7652332 |
287 | 18.9 | 71.8 - 82 | 10.2 | 5.1 | 5.12 | ||||||
| 90352321 |
152 | (38) | 213 - 226 | 13.0 | 12.2 | 3.73 | ||||||
| 90352322 |
144.4 | (47.5) | 212 - 226 | 14.0 | 11.5 | 3.94 | ||||||
| 90352335 |
157.5 | (51.6) | 231.5 - 234.9 | 3.4 | 3.1 | 6.64 | ||||||
| 4502307 |
299.3 | (25.5) | 178 - 185 | 7.0 | 3.0 | 3.62 | ||||||
| a. | All intercepts calculated using a 2.68 g/t Au cutoff. 9035 holes are capped to 80 g/t Au; 765 and 450 holes are capped to 40 g/t Au, minimum intercept width is 2.50 meters; internal dilution is less than 42% total width. |
| b. | Hemlo drill hole nomenclature: Underground hole nomenclature is defined by level (e.g. 9035 for the 9035m level) then year (e.g. 23 for 2023) then hole number. |
| c. | True width of intercepts are estimated using the angle to core axis. |
The drilling results for Hemlo contained in this MD&A have been prepared in accordance with National Instrument 43-101 – Standards of Disclosure for Mineral Projects. All drill hole assay information has been manually reviewed and approved by staff geologists and re-checked by the project manager. Sample preparation and analyses are conducted by an independent laboratory, ALS Minerals. Procedures are employed to ensure security of samples during their delivery from the drill rig to the laboratory. The quality assurance procedures, data verification and assay protocols used in connection with drilling and sampling at Hemlo conform to industry accepted quality control methods.
| BARRICK FIRST QUARTER 2024 | 69 | MANAGEMENT’S DISCUSSION AND ANALYSIS |
| OVERVIEW | OPERATING PERFORMANCE
|
GROWTH PROJECTS & EXPLORATION
|
REVIEW OF FINANCIAL RESULTS
|
OTHER INFORMATION & NON-GAAP RECONCILIATIONS |
FINANCIAL STATEMENTS |
|||||
| 13 | Bambadji and Bambadji South Significant Interceptsa |
| Drill Results from Q1 2024 | ||||||||||||||||||||
| Includingd | ||||||||||||||||||||
| Drill Holeb | Azimuth | Dip | Interval (m) | Width (m)c | Au (g/t) | Interval (m) | Width (m) C | Au (g/t) | ||||||||||||
| KBWDH022 |
135 | (50) | 82.5.00 - 138.00 | 55.5 | 1.20 | 117-120.3 | 3.30 | 3.50 | ||||||||||||
| KBWDH022 |
135 | (50) | 313.4.00 -325.00 | 11.6 | 1.06 | |||||||||||||||
| KBWDH022 |
135 | (50) | 351.5.00 - 364.6.00 | 13.1 | 1.68 | 359.6-364.6 | 5.00 | 3.00 | ||||||||||||
| KBWDH022 |
135 | (50) | 424.2.00 - 435.25.00 | 11.05 | 5.32 | 426.7-435.25 | 8.55 | 6.64 | ||||||||||||
| GFDT001 |
90 | (50) | 458.4.00 - 469.2.00 | 10.8 | 3.63 | 458.4-464.2 | 5.80 | 5.10 | ||||||||||||
| SATRC004 |
90 | (50) | 64.00 - 70.00 | 6.0 | 0.68 | |||||||||||||||
| SATRC006 |
90 | (50) | 42.00 - 46.00 | 4.0 | 0.77 | |||||||||||||||
| SATRC019 |
90 | (50) | 56.00 - 62.00 | 6.0 | 4.71 | 56-69 | 3.00 | 8.82 | ||||||||||||
| SATRC024 |
90 | (50) | 11.00 - 18.00 | 7.0 | 2.21 | 13-15 | 2.00 | 6.26 | ||||||||||||
| SATRC024 |
90 | (50) | 30.00 - 35.00 | 5.0 | 0.94 | |||||||||||||||
| SATRC025 |
90 | (50) | 59.00 - 61.00 | 2.0 | 7.02 | |||||||||||||||
| SATRC031 |
90 | (50) | 18.00 - 32.00 | 14.0 | 0.84 | 18-25 | 7.00 | 1.30 | ||||||||||||
| a. | All intercepts calculated using a 0.5 g/t Au cutoff and are uncapped; minimum intercept width is 2.0 meters; internal dilution is equal to or less than 2 meters width. |
| b. | Drill hole nomenclature: Project initial GF (Gefa), KBW (Kabewest), SAT (Satadougou), followed by type of drilling AC (Aircore), RC (Reverse Circulation), DH (Diamond Hole). |
| c. | True widths uncertain at this stage. |
| d. | Includings calculated using a 3.0 g/t Au cutoff and are uncapped; minimum intercept width is 2 meters; internal dilution is equal to or less than 2 meters width. |
The drilling results for Bambadji and Bambadji South properties contained in this MD&A have been prepared in accordance with National Instrument 43-101 – Standards of Disclosure for Mineral Projects. All drill hole assay information has been manually reviewed and approved by staff geologists and re-checked by the project manager. Sample preparation and analyses are conducted by an independent laboratory, SGS. Procedures are employed to ensure security of samples during their delivery from the drill rig to the laboratory. The quality assurance procedures, data verification and assay protocols used in connection with drilling and sampling on the Bambadji and Bambadji South properties conform to industry accepted quality control methods.
| 14 | Loulo-Gounkoto Significant Interceptsa |
| Drill Results from Q1 2024 | ||||||||||||||||||
| Includingd | ||||||||||||||||||
| Drill Holeb | Azimuth | Dip | Interval (m) | Width (m)c | Au (g/t) | Interval (m) | Width (m) c | Au (g/t) | ||||||||||
| GKDH522 |
253.28 | (75.66) | 840.90 - 852.50 | 11.60 | 2.29 | |||||||||||||
| BKDH001 |
87 | (50) | 240.70 - 246.25 | 5.55 | 1.48 | |||||||||||||
| BKRC001 |
87 | (50) | 191 - 204 | 13.00 | 3.11 | 199-202 | 3.0 | 9.16 | ||||||||||
| BKRC001 |
87 | (50) | 208 - 212 | 4.00 | 3.30 | 209-212 | 3 | 4.12 | ||||||||||
| BKRC001 |
87 | (50) | 219 - 232 | 13.00 | 1.06 | |||||||||||||
| BKRC001 |
87 | (50) | 234 - 236 | 2.00 | 0.67 | |||||||||||||
| BKRC002 |
87 | (50) | 52 - 70 | 18.00 | 1.66 | |||||||||||||
| BKRC002 |
87 | (50) | 74 - 81 | 7.00 | 1.00 | |||||||||||||
| BKRC003 |
87 | (50) | 115 - 117 | 2.00 | 0.74 | |||||||||||||
| BKRC004 |
90 | (50) | 97 - 99 | 2.00 | 2.70 | |||||||||||||
| BKRC004 |
90 | (50) | 124 - 135 | 11.00 | 1.23 | |||||||||||||
| BNRCDH344 |
90 | (50) | 245.3 - 253.4 | 8.10 | 0.92 | |||||||||||||
| BNRCDH344 |
90 | (50) | 264.7 - 268.7 | 4.00 | 1.00 | |||||||||||||
| BNRCDH344 |
90 | (50) | 474.65 - 492.8 | 18.15 | 3.00 | 475.45 - 482.95 | 7.5 | 4.56 | ||||||||||
| YADH244 |
227.8 | (72.4) | 157.25 - 161 | 3.75 | 5.42 | |||||||||||||
| YADH244 |
227.8 | (72.4) | 1500.65 - 1507.10 | 6.45 | 1.37 | |||||||||||||
| YADH244 |
227.8 | (72.4) | 1695.95 - 1700.60 | 4.65 | 4.21 | |||||||||||||
| YADH244 |
227.8 | (72.4) | 1708.15 - 1735.40 | 27.25 | 1.82 | 1717.5-1721.2 | 3.7 | 4.5 | ||||||||||
| YADH244 |
227.8 | (72.4) | 1741.5 - 1745.95 | 4.45 | 1.90 | |||||||||||||
| YADH248 |
221.8 | (71.1) | 1467.45 -1488.35 | 20.9 | 6.91 | 1473.65 - 1482.65 | 9 | 13.91 | ||||||||||
| a. | All intercepts calculated using a 0.5 g/t Au cutoff and are uncapped; minimum intercept width is 2 meters; internal dilution is equal to or less than 2 meters total width. |
| b. | Loulo-Gounkoto drill hole nomeclature: prospect initial GK (Gounkoto), BN (Baboto North), BK (Barika), YA (Yalea) followed by type of drilling RC (Reverse Circulation), DH (Diamond Drilling), RCDH (Diamond tail). |
| c. | True widths uncertain at this stage. |
| d. | All intercepts calculated using a 3.0 g/t Au cutoff and are uncapped; minimum intercept width is 2 meters; internal dilution is equal to or less than 2 meters total width. |
| BARRICK FIRST QUARTER 2024 | 70 | MANAGEMENT’S DISCUSSION AND ANALYSIS |
| OVERVIEW | OPERATING PERFORMANCE
|
GROWTH PROJECTS & EXPLORATION
|
REVIEW OF FINANCIAL RESULTS
|
OTHER INFORMATION & NON-GAAP RECONCILIATIONS |
FINANCIAL STATEMENTS |
|||||
The drilling results for the Loulo-Gounkoto property contained in this MD&A have been prepared in accordance with National Instrument 43-101 – Standards of Disclosure for Mineral Projects. All drill hole assay information has been manually reviewed and approved by staff geologists and re-checked by the project manager. Sample preparation and analyses are conducted by an independent laboratory, SGS. Procedures are employed to ensure security of samples during their delivery from the drill rig to the laboratory. The quality assurance procedures, data verification and assay protocols used in connection with drilling and sampling on the Loulo property conform to industry accepted quality control methods.
| 15 | Nielle Significant Interceptsa |
| Drill Results from Q1 2024 | ||||||||||||||||
| Including | ||||||||||||||||
| Drill Holeb |
Azimuth | Dip | Interval (m) | Width (m)c | Au (g/t) | Interval (m) | Width (m)c | Au (g/t) | ||||||||
| JWDH002 |
230 | (50) | 38.80 -40.85 | 2.05 | 0.98 | |||||||||||
| JWDH002 |
230 | (50) | 121.80 -125.97 | 4.17 | 0.64 | |||||||||||
| KKH2AC003 |
270 | (50) | 23.00 - 25.00 | 2 | 2.1 | |||||||||||
| KKH2AC012 |
270 | (50) | 30.00 - 32.00 | 2 | 0.51 | |||||||||||
| KKH2AC018 |
270 | (50) | 43.00 - 47.00 | 4 | 3.08 | |||||||||||
| KKH2AC030 |
270 | (50) | 50.00 - 52.00 | 2 | 0.7 | |||||||||||
| KKH2AC035 |
270 | (50) | 43.00 - 46.00 | 3 | 0.68 | |||||||||||
| KKH2AC036 |
270 | (50) | 11.00 - 13.00 | 2 | 0.74 | |||||||||||
| KKH2AC039 |
270 | (50) | 26.00 - 28.00 | 2 | 1.15 | |||||||||||
| KKHAC006 |
270 | (50) | 19.00 - 21.00 | 2 | 1.7 | |||||||||||
| KKHAC006 |
270 | (50) | 24.00 - 29.00 | 5 | 1.66 | |||||||||||
| KKHAC006 |
270 | (50) | 33.00 - 38.00 | 5 | 1.16 | |||||||||||
| KKHAC012 |
270 | (50) | 13.00 - 23.00 | 10 | 0.92 | |||||||||||
| KKHAC012 |
270 | (50) | 38.00 - 44.00 | 6 | 1.62 | |||||||||||
| KKHAC018 |
270 | (50) | 75.00 - 78.00 | 3 | 4.95 | 76.00 - 78.00 | 2 | 5.95 | ||||||||
| KKHAC019 |
270 | (50) | 83.00 - 85.00 | 2 | 0.67 | |||||||||||
| KKHAC020 |
270 | (50) | 10.00 - 12.00 | 2 | 27.46 | |||||||||||
| KKHAC020 |
270 | (50) | 30.00 - 32.00 | 2 | 37.23 | |||||||||||
| KKHAC028 |
270 | (50) | 55.00 - 57.00 | 2 | 0.98 | |||||||||||
| KKHAC033 |
270 | (50) | 23.00 - 25.00 | 2 | 0.8 | |||||||||||
| KKHAC033 |
270 | (50) | 27.00 - 29.00 | 2 | 0.54 | |||||||||||
| KKHAC033 |
270 | (50) | 51.00 - 53.00 | 2 | 1.48 | |||||||||||
| KKHAC035 |
270 | (50) | 18.00 - 21.00 | 3 | 1.29 | |||||||||||
| KKHAC048 |
270 | (50) | 49.00 - 53.00 | 4 | 3 | |||||||||||
| KKHAC050 |
270 | (50) | 52.00 - 54.00 | 2 | 1.23 | |||||||||||
| KKHAC053 |
270 | (50) | 28.00 - 31.00 | 3 | 0.61 | |||||||||||
| KKHAC053 |
270 | (50) | 42.00 - 47.00 | 5 | 1.41 | |||||||||||
| KKHAC071 |
270 | (50) | 12.00 - 14.00 | 2 | 3.26 | |||||||||||
| KKHAC071 |
270 | (50) | 28.00 - 30.00 | 2 | 6.78 | |||||||||||
| KKHAC072 |
270 | (50) | 22.00 - 24.00 | 2 | 1.84 | |||||||||||
| KKHAC074 |
270 | (50) | 34.00 - 39.00 | 5 | 27.15 | 36.00 - 38.00 | 2 | 63.05 | ||||||||
| KKHAC074 |
270 | (50) | 49.00 - 51.00 | 2 | 0.94 | |||||||||||
| KKHAC090 |
270 | (50) | 18.00 - 20.00 | 2 | 3.01 | |||||||||||
| KKHAC090 |
270 | (50) | 22.00 - 26.00 | 4 | 1.47 | |||||||||||
| KKHAC092 |
270 | (50) | 31.00 - 33.00 | 2 | 0.71 | |||||||||||
| KKHAC097 |
270 | (50) | 55.00 - 57.00 | 2 | 0.53 | |||||||||||
| KKHAC098 |
270 | (50) | 21.00 - 23.00 | 2 | 0.63 | |||||||||||
| KKHAC099 |
270 | (50) | 28.00 - 30.00 | 2 | 1.27 | |||||||||||
| KKHAC099 |
270 | (50) | 51.00 - 53.00 | 2 | 0.5 | |||||||||||
| KKHAC099 |
270 | (50) | 72.00 - 78.00 | 6 | 2.2 | |||||||||||
| KKHAC110 |
270 | (50) | 18.00 - 20.00 | 2 | 1.03 | |||||||||||
| KKHAC112 |
270 | (50) | 26.00 - 28.00 | 2 | 1 | |||||||||||
| KKHAC112 |
270 | (50) | 33.00 - 35.00 | 2 | 0.53 | |||||||||||
| KKHAC112 |
270 | (50) | 50.00 - 53.00 | 3 | 0.83 | |||||||||||
| KKHRC001 |
290 | (50) | 127.00 - 137.00 | 10 | 2.16 | 128.00 - 132.00 | 4 | 3.29 | ||||||||
| KKHRC001 |
290 | (50) | 158.00 - 163.00 | 5 | 1.52 | |||||||||||
| KKHRC002 |
290 | (50) | 105.00 - 107.00 | 2 | 0.82 | |||||||||||
| KKHRC002 |
290 | (50) | 176.00 - 180.00 | 4 | 1.11 | |||||||||||
| KKHRC003 |
290 | (50) | 72.00 - 78.00 | 6 | 1.58 | |||||||||||
| a. | All intercepts calculated using a 0.5 g/t Au cutoff and are uncapped; minimum intercept width is 2 meters; internal dilution is equal to or less than 2 meters width. |
| BARRICK FIRST QUARTER 2024 | 71 | MANAGEMENT’S DISCUSSION AND ANALYSIS |
| OVERVIEW | OPERATING PERFORMANCE
|
GROWTH PROJECTS & EXPLORATION
|
REVIEW OF FINANCIAL RESULTS
|
OTHER INFORMATION & NON-GAAP RECONCILIATIONS |
FINANCIAL STATEMENTS |
|||||
| b. | Nielle drill hole nomenclature: prospect initial KOR (Koro A2), JBS (Jubula South), IND (Indigo), NEL (Nela), KKH (Korokaha), JW (Jubula West), followed by type of drilling AC (Aircore), RC (Reverse Circulation), DH (Diamond Hole). |
| c. | True widths uncertain at this stage. |
| d. | Includings calculated using a 3.0 g/t Au cutoff and are uncapped; minimum intercept width is 2 meters; internal dilution is equal to or less than 2 meters width. |
The drilling results for the Nielle property contained in this MD&A have been prepared in accordance with National Instrument 43-101 – Standards of Disclosure for Mineral Projects. All drill hole assay information has been manually reviewed and approved by staff geologists and re-checked by the project manager. Sample preparation and analyses are conducted by SGS, an independent laboratory. Industry accepted best practices for preparation and fire assaying procedures are utilized to determine gold content. Procedures are employed to ensure security of samples during their delivery from the drill rig to the laboratory. The quality assurance procedures, data verification and assay protocols used in connection with drilling and sampling on the Nielle property conform to industry accepted quality control methods.
| 16 | Kibali Significant Interceptsa |
| Drill Results from Q1 2024 | ||||||||||||||||
| Includingd | ||||||||||||||||
| Drill Holeb | Azimuth | Dip | Interval (m) | Width (m)c | Au (g/t) | Interval (m) | Width (m)e | Au (g/t) | ||||||||
| AGDD001 |
315 | (42) | 18.50 - 22.50 | 4 | 0.84 | |||||||||||
| 47.00 - 51.00 | 4 | 0.66 | ||||||||||||||
| 95.30 - 99.10 | 3.8 | 1.35 | ||||||||||||||
| 103.80 - 112.00 | 8.2 | 1.01 | ||||||||||||||
| 128.00 - 130.00 | 2 | 1.10 | ||||||||||||||
| 132.00 - 135.50 | 3.5 | 1.15 | ||||||||||||||
| AGDD002 |
315 | (50) | 18.00 - 20.00 | 2 | 1.27 | |||||||||||
| 80.87 - 82.87 | 2 | 5.89 | ||||||||||||||
| 100.20 - 103.00 | 2.8 | 1.71 | ||||||||||||||
| 116.00 - 118.00 | 2 | 1.02 | ||||||||||||||
| 139.50 - 145.30 | 5.8 | 12.39 | ||||||||||||||
| 157.50 - 159.50 | 2 | 0.88 | ||||||||||||||
| 162.50 - 167.00 | 4.5 | 22.21 | ||||||||||||||
| AGDD002A |
316 | (50) | 101.00 - 104.75 | 3.75 | 0.93 | |||||||||||
| AGDD003 |
310 | (50) | 0.00 - 2.00 | 2 | 0.75 | |||||||||||
| 41.00 - 45.00 | 4 | 1.57 | ||||||||||||||
| 89.00 - 126.90 | 37.9 | 1.25 | ||||||||||||||
| AGDD004 |
317 | (50) | 0.00 - 2.00 | 2 | 0.80 | |||||||||||
| 37.50 - 51.00 | 13.5 | 5.04 | 44.50 - 49.20 | 4.7 | 8.94 | |||||||||||
| 62.50 - 66.50 | 4 | 1.51 | ||||||||||||||
| 110.30 - 126.95 | 16.65 | 11.57 | 110.30 - 111.90 | 1.6 | 100.82 | |||||||||||
| 132.70 - 134.80 | 2.1 | 1.85 | ||||||||||||||
| AGDD005 |
315 | (54) | 13.50 - 15.50 | 2 | 1.20 | |||||||||||
| 23.50 - 28.00 | 4.5 | 1.73 | ||||||||||||||
| 76.00 - 89.00 | 13 | 1.64 | ||||||||||||||
| 92.00 - 94.00 | 2 | 0.83 | ||||||||||||||
| 123.00 - 125.00 | 2 | 6.52 | ||||||||||||||
| DDD614 |
135 | (85) | 1.00 - 5.00 | 4 | 1.45 | |||||||||||
| 146.20 - 154.20 | 8 | 2.16 | 146.20 - 148.00 | 1.8 | 5.53 | |||||||||||
| 159.00 - 174.00 | 15 | 2.54 | 169.50 - 172.20 | 2.7 | 6.58 | |||||||||||
| 178.90 - 181.70 | 2.8 | 4.00 | ||||||||||||||
| DDD616 |
135 | (85) | 133.20 - 135.20 | 2 | 1.10 | |||||||||||
| DDD617 |
200 | (70) | 211.50 - 213.60 | 2.1 | 2.74 | |||||||||||
| 238.00 - 243.20 | 5.2 | 8.85 | ||||||||||||||
| 246.85 - 251.20 | 4.35 | 1.38 | ||||||||||||||
| 326.00 - 328.10 | 2.1 | 0.70 | ||||||||||||||
| 345.35 - 347.40 | 2.05 | 0.83 | ||||||||||||||
| 354.70 - 358.95 | 4.25 | 6.02 | ||||||||||||||
| DDD619A |
135 | (72) | 196.05 - 198.60 | 2.55 | 0.81 | |||||||||||
| 289.00 - 292.00 | 3 | 0.79 | ||||||||||||||
| SRRC0065 |
225 | (70) | 103.00 - 105.00 | 2 | 4.26 | |||||||||||
| SRRC0066 |
225 | (70) | 130.00 - 132.00 | 2 | 0.65 | |||||||||||
| SRRC0067 |
225 | (70) | 112.00 - 116.00 | 4 | 0.88 | |||||||||||
| SRRC0069 |
225 | (70) | 70.00 - 72.00 | 2 | 0.58 | |||||||||||
| 75.00 - 77.00 | 2 | 0.74 | ||||||||||||||
| 84.00 - 87.00 | 3 | 1.02 | ||||||||||||||
| BARRICK FIRST QUARTER 2024 | 72 | MANAGEMENT’S DISCUSSION AND ANALYSIS |
| OVERVIEW | OPERATING PERFORMANCE
|
GROWTH PROJECTS & EXPLORATION
|
REVIEW OF FINANCIAL RESULTS
|
OTHER INFORMATION & NON-GAAP RECONCILIATIONS |
FINANCIAL STATEMENTS |
|||||
| SRRC0071 |
225 | (70 | ) | 78.00 - 118.00 | 40 | 1.40 | 103.00 - 106.00 | 3 | 6.76 | |||||||||||||||||||||
| 123.00 - 127.00 | 4 | 1.69 | ||||||||||||||||||||||||||||
| SRRC0072 |
225 | (70 | ) | 2.00 - 4.00 | 2 | 1.98 | ||||||||||||||||||||||||
| SRRC0076 |
225 | (70 | ) | 136.00 - 138.00 | 2 | 2.18 | ||||||||||||||||||||||||
| SRRC0080 |
225 | (70 | ) | 95.00 - 99.00 | 4 | 0.62 | ||||||||||||||||||||||||
| SRRC0085 |
225 | (70 | ) | 70.00 - 113.00 | 43 | 3.69 | 87.00 - 100.00 | 13 | 7.00 | |||||||||||||||||||||
| 122.00 - 126.00 | 4 | 2.84 | ||||||||||||||||||||||||||||
| SRRC0086 |
225 | (70 | ) | 115.00 - 119.00 | 4 | 1.13 | ||||||||||||||||||||||||
| 144.00 - 150.00 | 6 | 0.99 | ||||||||||||||||||||||||||||
| SRRC0087 |
225 | (70 | ) | 89.00 - 102.00 | 13 | 6.68 | 99.00 - 102.00 | 3 | 21.76 | |||||||||||||||||||||
| 154.00 - 156.00 | 2 | 0.67 | ||||||||||||||||||||||||||||
| a. | All intercepts calculated using a 0.5 g/t Au cutoff and are uncapped; minimum intercept width is 2 meters; internal dilution is equal to or less than 25% total width. |
| b. | Kibali drill hole nomenclature: prospect initial (AG=Agbarabo; D=Durba (KCD); O=Oere; ZB=Zambula; SR=AIRBO), followed by type of drilling (RC=Reverse Circulation, DD=Diamond, GC=Grade control), with no desigination of the year. KCDU=KCD Underground. |
| c. | True width of intercepts are uncertain at this stage. |
| d. | Weighted average is calculated by fence using significant intercepts, over the strike length. |
| e. | All including intercepts, calculated using a 0.5 g/t Au cutoff and are uncapped; minimum intercept width is 1 meter; no internal dilution, with grade significantly above (>40%) the overall intercept grade. |
The drilling results for the Kibali property contained in this MD&A have been prepared in accordance with National Instrument 43-101 – Standards of Disclosure for Mineral Projects. All drill hole assay information has been manually reviewed and approved by staff geologists and re-checked by the project manager. Sample preparation and analyses are conducted by SGS, an independent laboratory. Industry accepted best practices for preparation and fire assaying procedures are utilized to determine gold content. Procedures are employed to ensure security of samples during their delivery from the drill rig to the laboratory. The quality assurance procedures, data verification and assay protocols used in connection with drilling and sampling on the Kibali property conform to industry accepted quality control methods.
| 17 | North Mara Significant Interceptsa |
| Drill Results from Q1 2024 | ||||||||||||||||||||
| Drill Holeb | Azimuth | Dip | Interval (m) | Width (m)c | Au (g/t) | |||||||||||||||
| TGRC046 |
172 | (70) | 28 - 33 | 5 | 0.74 | |||||||||||||||
| TGRC048 |
170 | (70) | 27 - 33 | 6 | 1.08 | |||||||||||||||
| 68 - 79 | 11 | 1.36 | ||||||||||||||||||
| a. | All intercepts are a weighted average using a 0.5 g/t Au cutoff and are uncapped. |
| b. | North Mara drill hole nomenclature: prospect initial (TG=Tagota) followed by the type of drilling (RC=Reverse Circulation) with no designation of the year |
| c. | True widths of intercepts are uncertain at this stage. |
The drilling results for North Mara contained in this MD&A have been prepared in accordance with National Instrument 43-101 – Standards of Disclosure for Mineral Projects. All drill hole assay information has been manually reviewed and approved by staff geologists and re-checked by the project manager. Sample preparation and analyses are conducted by both the MSA Bulyanhulu and the SGS North Mara laboratory, both of which are independently operated by MSA and SGS, respectively. Industry accepted best practices for preparation and fire assaying procedures are utilized to determine gold content. Procedures are employed to ensure security of samples during their delivery from the drill rig to the laboratory. The quality assurance procedures, data verification and assay protocols used in connection with drilling and sampling at North Mara property conform to industry accepted quality control methods.
| BARRICK FIRST QUARTER 2024 | 73 | MANAGEMENT’S DISCUSSION AND ANALYSIS |
| OVERVIEW | OPERATING PERFORMANCE
|
GROWTH PROJECTS & EXPLORATION
|
REVIEW OF FINANCIAL RESULTS
|
OTHER INFORMATION & NON-GAAP RECONCILIATIONS |
FINANCIAL STATEMENTS |
|||||
Consolidated Statements of Income
| Barrick Gold Corporation (in millions of United States dollars, except per share data) (Unaudited) |
Three months ended March 31, |
|||||||
| 2024 | 2023 | |||||||
| Revenue (notes 4 and 5) |
$2,747 | $2,643 | ||||||
| Costs and expenses (income) |
||||||||
| Cost of sales (notes 4 and 6) |
1,936 | 1,941 | ||||||
| General and administrative expenses |
28 | 39 | ||||||
| Exploration, evaluation and project expenses |
95 | 71 | ||||||
| Impairment charges (note 8b) |
17 | 1 | ||||||
| Loss on currency translation |
12 | 38 | ||||||
| Closed mine rehabilitation |
(2 | ) | 22 | |||||
| Income from equity investees (note 11) |
(48 | ) | (53 | ) | ||||
| Other expense (note 8a) |
17 | 52 | ||||||
| Income before finance costs and income taxes |
$692 | $532 | ||||||
| Finance costs, net |
(31 | ) | (58 | ) | ||||
| Income before income taxes |
$661 | $474 | ||||||
| Income tax expense (note 9) |
(174 | ) | (205 | ) | ||||
| Net income |
$487 | $269 | ||||||
| Attributable to: |
||||||||
| Equity holders of Barrick Gold Corporation |
$295 | $120 | ||||||
| Non-controlling interests (note 14) |
$192 | $149 | ||||||
| Earnings per share data attributable to the equity holders of Barrick Gold Corporation (note 7) |
||||||||
| Net income |
||||||||
| Basic |
$0.17 | $0.07 | ||||||
| Diluted |
$0.17 | $0.07 | ||||||
The accompanying notes are an integral part of these condensed interim consolidated financial statements.
| BARRICK FIRST QUARTER 2024 | 74 | FINANCIAL STATEMENTS (UNAUDITED) |
| OVERVIEW | OPERATING PERFORMANCE
|
GROWTH PROJECTS & EXPLORATION
|
REVIEW OF FINANCIAL RESULTS
|
OTHER INFORMATION & NON-GAAP RECONCILIATIONS |
FINANCIAL STATEMENTS |
|||||
Consolidated Statements
of Comprehensive Income
| Barrick Gold Corporation (in millions of United States dollars) (Unaudited) |
Three months ended March 31, |
|||||||
| 2024 | 2023 | |||||||
| Net income |
$487 | $269 | ||||||
| Other comprehensive income (loss), net of taxes |
||||||||
| Items that may be reclassified subsequently to profit or loss: |
||||||||
| Unrealized gains on derivatives designated as cash flow hedges, net of tax $nil and $nil |
1 | — | ||||||
| Currency translation adjustments, net of tax $nil and $nil |
— | (3 | ) | |||||
| Items that will not be reclassified to profit or loss: |
||||||||
| Net change on equity investments, net of tax $nil and $nil |
1 | — | ||||||
| Total other comprehensive income (loss) |
2 | (3 | ) | |||||
| Total comprehensive income |
$489 | $266 | ||||||
| Attributable to: |
||||||||
| Equity holders of Barrick Gold Corporation |
$297 | $117 | ||||||
| Non-controlling interests |
$192 | $149 | ||||||
The accompanying notes are an integral part of these condensed interim consolidated financial statements.
| BARRICK FIRST QUARTER 2024 | 75 | FINANCIAL STATEMENTS (UNAUDITED) |
| OVERVIEW | OPERATING PERFORMANCE
|
GROWTH PROJECTS & EXPLORATION
|
REVIEW OF FINANCIAL RESULTS
|
OTHER INFORMATION & NON-GAAP RECONCILIATIONS |
FINANCIAL STATEMENTS |
|||||
Consolidated Statements of Cash Flow
| Barrick Gold Corporation (in millions of United States dollars) (Unaudited) |
Three months ended March 31, |
|||||||
| 2024 | 2023 | |||||||
| OPERATING ACTIVITIES |
||||||||
| Net income |
$487 | $269 | ||||||
| Adjustments for the following items: |
||||||||
| Depreciation |
474 | 495 | ||||||
| Finance costs, net |
31 | 58 | ||||||
| Impairment charges (note 8b) |
17 | 1 | ||||||
| Income tax expense (note 9) |
174 | 205 | ||||||
| Income from equity investees (note 11) |
(48 | ) | (53 | ) | ||||
| Gain on sale of non-current assets |
(1 | ) | (3 | ) | ||||
| Loss on currency translation |
12 | 38 | ||||||
| Change in working capital (note 10) |
(241 | ) | (191 | ) | ||||
| Other operating activities (note 10) |
(70 | ) | 37 | |||||
| Operating cash flows before interest and income taxes |
835 | 856 | ||||||
| Interest paid |
(27 | ) | (23 | ) | ||||
| Interest received |
68 | 49 | ||||||
| Income taxes paid1 |
(116 | ) | (106 | ) | ||||
| Net cash provided by operating activities |
760 | 776 | ||||||
| INVESTING ACTIVITIES |
||||||||
| Property, plant and equipment |
||||||||
| Capital expenditures (note 4) |
(728 | ) | (688 | ) | ||||
| Sales proceeds |
— | 3 | ||||||
| Funding of equity method investments (note 11) |
(44 | ) | — | |||||
| Dividends received from equity method investments (note 11) |
47 | 67 | ||||||
| Shareholder loan repayments from equity method investments |
45 | — | ||||||
| Net cash used in investing activities |
(680 | ) | (618 | ) | ||||
| FINANCING ACTIVITIES |
||||||||
| Lease repayments |
(3 | ) | (4 | ) | ||||
| Dividends |
(175 | ) | (175 | ) | ||||
| Funding from non-controlling interests (note 14) |
22 | — | ||||||
| Disbursements to non-controlling interests (note 14) |
(121 | ) | (62 | ) | ||||
| Pueblo Viejo JV partner shareholder loan |
(7 | ) | 20 | |||||
| Net cash used in financing activities |
(284 | ) | (221 | ) | ||||
| Effect of exchange rate changes on cash and equivalents |
(2 | ) | — | |||||
| Net decrease in cash and equivalents |
(206 | ) | (63 | ) | ||||
| Cash and equivalents at the beginning of period |
4,148 | 4,440 | ||||||
| Cash and equivalents at the end of period |
$3,942 | $4,377 | ||||||
| 1 | Income taxes paid excludes $17 million (2023: $28 million) for the three months ended March 31, 2024 of income taxes payable that were settled against offsetting value added tax (“VAT”) receivables. |
The accompanying notes are an integral part of these condensed interim consolidated financial statements.
| BARRICK FIRST QUARTER 2024 | 76 | FINANCIAL STATEMENTS (UNAUDITED) |
| OVERVIEW | OPERATING PERFORMANCE
|
GROWTH PROJECTS & EXPLORATION
|
REVIEW OF FINANCIAL RESULTS
|
OTHER INFORMATION & NON-GAAP RECONCILIATIONS |
FINANCIAL STATEMENTS |
|||||
Consolidated Balance Sheets
| Barrick Gold Corporation (in millions of United States dollars) (Unaudited) |
As at March 31, 2024 |
As at December 31, 2023 |
||||||
| ASSETS |
||||||||
| Current assets |
||||||||
| Cash and equivalents |
$3,942 | $4,148 | ||||||
| Accounts receivable |
654 | 693 | ||||||
| Inventories |
1,805 | 1,782 | ||||||
| Other current assets |
880 | 815 | ||||||
| Total current assets |
$7,281 | $7,438 | ||||||
| Non-current assets |
||||||||
| Non-current portion of inventory |
2,684 | 2,738 | ||||||
| Equity in investees (note 11) |
4,178 | 4,133 | ||||||
| Property, plant and equipment |
26,648 | 26,416 | ||||||
| Intangible assets |
148 | 149 | ||||||
| Goodwill |
3,581 | 3,581 | ||||||
| Other assets |
1,323 | 1,356 | ||||||
| Total assets |
$45,843 | $45,811 | ||||||
| LIABILITIES AND EQUITY |
||||||||
| Current liabilities |
||||||||
| Accounts payable |
$1,360 | $1,503 | ||||||
| Debt |
12 | 11 | ||||||
| Current income tax liabilities |
317 | 303 | ||||||
| Other current liabilities |
506 | 539 | ||||||
| Total current liabilities |
$2,195 | $2,356 | ||||||
| Non-current liabilities |
||||||||
| Debt |
4,713 | 4,715 | ||||||
| Provisions |
2,008 | 2,058 | ||||||
| Deferred income tax liabilities |
3,472 | 3,439 | ||||||
| Other liabilities |
1,238 | 1,241 | ||||||
| Total liabilities |
$13,626 | $13,809 | ||||||
| Equity |
||||||||
| Capital stock (note 13) |
$28,118 | $28,117 | ||||||
| Deficit |
(6,594 | ) | (6,713 | ) | ||||
| Accumulated other comprehensive income |
26 | 24 | ||||||
| Other |
1,913 | 1,913 | ||||||
| Total equity attributable to Barrick Gold Corporation shareholders |
$23,463 | $23,341 | ||||||
|
Non-controlling interests (note 14) |
8,754 | 8,661 | ||||||
| Total equity |
$32,217 | $32,002 | ||||||
| Contingencies and commitments (notes 4 and 15) |
||||||||
| Total liabilities and equity |
$45,843 | $45,811 | ||||||
The accompanying notes are an integral part of these condensed interim consolidated financial statements.
| BARRICK FIRST QUARTER 2024 | 77 | FINANCIAL STATEMENTS (UNAUDITED) |
| OVERVIEW | OPERATING PERFORMANCE
|
GROWTH PROJECTS & EXPLORATION
|
REVIEW OF FINANCIAL RESULTS
|
OTHER INFORMATION & NON-GAAP RECONCILIATIONS |
FINANCIAL STATEMENTS |
|||||
Consolidated Statements of Changes in Equity
| Barrick Gold Corporation | Attributable to equity holders of the company | |||||||||||||||||||||||||||||||
| (in millions of United States dollars) (Unaudited) |
|
Common Shares (in thousands) |
|
|
Capital stock |
|
|
Retained earnings (deficit) |
|
|
Accumulated other comprehensive income (loss)1 |
|
Other2 | |
Total equity attributable to shareholders |
|
|
Non- controlling interests |
|
|
Total equity |
|
||||||||||
| At January 1, 2024 |
1,755,570 | $28,117 | ($6,713 | ) | $24 | $1,913 | $23,341 | $8,661 | $32,002 | |||||||||||||||||||||||
| Net income |
— | — | 295 | — | — | 295 | 192 | 487 | ||||||||||||||||||||||||
| Total other comprehensive income |
— | — | — | 2 | — | 2 | — | 2 | ||||||||||||||||||||||||
| Total comprehensive income |
— | — | 295 | 2 | — | 297 | 192 | 489 | ||||||||||||||||||||||||
| Transactions with owners |
||||||||||||||||||||||||||||||||
| Dividends |
— | — | (175 | ) | — | — | (175 | ) | — | (175 | ) | |||||||||||||||||||||
| Funding from non-controlling interests (note 14) |
— | — | — | — | — | — | 22 | 22 | ||||||||||||||||||||||||
| Disbursements to non-controlling interests (note 14) |
— | — | — | — | — | — | (121 | ) | (121 | ) | ||||||||||||||||||||||
| Dividend reinvestment plan (note 13) |
66 | 1 | (1 | ) | — | — | — | — | — | |||||||||||||||||||||||
| Total transactions with owners |
66 | 1 | (176 | ) | — | — | (175 | ) | (99 | ) | (274 | ) | ||||||||||||||||||||
| At March 31, 2024 |
1,755,636 | $28,118 | ($6,594 | ) | $26 | $1,913 | $23,463 | $8,754 | $32,217 | |||||||||||||||||||||||
| At January 1, 2023 |
1,755,350 | $28,114 | ($7,282 | ) | $26 | $1,913 | $22,771 | $8,518 | $31,289 | |||||||||||||||||||||||
| Net income |
— | — | 120 | — | — | 120 | 149 | 269 | ||||||||||||||||||||||||
| Total other comprehensive loss |
— | — | — | (3 | ) | — | (3 | ) | — | (3 | ) | |||||||||||||||||||||
| Total comprehensive income (loss) |
— | — | 120 | (3 | ) | — | 117 | 149 | 266 | |||||||||||||||||||||||
| Transactions with owners |
||||||||||||||||||||||||||||||||
| Dividends |
— | — | (175 | ) | — | — | (175 | ) | — | (175 | ) | |||||||||||||||||||||
| Disbursements to non-controlling interests |
— | — | — | — | — | — | (62 | ) | (62 | ) | ||||||||||||||||||||||
| Dividend reinvestment plan |
58 | 1 | (1 | ) | — | — | — | — | — | |||||||||||||||||||||||
| Total transactions with owners |
58 | 1 | (176 | ) | — | — | (175 | ) | (62 | ) | (237 | ) | ||||||||||||||||||||
| At March 31, 2023 |
1,755,408 | $28,115 | ($7,338 | ) | $23 | $1,913 | $22,713 | $8,605 | $31,318 | |||||||||||||||||||||||
| 1 | Includes cumulative translation losses at March 31, 2024: $95 million (December 31, 2023: $95 million; March 31, 2023: $95 million). |
| 2 | Includes additional paid-in capital as at March 31, 2024: $1,875 million (December 31, 2023: $1,875 million; March 31, 2023: $1,875 million). |
The accompanying notes are an integral part of these condensed interim consolidated financial statements.
| BARRICK FIRST QUARTER 2024 | 78 | FINANCIAL STATEMENTS (UNAUDITED) |
| OVERVIEW | OPERATING PERFORMANCE
|
GROWTH PROJECTS & EXPLORATION
|
REVIEW OF FINANCIAL RESULTS
|
OTHER INFORMATION & NON-GAAP RECONCILIATIONS |
FINANCIAL STATEMENTS |
|||||
Notes to Consolidated Financial Statements
Barrick Gold Corporation. Tabular dollar amounts in millions of United States dollars, unless otherwise shown.
1 ∎ Corporate Information
Barrick Gold Corporation (“Barrick”, “we” or the “Company”) is a corporation governed by the Business Corporations Act (British Columbia). The Company’s corporate office is located at Brookfield Place, TD Canada Trust Tower, 161 Bay Street, Suite 3700, Toronto, Ontario, M5J 2S1. The Company’s registered office is 925 West Georgia Street, Suite 1600, Vancouver, British Columbia, V6C 3L2. Barrick shares trade on the New York Stock Exchange under the symbol GOLD and the Toronto Stock Exchange under the symbol ABX. We are principally engaged in the production and sale of gold and copper, as well as related activities such as exploration and mine development. We sell our gold and copper into the world market.
We have ownership interests in producing gold mines that are located in Argentina, Canada, Côte d’Ivoire, the Democratic Republic of the Congo, the Dominican Republic, Mali, Papua New Guinea, Tanzania and the United States. We have ownership interests in producing copper mines in Chile, Saudi Arabia and Zambia. We also have various projects located throughout the Americas, Asia and Africa.
2 ∎ Material Accounting Policy Information
a) Statement of Compliance
These condensed interim consolidated financial statements have been prepared in accordance with IFRS Accounting Standards as issued by the International Accounting Standards Board applicable to the preparation of interim financial statements, under International Accounting Standard 34, Interim Financial Reporting. These interim financial statements should be read in conjunction with Barrick’s most recently issued Annual Report, which includes information necessary or useful to understanding the Company’s business and financial statement presentation. In particular, the Company’s material accounting policy information was presented in Note 2 of the Annual Consolidated Financial Statements for the year ended December 31, 2023 (“2023 Annual Financial Statements”), and have been consistently applied in the preparation of these interim financial statements. These condensed interim consolidated financial statements were authorized for issuance by the Board of Directors on April 30, 2024.
b) New Accounting Standards Issued
Certain new accounting standards and interpretations have been published that are either applicable in the current year or not mandatory for the current period. We have assessed these standards, including Amendments to IAS 1 - Non-current Liabilities with Covenants, and determined they do not have a material impact on Barrick in the current reporting period. In addition, IFRS 18 Presentation and Disclosure in Financial Statements was issued by the IASB in April 2024, with mandatory application of the standard in annual reporting periods beginning on or after January 1, 2027. We are currently assessing the impact of IFRS 18 on our consolidated financial statements. No standards have been early adopted in the current period.
3 ∎ Critical Judgements, Estimates, Assumptions and Risks
The judgments, estimates, assumptions and risks discussed here reflect updates from the 2023 Annual Financial Statements. For judgments, estimates, assumptions and risks related to other areas not discussed in these interim consolidated financial statements, please refer to Notes 3 and 28 of the 2023 Annual Financial Statements.
a) Provision for Environmental Rehabilitation (“PER”)
Provisions are updated each reporting period for changes to expected cash flows and for the effect of changes in the discount rate and foreign exchange rates. The change in estimate is added or deducted from the related asset and depreciated over the expected economic life of the operation to which it relates. In the case of closed sites, changes in estimates and assumptions are recognized immediately in the consolidated statements of income. We recorded a net decrease of $41 million (2023: $38 million net increase) for the three months ended March 31, 2024 primarily due to spending incurred during the year and an increase in the discount rate, partially offset by accretion.
Adjustments to the estimated amount and timing of future closure and rehabilitation cash flows are a normal occurrence in light of the significant judgments and estimates involved. Rehabilitation provisions are adjusted as a result of changes in estimates and assumptions and are accounted for prospectively. In the fourth quarter of each year, our life of mine plans are updated and that typically results in an update to the rehabilitation provision.
b) Pascua-Lama
The Pascua-Lama project received $429 million as at March 31, 2024 (December 31, 2023: $472 million) in VAT refunds in Chile relating to the development of the Chilean side of the project. Under the current arrangement, this amount must be repaid if the project does not evidence exports for an amount of $3,538 million within a term that expires on December 31, 2026, unless extended.
In addition, we have recorded $9 million in VAT recoverable in Argentina as at March 31, 2024 (December 31, 2023: $9 million) relating to the development of the Argentinean side of the project. These amounts may not be fully recoverable if the project does not enter into production and are subject to foreign currency risk as the amounts are recoverable in Argentine pesos.
c) Contingencies
Contingencies can be either possible assets or possible liabilities arising from past events which, by their nature, will be resolved only when one or more future events, not wholly within our control, occur or fail to occur. The assessment of such contingencies inherently involves the exercise of significant judgment and estimates of the outcome of future events. Refer to Note 15 for further details on contingencies.
| BARRICK FIRST QUARTER 2024 |
79 |
NOTES TO FINANCIAL STATEMENTS (UNAUDITED) |
| OVERVIEW | OPERATING PERFORMANCE
|
GROWTH PROJECTS & EXPLORATION
|
REVIEW OF FINANCIAL RESULTS
|
OTHER INFORMATION & NON-GAAP RECONCILIATIONS |
FINANCIAL STATEMENTS |
|||||
4 ∎ Segment Information
Barrick’s business is organized into sixteen minesites. Barrick’s Chief Operating Decision Maker (“CODM”) (Mark Bristow, President and Chief Executive Officer) reviews the operating results, assesses performance and makes capital allocation decisions at the minesite level. Our presentation of our reportable operating segments consists of eight gold mines (Carlin, Cortez, Turquoise Ridge, Pueblo Viejo, Loulo-Gounkoto, Kibali, North Mara and Bulyanhulu) and one copper mine (Lumwana). The remaining operating segments, including our remaining gold mines, have been grouped into an “Other Mines” category and will not be reported on individually. Segment performance is evaluated based on a number of measures including operating income before tax, production levels and unit production costs. Certain costs are managed on a consolidated basis and are therefore not reflected in segment income.
Consolidated Statement of Income Information
| Cost of Sales | ||||||||||||||||||||||||
| For the three months ended March 31, 2024 |
Revenue | Site operating costs, royalties and community relations |
Depreciation | Exploration, evaluation and project expenses |
Other expenses (income)1 |
Segment income (loss) |
||||||||||||||||||
| Carlin2 |
$712 | $385 | $83 | $3 | $2 | $239 | ||||||||||||||||||
| Cortez2 |
413 | 186 | 75 | 1 | 2 | 149 | ||||||||||||||||||
| Turquoise Ridge2 |
211 | 137 | 37 | 1 | — | 36 | ||||||||||||||||||
| Pueblo Viejo2 |
290 | 148 | 62 | 1 | 2 | 77 | ||||||||||||||||||
| Loulo-Gounkoto2 |
361 | 139 | 67 | — | 12 | 143 | ||||||||||||||||||
| Kibali |
152 | 58 | 28 | — | 2 | 64 | ||||||||||||||||||
| Lumwana |
163 | 108 | 60 | — | 2 | (7 | ) | |||||||||||||||||
| North Mara2 |
114 | 74 | 18 | — | 5 | 17 | ||||||||||||||||||
| Bulyanhulu2 |
106 | 56 | 15 | — | 1 | 34 | ||||||||||||||||||
| Other Mines2 |
382 | 224 | 47 | 3 | 5 | 103 | ||||||||||||||||||
| Reportable segment total |
$2,904 | $1,515 | $492 | $9 | $33 | $855 | ||||||||||||||||||
| Share of equity investees |
(152 | ) | (58 | ) | (28 | ) | — | (2 | ) | (64 | ) | |||||||||||||
| Segment total |
$2,752 | $1,457 | $464 | $9 | $31 | $791 | ||||||||||||||||||
Consolidated Statement of Income Information
| Cost of Sales | ||||||||||||||||||||||||
| For the three months ended March 31, 2023 |
Revenue | Site operating costs, royalties and community relations |
Depreciation | Exploration, evaluation and project expenses |
Other expenses (income)1 |
Segment income (loss) |
||||||||||||||||||
| Carlin2 |
$511 | $330 | $63 | $8 | $2 | $108 | ||||||||||||||||||
| Cortez2 |
425 | 204 | 91 | 2 | 2 | 126 | ||||||||||||||||||
| Turquoise Ridge2 |
254 | 139 | 50 | 1 | — | 64 | ||||||||||||||||||
| Pueblo Viejo2 |
291 | 120 | 64 | 1 | 1 | 105 | ||||||||||||||||||
| Loulo-Gounkoto2 |
321 | 144 | 71 | — | 1 | 105 | ||||||||||||||||||
| Kibali |
127 | 66 | 25 | — | 3 | 33 | ||||||||||||||||||
| Lumwana |
171 | 130 | 44 | 7 | 2 | (12 | ) | |||||||||||||||||
| North Mara2 |
158 | 64 | 19 | — | 19 | 56 | ||||||||||||||||||
| Bulyanhulu2 |
111 | 58 | 16 | — | 16 | 21 | ||||||||||||||||||
| Other Mines2 |
394 | 251 | 71 | 2 | 20 | 50 | ||||||||||||||||||
| Reportable segment total |
$2,763 | $1,506 | $514 | $21 | $66 | $656 | ||||||||||||||||||
| Share of equity investees |
(127 | ) | (66 | ) | (25 | ) | — | (3 | ) | (33 | ) | |||||||||||||
| Segment total |
$2,636 | $1,440 | $489 | $21 | $63 | $623 | ||||||||||||||||||
| 1 | Includes accretion expense, which is included within finance costs in the consolidated statement of income. For the three months ended March 31, 2024, accretion expense was $13 million (2023: $12 million). |
| 2 | Includes non-controlling interest portion of revenues, cost of sales and segment income for the three months ended March 31, 2024 for Nevada Gold Mines $572 million, $381 million, $186 million (2023: $505 million, $379 million, $120 million), Pueblo Viejo $118 million, $84 million, $34 million (2023: $116 million, $73 million, $42 million), Loulo-Gounkoto $72 million, $41 million, $29 million (2023: $64 million, $43 million, $22 million), North Mara and Bulyanhulu $35 million, $26 million, $8 million (2023: $43 million, $25 million, $12 million) and Tongon $8 million, $8 million, $1 million (2023: $11 million, $9 million, $3 million), respectively. |
| BARRICK FIRST QUARTER 2024 |
80 |
NOTES TO FINANCIAL STATEMENTS (UNAUDITED) |
| OVERVIEW | OPERATING PERFORMANCE
|
GROWTH PROJECTS & EXPLORATION
|
REVIEW OF FINANCIAL RESULTS
|
OTHER INFORMATION & NON-GAAP RECONCILIATIONS |
FINANCIAL STATEMENTS |
|||||
Reconciliation of Segment Income to Income Before Income Taxes
| For the three months ended March 31 |
||||
| 2024 | 2023 | |||
| Segment income |
$791 | $623 | ||
| Other revenue |
(5) | 7 | ||
| Other cost of sales/amortization |
(15) | (12) | ||
| Exploration, evaluation and project expenses not attributable to segments |
(86) | (50) | ||
| General and administrative expenses |
(28) | (39) | ||
| Other income (expense) not attributable to segments |
1 | (2) | ||
| Impairment charges |
(17) | (1) | ||
| Loss on currency translation |
(12) | (38) | ||
| Closed mine rehabilitation |
2 | (22) | ||
| Income from equity investees |
48 | 53 | ||
| Finance costs, net (includes non-segment accretion) |
(18) | (46) | ||
| Gain on non-hedge derivatives |
— | 1 | ||
| Income before income taxes |
$661 | $474 | ||
| Capital Expenditures Information |
Segment capital expenditures1 |
|||
| For the three months ended March 31 |
||||
| 2024 | 2023 | |||
| Carlin |
$203 | $120 | ||
| Cortez |
94 | 86 | ||
| Turquoise Ridge |
30 | 27 | ||
| Pueblo Viejo |
57 | 127 | ||
| Loulo-Gounkoto |
74 | 104 | ||
| Kibali |
25 | 19 | ||
| Lumwana |
79 | 52 | ||
| North Mara |
44 | 40 | ||
| Bulyanhulu |
31 | 20 | ||
| Other Mines |
50 | 61 | ||
| Reportable segment total |
$687 | $656 | ||
| Other items not allocated to segments |
32 | 41 | ||
| Total |
$719 | $697 | ||
| Share of equity investees |
(25) | (19) | ||
| Total |
$694 | $678 | ||
| 1 | Segment capital expenditures are presented for internal management reporting purposes on an accrual basis. Capital expenditures in the Consolidated Statements of Cash Flow are presented on a cash basis. For the three months ended March 31, 2024, cash expenditures were $728 million (2023: $688 million) and the decrease in accrued expenditures was $34 million (2023: $10 million decrease). |
Purchase Commitments
At March 31, 2024, we had purchase obligations for supplies and consumables of $1,796 million (December 31, 2023: $1,827 million).
Capital Commitments
In addition to entering into various operational commitments in the normal course of business, we had capital commitments of $344 million at March 31, 2024 (December 31, 2023: $258 million).
| BARRICK FIRST QUARTER 2024 |
81 |
NOTES TO FINANCIAL STATEMENTS (UNAUDITED) |
| OVERVIEW | OPERATING PERFORMANCE
|
GROWTH PROJECTS & EXPLORATION
|
REVIEW OF FINANCIAL RESULTS
|
OTHER INFORMATION & NON-GAAP RECONCILIATIONS |
FINANCIAL STATEMENTS |
|||||
5 ∎ Revenue
| For the three months ended March 31 |
||||
| 2024 | 2023 | |||
| Gold sales |
||||
| Spot market sales |
$2,416 | $2,326 | ||
| Concentrate sales |
103 | 77 | ||
| Provisional pricing adjustments |
9 | 8 | ||
| $2,528 | $2,411 | |||
| Copper sales |
||||
| Concentrate sales |
$159 | $159 | ||
| Provisional pricing adjustments |
4 | 12 | ||
| $163 | $171 | |||
| Other sales1 |
56 | 61 | ||
| Total |
$2,747 | $2,643 | ||
| 1 | Revenues include the sale of by-products for our gold and copper mines. |
6 ∎ Cost of Sales
| Gold | Copper | Other3 | Total | |||||||||||||||||||||||||||||
|
For the three months ended March 31 |
2024 |
2023 |
2024 |
2023 |
2024 |
2023 |
2024 |
2023 |
||||||||||||||||||||||||
| Site operating costs1,2 |
$1,257 | $1,208 | $95 | $115 | $— | $— | $1,352 | $1,323 | ||||||||||||||||||||||||
| Depreciation1 |
407 | 445 | 60 | 44 | 7 | 6 | 474 | 495 | ||||||||||||||||||||||||
| Royalty expense |
88 | 101 | 12 | 15 | — | — | 100 | 116 | ||||||||||||||||||||||||
| Community relations |
9 | 7 | 1 | — | — | — | 10 | 7 | ||||||||||||||||||||||||
| $1,761 | $1,761 | $168 | $174 | $7 | $6 | $1,936 | $1,941 | |||||||||||||||||||||||||
| 1 | Site operating costs and depreciation include charges to reduce the cost of inventory to net realizable value as follows: $22 million for the three months ended March 31, 2024 (2023: $13 million). |
| 2 | Site operating costs includes the costs of extracting by-products. |
| 3 | Other includes corporate amortization. |
7 ∎ Earnings Per Share
| For the three months ended March 31 | ||||||||||||||
| 2024 | 2023 | |||||||||||||
| Basic | Diluted | Basic | Diluted | |||||||||||
| Net income |
$487 | $487 | $269 | $269 | ||||||||||
| Net income attributable to non-controlling interests |
(192 | ) | (192) | (149 | ) | (149 | ) | |||||||
| Net income attributable to equity holders of Barrick Gold Corporation |
$295 | $295 | $120 | $120 | ||||||||||
| Weighted average shares outstanding |
1,756 | 1,756 | 1,755 | 1,755 | ||||||||||
|
Basic and diluted earnings per share data attributable to the equity holders of Barrick Gold Corporation |
$0.17 | $0.17 | $0.07 | $0.07 | ||||||||||
| BARRICK FIRST QUARTER 2024 |
82 |
NOTES TO FINANCIAL STATEMENTS (UNAUDITED) |
| OVERVIEW | OPERATING PERFORMANCE
|
GROWTH PROJECTS & EXPLORATION
|
REVIEW OF FINANCIAL RESULTS
|
OTHER INFORMATION & NON-GAAP RECONCILIATIONS |
FINANCIAL STATEMENTS |
|||||
8 ∎ Other Expense
a) Other Expense (Income)
| For the three months ended March 31 |
||||||||
| 2024 | 2023 | |||||||
| Other expense: |
||||||||
| Bank charges |
$1 | $1 | ||||||
| Litigation |
4 | 5 | ||||||
| Loss on warrant investments at fair value through profit or loss (“FVPL”) |
2 | 2 | ||||||
| Porgera care and maintenance costs |
— | 17 | ||||||
| Tanzania education program |
— | 30 | ||||||
| Other |
16 | 6 | ||||||
| Total other expense |
$23 | $61 | ||||||
| Other income: |
||||||||
| Gain on sale of non-current assets |
($1 | ) | ($3 | ) | ||||
| Gain on non-hedge derivatives |
— | (1 | ) | |||||
| Interest income on other assets |
(5 | ) | (5 | ) | ||||
| Total other income |
($6 | ) | ($9 | ) | ||||
| Total |
$17 | $52 | ||||||
b) Impairment Charges
| For the three months ended March 31 |
||||||||
| 2024 | 2023 | |||||||
| Impairment charges of non-current assets |
$17 | $1 | ||||||
| Total |
$17 | $1 | ||||||
9 ∎ Income Tax Expense
| For the three months ended March 31 |
||||||||
| 2024 | 2023 | |||||||
| Current |
$140 | $182 | ||||||
| Deferred |
34 | 23 | ||||||
| Total |
$174 | $205 | ||||||
Income tax expense was $174 million for the three months ended March 31, 2024 (2023: $205 million). The unadjusted effective income tax rate for the three months ended March 31, 2024 was 26% of income before income taxes.
The underlying effective income tax rate on ordinary income for the three months ended March 31, 2024 was 22% after adjusting for the impact of foreign currency translation losses on deferred tax balances; the impact of the de-recognition of deferred tax assets; the impact of updates to the rehabilitation provision for our non-operating mines; the impact of non-deductible foreign exchange losses; and the impact of other expense adjustments.
Currency Translation
Current and deferred tax balances are subject to remeasurement for changes in foreign currency exchange rates each period. This is required in countries where tax is paid in local currency and the subsidiary has a different
functional currency (typically US dollars). The most significant balances relate to Argentine and Malian tax liabilities.
In the three months ended March 31, 2024, a tax expense of $21 million (2023: $4 million tax expense) arose primarily from translation losses on deferred tax balances in Argentina and Mali due to the weakening of the Argentine peso and West African CFA franc, respectively, against the US dollar. These net translation losses are included within income tax expense.
Withholding Taxes
For the three months ended March 31, 2024, we have recorded $14 million (2023: $16 million related to the United States) of dividend withholding taxes related to the undistributed earnings of our subsidiaries in Peru and the United States.
United States Tax Reform
In August 2022, President Joe Biden signed the Inflation Reduction Act (“the Act”) into law. The Act includes a 15% corporate alternative minimum tax (“CAMT”) that is imposed on applicable financial statement income and therefore would be considered in scope for IAS 12 given it is a tax on profits. The CAMT is effective for tax years beginning after December 31, 2022 and CAMT credit carryforwards have an indefinite life. Barrick is subject to CAMT because the Company meets the applicable income thresholds for a foreign-parented multi-national group.
We are awaiting the final US Treasury Regulations detailing the application of CAMT.
For the three months ended March 31, 2024, the deferred tax asset arising from the CAMT credit carryforwards has been recognized on the basis we expect that it will be recovered against US Federal Income Tax in the future.
Organization for Economic Co-operation and Development (“OECD”) Pillar Two model rules
In October 2021, more than 135 jurisdictions agreed to the OECD/G20 Inclusive Framework on Base Erosion and Profit Shifting Statement on a Two-Pillar Solution to Address the Tax Challenges Arising from the Digitalization of the Economy. Since then, the OECD has published model rules and other documents related to the second pillar of this solution (the Pillar Two model rules). The Pillar Two model rules provide a template that jurisdictions can translate into domestic tax law and implement as part of an agreed common approach.
Pillar Two legislation in Canada has been published in draft but it is not substantively enacted. Other jurisdictions where the group operates have either enacted legislation or are in the process of doing so.
In terms of the potential implications for income tax accounting, we have applied the exception available under the amendments to IAS 12 published by the IASB in May 2023 and are not recognizing or disclosing information about deferred tax assets and liabilities related to Pillar Two income taxes. We continue working on assessing our exposure to Pillar Two income taxes and based on the analysis performed to date, we do not expect the impact of Pillar Two provisions to be material to the Company.
| BARRICK FIRST QUARTER 2024 |
83 |
NOTES TO FINANCIAL STATEMENTS (UNAUDITED) |
| OVERVIEW | OPERATING PERFORMANCE
|
GROWTH PROJECTS & EXPLORATION
|
REVIEW OF FINANCIAL RESULTS
|
OTHER INFORMATION & NON-GAAP RECONCILIATIONS |
FINANCIAL STATEMENTS |
|||||
10 ∎ Cash Flow - Other Items
| Operating Cash Flows – Other Items | For the three months ended March 31 |
|||||||
| 2024 | 2023 | |||||||
| Adjustments for non-cash income statement items: |
||||||||
| Gain on non-hedge derivatives |
$— | ($1 | ) | |||||
| Loss on warrant investments at FVPL |
2 | 2 | ||||||
| Tanzania education program |
— | 30 | ||||||
| Share-based compensation expense |
13 | 19 | ||||||
| Change in estimate of rehabilitation costs at closed mines |
(2 | ) | 22 | |||||
| Inventory impairment charges |
14 | 9 | ||||||
| Non-cash revenue recognized on Pueblo Viejo gold and silver streaming agreement |
(7 | ) | (10 | ) | ||||
| Change in other assets and liabilities |
(19 | ) | 33 | |||||
| Settlement of share-based compensation |
(39 | ) | (29 | ) | ||||
| Settlement of rehabilitation obligations |
(32 | ) | (38 | ) | ||||
| Other operating activities |
($70 | ) | $37 | |||||
| Cash flow arising from changes in: |
||||||||
| Accounts receivable |
$39 | $6 | ||||||
| Inventory |
(28 | ) | (72 | ) | ||||
| Other current assets |
(100 | ) | (4 | ) | ||||
| Accounts payable |
(141 | ) | (119 | ) | ||||
| Other current liabilities |
(11 | ) | (2 | ) | ||||
| Change in working capital |
($241 | ) | ($191 | ) | ||||
11 ∎ Equity Accounting Method Investment Continuity
| Kibali | Jabal Sayid | Zaldívar | Porgera | Other | Total | |||||||||||||||||||
| At January 1, 2023 |
$ | 2,659 | $ | 382 | $ | 890 | $ | — | $ | 52 | $ | 3,983 | ||||||||||||
| Investment in equity accounting method investment |
— | — | — | 703 | — | 703 | ||||||||||||||||||
| Equity pick-up (loss) from equity investees |
145 | 102 | (16 | ) | — | 1 | 232 | |||||||||||||||||
| Dividends received from equity investees |
(180 | ) | (93 | ) | — | — | — | (273 | ) | |||||||||||||||
| Non-cash dividends received from equity investees |
(505 | ) | — | — | — | — | (505 | ) | ||||||||||||||||
| Shareholder loan repayment |
— | — | — | — | (7 | ) | (7 | ) | ||||||||||||||||
| At December 31, 2023 |
$ | 2,119 | $ | 391 | $ | 874 | $ | 703 | $ | 46 | $ | 4,133 | ||||||||||||
| Equity pick-up (loss) from equity investees |
25 | 27 | 1 | (5 | ) | — | 48 | |||||||||||||||||
| Funds invested |
— | — | — | 44 | — | 44 | ||||||||||||||||||
| Dividends received from equity investees |
(14 | ) | (33 | ) | — | — | — | (47 | ) | |||||||||||||||
| At March 31, 2024 |
$ | 2,130 | $ | 385 | $ | 875 | $ | 742 | $ | 46 | $ | 4,178 | ||||||||||||
| BARRICK FIRST QUARTER 2024 |
84 |
NOTES TO FINANCIAL STATEMENTS (UNAUDITED) |
| OVERVIEW | OPERATING PERFORMANCE
|
GROWTH PROJECTS & EXPLORATION
|
REVIEW OF FINANCIAL RESULTS
|
OTHER INFORMATION & NON-GAAP RECONCILIATIONS |
FINANCIAL STATEMENTS |
|||||
12 ∎ Fair Value Measurements
a) Assets and Liabilities Measured at Fair Value on a Recurring Basis
| As at March 31, 2024 |
Quoted
(Level 1) |
Significant
(Level 2) |
Significant
(Level 3) |
Aggregate
|
||||||||||||
| Other investments1 |
$129 | $— | $— | $129 | ||||||||||||
| Receivables from provisional copper and gold sales |
— | 221 | — | 221 | ||||||||||||
| $129 | $221 | $— | $350 | |||||||||||||
| 1 | Includes equity investments in other mining companies. |
b) Fair Values of Financial Assets and Liabilities
| As at March 31, 2024 | As at December 31, 2023 |
|||||||||||||||
| Carrying amount |
Estimated fair values |
Carrying amount |
Estimated fair value |
|||||||||||||
| Financial assets | ||||||||||||||||
| Other assets1 | $783 | $783 | $807 | $807 | ||||||||||||
| Other investments2 | 129 | 129 | 131 | 131 | ||||||||||||
| $912 | $912 | $938 | $938 | |||||||||||||
| Financial liabilities | ||||||||||||||||
| Debt3 | $4,725 | $4,959 | $4,726 | $5,107 | ||||||||||||
| Other liabilities | 566 | 566 | 574 | 574 | ||||||||||||
| $5,291 | $5,525 | $5,300 | $5,681 | |||||||||||||
| 1 | Includes restricted cash and amounts due from our partners. |
| 2 | Includes equity investments in other mining companies. Recorded at fair value. Quoted market prices are used to determine fair value. |
| 3 | Debt is generally recorded at amortized cost. The fair value of debt is primarily determined using quoted market prices. Balance includes both current and long-term portions of debt. |
The Company’s valuation techniques were presented in Note 26 of the 2023 Annual Financial Statements and have been consistently applied in these interim financial statements.
13 ∎ Capital Stock
a) Authorized Capital Stock
Our authorized capital stock is composed of an unlimited number of common shares (issued 1,755,636,101 common shares as at March 31, 2024). Our common shares have no par value.
b) Dividends
The Company’s practice has been to declare dividends after a quarter as part of the announcement of the results for the quarter. Dividends declared are paid in the same quarter.
The Company’s dividend reinvestment plan resulted in 66,547 common shares issued to shareholders for the three months ended March 31, 2024.
c) Share Buyback Program
At the February 13, 2024 meeting, the Board of Directors authorized a new share buyback program for the repurchase of up to $1.0 billion of the Company’s outstanding common shares over the next 12 months. During the three months ended March 31, 2024, Barrick did not purchase any shares under this program.
The actual number of common shares that may be purchased, and the timing of any such purchases, will be determined by Barrick based on a number of factors, including the Company’s financial performance, the availability of cash flows, and the consideration of other uses of cash, including capital investment opportunities, returns to shareholders, and debt reduction.
The repurchase program does not obligate the Company to acquire any particular number of common shares, and the repurchase program may be suspended or discontinued at any time at the Company’s discretion.
14 ∎ Non-controlling Interests Continuity
| Nevada Gold Mines |
Pueblo Viejo |
Tanzania Mines1 |
Loulo- Gounkoto |
Tongon | Reko Diq | Other | Total | |||||||||||||||||||||||||
| NCI in subsidiary at March 31, 2024 |
38.5 | % | 40 | % | 16 | % | 20 | % | 10.3 | % | 50 | % | Various | |||||||||||||||||||
| At January 1, 2023 |
$ | 6,068 | $ | 1,128 | $ | 321 | $ | 739 | $ | 13 | $ | 329 | ($ | 80 | ) | $ | 8,518 | |||||||||||||||
| Share of income (loss) |
548 | 63 | 25 | 69 | 7 | (31 | ) | — | 681 | |||||||||||||||||||||||
| Cash contributed |
— | — | — | — | — | 40 | — | 40 | ||||||||||||||||||||||||
| Disbursements |
(454 | ) | (48 | ) | (24 | ) | (48 | ) | (4 | ) | — | — | (578 | ) | ||||||||||||||||||
| At December 31, 2023 |
$ | 6,162 | $ | 1,143 | $ | 322 | $ | 760 | $ | 16 | $ | 338 | ($ | 80 | ) | $ | 8,661 | |||||||||||||||
| Share of income (loss) |
172 | 15 | 5 | 19 | 1 | (20 | ) | — | 192 | |||||||||||||||||||||||
| Cash contributed |
— | — | — | — | — | 22 | — | 22 | ||||||||||||||||||||||||
| Disbursements |
(96 | ) | (16 | ) | — | (9 | ) | — | — | — | (121 | ) | ||||||||||||||||||||
| At March 31, 2024 |
$ | 6,238 | $ | 1,142 | $ | 327 | $ | 770 | $ | 17 | $ | 340 | ($ | 80 | ) | $ | 8,754 | |||||||||||||||
| 1 | Tanzania mines consist of the two operating mines, North Mara and Bulyanhulu. |
| BARRICK FIRST QUARTER 2024 |
85 |
NOTES TO FINANCIAL STATEMENTS (UNAUDITED) |
| OVERVIEW | OPERATING PERFORMANCE
|
GROWTH PROJECTS & EXPLORATION
|
REVIEW OF FINANCIAL RESULTS
|
OTHER INFORMATION & NON-GAAP RECONCILIATIONS |
FINANCIAL STATEMENTS |
|||||
15 ∎ Contingencies
Certain conditions may exist as of the date the financial statements are issued that may result in a loss to the Company, but which will only be resolved when one or more future events occur or fail to occur. The impact of any resulting loss from such matters affecting these financial statements and noted below may be material.
Except as noted below, no material changes have occurred with respect to the matters disclosed in Note 35 “Contingencies” to the 2023 Annual Financial Statements, and no new contingencies have occurred that are material to the Company since the issuance of the 2023 Annual Financial Statements.
The description set out below should be read in conjunction with Note 35 “Contingencies” to the 2023 Annual Financial Statements.
Litigation and Claims Update
Pascua-Lama — Proposed Canadian Securities Class Actions
In the Quebec proceeding, the Plaintiff filed his Originating Application, (which is the Quebec equivalent of a Statement of Claim), on February 22, 2024.
In the Ontario case, on April 15, 2024, the Plaintiffs filed an application for leave to appeal to the Supreme Court of Canada from the February 13, 2024 decision of the Court of Appeal.
Veladero — Operational Incidents and Associated Proceedings
On February 22, 2024, the Supreme Court of San Juan Province rejected the legal action brought by MAS in September 2017 to challenge certain aspects of the administrative sanction issued by the San Juan Provincial mining authority in connection with the September 2015 incident. MAS did not appeal this decision and the matter is now closed.
On March 14, 2024, MAS withdrew its appeal of the administrative sanction issued by the San Juan Provincial mining authority in connection with the September 2016 and March 2017 incidents. This matter is now closed.
Veladero — Tax Assessment and Criminal Charges
On February 27, 2024, the Court of Cassation rejected the appeal brought by the Argentinean Federal Tax Authority (“AFIP”), upholding the Court of Appeals’ dismissal of the criminal charges against the MAS directors. AFIP did not appeal this decision and the matter is now closed.
Writ of Kalikasan
On February 14, 2024, the Court issued a Resolution confirming that the suspension of the proceeding will be extended and that the various motions that remain pending will be held in abeyance for six months, until August 13, 2024.
North Mara — Ontario Litigation
In February 2024, an additional action was commenced against the Company in the Ontario Superior Court of Justice on behalf of different named plaintiffs in respect of alleged security-related incidents said to have occurred in the vicinity of the North Mara mine. The Statement of Claim in this second action is substantially similar to the Statement of Claim issued in November 2022.
Loulo-Gounkoto Mining Convention Negotiations
The Company has continued to engage with the Government of Mali to resolve this matter in a manner that protects the rights of Loulo and Gounkoto under their existing establishment conventions while also achieving the stated objectives of the Transitional Government to provide for the equitable sharing of economic benefits from the mining industry. On April 26, 2024, Barrick received correspondence from the Malian Government reiterating its commitment to continued partnership with Barrick while seeking a number of changes to the tax, financial and legal regime applicable to the Loulo-Gounkoto complex, among other demands. While the proposed changes are not acceptable to Barrick on the basis that they do not respect Barrick’s pre-existing rights, Barrick will nevertheless continue to engage with the committee established by the Transitional Government to renegotiate mining conventions.
Zaldívar Water Claims
Additional Court-ordered evidentiary measures were completed on March 1, 2024, and the evidentiary record is now closed. A decision from the Court is pending.
| BARRICK FIRST QUARTER 2024 |
86 |
NOTES TO FINANCIAL STATEMENTS (UNAUDITED) |
Shares Listed
| GOLD | The New York Stock Exchange | |
| ABX | The Toronto Stock Exchange |
Transfer Agents and Registrars
TSX Trust Company
301 – 100 Adelaide Street West
Toronto, Ontario M5H 4H1
Canada
or
Equiniti Trust Company, LLC
6201 – 15th Avenue
Brooklyn, New York 11219
USA
Telephone: 1 800 387 0825
Fax: 1 888 249 6189
Email: shareholderinquiries@tmx.com
Website: www.tsxtrust.com
Corporate Office
Barrick Gold Corporation
161 Bay Street, Suite 3700
Toronto, Ontario M5J 2S1
Canada
Telephone: +1 416 861 9911
Email: investor@barrick.com
Website: www.barrick.com
Enquiries
President and Chief Executive Officer
Mark Bristow
+1 647 205 7694
+44 7880 711 386
Senior Executive Vice-President and
Chief Financial Officer
Graham Shuttleworth
+1 647 262 2095
+44 7797 711 338
Investor and Media Relations
Kathy du Plessis
+44 207 557 7738
Email: barrick@dpapr.com
Cautionary Statement on Forward-Looking Information
Certain information contained or incorporated by reference in this MD&A, including any information as to our strategy, projects, plans or future financial or operating performance, constitutes “forward-looking statements”. All statements, other than statements of historical fact, are forward-looking statements. The words “believe”, “expect”, “anticipated”, “vision”, “aim”, “on track”, “strategy”, “target”, “plan”, “opportunities”, “guidance”, “forecast”, “outlook”, ”objective”, “intend”, “project”, “pursue” “develop”, “progress”, “continue”, ”committed”, “budget”, “estimate”, “potential”, “prospective”, “future”, “focus”, “during”, “ongoing”, “following”, “subject to”, “scheduled”, “may”, “will”, “can”, “could”, “would”, “should” and similar expressions identify forward-looking statements. In particular, this MD&A contains forward-looking statements including, without limitation, with respect to: Barrick’s forward-looking production guidance, including the anticipated increase in gold and copper production during the remainder of 2024; estimates of future cost of sales per ounce for gold and per pound for copper, total cash costs per ounce and C1 cash costs per pound, and all-in-sustaining costs per ounce/ pound; cash flow forecasts; projected capital, operating and exploration expenditures; the share buyback program and performance dividend policy, including the criteria for dividend payments; mine life and production rates; the resumption of operations at the Porgera mine and expected ramp up of mining and processing in 2024; our plans and expected completion and benefits of our growth and capital projects, including the Goldrush Project, Fourmile, Pueblo Viejo plant expansion and mine life extension project, including the anticipated ramp-up of the plant expansion during 2024, Veladero Phase 7 leach pad project, the Reko
Diq project, solar power projects at NGM and Loulo-Gounkoto, Donlin Gold, the Jabal Sayid Lode 1 project and the development of the Lumwana Super Pit; expected timing for production for Goldrush, Reko Diq and the Lumwana Super Pit; the new mining code in Mali and the status of the establishment conventions for the Loulo-Gounkoto complex; capital expenditures related to upgrades and ongoing management initiatives; our ability to identify new Tier One assets and the potential for existing assets to attain Tier One status; Barrick’s global exploration strategy and planned exploration activities; our pipeline of high confidence projects at or near existing operations; potential mineralization and metal or mineral recoveries; our ability to convert resources into reserves; asset sales, joint ventures and partnerships; Barrick’s strategy, plans and targets in respect of environmental and social governance issues, including climate change, GHG emissions reduction targets, safety performance, responsible water use, TSF management, including Barrick’s conformance with the GISTM, community development, biodiversity and human rights initiatives; and expectations regarding future price assumptions, financial performance and other outlook or guidance.
Forward-looking statements are necessarily based upon a number of estimates and assumptions including material estimates and assumptions related to the factors set forth below that, while considered reasonable by the Company as at the date of this MD&A in light of management’s experience and perception of current conditions and expected developments, are inherently subject to significant business, economic and competitive uncertainties and contingencies. Known and unknown factors could cause actual results to differ materially from those projected in the forward-looking statements and undue reliance should not be placed on such statements and information.
Such factors include, but are not limited to: fluctuations in the spot and forward price of gold, copper or certain other commodities (such as silver, diesel fuel, natural gas and electricity); risks associated with projects in the early stages of evaluation and for which additional engineering and other analysis is required; risks related to the possibility that future exploration results will not be consistent with the Company’s expectations, that quantities or grades of reserves will be diminished, and that resources may not be converted to reserves; risks associated with the fact that certain of the initiatives described in this MD&A are still in the early stages and may not materialize; changes in mineral production performance, exploitation and exploration successes; risks that exploration data may be incomplete and considerable additional work may be required to complete further evaluation, including but not limited to drilling, engineering and socioeconomic studies and investment; the speculative nature of mineral exploration and development; lack of certainty with respect to foreign legal systems, corruption and other factors that are inconsistent with the rule of law; changes in national and local government legislation, taxation, controls or regulations and/or changes in the administration of laws, policies and practices, including the potential impact of proposed changes to Chilean law on the status of value-added tax (“VAT”) refunds received in Chile in connection with the development of the Pascua-Lama project; expropriation or nationalization of property and political or economic developments in Canada, the United States or other countries in which Barrick does or may carry on business in the future; risks relating to political instability in certain of the jurisdictions in which Barrick operates; timing of receipt of, or failure to comply with, necessary permits and approvals; non-renewal of key licenses by governmental authorities; failure to comply with environmental and health and safety laws and regulations; increased costs and physical and transition risks related to climate change, including extreme weather events, resource shortages, emerging policies and increased regulations related to greenhouse gas emission levels, energy efficiency and reporting of risks; the Company’s ability to achieve its sustainability goals, including its climate-related goals and GHG emissions reduction targets, in particular its ability to achieve its Scope 3 emissions targets which requires reliance on entities within Barrick’s value chain, but outside of the Company’s direct control, to achieve such targets within the specified time frames; contests over title to properties, particularly title to undeveloped properties, or over access to water, power and other required infrastructure; the liability associated with risks and hazards in the mining industry, and the ability to maintain insurance to cover such losses; damage to the Company’s reputation due to the actual or perceived occurrence of any number of events, including negative publicity with respect to the Company’s handling of environmental matters or dealings with community groups, whether true or not; risks related to operations near communities that may regard Barrick’s operations as being detrimental to them; litigation and legal and administrative proceedings; operating or technical difficulties in connection with mining or development activities, including geotechnical challenges, tailings dam and storage facilities failures, and disruptions in the maintenance or provision of required infrastructure and information technology systems; increased costs, delays, suspensions and technical challenges associated with the construction of capital projects; risks associated with working with partners in
jointly controlled assets; risks related to disruption of supply routes which may cause delays in construction and mining activities, including disruptions in the supply of key mining inputs due to the invasion of Ukraine by Russia and conflicts in the Middle East; risk of loss due to acts of war, terrorism, sabotage and civil disturbances; risks associated with artisanal and illegal mining; risks associated with Barrick’s infrastructure, information technology systems and the implementation of Barrick’s technological initiatives, including risks related to cybersecurity incidents, including those caused by computer viruses, malware, ransomware and other cyberattacks, or similar information technology system failures, delays and/or disruptions; the impact of global liquidity and credit availability on the timing of cash flows and the values of assets and liabilities based on projected future cash flows; the impact of inflation, including global inflationary pressures driven by ongoing global supply chain disruptions, global energy cost increases following the invasion of Ukraine by Russia and country-specific political and economic factors in Argentina; adverse changes in our credit ratings; fluctuations in the currency markets; changes in U.S. dollar interest rates; risks arising from holding derivative instruments (such as credit risk, market liquidity risk and mark-to-market risk); risks related to the demands placed on the Company’s management, the ability of management to implement its business strategy and enhanced political risk in certain jurisdictions; uncertainty whether some or all of Barrick’s targeted investments and projects will meet the Company’s capital allocation objectives and internal hurdle rate; whether benefits expected from recent transactions are realized; business opportunities that may be presented to, or pursued by, the Company; our ability to successfully integrate acquisitions or complete divestitures; risks related to competition in the mining industry; employee relations including loss of key employees; availability and increased costs associated with mining inputs and labor; risks associated with diseases, epidemics and pandemics, including the effects and potential effects of the global Covid-19 pandemic; risks related to the failure of internal controls; and risks related to the impairment of the Company’s goodwill and assets.
In addition, there are risks and hazards associated with the business of mineral exploration, development and mining, including environmental hazards, industrial accidents, unusual or unexpected formations, pressures, cave-ins, flooding and gold bullion, copper cathode or gold or copper concentrate losses (and the risk of inadequate insurance, or inability to obtain insurance, to cover these risks).
Many of these uncertainties and contingencies can affect our actual results and could cause actual results to differ materially from those expressed or implied in any forward-looking statements made by, or on behalf of, us. Readers are cautioned that forward-looking statements are not guarantees of future performance. All of the forward-looking statements made in this MD&A are qualified by these cautionary statements. Specific reference is made to the most recent Form 40-F/Annual Information Form on file with the SEC and Canadian provincial securities regulatory authorities for a more detailed discussion of some of the factors underlying forward-looking statements and the risks that may affect Barrick’s ability to achieve the expectations set forth in the forward-looking statements contained in this MD&A. We disclaim any intention or obligation to update or revise any forward-looking statements whether as a result of new information, future events or otherwise, except as required by applicable law.