UNITED STATES
SECURITIES AND EXCHANGE COMMISSION
Washington, D.C. 20549
FORM 8-K
CURRENT REPORT
Pursuant to Section 13 or 15(d)
of the Securities Exchange Act of 1934
Date of Report (Date of earliest event reported): May 2, 2024
WestRock Company
(Exact name of registrant as specified in its charter)
| Delaware | 001-38736 | 37-1880617 | ||
| (State or other jurisdiction of incorporation) |
(Commission File Number) |
(IRS Employer Identification No.) |
| 1000 Abernathy Road, Atlanta, GA | 30328 | |
| (Address of principal executive offices) | (Zip Code) |
(770) 448-2193
(Registrant’s telephone number, including area code)
Not Applicable
(Former name or former address, if changed since last report)
Check the appropriate box below if the Form 8-K filing is intended to simultaneously satisfy the filing obligation of the registrant under any of the following provisions:
| ☐ | Written communications pursuant to Rule 425 under the Securities Act (17 CFR 230.425) |
| ☐ | Soliciting material pursuant to Rule 14a-12 under the Exchange Act (17 CFR 240.14a-12) |
| ☐ | Pre-commencement communications pursuant to Rule 14d-2(b) under the Exchange Act (17 CFR 240.14d-2(b)) |
| ☐ | Pre-commencement communications pursuant to Rule 13e-4(c) under the Exchange Act (17 CFR 240.13e-4(c)) |
Securities registered pursuant to Section 12(b) of the Act:
| Title of each class |
Trading |
Name of each exchange |
||
| Common Stock, par value $0.01 per share | WRK | New York Stock Exchange |
Indicate by check mark whether the registrant is an emerging growth company as defined in Rule 405 of the Securities Act of 1933 (17 CFR §230.405) or Rule 12b-2 of the Securities Exchange Act of 1934 (17 CFR §240.12b-2). Emerging growth company ☐
If an emerging growth company, indicate by check mark if the registrant has elected not to use the extended transition period for complying with any new or revised financial accounting standards provided pursuant to Section 13(a) of the Exchange Act. ☐
| Item 2.02. | Results of Operations and Financial Condition. |
On May 2, 2024, WestRock Company (the “Company”) issued a press release announcing the Company’s financial results for the second quarter of fiscal 2024. A copy of the press release is attached as Exhibit 99.1.
The information provided pursuant to this Item 2.02, including Exhibit 99.1 in Item 9.01, is “furnished” and shall not be deemed to be “filed” with the Securities and Exchange Commission (the “SEC”) or incorporated by reference in any filing under the Securities Exchange Act of 1934, as amended (the “Exchange Act”), or the Securities Act of 1933, as amended (the “Securities Act”), except as shall be expressly set forth by specific reference in any such filings.
| Item 7.01. | Regulation FD Disclosure. |
Due to its proposed business combination with Smurfit Kappa Group plc, the Company will not host a conference call to discuss its financial results for the second quarter of fiscal 2024. However, on May 2, 2024, the Company released a slide presentation regarding its financial results for that period. A copy of the presentation is attached as Exhibit 99.2.
The information provided pursuant to this Item 7.01, including Exhibit 99.2 in Item 9.01, is “furnished” and shall not be deemed to be “filed” with the SEC or incorporated by reference in any filing under the Exchange Act or the Securities Act, except as shall be expressly set forth by specific reference in any such filings.
| Item 9.01. | Financial Statements and Exhibits. |
| (c) | Exhibits |
| 99.1 | WestRock Reports Second Quarter Fiscal 2024 Results | |
| 99.2 | WestRock Q2 FY2024 Results | |
| 104 | The cover page from this Current Report on Form 8-K, formatted in Inline XBRL | |
SIGNATURES
Pursuant to the requirements of the Securities Exchange Act of 1934, the Registrant has duly caused this report to be signed on its behalf by the undersigned hereunto duly authorized.
| WESTROCK COMPANY |
||||||
| (Registrant) |
||||||
| Date: May 2, 2024 | By: | /s/ Alexander W. Pease |
||||
| Alexander W. Pease | ||||||
| Executive Vice President and Chief Financial Officer |
||||||
Exhibit 99.1

WestRock Reports Second Quarter Fiscal 2024 Results
ATLANTA, GA, May 2, 2024 (BUSINESS WIRE) — WestRock Company (NYSE:WRK), a leading provider of sustainable paper and packaging solutions, today announced results for its fiscal second quarter ended March 31, 2024.
Second Quarter Highlights and other notable items:
| • | Net sales of $4.73 billion |
| • | Net income of $16 million, Adjusted Net Income of $101 million; net income included $81 million of restructuring and other costs, net |
| • | Earnings of $0.06 per diluted share (“EPS”) and Adjusted EPS of $0.39 |
| • | Consolidated Adjusted EBITDA of $618 million |
| • | Consumer Packaging Adjusted EBITDA margin increased 70 bps to 18.0% |
| • | Achieved over $160 million in cost savings; expect to significantly exceed previously announced fiscal 2024 target of $300 to $400 million |
“I’m proud of our team’s continued focus and execution, as we delivered strong results and made significant progress on our cost savings initiatives,” said David B. Sewell, chief executive officer. “We have already exceeded the midpoint of our targeted cost savings for fiscal 2024, and we expect further savings through the remainder of the year and beyond. Our efforts are better positioning us to compete in the market and making us a more efficient company. Together with our scale and innovative, sustainable packaging solutions, WestRock is well positioned to capture share and drive long-term earnings growth.”
Consolidated Financial Results
WestRock’s performance for the three months ended March 31, 2024 and 2023 (in millions):
| Three Months Ended | ||||||||
| Mar. 31, 2024 | Mar. 31, 2023 | |||||||
| Net sales |
$ | 4,726.7 | $ | 5,277.6 | ||||
| Net income (loss) |
$ | 15.5 | $ | (2,006.1 | ) | |||
| Consolidated Adjusted EBITDA |
$ | 618.3 | $ | 788.6 | ||||
The decline in net sales compared to the second quarter of fiscal 2023 was driven primarily by a $229 million, or 8.7%, decrease in Corrugated Packaging segment sales, a $152 million, or 13.0%, decrease in Global Paper segment sales and a $152 million, or 12.0%, decrease in Consumer Packaging segment sales. The decrease in net sales was primarily due to lower selling price/mix largely driven by published price declines and softer volumes. Current year results were also impacted by the prior year mill and interior partition divestitures.
Net income in the second quarter of fiscal 2024 was not comparable to the prior year quarter primarily due to the $1.9 billion pre-tax, non-cash goodwill impairment and higher restructuring and other costs, net in the second quarter of fiscal 2023. Net income in the second quarter of fiscal 2024 was primarily impacted by lower selling price/mix and increased cost savings.
1
Consolidated Adjusted EBITDA decreased $170 million, or 21.6%, compared to the second quarter of fiscal 2023, primarily due to lower Adjusted EBITDA across each of our segments.
Additional information about the changes in segment sales and Adjusted EBITDA by segment is included below.
Restructuring and Other Costs, Net
Restructuring and other costs, net during the second quarter of fiscal 2024 were $81 million. The charges were primarily acquisition costs related to the Transaction (as hereinafter defined), ongoing costs related to previously closed operations and severance associated with converting plant closures.
Cash Flow Activities
Net cash provided by operating activities was $37 million in the second quarter of fiscal 2024 compared to $284 million in the prior year quarter. The decrease was primarily due to increased working capital usage in the second quarter of fiscal 2024.
Total debt was $9.0 billion at March 31, 2024, and Adjusted Net Debt was $8.4 billion. The Company had approximately $3.0 billion of available liquidity from long-term committed credit facilities and cash and cash equivalents at March 31, 2024.
During the second quarter of fiscal 2024, WestRock invested $301 million in capital expenditures and returned $78 million in capital to stockholders in dividend payments.
Segment Results
WestRock’s segment performance for the three months ended March 31, 2024 and 2023 was as follows (in millions):
Corrugated Packaging Segment
| Three Months Ended | ||||||||
| Mar. 31, 2024 | Mar. 31, 2023 | |||||||
| Segment sales |
$ | 2,398.3 | $ | 2,627.4 | ||||
| Adjusted EBITDA |
$ | 317.9 | $ | 407.5 | ||||
| Adjusted EBITDA Margin |
13.3 | % | 15.5 | % | ||||
Corrugated Packaging segment sales decreased primarily due to lower selling price/mix and lower volumes. These declines were partially offset by favorable foreign exchange rates.
Corrugated Packaging Adjusted EBITDA decreased primarily due to the margin impact of lower selling price/mix driven by published price declines, net cost inflation, lower volumes and the impact of winter weather, which were partially offset by increased cost savings, and the net impact of lower economic downtime and prior year mill closures. Corrugated Packaging Adjusted EBITDA margin was 13.3% and Adjusted EBITDA margin excluding trade sales was 13.7%.
2
Consumer Packaging Segment
| Three Months Ended | ||||||||
| Mar. 31, 2024 | Mar. 31, 2023 | |||||||
| Segment sales |
$ | 1,113.5 | $ | 1,265.1 | ||||
| Adjusted EBITDA |
$ | 200.3 | $ | 218.6 | ||||
| Adjusted EBITDA Margin |
18.0 | % | 17.3 | % | ||||
Consumer Packaging segment sales decreased primarily due to lower volumes and the prior year divestiture of our interior partition operations.
Consumer Packaging Adjusted EBITDA decreased primarily due to net cost inflation, increased economic downtime, lower volumes and the prior year divestiture of our interior partition operations. These items were partially offset by increased cost savings. Consumer Packaging Adjusted EBITDA margin was 18.0%.
Global Paper Segment
| Three Months Ended | ||||||||
| Mar. 31, 2024 | Mar. 31, 2023 | |||||||
| Segment sales |
$ | 1,016.2 | $ | 1,168.2 | ||||
| Adjusted EBITDA |
$ | 129.5 | $ | 187.1 | ||||
| Adjusted EBITDA Margin |
12.7 | % | 16.0 | % | ||||
Global Paper segment sales decreased primarily due to lower selling price/mix driven by published price declines and the impact of prior year divested mill operations.
Global Paper Adjusted EBITDA decreased primarily due to the margin impact of lower selling price/mix, the impact of increased economic downtime and prior year mill closures, the impact of prior year divested mill operations and the impact of winter weather. These items were partially offset by increased cost savings, net cost deflation and lower planned maintenance downtime. Global Paper Adjusted EBITDA margin was 12.7%.
Distribution Segment
| Three Months Ended | ||||||||
| Mar. 31, 2024 | Mar. 31, 2023 | |||||||
| Segment sales |
$ | 272.0 | $ | 307.3 | ||||
| Adjusted EBITDA |
$ | 8.9 | $ | 9.3 | ||||
| Adjusted EBITDA Margin |
3.3 | % | 3.0 | % | ||||
Distribution segment sales decreased primarily due to lower volumes and lower selling price/mix.
Distribution Adjusted EBITDA decreased primarily due to lower volumes and the margin impact of lower selling price/mix. These items were largely offset by increased cost savings and by increased cost deflation.
Conference Call and Financial Guidance for Subsequent Periods
Due to the proposed business combination with Smurfit Kappa Group plc to create a global leader in sustainable packaging (the “Transaction”), WestRock will not host a conference call to discuss its financial results for the fiscal second quarter ended March 31, 2024. A slide presentation and other relevant financial and statistical information along with this release can be accessed at ir.westrock.com.
Preparations for the Transaction, including regulatory submissions, are currently underway, and WestRock continues to expect the Transaction to close in early July 2024. As previously communicated, to avoid a delay in this anticipated timeline caused by the inclusion of financial guidance after the second fiscal quarter in certain of those submissions, WestRock does not intend to provide such guidance for this and subsequent periods.
3
About WestRock
WestRock (NYSE:WRK) partners with our customers to provide differentiated, sustainable paper and packaging solutions that help them win in the marketplace. WestRock’s team members support customers around the world from locations spanning North America, South America, Europe, Asia and Australia. Learn more at www.westrock.com.
Cautionary Statements
This release contains forward-looking statements within the meaning of the Private Securities Litigation Reform Act of 1995. Forward-looking statements are based on our current expectations, beliefs, plans or forecasts and use words or phrases such as “may,” “will,” “could,” “should,” “would,” “anticipate,” “estimate,” “expect,” “project,” “intend,” “plan,” “believe,” “target,” “prospects,” “potential,” “commit,” and “forecast,” and other words, terms and phrases of similar meaning or refer to future time periods. Forward-looking statements involve estimates, expectations, projections, goals, targets, forecasts, assumptions, risks and uncertainties. A forward-looking statement is not a guarantee of future performance, and actual results could differ materially from those contained in the forward-looking statement.
Forward-looking statements are subject to a number of assumptions, risks and uncertainties, many of which are beyond our control, such as developments related to pricing cycles and volumes; economic, competitive and market conditions generally, including macroeconomic uncertainty, customer inventory rebalancing, the impact of inflation and increases in energy, raw materials, shipping, labor and capital equipment costs; reduced supply of raw materials, energy and transportation, including from supply chain disruptions and labor shortages; intense competition; results and impacts of acquisitions, including operational and financial effects from the Mexico Acquisition, and divestitures; business disruptions, including from the occurrence of severe weather or a natural disaster or other unanticipated problems, such as labor difficulties, equipment failure or unscheduled maintenance and repair, or public health crises; failure to respond to changing customer preferences and to protect our intellectual property; the amount and timing of capital expenditures, including installation costs, project development and implementation costs, and costs related to resolving disputes with third parties with which we work to manage and implement capital projects; risks related to international sales and operations; the production of faulty or contaminated products; the loss of certain customers; adverse legal, reputational, operational and financial effects resulting from information security incidents and the effectiveness of business continuity plans during a ransomware or other cyber incident; work stoppages and other labor relations difficulties; inability to attract, motivate and retain qualified personnel, including as a result of the proposed Transaction; risks associated with sustainability and climate change, including our ability to achieve our sustainability targets and commitments and realize climate-related opportunities on announced timelines or at all; our inability to successfully identify and make performance improvements and deliver cost savings and risks associated with completing strategic projects on anticipated timelines and realizing anticipated financial or operational improvements on announced timelines or at all, including with respect to our business systems transformation; risks related to the proposed Transaction, including our ability to complete the Transaction on the anticipated timeline, or at all, restrictions imposed on our business under the Transaction, disruptions to our business while the proposed Transaction is pending, the impact of management’s time and attention being focused on consummation of the proposed Transaction, costs associated with the proposed Transaction, and integration difficulties; risks related to our indebtedness, including increases in interest rates; the scope, costs, timing and impact of any restructuring of our operations and corporate and tax structure; the scope, timing and outcome of any litigation, claims or other proceedings or dispute resolutions and the impact of any such litigation (including with respect to the Brazil tax liability matter); and additional impairment charges. Such risks and other factors that may impact forward-looking statements are discussed in our Annual Report on Form 10-K for the fiscal year ended September 30, 2023, including in Item 1A “Risk Factors”, as well as in our subsequent filings with the Securities and Exchange Commission. The information contained herein speaks as of the date hereof, and the Company does not have or undertake any obligation to update or revise its forward-looking statements, whether as a result of new information, future events or otherwise, except to the extent required by law.
4
WestRock Company
Consolidated Statements of Operations
In millions, except per share amounts (unaudited)
| Three Months Ended March 31, |
Six Months Ended March 31, |
|||||||||||||||
| 2024 | 2023 | 2024 | 2023 | |||||||||||||
| Net sales |
$ | 4,726.7 | $ | 5,277.6 | $ | 9,346.7 | $ | 10,200.7 | ||||||||
| Cost of goods sold |
3,946.6 | 4,357.6 | 7,807.8 | 8,514.7 | ||||||||||||
|
|
|
|
|
|
|
|
|
|||||||||
| Gross profit |
780.1 | 920.0 | 1,538.9 | 1,686.0 | ||||||||||||
| Selling, general and administrative expense excluding intangible amortization |
499.5 | 498.9 | 1,026.6 | 978.0 | ||||||||||||
| Selling, general and administrative intangible amortization expense |
79.0 | 86.2 | 161.0 | 172.8 | ||||||||||||
| Restructuring and other costs, net |
81.2 | 435.8 | 146.7 | 467.9 | ||||||||||||
| Impairment of goodwill |
— | 1,893.0 | — | 1,893.0 | ||||||||||||
|
|
|
|
|
|
|
|
|
|||||||||
| Operating profit (loss) |
120.4 | (1,993.9 | ) | 204.6 | (1,825.7 | ) | ||||||||||
| Interest expense, net |
(100.8 | ) | (108.4 | ) | (202.2 | ) | (205.7 | ) | ||||||||
| Pension and other postretirement non-service cost |
(0.6 | ) | (6.0 | ) | (0.4 | ) | (11.0 | ) | ||||||||
| Other (expense) income, net |
(13.5 | ) | (17.8 | ) | (18.2 | ) | 7.4 | |||||||||
| Equity in income (loss) of unconsolidated entities |
2.9 | 4.5 | 7.1 | (31.5 | ) | |||||||||||
| Loss on sale of RTS and Chattanooga |
(2.0 | ) | — | (1.5 | ) | — | ||||||||||
|
|
|
|
|
|
|
|
|
|||||||||
| Income (loss) before income taxes |
6.4 | (2,121.6 | ) | (10.6 | ) | (2,066.5 | ) | |||||||||
| Income tax benefit |
10.0 | 116.8 | 4.3 | 108.5 | ||||||||||||
|
|
|
|
|
|
|
|
|
|||||||||
| Consolidated net income (loss) |
16.4 | (2,004.8 | ) | (6.3 | ) | (1,958.0 | ) | |||||||||
| Less: Net income attributable to noncontrolling interests |
(0.9 | ) | (1.3 | ) | (0.6 | ) | (2.8 | ) | ||||||||
|
|
|
|
|
|
|
|
|
|||||||||
| Net income (loss) attributable to common stockholders |
$ | 15.5 | $ | (2,006.1 | ) | $ | (6.9 | ) | $ | (1,960.8 | ) | |||||
|
|
|
|
|
|
|
|
|
|||||||||
| Computation of diluted earnings per share (in millions, except per share data): |
||||||||||||||||
| Net income (loss) attributable to common stockholders |
$ | 15.5 | $ | (2,006.1 | ) | $ | (6.9 | ) | $ | (1,960.8 | ) | |||||
| Diluted weighted average shares outstanding |
259.3 | 255.6 | 257.5 | 255.2 | ||||||||||||
| Diluted earnings (loss) per share |
$ | 0.06 | $ | (7.85 | ) | $ | (0.03 | ) | $ | (7.68 | ) | |||||
|
|
|
|
|
|
|
|
|
|||||||||
5
WestRock Company
Segment Information
In millions (unaudited)
| Three Months Ended March 31, |
Six Months Ended March 31, |
|||||||||||||||
| 2024 | 2023 | 2024 | 2023 | |||||||||||||
| Net sales: |
||||||||||||||||
| Corrugated Packaging |
$ | 2,398.3 | $ | 2,627.4 | $ | 4,818.2 | $ | 4,964.8 | ||||||||
| Consumer Packaging |
1,113.5 | 1,265.1 | 2,172.8 | 2,480.1 | ||||||||||||
| Global Paper |
1,016.2 | 1,168.2 | 1,934.5 | 2,291.8 | ||||||||||||
| Distribution |
272.0 | 307.3 | 561.7 | 628.8 | ||||||||||||
| Intersegment Eliminations |
(73.3 | ) | (90.4 | ) | (140.5 | ) | (164.8 | ) | ||||||||
|
|
|
|
|
|
|
|
|
|||||||||
| Total |
$ | 4,726.7 | $ | 5,277.6 | $ | 9,346.7 | $ | 10,200.7 | ||||||||
|
|
|
|
|
|
|
|
|
|||||||||
| Adjusted EBITDA: |
||||||||||||||||
| Corrugated Packaging |
$ | 317.9 | $ | 407.5 | $ | 645.7 | $ | 736.9 | ||||||||
| Consumer Packaging |
200.3 | 218.6 | 366.5 | 401.9 | ||||||||||||
| Global Paper |
129.5 | 187.1 | 247.9 | 344.4 | ||||||||||||
| Distribution |
8.9 | 9.3 | 17.9 | 20.1 | ||||||||||||
|
|
|
|
|
|
|
|
|
|||||||||
| Total |
656.6 | 822.5 | 1,278.0 | 1,503.3 | ||||||||||||
| Depreciation, depletion and amortization |
(388.4 | ) | (395.8 | ) | (770.2 | ) | (769.0 | ) | ||||||||
| Restructuring and other costs, net |
(81.2 | ) | (435.8 | ) | (146.7 | ) | (467.9 | ) | ||||||||
| Impairment of goodwill |
— | (1,893.0 | ) | — | (1,893.0 | ) | ||||||||||
| Non-allocated expenses |
(38.3 | ) | (33.9 | ) | (89.0 | ) | (62.6 | ) | ||||||||
| Interest expense, net |
(100.8 | ) | (108.4 | ) | (202.2 | ) | (205.7 | ) | ||||||||
| Other (expense) income, net |
(13.5 | ) | (17.8 | ) | (18.2 | ) | 7.4 | |||||||||
| Loss on sale of RTS and Chattanooga |
(2.0 | ) | — | (1.5 | ) | — | ||||||||||
| Other adjustments |
(26.0 | ) | (59.4 | ) | (60.8 | ) | (179.0 | ) | ||||||||
|
|
|
|
|
|
|
|
|
|||||||||
| Income (loss) before income taxes |
$ | 6.4 | $ | (2,121.6 | ) | $ | (10.6 | ) | $ | (2,066.5 | ) | |||||
|
|
|
|
|
|
|
|
|
|||||||||
| Depreciation, depletion and amortization: |
||||||||||||||||
| Corrugated Packaging |
$ | 202.6 | $ | 211.2 | $ | 407.9 | $ | 403.4 | ||||||||
| Consumer Packaging |
90.9 | 85.5 | 177.4 | 169.6 | ||||||||||||
| Global Paper |
85.6 | 91.2 | 166.7 | 180.3 | ||||||||||||
| Distribution |
7.5 | 6.9 | 14.8 | 13.8 | ||||||||||||
| Corporate |
1.8 | 1.0 | 3.4 | 1.9 | ||||||||||||
|
|
|
|
|
|
|
|
|
|||||||||
| Total |
$ | 388.4 | $ | 395.8 | $ | 770.2 | $ | 769.0 | ||||||||
|
|
|
|
|
|
|
|
|
|||||||||
| Other adjustments: |
||||||||||||||||
| Corrugated Packaging |
$ | 1.7 | $ | 4.7 | $ | 6.8 | $ | 54.5 | ||||||||
| Consumer Packaging |
3.4 | 28.0 | 7.0 | 59.6 | ||||||||||||
| Global Paper |
0.7 | 9.1 | 2.2 | 26.6 | ||||||||||||
| Distribution |
— | — | (0.3 | ) | — | |||||||||||
| Corporate |
20.2 | 17.6 | 45.1 | 38.3 | ||||||||||||
|
|
|
|
|
|
|
|
|
|||||||||
| Total |
$ | 26.0 | $ | 59.4 | $ | 60.8 | $ | 179.0 | ||||||||
|
|
|
|
|
|
|
|
|
|||||||||
6
WestRock Company
Consolidated Statements of Cash Flows
In millions (unaudited)
| Three Months Ended March 31, |
Six Months Ended March 31, |
|||||||||||||||
| 2024 | 2023 | 2024 | 2023 | |||||||||||||
| Cash flows from operating activities: |
||||||||||||||||
| Consolidated net income (loss) |
$ | 16.4 | $ | (2,004.8 | ) | $ | (6.3 | ) | $ | (1,958.0 | ) | |||||
| Adjustments to reconcile consolidated net income (loss) to net cash provided by operating activities: |
||||||||||||||||
| Depreciation, depletion and amortization |
388.4 | 395.8 | 770.2 | 769.0 | ||||||||||||
| Deferred income tax benefit |
(10.0 | ) | (220.1 | ) | (33.3 | ) | (239.6 | ) | ||||||||
| Share-based compensation expense |
5.7 | 13.5 | 13.0 | 23.1 | ||||||||||||
| Pension and other postretirement cost (income), net of contributions |
1.1 | 4.6 | 1.6 | 8.2 | ||||||||||||
| Cash surrender value increase in excess of premiums paid |
(14.5 | ) | (12.3 | ) | (31.9 | ) | (25.4 | ) | ||||||||
| Equity in (income) loss of unconsolidated entities |
(2.9 | ) | (4.5 | ) | (7.1 | ) | 31.5 | |||||||||
| Loss on sale of RTS and Chattanooga |
2.0 | — | 1.5 | — | ||||||||||||
| Gain on sale of other businesses |
— | — | — | (11.1 | ) | |||||||||||
| Impairment of goodwill |
— | 1,893.0 | — | 1,893.0 | ||||||||||||
| Other impairment adjustments |
4.7 | 388.4 | (0.1 | ) | 387.7 | |||||||||||
| (Gain) loss on disposal of assets, net |
2.3 | (7.9 | ) | — | (9.6 | ) | ||||||||||
| Other, net |
0.7 | (15.0 | ) | (1.3 | ) | (14.3 | ) | |||||||||
| Changes in operating assets and liabilities, net of acquisitions / divestitures: |
||||||||||||||||
| Accounts receivable |
(154.7 | ) | (114.6 | ) | 26.8 | 170.3 | ||||||||||
| Inventories |
(30.0 | ) | 9.0 | (55.7 | ) | (44.8 | ) | |||||||||
| Other assets |
(7.2 | ) | 14.6 | (80.7 | ) | (49.7 | ) | |||||||||
| Accounts payable |
8.9 | (100.4 | ) | (14.6 | ) | (214.3 | ) | |||||||||
| Income taxes |
(186.5 | ) | 46.5 | (175.7 | ) | 46.7 | ||||||||||
| Accrued liabilities and other |
12.7 | (1.7 | ) | (94.3 | ) | (212.7 | ) | |||||||||
|
|
|
|
|
|
|
|
|
|||||||||
| Net cash provided by operating activities |
37.1 | 284.1 | 312.1 | 550.0 | ||||||||||||
|
|
|
|
|
|
|
|
|
|||||||||
| Investing activities: |
||||||||||||||||
| Capital expenditures |
(301.3 | ) | (281.5 | ) | (548.6 | ) | (563.7 | ) | ||||||||
| Cash paid for purchase of businesses, net of cash acquired |
— | — | — | (853.5 | ) | |||||||||||
| Proceeds from settlement of Timber Note related to SPEs |
— | — | 860.0 | — | ||||||||||||
| Proceeds from corporate owned life insurance |
1.9 | 4.5 | 5.0 | 6.7 | ||||||||||||
| Proceeds from sale of other businesses |
0.3 | — | 0.8 | 25.9 | ||||||||||||
| Proceeds from sale of unconsolidated entities |
— | — | 1.0 | — | ||||||||||||
| Proceeds from currency forward contracts |
— | — | — | 23.2 | ||||||||||||
| Proceeds from sale of property, plant and equipment |
30.4 | 14.2 | 38.7 | 18.7 | ||||||||||||
| Other, net |
— | (0.5 | ) | (0.2 | ) | (0.8 | ) | |||||||||
|
|
|
|
|
|
|
|
|
|||||||||
| Net cash (used for) provided by investing activities |
(268.7 | ) | (263.3 | ) | 356.7 | (1,343.5 | ) | |||||||||
|
|
|
|
|
|
|
|
|
|||||||||
| Financing activities: |
||||||||||||||||
| Additions to revolving credit facilities |
86.9 | 32.1 | 86.9 | 52.9 | ||||||||||||
| Repayments of revolving credit facilities |
— | — | — | (126.9 | ) | |||||||||||
| Additions to debt |
2.2 | 176.2 | 104.5 | 1,704.1 | ||||||||||||
| Repayments of debt |
(35.2 | ) | (192.9 | ) | (70.2 | ) | (841.7 | ) | ||||||||
| Changes in commercial paper, net |
314.9 | (10.1 | ) | 280.2 | 291.4 | |||||||||||
| Other debt (repayments) additions, net |
(45.7 | ) | 7.5 | (29.2 | ) | (16.1 | ) | |||||||||
| Repayment of Timber Loan related to SPEs |
— | — | (774.0 | ) | — | |||||||||||
| Cash dividends paid to stockholders |
(78.0 | ) | (70.3 | ) | (155.6 | ) | (140.3 | ) | ||||||||
| Other, net |
(10.8 | ) | (17.8 | ) | (12.3 | ) | (15.8 | ) | ||||||||
|
|
|
|
|
|
|
|
|
|||||||||
| Net cash provided by (used for) financing activities |
234.3 | (75.3 | ) | (569.7 | ) | 907.6 | ||||||||||
|
|
|
|
|
|
|
|
|
|||||||||
| Effect of exchange rate changes on cash and cash equivalents, and restricted cash |
3.9 | 3.7 | 2.2 | (2.0 | ) | |||||||||||
| Changes in cash and cash equivalents, and restricted cash in assets held-for-sale |
— | (1.0 | ) | — | (8.9 | ) | ||||||||||
|
|
|
|
|
|
|
|
|
|||||||||
| Increase in cash and cash equivalents and restricted cash |
6.6 | (51.8 | ) | 101.3 | 103.2 | |||||||||||
| Cash and cash equivalents, and restricted cash at beginning of period |
488.1 | 415.2 | 393.4 | 260.2 | ||||||||||||
|
|
|
|
|
|
|
|
|
|||||||||
| Cash and cash equivalents, and restricted cash at end of period |
$ | 494.7 | $ | 363.4 | $ | 494.7 | $ | 363.4 | ||||||||
|
|
|
|
|
|
|
|
|
|||||||||
| Supplemental disclosure of cash flow information: |
||||||||||||||||
| Cash paid during the period for: |
||||||||||||||||
| Income taxes, net of refunds |
$ | 184.2 | $ | 57.6 | $ | 203.5 | $ | 86.2 | ||||||||
| Interest, net of amounts capitalized |
$ | 144.5 | $ | 145.4 | $ | 237.7 | $ | 213.5 | ||||||||
7
WestRock Company
Condensed Consolidated Balance Sheets
In millions (unaudited)
| March 31, 2024 |
September 30, 2023 |
|||||||
| Assets |
||||||||
| Current assets: |
||||||||
| Cash and cash equivalents |
$ | 494.7 | $ | 393.4 | ||||
| Accounts receivable (net of allowances of $60.1 and $60.2) |
2,583.7 | 2,591.9 | ||||||
| Inventories |
2,328.4 | 2,331.5 | ||||||
| Other current assets (amount related to SPEs of $0 and $862.1) |
873.7 | 1,584.8 | ||||||
| Assets held for sale |
62.8 | 91.5 | ||||||
|
|
|
|
|
|||||
| Total current assets |
6,343.3 | 6,993.1 | ||||||
| Property, plant and equipment, net |
11,240.7 | 11,063.2 | ||||||
| Goodwill |
4,266.5 | 4,248.7 | ||||||
| Intangibles, net |
2,424.0 | 2,576.2 | ||||||
| Prepaid pension asset |
637.2 | 618.3 | ||||||
| Other noncurrent assets (amount related to SPEs of $384.4 and $382.7) |
1,972.3 | 1,944.2 | ||||||
|
|
|
|
|
|||||
| Total Assets |
$ | 26,884.0 | $ | 27,443.7 | ||||
|
|
|
|
|
|||||
| Liabilities and Equity |
||||||||
| Current liabilities: |
||||||||
| Current portion of debt |
$ | 1,317.5 | $ | 533.0 | ||||
| Accounts payable |
2,138.0 | 2,123.9 | ||||||
| Accrued compensation and benefits |
426.1 | 524.9 | ||||||
| Other current liabilities (amount related to SPEs of $0 and $776.7) |
855.8 | 1,737.6 | ||||||
|
|
|
|
|
|||||
| Total current liabilities |
4,737.4 | 4,919.4 | ||||||
| Long-term debt due after one year |
7,718.2 | 8,050.9 | ||||||
| Pension liabilities, net of current portion |
194.4 | 191.2 | ||||||
| Postretirement medical liabilities, net of current portion |
99.9 | 99.1 | ||||||
| Deferred income taxes |
2,251.6 | 2,433.2 | ||||||
| Other noncurrent liabilities (amount related to SPEs of $331.1 and $330.2) |
1,798.7 | 1,652.2 | ||||||
| Total stockholders’ equity |
10,066.2 | 10,080.7 | ||||||
| Noncontrolling interests |
17.6 | 17.0 | ||||||
|
|
|
|
|
|||||
| Total Equity |
10,083.8 | 10,097.7 | ||||||
|
|
|
|
|
|||||
| Total Liabilities and Equity |
$ | 26,884.0 | $ | 27,443.7 | ||||
|
|
|
|
|
|||||
8
Definitions, Non-GAAP Financial Measures and Reconciliations
We calculate cost savings as the year-over-year change in certain costs incurred for manufacturing, procurement, logistics, and selling, general and administrative, in each case excluding the impact of economic downtime and inflation. Cost savings achieved to date may not recur in future periods, and estimates of future savings are subject to change.
WestRock reports its financial results in accordance with accounting principles generally accepted in the United States (“GAAP”). However, management believes certain non-GAAP financial measures provide additional meaningful financial information that may be relevant when assessing our ongoing performance. Non-GAAP financial measures should be viewed in addition to, and not as an alternative for, WestRock’s GAAP results. The non-GAAP financial measures we present may differ from similarly captioned measures presented by other companies.
Business Systems Transformation Costs
In the fourth quarter of fiscal 2022, WestRock launched a multi-year phased business systems transformation project. Due to the nature, scope and magnitude of this investment, management believes these incremental transformation costs are above the normal, recurring level of spending for information technology to support operations. Since these strategic investments, including incremental nonrecurring operating costs, will cease at the end of the investment period, are not expected to recur in the foreseeable future, and are not considered representative of our underlying operating performance, management believes presenting these costs as an adjustment in the non-GAAP results provides additional information to investors about trends in our operations and is useful for period-over-period comparisons. This presentation also allows investors to view our underlying operating results in the same manner as they are viewed by management.
We discuss below details of the non-GAAP financial measures presented by us and provide reconciliations of these non-GAAP financial measures to the most directly comparable financial measures calculated in accordance with GAAP.
Consolidated Adjusted EBITDA and Adjusted EBITDA
WestRock uses the non-GAAP financial measure “Consolidated Adjusted EBITDA”, along with other measures such as “Adjusted EBITDA” (a measure of performance the Company uses to evaluate segment results in accordance with Accounting Standards Codification 280 (“ASC 280”)), to evaluate our overall performance. Management believes that the most directly comparable GAAP measure to “Consolidated Adjusted EBITDA” is “Net income (loss) attributable to common stockholders”. It can also be derived by adding together each segment’s “Adjusted EBITDA” plus “Non-allocated expenses”. Management believes this measure provides WestRock’s management, board of directors, investors, potential investors, securities analysts and others with useful information to evaluate WestRock’s performance because it excludes restructuring and other costs, net, business systems transformation costs and other specific items that management believes are not indicative of the ongoing operating results of the business. WestRock’s management and board use this information in making financial, operating and planning decisions and when evaluating WestRock’s performance relative to other periods.
Adjusted EBITDA, a measure of segment performance in accordance with ASC 280, is defined as pretax earnings of a reportable segment before depreciation, depletion and amortization, and excludes the following items the Company does not consider part of our segment performance: restructuring and other costs, net, impairment of goodwill, non-allocated expenses, interest expense, net, other (expense) income, net, loss on sale of RTS and Chattanooga and other adjustments—each as outlined in the table on page 6 (“Adjusted EBITDA”). The composition of Adjusted EBITDA is not addressed or prescribed by GAAP.
Adjusted Segment Sales and Adjusted EBITDA Margin, Excluding Trade Sales
WestRock uses the non-GAAP financial measures “Adjusted Segment Sales” and “Adjusted EBITDA Margin, excluding trade sales”. Management believes that adjusting segment sales for trade sales is consistent with how our peers present their sales for purposes of computing segment margins and helps WestRock’s management, board of directors, investors, potential investors, securities analysts and others compare companies in the same peer group. Management believes that the most directly comparable GAAP measure to “Adjusted Segment Sales” is “segment sales”.
9
Additionally, the most directly comparable GAAP measure to “Adjusted EBITDA Margin, excluding trade sales” is “Adjusted EBITDA Margin”. “Adjusted EBITDA Margin, excluding trade sales” is calculated by dividing that segment’s Adjusted EBITDA by Adjusted Segment Sales. “Adjusted EBITDA Margin” is a profitability measure in accordance with ASC 280, and it is calculated for each segment by dividing that segment’s Adjusted EBITDA by segment sales.
Adjusted Net Income and Adjusted Earnings Per Diluted Share
WestRock uses the non-GAAP financial measures “Adjusted Net Income” and “Adjusted Earnings Per Diluted Share”. Management believes these measures provide WestRock’s management, board of directors, investors, potential investors, securities analysts and others with useful information to evaluate WestRock’s performance because they exclude restructuring and other costs, net, business systems transformation costs and other specific items that management believes are not indicative of the ongoing operating results of the business. WestRock and its board of directors use this information in making financial, operating and planning decisions and when evaluating WestRock’s performance relative to other periods. WestRock believes that the most directly comparable GAAP measures to Adjusted Net Income and Adjusted Earnings Per Diluted Share are Net income (loss) attributable to common stockholders and Earnings (loss) per diluted share, respectively.
Adjusted Net Debt
WestRock uses the non-GAAP financial measure “Adjusted Net Debt”. Management believes this measure provides WestRock’s board of directors, investors, potential investors, securities analysts and others with useful information to evaluate WestRock’s repayment of debt relative to other periods because it includes or excludes certain items management believes are not comparable from period to period. Management believes “Adjusted Net Debt” provides greater comparability across periods by adjusting for cash and cash equivalents, as well as fair value of debt step-up included in Total Debt that is not subject to debt repayment. WestRock believes that the most directly comparable GAAP measure is “Total Debt” which is the sum of the current portion of debt and long-term debt due after one year.
This release includes reconciliations of our non-GAAP financial measures to their respective directly comparable GAAP measures, as identified above, for the periods indicated (in millions, except percentages and dollars per share).
Reconciliations of Consolidated Adjusted EBITDA
| Three Months Ended | ||||||||
| Mar. 31, 2024 | Mar. 31, 2023 | |||||||
| Net income (loss) attributable to common stockholders |
$ | 15.5 | $ | (2,006.1 | ) | |||
| Adjustments: (1) |
||||||||
| Less: Net income attributable to noncontrolling interests |
0.9 | 1.3 | ||||||
| Income tax benefit |
(10.0 | ) | (116.8 | ) | ||||
| Other expense (income), net |
13.5 | 17.8 | ||||||
| Interest expense, net |
100.8 | 108.4 | ||||||
| Restructuring and other costs, net |
81.2 | 435.8 | ||||||
| Impairment of goodwill |
— | 1,893.0 | ||||||
| Loss on sale of RTS and Chattanooga |
2.0 | — | ||||||
| Depreciation, depletion and amortization |
388.4 | 395.8 | ||||||
| Other adjustments |
26.0 | 59.4 | ||||||
|
|
|
|
|
|||||
| Consolidated Adjusted EBITDA |
$ | 618.3 | $ | 788.6 | ||||
|
|
|
|
|
|||||
| (1) | Schedule adds back expense or subtracts income for certain financial statement and segment footnote items to compute Consolidated Adjusted EBITDA. |
10
Reconciliations of Adjusted Net Income
| Three Months Ended March 31, 2024 | ||||||||||||
| Pre-Tax | Tax | Net of Tax | ||||||||||
| As reported (1) |
$ | 6.4 | $ | 10.0 | $ | 16.4 | ||||||
| Restructuring and other costs, net |
81.2 | (19.9 | ) | 61.3 | ||||||||
| Business systems transformation costs (2) |
20.2 | (4.9 | ) | 15.3 | ||||||||
| Losses at closed facilities (2) |
7.1 | (1.8 | ) | 5.3 | ||||||||
| Accelerated depreciation on certain consolidated facilities |
2.8 | (0.6 | ) | 2.2 | ||||||||
| Loss on sale of RTS and Chattanooga |
2.0 | (0.6 | ) | 1.4 | ||||||||
|
|
|
|
|
|
|
|||||||
| Adjusted Results |
$ | 119.7 | $ | (17.8 | ) | $ | 101.9 | |||||
|
|
|
|
|
|||||||||
| Noncontrolling interests |
(0.9 | ) | ||||||||||
|
|
|
|||||||||||
| Adjusted Net Income |
$ | 101.0 | ||||||||||
|
|
|
|||||||||||
| (1) | The as reported results for Pre-Tax, Tax and Net of Tax are equivalent to the line items “Income (loss) before income taxes”, “Income tax benefit” and “Consolidated net income (loss)”, respectively, as reported on the Consolidated Statements of Operations. |
| (2) | These footnoted items are the “Other adjustments” reported in the Segment Information table on page 6. The “Losses at closed facilities” line includes $1.3 million of depreciation and amortization. |
| Three Months Ended March 31, 2023 | ||||||||||||
| Pre-Tax | Tax | Net of Tax | ||||||||||
| As reported (1) |
$ | (2,121.6 | ) | $ | 116.8 | $ | (2,004.8 | ) | ||||
| Impairment of goodwill |
1,893.0 | (63.2 | ) | 1,829.8 | ||||||||
| Restructuring and other costs |
435.8 | (106.9 | ) | 328.9 | ||||||||
| Mahrt mill work stoppage (2) |
36.2 | (8.9 | ) | 27.3 | ||||||||
| Business systems transformation costs (2) |
17.5 | (4.3 | ) | 13.2 | ||||||||
| Acquisition accounting inventory related adjustments (2) |
4.6 | (1.1 | ) | 3.5 | ||||||||
| Losses at closed facilities (2) |
1.2 | (0.3 | ) | 0.9 | ||||||||
| Other (2) |
0.1 | — | 0.1 | |||||||||
|
|
|
|
|
|
|
|||||||
| Adjusted Results |
$ | 266.8 | $ | (67.9 | ) | $ | 198.9 | |||||
|
|
|
|
|
|||||||||
| Noncontrolling interests |
(1.3 | ) | ||||||||||
|
|
|
|||||||||||
| Adjusted Net Income |
$ | 197.6 | ||||||||||
|
|
|
|||||||||||
| (1) | The as reported results for Pre-Tax, Tax and Net of Tax are equivalent to the line items “Income (loss) before income taxes”, “Income tax benefit” and “Consolidated net income (loss)”, respectively, as reported on the Consolidated Statements of Operations. |
| (2) | These footnoted items are the “Other adjustments” reported in the Segment Information table on page 6. The “Losses at closed facilities” line includes $0.2 million of depreciation and amortization. |
11
Reconciliations of Adjusted Earnings Per Diluted Share
| Three Months Ended | ||||||||
| Mar. 31, 2024 | Mar. 31, 2023 | |||||||
| Earnings (loss) per diluted share |
$ | 0.06 | $ | (7.85 | ) | |||
| Impairment of goodwill |
— | 7.16 | ||||||
| Restructuring and other costs, net |
0.24 | 1.29 | ||||||
| Business systems transformation costs |
0.06 | 0.05 | ||||||
| Losses at closed facilities |
0.02 | — | ||||||
| Accelerated depreciation on certain consolidated facilities |
0.01 | — | ||||||
| Work stoppage costs |
— | 0.11 | ||||||
| Acquisition accounting inventory related adjustments |
— | 0.01 | ||||||
|
|
|
|
|
|||||
| Adjusted Earnings Per Diluted Share |
$ | 0.39 | $ | 0.77 | ||||
|
|
|
|
|
|||||
Reconciliations of Adjusted Segment Sales and Adjusted EBITDA Margin, Excluding Trade Sales
| Corrugated Packaging Segment |
| Three Months Ended | ||||||||
| Mar. 31, 2024 | Mar. 31, 2023 | |||||||
| Segment sales |
$ | 2,398.3 | $ | 2,627.4 | ||||
| Less: Trade Sales |
(70.8 | ) | (86.9 | ) | ||||
|
|
|
|
|
|||||
| Adjusted Segment Sales |
$ | 2,327.5 | $ | 2,540.5 | ||||
| Adjusted EBITDA |
$ | 317.9 | $ | 407.5 | ||||
| Adjusted EBITDA Margin |
13.3 | % | 15.5 | % | ||||
|
|
|
|
|
|||||
| Adjusted EBITDA Margin, excluding Trade Sales |
13.7 | % | 16.0 | % | ||||
|
|
|
|
|
|||||
Reconciliation of Total Debt to Adjusted Net Debt
| Mar. 31, 2024 | ||||
| Current portion of debt |
$ | 1,317.5 | ||
| Long-term debt due after one year |
7,718.2 | |||
|
|
|
|||
| Total debt |
9,035.7 | |||
| Less: Cash and cash equivalents |
(494.7 | ) | ||
| Less: Fair value of debt step-up |
(147.6 | ) | ||
|
|
|
|||
| Adjusted Net Debt |
$ | 8,393.4 | ||
|
|
|
|||
| CONTACT: | ||
| Investors: | Media: | |
| Robert Quartaro, 470-328-6979 | Robby Johnson, 470-328-6397 | |
| Vice President, Investor Relations | Manager, Corporate Communications | |
| robert.quartaro@westrock.com | s-crp-mediainquiries@westrock.com | |
12
May 2, 2024 WestRock Q2 FY2024 Results Exhibit 99.2
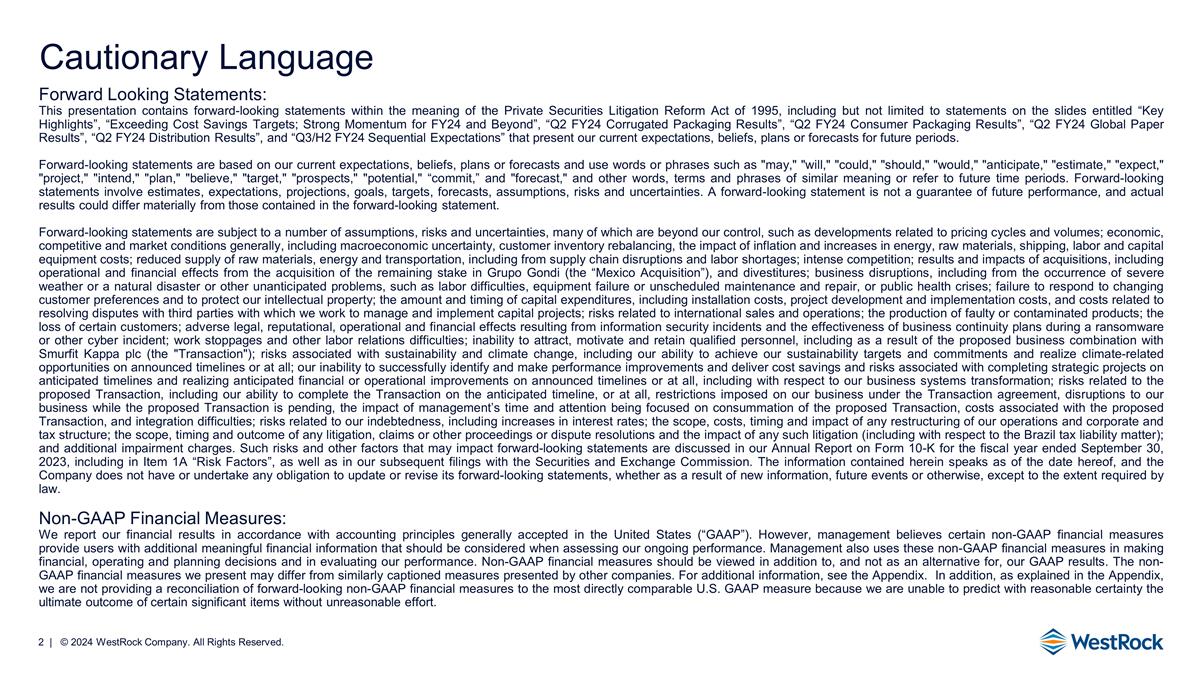
Cautionary Language Forward Looking Statements: This presentation contains forward-looking statements within the meaning of the Private Securities Litigation Reform Act of 1995, including but not limited to statements on the slides entitled “Key Highlights”, “Exceeding Cost Savings Targets; Strong Momentum for FY24 and Beyond”, “Q2 FY24 Corrugated Packaging Results”, “Q2 FY24 Consumer Packaging Results”, “Q2 FY24 Global Paper Results”, “Q2 FY24 Distribution Results”, and “Q3/H2 FY24 Sequential Expectations” that present our current expectations, beliefs, plans or forecasts for future periods. Forward-looking statements are based on our current expectations, beliefs, plans or forecasts and use words or phrases such as "may," "will," "could," "should," "would," "anticipate," "estimate," "expect," "project," "intend," "plan," "believe," "target," "prospects," "potential," “commit,” and "forecast," and other words, terms and phrases of similar meaning or refer to future time periods. Forward-looking statements involve estimates, expectations, projections, goals, targets, forecasts, assumptions, risks and uncertainties. A forward-looking statement is not a guarantee of future performance, and actual results could differ materially from those contained in the forward-looking statement. Forward-looking statements are subject to a number of assumptions, risks and uncertainties, many of which are beyond our control, such as developments related to pricing cycles and volumes; economic, competitive and market conditions generally, including macroeconomic uncertainty, customer inventory rebalancing, the impact of inflation and increases in energy, raw materials, shipping, labor and capital equipment costs; reduced supply of raw materials, energy and transportation, including from supply chain disruptions and labor shortages; intense competition; results and impacts of acquisitions, including operational and financial effects from the acquisition of the remaining stake in Grupo Gondi (the “Mexico Acquisition”), and divestitures; business disruptions, including from the occurrence of severe weather or a natural disaster or other unanticipated problems, such as labor difficulties, equipment failure or unscheduled maintenance and repair, or public health crises; failure to respond to changing customer preferences and to protect our intellectual property; the amount and timing of capital expenditures, including installation costs, project development and implementation costs, and costs related to resolving disputes with third parties with which we work to manage and implement capital projects; risks related to international sales and operations; the production of faulty or contaminated products; the loss of certain customers; adverse legal, reputational, operational and financial effects resulting from information security incidents and the effectiveness of business continuity plans during a ransomware or other cyber incident; work stoppages and other labor relations difficulties; inability to attract, motivate and retain qualified personnel, including as a result of the proposed business combination with Smurfit Kappa plc (the "Transaction"); risks associated with sustainability and climate change, including our ability to achieve our sustainability targets and commitments and realize climate-related opportunities on announced timelines or at all; our inability to successfully identify and make performance improvements and deliver cost savings and risks associated with completing strategic projects on anticipated timelines and realizing anticipated financial or operational improvements on announced timelines or at all, including with respect to our business systems transformation; risks related to the proposed Transaction, including our ability to complete the Transaction on the anticipated timeline, or at all, restrictions imposed on our business under the Transaction agreement, disruptions to our business while the proposed Transaction is pending, the impact of management’s time and attention being focused on consummation of the proposed Transaction, costs associated with the proposed Transaction, and integration difficulties; risks related to our indebtedness, including increases in interest rates; the scope, costs, timing and impact of any restructuring of our operations and corporate and tax structure; the scope, timing and outcome of any litigation, claims or other proceedings or dispute resolutions and the impact of any such litigation (including with respect to the Brazil tax liability matter); and additional impairment charges. Such risks and other factors that may impact forward-looking statements are discussed in our Annual Report on Form 10-K for the fiscal year ended September 30, 2023, including in Item 1A “Risk Factors”, as well as in our subsequent filings with the Securities and Exchange Commission. The information contained herein speaks as of the date hereof, and the Company does not have or undertake any obligation to update or revise its forward-looking statements, whether as a result of new information, future events or otherwise, except to the extent required by law. Non-GAAP Financial Measures: We report our financial results in accordance with accounting principles generally accepted in the United States (“GAAP”). However, management believes certain non-GAAP financial measures provide users with additional meaningful financial information that should be considered when assessing our ongoing performance. Management also uses these non-GAAP financial measures in making financial, operating and planning decisions and in evaluating our performance. Non-GAAP financial measures should be viewed in addition to, and not as an alternative for, our GAAP results. The non-GAAP financial measures we present may differ from similarly captioned measures presented by other companies. For additional information, see the Appendix. In addition, as explained in the Appendix, we are not providing a reconciliation of forward-looking non-GAAP financial measures to the most directly comparable U.S. GAAP measure because we are unable to predict with reasonable certainty the ultimate outcome of certain significant items without unreasonable effort.
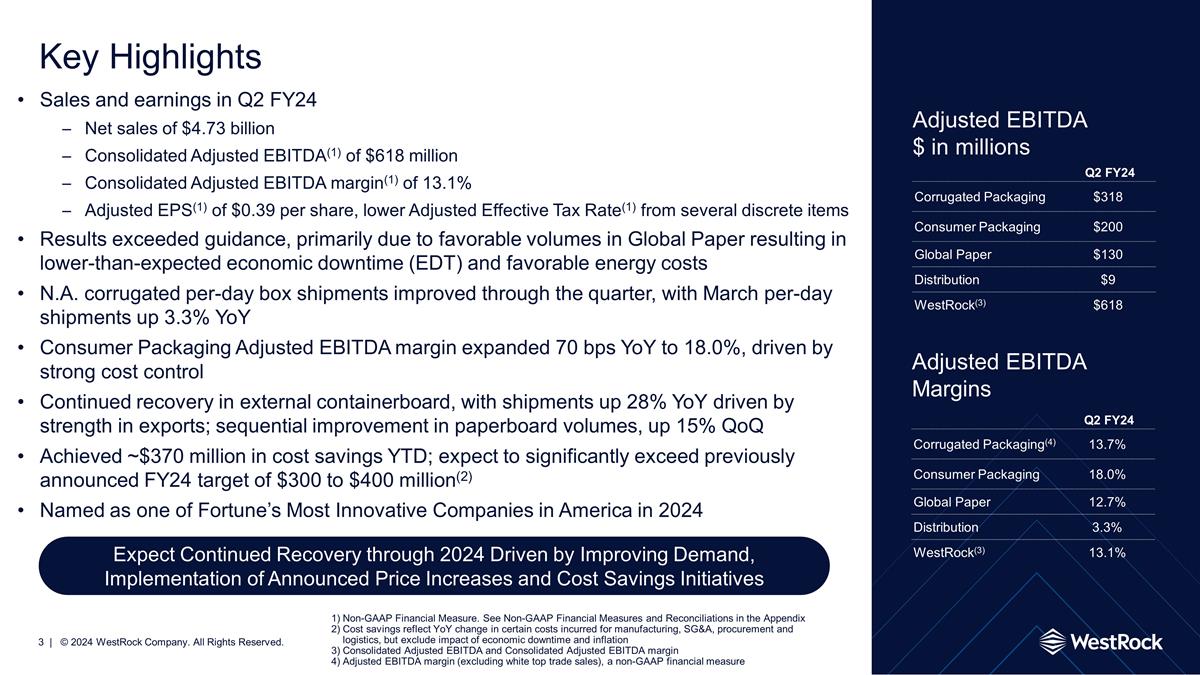
Key Highlights Sales and earnings in Q2 FY24 Net sales of $4.73 billion Consolidated Adjusted EBITDA(1) of $618 million Consolidated Adjusted EBITDA margin(1) of 13.1% Adjusted EPS(1) of $0.39 per share, lower Adjusted Effective Tax Rate(1) from several discrete items Results exceeded guidance, primarily due to favorable volumes in Global Paper resulting in lower-than-expected economic downtime (EDT) and favorable energy costs N.A. corrugated per-day box shipments improved through the quarter, with March per-day shipments up 3.3% YoY Consumer Packaging Adjusted EBITDA margin expanded 70 bps YoY to 18.0%, driven by strong cost control Continued recovery in external containerboard, with shipments up 28% YoY driven by strength in exports; sequential improvement in paperboard volumes, up 15% QoQ Achieved ~$370 million in cost savings YTD; expect to significantly exceed previously announced FY24 target of $300 to $400 million(2) Named as one of Fortune’s Most Innovative Companies in America in 2024 Non-GAAP Financial Measure. See Non-GAAP Financial Measures and Reconciliations in the Appendix Cost savings reflect YoY change in certain costs incurred for manufacturing, SG&A, procurement and logistics, but exclude impact of economic downtime and inflation Consolidated Adjusted EBITDA and Consolidated Adjusted EBITDA margin Adjusted EBITDA margin (excluding white top trade sales), a non-GAAP financial measure Adjusted EBITDA $ in millions Q2 fy24 Corrugated Packaging(4) 13.7% Consumer Packaging 18.0% Global Paper 12.7% Distribution 3.3% WestRock(3) 13.1% Adjusted EBITDA Margins Q2 fy24 Corrugated Packaging $318 Consumer Packaging $200 Global Paper $130 Distribution $9 WestRock(3) $618 Expect Continued Recovery through 2024 Driven by Improving Demand, Implementation of Announced Price Increases and Cost Savings Initiatives

WestRock named as one of Fortune’s Most Innovative Companies in America in 2024 WestRock has ranked among the top 200 U.S. companies on Fortune’s list of America’s Most Innovative Companies 2024. The only packaging company to make the list! | © 2024 WestRock Company. All Rights Reserved.
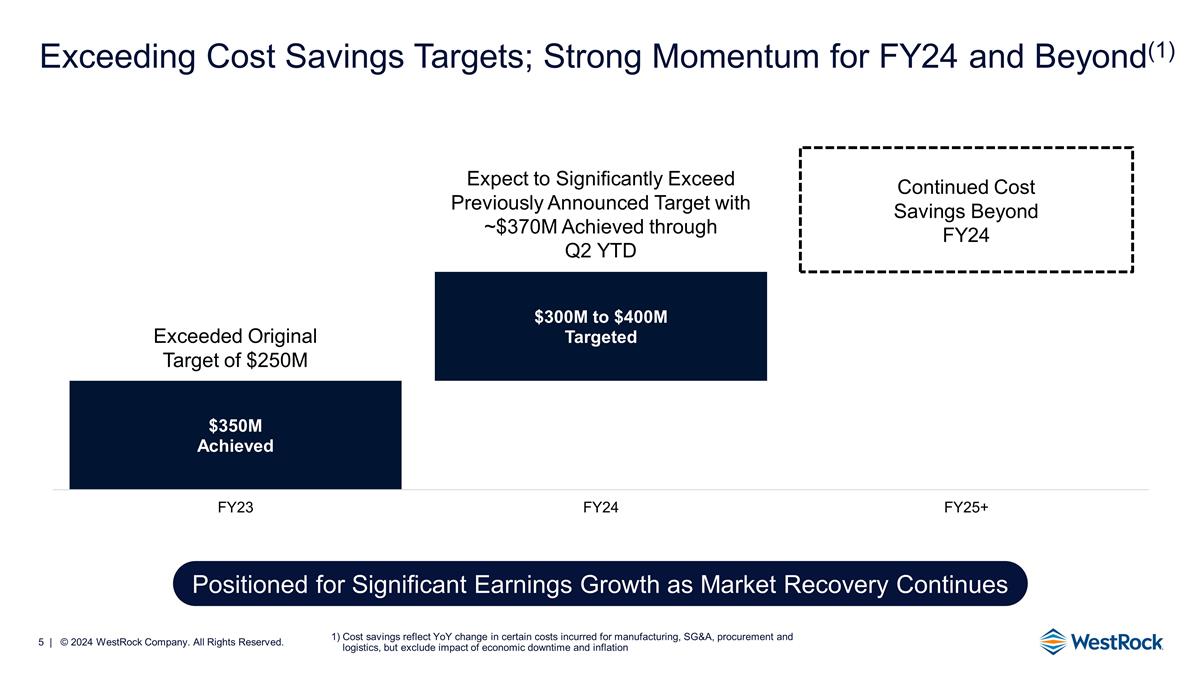
Exceeding Cost Savings Targets; Strong Momentum for FY24 and Beyond(1) Cost savings reflect YoY change in certain costs incurred for manufacturing, SG&A, procurement and logistics, but exclude impact of economic downtime and inflation Continued Cost Savings Beyond FY24 Expect to Significantly Exceed Previously Announced Target with ~$370M Achieved through Q2 YTD Positioned for Significant Earnings Growth as Market Recovery Continues
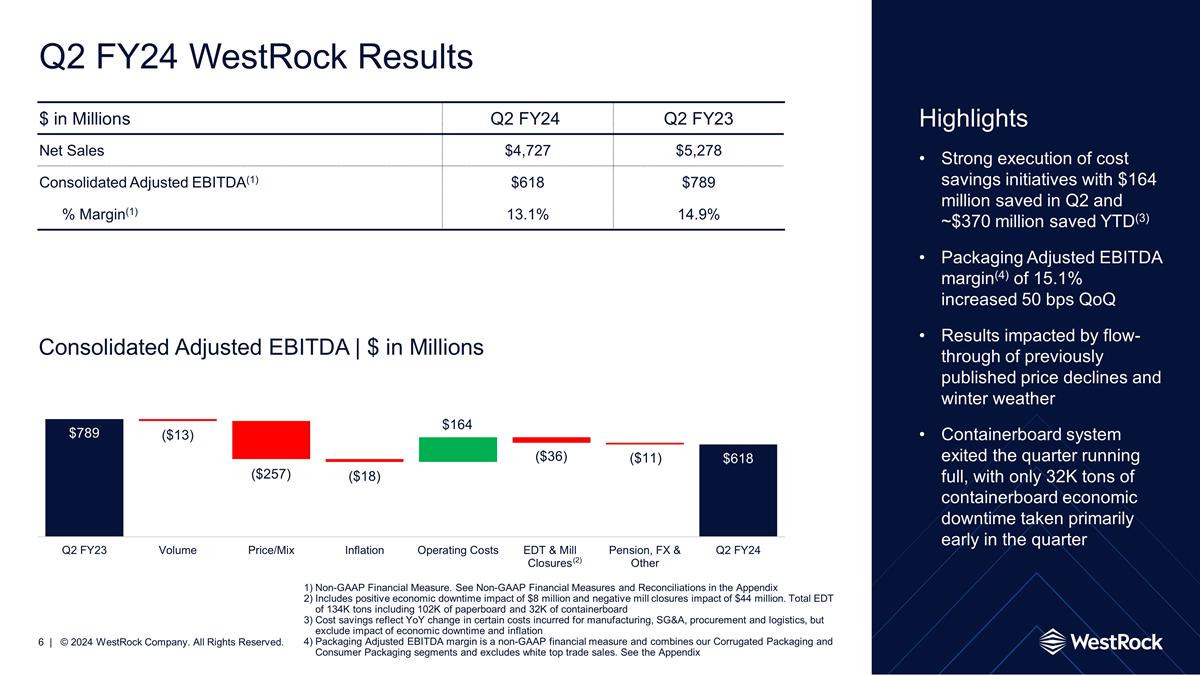
Q2 FY24 WestRock Results Highlights Strong execution of cost savings initiatives with $164 million saved in Q2 and ~$370 million saved YTD(3) Packaging Adjusted EBITDA margin(4) of 15.1% increased 50 bps QoQ Results impacted by flow-through of previously published price declines and winter weather Containerboard system exited the quarter running full, with only 32K tons of containerboard economic downtime taken primarily early in the quarter $ in Millions Q2 fy24 Q2 FY23 Net Sales $4,727 $5,278 Consolidated Adjusted EBITDA(1) $618 $789 % Margin(1) 13.1% 14.9% Consolidated Adjusted EBITDA | $ in Millions Non-GAAP Financial Measure. See Non-GAAP Financial Measures and Reconciliations in the Appendix Includes positive economic downtime impact of $8 million and negative mill closures impact of $44 million. Total EDT of 134K tons including 102K of paperboard and 32K of containerboard Cost savings reflect YoY change in certain costs incurred for manufacturing, SG&A, procurement and logistics, but exclude impact of economic downtime and inflation Packaging Adjusted EBITDA margin is a non-GAAP financial measure and combines our Corrugated Packaging and Consumer Packaging segments and excludes white top trade sales. See the Appendix ($11) ($36) $164 ($18) ($257) ($13) (2)
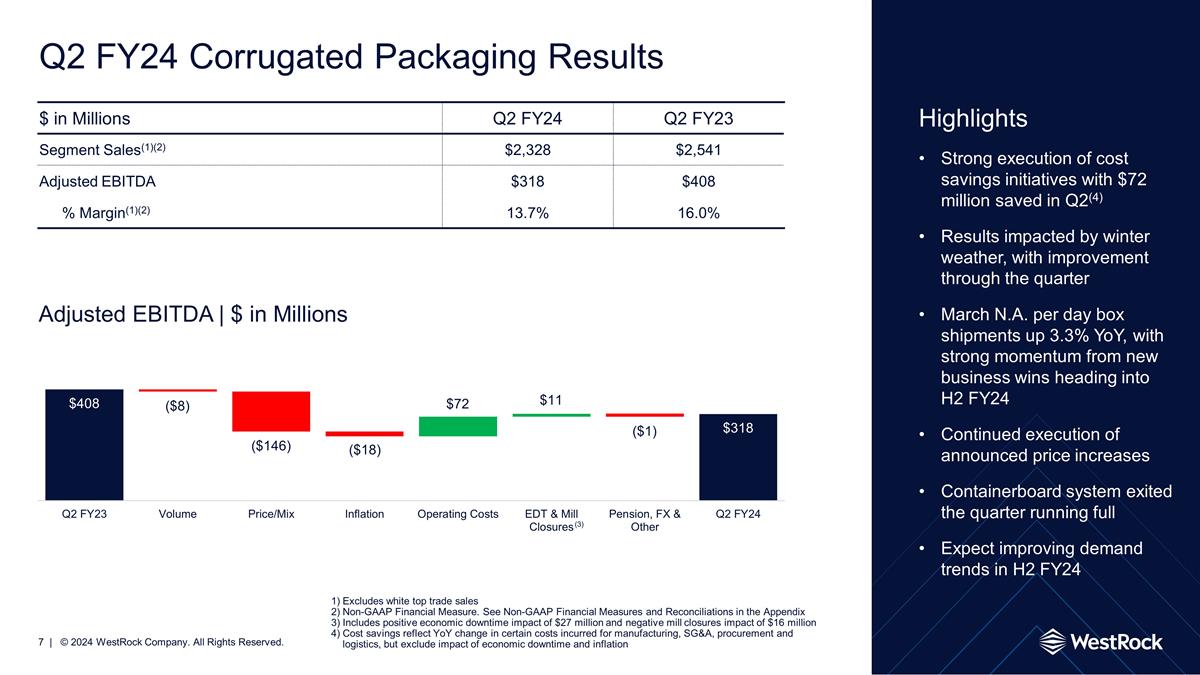
$ in Millions Q2 fy24 Q2 FY23 Segment Sales(1)(2) $2,328 $2,541 Adjusted EBITDA $318 $408 % Margin(1)(2) 13.7% 16.0% Q2 FY24 Corrugated Packaging Results Highlights Strong execution of cost savings initiatives with $72 million saved in Q2(4) Results impacted by winter weather, with improvement through the quarter March N.A. per day box shipments up 3.3% YoY, with strong momentum from new business wins heading into H2 FY24 Continued execution of announced price increases Containerboard system exited the quarter running full Expect improving demand trends in H2 FY24 Excludes white top trade sales Non-GAAP Financial Measure. See Non-GAAP Financial Measures and Reconciliations in the Appendix Includes positive economic downtime impact of $27 million and negative mill closures impact of $16 million Cost savings reflect YoY change in certain costs incurred for manufacturing, SG&A, procurement and logistics, but exclude impact of economic downtime and inflation ($146) Adjusted EBITDA | $ in Millions ($8) ($18) $72 $11 ($1) (3)
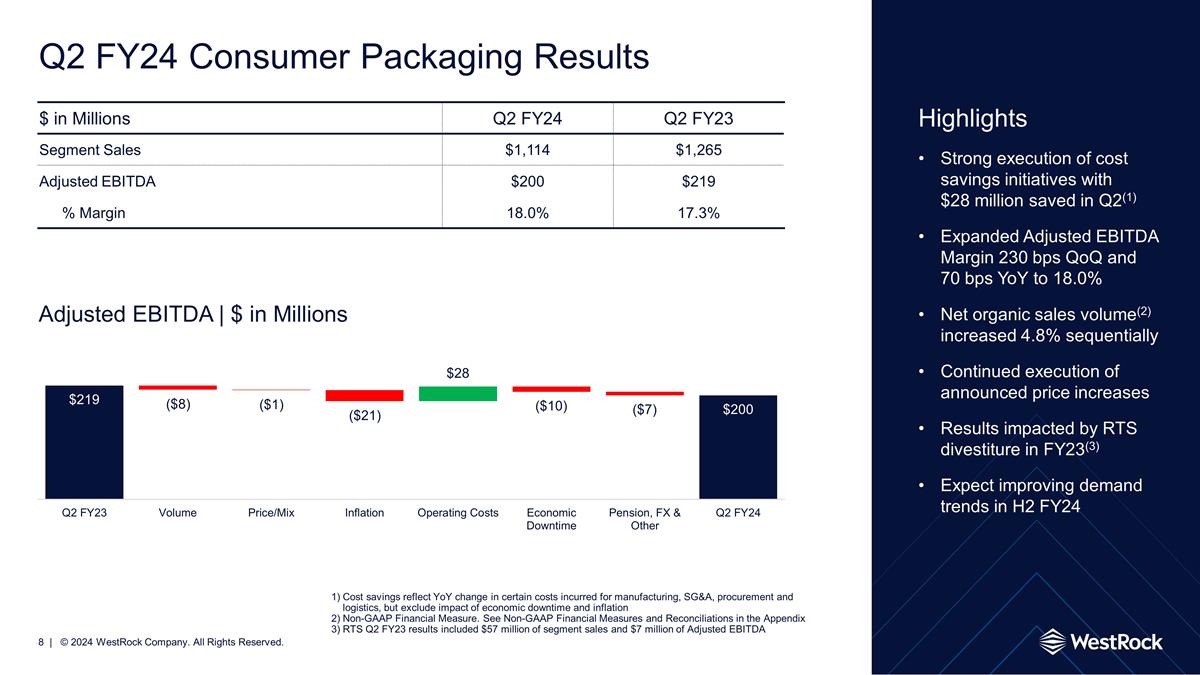
$ in Millions Q2 fy24 Q2 FY23 Segment Sales $1,114 $1,265 Adjusted EBITDA $200 $219 % Margin 18.0% 17.3% Q2 FY24 Consumer Packaging Results Highlights Strong execution of cost savings initiatives with $28 million saved in Q2(1) Expanded Adjusted EBITDA Margin 230 bps QoQ and 70 bps YoY to 18.0% Net organic sales volume(2) increased 4.8% sequentially Continued execution of announced price increases Results impacted by RTS divestiture in FY23(3) Expect improving demand trends in H2 FY24 ($8) Adjusted EBITDA | $ in Millions ($1) ($21) $28 ($10) ($7) Cost savings reflect YoY change in certain costs incurred for manufacturing, SG&A, procurement and logistics, but exclude impact of economic downtime and inflation Non-GAAP Financial Measure. See Non-GAAP Financial Measures and Reconciliations in the Appendix RTS Q2 FY23 results included $57 million of segment sales and $7 million of Adjusted EBITDA
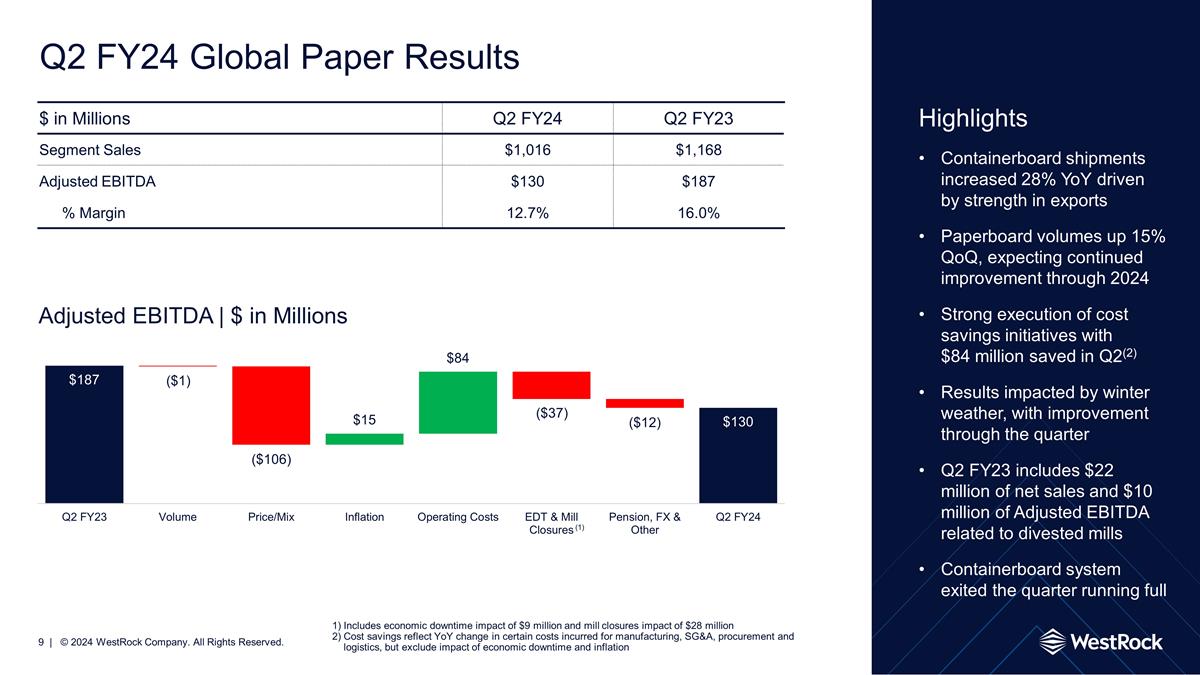
$ in Millions Q2 fy24 Q2 FY23 Segment Sales $1,016 $1,168 Adjusted EBITDA $130 $187 % Margin 12.7% 16.0% Q2 FY24 Global Paper Results Highlights Containerboard shipments increased 28% YoY driven by strength in exports Paperboard volumes up 15% QoQ, expecting continued improvement through 2024 Strong execution of cost savings initiatives with $84 million saved in Q2(2) Results impacted by winter weather, with improvement through the quarter Q2 FY23 includes $22 million of net sales and $10 million of Adjusted EBITDA related to divested mills Containerboard system exited the quarter running full ($1) ($106) $15 $84 ($12) Adjusted EBITDA | $ in Millions Includes economic downtime impact of $9 million and mill closures impact of $28 million Cost savings reflect YoY change in certain costs incurred for manufacturing, SG&A, procurement and logistics, but exclude impact of economic downtime and inflation (1) ($37)
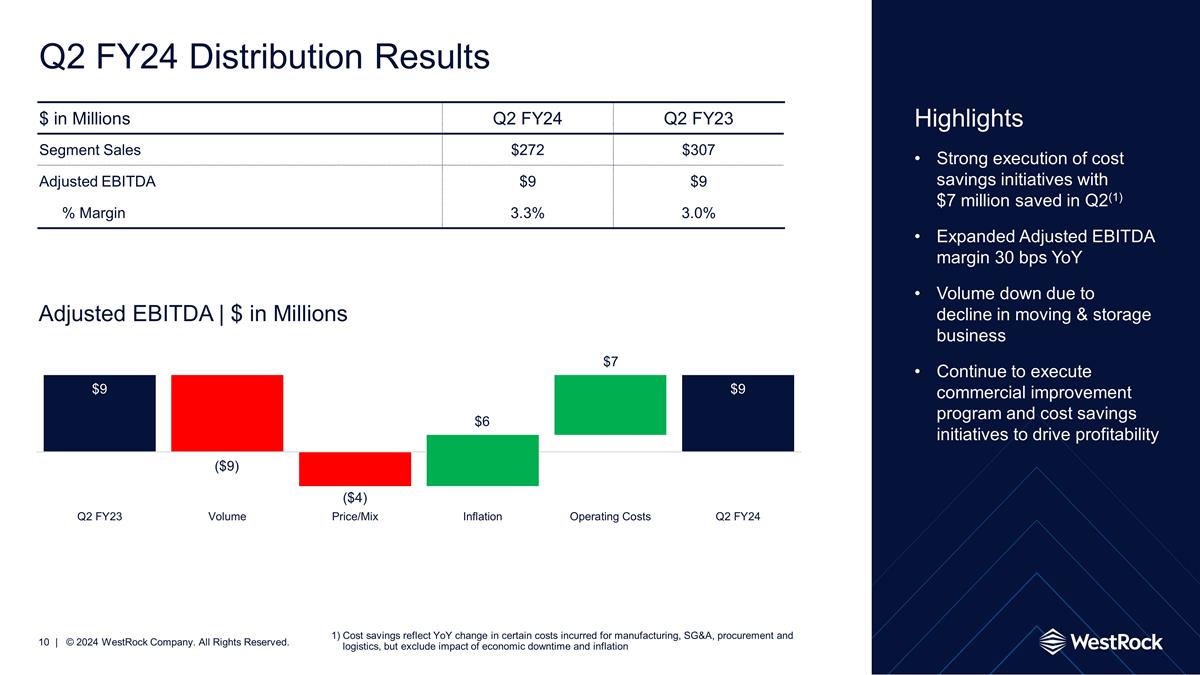
$ in Millions Q2 fy24 Q2 FY23 Segment Sales $272 $307 Adjusted EBITDA $9 $9 % Margin 3.3% 3.0% Q2 FY24 Distribution Results Highlights Strong execution of cost savings initiatives with $7 million saved in Q2(1) Expanded Adjusted EBITDA margin 30 bps YoY Volume down due to decline in moving & storage business Continue to execute commercial improvement program and cost savings initiatives to drive profitability ($9) Adjusted EBITDA | $ in Millions ($4) $6 $7 Cost savings reflect YoY change in certain costs incurred for manufacturing, SG&A, procurement and logistics, but exclude impact of economic downtime and inflation
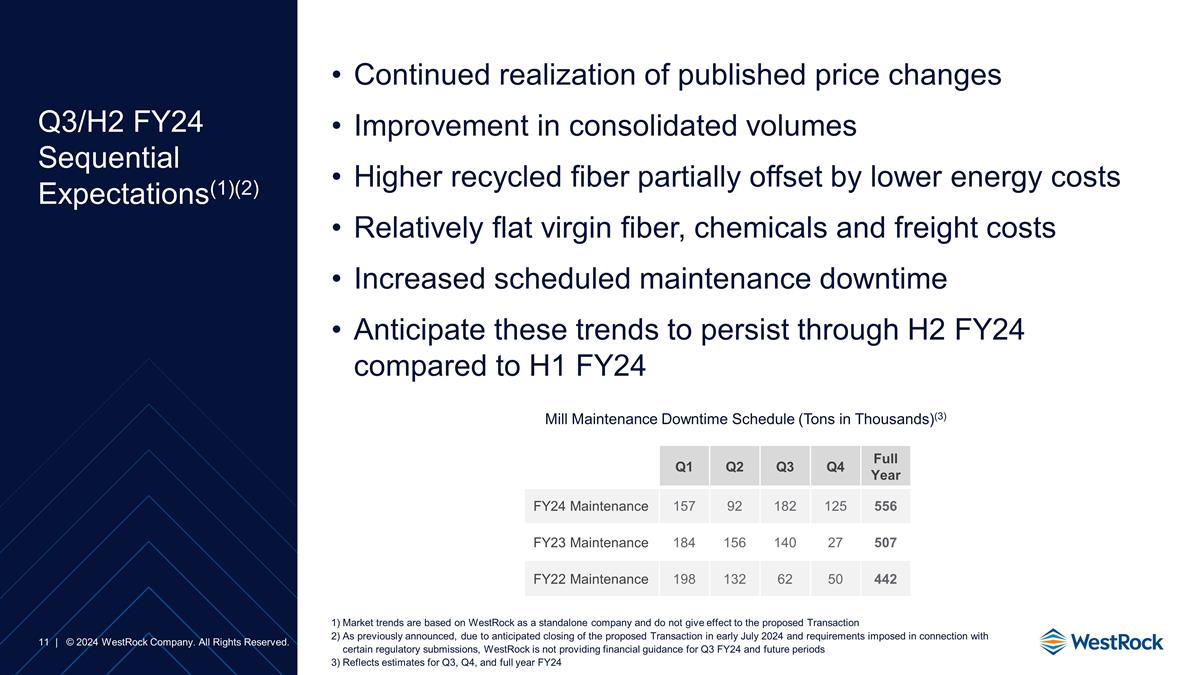
Q3/H2 FY24 Sequential Expectations(1)(2) Continued realization of published price changes Improvement in consolidated volumes Higher recycled fiber partially offset by lower energy costs Relatively flat virgin fiber, chemicals and freight costs Increased scheduled maintenance downtime Anticipate these trends to persist through H2 FY24 compared to H1 FY24 Q1 Q2 Q3 Q4 Full Year FY24 Maintenance 157 92 182 125 556 FY23 Maintenance 184 156 140 27 507 FY22 Maintenance 198 132 62 50 442 Mill Maintenance Downtime Schedule (Tons in Thousands)(3) Market trends are based on WestRock as a standalone company and do not give effect to the proposed Transaction As previously announced, due to anticipated closing of the proposed Transaction in early July 2024 and requirements imposed in connection with certain regulatory submissions, WestRock is not providing financial guidance for Q3 FY24 and future periods Reflects estimates for Q3, Q4, and full year FY24
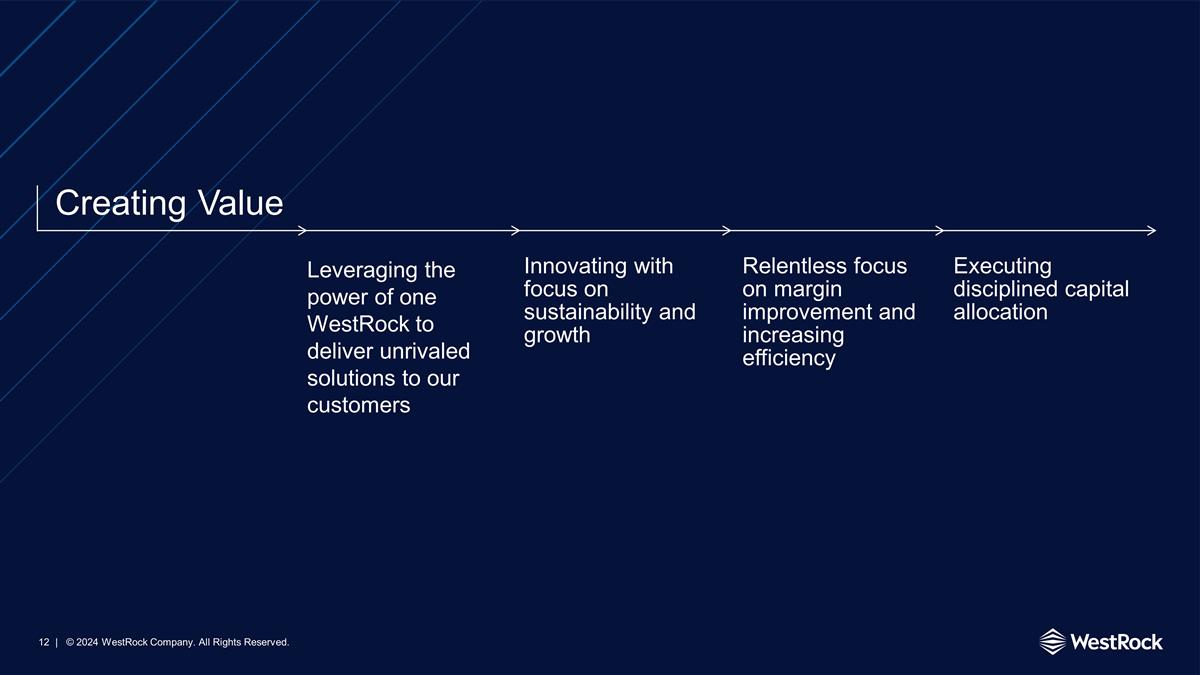
Creating Value Leveraging the power of one WestRock to deliver unrivaled solutions to our customers Innovating with focus on sustainability and growth Relentless focus on margin improvement and increasing efficiency Executing disciplined capital allocation
Appendix
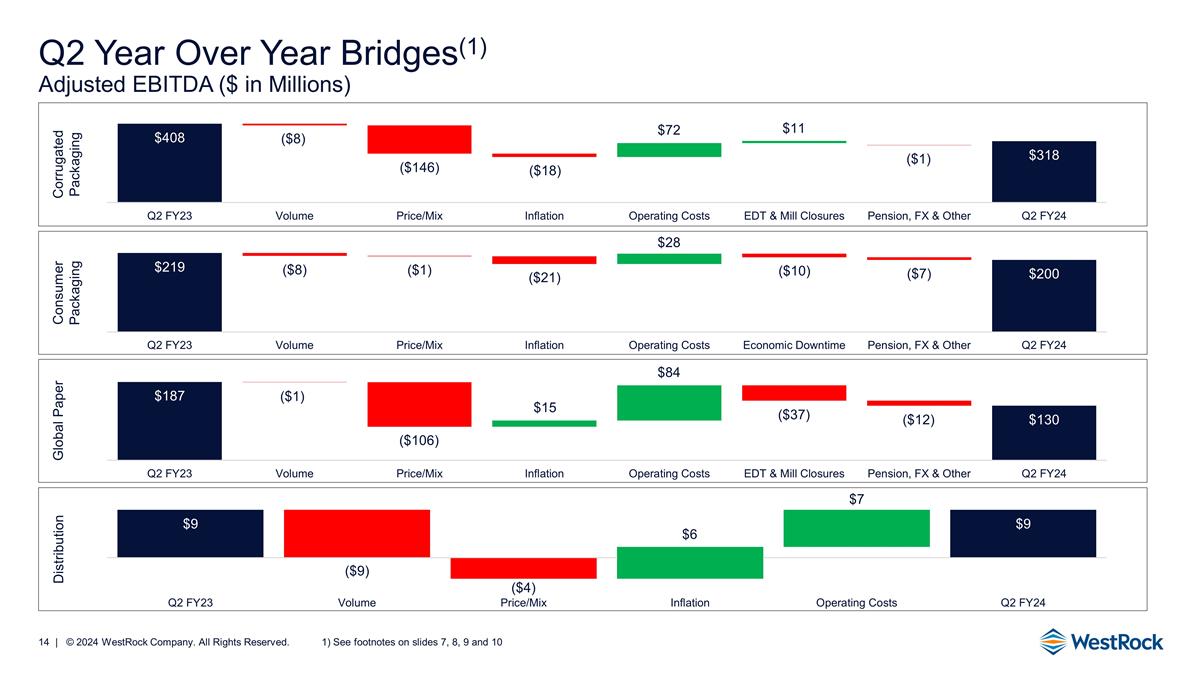
Corrugated Packaging Q2 Year Over Year Bridges(1) Adjusted EBITDA ($ in Millions) Distribution Global Paper ($8) ($1) ($146) ($18) $72 $11 ($1) ($106) $15 $84 ($37) See footnotes on slides 7, 8, 9 and 10 ($9) ($4) $7 $6 ($12) Consumer Packaging ($8) ($1) ($21) $28 ($10) ($7)
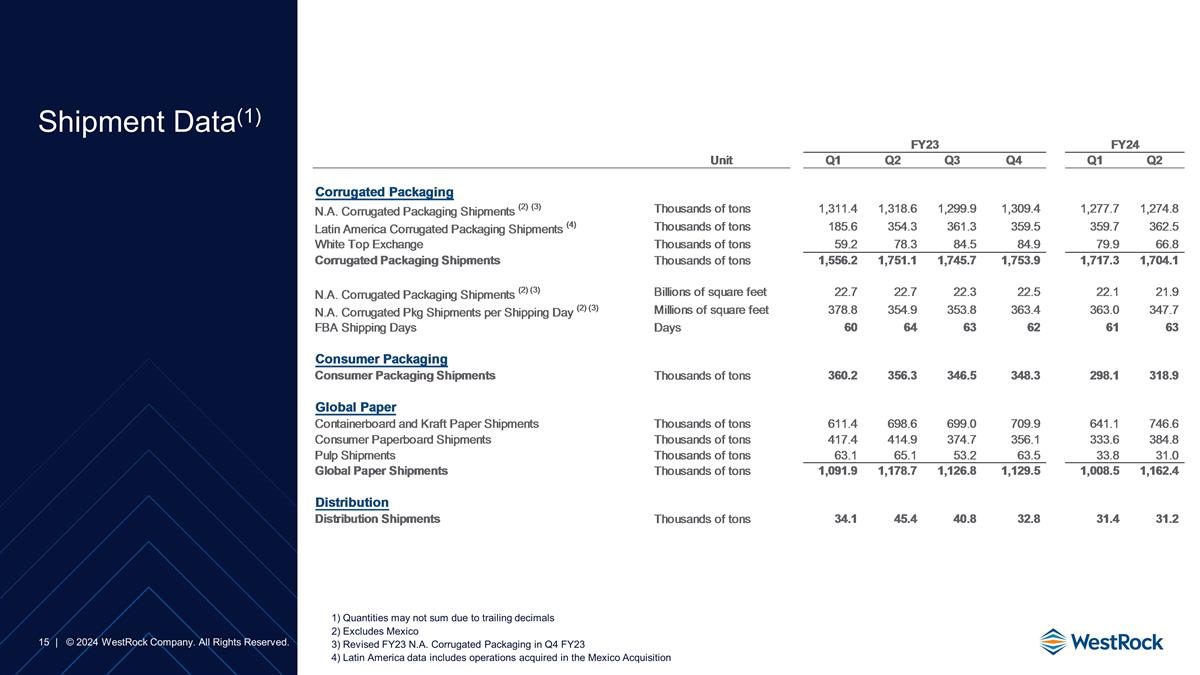
Shipment Data(1) Quantities may not sum due to trailing decimals Excludes Mexico Revised FY23 N.A. Corrugated Packaging in Q4 FY23 Latin America data includes operations acquired in the Mexico Acquisition
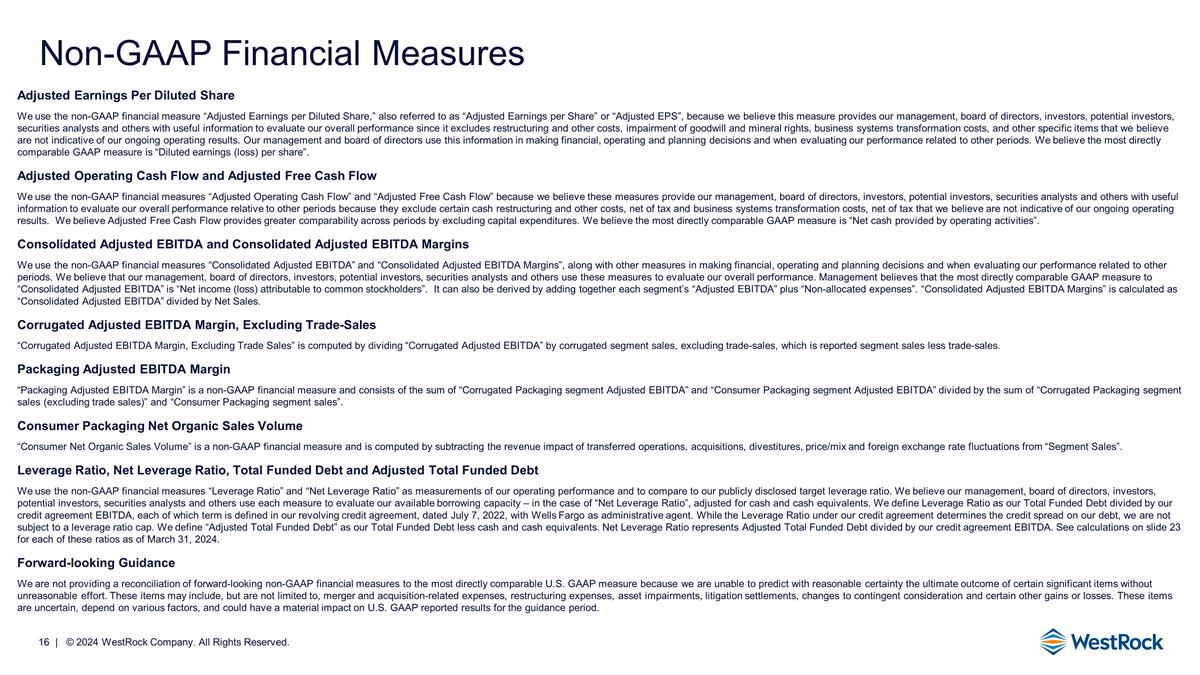
Non-GAAP Financial Measures Adjusted Earnings Per Diluted Share We use the non-GAAP financial measure “Adjusted Earnings per Diluted Share,” also referred to as “Adjusted Earnings per Share” or “Adjusted EPS”, because we believe this measure provides our management, board of directors, investors, potential investors, securities analysts and others with useful information to evaluate our overall performance since it excludes restructuring and other costs, impairment of goodwill and mineral rights, business systems transformation costs, and other specific items that we believe are not indicative of our ongoing operating results. Our management and board of directors use this information in making financial, operating and planning decisions and when evaluating our performance related to other periods. We believe the most directly comparable GAAP measure is “Diluted earnings (loss) per share”. Adjusted Operating Cash Flow and Adjusted Free Cash Flow We use the non-GAAP financial measures “Adjusted Operating Cash Flow” and “Adjusted Free Cash Flow” because we believe these measures provide our management, board of directors, investors, potential investors, securities analysts and others with useful information to evaluate our overall performance relative to other periods because they exclude certain cash restructuring and other costs, net of tax and business systems transformation costs, net of tax that we believe are not indicative of our ongoing operating results. We believe Adjusted Free Cash Flow provides greater comparability across periods by excluding capital expenditures. We believe the most directly comparable GAAP measure is “Net cash provided by operating activities”. Consolidated Adjusted EBITDA and Consolidated Adjusted EBITDA Margins We use the non-GAAP financial measures “Consolidated Adjusted EBITDA” and “Consolidated Adjusted EBITDA Margins”, along with other measures in making financial, operating and planning decisions and when evaluating our performance related to other periods. We believe that our management, board of directors, investors, potential investors, securities analysts and others use these measures to evaluate our overall performance. Management believes that the most directly comparable GAAP measure to “Consolidated Adjusted EBITDA” is “Net income (loss) attributable to common stockholders”. It can also be derived by adding together each segment’s “Adjusted EBITDA” plus “Non-allocated expenses”. “Consolidated Adjusted EBITDA Margins” is calculated as “Consolidated Adjusted EBITDA” divided by Net Sales. Corrugated Adjusted EBITDA Margin, Excluding Trade-Sales “Corrugated Adjusted EBITDA Margin, Excluding Trade Sales” is computed by dividing “Corrugated Adjusted EBITDA” by corrugated segment sales, excluding trade-sales, which is reported segment sales less trade-sales. Packaging Adjusted EBITDA Margin “Packaging Adjusted EBITDA Margin” is a non-GAAP financial measure and consists of the sum of “Corrugated Packaging segment Adjusted EBITDA” and “Consumer Packaging segment Adjusted EBITDA” divided by the sum of “Corrugated Packaging segment sales (excluding trade sales)” and “Consumer Packaging segment sales”. Consumer Packaging Net Organic Sales Volume “Consumer Net Organic Sales Volume” is a non-GAAP financial measure and is computed by subtracting the revenue impact of transferred operations, acquisitions, divestitures, price/mix and foreign exchange rate fluctuations from “Segment Sales”. Leverage Ratio, Net Leverage Ratio, Total Funded Debt and Adjusted Total Funded Debt We use the non-GAAP financial measures “Leverage Ratio” and “Net Leverage Ratio” as measurements of our operating performance and to compare to our publicly disclosed target leverage ratio. We believe our management, board of directors, investors, potential investors, securities analysts and others use each measure to evaluate our available borrowing capacity – in the case of “Net Leverage Ratio”, adjusted for cash and cash equivalents. We define Leverage Ratio as our Total Funded Debt divided by our credit agreement EBITDA, each of which term is defined in our revolving credit agreement, dated July 7, 2022, with Wells Fargo as administrative agent. While the Leverage Ratio under our credit agreement determines the credit spread on our debt, we are not subject to a leverage ratio cap. We define “Adjusted Total Funded Debt” as our Total Funded Debt less cash and cash equivalents. Net Leverage Ratio represents Adjusted Total Funded Debt divided by our credit agreement EBITDA. See calculations on slide 23 for each of these ratios as of March 31, 2024. Forward-looking Guidance We are not providing a reconciliation of forward-looking non-GAAP financial measures to the most directly comparable U.S. GAAP measure because we are unable to predict with reasonable certainty the ultimate outcome of certain significant items without unreasonable effort. These items may include, but are not limited to, merger and acquisition-related expenses, restructuring expenses, asset impairments, litigation settlements, changes to contingent consideration and certain other gains or losses. These items are uncertain, depend on various factors, and could have a material impact on U.S. GAAP reported results for the guidance period.
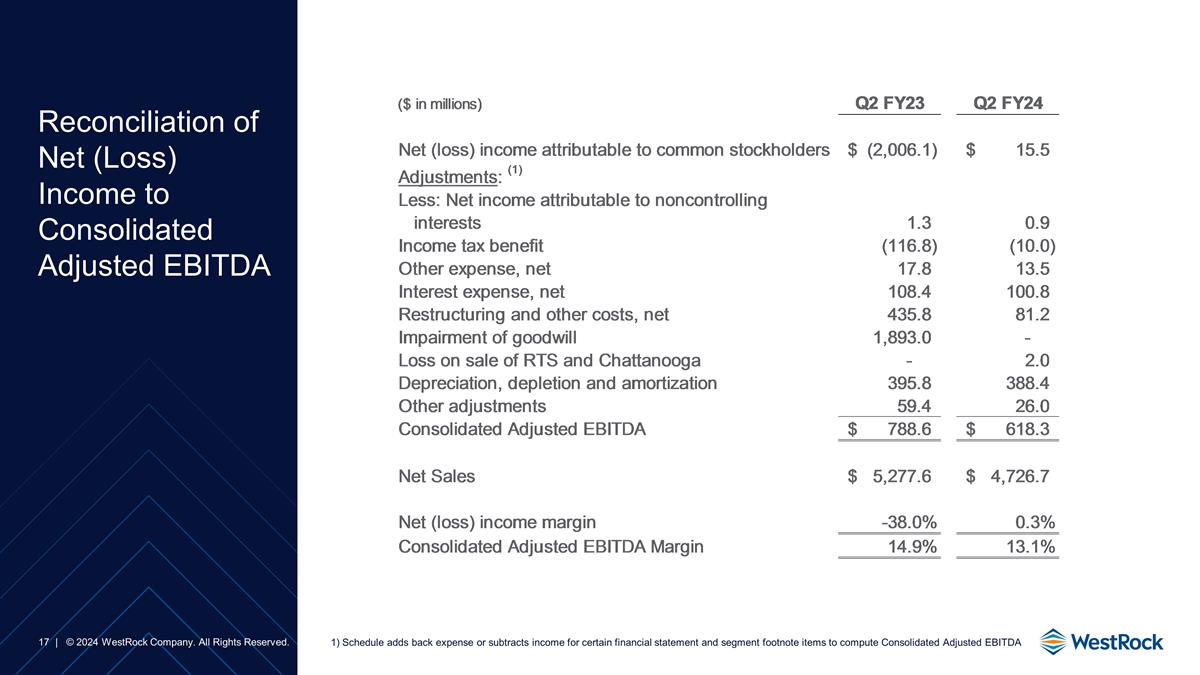
Reconciliation of Net (Loss) Income to Consolidated Adjusted EBITDA Schedule adds back expense or subtracts income for certain financial statement and segment footnote items to compute Consolidated Adjusted EBITDA
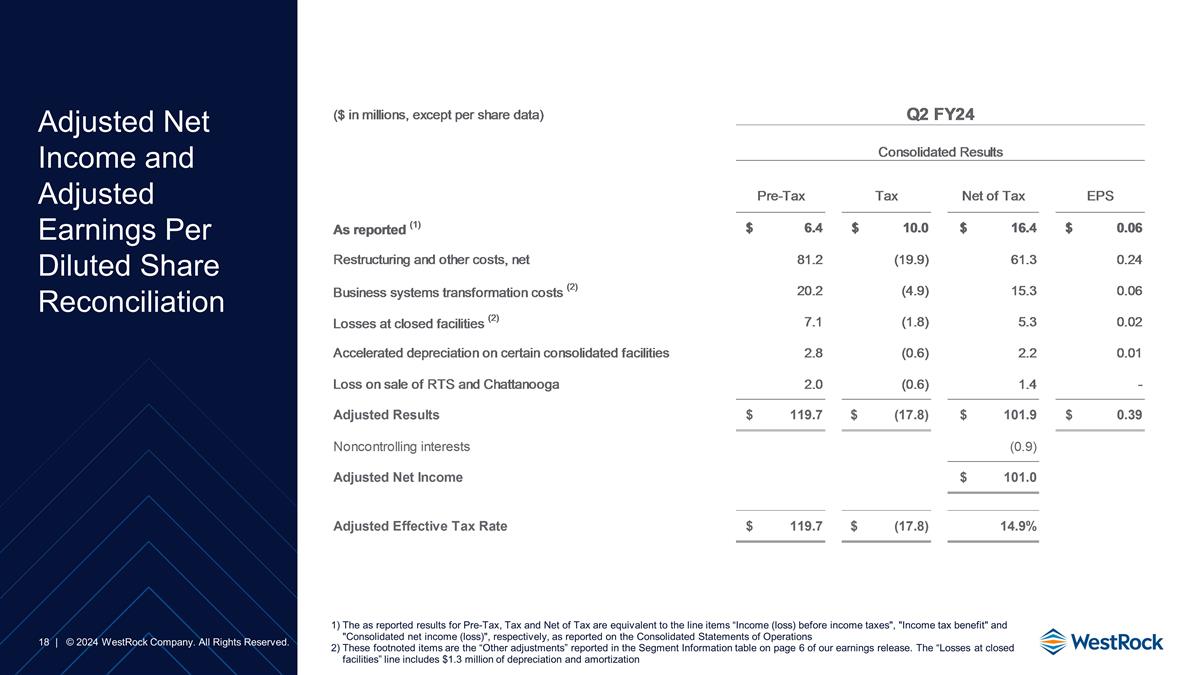
Adjusted Net Income and Adjusted Earnings Per Diluted Share Reconciliation The as reported results for Pre-Tax, Tax and Net of Tax are equivalent to the line items “Income (loss) before income taxes", "Income tax benefit" and "Consolidated net income (loss)", respectively, as reported on the Consolidated Statements of Operations These footnoted items are the “Other adjustments” reported in the Segment Information table on page 6 of our earnings release. The “Losses at closed facilities” line includes $1.3 million of depreciation and amortization
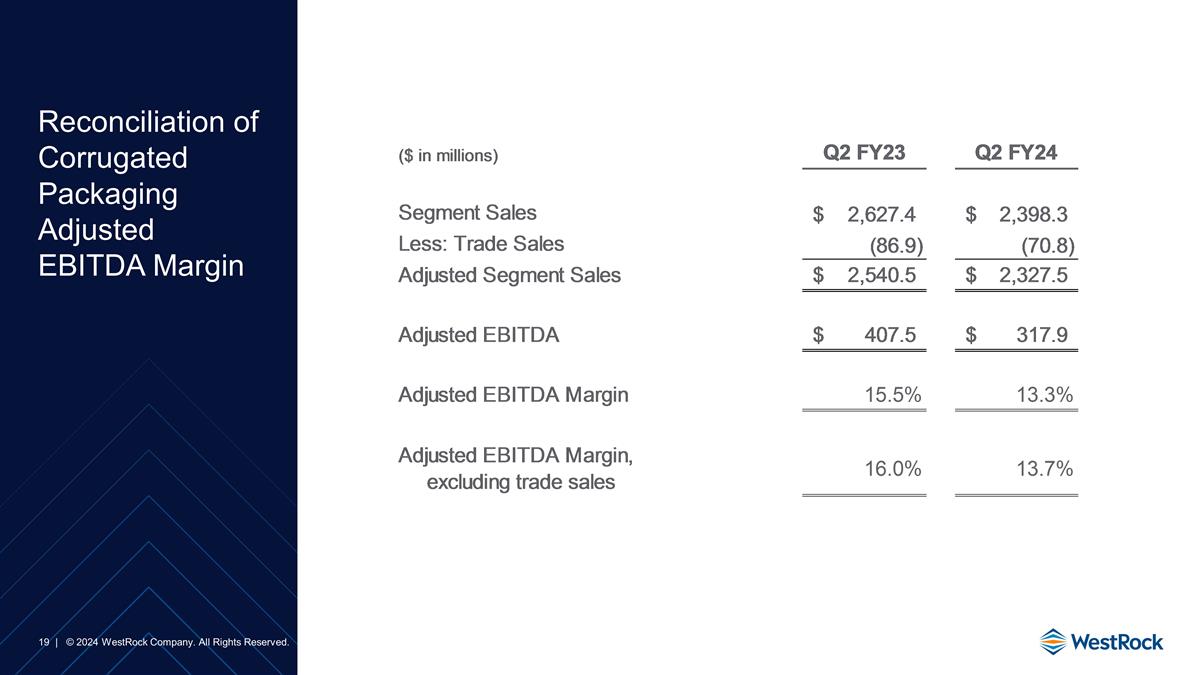
Reconciliation of Corrugated Packaging Adjusted EBITDA Margin
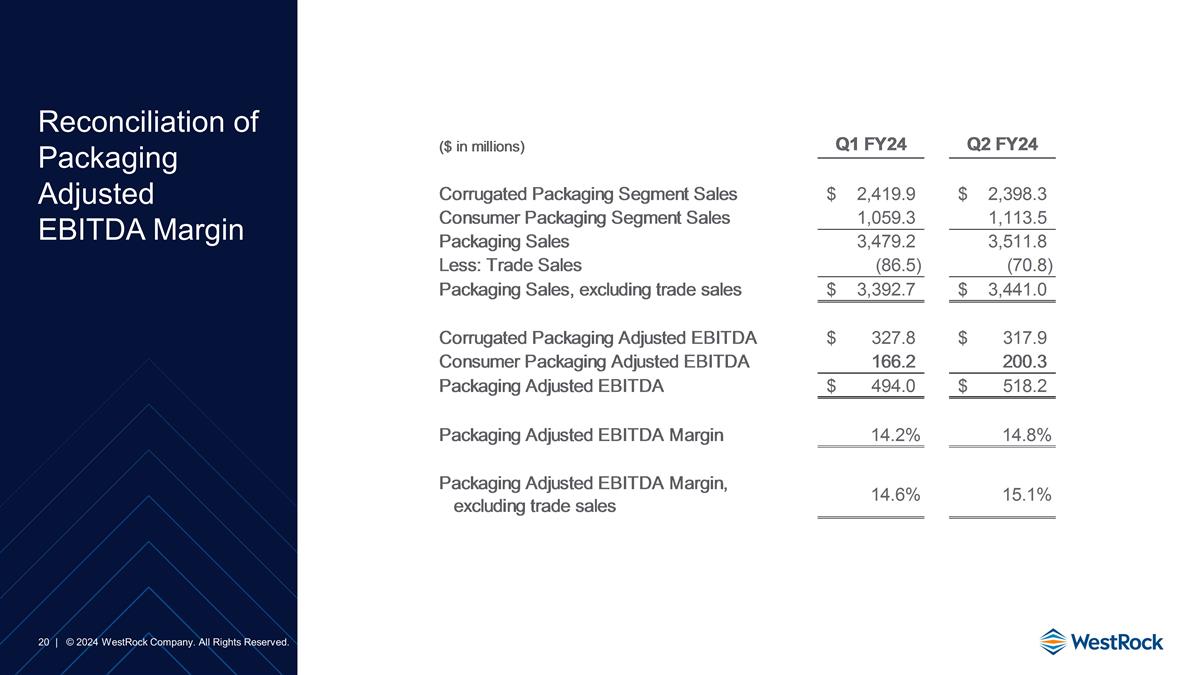
Reconciliation of Packaging Adjusted EBITDA Margin
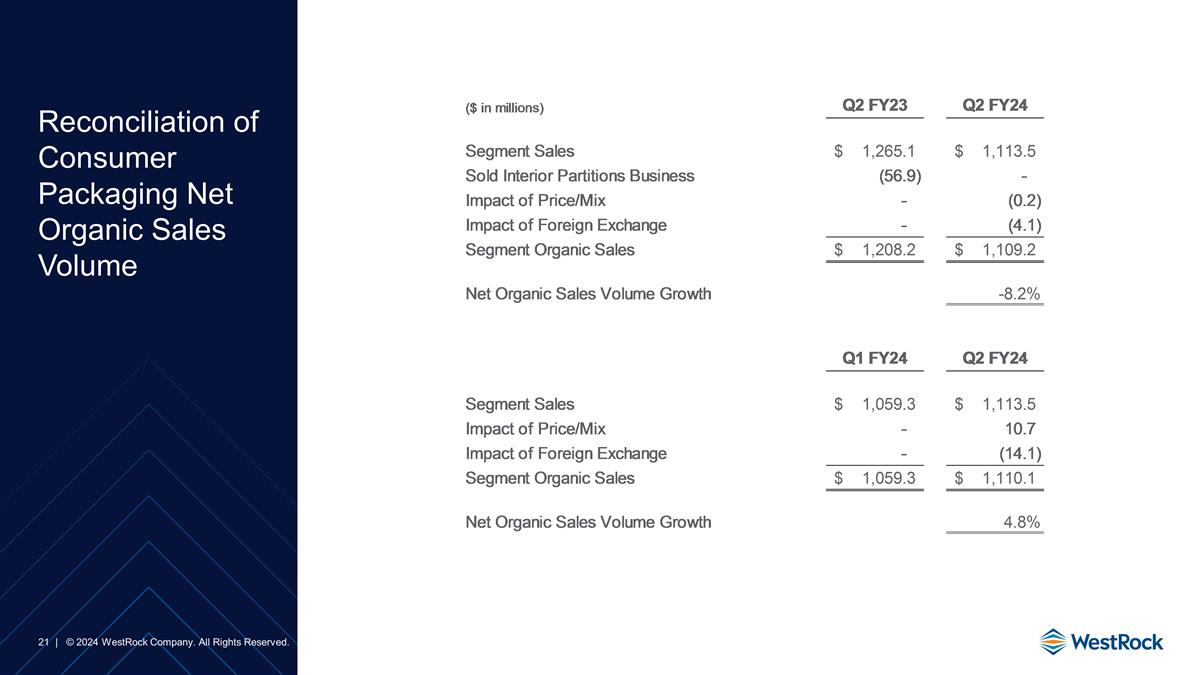
Reconciliation of Consumer Packaging Net Organic Sales Volume
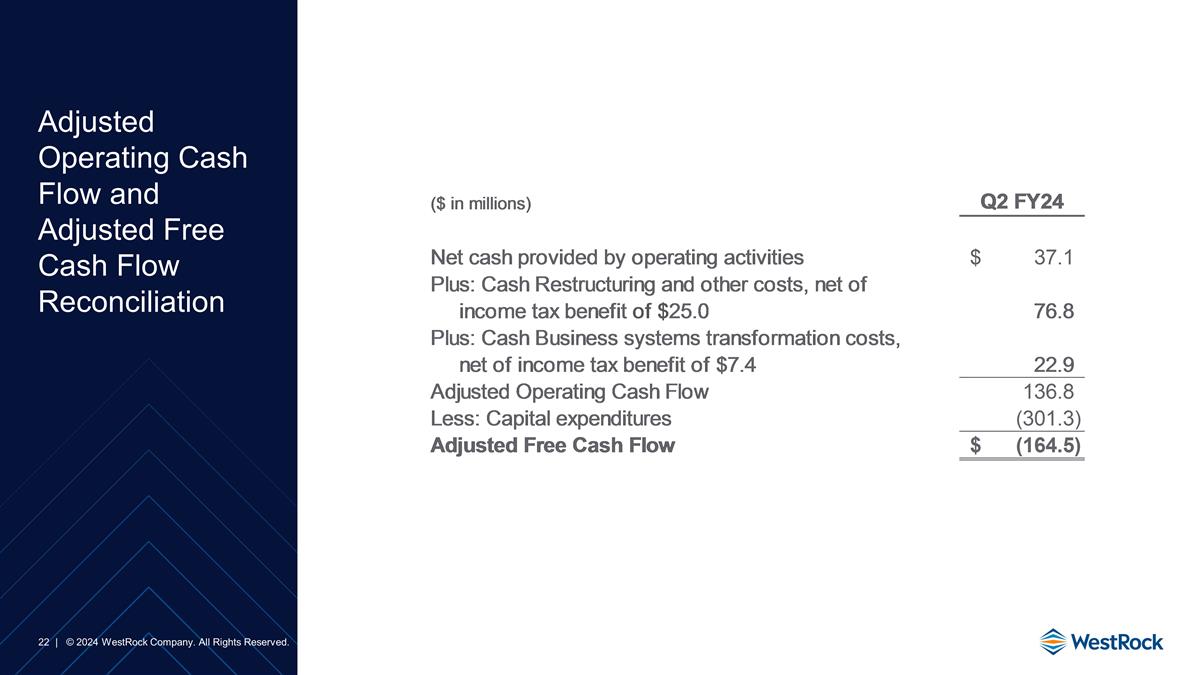
Adjusted Operating Cash Flow and Adjusted Free Cash Flow Reconciliation
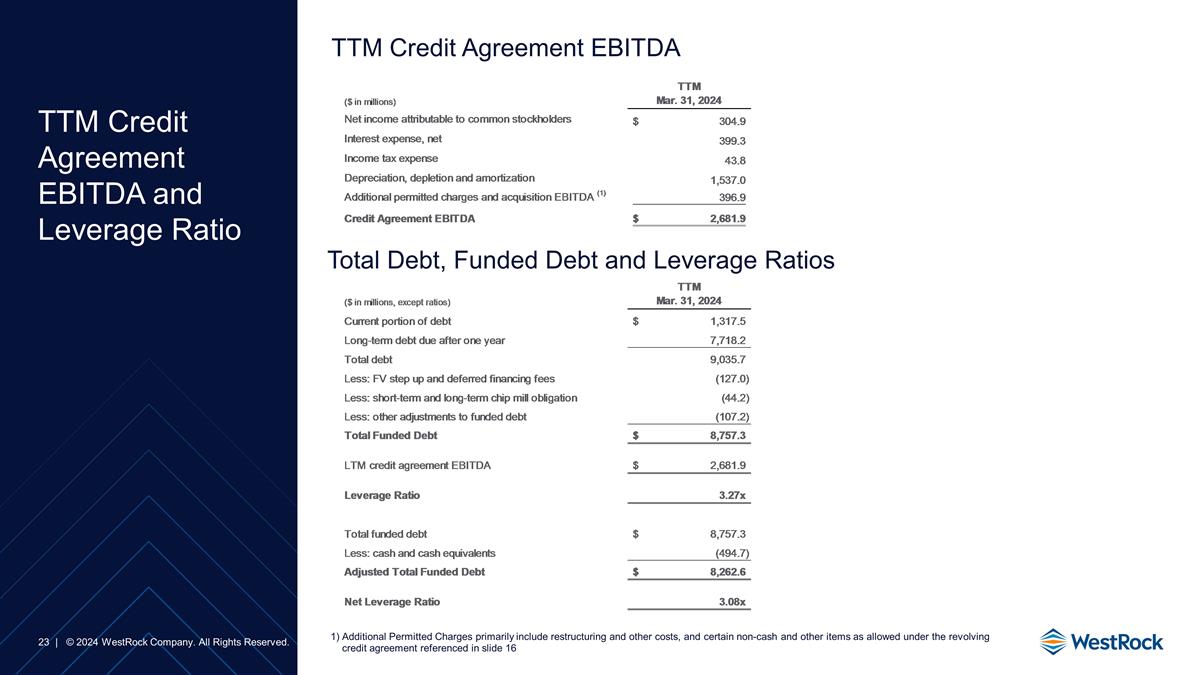
TTM Credit Agreement EBITDA TTM Credit Agreement EBITDA and Leverage Ratio Total Debt, Funded Debt and Leverage Ratios Additional Permitted Charges primarily include restructuring and other costs, and certain non-cash and other items as allowed under the revolving credit agreement referenced in slide 16
