UNITED STATES
SECURITIES AND EXCHANGE COMMISSION
WASHINGTON, D.C. 20549
FORM 6-K
REPORT OF FOREIGN PRIVATE ISSUER
PURSUANT TO RULE 13a-16 OR 15d-16
OF THE SECURITIES EXCHANGE ACT OF 1934
For the Month of April 2024
Commission File Number: 001-41569
LANVIN GROUP HOLDINGS LIMITED
4F, 168 Jiujiang Road,
Carlowitz & Co, Huangpu District
Shanghai, 200001, China
(Address of principal executive offices)
Indicate by check mark whether the registrant files or will file annual reports under cover of Form 20-F or Form 40-F.
Form 20-F ☒ Form 40-F ☐
INCORPORATION BY REFERNECE
Exhibits 99.1 and 99.2 to this Form 6-K are incorporated by reference into the registration statement on Form F-3 of Lanvin Group Holdings Limited (File No. 333-276476), and shall be a part thereof from the date on which this report is furnished, to the extent not superseded by documents or reports subsequently filed or furnished.
EXHIBIT INDEX
| Exhibit Number | Description |
|
| 99.1 | ||
| 99.2 | Lanvin Group 2023 Full-Year Earning Results Press Release | |
SIGNATURES
Pursuant to the requirements of the Securities Exchange Act of 1934, the registrant has duly caused this report to be signed on its behalf by the undersigned, thereunto duly authorized.
| LANVIN GROUP HOLDINGS LIMITED | ||
| By: | /s/ Eric Chan | |
| Name: Eric Chan | ||
| Title: Chief Executive Officer | ||
Date: April 30, 2024
Exhibit 99.1

|
LANVIN GROUP 2023 FULL-YEAR RESULTS April 30, 2024
|
DISCLAIMER Forward-Looking Statements This presentation, including the sections “2024 GUIDANCE“, “BRAND-LEVEL PERFORMANCE“ and “APPENDIX“, contain “forward-looking statements“ within the meaning of the “safe harbor“ provisions of the Private Securities Litigation Reform Act of 1995. Forward-looking statements generally are accompanied by words such as “believe,“ “may,“ “will,“ “estimate,“ “continue,“ “anticipate,“ “intend,“ “expect,“ “should,“ “would,“ “plan,“ “predict,“ “potential,“ “seem,“ “seek,“ “future,“ “outlook,“ “project“ and similar expressions that predict or indicate future events or trends or that are not statements of historical matters. These forward-looking statements include, but are not limited to, statements regarding estimates and forecasts of other financial and performance metrics and projections of market opportunity. These statements are based on various assumptions, whether or not identified in this presentation, and on the current expectations of the respective management of Lanvin Group and are not predictions of actual performance. These forward-looking statements are provided for illustrative purposes only and must not be relied on by an investor as, a guarantee, an assurance, a prediction or a definitive statement of fact or probability. Actual events and circumstances are difficult or impossible to predict and will differ from assumptions. Many actual events and circumstances are beyond the control of Lanvin Group. Potential risks and uncertainties that could cause the actual results to differ materially from those expressed or implied by forward-looking statements include, but are not limited to, Lanvin Group“s ability to timely complete its financial closing procedures and finalize its consolidated financial statements for fiscal year 2023; changes adversely affecting the business in which Lanvin Group is engaged; Lanvin Group“s projected financial information, anticipated growth rate, profitability and market opportunity may not be an indication of its actual results or future results; management of growth; the impact of health epidemics, pandemics and similar outbreaks, including the COVID-19 pandemic on Lanvin Group“s business; Lanvin Group“s ability to safeguard the value, recognition and reputation of its brands and to identify and respond to new and changing customer preferences; the ability and desire of consumers to shop; Lanvin Group“s ability to successfully implement its business strategies and plans; Lanvin Group“s ability to effectively manage its advertising and marketing expenses and achieve desired impact; its ability to accurately forecast consumer demand; high levels of competition in the personal luxury products market; disruptions to Lanvin Group“s distribution facilities or its distribution partners; Lanvin Group“s ability to negotiate, maintain or renew its license agreements; Lanvin Group“s ability to protect its intellectual property rights; Lanvin Group“s ability to attract and retain qualified employees and preserve craftmanship skills; Lanvin Group“s ability to develop and maintain effective internal controls; general economic conditions; the result of future financing efforts; and those factors discussed in the reports filed by Lanvin Group from time to time with the SEC. If any of these risks materialize or Lanvin Group“s assumptions prove incorrect, actual results could differ materially from the results implied by these forward-looking statements. There may be additional risks that Lanvin Group presently does not know, or that Lanvin Group currently believes are immaterial, that could also cause actual results to differ from those contained in the forward-looking statements. In addition, forward-looking statements reflect Lanvin Group“s expectations, plans, or forecasts of future events and views as of the date of this presentation. Lanvin Group anticipates that subsequent events and developments will cause Lanvin Group“s assessments to change. However, while Lanvin Group may elect to update these forward-looking statements at some point in the future, Lanvin Group specifically disclaim any obligation to do so. These forward-looking statements should not be relied upon as representing Lanvin Group“s assessments of any date subsequent to the date of this presentation. Accordingly, reliance should not be placed upon the forward-looking statements. Use of Non-IFRS Financial Metrics This presentation includes certain non-IFRS financial measures (including on a forward-looking basis) such as contribution profit, contribution margin, adjusted earnings before interest and taxes (“Adjusted EBIT“), and adjusted earnings before interest, taxes, depreciation and amortization (“Adjusted EBITDA“ and trade working capital). These non-IFRS measures are an addition, and not a substitute for or superior to measures of financial performance prepared in accordance with IFRS and should not be considered as an alternative to net income, operating income or any other performance measures derived in accordance with IFRS. Reconciliations of non-IFRS measures to their most directly comparable IFRS counterparts are included in the Appendix to this presentation. Lanvin Group believes that these non- IFRS measures of financial results (including on a forward-looking basis) provide useful supplemental information to investors about Lanvin Group. Lanvin Group’s management uses forward looking non-IFRS measures to evaluate Lanvin Group’s projected financial and operating performance. Lanvin Group believes that the use of these non-IFRS financial measures provides an additional tool for investors to use in evaluating projected operating results and trends in and in comparing Lanvin Group’s financial measures with other similar companies, many of which present similar non-IFRS financial measures to investors. However, there are a number of limitations related to the use of these non-IFRS measures and their nearest IFRS equivalents. For example, other companies may calculate non-IFRS measures differently, or may use other measures to calculate their financial performance, and therefore Lanvin Group’s non-IFRS measures may not be directly comparable to similarly titled measures of other companies. Lanvin Group does not consider these non-IFRS measures in isolation or as an alternative to financial measures determined in accordance with IFRS. The principal limitation of these non-IFRS financial measures is that they exclude significant expenses, income and tax liabilities that are required by IFRS to be recorded in Lanvin Group’s financial statements. In addition, they are subject to inherent limitations as they reflect the exercise of judgements by Lanvin Group about which expense and income are excluded or included in determining these non-IFRS financial measures. In order to compensate for these limitations, Lanvin Group presents non-IFRS financial measures in connection with IFRS results. 2

|
BUILDING THE NEW LUXURY Lanvin Group is a leading global luxury fashion group headquartered in Shanghai, China, managing iconic brands worldwide, including Lanvin, Wolford, Sergio Rossi, St. John Knits, and Caruso. Harnessing the power of its unique strategic alliance of industry-leading partners in the luxury fashion sector, Lanvin Group strives to expand the global footprint of its portfolio brands and achieve sustainable growth through strategic investment and extensive operational know-how, combined with an intimate understanding and unparalleled access to the fastest-growing luxury fashion markets in the world.

|
TABLE OF CONTENTS PAGE 7 A UNIQUE GLOBAL LUXURY PLATFORM PAGE 12 2023 KEY STRATEGIES AND ACHIEVEMENTS PAGE 19 GROUP CONSOLIDATED FINANCIAL RESULTS PAGE 27 BRAND-LEVEL PERFORMANCE 4
|
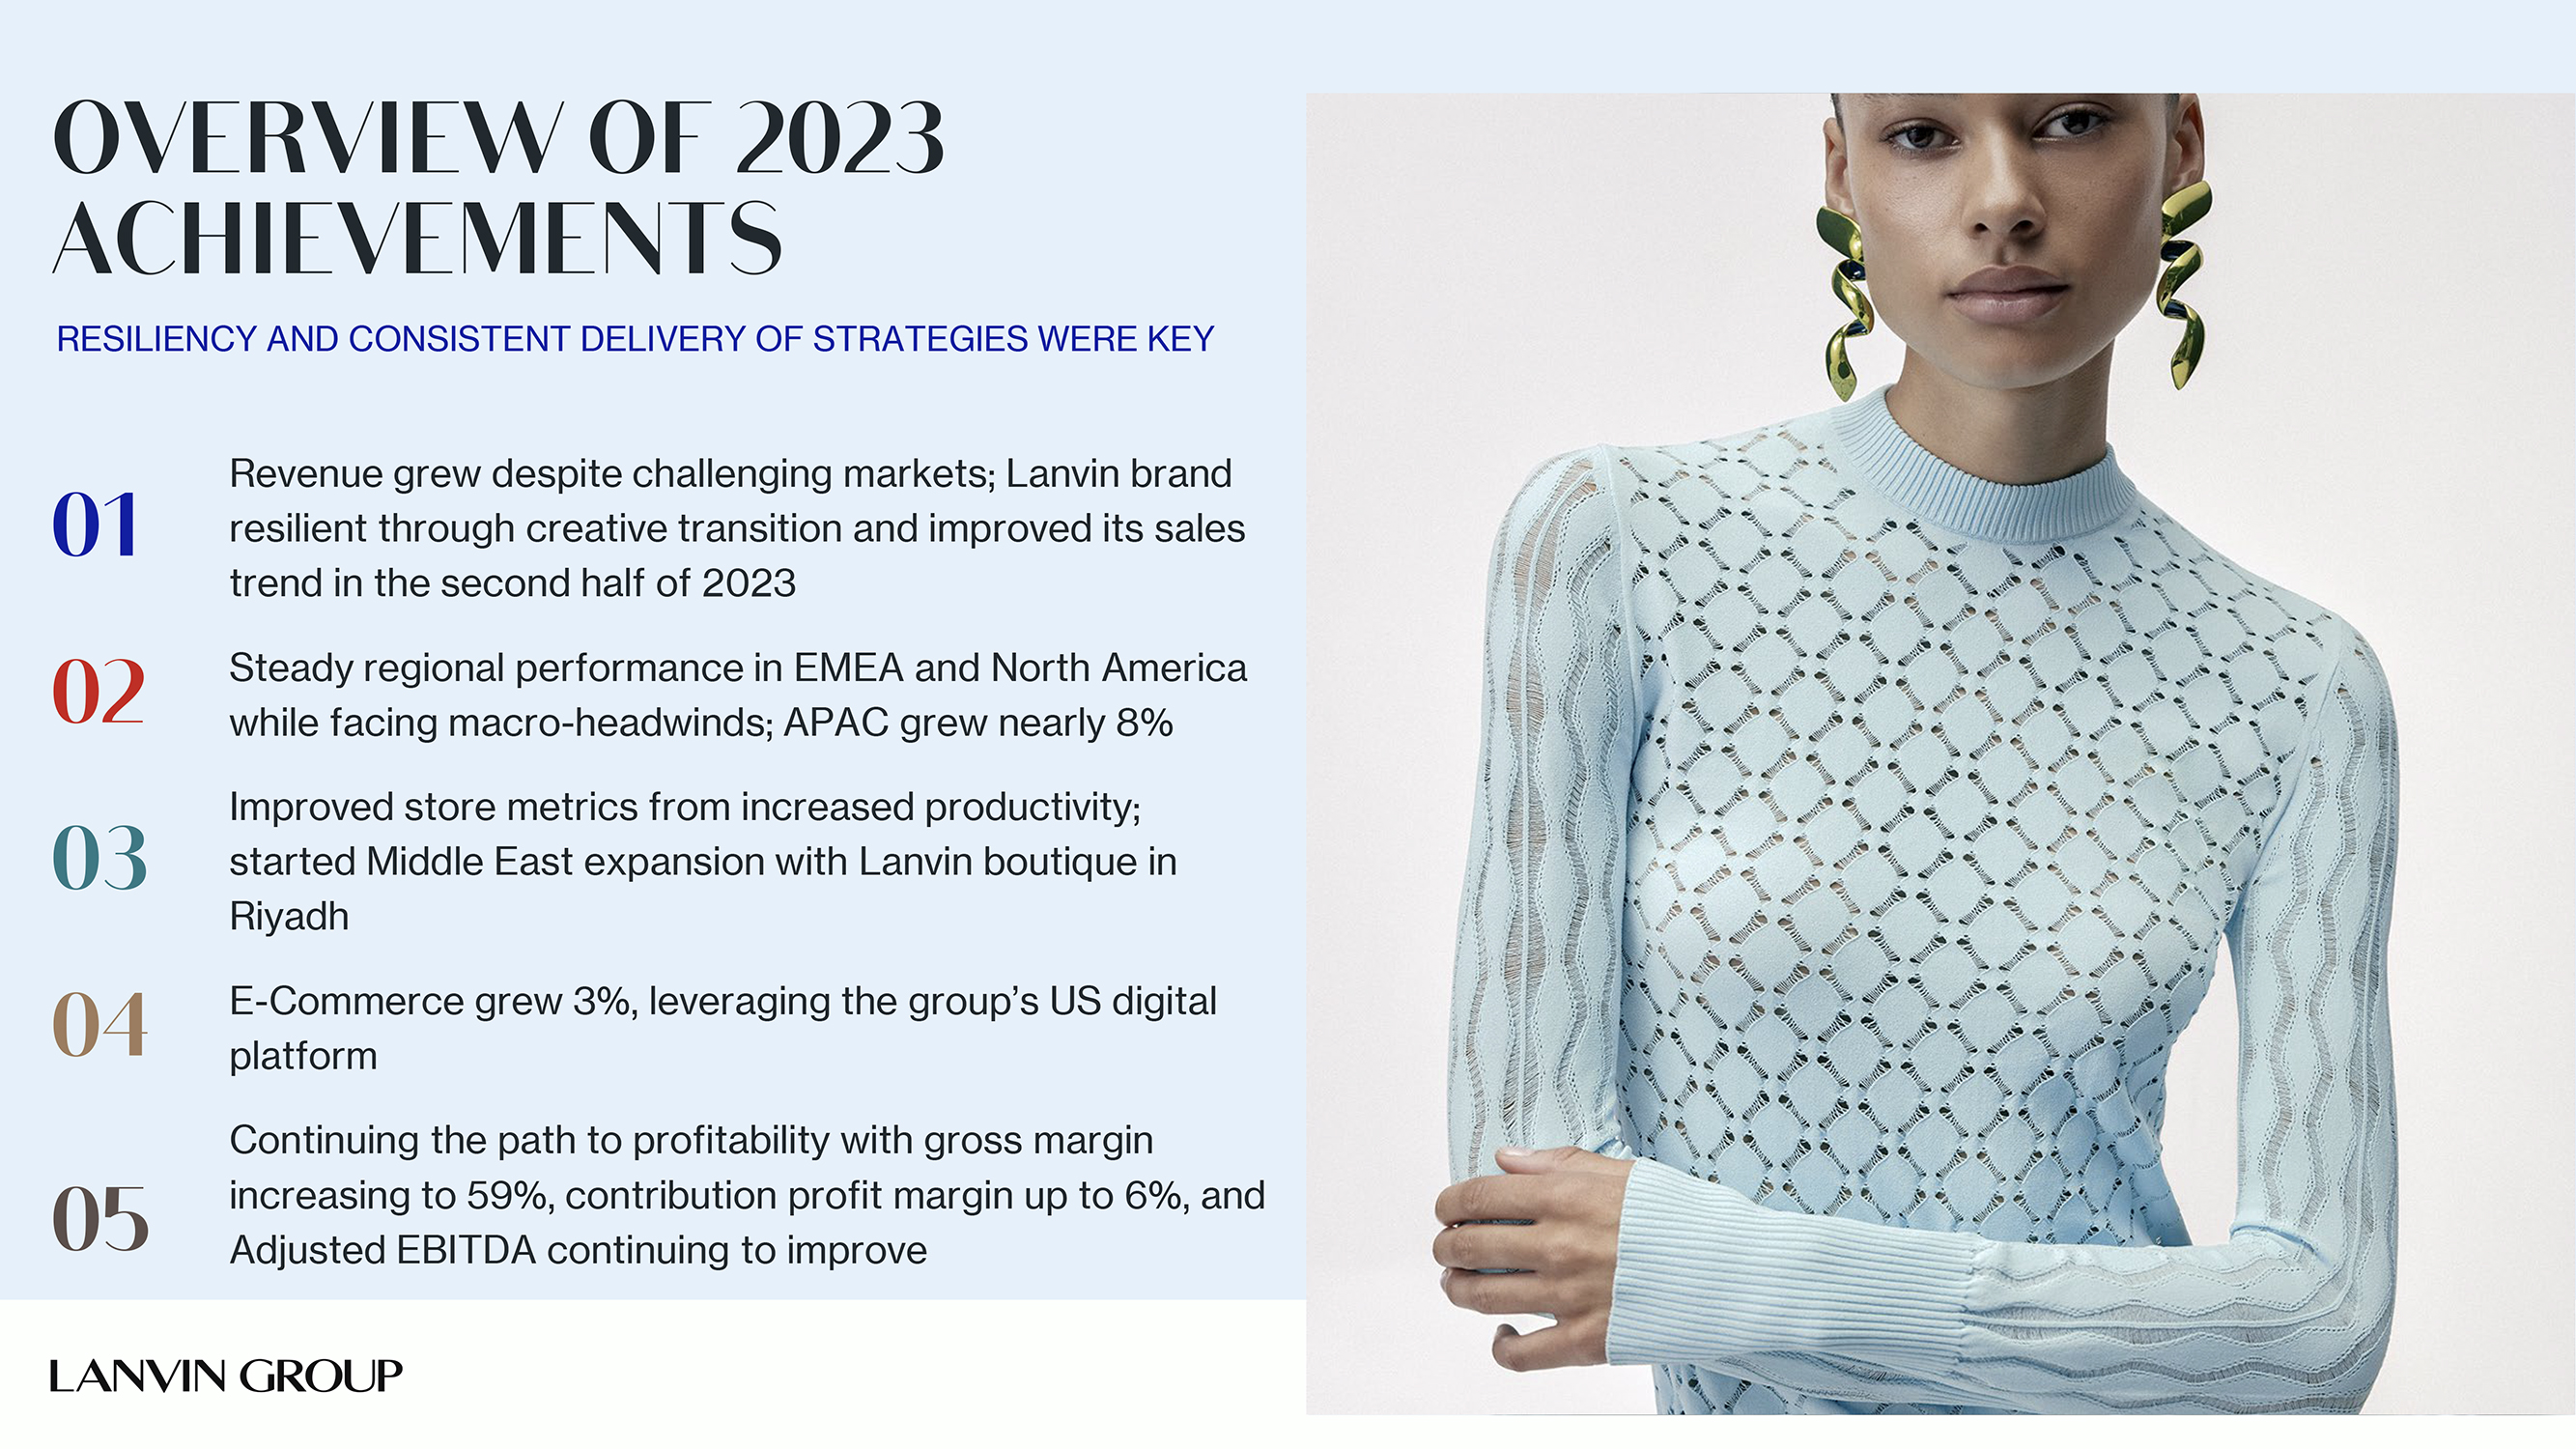
OVERVIEW OF 2023 ACHIEVEMENTS RESILIENCY AND CONSISTENT DELIVERY OF STRATEGIES WERE KEY Revenue grew despite challenging markets; Lanvin brand 01 resilient through creative transition and improved its sales trend in the second half of 2023 02 Steady regional performance in EMEA and North America while facing macro-headwinds; APAC grew nearly 8% Improved store metrics from increased productivity; 03 started Middle East expansion with Lanvin boutique in Riyadh 04 E-Commerce grew 3%, leveraging the group?s US digital platform Continuing the path to profitability with gross margin 05 increasing to 59%, contribution profit margin up to 6%, and Adjusted EBITDA continuing to improve
|
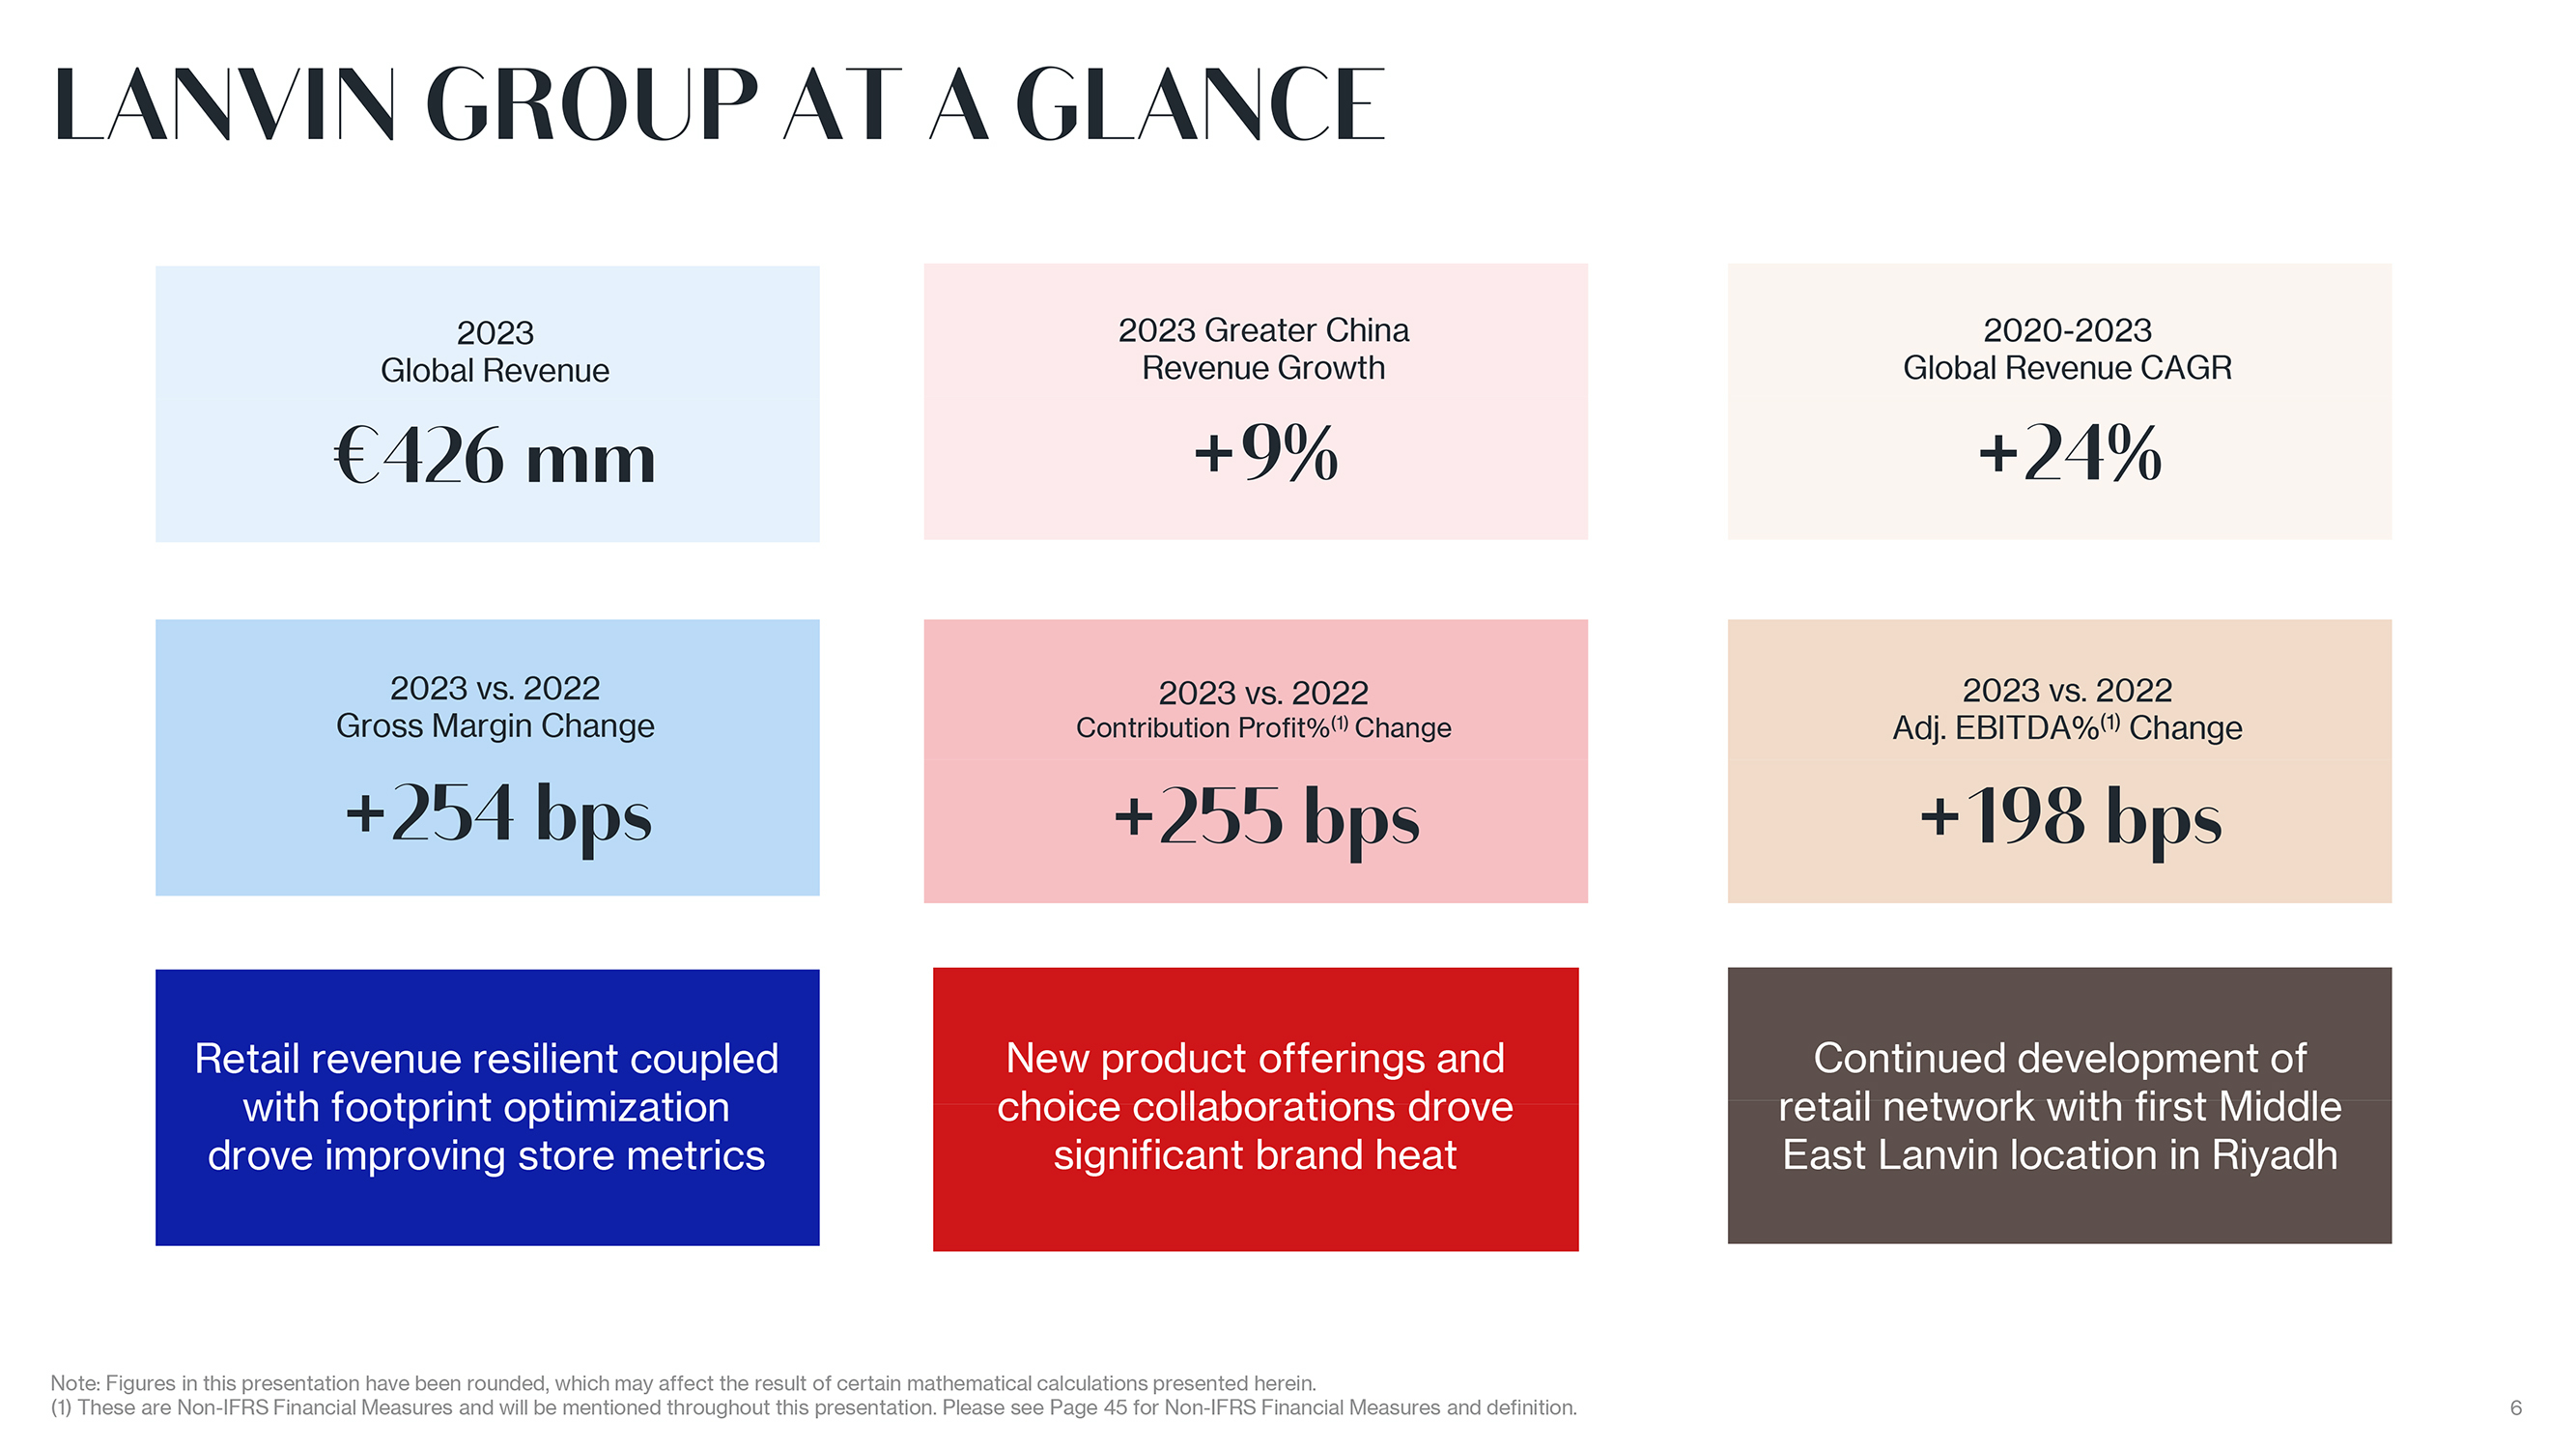
LANVIN GROUP AT A GLANCE 2023 Global Revenue 426 mm 2023 vs. 2022 Gross Margin Change +254 bps Retail revenue resilient coupled with footprint optimization drove improving store metrics 2023 Greater China Revenue Growth +9% 2023 vs. 2022 Contribution Profit%(1) Change +255 bps New product offerings and choice collaborations drove significant brand heat 2020-2023 Global Revenue CAGR +24% 2023 vs. 2022 Adj. EBITDA%(1) Change +198 bps Continued development of retail network with first Middle East Lanvin location in Riyadh Note: Figures in this presentation have been rounded, which may affect the result of certain mathematical calculations presented herein. (1) These are Non-IFRS Financial Measures and will be mentioned throughout this presentation. Please see Page 45 for Non-IFRS Financial Measures and definition. 6

|
OUR UNIQUE GLOBAL PLATFORM AND RESILIENT STRATEGIES DELIVERED GROWTH.
|
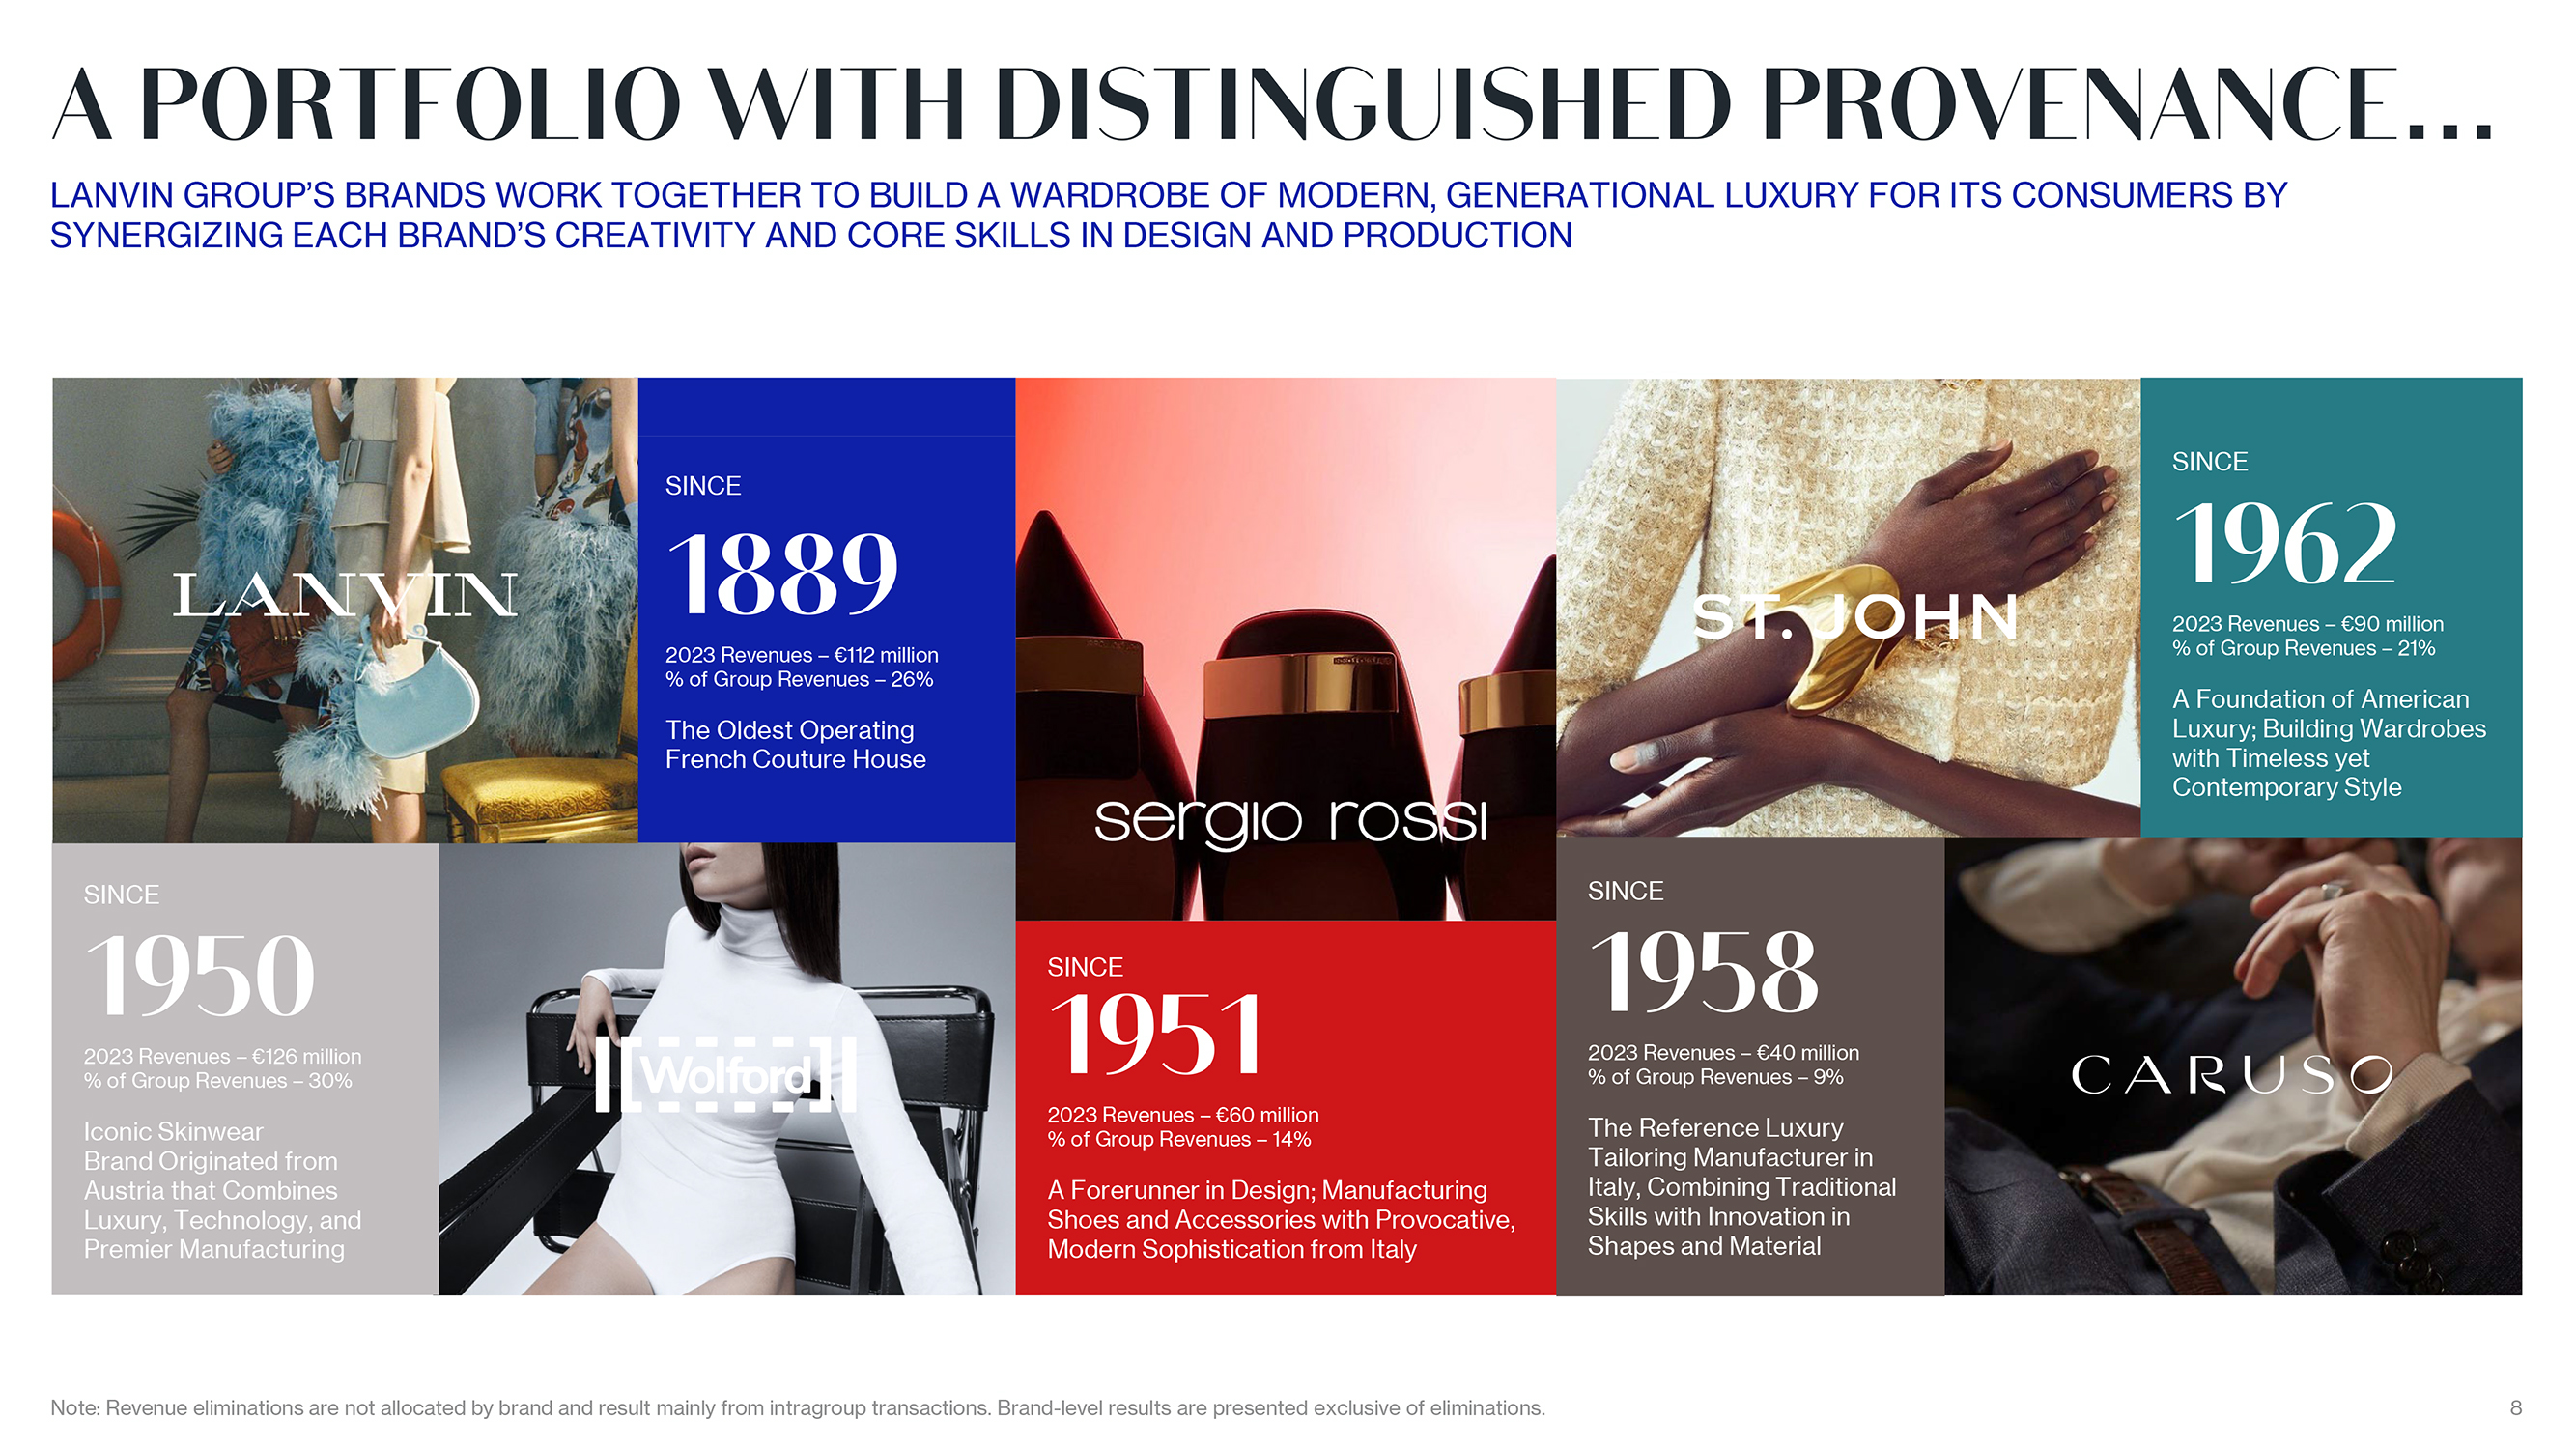
A PORTFOLIO WITH DISTINGUISHED PROVENANCE LANVIN GROUP?S BRANDS WORK TOGETHER TO BUILD A WARDROBE OF MODERN, GENERATIONAL LUXURY FOR ITS CONSUMERS BY SYNERGIZING EACH BRAND?S CREATIVITY AND CORE SKILLS IN DESIGN AND PRODUCTION SINCE 1889 2023 Revenues ? 112 million % of Group Revenues ? 26% The Oldest Operating French Couture House SINCE 1962 2023 Revenues ? 90 million % of Group Revenues ? 21% A Foundation of American Luxury; Building Wardrobes with Timeless yet Contemporary Style SINCE 1950 2023 Revenues ? 126 million % of Group Revenues ? 30% Iconic Skinwear Brand Originated from Austria that Combines Luxury, Technology, and Premier Manufacturing SINCE 1951 2023 Revenues ? 60 million % of Group Revenues ? 14% A Forerunner in Design; Manufacturing Shoes and Accessories with Provocative, Modern Sophistication from Italy SINCE 1958 2023 Revenues ? 40 million % of Group Revenues ? 9% The Reference Luxury Tailoring Manufacturer in Italy, Combining Traditional Skills with Innovation in Shapes and Material Note: Revenue eliminations are not allocated by brand and result mainly from intragroup transactions. Brand-level results are presented exclusive of eliminations. 8
|
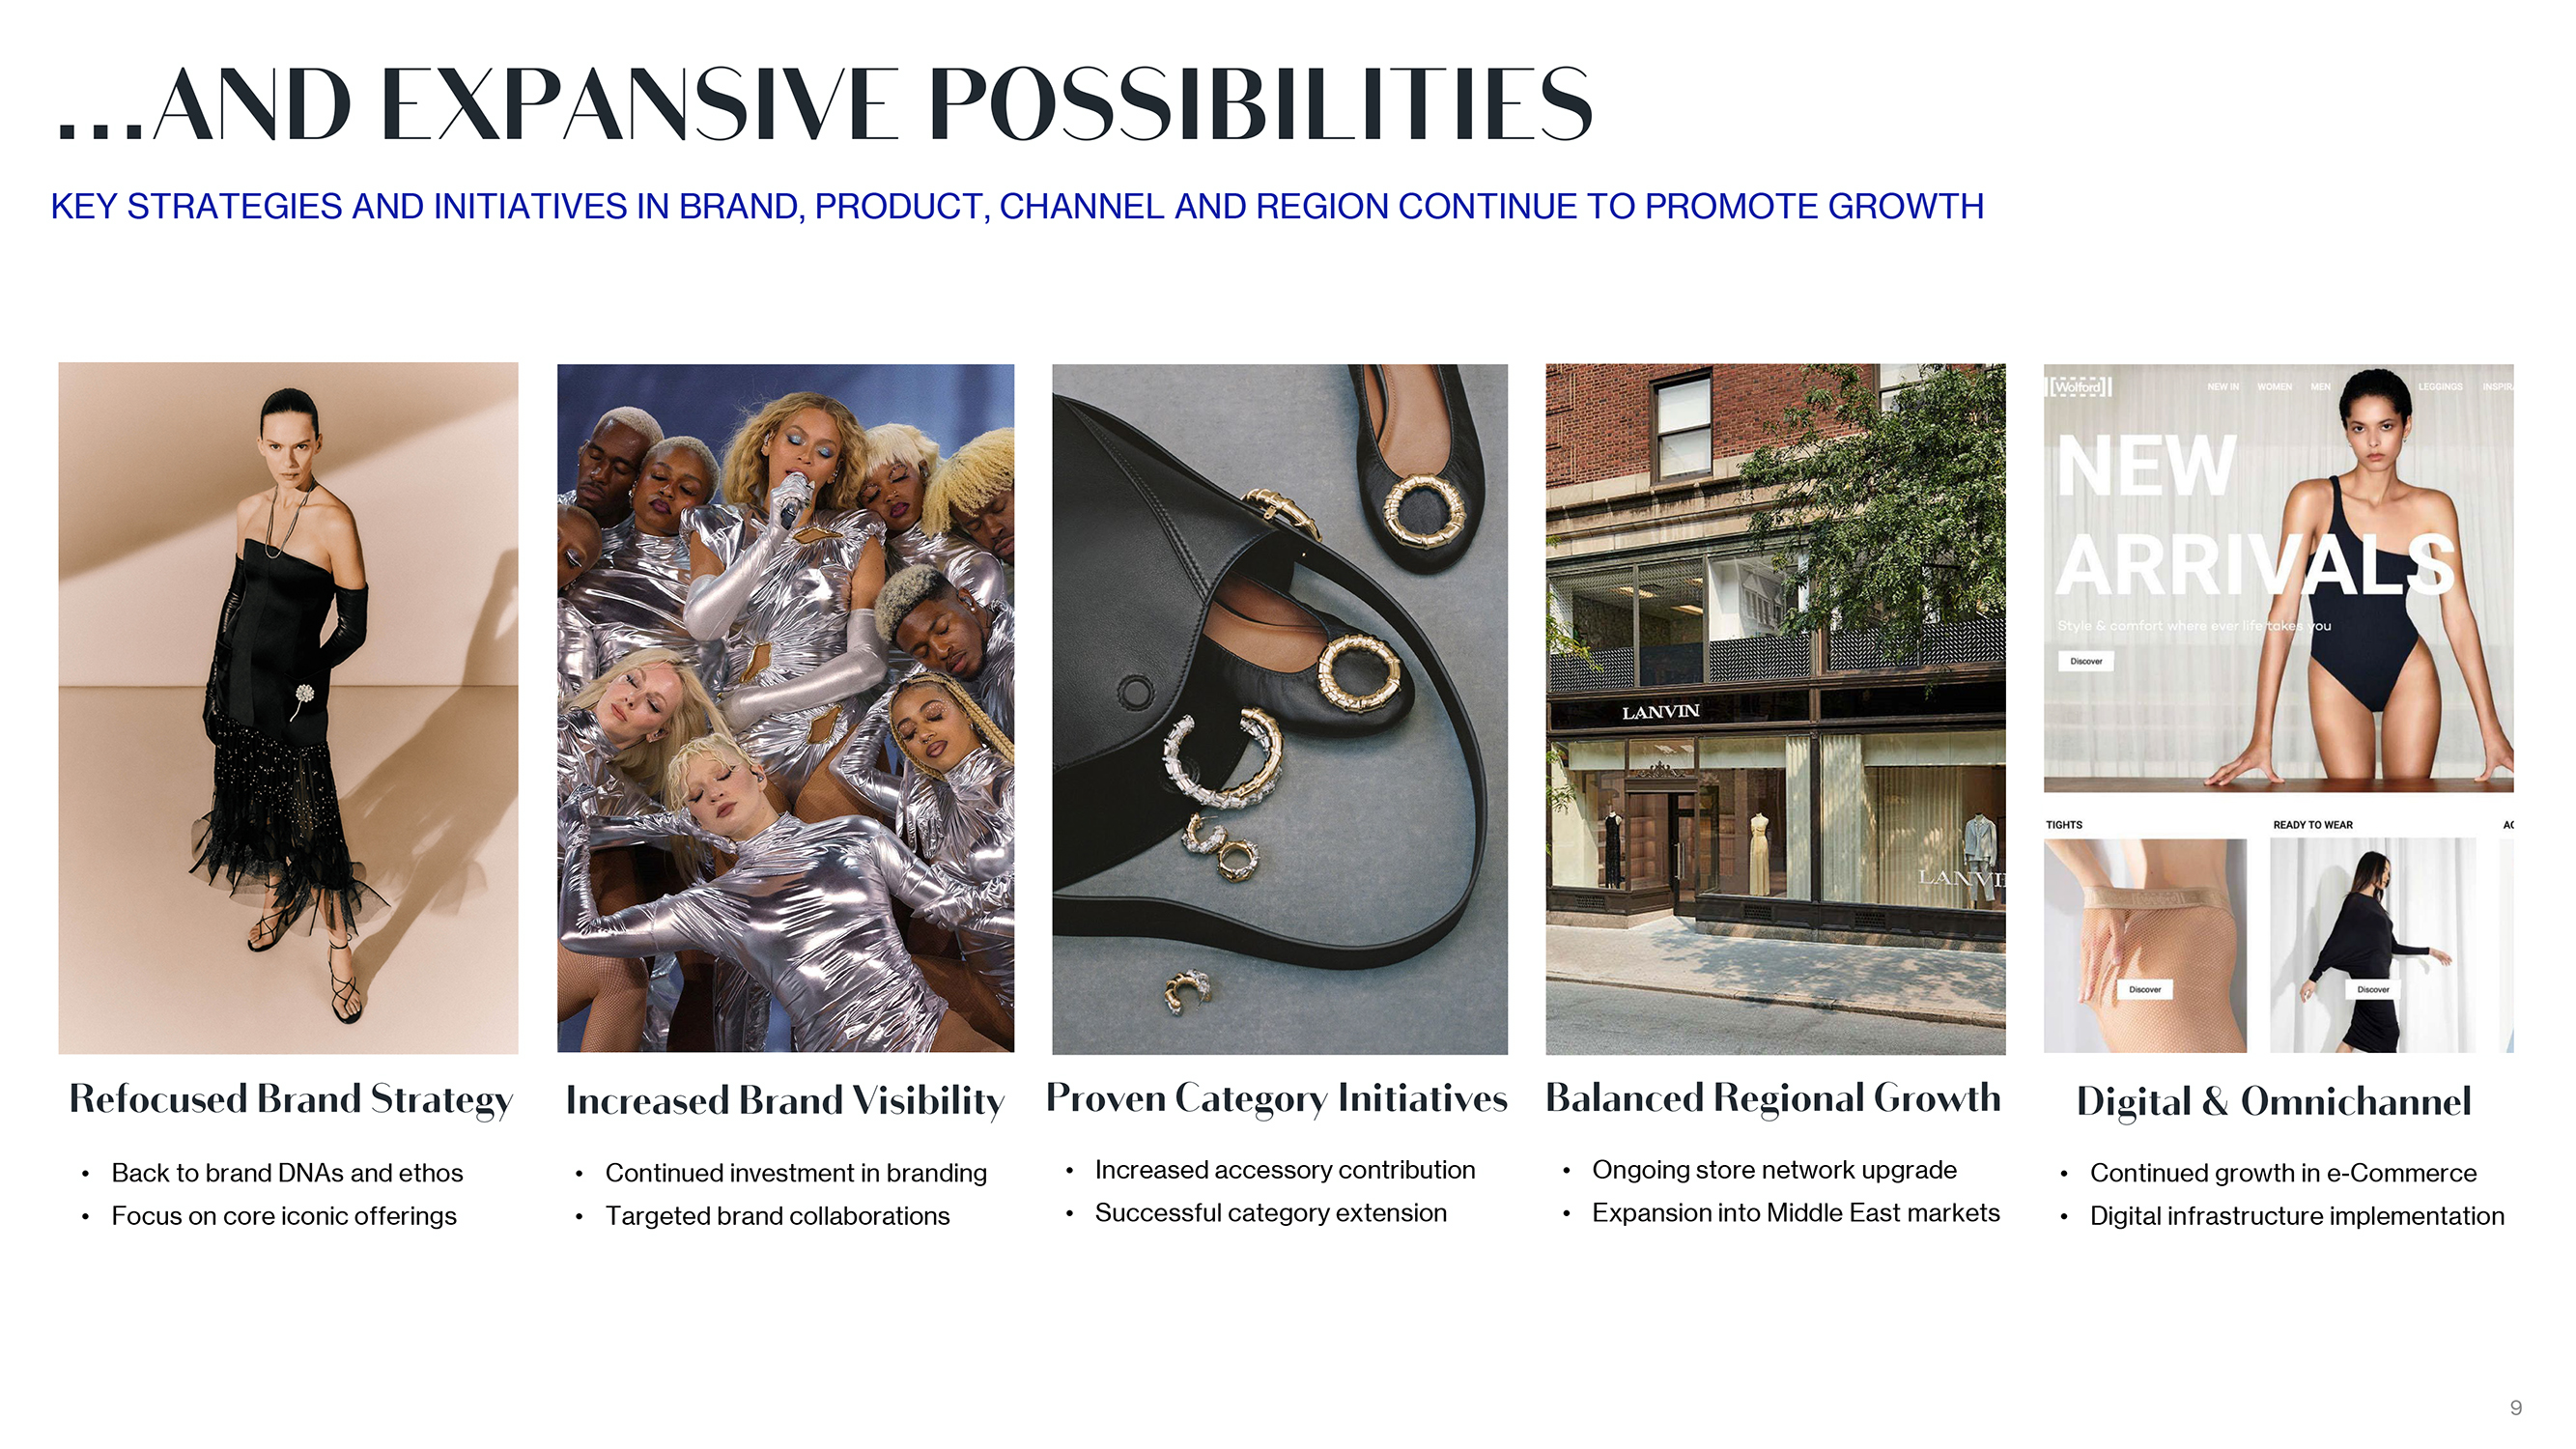
AND EXPANSIVE POSSIBILITIES KEY STRATEGIES AND INITIATIVES IN BRAND, PRODUCT, CHANNEL AND REGION CONTINUE TO PROMOTE GROWTH Refocused Brand Strategy Back to brand DNAs and ethos Focus on core iconic offerings Increased Brand Visibility Continued investment in branding Targeted brand collaborations Proven Category Initiatives Increased accessory contribution Successful category extension Balanced Regional Growth Ongoing store network upgrade Expansion into Middle East markets Digital & Omnichannel Continued growth in e-Commerce Digital infrastructure implementation 9

|
THE KEYS TO SUCCESS NIMBLE APPROACH DIGITAL MIND-SET START-UP VALUE UNICORN TRACKRECORD 10
|
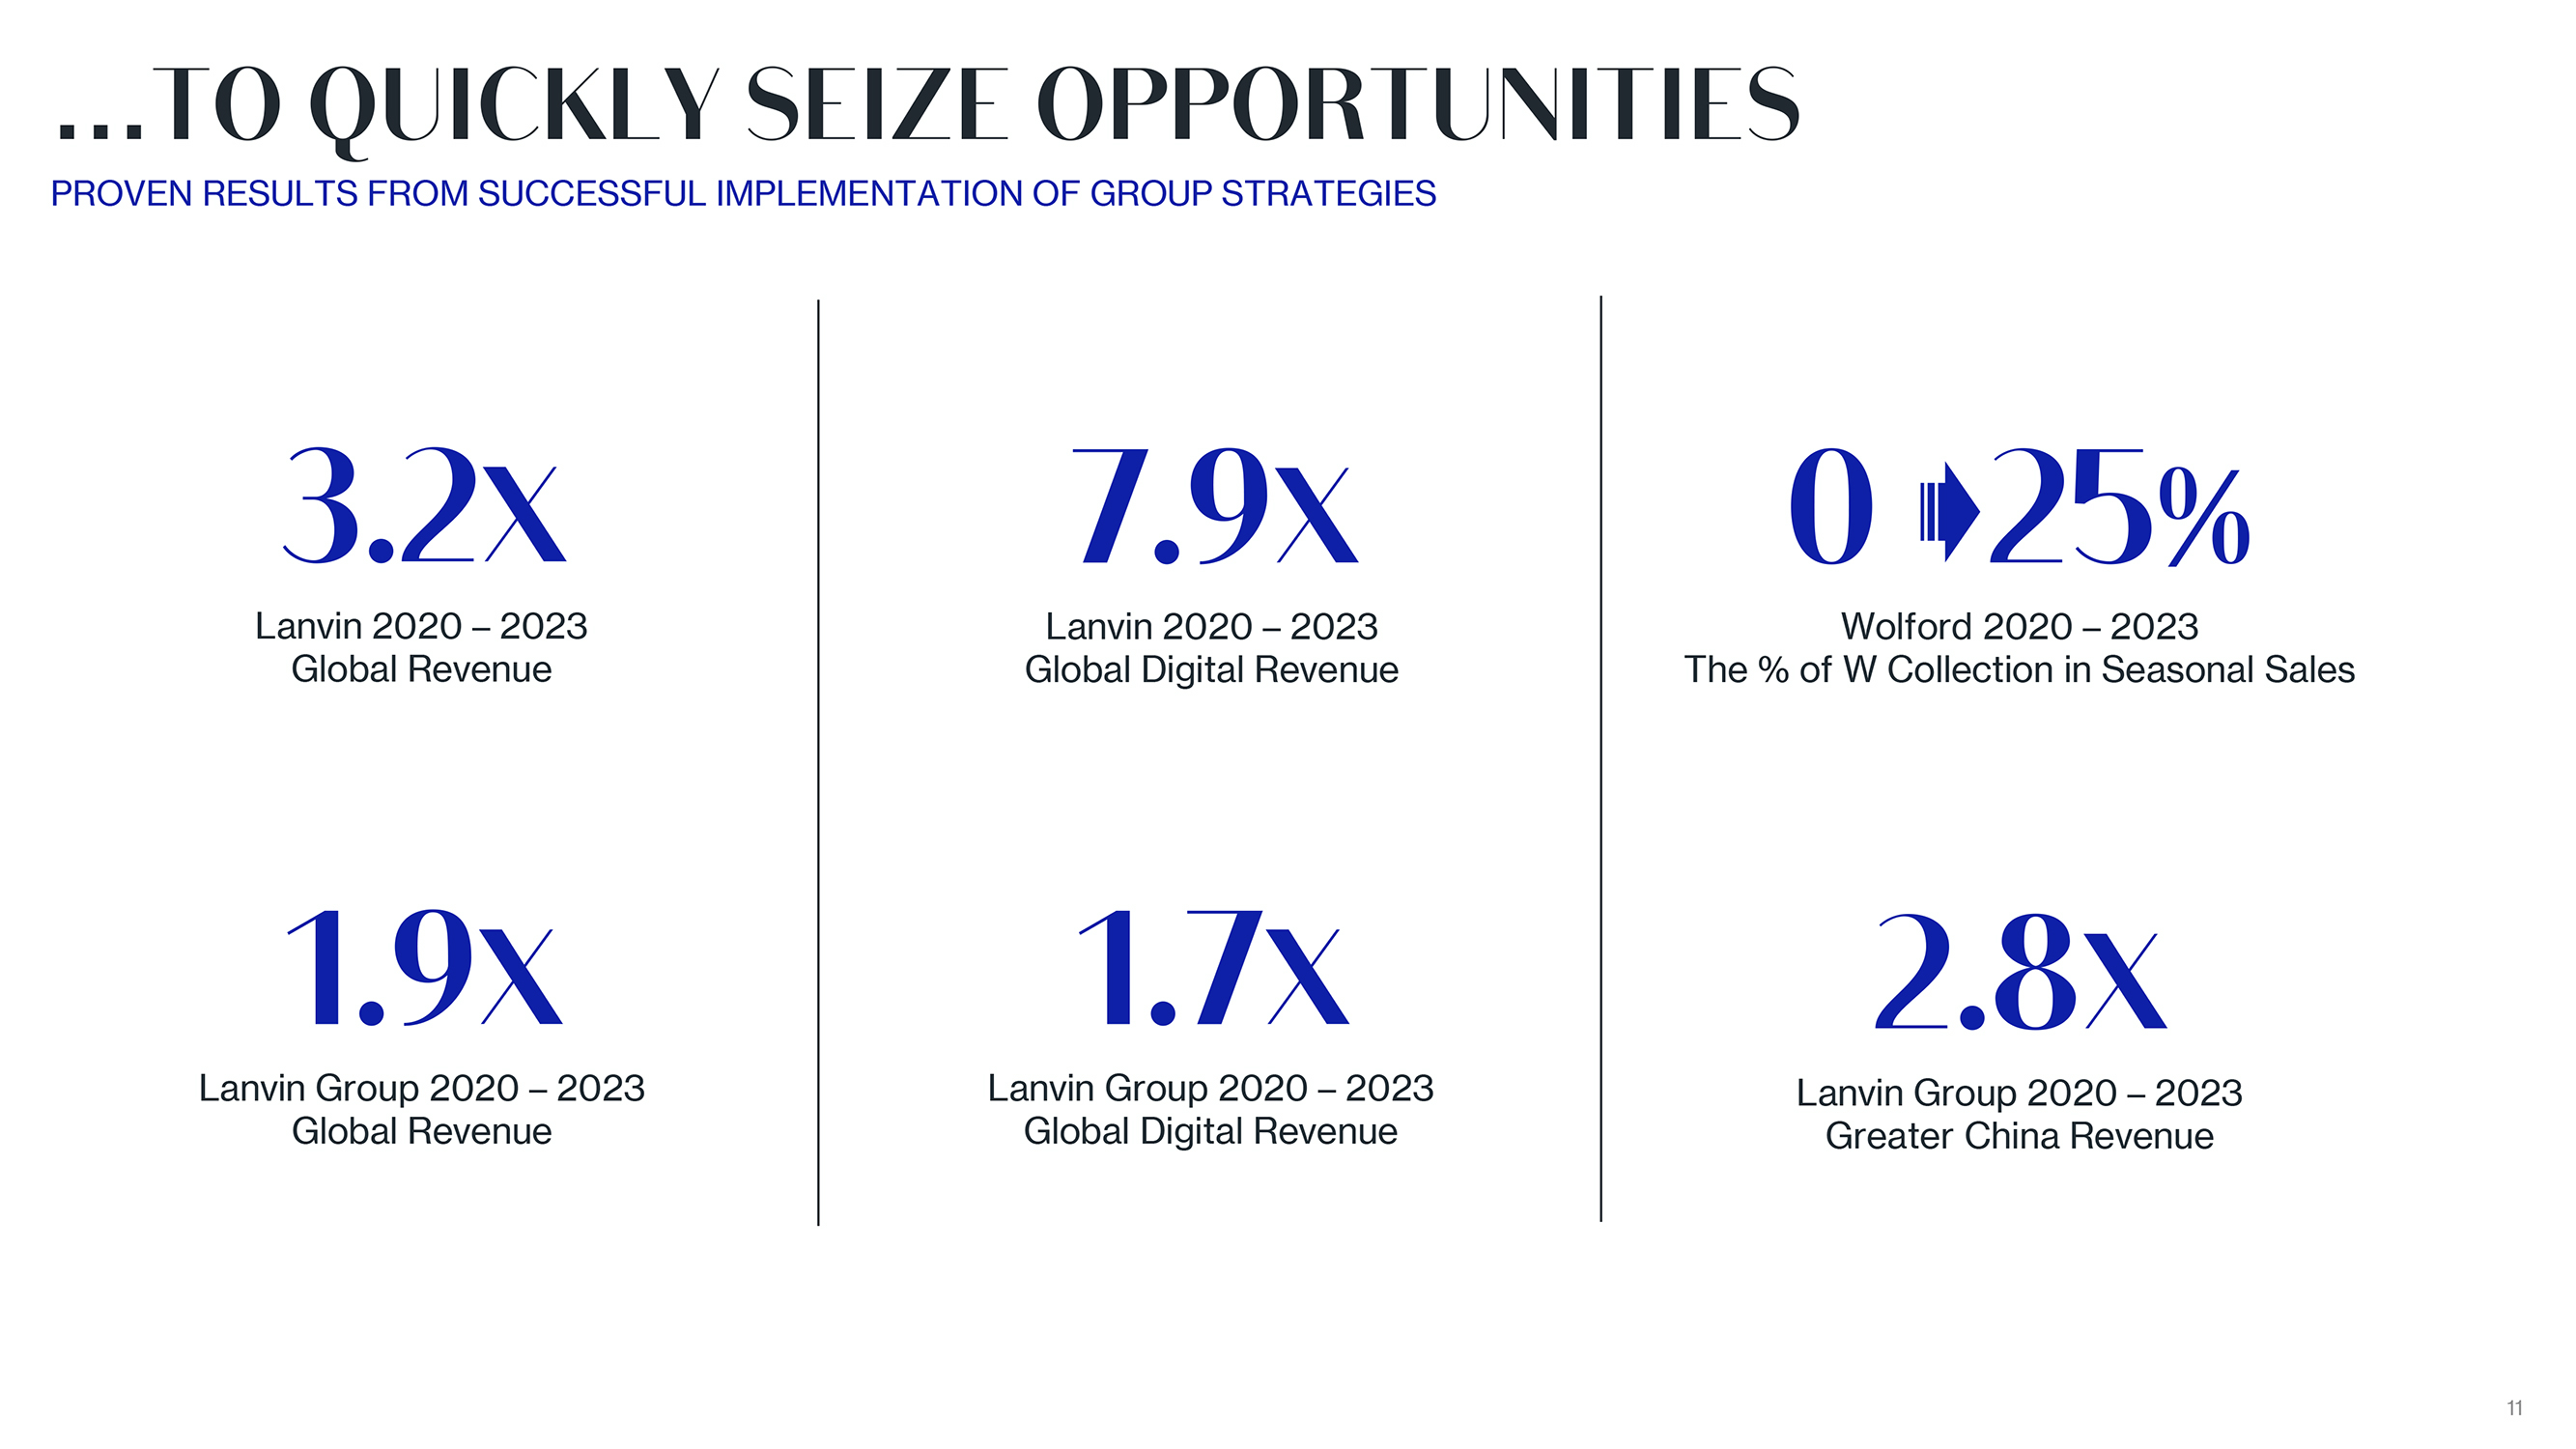
TO QUICKLY SEIZE OPPORTUNITIES PROVEN RESULTS FROM SUCCESSFUL IMPLEMENTATION OF GROUP STRATEGIES 3.2X Lanvin 2020 ? 2023 Global Revenue 1.9X Lanvin Group 2020 ? 2023 Global Revenue 7.9X Lanvin 2020 ? 2023 Global Digital Revenue 1.7X Lanvin Group 2020 ? 2023 Global Digital Revenue 0 25% Wolford 2020 ? 2023 The % of W Collection in Seasonal Sales 2.8X Lanvin Group 2020 ? 2023 Greater China Revenue 11

|
BRANDS? KEY STRATEGIES AND ACHIEVEMENTS

|
1 Successful Creative Reorganization Reframed the creative strategy around a singular vision; established two additional verticals alongside Ready-to-Wear: Leather Goods & Accessories and Lanvin Lab 2 Leather Goods & Accessories Enhanced leather goods and footwear with key initiatives: relaunch of the iconic ballerina flats, Curb sneaker collaboration with The Surgeon and the Pencil Box campaign 3 The Launch of Lanvin Lab An experimental space for the cultural expression of the brand, Lanvin Lab released its first project with Grammy-winning artist Future 4 Further Retail Expansion Net increase of 5 stores, including Lanvin?s new concept flagship boutique on Madison Avenue and first freestanding boutique in Middle East (Riyadh, Saudi Arabia) 13
|
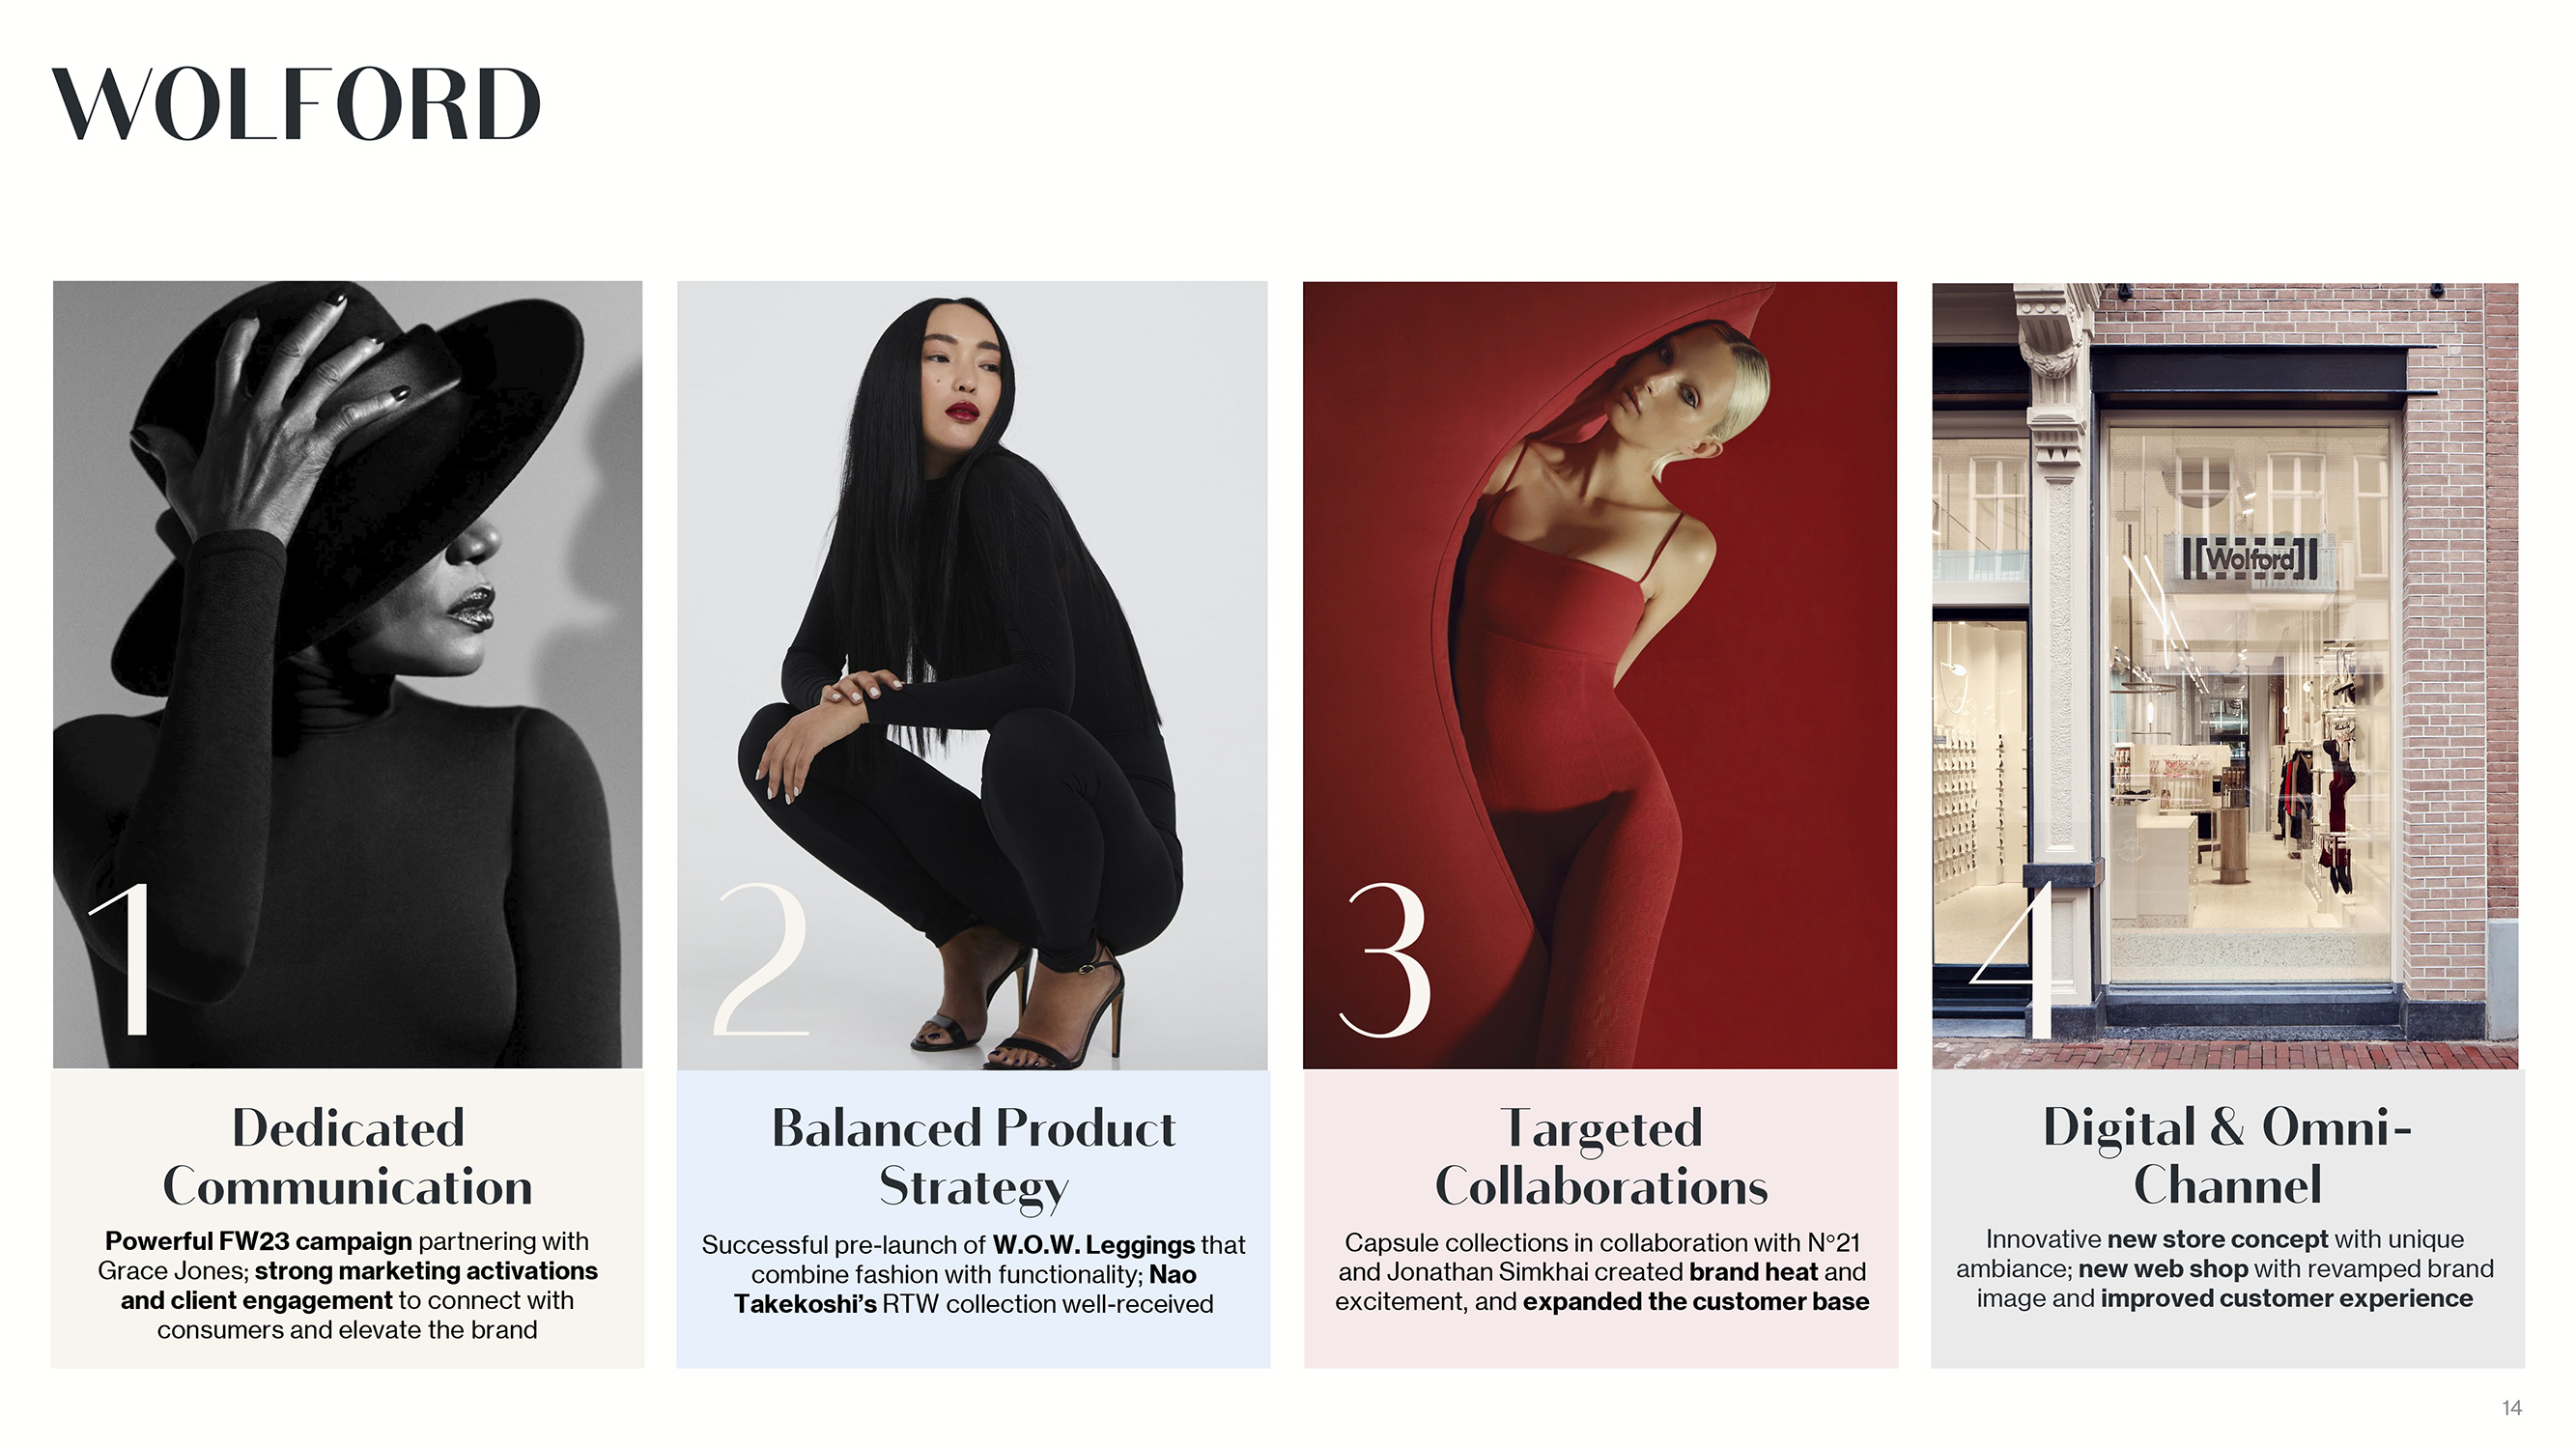
1 Dedicated Communication Powerful FW23 campaign partnering with Grace Jones; strong marketing activations and client engagement to connect with consumers and elevate the brand 2 Balanced Product Strategy Successful pre-launch of W.O.W. Leggings that combine fashion with functionality; Nao Takekoshi?s RTW collection well-received 3 Targeted Collaborations Capsule collections in collaboration with N21 and Jonathan Simkhai created brand heat and excitement, and expanded the customer base 4 Digital & Omni-Channel Innovative new store concept with unique ambiance; new web shop with revamped brand image and improved customer experience 14

|
ST. JOHN 1 Enhanced Product Offering Well-received Foundation collection and strong performance in eveningwear; successful product offerings elevated the brand and drove growth 2 Retail Optimization Strengthened brand presence by expanding retail footprint in selective locations and reestablishing flagship boutiques 3 Client Engagement Impactful #OwnYourPower campaign featuring Shonda Rhimes; successful engagement events strengthened connections with consumers and reached new audiences 4 Supply Chain Upgrade Refined supply chain to improve gross margin and realigned with more diversified product assortment; partnered with best-in-class factories globally 15
|
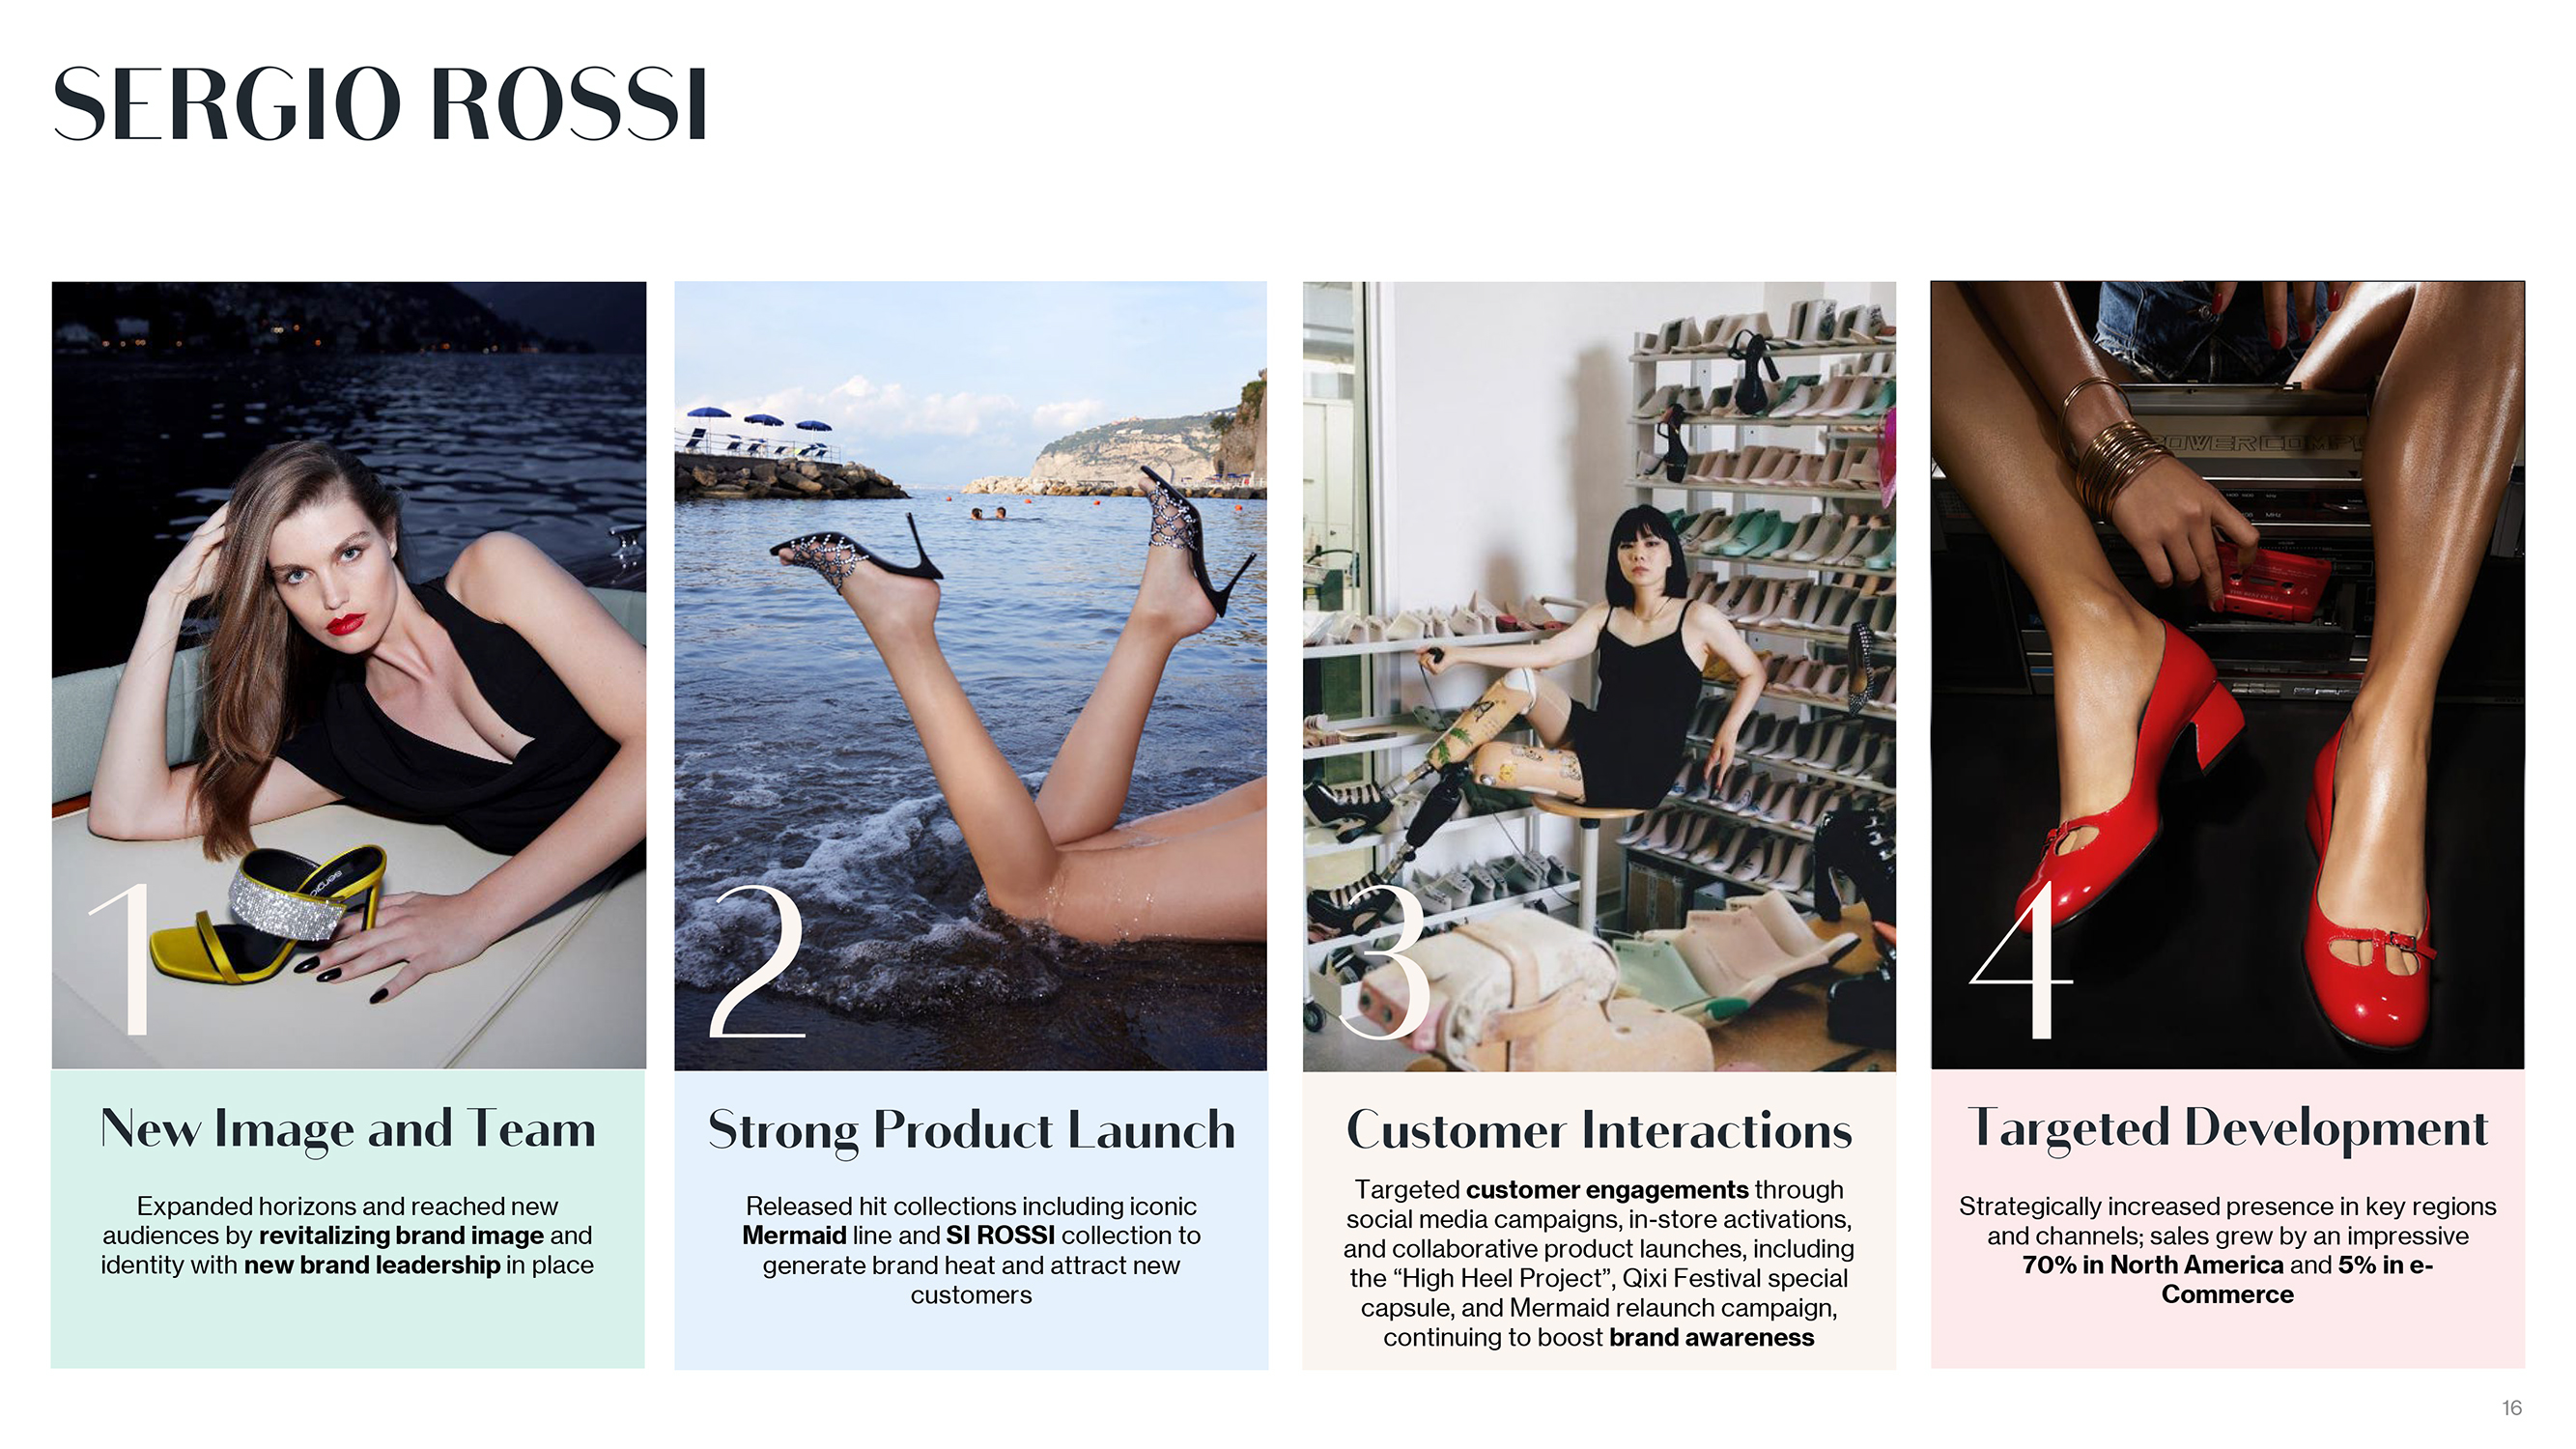
SERGIO ROSSI 1 New Image and Team Expanded horizons and reached new audiences by revitalizing brand image and identity with new brand leadership in place 2 Strong Product Launch Released hit collections including iconic Mermaid line and SI ROSSI collection to generate brand heat and attract new customers 3 Customer Interactions Targeted customer engagements through social media campaigns, in-store activations, and collaborative product launches, including the ?High Heel Project?, Qixi Festival special capsule, and Mermaid relaunch campaign, continuing to boost brand awareness 4 Targeted Development Strategically increased presence in key regions and channels; sales grew by an impressive 70% in North America and 5% in e-Commerce 16

|
CARUSO 1 Business Expansion Ongoing account expansion and solid 30% growth in revenue, a demonstration of passion for quality and belief in elegance paying off 2 Margin Improvement Achieved Adjusted EBITDA breakeven; grew the Caruso brand and partnered with AAA Maisons while expanding production capacity and improving utilization 3 Direct Reach Launched e-Commerce with original, effective content creation to enhance brand awareness and gain direct touch with customers 4 Evolved Organization Significant human capital expansion, organizational evolution, supply chain reinforcement and service enhancement to support demand in a period of offer scarcity 17
|
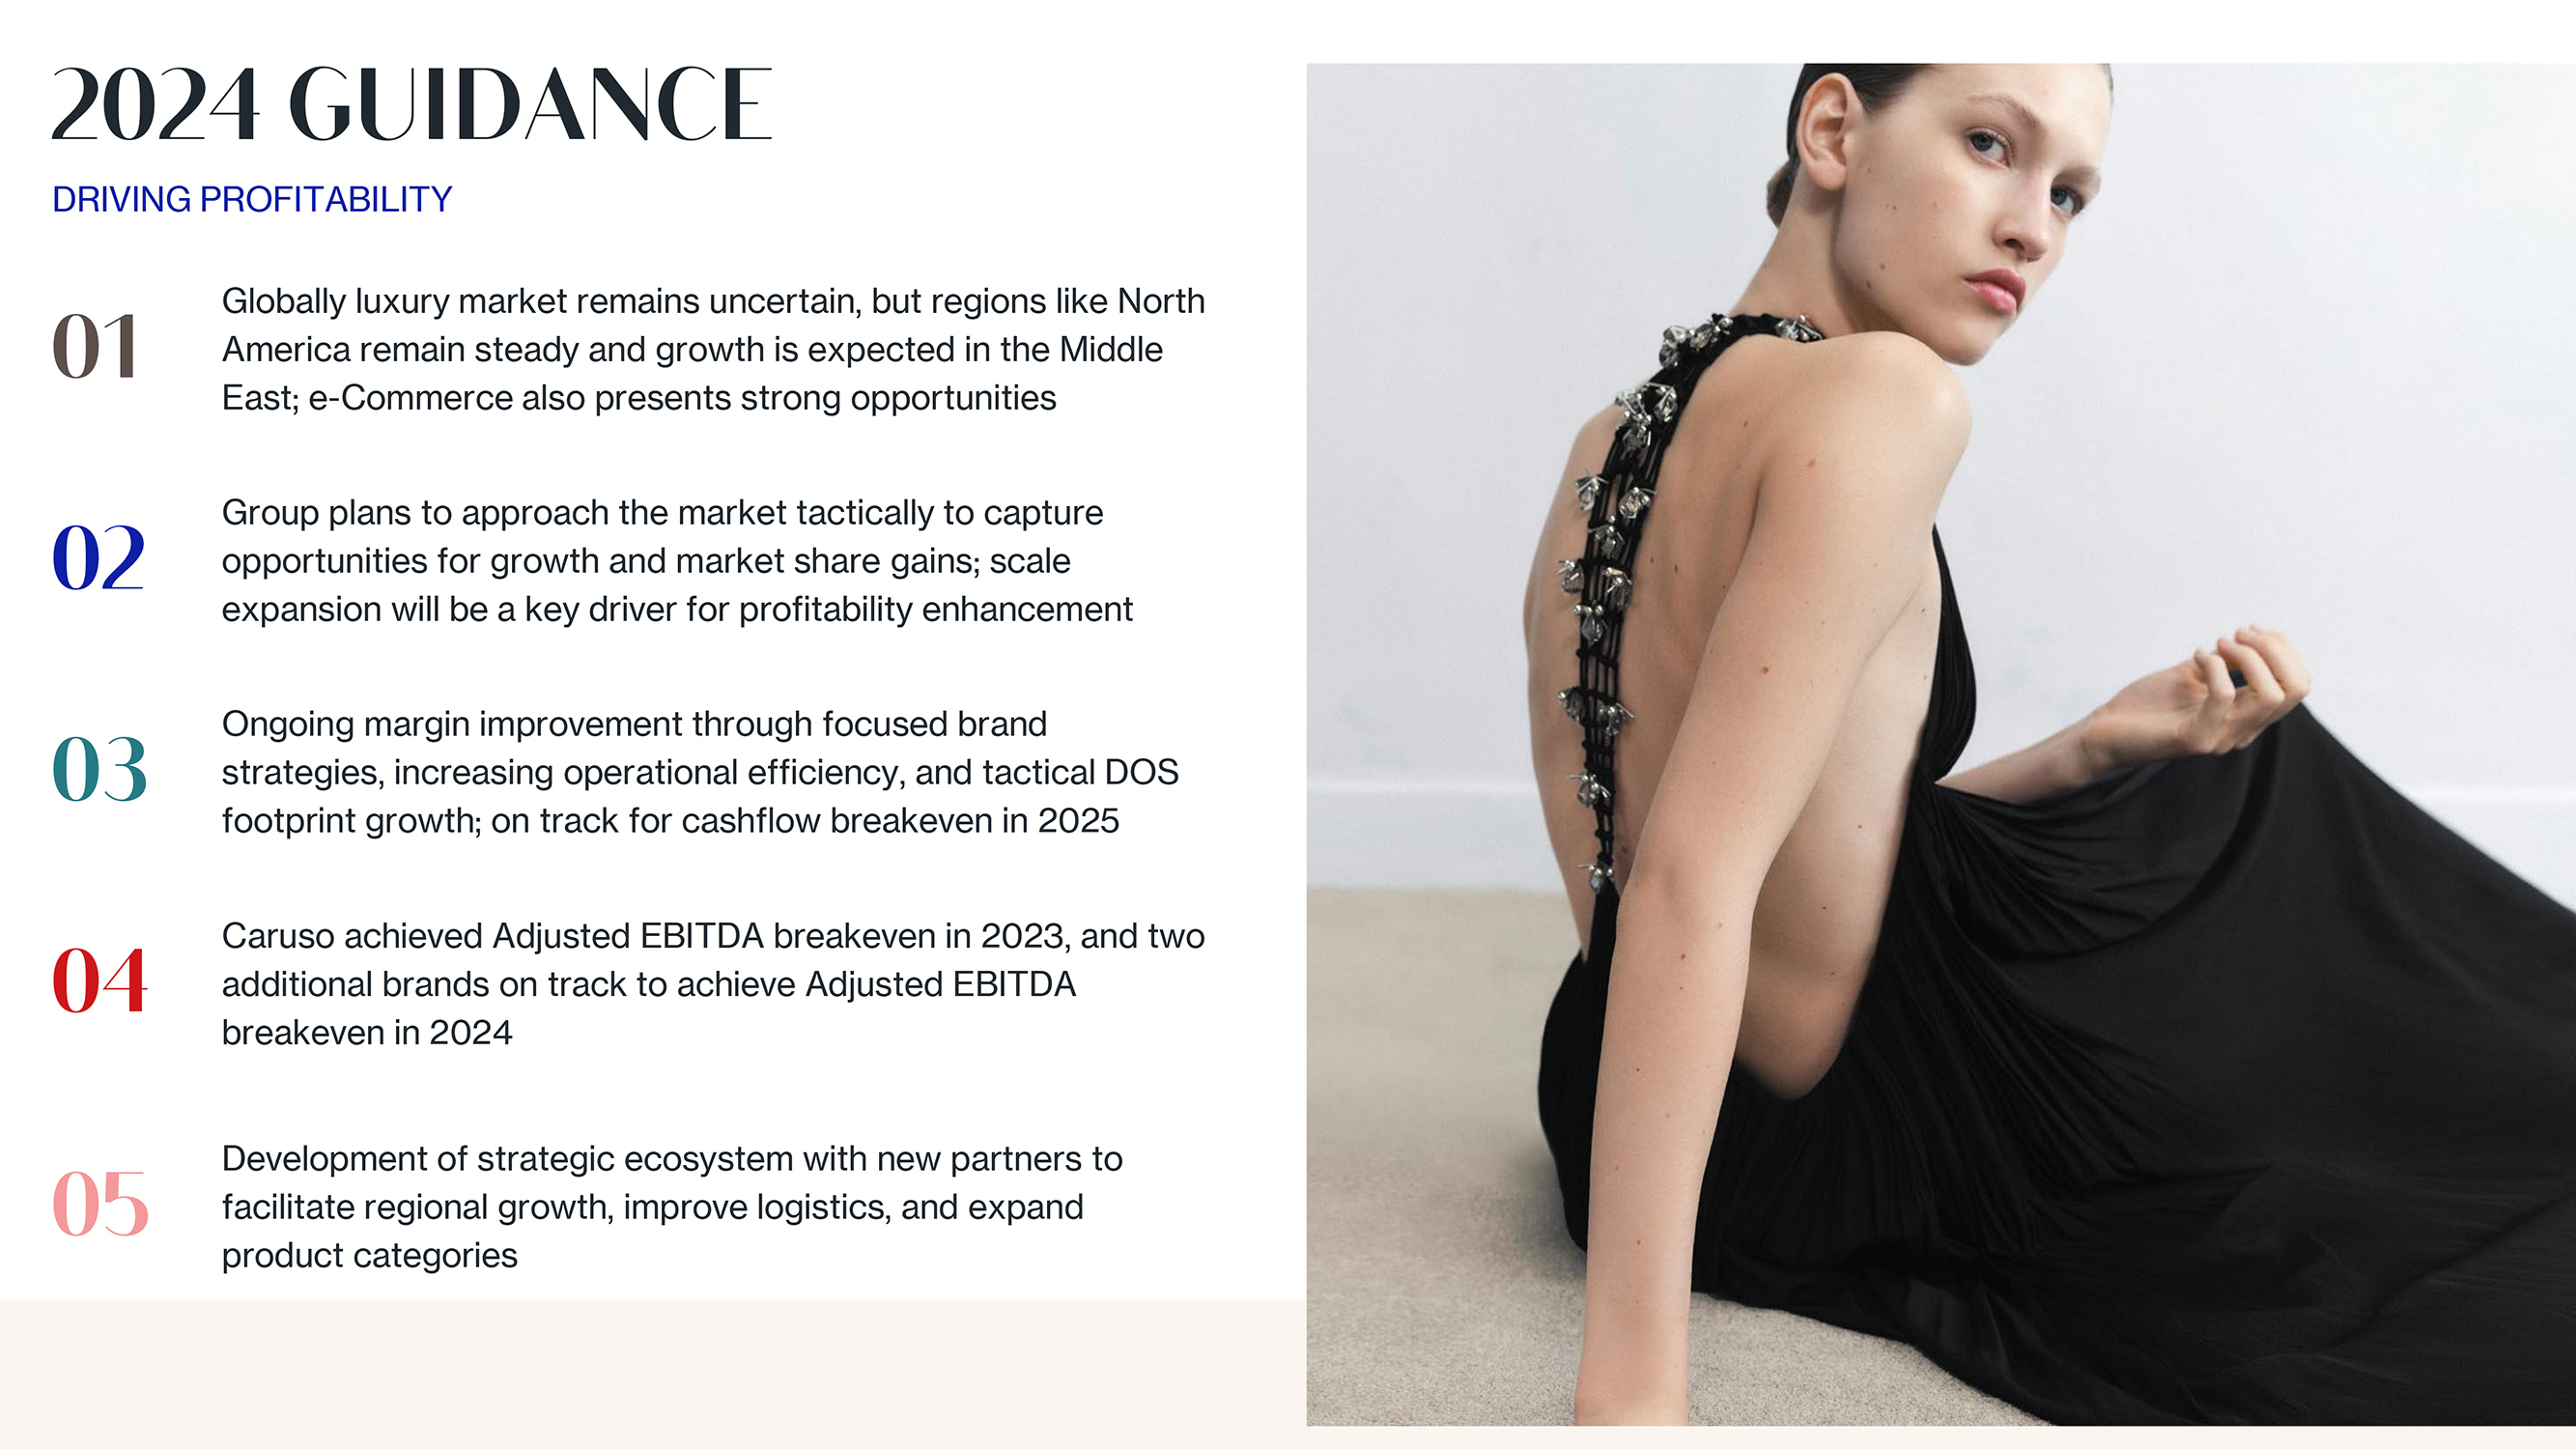
2024 GUIDANCE DRIVING PROFITABILITY Globally luxury market remains uncertain, but regions like North 01 America remain steady and growth is expected in the Middle East; e-Commerce also presents strong opportunities Group plans to approach the market tactically to capture 02 opportunities for growth and market share gains; scale expansion will be a key driver for profitability enhancement Ongoing margin improvement through focused brand 03 strategies, increasing operational efficiency, and tactical DOS footprint growth; on track for cashflow breakeven in 2025 Caruso achieved Adjusted EBITDA breakeven in 2023, and two 04 additional brands on track to achieve Adjusted EBITDA breakeven in 2024 Development of strategic ecosystem with new partners to 05 facilitate regional growth, improve logistics, and expand product categories

|
GROUP CONSOLIDATED FINANCIAL RESULTS
|
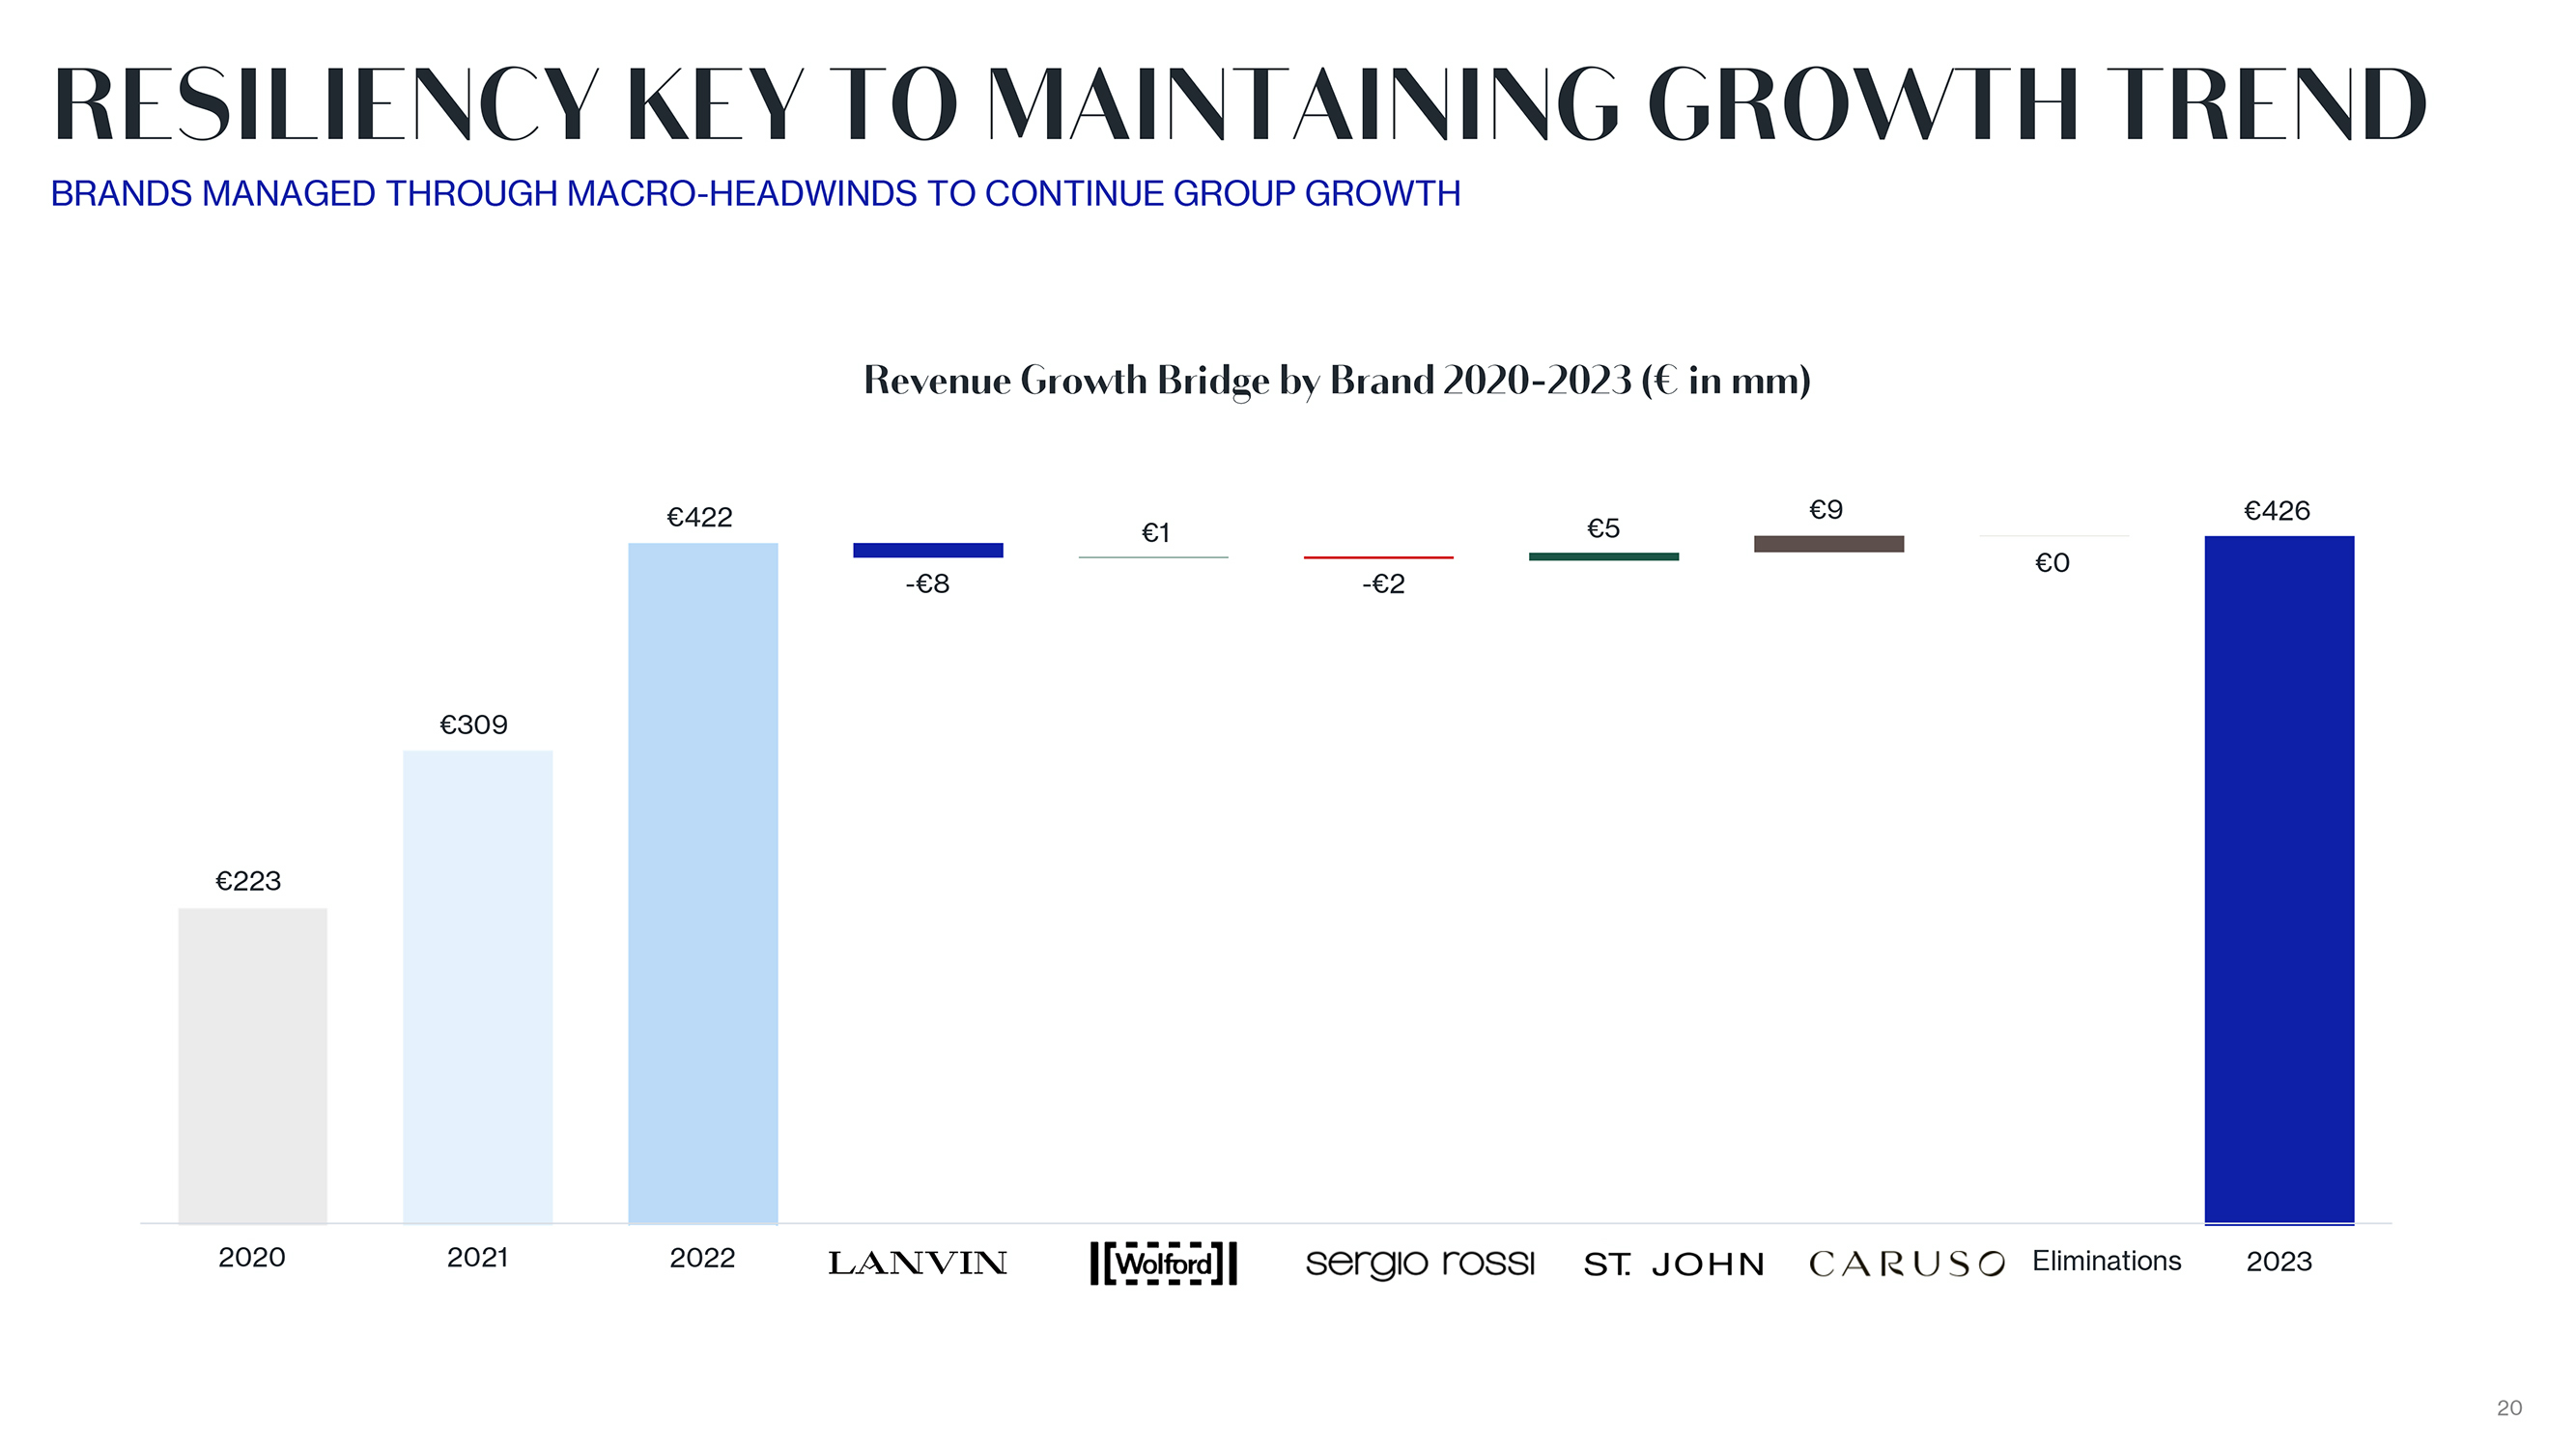
RESILIENCY KEY TO MAINTAINING GROWTH TREND BRANDS MANAGED THROUGH MACRO-HEADWINDS TO CONTINUE GROUP GROWTH Revenue Growth Bridge by Brand 2020-2023 ( in mm) 422 9 426 1 5 0 -8 -2 309 223 2020 2021 2022 Eliminations 2023 20
|
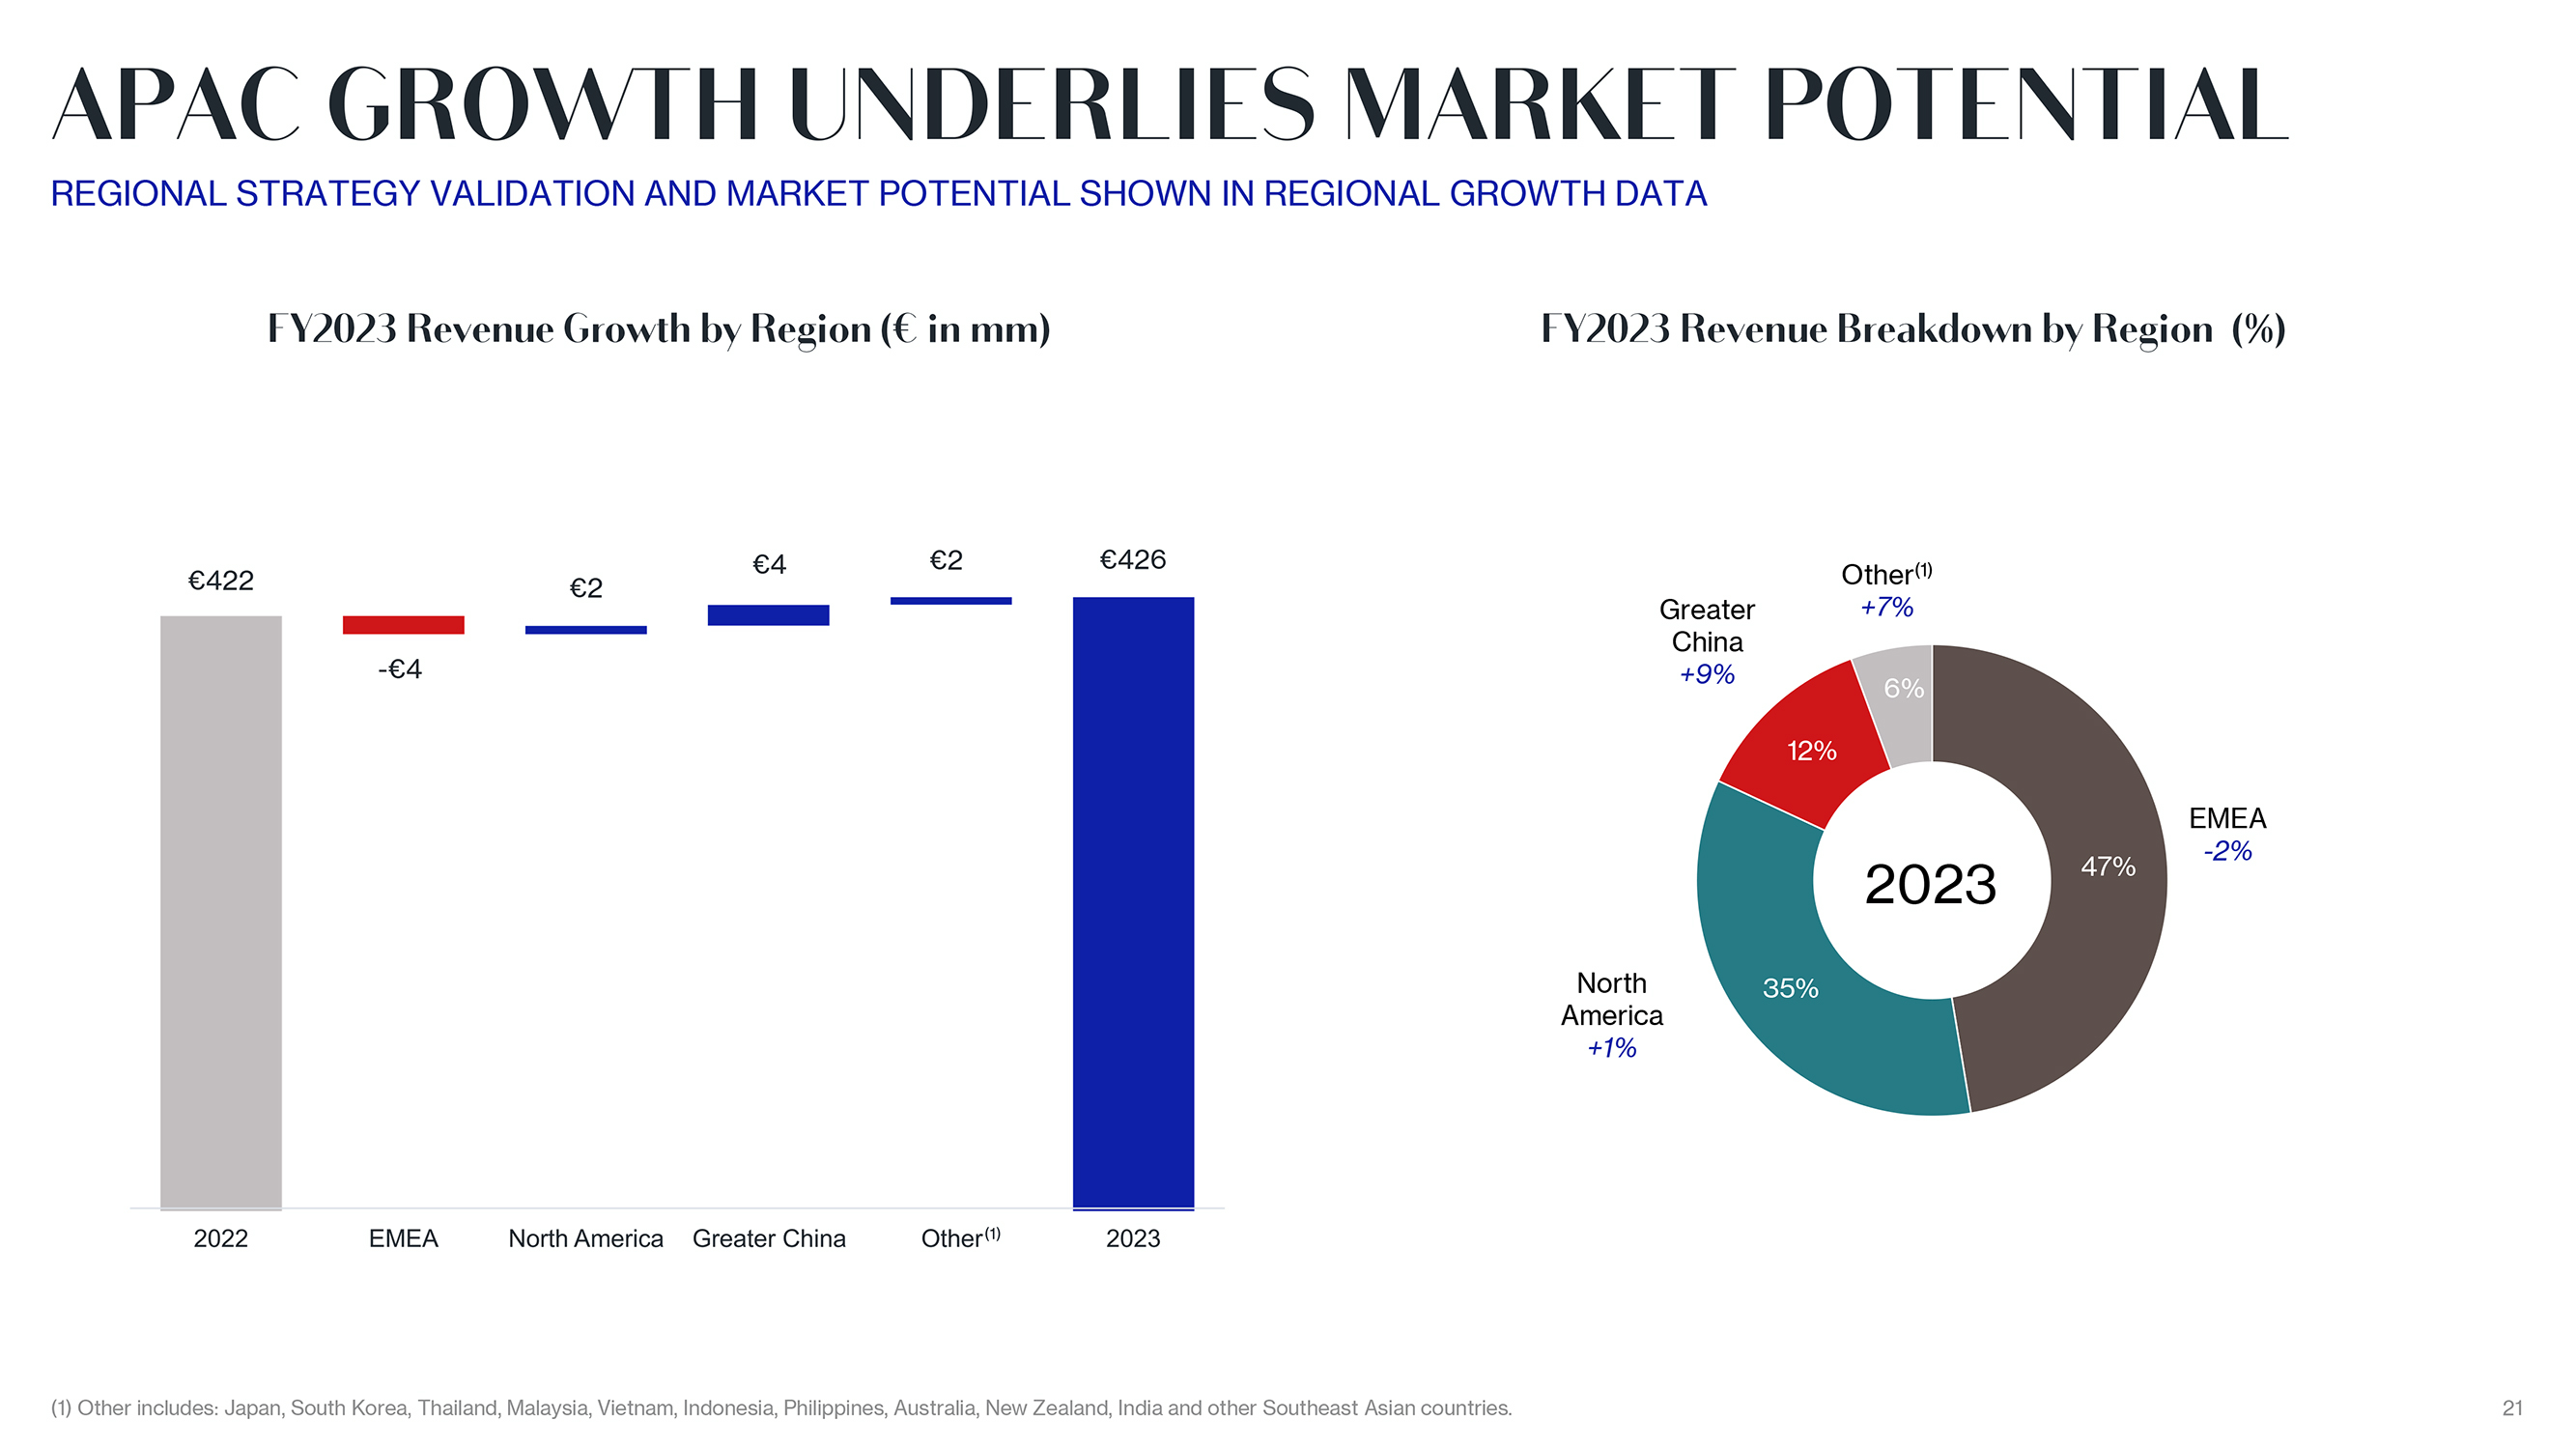
APAC GROWTH UNDERLIES MARKET POTENTIAL REGIONAL STRATEGY VALIDATION AND MARKET POTENTIAL SHOWN IN REGIONAL GROWTH DATA FY2023 Revenue Growth by Region ( in mm) 4 2 426 422 2 -4 FY2023 Revenue Breakdown by Region (%) Other(1) Greater +7% China +9% 6% 12% EMEA -2% 2023 47% North 35% America +1% (1) Other includes: Japan, South Korea, Thailand, Malaysia, Vietnam, Indonesia, Philippines, Australia, New Zealand, India and other Southeast Asian countries. 21
|
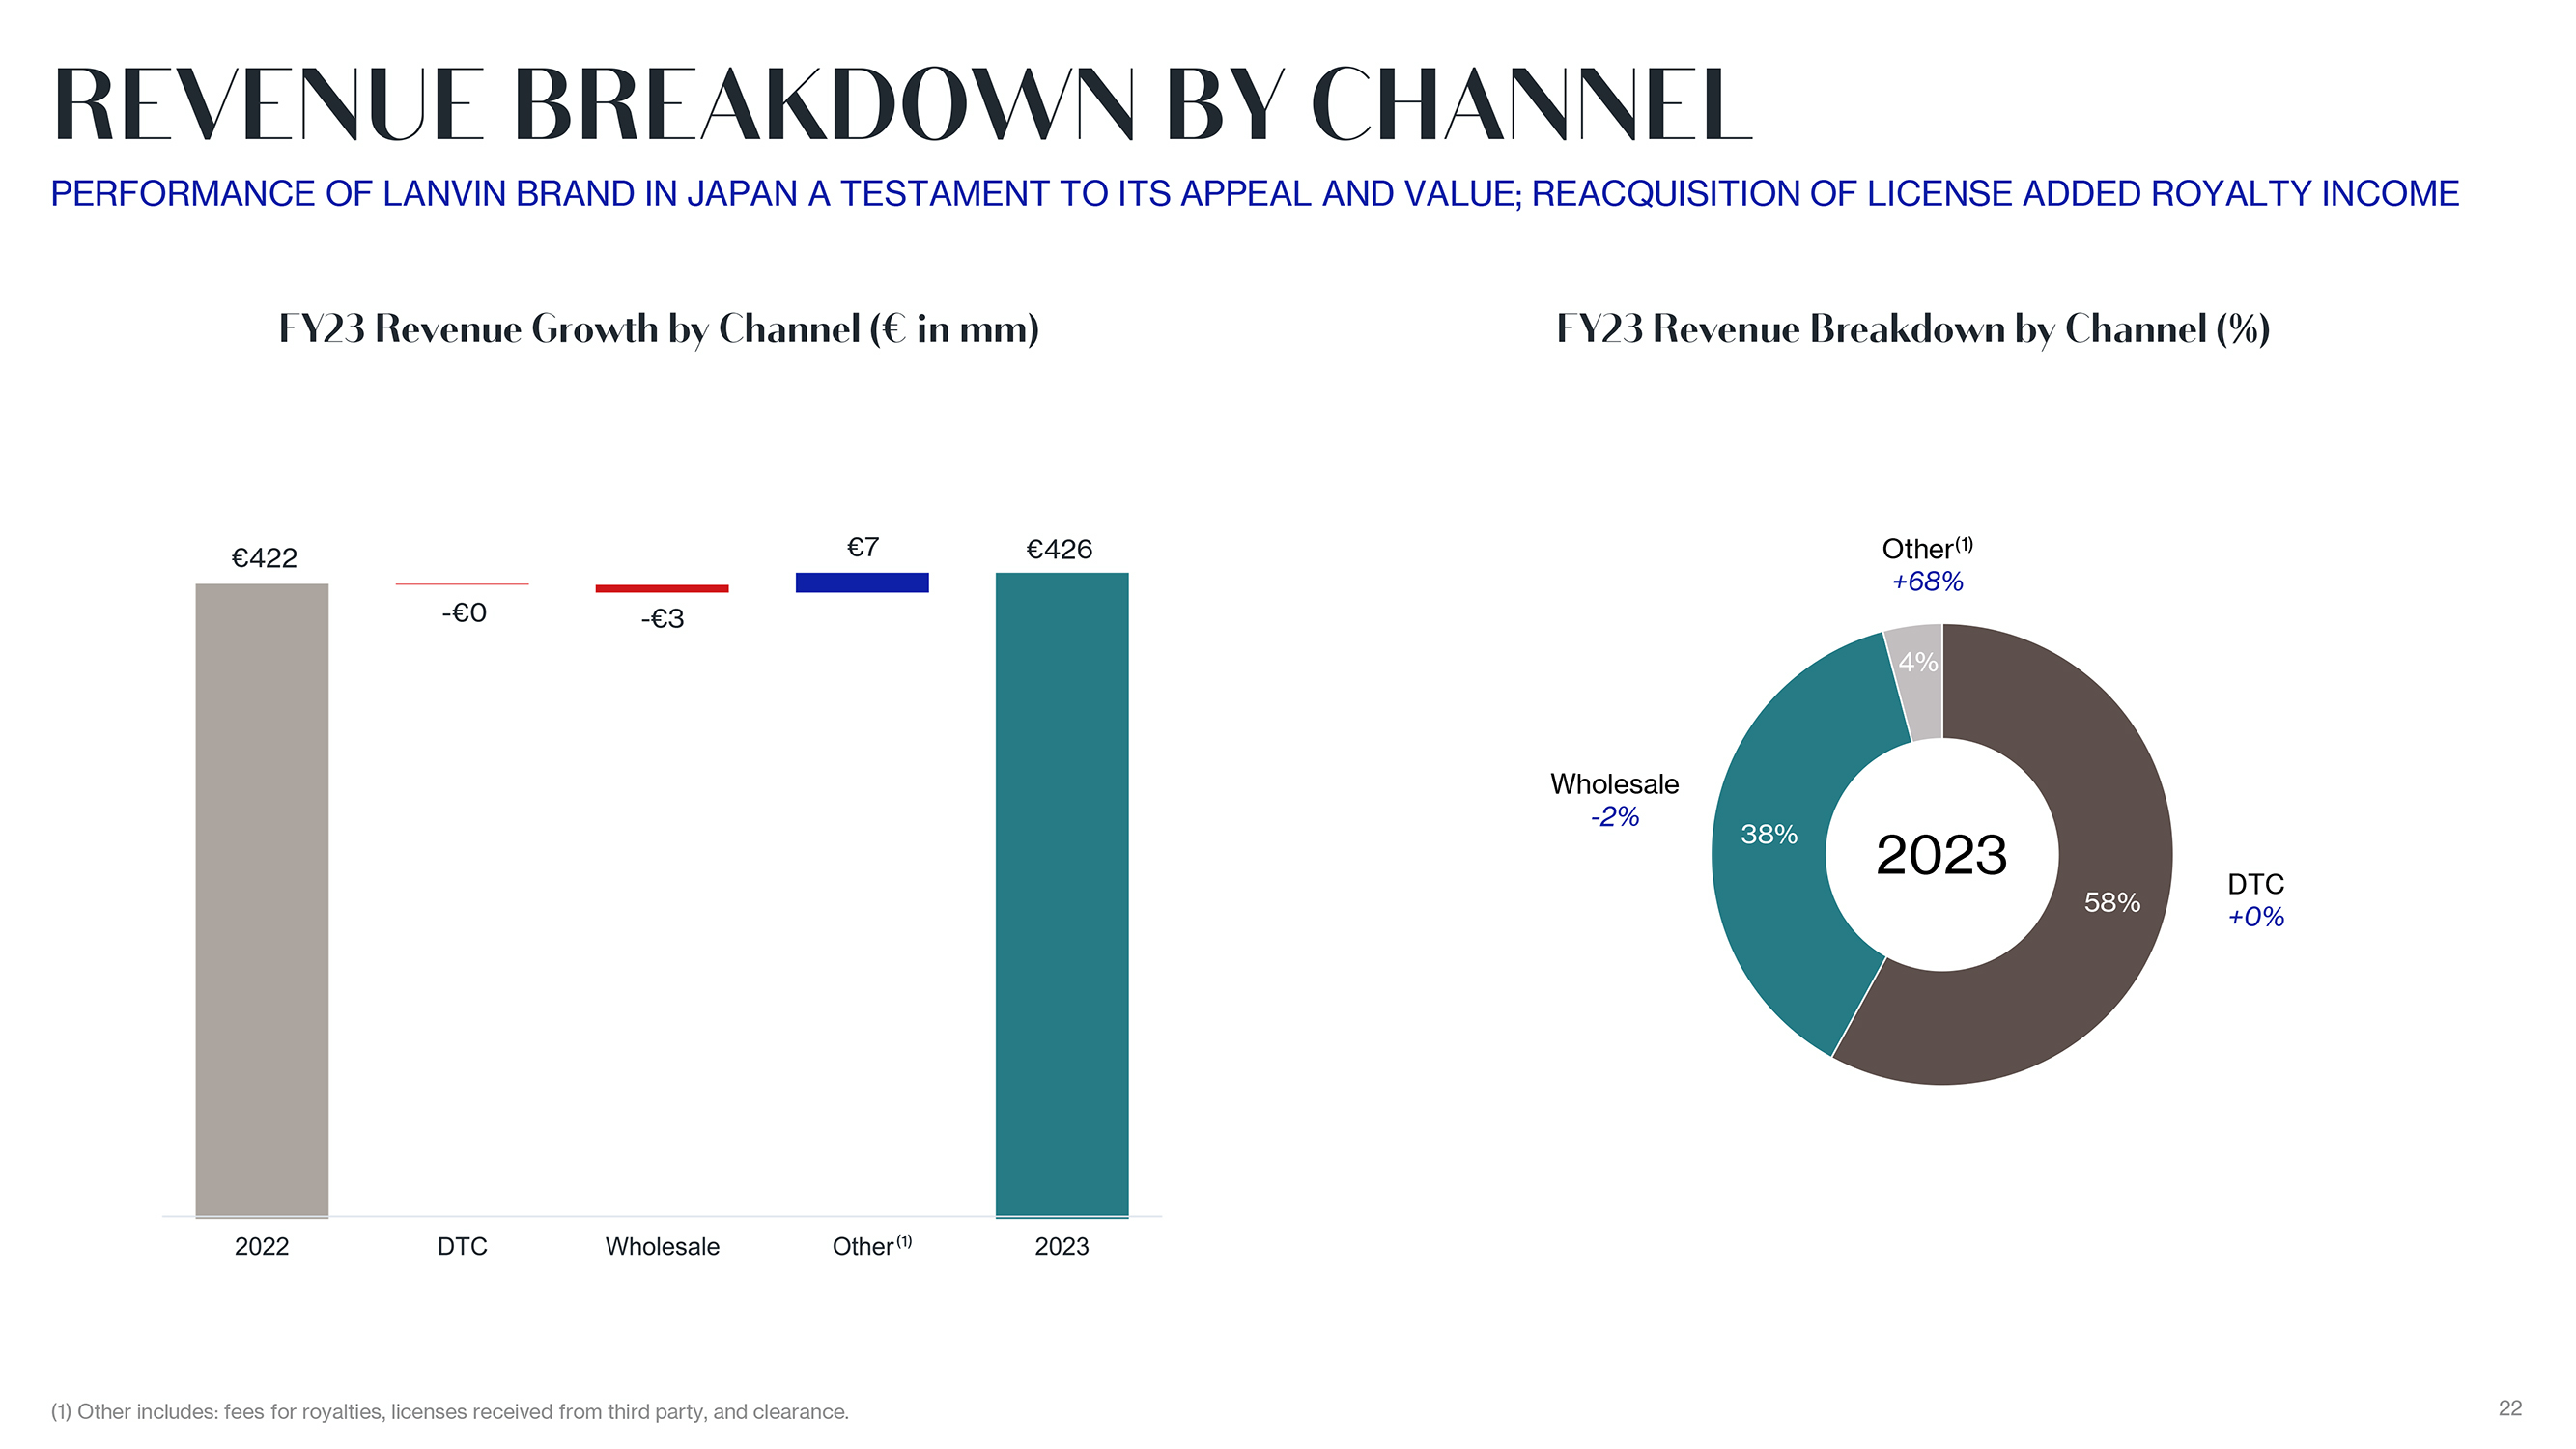
REVENUE BREAKDOWN BY CHANNEL PERFORMANCE OF LANVIN BRAND IN JAPAN A TESTAMENT TO ITS APPEAL AND VALUE; REACQUISITION OF LICENSE ADDED ROYALTY INCOME FY23 Revenue Growth by Channel ( in mm) 422 7 426 -0 -3 FY23 Revenue Breakdown by Channel (%) Other(1) +68% 4% Wholesale -2% 38% 2023 DTC 58% +0% (1) Other includes: fees for royalties, licenses received from third party, and clearance. 22
|
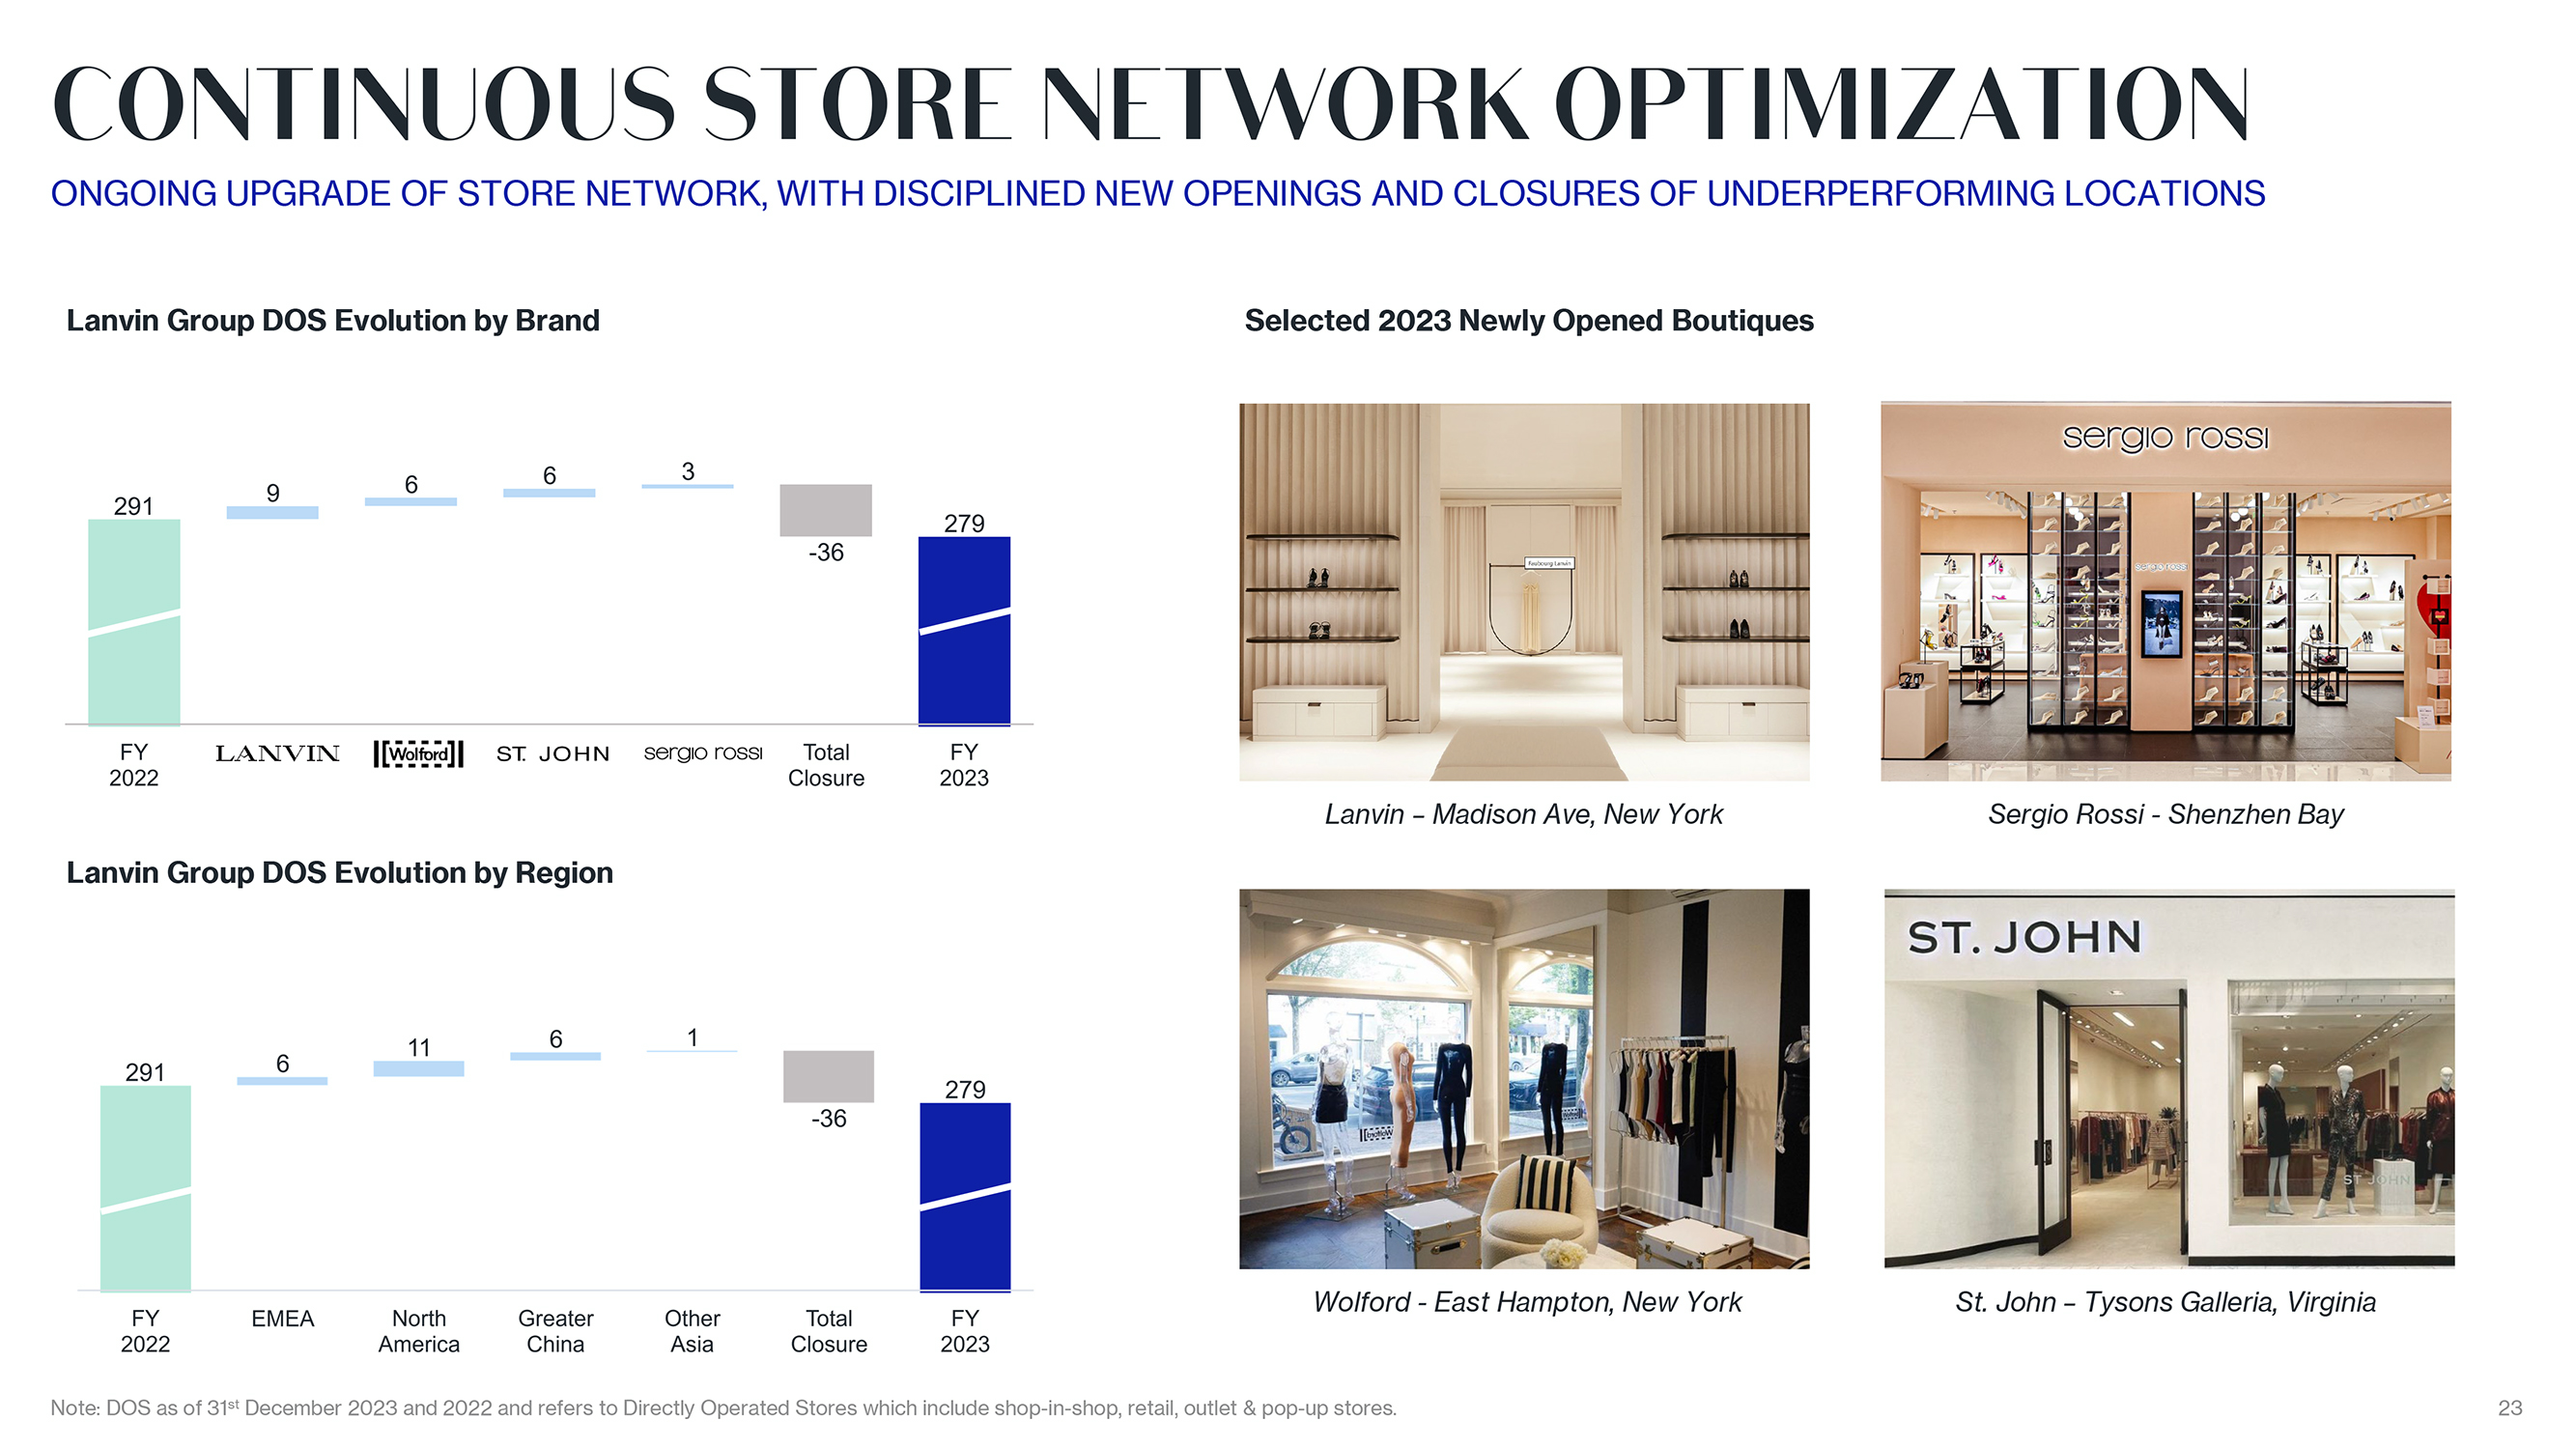
CONTINUOUS STORE NETWORK OPTIMIZATION ONGOING UPGRADE OF STORE NETWORK, WITH DISCIPLINED NEW OPENINGS AND CLOSURES OF UNDERPERFORMING LOCATIONS Lanvin Group DOS Evolution by Brand Lanvin Group DOS Evolution by Region Note: DOS as of 31st December 2023 and 2022 and refers to Directly Operated Stores which include shop-in-shop, retail, outlet & pop-up stores. Selected 2023 Newly Opened Boutiques Lanvin ? Madison Ave, New York Sergio Rossi—Shenzhen Bay Wolford—East Hampton, New York St. John ? Tysons Galleria, Virginia 23
|
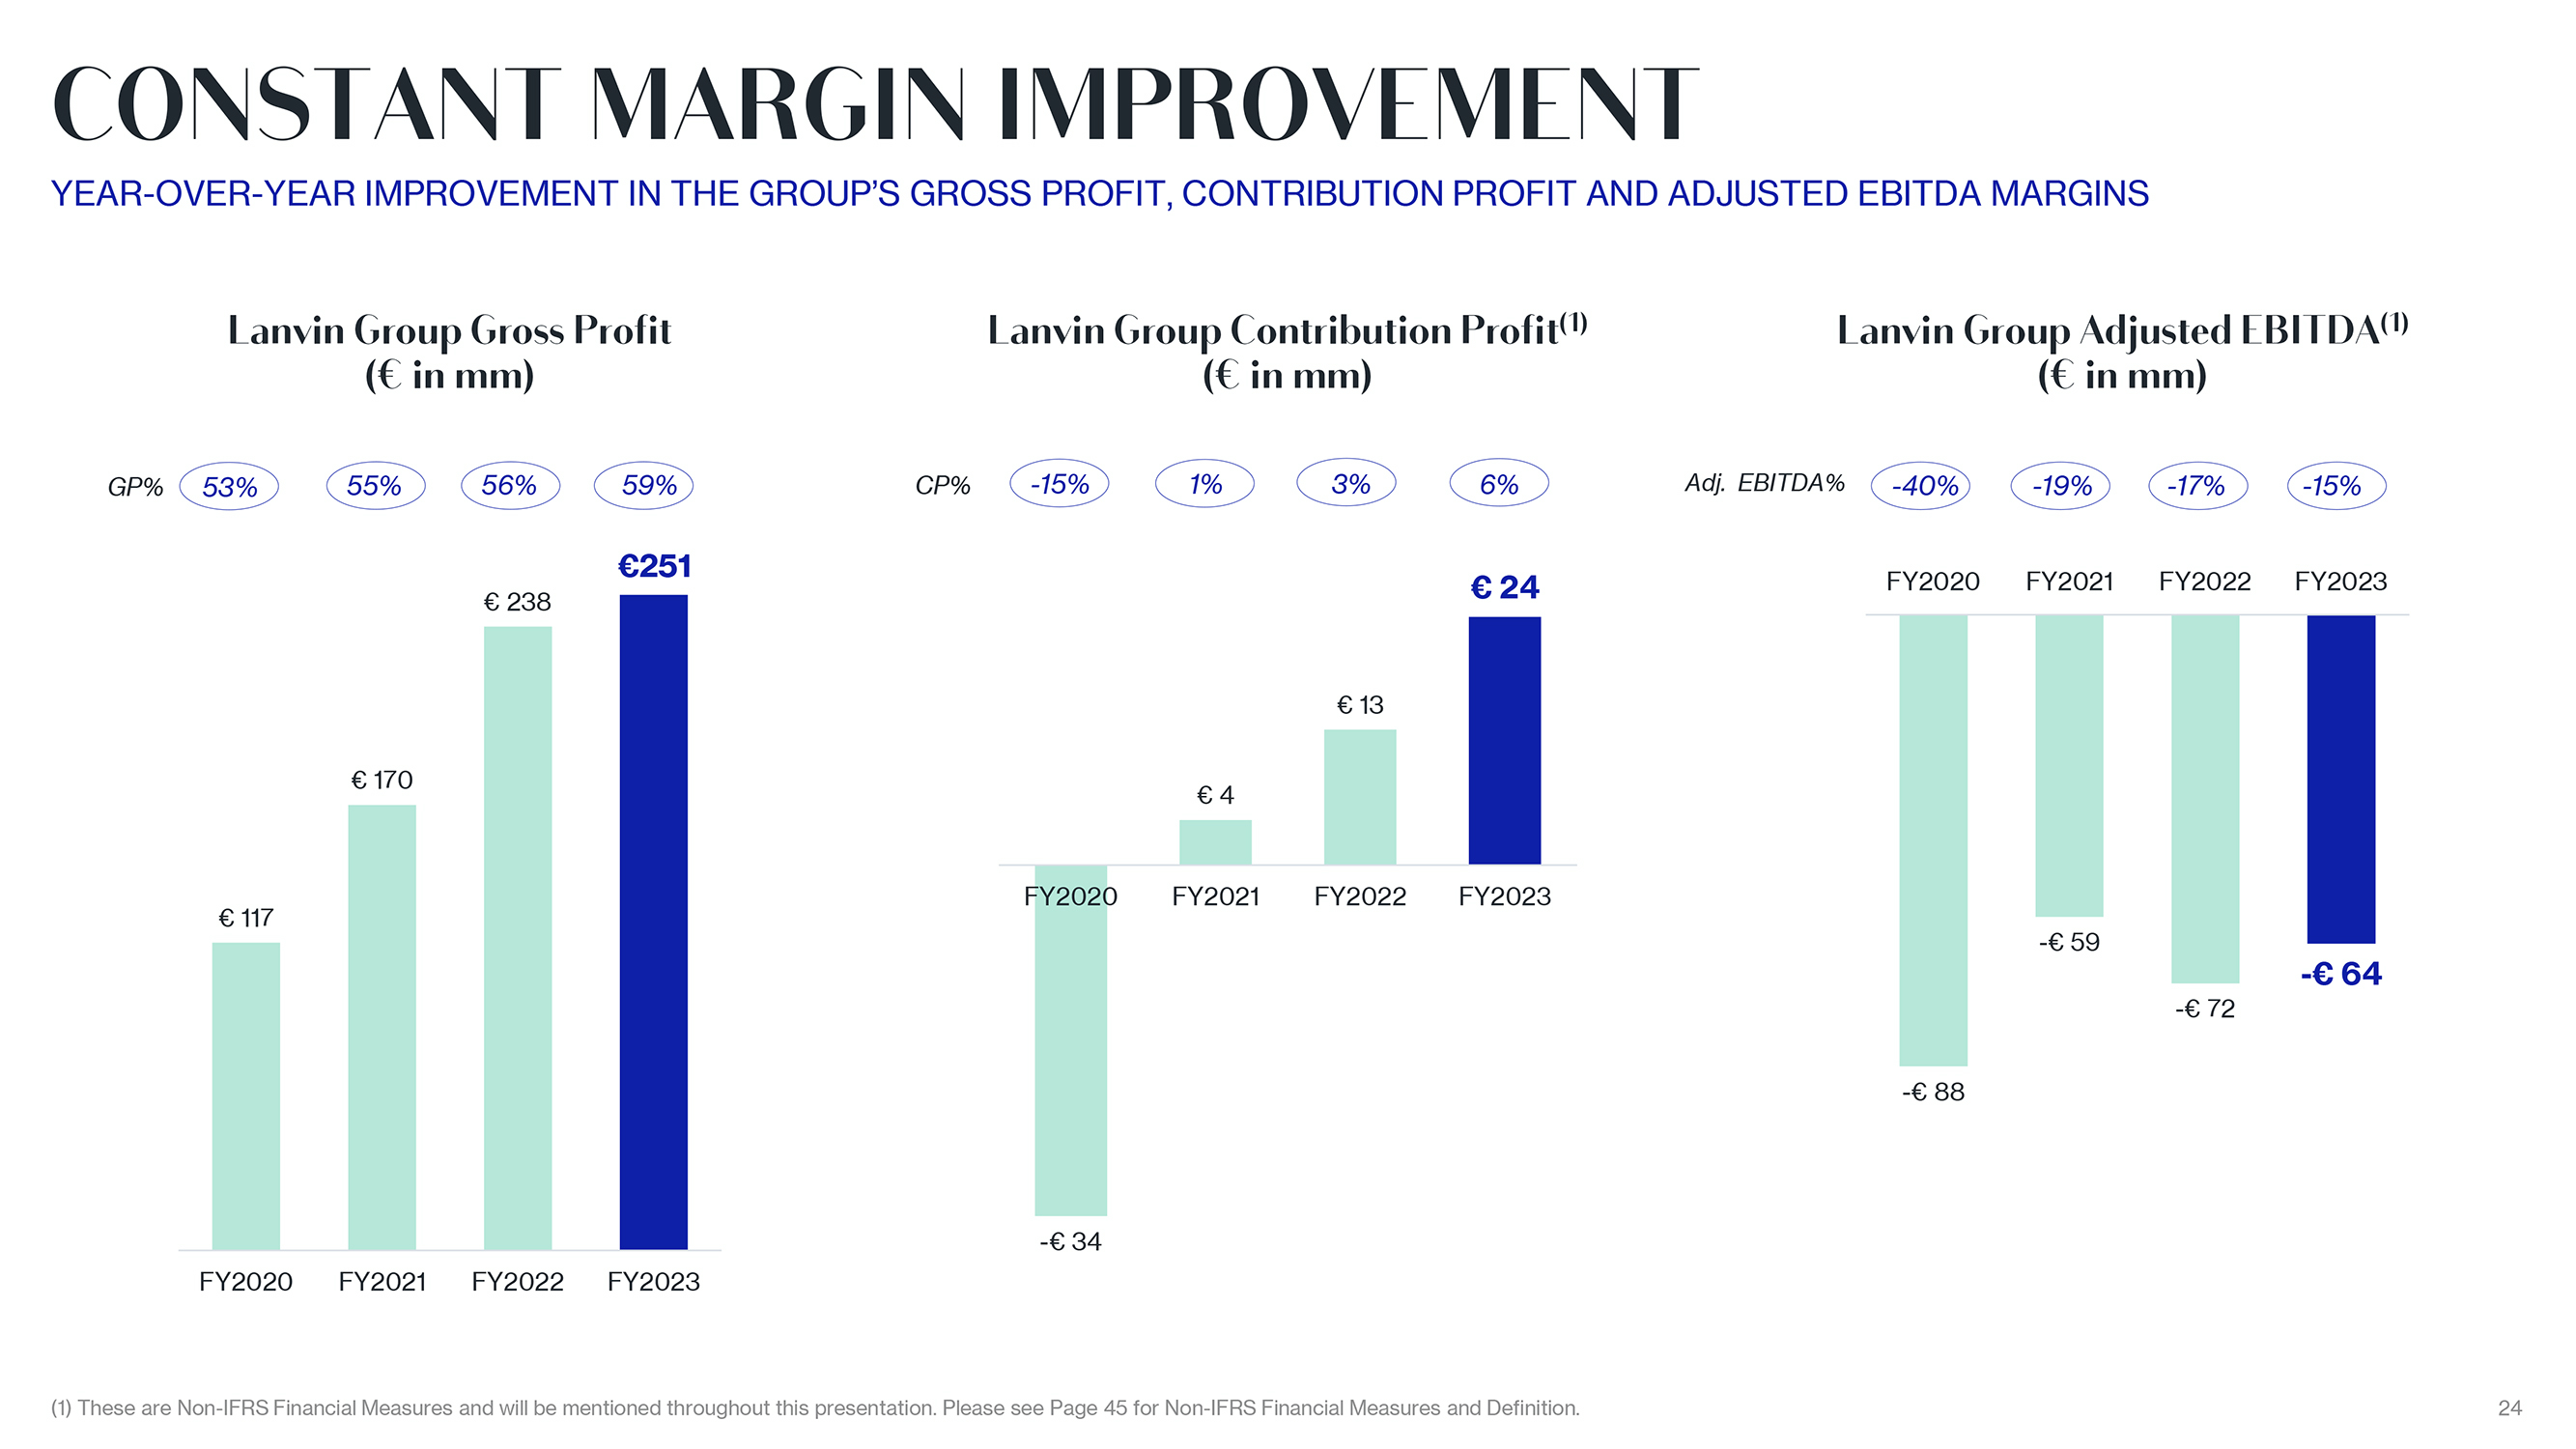
CONSTANT MARGIN IMPROVEMENT YEAR-OVER-YEAR IMPROVEMENT IN THE GROUP?S GROSS PROFIT, CONTRIBUTION PROFIT AND ADJUSTED EBITDA MARGINS Lanvin Group Gross Profit ( in mm) GP% 53% 55% 56% 59% 251 238 170 117 FY2020 FY2021 FY2022 FY2023 Lanvin Group Contribution Profit(1) ( in mm) CP% -15% 1% 3% 6% 24 13 4 FY2020 FY2021 FY2022 FY2023—34 Lanvin Group Adjusted EBITDA(1) ( in mm) Adj. EBITDA% -40% -19% -17% -15% FY2020 FY2021 FY2022 FY2023—59—64—72—88 (1) These are Non-IFRS Financial Measures and will be mentioned throughout this presentation. Please see Page 45 for Non-IFRS Financial Measures and Definition. 24
|
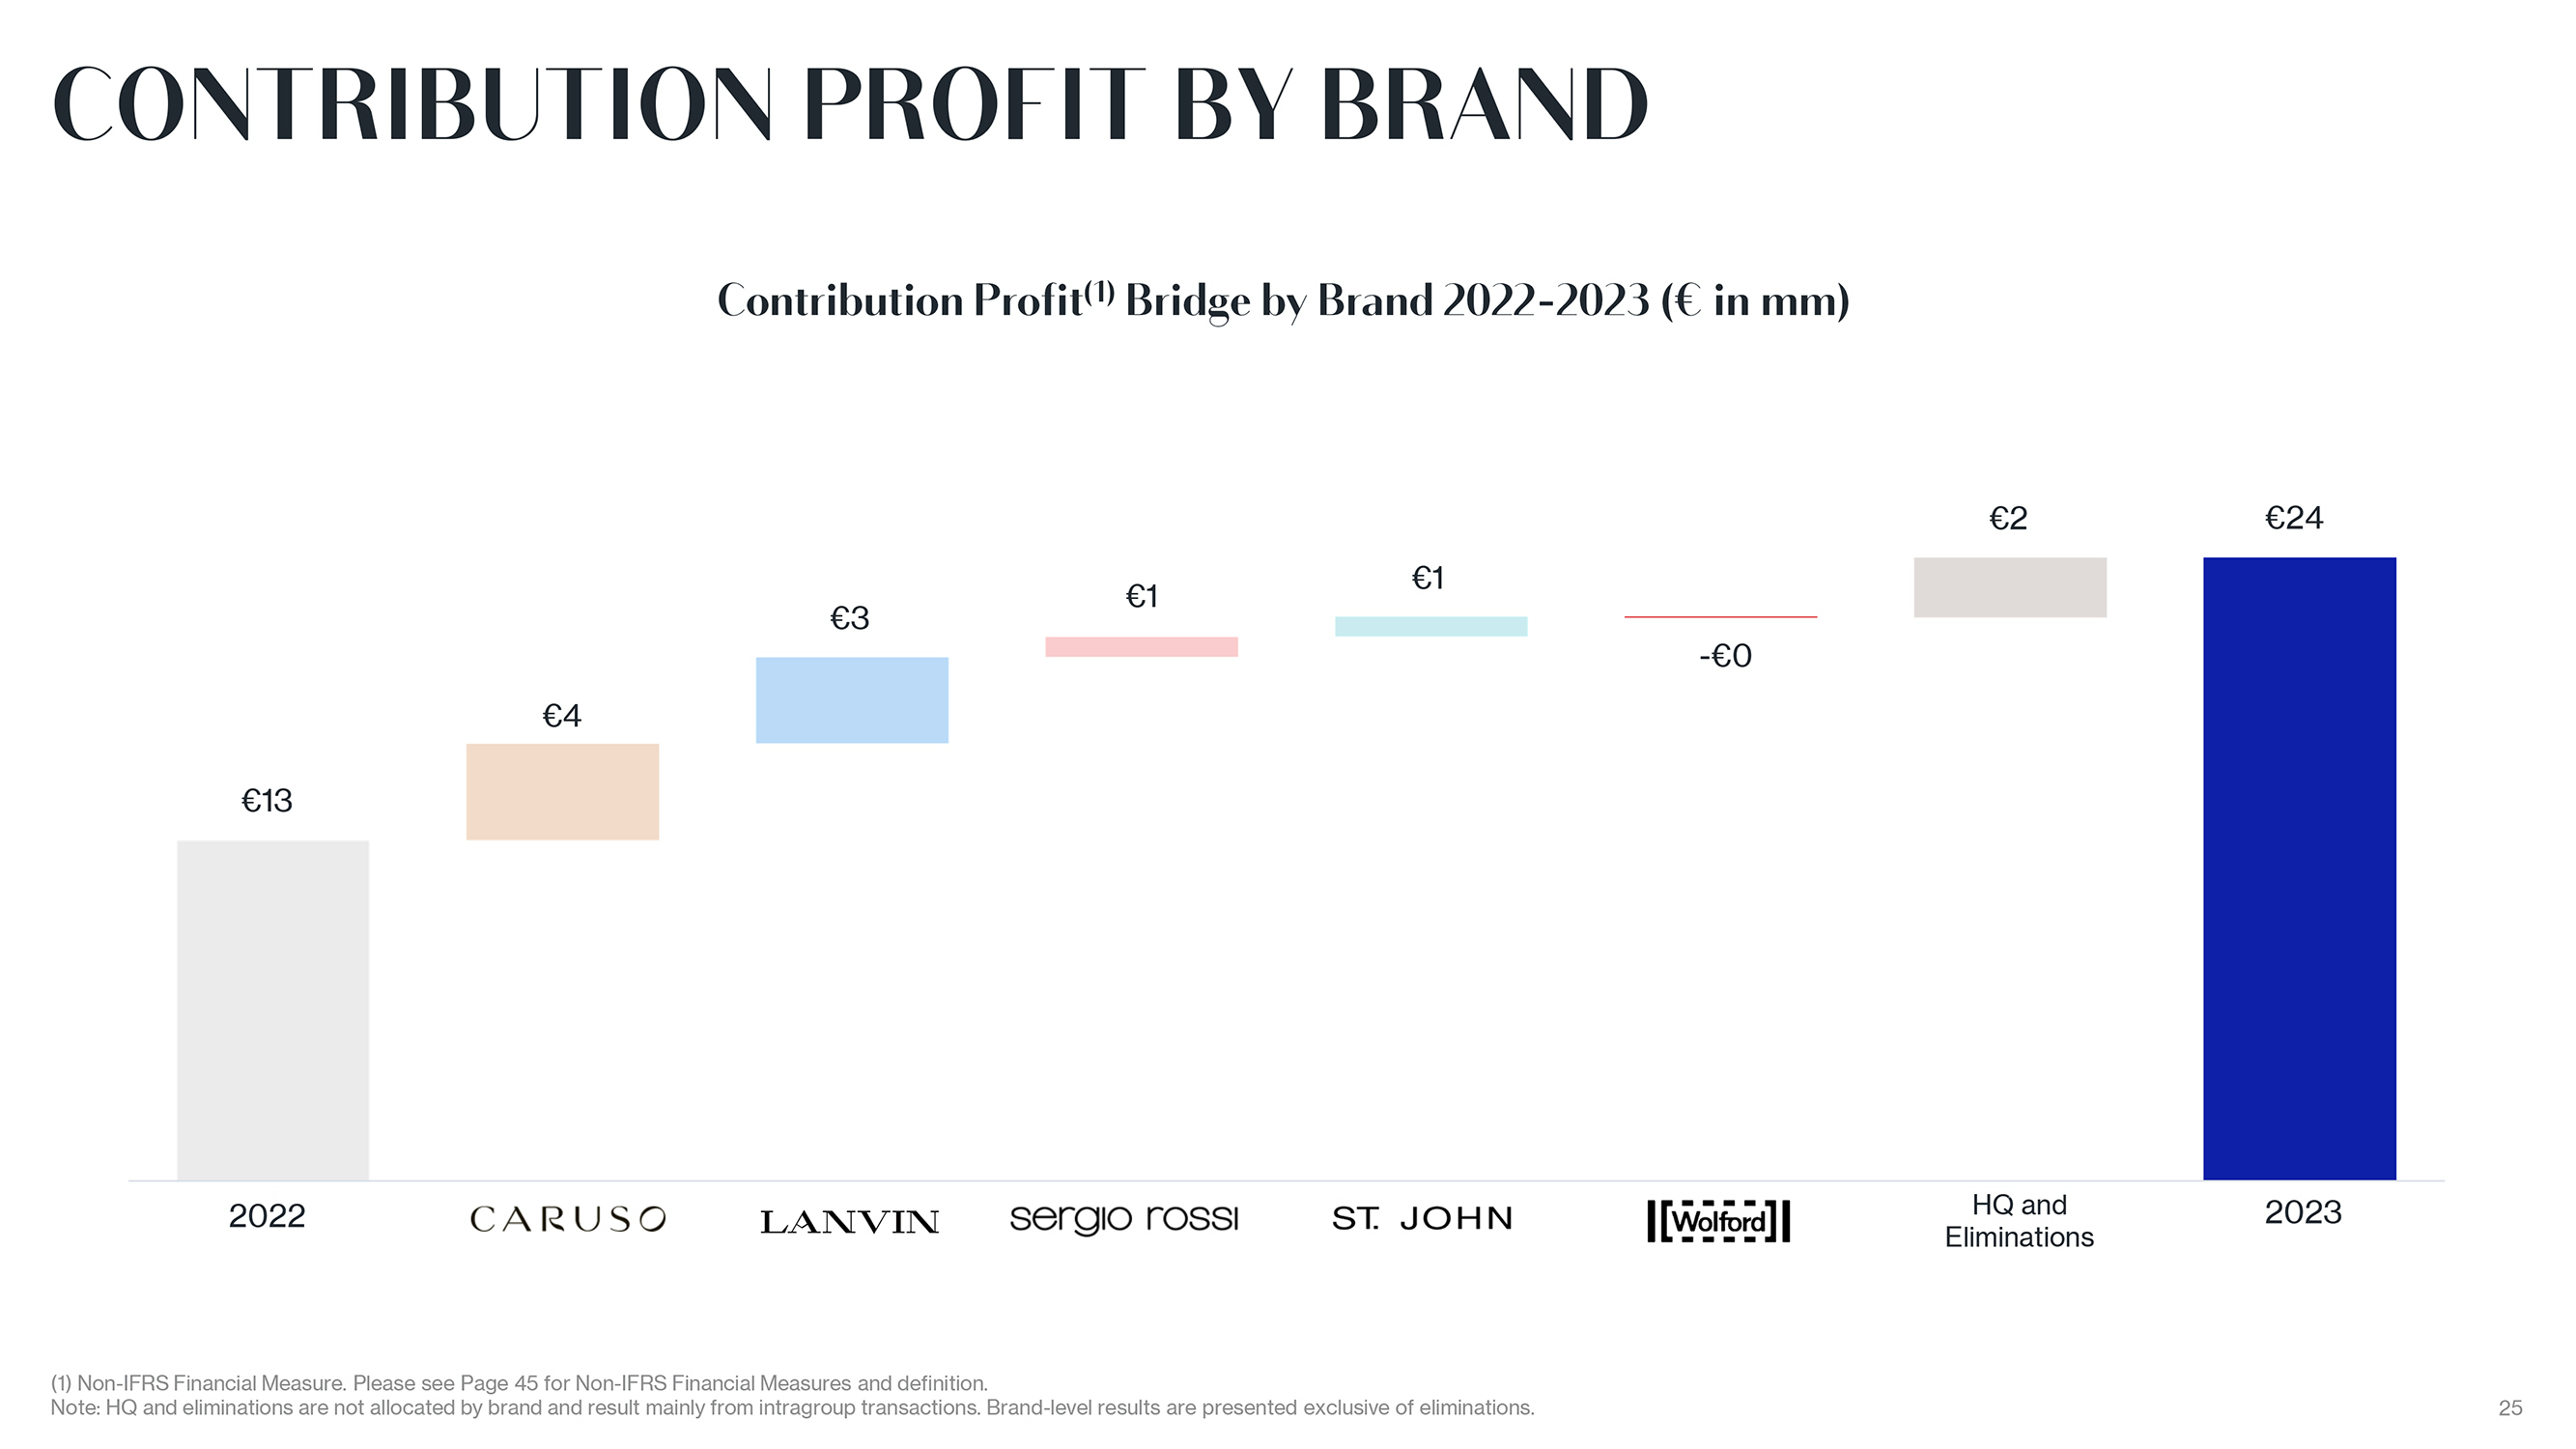
CONTRIBUTION PROFIT BY BRAND Contribution Profit(1) Bridge by Brand 2022-2023 ( in mm) 2 24 1 1 3 -0 4 13 2022 Eliminations (1) Non-IFRS Financial Measure. Please see Page 45 for Non-IFRS Financial Measures and definition. Note: HQ and eliminations are not allocated by brand and result mainly from intragroup transactions. Brand-level results are presented exclusive of eliminations. 25
|
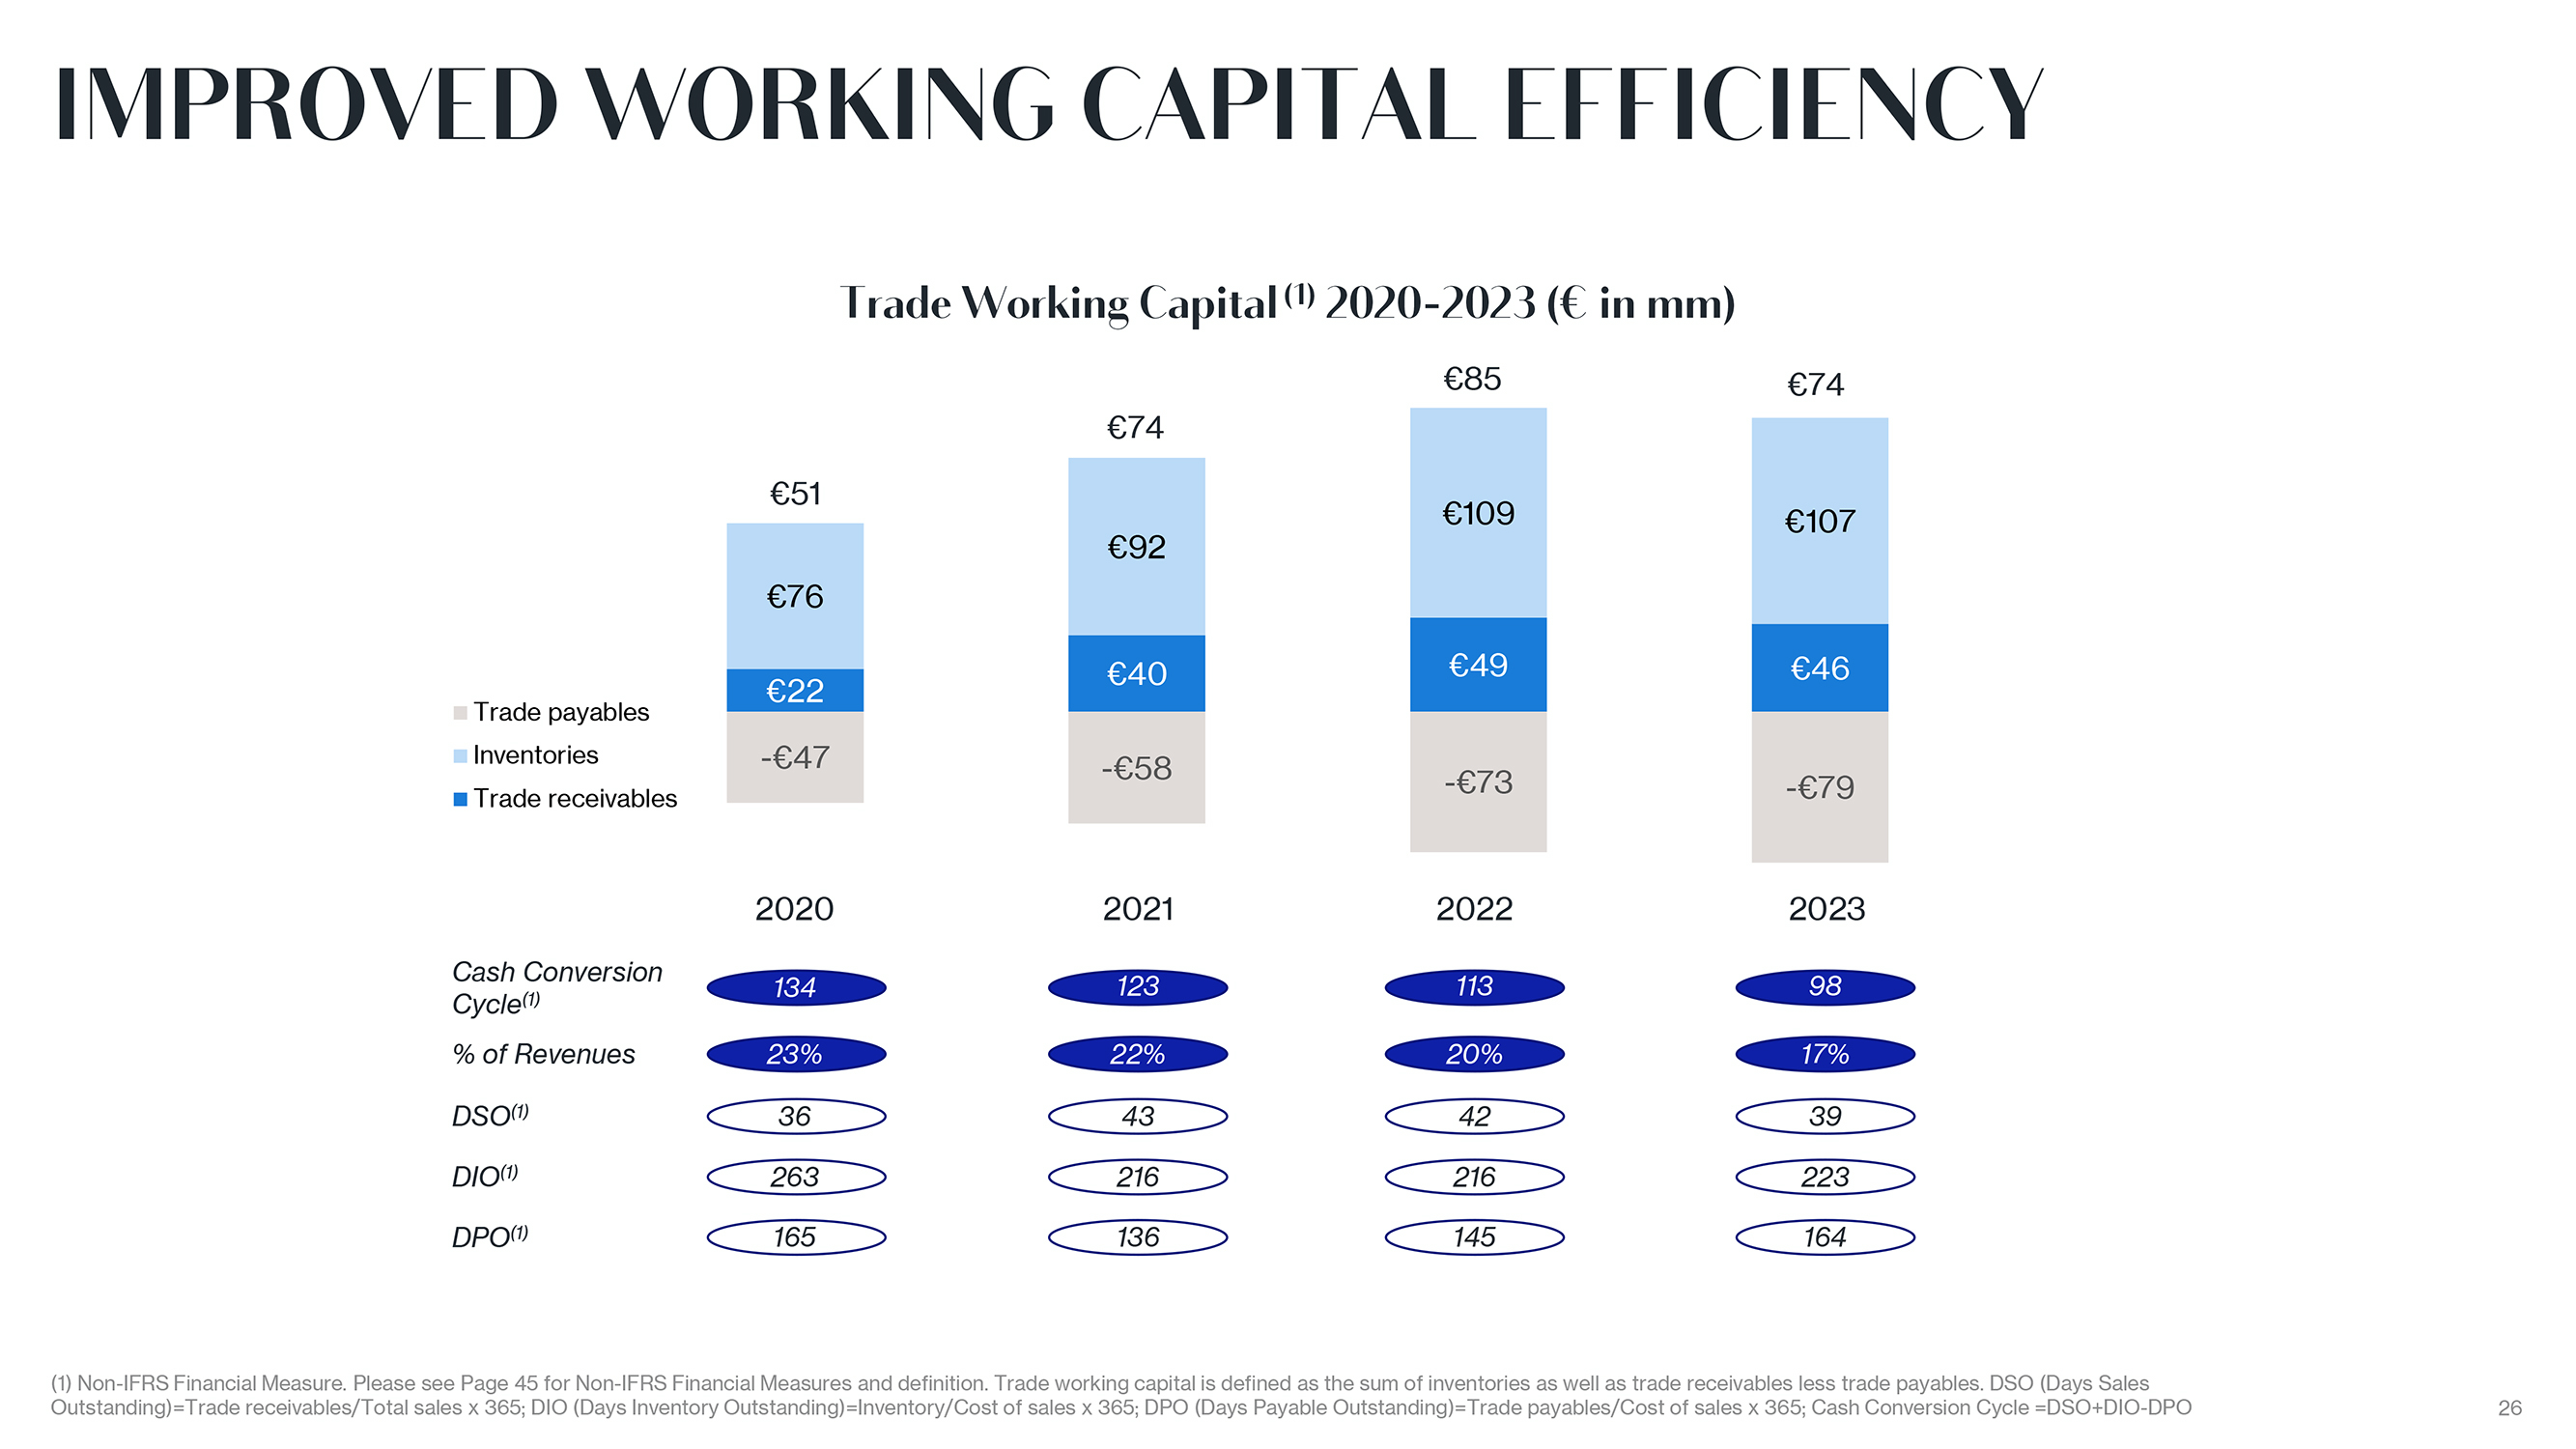
IMPROVED WORKING CAPITAL EFFICIENCY Trade Working Capital (1) 2020-2023 ( in mm) 85 74 74 51 109 107 92 76 40 49 46 22 Trade payables Inventories -47 -58 -73 -79 Trade receivables 2020 2021 2022 2023 Cash Conversion 134 123 113 98 Cycle(1) % of Revenues 23% 22% 20% 17% DSO(1) 36 43 42 39 DIO(1) 263 216 216 223 DPO(1) 165 136 145 164 (1) Non-IFRS Financial Measure. Please see Page 45 for Non-IFRS Financial Measures and definition. Trade working capital is defined as the sum of inventories as well as trade receivables less trade payables. DSO (Days Sales Outstanding)=Trade receivables/Total sales x 365; DIO (Days Inventory Outstanding)=Inventory/Cost of sales x 365; DPO (Days Payable Outstanding)=Trade payables/Cost of sales x 365; Cash Conversion Cycle =DSO+DIO-DPO 26

|
BRAND-LEVEL PERFORMANCE
|
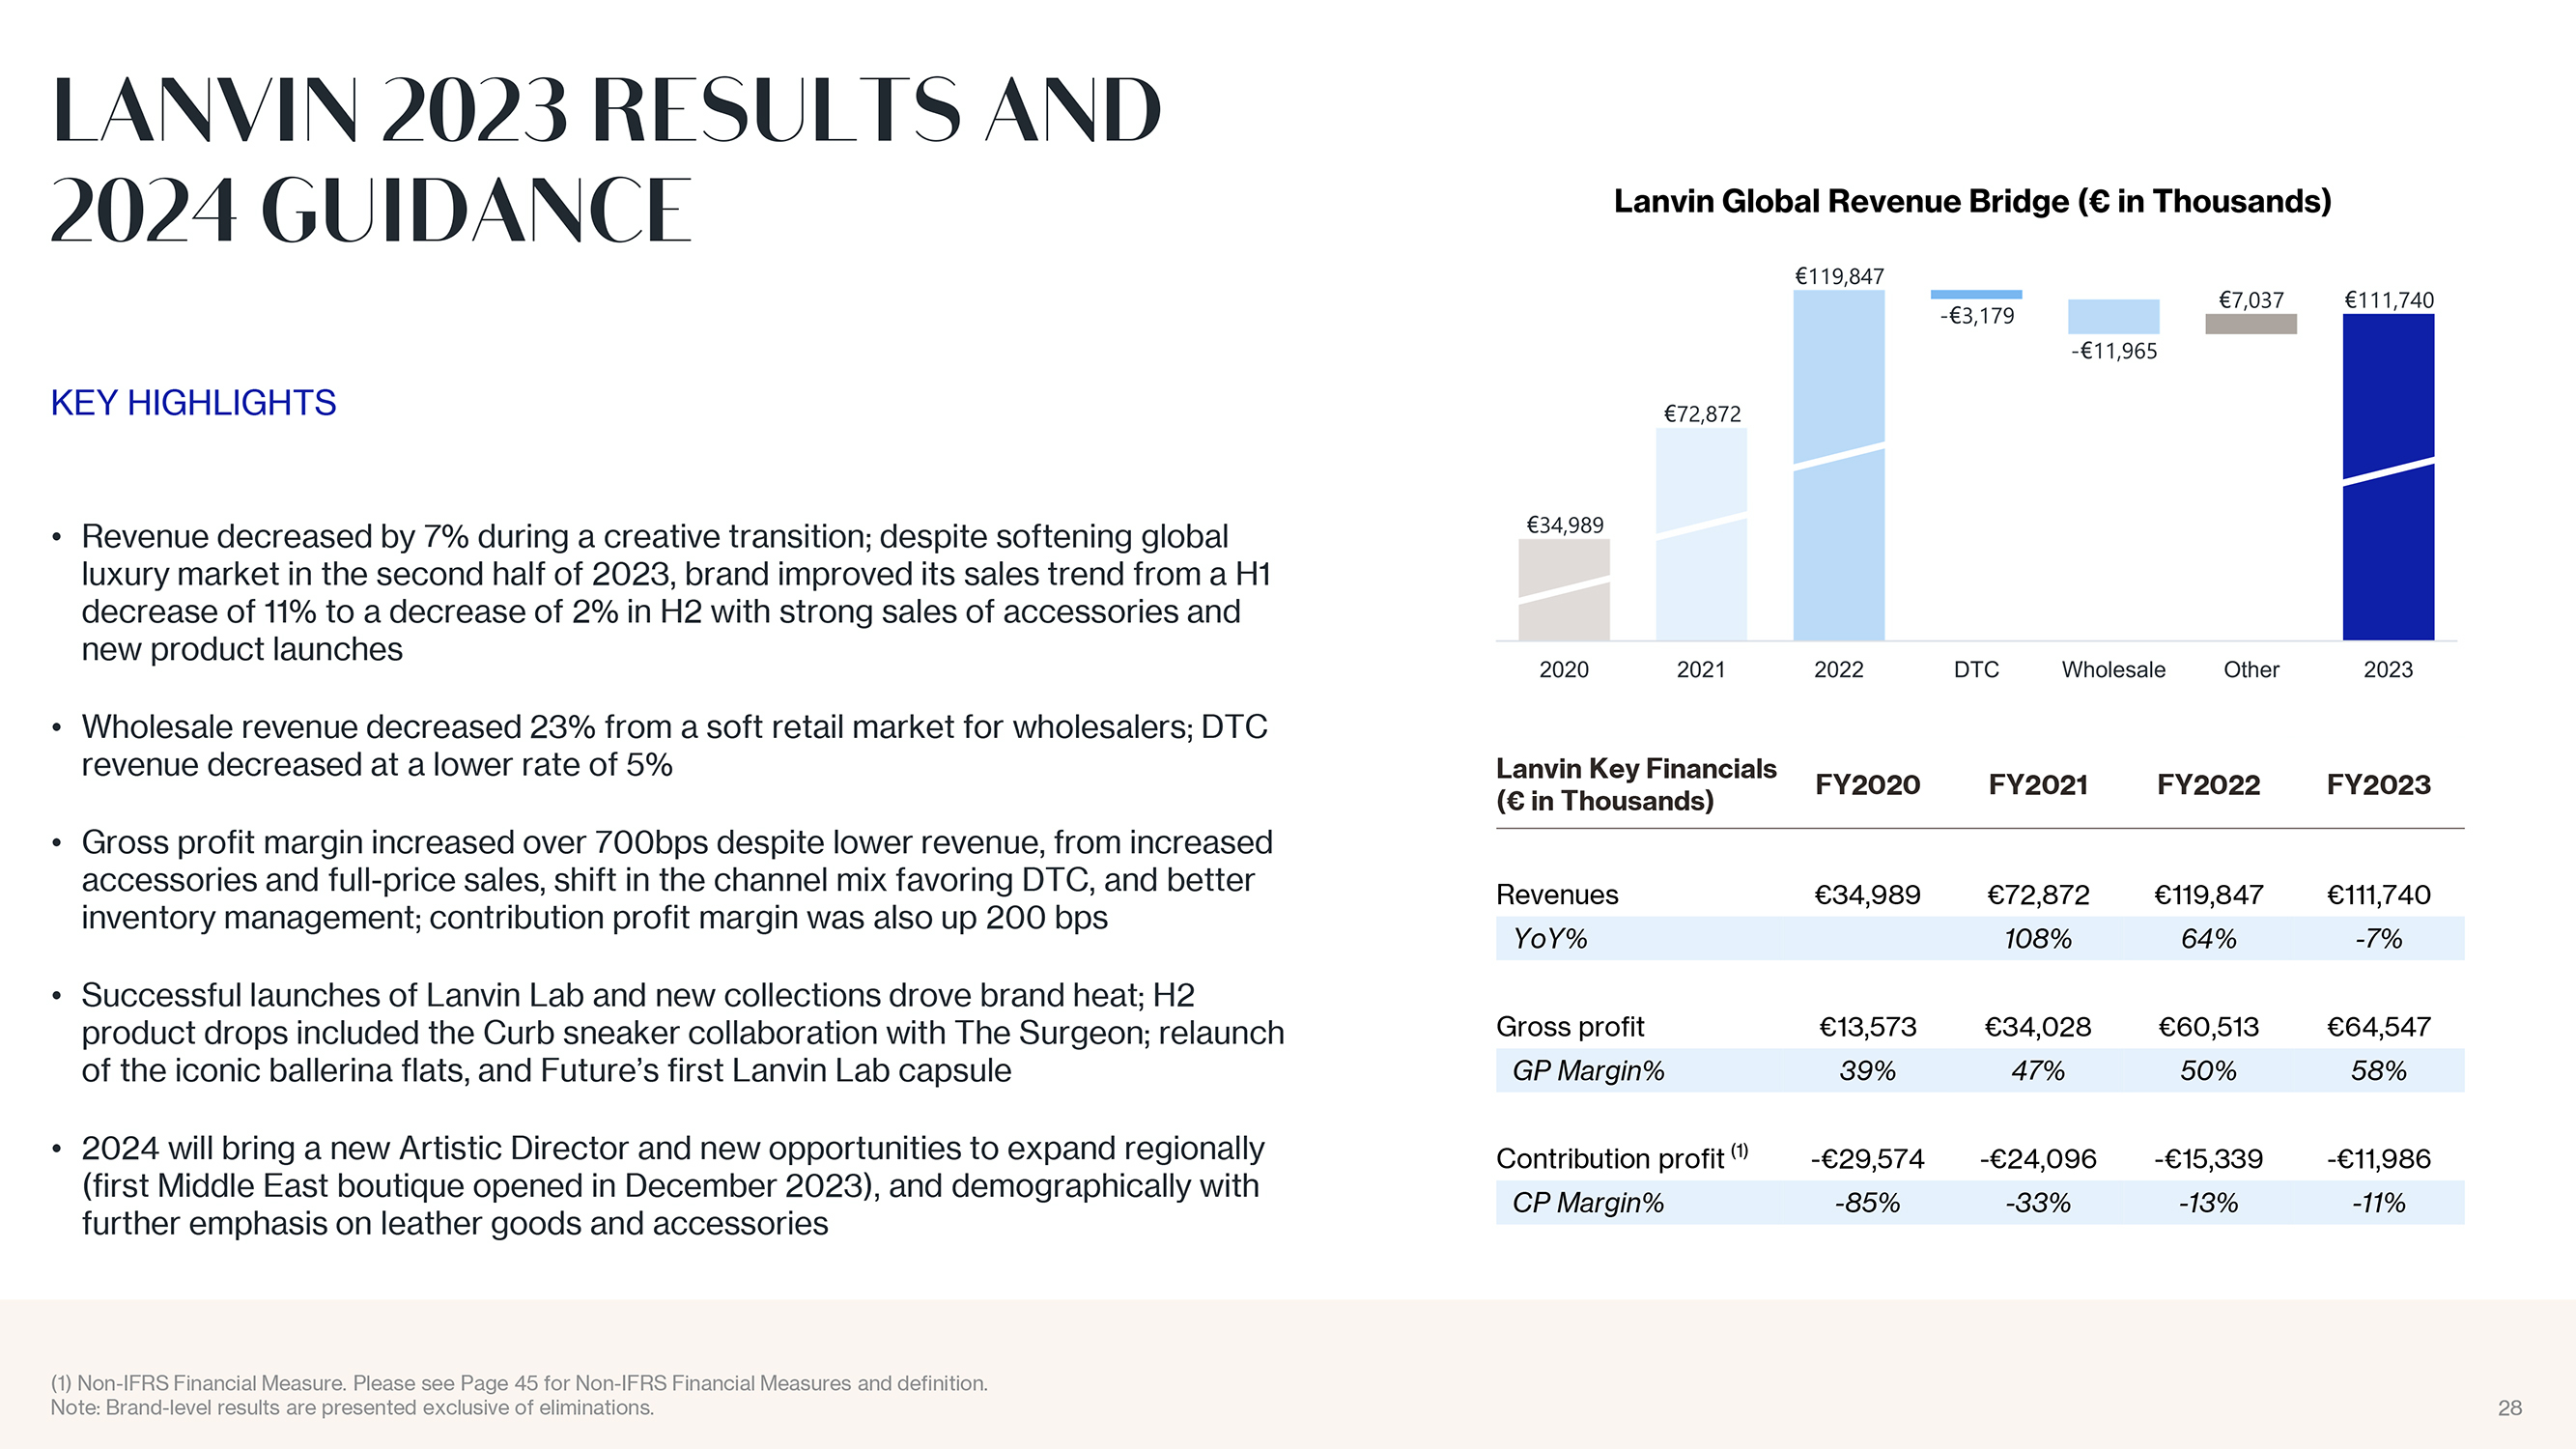
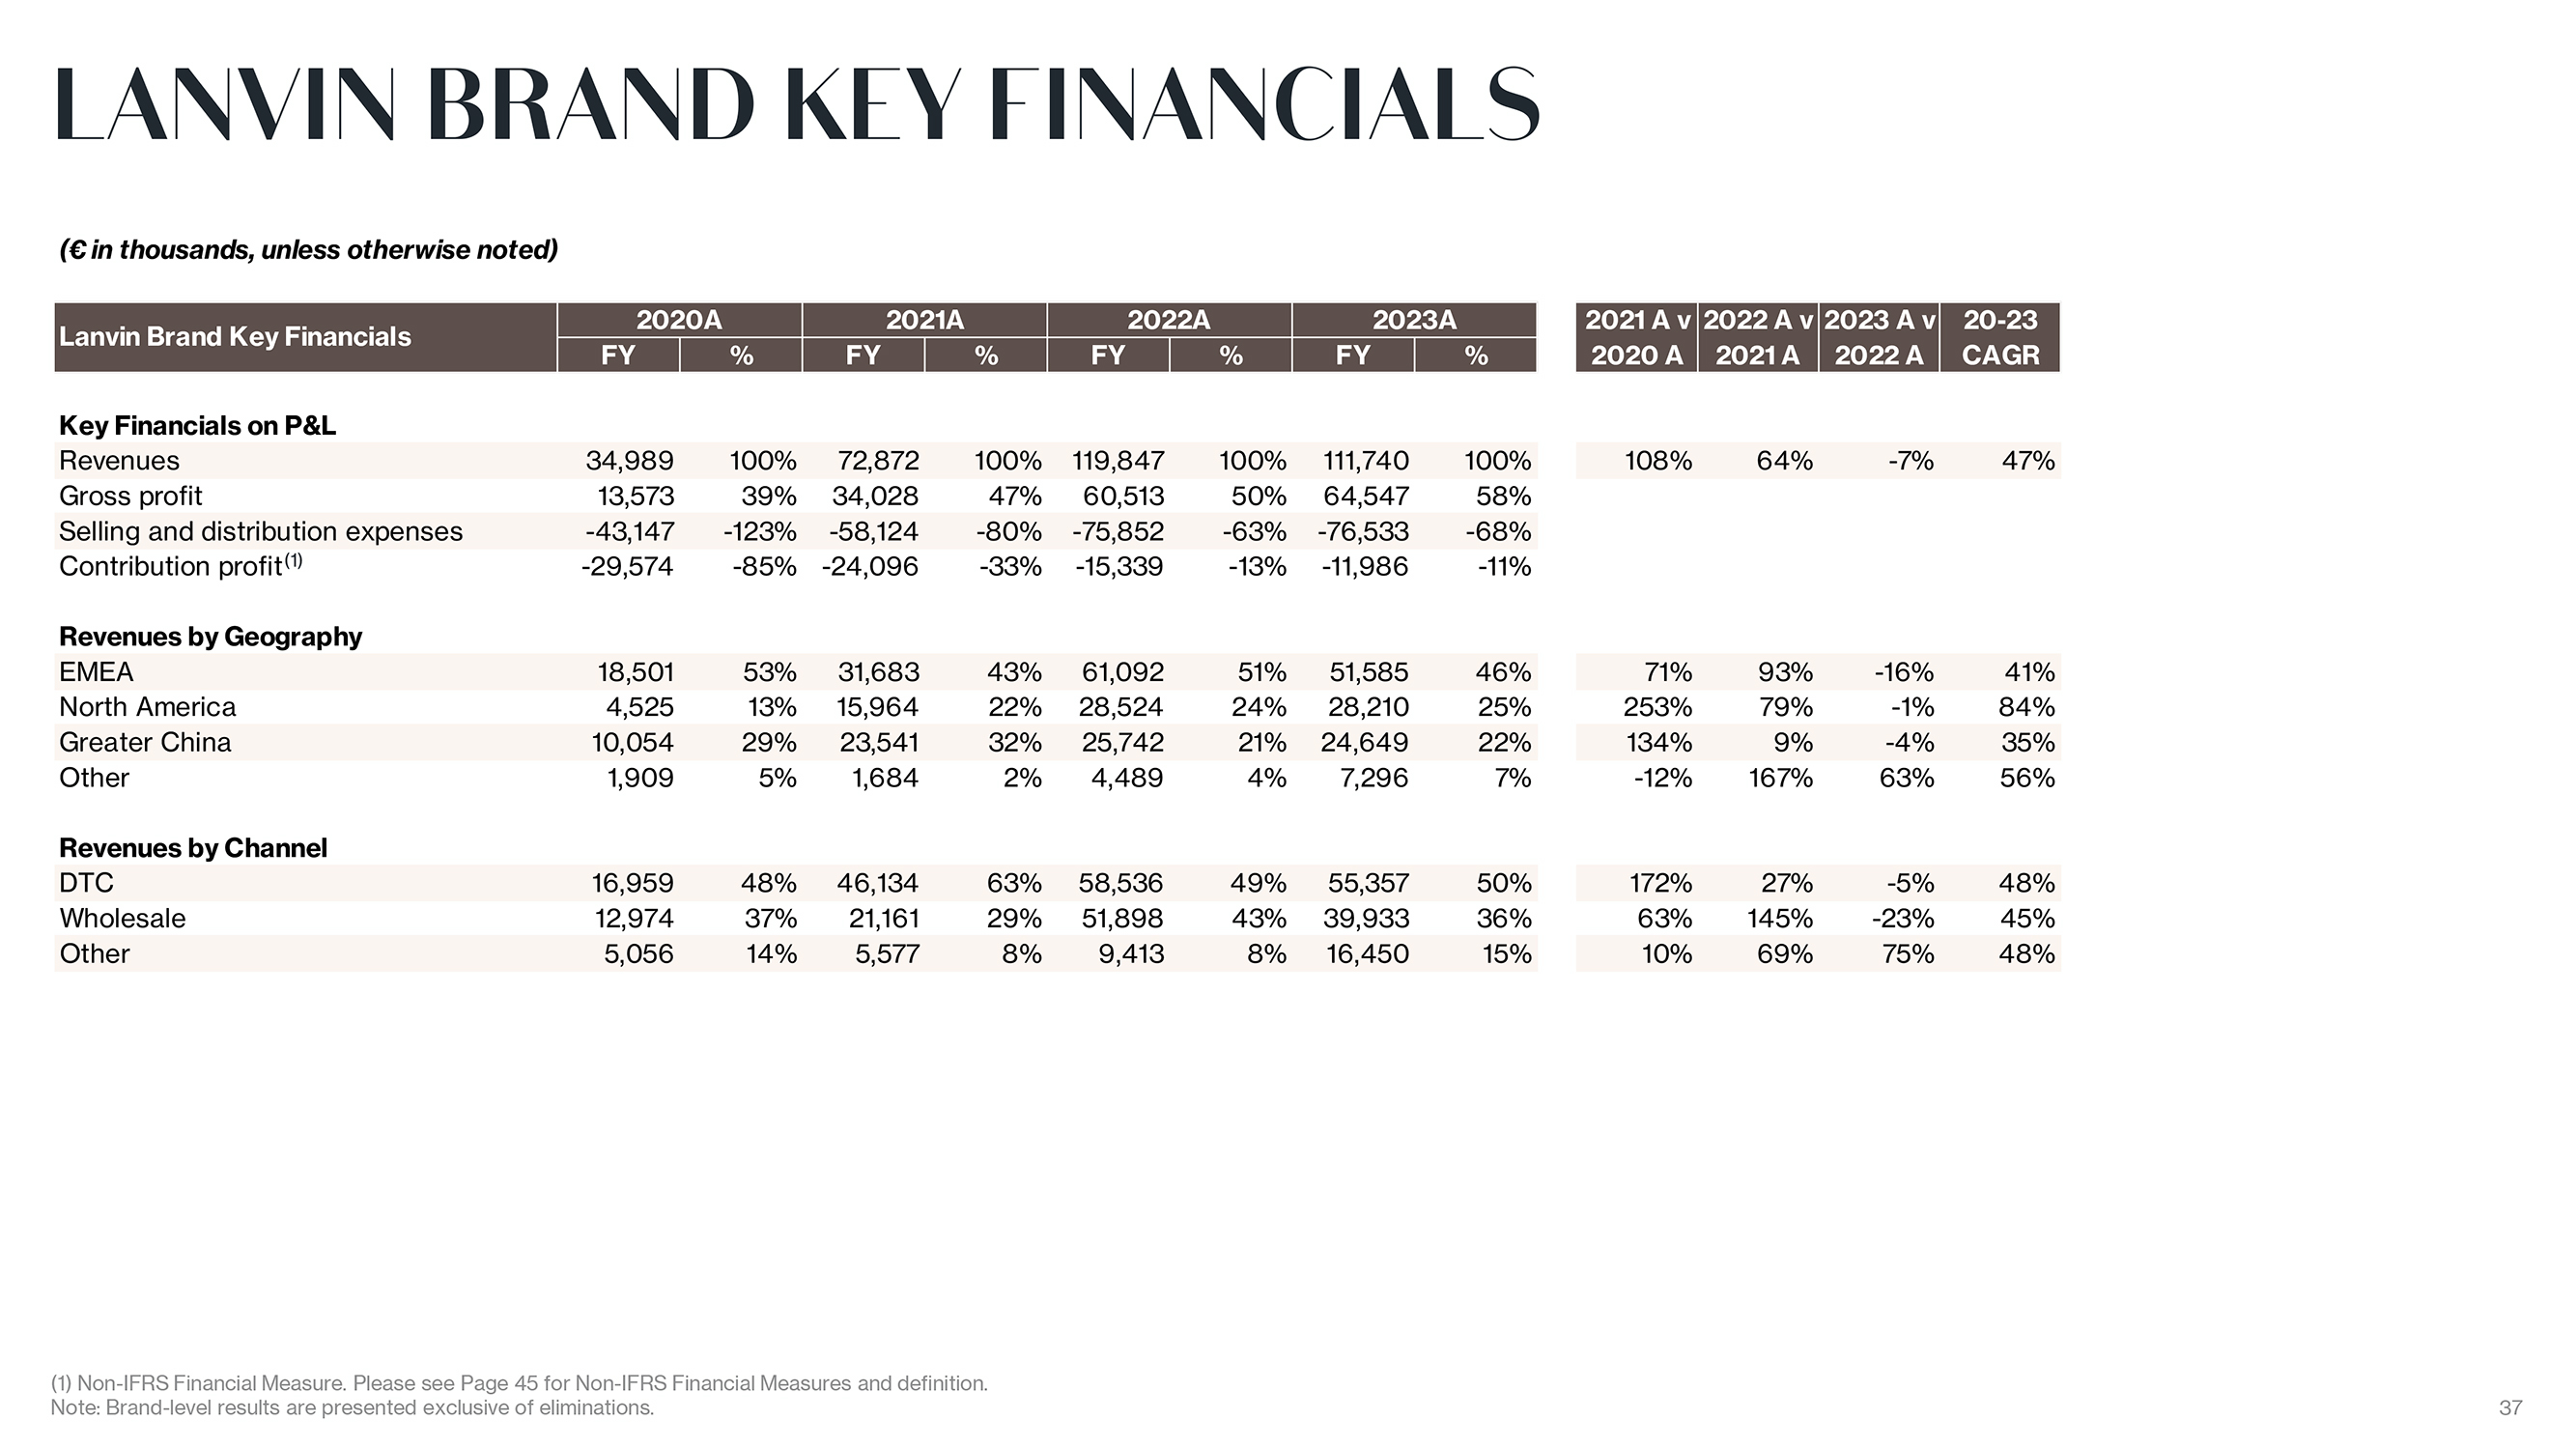
LANVIN 2023 RESULTS AND 2024 GUIDANCE KEY HIGHLIGHTS Revenue decreased by 7% during a creative transition; despite softening global luxury market in the second half of 2023, brand improved its sales trend from a H1 decrease of 11% to a decrease of 2% in H2 with strong sales of accessories and new product launches Wholesale revenue decreased 23% from a soft retail market for wholesalers; DTC revenue decreased at a lower rate of 5% Gross profit margin increased over 700bps despite lower revenue, from increased accessories and full-price sales, shift in the channel mix favoring DTC, and better inventory management; contribution profit margin was also up 200 bps Successful launches of Lanvin Lab and new collections drove brand heat; H2 product drops included the Curb sneaker collaboration with The Surgeon; relaunch of the iconic ballerina flats, and Future?s first Lanvin Lab capsule 2024 will bring a new Artistic Director and new opportunities to expand regionally (first Middle East boutique opened in December 2023), and demographically with further emphasis on leather goods and accessories Lanvin Key Financials FY2020 FY2021 FY2022 FY2023 ( in Thousands) Revenues 34,989 72,872 119,847 111,740 YoY% 108% 64% -7% Gross profit 13,573 34,028 60,513 64,547 GP Margin% 39% 47% 50% 58% Contribution profit (1) -29,574 -24,096 -15,339 -11,986 CP Margin% -85% -33% -13% -11% (1) Non-IFRS Financial Measure. Please see Page 45 for Non-IFRS Financial Measures and definition. Note: Brand-level results are presented exclusive of eliminations. 28
|
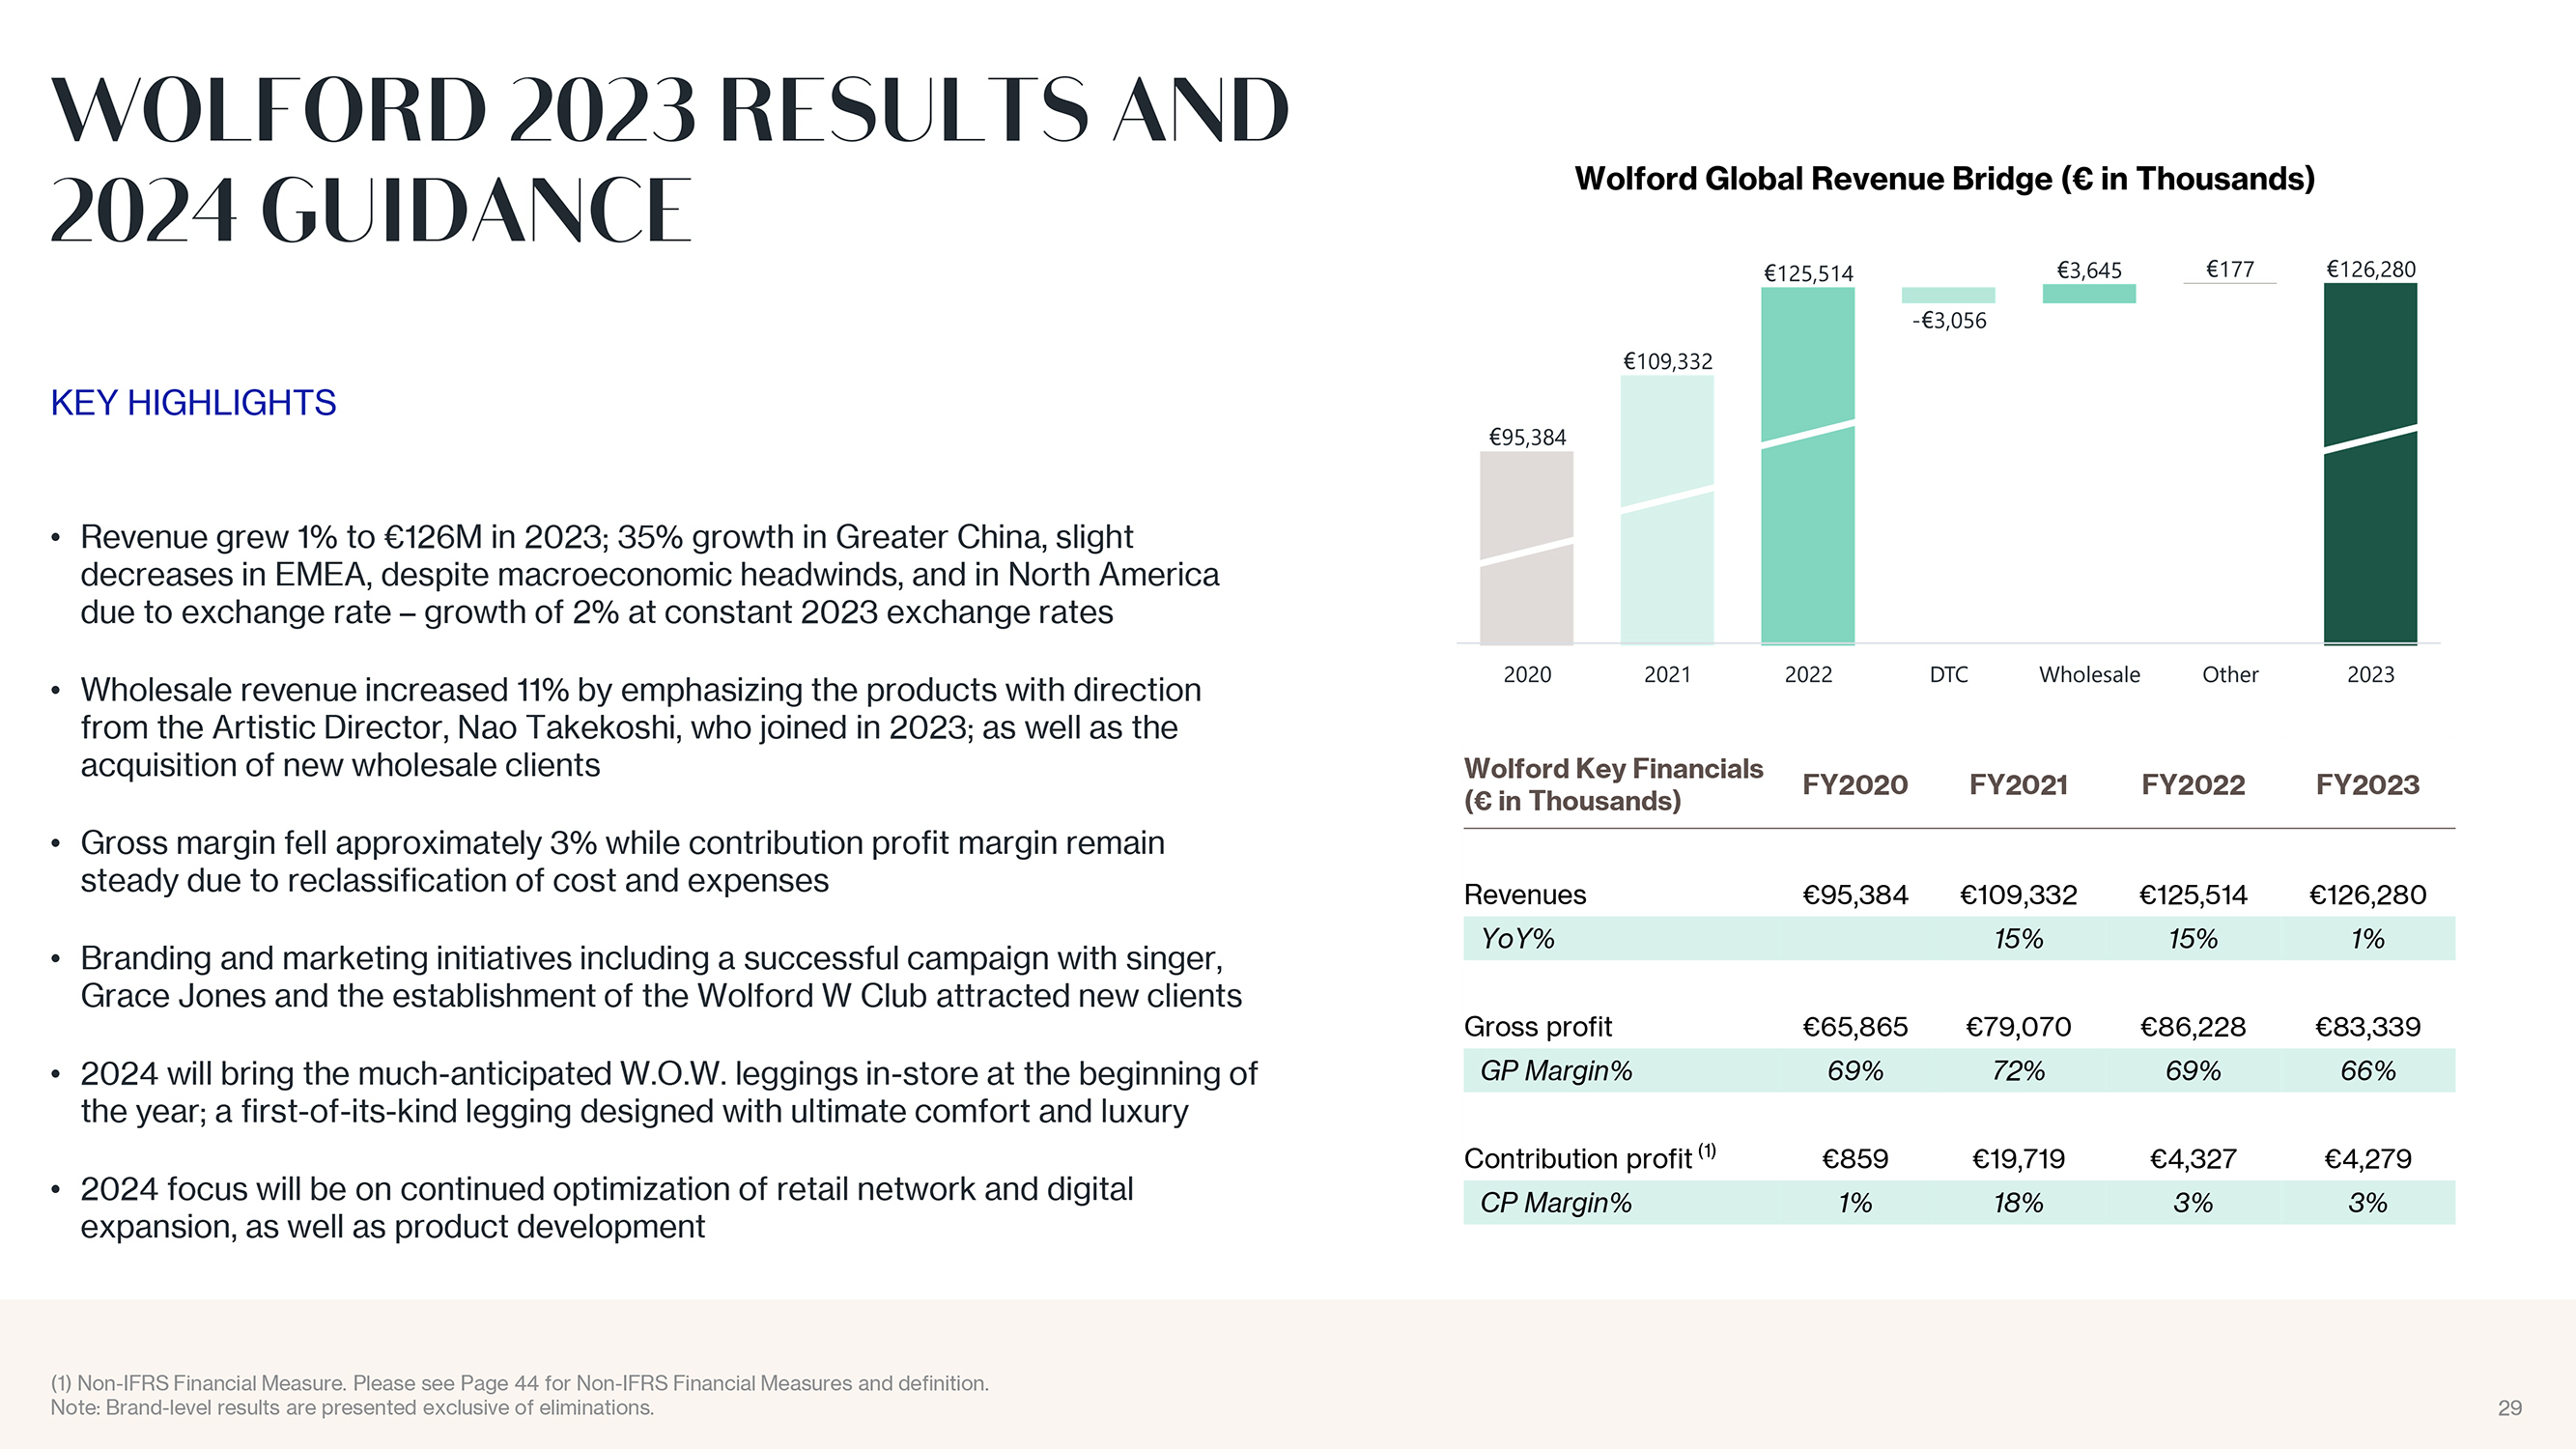
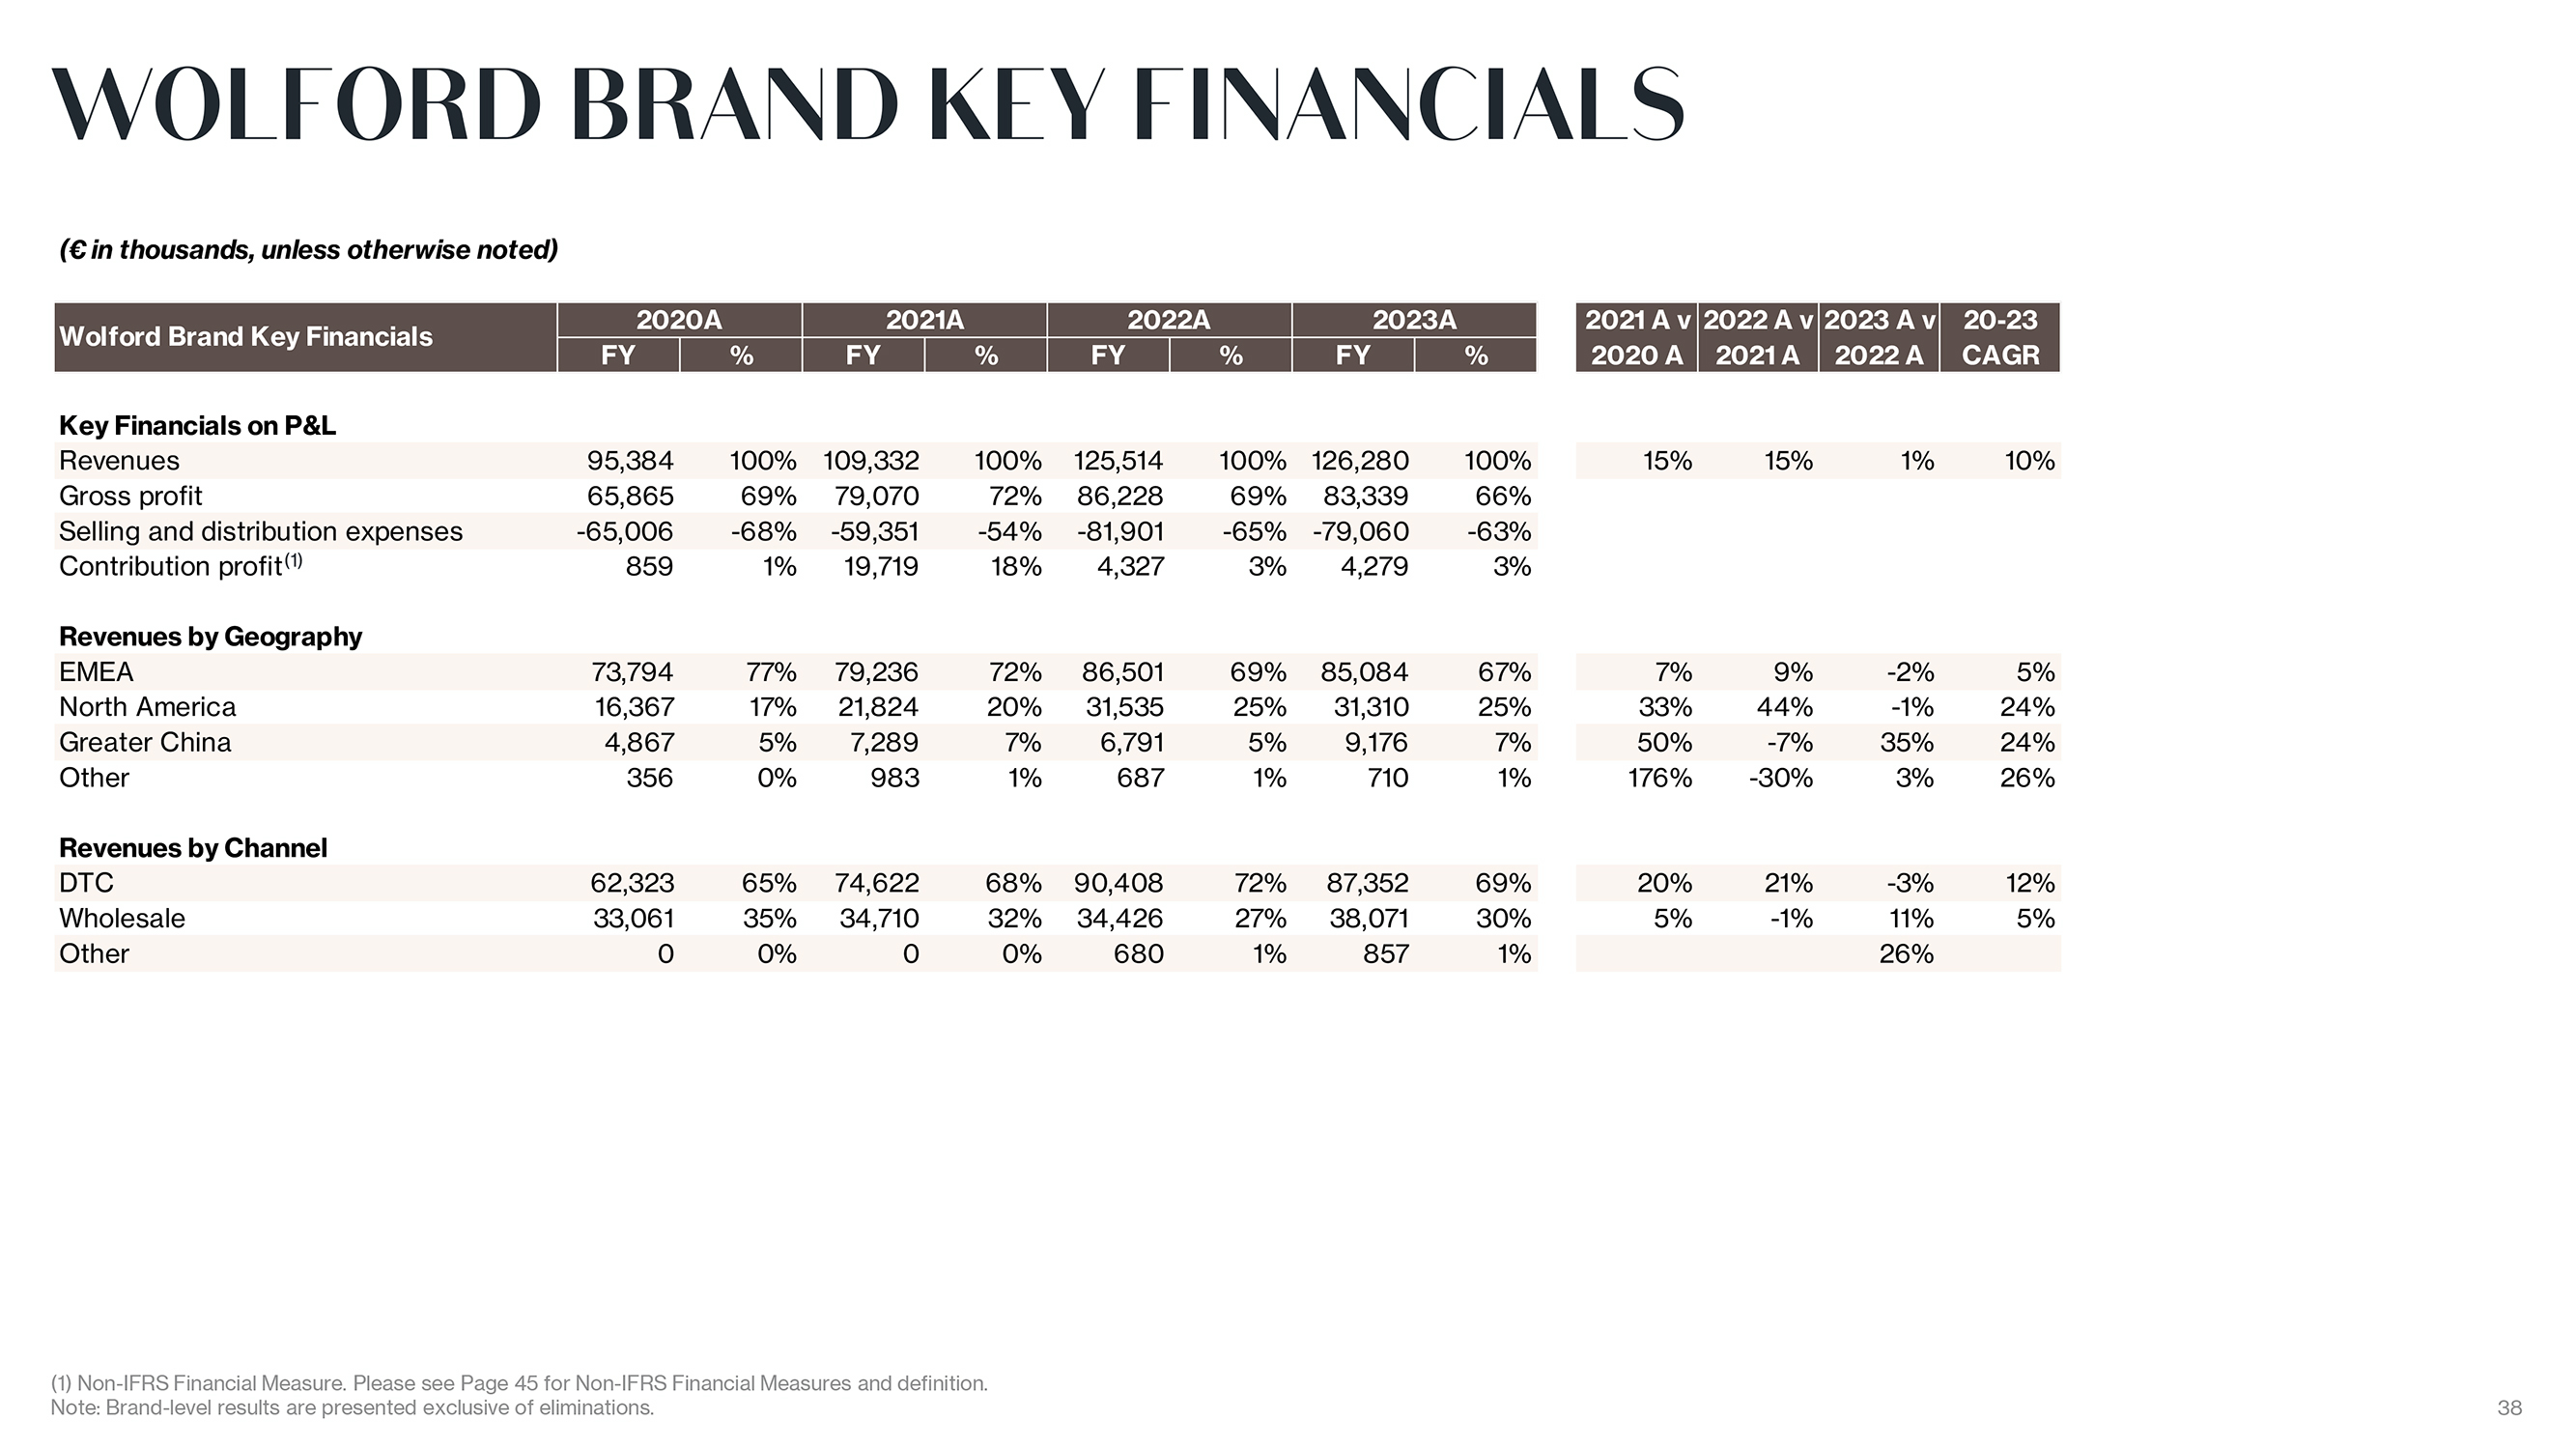
WOLFORD 2023 RESULTS AND 2024 GUIDANCE KEY HIGHLIGHTS Revenue grew 1% to 126M in 2023; 35% growth in Greater China, slight decreases in EMEA, despite macroeconomic headwinds, and in North America due to exchange rate ? growth of 2% at constant 2023 exchange rates Wholesale revenue increased 11% by emphasizing the products with direction from the Artistic Director, Nao Takekoshi, who joined in 2023; as well as the acquisition of new wholesale clients Gross margin fell approximately 3% while contribution profit margin remain steady due to reclassification of cost and expenses Branding and marketing initiatives including a successful campaign with singer, Grace Jones and the establishment of the Wolford W Club attracted new clients 2024 will bring the much-anticipated W.O.W. leggings in-store at the beginning of the year; a first-of-its-kind legging designed with ultimate comfort and luxury 2024 focus will be on continued optimization of retail network and digital expansion, as well as product development Wolford Key Financials FY2020 FY2021 FY2022 FY2023 ( in Thousands) Revenues 95,384 109,332 125,514 126,280 YoY% 15% 15% 1% Gross profit 65,865 79,070 86,228 83,339 GP Margin% 69% 72% 69% 66% Contribution profit (1) 859 19,719 4,327 4,279 CP Margin% 1% 18% 3% 3% (1) Non-IFRS Financial Measure. Please see Page 44 for Non-IFRS Financial Measures and definition. Note: Brand-level results are presented exclusive of eliminations. 29
|
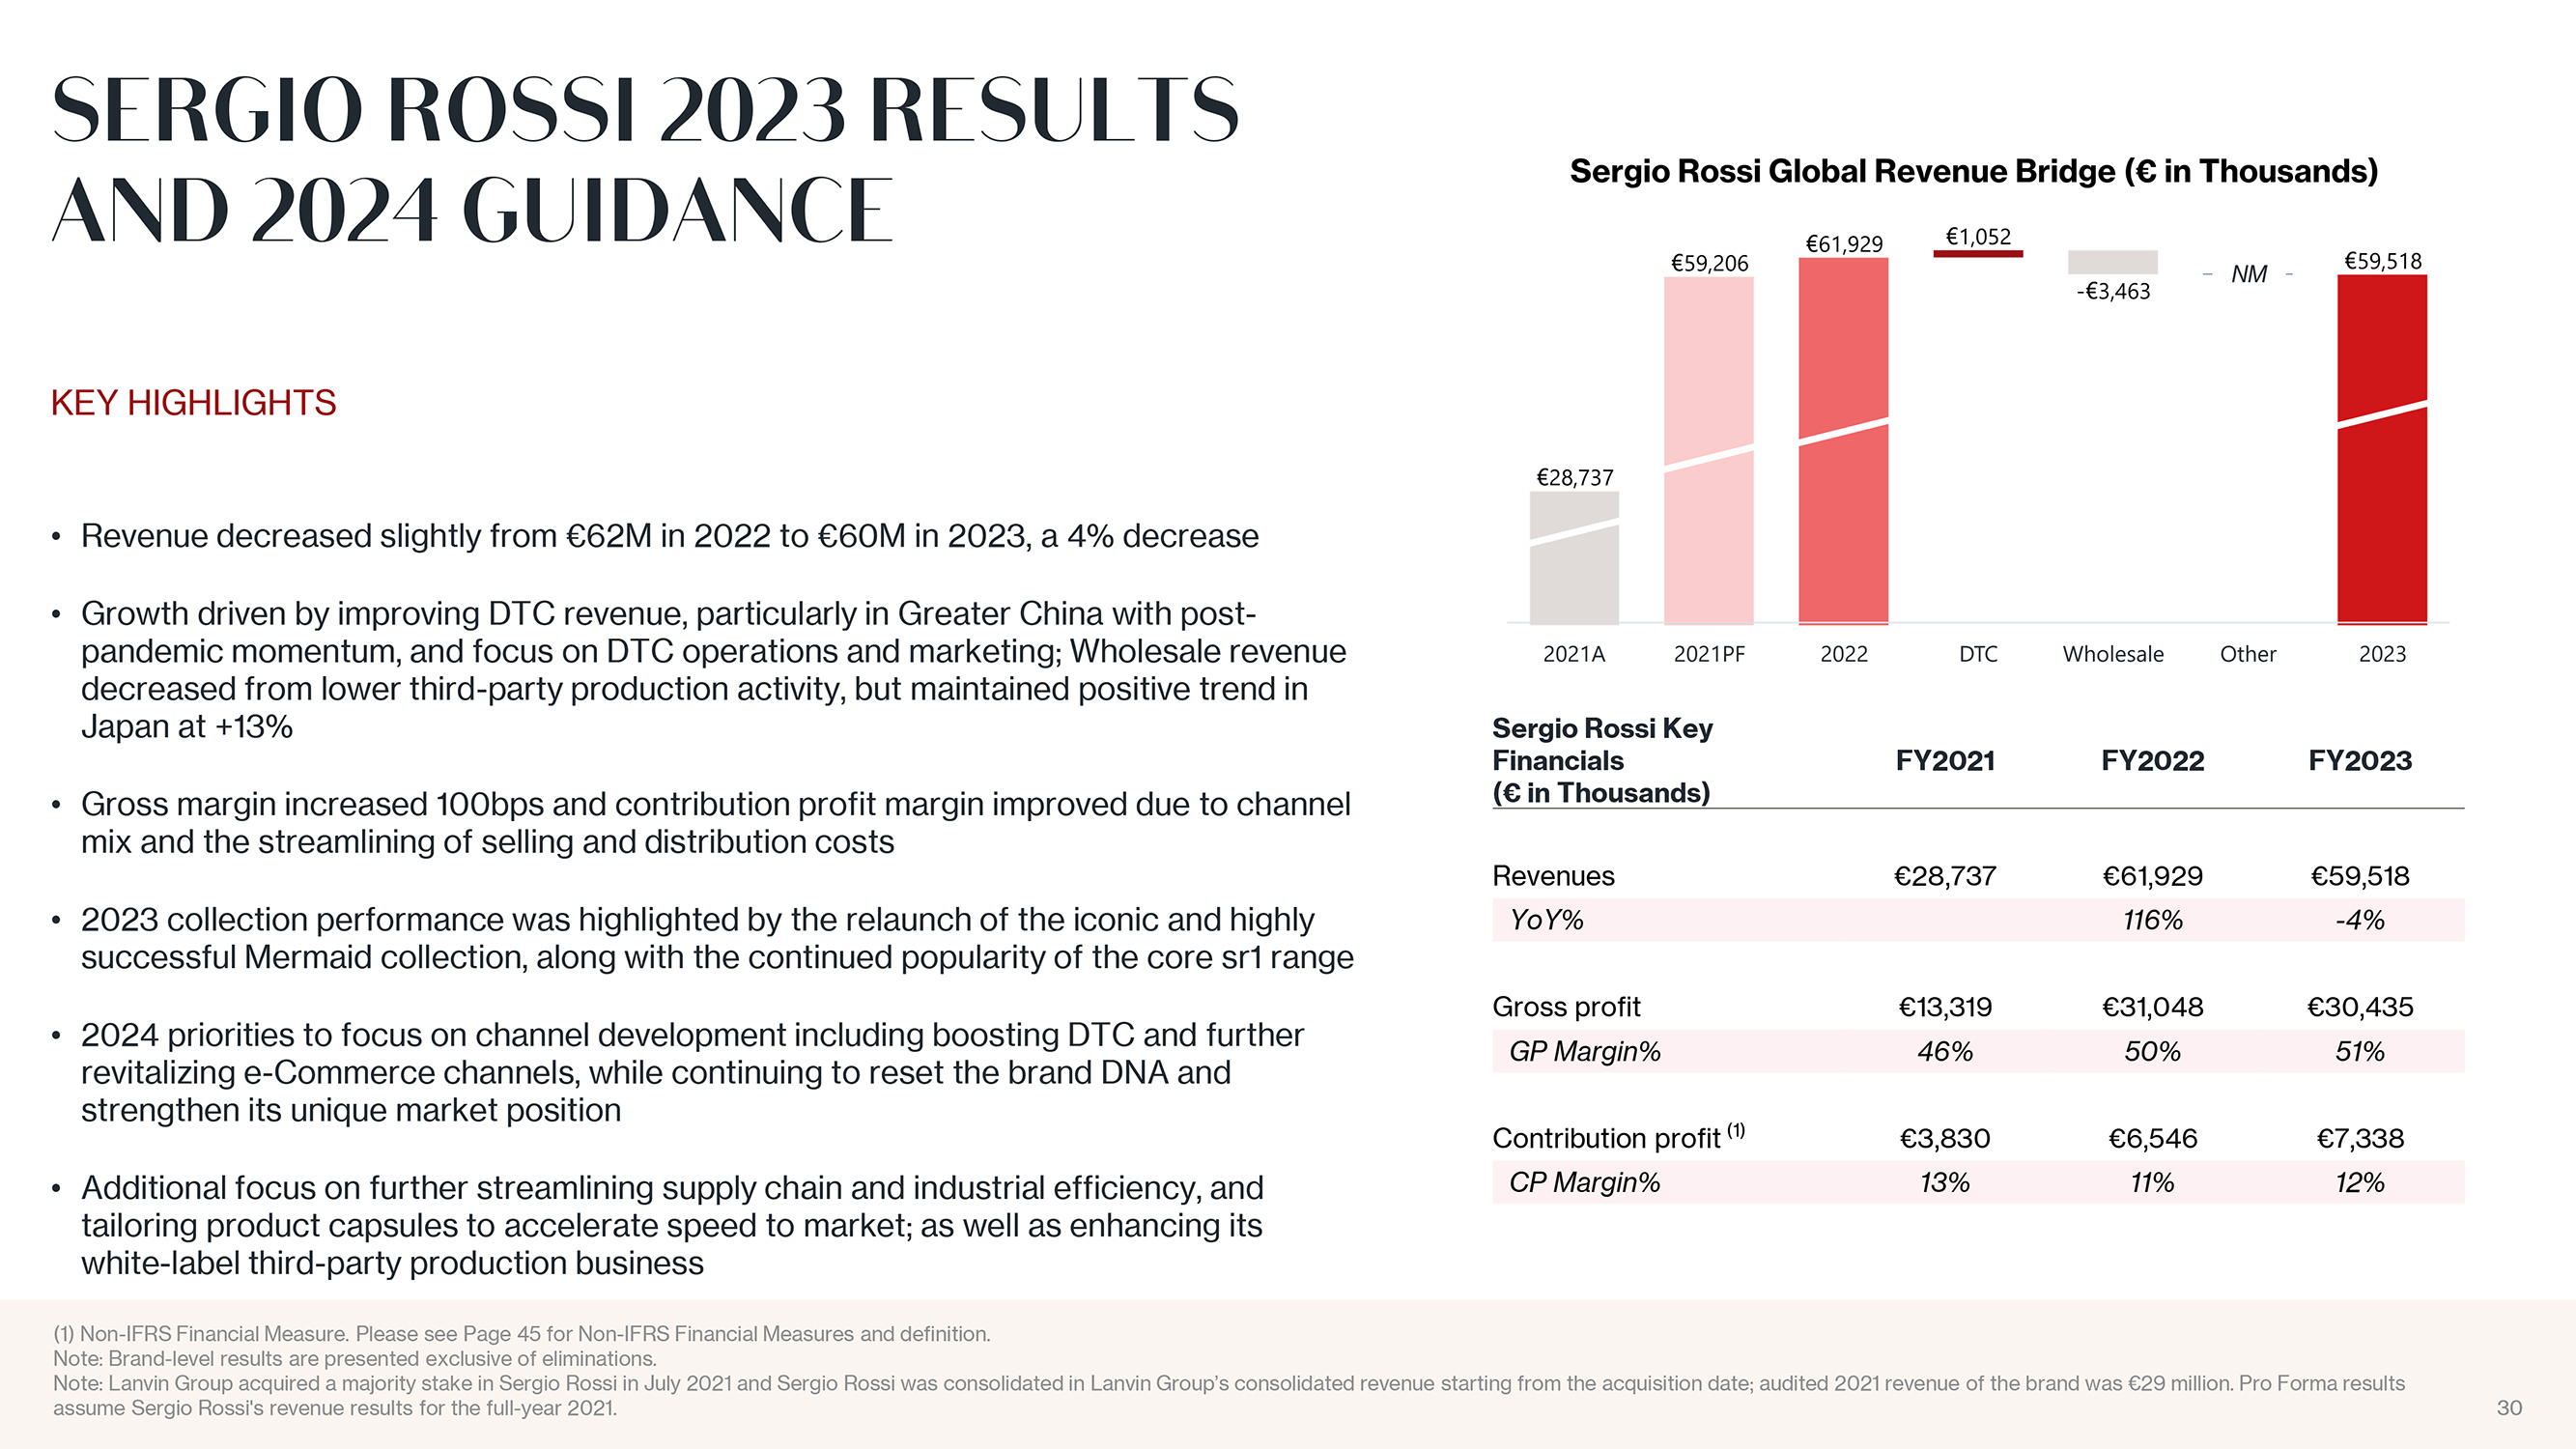
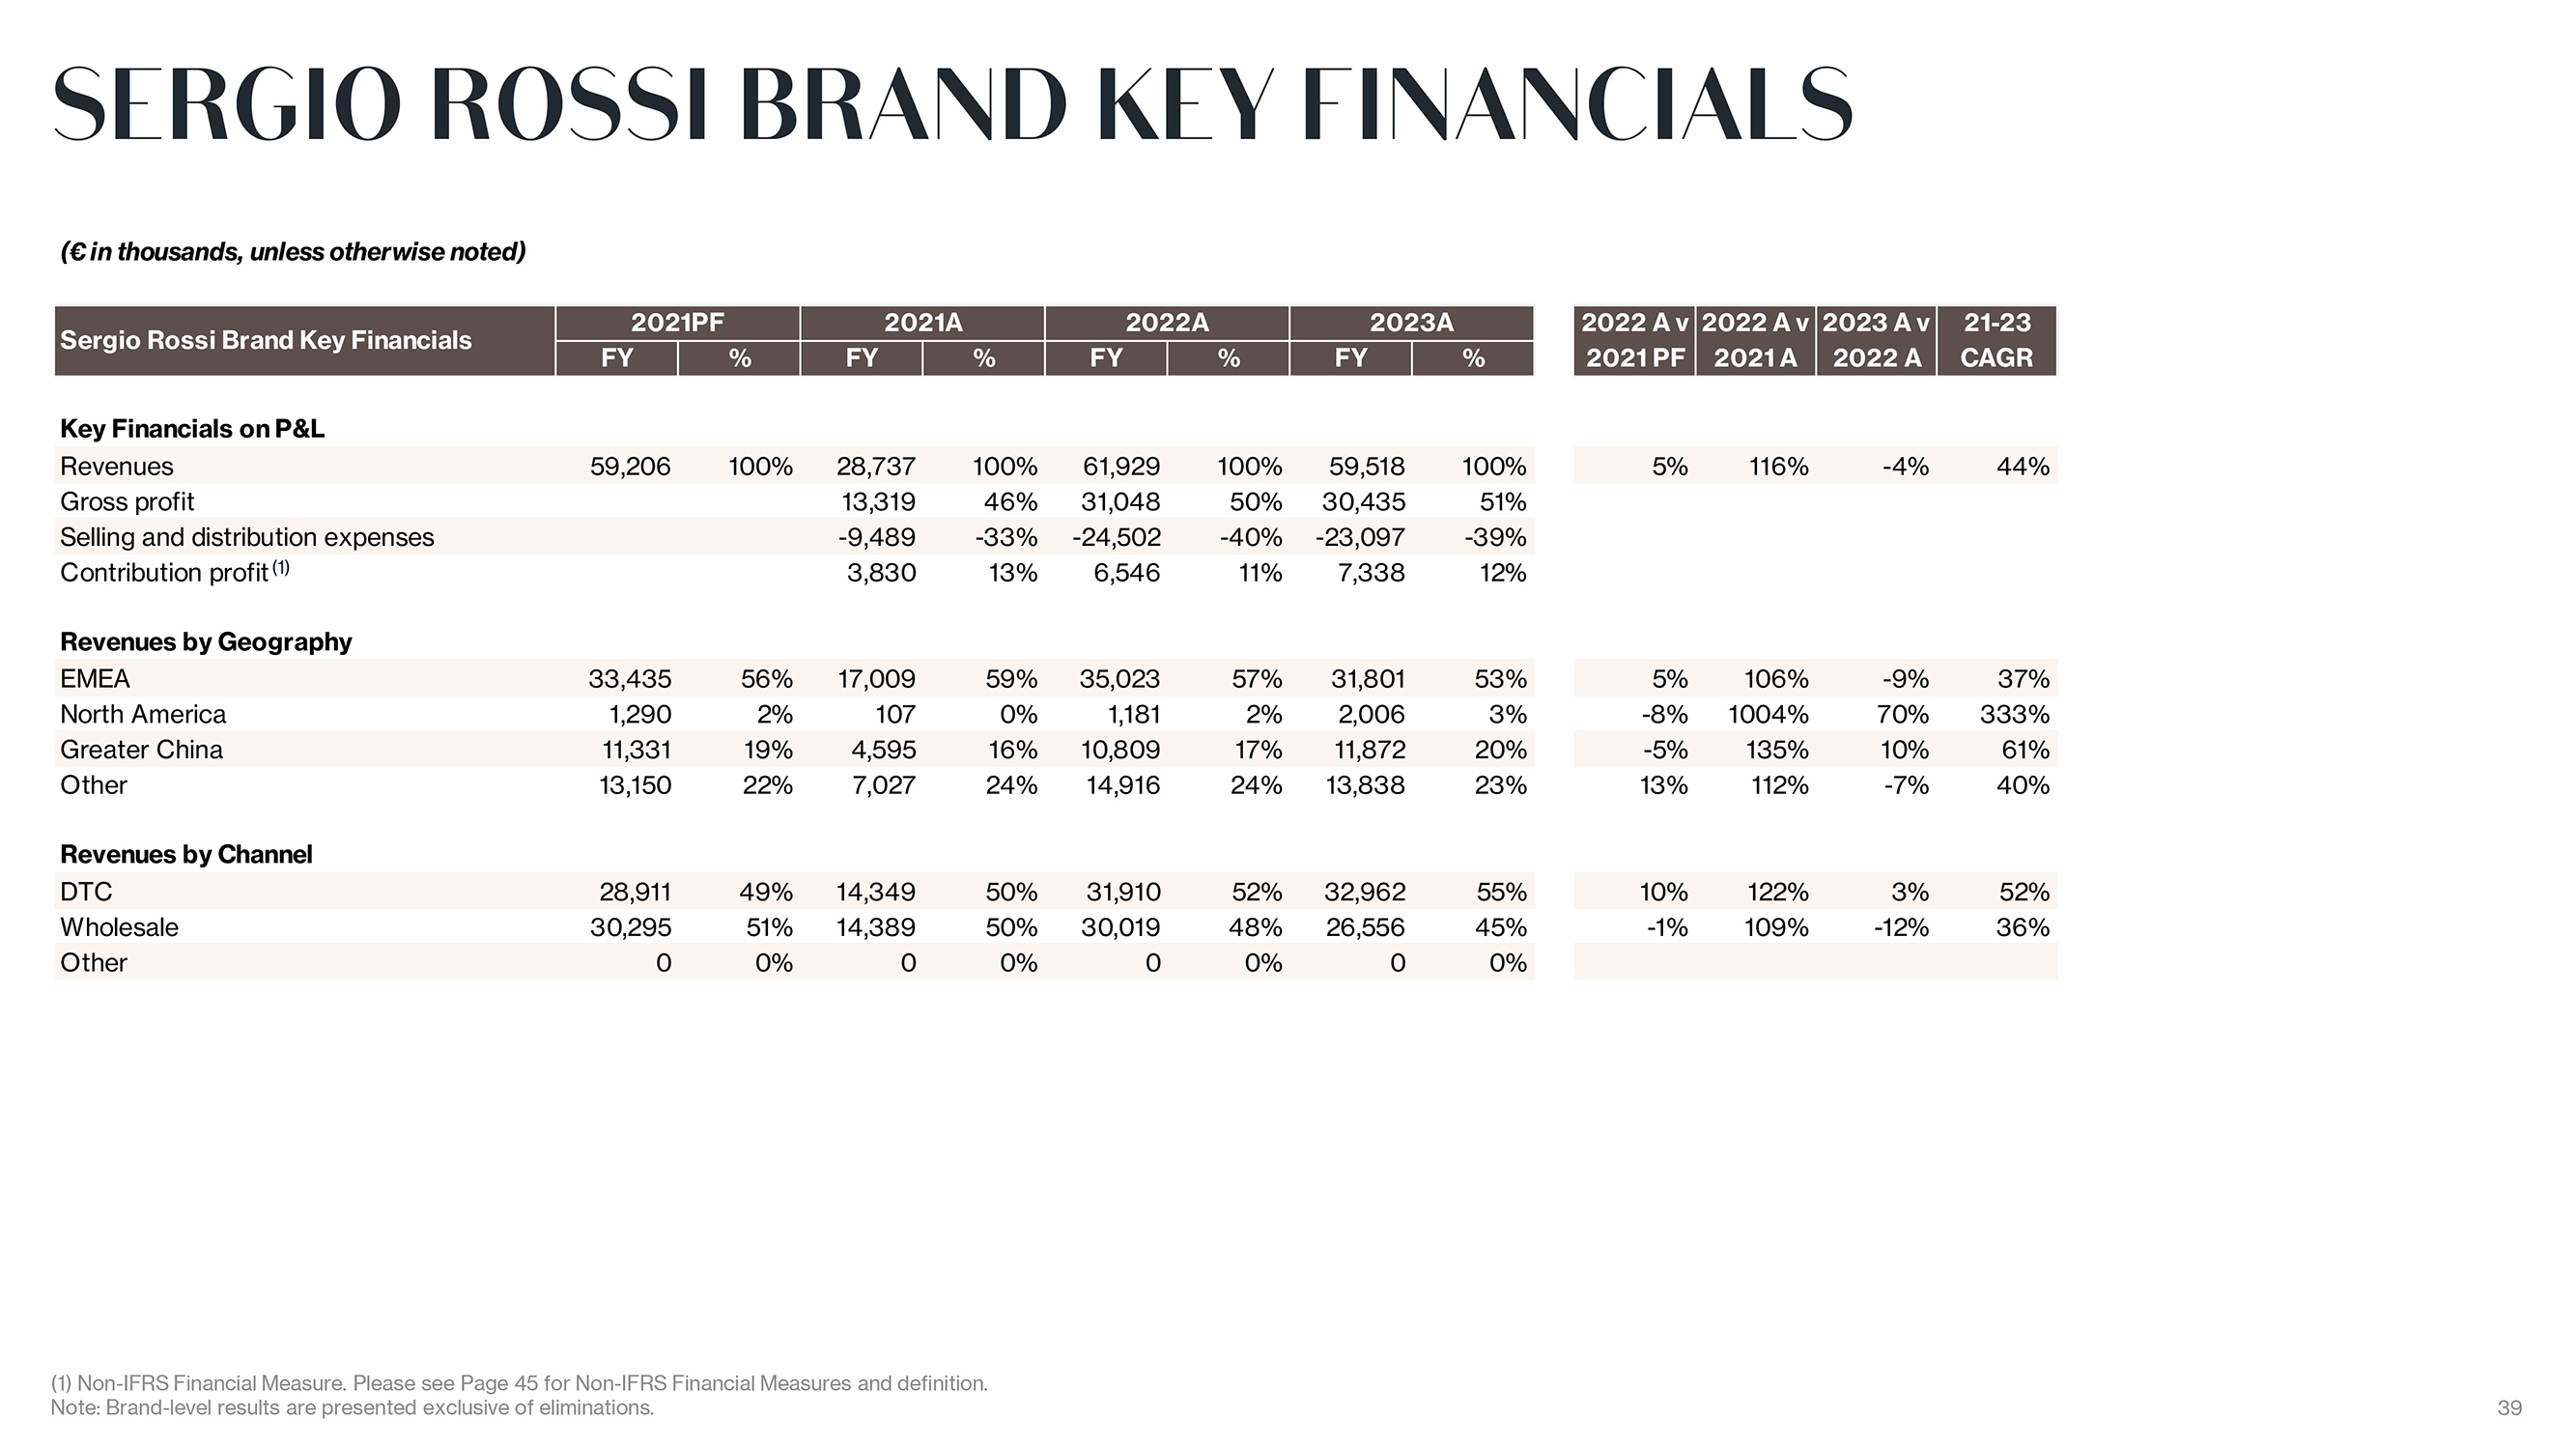
SERGIO ROSSI 2023 RESULTS AND 2024 GUIDANCE KEY HIGHLIGHTS Revenue decreased slightly from 62M in 2022 to 60M in 2023, a 4% decrease Growth driven by improving DTC revenue, particularly in Greater China with post-pandemic momentum, and focus on DTC operations and marketing; Wholesale revenue decreased from lower third-party production activity, but maintained positive trend in Japan at +13% Gross margin increased 100bps and contribution profit margin improved due to channel mix and the streamlining of selling and distribution costs 2023 collection performance was highlighted by the relaunch of the iconic and highly successful Mermaid collection, along with the continued popularity of the core sr1 range 2024 priorities to focus on channel development including boosting DTC and further revitalizing e-Commerce channels, while continuing to reset the brand DNA and strengthen its unique market position Additional focus on further streamlining supply chain and industrial efficiency, and tailoring product capsules to accelerate speed to market; as well as enhancing its white-label third-party production business Sergio Rossi Key Financials FY2021 FY2022 FY2023 ( in Thousands) Revenues 28,737 61,929 59,518 YoY% 116% -4% Gross profit 13,319 31,048 30,435 GP Margin% 46% 50% 51% Contribution profit (1) 3,830 6,546 7,338 CP Margin% 13% 11% 12% (1) Non-IFRS Financial Measure. Please see Page 45 for Non-IFRS Financial Measures and definition. Note: Brand-level results are presented exclusive of eliminations. Note: Lanvin Group acquired a majority stake in Sergio Rossi in July 2021 and Sergio Rossi was consolidated in Lanvin Group?s consolidated revenue starting from the acquisition date; audited 2021 revenue of the brand was 29 million. Pro Forma results assume Sergio Rossi’s revenue results for the full-year 2021. 30
|
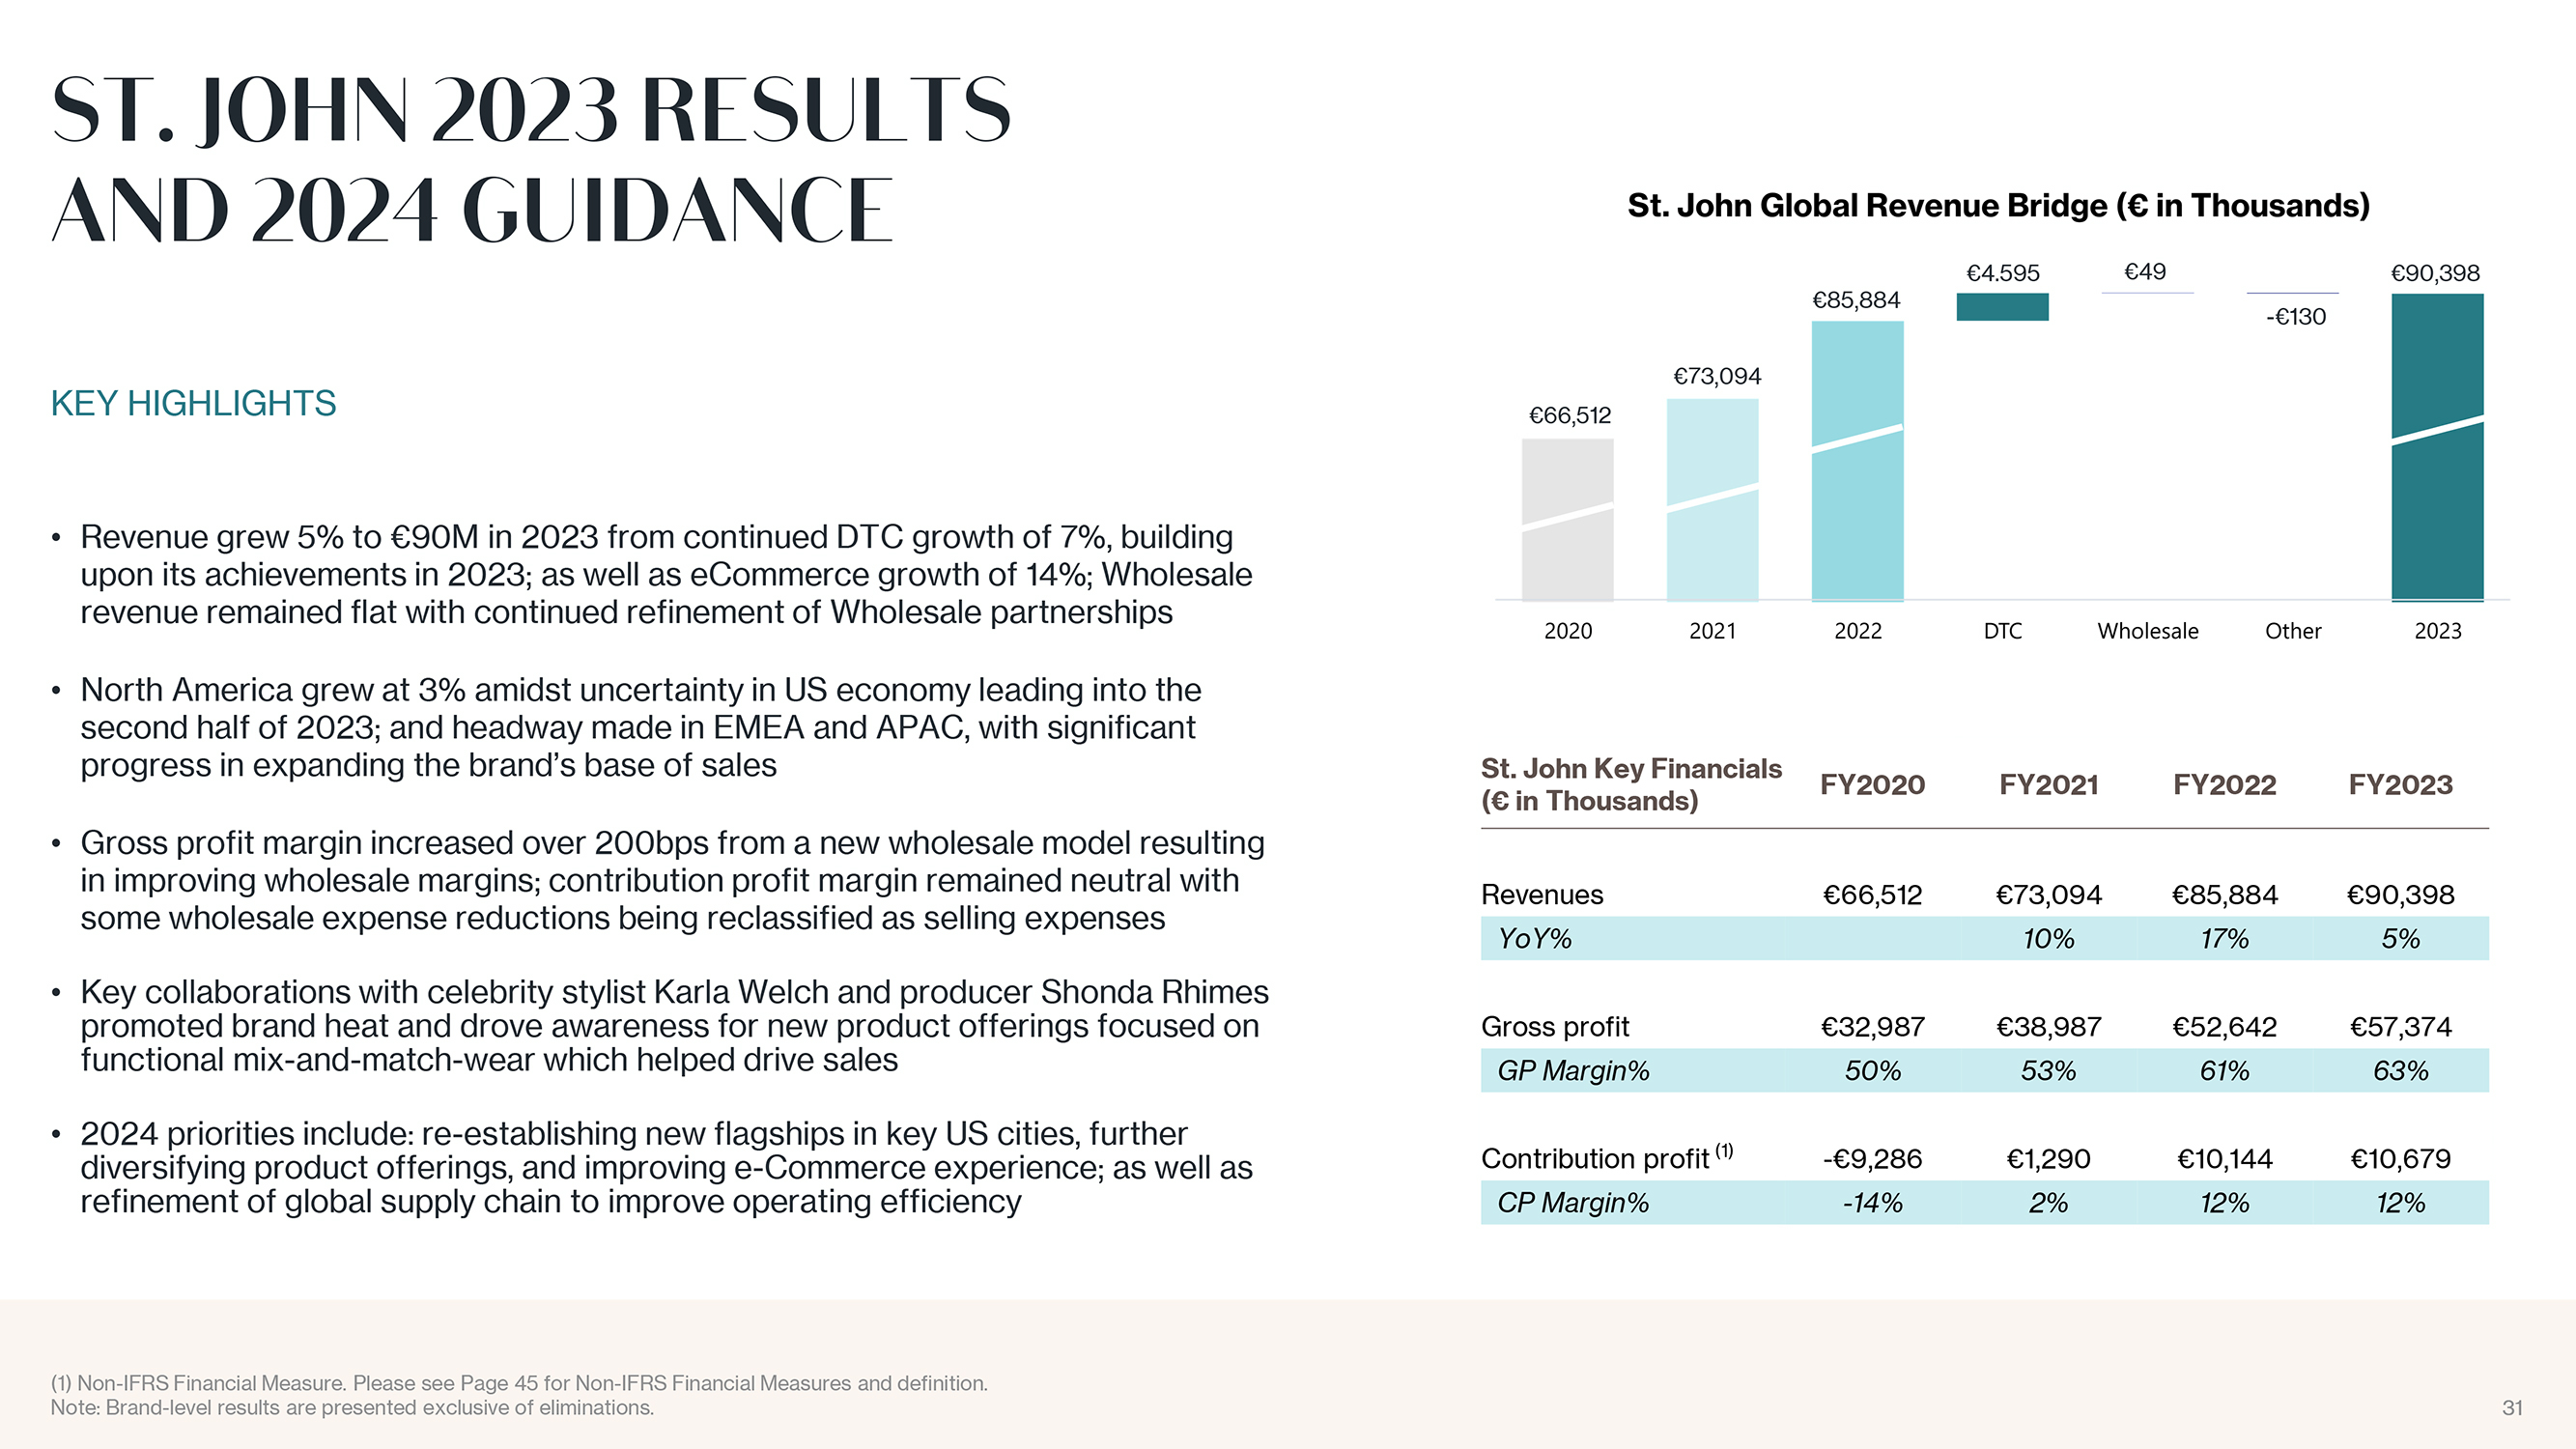
ST. JOHN 2023 RESULTS AND 2024 GUIDANCE KEY HIGHLIGHTS Revenue grew 5% to 90M in 2023 from continued DTC growth of 7%, building upon its achievements in 2023; as well as eCommerce growth of 14%; Wholesale revenue remained flat with continued refinement of Wholesale partnerships North America grew at 3% amidst uncertainty in US economy leading into the second half of 2023; and headway made in EMEA and APAC, with significant progress in expanding the brand?s base of sales Gross profit margin increased over 200bps from a new wholesale model resulting in improving wholesale margins; contribution profit margin remained neutral with some wholesale expense reductions being reclassified as selling expenses Key collaborations with celebrity stylist Karla Welch and producer Shonda Rhimes promoted brand heat and drove awareness for new product offerings focused on functional mix-and-match-wear which helped drive sales 2024 priorities include: re-establishing new flagships in key US cities, further diversifying product offerings, and improving e-Commerce experience; as well as refinement of global supply chain to improve operating efficiency St. John Key Financials FY2020 FY2021 FY2022 FY2023 ( in Thousands) Revenues 66,512 73,094 85,884 90,398 YoY% 10% 17% 5% Gross profit 32,987 38,987 52,642 57,374 GP Margin% 50% 53% 61% 63% Contribution profit (1) -9,286 1,290 10,144 10,679 CP Margin% -14% 2% 12% 12% (1) Non-IFRS Financial Measure. Please see Page 45 for Non-IFRS Financial Measures and definition. Note: Brand-level results are presented exclusive of eliminations. 31
|
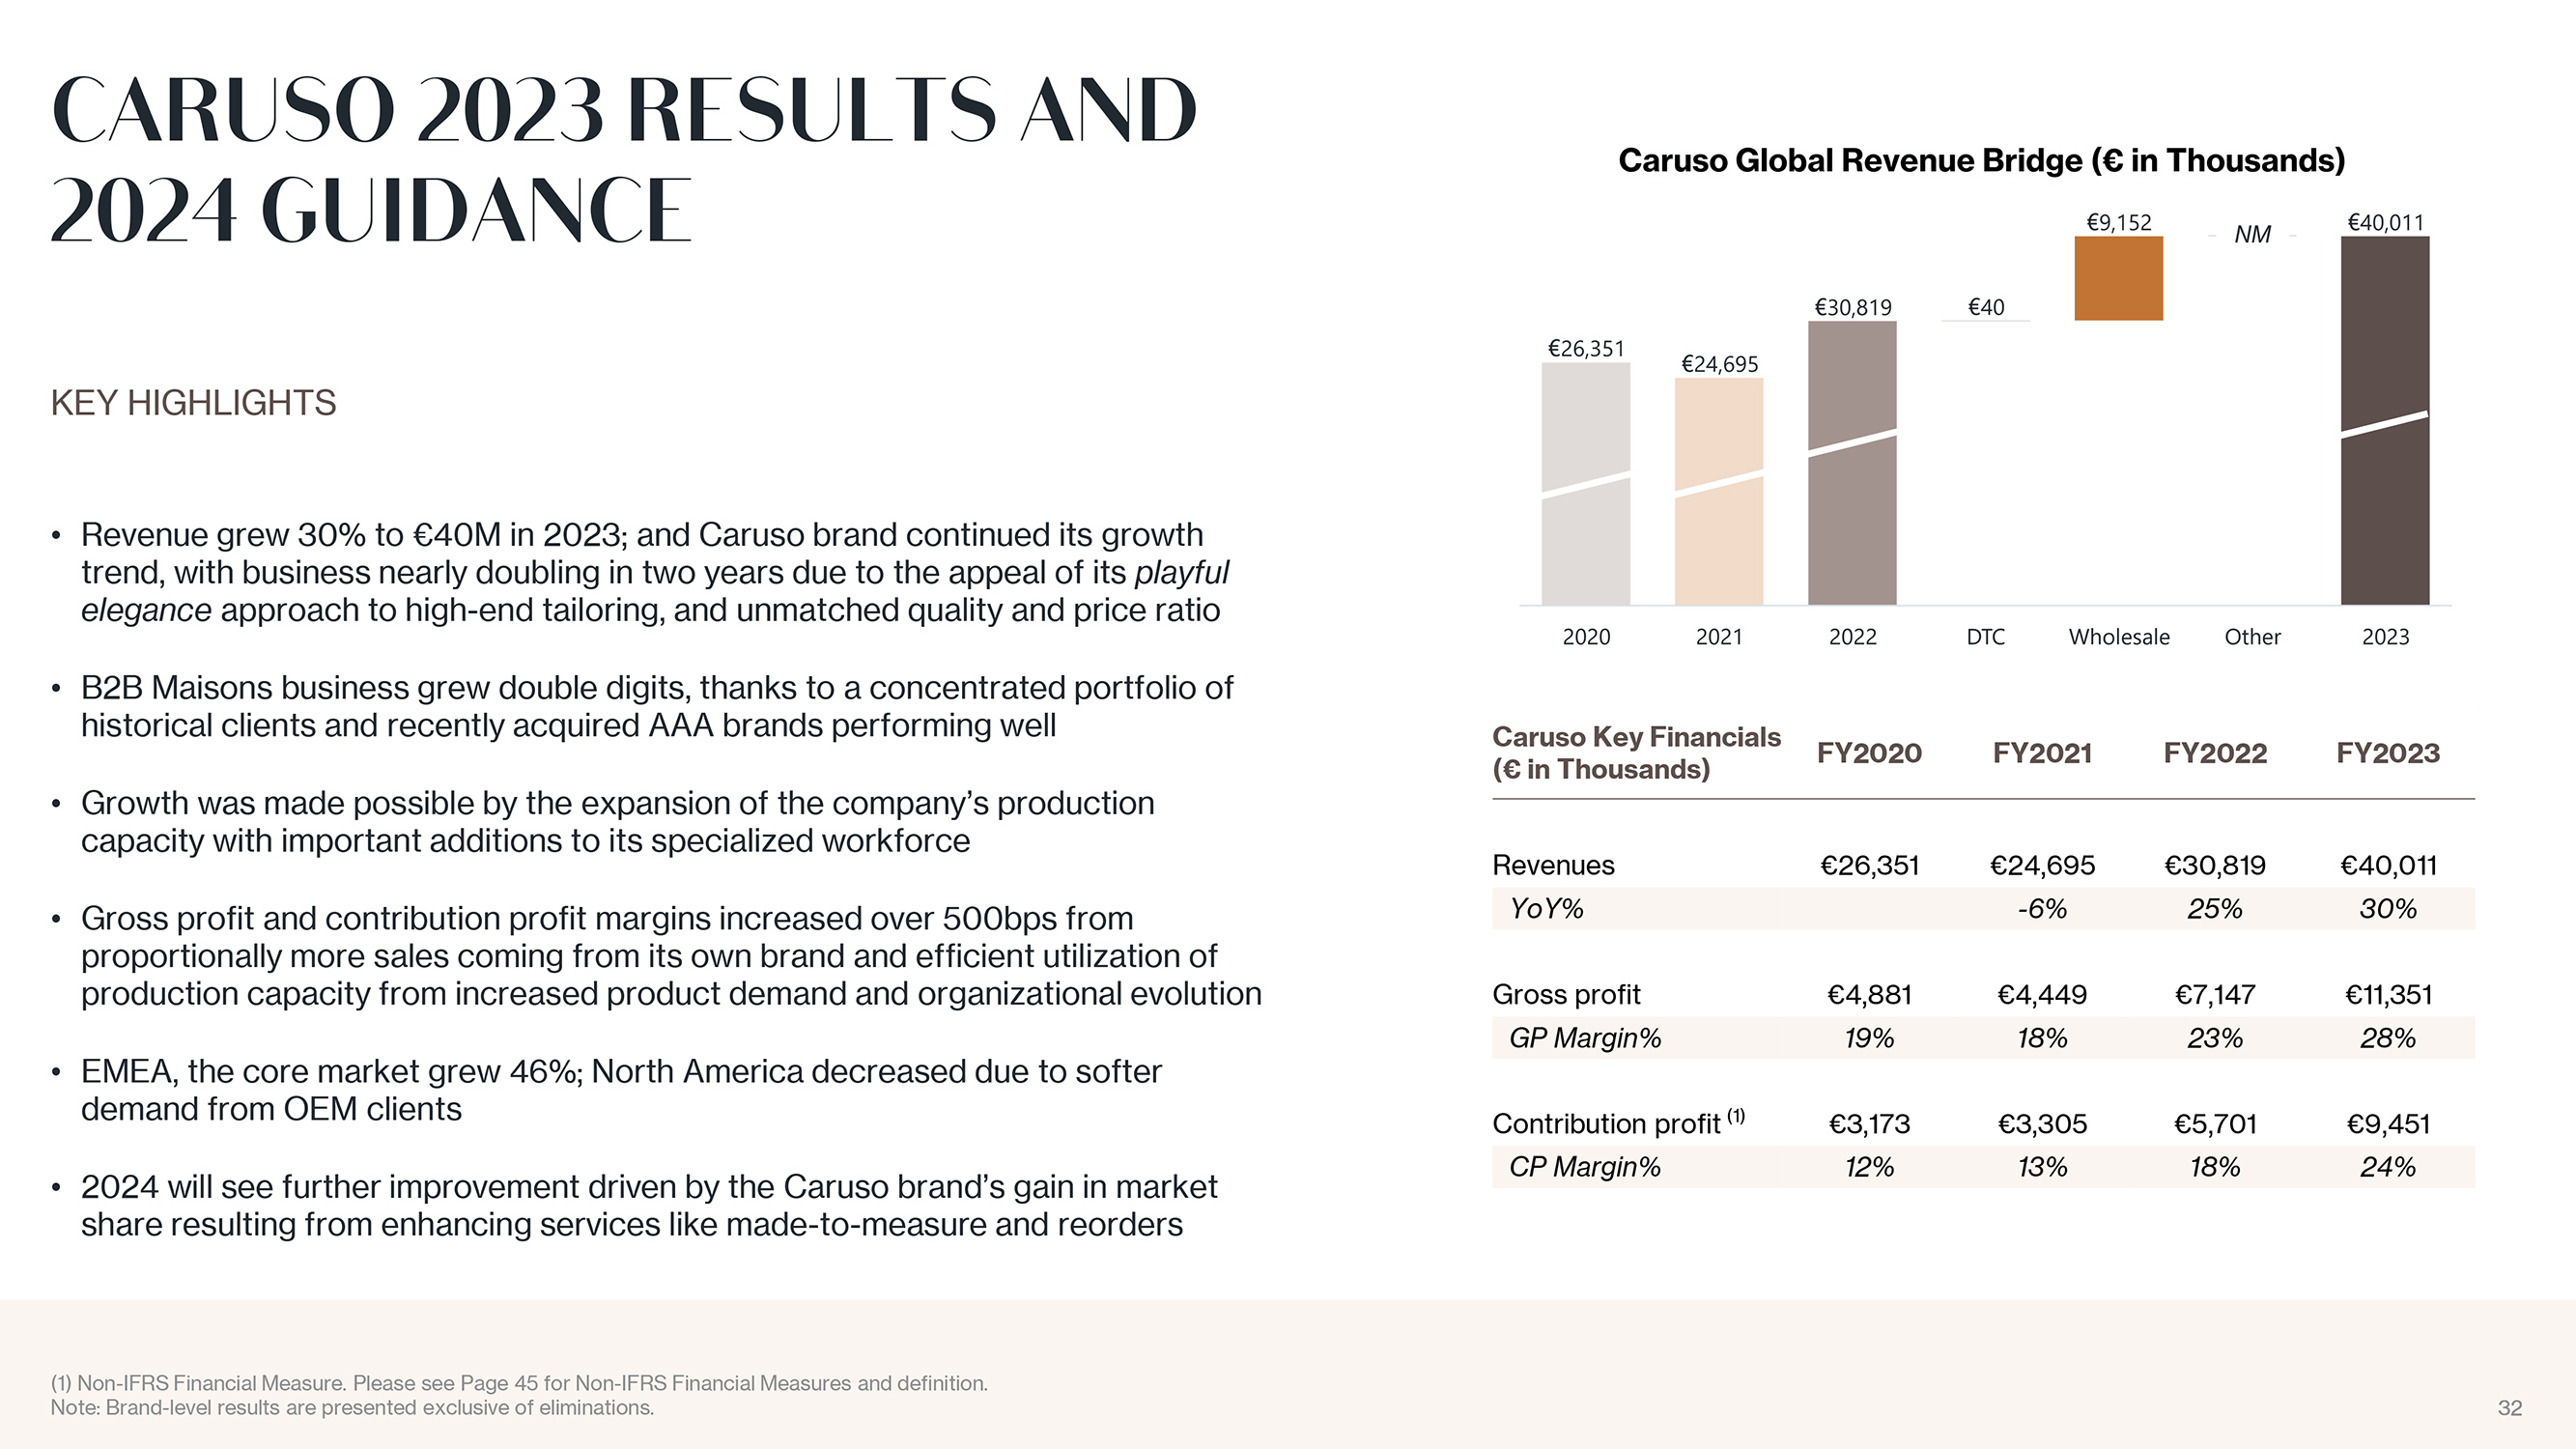
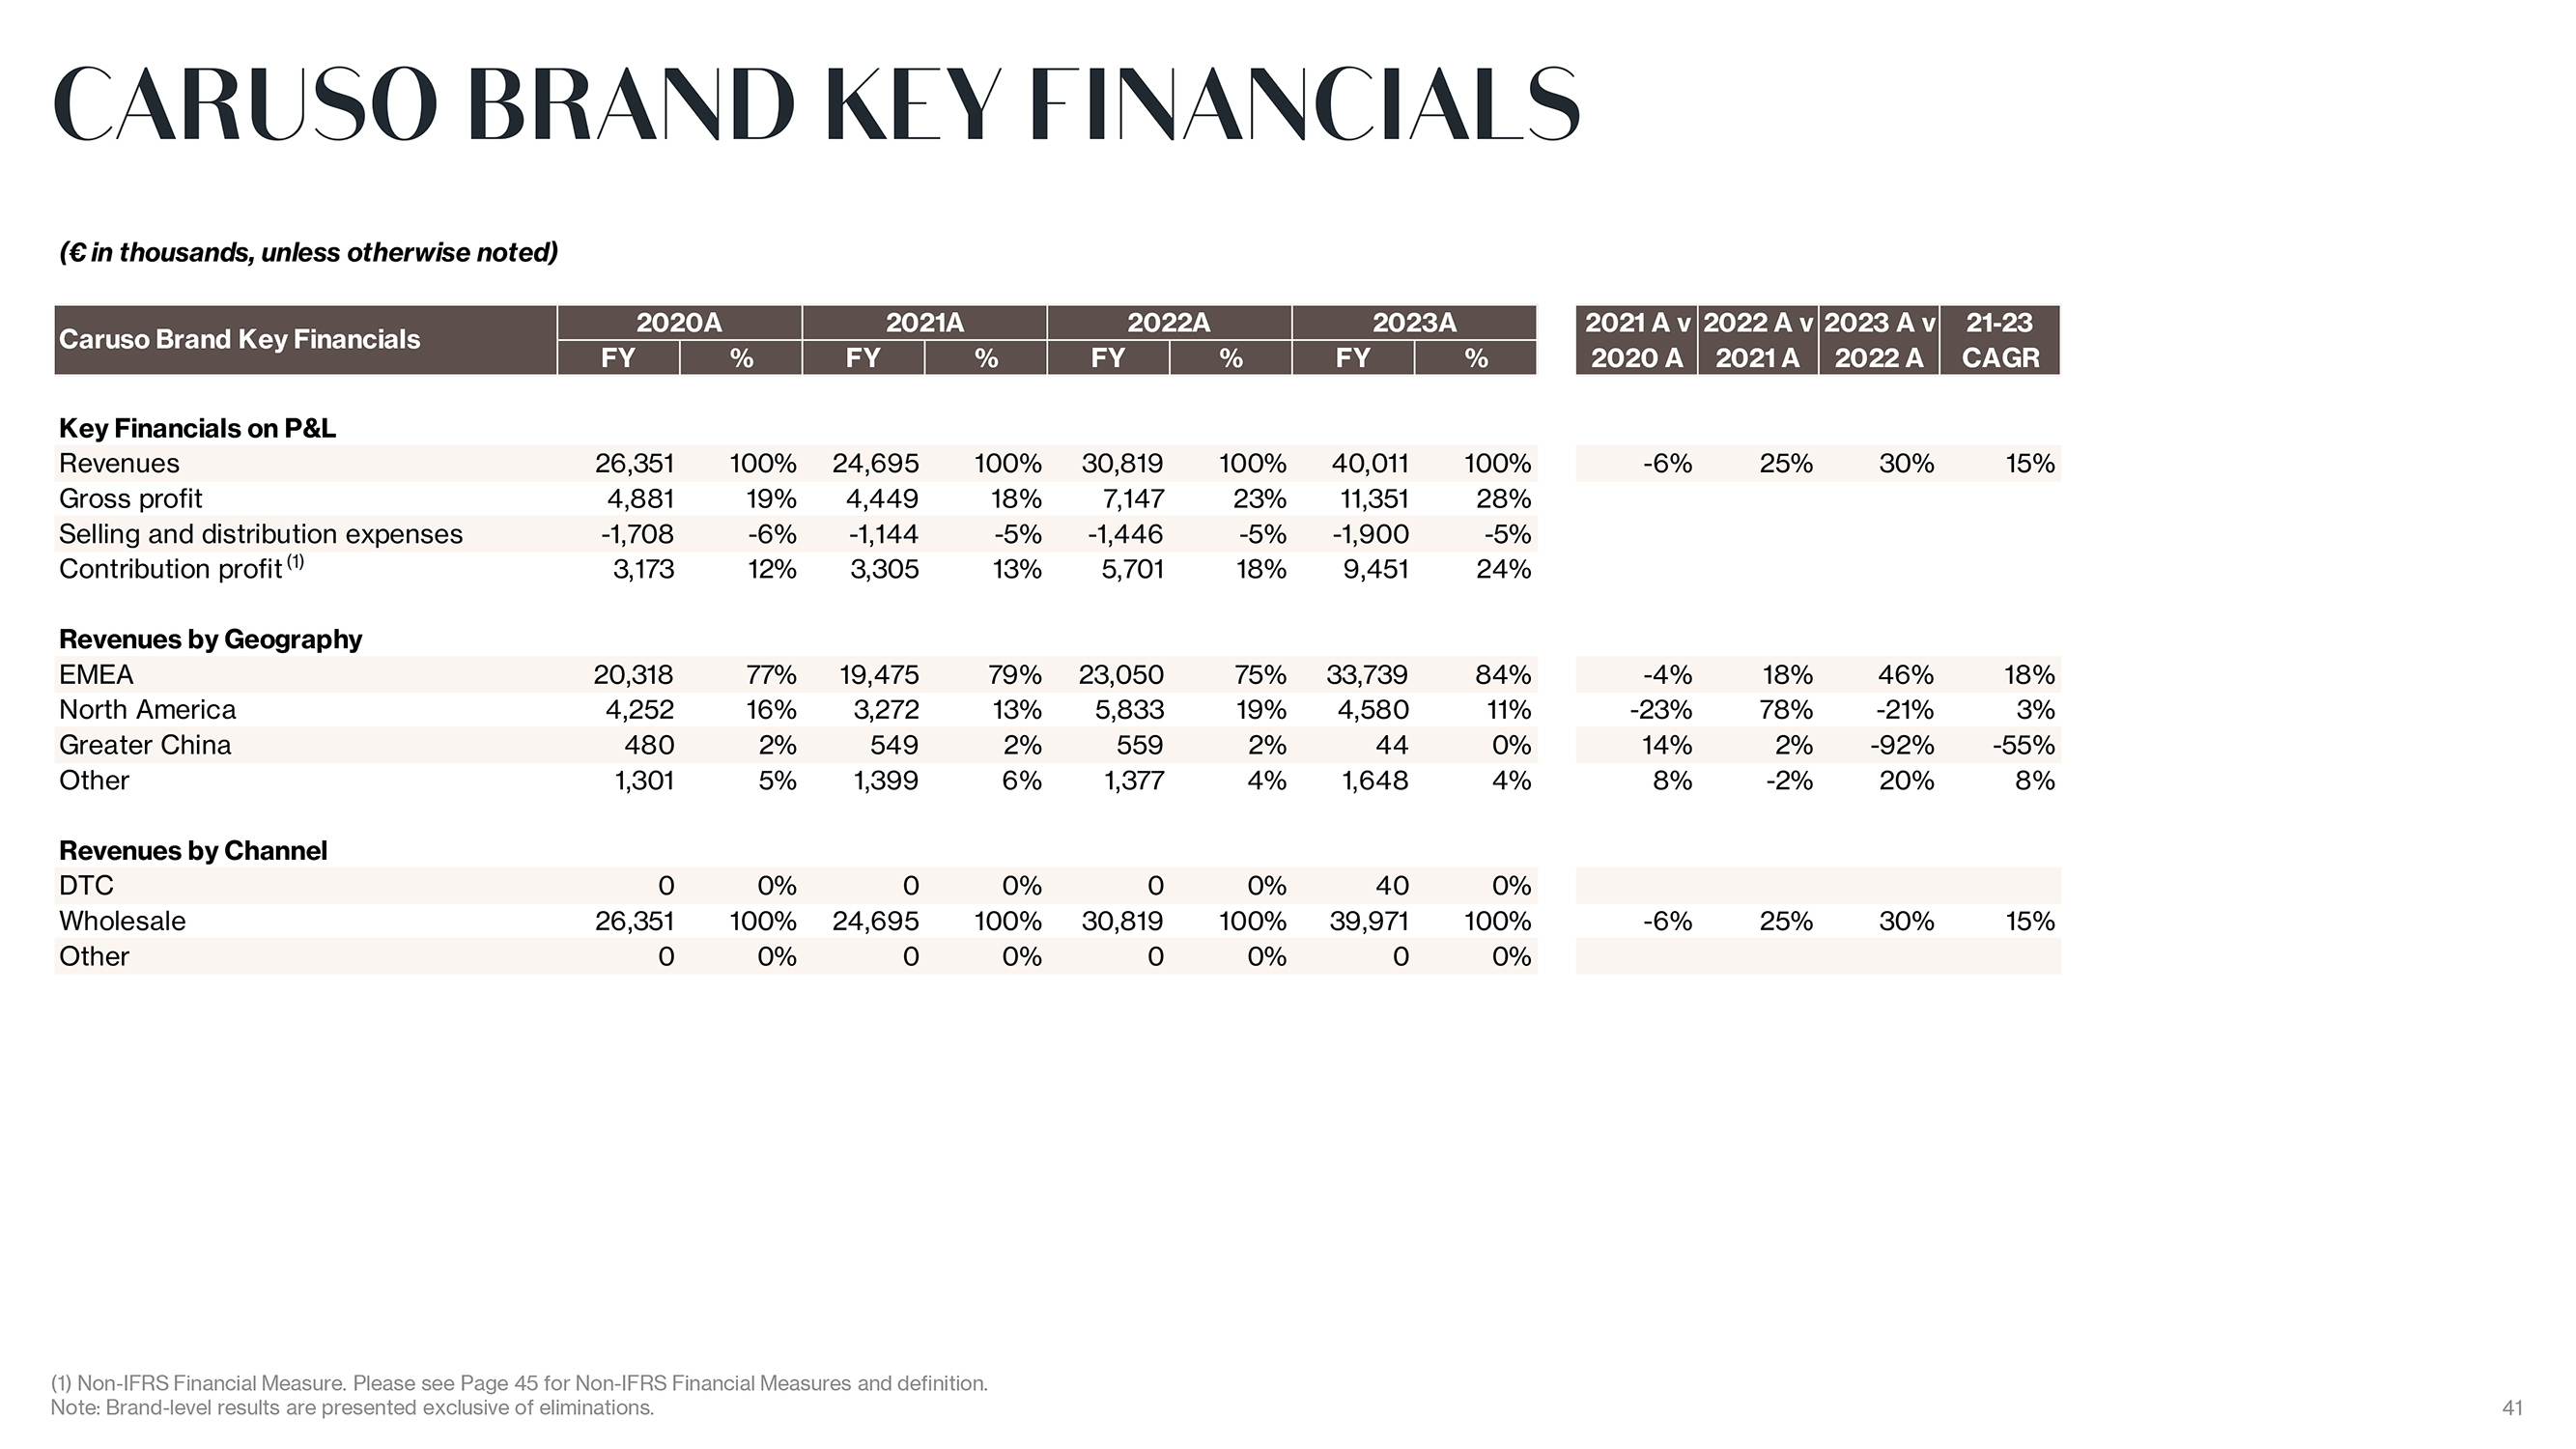
CARUSO 2023 RESULTS AND 2024 GUIDANCE KEY HIGHLIGHTS Revenue grew 30% to 40M in 2023; and Caruso brand continued its growth trend, with business nearly doubling in two years due to the appeal of its playful elegance approach to high-end tailoring, and unmatched quality and price ratio B2B Maisons business grew double digits, thanks to a concentrated portfolio of historical clients and recently acquired AAA brands performing well Growth was made possible by the expansion of the company?s production capacity with important additions to its specialized workforce Gross profit and contribution profit margins increased over 500bps from proportionally more sales coming from its own brand and efficient utilization of production capacity from increased product demand and organizational evolution EMEA, the core market grew 46%; North America decreased due to softer demand from OEM clients 2024 will see further improvement driven by the Caruso brand?s gain in market share resulting from enhancing services like made-to-measure and reorders Caruso Key Financials FY2020 FY2021 FY2022 FY2023 ( in Thousands) Revenues 26,351 24,695 30,819 40,011 YoY% -6% 25% 30% Gross profit 4,881 4,449 7,147 11,351 GP Margin% 19% 18% 23% 28% Contribution profit (1) 3,173 3,305 5,701 9,451 CP Margin% 12% 13% 18% 24% (1) Non-IFRS Financial Measure. Please see Page 45 for Non-IFRS Financial Measures and definition. Note: Brand-level results are presented exclusive of eliminations. 32

|
APPENDIX
|
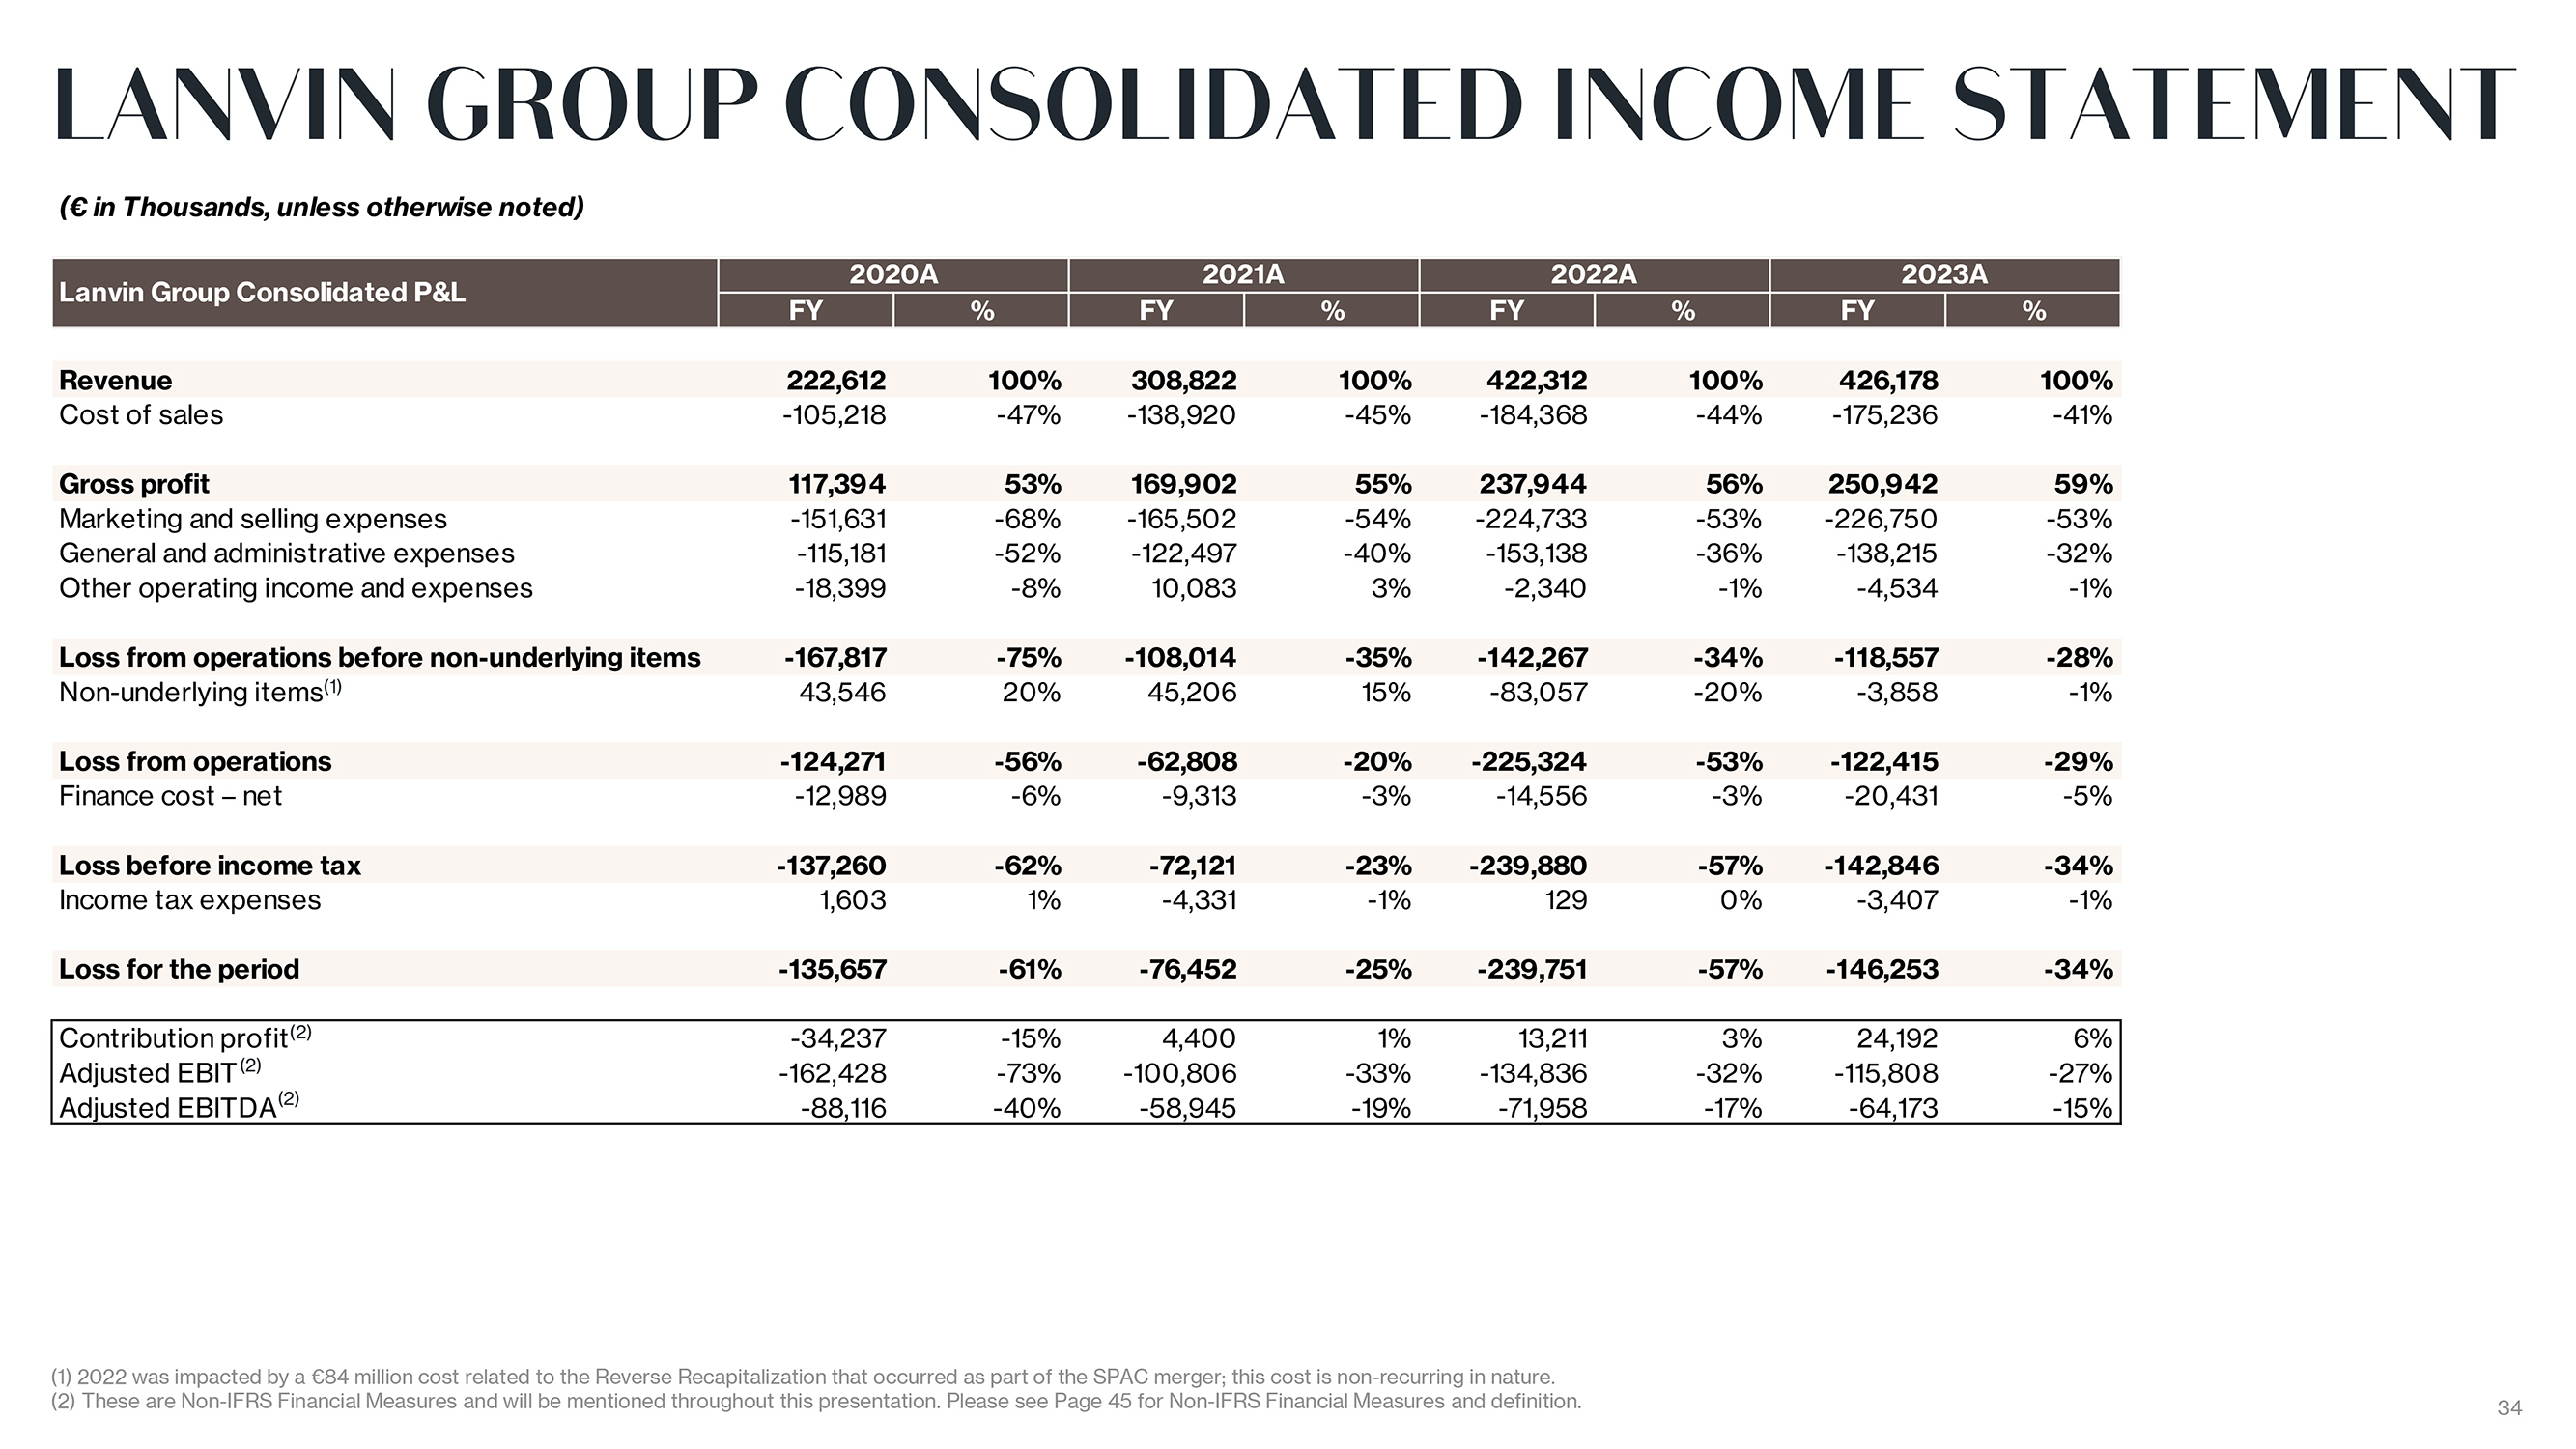
LANVIN GROUP CONSOLIDATED INCOME STATEMENT ( in Thousands, unless otherwise noted) 2020A 2021A 2022A 2023A Lanvin Group Consolidated P&L FY % FY % FY % FY % Revenue 222,612 100% 308,822 100% 422,312 100% 426,178 100% Cost of sales -105,218 -47% -138,920 -45% -184,368 -44% -175,236 -41% Gross profit 117,394 53% 169,902 55% 237,944 56% 250,942 59% Marketing and selling expenses -151,631 -68% -165,502 -54% -224,733 -53% -226,750 -53% General and administrative expenses -115,181 -52% -122,497 -40% -153,138 -36% -138,215 -32% Other operating income and expenses -18,399 -8% 10,083 3% -2,340 -1% -4,534 -1% Loss from operations before non-underlying items -167,817 -75% -108,014 -35% -142,267 -34% -118,557 -28% Non-underlying items(1) 43,546 20% 45,206 15% -83,057 -20% -3,858 -1% Loss from operations -124,271 -56% -62,808 -20% -225,324 -53% -122,415 -29% Finance cost ? net -12,989 -6% -9,313 -3% -14,556 -3% -20,431 -5% Loss before income tax -137,260 -62% -72,121 -23% -239,880 -57% -142,846 -34% Income tax expenses 1,603 1% -4,331 -1% 129 0% -3,407 -1% Loss for the period -135,657 -61% -76,452 -25% -239,751 -57% -146,253 -34% Contribution profit(2) -34,237 -15% 4,400 1% 13,211 3% 24,192 6% Adjusted EBIT(2) -162,428 -73% -100,806 -33% -134,836 -32% -115,808 -27% Adjusted EBITDA(2) -88,116 -40% -58,945 -19% -71,958 -17% -64,173 -15% (1) 2022 was impacted by a 84 million cost related to the Reverse Recapitalization that occurred as part of the SPAC merger; this cost is non-recurring in nature. (2) These are Non-IFRS Financial Measures and will be mentioned throughout this presentation. Please see Page 45 for Non-IFRS Financial Measures and definition. 34
|
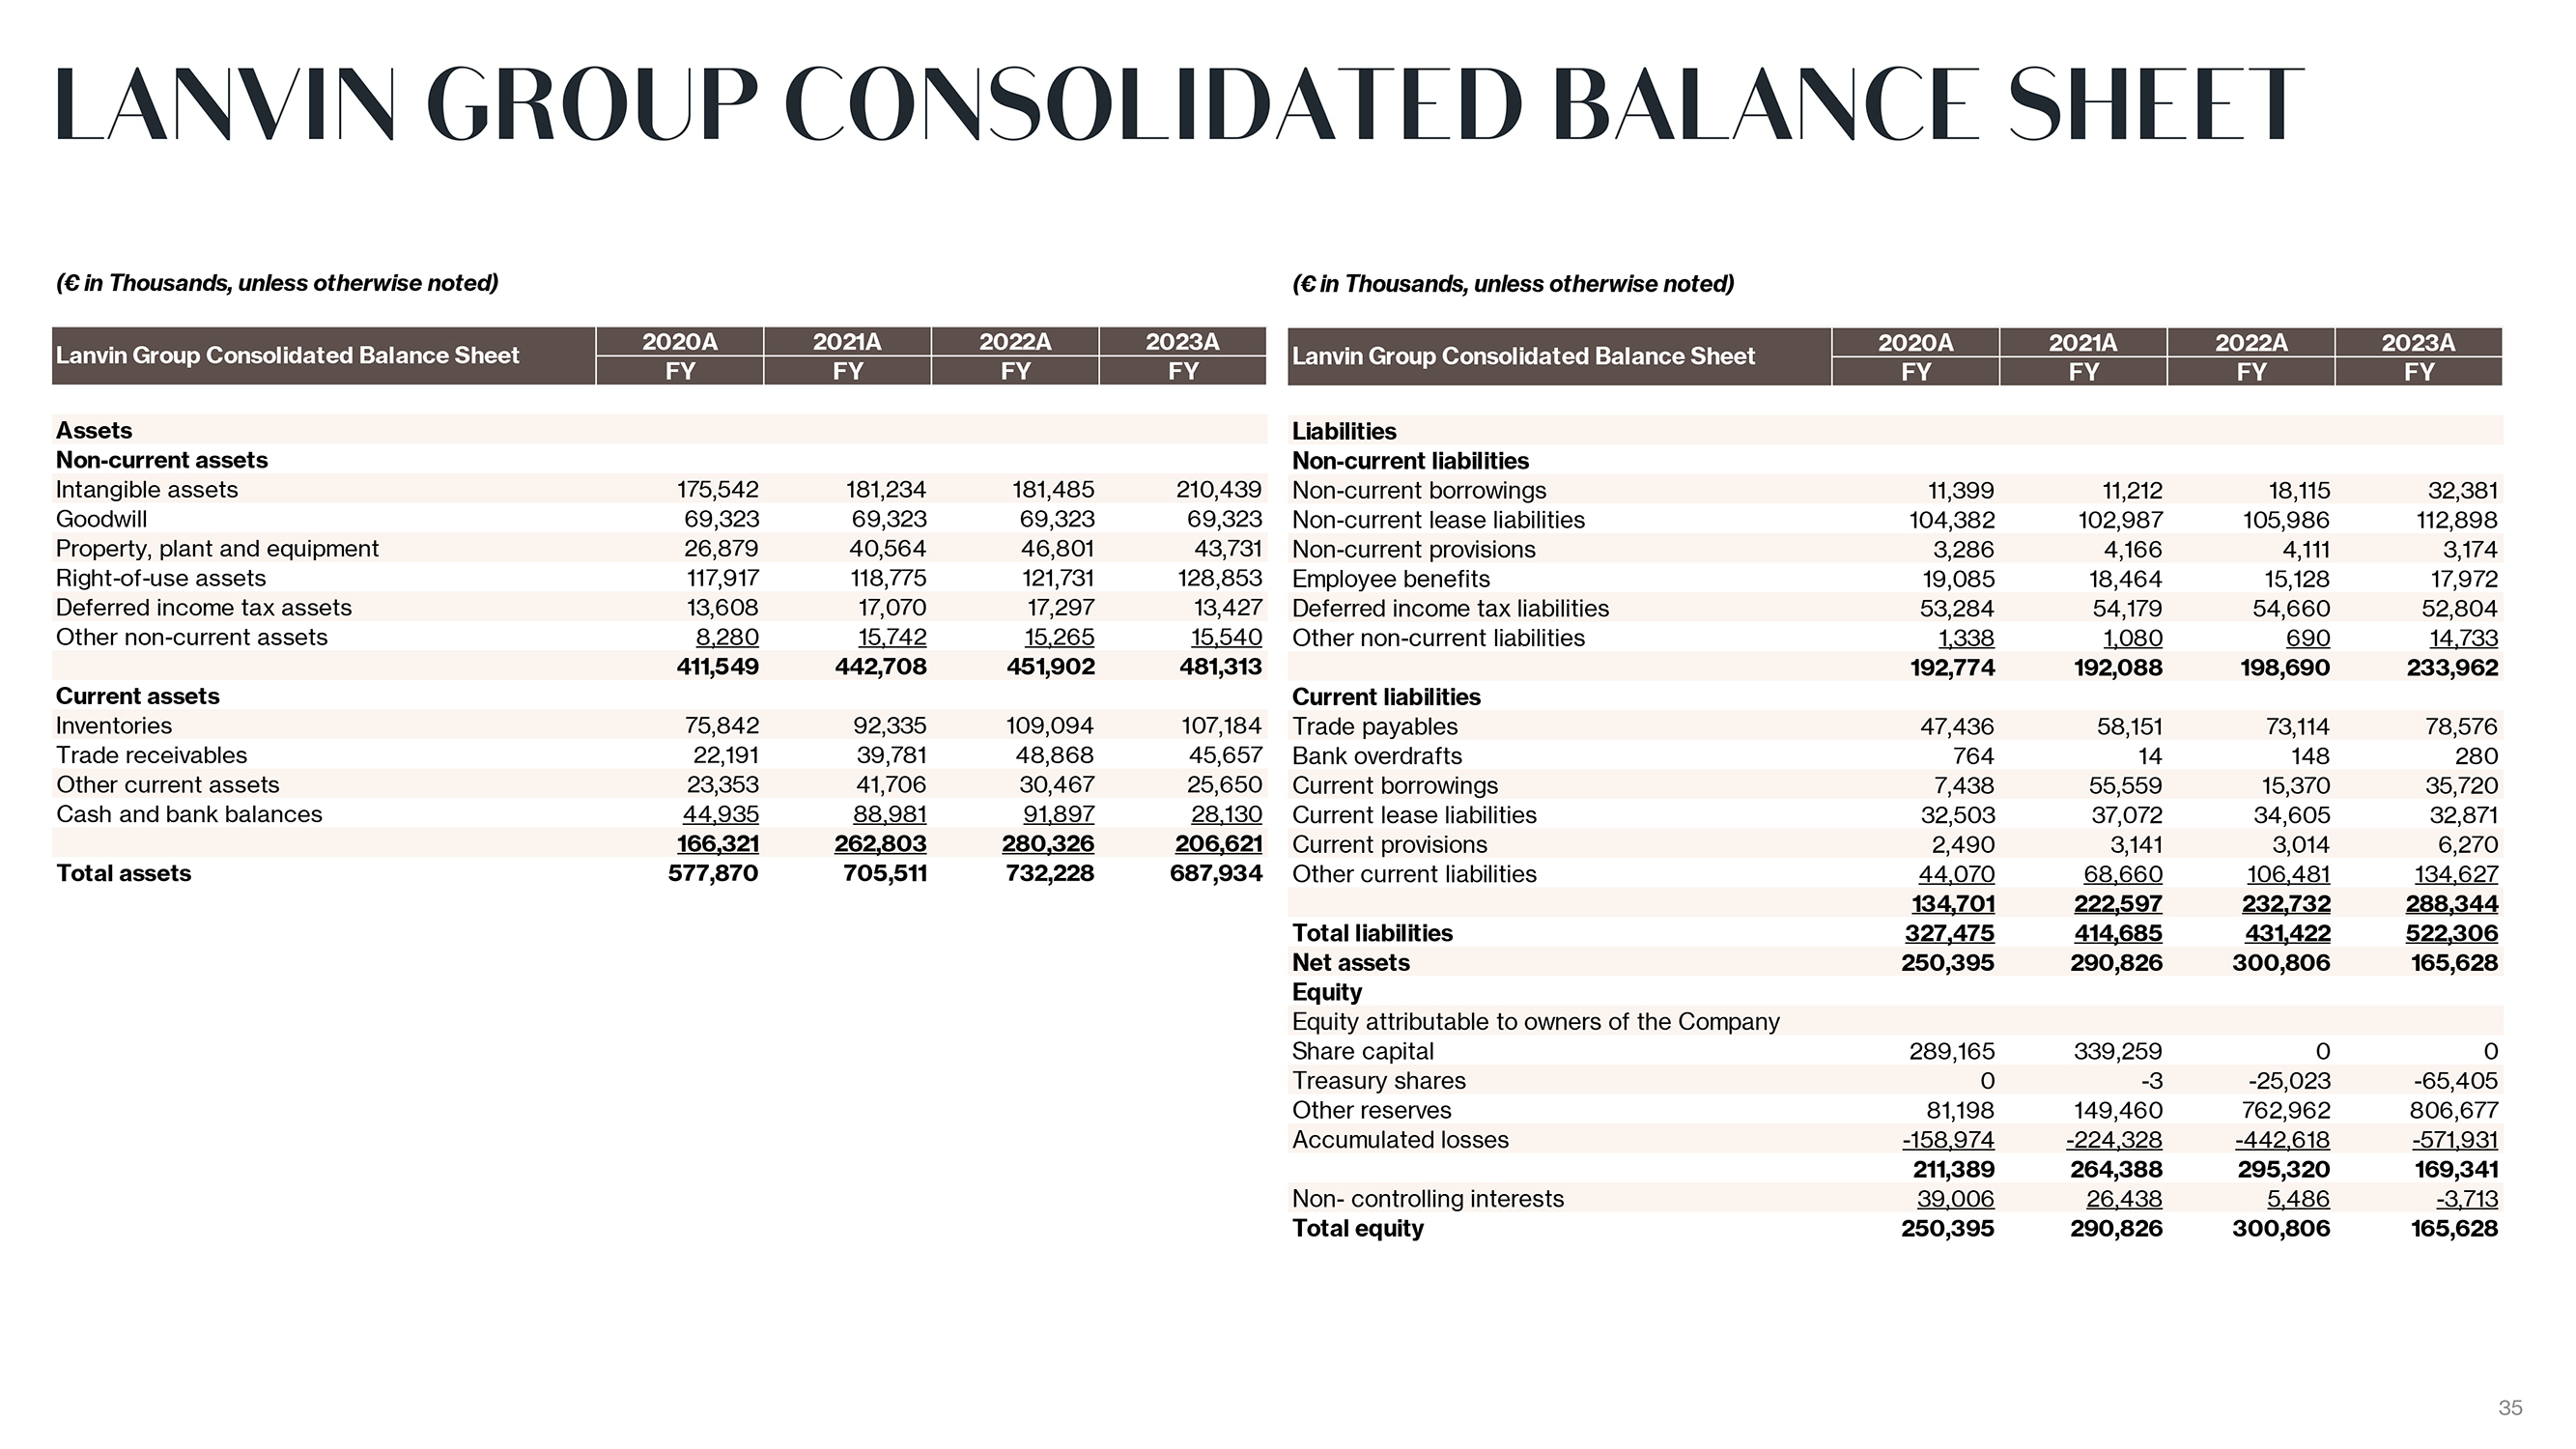
LANVIN GROUP CONSOLIDATED BALANCE SHEET ( in Thousands, unless otherwise noted) 2020A 2021A 2022A 2023A Lanvin Group Consolidated Balance Sheet FY FY FY FY Assets Non-current assets Intangible assets 175,542 181,234 181,485 210,439 Goodwill 69,323 69,323 69,323 69,323 Property, plant and equipment 26,879 40,564 46,801 43,731 Right-of-use assets 117,917 118,775 121,731 128,853 Deferred income tax assets 13,608 17,070 17,297 13,427 Other non-current assets 8,280 15,742 15,265 15,540 411,549 442,708 451,902 481,313 Current assets Inventories 75,842 92,335 109,094 107,184 Trade receivables 22,191 39,781 48,868 45,657 Other current assets 23,353 41,706 30,467 25,650 Cash and bank balances 44,935 88,981 91,897 28,130 166,321 262,803 280,326 206,621 Total assets 577,870 705,511 732,228 687,934 ( in Thousands, unless otherwise noted) 2020A 2021A 2022A 2023A Lanvin Group Consolidated Balance Sheet FY FY FY FY Liabilities Non-current liabilities Non-current borrowings 11,399 11,212 18,115 32,381 Non-current lease liabilities 104,382 102,987 105,986 112,898 Non-current provisions 3,286 4,166 4,111 3,174 Employee benefits 19,085 18,464 15,128 17,972 Deferred income tax liabilities 53,284 54,179 54,660 52,804 Other non-current liabilities 1,338 1,080 690 14,733 192,774 192,088 198,690 233,962 Current liabilities Trade payables 47,436 58,151 73,114 78,576 Bank overdrafts 764 14 148 280 Current borrowings 7,438 55,559 15,370 35,720 Current lease liabilities 32,503 37,072 34,605 32,871 Current provisions 2,490 3,141 3,014 6,270 Other current liabilities 44,070 68,660 106,481 134,627 134,701 222,597 232,732 288,344 Total liabilities 327,475 414,685 431,422 522,306 Net assets 250,395 290,826 300,806 165,628 Equity Equity attributable to owners of the Company Share capital 289,165 339,259 0 0 Treasury shares 0 -3 -25,023 -65,405 Other reserves 81,198 149,460 762,962 806,677 Accumulated losses -158,974 -224,328 -442,618 -571,931 211,389 264,388 295,320 169,341 Non- controlling interests 39,006 26,438 5,486 -3,713 Total equity 250,395 290,826 300,806 165,628 35
|
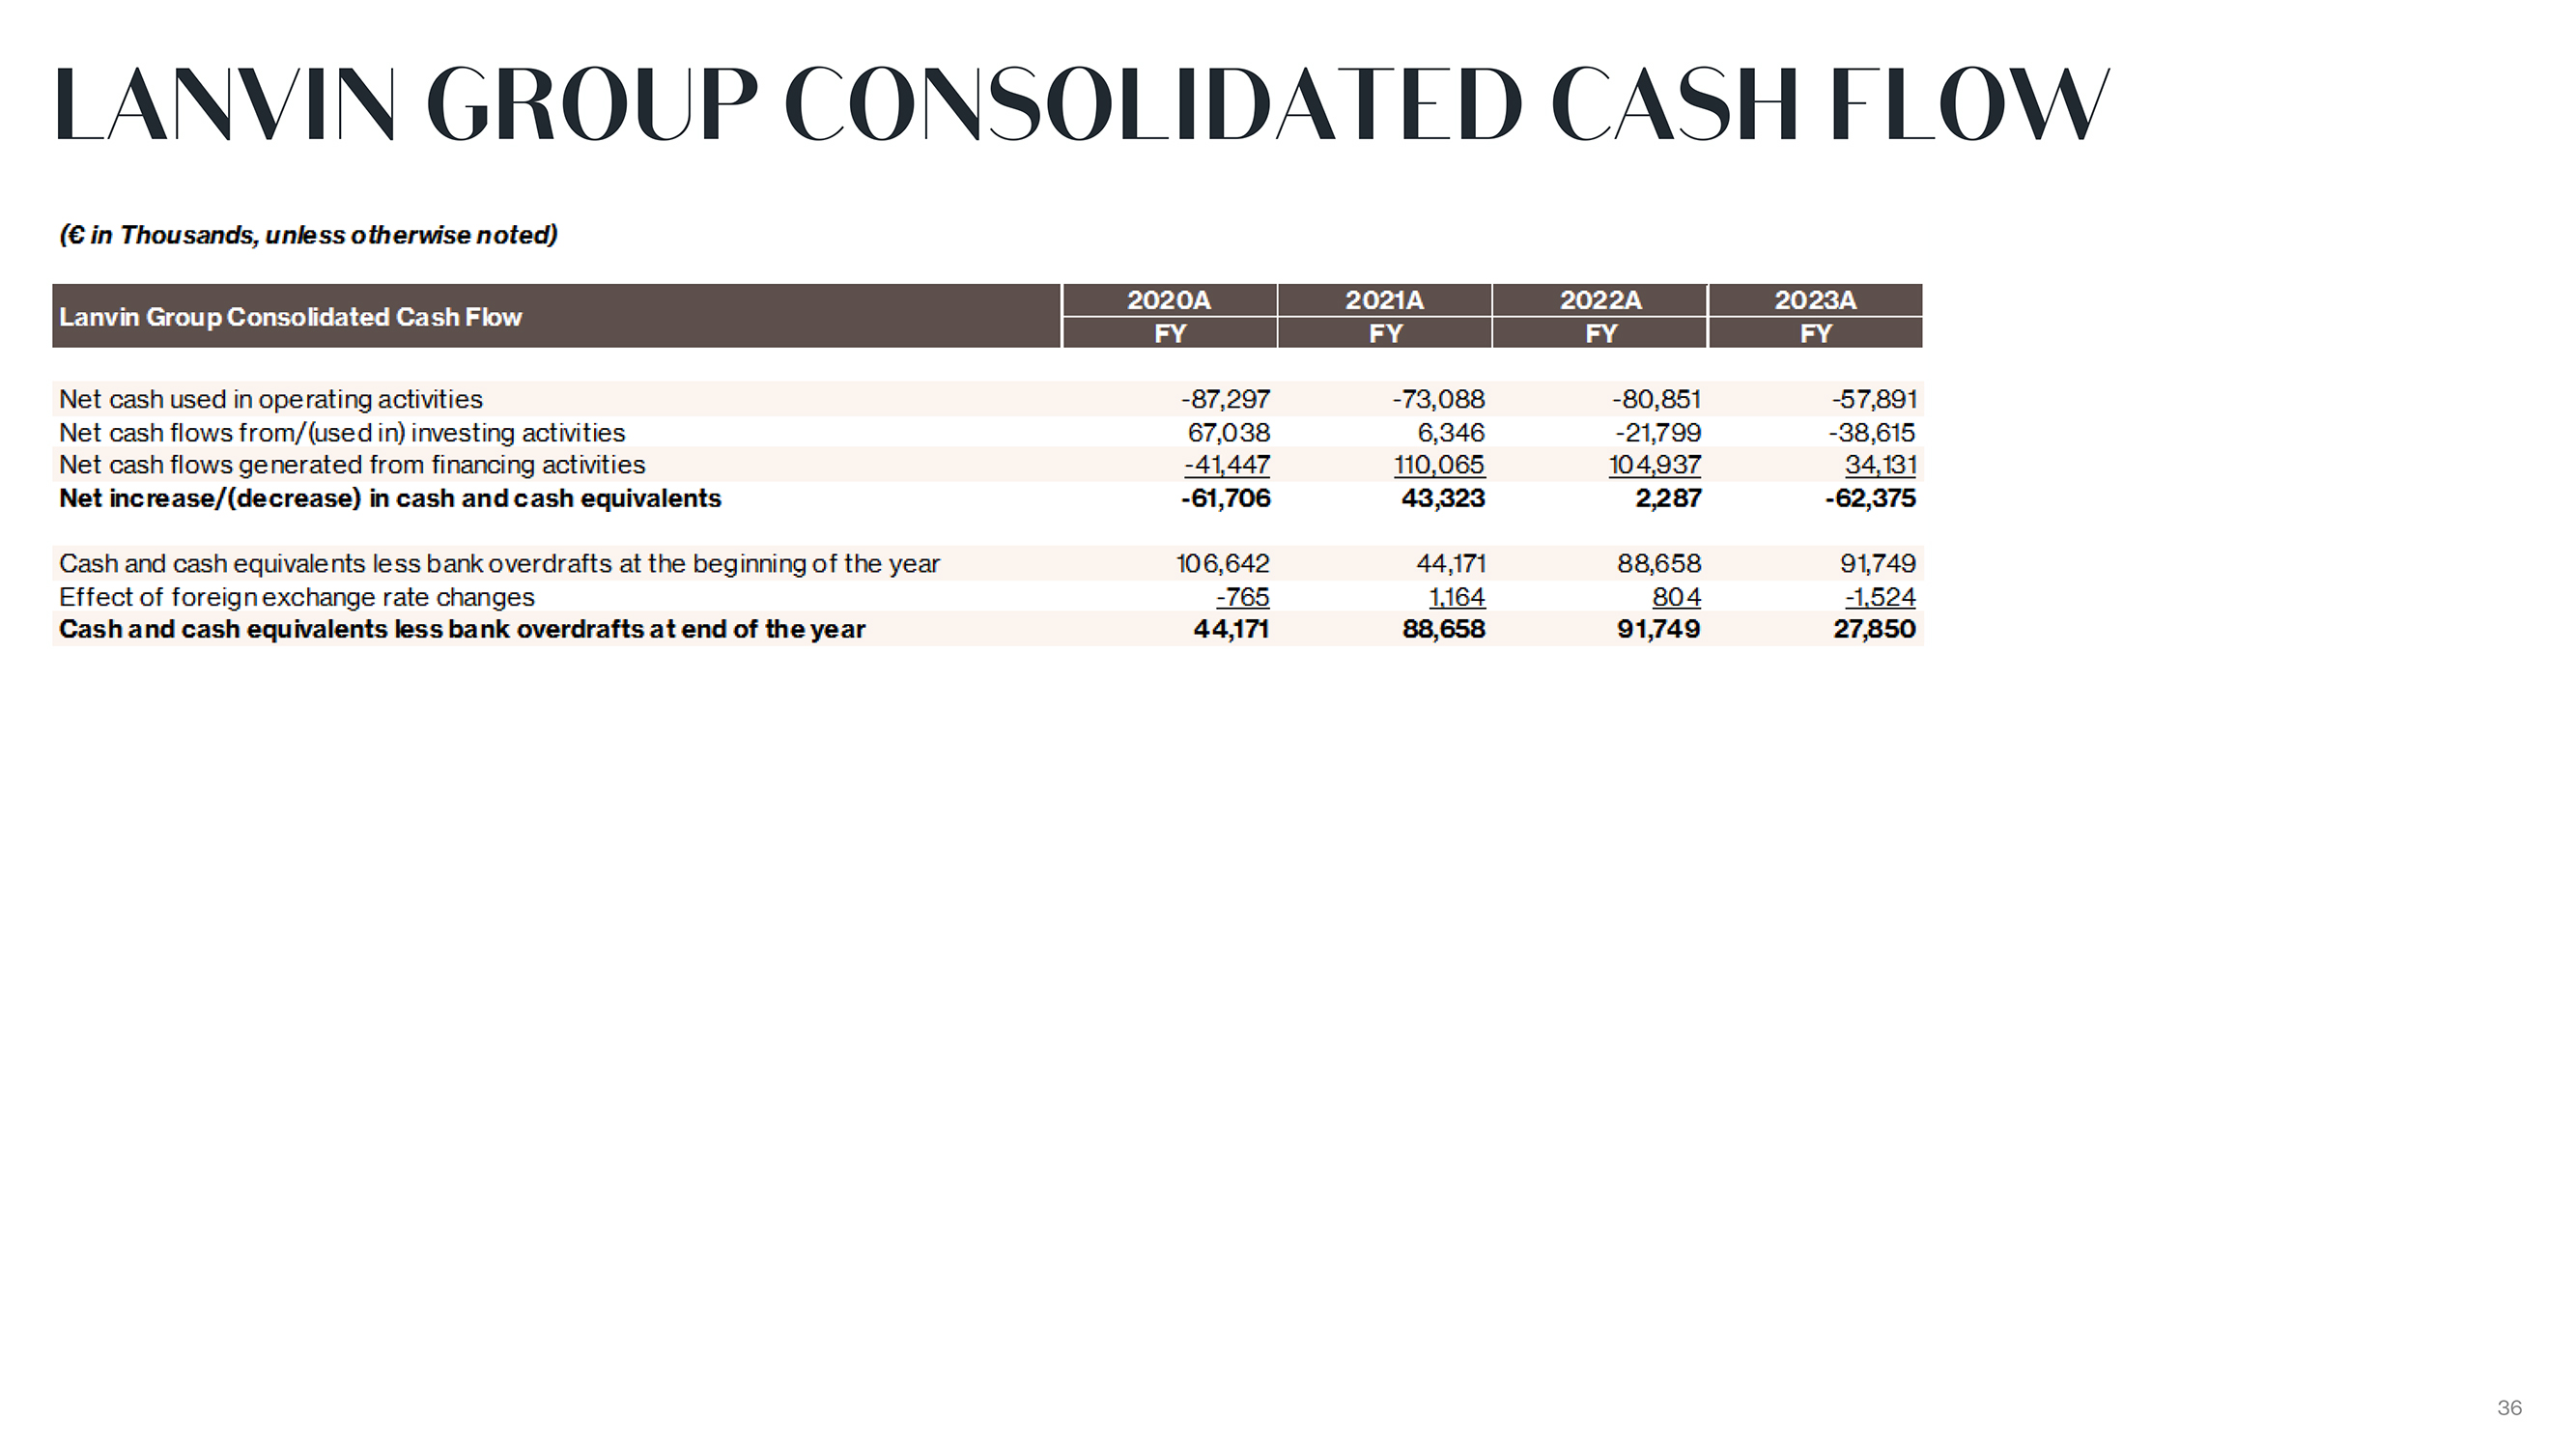
LANVIN GROUP CONSOLIDATED CASH FLOW 36
|
LANVIN BRAND KEY FINANCIALS ( in thousands, unless otherwise noted) 2020A 2021A 2022A 2023A 2021 A v 2022 A v 2023 A v 20-23 Lanvin Brand Key Financials FY % FY % FY % FY % 2020 A 2021 A 2022 A CAGR Key Financials on P&L Revenues 34,989 100% 72,872 100% 119,847 100% 111,740 100% 108% 64% -7% 47% Gross profit 13,573 39% 34,028 47% 60,513 50% 64,547 58% Selling and distribution expenses -43,147 -123% -58,124 -80% -75,852 -63% -76,533 -68% Contribution profit(1) -29,574 -85% -24,096 -33% -15,339 -13% -11,986 -11% Revenues by Geography EMEA 18,501 53% 31,683 43% 61,092 51% 51,585 46% 71% 93% -16% 41% North America 4,525 13% 15,964 22% 28,524 24% 28,210 25% 253% 79% -1% 84% Greater China 10,054 29% 23,541 32% 25,742 21% 24,649 22% 134% 9% -4% 35% Other 1,909 5% 1,684 2% 4,489 4% 7,296 7% -12% 167% 63% 56% Revenues by Channel DTC 16,959 48% 46,134 63% 58,536 49% 55,357 50% 172% 27% -5% 48% Wholesale 12,974 37% 21,161 29% 51,898 43% 39,933 36% 63% 145% -23% 45% Other 5,056 14% 5,577 8% 9,413 8% 16,450 15% 10% 69% 75% 48% (1) Non-IFRS Financial Measure. Please see Page 45 for Non-IFRS Financial Measures and definition. Note: Brand-level results are presented exclusive of eliminations. 37
|
WOLFORD BRAND KEY FINANCIALS ( in thousands, unless otherwise noted) 2020A 2021A 2022A 2023A 2021 A v 2022 A v 2023 A v 20-23 Wolford Brand Key Financials FY % FY % FY % FY % 2020 A 2021 A 2022 A CAGR Key Financials on P&L Revenues 95,384 100% 109,332 100% 125,514 100% 126,280 100% 15% 15% 1% 10% Gross profit 65,865 69% 79,070 72% 86,228 69% 83,339 66% Selling and distribution expenses -65,006 -68% -59,351 -54% -81,901 -65% -79,060 -63% Contribution profit(1) 859 1% 19,719 18% 4,327 3% 4,279 3% Revenues by Geography EMEA 73,794 77% 79,236 72% 86,501 69% 85,084 67% 7% 9% -2% 5% North America 16,367 17% 21,824 20% 31,535 25% 31,310 25% 33% 44% -1% 24% Greater China 4,867 5% 7,289 7% 6,791 5% 9,176 7% 50% -7% 35% 24% Other 356 0% 983 1% 687 1% 710 1% 176% -30% 3% 26% Revenues by Channel DTC 62,323 65% 74,622 68% 90,408 72% 87,352 69% 20% 21% -3% 12% Wholesale 33,061 35% 34,710 32% 34,426 27% 38,071 30% 5% -1% 11% 5% Other 0 0% 0 0% 680 1% 857 1% 26% (1) Non-IFRS Financial Measure. Please see Page 45 for Non-IFRS Financial Measures and definition. Note: Brand-level results are presented exclusive of eliminations. 38
|
SERGIO ROSSI BRAND KEY FINANCIALS ( in thousands, unless otherwise noted) 2021PF 2021A 2022A 2023A 2022 A v 2022 A v 2023 A v 21-23 Sergio Rossi Brand Key Financials FY % FY % FY % FY % 2021 PF 2021 A 2022 A CAGR Key Financials on P&L Revenues 59,206 100% 28,737 100% 61,929 100% 59,518 100% 5% 116% -4% 44% Gross profit 13,319 46% 31,048 50% 30,435 51% Selling and distribution expenses -9,489 -33% -24,502 -40% -23,097 -39% Contribution profit(1) 3,830 13% 6,546 11% 7,338 12% Revenues by Geography EMEA 33,435 56% 17,009 59% 35,023 57% 31,801 53% 5% 106% -9% 37% North America 1,290 2% 107 0% 1,181 2% 2,006 3% -8% 1004% 70% 333% Greater China 11,331 19% 4,595 16% 10,809 17% 11,872 20% -5% 135% 10% 61% Other 13,150 22% 7,027 24% 14,916 24% 13,838 23% 13% 112% -7% 40% Revenues by Channel DTC 28,911 49% 14,349 50% 31,910 52% 32,962 55% 10% 122% 3% 52% Wholesale 30,295 51% 14,389 50% 30,019 48% 26,556 45% -1% 109% -12% 36% Other 0 0% 0 0% 0 0% 0 0% (1) Non-IFRS Financial Measure. Please see Page 45 for Non-IFRS Financial Measures and definition. Note: Brand-level results are presented exclusive of eliminations. 39

|
ST. JOHN BRAND KEY FINANCIALS ( in thousands, unless otherwise noted) 2020A 2021A 2022A 2023A 2021 A v 2022 A v 2023 A v 20-23 St.John Brand Key Financials FY % FY % FY % FY % 2020 A 2021 A 2022 A CAGR Key Financials on P&L Revenues 66,512 100% 73,094 100% 85,884 100% 90,398 100% 10% 17% 5% 11% Gross profit 32,987 50% 38,987 53% 52,642 61% 57,374 63% Selling and distribution expenses -42,273 -64% -37,697 -52% -42,498 -49% -46,695 -52% Contribution profit(1) -9,286 -14% 1,290 2% 10,144 12% 10,679 12% Revenues by Geography EMEA 2,254 3% 779 1% 1,224 1% 1,541 2% -65% 57% 26% -12% North America 60,528 91% 65,534 90% 78,774 92% 81,382 90% 8% 20% 3% 10% Greater China 2,919 4% 6,467 9% 5,153 6% 7,161 8% 122% -20% 39% 35% Other 811 1% 315 0% 733 1% 314 0% -61% 133% -57% -27% Revenues by Channel DTC 44,778 67% 51,581 71% 66,412 77% 71,007 79% 15% 29% 7% 17% Wholesale 21,734 33% 21,513 29% 19,077 22% 19,126 21% -1% -11% 0% -4% Other 0 0% 0 0% 395 0% 265 0% -33% (1) Non-IFRS Financial Measure. Please see Page 45 for Non-IFRS Financial Measures and definition. Note: Brand-level results are presented exclusive of eliminations. 40
|
CARUSO BRAND KEY FINANCIALS ( in thousands, unless otherwise noted) 2020A 2021A 2022A 2023A 2021 A v 2022 A v 2023 A v 21-23 Caruso Brand Key Financials FY % FY % FY % FY % 2020 A 2021 A 2022 A CAGR Key Financials on P&L Revenues 26,351 100% 24,695 100% 30,819 100% 40,011 100% -6% 25% 30% 15% Gross profit 4,881 19% 4,449 18% 7,147 23% 11,351 28% Selling and distribution expenses -1,708 -6% -1,144 -5% -1,446 -5% -1,900 -5% Contribution profit(1) 3,173 12% 3,305 13% 5,701 18% 9,451 24% Revenues by Geography EMEA 20,318 77% 19,475 79% 23,050 75% 33,739 84% -4% 18% 46% 18% North America 4,252 16% 3,272 13% 5,833 19% 4,580 11% -23% 78% -21% 3% Greater China 480 2% 549 2% 559 2% 44 0% 14% 2% -92% -55% Other 1,301 5% 1,399 6% 1,377 4% 1,648 4% 8% -2% 20% 8% Revenues by Channel DTC 0 0% 0 0% 0 0% 40 0% Wholesale 26,351 100% 24,695 100% 30,819 100% 39,971 100% -6% 25% 30% 15% Other 0 0% 0 0% 0 0% 0 0% (1) Non-IFRS Financial Measure. Please see Page 45 for Non-IFRS Financial Measures and definition. Note: Brand-level results are presented exclusive of eliminations. 41
|
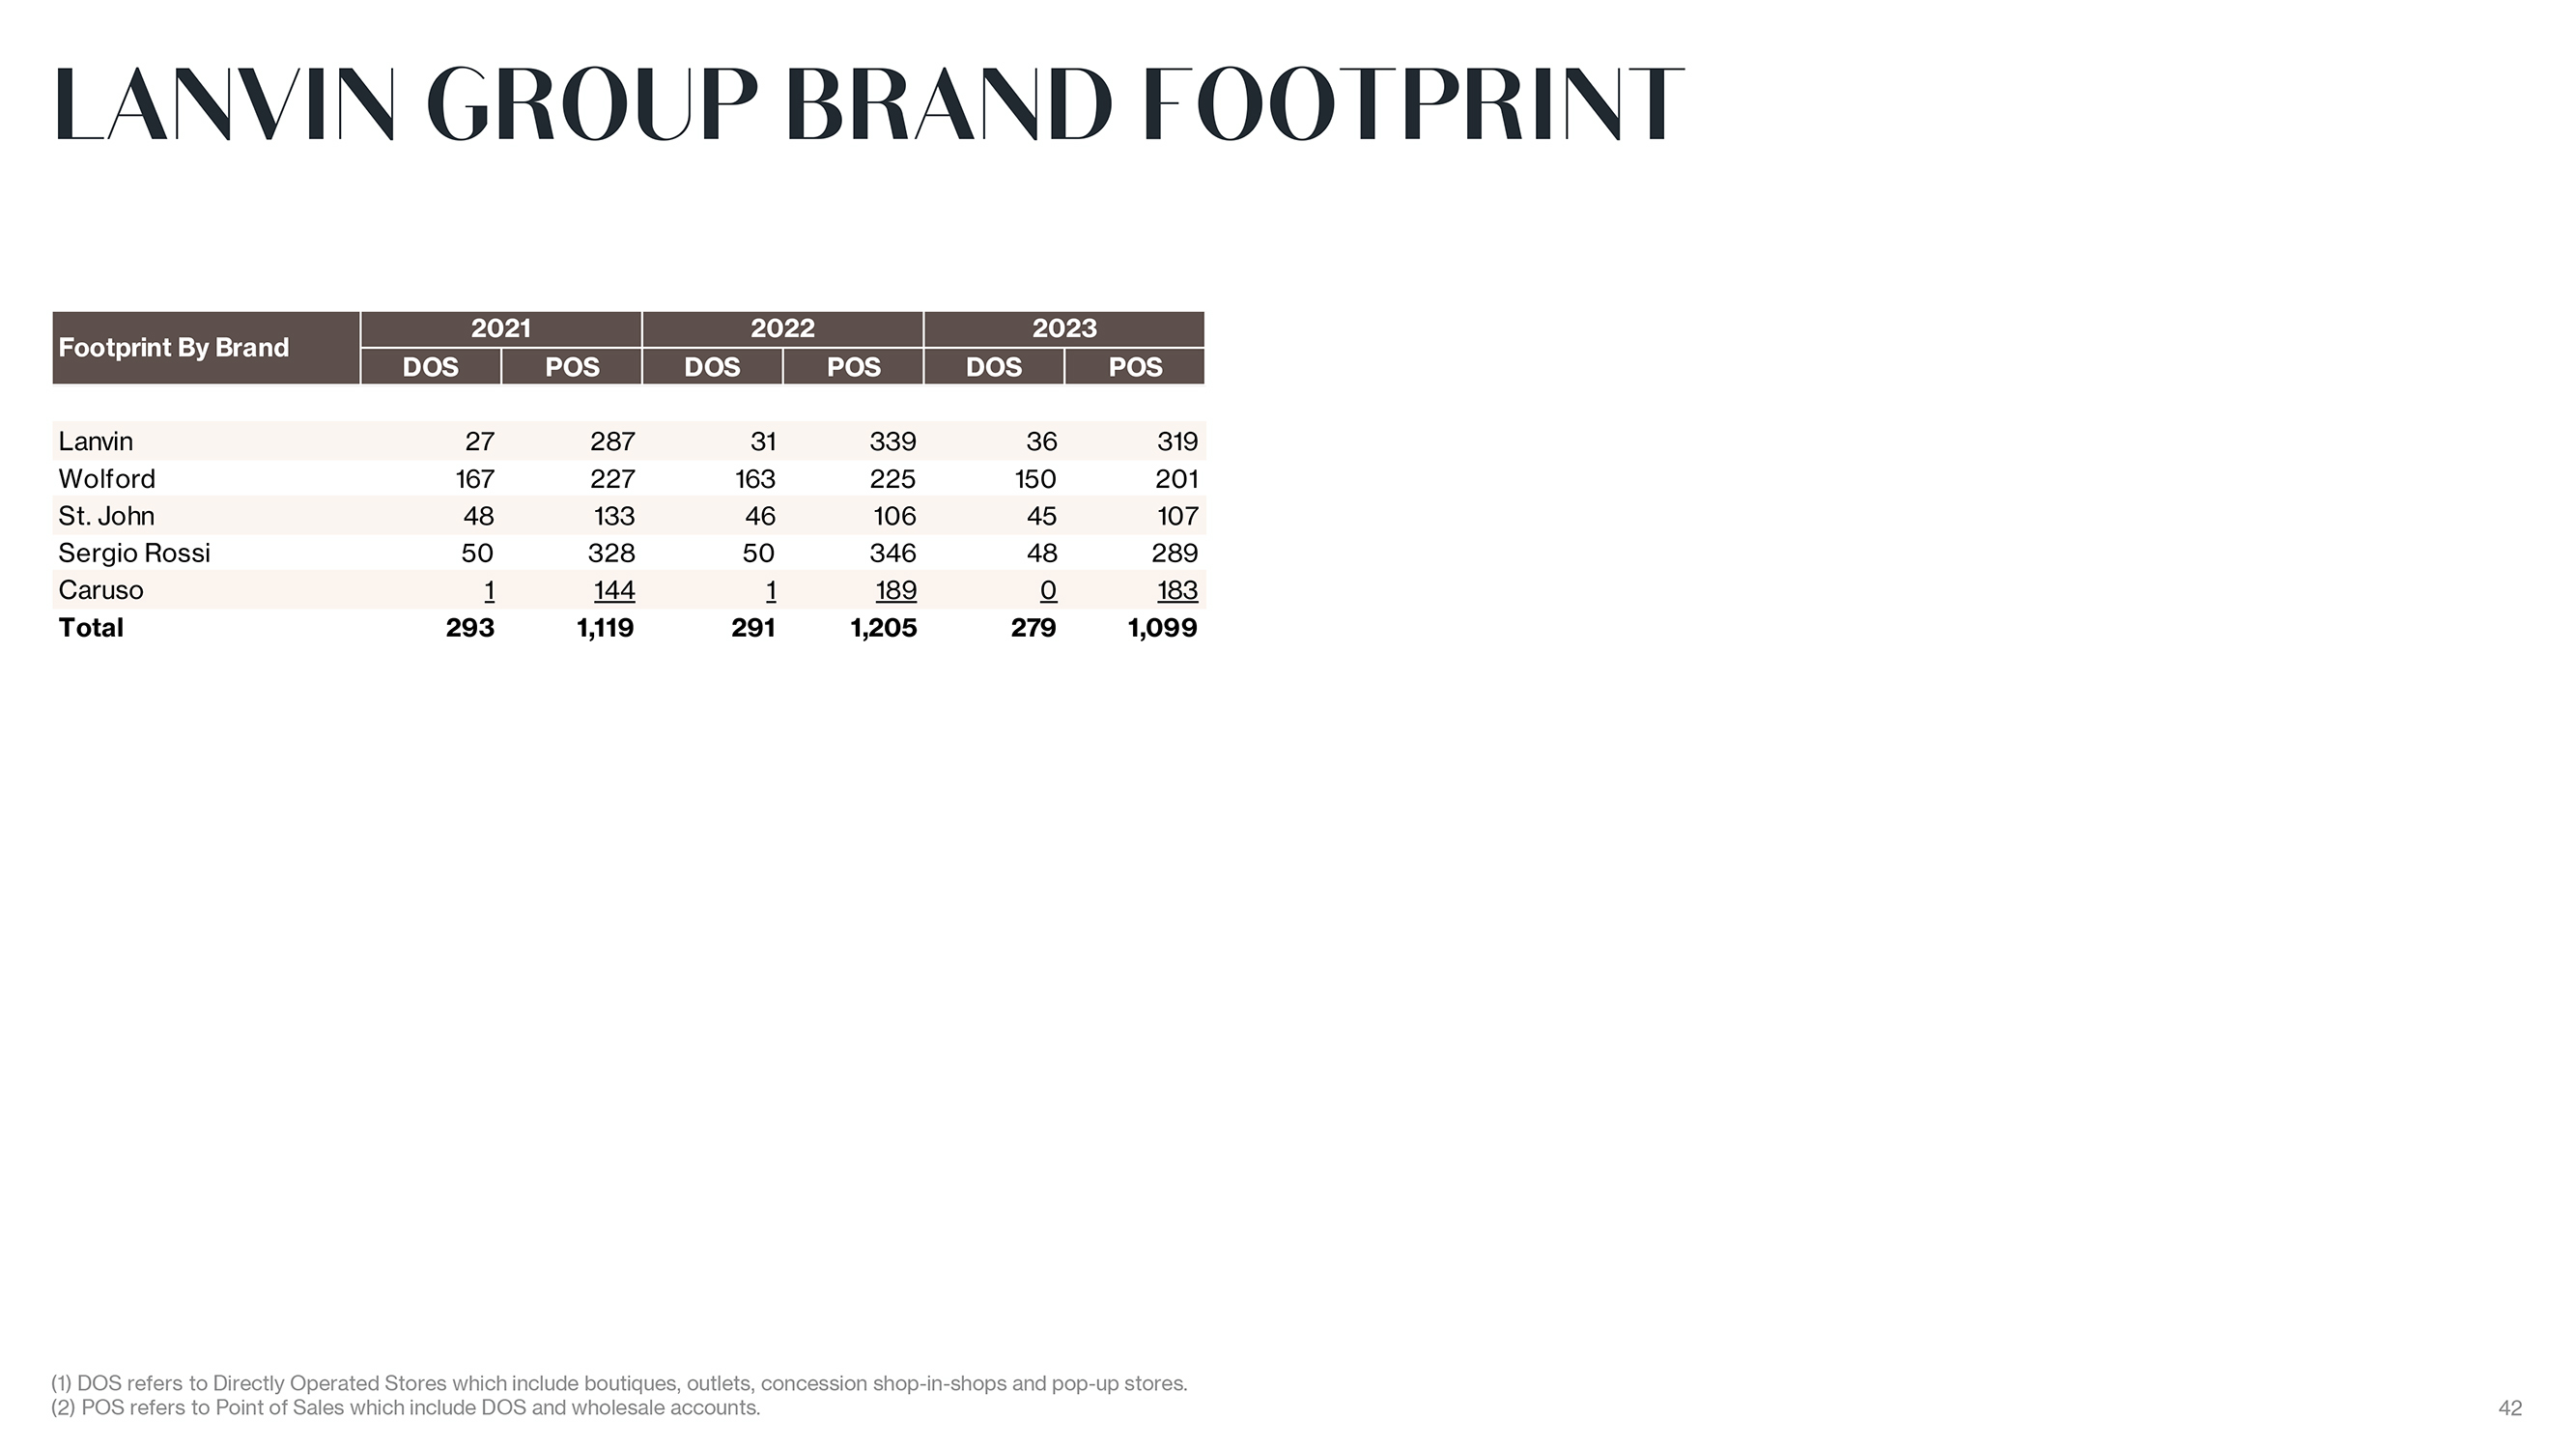
LANVIN GROUP BRAND FOOTPRINT 2021 2022 2023 Footprint By Brand DOS POS DOS POS DOS POS Lanvin 27 287 31 339 36 319 Wolford 167 227 163 225 150 201 St. John 48 133 46 106 45 107 Sergio Rossi 50 328 50 346 48 289 Caruso 1 144 1 189 0 183 Total 293 1,119 291 1,205 279 1,099 (1) DOS refers to Directly Operated Stores which include boutiques, outlets, concession shop-in-shops and pop-up stores. (2) POS refers to Point of Sales which include DOS and wholesale accounts. 42
|
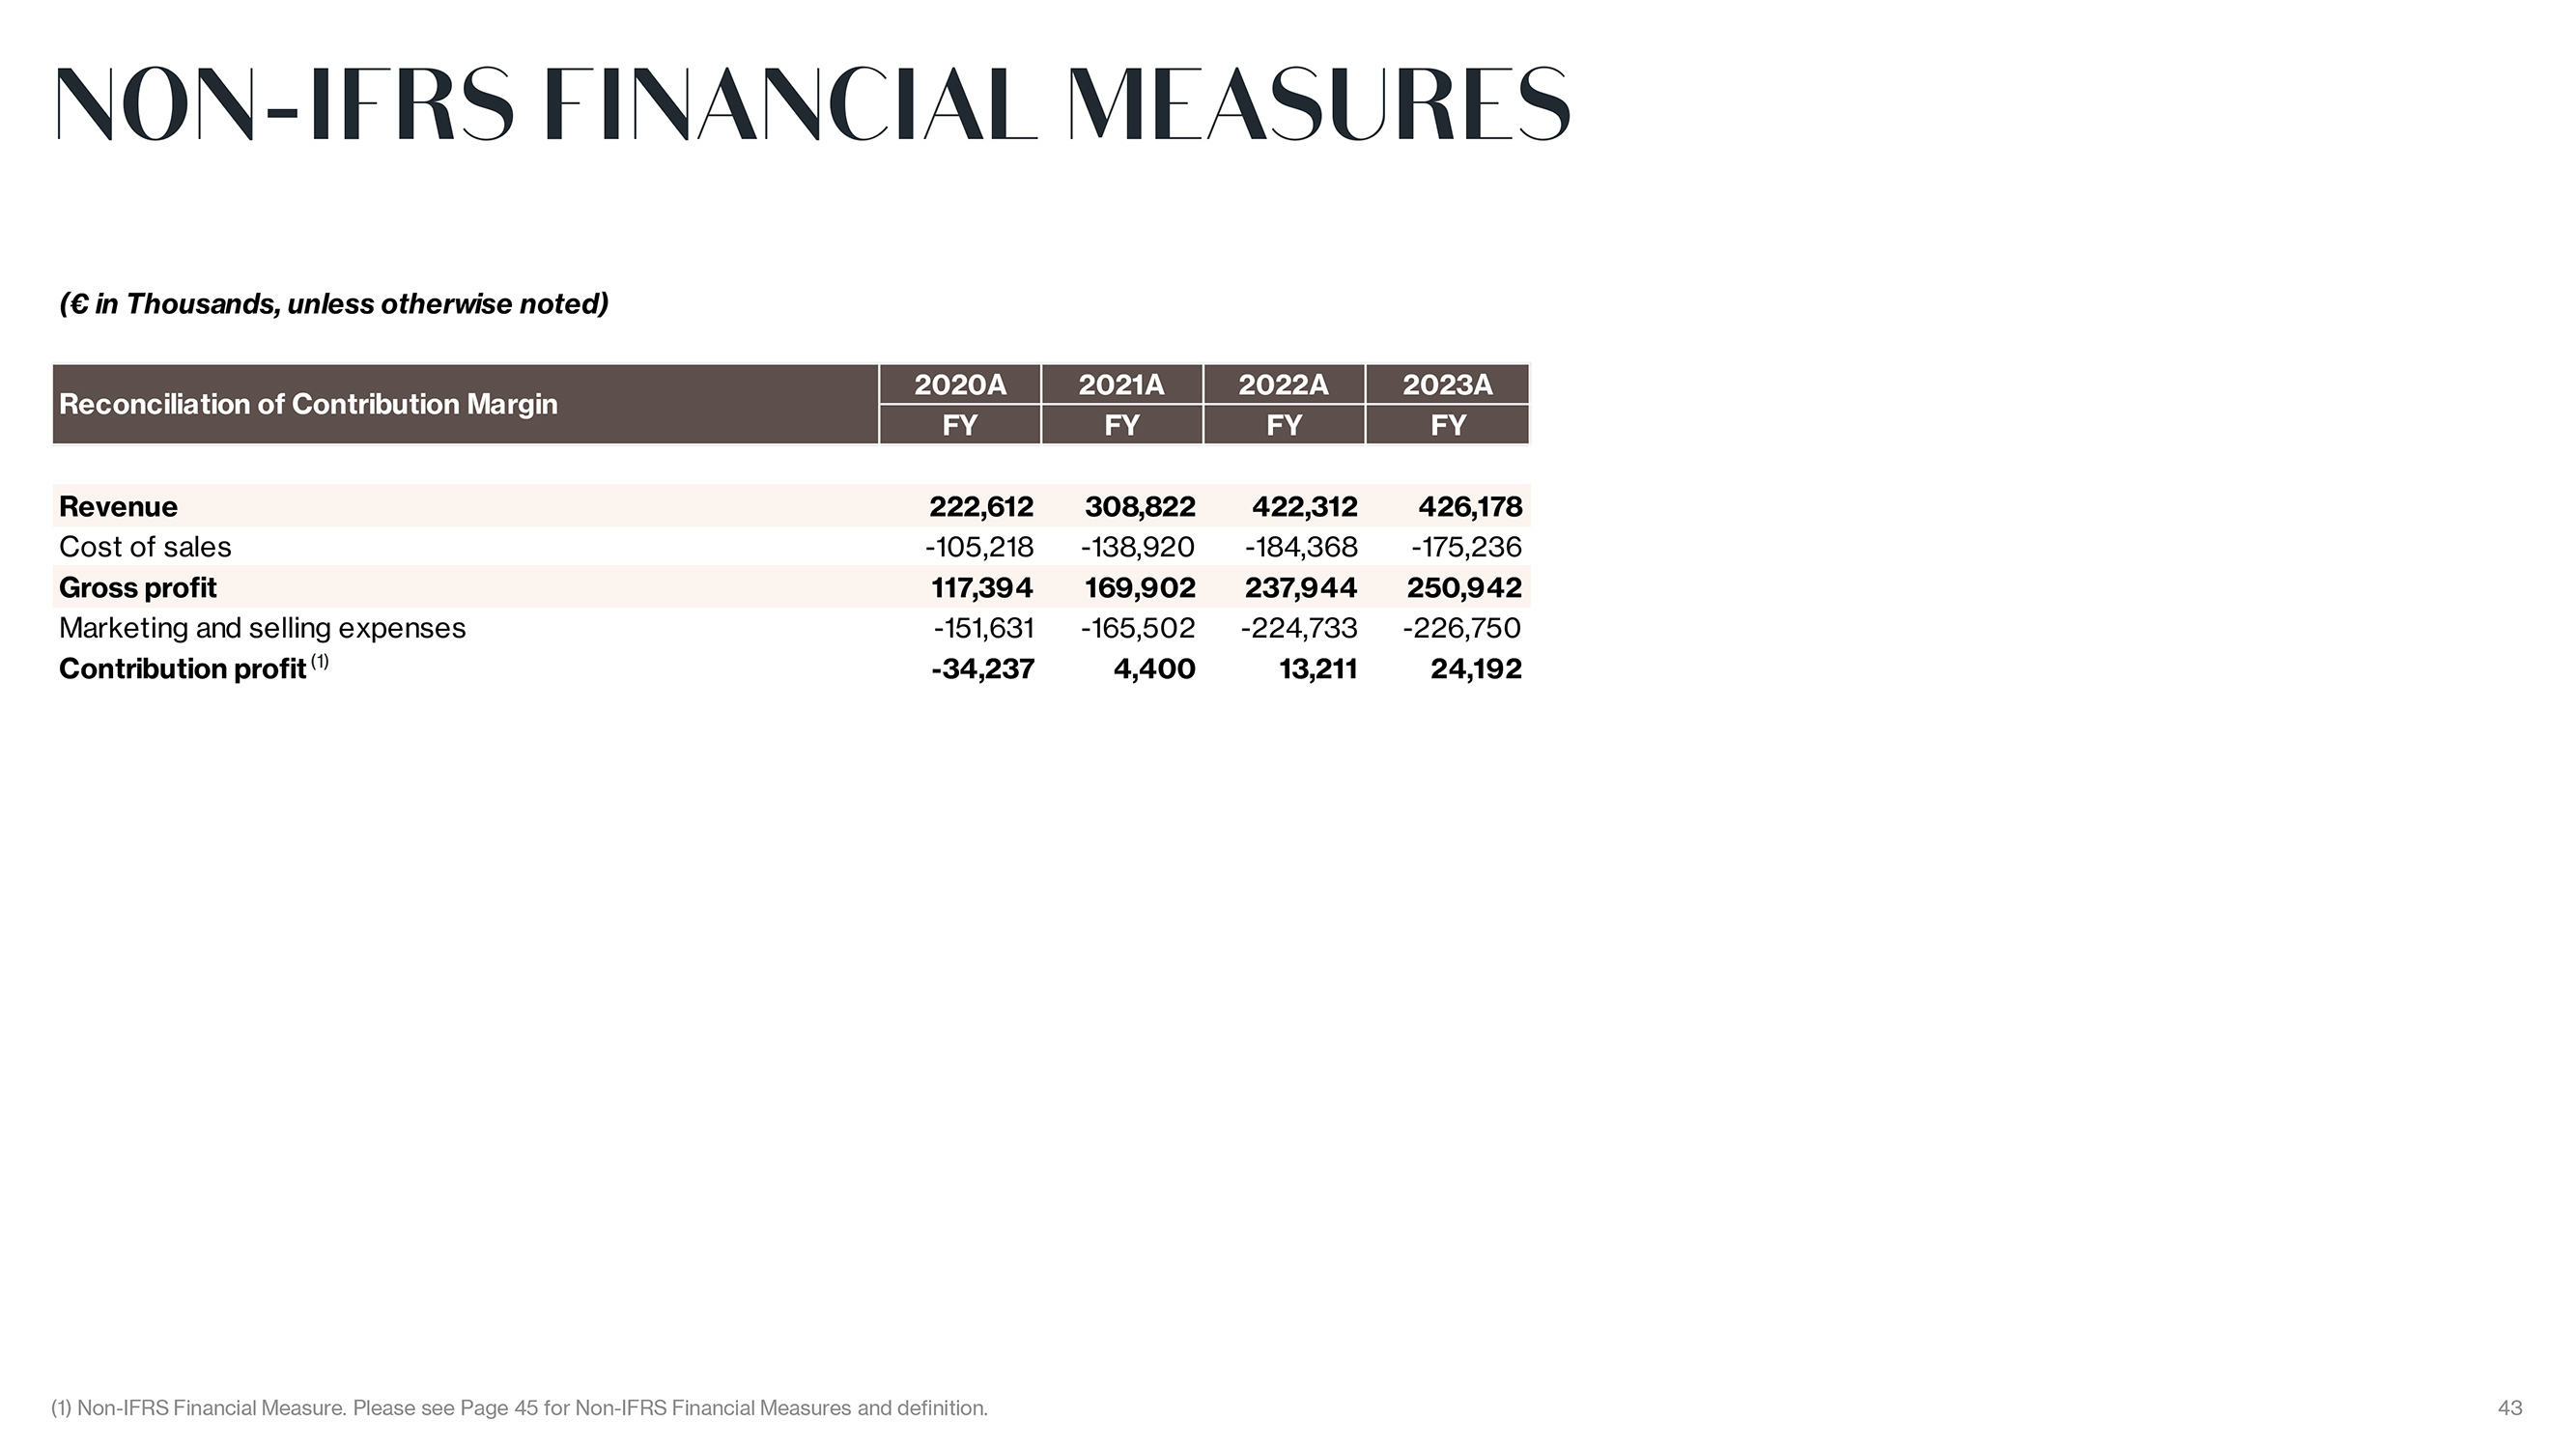
NON-IFRS FINANCIAL MEASURES ( in Thousands, unless otherwise noted) 2020A 2021A 2022A 2023A Reconciliation of Contribution Margin FY FY FY FY Revenue 222,612 308,822 422,312 426,178 Cost of sales -105,218 -138,920 -184,368 -175,236 Gross profit 117,394 169,902 237,944 250,942 Marketing and selling expenses -151,631 -165,502 -224,733 -226,750 Contribution profit (1) -34,237 4,400 13,211 24,192 (1) Non-IFRS Financial Measure. Please see Page 45 for Non-IFRS Financial Measures and definition. 43
|
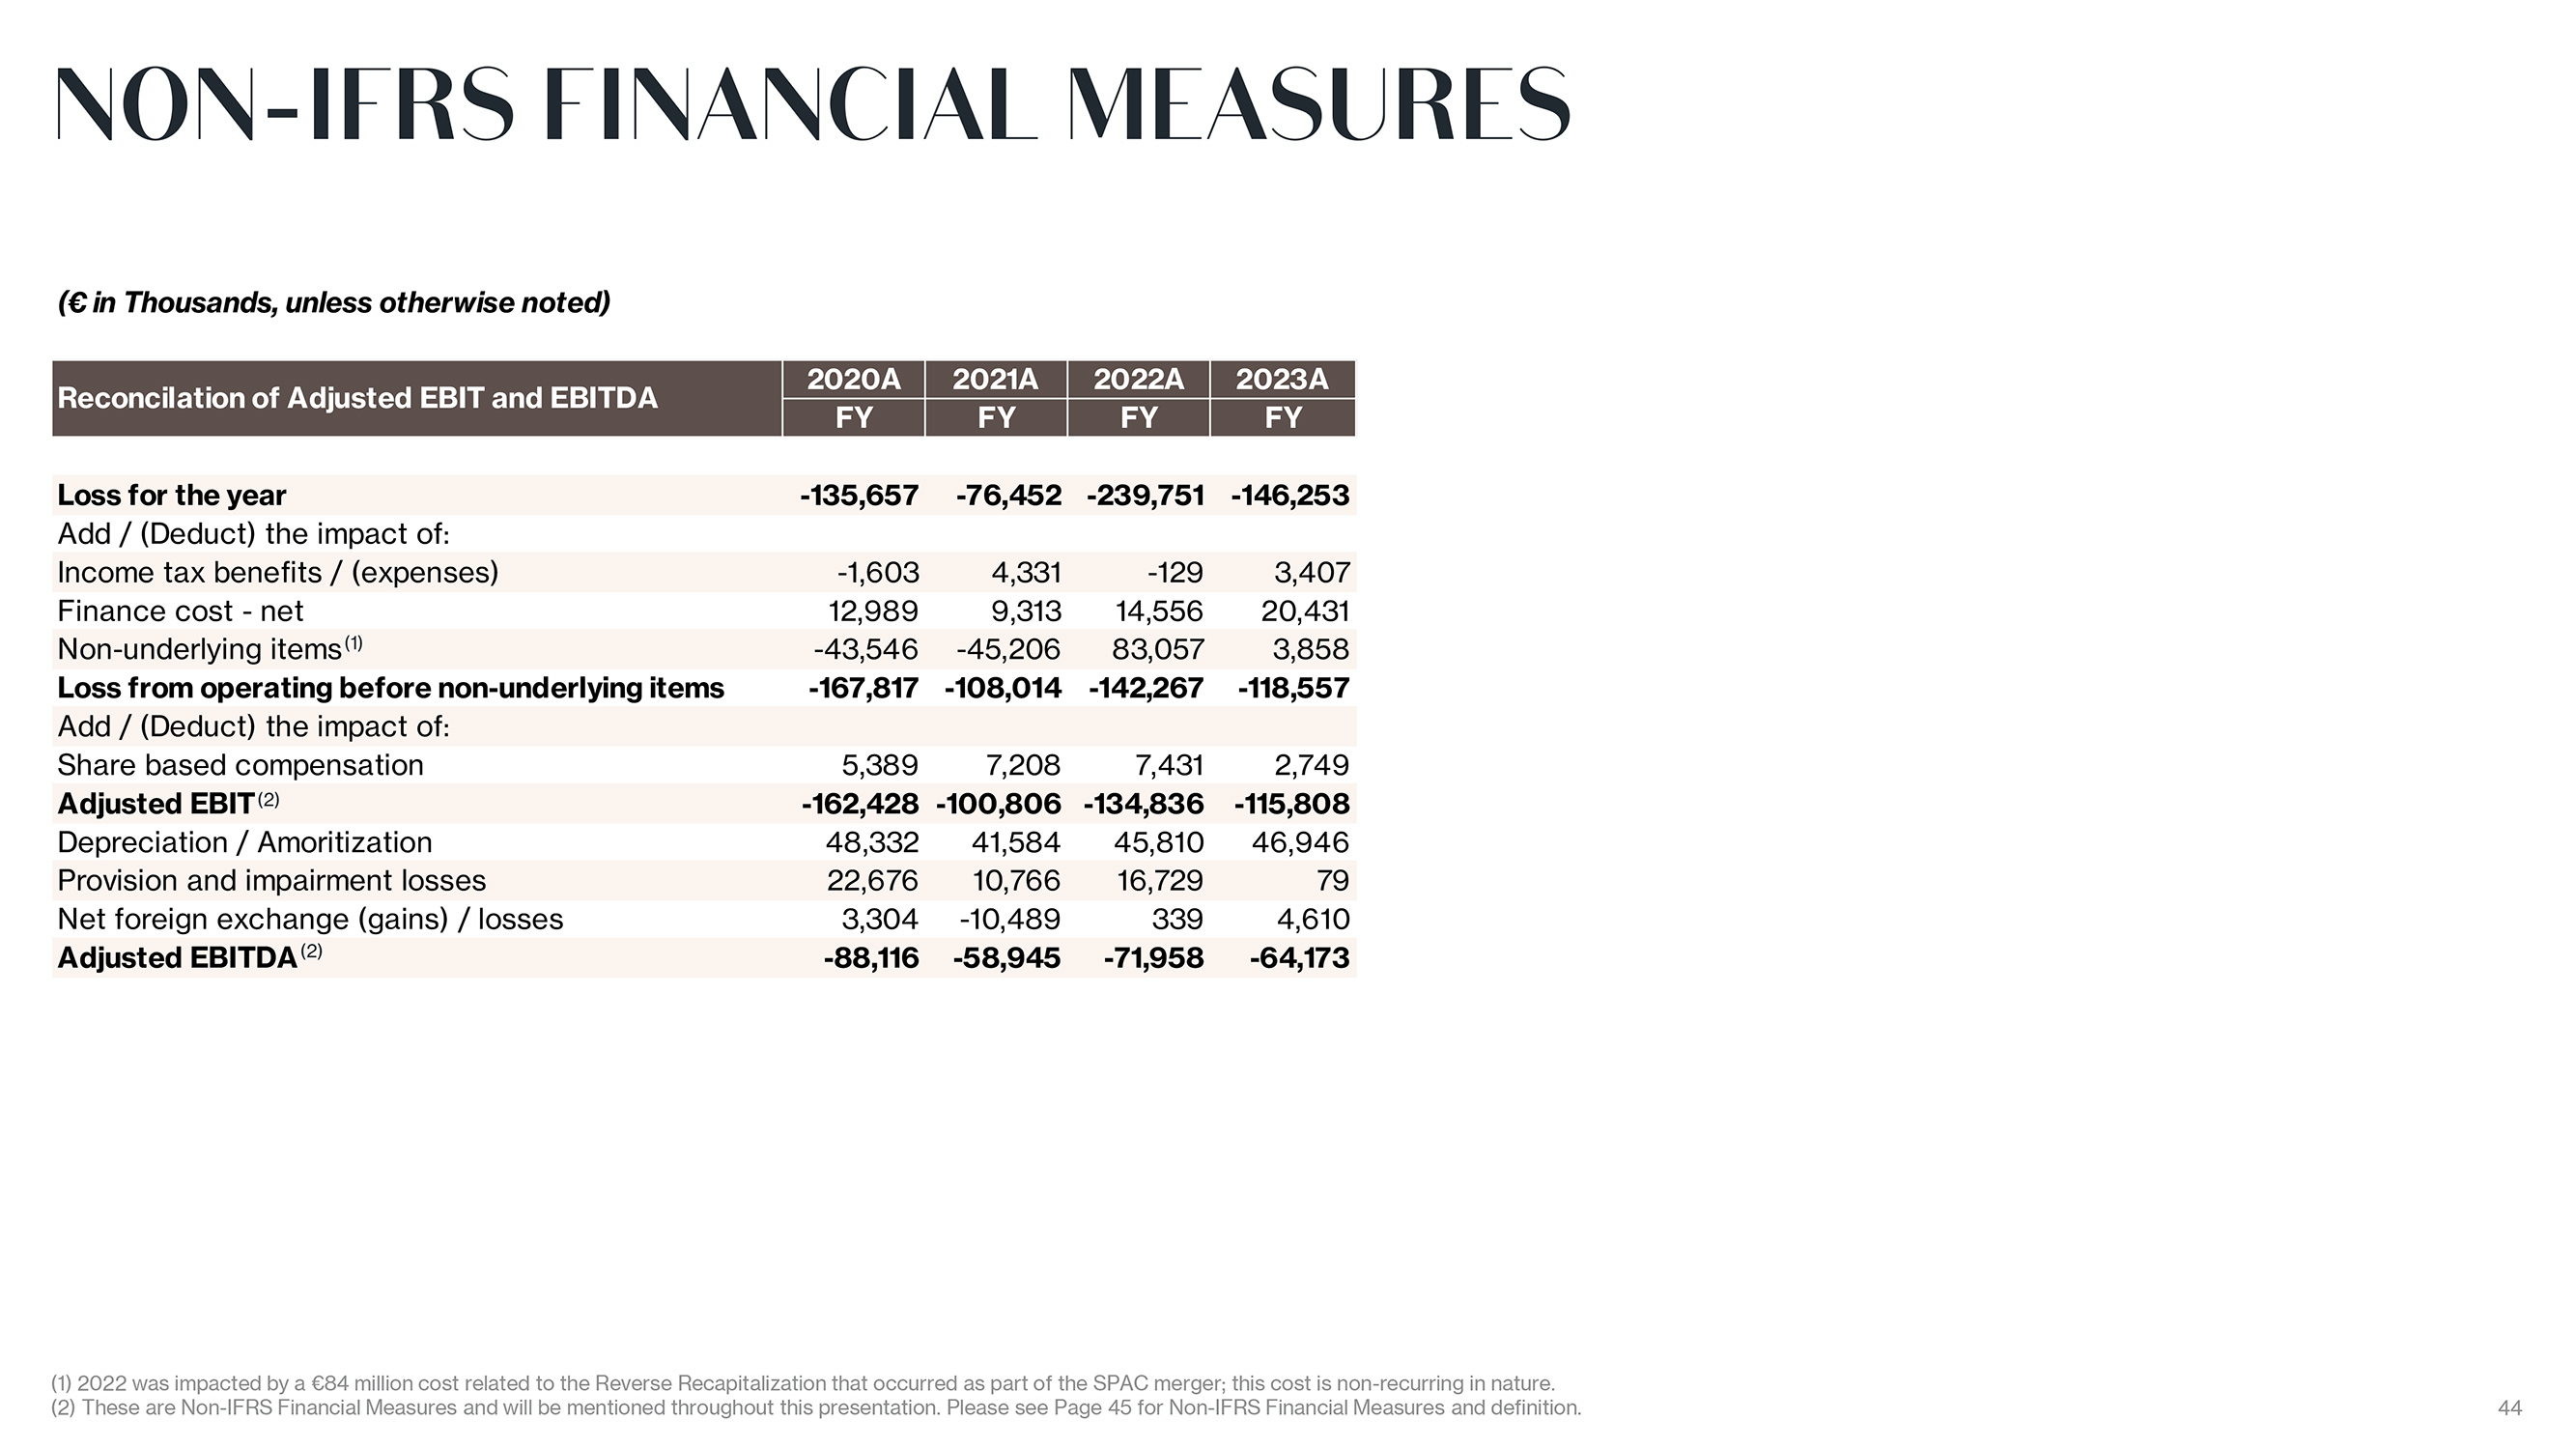
NON-IFRS FINANCIAL MEASURES ( in Thousands, unless otherwise noted) 2020A 2021A 2022A 2023A Reconcilation of Adjusted EBIT and EBITDA FY FY FY FY Loss for the year -135,657 -76,452 -239,751 -146,253 Add / (Deduct) the impact of: Income tax benefits / (expenses) -1,603 4,331 -129 3,407 Finance cost—net 12,989 9,313 14,556 20,431 Non-underlying items(1) -43,546 -45,206 83,057 3,858 Loss from operating before non-underlying items -167,817 -108,014 -142,267 -118,557 Add / (Deduct) the impact of: Share based compensation 5,389 7,208 7,431 2,749 Adjusted EBIT(2) -162,428 -100,806 -134,836 -115,808 Depreciation / Amoritization 48,332 41,584 45,810 46,946 Provision and impairment losses 22,676 10,766 16,729 79 Net foreign exchange (gains) / losses 3,304 -10,489 339 4,610 Adjusted EBITDA(2) -88,116 -58,945 -71,958 -64,173 (1) 2022 was impacted by a 84 million cost related to the Reverse Recapitalization that occurred as part of the SPAC merger; this cost is non-recurring in nature. (2) These are Non-IFRS Financial Measures and will be mentioned throughout this presentation. Please see Page 45 for Non-IFRS Financial Measures and definition. 44
|
NON-IFRS FINANCIAL MEASURES AND DEFINITION Our management monitors and evaluates operating and financial performance using several non-IFRS financial measures including: contribution profit, contribution margin, Adjusted EBIT and Adjusted EBITDA. Our management believes that these non-IFRS financial measures provide useful and relevant information regarding our performance and improve their ability to assess financial performance and financial position. They also provide comparable measures that facilitate management?s ability to identify operational trends, as well as make decisions regarding future spending, resource allocations and other operational decisions. While similar measures are widely used in the industry in which we operate, the financial measures that we use may not be comparable to other similarly named measures used by other companies nor are they intended to be substitutes for measures of financial performance or financial position as prepared in accordance with IFRS. Contribution profit is defined as revenues less the cost of sales and selling and marketing expenses. Contribution profit subtracts the main variable expenses of selling and marketing expenses from gross profit, and our management believes this measure is an important indicator of profitability at the marginal level. Below contribution profit, the main expenses are general administrative expenses and other operating expenses (which include foreign exchange gains or losses and impairment losses). As we continue to improve the management of our portfolio brands, we believe we can achieve greater economy of scale across the different brands by maintaining the fixed expenses at a lower level as a proportion of revenue. We therefore use contribution profit margin as a key indicator of profitability at the group level as well as the portfolio brand level. Contribution margin is defined as contribution profit divided by revenues. Adjusted EBIT is defined as profit or loss before income taxes, net finance cost, share based compensation, adjusted for income and costs which are significant in nature and that management considers not reflective of underlying operational activities, mainly including net gains on disposal of long-term assets, negative goodwill from acquisition of Sergio Rossi, gain on debt restructuring and government grants. Adjusted EBITDA is defined as profit or loss before income taxes, net finance cost, exchange gains/(losses), depreciation, amortization, share based compensation and provisions and impairment losses adjusted for income and costs which are significant in nature and that management considers not reflective of underlying operational activities, mainly including net gains on disposal of long-term assets, negative goodwill from acquisition of Sergio Rossi, gain on debt restructuring and government grants. Trade working capital is defined as the sum of inventories as well as trade receivables less trade payables. 45
Exhibit 99.2

Lanvin Group Shows Resiliency in Sales and On-Track Margin Improvement in 2023
Revenue Continues Year-over-Year Growth Trend
| • | Revenue of €426 million for FY2023, a 1% increase over FY2022 despite macroeconomic headwinds |
| • | Continued margin improvement with Group gross profit margin increasing to 59% and both contribution profit(1) and adjusted EBITDA margins steadily improving |
| • | Resilient performance of the brands through challenging market environment; Lanvin brand showed improving trend in the second half of the year while overall industry faced strong headwinds |
| • | Steady regional performance highlighted by nearly 8% growth in APAC |
| • | Improving store metrics with steady DTC revenue on a lower base of stores showed footprint rationalization strategy on track; first Middle East Lanvin location opened in Riyadh with two more anticipated in the coming months |
| • | On track for cashflow breakeven in 2025 with Caruso achieving breakeven Adjusted EBITDA in 2023 and two additional brands expected to achieve Adjusted EBITDA breakeven in 2024 |
April 30, 2024 - Lanvin Group (NYSE: LANV, the “Group”), a global luxury fashion group with Lanvin, Wolford, Sergio Rossi, St. John and Caruso in its portfolio of brands, today announced its results for the full-year 2023. The Group achieved revenue of €426 million, a 1% increase year-over-year versus 2022; and gross profit of €251 million, representing a 59% gross margin and a 250bps increase versus 2022.
Zhen Huang, Chairman of Lanvin Group, said: “I’m honored to have become the Chairman of Lanvin Group in 2023. The Group has made significant progress since its inception in 2018. In reviewing our 2023, I thought back to the resiliency we showed during the pandemic, posting growth every year, and I see the same resilience and our ability to thrive in any environment, this past year. I believe we are on the right track and am optimistic we will reach our growth and profitability goals.”
Eric Chan, CEO of Lanvin Group, said: “Managers drive companies, and their teams drive results. I am thoroughly impressed by the efforts of our managers and our teams to maintain growth and continue to forge the path to profitability in a challenging market environment. My team, along with our brand managers remain resolute in our mission to grow our brands and drive profitability.
We are a group of brands with a provenance and heritage second-to-none, and I am proud of what we have accomplished in 2023. We are collectively on a journey, and I am very optimistic about our future.”
Review of the Full-Year 2023 Results
Lanvin Group Revenue by Segment
(€ in Thousands, unless otherwise noted)
| Lanvin Group by Brand |
Revenue | Growth % | ||||||||||||||||||||||||||||||
| 2020A | 2021A | 2022A | 2023A | 2021A v | 2022 A v | 2023 A v | 20-23 | |||||||||||||||||||||||||
| FY | FY | FY | FY | 2020A | 2021 A | 2022 A | CAGR | |||||||||||||||||||||||||
| Lanvin |
34,989 | 72,872 | 119,847 | 111,740 | 108 | % | 64 | % | -7 | % | 47 | % | ||||||||||||||||||||
| Wolford |
95,384 | 109,332 | 125,514 | 126,280 | 15 | % | 15 | % | 1 | % | 10 | % | ||||||||||||||||||||
| St. John |
66,512 | 73,094 | 85,884 | 90,398 | 10 | % | 17 | % | 5 | % | 11 | % | ||||||||||||||||||||
| Sergio Rossi |
0 | 28,737 | 61,929 | 59,518 | 116 | % | -4 | % | ||||||||||||||||||||||||
| Caruso |
26,351 | 24,695 | 30,819 | 40,011 | -6 | % | 25 | % | 30 | % | 15 | % | ||||||||||||||||||||
|
|
|
|
|
|
|
|
|
|||||||||||||||||||||||||
| Total Brand |
223,236 | 308,730 | 423,993 | 427,947 | 38 | % | 37 | % | 1 | % | 24 | % | ||||||||||||||||||||
| Eliminations |
-624 | 92 | -1,681 | -1,769 | -115 | % | -1927 | % | 5 | % | 42 | % | ||||||||||||||||||||
|
|
|
|
|
|
|
|
|
|||||||||||||||||||||||||
| Total Group |
222,612 | 308,822 | 422,312 | 426,178 | 39 | % | 37 | % | 1 | % | 24 | % | ||||||||||||||||||||
Lanvin Group Key Financials
(€ in Thousands, unless otherwise noted)
| Lanvin Group Key Financials |
2020A | 2021A | 2022A | 2023A | ||||||||||||||||||||||||||||
| FY | % | FY | % | FY | % | FY | % | |||||||||||||||||||||||||
| Revenue |
222,612 | 100 | % | 308,822 | 100 | % | 422,312 | 100 | % | 426,178 | 100 | % | ||||||||||||||||||||
| Gross profit |
117,394 | 53 | % | 169,902 | 55 | % | 237,944 | 56 | % | 250,942 | 59 | % | ||||||||||||||||||||
| Contribution profit |
-34,237 | -15 | % | 4,400 | 1 | % | 13,211 | 3 | % | 24,192 | 6 | % | ||||||||||||||||||||
| Adjusted EBITDA |
-88,116 | -40 | % | -58,945 | -19 | % | -71,958 | -17 | % | -64,173 | -15 | % | ||||||||||||||||||||
Selected Highlights
Maintained growth trend: In the face of growing headwinds for the industry, the Group maintained growth with a 1% improvement over the prior year. All brands showed resiliency and maintained steady revenue in EMEA and North America and highlighted by nearly 8% growth in APAC. E-Commerce continued to thrive with 3% growth, while overall DTC and Wholesale channels stayed flat. E-Commerce sales in the US, in particular, saw growth by leveraging the group’s US digital platform.
Continued positive progress with margin profile: Margins at all levels, gross profit, contribution profit, and Adjusted EBITDA saw improvement in 2023. Gross margin increased to 59% from 56%, contribution profit margin improved to 6% from 3%, and Adjusted EBITDA as a percentage of sales improved by 198bps from 2022.
Refocused brand and product strategies showing results: One of the main drivers of growth in 2023 was the refocus of brand strategies and optimization of product categories and mix. New product lines and categories, collaborations, and a focus on accessories all impacted the growth and margins. Lanvin brand went through a creative transition in 2023, further cementing the vision for the future of the Group to harness each brand’s legacy and utilize its archives as we evolve our product categories and offerings.
Significant progress optimizing store network: The Group continued to cull its footprint with the closure of 36 stores while successfully launching 24 new retail doors, systemwide. Improved store strategies implemented in 2023 provided better unit economics, with the Group’s DTC revenue remaining steady despite an overall reduction of retail doors. Improved store metrics from strategic changes implemented starting in 2022 have paved the way for Lanvin to grow its base significantly with five, net new locations and its first in the Middle East in Riyadh.
Discussion of FY2023 Financials
Revenue
For FY2023, the Group generated revenue of €426 million, a 1% increase year-over-year. The DTC and Wholesale channels were slightly down, but e-Commerce sales (a part of the DTC channel) grew by 3%. Other revenue, which includes royalty income rose significantly, benefiting from the reacquisition of Lanvin’s Japanese trademarks in March 2023. The Group maintained its growth trend with a compound annual growth rate of 24% since 2020. Full details of the Group’s revenue can be found in our Annual Report on Form 20-F for the year ended December 31, 2023.
Gross Profit
Gross profit increased to €251 million, representing a 59% margin versus €238 million in 2022 at a margin of 56%. The improvement in gross profit margin was driven by increasing accessories as a proportion of sales, and continued emphasis on higher-margin DTC revenue as a proportion of total sales. Additionally, refining the product offerings helped improve inventory management, with more core products with higher sell-through rates.
Contribution Profit(1)
The Group uses a measure, internally, called contribution profit, defined as gross profit less selling & marketing expenses to gauge the variable profitability performance and analyze the improvements at our brands. Contribution profit for the year was €24 million, representing a 6% margin and an improvement of €11 million from 2022. The contribution profit is more than five times higher than in 2021, the first year of positive contribution profit. The Group continues to show steady progress in managing its operating expenses and increasing margins.
Adjusted EBITDA
Adjusted EBITDA remained at loss for 2023, but as a percentage of sales, continued to improve going from (19%) in 2021 to (17%) in 2022 and (15%) in 2023.
Results by Segment
Lanvin: Revenue was down, but the brand improved the trend in the second half of 2023, improving from a 11% decrease in the first half to land at a decrease of 7% for the full year with revenue of €112 million. Gross profit increased to €65 million, at a margin of 58%, from €61 million, at a margin of 50%, in 2022. Gross profit improved from higher full-price sell-through, an increase in the balance of accessories versus ready-to-where sales, a further shift to higher-margin boutique sales, and better inventory management. Contribution profit continued to improve going from a contribution loss of €15 million in 2022 to a contribution loss of €12 million in 2023 with the percentage of sales improving year-over-year from negative 13% to negative 11%.
Wolford: Revenue grew slightly by 1%. Gross profit decreased to €83 million from €86 million, in 2022, and margin declined from 69% to 66% due to a reclassification of expenses. Contribution profit remained steady at €4 million in 2023 at a margin of 3%.
Sergio Rossi: Revenue was down by 4% decreasing from €62 million in 2022, to €60 million. Gross profit margin increased from 50% to 51% in 2023. Gross profit margin improved from an increased proportion of higher-margin DTC sales. Contribution profit margin improved in 2023, from 11% to 12% from better management of selling and distribution costs.
St. John: Revenue increased by 5%, from €86 million to €90 million. St. John’s margin profile continued to improve with gross profit growing from €53 million to €57 million in 2023; with margin increasing from 61% to 63%. St. John implemented a new wholesale model, which improved its gross margin. Contribution profit also increased from €10 million to €11 million; margin remained steady at 12% with some of the wholesale expense reduction that helped improve gross margin being reclassified as selling expense.
Caruso: Revenue increased significantly by 30% going from €31 million to €40 million in 2023. Growth came from an expansion of production capacity and additions to its specialized workforce. Caruso continued its strong, steady performance with its gross profit increasing from €7 million to €11 million in 2023, and margin increasing from 23% to 28%. Contribution profit also increased from €6 million to €9 million, and contribution profit margin increased markedly from 18% to 24%. Profitability improved by streamlining production and higher sell-through of its proprietary Caruso brand products. Caruso achieved breakeven Adjusted EBITDA for the year.
2024 Outlook
The macroeconomy remains uncertain, but regions like North America remain steady, and regions like the Middle East present significant growth opportunities for Lanvin Group’s brands.
The Group plans to approach the market tactically to capture growth opportunities and market share. With one brand Adjusted EBITDA breakeven in 2023 and two additional brands expected to be in 2024, the Group is making significant progress in its path to profitability; and with much of the legwork of streamlining the organization completed, the Group sees scale expansion as a key driver of profitability, for 2024 and beyond.
The Group is built upon a collaborative eco-system and continues to work with their strategic partners to build the platform. As such, one of the Group’s focuses in 2024 will be the continued development of its eco-system with additional strategic partners that will facilitate regional growth, improve logistics and expand product categories.
Note: All % changes are calculated on an actual currency exchange rate basis.
Note: This communication includes certain non-IFRS financial measures such as contribution profit, contribution margin, adjusted earnings before interest and taxes (“Adjusted EBIT”), and adjusted earnings before interest, taxes, depreciation and amortization (“Adjusted EBITDA”). Please see Non-IFRS Financial Measures and Definition.
| (1) | Contribution profit defined as gross profit less Selling and Marketing Expenses |
***
Annual Report on Form 20-F
Our annual report on Form 20-F, including the consolidated financial statements for the fiscal year ended December 31, 2023, can be downloaded from the Company’s investor relations website (ir.lanvin-group.com) under the section Financials / SEC Filings, or from the SEC’s website (www.sec.gov).
***
Conference Call
As previously announced, today at 8:00AM EST/8:00PM CST/2:00PM CET, Lanvin Group will host a conference call to discuss its results for the full-year 2023 and provide an outlook for 2024. Management will refer to a slide presentation during the call, which will be made available on the day of the call. To view the presentation, please visit the “Events” tab of the Group’s investor relations website at https://ir.lanvin-group.com. To participant in the conference call, please register by clicking on the following link: https://dpregister.com/sreg/10188721/fc6969ad02
A replay of the conference call will be accessible approximately one hour after the live call until May 6, 2024, by dialing the following numbers:
US Toll Free: 1-877-344-7529
International Toll: 1-412-317-0088
Canada Toll Free: 855-669-9658
Replay Access Code: 1551559
A recorded webcast of the conference call and a slide presentation will also be available on the Group’s investor relations website at https://ir.lanvin-group.com.
***
Next Scheduled Announcement
The next scheduled announcement will be the H1 2024 earnings results release in August 2024. To receive email alerts of the timing of future financial news releases, as well as future announcements, please register at https://ir.lanvin-group.com.
***
About Lanvin Group
Lanvin Group is a leading global luxury fashion group headquartered in Shanghai, China, managing iconic brands worldwide including Lanvin, Wolford, Sergio Rossi, St. John Knits, and Caruso. Harnessing the power of its unique strategic alliance of industry-leading partners in the luxury fashion sector, Lanvin Group strives to expand the global footprint of its portfolio brands and achieve sustainable growth through strategic investment and extensive operational know-how, combined with an intimate understanding and unparalleled access to the fastest-growing luxury fashion markets in the world. Lanvin Group is listed on the New York Stock Exchange under the ticker symbol ‘LANV’. For more information about Lanvin Group, please visit www.lanvin-group.com, and to view our investor presentation, please visit https://ir.lanvin-group.com.
***
Forward-Looking Statements
This communication, including the section “2024 Outlook”, contains “forward-looking statements” within the meaning of the “safe harbor” provisions of the Private Securities Litigation Reform Act of 1995. Forward-looking statements generally are accompanied by words such as “believe,” “may,” “will,” “estimate,” “continue,” “anticipate,” “intend,” “expect,” “should,” “would,” “plan,” “predict,” “potential,” “seem,” “seek,” “future,” “outlook,” “project” and similar expressions that predict or indicate future events or trends or that are not statements of historical matters. These forward-looking statements include, but are not limited to, statements regarding estimates and forecasts of other financial and performance metrics and projections of market opportunity. These statements are based on various assumptions, whether or not identified in this communication, and on the current expectations of the respective management of Lanvin Group and are not predictions of actual performance. These forward-looking statements are provided for illustrative purposes only and must not be relied on by an investor as, a guarantee, an assurance, a prediction or a definitive statement of fact or probability. Actual events and circumstances are difficult or impossible to predict and will differ from assumptions. Many actual events and circumstances are beyond the control of Lanvin Group. Potential risks and uncertainties that could cause the actual results to differ materially from those expressed or implied by forward-looking statements include, but are not limited to, changes adversely affecting the business in which Lanvin Group is engaged; Lanvin Group’s projected financial information, anticipated growth rate, profitability and market opportunity may not be an indication of its actual results or future results; management of growth; the impact of COVID-19 or similar public health crises on Lanvin Group’s business; Lanvin Group’s ability to safeguard the value, recognition and reputation of its brands and to identify and respond to new and changing customer preferences; the ability and desire of consumers to shop; Lanvin Group’s ability to successfully implement its business strategies and plans; Lanvin Group’s ability to effectively manage its advertising and marketing expenses and achieve desired impact; its ability to accurately forecast consumer demand; high levels of competition in the personal luxury products market; disruptions to Lanvin Group’s distribution facilities or its distribution partners; Lanvin Group’s ability to negotiate, maintain or renew its license agreements; Lanvin Group’s ability to protect its intellectual property rights; Lanvin Group’s ability to attract and retain qualified employees and preserve craftmanship skills; Lanvin Group’s ability to develop and maintain effective internal controls; general economic conditions; the result of future financing efforts; and those factors discussed in the reports filed by Lanvin Group from time to time with the SEC. If any of these risks materialize or Lanvin Group’s assumptions prove incorrect, actual results could differ materially from the results implied by these forward-looking statements. There may be additional risks that Lanvin Group presently does not know, or that Lanvin Group currently believes are immaterial, that could also cause actual results to differ from those contained in the forward-looking statements. In addition, forward-looking statements reflect Lanvin Group’s expectations, plans, or forecasts of future events and views as of the date of this communication. Lanvin Group anticipates that subsequent events and developments will cause Lanvin Group’s assessments to change. However, while Lanvin Group may elect to update these forward-looking statements at some point in the future, Lanvin Group specifically disclaim any obligation to do so. These forward-looking statements should not be relied upon as representing Lanvin Group’s assessments of any date subsequent to the date of this communication. Accordingly, reliance should not be placed upon the forward-looking statements.
***
Use of Non-IFRS Financial Metrics
This communication includes certain non-IFRS financial measures such as contribution profit, contribution margin, adjusted earnings before interest and taxes (“Adjusted EBIT”), and adjusted earnings before interest, taxes, depreciation and amortization (“Adjusted EBITDA”). These non-IFRS measures are an addition, and not a substitute for or superior to measures of financial performance prepared in accordance with IFRS and should not be considered as an alternative to net income, operating income or any other performance measures derived in accordance with IFRS. Reconciliations of non-IFRS measures to their most directly comparable IFRS counterparts are included in the Appendix to this communication. Lanvin Group believes that these non-IFRS measures of financial results provide useful supplemental information to investors about Lanvin Group. Lanvin Group believes that the use of these non-IFRS financial measures provides an additional tool for investors to use in evaluating projected operating results and trends in and in comparing Lanvin Group’s financial measures with other similar companies, many of which present similar non-IFRS financial measures to investors. However, there are a number of limitations related to the use of these non-IFRS measures and their nearest IFRS equivalents. For example, other companies may calculate non-IFRS measures differently, or may use other measures to calculate their financial performance, and therefore Lanvin Group’s non-IFRS measures may not be directly comparable to similarly titled measures of other companies. Lanvin Group does not consider these non-IFRS measures in isolation or as an alternative to financial measures determined in accordance with IFRS. The principal limitation of these non-IFRS financial measures is that they exclude significant expenses, income and tax liabilities that are required by IFRS to be recorded in Lanvin Group’s financial statements. In addition, they are subject to inherent limitations as they reflect the exercise of judgements by Lanvin Group about which expense and income are excluded or included in determining these non-IFRS financial measures. In order to compensate for these limitations, Lanvin Group presents non-IFRS financial measures in connection with IFRS results.
***
Enquiries:
Media
Lanvin Group
Hezhi Zhang
hezhi.zhang@lanvin-group.com
Investors
Lanvin Group
James Kim
james.kim@lanvin-group.com
Appendix
Lanvin Group Consolidated Income Statement
(€ in Thousands, unless otherwise noted)
| 2020A | 2021A | 2022A | 2023A | |||||||||||||||||||||||||||||
| Lanvin Group Consolidated P&L |
FY | % | FY | % | FY | % | FY | % | ||||||||||||||||||||||||
| Revenue |
222,612 | 100 | % | 308,822 | 100 | % | 422,312 | 100 | % | 426,178 | 100 | % | ||||||||||||||||||||
| Cost of sales |
-105,218 | -47 | % | -138,920 | -45 | % | -184,368 | -44 | % | -175,236 | -41 | % | ||||||||||||||||||||
| Gross profit |
117,394 | 53 | % | 169,902 | 55 | % | 237,944 | 56 | % | 250,942 | 59 | % | ||||||||||||||||||||
| Marketing and selling expenses |
-151,631 | -68 | % | -165,502 | -54 | % | -224,733 | -53 | % | -226,750 | -53 | % | ||||||||||||||||||||
| General and administrative expenses |
-115,181 | -52 | % | -122,497 | -40 | % | -153,138 | -36 | % | -138,215 | -32 | % | ||||||||||||||||||||
| Other operating income and expenses |
-18,399 | -8 | % | 10,083 | 3 | % | -2,340 | -1 | % | -4,534 | -1 | % | ||||||||||||||||||||
| Loss from operations before non-underlying items |
-167,817 | -75 | % | -108,014 | -35 | % | -142,267 | -34 | % | -118,557 | -28 | % | ||||||||||||||||||||
| Non-underlying items (1) |
43,546 | 20 | % | 45,206 | 15 | % | -83,057 | -20 | % | -3,858 | -1 | % | ||||||||||||||||||||
| Loss from operations |
-124,271 | -56 | % | -62,808 | -20 | % | -225,324 | -53 | % | -122,415 | -29 | % | ||||||||||||||||||||
| Finance cost – net |
-12,989 | -6 | % | -9,313 | -3 | % | -14,556 | -3 | % | -20,431 | -5 | % | ||||||||||||||||||||
| Loss before income tax |
-137,260 | -62 | % | -72,121 | -23 | % | -239,880 | -57 | % | -142,846 | -34 | % | ||||||||||||||||||||
| Income tax expenses |
1,603 | 1 | % | -4,331 | -1 | % | 129 | 0 | % | -3,407 | -1 | % | ||||||||||||||||||||
| Loss for the period |
-135,657 | -61 | % | -76,452 | -25 | % | -239,751 | -57 | % | -146,253 | -34 | % | ||||||||||||||||||||
| Contribution profit (2) |
-34,237 | -15 | % | 4,400 | 1 | % | 13,211 | 3 | % | 24,192 | 6 | % | ||||||||||||||||||||
| Adjusted EBIT (2) |
-162,428 | -73 | % | -100,806 | -33 | % | -134,836 | -32 | % | -115,808 | -27 | % | ||||||||||||||||||||
| Adjusted EBITDA (2) |
-88,116 | -40 | % | -58,945 | -19 | % | -71,958 | -17 | % | -64,173 | -15 | % | ||||||||||||||||||||
Lanvin Group Consolidated Balance Sheet
(€ in Thousands, unless otherwise noted)
| Lanvin Group Consolidated Balance Sheet |
2020A | 2021A | 2022A | 2023A | ||||||||||||
| FY | FY | FY | FY | |||||||||||||
| Assets |
||||||||||||||||
| Non-current assets |
||||||||||||||||
| Intangible assets |
175,542 | 181,234 | 181,485 | 210,439 | ||||||||||||
| Goodwill |
69,323 | 69,323 | 69,323 | 69,323 | ||||||||||||
| Property, plant and equipment |
26,879 | 40,564 | 46,801 | 43,731 | ||||||||||||
| Right-of-use assets |
117,917 | 118,775 | 121,731 | 128,853 | ||||||||||||
| Deferred income tax assets |
13,608 | 17,070 | 17,297 | 13,427 | ||||||||||||
| Other non-current assets |
8,280 | 15,742 | 15,265 | 15,540 | ||||||||||||
|
|
|
|
|
|
|
|
|
|||||||||
| 411,549 | 442,708 | 451,902 | 481,313 | |||||||||||||
| Current assets |
||||||||||||||||
| Inventories |
75,842 | 92,335 | 109,094 | 107,184 | ||||||||||||
| Trade receivables |
22,191 | 39,781 | 48,868 | 45,657 | ||||||||||||
| Other current assets |
23,353 | 41,706 | 30,467 | 25,650 | ||||||||||||
| Cash and bank balances |
44,935 | 88,981 | 91,897 | 28,130 | ||||||||||||
|
|
|
|
|
|
|
|
|
|||||||||
| 166,321 | 262,803 | 280,326 | 206,621 | |||||||||||||
|
|
|
|
|
|
|
|
|
|||||||||
| Total assets |
577,870 | 705,511 | 732,228 | 687,934 | ||||||||||||
| Liabilities |
||||||||||||||||
| Non-current liabilities |
||||||||||||||||
| Non-current borrowings |
11,399 | 11,212 | 18,115 | 32,381 | ||||||||||||
| Non-current lease liabilities |
104,382 | 102,987 | 105,986 | 112,898 | ||||||||||||
| Non-current provisions |
3,286 | 4,166 | 4,111 | 3,174 | ||||||||||||
| Employee benefits |
19,085 | 18,464 | 15,128 | 17,972 | ||||||||||||
| Deferred income tax liabilities |
53,284 | 54,179 | 54,660 | 52,804 | ||||||||||||
| Other non-current liabilities |
1,338 | 1,080 | 690 | 14,733 | ||||||||||||
|
|
|
|
|
|
|
|
|
|||||||||
| 192,774 | 192,088 | 198,690 | 233,962 | |||||||||||||
| Current liabilities |
||||||||||||||||
| Trade payables |
47,436 | 58,151 | 73,114 | 78,576 | ||||||||||||
| Bank overdrafts |
764 | 14 | 148 | 280 | ||||||||||||
| Current borrowings |
7,438 | 55,559 | 15,370 | 35,720 | ||||||||||||
| Current lease liabilities |
32,503 | 37,072 | 34,605 | 32,871 | ||||||||||||
| Current provisions |
2,490 | 3,141 | 3,014 | 6,270 | ||||||||||||
| Other current liabilities |
44,070 | 68,660 | 106,481 | 134,627 | ||||||||||||
|
|
|
|
|
|
|
|
|
|||||||||
| 134,701 | 222,597 | 232,732 | 288,344 | |||||||||||||
|
|
|
|
|
|
|
|
|
|||||||||
| Total liabilities |
327,475 | 414,685 | 431,422 | 522,306 | ||||||||||||
|
|
|
|
|
|
|
|
|
|||||||||
| Net assets |
250,395 | 290,826 | 300,806 | 165,628 | ||||||||||||
| Equity |
||||||||||||||||
| Equity attributable to owners of the Company |
||||||||||||||||
| Share capital |
289,165 | 339,259 | 0 | 0 | ||||||||||||
| Treasury shares |
0 | -3 | -25,023 | -65,405 | ||||||||||||
| Other reserves |
81,198 | 149,460 | 762,962 | 806,677 | ||||||||||||
| Accumulated losses |
-158,974 | -224,328 | -442,618 | -571,931 | ||||||||||||
|
|
|
|
|
|
|
|
|
|||||||||
| 211,389 | 264,388 | 295,320 | 169,341 | |||||||||||||
| Non- controlling interests |
39,006 | 26,438 | 5,486 | -3,713 | ||||||||||||
|
|
|
|
|
|
|
|
|
|||||||||
| Total equity |
250,395 | 290,826 | 300,806 | 165,628 | ||||||||||||
Lanvin Group Consolidated Cash Flow
(€ in Thousands, unless otherwise noted)
| Lanvin Group Consolidated Cash Flow |
2020A | 2021A | 2022A | 2023A | ||||||||||||
| FY | FY | FY | FY | |||||||||||||
| Net cash used in operating activities |
-87,297 | -73,088 | -80,851 | -57,891 | ||||||||||||
| Net cash flows from/(used in) investing activities |
67,038 | 6,346 | -21,799 | -38,615 | ||||||||||||
| Net cash flows generated from financing activities |
-41,447 | 110,065 | 104,937 | 34,131 | ||||||||||||
|
|
|
|
|
|
|
|
|
|||||||||
| Net increase/(decrease) in cash and cash equivalents |
-61,706 | 43,323 | 2,287 | -62,375 | ||||||||||||
| Cash and cash equivalents less bank overdrafts at the beginning of the year |
106,642 | 44,171 | 88,658 | 91,749 | ||||||||||||
| Effect of foreign exchange rate changes |
-765 | 1,164 | 804 | -1,524 | ||||||||||||
|
|
|
|
|
|
|
|
|
|||||||||
| Cash and cash equivalents less bank overdrafts at end of the year |
44,171 | 88,658 | 91,749 | 27,850 | ||||||||||||
Lanvin Brand Key Financials(3)
(€ in Thousands, unless otherwise noted)
| Lanvin Brand Key Financials |
2020A | 2021A | 2022A | 2023A | 2021 A v | 2022 A v | 2023 A v | 20-23 | ||||||||||||||||||||||||||||||||||||||||
| FY | % | FY | % | FY | % | FY | % | 2020 A | 2021 A | 2022 A | CAGR | |||||||||||||||||||||||||||||||||||||
| Key Financials on P&L |
||||||||||||||||||||||||||||||||||||||||||||||||
| Revenues |
34,989 | 100 | % | 72,872 | 100 | % | 119,847 | 100 | % | 111,740 | 100 | % | 108 | % | 64 | % | -7 | % | 47 | % | ||||||||||||||||||||||||||||
| Gross profit |
13,573 | 39 | % | 34,028 | 47 | % | 60,513 | 50 | % | 64,547 | 58 | % | ||||||||||||||||||||||||||||||||||||
| Selling and distribution expenses |
-43,147 | -123 | % | -58,124 | -80 | % | -75,852 | -63 | % | -76,533 | -68 | % | ||||||||||||||||||||||||||||||||||||
| Contribution profit (2) |
-29,574 | -85 | % | -24,096 | -33 | % | -15,339 | -13 | % | -11,986 | -11 | % | ||||||||||||||||||||||||||||||||||||
| Revenues by Geography |
||||||||||||||||||||||||||||||||||||||||||||||||
| EMEA |
18,501 | 53 | % | 31,683 | 43 | % | 61,092 | 51 | % | 51,585 | 46 | % | 71 | % | 93 | % | -16 | % | 41 | % | ||||||||||||||||||||||||||||
| North America |
4,525 | 13 | % | 15,964 | 22 | % | 28,524 | 24 | % | 28,210 | 25 | % | 253 | % | 79 | % | -1 | % | 84 | % | ||||||||||||||||||||||||||||
| Greater China |
10,054 | 29 | % | 23,541 | 32 | % | 25,742 | 21 | % | 24,649 | 22 | % | 134 | % | 9 | % | -4 | % | 35 | % | ||||||||||||||||||||||||||||
| Other |
1,909 | 5 | % | 1,684 | 2 | % | 4,489 | 4 | % | 7,296 | 7 | % | -12 | % | 167 | % | 63 | % | 56 | % | ||||||||||||||||||||||||||||
| Revenues by Channel |
||||||||||||||||||||||||||||||||||||||||||||||||
| DTC |
16,959 | 48 | % | 46,134 | 63 | % | 58,536 | 49 | % | 55,357 | 50 | % | 172 | % | 27 | % | -5 | % | 48 | % | ||||||||||||||||||||||||||||
| Wholesale |
12,974 | 37 | % | 21,161 | 29 | % | 51,898 | 43 | % | 39,933 | 36 | % | 63 | % | 145 | % | -23 | % | 45 | % | ||||||||||||||||||||||||||||
| Other |
5,056 | 14 | % | 5,577 | 8 | % | 9,413 | 8 | % | 16,450 | 15 | % | 10 | % | 69 | % | 75 | % | 48 | % | ||||||||||||||||||||||||||||
Wolford Brand Key Financials(3)
(€ in Thousands, unless otherwise noted)
| Wolford Brand Key Financials |
2020A | 2021A | 2022A | 2023A | 2021 A v | 2022 A v | 2023 A v | 20-23 | ||||||||||||||||||||||||||||||||||||||||
| FY | % | FY | % | FY | % | FY | % | 2020 A | 2021 A | 2022 A | CAGR | |||||||||||||||||||||||||||||||||||||
| Key Financials on P&L |
||||||||||||||||||||||||||||||||||||||||||||||||
| Revenues |
95,384 | 100 | % | 109,332 | 100 | % | 125,514 | 100 | % | 126,280 | 100 | % | 15 | % | 15 | % | 1 | % | 10 | % | ||||||||||||||||||||||||||||
| Gross profit |
65,865 | 69 | % | 79,070 | 72 | % | 86,228 | 69 | % | 83,339 | 66 | % | ||||||||||||||||||||||||||||||||||||
| Selling and distribution expenses |
-65,006 | -68 | % | -59,351 | -54 | % | -81,901 | -65 | % | -79,060 | -63 | % | ||||||||||||||||||||||||||||||||||||
| Contribution profit (2) |
859 | 1 | % | 19,719 | 18 | % | 4,327 | 3 | % | 4,279 | 3 | % | ||||||||||||||||||||||||||||||||||||
| Revenues by Geography |
||||||||||||||||||||||||||||||||||||||||||||||||
| EMEA |
73,794 | 77 | % | 79,236 | 72 | % | 86,501 | 69 | % | 85,084 | 67 | % | 7 | % | 9 | % | -2 | % | 5 | % | ||||||||||||||||||||||||||||
| North America |
16,367 | 17 | % | 21,824 | 20 | % | 31,535 | 25 | % | 31,310 | 25 | % | 33 | % | 44 | % | -1 | % | 24 | % | ||||||||||||||||||||||||||||
| Greater China |
4,867 | 5 | % | 7,289 | 7 | % | 6,791 | 5 | % | 9,176 | 7 | % | 50 | % | -7 | % | 35 | % | 24 | % | ||||||||||||||||||||||||||||
| Other |
356 | 0 | % | 983 | 1 | % | 687 | 1 | % | 710 | 1 | % | 176 | % | -30 | % | 3 | % | 26 | % | ||||||||||||||||||||||||||||
| Revenues by Channel |
||||||||||||||||||||||||||||||||||||||||||||||||
| DTC |
62,323 | 65 | % | 74,622 | 68 | % | 90,408 | 72 | % | 87,352 | 69 | % | 20 | % | 21 | % | -3 | % | 12 | % | ||||||||||||||||||||||||||||
| Wholesale |
33,061 | 35 | % | 34,710 | 32 | % | 34,426 | 27 | % | 38,071 | 30 | % | 5 | % | -1 | % | 11 | % | 5 | % | ||||||||||||||||||||||||||||
| Other |
0 | 0 | % | 0 | 0 | % | 680 | 1 | % | 857 | 1 | % | 26 | % | ||||||||||||||||||||||||||||||||||
Sergio Rossi Brand Key Financials(3)
(€ in Thousands, unless otherwise noted)
| Sergio Rossi Brand Key Financials |
2020A | 2021A | 2022A | 2023A | 2021 A v | 2022 A v | 2023 A v | 20-23 | ||||||||||||||||||||||||||||||||||||||||
| FY | % | FY | % | FY | % | FY | % | 2020 A | 2021 A | 2022 A | CAGR | |||||||||||||||||||||||||||||||||||||
| Key Financials on P&L |
||||||||||||||||||||||||||||||||||||||||||||||||
| Revenues |
59,206 | 100 | % | 28,737 | 100 | % | 61,929 | 100 | % | 59,518 | 100 | % | 5 | % | 116 | % | -4 | % | 44 | % | ||||||||||||||||||||||||||||
| Gross profit |
13,319 | 46 | % | 31,048 | 50 | % | 30,435 | 51 | % | |||||||||||||||||||||||||||||||||||||||
| Selling and distribution expenses |
-9,489 | -33 | % | -24,502 | -40 | % | -23,097 | -39 | % | |||||||||||||||||||||||||||||||||||||||
| Contribution profit (2) |
3,830 | 13 | % | 6,546 | 11 | % | 7,338 | 12 | % | |||||||||||||||||||||||||||||||||||||||
| Revenues by Geography |
||||||||||||||||||||||||||||||||||||||||||||||||
| EMEA |
33,435 | 56 | % | 17,009 | 59 | % | 35,023 | 57 | % | 31,801 | 53 | % | 5 | % | 106 | % | -9 | % | 37 | % | ||||||||||||||||||||||||||||
| North America |
1,290 | 2 | % | 107 | 0 | % | 1,181 | 2 | % | 2,006 | 3 | % | -8 | % | 1004 | % | 70 | % | 333 | % | ||||||||||||||||||||||||||||
| Greater China |
11,331 | 19 | % | 4,595 | 16 | % | 10,809 | 17 | % | 11,872 | 20 | % | -5 | % | 135 | % | 10 | % | 61 | % | ||||||||||||||||||||||||||||
| Other |
13,150 | 22 | % | 7,027 | 24 | % | 14,916 | 24 | % | 13,838 | 23 | % | 13 | % | 112 | % | -7 | % | 40 | % | ||||||||||||||||||||||||||||
| Revenues by Channel |
||||||||||||||||||||||||||||||||||||||||||||||||
| DTC |
28,911 | 49 | % | 14,349 | 50 | % | 31,910 | 52 | % | 32,962 | 55 | % | 10 | % | 122 | % | 3 | % | 52 | % | ||||||||||||||||||||||||||||
| Wholesale |
30,295 | 51 | % | 14,389 | 50 | % | 30,019 | 48 | % | 26,556 | 45 | % | -1 | % | 109 | % | -12 | % | 36 | % | ||||||||||||||||||||||||||||
| Other |
0 | 0 | % | 0 | 0 | % | 0 | 0 | % | 0 | 0 | % | ||||||||||||||||||||||||||||||||||||
St. John Brand Key Financials(3)
(€ in Thousands, unless otherwise noted)
| St. John Brand Key Financials |
2020A | 2021A | 2022A | 2023A | 2021 A v | 2022 A v | 2023 A v | 20-23 | ||||||||||||||||||||||||||||||||||||||||
| FY | % | FY | % | FY | % | FY | % | 2020 A | 2021 A | 2022 A | CAGR | |||||||||||||||||||||||||||||||||||||
| Key Financials on P&L |
||||||||||||||||||||||||||||||||||||||||||||||||
| Revenues |
66,512 | 100 | % | 73,094 | 100 | % | 85,884 | 100 | % | 90,398 | 100 | % | 10 | % | 17 | % | 5 | % | 11 | % | ||||||||||||||||||||||||||||
| Gross profit |
32,987 | 50 | % | 38,987 | 53 | % | 52,642 | 61 | % | 57,374 | 63 | % | ||||||||||||||||||||||||||||||||||||
| Selling and distribution expenses |
-42,273 | -64 | % | -37,697 | -52 | % | -42,498 | -49 | % | -46,695 | -52 | % | ||||||||||||||||||||||||||||||||||||
| Contribution profit (2) |
-9,286 | -14 | % | 1,290 | 2 | % | 10,144 | 12 | % | 10,679 | 12 | % | ||||||||||||||||||||||||||||||||||||
| Revenues by Geography |
||||||||||||||||||||||||||||||||||||||||||||||||
| EMEA |
2,254 | 3 | % | 779 | 1 | % | 1,224 | 1 | % | 1,541 | 2 | % | -65 | % | 57 | % | 26 | % | -12 | % | ||||||||||||||||||||||||||||
| North America |
60,528 | 91 | % | 65,534 | 90 | % | 78,774 | 92 | % | 81,382 | 90 | % | 8 | % | 20 | % | 3 | % | 10 | % | ||||||||||||||||||||||||||||
| Greater China |
2,919 | 4 | % | 6,467 | 9 | % | 5,153 | 6 | % | 7,161 | 8 | % | 122 | % | -20 | % | 39 | % | 35 | % | ||||||||||||||||||||||||||||
| Other |
811 | 1 | % | 315 | 0 | % | 733 | 1 | % | 314 | 0 | % | -61 | % | 133 | % | -57 | % | -27 | % | ||||||||||||||||||||||||||||
| Revenues by Channel |
||||||||||||||||||||||||||||||||||||||||||||||||
| DTC |
44,778 | 67 | % | 51,581 | 71 | % | 66,412 | 77 | % | 71,007 | 79 | % | 15 | % | 29 | % | 7 | % | 17 | % | ||||||||||||||||||||||||||||
| Wholesale |
21,734 | 33 | % | 21,513 | 29 | % | 19,077 | 22 | % | 19,126 | 21 | % | -1 | % | -11 | % | 0 | % | -4 | % | ||||||||||||||||||||||||||||
| Other |
0 | 0 | % | 0 | 0 | % | 395 | 0 | % | 265 | 0 | % | -33 | % | ||||||||||||||||||||||||||||||||||
Caruso Brand Key Financials(3)
(€ in Thousands, unless otherwise noted)
| Caruso Brand Key Financials |
2020A | 2021A | 2022A | 2023A | 2021 A v | 2022 A v | 2023 A v | 20-23 | ||||||||||||||||||||||||||||||||||||||||
| FY | % | FY | % | FY | % | FY | % | 2020 A | 2021 A | 2022 A | CAGR | |||||||||||||||||||||||||||||||||||||
| Key Financials on P&L |
||||||||||||||||||||||||||||||||||||||||||||||||
| Revenues |
26,351 | 100 | % | 24,695 | 100 | % | 30,819 | 100 | % | 40,011 | 100 | % | -6 | % | 25 | % | 30 | % | 15 | % | ||||||||||||||||||||||||||||
| Gross profit |
4,881 | 19 | % | 4,449 | 18 | % | 7,147 | 23 | % | 11,351 | 28 | % | ||||||||||||||||||||||||||||||||||||
| Selling and distribution expenses |
-1,708 | -6 | % | -1,144 | -5 | % | -1,446 | -5 | % | -1,900 | -5 | % | ||||||||||||||||||||||||||||||||||||
| Contribution profit (2) |
3,173 | 12 | % | 3,305 | 13 | % | 5,701 | 18 | % | 9,451 | 24 | % | ||||||||||||||||||||||||||||||||||||
| Revenues by Geography |
||||||||||||||||||||||||||||||||||||||||||||||||
| EMEA |
20,318 | 77 | % | 19,475 | 79 | % | 23,050 | 75 | % | 33,739 | 84 | % | -4 | % | 18 | % | 46 | % | 18 | % | ||||||||||||||||||||||||||||
| North America |
4,252 | 16 | % | 3,272 | 13 | % | 5,833 | 19 | % | 4,580 | 11 | % | -23 | % | 78 | % | -21 | % | 3 | % | ||||||||||||||||||||||||||||
| Greater China |
480 | 2 | % | 549 | 2 | % | 559 | 2 | % | 44 | 0 | % | 14 | % | 2 | % | -92 | % | -55 | % | ||||||||||||||||||||||||||||
| Other |
1,301 | 5 | % | 1,399 | 6 | % | 1,377 | 4 | % | 1,648 | 4 | % | 8 | % | -2 | % | 20 | % | 8 | % | ||||||||||||||||||||||||||||
| Revenues by Channel |
||||||||||||||||||||||||||||||||||||||||||||||||
| DTC |
0 | 0 | % | 0 | 0 | % | 0 | 0 | % | 40 | 0 | % | ||||||||||||||||||||||||||||||||||||
| Wholesale |
26,351 | 100 | % | 24,695 | 100 | % | 30,819 | 100 | % | 39,971 | 100 | % | -6 | % | 25 | % | 30 | % | 15 | % | ||||||||||||||||||||||||||||
| Other |
0 | 0 | % | 0 | 0 | % | 0 | 0 | % | 0 | 0 | % | ||||||||||||||||||||||||||||||||||||
Lanvin Group Brand Footprint
| Footprint by Brand |
2021 | 2022 | 2023 | |||||||||||||||||||||
| DOS (4) | POS (5) | DOS (4) | POS (5) | DOS (4) | POS (5) | |||||||||||||||||||
| Lanvin |
27 | 287 | 31 | 339 | 36 | 319 | ||||||||||||||||||
| Wolford |
167 | 227 | 163 | 225 | 150 | 201 | ||||||||||||||||||
| St. John |
48 | 133 | 46 | 106 | 45 | 107 | ||||||||||||||||||
| Sergio Rossi |
50 | 328 | 50 | 346 | 48 | 289 | ||||||||||||||||||
| Caruso |
1 | 144 | 1 | 189 | 0 | 183 | ||||||||||||||||||
|
|
|
|
|
|
|
|
|
|
|
|
|
|||||||||||||
| Total |
293 | 1,119 | 291 | 1,205 | 279 | 1,099 | ||||||||||||||||||
Non-IFRS Financial Measures Reconciliation
(€ in Thousands, unless otherwise noted)
| Reconciliation of Contribution Margin |
2020A | 2021A | 2022A | 2023A | ||||||||||||
| FY | FY | FY | FY | |||||||||||||
| Revenue |
222,612 | 308,822 | 422,312 | 426,178 | ||||||||||||
| Cost of sales |
-105,218 | -138,920 | -184,368 | -175,236 | ||||||||||||
| Gross profit |
117,394 | 169,902 | 237,944 | 250,942 | ||||||||||||
| Marketing and selling expenses |
-151,631 | -165,502 | -224,733 | -226,750 | ||||||||||||
| Contribution profit (2) |
-34,237 | 4,400 | 13,211 | 24,192 | ||||||||||||
(€ in Thousands, unless otherwise noted)
| Reconciliation of Adjusted EBIT & EBITDA |
2020A | 2021A | 2022A | 2023A | ||||||||||||
| FY | FY | FY | FY | |||||||||||||
| Loss for the year |
-135,657 | -76,452 | -239,751 | -146,253 | ||||||||||||
| Add / (Deduct) the impact of: |
||||||||||||||||
| Income tax benefits / (expenses) |
-1,603 | 4,331 | -129 | 3,407 | ||||||||||||
| Finance cost—net |
12,989 | 9,313 | 14,556 | 20,431 | ||||||||||||
| Non-underlying items (1) |
-43,546 | -45,206 | 83,057 | 3,858 | ||||||||||||
| Loss from operations before non-underlying items |
-167,817 | -108,014 | -142,267 | -118,557 | ||||||||||||
| Add / (Deduct) the impact of: |
||||||||||||||||
| Share based compensation |
5,389 | 7,208 | 7,431 | 2,749 | ||||||||||||
| Adjusted EBIT (2) |
-162,428 | -100,806 | -134,836 | -115,808 | ||||||||||||
| Depreciation / Amortization |
48,332 | 41,584 | 45,810 | 46,946 | ||||||||||||
| Provisions and impairment losses |
22,676 | 10,766 | 16,729 | 79 | ||||||||||||
| Net foreign exchange (gains) / losses |
3,304 | -10,489 | 339 | 4,610 | ||||||||||||
| Adjusted EBITDA (2) |
-88,116 | -58,945 | -71,958 | -64,173 | ||||||||||||
Note:
| (1) | 2022 was impacted by a €84 million cost related to the Reverse Recapitalization that occurred as part of the SPAC merger; this cost is non-recurring in nature. |
| (2) | These are Non-IFRS Financial Measures and will be mentioned throughout this communication. Please see Non-IFRS Financial Measures and Definition. |
| (3) | Brand-level results are presented exclusive of eliminations. |
| (4) | DOS refers to Directly Operated Stores which include boutiques, outlets, concession shop-in-shops and pop-up stores. |
| (5) | POS refers to Point of Sales which include DOS and wholesale accounts. |
Non-IFRS Financial Measures and Definition
Our management monitors and evaluates operating and financial performance using several non-IFRS financial measures including: contribution profit, contribution margin, Adjusted EBIT and Adjusted EBITDA. Our management believes that these non-IFRS financial measures provide useful and relevant information regarding our performance and improve their ability to assess financial performance and financial position. They also provide comparable measures that facilitate management’s ability to identify operational trends, as well as make decisions regarding future spending, resource allocations and other operational decisions. While similar measures are widely used in the industry in which we operate, the financial measures that we use may not be comparable to other similarly named measures used by other companies nor are they intended to be substitutes for measures of financial performance or financial position as prepared in accordance with IFRS.
Contribution profit is defined as revenue less the cost of sales and selling and marketing expenses. Contribution profit subtracts the main variable expenses of selling and marketing expenses from gross profit, and our management believes this measure is an important indicator of profitability at the marginal level. Below contribution profit, the main expenses are general administrative expenses and other operating expenses (which include foreign exchange gains or losses and impairment losses). As we continue to improve the management of our portfolio brands, we believe we can achieve greater economy of scale across the different brands by maintaining the fixed expenses at a lower level as a proportion of revenue. We therefore use contribution profit margin as a key indicator of profitability at the group level as well as the portfolio brand level.
Contribution margin is defined as contribution profit divided by revenue.
Adjusted EBIT is defined as profit or loss before income taxes, net finance cost, share based compensation, adjusted for income and costs which are significant in nature and that management considers not reflective of underlying operational activities, mainly including net gains on disposal of long-term assets, negative goodwill from acquisition of Sergio Rossi, gain on debt restructuring and government grants.
Adjusted EBITDA is defined as profit or loss before income taxes, net finance cost, exchange gains/(losses), depreciation, amortization, share based compensation and provisions and impairment losses adjusted for income and costs which are significant in nature and that management considers not reflective of underlying operational activities, mainly including net gains on disposal of long-term assets, negative goodwill from acquisition of Sergio Rossi, gain on debt restructuring and government grants.