UNITED STATES
SECURITIES AND EXCHANGE COMMISSION
Washington, D.C. 20549
Form 8-K
CURRENT REPORT
Pursuant to Section 13 or 15(d)
of the Securities Exchange Act of 1934
Date of Report (Date of earliest event reported): 4/29/2024
UMB FINANCIAL CORPORATION
(Exact name of registrant as specified in its charter)
Commission File Number: 001-38481
| Missouri | 43-0903811 | |
| (State or other jurisdiction of incorporation) |
(IRS Employer Identification No.) |
1010 Grand Blvd., Kansas City, MO 64106
(Address of principal executive offices, including zip code)
(816) 860-7000
(Registrant’s telephone number, including area code)
(Former name or former address, if changed since last report)
Check the appropriate box below if the Form 8-K filing is intended to simultaneously satisfy the filing obligation of the registrant under any of the following provisions:
| ☐ | Written communications pursuant to Rule 425 under the Securities Act (17 CFR 230.425) |
| ☐ | Soliciting material pursuant to Rule 14a-12 under the Exchange Act (17 CFR 240.14a-12) |
| ☐ | Pre-commencement communications pursuant to Rule 14d-2(b) under the Exchange Act (17 CFR 240.14d-2(b)) |
| ☐ | Pre-commencement communications pursuant to Rule 13c-4(c) under the Exchange Act (17 CFR 240.13e-4(c)) |
Securities Registered Pursuant to Section 12(b) of the Act:
| Title of each class |
Trading |
Name of each exchange on which registered |
||
| Common Stock, $1.00 Par Value | UMBF | The NASDAQ Global Select Market |
Indicate by check mark whether the registrant is an emerging growth company as defined in Rule 405 of the Securities Act of 1933 (§230.405 of this chapter) or Rule 12b-2 of the Securities Exchange Act of 1934 (§240.12b-2 of this chapter).
Emerging growth company ☐
If an emerging growth company, indicate by check mark if the registrant has elected not to use the extended transition period for complying with any new or revised financial accounting standards provided pursuant to Section 13(a) of the Exchange Act. ☐
| Item 2.02 | Results of Operations and Financial Condition |
On April 29, 2024, UMB Financial Corporation (the “Company”) issued a press release announcing the financial results for the Company for the quarter ended March 31, 2024. A copy of the press release is attached as Exhibit 99.1 and the information is hereby incorporated by reference herein. The Company does not incorporate by reference information presented at any website referenced in the press release.
The information contained in Item 2.02 of this Current Report on Form 8-K, including Exhibit 99.1 hereto, is being furnished and shall not be deemed to be “filed” with the Securities and Exchange Commission (“SEC”) for the purposes of Section 18 of the Securities Exchange Act of 1934, as amended (the “Exchange Act”) or otherwise subject to the liabilities of that section and is not incorporated by reference into any filing of the Company under the Securities Act of 1933, as amended (the “Securities Act”), or the Exchange Act, whether made before or after the date hereof, except as shall be expressly set forth by specific reference to this Current Report on Form 8-K in such a filing.
| Item 7.01 | Regulation FD Disclosure |
On April 29, 2024, the Company announced in the same press release that the Board of Directors of the Company had declared a quarterly dividend of $0.39 per share that is payable on July 1, 2024 to shareholders of record of the Company as of the close of business on June 10, 2024.
The April 29, 2024 press release that is attached as Exhibit 99.1 also announced that the Board has authorized the repurchase of up to one million shares of the Company’s common stock from time to time until the meeting of the Board that immediately follows the 2025 annual meeting of the Company’s shareholders.
The Company is furnishing a copy of the investor presentation materials dated April 30, 2024, addressing the Company’s first quarter earnings. A copy of the materials is attached as Exhibit 99.2 and will be available on the Company’s website at www.umb.comThe Company disclaims any obligation to correct or update any of the materials in the future.
The information provided under Item 7.01 of this Current Report on Form 8-K, including Exhibits 99.1 and 99.2 hereto, is being furnished and is not deemed to be “filed” with the SEC for the purposes of Section 18 of the Exchange Act or otherwise subject to the liabilities of that section and is not incorporated by reference into any filing of the Company under the Securities Act or the Exchange Act, whether made before or after the date hereof, except as shall be expressly set forth by specific reference to this Current Report on Form 8-K in such a filing. The Company does not incorporate by reference to this Current Report on Form 8-K information presented at any website referenced in this report or in any of the Exhibits attached hereto.
| Item 9.01 | Financial Statements and Exhibits |
| 99.1 | Press Release announcing financial results for quarter ended March 31, 2024, and announcing dividend declaration and share repurchase. | |
| 99.2 | Investor Presentation Materials, dated April 29, 2024. | |
| 104 | The cover page from this Current Report on Form 8-K, formatted in Inline XBRL. | |
SIGNATURES
Pursuant to the requirements of the Securities Exchange Act of 1934, the registrant has duly caused this report to be signed on its behalf by the undersigned hereunto duly authorized.
| UMB FINANCIAL CORPORATION | ||
| By: | /s/ Ram Shankar |
|
| Ram Shankar | ||
| Chief Financial Officer | ||
Date: April 29, 2024
Exhibit 99.1

| UMB Financial Corporation 1010 Grand Boulevard Kansas City, MO 64106 816.860.7000 umb.com |
News Release |
//FOR IMMEDIATE RELEASE//
Media Contact: Stephanie Hague: 816.729.1027
Investor Relations Contact: Kay Gregory: 816.860.7106
UMB Financial Corporation Reports First Quarter 2024 Net Income of $110.3 Million and Net Operating Income(i) of $120.7 Million.
UMB investment community call today, Monday, April 29, at 7:30 a.m. (CT) / 8:30 a.m. (ET)
First Quarter 2024 Financial Highlights
| • | GAAP net income of $110.3 million, or $2.25 per diluted share. |
| • | Net operating income(i) of $120.7 million, or $2.47 per diluted share. |
| • | Average loans increased 4.2% on a linked-quarter, annualized basis, to $23.4 billion. |
| • | Average loans increased $2.1 billion, or 9.8%, as compared to the first quarter of 2023. |
| • | Average deposits increased 10.4% on a linked-quarter, annualized basis, to $33.5 billion. |
| • | Net interest income increased 3.9% from the linked quarter. |
| • | Net interest margin was 2.48%, an increase of two basis points from the linked quarter. |
| • | Noninterest income increased 22.3% from the first quarter of 2023, equal to 39.9% of total revenue. |
| • | Credit quality remained strong, with net charge-offs of just 0.05% of average loans. |
KANSAS CITY, Mo. (April 29, 2024) – UMB Financial Corporation (Nasdaq: UMBF), a financial services company, announced net income for the first quarter of 2024 of $110.3 million, or $2.25 per diluted share, compared to $70.9 million, or $1.45 per diluted share, in the fourth quarter of 2023 (linked quarter) and $92.4 million, or $1.90 per diluted share, in the first quarter of 2023. The results for the first quarter of 2024 and the fourth quarter of 2023 include pre-tax expense of $13.0 million and $52.8 million, respectively, for the industry-wide FDIC special assessment.
Net operating income, a non-GAAP financial measure reconciled later in this release to net income, the nearest comparable GAAP measure, was $120.7 million, or $2.47 per diluted share, for the first quarter of 2024, compared to $112.0 million, or $2.29 per diluted share, for the linked quarter and $92.8 million, or $1.91 per diluted share, for the first quarter of 2023. Operating pre-tax, pre-provision income (operating PTPP), a non-GAAP measure reconciled later in this release to the components of net income before taxes, the nearest comparable GAAP measure, was $157.5 million, or $3.22 per diluted share, for the first quarter of 2024, compared to $134.9 million, or $2.76 per diluted share, for the linked quarter, and $135.4 million, or $2.78 per diluted share, for the first quarter of 2023. These operating PTPP results represent increases of 16.7% on a linked-quarter basis and 16.3% compared to the first quarter of 2023.
“Our 2024 is off to a great start, with strong first quarter financial results driven by balance sheet and net interest income growth, net interest margin expansion, double-digit growth in our fee income revenue, and stable credit metrics,” said Mariner Kemper, UMB Financial Corporation chairman and chief executive officer.
“Our performance validates the perspective I shared earlier this year that the dramatized and highly exaggerated regional bank crisis from a year ago—and similar frenzy over idiosyncratic commercial real estate headlines earlier this year—do not apply to the whole regional banking industry, which remains on strong footing. As students of history, we believe in gravity and that what goes up will eventually come down. We run the company based on this expectation.
While indications suggest the economy is on reasonably stable footing, persistently high inflation, an upcoming presidential election cycle, and a potential ‘No Landing’ scenario may dictate a constrictive Federal Reserve monetary policy that could pose economic challenges.
In the first quarter of 2024, average loans increased 9.8% to $23.4 billion, while average deposits increased $2.0 billion or 6.2%, from one year ago. Our financial metrics demonstrate our borrowers and depository clients remain cautiously optimistic and selective with their investments. The overall loan portfolio remains healthy as exemplified by net charge-offs averaging less than 10 basis points in each of the past seven quarters, and non-performing loans at a meager eight basis points of total loans. Also of note for the quarter is that we closed on the purchase of a co-branded credit card portfolio partnership with Rural King, a preeminent, family-owned general merchandise store with more than 130 locations in a 13-state footprint.”
(i) A non-GAAP financial measure reconciled later in this release to net income, the nearest comparable GAAP measure.
First Quarter 2024 earnings discussion
| Summary of quarterly financial results |
UMB Financial Corporation | |||||||||||
| (unaudited, dollars in thousands, except per share data) | ||||||||||||
| Q1 2024 |
Q4 2023 |
Q1 2023 |
||||||||||
| Net income (GAAP) |
$ | 110,258 | $ | 70,923 | $ | 92,437 | ||||||
| Earnings per share - diluted (GAAP) |
2.25 | 1.45 | 1.90 | |||||||||
| Operating pre-tax, pre-provision income (Non-GAAP)(i) |
157,451 | 134,901 | 135,369 | |||||||||
| Operating pre-tax, pre-provision earnings per share - diluted (Non-GAAP)(i) |
3.22 | 2.76 | 2.78 | |||||||||
| Operating pre-tax, pre-provision income - FTE (Non-GAAP)(i) |
163,967 | 141,571 | 141,924 | |||||||||
| Operating pre-tax, pre-provision earnings per share - FTE - diluted (Non-GAAP)(i) |
3.35 | 2.90 | 2.91 | |||||||||
| Net operating income (Non-GAAP)(i) |
120,712 | 112,038 | 92,836 | |||||||||
| Operating earnings per share - diluted (Non-GAAP)(i) |
2.47 | 2.29 | 1.91 | |||||||||
| GAAP |
||||||||||||
| Return on average assets |
1.06 | % | 0.69 | % | 0.97 | % | ||||||
| Return on average equity |
14.11 | 9.52 | 13.76 | |||||||||
| Efficiency ratio |
63.44 | 77.65 | 63.12 | |||||||||
| Non-GAAP(i) |
||||||||||||
| Operating return on average assets |
1.16 | % | 1.10 | % | 0.98 | % | ||||||
| Operating return on average equity |
15.44 | 15.04 | 13.82 | |||||||||
| Operating efficiency ratio |
60.04 | 63.06 | 62.98 | |||||||||
| (i) | See reconciliation of Non-GAAP measures to their nearest comparable GAAP measures later in this release. |
| Summary of revenue |
UMB Financial Corporation | |||||||||||||||||||
| (unaudited, dollars in thousands) | ||||||||||||||||||||
| Q1 | Q4 | Q1 | CQ vs. | CQ vs. | ||||||||||||||||
| 2024 | 2023 | 2023 | LQ | PY | ||||||||||||||||
| Net interest income |
$ | 239,434 | $ | 230,522 | $ | 241,696 | $ | 8,912 | $ | (2,262 | ) | |||||||||
| Noninterest income: |
||||||||||||||||||||
| Trust and securities processing |
69,478 | 66,584 | 62,359 | 2,894 | 7,119 | |||||||||||||||
| Trading and investment banking |
5,462 | 5,751 | 5,308 | (289 | ) | 154 | ||||||||||||||
| Service charges on deposit accounts |
20,757 | 21,330 | 21,159 | (573 | ) | (402 | ) | |||||||||||||
| Insurance fees and commissions |
283 | 238 | 274 | 45 | 9 | |||||||||||||||
| Brokerage fees |
13,160 | 13,439 | 13,676 | (279 | ) | (516 | ) | |||||||||||||
| Bankcard fees |
21,968 | 18,672 | 18,172 | 3,296 | 3,796 | |||||||||||||||
| Investment securities gains (losses), net |
9,371 | 1,014 | (5,324 | ) | 8,357 | 14,695 | ||||||||||||||
| Other |
18,765 | 13,226 | 14,576 | 5,539 | 4,189 | |||||||||||||||
|
|
|
|
|
|
|
|
|
|
|
|||||||||||
| Total noninterest income |
$ | 159,244 | $ | 140,254 | $ | 130,200 | $ | 18,990 | $ | 29,044 | ||||||||||
|
|
|
|
|
|
|
|
|
|
|
|||||||||||
| Total revenue |
$ | 398,678 | $ | 370,776 | $ | 371,896 | $ | 27,902 | $ | 26,782 | ||||||||||
|
|
|
|
|
|
|
|
|
|
|
|||||||||||
| Net interest income (FTE) |
$ | 245,950 | $ | 237,192 | $ | 248,251 | ||||||||||||||
| Net interest margin (FTE) |
2.48 | % | 2.46 | % | 2.76 | % | ||||||||||||||
| Total noninterest income as a % of total revenue |
39.9 | 37.8 | 35.0 | |||||||||||||||||
Net interest income
| • | First quarter 2024 net interest income totaled $239.4 million, an increase of $8.9 million, or 3.9%, from the linked quarter, driven primarily by continued growth in average loans and higher levels of liquidity, $1.4 million in municipal bond hedge gain amortization, partially offset by higher interest expense. |
| • | Average earning assets increased $1.6 billion, or 4.1%, from the linked quarter, largely driven by an increase of $931.4 million in interest-bearing due from banks, an increase of $428.4 million in average securities, and an increase of $245.0 million in average loans. |
| • | Average interest-bearing liabilities increased $1.3 billion, or 4.9%, from the linked quarter, primarily driven by increases of $903.2 million in interest-bearing deposits and $501.4 million in federal funds and repurchase agreements, partially offset by a decrease of $102.8 million in borrowed funds. Average noninterest-bearing demand deposits decreased $52.3 million, or 0.5%, as compared to the linked quarter. |
| • | Net interest margin for the first quarter was 2.48%, an increase of two basis points from the linked quarter, driven by increased loan yields, the benefit of free funds, favorable impact of bond hedge gain amortization, and earning asset mix changes, partially offset by the increased cost of interest-bearing liabilities. The cost of interest-bearing liabilities increased eight basis points to 4.03%. Total cost of funds increased nine basis points from the linked quarter to 2.96%. Both average loan yields and earning asset yields increased 10 basis points from the linked quarter. |
| • | On a year-over-year basis, net interest income decreased $2.3 million, or 0.9%, driven by higher interest expense, primarily due to an unfavorable mix shift in the composition of liabilities and new deposit client acquisitions at prevailing market rates. This decrease was partially offset by a $2.1 billion, or 9.8%, increase in average loans as well as the benefit from higher short-term interest rates on loan pricing and yields. |
| • | Compared to the first quarter of 2023, average earning assets increased $3.4 billion, or 9.4%, largely driven by the increase in average loans noted above and an increase of $1.8 billion in interest-bearing due from banks, partially offset by a decrease of $244.7 million in federal funds sold and resell agreements. |
| • | Average deposits increased 6.2% compared to the first quarter of 2023. Average noninterest-bearing demand deposit balances decreased 15.5% compared to the first quarter of 2023, driven by migration to rate-bearing deposit categories, as expected in a higher interest rate environment. Average demand deposit balances comprised 30.0% of total deposits, compared to 31.0% in the linked quarter and 37.8% in the first quarter of 2023. |
| • | Average borrowed funds decreased $102.8 million as compared to the linked quarter and increased $983.1 million as compared to the first quarter of 2023, driven by short-term borrowings with the Federal Home Loan Bank and the Federal Reserve. |
Noninterest income
| • | First quarter 2024 noninterest income increased $19.0 million, or 13.5%, on a linked-quarter basis, largely due to: |
| • | $8.4 million in higher investment securities gains, primarily driven by a net $8.6 million gain on disposition of two of the company’s non-marketable securities. The company recognized a gain of $10.7 million and a loss of $2.1 million, respectively, on these two securities. |
| • | An increase of $5.8 million in other miscellaneous income, recorded in other income, related to a $4.0 million legal settlement and a $1.8 million gain on sale of land, both recorded during the first quarter of 2024. |
| • | An increase of $3.3 million in bankcard income primarily driven by higher interchange revenue and lower rebates and rewards expense as compared to the linked quarter. |
| • | Increases of $1.1 million in trust income, $1.0 million in fund services income, and $0.8 million in corporate trust income, all recorded in trust and securities processing. |
| • | These increases were partially offset by decreases of $0.8 million in derivative income, recorded in other income, and $0.6 million in service charges on deposits. |
| • | Compared to the prior year, noninterest income in the first quarter of 2024 increased $29.0 million, or 22.3%, primarily driven by: |
| • | An increase of $14.7 million in investment securities gains, primarily driven by a $10.7 million gain on disposition of one of the company’s non-marketable securities during the first quarter of 2024, coupled with the impairment loss on an available-for-sale subordinated debt security recorded in the prior year. |
| • | An increase of $5.7 million in other miscellaneous income, recorded in other income, related to a $4.0 million legal settlement and a $1.8 million gain on sale of land, both recorded during the first quarter of 2024. |
| • | Increases of $5.0 million in fund services income, $1.1 million in trust income, and $1.0 million in corporate trust income, all recorded in trust and securities processing. |
| • | An increase of $3.8 million in bankcard income primarily driven by higher interchange revenue and lower rebates and rewards expense as compared to the prior year. |
| • | These increases were partially offset by a decrease of $2.4 million in derivative income, recorded in other income. |
Noninterest expense
| Summary of noninterest expense |
UMB Financial Corporation | |||||||||||||||||||
| (unaudited, dollars in thousands) | ||||||||||||||||||||
| Q1 | Q4 | Q1 | CQ vs. | CQ vs. | ||||||||||||||||
| 2024 | 2023 | 2023 | LQ | PY | ||||||||||||||||
| Salaries and employee benefits |
$ | 143,006 | $ | 134,231 | $ | 142,498 | $ | 8,775 | $ | 508 | ||||||||||
| Occupancy, net |
12,270 | 12,296 | 12,177 | (26 | ) | 93 | ||||||||||||||
| Equipment |
16,503 | 16,579 | 17,849 | (76 | ) | (1,346 | ) | |||||||||||||
| Supplies and services |
3,301 | 5,546 | 3,875 | (2,245 | ) | (574 | ) | |||||||||||||
| Marketing and business development |
6,025 | 6,659 | 5,335 | (634 | ) | 690 | ||||||||||||||
| Processing fees |
27,936 | 27,271 | 23,240 | 665 | 4,696 | |||||||||||||||
| Legal and consulting |
7,894 | 8,424 | 7,285 | (530 | ) | 609 | ||||||||||||||
| Bankcard |
10,567 | 8,677 | 7,133 | 1,890 | 3,434 | |||||||||||||||
| Amortization of other intangible assets |
1,960 | 2,048 | 2,298 | (88 | ) | (338 | ) | |||||||||||||
| Regulatory fees |
19,395 | 59,183 | 5,551 | (39,788 | ) | 13,844 | ||||||||||||||
| Other |
5,947 | 9,060 | 9,811 | (3,113 | ) | (3,864 | ) | |||||||||||||
|
|
|
|
|
|
|
|
|
|
|
|||||||||||
| Total noninterest expense |
$ | 254,804 | $ | 289,974 | $ | 237,052 | $ | (35,170 | ) | $ | 17,752 | |||||||||
|
|
|
|
|
|
|
|
|
|
|
|||||||||||
| • | GAAP noninterest expense for the first quarter of 2024 was $254.8 million, a decrease of $35.2 million, or 12.1%, from the linked quarter and an increase of $17.8 million, or 7.5% from the first quarter of 2023. Operating noninterest expense, a non-GAAP financial measure reconciled later in this release to noninterest expense, the nearest comparable GAAP measure, was $241.2 million for the first quarter of 2024, an increase of $5.4 million, or 2.3%, from the linked quarter and an increase of $4.7 million, or 2.0%, from the first quarter of 2023. |
| • | The linked-quarter decrease in GAAP noninterest expense was driven by: |
| • | A decrease of $39.8 million in regulatory fees expense, driven by the lower FDIC special assessment levied on banks to recoup the losses related to two of the bank failures in March 2023. The results for the first quarter of 2024 and the fourth quarter of 2023 include pre-tax expense of $13.0 million and $52.8 million, respectively, for the industry-wide FDIC special assessment. |
| • | A decrease of $2.2 million in supplies driven by purchases of computers during the linked quarter. |
| • | Decreases of $1.5 million in operational losses and $1.3 million in charitable contribution expense, both recorded in other expense. |
| • | These decreases were partially offset by a seasonal increase of $9.1 million in payroll taxes, insurance, and 401(k) expense recognized in the first quarter. |
| • | The year-over-year increase in GAAP noninterest expense was driven by: |
| • | An increase of $13.8 million in regulatory fees, primarily driven by the aforementioned $13.0 million FDIC special assessment recorded in the first quarter of 2024. |
| • | An increase of $4.7 million in processing fees expense due to the ongoing modernization of the company’s core systems and the timing of multiple software projects. |
| • | An increase of $3.4 million in bankcard expense driven by higher administrative expenses and fraud losses. |
| • | These increases were partially offset by decreases of $3.5 million in operational losses, recorded in other expense, and $1.3 million in equipment expense, driven by reduced software expense. |
Income taxes
| • | The company’s effective tax rate was 17.6% for the three months ended March 31, 2024, compared to 17.2% for the same period in 2023. |
Balance sheet
| • | Average total assets for the first quarter of 2024 were $42.0 billion compared to $40.5 billion for the linked quarter and $38.5 billion for the same period in 2023. |
| Summary of average loans and leases - QTD Average |
UMB Financial Corporation | |||||||||||||||||||
| (unaudited, dollars in thousands) | ||||||||||||||||||||
| Q1 | Q4 | Q1 | CQ vs. | CQ vs. | ||||||||||||||||
| 2024 | 2023 | 2023 | LQ | PY | ||||||||||||||||
| Commercial and industrial |
$ | 9,942,457 | $ | 9,825,043 | $ | 9,287,319 | $ | 117,414 | $ | 655,138 | ||||||||||
| Specialty lending |
485,989 | 496,816 | 564,633 | (10,827 | ) | (78,644 | ) | |||||||||||||
| Commercial real estate |
9,026,511 | 8,890,057 | 7,812,140 | 136,454 | 1,214,371 | |||||||||||||||
| Consumer real estate |
2,968,320 | 2,945,114 | 2,738,184 | 23,206 | 230,136 | |||||||||||||||
| Consumer |
154,062 | 153,791 | 136,571 | 271 | 17,491 | |||||||||||||||
| Credit cards |
489,546 | 495,502 | 453,704 | (5,956 | ) | 35,842 | ||||||||||||||
| Leases and other |
287,158 | 302,740 | 279,049 | (15,582 | ) | 8,109 | ||||||||||||||
|
|
|
|
|
|
|
|
|
|
|
|||||||||||
| Total loans |
$ | 23,354,043 | $ | 23,109,063 | $ | 21,271,600 | $ | 244,980 | $ | 2,082,443 | ||||||||||
|
|
|
|
|
|
|
|
|
|
|
|||||||||||
| • | Average loans for the first quarter of 2024 increased $245.0 million, or 1.1%, on a linked-quarter basis and $2.1 billion, or 9.8%, compared to the first quarter of 2023. |
| Summary of average securities - QTD Average |
UMB Financial Corporation | |||||||||||||||||||
| (unaudited, dollars in thousands) | ||||||||||||||||||||
| Q1 | Q4 | Q1 | CQ vs. | CQ vs. | ||||||||||||||||
| 2024 | 2023 | 2023 | LQ | PY | ||||||||||||||||
| Securities available for sale: |
||||||||||||||||||||
| U.S. Treasury |
$ | 1,127,611 | $ | 859,114 | $ | 783,170 | $ | 268,497 | $ | 344,441 | ||||||||||
| U.S. Agencies |
199,719 | 169,723 | 171,825 | 29,996 | 27,894 | |||||||||||||||
| Mortgage-backed |
3,595,619 | 3,466,152 | 3,938,137 | 129,467 | (342,518 | ) | ||||||||||||||
| State and political subdivisions |
1,254,148 | 1,218,176 | 1,356,785 | 35,972 | (102,637 | ) | ||||||||||||||
| Corporates |
341,142 | 345,634 | 364,854 | (4,492 | ) | (23,712 | ) | |||||||||||||
| Collateralized loan obligations |
347,063 | 349,149 | 348,477 | (2,086 | ) | (1,414 | ) | |||||||||||||
|
|
|
|
|
|
|
|
|
|
|
|||||||||||
| Total securities available for sale |
$ | 6,865,302 | $ | 6,407,948 | $ | 6,963,248 | $ | 457,354 | $ | (97,946 | ) | |||||||||
|
|
|
|
|
|
|
|
|
|
|
|||||||||||
| Securities held to maturity: |
||||||||||||||||||||
| U.S. Agencies |
$ | 123,225 | $ | 123,195 | $ | 123,106 | $ | 30 | $ | 119 | ||||||||||
| Mortgage-backed |
2,707,780 | 2,756,528 | 2,934,113 | (48,748 | ) | (226,333 | ) | |||||||||||||
| State and political subdivisions |
2,821,799 | 2,825,138 | 2,814,912 | (3,339 | ) | 6,887 | ||||||||||||||
|
|
|
|
|
|
|
|
|
|
|
|||||||||||
| Total securities held to maturity |
$ | 5,652,804 | $ | 5,704,861 | $ | 5,872,131 | $ | (52,057 | ) | $ | (219,327 | ) | ||||||||
|
|
|
|
|
|
|
|
|
|
|
|||||||||||
| Trading securities |
$ | 17,893 | $ | 16,880 | $ | 9,258 | $ | 1,013 | $ | 8,635 | ||||||||||
| Other securities |
478,805 | 456,758 | 359,238 | 22,047 | 119,567 | |||||||||||||||
|
|
|
|
|
|
|
|
|
|
|
|||||||||||
| Total securities |
$ | 13,014,804 | $ | 12,586,447 | $ | 13,203,875 | $ | 428,357 | $ | (189,071 | ) | |||||||||
|
|
|
|
|
|
|
|
|
|
|
|||||||||||
| • | Average total securities increased 3.4% on a linked-quarter basis and decreased 1.4% compared to the first quarter of 2023. |
| • | At March 31, 2024, the unrealized pre-tax net loss on the available-for-sale securities portfolio was $665.9 million, or 9.2% of the $7.2 billion amortized cost balance. At March 31, 2024, the unrealized pre-tax net loss on the securities designated as held to maturity was $601.3 million, or 10.7% of the $5.6 billion amortized cost value. |
| Summary of average deposits - QTD Average |
UMB Financial Corporation | |||||||||||||||||||
| (unaudited, dollars in thousands) | ||||||||||||||||||||
| Q1 | Q4 | Q1 | CQ vs. | CQ vs. | ||||||||||||||||
| 2024 | 2023 | 2023 | LQ | PY | ||||||||||||||||
| Deposits: |
||||||||||||||||||||
| Noninterest-bearing demand |
$ | 10,066,409 | $ | 10,118,748 | $ | 11,919,277 | $ | (52,339 | ) | $ | (1,852,868 | ) | ||||||||
| Interest-bearing demand and savings |
20,701,659 | 19,457,878 | 18,427,662 | 1,243,781 | 2,273,997 | |||||||||||||||
| Time deposits |
2,758,064 | 3,098,636 | 1,215,506 | (340,572 | ) | 1,542,558 | ||||||||||||||
|
|
|
|
|
|
|
|
|
|
|
|||||||||||
| Total deposits |
$ | 33,526,132 | $ | 32,675,262 | $ | 31,562,445 | $ | 850,870 | $ | 1,963,687 | ||||||||||
|
|
|
|
|
|
|
|
|
|
|
|||||||||||
| Noninterest bearing deposits as % of total |
30.0 | % | 31.0 | % | 37.8 | % | ||||||||||||||
| • | Average deposits increased 2.6% on a linked-quarter basis and 6.2% compared to the first quarter of 2023. |
| • | As of March 31, 2024, total estimated uninsured deposits were $25.3 billion, or approximately 68.4% of total deposits. Estimated uninsured deposits, when adjusted to exclude affiliate (company-owned) and collateralized deposits, were $17.9 billion, and represented approximately 48.6% of total deposits. During the quarter, estimated adjusted uninsured deposits averaged $14.4 billion, or approximately 43.0% of total average deposits. |
Capital
| Capital information |
UMB Financial Corporation | |||||||||||
| (unaudited, dollars in thousands, except per share data) | ||||||||||||
| March 31, 2024 |
December 31, 2023 |
March 31, 2023 |
||||||||||
| Total equity |
$ | 3,152,816 | $ | 3,100,419 | $ | 2,814,659 | ||||||
| Accumulated other comprehensive loss, net |
(594,538 | ) | (556,935 | ) | (626,776 | ) | ||||||
| Book value per common share |
64.68 | 63.85 | 58.03 | |||||||||
| Tangible book value per common share (Non-GAAP)(i) |
59.01 | 58.12 | 52.17 | |||||||||
| Regulatory capital: |
||||||||||||
| Common equity Tier 1 capital |
$ | 3,503,837 | $ | 3,418,676 | $ | 3,196,111 | ||||||
| Tier 1 capital |
3,503,837 | 3,418,676 | 3,196,111 | |||||||||
| Total capital |
4,115,097 | 4,014,910 | 3,776,407 | |||||||||
| Regulatory capital ratios: |
||||||||||||
| Common equity Tier 1 capital ratio |
11.09 | % | 10.94 | % | 10.57 | % | ||||||
| Tier 1 risk-based capital ratio |
11.09 | 10.94 | 10.57 | |||||||||
| Total risk-based capital ratio |
13.03 | 12.85 | 12.49 | |||||||||
| Tier 1 leverage ratio |
8.39 | 8.49 | 8.35 | |||||||||
| (i) | See reconciliation of Non-GAAP measures to their nearest comparable GAAP measures later in this release. |
| • | At March 31, 2024, the regulatory capital ratios presented in the foregoing table exceeded all “well-capitalized” regulatory thresholds. |
Asset Quality
| Credit quality |
UMB Financial Corporation | |||||||||||||||||||
| (unaudited, dollars in thousands) | ||||||||||||||||||||
| Q1 | Q4 | Q3 | Q2 | Q1 | ||||||||||||||||
| 2024 | 2023 | 2023 | 2023 | 2023 | ||||||||||||||||
| Net charge-offs (recoveries) - total loans |
$ | 3,017 | $ | 1,352 | $ | 4,618 | $ | (139 | ) | $ | 4,643 | |||||||||
| Net loan charge-offs (recoveries) as a % of total average loans |
0.05 | % | 0.02 | % | 0.08 | % | (0.00 | )% | 0.09 | % | ||||||||||
| Loans over 90 days past due |
$ | 3,076 | $ | 3,111 | $ | 3,044 | $ | 10,675 | $ | 1,723 | ||||||||||
| Loans over 90 days past due as a % of total loans |
0.01 | % | 0.01 | % | 0.01 | % | 0.05 | % | 0.01 | % | ||||||||||
| Nonaccrual and restructured loans |
$ | 17,756 | $ | 13,212 | $ | 17,042 | $ | 19,347 | $ | 15,480 | ||||||||||
| Nonaccrual and restructured loans as a % of total loans |
0.08 | % | 0.06 | % | 0.07 | % | 0.09 | % | 0.07 | % | ||||||||||
| Provision for credit losses |
$ | 10,000 | $ | — | $ | 4,977 | $ | 13,000 | $ | 23,250 | ||||||||||
| • | Provision for credit losses for the first quarter increased $10.0 million from the linked quarter and decreased $13.3 million from the first quarter of 2023. This quarter’s provision included approximately $6.7 million related to the purchase of $109.4 million in co-branded credit card receivables. Excluding this, the variances in provision expense were driven largely by changes in macro-economic variables and credit metrics in the current period as compared to the prior periods. |
| • | Net charge-offs for the first quarter totaled $3.0 million, or 0.05% of average loans, compared to $1.4 million, or 0.02% of average loans in the linked quarter, and $4.6 million, or 0.09% of average loans for the first quarter of 2023. |
Dividend Declaration and Share Repurchase Authorization
At the company’s quarterly board meeting, the Board of Directors declared a $0.39 per share quarterly cash dividend, payable on July 1, 2024, to shareholders of record at the close of business on June 10, 2024.
The Board also approved the repurchase of up to 1,000,000 shares of the company’s common stock. Share repurchases may occur from time to time at any point until the regular meeting of the Board that immediately follows the 2025 annual meeting of the company’s shareholders. Shares acquired under the repurchase program may be available for reissuance or resale, including in connection with the company’s compensation plans and dividend reinvestment plan. Under the repurchase program, the company may acquire the shares from time to time in open market or privately negotiated transactions, at the discretion of management.
Conference Call
The company will host a call for the investment community on Monday, April 29, 2024, at 7:30 a.m. (CT). This call has been rescheduled from the previously announced date and time.
Interested parties may access the call by dialing (toll-free) 833-470-1428 or (international) 404-975-4839 and requesting to join the UMB Financial call with access code 397231. The live call may also be accessed by visiting investorrelations.umb.com or by using the following link:
UMB Financial Conference Call
A replay of the conference call may be heard through May 13, 2024, by calling (toll-free) 866-813-9403 or (international) 929-458-6194. The replay access code required for playback is 182605. The call replay may also be accessed at investorrelations.umb.com.
Non-GAAP Financial Information
In this release, we provide information about net operating income, operating earnings per share – diluted (operating EPS), operating return on average equity (operating ROE), operating return on average assets (operating ROA), operating noninterest expense, operating efficiency ratio, operating pre-tax, pre-provision income (operating PTPP), operating pre-tax, pre-provision earnings per share – diluted (operating PTPP EPS), operating pre-tax, pre-provision income on a fully tax equivalent basis (operating PTPP-FTE), operating pre-tax, pre-provision FTE earnings per share – diluted (operating PTPP-FTE EPS), tangible shareholders’ equity, and tangible book value per share, all of which are non-GAAP financial measures. This information supplements the results that are reported according to generally accepted accounting principles in the United States (GAAP) and should not be viewed in isolation from, or as a substitute for, GAAP results. The differences between the non-GAAP financial measures – net operating income, operating EPS, operating ROE, operating ROA, operating noninterest expense, operating efficiency ratio, operating PTPP, operating PTPP EPS, operating PTPP-FTE, operating PTPP-FTE EPS, tangible shareholders’ equity, and tangible book value per share – and the nearest comparable GAAP financial measures are reconciled later in this release. The company believes that these non-GAAP financial measures and the reconciliations may be useful to investors because they adjust for acquisition-and severance-related items, and the FDIC special assessment that management does not believe reflect the company’s fundamental operating performance.
Net operating income for the relevant period is defined as GAAP net income, adjusted to reflect the impact of excluding expenses related to acquisitions, severance expense, the FDIC special assessment, and the cumulative tax impact of these adjustments.
Operating EPS (diluted) is calculated as earnings per share as reported, adjusted to reflect, on a per share basis, the impact of excluding the non-GAAP adjustments described above for the relevant period. Operating ROE is calculated as net operating income, divided by the company’s average total shareholders’ equity for the relevant period. Operating ROA is calculated as net operating income, divided by the company’s average assets for the relevant period. Operating noninterest expense for the relevant period is defined as GAAP noninterest expense, adjusted to reflect the pre-tax impact of non-GAAP adjustments described above. Operating efficiency ratio is calculated as the company’s operating noninterest expense, net of amortization of other intangibles, divided by the company’s total non-GAAP revenue (calculated as net interest income plus noninterest income, less gains on sales of securities available for sale, net).
Operating PTPP income for the relevant period is defined as GAAP net interest income plus GAAP noninterest income, less noninterest expense, adjusted to reflect the impact of excluding expenses related to acquisitions and severance, and the FDIC special assessment.
Operating PTPP-FTE for the relevant period is defined as GAAP net interest income on a fully tax equivalent basis plus GAAP noninterest income, less noninterest expense, adjusted to reflect the impact of excluding expenses related to acquisitions and severance, and the FDIC special assessment.
Tangible shareholders’ equity for the relevant period is defined as GAAP shareholders’ equity, net of intangible assets. Tangible book value per share is defined as tangible shareholders’ equity divided by the Company’s total shares outstanding.
Forward-Looking Statements:
This press release contains, and our other communications may contain, forward-looking statements within the meaning of the Private Securities Litigation Reform Act of 1995. These statements can be identified by the fact that they do not relate strictly to historical or current facts. Forward-looking statements often use words such as “believe,” “expect,” “anticipate,” “intend,” “estimate,” “project,” “outlook,” “forecast,” “target,” “trend,” “plan,” “goal,” or other words of comparable meaning or future-tense or conditional verbs such as “may,” “will,” “should,” “would,” or “could.” Forward-looking statements convey our expectations, intentions, or forecasts about future events, circumstances, results, or aspirations. All forward-looking statements are subject to assumptions, risks, and uncertainties, which may change over time and many of which are beyond our control. You should not rely on any forward-looking statement as a prediction or guarantee about the future. Our actual future objectives, strategies, plans, prospects, performance, condition, or results may differ materially from those set forth in any forward-looking statement.
Some of the factors that may cause actual results or other future events, circumstances, or aspirations to differ from those in forward-looking statements are described in our Annual Report on Form 10-K for the year ended December 31, 2023, our subsequent Quarterly Reports on Form 10-Q or Current Reports on Form 8-K, or other applicable documents that are filed or furnished with the U.S. Securities and Exchange Commission (SEC). In addition to such factors that have been disclosed previously: macroeconomic and adverse developments and uncertainties related to the collateral effects of the collapse of, and challenges for, domestic and international banks, including the impacts to the U.S. and global economies; sustained levels of high inflation and the potential for an economic recession on the heels of aggressive quantitative tightening by the Federal Reserve; and impacts related to or resulting from instability in the Middle East and Russia’s military action in Ukraine, such as the broader impacts to financial markets and the global macroeconomic and geopolitical environments, may also cause actual results or other future events, circumstances, or aspirations to differ from our forward-looking statements. Any forward-looking statement made by us or on our behalf speaks only as of the date that it was made. We do not undertake to update any forward-looking statement to reflect the impact of events, circumstances, or results that arise after the date that the statement was made, except to the extent required by applicable securities laws. You, however, should consult further disclosures (including disclosures of a forward-looking nature) that we may make in any subsequent Annual Report on Form 10-K, Quarterly Report on Form 10-Q, Current Report on Form 8-K, or other applicable document that is filed or furnished with the SEC.
About UMB:
UMB Financial Corporation (Nasdaq: UMBF) is a financial services company headquartered in Kansas City, Missouri. UMB offers commercial banking, which includes comprehensive deposit, lending and investment services, personal banking, which includes wealth management and financial planning services, and institutional banking, which includes asset servicing, corporate trust solutions, investment banking, and healthcare services. UMB operates branches throughout Missouri, Illinois, Colorado, Kansas, Oklahoma, Nebraska, Arizona and Texas. As the company’s reach continues to grow, it also serves business clients nationwide and institutional clients in several countries. For more information, visit UMB.com, UMB Blog, UMB Facebook and UMB LinkedIn.
| Consolidated Balance Sheets |
UMB Financial Corporation | |||||||
| (unaudited, dollars in thousands) | ||||||||
| March 31, | ||||||||
| 2024 | 2023 | |||||||
| ASSETS |
||||||||
| Loans |
$ | 23,637,649 | $ | 21,812,972 | ||||
| Allowance for credit losses on loans |
(226,159 | ) | (210,509 | ) | ||||
|
|
|
|
|
|||||
| Net loans |
23,411,490 | 21,602,463 | ||||||
| Loans held for sale |
4,415 | 1,422 | ||||||
| Securities: |
||||||||
| Available for sale |
6,541,391 | 6,907,897 | ||||||
| Held to maturity, net of allowance for credit losses |
5,622,617 | 5,859,323 | ||||||
| Trading securities |
40,187 | 19,823 | ||||||
| Other securities |
473,434 | 416,337 | ||||||
|
|
|
|
|
|||||
| Total securities |
12,677,629 | 13,203,380 | ||||||
| Federal funds sold and resell agreements |
180,275 | 368,158 | ||||||
| Interest-bearing due from banks |
6,673,104 | 3,121,323 | ||||||
| Cash and due from banks |
356,963 | 472,248 | ||||||
| Premises and equipment, net |
231,918 | 260,623 | ||||||
| Accrued income |
221,447 | 181,586 | ||||||
| Goodwill |
207,385 | 207,385 | ||||||
| Other intangibles, net |
69,052 | 76,426 | ||||||
| Other assets |
1,309,697 | 1,112,176 | ||||||
|
|
|
|
|
|||||
| Total assets |
$ | 45,343,375 | $ | 40,607,190 | ||||
|
|
|
|
|
|||||
| LIABILITIES |
||||||||
| Deposits: |
||||||||
| Noninterest-bearing demand |
$ | 13,251,090 | $ | 12,488,803 | ||||
| Interest-bearing demand and savings |
21,018,911 | 16,760,603 | ||||||
| Time deposits under $250,000 |
2,044,280 | 456,129 | ||||||
| Time deposits of $250,000 or more |
599,329 | 2,226,369 | ||||||
|
|
|
|
|
|||||
| Total deposits |
36,913,610 | 31,931,904 | ||||||
| Federal funds purchased and repurchase agreements |
2,225,474 | 2,160,808 | ||||||
| Short-term debt |
1,800,000 | 2,800,000 | ||||||
| Long-term debt |
383,742 | 381,796 | ||||||
| Accrued expenses and taxes |
374,888 | 207,633 | ||||||
| Other liabilities |
492,845 | 310,390 | ||||||
|
|
|
|
|
|||||
| Total liabilities |
42,190,559 | 37,792,531 | ||||||
|
|
|
|
|
|||||
| SHAREHOLDERS’ EQUITY |
||||||||
| Common stock |
55,057 | 55,057 | ||||||
| Capital surplus |
1,127,806 | 1,120,877 | ||||||
| Retained earnings |
2,903,106 | 2,609,928 | ||||||
| Accumulated other comprehensive loss, net |
(594,538 | ) | (626,776 | ) | ||||
| Treasury stock |
(338,615 | ) | (344,427 | ) | ||||
|
|
|
|
|
|||||
| Total shareholders’ equity |
3,152,816 | 2,814,659 | ||||||
|
|
|
|
|
|||||
| Total liabilities and shareholders’ equity |
$ | 45,343,375 | $ | 40,607,190 | ||||
|
|
|
|
|
|||||
| Consolidated Statements of Income |
UMB Financial Corporation | |||||||
| (unaudited, dollars in thousands except share and per share data) | ||||||||
| Three Months Ended March 31, |
||||||||
| 2024 | 2023 | |||||||
| INTEREST INCOME |
||||||||
| Loans |
$ | 385,566 | $ | 308,441 | ||||
| Securities: |
||||||||
| Taxable interest |
61,111 | 53,049 | ||||||
| Tax-exempt interest |
25,333 | 25,306 | ||||||
|
|
|
|
|
|||||
| Total securities income |
86,444 | 78,355 | ||||||
| Federal funds and resell agreements |
3,062 | 5,651 | ||||||
| Interest-bearing due from banks |
44,688 | 16,166 | ||||||
| Trading securities |
305 | 134 | ||||||
|
|
|
|
|
|||||
| Total interest income |
520,065 | 408,747 | ||||||
|
|
|
|
|
|||||
| INTEREST EXPENSE |
||||||||
| Deposits |
223,875 | 127,899 | ||||||
| Federal funds and repurchase agreements |
27,662 | 23,302 | ||||||
| Other |
29,094 | 15,850 | ||||||
|
|
|
|
|
|||||
| Total interest expense |
280,631 | 167,051 | ||||||
|
|
|
|
|
|||||
| Net interest income |
239,434 | 241,696 | ||||||
| Provision for credit losses |
10,000 | 23,250 | ||||||
|
|
|
|
|
|||||
| Net interest income after provision for credit losses |
229,434 | 218,446 | ||||||
|
|
|
|
|
|||||
| NONINTEREST INCOME |
||||||||
| Trust and securities processing |
69,478 | 62,359 | ||||||
| Trading and investment banking |
5,462 | 5,308 | ||||||
| Service charges on deposit accounts |
20,757 | 21,159 | ||||||
| Insurance fees and commissions |
283 | 274 | ||||||
| Brokerage fees |
13,160 | 13,676 | ||||||
| Bankcard fees |
21,968 | 18,172 | ||||||
| Investment securities gains (losses), net |
9,371 | (5,324 | ) | |||||
| Other |
18,765 | 14,576 | ||||||
|
|
|
|
|
|||||
| Total noninterest income |
159,244 | 130,200 | ||||||
|
|
|
|
|
|||||
| NONINTEREST EXPENSE |
||||||||
| Salaries and employee benefits |
143,006 | 142,498 | ||||||
| Occupancy, net |
12,270 | 12,177 | ||||||
| Equipment |
16,503 | 17,849 | ||||||
| Supplies and services |
3,301 | 3,875 | ||||||
| Marketing and business development |
6,025 | 5,335 | ||||||
| Processing fees |
27,936 | 23,240 | ||||||
| Legal and consulting |
7,894 | 7,285 | ||||||
| Bankcard |
10,567 | 7,133 | ||||||
| Amortization of other intangible assets |
1,960 | 2,298 | ||||||
| Regulatory fees |
19,395 | 5,551 | ||||||
| Other |
5,947 | 9,811 | ||||||
|
|
|
|
|
|||||
| Total noninterest expense |
254,804 | 237,052 | ||||||
|
|
|
|
|
|||||
| Income before income taxes |
133,874 | 111,594 | ||||||
| Income tax expense |
23,616 | 19,157 | ||||||
|
|
|
|
|
|||||
| NET INCOME |
$ | 110,258 | $ | 92,437 | ||||
|
|
|
|
|
|||||
| PER SHARE DATA |
||||||||
| Net income – basic |
$ | 2.27 | $ | 1.91 | ||||
| Net income – diluted |
2.25 | 1.90 | ||||||
| Dividends |
0.39 | 0.38 | ||||||
| Weighted average shares outstanding – basic |
48,663,515 | 48,435,016 | ||||||
| Weighted average shares outstanding – diluted |
48,920,863 | 48,746,562 | ||||||
| Consolidated Statements of Comprehensive Income |
UMB Financial Corporation | |||||||
| (unaudited, dollars in thousands) | ||||||||
| Three Months Ended March 31, |
||||||||
| 2024 | 2023 | |||||||
| Net income |
$ | 110,258 | $ | 92,437 | ||||
| Other comprehensive (loss) income, before tax: |
||||||||
| Unrealized gains and losses on debt securities: |
||||||||
| Change in unrealized holding gains and losses, net |
(41,553 | ) | 93,657 | |||||
| Less: Reclassification adjustment for net (gains) losses included in net income |
(139 | ) | 433 | |||||
| Amortization of net unrealized loss on securities transferred from available-for-sale to held-to-maturity |
8,789 | 9,983 | ||||||
|
|
|
|
|
|||||
| Change in unrealized gains and losses on debt securities |
(32,903 | ) | 104,073 | |||||
| Unrealized gains and losses on derivative hedges: |
||||||||
| Change in unrealized gains and losses on derivative hedges, net |
(13,658 | ) | (1,527 | ) | ||||
| Less: Reclassification adjustment for net gains included in net income |
(3,660 | ) | (2,561 | ) | ||||
|
|
|
|
|
|||||
| Change in unrealized gains and losses on derivative hedges |
(17,318 | ) | (4,088 | ) | ||||
| Other comprehensive (loss) income, before tax |
(50,221 | ) | 99,985 | |||||
| Income tax benefit (expense) |
12,618 | (24,026 | ) | |||||
|
|
|
|
|
|||||
| Other comprehensive (loss) income |
(37,603 | ) | 75,959 | |||||
|
|
|
|
|
|||||
| Comprehensive income |
$ | 72,655 | $ | 168,396 | ||||
|
|
|
|
|
|||||
| Consolidated Statements of Shareholders’ Equity |
UMB Financial Corporation | |||
| (unaudited, dollars in thousands except per share data) | ||||
| Common Stock |
Capital Surplus |
Retained Earnings |
Accumulated Other Comprehensive (Loss) Income |
Treasury Stock |
Total | |||||||||||||||||||
| Balance - January 1, 2023 |
$ | 55,057 | $ | 1,125,949 | $ | 2,536,086 | $ | (702,735 | ) | $ | (347,264 | ) | $ | 2,667,093 | ||||||||||
| Total comprehensive income |
— | — | 92,437 | 75,959 | — | 168,396 | ||||||||||||||||||
| Dividends ($0.38 per share) |
— | — | (18,595 | ) | — | — | (18,595 | ) | ||||||||||||||||
| Purchase of treasury stock |
— | — | — | — | (7,902 | ) | (7,902 | ) | ||||||||||||||||
| Issuances of equity awards, net of forfeitures |
— | (9,764 | ) | — | — | 10,483 | 719 | |||||||||||||||||
| Recognition of equity-based compensation |
— | 4,516 | — | — | — | 4,516 | ||||||||||||||||||
| Sale of treasury stock |
— | 71 | — | — | 56 | 127 | ||||||||||||||||||
| Exercise of stock options |
— | 105 | — | — | 200 | 305 | ||||||||||||||||||
|
|
|
|
|
|
|
|
|
|
|
|
|
|||||||||||||
| Balance - March 31, 2023 |
$ | 55,057 | $ | 1,120,877 | $ | 2,609,928 | $ | (626,776 | ) | $ | (344,427 | ) | $ | 2,814,659 | ||||||||||
|
|
|
|
|
|
|
|
|
|
|
|
|
|||||||||||||
| Balance - January 1, 2024 |
$ | 55,057 | $ | 1,134,363 | $ | 2,810,824 | $ | (556,935 | ) | $ | (342,890 | ) | $ | 3,100,419 | ||||||||||
| Total comprehensive income (loss) |
— | — | 110,258 | (37,603 | ) | — | 72,655 | |||||||||||||||||
| Dividends ($0.39 per share) |
— | — | (17,976 | ) | — | — | (17,976 | ) | ||||||||||||||||
| Purchase of treasury stock |
— | — | — | — | (7,537 | ) | (7,537 | ) | ||||||||||||||||
| Issuances of equity awards, net of forfeitures |
— | (10,964 | ) | — | — | 11,667 | 703 | |||||||||||||||||
| Recognition of equity-based compensation |
— | 4,271 | — | — | — | 4,271 | ||||||||||||||||||
| Sale of treasury stock |
— | 70 | — | — | 60 | 130 | ||||||||||||||||||
| Exercise of stock options |
— | 66 | — | — | 85 | 151 | ||||||||||||||||||
|
|
|
|
|
|
|
|
|
|
|
|
|
|||||||||||||
| Balance - March 31, 2024 |
$ | 55,057 | $ | 1,127,806 | $ | 2,903,106 | $ | (594,538 | ) | $ | (338,615 | ) | $ | 3,152,816 | ||||||||||
|
|
|
|
|
|
|
|
|
|
|
|
|
|||||||||||||
| Average Balances / Yields and Rates |
UMB Financial Corporation | |||
| (tax - equivalent basis) (unaudited, dollars in thousands) |
||||
| Three Months Ended March 31, | ||||||||||||||||
| 2024 | 2023 | |||||||||||||||
| Average Balance |
Average Yield/Rate |
Average Balance |
Average Yield/Rate |
|||||||||||||
| Assets |
||||||||||||||||
| Loans, net of unearned interest |
$ | 23,354,043 | 6.64 | % | $ | 21,271,600 | 5.88 | % | ||||||||
| Securities: |
||||||||||||||||
| Taxable |
9,264,789 | 2.65 | 9,349,351 | 2.30 | ||||||||||||
| Tax-exempt |
3,732,122 | 3.42 | 3,845,266 | 3.35 | ||||||||||||
|
|
|
|
|
|
|
|
|
|||||||||
| Total securities |
12,996,911 | 2.87 | 13,194,617 | 2.61 | ||||||||||||
| Federal funds and resell agreements |
206,443 | 5.97 | 451,188 | 5.08 | ||||||||||||
| Interest bearing due from banks |
3,304,142 | 5.44 | 1,533,704 | 4.27 | ||||||||||||
| Trading securities |
17,893 | 7.33 | 9,258 | 6.31 | ||||||||||||
|
|
|
|
|
|
|
|
|
|||||||||
| Total earning assets |
39,879,432 | 5.31 | 36,460,367 | 4.62 | ||||||||||||
| Allowance for credit losses |
(222,116 | ) | (196,128 | ) | ||||||||||||
| Other assets |
2,360,092 | 2,239,140 | ||||||||||||||
|
|
|
|
|
|||||||||||||
| Total assets |
$ | 42,017,408 | $ | 38,503,379 | ||||||||||||
|
|
|
|
|
|||||||||||||
| Liabilities and Shareholders’ Equity |
||||||||||||||||
| Interest-bearing deposits |
$ | 23,459,723 | 3.84 | % | $ | 19,643,168 | 2.64 | % | ||||||||
| Federal funds and repurchase agreements |
2,384,754 | 4.67 | 2,461,942 | 3.84 | ||||||||||||
| Borrowed funds |
2,183,494 | 5.36 | 1,200,346 | 5.36 | ||||||||||||
|
|
|
|
|
|
|
|
|
|||||||||
| Total interest-bearing liabilities |
28,027,971 | 4.03 | 23,305,456 | 2.91 | ||||||||||||
| Noninterest-bearing demand deposits |
10,066,409 | 11,919,277 | ||||||||||||||
| Other liabilities |
779,510 | 554,211 | ||||||||||||||
| Shareholders’ equity |
3,143,518 | 2,724,435 | ||||||||||||||
|
|
|
|
|
|||||||||||||
| Total liabilities and shareholders’ equity |
$ | 42,017,408 | $ | 38,503,379 | ||||||||||||
|
|
|
|
|
|||||||||||||
| Net interest spread |
1.28 | % | 1.71 | % | ||||||||||||
| Net interest margin |
2.48 | 2.76 | ||||||||||||||
| Business Segment Information |
UMB Financial Corporation | |||
| (unaudited, dollars in thousands) | ||||
| Three Months Ended March 31, 2024 | ||||||||||||||||
| Commercial Banking |
Institutional Banking |
Personal Banking |
Total | |||||||||||||
| Net interest income |
$ | 157,247 | $ | 49,860 | $ | 32,327 | $ | 239,434 | ||||||||
| Provision for credit losses |
7,520 | 479 | 2,001 | 10,000 | ||||||||||||
| Noninterest income |
42,966 | 92,716 | 23,562 | 159,244 | ||||||||||||
| Noninterest expense |
92,420 | 100,376 | 62,008 | 254,804 | ||||||||||||
|
|
|
|
|
|
|
|
|
|||||||||
| Income (loss) before taxes |
100,273 | 41,721 | (8,120 | ) | 133,874 | |||||||||||
| Income tax expense (benefit) |
17,223 | 7,656 | (1,263 | ) | 23,616 | |||||||||||
|
|
|
|
|
|
|
|
|
|||||||||
| Net income (loss) |
$ | 83,050 | $ | 34,065 | $ | (6,857 | ) | $ | 110,258 | |||||||
|
|
|
|
|
|
|
|
|
|||||||||
| Three Months Ended March 31, 2023 | ||||||||||||||||
| Commercial Banking |
Institutional Banking |
Personal Banking |
Total | |||||||||||||
| Net interest income |
$ | 151,027 | $ | 55,085 | 35,584 | $ | 241,696 | |||||||||
| Provision for credit losses |
21,045 | 96 | 2,109 | 23,250 | ||||||||||||
| Noninterest income |
22,902 | 84,238 | 23,060 | 130,200 | ||||||||||||
| Noninterest expense |
84,002 | 89,372 | 63,678 | 237,052 | ||||||||||||
|
|
|
|
|
|
|
|
|
|||||||||
| Income (loss) before taxes |
68,882 | 49,855 | (7,143 | ) | 111,594 | |||||||||||
| Income tax expense (benefit) |
11,646 | 8,504 | (993 | ) | 19,157 | |||||||||||
|
|
|
|
|
|
|
|
|
|||||||||
| Net income (loss) |
$ | 57,236 | $ | 41,351 | $ | (6,150 | ) | $ | 92,437 | |||||||
|
|
|
|
|
|
|
|
|
|||||||||
The company has strategically aligned its operations into the following three reportable segments: Commercial Banking, Institutional Banking, and Personal Banking. Senior executive officers regularly evaluate business segment financial results produced by the company’s internal reporting system in deciding how to allocate resources and assess performance for individual business segments. The company’s reportable segments include certain corporate overhead, technology and service costs that are allocated based on methodologies that are applied consistently between periods. For comparability purposes, amounts in all periods are based on methodologies in effect at March 31, 2024.
Non-GAAP Financial Measures
| Net operating income Non-GAAP reconciliations: |
UMB Financial Corporation | |||
| (unaudited, dollars in thousands except per share data) | ||||
| Three Months Ended March 31, |
||||||||
| 2024 | 2023 | |||||||
| Net income (GAAP) |
$ | 110,258 | $ | 92,437 | ||||
| Adjustments: |
||||||||
| Acquisition expense |
431 | 39 | ||||||
| Severance expense |
146 | 486 | ||||||
| FDIC special assessment |
13,000 | — | ||||||
| Tax-impact of adjustments (i) |
(3,123 | ) | (126 | ) | ||||
|
|
|
|
|
|||||
| Total Non-GAAP adjustments (net of tax) |
10,454 | 399 | ||||||
|
|
|
|
|
|||||
| Net operating income (Non-GAAP) |
$ | 120,712 | $ | 92,836 | ||||
|
|
|
|
|
|||||
| Earnings per share - diluted (GAAP) |
$ | 2.25 | $ | 1.90 | ||||
| Acquisition expense |
0.01 | — | ||||||
| Severance expense |
— | 0.01 | ||||||
| FDIC special assessment |
0.27 | — | ||||||
| Tax-impact of adjustments (i) |
(0.06 | ) | — | |||||
|
|
|
|
|
|||||
| Operating earnings per share - diluted (Non-GAAP) |
$ | 2.47 | $ | 1.91 | ||||
|
|
|
|
|
|||||
| GAAP |
||||||||
| Return on average assets |
1.06 | % | 0.97 | % | ||||
| Return on average equity |
14.11 | 13.76 | ||||||
| Non-GAAP |
||||||||
| Operating return on average assets |
1.16 | % | 0.98 | % | ||||
| Operating return on average equity |
15.44 | 13.82 | ||||||
(i) Calculated using the company’s marginal tax rate of 23.0% for 2024 and 24.0% for 2023.
| Operating noninterest expense and operating efficiency ratio Non-GAAP reconciliations: |
UMB Financial Corporation | |||
| (unaudited, dollars in thousands) | ||||
| Three Months Ended March 31, |
||||||||
| 2024 | 2023 | |||||||
| Noninterest expense |
$ | 254,804 | $ | 237,052 | ||||
| Adjustments to arrive at operating noninterest expense (pre-tax): |
||||||||
| Acquisition expense |
431 | 39 | ||||||
| Severance expense |
146 | 486 | ||||||
| FDIC special assessment |
13,000 | — | ||||||
|
|
|
|
|
|||||
| Total Non-GAAP adjustments (pre-tax) |
13,577 | 525 | ||||||
|
|
|
|
|
|||||
| Operating noninterest expense (Non-GAAP) |
$ | 241,227 | $ | 236,527 | ||||
|
|
|
|
|
|||||
| Noninterest expense |
$ | 254,804 | $ | 237,052 | ||||
| Less: Amortization of other intangibles |
1,960 | 2,298 | ||||||
|
|
|
|
|
|||||
| Noninterest expense, net of amortization of other intangibles (Non-GAAP) (numerator A) |
$ | 252,844 | $ | 234,754 | ||||
|
|
|
|
|
|||||
| Operating noninterest expense |
$ | 241,227 | $ | 236,527 | ||||
| Less: Amortization of other intangibles |
1,960 | 2,298 | ||||||
|
|
|
|
|
|||||
| Operating expense, net of amortization of other intangibles (Non-GAAP) (numerator B) |
$ | 239,267 | $ | 234,229 | ||||
|
|
|
|
|
|||||
| Net interest income |
$ | 239,434 | $ | 241,696 | ||||
| Noninterest income |
159,244 | 130,200 | ||||||
| Less: Gains (losses) on sales of securities available for sale, net |
139 | (2 | ) | |||||
|
|
|
|
|
|||||
| Total Non-GAAP Revenue (denominator A) |
$ | 398,539 | $ | 371,898 | ||||
|
|
|
|
|
|||||
| Efficiency ratio (numerator A/denominator A) |
63.44 | % | 63.12 | % | ||||
| Operating efficiency ratio (Non-GAAP) (numerator B/denominator A) |
60.04 | 62.98 | ||||||
| Operating pre-tax, pre-provision income non-GAAP reconciliations: |
UMB Financial Corporation | |||
| (unaudited, dollars in thousands except per share data) | ||||
| Three Months Ended March 31, |
||||||||
| 2024 | 2023 | |||||||
| Net interest income (GAAP) |
$ | 239,434 | $ | 241,696 | ||||
| Noninterest income (GAAP) |
159,244 | 130,200 | ||||||
| Noninterest expense (GAAP) |
254,804 | 237,052 | ||||||
| Adjustments to arrive at operating noninterest expense: |
||||||||
| Acquisition expense |
431 | 39 | ||||||
| Severance expense |
146 | 486 | ||||||
| FDIC special assessment |
13,000 | — | ||||||
|
|
|
|
|
|||||
| Total Non-GAAP adjustments |
13,577 | 525 | ||||||
|
|
|
|
|
|||||
| Operating noninterest expense (Non-GAAP) |
241,227 | 236,527 | ||||||
|
|
|
|
|
|||||
| Operating pre-tax, pre-provision income (Non-GAAP) |
$ | 157,451 | $ | 135,369 | ||||
|
|
|
|
|
|||||
| Net interest income earnings per share - diluted (GAAP) |
$ | 4.89 | $ | 4.96 | ||||
| Noninterest income (GAAP) |
3.26 | 2.67 | ||||||
| Noninterest expense (GAAP) |
5.21 | 4.86 | ||||||
| Acquisition expense |
0.01 | — | ||||||
| Severance expense |
— | 0.01 | ||||||
| FDIC special assessment |
0.27 | — | ||||||
|
|
|
|
|
|||||
| Operating pre-tax, pre-provision earnings per share - diluted (Non-GAAP) |
$ | 3.22 | $ | 2.78 | ||||
|
|
|
|
|
|||||
| Operating pre-tax, pre-provision income - FTE Non-GAAP reconciliations: |
UMB Financial Corporation | |||
| (unaudited, dollars in thousands except per share data) | ||||
| Three Months Ended March 31, |
||||||||
| 2024 | 2023 | |||||||
| Net interest income (GAAP) |
$ | 239,434 | $ | 241,696 | ||||
| Adjustments to arrive at net interest income - FTE: |
||||||||
| Tax equivalent interest |
6,516 | 6,555 | ||||||
|
|
|
|
|
|||||
| Net interest income - FTE (Non-GAAP) |
245,950 | 248,251 | ||||||
|
|
|
|
|
|||||
| Noninterest income (GAAP) |
159,244 | 130,200 | ||||||
| Noninterest expense (GAAP) |
254,804 | 237,052 | ||||||
| Adjustments to arrive at operating noninterest expense: |
||||||||
| Acquisition expense |
431 | 39 | ||||||
| Severance expense |
146 | 486 | ||||||
| FDIC special assessment |
13,000 | — | ||||||
|
|
|
|
|
|||||
| Total Non-GAAP adjustments |
13,577 | 525 | ||||||
|
|
|
|
|
|||||
| Operating noninterest expense (Non-GAAP) |
241,227 | 236,527 | ||||||
|
|
|
|
|
|||||
| Operating pre-tax, pre-provision income - FTE (Non-GAAP) |
$ | 163,967 | $ | 141,924 | ||||
|
|
|
|
|
|||||
| Net interest income earnings per share - diluted (GAAP) |
$ | 4.89 | $ | 4.96 | ||||
| Tax equivalent interest |
0.13 | 0.13 | ||||||
|
|
|
|
|
|||||
| Net interest income - FTE (Non-GAAP) |
5.02 | 5.09 | ||||||
|
|
|
|
|
|||||
| Noninterest income (GAAP) |
3.26 | 2.67 | ||||||
| Noninterest expense (GAAP) |
5.21 | 4.86 | ||||||
| Acquisition expense |
0.01 | — | ||||||
| Severance expense |
— | 0.01 | ||||||
| FDIC special assessment |
0.27 | — | ||||||
|
|
|
|
|
|||||
| Operating pre-tax, pre-provision income - FTE earnings per share - diluted (Non-GAAP) |
$ | 3.35 | $ | 2.91 | ||||
|
|
|
|
|
|||||
| Tangible book value non-GAAP reconciliations: |
UMB Financial Corporation | |||
| (unaudited, dollars in thousands except share and per share data) | ||||
| As of March 31, | ||||||||
| 2024 | 2023 | |||||||
| Total shareholders’ equity (GAAP) |
$ | 3,152,816 | $ | 2,814,659 | ||||
| Less: Intangible assets |
||||||||
| Goodwill |
207,385 | 207,385 | ||||||
| Other intangibles, net |
69,052 | 76,426 | ||||||
|
|
|
|
|
|||||
| Total intangibles, net |
276,437 | 283,811 | ||||||
|
|
|
|
|
|||||
| Total tangible shareholders’ equity (Non-GAAP) |
$ | 2,876,379 | $ | 2,530,848 | ||||
|
|
|
|
|
|||||
| Total shares outstanding |
48,743,348 | 48,507,116 | ||||||
| Ratio of total shareholders’ equity (book value) per share |
$ | 64.68 | $ | 58.03 | ||||
| Ratio of total tangible shareholders’ equity (tangible book value) per share (Non-GAAP) |
59.01 | 52.17 | ||||||
Exhibit 99.2

Quarter 2024 Update Kansas City, MO April 29, 2024

Presentation Index Corporate Overview 3 Opportunity – Our Investment Thesis 8 1st Quarter 2024 Results 17 Line of Business Updates 33 Appendix 44 Board of Directors Peer Group Forward-Looking Statements Non-GAAP Reconciliations Please refer to the Forward-Looking Statements on slide 46 for important disclosures about information contained in this presentation. 2

Corporate Overview Highlights Founded 1913 Ticker UMBF—Nasdaq Market Cap $4.2 B Total Assets $45.3 B Gross Loans $23.6 B Total Deposits $36.9 B Private Wealth Customer Assets (1) $16.2 B Institutional Assets Under Administration (AUA) (2) $483.4 B UMB Financial Corporation Headquarters Common Equity Tier 1 Capital Ratio 11.09% Total Risk Based Capital Ratio 13.03% UMB Bank Presence & Expansion • 90 banking centers • 237 ATMs Return on Equity 14.11% Operating ROTCE (3) 16.94% National Presence • Asset-based lending • Specialized Lending Verticals Net Charge-offs / Average Loans 0.05% • Healthcare Services • Corporate Trust • Private Wealth Management • Capital Markets (4) NPLs / Total Loans 0.08% & Personal Trust • Fund Services ACL / Total Loans 0.96% International Presence Fee Income / Revenue 39.9% • UMBF Trust & Agency Services – Dublin, Ireland At, or for, 3 months ended 03/31/24. (1) Includes $13.0B in managed assets & $3.2B in Assets Under Administration for Private Wealth customers; (2) Includes AUA in Fund Services/custody, 3 corporate trust and Healthcare Services; (3) Operating ROTCE is a non-GAAP measure. See reconciliation on slide 52; (4) UMB Bank, n.a. Capital Markets Div.

Business Model Our Diverse Foundation Commercial & Personal Banking Services 1Q’24 Revenue: $256.1 million. 1Q’24 Average Deposits: $19.8 billion (1) Commercial Consumer Private Wealth Average loans: $19.7B (2) Average loans: $3.1B (2) (3) AUM = $13.0B Average deposits: $13.3B Average deposits: $6.5B AUA = $3.2B C&I lending Treasury management Retail deposit & lending services Financial planning Small business lending Merchant payments through 90 branches and online Investment management CRE & Construction lending Private banking services Wealth solutions Consumer mortgage Business succession and exit planning Specialized Expertise: – Agribusiness – Aviation Trust & custody – Energy – Asset-based lending Estate planning – Practice finance – Beverage Direct private equity investment access – Mezzanine debt & equity investments Institutional Banking Services 1Q’24 Revenue: $142.6 million. 1Q’24 Average Deposits: $12.4 billion (1) Institutional Banking provides solutions for the entire marketplace; $483.4 billion in AUA (4) Corporate Trust Specialty Trust & Agency Solutions Investor Solutions Bond trustee, paying agent & escrow services Default workout & successor trustee services Banking, cash management & specialty Aviation, ABS & loan agency services services for financial firms Institutional Custody Capital Markets Division (5) Healthcare Services Domestic & international custody services Fixed income sales & trading Health savings & benefit spending accounts Fund Services Public finance Healthcare payment solutions Fund accounting, fund administration & Asset / liability management services transfer agency Alternative investment servicing Balances at, or for quarter ended, 03/31/24 (1) Excludes brokered deposits issued by Corp. Treasury; (2) Excludes credit card; (3) Includes consumer plus residential real estate loans; (4) Includes AUA in 4 Fund Services/custody, corporate trust & Healthcare Services; (5) Products offered through UMB Bank Capital Markets Div.: NOT FDIC INSURED | MAY LOSE VALUE | NOT BANK GUARANTEED.

Beyond Financials Our Culture Our Vision Customers First the We do the unparalleled to create an environment that unparalleled consistently exceeds the expectations of our customers. customer experience Integrity & Trust We demonstrate our uncompromising honesty and integrity to earn the trust of everyone we serve. Performance & Strength We achieve sustainable greatness by delivering on our Our Commitment promise, remaining independent and maintaining financial soundness. Associate Spirit We rely upon our people and their collective attitude and skills to differentiate us from our competitors. An unwavering commitment to doing more for our customers Inclusion & Diversity . We believe an inclusive and diverse culture energizes the workplace and ignites innovation. 5

Beyond Financials Our Culture Creating an unparalleled customer experience requires a culture where our people feel part of something more, something bigger. We foster this experience through our policies, our business decisions and our expectations of each associate. MORE MORE MORE HEART TRUST OPPORTUNITY Whether it’s having a Our associates have Our goal is to grow the heart for each other, our confidence they will be existing strengths and customers or our encouraged and expected build new skills. We’re unparalleled communities, we support to do the right thing at all committed to empowering customer work through inclusive times — no matter what. our workforce to make an policies and empowering We’re focused on setting impact and achieve their experience people to create fulfilling clear expectations and a goals through open lives in and out of the leadership team who is conversations and workplace. accessible and providing the tools to transparent. develop potential. 6

Beyond Financials Our Commitment to Corporate Citizenship Inclusion & Diversity Strong Corporate Governance Effective governance practices preserve the confidence and We want our company to be as diverse as the world we live in. trust of our stakeholders. As an early CEO Action for Diversity and Inclusion signatory, we 11-person board of directors, with 10 independent members, a lead regularly review progress of our inclusion strategy with executives and independent director, and 100% independence on board committees our board of directors 36% board diversity Eight Business Resource Groups (BRGs) help us understand the needs Deliberate selection criteria which includes diversity standards in the of our associates, customers and communities and turn empathy into board nomination process action Robust risk oversight with distinct risk management committees: In 2023, 36% of all UMB hires were people of color, 54% were women enterprise risk, asset and liability, and credit and 3% were veterans Board oversight of the executive ESG Committee Diversity among executive leadership team – 50%; 7 of 14 members Community Impact Efficient & Sensible Resource Use Associate volunteerism and corporate philanthropy help build UMB recognizes the undeniable importance of sustainable strong community partnerships. business practices. $6.8 million in company donations and sponsorships in 2023, supporting All UMB-owned buildings and 4 leased locations use automated housing needs, small business, education and emerging talent systems to conserve energy, meeting our goal to have all converted by year-end 2023. Additionally, exterior lighting upgrades saved 920k UMB provided more than $8.3 million in grants and closing costs to first- Kilowatt hours during the year time homebuyers across the bank’s footprint More than 172k Kilowatt hours generated from solar panels We delivered more than 344 community engagement activities and held 127 financial education classes, serving more than 1,400 community 2023 recycling efforts produced more than 17k pounds of comingled participants recycling, 7k pounds of cardboard and 443 pounds of recycled batteries More than 1,000 associates participated in our matching gift program; Beehives housed at a Denver branch support the local honeybee combined with workplace giving, associated giving totaled nearly $650k population, with a peak of 270k resident bees. Since installation, we’ve harvested 330 pounds of edible honey Associates receive 16 hours of paid Volunteer Time Off annually. 697 participants logged nearly 7,700 hours of volunteer time in 2023, supporting 303 unique charities Read our 2023 Corporate Citizenship Report at UMB.com/ESGreport 7

Our Investment Thesis Salt Lake City, UT

Investment Thesis Our Opportunity Runway for Growth Soli sources Access to multiple contingent funding sources Div geographies tenured relationships: Clients that have been with us for more than 15 years hold ~46% of deposit balances (1) Track Underpenetrated vertically on an asset class basis; built out specialized teams Flexi changing ts > $1.3 billion of securities cash flow expected within 12 months 30% of average deposit balances in DDA Diff profi natural hedge in a variety of rate environments Low t peer reliance on mortgage and NSF/OD revenue Ti ears with UMB Chief Credit Offi 38 years with UMB Focu growth outpace peers over the l term Consistent dividend growth (1) Average collected balances for March 2024; excludes CDs, health savings and FinTech deposits. 9

Differentiated Revenue Profile Multiple Sources of Growth Net Interest Income $913.8 $920.1 15 Year $ 815.5 CAGR $731.2 8.4% $610.4 $670.9 $495.3 $558.9 $350.1 $412.1 $310.6 $317.0 $320.1 $333.3 $303.0 $275.1 Annual NII 18% 10% 3% 2% 1% 4% 5% 18% 20% 13% 9% 10% 9% 12% 12% 1% Growth Fee Income Provides Diversity $1,468.0 $1,462.0 $1,291.4 $ 1,282.7 15 Year $1,097.7 CAGR $982.5 $1,012.1 $971.4 6.3% $878.5 Revenue $778.2 $825.1 $848.7 Revenue $671.0 $731.3 Growth Total $587.8 $613.2 15 Year 53% CAGR 37% 3.7% 30% 20% Fee Income Growth Net Interest Income (before provision) Noninterest Income (1) % fee income Peer Median % Fee Income (2) Annual Revenue 13% 4% 9% 9% 6% 6% 3% 4% 11% 1% 3% 8% 18% -1% 14% -0.4% Growth Dollars in millions. (1) Contains income from discontinued operations prior to 2017; (2) UMB peers (15 banks) as of latest available annual period. Source: S&P Capital IQ. (3) 2022 noninterest 10 income included a $66.2 million pre-tax gain on the sale of Visa Inc. Class B shares.

Balance Sheet Growth Across All Business Cycles Average Deposits 15 Year CAGR 2.22% 11.1% 2.01% 1.51% 1.37% Average Deposits Average Total Deposit Cost Peer Median Deposit Cost (1) Annual Deposit 14% 16% 11% 14% 10% 13% 6% 11% 9% 4% 7% 14% 20% 25% 8% 1% Growth Average Loans (2) 15 Year CAGR 11.8% Annual Loan 7% 5% 2% 6% 10% 18% 12% 21% 19% 9% 7% 10% 10% 12% 19% 19% Growth Average annual balance in billions. (1) UMB peers (15 banks), as of latest available annual period. Source: S&P Capital IQ; (2) Loan balances exclude PPP loans for ’20 – ’22. 11

Resilient Credit Metrics Through All Economic Environments Net Charge-Offs / Average Loans 15 Year Average 0.29% 0.52% 0.18% 0.05% UMBF Peer Median (1) Industry (2) Nonperforming Loans / Loans 15 Year Average 0.44% 0.86% 0.33% 0.06% UMBF Peer Median (1) Industry (2) (1) UMB peers (15 banks), as of latest available annual period. Source: S&P Capital IQ; (2) All FDIC-insured banks, as of last available annual period. Source: FDIC. 12

Capital & Liquidity Supports Growth Outlook Tier 1 Capital Ratio Equity / Assets Tangible Equity / Tangible Assets (2) UMBF Peer Median (1) UMBF Equity / Assets UMBF TCE / Tang. Assets (2) Peer Median TCE / Tang. Assets (1) (2) Cash & Securities / Assets (3) Average Loans / Average Deposits UMBF Peer Median (1) UMBF Peer Median (1) (1) UMB peers (15 banks), as of latest available annual period. Source: S&P Capital IQ; Peer group defined on slide 47; (2) Tangible equity and tangible assets are non-GAAP measures. See 13 reconciliation on slide 51; (3) As defined by S&P Capital IQ: “Cash, cash equiv. & investment securities/assets.”

Risk-Adjusted Returns Rowing Close to Shore Risk-Weighted Assets / Assets UMBF Peer Median (1) Return on Risk-Weighted Assets (2) UMBF Peer Median (1) (1) UMB peers (15 banks), data as of latest available annual period. Source: S&P Capital IQ. (2) The numerator for the calculation of Return on Risk-Weighted Assets is GAAP net income, 14 which in 2023 included $52.8 million of pre-tax expense for the FDIC special assessment, recognized in 4Q’23.

Dividend Trends Sustained Growth Annual Dividends Declared (1) 2024 = $1.56 (2) +2.0% vs. 2023 +280.5% 2004—2024 (2) (1) Dividends adjusted for 2-for-1 stock split in 2006. (2) Annualized 2024 full-year dividend assumes all 4 quarterly dividends are declared at $0.39/share, consistent with 1Q 2024 15 dividends. The Board of Directors may declare dividends of different amounts in future quarters.

Outperformance Building Long-Term Value 15-Year Compounded Annual Growth Rates 2008 – 2023 (1) (2) Diluted Earnings Per Share Tangible Book Value Per Share UMBF KRX* Peer Median** Industry*** *KBW Nasdaq Regional Bank Index (median of 50 banks); **UMB’s traditional peers (median of 15 banks); ***Median of all publicly-traded banks with data reported for both 2008 and 2023. (1) ‘23 diluted EPS includes FDIC Special Assessment, as applicable; (2) Non-GAAP measure. See reconciliation on slide 48. Peer, KRX & Industry source: S&P Capital IQ. 16

1st Quarter 2024 Financial Review St. Louis, MO

1Q 2024 Results At-A-Glance 1Q ’23 4Q ’23 1Q ’24 Linked-Quarter Variance & Commentary Average Loans 21,271.6 23,109.1 23,354.0 +$245mm LQ; Top line production of $771mm. Construction balances +$169mm, C&I +$102mm LQ annualized growth % 19.3% 6.3% 4.2% End-of-Period Loans 21,813.0 23,172.5 23,637.6 LQ annualized growth % 14.9% 5.1% 8.0% Includes ~$109mm of co-branded credit card balances acquired in March Average Deposits 31,562.4 32,675.3 33,526.1 +$851mm vs. 4Q23, led by investor solutions and private banking. Partially offset by continued reduction in brokered CDs, -$511mm. Avg. DDA = 30% of avg. deposits LQ annualized growth % 2.4% 17.2% 10.4% End-of-Period Deposits 31,931.9 35,792.9 36,913.6 LQ annualized growth % -8.7% 28.2% 12.5% Typical quarter-end deposit buildup in institutional deposits, offset by lowered brokered CD balances Net charge-offs / avg. loans 0.09% 0.02% 0.05% Nonperforming loans / loans 0.07% 0.06% 0.08% Loan growth, higher liquidity levels and +$1.4mm from amortization of municipal bond hedge gain; Net Interest Income 241.7 230.5 239.4 Loan betas have outpaced deposit betas cycle-to-date +2 bps. Primary drivers: +7bps loan repricing & mix; +2bps inv. portfolio (including impact of muni bond FTE Net Interest Margin 2.76% 2.46% 2.48% hedge gain). Offsets include higher deposit pricing and increased borrowing. Provision for Credit Losses 23.3—10.0 Noninterest Income (loss) investment securities (1) (5.3) 1.0 9.4 Net gain of $8.6mm on disposition of two non-marketable securities in 1Q’24 +$4.0mm from gain on a legal settlement, +$3.3mm in bankcard income, +$2.9mm in trust & securities Noninterest Income ex. inv. security gains (losses) 135.5 139.3 149.8 processing, and +$1.8mm gain on sale of land Total Noninterest Income 130.2 140.3 159.2 Noninterest Expense 237.1 290.0 254.8 Includes the GAAP recognition of $13.0mm pre-tax expense for FDIC special assessment in 1Q’24 (2) Seasonal increase of +$9.1mm in payroll taxes, insurance & 401(k) expense; partially offset by lower Operating Noninterest Expense 236.5 235.9 241.2 supplies expense, reduced charitable expense following higher year-end contributions Net Income 92.4 70.9 110.3 GAAP results Include FDIC special assessment charges of $13mm in 1Q’24 & $52.8mm in 4Q’23 Earnings per share, diluted $1.90 $1.45 $2.25 Net Operating Income (3) 92.8 112.0 120.7 Operating Earnings per share, diluted (3) $1.91 $2.29 $2.47 Dividends per share 0.38 0.39 0.39 Operating PTPP income (2) 135.4 134.9 157.5 Operating PTPP EPS (2) $2.78 $2.76 $3.22 (1) Net gains/losses on any disposition or impairment of debt securities + mark-to-market valuations of equity investments; (2) Operating noninterest expense and operating PTPP income & 18 EPS are non-GAAP measures. See reconciliation on slide 50; (3) Net operating income & operating EPS are non-GAAP measures. See reconciliation on slide 49.

1Q 2024 Earnings Highlights Net Income & Net Operating Income (1) Operating PTPP Income (2) $157.5 $135.4 $134.9 $127.9 $126.6 $120.7 $112.0 $98.4 $92.8 $93.8 Net Income EPS Operating PTPP Income – gains/losses on inv. securities (3) Net Operating Income (1) Operating EPS (1) Operating PTPP Income, ex. gains/losses on inv. securities Dollars in millions, except per share amounts. (1) Net operating income and operating EPS are non-GAAP measures. See reconciliation on slide 49; (2) Operating PTPP income is a non- 19 GAAP measure. See reconciliation on slide 50; (3) Net gains/losses on any disposition or impairment of debt securities plus mark-to-market valuations of equity investments.

Revenue Trends 1Q ’23 2Q ’23 3Q ’23 4Q ’23 1Q ’24 Linked-Qtr. Variance $ % Interest Income 408.7 461.4 472.0 496.6 520.1 23.5 4.7 Interest Expense 167.1 235.8 249.7 266.1 280.6 14.6 5.5 Net Interest Income $ 241.7 $ 225.6 $ 222.3 $ 230.5 $ 239.4 $ 8.9 3.9% Trust & securities processing 62.4 61.6 66.7 66.6 69.5 2.9 4.3 Trading & investment banking 5.3 4.8 3.8 5.8 5.5 (0.3) (5.0) Deposit Service Charges 21.2 21.4 21.1 21.3 20.8 (0.6) (2.7) Insurance fees and commisions 0.3 0.2 0.3 0.2 0.3 0.0 18.9 Brokerage fees 13.7 13.6 13.4 13.4 13.2 (0.3) (2.1) Bankcard fees 18.2 18.6 19.3 18.7 22.0 3.3 17.7 Net inv. securities gains (losses) (5.3) 0.9 0.3 1.0 9.4 8.4 NM Other income 14.6 17.0 8.6 13.2 18.8 5.5 41.9 Total noninterest income $ 130.2 $ 138.1 $ 133.3 $ 140.3 $ 159.2 $ 19.0 13.5% Total Revenue $ 371.9 $ 363.7 $ 355.6 $ 370.8 $ 398.7 $ 27.9 7.5% Dollars in millions. Columns may not sum due to rounding differences. 20

Net Interest Income Asset Yield and Liability Cost Trends $241.7 $239.4 $230.5 EA % $225.6 $222.3 IBL % COF % Liquidity Trends millions $ $3.5B Pre- $3.0B pandemic $2.6B $2.1B $2.0B billions $1.8B $ 8.4% 5.4% 7.8% 5.0% 6.8% 8.8% Net Interest Income NIM Spread Int-bearing due from banks Fed funds & resell agreements % of average earning assets Liquidity trends shown as average quarterly balances. 21

Noninterest Income $159.2 Current Quarter Drivers Noninterest income increased $19.0mm or 13.5%, vs. 4Q’23. Primary drivers: $138.1 $140.3 An increase of $8.4mm in investment securities gains, driven by a net gain of $8.6mm $130.2 $133.3 on the disposition of two non-marketable securities during the quarter, +$4.0mm related to proceeds from a legal settlement and +$1.8mm in gains on sale of land, both recorded in other income, $3.3mm in additional bankcard income driven by higher interchange revenue and lower rebates and rewards expense, and An increase of $2.9mm in Trust and Securities Processing income, driven by strong performance in fund services, private wealth and corporate trust. COLI income was $3.7mm in 1Q’24, $3.3mm in 4Q’23, and $4.0mm in 1Q’23. This income variance is offset by a proportionate change in deferred compensation expense. Composition / Changes in Inv. Securities Gains (Losses) and Trust & Securities Processing LQ Variance 1Q’23 4Q’23 1Q’24 $ % Investment Securities Gains (Losses) Equity securities (0.5) 1.0 9.3 8.3 NM AFS debt securities (4.8)—0.1 0.1 NM $(5.3) $1.0 $9.4 $8.4 NM Trust & Securities Processing Personal Banking 13.2 13.2 14.3 1.1 7.5 Institutional Banking Trust / Securities Processing Deposit Svc. Charges. Bankcard Fees Fund Services 34.6 38.6 39.6 1.0 2.6 Trading / Invest. Banking Brokerage Fees Other Income Corp. Trust & Inst. Asset Mgmt. 14.6 14.8 15.6 0.8 5.8 Investment Securities Gains (Losses) $62.4 $66.6 $69.5 $ 2.9 4.3% Fee Income / Revenue Peer Median Fee Income / Revenue (1) Dollars in millions. (1) UMB peers (15 banks), data as of latest available quarter. Source: S&P Capital IQ. 22

Noninterest Expense Linked-Qtr. Variance $ in millions 1Q ’23 2Q ’23 3Q ’23 4Q ’23 1Q ’24 $ % Severance expense 0.5 4.9 2.4 1.2 0.1 (1.1) (87.9) Salary & Benefits, ex. severance expense 142.0 138.4 131.0 133.0 142.9 9.8 7.4 Occupancy 12.2 11.7 12.3 12.3 12.3 (0.0) (0.2) Equipment 17.8 17.1 17.2 16.6 16.5 (0.1) (0.5) Supplies & services 3.9 4.2 3.2 5.5 3.3 (2.2) (40.5) Marketing & business dev. 5.3 7.1 6.6 6.7 6.0 (0.6) (9.5) Processing fees 23.2 26.6 26.0 27.3 27.9 0.7 2.4 Legal & consulting 7.3 7.1 7.2 8.4 7.9 (0.5) (6.3) Bankcard 7.1 8.3 8.9 8.7 10.6 1.9 21.8 Amortization; other intangibles 2.3 2.1 2.1 2.0 2.0 (0.1) (4.3) Regulatory fees 5.6 6.1 6.2 59.2 19.4 (39.8) (67.2) Other expense 9.8 7.0 8.4 9.1 5.9 (3.1) (34.4) Total noninterest expense (1) $ 237.1 $ 240.7 $ 231.4 $ 290.0 $ 254.8 $(35.2) (12.1%) Operating noninterest expense (2) $ 236.5 $ 235.8 $ 229.0 $ 235.9 $ 241.2 $ 5.4 2.3% Excludes FDIC special assessments and other expenses as noted on slide 50. Current Quarter Drivers Noninterest expense decreased $35.2mm or 12.1%, vs. 4Q’23 on a GAAP basis. On an operating basis, which excludes FDIC special assessments and expenses related to acquisitions and severance, noninterest expense increased $5.4mm, or 2.3%. (2) Primary drivers: A seasonal increase of $9.1mm in payroll taxes, insurance and 401(k) expense; partially offset by A reduction of $2.2mm in supplies expense, reflecting the purchase of computers in 4Q’23, $1.5mm lower operational losses compared to the prior quarter, and A decrease of $1.3mm in charitable expense, following higher year-end contribution levels. Deferred compensation expense was $4.0mm in 1Q’24, $3.1mm in 4Q’23, and $3.2mm in 1Q’23. Variances are offset by a proportionate change in COLI income. (1) Columns may not sum due to rounding differences. (2) Operating noninterest expense is a non-GAAP metric. See reconciliation on slide 50. 23

Diversified Loan Portfolio 1Q ’23 4Q ’23 1Q ’24 Linked-Qtr. Variance $ % CRE/Construction 7,812 8,890 9,027 137 1.5 $ 23,109 $ 23,354 $ 22,751 Commercial & Industrial 9,566 10,128 10,230 102 1.0 $ 22,192 Residential Real Estate 2,738 2,945 2,968 23 0.8 $21,272 Consumer 137 153 153—0.2 Credit Card 454 496 490 (6) (1.2) Specialty Lending 565 497 486 (11) (2.2) Total Loans $21,272 $ 23,109 $ 23,354 $ 245 1.1% Loans by Region Greater MO 5% Arizona 9% Kansas City Texas 32% 11% Utah—4% OK—1% NE—2% KS—2% C&I Commercial R/E Consumer Asset-Based Lending Residential R/E Credit Card Colorado St. Louis 17% 17% Construction Average Loan Yield Average balances in millions. 24

Quarterly Loan Activity 1Q ’23 2Q ’23 3Q ’23 4Q ’23 1Q ’24 Gross Loan Production $933.8 $986.3 $648.9 $909.0 $771.2 Revolving Balance Changes 554.7 431.9 478.8 381.3 344.4 Net (Charge-offs) Recoveries (4.6) 0.1 (4.6) (1.4) (3.0) (1) Payoffs (395.7) (534.5) (497.3) (707.9) (293.4) (1) Paydow ns (306.4) (213.3) (227.6) (290.2) (354.1) Net Loan Grow th 781.8 670.5 398.2 290.8 465.1 End-of-Period Total Loans 21,813.0 22,483.5 22,881.7 23,172.5 23,637.6 Paydow ns/Payoffs as a % of Loans 3.3% 3.4% 3.2% 4.4% 2.8% (1) Payoffs and paydowns include C&I and CRE loans. 25

Strong Asset Quality Net Loan Charge-Offs (Recoveries) Delinquencies ($0.1) Net Charge-offs (Recoveries) NCOs / Average Loans Delinquencies (1) Delinquencies / Total Loans Nonperforming Loans Allowance for Credit Losses Nonperforming Loans NPLs / Total Loans Allowance for Credit Losses on Loans ACL / Total Loans Dollars in millions. (1) Delinquencies represent accruing loans > 30 days past due. 26

Detailed Net Charge-Off History Historical 2004 2005 2006 2007 2008 2009 2010 2011 2012 2013 Total Net Charge-Offs $ 6,141 $ 7,673 $ 6,992 $ 8,273 $11,755 $20,258 $21,697 $24,135 $18,091 $14,175 (Recoveries) $ thousands Average Total Loans $ 2,758 $ 3,110 $ 3,562 $ 3,888 $ 4,176 $ 4,356 $ 4,584 $ 4,749 $ 5,243 $ 6,217 $ millions NCOs as % of Avg Loans 0.22% 0.25% 0.20% 0.21% 0.28% 0.47% 0.48% 0.51% 0.35% 0.23% Historical 2014 2015 2016 2017 2018 2019 2020 2021 2022 2023 Total Net Charge-Offs $15,611 $10,497 $21,994 $32,045 $67,719 $34,697 $20,125 $44,872 $39,868 $10,474 (Recoveries) $ thousands Average Total Loans $ 6,974 $ 8,424 $ 9,986 $10,842 $11,605 $12,759 $15,109 $16,618 $18,822 $22,335 $ millions NCOs as % of Avg Loans 0.22% 0.12% 0.22% 0.30% 0.58% 0.27% 0.13% 0.27% 0.21% 0.05% Recent Quarterly Trends ($ in thousands) 1Q’23 2Q’23 3Q’23 4Q’23 1Q’24 Commercial & Industrial $ 2,031 $ (2,098) $ 1,463 $ (1,644) $ (308) Specialty Lending (1)—762—(1) Commercial Real Estate 21 (21)—155 250 Consumer Real Estate 1,108 16 5 11 (432) Consumer 247 311 222 241 332 Credit Cards 1,237 1,653 2,166 2,589 3,176 Leases & Other — — -Total Net C/O (Rec) $ 4,643 $ (139) $ 4,618 $ 1,352 $ 3,017 Average Total Loans $21,270 $22,189 $22,749 $23,107 $23,352 ($ in millions) NCOs as % of Avg Loans 0.09% (0.00%) 0.08% 0.02% 0.05% 27

High-Quality Investment Portfolio Available-for-Sale (1) Held-to-Maturity (1) $6,963 $6,865 $6,816 $6,537 $6,408 $5,872 $5,824 $5,766 $5,705 $5,653 millionsmillions $ $ —balancesbalances Average Average GNMA/GSE Mortgage-Backed General Obligation Municipals Corp. & Commercial Paper GSE Agencies Treasuries Collateralized Loan Obligations Revenue Bonds Average Blended Yield (1) Balances are presented at carrying value, which is fair value for the available-for-sale portfolio and amortized cost for the held-to-maturity portfolio. 28

Securities Portfolio Statistics Net Securities Portfolio Activity (1) Amortized Fair Unrealized Cost Value (5) $ in millions $ in millions; as of 03/31/24 Loss 1Q’23 2Q’23 3Q’23 4Q’23 (3) 1Q’24 (4) Available for Sale Roll-off / Cash Flow $250 $243 $240 $262 $619 Mortgage-backed 4,214 3,674 (540) Municipals 1,323 1,234 (89) Roll-off Yield 2.42% 2.07% 1.90% 2.38% 2.15% US Treasuries 810 803 (7) Purchased (2) 4 9 1 154 621 Corporates 358 330 (28) Purchased Yield 4.23% 4.89% 5.23% 4.69% 4.63% CLOs 341 342 1 US Agencies 162 159 (3) Next Qtr. Scheduled Cash Flow 259 230 292 623 487 Total AFS 7,207 6,541 (666) Expected Cash Flow Yield 1.96% 1.82% 2.33% 2.03% 2.49% Held to Maturity Next 12 mos. Scheduled Cash Flow 1,558 1,636 1,646 1,637 1,327 Mortgage-backed 2,691 2,287 (405) Municipals 1,586 1,432 (153) Expected Cash Flow Yield 2.01% 2.16% 2.18% 2.23% 2.43% US Agencies 123 121 (3) Portfolio Duration In Months Industrial Rev. Bonds 1,226 1,185 (41) Available-for-Sale 48 47 49 42 46 Total HTM 5,626 5,025 (601) Held-to-Maturity 91 90 96 86 86 Total Securities (5) 12,834 11,567 (1,267) Additional 4Q’23 & 1Q’24 Activity Purchased $500 million of short-term Treasury Bills @ 5.39% in 4Q’23 as additional collateral for public funds deposits; those T-Bills rolled off in 1Q’24 Purchase activity, cash flow and duration includes AFS securities and HTM portfolio exclusive of industrial revenue bonds held-to-maturity; (2) Purchases made for roll-off and overbuy, net of purchases related to sales/trades and short-term collateral needs within the quarter; (3) 4Q’23 purchased, purchased yield, expected cash flows and cash flow yields exclude impact of $500mm T- 29 Bills purchased as noted above; (4) 1Q’24 roll-off excludes the $500mm of those T-Bills noted in footnote 3; (5) Columns & rows may not sum due to rounding differences.

Diversified Deposit Mix Deposits by Line of Business $32,675 $33,526 $31,562 $31,475 $31,330 4% Fund Services 7% Commercial Institutional Capital Markets & Corp. Trust 12% Commercial Banking 40% Investor Solutions 9% Healthcare Services 9% Consumer & Private Wealth 19% Personal 1Q ’23 4Q ’23 1Q ’24 Linked-Qtr. Variance $ % Investor Solutions 2,350 2,538 2,985 447 17.7 38% 33% 32% 31% 30% Consumer & Private Wealth 6,177 6,082 6,487 405 6.7 Capital Markets / Corp. Trust 4,057 3,850 4,139 289 7.5 Healthcare Services 2,786 2,841 3,009 168 5.9 Fund Services 1,968 2,175 2,300 125 5.7 Demand Deposits Interest-Bearing Demand & Savings Commercial 13,953 13,393 13,321 (72) (0.5) Time Deposits Avg. Total Deposit Cost Brokered CDs 271 1,796 1,285 (511) (28.5) DDA / total deposits Total $31,562 $32,675 $33,526 $851 2.6% Average balances in millions. 30

Interest Rate Sensitivity Impact to Net Interest Income Assumptions Increase / decrease based on hypothetical rate Projected rates for new loans and deposits based on historical changes and stable balance sheet analysis, management outlook and repricing strategies Ramp Scenario Asset prepayments and other market risks are developed from industry estimates of prepayment speeds and other market changes Loan Maturities & Repricing Year 1 Year 2 66% of total end-of-period loans, or $15.6B, are variable. 72% of total loans reprice within the next 12 months. Shock Scenario Of variable loans—% tied to indices for next 12 months: o 70%—SOFR o 26%—Prime o 4%—other Year 1 Year 2—300—200—100 + 100 31
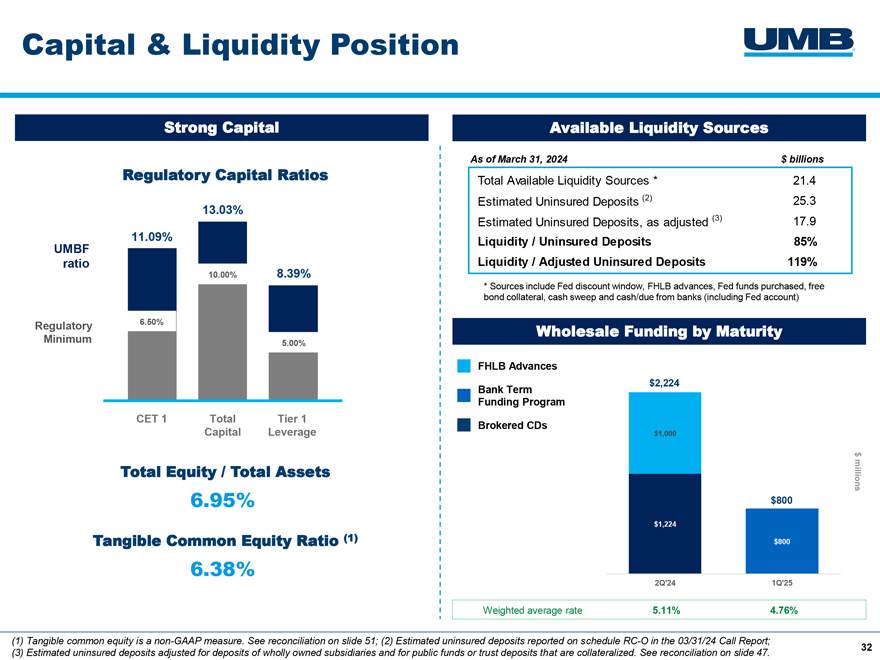
Capital & Liquidity Position Strong Capital Available Liquidity Sources As of March 31, 2024 $ billions Regulatory Capital Ratios Total Available Liquidity Sources * 21.4 Estimated Uninsured Deposits (2) 25.3 13.03% (3) Estimated Uninsured Deposits, as adjusted 17.9 11.09% Liquidity / Uninsured Deposits 85% UMBF ratio Liquidity / Adjusted Uninsured Deposits 119% 10.00% 8.39% * Sources include Fed discount window, FHLB advances, Fed funds purchased, free bond collateral, cash sweep and cash/due from banks (including Fed account) Regulatory 6.50% Wholesale Funding by Maturity Minimum 5.00% FHLB Advances $2,224 Bank Term Funding Program CET 1 Total Tier 1 Brokered CDs Capital Leverage $ Total Equity / Total Assets millions 6.95% $800 Tangible Common Equity Ratio (1) 6.38% Weighted average rate 5.11% 4.76% (1) Tangible common equity is a non-GAAP measure. See reconciliation on slide 51; (2) Estimated uninsured deposits reported on schedule RC-O in the 03/31/24 Call Report; 32 (3) Estimated uninsured deposits adjusted for deposits of wholly owned subsidiaries and for public funds or trust deposits that are collateralized. See reconciliation on slide 47.

Line of Business Updates Milwaukee, WI

Commercial Banking Commercial Capabilities Commercial Lending Portfolio Average Loan Balance & Composition $19.7B Middle Market C&I Lending Working capital lines Owner-Occupied CRE Equipment loans Investment Real Estate 32% Investment Real Estate Office Retail Middle Market Multi-family 52% Industrial Hotel Student Housing Specialized Verticals Lending Verticals 12% Agribusiness Beverage Lending Sm./Med Biz 4% Asset-based Lending Energy Lending Aviation Lending Small / Medium Business Business Banking Practice Finance Prepaid & Purchasing Small Business Banking Card Volume (1) #30 Commercial Credit Card of 100 Largest Farm Purchase Volume (1) Lenders in the U.S. (2) Average balance for 1Q’24, excludes credit card. (1) Rank among U.S. Visa & Mastercard Commercial Card Issuers, Source: Nilson Report, ‘22; (2) “Production ag lending” per ABA 4Q 34 2023, FDIC data. Additionally, UMB has significant relationships with “Agribusiness / Middle Market Ag” companies.

Commercial Banking C&I Lending Commercial & Industrial Statistics C&I Industries as % of UMB Loans (1) Includes Middle Market, Lending Verticals & Small / Medium Business Other (2) Considerations Retail Finance & Internal limits on loan size and projects per sponsor Insurance Tech. & 10% Concentration guidelines for all lending verticals, monitored for Telecom Portfolio Mgmt.–4% changing conditions Inv. Banking–2% Transp. / Leasing–1% Warehouse Other Financial-3% C&I Balance Trends (1) +3% YoY Total C&I Loans Commercial Services RE & $10.2B Construction 5% 43.1% of total Comml. Lessors–1% Healthcare UMB loans Plumbing / HVAC–1% ons Varied Construction billi Services– 3% $ Agri- Energy-business Related 4% Petroleum–2% Diversified Nat. Gas–1% Other Energy–1% Materials & Manu- Commodities Average Line Utilization Trends facturing (2) Other—4% of UMB loans Food & Beverage Apparel / Textiles Auto-related Consumer Services Entertainment / Recreation Government / Education (1) End-of-period balances as of March 31, 2024. 35

Commercial Banking Commercial Real Estate Commercial Real Estate Statistics Investment CRE as % of UMB Loans (1) Total CRE & Construction = 39% of UMB loans $9.3B 1-4 Unit Other (5) Owner-occupied – new purchase or refinance Rentals Real estate development – construction / perm financing, bridge financing, renovations Const. / Land Dev. 11% Sr. Living Total UMB Commercial R/E Rate Type: (2) Vacant o Fixed – 39% Industrial Land o Variable – 61% Investment CRE Total Inv. CRE & Investment CRE & Construction Portfolio 17% Hotel Construction Loans $6.6B Average Loan-to-Value: 57% 27.8% of total Recourse: 90% UMB loans Investment CRE Rate Type: (3) Farmland 2% Retail o Fixed – 29% o Variable – 71% Owner-Occupied 9% Multifamily Office as of Mar. 31, 2024 1-4 Unit Residential Construction < 1% of total UMB loans Regulatory Concentrations (4) Total non-farmland CRE / Total RBC: 189% (5) Other—2% of UMB loans Construction & Development / Total RBC: 71% Mixed Use Healthcare Student Housing Special Purpose Homebuilder for Sale Self-storage (1) End-of-period balances as of March 31, 2024; (2) Adjusting for customer interest rate swaps on variable rate loans, “fixed” rate exposure would be ~52% and variable rate exposure would be 36 ~48%; (3) Swap adjusted: “fixed” rate exposure ~43% and variable rate exposure ~57%; (4) Tier 1 capital plus an adjusted ACL, per regulatory guidelines.

Investment Real Estate Select Property Details Total Investment CRE Portfolio Office CRE Portfolio Average Loan-to-Value, Select Asset Classes MSA Diversification $ millions Statistics Dallas-Fort Worth-Arlington, TX MSA $227 Industrial: 61% Average Loan: $9.0mm Jacksonville, FL MSA 92 Multifamily: 54% Kansas City, MO-KS MSA 78 Average LTV: 64% Retail: 53% Tampa-St. Petersburg-Clearwater, FL 70 Recourse: 84% 51% St. Louis, MO-IL MSA 69 Hotel: Raleigh-Cary, NC MSA 60 Vacant Land: 54% Cincinnati-Middletown, OH-KY-IN MSA 53 Senior Living: 65% Milwaukee, WI MSA 53 1-4 Unit Rentals: 52% Phoenix-Mesa-Scottsdale, AZ MSA 51 Market Type Indianapolis-Carmel, IN MSA 50 Denver-Aurora, CO MSA 48 Geographic Diversity – By Property Location Tulsa, OK MSA 36 By outstanding balances as of March 31, 2024 Other 132 $1,019 $1,019 mm (No state > 3.1%) Suburban Central Business District Medical 37

Personal Banking Consumer Strategic & Stable Source of Low-Cost Funds High Customer Satisfaction Consumer plays a strategic role for UMB as a large and stable source of Consumer serves the personal banking needs of deposits. Poised for continued asset growth clients across all divisions of the bank Total Average Total Average NPS Deposits Loans (1) Score 72.7 $6.5B $3.1B UMBF Industry Average (2) +5% YoY +9% YoY 51.0 Hybrid Service & Sales Model – Provides broad products and services to meet diverse client needs Retail Banking Private Banking Mortgage Community Development Strategically positioned for Growth engine for new Provide competitive mortgage sales growth customers; deepening existing solutions for all client types Expand diversity of client relationships engagement in communities served $2.6B Avg. Mortgage Balances 90 25 Private Bankers +9% YoY Financial Education Banking Centers Across 9 regions 39 Classes Avg. Private 1st Time Homebuyer Program—237 $2.1B Down Payment Assistance to Community Partners ATMs Banking Deposits 13 Qualified Buyers Served Program to Date (1Q ‘22– 1Q ‘24): Community Digital Capabilities across Consumer 4,200+ Applications 739 Participants • Digital loan and deposit application and originations $6.5mm Down payment • Mobile Banking: Deposits, transfers, bill pay, acct review & more assistance Metrics at, or for the quarter ended, 03/31/24. (1) Includes residential real estate and other consumer loans; (2) 2023 Net Promoter Score for 55 financial services companies—Medallia, Inc. 38

Personal Banking Private Wealth Management Customer Assets Wealth Management Non-Managed Personal Financial planning AUA Trust $13.0B 23% Discretionary investment management 20% Strategic wealth solutions for ultra-high net worth Managed Assets Other families 6% (AUM) Business succession and exit planning IRAs Brokerage services 6% $3.2B Investment Non-Managed Personal Trust & Custody Advisory Assets (AUA) 42% Trust administration Charitable foundation planning and administration Personal custody services (1) Unique asset administration New Assets / Sales Fine art management Trust tax preparation Asset Management Direct private equity investment access millions $ Composition as of March 31, 2024. (1) Includes AUM and AUA. 39
Institutional Banking Fund Services & Institutional Custody Assets Under Administration Registered Funds & Alternative Investments $443B Provides services for 1,700 funds, including registered and alternative investment funds, PE funds, real estate and venture capital funds and $411B ETFs and more. $400B $383B Best Interval Fund Administrator (1) $379B Best Administrator – Technology (2) Best Administrator – GPs w/assets <$30B (3) Industry Leader in Client Service (4) Best Fund Accounting & Reporting Software (5) Best New Fund Services Project (6) Institutional Custody One of the nation’s leading providers of domestic and global custody, serving insurance companies, public & private corporations, nonprofits, municipalities, fund companies and endowments. Established in 1948. Best Custodian (7) (8) +345 Alternative Servicing Custody Net New Accounts YTD Fund Acct/Admin. Transfer Agency Custody AUA +30% YoY Note: Asset categories sum > total AUA due to shared client assets. (1) With Intelligence ’19, ’20, ‘22 & ‘23 Awards; (2) Hedgeweek US Awards ’20—’22; (3) PE Wire ’21 & ‘22; (4) Global Custodian Fund Admin Survey ’22; (5) Hedgeweek Emerging Managers 40 Awards ’23; (6) Global Custodian Leadership Awards ‘23; (7) HFM Services Awards ’21 & ’22; (8) Hedgeweek US Awards ‘23.
Institutional Banking Corp/Specialty Trust & Capital Markets Corporate Trust & Escrow Services Capital Markets Division Provides trustee, paying agent and escrow services to municipal Capital solutions including fixed income sales, trading and underwriting and corporate issuers. for institutional, municipal and not-for-profit organizations. Public Finance #3 March YTD Closed Deals Paying Agent $39B in U.S. (1) (2) #3 Assets Under Administration Municipal Trustee in U.S. (1) (2) Specialty Trust & Agency Solutions Services for asset-backed securitizations, aviation and other Examples of recent deals: transportation and real estate projects. Workout and successor trustee $103,950,000 $482,610,000 $121,955,000 services on behalf of bondholders of defaulted transactions. +58% owth in new Citizens Memorial Dallas Independent City of Mansfield, Tx business YTD Hospital District School District Waste Water & Sewer vs. 1Q ’23 Unlimited Tax School System Rev Bonds Hospital Revenue Bonds Building Bonds General Obligation Bonds Certificates of Obligation Winner – Turnaround Award — Series 2024 Series 2024 Series 2024 Divestiture of the Year (3) UMB as Sole Manager UMB as Co-Manager UMB as Co-Manager Products and services offered through UMB Bank Capital Markets Division NOT FDIC INSURED | MAY LOSE VALUE | NOT BANK GUARANTEED. (1)Thomson Reuters municipal rankings, December ‘23; (2) Ranked by number of issues; (3) M&A Advisor – ’22. 41
Institutional Banking Investor Solutions & Healthcare Services Investor Solutions Our banking as a service (BaaS) solution includes deposit services for checking, saving, and investment accounts, including expanded FDIC $52B ~84mm insurance through our proprietary Sweep Program. Sample BaaS Partnerships FDIC Sweep Assets Annual ACH Under Administration Transactions ~ 5.4 mm accounts Healthcare Services Provides a suite of tax-advantaged benefit accounts including Health Savings Accounts (HSAs), Flexible Spending Accounts (FSAs), Health Reimbursement 1.5mm 4.8mm Arrangements (HRAs), and Commuter Benefit Accounts. HSA Account Holders Benefit Cards Recognized for Investment Quality (1) $4.1B Top 10 HSA Custodians in the U.S. (2) In HSA Assets Named a Top HSA for Features & & Deposits Investment Options (1) (1) Investor’s Business Daily ‘21; (3) #6 in total accounts & #8 in total assets as of December 31, 2023—Devenir Research Year-end ‘23. 42

Payments Credit & Debit Card Products Card Purchase Volume & Interchange Trends 1Q ’24 Card Spend $4,558 $4,079 $4,020 $4,088 $4,009 $4.6B #24 24th in U.S. Credit Card Healthcare Debit Consumer Debit Inst. Cash Mgmt. Commercial Credit Consumer Credit Interchange Income Purchase Volume (1) Dollars in millions. (1) Rank in commercial, consumer and small business cards among top 50 U.S. issuers. Source: Nilson Report, December 2022. 43

Appendix Phoenix, AZ

Governance Our Board of Directors Robin Beery Janine Davidson K.C. Gallagher Greg Graves Mariner Kemper Gordon Lansford CC (Chair), RC CC, GC AC, RC Lead Independent Chairman of AC (Chair), CC Director, GC (Chair) the Board Tim Murphy Tammy Peterman Kris Robbins Josh Sosland Leroy Williams AC, CC GC, RC AC, RC (Chair) GC, RC CC, RC Advisory Directors Jim Rine Tom Wood CEO, UMB Bank, n.a. AC = Audit Committee; CC = Compensation Committee; GC = Governance Committee; RC = Risk Committee 45

Forward-Looking Statements This presentation contains, and our other communications may contain, forward-looking statements within the meaning of the Private Securities Litigation Reform Act of 1995. These statements can be identified by the fact that they do not relate strictly to historical or current facts. Forward-looking statements often use words such as “believe,” “expect,” “anticipate,” “intend,” “estimate,” “project,” “outlook,” “forecast,” “target,” “trend,” “plan,” “goal,” or other words of comparable meaning or future-tense or conditional verbs such as “may,” “will,” “should,” “would,” or “could.” Forward-looking statements convey our expectations, intentions, or forecasts about future events, circumstances, results, or aspirations. All forward-looking statements are subject to assumptions, risks, and uncertainties, which may change over time and many of which are beyond our control. You should not rely on any forward-looking statement as a prediction or guarantee about the future. Our actual future objectives, strategies, plans, prospects, performance, condition, or results may differ materially from those set forth in any forward-looking statement. Some of the factors that may cause actual results or other future events, circumstances, or aspirations to differ from those in forward-looking statements are described in our Annual Report on Form 10-K, our Quarterly Reports on Form 10-Q or Current Reports on Form 8-K, or other applicable documents that are filed or furnished with the U.S. Securities and Exchange Commission (SEC). In addition to such factors that have been disclosed previously: macroeconomic and adverse developments and uncertainties related to the collateral effects of the collapse of, and challenges for, domestic and international banks, including the impacts to the U.S. and global economies; sustained levels of high inflation and the potential for an economic recession on the heels of aggressive quantitative tightening by the Federal Reserve, decreases in demand for office space caused by shifts in the work environment, and impacts related to or resulting from instability in the Middle East and Russia’s military action in Ukraine, such as the broader impacts to financial markets and the global macroeconomic and geopolitical environments, may also cause actual results or other future events, circumstances, or aspirations to differ from our forward-looking statements. Any forward-looking statement made by us or on our behalf speaks only as of the date that it was made. We do not undertake to update any forward-looking statement to reflect the impact of events, circumstances, or results that arise after the date that the statement was made, except to the extent required by applicable securities laws. You, however, should consult disclosures (including disclosures of a forward-looking nature) that we may make in any subsequent Annual Report on Form 10-K, Quarterly Report on Form 10-Q, Current Report on Form 8-K, or other applicable document that is filed or furnished with the SEC. 46

Additional Information Estimated Uninsured Deposit Analysis $ billions Estimated Uninsured Deposits (1) 25.3 Less: Affiliate Deposits (2) (2.0) Less: Collateralized Deposits (3) (5.4) Estimated uninsured deposits ex. items above (4) $17.9 Total Deposits (5) $36.9 Estimated total uninsured deposits as % of Total Deposits 68.4% Estimated uninsured deposits (ex. affiliate and collateralized) 48.6% as % of Total Deposits Our Peer Group ASB Associated Banc-Corp HWC Hancock Whitney Corporation BOKF BOK Financial Corporation ONB Old National Bancorp CADE Cadence Bank PNFP Pinnacle Financial Partners, Inc. COLB Columbia Banking System, Inc. PB Prosperity Bancshares, Inc. CBSH Commerce Bancshares, Inc. SNV Synovus Financial Corp. CFR Cullen/Frost Bankers, Inc. VLY Valley National Bancorp FNB F.N.B. Corporation WTFC Wintrust Financial Corporation FULT Fulton Financial (1) Estimated uninsured deposits reported on schedule RC-O in the 03/31/24 Call Report; (2) Accounts of wholly-owned subsidiaries of UMBFC; (3) Public funds or corporate trust deposits that 47 are collateralized; (4) Columns may not sum due to rounding differences; (5) Total deposits as of March 31, 2024.

Non-GAAP Reconciliations The following are non-GAAP measures used from time to time. To the extent a non-GAAP measure is used in this presentation, a reconciliation to such measure’s closest GAAP equivalent is provided below. UMB believes that these non-GAAP financial measures may be useful to investors because they adjust for items that management does not believe reflect the Company’s fundamental operating performance. • Tangible book value per share is defined as total shareholders’ equity, net of intangible assets, divided by total shares outstanding. • Net operating income is defined as GAAP net income, adjusted to exclude expenses related to acquisitions and severance, the FDIC special assessment, and the cumulative tax impact of these adjustments. • Operating PTPP income for the relevant period is defined as GAAP net interest income plus GAAP noninterest income, less noninterest expense, adjusted to reflect the impact of excluding expenses related to acquisitions, severance expense, and the FDIC special assessment. • Tangible common equity ratio is total shareholders’ equity, net of intangible assets, divided by total assets, net of intangible assets. • Return on tangible common equity is calculated as net income divided by average tangible shareholders’ equity for the relevant period. • Operating return on tangible common equity is calculated as net operating income, divided by average tangible shareholders’ equity. Tangible Book Value As of Mar. 31, Dec. 31, Mar. 31, Dec. 31, 2024 2023 2023 2008 Total shareholders’ equity (GAAP) $ 3,152,816 $ 3,100,419 $ 2,814,659 $ 974,811 Less: Intangible assets Goodwill 207,385 207,385 207,385 104,924 Other intangibles, net 69,052 71,012 76,426 18,101 Total intangibles, net 276,437 278,397 283,811 123,025 Total tangible shareholders’ equity (Non-GAAP) $ 2,876,379 $ 2,822,022 $ 2,530,848 $ 851,786 Total shares outstanding 48,743,348 48,554,127 48,507,116 40,947,795 Ratio of total shareholders’ equity (book value) per share $ 64.68 $ 63.85 $ 58.03 $ 23.81 Ratio of total tangible shareholders’ equity $ 59.01 $ 58.12 $ 52.17 $ 20.80 (tangible book value) per share (Non-GAAP) Unaudited, dollars in thousands except per share data. 48

Non-GAAP Reconciliations Net Operating Income Three Months Ended Mar. 31, Dec. 31, Mar. 31, 2024 2023 2023 Net income (GAAP) $ 110,258 $ 70,923 $ 92,437 Adjustments: Acquisition expense 431 52 39 Severance expense 146 1,207 486 FDIC special assessment 13,000 52,840—Tax-impact of adjustments (1) (3,123) (12,984) (126) Total Non-GAAP adjustments (net of tax) 10,454 41,115 399 Net Operating Income (Non-GAAP) $ 120,712 $ 112,038 $ 92,836 Earnings per share—diluted (GAAP) $ 2.25 $ 1.45 $ 1.90 Acquisition expense 0.01 — Severance expense—0.02 0.01 FDIC special assessment 0.27 1.08—Tax-impact of adjustments (1) (0.06) (0.26) -Operating earnings per share—diluted (Non-GAAP) $ 2.47 $ 2.29 $ 1.91 • Net operating income is defined as GAAP net income, adjusted to exclude expenses related to acquisitions and severance, the FDIC special assessment in fourth quarter 2023 and first quarter 2024, and the cumulative tax impact of these adjustments. Unaudited, dollars in thousands except per share data. (1) Calculated using the company’s marginal tax rate of 23.0% for 2024 and 24.0% for 2023. 49

Non-GAAP Reconciliations Operating Pre-Tax, Pre-Provision Income Three Months Ended Mar. 31, Dec. 31, Mar. 31, 2024 2023 2023 Net interest income (GAAP) $ 239,434 $ 230,522 $ 241,696 Noninterest income (GAAP) 159,244 140,254 130,200 Noninterest expense (GAAP) 254,804 289,974 237,052 Adjustments to arrive at operating noninterest expense: Acquisition expense 431 52 39 Severance expense 146 1,207 486 FDIC special assessment 13,000 52,840—Total Non-GAAP adjustments 13,577 54,099 525 Operating noninterest expense (Non-GAAP) 241,227 235,875 236,527 Operating pre-tax, pre-provision income (Non-GAAP) $ 157,451 $ 134,901 $ 135,369 Net interest income EPS—diluted (GAAP) $ 4.89 $ 4.72 $ 4.96 Noninterest income (GAAP) 3.26 2.87 2.67 Noninterest expense (GAAP) 5.21 5.93 4.86 Acquisition expense 0.01 — Severance expense—0.02 0.01 FDIC special assessment 0.27 1.08 -Operating pre-tax, pre-provision EPS—diluted (Non-GAAP) $ 3.22 $ 2.76 $ 2.78 • Operating PTPP income for the relevant period is defined as GAAP net interest income plus GAAP noninterest income, less noninterest expense, adjusted to reflect the impact of excluding expenses related to acquisitions and severance, the FDIC special assessment. Unaudited, dollars in thousands except per share data. 50
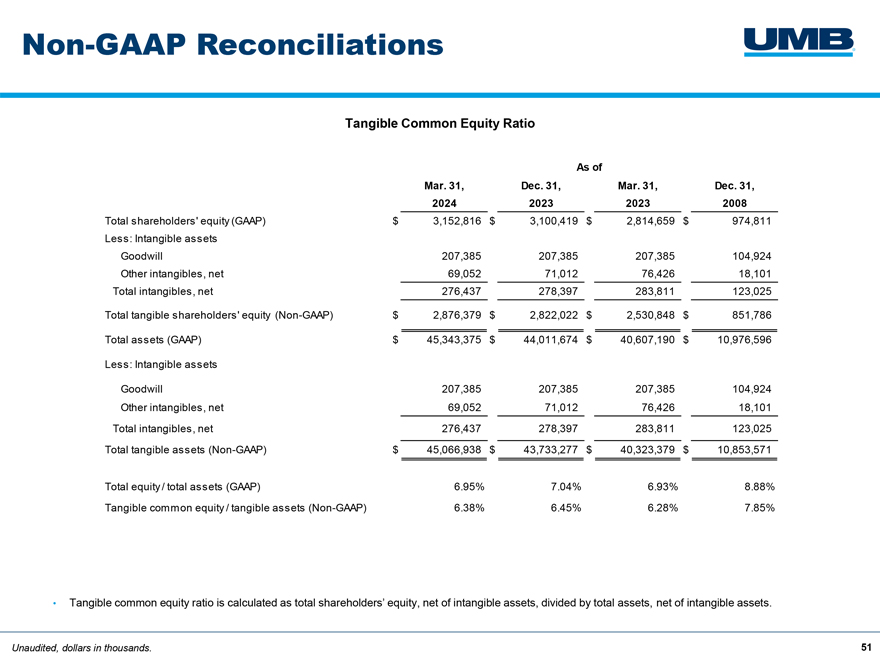
Non-GAAP Reconciliations Tangible Common Equity Ratio As of Mar. 31, Dec. 31, Mar. 31, Dec. 31, 2024 2023 2023 2008 Total shareholders’ equity (GAAP) $ 3,152,816 $ 3,100,419 $ 2,814,659 $ 974,811 Less: Intangible assets Goodwill 207,385 207,385 207,385 104,924 Other intangibles, net 69,052 71,012 76,426 18,101 Total intangibles, net 276,437 278,397 283,811 123,025 Total tangible shareholders’ equity (Non-GAAP) $ 2,876,379 $ 2,822,022 $ 2,530,848 $ 851,786 Total assets (GAAP) $ 45,343,375 $ 44,011,674 $ 40,607,190 $ 10,976,596 Less: Intangible assets Goodwill 207,385 207,385 207,385 104,924 Other intangibles, net 69,052 71,012 76,426 18,101 Total intangibles, net 276,437 278,397 283,811 123,025 Total tangible assets (Non-GAAP) $ 45,066,938 $ 43,733,277 $ 40,323,379 $ 10,853,571 Total equity / total assets (GAAP) 6.95% 7.04% 6.93% 8.88% Tangible common equity / tangible assets (Non-GAAP) 6.38% 6.45% 6.28% 7.85% • Tangible common equity ratio is calculated as total shareholders’ equity, net of intangible assets, divided by total assets, net of intangible assets. Unaudited, dollars in thousands. 51
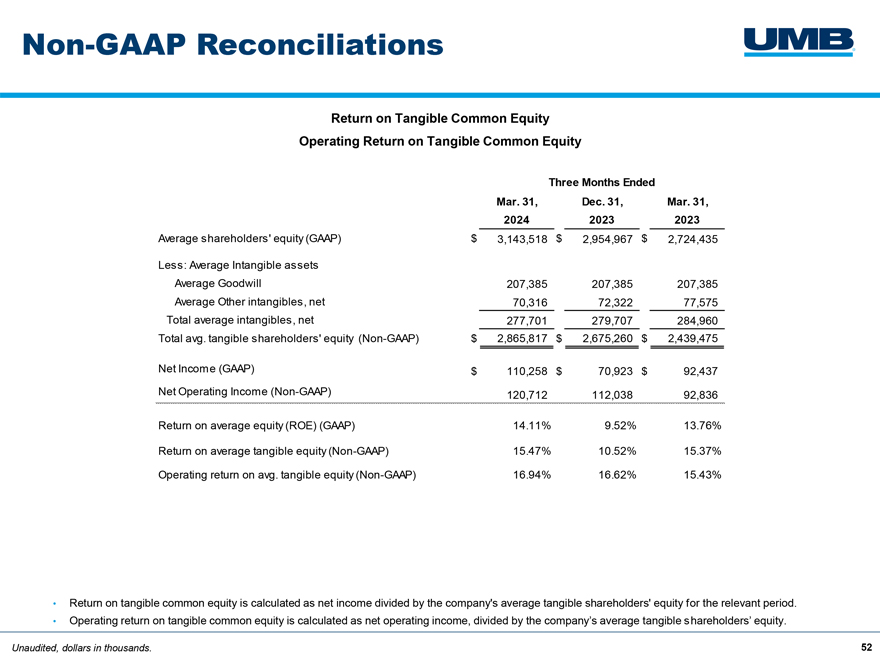
Non-GAAP Reconciliations Return on Tangible Common Equity Operating Return on Tangible Common Equity Three Months Ended Mar. 31, Dec. 31, Mar. 31, 2024 2023 2023 Average shareholders’ equity (GAAP) $ 3,143,518 $ 2,954,967 $ 2,724,435 Less: Average Intangible assets Average Goodwill 207,385 207,385 207,385 Average Other intangibles, net 70,316 72,322 77,575 Total average intangibles, net 277,701 279,707 284,960 Total avg. tangible shareholders’ equity (Non-GAAP) $ 2,865,817 $ 2,675,260 $ 2,439,475 Net Income (GAAP) $ 110,258 $ 70,923 $ 92,437 Net Operating Income (Non-GAAP) 120,712 112,038 92,836 Return on average equity (ROE) (GAAP) 14.11% 9.52% 13.76% Return on average tangible equity (Non-GAAP) 15.47% 10.52% 15.37% Operating return on avg. tangible equity (Non-GAAP) 16.94% 16.62% 15.43% • Return on tangible common equity is calculated as net income divided by the company’s average tangible shareholders’ equity for the relevant period. • Operating return on tangible common equity is calculated as net operating income, divided by the company’s average tangible shareholders’ equity. Unaudited, dollars in thousands. 52