UNITED STATES SECURITIES AND EXCHANGE
COMMISSION
WASHINGTON, D.C. 20549
FORM 6-K
REPORT OF FOREIGN ISSUER PURSUANT TO RULE 13a-16 OR 15d-16
UNDER THE SECURITIES EXCHANGE ACT OF 1934
For the month of April, 2024
Commission file number: 1-10110
BANCO BILBAO VIZCAYA ARGENTARIA, S.A.
(Exact name of Registrant as specified in its charter)
BANK BILBAO VIZCAYA ARGENTARIA, S.A.
(Translation of Registrant’s name into English)
Calle Azul 4,
28050 Madrid
Spain
(Address of principal executive offices)
Indicate by check mark whether the registrant files or will file annual reports under cover of Form 20-F or Form 40-F:
Form 20-F X Form 40-F
Indicate by check mark if the registrant is submitting the Form 6-K in paper as permitted by Regulation S-T Rule 101(b)(1):
Yes No X
Indicate by check mark if the registrant is submitting the Form 6-K in paper as permitted by Regulation S-T Rule 101(b)(7):
Yes No X

1Q24 Earnings April 29, 2024

Disclaimer 1Q24 Earnings 2 This document is only provided for information purposes and is not intended to provide financial advice and, therefore, does not constitute, nor should it be interpreted as, an offer to sell, exchange or acquire, or an invitation for offers to acquire securities issued by any of the aforementioned companies, or to contract any financial product. Any decision to purchase or invest in securities or contract any financial product must be made solely and exclusively on the basis of the information made available to such effects by the company in relation to each specific matter.The information contained in this document is subject to and should be read in conjunction with all other publicly available information of the issuer. This document contains forward-looking statements that constitute or may constitute “forward-looking statements” (within the meaning of the “safe harbor” provisions of the United States Private Securities Litigation Reform Act of 1995) with respect to intentions, objectives, expectations or estimates as of the date hereof, including those relating to future targets of both a financial and non-financial nature (such as environmental, social or governance (“ESG”) performance targets). Forward-looking statements may be identified by the fact that they do not refer to historical or current facts and include words such as “believe”, “expect”, “estimate”, “project”, “anticipate”, “duty”, “intend”, “likelihood”, “risk”, “VaR”, “purpose”, “commitment”, “goal”, “target” and similar expressions or variations of those expressions. They include, for example, statements regarding future growth rates or the achievement of future targets, including those relating to ESG performance. The information contained in this document reflects our current expectations and targets, which are based on various assumptions, judgments and projections, including non-financial considerations such as those related to sustainability, which may differ from and not be comparable to those used by other companies. Forward-looking statements are not guarantees of future results, and actual results may differ materially from those anticipated in the forward-looking statements as a result of certain risks, uncertainties and other factors. These factors include, but are not limited to, (1) market conditions, macroeconomic factors, domestic and international stock market movements, exchange rates, inflation and interest rates; (2) regulatory and oversight factors, political and governmental guidelines, social and demographic factors; (3) changes in the financial condition, creditworthiness or solvency of our clients, debtors or counterparties, such as changes in default rates, as well as changes in consumer spending, savings and investment behavior, and changes in our credit ratings; (4) competitive pressures and actions we take in response thereto; (5) performance of our IT, operations and control systems and our ability to adapt to technological changes; (6) climate change and the occurrence of natural or man-made disasters, such as an outbreak or escalation of hostilities; and (7) our ability to appropriately address any ESG expectations or obligations (related to our business, management, corporate governance, disclosure or otherwise), and the cost thereof. In the particular case of certain targets related to our ESG performance, such as, decarbonization targets or alignment of our portfolios, the achievement and progress towards such targets will depend to a large extent on the actions of third parties, such as clients, governments and other stakeholders, and may therefore be materially affected by such actions, or lack thereof, as well as by other exogenous factors that do not depend on BBVA (including, but not limited to, new technological developments, regulatory developments, military conflicts, the evolution of climate and energy crises, etc.). Therefore, these targets may be subject to future revisions. The factors mentioned in the preceding paragraphs could cause actual future results to differ substantially from those set forth in the forecasts, intentions, objectives, targets or other forward-looking statements included in this document or in other past or future documents. Accordingly, results, including those related to ESG performance targets, among others, may differ materially from the statements contained in the forward-looking statements. Recipients of this document are cautioned not to place undue reliance on such forward-looking statements. Past performance or growth rates are not indicative of future performance, results or share price (including earnings per share). Nothing in this document should be construed as a forecast of results or future earnings. BBVA does not intend, and undertakes no obligation, to update or revise the contents of this or any other document if there are any changes in the information contained therein, or including the forward-looking statements contained in any such document, as a result of events or circumstances after the date of such document or otherwise except as required by applicable law. This document may contain summarised information or information that has not been audited, and its recipients are invited to consult the documentation and public information filed by BBVA with stock market supervisory bodies, in particular, the prospectuses and periodical information filed with the Spanish Securities Exchange Commission (CNMV) and the Annual Report on Form 20-F and information on Form 6-K that are filed with the US Securities and Exchange Commission. Distribution of this document in other jurisdictions may be prohibited, and recipients into whose possession this document comes shall be solely responsible for informing themselves about, and observing any such restrictions. By accepting this document you agree to be bound by the foregoing restrictions.

BBVA once again reports an excellent quarter NET ATTRIBUTABLE PROFIT CET1 RATIO (CURRENT €M) (%) +19% +6.9% +15bps Includes -€285M extraordinary Spanish tax 12.82% 12.67% Target Range 11.5%-12.0% SREP Requirement 9.10% 1Q231 4Q23 1Q24 Dec-23 Mar-24 EPS (€)2 0.29 0.33 0.36 (1) 1Q23 results included an extraordinary Spanish tax of -225 €M (2) EPS calculated according to IAS33.

Operating income continues its strong upward trajectory OPERA (CURRENT 4,835 3,942 LAST 2 YEARS QUARTERLY AVERAGE 2,989 €4.0 Bn 1Q22 2Q22 3Q22 4Q22 1Q23 2Q23 3Q23 4Q23 1Q24
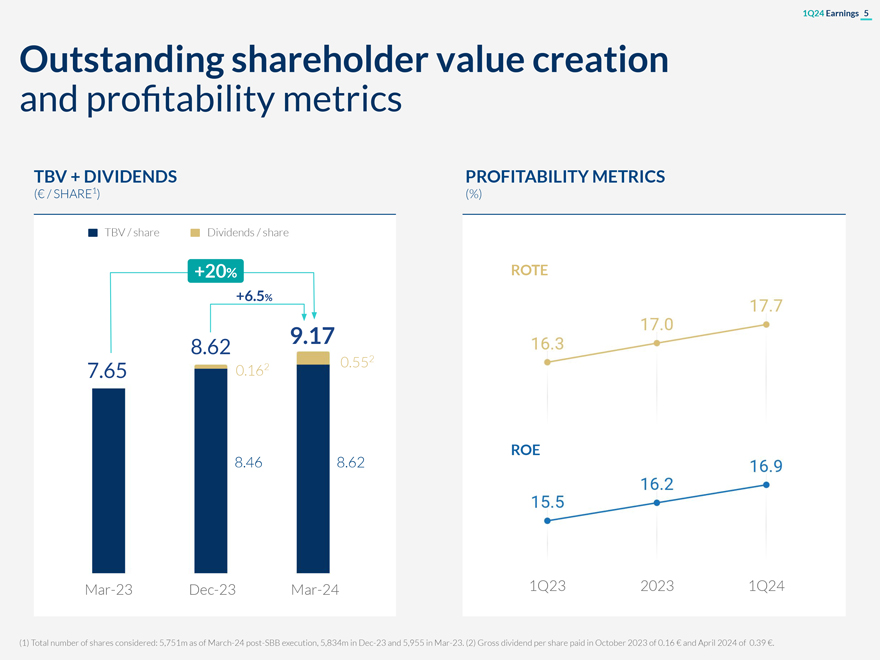
1Q24 Earnings 5 Outstanding shareholder value creation and profitability metrics TBV + DIVIDENDS PROFITABILITY METRICS (€ / SHARE1) (%) TBV / share Dividends / share +20% ROTE +6.5% 9.17 8.62 2 2 0.55 7.65 0.16 8.46 8.62 ROE Mar-23 Dec-23 Mar-24 1Q23 2023 1Q24 (1) Total number of shares considered: 5,751m as of March-24 post-SBB execution, 5,834m in Dec-23 and 5,955 in Mar-23. (2) Gross dividend per share paid in October 2023 of 0.16 € and April 2024 of 0.39 €.
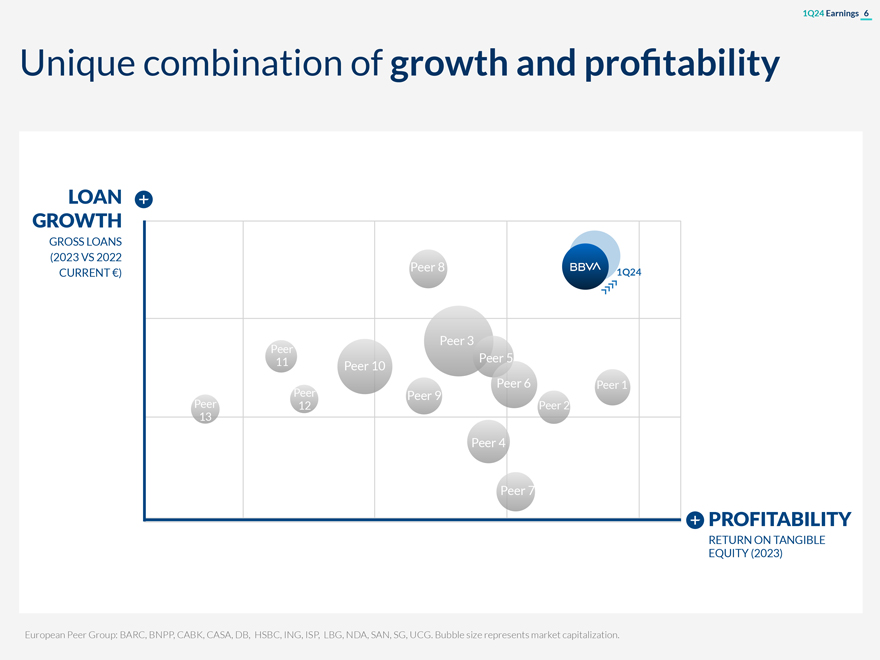
1Q24 Earnings 6 Unique combination of growth and profitability LOAN GROWTH GROSS LOANS (2023 VS 2022 Peer 8 CURRENT €) 1Q24 Peer 3 Peer Peer 5 11 Peer 10 Peer Peer 6 Peer 1 Peer 9 Peer 12 Peer 2 13 Peer 4 Peer 7 PROFITABILITY RETURN ON TANGIBLE EQUITY (2023) European Peer Group: BARC, BNPP, CABK, CASA, DB, HSBC, ING, ISP, LBG, NDA, SAN, SG, UCG. Bubble size represents market capitalization.
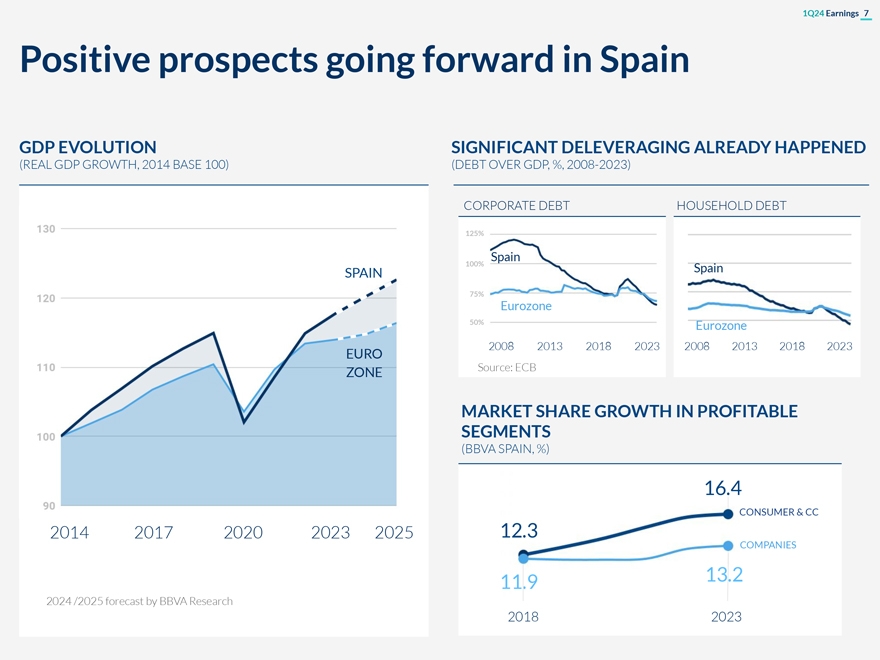
1Q24 Earnings 7 Positive prospects going forward in Spain GDP EVOLUTION SIGNIFICANT DELEVERAGING ALREADY HAPPENED (REAL GDP GROWTH, 2014 BASE 100) (DEBT OVER GDP, %, 2008-2023) CORPORATE DEBT HOUSEHOLD DEBT 125% Spain SPAIN 100% Spain 75% Eurozone 50% Eurozone 2008 2013 2018 2023 2008 2013 2018 2023 EURO ZONE Source: ECB MARKET SHARE GROWTH IN PROFITABLE SEGMENTS (BBVA SPAIN, %) 16.4 CONSUMER & CC 2014 2017 2020 2023 2025 12.3 COMPANIES 11.9 13.2 2024 /2025 forecast by BBVA Research 2018 2023
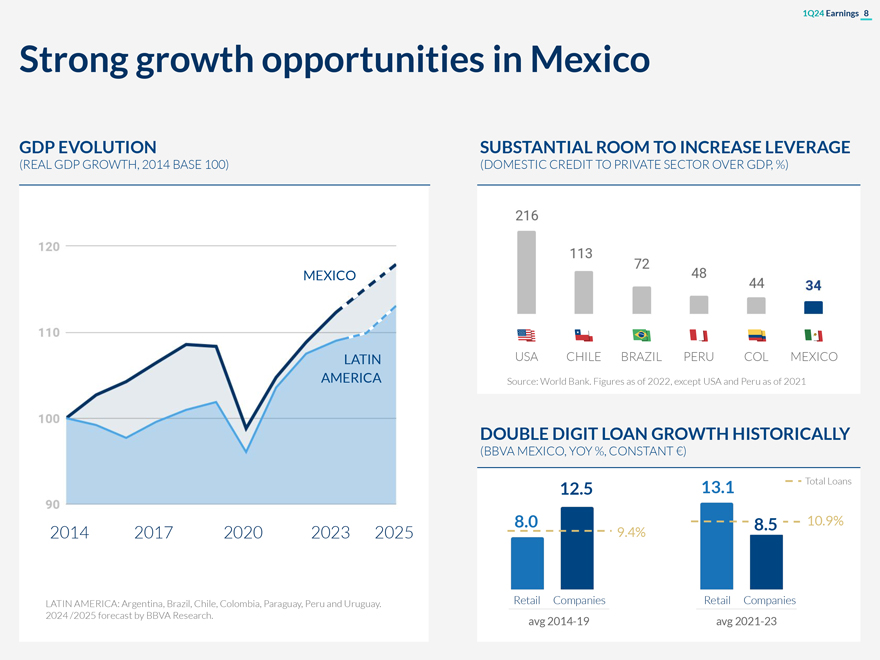
1Q24 Earnings 8 Strong growth opportunities in Mexico GDP EVOLUTION SUBSTANTIAL ROOM TO INCREASE LEVERAGE (REAL GDP GROWTH, 2014 BASE 100) (DOMESTIC CREDIT TO PRIVATE SECTOR OVER GDP, %) MEXICO LATIN USA CHILE BRAZIL PERU COL MEXICO AMERICA Source: World Bank. Figures as of 2022, except USA and Peru as of 2021 DOUBLE DIGIT LOAN GROWTH HISTORICALLY (BBVA MEXICO, YOY %, CONSTANT €) 13.1 Total Loans 12.5 8.0 8.5 10.9% 2014 2017 2020 2023 2025 9.4% LATIN AMERICA: Argentina, Brazil, Chile, Colombia, Paraguay, Peru and Uruguay. Retail Companies Retail Companies 2024 /2025 forecast by BBVA Research. avg 2014-19 avg 2021-23
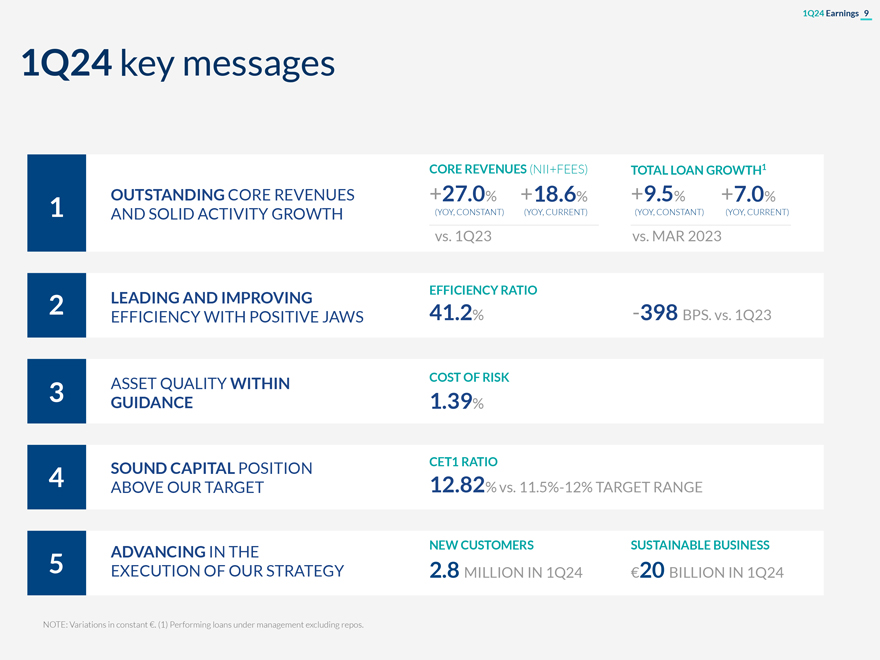
1Q24 key messages CORE REVENUES (NII+FEES) TOTAL LOAN GROWTH1 OUTSTANDING CORE REVENUES +27.0% +18.6% +9.5% +7.0% 1 AND SOLID ACTIVITY GROWTH (YOY, CONSTANT) (YOY, CURRENT) (YOY, CONSTANT) (YOY, CURRENT) vs. 1Q23 vs. MAR 2023 EFFICIENCY RATIO 2 LEADING AND IMPROVING EFFICIENCY WITH POSITIVE JAWS 41.2% -398 BPS. vs. 1Q23 ASSET QUALITY WITHIN COST OF RISK 3 GUIDANCE 1.39% SOUND CAPITAL POSITION CET1 RATIO 4 12.82% 5% 12% ABOVE OUR TARGET vs. 11.—TARGET RANGE NEW CUSTOMERS SUSTAINABLE BUSINESS ADVANCING IN THE 5 EXECUTION OF OUR STRATEGY 2.8 MILLION IN 1Q24 €20 BILLION IN 1Q24 NOTE: Variations in constant €. (1) Performing loans under management excluding repos.
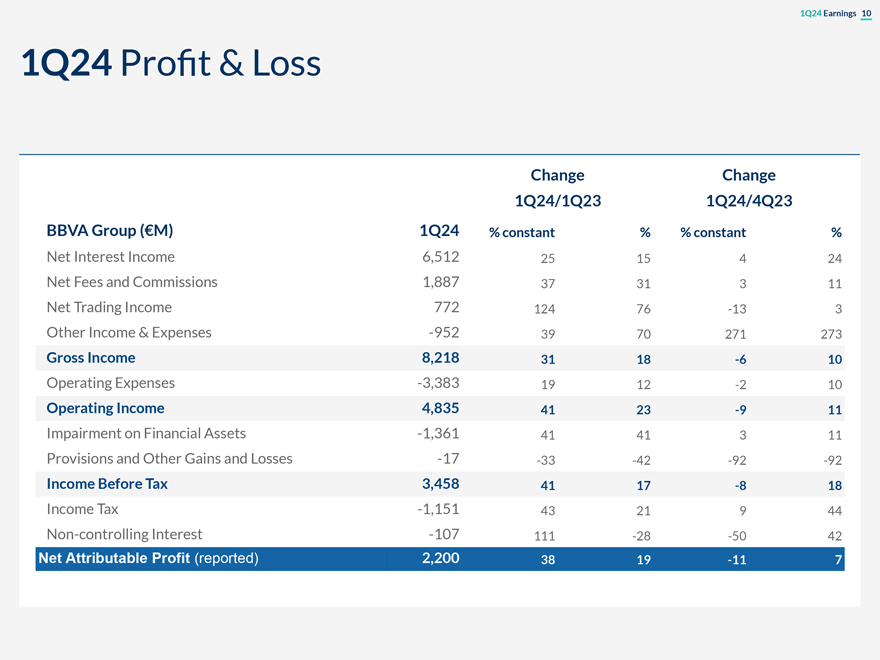
1Q24 Earnings 10 1Q24 Profit & Loss Change Change 1Q24/1Q23 1Q24/4Q23 BBVA Group (€M) 1Q24 % constant % % constant % Net Interest Income 6,512 25 15 4 24 Net Fees and Commissions 1,887 37 31 3 11 Net Trading Income 772 124 76 -13 3 Other Income & Expenses -952 39 70 271 273 Gross Income 8,218 31 18 -6 10 Operating Expenses -3,383 19 12 -2 10 Operating Income 4,835 41 23 -9 11 Impairment on Financial Assets -1,361 41 41 3 11 Provisions and Other Gains and Losses -17 -33 -42 -92 -92 Income Before Tax 3,458 41 17 -8 18 Income Tax -1,151 43 21 9 44 Non-controlling Interest -107 111 -28 -50 42 Net Attributable Profit (reported) 2,200 38 19 -11 7

1Q24 Earnings 11 Remarkable core revenues growth trend NET INTEREST INCOME NET FEES AND COMMISSIONS (CONSTANT €M) (CONSTANT €M) +25% +37% +3.6% +3.5% Strong NII growth Sound fee income driven by activity levered on and improving payments and customer spreads asset management businesses 1Q23 2Q23 3Q23 4Q23 1Q24 1Q23 2Q23 3Q23 4Q23 1Q24 NET TRADING INCOME GROSS INCOME (CONSTANT €M) (CONSTANT €M) +124% +31% -5.9% Sound annual gross -12.8% income growth. NTI driven by the QoQ negatively evolution of affected by high Global Markets hyperinflation and FX hedges impacts and extraordinary taxes in Spain (-€285 M) 1Q23 2Q23 3Q23 4Q23 1Q24 1Q23 2Q23 3Q23 4Q23 1Q24

1Q24 Earnings 12 Further improving industry-leading efficiency with positive jaws POSITIVE JAWS EFFICIENCY RATIO (1Q24 YOY, CONSTANT €) (COST-TO-INCOME, % CONSTANT €) FOOTPRINT INFLATION1 -398bps +31.0% 19.7% 12M AVERAGE +19.5% Gross Operating 1Q23 1Q24 Income Expenses (1) Weighted by operating expenses and excluding Venezuela.
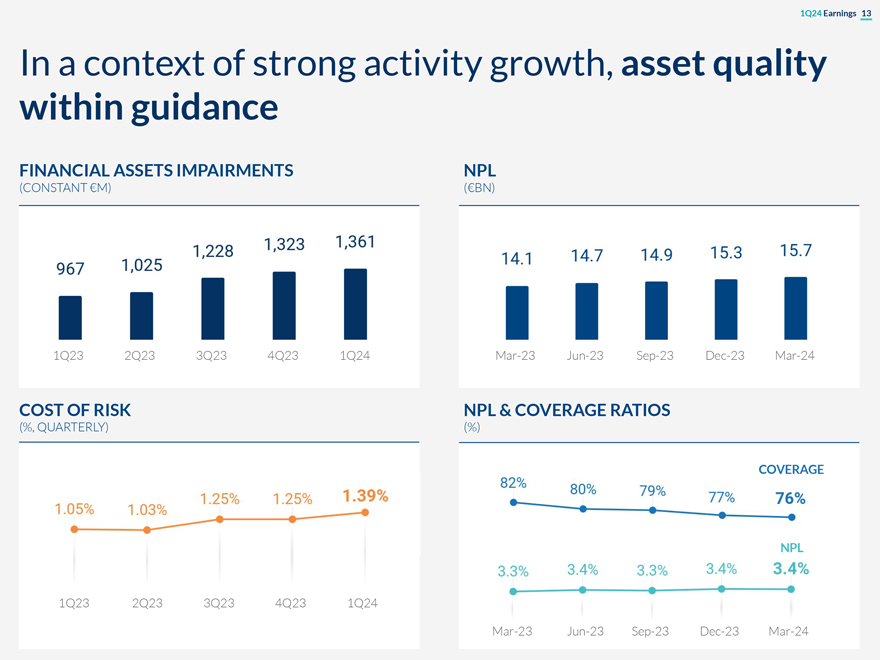
1Q24 Earnings 13 In a context of strong activity growth, asset quality within guidance FINANCIAL ASSETS IMPAIRMENTS NPL (CONSTANT €M) (€BN) 1Q23 2Q23 3Q23 4Q23 1Q24 Mar-23 Jun-23 Sep-23 Dec-23 Mar-24 COST OF RISK NPL & COVERAGE RATIOS (%, QUARTERLY) (%) COVERAGE NPL 1Q23 2Q23 3Q23 4Q23 1Q24 Mar-23 Jun-23 Sep-23 Dec-23 Mar-24
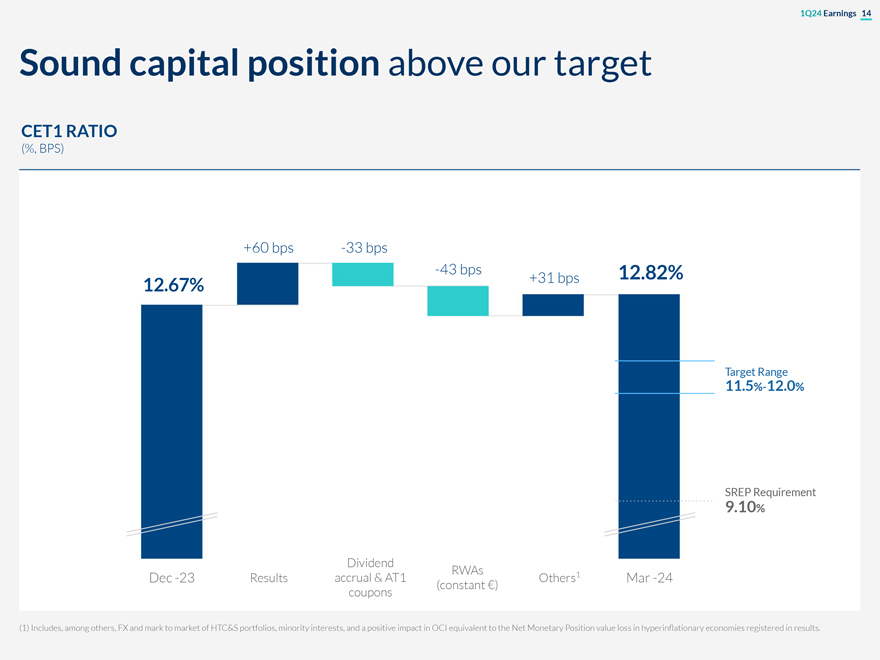
1Q24 Earnings 14 Sound capital position above our target CET1 RATIO (%, BPS) +60 bps -33 bps -43 bps 12.82% 12.67% +31 bps Target Range 11.5%-12.0% SREP Requirement 9.10% Dividend RWAs 1 Dec -23 Results accrual & AT1 Others Mar -24 (constant €) coupons (1) Includes, among others, FX and mark to market of HTC&S portfolios, minority interests, and a positive impact in OCI equivalent to the Net Monetary Position value loss in hyperinflationary economies registered in results.

1Q24 Earnings 15 Keeping good traction in customer acquisition NEW CUSTOMERS1 (BBVA GROUP, MILLION; % ACQUISITION THROUGH DIGITAL CHANNELS) DIGITAL 67% TOTAL 21% DIGITAL 1Q19 1Q20 1Q21 1Q22 1Q23 1Q24 (1) Gross customer acquisition through own channels for retail segment. Excludes the US business sold to PNC for comparison purposes.
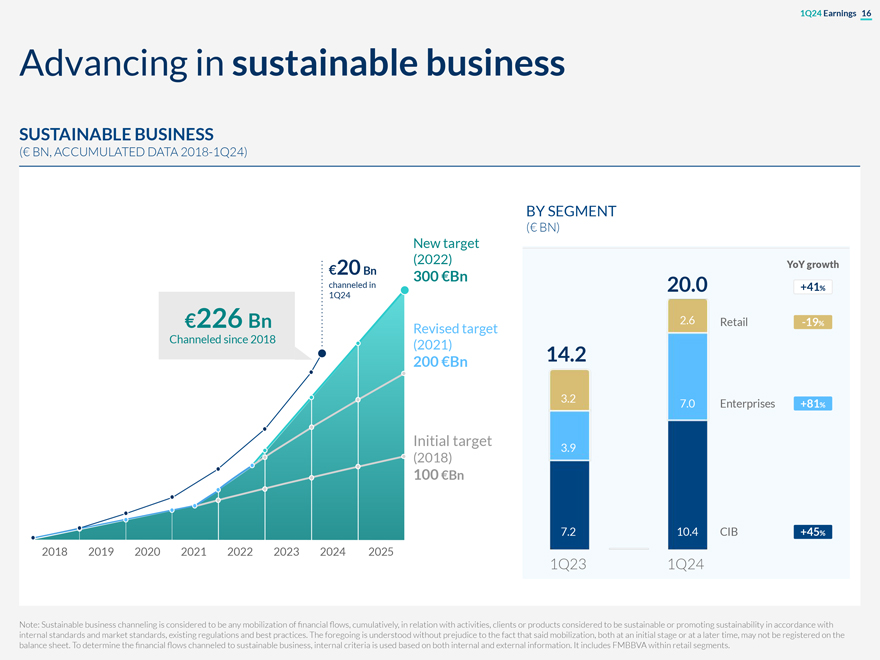
1Q24 Earnings 16 Advancing in sustainable business SUSTAINABLE BUSINESS (€ BN, ACCUMULATED DATA 2018-1Q24) BY SEGMENT (€ BN) New target €20 (2022) YoY growth Bn 300 €Bn channeled in 1Q24 20.0 +41% €226 Bn 2.6 Retail -19% Revised target Channeled since 2018 (2021) 200 €Bn 14.2 3.2 7.0 Enterprises +81% Initial target (2018) 3.9 100 €Bn 7.2 10.4 CIB +45% 2018 2019 2020 2021 2022 2023 2024 2025 1Q23 1Q24 Note: Sustainable business channeling is considered to be any mobilization of financial flows, cumulatively, in relation with activities, clients or products considered to be sustainable or promoting sustainability in accordance with internal standards and market standards, existing regulations and best practices. The foregoing is understood without prejudice to the fact that said mobilization, both at an initial stage or at a later time, may not be registered on the balance sheet. To determine the financial flows channeled to sustainable business, internal criteria is used based on both internal and external information. It includes FMBBVA within retail segments.
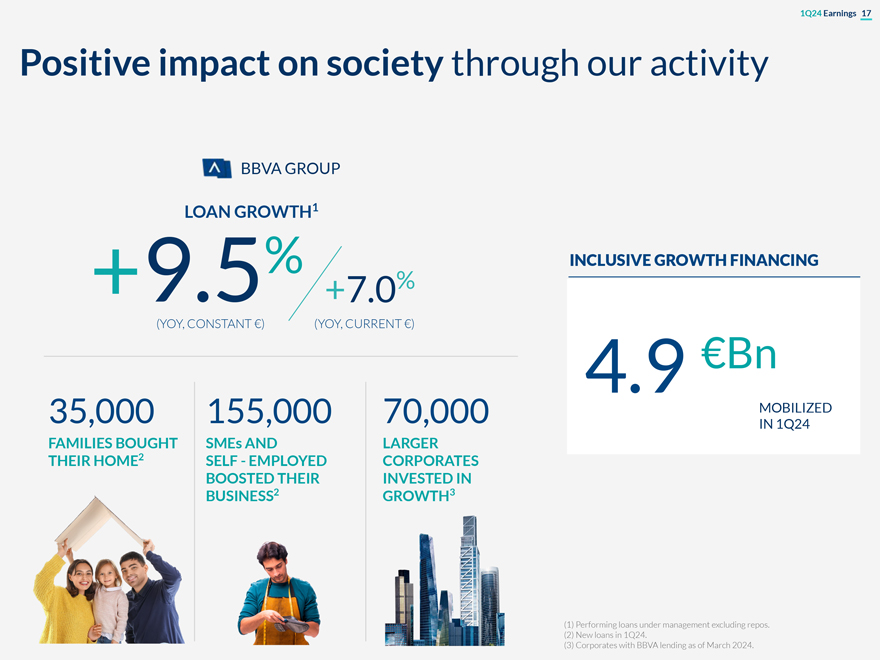
1Q24 Earnings 17 Positive impact on society through our activity BBVA GROUP LOAN GROWTH1 % INCLUSIVE GROWTH FINANCING +9.5 +7.0% (YOY, CONSTANT €) (YOY, CURRENT €) 4.9 €Bn 35,000 155,000 70,000 MOBILIZED IN 1Q24 FAMILIES BOUGHT SMEs AND LARGER THEIR HOME2 SELF—EMPLOYED CORPORATES BOOSTED THEIR INVESTED IN BUSINESS2 GROWTH3

1Q24 Earnings 18 We continue on our path to success regarding our ambitious 2021-2024 goals COST-TO-INCOME ROTE1 TBV + DIVIDENDS (%) (%, ANNUALIZED) (€/SHARE, %) CAGR HIGH 2021-3M24 TEENS MID TEENS CAGR SLIGHT IMPROVEMENT 2021-24 CAGR 3M 3M 3M NEW TARGET CUSTOMERS2 SUSTAINABLE BUSINESS (MILLION CUMULATIVE) (€ BILLION, CUMULATIVE SINCE 2018) 40%-50% ORIGINAL GOAL IMPROVEMENT IN LINE ACTUAL EXPECTED PERFORMANCE OF Revised target INDICATORS Original target 3M 3M (1) Excluding discontinued operations and non-recurring results (2) Target customers refers to those customers in which the bank wants to grow and retain, as they are considered valuable due to their assets, liabilities and/or transactionality with BBVA.

1Q24 Earnings 19 Business SPAIN Areas MEXICO TURKEY SOUTH AMERICA
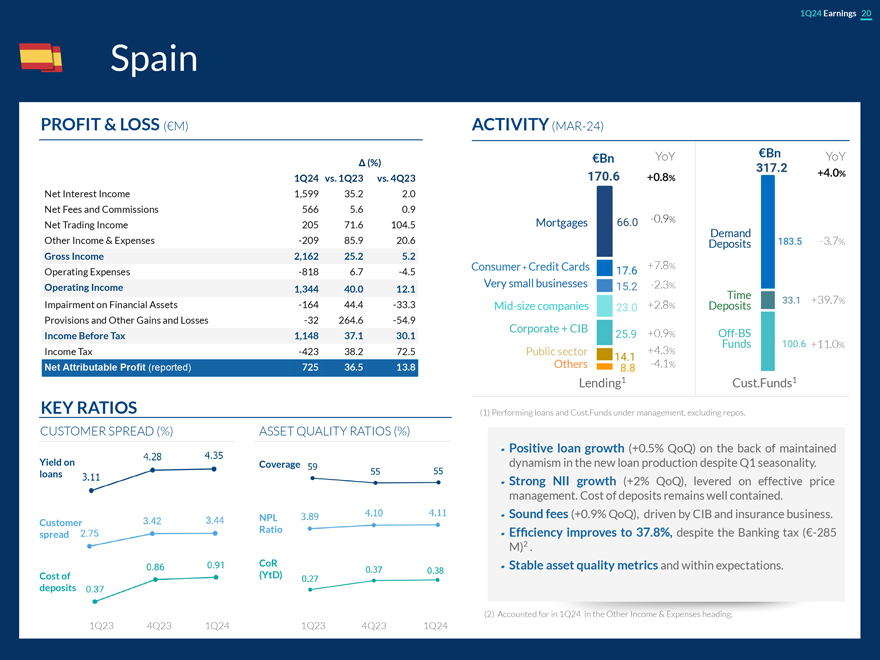
1Q24 Earnings 20 Spain PROFIT & LOSS (€M) ACTIVITY (MAR-24) YoY €Bn YoY €Bn (%) +0.8 +4.0% 1Q24 vs. 1Q23 vs. 4Q23 % Net Interest Income 1,599 35.2 2.0 Net Fees and Commissions 566 5.6 0.9 Mortgages -0.9% Net Trading Income 205 71.6 104.5 Demand Other Income & Expenses -209 85.9 20.6 Deposits -3.7% Gross Income 2,162 25.2 5.2 Consumer + Credit Cards +7.8% Operating Expenses -818 6.7 -4.5 Operating Income Very small businesses -2.3% 1,344 40.0 12.1 Time +39.7% Impairment on Financial Assets -164 44.4 -33.3 Mid-size companies +2.8% Deposits Provisions and Other Gains and Losses -32 264.6 -54.9 Corporate + CIB Income Before Tax 1,148 37.1 30.1 +0.9% Off-BS Funds +11.0% Income Tax -423 38.2 72.5 Public sector +4.3% Net Attributable Profit (reported) 725 36.5 13.8 Others -4.1% Lending1 Cust.Funds1 KEY RATIOS (1) Performing loans and Cust.Funds under management, excluding repos. CUSTOMER SPREAD (%) ASSET QUALITY RATIOS (%) Positive loan growth (+0.5% QoQ) on the back of maintained Yield on Coverage dynamism in the new loan production despite Q1 seasonality. loans Strong NII growth (+2% QoQ), levered on effective price management. Cost of deposits remains well contained. Customer NPL Sound fees (+0.9% QoQ), driven by CIB and insurance business. Ratio Efficiency spread improves to 37.8%, despite the Banking tax (€ -285 M)2 . CoR Stable asset quality metrics and within expectations. Cost (YtD) (2) Accounted for in 1Q24 in the Other Income & Expenses heading. 1Q23 4Q23 1Q24 1Q23 4Q23 1Q24
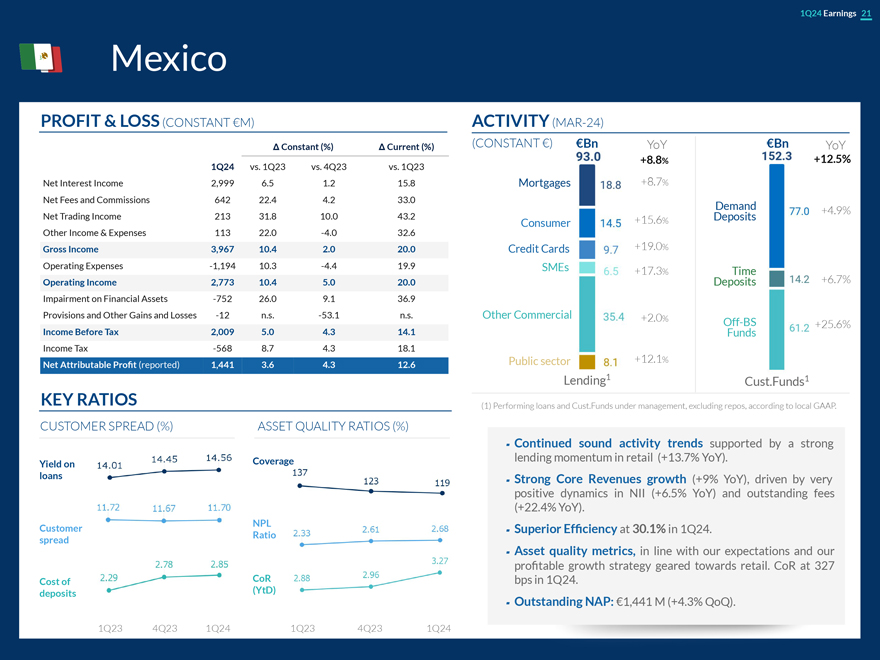
1Q24 Earnings 21 Mexico PROFIT & LOSS (CONSTANT €M) ACTIVITY (MAR-24) Constant (%) Current (%) (CONSTANT €) €Bn YoY €Bn YoY 1Q24 vs. 1Q23 vs. 4Q23 vs. 1Q23 +8.8% +12.5% Net Interest Income 2,999 6.5 1.2 15.8 Mortgages +8.7% Net Fees and Commissions 642 22.4 4.2 33.0 Demand +4.9% Net Trading Income 213 31.8 10.0 43.2 .6 Deposits Consumer +15 % Other Income & Expenses 113 22.0 -4.0 32.6 Gross Income 3,967 10.4 2.0 20.0 Credit Cards +19.0% Operating Expenses -1,194 10.3 -4.4 19.9 SMEs +17.3% Time +6.7% Operating Income 2,773 10.4 5.0 20.0 Deposits Impairment on Financial Assets -752 26.0 9.1 36.9 Provisions and Other Gains and Losses -12 n.s. -53.1 n.s. Other Commercial +2.0% Off-BS +25.6% Income Before Tax 2,009 5.0 4.3 14.1 Funds Income Tax -568 8.7 4.3 18.1 Public sector +12.1% Net Attributable Profit (reported) 1,441 3.6 4.3 12.6 Lending1 Cust.Funds1 KEY RATIOS (1) Performing loans and Cust.Funds under management, excluding repos, according to local GAAP. CUSTOMER SPREAD (%) ASSET QUALITY RATIOS (%) Continued sound activity trends supported by a strong Coverage lending momentum in retail (+13.7% YoY). Yield loans Core Revenues Strong growth (+9% YoY), driven by very positive dynamics in NII (+6.5% YoY) and outstanding fees (+22.4% YoY). Superior Efficiency at 30.1% in 1Q24. spread Asset quality metrics, in line with our expectations and our profitable growth strategy geared towards retail. CoR at 327 Cost bps in 1Q24. deposits (YtD) Outstanding NAP: €1,441 M (+4.3% QoQ). 1Q23 4Q23 1Q24
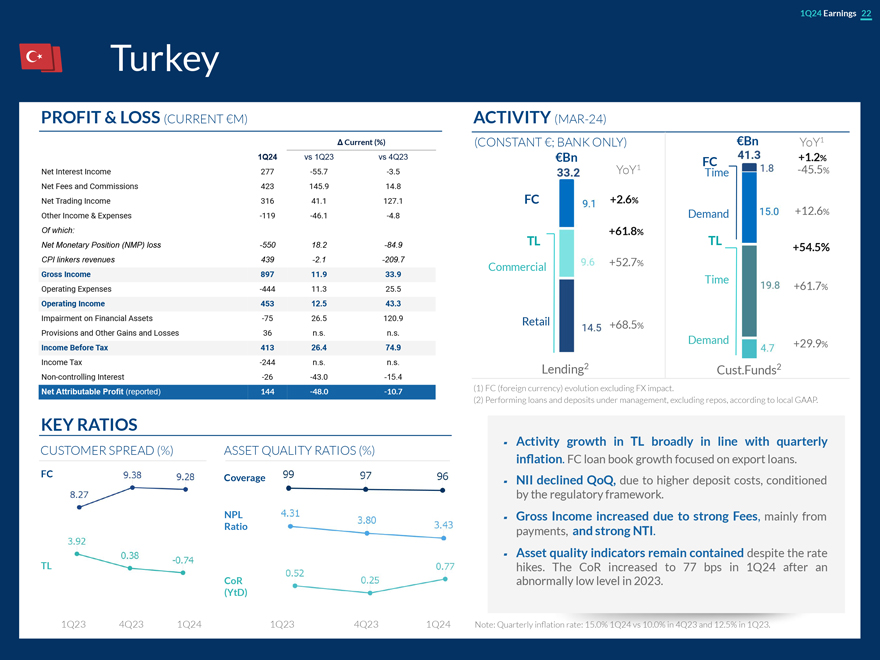
1Q24 Earnings 22 Turkey PROFIT & LOSS (CURRENT €M) ACTIVITY (MAR-24) Current (%) (CONSTANT €; BANK ONLY) €Bn YoY1 1Q24 vs 1Q23 vs 4Q23 €Bn FC +1.2% YoY1 -45.5% Net Interest Income 277 -55.7 -3.5 Time Net Fees and Commissions 423 145.9 14.8 Net Trading Income 316 41.1 127.1 FC +2.6% Demand +12.6% Other Income & Expenses -119 -46.1 -4.8 Of which: +61.8% Net Monetary Position (NMP) loss -550 18.2 -84.9 TL TL +54.5% CPI linkers revenues 439 -2.1 -209.7 Commercial +52.7% Gross Income 897 11.9 33.9 Time Operating Expenses -444 11.3 25.5 +61.7% Operating Income 453 12.5 43.3 Impairment on Financial Assets -75 26.5 120.9 Retail +68.5% Provisions and Other Gains and Losses 36 n.s. n.s. Demand Income Before Tax 413 26.4 74.9 +29.9% Income Tax -244 n.s. n.s. Lending2 Cust.Funds2 Non-controlling Interest -26 -43.0 -15.4 (1) FC (foreign currency) evolution excluding FX impact. Net Attributable Profit (reported) 144 -48.0 -10.7 (2) Performing loans and deposits under management, excluding repos, according to local GAAP. KEY RATIOS Activity growth in TL broadly in line with quarterly CUSTOMER SPREAD (%) ASSET QUALITY RATIOS (%) inflation. FC loan book growth focused on export loans. FC Coverage NII declined QoQ, due to higher deposit costs, conditioned by the regulatory framework. NPL Gross Income increased due to strong Fees, mainly from Ratio payments, and strong NTI. Asset quality indicators remain contained despite the rate TL hikes. The CoR increased to 77 bps in 1Q24 after an CoR abnormally low level in 2023. (YtD) 1Q23 4Q23 1Q24 1Q23 4Q23 1Q24 Note: Quarterly inflation rate: 15.0% 1Q24 vs 10.0% in 4Q23 and 12.5% in 1Q23.

1Q24 Earnings 23 South America NET ATTRIBUTABLE PROFIT (CURRENT €M) ACTIVITY (MAR-24) (CONSTANT €) €Bn YoY €Bn YoY Current (%) -9.1% +8.4% 1Q24 vs. 1Q23 vs. 4Q23 Colombia +7.8% Colombia 20 -50.6 -50.9 Peru 42 -24.3 -9.8 Colombia +3.5% Argentina 34 -33.2 n.s. Other ¹ 23 -31.1 -22.9 Peru +4.6% South America 119 -33.9 5.3 Peru +2.9% (1) Other includes BBVA Forum (Chile), Venezuela and Uruguay. Argentina .9 Argentina +198.6% +202 % Other +7.0% Other -75.2% Lending1 1 KEY RATIOS Cust.Funds CUSTOMER SPREAD (%) COST OF RISK (YTD, %) (1) Performing loans and Cust.Funds under management, excluding repos Colombia: strong NII growth supported by a continued customer spread improvement and sound activity primarily in retail. Impairments increase in a context of high rates. CoR at 285 bps. Peru: strong core revenues growth driven by activity and increasing customer spread. Impairments increase YoY in a very challenging macro environment but CoR stabilizes on a quarterly basis. Argentina: NAP at €34 M in 1Q24, in a very challenging environment, negatively affected by a high hyperinflation adjustment2. 1Q23 4Q23 1Q24 1Q23 4Q23 1Q24 (2) Inflation rate ARG: 52% 1Q24 vs 22% 1Q23.

24 BBVA delivered Significant progress in the • Raising 2024 Group core another record execution of our strategy revenue outlook on the quarter mainly driven focused on digitization, back of upgraded Spain NII by Spain and Mexico innovation and guidance and rate sustainability environment Excellent core On track to clearly • Outlook for 2024 Net revenues evolution exceed our ambitious Attributable Profit (NAP) on the back of 2021-2024 goals activity growth further improves to double-digit growth Outstanding shareholder value creation and profitability metrics

LCO portfolio, NII sensitivity and LCRs & NSFRs 1Q24 Earnings 25 Annex 01 Net Attributable Profit 08 CET1 Sensitivity to market evolution impacts 02 Gross Income breakdown 09 RWAs by business area 03 P&L Accounts by business unit Book Value of the main 10 subsidiaries 04 Customer spread by country TBV per share & dividends 11 Stages breakdown by business evolution 05 area 12 MREL 06 Exposure to Covid-related loans and Commercial Real Estate 13 Digital metrics 07 ALCO portfolio, NII sensitivity and LCRs & NSFRs
Net Attributable Profit evolution

1Q24 Earnings 27 Business Areas Contribution to Group’s NAP 1Q24 yoy growth NET ATTRIBUTABLE PROFIT (BUSINESS AREAS CONTRIBUTION TO 1Q24 YOY GROWTH; CURRENT €M) +19% 1Q23 Spain Mexico Turkey South Rest of Corporate 1Q24 America Business Center NAP 1Q24 (€M) 725 1,441 144 119 121 -350 NAP growth (YoY) +36% +13% -48% -34% +29% -32%

Gross Income breakdown
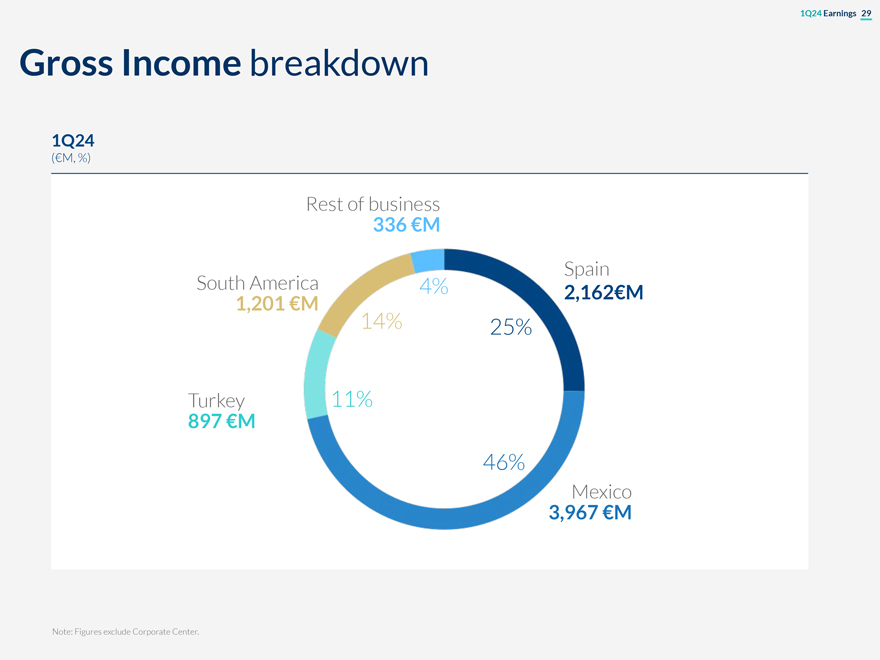
1Q24 Earnings 29 Gross Income breakdown 1Q24 (€M, %) Rest of business 336 €M Spain South America 4% 2,162€M 1,201 €M 14% 25% Turkey 11% 897 €M 46% Mexico 3,967 €M Note: Figures exclude Corporate Center.

1Q24 Earnings 30 P&L Accounts by business unit Rest of Business Corporate Center Turkey (hyperinflation adjustment) Argentina (hyperinflation adjustment) Colombia Peru

1Q24 Earnings 31 Rest of Business - Profit & Loss PROFIT & LOSS (€M) Δ (%) 1Q24 vs 1Q23 vs 4Q23 Net Interest Income 157 38.6 17.5 Net Fees and Commissions 67 -2.4 27.9 Net Trading Income 111 44.6 69.1 Other Income & Expenses 1 -23.1 n.s. Gross Income 336 29.3 33.7 Operating Expenses -160 18.0 -3.3 Operating Income 176 41.6 105.0 Impairment on Financial Assets -16 -13.0 n.s. Provisions and Other Gains and Losses 0 -99.4 n.s. Income Before Tax 160 41.3 122.6 Income Tax -40 97.8 n.s. Net Attributable Profit 121 29.2 74.5

1Q24 Earnings 32 Corporate Center—Profit & Loss PROFIT & LOSS (€M) Δ (%) 1Q24 vs 1Q23 vs 4Q23 Net Interest Income -76 25.9 -43.2 Net Fees and Commissions -4 -2.8 5.1 Net Trading Income -269 4.4 n.s. Other Income & Expenses 5 -56.1 -87.0 Gross Income -344 10.7 297.1 Operating Expenses -167 -8.3 -21.6 Operating Income -511 3.7 70.6 Impairment on Financial Assets 1 n.s. n.s. Provisions and Other Gains and Losses 36 n.s. n.s. Income Before Tax -474 -4.3 48.9 Income Tax 129 n.s. 161.4 Non-controlling Interest -5 28.9 179.6 Net Attributable Profit -350 -32.1 29.2
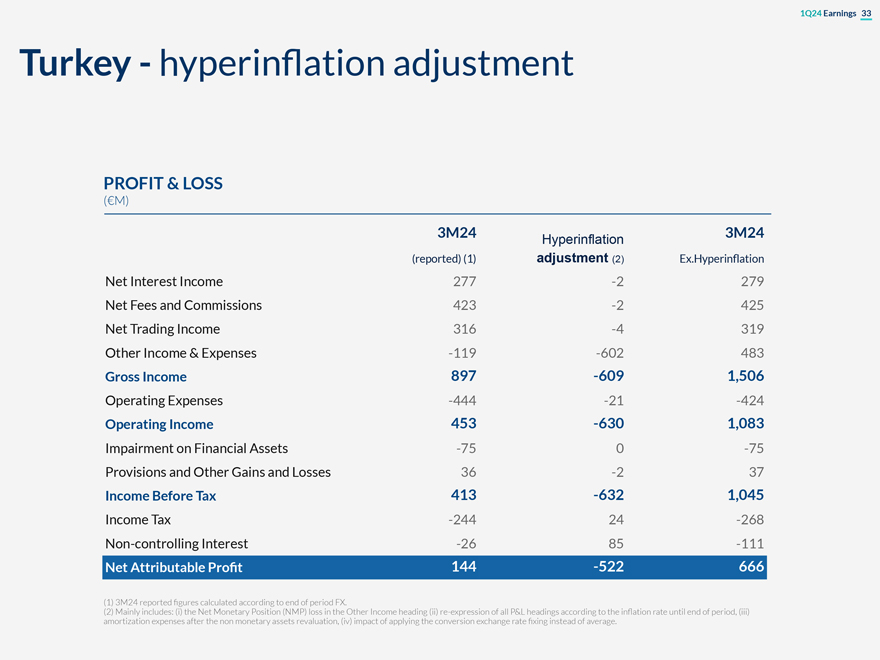
1Q24 Earnings 33 Turkey - hyperinflation adjustment PROFIT & LOSS (€M) 3M24 3M24 Hyperinflation (reported) (1) adjustment (2) Ex.Hyperinflation Net Interest Income 277 -2 279 Net Fees and Commissions 423 -2 425 Net Trading Income 316 -4 319 Other Income & Expenses -119 -602 483 Gross Income 897 -609 1,506 Operating Expenses -444 -21 -424 Operating Income 453 -630 1,083 Impairment on Financial Assets -75 0 -75 Provisions and Other Gains and Losses 36 -2 37 Income Before Tax 413 -632 1,045 Income Tax -244 24 -268 Non-controlling Interest -26 85 -111 Net Attributable Profit 144 -522 666 (1) 3M24 reported figures calculated according to end of period FX. (2) Mainly includes: (i) the Net Monetary Position (NMP) loss in the Other Income heading (ii) re-expression of all P&L headings according to the inflation rate until end of period, (iii) amortization expenses after the non monetary assets revaluation, (iv) impact of applying the conversion exchange rate fixing instead of average.
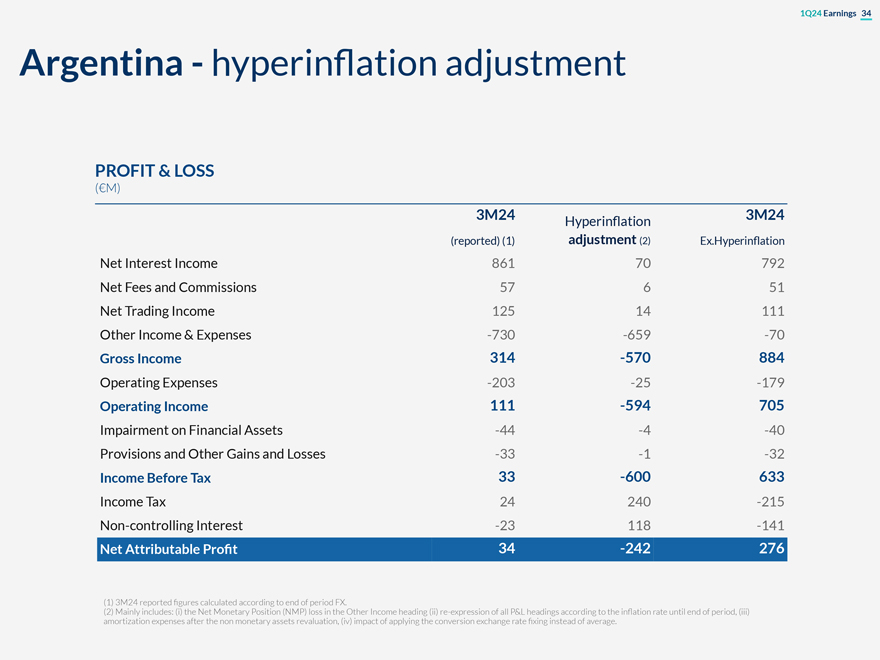
1Q24 Earnings 34 Argentina—hyperinflation adjustment PROFIT & LOSS (€M) 3M24 3M24 Hyperinflation (reported) (1) adjustment (2) Ex.Hyperinflation Net Interest Income 861 70 792 Net Fees and Commissions 57 6 51 Net Trading Income 125 14 111 Other Income & Expenses -730 -659 -70 Gross Income 314 -570 884 Operating Expenses -203 -25 -179 Operating Income 111 -594 705 Impairment on Financial Assets -44 -4 -40 Provisions and Other Gains and Losses -33 -1 -32 Income Before Tax 33 -600 633 Income Tax 24 240 -215 Non-controlling Interest -23 118 -141 Net Attributable Profit 34 -242 276 (1) 3M24 reported figures calculated according to end of period FX. (2) Mainly includes: (i) the Net Monetary Position (NMP) loss in the Other Income heading (ii) re-expression of all P&L headings according to the inflation rate until end of period, (iii) amortization expenses after the non monetary assets revaluation, (iv) impact of applying the conversion exchange rate fixing instead of average.
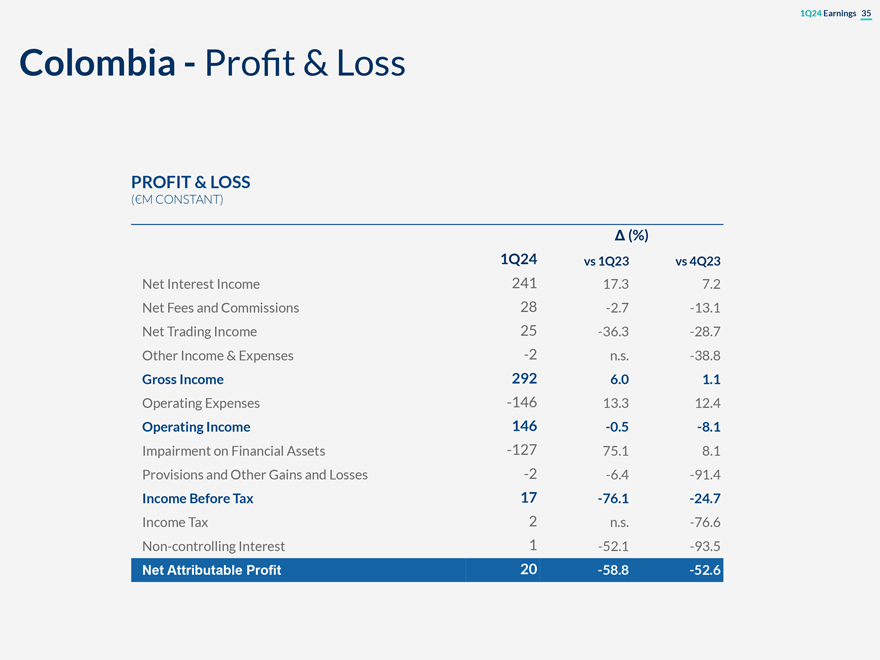
1Q24 Earnings 35 Colombia - Profit & Loss PROFIT & LOSS (€M CONSTANT) Δ (%) 1Q24 vs 1Q23 vs 4Q23 Net Interest Income 241 17.3 7.2 Net Fees and Commissions 28 -2.7 -13.1 Net Trading Income 25 -36.3 -28.7 Other Income & Expenses -2 n.s. -38.8 Gross Income 292 6.0 1.1 Operating Expenses -146 13.3 12.4 Operating Income 146 -0.5 -8.1 Impairment on Financial Assets -127 75.1 8.1 Provisions and Other Gains and Losses -2 -6.4 -91.4 Income Before Tax 17 -76.1 -24.7 Income Tax 2 n.s. -76.6 Non-controlling Interest 1 -52.1 -93.5 Net Attributable Profit 20 -58.8 -52.6

Peru - Profit & Loss PROFIT & LOSS (€M CONSTANT) Δ (%) 1Q24 vs 1Q23 vs 4Q23 Net Interest Income 352 15.4 3.2 Net Fees and Commissions 79 7.8 11.2 Net Trading Income 38 -20.1 -23.5 Other Income & Expenses -10 -21.8 -1.0 Gross Income 459 11.1 1.6 Operating Expenses -174 11.7 6.9 Operating Income 285 10.8 -1.3 Impairment on Financial Assets -156 68.9 -9.5 Provisions and Other Gains and Losses -8 n.s. -59.1 Income Before Tax 121 -27.5 24.7 Income Tax -29 -36.8 n.s. Non-controlling Interest -50 -23.5 -10.3 Net Attributable Profit 42 -24.5 -9.4
Customer Spread by country
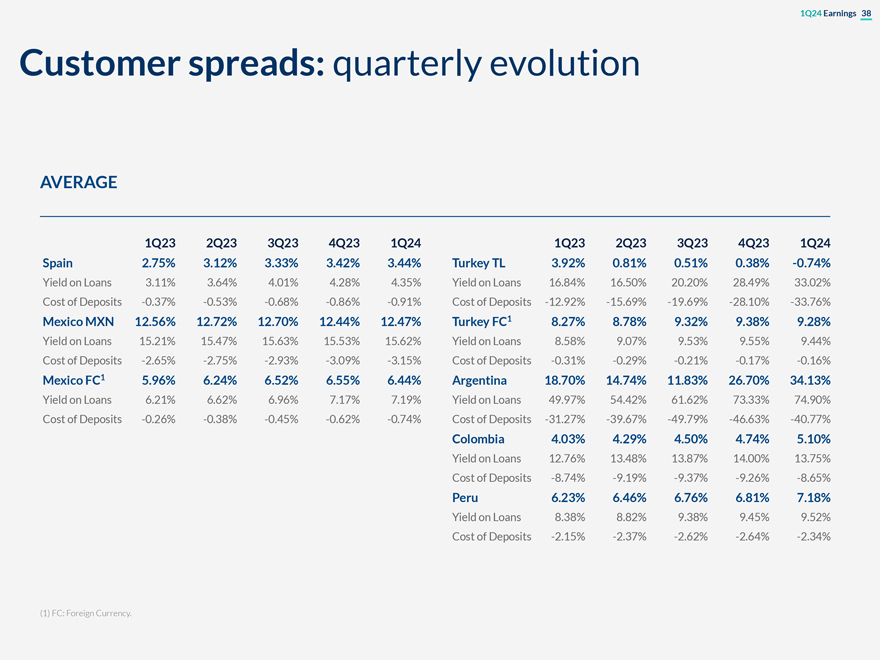
1Q24 Earnings 38 Customer spreads: quarterly evolution AVERAGE 1Q23 2Q23 3Q23 4Q23 1Q24 1Q23 2Q23 3Q23 4Q23 1Q24 Spain 2.75% 3.12% 3.33% 3.42% 3.44% Turkey TL 3.92% 0.81% 0.51% 0.38% -0.74% Yield on Loans 3.11% 3.64% 4.01% 4.28% 4.35% Yield on Loans 16.84% 16.50% 20.20% 28.49% 33.02% Cost of Deposits -0.37% -0.53% -0.68% -0.86% -0.91% Cost of Deposits -12.92% -15.69% -19.69% -28.10% -33.76% Mexico MXN 12.56% 12.72% 12.70% 12.44% 12.47% Turkey FC1 8.27% 8.78% 9.32% 9.38% 9.28% Yield on Loans 15.21% 15.47% 15.63% 15.53% 15.62% Yield on Loans 8.58% 9.07% 9.53% 9.55% 9.44% Cost of Deposits -2.65% -2.75% -2.93% -3.09% -3.15% Cost of Deposits -0.31% -0.29% -0.21% -0.17% -0.16% Mexico FC1 5.96% 6.24% 6.52% 6.55% 6.44% Argentina 18.70% 14.74% 11.83% 26.70% 34.13% Yield on Loans 6.21% 6.62% 6.96% 7.17% 7.19% Yield on Loans 49.97% 54.42% 61.62% 73.33% 74.90% Cost of Deposits -0.26% -0.38% -0.45% -0.62% -0.74% Cost of Deposits -31.27% -39.67% -49.79% -46.63% -40.77% Colombia 4.03% 4.29% 4.50% 4.74% 5.10% Yield on Loans 12.76% 13.48% 13.87% 14.00% 13.75% Cost of Deposits -8.74% -9.19% -9.37% -9.26% -8.65% Peru 6.23% 6.46% 6.76% 6.81% 7.18% Yield on Loans 8.38% 8.82% 9.38% 9.45% 9.52% Cost of Deposits -2.15% -2.37% -2.62% -2.64% -2.34%

Stages breakdown by business areas

1Q24 Earnings Stages breakdown by business areas CREDIT RISK BUSINESS BREAKDOWN BY AREA (MAR-24, € M) Gross Accumulated Gross Accumulated Gross Accumulated BBVA GROUP Exposure impairments SPAIN Exposure impairments MEXICO Exposure impairments Stage 1 405,765 2,198 Stage 1 169,890 466 Stage 1 90,188 1,170 Stage 2 40,975 2,130 Stage 2 22,690 693 Stage 2 6,992 627 Stage 3 15,716 7,615 Stage 3 8,262 3,410 Stage 3 2,673 1,376 Gross Accumulated SOUTH Gross Accumulated TURKEY Exposure impairments AMERICA Exposure impairments Stage 1 49,575 210 Stage 1 41,244 314 Stage 2 3,786 330 Stage 2 5,514 416 Stage 3 1,896 1,279 Stage 3 2,448 1,368 Gross Accumulated Gross Accumulated Gross Accumulated COLOMBIA Exposure impairments PERU Exposure impairments ARGENTINA Exposure impairments Stage 1 16,120 93 Stage 1 17,957 162 Stage 1 2,730 23 Stage 2 1,737 143 Stage 2 3,189 233 Stage 2 257 11 Stage 3 958 587 Stage 3 1,272 645 Stage 3 48 34

Exposure to Covid-related loans and Commercial Real Estate

1Q24 Earnings Exposure to Covid-related loans backed by State guarantees and Commercial Real Estate COVID-RELATED LOANS, SPAIN AND PERU COMMERCIAL REAL ESTATE (OUTSTANDING LOANS AS OF MAR’24) (GROUP’s CRE EAD, %, AS OF MAR’24) €8.2 Bn1 €0.4 Bn €c.11 Bn2 of which of which 66% Retail 56% Retail c.2% over Total 34% Wholesale 44% Wholesale Credit EAD 77% 88% guaranteed by the State guaranteed by the State Note: data according to management information (1) In Spain, if we also consider undrawn credit lines, BBVA Spain has granted a total of €23.6 billion ICO loans as of Mar, 2024 (of which € 8.2 billion is the outstanding drawn amount). (2) Group’s CRE Exposure At Default (EAD) within the wholesale portfolio.
ALCO Portfolio, NII Sensitivity and LCRs & NSFRs

1Q24 Earnings 44 ALCO Portfolio ALCO PORTFOLIO BREAKDOWN BY REGION (€ BN) Amort Cost Fair Value (HTC) (HTC&S) (duration Mar-24 (€BN) (€BN) incl. hedges) South America 0.2 4.9 1.5 years Turkey 6.8 2.4 3.6 years Mexico 7.0 13.3 2.7 years Euro 27.6 11.6 2.6 years (1) Spain 21.8 5.1 Italy 2.9 4.1 Rest 2.9 2.4 (1) Figures exclude SAREB senior bonds (€3.9bn as of Mar-23, €3.8bn as of Dec-23 and Mar-24) EURO ALCO PORTFOLIO MATURITY PROFILE EURO ALCO YIELD (€ BN) (Mar-24, %) 3.2%
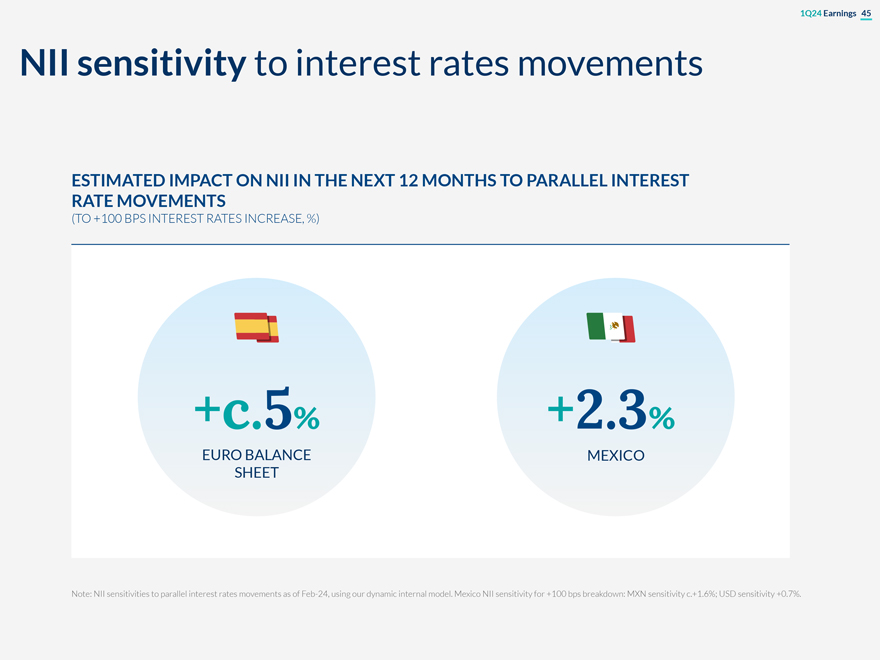
1Q24 Earnings 45 NII sensitivity to interest rates movements ESTIMATED IMPACT ON NII IN THE NEXT 12 MONTHS TO PARALLEL INTEREST RATE MOVEMENTS (TO +100 BPS INTEREST RATES INCREASE, %) +c.5% +2.3% EURO BALANCE MEXICO SHEET Note: NII sensitivities to parallel interest rates movements as of Feb-24, using our dynamic internal model. Mexico NII sensitivity for +100 bps breakdown: MXN sensitivity c.+1.6%; USD sensitivity +0.7%.
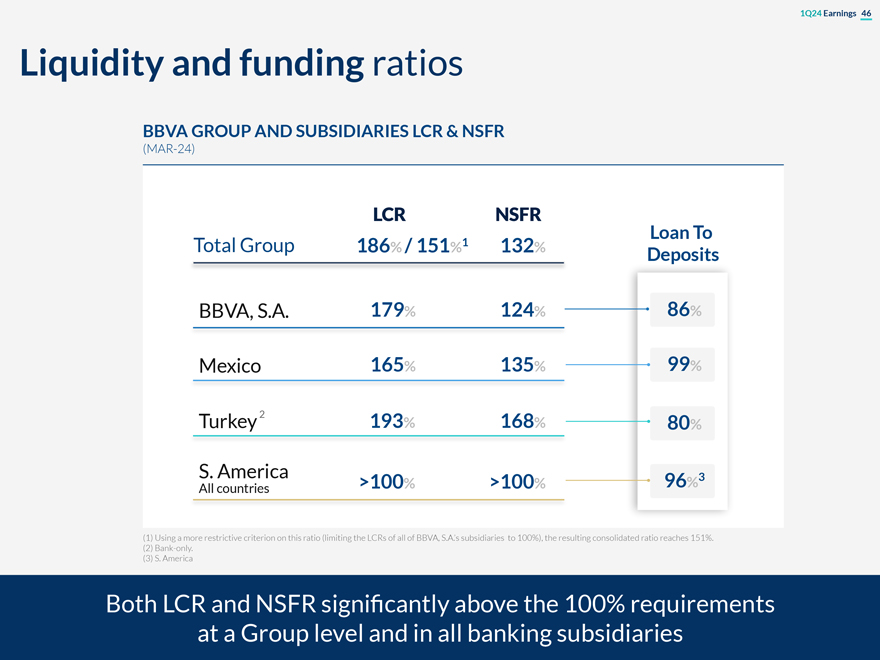
1Q24 Earnings 46 Liquidity and funding ratios BBVA GROUP AND SUBSIDIARIES LCR & NSFR (MAR-24) LCR NSFR Loan To Total Group 186% / 151%1 132% Deposits BBVA, S.A. 179% 124% 86% Mexico 165% 135% 99% 2 Turkey 193% 168% 80% S. America 3 >100% >100% 96% All countries (1) Using a more restrictive criterion on this ratio (limiting the LCRs of all of BBVA, S.A.’s subsidiaries to 100%), the resulting consolidated ratio reaches 151%. (2) Bank-only. (3) S. America Both LCR and NSFR significantly above the 100% requirements at a Group level and in all banking subsidiaries
1Q24 Earnings CET1 Sensitivity to market impacts

1Q24 Earnings 48 CET1 Sensitivity to Market Impacts1 TO A 10% CURRENCY DEPRECIATION2 TO A 10% DECLINE IN TELEFONICA’S (MAR-24) SHARE PRICE (MAR-24) MXN -10bps -3 pbs TRY -4bps TO +100 BPS MOVEMENT IN THE SPANISH SOVEREIGN BOND (MAR-24) USD +17bps -10 pbs (1) CET1 sensitivity considering the FL capital ratio as of Mar 31th, 2024 (2) This sensitivity does not include the cost of capital hedges, which are currently estimated at 3 bp per quarter for MXN and 3 bp per quarter for TRY.
1Q24 Earnings 49 RWAs by business area
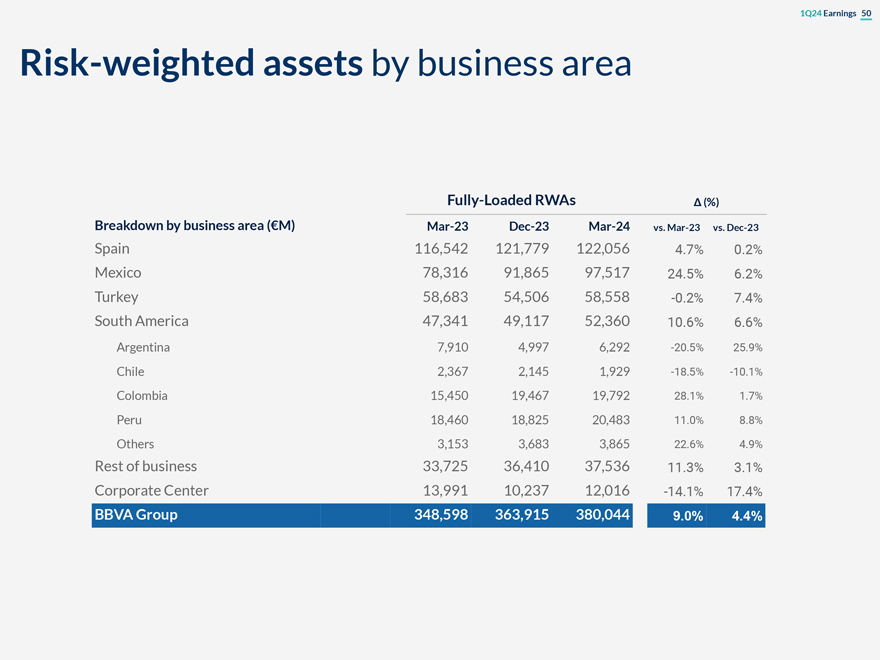
1Q24 Earnings Risk-weighted assets by business area Fully-Loaded RWAs Δ (%) Breakdown by business area (€M) Mar-23 Dec-23 Mar-24 vs. Mar-23 vs. Dec-23 Spain 116,542 121,779 122,056 4.7% 0.2% Mexico 78,316 91,865 97,517 24.5% 6.2% Turkey 58,683 54,506 58,558 -0.2% 7.4% South America 47,341 49,117 52,360 10.6% 6.6% Argentina 7,910 4,997 6,292 -20.5% 25.9% Chile 2,367 2,145 1,929 -18.5% -10.1% Colombia 15,450 19,467 19,792 28.1% 1.7% Peru 18,460 18,825 20,483 11.0% 8.8% Others 3,153 3,683 3,865 22.6% 4.9% Rest of business 33,725 36,410 37,536 11.3% 3.1% Corporate Center 13,991 10,237 12,016 -14.1% 17.4% BBVA Group 348,598 363,915 380,044 9.0% 4.4%
1Q24 Earnings 51 Book Value of the main subsidiaries

1Q24 Earnings 52 Book Value of the main subsidiaries1,2 € BN; MAR-24 (%) QoQ Mexico 20.8 -2.2% Turkey 6.8 +0.3% Colombia 1.8 -0.7% Argentina 1.6 +42.9% Peru 1.3 -2.9% Chile 0.3 -4.3% Venezuela 0.1 -14.4% (1) Includes the initial investment + BBVA’s undistributed results + FX impact + other valuation adjustments. The Goodwill associated to each subsidiary has been deducted from its Book Value (2) Turkey includes Garanti BBVA subsidiaries
1Q24 Earnings 53 TBV per share & dividends evolution

1Q24 Earnings 54 Shareholders’ return: TBV per share & dividends evolution TBV PER SHARE & DIVIDENDS(1) (€ PER SHARE) TBV Dividends +19.9% (2) (2) (2) (1) Including the deduction of the whole Share Buy Back program. (1) October 2023 dividend per share paid (0.16€) and April 2024 dividend per share paid (0.39€)

1Q24 Earnings 55 MREL
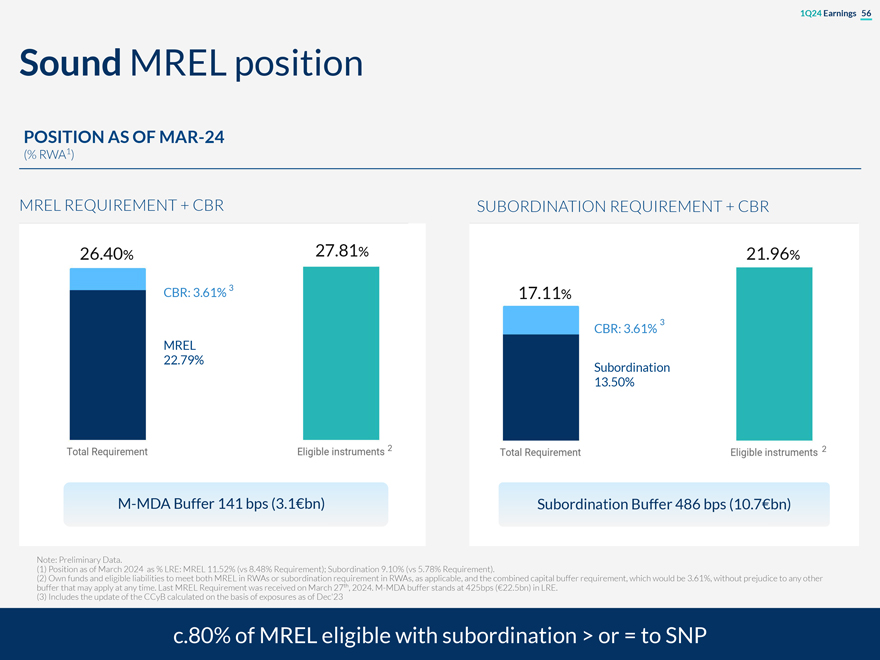
1Q24 Earnings 56 Sound MREL position POSITION AS OF MAR-24 (% RWA1) MREL REQUIREMENT + CBR SUBORDINATION REQUIREMENT + CBR 26.40% 27.81% 21.96% CBR: 3.61% 3 .11 17 % 3 CBR: 3.61% MREL 22.79% Subordination 13.50% 2 2 M-MDA Buffer 141 bps (3.1€bn) Subordination Buffer 486 bps (10.7€bn) Note: Preliminary Data. (1) Position as of March 2024 as % LRE: MREL 11.52% (vs 8.48% Requirement); Subordination 9.10% (vs 5.78% Requirement). (2) Own funds and eligible liabilities to meet both MREL in RWAs or subordination requirement in RWAs, as applicable, and the combined capital buffer requirement, which would be 3.61%, without prejudice to any other buffer that may apply at any time. Last MREL Requirement was received on March 27th, 2024. M-MDA buffer stands at 425bps (€22.5bn) in LRE. (3) Includes the update of the CCyB calculated on the basis of exposures as of Dec’23 c.80% of MREL eligible with subordination > or = to SNP
1Q24 Earnings 57 Digital metrics

1Q24 Earnings 58 Digital metrics mobile customers & digital sales MOBILE CUSTOMERS DIGITAL SALES—UNITS (MILLION CUSTOMERS, %) % OF TOTAL SALES YTD, # OF TRANSACTIONS) +30% DIGITAL SALES—PRV2 % OF TOTAL SALES YTD, PRV) CUSTOMER PENETRATION RATE1 65.8% 70.2% 73.6% (1) Mobile over active customers. Ex-Italy. (2) Product Relative Value as a proxy of lifetime economic representation of units sold.

BBV^
SIGNATURE
Pursuant to the requirements of the Securities Exchange Act of 1934, the registrant has duly caused this report to be signed on its behalf by the undersigned, thereunto duly authorized.
| Banco Bilbao Vizcaya Argentaria, S.A. | ||||||||
| Date: April 29, 2024 | ||||||||
| By: /s/ María Ángeles Peláez Morón | ||||||||
| Name: María Ángeles Peláez Morón | ||||||||
| Title: Authorized representative | ||||||||