UNITED STATES
SECURITIES AND EXCHANGE COMMISSION
WASHINGTON, D.C. 20549
FORM 6-K
REPORT OF FOREIGN ISSUER
PURSUANT TO RULE 13a-16 OR 15d-16
UNDER THE SECURITIES EXCHANGE ACT OF 1934
For the month of April, 2024
Commission file number: 1-10110
BANCO BILBAO VIZCAYA ARGENTARIA, S.A.
(Exact name of Registrant as specified in its charter)
BANK BILBAO VIZCAYA ARGENTARIA, S.A.
(Translation of Registrant’s name into English)
Calle Azul 4,
28050 Madrid
Spain
(Address of principal executive offices)
Indicate by check mark whether the registrant files or will file annual reports under cover of Form 20-F or Form 40-F:
Form 20-F ☒ Form 40-F ☐
Indicate by check mark if the registrant is submitting the Form 6-K in paper as permitted by Regulation S-T Rule 101(b)(1):
Yes ☐ No ☒
Indicate by check mark if the registrant is submitting the Form 6-K in paper as permitted by Regulation S-T Rule 101(b)(7):
Yes ☐ No ☒

|
|
Main data
| BBVA GROUP MAIN DATA (CONSOLIDATED FIGURES) |
||||||||||||||||
| 31-03-24 | Δ % | 31-03-23 | 31-12-23 | |||||||||||||
| Balance sheet (millions of euros) |
||||||||||||||||
| Total assets |
801,690 | 8.4 | 739,564 | 775,558 | ||||||||||||
| Loans and advances to customers (gross) |
400,457 | 7.2 | 373,481 | 388,912 | ||||||||||||
| Deposits from customers |
436,763 | 10.3 | 395,880 | 413,487 | ||||||||||||
| Total customer funds |
615,076 | 10.5 | 556,839 | 577,853 | ||||||||||||
| Total equity |
55,778 | 8.4 | 51,471 | 55,265 | ||||||||||||
| Income statement (millions of euros) |
||||||||||||||||
| Net interest income |
6,512 | 15.4 | 5,642 | 23,089 | ||||||||||||
| Gross income |
8,218 | 18.1 | 6,958 | 29,542 | ||||||||||||
| Operating income |
4,835 | 22.7 | 3,942 | 17,233 | ||||||||||||
| Net attributable profit (loss) |
2,200 | 19.1 | 1,846 | 8,019 | ||||||||||||
| The BBVA share and share performance ratios |
||||||||||||||||
| Number of shares outstanding (million) |
5,838 | (3.2) | 6,030 | 5,838 | ||||||||||||
| Share price (euros) |
11.04 | 68.0 | 6.57 | 8.23 | ||||||||||||
| Adjusted earning (loss) per share (euros) (1) |
0.37 | 20.9 | 0.30 | 1.32 | ||||||||||||
| Earning (loss) per share (euros) (1) |
0.36 | 23.4 | 0.29 | 1.29 | ||||||||||||
| Book value per share (euros) (1) |
9.04 | 12.7 | 8.02 | 8.86 | ||||||||||||
| Tangible book value per share (euros) (1) |
8.62 | 12.7 | 7.65 | 8.46 | ||||||||||||
| Market capitalization (millions of euros) |
64,451 | 62.7 | 39,624 | 48,023 | ||||||||||||
| Significant ratios (%) |
||||||||||||||||
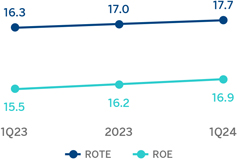
| ROE (net attributable profit (loss)/average shareholders’ funds +/- average accumulated other comprehensive income) (1) |
16.9 | 15.5 | 16.2 | |||||||||||||
| ROTE (net attributable profit (loss)/average shareholders’ funds excluding average intangible assets +/- average accumulated other comprehensive income) (1) |
17.7 | 16.3 | 17.0 | |||||||||||||
| ROA (profit (loss) for the period / average total assets-ATA) (1) |
1.19 | 1.11 | 1.12 | |||||||||||||
| RORWA (profit (loss) for the period / average risk-weighted assets - RWA) (1) |
2.50 | 2.36 | 2.38 | |||||||||||||
| Efficiency ratio (1) |
41.2 | 43.3 | 41.7 | |||||||||||||
| Cost of risk (1) |
1.39 | 1.05 | 1.15 | |||||||||||||
| NPL ratio (1) |
3.4 | 3.3 | 3.4 | |||||||||||||
| NPL coverage ratio (1) |
76 | 82 | 77 | |||||||||||||
| Capital adequacy ratios (%) |
||||||||||||||||
| CET1 fully-loaded |
12.82 | 13.13 | 12.67 | |||||||||||||
| CET1 phased-in (2) |
12.82 | 13.13 | 12.67 | |||||||||||||
| Total ratio phased-in (2) |
16.66 | 16.30 | 16.58 | |||||||||||||
| Other information |
||||||||||||||||
| Number of active customers (million) (3) |
74.1 | 6.6 | 69.4 | 73.0 | ||||||||||||
| Number of shareholders (4) |
726,100 | (7.6) | 786,031 | 742,194 | ||||||||||||
| Number of employees |
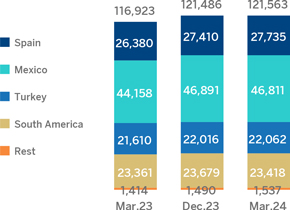
121,563 | 4.0 | 116,923 | 121,486 | ||||||||||||
| Number of branches |
5,912 | (2.3) | 6,051 | 5,949 | ||||||||||||
| Number of ATMs |
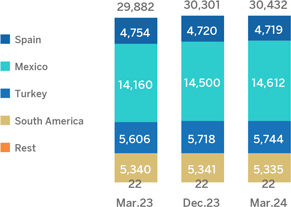
30,432 | 1.8 | 29,882 | 30,301 | ||||||||||||
(1) For more information, see Alternative Performance Measures at the end of this report.
(2) Phased-in ratios include the temporary treatment on the impact of IFRS 9, calculated in accordance with Article 473 bis amendments of the Capital Requirements Regulation (CRR), introduced by the Regulation (EU) 2020/873. For the periods shown in this table, there are no differences between phased-in and fully-loaded ratios due to the aforementioned temporary treatment.
(3) Reported figures include clients from Italy, as well as an adjustment for homogenization of criteria in Peru with the rest of the countries.
(4) See footnote to table of structural distribution of shareholders in the Capital and shareholders chapter of this report.
Translation of this report originally issued in Spanish. In the event of a discrepancy, the Spanish-language version prevails.
| 4 | ||||
| 8 | ||||
| 9 | ||||
| 9 | ||||
| 14 | ||||
| 16 | ||||
| 19 | ||||
| 25 | ||||
| 28 | ||||
| 31 | ||||
| 34 | ||||
| 38 | ||||
| 43 | ||||
| 46 | ||||
| 48 | ||||
| 51 | ||||
| 57 | ||||
Translation of this report originally issued in Spanish. In the event of a discrepancy, the Spanish-language version prevails.
|
|
4 |
Results and business activity
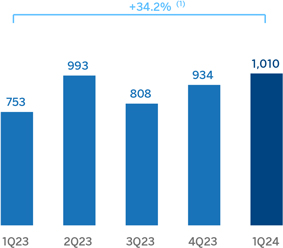
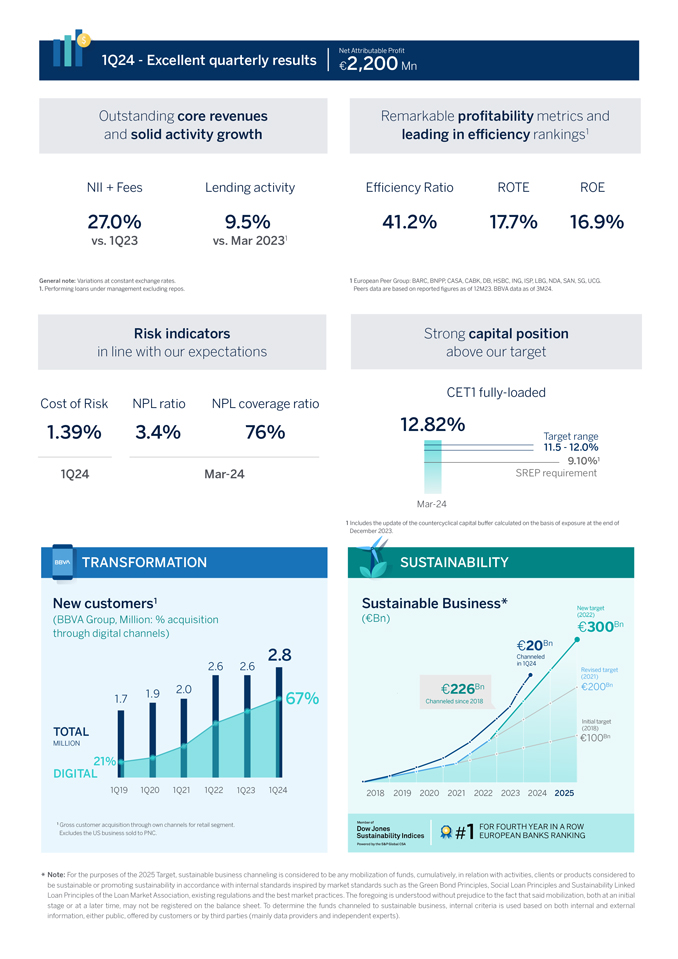
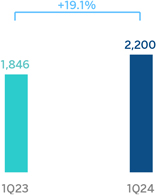
The BBVA Group generated a net attributable profit of €2,200m between January and March of 2024, driven by the performance of recurring revenues of the banking business. Thus, the net interest income grew at a year-on-year rate of 15.4% and net fees and commissions by 31.1%. This result represents an increase of 19.1% compared to the same period of the previous year, 38.1% excluding the impact of the evolution of currencies.
These results include the recording of the total estimated annual amount of the temporary tax on credit institutions and financial credit institutions for €285m, included in the other operating income and expenses line of the income statement.
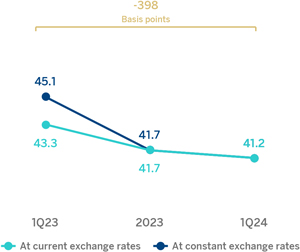
Operating expenses increased by 19.5% at Group level at constant exchange rates, affected by the inflation rates observed in the countries in which the Group operates. Thanks to the remarkable growth in gross income (+31.0%), greater than the growth in operating expenses, the efficiency ratio stood at 41.2% as of March 31, 2024, with an improvement of 398 basis points, in constant terms, compared to the ratio recorded 12 months earlier.
The provisions for impairment on financial assets increased (+40.7% in year-on-year terms and at constant exchange rates), with higher requirements linked to the growth in the most profitable segments, in line with the Group´s strategy.
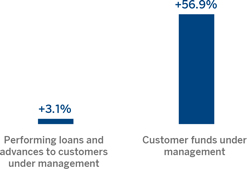
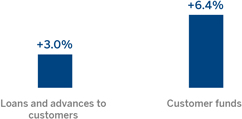
Loans and advances to customers recorded an increase of 3.0% compared to the end of December 2023, particularly driven by the evolution of corporate loans (+3.2% at Group level), and by the positive performance of loans of all segments to individuals.
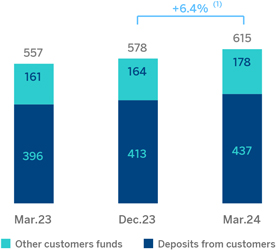
Customer funds increased by 6.4% compared to the end of the previous year, thanks to both the growth in deposits from customers, which increased by 5.6%, and to the increase in off-balance sheet funds, which grew by 8.5%.
| LOANS AND ADVANCES TO CUSTOMERS AND TOTAL CUSTOMER FUNDS (VARIATION COMPARED TO 31-12-2023) |
Business areas
As for the business areas evolution, excluding the effect of currency fluctuation in those areas where it has an impact, in each of them it is worth mentioning:
| – | Spain generated a net attributable profit of €725m in the first quarter of 2024, 36.5% higher than in the same period of the previous year, mainly supported by the favorable evolution of the net interest income. These solid results include the negative impact of €285m caused by the recording of the temporary tax on credit institutions and financial credit institutions. |
| – | In Mexico, BBVA achieved a cumulative net attributable profit of €1,441m by the end of March 2024, representing an increase of 3.6% compared to the same period of the previous year, mainly as a result of the strength of the recurring income from the banking business. |
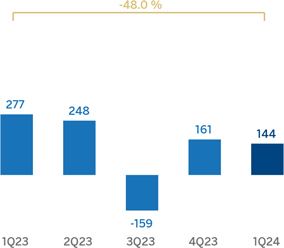
| – | Turkey generated a net attributable profit of €144m during the first quarter of 2024, which compares positively with the accumulated result reached at the end of March 2023 at constant exchange rate, both periods reflecting the impact of the application of hyperinflation accounting. |
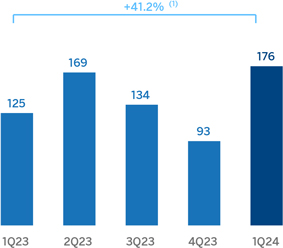
| – | South America generated a cumulative net attributable profit of €119m at the end of the first quarter of 2024, which represents a year-on-year increase of +54.6%, driven by the good performance of recurring income (84.1%) and the area’s NTI (net trading income). |
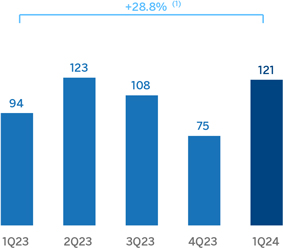
| – | Rest of Business achieved an accumulated net attributable profit of €121m during the first quarter of 2024, 28.8% higher than in the same period of the previous year, favored by the performance of the net interest income and the NTI. |
The Corporate Center recorded a net attributable loss of €-350m between January and March of 2024, which is an improvement compared with the €-515m recorded in the same period of the previous year.
Translation of this report originally issued in Spanish. In the event of a discrepancy, the Spanish-language version prevails.
|
|
5 |
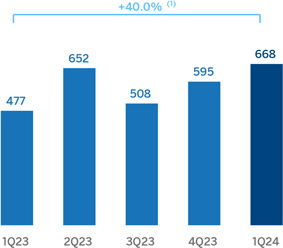
Lastly, and for a broader understanding of the Group’s activity and results, supplementary information is provided below for the wholesale business, Corporate & Investment Banking (CIB), carried out by BBVA in the countries where it operates. CIB generated a net attributable profit of €668m between January and March of 2024. These results represent an increase of 40.0% on a year-on-year basis and reflect the contribution of the diversification of products and geographical areas, as well as the progress of the Group’s wholesale businesses in its strategy, leveraged on globality and sustainability, with the purpose of being relevant to its clients.
|
NET ATTRIBUTABLE PROFIT (LOSS) (MILLIONS OF EUROS) |
NET ATTRIBUTABLE PROFIT BREAKDOWN (1) (PERCENTAGE. 1Q24) |
|||
|

|
|||
Solvency
The Group’s CET1 fully-loaded ratio stood at 12.82% as of March 31, 2024, which allows to keep maintaining a large management buffer over the Group’s CET1 requirement (9.10%)1 and above the Group’s established target management range of 11.5-12.0% of CET1.
Shareholder remuneration
Regarding shareholder remuneration, as approved by the General Shareholders´ Meeting on March 15, 2024, in its first item on the agenda, on April 10, 2024, a cash payment of €0.39 gross per each outstanding BBVA share entitled to receive such amount was made against the 2023 results, as an additional shareholder remuneration for the financial year 2023. Thus, the total amount of cash distributions for 2023, taking into account the €0.16 gross per share that was distributed in October 2023, amounted to €0.55 gross per share.
Total shareholder remuneration includes, in addition to the cash payments mentioned above, the remuneration resulting from the BBVA’s buyback program for the repurchase of own shares announced on January 30, 2024 for a maximum amount of €781m, and which started being executed on March 1, 2024. By means of an Other Relevant Information notice dated April 9, 2024, BBVA announced the completion of the share buyback program upon reaching the maximum monetary amount, having acquired 74,654,915 own shares, between March 4 and April 9, 2024, representing, approximately, 1.28% of BBVA’s share capital as of such date. The redemption of such shares is pending execution.
1 This includes the update of the countercyclical capital buffer calculated on the basis of exposure at end December 2023.
Translation of this report originally issued in Spanish. In the event of a discrepancy, the Spanish-language version prevails.
|
|
6 |
Sustainability
Channeling sustainable business
| SUSTAINABLE BUSINESS BREAKDOWN (PERCENTAGE. TOTAL AMOUNT CHANNELED 2018-MARCH 2024) |

(1) In those cases where it is not feasible or sufficient information is not available to allow an exact distribution between the categories of climate change and inclusive growth, internal estimates are made based on the available information.
(2) It fundamentally includes products whose funds are allocated to activities considered sustainable (in accordance with both internal and market standards, existing regulations and best practices), as well as products linked to sustainability (in accordance with both internal and market and best practices), such as those linked to environmental and/or social indicators.
(3) Bonds in which BBVA acts as bookrunner.
(4) Investment products art.8 or 9 under SFDR or similar criteria outside the EU managed, intermediated or marketed by BBVA. “Other” includes deposits under the Sustainable Transaction Banking Framework until its replacement by the CIB Sustainable Products Framework (both Frameworks published on the bank’s website), insurance policies related to energy efficiency and inclusive growth and electric vehicle autorenting, mainly.
(5) Includes the activity of the BBVA Microfinance Foundation (BBVAMF), which is not part of the consolidated Group and which has channeled around €8 billion in the period from 2018 to March 2024 to support vulnerable entrepreneurs with microcredits.
Regarding the objective of channeling €300 billion between 2018 and 20252 as part of the sustainability strategy, the BBVA Group has mobilized an approximate total of €226 billion in sustainable business between 2018 and March 2024, of which approximately 77% corresponds to the area of promoting the fight against climate change and the remaining 23% to promote inclusive growth. The amount channeled includes financing, intermediation, investment, off-balance sheet and insurance transactions. These operations have contractual maturity or amortization dates, so the above mentioned accumulated figure does not represent the amount reflected on the balance sheet.
During the first quarter of 2024, approximately €20 billion were mobilized (+41% compared with the same period of the previous year).
In this first quarter, retail business has been mobilized for an amount of around €2.6 billion. During this quarter, BBVA has continued to promote customized digital solutions aimed at the mass consumer market, offering retail customers a vision of the potential savings they can obtain by adopting energy-saving measures in their homes and transportation. It is worth highlighting the good performance of the channeling related to the acquisition of hybrid or electric vehicles with €124 million, which represents a growth of 136% compared to the same period of the previous year.
Between January and March 2024, the commercial business (enterprises) mobilized around €7 billion. This quarter, the unit continued to advise corporate clients on sustainable solutions that enable economic savings by focusing on cross-cutting issues such as energy efficiency, car fleet renewal and water. In this regard, it is worth highlighting the financing allocated to agribusiness, water and circular economy with €700m, representing an increase of 258% year-on-year. In this area, Mexico’s contribution is fundamental, as it accounts for about half of this channeling.
CIB has channeled around €10.4 billion during the first quarter of 2024, with a positive performance in all products, both long and short-term financing and the intermediation of green, social, sustainable and environmental and/or social indicators-linked bonds in which BBVA acts as bookrunner. During the quarter, BBVA has continued to promote in the wholesale segment the financing of clean technologies and of renewable energy projects as well as confirming linked to sustainability, among other strategic lines. In terms of channeling, the financing of renewable energy projects stands out, contributing around €800m during this quarter and more than doubling compared to the same period of the previous year.
2 For the purposes of the 2025 goal, channeling is considered as any mobilization of financial flows, on a cumulative basis, in relation to activities, customers or products considered sustainable or that promote sustainability primarily in accordance with internal standards inspired by existing regulations, market standards such as the Green Bond Principles, the Social Bond Principles and the Sustainability Linked Bond Principles of the International Capital Markets Association, as well as the Green Loan Principles, Social Loan Principles and Sustainability Linked Loan Principles of the Loan Market Association, existing regulations and best market practices. The foregoing is without prejudice to the fact that such mobilization, both initially and at a later time, may not be recorded in the balance sheet. To determine the amount of sustainable business channeled, internal criteria are used based on both internal and external information, whether public, provided by customers or by a third party (mainly data providers and independent experts).
Translation of this report originally issued in Spanish. In the event of a discrepancy, the Spanish-language version prevails.
|
|
7 |
Relevant advances in the field of sustainability
| • | TCFD |
In March 2024, BBVA published its fifth TCFD (Task Force on Climate-Related Financial Disclosure) report, which summarizes its strategy to manage the risks and opportunities related to climate change, as well as the measures it is taking in this regard. The Group has continued to incorporate the elements of a Transition Plan, applying the guides and recommendations for financial institutions published by Glasgow Financial Alliance for Net Zero (GFANZ) in November 2022.
| • | Target presence of women in management positions by 2026 |
To promote gender equality, in 2022 BBVA set a target of 35% women in management positions by 2024. After achieving an indicator of 34.7% in 2023, in February 2024 a new target was announced for the next 2 years, so that BBVA aims to have 36.8% of women in management positions by the end of 2026.
This indicator, which measures the evolution of the representation of women in management positions in the Group, is included in the long-term variable incentives for executive directors and senior management.
| • | Issuance of a green bond |
In March 2024, BBVA issued a senior preferred green bond in the amount of €1,000m, maturing in 7 years and at a price set at mid swap plus 90 basis points. For this new issue, projects financed during the 6 months prior to the bond issue have been identified and divided into two eligible categories according to BBVA’s Sustainable Debt Financing Framework: renewable energy and clean transportation.
| • | Sustainability forums |
On February 29, 2024, the third edition of the BBVA Sustainability Forum was held in BBVA City. The event, which welcomed more than 400 attendees including representatives of the Public Administration, personalities and global companies and institutions very active in the fight against climate change and the promotion of inclusive growth, has become a reference event for the high-level dialogue on the economic and social challenges of sustainability.
On March 20, 2024, the first edition of the BBVA Sustainability Summit in Peru took place in Lima. A space that brought together more than 500 attendees including clients, businessmen, representatives of institutions and important local and international personalities from the world of sustainability at the bank’s headquarters. At the meeting, experiences, strategies and sustainable practices were shared with the aim of informing, raising awareness and mobilizing about the challenges and opportunities that sustainability represents for the private sector.
Translation of this report originally issued in Spanish. In the event of a discrepancy, the Spanish-language version prevails.
|
|
8 |
The high inflation, the tightening of monetary conditions and the gradual fading of the positive effects linked to the reopening after the COVID-19 pandemic have contributed to a slowdown in economic activity in recent quarters. However, the slowdown has been, in general, less abrupt than expected, and economic activity remains relatively dynamic, particularly in the United States and in the services sector, thanks to the dynamism of the labor markets, expansionary fiscal policies and the gradual fading of supply shocks triggered by the pandemic and the war in Ukraine.
The resilience of aggregate demand has contributed to inflation remaining relatively high in the first months of 2024 (3.5% in the United States and 2.4% in the Eurozone in March 2024), after decreasing significantly since mid-2022.
According to BBVA Research, it is most likely that inflation will moderate in the next months, enabling the start of a gradual process of relaxation of monetary conditions around mid-2024, which would take monetary policy interest rates to around 4.75% in the United States and 3.25% (in the case of the deposit facility interest rate) in the Eurozone by the end of 2024.
BBVA Research forecasts that global growth will be approximately 3.1% in 2024, close to the estimated GDP growth for 2023 and slightly over the previous forecast (3.0%). In the United States, the strong domestic demand has supported a GDP growth of 2.5% in 2023 and a revision of growth forecasts for 2024 to 1.9% (40 basis points above the previous forecast). In China, structural challenges to avoid a fast economic deceleration remain, but a series of stimulus measures have enabled a greater than expected dynamism of activity in the past few months and a 5.2% GDP growth in 2023. The GDP growth forecast for 2024 has been adjusted somewhat upwards to 4.6% (20 basis points above the previous forecast). In the Eurozone, economic activity came to a standstill in the last months, reinforcing the low growth prospects. After expanding by around 0.5% in 2023, the forecast of the GDP expansion is expected to grow 0.7% for 2024 (with no change compared to the previous forecast).
Although it is expected that inflation will gradually moderate both in United States and Eurozone, and it is likely to remain low in China, it is most likely that inflationary pressures -and, therefore, interest rates- will continue to be above the levels observed before the COVID-19 pandemic due to the geopolitical factors, such as the war in Ukraine and the armed conflict in Middle East, and to other factors like protectionist policies, an expansionary fiscal stance and climatic shocks. Indeed, these factors increase the uncertainty about the evolution of the global economy and the risk of having a higher inflation and interest rates than currently expected.
| GDP GROWTH ESTIMATES IN 2024 (PERCENTAGE. YEAR-ON-YEAR |
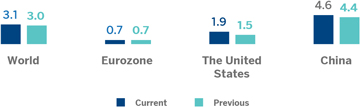
Source: BBVA Research estimates.
Translation of this report originally issued in Spanish. In the event of a discrepancy, the Spanish-language version prevails.
|
|
9 |
The BBVA Group generated a net attributable profit of €2,200m between January and March of 2024, driven by the performance of recurring revenues of the banking business. Thus, the net interest income grew at a year-on-year rate of 15.4% and net fees and commissions by 31.1%. This result represents an increase of 19.1% compared to the same period of the previous year.
It should to be noted that the results of the first quarter of 2024 include the recording for the total annual amount paid for the temporary tax on credit institutions and financial credit institutions for €285m, included in the other operating income and expenses line of the income statement. This amount is higher than the recorded in the same line in the same period of the previous year.
| CONSOLIDATED INCOME STATEMENT (MILLIONS OF EUROS) |
||||||||||||||||
| 1Q24 | Δ % | Δ % at constant exchange rates |
1Q23 | |||||||||||||
| Net interest income |
6,512 | 15.4 | 24.5 | 5,642 | ||||||||||||
| Net fees and commissions |
1,887 | 31.1 | 36.5 | 1,439 | ||||||||||||
| Net trading income |
772 | 76.2 | 123.9 | 438 | ||||||||||||
| Other operating income and expenses |
(952) | 69.7 | 39.5 | (561) | ||||||||||||
| Gross income |
8,218 | 18.1 | 31.0 | 6,958 | ||||||||||||
| Operating expenses |
(3,383) | 12.2 | 19.5 | (3,016) | ||||||||||||
| Personnel expenses |
(1,778) | 14.7 | 22.9 | (1,551) | ||||||||||||
| Other administrative expenses |
(1,229) | 9.1 | 17.4 | (1,127) | ||||||||||||
| Depreciation |
(375) | 10.9 | 11.2 | (339) | ||||||||||||
| Operating income |
4,835 | 22.7 | 40.5 | 3,942 | ||||||||||||
| Impairment on financial assets not measured at fair value through profit or loss |
(1,361) | 40.5 | 40.7 | (968) | ||||||||||||
| Provisions or reversal of provisions |
(57) | n.s. | n.s. | (14) | ||||||||||||
| Other gains (losses) |
40 | n.s. | n.s. | (16) | ||||||||||||
| Profit (loss) before tax |
3,458 | 17.4 | 41.2 | 2,944 | ||||||||||||
| Income tax |
(1,151) | 21.2 | 43.0 | (950) | ||||||||||||
| Profit (loss) for the period |
2,307 | 15.7 | 40.4 | 1,994 | ||||||||||||
| Non-controlling interests |
(107) | (27.9) | 111.1 | (148) | ||||||||||||
| Net attributable profit (loss) |
2,200 | 19.1 | 38.1 | 1,846 | ||||||||||||
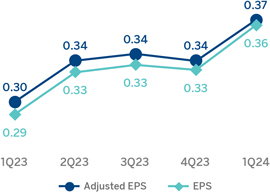
| Adjusted earning (loss) per share (euros) (1) |
0.37 | 0.30 | ||||||||||||||
| Earning (loss) per share (euros) (1) |
0.36 | 0.29 | ||||||||||||||
(1) Adjusted by additional Tier 1 instrument remuneration. For more information, see Alternative Performance Measures at the end of this report.
Unless expressly indicated otherwise, for a better understanding of the changes under the main headings of the Group’s income statement, the rates of change provided below refer to constant exchange rates. When comparing two dates or periods in this report, the impact of changes in the exchange rates against the euro of the currencies of the countries in which BBVA operates is sometimes excluded, assuming that exchange rates remain constant. For this purpose, the average exchange rate of the currency of each geographical area of the most recent period is used for both periods, except for those countries whose economies have been considered hyperinflationary, for which the closing exchange rate of the most recent period is used.
3 In compliance with Law 38/2022, of December 27, which establishes the obligation to pay a patrimonial benefit of a public and non-taxable nature during the years 2023 and 2024 for credit institutions that operate in Spanish territory whose sum of total interest income and fee and commission income corresponding to the year 2019 is equal to or greater than €800m.
Translation of this report originally issued in Spanish. In the event of a discrepancy, the Spanish-language version prevails.
|
|
10 |
| CONSOLIDATED INCOME STATEMENT: QUARTERLY EVOLUTION (MILLIONS OF EUROS) |
||||||||||||||||||||
| 2024 | 2023 | |||||||||||||||||||
| 1Q | 4Q | 3Q | 2Q | 1Q | ||||||||||||||||
| Net interest income |
6,512 | 5,246 | 6,434 | 5,768 | 5,642 | |||||||||||||||
| Net fees and commissions |
1,887 | 1,694 | 1,685 | 1,470 | 1,439 | |||||||||||||||
| Net trading income |
772 | 753 | 658 | 334 | 438 | |||||||||||||||
| Other operating income and expenses |
(952) | (255) | (820) | (383) | (561) | |||||||||||||||
| Gross income |
8,218 | 7,438 | 7,956 | 7,189 | 6,958 | |||||||||||||||
| Operating expenses |
(3,383) | (3,068) | (3,303) | (2,922) | (3,016) | |||||||||||||||
| Personnel expenses |
(1,778) | (1,693) | (1,756) | (1,530) | (1,551) | |||||||||||||||
| Other administrative expenses |
(1,229) | (1,025) | (1,169) | (1,054) | (1,127) | |||||||||||||||
| Depreciation |
(375) | (349) | (378) | (337) | (339) | |||||||||||||||
| Operating income |
4,835 | 4,370 | 4,654 | 4,267 | 3,942 | |||||||||||||||
| Impairment on financial assets not measured at fair value through profit or loss |
(1,361) | (1,225) | (1,210) | (1,025) | (968) | |||||||||||||||
| Provisions or reversal of provisions |
(57) | (163) | (81) | (115) | (14) | |||||||||||||||
| Other gains (losses) |
40 | (49) | 2 | 50 | (16) | |||||||||||||||
| Profit (loss) before tax |
3,458 | 2,932 | 3,365 | 3,178 | 2,944 | |||||||||||||||
| Income tax |
(1,151) | (799) | (1,226) | (1,028) | (950) | |||||||||||||||
| Profit (loss) for the period |
2,307 | 2,133 | 2,139 | 2,150 | 1,994 | |||||||||||||||
| Non-controlling interests |
(107) | (75) | (56) | (118) | (148) | |||||||||||||||
| Net attributable profit (loss) |
2,200 | 2,058 | 2,083 | 2,032 | 1,846 | |||||||||||||||
| Adjusted earning (loss) per share (euros) (1) |
0.37 | 0.34 | 0.34 | 0.34 | 0.30 | |||||||||||||||
| Earning (loss) per share (euros) (1) |
0.36 | 0.33 | 0.33 | 0.33 | 0.29 | |||||||||||||||
(1) Adjusted by additional Tier 1 instrument remuneration. For more information, see Alternative Performance Measures at the end of this report.
The accumulated net interest income as of March 31, 2024 was higher than in the same period of the previous year (+24.5%), with increases in all business areas except for Turkey, as a result of greater volumes of performing loan. The good evolution in South America and Spain is noteworthy.
Positive evolution in the net fees and commissions line, which increased by 36.5% year-on-year due to the favorable performance in payment systems and, to a lesser extent, asset management. By business areas, Turkey´s and Mexico´s contribution stood out.
| NET INTEREST INCOME / AVERAGE TOTAL ASSETS (PERCENTAGE AT CONSTANT EXCHANGE RATES) |
|
NET INTEREST INCOME PLUS NET FEES AND COMMISSIONS (MILLIONS OF EUROS AT CONSTANT EXCHANGE RATES) |
||
|
|
|
|||
At the end of March 2024, NTI grew by 123.9%, with a positive performance of this line in all business areas, favored by the results of the Global Markets unit, which offset comfortably the negative results recorded in the Corporate Center.
Translation of this report originally issued in Spanish. In the event of a discrepancy, the Spanish-language version prevails.
|
|
11 |
The other operating income and expenses line accumulated as of March 31, 2024 a result that compares negatively with the same date of the same period of last year, mainly due to the recording in the line of a more negative adjustment for hyperinflation in Argentina. This line also reflects the total estimated amount of the temporary tax on credit institutions and financial credit establishments for year 2024 registered in the first quarter of 2024 and 60 million higher than the annual amount estimated for year 2023, registered in the first quarter of that year.
|
GROSS INCOME (MILLIONS OF EUROS AT CONSTANT EXCHANGE RATES) |
||||
|
(1) At current exchange rates: +18.1%. |
||||
On a year-on-year basis, operating expenses increased by 19.5% at the Group level, a rate that is below the inflation rates observed in the countries in which the Group operates (an average of 19,7% in the last 12 months).
Thanks to the remarkable growth in gross income (+31.0%), the efficiency ratio stood at 41.2% as of March 31, 2024, with an improvement of 398 basis points compared to the ratio recorded 12 months earlier.
| OPERATING EXPENSES (MILLIONS OF EUROS AT CONSTANT EXCHANGE RATES) |
|
EFFICIENCY RATIO (PERCENTAGE) | ||
|
(1) At current exchange rates: +12.2%. |
|
|||
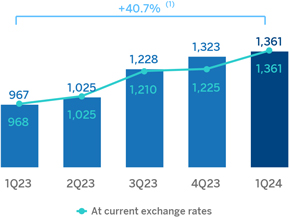
The impairment on financial assets not measured at fair value through profit or loss (impairment on financial assets) at the end of March 2024 was 40.7% higher than in the same period of the previous year, with higher requirements linked to the growth in the most profitable segments, in line with the Group´s strategy.
Translation of this report originally issued in Spanish. In the event of a discrepancy, the Spanish-language version prevails.
|
|
12 |
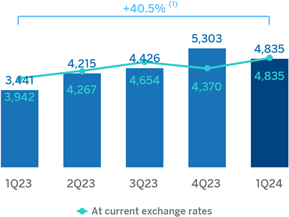
| OPERATING INCOME (MILLIONS OF EUROS AT CONSTANT EXCHANGE RATES) |
|
IMPAIRMENT ON FINANCIAL ASSETS (MILLIONS OF EUROS AT CONSTANT EXCHANGE RATES) |
||
|
(1) At current exchange rates: +22.7%. |
(1) At current exchange rates: +40.5%. |
|||
The provisions or reversal of provisions line (hereinafter, provisions) registered at the end of March 2024 higher provisions compared to the same period of the previous year, mainly originated in Spain and South America.
On the other hand, the other gains (losses) line ended March 2024 with a balance of €40m, which compares favorably with the result of the previous year and reflects the positive impact of the reversal of impairments for investments on associated companies.
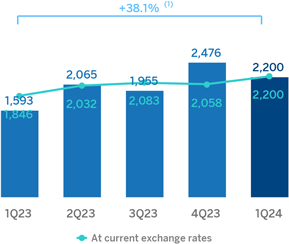
As a result of the above, the BBVA Group generated a net attributable profit of €2,200m between January and March of the year 2024, which compares very positively with the result of the same period of the previous year. These solid results are supported by the favorable evolution of the banking business recurring income, which offsets the higher operating expenses and the increase in provisions for impairment losses on financial assets.
The cumulative net attributable profits, in millions of euros, at the end of March 2024 for the business areas that compose the Group were as follows: €725m in Spain, €1,441m in Mexico, €144m in Turkey, €119m in South America and €121m in Rest of Business.
|
NET ATTRIBUTABLE PROFIT (LOSS) (MILLIONS OF EUROS AT CONSTANT EXCHANGE RATES) |
||||
|
(1) At current exchange rates: +19.1% |
||||
Translation of this report originally issued in Spanish. In the event of a discrepancy, the Spanish-language version prevails.
|
|
13 |
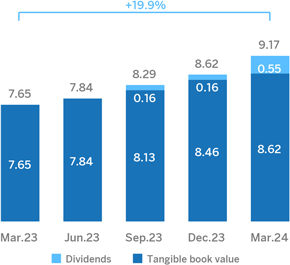
The Group’s excellent performance has also allowed to accelerate value creation, as reflected in the growth of the tangible book value per share and dividends, which as of the end of March 2024 was 19.9% higher than in the same period of the previous year.
| TANGIBLE BOOK VALUE PER SHARE AND DIVIDENDS (EUROS) |
|
EARNING (LOSS) PER SHARE (EUROS) | ||
|
|
|
|||
|
General note: replenishing dividends paid in the period. For more information, see Alternative Performance Measures at the end of this report. |
General note; adjusted by additional Tier 1 instrument remuneration. For more information, see Alternative Performance Measures at the end of this report. |
|||
Lastly, the Group’s profitability indicators improved in year-on-year terms supported by the favorable performance of results.
| ROE AND ROTE (PERCENTAGE) |
|
ROA AND RORWA (PERCENTAGE) |
||
|
|
|
|||
Translation of this report originally issued in Spanish. In the event of a discrepancy, the Spanish-language version prevails.
|
|
14 |
Balance sheet and business activity
The most relevant aspects related to the evolution of the Group’s balance sheet and business activity as of March 31, 2024 are summarized below:
| – | Loans and advances to customers recorded an increase of 3.0% compared to the end of December 2023, particularly driven by the evolution of corporate loans (+3.2% at Group level), and by the positive performance of loans of all segments to individuals, especially consumer loans (+3.5%). |
| – | Customer funds increased by 6.4% compared to the end of 2023, thanks to both the growth in deposits from customers, which increased by 5.6% due to the positive evolution of time deposits in all business areas, especially Spain and Rest of Business, and to the increase in off-balance sheet funds, which grew by 8.5%, favored by the evolution of mutual funds and customer portfolios, with the good performance in Mexico and Spain. |
|
CONSOLIDATED BALANCE SHEET (MILLIONS OF EUROS)
|
||||||||||||||||
| 31-03-24 | Δ % | 31-12-23 | 31-03-23 | |||||||||||||
| Cash, cash balances at central banks and other demand deposits |
76,524 | 1.5 | 75,416 | 83,267 | ||||||||||||
| Financial assets held for trading |
144,253 | 2.3 | 141,042 | 119,877 | ||||||||||||
| Non-trading financial assets mandatorily at fair value through profit or loss |
9,384 | 7.4 | 8,737 | 7,227 | ||||||||||||
| Financial assets designated at fair value through profit or loss |
840 | (12.1) | 955 | 997 | ||||||||||||
| Financial assets at fair value through accumulated other comprehensive income |
62,884 | 1.1 | 62,205 | 66,277 | ||||||||||||
| Financial assets at amortized cost |
470,380 | 4.1 | 451,732 | 427,259 | ||||||||||||
| Loans and advances to central banks and credit institutions |
28,975 | 17.7 | 24,627 | 22,256 | ||||||||||||
| Loans and advances to customers |
388,949 | 3.0 | 377,643 | 362,317 | ||||||||||||
| Debt securities |
52,456 | 6.1 | 49,462 | 42,686 | ||||||||||||
| Investments in joint ventures and associates |
996 | 2.0 | 976 | 920 | ||||||||||||
| Tangible assets |
9,660 | 4.4 | 9,253 | 8,945 | ||||||||||||
| Intangible assets |
2,407 | 1.9 | 2,363 | 2,209 | ||||||||||||
| Other assets |
24,362 | 6.5 | 22,878 | 22,586 | ||||||||||||
| Total assets |
801,690 | 3.4 | 775,558 | 739,564 | ||||||||||||
| Financial liabilities held for trading |
118,731 | (2.5) | 121,715 | 107,185 | ||||||||||||
| Other financial liabilities designated at fair value through profit or loss |
14,544 | 9.4 | 13,299 | 11,309 | ||||||||||||
| Financial liabilities at amortized cost |
584,698 | 4.9 | 557,589 | 542,326 | ||||||||||||
| Deposits from central banks and credit institutions |
53,824 | (10.8) | 60,349 | 75,109 | ||||||||||||
| Deposits from customers |
436,763 | 5.6 | 413,487 | 395,880 | ||||||||||||
| Debt certificates |
73,627 | 7.2 | 68,707 | 54,586 | ||||||||||||
| Other financial liabilities |
20,484 | 36.1 | 15,046 | 16,751 | ||||||||||||
| Liabilities under insurance and reinsurance contracts |
12,241 | 1.1 | 12,110 | 11,010 | ||||||||||||
| Other liabilities |
15,697 | 0.8 | 15,580 | 16,263 | ||||||||||||
| Total liabilities |
745,912 | 3.6 | 720,293 | 688,093 | ||||||||||||
| Non-controlling interests |
3,775 | 5.9 | 3,564 | 3,680 | ||||||||||||
| Accumulated other comprehensive income |
(14,944) | (8.1) | (16,254) | (16,195) | ||||||||||||
| Shareholders’ funds |
66,947 | (1.5) | 67,955 | 63,986 | ||||||||||||
| Total equity |
55,778 | 0.9 | 55,265 | 51,471 | ||||||||||||
| Total liabilities and equity |
801,690 | 3.4 | 775,558 | 739,564 | ||||||||||||
| Memorandum item: |
||||||||||||||||
| Guarantees given |
62,077 | 3.4 | 60,019 | 55,042 | ||||||||||||
Translation of this report originally issued in Spanish. In the event of a discrepancy, the Spanish-language version prevails.
|
|
15 |
|
LOANS AND ADVANCES TO CUSTOMERS (MILLIONS OF EUROS)
|
|
|||||||||||||||||||||||||||
| 31-03-24 | Δ % | 31-12-23 | 31-03-23 | |||||||||||||||||||||||||
| Public sector | 24,012 | 3.2 | 23,269 | 21,752 | ||||||||||||||||||||||||
| Individuals | 172,604 | 2.7 | 168,123 | 161,346 | ||||||||||||||||||||||||
| Mortgages |
94,887 | 1.6 | 93,358 | 91,999 | ||||||||||||||||||||||||
| Consumer |
44,175 | 3.5 | 42,695 | 40,147 | ||||||||||||||||||||||||
| Credit cards |
22,816 | 5.6 | 21,609 | 18,997 | ||||||||||||||||||||||||
| Other loans |
10,725 | 2.5 | 10,461 | 10,203 | ||||||||||||||||||||||||
| Business | 188,902 | 3.2 | 183,076 | 177,168 | ||||||||||||||||||||||||
| Non-performing loans | 14,938 | 3.4 | 14,444 | 13,215 | ||||||||||||||||||||||||
| Loans and advances to customers (gross) |
400,457 | 3.0 | 388,912 | 373,481 | ||||||||||||||||||||||||
| Allowances (1) |
(11,508) | 2.1 | (11,269) | (11,164) | ||||||||||||||||||||||||
| Loans and advances to customers |
388,949 | 3.0 | 377,643 | 362,317 | ||||||||||||||||||||||||
(1) Allowances include valuation adjustments for credit risk throughout the expected residual life in those financial instruments that have been acquired (mainly originating from the acquisition of Catalunya Banc, S.A.). As of March 31, 2024, December 31, 2023 and March 31, 2023 the remaining amount was €134m, €142m and €173m respectively.
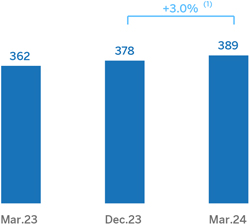
| LOANS AND ADVANCES TO CUSTOMERS (BILLIONS OF EUROS) |
CUSTOMER FUNDS (BILLIONS OF EUROS) | |||
|
(1) At constant exchange rates: +2.4%. |
|
|||
| (1) At constant exchange rates: +6.0%. |
||||
|
CUSTOMER FUNDS (MILLIONS OF EUROS)
|
|
|||||||||||||||||||||||||||
| 31-03-24 | Δ % | 31-12-23 | 31-03-23 | |||||||||||||||||||||||||
| Deposits from customers | 436,763 | 5.6 | 413,487 | 395,880 | ||||||||||||||||||||||||
| Current accounts |
318,367 | 0.3 | 317,543 | 308,918 | ||||||||||||||||||||||||
| Time deposits |
103,807 | 13.4 | 91,524 | 83,516 | ||||||||||||||||||||||||
| Other deposits |
14,589 | 230.1 | 4,420 | 3,446 | ||||||||||||||||||||||||
| Other customer funds | 178,313 | 8.5 | 164,367 | 160,959 | ||||||||||||||||||||||||
| Mutual funds and investment companies and customer portfolios (1) |
143,345 | 8.7 | 131,849 | 118,640 | ||||||||||||||||||||||||
| Pension funds |
29,286 | 3.4 | 28,326 | 38,901 | ||||||||||||||||||||||||
| Other off-balance sheet funds |
5,682 | 35.5 | 4,192 | 3,418 | ||||||||||||||||||||||||
| Total customer funds |
615,076 | 6.4 | 577,853 | 556,839 | ||||||||||||||||||||||||
(1) Includes the customer portfolios in Spain, Mexico, Colombia (preliminary data) and Peru.
Translation of this report originally issued in Spanish. In the event of a discrepancy, the Spanish-language version prevails.
|
|
16 |
Capital base
The BBVA Group’s strong results during the quarter, which are in line with those of the fourth quarter of 2023, contributed to the consolidated CET1 fully-loaded ratio to reach 12.82% as of March 31, 2024, which allows to keep maintaining a large management buffer over the Group’s CET1 requirement (9.10%)4 and above the Group’s established target management range of 11.5-12.0% of CET1.
During the first quarter of the year, the CET1 ratio increased by 15 basis points. The strong generation of profit, net of dividends and remuneration of capital instruments, generated a contribution of 27 basis points in the CET1 ratio, which, together with the compensation in equity of the negative effect on results due to the monetary loss given by the net monetary position in hyperinflationary economies allowed it to absorb the growth of risk-weighted assets (RWA) derived from the increase in activity in the quarter (consumption of -43 basis points), in line with the Group’s strategy of promoting profitable growth. On the other hand, among the other impacts, it is worth highlighting those associated with market variables, where the negative evolution of some currencies in the quarter stands out (mainly the impact of the Turkish lira and the US dollar), and in a lesser extent, the evolution of the fixed income portfolios valuation, partially offset by the positive evolution of the investments in equity portfolio.
| Quarterly evolution of the CET1 fully-loaded ratio |

|
(1) Includes, among others, Held to collect and sale (HTC&S) currencies and portfolios, non-controlling interests and a positive increase of “Accumulated other comprehensive income”, which offsets the negative impact on the income statement of the value loss of the net monetary position in hyperinflationary economies.
The consolidated fully-loaded additional Tier 1 capital (AT1) stood at 1.35% as of March 31, 2024, resulting a decrease of -31 basis points from the previous quarter, mainly due to the early redemption of a contingent convertible issuance valued at €1 billion.
On the other hand, the consolidated fully-loaded Tier 2 ratio at the end of March 2024 stood at 2.49%, with an increase of 24 basis points in the quarter, mainly due to the issuance of a subordinated bond in Spain for € 1,250m and, to a lesser extent, to the issuance in Mexico, Turkey and Peru of subordinated debt valued at 900, 500 and 300 million dollars, respectively. On the contrary, a subordinated issuance valued at €750 million has been redeemed in Spain Thus, the total fully-loaded capital ratio stood at 16.66%.
Following the latest SREP (Supervisory Review and Evaluation Process) decision, the ECB has informed to the Group that, with effect from January 1, 2024, it will have to maintain a total capital ratio of 13.25% and a CET1 capital ratio of 9.09% at the consolidated level (9.10% with the countercyclical buffer update calculated as of December 31, 2023), which includes the consolidated Pillar 2 requirement of 1.68% (of which at least 1.02% shall be met with CET1), of which 0.18% is determined on the basis of the ECB’s prudential provisioning expectation and shall be met with CET1.
It is worth mentioning that, with effect from January 1, 2023, the application of part of the transitional effects applied by the Group in the determination of the phased-in ratio has ended, so that as of March 31, 2024, this ratio coincides with the fully-loaded ratio.
4 This includes the update of the countercyclical capital buffer calculated on the basis of exposure at end December 2023.
Translation of this report originally issued in Spanish. In the event of a discrepancy, the Spanish-language version prevails.
|
|
17 |
| FULLY-LOADED CAPITAL RATIOS (PERCENTAGE) |

|
|
CAPITAL BASE (MILLIONS OF EUROS)
|
|
|||||||||||||||||||||||
| Phased-in (1) | Fully-loaded (1) | |||||||||||||||||||||||
| 31-03-24 (2) | 31-12-23 | 31-03-23 | 31-03-24 (2) | 31-12-23 | 31-03-23 | |||||||||||||||||||
| Common Equity Tier 1 (CET1) |
48,739 | 46,116 | 45,761 | 48,739 | 46,116 | 45,761 | ||||||||||||||||||
| Tier 1 |
53,868 | 52,150 | 50,948 | 53,868 | 52,150 | 50,948 | ||||||||||||||||||
| Tier 2 |
9,450 | 8,182 | 5,865 | 9,450 | 8,182 | 5,865 | ||||||||||||||||||
| Total capital (Tier 1 + Tier 2) |
63,318 | 60,332 | 56,812 | 63,318 | 60,332 | 56,812 | ||||||||||||||||||
| Risk-weighted assets |
380,044 | 363,915 | 348,598 | 380,044 | 363,915 | 348,598 | ||||||||||||||||||
| CET1 (%) |
12.82 | 12.67 | 13.13 | 12.82 | 12.67 | 13.13 | ||||||||||||||||||
| Tier 1 (%) |
14.17 | 14.33 | 14.62 | 14.17 | 14.33 | 14.62 | ||||||||||||||||||
| Tier 2 (%) |
2.49 | 2.25 | 1.68 | 2.49 | 2.25 | 1.68 | ||||||||||||||||||
| Total capital ratio (%) |
16.66 | 16.58 | 16.30 | 16.66 | 16.58 | 16.30 | ||||||||||||||||||
(1) The difference between the phased-in and fully-loaded ratios arises from the temporary treatment of certain capital items, mainly of the impact of IFRS 9, to which the BBVA Group has adhered voluntarily (in accordance with article 473bis of the CRR and the subsequent amendments introduced by the Regulation (EU) 2020/873). For the periods shown in this table, there are no differences between phased-in and fully-loaded ratios due to the aforementioned temporary treatment.
(2) Preliminary data.
Regarding leverage ratio, as of March 31, 2024, the Group’s fully-loaded ratio stood at 6.5%5, -6 basis points less than in December 2023, mainly due to the increase of the exposure.
| LEVERAGE RATIO (FULLY-LOADED) | ||||||||||||
| 31-03-24 | 31-12-23 | 31-03-23 | ||||||||||
| Exposure to Leverage Ratio (fully-loaded) (million euros) |
830,725 | 797,888 | 773,495 | |||||||||
| Leverage ratio (fully-loaded) (%) |
6.5 | 6.5 | 6.6 | |||||||||
Lastly, with regard to MREL, the RWA and leverage ratios6 stand at 27.8% and 11.5%, respectively, reaching the subordinated ratios of 22.0% and 9.1%, respectively. A summarizing chart is shown below:
|
MREL
|
||||||||||||
| 31-03-24 | 31-12-23 | 31-03-23 | ||||||||||
| Total own funds and eligible liabilities (million euros) |
53,171 | 49,398 | 48,745 | |||||||||
| Total RWA of the resolution group (million euros) |
219,681 | 214,757 | 206,655 | |||||||||
| RWA ratio (%) |
27.8 | 26.4 | 26.9 | |||||||||
| Total exposure for the Leverage calculation (million euros) |
530,175 | 517,470 | 508,210 | |||||||||
| Leverage ratio (%) |
11.5 | 10.9 | 10.94 | |||||||||
5 The Group’s leverage ratio is provisional at the date of release of this report.
6 Calculated at consolidated level in accordance with the resolution strategy MPE (“Multiple Point of Entry”) of the BBVA Group, established by the SRB. The resolution group is made up of Banco Bilbao Vizcaya Argentaria, S.A. and subsidiaries that belong to the same European resolution group.
Translation of this report originally issued in Spanish. In the event of a discrepancy, the Spanish-language version prevails.
|
|
18 |
In terms of requirements, on March 27, 2024 the Group disclosed the receipt of a new communication from the Bank of Spain regarding its MREL requirement, established by the Single Resolution Board (hereinafter “SRB”). In accordance with this communication, BBVA has to reach, from that day on, an MREL in RWA equal to 22.79%7, without taking into consideration the current combined capital requirement of 3.61%. Additionally, BBVA must reach, also by March 27, 2024, a volume of own funds and eligible liabilities in terms of total exposure considered for the purpose of the calculation of the leverage ratio of 8.48% (the “MREL in LR”)8. Given the own funds and eligible liabilities of the resolution group, as of March 31, 2024, the Group meets the requirements.
Likewise, with the aim of reinforcing compliance with these requirements, BBVA has made several debt issuances during the first quarter of 2024. For more information on made issues, see “Structural risks” section within the “Risk management” chapter.
Shareholder remuneration
Regarding shareholder remuneration, as approved by the General Shareholders´ Meeting on March 15, 2024, in its first item on the agenda, on April 10, 2024, a cash payment of €0.39 gross per each outstanding BBVA share entitled to receive such amount was made against the 2023 results, as an additional shareholder remuneration for the financial year 2023. Thus, the total amount of cash distributions for 2023, taking into account the €0.16 gross per share that was distributed in October 2023, amounted to €0.55 gross per share.
Total shareholder remuneration includes, in addition to the cash payments mentioned above, the remuneration resulting from the BBVA’s buyback program for the repurchase of own shares announced on January 30, 2024 for a maximum amount of €781m, and which started being executed on March 1, 2024. By means of an Other Relevant Information notice dated April 9, 2024, BBVA announced the completion of the share buyback program upon reaching the maximum monetary amount, having acquired 74,654,915 own shares, between March 4 and April 9, 2024, representing, approximately, 1.28% of BBVA’s share capital as of such date. The redemption of such shares is pending execution.
As of March 31, 2024 and December 31, 2023, BBVA’s share capital amounted to €2,860,590,786.20 divided into 5,837,940,380 shares.
| SHAREHOLDER STRUCTURE (31-03-24) | ||||||||||||||||
| Shareholders | Shares outstanding | |||||||||||||||
| Number of shares | Number | % | Number | % | ||||||||||||
| Up to 500 |
311,091 | 42.8 | 57,443,656 | 1.0 | ||||||||||||
| 501 to 5,000 |
325,542 | 44.8 | 576,148,338 | 9.9 | ||||||||||||
| 5,001 to 10,000 |
48,110 | 6.6 | 337,256,570 | 5.8 | ||||||||||||
| 10,001 to 50,000 |
37,273 | 5.1 | 711,737,987 | 12.2 | ||||||||||||
| 50,001 to 100,000 |
2,639 | 0.4 | 180,407,925 | 3.1 | ||||||||||||
| 100,001 to 500,000 |
1,187 | 0.2 | 210,691,513 | 3.6 | ||||||||||||
| More than 500,001 |
258 | 0.04 | 3,764,254,391 | 64.5 | ||||||||||||
|
Total |
726,100 | 100 | 5,837,940,380 | 100 | ||||||||||||
Note: in the case of shares kept by investors through a custodian placed outside Spain, only the custodian will be considered as a shareholder, which is who appears registered in the accounting record of book entries, so the number of shareholders stated does not consider those indirect holders.
Ratings
During the first quarter of 2024, BBVA’s rating has continued to demonstrate its strength and all agencies have maintained their rating in the A category. In March, Moody´s changed its long-term outlook on the senior preferred debt from stable to positive (maintaining its rating in A3) after a similar action on the Spanish Sovereign rating and reflecting the expectations of the agency that the profitability levels of the bank will continue being high and that the pressures on the quality of assets will remain contained. Additionally, in March too, DBRS communicated the result of its annual revision of BBVA confirming the rating in A (high) with a stable outlook. S&P and Fitch have maintained without changes in the quarter the BBVA rating in A and A-, respectively, both of them with a stable outlook. The following table shows the credit ratings and outlooks assigned by the agencies:
|
RATINGS
|
||||||||
| Rating agency | Long term (1) | Short term | Outlook | |||||
| DBRS |
A (high) | R-1 (middle) | Stable | |||||
| Fitch |
A- | F-2 | Stable | |||||
| Moody’s |
A3 | P-2 | Positive | |||||
| Standard & Poor’s |
A | A-1 | Stable | |||||
(1) Ratings assigned to long term senior preferred debt. Additionally, Moody’s and Fitch assign A2 and A- rating, respectively, to BBVA’s long term deposits.
7 The subordination requirement in RWA is 13.5%.
8 The subordination requirement in Leverage ratio is 5.78%.
Translation of this report originally issued in Spanish. In the event of a discrepancy, the Spanish-language version prevails.
|
|
19 |
Credit risk
Uncertainty within the macroeconomic environment remains high, and the geopolitical turbulence at the time of preparation of this report could contribute to a new spike in energy prices, and therefore, increase the biases towards more negative scenarios, with higher than expected interest rates, and more persistent inflation, which can affect credit demand and hinder the payment capacity of families and business.
For the estimation of expected losses, the models include individual and collective estimates, taking into account the macroeconomic forecasts in accordance with IFRS 9. Thus, the estimate at the end of the year includes the effect on expected losses of updating macroeconomic forecasts, which take into account the current global environment. Additionally, the Group may complement the expected losses either by considering additional risk drivers, the incorporation of sectorial particularities or those that may affect a set of operations or borrowers, following a formal internal process established for the purpose.
By region, the evolution during the year has been uneven. In Spain, growth forecasts for 2024 have been revised upwards, and the household debt levels are far from the historical highs, whereas in Mexico, less dynamism in activity is observed while we await a gradual cycle of monetary policy normalization. The uncertainty in Turkey continues, although growth remains solid. Despite changes in economic policy, quality indicators for the system remain at low levels. Finally, in general, growth has been less dynamic in South America, in a context of high inflation and interest rates on a downward trend.
BBVA Group’s credit risk indicators
The evolution of the Group’s main credit risk indicators is summarized below:
| – | Credit risk increased in the first quarter of the year by 3.0% (+2.4% in constant terms), with generalized growth at constant exchange rates in all geographical areas. |
| – | Non-performing loans increased by 2.7% at the Group level between December 2023 and March 2024 (+2.1% in constant terms), with general increases in all geographical areas except of Turkey, which has been favored by the effect of exchange rates, sales of retail portfolios and positive dynamics in the recovery and repayments of the wholesale business. In general, the increases were concentrated in retail portfolios and, in the case of Rest of Business, in the entry into default of a single customer. |
|
NON-PERFORMING LOANS AND PROVISIONS (MILLIONS OF EUROS)
|
||||
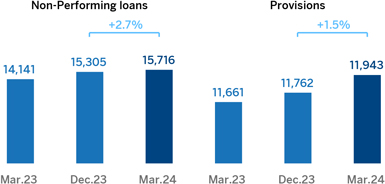
| – | The NPL remained practically stable as of March 31, 2024, standing at 3.4%. |
| – | The NPL coverage ratio ended the quarter at 76%, steady compared to the previous quarter (86 basis points below the figure of the end of December), with stability in Spain and decreases in the rest of business areas, mainly in Mexico and Rest of Business. |
| – | The cumulative cost of risk as of March 31, 2024 stood at 1.39%, which is above the previous quarter, yet in line with the expectations, with lower requirements in Spain, more normalized levels in Turkey, South America continuing the trend observed in 2023 and Mexico affected by the requirements of the retail portfolio. |
Translation of this report originally issued in Spanish. In the event of a discrepancy, the Spanish-language version prevails.
|
|
20 |
|
NPL AND NPL COVERAGE RATIOS AND COST OF RISK (PERCENTAGE)
|

|
CREDIT RISK (1) (MILLIONS OF EUROS)
|
| 31-03-24 | 31-12-23 | 30-09-23 | 30-06-23 | 31-03-23 | ||||||||||||||||
| Credit risk |
462,457 | 448,840 | 444,984 | 436,174 | 428,423 | |||||||||||||||
| Stage 1 |
405,765 | 392,528 | 394,329 | 386,711 | 377,908 | |||||||||||||||
| Stage 2 |
40,975 | 41,006 | 35,791 | 34,772 | 36,373 | |||||||||||||||
| Stage 3 (non-performing loans) |
15,716 | 15,305 | 14,864 | 14,691 | 14,141 | |||||||||||||||
|
Provisions |
11,943 | 11,762 | 11,751 | 11,697 | 11,661 | |||||||||||||||
| Stage 1 |
2,198 | 2,142 | 2,143 | 2,107 | 2,062 | |||||||||||||||
| Stage 2 |
2,130 | 2,170 | 2,198 | 2,181 | 2,243 | |||||||||||||||
| Stage 3 (non-performing loans) |
7,615 | 7,450 | 7,410 | 7,409 | 7,357 | |||||||||||||||
| NPL ratio (%) |
3.4 | 3.4 | 3.3 | 3.4 | 3.3 | |||||||||||||||
| NPL coverage ratio (%) (2) |
76 | 77 | 79 | 80 | 82 | |||||||||||||||
(1) Includes gross loans and advances to customers plus guarantees given.
(2) The NPL coverage ratio includes the valuation adjustments for credit risk throughout the expected residual life in those financial instruments that have been acquired (mainly originating from the acquisition of Catalunya Banc, S.A.). If these valuation corrections had not been taken into account, the NPL coverage ratio would have stood at 76% as of March 31, 2024.
|
NON-PERFORMING LOANS EVOLUTION (MILLIONS OF EUROS)
|
| 1Q24 (1) | 4Q23 | 3Q23 | 2Q23 | 1Q23 | ||||||||||||||||||||||||||||||||
| Beginning balance |
15,305 | 14,864 | 14,691 | 14,141 | 14,463 | |||||||||||||||||||||||||||||||
| Entries |
3,243 | 3,038 | 2,898 | 2,875 | 2,256 | |||||||||||||||||||||||||||||||
| Recoveries |
(1,585) | (1,373) | (1,538) | (1,394) | (1,489) | |||||||||||||||||||||||||||||||
| Net variation |
1,661 | 1,665 | 1,360 | 1,481 | 767 | |||||||||||||||||||||||||||||||
| Write-offs |
(1,211) | (983) | (830) | (877) | (1,081) | |||||||||||||||||||||||||||||||
| Exchange rate differences and other |
(36) | (241) | (357) | (54) | (8) | |||||||||||||||||||||||||||||||
|
Period-end balance |
15,716 | 15,305 | 14,864 | 14,691 | 14,141 | |||||||||||||||||||||||||||||||
| Memorandum item: |
||||||||||||||||||||||||||||||||||||
| Non-performing loans |
14,938 | 14,444 | 13,947 | 13,787 | 13,215 | |||||||||||||||||||||||||||||||
| Non performing guarantees given |
778 | 862 | 918 | 905 | 926 | |||||||||||||||||||||||||||||||
(1) Preliminary data.
Translation of this report originally issued in Spanish. In the event of a discrepancy, the Spanish-language version prevails.
|
|
21 |
Structural risks
Liquidity and funding
Liquidity and funding management at BBVA promotes the financing of the recurring growth of the banking business at suitable maturities and costs using a wide range of funding sources. BBVA’s business model, risk appetite framework and funding strategy are designed to reach a solid funding structure based on stable customer deposits, mainly retail (granular). As a result of this model, deposits have a high degree of assurance in each geographical area, close to 55% in Spain and Mexico. It is important to note that, given the nature of BBVA’s business, lending is mainly financed through stable customer funds.
One of the key elements in the BBVA Group’s liquidity and funding management is the maintenance of large high-quality liquidity buffers in all geographical areas. In this respect, the Group has maintained during the last 12 months an average volume of high quality liquid assets (HQLA) of €132.5 billion, of which 97% correspond to maximum quality assets (level 1 in the liquidity coverage ratio, LCR).
Due to its subsidiary-based management model, BBVA is one of the few major European banks that follows the Multiple Point of Entry (MPE) resolution strategy: the parent company sets the liquidity policies, but the subsidiaries are self-sufficient and responsible for managing their own liquidity and funding (taking deposits or accessing the market with their own rating). This strategy limits the spread of a liquidity crisis among the Group’s different areas and ensures the adequate transmission of the cost of liquidity and financing to the price formation process.
The BBVA Group maintains a solid liquidity position in every geographical area in which it operates, with ratios well above the minimum required:
| – | The LCR requires banks to maintain a volume of high-quality liquid assets sufficient to withstand liquidity stress for 30 days. BBVA Group’s consolidated LCR remained comfortably above 100% during the first quarter and stood at 151% as of March 31, 2024. It should be noted that, given the MPE nature of BBVA, this ratio limits the numerator of the LCR for subsidiaries other than BBVA S.A. to 100% of its net outflows. Therefore, the resulting ratio is below that of the individual units (the LCR of the main components reaches 179% in BBVA, S.A., 165% in Mexico and 193% in Turkey). Without considering this restriction, the Group’s LCR ratio reaches 186%. |
| – | The net stable funding ratio (NSFR) requires banks to maintain a stable funding profile in relation to the composition of their assets and off-balance sheet activities. The BBVA Group’s NSFR ratio stood at 132% as of March 31, 2024. |
The breakdown of these ratios in the main geographical areas in which the Group operates is shown below:
|
LCR AND NSFR RATIOS (PERCENTAGE. 31-03-24)
|
||||||||
| BBVA, S.A. | Mexico | Turkey | South America | |||||
|
LCR |
179% | 165% | 193% | All countries >100 | ||||
|
NSFR |
124% | 135% | 168% | All countries >100 | ||||
In addition to the above, the most relevant aspects related to the main geographical areas are the following:
| – | BBVA, S.A. has maintained a strong position with a large high-quality liquidity buffer, having repaid the entire TLTRO III program, maintaining at all times the regulatory liquidity metrics well above the set minimums. During the first quarter of 2024, commercial activity has provided liquidity to the balance sheet mainly due to the good evolution of customer deposits, with growth greater than that of lending activity. |
| – | BBVA Mexico shows a solid liquidity situation, even though the credit gap increased in the first quarter of the year as a consequence of the outflows of the end-year seasonal fund gathering. Despite that, the cost of funds has been efficiently managed. |
| – | In Turkey, in the first quarter of 2024, the lending gap in local currency increased, due to a greater growth in loans than in deposits, while the lending gap in foreign currency decreased due to higher demand for foreign currency deposits before the local elections. Garanti BBVA continues to maintain a stable liquidity position with comfortable ratios. On the other hand, the Central Bank of Turkey has continued updating the measures to continue with the dedollarization process of the economy and control the inflation. |
| – | In South America, the liquidity situation remains adequate throughout the region. In Argentina, liquidity in the system continues to increase, as well as in BBVA due to a higher growth in deposits than in loans in both local and foreign currency. In BBVA Colombia, the credit gap remains essentially unchanged in the first quarter, after a slight fall of the volume of credit investment, in line with the evolution of customer deposits. BBVA Peru maintains solid liquidity levels. |
Translation of this report originally issued in Spanish. In the event of a discrepancy, the Spanish-language version prevails.
|
|
22 |
The main wholesale financing transactions carried out by the BBVA Group during the first quarter of 2024 are listed below:
| Issuer |
Type of issue | Date of issue | Nominal (millions) |
Currency | Coupon | Early redemption |
Maturity date | |||||||||
| BBVA, S.A. | Senior preferred |
Jan-24 | 1,250 | EUR | 3.875 % | — | Jan-34 | |||||||||
|
|
||||||||||||||||
| Tier 2 | Feb-24 | 1,250 | EUR | 4.875 % | Feb-31 | Feb-36 | ||||||||||
|
|
||||||||||||||||
| Senior preferred |
Mar-24 | 1,000 | USD | 5.381 % | — | Mar-29 | ||||||||||
|
|
||||||||||||||||
| Senior non-preferred |
Mar-24 | 1,000 | USD | 6.033% | — | Mar-35 | ||||||||||
|
|
||||||||||||||||
|
|
Senior preferred (green bond) |
Mar-24 | 1,000 | EUR | 3.500 % | — | Mar-31 | |||||||||
Additionally, BBVA, S.A. redeemed two capital issuances in the first quarter: in February 2024, a Tier 2 issuance of subordinated bonds issued in February 2019, for an amount of €750m and, in March 2024, an AT1 issued in 2019 on its first date of optional redemption, for an amount of €1,000m.
BBVA Mexico issued in January Tier 2 bonds for USD 900m with a maturity of 15 years and early repayment option in 10 years with a coupon of 8.125%.
In Turkey, Garanti BBVA issued Tier 2 10-year bonds for an amount of USD 500m, with a coupon of 8.375% and a redemption option in 5 years.
For its part, BBVA Peru issued Tier 2 bonds in the international market for USD 300m, with a 6.20% coupon, a term of 10.25-year maturity and an early redemption option in year 5.
In conclusion, the first quarter of 2024 has turned into one of the historically more actives in terms of issuance of wholesale funding of BBVA, S.A., with €5,400m funded in 5 tranches. If we also consider the issuance activity of BBVA Mexico, BBVA Turkey and BBVA Peru, this access to international markets increases by USD 1,700m, which shows the strength of the Group´s access to wholesale markets from its main issuance units.
Additionally, on April 10th, BBVA Mexico issued senior bank bonds for 15,000m Mexican pesos, in two tranches. The first one was placed with a term of three and a half years, with a variable TIIE anchoring rate of one day plus 32 basis points, registering a total of 8,439m Mexican pesos. The second tranche was issued to seven years, with a fixed 10.35% rate, for a total of 6,561m Mexican pesos.
Foreign exchange
Foreign exchange risk management aims to reduce both the sensitivity of the capital ratios and the net attributable profit variability to currency fluctuations.
The performance of the Group’s main currencies during the first quarter of 2024 has been very uneven. Due to its relevance for the Group, it should be noted the strength of the Mexican peso, which has appreciated 4.5% against the euro. In the same way, the US dollar and the Peruvian sol registered an appreciation of 2.2% against the euro and, in the case of the Colombian peso, this appreciation was slightly smaller, of 1.7%. On the downside, the depreciation of the Chilean peso (-7.9%), of the Turkish lira (-6.6%) and, to a lesser extent, of the Argentinian peso (-3.7%) stand out.
|
EXCHANGE RATES (EXPRESSED IN CURRENCY/EURO)
|
||||||||||||||||
| Year-end exchange rates | Average exchange rates | |||||||||||||||||||
| Δ % on | Δ % on | Δ % on | ||||||||||||||||||
| 31-03-24 | 31-03-23 | 31-12-23 | 1Q24 | 1Q23 | ||||||||||||||||
| U.S. dollar |
1.0811 | 0.6 | 2.2 | 1.0857 | (1.2) | |||||||||||||||
| Mexican peso |
17.9179 | 9.6 | 4.5 | 18.4409 | 8.7 | |||||||||||||||
| Turkish lira (1) |
34.9487 | (40.3) | (6.6) | — | — | |||||||||||||||
| Peruvian sol |
4.0144 | 1.9 | 2.2 | 4.0789 | 0.3 | |||||||||||||||
| Argentine peso (1) |
926.95 | (75.5) | (3.7) | — | — | |||||||||||||||
| Chilean peso |
1,061.33 | (19.1) | (7.9) | 1,027.06 | (15.2) | |||||||||||||||
| Colombian peso |
4,153.91 | 21.1 | 1.7 | 4,253.73 | 20.1 | |||||||||||||||
(1) According to IAS 21 “The effects of changes in foreign exchange rates”, the year-end exchange rate is used for the conversion of the Turkey and Argentina income statement.
In relation to the hedging of the capital ratios, BBVA covers, in aggregate, 70% of its subsidiaries’ capital excess. The sensitivity of the Group’s CET1 fully-loaded ratio to 10% depreciations in major currencies is estimated at: +17 basis points for the U.S. dollar, -10 basis
Translation of this report originally issued in Spanish. In the event of a discrepancy, the Spanish-language version prevails.
|
|
23 |
points for the Mexican peso and -4 basis points for the Turkish lira9. With regard to the hedging of results, BBVA hedges between 40% and 50% of the aggregate net attributable profit it expects to generate in the next 12 months. For each currency, the final amount hedged depends on its expected future evolution, the costs and the relevance of the incomes related to the Group’s results as a whole.
Interest rate
Interest rate risk management seeks to limit the impact that BBVA may suffer, both in terms of net interest income (short-term) and economic value (long-term), from adverse movements in the interest rate curves in the various currencies in which the Group operates. BBVA carries out this work through an internal procedure, pursuant to the guidelines established by the European Banking Authority (EBA), with the aim of analyzing the potential impact that could derive from a range of scenarios on the Group’s different balance sheets.
The model is based on assumptions intended to realistically mimic the behavior of the balance sheet. The assumptions regarding the behavior of accounts with no explicit maturity and prepayment estimates are specially relevant. These assumptions are reviewed and adapted at least once a year according to the evolution in observed behaviors.
At the aggregate level, BBVA continues to have a positive sensitivity toward interest rate increases in the net interest income.
In the first quarter of 2024, inflation data were slightly surprisingly high. This has caused the market to anticipate smaller rate drops for the year in Europe and in the United States and to expect the first rate fall from the Fed by the end of the summer, which has triggered a rise in sovereign bond profitability and has led to a slightly negative performance in most debt portfolios of the Group. For their part, peripheral rate curve spreads remain well supported, even tightening in the quarter. In Mexico, the central bank cut for the first time in three years the official interest rate, in line with the monetary policy actions of most South American countries, where by end-2023 interest rate cuts had begun. In Turkey, the Central Bank of Turkey has continued the tightening of its monetary policy launched in June 2023.
By area, the main features are:
| – | Spain has a balance sheet characterized by a lending portfolio with high proportion of variable-rate loans (mortgages and corporate lending) and liabilities composed mainly by customer demand deposits. The ALCO portfolio acts as a management lever and hedge for the balance sheet, mitigating its sensitivity to interest rate fluctuations. In an environment of high rates, currently close to their market-predicted terminal rates, the interest rate risk profile of the balance sheet has been reduced in the last quarters. |
| On the other hand, the ECB left rates unchanged in the first quarter of the year, bringing the benchmark interest rate by the end of March to 4.5%, the marginal deposit facility rate at 4.0% and the marginal loan facility rate at 4.75%. Additionally, the ECB announced in March the changes on its operative framework, highlighting that, from September on, the spread between the benchmark interest rate and that of the deposit facility will be reduced to 15 basis points. Finally, the market expectations on the start of rate falls by mid-2024 has continued, which has led to the benchmark Euribor types to remain fundamentally stable during the first quarter. |
| – | Mexico continues to show a balance between fixed and variable interest rates balances, which results in a limited sensitivity to interest rates fluctuations. In terms of assets that are most sensitive to interest rate changes, the commercial portfolio stood out, while consumer loans and mortgages are mostly at a fixed rate. With regard to customer funds, the high proportion of non-interest bearing deposits, which are insensitive to interest rate movements, should be highlighted. The ALCO portfolio is invested primarily in fixed-rate sovereign bonds with limited maturities. The monetary policy rate stood at 11.00%, 25 basis points below the end-of-year level of 2023. |
| – | In Turkey, the sensitivity of deposits is offset by the ALCO portfolio and loans (fixed rate and relatively short-term). The sensitivity of the net interest income remains very limited thanks to the different efforts carried out by the Bank. The CBRT has recently increased monetary policy rates, taking interest rates from 8.5% by the end of March 2023 to 50% by the end of March 2024. Linked to regulatory measures, the central bank has also started to remunerate some reserves in Turkish lira. |
| – | In South America, the interest rate risk profile remains low as most countries in the area have a fixed/variable composition and maturities that are very similar for assets and liabilities, with limited net interest income sensitivity. In addition, the in balance sheets with several currencies, the interest rate risk is managed for each of the currencies, showing a very low level of exposure. Regarding benchmark rates, the cut cycle has begun in the region. In Peru it stood at 6.25% as of March 2024, 50 basis points below its 2023 closing level. In Colombia, the interest rate was placed by the end of March 2024 in 12.25%, 75 basis points below the end of 2023. In Argentina, the central bank unexpectedly cut in March the benchmark interest rate to 80%, making another cut of 10 basis points in April up to 70%, which is a decrease of 30 basis points from 100% as of December 2023. |
9 This sensitivity does not include the cost of capital hedges, which are currently estimated at 3 basis points per quarter for Mexican peso and 3 basis points per quarter for Turkish lira.
Translation of this report originally issued in Spanish. In the event of a discrepancy, the Spanish-language version prevails.
|
|
24 |
|
INTEREST RATES (PERCENTAGE)
|
||||||||||||||||||||
| 31-03-24 | 31-12-23 | 30-09-23 | 30-06-23 | 31-03-23 | ||||||||||||||||
| Official ECB rate | 4.50 | 4.50 | 4.50 | 4.00 | 3.50 | |||||||||||||||
| Euribor 3 months (1) | 3.92 | 3.94 | 3.88 | 3.54 | 2.91 | |||||||||||||||
| Euribor 1 year (1) | 3.72 | 3.68 | 4.15 | 4.01 | 3.65 | |||||||||||||||
| USA Federal rates | 5.50 | 5.50 | 5.50 | 5.25 | 5.00 | |||||||||||||||
| TIIE (Mexico) | 11.00 | 11.25 | 11.25 | 11.25 | 11.25 | |||||||||||||||
| CBRT (Turkey) | 50.00 | 42.50 | 30.00 | 15.00 | 8.50 | |||||||||||||||
(1) Calculated as the month average.
Translation of this report originally issued in Spanish. In the event of a discrepancy, the Spanish-language version prevails.
|
|
25 |
This section presents the most relevant aspects of the Group’s different business areas. Specifically, for each one of them, it shows a summary of the income statements and balance sheets, the business activity figures and the most significant ratios.
The structure of the business areas reported by the BBVA Group as of March 31, 2024, is the same as the one presented at the end of 2023.
The composition of BBVA Group’s business areas is summarized below:
| – | Spain mainly includes the banking, insurance and asset management activities that the Group carries out in this country. |
| – | Mexico includes banking, insurance and asset management activities in this country, as well as the activity that BBVA Mexico carries out through its agency in Houston. |
| – | Turkey reports the activity of the group Garanti BBVA that is mainly carried out in this country and, to a lesser extent, in Romania and the Netherlands. |
| – | South America includes banking, financial, insurance and asset management activities conducted, mainly, in Argentina, Chile, Colombia, Peru, Uruguay and Venezuela. |
| – | Rest of Business mainly incorporates the wholesale activity carried out in Europe (excluding Spain), the United States, and BBVA’s branches in Asia. |
The Corporate Center contains the centralized functions of the Group, including: the costs of the head offices with a corporate function; structural exchange rate positions management; portfolios whose management is not linked to customer relations, such as financial and industrial holdings; stakes in Funds & Investment Vehicles in tech companies; certain tax assets and liabilities; funds due to commitments to employees; goodwill and other intangible assets as well as portfolios and assets’ funding. Finally, in the description of this aggregate, it is worth mentioning that the Corporate Center’s tax expense includes for each period the difference between the effective tax rate in the period of each business area and the expected tax rate of the Group for the year as a whole.
In addition to these geographical breakdowns, supplementary pro forma information is provided for the wholesale business, Corporate & Investment Banking (CIB), carried out by BBVA in the countries where it operates. This business is relevant to have a broader understanding of the Group’s activity and results due to the important features of the type of customers served, products offered and risks assumed, even if this is a pro forma information that does not capture the application of the hyperinflation accounting nor the wholesale business of the Group in Venezuela.
The information by business areas is based on units at the lowest level and/or companies that make up the Group, which are assigned to the different areas according to the main region or company group in which they carry out their activity. In regards to the information on the business areas and on the supplementary pro-forma information about CIB, in the first quarter of 2024 the Group changed its allocation criteria for certain expenses, mainly related with global international projects between the Corporate Center and the business areas (where they are currently charged). Consequently, in order to guarantee that year-on-year comparisons are homogeneous, the figures for year 2023 have been restated, without it affecting the consolidated financial information of the Group.
Regarding the shareholders’ funds allocation, in the business areas, a capital allocation system based on the consumed regulatory capital is used.
Finally, it should be noted that, as usual, in the case of the different business areas, that is, Mexico, Turkey, South America and Rest of Business, and, additionally, CIB, in addition to the year-on-year variations applying current exchange rates, the variations at constant exchange rates are also disclosed.
| GROSS INCOME (1), OPERATING INCOME (1) AND NET ATTRIBUTABLE PROFIT (1) BREAKDOWN (PERCENTAGE. 1Q24) |
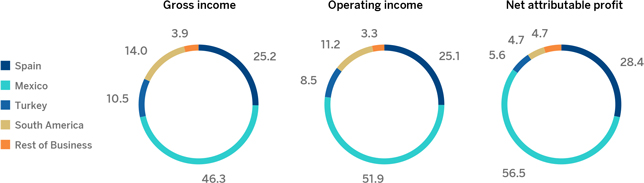
(1) Excludes the Corporate Center.
Translation of this report originally issued in Spanish. In the event of a discrepancy, the Spanish-language version prevails.
|
|
26 |
| MAIN INCOME STATEMENT LINE ITEMS BY BUSINESS AREA (MILLIONS OF EUROS) |
|
|||||||||||||||||||||||||||||||
| Business areas | ||||||||||||||||||||||||||||||||
| BBVA Group |
Spain | Mexico | Turkey | South America |
Rest of Business |
Σ Business
areas |
Corporate Center |
|||||||||||||||||||||||||
| 1Q24 |
||||||||||||||||||||||||||||||||
| Net interest income |
6,512 | 1,599 | 2,999 | 277 | 1,555 | 157 | 6,588 | (76) | ||||||||||||||||||||||||
| Gross income |
8,218 | 2,162 | 3,967 | 897 | 1,201 | 336 | 8,562 | (344) | ||||||||||||||||||||||||
| Operating income |
4,835 | 1,344 | 2,773 | 453 | 600 | 176 | 5,346 | (511) | ||||||||||||||||||||||||
| Profit (loss) before tax |
3,458 | 1,148 | 2,009 | 413 | 201 | 160 | 3,932 | (474) | ||||||||||||||||||||||||
| Net attributable profit (loss) |
2,200 | 725 | 1,441 | 144 | 119 | 121 | 2,549 | (350) | ||||||||||||||||||||||||
| 1Q23 (1) |
||||||||||||||||||||||||||||||||
| Net interest income |
5,642 | 1,183 | 2,589 | 626 | 1,190 | 113 | 5,702 | (60) | ||||||||||||||||||||||||
| Gross income |
6,958 | 1,726 | 3,306 | 802 | 1,175 | 260 | 7,269 | (311) | ||||||||||||||||||||||||
| Operating income |
3,942 | 960 | 2,311 | 403 | 637 | 124 | 4,435 | (493) | ||||||||||||||||||||||||
| Profit (loss) before tax |
2,944 | 837 | 1,760 | 327 | 401 | 113 | 3,439 | (495) | ||||||||||||||||||||||||
| Net attributable profit (loss) |
1,846 | 531 | 1,279 | 277 | 181 | 93 | 2,361 | (515) | ||||||||||||||||||||||||
(1) Restated balances.
| MAIN BALANCE-SHEET ITEMS AND RISK-WEIGHTED ASSETS BY BUSINESS AREA (MILLIONS OF EUROS) |
|
|||||||||||||||||||||||||||||||||||
| Business areas | ||||||||||||||||||||||||||||||||||||
| BBVA Group |
Spain | Mexico | Turkey | South America |
Rest of Business |
Σ Business
areas |
Corporate Center |
Deletions | ||||||||||||||||||||||||||||
|
31-03-24 |
||||||||||||||||||||||||||||||||||||
| Loans and advances to customers | 388,949 | 174,094 | 92,776 | 39,636 | 42,762 | 40,858 | 390,125 | 455 | (1,631) | |||||||||||||||||||||||||||
| Deposits from customers |
436,763 | 227,410 | 93,566 | 52,676 | 44,638 | 20,865 | 439,155 | 204 | (2,596) | |||||||||||||||||||||||||||
| Off-balance sheet funds |
178,313 | 100,561 | 61,154 | 9,988 | 6,028 | 581 | 178,312 | 1 | — | |||||||||||||||||||||||||||
| Total assets/liabilities and equity | 801,690 | 452,227 | 184,677 | 71,389 | 68,719 | 62,559 | 839,570 | 23,211 | (61,091) | |||||||||||||||||||||||||||
| RWAs |
380,044 | 122,056 | 97,517 | 58,558 | 52,360 | 37,536 | 368,027 | 12,016 | — | |||||||||||||||||||||||||||
| 31-12-23 |
||||||||||||||||||||||||||||||||||||
| Loans and advances to customers | 377,643 | 173,169 | 88,112 | 37,416 | 41,213 | 39,322 | 379,231 | 230 | (1,819) | |||||||||||||||||||||||||||
| Deposits from customers |
413,487 | 217,235 | 92,564 | 50,651 | 42,567 | 13,056 | 416,073 | 181 | (2,768) | |||||||||||||||||||||||||||
| Off-balance sheet funds |
164,367 | 97,253 | 53,254 | 7,768 | 5,525 | 566 | 164,366 | 1 | — | |||||||||||||||||||||||||||
| Total assets/liabilities and equity | 775,558 | 457,573 | 173,489 | 68,329 | 64,779 | 64,274 | 828,445 | 23,074 | (75,961) | |||||||||||||||||||||||||||
| RWAs |
363,915 | 121,779 | 91,865 | 54,506 | 49,117 | 36,410 | 353,678 | 10,237 | — | |||||||||||||||||||||||||||
Translation of this report originally issued in Spanish. In the event of a discrepancy, the Spanish-language version prevails.
|
|
27 |
| NUMBER OF EMPLOYEES |
NUMBER OF BRANCHES | |||
|
|
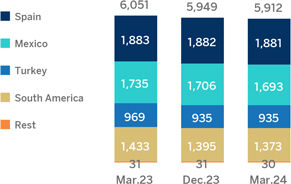
|
|||
|
|
||||
| NUMBER OF ATMS |
||||
|
|
||||
Translation of this report originally issued in Spanish. In the event of a discrepancy, the Spanish-language version prevails.
|
|
28 |
Highlights
| • | Growth in lending and customer funds in the quarter |
| • | Favorable evolution of the recurring income and improvement of the efficiency ratio |
| • | Recording of the tax on credit institutions corresponding to the fiscal year 2024 |
| • | Stability of the risk indicators |
|
BUSINESS ACTIVITY (1) (VARIATION COMPARED TO 31-12-23) |
NET INTEREST INCOME / AVERAGE TOTAL ASSETS (PERCENTAGE) |
|||
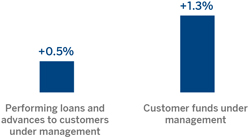
|
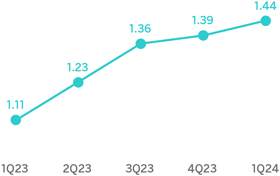
|
|||
(1) Excluding repos.
|
OPERATING INCOME (MILLIONS OF EUROS)
|
NET ATTRIBUTABLE PROFIT (LOSS) (MILLIONS OF EUROS) |
|||

|

|
|||
Translation of this report originally issued in Spanish. In the event of a discrepancy, the Spanish-language version prevails.
|
|
29 |
| FINANCIAL STATEMENTS AND RELEVANT BUSINESS INDICATORS (MILLIONS OF EUROS AND PERCENTAGE) |
|
|||||||||||
| Income statement | 1Q24 | Δ % | 1Q23 (1) | |||||||||
| Net interest income |
1,599 | 35.2 | 1,183 | |||||||||
| Net fees and commissions |
566 | 5.6 | 536 | |||||||||
| Net trading income |
205 | 71.6 | 120 | |||||||||
| Other operating income and expenses |
(209) | 85.9 | (112) | |||||||||
| Of which: Insurance activities |
97 | (2.4) | 99 | |||||||||
| Gross income |
2,162 | 25.2 | 1,726 | |||||||||
| Operating expenses |
(818) | 6.7 | (767) | |||||||||
| Personnel expenses |
(419) | 1.8 | (412) | |||||||||
| Other administrative expenses |
(305) | 17.0 | (260) | |||||||||
| Depreciation |
(94) | (0.7) | (94) | |||||||||
| Operating income |
1,344 | 40.0 | 960 | |||||||||
| Impairment on financial assets not measured at fair value through profit or loss |
(164) | 44.4 | (114) | |||||||||
| Provisions or reversal of provisions and other results |
(32) | 264.6 | (9) | |||||||||
| Profit (loss) before tax |
1,148 | 37.1 | 837 | |||||||||
| Income tax |
(423) | 38.2 | (306) | |||||||||
| Profit (loss) for the period |
725 | 36.5 | 532 | |||||||||
| Non-controlling interests |
(1) | 31.6 | (1) | |||||||||
| Net attributable profit (loss) |
725 | 36.5 | 531 | |||||||||
| (1) Restated balances. For more information, please refer to the “Business Areas” section. | ||||||||||||
| Balance sheets | 31-03-24 | Δ % | 31-12-23 | |||||||||
| Cash, cash balances at central banks and other demand deposits |
43,416 | (2.8) | 44,653 | |||||||||
| Financial assets designated at fair value |
147,143 | 0.7 | 146,136 | |||||||||
| Of which: Loans and advances |
69,202 | (1.5) | 70,265 | |||||||||
| Financial assets at amortized cost |
221,240 | 2.3 | 216,334 | |||||||||
| Of which: Loans and advances to customers |
174,094 | 0.5 | 173,169 | |||||||||
| Inter-area positions |
33,121 | (22.7) | 42,869 | |||||||||
| Tangible assets |
2,842 | (1.5) | 2,884 | |||||||||
| Other assets |
4,466 | (4.9) | 4,697 | |||||||||
| Total assets/liabilities and equity |
452,227 | (1.2) | 457,573 | |||||||||
| Financial liabilities held for trading and designated at fair value through profit or loss | 103,945 | (6.9) | 111,701 | |||||||||
| Deposits from central banks and credit institutions | 37,027 | (15.3) | 43,694 | |||||||||
| Deposits from customers | 227,410 | 4.7 | 217,235 | |||||||||
| Debt certificates | 54,059 | 5.0 | 51,472 | |||||||||
| Inter-area positions | — | — | — | |||||||||
| Other liabilities |
14,518 | (21.9) | 18,579 | |||||||||
| Regulatory capital allocated |
15,267 | 2.5 | 14,892 | |||||||||
| Relevant business indicators | 31-03-24 | Δ % | 31-12-23 | |||||||||
| Performing loans and advances to customers under management (2) |
170,611 | 0.5 | 169,712 | |||||||||
|
Non-performing loans |
8,262 | 0.9 | 8,189 | |||||||||
| Customer deposits under management (2) |
216,659 | 0.3 | 216,005 | |||||||||
|
Off-balance sheet funds (3) |
100,561 | 3.4 | 97,253 | |||||||||
| Risk-weighted assets |
122,056 | 0.2 | 121,779 | |||||||||
| Efficiency ratio (%) |
37.8 | 40.5 | ||||||||||
| NPL ratio (%) |
4.1 | 4.1 | ||||||||||
| NPL coverage ratio (%) |
55 | 55 | ||||||||||
| Cost of risk (%) |
0.38 | 0.37 | ||||||||||
(2) Excluding repos.
(3) Includes mutual funds, customer portfolios and pension funds.
Translation of this report originally issued in Spanish. In the event of a discrepancy, the Spanish-language version prevails.
|
|
30 |
Macro and industry trends
Financial indicators show dynamism in economic activity in general, but mostly in consumption and exports of services, that will favor a revision of BBVA Research’s forecast for GDP growth in 2024 from 1.5% to 2.1%. According to this, despite the fact that the growth could slow down from 2023, when GDP reached 2.5%, it will remain significantly above that of the Eurozone, partly due to factors such as gains in competitiveness in the services sector, migratory influxes and the effect of European recovery funds. On the other hand, annual inflation, which fell from particularly high values in 2022 to 3.2% in March 2024, is expected to remain close to this level during 2024.
As for the banking system, data at the end of February 2024 showed that the volume of credit to the private sector declined by 2.7% year-on-year. At the end of February, household and non-financial corporate loan portfolios fell by 1.8% and 3.9% year-on-year, respectively. Customer deposits increased by 4.3% year-on-year as of the end of February 2024, due to a 3.8% reduction in demand deposits, more than offset by the growth in time deposits (102.5% year-on-year). The NPL ratio stood at 3.62% in February 2024, practically the same as in the same month of the previous year. Furthermore, the system maintains comfortable solvency and liquidity levels.
Activity
The most relevant aspects related to the area’s activity during the first quarter of 2024 were:
| – | Lending activity grew slightly compared to the end of 2023 (+0.5%), mainly due to the dynamism in loans to large corporations (+4.9% in the first quarter of 2024). This evolution was partly offset by the deleveraging of smaller companies. On the other hand, mortgage loans remained flat during the quarter (+0.2%), with good levels of new production and supported by a slower pace of mortgage cancellations, and consumer loans ( +0.3% including credit cards) and loans to the public sector (+0.1%) also showed stability. |
| – | Regarding credit quality, the NPL ratio remains unchanged compared to the end of 2023 and stood at 4.1%, where increase in retail portfolios have been mitigated by the good wholesale trends and a portfolio sale. The NPL coverage ratio has remained at 55%, the same ratio as the registered by the end of 2023. |
| – | Total customer funds increased in the first quarter of the year (+1.3%), which is mainly explained by the increase in off-balance sheet funds (+3.4%), which registered positive net contributions, as well as a favorable market effect, and, to a lesser extent, by the growth in time deposits (+18.1%). |
Results
Spain generated a net attributable profit of €725m in the first quarter of 2024, 36.5% higher than in the same period of the previous year, mainly supported by the favorable evolution of the net interest income, and to a lesser extent, by the net trading income (NTI).
The most relevant aspects of the year-on-year changes in the area’s income statement at the end of March 2024 were:
| – | Net interest income increased 35.2%, mainly due to the increase in the customer spread in a context of higher benchmark interest rates compared to the first quarter of 2023. |
| – | Net fees and commissions grew by 5.6% compared to the first quarter of 2023, favored by the contribution of revenues associated with asset management, insurance and securities, as well as CIB operations. |
| – | Growth in the NTI contribution (+71.6%), mainly supported by the management of the portfolios. |
| – | The other operating income and expenses line includes the total annual estimated amount for the temporary tax on credit institutions and financial credit institutions for year 2024 of €285m, which is €60m higher than that registered in the same period of the previous year. |
| – | Operating expenses increased by 6.7%, mainly due to an increase in general expenses, as a result of inflation, especially higher IT expenses. This increase of operating expenses is well under the gross income increase (+25.2%), which allowed for a very significant improvement of the efficiency ratio by 658 basis points in the last twelve months. |
| – | Impairment on financial assets increased by 44.4%, mainly due to higher recurrent flows in retail portfolios in the face of high rates. As a result of the above, the cumulative cost of risk at the end of March 2024 stood at 0.38%, remaining stable in comparison with the cumulative cost of risk by the end of 2023 (+1 basis points). |
Translation of this report originally issued in Spanish. In the event of a discrepancy, the Spanish-language version prevails.
|
|
31 |
Highlights
| ● | Dynamism of credit activity in the retail segment |
| ● | Recurring revenue growth |
| ● | Stability of the efficiency ratio |
| ● | Quarterly net attributable profit continues at high levels |
| BUSINESS ACTIVITY (1) (VARIATION AT CONSTANT EXCHANGE RATE COMPARED TO 31-12-23) |
NET INTEREST INCOME / AVERAGE TOTAL ASSETS (PERCENTAGE AT CONSTANT EXCHANGE RATE) |
|||
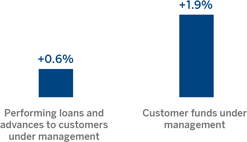
|

|
|||
| (1) Excluding repos.
|
||||
| OPERATING INCOME (MILLIONS OF EUROS AT CONSTANT EXCHANGE RATE) |
|
NET ATTRIBUTABLE PROFIT (LOSS) (MILLIONS OF EUROS AT CONSTANT EXCHANGE RATE) | ||
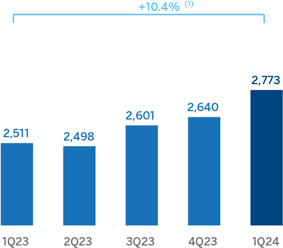
|
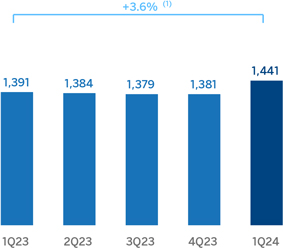
|
|||
| (1) At current exchange rate: +20.0%. |
(1) At current exchange rate: +12.6%. |
|||
Translation of this report originally issued in Spanish. In the event of a discrepancy, the Spanish-language version prevails.
|
|
32 |
| FINANCIAL STATEMENTS AND RELEVANT BUSINESS INDICATORS (MILLIONS OF EUROS AND PERCENTAGE) |
||||||||||||||||
| Income statement | 1Q24 | Δ % | Δ % (2) | 1Q23 (1) | ||||||||||||
| Net interest income |
2,999 | 15.8 | 6.5 | 2,589 | ||||||||||||
| Net fees and commissions |
642 | 33.0 | 22.4 | 483 | ||||||||||||
| Net trading income |
213 | 43.2 | 31.8 | 149 | ||||||||||||
| Other operating income and expenses |
113 | 32.6 | 22.0 | 86 | ||||||||||||
| Gross income |
3,967 | 20.0 | 10.4 | 3,306 | ||||||||||||
| Operating expenses |
(1,194) | 19.9 | 10.3 | (996) | ||||||||||||
| Personnel expenses |
(568) | 24.8 | 14.8 | (455) | ||||||||||||
| Other administrative expenses |
(498) | 15.3 | 6.1 | (432) | ||||||||||||
| Depreciation |
(127) | 17.4 | 8.0 | (109) | ||||||||||||
| Operating income |
2,773 | 20.0 | 10.4 | 2,311 | ||||||||||||
| Impairment on financial assets not measured at fair value through profit or loss |
(752) | 36.9 | 26.0 | (549) | ||||||||||||
| Provisions or reversal of provisions and other results |
(12) | n.s. | n.s. | (1) | ||||||||||||
| Profit (loss) before tax |
2,009 | 14.1 | 5.0 | 1,760 | ||||||||||||
| Income tax |
(568) | 18.1 | 8.7 | (481) | ||||||||||||
| Profit (loss) for the period |
1,441 | 12.6 | 3.6 | 1,280 | ||||||||||||
| Non-controlling interests |
(0) | 10.7 | 1.8 | (0) | ||||||||||||
| Net attributable profit (loss) |
1,441 | 12.6 | 3.6 | 1,279 | ||||||||||||
(1) Restated balances. For more information, please refer to the “Business Areas” section.
| Balance sheets | 31-03-24 | Δ % | Δ % (2) | 31-12-23 | ||||||||||||
| Cash, cash balances at central banks and other demand deposits |
11,577 | 14.7 | 9.8 | 10,089 | ||||||||||||
| Financial assets designated at fair value |
63,973 | 6.0 | 1.4 | 60,379 | ||||||||||||
| Of which: Loans and advances |
3,080 | (40.5) | (43.1) | 5,180 | ||||||||||||
| Financial assets at amortized cost |
101,063 | 4.9 | 0.4 | 96,342 | ||||||||||||
| Of which: Loans and advances to customers |
92,776 | 5.3 | 0.8 | 88,112 | ||||||||||||
| Tangible assets |
2,469 | 3.5 | (1.0) | 2,387 | ||||||||||||
| Other assets |
5,594 | 30.3 | 24.7 | 4,293 | ||||||||||||
| Total assets/liabilities and equity |
184,677 | 6.4 | 1.9 | 173,489 | ||||||||||||
| Financial liabilities held for trading and designated at fair value through profit or loss |
35,252 | 23.7 | 18.4 | 28,492 | ||||||||||||
| Deposits from central banks and credit institutions |
10,177 | 16.5 | 11.4 | 8,739 | ||||||||||||
| Deposits from customers |
93,566 | 1.1 | (3.3) | 92,564 | ||||||||||||
| Debt certificates |
10,758 | 10.7 | 5.9 | 9,719 | ||||||||||||
| Other liabilities |
22,922 | 0.7 | (3.6) | 22,756 | ||||||||||||
| Regulatory capital allocated |
12,002 | 7.0 | 2.4 | 11,218 | ||||||||||||
| Relevant business indicators | 31-03-24 | Δ% | Δ% (2) | 31-12-23 | ||||||||||||
| Performing loans and advances to customers under management (3) |
93,275 | 5.2 | 0.6 | 88,688 | ||||||||||||
| Non-performing loans |
2,673 | 8.1 | 3.5 | 2,472 | ||||||||||||
| Customer deposits under management (3) |
92,321 | 1.5 | (2.8) | 90,926 | ||||||||||||
| Off-balance sheet funds (4) |
61,154 | 14.8 | 9.9 | 53,254 | ||||||||||||
| Risk-weighted assets |
97,517 | 6.2 | 1.6 | 91,865 | ||||||||||||
| Efficiency ratio (%) |
30.1 | 30.9 | ||||||||||||||
| NPL ratio (%) |
2.7 | 2.6 | ||||||||||||||
| NPL coverage ratio (%) |
119 | 123 | ||||||||||||||
| Cost of risk (%) |
3.27 | 2.96 | ||||||||||||||
(2) At constant exchange rate.
(3) Excluding repos.
(4) Includes mutual funds, customer portfolios and other off-balance sheet funds.
Translation of this report originally issued in Spanish. In the event of a discrepancy, the Spanish-language version prevails.
|
|
33 |
Macro and industry trends
After expanding at a relatively high rate during the first three quarters of 2023, growth has moderated in the last months of the year. Nonetheless, GDP has increased 3.2% in 2023, mostly due to the dynamism of private consumption, the resilience of the manufacturing sector, the effects on private investment of the prospects for nearshoring of industrial production outside of China and the impact of higher public spending on the construction sector, in an environment of growth in the United States. According to BBVA Research, GDP could grow around 2.5% in 2024 (40 basis points below the previous forecasts). Annual inflation eased through 2023 and early 2024, reaching 4.4% in March, and it will probably continue to gradually moderate in the coming quarters, converging to around 3.9% in December 2024. Policy rates, which stood at 11.00% in April 2024 after a cut of 25 basis points in the previous month, are expected to continue decrease to around 9.25% by the end of the year.
With respect to the banking system, at the end of February 2024, the volume of outstanding credit to the non-financial private sector increased by 8,1% in year-on-year terms, with a greater boost from the consumer portfolio (+15.9%), followed by mortgages (+9.2%) and loans to business (+7.0%). Growth in total (demand and time) deposits remains at similar levels to those of total credit, with a year-on-year growth of 8.4% at the end of January 2024, with greater dynamism in time deposits (+13.7% year-on-year) than in demand deposits (+8.0% year-on-year). The industry’s non-performing loans remained stable at around 2.11% and capital ratios are at comfortable levels.
Unless expressly stated otherwise, all the comments below on rates of change, for both activity and results, will be given at constant exchange rate. These rates, together with changes at current exchange rates, can be found in the attached tables of financial statements and relevant business indicators.
Activity
The most relevant aspects related to the area’s activity in the first quarter of 2024 were:
| – | Lending activity (performing loans under management) grew by 0.6% between January and March 2024, with greater dynamism in the retail portfolio, which grew at a rate of 2.4%. This evolution is supported by the increase in consumer credits (+4.3%, driven by the product “Nómina y Personales BBVA”), mortgage loans (+2.1%) and SMEs (+3.4%). As a result, the weight of the retail portfolio, which is the most profitable for BBVA Mexico, stood at 53.4% at the end of March 2024. |
| – | With regard to the asset quality indicators, the NPL ratio stood at 2.7% at the end of March 2024, which represents a growth of 7 basis points compared to the end of the 2023, affected by a lower dynamism of the wholesale portfolio. On the other hand, the NPL coverage ratio decreased to 119% at the end of March 2024, mainly explained by the evolution of the wholesale portfolio. |
| – | Customer deposits under management increased by 1.9%, favored by the growth of off-balance sheet funds, which increased by 9.9% in the first three months of 2024. |
Results
In Mexico, BBVA achieved a cumulative net attributable profit of €1,441m by the end of March 2024, representing an increase of 3.6% compared to the same period of the previous year, mainly as a result of the strength of the recurring income from the banking business.
The most relevant aspects of the year-on-year changes in the income statement as of the end of March 2024 are summarized below:
| – | Net interest income increased (+6.5%), as a result of growth in lending activity and a higher securities portfolio yield. For its part, the customer spread continues benefiting from a higher bias towards retail portfolios, despite the increase in the cost of funding. |
| – | Net fees and commissions, boosted by greater transactions, continued to increase at double digit (+22.4%), with favorable evolution in almost all commissions types, highlighting credit cards, those derived from mutual funds management and from wholesale activity. |
| – | The contribution from NTI increased (+31.8%) mainly as a result of the performance of Global Markets. |
| – | The other operating income and expenses line grew by 22.0%, driven by the evolution of the insurance business. |
| – | Operating expenses increased (+10.3%), mainly originated in higher personnel expenses linked to the workforce increase over 2023 and, to a lesser extent, in the increase of general expenses, particularly technology expenditure. |
| – | Loan-loss provisions increased (+26.0%), mainly due to the higher provisioning needs of the retail portfolio, mainly in consumer and credit cards, partially affected by the growth of these segments. Consequently, the cumulative cost of risk at the end of March 2024 stood at 3.27%, which represents a growth of 31 basis points compared to the one registered at the end of December 2023. |
Translation of this report originally issued in Spanish. In the event of a discrepancy, the Spanish-language version prevails.
|
|
34 |
Highlights
| ● | Growth in lending and customer funds |
| ● | NPL ratio improvement |
| ● | Favorable year-on-year evolution of recurring income |
| ● | Lower hyperinflation impact |
| BUSINESS ACTIVITY (1) (VARIATION AT CONSTANT EXCHANGE RATE COMPARED TO 31-12-23) |
NET INTEREST INCOME / AVERAGE TOTAL ASSETS (PERCENTAGE AT CONSTANT EXCHANGE RATE) |
|||
|
(1) Excluding repos. |
|
|||
| OPERATING INCOME (MILLIONS OF EUROS AT CURRENT EXCHANGE RATE) |
|
NET ATTRIBUTABLE PROFIT (LOSS) (MILLIONS OF EUROS AT CURRENT EXCHANGE RATE) |
||
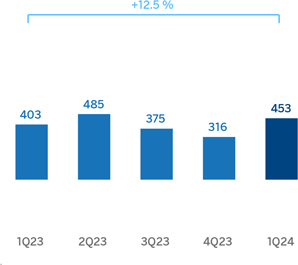
|
|
|||
Translation of this report originally issued in Spanish. In the event of a discrepancy, the Spanish-language version prevails.
|
|
35 |
| FINANCIAL STATEMENTS AND RELEVANT BUSINESS INDICATORS (MILLIONS OF EUROS AND PERCENTAGE) |
||||||||||||||||
| Income statement | 1Q24 | Δ % | Δ % (2) | 1Q23 (1) | ||||||||||||
| Net interest income |
277 | (55.7) | (27.2) | 626 | ||||||||||||
| Net fees and commissions |
423 | 145.9 | n.s. | 172 | ||||||||||||
| Net trading income |
316 | 41.1 | 131.0 | 224 | ||||||||||||
| Other operating income and expenses |
(119) | (46.1) | (70.3) | (220) | ||||||||||||
| Gross income |
897 | 11.9 | n.s. | 802 | ||||||||||||
| Operating expenses |
(444) | 11.3 | 79.3 | (399) | ||||||||||||
| Personnel expenses |
(254) | 21.7 | 100.5 | (209) | ||||||||||||
| Other administrative expenses |
(146) | (5.5) | 55.6 | (154) | ||||||||||||
| Depreciation |
(45) | 23.2 | 62.3 | (36) | ||||||||||||
| Operating income |
453 | 12.5 | n.s. | 403 | ||||||||||||
| Impairment on financial assets not measured at fair value through profit or loss |
(75) | 26.5 | 109.1 | (59) | ||||||||||||
| Provisions or reversal of provisions and other results |
36 | n.s. | n.s. | (16) | ||||||||||||
| Profit (loss) before tax |
413 | 26.4 | n.s. | 327 | ||||||||||||
| Income tax |
(244) | n.s. | n.s. | (5) | ||||||||||||
| Profit (loss) for the period |
170 | (47.3) | n.s. | 322 | ||||||||||||
| Non-controlling interests |
(26) | (43.0) | n.s. | (45) | ||||||||||||
| Net attributable profit (loss) |
144 | (48.0) | n.s. | 277 | ||||||||||||
(1) Restated balances. For more information, please refer to the “Business Areas” section.
| Balance sheets | 31-03-24 | Δ% | Δ% (2) | 31-12-23 | ||||||||||||
| Cash, cash balances at central banks and other demand deposits |
8,187 | (15.6) | (9.7) | 9,700 | ||||||||||||
| Financial assets designated at fair value |
3,943 | 6.8 | 14.3 | 3,692 | ||||||||||||
| Of which: Loans and advances |
2 | (2.6) | 4.2 | 2 | ||||||||||||
| Financial assets at amortized cost |
55,727 | 8.1 | 15.7 | 51,543 | ||||||||||||
| Of which: Loans and advances to customers |
39,636 | 5.9 | 13.4 | 37,416 | ||||||||||||
| Tangible assets |
1,630 | 9.0 | 14.2 | 1,496 | ||||||||||||
| Other assets |
1,901 | 0.1 | 6.9 | 1,899 | ||||||||||||
| Total assets/liabilities and equity |
71,389 | 4.5 | 11.8 | 68,329 | ||||||||||||
| Financial liabilities held for trading and designated at fair value through profit or loss |
1,919 | 2.2 | 9.3 | 1,878 | ||||||||||||
| Deposits from central banks and credit institutions |
2,116 | (8.3) | (1.8) | 2,306 | ||||||||||||
| Deposits from customers |
52,676 | 4.0 | 11.3 | 50,651 | ||||||||||||
| Debt certificates |
3,115 | 13.8 | 21.8 | 2,737 | ||||||||||||
| Other liabilities |
4,422 | 2.4 | 8.7 | 4,319 | ||||||||||||
| Regulatory capital allocated |
7,143 | 11.0 | 18.7 | 6,438 | ||||||||||||
| Relevant business indicators | 31-03-24 | Δ% | Δ% (2) | 31-12-23 | ||||||||||||
| Performing loans and advances to customers under management (3) |
39,546 | 5.9 | 13.4 | 37,339 | ||||||||||||
| Non-performing loans |
1,896 | (3.5) | 3.3 | 1,965 | ||||||||||||
| Customer deposits under management (3) |
50,388 | 2.2 | 9.3 | 49,321 | ||||||||||||
| Off-balance sheet funds (4) |
9,988 | 28.6 | 37.6 | 7,768 | ||||||||||||
| Risk-weighted assets |
58,558 | 7.4 | 14.9 | 54,506 | ||||||||||||
| Efficiency ratio (%) |
49.5 | 47.0 | ||||||||||||||
| NPL ratio (%) |
3.4 | 3.8 | ||||||||||||||
| NPL coverage ratio (%) |
96 | 97 | ||||||||||||||
| Cost of risk (%) |
0.77 | 0.25 | ||||||||||||||
(2) At constant exchange rate.
(3) Excluding repos.
(4) Includes mutual funds and pension funds.
Translation of this report originally issued in Spanish. In the event of a discrepancy, the Spanish-language version prevails.
|
|
36 |
Macro and industry trends
Since the general elections held in May 2023, there are increasing signs of normalization in economic policy in general, and monetary policy in particular, which point to a gradual reversal of the current macroeconomic distortions. Thus, benchmark interest rates have increased from 8.5% at the beginning of 2023 to 50% in March 2024, and new countercyclical measures could be implemented in the next months in order to try to control inflation, which reached 68.5% in March 2024 on year-on-year terms, and allow for more stability of the Turkish lira. Economic growth is expected to moderate from 4.5% in 2023 to 3.5% in 2024 (unchanged from the previous forecasts), supported by a still expansive fiscal policy. Despite the uncertainty, it is likely that the pace of GDP growth will moderate, eventually easing the pressures on inflation, which will however remain at relatively high levels.
As for the Turkish banking system, the effect of inflation remains strong. Total lending in the system increased 53.3% on a year-on-year basis as of February 2024, at similar levels to the previous months. The credit stock continues to be driven by the increase of consumer finance and credit cards (+69.83% year-on-year) while credit to businesses grew slightly less (+50.26% year-on-year). Total deposits maintain their strength from the previous months and increased at the end of February by 60.2% on a year-on-year basis. The growth of Turkish lira deposits remains strong in the same month (+64.9%), while U.S. dollar deposits grew more slowly (+53.8%), but faster than in previous quarters, due to the easing from the central bank of several rules that promoted deposits in the local currency. Despite this, dollarization decreased to 40,4% in February 2024 versus 42.1% a year earlier. The system’s NPL ratio has continued falling in the last months and as of February 2024 it was of 1.67% (40 basis points lower than in the same month of 2023). Capital indicators remained at more than comfortable levels on the same date.
Unless expressly stated otherwise, all comments below on rates of changes for both activity and results, will be presented at constant exchange rates. These rates, together with changes at current exchange rates, can be observed in the attached tables of the financial statements and relevant business indicators. For the conversion of these figures, the end of period exchange rate as of March 31, 2024 is used, reflecting the considerable depreciation by the Turkish lira in the last twelve months. Likewise, the Balance sheet, the Risk-Weighted Asset (RWA) and the equity are affected.
Activity
The most relevant aspects related to the area’s activity10 in the first quarter of 2024 were:
| – | Lending activity (performing loans under management) increased by 13.4%, mainly driven by the growth in Turkish lira loans (+15.6%) and, to a lesser extent, by the growth of foreign currency loans (+1.9%). Within loans in Turkish liras, the evolution of credit cards (+19.1%) and of consumer loans (+13.7%) stand out. |
| – | In terms of asset quality, the NPL ratio decreased 36 basis points from that at the end of December 2023 to 3.4%, and 88 basis points compared to the figure as of the end of March 2023, mainly as a result of the growth in activity, the sale of a retail portfolio and the positive dynamics in the wholesale portfolio in recoveries and repayments, which offset higher net entries in the retail portfolio. The NPL coverage ratio recorded a decrease of 118 basis points in the quarter to 96% as of March 31, 2024. |
| – | Customer deposits increased by 9.3%, mainly thanks to the performance of demand deposits in U.S. dollars (+8.2%), whose demand increased before the local elections taking place in March and, to a lesser extent, to the growth in Turkish lira deposits (+3.3%). Additionally, off-balance sheet funds had a remarkable evolution (+37.6%). |
Results
Turkey generated a net attributable profit of €144m during the first quarter of 2024, which compares positively with the accumulated result reached at the end of March 2023 at constant exchange rate, both periods reflecting the impact of the application of hyperinflation accounting.
As mentioned above, the year-on-year comparison of the accumulated income statement at the end of March 2024 at current exchange rate is affected by the strong depreciation of the Turkish lira in the last year (-40.3%). Excluding this effect, the highlights of the results for the year at constant exchange rate are summarized below:
| – | Net interest income recorded a year-on-year fall, mainly due to the decline in the Turkish lira spread and greater wholesale funding costs, partially offset by the growth in Turkish lira loans and, as a novelty, the remuneration of certain reserves in Turkish lira from the central bank. |
| – | Net fees and commissions increased significantly, favored by the performance in payment systems fees, brokerage activity, guarantees and asset management. |
| – | NTI showed an excellent evolution thanks to higher results from derivatives, as well as to the increase in the results of the Global Markets unit and in foreign exchange operations. |
| – | The other operating income and expenses line showed a balance of €-119m, which compares favorably with the previous year. This line includes, among others, the loss in the value of the net monetary position due to the country’s inflation rate, which stood below the loss recorded in the first quarter of 2023, partially offset by the income derived from inflation-linked bonds (CPI linkers). It is also worth highlighting the improved performance of the results of Garanti BBVA´s subsidiaries, also included in this line. |
| – | Operating expenses increased, mainly due to the growth in personnel expenses, linked to the growth in the workforce in 2023 and, to a lesser extent, to the increase in general expenses, highlighting the higher technology expenditure. |
10 The variation rates of loans in Turkish lira and loans in foreign currency (U.S. dollars) only refer to Garanti Bank. Thus they exclude the subsidiaries of Garanti BBVA, mainly in Romania and Netherlands.
Translation of this report originally issued in Spanish. In the event of a discrepancy, the Spanish-language version prevails.
|
|
37 |
| – | Regarding the impairment on financial assets, it increased due to both higher requirements in retail portfolios and to recoveries in the wholesale segment, which, despite continuing to be relevant in terms of credit quality and repayments improvement, have not been as high as in the first quarter of 2023. Thus, the cumulative cost of risk as of March 31, 2024 increased to 0.77%, a more standard level after an abnormally low level in 2023. |
| – | The provisions and other results line closed March 2024 with a release of 36 million euros, linked to remarkable recoveries in wholesale clients, which compare favorably with the previous year, due to the provisions constituted in the first quarter of 2023 as a result of the earthquake that affected an area in the south of Turkey. |
| – | Lastly, the tax expense of March 2023 included the initial positive impact due to a legal change with regard to the revaluation, from the fiscal point of view, of real estate and other depreciable fixed assets of Garanti BBVA AS, which generated a credit in the corporate income tax rate registered at the time. |
Translation of this report originally issued in Spanish. In the event of a discrepancy, the Spanish-language version prevails.
|
|
38 |
Highlights
| • | Growth in lending activity and customer funds in the quarter |
| • | Favorable performance of recurring income |
| • | Year-on-year improvement in the efficiency of the area at constant exchange rates |
| • | Higher adjustment for hyperinflation in Argentina |
| BUSINESS ACTIVITY (1) (VARIATION AT CONSTANT EXCHANGE RATES COMPARED TO 31-12-23) |
|
NET INTEREST INCOME / AVERAGE TOTAL ASSETS (PERCENTAGE AT CONSTANT EXCHANGE RATES) |
||

|

|
|||
(1) Excluding repos.
| OPERATING INCOME (MILLIONS OF EUROS AT CURRENT EXCHANGE RATES) |
|
NET ATTRIBUTABLE PROFIT (LOSS) (MILLIONS OF EUROS AT CURRENT EXCHANGE RATES) |
||
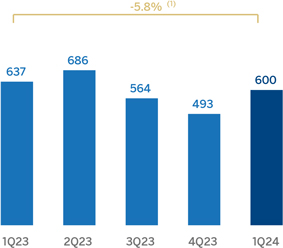
|

|
|||
| (1) At constant exchange rates: +64.8%. |
(1) At constant exchange rates: +54.6%. |
|||
Translation of this report originally issued in Spanish. In the event of a discrepancy, the Spanish-language version prevails.
|
|
39 |
| FINANCIAL STATEMENTS AND RELEVANT BUSINESS INDICATORS (MILLIONS OF EUROS AND PERCENTAGE) |
|
|||||||||||||||
| Income statement | 1Q24 | Δ % | Δ % (2) | 1Q23 (1) | ||||||||||||
| Net interest income |
1,555 | 30.7 | 95.2 | 1,190 | ||||||||||||
| Net fees and commissions |
193 | 4.7 | 26.5 | 184 | ||||||||||||
| Net trading income |
196 | 54.4 | 81.1 | 127 | ||||||||||||
| Other operating income and expenses |
(744) | 127.9 | 169.5 | (326) | ||||||||||||
| Gross income |
1,201 | 2.2 | 53.6 | 1,175 | ||||||||||||
| Operating expenses |
(600) | 11.7 | 43.8 | (537) | ||||||||||||
| Personnel expenses |
(273) | 8.4 | 44.1 | (252) | ||||||||||||
| Other administrative expenses |
(279) | 14.9 | 49.1 | (243) | ||||||||||||
| Depreciation |
(49) | 13.3 | 18.4 | (43) | ||||||||||||
| Operating income |
600 | (5.8) | 64.8 | 637 | ||||||||||||
| Impairment on financial assets not measured at fair value through profit or loss |
(354) | 55.7 | 75.2 | (227) | ||||||||||||
| Provisions or reversal of provisions and other results |
(45) | n.s. | n.s. | (9) | ||||||||||||
| Profit (loss) before tax |
201 | (49.8) | 27.5 | 401 | ||||||||||||
| Income tax |
(7) | (94.6) | (82.3) | (122) | ||||||||||||
| Profit (loss) for the period |
195 | (30.2) | 61.1 | 279 | ||||||||||||
| Non-controlling interests |
(75) | (23.4) | 72.6 | (98) | ||||||||||||
| Net attributable profit (loss) |
119 | (33.9) | 54.6 | 181 | ||||||||||||
(1) Restated balances. For more information, please refer to the “Business Areas” section.
| Balance sheets | 31-03-24 | Δ % | Δ % (2) | 31-12-23 | ||||||||||||
| Cash, cash balances at central banks and other demand deposits |
7,626 | 15.8 | 14.4 | 6,585 | ||||||||||||
| Financial assets designated at fair value |
9,823 | (6.5) | (7.8) | 10,508 | ||||||||||||
| Of which: Loans and advances |
114 | (80.7) | (81.0) | 592 | ||||||||||||
| Financial assets at amortized cost |
47,353 | 6.4 | 5.1 | 44,508 | ||||||||||||
| Of which: Loans and advances to customers |
42,762 | 3.8 | 2.3 | 41,213 | ||||||||||||
| Tangible assets |
1,132 | 20.6 | 19.5 | 939 | ||||||||||||
| Other assets |
2,785 | 24.4 | 24.2 | 2,239 | ||||||||||||
| Total assets/liabilities and equity |
68,719 | 6.1 | 4.8 | 64,779 | ||||||||||||
| Financial liabilities held for trading and designated at fair value through profit or loss |
2,587 | (21.4) | (22.7) | 3,289 | ||||||||||||
| Deposits from central banks and credit institutions |
5,136 | (0.1) | (0.1) | 5,140 | ||||||||||||
| Deposits from customers |
44,638 | 4.9 | 3.1 | 42,567 | ||||||||||||
| Debt certificates |
3,057 | 2.4 | 3.1 | 2,986 | ||||||||||||
| Other liabilities |
7,028 | 56.1 | 57.0 | 4,502 | ||||||||||||
| Regulatory capital allocated |
6,273 | (0.3) | (1.2) | 6,294 | ||||||||||||
| Relevant business indicators | 31-03-24 | Δ % | Δ % (2) | 31-12-23 | ||||||||||||
| Performing loans and advances to customers under management (3) |
42,489 | 3.6 | 2.2 | 41,013 | ||||||||||||
|
Non-performing loans |
2,448 | 6.3 | 4.8 | 2,302 | ||||||||||||
| Customer deposits under management (4) |
44,638 | 4.9 | 3.1 | 42,567 | ||||||||||||
|
Off-balance sheet funds (5) |
6,028 | 9.1 | 8.6 | 5,525 | ||||||||||||
| Risk-weighted assets |
52,360 | 6.6 | 5.3 | 49,117 | ||||||||||||
| Efficiency ratio (%) |
50.0 | 45.0 | ||||||||||||||
| NPL ratio (%) |
5.0 | 4.8 | ||||||||||||||
| NPL coverage ratio (%) |
86 | 88 | ||||||||||||||
| Cost of risk (%) |
3.11 | 2.51 | ||||||||||||||
(2) At constant exchange rate.
(3) Excluding repos.
(4) Excluding repos and including specific marketable debt securities.
(5) Includes mutual funds, customer portfolios in Colombia and Peru.
Translation of this report originally issued in Spanish. In the event of a discrepancy, the Spanish-language version prevails.
|
|
40 |
| SOUTH AMERICA. DATA PER COUNTRY (MILLIONS OF EUROS) |
|
|||||||||||||||||||||||||||||||
| Operating income | Net attributable profit (loss) | |||||||||||||||||||||||||||||||
| Country |
1Q24 | Δ % | Δ % (1) | 1Q23 (2) | 1Q24 | Δ % | Δ % (1) | 1Q23 (2) | ||||||||||||||||||||||||
| Argentina |
111 | (34.3) | n.s. | 169 | 34 | (33.2 | ) | n.s. | 51 | |||||||||||||||||||||||
| Colombia |
146 | 19.4 | (0.5) | 122 | 20 | (50.6 | ) | (58.8) | 40 | |||||||||||||||||||||||
| Peru |
285 | 11.1 | 10.8 | 256 | 42 | (24.3 | ) | (24.5) | 56 | |||||||||||||||||||||||
| Other countries (3) |
59 | (34.7) | (31.8) | 90 | 23 | (31.1 | ) | (30.2) | 34 | |||||||||||||||||||||||
| Total |
600 | (5.8) | 64.8 | 637 | 119 | (33.9 | ) | 54.6 | 181 | |||||||||||||||||||||||
(1) Figures at constant exchange rates.
(2) Restated balances. For more information, please refer to the “Business Areas” section.
(3) Chile (Forum), Uruguay and Venezuela. Additionally, it includes eliminations and other charges.
| SOUTH AMERICA. RELEVANT BUSINESS INDICATORS PER COUNTRY (MILLIONS OF EUROS) |
|
|||||||||||||||||||||||
| Argentina | Colombia | Peru | ||||||||||||||||||||||
| 31-03-24 | 31-12-23 | 31-03-24 | 31-12-23 | 31-03-24 | 31-12-23 | |||||||||||||||||||
| Performing loans and advances to customers under management (1) (2) |
2,857 | 2,175 | 17,203 | 17,235 | 17,863 | 17,563 | ||||||||||||||||||
| Non-performing loans (1) |
48 | 37 | 958 | 906 | 1,272 | 1,229 | ||||||||||||||||||
| Customer deposits under management (1) (3) |
5,129 | 3,910 | 18,356 | 18,174 | 17,226 | 17,317 | ||||||||||||||||||
| Off-balance sheet funds (1) (4) |
1,603 | 1,391 | 2,598 | 2,548 | 1,824 | 1,608 | ||||||||||||||||||
| Risk-weighted assets |
6,292 | 4,997 | 19,792 | 19,467 | 20,483 | 18,825 | ||||||||||||||||||
| Efficiency ratio (%) |
64.7 | 54.1 | 50.1 | 47.5 | 37.9 | 36.7 | ||||||||||||||||||
| NPL ratio (%) |
1.6 | 1.6 | 5.1 | 4.8 | 5.7 | 5.5 | ||||||||||||||||||
| NPL coverage ratio (%) |
140 | 136 | 86 | 89 | 82 | 84 | ||||||||||||||||||
| Cost of risk (%) |
4.57 | 2.18 | 2.85 | 2.13 | 3.40 | 3.04 | ||||||||||||||||||
(1) Figures at constant exchange rates.
(2) Excluding repos.
(3) Excluding repos and including specific marketable debt securities.
(4) Includes mutual funds and customer portfolios (in Colombia and Peru).
Unless expressly stated otherwise, all the comments below on rates of change, for both activity and results, will be given at constant exchange rates. These rates, together with the changes at current exchange rates, can be found in the attached tables of the financial statements and relevant business indicators.
Activity and results
The most relevant aspects related to the area’s activity during the first quarter of the year 2024 have been:
| – | Lending activity (performing loans under management) recorded a variation of +2.2%, mainly boosted by the momentum of corporate loans (+2.8%), credit cards (+7.0%) and mortgage loans (+2.2%). |
| – | With regard to asset quality, the NPL ratio stood at 5.0%, with an increase of 15 basis points in the quarter at the regional level as a result of NPL entries, mostly in the retail portfolio, affecting the NPL coverage ratio, which stood at 86%. |
| – | Customer funds under management increased by 3.7%, mainly due to the increase of low cost transactional funds, which are demand deposits (+3.4%) supported by higher balances of time deposits (+2.6%) and the evolution of off-balance sheet funds (+8.6 %). |
South America generated a cumulative net attributable profit of €119m at the end of the first quarter of 2024, which represents a year-on-year increase of +54.6%, driven by the good performance of recurring income (+84.1%) and the area’s NTI, which offset the increase in expenses and the more negative impact of “Other operating income and expenses”. This line mainly includes the impact of the adjustment for hyperinflation in Argentina, whose net monetary loss stood at €655m in the period from January-March 2024, which is higher than the €236m registered in the period from January-March 2023.
More detailed information on the most representative countries of the business area is provided below.
Translation of this report originally issued in Spanish. In the event of a discrepancy, the Spanish-language version prevails.
|
|
41 |
Argentina
Macro and industry trends
The new government substantially modified the economic policy framework and focused its efforts on a strong fiscal and monetary adjustment to reduce inflation. The reduction of fiscal deficit in the first months of the year, the relative currency stability observed after the significant depreciation of the Argentinean peso in December 2023, in a context of accumulation of international reserves, and the contraction of economic activity have allowed a recent moderation of the inflation measured monthly, which, however, still remains high. In spite of the uncertainty and related risks, it is likely, according to BBVA Research, that these factors, eventually complemented by additional measures in the context of the release of a more integral stabilization program, could set the bases for an inflation slowdown in the following months. On the other hand, although the sharp deterioration of economic activity could be reversed by mid-year if the adjustment plan is successful, it is expected that, after falling by 1.6% in 2023, GDP will be drop by 4.0% in 2024 (unchanged since the last forecast).
The banking system continues to grow at a stable pace but is affected by high inflation. At the end of February 2024, total credit had grown by 167% compared to the same month in 2023, favored by both consumer and corporate portfolios, which reached year-on-year growth rates of 147% and 200%, respectively. On the other hand, deposits continued the trend of the previous months and at the end of February had grown by 138% year-on-year at the end of February. Finally, the NPL ratio increased slightly to 3.5% as of January 2024 (30 basis points more than the same month in 2023).
Activity and results
| – | Between January and March 2024, performing loans under management increased by 31.3%, showing growth in both the wholesale portfolio (+35.0%) and the retail portfolio (+27.4%), highlighting in the latter the growth in credit cards (+24.6%). The NPL ratio stood at 1.6%, which represents a decrease of 2 basis points compared to the previous quarter, positively affected by activity growth. On the other hand, the NPL coverage ratio stood at 140%. |
| – | Balance sheet funds grew by 31.2% between January and March 2024, with growth of both demand deposits (+26.5%) and time deposits (+44.3%). Mutual funds also had a good performance (+15.3% in the same period). |
| – | The cumulative net attributable profit at the end of March 2024 stood at €34m. Net interest income continued to be driven by both higher activity and prices, offsetting the rising costs of funds. On the other hand, there was a more negative adjustment for hyperinflation (mainly reflected in the other operating income and expenses line) and higher expenses, both in personnel due to salary revisions, and general expenses. |
Colombia
Macro and industry trends
After a period of weakness in economic activity, during the year 2023 and to some extent also at the beginning of 2024, BBVA Research forecasts a recovery starting in the middle of this year. A further decrease in inflation, which reached 7.4% in March and would fall to around 5.4% in December, and in interest rates, from 12.25% in March to around 7.5% in December, would likely allow GDP growth to increase to 1.5% this year (unchanged from the previous forecast) from 0.6% in 2023.
Total credit growth for the banking system stood at 1.5% year-on-year in February 2024. As in previous months, system’s credit continues to be driven by the growth in corporate lending and mortgages at 2.2% and 8.9% respectively. Noteworthy is the slowdown in consumer credit, which changed from a year-on-year growth rate of 20% during 2022, to year-on-year decreases since October 2023. In February 2024, consumer credit has decreased by 3.6% compared to the same month in 2023.Total deposits showed a year-on-year growth rate of 6.7% at the end of February 2024, with a strong shift towards time deposits (up 16.4% year-on-year) and a fall in demand deposits (-0.9%). The NPL ratio of the system has climbed in recent months to 5.15% in February 2024, 103 basis points higher than in the same month of 2023.
Activity and results
| – | Lending activity remained practically stable compared to the end of 2023 (-0.2%), mainly due to the reduction in consumer loans by 1.9%, partially offset by the growth in both corporate (+1.0%) and mortgage loans (+0.5%). In terms of asset quality, the NPL ratio stood at 5.1%, increasing compared to the previous quarter (+26 basis points), affected by the activity deceleration and NPL inflows in the retail portfolio, mainly in the consumer portfolio. On the other hand, the NPL coverage ratio declined to 86% due to the new NPL inflows as mentioned. |
| – | In the first quarter of 2024, customer deposits increased by 1.0% compared to the end of 2023, mainly thanks to the favorable evolution of time deposits (+3.6%) and, to a lesser extent, off-balance sheet funds (+2.0%). |
| – | The cumulative net attributable profit at the end of March 2024 stood at €20m, that is 58.8% lower than the same period of the previous year. The significant growth of the net interest income (+17.3%) stands out, mainly explained by the increase of costumer spread, due to the improvement of the cost of funds. This situation was offset by NTI, which was penalized by the results from derivatives and fixed income, the operating expenses increase and greater needs for impairment on financial assets due to higher portfolios requirements. |
Translation of this report originally issued in Spanish. In the event of a discrepancy, the Spanish-language version prevails.
|
|
42 |
Peru
Macro and industry trends
In a context marked by adverse weather shocks and the effects of high inflation and of a contractionary monetary policy, GDP contracted by 0.6% in 2023. BBVA Research expects economic activity to gradually recover in 2024, as weather conditions become more favorable (there are signs that the “El Niño” phenomenon will be more moderate than previously expected), inflation, which peaked at 3.1% in March 2024, is expected to continue to decline to 2.6% in December, and interest rates are expected to be cut further from 6.0% in April to approximately 4.75% at year-end. In this context, GDP is expected to grow by around 2.7% this year (70 basis points over the previous forecast).
Total credit in the Peruvian banking system fell by 2.0% year-on-year in February 2024. Performance by portfolios is uneven, with the biggest slowdown in corporate lending, with a year-on-year contraction of 6.1%. In contrast, consumer finance remained buoyant, growing by 4.3% year-on-year as of February 2024, while the mortgage portfolio maintained a stable growth rate of around 5.3% year-on-year, in line with previous months. Total deposits in the system increased at the end of February 2024 by 2.0% year-on-year, showing a continued shift towards time deposits (+9.6% year-on-year) to the detriment of demand deposits (-1.9% year-on-year). The NPL ratio across the banking system rose very slightly to 4.43% since the end of 2023.
Activity and results
| – | Lending activity increased compared to the end of December 2023 (+1.7%), mainly due to the positive evolution of corporate loans (+1.8%, favored by CIB operations), and, to a lesser extent, consumer loans (+3.1%) and mortgages (+2.3%). In terms of credit quality indicators, the NPL ratio increased by 16 basis points in the quarter and stood at 5.7%, with entries mainly in the retail portfolio, credit cards and SMEs. On the other hand, the NPL coverage ratio stood at 82%, impacted by the increase in NPLs and write-offs. |
| – | Customers funds under management increased slightly during the first quarter of 2024 (+0.7%), boosted by the good performance of demand deposits (+2.2%) and by off-balance sheet funds (+13.5%). |
| – | BBVA Peru’s net attributable profit stood at €42m at the end of March 2024, 24.5% below the figure achieved at the end of the first quarter of 2023. Good performance of the net interest income, with an increasing customer spread, and of commissions, while the NTI performance was below the same period of the previous year, affected by a lower result from Global Markets. The increase of provisions for impairment of financial assets (+68.9%) stands out negatively, with higher requirements mainly due to the impairment of the retail portfolio. |
Translation of this report originally issued in Spanish. In the event of a discrepancy, the Spanish-language version prevails.
|
|
43 |
Highlights
| ● | Favorable evolution of lending activity and significant growth in customers funds |
| ● | Dynamism in the net interest income and NTI in the quarter |
| ● | The cost of risk remains at low levels |
| ● | Good performance of the efficiency ratio |
| BUSINESS ACTIVITY (1) (VARIATION AT CONSTANT EXCHANGE RATES COMPARED TO 31-12-23) |
|
NET INTEREST INCOME / AVERAGE TOTAL ASSETS (PERCENTAGE AT CONSTANT EXCHANGE RATES) |
||
|
(1) Excluding repos. |
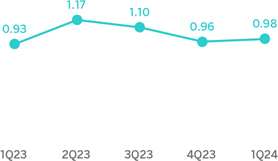
|
|||
| OPERATING INCOME (MILLIONS OF EUROS AT CONSTANT EXCHANGE RATES) |
NET ATTRIBUTABLE PROFIT (LOSS) (MILLIONS OF EUROS AT CONSTANT EXCHANGE RATES) |
|||
|
(1) At current exchange rates: +41.6%. |
(1) At current exchange rates: +29.2%. |
|||
Translation of this report originally issued in Spanish. In the event of a discrepancy, the Spanish-language version prevails.
|
|
44 |
| FINANCIAL STATEMENTS AND RELEVANT BUSINESS INDICATORS (MILLIONS OF EUROS AND PERCENTAGE) |
||||||||||||||||
| Income statement |
1Q24 | Δ % | Δ % (2) | 1Q23 (1) | ||||||||||||
| Net interest income |
157 | 38.6 | 38.2 | 113 | ||||||||||||
| Net fees and commissions |
67 | (2.4) | (3.0) | 69 | ||||||||||||
| Net trading income |
111 | 44.6 | 44.5 | 77 | ||||||||||||
| Other operating income and expenses |
1 | (23.1) | (28.2) | 1 | ||||||||||||
| Gross income |
336 | 29.3 | 28.9 | 260 | ||||||||||||
| Operating expenses |
(160) | 18.0 | 17.6 | (135) | ||||||||||||
| Personnel expenses |
(82) | 18.3 | 17.8 | (70) | ||||||||||||
| Other administrative expenses |
(70) | 17.1 | 16.8 | (60) | ||||||||||||
| Depreciation |
(7) | 24.9 | 24.2 | (6) | ||||||||||||
| Operating income |
176 | 41.6 | 41.2 | 124 | ||||||||||||
| Impairment on financial assets not measured at fair value through profit or loss |
(16) | (13.0) | (12.9) | (18) | ||||||||||||
| Provisions or reversal of provisions and other results |
— | (99.4) | (99.4) | 7 | ||||||||||||
| Profit (loss) before tax |
160 | 41.3 | 40.9 | 113 | ||||||||||||
| Income tax |
(40) | 97.8 | 97.1 | (20) | ||||||||||||
| Profit (loss) for the period |
121 | 29.2 | 28.8 | 93 | ||||||||||||
| Non-controlling interests |
— | — | — | — | ||||||||||||
| Net attributable profit (loss) |
121 | 29.2 | 28.8 | 93 | ||||||||||||
| (1) Restated balances. For more information, please refer to the “Business Areas” section. | ||||||||||||||||
| Balance sheets |
31-03-24 | Δ % | Δ % (2) | 31-12-23 | ||||||||||||
| Cash, cash balances at central banks and other demand deposits |
6,172 | 30.0 | 27.4 | 4,748 | ||||||||||||
| Financial assets designated at fair value |
10,528 | (32.0) | (33.4) | 15,475 | ||||||||||||
| Of which: Loans and advances |
9,817 | (33.6) | (35.0) | 14,783 | ||||||||||||
| Financial assets at amortized cost |
44,809 | 3.3 | 2.7 | 43,363 | ||||||||||||
| Of which: Loans and advances to customers |
40,858 | 3.9 | 3.2 | 39,322 | ||||||||||||
| Inter-area positions |
— | — | — | — | ||||||||||||
| Tangible assets |
156 | 3.2 | 2.2 | 151 | ||||||||||||
| Other assets |
894 | 66.6 | 64.5 | 537 | ||||||||||||
| Total assets/liabilities and equity |
62,559 | (2.7) | (3.7) | 64,274 | ||||||||||||
| Financial liabilities held for trading and designated at fair value through profit or loss |
9,693 | (34.6) | (36.0) | 14,831 | ||||||||||||
| Deposits from central banks and credit institutions |
2,294 | (25.6) | (26.1) | 3,085 | ||||||||||||
| Deposits from customers |
20,865 | 59.8 | 59.3 | 13,056 | ||||||||||||
| Debt certificates |
1,498 | 6.0 | 5.2 | 1,413 | ||||||||||||
| Inter-area positions |
22,176 | (16.2) | (17.0) | 26,466 | ||||||||||||
| Other liabilities |
1,700 | 38.0 | 37.3 | 1,232 | ||||||||||||
| Regulatory capital allocated |
4,332 | 3.4 | 2.6 | 4,191 | ||||||||||||
| Relevant business indicators |
31-03-24 | Δ % | Δ % (2) | 31-12-23 | ||||||||||||
| Performing loans and advances to customers under management (3) |
40,680 | 3.8 | 3.1 | 39,202 | ||||||||||||
| Non-performing loans |
433 | 17.7 | 17.7 | 368 | ||||||||||||
| Customer deposits under management (3) |
20,865 | 59.8 | 59.3 | 13,056 | ||||||||||||
| Off-balance sheet funds (4) |
581 | 2.7 | 2.7 | 566 | ||||||||||||
| Risk-weighted assets |
37,536 | 3.1 | 2.4 | 36,410 | ||||||||||||
| Efficiency ratio (%) |
47.6 | 53.1 | ||||||||||||||
| NPL ratio (%) |
0.7 | 0.7 | ||||||||||||||
| NPL coverage ratio (%) |
60 | 69 | ||||||||||||||
| Cost of risk (%) |
0.16 | 0.08 | ||||||||||||||
(2) At constant exchange rate.
(3) Excluding repos.
(4) Includes pension funds.
Translation of this report originally issued in Spanish. In the event of a discrepancy, the Spanish-language version prevails.
|
|
45 |
Unless expressly stated otherwise, all the comments below on rates of change, for both activity and results, will be given at constant exchange rates. These rates, together with the changes at current exchange rates, can be found in the attached tables of the financial statements and relevant business indicators. Comments that refer to Europe exclude Spain.
Activity
The most relevant aspects of the evolution of BBVA Group’s Rest of Business activity during the first quarter of 2024 were:
| – | Lending activity (performing loans under management) grew at a rate of 3.1%, mainly due to the evolution of corporate loans (+2.0%) and to the public sector (+95.3%). In respect of the geographical areas that compose this area, New York and Europe stood out for their good performance once again. |
| – | Compared to the end of 2023, the NPL ratio remained at 0.7%, and the coverage ratio fell by 60% affected by a NPL inflow from a particular customer. |
| – | Customer funds under management increased by 56.9% due to the performance of deposits in the European branches. On the other hand, off-balance-sheet customer funds registered a growth of 2.7%, originating in Europe as well. |
Results
Rest of Business achieved an accumulated net attributable profit of €121m during the first quarter of 2024, 28.8% higher than in the same period of the previous year, favored by the performance of the net interest income and the NTI, which offset the increase in operating expenses.
In the year-on-year evolution of the main lines of the area’s income statement at the end of March 2024, the following was particularly noteworthy:
| – | Net interest income increased by 38.2%. The performance of Europe and, to a lesser extent, of the New York branch, are particularly worthy of mention. |
| – | Net fees and commissions decreased by 3.0%, due to lower commissions from the Group’s businesses in Europe and despite the good performance of the commissions from the New York branch in the primary market. |
| – | The NTI grew by 44.5% supported by the good results of the commercial activity in Europe, especially in Credit and the income generated by foreign currency operations, as well as, to a lesser extent, by the business of the Group in the United States, where the evolution of the Equity trading positions stands out. |
| – | Increase in operating expenses of 17.6%, with growth mainly in Europe and in the New York branch. |
| – | The impairment on financial assets line at the end of March 2024 registered a provision of € -16m, mainly originated in Europe. |
Translation of this report originally issued in Spanish. In the event of a discrepancy, the Spanish-language version prevails.
|
|
46 |
| FINANCIAL STATEMENTS (MILLIONS OF EUROS AND PERCENTAGE) |
||||||||||||
| Income statement |
1Q24 | Δ % | 1Q23 (1) | |||||||||
| Net interest income |
(76) | 25.9 | (60) | |||||||||
| Net fees and commissions |
(4) | (2.8) | (4) | |||||||||
| Net trading income |
(269) | 4.4 | (258) | |||||||||
| Other operating income and expenses |
5 | (56.1) | 12 | |||||||||
| Gross income |
(344) | 10.7 | (311) | |||||||||
| Operating expenses |
(167) | (8.3) | (182) | |||||||||
| Personnel expenses |
(181) | 18.3 | (153) | |||||||||
| Other administrative expenses |
68 | 215.6 | 21 | |||||||||
| Depreciation |
(53) | 6.2 | (50) | |||||||||
| Operating income |
(511) | 3.7 | (493) | |||||||||
| Impairment on financial assets not measured at fair value through profit or loss |
1 | n.s. | 0 | |||||||||
| Provisions or reversal of provisions and other results |
36 | n.s. | (3) | |||||||||
| Profit (loss) before tax |
(474) | (4.3) | (495) | |||||||||
| Income tax |
129 | n.s. | (16) | |||||||||
| Profit (loss) for the period |
(345) | (32.5) | (511) | |||||||||
| Non-controlling interests |
(5) | 28.9 | (4) | |||||||||
| Net attributable profit (loss) |
(350) | (32.1) | (515) | |||||||||
| (1) Restated balances. For more information, please refer to the “Business Areas” section. | ||||||||||||
| Balance sheets |
31-03-24 | Δ % | 31-12-23 | |||||||||
| Cash, cash balances at central banks and other demand deposits |
630 | (7.9) | 684 | |||||||||
| Financial assets designated at fair value |
2,745 | 9.2 | 2,512 | |||||||||
| Of which: Loans and advances |
— | n.s. | — | |||||||||
| Financial assets at amortized cost |
4,098 | 13.2 | 3,622 | |||||||||
| Of which: Loans and advances to customers |
455 | 97.5 | 230 | |||||||||
| Inter-area positions |
— | — | — | |||||||||
| Tangible assets |
1,751 | 1.4 | 1,727 | |||||||||
| Other assets |
13,987 | (3.7) | 14,530 | |||||||||
| Total assets/liabilities and equity |
23,211 | 0.6 | 23,074 | |||||||||
| Financial liabilities held for trading and designated at fair value through profit or loss |
279 | 122.6 | 125 | |||||||||
| Deposits from central banks and credit institutions |
757 | (1.1) | 765 | |||||||||
| Deposits from customers |
204 | 12.4 | 181 | |||||||||
| Debt certificates |
1,140 | 200.4 | 380 | |||||||||
| Inter-area positions |
3,897 | (32.9) | 5,809 | |||||||||
| Other liabilities |
6,172 | 72.4 | 3,581 | |||||||||
| Regulatory capital allocated |
(45,016) | 4.6 | (43,033) | |||||||||
| Total equity |
55,778 | 0.9 | 55,265 | |||||||||
Translation of this report originally issued in Spanish. In the event of a discrepancy, the Spanish-language version prevails.
|
|
47 |
Results
The Corporate Center recorded a net attributable loss of €-350m between January and March of 2024, which is an improvement compared with the €-515m recorded in the same period of the previous year.
In the year-on-year evolution of the results of this aggregate, it is worth highlighting:
| – | Operating expenses of the Corporate Center have resulted to be more moderate, as a result of the increase in costs charged to the business areas related to technological projects developed at the corporate level, which represent income for this aggregate. |
| – | The provisions line reflects the positive impact of the reversal of the impairments for the investments in associated companies. |
| – | Lastly, the Corporate Center’s tax expense reflects the difference between the effective tax rate in the period for each business area and the Group’s expected tax rate for the year as a whole. The year-on-year comparison is affected by the tax expense of the first quarter of 2023, which included the positive one-off effect recorded in Turkey derived from a tax change in that country11. |
11 For more information on this matter, please refer to the information included in “Turkey”, within the “Business areas” section.
Translation of this report originally issued in Spanish. In the event of a discrepancy, the Spanish-language version prevails.
|
|
48 |
Additional pro forma information: Corporate & Investment Banking
Highlights
| ● | Increase in lending activity supported by IB&F and GTB |
| ● | Favorable evolution of recurring income and NTI |
| ● | Efficiency improvement and increased in business profitability |
| ● | Year-on-year increase in net attributable profit |
| BUSINESS ACTIVITY (1) (VARIATION AT CONSTANT EXCHANGE RATES COMPARED TO 31-12-23) |
|
GROSS INCOME / AVERAGE TOTAL ASSETS (PERCENTAGE AT CONSTANT EXCHANGE RATES) |
||
|
(1) Excluding repos. |
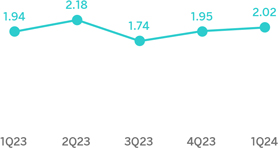
|
|||
| OPERATING INCOME (MILLIONS OF EUROS AT CONSTANT EXCHANGE RATES) |
NET ATTRIBUTABLE PROFIT (LOSS) (MILLIONS OF EUROS AT CONSTANT EXCHANGE RATES) |
|||
|
(1) At current exchange rates: +15.7%. |
(1) At current exchange rates: +25.7%. |
|||
The pro forma information of CIB does not include the application of hyperinflation accounting nor the wholesale business of the Group in Venezuela.
Translation of this report originally issued in Spanish. In the event of a discrepancy, the Spanish-language version prevails.
|
|
49 |
| FINANCIAL STATEMENTS AND RELEVANT BUSINESS INDICATORS (MILLIONS OF EUROS AND PERCENTAGE) | ||||||
| Income statement | 1Q24 | Δ % | Δ % (2) | 1Q23 (1) | ||||||||||||
| Net interest income |
571 | 14.1 | 31.8 | 500 | ||||||||||||
| Net fees and commissions |
308 | 11.7 | 19.4 | 276 | ||||||||||||
| Net trading income |
512 | 19.2 | 34.7 | 430 | ||||||||||||
| Other operating income and expenses |
(23) | (18.0) | (9.5) | (28) | ||||||||||||
| Gross income |
1,369 | 16.2 | 30.8 | 1,179 | ||||||||||||
| Operating expenses |
(359) | 17.4 | 22.1 | (306) | ||||||||||||
| Personnel expenses |
(169) | 18.4 | 21.3 | (143) | ||||||||||||
| Other administrative expenses |
(161) | 17.5 | 25.6 | (137) | ||||||||||||
| Depreciation |
(28) | 10.7 | 9.4 | (25) | ||||||||||||
| Operating income |
1,010 | 15.7 | 34.2 | 873 | ||||||||||||
| Impairment on financial assets not measured at fair value through profit or loss |
34 | n.s. | n.s. | (43) | ||||||||||||
| Provisions or reversal of provisions and other results |
(1) | n.s. | n.s. | 15 | ||||||||||||
| Profit (loss) before tax |
1,043 | 23.5 | 41.0 | 845 | ||||||||||||
| Income tax |
(309) | 24.0 | 42.3 | (249) | ||||||||||||
| Profit (loss) for the period |
734 | 23.3 | 40.5 | 595 | ||||||||||||
| Non-controlling interests |
(66) | 3.2 | 44.7 | (64) | ||||||||||||
| Net attributable profit (loss) |
668 | 25.7 | 40.0 | 531 | ||||||||||||
General note: For the translation of the income statement in those countries where hyperinflation accounting is applied, the punctual exchange rate as of March 31, 2024 is used.
(1) Restated balances. For more information, please refer to the “Business Areas” section.
| Balance sheets | 31-03-24 | Δ % | Δ % (2) | 31-12-23 | ||||||||||||
| Cash, cash balances at central banks and other demand deposits |
5,926 | 20.8 | 18.3 | 4,905 | ||||||||||||
| Financial assets designated at fair value |
160,532 | 0.7 | 0.1 | 159,372 | ||||||||||||
| Of which: Loans and advances |
80,058 | (4.8) | (5.2) | 84,126 | ||||||||||||
| Financial assets at amortized cost |
99,643 | 2.4 | 1.5 | 97,302 | ||||||||||||
| Of which: Loans and advances to customers |
81,550 | 4.1 | 3.2 | 78,354 | ||||||||||||
| Inter-area positions |
— | — | — | — | ||||||||||||
| Tangible assets |
141 | (0.1) | (1.9) | 141 | ||||||||||||
| Other assets |
13,008 | 22.2 | 18.1 | 10,646 | ||||||||||||
| Total assets/liabilities and equity |
279,250 | 2.5 | 1.6 | 272,366 | ||||||||||||
| Financial liabilities held for trading and designated at fair value through profit or loss |
119,616 | (8.0) | (8.4) | 130,081 | ||||||||||||
| Deposits from central banks and credit institutions |
38,832 | 36.2 | 35.4 | 28,502 | ||||||||||||
| Deposits from customers |
64,701 | 7.8 | 6.3 | 60,031 | ||||||||||||
| Debt certificates |
6,279 | 3.3 | 2.9 | 6,076 | ||||||||||||
| Inter-area positions |
32,395 | 7.4 | 7.4 | 30,172 | ||||||||||||
| Other liabilities |
5,719 | (22.1) | (22.1) | 7,343 | ||||||||||||
| Regulatory capital allocated |
11,709 | 5.3 | 5.3 | 11,115 | ||||||||||||
| Relevant business indicators | 31-03-24 | Δ % | Δ % (2) | 31-12-23 | ||||||||||||
| Performing loans and advances to customers under management (3) |
81,328 | 4.9 | 4.1 | 77,510 | ||||||||||||
| Non-performing loans |
930 | 2.8 | 7.2 | 905 | ||||||||||||
| Customer deposits under management (3) |
57,948 | 6.4 | 5.1 | 54,483 | ||||||||||||
| Off-balance sheet funds (4) |
4,188 | — | (2.9) | 4,189 | ||||||||||||
| Efficiency ratio (%) |
26.2 | 26.5 | ||||||||||||||
(2) At constant exchange rates.
(3) Excluding repos.
(4) Includes mutual funds, customer portfolios and other off-balance sheet funds.
Translation of this report originally issued in Spanish. In the event of a discrepancy, the Spanish-language version prevails.
|
|
50 |
Unless expressly stated otherwise, all the comments below on rates of change, for both activity and results, will be given at constant exchange rates. For the conversion of these figures in those countries in which accounting for hyperinflation is applied, the end of period exchange rate as of March 31, 2024 is used. These rates, together with changes at current exchange rates, can be found in the attached tables of financial statements and relevant business indicators.
Activity
The most relevant aspects related to the area’s activity in the first quarter of 2024 were:
| – | Rebound in lending activity (performing loans under management), which was higher than at the end of December 2023 (+4.1%), highlighting the favorable evolution of Investment Banking & Finance, especially in the New York branch, with relevant Project Finance and Corporate Lending operations, and of Global Transaction Banking. |
| – | Customer funds grew by 4.5% in the quarter, driven by the increase in volumes in an environment of narrowing margins, thanks to the contribution from Rest of Business and the New York branch. |
Results
CIB generated a net attributable profit of €668m between January and March of 2024. These results represent an increase of 40.0% on a year-on-year basis and reflect the contribution of the diversification of products and geographical areas, as well as the progress of the Group’s wholesale businesses in its strategy, leveraged on globality and sustainability, with the purpose of being relevant to its clients.12
All divisions have achieved good results, particularly highlighting the performance of Global Transaction Banking (GTB), especially in Mexico and Spain, the contribution of Global Markets supported by intense commercial activity and of Investment Banking & Finance (IB&F), with excellent activity in Project Finance in the Americas and Europe.
The most relevant aspects of the year-on-year evolution in the income statement of this aggregate are summarized below:
| – | Net interest income for the quarter was 31.8% higher than in the same period of the previous year, supported by the good evolution of the activity with growth in all geographical areas except for Mexico, Colombia and Peru. The positive evolution of GTB in Mexico, Spain and the United States stands out thanks to the preservation of volumes and customer spreads in loans and obtaining, furthermore, good factoring results. |
| – | Net fees and commissions increased 19.4%, with positive evolution in all businesses. The primary market issuance activity, the liquidity management in South America and relevant operations in Project Finance and Corporate Lending are noteworthy. |
| – | Excellent NTI evolution (+34.7%), mainly due to the performance of the Global Markets unit. Commercial activity showed significant growth in all areas, with Spain, México and Rest of Business standing out while the activity in emerging markets continues its positive evolution, even though a moderation of the year-on-year growth is observed. |
| – | Operating expenses increased by 22.1% due to new personnel hires carried out during 2023. On the other hand, general expenses continue to be affected by inflation and higher technology expenses linked to the execution of strategic projects for the area. Despite this, the efficiency ratio stood at 26.2%, which represents an improvement compared to the figure registered twelve months before. |
| – | Provisions for impairment on financial assets stood below the previous year, partly due to the releases in Mexico and Turkey. |
12 CIB results do not include the application of hyperinflation accounting.
Translation of this report originally issued in Spanish. In the event of a discrepancy, the Spanish-language version prevails.
|
|
51 |
Alternative Performance Measures (APMs)
BBVA presents its results in accordance with the International Financial Reporting Standards (EU-IFRS). Additionally, the Group also considers that some Alternative Performance Measures (hereinafter APMs) provide useful additional financial information that should be taken into account when evaluating performance. They are considered complementary information and do not replace the financial information drafted according to the EU-IFRS. These APMs are also used when making financial, operational and planning decisions within the Entity. The Group firmly believes that they give a true and fair view of its financial information. These APMs are generally used in the financial sector as indicators for monitoring the assets, liabilities and economic and financial situation of entities.
BBVA Group’s APMs are given below. They are presented in accordance with the European Securities and Markets Authority (ESMA) guidelines, published on October 5, 2015 (ESMA/2015/1415en). The guideline mentioned before is aimed at promoting the usefulness and transparency of APMs included in prospectuses or regulated information in order to protect investors in the European Union. In accordance with the indications given in the aforementioned guideline, BBVA Group’s APMs:
| – | Include clear and readable definitions of the APMs. |
| – | Disclose the reconciliations to the most directly reconcilable line item, subtotal or total presented in the financial statements of the corresponding period, separately identifying and explaining the material reconciling items. |
| – | Are standard measures generally used in the financial industry, so their use provides comparability in the analysis of performance between issuers. |
| – | Do not have greater preponderance than measures directly stemming from financial statements. |
| – | Are accompanied by comparatives for previous periods. |
| – | Are consistent over time. |
Other considerations
When comparing two dates or periods in this report, the impact of changes in the exchange rates against the euro of the currencies of the countries in which BBVA operates is sometimes excluded, assuming that exchange rates remain constant. This is done for the amounts in the income statement by using the average exchange rate against the euro in the most recent period for each currency13 of the geographical areas in which the Group operates, and applying it to both periods; for amounts in the balance sheet and activity, the closing exchange rates in the most recent period are used.
During the year 2023 and at the end of the first quarter of 2024, there were no corporate operations, non-recurring impacts or other types of adjustments for management purposes that determine an net attributable profit or a profit for the period different to that from the financial statements. For this reason, as there are no differences between the Consolidated Financial Statements and the consolidated management results statement, no reconciliation is presented for the periods disclosed in this report. For the same reason, the Group does not present among its Alternative Performance Measures shown below an adjusted profit for the period nor an adjusted net attributable profit, neither does it present the profitability ratios derived from them: i.e. adjusted ROE, adjusted ROTE, adjusted ROA and adjusted RORWA.
Within the revision and update process of these APMs, it has been determined that the dividend yield measure is not a relevant indicator for monitoring the economic-financial situation of BBVA Group.
ROE
The ROE (return on equity) ratio measures the accounting return obtained on an entity’s shareholders’ funds plus accumulated other comprehensive income. It is calculated as follows:
| Net attributable profit (loss) |
| Average shareholders’ funds + Average accumulated other comprehensive income |
Explanation of the formula: the numerator is the net attributable profit (loss) of the Group’s consolidated income statement. If the metric is presented on a date before the close of the fiscal year, the numerator will be annualized.
Average shareholders’ funds are the weighted moving average of the shareholders’ funds at the end of each month of the period analyzed, adjusted to take into account the execution of the “dividend-option” at the closing dates on which it was agreed to deliver this type of dividend prior to the publication of the Group´s results.
Average accumulated other comprehensive income is the moving weighted average of “Accumulated other comprehensive income”, which is part of the equity on the Entity’s balance sheet and is calculated in the same way as average shareholders’ funds (above).
Relevance of its use: this ratio is very commonly used not only in the banking sector but also in other sectors to measure the return obtained on shareholders’ funds.
13 With the exception of those countries whose economies have been considered hyperinflationary, for which the closing exchange rate of the most recent period will be used.
Translation of this report originally issued in Spanish. In the event of a discrepancy, the Spanish-language version prevails.
|
|
52 |
| ROE |
||||||||||||||
| Jan.-Mar.2024 | Jan.-Dec.2023 | Jan.-Mar.2023 | ||||||||||||
| Numerator (Millions of euros) |
= Annualized net attributable profit (loss) | 8,848 | 8,019 | 7,488 | ||||||||||
| Denominator (Millions of euros) |
+ Average shareholders’ funds | 68,130 | 65,907 | 64,967 | ||||||||||
| + Average accumulated other comprehensive income | (15,695) | (16,437) | (16,811) | |||||||||||
| = ROE | 16.9% | 16.2% | 15.5% | |||||||||||
ROTE
The ROTE (return on tangible equity) ratio measures the accounting return on an entity’s shareholders’ funds, plus accumulated other comprehensive income, and excluding intangible assets. It is calculated as follows:
| Net attributable profit (loss) |
| Average shareholders’ funds + Average accumulated other comprehensive income - Average intangible assets |
Explanation of the formula: the numerator “Net attributable profit (loss)” and the items in the denominator “Average intangible assets” and “Average accumulated other comprehensive income” are the same items and are calculated in the same way as explained for ROE.
Average intangible assets are the intangible assets on the Group’s consolidated balance sheet, including goodwill and other intangible assets. The average balance is calculated in the same way as explained for shareholders funds in ROE.
Relevance of its use: this metric is generally used not only in the banking sector but also in other sectors to measure the return obtained on shareholders’ funds, not including intangible assets.
| ROTE |
||||||||||||||
| Jan.-Mar.2024 | Jan.-Dec.2023 | Jan.-Mar.2023 | ||||||||||||
| Numerator (Millions of euros) |
= Annualized net attributable profit (loss) | 8,848 | 8,019 | 7,488 | ||||||||||
| Denominator (Millions of euros) |
+ Average shareholders’ funds | 68,130 | 65,907 | 64,967 | ||||||||||
| + Average accumulated other comprehensive income | (15,695 | ) | (16,437 | ) | (16,811 | ) | ||||||||
| - Average intangible assets | 2,357 | 2,254 | 2,170 | |||||||||||
| = ROTE | 17.7% | 17.0% | 16.3% | |||||||||||
ROA
The ROA (return on assets) ratio measures the accounting return obtained on an entity’s assets. It is calculated as follows:
| Profit (loss) for the period |
| Average total assets |
Explanation of the formula: the numerator is the profit (loss) for the period of the Group’s consolidated income statement. If the metric is presented on a date before the close of the fiscal year, the numerator must be annualized.
Average total assets are taken from the Group’s consolidated balance sheet. The average balance is calculated as explained for average shareholders’ funds in the ROE.
Relevance of its use: this ratio is generally used not only in the banking sector but also in other sectors to measure the return obtained on assets.
| ROA |
||||||||||||||
| Jan.-Mar.2024 | Jan.-Dec.2023 | Jan.-Mar.2023 | ||||||||||||
| Numerator (Millions of euros) |
Annualized profit (loss) for the period | 9,277 | 8,416 | 8,088 | ||||||||||
| Denominator (Millions of euros) |
Average total assets | 781,568 | 748,459 | 726,032 | ||||||||||
| = ROA | 1.19% | 1.12% | 1.11% | |||||||||||
Translation of this report originally issued in Spanish. In the event of a discrepancy, the Spanish-language version prevails.
|
|
53 |
RORWA
The RORWA (return on risk-weighted assets) ratio measures the accounting return obtained on average risk-weighted assets. It is calculated as follows:
| Profit (loss) for the period |
| Average risk-weighted assets |
Explanation of the formula: the numerator “Profit (loss) for the period” is the same and is calculated in the same way as explained for ROA.
Average risk-weighted assets (RWA) are the moving weighted average of the RWA at the end of each month of the period under analysis.
Relevance of its use: this ratio is generally used in the banking sector to measure the return obtained on RWA.
| RORWA |
||||||||||||||
| Jan.-Mar.2024 | Jan.-Dec.2023 | Jan.-Mar.2023 | ||||||||||||
| Numerator (Millions of euros) |
Annualized profit (loss) for the period | 9,277 | 8,416 | 8,088 | ||||||||||
| Denominator (Millions of euros) |
Average RWA | 371,411 | 353,139 | 342,154 | ||||||||||
| = RORWA | 2.50% | 2.38% | 2.36% | |||||||||||
Earning (loss) per share
The earning (loss) per share is calculated in accordance to the criteria established in the IAS 33 “Earnings per share”.
| Earning (loss) per share |
||||||||||||||
| Jan.-Mar.2024 | Jan.-Dec.2023 | Jan.-Mar.2023 | ||||||||||||
| (Millions of euros) |
+ Net attributable profit (loss) | 2,200 | 8,019 | 1,846 | ||||||||||
| (Millions of euros) |
- Remuneration related to the Additional Tier 1 securities (CoCos) | 87 | 345 | 74 | ||||||||||
| Numerator (millions of euros) |
= Net attributable profit (loss) ex.CoCos remuneration | 2,113 | 7,675 | 1,772 | ||||||||||
| Denominator (millions) |
+ Average number of shares outstanding | 5,838 | 5,988 | 6,030 | ||||||||||
| - Average treasury shares of the period | 13 | 5 | 9 | |||||||||||
| - Share buyback program (average) (1) | 10 | 28 | 2 | |||||||||||
| = Earning (loss) per share (euros) | 0.36 | 1.29 | 0.29 | |||||||||||
(1) The period January-March 2024 includes the average number of shares acquired until March 31, 2024, in execution of the share buyback program initiated on March 1, 2024. In the period January-December 2023 the average number of shares is included taking into account the two redemptions made corresponding to the programs announced in that year.
Additionally, for management purposes, the adjusted earning (loss) per share is presented. As observed in the relevant tables, there is no difference between the numerator and denominator of the Earning (loss) per share and the Adjusted Earning (loss) per share.
| Adjusted earning (loss) per share |
||||||||||||||
| Jan.-Mar.2024 | Jan.-Dec.2023 | Jan.-Mar.2023 | ||||||||||||
| Numerator (millions of euros) |
= Net Attributable profit (loss) ex.CoCos | 2,113 | 7,675 | 1,772 | ||||||||||
| Denominator (millions) |
+ Number of shares outstanding | 5,838 | 5,838 | 5,838 | ||||||||||
| - Average treasury shares of the period | 13 | 5 | 9 | |||||||||||
| - Shares buyback program (1) | 75 | |||||||||||||
| = Adjusted earning (loss) per share (euros) | 0.37 | 1.32 | 0.30 | |||||||||||
(1) The period January-March 2024 includes the total shares acquired in execution of the share buyback program initiated on March 1, 2024. In the periods January-March and January-December 2023 the two redemptions made corresponding to the programs announced in that year are considered.
Translation of this report originally issued in Spanish. In the event of a discrepancy, the Spanish-language version prevails.
|
|
54 |
Efficiency ratio
This measures the percentage of gross income consumed by an entity’s operating expenses. It is calculated as follows:
| Operating expenses |
| Gross income |
Explanation of the formula: both “Operating expenses” and “Gross income” are taken from the Group’s consolidated income statement. Operating expenses are the sum of the administration costs (personnel expenses plus other administrative expenses) plus depreciation. Gross income is the sum of net interest income, net fees and commissions, net trading income dividend income, share of profit or loss of entities accounted for using the equity method, other operating income and expenses, and income from assets and expenses from liabilities under insurance and reinsurance contracts. For a more detailed calculation of this ratio, the graphs on “Results” section of this report should be consulted, one of them with calculations with figures at current exchange rates and another with the data at constant exchange rates.
Relevance of its use: this ratio is generally used in the banking sector. In addition, it is the metric for one of the six Strategic Priorities of the Group.
| Efficiency ratio |
||||||||||||||
| Jan.-Mar.2024 | Jan.-Dec.2023 | Jan.-Mar.2023 | ||||||||||||
| Numerator (Millions of euros) |
+ Operating expenses | 3,383 | 12,308 | 3,016 | ||||||||||
| Denominator (Millions of euros) |
+ Gross income | 8,218 | 29,542 | 6,958 | ||||||||||
| = Efficiency ratio | 41.2% | 41.7% | 43.3% | |||||||||||
Book value per share
The book value per share determines the value of a company on its books for each share held. It is calculated as follows:
| Shareholders’ funds + Accumulated other comprehensive income |
| Number of shares outstanding - Treasury shares |
Explanation of the formula: the figures for both “Shareholders’ funds” and “Accumulated other comprehensive income” are taken from the balance sheet. Shareholders’ funds are adjusted to take into account the execution of the “dividend-option” at the closing dates on which it was agreed to deliver this type of dividend prior to the publication of the Group´s results. The denominator includes the final number of outstanding shares excluding own shares (treasury shares) and excluding the shares corresponding to share buyback programs. In addition, the denominator is also adjusted to include the capital increase resulting from the execution of the dividend options explained above. Both the numerator and the denominator take into account period-end balances.
Relevance of its use: it shows the company’s book value for each share issued. It is a generally used ratio, not only in the banking sector but also in others.
| Book value per share |
||||||||||||||||
| 31-03-24 | 31-12-23 | 31-03-23 | ||||||||||||||
| Numerator (Millions of euros) |
+ | Shareholders’ funds | 66,947 | 67,955 | 63,986 | |||||||||||
| + | Accumulated other comprehensive income | (14,944) | (16,254) | (16,195) | ||||||||||||
| Denominator (Millions of shares) |
+ | Number of shares outstanding | 5,838 | 5,838 | 6,030 | |||||||||||
| - | Treasury shares | 12 | 4 | 10 | ||||||||||||
| - | Share buyback program (1) | 75 | — | 65 | ||||||||||||
| = | Book value per share (euros / share) |
9.04 | 8.86 | 8.02 | ||||||||||||
(1) The period January-March 2024 includes the total shares acquired in execution of the share buyback program initiated on March 1, 2024.
Tangible book value per share
The tangible book value per share determines the value of the company on its books for each share held by shareholders in the event of liquidation. It is calculated as follows:
| Shareholders’ funds + Accumulated other comprehensive income - Intangible assets |
| Number of shares outstanding - Treasury shares |
Explanation of the formula: the figures for “Shareholders’ funds”, “Accumulated other comprehensive income” and “Intangible assets” are all taken from the balance sheet. Shareholders’ funds are adjusted to take into account the execution of the “Dividend-option” at the closing dates on which it was agreed to deliver this type of dividend prior to the publication of the Group´s results.
Translation of this report originally issued in Spanish. In the event of a discrepancy, the Spanish-language version prevails.
|
|
55 |
The denominator includes the final number of shares outstanding excluding own shares (treasury shares) and excluding the shares corresponding to share buyback programs which are deducted from the shareholders’ funds. In addition, the denominator is also adjusted to include the result of the capital increase resulting from the execution of the dividend options explained above. Both the numerator and the denominator take into account period-end balances.
Relevance of its use: it shows the company’s book value for each share issued, after deducting intangible assets. It is a generally used ratio, not only in the banking sector but also in others.
| Tangible book value per share |
||||||||||||||||
| 31-03-24 | 31-12-23 | 31-03-23 | ||||||||||||||
| Numerator (Millions of euros) |
+ |
Shareholders’ funds | 66,947 | 67,955 | 63,986 | |||||||||||
| + |
Accumulated other comprehensive income |
(14,944) | (16,254) | (16,195) | ||||||||||||
| - |
Intangible assets |
2,407 | 2,363 | 2,209 | ||||||||||||
| Denominator (Millions of shares) |
+ |
Number of shares outstanding | 5,838 | 5,838 | 6,030 | |||||||||||
| - |
Treasury shares |
12 | 4 | 10 | ||||||||||||
| - |
Share buyback program (1) |
75 | — | 65 | ||||||||||||
| = |
Tangible book value per share (euros / share) |
8.62 | 8.46 | 7.65 | ||||||||||||
(1) The period January-March 2024 includes the total shares acquired in execution of the share buyback program initiated on March 1, 2024.
Non-performing loan (NPL) ratio
It is the ratio between the risks classified for accounting purposes as non-performing loans and the total credit risk balance. It is calculated as follows:
| Non-performing loans |
| Total credit risk |
Explanation of the formula: non-performing loans and the credit risk balance are gross, meaning they are not adjusted by associated accounting provisions.
Non-performing loans are calculated as the sum of “loans and advances at amortized cost” and the “contingent risk” in stage 314 and the following counterparties:
| • | other financial entities |
| • | public sector |
| • | non-financial institutions |
| • | households. |
The credit risk balance is calculated as the sum of “Loans and advances at amortized cost” and “Contingent risk” in stage 1 + stage 2 + stage 3 of the previous counterparts.
This indicator is shown, as others, at a business area level.
Relevance of its use: this is one of the main indicators used in the banking sector to monitor the current situation and changes in credit risk quality, and specifically, the relationship between risks classified in the accounts as non-performing loans and the total balance of credit risk, with respect to customers and contingent liabilities.
| Non-Performing Loans (NPLs) ratio |
||||||||||||||||
| 31-03-24 | 31-12-23 | 31-03-23 | ||||||||||||||
| Numerator (Millions of euros) | NPLs | 15,716 | 15,305 | 14,141 | ||||||||||||
| Denominator (Millions of euros) | Credit Risk | 462,457 | 448,840 | 428,423 | ||||||||||||
| = | Non-Performing Loans (NPLs) ratio | 3.4% | 3.4% | 3.3% | ||||||||||||
NPL coverage ratio
This ratio reflects the degree to which the impairment of non-performing loans has been covered in the accounts via allowances. It is calculated as follows:
| Provisions |
| Non-performing loans |
Explanation of the formula: it is calculated as “Provisions” from stage 1 + stage 2 + stage 3, divided by non-performing loans, formed by “credit risk” from stage 3.
14 IFRS 9 classifies financial instruments into three stages, which depend on the evolution of their credit risk from the moment of initial recognition. The stage 1 includes operations when they are initially recognized, stage 2 comprises operations for which a significant increase in credit risk has been identified since their initial recognition and, stage 3, impaired operations.
Translation of this report originally issued in Spanish. In the event of a discrepancy, the Spanish-language version prevails.
|
|
56 |
This indicator is shown, as others, at a business area level.
Relevance of its use: this is one of the main indicators used in the banking sector to monitor the situation and changes in the quality of credit risk, reflecting the degree to which the impairment of non-performing loans has been covered in the accounts via value adjustments.
| NPL coverage ratio |
||||||||||||||||
| 31-03-24 | 31-12-23 | 31-03-23 | ||||||||||||||
| Numerator (Millions of euros) | Provisions | 11,943 | 11,762 | 11,661 | ||||||||||||
| Denominator (Millions of euros) | NPLs | 15,716 | 15,305 | 14,141 | ||||||||||||
| = | NPL coverage ratio | 76 % | 77 % | 82 % | ||||||||||||
Cost of risk
This ratio indicates the current situation and changes in credit-risk quality through the annual cost in terms of impairment losses (accounting loan-loss provisions) of each unit of loans and advances to customers (gross). It is calculated as follows:
| Loan-loss provisions |
| Average loans and advances to customers (gross) |
Explanation of the formula: “Loans to customers (gross)” refers to the “Loans and advances at amortized cost” portfolios with the following counterparts:
| • | other financial entities |
| • | public sector |
| • | non-financial institutions |
| • | households, excluding central banks and other credit institutions. |
Average loans to customers (gross) is calculated by using the average of the period-end balances of each month of the period analyzed plus the previous month. If the metric is presented on a date before the close of the fiscal year, the numerator will be annualized. By doing this, “Annualized loan-loss provisions” are calculated by accumulating and annualizing the loan-loss provisions of each month of the period under analysis (based on days passed).
Loan-loss provisions refer to the aforementioned loans and advances at amortized cost portfolios.
This indicator is shown, as others, at a business area level.
Relevance of its use: this is one of the main indicators used in the banking sector to monitor the situation and changes in the quality of credit risk through the cost over the year.
| Cost of risk |
||||||||||||||||
| Jan.-Mar.2024 | Jan.-Dec.2023 | Jan.-Mar.2023 | ||||||||||||||
| Numerator (Millions of euros) | Annualized loan-loss provisions | 5,421 | 4,345 | 3,864 | ||||||||||||
| Denominator (Millions of euros) | Average loans to customers (gross) | 390,828 | 378,402 | 369,340 | ||||||||||||
| = | Cost of risk | 1.39 % | 1.15 % | 1.05 % | ||||||||||||
Translation of this report originally issued in Spanish. In the event of a discrepancy, the Spanish-language version prevails.
|
|
57 |
This document is for informative purposes only and is not intended to provide financial advice and, therefore, does not constitute, nor should it be interpreted as, an offer to sell, exchange or acquire, or an invitation for offers to acquire securities issued by any of the aforementioned companies, or to contract any financial product. Any decision to purchase or invest in securities or contract any financial product must be made solely and exclusively on the basis of the information made available to such effects by the company in relation to each specific matter. The information contained in this document is subject to and should be read in conjunction with all other publicly available information of the issuer.
This document contains forward-looking statements that constitute or may constitute “forward-looking statements” (within the meaning of the “safe harbor” provisions of the United States Private Securities Litigation Reform Act of 1995) with respect to intentions, objectives, expectations or estimates as of the date hereof, including those relating to future targets of both a financial and non-financial nature (such as environmental, social or governance (“ESG”) performance targets).
Forward-looking statements may be identified by the fact that they do not refer to historical or current facts and include words such as “believe”, “expect”, “estimate”, “project”, “anticipate”, “duty”, “intend”, “likelihood”, “risk”, “VaR”, “purpose”, “commitment”, “goal”, “target” and similar expressions or variations of those expressions. They include, for example, statements regarding future growth rates or the achievement of future targets, including those relating to ESG performance.
The information contained in this document reflects our current expectations and targets, which are based on various assumptions and projections, including non-financial considerations such as those related to sustainability. Forward-looking statements are not guarantees of future results, and actual results may differ materially from those anticipated in the forward-looking statements as a result of certain risks, uncertainties and other factors. These factors include, but are not limited to, (1) market conditions, macroeconomic factors, domestic and international stock market movements, exchange rates, inflation and interest rates; (2) regulatory and oversight factors, political and governmental guidelines, social and demographic factors; (3) changes in the financial condition, creditworthiness or solvency of our clients, debtors or counterparties, such as changes in default rates, as well as changes in consumer spending, savings and investment behavior, and changes in our credit ratings; (4) competitive pressures and actions we take in response thereto; (5) performance of our IT, operations and control systems and our ability to adapt to technological changes; (6) climate change and the occurrence of natural or man-made disasters, such as an outbreak or escalation of hostilities; and (7) our ability to appropriately address any ESG expectations or obligations (related to our business, management, corporate governance, disclosure or otherwise), and the cost thereof. In the particular case of certain targets related to our ESG performance, such as, decarbonization targets or alignment of our portfolios, the achievement and progress towards such targets will depend to a large extent on the actions of third parties, such as clients, governments and other stakeholders, and may therefore be materially affected by such actions, or lack thereof, as well as by other exogenous factors that do not depend on BBVA (including, but not limited to, new technological developments, regulatory developments, military conflicts, the evolution of climate and energy crises, etc.). Therefore, these targets may be subject to future revisions.
The factors mentioned in the preceding paragraphs could cause actual future results to differ substantially from those set forth in the forecasts, intentions, objectives, targets or other forward-looking statements included in this document or in other past or future documents. Accordingly, results, including those related to ESG performance targets, among others, may differ materially from the statements contained in the forward-looking statements.
Recipients of this document are cautioned not to place undue reliance on such forward-looking statements.
Past performance or growth rates are not indicative of future performance, results or share price (including earnings per share). Nothing in this document should be construed as a forecast of results or future earnings.
BBVA does not intend, and undertakes no obligation, to update or revise the contents of this or any other document if there are any changes in the information contained therein, or including the forward-looking statements contained in any such document, as a result of events or circumstances after the date of such document or otherwise except as required by applicable law.
Translation of this report originally issued in Spanish. In the event of a discrepancy, the Spanish-language version prevails.
SIGNATURE
Pursuant to the requirements of the Securities Exchange Act of 1934, the registrant has duly caused this report to be signed on its behalf by the undersigned, thereunto duly authorized.
| Banco Bilbao Vizcaya Argentaria, S.A. | ||
| Date: April 29, 2024
|
By: /s/ María Ángeles Peláez Morón |
|
| Name: María Ángeles Peláez Morón | ||
| Title: Authorized representative | ||