UNITED STATES
SECURITIES AND EXCHANGE COMMISSION
Washington, D.C. 20549
FORM 8-K
CURRENT REPORT
Pursuant to Section 13 or 15(d)
of the Securities Exchange Act of 1934
Date of Report (Date of earliest event reported) April 24, 2024
SIMMONS FIRST NATIONAL CORPORATION
(Exact name of registrant as specified in its charter)
| Arkansas | 0-6253 | 71-0407808 | ||
| (State or other jurisdiction of incorporation) |
(Commission File Number) |
(I.R.S. Employer Identification No.) |
| 501 Main Street, Pine Bluff, Arkansas | 71601 | |
| (Address of principal executive offices) | (Zip Code) |
(870) 541-1000
(Registrant’s telephone number, including area code)
Not Applicable
(Former name or former address, if changed since last report.)
Check the appropriate box below if the Form 8-K filing is intended to simultaneously satisfy the filing obligation of the registrant under any of the following provisions (see General Instruction A.2. below):
| ☐ | Written communications pursuant to Rule 425 under the Securities Act (17 CFR 230.425) |
| ☐ | Soliciting material pursuant to Rule 14a-12 under the Exchange Act (17 CFR 240.14a-12) |
| ☐ | Pre-commencement communications pursuant to Rule 14d-2(b) under the Exchange Act (17 CFR 240.14d-2(b)) |
| ☐ | Pre-commencement communications pursuant to Rule 13e-4(c) under the Exchange Act (17 CFR 240.13e-4(c)) |
Securities registered pursuant to Section 12(b) of the Act:
| Title of each class |
Trading |
Name of each exchange |
||
| Common stock, par value $0.01 per share | SFNC | The Nasdaq Global Select Market |
Indicate by check mark whether the registrant is an emerging growth company as defined in Rule 405 of the Securities Act of 1933 (17 CFR §230.405) or Rule 12b-2 of the Securities Exchange Act of 1934 (17 CFR §240.12b-2). Emerging growth company ☐
If an emerging growth company, indicate by check mark if the registrant has elected not to use the extended transition period for complying with any new or revised financial accounting standards provided pursuant to Section 13(a) of the Exchange Act. ☐
| Item 2.02 | Results of Operations and Financial Condition. |
On April 24, 2024, the Registrant issued a press release, a copy of which is attached hereto as Exhibit 99.1 and is incorporated herein by reference.
The information provided pursuant to this Item 2.02, including Exhibit 99.1, is being furnished and shall not be deemed “filed” for purposes of Section 18 of the Securities Exchange Act of 1934 (“Exchange Act”) or otherwise subject to the liabilities under that Section and shall not be deemed to be incorporated by reference into any filing of the Registrant under the Securities Act of 1933 (“Securities Act”) or the Exchange Act, except as shall be expressly set forth by specific reference in such filing.
| Item 7.01 | Regulation FD Disclosure. |
On April 24, 2024, the Registrant issued an investor presentation, a copy of which is attached hereto as Exhibit 99.2 and is incorporated herein by reference.
The information provided pursuant to this Item 7.01, including Exhibit 99.2, is being furnished and shall not be deemed “filed” for purposes of Section 18 of the Exchange Act or otherwise subject to the liabilities under that Section and shall not be deemed to be incorporated by reference into any filing of the Registrant under the Securities Act or the Exchange Act, except as shall be expressly set forth by specific reference in such filing.
| Item 9.01 | Financial Statements and Exhibits. |
| Exhibit 99.1 | Press Release dated April 24, 2024 | |
| Exhibit 99.2 | Investor Presentation issued on April 24, 2024 | |
| Exhibit 104 | Cover Page Interactive Data File (embedded within the Inline XBRL Document) | |
SIGNATURE
Pursuant to the requirements of the Securities Exchange Act of 1934, the registrant has duly caused this report to be signed on its behalf by the undersigned hereunto duly authorized.
| SIMMONS FIRST NATIONAL CORPORATION | ||||||
| /s/ C. Daniel Hobbs |
||||||
| Date: April 24, 2024 | C. Daniel Hobbs, Executive Vice President and | |||||
| Chief Financial Officer | ||||||
Exhibit 99.1

April 24, 2024
Simmons First National Corporation Reports First Quarter 2024 Results
Bob Fehlman, Simmons’ Chief Executive Officer, commented on first quarter 2024 results:
Simmons delivered solid results in the quarter that clearly reflect our driving principles centered on a strong risk management culture, profitability and organic growth.
Total loans increased 4 percent on a linked quarter annualized basis and our commercial loan pipeline expanded for the third consecutive quarter. Total deposits were up 2 percent on a linked quarter annualized basis. We were particularly encouraged by the growth in money market and savings accounts again this quarter after robust growth in the fourth quarter of 2023. Importantly, the growth in loans and deposits, coupled with lower wholesale funding costs, enabled us to maintain a relatively stable net interest margin despite continued low-cost deposit migration.
Credit trends throughout the industry are beginning to normalize after an extended period at historically low levels. To that end, provision expense exceeded net charge-offs in the quarter and our allowance for credit losses as a percentage of loans stood at 1.34 percent. Moreover, our strong capital and liquidity positions provide us a solid foundation to continue delivering sound, profitable growth.
| FINANCIAL HIGHLIGHTS |
1Q24 | 4Q23 | 1Q23 | 1Q24 Highlights |
||||||||||
| BALANCE SHEET (in millions) |
Comparisons reflect 1Q24 vs 4Q23
• Net income of $38.9 million and diluted EPS of $0.31
• Adjusted earnings1 of $40.4 million and adjusted diluted EPS1 of $0.32
• Total revenue of $195.1 million. PPNR1 of $55.2 million; Adjusted PPNR1 of $57.2 million
• Net interest margin at 2.66%, relatively stable on a linked quarter basis
• Provision for credit losses on loans exceeded net charge-offs in the quarter by $2.1 million
• Noninterest expense includes $1.6 million FDIC special assessment in 1Q24 and $10.5 million in 4Q23
• NCO 19 bps in 1Q24; 11 bps of NCOs associated with run-off/ acquired portfolios
• Increase in NPAs primarily due to two loans from run-off/ acquired portfolios
• ACL ratio ends the quarter at 1.34%; NPL coverage ratio at 212%
• EA ratio 12.56%; TCE ratio1 up 6 bps to 7.75% |
|||||||||||||
| Total loans |
$ | 17,002 | $ | 16,846 | $ | 16,555 | ||||||||
| Total investment securities |
6,735 | 6,878 | 7,521 | |||||||||||
| Total deposits |
22,353 | 22,245 | 22,452 | |||||||||||
| Total assets |
27,372 | 27,346 | 27,583 | |||||||||||
| Total shareholders’ equity |
3,439 | 3,426 | 3,340 | |||||||||||
|
|
|
|
|
|
|
|||||||||
| ASSET QUALITY |
||||||||||||||
| Net charge-off ratio (NCO ratio) |
0.19 | % | 0.11 | % | 0.03 | % | ||||||||
| Nonperforming loan ratio |
0.63 | 0.50 | 0.38 | |||||||||||
| Nonperforming assets to total assets |
0.41 | 0.33 | 0.26 | |||||||||||
| Allowance for credit losses to total loans |
1.34 | 1.34 | 1.25 | |||||||||||
| Nonperforming loan coverage ratio |
212 | 267 | 324 | |||||||||||
|
|
|
|
|
|
|
|||||||||
| PERFORMANCE MEASURES (in millions) |
||||||||||||||
| Total revenue |
$ | 195.1 | $ | 177.6 | $ | 223.7 | ||||||||
| Adjusted total revenue1 |
195.1 | 197.8 | 223.7 | |||||||||||
| Pre-provision net revenue1 (PPNR) |
55.2 | 29.5 | 80.4 | |||||||||||
| Adjusted pre-provision net revenue1 |
57.2 | 65.1 | 82.8 | |||||||||||
| Provision for credit losses |
10.2 | 10.0 | 24.2 | |||||||||||
|
|
|
|
|
|
|
|||||||||
| PER SHARE DATA |
||||||||||||||
| Diluted earnings |
$ | 0.31 | $ | 0.19 | $ | 0.36 | ||||||||
| Adjusted diluted earnings1 |
0.32 | 0.40 | 0.37 | |||||||||||
| Book value |
27.42 | 27.37 | 26.24 | |||||||||||
| Tangible book value1 |
16.02 | 15.92 | 14.88 | |||||||||||
|
|
|
|
|
|
|
|||||||||
| CAPITAL RATIOS |
||||||||||||||
| Equity to assets (EA ratio) |
12.56 | % | 12.53 | % | 12.11 | % | ||||||||
| Tangible common equity (TCE) ratio1 |
7.75 | 7.69 | 7.25 | |||||||||||
| Common equity tier 1 (CET1) ratio |
11.95 | 12.11 | 11.87 | |||||||||||
| Total risk-based capital ratio |
14.43 | 14.39 | 14.47 | |||||||||||
|
|
|
|
|
|
|
|||||||||
| LIQUIDITY ($ in millions) |
||||||||||||||
| Loan to deposit ratio |
76.06 | % | 75.73 | % | 73.74 | % | ||||||||
| Borrowed funds to total liabilities |
5.42 | 5.88 | 6.32 | |||||||||||
| Uninsured, non-collateralized deposits (UCD) |
$ | 4,643 | $ | 4,753 | $ | 5,268 | ||||||||
| Additional liquidity sources |
11,457 | 11,216 | 10,780 | |||||||||||
| Coverage ratio of UCD |
2.5 | x | 2.4 | x | 2.0 | x | ||||||||
|
|
|
|
|
|
|
|||||||||
Simmons First National Corporation (NASDAQ: SFNC) (Simmons or Company) today reported net income of $38.9 million for the first quarter of 2024, compared to $23.9 million for the fourth quarter of 2023 and $45.6 million for the first quarter of 2023. Diluted earnings per share were $0.31 for the first quarter of 2024, compared to $0.19 in the fourth quarter of 2023 and $0.36 for the first quarter of 2023. Adjusted earnings1 for the first quarter of 2024 were $40.4 million, compared to $50.2 million for the fourth quarter of 2023 and $47.3 million for the first quarter of 2023. Adjusted diluted earnings per share1 for the first quarter of 2024 were $0.32, compared to $0.40 for the fourth quarter of 2023 and $0.37 for the first quarter of 2023.
During the first quarter of 2024, we recorded $1.6 million of noninterest expense for an FDIC special assessment levied to support the Deposit Insurance Fund following the failure of certain banks in 2023. This expense was in addition to the $10.5 million FDIC special assessment we recorded in the fourth quarter of 2023. The table below summarizes the impact of these items, along with the impact of certain other items, consisting primarily of branch right sizing, early retirement and a loss recorded in connection with the strategic sale of available-for-sale securities. They are also described in further detail in the “Reconciliation of Non-GAAP Financial Measures” tables contained in this press release.
Impact of Certain Items on Earnings and Diluted EPS
| $ in millions, except per share data |
1Q24 | 4Q23 | 1Q23 | |||||||||
| Net income |
$ | 38.9 | $ | 23.9 | $ | 45.6 | ||||||
| Loss on sale of AFS investment securities |
— | 20.2 | — | |||||||||
| FDIC special assessment |
1.6 | 10.5 | — | |||||||||
| Branch right sizing, net |
0.2 | 3.9 | 0.9 | |||||||||
| Early retirement program |
0.2 | 1.0 | — | |||||||||
| Merger related costs |
— | — | 1.4 | |||||||||
|
|
|
|
|
|
|
|||||||
| Total pre-tax impact |
2.0 | 35.6 | 2.3 | |||||||||
| Tax effect2 |
(0.5 | ) | (9.3 | ) | (0.6 | ) | ||||||
|
|
|
|
|
|
|
|||||||
| Total impact on earnings |
1.5 | 26.3 | 1.7 | |||||||||
|
|
|
|
|
|
|
|||||||
| Adjusted earnings1 |
$ | 40.4 | $ | 50.2 | $ | 47.3 | ||||||
|
|
|
|
|
|
|
|||||||
| Diluted EPS |
$ | 0.31 | $ | 0.19 | $ | 0.36 | ||||||
| Loss on sale of AFS investment securities |
— | 0.16 | — | |||||||||
| FDIC special assessment |
0.01 | 0.08 | — | |||||||||
| Branch right sizing, net |
— | 0.03 | 0.01 | |||||||||
| Early retirement program |
— | 0.01 | — | |||||||||
| Merger related costs |
— | — | 0.01 | |||||||||
|
|
|
|
|
|
|
|||||||
| Total pre-tax impact |
0.01 | 0.28 | 0.02 | |||||||||
| Tax effect2 |
— | (0.07 | ) | (0.01 | ) | |||||||
|
|
|
|
|
|
|
|||||||
| Total impact on earnings |
0.01 | 0.21 | 0.01 | |||||||||
|
|
|
|
|
|
|
|||||||
| Adjusted Diluted EPS1 |
$ | 0.32 | $ | 0.40 | $ | 0.37 | ||||||
|
|
|
|
|
|
|
|||||||
Net Interest Income
Net interest income for the first quarter of 2024 totaled $151.9 million, compared to $155.6 million for the fourth quarter of 2023 and $177.8 million for the first quarter of 2023. Interest income totaled $322.6 million for the first quarter of 2024, compared to $323.5 million for the fourth quarter of 2023. The decrease in interest income on a linked quarter basis was primarily due to a decline in the contribution from investment securities resulting from a lower average balance in the portfolio. Interest expense totaled $170.7 million for the first quarter of 2024, up $2.9 million on a linked quarter basis as an increase in deposit costs more than offset a decline in other borrowings. Included in net interest income is accretion recognized on assets, which totaled $1.1 million for the first quarter of 2024, $1.8 million in the fourth quarter of 2023 and $2.6 million in the first quarter of 2023.
The yield on loans on a fully taxable equivalent (FTE) basis for the first quarter of 2024 was 6.24 percent, compared to 6.20 percent in the fourth quarter of 2023 and 5.67 percent in the first quarter of 2023. The yield on investment securities in the first quarter of 2024 was 3.76 percent, compared to 3.67 percent in the fourth quarter of 2023 and 2.92 percent in the first quarter of 2023. Cost of deposits for the first quarter of 2024 was 2.75 percent, compared to 2.58 percent in the fourth quarter of 2023 and 1.58 percent in the first quarter of 2023. The net interest margin on an FTE basis for the first quarter of 2024 was 2.66 percent, compared to 2.68 percent in the fourth quarter of 2023 and 3.09 percent in the first quarter of 2023.
Select Yield/Rates
| 1Q24 | 4Q23 | 3Q23 | 2Q23 | 1Q23 | ||||||||||||||||
| Loan yield (FTE)2 |
6.24 | % | 6.20 | % | 6.08 | % | 5.89 | % | 5.67 | % | ||||||||||
| Investment securities yield (FTE)2 |
3.76 | 3.67 | 3.08 | 2.91 | 2.92 | |||||||||||||||
| Cost of interest bearing deposits |
3.48 | 3.31 | 3.06 | 2.57 | 2.10 | |||||||||||||||
| Cost of deposits |
2.75 | 2.58 | 2.37 | 1.96 | 1.58 | |||||||||||||||
| Cost of borrowed funds |
5.85 | 5.79 | 5.60 | 5.31 | 4.29 | |||||||||||||||
| Net interest spread (FTE)2 |
1.89 | 1.93 | 1.87 | 2.10 | 2.52 | |||||||||||||||
| Net interest margin (FTE)2 |
2.66 | 2.68 | 2.61 | 2.76 | 3.09 | |||||||||||||||
Noninterest Income
Noninterest income for the first quarter of 2024 was $43.2 million, compared to $22.0 million in the fourth quarter of 2023 and $45.8 million in the first quarter of 2023. Adjusted noninterest income1 was $43.2 million in the first quarter of 2024, compared to $42.2 million in the fourth quarter of 2023 and $45.8 million in the first quarter of 2023. The increase in noninterest income on a linked quarter basis was primarily the result of increased activity related to debit and credit card fees, mortgage banking income and bank owned life insurance income, as well as a $20.2 million loss on the strategic sale of available-for-sale securities recorded in the fourth quarter of 2023.
Noninterest Income
| $ in millions |
1Q24 | 4Q23 | 3Q23 | 2Q23 | 1Q23 | |||||||||||||||
| Service charges on deposit accounts |
$ | 12.0 | $ | 12.8 | $ | 12.4 | $ | 12.9 | $ | 12.4 | ||||||||||
| Wealth management fees |
7.5 | 7.7 | 7.7 | 7.4 | 7.4 | |||||||||||||||
| Debit and credit card fees |
8.2 | 7.8 | 7.7 | 8.0 | 8.0 | |||||||||||||||
| Mortgage lending income |
2.3 | 1.6 | 2.2 | 2.4 | 1.6 | |||||||||||||||
| Other service charges and fees |
2.2 | 2.3 | 2.2 | 2.3 | 2.3 | |||||||||||||||
| Bank owned life insurance |
3.8 | 3.1 | 3.1 | 2.6 | 3.0 | |||||||||||||||
| Gain (loss) on sale of securities |
— | (20.2 | ) | — | (0.4 | ) | — | |||||||||||||
| Other income |
7.2 | 6.9 | 7.4 | 9.8 | 11.3 | |||||||||||||||
|
|
|
|
|
|
|
|
|
|
|
|||||||||||
| Total noninterest income |
$ | 43.2 | $ | 22.0 | $ | 42.8 | $ | 45.0 | $ | 45.8 | ||||||||||
|
|
|
|
|
|
|
|
|
|
|
|||||||||||
| Adjusted noninterest income1 |
$ | 43.2 | $ | 42.2 | $ | 42.8 | $ | 45.4 | $ | 45.8 | ||||||||||
Noninterest Expense
Noninterest expense for the first quarter of 2024 was $139.9 million, compared to $148.1 million for the fourth quarter of 2023 and $143.2 million for the first quarter of 2023. During the first quarter of 2024 and fourth quarter of 2023, noninterest expense included an FDIC special assessment of $1.6 million and $10.5 million, respectively. Also included in noninterest expense are certain items consisting of branch right sizing, early retirement and merger and integration costs. Collectively, these items totaled $2.0 million for the first quarter of 2024, $15.4 million for the fourth quarter of 2023 and $2.4 million for the first quarter of 2023. Excluding these items (which are described in the “Reconciliation of Non-GAAP Financial Measures” tables below), adjusted noninterest expense1 was $137.9 million for the first quarter of 2024, $132.7 million for the fourth quarter of 2023 and $140.9 million for the first quarter of 2023. The decrease in noninterest expense on a linked quarter basis was primarily the result of lower FDIC special assessment charges and branch right sizing costs during the first quarter of 2024, offset in part by an increase in salaries and employee benefits principally due to higher payroll taxes typically incurred during the first quarter.
Noninterest Expense
| $ in millions |
1Q24 | 4Q23 | 3Q23 | 2Q23 | 1Q23 | |||||||||||||||
| Salaries and employee benefits |
$ | 72.7 | $ | 67.0 | $ | 67.4 | $ | 74.7 | $ | 77.0 | ||||||||||
| Occupancy expense, net |
12.3 | 11.7 | 12.0 | 11.4 | 11.6 | |||||||||||||||
| Furniture and equipment |
5.1 | 5.4 | 5.1 | 5.1 | 5.1 | |||||||||||||||
| Deposit insurance |
5.5 | 4.7 | 4.7 | 5.2 | 4.9 | |||||||||||||||
| Other real estate and foreclosure expense |
0.2 | 0.2 | 0.2 | 0.3 | 0.2 | |||||||||||||||
| Merger related costs |
— | — | — | — | 1.4 | |||||||||||||||
| FDIC special assessment |
1.6 | 10.5 | — | — | — | |||||||||||||||
| Other operating expenses |
42.5 | 48.6 | 42.6 | 42.9 | 43.1 | |||||||||||||||
|
|
|
|
|
|
|
|
|
|
|
|||||||||||
| Total noninterest expense |
$ | 139.9 | $ | 148.1 | $ | 132.0 | $ | 139.7 | $ | 143.2 | ||||||||||
|
|
|
|
|
|
|
|
|
|
|
|||||||||||
| Adjusted salaries and employee benefits1 |
$ | 72.4 | $ | 66.0 | $ | 65.8 | $ | 71.1 | $ | 77.0 | ||||||||||
| Adjusted other operating expenses1 |
42.4 | 44.9 | 42.1 | 43.0 | 42.3 | |||||||||||||||
| Adjusted noninterest expense1 |
137.9 | 132.7 | 129.9 | 136.0 | 140.9 | |||||||||||||||
| Efficiency ratio |
69.41 | % | 80.46 | % | 65.11 | % | 65.18 | % | 62.28 | % | ||||||||||
| Adjusted efficiency ratio1 |
66.42 | 62.91 | 61.94 | 61.29 | 59.38 | |||||||||||||||
| Full-time equivalent employees |
2,989 | 3,007 | 3,005 | 3,066 | 3,189 |
Loans and Unfunded Loan Commitments
Total loans at the end of the first quarter of 2024 were $17.0 billion, up $447 million, or 3 percent, compared to $16.6 billion at the end of the first quarter of 2023. Total loans on a linked quarter basis increased $156 million, or 1 percent, reflecting our focus on maintaining disciplined pricing strategies and prudent underwriting standards given projections surrounding near-term economic activity and conditions. Unfunded loan commitments at the end of the first quarter of 2024 were $3.9 billion, compared to $3.9 billion at the end of the fourth quarter of 2023 and $4.7 billion at the end of the first quarter of 2023. At the same time, our commercial loan pipeline experienced measured growth for the third consecutive quarter. Commercial loans ready to close at the end of the first quarter of 2024 were $381 million and the rate on ready to close commercial loans was 8.38 percent.
Loans and Unfunded Loan Commitments
| $ in millions |
1Q24 | 4Q23 | 3Q23 | 2Q23 | 1Q23 | |||||||||||||||
| Total loans |
$ | 17,002 | $ | 16,846 | $ | 16,772 | $ | 16,834 | $ | 16,555 | ||||||||||
| Unfunded loan commitments |
3,875 | 3,880 | 4,049 | 4,443 | 4,725 | |||||||||||||||
Deposits
Total deposits at the end of the first quarter of 2024 were $22.4 billion, compared to $22.2 billion at the end of the fourth quarter of 2023 and $22.5 billion at the end of the first quarter of 2023. On a linked quarter basis, deposit growth was driven by increased levels of interest bearing transaction accounts (interest bearing checking, money market and savings accounts), time deposits and brokered deposits. Noninterest bearing deposits totaled $4.7 billion at the end of the first quarter of 2024, compared to $4.8 billion at the end of the fourth quarter of 2023. The loan-to-deposit ratio at the end of the first quarter of 2024 was 76 percent, unchanged from the end of the fourth quarter of 2023 and up slightly from 74 percent at the end of the first quarter of 2023.
Deposits
| $ in millions |
1Q24 | 4Q23 | 3Q23 | 2Q23 | 1Q23 | |||||||||||||||
| Noninterest bearing deposits |
$ | 4,698 | $ | 4,801 | $ | 4,991 | $ | 5,265 | $ | 5,489 | ||||||||||
| Interest bearing transaction accounts |
10,316 | 10,277 | 9,875 | 10,203 | 10,625 | |||||||||||||||
| Time deposits |
4,314 | 4,266 | 4,103 | 3,784 | 3,385 | |||||||||||||||
| Brokered deposits |
3,025 | 2,901 | 3,262 | 3,237 | 2,953 | |||||||||||||||
|
|
|
|
|
|
|
|
|
|
|
|||||||||||
| Total deposits |
$ | 22,353 | $ | 22,245 | $ | 22,231 | $ | 22,489 | $ | 22,452 | ||||||||||
|
|
|
|
|
|
|
|
|
|
|
|||||||||||
| Noninterest bearing deposits to total deposits |
21 | % | 22 | % | 22 | % | 23 | % | 24 | % | ||||||||||
| Total loans to total deposits |
76 | 76 | 75 | 75 | 74 | |||||||||||||||
Asset Quality
Provision for credit losses totaled $10.2 million for the first quarter of 2024, compared to $10.0 million for the fourth quarter of 2023 and $24.2 million for the first quarter of 2023. Included in provision for credit losses was the recapture of provision expense on investment securities totaling $1.2 million for the fourth quarter of 2023, while the first quarter of 2023 included provision expense on investment securities totaling $13.3 million. The allowance for credit losses on loans at the end of the first quarter of 2024 was $227.4 million, compared to $225.2 million at the end of the fourth quarter of 2023 and $206.6 million at the end of the first quarter of 2023. The increase in allowance for credit losses on loans on a linked quarter and year-over-year basis reflected in part increased activity in the loan portfolio, as well as changes in macroeconomic conditions. The allowance for credit losses on loans as a percentage of total loans was 1.34 percent at the end of the first quarter of 2024, unchanged from fourth quarter 2023 levels and up from 1.25 percent at the end of the first quarter of 2023.
Net charge-offs as a percentage of average loans for the first quarter of 2024 were 19 basis points, compared to 11 basis points for the fourth quarter of 2023 and 3 basis points for the first quarter of 2023. The increase in net charge-offs on a linked quarter basis was primarily due to $4.5 million of charge-offs associated with the small ticket equipment finance portfolio that has been designated for run-off, as well as certain loans acquired through mergers since 2020. Net charge-offs from run-off and acquired portfolios accounted for 11 basis points of total net charge-offs recorded during the first quarter of 2024.
Total nonperforming loans at the end of the first quarter of 2024 were $107.3 million, compared to $84.5 million at the end of the fourth quarter of 2023 and $63.7 million at the end of the first quarter of 2023. The increase in nonperforming loans on a linked quarter basis was primarily due to an $11.0 million asset based lending loan and a $6.6 million non-owner occupied real estate loan to a business that was negatively impacted by Covid. The asset based lending portfolio was acquired in 2021 and has also been designated for run-off. The nonperforming loan coverage ratio ended the first quarter of 2024 at 212 percent. Total nonperforming assets as a percentage of total assets were 0.41 percent at the end of the first quarter of 2024, compared to 0.33 percent at the end of the fourth quarter of 2023 and 0.26 percent at the end of the first quarter of 2023.
Asset Quality
| $ in millions |
1Q24 | 4Q23 | 3Q23 | 2Q23 | 1Q23 | |||||||||||||||
| Allowance for credit losses on loans to total loans |
1.34 | % | 1.34 | % | 1.30 | % | 1.25 | % | 1.25 | % | ||||||||||
| Allowance for credit losses on loans to nonperforming loans |
212 | 267 | 267 | 292 | 324 | |||||||||||||||
| Nonperforming loans to total loans |
0.63 | 0.50 | 0.49 | 0.43 | 0.38 | |||||||||||||||
| Net charge-off ratio (annualized) |
0.19 | 0.11 | 0.28 | 0.04 | 0.03 | |||||||||||||||
| Net charge-off ratio YTD (annualized) |
0.19 | 0.12 | 0.12 | 0.04 | 0.03 | |||||||||||||||
| Total nonperforming loans |
$ | 107.3 | $ | 84.5 | $ | 81.9 | $ | 72.0 | $ | 63.7 | ||||||||||
| Total other nonperforming assets |
5.0 | 5.8 | 5.2 | 4.9 | 7.7 | |||||||||||||||
|
|
|
|
|
|
|
|
|
|
|
|||||||||||
| Total nonperforming assets |
$ | 112.3 | $ | 90.3 | $ | 87.1 | $ | 76.9 | $ | 71.4 | ||||||||||
|
|
|
|
|
|
|
|
|
|
|
|||||||||||
| Reserve for unfunded commitments |
$ | 25.6 | $ | 25.6 | $ | 25.6 | $ | 36.9 | $ | 41.9 | ||||||||||
Capital
Total stockholders’ equity at the end of the first quarter of 2024 was $3.4 billion, compared to $3.3 billion at the end of the first quarter of 2023. On a linked quarter basis, total stockholders’ equity increased $12.6 million, primarily as a result of a $12.5 million increase in retained earnings. Book value per share at the end of the first quarter of 2024 was $27.42, compared to $27.37 at the end of the fourth quarter of 2023 and $26.24 at the end of the first quarter of 2023. Tangible book value per share1 at the end of the first quarter of 2024 was $16.02, compared to $15.92 at the end of the fourth quarter of 2023 and $14.88 at the end of the first quarter of 2023.
Stockholders’ equity as a percentage of total assets at March 31, 2024, was 12.6 percent, compared to 12.5 percent at December 31, 2023, and 12.1 percent at March 31, 2023. Tangible common equity as a percentage of tangible assets1 was 7.8 percent at March 31, 2024, compared to 7.7 percent at December 31, 2023, and 7.3 percent at March 31, 2023. Both Simmons and Simmons Bank continue to maintain strong regulatory capital positions with all regulatory capital ratios significantly exceeding “well-capitalized” guidelines.
Select Capital Ratios
| 1Q24 | 4Q23 | 3Q23 | 2Q23 | 1Q23 | ||||||||||||||||
| Stockholders’ equity to total assets |
12.6 | % | 12.5 | % | 11.9 | % | 12.0 | % | 12.1 | % | ||||||||||
| Tangible common equity to tangible assets1 |
7.8 | 7.7 | 7.1 | 7.2 | 7.3 | |||||||||||||||
| Common equity tier 1 (CET1) ratio |
12.0 | 12.1 | 12.0 | 11.9 | 11.9 | |||||||||||||||
| Tier 1 leverage ratio |
9.4 | 9.4 | 9.3 | 9.2 | 9.2 | |||||||||||||||
| Tier 1 risk-based capital ratio |
12.0 | 12.1 | 12.0 | 11.9 | 11.9 | |||||||||||||||
| Total risk-based capital ratio |
14.4 | 14.4 | 14.3 | 14.2 | 14.5 | |||||||||||||||
Cash Dividend and Share Repurchase Program
As a result of Simmons’ solid capital position and its ability to organically generate capital, the board of directors declared a quarterly cash dividend on Simmons’ Class A common stock of $0.21 per share, which represents a 5 percent increase from the cash dividend paid for the same time period last year. The cash dividend is payable on July 1, 2024, to shareholders of record as of June 14, 2024. Simmons has paid cash dividends for 115 consecutive years, and 2024 represents the 13th consecutive year that Simmons has increased its dividend. According to research by Dividend Power, Simmons is one of only 26 U.S. publicly traded companies that have paid dividends for 100+ uninterrupted years. Simmons also earned Dividend Power’s designation as a “Dividend Contender,” a title reserved exclusively for companies that have increased their dividend for 10 to 24 consecutive years.
As of April 8, 2024, Dividend Power research noted that Simmons is one of only 347 companies out of nearly 6,000 companies listed on the New York Stock Exchange and NASDAQ to achieve this distinction.
During the first quarter of 2024, Simmons did not repurchase shares under its stock repurchase program that was authorized in January 2024 (2024 Program) and which replaced its former repurchase program that was authorized in January 2022. Remaining authorization under the 2024 Program as of March 31, 2024, was approximately $175 million. The timing, pricing and amount of any repurchases under the 2024 Program will be determined by Simmons’ management at its discretion based on a variety of factors including, but not limited to, market conditions, trading volume and market price of Simmons’ common stock, Simmons’ capital needs, Simmons’ working capital and investment requirements, other corporate considerations, economic conditions, and legal requirements. The 2024 Program does not obligate Simmons to repurchase any common stock and may be modified, discontinued or suspended at any time without prior notice.
| (1) | Non-GAAP measurement. See “Non-GAAP Financial Measures” and “Reconciliation of Non-GAAP Financial Measures” below |
| (2) | FTE – fully taxable equivalent basis using an effective tax rate of 26.135% |
Conference Call
Management will conduct a live conference call to review this information beginning at 9:00 a.m. Central Time today, Wednesday, April 24, 2024. Interested persons can listen to this call by dialing toll-free 1-844-481-2779 (North America only) and asking for the Simmons First National Corporation conference call, conference ID 10187669. In addition, the call will be available live or in recorded version on Simmons’ website at simmonsbank.com for at least 60 days following the date of the call.
Simmons First National Corporation
Simmons First National Corporation (NASDAQ: SFNC) is a Mid-South based financial holding company that has paid cash dividends to its shareholders for 115 consecutive years. Its principal subsidiary, Simmons Bank, operates 233 branches in Arkansas, Kansas, Missouri, Oklahoma, Tennessee and Texas. Founded in 1903, Simmons Bank offers comprehensive financial solutions delivered with a client-centric approach. In 2023, Simmons Bank was recognized by Forbes as one of America’s Best Midsize Employers and among the World’s Best Banks for the fourth consecutive year. Additional information about Simmons Bank can be found on our website at simmonsbank.com, by following @Simmons_Bank on X (formerly Twitter) or by visiting our newsroom.
Non-GAAP Financial Measures
This press release contains financial information determined by methods other than in accordance with U.S. generally accepted accounting principles (GAAP). The Company’s management uses these non-GAAP financial measures in their analysis of the Company’s performance. These measures adjust GAAP performance measures to, among other things, include the tax benefit associated with revenue items that are tax-exempt, as well as exclude from net income (including on a per share diluted basis), pre-tax, pre-provision earnings, net charge-offs, income available to common shareholders, non-interest income, and non-interest expense certain income and expense items attributable to, for example, merger activity (primarily including merger-related expenses), gains and/or losses on sale of branches, net branch right-sizing initiatives, FDIC special assessment charges and gain/loss on the sale of AFS investment securities. The Company has updated its calculation of certain non-GAAP financial measures to exclude the impact of gains or losses on the sale of AFS investment securities in light of the impact of the Company’s strategic AFS investment securities transactions during the fourth quarter of 2023 and has presented past periods on a comparable basis.
In addition, the Company also presents certain figures based on tangible common stockholders’ equity, tangible assets and tangible book value, which exclude goodwill and other intangible assets. The Company further presents certain figures that are exclusive of the impact of deposits and/or loans acquired through acquisitions, mortgage warehouse loans, and/or energy loans, or gains and/or losses on the sale of securities. The Company’s management believes that these non-GAAP financial measures are useful to investors because they, among other things, present the results of the Company’s ongoing operations without the effect of mergers or other items not central to the Company’s ongoing business, as well as normalize for tax effects and certain other effects. Management, therefore, believes presentations of these non-GAAP financial measures provide useful supplemental information that is essential to a proper understanding of the operating results of the Company’s ongoing businesses, and management uses these non-GAAP financial measures to assess the performance of the Company’s ongoing businesses as related to prior financial periods. These non-GAAP disclosures should not be viewed as a substitute for operating results determined in accordance with GAAP, nor are they necessarily comparable to non-GAAP performance measures that may be presented by other companies. Where non-GAAP financial measures are used, the comparable GAAP financial measure, as well as the reconciliation to the comparable GAAP financial measure, can be found in the tables of this release.
Forward-Looking Statements
Certain statements in this press release may not be based on historical facts and should be considered “forward-looking statements” within the meaning of the Private Securities Litigation Reform Act of 1995. These forward-looking statements, including, without limitation, statements made in Mr. Fehlman’s quote and estimated earn back periods, may be identified by reference to future periods or by the use of forward-looking terminology, such as “believe,” “budget,” “expect,” “foresee,” “anticipate,” “intend,” “indicate,” “target,” “estimate,” “plan,” “project,” “continue,” “contemplate,” “positions,” “prospects,” “predict,” or “potential,” by future conditional verbs such as “will,” “would,” “should,” “could,” “might” or “may,” or by variations of such words or by similar expressions. These forward-looking statements include, without limitation, statements relating to Simmons’ future growth, business strategies, lending capacity and lending activity, loan demand, revenue, assets, asset quality, profitability, dividends, net interest margin, non-interest revenue, share repurchase program, acquisition strategy, digital banking initiatives, the Company’s ability to recruit and retain key employees, the adequacy of the allowance for credit losses, and future economic conditions and interest rates. Any forward-looking statement speaks only as of the date of this press release, and Simmons undertakes no obligation to update these forward-looking statements to reflect events or circumstances that occur after the date of this press release. By nature, forward-looking statements are based on various assumptions and involve inherent risk and uncertainties. Various factors, including, but not limited to, changes in economic conditions, changes in credit quality, changes in interest rates and related governmental policies, changes in loan demand, changes in deposit flows, changes in real estate values, changes in the assumptions used in making the forward- looking statements, changes in the securities markets generally or the price of Simmons’ common stock specifically, changes in information technology affecting the financial industry, and changes in customer behaviors, including consumer spending, borrowing, and saving habits; general economic and market conditions; market disruptions including pandemics or significant health hazards, severe weather conditions, natural disasters, terrorist activities, financial crises, political crises, war and other military conflicts (including the ongoing military conflicts between Russia and Ukraine and between Israel and Hamas) or other major events, or the prospect of these events; the soundness of other financial institutions and any indirect exposure related to the closings of other financial institutions and their impact on the broader market through other customers, suppliers and partners, or that the conditions which resulted in the liquidity concerns experienced by closed financial institutions may also adversely impact, directly or indirectly, other financial institutions and market participants with which the Company has commercial or deposit relationships; increased inflation; the loss of key employees; increased competition in the markets in which the Company operates; increased unemployment; labor shortages; claims, damages, and fines related to litigation or government actions; changes in accounting principles relating to loan loss recognition (current expected credit losses); the Company’s ability to manage and successfully integrate its mergers and acquisitions and to fully realize cost savings and other benefits associated with acquisitions; increased delinquency and foreclosure rates on commercial real estate loans; cyber threats, attacks or events; reliance on third parties for key services; government legislation; and other factors, many of which are beyond the control of the Company, could cause actual results to differ materially from those projected in or contemplated by the forward-looking statements. Additional information on factors that might affect the Company’s financial results is included in the Company’s Form 10-K for the year ended December 31, 2023, and other reports that the Company has filed with or furnished to the U.S. Securities and Exchange Commission (the SEC), all of which are available from the SEC on its website, www.sec.gov. In addition, there can be no guarantee that the board of directors (Board) of Simmons will approve a quarterly dividend in future quarters, and the timing, payment, and amount of future dividends (if any) is subject to, among other things, the discretion of the Board and may differ significantly from past dividends.
FOR MORE INFORMATION CONTACT:
Ed Bilek, EVP, Director of Investor and Media Relations
ed.bilek@simmonsbank.com or 205.612.3378 (cell)
| Simmons First National Corporation | SFNC | |
| Consolidated End of Period Balance Sheets | ||
| For the Quarters Ended | ||
| (Unaudited) |
| Mar 31 2024 |
Dec 31 2023 |
Sep 30 2023 |
Jun 30 2023 |
Mar 31 2023 |
||||||||||||||||
| ($ in thousands) | ||||||||||||||||||||
| ASSETS |
||||||||||||||||||||
| Cash and noninterest bearing balances due from banks |
$ | 380,324 | $ | 345,258 | $ | 181,822 | $ | 181,268 | $ | 199,316 | ||||||||||
| Interest bearing balances due from banks and federal funds sold |
222,979 | 268,834 | 423,826 | 564,644 | 325,135 | |||||||||||||||
|
|
|
|
|
|
|
|
|
|
|
|||||||||||
| Cash and cash equivalents |
603,303 | 614,092 | 605,648 | 745,912 | 524,451 | |||||||||||||||
| Interest bearing balances due from banks - time |
100 | 100 | 100 | 545 | 795 | |||||||||||||||
| Investment securities - held-to-maturity |
3,707,258 | 3,726,288 | 3,742,292 | 3,756,754 | 3,765,483 | |||||||||||||||
| Investment securities - available-for-sale |
3,027,558 | 3,152,153 | 3,358,421 | 3,579,758 | 3,755,956 | |||||||||||||||
| Mortgage loans held for sale |
11,899 | 9,373 | 11,690 | 10,342 | 4,244 | |||||||||||||||
| Loans: |
||||||||||||||||||||
| Loans |
17,001,760 | 16,845,670 | 16,771,888 | 16,833,653 | 16,555,098 | |||||||||||||||
| Allowance for credit losses on loans |
(227,367 | ) | (225,231 | ) | (218,547 | ) | (209,966 | ) | (206,557 | ) | ||||||||||
|
|
|
|
|
|
|
|
|
|
|
|||||||||||
| Net loans |
16,774,393 | 16,620,439 | 16,553,341 | 16,623,687 | 16,348,541 | |||||||||||||||
| Premises and equipment |
576,466 | 570,678 | 567,167 | 562,025 | 564,497 | |||||||||||||||
| Foreclosed assets and other real estate owned |
3,511 | 4,073 | 3,809 | 3,909 | 2,721 | |||||||||||||||
| Interest receivable |
122,781 | 122,430 | 110,361 | 103,431 | 98,775 | |||||||||||||||
| Bank owned life insurance |
503,348 | 500,559 | 497,465 | 494,370 | 493,191 | |||||||||||||||
| Goodwill |
1,320,799 | 1,320,799 | 1,320,799 | 1,320,799 | 1,320,799 | |||||||||||||||
| Other intangible assets |
108,795 | 112,645 | 116,660 | 120,758 | 124,854 | |||||||||||||||
| Other assets |
611,964 | 592,045 | 676,572 | 636,833 | 579,139 | |||||||||||||||
|
|
|
|
|
|
|
|
|
|
|
|||||||||||
| Total assets |
$ | 27,372,175 | $ | 27,345,674 | $ | 27,564,325 | $ | 27,959,123 | $ | 27,583,446 | ||||||||||
|
|
|
|
|
|
|
|
|
|
|
|||||||||||
| LIABILITIES AND STOCKHOLDERS’ EQUITY |
||||||||||||||||||||
| Deposits: |
||||||||||||||||||||
| Noninterest bearing transaction accounts |
$ | 4,697,539 | $ | 4,800,880 | $ | 4,991,034 | $ | 5,264,962 | $ | 5,489,434 | ||||||||||
| Interest bearing transaction accounts and savings deposits |
11,071,762 | 10,997,425 | 10,571,807 | 10,866,078 | 11,283,584 | |||||||||||||||
| Time deposits |
6,583,703 | 6,446,673 | 6,668,370 | 6,357,682 | 5,678,757 | |||||||||||||||
|
|
|
|
|
|
|
|
|
|
|
|||||||||||
| Total deposits |
22,353,004 | 22,244,978 | 22,231,211 | 22,488,722 | 22,451,775 | |||||||||||||||
| Federal funds purchased and securities sold under agreements to repurchase |
58,760 | 67,969 | 74,482 | 102,586 | 142,862 | |||||||||||||||
| Other borrowings |
871,874 | 972,366 | 1,347,855 | 1,373,339 | 1,023,826 | |||||||||||||||
| Subordinated notes and debentures |
366,179 | 366,141 | 366,103 | 366,065 | 366,027 | |||||||||||||||
| Accrued interest and other liabilities |
283,232 | 267,732 | 259,119 | 272,085 | 259,055 | |||||||||||||||
|
|
|
|
|
|
|
|
|
|
|
|||||||||||
| Total liabilities |
23,933,049 | 23,919,186 | 24,278,770 | 24,602,797 | 24,243,545 | |||||||||||||||
|
|
|
|
|
|
|
|
|
|
|
|||||||||||
| Stockholders’ equity: |
||||||||||||||||||||
| Common stock |
1,254 | 1,252 | 1,251 | 1,262 | 1,273 | |||||||||||||||
| Surplus |
2,503,673 | 2,499,930 | 2,497,874 | 2,516,398 | 2,533,589 | |||||||||||||||
| Undivided profits |
1,342,215 | 1,329,681 | 1,330,810 | 1,308,654 | 1,275,720 | |||||||||||||||
| Accumulated other comprehensive (loss) income |
(408,016 | ) | (404,375 | ) | (544,380 | ) | (469,988 | ) | (470,681 | ) | ||||||||||
|
|
|
|
|
|
|
|
|
|
|
|||||||||||
| Total stockholders’ equity |
3,439,126 | 3,426,488 | 3,285,555 | 3,356,326 | 3,339,901 | |||||||||||||||
|
|
|
|
|
|
|
|
|
|
|
|||||||||||
| Total liabilities and stockholders’ equity |
$ | 27,372,175 | $ | 27,345,674 | $ | 27,564,325 | $ | 27,959,123 | $ | 27,583,446 | ||||||||||
|
|
|
|
|
|
|
|
|
|
|
|||||||||||
Page 1
| Simmons First National Corporation | SFNC | |
| Consolidated Statements of Income - Quarter-to-Date | ||
| For the Quarters Ended | ||
| (Unaudited) |
| Mar 31 2024 |
Dec 31 2023 |
Sep 30 2023 |
Jun 30 2023 |
Mar 31 2023 |
||||||||||||||||
| ($ in thousands, except per share data) | ||||||||||||||||||||
| INTEREST INCOME |
||||||||||||||||||||
| Loans (including fees) |
$ | 261,490 | $ | 261,505 | $ | 255,901 | $ | 244,292 | $ | 227,498 | ||||||||||
| Interest bearing balances due from banks and federal funds sold |
3,010 | 3,115 | 3,569 | 4,023 | 2,783 | |||||||||||||||
| Investment securities |
58,001 | 58,755 | 50,638 | 48,751 | 48,774 | |||||||||||||||
| Mortgage loans held for sale |
148 | 143 | 178 | 154 | 82 | |||||||||||||||
|
|
|
|
|
|
|
|
|
|
|
|||||||||||
| TOTAL INTEREST INCOME |
322,649 | 323,518 | 310,286 | 297,220 | 279,137 | |||||||||||||||
|
|
|
|
|
|
|
|
|
|
|
|||||||||||
| INTEREST EXPENSE |
||||||||||||||||||||
| Time deposits |
73,241 | 72,458 | 68,062 | 53,879 | 39,538 | |||||||||||||||
| Other deposits |
78,692 | 71,412 | 65,095 | 54,485 | 47,990 | |||||||||||||||
| Federal funds purchased and securities sold under agreements to repurchase |
189 | 232 | 277 | 318 | 323 | |||||||||||||||
| Other borrowings |
11,649 | 16,607 | 16,450 | 18,612 | 8,848 | |||||||||||||||
| Subordinated notes and debentures |
6,972 | 7,181 | 6,969 | 6,696 | 4,603 | |||||||||||||||
|
|
|
|
|
|
|
|
|
|
|
|||||||||||
| TOTAL INTEREST EXPENSE |
170,743 | 167,890 | 156,853 | 133,990 | 101,302 | |||||||||||||||
|
|
|
|
|
|
|
|
|
|
|
|||||||||||
| NET INTEREST INCOME |
151,906 | 155,628 | 153,433 | 163,230 | 177,835 | |||||||||||||||
|
|
|
|
|
|
|
|
|
|
|
|||||||||||
| PROVISION FOR CREDIT LOSSES |
||||||||||||||||||||
| Provision for credit losses on loans |
10,206 | 11,225 | 20,222 | 5,061 | 10,916 | |||||||||||||||
| Provision for credit losses on unfunded commitments |
— | — | (11,300 | ) | (5,000 | ) | — | |||||||||||||
| Provision for credit losses on investment securities - AFS |
— | (1,196 | ) | (1,200 | ) | (1,326 | ) | 12,800 | ||||||||||||
| Provision for credit losses on investment securities - HTM |
— | — | — | 1,326 | 500 | |||||||||||||||
|
|
|
|
|
|
|
|
|
|
|
|||||||||||
| TOTAL PROVISION FOR CREDIT LOSSES |
10,206 | 10,029 | 7,722 | 61 | 24,216 | |||||||||||||||
|
|
|
|
|
|
|
|
|
|
|
|||||||||||
| NET INTEREST INCOME AFTER PROVISION FOR CREDIT LOSSES |
141,700 | 145,599 | 145,711 | 163,169 | 153,619 | |||||||||||||||
|
|
|
|
|
|
|
|
|
|
|
|||||||||||
| NONINTEREST INCOME |
||||||||||||||||||||
| Service charges on deposit accounts |
11,955 | 12,782 | 12,429 | 12,882 | 12,437 | |||||||||||||||
| Debit and credit card fees |
8,246 | 7,822 | 7,712 | 7,986 | 7,952 | |||||||||||||||
| Wealth management fees |
7,478 | 7,679 | 7,719 | 7,440 | 7,365 | |||||||||||||||
| Mortgage lending income |
2,320 | 1,603 | 2,157 | 2,403 | 1,570 | |||||||||||||||
| Bank owned life insurance income |
3,814 | 3,094 | 3,095 | 2,555 | 2,973 | |||||||||||||||
| Other service charges and fees (includes insurance income) |
2,199 | 2,346 | 2,232 | 2,262 | 2,282 | |||||||||||||||
| Gain (loss) on sale of securities |
— | (20,218 | ) | — | (391 | ) | — | |||||||||||||
| Other income |
7,172 | 6,866 | 7,433 | 9,843 | 11,256 | |||||||||||||||
|
|
|
|
|
|
|
|
|
|
|
|||||||||||
| TOTAL NONINTEREST INCOME |
43,184 | 21,974 | 42,777 | 44,980 | 45,835 | |||||||||||||||
|
|
|
|
|
|
|
|
|
|
|
|||||||||||
| NONINTEREST EXPENSE |
||||||||||||||||||||
| Salaries and employee benefits |
72,653 | 66,982 | 67,374 | 74,723 | 77,038 | |||||||||||||||
| Occupancy expense, net |
12,258 | 11,733 | 12,020 | 11,410 | 11,578 | |||||||||||||||
| Furniture and equipment expense |
5,141 | 5,445 | 5,117 | 5,128 | 5,051 | |||||||||||||||
| Other real estate and foreclosure expense |
179 | 189 | 228 | 289 | 186 | |||||||||||||||
| Deposit insurance |
7,135 | 15,220 | 4,672 | 5,201 | 4,893 | |||||||||||||||
| Merger-related costs |
— | — | 5 | 19 | 1,396 | |||||||||||||||
| Other operating expenses |
42,513 | 48,570 | 42,582 | 42,926 | 43,086 | |||||||||||||||
|
|
|
|
|
|
|
|
|
|
|
|||||||||||
| TOTAL NONINTEREST EXPENSE |
139,879 | 148,139 | 131,998 | 139,696 | 143,228 | |||||||||||||||
|
|
|
|
|
|
|
|
|
|
|
|||||||||||
| NET INCOME BEFORE INCOME TAXES |
45,005 | 19,434 | 56,490 | 68,453 | 56,226 | |||||||||||||||
| Provision for income taxes |
6,134 | (4,473 | ) | 9,243 | 10,139 | 10,637 | ||||||||||||||
|
|
|
|
|
|
|
|
|
|
|
|||||||||||
| NET INCOME |
$ | 38,871 | $ | 23,907 | $ | 47,247 | $ | 58,314 | $ | 45,589 | ||||||||||
|
|
|
|
|
|
|
|
|
|
|
|||||||||||
| BASIC EARNINGS PER SHARE |
$ | 0.31 | $ | 0.19 | $ | 0.38 | $ | 0.46 | $ | 0.36 | ||||||||||
|
|
|
|
|
|
|
|
|
|
|
|||||||||||
| DILUTED EARNINGS PER SHARE |
$ | 0.31 | $ | 0.19 | $ | 0.37 | $ | 0.46 | $ | 0.36 | ||||||||||
|
|
|
|
|
|
|
|
|
|
|
|||||||||||
Page 2
| Simmons First National Corporation | SFNC | |||
| Consolidated Risk-Based Capital | ||||
| For the Quarters Ended | ||||
| (Unaudited) |
| Mar 31 2024 |
Dec 31 2023 |
Sep 30 2023 |
Jun 30 2023 |
Mar 31 2023 |
||||||||||||||||
| ($ in thousands) | ||||||||||||||||||||
| Tier 1 capital |
||||||||||||||||||||
| Stockholders’ equity |
$ | 3,439,126 | $ | 3,426,488 | $ | 3,285,555 | $ | 3,356,326 | $ | 3,339,901 | ||||||||||
| CECL transition provision (1) |
30,873 | 61,746 | 61,746 | 61,746 | 61,746 | |||||||||||||||
| Disallowed intangible assets, net of deferred tax |
(1,394,672 | ) | (1,398,810 | ) | (1,402,682 | ) | (1,406,500 | ) | (1,410,141 | ) | ||||||||||
| Unrealized loss (gain) on AFS securities |
408,016 | 404,375 | 544,380 | 469,988 | 470,681 | |||||||||||||||
|
|
|
|
|
|
|
|
|
|
|
|||||||||||
| Total Tier 1 capital |
2,483,343 | 2,493,799 | 2,488,999 | 2,481,560 | 2,462,187 | |||||||||||||||
|
|
|
|
|
|
|
|
|
|
|
|||||||||||
| Tier 2 capital |
||||||||||||||||||||
| Subordinated notes and debentures |
366,179 | 366,141 | 366,103 | 366,065 | 366,027 | |||||||||||||||
| Subordinated debt phase out |
(66,000 | ) | (66,000 | ) | (66,000 | ) | (66,000 | ) | — | |||||||||||
| Qualifying allowance for loan losses and reserve for unfunded commitments |
214,660 | 170,977 | 165,490 | 169,409 | 173,077 | |||||||||||||||
|
|
|
|
|
|
|
|
|
|
|
|||||||||||
| Total Tier 2 capital |
514,839 | 471,118 | 465,593 | 469,474 | 539,104 | |||||||||||||||
|
|
|
|
|
|
|
|
|
|
|
|||||||||||
| Total risk-based capital |
$ | 2,998,182 | $ | 2,964,917 | $ | 2,954,592 | $ | 2,951,034 | $ | 3,001,291 | ||||||||||
|
|
|
|
|
|
|
|
|
|
|
|||||||||||
| Risk weighted assets |
$ | 20,782,094 | $ | 20,599,238 | $ | 20,703,669 | $ | 20,821,075 | $ | 20,748,605 | ||||||||||
|
|
|
|
|
|
|
|
|
|
|
|||||||||||
| Adjusted average assets for leverage ratio |
$ | 26,312,873 | $ | 26,552,988 | $ | 26,733,658 | $ | 26,896,289 | $ | 26,632,691 | ||||||||||
|
|
|
|
|
|
|
|
|
|
|
|||||||||||
| Ratios at end of quarter |
||||||||||||||||||||
| Equity to assets |
12.56 | % | 12.53 | % | 11.92 | % | 12.00 | % | 12.11 | % | ||||||||||
| Tangible common equity to tangible assets (2) |
7.75 | % | 7.69 | % | 7.07 | % | 7.22 | % | 7.25 | % | ||||||||||
| Common equity Tier 1 ratio (CET1) |
11.95 | % | 12.11 | % | 12.02 | % | 11.92 | % | 11.87 | % | ||||||||||
| Tier 1 leverage ratio |
9.44 | % | 9.39 | % | 9.31 | % | 9.23 | % | 9.24 | % | ||||||||||
| Tier 1 risk-based capital ratio |
11.95 | % | 12.11 | % | 12.02 | % | 11.92 | % | 11.87 | % | ||||||||||
| Total risk-based capital ratio |
14.43 | % | 14.39 | % | 14.27 | % | 14.17 | % | 14.47 | % | ||||||||||
| (1) | The Company has elected to use the CECL transition provision allowed for in the year of adopting ASC 326. |
| (2) | Calculations of tangible common equity to tangible assets and the reconciliations to GAAP are included in the schedules accompanying this release. |
Page 3
| Simmons First National Corporation | SFNC | |||
| Consolidated Investment Securities | ||||
| For the Quarters Ended | ||||
| (Unaudited) |
| Mar 31 2024 |
Dec 31 2023 |
Sep 30 2023 |
Jun 30 2023 |
Mar 31 2023 |
||||||||||||||||
| ($ in thousands) | ||||||||||||||||||||
| Investment Securities - End of Period |
||||||||||||||||||||
|
Held-to-Maturity |
||||||||||||||||||||
| U.S. Government agencies |
$ | 453,805 | $ | 453,121 | $ | 452,428 | $ | 451,737 | $ | 451,052 | ||||||||||
| Mortgage-backed securities |
1,142,352 | 1,161,694 | 1,178,324 | 1,193,118 | 1,201,418 | |||||||||||||||
| State and political subdivisions |
1,855,642 | 1,856,674 | 1,857,652 | 1,859,022 | 1,859,970 | |||||||||||||||
| Other securities |
255,459 | 254,799 | 253,888 | 252,877 | 253,043 | |||||||||||||||
|
|
|
|
|
|
|
|
|
|
|
|||||||||||
| Total held-to-maturity (net of credit losses) |
3,707,258 | 3,726,288 | 3,742,292 | 3,756,754 | 3,765,483 | |||||||||||||||
|
|
|
|
|
|
|
|
|
|
|
|||||||||||
|
Available-for-Sale |
||||||||||||||||||||
| U.S. Treasury |
$ | 1,964 | $ | 2,254 | $ | 2,224 | $ | 2,209 | $ | 2,220 | ||||||||||
| U.S. Government agencies |
69,801 | 72,502 | 172,759 | 176,564 | 181,843 | |||||||||||||||
| Mortgage-backed securities |
1,845,364 | 1,940,307 | 2,157,092 | 2,282,328 | 2,433,530 | |||||||||||||||
| State and political subdivisions |
874,849 | 902,793 | 790,344 | 885,505 | 895,896 | |||||||||||||||
| Other securities |
235,580 | 234,297 | 236,002 | 233,152 | 242,467 | |||||||||||||||
|
|
|
|
|
|
|
|
|
|
|
|||||||||||
| Total available-for-sale (net of credit losses) |
3,027,558 | 3,152,153 | 3,358,421 | 3,579,758 | 3,755,956 | |||||||||||||||
|
|
|
|
|
|
|
|
|
|
|
|||||||||||
| Total investment securities (net of credit losses) |
$ | 6,734,816 | $ | 6,878,441 | $ | 7,100,713 | $ | 7,336,512 | $ | 7,521,439 | ||||||||||
|
|
|
|
|
|
|
|
|
|
|
|||||||||||
| Fair value - HTM investment securities |
$ | 3,049,281 | $ | 3,135,370 | $ | 2,848,211 | $ | 3,094,958 | $ | 3,148,976 | ||||||||||
|
|
|
|
|
|
|
|
|
|
|
|||||||||||
Page 4
| Simmons First National Corporation |
SFNC | |||
| Consolidated Loans |
||||
| For the Quarters Ended |
||||
| (Unaudited) |
| Mar 31 2024 |
Dec 31 2023 |
Sep 30 2023 |
Jun 30 2023 |
Mar 31 2023 |
||||||||||||||||
| ($ in thousands) | ||||||||||||||||||||
| Loan Portfolio - End of Period |
||||||||||||||||||||
| Consumer: |
||||||||||||||||||||
| Credit cards |
$ | 182,742 | $ | 191,204 | $ | 191,550 | $ | 209,452 | $ | 188,590 | ||||||||||
| Other consumer |
124,531 | 127,462 | 112,832 | 148,333 | 142,817 | |||||||||||||||
|
|
|
|
|
|
|
|
|
|
|
|||||||||||
| Total consumer |
307,273 | 318,666 | 304,382 | 357,785 | 331,407 | |||||||||||||||
| Real Estate: |
||||||||||||||||||||
| Construction |
3,331,739 | 3,144,220 | 3,022,321 | 2,930,586 | 2,777,122 | |||||||||||||||
| Single-family residential |
2,624,738 | 2,641,556 | 2,657,879 | 2,633,365 | 2,589,831 | |||||||||||||||
| Other commercial real estate |
7,508,049 | 7,552,410 | 7,565,008 | 7,546,130 | 7,520,964 | |||||||||||||||
|
|
|
|
|
|
|
|
|
|
|
|||||||||||
| Total real estate |
13,464,526 | 13,338,186 | 13,245,208 | 13,110,081 | 12,887,917 | |||||||||||||||
| Commercial: |
||||||||||||||||||||
| Commercial |
2,499,311 | 2,490,176 | 2,477,077 | 2,569,330 | 2,669,731 | |||||||||||||||
| Agricultural |
226,642 | 232,710 | 296,912 | 280,541 | 220,641 | |||||||||||||||
|
|
|
|
|
|
|
|
|
|
|
|||||||||||
| Total commercial |
2,725,953 | 2,722,886 | 2,773,989 | 2,849,871 | 2,890,372 | |||||||||||||||
| Other |
504,008 | 465,932 | 448,309 | 515,916 | 445,402 | |||||||||||||||
|
|
|
|
|
|
|
|
|
|
|
|||||||||||
| Total loans |
$ | 17,001,760 | $ | 16,845,670 | $ | 16,771,888 | $ | 16,833,653 | $ | 16,555,098 | ||||||||||
|
|
|
|
|
|
|
|
|
|
|
|||||||||||
Page 5
| Simmons First National Corporation | SFNC | |
| Consolidated Allowance and Asset Quality | ||
| For the Quarters Ended | ||
| (Unaudited) |
| Mar 31 | Dec 31 | Sep 30 | Jun 30 | Mar 31 | ||||||||||||||||
| 2024 | 2023 | 2023 | 2023 | 2023 | ||||||||||||||||
| ($ in thousands) |
||||||||||||||||||||
| Allowance for Credit Losses on Loans | ||||||||||||||||||||
| Beginning balance |
$ | 225,231 | $ | 218,547 | $ | 209,966 | $ | 206,557 | $ | 196,955 | ||||||||||
| Loans charged off: |
||||||||||||||||||||
| Credit cards |
1,646 | 1,500 | 1,318 | 1,409 | 1,076 | |||||||||||||||
| Other consumer |
732 | 767 | 633 | 666 | 456 | |||||||||||||||
| Real estate |
2,857 | 1,023 | 9,723 | 435 | 1,204 | |||||||||||||||
| Commercial |
4,593 | 3,105 | 1,219 | 1,225 | 413 | |||||||||||||||
|
|
|
|
|
|
|
|
|
|
|
|||||||||||
| Total loans charged off |
9,828 | 6,395 | 12,893 | 3,735 | 3,149 | |||||||||||||||
| Recoveries of loans previously charged off: |
||||||||||||||||||||
| Credit cards |
248 | 242 | 234 | 298 | 234 | |||||||||||||||
| Other consumer |
333 | 518 | 344 | 436 | 240 | |||||||||||||||
| Real estate |
735 | 785 | 429 | 878 | 294 | |||||||||||||||
| Commercial |
442 | 309 | 245 | 471 | 1,067 | |||||||||||||||
|
|
|
|
|
|
|
|
|
|
|
|||||||||||
| Total recoveries |
1,758 | 1,854 | 1,252 | 2,083 | 1,835 | |||||||||||||||
|
|
|
|
|
|
|
|
|
|
|
|||||||||||
| Net loans charged off |
8,070 | 4,541 | 11,641 | 1,652 | 1,314 | |||||||||||||||
| Provision for credit losses on loans |
10,206 | 11,225 | 20,222 | 5,061 | 10,916 | |||||||||||||||
|
|
|
|
|
|
|
|
|
|
|
|||||||||||
| Balance, end of quarter |
$ | 227,367 | $ | 225,231 | $ | 218,547 | $ | 209,966 | $ | 206,557 | ||||||||||
|
|
|
|
|
|
|
|
|
|
|
|||||||||||
| Nonperforming assets | ||||||||||||||||||||
| Nonperforming loans: |
||||||||||||||||||||
| Nonaccrual loans |
$ | 105,788 | $ | 83,325 | $ | 81,135 | $ | 71,279 | $ | 63,218 | ||||||||||
| Loans past due 90 days or more |
1,527 | 1,147 | 806 | 738 | 437 | |||||||||||||||
|
|
|
|
|
|
|
|
|
|
|
|||||||||||
| Total nonperforming loans |
107,315 | 84,472 | 81,941 | 72,017 | 63,655 | |||||||||||||||
|
|
|
|
|
|
|
|
|
|
|
|||||||||||
| Other nonperforming assets: |
||||||||||||||||||||
| Foreclosed assets and other real estate owned |
3,511 | 4,073 | 3,809 | 3,909 | 2,721 | |||||||||||||||
| Other nonperforming assets |
1,491 | 1,726 | 1,417 | 1,013 | 5,012 | |||||||||||||||
|
|
|
|
|
|
|
|
|
|
|
|||||||||||
| Total other nonperforming assets |
5,002 | 5,799 | 5,226 | 4,922 | 7,733 | |||||||||||||||
|
|
|
|
|
|
|
|
|
|
|
|||||||||||
| Total nonperforming assets |
$ | 112,317 | $ | 90,271 | $ | 87,167 | $ | 76,939 | $ | 71,388 | ||||||||||
|
|
|
|
|
|
|
|
|
|
|
|||||||||||
| Performing FDMs (modifications to borrowers experiencing financial difficulty) |
$ | 33,576 | $ | 33,577 | $ | 33,723 | $ | 2,996 | $ | 2,183 | ||||||||||
| Ratios | ||||||||||||||||||||
| Allowance for credit losses on loans to total loans |
1.34 | % | 1.34 | % | 1.30 | % | 1.25 | % | 1.25 | % | ||||||||||
| Allowance for credit losses to nonperforming loans |
212 | % | 267 | % | 267 | % | 292 | % | 324 | % | ||||||||||
| Nonperforming loans to total loans |
0.63 | % | 0.50 | % | 0.49 | % | 0.43 | % | 0.38 | % | ||||||||||
| Nonperforming assets (including performing FDMs) to total assets |
0.53 | % | 0.45 | % | 0.44 | % | 0.29 | % | 0.27 | % | ||||||||||
| Nonperforming assets to total assets |
0.41 | % | 0.33 | % | 0.32 | % | 0.28 | % | 0.26 | % | ||||||||||
| Annualized net charge offs to average loans (QTD) |
0.19 | % | 0.11 | % | 0.28 | % | 0.04 | % | 0.03 | % | ||||||||||
| Annualized net charge offs to average loans (YTD) |
0.19 | % | 0.12 | % | 0.12 | % | 0.04 | % | 0.03 | % | ||||||||||
| Annualized net credit card charge offs to average credit card loans (QTD) |
2.88 | % | 2.49 | % | 2.19 | % | 2.25 | % | 1.69 | % | ||||||||||
Page 6
| Simmons First National Corporation |
SFNC | |
| Consolidated - Average Balance Sheet and Net Interest Income Analysis |
||
| For the Quarters Ended |
||
| (Unaudited) |
||
| Three Months Ended Mar 2024 |
Three Months Ended Dec 2023 |
Three Months Ended Mar 2023 |
||||||||||||||||||||||||||||||||||
| ($ in thousands) | Average Balance |
Income/ Expense |
Yield/ Rate |
Average Balance |
Income/ Expense |
Yield/ Rate |
Average Balance |
Income/ Expense |
Yield/ Rate |
|||||||||||||||||||||||||||
| ASSETS |
|
|||||||||||||||||||||||||||||||||||
| Earning assets: |
||||||||||||||||||||||||||||||||||||
| Interest bearing balances due from banks and federal funds sold |
$ | 211,121 | $ | 3,010 | 5.73 | % | $ | 230,464 | $ | 3,115 | 5.36 | % | $ | 315,307 | $ | 2,783 | 3.58 | % | ||||||||||||||||||
| Investment securities - taxable |
4,162,455 | 42,198 | 4.08 | % | 4,410,681 | 42,895 | 3.86 | % | 4,930,945 | 32,804 | 2.70 | % | ||||||||||||||||||||||||
| Investment securities - non-taxable (FTE) |
2,635,368 | 21,301 | 3.25 | % | 2,555,125 | 21,523 | 3.34 | % | 2,624,642 | 21,522 | 3.33 | % | ||||||||||||||||||||||||
| Mortgage loans held for sale |
9,048 | 148 | 6.58 | % | 7,644 | 143 | 7.42 | % | 5,470 | 82 | 6.08 | % | ||||||||||||||||||||||||
| Loans - including fees (FTE) |
16,900,496 | 262,414 | 6.24 | % | 16,793,211 | 262,353 | 6.20 | % | 16,329,761 | 228,257 | 5.67 | % | ||||||||||||||||||||||||
|
|
|
|
|
|
|
|
|
|
|
|
|
|
|
|
|
|
|
|||||||||||||||||||
| Total interest earning assets (FTE) |
23,918,488 | 329,071 | 5.53 | % | 23,997,125 | 330,029 | 5.46 | % | 24,206,125 | 285,448 | 4.78 | % | ||||||||||||||||||||||||
| Non-earning assets |
3,340,911 | 3,373,686 | 3,282,607 | |||||||||||||||||||||||||||||||||
|
|
|
|
|
|
|
|||||||||||||||||||||||||||||||
| Total assets |
$ | 27,259,399 | $ | 27,370,811 | $ | 27,488,732 | ||||||||||||||||||||||||||||||
|
|
|
|
|
|
|
|||||||||||||||||||||||||||||||
| LIABILITIES AND STOCKHOLDERS’ EQUITY |
|
|||||||||||||||||||||||||||||||||||
| Interest bearing liabilities: |
||||||||||||||||||||||||||||||||||||
| Interest bearing transaction and savings accounts |
$ | 11,132,396 | $ | 78,692 | 2.84 | % | $ | 10,730,701 | $ | 71,412 | 2.64 | % | $ | 11,722,591 | $ | 47,990 | 1.66 | % | ||||||||||||||||||
| Time deposits |
6,448,014 | 73,241 | 4.57 | % | 6,509,663 | 72,458 | 4.42 | % | 5,155,055 | 39,538 | 3.11 | % | ||||||||||||||||||||||||
|
|
|
|
|
|
|
|
|
|
|
|
|
|
|
|
|
|
|
|||||||||||||||||||
| Total interest bearing deposits |
17,580,410 | 151,933 | 3.48 | % | 17,240,364 | 143,870 | 3.31 | % | 16,877,646 | 87,528 | 2.10 | % | ||||||||||||||||||||||||
| Federal funds purchased and securities sold under agreement to repurchase |
54,160 | 189 | 1.40 | % | 65,871 | 232 | 1.40 | % | 148,673 | 323 | 0.88 | % | ||||||||||||||||||||||||
| Other borrowings |
873,278 | 11,649 | 5.37 | % | 1,212,501 | 16,607 | 5.43 | % | 787,783 | 8,848 | 4.56 | % | ||||||||||||||||||||||||
| Subordinated notes and debentures |
366,160 | 6,972 | 7.66 | % | 366,123 | 7,181 | 7.78 | % | 366,009 | 4,603 | 5.10 | % | ||||||||||||||||||||||||
|
|
|
|
|
|
|
|
|
|
|
|
|
|
|
|
|
|
|
|||||||||||||||||||
| Total interest bearing liabilities |
18,874,008 | 170,743 | 3.64 | % | 18,884,859 | 167,890 | 3.53 | % | 18,180,111 | 101,302 | 2.26 | % | ||||||||||||||||||||||||
|
|
|
|
|
|
|
|
|
|
|
|
|
|||||||||||||||||||||||||
| Noninterest bearing liabilities: |
||||||||||||||||||||||||||||||||||||
| Noninterest bearing deposits |
4,654,179 | 4,864,274 | 5,642,779 | |||||||||||||||||||||||||||||||||
| Other liabilities |
284,191 | 285,431 | 295,191 | |||||||||||||||||||||||||||||||||
|
|
|
|
|
|
|
|||||||||||||||||||||||||||||||
| Total liabilities |
23,812,378 | 24,034,564 | 24,118,081 | |||||||||||||||||||||||||||||||||
| Stockholders’ equity |
3,447,021 | 3,336,247 | 3,370,651 | |||||||||||||||||||||||||||||||||
|
|
|
|
|
|
|
|||||||||||||||||||||||||||||||
| Total liabilities and stockholders’ equity |
$ | 27,259,399 | $ | 27,370,811 | $ | 27,488,732 | ||||||||||||||||||||||||||||||
|
|
|
|
|
|
|
|||||||||||||||||||||||||||||||
| Net interest income (FTE) |
$ | 158,328 | $ | 162,139 | $ | 184,146 | ||||||||||||||||||||||||||||||
|
|
|
|
|
|
|
|||||||||||||||||||||||||||||||
| Net interest spread (FTE) |
1.89 | % | 1.93 | % | 2.52 | % | ||||||||||||||||||||||||||||||
|
|
|
|
|
|
|
|||||||||||||||||||||||||||||||
| Net interest margin (FTE) |
2.66 | % | 2.68 | % | 3.09 | % | ||||||||||||||||||||||||||||||
|
|
|
|
|
|
|
|||||||||||||||||||||||||||||||
Page 7
| Simmons First National Corporation |
SFNC | |
| Consolidated - Selected Financial Data |
||
| For the Quarters Ended |
||
| (Unaudited) |
| Mar 31 | Dec 31 | Sep 30 | Jun 30 | Mar 31 | ||||||||||||||||
| 2024 | 2023 | 2023 | 2023 | 2023 | ||||||||||||||||
| ($ in thousands, except share data) |
||||||||||||||||||||
| QUARTER-TO-DATE | ||||||||||||||||||||
| Financial Highlights - As Reported |
||||||||||||||||||||
| Net Income |
$ | 38,871 | $ | 23,907 | $ | 47,247 | $ | 58,314 | $ | 45,589 | ||||||||||
| Diluted earnings per share |
0.31 | 0.19 | 0.37 | 0.46 | 0.36 | |||||||||||||||
| Return on average assets |
0.57 | % | 0.35 | % | 0.68 | % | 0.84 | % | 0.67 | % | ||||||||||
| Return on average common equity |
4.54 | % | 2.84 | % | 5.56 | % | 6.96 | % | 5.49 | % | ||||||||||
| Return on tangible common equity (non-GAAP) (1) |
8.33 | % | 5.61 | % | 10.33 | % | 12.85 | % | 10.25 | % | ||||||||||
| Net interest margin (FTE) |
2.66 | % | 2.68 | % | 2.61 | % | 2.76 | % | 3.09 | % | ||||||||||
| Efficiency ratio (2) |
69.41 | % | 80.46 | % | 65.11 | % | 65.18 | % | 62.28 | % | ||||||||||
| FTE adjustment |
6,422 | 6,511 | 6,515 | 6,106 | 6,311 | |||||||||||||||
| Average diluted shares outstanding |
125,661,950 | 125,609,265 | 126,283,609 | 127,379,976 | 127,516,478 | |||||||||||||||
| Shares repurchased under plan |
— | — | 1,128,962 | 1,128,087 | — | |||||||||||||||
| Average price of shares repurchased |
— | — | 17.69 | 17.75 | — | |||||||||||||||
| Cash dividends declared per common share |
0.210 | 0.200 | 0.200 | 0.200 | 0.200 | |||||||||||||||
| Accretable yield on acquired loans |
1,123 | 1,762 | 2,146 | 2,267 | 2,579 | |||||||||||||||
| Financial Highlights - Adjusted (non-GAAP) (1) |
||||||||||||||||||||
| Adjusted earnings |
$ | 40,351 | $ | 50,215 | $ | 48,804 | $ | 61,354 | $ | 47,343 | ||||||||||
| Adjusted diluted earnings per share |
0.32 | 0.40 | 0.39 | 0.48 | 0.37 | |||||||||||||||
| Adjusted return on average assets |
0.60 | % | 0.73 | % | 0.70 | % | 0.89 | % | 0.70 | % | ||||||||||
| Adjusted return on average common equity |
4.71 | % | 5.97 | % | 5.74 | % | 7.33 | % | 5.70 | % | ||||||||||
| Adjusted return on tangible common equity |
8.62 | % | 11.10 | % | 10.64 | % | 13.48 | % | 10.62 | % | ||||||||||
| Adjusted efficiency ratio (2) |
66.42 | % | 62.91 | % | 61.94 | % | 61.29 | % | 59.38 | % | ||||||||||
|
YEAR-TO-DATE |
||||||||||||||||||||
| Financial Highlights - GAAP |
||||||||||||||||||||
| Net Income |
$ | 38,871 | $ | 175,057 | $ | 151,150 | $ | 103,903 | $ | 45,589 | ||||||||||
| Diluted earnings per share |
0.31 | 1.38 | 1.19 | 0.82 | 0.36 | |||||||||||||||
| Return on average assets |
0.57 | % | 0.64 | % | 0.73 | % | 0.76 | % | 0.67 | % | ||||||||||
| Return on average common equity |
4.54 | % | 5.21 | % | 6.00 | % | 6.23 | % | 5.49 | % | ||||||||||
| Return on tangible common equity (non-GAAP) (1) |
8.33 | % | 9.76 | % | 11.14 | % | 11.55 | % | 10.25 | % | ||||||||||
| Net interest margin (FTE) |
2.66 | % | 2.78 | % | 2.82 | % | 2.92 | % | 3.09 | % | ||||||||||
| Efficiency ratio (2) |
69.41 | % | 67.75 | % | 64.13 | % | 63.68 | % | 62.28 | % | ||||||||||
| FTE adjustment |
6,422 | 25,443 | 18,932 | 12,417 | 6,311 | |||||||||||||||
| Average diluted shares outstanding |
125,661,950 | 126,775,704 | 127,099,727 | 127,421,034 | 127,516,478 | |||||||||||||||
| Cash dividends declared per common share |
0.210 | 0.800 | 0.600 | 0.400 | 0.200 | |||||||||||||||
| Financial Highlights - Adjusted (non-GAAP) (1) |
||||||||||||||||||||
| Adjusted earnings |
$ | 40,351 | $ | 207,716 | $ | 157,501 | $ | 108,697 | $ | 47,343 | ||||||||||
| Adjusted diluted earnings per share |
0.32 | 1.64 | 1.24 | 0.85 | 0.37 | |||||||||||||||
| Adjusted return on average assets |
0.60 | % | 0.75 | % | 0.76 | % | 0.79 | % | 0.70 | % | ||||||||||
| Adjusted return on average common equity |
4.71 | % | 6.18 | % | 6.25 | % | 6.51 | % | 5.70 | % | ||||||||||
| Adjusted return on tangible common equity |
8.62 | % | 11.46 | % | 11.58 | % | 12.06 | % | 10.62 | % | ||||||||||
| Adjusted efficiency ratio (2) |
66.42 | % | 61.32 | % | 60.81 | % | 60.30 | % | 59.38 | % | ||||||||||
| END OF PERIOD |
||||||||||||||||||||
| Book value per share |
$ | 27.42 | $ | 27.37 | $ | 26.26 | $ | 26.59 | $ | 26.24 | ||||||||||
| Tangible book value per share |
16.02 | 15.92 | 14.77 | 15.17 | 14.88 | |||||||||||||||
| Shares outstanding |
125,419,618 | 125,184,119 | 125,133,281 | 126,224,707 | 127,282,192 | |||||||||||||||
| Full-time equivalent employees |
2,989 | 3,007 | 3,005 | 3,066 | 3,189 | |||||||||||||||
| Total number of financial centers |
233 | 234 | 232 | 231 | 231 | |||||||||||||||
| (1) | Non-GAAP measurement that management believes aids in the understanding and discussion of results. Reconciliations to GAAP are included in the schedules accompanying this release. |
| (2) | Efficiency ratio is noninterest expense as a percent of net interest income (fully taxable equivalent) and noninterest revenues. |
Adjusted efficiency ratio is noninterest expense before foreclosed property expense, amortization of intangibles and certain adjusting items as a percent of net interest income (fully taxable equivalent) and noninterest revenues, excluding gains and losses from securities transactions and certain adjusting items, and is a non-GAAP measurement.
Page 8
| Simmons First National Corporation | SFNC | |
| Reconciliation Of Non-GAAP Financial Measures - Adjusted Earnings - Quarter-to-Date | ||
| For the Quarters Ended | ||
| (Unaudited) | ||
| Mar 31 | Dec 31 | Sep 30 | Jun 30 | Mar 31 | ||||||||||||||||
| 2024 | 2023 | 2023 | 2023 | 2023 | ||||||||||||||||
| (in thousands, except per share data) |
||||||||||||||||||||
|
QUARTER-TO-DATE |
||||||||||||||||||||
| Net income |
$ | 38,871 | $ | 23,907 | $ | 47,247 | $ | 58,314 | $ | 45,589 | ||||||||||
| Certain items (non-GAAP) |
||||||||||||||||||||
| FDIC Deposit Insurance special assessment |
1,549 | 10,521 | — | — | — | |||||||||||||||
| Merger related costs |
— | — | 5 | 19 | 1,396 | |||||||||||||||
| Early retirement program |
219 | 1,032 | 1,557 | 3,609 | — | |||||||||||||||
| Loss (gain) on sale of securities |
— | 20,218 | — | 391 | — | |||||||||||||||
| Branch right sizing (net) |
236 | 3,846 | 547 | 95 | 979 | |||||||||||||||
| Tax effect of certain items (1) |
(524 | ) | (9,309 | ) | (552 | ) | (1,074 | ) | (621 | ) | ||||||||||
|
|
|
|
|
|
|
|
|
|
|
|||||||||||
| Certain items, net of tax |
1,480 | 26,308 | 1,557 | 3,040 | 1,754 | |||||||||||||||
|
|
|
|
|
|
|
|
|
|
|
|||||||||||
| Adjusted earnings (non-GAAP) |
$ | 40,351 | $ | 50,215 | $ | 48,804 | $ | 61,354 | $ | 47,343 | ||||||||||
|
|
|
|
|
|
|
|
|
|
|
|||||||||||
| Diluted earnings per share |
$ | 0.31 | $ | 0.19 | $ | 0.37 | $ | 0.46 | $ | 0.36 | ||||||||||
| Certain items (non-GAAP) |
||||||||||||||||||||
| FDIC Deposit Insurance special assessment |
0.01 | 0.08 | — | — | — | |||||||||||||||
| Merger related costs |
— | — | — | — | 0.01 | |||||||||||||||
| Early retirement program |
— | 0.01 | 0.01 | 0.03 | — | |||||||||||||||
| Loss (gain) on sale of securities |
— | 0.16 | — | — | — | |||||||||||||||
| Branch right sizing (net) |
— | 0.03 | 0.01 | — | 0.01 | |||||||||||||||
| Tax effect of certain items (1) |
— | (0.07 | ) | — | (0.01 | ) | (0.01 | ) | ||||||||||||
|
|
|
|
|
|
|
|
|
|
|
|||||||||||
| Certain items, net of tax |
0.01 | 0.21 | 0.02 | 0.02 | 0.01 | |||||||||||||||
|
|
|
|
|
|
|
|
|
|
|
|||||||||||
| Adjusted diluted earnings per share (non-GAAP) |
$ | 0.32 | $ | 0.40 | $ | 0.39 | $ | 0.48 | $ | 0.37 | ||||||||||
|
|
|
|
|
|
|
|
|
|
|
|||||||||||
(1) Effective tax rate of 26.135%.
| Reconciliation of Certain Noninterest Income and Expense Items (non-GAAP) |
|
|||||||||||||||||||
|
QUARTER-TO-DATE |
||||||||||||||||||||
| Noninterest income |
$ | 43,184 | $ | 21,974 | $ | 42,777 | $ | 44,980 | $ | 45,835 | ||||||||||
| Certain noninterest income items |
||||||||||||||||||||
| Loss (gain) on sale of securities |
— | 20,218 | — | 391 | — | |||||||||||||||
|
|
|
|
|
|
|
|
|
|
|
|||||||||||
| Adjusted noninterest income (non-GAAP) |
$ | 43,184 | $ | 42,192 | $ | 42,777 | $ | 45,371 | $ | 45,835 | ||||||||||
|
|
|
|
|
|
|
|
|
|
|
|||||||||||
| Noninterest expense |
$ | 139,879 | $ | 148,139 | $ | 131,998 | $ | 139,696 | $ | 143,228 | ||||||||||
| Certain noninterest expense items |
||||||||||||||||||||
| Merger related costs |
— | — | (5 | ) | (19 | ) | (1,396 | ) | ||||||||||||
| Early retirement program |
(219 | ) | (1,032 | ) | (1,557 | ) | (3,609 | ) | — | |||||||||||
| FDIC Deposit Insurance special assessment |
(1,549 | ) | (10,521 | ) | — | — | — | |||||||||||||
| Branch right sizing expense |
(236 | ) | (3,846 | ) | (547 | ) | (95 | ) | (979 | ) | ||||||||||
|
|
|
|
|
|
|
|
|
|
|
|||||||||||
| Adjusted noninterest expense (non-GAAP) |
$ | 137,875 | $ | 132,740 | $ | 129,889 | $ | 135,973 | $ | 140,853 | ||||||||||
|
|
|
|
|
|
|
|
|
|
|
|||||||||||
| Salaries and employee benefits |
$ | 72,653 | $ | 66,982 | $ | 67,374 | $ | 74,723 | $ | 77,038 | ||||||||||
| Certain salaries and employee benefits items |
||||||||||||||||||||
| Early retirement program |
(219 | ) | (1,032 | ) | (1,557 | ) | (3,609 | ) | — | |||||||||||
| Other |
— | 2 | — | — | — | |||||||||||||||
|
|
|
|
|
|
|
|
|
|
|
|||||||||||
| Adjusted salaries and employee benefits (non-GAAP) |
$ | 72,434 | $ | 65,952 | $ | 65,817 | $ | 71,114 | $ | 77,038 | ||||||||||
|
|
|
|
|
|
|
|
|
|
|
|||||||||||
| Other operating expenses |
$ | 42,513 | $ | 48,570 | $ | 42,582 | $ | 42,926 | $ | 43,086 | ||||||||||
| Certain other operating expenses items |
||||||||||||||||||||
| Branch right sizing expense |
(83 | ) | (3,708 | ) | (466 | ) | 53 | (816 | ) | |||||||||||
|
|
|
|
|
|
|
|
|
|
|
|||||||||||
| Adjusted other operating expenses (non-GAAP) |
$ | 42,430 | $ | 44,862 | $ | 42,116 | $ | 42,979 | $ | 42,270 | ||||||||||
|
|
|
|
|
|
|
|
|
|
|
|||||||||||
Page 9
| Simmons First National Corporation |
SFNC | |
| Reconciliation Of Non-GAAP Financial Measures - Adjusted Earnings - Year-to-Date |
||
| For the Quarters Ended |
||
| (Unaudited) |
||
| Mar 31 | Dec 31 | Sep 30 | Jun 30 | Mar 31 | ||||||||||||||||
| 2024 | 2023 | 2023 | 2023 | 2023 | ||||||||||||||||
| (in thousands, except per share data) |
||||||||||||||||||||
|
YEAR-TO-DATE |
||||||||||||||||||||
| Net income |
$ | 38,871 | $ | 175,057 | $ | 151,150 | $ | 103,903 | $ | 45,589 | ||||||||||
| Certain items (non-GAAP) |
||||||||||||||||||||
| FDIC Deposit Insurance special assessment |
1,549 | 10,521 | — | — | — | |||||||||||||||
| Merger related costs |
— | 1,420 | 1,420 | 1,415 | 1,396 | |||||||||||||||
| Early retirement program |
219 | 6,198 | 5,166 | 3,609 | — | |||||||||||||||
| Loss (gain) on sale of securities |
— | 20,609 | 391 | 391 | — | |||||||||||||||
| Branch right sizing (net) |
236 | 5,467 | 1,621 | 1,074 | 979 | |||||||||||||||
| Tax effect of certain items (1) |
(524 | ) | (11,556 | ) | (2,247 | ) | (1,695 | ) | (621 | ) | ||||||||||
|
|
|
|
|
|
|
|
|
|
|
|||||||||||
| Certain items, net of tax |
1,480 | 32,659 | 6,351 | 4,794 | 1,754 | |||||||||||||||
|
|
|
|
|
|
|
|
|
|
|
|||||||||||
| Adjusted earnings (non-GAAP) |
$ | 40,351 | $ | 207,716 | $ | 157,501 | $ | 108,697 | $ | 47,343 | ||||||||||
|
|
|
|
|
|
|
|
|
|
|
|||||||||||
| Diluted earnings per share |
$ | 0.31 | $ | 1.38 | $ | 1.19 | $ | 0.82 | $ | 0.36 | ||||||||||
| Certain items (non-GAAP) |
||||||||||||||||||||
| FDIC Deposit Insurance special assessment |
0.01 | 0.08 | — | — | — | |||||||||||||||
| Merger related costs |
— | 0.01 | 0.01 | 0.01 | 0.01 | |||||||||||||||
| Early retirement program |
— | 0.05 | 0.04 | 0.03 | — | |||||||||||||||
| Loss (gain) on sale of securities |
— | 0.17 | — | — | — | |||||||||||||||
| Branch right sizing (net) |
— | 0.04 | 0.02 | 0.01 | 0.01 | |||||||||||||||
| Tax effect of certain items (1) |
— | (0.09 | ) | (0.02 | ) | (0.02 | ) | (0.01 | ) | |||||||||||
|
|
|
|
|
|
|
|
|
|
|
|||||||||||
| Certain items, net of tax |
0.01 | 0.26 | 0.05 | 0.03 | 0.01 | |||||||||||||||
|
|
|
|
|
|
|
|
|
|
|
|||||||||||
| Adjusted diluted earnings per share (non-GAAP) |
$ | 0.32 | $ | 1.64 | $ | 1.24 | $ | 0.85 | $ | 0.37 | ||||||||||
|
|
|
|
|
|
|
|
|
|
|
|||||||||||
(1) Effective tax rate of 26.135%.
| Reconciliation of Certain Noninterest Income and Expense Items (non-GAAP) |
|
|||||||||||||||||||
|
YEAR-TO-DATE |
||||||||||||||||||||
| Noninterest income |
$ | 43,184 | $ | 155,566 | $ | 133,592 | $ | 90,815 | $ | 45,835 | ||||||||||
| Certain noninterest income items |
||||||||||||||||||||
| Loss (gain) on sale of securities |
— | 20,609 | 391 | 391 | — | |||||||||||||||
|
|
|
|
|
|
|
|
|
|
|
|||||||||||
| Adjusted noninterest income (non-GAAP) |
$ | 43,184 | $ | 176,175 | $ | 133,983 | $ | 91,206 | $ | 45,835 | ||||||||||
|
|
|
|
|
|
|
|
|
|
|
|||||||||||
| Noninterest expense |
$ | 139,879 | $ | 563,061 | $ | 414,922 | $ | 282,924 | $ | 143,228 | ||||||||||
| Certain noninterest expense items |
||||||||||||||||||||
| Merger related costs |
— | (1,420 | ) | (1,420 | ) | (1,415 | ) | (1,396 | ) | |||||||||||
| Early retirement program |
(219 | ) | (6,198 | ) | (5,166 | ) | (3,609 | ) | — | |||||||||||
| FDIC Deposit Insurance special assessment |
(1,549 | ) | (10,521 | ) | — | — | — | |||||||||||||
| Branch right sizing expense |
(236 | ) | (5,467 | ) | (1,621 | ) | (1,074 | ) | (979 | ) | ||||||||||
|
|
|
|
|
|
|
|
|
|
|
|||||||||||
| Adjusted noninterest expense (non-GAAP) |
$ | 137,875 | $ | 539,455 | $ | 406,715 | $ | 276,826 | $ | 140,853 | ||||||||||
|
|
|
|
|
|
|
|
|
|
|
|||||||||||
| Salaries and employee benefits |
$ | 72,653 | $ | 286,117 | $ | 219,135 | $ | 151,761 | $ | 77,038 | ||||||||||
| Certain salaries and employee benefits items |
||||||||||||||||||||
| Early retirement program |
(219 | ) | (6,198 | ) | (5,166 | ) | (3,609 | ) | — | |||||||||||
| Other |
— | 2 | — | — | — | |||||||||||||||
|
|
|
|
|
|
|
|
|
|
|
|||||||||||
| Adjusted salaries and employee benefits (non-GAAP) |
$ | 72,434 | $ | 279,921 | $ | 213,969 | $ | 148,152 | $ | 77,038 | ||||||||||
|
|
|
|
|
|
|
|
|
|
|
|||||||||||
| Merger related costs |
$ | — | $ | 1,420 | $ | 1,420 | $ | 1,415 | $ | 1,396 | ||||||||||
| Adjustment for merger related costs |
— | (1,420 | ) | (1,420 | ) | (1,415 | ) | (1,396 | ) | |||||||||||
|
|
|
|
|
|
|
|
|
|
|
|||||||||||
| Adjusted merger related costs (non-GAAP) |
$ | — | $ | — | $ | — | $ | — | $ | — | ||||||||||
|
|
|
|
|
|
|
|
|
|
|
|||||||||||
| Other operating expenses |
$ | 42,513 | $ | 177,164 | $ | 128,594 | $ | 86,012 | $ | 43,086 | ||||||||||
| Certain other operating expenses items |
||||||||||||||||||||
| Branch right sizing expense |
(83 | ) | (4,937 | ) | (1,229 | ) | (763 | ) | (816 | ) | ||||||||||
|
|
|
|
|
|
|
|
|
|
|
|||||||||||
| Adjusted other operating expenses (non-GAAP) |
$ | 42,430 | $ | 172,227 | $ | 127,365 | $ | 85,249 | $ | 42,270 | ||||||||||
|
|
|
|
|
|
|
|
|
|
|
|||||||||||
Page 10
| Simmons First National Corporation | SFNC | |||
| Reconciliation Of Non-GAAP Financial Measures - End of Period | ||||
| For the Quarters Ended |
||||
| (Unaudited) |
| Mar 31 2024 |
Dec 31 2023 |
Sep 30 2023 |
Jun 30 2023 |
Mar 31 2023 |
||||||||||||||||
| ($ in thousands, except per share data) |
||||||||||||||||||||
| Calculation of Tangible Common Equity and the Ratio of Tangible Common Equity to Tangible Assets |
|
|||||||||||||||||||
| Total common stockholders’ equity |
$ | 3,439,126 | $ | 3,426,488 | $ | 3,285,555 | $ | 3,356,326 | $ | 3,339,901 | ||||||||||
| Intangible assets: |
||||||||||||||||||||
| Goodwill |
(1,320,799 | ) | (1,320,799 | ) | (1,320,799 | ) | (1,320,799 | ) | (1,320,799 | ) | ||||||||||
| Other intangible assets |
(108,795 | ) | (112,645 | ) | (116,660 | ) | (120,758 | ) | (124,854 | ) | ||||||||||
|
|
|
|
|
|
|
|
|
|
|
|||||||||||
| Total intangibles |
(1,429,594 | ) | (1,433,444 | ) | (1,437,459 | ) | (1,441,557 | ) | (1,445,653 | ) | ||||||||||
|
|
|
|
|
|
|
|
|
|
|
|||||||||||
| Tangible common stockholders’ equity |
$ | 2,009,532 | $ | 1,993,044 | $ | 1,848,096 | $ | 1,914,769 | $ | 1,894,248 | ||||||||||
|
|
|
|
|
|
|
|
|
|
|
|||||||||||
| Total assets |
$ | 27,372,175 | $ | 27,345,674 | $ | 27,564,325 | $ | 27,959,123 | $ | 27,583,446 | ||||||||||
| Intangible assets: |
||||||||||||||||||||
| Goodwill |
(1,320,799 | ) | (1,320,799 | ) | (1,320,799 | ) | (1,320,799 | ) | (1,320,799 | ) | ||||||||||
| Other intangible assets |
(108,795 | ) | (112,645 | ) | (116,660 | ) | (120,758 | ) | (124,854 | ) | ||||||||||
|
|
|
|
|
|
|
|
|
|
|
|||||||||||
| Total intangibles |
(1,429,594 | ) | (1,433,444 | ) | (1,437,459 | ) | (1,441,557 | ) | (1,445,653 | ) | ||||||||||
|
|
|
|
|
|
|
|
|
|
|
|||||||||||
| Tangible assets |
$ | 25,942,581 | $ | 25,912,230 | $ | 26,126,866 | $ | 26,517,566 | $ | 26,137,793 | ||||||||||
|
|
|
|
|
|
|
|
|
|
|
|||||||||||
| Ratio of common equity to assets |
12.56 | % | 12.53 | % | 11.92 | % | 12.00 | % | 12.11 | % | ||||||||||
|
|
|
|
|
|
|
|
|
|
|
|||||||||||
| Ratio of tangible common equity to tangible assets |
7.75 | % | 7.69 | % | 7.07 | % | 7.22 | % | 7.25 | % | ||||||||||
|
|
|
|
|
|
|
|
|
|
|
|||||||||||
| Calculation of Tangible Book Value per Share |
||||||||||||||||||||
| Total common stockholders’ equity |
$ | 3,439,126 | $ | 3,426,488 | $ | 3,285,555 | $ | 3,356,326 | $ | 3,339,901 | ||||||||||
| Intangible assets: |
||||||||||||||||||||
| Goodwill |
(1,320,799 | ) | (1,320,799 | ) | (1,320,799 | ) | (1,320,799 | ) | (1,320,799 | ) | ||||||||||
| Other intangible assets |
(108,795 | ) | (112,645 | ) | (116,660 | ) | (120,758 | ) | (124,854 | ) | ||||||||||
|
|
|
|
|
|
|
|
|
|
|
|||||||||||
| Total intangibles |
(1,429,594 | ) | (1,433,444 | ) | (1,437,459 | ) | (1,441,557 | ) | (1,445,653 | ) | ||||||||||
|
|
|
|
|
|
|
|
|
|
|
|||||||||||
| Tangible common stockholders’ equity |
$ | 2,009,532 | $ | 1,993,044 | $ | 1,848,096 | $ | 1,914,769 | $ | 1,894,248 | ||||||||||
|
|
|
|
|
|
|
|
|
|
|
|||||||||||
| Shares of common stock outstanding |
125,419,618 | 125,184,119 | 125,133,281 | 126,224,707 | 127,282,192 | |||||||||||||||
|
|
|
|
|
|
|
|
|
|
|
|||||||||||
| Book value per common share |
$ | 27.42 | $ | 27.37 | $ | 26.26 | $ | 26.59 | $ | 26.24 | ||||||||||
|
|
|
|
|
|
|
|
|
|
|
|||||||||||
| Tangible book value per common share |
$ | 16.02 | $ | 15.92 | $ | 14.77 | $ | 15.17 | $ | 14.88 | ||||||||||
|
|
|
|
|
|
|
|
|
|
|
|||||||||||
| Calculation of Coverage Ratio of Uninsured, Non-Collateralized Deposits |
|
|||||||||||||||||||
| Uninsured deposits at Simmons Bank |
$ | 8,413,514 | $ | 8,328,444 | $ | 8,143,200 | $ | 8,507,395 | $ | 8,978,581 | ||||||||||
| Less: Collateralized deposits (excluding portion that is FDIC insured) |
2,995,241 | 2,846,716 | 2,835,405 | 3,030,550 | 3,081,829 | |||||||||||||||
| Less: Intercompany eliminations |
775,461 | 728,480 | 676,840 | 674,552 | 628,592 | |||||||||||||||
|
|
|
|
|
|
|
|
|
|
|
|||||||||||
| Total uninsured, non-collateralized deposits |
$ | 4,642,812 | $ | 4,753,248 | $ | 4,630,955 | $ | 4,802,293 | $ | 5,268,160 | ||||||||||
|
|
|
|
|
|
|
|
|
|
|
|||||||||||
| FHLB borrowing availability |
$ | 5,326,000 | $ | 5,401,000 | $ | 5,372,000 | $ | 5,345,000 | $ | 5,574,000 | ||||||||||
| Unpledged securities |
4,122,000 | 3,817,000 | 4,124,000 | 3,877,000 | 3,000,000 | |||||||||||||||
| Fed funds lines, Fed discount window and Bank Term Funding Program (1) |
2,009,000 | 1,998,000 | 1,951,000 | 1,874,000 | 2,206,000 | |||||||||||||||
|
|
|
|
|
|
|
|
|
|
|
|||||||||||
| Additional liquidity sources |
$ | 11,457,000 | $ | 11,216,000 | $ | 11,447,000 | $ | 11,096,000 | $ | 10,780,000 | ||||||||||
|
|
|
|
|
|
|
|
|
|
|
|||||||||||
| Uninsured, non-collateralized deposit coverage ratio |
2.5 | 2.4 | 2.5 | 2.3 | 2.0 | |||||||||||||||
|
|
|
|
|
|
|
|
|
|
|
|||||||||||
| (1) The Bank Term Funding Program closed for new loans on March 11, 2024. At no time did Simmons borrow funds under this program.
|
|
|||||||||||||||||||
| Calculation of Net Charge Off Ratio | ||||||||||||||||||||
| Net charge offs |
$ | 8,070 | ||||||||||||||||||
| Less: Net charge offs from run-off (1) and acquired portfolios |
4,500 | |||||||||||||||||||
|
|
|
|||||||||||||||||||
| Net charge offs excluding run-off and acquired portfolios |
$ | 3,570 | ||||||||||||||||||
|
|
|
|||||||||||||||||||
| Average total loans |
$ | 16,900,496 | ||||||||||||||||||
|
|
|
|||||||||||||||||||
| Annualized net charge offs to average loans (NCO ratio) |
0.19 | % | ||||||||||||||||||
|
|
|
|||||||||||||||||||
| NCO ratio, excluding net charge offs of run-off and acquired portfolios (annualized) |
0.08 | % | ||||||||||||||||||
|
|
|
|||||||||||||||||||
| (1) | Run-off portfolio consists of asset based lending and small equipment finance portfolios obtained in acquisitions. |
Page 11
| Simmons First National Corporation | SFNC | |||
| Reconciliation Of Non-GAAP Financial Measures - Quarter-to-Date | ||||
| For the Quarters Ended | ||||
| (Unaudited) |
| Mar 31 | Dec 31 | Sep 30 | Jun 30 | Mar 31 | ||||||||||||||||
| 2024 | 2023 | 2023 | 2023 | 2023 | ||||||||||||||||
| ($ in thousands) |
||||||||||||||||||||
| Calculation of Adjusted Return on Average Assets |
||||||||||||||||||||
| Net income |
$ | 38,871 | $ | 23,907 | $ | 47,247 | $ | 58,314 | $ | 45,589 | ||||||||||
| Certain items (non-GAAP) |
||||||||||||||||||||
| FDIC Deposit Insurance special assessment |
1,549 | 10,521 | — | — | — | |||||||||||||||
| Merger related costs |
— | — | 5 | 19 | 1,396 | |||||||||||||||
| Early retirement program |
219 | 1,032 | 1,557 | 3,609 | — | |||||||||||||||
| Loss (gain) on sale of securities |
— | 20,218 | — | 391 | — | |||||||||||||||
| Branch right sizing (net) |
236 | 3,846 | 547 | 95 | 979 | |||||||||||||||
| Tax effect of certain items (2) |
(524 | ) | (9,309 | ) | (552 | ) | (1,074 | ) | (621 | ) | ||||||||||
|
|
|
|
|
|
|
|
|
|
|
|||||||||||
| Adjusted earnings (non-GAAP) |
$ | 40,351 | $ | 50,215 | $ | 48,804 | $ | 61,354 | $ | 47,343 | ||||||||||
|
|
|
|
|
|
|
|
|
|
|
|||||||||||
| Average total assets |
$ | 27,259,399 | $ | 27,370,811 | $ | 27,594,611 | $ | 27,766,139 | $ | 27,488,732 | ||||||||||
|
|
|
|
|
|
|
|
|
|
|
|||||||||||
| Return on average assets |
0.57 | % | 0.35 | % | 0.68 | % | 0.84 | % | 0.67 | % | ||||||||||
|
|
|
|
|
|
|
|
|
|
|
|||||||||||
| Adjusted return on average assets (non-GAAP) |
0.60 | % | 0.73 | % | 0.70 | % | 0.89 | % | 0.70 | % | ||||||||||
|
|
|
|
|
|
|
|
|
|
|
|||||||||||
| Calculation of Return on Tangible Common Equity |
||||||||||||||||||||
| Net income available to common stockholders |
$ | 38,871 | $ | 23,907 | $ | 47,247 | $ | 58,314 | $ | 45,589 | ||||||||||
| Amortization of intangibles, net of taxes |
2,844 | 2,965 | 3,027 | 3,026 | 3,026 | |||||||||||||||
|
|
|
|
|
|
|
|
|
|
|
|||||||||||
| Total income available to common stockholders |
$ | 41,715 | $ | 26,872 | $ | 50,274 | $ | 61,340 | $ | 48,615 | ||||||||||
|
|
|
|
|
|
|
|
|
|
|
|||||||||||
| Certain items (non-GAAP) |
||||||||||||||||||||
| Gain on insurance settlement |
$ | — | $ | — | $ | — | $ | — | $ | — | ||||||||||
| FDIC Deposit Insurance special assessment |
1,549 | 10,521 | — | — | — | |||||||||||||||
| Merger related costs |
— | — | 5 | 19 | 1,396 | |||||||||||||||
| Early retirement program |
219 | 1,032 | 1,557 | 3,609 | — | |||||||||||||||
| Loss (gain) on sale of securities |
— | 20,218 | — | 391 | — | |||||||||||||||
| Branch right sizing (net) |
236 | 3,846 | 547 | 95 | 979 | |||||||||||||||
| Tax effect of certain items (2) |
(524 | ) | (9,309 | ) | (552 | ) | (1,074 | ) | (621 | ) | ||||||||||
|
|
|
|
|
|
|
|
|
|
|
|||||||||||
| Adjusted earnings (non-GAAP) |
40,351 | 50,215 | 48,804 | 61,354 | 47,343 | |||||||||||||||
| Amortization of intangibles, net of taxes |
2,844 | 2,965 | 3,027 | 3,026 | 3,026 | |||||||||||||||
|
|
|
|
|
|
|
|
|
|
|
|||||||||||
| Total adjusted earnings available to common stockholders (non-GAAP) |
$ | 43,195 | $ | 53,180 | $ | 51,831 | $ | 64,380 | $ | 50,369 | ||||||||||
|
|
|
|
|
|
|
|
|
|
|
|||||||||||
| Average common stockholders’ equity |
$ | 3,447,021 | $ | 3,336,247 | $ | 3,371,678 | $ | 3,358,924 | $ | 3,370,651 | ||||||||||
| Average intangible assets: |
||||||||||||||||||||
| Goodwill |
(1,320,799 | ) | (1,320,799 | ) | (1,320,799 | ) | (1,320,799 | ) | (1,319,624 | ) | ||||||||||
| Other intangibles |
(111,023 | ) | (114,861 | ) | (119,125 | ) | (123,173 | ) | (127,394 | ) | ||||||||||
|
|
|
|
|
|
|
|
|
|
|
|||||||||||
| Total average intangibles |
(1,431,822 | ) | (1,435,660 | ) | (1,439,924 | ) | (1,443,972 | ) | (1,447,018 | ) | ||||||||||
|
|
|
|
|
|
|
|
|
|
|
|||||||||||
| Average tangible common stockholders’ equity (non-GAAP) |
$ | 2,015,199 | $ | 1,900,587 | $ | 1,931,754 | $ | 1,914,952 | $ | 1,923,633 | ||||||||||
|
|
|
|
|
|
|
|
|
|
|
|||||||||||
| Return on average common equity |
4.54 | % | 2.84 | % | 5.56 | % | 6.96 | % | 5.49 | % | ||||||||||
|
|
|
|
|
|
|
|
|
|
|
|||||||||||
| Return on tangible common equity |
8.33 | % | 5.61 | % | 10.33 | % | 12.85 | % | 10.25 | % | ||||||||||
|
|
|
|
|
|
|
|
|
|
|
|||||||||||
| Adjusted return on average common equity (non-GAAP) |
4.71 | % | 5.97 | % | 5.74 | % | 7.33 | % | 5.70 | % | ||||||||||
|
|
|
|
|
|
|
|
|
|
|
|||||||||||
| Adjusted return on tangible common equity (non-GAAP) |
8.62 | % | 11.10 | % | 10.64 | % | 13.48 | % | 10.62 | % | ||||||||||
|
|
|
|
|
|
|
|
|
|
|
|||||||||||
| Calculation of Efficiency Ratio and Adjusted Efficiency Ratio (1) |
||||||||||||||||||||
| Noninterest expense (efficiency ratio numerator) |
$ | 139,879 | $ | 148,139 | $ | 131,998 | $ | 139,696 | $ | 143,228 | ||||||||||
| Certain noninterest expense items (non-GAAP) |
||||||||||||||||||||
| Merger related costs |
— | — | (5 | ) | (19 | ) | (1,396 | ) | ||||||||||||
| Early retirement program |
(219 | ) | (1,032 | ) | (1,557 | ) | (3,609 | ) | — | |||||||||||
| FDIC Deposit Insurance special assessment |
(1,549 | ) | (10,521 | ) | — | — | — | |||||||||||||
| Branch right sizing expense |
(236 | ) | (3,846 | ) | (547 | ) | (95 | ) | (979 | ) | ||||||||||
| Other real estate and foreclosure expense adjustment |
(179 | ) | (189 | ) | (228 | ) | (289 | ) | (186 | ) | ||||||||||
| Amortization of intangibles adjustment |
(3,850 | ) | (4,015 | ) | (4,097 | ) | (4,098 | ) | (4,096 | ) | ||||||||||
|
|
|
|
|
|
|
|
|
|
|
|||||||||||
| Adjusted efficiency ratio numerator |
$ | 133,846 | $ | 128,536 | $ | 125,564 | $ | 131,586 | $ | 136,571 | ||||||||||
|
|
|
|
|
|
|
|
|
|
|
|||||||||||
| Net interest income |
$ | 151,906 | $ | 155,628 | $ | 153,433 | $ | 163,230 | $ | 177,835 | ||||||||||
| Noninterest income |
43,184 | 21,974 | 42,777 | 44,980 | 45,835 | |||||||||||||||
| Fully tax-equivalent adjustment (effective tax rate of 26.135%) |
6,422 | 6,511 | 6,515 | 6,106 | 6,311 | |||||||||||||||
|
|
|
|
|
|
|
|
|
|
|
|||||||||||
| Efficiency ratio denominator |
201,512 | 184,113 | 202,725 | 214,316 | 229,981 | |||||||||||||||
| Certain noninterest income items (non-GAAP) Branch right sizing income |
— | — | — | — | — | |||||||||||||||
| (Gain) loss on sale of securities |
— | 20,218 | — | 391 | — | |||||||||||||||
|
|
|
|
|
|
|
|
|
|
|
|||||||||||
| Adjusted efficiency ratio denominator |
$ | 201,512 | $ | 204,331 | $ | 202,725 | $ | 214,707 | $ | 229,981 | ||||||||||
|
|
|
|
|
|
|
|
|
|
|
|||||||||||
| Efficiency ratio (1) |
69.41 | % | 80.46 | % | 65.11 | % | 65.18 | % | 62.28 | % | ||||||||||
|
|
|
|
|
|
|
|
|
|
|
|||||||||||
| Adjusted efficiency ratio (non-GAAP) (1) |
66.42 | % | 62.91 | % | 61.94 | % | 61.29 | % | 59.38 | % | ||||||||||
|
|
|
|
|
|
|
|
|
|
|
|||||||||||
| (1) | Efficiency ratio is noninterest expense as a percent of net interest income (fully taxable equivalent) and noninterest revenues. Adjusted efficiency ratio is noninterest expense before foreclosed property expense, amortization of intangibles and certain adjusting items as a percent of net interest income (fully taxable equivalent) and noninterest revenues, excluding gains and losses from securities transactions and certain adjusting items, and is a non-GAAP measurement. |
| (2) | Effective tax rate of 26.135%. |
Page 12
| Simmons First National Corporation | SFNC | |||
| Reconciliation Of Non-GAAP Financial Measures - Quarter-to-Date (continued) | ||||
| For the Quarters Ended | ||||
| (Unaudited) |
| Mar 31 | Dec 31 | Sep 30 | Jun 30 | Mar 31 | ||||||||||||||||
| 2024 | 2023 | 2023 | 2023 | 2023 | ||||||||||||||||
| ($ in thousands) |
||||||||||||||||||||
| Calculation of Total Revenue and Adjusted Total Revenue |
||||||||||||||||||||
| Net interest income |
$ | 151,906 | $ | 155,628 | $ | 153,433 | $ | 163,230 | $ | 177,835 | ||||||||||
| Noninterest income |
43,184 | 21,974 | 42,777 | 44,980 | 45,835 | |||||||||||||||
|
|
|
|
|
|
|
|
|
|
|
|||||||||||
| Total revenue |
195,090 | 177,602 | 196,210 | 208,210 | 223,670 | |||||||||||||||
| Certain items, pre-tax (non-GAAP) |
||||||||||||||||||||
| Less: Gain (loss) on sale of securities |
— | (20,218 | ) | — | (391 | ) | — | |||||||||||||
|
|
|
|
|
|
|
|
|
|
|
|||||||||||
| Adjusted total revenue |
$ | 195,090 | $ | 197,820 | $ | 196,210 | $ | 208,601 | $ | 223,670 | ||||||||||
|
|
|
|
|
|
|
|
|
|
|
|||||||||||
| Calculation of Pre-Provision Net Revenue (PPNR) |
||||||||||||||||||||
| Net interest income |
$ | 151,906 | $ | 155,628 | $ | 153,433 | $ | 163,230 | $ | 177,835 | ||||||||||
| Noninterest income |
43,184 | 21,974 | 42,777 | 44,980 | 45,835 | |||||||||||||||
|
|
|
|
|
|
|
|
|
|
|
|||||||||||
| Total revenue |
195,090 | 177,602 | 196,210 | 208,210 | 223,670 | |||||||||||||||
| Less: Noninterest expense |
139,879 | 148,139 | 131,998 | 139,696 | 143,228 | |||||||||||||||
|
|
|
|
|
|
|
|
|
|
|
|||||||||||
| Pre-Provision Net Revenue (PPNR) |
$ | 55,211 | $ | 29,463 | $ | 64,212 | $ | 68,514 | $ | 80,442 | ||||||||||
|
|
|
|
|
|
|
|
|
|
|
|||||||||||
| Calculation of Adjusted Pre-Provision Net Revenue |
||||||||||||||||||||
| Pre-Provision Net Revenue (PPNR) |
$ | 55,211 | $ | 29,463 | $ | 64,212 | $ | 68,514 | $ | 80,442 | ||||||||||
| Certain items, pre-tax (non-GAAP) |
||||||||||||||||||||
| Plus: Loss (gain) on sale of securities |
— | 20,218 | — | 391 | — | |||||||||||||||
| Plus: FDIC Deposit Insurance special assessment |
1,549 | 10,521 | — | — | — | |||||||||||||||
| Plus: Merger related costs |
— | — | 5 | 19 | 1,396 | |||||||||||||||
| Plus: Early retirement program costs |
219 | 1,032 | 1,557 | 3,609 | — | |||||||||||||||
| Plus: Branch right sizing costs (net) |
236 | 3,846 | 547 | 95 | 979 | |||||||||||||||
|
|
|
|
|
|
|
|
|
|
|
|||||||||||
| Adjusted Pre-Provision Net Revenue |
$ | 57,215 | $ | 65,080 | $ | 66,321 | $ | 72,628 | $ | 82,817 | ||||||||||
|
|
|
|
|
|
|
|
|
|
|
|||||||||||
Page 13
| Simmons First National Corporation | SFNC | |||
| Reconciliation Of Non-GAAP Financial Measures - Year-to-Date | ||||
| For the Quarters Ended | ||||
| (Unaudited) |
| Mar 31 | Dec 31 | Sep 30 | Jun 30 | Mar 31 | ||||||||||||||||
| 2024 | 2023 | 2023 | 2023 | 2023 | ||||||||||||||||
| ($ in thousands) |
||||||||||||||||||||
| Calculation of Adjusted Return on Average Assets |
||||||||||||||||||||
| Net income |
$ | 38,871 | $ | 175,057 | $ | 151,150 | $ | 103,903 | $ | 45,589 | ||||||||||
| Certain items (non-GAAP) |
||||||||||||||||||||
| FDIC Deposit Insurance special assessment |
1,549 | 10,521 | — | — | — | |||||||||||||||
| Merger related costs |
— | 1,420 | 1,420 | 1,415 | 1,396 | |||||||||||||||
| Early retirement program |
219 | 6,198 | 5,166 | 3,609 | — | |||||||||||||||
| Loss (gain) on sale of securities |
— | 20,609 | 391 | 391 | — | |||||||||||||||
| Branch right sizing (net) |
236 | 5,467 | 1,621 | 1,074 | 979 | |||||||||||||||
| Tax effect of certain items (2) |
(524 | ) | (11,556 | ) | (2,247 | ) | (1,695 | ) | (621 | ) | ||||||||||
|
|
|
|
|
|
|
|
|
|
|
|||||||||||
| Adjusted earnings (non-GAAP) |
$ | 40,351 | $ | 207,716 | $ | 157,501 | $ | 108,697 | $ | 47,343 | ||||||||||
|
|
|
|
|
|
|
|
|
|
|
|||||||||||
| Average total assets |
$ | 27,259,399 | $ | 27,554,859 | $ | 27,616,882 | $ | 27,628,202 | $ | 27,488,732 | ||||||||||
|
|
|
|
|
|
|
|
|
|
|
|||||||||||
| Return on average assets |
0.57 | % | 0.64 | % | 0.73 | % | 0.76 | % | 0.67 | % | ||||||||||
|
|
|
|
|
|
|
|
|
|
|
|||||||||||
| Adjusted return on average assets (non-GAAP) |
0.60 | % | 0.75 | % | 0.76 | % | 0.79 | % | 0.70 | % | ||||||||||
|
|
|
|
|
|
|
|
|
|
|
|||||||||||
| Calculation of Return on Tangible Common Equity |
||||||||||||||||||||
| Net income available to common stockholders |
$ | 38,871 | $ | 175,057 | $ | 151,150 | $ | 103,903 | $ | 45,589 | ||||||||||
| Amortization of intangibles, net of taxes |
2,844 | 12,044 | 9,079 | 6,052 | 3,026 | |||||||||||||||
|
|
|
|
|
|
|
|
|
|
|
|||||||||||
| Total income available to common stockholders |
$ | 41,715 | $ | 187,101 | $ | 160,229 | $ | 109,955 | $ | 48,615 | ||||||||||
|
|
|
|
|
|
|
|
|
|
|
|||||||||||
| Certain items (non-GAAP) |
||||||||||||||||||||
| FDIC Deposit Insurance special assessment |
$ | 1,549 | $ | 10,521 | $ | — | $ | — | $ | — | ||||||||||
| Merger related costs |
— | 1,420 | 1,420 | 1,415 | 1,396 | |||||||||||||||
| Early retirement program |
219 | 6,198 | 5,166 | 3,609 | — | |||||||||||||||
| Loss (gain) on sale of securities |
— | 20,609 | 391 | 391 | — | |||||||||||||||
| Branch right sizing (net) |
236 | 5,467 | 1,621 | 1,074 | 979 | |||||||||||||||
| Tax effect of certain items (2) |
(524 | ) | (11,556 | ) | (2,247 | ) | (1,695 | ) | (621 | ) | ||||||||||
|
|
|
|
|
|
|
|
|
|
|
|||||||||||
| Adjusted earnings (non-GAAP) |
40,351 | 207,716 | 157,501 | 108,697 | 47,343 | |||||||||||||||
| Amortization of intangibles, net of taxes |
2,844 | 12,044 | 9,079 | 6,052 | 3,026 | |||||||||||||||
|
|
|
|
|
|
|
|
|
|
|
|||||||||||
| Total adjusted earnings available to common stockholders (non-GAAP) |
$ | 43,195 | $ | 219,760 | $ | 166,580 | $ | 114,749 | $ | 50,369 | ||||||||||
|
|
|
|
|
|
|
|
|
|
|
|||||||||||
| Average common stockholders’ equity |
$ | 3,447,021 | $ | 3,359,312 | $ | 3,367,088 | $ | 3,364,755 | $ | 3,370,651 | ||||||||||
| Average intangible assets: |
||||||||||||||||||||
| Goodwill |
(1,320,799 | ) | (1,320,510 | ) | (1,320,412 | ) | (1,320,215 | ) | (1,319,624 | ) | ||||||||||
| Other intangibles |
(111,023 | ) | (121,098 | ) | (123,200 | ) | (125,272 | ) | (127,394 | ) | ||||||||||
|
|
|
|
|
|
|
|
|
|
|
|||||||||||
| Total average intangibles |
(1,431,822 | ) | (1,441,608 | ) | (1,443,612 | ) | (1,445,487 | ) | (1,447,018 | ) | ||||||||||
|
|
|
|
|
|
|
|
|
|
|
|||||||||||
| Average tangible common stockholders’ equity (non-GAAP) |
$ | 2,015,199 | $ | 1,917,704 | $ | 1,923,476 | $ | 1,919,268 | $ | 1,923,633 | ||||||||||
|
|
|
|
|
|
|
|
|
|
|
|||||||||||
| Return on average common equity |
4.54 | % | 5.21 | % | 6.00 | % | 6.23 | % | 5.49 | % | ||||||||||
|
|
|
|
|
|
|
|
|
|
|
|||||||||||
| Return on tangible common equity |
8.33 | % | 9.76 | % | 11.14 | % | 11.55 | % | 10.25 | % | ||||||||||
|
|
|
|
|
|
|
|
|
|
|
|||||||||||
| Adjusted return on average common equity (non-GAAP) |
4.71 | % | 6.18 | % | 6.25 | % | 6.51 | % | 5.70 | % | ||||||||||
|
|
|
|
|
|
|
|
|
|
|
|||||||||||
| Adjusted return on tangible common equity (non-GAAP) |
8.62 | % | 11.46 | % | 11.58 | % | 12.06 | % | 10.62 | % | ||||||||||
|
|
|
|
|
|
|
|
|
|
|
|||||||||||
| Calculation of Efficiency Ratio and Adjusted Efficiency Ratio (1) |
||||||||||||||||||||
| Noninterest expense (efficiency ratio numerator) |
$ | 139,879 | $ | 563,061 | $ | 414,922 | $ | 282,924 | $ | 143,228 | ||||||||||
| Certain noninterest expense items (non-GAAP) |
||||||||||||||||||||
| Merger related costs |
— | (1,420 | ) | (1,420 | ) | (1,415 | ) | (1,396 | ) | |||||||||||
| Early retirement program |
(219 | ) | (6,198 | ) | (5,166 | ) | (3,609 | ) | — | |||||||||||
| FDIC Deposit Insurance special assessment |
(1,549 | ) | (10,521 | ) | — | — | — | |||||||||||||
| Branch right sizing expense |
(236 | ) | (5,467 | ) | (1,621 | ) | (1,074 | ) | (979 | ) | ||||||||||
| Other real estate and foreclosure expense adjustment |
(179 | ) | (892 | ) | (703 | ) | (475 | ) | (186 | ) | ||||||||||
| Amortization of intangibles adjustment |
(3,850 | ) | (16,306 | ) | (12,291 | ) | (8,194 | ) | (4,096 | ) | ||||||||||
|
|
|
|
|
|
|
|
|
|
|
|||||||||||
| Adjusted efficiency ratio numerator |
$ | 133,846 | $ | 522,257 | $ | 393,721 | $ | 268,157 | $ | 136,571 | ||||||||||
|
|
|
|
|
|
|
|
|
|
|
|||||||||||
| Net interest income |
$ | 151,906 | $ | 650,126 | $ | 494,498 | $ | 341,065 | $ | 177,835 | ||||||||||
| Noninterest income |
43,184 | 155,566 | 133,592 | 90,815 | 45,835 | |||||||||||||||
| Fully tax-equivalent adjustment (effective tax rate of 26.135%) |
6,422 | 25,443 | 18,932 | 12,417 | 6,311 | |||||||||||||||
|
|
|
|
|
|
|
|
|
|
|
|||||||||||
| Efficiency ratio denominator |
201,512 | 831,135 | 647,022 | 444,297 | 229,981 | |||||||||||||||
| Certain noninterest income items (non-GAAP) Branch right sizing income |
— | — | — | — | — | |||||||||||||||
| (Gain) loss on sale of securities |
— | 20,609 | 391 | 391 | — | |||||||||||||||
|
|
|
|
|
|
|
|
|
|
|
|||||||||||
| Adjusted efficiency ratio denominator |
$ | 201,512 | $ | 851,744 | $ | 647,413 | $ | 444,688 | $ | 229,981 | ||||||||||
|
|
|
|
|
|
|
|
|
|
|
|||||||||||
| Efficiency ratio (1) |
69.41 | % | 67.75 | % | 64.13 | % | 63.68 | % | 62.28 | % | ||||||||||
|
|
|
|
|
|
|
|
|
|
|
|||||||||||
| Adjusted efficiency ratio (non-GAAP) (1) |
66.42 | % | 61.32 | % | 60.81 | % | 60.30 | % | 59.38 | % | ||||||||||
|
|
|
|
|
|
|
|
|
|
|
|||||||||||
| (1) | Efficiency ratio is noninterest expense as a percent of net interest income (fully taxable equivalent) and noninterest revenues. Adjusted efficiency ratio is noninterest expense before foreclosed property expense, amortization of intangibles and certain adjusting items as a percent of net interest income (fully taxable equivalent) and noninterest revenues, excluding gains and losses from securities transactions and certain adjusting items, and is a non-GAAP measurement. |
| (2) | Effective tax rate of 26.135%. |
Page 14
Exhibit 99.2

Simmons First National Corporation Nasdaq: SFNC 1st Quarter 2024 Earnings Presentation Contents 3 Company Profile 4 1Q24 Financial Highlights 11 Deposits, Securities, Liquidity, Interest Rate Sensitivity and Capital 17 Loan Portfolio 22 Credit Quality 28 Appendix
Forward-Looking Statements and Non-GAAP Financial Measures Forward-Looking Statements. Certain statements by Simmons First National Corporation (the “Company”, which where appropriate includes the Company’s wholly-owned banking subsidiary, Simmons Bank) contained in this presentation may not be based on historical facts and should be considered “forward-looking statements” within the meaning of the Private Securities Litigation Reform Act of 1995. These forward-looking statements may be identified by reference to a future period(s) or by the use of forward-looking terminology, such as “anticipate,” “believe,” “continue,” “estimate,” “expect,” “foresee,“ “indicate,” “plan,” “potential,” “project,” “target,” “may,” “might,” “will,” “would,” “could,“ “should,” “likely” or “intend,” future or conditional verb tenses, and variations or negatives of such terms or by similar expressions. These forward-looking statements include, without limitation, statements relating to the Company’s future growth; business strategies; product development; revenue; expenses (including interest expense and non-interest expenses); assets; loan demand (including loan growth, loan capacity, and other lending activity); deposit levels; asset quality; profitability; earnings; critical accounting policies; accretion; net interest margin; noninterest income; the Company’s common stock repurchase program; adequacy of the allowance for credit losses; income tax deductions; credit quality; level of credit losses from lending commitments; net interest revenue; interest rate sensitivity (including, among other things, the potential impact of rising rates); loan loss experience; liquidity; capital resources; future economic conditions and market risk; interest rates; the expected benefits, milestones, timelines, and costs associated with the Company’s merger and acquisition strategy and activity; the Company’s ability to recruit and retain key employees; increases in, and cash flows associated with, the Company’s securities portfolio; legal and regulatory limitations and compliance and competition; anticipated loan principal reductions; plans for investments in and cash flows from securities; estimated earn back periods; projections regarding securities investments and maturities thereof; estimates of future swap income set forth on slide 8; the interest rate sensitivity estimates and projections noted on slide 15; and dividends. Readers are cautioned not to place undue reliance on the forward-looking statements contained in this presentation in that actual results could differ materially from those indicated in or implied by such forward-looking statements due to a variety of factors. These factors include, but are not limited to, changes in the Company’s operating or expansion strategy; the availability of and costs associated with obtaining adequate and timely sources of liquidity; the ability to maintain credit quality; changes in general market and economic conditions; increased unemployment; labor shortages; possible adverse rulings, judgments, settlements and other outcomes of pending or future litigation; the ability of the Company to collect amounts due under loan agreements; changes in consumer preferences and loan demand; the effectiveness of the Company’s interest rate risk management strategies; laws and regulations affecting financial institutions in general or relating to taxes; the effect of pending or future legislation; the ability of the Company to repurchase its common stock on favorable terms; the ability of the Company to successfully manage and implement its acquisition strategy and integrate acquired institutions; difficulties and delays in integrating an acquired business or fully realizing cost savings and other benefits of mergers and acquisitions; changes in interest rates, deposit flows, real estate values, and capital markets; increased inflation; customer acceptance of the Company’s products and services; changes or disruptions in technology and IT systems (including cyber threats, attacks and events); changes in accounting principles relating to loan loss recognition (current expected credit losses, or CECL); the benefits associated with the Company’s early retirement program; political crises, war, and other military conflicts (including the ongoing military conflicts between Russia and Ukraine and between Israel and Hamas) or other major events, or the prospect of these events; increased competition; changes in governmental policies; loss of key employees; the soundness of other financial institutions and any indirect exposure related to the closings of other financial institutions and their impact on the broader market through other customers, suppliers and partners, or that the conditions which resulted in the liquidity concerns experienced by closed financial institutions may also adversely impact, directly or indirectly, other financial institutions and market participants with which the Company has commercial or deposit relationships; increased delinquency and foreclosure rates on commercial real estate loans; and other risk factors. Other relevant risk factors may be detailed from time to time in the Company’s press releases and filings with the U.S. Securities and Exchange Commission, including, without limitation, the Company’s Form 10-K for the year ended December 31, 2023. In addition, there can be no guarantee that the board of directors (“Board”) of the Company will approve a quarterly dividend in future quarters, and the timing, payment, and amount of future dividends (if any) is subject to, among other things, the discretion of the Board and may differ significantly from past dividends. Any forward-looking statement speaks only as of the date of this presentation, and the Company undertakes no obligation to update these forward-looking statements to reflect events or circumstances that occur after the date of this presentation. Annualized, pro forma, projected and estimated numbers are used for illustrative purpose only, are not forecasts and may not reflect actual results. Non-GAAP Financial Measures. This presentation contains financial information determined by methods other than in accordance with U.S. generally accepted accounting principles (“GAAP”). The Company’s management uses these non-GAAP financial measures in their analysis of the Company’s performance and capital adequacy. These measures adjust GAAP performance measures to, among other things, include the tax benefit associated with revenue items that are tax-exempt, as well as exclude from net income (including on a per share diluted basis), pre-tax, pre-provision earnings, net charge-offs, income available to common shareholders, non-interest income, and non-interest expense certain income and expense items attributable to, for example, merger activity (primarily including merger-related expenses), gains and/or losses on sale of branches, net branch right-sizing initiatives, FDIC special assessment charges and gain/loss on the sale of AFS investment securities. The Company has updated its calculation of certain non-GAAP financial measures to exclude the impact of gains or losses on the sale of AFS investment securities in light of the impact of the Company’s strategic AFS investment securities transactions during the fourth quarter of 2023, and has presented past periods on a comparable basis. In addition, the Company also presents certain figures based on tangible common stockholders’ equity, tangible assets and tangible book value, which exclude goodwill and other intangible assets, and presents certain other figures to include the effect that accumulated other comprehensive income could have on the Company’s capital levels . The Company further presents certain figures that are exclusive of the impact of deposits and/or loans acquired through acquisitions, mortgage warehouse loans, and/or energy loans, or gains and/or losses on the sale of securities. The Company’s management believes that these non-GAAP financial measures are useful to investors because they, among other things, present the results of the Company’s ongoing operations without the effect of mergers or other items not central to the Company’s ongoing business, present the Company’s capital inclusive of the potential impact of AOCI (primarily comprised of unrealized losses on securities), as well as normalize for tax effects and certain other effects. Management, therefore, believes presentations of these non-GAAP financial measures provide useful supplemental information that is essential to a proper understanding of the operating results of the Company’s ongoing businesses, and management uses these non-GAAP financial measures to assess the performance of the Company’s ongoing businesses as related to prior financial periods. These non-GAAP disclosures should not be viewed as a substitute for operating results determined in accordance with GAAP, nor are they necessarily comparable to non-GAAP performance measures that may be presented by other companies. Where non-GAAP financial measures are used, the comparable GAAP financial measure, as well as the reconciliation to the comparable GAAP financial measure, can be found in the appendix to this presentation. 2
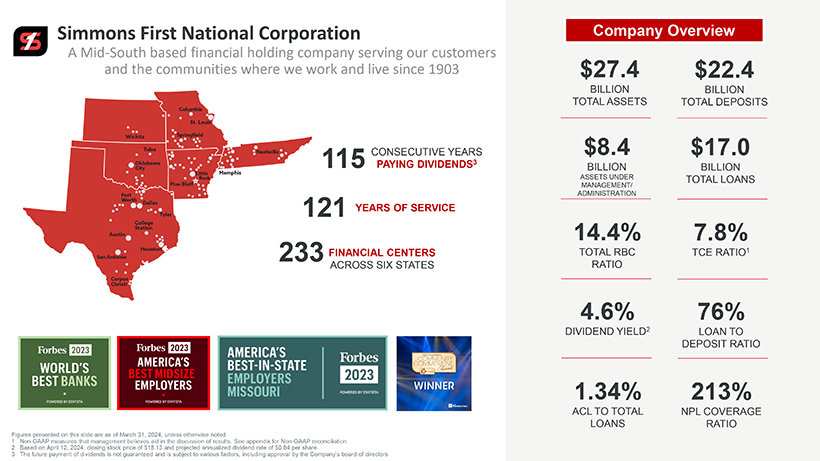
Simmons First National Corporation A Mid-South based financial holding company serving our customers and the communities where we work and live since 1903 CONSECUTIVE YEARS 115 PAYING DIVIDENDS3 121 YEARS OF SERVICE 233 FINANCIAL CENTERS ACROSS SIX STATES Figures presented on this slide are as of March 31, 2024, unless otherwise noted 1 Non-GAAP measures that management believes aid in the discussion of results. See appendix for Non-GAAP reconciliation 2 Based on April 12, 2024, closing stock price of $18.13 and projected annualized dividend rate of $0.84 per share 3 The future payment of dividends is not guaranteed and is subject to various factors, including approval by the Company’s board of directors Company Overview $27.4 $22.4 BILLION BILLION TOTAL ASSETS TOTAL DEPOSITS $8.4 $17.0 BILLION BILLION ASSETS UNDER TOTAL LOANS MANAGEMENT/ ADMINISTRATION 14.4% 7.8% TOTAL RBC TCE RATIO1 RATIO 4.6% 76% DIVIDEND YIELD2 LOAN TO DEPOSIT RATIO 1.34% 213% ACL TO TOTAL NPL COVERAGE LOANS RATIO Forbes 2023 WORLD’S BEST BANKS Forbes 2023 AMERICA’S BEST MIDSIZE EMPLOYERS AMERICA’S BEST-IN-STATE EMPLOYERS MISSOURI Forbes 2023 WINNER POWERED BY STATISTA POWERED BY STATISTA POWERED BY STATISTA

Simmons First National Corporation 1Q24 Financial Highlights
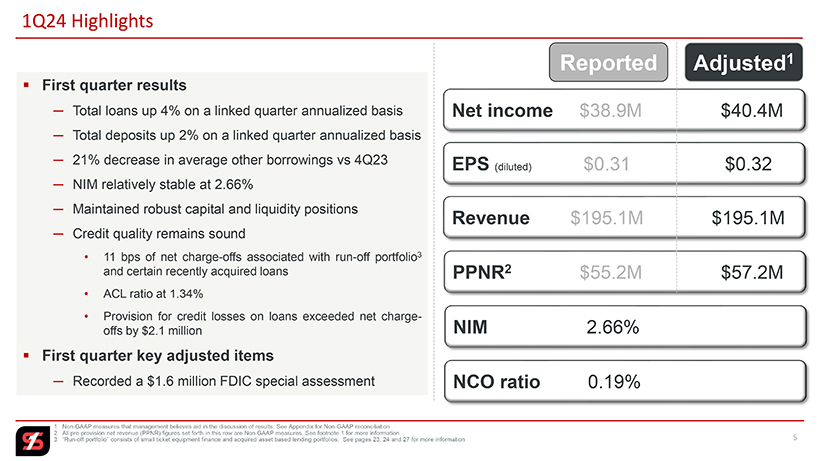
1Q24 Highlights First quarter results Total loans up 4% on a linked quarter annualized basis Total deposits up 2% on a linked quarter annualized basis 21% decrease in average other borrowings vs 4Q23 NIM relatively stable at 2.66% Maintained robust capital and liquidity positions Credit quality remains sound • 11 bps of net charge-offs associated with run-off portfolio3 and certain recently acquired loans • ACL ratio at 1.34% • Provision for credit losses on loans exceeded net charge-offs by $2.1 million First quarter key adjusted items Recorded a $1.6 million FDIC special assessment Reported Adjusted1 Net income $38.9M $40.4M EPS (diluted) $0.31 $0.32 Revenue $195.1M $195.1M PPNR2 $55.2M $57.2M NIM 2.66% NCO ratio 0.19% 1 Non-GAAP measures that management believes aid in the discussion of results. See Appendix for Non-GAAP reconciliation 2 All pre-provision net revenue (PPNR) figures set forth in this row are Non-GAAP measures. See footnote 1 for more information 3 “Run-off portfolio” consists of small ticket equipment finance and acquired asset based lending portfolios. See pages 23, 24 and 27 for more information 5
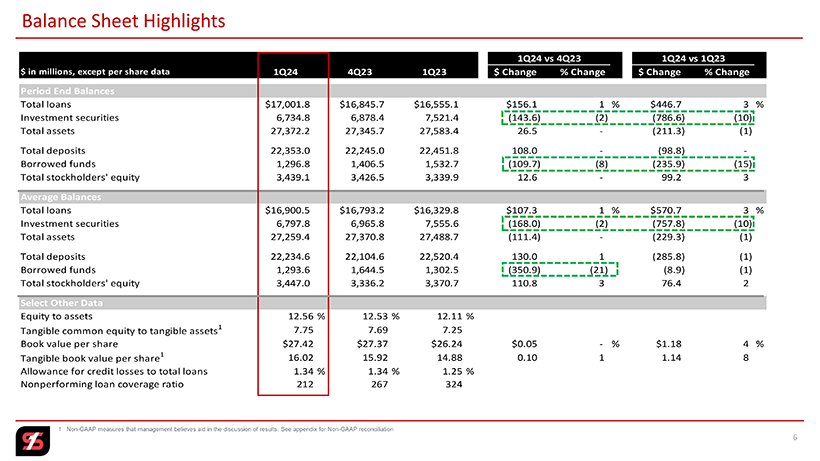
Balance Sheet Highlights 1Q24 vs 4Q23 1Q24 vs 1Q23 $ in millions, except per share data 1Q24 4Q23 1Q23 $ Change % Change $ Change % Change Period End Balances Total loans $17,001.8 $16,845.7 $16,555.1 $156.1 1 % $446.7 3 % Investment securities 6,734.8 6,878.4 7,521.4 (143.6) (2) (786.6) (10) Total assets 27,372.2 27,345.7 27,583.4 26.5 - (211.3) (1) Total deposits 22,353.0 22,245.0 22,451.8 108.0 - (98.8) - Borrowed funds 1,296.8 1,406.5 1,532.7 (109.7) (8) (235.9) (15) Total stockholders’ equity 3,439.1 3,426.5 3,339.9 12.6 - 99.2 3 Average Balances Total loans $16,900.5 $16,793.2 $16,329.8 $107.3 1 % $570.7 3 % Investment securities 6,797.8 6,965.8 7,555.6 (168.0) (2) (757.8) (10) Total assets 27,259.4 27,370.8 27,488.7 (111.4) - (229.3) (1) Total deposits 22,234.6 22,104.6 22,520.4 130.0 1 (285.8) (1) Borrowed funds 1,293.6 1,644.5 1,302.5 (350.9) (21) (8.9) (1) Total stockholders’ equity 3,447.0 3,336.2 3,370.7 110.8 3 76.4 2 Select Other Data Equity to assets 12.56 % 12.53 % 12.11 % 1 7.75 7.69 7.25 Tangible common equity to tangible assets Book value per share $27.42 $27.37 $26.24 $0.05 - % $1.18 4 % 1 16.02 15.92 14.88 0.10 1 1.14 8 Tangible book value per share Allowance for credit losses to total loans 1.34 % 1.34 % 1.25 % Nonperforming loan coverage ratio 212 267 324 1 Non-GAAP measures that management believes aid in the discussion of results. See appendix for Non-GAAP reconciliation 6
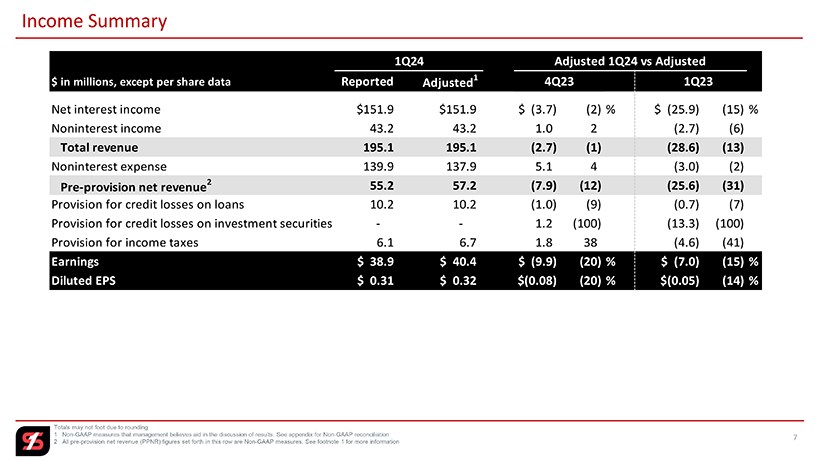
Income Summary 1Q24 Adjusted 1Q24 vs Adjusted $ in millions, except per share data Reported 1 4Q23 1Q23 Adjusted Net interest income $151.9 $151.9 $ (3.7) (2) % $ (25.9) (15) % Noninterest income 43.2 43.2 1.0 2 (2.7) (6) Total revenue 195.1 195.1 (2.7) (1) (28.6) (13) Noninterest expense 139.9 137.9 5.1 4 (3.0) (2) 2 55.2 57.2 (7.9) (12) (25.6) (31) Pre-provision net revenue Provision for credit losses on loans 10.2 10.2 (1.0) (9) (0.7) (7) Provision for credit losses on investment securities - - 1.2 (100) (13.3) (100) Provision for income taxes 6.1 6.7 1.8 38 (4.6) (41) Earnings $ 38.9 $ 40.4 $ (9.9) (20) % $ (7.0) (15) % Diluted EPS $ 0.31 $ 0.32 $(0.08) (20) % $(0.05) (14) % Totals may not foot due to rounding 1 Non-GAAP measures that management believes aid in the discussion of results. See appendix for Non-GAAP reconciliation 2 All pre-provision net revenue (PPNR) figures set forth in this row are Non-GAAP measures. See footnote 1 for more information 7
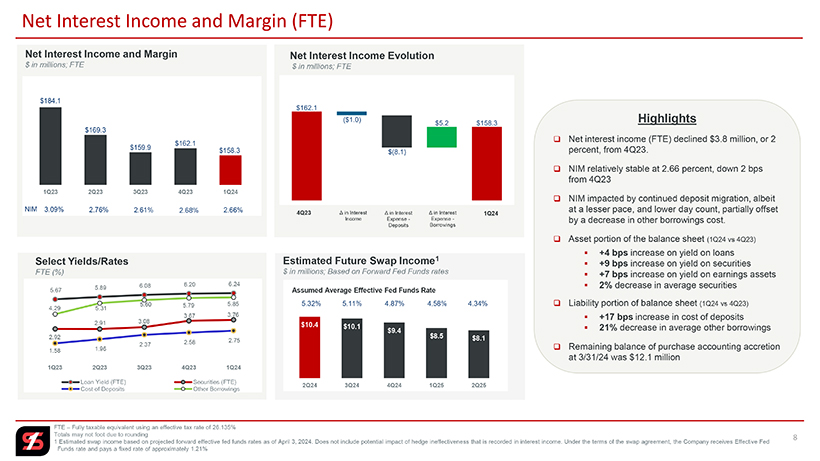
Net Interest Income and Margin (FTE) Net Interest Income and Margin Net Interest Income Evolution $ in millions; FTE $ in millions; FTE Select Yields/Rates Estimated Future Swap Income1 FTE (%) $ in millions; Based on Forward Fed Funds rates Highlights Net interest income (FTE) declined $3.8 million, or 2 percent, from 4Q23. NIM relatively stable at 2.66 percent, down 2 bps from 4Q23 NIM impacted by continued deposit migration, albeit at a lesser pace, and lower day count, partially offset by a decrease in other borrowings cost. Asset portion of the balance sheet (1Q24 vs 4Q23) +4 bps increase on yield on loans +9 bps increase on yield on securities +7 bps increase on yield on earnings assets 2% decrease in average securities Liability portion of balance sheet (1Q24 vs 4Q23) +17 bps increase in cost of deposits 21% decrease in average other borrowings Remaining balance of purchase accounting accretion at 3/31/24 was $12.1 million $184.1 $169.3 $162.1 $159.9 $158.3 1Q23 2Q23 3Q23 4Q23 1Q24 NIM 3.09% 2.76% 2.61% 2.68% 2.66% 4Q23 in Interest in Interest in Interest 1Q24 Income Expense - Expense - Deposits Borrowings 5.67 5.89 5.60 5.79 5.85 4.29 5.31 3.67 3.76 2.91 3.08 2.92 2.58 2.75 2.37 1.58 1.96 1Q23 2Q23 3Q23 4Q23 1Q24 Loan Yield (FTE) Securities (FTE) Cost of Deposits Other Borrowings Assumed Average Effective Fed Funds Rate 5.32% 5.11% 4.87% 4.58% 4.34% $10.4 $10.1 $9.4 $8.5 $8.1 2Q24 3Q24 4Q24 1Q25 2Q25 FTE – Fully taxable equivalent using an effective tax rate of 26.135% Totals may not foot due to rounding 1 Estimated swap income based on projected forward effective fed funds rates as of April 3, 2024. Does not include potential impact of hedge ineffectiveness that is recorded in interest income. Under the terms of the swap agreement, the Company receives Effective Fed Funds rate and pays a fixed rate of approximately 1.21% 8
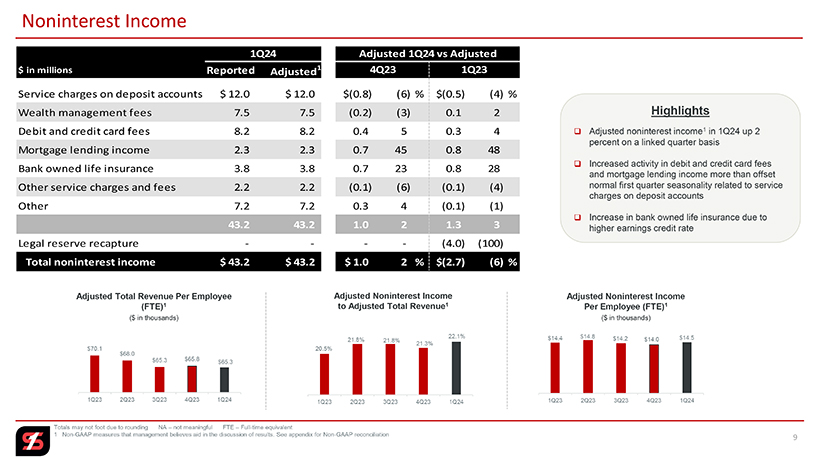
Noninterest Income 1Q24 Adjusted 1Q24 vs Adjusted $ in millions Reported Adjusted1 4Q23 1Q23 Service charges on deposit accounts $ 12.0 $ 12.0 $(0.8) (6) % $(0.5) (4) % Wealth management fees 7.5 7.5 (0.2) (3) 0.1 2 Highlights Debit and credit card fees 8.2 8.2 0.4 5 0.3 4 ? Adjusted noninterest income1 in 1Q24 up 2 Mortgage lending income 2.3 2.3 0.7 45 0.8 48 percent on a linked quarter basis ? Increased activity in debit and credit card fees Bank owned life insurance 3.8 3.8 0.7 23 0.8 28 and mortgage lending income more than offset Other service charges and fees 2.2 2.2 (0.1) (6) (0.1) (4) normal first quarter seasonality related to service charges on deposit accounts Other 7.2 7.2 0.3 4 (0.1) (1) ? Increase in bank owned life insurance due to 43.2 43.2 1.0 2 1.3 3 higher earnings credit rate Legal reserve recapture — — (4.0) (100) Total noninterest income $ 43.2 $ 43.2 $ 1.0 2 % $(2.7) (6) % Adjusted Total Revenue Per Employee Adjusted Noninterest Income Adjusted Noninterest Income (FTE)1 to Adjusted Total Revenue1 Per Employee (FTE)1 ($ in thousands) ($ in thousands) 22.1% $14.4 $14.8 $14.2 $14.5 21.8% 21.8% $14.0 $70.1 20.5% 21.3% $68.0 $65.8 $65.3 $65.3 1Q23 2Q23 3Q23 4Q23 1Q24 1Q23 2Q23 3Q23 4Q23 1Q24 1Q23 2Q23 3Q23 4Q23 1Q24 Totals may not foot due to rounding NA – not meaningful FTE – Full-time equivalent 1 Non-GAAP measures that management believes aid in the discussion of results. See appendix for Non-GAAP reconciliation 9
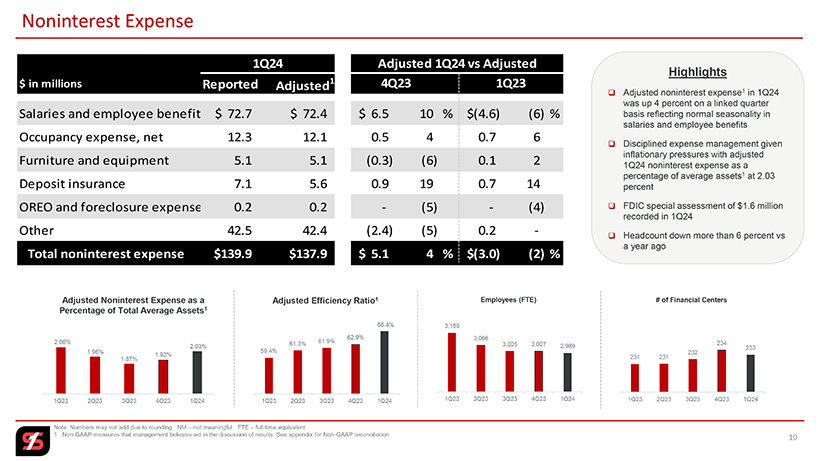
Noninterest Expense 1Q24 Adjusted 1Q24 vs Adjusted Highlights $ in millions Reported Adjusted1 4Q23 1Q23 Adjusted noninterest expense1 in 1Q24 was up 4 percent on a linked quarter Salaries and employee benefit $ 72.7 $ 72.4 $ 6.5 10 % $(4.6) (6) % basis reflecting normal seasonality in salaries and employee benefits Occupancy expense, net 12.3 12.1 0.5 40.7 6 Disciplined expense management given inflationary pressures with adjusted Furniture and equipment 5.1 5.1 (0.3) (6) 0.1 2 1Q24 noninterest expense as a percentage of average assets1 at 2.03 Deposit insurance 7.1 5.6 0.9 19 0.7 14 percent OREO and foreclosure expense 0.2 0.2 — (5) —(4) FDIC special assessment of $1.6 million recorded in 1Q24 Other 42.5 42.4 (2.4) (5) 0.2 — Headcount down more than 6 percent vs a year ago Total noninterest expense $139.9 $137.9 $ 5.1 4 % $(3.0) (2) % Adjusted Noninterest Expense as a Adjusted Efficiency Ratio1 Employees (FTE) # of Financial Centers Percentage of Total Average Assets1 66.4% 3,189 62.9% 3,066 2.08% 61.3% 61.9% 234 2.03% 3,005 3,007 2,989 233 1.96% 59.4% 232 1.92% 231 231 1.87% 1Q23 2Q23 3Q23 4Q23 1Q24 1Q23 2Q23 3Q23 4Q23 1Q24 1Q23 2Q23 3Q23 4Q23 1Q24 1Q23 2Q23 3Q23 4Q23 1Q24 Note: 765327 Numbers may -003 not add due to rounding 23Apr24 NM – not meaningful 15:23 FTE – full-time equivalentPage 1 1 Non-GAAP measures that management believes aid in the discussion of results. See appendix for Non-GAAP reconciliation 10

Simmons First National Corporation Deposits, Securities, Liquidity, Interest Rate Sensitivity and Capital
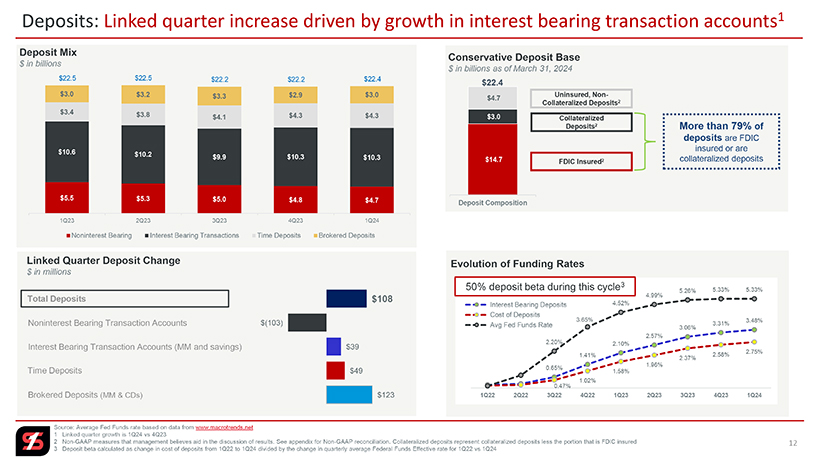
Deposits: Linked quarter increase driven by growth in interest bearing transaction accounts1 Deposit Mix $ in billions $22.5 $22.5 $22.2 $22.2 $22.4 $3.0 $3.2 $3.3 $2.9 $3.0 $3.4 $3.8 $4.1 $4.3 $4.3 $10.6 $10.2 $9.9 $10.3 $10.3 $5.5 $5.3 $5.0 $4.8 $4.7 1Q23 2Q23 3Q23 4Q23 1Q24 Noninterest Bearing Interest Bearing Transactions Time Deposits Brokered Deposits Linked Quarter Deposit Change $ in millions Total Deposits $108 Noninterest Bearing Transaction Accounts $(103) Interest Bearing Transaction Accounts (MM and savings) $39 Time Deposits $49 Brokered Deposits (MM & CDs) $123 Source: Average Fed Funds rate based on data from www.macrotrends.net 1 Linked quarter growth is 1Q24 vs 4Q23 2 Non-GAAP measures that management believes aid in the discussion of results. See appendix for Non-GAAP reconciliation. Collateralized deposits represent collateralized deposits less the portion that is FDIC insured 3 Deposit beta calculated as change in cost of deposits from 1Q22 to 1Q24 divided by the change in quarterly average Federal Funds Effective rate for 1Q22 vs 1Q24 Conservative Deposit Base $ in billions as of March 31, 2024 $22.4 Uninsured, Non-Collateralized $4.7 Deposits2 Collateralized Deposits2 More than 79% of deposits are FDIC insured or are FDIC Insured2 collateralized deposits Deposit Composition Evolution of Funding Rates 50% deposit beta during this cycle3 5.26% 5.33% 5.33% 4.99% Interest Bearing Deposits 4.52% Cost of Deposits 3.65% 3.48% Avg Fed Funds Rate 3.31% 3.06% 2.57% 2.20% 2.10% 2.75% 1.41% 2.58% 2.37% 1.96% 0.65% 1.58% 0.47% 1.02% 1Q22 2Q22 3Q22 4Q22 1Q23 2Q23 3Q23 4Q23 1Q24 12
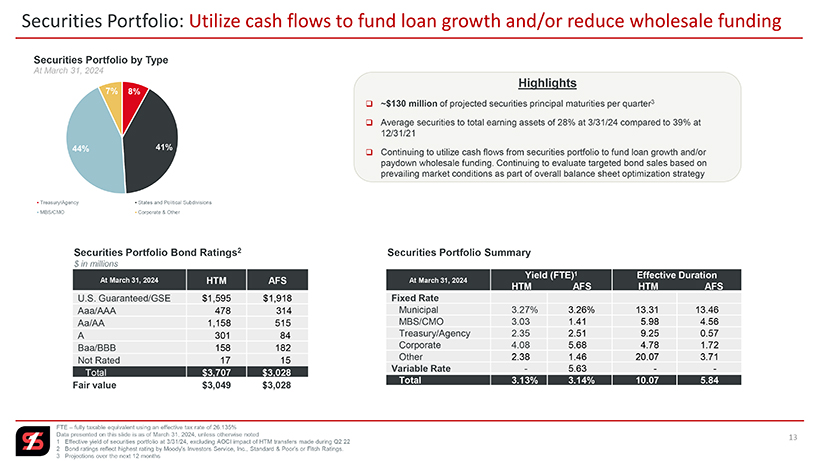
Securities Portfolio: Utilize cash flows to fund loan growth and/or reduce wholesale funding Securities Portfolio by Type At March 31, 2024 Treasury/Agency States and Political Subdivisions MBS/CMO Corporate & Other 44% 7% 8% 41% Securities Portfolio Bond Ratings2 $ in millions At March 31, 2024 HTM AFS U.S. Guaranteed/GSE $1,595 $1,918 Aaa/AAA 478 314 15 Fair value $3,049 $3,028 Highlights ~$130 million of projected securities principal maturities per quarter3 Average securities to total earning assets of 28% at 3/31/24 compared to 39% at 12/31/21 Continuing to utilize cash flows from securities portfolio to fund loan growth and/or paydown wholesale funding. Continuing to evaluate targeted bond sales based on prevailing market conditions as part of overall balance sheet optimization strategy Securities Portfolio Summary Yield (FTE)1 Effective Duration At March 31, 2024 HTM AFS HTM AFS Fixed Rate Municipal 3.27% 3.26% 13.31 13.46 MBS/CMO 3.03 1.41 5.98 4.56 Treasury/Agency 2.35 2.51 9.25 0.57 Corporate 4.08 5.68 4.78 1.72 Other 2.38 1.46 20.07 3.71 Variable Rate - 5.63 - Total 3.13% 3.14% 10.07 5.84 FTE – fully taxable equivalent using an effective tax rate of 26.135% Data presented on this slide is as of March 31, 2024, unless otherwise noted 1 Effective yield of securities portfolio at 3/31/24, excluding AOCI impact of HTM transfers made during Q2 22 2 Bond ratings reflect highest rating by Moody’s Investors Service, Inc., Standard & Poor’s or Fitch Ratings. 3 Projections over the next 12 months 13
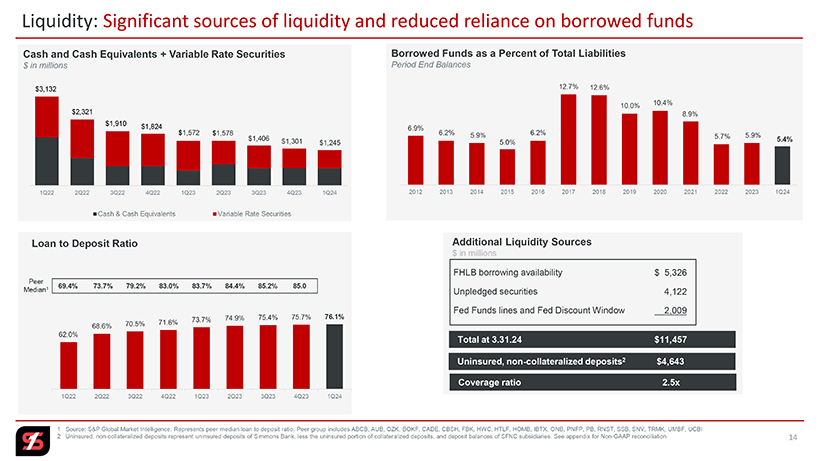
Liquidity: Significant sources of liquidity and reduced reliance on borrowed funds Cash and Cash Equivalents + Variable Rate Securities $ in millions $3,132 $2,321 $1,910 $1,824 $1,572 $1,578 $1,406 $1,301 $1,245 1Q22 2Q22 3Q22 4Q22 1Q23 2Q23 3Q23 4Q23 1Q24 Cash & Cash Equivalents Variable Rate Securities Loan to Deposit Ratio Peer 1 69.4% 73.7% 79.2% 83.0% 83.7% 84.4% 85.2% 85.0 Median 71.6% 73.7% 74.9% 75.4% 75.7% 76.1% 68.6% 70.5% 62.0% 1Q22 2Q22 3Q22 4Q22 1Q23 2Q23 3Q23 4Q23 1Q24 Borrowed Funds as a Percent of Total Liabilities Period End Balances 12.7% 12.6% 10.0% 10.4% 8.9% 6.9% 6.2% 5.9% 6.2% 5.9% 5.0% 5.7% 5.4% 2012 2013 2014 2015 2016 2017 2018 2019 2020 2021 2022 2023 1Q24 Additional Liquidity Sources $ in millions FHLB borrowing availability $ 5,326 Unpledged securities 4,122 Fed Funds lines and Fed Discount Window 2,009 Total at 3.31.24 $11,457 Uninsured, non-collateralized deposits2 $4,643 Coverage ratio 2.5x 1 Source: S&P Global Market Intelligence. Represents peer median loan to deposit ratio. Peer group includes ABCB, AUB, OZK, BOKF, CADE, CBSH, FBK, HWC, HTLF, HOMB, IBTX, ONB, PNFP, PB, RNST, SSB, SNV, TRMK, UMBF, UCBI 2 Uninsured, non-collateralized deposits represent uninsured deposits of Simmons Bank, less the uninsured portion of collateralized deposits, and deposit balances of SFNC subsidiaries. See appendix for Non-GAAP reconciliation 14
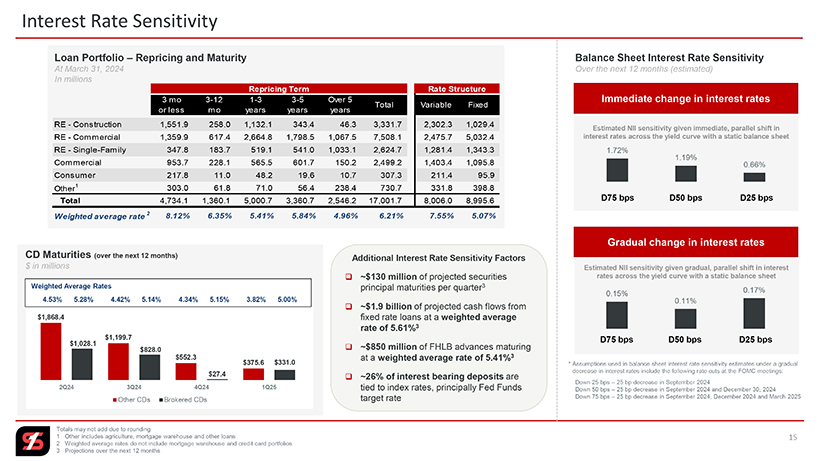
Interest Rate Sensitivity Loan Portfolio – Repricing and Maturity Balance Sheet Interest Rate Sensitivity At March 31, 2024 Over the next 12 months (estimated) In millions Repricing Term Rate Structure 3 mo 3-12 1-3 3-5 Over 5 Immediate change in interest rates Total Variable Fixed or less mo years years years RE—Construction 1,551.9 258.0 1,132.1 343.4 46.3 3,331.7 2,302.3 1,029.4 Estimated NII sensitivity given immediate, parallel shift in RE—Commercial 1,359.9 617.4 2,664.8 1,798.5 1,067.5 7,508.1 2,475.7 5,032.4 interest rates across the yield curve with a static balance sheet RE—Single-Family 347.8 183.7 519.1 541.0 1,033.1 2,624.7 1,281.4 1,343.3 1.72% 1.19% Commercial 953.7 228.1 565.5 601.7 150.2 2,499.2 1,403.4 1,095.8 0.66% Consumer 217.8 11.0 48.2 19.6 10.7 307.3 211.4 95.9 Other1 303.0 61.8 71.0 56.4 238.4 730.7 331.8 398.8 Total 4,734.1 1,360.1 5,000.7 3,360.7 2,546.2 17,001.7 8,006.0 8,995.6 D75 bps D50 bps D25 bps Weighted average rate 2 8.12% 6.35% 5.41% 5.84% 4.96% 6.21% 7.55% 5.07% Gradual change in interest rates CD Maturities (over the next 12 months) Additional Interest Rate Sensitivity Factors $ in millions Estimated NII sensitivity given gradual, parallel shift in interest ~$130 million of projected securities rates across the yield curve with a static balance sheet Weighted Average Rates principal maturities per quarter3 0.17% 4.53% 5.28% 4.42% 5.14% 4.34% 5.15% 3.82% 5.00% 0.15% 0.11% ~$1.9 billion of projected cash flows from $1,868.4 fixed rate loans at a weighted average rate of 5.61%3 $1,028.1 $1,199.7 D75 bps D50 bps D25 bps $828.0 ~$850 million of FHLB advances maturing $552.3 at a weighted average rate of 5.41%3 $375.6 $331.0 * Assumptions used in balance sheet interest rate sensitivity estimates under a gradual decrease in interest rates include the following rate cuts at the FOMC meetings: $27.4 ~26% of interest bearing deposits are 2Q24 3Q24 4Q24 1Q25 Down 25 bps – 25 bp decrease in September 2024 tied to index rates, principally Fed Funds Down 50 bps – 25 bp decrease in September 2024 and December 30, 2024 target rate Down 75 bps – 25 bp decrease in September 2024, December 2024 and March 2025 Other CDs Brokered CDs 765327-003 23Apr24 15:23 Page 2 Totals may not add due to rounding 1 Other includes agriculture, mortgage warehouse and other loans 15 2 Weighted average rates do not include mortgage warehouse and credit card portfolios 3 Projections over the next 12 months 15
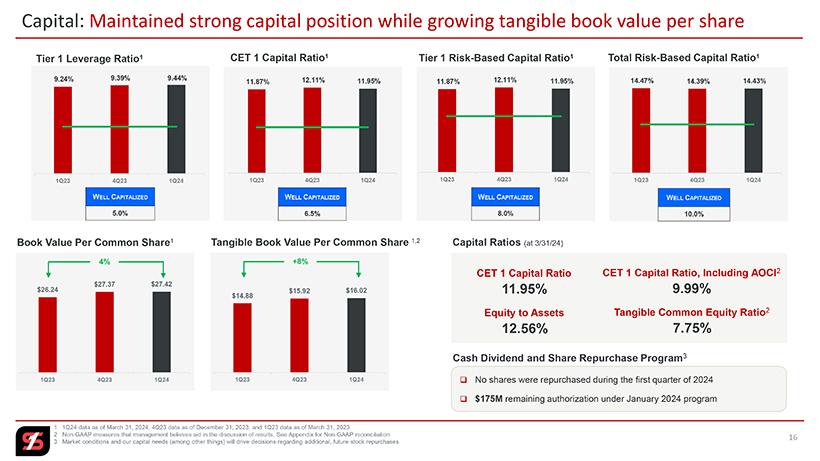
Capital: Maintained strong capital position while growing tangible book value per share Tier 1 Leverage Ratio1 CET 1 Capital Ratio1 Tier 1 Risk-Based Capital Ratio1 Total Risk-Based Capital Ratio1 9.24% 9.39% 9.44% 12.11% 12.11% 11.95% 14.47% 14.43% 11.87% 11.95% 11.87% 14.39% 1Q23 4Q23 1Q24 1Q23 4Q23 1Q24 1Q23 4Q23 1Q24 1Q23 4Q23 1Q24 WELL CAPITALIZED WELL CAPITALIZED WELL CAPITALIZED WELL CAPITALIZED 5.0% 6.5% 8.0% 10.0% Book Value Per Common Share1 Tangible Book Value Per Common Share 1,2 Capital Ratios (at 3/31/24) 4% +8% CET 1 Capital Ratio CET 1 Capital Ratio, Including AOCI2 $27.37 $27.42 $26.24 $14.88 $15.92 $16.02 11.95% 9.99% Equity to Assets Tangible Common Equity Ratio2 12.56% 7.75% Cash Dividend and Share Repurchase Program3 1Q23 4Q23 1Q24 1Q23 4Q23 1Q24 No shares were repurchased during the first quarter of 2024 $175M remaining authorization under January 2024 program 1 1Q24 data as of March 31, 2024, 4Q23 data as of December 31, 2023, and 1Q23 data as of March 31, 2023 2 Non-GAAP measures that management believes aid in the discussion of results. See Appendix for Non-GAAP reconciliation 3 Market conditions and our capital needs (among other things) will drive decisions regarding additional, future stock repurchases 16

Loan Portfolio Simmons First National Corporation
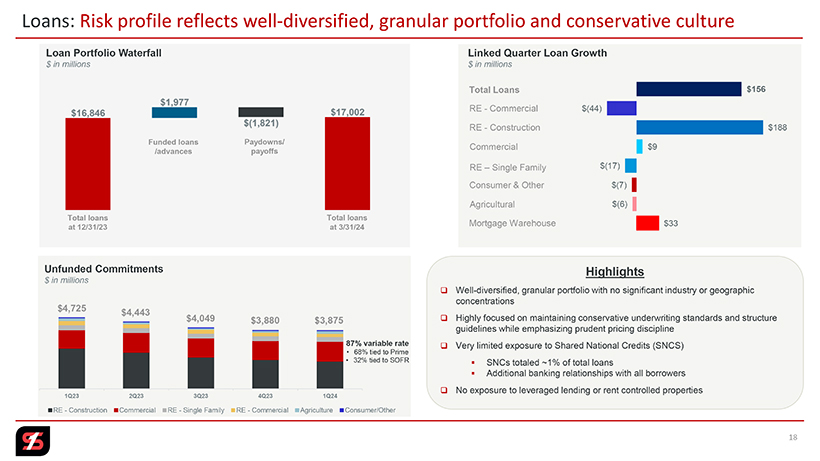
Loans: Risk profile reflects well-diversified, granular portfolio and conservative culture Loan Portfolio Waterfall Linked Quarter Loan Growth $ in millions $ in millions Total Loans $156 RE - Commercial $(44) RE - Construction $188 Funded loans Paydowns/ Commercial $9 /advances payoffs RE – Single Family $(17) Consumer & Other $(7) Agricultural $(6) Total loans Total loans Mortgage Warehouse $33 at 12/31/23 at 3/31/24 Unfunded Commitments Highlights $ in millions Well-diversified, granular portfolio with no significant industry or geographic concentrations $4,725 $4,443 $4,049 $3,880 $3,875 Highly focused on maintaining conservative underwriting standards and structure guidelines while emphasizing prudent pricing discipline 87% variable rate Very limited exposure to Shared National Credits (SNCS) • 68% tied to Prime • 32% tied to SOFR SNCs totaled ~1% of total loans Additional banking relationships with all borrowers No exposure to leveraged lending or rent controlled properties 1Q23 2Q23 3Q23 4Q23 1Q24 18
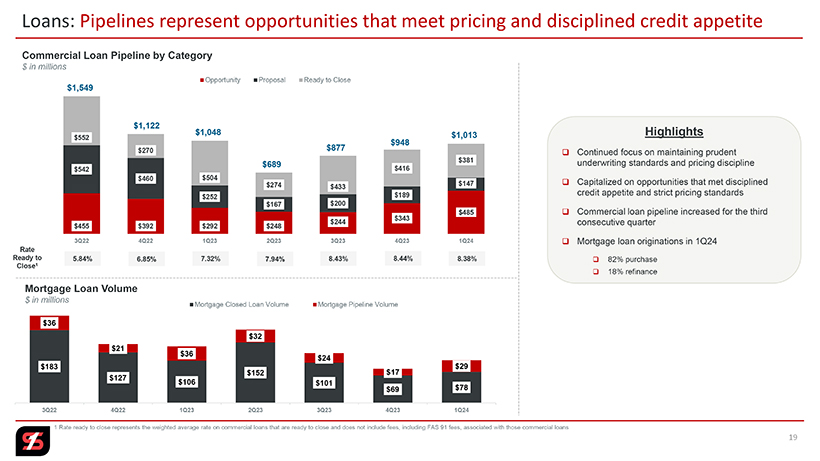
Loans: Pipelines represent opportunities that meet pricing and disciplined credit appetite Commercial Loan Pipeline by Category $ in millions Opportunity Proposal Ready to Close $1,549 $1,122 $1,048 $1,013 $552 $948 $270 $877 $381 $689 $542 $416 $460 $504 $147 $274 $433 $252 $189 $167 $200 $343 $485 $244 $455 $392 $292 $248 3Q22 4Q22 1Q23 2Q23 3Q23 4Q23 1Q24 Rate Ready to 5.84% 6.85% 7.32% 7.94% 8.43% 8.44% 8.38% Close1 Mortgage Loan Volume $ in millions Mortgage Closed Loan Volume Mortgage Pipeline Volume $36 $32 $21 $36 $24 $183 $29 $152 $17 $127 $106 $101 $69 $78 3Q22 4Q22 1Q23 2Q23 3Q23 4Q23 1Q24 Highlights Continued focus on maintaining prudent underwriting standards and pricing discipline Capitalized on opportunities that met disciplined credit appetite and strict pricing standards Commercial loan pipeline increased for the third consecutive quarter Mortgage loan originations in 1Q24 82% purchase 18% refinance 1 Rate ready to close represents the weighted average rate on commercial loans that are ready to close and does not include fees, including FAS 91 fees, associated with those commercial loans 19
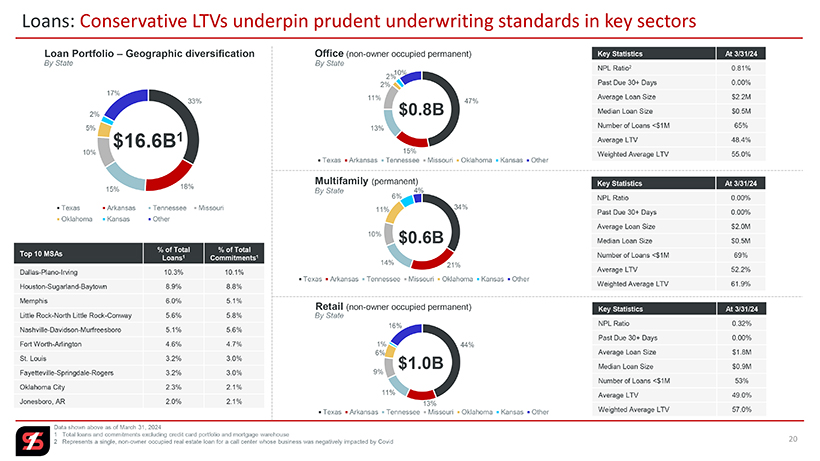
Loans: Conservative LTVs underpin prudent underwriting standards in key sectors Loan Portfolio– Geographic diversification By State 17% 33% 2% 5% $16.6B1 10% 15% 18% Texas Arkansas Tennessee Missouri Oklahoma Kansas Other Top 10 MSAs % of Total Loans1 % of Total Commitments1 Dallas-Plano-Irving 10.3% 10.1% Houston-Sugarland-Baytown 8.9% 8.8% Memphis 6.0% 5.1% Little Rock-North Little Rock-Conway 5.6% 5.8% Nashville-Davidson Murfreesboro 5.1% 5.6% Fort Worth-Arlington 4.6% 4.7% St. Louis 3.2% 3.0% Fayetteville-Springdale-Rogers 3.2% 3.0% Oklahoma City 2.3% 2.1% Jonesboro, AR 2.0% 2.1%Office (non-owner occupied permanent) By State 10% 2% 2% 11% $0.8B 47% 13% 15% Texas Arkansas Tennessee Missouri Oklahoma Kansas Other Multifamily (permanent) By State 6% 4% 11% 34% 10% $0.6B 14% 21% Texas Arkansas Tennessee Missouri Oklahoma Kansas Other Retail (non-owner occupied permanent) By State 16% 1% 44% 6% $1.0B 9% 11% 13% Texas Arkansas Tennessee Missouri Oklahoma Kansas Other Key Statistics At 3/31/24 NPL Ratio(2) 0.81% Past Due 30+ Days 0.00% Average Loan Size $2.2M Median Loan Size $0.5M Number of Loans <$1M 65% Average LTV 48.4% Weighted Average LTV 55.0% Key Statistics At 3/31/24 NPL Ratio 0.00% Past Due 30+ Days 0.00% Average Loan Size $2.0M Median Loan Size $0.5M Number of Loans <$1M 69% Average LTV 52.2% Weighted Average LTV 61.9% Key Statistics At 3/31/24 NPL Ratio 0.32% Past Due 30+ Days 0.00% Average Loan Size $1.8M Median Loan Size $0.9M Number of Loans <$1M 53% Average LTV 49.0% Weighted Average LTV 57.0% Data shown above as of March 31, 2024 1 Total loans and commitments excluding credit card portfolio and mortgage warehouse 2 Represents a single, non-owner occupied real estate loan for a call center whose business was negatively impacted by Covid 20
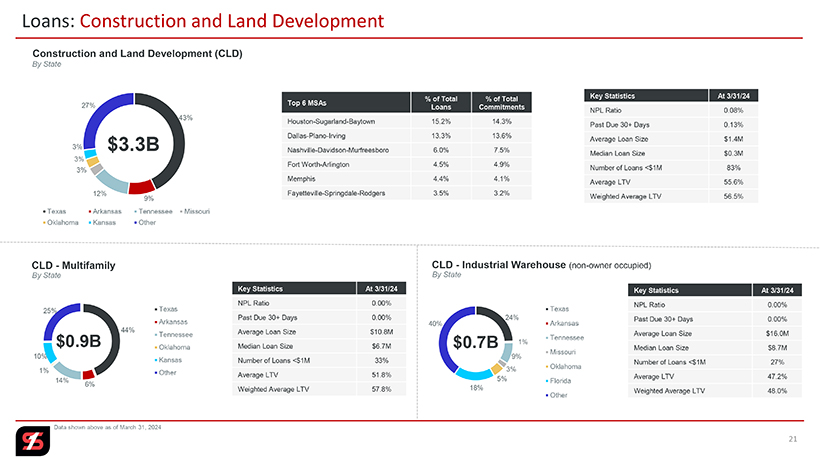
Loans: Construction and Land Development Construction and Land Development (CLD) By State 27% 43% 3% $3.3B 3% 3% 12% 9% Texas Arkansas Tennessee Missouri Oklahoma Kansas Other Top 6 MSAs % of Total % of Total Loans Commitments Houston-Sugarland-Baytown 15.2% 14.3% Dallas-Plano-Irving 13.3% 13.6% Nashville-Davidson-Murfreesboro 6.0% 7.5% Fort Worth-Arlington 4.5% 4.9% Memphis 4.4% 4.1% Fayetteville-Springdale-Rodgers 3.5% 3.2% Key Statistics At 3/31/24 NPL Ratio 0.08% Past Due 30+ Days 0.13% Average Loan Size $1.4M Median Loan Size $0.3M Number of Loans <$1M 83% Average LTV 55.6% Weighted Average LTV 56.5% CLD – Multifamily By State 25% Texas Arkansas 44% $0.9B Tennessee Oklahoma 10% Kansas 1% Other 14% 6% NPL Ratio 0.00% Past Due 30+ Days 0.00% Average Loan Size $10.8M Median Loan Size $6.7M Number of Loans <$1M 33% Average LTV 51.8% Weighted Average LTV 57.8% CLD - Industrial Warehouse (non-owner occupied) By State Texas 40% 24% Arkansas Tennessee $0.7B 1% Missouri 9% 3% Oklahoma 5% Florida 18% Other Key Statistics At 3/31/24 NPL Ratio 0.00% Past Due 30+ Days 0.00% Average Loan Size $16.0M Median Loan Size $8.7M Number of Loans <$1M 27% Average LTV 47.2% Weighted Average LTV 48.0% Data shown above as of March 31, 2024 21

Simmons First National Corporation Credit Quality
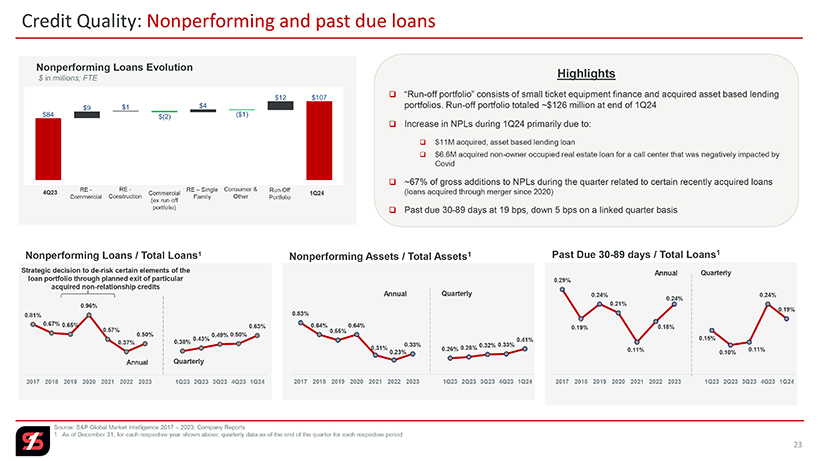
Credit Quality: Nonperforming and past due loans Nonperforming Loans Evolution $ in millions; FTE RE—RE—RE – Single Consumer & Run-Off 4Q23 Commercial 1Q24 Commercial Construction Family Other Portfolio (ex run-off portfolio) Highlights “Run-off portfolio” consists of small ticket equipment finance and acquired asset based lending portfolios. Run-off portfolio totaled ~$126 million at end of 1Q24 Increase in NPLs during 1Q24 primarily due to: $11M acquired, asset based lending loan $6.6M acquired non-owner occupied real estate loan for a call center that was negatively impacted by Covid ~67% of gross additions to NPLs during the quarter related to certain recently acquired loans (loans acquired through merger since 2020) Past due 30-89 days at 19 bps, down 5 bps on a linked quarter basis Nonperforming Loans / Total Loans1 Strategic decision to de-risk certain elements of the loan portfolio through planned exit of particular acquired non-relationship credits 0.96% 0.81% 0.67% 0.65% 0.63% 0.57% 0.50% 0.49% 0.50% 0.43% 0.37% 0.38% Annual Quarterly 2017 2018 2019 2020 2021 2022 2023 1Q23 2Q23 3Q23 4Q23 1Q24 Nonperforming Assets / Total Assets1 Annual Quarterly 0.83% 0.64% 0.64% 0.55% 0.33% 0.33% 0.41% 0.28% 0.32% 0.31% 0.26% 0.23% 2017 2018 2019 2020 2021 2022 2023 1Q23 2Q23 3Q23 4Q23 1Q24 Past Due 30-89 days / Total Loans1 Annual Quarterly 0.29% 0.24% 0.24% 0.21% 0.24% 0.19% 0.19% 0.18% 0.15% 0.11% 0.11% 0.10% 2017 2018 2019 2020 2021 2022 2023 1Q23 2Q23 3Q23 4Q23 1Q24 Source: S&P Global Market Intelligence 2017 – 2023; Company Reports 1 As of December 31, for each respective year shown above; quarterly data as of the end of the quarter for each respective period 23
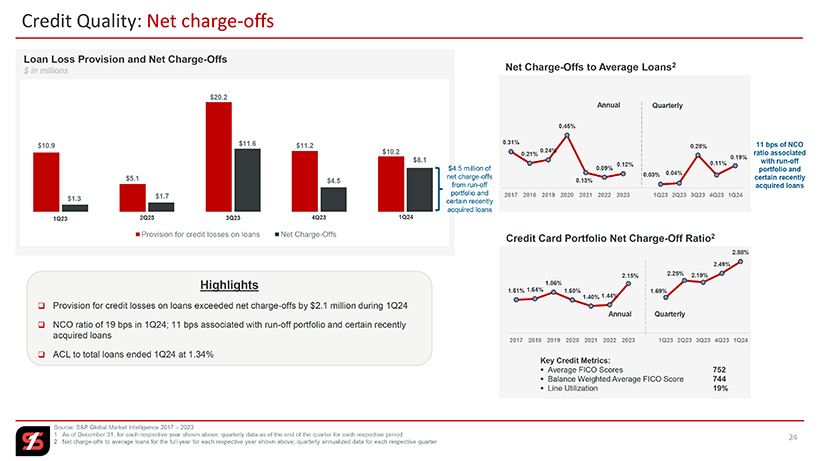
Credit Quality: Net charge-offs Loan Loss Provision and Net Charge-Offs Net Charge-Offs to Average Loans2 $ in millions $20.2 Annual Quarterly 0.45% $11.6 0.31% 11 bps of NCO $10.9 $11.2 0.28% $10.2 0.24% ratio associated 0.21% $8.1 0.19% 0.11% with run-off 0.12% $4.5 million of 0.09% 0.04% portfolio and net charge-offs 0.03% certain recently $5.1 $4.5 0.13% from run-off acquired loans portfolio and 2017 2018 2019 2020 2021 2022 2023 1Q23 2Q23 3Q23 4Q23 1Q24 $1.3 $1.7 certain recently acquired loans 1Q23 2Q23 3Q23 4Q23 1Q24 Provision for credit losses on loans Net Charge-Offs Credit Card Portfolio Net Charge-Off Ratio2 2.88% 2.49% 2.15% 2.25% 2.19% Highlights 1.86% 1.61% 1.64% 1.60% 1.69% 1.40% 1.44% Provision for credit losses on loans exceeded net charge-offs by $2.1 million during 1Q24 Annual Quarterly NCO ratio of 19 bps in 1Q24; 11 bps associated with run-off portfolio and certain recently acquired loans 2017 2018 2019 2020 2021 2022 2023 1Q23 2Q23 3Q23 4Q23 1Q24 ACL to total loans ended 1Q24 at 1.34% Key Credit Metrics: Average FICO Scores 752 Balance Weighted Average FICO Score 744 Line Utilization 19% Source: S&P Global Market Intelligence 2017 – 2023 1 As of December 31, for each respective year shown above; quarterly data as of the end of the quarter for each respective period 24 2 Net charge-offs to average loans for the full-year for each respective year shown above; quarterly annualized data for each respective quarter 24
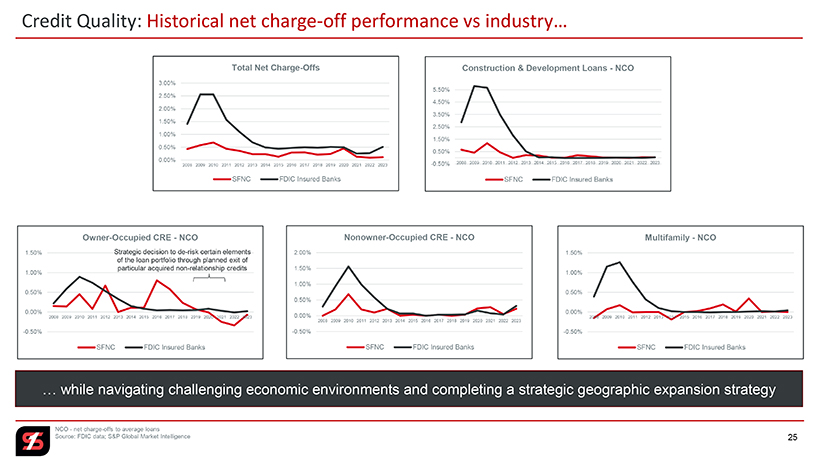
Credit Quality: Historical net charge-off performance vs industry Total Net Charge-Offs Construction & Development Loans—NCO 3.00% 5.50% 2.50% 4.50% 2.00% 3.50% 1.50% 2.50% 1.00% 1.50% 0.50% 0.50% 0.00% -0.50% 2008 2009 2010 2011 2012 2013 2014 2015 2016 2017 2018 2019 2020 2021 2022 2023 2008 2009 2010 2011 2012 2013 2014 2015 2016 2017 2018 2019 2020 2021 2022 2023 SFNC FDIC Insured Banks SFNC FDIC Insured Banks Owner-Occupied CRE—NCO Nonowner-Occupied CRE—NCO Multifamily—NCO 1.50% Strategic decision to de-risk certain elements 2.00% 1.50% of the loan portfolio through planned exit of particular acquired non-relationship credits 1.50% 1.00% 1.00% 1.00% 0.50% 0.50% 0.50% 0.00% 0.00% 2008 2009 2010 2011 2012 2013 2014 2015 2016 2017 2018 2019 2020 2021 2022 2023 0.00% 2008 2009 2010 2011 2012 2013 2014 2015 2016 2017 2018 2019 2020 2021 2022 2023 2008 2009 2010 2011 2012 2013 2014 2015 2016 2017 2018 2019 2020 2021 2022 2023 -0.50% -0.50% -0.50% SFNC FDIC Insured Banks SFNC FDIC Insured Banks SFNC FDIC Insured Banks while navigating challenging economic environments and completing a strategic geographic expansion strategy NCO—net charge-offs to average loans Source: FDIC data; S&P Global Market Intelligence 25
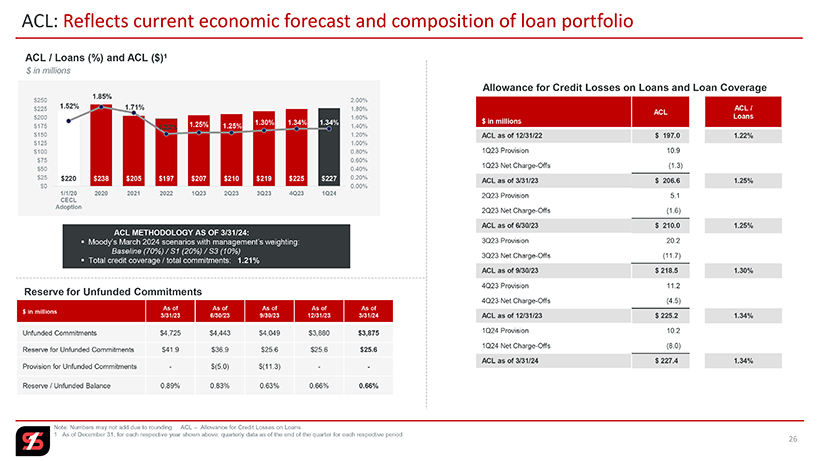
ACL: Reflects current economic forecast and composition of loan portfolio ACL / Loans (%) and ACL ($)1 $ in millions Allowance for Credit Losses on Loans and Loan Coverage 1.85% $250 1.52% 2.00% $225 1.71% 1.80% ACL / ACL $200 1.60% Loans 1.30% 1.34% 1.34% $ in millions $175 1.22% 1.25% 1.25% 1.40% $150 1.20% ACL as of 12/31/22 $ 197.0 1.22% $125 1.00% $100 0.80% 1Q23 Provision 10.9 $75 0.60% 1Q23 Net Charge-Offs (1.3) $50 0.40% $25 $220 $238 $205 $197 $207 $210 $219 $225 $227 0.20% $0 0.00% ACL as of 3/31/23 $ 206.6 1.25% 1/1/20 2020 2021 2022 1Q23 2Q23 3Q23 4Q23 1Q24 2Q23 Provision 5.1 CECL Adoption 2Q23 Net Charge-Offs (1.6) ACL as of 6/30/23 $ 210.0 1.25% ACL METHODOLOGY AS OF 3/31/24: Moody’s March 2024 scenarios with management’s weighting: 3Q23 Provision 20.2 Baseline (70%) / S1 (20%) / S3 (10%) 3Q23 Net Charge-Offs (11.7) Total credit coverage / total commitments: 1.21% ACL as of 9/30/23 $ 218.5 1.30% 4Q23 Provision 11.2 Reserve for Unfunded Commitments 4Q23 Net Charge-Offs (4.5) As of As of As of As of As of $ in millions 3/31/23 6/30/23 9/30/23 12/31/23 3/31/24 ACL as of 12/31/23 $ 225.2 1.34% Unfunded Commitments $4,725 $4,443 $4,049 $3,880 $3,875 1Q24 Provision 10.2 1Q24 Net Charge-Offs (8.0) Reserve for Unfunded Commitments $41.9 $36.9 $25.6 $25.6 $25.6 Provision for Unfunded Commitments—$(5.0) $(11.3) — ACL as of 3/31/24 $ 227.4 1.34% Reserve / Unfunded Balance 0.89% 0.83% 0.63% 0.66% 0.66% Note: Numbers may not add due to rounding ACL – Allowance for Credit Losses on Loans 1 As of December 31, for each respective year shown above; quarterly data as of the end of the quarter for each respective period 26
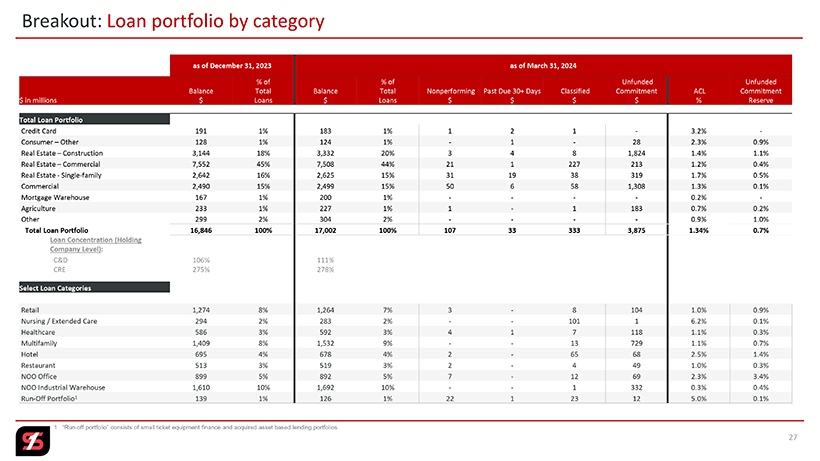
Breakout: Loan portfolio by category as of December 31, 2023 as of March 31, 2024 % of % of Unfunded Unfunded Balance Total Balance Total Nonperforming Past Due 30+ Days Classified Commitment ACL Commitment $ in millions $ Loans $ Loans $ $ $ $ % Reserve Total Loan Portfolio Credit Card 191 1% 183 1% 1 2 1—3.2% -Consumer – Other 128 1% 124 1%—1—28 2.3% 0.9% Real Estate – Construction 3,144 18% 3,332 20% 3 4 8 1,824 1.4% 1.1% Real Estate – Commercial 7,552 45% 7,508 44% 21 1 227 213 1.2% 0.4% Real Estate—Single-family 2,642 16% 2,625 15% 31 19 38 319 1.7% 0.5% Commercial 2,490 15% 2,499 15% 50 6 58 1,308 1.3% 0.1% Mortgage Warehouse 167 1% 200 1% — — 0.2% -Agriculture 233 1% 227 1% 1—1 183 0.7% 0.2% Other 299 2% 304 2% — — 0.9% 1.0% Total Loan Portfolio 16,846 100% 17,002 100% 107 33 333 3,875 1.34% 0.7% Loan Concentration (Holding Company Level): C&D 106% 111% CRE 275% 278% Select Loan Categories Retail 1,274 8% 1,264 7% 3—8 104 1.0% 0.9% Nursing / Extended Care 294 2% 283 2% — 101 1 6.2% 0.1% Healthcare 586 3% 592 3% 4 1 7 118 1.1% 0.3% Multifamily 1,409 8% 1,532 9% — 13 729 1.1% 0.7% Hotel 695 4% 678 4% 2—65 68 2.5% 1.4% Restaurant 513 3% 519 3% 2—4 49 1.0% 0.3% NOO Office 899 5% 892 5% 7—12 69 2.3% 3.4% NOO Industrial Warehouse 1,610 10% 1,692 10% — 1 332 0.3% 0.4% Run-Off Portfolio1 139 1% 126 1% 22 1 23 12 5.0% 0.1% 1 “Run-off portfolio” consists of small ticket equipment finance and acquired asset based lending portfolios 27

Simmons First National Corporation Appendix
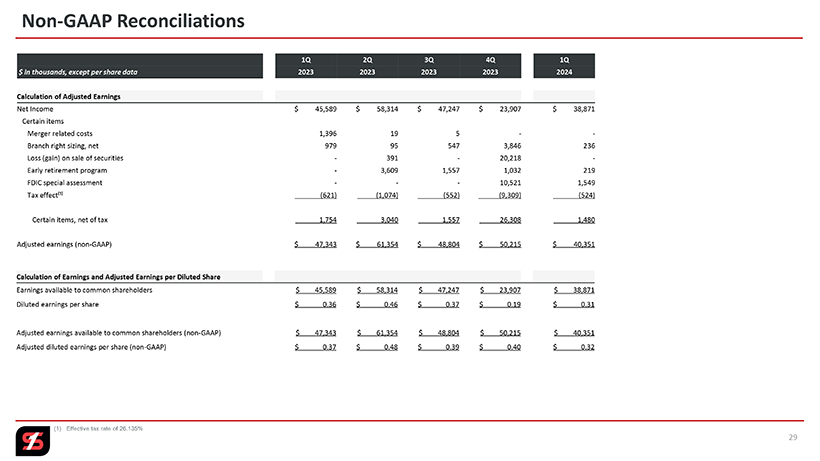
Non-GAAP Reconciliations 1Q 2Q 3Q 4Q 1Q $ in thousands, except per share data 2023 2023 2023 2023 2024 Calculation of Adjusted Earnings Net Income $ 45,589 $ 58,314 $ 47,247 $ 23,907 $ 38,871 Certain items Merger related costs 1,396 19 5 —Branch right sizing, net 979 95 547 3,846 236 Loss (gain) on sale of securities—391—20,218 -Early retirement program—3,609 1,557 1,032 219 FDIC special assessment —10,521 1,549 Tax effect ¹ (621) (1,074) (552) (9,309) (524) Certain items, net of tax 1,754 3,040 1,557 26,308 1,480 Adjusted earnings (non-GAAP) $ 47,343 $ 61,354 $ 48,804 $ 50,215 $ 40,351 Calculation of Earnings and Adjusted Earnings per Diluted Share Earnings available to common shareholders $ 45,589 $ 58,314 $ 47,247 $ 23,907 $ 38,871 Diluted earnings per share $ 0.36 $ 0.46 $ 0.37 $ 0.19 $ 0.31 Adjusted earnings available to common shareholders (non-GAAP) $ 47,343 $ 61,354 $ 48,804 $ 50,215 $ 40,351 Adjusted diluted earnings per share (non-GAAP) $ 0.37 $ 0.48 $ 0.39 $ 0.40 $ 0.32 (1) Effective tax rate of 26.135% 29
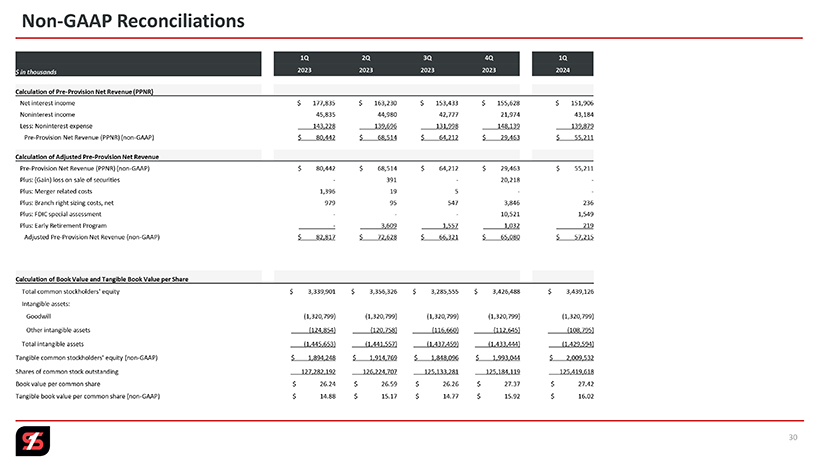
Non-GAAP Reconciliations 1Q 2Q 3Q 4Q 1Q $ in thousands 2023 2023 2023 2023 2024 Calculation of Pre-Provision Net Revenue (PPNR) Net interest income $ 177,835 $ 163,230 $ 153,433 $ 155,628 $ 151,906 Noninterest income 45,835 44,980 42,777 21,974 43,184 Less: Noninterest expense 143,228 139,696 131,998 148,139 139,879 Pre-Provision Net Revenue (PPNR) (non-GAAP) $ 80,442 $ 68,514 $ 64,212 $ 29,463 $ 55,211 Calculation of Adjusted Pre-Provision Net Revenue Pre-Provision Net Revenue (PPNR) (non-GAAP) $ 80,442 $ 68,514 $ 64,212 $ 29,463 $ 55,211 Plus: (Gain) loss on sale of securities—391—20,218 -Plus: Merger related costs 1,396 19 5 —Plus: Branch right sizing costs, net 979 95 547 3,846 236 Plus: FDIC special assessment —10,521 1,549 Plus: Early Retirement Program — 3,609 1,557 1,032 219 Adjusted Pre-Provision Net Revenue (non-GAAP) $ 82,817 $ 72,628 $ 66,321 $ 65,080 $ 57,215 Calculation of Book Value and Tangible Book Value per Share Total common stockholders’ equity $ 3,339,901 $ 3,356,326 $ 3,285,555 $ 3,426,488 $ 3,439,126 Intangible assets: Goodwill (1,320,799) (1,320,799) (1,320,799) (1,320,799) (1,320,799) Other intangible assets (124,854) (120,758) (116,660) (112,645) (108,795) Total intangible assets (1,445,653) (1,441,557) (1,437,459) (1,433,444) (1,429,594) Tangible common stockholders’ equity (non-GAAP) $ 1,894,248 $ 1,914,769 $ 1,848,096 $ 1,993,044 $ 2,009,532 Shares of common stock outstanding 127,282,192 126,224,707 125,133,281 125,184,119 125,419,618 Book value per common share $ 26.24 $ 26.59 $ 26.26 $ 27.37 $ 27.42 Tangible book value per common share (non-GAAP) $ 14.88 $ 15.17 $ 14.77 $ 15.92 $ 16.02 30
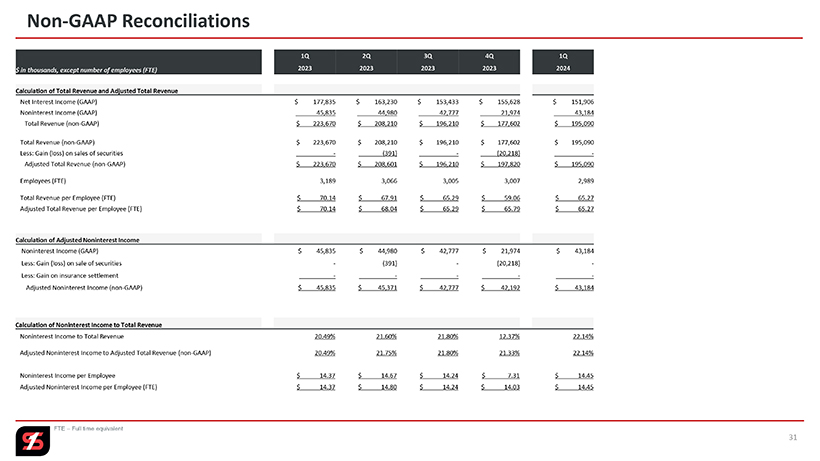
Non-GAAP Reconciliations 1Q 2Q 3Q 4Q 1Q $ in thousands, except number of employees (FTE) 2023 2023 2023 2023 2024 Calculation of Total Revenue and Adjusted Total Revenue Net Interest Income (GAAP) $ 177,835 $ 163,230 $ 153,433 $ 155,628 $ 151,906 Noninterest Income (GAAP) 45,835 44,980 42,777 21,974 43,184 Total Revenue (non-GAAP) $ 223,670 $ 208,210 $ 196,210 $ 177,602 $ 195,090 Total Revenue (non-GAAP) $ 223,670 $ 208,210 $ 196,210 $ 177,602 $ 195,090 Less: Gain (loss) on sales of securities — (391) — (20,218) -Adjusted Total Revenue (non-GAAP) $ 223,670 $ 208,601 $ 196,210 $ 197,820 $ 195,090 Employees (FTE) 3,189 3,066 3,005 3,007 2,989 Total Revenue per Employee (FTE) $ 70.14 $ 67.91 $ 65.29 $ 59.06 $ 65.27 Adjusted Total Revenue per Employee (FTE) $ 70.14 $ 68.04 $ 65.29 $ 65.79 $ 65.27 Calculation of Adjusted Noninterest Income Noninterest Income (GAAP) $ 45,835 $ 44,980 $ 42,777 $ 21,974 $ 43,184 Less: Gain (loss) on sale of securities—(391)—(20,218) -Less: Gain on insurance settlement — — — — -Adjusted Noninterest Income (non-GAAP) $ 45,835 $ 45,371 $ 42,777 $ 42,192 $ 43,184 Calculation of Noninterest Income to Total Revenue Noninterest Income to Total Revenue 20.49% 21.60% 21.80% 12.37% 22.14% Adjusted Noninterest Income to Adjusted Total Revenue (non-GAAP) 20.49% 21.75% 21.80% 21.33% 22.14% Noninterest Income per Employee $ 14.37 $ 14.67 $ 14.24 $ 7.31 $ 14.45 Adjusted Noninterest Income per Employee (FTE) $ 14.37 $ 14.80 $ 14.24 $ 14.03 $ 14.45 FTE – Full time equivalent 31
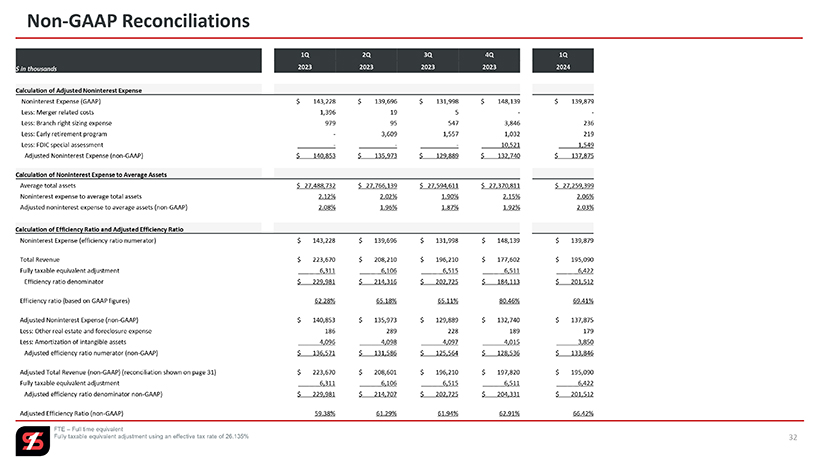
Non-GAAP Reconciliations 1Q 2Q 3Q 4Q 1Q $ in thousands 2023 2023 2023 2023 2024 Calculation of Adjusted Noninterest Expense Noninterest Expense (GAAP) $ 143,228 $ 139,696 $ 131,998 $ 148,139 $ 139,879 Less: Merger related costs 1,396 19 5 —Less: Branch right sizing expense 979 95 547 3,846 236 Less: Early retirement program—3,609 1,557 1,032 219 Less: FDIC special assessment — — — 10,521 1,549 Adjusted Noninterest Expense (non-GAAP) $ 140,853 $ 135,973 $ 129,889 $ 132,740 $ 137,875 Calculation of Noninterest Expense to Average Assets Average total assets $ 27,488,732 $ 27,766,139 $ 27,594,611 $ 27,370,811 $ 27,259,399 Noninterest expense to average total assets 2.12% 2.02% 1.90% 2.15% 2.06% Adjusted noninterest expense to average assets (non-GAAP) 2.08% 1.96% 1.87% 1.92% 2.03% Calculation of Efficiency Ratio and Adjusted Efficiency Ratio Noninterest Expense (efficiency ratio numerator) $ 143,228 $ 139,696 $ 131,998 $ 148,139 $ 139,879 Total Revenue $ 223,670 $ 208,210 $ 196,210 $ 177,602 $ 195,090 Fully taxable equivalent adjustment ___ _ _6,311 ___ _ _6,106 ___ _ _6,515 ___ _ _6,511 ___ _ _6,422 Efficiency ratio denominator $ 229,981 $ 214,316 $ 202,725 $ 184,113 $ 201,512 Efficiency ratio (based on GAAP figures) 62.28% 65.18% 65.11% 80.46% 69.41% Adjusted Noninterest Expense (non-GAAP) $ 140,853 $ 135,973 $ 129,889 $ 132,740 $ 137,875 Less: Other real estate and foreclosure expense 186 289 228 189 179 Less: Amortization of intangible assets ___ __ 4,096 ___ __ 4,098 ___ __ 4,097 ___ __ 4,015 ___ __ 3,850 Adjusted efficiency ratio numerator (non-GAAP) $ 136,571 $ 131,586 $ 125,564 $ 128,536 $ 133,846 Adjusted Total Revenue (non-GAAP) (reconciliation shown on page 31) $ 223,670 $ 208,601 $ 196,210 $ 197,820 $ 195,090 Fully taxable equivalent adjustment ___ _ _6,311 ___ _ _6,106 ___ _ _6,515 ___ _ _6,511 ___ _ _6,422 Adjusted efficiency ratio denominator non-GAAP) $ 229,981 $ 214,707 $ 202,725 $ 204,331 $ 201,512 Adjusted Efficiency Ratio (non-GAAP) 59.38% 61.29% 61.94% 62.91% 66.42% FTE – Full time equivalent Fully taxable equivalent adjustment using an effective tax rate of 26.135% 32
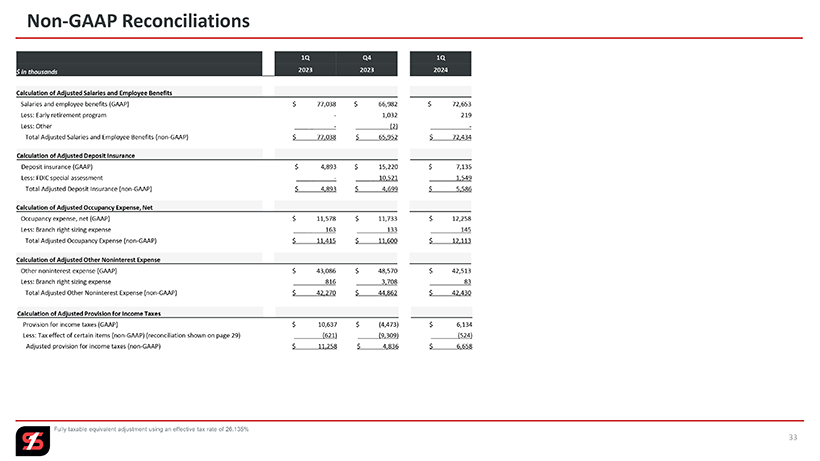
Non-GAAP Reconciliations 1Q Q4 1Q $ in thousands 2023 2023 2024 Calculation of Adjusted Salaries and Employee Benefits Salaries and employee benefits (GAAP) $ 77,038 $ 66,982 $ 72,653 Less: Early retirement program—1,032 219 Less: Other ____ _ — (2) -Total Adjusted Salaries and Employee Benefits (non-GAAP) $ 77,038 $ 65,952 $ 72,434 Calculation of Adjusted Deposit Insurance Deposit insurance (GAAP) $ 4,893 $ 15,220 $ 7,135 Less: FDIC special assessment ____ _ —____ _ 10,521 1,549 Total Adjusted Deposit Insurance (non-GAAP) $ 4,893 $ 4,699 $ 5,586 Calculation of Adjusted Occupancy Expense, Net Occupancy expense, net (GAAP) $ 11,578 $ 11,733 $ 12,258 Less: Branch right sizing expense ____ _ 163 133 145 Total Adjusted Occupancy Expense (non-GAAP) $ 11,415 $ 11,600 $ 12,113 Calculation of Adjusted Other Noninterest Expense Other noninterest expense (GAAP) $ 43,086 $ 48,570 $ 42,513 Less: Branch right sizing expense ____ _ 816 3,708 83 Total Adjusted Other Noninterest Expense (non-GAAP) $ 42,270 $ 44,862 $ 42,430 Calculation of Adjusted Provision for Income Taxes Provision for income taxes (GAAP) $ 10,637 $ (4,473) $ 6,134 Less: Tax effect of certain items (non-GAAP) (reconciliation shown on page 29) (621) (9,309) (524) Adjusted provision for income taxes (non-GAAP) $ 11,258 $ 4,836 $ 6,658 Fully taxable equivalent adjustment using an effective tax rate of 26.135% 33
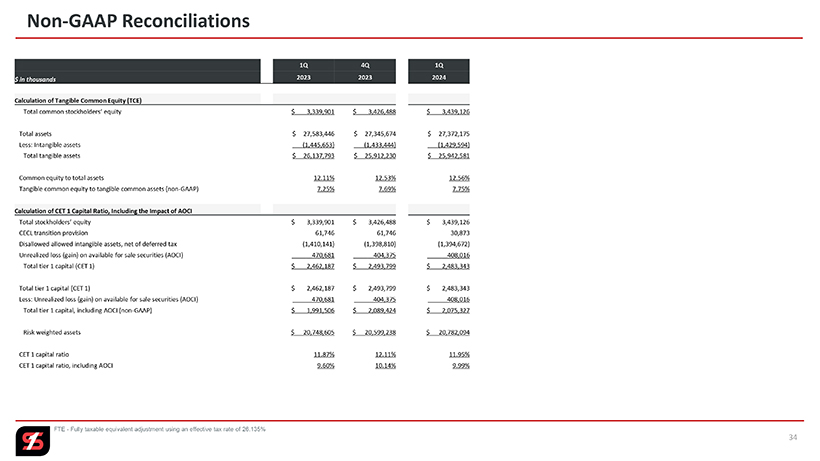
Non-GAAP Reconciliations 1Q 4Q 1Q $ in thousands 2023 2023 2024 Calculation of Tangible Common Equity (TCE) Total common stockholders’ equity $ 3,339,901 $ 3,426,488 $ 3,439,126 Total assets $ 27,583,446 $ 27,345,674 $ 27,372,175 Less: Intangible assets (1,445,653) (1,433,444) (1,429,594) Total tangible assets $ 26,137,793 $ 25,912,230 $ 25,942,581 Common equity to total assets 12.11% 12.53% 12.56% Tangible common equity to tangible common assets (non-GAAP) 7.25% 7.69% 7.75% Calculation of CET 1 Capital Ratio, Including the Impact of AOCI Total stockholders’ equity $ 3,339,901 $ 3,426,488 $ 3,439,126 CECL transition provision 61,746 61,746 30,873 Disallowed allowed intangible assets, net of deferred tax (1,410,141) (1,398,810) (1,394,672) Unrealized loss (gain) on available for sale securities (AOCI) ____ _ 470,681 ____ _ 404,375 ____ _ 408,016 Total tier 1 capital (CET 1) $ 2,462,187 $ 2,493,799 $ 2,483,343 Total tier 1 capital (CET 1) $ 2,462,187 $ 2,493,799 $ 2,483,343 Less: Unrealized loss (gain) on available for sale securities (AOCI) 470,681 404,375 408,016 Total tier 1 capital, including AOCI (non-GAAP) $ 1,991,506 $ 2,089,424 $ 2,075,327 Risk weighted assets $ 20,748,605 $ 20,599,238 $ 20,782,094 CET 1 capital ratio 11.87% 12.11% 11.95% CET 1 capital ratio, including AOCI 9.60% 10.14% 9.99% FTE—Fully taxable equivalent adjustment using an effective tax rate of 26.135% 34
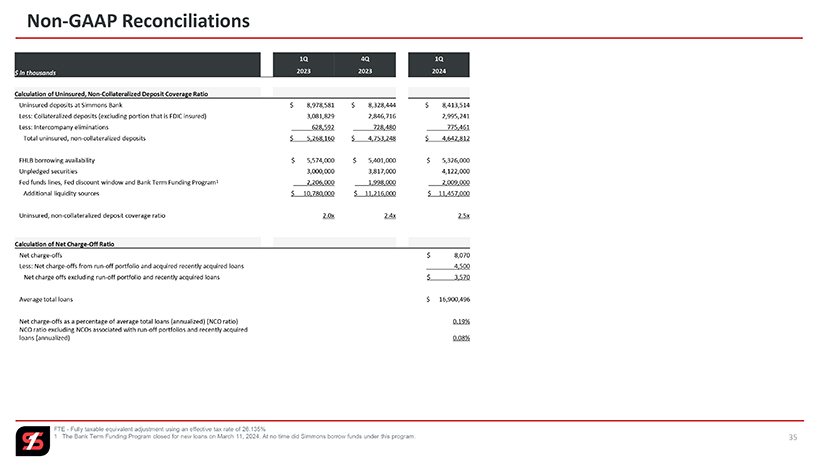
Non-GAAP Reconciliations 1Q 4Q 1Q $ in thousands 2023 2023 2024 Calculation of Uninsured, Non-Collateralized Deposit Coverage Ratio Uninsured deposits at Simmons Bank $ 8,978,581 $ 8,328,444 $ 8,413,514 Less: Collateralized deposits (excluding portion that is FDIC insured) 3,081,829 2,846,716 2,995,241 Less: Intercompany eliminations ______628,592 ______728,480 ______775,461 Total uninsured, non-collateralized deposits $ 5,268,160 $ 4,753,248 $ 4,642,812 FHLB borrowing availability $ 5,574,000 $ 5,401,000 $ 5,326,000 Unpledged securities 3,000,000 3,817,000 4,122,000 Fed funds lines, Fed discount window and Bank Term Funding Program1 2,206,000 1,998,000 2,009,000 Additional liquidity sources $ 10,780,000 $ 11,216,000 $ 11,457,000 Uninsured, non-collateralized deposit coverage ratio 2.0x 2.4x 2.5x Calculation of Net Charge-Off Ratio Net charge-offs $ 8,070 Less: Net charge-offs from run-off portfolio and acquired recently acquired loans ______ 4,500 Net charge offs excluding run-off portfolio and recently acquired loans $ 3,570 Average total loans $ 16,900,496 Net charge-offs as a percentage of average total loans (annualized) (NCO ratio) 0.19% NCO ratio excluding NCOs associated with run-off portfolios and recently acquired loans (annualized) 0.08% FTE—Fully taxable equivalent adjustment using an effective tax rate of 26.135% 1 The Bank Term Funding Program closed for new loans on March 11, 2024. At no time did Simmons borrow funds under this program. 35

Simmons First National Corporation Nasdaq: SFNC 1st Quarter 2024 Earnings Presentation Contents 3 Company Profile 4 1Q24 Financial Highlights 11 Deposits, Securities, Liquidity, Interest Rate Sensitivity and Capital 17 Loan Portfolio 22 Credit Quality 28 Appendix