UNITED STATES
SECURITIES AND EXCHANGE COMMISSION
WASHINGTON, D.C. 20549
FORM 8-K
CURRENT REPORT
PURSUANT TO SECTION 13 OR 15(d)
OF THE SECURITIES EXCHANGE ACT OF 1934
Date of Report (Date of earliest event reported): April 24, 2024
Farmers National Banc Corp.
(Exact name of registrant as specified in its charter)
| Ohio | 001-35296 | 34-1371693 | ||
| (State or other jurisdiction of incorporation) |
(Commission File Number) |
(IRS Employer Identification No.) |
| 20 South Broad Street, P.O. Box 555, Canfield, Ohio | 44406-0555 | |
| (Address of principal executive offices) | (Zip Code) |
(330) 533-3341
(Registrant’s telephone number, including area code)
(Former name or former address, if changed since last report)
Check the appropriate box below if the Form 8-K filing is intended to simultaneously satisfy the filing obligation of the registrant under any of the following provisions:
| ☐ | Written communication pursuant to Rule 425 under the Securities Act (17 CFR 230.425) |
| ☐ | Soliciting material pursuant to Rule 14a-12 under the Exchange Act (17 CFR 240.14a-12) |
| ☐ | Pre-commencement communication pursuant to Rule 14d-2(b) under the Exchange Act (17 CFR 240.14d-2(b)) |
| ☐ | Pre-commencement communication pursuant to Rule 13e-4(c) under the Exchange Act (17 CFR 240.13e-4(c)) |
Securities registered pursuant to Section 12(b) of the Act:
| Title of each class |
Trading |
Name of each exchange on |
||
| Common Stock, No Par Value | FMNB | The NASDAQ Stock Market |
Indicate by check mark whether the registrant is an emerging growth company as defined in Rule 405 of the Securities Act of 1933 (§230.405 of this chapter) or Rule 12b-2 of the Securities Exchange Act of 1934 (§240.12b-2 of this chapter).
Emerging growth company ☐
If an emerging growth company, indicate by check mark if the registrant has elected not to use the extended transition period for complying with any new or revised financial accounting standards provided pursuant to Section 13(a) of the Exchange Act. ☐
| Item 2.02 | Results of Operations and Financial Condition. |
On April 24, 2024, Farmers National Banc Corp. (the “Company”) announced earnings for the quarter ended March 31, 2024. A copy of the press release and certain financial information for that period is attached as Exhibit 99.1 hereto and incorporated by reference herein.
Also on April 24, 2024, the Company first provided investors with a supplemental presentation regarding first quarter earnings and other current financial information, attached as Exhibit 99.2 hereto and incorporated by reference herein.
Pursuant to General Instruction B.2 of Current Report on Form 8-K, the information in this Item 2.02 and Exhibits 99.1 and 99.2 are being furnished and shall not be deemed to be “filed” for purposes of Section 18 of the Securities Exchange Act of 1934, as amended (the “Exchange Act”), or otherwise subject to the liability of that section. Furthermore, the information in this Item 2.02 and Exhibits 99.1 and 99.2 shall not be deemed to be incorporated by reference into the filings of the Company under the Securities Act of 1933, as amended (the “Securities Act”) except as may be expressly set forth by specific reference in such filing.
| Item 7.01 | Regulation FD Disclosure. |
On April 24, 2024, the Company first provided investors with a supplemental presentation regarding first quarter earnings and other current financial information, attached as Exhibit 99.2 hereto and incorporated by reference herein.
The presentation is furnished herein, as part of this Item 7.01, as Exhibit 99.2. Pursuant to General Instruction B.2 of Current Report on Form 8-K, the information in this Item 7.01 and Exhibit 99.2 shall not be deemed to be “filed” for purposes of Section 18 of the Exchange Act, or otherwise subject to the liability of that section. Furthermore, the information in this Item 7.01 and Exhibit 99.2 shall not be deemed to be incorporated by reference into the filings of the Company under the Securities Act, except as may be expressly set forth by specific reference in such filing.
| Item 9.01 | Financial Statements and Exhibits. |
| (d) | Exhibits. |
| Exhibit |
Description |
|
| 99.1 | Press Release, dated April 24, 2024 | |
| 99.2 | Investor Presentation, dated April 24, 2024 | |
| 104 | Cover Page Interactive Data File (embedded within the Inline XBRL document) | |
SIGNATURES
Pursuant to the requirements of the Securities Exchange Act of 1934, the registrant has duly caused this report to be signed on its behalf by the undersigned hereunto duly authorized.
| Farmers National Banc Corp. | ||
| By: | /s/ Kevin J. Helmick |
|
| Kevin J. Helmick | ||
| President and Chief Executive Officer | ||
Date: April 24, 2024
Exhibit 99.1
April 24, 2024
Press Release
| Source: | Farmers National Banc Corp. |
Kevin J. Helmick, President and CEO
20 South Broad Street, P.O. Box 555
Canfield, OH 44406
330.533.3341
Email: exec@farmersbankgroup.com
FARMERS NATIONAL BANC CORP. ANNOUNCES
STRONG RESULTS FOR FIRST QUARTER OF 2024
| • | Earnings per diluted share of $0.30 ($0.34 excluding certain items, non-GAAP) for the first quarter of 2024 |
| • | 165 consecutive quarters of profitability |
| • | Strategically restructured $44.3 million of investment securities improving the yield by almost 200 basis points – incurred a $2.1 million loss on the sale |
| • | Deposit growth of $20.7 million, or 2.0% annualized, for the first quarter of 2024 |
| • | Excellent asset quality as non-performing loans to total loans improved to 0.38% at March 31, 2024 from 0.47% at December 31, 2023 |
CANFIELD, Ohio (April 24, 2024) – Farmers National Banc Corp. (“Farmers” or the “Company”) (NASDAQ: FMNB) reported net income of $11.2 million, or $0.30 per diluted share, for the three months ended March 31, 2024, compared to $7.1 million, or $0.19 per diluted share, for the three months ended March 31, 2023. Net income for the first quarter of 2024 included a pretax item of $2.1 million for the loss on the sale of investment securities. Excluding this item (non-GAAP), net income for the first quarter of 2024 was $12.9 million, or $0.34 per diluted share.
Kevin J. Helmick, President and CEO, stated “I am encouraged by the solid start to 2024 as we focus on leveraging the investments we made over the past year, pursuing actions to strategically improve our balance sheet, and maintaining the Company’s longstanding commitment to strong asset quality. While we expect the economic and interest rate environment to remain fluid in 2024, we believe we are well positioned to help our local communities build a better future by continuing to provide our customers with leading financial services.”
Balance Sheet
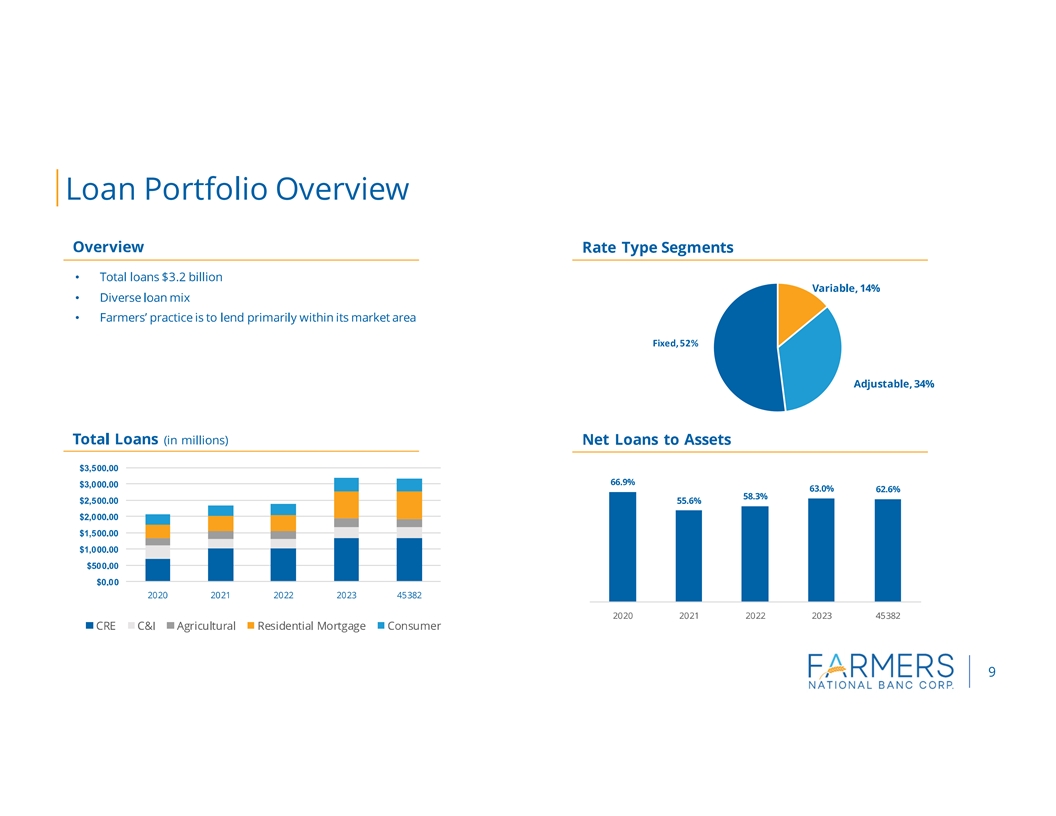
Total assets were $5.08 billion at March 31, 2024, unchanged from December 31, 2023. Loans decreased slightly to $3.18 billion at March 31, 2024 compared to $3.20 billion at December 31, 2023. The Company anticipates loan growth of 1—2%, in 2024 reflecting a more challenging economic and interest rate environment, as well as the Company’s focus on maintaining excellent asset quality.
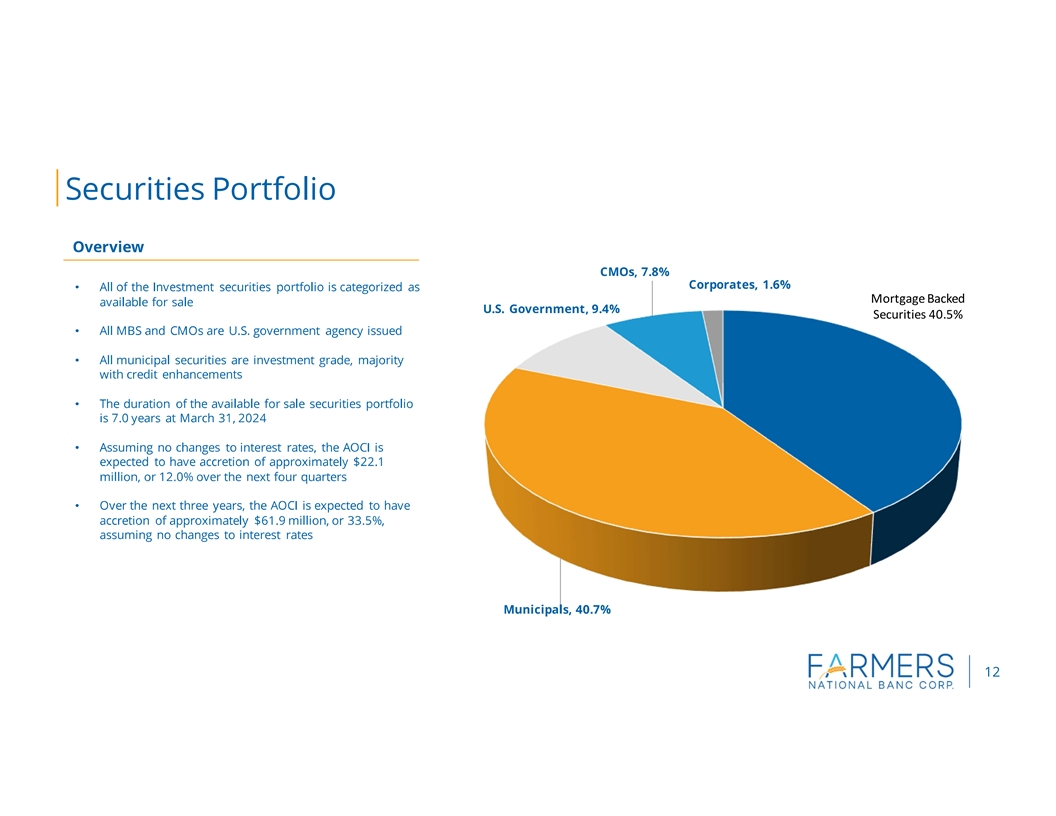
The Company had securities available for sale of $1.27 billion at March 31, 2024, compared to $1.30 billion at December 31, 2023. Gross unrealized losses on the portfolio totaled $234.2 million at March 31, 2024, compared to gross unrealized losses of $217.1 million at December 31, 2023. The Company also completed a security restructure during the quarter, which involved selling approximately $44.3 million of securities and reinvesting the proceeds into securities with yields 200 basis points higher than those sold. The earn back on the $2.1 million loss that was incurred on the sale is approximately 2.5 years. The Company expects bond market volatility to continue in 2024 and anticipates that it will continue to allow the size of the securities portfolio to shrink via runoff to optimize profitability and provide liquidity.
Total deposits increased to $4.20 billion at March 31, 2024, compared to $4.18 billion at December 31, 2023. Noninterest bearing deposits declined $49.2 million during the first quarter of 2024 even as interest bearing deposits increased $69.9 million. Customers continue to seek higher rates on their deposit balances but the pace of activity has slowed somewhat.
Total stockholders’ equity was $397.0 million at March 31, 2024 compared to $404.4 million at December 31, 2023. The decline was driven by an increase in the unrealized losses on investment securities of $12.4 million offset by earnings net of dividend payments to shareholders.
Credit Quality
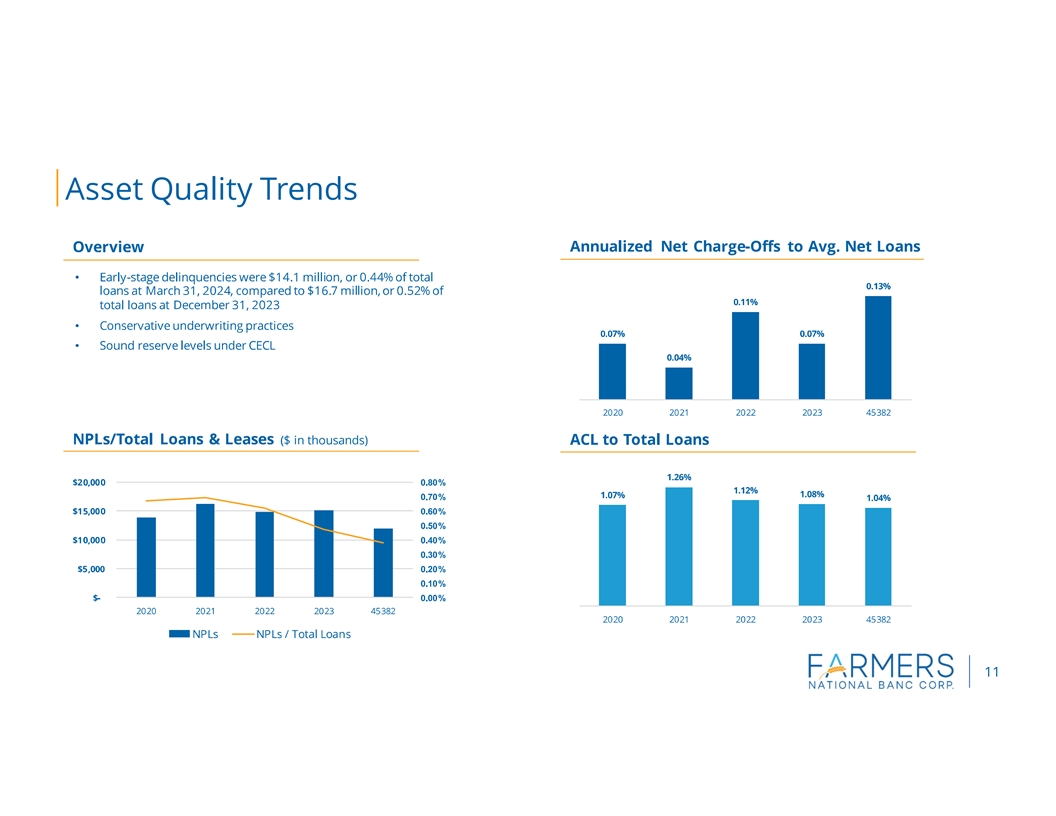
The Company’s non-performing loans dropped to $12.0 million at March 31, 2024, from $15.1 million at December 31, 2023. Non-performing loans to total loans was 0.38% at March 31, 2024, compared to 0.47% at December 31, 2023. Non-performing assets to total assets were 0.24% at March 31, 2024, compared to 0.30% at December 31, 2023. The Company’s loans which were 30-89 days delinquent were $14.1 million at March 31, 2024, or 0.44% of total loans.
The provision for credit losses and unfunded commitments was a recovery of $449,000 in the first quarter of 2024 compared to provision expense for credit losses and unfunded commitments of $8.6 million for the first quarter of 2023. On January 1, 2023, the Company completed its acquisition of Emclaire Financial Corp. As a result of this acquisition, the Company incurred a day one provision expense for credit losses and unfunded commitments of $7.7 million. The recovery of provision expense in the first quarter of 2024 was due to shrinkage in the loan portfolio and continued improvements in the Company’s credit metrics. Annualized net charge-offs as a percentage of average loans were 0.13% for the three months ended March 31, 2024, compared to 0.03% for the three months ended March 31, 2023. The allowance for credit losses to total loans was 1.04% at March 31, 2024, compared to 1.08% at December 31, 2023.
Net Interest Income
The Company’s net interest income for the three months ended March 31, 2024, totaled $31.7 million compared to $36.6 million in the first quarter of 2023. Average earning assets have declined $69.3 million when comparing the first quarter of 2024 to the first quarter of 2023 due to the runoff in investment securities exceeding the growth in loan balances. In addition, the net interest margin has declined from 3.07% in the first quarter of 2023 to 2.70% in the first quarter of 2024. The decline in net interest margin between the first quarter of 2024 and the first quarter of 2023 was due to increased funding costs outstripping the increase in yields on earning assets. This increase in funding costs has been due to the rapid increase in deposit rates due to intense competition for deposits, the Federal Reserve’s rate hiking cycle, and runoff of deposit balances which are being replaced with more costly wholesale funding.
Noninterest Income
The Company reported noninterest income of $8.4 million during the first quarter of 2024 compared to $10.4 million for the first quarter of 2023. This decrease is primarily due to the Company completing the securities restructure in the first quarter of 2024, which resulted in a $2.1 million loss on the sale of the securities. In the first quarter of 2023, the Company recognized $121,000 in securities gains.
Service charges on deposit accounts were $1.6 million for the first quarter of 2024 compared to $1.4 million for the same period in 2023 due to increased activity. Bank owned life insurance income increased to $707,000 in the first quarter from $547,000 in the first quarter of 2023. A death benefit of $83,000 in 2024 and higher earnings credit on the policies drove the increase. Trust fees increased by $206,000 in the first quarter of 2024 compared to the same period in 2023 due to continued strong growth in this line of business. Likewise, insurance commissions, retirement consulting fees and investment commissions all exhibited solid growth in the first quarter of 2024 compared to the first quarter of 2023. Debit card income declined $222,000 to $1.6 million in the first quarter of 2024 compared to $1.8 million for the first quarter of 2023 reflecting a year-over-year decline in average customer spend per transaction. Other noninterest income declined to $1.1 million for the first three months of 2024 compared to $1.3 million for the first three months of 2023 as the Company received less SBIC income from its investments in 2024 compared to 2023.
Noninterest Expense
Noninterest expense was $27.0 million for the first three months of 2024 compared to $30.7 million for the first three months of 2023. This decrease was primarily driven by the Company recording $4.3 million in merger related charges in 2023. There were no merger related charges recorded in 2024. Salaries and employee benefits were $15.1 million in the first quarter of 2024 compared to $14.6 million in the first quarter of 2023. The increase was primarily driven by higher salaries associated with employee raises. Occupancy and equipment expense decreased by $139,000 in the first quarter of 2024 compared to the first quarter of 2023 primarily due to several branch closures. FDIC and state and local taxes increased $123,000 to $1.3 million for the first three months of 2024 compared to $1.2 million for the first three months of 2023 due to an increase in the FDIC assessment rate. Professional fees increased $140,000 for the three months ended March 31, 2024, compared to the first quarter of 2023 primarily due to increased legal fees. Intangible amortization declined $220,000 in the first three months of 2024 to $688,000 compared to $909,000 for the first three months of 2023 primarily due to the amortization from a prior acquisition running off. Other noninterest expense increased $309,000 in the first quarter of 2024 compared to the first quarter of 2023.
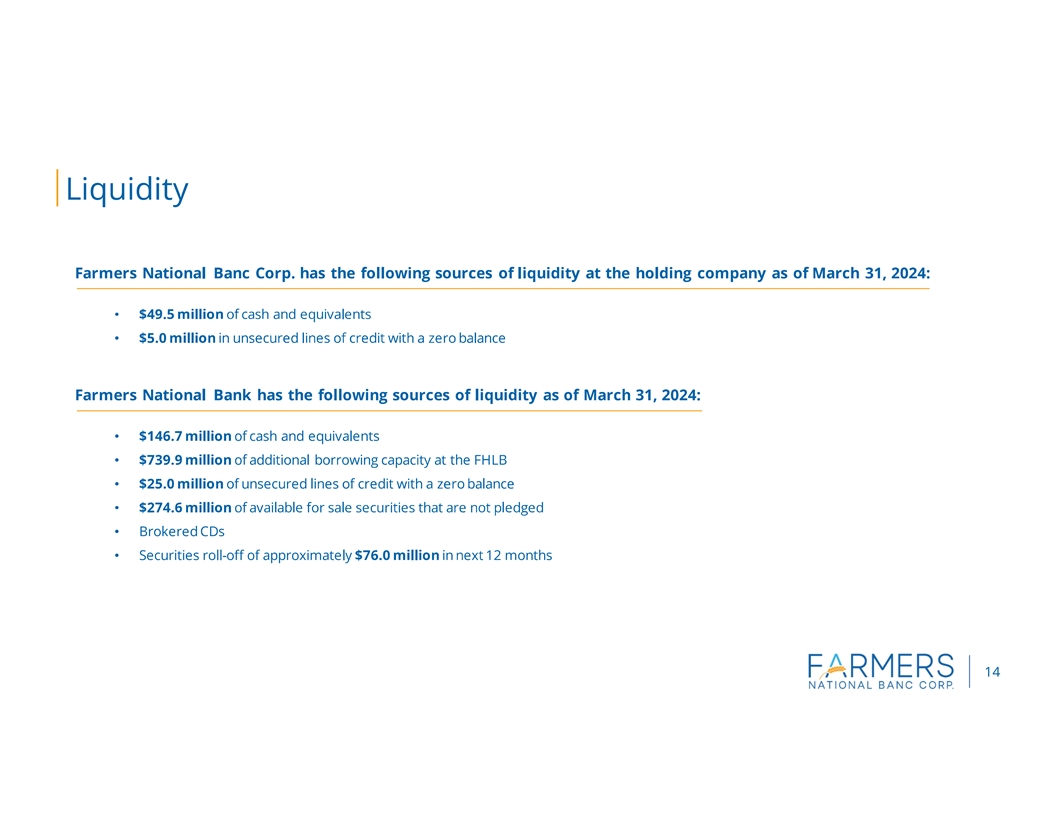
Liquidity
At March 31, 2024, the Company’s loan to deposit ratio was 75.8% and the Company’s average deposit balance per account (excluding collateralized deposits) was $22,748. The Company has access to an additional $739.9 million of FHLB borrowing capacity at March 31, 2024, along with $274.6 million of available for sale securities that are not pledged.
About Farmers National Banc Corp.
Founded in 1887, Farmers National Banc Corp. is a diversified financial services company headquartered in Canfield, Ohio, with $5.1 billion in banking assets. Farmers National Banc Corp.’s wholly-owned subsidiaries are comprised of The Farmers National Bank of Canfield, a full-service national bank engaged in commercial and retail banking with 62 banking locations in Mahoning, Trumbull, Columbiana, Portage, Stark, Wayne, Medina, Geauga and Cuyahoga Counties in Ohio and Beaver, Butler, Allegheny, Jefferson, Clarion, Venango, Clearfield, Mercer, Elk and Crawford Counties in Pennsylvania, and Farmers Trust Company, which operates five trust offices and offers services in the same geographic markets.
Total wealth management assets under care at March 31, 2024 are $3.8 billion. Farmers National Insurance, LLC, a wholly-owned subsidiary of The Farmers National Bank of Canfield, offers a variety of insurance products.
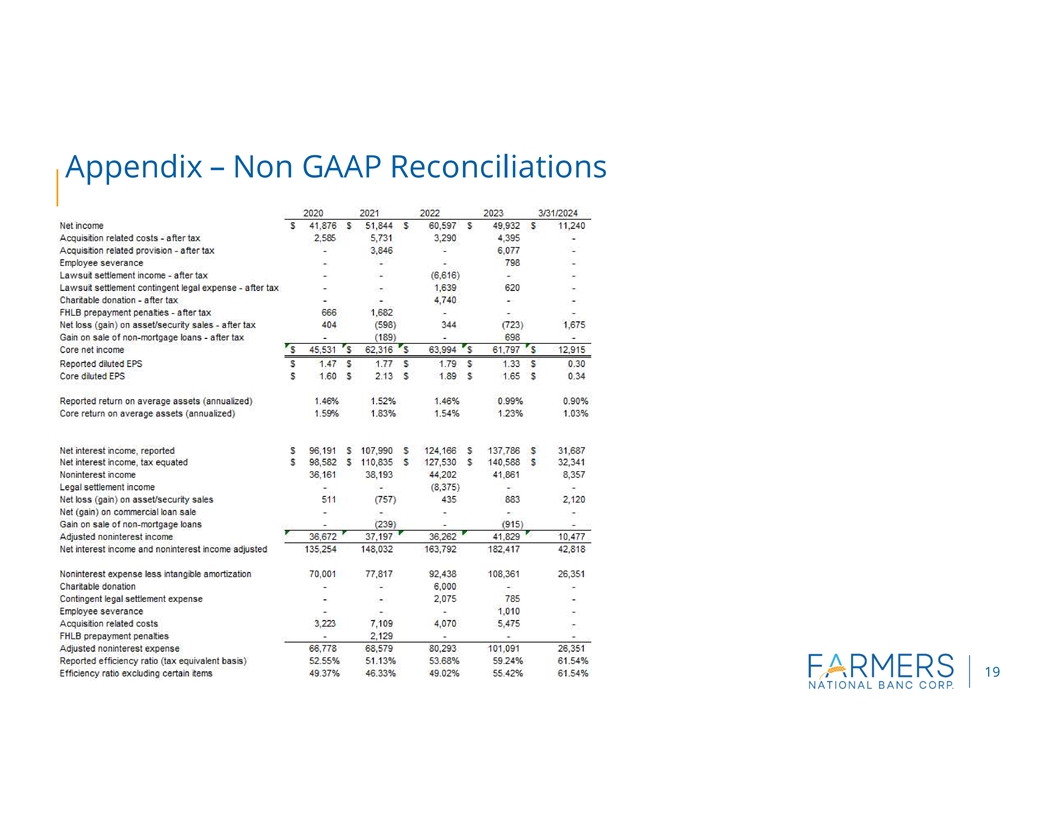
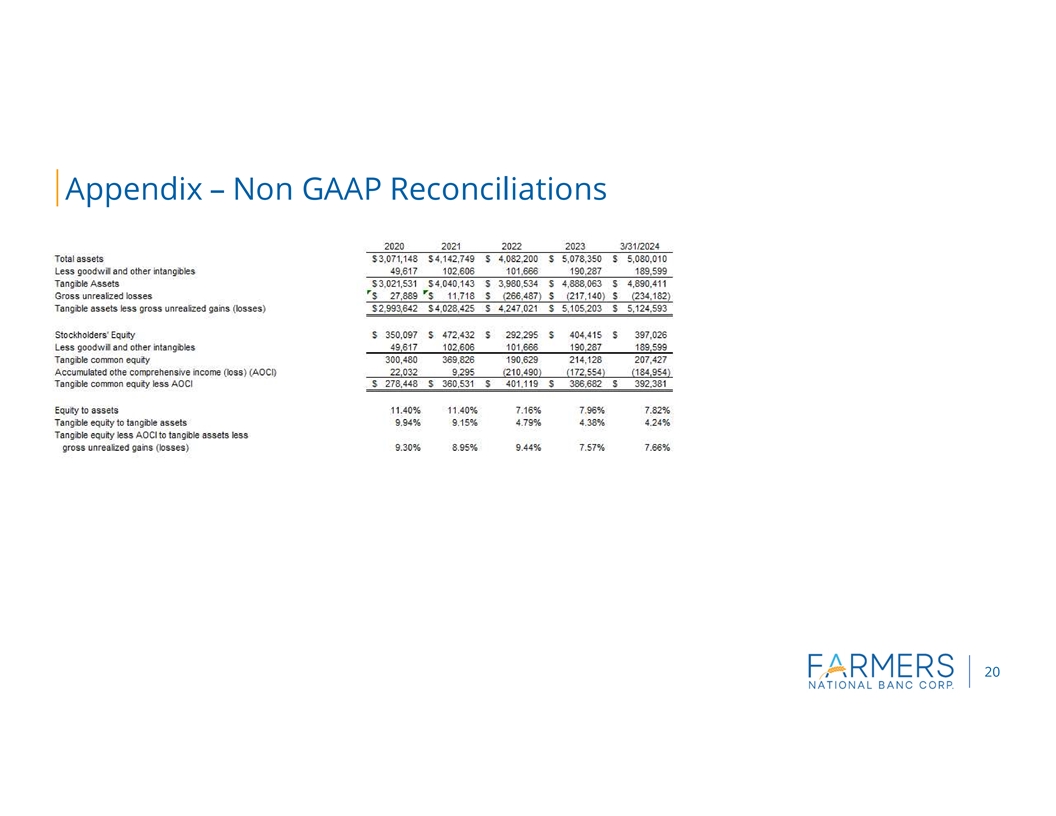
Non-GAAP Disclosure
This press release includes disclosures of Farmers’ tangible common equity ratio, return on average tangible assets, return on average tangible equity, net income excluding costs related to acquisition activities and certain items, return on average assets excluding merger costs and certain items, return on average equity excluding merger costs and certain items, net interest margin excluding acquisition marks and related accretion and PPP interest and fees and efficiency ratio less certain items, which are financial measures not prepared in accordance with generally accepted accounting principles in the United States (GAAP). A non-GAAP financial measure is a numerical measure of historical or future financial performance, financial position or cash flows that excludes or includes amounts that are required to be disclosed by GAAP. Farmers believes that these non-GAAP financial measures provide both management and investors a more complete understanding of the underlying operational results and trends and Farmers’ marketplace performance. The presentation of this additional information is not meant to be considered in isolation or as a substitute for the numbers prepared in accordance with GAAP. The reconciliations of non-GAAP financial measures to their GAAP equivalents are included in the tables following Consolidated Financial Highlights below.
Cautionary Statements Regarding Forward-Looking Statements
We make statements in this news release and our related investor conference call, and we may from time to time make other statements, that are forward-looking statements within the meaning of the Private Securities Litigation Reform Act of 1995, including statements about Farmers’ financial condition, results of operations, asset quality trends and profitability. Forward-looking statements are not historical facts but instead represent only management’s current expectations and forecasts regarding future events, many of which, by their nature, are inherently uncertain and outside of Farmers’ control. Forward-looking statements are preceded by terms such as “expects,” “believes,” “anticipates,” “intends” and similar expressions, as well as any statements related to future expectations of performance or conditional verbs, such as “will,” “would,” “should,” “could” or “may.” Farmers’ actual results and financial condition may differ, possibly materially, from the anticipated results and financial condition indicated in these forward-looking statements. Factors that could cause Farmers’ actual results to differ materially from those described in certain forward-looking statements include significant changes in near-term local, regional, and U.S. economic conditions including those resulting from continued high rates of inflation, tightening monetary policy of the Board of Governors of the Federal Reserve, and possibility of a recession; and the other factors contained in Farmers’ Annual Report on Form 10-K for the year ended December 31, 2023 and subsequent Quarterly Reports on Form 10-Q filed with the Securities and Exchange Commission (SEC) and available on Farmers’ website (www.farmersbankgroup.com) and on the SEC’s website (www.sec.gov). Forward-looking statements are not guarantees of future performance and should not be relied upon as representing management’s views as of any subsequent date. Farmers does not undertake any obligation to update the forward-looking statements to reflect the impact of circumstances or events that may arise after the date of the forward-looking statements.
Farmers National Banc Corp. and Subsidiaries
Consolidated Financial Highlights
(Amounts in thousands, except per share results) Unaudited
| Consolidated Statements of Income | For the Three Months Ended | |||||||||||||||||||
| March 31, 2024 |
Dec. 31, 2023 |
Sept. 30, 2023 |
June 30, 2023 |
March 31, 2023 |
||||||||||||||||
| Total interest income |
$ | 55,054 | $ | 55,069 | $ | 54,229 | $ | 52,804 | $ | 51,233 | ||||||||||
| Total interest expense |
23,367 | 22,239 | 20,461 | 18,226 | 14,623 | |||||||||||||||
|
|
|
|
|
|
|
|
|
|
|
|||||||||||
| Net interest income |
31,687 | 32,830 | 33,768 | 34,578 | 36,610 | |||||||||||||||
| Provision (credit) for credit losses |
(449 | ) | 286 | 243 | 25 | 8,599 | ||||||||||||||
| Noninterest income |
8,357 | 12,156 | 9,831 | 9,449 | 10,425 | |||||||||||||||
| Acquisition related costs |
0 | 452 | 268 | 442 | 4,313 | |||||||||||||||
| Other expense |
27,039 | 26,520 | 27,448 | 25,944 | 26,409 | |||||||||||||||
|
|
|
|
|
|
|
|
|
|
|
|||||||||||
| Income before income taxes |
13,454 | 17,728 | 15,640 | 17,616 | 7,714 | |||||||||||||||
| Income taxes |
2,214 | 3,151 | 2,326 | 2,650 | 639 | |||||||||||||||
|
|
|
|
|
|
|
|
|
|
|
|||||||||||
| Net income |
$ | 11,240 | $ | 14,577 | $ | 13,314 | $ | 14,966 | $ | 7,075 | ||||||||||
|
|
|
|
|
|
|
|
|
|
|
|||||||||||
| Average diluted shares outstanding |
37,479 | 37,426 | 37,379 | 37,320 | 37,933 | |||||||||||||||
| Basic earnings per share |
0.30 | 0.39 | 0.36 | 0.40 | 0.19 | |||||||||||||||
| Diluted earnings per share |
0.30 | 0.39 | 0.36 | 0.40 | 0.19 | |||||||||||||||
| Cash dividends per share |
0.17 | 0.17 | 0.17 | 0.17 | 0.17 | |||||||||||||||
| Performance Ratios |
||||||||||||||||||||
| Net Interest Margin (Annualized) |
2.70 | % | 2.78 | % | 2.86 | % | 2.92 | % | 3.07 | % | ||||||||||
| Efficiency Ratio (Tax equivalent basis) |
61.54 | % | 57.84 | % | 60.11 | % | 56.28 | % | 62.53 | % | ||||||||||
| Return on Average Assets (Annualized) |
0.90 | % | 1.17 | % | 1.06 | % | 1.18 | % | 0.56 | % | ||||||||||
| Return on Average Equity (Annualized) |
11.47 | % | 17.98 | % | 14.49 | % | 16.12 | % | 7.71 | % | ||||||||||
| Dividends to Net Income |
56.65 | % | 43.68 | % | 47.82 | % | 42.54 | % | 90.50 | % | ||||||||||
| Other Performance Ratios (Non-GAAP) |
||||||||||||||||||||
| Return on Average Tangible Assets |
0.93 | % | 1.22 | % | 1.09 | % | 1.23 | % | 0.58 | % | ||||||||||
| Return on Average Tangible Equity |
21.88 | % | 43.77 | % | 30.29 | % | 33.55 | % | 16.31 | % | ||||||||||
| Consolidated Statements of Financial Condition | March 31, 2024 |
Dec. 31, 2023 |
Sept. 30, 2023 |
June 30, 2023 |
March 31, 2023 |
|||||||||||||||
| Assets |
||||||||||||||||||||
| Cash and cash equivalents |
$ | 148,630 | $ | 103,658 | $ | 93,923 | $ | 116,063 | $ | 128,001 | ||||||||||
| Debt securities available for sale |
1,270,149 | 1,299,701 | 1,210,736 | 1,316,878 | 1,355,449 | |||||||||||||||
| Other investments |
34,619 | 35,311 | 35,342 | 44,975 | 39,670 | |||||||||||||||
| Loans held for sale |
1,854 | 3,711 | 1,910 | 2,197 | 1,703 | |||||||||||||||
| Loans |
3,181,318 | 3,198,127 | 3,168,554 | 3,155,200 | 3,152,339 | |||||||||||||||
| Less allowance for credit losses |
33,159 | 34,440 | 34,753 | 34,957 | 36,011 | |||||||||||||||
|
|
|
|
|
|
|
|
|
|
|
|||||||||||
| Net Loans |
3,148,159 | 3,163,687 | 3,133,801 | 3,120,243 | 3,116,328 | |||||||||||||||
|
|
|
|
|
|
|
|
|
|
|
|||||||||||
| Other assets |
476,599 | 472,282 | 495,451 | 473,098 | 468,735 | |||||||||||||||
|
|
|
|
|
|
|
|
|
|
|
|||||||||||
| Total Assets |
$ | 5,080,010 | $ | 5,078,350 | $ | 4,971,163 | $ | 5,073,454 | $ | 5,109,886 | ||||||||||
|
|
|
|
|
|
|
|
|
|
|
|||||||||||
| Liabilities and Stockholders’ Equity |
||||||||||||||||||||
| Deposits |
||||||||||||||||||||
| Noninterest-bearing |
$ | 977,475 | $ | 1,026,630 | $ | 1,039,524 | $ | 1,084,232 | $ | 1,106,870 | ||||||||||
| Interest-bearing |
3,220,650 | 3,150,756 | 3,217,869 | 3,165,381 | 3,207,121 | |||||||||||||||
| Brokered time deposits |
0 | 0 | 254,257 | 21,135 | 82,169 | |||||||||||||||
|
|
|
|
|
|
|
|
|
|
|
|||||||||||
| Total deposits |
4,198,125 | 4,177,386 | 4,511,650 | 4,270,748 | 4,396,160 | |||||||||||||||
| Other interest-bearing liabilities |
433,777 | 443,663 | 88,550 | 388,437 | 292,324 | |||||||||||||||
| Other liabilities |
51,082 | 52,886 | 54,981 | 47,278 | 46,760 | |||||||||||||||
|
|
|
|
|
|
|
|
|
|
|
|||||||||||
| Total liabilities |
4,682,984 | 4,673,935 | 4,655,181 | 4,706,463 | 4,735,244 | |||||||||||||||
| Stockholders’ Equity |
397,026 | 404,415 | 315,982 | 366,991 | 374,642 | |||||||||||||||
|
|
|
|
|
|
|
|
|
|
|
|||||||||||
| Total Liabilities and Stockholders’ Equity |
$ | 5,080,010 | $ | 5,078,350 | $ | 4,971,163 | $ | 5,073,454 | $ | 5,109,886 | ||||||||||
|
|
|
|
|
|
|
|
|
|
|
|||||||||||
| Period-end shares outstanding |
37,546 | 37,503 | 37,489 | 37,457 | 37,439 | |||||||||||||||
| Book value per share |
$ | 10.57 | $ | 10.78 | $ | 8.43 | $ | 9.80 | $ | 10.01 | ||||||||||
| Tangible book value per share (Non-GAAP)* |
5.52 | 5.71 | 3.33 | 4.67 | 4.84 | |||||||||||||||
| * | Tangible book value per share is calculated by dividing tangible common equity by outstanding shares |
| For the Three Months Ended | ||||||||||||||||||||
| Capital and Liquidity | March 31, 2024 |
Dec. 31, 2023 |
Sept. 30, 2023 |
June 30, 2023 |
March 31, 2023 |
|||||||||||||||
| Common Equity Tier 1 Capital Ratio (a) |
10.88 | % | 10.61 | % | 10.37 | % | 10.25 | % | 10.04 | % | ||||||||||
| Total Risk Based Capital Ratio (a) |
14.33 | % | 14.06 | % | 13.83 | % | 13.76 | % | 13.60 | % | ||||||||||
| Tier 1 Risk Based Capital Ratio (a) |
11.38 | % | 11.10 | % | 10.86 | % | 10.74 | % | 10.54 | % | ||||||||||
| Tier 1 Leverage Ratio (a) |
8.19 | % | 8.02 | % | 7.84 | % | 7.68 | % | 7.43 | % | ||||||||||
| Equity to Asset Ratio |
7.82 | % | 7.96 | % | 6.36 | % | 7.23 | % | 7.33 | % | ||||||||||
| Tangible Common Equity Ratio (b) |
4.24 | % | 4.38 | % | 2.61 | % | 3.58 | % | 3.69 | % | ||||||||||
| Net Loans to Assets |
61.97 | % | 62.30 | % | 63.04 | % | 61.50 | % | 60.99 | % | ||||||||||
| Loans to Deposits |
75.78 | % | 76.56 | % | 70.23 | % | 73.88 | % | 71.71 | % | ||||||||||
| Asset Quality |
||||||||||||||||||||
| Non-performing loans |
$ | 11,951 | $ | 15,063 | $ | 18,368 | $ | 17,956 | $ | 17,959 | ||||||||||
| Non-performing assets |
12,215 | 15,321 | 18,522 | 18,167 | 18,053 | |||||||||||||||
| Loans 30 - 89 days delinquent |
14,069 | 16,705 | 13,314 | 12,321 | 10,219 | |||||||||||||||
| Charged-off loans |
1,282 | 972 | 525 | 971 | 469 | |||||||||||||||
| Recoveries |
271 | 172 | 139 | 172 | 198 | |||||||||||||||
| Net Charge-offs |
1,011 | 800 | 386 | 799 | 271 | |||||||||||||||
| Annualized Net Charge-offs to Average Net Loans |
0.13 | % | 0.10 | % | 0.05 | % | 0.10 | % | 0.03 | % | ||||||||||
| Allowance for Credit Losses to Total Loans |
1.04 | % | 1.08 | % | 1.10 | % | 1.11 | % | 1.14 | % | ||||||||||
| Non-performing Loans to Total Loans |
0.38 | % | 0.47 | % | 0.58 | % | 0.57 | % | 0.57 | % | ||||||||||
| Loans 30 - 89 Days Delinquent to Total Loans |
0.44 | % | 0.52 | % | 0.42 | % | 0.39 | % | 0.32 | % | ||||||||||
| Allowance to Non-performing Loans |
277.46 | % | 228.64 | % | 189.20 | % | 194.68 | % | 200.52 | % | ||||||||||
| Non-performing Assets to Total Assets |
0.24 | % | 0.30 | % | 0.37 | % | 0.36 | % | 0.35 | % | ||||||||||
| (a) | March 31, 2024 ratio is estimated |
| (b) | This is a non-GAAP financial measure. A reconciliation to GAAP is shown below |
| For the Three Months Ended | ||||||||||||||||||||
| End of Period Loan Balances | March 31, 2024 |
Dec. 31, 2023 |
Sept. 30, 2023 |
June 30, 2023 |
March 31, 2023 |
|||||||||||||||
| Commercial real estate |
$ | 1,339,372 | $ | 1,335,806 | $ | 1,295,847 | $ | 1,284,974 | $ | 1,286,830 | ||||||||||
| Commercial |
335,747 | 346,354 | 357,691 | 362,664 | 361,845 | |||||||||||||||
| Residential real estate |
836,252 | 843,697 | 842,729 | 849,533 | 853,074 | |||||||||||||||
| HELOC |
143,696 | 142,441 | 140,772 | 138,535 | 137,319 | |||||||||||||||
| Consumer |
256,846 | 259,784 | 261,136 | 260,326 | 260,596 | |||||||||||||||
| Agricultural loans |
260,425 | 261,288 | 261,738 | 250,807 | 244,938 | |||||||||||||||
|
|
|
|
|
|
|
|
|
|
|
|||||||||||
| Total, excluding net deferred loan costs |
$ | 3,172,338 | $ | 3,189,370 | $ | 3,159,913 | $ | 3,146,839 | $ | 3,144,602 | ||||||||||
|
|
|
|
|
|
|
|
|
|
|
|||||||||||
| For the Three Months Ended | ||||||||||||||||||||
| March 31, | Dec. 31, | Sept. 30, | June 30, | March 31, | ||||||||||||||||
| End of Period Customer Deposit Balances | 2024 | 2023 | 2023 | 2023 | 2023 | |||||||||||||||
| Noninterest-bearing demand |
$ | 977,474 | $ | 1,026,630 | $ | 1,039,524 | $ | 1,084,232 | $ | 1,106,870 | ||||||||||
| Interest-bearing demand |
1,381,383 | 1,362,609 | 1,426,349 | 1,383,326 | 1,473,001 | |||||||||||||||
| Money market |
646,308 | 593,975 | 588,043 | 610,051 | 599,037 | |||||||||||||||
| Savings |
452,949 | 468,890 | 488,991 | 511,642 | 535,321 | |||||||||||||||
| Certificate of deposit |
740,011 | 725,282 | 714,486 | 660,362 | 599,762 | |||||||||||||||
|
|
|
|
|
|
|
|
|
|
|
|||||||||||
| Total customer deposits |
$ | 4,198,125 | $ | 4,177,386 | $ | 4,257,393 | $ | 4,249,613 | $ | 4,313,991 | ||||||||||
|
|
|
|
|
|
|
|
|
|
|
|||||||||||
| For the Three Months Ended | ||||||||||||||||||||
| Noninterest Income | March 31, 2024 |
Dec. 31, 2023 |
Sept. 30, 2023 |
June 30, 2023 |
March 31, 2023 |
|||||||||||||||
| Service charges on deposit accounts |
$ | 1,583 | $ | 1,677 | $ | 1,712 | $ | 1,501 | $ | 1,432 | ||||||||||
| Bank owned life insurance income, including death benefits |
707 | 617 | 694 | 584 | 547 | |||||||||||||||
| Trust fees |
2,793 | 2,656 | 2,617 | 2,248 | 2,587 | |||||||||||||||
| Insurance agency commissions |
1,528 | 1,540 | 1,116 | 1,332 | 1,456 | |||||||||||||||
| Security gains (losses), including fair value changes for equity securities |
(2,120 | ) | 19 | (624 | ) | 13 | 121 | |||||||||||||
| Retirement plan consulting fees |
334 | 357 | 360 | 382 | 307 | |||||||||||||||
| Investment commissions |
432 | 589 | 520 | 476 | 393 | |||||||||||||||
| Net gains on sale of loans |
297 | 1,280 | 395 | 406 | 310 | |||||||||||||||
| Other mortgage banking fee income (loss), net |
125 | 139 | 185 | 234 | 153 | |||||||||||||||
| Debit card and EFT fees |
1,567 | 1,697 | 1,763 | 1,810 | 1,789 | |||||||||||||||
| Other noninterest income |
1,111 | 1,585 | 1,093 | 463 | 1,330 | |||||||||||||||
|
|
|
|
|
|
|
|
|
|
|
|||||||||||
| Total Noninterest Income |
$ | 8,357 | $ | 12,156 | $ | 9,831 | $ | 9,449 | $ | 10,425 | ||||||||||
|
|
|
|
|
|
|
|
|
|
|
|||||||||||
| For the Three Months Ended | ||||||||||||||||||||
| Noninterest Expense | March 31, 2024 |
Dec. 31, 2023 |
Sept. 30, 2023 |
June 30, 2023 |
March 31, 2023 |
|||||||||||||||
| Salaries and employee benefits |
$ | 15,069 | $ | 14,871 | $ | 14,233 | $ | 13,625 | $ | 14,645 | ||||||||||
| Occupancy and equipment |
3,730 | 3,896 | 3,810 | 3,859 | 3,869 | |||||||||||||||
| FDIC insurance and state and local taxes |
1,345 | 1,484 | 1,648 | 1,494 | 1,222 | |||||||||||||||
| Professional fees |
1,254 | 1,004 | 1,043 | 1,190 | 1,114 | |||||||||||||||
| Merger related costs |
0 | 452 | 268 | 442 | 4,313 | |||||||||||||||
| Advertising |
431 | 414 | 492 | 478 | 409 | |||||||||||||||
| Intangible amortization |
688 | 578 | 725 | 1,222 | 909 | |||||||||||||||
| Core processing charges |
1,135 | 1,057 | 1,274 | 1,144 | 1,164 | |||||||||||||||
| Other noninterest expenses |
3,387 | 3,216 | 4,223 | 2,932 | 3,077 | |||||||||||||||
|
|
|
|
|
|
|
|
|
|
|
|||||||||||
| Total Noninterest Expense |
$ | 27,039 | $ | 26,972 | $ | 27,716 | $ | 26,386 | $ | 30,722 | ||||||||||
|
|
|
|
|
|
|
|
|
|
|
|||||||||||
Average Balance Sheets and Related Yields and Rates
(Dollar Amounts in Thousands)
| Three Months Ended March 31, 2024 |
Three Months Ended March 31, 2023 |
|||||||||||||||||||||||
| AVERAGE BALANCE |
INTEREST (1) | YIELD/ RATE (1) |
AVERAGE BALANCE |
INTEREST (1) | YIELD/ RATE (1) |
|||||||||||||||||||
| EARNING ASSETS |
||||||||||||||||||||||||
| Loans (2) |
$ | 3,181,337 | $ | 45,096 | 5.67 | % | $ | 3,136,494 | $ | 40,942 | 5.22 | % | ||||||||||||
| Taxable securities |
1,101,347 | 6,415 | 2.33 | 1,171,596 | 6,550 | 2.24 | ||||||||||||||||||
| Tax-exempt securities (2) |
408,075 | 3,208 | 3.14 | 438,614 | 3,519 | 3.21 | ||||||||||||||||||
| Other investments |
34,406 | 362 | 4.21 | 36,564 | 376 | 4.11 | ||||||||||||||||||
| Federal funds sold and other |
71,757 | 626 | 3.49 | 82,995 | 610 | 2.94 | ||||||||||||||||||
|
|
|
|
|
|
|
|
|
|||||||||||||||||
| Total earning assets |
4,796,922 | 55,707 | 4.65 | 4,866,263 | 51,997 | 4.27 | ||||||||||||||||||
| Nonearning assets |
227,044 | 218,746 | ||||||||||||||||||||||
|
|
|
|
|
|||||||||||||||||||||
| Total assets |
$ | 5,023,966 | $ | 5,085,009 | ||||||||||||||||||||
|
|
|
|
|
|||||||||||||||||||||
| INTEREST-BEARING LIABILITIES |
||||||||||||||||||||||||
| Time deposits |
$ | 736,932 | $ | 7,048 | 3.83 | % | $ | 590,412 | $ | 3,339 | 2.26 | % | ||||||||||||
| Brokered time deposits |
0 | 0 | 0.00 | 231,040 | 2,321 | 4.02 | ||||||||||||||||||
| Savings deposits |
1,084,579 | 3,598 | 1.33 | 1,153,588 | 1,954 | 0.68 | ||||||||||||||||||
| Demand deposits - interest bearing |
1,345,311 | 7,743 | 2.30 | 1,417,955 | 5,093 | 1.44 | ||||||||||||||||||
|
|
|
|
|
|
|
|
|
|||||||||||||||||
| Total interest-bearing deposits |
3,166,822 | 18,389 | 2.32 | 3,392,995 | 12,707 | 1.50 | ||||||||||||||||||
| Short term borrowings |
324,791 | 3,939 | 4.85 | 80,589 | 921 | 4.57 | ||||||||||||||||||
| Long term borrowings |
88,721 | 1,038 | 4.68 | 88,269 | 995 | 4.51 | ||||||||||||||||||
|
|
|
|
|
|
|
|
|
|||||||||||||||||
| Total borrowed funds |
413,512 | 4,977 | 4.81 | 168,858 | 1,916 | 4.54 | ||||||||||||||||||
|
|
|
|
|
|
|
|
|
|||||||||||||||||
| Total interest-bearing liabilities |
3,580,334 | 23,366 | 2.61 | 3,561,853 | 14,623 | 1.64 | ||||||||||||||||||
|
|
|
|
|
|
|
|
|
|||||||||||||||||
| NONINTEREST-BEARING LIABILITIES AND STOCKHOLDERS’ EQUITY |
||||||||||||||||||||||||
| Demand deposits—noninterest bearing |
995,168 | 1,107,422 | ||||||||||||||||||||||
| Other liabilities |
52,915 | 48,883 | ||||||||||||||||||||||
| Stockholders’ equity |
395,549 | 366,851 | ||||||||||||||||||||||
|
|
|
|
|
|||||||||||||||||||||
| TOTAL LIABILITIES AND STOCKHOLDERS’ EQUITY |
$ | 5,023,966 | $ | 5,085,009 | ||||||||||||||||||||
|
|
|
|
|
|||||||||||||||||||||
| Net interest income and interest rate spread |
$ | 32,341 | 2.04 | % | $ | 37,374 | 2.63 | % | ||||||||||||||||
|
|
|
|
|
|
|
|
|
|||||||||||||||||
| Net interest margin |
2.70 | % | 3.07 | % | ||||||||||||||||||||
|
|
|
|
|
| (1) | Interest and yields are calculated on a tax-equivalent basis where applicable. |
| (2) | For 2024, adjustments of $80 thousand and $573 thousand, respectively, were made to tax equate income on tax exempt loans and tax exempt securities. For 2023, adjustments of $86 thousand and $678 thousand, respectively, were made to tax equate income on tax exempt loans and tax exempt securities. These adjustments were based on a marginal federal income tax rate of 21%, less disallowances. |
Reconciliation of Total Assets to Tangible Assets
| For the Three Months Ended | ||||||||||||||||||||
| March 31, 2024 |
Dec. 31, 2023 |
Sept. 30, 2023 |
June 30, 2023 |
March 31, 2023 |
||||||||||||||||
| Total Assets |
$ | 5,080,010 | $ | 5,078,350 | $ | 4,971,163 | $ | 5,073,454 | $ | 5,109,886 | ||||||||||
| Less Goodwill and other intangibles |
189,599 | 190,288 | 191,326 | 192,052 | 193,273 | |||||||||||||||
|
|
|
|
|
|
|
|
|
|
|
|||||||||||
| Tangible Assets |
$ | 4,890,411 | $ | 4,888,062 | $ | 4,779,837 | $ | 4,881,402 | $ | 4,916,613 | ||||||||||
|
|
|
|
|
|
|
|
|
|
|
|||||||||||
| Average Assets |
5,023,966 | 4,980,314 | 5,058,969 | 5,070,444 | 5,085,009 | |||||||||||||||
| Less average Goodwill and other intangibles |
190,040 | 191,108 | 191,804 | 192,972 | 193,368 | |||||||||||||||
|
|
|
|
|
|
|
|
|
|
|
|||||||||||
| Average Tangible Assets |
$ | 4,833,926 | $ | 4,789,206 | $ | 4,867,165 | $ | 4,877,472 | $ | 4,891,641 | ||||||||||
|
|
|
|
|
|
|
|
|
|
|
|||||||||||
Reconciliation of Common Stockholders’ Equity to Tangible Common Equity
| For the Three Months Ended | ||||||||||||||||||||
| March 31, 2024 |
Dec. 31, 2023 |
Sept. 30, 2023 |
June 30, 2023 |
March 31, 2023 |
||||||||||||||||
| Stockholders’ Equity |
$ | 397,026 | $ | 404,415 | $ | 315,982 | $ | 366,991 | $ | 374,642 | ||||||||||
| Less Goodwill and other intangibles |
189,599 | 190,288 | 191,326 | 192,052 | 193,273 | |||||||||||||||
|
|
|
|
|
|
|
|
|
|
|
|||||||||||
| Tangible Common Equity |
$ | 207,427 | $ | 214,127 | $ | 124,656 | $ | 174,939 | $ | 181,369 | ||||||||||
|
|
|
|
|
|
|
|
|
|
|
|||||||||||
| Average Stockholders’ Equity |
395,549 | 324,332 | 367,600 | 371,421 | 366,851 | |||||||||||||||
| Less average Goodwill and other intangibles |
190,040 | 191,108 | 191,804 | 192,972 | 193,368 | |||||||||||||||
|
|
|
|
|
|
|
|
|
|
|
|||||||||||
| Average Tangible Common Equity |
$ | 205,509 | $ | 133,224 | $ | 175,796 | $ | 178,449 | $ | 173,483 | ||||||||||
|
|
|
|
|
|
|
|
|
|
|
|||||||||||
Reconciliation of Net Income, Less Merger and Certain Items
| For the Three Months Ended | ||||||||||||||||||||
| March 31, 2024 |
Dec. 31, 2023 |
Sept. 30, 2023 |
June 30, 2023 |
March 31, 2023 |
||||||||||||||||
| Net income |
$ | 11,240 | $ | 14,577 | $ | 13,314 | $ | 14,966 | $ | 7,075 | ||||||||||
| Acquisition related costs - after tax |
0 | 358 | 234 | 354 | 3,449 | |||||||||||||||
| Acquisition related provision - after tax |
0 | 0 | 0 | 0 | 6,077 | |||||||||||||||
| Employee severence - after tax |
0 | 798 | 0 | 0 | 0 | |||||||||||||||
| Lawsuit settlement expense - after tax |
0 | 0 | 620 | 0 | 0 | |||||||||||||||
| Net (gain) on loan sale - after tax |
0 | (723 | ) | 0 | 0 | 0 | ||||||||||||||
| Net loss (gain) on security sales - after tax |
1,675 | 171 | 604 | (5 | ) | (72 | ) | |||||||||||||
|
|
|
|
|
|
|
|
|
|
|
|||||||||||
| Net income - Adjusted |
$ | 12,915 | $ | 15,181 | $ | 14,772 | $ | 15,315 | $ | 16,529 | ||||||||||
|
|
|
|
|
|
|
|
|
|
|
|||||||||||
| Diluted EPS excluding merger and certain items |
$ | 0.34 | $ | 0.41 | $ | 0.40 | $ | 0.41 | $ | 0.44 | ||||||||||
|
|
|
|
|
|
|
|
|
|
|
|||||||||||
| Return on Average Assets excluding merger and certain items (Annualized) |
1.03 | % | 1.22 | % | 1.17 | % | 1.21 | % | 1.30 | % | ||||||||||
| Return on Average Equity excluding merger and certain items (Annualized) |
13.06 | % | 18.72 | % | 16.07 | % | 16.49 | % | 18.02 | % | ||||||||||
| Return on Average Tangible Equity excluding acquisition costs and certain items (Annualized) |
25.14 | % | 45.58 | % | 33.61 | % | 34.33 | % | 38.11 | % | ||||||||||
Efficiency ratio excluding certain items
| For the Three Months Ended | ||||||||||||||||||||
| March 31, 2024 |
Dec. 31, 2023 |
Sept. 30, 2023 |
June 30, 2023 |
March 31, 2023 |
||||||||||||||||
| Net interest income, tax equated |
$ | 32,341 | $ | 33,494 | $ | 34,448 | $ | 35,273 | $ | 37,374 | ||||||||||
| Noninterest income |
8,357 | 12,156 | 9,831 | 9,449 | 10,425 | |||||||||||||||
| Net (gain) on loan sale |
0 | (915 | ) | 0 | 0 | 0 | ||||||||||||||
| Net loss (gain) on security sales |
2,120 | 217 | 764 | (6 | ) | (91 | ) | |||||||||||||
|
|
|
|
|
|
|
|
|
|
|
|||||||||||
| Net interest income and noninterest income adjusted |
42,818 | 44,952 | 45,043 | 44,716 | 47,708 | |||||||||||||||
| Noninterest expense less intangible amortization |
26,351 | 26,394 | 26,991 | 25,163 | 29,813 | |||||||||||||||
| Legal settlement expense |
0 | 0 | 785 | 0 | 0 | |||||||||||||||
| Employee severence |
0 | 1,010 | 0 | 0 | 0 | |||||||||||||||
| Acquisition related costs |
0 | 452 | 268 | 442 | 4,313 | |||||||||||||||
|
|
|
|
|
|
|
|
|
|
|
|||||||||||
| Noninterest expense adjusted |
26,351 | 24,932 | 25,938 | 24,721 | 25.500 | |||||||||||||||
|
|
|
|
|
|
|
|
|
|
|
|||||||||||
| Efficiency ratio excluding certain items |
61.54 | % | 55.46 | % | 57.58 | % | 55.28 | % | 53.45 | % | ||||||||||
|
|
|
|
|
|
|
|
|
|
|
|||||||||||
Net interest margin excluding acquisition marks and PPP interest and fees
| For the Three Months Ended | ||||||||||||||||||||
| March 31, 2024 |
Dec. 31, 2023 |
Sept. 30, 2023 |
June 30, 2023 |
March 31, 2023 |
||||||||||||||||
| Net interest income, tax equated |
$ | 32,341 | $ | 33,494 | $ | 34,448 | $ | 35,273 | $ | 37,374 | ||||||||||
| Acquisition marks |
2,370 | 2,475 | 2,959 | 2,884 | 2,628 | |||||||||||||||
| PPP interest and fees |
0 | 1 | 1 | 3 | 0 | |||||||||||||||
| Adjusted and annualized net interest income |
119,884 | 124,072 | 125,952 | 129,544 | 138,984 | |||||||||||||||
|
|
|
|
|
|
|
|
|
|
|
|||||||||||
| Average earning assets |
4,796,922 | 4,816,409 | 4,820,888 | 4,830,910 | 4,866,263 | |||||||||||||||
|
|
|
|
|
|
|
|
|
|
|
|||||||||||
| Less PPP average balances |
213 | 229 | 247 | 277 | 310 | |||||||||||||||
|
|
|
|
|
|
|
|
|
|
|
|||||||||||
| Adjusted average earning assets |
4,796,709 | 4,816,180 | 4,820,641 | 4,830,633 | 4,865,953 | |||||||||||||||
|
|
|
|
|
|
|
|
|
|
|
|||||||||||
| Net interest margin excluding marks and PPP interest and fees |
2.50 | % | 2.58 | % | 2.61 | % | 2.68 | % | 2.86 | % | ||||||||||
|
|
|
|
|
|
|
|
|
|
|
|||||||||||

Exhibit 99.2