UNITED STATES
SECURITIES AND EXCHANGE COMMISSION
Washington, D.C. 20549
Form 6-K
Report of Foreign Private Issuer
Pursuant to Rule 13a-16 or 15d-16
under the Securities Exchange Act of 1934
For the month of April 2024
Commission File Number 001-16139
Wipro Limited
(Exact name of Registrant as specified in its charter)
Not Applicable
(Translation of Registrant’s name into English)
Karnataka, India
(Jurisdiction of incorporation or organization)
Doddakannelli
Sarjapur Road
Bangalore, Karnataka 560035, India +91-80-2844-0011
(Address of principal executive offices)
Indicate by check mark whether the registrant files or will file annual reports under cover Form 20-F or Form 40-F:
Form 20-F ☒ Form 40-F ☐
Indicate by check mark if the registrant is submitting the Form 6-K in paper as permitted by Regulation S-T Rule 101(b)(1):
Yes ☐ No ☒
Note: Regulation S-T Rule 101(b)(1) only permits the submission in paper of a Form 6-K if submitted solely to provide an attached annual report to security holders.
Indicate by check mark if the registrant is submitting the Form 6-K in paper as permitted by Regulation S-T Rule 101(b)(7):
Yes ☐ No ☒
Note: Regulation S-T Rule 101(b)(7) only permits the submission in paper of a Form 6-K if submitted to furnish a report or other document that the registrant foreign private issuer must furnish and make public under the laws of the jurisdiction in which the registrant is incorporated, domiciled or legally organized (the registrant’s “home country”), or under the rules of the home country exchange on which the registrant’s securities are traded, as long as the report or other document is not a press release, is not required to be and has not been distributed to the registrant’s security holders, and, if discussing a material event, has already been the subject of a Form 6-K submission or other Commission filing on EDGAR.
DISCLOSURE OF OUTCOME OF BOARD MEETING
Wipro Limited, a company organized under the laws of the Republic of India (the “Company”), hereby furnishes the Commission with the following information relating to the outcome of the meeting of the Board of Directors of the Company (the “Board”) held over April 18-19, 2024. The following information shall not be deemed “filed” for purposes of Section 18 of the Securities Exchange Act of 1934, as amended (the “Exchange Act”), or incorporated by reference in any filing under the Securities Act of 1933, as amended, or the Exchange Act, except as shall be expressly set forth by specific reference in such a filing.
On April 19, 2024, the Company informed the securities exchanges in India on which its securities are listed and the New York Stock Exchange (together, the “Exchanges”) that the Board approved the reappointments of (i) Mr. Rishad A. Premji as Whole-Time Director designated as Executive Chairman for a period of 5 years with effect from July 31, 2024 to July 30, 2029 and (ii) Mr. Azim H. Premji as Non-Executive, Non-Independent Director for a period of 5 years with effect from July 31, 2024 to July 30, 2029 (the “Reappointments”). A copy of the letter to the Exchanges concerning the Reappointments is attached hereto as Item 99.1.
On April 19, 2024, the Company informed the Exchanges that the Board approved the financial results of the Company for the quarter and year ended March 31, 2024 (the “Financial Results”). A copy of the letter to the Exchanges concerning the Financial Results is attached hereto as Item 99.2.
SIGNATURES
Pursuant to the requirements of the Securities Exchange Act of 1934, the registrant has duly caused this report to be signed on its behalf by the undersigned, thereunto duly organized.
| WIPRO LIMITED |
| /s/ M. Sanaulla Khan |
| M. Sanaulla Khan |
| Senior Vice President and Company Secretary |
Dated: April 22, 2024
INDEX TO EXHIBITS
| Item | ||
| 99.1 | Letter to the Exchanges dated April 19, 2024. | |
| 99.2 | Letter to the Exchanges dated April 19, 2024. | |
Exhibit 99.1

April 19, 2024
The Manager – Listing
National Stock Exchange of India Limited
(NSE: WIPRO)
The Manager – Listing
BSE Limited
(BSE: 507685)
The Market Operations
NYSE, New York
(NYSE: WIT)
Dear Sir/Madam,
Sub: Intimation under Regulation 30 of SEBI (Listing Obligations and Disclosure Requirements) Regulations, 2015- Outcome of Board Meeting
The Board of Directors (“Board”) of Wipro Limited, have at their meeting held over April 18-19, 2024, considered and approved the following, subject to the approval of shareholders:
| 1. | Re-appointment of Mr. Rishad A. Premji (DIN: 02983899) as Whole-Time Director designated as Executive Chairman for a period of 5 years with effect from July 31, 2024 to July 30, 2029. |
| 2. | Re-appointment of Mr. Azim H. Premji (DIN: 00234280) as Non-Executive, Non-Independent Director for a period of 5 years with effect from July 31, 2024 to July 30, 2029. |
The Board Meeting commenced on April 18, 2024 at 4:10 PM, and finally concluded on April 19, 2024 at 3:30 PM.
This is for your information and records.
Thanking You,
For Wipro Limited
M Sanaulla Khan
Company Secretary
ENCL: As Above
Annexure-1
Details required under SEBI (Listing Obligations and Disclosure Requirements) Regulations, 2015 read with SEBI Circular No. SEBI/HO/CFD/CFD-PoD-1/P/CIR/2023/123 dated July 13, 2023
| Sl. No. |
Particulars |
Details |
||
| 1. | Reason for change viz. appointment, re-appointment, resignation, removal, death or otherwise | 1. Re-appointment of Mr. Rishad A. Premji as Whole-Time Director designated as Executive Chairman for a period of 5 years with effect from July 31, 2024 to July 30, 2029, subject to approval of shareholders.
2. Re-appointment of Mr. Azim H. Premji as Non-Executive, Non-Independent Director for a period of 5 years with effect from July 31, 2024 to July 30, 2029, subject to approval of shareholders. |
||
| 2. | Date of appointment / re-appointment / cessation (as applicable) & term of appointment / re-appointment | Re-appointment of Mr. Rishad A. Premji and Mr. Azim H. Premji for a period of 5 years with effect from July 31, 2024 to July 30, 2029, subject to approval of shareholders. | ||
| 3. | Brief profile (in case of appointment) | Refer Annexures 2 & 3. | ||
| 4. | Disclosure of relationships between directors (in case of appointment of a director) | Mr. Rishad A. Premji is the son of Mr. Azim H. Premji. | ||
| 5. | Information as required under BSE circular no. LIST/COMP/14/2018-19 and NSE circular no. NSE/CML/2018/24, dated June 20, 2018 | Mr. Rishad A. Premji and Mr. Azim H. Premji are not debarred from holding the office of director by any SEBI order or any other such authority. | ||
Annexure-2
Brief Profile of Mr. Rishad A. Premji

|
Rishad Premji is the Executive Chairman of Wipro Limited, an over $10.5 billion global information technology, consulting, and business process services company, with over 230,000 employees in 65 countries.
Rishad joined Wipro in 2007 and worked in several roles before becoming Executive Chairman in 2019. He started as a general manager in Wipro’s Banking and Financial Services business, went on to head Investor Relations, and then led Wipro’s Strategy and M&A function. As Wipro’s Chief Strategy Officer, Rishad conceptualized Wipro Ventures, a $250 million fund to invest in start-ups developing technologies and solutions that complement Wipro’s businesses with next-generation services and products. He was also responsible for investor and government relations for the company. |
In his role as Executive Chairman, Rishad works closely with Wipro’s leadership team in providing direction and strategic insight to the business. Rishad believes that the culture of an organization is its strongest asset, and has worked tirelessly to ensure that every Wiproite understands and upholds the values of Wipro, articulated as the Spirit of Wipro.
Rishad is on the boards of Wipro Enterprises Limited (a leading player in FMCG and infrastructure engineering), Wipro-GE (a joint healthcare venture between Wipro and General Electric) and the Azim Premji Foundation (one of the largest not-for-profit initiatives in India). The Foundation, which is focused on improving public school education, works with more than 350,000 government schools across seven states in India.
For financial year 2018-19, Rishad was Chairman of NASSCOM, the trade body representing India’s $250 billion software industry.
Prior to joining Wipro, Rishad was with Bain & Company in London, and also worked with GE Capital in the US in the insurance and consumer lending spaces. He is a graduate of GE’s Financial Management Program (FMP).
Rishad has an MBA from Harvard Business School and a B.A. in economics from Wesleyan University in the US.
Annexure-3
Brief Profile of Mr. Azim H. Premji

|
Azim Premji took over the leadership of Wipro in the late 1960’s. On that kernel of a $2 million hydrogenated cooking fat business, he founded multiple businesses including what is now an over $ 10.5 billion revenue IT Services organization with a presence in 65 countries. The other businesses of the Wipro group led by Premji have now grown to about $ 2 billion in revenues, spanning across the sectors of consumer goods, precision engineering and healthcare systems. He relinquished executive responsibilities at Wipro Limited in July 2019, to focus on the philanthropic work of the Foundation. Premji is a graduate in Electrical Engineering from Stanford University, USA. |
Premji’s success in business has been driven by one fundamental idea – to build organizations deeply committed to Values with the Client as the focus of all efforts. Unflinching commitment to Values continues to remain at the core of Wipro. Premji strongly believes that ordinary people are capable of extraordinary things when organized into highly charged teams.
Wipro’s cutting-edge technology expertise and its understanding of global industries delivers innovation and real business value to its clients – with consistency and predictability based on pioneering efforts in service quality and operational rigor.
Premji firmly believes that businesses must employ ethical, fair and ecologically sustainable business practices, and must actively engage with fundamental societal issues. Wipro’s deep and focused, social and environmental initiatives span its world-wide operational footprint, leading to Wipro being recognized as a global leader in Sustainability.
In 2001, Premji established the Azim Premji Foundation, a not-for-profit organization, with a vision of contributing towards a just, equitable, humane, and sustainable society. Today the Foundation’s work spans across education and other critical fields of human development & justice. The Foundation has its own large-scale organization in education, to help improve quality and equity of the public education system in India, with field operations across 7 states of the country which have over 350,000 schools. It runs the not-for-profit Azim Premji University in Bangalore and Bhopal. The work on the third University in Ranchi has started and subsequently a fourth University in the northeast will be established. The Foundation also has a rapidly scaling initiative to support other not-for-profits, through financial grants, which work across other fields which contribute to equity & justice, such as gender issues, nutrition, local governance, and well-being of vulnerable groups. Premji’s donations to the endowment of the Foundation, valued as of January 2024 at Rs. 2,69,000 Crores (USD 32 billion), make it one of the largest Foundations in the world.
Over the years, Azim Premji has received numerous honors and accolades, which he considers as recognitions for the team of Wipro and the Foundation. BusinessWeek listed him amongst the top 30 entrepreneurs in world history. Financial Times, Time, Fortune and Forbes have all named him as of one the most influential people in the world, citing his leadership in business and philanthropy, including the contributions to improving public education. The Journal of Foreign Policy has listed him amongst the top global thinkers. Economic Times bestowed Mr. Premji with the Life-Time Achievement Award.
Premji is the first Indian recipient of the Faraday Medal and has been conferred honorary doctorates by the Michigan State University and Wesleyan University (in the US), and the Indian Institutes of Technology at Bombay, Roorkee and Kharagpur amongst others. The Republic of France bestowed upon him the “Legion of Honor”. He was conferred in January 2011 with Padma Vibhushan, the second highest civilian award in India. The Carnegie Medal of Philanthropy was bestowed on him in 2017, hailing the “conscience, integrity, and compassion that have guided his visionary giving…….(with) invaluable benefit to both that nation and to the world.”
Exhibit 99.2
April 19, 2024 The Manager—Listing National Stock Exchange of India Limited (NSE: WIPRO) The Manager—Listing BSE Limited (BSE: 507685) The Market Operations NYSE, New York (NYSE: WIT) Dear Sir/Madam, Sub: Outcome of Board Meeting The Board of Directors (“Board”) of Wipro Limited, have at their meeting held over April 18-19, 2024, considered and approved the financial results of the Company for the quarter and year ended March 31, 2024, as per Regulation 33 of the SEBI (Listing Obligations and Disclosure Requirements) Regulations, 2015. Please find enclosed the Audited Standalone and Consolidated financial results under lndAS and Audited Consolidated financial results under IFRS for the quarter and year ended March 31, 2024, together with the Auditor’s Report, as approved by the Board today. The financial results are also being made available on the Company’s website at www.wipro.com. The Board Meeting commenced on April 18, 2024 at 4: 10 PM, and finally concluded on April 19, 2024 at 3:30 PM. Thanking You, For Wipro Limited M Sanaulla Khan Company Secretary ENCL: As Above
Chartered Accountants Deloitte Prestige Trade Tower, Level 19 46, Palace Road, High Grounds Bengaluru-560 001 Haskins & Sells LLP Karnataka, India Tel: +91 80 6188 6000 Fax: +91 80 6188 601 1 INDEPENDENT AUDITOR’S REPORT ON THE AUDIT OF STANDALONE FINANCIAL RESULTS TO THE BOARD OF DIRECTORS OF WIPRO LIMITED Opinion We have audited the accompanying Statement of Standalone Financial Results of WIPRO LIMITED (“the Company”), for the three months and year ended March 31, 2024 (“the Statement”/” Standalone Financial Results”), being submitted by the Company pursuant to the requirement of Regulation 33 of the SEBI (Listing Obligations and Disclosure Requirements) Regulations, 2015, as amended (“the Listing Regulations”) . In our opinion and to the best of our information and according to the explanations given to us, the Statement: a. is presented in accordance with the requirements of Regulation 33 of the SEBI (Listing Obligations and Disclosure Requirements) Regulations, 2015, as amended; and b. gives a true and fair view in conformity with the recognition and measurement principles laid down in the Indian Accounting Standard 34 “ Interim Financial Reporting” (“Ind AS 34”) prescribed under section 133 of the Companies Act 2013 (“the Act”) read with relevant rules issued thereunder and other accounting principles generally accepted in India of the net profit and total comprehensive income and other financial information of the Company for the three months and year ended March 31, 2024. Basis for Opinion We conducted our audit of these Standalone Financial Results in accordance with the Standards on Auditing (“SAs”) specified under Section 143(10) of the Act. Our responsibilities under t hose Standards are further described in the Auditor’s Responsibilities for the Audit of the Standalone Financial Results section below. We are independent of the Company in accordance with the Code of Ethics issued by the Institute of Chartered Accountants of India (“ICAI”) together with the ethical requirements that are relevant to our audit of the Standalone Financial Results under the provisions of the Act and the Rules thereunder and we have fulfil led our other ethical responsibilities in accordance with these requirements and the ICAI’s Code of Ethics. We believe that the audit evidence obtained by us is sufficient and appropriate to provide a basis for our audit opinion. Management’s Responsibilities for the Standalone Financial Results This Statement, which is the responsibility of the Company’s Management and approved by the Board of Directors, has been compiled from the related audited Interim Condensed Standalone Financial Statements for the three months and year ended March 31, 2024. The Company’s Board of Directors are responsible for the preparation and presentation of the Standalone Financial Results that give a true and fair view of the net profit and other comprehensive income and other financial information of the Company in accordance with the recognition and measurement principles laid down in Ind AS 34 prescribed under section 133 of the Act, read with relevant rules issued thereunder and other accounting principles generally accepted in India and in compliance with Regulation 33 of the Listing Regulations. This responsibility also includes maintenance of adequate accounting records in accordance with the provisions of the Act for safeguarding the assets of the Company and for preventing and detecting frauds and other irregularities; selection and application of appropriate accounting policies; making Regd. Office: One International Center, Tower 3, 27th-32nd Floor, Senapati Bapat Marg. Elphinstone Road (West), Mumbai-400 013, Maharashtra, India. (LLP Identification No. AAB-8737)
Deloitte Haskins & Sells LLP judgments and estimates that are reasonable and prudent; and the design, implementation and maintenance of adequate internal financial controls that were operating effectively for ensuring the accuracy and completeness of the accounting records, relevant to the preparation and presentation of the Standalone Financial Results that give a true and fair view and are free from material misstatement, whether due to fraud or error. I n preparing the Standalone Financial Results, the Board of Directors are responsible for assessing the Company’s ability, to continue as a going concern, disclosing, as applicable, matters related to going concern and using the going concern basis of accounting unless the Board of Directors either intends to liquidate the Company or to cease operations, or has no realistic alternative but to do so. The Board of Directors are also responsible for overseeing the financial reporting process of the Company. Auditor’s Responsibilities for the Audit of the Standalone Financial Results Our objectives are to obtain reasonable assurance about whether the Standalone Financial Results as a whole are free from material misstatement, whether due to fraud or error, and to issue an auditor’s report that includes our opinion. Reasonable assurance is a high level of assurance but is not a guarantee that an audit conducted in accordance with SAs will always detect a material misstatement when it exists. Misstatements can arise from fraud or error and are considered material if, individually or in the aggregate, they could reasonably be expected to influence the economic decisions of users taken on the basis of these Standalone Financial Results. As part of an audit in accordance with SAs, we exercise professional judgment and maintain professional skepticism throughout the audit. We also: • Identify and assess the risks of material misstatement of the Standalone Financial Results, whether due to fraud or error, design and perform audit procedures responsive to those risks, and obtain audit evidence that is sufficient and appropriate to provide a basis for our opinion . The risk of not detecting a material misstatement resulting from fraud is higher than for one resulting from error, as fraud may involve col lusion, forgery, intentional omissions, misrepresentations, or the override of internal controls. • Obtain an understanding of internal financial controls relevant to the audit in order to design audit procedures that are appropriate in the circumstances, but not for the purpose of expressing an opinion on effectiveness of such controls. • Evaluate the appropriateness of accounting policies used and the reasonableness of accounting estimates and related disclosures made by the Management. • Evaluate the appropriateness and reasonableness of disclosures made by the Board of Directors in terms of the requirements specified under Regulation 33 of the Listing Regulations. • Conclude on the appropriateness of the Management’s use of the going concern basis of accounting and, based on the audit evidence obtained, whether a material uncertainty exist s related to events or conditions that may cast significant doubt on the Company’s ability to continue as a going concern. If we conclude that a material uncertainty exists, we are required to draw attention in our auditor’s report to the related disclosures 1n the Statement or, if such disclosures are inadequate, to modify our opinion. Our conclusions are based on the audit evidence obtained up to the date of our auditor’s report. However, future events or conditions may cause the Company to cease to continue as a going concern.
Deloitte Haskins & Sells LLP • Evaluate the overall presentation, structure and content of the Standalone Financial Results, including the disclosures, and whether the Standalone Financial Results represent the underlying transactions and events in a manner that achieves fair presentation. • Obtain sufficient appropriate audit evidence regarding the Standalone Financial Results of the Company to express an opinion on the Standalone Financial Results. Materiality is the magnitude of misstatements in the Standalone Financial Results that, individually or in aggregate, makes it probable that the economic decisions of a reasonably knowledgeable user of the Standalone Financial Results may be influenced. We consider quantitative materiality and qualitative factors in (i) planning the scope of our audit work and in evaluating the results of our work; and (ii) to evaluate the effect of any identified misstatements in the Standalone Financial Results. We communicate with those charged with governance regarding, among other matters, the planned scope and timing of the audit and significant audit findings, including any significant deficiencies in internal controls that we identify during our audit. We also provide those charged with governance with a statement that we have complied with relevant ethical requirements regarding independence, and to communicate with them all relationships and other matters that may reasonably be thought to bear on our independence, and where applicable, related safeguards. For DELOITTE HASKINS & SELLS LLP Chartered Accountants (Firm’s Registration No. 117366W/ W- 100018) Partner (Membership No . 110815) UDIN: Bengaluru, April 19, 2024
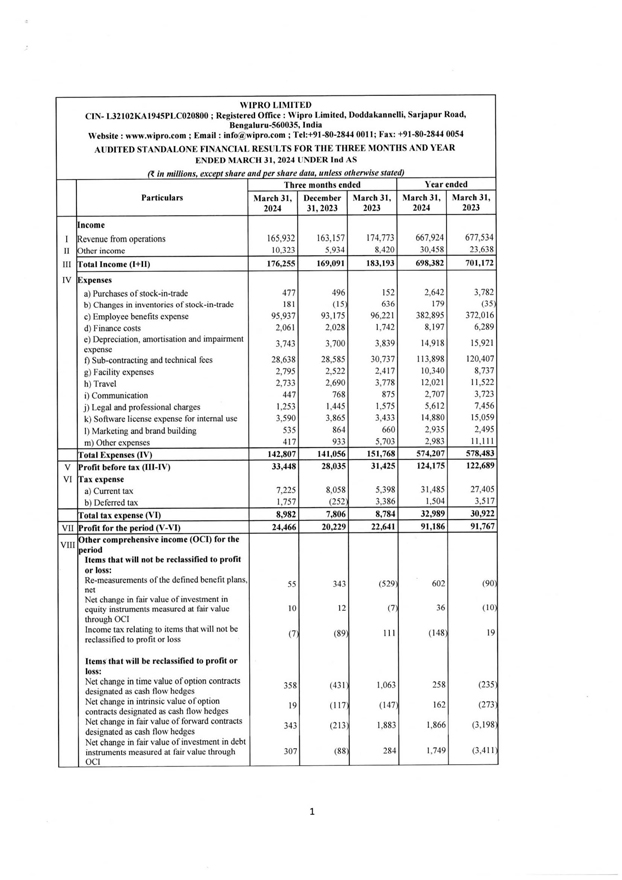
WIPRO LIMITED CIN- L32102KAl945PLC020800; Registered Office: Wipro Limited, Doddakannelli, Sarjapur Road, Bengaluru-560035, India Website: www.wipro.com; Email: info@wipro.com; Tel:+91-80-2844 0011; Fax: +91-80-2844 0054 AUDITED STANDALONE FINANCIAL RES ULTS FOR THE THREE MONTHS AND YEAR ENDED MARCH 31, 2024 UNDER Ind AS ft in millions, exceot share and oer share data, unless otherwise stated) Three months ended Year ended Particulars March 31, December March 31, March 31, March 31, 2024 31,2023 2023 2024 2023 Income I !Revenue from operations 165,932 163,157 174,773 667,924 677,534 II K)ther income 10,323 5,934 8,420 30,458 23,638 JII tfotal Income (1+11) 176,255 169,091 183,193 698,382 701,172 IV Expenses a) Purchases of stock-in-trade 477 496 152 2,642 3,782 b) Changes in inventories ofstock-in-trade 18 1 (15 636 179 (35 c) Employee benefits expense 95,937 93, 175 96,22 1 382,895 372,0 16 d) Finance costs 2,061 2,028 1,742 8, 197 6,289 e) Depreciation, amortisation and impairment 3,743 3,700 3,839 14,918 15,92 1 expense t) Sub-contracting and technical fees 28,638 28,585 30,737 113,898 120,407 g) Facility expenses 2,795 2,522 2,417 10,340 8,737 h) Travel 2,733 2,690 3,778 12,021 11 ,522 i) Communication 447 768 875 2,707 3,723 j) Legal and professional charges 1,253 1,445 1,575 5,612 7,456 k) Software license expense for internal use 3,590 3,865 3,433 14,880 15,059 I) Marketing and brand building 535 864 660 2,935 2,495 m) Other expenses 417 933 5,703 2,983 11 ,111 trotal Expenses (IV) 142,807 141,056 151,768 574,207 578,483 V Profit before tax (III-IV) 33,448 28,035 31 ,425 124,175 122,689 Vl trax expense a) Current tax 7,225 8,058 5,398 31,485 27,405 b) Deferred tax 1,757 (252 3,386 1,504 3,517 Total tax expense (VI) 8,982 7,806 8,784 32,989 30,922 VII Profit for the period (V-VI) 24,466 20,229 22,641 91,186 91,767 !Other comprehensive income (OCI) for the VIII period Items that will not be reclassified to profit or loss: Re-measurements of the defined benefit plans, 55 343 (529, 602 (90 net Net change in fair value of investment in equity instruments measured at fair value 10 12 (7 36 ( JO through OCI Income tax relating to items that will not be (7 (89 111 (148; 19 reclassified to profit or loss Items that will be reclassified to profit or loss: Net change in time value ofoption contracts 358 (43 1 1,063 258 (235 designated as cash flow hedges Net change in intrinsic value ofoption 19 (117 ( 147 162 (273 contracts designated as cash flow hedges Net change in fair value of forward contracts 343 (2 13 1,883 1,866 (3,198 designated as cash flow hedges Net change in fair value of investment in debt instruments measured at fair value through 307 (88 284 1,749 (3,4 11 OCI
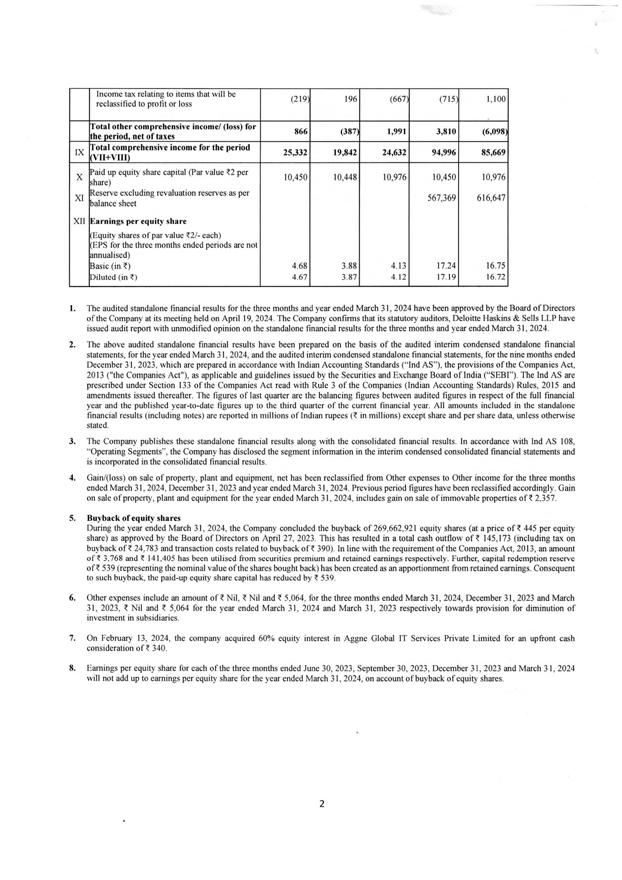
Income tax relating to items that will be (2 19 196 (667 (715 1, 100 reclassified to profit or loss Total other comprehensive income/ (loss) for 866 (387 1,991 3,810 (6,098 he period, net of taxes Tota l comprehensive income for the period IX 25,332 19,842 24,632 94,996 85,669 Vli+VIII) !Paid up equity share capital (Par value n per X 10,450 10,448 10,976 10,450 10,976 ~hare) Reserve excluding revaluation reserves as per XI 567,369 616,647 !balance sheet XII Earnings per equity share Equity shares ofpar value f.2/- each) EPS for the three months ended periods are not !annualised) !Basic (in~) 4.68 3.88 4. 13 17.24 16.75 piluted (in ~) 4.67 3.87 4. 12 17.19 t6.72 The audited standalone financial results for the three months and year ended March 31, 2024 have been approved by the Board of Directors ofthe Company at its meeting held on April 19, 2024. The Company confinns that its statutory auditors, Deloitte Haskins & Sells LLP have issued audit report with unmodified opinion on the standalone financial results for the three months and year ended March 31, 2024. The above audited standalone financial results have been prepared on the basis of the audited interim condensed standalone financial statements, for the year ended March 31, 2024, and the audited interim condensed standalone financial statements, for the nine months ended December 31, 2023, which are prepared in accordance with Indian Accounting Standards (“Ind AS”), the provisions ofthe Companies Act, 2013 (“the Companies Act”), as applicable and guidelines issued by the Securities and Exchange Board of India (“SEBI”). The Ind AS are prescribed under Section 133 of the Companies Act read with Rule 3 of the Companies (Indian Accounting Standards) Rules, 2015 and amendments issued thereafter. The figures of last quarter are the balancing figures between audited figures in respect of the full financial year and the published year-to-date figures up to the third quarter of the current financial year. All amounts included in the standalone financial results (including notes) are reported in millions of Indian rupees (t in millions) except share and per share data, unless otherwise stated. The Company publishes these standalone financial results along with the consolidated financial results. In accordance with Ind AS I08, “Operating Segments”, the Company has disclosed the segment infonnation in the interim condensed consolidated financial statements and is incorporated in the consolidated financial results. Gain/(loss) on sale of property, plant and equipment, net has been reclassified from Other expenses to Other income for the three months ended March 31 , 2024, December 31, 2023 and year ended March 31, 2024. Previous period figures have been reclassified accordingly. Gain on sale ofproperty, plant and equipment for the year ended March 3 1, 2024, includes gain on sale ofimmovable properties on 2,357. Buyback ofequity shares During the year ended March 3 1, 2024, the Company concluded the buyback of269,662,92I equity shares (at a price on 445 per equity share) as approved by the Board of Directors on April 27, 2023. This has resulted in a total cash outflow on 145,173 (including tax on buyback on 24,783 and transaction costs related to buyback on 390). In line with the requirement ofthe Companies Act, 2013, an amount of~ 3,768 and~ 141 ,405 has been utilised from securities premium and retained earnings respectively. Further, capital redemption reserve on- 539 (representing the nominal value ofthe shares bought back) has been created as an apportionment from retained earnings. Consequent to such buyback, the paid-up equity share capital has reduced by t 539. Other expenses include an amount on Nil, t Nil and t 5,064, for the three months ended March 31, 2024, December 31 , 2023 and March 31, 2023, t Nil and t 5,064 for the year ended March 3 1, 2024 and March 31, 2023 respectively towards provision for diminution of investment in subsidiaries. On February 13, 2024, the company acquired 60% equity interest in Aggne Global IT Services Private Limited for an upfront cash consideration on 340. Earnings per equity share for each ofthe three months ended June 30, 2023, September 30, 2023, December 31 , 2023 and March 3 1, 2024 will not add up to earnings per equity share for the year ended March 31, 2024, on account ofbuyback of equity shares.
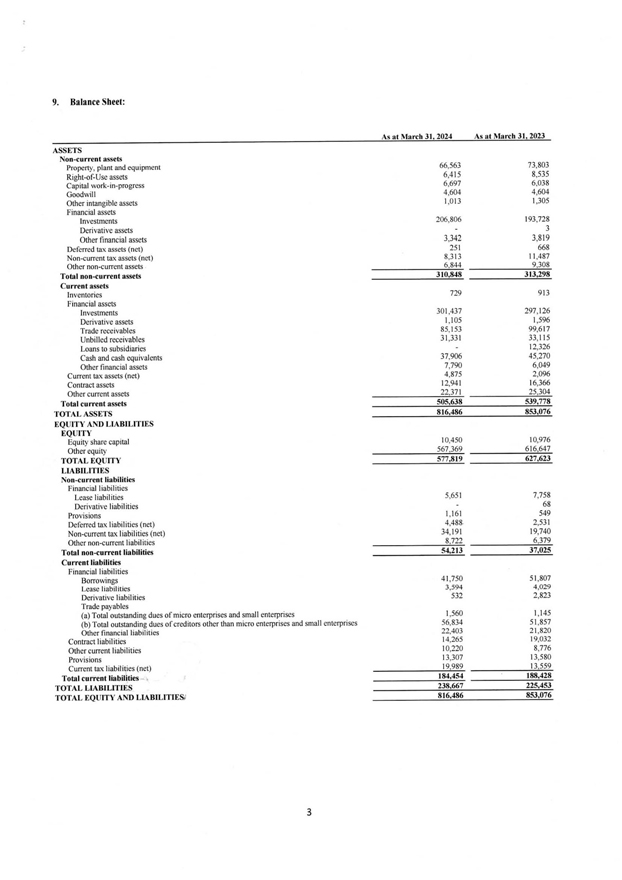
9. Balance Sheet: As at March 31, 2024 As at March 31,2023 ASSETS Non-current assets Property, plant and equipment 66,563 73,803 Right-of-Use assets 6,415 8,535 Capital work-in-progress 6,697 6,038 Goodwill 4,604 4,604 Other intangible assets 1,013 1,305 Financial assets lnvesnnents 206,806 193,728 Derivative assets 3 Other financial assets 3,342 3,819 Deferred tax assets (net) 251 668 Non-current tax assets (net) 8,313 11,487 Other non-current assets 6,844 9,308 Total non-current assets 3 10,848 313,298 C urrent assets Inventories 729 9 13 Financial assets Investments 301 ,437 297, 126 Derivative assets 1,105 1,596 Trade receivables 85, 153 99,6 17 Unbilled receivables 31,331 33,115 Loans to subsidiaries 12,326 Cash and cash equivalents 37,906 45,270 Other financial assets 7,790 6,049 Current tax assets (net) 4,875 2,096 Contract assets 12,941 16,366 Other current assets 22 371 25 304 Total current assets 505,638 539 778 TOTAL ASSETS 816,486 853,076 EQUITY AND LIABILITIES EQUITY Equity share capital 10,450 10,976 Other equity 567.369 616 647 TOTAL EQUITY 577,819 627,623 LIABILITIES Non-current liabilities Financial liabilities Lease liabilities 5,651 7,758 Derivative liabilities 68 Provisions 1,161 549 Deferred tax liabilities (net) 4,488 2,531 Non-current tax liabilities (net) 34, 191 19,740 Other non-current liabilities 8 722 6,379 Total non-current liabilities 54,213 37,025 Current liabilities Financial liabilities Borrowings 4 1,750 51,807 Lease liabilities 3,594 4,029 Derivative liabilities 532 2,823 Trade payables (a) Total outstanding dues ofmicro enterprises and small enterprises 1,560 1,145 (b) Total outstanding dues ofcreditors other than micro enterprises and small enterprises 56,834 51 ,857 Other financial liabilities 22,403 21 ,820 Contract liabilities 14,265 19,032 Other current liabilities 10,220 8,776 Provisions 13,307 13,580 Current tax liabilities (net) 19989 13 559 Total current liabilities 184,454 188,428 TOTAL LIABILITIES 238,667 225,453 TOTAL EQUITY AND LIABILITIES. 816,486 853,076
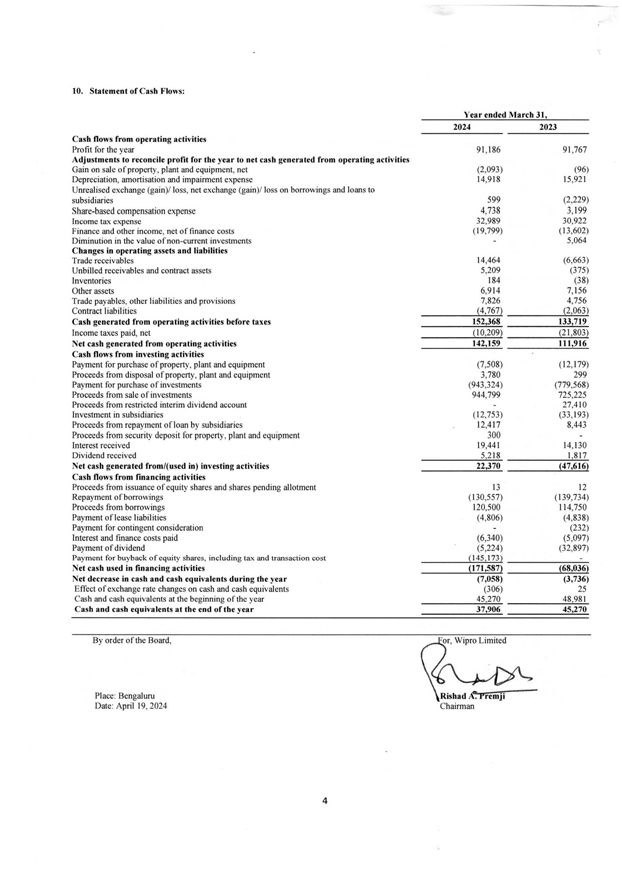
10. Statement ofCash Flows: Year ended March 31, 2024 2023 Cash flows from operating activities Profit for the year 91, 186 91,767 Adjustments to reconcile profit for the year to net cash generated from operating activities Gain on sale ofproperty, plant and equipment, net (2,093) (96) Depreciation, amortisation and impairment expense 14,918 15,921 Unrealiscd exchange (gain)/ loss, net exchange (gain)/ loss on borrowings and loans to subsidiaries 599 (2,229) Share-based compensation expense 4,738 3,199 Income tax expense 32,989 30,922 Finance and other income, net of finance costs (19,799) (13,602) Diminution in the value of non-current investments 5,064 Changes in operating assets and liabilities Trade receivables 14,464 (6,663) Unbilled receivables and contract assets 5,209 (375) Inventories 184 (38) Other assets 6,9 14 7,156 Trade payables, other liabilities and provisions 7,826 4,756 Contract liabilities (4,767) {2,063) Cash generated from operating activities before taxes 152,368 133719 Income taxes paid, net (10,209) (21,803) Net cash generated from operating activities 142,159 111,916 Cash flows from investing activities Payment for purchase of property, plant and equipment (7,508) (12, 179) Proceeds from disposal of property, plant and equipment 3,780 299 Payment for purchase of investments (943,324) (779,568) Proceeds from sale of investments 944,799 725,225 Proceeds from restricted interim dividend account 27,4 10 Investment in subsidiaries (12,753) (33, 193) Proceeds from repayment of loan by subsidiaries 12,4 17 8,443 Proceeds from security deposit for property, plant and equipment 300 Interest received 19,441 14,130 Dividend received 5 2 18 I 817 Net cash generated from/(used in) investing activities 22,370 {47,616} Cash flows from financing activities Proceeds from issuance of equity shares and shares pending allotment 13 12 Repayment of borrowings ( 130,557) ( 139,734) Proceeds from borrowings 120,500 114,750 Payment of lease liabilities (4,806) (4,838) Payment for contingent consideration (232) Interest and finance costs paid (6,340) (5,097) Payment of dividend (5,224) (32,897) Payment for buyback of equity shares, including tax and transaction cost ( 145, t73) Net cash used in financing activities (171,587} {68,036} Net decrease in cash and cash equivalents during the year (7,058) (3,736) Effect of exchange rate changes on cash and cash equivalents (306) 25 Cash and cash equivalents at the beginning of the year 45 270 48 98 1 Cash and cash equivalents at the end of the year 37 906 45,270 By order of the Board,Place: BengaluruDate: April 19, 2024 4.
Chartered Accountants Deloitte Prestige Trade Tower, Level 19 46, Palace Road, High Grounds Haskins & Sells LLP Bengaluru-560 001 Karnataka, India Tel: +91 80 6188 6000 Fax: +91 80 6188 6011 INDEPENDENT AUDITOR’S REPORT ON THE AUDIT OF CONSOLIDATED FINANCIAL RESULTS TO THE BOARD OF DIRECTORS OF WIPRO LIMITED Opinion We have audited the accompanying Statement of Consolidated Financial Results of WIPRO LIMITED (“the Company”) and its subsidiaries (the Company and its subsidiaries together referred to as “the Group”) for the three months and year ended March 31, 2024 (“the Statement”/” Consolidated Financial Results”) being submitted by the Company pursuant to the requirement of Regulation 33 of the SEBI (Listing Obligations and Disclosure Requirements) Regulations, 2015, as amended (“the Listing Regulations”). In our opinion and to th e best of our information and according to the explanations given to us, the statement: a. includes the results of the entities as listed in note 4 to the Statement; b. is presented in accordance with the requirements of Regulation 33 of the SEBI (Listing Obligations and Disclosure Requiremen ts) Regulations, 2015, as amended; and c. gives a true and fair view in conformity with the recognition and measurement principles laid down in the Indian Accounting Standard 34 “ Interim Financial Reporting” (“Ind AS 34”) prescribed under section 133 of the Companies Act 2013 (“the Act”) read with relevant rules issued thereunder and other accounting principles generally accepted in India of the consolidated net profit and consolidated total comprehensive income and other financial information of the Group for the th ree months and year ended March 31, 2024. Basis for Opinion We conducted our audit of this Consolidated Financial Results in accordance with the Standards on Auditing (“SAs”) specified under Section 143( 10) of the Act. Our responsibilities under those Standards are further described in the Auditor’s Responsibilities for the Audit of the Consolidated Financial Results sect1on below. We are independent of the Group in accordance with the Code of Ethics issued by the Institute of Chartered Accountants of I ndia (“ICAI”) together with the ethical requirements that are relevant to our audit of the Consolidated Financial Results under the provisions of the Act and the Rules thereunder and we have fulfilled our other ethical responsibilities in accordance with these requirements and the ICAI’s Code of Ethics. We believe that the audit evidence obtained by us is sufficient and appropriate to provide a basis fo r our audit opinion. Management’s Responsibilities for the Consolidated Financial Results This Statement, wh1ch is the responsibility of the Company’s Management and approved by the Board of Directors, has been compiled from the related audited interim condensed consolidated financial statements. The Company’s Board of Directors are responsible for the preparation and presentation of the Consolidated Financial Results that give a true and fair view of the consolidated net profit and consolidated other comprehensive income and other financial information of the Group in accordance with the recognition and measurement principles laid down in the Ind AS 34, prescribed under Section 133 of the Act, read with relevant rules issued Regd. Office: One International Center, Tower 3, 27th-32nd Floor, Senapati Bapat Marg. Elphinstone Road (West), Mumbai-400 013, Maharashtra, India. (LLP Identification No. AAB-8737)
Deloitte Haskins & Sells LLP thereunder and other accounting principles generally accepted in India and in compliance with Regulation 33 of the Listing Regulations. The respective Board of Directors of the companies included in the Group are responsible for maintenance of adequate accounting records in accordance with the provisions of the Act for safeguarding the assets of the Group and for preventing and detecting frauds and other irregularities; selection and application of appropriate accounting policies; making judgments and estimates that are reasonable and prudent; and design, implementation and maintenance of adequate internal financial controls, that were operating effectively for ensuring the accuracy and completeness of the accounting records, relevant to the preparation and presentation of the respective financial results that give a true and fair view and are free from material misstatement, whether due to fraud or error, which have been used for the purpose of preparation of Consolidated Financia l Results by the Directors of the Company, as aforesaid. In preparing the Consolidated Financial Results, the respective Board of Directors of the companies included in the Group are responsible for assessing the ability of the respective entities to continue as a going concern, disclosing, as applicable, matters related to going concern and using the going concern basis of accounting unless the respective Board of Directors either intends to liquidate their respective entities or to cease operations, or has no realistic alternative but to do so. The respective Board of Directors of the companies included in the Group are responsible for overseeing the financial reporting process of the Group. Auditor’s Responsibilities for the Audit of the Consolidated Financial Results Our objectives are to obtain reasonable assurance about whether the Consolidated Financial Results as a whole are free from material misstatement, whether due to fraud or error, and to issue an auditor’s report that includes our opinion. Reasonable assurance is a high level of assurance but is not a guarantee that an audit conducted in accordance with SAs will always detect a material misstatement when it exists. Misstatements can arise from fraud or error and are considered material if, individually or in the aggregate, they could reasonably be expected to influence the economic decisions of users taken on the basis of these Consolidated Financial Results. As part of an audit in accordance with SAs, we exercise professional judgment and maintain professional skepticism throughout the audit. We also: • Identify and assess the risks of material misstatement of the Consolidated Financial Results, whether due to fraud or error, design and perform audit procedures responsive to those risks, and obtain audit evidence that is sufficient and appropriate to provide a basis for our opinion. The risk of not detecting a material misstatement resulting from fraud is higher than for one resulting from error, as fraud may involve collusion, forgery, intentional omissions, misrepresentations, or the override of internal controls. • Obtain an understanding of internal financial controls relevant to the audit in order to design audit procedures that are appropriate in the circumstances, but not for the purpose of expressing an opinion on effectiveness of such controls. • Evaluate the appropriateness of accounting policies used and the reasonableness of accounting estimates and related disclosures made by the management.
Deloitte Haskins & Sells LLP • Evaluate the appropriateness and reasonableness of disclosures made by the Board of Directors in terms of the requirements specified under Regulation 33 of the Listing Regulations. • Conclude on the appropriateness of the management’s use of the going concern basis of accounting and, based on the audit evidence obtained, whether a material uncertainty exists related to events or conditions that may cast significant doubt on the ability of the Group to continue as a going concern. If we conclude that a material uncertainty exists, we are required to draw attention in our auditor’s report to the related disclosures in the Consolidated Financial Results or, if such disclosures are inadequate, to modify our opinion. Our conclusions are based on the audit evidence obtained up to the date of our auditor’s report. However, future events or conditions may cause the Group to cease to continue as a going concern. • Evaluate the overall presentation, structure and content of the Consolidated Financial Results, including the disclosures, and whether the Consolidated Financial Results represent the underlying transactions and events in a manner that achieves fair presentation. • Obtain sufficient appropriate audit evidence regarding the financial results of the entities within the Group to express an opinion on the Consolidated Financial Results. We are responsible for the direction, supervision and performance of the audit of financial information of entities included in the Consolidated Financial Results. Materiality is the magnitude of misstatements in the Consolidated Financial Results that, individually or in aggregate, makes it probable that the economic decisions of a reasonably knowledgeable user of the Consolidated Financial Results may be influenced. We consider quantitative materiality and qualitative factors in (i) planning the scope of our audit work and in evaluating the results of our work; and (ii) to evaluate the effect of any identified misstatements in the Consolidated Financial Results. We communicate with those charged with governance of the Company regarding, among other matters, the planned scope and timing of the audit and significant audit findings, including any significant deficiencies in internal controls that we identify during our audit. We also provide those charged with governance with a statement that we have complied with relevant ethical requirements regarding independence, and to communicate with them all relationships and other matters that may reasonably be thought to bear on our independence, and where applicable, related safeguards. For DELOITTE HASKINS & SELLS LLP Chartered Accountants ( Firm’s Registration No. 117366W/ W-100018) Afl.and Subramanian Partner (Membership No.l10815) UDIN: Bengaluru, April 19, 2024
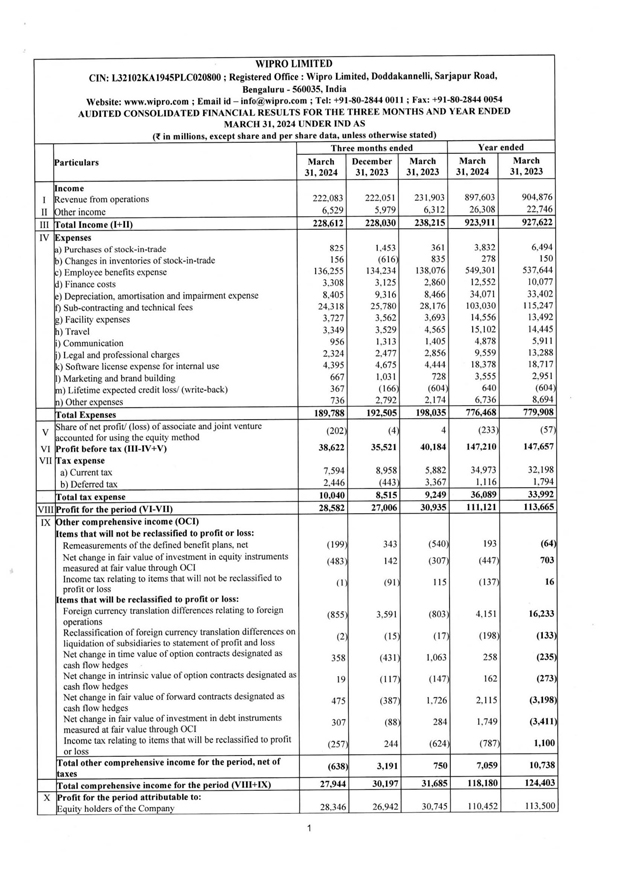
WIPRO LIMITED CIN: L32102KA1945PLC020800 ; Registered Office : Wipro Limited, Doddakannelli, Sarjapur Road, Bengaluru—560035, India Website: www.wipro.com ; Email id-info@wipro.com ; Tel: +91-80-2844 0011; Fax: +91-80-2844 0054 AUDITED CONSOLIDATED FINANCIAL RESULTS FOR THE THREE MONTHS AND YEAR ENDED MARCH 31, 2024 UNDER IND AS (? in millions, except share and per share data, unless otherwise stated) Particulars Three months ended Year ended March 31,2024 December 31, 2023 March 31,2023 March 31, 2024 March 31, 2023 Income I Revenue from operations 222,083 222,051 231,903 897,603 904,876 II Other income 6.529 5,979 6,312 26,308 22,746 ill Total Income (I+II) 228,612 228,030 238,215 923,911 927,622 IV Expenses a) Purchases of stock-in-trade 825 1,453 361 3,832 6,494 ?) Changes in inventories of stock-in-trade 156 (616) 835 278 150 c) Employee benefits expense 136.255 134,234 138,076 549,301 537,644 d) Finance costs 3,308 3,125 2,860 12,552 10,077 e) Depreciation, amortisation and impairment expense 8,405 9,316 8,466 34,071 33,402 f) Sub-contracting and technical fees 24,318 25,780 28,176 103,030 115,247 g) Facility expenses 3,727 3,562 3,693 14,556 13,492 h) Travel 3,349 3,529 4.565 15,102 14,445 i) Communication 956 1,313 1,405 4,878 5,911 i) Legal and professional charges 2.324 2,477 2.856 9,559 13.288 K) Software license expense for internal use 4,395 4,675 4,444 18,378 18,717 I) Marketing and brand building 667 1,031 728 3,555 2,951 m) Lifetime expected credit loss/ (write-back) 367 (166) (604) 640 (604) n) Other expenses 736 2.792 2,174 6,736 8,694 Total Expenses 189,788 192,505 198,035 776,468 779,908 V Share of net profit/ (loss) of associate and joint venture accounted for using the equity method (202) (4) 4 (233) (57) VI Profit before tax (III-IV+V) 38,622 35,521 40,184 147,210 147,657 vII Tax expense a) Current tax 7,594 8,958 5,882 34,973 32,198 b) Deferred tax 2,446 (443) 3,367 1,116 1,794 Total tax expense 10,040 8,515 9,249 36,089 33,992 VIII Profit for the period (Vi-VII) 28,582 27,006 30,935 111,121 113,665 IX Other comprehensive income (OCI) Items that will not be reclassified to profit or loss: Remeasurements of the defined benefit plans, net (199) 343 (540) 193 (64) Net change in fair value of investment in equity instruments measured at fair value through OCI (483) 142 (307) (447) 703 Income tax relating to items that will not be reclassified to profit or loss (1) (91) 115 (137) 16 Items that will be reclassified to profit or loss: Foreign currency translation differences relating to foreign operations Reclassification of foreign currency translation differences on liquidation of subsidiaries to statement of profit and loss (855) (2) 3,591 (15) (803) (17) 4,151 (198) 16,233 (133) Net change in time value of option contracts designated as 358 (431 1,063 258 (235) cash flow hedges Net change in intrinsic value of option contracts designated as 19 162 (117) (147 (273) cash flow hedges Net change in fair value of forward contracts designated as cash flow hedges 2,115 475 (387) 1,726 (3,198) Net change in fair value of investment in debt instruments measured at fair value through OCI 307 (88 284 1,749 (3,411) Income tax relating to items that will be reclassified to profit or loss (257) 244 (624 (787) 1,100 Total other comprehensive income for the period, net of taxes (638 3,191 750 7,059 10,738 Total comprehensive income for the period (VIII+IX) 27,944 30,197 31,685 118,180 124,403 X Profit for the period attributable to: Equity holders of the Company 28.346 26,942 30,745 110,452 113,500 1
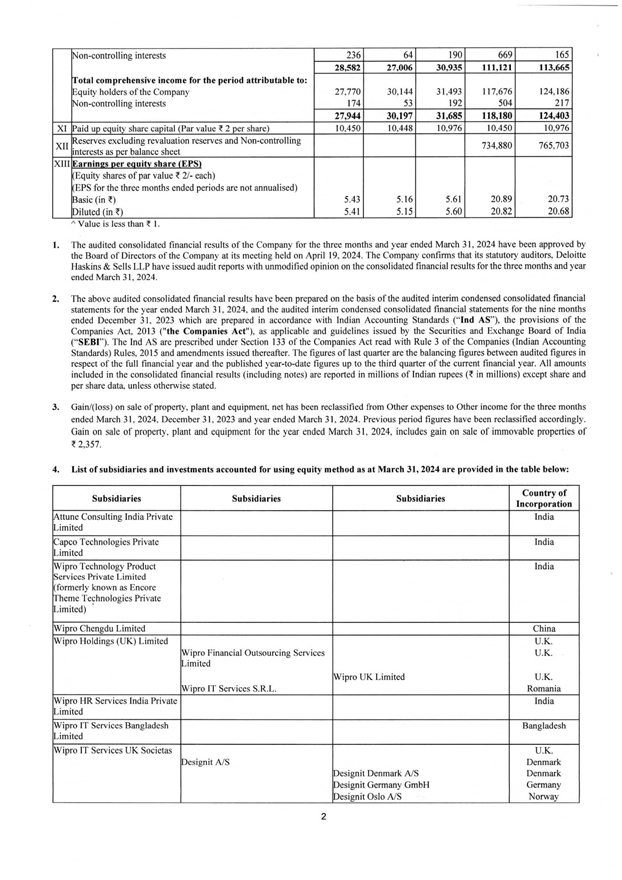
Non-controlling interests Total comprehensive income for the period attributable to: Equity holders of the Company Non-controlling interests 236 64 190 669 165 28,582 27,006 30,935 111,121 113,665 27,770 174 30,144 53 31,493 192 117,676 504 124,186 217 27,944 30,197 31,685 118,180 124,403 XI Paid up equity share capital (Par value ? 2 per share) 10,450 10,448 10,976 10,450 10,976 XII Reserves excluding revaluation reserves and Non-controlling interests as per balance sheet 734,880 765.703 XIII Earnings per equity share (EPS) (Equity shares of par value ? 2/- each) (EPS for the three months ended periods are not annualised) Basic (in ?) Diluted (in ?) 5.43 5.41 5.16 5.15 5.61 5.60 20.89 20.82 20.73 20.68 Value is less than ? 1. The audited consolidated financial results of the Company for the three months and year ended March 31, 2024 have been approved by the Board of Directors of the Company at its meeting held on April 19, 2024. The Company confirms that its statutory auditors, Deloitte Haskins & Sells LLP have issued audit reports with unmodified opinion on the consolidated financial results for the three months and year ended March 31, 2024. The above audited consolidated financial results have been prepared on the basis of the audited interim condensed consolidated financial statements for the year ended March 31, 2024, and the audited interim condensed consolidated financial statements for the nine months ended December 31, 2023 which are prepared in accordance with Indian Accounting Standards (“Ind AS”), the provisions of the Companies Act. 2013 (“the Companies Act”), as applicable and guidelines issued by the Securities and Exchange Board of India (“SEBI”). The Ind AS are prescribed under Section 133 of the Companies Act read with Rule 3 of the Companies (Indian Accounting Standards) Rules. 2015 and amendments issued thereafter. The figures of last quarter are the balancing figures between audited figures in respect of the full financial year and the published year-to-date figures up to the third quarter of the current financial year. All amounts included in the consolidated financial results (including notes) are reported in millions of Indian rupees (? in millions) except share and per share data, unless otherwise stated. Gain/(loss) on sale of property, plant and equipment, net has been reclassified from Other expenses to Other income for the three months ended March 31, 2024, December 31, 2023 and year ended March 31, 2024. Previous period figures have been reclassified accordingly. Gain on sale of property, plant and equipment for the year ended March 31, 2024, includes gain on sale of immovable properties of ? 2,357. List of subsidiaries and investments accounted for using equity method as at March 31, 2024 are provided in the table below: Subsidiaries Subsidiaries Subsidiaries Country of Incorporation Attune Consulting India Private Limited India Capco Technologies Private Limited India Wipro Technology Product Services Private Limited (formerly known as Encore Theme Technologies Private Limited) India Wipro Chengdu Limited China Wipro Holdings (UK) Limited Wipro Financial Outsourcing Services Limited Wipro IT Services S.R.L. Wipro UK Limited U.K. U.K. U.K. Romania Wipro HR Services India Private Limited India Wipro IT Services Bangladesh Limited Bangladesh Wipro IT Services UK Societas Designit A/S Designit Denmark A/S Designit Germany GmbH Designit Oslo A/S U.K. Denmark Denmark Germany Norway
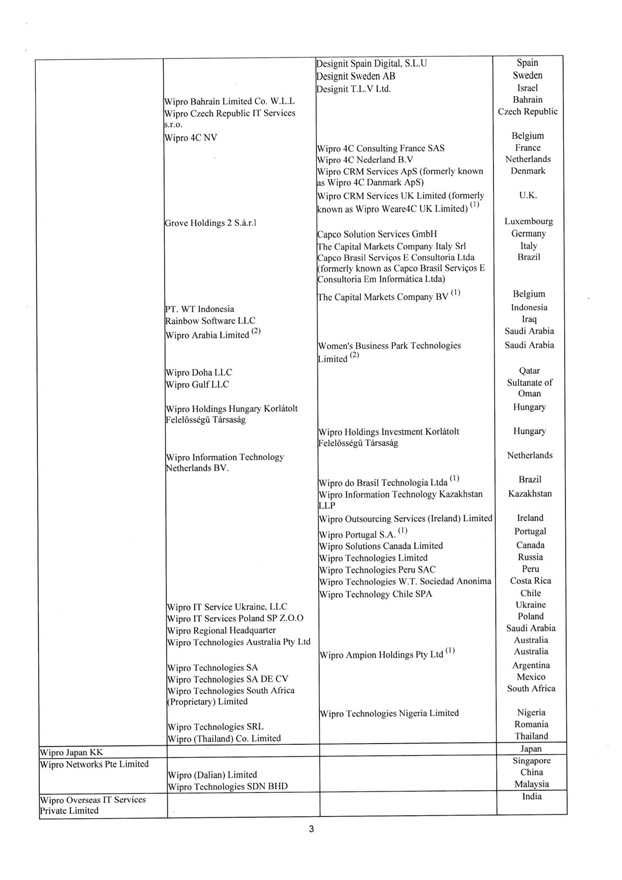
Wipro Bahrain Limited Co. W.L.L Wipro Czech Republic IT Services Designit Spain Digital. S.L.U Designit Sweden AB )esignit T.L.V Ltd. Spain Sweden Israel Bahrain Czech Republic Wipro 4C NV Belgium Wipro 4C Consulting France SAS France Wipro 4C Nederland B.V Netherlands Wipro CRM Services ApS (formerly known as Wipro 4C Danmark ApS) Denmark Wipro CRM Services UK. Limited (formerly known as Wipro Weare4C UK Limited)(1) U.K. Grove Holdings 2 S.a.r.l Luxembourg Capco Solution Services GmbH Germany The Capital Markets Company Italy Sri Italy Capco Brasi] Servicos E Consultoria Ltda formerly known as Capco Brasil Servicos E Consultoria Em Informatica Ltda) Brazil The Capital Markets Company BV(1) Belgium PT. WT Indonesia Indonesia Rainbow Software LLC Iraq (2) Wipro Arabia Limited(2) Saudi Arabia Women’s Business Park Technologies Limited(2) Saudi Arabia Wipro Doha LLC Qatar Wipro Gulf LLC Sultanate of Oman Wipro Holdings Hungary Korlatolt Hungary’ Feleldssegu Tarsasag Wipro Holdings Investment Korlatolt Feleldssegu Tarsasag Hungary Wipro Information Technology Netherlands Netherlands BV. Wipro do Brasil Technologia Ltda (1) Brazil Wipro Information Technology Kazakhstan LLP Kazakhstan Wipro Outsourcing Services (Ireland) Limited Ireland Wipro Portugal S.A. Portugal Wipro Solutions Canada Limited Canada Wipro Technologies Limited Russia Wipro Technologies Peru SAC Peru Wipro Technologies W.T. Sociedad Anonima Costa Rica Wipro Technology Chile SPA Chile Wipro IT Service Ukraine, LLC Ukraine Wipro IT Services Poland SP Z.O.O Poland Wipro Regional Headquarter Saudi Arabia Wipro Technologies Australia Pty Ltd Wipro Ampion Holdings Pty Ltd(1) Australia Australia Wipro Technologies SA Argentina Wipro Technologies SA DE CV Mexico Wipro Technologies South Africa South Africa [Proprietary) Limited Wipro Technologies Nigeria Limited Nigeria Wipro Technologies SRL Romania Wipro (Thailand) Co. Limited Thailand Wipro Japan KK Japan Wipro Networks Pte Limited Singapore Wipro (Dalian) Limited China Wipro Technologies SDN BHD Malaysia Wipro Overseas IT Services Private Limited India
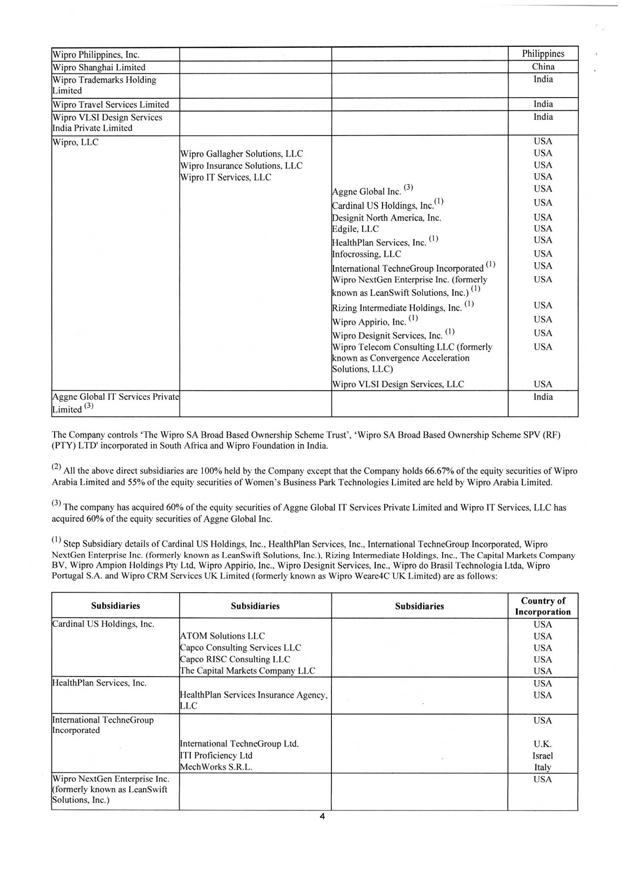
Wipro Philippines, Inc. Philippines Wipro Shanghai Limited China Wipro Trademarks Holding Limited India Wipro Travel Services Limited India Wipro VLSI Design Services India Private Limited India Wipro. LLC USA Wipro Gallagher Solutions, LLC USA Wipro Insurance Solutions. LLC USA Wipro IT Services, LLC USA Aggne Global Inc. USA Cardinal US Holdings, Inc(1) USA Designit North America. Inc. USA Edgile, LLC USA HealthPlan Services. Inc.(1) USA Infocrossing, LLC USA International TechneGroup Incorporated USA Wipro NextGen Enterprise Inc. (formerly USA known as LeanSwift Solutions. Inc.(1) Rizing Intermediate Holdings, Inc.(l) USA Wipro Appirio. Inc. (1) USA Wipro Designit Services. Inc. USA Wipro Telecom Consulting LLC (formerly known as Convergence Acceleration Solutions, LLC) USA Wipro VLSI Design Services, LLC USA Aggne Global IT Services Private Limited (3) India The Company controls ‘The Wipro SA Broad Based Ownership Scheme Trust1. ‘Wipro SA Broad Based Ownership Scheme SPV (RF) (PTY) LTD’ incorporated in South Africa and Wipro Foundation in India. (2) All the above direct subsidiaries are 100% held by the Company except that the Company holds 66.67% of the equity securities of Wipro Arabia Limited and 55% of the equity securities of Women’s Business Park Technologies Limited are held by Wipro Arabia Limited. (3) The company has acquired 60% of the equity securities of Aggne Global IT Services Private Limited and Wipro IT Services, LLC has acquired 60% of the equity securities of Aggne Global Inc. (1) Step Subsidiary details of Cardinal US Holdings, Inc., HealthPlan Services, Inc., International TechneGroup Incorporated. Wipro NextGen Enterprise Inc. (formerly known as LeanSwift Solutions. Inc ). Rizing intermediate Holdings. Inc.. The Capital Markets Company BV, Wipro Ampion Holdings Pty Ltd. Wipro Appirio, Inc.. Wipro Designit Services, Inc., Wipro do Brasil Technologia Ltda, Wipro Portugal S.A. and Wipro CRM Services UK Limited (formerly known as Wipro Weare4C UK Limited) are as follows: Subsidiaries Subsidiaries Subsidiaries Country of Incorporation Cardinal US Holdings, Inc. ATOM Solutions LLC Capco Consulting Services LLC Capco RISC Consulting LLC The Capital Markets Company LLC USA USA USA USA USA HealthPlan Services, Inc. HealthPlan Services Insurance Agency. LLC USA USA International TechneGroup Incorporated International TechneGroup Ltd. ITI Proficiency Ltd MechWorks S.R.L. USA U.K. Israel Italy Wipro NextGen Enterprise Inc. (formerly known as LeanSwift Solutions. Inc.) USA 4
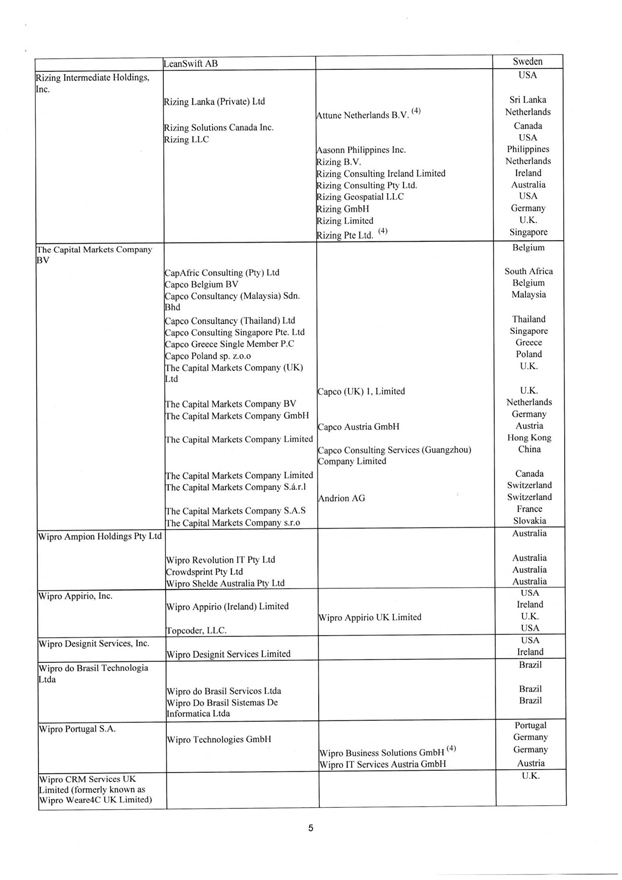
LeanSwift AB Sweden Rizing Intermediate Holdings, Inc. Rizing Lanka (Private) Ltd Rizing Solutions Canada Inc. Rizing LLC Attune Netherlands B.V.(l4) Aasonn Philippines Inc. Rizing B.V. Rizing Consulting Ireland Limited Rizing Consulting Pty Ltd. Rizing Geospatial LLC Rizing GmbH Rizing Limited Rizing Pte Ltd. (4) USA Sri Lanka Netherlands Canada USA Philippines Netherlands Ireland Australia USA Germany U.K. Singapore The Capital Markets Company BV CapAfric Consulting (Pty) Ltd Capco Belgium BV Capco Consultancy (Malaysia) Sdn. Bhd Capco Consultancy (Thailand) Ltd Capco Consulting Singapore Pte. Ltd Capco Greece Single Member P.C Capco Poland sp. z.o.o The Capital Markets Company (UK) Ltd The Capital Markets Company BV The Capital Markets Company GmbH The Capital Markets Company Limited The Capital Markets Company Limited The Capita! Markets Company S.a.r.l The Capital Markets Company S.A.S The Capital Markets Company s.r.o Capco (UK) 1. Limited Capco Austria GmbH Capco Consulting Services (Guangzhou) Company Limited Andrion AG Belgium South Africa Belgium Malaysia Thailand Singapore Greece Poland U.K. U.K. Netherlands Germany Austria Hong Kong China Canada Switzerland Switzerland France Slovakia Wipro Ampion Holdings Pty Ltd Australia Wipro Revolution IT Pty Ltd Crowdsprint Pty Ltd Wipro Shelde Australia Pty Ltd Australia Australia Australia Wipro Appirio, Inc. Wipro Appirio (Ireland) Limited Topcoder, LLC. Wipro Appirio UK Limited USA Ireland U.K. USA Wipro Designit Services, Inc. Wipro Designit Services Limited USA Ireland Wipro do Brasil Technologia Ltda Wipro do Brasil Servicos Ltda Wipro Do Brasil Sistemas De Informatica Ltda Brazil Brazil Brazil Wipro Portugal S.A. Wipro Technologies GmbH (4) Wipro Business Solutions GmbH Wipro IT Services Austria GmbH Portugal Germany Germany Austria Wipro CRM Services UK Limited (formerly known as Wipro Weare4C UK Limited) U.K.
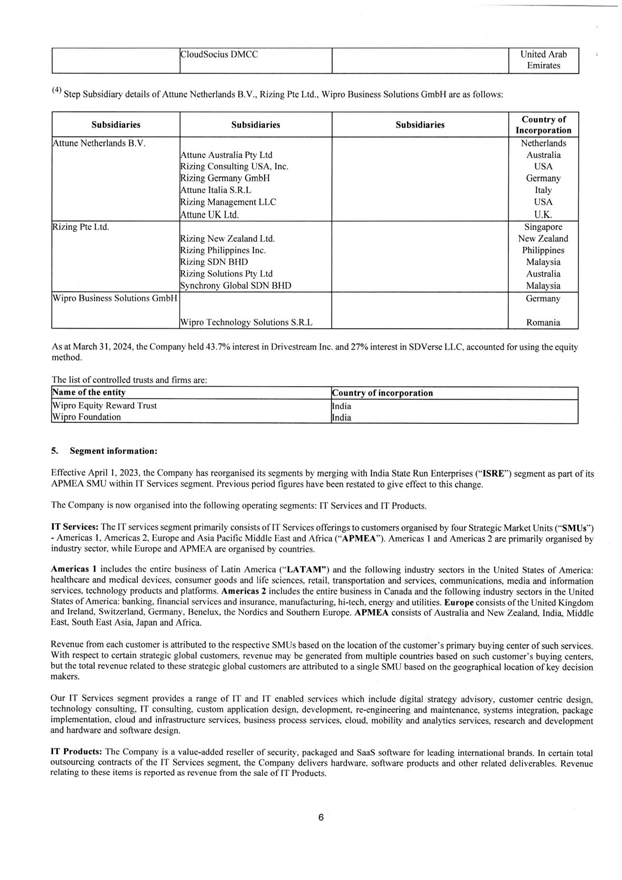
(4) Step Subsidiary details of Attune Netherlands B.V., Rizing Pte Ltd., Wipro Business Solutions GmbH are as follows: Subsidiaries Subsidiaries Subsidiaries Country of Incorporation Attune Netherlands B.V. Attune Australia Pty Ltd Rizing Consulting USA. Inc. Rizing Germany GmbH Attune Italia S.R.L Rizing Management LLC Attune UK Ltd. Netherlands Australia USA Germany Italy USA U.K. Rizing Pte Ltd. Rizing New Zealand Ltd. Rizing Philippines Inc. Rizing SDN BHD Rizing Solutions Pty Ltd Synchrony Global SDN BHD Singapore New Zealand Philippines Malaysia Australia Malaysia Wipro Business Solutions GmbH Germany Wipro Technology Solutions S.R.L Romania As at March 31, 2024, the Company held 43.7% interest in Drivestream Inc. and 27% interest in SDVerse LLC, accounted for using the equity method. The list of controlled trusts and firms are: Name of the entity Country of incorporation Wipro Equity Reward Trust India Wipro Foundation India Segment information: Effective April 1. 2023. the Company has reorganised its segments by merging with India State Run Enterprises (“ISRE”) segment as part of its APMEA SMU within IT Services segment. Previous period figures have been restated to give effect to this change. ‘[‘he Company is now organised into the following operating segments: IT Services and IT Products. IT Services: The IT services segment primarily consists of IT Services offerings to customers organised by four Strategic Market Units (“SMUs”) - Americas I, Americas 2, Europe and Asia Pacific Middle East and Africa (‘‘APMEA’’). Americas 1 and Americas 2 are primarily organised by industry sector, while Europe and APMEA are organised by countries. Americas 1 includes the entire business of Latin America (“LATAM”) and the following industry sectors in the United States of America: healthcare and medical devices, consumer goods and life sciences, retail, transportation and services, communications, media and information services, technology products and platforms. Americas 2 includes the entire business in Canada and the following industry sectors in the United States of America: banking, financial services and insurance, manufacturing, hi-tech, energy and utilities. Europe consists of the United Kingdom and Ireland, Switzerland, Germany. Benelux, the Nordics and Southern Europe. APMEA consists of Australia and New Zealand. India. Middle East, South East Asia. Japan and Africa. Revenue from each customer is attributed to the respective SMUs based on the location of the customer’s primary buying center of such services. With respect to certain strategic global customers, revenue may be generated from multiple countries based on such customer’s buying centers, but the total revenue related to these strategic global customers are attributed to a single SMU based on the geographical location of key decision makers. Our IT Services segment provides a range of IT and IT enabled services which include digital strategy advisory, customer centric design, technology consulting. IT consulting, custom application design, development, re-engineering and maintenance, systems integration, package implementation, cloud and infrastructure services, business process services, cloud, mobility and analytics services, research and development and hardware and software design. IT Products: The Company is a value-added reseller of security, packaged and SaaS software for leading international brands. In certain total outsourcing contracts of the IT Services segment, the Company delivers hardware, software products and other related deliverables. Revenue relating to these items is reported as revenue from the sale of IT Products.
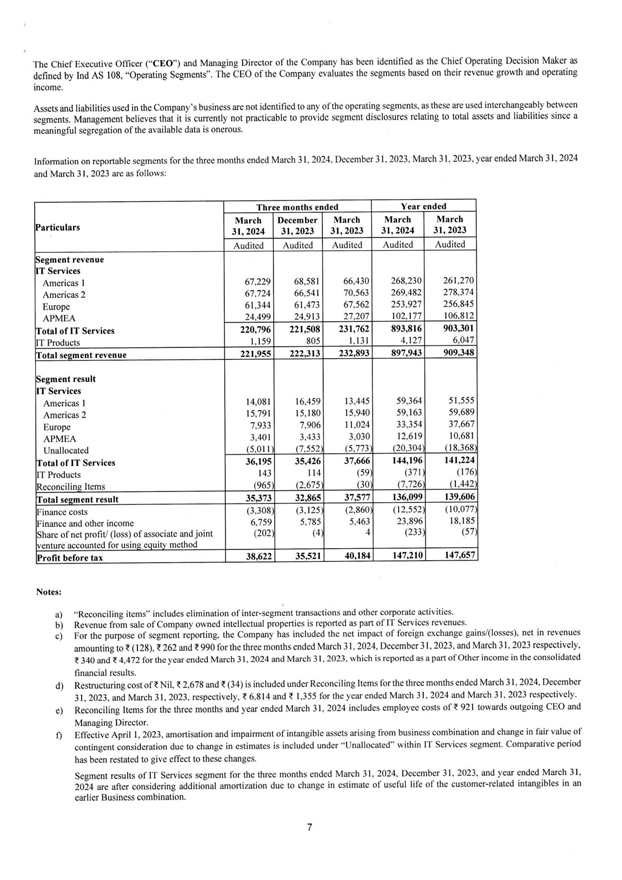
The Chief Executive Officer (“CEO”) and Managing Director of the Company has been identified as the Chief Operating Decision Maker as defined by Ind AS 108, “Operating Segments”. The CEO of the Company evaluates the segments based on their revenue growth and operating income. Assets and liabilities used in the Company’s business are not identified to any of the operating segments, as these are used interchangeably between segments. Management believes that it is currently not practicable to provide segment disclosures relating to total assets and liabilities since a meaningful segregation of the available data is onerous. Information on reportable segments for the three months ended March 31, 2024, December 31, 2023, March 31, 2023, year ended March 31, 2024 and March 31, 2023 are as follows: Particulars Three months ended Year ended March 31, 2024 December 31, 2023 March 31, 2023 March 31, 2024 March 31, 2023 Audited Audited Audited Audited Audited Segment revenue IT Services Americas 1 Americas 2 Europe APMEA Total of IT Services IT Products 67,229 67.724 61,344 24,499 68.581 66,541 61,473 24,913 66,430 70,563 67,562 27.207 268,230 269,482 253,927 102,177 261,270 278.374 256.845 106,812 220,796 1,159 221,508 805 231,762 1,131 893,816 4.127 903,301 6.047 Total segment revenue 221,955 222,313 232,893 897,943 909,348 Segment result IT Services Americas 1 Americas 2 Europe APMEA Unallocated Total of IT Services IT Products Reconciling Items 14,081 15,791 7,933 3,401 (5,011) 16,459 15,180 7.906 3,433 (7,552) 13,445 15,940 11,024 3,030 (5,773) 59,364 59,163 33.354 12.619 (20,304) 51.555 59,689 37.667 10,681 (18,368) 36,195 143 (965) 35,426 114 (2,675) 37,666 (59) (30) 144,196 (371) (7.726) 141,224 (176) (1,442) Total segment result 35,373 32,865 37,577 136,099 139,606 Finance costs Finance and other income Share of net profit/ (loss) of associate and joint venture accounted for using equity method (3,308) 6,759 (202) (3.125) 5,785 (4) (2,860) 5,463 4 (12,552) 23,896 (233 (10,077) 18.185 (57) Profit before tax 38,622 35,521 40,184 147,210 147,657 Notes: “Reconciling items” includes elimination of inter-segment transactions and other corporate activities. Revenue from sale of Company owned intellectual properties is reported as part of IT Services revenues. For the purpose of segment reporting, the Company has included the net impact of foreign exchange gains/( losses), net in revenues amounting to ? (128), ? 262 and ? 990 for the three months ended March 31, 2024, December 31, 2023. and March 31, 2023 respectively, ? 340 and ? 4,472 for the year ended March 31. 2024 and March 31. 2023, which is reported as a part of Other income in the consolidated financial results. Restructuring cost of ? Nil. ? 2.678 and ? (34) is included under Reconciling Items for the three months ended March 31, 2024, December 31, 2023, and March 31, 2023, respectively, ? 6,814 and ? 1.355 for the year ended March 31. 2024 and March 31. 2023 respectively. Reconciling Items for the three months and year ended March 31, 2024 includes employee costs of? 921 towards outgoing CEO and Managing Director, Effective April 1, 2023. amortisation and impairment of intangible assets arising from business combination and change in fair value of contingent consideration due to change in estimates is included under “Unallocated within IT Services segment. Comparative period has been restated to give effect to these changes. Segment results of IT Services segment for the three months ended March 31. 2024. December 31, 2023. and year ended March 31, 2024 are after considering additional amortization due to change in estimate of useful life of the customer-related intangibles in an earlier Business combination.
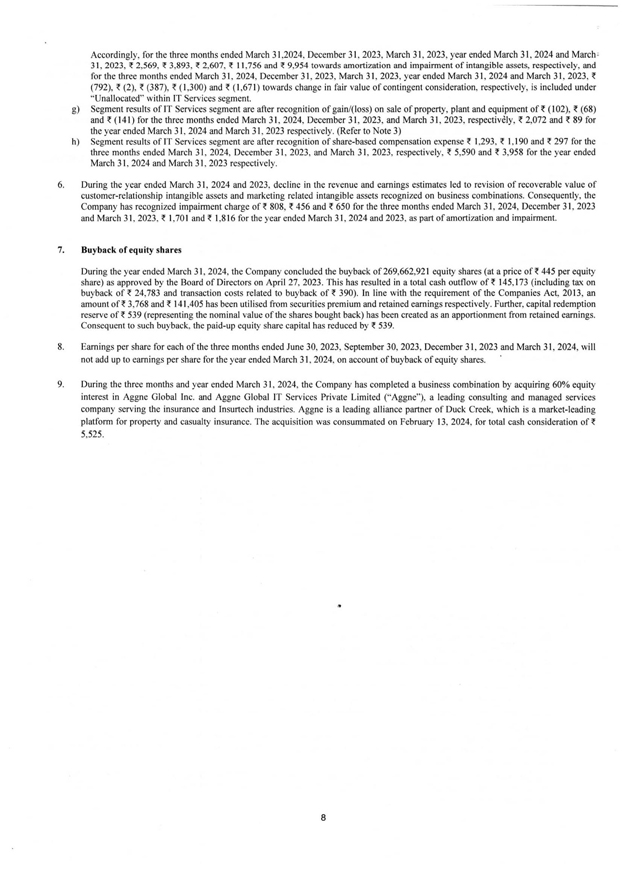
Accordingly, for the three months ended March 31, 2024. December 31, 2023, March 31, 2023, year ended March 31, 2024 and March 31, 2023, ? 2,569, ? 3,893, ? 2,607, ? 11,756 and ? 9,954 towards amortization and impairment of intangible assets, respectively, and for the three months ended March 31, 2024, December 31, 2023, March 31, 2023, year ended March 31, 2024 and March 31, 2023, ? (792), ? (2), ? (387). ? (1,300) and ? (1,671) towards change in fair value of contingent consideration, respectively, is included under “Unallocated” within IT Services segment. Segment results of IT Services segment are after recognition of gain/(loss) on sale of property, plant and equipment of? (102), ? (68) and ? (141) for the three months ended March 31, 2024, December 31, 2023, and March 31, 2023. respectively, ? 2,072 and ? 89 for the year ended March 31, 2024 and March 31, 2023 respectively. (Refer to Note 3) Segment results of IT Services segment are after recognition of share-based compensation expense ? 1.293, ? 1,190 and ? 297 for the three months ended March 31. 2024. December 31, 2023, and March 31, 2023, respectively, ? 5,590 and ? 3.958 for the year ended March 31, 2024 and March 31. 2023 respectively. During the year ended March 31, 2024 and 2023, decline in the revenue and earnings estimates led to revision of recoverable value of customer-relationship intangible assets and marketing related intangible assets recognized on business combinations. Consequently, the Company has recognized impairment charge of ? 808, ? 456 and ? 650 for the three months ended March 31, 2024, December 31, 2023 and March 31. 2023. ? 1,701 and ? 1,816 for the year ended March 31, 2024 and 2023, as part of amortization and impairment. Buyback of equity shares During the year ended March 31, 2024, the Company concluded the buyback of 269,662,921 equity shares (at a price of? 445 per equity share) as approved by the Board of Directors on April 27, 2023. This has resulted in a total cash outflow of? 145,173 (including tax on buyback of? 24.783 and transaction costs related to buyback of ? 390). In line with the requirement of the Companies Act, 2013, an amount of ? 3.768 and ? 141,405 has been utilised from securities premium and retained eamings respectively. Further, capital redemption reserve of? 539 (representing the nominal value of the shares bought back) has been created as an apportionment from retained earnings. Consequent to such buyback, the paid-up equity share capital has reduced by ? 539. Eamings per share for each of the three months ended June 30, 2023. September 30, 2023. December 31. 2023 and March 31. 2024. will not add up to eamings per share for the year ended March 31, 2024. on account of buyback of equity shares. During the three months and year ended March 31, 2024, the Company has completed a business combination by acquiring 60% equity interest in Aggne Global Inc. and Aggne Global IT Services Private Limited (“Aggne’’). a leading consulting and managed services company serving the insurance and Insurtech industries. Aggne is a leading alliance partner of Duck Creek, which is a market-leading platform for property and casualty insurance. The acquisition was consummated on February 13, 2024, for total cash consideration of ? 5.525.
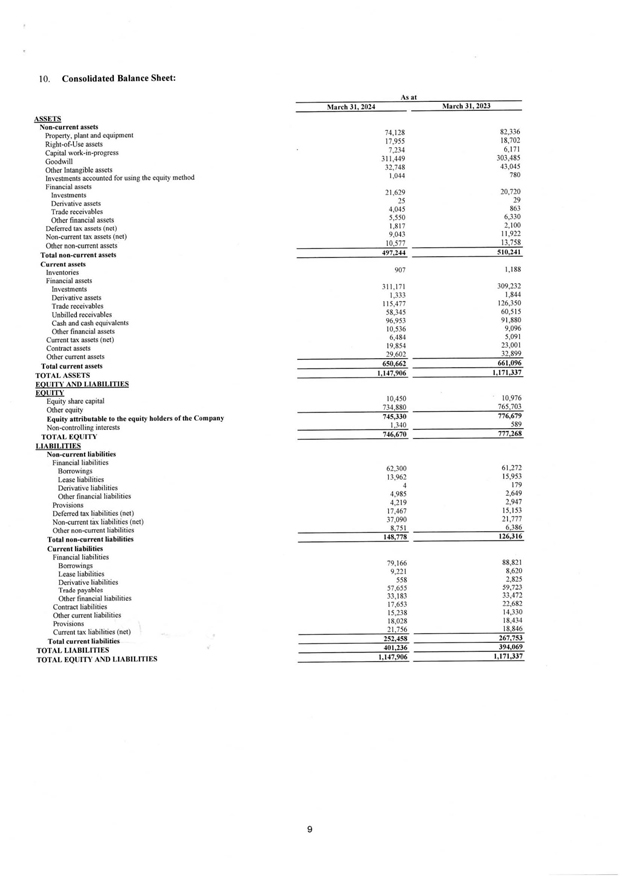
10. Consolidated Balance Sheet: As at March 3 I, 2024 March 31, 2023 ASSETS Non-current assets Property, plant and equipment 74,128 82,336 Right-of-Use assets 17,955 18,702 Capital work-in-progress 7,234 6, 171 Goodwill 311 ,449 303,485 Other Intangible assets 32,748 43,045 Investments accounted for using the equity method 1,044 780 Financial assets Investments 21,629 20,720 Derivative assets 25 29 Trade receivables 4,045 863 Other financial assets 5,550 6,330 Deferred tax assets (net) 1,817 2,100 Non-current tax assets (net) 9,043 11 ,922 Other non-current assets 10,577 13 758 Total non-current assets 497,244 510,241 Current assets Inventories 907 1,188 Financial assets Investments 3 11 ,171 309,232 Derivative assets 1,333 1,844 Trade receivables 115,477 126,350 Unbilled receivables 58,345 60,515 Cash and cash equivalents 96,953 91,880 Other financial assets 10,536 9,096 Current tax assets (net) 6,484 5,091 Contract assets 19,854 23,001 Other current assets 29,602 32,899 Total current assets 650,662 661,096 TOTAL ASSETS 1,147,906 1, 171,337 EQUITY AND LIABILITIES EQUITY Equity share capital 10,450 10,976 Other equity 734,880 765,703 Equity attributable to the equity holders of the Company 745,330 776,679 Non-controlling interests 1,340 589 TOTAL EQUITY 746,670 777 268 LIABILITIES Non-current liabilities Financial liabilities Borrowings 62,300 61,272 Lease liabilities 13,962 15,953 Derivative liabilities 4 179 Other financial liabilities 4,985 2,649 Provisions 4,219 2,947 Deferred lax liabilities (net) 17,467 15,153 Non-current tax liabilities (net) 37,090 21,777 Other non-current liabilities 8,751 6 386 Total non-current liabilities 148,778 126,316 Current liabilities Financial liabilities Borrowings 79,166 88,821 Lease liabilities 9,221 8,620 Derivative liabilities 558 2,825 Trade payables 57,655 59,723 Other financial liabilities 33,183 33,472 Contract liabilities 17,653 22,682 Other current liabilities 15,238 14,330 Provisions 18,028 18,434 Current tax liabilities (net) 21,756 18,846 Total current liabilities 252,458 267,753 TOTAL LIABILITIES 401,236 394,069 TOTAL EQUITY AND LIABILITIES 1,147,906 1,171,337
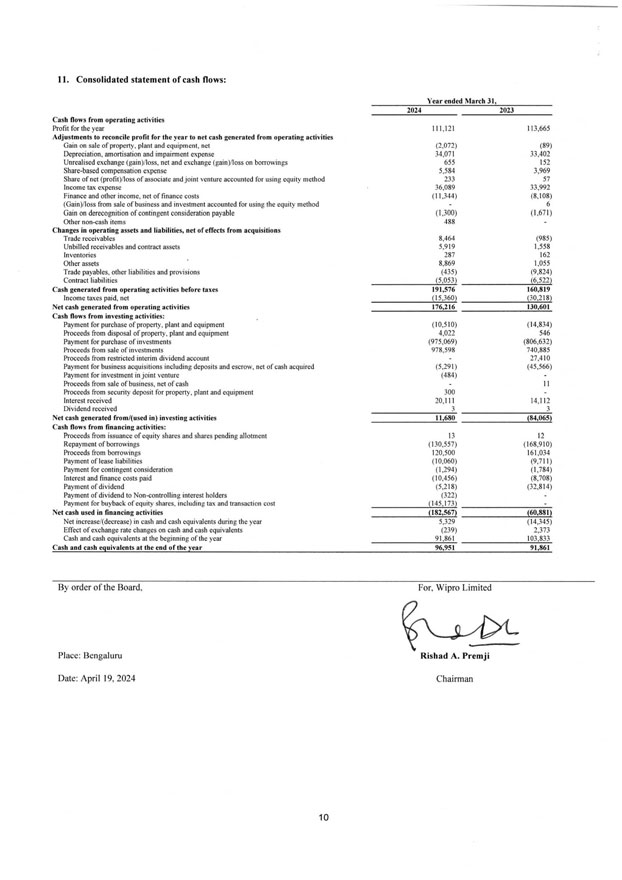
11. Consolidated statement of cash flows: Year ended March 3 1, 2024 2023 Cash flows from operating activities Profit for the year 111,121 113,665 Adjustments to reconcile profit for the year to net cash generated from operating activities Gain on sale of property, plant and equipment, net (2,072) (89) Depreciation, amortisation and impairment expense 34,071 33,402 Unrealised exchange (gain)/loss, net and exchange (gain)/loss on borrowings 655 152 Share-based compensation expense 5,584 3,969 Share of net (profit)/loss of associate and joint venture accounted for using equity method 233 57 Income tax expense 36,089 33,992 Finance and other income, net of finance costs ( 11,344) (8,108) (Gain)/loss from sale of business and investment accounted for using the equity method 6 Gain on derecognition of contingent consideration payable (1,300) ( 1,671) Other non-cash items 488 Changes in operating assets and liabilities, net of effects from acquisitions Trade receivables 8,464 (985) Unbilled receivables and contract assets 5,919 1,558 Inventories 287 162 Other assets 8,869 1,055 Trade payables, other liabilities and provisions (435) (9,824) Contract liabilities (5,053) (6,522) Cash generated from operating activities before taxes 191,576 160,819 Income taxes paid, net (15,360) (30,2 I8) Net cash generated from operating activities 176,216 130,601 Cash flows from investing activities: Payment for purchase of property, plant and equipment ( 10,510) ( 14,834) Proceeds from disposal of property, plant and equipment 4,022 546 Payment for purchase of investments (975,069) (806,632) Proceeds from sale of investments 978,598 740,885 Proceeds from restricted interim dividend account 27,410 Payment for business acquisitions including deposits and escrow, net of cash acquired (5,291) (45,566) Payment for investment in joint venture (484) Proceeds from sale of business, net of cash 11 Proceeds from security deposit for property, plant and equipment 300 Interest received 20,11 1 14,11 2 Dividend received 3 3 Net cash generated from/(used in) investing activities 11,680 (84,065) Cash flows from financing activities: Proceeds from issuance of equity shares and shares pending allotment 13 12 Repayment of borrowings (130,557) ( 168,910) Proceeds from borrowings 120,500 161,034 Payment of lease liabilities ( 10,060) (9,7 11) Payment for contingent consideration (1,294) ( 1,784) Interest and finance costs paid ( 10,456) (8,708) Payment of dividend (5,218) (32,8 14) Payment of dividend to Non-controlling interest holders (322) Payment for buyback of equity shares, including lax and transaction cost (145,173) Net cash used in financing activities (182,567) (60,881) Net increase/(decrease) in cash and cash equivalents during the year 5,329 ( 14,345) Effect of exchange rate changes on cash and cash equivalents (239) 2,373 Cash and cash equivalents at the beginning of the year 91,861 103,833 Cash and cash equivalents at the end of the year 96,951 91,861 By order of the Board, For, Wipro Limited Place: Bengaluru Rishad A. Premji Date: April 19, 2024 Chairman
Chartered Accountants Deloitte Prestige Trade Tower, Level 19 46, Palace Road, High Grounds Haskins & Sells LLP Bengaluru-560 001 Karnataka, India Tel: -+-91 80 6188 6000 Fax: -+-91 80 6188 6011 INDEPENDENT AUDITOR’S REPORT ON THE AUDIT OF CONSOLIDATED FINANCIAL RESULTS TO THE BOARD OF DIRECTORS OF WIPRO LIMITED Opinion We have audited the accompanying Statement of Consolidated Financial Results of WIPRO LIMITED (“the Company”) and its subsidiaries (the Company and its subsidiaries together referred to as “the Group”) for the three months and year ended March 31, 2024 (“the Statement”/” Consolidated Financial Results”). In our opinion and to the best of our information and according to the explanations given to us, the Statement gives a true and fair view in conformity with the recognition and measurement principles laid down in the International Accounting Standard 34 “Interim Financial Reporting” (“IAS 34”) as issued by the International Accounting Standards Board (“IASB”) of the consolidated net profit and consolidated total comprehensive income and other financial information of the Group for the three months and year ended March 31, 2024. Basis for Opinion We conducted our audit of the Consolidated Financial Results in accordance with the Standards on Auditing (“SAs”) issued by the Institute of Chartered Accountants of India (“ICAI”). Our responsibilities under those Standards are further described in the Auditor’s Responsibilities for the Audit of the Consolidated Financial Results section below. We are independent of the Group in accordance with the Code of Ethics issued by the ICAI together with the ethical requirements that are relevant to our audit of the Statement and we have fulfilled our other ethical responsibilities in accordance with these requirements and the ICAI’s Code of Ethics. We believe that the audit evidence obtained by us is sufficient and appropriate to provide a basis for our audit opinion. Management’s Responsibilities for the Consolidated Financial Results This Statement, which is the responsibility of the Company’s Management and approved by the Company’s Board of Directors has been compiled from the related audited interim condensed consolidated financial statements. The Company’s Board of Directors are responsible for the preparation and presentation of the Consolidated Financial Results that give a true and fair view of the consolidated net profit and consolidated other comprehensive income and other financial information of the Group in accordance with the recognition and measurement principles laid down in the IAS 34 as issued by IASB. The respective Board of Directors of the companies included in the Group are responsible for maintenance of adequate accounting records for safeguarding the assets of the Group and for preventing and detecting frauds and other irregularities; selection and application of appropriate accounting policies; making judgments and estimates that are reasonable and prudent; and design, implementation and maintenance of adequate internal financial controls, that were operating effectively for ensuring the accuracy and completeness of the accounting records, relevant to the preparation and presentation of the respective financial results that give a true and fair view and are free from material misstatement, whether due to fraud or error, which have been used for the purpose of preparation of this Consolidated Financial Results by the Directors of the Company, as aforesaid. Regd. Office: One International Center, Tower 3, 27th-32nd Floor, Senapati Bapat Marg, Elphinstone Road (West), Mumbai-400 013, Maharashtra, India. (LLP Identification No. AAB-B737)
Deloitte Haskins & Sells LLP In preparing the Consolidated Financial Results, the respective Board of Directors of the companies included in the Group are responsible for assessing the ability of the respective entities to continue as a going concern, disclosing, as applicable, matters related to going concern and using the going concern basis of accounting unless the respective Board of Directors either intends to liquidate their respective entities or to cease operations, or has no realistic alternative but to do so. The respective Board of Directors of the companies included in the Group are responsible for overseeing the financial reporting process of the Group. Auditor’s Responsibilities for the Audit of the Consolidated Financial Results Our objectives are to obtain reasonable assurance about whether the Consolidated Financial Results as a whole are free from material misstatement, whether due to fraud or error, and to issue an auditor’s report that includes our opinion. Reasonable assurance is a high level of assurance but is not a guarantee that an audit conducted in accordance with SAs will always detect a material misstatement when it exists. Misstatements can arise from fraud or error and are considered material if, individually or in the aggregate, they could reasonably be expected to influence the economic decisions of users taken on the basis of these Consolidated Financial Results. As part of an audit in accordance with SAs, we exercise professional judgment and maintain professional skepticism throughout the audit. We also: • Identify and assess the risks of material misstatement of the Consolidated Financial Results, whether due to fraud or error, design and perform audit procedures responsive to those risks, and obtain audit evidence that is sufficient and appropriate to provide a basis for our opinion. The risk of not detecting a material misstatement resulting from fraud is higher than for one resulting from error, as fraud may involve collusion, forgery, intentional omissions, misrepresentations, or the override of internal control. • Obtain an understanding of internal financial controls relevant to the audit in order to design audit procedures that are appropriate in the circumstances, but not for the purpose of expressing an opinion on effectiveness of such controls. • Evaluate the appropriateness of accounting policies used and the reasonableness of accounting estimates and related disclosures made by the management. • Conclude on the appropriateness of the management’s use of the going concern basis of accounting and, based on the audit evidence obtained, whether a material uncertainty exists related to events or conditions that may cast significant doubt on the ability of the Group to continue as a going concern. If we conclude that a material uncertainty exists, we are required to draw attention in our auditor’s report to the related disclosures in the Consolidated Financial Results or, if such disclosures are inadequate, to modify our opinion. Our conclusions are based on the audit evidence obtained up to the date of our auditor’s report. However, future events or conditions may cause the Group to cease to continue as a going concern. • Evaluate the overall presentation, structure and content of the Consolidated Financial Results, including the disclosures, and whether the Consolidated Financial Results represent the underlying transactions and events in a manner that achieves fair presentation.

Deloitte Haskins & Sells LLP • Obtain sufficient appropriate audit evidence regarding the financial results of the entities within the Group to express an opinion on the Consolidated Financial Results. We are responsible for the direction, supervision and performance of the audit of financial informat ion of entities included in the Consolidated Financial Results. Materiality is the magnitude of misstatements in the Consolidated Financial Results that, individually or in aggregate, makes it probable that the economic decisions of a reasonably knowledgeable user of the Consolidated Financial Results may be influenced. We consider quantitative materiality and qualitative factors in (i) planning the scope of our audit work and in evaluating the results of our work; and (ii) to evaluate the effect of any identified misstatements in the Consolidated Financial Results. We communicate with those charged with governance of the Company regarding, among other matters, the planned scope and timing of the audit and significant audit findings, including any significant deficiencies in internal control that we identify during our audit. We also provide those charged with governance with a statement that we have complied with relevant ethical requirements regarding independence, and to communicate with them all relationships and other matters that may reasonably be thought to bear on our independence, and where applicable, related safeguards. For DELOITTE HASKINS & SELLS LLP Chartered Accountants (Firm’s Registration No. 117366W/ W-100018) Anand Subramanian Partner ( Membership No. 110815) UDIN: Bengaluru, April 19, 2024
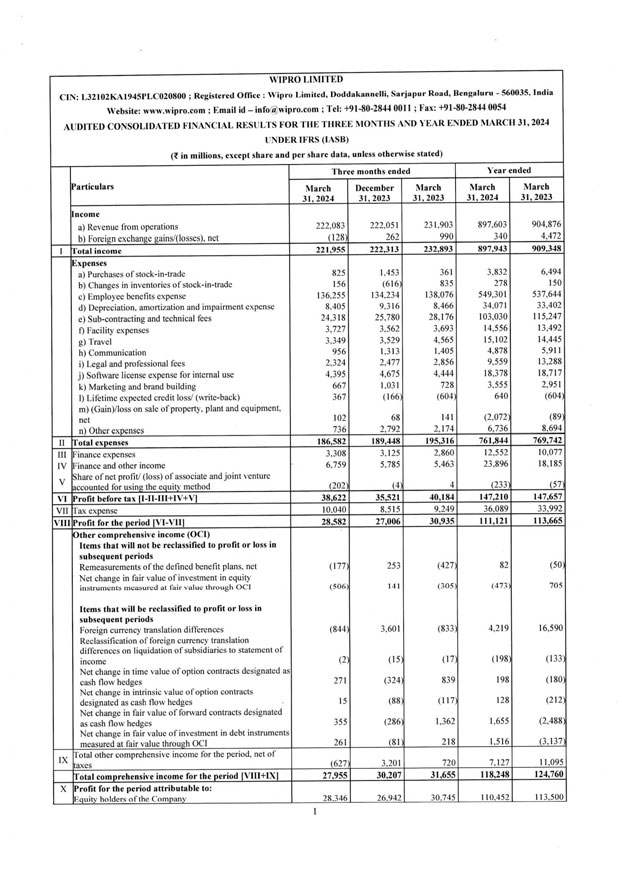
WIPRO LIMITED CIN: L32102KAl945PLC020800 ; Registered Office: Wipro Limited, Doddakannelli, Sarjapur Road, Bengaluru—560035, India Website: www.wipro.com; Email id- info@wipro.com; Tel: +91-80-2844 0011; Fax: +91-80-2844 0054 AUDITED CONSOLIDATED FINANCIAL RESULTS FOR THE THREE MONTHS AND YEAR ENDED MARCH 31, 2024 UNDER IFRS (IASB) (t in millions, except share and per share data, unless otherwise stated) Three months ended Year ended Particulars March December March March March 31, 2024 31, 2023 31,2023 31,2024 31 2023 Income a) Revenue from operations 222,083 222,051 231,903 897,603 904,876 b) Foreign exchange gains/(losses), net (128) 262 990 340 4,472 I Total income 221,955 222,313 232,893 897,943 909,348 Expenses a) Purchases of stock-in-trade 825 1.453 361 3,832 6,494 b) Changes in inventories of stock-in-trade 156 (6 16: 835 278 150 c) Employee benefits expense 136,255 134,234 138,076 549,301 537,644 d) Depreciation, amortization and impairment expense 8.405 9.316 8,466 34,071 33,402 e) Sub-contracting and technical fees 24,3 18 25,780 28, 176 103,030 11 5,247 f) Facility expenses 3,727 3,562 3,693 14,556 13,492 g) Travel 3.349 3,529 4,565 15,102 14,445 h) Communication 956 1,3 13 1,405 4,878 5,911 i) Legal and professional fees 2,324 2,477 2,856 9,559 13,288 j) Software license expense for internal use 4,395 4,675 4,444 18,378 18,7 17 k) Marketing and brand building 667 1.031 728 3,555 2,951 1) Lifetime expected credit loss/ (write-back) 367 (166) (604) 640 (604) m) (Gain)/loss on sale of property, plant and equipment, Net 102 68 141 (2,072) (89) n) Other expenses 736 2,792 2, 174 6,,736 8 694 II Total expenses 186,582 189,448 195,316 761,844 769,742 Ill Finance expenses 3,308 3,125 2,860 12,552 10,077 IV Finance and other income 6,759 5,785 5,463 23,896 18,185 Share of net profit/ (loss) of associate and joint venture V accounted for using the equity method (202) (4) 4 (233) (57) VI Profit before tax 11-11-lll+IV+V) 38,622 35,521 40,184 147,210 147,657 VIl Tax expense 10,040 8,5 15 9,249 36,089 33,992 VIII Profit for the period [VI-VII] 28,582 27 006 30,935 111,121 113,665 the r comprehensive income (OCI) Items that will not be reclassified to profit or loss in subsequent periods Remeasurements of the defined benefit plans, net (177) 253 (427) 82 (50) Net change in fair value of investment in equity instruments measured at fair value through OCI (506) 141 (305) (473) 705 Items that will be reclassified to profit or loss in subsequent periods Foreign currency translation differences (844) 3,601 (833) 4,219 16,590 Reclassification of foreign currency translation differences on liquidation of subsidiaries to statement of income (2) (15) (17) (198) (133) Net change in time value of option contracts designated as cash flow hedges 271 (324) 839 198 (180) Net change in intrinsic value of option contracts designated as cash flow hedges 15 (88) (117) 128 (212) Net change in fair value of forward contracts designated as cash flow hedges 355 (286 1,362 1,655 (2,488 Net change in fair value of investment in debt instruments measured at fair value through OCI 26 1 (8 1 218 1,516 (3,137 IX Total other comprehensive income for the period, net of (627) 3,201 720 7, 127 11 ,095 taxes Total comprehensive income for the period [Vlll+IX] 27,955 30,207 31,655 118,248 124,760 X Profit for the period attributable to: Equity holders of the Company 28.346 26.942 30.745 110.452 11 3,500
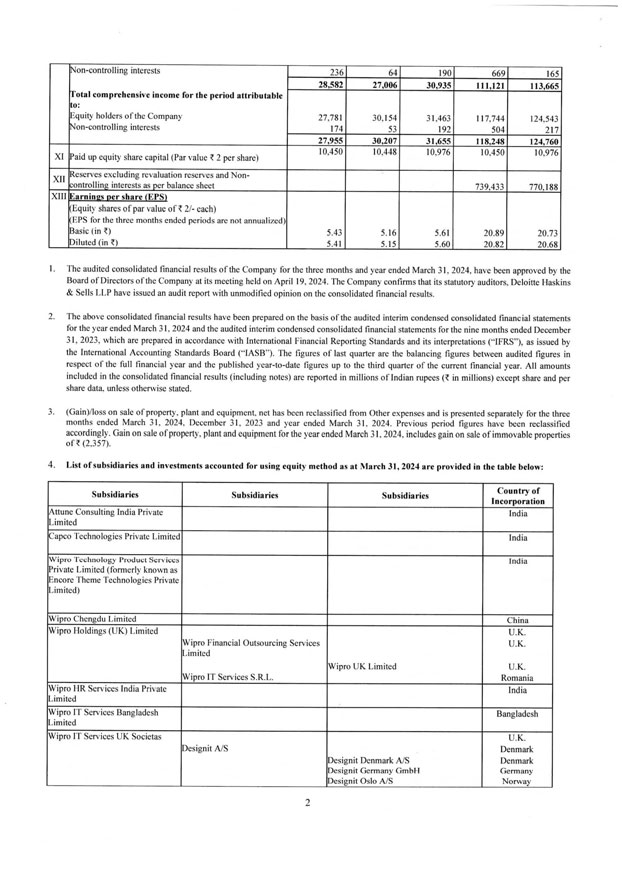
Non-controlling interests 236 64 190 669 165 28,582 27,006 30,935 11 1,121 113.665 Total comprehensive income for the period attributable to: Equity holders of the Company 27,781 30,154 31,463 117,744 124,543 Non-controlling interests 174 53 192 504 2 17 27,955 30,207 31,655 118 248 124,760 XI Paid up equity share capital (Par value t 2 per share) 10,450 10,448 10,976 10,450 10,976 XII Reserves excluding revaluation reserves and Non- controlling interests as per balance sheet 739,433 770,188 XIII Earnings per share (EPS) Equity shares of par value of t 2/- each) EPS for the three months ended periods are not annualized) Basic (in ~) 5.43 5.1 6 5.61 20.89 20.73 Diluted (in ~) 5.41 5. 15 5.60 20.82 20.68 1. The audited consolidated financial results of the Company for the three months and year ended March 3 1, 2024, have been approved by the Board of Directors of the Company at its meeting held on April 19, 2024. The Company confirms that its statutory auditors, Deloitte Haskins & Sells LLP have issued an audit report with unmodified opinion on the consolidated financial results. 2. The above consolidated financial results have been prepared on the basis of the audited interim condensed consolidated financial statements for the year ended March 31, 2024 and the audited interim condensed consolidated financial statements for the nine months ended December 31, 2023, which are prepared in accordance with International Financial Reporting Standards and its interpretations (‘‘IFRS”), as issued by the International Accounting Standards Board (‘‘IASB”). The figures of last quarter are the balancing figures between audited figures in respect of the full financial year and the published year-to-date figures up to the third quarter of the current financial year. All amounts included in the consolidated financial results (including notes) are reported in millions of Indian rupees (t in millions) except share and per share data, unless otherwise stated. 3. (Gain)/loss on sale of property, plant and equipment. net has been reclassified from Other expenses and is presented separately for the three months ended March 31, 2024, December 31, 2023 and year ended March 31. 2024. Previous period figures have been reclassified accordingly. Gain on sale of property, plant and equipment for the year ended March 3 1. 2024, includes gain on sale of immovable properties oft (2.357). 4. List of subsidiaries and investments accounted for using equity method as at March 31, 2024 are provided in the table below: Subsidiaries Subsidiaries Subsidiaries Country of Incorporation !Attune Consulting India Private India Limited Capco Technologies Private Limited India Wipro Technology Product Services India Private Limited (formerly known as Encore Theme Technologies Private Limited) Wipro Chengdu Limited China Wipro Holdings (UK) Limited U.K. Wipro Financial Outsourcing Services U.K. Limited Wipro UK Limited U.K. Wipro IT Services S.R.L. Romania Wipro HR Services India Private India Limited Wipro IT Services Bangladesh Bangladesh Limited Wipro IT Services UK Societas U.K. Designit A/S Denmark Designit Denmark A/S Denmark Designit Germany GmbH Germany Designit Oslo A/S Norway
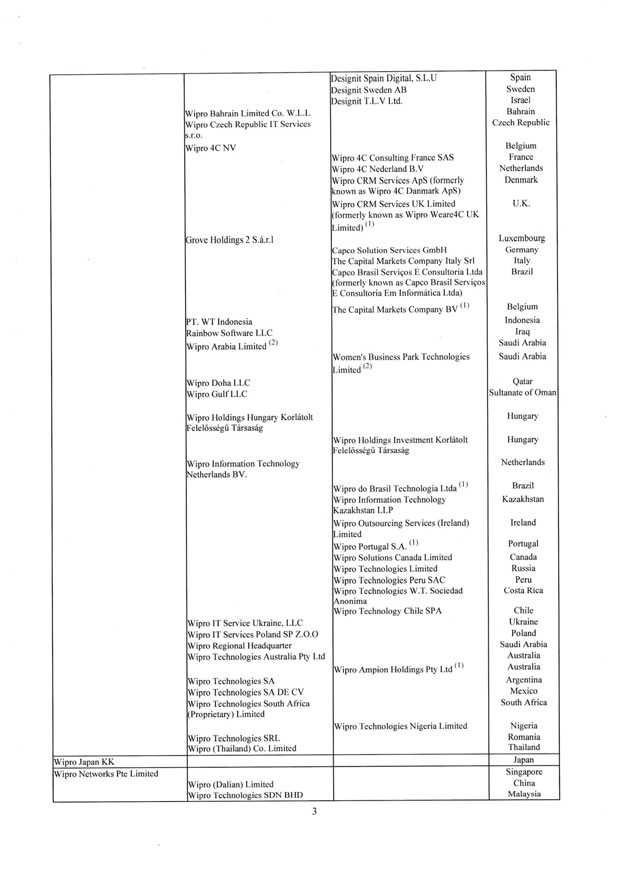
Wipro Bahrain Limited Co. W.L.L Wipro Czech Republic IT Services Designit Spain Digital. S.L.U Design it Sweden AB Designit T.L.V Ltd. Spain Sweden Israel Bahrain Czech Republic Wipro 4C NV Belgium Wipro 4C Consulting France SAS France Wipro 4C Nederland B.V Netherlands Wipro CRM Services ApS (formerly Known as Wipro 4C Danmark ApS) Denmark Wipro CRM Services UK Limited (formerly known as Wipro Weare4C UK Limited)(1) U.K. Grove Holdings 2 S.ä.r.l Luxembourg Capco Solution Services GmbH Germany The Capital Markets Company Italy Srl Italy Capco Brasil Servicos E Consultoria Ltda (formerly known as Capco Brasil Servi¿os E Consultoria Em Informatica Ltda) Brazil The Capital Markets Company BV (1) Belgium PT. WT Indonesia Indonesia Rainbow Software LLC Iraq Wipro Arabia Limited (2) Saudi Arabia Women’s Business Park Technologies Limited (2) Saudi Arabia Wipro Doha LLC Qatar Wipro Gulf LLC Sultanate of Oman Wipro Holdings Hungary Hungary’ Felelsseg Trsasg Wipro Holdings Investment Korltolt Felelsseg Trsasg Hungary Wipro Information Technology Netherlands Netherlands BV. Wipro do Brasil Technologia Ltda (1) Brazil Wipro Information Technology Kazakhstan LLP Kazakhstan Wipro Outsourcing Services (Ireland) Limited Ireland Wipro Portugal S.A. (1) Portugal Wipro Solutions Canada Limited Canada Wipro Technologies Limited Russia Wipro Tecchnologies Peru SAC Peru Wipro Technologies W.T. Sociedad Anonima Costa Rica Wipro Technology Chile SPA Chile Wipro IT Service Ukraine. LLC Ukraine Wipro IT Services Poland SP Z.O.O Poland Wipro Regional Headquarter Saudi Arabia Wipro Technologies Australia Pty Ltd Wipro Ampion Holdings Pty Ltd (1) Australia Australia Wipro Technologies SA Argentina Wipro Technologies SA DE CV Mexico Wipro Technologies South Africa South Africa [Proprietary’) Limited Wipro Technologies Nigeria Limited Nigeria Wipro Technologies SRL Romania Wipro (Thailand) Co. Limited Thailand Wipro Japan KK Japan Wipro Networks Pte Limited Singapore Wipro (Dalian) Limited China Wipro Technologies SDN BHD Malaysia
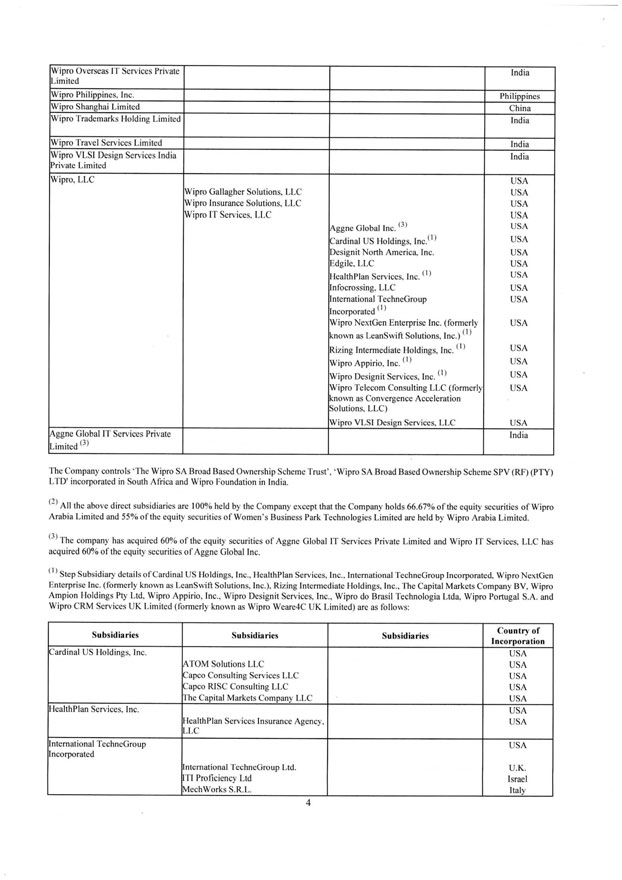
Wipro Overseas IT Services Private Limited India Wipro Philippines, Inc. Philippines Wipro Shanghai Limited China Wipro Trademarks Holding Limited India Wipro Travel Services Limited India Wipro VLSI Design Services India Private Limited India Wipro. LLC USA Wipro Gallagher Solutions. LLC USA Wipro Insurance Solutions, LLC USA Wipro IT Services, LLC USA Aggne Global Inc. (3) USA Cardinal US Holdings, Inc.(1) USA Designit North America. Inc. USA Edgile, LLC USA HealthPlan Services. Inc. (1) USA Infocrossing. LLC USA International TechneGroup USA Incorporated (1) Wipro NextGen Enterprise Inc. (formerly known as LeanSwift Solutions. Inc.) (1) USA Rizing Intermediate Holdings, Inc. (1) USA Wipro Appirio. Inc. (1) USA Wipro Designit Services. Inc. (1) USA Wipro Telecom Consulting LLC (formerly known as Convergence Acceleration Solutions, LLC) USA Wipro VLSI Design Services, LLC USA Aggne Global IT Services Private Limited India The Company controls ‘The Wipro SA Broad Based Ownership Scheme Trust’, ‘Wipro SA Broad Based Ownership Scheme SPV (RF) (PTY) LTD’ incorporated in South Africa and Wipro Foundation in India. (2) All the above direct subsidiaries are 100% held by the Company except that the Company holds 66.67% of the equity securities of Wipro Arabia Limited and 55% of the equity securities of Women’s Business Park Technologies Limited are held by Wipro Arabia Limited. (3) The company has acquired 60% of the equity securities of Aggne Global IT Services Private Limited and Wipro IT Services, LLC has acquired 60% of the equity securities of Aggne Global Inc. (1) Step Subsidiary details of Cardinal US Holdings, Inc., HealthPlan Services. Inc.. International TechneGroup Incorporated. Wipro NextGen Enterprise Inc. (formerly known as LeanSwift Solutions, Inc.). Rizing Intermediate Holdings, Inc., The Capital Markets Company BV, Wipro Ampion Holdings Pty Ltd. Wipro Appirio, Inc.. Wipro Designit Services, Inc., Wipro do Brasil Technologia Ltda, Wipro Portugal S.A. and Wipro CRM Services UK Limited (formerly known as Wipro Wcare4C UK Limited) are as follo vs: Subsidiaries Subsidiaries Subsidiaries Country of Incorporation Cardinal US Holdings. Inc. ATOM Solutions LLC Capco Consulting Services LLC Capco RISC Consulting LLC The Capital Markets Company LLC USA USA USA USA USA HealthPlan Services. Inc. HealthPlan Services Insurance Agency, LLC USA USA International TechneGroup Incorporated International TechneGroup Ltd. ITI Proficiency Ltd MechWorks S.R.L. USA U.K. Israel Italy
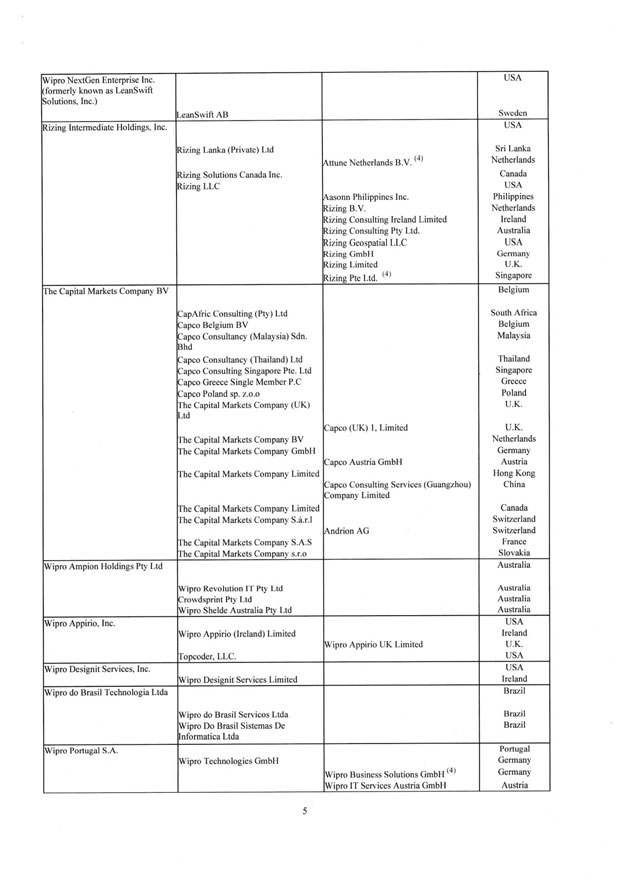
Wipro NextGen Enterprise Inc. (formerly known as LeanSwift Solutions. Inc.) eanSwift AB USA Sweden Rizing Intermediate Holdings. Inc. Rizing Lanka (Private) Ltd Rizing Solutions Canada Inc. Rizing LLC Attune Netherlands B.V. (4) Aasonn Philippines Inc. Rizing B.V. Rizing Consulting Ireland Limited Rizing Consulting Pty Ltd. Rizing Geospatial LLC Rizing GmbH Rizing Limited Rizing Pte Ltd. (4) USA Sri Lanka Netherlands Canada USA Philippines Netherlands Ireland Australia USA Germany U.K. Singapore The Capital Markets Company BV CapAfric Consulting (Pty) Ltd Capco Belgium BV Capco Consultancy (Malaysia) Sdn. Bhd Capco Consultancy (Thailand) Ltd Capco Consulting Singapore Pte. Ltd Capco Greece Single Member P.C Capco Poland sp. z.o.o The Capital Markets Company (UK) Ltd The Capital Markets Company BV The Capital Markets Company GmbH The Capital Markets Company Limited The Capital Markets Company Limited The Capital Markets Company S.a.r.l The Capital Markets Company S.A.S The Capital Markets Company s.r.o Capco (UK) 1. Limited Capco Austria GmbH Capco Consulting Services (Guangzhou) Company Limited Andrion AG Belgium South Africa Belgium Malaysia Thailand Singapore Greece Poland U.K. U.K, Netherlands Germany Austria Hong Kong China Canada Switzerland Switzerland France Slovakia Wipro Ampion Holdings Pty Ltd Wipro Revolution IT Pty Ltd Crowdsprint Pty Ltd Wipro Shelde Australia Pty Ltd Australia Australia Australia Australia Wipro Appirio. Inc. Wipro Appirio (Ireland) Limited Topcoder, LLC. Wipro Appirio UK Limited USA Ireland U.K. USA Wipro Designit Services. Inc. Wipro Designit Services Limited USA Ireland Wipro do Brasil Technologia Ltda Wipro do Brasil Servicos Ltda Wipro Do Brasil Sistemas De Infortnatica Ltda Brazil Brazil Brazil Wipro Portugal S.A. Wipro Technologies GmbH (4) Wipro Business Solutions GmbH Wipro IT Services Austria GmbH Portugal Germany Germany Austria
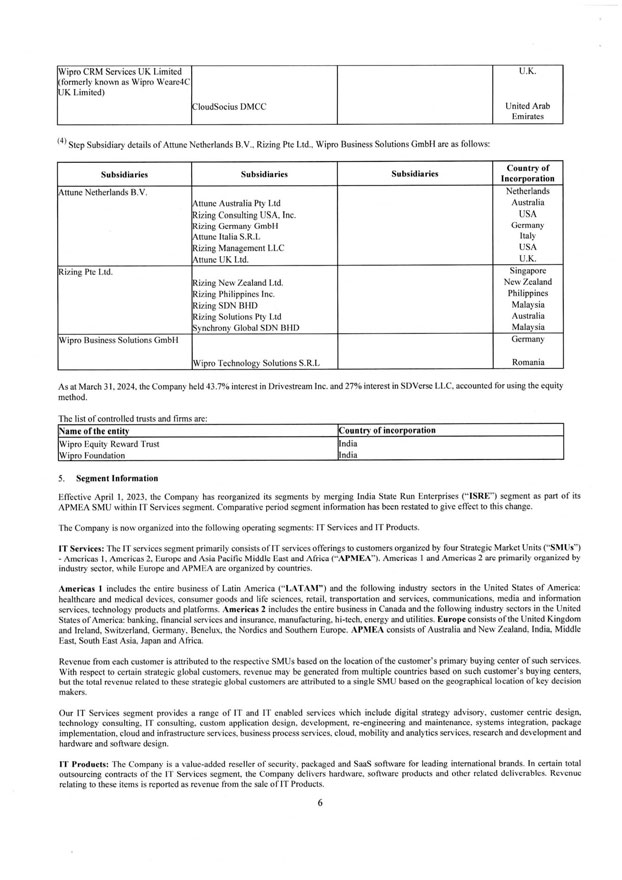
Wipro CRM Services UK Limited U.K.(formerly known as Wipro Weare4C UK Limited) CloudSocius DMCC United Arab Emirates (4) Step Subsidiary details of Attune Netherlands B.V.. Ring Pte Ltd., Wipro Business Solutions GmbH are as follows: Subsidiaries Subsidiaries Subsidiaries Country of Incorporation Attune Netherlands B.V. Attune Australia Pty Ltd Rizing Consulting USA. Inc. Rizing Germany GmbH Attune Italia S.R.L Rizing Management LLC Attune UK Ltd. Netherlands Australia USA Germany Italy USA U.K. Rizing Pte Ltd. Rizing New Zealand Ltd. Rizing Philippines Inc. Rizing SDN BHD Rizing Solutions Pty Ltd Synchrony Global SDN BHD Singapore New Zealand Philippines Malaysia Australia Malaysia Wipro Business Solutions GmbH Germany Wipro Technology Solutions S.R.L Romania As at March 31, 2024, the Company held 43.7% interest in Drivestream Inc. and 27% interest in SDVerse LLC, accounted for using the equity method. The list of controlled trusts and firms are: Name of the entity Country of incorporation Wipro Equity Reward Trust India Wipro foundation India 5. Segment Information Effective April 1, 2023, the Company has reorganized its segments by merging India State Run Enterprises (“lSRE”) segment as part of its APMEA SMU within IT Services segment. Comparative period segment information has been restated to give effect to this change. The Company is now organized into the following operating segments: IT Services and IT Products. IT Services: The IT services segment primarily consists of IT services offerings to customers organized by four Strategic Market Units (“SMUs”)—Americas 1, Americas 2. Europe and Asia Pacific Middle East and Africa ”APMEA”). Americas 1 and Americas 2 arc primarily organized by industry sector, while Europe and APMEA are organized by countries. Americas 1 includes the entire business of Latin America (“LATAM”) and the following industry’ sectors in the United States of America: healthcare and medical devices, consumer goods and life sciences, retail, transportation and services, communications, media and information services, technology products and platforms. Americas 2 includes the entire business in Canada and the following industry sectors in the United States of America: banking, financial services and insurance, manufacturing, hi-tech, energy and utilities. Europe consists of the United Kingdom and Ireland. Switzerland. Germany. Benelux, the Nordics and Southern Europe. APMEA consists of Australia and New Zealand. India. Middle East. South East Asia, Japan and Africa. Revenue from each customer is attributed to the respective SMUs based on the location of the customer’s primary buying center of such services. With respect to certain strategic global customers, revenue may be generated from multiple countries based on such customer’s buying centers, but the total revenue related to these strategic global customers are attributed to a single SMU based on the geographical location of key decision makers. Our IT Services segment provides a range of IT and IT enabled services which include digital strategy advisory, customer centric design, technology consulting. IT consulting, custom application design, development. re-engineering and maintenance, systems integration, package implementation, cloud and infrastructure services, business process services, cloud, mobility and analytics services, research and development and hardware and software design. IT Products: The Company is a value-added reseller of security, packaged and SaaS software for leading international brands. In certain total outsourcing contracts of the IT Services segment, the Company delivers hardware, software products and other related deliverables. Revenue relating to these items is reported as revenue from the sale of IT Products.
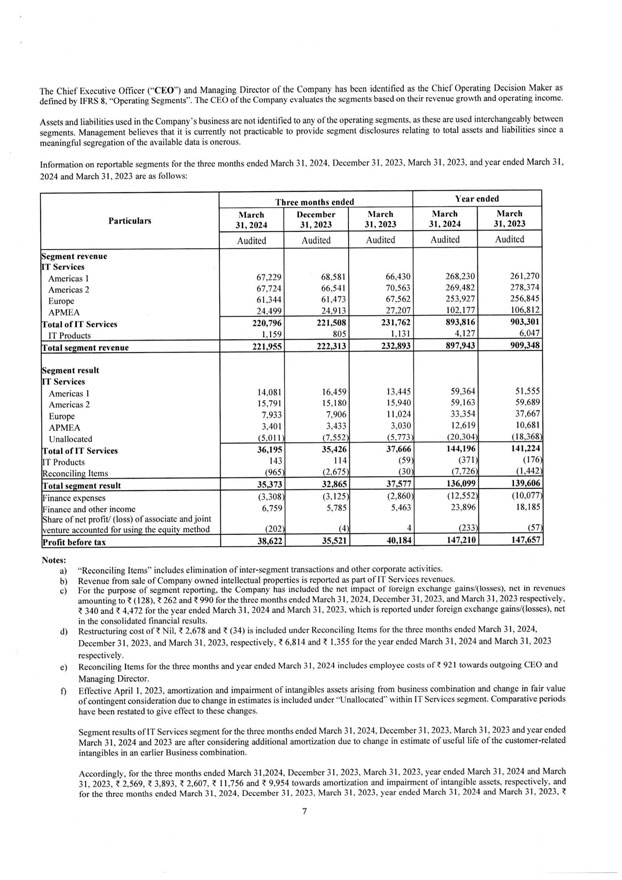
The Chief Executive Officer (“CEO”) and Managing Director of the Company has been identified as the Chief Operating Decision Maker as defined by IFRS 8. “Operating Segments”. The CEO of the Company evaluates the segments based on their revenue growth and operating income. Assets and liabilities used in the Company’s business are not identified to any of the operating segments, as these are used interchangeably between segments. Management believes that it is currently not practicable to provide segment disclosures relating to total assets and liabilities since a meaningful segregation of the available data is onerous. Information on reportable segments for the three months ended March 31, 2024. December 31. 2023, March 31, 2023, and year ended March 31, 2024 and March 31, 2023 are as follows: Particulars Three months ended Year ended March 31, 2024 December 31,2023 March 31,2023 March 31,2024 March 31,2023 Audited Audited Audited Audited Audited Segment revenue IT Services Americas 1 67,229 68.581 66,430 268,230 261,270 Americas 2 61,724 66.541 70,563 269,482 278.374 Europe 61.344 61,473 67.562 253.927 256,845 APMEA 24.499 24.913 27,207 102.177 106,812 Total of IT Services 220,796 221,508 231,762 893,816 903,301 IT Products 1,159 805 1,131 4,127 6,047 Total segment revenue 221,955 222,313 232,893 897,943 909,348 Segment result IT Services Americas I 14,081 16,459 13.445 59,364 51,555 Americas 2 15,791 15,180 15,940 59,163 59.689 Europe 7,933 7,906 11,024 33,354 37,667 APMEA 3,401 3.433 3,030 12,619 10,681 Unallocated (5,011) (7,552) (5,773) (20.304) (18,368) Total of IT Services 36,195 35,426 37,666 144,196 141,224 IT Products 143 114 (59) (371) (176) Reconciling Items (965) (2,675) (30) (7,726) (1,442) Total segment result 35,373 32,865 37,577 136,099 139,606 Finance expenses (3,308) (3,125) (2,860) (12,552) (10,077) Finance and other income 6,759 5,785 5,463 23,896 18,185 Share of net profit/ (loss) of associate and joint venture accounted for using the equity method (202) (4) 4 (233) (57) Profit before tax 38,622 35,521 40,184 147,210 147,677 Notes: a) “Reconciling Items” includes elimination of inter-segment transactions and other corporate activities. b) Revenue from sale of Company owned intellectual properties is reported as part of IT Services revenues. c) For the purpose of segment reporting, the Company has included the net impact of foreign exchange gains/(losses), net in revenues amounting to ? (128), ? 262 and ? 990 for the three months ended March 31, 2024, December 31, 2023, and March 31, 2023 respectively, ? 340 and ?4,472 for the year ended March 31, 2024 and March 31, 2023. which is reported under foreign exchange gains/(losses), net in the consolidated financial results. d) Restructuring cost of ? Nil. ? 2,678 and ? (34) is included under Reconciling Items for the three months ended March 31, 2024, December 31, 2023, and March 31, 2023, respectively,? 6,814 and ? 1.355 for the year ended March 31, 2024 and March 31, 2023 respectively. e) Reconciling Items for the three months and year ended March 31, 2024 includes employee costs of? 921 towards outgoing CEO and Managing Director. f) Effective April 1, 2023, amortization and impairment of intangibles assets arising from business combination and change in fair value of contingent consideration due to change in estimates is included under “Unallocated” within IT Services segment. Comparative periods have been restated to give effect to these changes. Segment results of IT Services segment for the three months ended March 31, 2024, December 31, 2023, March 31. 2023 and year ended March 31, 2024 and 2023 are after considering additional amortization due to change in estimate of useful life of the customer-related intangibles in an earlier Business combination. Accordingly, for the three months ended March 31, 2024, December 31, 2023. March 31, 2023, year ended March 31, 2024 and March 31, 2023, ? 2,569, ? 3,893, ? 2,607, ? 11,756 and ? 9,954 towards amortization and impairment of intangible assets, respectively, and for the three months ended March 31. 2024, December 31, 2023, March 31, 2023, year ended March 31, 2024 and March 31, 2023, ?
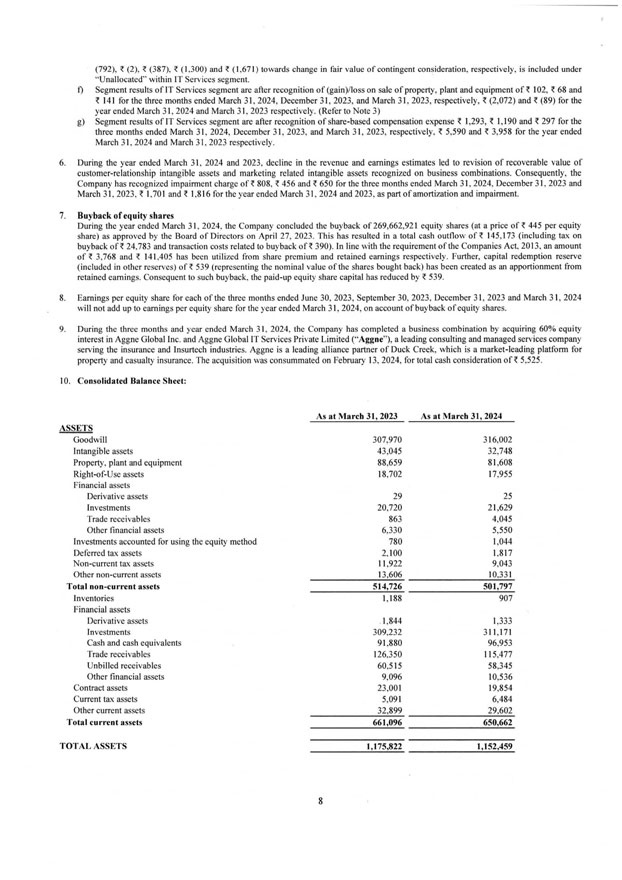
(792), 1,300) ? (387), ,(2), and ? (1,671) towards change in fair value contingent consideration, respectively, is included under “Unallocated” within IT Services segment. $$/BREAK/$$END f) Segment results of IT Services segment are after recognition of (gain)/loss on sale of property, plant and equipment of ? 102, ? 68 and ? 141 for the three months ended March 31, 2024, December 31, 2023, and March 31, 2023, respectively, ? (2,072) and ? (89) for the year ended March 31, 2024 and March 31, 2023 respectively. (Refer to Note 3) g) Segment results of IT Services segment are after recognition of share-based compensation expense ? 1,293, ?1.190 and ? 297 for the three months ended March 31, 2024, December 31. 2023. and March 31, 2023, respectively. ? 5,590 and ? 3.958 for the year ended March 31. 2024 and March 31, 2023 respectively. 6. During the year ended March 31, 2024 and 2023, decline in the revenue and earnings estimates led to revision of recoverable value of customer-relationship intangible assets and marketing related intangible assets recognized on business combinations. Consequently, the Company has recognized impairment charge of ? 808. ? 456 and ? 650 for the three months ended March 31, 2024. December 31, 2023 and March 31, 2023, ?1,701 and ?1,816 for the year ended March 31, 2024 and 2023. as part of amortization and impairment. 7. Buyback of equity shares During the year ended March 31. 2024. the Company concluded the buyback of 269,662,921 equity shares (at a price of ? 445 per equity share) as approved by the Board of Directors on April 27, 2023. This has resulted in a total cash outflow of? 145,173 (including tax on buyback of? 24,783 and transaction costs related to buyback of ? 390), In line with the requirement of the Companies Act 2013, an amount of ? 3.768 and ? 141,405 has been utilized from share premium and retained earnings respectively. Further, capital redemption reserve (included in other reserves) of ? 539 (representing the nominal value of the shares bought back) has been created as an apportionment from retained earnings. Consequent to such buyback, the paid-up equity share capital has reduced by ? 539. 8. Earnings per equity share for each of the three months ended June 30, 2023, September 30. 2023. December 31. 2023 and March 31, 2024 will not add up to earnings per equity share for the year ended March 31, 2024, on account of buyback of equity shares. 9. During the three months and year ended March 31. 2024. the Company has completed a business combination by acquiring 60% equity interest in Aggne Global Inc. and Aggne Global IT Services Private Limited (“Aggne”) a leading consulting and managed services company serving the insurance and Insurtech industries. Aggne is a leading alliance partner of Duck Creek, which is a market-leading platform for property and casualty insurance. The acquisition was consummated on February 13, 2024, for total cash consideration of? 5.525. 10. Consolidated Balance Sheet: As at March 31, 2023 As at March 31, 2024 ASSETS Goodwill 307.970 316,002 Intangible assets 43.045 32.748 Property, plant and equipment 88.659 81.608 Right-of-Use assets 18,702 17,955 Financial assets Derivative assets 29 25 Investments 20.720 21,629 Trade receivables 863 4.045 Other financial assets 6.330 5.550 Investments accounted for using the equity method 780 1,044 Deferred tax assets 2.100 1,817 Non-current tax assets 11,922 9.043 Other non-current assets 13,606 10.331 Total non-current assets 514,726 501,797 Inventories 1,188 907 Financial assets Derivative assets .1.844 1,333 Investments 309.232 311.171 Cash and cash equivalents 91,880 96.953 Trade receivables 126.350 115.477 Unbilled receivables 60,515 58.345 Other financial assets 9.096 10.536 Contract assets 23.001 19,854 Current tax assets 5.091 6.484 Other current assets 32,899 29,602 Total current assets 661,096 650,662 TOTAL ASSETS 1,175,822 1,152,459
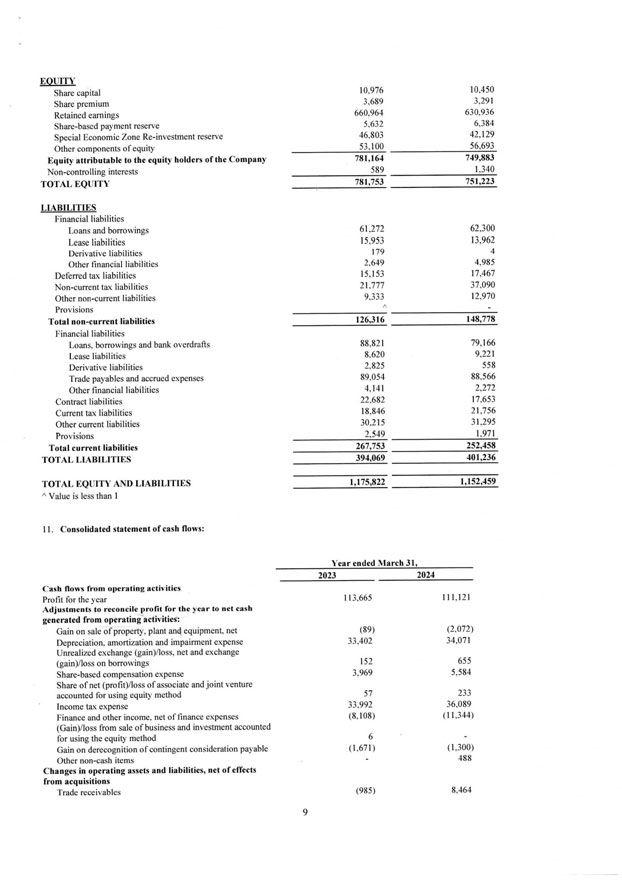
EQUITY 10,450 Share capital 10,976 Share premium 3,689 3,291 Retained earnings 660.964 630,936 Share-based payment reserve 5,632 6.384 Special Economic Zone Re-investment reserve 46.803 42.129 Other components of equity 53,100 Equity attributable to the equity holders of the Company 781,164 749,883 Non-controlling interests 589 1.340 TOTAL EQUITY LIABILITIES Financial liabilities 781,753 751,223 Loans and borrowings 61,272 62,300 Lease liabilities 15.953 13.962 Derivative liabilities 179 4 Other financial liabilities 2.649 4.985 Deferred tax liabilities 15.153 17,467 Non-current tax liabilities 21,777 37.090 Other non-current liabilities 9.333 12.970 Provisions —Total non-current liabilities Financial liabilities 126,316 148,778 Loans, borrowings and bank overdrafts 88.821 79,166 Lease liabilities 8.620 9,221 Derivative liabilities 2.825 558 Trade payables and accrued expenses 89,054 88.566 Other financial liabilities 4.141 2.272 Contract liabilities 22,682 17.653 Current tax liabilities 18.846 21.756 Other current liabilities 30,215 31.295 Provisions 2,549 1.971 Total current liabilities 267,753 252,458 TOTAL LIABILITIES 394,069 401,236 TOTAL EQUITY AND LIABILITIES Value is less than 1 1,175,822 1,152,459 11. Consolidated statement of cash flows: Ù¡‘ear ended March 31, 2023 2024 Cash flows from operating activities Profit for the year 113.665 111.121 Adjustments to reconcile profit for the year to net cash generated from operating activities: Gain on sale of property, plant and equipment, net (89) (2.072) Depreciation, amortization and impairment expense 33.402 34.071 Unrealized exchange (gain)/loss, net and exchange (gain )/loss on borrowings 152 655 Share-based compensation expense 3,969 5,584 Share of net (profit)/loss of associate and joint venture accounted for using equity method 57 233 Income tax expense 33.992 36.089 Finance and other income, net of finance expenses (8,108) ØŒ11.344) (Gain)/loss from sale of business and investment accounted for using the equity method 6—Gain on derecognition of contingent consideration payable (1,671) (1,300) Other non-cash items ‘ 488 Changes in operating assets and liabilities, net of effects from acquisitions Trade receivables (985) 8.464
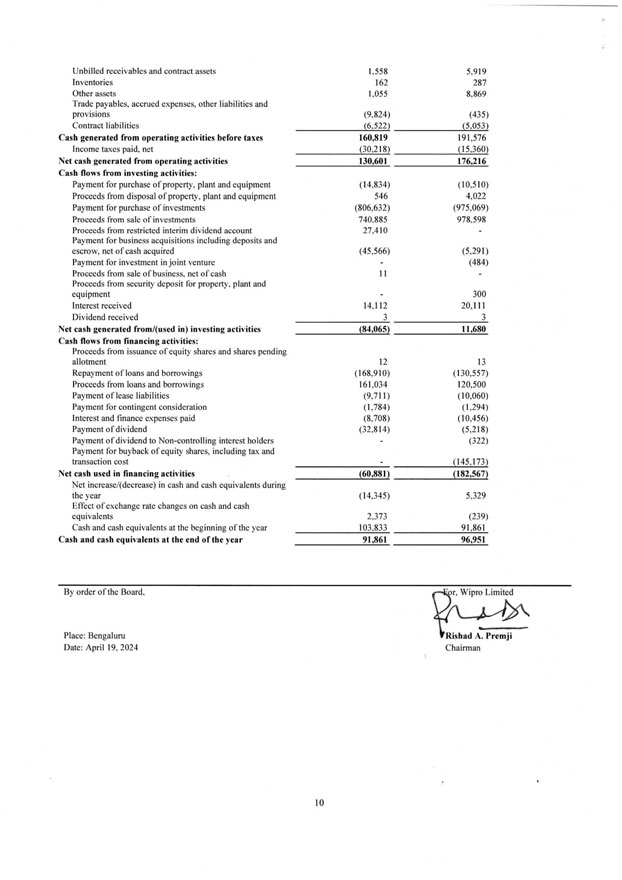
Unbilled receivables and contract assets 1,558 5,919 Inventories 162 287 Other assets 1,055 8,869 Trade payables, accrued expenses, other liabilities and provisions (9,824) (435) Contract liabilities (,522) (5,053) Cash generated from operating activities before taxes 160,819 191,576 Income taxes paid, net (30,218) (15,360) Net cash generated from operating activities 130,601 176,216 Cash flows from investing activities: Payment for purchase of property, plant and equipment (14.834) (10,510) Proceeds from disposal of property, plant and equipment 546 4.022 Payment for purchase of investments (.806,632) (975,069) Proceeds from sale of investments 740.885 978.598 Proceeds from restricted interim dividend account 27,410—Payment for business acquisitions including deposits and escrow, net of cash acquired (5.291) Payment for investment in joint venture—(484) Proceeds from sale of business, net of cash 11—Proceeds from security deposit for property, plant and equipment 300 Interest received 14,112 20.111 Dividend received 3 3 Net cash generated from/(used in) investing activities (84,065) 11,680 Cash flows from financing activities: Proceeds from issuance of equity shares and shares pending allotment 12 13 Repayment of loans and borrowings (168,910) (130,557) Proceeds from loans and borrowings 161,034 120,500 Payment of lease liabilities (9,711) (10.060) Payment for contingent consideration (1.784) (1,294) Interest and finance expenses paid (8,708) (10.456) Payment of dividend (32,814) (5,218) Payment of dividend to Non-controlling interest holders—(322) Payment for buyback of equity shares, including tax and transaction cost—(145.173) Net cash used in financing activities (60,881) (182,567) Net increase/(decrease) in cash and cash equivalents during the year (14.345) 5.329 Effect of exchange rate changes on cash and cash equivalents 2,373 (239) Cash and cash equivalents at the beginning of the year 103,833 91.861 Cash and cash equivalents at the end of the year 91,861 96,951 By order of the Board. For, Wipro Limited Place: Bengaluru Rishad A. Premji Date: April 19. 2024 Chairman