UNITED STATES
SECURITIES AND EXCHANGE COMMISSION
WASHINGTON, D.C. 20549
FORM 8-K
CURRENT REPORT
Pursuant to Section 13 or 15(d)
of the Securities Exchange Act of 1934
Date of Report (Date of earliest event reported): April 22, 2024
NUCOR CORPORATION
(Exact name of Registrant as Specified in Its Charter)
| Delaware | 1-4119 | 13-1860817 | ||
| (State or Other Jurisdiction of Incorporation) |
(Commission File Number) |
(IRS Employer Identification No.) |
||
| 1915 Rexford Road, Charlotte, NC |
28211 | |||
| (Address of Principal Executive Offices) | (Zip Code) | |||
Registrant’s Telephone Number, Including Area Code: (704) 366-7000
Not Applicable
(Former Name or Former Address, if Changed Since Last Report)
Check the appropriate box below if the Form 8-K filing is intended to simultaneously satisfy the filing obligation of the registrant under any of the following provisions:
| ☐ | Written communications pursuant to Rule 425 under the Securities Act (17 CFR 230.425) |
| ☐ | Soliciting material pursuant to Rule 14a-12 under the Exchange Act (17 CFR 240.14a-12) |
| ☐ | Pre-commencement communications pursuant to Rule 14d-2(b) under the Exchange Act (17 CFR 240.14d-2(b)) |
| ☐ | Pre-commencement communications pursuant to Rule 13e-4(c) under the Exchange Act (17 CFR 240.13e-4(c)) |
Securities registered pursuant to Section 12(b) of the Act:
| Title of each class |
Trading Symbol(s) |
Name of each exchange on which registered |
||
| Common Stock, par value $0.40 per share | NUE | New York Stock Exchange |
Indicate by check mark whether the registrant is an emerging growth company as defined in Rule 405 of the Securities Act of 1933 (§ 230.405 of this chapter) or Rule 12b-2 of the Securities Exchange Act of 1934 (§ 240.12b-2 of this chapter).
Emerging growth company ☐
If an emerging growth company, indicate by check mark if the registrant has elected not to use the extended transition period for complying with any new or revised financial accounting standards provided pursuant to Section 13(a) of the Exchange Act. ☐
| Item 2.02. | Results of Operations and Financial Condition. |
On April 22, 2024, Nucor Corporation issued a news release reporting its financial results for the quarter ended March 30, 2024. A copy of the news release is furnished as Exhibit 99.1 and incorporated herein by reference.
| Item 7.01. | Regulation FD Disclosure. |
On April 22, 2024, Nucor Corporation, in conjunction with the issuance of the aforementioned news release, posted an investor presentation to its Investor Relations website. A copy of the investor presentation is furnished as Exhibit 99.2 and incorporated herein by reference.
| Item 9.01. | Financial Statements and Exhibits. |
| (d) | Exhibits |
| 99.1 | News Release of Nucor Corporation dated April 22, 2024 | |
| 99.2 | Investor Presentation dated April 22, 2024 | |
| 104 | Cover Page from this Current Report on Form 8-K, formatted in Inline XBRL | |
The information contained in this Current Report on Form 8-K, including the exhibits attached hereto, is being furnished and shall not be deemed to be “filed” for the purposes of Section 18 of the Securities Exchange Act of 1934, as amended (the “Exchange Act”), or otherwise subject to the liabilities of that Section. Furthermore, the information contained in this Current Report on Form 8-K shall not be deemed to be incorporated by reference into any registration statement or other document filed pursuant to the Securities Act of 1933, as amended, or the Exchange Act, except as shall be expressly set forth by specific reference in any such registration statement or other document.
1
SIGNATURES
Pursuant to the requirements of the Securities Exchange Act of 1934, the registrant has duly caused this report to be signed on its behalf by the undersigned hereunto duly authorized.
| NUCOR CORPORATION | ||||||
| Date: April 22, 2024 | By: | /s/ Stephen D. Laxton |
||||
| Stephen D. Laxton | ||||||
| Chief Financial Officer, Treasurer and Executive Vice President |
||||||
2
Exhibit 99.1
| News Release |

|
Nucor Reports Results for the First Quarter of 2024
First Quarter of 2024 Highlights
| • | Net earnings attributable to Nucor stockholders of $844.8 million, or $3.46 per diluted share. |
| • | Net sales of $8.14 billion. |
| • | Net earnings before noncontrolling interests of $959.0 million; EBITDA of $1.50 billion. |
CHARLOTTE, N.C. – April 22, 2024 - Nucor Corporation (NYSE: NUE) today announced consolidated net earnings attributable to Nucor stockholders of $844.8 million, or $3.46 per diluted share, for the first quarter of 2024. By comparison, Nucor reported consolidated net earnings attributable to Nucor stockholders of $785.4 million, or $3.16 per diluted share, for the fourth quarter of 2023 and $1.14 billion, or $4.45 per diluted share, for the first quarter of 2023.
“Nucor’s performance continues to be strong even as steel market conditions have come off their post-pandemic record highs,” said Leon Topalian, Nucor’s Chair, President, and Chief Executive Officer. “We also took several bold steps to advance our growth, sustainability, and commercial strategies during the first quarter. We broadened our capabilities in the rapidly growing data center market, announced new partnerships to supply our customers with low carbon steel and accelerate the development of cleaner forms of energy, and introduced the Nucor Consumer Spot Price for our hot-rolled coil products to provide our customers with more timely and transparent information.”
Selected Segment Data
Earnings (loss) before income taxes and noncontrolling interests by segment for the first quarter of 2024 and 2023 were as follows (in thousands):
| Three Months (13 Weeks) Ended | ||||||||
| March 30, 2024 | April 1, 2023 | |||||||
| Steel mills |
$ | 1,102,251 | $ | 838,388 | ||||
| Steel products |
511,559 | 970,802 | ||||||
| Raw materials |
9,581 | 58,140 | ||||||
| Corporate/eliminations |
(398,050 | ) | (270,546 | ) | ||||
|
|
|
|
|
|||||
| $ | 1,225,341 | $ | 1,596,784 | |||||
|
|
|
|
|
|||||
Financial Review
Nucor’s consolidated net sales were $8.14 billion in the first quarter of 2024, a 6% increase compared to $7.70 billion in the fourth quarter of 2023 and a 7% decrease compared to $8.71 billion in the first quarter of 2023. Average sales price per ton in the first quarter of 2024 increased 1% compared to the fourth quarter of 2023 and decreased 3% compared to the first quarter of 2023. A total of 6,224,000 tons were shipped to outside customers in the first quarter of 2024, an increase of 5% compared to the fourth quarter of 2023 and a decrease of 3% compared to the first quarter of 2023.
Page 1 of 10
Nucor Executive Offices: 1915 Rexford Road, Charlotte, North Carolina 28211
Phone 704-366-7000 Fax 704-362-4208 www.nucor.com
| News Release |
|
Nucor Reports Results for the First Quarter of 2024 (Continued)
Total steel mill shipments in the first quarter of 2024 increased 7% compared to the fourth quarter of 2023 and decreased 2% compared to the first quarter of 2023. Steel mill shipments to internal customers represented 21% of total steel mill shipments in the first quarter of 2024, compared to 20% in the fourth quarter of 2023 and the first quarter of 2023. Downstream steel product shipments to outside customers in the first quarter of 2024 decreased 5% from the fourth quarter of 2023 and decreased 15% from the first quarter of 2023.
The average scrap and scrap substitute cost per gross ton used in the first quarter of 2024 was $421, a 6% increase compared to $397 in the fourth quarter of 2023 and a 2% increase compared to $414 in the first quarter of 2023.
Pre-operating and start-up costs related to the Company’s growth projects were approximately $125 million, or $0.39 per diluted share, in the first quarter of 2024, compared with approximately $127 million, or $0.39 per diluted share, in the fourth quarter of 2023 and approximately $82 million, or $0.24 per diluted share, in the first quarter of 2023.
Overall operating rates at the Company’s steel mills increased to 82% in the first quarter of 2024 compared to 74% in the fourth quarter of 2023 and 79% in the first quarter of 2023.
Financial Strength
At the end of the first quarter of 2024, we had $5.54 billion in cash and cash equivalents, short-term investments and restricted cash and cash equivalents on hand. The Company’s $1.75 billion revolving credit facility remains undrawn and does not expire until November 2026. Nucor continues to have the strongest credit rating in the North American steel sector (A-/A-/Baa1) with stable outlooks at Standard & Poor’s, Fitch Ratings and Moody’s.
Commitment to Returning Capital to Stockholders
During the first quarter of 2024, Nucor repurchased approximately 5.5 million shares of its common stock at an average price of $180.79 per share. As of March 30, 2024, Nucor had approximately $2.32 billion remaining authorized and available for repurchases under its share repurchase program. This share repurchase authorization is discretionary and has no scheduled expiration date.
On February 20, 2024, Nucor’s Board of Directors declared a cash dividend of $0.54 per share. This cash dividend is payable on May 10, 2024 to stockholders of record as of March 28, 2024 and is Nucor’s 204th consecutive quarterly cash dividend.
Page 2 of 10
Nucor Executive Offices: 1915 Rexford Road, Charlotte, North Carolina 28211
Phone 704-366-7000 Fax 704-362-4208 www.nucor.com
| News Release |
|
Nucor Reports Results for the First Quarter of 2024 (Continued)
First Quarter of 2024 Analysis
Steel mills segment earnings in the first quarter of 2024 increased from the fourth quarter of 2023, primarily due to higher average selling prices and increased volumes, particularly at our sheet mills. Earnings in the steel products segment decreased in the first quarter of 2024 as compared to the fourth quarter of 2023 due to lower average selling prices and decreased volumes. Earnings in the raw materials segment increased in the first quarter of 2024 as compared to the fourth quarter of 2023.
Second Quarter of 2024 Outlook
We expect earnings in the second quarter of 2024 to decrease compared to the first quarter of 2024. The largest driver for the expected decrease in earnings in the second quarter of 2024 is the decreased earnings of the steel mills segment, primarily due to lower average selling prices partially offset by modestly increased volumes. The steel products segment is expected to have moderately decreased earnings in the second quarter of 2024 as compared to the first quarter of 2024 due to lower average selling prices, partially offset by increased volumes. Earnings in the raw materials segment are expected to be higher in the second quarter of 2024 as compared to the first quarter of 2024 due to the increased profitability of our direct reduced iron facilities and scrap processing operations.
Earnings Conference Call
You are invited to listen to the live broadcast of Nucor’s conference call during which management will discuss Nucor’s first quarter results on April 23, 2024 at 10:00 a.m. Eastern Time. The call can be accessed via webcast from the Investor Relations section of Nucor’s website (nucor.com/investors). A presentation with supplemental information to accompany the call has been posted to Nucor’s Investor Relations website. A playback of the webcast will be posted to the same site within one day of the live event.
About Nucor
Nucor and its affiliates are manufacturers of steel and steel products, with operating facilities in the United States, Canada and Mexico. Products produced include: carbon and alloy steel — in bars, beams, sheet and plate; hollow structural section tubing; electrical conduit; steel racking; steel piling; steel joists and joist girders; steel deck; fabricated concrete reinforcing steel; cold finished steel; precision castings; steel fasteners; metal building systems; insulated metal panels; overhead doors; steel grating; wire and wire mesh; and utility structures. Nucor, through The David J. Joseph Company and its affiliates, also brokers ferrous and nonferrous metals, pig iron and hot briquetted iron / direct reduced iron; supplies ferro-alloys; and processes ferrous and nonferrous scrap. Nucor is North America’s largest recycler.
Non-GAAP Financial Measures
The Company uses certain non-GAAP (Generally Accepted Accounting Principles) financial measures in this news release, including EBITDA. Generally, a non-GAAP financial measure is a numerical measure of a company’s performance or financial position that either excludes or includes amounts that are not normally excluded or included in the most directly comparable financial measure calculated and presented in accordance with GAAP.
Page 3 of 10
Nucor Executive Offices: 1915 Rexford Road, Charlotte, North Carolina 28211
Phone 704-366-7000 Fax 704-362-4208 www.nucor.com
| News Release |
|
Nucor Reports Results for the First Quarter of 2024 (Continued)
We define EBITDA as net earnings before noncontrolling interests, adding back the following items: interest (income) expense, net; provision for income taxes; depreciation; and amortization. Please note that other companies might define their non-GAAP financial measures differently than we do.
Management presents the non-GAAP financial measure of EBITDA in this news release because it considers it to be an important supplemental measure of performance. Management believes that this non-GAAP financial measure provides additional insight for analysts and investors evaluating the Company’s financial and operational performance by providing a consistent basis of comparison across periods.
Forward-Looking Statements
Certain statements contained in this news release are “forward-looking statements” that involve risks and uncertainties which we expect will or may occur in the future and may impact our business, financial condition and results of operations. The words “anticipate,” “believe,” “expect,” “intend,” “project,” “may,” “will,” “should,” “could” and similar expressions are intended to identify those forward-looking statements. These forward-looking statements reflect the Company’s best judgment based on current information, and, although we base these statements on circumstances that we believe to be reasonable when made, there can be no assurance that future events will not affect the accuracy of such forward-looking information. As such, the forward-looking statements are not guarantees of future performance, and actual results may vary materially from the projected results and expectations discussed in this news release. Factors that might cause the Company’s actual results to differ materially from those anticipated in forward-looking statements include, but are not limited to: (1) competitive pressure on sales and pricing, including pressure from imports and substitute materials; (2) U.S. and foreign trade policies affecting steel imports or exports; (3) the sensitivity of the results of our operations to general market conditions, and in particular, prevailing market steel prices and changes in the supply and cost of raw materials, including pig iron, iron ore and scrap steel; (4) the availability and cost of electricity and natural gas, which could negatively affect our cost of steel production or result in a delay or cancellation of existing or future drilling within our natural gas drilling programs; (5) critical equipment failures and business interruptions; (6) market demand for steel products, which, in the case of many of our products, is driven by the level of nonresidential construction activity in the United States; (7) impairment in the recorded value of inventory, equity investments, fixed assets, goodwill or other long-lived assets; (8) uncertainties and volatility surrounding the global economy, including excess world capacity for steel production, inflation and interest rate changes; (9) fluctuations in currency conversion rates; (10) significant changes in laws or government regulations affecting environmental compliance, including legislation and regulations that result in greater regulation of greenhouse gas emissions that could increase our energy costs, capital expenditures and operating costs or cause one or more of our permits to be revoked or make it more difficult to obtain permit modifications; (11) the cyclical nature of the steel industry; (12)
Page 4 of 10
Nucor Executive Offices: 1915 Rexford Road, Charlotte, North Carolina 28211
Phone 704-366-7000 Fax 704-362-4208 www.nucor.com
| News Release |
|
Nucor Reports Results for the First Quarter of 2024 (Continued)
capital investments and their impact on our performance; (13) our safety performance; (14) our ability to integrate businesses we acquire; and (15) any pandemic or public health situation. These and other factors are discussed in Nucor’s regulatory filings with the United States Securities and Exchange Commission, including those in “Item 1A. Risk Factors” of Nucor’s Annual Report on Form 10-K for the year ended December 31, 2023. The forward-looking statements contained in this news release speak only as of this date, and Nucor does not assume any obligation to update them, except as may be required by applicable law.
Contact Information
For Investor/Analyst Inquiries - Jack Sullivan, 704-264-8942, or Paul Donnelly, 704-264-8807
For Media Inquiries - Katherine Miller, 704-353-9015
Page 5 of 10
Nucor Executive Offices: 1915 Rexford Road, Charlotte, North Carolina 28211
Phone 704-366-7000 Fax 704-362-4208 www.nucor.com
| News Release |
|
Nucor Reports Results for the First Quarter of 2024 (Continued)
Tonnage Data
(In thousands)
| Three Months (13 Weeks) Ended | ||||||||||||
| March 30, 2024 | April 1, 2023 | Percent Change | ||||||||||
| Steel mills total shipments: |
||||||||||||
| Sheet |
2,974 | 2,819 | 5 | % | ||||||||
| Bars |
1,912 | 2,169 | -12 | % | ||||||||
| Structural |
550 | 536 | 3 | % | ||||||||
| Plate |
412 | 454 | -9 | % | ||||||||
| Other |
42 | 57 | -26 | % | ||||||||
|
|
|
|
|
|
|
|||||||
| 5,890 | 6,035 | -2 | % | |||||||||
|
|
|
|
|
|
|
|||||||
| Sales tons to outside customers: |
||||||||||||
| Steel mills |
4,676 | 4,804 | -3 | % | ||||||||
| Joist |
99 | 135 | -27 | % | ||||||||
| Deck |
81 | 99 | -18 | % | ||||||||
| Cold finished |
99 | 117 | -15 | % | ||||||||
| Rebar fabrication products |
238 | 279 | -15 | % | ||||||||
| Piling |
98 | 101 | -3 | % | ||||||||
| Tubular products |
208 | 275 | -24 | % | ||||||||
| Other steel products |
142 | 135 | 5 | % | ||||||||
| Raw materials |
583 | 498 | 17 | % | ||||||||
|
|
|
|
|
|
|
|||||||
| 6,224 | 6,443 | -3 | % | |||||||||
|
|
|
|
|
|
|
|||||||
Page 6 of 10
Nucor Executive Offices: 1915 Rexford Road, Charlotte, North Carolina 28211
Phone 704-366-7000 Fax 704-362-4208 www.nucor.com
| News Release |
|
Nucor Reports Results for the First Quarter of 2024 (Continued)
Condensed Consolidated Statements of Earnings (Unaudited)
(In thousands, except per share data)
| Three Months (13 Weeks) Ended | ||||||||
| March 30, 2024 | April 1, 2023 | |||||||
| Net sales |
$ | 8,137,083 | $ | 8,709,980 | ||||
|
|
|
|
|
|||||
| Costs, expenses and other: |
||||||||
| Cost of products sold |
6,613,903 | 6,711,778 | ||||||
| Marketing, administrative and other expenses |
345,395 | 389,895 | ||||||
| Equity in (earnings) losses of unconsolidated affiliates |
(9,769 | ) | 1,340 | |||||
| Interest (income) expense, net |
(37,787 | ) | 10,183 | |||||
|
|
|
|
|
|||||
| 6,911,742 | 7,113,196 | |||||||
|
|
|
|
|
|||||
| Earnings before income taxes and noncontrolling interests |
1,225,341 | 1,596,784 | ||||||
| Provision for income taxes |
266,379 | 365,155 | ||||||
|
|
|
|
|
|||||
| Net earnings before noncontrolling interests |
958,962 | 1,231,629 | ||||||
| Earnings attributable to noncontrolling interests |
114,121 | 95,087 | ||||||
|
|
|
|
|
|||||
| Net earnings attributable to Nucor stockholders |
$ | 844,841 | $ | 1,136,542 | ||||
|
|
|
|
|
|||||
| Net earnings per share: |
||||||||
| Basic |
$ | 3.46 | $ | 4.47 | ||||
| Diluted |
$ | 3.46 | $ | 4.45 | ||||
| Average shares outstanding: |
||||||||
| Basic |
243,098 | 253,608 | ||||||
| Diluted |
243,497 | 254,397 | ||||||
Page 7 of 10
Nucor Executive Offices: 1915 Rexford Road, Charlotte, North Carolina 28211
Phone 704-366-7000 Fax 704-362-4208 www.nucor.com
| News Release |
|
Nucor Reports Results for the First Quarter of 2024 (Continued)
Condensed Consolidated Balance Sheets (Unaudited)
(In thousands)
| March 30, 2024 | Dec. 31, 2023 | |||||||
| ASSETS |
||||||||
| Current assets: |
||||||||
| Cash and cash equivalents |
$ | 4,557,759 | $ | 6,383,298 | ||||
| Short-term investments |
981,179 | 747,479 | ||||||
| Accounts receivable, net |
3,157,184 | 2,953,311 | ||||||
| Inventories, net |
5,589,675 | 5,577,758 | ||||||
| Other current assets |
356,882 | 724,012 | ||||||
|
|
|
|
|
|||||
| Total current assets |
14,642,679 | 16,385,858 | ||||||
| Property, plant and equipment, net |
11,456,683 | 11,049,767 | ||||||
| Restricted cash and cash equivalents |
46 | 3,494 | ||||||
| Goodwill |
3,956,062 | 3,968,847 | ||||||
| Other intangible assets, net |
3,049,070 | 3,108,015 | ||||||
| Other assets |
827,985 | 824,518 | ||||||
|
|
|
|
|
|||||
| Total assets |
$ | 33,932,525 | $ | 35,340,499 | ||||
|
|
|
|
|
|||||
| LIABILITIES |
||||||||
| Current liabilities: |
||||||||
| Short-term debt |
$ | 130,002 | $ | 119,211 | ||||
| Current portion of long-term debt and finance lease obligations |
73,890 | 74,102 | ||||||
| Accounts payable |
1,616,366 | 2,020,289 | ||||||
| Salaries, wages and related accruals |
686,186 | 1,326,390 | ||||||
| Accrued expenses and other current liabilities |
1,139,532 | 1,054,517 | ||||||
|
|
|
|
|
|||||
| Total current liabilities |
3,645,976 | 4,594,509 | ||||||
| Long-term debt and finance lease obligations due after one year |
6,647,560 | 6,648,873 | ||||||
| Deferred credits and other liabilities |
1,913,470 | 1,973,363 | ||||||
|
|
|
|
|
|||||
| Total liabilities |
12,207,006 | 13,216,745 | ||||||
|
|
|
|
|
|||||
| Commitments and contingencies |
||||||||
| EQUITY |
||||||||
| Nucor stockholders’ equity: |
||||||||
| Common stock |
152,061 | 152,061 | ||||||
| Additional paid-in capital |
2,210,823 | 2,176,243 | ||||||
| Retained earnings |
29,476,087 | 28,762,045 | ||||||
| Accumulated other comprehensive loss, net of income taxes |
(177,440 | ) | (162,072 | ) | ||||
| Treasury stock |
(10,967,818 | ) | (9,987,643 | ) | ||||
|
|
|
|
|
|||||
| Total Nucor stockholders’ equity |
20,693,713 | 20,940,634 | ||||||
| Noncontrolling interests |
1,031,806 | 1,183,120 | ||||||
|
|
|
|
|
|||||
| Total equity |
21,725,519 | 22,123,754 | ||||||
|
|
|
|
|
|||||
| Total liabilities and equity |
$ | 33,932,525 | $ | 35,340,499 | ||||
|
|
|
|
|
|||||
Page 8 of 10
Nucor Executive Offices: 1915 Rexford Road, Charlotte, North Carolina 28211
Phone 704-366-7000 Fax 704-362-4208 www.nucor.com
| News Release |
|
Nucor Reports Results for the First Quarter of 2024 (Continued)
Condensed Consolidated Statements of Cash Flows (Unaudited)
(In thousands)
| Three Months (13 Weeks) Ended | ||||||||
| March 30, 2024 | April 1, 2023 | |||||||
| Operating activities: |
||||||||
| Net earnings before noncontrolling interests |
$ | 958,962 | $ | 1,231,629 | ||||
| Adjustments: |
||||||||
| Depreciation |
256,938 | 221,089 | ||||||
| Amortization |
58,683 | 58,769 | ||||||
| Stock-based compensation |
21,341 | 20,401 | ||||||
| Deferred income taxes |
(39,627 | ) | (28,193 | ) | ||||
| Distributions from affiliates |
7,241 | 17,394 | ||||||
| Equity in (earnings)/losses of unconsolidated affiliates |
(9,769 | ) | 1,340 | |||||
| Changes in assets and liabilities (exclusive of acquisitions and dispositions): |
||||||||
| Accounts receivable |
(207,682 | ) | (67,505 | ) | ||||
| Inventories |
(13,980 | ) | (138,694 | ) | ||||
| Accounts payable |
(392,403 | ) | 394,602 | |||||
| Federal income taxes |
247,783 | 330,781 | ||||||
| Salaries, wages and related accruals |
(595,861 | ) | (858,925 | ) | ||||
| Other operating activities |
168,027 | 24,485 | ||||||
|
|
|
|
|
|||||
| Cash provided by operating activities |
459,653 | 1,207,173 | ||||||
|
|
|
|
|
|||||
| Investing activities: |
||||||||
| Capital expenditures |
(670,340 | ) | (531,733 | ) | ||||
| Investment in and advances to affiliates |
(79 | ) | — | |||||
| Disposition of plant and equipment |
4,439 | 2,276 | ||||||
| Acquisitions (net of cash acquired) |
991 | — | ||||||
| Purchases of investments |
(646,570 | ) | (468,412 | ) | ||||
| Proceeds from the sale of investments |
421,831 | 228,086 | ||||||
|
|
|
|
|
|||||
| Cash used in investing activities |
(889,728 | ) | (769,783 | ) | ||||
|
|
|
|
|
|||||
| Financing activities: |
||||||||
| Net change in short-term debt |
10,791 | (19,765 | ) | |||||
| Repayment of long-term debt |
(2,500 | ) | (2,500 | ) | ||||
| Proceeds from exercise of stock options |
3,165 | 7,123 | ||||||
| Payment of tax withholdings on certain stock-based compensation |
(3,280 | ) | (7,105 | ) | ||||
| Distributions to noncontrolling interests |
(265,435 | ) | (337,810 | ) | ||||
| Cash dividends |
(133,568 | ) | (130,525 | ) | ||||
| Acquisition of treasury stock |
(1,001,300 | ) | (425,820 | ) | ||||
| Other financing activities |
(3,419 | ) | (4,272 | ) | ||||
|
|
|
|
|
|||||
| Cash used in financing activities |
(1,395,546 | ) | (920,674 | ) | ||||
|
|
|
|
|
|||||
| Effect of exchange rate changes on cash |
(3,366 | ) | 3,243 | |||||
|
|
|
|
|
|||||
| (Decrease) Increase in cash and cash equivalents and restricted cash and cash equivalents |
(1,828,987 | ) | (480,041 | ) | ||||
| Cash and cash equivalents and restricted cash and cash equivalents - beginning of year |
6,386,792 | 4,361,220 | ||||||
|
|
|
|
|
|||||
| Cash and cash equivalents and restricted cash and cash equivalents - end of three months |
$ | 4,557,805 | $ | 3,881,179 | ||||
|
|
|
|
|
|||||
| Non-cash investing activity: |
||||||||
| Change in accrued plant and equipment purchases |
$ | (10,880 | ) | $ | (36,280 | ) | ||
|
|
|
|
|
|||||
Page 9 of 10
Nucor Executive Offices: 1915 Rexford Road, Charlotte, North Carolina 28211
Phone 704-366-7000 Fax 704-362-4208 www.nucor.com
| News Release |
|
Nucor Reports Results for the First Quarter of 2024 (Continued)
Non-GAAP Financial Measures
Reconciliation of EBITDA (Unaudited)
(In thousands)
| Three Months (13 Weeks) Ended | ||||||||
| March 30, 2024 | April 1, 2023 | |||||||
| Net earnings before noncontrolling interests |
$ | 958,962 | $ | 1,231,629 | ||||
| Depreciation |
256,938 | 221,089 | ||||||
| Amortization |
58,683 | 58,769 | ||||||
| Interest (income) expense, net |
(37,787 | ) | 10,183 | |||||
| Provision for income taxes |
266,379 | 365,155 | ||||||
|
|
|
|
|
|||||
| EBITDA |
$ | 1,503,175 | $ | 1,886,825 | ||||
|
|
|
|
|
|||||
Page 10 of 10
Nucor Executive Offices: 1915 Rexford Road, Charlotte, North Carolina 28211
Phone 704-366-7000 Fax 704-362-4208 www.nucor.com

Exhibit 99.2 FIRST QUARTER 2024 EARNINGS CALL LEON TOPALIAN Chair, President and CEO STEVE LAXTON Executive Vice President and CFO April 23, 2024
FORWARD-LOOKING STATEMENTS Certainstatementsmadeinthispresentation may constitute forward-looking statements within the meaning of the Private Securities Litigation Reform Act of 1995. These statements involve risks and uncertainties. The words “anticipate,” “believe,” “expect,” “intend,” “may,” “project,” “will,” “should,” “could” and similar expressions are intended to identify forward-looking statements. These forward-looking statements reflect the Company’s best judgment based on current information, and although we base these statements on circumstances that we believe to be reasonable when made, there can be no assurance that future events will not affect the accuracy of such forward-looking information. The Company does not undertake any obligation to update these statements. The forward-looking statements are not guarantees of future performance, and actual results may vary materially from the projected results and expectations discussed in this presentation. Factors that might cause the Company’s actual results to differ materially from those anticipated in forward- looking statements include, but are not limited to: (1) competitive pressure on sales and pricing, including pressure from imports and substitute materials; (2) U.S. and foreign trade policies affecting steel imports or exports; (3) the sensitivity of the results of our operations to general market conditions, and in particular, prevailing market steel prices and changes in the supply and cost of raw materials, including pig iron, iron ore and scrap steel; (4) the availability and cost of electricity and natural gas, which could negatively affect our cost of steel production or result in a delay or cancellation of existing or future drilling within our natural gas drilling programs; (5) critical equipment failures and business interruptions; (6) market demand for steel products, which, in the case of many of our products, is driven by the level of nonresidential construction activity in the United States; (7) impairment in the recorded value of inventory, equity investments, fixed assets, goodwill or other long- lived assets; (8) uncertainties and volatility surrounding the global economy, including excess world capacity for steel production, inflation and interest rate changes; (9) fluctuations in currency conversion rates; (10) significant changes in laws or government regulations affecting environmental compliance, including legislation and regulations that result in greater regulation of greenhouse gas emissions that could increase our energy costs, capital expenditures and operating costs or cause one or more of our permits to be revoked or make it more difficult to obtain permit modifications; (11) the cyclical nature of the steel industry; (12) capital investments and their impact on our performance; (13) our safety performance; (14) our ability to integrate businesses we acquire; (15) the impact of the COVID-19 pandemic, any variants of the virus, and any other similar public health situation; and (16) the risks discussed in “Item 1A. Risk Factors” of the Company’s Annual Report on Form 10-K for the year ended December 31, 2023 and elsewhere therein and in the other reports we file with the U.S. Securities and Exchange Commission. 2
NON-GAAP FINANCIAL MEASURES The Company uses certain non-GAAP (Generally Accepted Accounting Principles) financial measures in this news release, including EBITDA. Generally, a non-GAAP financial measure is a numerical measure of a company’s performance or financial position that either excludes or includes amounts that are not normally excluded or included in the most directly comparable financial measure calculated and presented in accordance with GAAP. We define EBITDA as net earnings before noncontrolling interests adding back the following items: interest expense, net; provision for income taxes; depreciation; amortization; and losses and impairments of assets. Please note that other companies might define their non-GAAP financial measures differently than we do. Management presents the non-GAAP financial measure of EBITDA in this news release because it considers it to be an important supplemental measure of performance. Management believes that this non- GAAP financial measure provides additional insight for analysts and investors evaluating the Company’s financial and operational performance by providing a consistent basis of comparison across periods. Non-GAAP financial measures have limitations as an analytical tool. Investors are encouraged to review the reconciliation of non-GAAP financial measures to their most directly comparable GAAP financial measures provided in this news release, including in the accompanying tables. 3
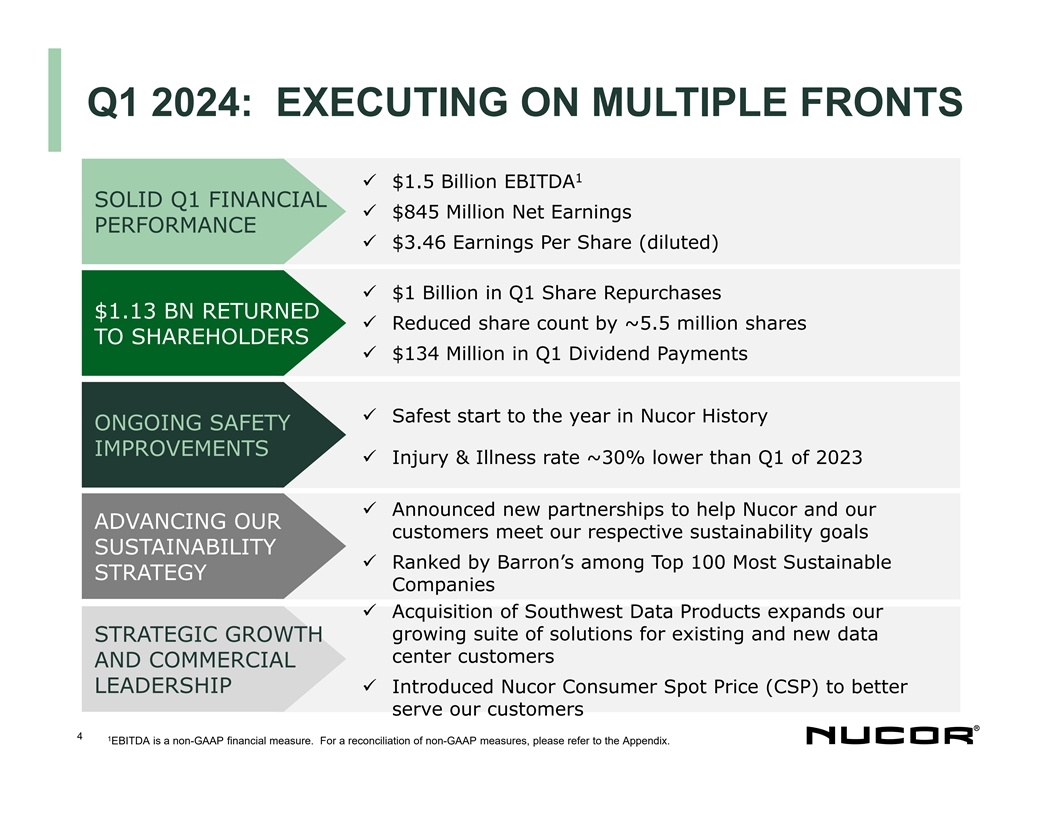
Q1 2024: EXECUTING ON MULTIPLE FRONTS 1 ü $1.5 Billion EBITDA ü $1.5 Billion EBITDA SOLID Q1 FINANCIAL üü $845 Million $845 Million Net Earnings Net Earnings PERFORMANCE üü $3.46 Earnings $3.46 Earnings P Pe er r Share Share (diluted) (diluted) ü $1 Billion in Share Repurchases ü $1 Billion in Q1 Share Repurchases $1.13 BN RETURNED ü Reduced share count by ~5.5 million shares ü Reduces share count by ~5.5 million shares TO SHAREHOLDERS ü $134 Million in Q1 Dividend Payments ü $128 Million in Dividend Payments ü Safest start to the year in Nucor History ONGOING SAFETY IMPROVEMENTS ü Injury & Illness rate ~30% lower than Q1 of 2023 üü Announced partnerships aligned with Announced new partnerships to help Nucor and our our sustainability ADVANCING OUR customers meet goals our respective sustainability goals SUSTAINABILITY üü R Ra ank nked by Barron’ ed among Top 100 most Sustainable s among Top 100 Most Sustainable Companies STRATEGY Companies in the World (Barron’s 2024) ü Acquisition of Southwest Data Products expands our growing suite of solutions for existing and new data STRATEGIC GROWTH center customers AND COMMERCIAL LEADERSHIP ü Introduced Nucor Consumer Spot Price (CSP) to better serve our customers 4 1 EBITDA is a non-GAAP financial measure. For a reconciliation of non-GAAP measures, please refer to the Appendix.
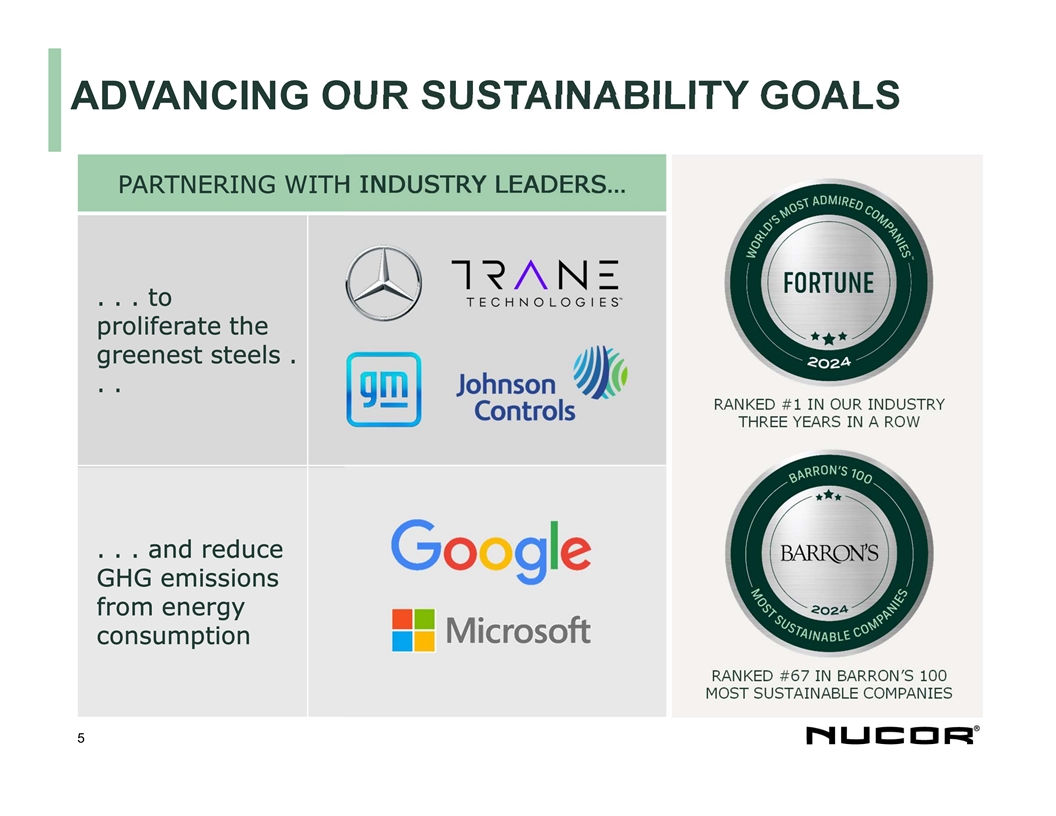
ADVANCING OUR SUSTAINABILITY GOALS PARTNERING WITH INDUSTRY LEADERS… . . . to proliferate the greenest steels . . . RANKED #1 IN OUR INDUSTRY THREE YEARS IN A ROW . . . and reduce GHG emissions from energy consumption RANKED #67 IN BARRON’S 100 MOST SUSTAINABLE COMPANIES 5
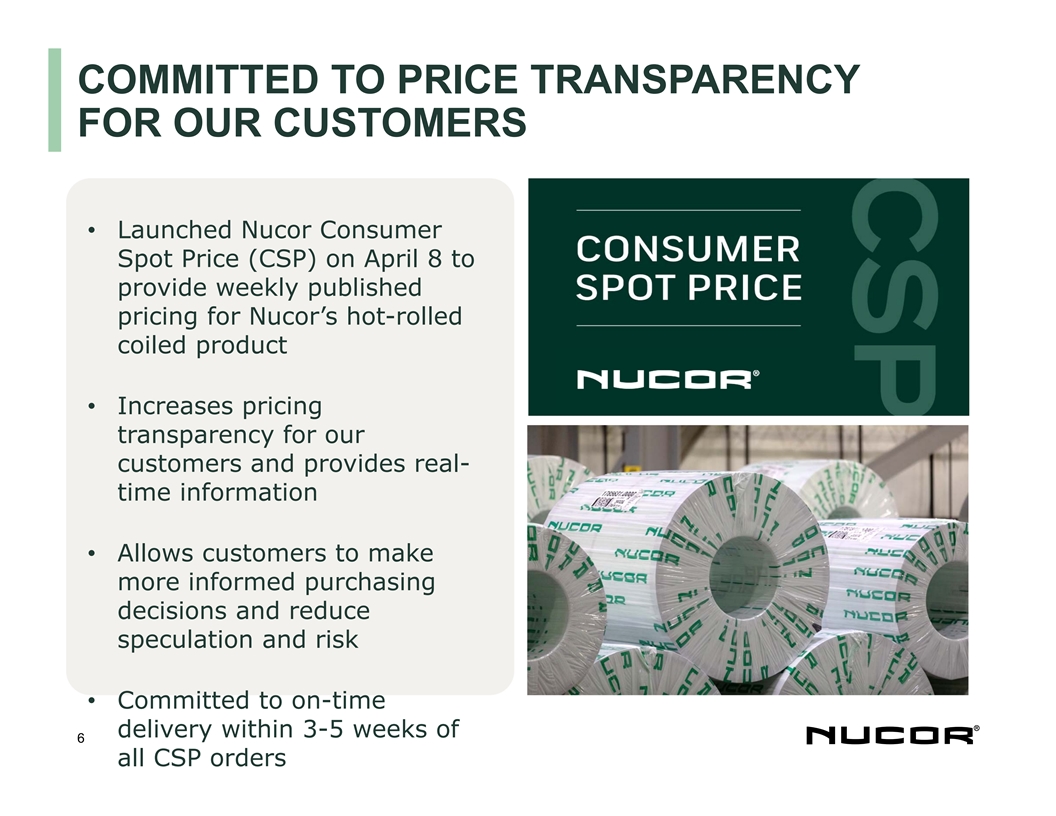
COMMITTED TO PRICE TRANSPARENCY FOR OUR CUSTOMERS • Launched Nucor Consumer Spot Price (CSP) on April 8 to provide weekly published pricing for Nucor’s hot-rolled coiled product • Increases pricing transparency for our customers and provides real- time information • Allows customers to make more informed purchasing decisions and reduce speculation and risk • Committed to on-time delivery within 3-5 weeks of 6 all CSP orders
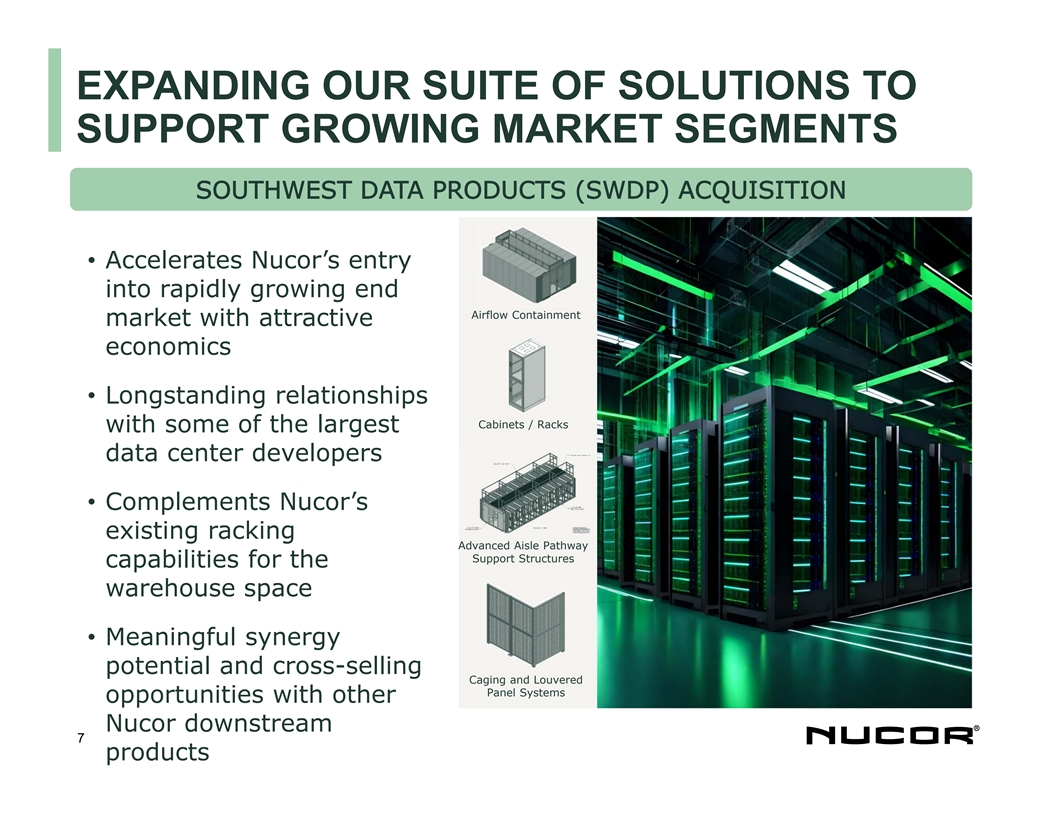
EXPANDING OUR SUITE OF SOLUTIONS TO SUPPORT GROWING MARKET SEGMENTS SOUTHWEST DATA PRODUCTS (SWDP) ACQUISITION • Accelerates Nucor’s entry into rapidly growing end Airflow Containment market with attractive economics • Longstanding relationships Cabinets / Racks with some of the largest data center developers • Complements Nucor’s existing racking Advanced Aisle Pathway Support Structures capabilities for the warehouse space • Meaningful synergy potential and cross-selling Caging and Louvered Panel Systems opportunities with other Nucor downstream 7 products
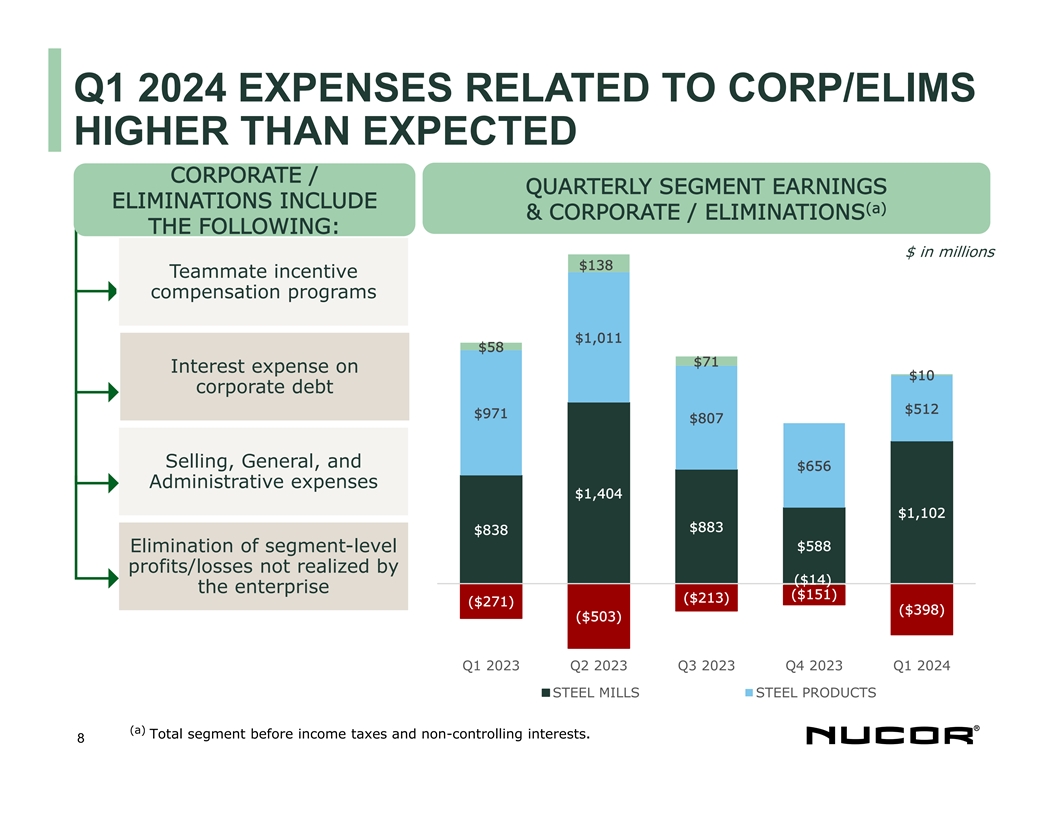
Q1 2024 EXPENSES RELATED TO CORP/ELIMS HIGHER THAN EXPECTED CORPORATE / QUARTERLY SEGMENT EARNINGS ELIMINATIONS INCLUDE (a) & CORPORATE / ELIMINATIONS THE FOLLOWING: $ in millions $138 Teammate incentive compensation programs $1,011 $58 $71 Interest expense on $10 corporate debt $512 $971 $807 Selling, General, and $656 Administrative expenses $1,404 $1,102 $883 $838 $588 Elimination of segment-level profits/losses not realized by ($14) the enterprise ($151) ($213) ($271) ($398) ($503) Q1 2023 Q2 2023 Q3 2023 Q4 2023 Q1 2024 STEEL MILLS STEEL PRODUCTS (a) Total segment before income taxes and non-controlling interests. 8
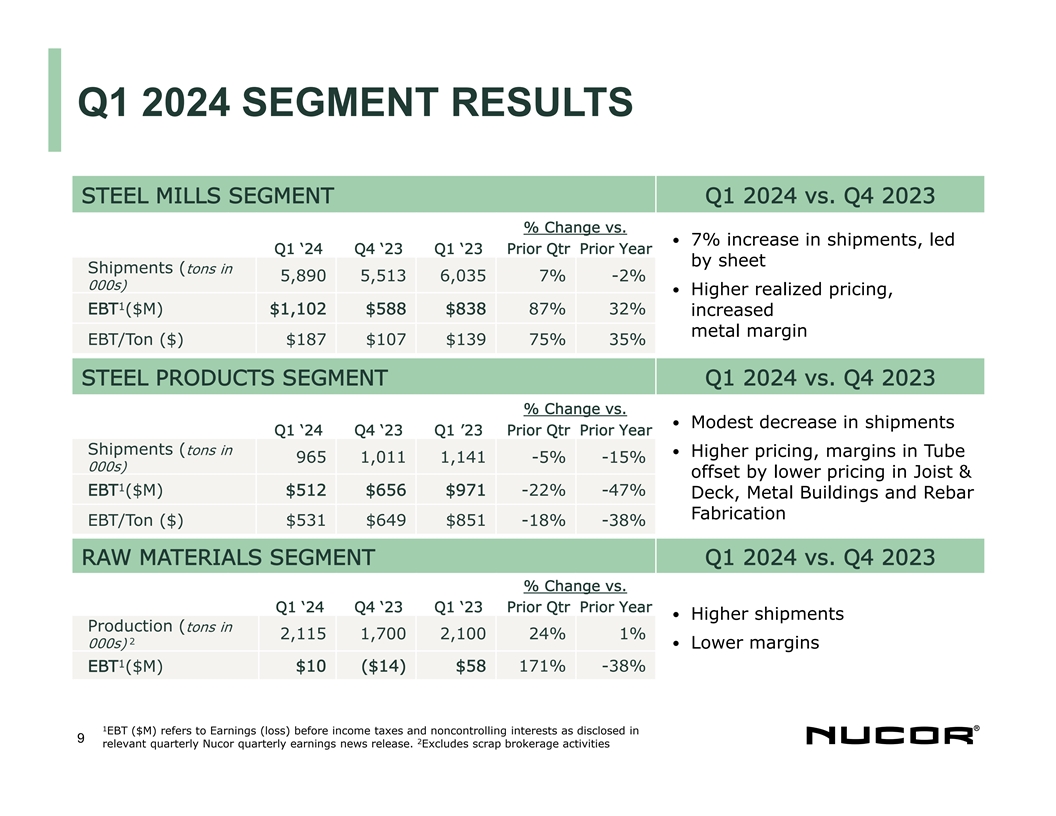
Q1 2024 SEGMENT RESULTS STEEL MILLS SEGMENT Q1 2024 vs. Q4 2023 % Change vs. · 7% increase in shipments, led Q1 ‘24 Q4 ‘23 Q1 ‘23 Prior Qtr Prior Year by sheet Shipments (tons in 5,890 5,513 6,035 7% -2% 000s) · Higher realized pricing, 1 EBT ($M) $1,102 $588 $838 87% 32% increased metal margin EBT/Ton ($) $187 $107 $139 75% 35% STEEL PRODUCTS SEGMENT Q1 2024 vs. Q4 2023 % Change vs. · Modest decrease in shipments Q1 ‘24 Q4 ‘23 Q1 ’23 Prior Qtr Prior Year Shipments (tons in · Higher pricing, margins in Tube 965 1,011 1,141 -5% -15% 000s) offset by lower pricing in Joist & 1 EBT ($M) $512 $656 $971 -22% -47% Deck, Metal Buildings and Rebar Fabrication EBT/Ton ($) $531 $649 $851 -18% -38% RAW MATERIALS SEGMENT Q1 2024 vs. Q4 2023 % Change vs. Q1 ‘24 Q4 ‘23 Q1 ‘23 Prior Qtr Prior Year · Higher shipments Production (tons in 2,115 1,700 2,100 24% 1% 2 000s)· Lower margins 1 EBT ($M) $10 ($14) $58 171% -38% 1 EBT ($M) refers to Earnings (loss) before income taxes and noncontrolling interests as disclosed in 9 2 relevant quarterly Nucor quarterly earnings news release. Excludes scrap brokerage activities
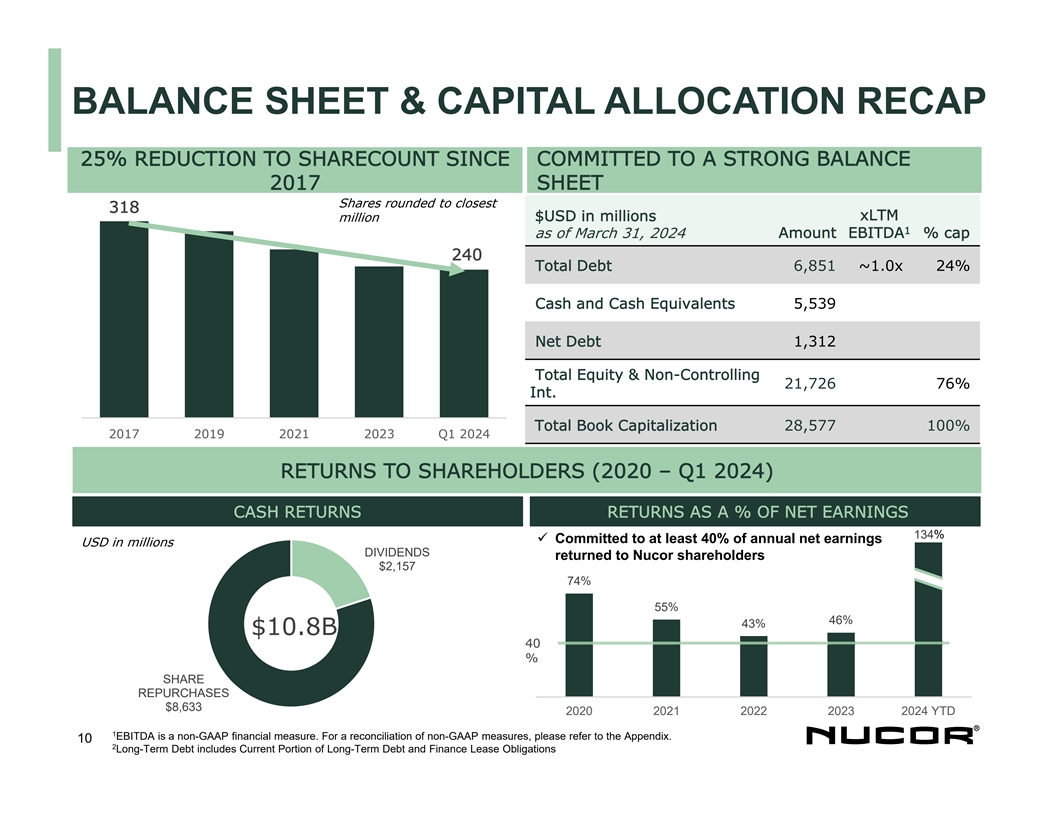
BALANCE SHEET & CAPITAL ALLOCATION RECAP COMMITTED TO A STRONG BALANCE 25% REDUCTION TO SHARECOUNT SINCE SHEET 2017 Shares rounded to closest 318 xLTM $USD in millions million 1 as of March 31, 2024 Amount EBITDA % cap 240 Total Debt 6,851 ~1.0x 24% Cash and Cash Equivalents 5,539 Net Debt 1,312 Total Equity & Non-Controlling 21,726 76% Int. Total Book Capitalization 28,577 100% 2017 2019 2021 2023 Q1 2024 RETURNS TO SHAREHOLDERS (2020 – Q1 2024) CASH RETURNS RETURNS AS A % OF NET EARNINGS 134% ü Committed to at least 40% of annual net earnings USD in millions DIVIDENDS returned to Nucor shareholders $2,157 74% 55% 46% 43% $10.8B 40 % SHARE REPURCHASES $8,633 2020 2021 2022 2023 2024 YTD 1 EBITDA is a non-GAAP financial measure. For a reconciliation of non-GAAP measures, please refer to the Appendix. 10 2 Long-Term Debt includes Current Portion of Long-Term Debt and Finance Lease Obligations
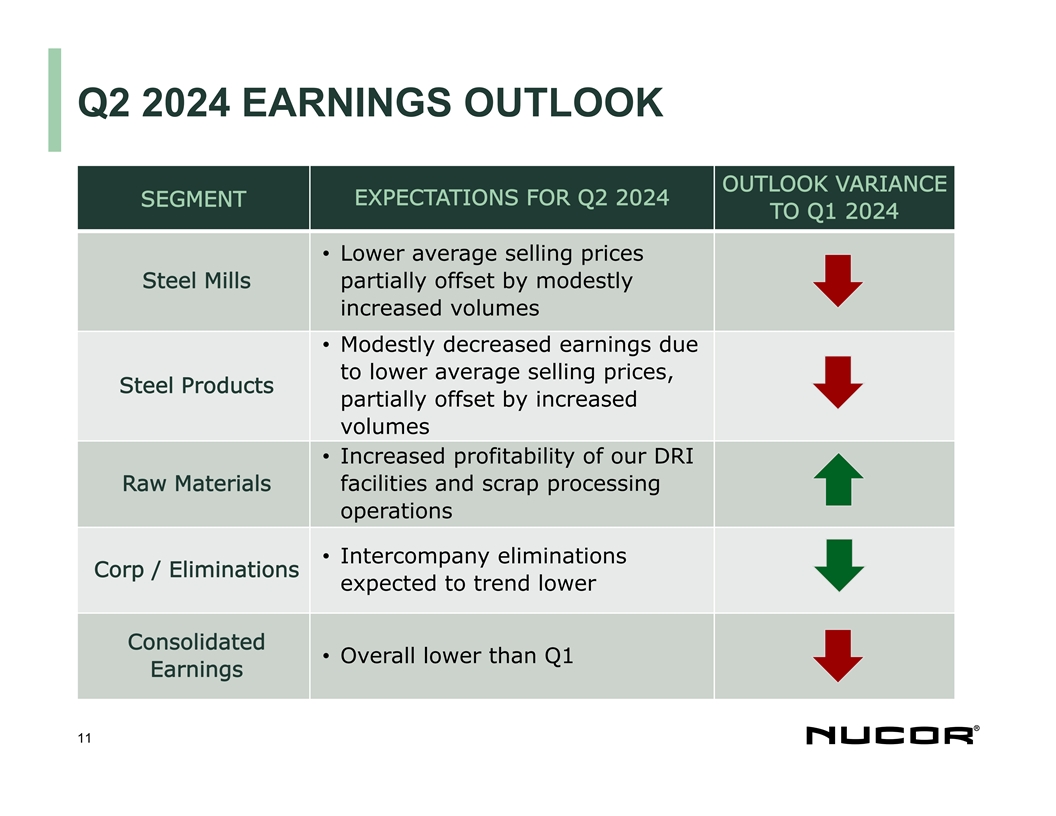
Q2 2024 EARNINGS OUTLOOK OUTLOOK VARIANCE EXPECTATIONS FOR Q2 2024 SEGMENT TO Q1 2024 • Lower average selling prices Steel Mills partially offset by modestly increased volumes • Modestly decreased earnings due to lower average selling prices, Steel Products partially offset by increased volumes • Increased profitability of our DRI Raw Materials facilities and scrap processing operations • Intercompany eliminations Corp / Eliminations expected to trend lower Consolidated • Overall lower than Q1 Earnings 11
APPENDIX 12
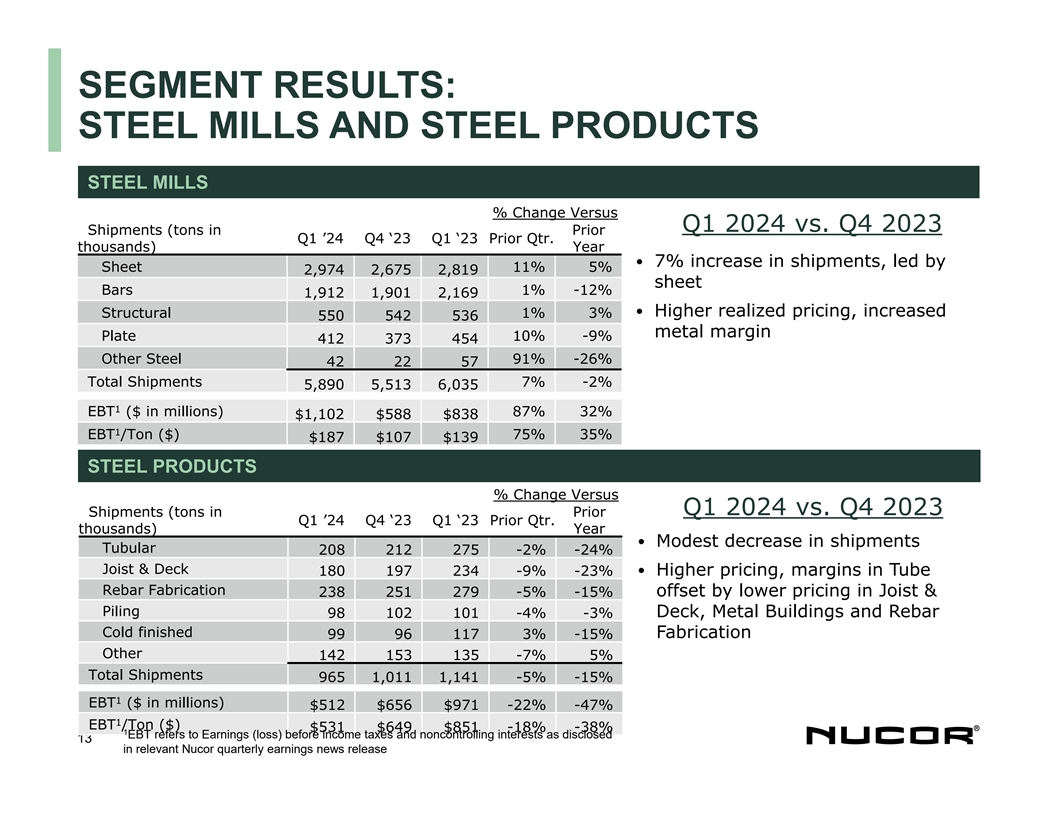
SEGMENT RESULTS: STEEL MILLS AND STEEL PRODUCTS STEEL MILLS % Change Versus Q1 2024 vs. Q4 2023 Shipments (tons in Prior Q1 ’24 Q4 ‘23 Q1 ‘23 Prior Qtr. thousands) Year · 7% increase in shipments, led by Sheet 11% 5% 2,974 2,675 2,819 sheet Bars 1% -12% 1,912 1,901 2,169 · Higher realized pricing, increased Structural 1% 3% 550 542 536 metal margin Plate 10% -9% 412 373 454 Other Steel 91% -26% 42 22 57 Total Shipments 7% -2% 5,890 5,513 6,035 1 EBT ($ in millions) 87% 32% $1,102 $588 $838 1 EBT /Ton ($) 75% 35% $187 $107 $139 STEEL PRODUCTS % Change Versus Q1 2024 vs. Q4 2023 Shipments (tons in Prior Q1 ’24 Q4 ‘23 Q1 ‘23 Prior Qtr. thousands) Year · Modest decrease in shipments Tubular 208 212 275 -2% -24% Joist & Deck· 180 197 234 -9% -23% Higher pricing, margins in Tube Rebar Fabrication 238 251 279 -5% -15% offset by lower pricing in Joist & Piling Deck, Metal Buildings and Rebar 98 102 101 -4% -3% Cold finished 99 96 117 3% -15% Fabrication Other 142 153 135 -7% 5% Total Shipments 965 1,011 1,141 -5% -15% 1 EBT ($ in millions) $512 $656 $971 -22% -47% 1 EBT /Ton ($) $531 $649 $851 -18% -38% 1 EBT refers to Earnings (loss) before income taxes and noncontrolling interests as disclosed 13 in relevant Nucor quarterly earnings news release
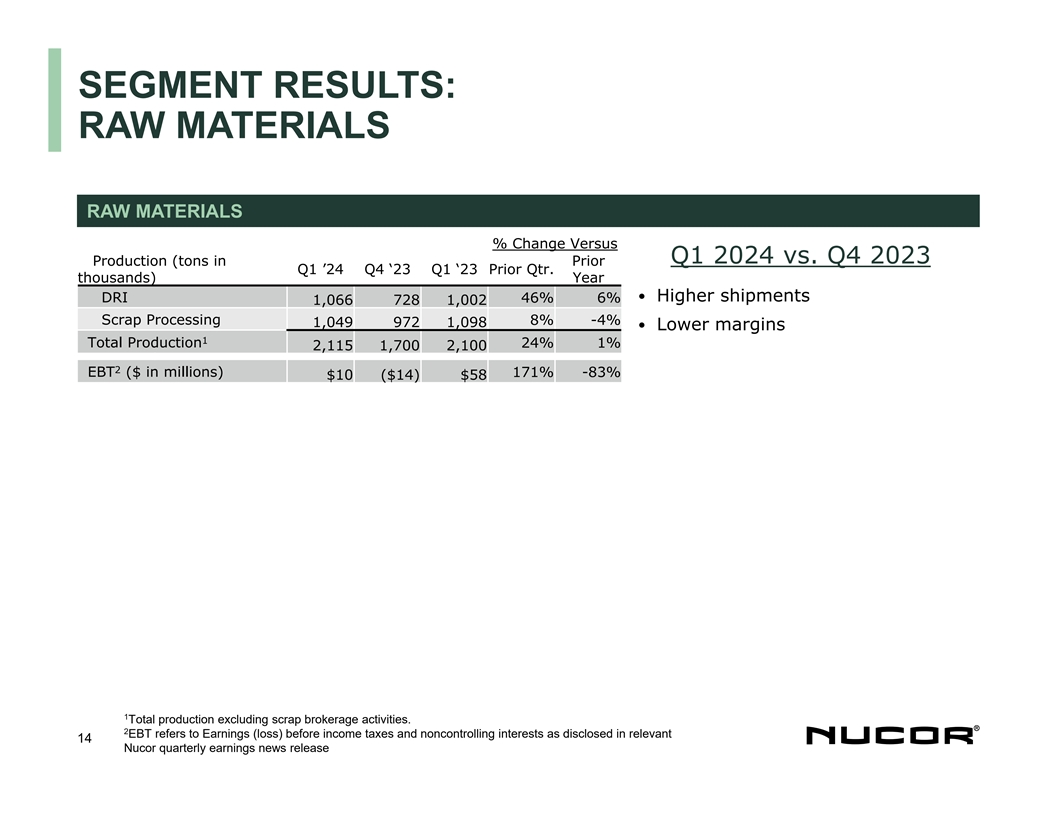
SEGMENT RESULTS: RAW MATERIALS RAW MATERIALS % Change Versus Q1 2024 vs. Q4 2023 Production (tons in Prior Q1 ’24 Q4 ‘23 Q1 ‘23 Prior Qtr. thousands) Year · Higher shipments DRI 46% 6% 1,066 728 1,002 Scrap Processing 8% -4% 1,049 972 1,098 · Lower margins 1 Total Production 24% 1% 2,115 1,700 2,100 2 EBT ($ in millions) 171% -83% $10 ($14) $58 1 Total production excluding scrap brokerage activities. 2 EBT refers to Earnings (loss) before income taxes and noncontrolling interests as disclosed in relevant 14 Nucor quarterly earnings news release
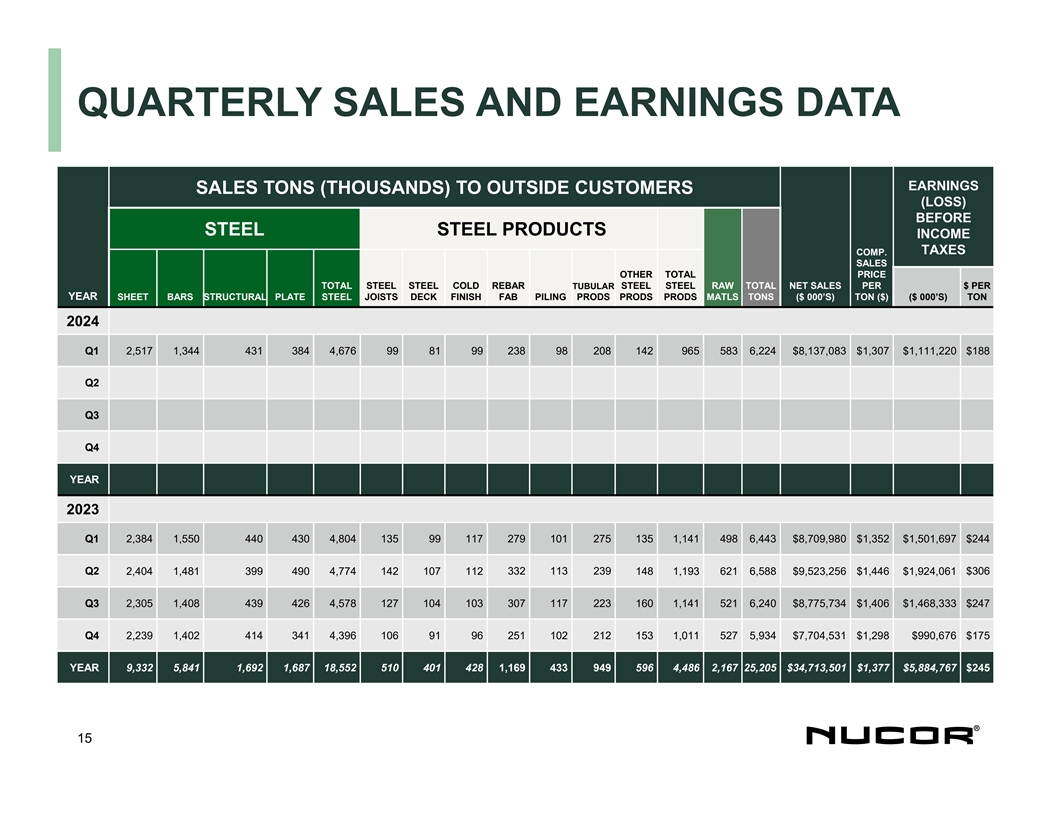
QUARTERLY SALES AND EARNINGS DATA EARNINGS SALES TONS (THOUSANDS) TO OUTSIDE CUSTOMERS (LOSS) BEFORE STEEL STEEL PRODUCTS INCOME TAXES COMP. SALES OTHER TOTAL PRICE TOTAL STEEL STEEL COLD REBAR TUBULAR STEEL STEEL RAW TOTAL NET SALES PER $ PER YEAR SHEET BARS STRUCTURAL PLATE STEEL JOISTS DECK FINISH FAB PILING PRODS PRODS PRODS MATLS TONS ($ 000’S) TON ($) ($ 000’S) TON 2024 Q1 2,517 1,344 431 384 4,676 99 81 99 238 98 208 142 965 583 6,224 $8,137,083 $1,307 $1,111,220 $188 Q2 Q3 Q4 YEAR 2023 Q1 2,384 1,550 440 430 4,804 135 99 117 279 101 275 135 1,141 498 6,443 $8,709,980 $1,352 $1,501,697 $244 Q2 2,404 1,481 399 490 4,774 142 107 112 332 113 239 148 1,193 621 6,588 $9,523,256 $1,446 $1,924,061 $306 Q3 2,305 1,408 439 426 4,578 127 104 103 307 117 223 160 1,141 521 6,240 $8,775,734 $1,406 $1,468,333 $247 Q4 2,239 1,402 414 341 4,396 106 91 96 251 102 212 153 1,011 527 5,934 $7,704,531 $1,298 $990,676 $175 YEAR 9,332 5,841 1,692 1,687 18,552 510 401 428 1,169 433 949 596 4,486 2,167 25,205 $34,713,501 $1,377 $5,884,767 $245 15
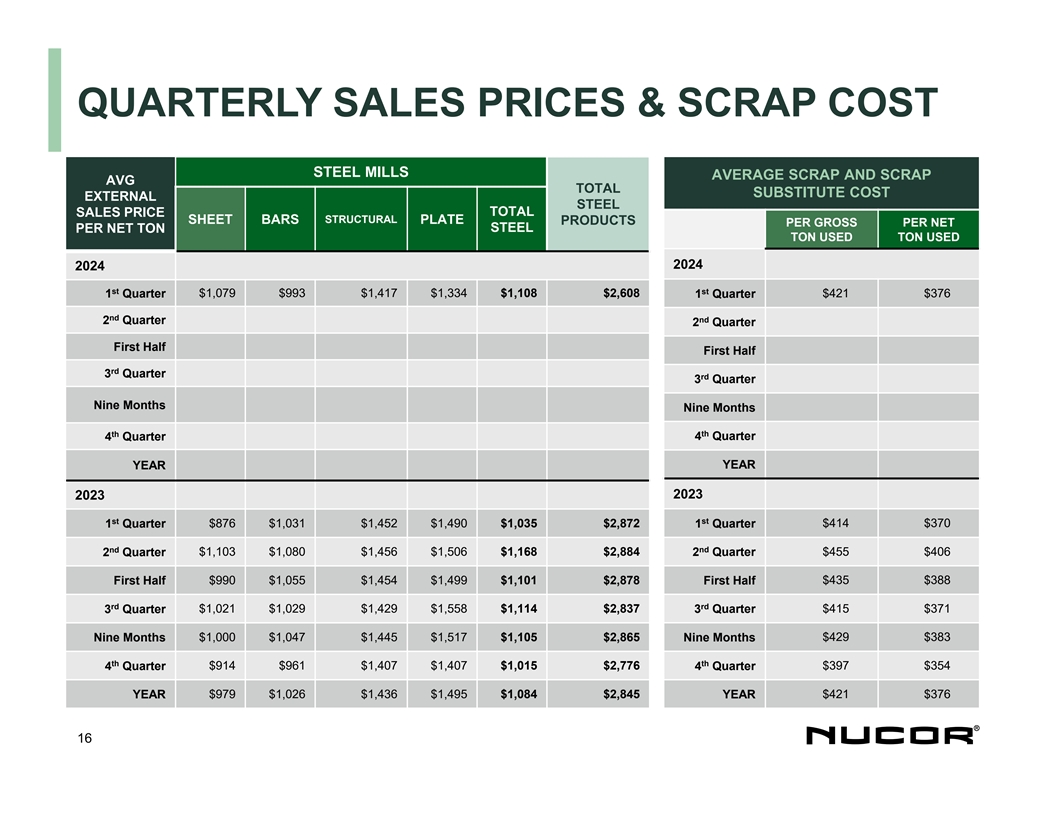
QUARTERLY SALES PRICES & SCRAP COST STEEL MILLS AVERAGE SCRAP AND SCRAP AVG TOTAL SUBSTITUTE COST EXTERNAL STEEL TOTAL SALES PRICE STRUCTURAL SHEET BARS PLATE PRODUCTS PER GROSS PER NET STEEL PER NET TON TON USED TON USED 2024 2024 st st 1 Quarter $1,079 $993 $1,417 $1,334 $1,108 $2,608 $421 $376 1 Quarter nd nd 2 Quarter 2 Quarter First Half First Half rd 3 Quarter rd 3 Quarter Nine Months Nine Months th th 4 Quarter 4 Quarter YEAR YEAR 2023 2023 st st 1 Quarter $876 $1,031 $1,452 $1,490 $1,035 $2,872 1 Quarter $414 $370 nd nd 2 Quarter $1,103 $1,080 $1,456 $1,506 $1,168 $2,884 2 Quarter $455 $406 $990 $1,055 $1,454 $1,499 $1,101 $2,878 $435 $388 First Half First Half rd rd 3 Quarter $1,021 $1,029 $1,429 $1,558 $1,114 $2,837 3 Quarter $415 $371 Nine Months $1,000 $1,047 $1,445 $1,517 $1,105 $2,865 Nine Months $429 $383 th th $914 $961 $1,407 $1,407 $1,015 $2,776 $397 $354 4 Quarter 4 Quarter YEAR $979 $1,026 $1,436 $1,495 $1,084 $2,845 YEAR $421 $376 16
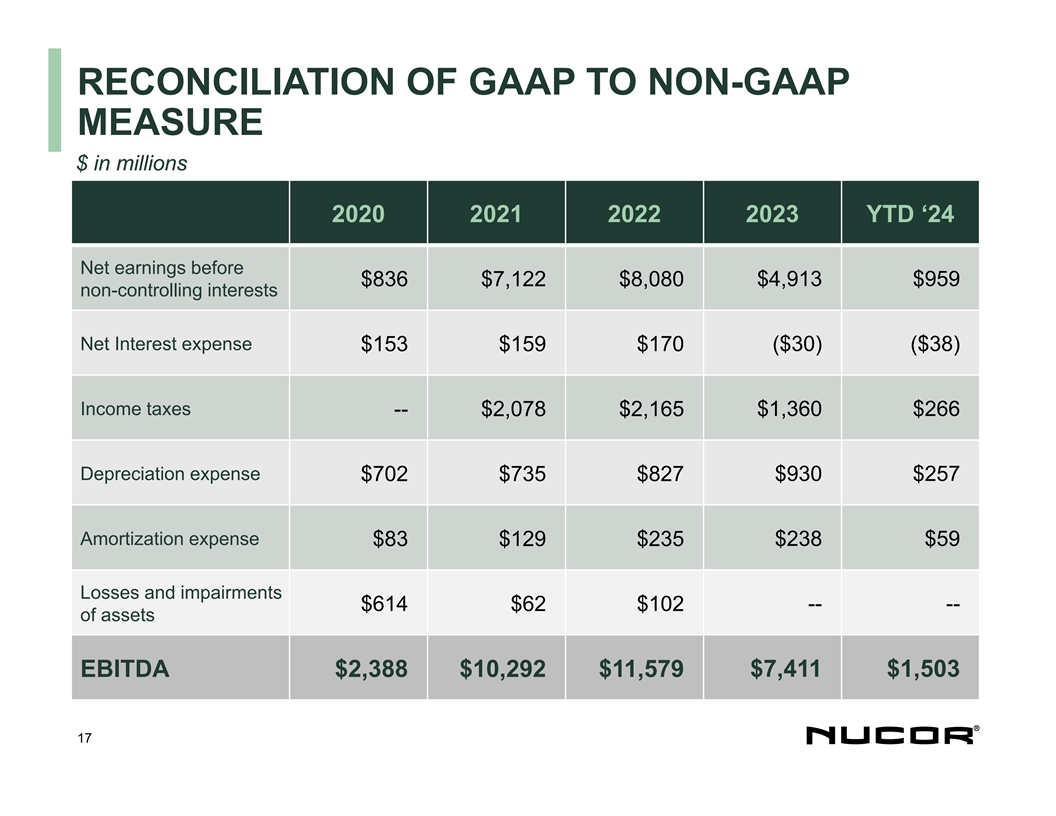
RECONCILIATION OF GAAP TO NON-GAAP MEASURE $ in millions 2020 2021 2022 2023 YTD ‘24 Net earnings before $836 $7,122 $8,080 $4,913 $959 non-controlling interests Net Interest expense ($30) ($38) $153 $159 $170 Income taxes -- $2,078 $2,165 $1,360 $266 Depreciation expense $702 $735 $827 $930 $257 Amortization expense $83 $129 $235 $238 $59 Losses and impairments $614 $62 $102 -- -- of assets EBITDA $2,388 $10,292 $11,579 $7,411 $1,503 17
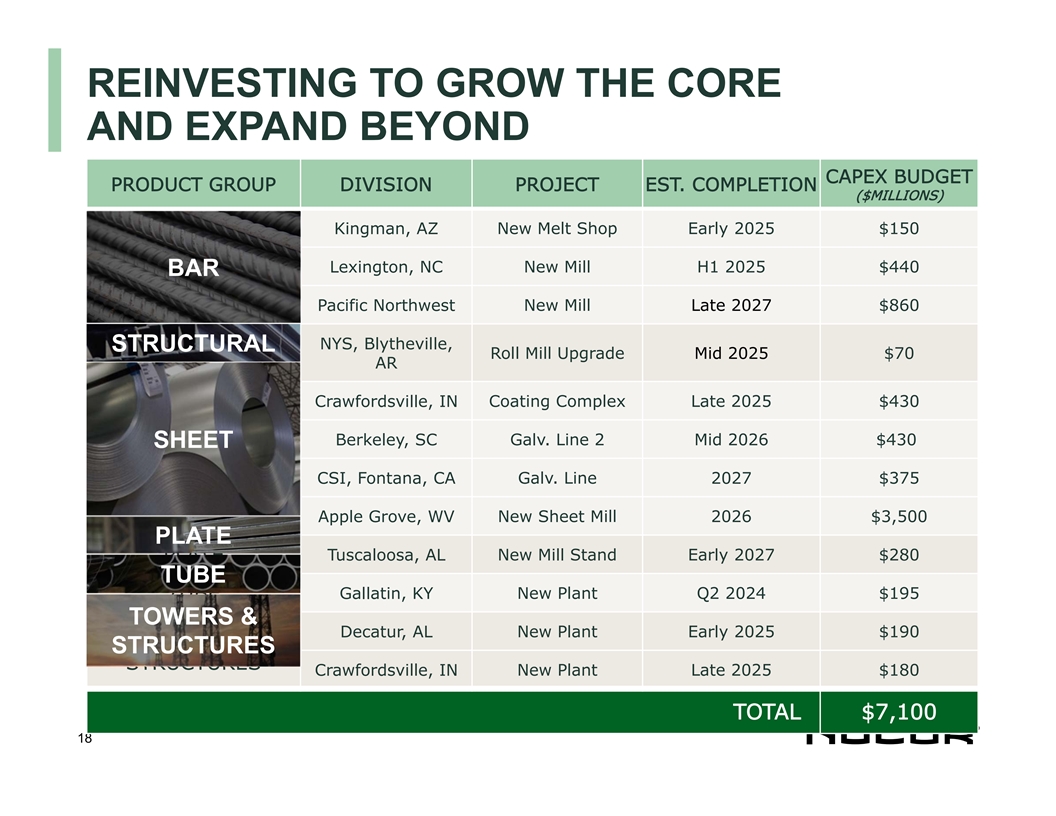
REINVESTING TO GROW THE CORE AND EXPAND BEYOND CAPEX BUDGET PRODUCT GROUP DIVISION PROJECT EST. COMPLETION ($MILLIONS) Kingman, AZ New Melt Shop Early 2025 $150 Lexington, NC New Mill H1 2025 $440 BAR BAR Pacific Northwest New Mill Late 2027 $860 NYS, Blytheville, STRUCTURAL Roll Mill Upgrade Mid 2025 $70 STRUCTURAL AR Crawfordsville, IN Coating Complex Late 2025 $430 Berkeley, SC Galv. Line 2 Mid 2026 $430 SHEET SHEET CSI, Fontana, CA Galv. Line 2027 $375 Apple Grove, WV New Sheet Mill 2026 $3,500 PLATE Tuscaloosa, AL New Mill Stand Early 2027 $280 PLATE TUBE Gallatin, KY New Plant Q2 2024 $195 TUBE TOWERS & Decatur, AL New Plant Early 2025 $190 TOWERS & STRUCTURES STRUCTURES Crawfordsville, IN New Plant Late 2025 $180 TOTAL $7,100 18
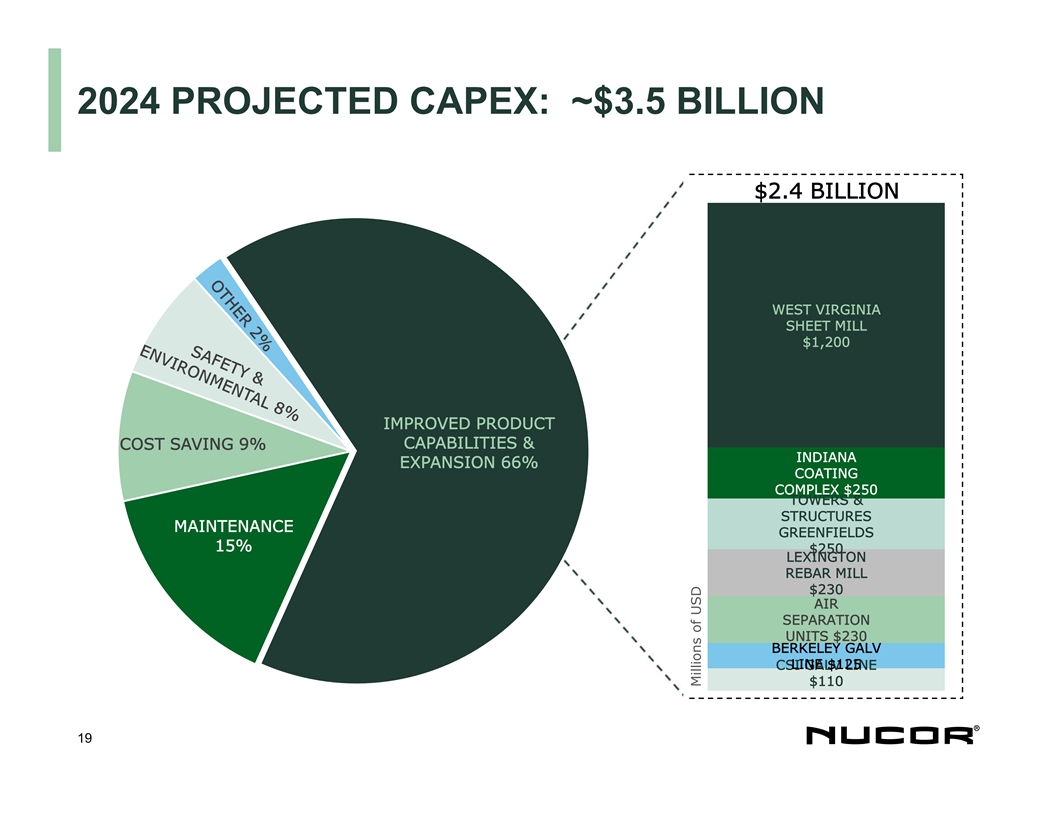
2024 PROJECTED CAPEX: ~$3.5 BILLION $2.4 BILLION WEST VIRGINIA SHEET MILL $1,200 IMPROVED PRODUCT CAPABILITIES & COST SAVING 9% INDIANA EXPANSION 66% COATING COMPLEX $250 TOWERS & STRUCTURES MAINTENANCE GREENFIELDS 15% $250 LEXINGTON REBAR MILL $230 AIR SEPARATION UNITS $230 BERKELEY GALV LINE $125 CSI GALV LINE $110 19 Millions of USD
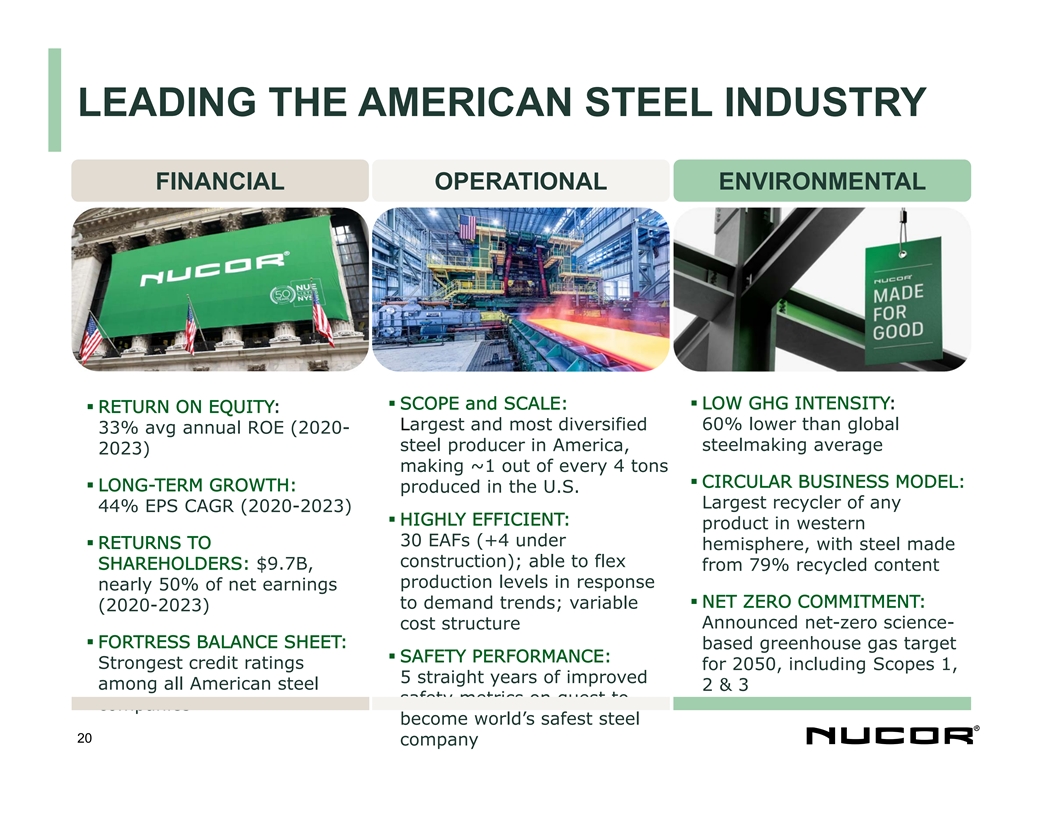
LEADING THE AMERICAN STEEL INDUSTRY FINANCIAL OPERATIONAL ENVIRONMENTAL MVA, please insert “made for good” photo from slide 5 of Q3’23 earnings call deck and improve formatting below § SCOPE and SCALE: § LOW GHG INTENSITY: § RETURN ON EQUITY: Largest and most diversified 60% lower than global 33% avg annual ROE (2020- steelmaking average steel producer in America, 2023) making ~1 out of every 4 tons § CIRCULAR BUSINESS MODEL: § LONG-TERM GROWTH: produced in the U.S. Largest recycler of any 44% EPS CAGR (2020-2023) § HIGHLY EFFICIENT: product in western 30 EAFs (+4 under § RETURNS TO hemisphere, with steel made construction); able to flex SHAREHOLDERS: $9.7B, from 79% recycled content production levels in response nearly 50% of net earnings § NET ZERO COMMITMENT: to demand trends; variable (2020-2023) cost structure Announced net-zero science- § FORTRESS BALANCE SHEET: based greenhouse gas target § SAFETY PERFORMANCE: Strongest credit ratings for 2050, including Scopes 1, 5 straight years of improved among all American steel 2 & 3 safety metrics on quest to companies become world’s safest steel 20 company
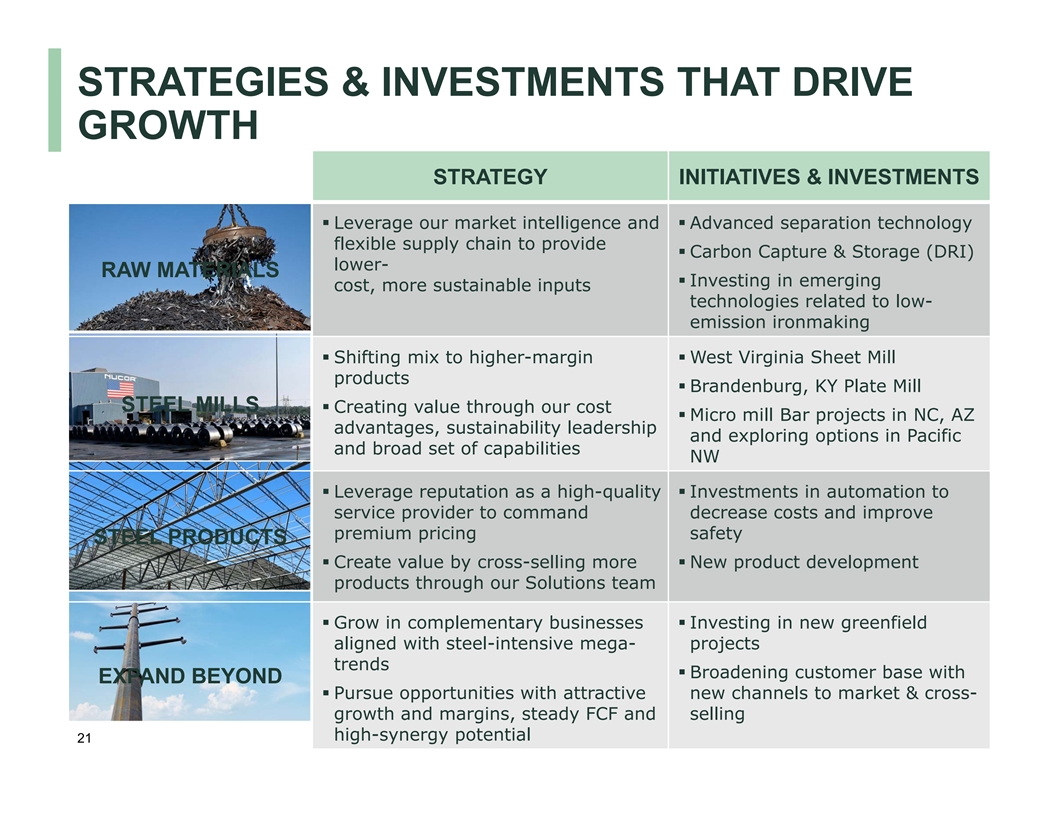
STRATEGIES & INVESTMENTS THAT DRIVE GROWTH STRATEGY INITIATIVES & INVESTMENTS § Leverage our market intelligence and § Advanced separation technology flexible supply chain to provide § Carbon Capture & Storage (DRI) lower- RAW MATERIALS § Investing in emerging cost, more sustainable inputs technologies related to low- emission ironmaking § Shifting mix to higher-margin § West Virginia Sheet Mill products § Brandenburg, KY Plate Mill STEEL MILLS § Creating value through our cost § Micro mill Bar projects in NC, AZ advantages, sustainability leadership and exploring options in Pacific and broad set of capabilities NW § Leverage reputation as a high-quality § Investments in automation to service provider to command decrease costs and improve premium pricing safety STEEL PRODUCTS § Create value by cross-selling more § New product development products through our Solutions team § Grow in complementary businesses § Investing in new greenfield aligned with steel-intensive mega- projects trends § Broadening customer base with EXPAND BEYOND § Pursue opportunities with attractive new channels to market & cross- growth and margins, steady FCF and selling high-synergy potential 21
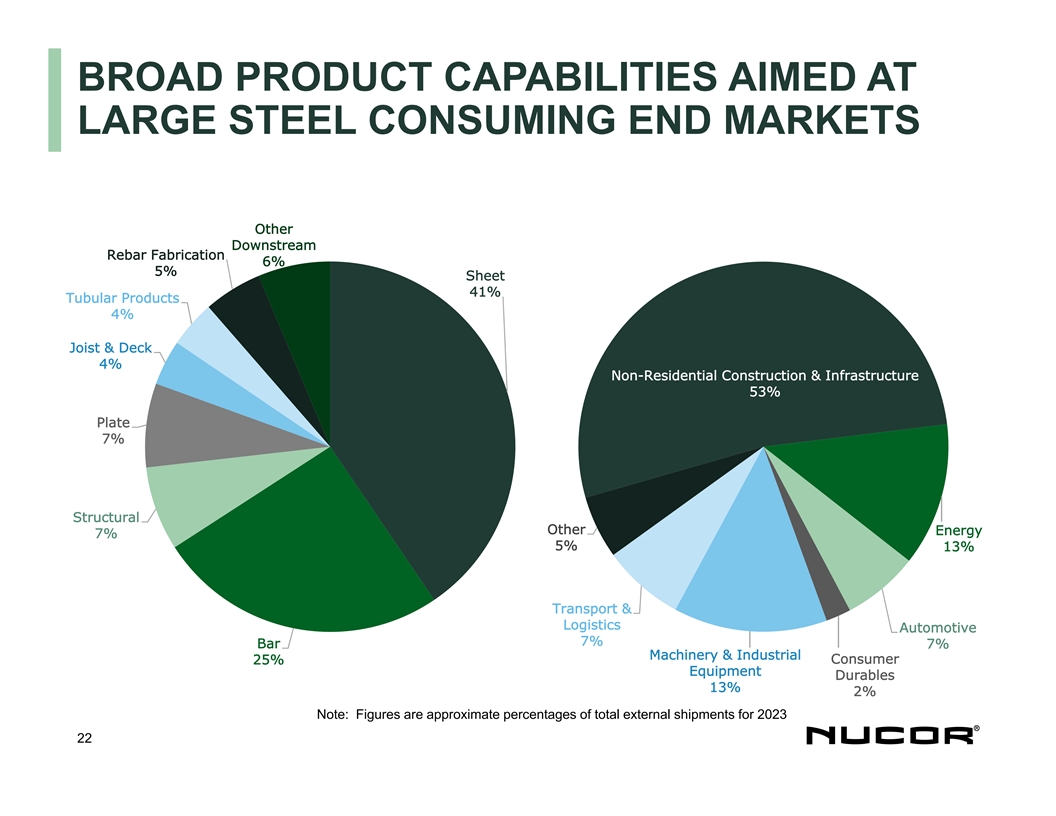
BROAD PRODUCT CAPABILITIES AIMED AT LARGE STEEL CONSUMING END MARKETS Other Downstream Rebar Fabrication 6% 5% Sheet 41% Tubular Products 4% Joist & Deck 4% Non-Residential Construction & Infrastructure 53% Plate 7% Structural Other Energy 7% 5% 13% Transport & Logistics Automotive 7% Bar 7% Machinery & Industrial Consumer 25% Equipment Durables 13% 2% Note: Figures are approximate percentages of total external shipments for 2023 22