| ☐ | REGISTRATION STATEMENT PURSUANT TO SECTION 12 OF THE SECURITIES EXCHANGE ACT OF 1934 |
| ☒ | ANNUAL REPORT PURSUANT TO SECTION 13(a) or 15(d) of THE SECURITIES EXCHANGE ACT OF 1934 |
For the fiscal year ended December 31, 2023 |
Commission File Number 001-11444
|
Title of each class |
Name of each exchange on which registered |
|
Common Shares |
New York Stock Exchange |
| ☒ Annual Information Form |
☒ Audited Annual Financial Statements |
† |
The term “new or revised financial accounting standard” refers to any update issued by the Financial Accounting Standards Board to its Accounting Standards Codification after April 5, 2012. |
| Auditor Name: Deloitte LLP | Auditor Location: Toronto, Canada | Auditor Firm ID: 1208 |
| 1. | ANNUAL INFORMATION FORM |
The Registrant’s Annual Information Form for the year ended December 31, 2023 is attached as Exhibit 1 (the “Annual Information Form”) to this annual report on Form 40-F and is incorporated by reference herein.
| 2. | AUDITED ANNUAL FINANCIAL STATEMENTS |
The Registrant’s consolidated audited financial statements as at and for the fiscal years ended December 31, 2023 and December 31, 2022, including the reports of independent registered public accounting firm, prepared by Deloitte LLP (“Deloitte”) with respect thereto, are included in Exhibit 2 attached to this annual report on Form 40-F and are incorporated by reference herein.
| 3. | MANAGEMENT’S DISCUSSION AND ANALYSIS |
The Registrant’s Management’s Discussion and Analysis of Operations and Financial Position for the year ended December 31, 2023 is included in Exhibit 3 attached to this annual report on Form 40-F and is incorporated by reference herein.
| 4. | WEBSITE INFORMATION |
Notwithstanding any reference to the Registrant’s website on the World Wide Web in the Annual Information Form or in the documents attached or incorporated as exhibits hereto, the information contained in the Registrant’s website, or any other site on the World Wide Web referred to in the Registrant’s website, is not a part of this annual report on Form 40-F and, therefore, is not filed with the Commission.
| 5. | FORWARD-LOOKING STATEMENTS |
The Registrant has made in the documents filed as part of this annual report on Form 40-F, and from time to time may otherwise make “forward-looking statements”, within the meaning of Section 21E under the Securities Exchange Act of 1934, as amended (the “Exchange Act”) and Section 27A of the U.S. Securities Act of 1933, and related assumptions concerning its operations, economic performance and financial matters. Actual results or events could differ materially from those set forth in, or implied by, the forward-looking statements and the related assumptions due to a variety of factors. Reference is made to the section titled “Forward-Looking Statements” on page 2 of the Annual Information Form for a discussion of such factors.
| 6. | CONTROLS AND PROCEDURES |
The Registrant’s Chief Executive Officer and its Executive Vice-President and Chief Financial Officer are responsible for establishing and maintaining the Registrant’s disclosure controls and procedures (as such term is defined in Rules 13a-15(e) and 15d-15(e) under the Exchange Act) and internal control over financial reporting (as such term is defined in Rules 13a-15(f) and 15d-15(f) under the Exchange Act).
Disclosure Controls and Procedures
The disclosure provided under the heading Controls and Procedures – Disclosure Controls and Procedures included in Exhibit 3: Management’s Discussion and Analysis is incorporated by reference herein.
Internal Control Over Financial Reporting
The disclosure provided under the heading Controls and Procedures – Management’s Annual Report on Internal Control Over Financial Reporting included in Exhibit 3: Management’s Discussion and Analysis is incorporated by reference herein.
Changes in Internal Controls Over Financial Reporting
The disclosure provided under the heading Controls and Procedures – Changes in Internal Controls Over Financial Reporting included in Exhibit 3: Management’s Discussion and Analysis is incorporated by reference herein.
| 7. | AUDIT COMMITTEE MEMBERS AND AUDIT COMMITTEE FINANCIAL EXPERT |
The Registrant has a separately designated standing audit committee of its Board of Directors (the “Audit Committee”), which is currently comprised of the following members of the Registrant’s Board of Directors: Peter G. Bowie (Chair), Jan R. Hauser, Jay K. Kunkel and Mary Lou Maher.
The Registrant’s Board of Directors has determined that each of Mr. Bowie, Ms. Hauser, Mr. Kunkel and Ms. Maher, is an “audit committee financial expert” and that each member of the Audit Committee is “independent” and “financially literate”, as such terms are defined in the listing standards of the New York Stock Exchange and Exchange Act Rule 10A-3.
| 8. | CODE OF ETHICS |
The Registrant has adopted a code of ethics that applies to all of its employees, including its Chief Executive Officer, its Chief Financial Officer, its Controller and other persons performing similar functions. The full text of such code of ethics is available on the Registrant’s website at www.magna.com under the Leadership & Governance section.
| 9. | CORPORATE GOVERNANCE |
As a “foreign private issuer” listed on The New York Stock Exchange (the “NYSE”), the Registrant is required to disclose the significant ways in which its corporate governance practices differ from those to be followed by U.S. domestic issuers under the NYSE listing standards. There is only one significant difference between the Registrant’s corporate governance practices and those required of U.S. domestic companies under NYSE listing standards. NYSE listing standards require shareholder approval of all “equity compensation plans” and material revisions to these types of plans (with limited exceptions). The rules of the Toronto Stock Exchange (the “TSX”) require shareholder approval of “security-based compensation arrangements,” which are plans that involve newly issued shares, or specified amendments to such plans. The Registrant follows the TSX rules and has previously obtained shareholder approval for the following security-based compensation arrangements:
| • | Treasury PSU Plan approved by shareholders on May 3, 2022; and |
| • | Amended and Restated 2009 Stock Option Plan approved by shareholders on May 6, 2010. |
The Registrant also has two equity compensation arrangements which involve the purchase of its common shares in the secondary trading market at market prices:
| • | Performance Stock Unit Plan approved by the Registrant’s Board of Directors on August 7, 2018; and |
| • | Restricted Stock Unit arrangements. |
The rules of the TSX do not require shareholder approval for these equity compensation arrangements and accordingly the Registrant has not sought shareholder approval of either.
| 10. | PRINCIPAL ACCOUNTANT FEES AND SERVICES |
The table below shows the fees for professional services rendered by our principal accountant, Deloitte, for the fiscal years ended December 31, 2023 and December 31, 2022.
| Fiscal 2023 | Fiscal 2022 | |||||||||||||||
| Type of Services |
Fees | % of Total | Fees | % of Total | ||||||||||||
| Audit Fees |
10,199,000 | 52% | 9,773,000 | 57% | ||||||||||||
| Audit-Related Fees |
8,198,000 | 42% | 6,589,000 | 39% | ||||||||||||
| Tax Fees |
1,069,000 | 6% | 685,000 | 4% | ||||||||||||
| All Other Fees |
7,000 | <1% | 48,000 | <1% | ||||||||||||
|
|
|
|
|
|
|
|
|
|||||||||
| Total |
19,473,000 | 100.00% | 17,095,000 | 100.00% | ||||||||||||
|
|
|
|
|
|
|
|
|
|||||||||
The services comprising the “Audit Fees” category for each of the last two fiscal years were performed by Deloitte to comply with the standards of the Public Company Accounting Oversight Board (United States) (“PCAOB”), including integrated audit of the consolidated financial statements and quarterly reviews. In some cases, fees in this category may include an appropriate allocation of fees for tax services or accounting consultations, to the extent such services were necessary to comply with the standards of the PCAOB. This category includes fees incurred in connection with the audit of our internal control over financial reporting for purposes of Section 404 of the Sarbanes-Oxley Act of 2002.
The services comprising the “Audit-Related Fees” category consists of fees paid in respect of assurance and related services, including such things as due diligence relating to mergers and acquisitions, accounting consultations and audits in connection with acquisitions, services related to statutory audits of certain foreign subsidiaries, attest services that are not required by statute or regulation and consultation concerning financial accounting and reporting standards. Audit-related services actually provided by Deloitte in each of fiscal 2023 and fiscal 2022 consisted of: services related to statutory audits of certain foreign subsidiaries, assurance services and procedures related to attest engagements not required by statute or regulation, due diligence relating to mergers and acquisitions and other assurance services.
The services comprising the “Tax Fees” category consists of all fees paid in respect of tax compliance, planning and advisory services performed by Deloitte’s tax professionals, except those services required in order to comply with the standards of the PCAOB which are included under “Audit Services”. The tax services actually provided by Deloitte in each of fiscal 2023 and fiscal 2022 consisted of: domestic and international tax advisory, compliance and research services, as well as transfer pricing advisory services.
The category “All Other Fees” captures fees in respect of all permitted services not falling under any of the previous categories.
In order to protect Deloitte’s independence, the Audit Committee has a process for pre-approving all services provided by, and related fees to be paid to, Deloitte. This process includes reviewing, on a quarterly basis, the details and associated costs of the services expected to be provided by Deloitte. Audit Committee approval is required for any services that have not previously been approved by the Audit Committee. In assessing the impact of any proposed services on auditor independence, the Audit Committee considers whether:
| • | the services are consistent with applicable auditor independence rules; |
| • | the independent auditor is best positioned to provide the most effective and efficient service, for reasons such as its familiarity with the Registrant’s business, people, culture, accounting systems and risk profile; and |
| • | the services enhance the Registrant’s ability to manage or control risks and improve audit quality. |
None of the services provided by Deloitte in 2023 were treated as exempt from pre-approval pursuant to the de minimis provision of paragraph (c)(7)(i)(C) of Rule 2-01 of Regulation S-X.
| 11. | TABULAR DISCLOSURE OF CONTRACTUAL OBLIGATIONS |
The tabular disclosure regarding the Registrant’s known contractual obligations provided under the heading Financial Condition, Liquidity and Capital Resources – Contractual Obligations included in Exhibit 3: Management’s Discussion and Analysis is incorporated by reference herein.
| 12. | RECOVERY OF ERRONEOUSLY AWARDED COMPENSATION |
The Registrant has adopted a policy on recovery of erroneously awarded incentive-based compensation, which is consistent with the NYSE Listing Standards implementing Section 954 of the Dodd-Frank Act.
UNDERTAKING AND CONSENT TO SERVICE OF PROCESS
| A. | Undertaking |
Registrant undertakes to make available, in person or by telephone, representatives to respond to inquiries made by the Commission staff, and to furnish promptly, when requested to do so by the Commission staff, information relating to: the securities registered pursuant to Form 40-F; the securities in relation to which the obligation to file an annual report on Form 40-F arises; or transactions in said securities.
| B. | Consent to Service of Process |
A Form F-X signed by the Registrant and its agent for service of process was previously filed with the Commission.
SIGNATURES
Pursuant to the requirements of the Exchange Act, the Registrant certifies that it meets all of the requirements for filing on Form 40-F and has duly caused this annual report to be signed on its behalf by the undersigned, thereunto duly authorized.
| Registrant: | MAGNA INTERNATIONAL INC. | |
| By (Signature and Title): | /s/ “Bassem Shakeel” | |
| Bassem A. Shakeel, | ||
| Vice-President, Associate General Counsel and Corporate Secretary |
||
| Date: | March 28, 2024. | |
EXHIBIT INDEX
Exhibit 1
2024 Annual Information Form March 27, 2024 Magna International Inc.
| Contents
|
| Annual Information Form |
| 2 | Forward-Looking Statements | |
| 4 | Corporate Structure | |
| 4 | About Magna | |
| 6 | Our Industry | |
| 9 | Our Business & Strategy | |
| 18 | Risk Factors | |
| 26 | Description of the Business | |
| 38 | Innovation and Research & Development | |
| 42 | Capital Structure, Financings & Credit Ratings | |
| 46 | Directors & Executive Officers | |
| 49 | Legal Proceedings | |
| 50 | Other Information | |
| 51 | Schedules | |
| A-1 | Appendix 1 – Sustainability Report FY 2023 |
Important Information About this Document
This Annual Information Form (“AIF”) provides information about Magna International Inc. (“Magna”), including its industry, corporate structure, strategy, risk factors relating to its business and operations, products and services, sustainability activities, and other information related to its business activities.
Readers should note that in this AIF:
| ◾ | we use the terms “you” and “your” to refer to the shareholder, potential investor, or reader while “we”, “us”, “our”, “company” and “Magna” refer to Magna International Inc. and, where applicable, its subsidiaries; |
| ◾ | we use the term “Executive Management” to refer to our Chief Executive Officer, together with our Presidents and our corporate Executive Vice-Presidents; |
| ◾ | we use the term “Operating Group management” to refer to the senior management within each of our product-based business units corresponding to the capabilities described in “Section 6 – Description of the Business – Products & Services” in this AIF; |
| ◾ | dollar amounts in this AIF are stated in U.S. dollars, unless otherwise indicated; |
| ◾ | a reference to “fiscal year” is a reference to the fiscal or financial year from January 1 to December 31 of the year stated; |
| ◾ | sales figures disclosed have been prepared in accordance with United States Generally Accepted Accounting Principles (U.S. GAAP); |
| ◾ | where we have referred to specific customers or competitors, the reference includes the customers’ or competitors’ operating divisions and subsidiaries, unless otherwise stated; |
| ◾ | facility and employee figures include certain equity-accounted operations, unless otherwise indicated; |
| ◾ | references to our “Circular” refer to our Management Information Circular/Proxy Statement dated March 27, 2024 for our virtual-only 2024 Annual Meeting of Shareholders to be held on May 9, 2024 (the “Meeting”); and |
| ◾ | information is current as of March 27, 2024, unless otherwise indicated. |
Forward-Looking Statements
We disclose “forward-looking information” or “forward-looking statements” (collectively, “forward-looking statements”) to provide information about management’s current expectations and plans. Such forward-looking statements may not be appropriate for other purposes.
Forward-looking statements may include financial and other projections, as well as statements regarding our future plans, objectives or economic performance, or the assumptions underlying any of the foregoing, and other statements that are not recitations of historical fact. We use words such as “may”, “would”, “could”, “should”, “will”, “likely”, “expect”, “anticipate”, “believe”, “intend”, “plan”, “aim”, “forecast”, “outlook”, “project”, “estimate”, “future” “target” and similar expressions suggesting future outcomes or events to identify forward-looking statements.
Forward-looking statements in this AIF include, but are not limited to, statements relating to:
| ◾ | implementation of our business strategy, including: increasing capital deployment toward high-growth/megatrend areas aligned with the “Car of the Future”; driving operational excellence; and unlocking new business models and markets; |
| ◾ | implementation of our segment-specific strategic initiatives; |
| ◾ | implementation of our sustainability strategy and initiatives, and achievement of sustainability targets/commitments; |
| ◾ | our approach to capital structure, including; maintenance of a strong balance sheet; preservation of strong investment grade ratings; delivering strong Return on Invested Capital; investing for growth; achieving our target leverage ratio; future returns of capital to our shareholders through dividends; and repurchasing shares with excess liquidity; |
| ◾ | implementation of our supply chain initiatives; and |
| ◾ | estimates of future environmental clean-up and remediation costs. |
Forward-looking statements are based on information currently available to us and are based on assumptions and analyses made by us in light of our experience and our perception of historical trends, current conditions and expected future developments, as well as other factors we believe are appropriate in the circumstances.
While we believe we have a reasonable basis for making such forward-looking statements, they are not a guarantee of future performance or outcomes. Whether actual results and developments conform to our expectations and predictions is subject to a number of risks, assumptions, and uncertainties, many of which are beyond our control, and the effects of which can be difficult to predict, including, without limitation:
2 Annual Information Form
Macroeconomic, Geopolitical and Other Risks
| ◾ | inflationary pressures; |
| ◾ | interest rate levels; |
| ◾ | geopolitical risks; |
Risks Related to the Automotive Industry
| ◾ | economic cyclicality; |
| ◾ | regional production volume declines; |
| ◾ | deteriorating vehicle affordability; |
| ◾ | misalignment between Electric Vehicles (“EVs”) production and sales; |
| ◾ | intense competition; |
Strategic Risks
| ◾ | alignment with the “Car of the Future”; |
| ◾ | evolving business risk profile; |
| ◾ | technology and innovation; |
| ◾ | investments in mobility and technology companies; |
Customer-Related Risks
| ◾ | customer concentration; |
| ◾ | growth of EV-focused original equipment manufacturers (“OEMs”); |
| ◾ | growth with Asian customers; |
| ◾ | risks of conducting business with newer EV-focused OEMs; |
| ◾ | Fisker’s ability to continue as a going concern; |
| ◾ | dependence on outsourcing; |
| ◾ | OEM cooperation and consolidation; |
| ◾ | market shifts; |
| ◾ | consumer “take rates” shifts; |
| ◾ | quarterly sales fluctuations; |
| ◾ | customer purchase orders; |
| ◾ | potential OEM production-related disruptions; |
Supply Chain Risks
| ◾ | semiconductor chip supply disruptions and price increases; |
| ◾ | supply chain disruptions; |
| ◾ | regional energy supply and pricing; |
| ◾ | supply base condition; |
Manufacturing/Operational Risks
| ◾ | product launch; |
| ◾ | operational underperformance; |
| ◾ | restructuring costs; |
| ◾ | impairments; |
| ◾ | labour disruptions; |
| ◾ | skilled labour attraction/retention; |
| ◾ | leadership expertise and succession; |
Pricing Risks
| ◾ | quote/pricing assumptions; |
| ◾ | customer pricing pressure/contractual arrangements; |
| ◾ | commodity price volatility; |
| ◾ | scrap steel/aluminum price volatility; |
Warranty/Recall Risks
| ◾ | repair/replacement costs; |
| ◾ | warranty provisions; |
| ◾ | product liability; |
Climate Change Risks
| ◾ | transition risks and physical risks; |
| ◾ | strategic and other risks; |
IT Security/Cybersecurity Risks
| ◾ | IT/cybersecurity breach; |
| ◾ | product cybersecurity breach; |
Acquisition Risks
| ◾ | acquisition of strategic targets; |
| ◾ | inherent merger and acquisition risks; |
| ◾ | acquisition integration and synergies; |
Other Business Risks
| ◾ | joint ventures; |
| ◾ | intellectual property; |
| ◾ | risks of doing business in foreign markets; |
| ◾ | relative foreign exchange rates; |
| ◾ | currency devaluation in Argentina; |
| ◾ | pension risks; |
| ◾ | tax risks; |
| ◾ | financial flexibility; |
| ◾ | returns on capital investments; |
| ◾ | credit ratings changes; |
| ◾ | stock price fluctuation; |
| ◾ | payment of dividends; |
Legal, Regulatory and Other Risks
| ◾ | antitrust proceedings; |
| ◾ | legal and regulatory proceedings; |
| ◾ | changes in laws; |
| ◾ | free trade agreements; |
| ◾ | trade disputes/tariffs; and |
| ◾ | environmental compliance. |
In evaluating forward-looking statements or forward-looking information, we caution readers not to place undue reliance on any forward-looking statement, and readers should specifically consider the various factors which could cause actual events or results to differ materially from those indicated by such forward-looking statements, including the risks, assumptions, and uncertainties above that are discussed in greater detail in this AIF under “Section 5 – Risk Factors”.
Magna International Inc. 3
| 1. | Corporate Structure |
Issuer
Magna was originally incorporated under the laws of the Province of Ontario, Canada on November 16, 1961. Our charter documents currently consist of amended and restated articles of incorporation dated December 31, 2017, which were issued pursuant to the Business Corporations Act (Ontario).
Our registered and head office is located at 337 Magna Drive, Aurora, Ontario, Canada L4G 7K1. Our Common Shares trade on the Toronto Stock Exchange (“TSX”) under the trading symbol “MG”, and the New York Stock Exchange (“NYSE”) under the trading symbol “MGA”. For a list of our principal subsidiaries and investments, please refer to Schedule A.
| 2. | About Magna |
Overview
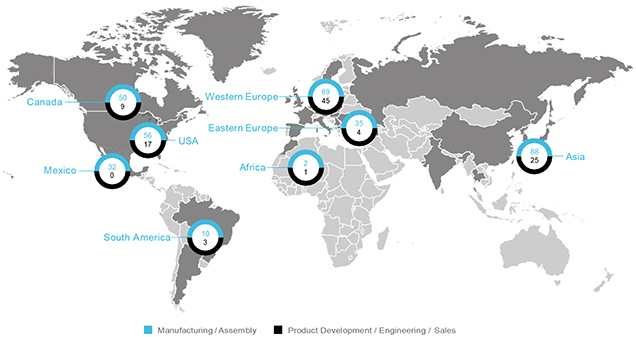
Magna is more than one of the world’s largest Tier 1 suppliers in the automotive space. We are a mobility technology company with more than 179,000 entrepreneurial-minded employees(1), 342 manufacturing and assembly operations and 104 product development, engineering, and sales (“PDE&S”) centres in 28 countries(2), as follows:
Our systems approach to design, engineering, and manufacturing touches nearly every aspect of the vehicle. We have complete vehicle engineering and contract manufacturing expertise, as well as product capabilities which include body, chassis, exterior, seating, powertrain, active driver assistance, electronics, mechatronics, mirrors, lighting, and roof systems. Magna also has electronic and software capabilities across many of these areas. In addition, we are leveraging our capabilities and platform technologies in areas such as battery management, software stack, and sensors to enter growing adjacent mobility markets such as micromobility.
Our business is managed under four operating segments which have been determined on the basis of technological opportunities, product similarities, as well as market and operating factors, as follows:
| ◾ | Body Exteriors & Structures |
| ◾ | Power & Vision |
| ◾ | Seating Systems |
| ◾ | Complete Vehicles |
Our internal financial reporting is aligned with the way our business is managed. Accordingly, we present key internal operating performance measures for the reporting segments described above to our chief operating decision maker to use in the assessment of operating performance, allocation of resources, and to help plan our long-term strategic direction and future global growth.
| (1) | Number of employees includes over 166,000 employees at our wholly owned or controlled entities and over 13,000 employees at certain operations accounted for under the equity method. |
| (2) | Manufacturing operations and PDES centres include certain operations accounted for under the equity method. |
4 Annual Information Form
Our Corporate Culture
At Magna’s foundation is an entrepreneurial, decentralized, fair enterprise culture, the key elements of which are as follows:
Entrepreneurialism and Decentralization
We follow a corporate policy of functional and operational decentralization, which we believe increases flexibility, customer responsiveness and productivity.
| ◾ | Our manufacturing and assembly operations are conducted through “Divisions”, each of which is an autonomous business unit operating within pre-determined guidelines. Each Division is a separate profit centre under the authority of a general manager who has the discretion to determine rates of pay, hours of work and sources of supply, within the framework of our Employee’s Charter, our Global Labour Standards Policy and our Operational Principles (each as described below), as well as our corporate policies. |
| ◾ | Divisions are aligned globally by product area in Operating Groups. Operating Group management is responsible for overseeing the Divisions within its product area(s), including approval of Divisional business plans and preparation of Operating Group business plans for presentation to Executive Management. Our Operating Groups are aligned under four reporting segments overseen by members of Executive Management to ensure that the Operating Groups are: taking advantage of cross-Group synergies; sharing research and development and best practices; and consistently approaching technology trends that impact their business and our customers. |
| ◾ | Our Executive Management team, led by our CEO, interfaces with the investment community and is responsible for our long-term strategic planning and future growth, as well as monitoring the performance of Operating Group management. In addition, our Executive Management: allocates capital; oversees mergers, acquisitions and strategic alliances; manages global marketing and customer strategies; develops employee policies and programs; manages leadership training, development and succession planning; oversees and supports our sustainability and environmental, social and governance (“ESG”) strategy, targets and global initiatives; and develops common finance, internal controls, compliance, IT, quality, environmental, health & safety, ergonomics and other policies, programs or global standards. |
Employee’s Charter & Global Labour Standards Policy
We are committed to operating our business in a way that is based on fairness and concern for our employees. Our Employee’s Charter sets out key principles outlining this commitment. Our Global Labour Standards Policy further articulates our Fair Enterprise Culture and provides a framework for our commitment to fundamental human rights and international labour relations. See “Appendix 1 – Sustainability Report – Section 4.2 Fairness and Concern for Employees” for a description of our human resource principles, including our Employee’s Charter, as well as the details of our Global Labour Standards Policy and the key commitments that it sets out.
Operational Excellence
As part of our strategic priority of achieving operational excellence in our facilities globally, each facility is required to adhere to a set of Operational Principles that define a set of common goals and recommended tools/business practices in the following areas: Employee Focus; Safe and Healthful Work Environment; Pride in Craftsmanship and Total Quality; Integrity and Respect; Operational Effectiveness; Scrap and Waste Elimination; Operational Availability; Communication; and Recognition and Rewards. The Magna Operational Principles are linked to our MAFACT assessment system (detailed in “Section 6 – Description of the Business – Manufacturing & Engineering” and “Factory of the Future (FoF) Initiatives” in this AIF) to allow our operations to continually measure their progress in achieving operational excellence.
Incentive-Based Management Compensation
We maintain an incentive-based compensation system for management, which directly links short-term incentive compensation to the operational performance of an applicable business unit, as measured by profitability. In the case of our Divisions and Operating Groups, the short-term incentive formula is based on Divisional or Operating Group EBIT, after taking into account a funds employed charge. For our Executive Management, the short-term incentive is directly linked to Magna’s pre-tax profit and, beginning in 2024, free cash flow. Members of our Operating Group management and Executive Management also receive equity-based incentives tied to metrics such as return on invested capital (ROIC), stock price performance, and relative total shareholder return. Our approach to executive compensation is described in further detail in the sections of our Circular titled “Compensation and Performance Report” and “Compensation Discussion & Analysis”.
Sustainability
We are committed to being a responsible corporate citizen that conducts business in a manner that balances profits, people, and planet. Magna accepts the reality of climate change and the importance of addressing sustainability in our operations. To this end, we are committed to decarbonization of our operations and have committed to near-term (by 2030) and net-zero (by 2050) science-based targets with respect to Scopes 1, 2 and 3 GHG emissions. In support of these targets, we have committed to achieving 100% renewable electricity usage by 2025 in our European operations, and by 2030 globally. For a full discussion of our sustainability strategy, initiatives, targets, and achievements to date, see “Appendix 1 – Sustainability Report”.
Magna International Inc. 5
| 3. | Our Industry |
General
The global automotive industry is a complex, high-tech manufacturing industry. The industry is rapidly evolving in response to societal, mobility-related, and economic trends, including the transition to a lower carbon economy, which is accelerating the shift from internal combustion to electric propulsion. These trends are detailed in “Section 4 – Our Business & Strategy – Industry Trends”. Tier 1 automotive suppliers (“Tier 1 Suppliers”) design, engineer and manufacture components, assemblies, systems, subsystems, and modules for original equipment manufacturers (“OEMs” or “automobile manufacturers”) of vehicles and light trucks. Tier 1 Suppliers source subcomponents from Tier 2 and other sub-suppliers, which are integrated into the products sold by the Tier 1 Suppliers directly to OEMs.
The global automotive industry is cyclical and is sensitive to a broad range of macroeconomic, political, and other trends as discussed in “Section 4 – Our Business & Strategy” in this AIF. Throughout 2023, the automotive industry continued to experience a number of macroeconomic and industry challenges, although a number of these challenges have moderated compared to prior years:
| ◾ | elevated levels of inflation, with higher commodity, energy, labour, freight, and other production input pricing expected to persist in 2024; |
| ◾ | supply chain disruptions, including the global shortage of semiconductor chips that has had a material adverse effect on global automotive production volumes since 2020 and may continue having some impact in 2024; |
| ◾ | a deterioration in vehicle affordability due to a combination of factors, including: higher prices for Electric Vehicles (“EVs”); costs related to advanced electronic systems; increasing vehicle finance costs due to elevated interest rates; inflationary cost increases impacting the entire bill of materials for a vehicle; and, in some cases, limited vehicle supply; and |
| ◾ | misalignment between EV production and sales as a result of uncertainty as to consumer acceptance of EVs due to issues including: vehicle affordability; availability of government subsidies; concerns regarding battery technologies; driving range anxiety; charging infrastructure concerns; and new EV OEM limited operating/warranty history. |
See “Section 4 – Our Business & Strategy – Macroeconomic, Political and Other Trends” and “Industry Trends” for details of how these trends affect Magna and the automotive industry. See also “Industry Trends” in our Management’s Discussion & Analysis of Results of Operations and Financial Position for the year ended December 31, 2023 (“MD&A”).
Automotive Production Markets
OEMs have historically built their vehicles in the regions where those vehicles are primarily sold and, as a result, many OEMs have established manufacturing facilities in multiple countries. While we believe this historical practice will continue long term; currently some of the China-based, EV-focused OEMs, such as BYD and Geely, are entering the European market with vehicles exported from China, while VinFast, a Vietnam-based, EV-focused OEM, has entered the European and North American markets with vehicles exported from Vietnam. Since OEMs typically use lean manufacturing and supply chain management techniques in their operations, many Tier 1 Supplier facilities are generally located relatively close to OEM facilities to reduce the cost and risks associated with longer supply chains. See “Section 6 – Description of the Business – Manufacturing & Engineering” of this AIF for details of Magna’s global manufacturing footprint.
China, Europe, North America, Japan, India, and South Korea represent the largest automotive production markets in the world, accounting for approximately 89% of vehicles produced globally.(1) China’s approximate 32% share of global production led all markets in 2023, followed by the United States and Japan, with 11% and 10% shares, respectively.(1) The local demand for vehicles in China, India, and certain markets outside of North America and Western Europe has increased over time. This increasing local demand has helped boost the local automotive industry in these countries and attracted investments in manufacturing from North American, European, and Asian-based automobile manufacturers, through stand-alone investments and/or joint ventures with local partners. In the case of China, the increasing migration of component system and vehicle design, development, and engineering, especially for battery electric vehicles (“BEVs”), is expected to further benefit the automotive industry in that market.
Customers
OEMs produced over 90 million light vehicles in 2023, an approximately 10% increase over 2022 production.(1) The top 15 OEMs, representing approximately 80% or approximately 72 million vehicles based on 2023 light vehicle production, were:(1)
1. Toyota Motor Corporation
2. Volkswagen Group
3. Hyundai Motor Group
4. Renault-Nissan-Mitsubishi Alliance
5. Stellantis N.V.
6. General Motors Company
7. Ford Motor Company
8. Honda Motor Company
9. Suzuki Motor Corporation
10. BYD Auto
11. Zhejiang Geely Holding Group
12. BMW AG
13. Mercedes-Benz AG
14. Chang’an Automobile (Group) Co., Ltd.
15. Tesla, Inc.
| (1) | S&P Global Mobility |
6 Annual Information Form
The considerable growth of the Chinese automotive market over the past decade has led to the significant growth of several Chinese OEMs, including BYD Auto, Geely, and Chang’an, as listed above. In addition, the growing trend toward vehicle electrification has led to the emergence of newer EV-focused OEMs, particularly in China. See “Section 5 – Risk Factors – Growth of EV-Focused OEMs; Risks of Conducting Business with Newer EV-Focused OEMs”, and “Fisker’s Ability to Continue as a Going Concern” in this AIF.
For a list of our top customers on a consolidated basis and within each reporting segment, see “Section 6 – Description of the Business – Products & Services” in this AIF.
Competition
In spite of high barriers to entry in many product areas, as well as the highly capital intensive nature of the global Tier 1 automotive supply industry, competition is fierce and intensifying from many different sources. For most of our Operating Groups, competition comes primarily from automobile manufacturers and from other “traditional” Tier 1 Suppliers, including ones in which one or more automobile manufacturers may have direct or indirect investments. However, with the growing importance of electrification and electronics in the automotive value chain, a number of established electronics and semiconductor chip and manufacturing companies have entered or expanded their presence in the automotive industry, becoming direct competitors to Tier 1 Suppliers, including us. Additionally, disruptive technology innovators are changing the competitive landscape of the automotive industry through the development of high-value product and service offerings, particularly in areas related to vehicle electrification, vehicle autonomy, new mobility, and connectivity, which traditional automotive suppliers may not be able to match. As a result of these trends, some suppliers seek to enhance their competitive positioning by entering into strategic partnerships, joint ventures or collaborations with technology and software companies. Lastly, competition has also intensified as automobile manufacturers have reduced the number of their Tier 1 Suppliers in connection with their strategy to increase the number and range of vehicles built from high-volume global platforms.
The basis on which automobile manufacturers select automotive suppliers for particular programs is determined by a number of factors, which may include, among other factors: price; overall relationship, including historical performance with respect to innovation, quality/ warranty and timeliness of delivery; manufacturing footprint; proprietary technologies; financial strength; ability to test and validate new technologies for application in the automotive industry; scope of in-house engineering and tooling capabilities; carbon footprint and alignment with the customer’s sustainability/ESG goals and targets; existing agreements.
The number of competitors that are asked by automobile manufacturers to bid on any individual product has been reduced in many cases. We expect further reductions as a result of the increasing preference of automobile manufacturers to deal with fewer suppliers and reward those suppliers with earlier and deeper involvement.
Based on 2022 global automotive parts sales to OEMs, the top 10 Tier 1 Suppliers globally were(1):
| Supplier | Key Automotive Products(2) | Supplier | Key Automotive Products(2) | |||
| 1. Robert Bosch | Powertrain solutions, chassis systems control, electrical drives, car multimedia, electronics, aftermarket products, steering | 6. Hyundai Mobis(3) | In-vehicle infotainment systems, braking, steering, lamps, safety, suspension, autonomous driving, electrification systems, advanced driver assistance systems | |||
| 2. Denso Corporation(3) | Thermal systems, powertrain systems, electrification systems, mobility electronics, sensor system & semiconductors | 7. Aisin Corporation(3) | Powertrain, chassis and vehicle safety systems, body electronics, vehicle navigation systems | |||
| 3. ZF Friedrichshafen AG | Electrified powertrain, chassis, driveline, braking systems, steering wheel, autonomous transport systems, electronics & advanced driver assistance systems, active & passive safety systems | 8. Forvia Group | Seating, interiors, clean mobility (exhaust systems), lighting, hydrogen mobility, electrification and energy management, cockpit, electronics & software integration | |||
| 4. Magna International Inc. | Body and chassis, exteriors, powertrain, active driver assistance, electronics, mirrors and lighting, mechatronics, seating systems, vehicle engineering and manufacturing, roof systems | 9. Continental Corporation | Autonomous mobility, passive safety, brake, chassis, motion and motion-controlled systems, tires, rubber, electric mobility, connected mobility | |||
Magna International Inc. 7
| Supplier | Key Automotive Products(2) | Supplier | Key Automotive Products(2) | |||
| 5. Contemporary Amperex Technology Co., Ltd. | Electric vehicle battery systems and services, battery swapping service, building automation, energy management system and facility management, cells, modules and battery pads, battery materials, clean energy storage solutions, battery recycling | 10. Lear Corporation | Seating, electrical distribution and connection systems, battery disconnect systems, electronic systems, software and connected services, electronic control modules, electrification products, connectivity products | |||
Notes:
| (1) | Automotive News (supplement) (June 26, 2023). |
| (2) | Key automotive product descriptions are based on information from each Tier 1 Supplier’s website. |
| (3) | OEM subsidiary or OEM investee. |
While no single Tier 1 Supplier currently supplies a full range of products which compete with ours, a number of Tier 1 Suppliers can produce some or many of the same types of components, assemblies, modules, and systems that we currently produce. Some of our competitors may have greater technical or other resources than we do and some of them may be stronger in markets in which we operate. A list of our key competitors within each product capability in our reporting segments can be found in “Section 6 – Description of the Business – Products & Services” in this AIF. See also the risk factors related to “Intense Competition” and “Technology and Innovation” in “Section 5 – Risk Factors” in this AIF.
Magna’s Foundational Strengths
We believe that we possess a number of foundational strengths that give us a competitive advantage as a Tier 1 Supplier, including our:
| ◾ | decentralized operating model, entrepreneurial culture, and “ownership” mentality; |
| ◾ | manufacturing expertise; |
| ◾ | complete vehicle and broad systems engineering expertise; |
| ◾ | strong balance sheet and emphasis on disciplined, profitable growth; |
| ◾ | depth of talent; |
| ◾ | global scale; |
| ◾ | focus on innovation and our “start-up” mindset, as well as a strategic portfolio of product groups that enable us to provide innovative, complete vehicle solutions to our customers, while: |
| ◾ | generating cash to fund investments in high-growth areas; and |
| ◾ | enabling access to new business models and/or new customers. |
8 Annual Information Form
| 4. | Our Business & Strategy |
Business Drivers
Our business and operating results are primarily dependent on the levels of North American, European, and Chinese car and light truck production by our customers. Ordinarily, OEM vehicle production levels are aligned with vehicle sales levels and thus affected by changes in such levels. While we supply systems and components to every major OEM, we do not supply systems and components for every vehicle, nor is the value of our content consistent from one vehicle to the next. As a result, customer and program mix relative to market trends, as well as the value of our content on specific vehicle production programs, are important drivers of our performance. Key factors impacting production volumes, product/customer mix and content, as well as legislative/regulatory trends are listed below.
| Growth Driver | Factors Potentially Impacting Growth Driver | |
| Vehicle Production Volumes | § Vehicle sales levels, which are affected by: § General macroeconomic and political conditions § Consumer confidence levels, which may be affected by consumer perceptions and general trends related to the job, housing, and stock markets, as well as elevated levels of inflation, and other macroeconomic and political factors § Vehicle affordability § Interest rates and/or availability of credit § Fuel and energy prices § Relative currency values § Regulatory restrictions on the use of vehicles in certain megacities § Uncertainty as to consumer acceptance of EVs, including due to: availability of government subsidies; concern regarding battery technologies; driving range anxiety; adequacy of charging infrastructure; new EV-focused OEMs with little to no operating/ warranty history § Supply chains and infrastructure, including supply chain disruptions § Energy supply disruptions or shortages that could result in unplanned production shutdowns of some of our, our sub-suppliers’ and customers’ manufacturing facilities § Free trade arrangements, trade disputes and tariffs § Availability and relative cost of skilled labour § Labour disruptions § OEM production disruptions § Commodities prices § Relative currency values § Regulatory considerations, including environmental, emissions, and safety standards |
|
| Customer and Program Mix | § OEM outsourcing strategy, as well as their supplier preferences and relationships § OEM decisions to allocate production inputs that are in limited supply, such as semiconductor chips, to certain programs and not others § Our systems level approach and diversified portfolio which provides flexibility in responding to OEM requirements § Business relations between us and each of our OEM customers § Our ability to supply products from multiple production locations for global vehicle platforms § Our capital allocation decisions § Competitiveness of our products, including in megatrend-aligned product areas § Exclusivity of our products due to certain intellectual property rights § OEM cooperation and consolidation § Our ability to grow sales to newer EV OEMs that achieve significant commercial success |
|
| Magna Content on Specific Programs or Platforms |
§ OEM outsourcing strategy, as well as their supplier preferences and relationships § Our ability to supply products from multiple production locations for global vehicle platforms § Our systems level approach and diversified portfolio which provides flexibility in responding to OEM requirements § Our capital allocation decisions § Technological, visual, haptic, and other features/attributes of our products compared to competing products or the overall cost of such products to the end consumer § Pricing of our products relative to competing products § Perception/reputation for product quality, as well as timeliness of delivery § Our product engineering capabilities § Our ability to finance pre-production engineering costs § The scope of our authority relative to the OEM, regarding sourcing of sub-components or |
|
Magna International Inc. 9
| Growth Driver | Factors Potentially Impacting Growth Driver | |
| products which are incorporated into the systems which we supply § Consumer “take rates” for products we sell § Collaboration among our Operating Groups § Our ability to meet OEM customers’ sustainability/ESG criteria embedded in their sourcing decisions for requirements for specific programs, including growing requirements regarding the use of ‘green’ materials for specific programs |
||
| Legislative/regulatory trends promoting sustainability and safety |
§ Regulatory actions towards mandating higher fuel efficiency, lower carbon emissions and/or enhanced safety features § Rise in the number of jurisdictions committing to, or accelerating existing commitments to, phase-out of the sale or registration of new ICE engines over the medium- to long term, which could accelerate OEM development of non-ICE vehicles |
|
Macroeconomic, Political and Other Trends
The global automotive industry is cyclical and, as noted above, vehicle production and/or sales may be affected by a broad range of macroeconomic, political, and other factors. Some such factors which are currently affecting the industry are discussed below.
| Macroeconomic, Political & Other Trends | Description | Potential Impact on Magna | ||
| Inflationary Price Increases |
§ Global markets currently experiencing elevated inflation § Inflationary pressures remained in 2023 and have continued into 2024 |
§ Higher operating costs, including for: commodities; energy; labour; freight; and other production inputs; which may potentially be unrecoverable from customers § Longer-term increases in cost structure as a result of recent increases in wage levels § Sub-supplier pricing pressures which may not be recoverable through continuous improvement actions, customer recoveries, modifications to our products or otherwise |
||
| Elevated Interest Rates |
§ Increasing global inflation rates have spurred a cycle of monetary policy tightening, including through central bank increases to key short-term lending rates § Availability and cost of credit are both factors affecting consumer confidence, which is a critical driver of vehicle sales and thus automotive production |
§ Lower sales as a result of a decrease in consumer demand for vehicles, and in turn, lower production § Higher borrowing costs, at a time when our aggregate debt level is increasing to finance higher capital expenditures in connection with program awards and our continued growth, including in megatrend areas |
||
| Supply Chain Disruptions |
§ Supply chain disruptions, including the continued impact from the global shortage of semiconductor chips that has materially affected global automotive production volumes since 2020 and may continue having some impact in 2024 § Supply chain disruptions caused by geopolitical conflict § Supply chain disruptions caused by extreme weather events growing in frequency |
§ Lower sales § Unrecoverable price increases § Elevated unrecoverable costs such as those for premium freight or re-sourcing of supply § Significant production inefficiencies from our production lines being stopped/restarted § Penalties or business interruption claims from customers § Loss of future business § Reputational damage § Higher inventory levels § Pricing pressures from sub-suppliers negatively impacted by production inefficiencies, premium freight costs and/or other costs and surcharges § Challenges in retaining employees due to production volatility § Financial stress on supply base |
||
10 Annual Information Form
| Macroeconomic, Political & Other Trends | Description | Potential Impact on Magna | ||
| Geopolitical Conflicts |
§ Current military conflicts in Ukraine and Gaza § U.S./China relations § Political pressure to manufacture and source from countries that are geopolitical allies |
§ Potential creation of risks, including: § Disruption of energy supplies (particularly natural gas and oil), shipping/transportation and logistics, vehicle production and/or supply chains; § Weaking of economic growth and consumer confidence; and § Increasing physical and cybersecurity threats § Potential worsening of current risks, including: § inflationary pressures; § Commodities prices; § Relative foreign exchange rates; and § Risks of doing business in foreign markets |
||
| Economic/political uncertainty |
§ Deterioration of consumer confidence, including as a result of: § Impact of elevated levels of inflation § Impact of elevated long-term interest rates § Direct/indirect impacts of geopolitical events, including military conflicts |
§ Potential for lower vehicle sales, and thus lower production volumes § Planning and investment uncertainty § Increasing risk of pricing pressure from OEMs and increasing financial stress on supply base § Potential impact on our sales and profits |
||
| Accelerating focus on impact of climate change |
§ Acceleration of government regulation banning the sale of new vehicles with ICE engines by certain future dates § Governmental authorities, customers, equity investors, lenders, rating agencies, employees and other stakeholders increasing scrutiny of companies’ impact on and resilience to climate change § Focus on energy reduction and transition to renewable / carbon neutral energy sources § Increasing expectations regarding disclosures of ESG metrics § Growth in investment demand for companies demonstrating sustainable strategy and operations § Heightened focus and concern on risk of supply chain disruptions from climate-related events |
§ Opportunities from product strategy aligned with sustainable goals § Potential energy reduction opportunities could reduce operating costs § Decarbonization strategies / commitments could require increased capital spending and/or involve higher operating costs, including higher costs to purchase renewable energy § Potential for increased / decreased demand for Magna’s Common Shares, based on market views as to sustainability of the company § Risk of disruption to automotive supply chains, transportation routes and electricity grids from climate-related events |
||
| Localization of production |
§ Pressure on OEMs to localize production of vehicles in markets in which they are sold § Potential to reduce costs and mitigate risks associated with longer supply chains § Tier 1 Suppliers also increasing localization to meet demands of local market and pace of new products § However, some of the China-based, EV-focused OEMs and Vietnam’s VinFast are exporting vehicles produced domestically into Europe and North American markets |
§ Planning and investment uncertainty § Potential incentives for expansion into local markets § May result in new opportunities for Magna in markets where we have available capacity or are well established § Could also result in duplication of capacity across markets |
||
Magna International Inc. 11
Industry Trends
The automotive industry is being defined by a number of global megatrends that have shaped our long-term strategy, including:
| Megatrend | Impact on Automotive | |||
| Economy |
Globalization
|
Industry built through globalization appears to be undergoing regionalization
|
||
| Environmental Impact | Concern for environment/climate change driving vehicle electrification, including through acceleration of sustainability-related legislation | |||
| Natural Resources & Energy | Access to critical battery minerals and availability of sufficient renewable energy may define success of drive to vehicle electrification | |||
| Society |
Demographic Change
|
Product design will be influenced by aging population
|
||
| Digital Transformation | Connectivity and digitization impact both product and process. New vehicle architectures that connect the subsystems along with software functionality creates additional value to products. Process is also impacted due to increased digitization, driven by increased requirements for productivity and quality | |||
| Individualism | Product design will be influenced by growing individualism, including desire for greater personalized experiences | |||
| Health & Well-Being | Active Driver Assistance Systems (“ADAS”) and autonomy take rates will be driven both by consumer preferences as well as regulatory requirements tied to increased safety | |||
| Mobility |
Urbanization | Continued growth in urban population will lead to changes in mobility as a result of increased density and congestion with an increase in EV adoption and new transport modalities | ||
| New Mobility | Emerging new mobility eco-system offers a range of potential opportunities for new products and services, including automated delivery and mobility solutions | |||
These global megatrends and other factors are driving a number of industry trends, which are discussed below together with their potential impact on Magna.
| Automotive Industry Trends | Description | Potential Impact on Magna | ||
| Continuing focus on reducing vehicle’s energy consumption and CO2 emissions |
§ Sustainability considerations and regulatory action, resulting in push for more efficient, cleaner, and smaller-displacement engines § Trend toward electrified vehicles drives demand for solutions to help extend driving range from single battery charge |
§ Continuing opportunities to support OEM customers’ efforts through lightweighting, more efficient drivetrains, electrification, and active aerodynamics § Magna’s diversified portfolio supports both transition to EV, as well as traditional vehicle architectures — positioning Magna to proactively manage the speed of the transition to EVs |
||
12 Annual Information Form
| Automotive Industry Trends | Description | Potential Impact on Magna | ||
| Demand for electric and hybrid vehicles, as well as investment in vehicle electrification |
§ Sustainability considerations and regulatory actions, including mandatory phase-outs of the sale or registration of new ICE vehicles in the future, driving increased emphasis on electrified powertrains § Interest in electrified solutions, especially in Europe and China § Significant development and engineering costs for OEMs may drive increased outsourcing to suppliers and increased collaboration among OEMs § Number of EVs sold globally growing, but rate of growth has moderated in some markets with a misalignment between EV production/supply and consumer demand for certain models |
§ Opportunities to grow Magna content and sales in areas such as drivetrain products and battery enclosures § Strong level of investment required to grow or maintain market share could impact short term financial performance § Potential non recovery of certain capital investments if planned production volumes do not materialize due to EV production/ sales misalignment § Pricing pressure on, and migration of value away from, traditional products in order for OEMs to accommodate cost of battery systems and electrified products § Quoting risk and technology risks, as well as lack of warranty experience with electrified products § Increased competition, including from new market entrants providing electrified solutions § Potential risk of OEMs in-sourcing a greater proportion of EV components and systems production § Potential long-term displacement of some mechanical products where there are alternative electrified solutions § Potential challenges in attracting and retaining highly skilled engineering and software personnel |
||
| Continued growth in demand for driver assistance/active safety systems |
§ Growth in demand for driver assistance features/active safety systems driven by tightening safety regulations and continued growth in demand for luxury segment vehicles |
§ Opportunity to grow Magna content and sales, particularly in ADAS products § Continued expenditures for growth in ADAS required to develop Magna’s autonomous driving capabilities could impact short-term financial performance § Quoting risk and technology risks, as well as lack of warranty experience with ADAS products § Potential challenges in attracting and retaining highly skilled engineering and software personnel |
||
| Disruption by new industry entrants offering “mobility as a service” (“MaaS”) |
§ Growth of ride hailing and ride sharing services in urban areas § Potential substitute for personal mobility vehicles, particularly in congested urban centres § May result in lower production volumes of vehicles from traditional OEMs |
§ Alternative revenue streams or new business opportunities for full-vehicle engineering and manufacturing, as well as additional service offerings § Potential loss of business with traditional OEMs, to the extent MaaS adversely impacts OEMs § Potential risks relating to conducting business with new MaaS entrants that may have limited operating history, as well as financial, liquidity/capital, or other resources § Uncertainty with respect to volume of new MaaS product offerings creates risks relating to recovery of engineering/capital investments |
||
Magna International Inc. 13
| Automotive Industry Trends | Description | Potential Impact on Magna | ||
| Emergence of newer EV-focused OEMs |
§ Trend towards vehicle electrification has led to the emergence of EV-focused OEMs |
§ Potential for cooperative relationships and new business opportunities with new EV entrants § Potential risks relating to conducting business with newer OEMs that may have limited: operating history, as well as financial, liquidity/capital, or other resources; as well as untested business models § Uncertainty regarding consumer acceptance of EVs, particularly those made by new OEMs § Potential risks of non-recovery of pre-production and production receivables; inventory; fixed assets and capitalized pre-production expenditures; and third party obligations related to such items § Uncertainty regarding which newer OEMs will succeed in the long-term creates potential customer and/or partnership risk § Failure to grow with those newer OEMs that achieve commercial success could impact our long-term strategy |
||
| Accelerating demand for connected vehicles |
§ Growing demand to include connectivity features in vehicles driven by pervasiveness of digitalization in consumer’s daily lives § Personalization of end user functionality in vehicle experience § Growth in vehicle architectures that connect subsystems and include software functionality |
§ Opportunities to grow Magna high-value content, particularly given our systems capabilities § Potential for establishment of new business models, including software as a service § Potential challenges in attracting and retaining highly skilled engineers and software personnel § Potential product cybersecurity risks related to vehicles connected to external networks, which could impact consumer adoption of connectivity related products/systems |
||
| Significant R&D spending |
§ Large-scale OEM and Tier 1 Supplier investments to comply with tightening emissions regulations § Significant spending by OEMs, new market entrants and Tier 1 Suppliers on vehicle autonomy systems and new mobility solutions § May drive increased collaboration among OEMs |
§ Pricing pressure on, and migration of value away from, traditional products in order for OEMs to accommodate cost of electrification, as well as active safety / autonomous features § OEM inability to achieve planned sales volumes for electrified vehicles could impact suppliers’ ability to recover pre-production costs § Technical challenges to commercialize new technologies in ADAS § Intense competition from established and new market entrants § Risks related to establishing and maintaining intellectual property rights, including potential challenges to intellectual property ownership |
||
14 Annual Information Form
| Automotive Industry Trends | Description | Potential Impact on Magna | ||
| Continuing elevated product warranty expectations and product recall levels |
§ Over the last decade, OEMs have become more inclined to recall vehicles with potentially faulty products § Increased frequency and severity of recalls, together with other factors, have impacted coverage and pricing for recall insurance |
§ Increased OEM pricing pressure, including pressure to assume greater warranty responsibility § Increasing product recall claims and related product replacement cost risk, even where root cause is not agreed with OEM or cannot be determined § Higher self-insured retentions and, reduced coverage limits on recall insurance, as well as increased reluctance by certain sub-suppliers to absorb the full cost of warranty/ recall expenses relating to the failure of their components, create greater net exposure |
||
| OEM cooperative alliances / consolidation |
§ Joint platform development, powertrain sharing, and/or purchasing § Regional joint ventures § Partnerships expanding to new areas of vehicle ecosystem (raw materials/batteries; components/software; infrastructure/aftersales) § OEM consolidation from time to time |
§ Increased OEM pricing pressure § Increase in sales, where Magna has strong relationship with lead OEM § Decrease in sales, where Magna has weaker relationship with lead OEM |
||
| Long-term growth of Chinese OEMs and suppliers aided by China’s accelerated focus on vehicle electrification |
§ Lower cost base of Chinese OEMs on EVs could provide advantage for expansion into global markets § Large number of Chinese OEMs and excess production capacity could result in consolidation § Certain Chinese OEMs targeting expansion into North America and Europe |
§ New business opportunities, including drivetrain, electronics and ADAS products, and full vehicle engineering and assembly § Potential loss of business with traditional OEMs, to the extent new OEMs adversely impact traditional OEMs § Vertical integration risk as a result of Chinese OEMs having a financial / ownership interest in certain suppliers § Potential for consolidation, and/or new partnerships and collaborations |
||
| Chinese policies aimed at growing high-value domestic development/production |
§ Chinese government plans to increase engineering, development and manufacturing of high-value, high-tech products in China |
§ Increased localization of engineering, development, and manufacturing § Uncertainty regarding whether Chinese domestic companies will be preferred over foreign-owned companies operating in China § Potential for increased export control restrictions in the U.S. and Western Europe relating to strategically important and/or technologically advanced products and technology |
||
| Growth of “best-cost” automotive markets |
§ Growth of “best-cost” automotive markets, which are close to larger established manufacturing markets § Migration of manufacturing from traditional automotive markets such as the U.S., Western Europe |
§ Potential new “best-cost” market for engineering talent § Increased level of investment in new markets required § Various risks of doing business in foreign markets |
||
Magna International Inc. 15
Our Corporate Strategy
We have distilled the impacts of the global megatrends into four long-term strategic factors which we see defining the “Car of the Future” – electrification, autonomy, new mobility, and connectivity. We believe we are well-positioned to capitalize on opportunities in each area:

|
We possess an enhanced e-Powertrain portfolio with a range of products that addresses the roadmap for the transition to EVs. We continue to win new EV business. | |

|
We possess full ADAS capability and complete ADAS system expertise. We take a systems level approach in developing ADAS building blocks for OEM customers with a focus up to level 2+/3 ADAS capabilities. | |

|
We have expanded our collaboration ecosystem and continue to look at opportunities to leverage new business models. The breadth of our capabilities make us a key enabler of OEM customers and new entrants in the New Mobility space. | |

|
We possess software-enabled functionality in our electronic control unit-related products. This functionality could help optimize performance and efficiency in connected products, such as our connected powertrains. | |
We have developed our corporate strategy to realize the opportunities from these trends. Key elements of such strategy include:
1. Increasing capital deployment toward high-growth areas aligned with the “Car of the Future”
We are proactively managing our portfolio and evolving our product mix based on alignment with the Car of the Future which we see as electrified, connected, assisted/autonomous, personalized, and sustainable. We seek to grow our business and capabilities in areas which are positively impacted by the global megatrends discussed earlier through an approach that emphasizes functionally integrated solutions, systems development, and cross-Operating Group collaboration. Examples of such areas include powertrain electrification, ADAS and battery enclosures, as well as our contract vehicle manufacturing operations. As illustrated below, we believe that a substantial proportion of our product areas are not adversely impacted by the global megatrends, including our body, chassis, lighting, active aerodynamics, dual clutch transmissions, mirrors, mechatronics, and seating products.
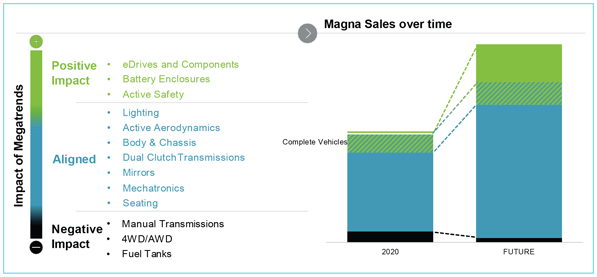
Lastly, there are elements of our product portfolio which are negatively impacted by the global megatrends and are expected to be less directly relevant to the Car of the Future. Examples of such products include manual transmissions, mechanical AWD/4WD systems and fuel tank systems. Despite their declining long-term strategic importance, our assets and expertise associated with these products remain relevant to, and can be redeployed for, growing product areas aligned with the Car of the Future.
16 Annual Information Form
2. Driving Operational Excellence
We are committed to manufacturing excellence. We continue to elevate our approach to manufacturing by implementing “factory of the future” initiatives including: enhanced use of big data and analytics; digitization; advanced robotics; additive manufacturing; and augmented reality. The ultimate goal is to achieve greater profitability through further enhanced quality, production efficiency, reduction of floor space and improved return on investments. Critical elements of our approach to operational excellence include our Factory of the Future initiatives and MAFACT operating system, which are discussed in “Section 6 – Description of the Business – Manufacturing & Engineering” in this AIF. Additionally, our sustainability strategy dovetails with our efforts around operational excellence, due to the focus on energy optimization and minimization of water withdrawals, as well as waste streams to landfill. Details of our approach to Sustainability, including emissions, energy, water, and waste reduction targets, can be found in our Sustainability Report, which is Appendix 1 to this AIF.
3. Unlocking New Business Models and Markets
The new mobility landscape, which is generally urban, electrified, autonomous and connected, is creating new business models and markets. We believe that our systems and complete vehicle knowledge, including elements of our portfolio such as EV and ADAS platforms, provide us with an advantage in pursuing such opportunities. In addition, our ability to use capital efficiently, launch programs reliably and help speed products to market, makes Magna a key enabler of new entrants. Additionally, we are using our capabilities and platform technologies to enter the micromobility market. For example, we invested in the Yulu electrified two-wheeler shared mobility business in India and related battery-swapping business and have a number of activities underway involving Magna-developed and third party-developed robots for potential industrial and last-mile delivery applications.
Magna International Inc. 17
| 5. | Risk Factors |
The industry in which we compete and the business we conduct are subject to a number of risks and uncertainties. Our short and medium-term operational success, as well as our ability to create long-term value through our corporate strategy, are subject to a number of risks and uncertainties. These risks and uncertainties, together with a number of assumptions, underlie the forward-looking statements made in this AIF. In order to fully understand these risks, uncertainties, and assumptions, you should carefully consider the following risk factors in addition to other information included in this AIF:
Macroeconomic, Geopolitical and Other Risks
| ◾ | Inflationary Pressures: We continue to experience elevated inflation in all markets in which we operate, with higher commodity, energy, labour, freight, and other production input pricing expected to persist in 2024. While many of these input price increases will moderate over time, the increases in wage levels we are currently experiencing are likely to have a longer-term effect on our cost structure. Additionally, we may continue to experience price increases or surcharges from sub-suppliers in connection with the inflationary pressures they face. The inability to offset inflationary price increases, including through recoveries from our customers, modifications to our products, continuous improvement actions or otherwise, could have a material adverse effect on our profitability. |
| ◾ | Interest Rates: Increasing global inflation rates have spurred a cycle of monetary policy tightening, including through central bank increases to key short-term lending rates. The availability and cost of credit are both factors affecting consumer confidence, which is a critical driver of vehicle sales and thus automotive production. A material, sustained decrease in consumer demand for vehicles could result in further reductions to vehicle production from levels assumed in our business plan, which could have a material adverse effect on our profitability and financial condition. Higher interest rates will have an adverse effect on our borrowing costs, and if prolonged, could have an adverse effect on our profitability. |
| ◾ | Geopolitical Risks: The occurrence of geopolitical crises, including from the current military conflicts in Ukraine and Gaza, could create a number of risks, including: disruption of energy supplies (particularly natural gas and oil), shipping/transportation and logistics, vehicle production and/or supply chains; weakening economic growth and consumer confidence; increasing physical or cybersecurity threats; and/or worsening other risks described elsewhere in these Risk Factors, such as inflationary pressures, commodity prices, relative foreign exchange rates and risks of doing business in foreign markets. An expansion or worsening of existing geopolitical crises, or the occurrence of significant new geopolitical risks, could have a material adverse effect on our business and operations. |
Risks Related to the Automotive Industry
| ◾ | Economic Cyclicality: Ordinarily, the global automotive industry is cyclical, with potential for regional differences in the timing of expansion and contraction of economic cycles. In normal industry cycles, lower consumer confidence typically translates to lower vehicle sales and production volumes. Examples of factors which often reduce consumer confidence include: worsening economic, political, and other conditions; military conflict; increasing inflation (particularly fuel and energy prices); and rising interest rates. A significant decline in vehicle production volumes from levels assumed in our business plan could have a material adverse effect on our profitability and financial condition. |
| ◾ | Regional Production Volume Declines: North America, Europe and China are key automotive producing regions for us, and our operating results are primarily dependent on car and light truck production by our customers in these regions. A significant or sustained decline in vehicle production volumes in any or all these geographic regions could have a material adverse effect on our operations, sales, and profitability. |
| ◾ | Deteriorating Vehicle Affordability: Vehicle affordability to consumers is becoming more challenged due to a combination of factors, including: higher prices for electric vehicles (“EVs”); costs related to advanced electronic systems; increasing vehicle finance costs due to rising interest rates; inflationary cost increases impacting the entire bill of materials for a vehicle; and, in some cases, limited vehicle supply. A material, sustained decrease in consumer demand for vehicles due to deteriorating vehicle affordability could result in reductions to vehicle production from levels assumed in our business plan, which could have a material adverse effect on our profitability and financial condition. |
| ◾ | Misalignment Between EV Production and Sales: The automotive industry is transitioning from vehicles powered by internal combustion engines (“ICE”) to EVs, resulting in significant, industry-wide capital investment in EV-related production capacity. At the same time, there remains some uncertainty as to consumer acceptance of EVs due to issues such as vehicle affordability; availability of government subsidies; concerns regarding evolving battery technologies; anxiety regarding driving range; adequacy of charging infrastructure; the proliferation of new, EV-focused OEMs and/or new EV models with little or no operating and warranty history; and other factors. Although the number of EVs sold globally is growing, the rate of growth has moderated in some markets, with a misalignment between EV production/supply and consumer demand for certain models. If planned production volumes for EV programs do not materialize, we may not be able to recover our capital investments related to such programs, or to recover such investments within the timeframes contemplated. |
| ◾ | Intense Competition: The automotive supply industry is highly competitive and becoming more so. Some of our competitors have higher or more rapidly growing market share than we do in certain product or geographic markets. Additionally, a number of established |
18 Annual Information Form
| electronics, semiconductor chip and contract manufacturing companies have entered or expanded their presence in the automotive industry. At the same time, disruptive technology innovators have been introducing novel product and service solutions which traditional automotive suppliers may not be able to match. Failure to successfully compete with existing or new competitors, including failure to grow our electronics and/or EV content at or above the industry rates of growth for such products, could affect our ability to fully implement our corporate strategy. |
Strategic Risks
| ◾ | Alignment With “Car of the Future”: The success of our corporate strategy is correlated in part to our ability to evolve our product mix based on alignment with global megatrends defining the “Car of the Future.” Accordingly, we seek to grow our business and capabilities in areas which are positively impacted by megatrends related to vehicle electrification, autonomy, new mobility, and connectivity. Examples of such product areas include powertrain electrification, ADAS and battery enclosures. Some systems in our product portfolio are negatively impacted by the foregoing megatrends, including manual transmissions, mechanical all-wheel drive/four-wheel drive systems and fuel tank systems. The failure to grow our megatrend-aligned product areas at or above the industry rates of growth for such products could have a material adverse effect on our profitability and financial condition. |
| ◾ | Evolving Business Risk Profile: The risk profile of our business continues to evolve with the increasing importance to us of product areas such as electrified powertrains and ADAS. With this continuing evolution, we may face new or heightened risks, including: forecasting and planning risks related to penetration rates of EVs, as well as take-rates for ADAS or features offered to consumers as optional items; reduction in demand for certain products which are unique to internal combustion engine vehicles; challenges in quoting for profitable returns on products with leading-edge technologies and/or new service models for which we may not have significant quoting experience; rigorous testing and validation requirements from OEM customers for complex new products; increased warranty and recall risks on new products and leading-edge technologies; increased product liability risks; heightened risk of technological obsolescence of some of our products, processes and/or assets; and difficulties in attracting or retaining employees with critical skills in high-demand areas. Realization of one or more such risks could have a material adverse effect on our operations, profitability, or financial condition. |
| ◾ | Technology and Innovation: While we continue to invest in technology and innovation which we believe will be critical to our long-term growth, the automotive industry is experiencing significant electrical, electronic, and software-driven change and disruption. Our ability to anticipate changes in technology and to successfully develop and introduce new and enhanced products and/or manufacturing processes on a timely basis will be significant factors in our ability to remain competitive. Additionally, our success is dependent on our ability to attract, develop and retain employees with the required technical and/or software skills. If we are unsuccessful or are less successful than our competitors in consistently developing innovative products and/or processes, we may be placed at a competitive disadvantage in bidding for new business and may not be able to recover some or all our engineering, research and development costs, which could have a material adverse effect on our profitability and financial condition and ability to fully implement our corporate strategy. |
| ◾ | Investments in Mobility and Technology Companies: In addition to our development activities, we have invested in various mobility and technology companies, as well as funds that invest in such companies. Such investments are an important element of our long-term strategy, and we may make further investments in such companies. However, investing in such companies involves a high degree of risk, including the potential loss of some or all our investment value. There is currently no public market for the shares or units of some of these investments and, as a result, we may be unable to monetize such investments in the future. In some cases, we have shares or share purchase warrants with technology-driven suppliers or OEMs with which we have commercial supply relations; while the value of such equity may be affected by the commercial prospects of such programs, our ability to exit our investments may be impaired by the existence of our commercial supply relationship. Investments in companies or funds which are currently or subsequently become publicly traded are “marked-to-market” quarterly, which may result in us recording unrealized gains or losses in any given quarter. The realization of any of the foregoing investment-related risks could have an adverse effect on our profitability and financial condition. |
Customer-Related Risks
| ◾ | Customer Concentration: Although we supply parts to all the leading OEMs, a significant majority of our sales are to six customers: General Motors, Mercedes-Benz, BMW, Ford, Stellantis, and Volkswagen. In light of the amount of business we currently have with these six customers, our opportunities for incremental growth with them may be limited. Additionally, growth rates of OEMs differ by region and segment, with significant growth by some EV-focused OEMs in certain markets. Shifts in market share away from our top customers could have a material adverse effect on our profitability to the extent we are unable to offset such lost sales with sufficient sales growth with alternative OEMs. |
| ◾ | Growth with Asian OEMs: The amount of business we have with Japanese, Korean and Chinese-based OEMs generally lags with that of our six largest customers, due in part to the existing relationships between such Asian OEMs and their preferred suppliers. Our inability to significantly grow our business with Asian-based OEMs could have an adverse effect on our profitability. |
| ◾ | Growth of EV-Focused OEMs: The number of EV-focused OEMs has increased in recent years but it remains too early to predict which of the other EV-focused OEMs will succeed globally. Some of the China-based, EV-focused OEMs, such as BYD and Geely, are entering |
Magna International Inc. 19
| the European market with vehicles exported from China, while VinFast has entered both the European and North American markets with vehicles exported from Vietnam. Vehicle electrification is an important component of our strategy, including through product areas such as electric drive systems and battery enclosures, as well as services such as complete vehicle engineering and contract vehicle manufacturing. While we are targeting growth with some of the newer EV-focused OEMs, we do not have relations with all, nor are such relationships as well established as those with our traditional customers. The failure to sufficiently grow our sales to those EV-focused OEMs which achieve significant commercial success could adversely impact our long-term strategy. At the same time, the failure of newer EV-focused OEMs to which we supply systems or vehicles to achieve their sales projections could adversely impact the success of our customer diversification and electrified product strategies, as well as create counterparty risks described below. |
| ◾ | Risks of Conducting Business with Newer EV-Focused OEMs: Conducting business with newer EV-focused OEMs continues to alter the risk profile of our business and poses incremental risks and challenges compared to our traditional customers, including as a result of: their relatively short operating histories; limited financial, liquidity/capital or other resources; less mature product development and validation processes; uncertain market acceptance of their products/services; and untested business models. These factors may elevate our counterparty risks in dealing with such OEMs, particularly with respect to recovery of: pre-production (including tooling, engineering, and launch) and production receivables; inventory; fixed assets and capitalized pre-production expenditures; as well as other third party obligations related to such items. The inability of newer EV-focused OEMs to achieve commercial success, or the bankruptcy or insolvency of any such OEM with which we conduct business, could have a material adverse effect on our profitability and financial condition. |
| ◾ | Fisker’s Ability to Continue as a Going Concern: On February 29, 2024, Fisker Inc. (“Fisker”) raised substantial doubt as to its ability to continue as a going concern. As a result of Fisker’s subsequent inability to secure new financing, it may seek bankruptcy protection to restructure its business and operations which could have a material adverse effect on our financial condition and/or profitability, as follows: |
Financial Condition: Our Operating Groups and Divisions had exposure to Fisker pre-production (including tooling, engineering, and launch) and production receivables; inventory; fixed assets and capitalized preproduction expenditures; as well as other third-party obligations related to such items of approximately $450 million and $300 million as at December 31, 2023, and March 20, 2024, respectively. In addition to such amounts, we hold share purchase warrants in Fisker which are “marked-to-market” quarterly in Other Expense (Income). Based on the last trading price of Fisker shares, we expect to record a $35 million charge related to these warrants in the first quarter of 2024. Finally, when the warrants were issued, and the vesting provision realized, we recorded an offsetting amount to deferred revenue which is not marked-to-market but rather amortized to operating income as Fisker vehicles are produced and delivered. The unamortized amount of deferred revenue as of March 20, 2024, was approximately $195 million. Based on the above, and dependent on the outcome of a Fisker bankruptcy, insolvency, or restructuring plan, if any, we will be required to record an impairment charge in Other Expense in the range of approximately $140 million to $335 million.
Profitability: On February 9, 2024, we issued an Outlook that assumed production volumes of the Fisker Ocean SUV at our facility in Graz, Austria of approximately 20,000 units and 30,000 units for 2024 and 2026, respectively. Our 2024 sales outlook included consolidated sales associated with such Fisker production volumes of approximately $425 million, comprised of $200 million of assembly sales (including from fixed cost recoveries) and $225 million for the sale of systems and components. If Fisker is unable to meet its contractual commitments to Magna, the negative impact to our 2024 consolidated Adjusted EBIT margin is expected to be approximately 25 basis points, excluding the cost of any restructuring actions.
| ◾ | Dependence on Outsourcing: We depend on outsourcing by OEMs, including the outsourcing of complete vehicle assembly to our contract vehicle manufacturing business. The extent of such outsourcing is dependent on a number of factors, including: the cost, quality, and timeliness of outsourced production relative to in-house production by an OEM; the degree of unutilized capacity at an OEM’s facilities; and collective bargaining agreements and labour relations between OEMs and labour unions. Currently, OEMs in Europe and China have excess vehicle assembly capacity. Additionally, since EVs have fewer components than vehicles with internal combustion engines, some OEMs may insource production of certain components or systems to maintain employment levels committed to in collective bargaining agreements and/or in connection with government incentives. A reduction in outsourcing by OEMs, or the loss of any material production or assembly programs combined with the failure to secure alternative programs with sufficient volumes and margins, could have a material adverse effect on our profitability. |
| ◾ | Customer Cooperation and Consolidation: Competing OEMs have cooperated and collaborated in different ways to save costs, including through: joint purchasing activities; platform sharing; powertrain sharing; joint R&D; and regional joint ventures. Additionally, the automotive industry has experienced OEM consolidation, with the last material example being the merger of Fiat Chrysler Automobiles and PSA Group in 2021. While OEM cooperation and consolidation may present opportunities, they also present a risk that we could lose future business or experience even greater pricing pressure on certain production programs, either of which could have an adverse effect on our profitability. |
| ◾ | Market Shifts: While we supply parts for a wide variety of vehicles produced globally, we do not supply parts for all vehicles produced, nor is the number or value of parts evenly distributed among the vehicles for which we do supply parts. Shifts in market shares away from vehicles on which we have significant content, as well as vehicle segments in which our sales may be more heavily concentrated, could have a material adverse effect on our profitability. |
| ◾ | Consumer Take Rate Shifts: Shifts in consumer preferences may impact “take rates” for certain types of products we sell. Examples of such products include: all-wheel drive systems; power liftgates; active aerodynamics systems; ADAS; and complete vehicles with certain option packages or option choices. Where shifts in consumer preferences result in higher “take rates” for products that we do not sell or for products we sell at a lower margin, our profitability may be adversely affected. |
| ◾ | Quarterly Sales Fluctuations: Our business is generally not seasonal, but our sales and profits are closely related to our automotive customers’ vehicle production schedules. Our largest customers typically shut down vehicle production for brief periods which fall during our third and fourth fiscal quarters. These scheduled shutdowns of our customers’ production facilities could cause our sales and profitability to fluctuate when comparing fiscal quarters within any given year. |
| ◾ | Customer Purchase Orders: Contracts from our customers consist of blanket purchase orders which generally provide for the supply of a customer’s annual requirements rather than a specific quantity of products and can be terminated by a customer at any time. We may have various pre-production, tooling, engineering, and other costs which cannot be recovered from our customers if a purchase order is terminated and/or if forecast production volumes fail to materialize. The failure to recover such costs could have an adverse effect on our profitability. |
20 Annual Information Form
| ◾ | Potential OEM Production-Related Disruptions: Any significant OEM production disruptions, including as a result of labour unrest at customer or sub-supplier facilities, would lead to disruptions to our production, which could have a material adverse effect on our sales, and profitability. |
Supply Chain Risks
| ◾ | Semiconductor Chip Supply Disruptions and Price Increases: A global shortage of semiconductor chips for use in automotive applications has had a material adverse effect on global automotive production volumes since 2020 and may continue having some impact in 2024. In response to semiconductor chip shortages, OEMs may continue to take actions such as: unplanned shutdowns of production lines and/or plants; reductions in their vehicle production plans; and changes to their product mix. Such OEM responses can result in a number of direct and indirect consequences for Tier 1 suppliers like Magna, including: lower sales; significant production inefficiencies resulting from our production lines being stopped/restarted unexpectedly when OEMs’ allocate scarce chips to specific production programs; higher inventory levels; premium freight costs to expedite shipments; other unrecoverable costs and charges, including from sub-suppliers which have been adversely affected by higher chip prices and/or production inefficiencies; and increased challenges in retaining employees through production disruptions. Although supplies of semiconductor chips are significantly better than in the last two years, it remains unclear when supply and demand for automotive semiconductor chips will fully rebalance. A worsening or prolongation of the semiconductor chip shortage could have a material adverse effect on our operations, sales, and profitability. |
| ◾ | Supply Chain Disruptions: In addition to the global shortage of semiconductor chips for automotive applications, OEMs and Tier 1 automotive suppliers may also experience supply disruptions or constraints on other critical manufacturing inputs, for a number of different reasons, including: government regulation or intervention; geopolitical and/or military conflict; interruption of shipping or other transportation routes; natural catastrophes; labour disruptions; and pandemics. Supply chain disruptions which prevent us from timely supplying products to our customers could result in a range of potential adverse consequences, including: unrecoverable price increases; elevated, unrecoverable costs such as those for premium freight or re-sourcing of supply; penalties or business interruption claims by our customers; loss of future business; and reputational damage. The impacts of prolonged supply chain disruptions or constraints could have a material adverse effect on our operations and profitability. |
| ◾ | Regional Energy Supply and Pricing: Regional energy supplies have from time to time been disrupted due to geopolitical and military conflict, supply/demand imbalances, government regulation, severe weather events, and challenges related to the transition to renewable energy generation. Unforeseen supply disruptions or demand spikes, prolonged energy disruptions and/or significant energy price increases could have a material adverse effect on our operations and profitability. |
| ◾ | Supply Base Condition: We rely on a number of suppliers to supply us with a wide range of components required in connection with our business. The financial health of automotive suppliers is impacted by a number of factors, including economic conditions and production volumes. A significant worsening of economic conditions or reduction in production volumes could deteriorate the financial condition of our supply base, which could lead to, among other things: disruptions in the supply of critical components to us or our customers; and/or temporary shutdowns of one of our production lines or the production lines of one of our customers; all of which could have a material adverse effect on our profitability. |
Manufacturing/Operational Risks
| ◾ | Product Launch: The launch of production is a complex process, the success of which depends on a wide range of factors, including: the timing and frequency of design changes by our customers relative to start of production; product maturity and complexity; production readiness of our own, as well as our customers’ and suppliers’ manufacturing facilities; robustness of manufacturing and validation processes; launch volumes; quality and production readiness of tooling and equipment; sufficiency of skilled employees; and initial product quality. Failure by us to successfully launch a new product or complete vehicle could result in commercial or litigation claims against us which could have a material adverse effect on our profitability. Additionally, a significant product or program launch failure could adversely affect our reputation and/or ability to execute our strategy. |
| ◾ | Operational Underperformance: From time to time, we may have operating divisions which are not performing at expected levels of profitability. The size and complexity of automotive manufacturing operations often makes it difficult to achieve a quick turnaround of underperforming divisions. Significant underperformance in our operating divisions could have a material adverse effect on our profitability and operations. |
| ◾ | Restructuring Costs: We may sell some product lines and/or downsize, close, or sell some of our operating divisions. By taking such actions, we may incur restructuring, downsizing and/or other significant non-recurring costs. These costs may be higher in some countries than others and could have a material adverse effect on our profitability. |
| ◾ | Impairments: We have recorded significant impairment charges related to equity interests in joint ventures, goodwill, and long-lived assets in the past and may do so again in the future. The occurrence of any of a number of potential scenarios could result in indicators of impairment, including: the early termination, loss, renegotiation of the terms of, or delay in the implementation of, any significant production contract; the technological obsolescence of any of our products or production assets; production volumes that are lower than expected; and the insolvency of a customer. In conducting our impairment analysis, we make forward-looking assumptions regarding: the impact of turnaround plans on underperforming operations; new business opportunities; program price and cost assumptions on |
Magna International Inc. 21
| current and future business; the timing and success of new program launches; and forecast production volumes. To the extent such forward-looking assumptions are not met, any resulting impairment loss could have a material adverse effect on our profitability. |
| ◾ | Labour Disruptions: Some of our manufacturing facilities are unionized, as are many manufacturing facilities of our customers and suppliers. While unionized facilities are subject to the risk of labour disruptions from time to time, we cannot predict whether or when any labour disruption may arise, or how long such a disruption could last. A significant labour disruption could lead to a lengthy shutdown of our or our customers’ and/or our suppliers’ production lines, which could have a material adverse effect on our operations and profitability. |
| ◾ | Skilled Labour Attraction/Retention: Our business is based on successfully attracting, training, developing, and retaining employees at all levels of the company from “shop-floor” to Executive Management. The markets for highly skilled workers, as well as talented professionals and leaders in our industry are extremely competitive, particularly in the major global automotive and technology centres in which many of our operations are located. The inability to meet our needs for skilled workers and talented professionals and leaders, whether through recruitment or internal training and development activities could impact our ability to profitably conduct business and/or effectively implement our strategy. |
| ◾ | Leadership Expertise and Succession: Effective succession planning programs and practices are a critical element of our overall talent management strategy. We experienced a significant number of planned retirements in the last few years and may experience similar waves in future years. As a result of such retirements, we have multiple senior leaders recently appointed to roles at a time of significant macroeconomic, geopolitical, industry and other disruptions discussed elsewhere in these Risk Factors. While we believe that our leadership development and succession program has been effective in facilitating leadership transitions to date, our ability to profitably conduct business and/or successfully implement our strategy could be impacted by the failure to: identify, train, develop and support high-performing leaders; ensure effective knowledge transfers from transitioning leaders to successors; and/or otherwise promote organizational robustness and resilience through leadership transitions in critical roles. |
Pricing Risks
| ◾ | Quote/Pricing Assumptions: The time between award of new production business and start of production typically ranges between two and four years. Since product pricing is typically determined at the time of award, we are subject to significant pricing risk due to changes in input costs and quote assumptions from the time of award through the start of production. This risk is elevated in a rising inflation environment, particularly with respect to wages, energy, and commodities. The inability to quote effectively, or the occurrence of a material change in input cost or other quote assumptions between program award and production, could have a material adverse effect on our profitability. |
| ◾ | Customer Pricing Pressure/Contractual Arrangements: We face ongoing pricing pressure from OEMs, including through: quoting pre-requirements; long-term supply agreements with mutually agreed price reductions over the life of the agreement; non-contractual annual price concession demands; pressure to absorb costs related to product design, engineering and tooling, and/or amortize such costs through the piece price for the product; pressure to assume incremental warranty costs; and OEM refusal to fully offset inflationary price increases. OEMs possess significant leverage over their suppliers due to their purchasing power and the highly competitive nature of the automotive supply industry. As a result of the broad portfolio of parts we supply to our six largest OEM customers, such customers may be able to exert greater leverage over us as compared to our competitors. We attempt to offset price concessions and costs in a number of ways, including through commercial negotiations with our customers, improved operating efficiencies and cost reduction efforts. Our inability to fully offset price concessions, absorb design, engineering, and tooling costs, and/or fully recover such costs over the life of production, could have a material adverse effect on our profitability. Moreover, while we attempt to negotiate contractual terms with our suppliers that align with the contractual terms between us and our OEM customers, we may not always be successful in doing so. Any such gaps between our customer and supplier contract terms could, in certain circumstances, have an adverse effect on our profitability. |
| ◾ | Commodity Price Volatility: Prices for certain key raw materials and commodities used in our parts, including steel, aluminum, and resin, can be volatile. In some cases, our risk is mitigated because we purchase steel or aluminum under customer resale programs. Where such commodity purchases are not made under customer resale programs, we seek to offset commodity price increases by: passing such increases to our customers, engineering products with reduced commodity content, implementing hedging strategies, or otherwise. To the extent we are unable to offset commodity price increases, such additional commodity costs could have an adverse effect on our profitability. |
| ◾ | Scrap Steel/Aluminum Price Volatility: Some of our manufacturing facilities generate a significant amount of engineered scrap steel and/or aluminum in their manufacturing processes but recover some of the value through the sale of such scrap. Scrap steel and scrap aluminum prices can also be volatile and do not necessarily move in the same direction as steel or aluminum prices. Declines in scrap steel/aluminum prices from time to time could have an adverse effect on our profitability. |
Warranty/Recall Risks
| ◾ | Repair/Replacement Costs: We are responsible for repair and replacement costs of defective products we supply to our customers. Certain of our products, such as transmissions and battery enclosures, typically have a higher unit and labour service cost in the event of replacement. Other products, such as cameras, radars, and side door latches, are supplied in multiples of two or four for a single vehicle, |
22 Annual Information Form
| which could result in significant cost in the event all need to be replaced. OEMs and/or government regulators can initiate recalls of safety or regulated products, which could place us at risk for the administrative costs of the recall, in addition to the repair/replacement costs of defective products, even in situations where we dispute the need for a recall or the responsibility for any alleged defect. See the claim disclosed in “Section 10 — Legal Proceedings” in this AIF. The obligation to repair or replace defective products could have a material adverse effect on our operations and profitability. To the extent such obligation arises as a result of a product recall, we may face reputational damage, and the combination of administrative and repair/replacement costs could have a material adverse effect on our profitability. |
| ◾ | Warranty Provisions: In certain circumstances, we are at risk for warranty, product liability and recall costs. We are currently experiencing increased customer pressure to assume greater warranty responsibility. Certain customers seek to impose partial responsibility for warranty costs where the underlying root cause of a product or system failure cannot be determined, or where the root cause is disputed, as in the case of a claim disclosed in “Section 10 — Legal Proceedings” in this AIF. Warranty provisions for our products are based on our best estimate of the amounts necessary to settle existing or probable claims related to product defects. Warranty claims which exceed warranty provisions could have a material adverse effect on our profitability. In addition, warranty provisions for our powertrain systems, electronics and complete vehicle programs are also established based on our or our customers’ warranty experience with the applicable type of product and, in some cases, the terms in the applicable customer agreements. Actual warranty experience which results in costs that exceed our warranty provisions, could have a material adverse effect on our profitability. |
| ◾ | Product Liability: We cannot guarantee that the design, engineering, testing, validation, and manufacturing measures we employ to ensure high-quality products will be completely effective, particularly as electronic content and product complexity increases and/or as we enter newer product areas such as eDrives or ADAS. If our products fail to perform as expected or as required by governmental regulations, and/or to the extent any such failure results in, or is alleged to result in, bodily injury and/or property damage or other losses, our customers or government regulators may initiate a product recall of such products and/or third party product liability claims may be brought against us. The defense of product liability claims, particularly class action claims in North America, may be costly and judgements against us could impair our reputation and have a material adverse effect on our profitability. |
Climate Change Risks
| ◾ | Transition Risks and Physical Risks: Our Sustainability Report, which is appended to this AIF, contains a detailed discussion of transitional and physical climate change risks, along with our efforts to mitigate them. Readers are encouraged to review such climate risk disclosures. |
| ◾ | Strategic and Other Risks: A number of the risk factors discussed above contain detailed discussion of strategic and other risks related to the evolution of the automotive industry and our business within the context of the transition to electromobility, including: Alignment with “Car of the Future”; Technology and Innovation; Evolving Business Risk Profile; Growth of EV-Focused OEMs; Risks of Conducting Business with Newer EV-Focused OEMs; and Fisker’s Ability to Continue as a Going Concern. Readers are encouraged to review this entire Risk Factors section in its entirety. |
IT Security/Cybersecurity Risks
| ◾ | IT/Cybersecurity Breach: Although we have established and continue to enhance security controls intended to protect our IT systems and infrastructure, there is no guarantee that such security measures will be effective in preventing unauthorized physical access or cyber-attacks. A significant breach of our IT systems could: result in theft of funds; cause disruptions in our manufacturing operations; lead to the loss, destruction, or inappropriate use of sensitive data, including employees’ personal data; or result in theft of our, our customers’ or our suppliers’ intellectual property or confidential information. The occurrence of any of the foregoing could adversely affect our operations and/or reputation and could lead to claims against us that could have a material adverse effect on our profitability. |
| ◾ | Product Cybersecurity: The risk of vehicle cyber-attacks has risen with the proliferation of technology designed to connect vehicles to external networks. Although vehicle and systems-level cybersecurity controls and protections are typically managed and/or specified by our OEM customers, we cannot provide assurance that such controls and protections will be effective in preventing cyber intrusion through one of our products. Furthermore, an OEM customer may still seek to hold us financially responsible, even where the OEM specified the cybersecurity controls and protections. Any such cyber intrusion could cause reputational damage and lead to claims against us that have an adverse effect on our profitability. |
Acquisition Risks
| ◾ | Acquisition of Strategic Targets: We intend to continue to pursue acquisitions in those product areas which we have identified as key to our long-term corporate strategy. However, as a result of intense competition in these strategic areas, we may not be able to acquire the targets which we need to achieve our strategic objectives. |
| ◾ | Inherent Merger and Acquisition Risks: Acquisitions are subject to a range of inherent risks, including the assumption of incremental regulatory/compliance, pricing, supply chain, commodities, labour relations, litigation, environmental, pensions, warranty, recall, IT, tax, or other risks. While due diligence on an acquisition target is intended to mitigate such risks, these efforts may not always prove to be sufficient in identifying all risks and liabilities related to the acquisition, including as a result of: limited access to information; time constraints |
Magna International Inc. 23
for conducting due diligence; inability to access target company facilities and/or personnel; or other limitations in the due diligence process. Additionally, we may identify risks and liabilities that we are not able to sufficiently mitigate through appropriate contractual indemnities or other protections. The realization of any such risks could have a material adverse effect on our profitability.
| ◾ | Acquisition Integration and Synergies: We may not be able to successfully integrate or achieve anticipated synergies from our acquisitions and/or such acquisitions may be dilutive in the short to medium term. Either of these outcomes could have a material adverse effect on our profitability. |
Other Business Risks
| ◾ | Joint Ventures: We conduct certain of our operations through joint ventures under contractual arrangements under which we share management responsibilities with our joint venture partners. Joint venture operations carry a range of risks, including those relating to: failure of our joint venture partner(s) to satisfy contractual obligations; potential conflicts between us and our joint venture partner(s); strategic objectives of joint venture partners that may differ from our own; potential delays in decision-making; a limited ability to implement some or all of our policies, practices and controls, or to control legal and regulatory compliance, within the joint venture(s); and other risks inherent to non-wholly owned operations. The likelihood of such occurrences and their potential effect on us vary depending on the joint venture arrangement, however, the occurrence of any such risks could have an adverse effect on our operations, profitability, and reputation. |
| ◾ | Intellectual Property: We own intellectual property that is important to our business and product portfolio. Our intellectual property is an important factor in protecting our innovation activities and maintaining our competitive advantage. From time to time, our intellectual property rights may be challenged, including through the assertion of intellectual property infringement claims which could result in us: being prevented from selling certain products; having to license the infringed product/technology; and/or incurring monetary damages. The foregoing consequences could have an adverse effect on our sales, profitability, and ability to fully implement our corporate strategy. |
| ◾ | Risks of Doing Business in Foreign Markets: Conducting business in markets outside our traditional markets of North America and Europe carries a number of potential risks, including but not limited to, those relating to: political, civil and economic instability and uncertainty; military conflict; corruption risks; high inflation and our ability to recover inflation-related cost increases; trade, customs and tax risks; potential sanctions and export control risk; expropriation risks; currency exchange rates; currency controls; limitations on the repatriation of funds; insufficient infrastructure; competition to attract and retain qualified employees; and other risks associated with conducting business internationally. Expansion of our business in China is an element of our long-term strategy and, as a result, our exposure to the risks described above may be greater in the future. The likelihood of such occurrences and their potential effect on us vary from country to country and are unpredictable, however, the occurrence of any such risks could have an adverse effect on our operations, profitability, and financial condition. |
| ◾ | Relative Foreign Exchange Rates: Our profitability is affected by movements of our U.S. dollar reporting currency against the Canadian dollar, the euro, the Chinese renminbi, and other currencies in which we generate revenues and incur expenses. Significant long-term fluctuations in relative currency values, in particular a significant change in the relative values of the U.S. dollar, Canadian dollar, euro, or Chinese renminbi, could have an adverse effect on our profitability and financial condition and any sustained change in such relative currency values could adversely impact our competitiveness in certain geographic regions. |
| ◾ | Currency Devaluation in Argentina: Our sales in Argentina are generally paid to us in Argentine pesos. We import certain materials needed to generate these sales and are contractually obligated to pay in U.S. dollars or other foreign currencies for such materials. The Argentine peso has experienced significant devaluation recently, including a loss of over 50% of its value relative to the U.S. dollar in December 2023 alone. Foreign exchange controls imposed by the Government of Argentina have restricted our ability to easily exchange Argentine pesos for U.S. dollars and other foreign currencies, increasing our exposure to foreign denominated payables. As a result, our profitability may be adversely affected by the impact of further devaluation of the Argentine peso relative to foreign currencies. |
| ◾ | Pension Risks: Some of our current and former employees in Canada, the United States and Germany participate in defined benefit pension plans. Although such plans in North America have been closed to new participants, existing participants in Canada continue to accrue benefits. Our defined benefit pension plans in Germany are not funded and plans in Canada and the United States may not be fully funded. Our pension funding obligations in North America could increase significantly due to a reduction in plan funding status caused by a variety of factors, including: weak performance of capital markets; declining interest rates; failure to achieve sufficient investment returns; investment risks inherent in the investment portfolios of the plans; and other factors. A significant increase in our pension funding obligations could have an adverse effect on our profitability and financial condition. |
| ◾ | Tax Risks: At any given time, we may face tax exposures arising out of changes in tax or transfer pricing laws, tax reassessments or otherwise. To the extent we cannot implement measures to offset these exposures, they may have an adverse effect on our profitability. We have incurred losses in some countries which we may not be able to fully or partially offset against income we have earned in those countries. In some cases, we may not be able to utilize these losses at all if we cannot generate profits in those countries and/or if we have ceased conducting business in those countries altogether. Our inability to utilize tax losses could adversely affect our profitability. |
| ◾ | Returns on Capital Investments: In recent years, we have invested significant amounts of money in our business through capital expenditures to support new facilities, expansion of existing facilities, purchases of production equipment and acquisitions. We expect continued elevated capital expenditures in 2024 to support program awards and our continued growth, including in megatrend areas. |
24 Annual Information Form
| Returns achieved on such investments in the past are not necessarily indicative of the returns we may achieve on future investments and our inability to achieve returns on future investments which equal or exceed returns on past investments could have a material adverse effect on our level of profitability. |
| ◾ | Financial Flexibility: The occurrence of an economic shock not contemplated in our business plan, a rapid deterioration of conditions or a prolonged recession could result in the depletion of our cash resources, which could have a material adverse effect on our operations and financial condition. |
| ◾ | Credit Ratings Changes: There is no assurance that any credit rating currently assigned to us will remain in effect for any period of time or that any rating will not be revised or withdrawn entirely by a rating agency in the future. A downgrade in the credit ratings assigned to us by one or more agencies could increase our cost of borrowing or impact our ability to negotiate loans, which could have an adverse effect on our profitability, financial condition, and the trading price of our Common Shares. |
| ◾ | Stock Price Fluctuation: Trading prices of our Common Shares cannot be predicted and may fluctuate significantly due to a variety of factors, many of which are outside our control. |
| ◾ | Dividends: Our Board of Directors (“Board”) may in certain circumstances determine that it is in the best interests of the company to reduce or suspend our dividend. In such event, the trading price of our Common Shares may be materially affected. |
Legal, Regulatory and Other Risks
| ◾ | Antitrust Proceedings: The automotive industry has in recent years been the subject of increased government enforcement of antitrust and competition laws. Where wrongful conduct is found, the relevant antitrust authority can, depending on the jurisdiction, initiate administrative or criminal legal proceedings and impose administrative or criminal fines, penalties, or restitution payments. OEMs, car dealers and consumers may also be able to claim against antitrust violators through civil lawsuits. The company’s policy is to comply with all applicable laws, including antitrust and competition laws, and has implemented a robust compliance training program to mitigate against the risk of an antitrust violation. However, in the event of an antitrust violation, Magna could suffer reputational damage and be subject to criminal or administrative fines or penalties, restitution settlements, or civil damages that could have a material adverse effect on Magna’s profitability. |
| ◾ | Legal and Regulatory Proceedings: From time to time, we may become involved in regulatory proceedings, or become liable for legal, contractual, and other claims by various parties, including customers, suppliers, former employees, class action plaintiffs and others. Depending on the nature or duration of any potential proceedings or claims, we may incur substantial costs and expenses, be required to devote significant management time and resources to the matters and suffer reputational damage as a result of regulatory proceedings — irrespective of the basis for the claim or the ultimate outcome. On an ongoing basis, we attempt to assess the likelihood of any adverse judgements or outcomes to these proceedings or claims, although it is difficult to predict final outcomes with any degree of certainty. Except as disclosed from time to time in our consolidated financial statements and/or our MD&A, we do not believe that any of the proceedings or claims to which we are currently a party will have a material adverse effect on our profitability; however, we cannot provide any assurance to this effect. |
| ◾ | Changes in Laws: A significant change in the current regulatory environment in our principal markets, including changes in tax laws, laws related to vehicle emissions, and other laws which impose additional costs on automotive manufacturers or consumers, could have an adverse effect on our profitability. More than 135 jurisdictions have agreed to implement a new global minimum tax regime (“Pillar Two”) based on model rules published by the Organization for Economic Co-operation and Development. The proposed Pillar Two rules are intended to ensure that large multinational enterprises pay a minimum tax of 15% on the income arising in each jurisdiction in which they operate. Although the impact on Magna will depend on how each jurisdiction implements the model rules, as well as profitability and local tax liabilities of Magna’s operations in those jurisdictions, we do not believe that the proposed Pillar Two rules will have a material adverse effect; however, we cannot provide any assurance to this effect. |
| ◾ | Trade Agreements: Historical global growth of the automotive industry has been aided by the free movement of goods, services, people, and capital through bilateral and regional trade agreements, particularly in North America and Europe. Introduction of measures which impede free trade could have a material adverse effect on our operations and profitability. |
| ◾ | Trade Disputes/Tariffs: International trade disputes could, among other things, reduce demand for and production of vehicles, disrupt global supply chains, distort commodity pricing, impair the ability of automotive suppliers and vehicle manufacturers to make efficient long-term investment decisions, create volatility in relative foreign exchange rates, and contribute to stock market volatility. The imposition of sanctions, tariffs and/or escalation of trade disputes which interfere with automotive supply chains could have an adverse effect on our operations and profitability. |
| ◾ | Environmental Compliance: While we regularly attempt to estimate environmental clean-up liabilities, such an exercise is complex. In addition, environmental laws and regulations are complex, change frequently and have tended to become more stringent and expensive over time. In certain circumstances, we could be named as a Potentially Responsible Party (“PRP”) with respect to a contaminated site. Costs associated with being a PRP could be material depending on site conditions and the number of participating PRPs. As a result, we may incur material costs or liabilities significantly in excess of amounts we have reserved, which could have an adverse effect on our operations, profitability, financial condition, or reputation. |
Magna International Inc. 25
| 6. | Description of the Business |
Geographic Markets & Customers
Major Customers
While we supply products and services to a large number of customers worldwide, sales to our six largest customers represented the following proportions of our consolidated sales in 2023 and 2022:
|
Magna Sales Ranking |
OEM Ranking(1) |
Customer | Proportion of Magna Sales |
|||||
|
2023 |
2022 |
|||||||
| 1 | 6 | General Motors | 15% | 16% | ||||
| 2 | 13 | Mercedes-Benz | 14% | 13% | ||||
| 3 | 12 | BMW | 12% | 14% | ||||
| 4 | 7 | Ford | 12% | 13% | ||||
| 5 | 5 | Stellantis | 12% | 13% | ||||
| 6 | 2 | Volkswagen | 11% | 10% | ||||
| Other | 24% | 21% | ||||||
| TOTAL | 100% | 100% | ||||||
Note:
| (1) | Based on 2023 global light vehicle production. |
Customer Management Offices
We have a globally structured sales, engineering and marketing team spread across multiple global locations where our customers maintain engineering, commercial and/or manufacturing facilities. The various internal operating divisions and subsidiaries of the automobile manufacturers normally initiate many of their own purchasing decisions. As a result, an automobile manufacturer may effectively constitute multiple customers.
Purchase Orders
Our sales are generated through customer requests to quote on particular products, as well as the tools and dies required to produce parts. Purchase orders for our products are typically for one or more models, and typically extend over the life of each model, which is generally four to seven years. However, purchase orders issued by our automobile manufacturer customers typically do not require them to purchase any minimum number of our products. Releases under such purchase orders, which authorize us to supply specific quantities of products, are issued for planning, raw material, and production purposes, which is typically over a one to four month period in advance of anticipated delivery dates. The actual number of products that we supply under purchase orders in any given year is dependent upon the number of vehicles produced by the automobile manufacturers of the specific models in which those products are incorporated.
It has been our experience that once we receive purchase orders for products for a particular vehicle model or program, we will usually continue to supply those products until the end of that model or program, although most of our customers’ purchase orders allow them to terminate the purchase order for convenience. In addition, as part of our purchase contracts, we are generally required to supply service parts for up to 15 years after the end of production of any model, provided that we are the contracted supplier at the time production ceases. Automobile manufacturers could cease sourcing their production requirements from us for a number of reasons, including if we refuse to accept demands for price reductions or other concessions and if the vehicle is not meeting their sales targets. Should the latter occur, we are still required to provide service parts for up to 15 years, although we may be able to negotiate that this be supplied as a one-time up front purchase.
Manufacturing & Engineering
Operational Excellence
As part of our strategy of maintaining operational excellence, our global operating units strive to achieve “best in class” performance in all areas of manufacturing. In order to drive continuous improvement, we monitor our progress by using an assessment process known as the Magna Factory Concept or “MAFACT”, which includes elements we view as critical to achieving operational excellence in accordance with our Operational Principles. Best practices, “lessons learned” and key initiatives are shared among our global operating units.
26 Annual Information Form
Factory of the Future (FoF) Initiatives
We continue to look at ways to integrate leading edge manufacturing trends into our operations, including data analytics, as well as artificial intelligence (AI) capabilities designed to, among other things: increase information available to human operators to enhance decision making; automate certain processes to increase efficiency and safety; optimize material and process flows; and perform predictive maintenance on equipment. Specifically, a number of our global facilities have implemented a combination of new technological applications, software, and processes in order to benefit from more efficient and effective factory solutions, which is known as our “Factory of the Future (FoF)” approach. In 2023, we launched 83 FoF projects from our Corporate R&D team globally. A few examples of our FoF activities are set out below.
|
Advanced Robots & Digital Twin
• Our Corporate R&D team has developed a core Advanced Robotics System for high volume production using state-of-the-art 2D/3D vision systems and advanced robotics trajectory planning with AI supporting simplified, rapid implementation • The system has been launched in more than ten Magna facilities with over 40 systems in high volume production. As part of our planned “scaled implementation” approach, the system continues to scale in other facilities across all Magna Operating Groups for cost optimization • The advanced robotics platform allows continuous upgrades in performance and continues to introduce lower cost hardware enabled by software functionality |
Fenceless Robot System
• Our Corporate R&D team is working with several robotics companies, startups, research labs and universities to develop enabling technologies that can be scaled across Magna. Together with one of our Powertrain Divisions, we co-developed and implemented the first fenceless robot system for high volume production at Magna. • The fenceless robot system can handle almost double the payload at 10 times the speed of other collaborative robotic systems in the market for boxes, baskets, and trays. • Elimination of fencing and guarding of robot cells takes up less floor space and allows freedom of movement and access for human workers • The insight gained from the fenceless robot system is allowing Magna to co-develop, test, and validate the next generation of fenceless robotics for high volume automotive production in a safe, collaborative, and efficient way.
|
|
Predictive Maintenance
• Our Exteriors facilities have actively implemented predictive maintenance of injection moulding machines. Data from a machine controller, as well as additional sensors, is collected and processed in real time. • The data is then made available by way of a dashboard and automatic alerts allowing emerging maintenance issues to be pinpointed and addressed before they develop into larger issues. • These activities allow for production and efficiency improvements, including reduced equipment downtime, as well as avoidance of unexpected equipment failures. • This flexible hardware and software platform is being expanded to include additional equipment and processes throughout Magna, including additional use cases in metal forming.
|
Vision Inspection and Augmented Reality
• Our Corporate R&D team, working with vendor partners, is implementing multiple use cases of AI-enabled vision systems using low cost cameras to identify defects, track quality and process conditions to allow real-time process monitoring and feedback. • Magna works with multiple vendors, but also develops in house capabilities to support future scaling of use cases and improving technology. |
|
Data Analytics & Digital Infrastructure
|
|
• Our Corporate IT team, Operating Groups, Divisions, and Corporate R&D teams are implementing standards and data connectivity across the enterprise • Standardized digital infrastructure enables faster, more intelligent analytics solutions, ultimately aiding decision making • Standardized digital infrastructure also enables lower cost, faster implementation of shop floor solutions responsive to Industry 4.0 – which defines the rapid change to technology, industries, and society due to increasing interconnectivity and smart automation
|
Magna International Inc. 27
Facilities
As at December 31, 2023, we had the following manufacturing and PDE&S facilities in each designated geographic region:
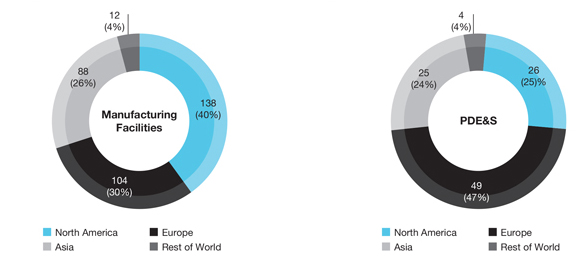
Our manufacturing and PDE&S facilities occupied approximately 79.9 million and 3.9 million square feet, respectively. These facilities were broken down between third party leases, and those owned by us as set out below. At this time, the largest percentage of properties leased (by square footage) from any single landlord is approximately 15%.
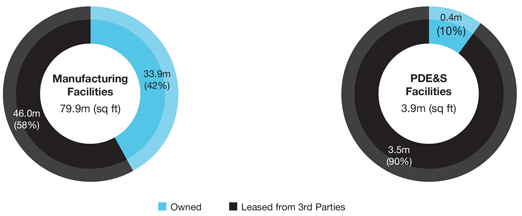
Our facility leases typically have terms of at least five years with one or more options to renew. Among other terms, our leases typically require us to return the facilities to the condition in which we received them at start of the lease (reasonable wear and tear excepted). From time to time, the cost of doing so may be significant due to such factors as the length of the lease period, the nature of the manufacturing operations, the extent of modifications made to the leased properties over the term of the lease and other factors.
We are also subject to environmental laws and regulations both as tenant and owner of our properties. Our leases with third party landlords generally provide that we must maintain the leased properties in accordance with all applicable laws, including environmental laws. Magna routinely conducts Phase 1 Environmental Assessments, and if necessary Phase 2 Site Investigations, at manufacturing, assembly, and warehousing locations prior to or at the start of occupancy to identify any actual and potential pre-existing environmental concerns at leased or owned sites. Magna is responsible for addressing certain environmental impacts arising at our properties, including exacerbations of existing impacts as defined by lease terms or regulatory requirements. Our leases with third party landlords generally also contain indemnities in favour of the landlord with respect to environmental matters and those indemnities may survive the termination of the leases.
Key Components and Raw Materials
Our key purchased components include: stampings, electronics, semiconductor chips, molded parts, die casting, forging, coverstock, and wire harnesses. Our key purchased raw materials are steel, resin and aluminum. While we endeavour to purchase the majority of these components and raw materials from regional suppliers where we do business, factors such as price, quality, transportation costs, warehousing costs, duties, tariffs, availability of supply, timeliness of delivery, and customer requirements have an impact on the decision to source from certain suppliers. In some cases, we are directed by our OEM customers to source components or commodities from specific suppliers, as is largely the case for leather we purchase for use in automotive seats we produce.
28 Annual Information Form
We also purchase some key components and raw materials offshore when shortages occur or when we choose to source one supplier for a global program. Prices for our raw materials used in our production of parts, like steel, resin, and aluminum, continue to be volatile.
Approximately two-thirds of our combined steel and aluminum is acquired through resale programs operated by automobile manufacturers and the balance is generally acquired through annual or six month contracts that fluctuate with market indices. Under customer steel resale programs we are not exposed to steel and aluminum price volatility, thus helping to manage our production costs. Certain of our operations generate steel and aluminum scrap, which we typically sell at prices that fluctuate with published market indices. Most of our resin purchases fluctuate directly with market indices, although we do participate in some customer resale programs on approximately one quarter of our resin purchases. In some cases, our customers direct us to buy certain other raw materials from specified suppliers, at specified prices. Consistent with lean manufacturing principles, we do not typically carry inventories of key raw materials or finished products significantly in excess of those reasonably required to meet production and shipping schedules. A global shortage of semiconductor chips for us in automotive applications has had a material adverse effect on global automotive production volumes since 2020 and may continue having some impact in 2024. Although supplies of semiconductor chips are significantly better than in the last two years, it remains unclear when supply and demand for automotive semiconductor chips will fully rebalance. Semiconductor supply remains sensitive to interruption from other impacts such as natural disasters, inventory levels, production capacity and lead-times that are not yet back to pre-2020 levels. The risks related to semiconductor supply and potential future shortages/supply constraints of key commodities are discussed in greater detail under “Section 4 – Our Business & Strategy – Macroeconomic, Political and Other Trends” and “Section 5 – Risk Factors”.
Products & Services
Top Programs
Our top fifteen programs/platforms based on 2023 production and vehicle assembly sales were:
| Customer | Vehicle | Capabilities | ||||||||||||||||||
|
Body Exteriors & Structures |
Power & Vision |
Seating Systems |
Complete Vehicles |
|||||||||||||||||

|

|

|

|

|

|

|

|
|
||||||||||||
|
General Motors
|
Full-Size SUVs & Pick-up Trucks
|
∎
|
∎
|
∎
|
∎
|
∎
|
∎
|
∎
|
||||||||||||
|
Mercedes- Benz
|
Mercedes-Benz G-Class
|
∎
|
∎
|
∎
|
∎
|
∎
|
∎
|
|||||||||||||
|
Stellantis
|
Jeep Grand Cherokee
|
∎
|
∎
|
∎
|
∎
|
∎
|
∎
|
∎
|
||||||||||||
|
General Motors
|
GMC Acadia, Buick Enclave, Cadillac XT6, Chevrolet Blazer, Chevrolet Traverse
|
∎
|
∎
|
∎
|
∎
|
∎
|
∎
|
∎
|
∎
|
|||||||||||
|
Ford
|
Ford Transit, Ford Transit Custom
|
∎
|
∎
|
∎
|
∎
|
∎
|
∎
|
|||||||||||||
|
Mercedes- Benz
|
Mercedes-Benz GLE/GLE Coupe, Mercedes-Benz GLS
|
∎
|
∎
|
∎
|
∎
|
∎
|
∎
|
|||||||||||||
|
BMW
|
BMW X5
|
∎
|
∎
|
∎
|
∎
|
∎
|
∎
|
∎
|
||||||||||||
|
Stellantis
|
RAM Pick-up Trucks
|
∎
|
∎
|
∎
|
∎
|
∎
|
∎
|
∎
|
||||||||||||
|
BMW
|
BMW X3
|
∎
|
∎
|
∎
|
∎
|
∎ | ||||||||||||||
|
BMW
|
BMW 5 Series
|
∎
|
∎
|
∎
|
∎
|
∎
|
∎
|
|||||||||||||
|
Ford
|
Ford Escape, Ford Kuga, Lincoln Corsair
|
∎
|
∎
|
∎
|
∎
|
∎
|
||||||||||||||
|
Ford
|
Ford Expedition, Lincoln Navigator
|
∎
|
∎
|
∎
|
∎
|
∎
|
||||||||||||||
|
Stellantis
|
Chrysler Pacifica
|
∎
|
∎
|
∎
|
∎
|
∎
|
∎
|
|||||||||||||
|
BMW
|
BMW X1
|
∎
|
∎
|
∎
|
∎
|
∎
|
∎
|
|||||||||||||
|
Ford
|
Ford F-Series Super Duty
|
∎
|
∎
|
∎
|
∎
|
∎
|
||||||||||||||
Note: Capabilities represented may not be on each vehicle or each trim level of each vehicle. Additionally, our capabilities in each product area range from components to full systems, only some of which may be represented on any particular program. Our Roof Systems capabilities are not present on the programs/platforms listed.
Magna International Inc. 29
Product Portfolio
We continue to evolve our product portfolio consistent with the strategy described under Section 4 “Our Business & Strategy – Corporate Strategy” in this AIF. The development of innovative technologies and solutions which are responsive to the global megatrends defining the “Car of the Future” requires research and development (“R&D”) spending, as well as capital investments and the acquisition of engineering talent with the necessary software and other expertise. We believe that in typical years, the relatively stable profitability and cash generation from our “traditional” businesses provide us with the ability to fund the R&D and capital investment required to realize opportunities related to product areas such as electrification, ADAS and others aligned with the Car of the Future.
Some of our recent innovations can be found in “Section 7 – Innovation and Research & Development – Innovations and Innovation Awards”.
Product Segments
A description of our product and service capabilities, processes, top customers, and key competitors by reporting segment follow. Manufacturing facility and PDE&S Centres counts below include joint venture facilities.
| Body Exteriors & Structures |
Our Body Exteriors & Structures segment includes our body and chassis systems, and exterior systems operations.

| * | Figure includes certain manufacturing facilities and PDE&S centres shared with other reporting segments. |
Top Segment Programs
| Customer | Vehicle | |
|
1. General Motors |
Full-Size SUVs & Pick-up Trucks | |
|
2. Stellantis |
Jeep Grand Cherokee | |
|
3. General Motors |
GMC Acadia, Buick Enclave, Chevrolet Traverse & Blazer, Cadillac XT6 | |
|
4. Mercedes-Benz |
Mercedes-Benz GLE/GLE Coupe, GLS | |
|
5. Ford |
Ford F-Series Super Duty | |
Segment Trends and Strategic Focus
Within our Body Exteriors & Structures segment, we aim to support our customers’ efforts to deliver vehicles which consume less fuel and produce lower CO2 emissions, particularly through reduced vehicle weight, aerodynamic enhancements, and use of multi-materials. We currently offer our customers a broad range of lightweight product solutions, such as thermoplastic liftgates, as well as reduced-weight products formed through advanced manufacturing processes, such as hot stamping, high-pressure aluminum casting and multi-material joinery.
30 Annual Information Form
Product Capabilities
Body and Chassis
| Products | Key Processes | Top Customers | Key Competitors | |||
| § body systems § chassis systems
§ battery enclosures
§ engineering and testing |
Forming technologies:
§ hydroforming
§ cold stamping, including high-strength steel & aluminum
§ hot stamping
§ roll forming
§ high pressure aluminum casting
§ advanced welding & joining
§ sealing and adhesive bonding
§ stretch bending of aluminum extrusions |
§ BMW
§ Ford
§ General Motors
§ Mercedes-Benz
§ Stellantis
§ Volkswagen |
§ Benteler International AG
§ Flex-N-Gate Corporation
§ F-Tech Inc.
§ Georg Fischer Ltd.
§ Gestamp Automoción S.L.
§ Martinrea International Inc. § Metalsa, S.A. de C.V.
§ Minth Group Ltd.
§ Nemak, S.A.B. de C.V.
§ Tower International, Inc. |
|||
| Finishing technologies:
§ e-coating
§ high temperature wax coating
§ heat treatment
§ machining
§ powder coating
§ conversion coating for aluminum castings |
||||||
Magna International Inc. 31
Exteriors
| Products | Key Processes | Top Customers | Key Competitors | |||
| § fascia & trim
§ front end modules
§ integration panels
§ liftgate modules
§ active aerodynamics
§ engineered glass
§ running boards
§ truck bed access products
§ breakthrough lighting § side doors
§ greenhouse products |
Molding technologies:
§ injection molding, such as two shot, structural, insert, injection compression for thermoplastics & reaction injection molding
§ extrusion processes, such as co-extrusion, thermoset and thermoplastic extrusion
§ compression-molding for thermosets
§ expanded polypropylene foam
§ metal rollforming
§ glass encapsulation
§ tooling |
§ BMW
§ Ford
§ General Motors
§ Renault-Nissan-Mitsubishi
§ Stellantis
§ Volkswagen |
§ ABC Group
§ Flex-N-Gate Corporation
§ Plastic Omnium S.A.
§ Röchling Group
§ Samvardhana Motherson Peguform
§ SRG Global Inc. |
|||
| Finishing processes:
§ painting
§ hardcoating
§ chrome plating
§ hot stamp foils
§ metal finishing
§ hydrographics
§ laser etching/engraving
§ in-mold film |
||||||
| Assembly processes:
§ adhesive bonding
§ infrared, ultrasonic, vibration, torsional and resistance implant welding
§ laser cutting and welding
§ manual and automated assembly & sequencing |
||||||
32 Annual Information Form
| Power & Vision |
Our Power and Vision segment comprises our global powertrain systems, electronics systems, and mechatronics, mirrors & lighting, and roof systems operations.

| * | Figure includes certain manufacturing facilities and PDE&S centres shared with other reporting segments. |
Top Segment Programs
| Customer | Vehicle | |
|
1. General Motors |
Full-Size SUVs & Pick-up Trucks | |
|
2. BMW |
BMW X1 | |
|
3. Chery |
Chery Tiggo 8 | |
|
4. Stellantis |
Ram Pick-up Trucks | |
|
5. BMW |
Mini Cooper | |
Segment Trends and Strategic Focus
In our Power and Vision segment, we seek to realize opportunities presented by trends toward electrification, advanced driver assistance systems and autonomous driving. We believe that our powertrain business is well-positioned to benefit from the shift toward electrification by leveraging the investments we have made in high-voltage technologies, including highly integrated primary and secondary electric drive systems, as well as individual components such as electric traction motors and inverters through our joint venture with LG Electronics Inc. While investing in electrified technologies we continue to optimize operations in our market-leading traditional products such as 4WD/AWD systems and transmissions. Our Vision Systems business is currently a leading supplier of camera-based driver assistance systems, and we continue to invest in advanced driver assistance technologies to expand the assisted driving systems expertise we can offer customers. We continue to leverage our expertise in supplying and integrating the sensor suite to create seamless functionality of features, software, and middleware. Vehicle connectivity is also a crucial aspect of our business, and we develop advanced systems that enable seamless communication between vehicles, infrastructure, and other devices. These investments include both in-house research and development, as well as venture capital investments in and strategic relationships with mobility and technology companies.
Magna International Inc. 33
Product Capabilities
Powertrain
| Products | Key Processes | Top Customers | Key Competitors | |||
| § high-voltage electric drive systems and components (eMotors*; inverters*, onboard chargers*, gearboxes, e-clutches for hybrid and BEVs
§ transmission systems (dedicated hybrid drives, dual clutch/hybrid dual clutch and manual transmissions)
§ driveline systems (AWD/4WD products, including transfer cases and rear drive modules)
§ metal-forming products (transmission, ICE, and driveline components)
* Through our joint venture with LG Electronics Inc. |
§ powertrain systems assembly and final testing
§ flow-forming,
§ stamping and spinning
§ grob, roller & cam die spline forming
§ precision heavy stamping
§ profilator processing
§ in-die fine cutting
§ soft and hard processing of gears and shafts
§ CNC machining & broaching
§ rotary swaging
§ heat treating
§ welding, including laser, electron beam (EB), capacitor discharge (CD), inertia, resistance & metal inert gas (MIG)/tungsten inert gas (TIG)
§ assembly & final test of eMotors*, inverters*, and on-board chargers*
* Through our joint venture with LG Electronics Inc. |
§ BMW
§ Ford
§ General Motors
§ Mercedes-Benz
§ Renault-Nissan-Mitsubishi
§ Stellantis
§ Volkswagen |
§ Aisin Group
§ BorgWarner Inc.
§ Dana Inc.
§ EnPower Electronics
§ GKN plc
§ JATCO Ltd.
§ Linamar Corporation
§ Nidec Corporation
§ Robert Bosch GmbH
§ Schaeffler AG
§ Valeo S.A.
§ ZF Group |
|||
34 Annual Information Form
Electronics
| Products | Key Processes | Top Customers | Key Competitors | |||
| § far camera modules (mono and stereo cameras) § remote camera heads § interior sensing cameras § radars § thermal sensing § domain controllers |
§ printed circuit board assembly § high volume flash programming § automated image & machine vision camera assembly capability § in-circuit and functional testing § complete ADAS engineering services; systems, electrical design, software design, cybersecurity, functional safety, mechanical mesign and validation |
§ General Motors § Mercedes-Benz § Stellantis § Subaru § Volkswagen § Volvo |
§ Aptiv PLC § Continental AG § Denso Corporation § Forvia Group § Robert Bosch GmbH § Valeo S.A. § ZF Group |
|||
Mirrors
| Products | Key Processes | Top Customers | Key Competitors | |||
| § interior mirrors § exterior mirrors § camera monitoring systems driver/occupant monitoring systems § smart actuators |
§ electronics integration § injection molding § painting § manual and automated assembly |
§ BMW § Ford § General Motors § Mercedes-Benz § Stellantis § Volkswagen |
§ Ficosa International S.A. § Gentex Corporation § SMR Automotive |
|||
Lighting
| Products | Key Processes | Top Customers | Key Competitors | |||
| § forward lighting
§ rear lighting
§ lit grilles/panels/displays |
§ electronics integration
§ injection molding
§ hardcoating/anti-fog treatment
§ metallizing
§ manual and automated assembly |
§ General Motors
§ Stellantis
§ Volkswagen
§ Volvo |
§ Changzhou Xingyu Automotive Lighting System Co, Ltd.
§ Hella KGaA Hueck & Co. (now part of Forvia Group)
§ Koito Manufacturing Co.
§ Marelli Automotive Lighting § Valeo S.A. |
|||
Mechatronics
| Products | Key Processes | Top Customers | Key Competitors | |||
| § latching systems
§ door modules
§ charge port doors
§ power systems
§ hinges
§ door handles |
§ light stamping
§ injection molding § manual and automated assembly |
§ BMW § Ford § General Motors § Renault-Nissan-Mitsubishi § Stellantis |
§ ADAC Automotive § Aisin Corporation § Brose Fahrzeugteile GmbH & Co. KG § Inteva Products, LLC § Kiekert AG |
|||
Roof Systems
| Products | Key Processes | Top Customers | Key Competitors | |||
| § modular roofs
§ hard tops and soft tops
§ textile folding roofs |
§ “cut and sew” of complete fabric covers
§ backlight gluing
§ manual and automated complete retractable roof assembly |
§ BMW
§ Mercedes-Benz
§ Renault-Nissan-Mitsubishi
§ Stellantis
§ Toyota |
§ Valmet Automotive Inc.
§ Webasto Group |
|||
Magna International Inc. 35
| Seating Systems |
Our Seating Systems segment comprises our global seating systems operations.

| * | Figure includes certain manufacturing facilities and PDE&S centres shared with other reporting segments. |
Top Segment Programs
| Customer | Vehicle | |
|
1. Stellantis |
Jeep Grand Cherokee | |
|
2. BMW |
BMW X5 | |
|
3. Ford |
Ford Expedition, Lincoln Navigator | |
|
4. Ford |
Ford Escape, Lincoln Corsair | |
|
5. Ford |
Ford Transit | |
Segment Trends and Strategic Focus
Our Seating Systems group continues to grow by winning new business based on its reputation for delivering innovative seating solutions. Longer term, our Seating Systems group aims to capitalize on its strength in seat mechanisms, vertical integration, and reconfigurable seating, specifically to supply reconfigurable seating solutions for applications such as car sharing and autonomous ride sharing; as well as seat products that are responsive to growing EV requirements, including lighter weight seats, lower seat box height, and sustainable seating solutions.
Product Capabilities
Seating Systems
| Products | Key Processes | Top Customers | Key Competitors | |||
| § complete seating systems
§ seat structures, mechanism & hardware solutions
§ foam & trim products, including sustainable seating solutions |
§ traditional “cut and sew” technology
§ manual and automated assembly |
§ BMW
§ Chang’an
§ Automobile
§ Ford
§ Geely
§ General Motors
§ Stellantis
§ Volkswagen |
§ Adient plc
§ Forvia Group
§ Lear Corporation |
|||
36 Annual Information Form
| Complete Vehicles |
Our Complete Vehicles segment comprises our global complete vehicle engineering and manufacturing operations.

| * | Figure includes certain manufacturing facilities and PDE&S centres shared with other reporting segments. |
Segment Programs
| Customer | Vehicle | |
|
1. Mercedes-Benz |
Mercedes-Benz G-Class | |
|
2. BMW |
BMW 5 Series | |
|
3. Tata Motors |
Jaguar I-Pace | |
|
5. Tata Motors |
Jaguar E-Pace | |
|
6. BMW |
BMW Z4 | |
Segment Trends and Strategic Focus
Our Complete Vehicles business continues to provide OEM-level expertise to traditional customers seeking a trusted vehicle complete vehicle outsource partner, as well as new market entrants seeking expertise for their traditional, electrified, autonomous and/or new mobility / MaaS concepts. Traditional OEMs currently represent the substantial majority of our Complete Vehicles group business customers. However, engineering sales with non-traditional customers, including Asian OEMs and new OEM entrants, continue to grow. MaaS providers represent an important source of new opportunities since they typically do not have the vehicle development, engineering, integration, and assembly capabilities of traditional OEMs and thus require outsource partners to commercialize their concepts. In this segment, we also focus on leveraging our expertise in alternative energy storage and propulsion systems by further strengthening and capitalizing on our know-how in different propulsion systems. In addition, we continue to focus on integration and testing of autonomous driving systems, and we support our customers with one of the most versatile test environments for highly automated vehicles.
Product Capabilities
Vehicle Engineering & Manufacturing
| Products | Key Processes | Top Customers | Key Competitors | |||
| § complete vehicle manufacturing
§ engineering services |
§ body-in-white
§ paint
§ assembly |
§ BMW
§ Fisker § Mercedes-Benz § Tata Motors |
Traditional and New OEMs
Contract Manufacturers § NEVS AB § Valmet Automotive § VDL Nedcar B.V.
Engineering Services § Bertrandt Group § EDAG Engineering GmbH § IAV GmbH |
|||
Tooling & Engineering
As part of our production programs, we design, engineer and manufacture tooling for our own use, as well as for sale to our customers. Tooling used in our production programs is often purchased by us from third parties and sold to our customers on a pass-through basis. In addition, we manufacture tooling for our customers on a standalone basis, which is tooling sold separately and not part of a production arrangement. We also provide engineering services independent of our production programs, as well as for programs for which we have production sales.
Acquisitions and Divestitures
For further details of our acquisitions and divestitures in the last three fiscal years, refer to “Schedule B – Acquisitions and Divestitures”.
Magna International Inc. 37
| 7. | Innovation and Research & Development |
Focus on Innovation and Technology
We have historically emphasized technology development and product and process innovation as a key element of our corporate strategy. See “Section 4 – Our Business & Strategy – Our Corporate Strategy” for further details. We continue to invest significant resources to develop and commercialize innovative technologies, which will provide additional value to our customers. In addition, we aim to advance our sustainability goals through innovations in electrification, driver assistance, lightweighting, adjacent mobility markets such as micromobility, materials, fuel efficiency, and energy efficiency for both end-use products and our manufacturing processes.
We expect that our involvement with automobile manufacturers and new mobility partners in the development of innovative product and process technologies will increase as such manufacturers and partners further involve suppliers like us in the overall vehicle concept, development, and manufacturing process.
Our Research and Development Process
Our R&D activities take place at our Division/Operating Group level and at the corporate level. Our Divisional/Operating Groups work with our customers to identify product and technology gaps. Magna’s Corporate R&D team, under the global direction of our Senior Vice President, Corporate R&D, analyzes the key megatrends that are expected to drive future mobility and automotive development. As part of these efforts, our Corporate R&D team engages with the advanced engineering and product development teams of our current and potential OEM customers to understand their product strategies and better align our own product strategy and technology development with customer needs.
All of our R&D projects follow an Innovation Development Process (IDP) process – a multi-stage process aimed at turning ideas into innovations that can ultimately be commercialized and scaled. The initial phase of the process is designed to foster the generation of ideas and includes, among other things: identification, understanding of and analysis of societal, digital, demographic, regulatory, industry and other trends which may create demand for and thus drive development of new automotive and mobility technologies; review of academic research; collecting and screening ideas submitted through innovation programs; review of emerging technologies in non-automotive industries; and automotive customer input.
Concepts that progress past this initial stage are further evaluated, including with respect to: fit with our strategy regarding electrification, autonomy, new mobility, vehicle connectivity and advanced manufacturing; commercialization potential; and risks and challenges to further development. Selected innovations then progress through subsequent stages towards product or process realization, validation and eventually, product launch.
Our R&D initiatives are supported by and involve close collaboration with our Corporate R&D group. Our Division/Operating Group R&D teams work together with our Corporate R&D group on technology development, and where necessary specific working groups are established to discuss and develop technological solutions.
As a result of our innovation activities, we have developed a number of product, process and materials innovations, some of which are described in this Section 7 under “Innovations and Innovation Awards”.
As a key part of our own innovation efforts and to gain further access to innovative thinking outside of our company, we partner with start-ups and early stage companies, inventors, entrepreneurs, universities, technical institutions, and the venture capital community to help bring innovative ideas to market. We also look for the best ideas from other industries and apply them to mobility – a process we call “auto-qualifying”. As part of our continuing efforts to develop innovative solutions to the technology challenges of new mobility and the automotive industry, in the last year we have considered thousands of potential innovations, which has led to several active projects. Such projects include: development of Driver Monitoring Systems and ADAS features; efficiency and performance technologies related to electric drives and power electronics; and advanced robotics, inspection systems, Digital Twin/simulation and data analytics technologies supporting our strategic focus on operational excellence.
As an example of our collaborative product innovation process in action – in 2023, we joined NorthStar – Telia Sweden and Ericsson’s 5G innovation program for industrial enterprises. As part of the agreement, Telia and Ericsson have built a dedicated, private 5G network at Magna’s test track located in Vårgårda, Sweden, where new cutting-edge ADAS solutions in vehicle-to-vehicle (V2V) and vehicle-to-everything (V2X) connectivity are being trialed. As part of NorthStar, Magna will have access to 5G millimeter wave (mmWave) technology, enabling low latency gigabit speeds and seamless connectivity for new ADAS trials. Additionally, the use of mmWave technology enables ongoing research into joint sensing and communication systems. Leveraging the 26GHz frequency band and 400MHz bandwidth, this network is crucial for Magna’s driving automation and driver support systems, which rely on real-time data from vehicle sensors. Fast network speeds and quick response times are essential for timely alerts to drivers, preventing accidents, and minimizing their impact.
38 Annual Information Form
Intellectual Property
We own and use numerous patents, trademarks, and other intellectual property in connection with our operations. In addition, certain of our Operating Groups license their technology to third parties on a limited basis. We also license and use, to a minor extent, patents owned by others. From time to time, claims of intellectual property infringement are made by us or against us. At present, we believe that the outcome of any pending claim, whether positive or negative, will not have a material adverse effect upon us. While in the aggregate our intellectual property and licenses are considered important in the operation of our business, we do not consider them of such importance that the expiry of any one patent or license would materially affect our business. See “Section 5 – Risk Factors – “Intellectual Property” in this AIF for a discussion of risks related to our intellectual property.
Innovations & Innovation Awards
We believe that innovation has been the foundation of Magna’s success and an important factor in our competitiveness, a key operational priority, and a critical element of our corporate strategy. Our current strategic focus is aimed at responding to key industry trends, as discussed in “Section 4 – Our Business & Strategy – Our Corporate Strategy”. Some examples of recent innovations are as follows:
Innovations

|
NEXT GENERATION 800V EDRIVE
|
|
| Magna’s next generation 800v eDrive solution is a drop-in solution that incorporates several advanced technologies, resulting in significant reductions in weight and size, enhanced performance, extended driving range and greater sustainability. The innovation offers enhanced flexibility due to its lightweight (75 kg) design and 20% reduction in height from Magna’s prior generation eDrive. A key technology and a supplier industry-first advancement is the ability to rotate the eDrive 90 degrees around the drive axis, which allows improved system integration in the front and rear vehicle space. Delivering peak power of 250 kW and a peak axle torque of 5,000 Nm, the system also achieves up to 93% efficiency in real-world driving (including Worldwide harmonized Light vehicles Test Cycles (WLTC) and highway driving), which significantly improves efficiency across a wide range of vehicle speeds. The eDrive system requires less aluminum and heavy rare earth materials, resulting in a significant reduction of CO2 emissions during production by approximately 20% compared to previous generation eDrives. |
||

|
ETELLIGENT TERRAIN WITH EBEAMTM
|
|
| The EtelligentTerrain is a battery electric 4WD powertrain system designed to maintain full on- and off-road capabilities with no compromise of payload and towing capabilities. The system is powered by Magna’s steerable eBeamTM Mid at the front and an eBeamTM High at the rear, with a combined output of 426 kW of peak power. The eBeamTM drops into the place of traditional beam axles, reusing existing suspension and brake systems, and avoiding the need for expensive restructuring of existing truck platforms These benefits help automakers simplify the transition toward electrification of these vehicle segments. Seamless decoupling capability of the front axle means more efficient operation. Magna’s sophisticated Energy and Motion Control software controls the two eBeamsTM which provides off-road specific drive modes (selectable crawl, auto hill ascent/descent) and torque distribution capabilities (high range, e-selectable low range). The scalable design is applicable to passenger sport utility, pickup trucks, and light commercial vehicles. |
||

|
BATTERY ENCLOSURES
|
|
| Magna has been awarded nine global customer programs for its battery enclosures, including the all-electric Ford F-150 Lightning, GMC Hummer EV, and Chevrolet Silverado EV. The product illustrates our ability to expand structural product opportunities as electrification grows. The enclosures, which all EVs require, house high-voltage batteries, electrical components, sensors, and connectors, contributing to the structural and safety aspects of a vehicle’s frame and protecting critical components from potential impact, heat, and water intrusion. These complex assemblies are available in steel, aluminum, and multi-material configurations including lightweight composites. |
||
Magna International Inc. 39
|
MODULAR eDECOUPLING UNIT
|
|
| Magna has started production of a first-to-market, modular eDecoupling unit to support multiple battery electric vehicle programs for a German premium OEM. A bolt-on, stand-alone solution for BEVs, Magna’s electro-magnetic eDecoupling is a robust product technology that is integrated as a complete module. The eDecoupling is an electromechanical device that disconnects the e-motor from the driveshaft in EVs when propulsion power is not needed, reducing energy consumption, and increasing efficiency. It contributes to increased electric driving range of up to nine percent, a significant benefit for all EVs. This is achieved by reducing drag torque losses of the e-motor and gearbox while its eDecoupling controls software smoothly operates all shifting sequences. The unit which has an activation time of less than 100 milliseconds, features a compact design to minimize added package space and weight in both axial and radial direction. |
||

|
ECOSPHERETM SEATING & INDUSTRY-FIRST, 100% MELT RECYCLABLE FOAM AND TRIM SEATING SOLUTIONS
|
|
| The EcoSphereTM product family, which is expected to be available for production in 2025, is an industry-first solution comprised of sustainable trim materials, trim padding, structures, and foam. Traditional soft materials in automotive seats are challenging to separate efficiently at the end of their lifecycle for recycling purposes due to their composition of various polymers and materials, such as polyurethane, nylon, vinyl, and adhesive. By utilizing mono-material polyethylene terephthalate (PET), a type of clear, strong, lightweight and 100% recyclable plastic commonly used to make water bottles, along with the company’s innovative 100% Melt Recyclable Foam and Trim system, EcoSphere eliminates the need to take the trim and foam apart to recycle because they are made from a single material. This innovation leverages Magna’s expertise in the integration of foam chemistry, trim manufacturing, craftsmanship and tooling to develop a seamless and affordable solution. |
||
| Our 100% Melt Recyclable Foam and Trim has similar properties to polyurethane, but it can be melted and used repeatedly to make more automotive seat components or other consumable goods such as clothing, while having half the carbon footprint of polyurethane. The technology has been named a 2023 Automotive News PACEpilot finalist, an award that recognizes pre-commercial innovation in the automotive or future mobility space. |
||

|
SMARTACCESSTM POWER DOOR SYSTEM
|
|
| Magna’s SmartAccessTM complete power door system, which is in production on the opposing rear doors of the Ferrari Purosangue, includes our power door drive unit, SmartLatchTM with cinch actuator, and a first-to-market HaptronikTM motion control. Haptronik is an innovative motion control software that enhances the tactile feel of door movement, enabling effortless opening and closing. It can detect when the vehicle is parked on a curb or a hill and automatically adapts the gravitational force so that opening and closing remains smooth in these conditions. It also includes anti-slam and wind catch features. SmartAccessTM was a finalist for the 2022 Automotive News Pace Awards, and the system can be configured for a wide range of vehicle embodiments – to serve the rapidly growing cargo and rideshare markets as well. |
||

|
CLEARVIEWTM VISION SYSTEM
|
|
| Magna’s ClearViewTM vision innovation is a unique system that combines camera and mirror technology, potentially reducing blind-spots and enhancing visibility around the vehicle. The complete vision system with first-to-market features, has been introduced on Ram 2500 and 3500 Heavy Duty trucks. The ClearViewTM system includes an interior rear-view video mirror, exterior mirrors with integrated cameras and a center high-mounted stop lamp camera. An additional trailer camera is available as an option to provide an unobstructed view while towing. All camera data is processed through Magna’s software in a central electronic control unit. The interior mirror includes Magna’s PACE award-winning InfinityTM glass. Drivers can switch between an optical rear-view and a video display that shows up to three camera views at the same time – the first of its kind on the market. |
||
40 Annual Information Form

|
NEXT GENERATION FRONT CAMERA MODULE
|
|
| Magna’s innovative Gen5 system builds on our market-leading camera expertise and global manufacturing processes to deliver a scalable, one-box front camera module delivering long range perception and side detection. The module will be featured on various platforms across regions and vehicle models over the next few years for a European OEM. The complete forward facing camera system features a wide field of view with opening angles of 120 degrees horizontally and 48 degrees vertically. This allows for both long-range perception of obstacles exceeding 160 meters in front of the vehicle, and detection of side objects, such as traffic lights, emergency vehicles and cut-in vehicles. The camera offers eight megapixels of resolution, a 36 frames per second frame rate and a full colour image. The microcontroller is scalable for sensor fusion with up to five radars. |
||
| The system offers features such as: (i) Trained Park Assist (TPA), a parking automation comfort feature that provides the driver with an option to park the vehicle automatically with a previously learned “park-in” or “park-out” trajectory; (ii) Environmental Condition Recognition (ECR) that classifies the current condition of road surfaces ahead with respect to wetness or snow coverage for piloted driving functions to control the vehicle; (iii) Monocular Scene Reconstruction (MSR) that detects the transition of drivable to non-drivable areas (e.g., asphalt to grass transitions); and Hazard Detection (HZD), noticing static obstacles on the road upfront to avoid collisions. |
||

|
IN-CABIN SENSING SYSTEM
|
|
| Planned for production in 2024 in multiple OEM vehicle platforms, our innovative radar-based in-cabin sensing system is designed with the potential to save lives by detecting if a child is left behind in a vehicle. Utilizing radar technology, our system can detect slight movements caused by heartbeats and breathing. Unlike cameras, our sensors can penetrate seat structures and operate with lower power requirements. If a child or pet is detected, the system triggers a warning. This advanced system surpasses the functionality of existing audible warning sensors that are linked to the rear door opening and closing. The Child Presence Detection functionality assists automakers in addressing the European New Car Assessment Programme (NCAP) 2023/2025 safety protocols. Subsequent planned features include a seat belt reminder, and vehicle and truck bed intrusion detection. |
||
|
IMPAIRED DRIVING DETECTION TECHNOLOGY
|
|
| Magna has demonstrated a breath and camera-based pre-development technology designed to combat impaired driving. Our new impaired driving detection technology determines if drivers are “fit to drive” in a fast, reliable, and affordable way. The integrated solution combines key elements of the interior sensing system, which utilizes camera technology to detect driver distraction, drowsiness, and intoxication through pupillary signals, with infrared sensor technology developed by Senseair, a leader in air and gas sensing. Cockpit-embedded sensors, placed in proximity to the driver, measure and quantify the alcohol and carbon dioxide levels in diluted exhalations from the driver to passively detect elevated blood alcohol concentration at or above legal limits. |
||
Innovation Awards
A number of our product and process innovations have received accolades and awards in recent years. Recently, Magna was:
| § | A 2024 Consumer Electronics Show (CES) Innovations Award honoree for our ClearviewTM Vision System (described above). This represents our fourth CES award since 2021. |
| § | A 2023 winner of a Society of Plastics Engineers (SPE) Automotive Innovation Award in Body Exterior Category for our first-to-market Thermoplastic Split Gate rear closure system. The complex, deep draw (>80 millimeter) design reduces the number of parts from nine to three, and uses only two materials (injection molded long-fibre-reinforced thermoplastic polypropylene and thermoplastic olefin). |
Two Magna product innovations were named as finalists for the upcoming 2023 Pace Awards. These finalist innovations are Magna’s:

|
§ Integrated Driver & Occupant Monitoring System, an industry-first solution which reduces packaging complexities, fully integrates Magna’s high-resolution camera, infrared emitters, and electronic control unit into the interior mirror of the vehicle and used advanced software to actively monitor the driver’s head, eye and body movement and sends customizable audible or visual alerts if signs of distracted behaviour, drowsiness and/or fatigue are detected; and
|
|
|
§ Rear Thermoplastic Swing Doors, an industry-first product that contains recycled materials that are 20 to 30 percent lighter than conventional steel solutions, helping to reduce vehicle weight, optimize range, make them easier to open, and through the use of thermoplastic resin materials, permit greater design flexibility and detailing, undercut surfaces and tighter radii. |

|
In addition, Magna has been named a finalist for the 2023 Automotive News PACEpilot Innovation to Watch awards – which acknowledge post-pilot, pre-commercial innovations in the automotive and future mobility space – for our Modular and Scalable Active Grille Shutter Assembly, and our 100% Melt Recyclable Foam and Trim. |
Magna International Inc. 41
| 8. | Capital Structure, Financings & Credit Ratings |
Capital Structure Approach
Our approach to capital structure remains unchanged from recent years. We aim to maintain the company’s financial flexibility in order to remain in a position to pursue opportunities and withstand an industry downturn, including by:
| § | maintaining sufficient liquidity, including committed lines of credit, to run our operations and continue investing in our business through organic growth, innovation spending, and acquisitions that fit our product strategy; |
| § | preserving a strong investment grade credit rating of BBB+ or better, and an Adjusted Debt to Adjusted EBITDA ratio that meets or exceeds the Moody’s Investors Service criteria for a strong investment grade credit rating; |
| § | growing dividends over time as earnings grow; and |
| § | repurchasing shares with excess liquidity. |
Other core elements of our approach to capital structure and strategy include:
| § | lowering our capital spending as a percentage of sales, thereby increasing free cash flow generation; |
| § | utilizing share repurchases to deploy excess cash not needed for organic growth and acquisitions; and |
| § | delivering strong Return on Invested Capital. |
In light of the above strategy, we have made significant levels of investment in our business in recent years and have also returned significant amounts of capital to our shareholders in the form of dividends and share repurchases. We had an Adjusted Debt(1) ratio of 1.85 times Adjusted EBITDA(1) at the end of 2023 and our capital structure strategy remains with a long-term target range of 1.0 – 1.5 times Adjusted EBITDA. Our Adjusted Debt ratio currently exceeds our target range as a result of our Notes issuances to fund the acquisition of the Veoneer Active Safety business in 2023 and investments to support new business awards, including in megatrend areas. However, we are committed to getting into our target range within approximately the next 24 months.
Authorized Share Capital
Our authorized share capital consists of an unlimited number of Common Shares and 99,760,000 Preference Shares, issuable in series, all with no par value. As of March 20, 2024, the Record Date for our Meeting, a total of 287,280,095 Common Shares were issued and outstanding. No Preference Shares have been issued or are outstanding.
The following is a brief description of the significant attributes of our authorized share capital and is qualified in its entirety by reference to the detailed provisions in our charter documents, that set out the attributes of our Common Shares and our Preference Shares.
Common Shares
The holders of our Common Shares are entitled to:
| § | one vote for each Common Share held at all meetings of our shareholders, other than meetings of the holders of another class or series of shares; |
| § | receive any dividends that may be declared by our Board, subject to the preferential rights attaching to any shares ranking in priority to our Common Shares; and |
| § | receive, after the payment of our liabilities and subject to the rights of the holders of any shares ranking in priority to our Common Shares, all our property and assets available for distribution in the event of our liquidation, dissolution or winding-up, whether voluntary or involuntary, or any other distribution of assets among our shareholders for the purpose of winding-up our affairs. |
For further details of the market for our securities, refer to “Schedule C – Market for Securities”.
Preference Shares
Our Board may, without the approval of any of our shareholders, fix the number of shares in, and determine the attributes of, an individual series of Preference Shares and issue shares of such series from time to time. The shares of each such series will be entitled to a preference over our Common Shares, but will rank equally with the Preference Shares of every other series with respect to the payment of dividends and in the distribution of all our property and assets available for distribution in the event of our liquidation, dissolution or winding-up, whether voluntary or involuntary, or any other distribution of assets among our shareholders for the purpose of winding-up our affairs. No Preference Shares have been issued or are outstanding and we do not currently anticipate issuing any such shares. In the event we do issue Preference Shares in the future, we would expect to issue them solely for legitimate financing purposes and not to block a change of control transaction.
| (1) | Adjusted Debt is calculated by taking our long- and short-term debt and operating lease liabilities and adding pension obligations and certain other Moody’s adjustments. Adjusted EBITDA is calculated by taking our Adjusted Earnings before Interest and Taxes and adding back Depreciation, operating lease expense, and interest income, and adding adjustments relating to the cash portion of Other Expense, net and pension obligation expenses. In each case, such adjustments reflect a methodology for calculating such ratios used by Moody’s. |
42 Annual Information Form
Amendments to Share Provisions and Other Matters
The provisions attaching to our Preference Shares, to a series of our Preference Shares and to our Common Shares may not be deleted or varied without the approval of the holders of the class or series concerned. In addition, no shares of a class ranking prior to or on a parity with our Preference Shares, or our Common Shares, may be created without the approval of the holders of the class or each series of the class concerned. Any approval required to be given must be given by two-thirds of the votes cast by those present or voting at a meeting of the holders of the class or series concerned duly called for that purpose in addition to any other consent or approval required by law.
Dividends
The following table sets forth the cash dividends paid and payable on our Common Shares in respect of each quarter for the last three years.
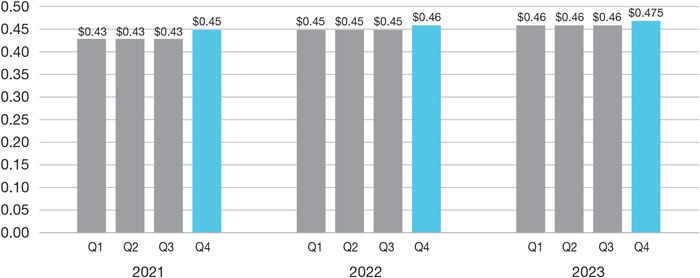
We intend to continue paying a quarterly dividend from our cash flow from operations, with the aim of regularly increasing the dividend consistent with our practice since 2010. Magna’s quarterly dividend has increased for fourteen consecutive years. The declaration and payment of dividends, including the dividend rate, is reviewed quarterly by our Board and is subject to the Board’s discretion taking into account our cash flow, capital requirements, our financial condition, and other factors they consider relevant. See “Section 5 – Risk Factors”.
Dividend Reinvestment Plan (DRIP)
Since 1994, we have maintained a dividend reinvestment plan in which registered shareholders have the option to purchase additional Common Shares by investing the cash dividends paid on their shares.
Financings and Securities/Corporate Transactions
Senior Unsecured Notes
We currently have the following senior unsecured notes outstanding:
| Issuance Date | Amount Issued | Interest Rate | Maturity Date | |||
|
June 16, 2014 |
$750,000,000 | 3.625% | June 15, 2024 | |||
|
September 23, 2015 |
$650,000,000 | 4.150% | October 1, 2025 | |||
|
September 25, 2017 |
€600,000,000 | 1.500% | September 25, 2027 | |||
|
June 15, 2020 |
$750,000,000 | 2.450% | June 15, 2030 | |||
|
March 10, 2023 |
C$350,000,000 | 4.95% | January 31, 2031 | |||
|
March 17, 2023 |
€550,000,000 | 4.375% | March 17, 2032 | |||
|
March 21, 2023 |
$300,000,000 | 5.980% | March 21, 2026 | |||
|
March 21, 2023 |
$500,000,000 | 5.500% | March 21, 2033 | |||
|
March 14, 2024 |
$400,000,000 | 5.050% | March 14, 2029 | |||
The prospectus supplements (or in the case of the 4.95% Canadian dollar-denominated notes, the offering memorandum) which describe each of the notes above have been filed and are available on SEDAR+ (www.sedarplus.ca).
On November 24, 2023, we repaid at maturity our Euro denominated 1.900% senior unsecured notes originally issued in November 2015.
Credit Facilities
We maintain a $2.7 billion syndicated revolving credit facility (the “Global Credit Facility”), which we amended in April 2023 to (i) cancel the $150 million Asian tranche and allocate the equivalent amount to the Canadian tranche, and (i) extend the maturity date from June 24, 2027, to June 24, 2028.
Magna International Inc. 43
The facility includes a $150 million Mexican tranche and a tranche for Canada, U.S., and Europe, which is fully transferable between jurisdictions and can be drawn in U.S. dollars, Canadian dollars, or euros. As at December 31, 2023, no amounts were outstanding under this facility.
We also maintain an $800 million, 364-day syndicated revolving credit facility that expires on June 24, 2024, and can be drawn in U.S. dollars or Canadian dollars. As at December 31, 2023, no amounts were outstanding under the 364-day facility.
On March 6, 2023, we entered into a syndicated credit agreement with several financial institutions providing for an unsecured term loan (the “Term Loan”) with a 3-year tranche of US$800 million and 5-year tranche of US$600 million. During 2023, the Company drew $100 million from the 3-year tranche and $300 million from the 5-year tranche of the Term Loan. The remaining loan commitment amounts under Term Loan were subsequently cancelled. As at December 31, 2023, $400 million in aggregate was outstanding under the Term Loan.
Commercial Paper Programs
We maintain a euro-commercial paper program (the “ECP Program”) and a U.S. commercial paper program (the “USCP Program”), each backstopped by our Global Credit Facility. Under the ECP Program, one of our indirect wholly owned subsidiaries may, from time to time, issue euro-commercial paper notes, subject to an aggregate maximum of €500 million or its equivalent in alternative currencies. Under the USCP Program, we may, from time to time, issue commercial paper notes, subject to an aggregate maximum of $2 billion or its equivalent in alternative currencies (increased from $1 billion in March 2023). As at December 31, 2023, we had outstanding issues of $210 million under the ECP Program and $299 million under the USCP Program.
Normal Course Issuer Bid
On February 13, 2024, the TSX accepted our Notice of Intention (the “Notice”) to Make a Normal Course Issuer Bid relating to the purchase of up to 300,000 Magna Common Shares (the “2024 Bid”), representing approximately 0.1% of our “public float” of Common Shares. The primary purposes of the 2024 Bid are purchases for cancellation, as well as purchases to fund our stock-based compensation awards or programs and/or our obligations to our deferred profit-sharing plans. The 2024 Bid commenced on February 15, 2024 and will terminate no later than February 14, 2025.
Purchases of Common Shares under the 2024 Bid as of the date of this AIF have been made on the TSX or the NYSE at the prevailing market price at the time of purchase and in accordance with the rules and policies of the TSX or in compliance with Rule 10b-18 under the U.S. Securities Exchange Act of 1934, respectively, or through other published markets, or by such other means permitted by the TSX.
We have purchased the following Common Shares pursuant to the 2024 Bid as at March 20, 2024, and under our previous normal course issuer bid which commenced on November 15, 2022 and terminated on November 14, 2023 (“2023 Bid”):
| 2024 Bid | 2023 Bid | |||||||||
|
Shares purchased and cancelled |
0 | 0 | ||||||||
|
Shares purchased and retained for stock-based compensation awards or programs and/or deferred profit sharing plans |
62,796 | 245,904 | ||||||||
|
Total |
62,796 | 245,904 | ||||||||
Ratings
As of the date of this AIF, we have been assigned the ratings in the table below:
| Credit Rating Agency |
Issuer Rating |
Senior Debt Rating |
Short-Term Debt Rating |
Outlook/ Trend |
||||||||||||||||
|
Dominion Bond Rating Service (DBRS)(1) |
A (low) | A (low) | R-1 (low) | Stable | ||||||||||||||||
|
Moody’s Investor Services (Moody’s)(2) |
A3 | A3 | P-2 | Stable | ||||||||||||||||
|
Standard & Poor’s (S&P)(3) |
A– | A– | A-2 | Stable | ||||||||||||||||
Notes:
| (1) | DBRS’s issuer and senior debt ratings are based on its long-term rating scale that ranges from “AAA” to “D” which represents the range from an issuer with the highest credit quality to one that has filed under bankruptcy, insolvency or winding up legislation or failed to satisfy an obligation after exhausting grace periods. A rating in the “A” rating category is in the third highest category of the relevant scale of eight major categories and is considered by DBRS to be of good credit quality, with substantial capacity for payment of financial obligations. “High” and “low” grades are used to indicate the relative standing of credit within a particular rating category. The absence of one of these designations indicates a rating which is in the middle of the category, excluding the AAA and D categories for which the “high”, “middle” or “low” designations are not used. The DBRS rating trends provide guidance in respect of DBRS’ opinion regarding the outlook for the rating in question, with rating trends falling into one of three categories – “Positive”, “Stable” or “Negative”. The rating trend indicates the direction in which DBRS considers the rating is headed should present tendencies continue, or in some cases, unless challenges are addressed. A “Positive” or “Negative” does not necessarily indicate a rating change is imminent, but rather the trend represents an indication that there is a greater likelihood that the rating could change in the future versus if a “Stable” trend was assigned. |
DBRS’s short-term debt rating is based on its commercial paper and short-term debt rating scale that ranges from “R-1 (high)” to “D” which represents the range from an issuer with the highest credit quality to one that has filed under bankruptcy, insolvency or winding up legislation or failed to satisfy an obligation after exhausting grace periods. A rating in the “R-1 (low)” category represents the third highest category of the relevant scale of ten major categories and is considered by DBRS to be of good credit quality, with substantial capacity for payment of financial obligations.
44 Annual Information Form
| (2) | Moody’s senior unsecured issuer rating is an opinion as to our future relative creditworthiness. The credit rating is based on a rating scale that, for global automotive suppliers, ranges from “Aaa” to “C”, which represents the range from those obligations with minimal credit risk to those obligations that are in default with little prospect of recovery. Issuers in the “A” rating category are in the third highest category of the relevant scale of nine major categories and are considered by Moody’s to be subject to low credit risk. The determination of the overall rating assigned to a global automotive supplier is based on an assessment of an issuer’s performance in five broad weighted categories, some of which are further broken down into a number of weighted sub-factors each of which maps to a specific letter rating in the range above. The indicated rating category for each sub-factor (i.e., Aaa, Aa, etc.) is then converted into a numeric value, which is then multiplied by the weight for that sub-factor with the results then totaled to produce a composite weighted-factor score, that is itself then mapped back to an alphanumeric rating based on the ratings range from Aaa to C. Moody’s appends the numerical modifiers 1, 2, or 3 to each generic rating classification from Aa through Caa. The modifiers 1, 2 and 3 indicate that the obligation ranks in the higher end, mid-range, or lower end of its generic rating category, respectively. The Moody’s rating outlook is an opinion regarding the likely direction of an issuer’s rating over the medium term, and fall into one of four categories: Positive, Negative, Stable or Developing. |
| (3) | S&P’s issuer credit rating is a current opinion of our overall financial capacity (i.e. credit worthiness) to pay our financial obligations in full and on time. This credit rating is based on a rating scale that ranges from “AAA” to “D”, which represents the range from extremely strong capacity to meet financial obligations to a failure to pay one or more financial obligations when it came due. An issuer with a long-term issuer rating in the “A” rating category is in the third highest category of the relevant scale of ten major categories and is considered by S&P to have a strong capacity to meet its financial commitments but is somewhat more susceptible to the adverse effects of changes in circumstances and economic conditions than issuers in higher-rated categories. The ratings from “AA” to “CCC” may be modified by the addition of a plus (+) or minus (-) sign to show relative standing within the major rating categories. The lack of one of these designations indicates a rating that is in the middle of the category. The S&P rating outlook assesses the potential direction of a credit rating over the intermediate term (typically six months to two years) but is not necessarily a precursor to a rating change. |
Credit ratings are intended to provide investors with an independent measure of the credit quality of debt and securities. The credit ratings assigned to us or our senior debt by the rating agencies are not recommendations to purchase, hold or sell our debt or securities, since such ratings do not address market price or suitability for a particular investor. There is no assurance that any rating will remain in effect for any given period of time or that any rating will not be revised or withdrawn entirely by a rating agency in the future, if in its judgement, circumstances warrant. See “Section 5 – Risk Factors – “Credit Ratings Changes” in this AIF. We have made payments in the ordinary course to the rating agencies listed above in connection with the assignment of ratings on our securities. In addition, we made payments to Moody’s and S&P in connection with the confirmation of our ratings in respect of the issuance of our Senior Notes and continued issuances under our ECP Program and USCP Program.
Magna International Inc. 45
| 9. | Directors & Executive Officers |
Directors
Our Board currently consists of the following members:
| Name & Municipality of Residence | Director Since | Principal Occupation | ||
| Peter G. Bowie(1) Ontario, Canada |
May 10, 2012 | Corporate Director | ||
| Mary S. Chan New Jersey, U.S.A. |
August 10, 2017 | Chief Operating Officer, Nikola Corporation and Corporate Director | ||
| Hon. V. Peter Harder Ontario, Canada |
January 10, 2020 | Senator and Corporate Director | ||
| Jan R. Hauser(2) Massachusetts, U.S.A. |
August 1, 2022 | Corporate Director | ||
| Seetarama (Swamy) Kotagiri Michigan, U.S.A. |
January 1, 2021 | Chief Executive Officer of Magna | ||
| Jay K. Kunkel Tokyo, Japan |
May 11, 2023 | Corporate Director | ||
| Robert F. MacLellan(3) Ontario, Canada |
May 10, 2018 | Chairman, Northleaf Capital Partners, and Corporate Director | ||
| Mary Lou Maher Ontario, Canada |
May 6, 2021 | Corporate Director | ||
| William A. Ruh Montana, U.S.A. |
May 11, 2017 | Chief Executive Officer, Lifestyle Solutions Real Estate and Corporate Director | ||
|
Dr. Indira V. Samarasekera British Columbia, Canada |
May 8, 2014 | Senior Advisor, Bennett Jones LLP, and Corporate Director | ||
| Matthew Tsien Washington, U.S.A. |
May 11, 2023 | Corporate Director | ||
| Dr. Thomas Weber Baden-Württemberg, Germany |
January 1, 2022 | Corporate Director | ||
| Lisa S. Westlake Florida, U.S.A. |
May 9, 2019 | Corporate Director | ||
Notes:
| (1) | Retiring at the end of the current term on May 9, 2024. Mr. Bowie was a director of Xebec Adsorption, Inc. (“Xebec”) when it sought protection under the Companies’ Creditors Arrangement Act (“CCAA”) on September 29, 2022. Xebec’s shares were suspended from trading by the Toronto Stock Exchange on the same date and subsequently delisted on November 14, 2022. |
| (2) | Ms. Hauser was a director of Proterra Inc. (“Proterra”) when it filed a voluntary petition for bankruptcy protection under Chapter 11 of the U.S. Bankruptcy Code on August 7, 2023. Proterra’s shares were suspended from trading on August 17, 2023. Ms. Hauser’s term as a director for Proterra ended effective March 13, 2024, when it emerged from bankruptcy. |
| (3) | Chairman of the Board. |
All of our directors were elected to their present terms of office by our shareholders at our Annual Meeting of Shareholders held on May 11, 2023. The term of office for each director expires at the conclusion of the next annual meeting of our shareholders. Each of our current directors is being nominated for election at the Meeting, except Peter Bowie who has reached his term limit under the Company’s 12 year Director tenure guideline and will retire from the Board at the Meeting.
All of the directors have held the principal occupations identified above (or another position with the same employer) for not less than five years, except as follows:
| § | Mrs. Chan was Managing Partner of VectoIQ LLP from January 2016 to October 2023; |
| § | Mr. Harder served as the Representative of the Government of Canada in the Senate from March 2016 to January 2020; |
| § | Mr. Kunkel was Executive Vice President for Tenneco Federal Mogul Corporation and President of Tenneco’s Asia operations from November 2018 to September 2020; |
| § | Ms. Maher was concurrently the Canadian Managing Partner, Quality and Risk, KPMG Canada and Global Head of Inclusion and Diversity, KPMG International from October 2017 to February 2021; |
| § | Mr. Ruh was Chief Executive Officer, Digital of Lendlease Group from January 2019 to December 2023; and |
| § | Mr. Tsien held various roles with General Motors and its group of companies, including Executive Vice President, Chief Technology Officer, and President, General Motors Ventures from June 2020 to October 2021, as well as Executive Vice President and President, GM China from January 2014 to June 2020. |
With the exception of Mr. Kotagiri, our CEO, all other directors have been determined by our Board to be “independent directors” within the meaning of such term under applicable law.
46 Annual Information Form
Board Committees
Our Board has four standing committees: Audit Committee; Governance, Nominating and Sustainability Committee (“GNSC”); Talent Oversight and Compensation Committee (“TOCC”); and Technology Committee.
A copy of our Board Charter, Audit Committee Charter, as well as the charters of our other Board Committees are available on our website (www.magna.com), have been filed on SEDAR+ (www.sedarplus.ca) and EDGAR (www.sec.gov/edgar) and are incorporated by reference into this AIF. Additional information about our Audit Committee is contained under “Corporate Governance – Report of the Audit Committee” in our Circular for our Meeting, which is incorporated by reference into this AIF.
Membership of these Committees as of the date of this AIF are as follows:
| Name | Audit Committee |
Governance, Nominating & Sustainability Committee |
Talent Oversight & Compensation Committee |
Technology Committee |
||||
| Peter G. Bowie(1) |

|
∎ | ||||||
| Mary S. Chan | ∎ | ∎ | ||||||
| Hon. V. Peter Harder |
|
∎ | ||||||
| Jan R. Hauser | ∎ | ∎ | ||||||
| Jay K. Kunkel | ∎ | ∎ | ||||||
| Robert F. MacLellan(2) | ∎ | |||||||
| Mary Lou Maher | ∎ | ∎ | ||||||
| William A. Ruh | ∎ |
|
||||||
| Dr. Indira V. Samarasekera |
|
∎ | ||||||
| Matthew Tsien | ∎ | ∎ | ||||||
| Dr. Thomas Weber | ∎ | ∎ | ||||||
| Lisa S. Westlake | ∎ | ∎ | ||||||
∎ Committee
Member Committee Chair
Notes:
| (1) | Mr. Bowie will retire from his committee assignments in connection with his retirement from the Board at the end of his current term on May 9, 2024. |
| (2) | Chairman of the Board |
Additional details regarding our Committee structure can be found in the “Corporate Governance” section of our Circular.
Magna International Inc. 47
Executive Officers
Our executive officers currently consist of the following persons:
| Name & Municipality of Residence | Principal Occupation | |
| Seetarama (Swamy) Kotagiri Michigan, U.S.A. |
Chief Executive Officer (since January 2021) | |
| Patrick W.D. McCann Ontario, Canada |
Executive Vice-President and Chief Financial Officer (since January 2022) | |
| John H. Farrell Ontario, Canada |
President (Cosma, Exteriors and Seating) (since January 2023) | |
| Tom J. Rucker Ontario, Canada |
President (MPT, MML, Electronics and Complete Vehicles) (since January 2023) | |
| Bruce R. Cluney Ontario, Canada |
Executive Vice-President and Chief Legal Officer (since July 2020) | |
| Matteo Del Sorbo Ontario, Canada |
Executive Vice-President, Magna New Mobility (since January 2022) | |
| Uwe Geissinger Hesse, Germany |
Executive Vice-President (since February 2021) and President of Magna Europe (since May 2023) | |
| Aaron D. McCarthy Ontario, Canada |
Executive Vice-President and Chief Human Resources Officer (since January 2019) | |
| Boris Shulkin Michigan, U.S.A. |
Executive Vice-President (since February 2021) and Chief Digital & Information Officer (since April 2022) | |
| Eric J. Wilds Michigan, U.S.A. |
Executive Vice-President and Chief Sales & Marketing Officer (since January 2020) | |
To the extent that our executive officers have not held the offices identified above for the last five years, they have held the following offices or positions with us and/or have had the following principal occupations during the last five years:
| § | Prior to becoming our CEO, Mr. Kotagiri was President, Magna International from January 2020 to December 2020 and Executive Vice-President and Chief Technology Officer from January 2014 to January 2020. He also served as President, Power and Vision from May 2018 to December 2020; |
| § | Mr. McCann was Senior Vice-President, Finance from May 2019 to December 2021, and Vice-President, Cosma Group from January 2016 to April 2019; |
| § | Mr. Farrell was President of Cosma International from January 2013 to December 2022; |
| § | Mr. Rucker was President of Magna Powertrain from October 2019 to December 2022, Senior Vice President, Program Management and Launch Excellence of Magna Powertrain from April 2018 to September 2019; |
| § | Mr. Cluney was Executive Vice-President and General Counsel, Power and Vision from July 2018 to July 2020; |
| § | Mr. Del Sorbo was Vice-President, Business Development from January 2020 to January 2022 and Vice-President, Business Development – Exteriors, Seating, Mirrors, Closures and Cosma Groups from January 2017 to January 2020; |
| § | Mr. Geissinger was Executive Vice President, Operational Efficiency from February 2021 to May 2023, President, Magna Electronics and Senior Vice-President Operations, Power & Vision Group from April 2019 to February 2021, and Senior Vice-President, Fluid Pressure & Controls Group from January 2017 to March 2019; |
| § | Mr. Shulkin was Executive Vice President, Technology & Investments from February 2021 to March 2022, Senior Vice-President, Technology and Development from July 2020 to February 2021, and Vice-President, Research and Development from May 2011 to July 2020; and |
| § | Mr. Wilds was Executive Vice President, Business Development & Strategy, Magna Power and Vision from January 2018 to January 2020. |
48 Annual Information Form
Beneficial Ownership of Securities
As at March 20, 2024, we had 287,280,095 Common Shares issued and outstanding. All our directors and executive officers (as a group 22 persons) owned beneficially or exercised control or direction over 383,854 Common Shares representing approximately 0.1% of the class, as at March 20, 2024. Our issued and outstanding Common Shares are held as follows:
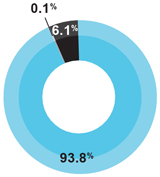

|
Public, 269,424,634 |

|
North American and European DPSPs, 17,471,607 |

|
Directors/Executive Officers, 383,854 |
10. Legal Proceedings
Regulatory Proceedings
From time to time, the Company may become involved in regulatory proceedings. Magna’s policy is to comply with all applicable laws, including antitrust and competition laws. Based on a previously completed global review of legacy antitrust risks which led to a September 2020 settlement with the European Commission and a June 2022 settlement with Brazil’s federal competition authority involving in both cases the supply of closure systems, Magna does not currently anticipate any material liabilities. However, we could be subject to restitution settlements, civil proceedings, reputational damage, and other consequences, including as a result of the matters specifically referred to above.
Other
In the ordinary course of business activities, we may become contingently liable for litigation and claims with customers, suppliers, former employees, and other parties. In addition, we may be, or could become, liable to incur environmental remediation costs to bring environmental contamination levels back within acceptable legal limits. On an ongoing basis, we assess the potential of any adverse judgments or outcomes to these matters, as well as any associated probable costs and losses.
A determination of the provision required, if any, for these contingencies is made after analysis of each individual issue. The required provision may change in the future due to new developments in each matter or changes in approach, such as a change in settlement strategy in dealing with these matters.
Warranty, Product Liability and Recall Costs
In certain circumstances, we are at risk for warranty, product liability and recall costs, and are currently experiencing increased customer pressure to assume greater warranty responsibility. Certain customers seek to impose, partial responsibility for the warranty costs where the underlying root cause of product or system failure cannot be determined. Due to the nature of the costs, we make our best estimate of the expected future costs, however, the ultimate amount of such costs could be materially different. For most types of products, we only account for existing or probable claims on product defect issues when amounts related to such issues are probable and reasonably estimable. However, for certain complete vehicle assembly, powertrain systems, and electronics contracts, we record an estimate of future warranty-related costs based on the terms of the specific customer agreements and/or our warranty experience.
Product liability and recall provisions are established based on our best estimate of the amounts necessary to settle existing claims, which typically take into account: the number of units that may be returned; the cost of the product being replaced; labour to remove and replace the defective part; and the customer’s administrative costs relating to the recall. In making this estimate, judgement is also required as to the ultimate negotiated sharing of the cost between us, the customer and, in some cases a supplier. Where applicable, insurance recoveries related to such provisions are also recorded.
In December 2023, we received a notification (the “Notification Letter”) from a customer informing us as to the customer’s initial determination that one of Magna’s Operating Groups bears responsibility for costs totaling $352 million related to two product recalls. The Notification Letter has triggered a 90-day negotiation period regarding financial allocation of the total costs for the two recalls. In the event such negotiations are not concluded successfully during this period, the customer has discretion under its Terms and Conditions to debit Magna up to 50% of the parts and labour costs actually incurred related to the recalls. We believe that the product in question met the customer’s specifications, and accordingly, we are vigorously contesting the customer’s determination. Magna does not currently anticipate any material liabilities.
Magna International Inc. 49
11. Other Information
Additional Information
Our Circular contains the following additional information:
| ∎ | our directors’ and named executive officers’ remuneration and indebtedness; |
| ∎ | our voting securities and their principal holders; and |
| ∎ | securities authorized for issuance under our equity-based compensation plans. |
Additional financial information about us is provided in our consolidated financial statement as at and for the year ended December 31, 2023, and in our MD&A. These documents and additional information about us may be found on SEDAR+, at www.sedarplus.ca, on EDGAR at www.sec.gov/edgar and on our website, at www.magna.com.
Interests of Management & Others in Material Transactions
Reference is made to “Interests of Management and Other Insiders in Certain Transactions” in our Circular for our Meeting, which is incorporated by reference into this AIF.
Transfer Agent & Registrar
The transfer agent and registrar for our Common Shares is TSX Trust Company, at its principal offices in Toronto, Ontario set out below. The co-transfer agent and co-registrar for our Common Shares in the United States is Continental Stock Transfer & Trust Co., at its offices in New York, NY set out below.
| TSX Trust Company 301 – 100 Adelaide St. West Toronto, ON M5H 4H1 |
Continental Stock Transfer & Trust Co. 1 State Street, 30th Floor New York, NY 10004 |
|
| Telephone: 1-800-387-0825 or 416-682-3860 Fax: 1-888-249-6189 or 1-514-985-8843 Email: shareholderinquiries@tmx.com |
||
Interests of Experts
Our independent auditor for the 2023 fiscal year is Deloitte LLP. Deloitte LLP is independent within the meaning of the Rules of Professional Conduct of the Chartered Professional Accountants of Ontario, and the applicable rules and regulations adopted by the SEC and the Public Company Accounting Oversight Board (United States) (PCAOB). Additional information regarding the fees paid to our independent auditors is contained under “Business of the Meeting – Reappointment of Deloitte LLP as Magna’s Independent Auditors” in our Circular, which is incorporated by reference into this AIF.
50 Annual Information Form
Schedules
Schedule A
Principal Subsidiaries and Investments
Subsidiaries
A list of our principal subsidiaries and each of their jurisdictions of incorporation as of December 31, 2023, is set out below. Our legal structure (including that of our subsidiaries) is not necessarily indicative of our operational structure.
| Subsidiary(1)(2) | Voting Securities |
Jurisdiction of Incorporation |
||
| 1305290 Ontario Inc. |
100% | Ontario | ||
| Magna International Investments S.A. |
100% | Luxembourg | ||
| Magna International Automotive Holding GmbH |
100% | Austria | ||
| Magna Automotive Europe GmbH |
100% | Austria | ||
| Magna Automotive Holding GmbH |
100% | Austria | ||
| Magna Metalforming GmbH |
100% | Austria | ||
| Magna Steyr GmbH & Co. KG |
100% | Austria | ||
| Magna Powertrain GmbH & Co KG |
100% | Austria | ||
| Magna Steyr Fahrzeugtechnik AG & Co. KG |
100% | Austria | ||
| Engineering Center Steyr GmbH |
100% | Austria | ||
| Magna Powertrain GmbH |
100% | Austria | ||
| Magna Electronics Foreign Holdco AB |
100% | Sweden | ||
| Magna Electronics AB |
100% | Sweden | ||
| Magna Automotive Holding (Germany) GmbH |
100% | Germany | ||
| Magna PT Holding GmbH |
100% | Germany | ||
| Magna Financing Luxembourg Canada ULC |
100% | Alberta | ||
| Magna US Holding, Inc. |
100% | Delaware | ||
| Cosma International of America, Inc. |
100% | Michigan | ||
| Intier Automotive of America, Inc. |
100% | Delaware | ||
| Intier Automotive of America Holdings, Inc. |
100% | Delaware | ||
| Magna Seating of America, Inc. |
100% | Delaware | ||
| Magna Exteriors Holdings, Inc. |
100% | Delaware | ||
| Magna Exteriors of America, Inc. |
100% | Delaware | ||
| Magna Mirrors of America, Inc. |
100% | Michigan | ||
| Magna International (Hong Kong) Limited |
100% | Hong Kong | ||
| Magna Exteriors Inc. |
100% | Ontario | ||
| Magna Powertrain de Mexico, S.A. de C.V. |
100% | Mexico | ||
| Magna Seating Inc. |
100% | Ontario | ||
| Magna Internacional de Mexico, S.A. de C.V. |
100% | Mexico | ||
| Magna Powertrain Inc. |
100% | Ontario | ||
Notes:
| (1) | The table shows the percentages of the votes attached to all voting securities and of each class of non-voting securities, owned by us or over which control or direction is exercised by us. Parent/subsidiary relationships are identified by indentations. Percentages represent the total equity interest in a subsidiary, which is not necessarily indicative of percentage voting control. |
| (2) | Subsidiaries not shown each represent less than 10% of our total consolidated revenues and total consolidated assets (although not all subsidiaries shown necessarily each represent more than 10% of our total consolidated assets and total consolidated sales) and, if considered in aggregate as a single subsidiary, represent less than 20% of our total consolidated revenues and total consolidated assets. |
Magna International Inc. 51
Investments
Our principal equity method investments are the following:
| Joint Venture | Magna Equity Ownership % |
Partner(s) | Reporting Segment | |||
| Litens Automotive Partnership | 76.7% (non-controlling 50% voting interest) |
Current and retired members of senior Litens management | Power & Vision | |||
| Hubei HAPM MAGNA Seating Systems Co., Ltd. | 49.9% | Hubei Aviation Precision Machinery Co., Ltd. |
Seating Systems | |||
| LG Magna e-Powertrain Co., Ltd. | 49.0% | LG Electronics Inc. | Power & Vision | |||
| BAIC Bluepark Magna Automobile Co., Ltd. | 49.0% | Blue Sky New Energy Industry Investment Co., Ltd. | Complete Vehicles | |||
52 Annual Information Form
Schedule B
Acquisitions and Divestitures
We have completed a number of acquisitions, divestitures, financings, and securities/corporate transactions in the last three fiscal years, including those listed below. None of these acquisitions constitutes a “significant acquisition” within the meaning of such term in National Instrument 51-102 – Continuous Disclosure Obligations of the Canadian Securities Administrators. Additional information about the acquisitions and/or divestitures listed below can be found in Note 7 of our consolidated financial statement as at and for the year ended December 31, 2023, Note 21 of our consolidated financial statement as at and for the year ended December 31, 2022, and Note 5 of our consolidated financial statement as at and for the year ended December 31, 2021.
Acquisitions
| Year | Acquisition | |
| 2023 |
100% of the common shares and voting interests of the entities holding the Veoneer Active Safety Business. Veoneer AS supplies active safety products globally including active safety integration systems, radar, camera systems, internal cabin sensing, thermal sensing, and light detection. | |
| 2022 |
Investment in Yulu Mobility, an electrified mobility provider in India and together with Yulu Mobility, establishment of 51% controlling interest in a new battery swapping entity (“Magna Yuma”) to support electrification of mobility and required infrastructure. | |
| 2021 |
∎ Getrag Ford Transmission GmbH’s non-controlling interest in Getrag (Jiangxi) Transmission Co., Ltd., a Chinese joint venture controlled by Magna, and a facility in Europe.
∎ 65% equity interest and a controlling financial interest in Chongqing Hongli Zhixin Scientific Technology Development Group LLC.
∎ Klein Automotive, a metalforming operation in Czechia. |
|
Divestitures
| Year | Divestiture | |
| 2023 |
Sale of the Company’s divisions in Russia | |
| 2022 |
None | |
| 2021 |
∎ Distribution to Ford Motor Company of certain assets of Getrag Ford Transmission GmbH, a European joint venture with Ford, in connection with multiple agreements with Ford to operate certain businesses within the joint venture under separate ownership.
∎ Sale of three Body Exteriors & Structures operations in Germany. |
|
Magna International Inc. 53
Schedule C
Market for Securities
Our Common Shares are listed and posted for trading on the TSX under the trading symbol “MG”, and on the NYSE under the trading symbol “MGA”.
The high and low sale prices and volume of shares traded for our Common Shares, as reported by the TSX and NYSE, respectively, for the months during the year ended December 31, 2023 were as follows:
| Month | TSX High (C$) |
TSX Low (C$) |
TSX Volume |
NYSE High ($) |
NYSE Low ($) |
NYSE Volume |
||||||
|
January |
88.27 | 77.30 | 14,205,047 | 65.99 | 56.79 | 21,732,479 | ||||||
|
February |
91.74 | 71.69 | 21,604,315 | 68.92 | 53.30 | 32,196,602 | ||||||
|
March |
78.48 | 68.18 | 18,456,856 | 57.64 | 49.46 | 21,975,856 | ||||||
|
April |
74.72 | 68.01 | 17,281,905 | 55.82 | 50.37 | 17,841,873 | ||||||
| May |
73.45 | 65.44 | 24,655,150 | 55.09 | 48.18 | 30,963,548 | ||||||
| June |
75.77 | 65.24 | 18,199,632 | 57.26 | 48.30 | 17,011,595 | ||||||
| July |
84.93 | 74.89 | 14,462,166 | 64.50 | 56.30 | 20,854,840 | ||||||
|
August |
87.00 | 73.11 | 16,523,747 | 65.27 | 53.91 | 33,072,630 | ||||||
|
September |
81.65 | 70.50 | 12,719,017 | 59.91 | 52.16 | 18,926,645 | ||||||
|
October |
74.41 | 65.40 | 12,088,783 | 54.74 | 47.25 | 20,018,227 | ||||||
|
November |
77.38 | 64.41 | 30,840,737 | 56.44 | 46.71 | 31,396,867 | ||||||
|
December |
79.70 | 71.50 | 17,379,149 | 60.32 | 52.61 | 18,024,050 | ||||||
54 Annual Information Form
Appendix 1
Sustainability
Report
FY 2023

Magna International Inc. A-1
| Contents |
||
Sustainability Report
| A-6 | Summary Sustainability Metrics | |
| A-7 | Introduction | |
| A-8 | Sustainability Governance | |
| A-13 | Climate-Related Opportunities | |
| A-18 | Climate-Related Risks and Risk Mitigation | |
| A-25 | Non-Climate Elements of Sustainability | |
| A-41 | Sustainability Metrics |
A-2 Annual Information Form

Our Evolving Sustainability Strategy
The automotive industry is undergoing a significant transformation as we transition to a net-zero world. This transformation affects how people and goods move, as well as how we develop and manufacture our products.
At Magna, we are navigating complexities of this evolving sustainability landscape by focusing our efforts on areas where we can make the greatest positive impact. I am proud that our efforts are producing tangible results and reflect our consistent company purpose: advancing mobility for everyone and everything, responsibly.
Our commitment to a sustainable enterprise began more than 65 years ago and is the foundation on which we build today. Our pledge to support the planet is deeply rooted in our culture. Magna has always been a company that is well respected in the industry and world for doing what is right – not because we have to, but because we want to.
This report provides a comprehensive overview of our achievements in 2023, but I am most inspired by what comes next. The groundwork we have laid in recent years will allow us to build on our momentum and further yield significant competitive advantage. Being a sustainable company benefits every Magna stakeholder, touches every part of our business, and is the key to making this world a better place for current and future generations.
Magna International Inc. A-3

Moving the Needle on Sustainability
Since its inception, Magna has been committed to safeguarding our people, products and processes. We have taken a proactive approach, constantly evolving our products, technologies, and operations to lead by example to create a more sustainable future.
As a mobility technology company and one of the world’s largest auto suppliers, Magna has a unique vantage point. With our presence in many segments of mobility and across the vehicle, our progress in sustainability has the potential to catalyze advancements throughout the industry. It is our dedication to sustainability and our willingness to evolve that sets us apart. By setting ambitious goals and adopting a science based approach, we are gaining momentum and empowering our employees across the world to help make significant progress.
In 2023, we embraced the spirit of evolution in our sustainability strategy, driving positive change across our business and beyond. We partnered with our customers and communities to navigate the transition to electric vehicles and implement more efficient manufacturing processes. We are upholding Magna’s core values and helping to build a more sustainable, equitable, and inclusive transportation future.
As we accelerate change within our company and the automotive industry, we are optimistic that even greater opportunities to make a difference lie ahead.
A-4 Annual Information Form

Evolving Our Commitment to a Sustainable Future
The fight against climate change is leading to significant transformation in the mobility sector. As a global leader within the industry, Magna has set itself ambitious net-zero targets; in 2023 Magna submitted near-term 2030 and longer-term 2050 net-zero targets to the Science Based Targets initiative (SBTi) for validation.
Magna’s Decarbonization Targets
| Target | Target Year | Status | ||
|
1-year 5% energy savings in implemented energy projects (From 2022 absolute energy usage) |
2023 |
Achieved | ||
| 1-year 5% energy intensity reduction (Compared to 2022) |
2023 |
Exceeded | ||
| 1-Year 10% energy intensity reduction (Stretch goal) (Compared to 2022) |
2023 |
Exceeded | ||
| 2-Year 10% energy intensity reduction (Compared to 2022) |
2024 |
On Track |
||
| ESG scoring for 90% of supplier spend |
2025 |
In Progress |
||
| 100% renewable electricity in EU operations |
2025 |
On Track |
||
| 5-year 20% energy intensity reduction (Compared to 2022) |
2027 |
On Track |
||
| 100% renewable electricity in global operations |
2030 |
On Track |
||
| 25% reduction in value chain (Scope 3) emissions from 2021 baseline (Near-term SBT) |
2030 |
In Progress |
||
| 42% reduction in global operational (Scope 1 & 2) emissions from 2021 baseline (Near-term SBT) |
2030 |
On Track |
||
|
Net-zero emissions reduction (90% absolute reduction in Scopes 1, 2 & 3) (Long-term SBT) |
2050 |
In Progress |
||
| Where We Are |
Year Over Year Progress |
Where We Are Going |
||||
| % of global electricity used that is renewable electricity |
22% |
+500bps |
39% Expected by 2025 |
|||
| Divisions using renewable electricity |
103 |
+42 |
>170 Expected by 2025 |
|||
| Divisions with 100% renewable electricity |
75 |
+14 |
>150 Expected by 2025 |
|||
| Divisions with on-site solar generation |
18 |
+12 |
19 In progress or currently investigating |
|||
Magna International Inc. A-5
Summary Sustainability Metrics
| TOPIC | ISSB CODE | METRIC | UNIT OF MEASURE | MAGNA 2023 DATA(2) | CHANGE FROM 2021 BASELINE(3) |
|||||
|
Emissions |
ISSB S2, 29(a)(i) | Scope 1 emissions | Metric Tons (t) CO2e | 424,561 t | i 2.7% | |||||
| ISSB S2, 29(a)(i) | Scope 2 emissions(1) | Metric Tons (t) CO2e | 1,150,656 t | h 5.6% | ||||||
| ISSB S2, 29(a)(i) | Scope 3 emissions(3) | Metric Tons (t) CO2e | 58,655,441 t(4) | — | ||||||
| TOPIC | SASB CODE | METRIC | UNIT OF MEASURE | MAGNA 2023 DATA(2) | CHANGE FROM 2019 BASELINE(3) |
|||||
|
Energy Management |
TR-AP-130a.1 | Aggregate amount of energy consumed |
Gigajoules (GJ) MegaWatt hours (MWh) |
20,077,657 GJ 5,577,127 MWh | i 11.0% | |||||
| % of energy consumed supplied from electrical grid | Percentage (%) | 59.2% | h 240 bps | |||||||
| % of energy consumed that is renewable energy | Percentage (%) | 12.9% | — | |||||||
| — | Energy intensity | MegaWatt hours (MWh) / Sales (USDm) | 130 MWh / USDm | i 19.8% | ||||||
| Energy intensity reduction | MegaWatt hours (MWh) / Sales (USDm) |
Target: ≥5% p.a. Actual: 10.6% (2023) |
— | |||||||
|
Waste Management |
TR-AP-150a.1 | Aggregate amount of waste generated from manufacturing operations | Metric Tons (t) | 1,365,712 t | — | |||||
| % of waste generated that is hazardous | Percentage (%) | 3.9% | — | |||||||
| % of waste generated that was recycled | Percentage (%) | 91.8% | — | |||||||
| — | % hazardous waste diverted from landfill | Percentage (%) | 91.8% | — | ||||||
| Waste diversion from landfill | Percentage (%) |
Target: ≥95% p.a. Actual: 96.2% (2023) |
— | |||||||
|
Water Management |
— | Annual water withdrawals
|
Megalitres (ML) | 6,571 ML | i 15.1% | |||||
| Water reduction | Percentage (%) | Target: 1.5% p.a. 15% by 2030 (vs. 2019) Actual: 15% (2023) |
— | |||||||
|
Environmental Management |
— | Annual remediation expenses
|
Reporting Currency (USD) | <$1.0m | No Change | |||||
| Aggregate remediation balance for known events | Reporting Currency (USD) | $18.8m | h 40.3% | |||||||
| Environmental violations > $10,000 USD | Number | 1 | — | |||||||
| Amount paid as a result of such environmental violations | Reporting Currency (USD) | $30,000 | — | |||||||
|
Competitive Behaviour |
TR-AP-520a.1 | Total amount of monetary losses incurred as a result of legal proceedings associated with anti-competitive behaviour regulations | Reporting Currency (USD) | NIL | — | |||||
|
Health and Safety |
— | Accident frequency rate |
1.0 = 1 injury / illness per 100 employees working 40 hours/week, 50 weeks/year |
0.50 | i 51.9% | |||||
| Accident severity rate |
10.0 = 10 lost work days / 100 employees working 40 hours/week, 50 weeks/year |
10.22 | i 17.3% | |||||||
|
Gender Diversity |
— | % of employees who are women(5) | Percentage (%) | 28.0% | — | |||||
| % Women in Critical Positions | Percentage (%) | 18.0% | — | |||||||
| % Women on the Board of Magna | Percentage (%) | 38.0%(6) | h 200 bps | |||||||
Notes:
| (1) | Market-based emissions calculation method. |
| (2) | 2023 data with respect to emissions, and water withdrawals have been verified by an independent third-party verification firm. Energy management, waste management, and health and safety data is preliminary. |
| (3) | Items indicated by a dash were not tracked in applicable baseline year. We have used a 2021 baseline for our emissions reporting in line with our science-based near-term and net zero targets. We have used a 2019 baseline for other metrics consistent with our previous sustainability reports. Our 2023 Scope 1 and 2 emissions represent reductions of 17.8% and 28.5%, respectively against our original 2019 baseline. |
| (4) | Scope 3 emissions data reported is based on 2021 and represents our baseline Scope 3 emissions calculated in connection with our science-based near-term and net-zero targets submission in 2023. We performed an inventory covering all 15 Scope 3 emissions categories. Our Scope 3 emissions data includes all relevant categories. Categories 8, 13, and 15 are not relevant to Magna. |
| (5) | Wholly owned operations only. |
| (6) | As of May 9, 2024, the percentage of women on the Board will be 42%, assuming election of all nominees for Magna’s annual meeting of shareholders. |
A-6 Annual Information Form
Introduction
At Magna we are committed to making a difference through our products and processes, as well as care and concern for our people and the communities in which they live.
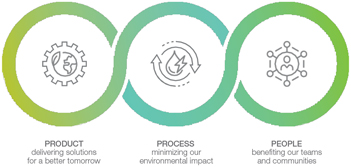
Magna’s Climate Change Commitment
We recognize the reality of climate change and its impact on the planet. As a result, we are focused on doing the right things today so that our corporate interests do not come at the expense of the viability of life for the generations that follow. Although combating climate change requires a collective global response, Magna is determined to play its part in addressing this existential threat to our planet. We took a significant step in 2023 when we submitted our near-term and net-zero emission reduction targets for validation by the Science-Based Targets initiative (“SBTi”).
The details of Magna’s SBTi net-zero commitment are outlined in Section 1.4 of this Sustainability Report.
Approach to Sustainable Value Creation
Overall, our approach to sustainable value creation involves:
| ◾ | designing, engineering, manufacturing and delivering innovative product solutions for our customers, which achieve shared goals of reduced weight, lower fuel consumption and reduced carbon emissions; |
| ◾ | optimizing and innovating our manufacturing processes for resource and input efficiency, as well as product quality; |
| ◾ | enhancing the energy efficiency of our plants and transitioning to 100% renewable energy by 2030 to achieve our SBT requirement to reduce scope 1 and 2 emissions by 42% from a 2021 baseline; |
| ◾ | engaging our supply chain to reduce Scope 3 emissions 25% by 2030 from a 2021 baseline; |
| ◾ | staying focused on our net-zero commitment to reduce Scope 1, 2 and 3 emissions 90% by 2050 from a 2021 baseline; |
| ◾ | treating our employees fairly and looking out for their health, safety and general well-being; |
| ◾ | serving as a good community partner, particularly in the communities in which our employees live and work; and |
| ◾ | enhancing the sustainability of our supply chain with respect to human rights and working conditions through communication, monitoring, and where necessary, corrective action. |
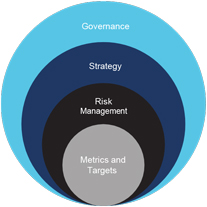
|
This Sustainability Report aims to provide our stakeholders with a better understanding of how we approach the creation of sustainable, long-term value and our management of sustainability-related risks. The report has been structured to align with the International Sustainability Standards Board (ISSB) IFRS S1 and S2 Climate Related Disclosures Standards, as well as the Sustainability Accounting Standards Board’s (“SASB”) Auto Parts accounting standard, where possible. This includes, for the first time, reporting of our (2021 baseline) Scope 3 emissions. While this report may not currently provide stakeholders with all the information sought through the ISSB and SASB frameworks; we continue to evolve and enhance our disclosure as our collection and validation of the applicable data improves. While the ISSB and SASB Auto Parts frameworks primarily address climate-related factors, this Sustainability Report aims to go beyond such items to give stakeholders a better understanding of the broad range of environmental, social and governance initiatives that define our approach to sustainable value creation. |
Magna International Inc. A-7
| 1. | Sustainability Governance |
| 1.1 | Board Oversight |
Magna’s Board of Directors is the company’s highest decision-making body, except to the extent certain rights have been reserved for shareholders under applicable law or Magna’s articles of incorporation or by-laws. As such, the Board is responsible for the overall stewardship of the company by: supervising the management of the business and affairs of Magna in accordance with the legal requirements set out in applicable company law (Business Corporations Act (Ontario)), as well as other applicable law; and, jointly with Management, seeking to create long-term shareholder value. The Board operates under a written Board Charter, in addition to applicable law, our articles of incorporation and by-laws. The Board Charter, which has been filed with securities regulatory authorities on SEDAR+ (www.sedarplus.ca), and is available in the Leadership & Governance section of Magna’s website (www.magna.com), delineates Board oversight responsibilities including with respect to a number of areas relevant to sustainability such as: corporate culture; corporate governance; strategy; risk; shareholder engagement; and fundamental corporate actions.
The Board takes an integrated and coordinated approach to oversight (including climate-related issues). This includes oversight of:
| ◾ | the Company’s corporate culture, including its commitment to innovation/R&D, as well as its overall approach to corporate governance; |
| ◾ | long-term strategy, including sustainability strategy and near-term business plans; |
| ◾ | fundamental corporate actions, including acquisitions/divestitures and capital allocation; |
| ◾ | major corporate policies; |
| ◾ | enterprise risk management, including Sustainability Risks; |
| ◾ | our overall system of compensation of executive management, rooted in profitability and which drives desired management behaviours that are central to our climate strategy, including operational efficiency and acceleration of electrification activities. |
| ◾ | material public disclosures (including this Sustainability Report); |
| ◾ | preparedness of the Company to comply with emerging sustainability/ESG related legislation; and |
| ◾ | shareholder engagement, including on sustainability/ESG topics. |
Climate-related and other sustainability issues are typically considered by the Board at least annually through the Board’s strategic planning process. Typically, Magna’s most senior corporate R&D executive identifies and analyses material “megatrends” impacting the automotive industry, including automotive and mobility trends arising from climate-related issues. Significant opportunities and risks are then addressed at the annual Board strategy meeting, while Operating Group Presidents address the opportunities and risks applicable to their respective business units at the annual business planning meeting. Guidance, feedback and other outputs from the strategy meeting are incorporated and integrated into business unit business plans for the next business planning meeting. Sustainability issues may also arise before the Board in connection with its oversight of fundamental corporate actions such as review/approval of material acquisitions/divestitures, three-year business plans and capital expenditures. Additionally, the Board annually monitors our progress in reducing our carbon footprint and reviews/approves the company’s material public disclosures, including our Annual Information Form / Annual Report on Form 40-F incorporating this Sustainability Report.
| 1.1.1 | GNSC and TOCC Roles |
The Board carries out its duties in part through standing committees composed solely of independent directors. One such committee, the GNSC, supports the Board’s oversight of the company’s approach to sustainability and climate change issues to ensure alignment with Magna’s overall strategy, including by assessing Magna’s overall approach to decarbonization of its operations, environmental compliance, the Company’s approach to human rights and supply chain due diligence, the continued effectiveness of the Company’s ESG management programs, as well as Magna’s actions to identify, monitor and mitigate any material risk exposures relating to such areas. The Board’s TOCC also supports the Board’s sustainability oversight activities by assessing Magna’s approach to certain non-climate elements of sustainability, including its approach to advancing diversity and inclusion in our workplace, and occupational health and safety compliance, as well as Magna’s actions to identify, monitor and mitigate any material risk exposures relating to such areas.
Like the Board, the GNSC and TOCC maintain a written charter which outlines its specific roles and responsibilities. The GNSC and TOCC Charters have been filed on SEDAR+ and is available in the Leadership & Governance section of Magna’s website (www.magna.com). Matters under the GNSC’s responsibility include: corporate governance, sustainability, and other matters. The scope of the GNSC’s oversight role with respect to sustainability includes climate-related issues generally, as well as related elements such as environmental management and compliance. As Magna defines “sustainability” in a broad and inclusive manner to include areas that go beyond climate-related issues, the GNSC’s role also extends to matters such as supply chain sustainability. The GNSC periodically reviews Magna’s policies, practices and public disclosures relating to sustainability topics, and makes recommendations to the Board regarding such items. During 2023, the GNSC received updates on Magna’s evolving sustainability strategy, its development of science-based near-term and net-zero targets, progress towards its decarbonization and renewable electricity targets, and its activities in relation to supply chain monitoring. The GNSC also reviewed, provided input into, and approved the organization’s Sustainability Report and presented its recommendations to the Board regarding the Board’s approval of the Sustainability Report. Additionally, the GNSC received reporting relating to the performance of Magna’s environmental compliance and management program. The TOCC’s responsibility include: talent management and succession planning, executive and incentive compensation, employee health and safety, and other matters.
A-8 Annual Information Form
During 2023, the TOCC received updates on Magna’s occupational health and safety management program, leadership development and succession planning, culture and employee engagement, and diversity and inclusion activities.
| 1.1.2 | Other Board Committees |
In addition to the GNSC and TOCC, the Board maintains two other standing committees – the Audit Committee and the Technology Committee. While neither of these committees have specific sustainability responsibilities, each may have a role with respect to sustainability risks and opportunities that arise indirectly out of the committee’s primary role and responsibilities.
Magna’s Audit Committee supports the Board through its oversight of financial and audit-related matters, including financial risks and disclosures. To the extent that climate-related or other sustainability risks are or could be financially material, the Audit Committee would be involved through its consideration of the financial statement or other disclosure of the nature and scale of the risk. During 2023, the Audit Committee received updates on financial reporting of sustainability matters, and Magna’s Ethics and Legal Compliance Program, including administration of our Code of Conduct and Ethics, compliance training initiatives, and activities of the Company’s Compliance Council.
The Technology Committee supports the Board’s oversight duties by advising it on technology trends, related opportunities and risks, R&D and innovation, and technology-focused acquisitions, as well as the alignment between the company’s technology and its strategic priorities. As such, the scope of the Technology Committee’s role includes products and processes that seek to realize opportunities created by climate-related challenges. In this regard, the Technology Committee engaged in “deep dive” reviews of technology trends, opportunities and risks, including battery enclosures technology landscape, integrated systems, digital transformation and automation and Factory of the Future. In addition, the Technology Committee reviewed Magna’s R&D/innovation initiatives in relation to Magna’s overall strategy.
| 1.2 | Management |
Climate-related issues are part of the CEO’s responsibility. As Magna’s highest-ranking member of management, the CEO guides and directs Executive Management and Operating Group Presidents with respect to product portfolio and strategic planning, business planning, capital expenditures, innovation/R&D, manufacturing productivity and efficiency, as well as other critical areas, including the setting of the near-term and net-zero commitments announced by Magna in 2023. The CEO is also the highest executive responsible for customer management, shareholder engagement/investor relations, as well as talent management. The criticality of climate sustainability to the future of the automotive industry generally means that climate-related issues are interwoven through all of the foregoing areas of the CEO’s responsibilities. At the same time, the importance of making demonstrable progress with climate sustainability goals requires CEO-level engagement and direction to ensure organizational alignment.
To assist our CEO, one of Magna’s Presidents functions as an executive “champion” for climate-related sustainability matters (the “Sustainability Champion”). The Sustainability Champion reports directly to Magna’s CEO on sustainability matters and helps coordinate and align sustainability priorities across the company’s Operating Groups. Operating Group management is responsible for development of product strategies to address megatrends, industry trends, and business opportunities and risks, including those which arise due to climate-related challenges.
We also have a bottom-up sustainability structure (See Magna’s Decarbonization Organizational Structure below) with representatives at each of our three main management levels (Divisional, Operating Group and Corporate). Approximately 95% of our manufacturing Divisions have an energy management champion who works with members of our Global Energy Team to identify and implement high-priority energy management projects. The Global Energy Team functions across all of our Divisions and Operating Groups to share energy efficiency/ management case studies and best practices. Each Operating Group’s day-to-day sustainability activities are coordinated through a Group sustainability “lead”. Operating Group sustainability leads routinely interact with our Global Director, Sustainability & Energy who oversees and tracks key sustainability metrics and KPIs, such as the energy reduction goals. The Global Director, who reports to the Sustainability Champion, collaborates with Operating Group sustainability leads and cross-functional corporate leaders, including operational improvement, environmental, purchasing, legal, finance, real estate, to develop Magna’s long-term sustainability and decarbonization strategy and near-term goals. In connection with our evolving sustainability strategy and our commitment to reaching our near-term and net-zero targets, our energy reduction progress and initiatives are reported to our Sustainability Champion, helping to increase the visibility of these initiatives across our Operating Groups through the Sustainability Champion’s regular interaction with Operating Group Presidents.
A number of initiatives intended to help us achieve our near-term and net-zero targets are underway, including energy optimization initiatives at most of our operating Divisions and a phased in transition to renewable electricity globally. In 2023, we launched new initiatives within our Operating Groups focused on Life Cycle Assessments (LCA), Sustainable Materials and Supply Chain Decarbonization. Each initiative is led by an Operating Group-level champion in their respective subject matter that directly supports the execution of our decarbonization strategy. LCA Champions oversee Operating Group LCA processes and requirements, including understanding frameworks governing LCAs and customer requirements. Sustainable Materials Champions assist in the development of sustainable materials sourcing plans, identify potential sustainable materials relevant to current and future products, identify and oversee participation in sustainable materials certification schemes, and support our purchasing team in communicating with OEM customers and suppliers on relevant sustainable materials topics. Supply Chain Sustainability Champions assist on all ESG related supply chain topics for their Operating Groups and support supplier ESG monitoring and corrective action. They will also oversee Operating Group compliance with ESG nomination criteria being developed.
Magna International Inc. A-9
Magna’s decarbonization organizational structure is as follows:
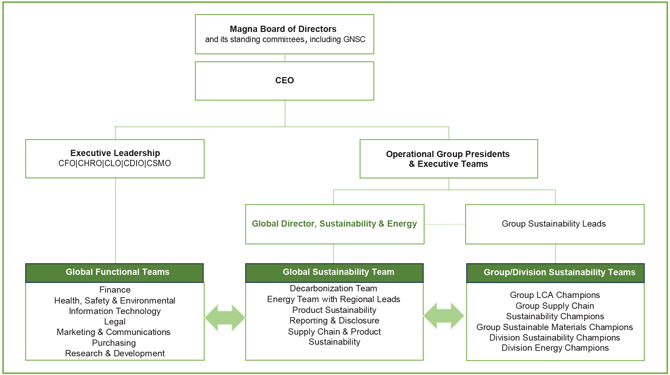
Aspects of sustainability beyond climate change concerns are typically managed through a matrix structure in which corporate-wide functions support initiatives implemented or managed by Operating Groups and Divisions. Examples of functional areas managed in this manner include: environmental management and compliance; occupational health and safety; quality and operational improvement; talent management, including diversity and inclusion; ethics and legal compliance; lobbying and political engagement; cybersecurity; data privacy; and supply chain management.
| 1.3 | Evolution of Our Sustainability Program |
In 2023, our Sustainability program evolved in a number of ways, including:
| ◾ | Establishing global near-term (to 2030) and net-zero (to 2050) targets (discussed in detail in Section 1.4 of this Sustainability Report). |
| ◾ | Our science-based near-term target aims to achieve a 42% reduction in Scopes 1 and 2 emissions, and a 25% reduction in Scope 3 emissions by 2030, from a 2021 baseline. In support of our near-term commitment, we are targeting 100% renewable energy in our European operations (by 2025) and globally (by 2030). |
| ◾ | Our science-based net-zero commitment requires a 90% reduction in Scope 1, 2 and 3 emissions by 2050 from a 2021 baseline. |
| ◾ | Introducing a net-zero module to Magna’s global Fundamentals of Sustainability Training, which was rolled out in 11 languages and completed by approximately 66,000 employees since the training was introduced in 2022. The training provides a review of sustainability basics and their relation to our business, and helps our organization continue to cultivate interest, ideas and opportunities for improving our operations, products and our world in general. |
| ◾ | Launching new initiatives within our Operating Groups focused on Life Cycle Assessments (LCA), Sustainable Materials and Supply Chain Decarbonization. Each initiative is led by an Operating Group-level champion in the respective subject matter that directly supports the execution of our decarbonization strategy. These initiatives will help Magna continue to integrate sustainability within our operations and make progress on our near- and long-term decarbonization goals. |
| ◾ | Rolling out a new supplier roundtable program. The objective of this round table program is to initiate a dialogue and collaboration between Magna and our suppliers to promote sustainability practices across the supply chain. The focus is on sharing best practices, discussing challenges, and identifying opportunities for improvement in sustainability initiatives. |
| ◾ | Continuing to grow our annual Commitment to Sustainability Awards that recognize how sustainable activities benefit our Divisions, our environment, and all stakeholders. In 2023 we received approximately 300 submissions, an increase of over 60%, year-over-year. Our Sustainability awards winners are detailed on pages A-39 and A-40 of this Sustainability Report. |
| ◾ | Aligning the sustainability module in our MAFACT system to our net-zero commitment. The module includes five scoring levels that assess a Divison’s performance on sustainability, including: carbon/air emissions, water usage, waste, and support for United Nations Sustainable Development Goals. Scoring is based on development of a strong foundation for data collection (level 1) through to achieving 100% Renewable Energy (level 5). |
| ◾ | Implementing a Sustainability Ambassador program that aims to educate, inspire and create relationships across Magna from senior management to Divisional employees. The inaugural meeting took place in December 2023, and included the participation of nearly 150 employees from across the world. |
A-10 Annual Information Form
| 1.4 | Magna’s Net-Zero Commitment |
| 1.4.1 | Science Based Targets |
The fight against climate change is leading to major transformation in the mobility sector. As a global leader within the industry, Magna has set ambitious targets to the SBTi as discussed under “Magna’s Climate Commitment” on page A-7.
Magna prides itself on continuous improvement and innovation. For over 65 years, we have showcased our commitment to design and deliver some of the most sophisticated mobility solutions; and we continue to leverage this ingenuity and entrepreneurial spirit to tackle one of our world’s most pressing challenges: climate change. Focus is needed on true decarbonization and elimination of carbon to keep global warming below 1.5 degrees according to the latest Intergovernmental Panel on Climate Change (IPCC) 2023 Climate Change Report. To meet our communities’, customers’, and stakeholder expectations, Magna has evolved its previous carbon neutrality commitment to the 2050 net-zero commitments.
Magna’s pursuit of net-zero begins with our near-term commitment of 42% reduction in Scopes 1 and 2 emissions, and 25% reduction in Scope 3 emissions by 2030, each from a 2021 baseline. Our near-term commitments are the launch point towards our net-zero by 2050 commitment which requires 90% reduction in Scope 1, 2 and 3 emissions from a 2021 baseline, as required by the SBTi net-zero standard.
| 1.4.2 | Roadmap for Fulfilling Our Commitment |
Achieving net-zero is an ambitious and complex challenge. We have taken the first step to indicate our commitment and outline our net-zero emissions strategy. We have also developed a framework through collaboration with internal and external stakeholders. By leveraging experts across all Operating Groups and Divisions to identify the most appropriate technical solutions, while monitoring for emerging technologies, we will continue to progress towards our net-zero goal. Our strategy and roadmap will continue to evolve, including through the development of climate scenario analysis and a formal climate transition plan as discussed in Section 1.4.3 below.
We are focused on the following four pillars as we continue to evolve our net-zero roadmap:

As Magna carries out activities within each pillar, with support from Operating Groups and Divisions, our focus will continue to be on energy conservation and reduction. In the near-term, our net-zero commitment is supported by our goal of achieving 100% renewable electricity in Europe by 2025 and globally by 2030. To support this effort, Magna’s Global Energy Leads have been integrated directly into our global sustainability organization. Each Division’s Energy Champion is critical to achieving our net-zero commitments; working to deliver emission reductions, as well as cost savings and risk minimization. Progress is already being made in our manufacturing operations which implemented approximately 280,000 mWh of energy saving projects in 2023. Magna also successfully achieved its 2023 stretch goal of a 10% energy intensity reduction (compared to the prior year).
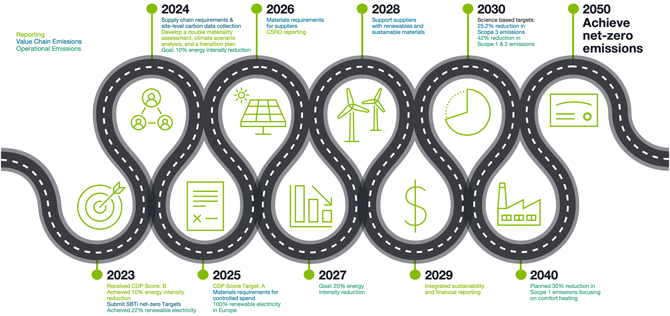
Magna International Inc. A-11
| 1.4.3 | Evolution of our Roadmap |
Over the next 12 months, Magna expects to complete a double materiality assessment, scenario analysis and develop a climate transition plan to further evolve our commitment to sustainability and transparency. A double materiality assessment is a tool we will use to evaluate environmental and social risks and opportunities through the lens of financial and impact materiality. Scenario analysis enables us to support our net-zero strategy by exploring various future pathways based on different climate scenarios. A climate transition plan will act as a blueprint for achieving net-zero.
| 1.4.4 | Addressing Scope 3 Emissions |
Magna has established near term energy saving goals (details on page A-16) and renewable electricity goals (details on page A-11) to tackle our Scope 1 and 2 emissions. For Scope 3 emissions, our near-term and net-zero targets are reductions of 25% by 2030 and reductions of 90% by 2050, respectively, taking into account all 15 emissions categories (12 of which are relevant to Magna). While Magna intends to work on reducing the impact in all relevant categories; there will be a significant focus on category 1 (Purchased Goods and Services) and category 11 (Use of Sold Product) which account for the vast majority (approximately 90%) of our Scope 3 emissions based on our current Scope 3 emissions inventory. Two working groups (discussed above): Sustainable Materials, and Supply Chain Sustainability, have been created with a champion from each Operating Group and led by the Magna’s Global Sustainability Team. These cross-functional groups contribute in-depth knowledge on commodities and technologies that will be instrumental in executing our net-zero strategy.
A-12 Annual Information Form
| 2. | Climate-Related Opportunities |
| 2.1 | Corporate Strategy |
The automotive industry is being defined by a number of global megatrends that have shaped our long-term strategy, including:
| Megatrend | Impact on Automotive | |||
|
Economy |
Globalization | Industry built through globalization appears to be undergoing regionalization | ||
| Environmental Impact | Concern for environment/climate change driving vehicle electrification, including through acceleration of sustainability-related legislation | |||
| Natural Resources & Energy | Access to critical battery minerals and availability of sufficient renewable energy may define success of drive to vehicle electrification | |||
| Society | Demographic Change | Product design will be influenced by aging population | ||
| Digital Transformation | Connectivity and digitization impact both product and process. New vehicle architectures that connect the subsystems along with software functionality creates additional value to products. Process is also impacted due to increased digitization, driven by increased requirements for productivity and quality | |||
| Individualism | Product design will be influenced by growing individualism, including desire for greater personalized experiences | |||
| Health & Well-Being | ADAS and autonomy take rates will be driven both by consumer preferences as well as regulatory requirements tied to increased safety | |||
| Mobility | Urbanization | Continued growth in urban population will lead to changes in mobility as a result of increased density and congestion with an increase in EV adoption and new transport modalities | ||
| New Mobility | Emerging new mobility eco-system offers a range of potential opportunities for new products and services, including automated delivery and mobility solutions | |||
We have distilled the impacts of the global megatrends into four long-term strategic factors which we see defining the “Car of the Future” – electrification, autonomy, new mobility, and connectivity. We believe we are well-positioned to capitalize on opportunities in each area:
|
|
We possess an enhanced e-Powertrain portfolio with a range of products that addresses the roadmap for the transition to EVs. We continue to win new EV business. | |
|
|
We possess full ADAS capability and complete ADAS system expertise. We take a systems level approach in developing ADAS building blocks for OEM customers with a focus up to level 2+/3 ADAS capabilities. | |
|
|
We have expanded our collaboration ecosystem and continue to look for opportunities to leverage new business models. The breadth of our capabilities make us a key enabler of OEM customers and new entrants in the New Mobility space. | |
|
|
We possess software-enabled functionality in our electronic control unit-related products. This functionality could help optimize performance and efficiency in connected products, such as our connected powertrains. |
Magna International Inc. A-13
We have developed our corporate strategy to realize the opportunities from these trends. Key elements of such strategy include:
Increasing capital deployment toward high-growth areas aligned with the “Car of the Future”
We are proactively managing our portfolio and evolving our product mix based on alignment with the Car of the Future, which we see as electrified, connected, assisted/autonomous, personalized and sustainable. We seek to grow our business and capabilities in areas which are positively impacted by the megatrends discussed earlier through an approach that emphasizes functionally integrated solutions, systems development, and cross-group collaboration. Examples of such areas include powertrain electrification, ADAS and battery enclosures, as well as our contract vehicle manufacturing operations. As illustrated below, we believe that a substantial proportion of our product areas are not adversely impacted by the global megatrends, including our body, chassis, lighting, active aerodynamics, dual clutch transmissions, mirrors, mechatronics, and seating products. The strong returns and cash flow from these product areas enable us to fund the R&D and capital investments required to realize the opportunities in high-growth products which are benefiting directly from the global megatrends.

Lastly, there are elements of our product portfolio which are negatively impacted by the global megatrends and are expected to be less directly relevant to the Car of the Future. Examples of such products include manual transmissions, mechanical AWD/4WD systems and fuel tank systems. Despite their declining long-term strategic importance, our assets and expertise associated with these products remain relevant to, and can be redeployed for, growing product areas aligned with the Car of the Future.
Driving Operational Excellence
We are committed to manufacturing excellence. We continue to elevate our approach to manufacturing by implementing “factory of the future” initiatives including: enhanced use of big data and analytics; advanced robotics, additive manufacturing and augmented reality. The ultimate goal is to achieve greater profitability through further enhanced quality, production efficiency, reduction of floor space and improved return on investments. Critical elements of our approach to operational excellence include our operational excellence initiatives and MAFACT operating system, which are discussed in “Section 6 – Description of the Business – Manufacturing & Engineering” in our AIF. Additionally, our sustainability strategy dovetails with our efforts around operational excellence, due to the focus on energy optimization and minimization of water withdrawals, as well as waste streams to landfill.
Unlocking New Business Models and Markets
The new mobility landscape, which is generally urban, electrified, autonomous and connected, is creating new business models and markets. We believe that our systems and complete vehicle knowledge, including elements of our portfolio such as EV and ADAS platforms, provide us with an advantage in pursuing such opportunities. In addition, our ability to use capital efficiently, launch programs reliably and help speed products to market, makes Magna a key enabler of new entrants. Additionally, we are using our capabilities and platform technologies to enter the micromobility market. For example, we invested in the Yulu electrified two-wheeler shared mobility business in India and related battery-swapping business and have a number of activities underway involving Magna-developed and third party-developed robots for potential industrial and last-mile delivery applications.
Our long-term strategy is well-aligned with climate change-related trends impacting the automotive industry, including vehicle electrification, operational efficiency to minimize manufacturing inputs and waste outputs, as well as the pursuit of new mobility business models. We cannot determine for certain how quickly the market for the declining products in our portfolio may deteriorate, but products such as AWD/4WD systems appear to have continuing relevance for the next decade. However, we believe that our physical assets, human capital and know-how related to the mechanical solutions can be repurposed as vehicle development plans migrate toward electrified AWD/4WD solutions. We currently offer multiple alternatives to manual transmissions, including efficient dual-clutch, hybrid dual-clutch and dedicated hybrid transmissions, as well as complete e-drive systems, and expect to be able to continue growing our market share in the drivetrain market.
A-14 Annual Information Form
Fuel tank systems are not a material part of our business, but also have continuing relevance for a number of years to come. The physical assets, human capital and know-how related to fuel tank systems could be repurposed for adjacent product areas such as vehicle hydrogen storage tank systems.
2.2 Markets & Products
The transition to a lower-carbon economy has provided, and is expected to continue to provide, opportunities to enter new product and service markets. Some recent new products developed to take advantage of opportunities from such transition include:
|
|
NEXT GENERATION 800V EDRIVE
|
|
| Magna’s next generation 800v eDrive solution is a drop-in solution that incorporates several advanced technologies, resulting in significant reductions in weight and size, enhanced performance, extended driving range and greater sustainability. The innovation offers enhanced flexibility due to its lightweight (75 kg) design and 20% reduction in height from Magna’s prior generation eDrive. A key technology and a supplier industry-first advancement is the ability to rotate the eDrive 90 degrees around the drive axis, which allows improved system integration in the front and rear vehicle space. Delivering peak power of 250 kW and a peak axle torque of 5,000 Nm, the system also achieves up to 93% efficiency in real-world driving (including Worldwide harmonized Light vehicles Test Cycles (WLTC) and highway driving), which significantly improves efficiency across a wide range of vehicle speeds. The eDrive system requires less aluminum and heavy rare earth materials, resulting in a significant reduction of CO2 emissions during production by approximately 20% compared to previous generation eDrives.
|
||
|
|
ETELLIGENT TERRAIN WITH EBEAMTM
|
|
| The EtelligentTerrain is a battery electric 4WD powertrain system designed to maintain full on- and off-road capabilities with no compromise of payload and towing capabilities. The system is powered by Magna’s steerable eBeamTM Mid at the front and an eBeamTM High at the rear, with a combined output of 426 kW of peak power. The eBeamTM drops into the place of traditional beam axles, reusing existing suspension and brake systems, and avoiding the need for expensive restructuring of existing truck platforms These benefits help automakers simplify the transition toward electrification of these vehicle segments. Seamless decoupling capability of the front axle means more efficient operation. Magna’s sophisticated Energy and Motion Control software controls the two eBeamsTM which provides off-road specific drive modes (selectable crawl, auto hill ascent/descent) and torque distribution capabilities (high range, e-selectable low range). The scalable design is applicable to passenger sport utility, pickup trucks, and light commercial vehicles.
|
||
|
|
BATTERY ENCLOSURES
|
|
| Magna has been awarded nine global customer programs for its battery enclosures, including the all-electric Ford F-150 Lightning, GMC Hummer EV, and Chevrolet Silverado EV. The product illustrates our ability to expand structural product opportunities as electrification grows. The enclosures, which all EVs require, house high-voltage batteries, electrical components, sensors, and connectors, contributing to the structural and safety aspects of a vehicle’s frame and protecting critical components from potential impact, heat, and water intrusion. These complex assemblies are available in steel, aluminum, and multi-material configurations including lightweight composites.
|
||
|
|
MODULAR eDECOUPLING UNIT
|
|
| Magna has started production of a first-to-market, modular eDecoupling unit to support multiple battery electric vehicle programs for a German premium OEM. A bolt-on, stand-alone solution for BEVs, Magna’s electro-magnetic eDecoupling is a robust product technology that is integrated as a complete module. The eDecoupling is an electromechanical device that disconnects the e-motor from the driveshaft in EVs when propulsion power is not needed, reducing energy consumption, and increasing efficiency. It contributes to increased electric driving range of up to nine percent, a significant benefit for all EVs. This is achieved by reducing drag torque losses of the e-motor and gearbox while its eDecoupling controls software smoothly operates all shifting sequences. The unit which has an activation time of less than 100 milliseconds, features a compact design to minimize added package space and weight in both axial and radial direction. |
In addition to Magna’s highlighted product innovations above, we continue to seek out ways to support decarbonization initiatives in the industry. To this end, Greentown Go Move 2022 a startup-corporate partnerships accelerator program led by Greentown Labs from 2022-2023 united BASF and Magna with five climatetech startups to drive solutions that decarbonize the automotive industry’s life-cycle impact.
Magna International Inc. A-15
Beyond electrification, transforming the transportation sector necessitates sweeping changes. This Greentown Go program, is focused on material innovations across three critical areas: (i) automotive efficiency (ii) shared and future mobility (iii) recycling processes. The five participating startups – Carbonova, Endeavor Composites, FibreCoat, Heartland Industries, and MITO Material Solutions – were meticulously selected from nearly 100 applicants spanning 27 countries. Throughout the accelerator program, the startups collaborated with BASF and Magna to de-risk their technologies, explore potential industrial applications, and devise go-to-market strategies.
| 2.3 | Resource Efficiency |
| 2.3.1 | Energy |
Our aggregate global energy spend in 2023 amounted to approximately $537 million broken down by type as follows:
| ◾ | Electricity – approximately $432 million |
| ◾ | Natural Gas – approximately $85 million |
| ◾ | Other (Propane; Liquid Petrol; Diesel; District Heat; Steam; Coal Gas) – $20 million |
As part of our sustainability and operational efficiency efforts, we are focused on optimizing energy use, which may result in savings in overall energy costs. However, as we continue to forecast growth in Sales and number of facilities over the medium-term, we anticipate that our aggregate energy consumption may increase. Accordingly, we are focused on becoming more energy efficient (measured by energy consumption relative to Sales) so that, at minimum, our rate of increase in energy consumption slows.
In connection with our efforts to promote energy efficiency, in 2023 we established one-, two- and five-year energy reduction targets for each of our Operating Groups, as illustrated below. We achieved our 1 year target in 2023 (completing energy projects that amounted to a 5% reduction of each Operating Group’s 2022 absolute energy usage). We also exceeded our 1-year stretch target aimed at reducing energy cost intensity by 10% (achieving approximately 11%) in 2023 (compared to 2022). Our remaining 2-year and 5-year energy intensity reduction targets remain on track.
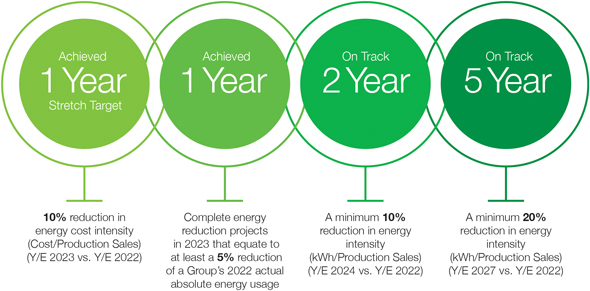
Approximately 95% of our Divisions have active energy teams pursuing energy efficiency measures in their respective Divisions (100% when excluding our acquisition of the Veoneer Active Safety Business midway through 2023). These teams are supported at the corporate level by a Global Energy Team which helps identify and promote energy reduction initiatives, including through: training courses designed to promote strategies for reduced energy use; regional benchmarking sessions; regular communication through newsletters; an internal energy savings collaboration site; and best practice sharing.
Some of the incremental changes made by our Divisions to their facilities and processes to reduce our energy consumption and improve energy efficiency include:
| ◾ | Installation of LED lighting and installation of lighting controls into the building management system (BMS); |
| ◾ | Equipment start-up/shut-down/idling procedures to achieve energy-savings during production downtimes; |
| ◾ | Compressed air leak identification and repair initiatives; |
| ◾ | Use of ceiling fans to blend air temperatures evenly within our operations; |
| ◾ | Computer-controlled utility and HVAC systems to allow for improved performance and energy reduction; |
| ◾ | Installation of energy metering and monitoring systems, a requirement for all our manufacturing facilities; |
| ◾ | Door and dock seal repairs to reduce heat loss; |
| ◾ | High efficiency chiller and compressor upgrades; |
| ◾ | Integration of air economizers and heat recovery units into HVAC systems; |
| ◾ | Software-managed and occupancy-sensor-controlled lighting and energy efficient lighting retrofits; |
| ◾ | Use of solar panels at certain facilities; |
| ◾ | Installation of insulation mattresses on equipment and heating units; |
A-16 Annual Information Form
| ◾ | Recovery of waste heat from certain high heat processes for use in other areas; |
| ◾ | Installation of variable frequency drives on motors and pumps; and |
| ◾ | Participation in energy savings and incentives programs offered by utilities providers in some jurisdictions in which we operate. |
In 2023, our Global Energy Team implemented an Energy Transformation Program to further evolve our energy efficiency activities and contribute to achieving our net-zero commitment. The holistic Program creates a more standardized globa approach that aims to minimize consumption, maximize efficiency, and use renewable energy sources to reduce the CO2 footprint through four phases aimed at detailed investigation of areas for improvement: Identification; Development; Implementation; and Evidence Phase.
Our efforts to reduce energy consumption and operate facilities on a more energy efficient basis forms part of our formal MAFACT system – the primary operational assessment audit tool used to support our operational excellence. The MAFACT system establishes standards for achieving operational efficiencies, identifies benchmarks and promotes best practice sharing among Divisions in Magna. The integration of energy management elements into a core operational assessment tool such as MAFACT is intended to reinforce the importance of energy management throughout the organization and help realize potential cost savings. In 2023, we implemented over 1400 energy projects across all of our Operating Groups which resulted in approximately 76,000 tons of CO2 equivalent in annual savings using the location-based method and approximately 62,000 tons of CO2 equivalent in annual savings using the market-based method. Given the importance of energy optimization in meeting our net-zero targets and to further incentivize our Divisions, we have established a separate approval category for energy efficiency and sustainability-related capital improvements. We have also developed a phased-in renewable energy strategy focused on Europe and the U.S. first, followed by the other markets in which we operate. In 2023, 22% of our global electricity purchase was from renewable energy sources evidenced by renewable Energy Attribute Certificates (EACs) or from on-site generation from photovoltaic (solar panel) or solar thermal systems. 103 of our Divisions currently use renewable electricity, with 75 Divisions currently using 100% renewable electricity. In the near – and medium-terms, adoption of renewable energy may increase our energy costs, but we are working to offset the impact of such increases through energy use reductions. While we currently have a few examples of renewable energy self-generation at certain facilities, self-generation is not a significant opportunity for us primarily since the vast majority of our facilities are leased, as well as other factors such as footprint constraints for solar panels at certain owned facilities, and/or facilities in locations with relatively clean electrical grids that make self-generation economically unfeasible.
| 2.3.2 | Water |
We have implemented a 1.5% per year water reduction target, with the aim of reducing water use 15% by 2030, in each case referencing 2019 as the baseline year. To date, we have met this target, having achieved a reduction of 15% at the end of 2023. While we are not a significant water user, achievement of water reductions would be expected to result in cost savings, potentially by offsetting (in whole or in part) any increase in the rates charged by applicable water utilities. Overall, we do not anticipate that any savings will be material.
| 2.3.3 | Waste |
We have also implemented a zero waste to landfill (“ZWTL”) target. Waste sent to landfill bears both an economic cost borne by Magna, and an environmental cost borne by society as a whole. Although achievement of our ZWTL target will help reduce or eliminate the economic cost, we do not anticipate any such savings will be material. In 2023 we diverted 96.2% of waste generated away from landfill.
| 2.4 | Resilience |
The automotive industry as a whole is investing in innovations aimed at adapting mobility products and service solutions to a lower carbon economy. The risk mitigation factors below in “Section 3 – Climate-Related Risks and Risk Mitigation” and initiatives to realize opportunities discussed in this Section of the Sustainability Report, together with factors addressed in “Section 4 – Our Business & Strategy” of our AIF, are expected to promote our ability to adapt and succeed in a lower carbon economy.
Magna International Inc. A-17
| 3. | Climate-Related Risks and Risk Mitigation |
Magna maintains both top-down and bottom-up processes for identifying and assessing sustainability-related risks within the governance structure described in “Section 1 – Sustainability Governance” of this Sustainability Report. In order to fully understand the risks set out below, you should also carefully consider the risk factors set out in “Section 5 – Risk Factors” in our AIF.
| 3.1 | Transition Risks and Risk Mitigation |
| 3.1.1 | Regulatory Policy Actions |
Applicable near-term policy actions related to climate change generally fall into one of the following categories, each of which may have an indirect effect on Magna:
| ◾ | Average Fleet Emissions or Fuel Efficiency Regulations: Governments in key auto producing regions have set challenging average vehicle fleet emissions or fuel efficiency targets which OEMs must meet, including the European Union (“E.U.”), China, and the U.S., as detailed below. We regularly monitor changes in regulation relating to emissions and fuel efficiency as part of our strategic planning processes: |
European Union: E.U. regulations generally require OEMs to have achieved E.U. fleet-wide average emissions of 95g CO2/km from 2021 through to 2024, which corresponds to 4.1 litres/100 km of gas or 3.6 litres/100 km of diesel. Vehicle manufacturers with an average fleet economy in excess of the target must pay an excess emissions penalty for each vehicle registered within the E.U. The 2021 average emissions level forms the baseline for a further 15% fleet-wide average emissions reduction from 2025 onwards; and 37.5% from 2030 onwards. In addition, in 2023, the E.U. approved its “Fit for 55” legislation to aggressively increase such targets to a 55% reduction by 2030 and a 100% reduction by 2035 (as discussed below). Penalties levied on non-compliant OEMs may be passed on to vehicle-buying consumers, which could impact demand for such vehicles and thus demand for Magna products supplied for such programs. Additionally, E.U. regulations contain incentives aimed at promoting the development of Zero- and low-emission vehicles (“ZLEVs”). The CO2 emissions targets applying to any particular OEM will be relaxed if its share of ZLEVs registered within the E.U. in any year exceeds 25% from 2025 to 2029; however, such incentives will be eliminated under the Fit for 55 legislation from 2030 onwards. The Fit for 55 legislation will be integrated into the E.U. member states through domestic legislation.
China: In China, effective July 1, 2021, stringent China VI emissions regulations addressing particulate emissions were implemented, which could affect consumer demand for vehicles, or powertrain options for vehicles, that do meet the new emissions standard. For example, in 2019, one of our equity-accounted joint ventures in China experienced a significant drop in demand for one transmission model supplied to a Chinese OEM. One of the factors underlying the drop in demand was the fact that the transmission would not have met the China VI standard, had it been in effect at that time. In 2023, a new phase of China’s emission standards was implemented whereby non-compliant vehicles are no longer allowed to be produced, imported, or sold in China (subject to a 6-month grace period that ended December 31, 2023).
United States: In the U.S., the current administration issued an executive order with a non-binding target of 50% of all new vehicles sold in 2030 to be zero-emission vehicles (“ZEVs”), including battery electric, plug-in hybrid electric, or fuel cell EVs. Subsequently, the EPA finalized new vehicle emissions standards for passenger cars and light-duty trucks with model years 2023-2026 which increase in stringency through that period, and would result in a fleetwide average fuel economy of approximately 40 mpg in 2026. In March 2024, the EPA issued its new emissions standards that would increase in stringency each year from model year 2027 to model year 2032. The new standards would result in an industry-wide average target of:
| ◾ | 85 grams/mile of CO2 for light-duty vehicles by 2032, representing a 50% reduction in projected fleet average GHG emissions compared to 2026 model year standards, and |
| ◾ | 274 grams/mile of CO2 for medium-duty vehicles by 2032, representing a 44% reduction in projected fleet average GHG emissions compared to 2026 model year standards. |
In addition, the U.S. National Highway Traffic Safety Administration (NHTSA) issued new corporate Average Fuel Economy (CAFE) standards - regulating how far our vehicles must travel on a gallon of fuel. The new CAFE standards for passenger cars and light trucks manufactured in model years 2024-2026, would increase fuel efficiency requirements by 8% annually (compared to 1.5% annually under previous standards) for model years 2024-2026 and increase the estimated fleetwide average fuel economy by 12 miles per gallon for model year 2026 vehicles, relative to model year 2021. In 2022, the U.S. also announced stricter standards on smog-forming emissions from trucks, vans and buses starting in the 2027 model year. The new EPA rules are more than 80% stronger than current rules and represent the first update to clean air standards for heavy-duty vehicles in over 20 years.
The tightening emissions standards in the E.U., China and the U.S. are intended to promote the transition to ZEVs. OEMs have been spending significant sums in R&D in order to meet the higher regulatory standards. Although production of ZLEVs/ZEVs is accelerating due to regulatory requirements, to the extent that ZLEVs/ZEVs do not sell at the levels expected, production volumes may need to be reduced. Lower than forecast production poses a risk to our ability to recover pre-production expenses amortized in the piece-price of our product, as discussed above.
A-18 Annual Information Form
| ◾ | Phase-Out of New ICE Vehicles: In addition to more stringent fleet emissions and fuel efficiency standards, the number of national and subnational jurisdictions committing to, or accelerating existing commitments to, phase-out of the sale or registration of new ICE engines is growing. As part of its Fit for 55 legislation, the E.U. will require 100% reduction in CO2 emissions by 2035 effectively banning the sale of new gasoline and diesel fueled vehicles in E.U. member countries by that date, with an interim reduction of 55% by 2030. |
The United Kingdom introduced new regulations (the Zero Emission Vehicle (ZEV) Mandate) in January 2024 requiring 22% of all new cars and vans sold by OEMs in the UK to be zero emission, with the percentage rising to 80% by 2030, and culminating in the complete ban on the sale of new ICE vehicles by 2035.
In North America, Canada has accelerated its mandatory phase out of ICE and diesel powered vehicles through a newly adopted regulation (the Electric Vehicle Availability Standard) that requires all new sales of light-duty vehicles to be ZEVs by 2035; with interim targets requiring 20% ZEVs from 2026, and at least 60% by 2030. Companies offering vehicles for sale in Canada will be required to offer a growing percentage of their fleet as ZEVs starting in 2026 and increasing to 100 per cent by 2035.
In the US, the State of California’s, California Air Resources Board (CARB) has adopted the Advanced Clean Cars II regulations. The regulations ban ICE-powered vehicles in California by 2035, and include progressive targets for ZLEVs in the intervening years. Several US States and the District of Columbia have existing laws that require state emissions policies to mirror those of California. Currently 17 US states have adopted all or part of California’s low-emissions or zero-emission vehicle regulations. In addition, the following US states have adopted California’s Advanced Clean Cars II regulations: Colorado; Delaware; Maryland; Massachusetts; New Jersey; New Mexico; New York; Oregon; Rhode Island; Vermont; Virginia; Washington and the District of Columbia.
Given the long lead times for vehicle development such regulation and proposed regulation are expected to increasingly impact OEM and automotive supplier product planning and development this decade, and have led to several OEM establishing EV targets for specific brands or their complete vehicle offerings. Each of our top six customers plan to reach 50% EV production within the next 10 years. EVs accounted for approximately 13% of total of global light vehicle production in 2023, and are projected to reach 43% by 2029 based on current IHS Light Vehicle Production Forecasts.
| ◾ | Vehicle Restrictions in Congested Urban Centres: municipal governments in a number of cities around the world have introduced restrictions on personal-use vehicles in congested urban centres, in an effort to reduce CO2 emissions and improve urban air quality. Examples of the types of restrictions include: car-free zones; toll charges; and use restrictions by license plate. Continued expansion of such initiatives could reduce the demand for personal-use vehicles, which could affect our profitability. As a result of measurable air quality improvements in many cities during COVID-19-related mandatory lockdowns/stay-at-home orders, an expansion of restrictions on personal-use vehicles in urban centres is likely. |
We attempt to mitigate applicable policy risks relating to climate change-related regulation in a number of ways, including:
| ◾ | monitoring and evaluating global regulatory developments; |
| ◾ | early-stage interaction with our OEM customers to understand their product priorities and regulatory compliance requirements; |
| ◾ | in-house R&D, including our ongoing analysis of megatrends and the “Car of the Future”, combined with investment strategies in mobility and technology start-ups; and |
| ◾ | strategic planning processes at both Operating Group and Corporate levels, including Board oversight of strategic plans. |
In terms of direct policy actions affecting our operations, we anticipate continued strengthening of environmental regulations related to industrial emissions and discharge of pollutants to air, water and ground. We currently face strict environmental regulations in the countries where we operate and have developed a global environmental management program in order to comply with or exceed regulatory standards. Our environmental management program is regularly updated to address changing environmental laws and regulations. Refer to “Section 4.1 – Environmental Stewardship” in this Sustainability Report for a description of the program.
In considering the potential impact of the above or other climate-related policy actions, readers are encouraged to review the following risk factors in “Section 5 – Risk Factors” in our AIF:
| ◾ | Regional Volume Declines |
| ◾ | Deteriorating Vehicle Affordability |
| ◾ | Consumer Take Rate Shifts |
| ◾ | Misalignment Between EV Production and Sales |
| ◾ | Alignment with the “Car of the Future” |
| ◾ | Growth of EV-focused OEMs |
| ◾ | Risks of Conducting Business with Newer EV-Focused OEMs |
| ◾ | Fisker’s Ability to Continue as a Going Concern |
| ◾ | Impairments |
| ◾ | Changes in Laws |
| ◾ | Market Shifts |
| ◾ | Customer Purchase Orders |
| ◾ | Customer Pricing Pressure/Contractual Arrangements |
| ◾ | Environmental Compliance |
Over the medium-to long-term, carbon pricing initiatives may present a risk to our profitability. According to the World Bank, in 2023 there were 73 carbon pricing initiatives implemented or scheduled for implementation in 39 countries and 33 sub-national jurisdictions, which would cover emissions representing 23% of global GHG emissions.
Magna International Inc. A-19
Currently, certain of our operations are impacted by two emissions trading schemes:
| ◾ | E.U. Emissions Trading Scheme (ETS): Our Magna Steyr complete vehicle assembly operations participate in the E.U. Emissions Trading Scheme which works on the ‘cap and trade’ principle. A cap is set on the total amount of certain GHG that can be emitted by the operators covered by the system. The cap is reduced over time so that total emissions fall. Within the cap, operators purchases or receive emissions allowances, which they can trade with one another as needed. The limit on the total number of allowances available ensures that they have a value. The price signal incentivizes emission reductions and promotes investment in innovative, low-carbon technologies, while trading brings flexibility that ensures emissions are cut where it costs least to do so. After each year, an operator must surrender enough allowances to cover fully its emissions, otherwise heavy fines are imposed. If an installation reduces its emissions, it can keep the spare allowances to cover its future needs or else sell them to another operator that is short of allowances. |
| ◾ | Ontario Emission Performance Standards (EPS) Program: While none of our facilities are currently mandated to join the EPS Program, one of our Exterior Operating Group facilities in Ontario voluntarily joined the Program in 2022 and several other of our Ontario facilities are in the process of voluntarily opting in. The Province of Ontario Emissions Performance Standards Regulation is used to determine an emissions limit that industrial facilities must meet each year, with the intent of, among other things, encouraging Ontario’s industrial sector to reduce greenhouse gas emissions. Facilities registered under the Ontario EPS must quantify and report their GHG emissions data to the authorities, have such emissions data verified and must comply with their emissions limits. The compliance obligation for a facility under the Ontario EPS program is the difference between its verified total emissions and its verified total annual emissions limit imposed by the Ontario EPS program. A facility can satisfy its compliance obligation either by reducing its GHG emissions or submitting a compliance instrument. The two compliance instruments available are (i) excess emissions units (EEUs) where the facility pays a carbon price per tonne of CO2e for exceeding the annual emissions limit; and (ii) emissions performance units (EPUs), which are credits earned by a facility for emitting less GHG that its annual emissions limit under the Program. The Program aligns carbon prices for future years with Canada’s federal benchmark, which will result in the price of EEUs to increase annually. |
The carbon pricing schemes discussed above have not significantly impacted our profitability to date. We are pursuing energy reduction measures and developing decarbonization strategies for our manufacturing facilities as detailed in this Sustainability Report. However, over the medium- to long-term, carbon pricing initiatives could affect our profitability to the extent we are unable to implement cost-saving or energy reduction measures within a timeframe and/or at a cost which enables us to offset or avoid the cost of carbon pricing initiatives.
| 3.1.2 | Customer-Driven Policy Actions |
A number of our OEM customers have set carbon reduction targets and are challenging Tier 1 Suppliers to support such targets. Some such OEM targets and expectations are more aggressive than our own decarbonization targets. In some cases, we are being asked to quote the supply of future programs based on 100% renewable energy use for production. Although we expect to meet or exceed our customers’ expectations, the inability to do so within the timeframes expected could result in the loss of some future business.
| 3.1.3 | Climate-Related Litigation |
We do not currently believe that climate-change related litigation represents a significant legal risk for us. However, if OEMs are adversely impacted by climate-change litigation, there is a possibility that Tier 1 Suppliers like Magna could face additional pricing pressure. Readers are encouraged to review the “Customer Pricing Pressure/Contractual Arrangements” risk factor in “Section 5 – Risk Factors” in our AIF.
| 3.1.4 | Technology |
Investments in automotive technologies that support the transition to ZLEVs can be significant, particularly in product areas such as battery systems for hybrid and EVs. While our product strategy does not currently include battery systems or other components which generate or store energy for ZLEVs, we have been awarded several battery enclosure programs and currently offer a range of electrified drivetrain products, hybrid dual-clutch transmissions (“HDTs”), dedicated hybrid transmissions (“DHTs”), as well as complete electric-drive (“e-Drive”) systems. We have also expanded our product offering into other areas relevant to ZLEVs – for example, in conjunction with a joint venture partner, we can offer customers a complete EV platform. Our R&D spending for electrification solutions has been significant over the last few years and is expected to continue to be in coming years as electrification-related technologies continue to evolve. Additionally, our OEM customers are making significant investments in the development of ZLEVs, which is impacting their profitability and could lead to increased pricing pressure on us.
As ZLEVs increase their proportion of the overall vehicle market over the medium – to long-term, we expect our sales of manual transmissions and traditional DCTs to decline, and sales of HDTs, DHTs and e-Drive systems to increase. The increasing adoption of electrified drivetrain solutions adversely impacts our AWD and 4WD businesses over the long term, since it is possible to achieve AWD through the use of electric motors in hybrid or fully-electrified drivetrains. However, OEM product plans show mechanical AWD and 4WD programs extending out for approximately the next decade. We seek to offset displacement of mechanical AWD and 4WD systems through increased sales of electrified product offerings such as e-Drive systems.
Overall, we believe that the range of products we offer our OEM customers provides us with a competitive advantage and an effective hedge against the market uncertainties associated with the transition to ZLEVs. As illustrated below, a substantial majority of our products are “agnostic” with respect to the type of vehicle propulsion system used, and therefore remain relevant to ZLEVs:
A-20 Annual Information Form
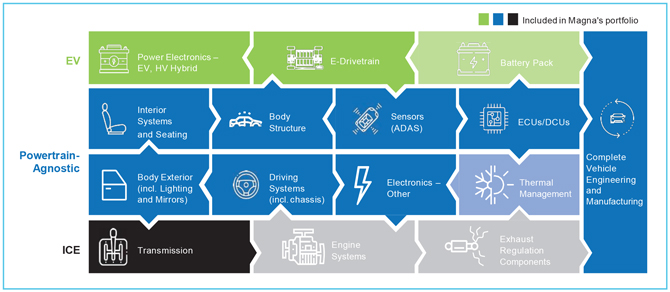
In the case of drivetrain products, we view the know-how gained from our mechanical drivetrain expertise as being critical to our ability to deliver innovative electrified solutions that meet our customers’ needs. In addition to continuing to offer a range of mechanical and electrified drivetrain products, we aim to mitigate technology transition risks through:
| ◾ | early-stage interaction with our OEM customers to understand their product priorities and regulatory compliance requirements; |
| ◾ | in-house R&D including our ongoing analysis of megatrends and the “Car of the Future”, combined with investment strategies in mobility and technology start-ups; and |
| ◾ | strategic planning processes at both Operating Group and Corporate levels, including Board oversight of strategic plans. |
In considering the potential impact of the above or other climate-related policy actions, readers are encouraged to review the following risk factors in “Section 5 – Risk Factors” in our AIF:
| ◾ | Intense Competition |
| ◾ | Consumer “Take Rate” Shifts |
| ◾ | Growth of EV-Focused OEMs |
| ◾ | Risks of Conducting Business with Newer EV-Focused OEMs |
| ◾ | Fisker’s Ability to Continue as a Going Concern |
| ◾ | Deteriorating Vehicle Affordability |
| ◾ | Misalignment Between EV Production and Sales |
| ◾ | Alignment with the “Car of the Future” |
| ◾ | Customer Purchase Orders |
| ◾ | Restructuring Costs |
| ◾ | Technology and Innovation |
| ◾ | Changes in Laws |
| ◾ | Market Shifts |
| ◾ | Dependence on Outsourcing |
| ◾ | Impairments |
| ◾ | Customer Pricing Pressure/Contractual Arrangements |
| ◾ | Investments in Mobility and Technology Companies |
| ◾ | Intellectual Property |
| 3.1.5 | Market |
Some of the risks impacting the market for our products in the transition to a lower carbon economy are described above under “Section 3.1.1 – Regulatory Policy Actions” and “Section 3.1.4 – Technology”. Additionally, there are potential risks to the demand for personal mobility vehicles, and thus for our products, from technology-driven shared mobility solutions such as ride hailing and ride sharing. To date, such shared mobility solutions have not had a material impact on the demand for new vehicles and no such adverse effect is expected in the near- to medium-term. In any event, our own strategy related to new mobility seeks to mitigate risks to our business and realize opportunities based on the breadth of capabilities we can offer new mobility customers.
Additionally, in order to enhance our understanding of potential shifts in consumer behavior, we conduct our own analysis of various factors that are expected to drive future personal and shared mobility trends, including through:
| ◾ | monitoring and analysis of social, digital, demographic, regulatory, industry, geopolitical and other trends which may create demand for and drive development of new automotive and mobility technologies; |
| ◾ | review of academic research; |
| ◾ | collection and screening of ideas submitted through innovation programs; and |
| ◾ | early-stage interaction with our OEM customers and new mobility market entrants to understand their product priorities. |
We do not currently anticipate long-term supply constraints on key commodities required by us in our business, including steel, aluminum or resin. However, production processes for steel and aluminum are carbon intensive, with relatively scarce supply of low-carbon alternatives.
Magna International Inc. A-21
As the entire industry’s decarbonization and net-zero efforts increase, the price of low-carbon steel and aluminum may increase in the near- and medium-terms until the supply of low-carbon product is sufficient to meet growing demand. In the near- and medium-term, the increasing production of ZLEVs may also strain supplies of the rare earth minerals and other metals required for vehicle battery systems, which we do not supply, including nickel, cobalt and lithium used in EV batteries, copper for EV charging infrastructure and rare earth metals for EV motor magnets. However, such supply constraints could help spur the development of alternative battery technologies or low carbon fuels and/or promote technological breakthroughs that could facilitate market penetration of hydrogen fuel cell or other technologies. We intend to continue developing and offering solutions such as e-Drive systems which are neutral as to electric power source (battery or hydrogen fuel cell stack) in order to mitigate potential risks related to supply constraints of rare earth minerals or other commodities needed for current ZLEV power source technologies.
In considering the potential impact of market risks, readers are encouraged to review the following risk factors in “Section 5 – Risk Factors” in our AIF:
| ◾ | Intense Competition |
| ◾ | Consumer “Take Rate” Shifts |
| ◾ | Deteriorating Vehicle Affordability |
| ◾ | Misalignment Between EV Production and Sales |
| ◾ | Alignment with the “Car of the Future” |
| ◾ | Growth of EV-Focused OEMs |
| ◾ | Risks of Conducting Business with Newer EV-Focused OEMs |
| ◾ | Fisker’s Ability to Continue as a Going Concern |
| ◾ | Supply Chain Disruptions |
| ◾ | Quote/Pricing Assumptions |
| ◾ | Commodity Price Volatility |
| ◾ | Technology and Innovation |
| ◾ | Market Shifts |
| ◾ | Dependence on Outsourcing |
| ◾ | Customer Pricing Pressure/Contractual Arrangements |
| ◾ | Investments in Mobility and Technology Companies |
| 3.1.6 | Reputation |
Since light vehicles are contributors to global GHG emissions, Tier 1 suppliers like Magna may face reputational risks from participation in the automotive industry. Examples of such risk types include potential loss of business from sustainability-focused customers, reduced investor demand for our shares, and challenges attracting talent. A number of our OEM customers are embedding sustainability criteria in their sourcing decisions and could reduce purchases from us if they perceive Magna to lag other suppliers with respect to sustainability. Stakeholders, including investors and employees, as well as prospective employees are increasingly focused on companies’ sustainability efforts. Investors may sell shares of investee companies perceived to be less sustainable. In addition, millennial and other components of the workforce want to work in companies they perceive as sustainable, making it difficult for companies to attract such talent if the company is perceived as lagging in sustainability. However, OEMs and Tier 1 Suppliers have been proactively adapting to climate change and transitioning to a lower carbon economy, as evidenced by the significant spending on R&D and technological innovation to reduce CO2 emissions, particularly through electrification and powertrain efficiency, as well as the setting of decarbonization targets in their own operations. At the same time, particular OEMs may be viewed as more or less sustainable based on their sustainability strategies and commitment to transitioning to a lower-carbon economy. Equally, particular vehicle models or even entire vehicle segments may be perceived to be more or less sustainable. As a supplier of a broad range of systems to all major OEMs, we do not anticipate any consequences to our reputation by virtue of the fact that we may supply to any particular OEM, vehicle or vehicle segment. In any event, we believe that our R&D and technological innovation, which is focused on lightweighting, improved fuel economy and lower emissions, together with our sustainability strategy, including our net-zero commitments, serve to mitigate potential reputational risks.
| 3.2 | Physical Risks and Risk Mitigation |
| 3.2.1 | Acute |
With the increased frequency and severity of extreme weather events associated with Climate change, including floods, windstorms, wildfires, tornados, tsunamis, hailstorms and other natural weather hazards, we face the risk that such an event could cause significant damage to one or more of our facilities or those of our customers and/or sub-suppliers. While our primary concern in an acute climate event affecting one of our facilities would be the safety and well-being of our employees, property damage and business interruption would represent the primary financial risk.
An acute climate event that significantly damages one of our facilities, could disrupt our production and/or prevent us from supplying products to our customers. Such an event could lead to us incurring a number of costs, many of which may be unrecoverable, including: costs related to the physical repair of any damage to our facility; costs related to premium freight or re-sourcing of supply; penalties or business interruption claims by our customers; loss of future business and reputational damage; and higher insurance costs going forward.
Extreme climate events could also disrupt supply chains for the entire industry over the near-, medium- and long-term. The National Centers for Environmental Information, a U.S. federal agency, estimates that the number of billion-dollar weather and climate disasters in the United States has risen significantly to an annual average of over 20 in the last five years, from an annual average of three per year in the 1980s. In recent years, a number of supply disruptions resulting from extreme weather have occurred around the world, including:
A-22 Annual Information Form
| ◾ | a rare and extreme storm impacted the U.S. state of Texas that disrupted oil production and thus supplies of resins and materials required for automotive seating. The storm also forced three major semiconductor facilities clustered in the Austin, Texas area to temporarily shut down, which exacerbated the global semiconductor shortage. |
| ◾ | flooding in central China that disrupted supply chains for commodities and forced the closure of several automotive OEM plants. |
| ◾ | a typhoon in Malaysia that damaged Southeast Asia’s second-largest port, causing a disruption in the semiconductor supply chain and causing some U.S.-based automotive OEMs to temporarily suspend operations. |
| ◾ | the Rhine river, Europe’s most important commercial waterway, experienced both bursting from heavy rainfall and snowmelt, as well as, low water levels from drought conditions. The conditions halted shipping for extended periods, forced reduced cargo loads, and disrupted both inbound raw material and outbound product deliveries, which impacted the German automotive industry, in particular. |
Such events can cause shortages of critical materials, which in turn drives prices higher. Efforts to mitigate the impact of such events often result in higher near-term costs until disruption of the affected material has been resolved, due to factors such as premium freight costs for substitute materials. As the frequency of such events increases, we may be forced to maintain higher inventories of various materials and components required for production, to minimize potential disruptions.
We maintain a global property risk control (PRC) program to support our efforts to mitigate risks to our employees’ safety, physical property risks and potential for business interruption due to extreme weather events. The program, which includes risk engineering with support from a third party property risk engineering consulting firm, includes the following elements to promote the physical resiliency of our facilities and minimize the risk of disruption to our operations: pre-screening of facility site selection; acquisition risk assessments; periodic facility inspections; facility construction design review and recommendations; and training and education. Our third party risk engineering consultant typically engages in over 200 physical on-site assessments annually to evaluate various risks, including those relating to natural hazards and also conducts targeted analysis of areas of concern. Using the Swiss Re NatCat database, the advisor has analyzed over 400 unique Magna locations to assess climate related exposures, including: flood, wind, storm surge, wildfire, tornado. tsunami, hailstorm, lightning, temperature change, precipitation, sea level rise risk and water security. The results of the analysis form the basis of discussions with our PRC group regarding potential risk control recommendations to be implemented in our facilities.
In certain circumstances, the program extends the risk assessment to our direct suppliers by identifying and evaluating potential exposures to our direct supply chain (including natural hazards) which could potentially disrupt business operations. To augment our monitoring capabilities, we use a third party software platform that, among other things, includes live monitoring of supply chain risks, including weather events such as drought, floods, earthquakes, landslides, and tropical storms. Where such supply chain exposures are identified, a more detailed assessment may be performed to better understand the supply chain risk, including further on-site assessment, where practicable.
In considering the potential impact of acute physical risks, readers are encouraged to review the following risk factors in “Section 5 – Risk Factors” in our AIF:
| ◾ | Supply Chain Disruptions |
| ◾ | Semiconductor chip supply disruptions and price increases |
| ◾ | Regional Energy Supply and Pricing |
| ◾ | Legal and Regulatory Proceedings |
| ◾ | Climate Change Risks – Transition and Physical Risks |
An extreme weather event that damages any of our manufacturing Divisions and results in injuries or fatalities among employees at such Division could have a material adverse effect on our reputation and could result in legal claims being brought against us.
Climate change considerations may impact the availability of and premiums for insurance coverage in general, and in particular, for properties in high-risk locations. Additionally, we may need to self-insure a higher level of risk, which could result in a material adverse effect on profitability in the event of an extreme weather event which causes damage to one or more of our facilities.
| 3.2.2 | Chronic |
As part of our PRC program, we have retained an advisor to map our global footprint against identified earthquake, wind exposed/ hurricane, flood exposed and wildfire zones, as well as areas with low water security, in order to assist us with footprint planning, as well as our understanding of, and efforts to address, potential risks associated with such types of natural catastrophes. This footprint mapping exercise provided the following conclusions:
| ◾ | Property Risk Concentrations: There are ten geographic regions (in Austria, Canada, Germany, Mexico and the U.S.) in which we have concentrations of property/asset risk, meaning multiple locations within a 35 km radius, and comprising approximately 46% of the total insured value (“TIV”) under our property risk program. All of the regions of concentrated property/asset value are considered to be “Low” seismic hazard zones and are not exposed to tropical cyclones. |
| ◾ | Seismic Zones: We have operations in Austria, Germany, Slovenia, Slovak Republic, Morocco, Portugal, India, Turkey, Japan, Italy, Romania, North Macedonia, China, the U.S., and Mexico comprising approximately 19% of the TIV under our property risk program, which are located in regions of “Moderately High” or greater seismic hazard. None of our operations are in regions where the seismic hazard is considered “Very High” or “Extreme”. |
Magna International Inc. A-23
| ◾ | Tropical Cyclone Zones: Operations in certain parts of Mexico, Japan, China, India, and the U.S. comprising approximately 4% of the TIV under our property risk program are located in hurricane risk Zone 1 to Zone 5, as per Munich Re’s Natural Hazards Assessment Network (NATHAN) categorization, with three locations in Mexico and thee in China falling in Zone 3. TIV by Tropical Cyclone Zones are as follows: |
| Munich Re (NATHAN) Tropical Cyclone Zone | Proportion of TIV | |||
| Zone 5: > 300 km/h |
NIL | |||
| Zone 4: 252-300 km/h |
NIL | |||
| Zone 3: 213-251 km/h |
0.6% | |||
| Zone 2: 185-212 km/h |
0.4% | |||
| Zone 1: 142-184 km/h |
3.2% | |||
| Zone 0: 76-141 km/h |
24.2% | |||
| No hazard: < 76 km/h |
71.6% | |||
| ◾ | Flood Zones: Flood risk is typically categorized as 50-year, 100-year, 200-year and 500-year flood risks. Definitions of these categories based on Swiss Re’s CatNet Global Flood Zone (GFZ) categorization showing the number of our locations and the proportion by TIV for each category are as follows: |
| Category | Flood Probability |
Number of Locations |
Proportion of TIV within 5 km Radius |
|||||||
|
50 year |
1 in 50 (2%) chance of occurring in a year |
22 | 1.5% | |||||||
|
100 year |
1 in 100 (1%) chance of occurring in a year |
68 | 10.8% | |||||||
|
200 year |
1 in 200 (0.5%) chance of occurring in a year |
103 | 12.1% | |||||||
|
500 year |
1 in 500 (0.2%) chance of occurring in a year |
36 | 2.7% | |||||||
|
Outside |
Outside recognized flood zones |
522 | 73.0% | |||||||
Climate change is associated with a rise in sea levels, which places properties located within a five kilometre radius of the current coastline at greater risk of coastal flooding. A total of 13 of our Divisions are located five kilometres or closer to a coastline and thus may be at higher risk from the effects of climate-change related sea rise:
| No. of Divisions | Location(s) | Body of Water | ||
|
2 |
Michigan, U.S. | Lake Michigan | ||
|
1 |
Ohio, U.S. | Lake Erie | ||
|
1 |
California, U.S. | San Pedro | ||
|
1 |
Ontario, Canada | Lake Ontario | ||
|
1 |
Liverpool, U.K. | River Mersey | ||
|
1 |
Bari, Italy | Adriatic Sea | ||
|
1 |
Kocaeli, Turkey | Lake Sapanca | ||
|
1 |
Tangier, Morocco | Atlantic Ocean | ||
|
1 |
Santa Caterina, Brazil | Rio Pirai | ||
|
1 |
Hangzhou, China | East China Sea | ||
|
1 |
Taizhou, China | East China Sea | ||
|
1 |
Kanagawa, Japan | Onda River | ||
Two of such Divisions (Kocaeli, Turkey and Taizhou, China) representing less than 0.5% of TIV are located within one kilometre of a coastline.
| ◾ | Wildfires: One of our Divisions located in Brazil, representing less than ≤1% of TIV, is considered as being exposed to significant wildfire risk. All other wildfire risk is considered moderate to negligible. Wildfire risk is reviewed based on proximity to forests and grasslands with consideration of topography and climate conditions. |
| ◾ | Water Security: Water scarcity is a chronic condition in a number of regions of the world, and it is expected to be amplified due to the effects of climate change. |
A-24 Annual Information Form
As part of our PRM program we conducted an assessment of water security risk in 2022. Water security suggests the reliability/security of an acceptable quantity and quality of water, since water is a critical input in many production processes as well as the lifeblood of sprinkler protection systems. A reduction or failure of water supply could cause a significant impact on operations in the affected region. The methodology for determining water security exposure was based on the “Baseline Water Stress” 4 of the World Resources Institute (WRI) Aqueduct Global Maps 3.0, that measures the ratio of water withdrawals to available renewable surface and groundwater at the catchment scale. Water withdrawals include domestic, industrial, irrigation, and livestock consumptive and non-consumptive uses. Available renewable water supplies include the impact of upstream consumptive water users and large dams on downstream water availability. The indicator used is calculated by inverting the “Baseline Water Stress” scores and converted to a 0-100 scale to represent “Water Availability” as a percentage. Low values represent water stressed areas, due to either high water withdrawals or low water supplies.
Our assessment showed 61 locations in regions deemed to have “low” water security, comprising approximately 14% of 2022 TIV at the time. The assessment indicated exposure locations in China, Germany, India, Italy, Mexico, Spain and the United States. However, Mexico represented the most significant region for us in terms of exposure to water security risks as approximately 50% of the affected locations were in Mexico. While we currently attempt to mitigate the impact of water scarcity risks through water reduction and re-use activities, including the use of treated waste water for irrigation of green areas on a site, the water security analysis is used for additional discussions with our risk engineering consultant, including potential additional recommendations for action plans to mitigate water security risks in the affected regions.
In considering the potential impact of chronic physical risks, readers are encouraged to review the following risk factors in “Section 5 – Risk Factors” in our AIF:
| ◾ | Supply Chain Disruptions |
| ◾ | Climate Change Risks – Transition and Physical Risks |
| ◾ | Regional Energy Shortages and Pricing |
| 4. | Non-Climate Elements of Sustainability |
| 4.1 | Environmental Stewardship |
|
Magna strives to be an industry leader in health, safety and environmental practices in all operations through technological innovation and process efficiencies to minimize the impact of our operations on the environment and to provide safe and healthful working conditions. In furtherance of this objective, Magna’s Health, Safety and Environmental Policy (“HSE Policy”) commits Magna to, among other things:
§ complying with, and exceeding where reasonably possible, all applicable health, safety and environmental laws and regulations and conforming with our internal standards based on generally accepted environmental practices and industry codes of practice; § regularly evaluating and monitoring past and present business activities impacting on health, safety and environmental matters; § improving the efficient use of natural resources, including energy and water; § minimizing waste streams and emissions, including CO2e; § implementing environmental sustainability targets as defined in the Magna Environmental Principles; § utilizing innovative design and engineering to reduce the environmental impact of our products during vehicle operation and at end of life; |
| ◾ | ensuring that a systematic review program is implemented and monitored at all times for each of our operations, with a goal of continuous improvement in health, safety and environmental matters and zero accidents or environmental incidents; and |
| ◾ | reporting to the Board at least annually. |
The full text of the HSE Policy is located on Magna’s website (www.magna.com).
Magna International Inc. A-25
| 4.1.1 | Environmental Compliance |
Magna is subject to a wide range of environmental laws and regulations relating to emissions, soil and ground water quality, wastewater discharge, waste management and storage of hazardous substances. Magna maintains a global environmental program which consists of both internal and third party audits and inspections of our facilities for compliance with local regulations, internal corporate environmental requirements and industry best practices as detailed below:
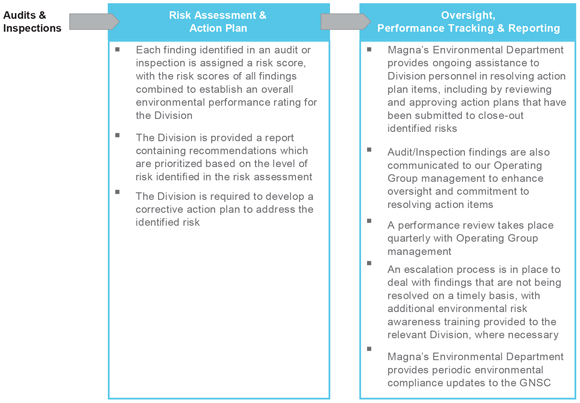
General environmental awareness training is provided to employees by Division management as well as Magna’s Environmental Department as part of ISO 14001 certification compliance. In addition, Magna’s Environmental Department holds regular conferences for representatives of our manufacturing facilities in order to:
| ◾ | reinforce Magna’s commitment to environmental responsibility; |
| ◾ | communicate changes in local and regional regulations; and |
| ◾ | share best practices with respect to environmental protection, compliance and sustainability initiatives. |
| 4.1.2 | Hazardous Waste and Industrial Emissions |
We operate a number of manufacturing facilities that use environmentally-sensitive processes and hazardous materials. We believe that all of these operations meet, in all material respects, applicable governmental standards for management of hazardous waste and industrial emissions. Occasionally our operations may receive a notice of violation or similar communication from local regulators during routine reviews. We have in the past and will continue in the future to address any such notices promptly. Based on our preliminary data, approximately 4% of the aggregate waste generated by Magna in 2023 was hazardous, similar to 2022. We attempt to reduce the amount of hazardous waste that ends up in secure landfills through: recycling, reuse or energy recovery initiatives. Approximately 91% of the hazardous waste generated by Magna in 2023 was diverted from secure landfills through such initiatives.
A-26 Annual Information Form
| 4.2 | Fairness and Concern for Employees |
|
|
4.2.1 Our Commitment to Magna Employees
|
|||
| We are committed to an operating philosophy based on fairness and concern for people. This philosophy is one in which employees and management share in the responsibility of ensuring our company’s success. Our Employee’s Charter, a foundational document in our business, sets out this philosophy through the following principles:
|
||||
|
∎ |
Job Security – Being competitive by making a better product for a better price is the best way to enhance job security. Magna is committed to working together with employees to help protect their job security. To assist employees Magna will provide job counselling and training, as well as employee and family assistance programs. |
|||
|
∎ |
A Safe & Healthful Workplace – Magna is committed to providing employees with a working environment which is safe and healthful. |
|||
|
∎ |
Fair Treatment – Magna offers equal opportunities based on an individual’s qualifications and performance, free from discrimination or favouritism. |
|||
|
∎ |
Competitive Wages & Benefits – Magna provides employees with information which enables them to compare their total compensation, including wages and benefits, with those earned by employees of their direct competitors and local companies their Division competes with for people. If total compensation is found not to be competitive, it will be adjusted. |
|||
|
∎ |
Employee Equity & Profit Participation – Magna believes that every employee should share in the financial success of the company. |
|||
|
∎ |
Communication & Information – Through regular monthly meetings between management and employees, continuous improvement meetings and through various publications and videos, we keep our employees informed about company and industry developments. We also conduct regular employee opinion surveys to help facilitate employee engagement and to receive valuable feedback from employees to help drive continuous improvement. |
|||
|
∎ |
The Hotline – Should an employee have a problem, or feel the above principles are not being met, we encourage them to contact the Hotline to register their complaint(s). Those using the Hotline do not have to give their name, but if they choose to do so, it will be held in strict confidence. Hotline Investigators will respond to those using the Hotline. The Hotline is committed to investigating and resolving all concerns or complaints and must report the outcome to Magna’s Global Human Resources Department. We also maintain a confidential and anonymous whistle-blower hotline for employees and other stakeholders that is overseen by our Audit Committee. See Section 4.5 – “Corporate Ethics and Compliance” below for further details. |
|||
|
We also maintain a Global Labour Standards Policy, which codifies our existing practices consistent with our Fair Enterprise culture. This Policy provides a framework for our commitment to fundamental human rights and international standards that help support positive employee relations, including:
|
||||
|
∎ |
promoting the importance of diversity, inclusion, and respect for one another, regardless of personal differences; |
|||
|
∎ |
not tolerating harassment of any kind, including physical, sexual, psychological or verbal abuse; |
|||
|
∎ |
ensuring employees do not face discrimination in accordance with the protections afforded by |
|||
|
∎ |
applicable law, including discrimination based on race, nationality or social origin, colour, sex, religion, gender identity, disability or sexual orientation; |
|||
|
∎ |
condemning child labour; |
|||
|
∎ |
rejecting forced or compulsory labour; |
|||
|
∎ |
maintaining safe and healthy workplaces; and |
|||
|
∎ |
providing employees with appropriate rest and leisure time. |
|||
|
We publish a Slavery and Human Trafficking Statement setting out the steps Magna has taken to address the risk of slavery and human trafficking in our operations and supply chain. The statement can be found in the “Financial Reports & Public Filings” section of our website, at www.magna.com.
|
||||
| Our commitment to our employees continued to garner recognition, including:
|
||||
|
∎ |
Forbes: World’s Best Employers (2023) – Our 7th consecutive year receiving this accolade |
|||
|
∎ |
Forbes: America’s Best Large Employers (2023) |
|||
|
∎ |
Forbes: Canada’s Best Employers (2023 and 2024) |
|||
|
∎ |
Fortune: World’s Most Admired Companies (2023 and 2024) |
|||
|
∎ |
Built in: Best Places to Work (2023 and 2024) |
|||
|
∎ |
“Open Company” Certification from Glassdoor |
|||
|
∎ |
Great Place to Work® – Turkey (2022 – 2023) |
|||
|
∎ |
Mercier China: Healthiest Workplace Awards (2022-2023) |
|||
|
∎ |
Zhaopin: China Best Employer Award (2023) |
|||
|
∎ |
Universum: Most Attractive Employer Award – Austria, Canada & Maxico (2023) |
|||
|
∎ |
51job: 100 Excellence Employer of China of 2023; Excellence in Women’s Leadership Development (2023) |
|||
Magna International Inc. A-27
| 4.2.2 | Collective Rights |
We are committed to providing workplace environments that promote the dignified, ethical, and respectful treatment of our employees, as reflected in the standards contained in our Global Labour Standards Policy and our Code of Conduct and Ethics (“Code”).
Our Global Labour Standards Policy articulates our respect for employees’ right to associate freely and to choose for themselves whether or not they wish to be represented by a third party in accordance with local laws. We operate both unionized and non-unionized facilities across multiple regions, as well as having facilities where other forms of representative structures exist, such as works councils, and/or where industry-wide tariff agreements apply. In our core regions such as the Americas, Europe and Asia, we have a number of locations formally represented by trade unions, where local collective bargaining agreements are in place. Where such arrangements exist, we strive to maintain positive and productive business relationships with these organizations, resulting in competitive industry agreements.
Employees in our unrepresented facilities benefit from a system of progressive and people-focused human resources policies, coupled with consultative concern resolution programs which include our Fairness Committee, Employee Advocates, Employee Opinion Survey, Open-Door Process and our Hotline, all designed to proactively address individual and workplace issues in a constructive and respectful manner.
| 4.2.3 | Magna’s Open-Door Process |
Magna maintains a comprehensive Open-Door Process, whereby employees are empowered to bring issues and concerns forward to leadership at all levels of the organization, without fear of retaliation. This process enables management and employees to collaborate on resolving workplace issues together. This process includes regular use of Employee Opinion Surveys, focus groups, and local continuous improvement action plans, focused on maintaining a positive workplace environment.
As a part of our Open-Door Process, we maintain Fairness Committees in many of our North American and European manufacturing facilities, as well as at various manufacturing facilities in India and China. These Fairness Committees enable employees to have many of their concerns resolved by a peer review committee comprised of both management and fellow employees. Most of our North American manufacturing facilities also have an Employee Advocate who works with our employees and management to help ensure that any concerns that arise in the workplace are addressed quickly and in accordance with our Employee’s Charter, Global Labour Standards Policy and Operational Principles.
| 4.2.4 | Leadership Development / Talent Management |
We have implemented, and continue to enhance, our Leadership Development System to help identify, train and develop future leaders with the skills and expertise needed to manage a complex, global business. We have also based our talent management strategy on our current business objectives and strategy and our understanding of the transformation taking place in the automotive industry. Given that an effective workforce will increasingly be required to be lean and digitally adept, we are focused on building such a workforce through attraction and recruitment, professional development, succession planning, promoting diversity and inclusion and preservation of our Fair Enterprise culture.
| 4.2.5 | Employee Training |
To support our talent management programs and employee career development we provide numerous learning opportunities to our employees. These include:
| ◾ | Required training for designated employees, including: |
| ◾ | Global Compliance, Legal and Ethics training (discussed in Section 4.5 of this Sustainability Report), including with respect to our Code and supplementary policies; |
| ◾ | Information Security/Cybersecurity and data classification; |
| ◾ | Sustainability objectives and priorities, including gender equality, industry innovation and infrastructure, safety, good health and well-being, which has been completed by almost 50,000 employees to date; |
| ◾ | Continuous learning opportunities supported by a global team, with localized resources in our major footprint locations in the following areas for employees on the shop floor to senior management: |
| ◾ | Manufacturing operations, technical skills, and apprenticeships; |
| ◾ | Business and functional knowledge and skills; |
| ◾ | Interpersonal skills, mentoring , and coaching |
Magna’s Leadership Development Framework is built on best practices in the business and manufacturing environment that includes multiple levels of incumbent programs. All new employees are required to receive compliance on-boarding training on Code and related topics as part of their on-boarding process when joining the company. Finally, all new people managers receive advanced ethics training; and all customer facing employees receive advanced anti-trust training upon hiring.
In order to support our talent management programs and employee career development, we provide numerous training resources and opportunities for our employees. These include:
| ◾ | required training for designated employees with regard to global compliance topics (discussed in Section 4.5 of this Sustainability Report), including our Code and supplementary policies; |
A-28 Annual Information Form
| ◾ | required training for designated employees with respect to various topics, including: information security/cybersecurity and data classification; |
| ◾ | training with regard to sustainability objectives and priorities, including gender equality, industry innovation and infrastructure, and good health and well-being, which has been completed by approximately 33,000 of our employees to date; |
| ◾ | providing a Leadership Excellence Program (LE), built on best practices in the business and manufacturing environment; |
| ◾ | online Magna Training Centres (MTCs) for Canada/USA, Mexico, Austria, Germany, Czech Republic, Slovakia, Poland, China and India. The MTCs offer programs to develop technical, leadership and business skills to support the learning and development needs of Magna employees from the shop floor to senior management; and |
| ◾ | maintaining an online Learning Hub to provide employees with the ability to enhance and future proof their technical and other skills. |
Approximately 25% of our total workforce (i.e. all of our white collar employees) receives e-learning training each year, consisting of one course on the Code (including the topics of bribery, corruption, antitrust, and competition) and a second course on one ethics-related topic selected for that year. All new employees are required to receive compliance on-boarding training on Code and related topics as part of their on-boarding process when joining the company. Finally, all new people managers receive advanced ethics training; and all customer-facing employees receive advanced antitrust training upon hiring.
| 4.3 | Diversity and Inclusion in our Workplaces |
Magna is committed to attracting, retaining and developing under-represented talent across the globe. In order to pursue this commitment, Magna’s identified strategic pillars for Diversity and Inclusion (“D&I”) success are reviewed by our Executive Management with the Chairs of our Diversity and Inclusion Council. Periodic updates are provided to the Board of Directors about how the company is progressing the D&I strategy. Our key D&I priorities are to create expand inclusion programs; cultivate an inclusive culture; and to further strategic partnerships, as discussed below:
| 4.3.1 | Expanding Inclusion Programs |
Our employees are critical stakeholders in our business. The principle of Fair Treatment, outlined in our Employee’s Charter – one which we reinforce through employee meetings, training and communications – has been a key element in fostering an inclusive workplace at Magna. Any employee who feels that we are not living up to the principles of the Charter can seek redress through the Magna Hotline.
We seek to abide by all applicable labour and employment laws, including those prohibiting discrimination and harassment and those providing for the reasonable accommodation of differences. We are committed to providing equal employment and career advancement opportunities, without discrimination based on sex, race, ethnic background, religion, disability or any other personal characteristic protected by law. This is addressed in our Code documentation and training, which all Magna employees must complete. Building on the foundation of awareness, education, and constructive dialogue established at Magna, we are prioritizing the expansion of inclusion programs to support our employees along additional dimensions of diversity.
| 4.3.2 | Cultivating an Inclusive Culture |
Our Executive Management continues to reinforce the importance of an inclusive and diverse organization. We continue to roll out facilitated workshops to all leadership levels to better equip leaders with tools and resources to drive inclusive behaviour. We also host “listening sessions” to understand racial barriers and issues faced by diverse employees. We promote and embed diversity through our talent attraction and management processes. We have provided diversity and inclusion training for certain employees and have made various D&I tools and resources available for all employees. To further advance our D&I progress, we have implemented three employee-led, volunteer resource communities: Race & Ethnicity (EDGE); LGBQT+ and Allies (PRIDE); and the Women’s eXchange. These communities support the execution of Magna’s D&I strategy, raise awareness and help foster a more inclusive environment. The employee resource communities provide, among other things, opportunities for mentoring and career development. Our objective is to be an organization that enables every employee to reach their full potential. We are prioritizing ensuring consistent outcomes and experiences for our employees.
| 4.3.3 | Strengthening Strategic Partnerships |
We continue to enhance our capabilities by working with diversity and inclusion thought leaders, associations and non-profit organizations dedicated to the advancement of women, racial minorities, and employees of diverse backgrounds; promotion of inclusive work cultures; as well as strategies and actions to address the needs of a diverse workforce. These partnerships help us to benchmark our activities and progress, as well as provide insight into best practices and emerging topics for our D&I agenda. Recognizing the importance of improving gender diversity within key technical career streams and to support the development of the next generation of the talent in science, technology, engineering, and mathematics (STEM), we have formed strategic partnerships with a number of organizations that promote gender diversity in technical career streams. Our current strategic partnerships include: Automotive Women’s Alliance; Build a Dream; Centre for Automotive Diversity, Inclusion & Advancement (CADIA); Catalyst; FIRST Robotics – Girls in STEM; her Career; Institute of Electrical and Electronic Engineers (IEEE); Indspire; Inforum; KnowledgeStart; National Society of Black Engineers (NSBE); Queen’s University Engineering Society; Society of Hispanic Professional Engineers; Society of Women Engineers (SWE); WISE (Women in Science and Engineering); and Women in Manufacturing.
Magna International Inc. A-29
We also participate in various automotive advisory groups to ensure the focus on Diversity and Inclusion in the industry remains strong. We are leveraging the experience of organizations focused on inclusion to ensure Magna continues to be positioned as an employer of choice and to enhance our partnership criteria to embed diversity and inclusion into evaluations, selections, and agreements.
| 4.3.4 | Gender Diversity |
We are continuing to progress our agenda to increase the number of women in Magna. On a global basis, approximately 28% of the employees in our wholly owned operations are women. A total of approximately 4,958 employees in our wholly owned operations occupy critical roles with 885 of such employees, or 18%, being women. Both the percentage of women in our wholly owned operations, and the percentage of women in critical roles increased slightly from the previous year. Underrepresentation of women in our workforce is most pronounced in IT, operations, and product engineering career streams, which is a consistent trend throughout the automotive industry. We recognize that there are improvements to be made and we are pursuing strategies to accelerate the progression of women, in director and managerial level roles, and in our most critical operational and technical roles, where there is the greatest level of underrepresentation.
As part of our succession planning program we continue to identify high-potential, diverse talent candidates and implement accelerated development plans to support their progression to advanced roles. During talent and succession discussions, there is an increased level of focus on the number of women and diverse candidates nominated into each of our succession pools.
In addition, the Board as a whole continues to advocate for improved gender representation and other diversity in leadership and other critical roles, as well as STEM career streams. In addition to their strong advocacy, the female directors of the Board, currently representing 38% of our Board of Directors, have also sought opportunities to mentor and share their experiences with the company’s high-performing female employees. Recognizing the important example set by the Board with respect to its own composition, the Board adopted a Board Diversity Policy (located in the Board Charter) targeting gender parity by December 31, 2023, subject to a minimum of not less than 30% female director prior to that time, and successfully achieved this target. Consistent with the recommendations of the Canadian Coalition for Good Governance, gender parity will be achieved if the balance between male and female directors ranges between 40% and 60% over a rolling three-year time frame. As of May 9, 2024, the percentage of women on the Board will be 42%, assuming election of all nominees for Magna’s annual meeting of shareholders. In addition to the Board gender representation discussed above, 42% of nominees for election at Magna’s annual meeting of shareholders are diverse nominees (based on LGBTQ+ or being an underrepresented minority in their home country).
| 4.4 | Occupational Health and Safety |
| 4.4.1 | Health and Safety Standards and Compliance |
Our health and safety program at our Divisions must include specific areas of risk assessment and evaluation that at a minimum includes: machinery and equipment safety; incident and accident management; personal protective equipment; emergency preparedness policies and action plans; fire protection; ergonomics; mental health/stress; industrial hygiene and handling of chemical/biological substances; and working at heights and confined space.
Our commitment to providing a safe and healthful work environment is fulfilled through a regular program of health and safety audits and inspections of our global facilities. These audits and inspections cover the specific minimum topics listed above. Audits are designed to address documentation requirements, while inspections assess physical hazards. Audits and inspections are conducted on-site and followed with a report requiring the facility to develop an action plan to address deficiencies or best practices. The action plans are reviewed quarterly by senior Operating Group management.
The compliance program incorporates international and regional standards, including: ISO 45001, Canadian Standards Association (CSA), American National Standards Institute (ANSI), Conformité Européenne (CE), as well as country-specific standards. Audits and inspections are conducted by specialists with knowledge of Magna’s standards and country-specific requirements. Legislative changes, accident trends and changes to industry standards are incorporated into the program as part of the annual review of the program and updates of audit requirements are conducted every three years.
A-30 Annual Information Form
The key elements of the program are detailed below:
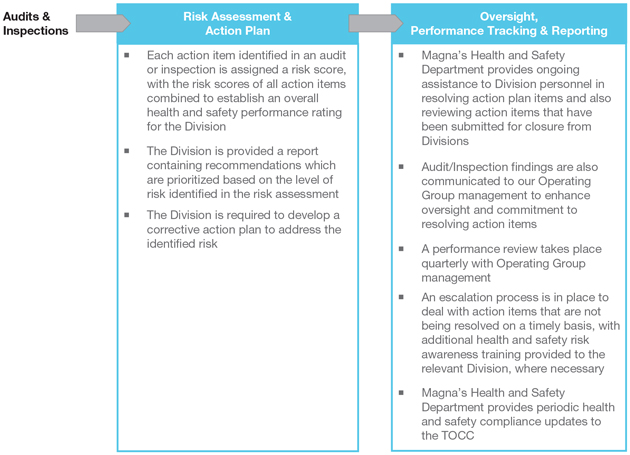
Our Health and Safety Department holds regular conferences with representatives of our Divisions to reinforce our commitment to providing a safe and healthful work environment, as well as to share best practices with respect to occupational health and safety. An employee who believes we have not fulfilled our promise to provide a safe and healthful working environment can seek redress through the Magna Hotline.
| 4.4.2 | Ergonomics Program |
Magna is committed to minimizing and eliminating ergonomics risk factors. A key program for supporting employee well-being is our ergonomics program which aims to reduce the risk of musculoskeletal injuries. Managed by each Division’s ergonomic committee and with the support and guidance of corporate ergonomists, the program regularly evaluates Division ergonomics against a set of established criteria.
| 4.5 | Corporate Ethics and Compliance |
| 4.5.1 | Code of Conduct and Ethics |
We are committed to conducting business in a legal and ethical manner globally. Our Code, which applies equally to all our directors, executive officers and employees, articulates our compliance-oriented values and expectations. The principles of the Code have been and continue to be reinforced by our Chief Executive Officer, Executive Management, Operating Group management and the Board.
The Code addresses standards of conduct in a number of specific areas, including:
| ◾ | how to report suspected violations of the Code, and prohibiting retaliation against persons who report such violations in good faith; |
| ◾ | respect for human rights, diversity and inclusion; |
| ◾ | conducting business with integrity, fairness and respect; |
| ◾ | giving and receiving gifts and entertainment; |
| ◾ | complying with all laws and regulations, including anti-corruption/bribery and antitrust/competition laws; |
| ◾ | lobbying and political contributions; |
| ◾ | full, accurate and timely public disclosures, including financial reporting; |
| ◾ | prohibiting insider trading; |
| ◾ | compliance with environmental, and occupational health and safety laws; |
| ◾ | protecting personal data; |
| ◾ | respect for human rights, diversity and inclusion; |
Magna International Inc. A-31
| ◾ | careful communication, and protecting confidential and personal information; |
| ◾ | managing conflicts of interest; |
| ◾ | giving and receiving gifts and entertainment; and |
| ◾ | compliance with related corporate policies. |
The Code, which is disclosed on the “For Employees” section of our website (www.magna.com) and posted on our employee intranet in 26 different languages, is reviewed regularly with all amendments approved by the Board. We have also supplemented the requirements of the Code through the adoption of policies covering specific topics, including: bribery and improper payments, tooling practices, gifts and entertainment, anti-retaliation, careful communication, conflicts of interest, sanctions and trade embargoes, antitrust and competition, data privacy, and the conduct of internal ethics investigations (all of which are also available on our website (www.magna.com)).
| 4.5.2 | Global Compliance Program |

|
In order to help our employees understand the values, standards and principles underlying our Code, we have implemented a global compliance program (the “Program”) overseen by the Audit Committee, which includes training of employees through different modalities (e-learning live in-person, and virtual instructor-led) on various topics relating to compliance and ethics. We also provide specialized compliance training modules which target specific functional audiences and high-risk regions. In addition to providing training on compliance and ethics topics generally, these specialized modules are designed to be interactive and incorporate real-life scenarios and exercises, which we believe amplify our Program expectations and resonate more powerfully with participants.
The Program is supervised by the Magna Compliance Council (“Compliance Council”), a body that includes key corporate officers representing our finance, legal, human resources, operations, internal audit, sales and marketing, technology, information, research and development, and compliance functions. The Compliance Council is tasked with, among other things, providing overall direction for our Program, approving key initiatives and ensuring that the required elements of our Program are being carried out globally by our cross-functional Operating Group Compliance Committees. |
For the third year in a row, in 2024 Magna was selected as a World’s Most Ethical Companies Honoree® by Ethisphere, a global leader in defining and advancing standards of ethical business practice.
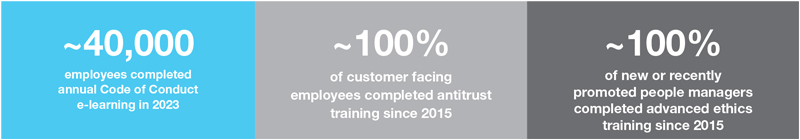
| 4.5.3 | Magna Hotline |
The Magna Hotline is a whistle-blower hotline. The Hotline is confidential and reporters can remain anonymous (except where local law requires disclosure of a reporter’s identity), and is available for employees and other stakeholders such as customers and suppliers at all levels of our supply chain to make reports by phone or online at any time in 27+ languages. Reports are received and tracked by an independent third party service provider. Reports to the Magna Hotline (other than reports of an HR nature) are reviewed by our Internal Audit Department and, when appropriate, an investigation is conducted in accordance with our Policy on Internal Ethics Investigations. Investigations are conducted by Magna’s Internal Audit Department, Corporate Security team, In-House lawyers and/or external counsel (where applicable). We maintain an Investigations Oversight Committee, a sub-committee of the Compliance Council, which meets quarterly (and on an ad hoc basis, as needed) to review such investigations to ensure consistency of discipline and promote early awareness and oversight. The Audit Committee receives quarterly presentations from the Vice-President, Internal Audit regarding Magna Hotline activity and details of compliance, fraud, financial reporting, and other investigations (other than HR-related investigations).
| 4.6 | Lobbying & Political Engagement |
Magna is committed to upholding the highest standards of integrity in our lobbying activities and political engagement. Our approach to conducting such activities in accordance with applicable law and ethical norms, and in alignment with our sustainability commitments, is as follows:
A-32 Annual Information Form
| 4.6.1 | Core Commitments |
Our core commitments in this area are:
| ◾ | Lobbying: Magna pledges to comply with applicable law and uphold the highest levels of integrity in all lobbying efforts. Our lobbying strategies and practices are designed with the best interests of our stakeholders in mind and reflect the core values of our company. We are committed to honest and ethical engagement with policymakers. |
| ◾ | Political Engagement: Magna is committed to being a responsible corporate citizen, which includes ensuring compliance with applicable law regarding political contributions and expenditures. |
| ◾ | Comprehensiveness of Commitment: Our commitment to integrity in lobbying is holistic, encompassing all areas of our business and supported by senior management. A dedicated governance structure ensures adherence to this strategy, with accountability assigned at the corporate level. |
Our strategy supports Magna’s interest in promoting public policies relevant to Magna and educating policymakers about our business, while complying with all relevant laws and regulations governing lobbying and political contributions or expenditures for federal, state, or local elections, including the reporting and disclosure of such amounts.
| 4.6.2 | Implementation Measures |
In order to give effect to our commitments we undertake a number of measures:
| ◾ | Disclosure: Detailed information about our lobbying activities as required by law. |
| ◾ | Approval Procedures: Magna has established a pre-approval procedure (“Disclose It” reporting system) for expenditures or government officials. |
| ◾ | Stakeholder Engagement: While our strategy is comprehensive and supported by management, we recognize the importance of involving stakeholders in the development and discussion of our lobbying strategies at the corporate level. Efforts to enhance stakeholder involvement are ongoing. |
Magna will comply with all applicable laws and regulations governing campaign finance, political contributions, or expenditures for elections and political activities, including reporting and disclosure requirements. Magna regularly consults inside and outside legal counsel to confirm its political expenditures and other political and lobbying activities are undertaken in compliance with applicable law and this strategy. Magna’s lobbying strategy is subject to regular review and updates to reflect changes in legal requirements, and industry best practices.
| 4.7 | Data and Cybersecurity/Privacy |
| 4.7.1 | Enterprise Cybersecurity |
Our enterprise cybersecurity strategy was developed by our Information Security, Risk and Compliance Department (“ISRC”) which ultimately reports to our EVP and Chief Digital and Information Officer. The strategy has been designed using guiding principles from our Code as well as enterprise risk considerations and aligns with industry standards including the National Institute of Standards and Technology, relevant ISO standards, and applicable customer requirements. Our Board has risk oversight responsibility for Magna’s enterprise IT/information security systems and cybersecurity program and receives reports regarding the program at periodic meetings.
Our cybersecurity initiatives are based on five key considerations:
| ◾ | Identify – develop an organizational understanding of cybersecurity risk to systems, people, assets, data, and capabilities; |
| ◾ | Protect – develop and implement appropriate safeguards to ensure against cybersecurity risk and continue to deliver critical services; |
| ◾ | Detect – internal and external 24 × 7 monitoring of all information traffic for cyber-attacks, including ransomware and other malware; |
| ◾ | Respond – our Security Operations Centre has appropriate incident response plans/processes and the necessary resources and expertise to respond to detected threats; and |
| ◾ | Recover – our Security Operations Centre works with IT operations to recover as quickly as possible by rebuilding affected systems and restoring data back-ups. |
We are committed to working with our customers and other stakeholders to ensure that appropriate cybersecurity standards and requirements are continually monitored and implemented as required. In addition, we ensure that we comply with all governmental rules and regulations regarding cybersecurity or privacy regulations (such as GDPR as defined and detailed below), which directly affect cybersecurity requirements. Our selection process for third party (e.g. Cloud-based) services includes a due diligence approach that ensures that such services are evaluated using industry standard security assurance approaches to assess and address the risks associated with third party technology services and aligns with our overall approach to cybersecurity.
We regularly evaluate and adjust our information security management strategy based on a variety of considerations including risk assessments, continuous monitoring and periodic independent cybersecurity maturity evaluations. This enables the ISRC to identify and prioritize responses to residual risk arising from changes to our business or the ever-changing threat landscape. Magna has developed and implemented centralized enterprise cybersecurity policies, compliance measures, as well as training and awareness programs designed to ensure that our cybersecurity strategy is executed to minimize our exposure.
Magna International Inc. A-33
Governance of cybersecurity over our shared global telecommunications and computer infrastructure is centralized under the ISRC. The ISRC facilitates identification of our risk exposures and mandates the implementation of appropriate security controls. We have processes in place to ensure that our IT systems receive appropriate upgrades, including patching and other protective measures, in a timely manner.
| 4.7.2 | Product-Embedded and Solution Software Cybersecurity |
In addition to the above centralized initiatives, our decentralized operating model assigns cybersecurity accountability to our Operating Groups with respect to risk/security issues inherent in products. However, the ISRC provides various standards-based approaches to assist our Operating Groups in assessing their respective product cybersecurity risk and maturity. From this assessment, our Divisions and Operating Groups are then able to determine appropriate cyber solutions that may be required. Our Technology Committee supports the Board through the committee’s risk oversight responsibility for Magna’s product-embedded or solution software cybersecurity.
| 4.7.3 | Privacy |
Magna is committed to preserving the privacy of our stakeholders in accordance with applicable laws. Our Code articulates our approach to the privacy of our employees and protection of their personal information. We only collect, use and disclose personal information for legitimate business or employment purposes, as required by law, or with an individual’s consent. In addition, like any other asset, confidential information which includes trade secrets and proprietary information is a valuable part of our business and we aim to safeguard it.
Magna has established a data privacy organization and program in our divisions in the E.U., Morocco, Brazil, Thailand, and China. The program includes the issuance of policies and procedures, employee training, gap assessments and the implementation of a data privacy management system.
In addition to our general privacy and confidentiality commitments, our Global Data Privacy Policy (the “Privacy Policy”) has been established. The Privacy Policy is designed to guide our compliance with, among others, the E.U. General Data Protection Regulation (“GDPR”), China’s Personal Information Protection Law, the Brazilian General Data Protection Law and Thailand’s Personal Data Protection Act.
The Privacy Policy sets out general data protection principles, responsibilities of data controllers and processors, circumstances under which personal data can be transferred, rights of data subjects and actions that must be taken in case of data breach, as well as addressing data retention periods. The Privacy Policy is accompanied by a variety of formal and comprehensive procedures, developed and overseen by our Compliance Council.
A training program has been implemented to address general data privacy awareness for all employees and provide more specific rules for those employees who are handling personal data as part of their daily work. Finally, those employees across our organization responsible for handling privacy requests by data subjects or for addressing data breaches have been provided with the tailored training and resources to carry out such responsibilities.
Furthermore, Magna continues to monitor legislative and regulatory developments in the fast-changing data privacy landscape in other regions with Magna operations.
| 4.8 | Supply Chain Responsibility |
| 4.8.1 | Supplier Code of Conduct |
We hold ourselves and our suppliers to high ethical standards. Our Supplier Code of Conduct and Ethics (“Supplier Code”) is a foundational document in our business relationships with suppliers. It outlines the principles we apply internally at Magna through our Code, as well as expectations we have for every company that supplies goods or services to Magna, relating to, among other things:
| ◾ | ethical business conduct, such as compliance with antitrust/competition, anti-corruption/bribery and export controls laws; conflict minerals reporting; avoidance and reporting of conflicts of interest; and protection of Magna intellectual property and confidential information; |
| ◾ | employee rights, including those rights set out in our Employee’s Charter, Global Working Conditions and Global Labour Standards Policy; and |
| ◾ | environmental responsibility and compliance. |
The Supplier Code forms an integral part of our overall contractual relationship with our suppliers. We expect the standards set out in the Supplier Code to be met by our suppliers, even in jurisdictions where meeting such standards may not be considered part of the usual business culture and a failure to do so can result in the termination by Magna of the supply relationship. The full text of our Supplier Code is available on our website (www.magna.com).
We continue to support and participate in industry efforts to develop common standards relating to business ethics, environmental standards, working conditions and employee rights. We will continue to engage with our suppliers to raise awareness of the importance of sustainability in our supply chain.
| 4.8.2 | Human Rights and Global Working Conditions in our Supply Chain |
Magna seeks to fully comply with all applicable labor and other laws in all jurisdictions in which we operate. While such jurisdictions have a range of different laws, Magna’s policy framework applies equally to all our operations across the globe to establish a common and consistent baseline for the fair treatment of our own employees, as well as those in our supply chain.
A-34 Annual Information Form
This policy framework, which includes our Code, Supplier Code and Global Labour Standards, articulates our fair enterprise culture and serves as a general endorsement of the human rights and international labor standards reflected in the United Nations Universal Declaration of Human Rights, International Labour Organization (“ILO”) Fundamental Conventions, and ILO Declaration on Fundamental Principles and Rights at Work. Our policy framework, which is discussed in greater detail in Sections 3.2.1, 3.5.1 and 3.7.1 of this Sustainability Report, reflects an express and unequivocal prohibition on the use of forced or child labor – both internally and by suppliers. We expect that our supply chain will adhere to our Global Working Conditions and our Supplier Code, which have a strong focus on protection of human rights and working conditions, including prohibitions on the use of child, underage, slave or forced labour. Our Global Working Conditions are an integral part of our supplier package that emphasize the importance of maintaining global working conditions and standards that result in dignified and respectful treatment of all employees within all our global operating locations, as well as those of our supply chain. A failure by any of our suppliers to comply with its terms can result in the termination by Magna of the supply relationship.
With respect to third party service providers and staffing agencies, we maintain a number of oversight and due diligence practices, including:
| ◾ | a global policy on “Doing Business with Staffing Agencies and 3rd Party Service Providers” that sets out best practices when doing business with 3rd party vendors supplying labour-related services to Magna, including: due diligence requirements; prohibition on the use of fees or worker debt arrangements that might result in conditions leading to debt bondage; requirements for transparent employment terms; and conducting checks on contract workers for the purposes of verifying ethical and legally compliant employment conditions; |
| ◾ | service agreement templates for use with 3rd party labour suppliers to ensure that contingent workers are subject to the same ethical standards applicable to Magna’s regular full-time employees. The service agreement templates include, among other things, robust audit and investigation provisions; |
| ◾ | a system for reporting non-compliant suppliers and which is designed to ensure that we do not do business with prohibited suppliers; and |
| ◾ | a global Labour and Employment Audit program designed to assess HR compliance-related issues, policies, and practices at the local Divisional level and adherence to both Magna policy and local laws, in a variety of areas, including fair working conditions and prevention of forced and child labour. |
In addition, during the first half of 2024, we are planning to roll out mandatory enhanced compliance training on responsible sourcing and global supply chain laws, covering such issues such as child labour, human trafficking, forced labour, and the responsible use of third party labour brokers.
| 4.8.3 | Supply Chain Management |
| 4.8.3.1 | General |
Magna’s supply chain management group focuses on a number of elements that we believe are integral to world class supply chain management, such as: standardized supplier quality and delivery performance ratings; specific roles and responsibilities; processes and standards; global training; and risk management. The supplier quality and delivery performance ratings have been established to help optimize business award decisions. We use cross-functional sourcing teams, in the majority of our sourcing decisions, to help ensure compliance with our internal standards when we place new business within our supply base. In order to promote awareness of the key elements of our supply chain risk management program, including the requirements in our Supplier Code, we provide global on-line training on an ongoing basis to internal purchasing employees.
We continue to increase digitization of our supply chain management, including focusing on spend analytics and online transportation risk tracking, as well as electronic tagging and tracing of certain assets.
As part of our strategy to improve sustainability performance across our supply chain, we are developing an ESG component for our program award criteria, as discussed under “Supplier Reviews” below.
Magna International Inc. A-35
Our governance framework and key activities with respect to supply chain ESG risk management is set forth below:
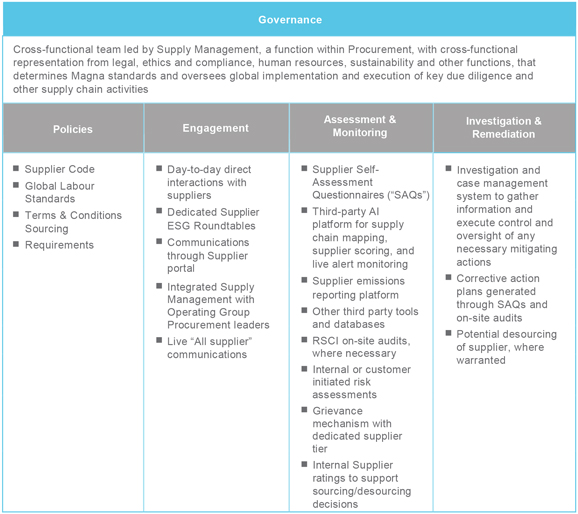
| 4.8.3.2 | Supply Chain ESG – Continuing to Enhance Transparency and Sustainability Performance |
In order to enhance transparency into our supply chain and work towards a more sustainable supply chain, we have made several enhancements to our supply chain management program in recent years:
| ◾ | We have implemented a third party supply chain risk monitoring and mapping tool, which monitors and provides real-time alerts affecting supply chains, including: human rights risks (i.e. forced/child labour), operational issues, financial or legal issues, CSR incidents (i.e., environmental incidents, poor working conditions), industrial accidents, product incidents (i.e., recalls), cyber risks, natural disasters, governance risks (i.e., corporate wrongdoing), labour unrest, and political unrest; |
| ◾ | We request our suppliers to report on their energy usage and emissions – a critical step in better understanding our Scope 3 emissions and executing on reductions in Scope 3 emissions in order to meet our science-based near-term and net-zero targets; |
| ◾ | We invite certain suppliers to respond to self-assessment questionnaires through NQC, a third party supply chain management organization who will be responsible for data collection and analysis via their SupplierAssurance platform. The self-assessment questionnaires (currently SAQ 5.0) which is a standard automotive industry sustainability questionnaire developed by global OEMs. The SAQ which Magna completes for requesting OEM customers annually, requires information, including documentation, relating to several topics, including, among other things: sustainability management; working conditions and human rights; health and safety; business ethics; environmental compliance; supplier management; and responsible sourcing of raw materials, as well as questions specifically addressed to German Act (as defined below) compliance; |
| ◾ | During 2023, we enhanced our complaints mechanism, the Magna Hotline, to create a separate submission tier for our supply chain; |
| ◾ | We have launched Supplier Roundtables to engage key suppliers on topics including energy reduction, decarbonization, sustainable materials and products, supply chain resiliency, and human rights and working conditions; |
| ◾ | Magna is a founding member of the Responsible Supply Chain Initiative (RSCI), an association of automotive OEMs, Tier 1 Suppliers and industry associations, which has established an assessment program for due diligence in the automotive supply chain relating to social compliance, occupational safety and environmental protection. |
A-36 Annual Information Form
| We initiated several RSCI audits of suppliers in 2023 and are planning to grow our third-party audit program in 2024. Magna has also had several of its employee trained as RSCI auditors to support our supply chain due diligence activities; and |
| ◾ | We have been accepted as a member company of the German automotive industry dialogue (“Branchendialog Automobilindustrie”). The industry dialogue is a multi-stakeholder forum consisting of relevant participants from the automotive industry as well as civil society with expertise on human rights risks in automotive supply and value chains; |
We continue to monitor compliance with emerging supply chain regulations that apply to our operations, including:
| ◾ | the German Supply Chain Due Diligence (Lieferkettensorgfaltspflichtengesetz (LkSG)) (the “German Act”) which came into force January 1, 2023, and which imposes a duty on companies, including several Magna subsidiaries in Germany, to make reasonable due diligence efforts to determine if there are violations of human rights or environmental obligations in their own business operations or in the their supply chain. We have appointed a Human Rights Officer (HRO) to oversee our compliance with the German Act. Senior personnel that reports directly to the HRO, coordinates implementation of activities implemented to meet obligations under the law, together with a cross-functional team that includes representatives from our compliance, legal, HR, environmental and purchasing functions. We also have a global advisory board comprised of senior Magna leadership that provides guidance and receives periodic reports on the activities of the HRO and the German Act compliance team. We are in the process of finalizing a global Company Statement focusing on Human Rights and Environmental issues as required by the German Act. Our first report for our subsidiaries under the German Act will be filed in Spring 2024; |
| ◾ | the U.S. Uyghur Forced Labor Prevention Act, which requires companies, starting in June 2022, to rebut the presumption that goods coming from Xinjiang, China were not made using forced labour, by meeting forced labor due diligence standards set forth in the Guidance published by U.S. Department of Homeland Security; |
| ◾ | Canada’s Fighting Against Forced Labour and Child Labour in Supply Chains Act (the “Canadian Forced Labour Act”) which came into force January 1, 2024. Magna’s first reporting obligation under the Canadian Forced Labour Act will arise in May 2024; |
| ◾ | the E.U. Corporate Sustainability Due Diligence Directive (CSDDD) approved by the European Council in March 2024 that, once formally adopted, would mandate supply chain due diligence relating to human rights and environmental matters in E.U. member states; and |
| ◾ | the E.U. provisional agreement on a new forced labour regulation that, once formally adopted, would ban products made with forced labour from being sold in, or exported from, the E.U. |
| 4.8.3.3 | Supplier Reviews |
We currently review production suppliers in order to assess their overall operational, performance and financial health. We use a scorecard to provide ongoing monitoring and assessment of suppliers, which tracks (among other things) whether suppliers have certain industry-recognized environmental and health and safety certifications, such as ISO 14001 and ISO 18001. We are in the process of introducing another pillar covering ESG to our supplier review scorecard process.
No production suppliers were terminated in 2023 as a result of a violation of working conditions or human rights. We have terminated business relationships with a number of temporary staffing/labour agencies that did not meet the requirements of our global staffing agency policy discussed in Section 4.8.2 above.
| 4.8.3.4 | Phytosanitation Program |
We maintain a phytosanitation program aimed at preventing the introduction and spread of plant diseases (i.e., pests and mold) through the cross-border import/export process. Our phytosanitation policy which applies to suppliers and shippers aligns with the International Plant Protection Convention (IPPC) standard for treatment of wood packaging material (e.g., wooden pallets), and includes the requirements of ISPM-15 (International Standards for Phytosanitary Measures). Our phytosanitation program includes training sessions for internal employees and suppliers, as well as reviews aimed at confirming compliance with our policy.
| 4.8.3.5 | Supplier Diversity |
To support the supplier diversity efforts which form part of our supply chain management program, we participate as a corporate member of several industry-recognized suppler diversity organizations, including:
| ◾ | the National Minority Supplier Development Council (NMSDC) |
| ◾ | the Canadian Aboriginal and Minority Supplier Council (CAMSC) |
| ◾ | Women Business Enterprises Canada Council (WBE Canada) |
| ◾ | Michigan Minority Supplier Development Council (MMSDC) |
| ◾ | National Veteran Business Development Council (NVBDC) |
| ◾ | the National LGBT Chamber of Commerce (NGLCC) |
| ◾ | Great Lakes Women’s Business Council (GL-WBC) |
| ◾ | Women’s Business Enterprise National Council (WBENC) |
| ◾ | Disability: IN |
| ◾ | WEConnect International |
In addition, we are supporters of the Michigan Hispanic Chamber of Commerce (MHCC), the US Hispanic Chamber of Commerce (USHCC), the Asian Pacific American Chamber of Commerce (APACC), the Detroit LGBT Chamber of Commerce, the Veteran Owned Business Roundtable (VOBRT), the Council of Supplier Diversity Professionals (CSDP), the Mid-South Minority Business Continuum (MMBC), and The National Business League.
Magna International Inc. A-37
We are also involved with a number of supplier diversity advocacy events, conferences, and procurement fairs, including many organized by our OEM customers, such as GM Supplier Inclusion Board, Stellantis MatchMaker, BMW Supplier Diversity Conference, Toyota Opportunity Exchange and Honda Network Partnership.
| 4.8.3.6 | Conflict Minerals Reporting |
Consistent with the approach taken by our customers, suppliers and other fellow members of the Automotive Industry Action Group with respect to “conflict minerals”, we are engaged in an annual process of determining whether any products which we make or buy contain such “conflict minerals”. Our latest conflict minerals report is available on our website www.magna.com and on the SEC’s EDGAR website (www.sec.gov/edgar). We continue to engage with our suppliers to increase awareness, and accuracy, of “conflict minerals” reporting requirements and, through our membership in the Responsible Minerals Initiative (RMI), support continuing cross-industry efforts to identify and validate conflict-free smelters and refiners. We also report to requesting OEM customers with respect to Cobalt and Mica.
| 4.9 | Contributing to Communities in Which we Operate |
| 4.9.1 | Commitment to Communities and Society |
Magna recognizes the importance of giving back to society. We have a long history of supporting many global social and charitable causes, primarily in the communities around the world in which our employees live and work.
While much of our corporate giving is to general philanthropic causes, we have identified seven United Nations Sustainable Development Goals that most directly relate to our business. Examples of Magna’s activities and accomplishments with respect to each relevant Development Goal is as follows:
|
Ensure healthy lives and promote well-being for all at all ages |
◾ | Since 2017, more than $1.3M has been raised from employee donations and Magna’s Matching program through annual participation in the World Vision Global 6K for Water, which aims to bring life-changing clean water to communities in need. The Suppliers Partnership for the Environment (SP) – an association of global automakers and their suppliers working together to advance environmental sustainability through the automotive supply chain – previously awarded Magna SP’s Community Impact Award for our support of the Global 6K for Water challenge
|
||
| ◾ | Magna’s corporate wellness initiatives help support the ongoing physical and mental health of employees globally
|
|||
| ◾ | Magna has contributed over $25M toward medical infrastructure and over $1M to the Red Cross and other organizations to aid with global disaster relief efforts. Magna’s Employee Disaster Relief Fund provides financial assistance to eligible employees and their families in the event they are victims of a disaster. In 2023, the program helped 46 employees in Austria, Canada, China, Czech Republic, India, Italy, Mexico, Poland, Slovenia, Turkey, and the United States. An additional 403 employees in China were supported with humanitarian aid relief after a typhoon destroyed a local community, and Magna also made a donation to the Red Cross to assist their efforts in response to the earthquake in parts of Turkey and Syria.
|
|||
| ◾ | Magna locations around the globe organize food drives and fundraisers to support local foodbanks and to address food security |
A-38 Annual Information Form
|
Ensure inclusive and equitable quality education and promote lifelong learning opportunities for all |
◾ | Magna sponsors and actively participates in FIRST Robotics globally to encourage students to consider careers in science, technology and engineering. FIRST organizes mentor-based programs that help participants build science, engineering and technology skills while also fostering self-confidence, communication skills and leadership
|
||||
| ◾ | Magna embraces a culture of learning, including a program that pays for employees to pursue job-related certificate programs and university degrees
|
|||||
| ◾ | Employees can access Magna-sponsored scholarships for their children to pursue university degrees
|
|||||
| ◾ | We have partnerships in several countries with universities and technical institutions to develop a talent pipeline and help promote skilled trades development
|
|||||
| ◾ | Magna sponsors several regional and international skills competitions through WorldSkills to enhance technical trades development and growth opportunities for students
|
|||||
| ◾ | We support the Canadian Institute for Advanced Research a Canadian-based global research organization that brings together teams of top researchers from around the world to address important and complex questions
|
|||||
| ◾ | We support Skills USA and Ontario, organizations that champion and stimulate the development of world-class technological and employability skills for youth
|
|||||
| ◾ | In 2023, we began to support Relay Education’s Renewable Energy STEM (Science, Technology, Engineering, and Math) workshops which provide support for thousands of kids in communities Magna operates in, from the United States, Austria and Mexico. These workshops bring interactive STEM experiences to students who otherwise may not have access to such programming. | |||||
|
Achieve gender equality and empower all women and girls |
◾ | Magna’s Women’s eXchange Employee Resource Community strives to empower, develop and recognize its female employees and encourage students to pursue STEM careers.
|
||||
| ◾ | We hosted the Women of Inforum@CES 2023 networking event in conjunction with Inforum, a nonprofit dedicated to accelerating the careers of women and building talent initiatives at companies
|
|||||
| ◾ | Magna’s Board has adopted a Board Diversity Policy targeting gender parity (achieved if the balance between male and female directors ranges between 40% and 60%, assessed over a three-year timeframe). Currently, 38% of our Board members are women, rising to 42% on May 9, 2024, assuming election of all nominees for Magna’s annual meeting of shareholders.
|
|||||
| ◾ | Since 2016, Magna has spent more than $2.1 billion with women-owned businesses/suppliers as part of its overall supplier diversity program
|
|||||
| ◾ | Magna celebrates and honors the many contributions of women around the world, including annually celebrating International Women’s Day through live global events for employees to connect with and honor outstanding women in the company | |||||
|
Build resilient infrastructure, promote inclusive and sustainable industrialization and foster innovation |
Magna:
|
|||||
| ◾ | completed thousands of energy/sustainability projects in recent years, resulting in significant and ongoing energy, emission, and costs savings throughout its global operations. Some examples of sustainable projects in our company are:
|
|||||
| ◾ | a Cosma Division in Mexico installed a photovoltaic (solar) panel system which can produce approximately 825 MWh of electricity annually.
|
|||||
| ◾ | An Exteriors Division in China installed a photovoltaic (solar) panel system which can produce approximately 5,200 MWh of electricity annually.
|
|||||
| ◾ | created a Global Bold Perspective Award to showcase student vehicle designs of the future. The automotive design competition annually selects a winner from entries from students in North America, Europe and China
|
|||||
| ◾ | Sponsored the development of The Scanlon Creek Nature Centre in Ontario. Based on universal design and net-zero carbon principles, construction of this new building will create a community hub where people of all ages and abilities can access award-winning, innovative programming that connects them to nature while building environmental knowledge and awareness.
|
|||||
| ◾ | Continued to grow our annual Commitment to Sustainability Awards, which are open to Magna’s Divisions globally and focus on three categories: (i) product excellence and innovation; (ii) process improvements that advance lean and sustainability efforts; and (iii) people – programs that overcome employee and community challenges in the areas of education and training, health and safety, diversity and inclusion, and other areas of social impact. | |||||
Magna International Inc. A-39
|
Reduce inequality within and among countries |
◾ | Magna’s race and ethnicity-focused (EDGE), LGBQT+ and Allies (PRIDE) Employee, and Women’s eXchange Resource Communities, support employee-led learning opportunities to foster open dialogue and understanding, as well as opportunities for mentoring and career development
|
||
| ◾ | 42% of Board nominees for election at Magna’s annual meeting of shareholders are diverse nominees (based on LGBTQ+ or being an underrepresented minority in their home country)
|
|||
| ◾ | Since 2016, Magna has spent more than $3.7 billion with Minority-owned businesses/suppliers as part of its overall supplier diversity program
|
|||
| ◾ | Unconscious bias training is required for all managers and available to any Magna employee
|
|||
| ◾ | Magna partners with various United Way agencies in North America to support a broad number of organizations that are delivering community-based solutions to address poverty and inequalities
|
|||
| ◾ | Magna has partnered with other industry leaders to support a variety of poverty-reduction efforts in the Greater Detroit and Greater Toronto Areas, including support for Pope Francis Center and Inn from the Cold, organizations that provide vital services to people experiencing homelessness | |||
|
Ensure sustainable consumption and production patterns |
Magna:
|
|||
| ◾ | has implemented a zero waste to landfill target. Approximately 92% of total waste outputs from operations in 2023 were recycled or diverted from landfills, rising to approximately 96% if energy recovery is included
|
|||
| ◾ | purchased 22% of its global electricity from renewable electricity sources (13% of our global energy purchase was renewable)
|
|||
| ◾ | reduced its energy intensity by approximately 11%, exceeding the 1-year 10% stretch goal set for 2023
|
|||
| ◾ | met its long-term (2030) water use reduction target, having achieved a 15% reduction in water withdrawals in 2023 against our 2019 baseline
|
|||
| ◾ | has received Performance Standard certification from the Aluminum Stewardship Initiative (ASI) for five of its Divisions in Europe. ASI is the only voluntary sustainability standard for the aluminum value chain. ASI’s independent third-party certification focuses on material stewardship, including as it relates to product design, life cycle assessments, management of process scrap, and recycling of products at end-of-life
|
|||
| ◾ | recognized our Cosma Division in Mexico with a Commitment to Sustainability Award for its innovative process allowing savings in electricity consumption and automated temperature controls at the facility.
|
|||
| ◾ | recognized its Seating Division in Poland with a Commitment to Sustainability Award for hosting education sessions on sustainability that lead to brainstorming and energy treasure hunts at the facility.
|
|||
| ◾ | is pursuing several packaging and logistics initiatives and aligning with industry partners to limit the overall use of materials and to increase transportation efficiency across the supply chain, including publication of automotive packaging guidelines through a committee of the Suppliers’ Partnership for the Environment which Magna Co-Chairs | |||
|
Take urgent action to combat climate change and its impacts
|
Magna:
|
|||
| ◾ | has approved near- and long-term science-based emission reduction targets with the SBTi, and the SBTi has verified our net-zero science-based target by 2050.
|
|||
| ◾ | is committed to achieving 100% renewable electricity usage by 2025 in its European operations and by 2030 in its global operations. 103 Divisions currently use renewable electricity, with 75 Divisions at 100% renewable electricity.
|
|||
| ◾ | is a financial sponsor of the Technical Office of the International Sustainability Standards Board (ISSB) that is establishing a comprehensive global baseline of climate change-related disclosure standards | |||
A-40 Annual Information Form
| 5. | Sustainability Metrics |
In this Sustainability Report we report according to the SASB framework, and the ISSB IFRS S2 Climate Related Disclosures Standard in relation to Scope 1, 2 and 3 emissions. SASB establishes and maintains industry-specific standards that assist companies in disclosing sustainability information to investors. SASB metrics indicated below are identified by the relevant SASB Auto Parts Sustainability Accounting Standard code. We currently obtain independent, third party validation of our Scope 1 and 2 emissions data, as well as our water withdrawal data. We are committed to continuing to enhance both the data collection/validation processes and thus the quality of the data, in the coming years.
| 5.1 | Energy Management and Emissions |
| 5.1.1 | Energy |
Energy management data is set out below.
| SASB Accounting Metric (TR-AP-130a.1) | 2023(1) | 2022 | 2021 | |||
| Aggregate amount of energy consumed by Magna |
20,077,657 GJ 5,577,127 MWh |
19,859,666 GJ 5,516,574 MWh |
19,681,540 GJ 5,467,094 MWh |
|||
| Percentage of energy consumed by Magna that was supplied from grid electricity |
59.0% | 58.0% | 57.0% | |||
| Percentage of energy consumed by Magna that is renewable energy |
12.9%(2) | 8.8%(2) | 8.2% | |||
Notes:
(1) Preliminary data.
(2) The percentage of renewable electricity used in 2023 was 22% (17% in 2022).
Energy intensity relative to Sales is as follows:
| 2023 | 2022 | 2021 | ||||
| Energy Intensity (MWh/Sales (USDm)) |
130 MWh/USDm | 146 MWh/USDm | 149 MWh/USDm | |||
In connection with our efforts to promote energy efficiency, we developed 1-year, 2-year, and 5-year energy reduction targets as detailed in Section 2.3.1 above. In 2023, we met our 1-year stretch target of reducing our energy intensity (measured in MWh/USDm sales) compared to 2022, achieving an approximately 11% reduction.
Emissions
Energy consumed can be converted to CO2 emissions based on regional conversion factors. In order to help us and our stakeholders better assess trends related to the emissions we generate, we track emissions “intensity” on the basis of total sales, employee headcount and aggregate square footage of our facilities and offices. These intensity metrics assist us in determining whether we are becoming more efficient by normalizing emissions on a per dollar of sales, per employee and per square footage basis. The raw data for Scope 1 & 2 emissions, together with intensity metrics are set out below. Magna adheres to the GHG Protocol Corporate Accounting and Reporting Standard (“GHG Protocol”) for its Scope 1 and 2 reporting. Magna adheres to the GHG Protocol Corporate Value Chain (Scope 3) Standard and guidance from the SBTi for its Scope 3 reporting. We use commonly accepted emission factors such as those available from the GHG Protocol, International Energy Association (IEA), United States EPA, including its eGrid database, United Kingdom Department for Energy Security and Net Zero, ecoinvent and CEDA (Comprehensive Environmental Data Archive), as well as other local or regional references. Our Scope 1 and 2 emissions data is verified annually by an independent third party verification firm.
| ISSB S2, 29(a)(i) | 2023 | 2022 | 2021 | |||||||||
| Scope 1 Emissions (metric tons) |
424,561 | 433,636 | 436,267 | |||||||||
| Scope 2 Emissions (metric tons)(1) |
1,150,656 | 1,168,803 | 1,089,730 | |||||||||
| Scope 1 & 2 Emissions (metric tons)(2) |
1,575,217 | 1,602,439 | 1,525,997 | |||||||||
| Sales (USD, millions) |
42,797 | 37,840 | 36,242 | |||||||||
| Sales Intensity (CO2 metric tons/$ Sales) |
0.0000368 | 0.0000424 | 0.0000421 | |||||||||
| Employees |
179,000 | 168,000 | 158,000 | |||||||||
| Employee Intensity (metric tons/employee) |
8.8 | 9.5 | 9.7 | |||||||||
| Square Footage (million sq. ft) |
83.8 | 84.4 | 83.5 | |||||||||
| Square Footage Intensity (metric tons/sq. ft.) |
0.0188 | 0.0189 | 0.0183 | |||||||||
Notes:
(1) Market-based emissions calculation method.
(2) Sales Intensity, Employee Intensity and Square Footage Intensity are calculated based on combined Scope 1 and 2 Emissions.
Magna International Inc. A-41
In connection with our net-zero commitment and submission of near-term and net-zero targets to SBTi for validation, we submitted our Scope 1, 2 and 3 baseline emissions for 2021 as per the table below:
| Emission Type | 2021 Baseline Year | |||
| Scope 1 (tCO2e) |
436,267 | |||
| Scope 2 (tCO2e) |
1,089,730 | |||
| Scope 3 (tCO2e) |
58,655,441 | |||
| Total |
60,181,438 | |||
| 5.2 | Water and Waste Management |
| 5.2.1 | Water |
We have implemented a 1.5% per year water reduction target, with the aim of reducing water use 15% by 2030, in each case referencing 2019 as the baseline year in which we withdrew 7,740 ML of water. Our water withdrawals in 2023 represent a 15% reduction from our 2019 baseline, meeting our overall 2030 target. Water withdrawal data is verified annually by an independent third party verification firm. Water withdrawal data is set out below:
| Description | 2023 | 2022 | 2021 | |||
| Water withdrawals (ML) |
6,571 | 6,292 | 6,922 | |||
| 5.2.2 | Waste Management |
Waste reduction and scrap elimination are important considerations in our manufacturing activities, including as part of our efforts to achieve operational excellence in our facilities globally. We have implemented a zero waste to landfill target, with the aim of eliminating landfill-bound waste.
Waste data is set out below:
| SASB Accounting Metric (TR-AP-150a.1) | 2023(1) | 2022 | 2021 | |||
| Aggregate amount of waste generated from manufacturing by Magna |
1,365,712 t | 1,476,282 t | 1,178,619 t | |||
| Percentage of waste generated by Magna that is hazardous |
3.9%(2) | 4.3%(2) | 7.0% | |||
| Percentage of waste generated by Magna that was recycled |
91.8%(3) | 87.2%(3) | 88.4% | |||
Notes:
(1) Preliminary data.
(2) Approximately 92% of such hazardous waste was diverted from secure landfills through recycling, reuse, or energy recovery initiatives in 2023 (90% in 2022).
(3) For 2023, this figure would be 96.2% if energy recovery was also included as a category of recycled waste (90.9% in 2022).
| 5.3 | Environmental Remediation |
The aggregate costs incurred in complying with environmental laws and regulations, including the costs of clean-up and remediation, have not had a material adverse effect on Magna to date and are set out below.
| Description | 2023 | 2022 | 2021 | |||
| Annual remediation expenses |
<$1.0m | <$1.0m | <$1.0m | |||
| Aggregate remediation balance for known events |
$18.8m | $16.3m | $14.1m | |||
| Environmental Violations > $10,000 USD |
1 | 0 | — | |||
| Amount paid (in USD) as a result of such Environmental Violations |
$30,000 | N/A | — | |||
| 5.4 | Product Safety |
Magna is at risk for product warranty, product liability and recall costs, and is currently experiencing increased customer pressure to assume greater warranty responsibility. Certain customers seek to impose partial responsibility for warranty costs where the underlying root cause of a product or system failure cannot be determined. For most types of products, we only account for existing or probable product warranty claims. However, for certain complete vehicle assembly, powertrain systems and electronics contracts, Magna also records an estimate of future warranty-related costs based on the terms of the specific customer agreements and/or Magna’s warranty experience. Product liability and recall provisions are established based on Magna’s best estimate of the amounts necessary to settle existing claims, which typically take into account: the number of units that may be returned; the cost of the product being replaced; labour to remove and replace the defective part; and the customer’s administrative costs relating to the recall. Where applicable, such provisions are booked net of recoveries from sub-suppliers and along with related insurance recoveries. Due to the uncertain nature of the net costs, actual product liability costs could be materially different from our best estimates of future costs.
A-42 Annual Information Form
In 2023, our warranty expense (net) decreased by $16 million compared to 2022. See Note 15 of our consolidated financial statements for the year ended December 31, 2023, which have been filed on SEDAR+ www.sedarplus.ca and are on Magna’s website (www.magna.com).
| 5.5 | Fuel Efficiency |
Our product strategy, which is discussed in “Section 4 – Our Business & Strategy – Our Corporate Strategy” of this AIF, includes as a core element the supply of product solutions which support our customers’ objectives of increased fuel efficiency and reduced vehicle CO2 emissions. We do not currently track total revenue from products designed to increase fuel efficiency and/or reduce emissions.
| 5.6 | Materials Sourcing |
The SASB Auto Parts Standard identifies critical materials as defined by the U.S. National Research Council (NRC) of which cobalt, magnesium, tantalum and tungsten are most relevant to our products. We do not purchase such materials in their raw form, however, they may be present in components and sub-assemblies that we purchase. Our key purchased raw materials are steel, resin and aluminum, and our key purchased components include: stampings, electronics, chips, molded parts, die casting, forging, coverstock, and wire harnesses. See the discussion in “Section 6 – Description of the Business – Manufacturing & Engineering – Key Components and Raw Materials” of our AIF.
We address strategic risks regarding critical materials with more limited supply and key commodities/raw materials in a number of ways, including: diversification of suppliers; carrying excess inventory, where appropriate; and, designing and engineering our products to minimize the use of scarce/limited materials, where not constrained by customer specifications. Risks related to continued impact from the global shortage of semiconductors that has materially affected global automotive production volumes since 2020 and may continue having some impact in 2024 is discussed in greater detail in “Section 4 – Our Business & Strategy – Macroeconomic, Political and Other Trends” and “Section 5 – Risk Factors” of our AIF.
We are a member of the Aluminum Stewardship Initiative (ASI), and five of our Powertrain Divisions have received certification under ASI’s Performance Standard, which supports responsible aluminium supply chains by among other things: providing a common standard for assessing ESG performance in the aluminium value chain, and establishing requirements that can be independently audited to provide objective evidence for meeting the criteria for certification, including product design, life cycle assessments, management of process scrap, and recycling of products at end-of-life.
With respect to reputational risk related to critical materials, we maintain a conflict minerals program, including an annual process of determining whether any of our products contain conflict minerals, and through our membership in the responsible mineral initiative (RMI) supporting continuing cross-industry efforts to identify conflict-free smelters and refiners. We also report to requesting OEM customers with respect to Cobalt and Mica.
| 5.7 | Competitive Behaviour |
Magna’s policy is to comply with all applicable laws, including antitrust and competition laws and have implemented a robust compliance training program to mitigate against the risk of an antitrust violation. Our Corporate Ethics and Compliance Program is described in Section 4.5 – “Corporate Ethics and Compliance” of this Sustainability Report.
We previously completed a global review focused on antitrust risk and do not currently anticipate any material liabilities in connection with the review. See “Section 10 – Legal Proceedings” of this AIF.
| SASB Accounting Metric (TR-AP-520a.1) | 2023 | 2022 | 2021 | |||
| Total amount of monetary losses incurred as a result of legal proceedings associated with anti-competitive behaviour regulations |
NIL | $1.2m(1) | NIL | |||
Note:
| (1) | June 2022 settlement with the Conselho Administrativo de Defesa Economica (CADE), Brazil’s Federal competition authority, in connection with an administrative proceeding commenced in 2019 into alleged anticompetitive behaviour regarding the supply of automotive door latches and related products. |
| 5.8 | Health & Safety |
We are committed to providing a safe and healthful workplace for our employees. This commitment is fulfilled through a regular program of health and safety audits and inspections of our global facilities. In connection with our health and safety program we track the frequency and severity of workplace accidents and conduct post-accident reviews to develop action plans to reduce/eliminate similar accidents in the future.
| Description | 2023(1) | 2022 | 2021 | |||
| Accident Frequency Rate(2)(4) |
0.50 | 0.62 | 0.59 | |||
| Accident Severity Rate(3)(4) |
10.2 | 12.4 | 17.4 | |||
Notes:
Magna International Inc. A-43
| (1) | Preliminary data. |
| (2) | Frequency 1.0 translates to 1 injury or illness per 100 employees working 40 hours/week, 50 weeks/year. |
| (3) | Severity 10.0 translates to 10 lost work days per 100 employees working 40 hours/week, 50 weeks/year. Severity Rate is reported as of March 27, 2024, but could change, including as a result of employees who continue to accrue lost work days in relation to an accident. |
| (4) | Global production facilities and certain engineering locations. |
The occurrence of injuries and fatalities is a matter of significant concern for both management and the Board. The TOCC reviews the circumstances related to significant injuries and all fatalities of employees or third parties on Magna properties and reports same to the Board. In 2023, there was 1 employee fatality at Magna facilities.
| 5.9 | Diversity |
Diversity within our employee population is important to us and we strive to create an inclusive work environment throughout our company. As part of our efforts to promote an inclusive workplace, we track metrics relating to gender diversity in our workforce.
| Description | 2023 | 2022 | 2021 | |||
| Percentage of global employees who are women (wholly owned operations) |
28.0% | 28.0% | 27.0% | |||
| Women in critical roles |
18.0%(1) | 18.0% | 16.0% | |||
| Women on the Board of Magna |
38.0%(2) | 42.0% | 42.0% | |||
Notes:
| (1) | 885 women in critical roles out of 4958 such roles. |
| (2) | As of May 9, 2024, the percentage of women on the Board will be 42%, assuming election of all nominees for Magna’s annual meeting of shareholders. |
| 5.10 | Reporting |
In addition to this Sustainability Report, we participate in CDP, a not-for-profit project designed to provide investors with information relating to corporate GHG emissions, water use, deforestation risk and perceived corporate risk due to climate change. Our current CDP submission is available on our website at www.magna.com. We also file a conflict minerals report, available on www.sec.gov/edgar, in accordance with SEC requirements, and publish a slavery and human trafficking statement on our website, at www.magna.com. Magna also provides sustainability reporting directly to our customers. These assessments are supplier requirements and typically follow common reporting templates approved by automotive industry associations in North America (Automotive Industry Action Group) and Europe (CSR Europe/Drive Sustainability).
We also continue to monitor the acceleration of climate/sustainability reporting initiatives by regulators, including:
| ◾ | the European Union’s European Sustainability Reporting Standards (ESRS) and Corporate Sustainability Reporting Directive (CSRD) which will first apply to certain of Magna’s European subsidiaries in 2025 and will be reported on in 2026 for such subsidiaries; |
| ◾ | initiatives by securities law regulators to mandate climate disclosure, including the recently adopted climate disclosure rule adopted by the U.S. SEC; and |
| ◾ | the proposed implementation of Canadian sustainability standards through the Canadian Sustainability Standards Board (CSSB), based on the ISSB Sustainability Disclosure Standards, and any proposed rule changes from Canadian securities regulators incorporating such standards. |
A-44 Annual Information Form
Magna International Inc. 337 Magna Drive Aurora, Ontario Canada L4G 7K1 Telephone: 905 726 2462
FSC CERT ADDED BY PRINTER

|
Magna International Inc. 337 Magna Drive Aurora, Ontario L4G 7K1 Tel (905)
726-2462
Fax (905)
726-7164
|
| • | Evaluated the effectiveness of controls over management’s process for determining the fair value of technology, including management’s controls over the forecasted revenues and the selection of the discount rate; |
| • | Evaluated the reasonableness of forecasted revenues by comparing the assumptions used in the projections to external market sources, historical data and results from other areas of the audit; |
| • | With the assistance of fair value specialists, evaluated the reasonableness of the discount rate by testing the source information underlying the determination of the discount rate and developing a range of independent estimates and comparing those to the discount rate selected by management. |
Note |
2023 |
2022 | ||||||||||
Sales |
$ |
42,797 |
$ | 37,840 | ||||||||
Costs and expenses |
||||||||||||
Cost of goods sold |
37,185 |
33,188 | ||||||||||
Selling, general and administrative |
2,050 |
1,660 | ||||||||||
Depreciation |
1,436 |
1,373 | ||||||||||
Amortization of acquired intangible assets |
88 |
46 | ||||||||||
Interest expense, net |
16 | 156 |
81 | |||||||||
Equity income |
(112 |
) |
(89 | ) | ||||||||
Other expense, net |
4 | 388 |
703 | |||||||||
Income from operations before income taxes |
1,606 |
878 | ||||||||||
Income taxes |
12 | 320 |
237 | |||||||||
Net income |
1,286 |
641 | ||||||||||
Income attributable to non-controlling interests |
(73 |
) |
(49 | ) | ||||||||
Net income attributable to Magna International Inc. |
$ |
1,213 |
$ | 592 | ||||||||
Earnings per Common Share: |
5 | |||||||||||
Basic |
$ |
4.24 |
$ | 2.04 | ||||||||
Diluted |
$ |
4.23 |
$ | 2.03 | ||||||||
Weighted average number of Common Shares outstanding during the year [in millions]: |
5 | |||||||||||
Basic |
286.2 |
290.4 | ||||||||||
Diluted |
286.6 |
291.2 | ||||||||||
Note |
2023 |
2022 | ||||||||||
| Net income |
$ |
1,286 |
$ | 641 | ||||||||
| |
|
|
|
|||||||||
| Other comprehensive income (loss), net of tax: |
21 | |||||||||||
| Net unrealized gain (loss) on translation of net investment in foreign operations |
166 |
(531 | ) | |||||||||
| Net unrealized gain on cash flow hedges |
94 |
1 | ||||||||||
| Reclassification of net gain on cash flow hedges to net income |
(56 |
) |
(20 | ) | ||||||||
| Reclassification of net loss on pensions to net income |
1 |
6 | ||||||||||
| Reclassification of loss on translation of net investment in foreign operations to income |
— |
203 | ||||||||||
| Pension and post-retirement benefits |
(5 |
) |
82 | |||||||||
| |
|
|
|
|||||||||
| Other comprehensive income (loss) |
200 |
(259 | ) | |||||||||
| |
|
|
|
|||||||||
| Comprehensive income |
1,486 |
382 | ||||||||||
| Comprehensive income attributable to non-controlling interests |
(56 |
) |
(13 | ) | ||||||||
| |
|
|
|
|||||||||
| Comprehensive income attributable to Magna International Inc. |
$1,430 |
$369 | ||||||||||
| |
|
|
|
|||||||||
Note |
2023 |
2022 | ||||||||||
ASSETS |
||||||||||||
Current assets |
||||||||||||
Cash and cash equivalents |
6 | $ |
1,198 |
$ | 1,234 | |||||||
Accounts receivable |
7,881 |
6,791 | ||||||||||
Inventories |
8 | 4,606 |
4,180 | |||||||||
Prepaid expenses and other |
352 |
320 | ||||||||||
14,037 |
12,525 | |||||||||||
Investments |
9 | 1,273 |
1,429 | |||||||||
Fixed assets, net |
10 | 9,618 |
8,173 | |||||||||
Operating lease right-of-use |
17 | 1,744 |
1,595 | |||||||||
Intangible assets, net |
13 | 876 |
452 | |||||||||
Goodwill |
11 | 2,767 |
2,031 | |||||||||
Other assets |
14, 18 | 1,319 |
1,093 | |||||||||
Deferred tax assets |
12 | 621 |
491 | |||||||||
$ |
32,255 |
$ | 27,789 | |||||||||
LIABILITIES AND SHAREHOLDERS’ EQUITY |
||||||||||||
Current liabilities |
||||||||||||
Short-term borrowing |
$ |
511 |
$ | 8 | ||||||||
Accounts payable |
7,842 |
6,999 | ||||||||||
Other accrued liabilities |
15 | 2,626 |
2,118 | |||||||||
Accrued salaries and wages |
912 |
850 | ||||||||||
Income taxes payable |
125 |
93 | ||||||||||
Long-term debt due within one year |
16 | 819 |
654 | |||||||||
Current portion of operating lease liabilities |
17 | 399 |
276 | |||||||||
13,234 |
10,998 | |||||||||||
Long-term debt |
16 | 4,175 |
2,847 | |||||||||
Operating lease liabilities |
17 | 1,319 |
1,288 | |||||||||
Long-term employee benefit liabilities |
18 | 591 |
548 | |||||||||
Other long-term liabilities |
19 | 475 |
461 | |||||||||
Deferred tax liabilities |
12 | 184 |
312 | |||||||||
19,978 |
16,454 | |||||||||||
Shareholders’ equity |
||||||||||||
Common Shares [issued: 2023 – 286,552,908; 2022 – 285,931,816] |
20 | 3,354 |
3,299 | |||||||||
Contributed surplus |
125 |
111 | ||||||||||
Retained earnings |
9,303 |
8,639 | ||||||||||
Accumulated other comprehensive loss |
21 | (898 |
) |
(1,114 |
) |
|||||||
11,884 |
10,935 | |||||||||||
Non-controlling interests |
393 |
400 | ||||||||||
12,277 |
11,335 | |||||||||||
$ |
32,255 |
$ | 27,789 | |||||||||
| On behalf of the Board: | ||||
/s/ “Peter Bowie” |
/s/ “Robert F. MacLellan” |
|||
| Director | Chairman of the Board | |||
Note |
2023 |
2022 | ||||||||||
OPERATING ACTIVITIES |
||||||||||||
Net income |
$ |
1,286 |
$ | 641 | ||||||||
Items not involving current cash flows |
6 | 1,642 |
1,776 | |||||||||
2,928 |
2,417 | |||||||||||
Changes in operating assets and liabilities |
6 | 221 |
(322 | ) | ||||||||
Cash provided from operating activities |
3,149 |
2,095 | ||||||||||
INVESTMENT ACTIVITIES |
||||||||||||
Acquisitions |
7 | (1,504 |
) |
(3 | ) | |||||||
Fixed asset additions |
(2,500 |
) |
(1,681 | ) | ||||||||
Increase in investments, other assets and intangible assets |
(562 |
) |
(455 | ) | ||||||||
Increase in public and private equity investments |
(11 |
) |
(29 | ) | ||||||||
Proceeds from dispositions |
122 |
124 | ||||||||||
Net cash (outflow) inflow from disposal of facilities |
4 | (48 |
) |
6 | ||||||||
Cash used for investing activities |
(4,503 |
) |
(2,038 | ) | ||||||||
FINANCING ACTIVITIES |
||||||||||||
Issues of debt |
16 | 2,083 |
54 | |||||||||
Increase in short-term borrowings |
487 |
11 | ||||||||||
Repayments of debt |
16 | (644 |
) |
(456 | ) | |||||||
Issue of Common Shares on exercise of stock options |
20 |
8 | ||||||||||
Tax withholdings on vesting of equity awards |
(11 |
) |
(15 | ) | ||||||||
Repurchase of Common Shares |
20 | (13 |
) |
(780 | ) | |||||||
Contributions to subsidiaries by non-controlling interests |
11 |
5 | ||||||||||
Dividends paid to non-controlling interests |
(74 |
) |
(46 | ) | ||||||||
Dividends |
(522 |
) |
(514 | ) | ||||||||
Cash provided from (used for) financing activities |
1,337 |
(1,733 | ) | |||||||||
Effect of exchange rate changes on cash and cash equivalents |
(19 |
) |
(38 | ) | ||||||||
Net decrease in cash, cash equivalents during the year |
(36 |
) |
(1,714 | ) | ||||||||
Cash and cash equivalents, beginning of year |
1,234 |
2,948 | ||||||||||
Cash and cash equivalents, end of year |
6 | $ |
1,198 |
$ | 1,234 | |||||||
Common Shares |
Contri- |
Non- |
||||||||||||||||||||||||||
Number |
Stated Value |
buted Surplus |
Retained Earnings |
AOCL [i]
|
controlling Interests |
Total Equity |
||||||||||||||||||||||
[in millions] |
||||||||||||||||||||||||||||
Balance, December 31, 2021 |
297.9 |
$ |
3,403 |
$ |
102 |
$ |
9,231 |
$ |
(900 |
) |
$ |
389 |
$ |
12,225 |
||||||||||||||
Net income |
592 | 49 | 641 | |||||||||||||||||||||||||
Other comprehensive loss |
(223 | ) | (36 | ) | (259 | ) | ||||||||||||||||||||||
Contribution by non-controlling interests |
5 | 5 | ||||||||||||||||||||||||||
Purchase of non-controlling interests |
(8 | ) | (8 | ) | ||||||||||||||||||||||||
Shares issued on exercise of stock options |
0.2 | 9 | (1 | ) | 8 | |||||||||||||||||||||||
Release of stock and stock units |
0.5 | 21 | (21 | ) | — | |||||||||||||||||||||||
Tax withholdings on vesting of equity awards |
(0.2 | ) | (2 | ) | (13 | ) | (15 | ) | ||||||||||||||||||||
Repurchase and cancellation under normal course issuer bids [note 20] |
(12.6 | ) | (141 | ) | (648 | ) | 9 | (780 | ) | |||||||||||||||||||
Stock-based compensation expense |
31 | 31 | ||||||||||||||||||||||||||
Business combinations |
47 | 47 | ||||||||||||||||||||||||||
Dividends paid to non-controlling interests |
(46 | ) | (46 | ) | ||||||||||||||||||||||||
Dividends paid [$1.80 per share] |
0.1 | 9 | (523 | ) | (514 | ) | ||||||||||||||||||||||
Balance, December 31, 2022 |
285.9 |
$ |
3,299 |
$ |
111 |
$ |
8,639 |
$ |
(1,114 |
) |
$ |
400 |
$ |
11,335 |
||||||||||||||
Net income |
1,213 | 73 | 1,286 | |||||||||||||||||||||||||
Other comprehensive income |
217 | (17 | ) | 200 | ||||||||||||||||||||||||
Contribution by non-controlling interests |
11 | 11 | ||||||||||||||||||||||||||
Shares issued on exercise of stock options |
0.5 | 25 | (5 | ) | 20 | |||||||||||||||||||||||
Release of stock and stock units |
0.4 | 26 | (26 | ) | — | |||||||||||||||||||||||
Tax withholdings on vesting of equity awards |
(0.2 | ) | (2 | ) | (9 | ) | (11 | ) | ||||||||||||||||||||
Repurchase and cancellation under normal course issuer bids [note20] |
(0.2 | ) | (2 | ) | (10 | ) | (1 | ) | (13 | ) | ||||||||||||||||||
Stock-based compensation expense |
45 | 45 | ||||||||||||||||||||||||||
Dividends paid to non-controlling interests |
(74 | ) | (74 | ) | ||||||||||||||||||||||||
Dividends paid [$1.84 per share] |
0.2 | 8 | (530 | ) | (522 | ) | ||||||||||||||||||||||
Balance, December 31, 2023 |
286.6 |
$ |
3,354 |
$ |
125 |
$ |
9,303 |
$ |
(898 |
) |
$ |
393 |
$ |
12,277 |
||||||||||||||
(i) |
AOCL is Accumulated Other Comprehensive Loss. |
1. |
NATURE OF OPERATIONS AND BASIS OF PRESENTATION |
2. |
SIGNIFICANT ACCOUNTING POLICIES |
3. |
ACCOUNTING STANDARDS |
4. |
OTHER EXPENSE, NET |
2023 |
2022 | |||||||
Investments [a]
|
$ |
201 |
$ | 221 | ||||
Restructuring [b]
|
148 |
22 | ||||||
Veoneer Active Safety Business transaction costs [c]
|
23 |
— | ||||||
Impairments and loss on sale of operations in Russia [d]
|
16 |
376 | ||||||
Loss on sale of business [e]
|
— |
58 | ||||||
Impairments [f]
|
— |
26 | ||||||
Other expense, net |
$ |
388 |
$ | 703 | ||||
[a] |
Investments |
2023 |
2022 | |||||||
Revaluation of public company warrants |
$ |
110 |
$ | 173 | ||||
Non-cash impairment charges [i]
|
90 |
— | ||||||
Revaluation of public and private equity investments |
1 |
49 | ||||||
Net gain on sale of public equity investments |
— |
(1 | ) | |||||
Other expense, net |
201 |
221 | ||||||
Tax effect |
(28 |
) |
(53 | ) | ||||
Net loss attributable to Magna |
$ |
173 |
$ | 168 | ||||
| [i] | The non-cash impairment charges relate to impairments of private equity investments and related long-term receivables within Other assets. |
[b] |
Restructuring |
[c] |
Veoneer Active Safety Business transaction costs |
[d] |
Impairments and loss on sale of operations in Russia |
[e] |
Loss on sale of business |
[f] |
Impairments |
5. |
EARNINGS PER SHARE |
2023 |
2022 | |||||||
Basic earnings per Common Share: |
||||||||
Net income attributable to Magna International Inc. |
$ |
1,213 |
$ | 592 | ||||
Weighted average number of Common Shares outstanding during the year |
286.2 |
290.4 | ||||||
Basic earnings per Common Share |
$ |
4.24 |
$ | 2.04 | ||||
Diluted earnings per Common Share [a]: |
||||||||
Net income attributable to Magna International Inc. |
$ |
1,213 |
$ | 592 | ||||
Weighted average number of Common Shares outstanding during the year |
286.2 |
290.4 | ||||||
Stock options and restricted stock |
0.4 |
0.8 | ||||||
286.6 |
291.2 | |||||||
Diluted earnings per Common Share |
$ |
4.23 |
$ | 2.03 | ||||
| [a] | Diluted earnings per Common Share exclude 2.8 million [2022 – 1.3 million] Common Shares issuable under the Company’s Incentive Stock Option Plan because these options were not “in-the-money”. two-class method was excluded from the calculation of earnings per share because the effect would be immaterial. |
6. |
DETAILS OF CASH FROM OPERATING ACTIVITIES |
| [a] | Cash and cash equivalents consist of: |
2023 |
2022 | |||||||
Bank term deposits and bankers' acceptances |
$ |
502 |
$ | 720 |
||||
Cash |
696 |
514 |
||||||
$ |
1,198 |
$ | 1,234 |
|||||
| [b] | Items not involving current cash flows: |
2023 |
2022 | |||||||
Depreciation |
$ |
1,436 |
$ | 1,373 | ||||
Amortization of acquired intangible assets |
88 |
46 | ||||||
Amortization of other assets and intangible assets included in cost of goods sold |
224 |
169 | ||||||
Deferred revenue amortization |
(159 |
) |
(201 | ) | ||||
Other non-cash charges |
41 |
21 | ||||||
Deferred tax recovery |
(261 |
) |
(202 | ) | ||||
Equity income less than (in excess of) dividends received |
37 |
(24 | ) | |||||
Non-cash portion of Other expense, net [note 4] |
236 |
594 | ||||||
$ |
1,642 |
$ | 1,776 | |||||
| [c] | Changes in operating assets and liabilities: |
2023 |
2022 | |||||||
Accounts receivable |
$ |
(819 |
) |
$ | (798 | ) | ||
Inventories |
(196 |
) |
(448 | ) | ||||
Prepaid expenses and other |
15 |
(43 | ) | |||||
Accounts payable |
609 |
812 | ||||||
Accrued salaries and wages |
(23 |
) |
20 | |||||
Other accrued liabilities |
636 |
250 | ||||||
Income taxes receivable |
(1 |
) |
(115 | ) | ||||
$ |
221 |
$ | (322 | ) | ||||
7. |
BUSINESS COMBINATIONS |
[a] |
Veoneer AS |
Non-cash working capital |
$ | 100 | ||
Fixed assets |
245 | |||
Other assets |
96 | |||
Intangible assets |
459 | |||
Goodwill |
670 | |||
Other liabilities |
(98 | ) | ||
Deferred tax liabilities |
(34 | ) | ||
Purchase price |
1,438 | |||
Receivable from seller |
37 | |||
Net cash outflow |
$ | 1,475 | ||
[b] |
Magna Yuma |
8. |
INVENTORIES |
2023 |
2022 | |||||||
Raw materials and supplies |
$ |
1,861 |
$ | 1,640 | ||||
Work-in-process |
450 |
427 | ||||||
Finished goods |
569 |
537 | ||||||
Tooling and engineering |
1,726 |
1,576 | ||||||
$ |
4,606 |
$ | 4,180 | |||||
9. |
INVESTMENTS |
2023 |
2022 | |||||||
Equity method investments [a]
|
$ |
987 |
$ | 997 | ||||
Public and private equity investments |
230 |
290 | ||||||
Warrants [b]
|
34 |
142 | ||||||
Debt investments |
22 |
— | ||||||
$ |
1,273 |
$ | 1,429 | |||||
| [a] | The ownership percentages and carrying values of the Company’s principal equity method investments at December 31 were as follows [in millions, except percentages]: |
2023 |
2022 | |||||||||||
LG Magna e-Powertrain Co., Ltd. [i]
|
49.0 |
% |
$ |
405 |
$ | 420 | ||||||
Litens Automotive Partnership [ii]
|
76.7 |
% |
$ |
332 |
$ | 337 | ||||||
Hubei HAPM Magna Seating Systems Co., Ltd. |
49.9 |
% |
$ |
129 |
$ | 120 | ||||||
BAIC BluePark Magna Automobile Co., Ltd. |
49.0 |
% |
$ |
95 |
$ | 91 | ||||||
| [i] | LG Magna e-Powertrain [“LGM”] is a variable interest entity [‘‘VIE’’] and depends on the Company and LG Electronics for any additional cash needs. The Company cannot make key operating decisions considered the most significant to the VIE, and is therefore not the primary beneficiary. The Company’s known maximum exposure to loss approximated the carrying value of its investment balance as at December 31, 2023. |
| [ii] | The Company accounts for its investments under the equity method of accounting as a result of significant participating rights that prevent control. |
| [b] | In October 2020, the Company signed agreements with Fisker Inc. [“Fisker”] for the platform sharing, engineering and manufacturing of the Fisker Ocean SUV. In connection with the arrangement, Fisker issued approximately 19.5 million penny warrants to the Company to purchase common stock, which vested during 2021 and 2022 based on specified milestones for a total value of $320 million. The initial value attributable to the warrants was deferred within other accrued liabilities and other long-term liabilities and is being recognized in income as performance obligations are satisfied. |
2023 |
2022 | |||||||
Current assets |
$ |
2,516 |
$ | 2,266 | ||||
Non-current assets |
$ |
1,884 |
$ | 1,866 | ||||
Current liabilities |
$ |
1,702 |
$ | 1,555 | ||||
Long-term liabilities |
$ |
876 |
$ | 715 | ||||
2023 |
2022 | |||||||
Sales |
$ |
5,008 |
$ | 4,447 | ||||
Cost of goods sold & expenses |
4,863 |
4,363 | ||||||
Net income |
$ |
145 |
$ | 84 | ||||
10. |
FIXED ASSETS |
2023 |
2022 | |||||||
Cost |
||||||||
Land |
$ |
188 |
$ | 181 | ||||
Buildings |
3,014 |
2,740 | ||||||
Machinery and equipment |
19,226 |
17,258 | ||||||
22,428 |
20,179 | |||||||
Accumulated depreciation |
||||||||
Buildings |
(1,394 |
) |
(1,310 | ) | ||||
Machinery and equipment |
(11,416 |
) |
(10,696 | ) | ||||
$ |
9,618 |
$ | 8,173 | |||||
11. |
GOODWILL |
Body Exteriors & Structures |
Power & Vision |
Seating Systems |
Complete Vehicles |
Corporate |
Total |
|||||||||||||||||||
Balance, December 31, 2021 |
471 | 1,269 | 270 | 112 | — | 2,122 | ||||||||||||||||||
Acquisitions [note 7] |
— | — | — | — | 20 | 20 | ||||||||||||||||||
Foreign exchange and other |
(23 | ) | (71 | ) | (10 | ) | (7 | ) |
— |
(111 | ) | |||||||||||||
Balance, December 31, 2022 |
448 | 1,198 | 260 | 105 | 20 | 2,031 | ||||||||||||||||||
Acquisitions [note 7] |
— |
670 |
— |
— |
— |
670 |
||||||||||||||||||
Foreign exchange and other |
4 |
60 |
(2 |
) |
4 |
— |
66 |
|||||||||||||||||
Balance, December 31, 2023 |
$ |
452 |
$ |
1,928 |
$ |
258 |
$ |
109 |
$ |
20 |
$ |
2,767 |
||||||||||||
12. |
INCOME TAXES |
| [a] | The provision for income taxes differs from the expense that would be obtained by applying the Canadian statutory income tax rate as a result of the following: |
2023 |
2022 | |||||||
Canadian statutory income tax rate |
26.5 |
% |
26.5 | % | ||||
Tax on repatriation of foreign earnings |
3.6 |
5.3 | ||||||
Net effect of losses not benefited |
1.2 |
7.7 | ||||||
Non-taxable capital losses (gains) |
1.2 |
(0.3 | ) | |||||
Reserve for uncertain tax positions |
0.6 |
0.4 | ||||||
Earnings of equity accounted investees |
(1.4 |
) |
(1.6 | ) | ||||
Foreign exchange re-measurement
|
(1.7 |
) |
(0.6 | ) | ||||
Deductible inflationary adjustments |
(1.7 |
) |
(3.3 | ) | ||||
Valuation allowance on deferred tax assets |
(3.0 |
) |
(2.2 | ) | ||||
Foreign rate differentials |
(3.2 |
) |
0.6 | |||||
Research and development tax credits |
(4.1 |
) |
(7.1 | ) | ||||
Others |
1.9 |
1.6 | ||||||
Effective income tax rate |
19.9 |
% |
27.0 | % | ||||
| [b] | The details of income (loss) before income taxes by jurisdiction are as follows: |
2023 |
2022 | |||||||
Canadian |
$ |
(184 |
) |
$ | (57 | ) | ||
Foreign |
1,790 |
935 | ||||||
$ |
1,606 |
$ | 878 | |||||
| [c] | The details of the income tax provision are as follows: |
2023 |
2022 | |||||||
Current |
||||||||
Canadian |
$ |
24 |
$ | 5 | ||||
Foreign |
557 |
452 | ||||||
581 |
457 | |||||||
Deferred |
||||||||
Canadian |
(26 |
) |
(25 | ) | ||||
Foreign |
(235 |
) |
(195 | ) | ||||
(261 |
) |
(220 | ) | |||||
$ |
320 |
$ | 237 | |||||
| [d] | Deferred income taxes have been provided on temporary differences, which consist of the following: |
2023 |
2022 | |||||||
Tax depreciation in excess of (less than) book depreciation |
$ |
33 |
$ |
(21 | ) | |||
Tax on undistributed foreign earnings |
4 |
(34 | ) | |||||
Re-measurement of deferred tax assets |
(8 |
) |
(7 | ) | ||||
Net tax losses (benefit) utilization |
(25 |
) |
10 | |||||
Unrealized loss on remeasurement of investments |
(26 |
) |
(48 | ) | ||||
Change in valuation allowance on deferred tax assets |
(47 |
) |
(19 | ) | ||||
Net (increase) decrease in non-deductible liabilities |
(63 |
) |
17 | |||||
Book amortization in excess of tax amortization |
(112 |
) |
(89 | ) | ||||
Others |
(17 |
) |
(29 | ) | ||||
$ |
(261 |
) |
$ | (220 | ) | |||
| [e] | Deferred tax assets and liabilities consist of the following temporary differences: |
2023 |
2022 | |||||||
Assets |
||||||||
Tax benefit of loss carryforwards |
$ |
892 |
$ | 760 | ||||
Liabilities currently not deductible for tax |
400 |
269 | ||||||
Operating lease liabilities |
399 |
367 | ||||||
Other assets tax value in excess of book value |
150 |
87 | ||||||
Tax credit carryforwards |
90 |
87 | ||||||
Unrealized losses on remeasurement of investments |
79 |
37 | ||||||
Unrealized loss on foreign exchange hedges and retirement liabilities |
44 |
70 | ||||||
Others |
29 |
29 | ||||||
2,083 |
1,706 | |||||||
Valuation allowance against tax benefit of loss carryforwards |
(597 |
) |
(579 | ) | ||||
Other valuation allowance |
(221 |
) |
(198 | ) | ||||
$ |
1,265 |
$ | 929 | |||||
Liabilities |
||||||||
Operating lease right-of-use assets |
403 |
372 | ||||||
Tax depreciation in excess of book depreciation |
232 |
186 | ||||||
Tax on undistributed foreign earnings |
171 |
171 | ||||||
Unrealized gain on foreign exchange hedges and retirement liabilities |
22 |
21 | ||||||
828 |
750 | |||||||
Net deferred tax assets |
$ |
437 |
$ | 179 | ||||
2023 |
2022 |
|||||||
Long-term deferred tax assets |
$ |
621 |
$ | 491 | ||||
Long-term deferred tax liabilities |
(184 |
) |
(312 | ) | ||||
$ |
437 |
$ | 179 | |||||
| [f] | Deferred income taxes have not been provided on $5.3 billion of undistributed earnings of certain foreign subsidiaries, as the Company has concluded that such earnings should not give rise to additional tax liabilities upon repatriation or are indefinitely reinvested. A determination of the amount of the unrecognized tax liability relating to the remittance of such undistributed earnings is not practicable. |
| [g] | Income taxes paid in cash [net of refunds] were $546 million for the year ended December 31, 2023 [2022 - $560 million]. |
| [h] | As at December 31, 2023, the Company had domestic and foreign operating loss carryforwards of $3.5 billion and tax credit carryforwards of $90 million. Approximately $2.3 billion of the operating losses can be carried forward indefinitely. The remaining operating losses and tax credit carryforwards expire between 2024 and 2043. |
| [i] | As at December 31, 2023 and 2022, the Company’s gross unrecognized tax benefits were $220 million and $142 million, respectively [excluding interest and penalties], of which $188 million and $135 million, respectively, if recognized, would affect the Company’s effective tax rate. The gross unrecognized tax benefits differ from the amount that would affect the Company’s effective tax rate due primarily to the impact of the valuation allowance on deferred tax assets. A summary of the changes in gross unrecognized tax benefits is as follows: |
2023 |
2022 | |||||||
Balance, beginning of year |
$ |
142 |
$ | 142 | ||||
Increase based on tax positions related to current year |
28 |
52 | ||||||
Decrease based on tax positions of prior years |
— |
(17 | ) | |||||
Settlements |
1 |
(10 | ) | |||||
Foreign currency translation |
5 |
(4 | ) | |||||
Statute expirations |
(14 |
) |
(21 | ) | ||||
Acquisitions [note 7] |
58 |
— |
||||||
$ |
220 |
$ | 142 | |||||
13. |
INTANGIBLE ASSETS |
|
Remaining
weighted average useful life in years |
2023 |
2022 | ||||||||||
Cost |
||||||||||||
Customer relationship intangibles |
7 | $ |
514 |
$ | 388 | |||||||
Patents and Technology |
7 | 613 |
249 | |||||||||
Computer software and other licenses |
6 | 621 |
529 | |||||||||
1,748 |
1,166 | |||||||||||
Accumulated depreciation |
||||||||||||
Customer relationship intangibles |
(236 |
) |
(194 | ) | ||||||||
Patents and Technology |
(163 |
) |
(118 | ) | ||||||||
Computer software and other licenses |
(473 |
) |
(402 | ) | ||||||||
$ |
876 |
$ | 452 | |||||||||
14. |
OTHER ASSETS |
2023 |
2022 | |||||||
Preproduction costs related to long-term supply agreements |
$ |
835 |
$ | 679 | ||||
Long-term receivables |
321 |
262 | ||||||
Unrealized gain on cash flow hedges [note 22] |
4 |
26 | ||||||
Pension overfunded status [note 18[a]] |
41 |
41 | ||||||
Other |
118 |
85 | ||||||
$ |
1,319 |
$ | 1,093 | |||||
15. |
WARRANTY |
2023 |
2022 | |||||||
Balance, beginning of year |
$ |
257 |
$ | 247 | ||||
Expense, net |
85 |
101 | ||||||
Settlements |
(91 |
) |
(77 | ) | ||||
Business combination [note 7] |
12 |
— | ||||||
Foreign exchange and other |
7 |
(14 | ) | |||||
$ |
270 |
$ | 257 | |||||
16. |
DEBT |
| [a] | Credit Facilities |
[b] |
Commercial Paper Program |
| [a] | The Company’s long-term debt, net of unamortized issuance costs, is substantially uncollateralized and consists of the following: |
2023 |
2022 | |||||||
Senior Notes [note 16 [c]] |
||||||||
$750 million Senior Notes due 2024 at 3.625% |
$ |
750 |
749 | |||||
$650 million Senior Notes due 2025 at 4.150% |
648 |
647 | ||||||
$300 million Senior Notes due 2026 at 5.980% |
298 |
— | ||||||
€600 million Senior Notes due 2027 at 1.500% |
662 |
640 | ||||||
$750 million Senior Notes due 2030 at 2.450% |
745 |
744 | ||||||
Cdn$350 million Senior Notes due 2031 at 4.950% |
263 |
— | ||||||
€550 million Senior Notes due 2032 at 4.375% |
604 |
— | ||||||
$500 million Senior Notes due 2033 at 5.500% |
495 |
— | ||||||
€550 million Senior Notes due 2023 at 1.900% |
— |
588 | ||||||
Bank term debt at a weighted average interest rate of 5.99% [2022 – 3.98%], denominated primarily in USD and Chinese Renminbi [note 16 [d]] |
510 |
114 | ||||||
Government loans at a weighted average interest rate of 0.12% [2022 – 0.12%], denominated primarily in Canadian dollar and euro |
8 |
8 | ||||||
Other |
11 |
11 | ||||||
4,994 |
3,501 | |||||||
Less due within one year |
819 |
654 | ||||||
$ |
4,175 |
$ | 2,847 | |||||
| [b] | Future principal repayments on long-term debt are estimated to be as follows: |
2024 |
$ |
819 |
||
2025 |
693 |
|||
2026 |
408 |
|||
2027 |
666 |
|||
2028 |
301 |
|||
Thereafter |
2,125 |
|||
$ |
5,012 |
|||
| [c] | During the first quarter of 2023, the Company issued the following Senior Notes: |
Issuance Date |
Maturity Date |
|||
| Cdn$350 million Senior Notes at 4.950% | March 10, 2023 | January 31, 2031 | ||
| €550 million Senior Notes at 4.375% | March 17, 2023 | March 17, 2032 | ||
| $300 million Senior Notes at 5.980% | March 21, 2023 | March 21, 2026 | ||
| $500 million Senior Notes at 5.500% | March 21, 2023 | March 21, 2033 |
| [d] | On March 6, 2023, the Company entered into a syndicated, unsecured, delayed draw term loan [the “Term Loan”] with a 3-year tranche of $800 million and 5-year tranche of $600 million. During the second quarter of 2023, the Company drew $100 million from the 3-year tranche and $300 million from the 5-year tranche of the Term Loan. The amounts are drawn in advances of 1, 3 or 6-month loans and may be rolled over until the end of the 3- and 5-year terms. The remaining balance of the facility was subsequently cancelled. |
| [e] | On April 27, 2023, the Company amended its $2.7 billion syndicated revolving credit facility, including to: (i) extend the maturity date from June 24, 2027 to June 24, 2028, and (ii) cancel the $150 million Asian tranche and allocate the equivalent amount to the Canadian tranche. The Company had limited borrowing under this credit facility. The facility also includes a $150 million Mexican tranche and a tranche for Canada, U.S. and Europe, which is fully transferable between jurisdictions and can be drawn in U.S. dollars, Canadian dollars or Euros. As at December 31, 2023, there was no amount outstanding [2022—$1 million]. |
| [f] | Interest expense, net includes: |
2023 |
2022 | |||||||
Interest expense |
||||||||
Current |
$ |
80 |
$ | 25 | ||||
Long-term |
162 |
101 | ||||||
242 |
126 | |||||||
Interest income |
(86 |
) |
(45 | ) | ||||
Interest expense, net |
$ |
156 |
$ | 81 | ||||
| [g] | Interest paid in cash was $242 million |
17. |
LEASES |
| [a] | The Company has entered into leases primarily for real estate, manufacturing equipment and vehicles with terms that range from 1 to 10 years, excluding land use rights which generally extend over 90 years. These leases often include options to extend the term of the lease, most often for a period of 5 years. When it is reasonably certain that the option will be exercised, the impact of the option is included in the lease term for purposes of determining total future lease payments. |
2023 |
||||||||
Operating lease expense |
$ |
353 |
$ |
344 |
||||
Short-term lease expense |
18 |
25 |
||||||
Variable lease expense |
27 |
26 |
||||||
Total lease expense |
$ |
398 |
$ |
395 |
||||
2023 |
2022 |
|||||||
Operating cash flows – cash paid |
$ |
366 |
$ |
375 |
||||
New right-of-use assets |
$ |
320 |
$ |
167 |
||||
Weighted-average remaining lease term |
8 years |
8 years |
||||||
Weighted-average discount rate |
5.4 |
% |
4.7 |
% |
||||
| [b] | Operating lease liabilities consist of: |
Current operating liabilities |
$ |
399 |
$ |
276 |
||||
Non-current operating lease liabilities |
1,319 |
1,288 |
||||||
Total lease liabilities |
$ |
1,718 |
$ |
1,564 |
||||
| [c] | Future annual payments for operating leases are as follows: |
2023 [i]
|
||||
2024 |
$ |
326 |
||
2025 |
291 |
|||
2026 |
244 |
|||
2027 |
215 |
|||
2028 |
186 |
|||
Thereafter |
779 |
|||
2,041 |
||||
Less: amount representing interest |
323 |
|||
Total lease liabilities |
$ |
1,718 |
||
| [i] | Excludes $143 million of future payments for leases, primarily for manufacturing facilities, commencing during 2024. |
| [d] | The Company’s finance leases were not material for any of the periods presented. |
18. |
LONG-TERM EMPLOYEE BENEFIT LIABILITIES |
2023 |
2022 | |||||||
Defined benefit pension plans and other [a] |
$ |
124 |
$ | 146 | ||||
Termination and long-term service arrangements [b] |
428 |
369 | ||||||
Retirement medical benefits plans [c] |
20 |
20 | ||||||
Other long-term employee benefits |
19 |
13 | ||||||
Long-term employee benefit obligations |
$ |
591 |
$ | 548 | ||||
[a] |
Defined benefit pension plans |
2023 |
2022 | |||||||
Projected benefit obligation |
||||||||
Discount rate |
4.7 |
% |
4.8 | % | ||||
Rate of compensation increase |
3.7 |
% |
3.6 | % | ||||
Net periodic benefit cost |
||||||||
Discount rate |
4.5 |
% |
2.8 | % | ||||
Rate of compensation increase |
3.7 |
% |
2.9 | % | ||||
Expected return on plan assets |
5.7 |
% |
4.6 | % | ||||
2023 |
2022 | |||||||
Projected benefit obligation |
||||||||
Beginning of year |
$ |
498 |
$ | 689 | ||||
Current service cost |
6 |
9 | ||||||
Interest cost |
22 |
14 | ||||||
Actuarial gains and changes in actuarial assumptions |
5 |
(155 | ) | |||||
Benefits paid |
(24 |
) |
(31 | ) | ||||
Acquisition [note 7] |
4 |
— | ||||||
Divestiture |
(10 |
) |
— | |||||
Foreign exchange |
10 |
(28 | ) | |||||
End of year |
511 |
498 | ||||||
Plan assets at fair value [i] |
||||||||
Beginning of year |
391 |
532 | ||||||
Return on plan assets |
41 |
(107 | ) | |||||
Employer contributions |
7 |
11 | ||||||
Benefits paid |
(19 |
) |
(27 | ) | ||||
Foreign exchange |
7 |
(18 | ) | |||||
End of year |
427 |
391 | ||||||
Ending funded status – Plan deficit |
$ |
84 |
$ | 107 | ||||
Amounts recorded in the consolidated balance sheet |
||||||||
Non-current asset [note 14] |
$ |
41 |
$ | 41 | ||||
Current liability |
1 |
2 | ||||||
Non-current liability |
124 |
146 | ||||||
Net liability |
$ |
84 |
$ | 107 | ||||
Amounts recorded in accumulated other comprehensive income Unrecognized actuarial losses |
$ |
(75 |
) |
$ | (86 | ) | ||
Net periodic benefit cost |
||||||||
Current service cost |
$ |
6 |
$ | 9 | ||||
Interest cost |
22 |
14 | ||||||
Return on plan assets |
(21 |
) |
(23 | ) | ||||
Actuarial losses |
3 |
3 | ||||||
Net periodic benefit cost |
$ |
10 |
$ | 3 | ||||
| [i] | The asset allocation of the Company’s defined benefit pension plans at December 31, 2023 and the target allocation range for 2024 are as follows: |
2024 |
2023 | |||||||
| Fixed income securities | 60-86 |
% |
67 | % | ||||
| Equity securities | 19-45 |
% |
28 | % | ||||
Cash and cash equivalents |
0-10 |
% |
5 | % | ||||
100 |
% |
100 | % | |||||
[b] |
Termination and long-term service arrangements |
2023 |
2022 |
|||||||
Discount rate |
5.3 |
% |
4.8 |
% |
||||
Rate of compensation increase |
3.7 |
% |
3.5 |
% |
||||
2023 |
2022 | |||||||
| Projected benefit obligation |
||||||||
| Beginning of year |
$ |
387 |
$ | 467 | ||||
| Current service cost |
16 |
13 | ||||||
| Interest cost |
20 |
11 | ||||||
| Actuarial losses (gains) and changes in actuarial assumptions |
21 |
(67 | ) | |||||
| Benefits paid |
(24 |
) |
(18 | ) | ||||
| Foreign exchange |
25 |
(19 | ) | |||||
| |
|
|
|
|||||
| Ending funded status – Plan deficit |
$ |
445 |
$ | 387 | ||||
| |
|
|
|
|||||
| Amounts recorded in the consolidated balance sheet |
||||||||
| Current liability |
$ |
17 |
$ | 18 | ||||
| Non-current liability |
428 |
369 | ||||||
| |
|
|
|
|||||
| Net liability |
$ |
445 |
$ | 387 | ||||
| |
|
|
|
|||||
| Amounts recorded in accumulated other comprehensive income Unrecognized actuarial losses |
$ |
(59 |
) |
$ | (38 | ) | ||
| |
|
|
|
|||||
| Net periodic benefit cost |
||||||||
| Current service cost |
$ |
16 |
$ | 13 | ||||
| Interest cost |
20 |
11 | ||||||
| Actuarial losses |
7 |
7 | ||||||
| |
|
|
|
|||||
| Net periodic benefit cost |
$ |
43 |
$ | 31 | ||||
| |
|
|
|
|||||
[c] |
Retirement medical benefits plans |
2023 |
2022 |
|||||||
| Retirement medical benefit obligations |
4.8 |
% |
5.1 |
% | ||||
| Net periodic benefit cost |
5.1 |
% |
3.1 |
% | ||||
| Health care cost inflation |
6.7 |
% |
6.8 |
% | ||||
2023 |
2022 |
|||||||
| Projected benefit obligation |
||||||||
| Beginning of year |
$ |
21 |
$ |
27 |
||||
| Interest cost |
1 |
1 |
||||||
| Employer contributions |
1 |
— |
||||||
| Actuarial gains and changes in actuarial assumptions |
(3 |
) |
(6 |
) | ||||
| Benefits paid |
(1 |
) |
(1 |
) | ||||
| Foreign exchange |
2 |
— |
||||||
| |
|
|
|
|||||
| Ending funded status – Plan deficit |
$ |
21 |
$ |
21 |
||||
| |
|
|
|
|||||
| Amounts recorded in the consolidated balance sheet |
||||||||
| Current liability |
$ |
1 |
$ |
1 |
||||
| Non-current liability |
20 |
20 |
||||||
| |
|
|
|
|||||
| Net liability |
$ |
21 |
$ |
21 |
||||
| |
|
|
|
|||||
| Amounts recorded in accumulated other comprehensive income |
||||||||
| Unrecognized actuarial gains |
$ |
19 |
$ |
17 |
||||
| |
|
|
|
|||||
| Net periodic benefit cost |
||||||||
| Interest cost |
$ |
1 |
$ |
1 |
||||
| Actuarial gains |
(1 |
) |
(1 |
) | ||||
| |
|
|
|
|||||
| Net periodic benefit cost |
$ |
— |
$ |
— |
||||
| |
|
|
|
|||||
[d] |
Future benefit payments |
| Defined benefit pension plans |
Termination and long service arrangements |
Retirement medical benefits plans |
Total | |||||||||||||
Expected employer contributions - 2024 |
$ | 13 | $ | 17 | $ | 1 | $ | 31 | ||||||||
Expected benefit payments: |
||||||||||||||||
2024 |
$ | 27 | $ | 17 | $ | 1 | $ | 45 | ||||||||
2025 |
26 | 19 | 1 | 46 | ||||||||||||
2026 |
27 | 22 | 1 | 50 | ||||||||||||
2027 |
29 | 25 | 1 | 55 | ||||||||||||
2028 |
30 | 31 | 2 | 63 | ||||||||||||
Thereafter |
166 | 314 | 6 | 486 | ||||||||||||
| $ | 305 | $ | 428 | $ | 12 | $ | 745 | |||||||||
19. |
OTHER LONG-TERM LIABILITIES |
2023 |
2022 | |||||||
Long-term portion of income taxes payable |
$ |
167 |
$ | 136 | ||||
Long-term portion of deferred revenue |
223 |
207 | ||||||
Asset retirement obligation |
37 |
35 | ||||||
Long-term portion of fair value of hedges [note 21] |
8 |
31 | ||||||
Other |
40 |
52 | ||||||
$ |
475 |
$ | 461 | |||||
20. |
CAPITAL STOCK |
| [a] | At December 31, 2023, the Company’s authorized, issued and outstanding capital stock are as follows: |
| [i] | Each share is entitled to one vote per share at all meetings of shareholders. |
| [ii] | Each share shall participate equally as to dividends. |
| [b] | The Company had Normal Course Issuer Bid in place for the 12-month periods beginning November 2021 and 2022. |
2023 |
2022 | |||||||||||||||
Shares purchased |
Cash amount |
Shares purchased |
Cash amount |
|||||||||||||
2021 Bid |
— |
$ |
— |
12,554,879 | $ | 779 | ||||||||||
2022 Bid |
239,296 |
13 |
6,608 | 1 | ||||||||||||
239,296 |
$ |
13 |
12,561,487 | $ | 780 | |||||||||||
| [c] | The following table presents the maximum number of shares that would be outstanding if all the dilutive instruments outstanding at February 22, 2024 were exercised or converted: |
Common Shares |
286,866,376 | |||
Stock options [i]
|
5,572,829 | |||
| 292,439,205 | ||||
| [i] | Options to purchase Common Shares are exercisable by the holder in accordance with the vesting provisions and upon payment of the exercise price as may be determined from time to time pursuant to the Company’s stock option plans. |
21. |
ACCUMULATED OTHER COMPREHENSIVE LOSS |
2023 |
2022 |
|||||||
Accumulated net unrealized loss on translation of net investment in foreign operations |
||||||||
Balance, beginning of year |
$ |
(1,018 |
) |
$ |
(735 |
) |
||
Net unrealized gain (loss) |
183 |
(495 |
) |
|||||
Repurchase of shares under Normal Course Issuer Bids [note 20] |
(1 |
) |
9 |
|||||
Recognition of cumulative translation adjustment loss in Russia [note 4] |
— |
203 |
||||||
Balance, end of year |
(836 |
) |
(1,018 |
) |
||||
Accumulated net unrealized gain on cash flow hedges [b] |
||||||||
Balance, beginning of year |
5 |
24 |
||||||
Net unrealized gain |
94 |
1 |
||||||
Reclassification of net gain to net income [a] |
(56 |
) |
(20 |
) |
||||
Balance, end of year |
43 |
5 |
||||||
Accumulated net unrealized loss on other long-term liabilities [b] |
||||||||
Balance, beginning of year |
(101 |
) |
(189 |
) |
||||
Net unrealized (loss) gains |
(5 |
) |
82 |
|||||
Reclassification of net loss to net income [a] |
1 |
6 |
||||||
Balance, end of year |
(105 |
) |
(101 |
) |
||||
Total accumulated other comprehensive loss [c] |
$ |
(898 |
) |
$ |
(1,114 |
) |
||
| [a] | The effects on net income of amounts reclassified from AOCL, with presentation location, were as follows: |
2023 |
2022 |
|||||||
Cash flow hedges |
||||||||
Sales |
$ |
(32 |
) |
$ |
(15 |
) |
||
Cost of sales |
107 |
41 |
||||||
Income tax |
(19 |
) |
(6 |
) |
||||
Net of tax |
56 |
20 |
||||||
Other long-term liabilities |
||||||||
Cost of sales |
(1 |
) |
(8 |
) |
||||
Income tax |
— |
2 |
||||||
Net of tax |
(1 |
) |
(6 |
) |
||||
Total net gain reclassified to net income |
$ |
55 |
$ |
14 |
||||
| [b] | The amount of income tax (loss) benefit that has been allocated to each component of other comprehensive loss is as follows: |
2023 |
2022 | |||||||
Accumulated net unrealized loss on translation of net investment in foreign operations |
$ |
6 |
$ | 4 | ||||
Accumulated net unrealized gain on cash flow hedges |
||||||||
Balance, beginning of year |
— |
(8 | ) | |||||
Net unrealized (loss) gain |
(35 |
) |
2 | |||||
Reclassification of net loss to net income |
19 |
6 | ||||||
Balance, end of year |
(16 |
) |
— |
|||||
Accumulated net unrealized loss on other long-term liabilities |
||||||||
Balance, beginning of year |
6 |
25 | ||||||
Net unrealized gain (loss) |
3 |
(17 | ) | |||||
Reclassification of net gain to net income |
— |
(2 | ) | |||||
Balance, end of year |
9 |
6 | ||||||
Total income tax (loss) benefit |
$ |
(1 |
) |
$ | 10 | |||
| [c] | The amount of other comprehensive gain that is expected to be reclassified to net income during 2024 is $64 million. |
22. |
FINANCIAL INSTRUMENTS |
[a] |
Foreign exchange contracts |
| For Canadian dollars | For U.S. dollars | For euros | ||||||||||||||||||||||||||||||
Buy (Sell) |
U.S. dollar amount |
Weighted average rate |
Peso amount |
Weighted average rate |
U.S. dollar amount |
Weighted average rate |
Czech Koruna amount |
Weighted average rate |
||||||||||||||||||||||||
2024 |
18 | 1.313 | 4,104 | 0.043 | 23 | 0.870 | 1,641 | 0.037 | ||||||||||||||||||||||||
2024 |
(397 | ) | 0.779 | — | — | (40 | ) | 1.141 | — | — | ||||||||||||||||||||||
2025 |
4 | 1.352 | 320 | 0.045 | 1 | 0.941 | — | — | ||||||||||||||||||||||||
2025 |
(234 | ) | 0.780 | — | — | (16 | ) | 1.076 | — | — | ||||||||||||||||||||||
2026 |
(72 | ) | 0.782 | — | — | — | — | — | — | |||||||||||||||||||||||
| (681 | ) | 4,424 | (32 | ) | 1,641 | |||||||||||||||||||||||||||
[b] |
Financial assets and liabilities |
2023 |
2022 | |||||||
| Financial assets |
||||||||
| Cash and cash equivalents |
$ |
1,198 |
$ | 1,234 | ||||
| Accounts receivable |
7,881 |
6,791 | ||||||
| Warrants and public and private equity investments |
56 |
432 | ||||||
| Long-term receivables included in other assets [note 14] |
321 |
262 | ||||||
| |
|
|
|
|||||
$ |
9,456 |
$ | 8,719 | |||||
| |
|
|
|
|||||
| Financial liabilities |
||||||||
| Short-term borrowing |
$ |
511 |
$ | 8 | ||||
| Long-term debt (including portion due within one year) |
4,994 |
3,501 | ||||||
| Accounts payable |
7,842 |
6,999 | ||||||
| |
|
|
|
|||||
$ |
13,347 |
$ | 10,508 | |||||
| |
|
|
|
|||||
| Derivatives designated as effective hedges, measured at fair value |
||||||||
| Foreign currency contracts |
||||||||
| Prepaid expenses |
$ |
78 |
$ | 65 | ||||
| Other assets |
4 |
26 | ||||||
| Other accrued liabilities |
(13 |
) |
(43 | ) | ||||
| Other long-term liabilities |
(8 |
) |
(31 | ) | ||||
| |
|
|
|
|||||
$ |
61 |
$ | 17 | |||||
| |
|
|
|
|||||
[c] |
Derivatives designated as effective hedges, measured at fair value |
Gross amounts presented in consolidated balance sheets |
Gross amounts not offset in consolidated balance sheets |
Net amounts |
||||||||||
| December 31, 2023 |
||||||||||||
| Assets |
$ | 82 | $ | 7 | $ | 75 | ||||||
| Liabilities |
$ | (20 | ) | $ | (7 | ) | $ | (13 | ) | |||
| |
|
|
|
|
|
|||||||
| December 31, 2022 |
||||||||||||
| Assets |
$ | 91 | $ | 42 | $ | 49 | ||||||
| Liabilities |
$ | (74 | ) | $ | (42 | ) | $ | (32 | ) | |||
| |
|
|
|
|
|
|||||||
[d] |
Supplier financing program |
[e] |
Fair value |
[f] |
Credit risk |
[g] |
Currency risk |
[h] |
Interest rate risk |
[i] |
Equity price risk |
23. |
CONTINGENCIES |
| [a] | In December 2023, the Company received a notification [the “Notification Letter”] from a customer informing the Company as to the customer’s initial determination that one of the Company’s operating groups bears responsibility for costs totaling $ 352 million related to two product recalls. The Notification Letter has triggered a 90-day |
| [b] | The Company’s policy is to comply with all applicable laws, including antitrust and competition laws. Based on a previously completed global review of legacy antitrust risks which led to a September 2020 settlement with the European Commission and a June 2022 settlement with Brazil’s federal competition authority involving in both cases the supply of closure systems, Magna does not currently anticipate any material liabilities. However, the Company could be subject to restitution settlements, civil proceedings, reputational damage and other consequences, including as a result of the matters specifically referred to above. |
24. |
SEGMENTED INFORMATION |
| [a] | Magna is a mobility technology company and a global supplier in the automotive space. Magna has complete vehicle engineering and contract manufacturing expertise, as well as product capabilities which include body, chassis, exterior, seating, powertrain, active driver assistance, electronics, mechatronics, mirrors, lighting and roof systems. Magna also has electronic and software capabilities across many of these areas. |
| [b] | The following tables show segment information for the Company’s reporting segments and a reconciliation of Adjusted EBIT to the Company’s consolidated income before income taxes: |
2023 |
||||||||||||||||||||
Total sales |
External sales |
Adjusted EBIT |
Depreciation |
Equity loss (income) |
||||||||||||||||
Body Exteriors & Structures |
$ |
17,511 |
$ |
17,199 |
$ |
1,304 |
$ |
716 |
$ |
4 |
||||||||||
Power & Vision |
14,305 |
14,052 |
668 |
510 |
(107 |
) |
||||||||||||||
Seating Systems |
6,047 |
6,027 |
218 |
89 |
(3 |
) |
||||||||||||||
Complete Vehicles |
5,538 |
5,502 |
124 |
100 |
(8 |
) |
||||||||||||||
Corporate & Other [i] |
(604 |
) |
17 |
(76 |
) |
21 |
2 |
|||||||||||||
Total Reportable Segments |
$ |
42,797 |
$ |
42,797 |
$ |
2,238 |
$ |
1,436 |
$ |
(112 |
) |
|||||||||
| 2022 | ||||||||||||||||||||
| Total sales |
External sales |
Adjusted EBIT |
Depreciation | Equity loss (income) |
||||||||||||||||
Body Exteriors & Structures |
$ | 16,004 | $ | 15,763 | $ | 852 | $ | 697 | $ | 10 | ||||||||||
Power & Vision |
11,861 | 11,636 | 502 | 473 | (77 | ) | ||||||||||||||
Seating Systems |
5,269 | 5,252 | 104 | 79 | (15 | ) | ||||||||||||||
Complete Vehicles |
5,221 | 5,180 | 235 | 107 | (10 | ) | ||||||||||||||
Corporate & Other [i] |
(515 | ) | 9 | 15 | 17 | 3 | ||||||||||||||
Total Reportable Segments |
$ | 37,840 | $ | 37,840 | $ | 1,708 | $ | 1,373 | $ | (89 | ) | |||||||||
2023 |
||||||||||||||||||||
|
Net assets |
Investments |
Goodwill |
Fixed assets, net |
Fixed asset additions |
||||||||||||||||
Body Exteriors & Structures |
$ |
8,147 |
$ |
2 |
$ |
452 |
$ |
5,569 |
$ |
1,638 |
||||||||||
Power & Vision |
7,880 |
696 |
1,929 |
2,991 |
664 |
|||||||||||||||
Seating Systems |
1,340 |
172 |
257 |
506 |
108 |
|||||||||||||||
Complete Vehicles |
574 |
100 |
109 |
453 |
65 |
|||||||||||||||
Corporate & Other |
1,066 |
303 |
20 |
100 |
25 |
|||||||||||||||
Total Reportable Segments |
$ |
19,007 |
$ |
1,273 |
$ |
2,767 |
$ |
9,619 |
$ |
2,500 |
||||||||||
| 2022 | ||||||||||||||||||||
| Net assets | Investments | Goodwill | Fixed assets, net |
Fixed asset additions |
||||||||||||||||
Body Exteriors & Structures |
$ | 7,168 | $ | 6 | $ | 448 | $ | 4,557 | $ | 928 | ||||||||||
Power & Vision |
6,104 | 728 | 1,198 | 2,569 | 544 | |||||||||||||||
Seating Systems |
1,377 | 143 | 260 | 486 | 101 | |||||||||||||||
Complete Vehicles |
632 | 95 | 105 | 471 | 94 | |||||||||||||||
Corporate & Other |
802 | 457 | 20 | 90 | 14 | |||||||||||||||
Total Reportable Segments |
$ | 16,083 | $ | 1,429 | $ | 2,031 | $ | 8,173 | $ | 1,681 | ||||||||||
| [i] | Included in Corporate and Other Adjusted EBIT are intercompany fees charged to the automotive segments. |
| [c] | The following table reconciles Net income from operations to Adjusted EBIT: |
2023 |
2022 | |||||||
Net Income |
$ |
1,286 |
$ | 641 | ||||
Add: |
||||||||
Amortization of acquired intangible assets |
88 |
46 | ||||||
Interest expense, net |
156 |
81 | ||||||
Other expense, net |
388 |
703 | ||||||
Income taxes |
320 |
237 | ||||||
Adjusted EBIT |
$ |
2,238 |
$ | 1,708 | ||||
| [d] | The following table reconciles Total Assets to Net Assets: |
2023 |
2022 | |||||||
Total Assets |
$ |
32,255 |
$ | 27,789 | ||||
Deduct assets not included in segment net assets: |
||||||||
Cash and cash equivalents |
(1,198 |
) |
(1,234 | ) | ||||
Deferred tax assets |
(621 |
) |
(491 | ) | ||||
Long-term receivables from joint venture partners |
(49 |
) |
(14 | ) | ||||
Deduct liabilities included in segment net assets: |
||||||||
Accounts payable |
(7,842 |
) |
(6,999 | ) | ||||
Accrued salaries and wages |
(912 |
) |
(850 | ) | ||||
Other accrued liabilities |
(2,626 |
) |
(2,118 | ) | ||||
Segment Net Assets |
$ |
19,007 |
$ | 16,083 | ||||
| [e] | The following table aggregates external revenues by customer as follows: |
2023 |
2022 | |||||||
General Motors |
$ |
6,162 |
$ | 5,903 | ||||
Daimler AG |
5,785 |
4,953 | ||||||
BMW |
5,334 |
5,243 | ||||||
Ford Motor Company |
5,317 |
4,904 | ||||||
Stellantis |
5,246 |
5,013 | ||||||
Volkswagen |
4,684 |
3,872 | ||||||
Other |
10,269 |
7,952 | ||||||
$ |
42,797 |
$ | 37,840 | |||||
| [f] | The following table summarizes external revenues and long-lived assets by geographic region: |
External Sales |
Fixed Assets, Net |
|||||||||||||||
2023 |
2022 | 2023 |
2022 | |||||||||||||
North America |
||||||||||||||||
United States |
$ |
10,855 |
$ | 9,648 | $ |
2,297 |
$ | 1,860 | ||||||||
Mexico |
4,958 |
4,393 | 1,509 |
1,260 | ||||||||||||
Canada |
4,909 |
4,870 | 1,211 |
921 | ||||||||||||
20,722 |
18,911 | 5,017 |
4,041 | |||||||||||||
Europe |
||||||||||||||||
Austria |
6,926 |
6,617 | 787 |
737 | ||||||||||||
Germany |
4,403 |
3,800 | 831 |
832 | ||||||||||||
Czech Republic |
1,330 |
1,024 | 342 |
307 | ||||||||||||
Poland |
798 |
695 | 238 |
224 | ||||||||||||
Italy |
464 |
357 | 240 |
223 | ||||||||||||
United Kingdom |
442 |
343 | 162 |
163 | ||||||||||||
Spain |
390 |
351 | 81 |
75 | ||||||||||||
France |
337 |
381 | 77 |
61 | ||||||||||||
Turkey |
325 |
305 | 9 |
7 | ||||||||||||
Sweden |
322 |
— |
150 |
— |
||||||||||||
Slovakia |
273 |
206 | 329 |
299 | ||||||||||||
Other Europe |
207 |
216 | 214 |
203 | ||||||||||||
16,217 |
14,295 | 3,460 |
3,131 | |||||||||||||
Asia Pacific |
||||||||||||||||
China |
4,843 |
3,901 | 958 |
852 | ||||||||||||
India |
242 |
228 | 100 |
82 | ||||||||||||
Other Asia Pacific |
231 |
38 | 12 |
6 | ||||||||||||
5,316 |
4,167 | 1,070 |
940 | |||||||||||||
Rest of World |
542 |
467 | 72 |
61 | ||||||||||||
$ |
42,797 |
$ | 37,840 | $ |
9,619 |
$ | 8,173 | |||||||||
Exhibit 3
MAGNA INTERNATIONAL INC.
Management’s Discussion and Analysis of Results of Operations and Financial Position
Unless otherwise noted, all amounts in this Management’s Discussion and Analysis of Results of Operations and Financial Position [“MD&A”] are in U.S. dollars and all tabular amounts are in millions of U.S. dollars, except per share figures, which are in U.S. dollars. When we use the terms “we”, “us”, “our” or “Magna”, we are referring to Magna International Inc. and its subsidiaries and jointly controlled entities, unless the context otherwise requires.
This MD&A should be read in conjunction with the audited consolidated financial statements for the year ended December 31, 2023 included in our 2023 Annual Report to Shareholders.
This MD&A may contain statements that are forward looking. Refer to the “Forward-Looking Statements” section in this MD&A for a more detailed discussion of our use of forward-looking statements.
This MD&A has been prepared as at February 22, 2024.
HIGHLIGHTS
INDUSTRY PRODUCTION ENVIRONMENT
| • | Global light vehicle production increased 8% in 2023, including increases of 9%, 11%, and 8% in North America, Europe, and China, respectively. |
| • | North American light vehicle production was negatively impacted by the UAW labour strikes at certain customers during the third and fourth quarters of 2023. |
SALES & EARNINGS
| • | Total sales increased 13% to a record $42.8 billion, primarily reflecting higher global vehicle production, the launch of new programs, and the acquisition of Veoneer Active Safety [“Veoneer AS”], partially offset by the negative impact of lost vehicle production as a result of the UAW labour strikes at certain customers during the third and fourth quarters of 2023. |
| • | Diluted earnings per share were $4.23 and adjusted diluted earnings per share(1) were $5.49 in 2023. Adjusted diluted earnings per share increased $1.25 compared to 2022 primarily reflecting earnings on higher sales, including higher margins due to the impact of operational excellence and cost initiatives, and productivity and efficiency improvements. These factors were partially offset by higher launch, engineering, and other costs associated with new assembly business, the negative impact of the UAW labour strikes, the net unfavourable impact of commercial items, lower amortization of the initial value of public company securities, higher launch costs associated with new manufacturing business, and the impact of acquisitions, net of divestitures. |
CASH & INVESTMENTS
| • | Cash generated from operating activities was $3.1 billion, compared to $2.1 billion in 2022, largely reflecting an increase in net income and generation of cash from operating assets and liabilities in 2023 compared to an investment in operating assets and liabilities in 2022. |
| • | We continued to invest in our business, including: |
| • | $2.5 billion for fixed assets; |
| • | $562 million in investment and other asset spending; and |
| • | $1.5 billion for acquisitions and business combinations, and public and private equity investments, including the acquisition of Veoneer AS. |
| • | We paid dividends of $522 million in 2023. |
| • | Our Board of Directors increased our quarterly dividend to $0.475 per share, our 14th consecutive year of dividend increases. |
| • | We raised $2 billion in debt, comprised of Senior Notes and $400 million in a delayed-draw Term Loan, fund the acquisition of Veoneer AS, invest in megatrend areas, and refinance €550 million in Senior Notes that came due in 2023. |
STRATEGIC UPDATES
| • | Active Safety – we further advanced our position in Active Safety, including: |
| • | Completing the acquisition of Veoneer AS, broadening our active safety portfolio with complementary products, customers, geographies, engineering and software resources; |
| • | Launching our innovative, Gen5 front camera module system on a high-volume program for a European-based global OEM, and winning further front camera module volume on the program for an additional region. |
| • | Electrification – we continued to strengthen our business in electrification, including through: |
| • | Winning two additional integrated e-drive programs for global OEMs, one based in North America and one in Europe; |
| • | Launching primary and secondary e-drives on a battery electric vehicle program for a new customer; |
| • | Launching a first-to-market modular eDecoupling unit to support multiple battery electric vehicle programs for a German premium OEM; |
| • | Winning significant new awards for battery enclosures on multiple OEM programs. |
| • | Sustainability – we committed to sustainability and environmental stewardship by submitting net-zero emission targets for validation by the Science Based Targets initiative, with a goal to achieve this target by 2050, and meet our near-term Scope 1, 2 and 3 targets by 2030. |
Magna International Inc. Annual Report 2023 1
OVERVIEW
OUR BUSINESS(2)
Magna is more than one of the world’s largest suppliers in the automotive space. We are a mobility technology company built to innovate, with a global, entrepreneurial-minded team of over 179,000(3) employees across 342 manufacturing operations and 104 product development, engineering and sales centres spanning 28 countries. With 65+ years of expertise, our ecosystem of interconnected products combined with our complete vehicle expertise uniquely positions us to advance mobility in an expanded transportation landscape. For further information about Magna (NYSE:MGA; TSX:MG), please visit www.magna.com or follow us on social.
| 1 | Adjusted diluted earnings per share is a Non-GAAP financial measure. Refer to the section “Use of Non-GAAP Measures”. |
| 2 | Manufacturing operations, product development, engineering and sales centres include certain operations accounted for under the equity method. |
| 3 | Number of employees includes over 166,000 employees at our wholly owned or controlled entities and over 13,000 employees at operations accounted for under the equity method. |
2 Magna International Inc. Annual Report 2023
FORWARD-LOOKING STATEMENTS
Certain statements in this MD&A may constitute “forward-looking information” or “forward-looking statements” (collectively, “forward-looking statements”). Any such forward-looking statements are intended to provide information about management’s current expectations and plans and may not be appropriate for other purposes. Forward-looking statements may include financial and other projections, as well as statements regarding our future plans, strategic objectives or economic performance, or the assumptions underlying any of the foregoing, and other statements that are not recitations of historical fact. We use words such as “may”, “would”, “could”, “should”, “will”, “likely”, “expect”, “anticipate”, “believe”, “intend”, “plan”, “aim”, “forecast”, “outlook”, “project”, “estimate”, “target” and similar expressions suggesting future outcomes or events to identify forward-looking statements.
Forward-looking statements in this document include, but are not limited to, statements relating to achievement of our near term emissions reductions target and 2050 net zero target.
Forward-looking statements are based on information currently available to us and are based on assumptions and analyses made by us in light of our experience and our perception of historical trends, current conditions and expected future developments, as well as other factors we believe are appropriate in the circumstances. While we believe we have a reasonable basis for making any such forward-looking statements, they are not a guarantee of future performance or outcomes. Whether actual results and developments conform to our expectations and predictions is subject to a number of risks, assumptions, and uncertainties, many of which are beyond our control, and the effects of which can be difficult to predict, including the risk factors which are described later in this MD&A.
INDUSTRY TRENDS
Our operating results are primarily dependent on the levels of North American, European, and Chinese car and light truck production by our customers. While we supply systems and components to every major original equipment manufacturer [“OEM”], we do not supply systems and components for every vehicle, nor is the value of our content consistent from one vehicle to the next. As a result, customer and program mix relative to market trends, as well as the value of our content on specific vehicle production programs, are also important drivers of our results.
Ordinarily, OEM production volumes are aligned with vehicle sales levels and thus affected by changes in such levels. Aside from vehicle sales levels, production volumes are typically impacted by a range of factors, including: general economic and political conditions; labour disruptions; free trade arrangements; tariffs; relative currency values; commodities prices; supply chains and infrastructure; availability and relative cost of skilled labour; regulatory considerations, including those related to environmental emissions and safety standards; and other factors.
Overall vehicle sales levels are significantly affected by changes in consumer confidence levels, which may in turn be impacted by consumer perceptions and general trends related to the job, housing, and stock markets, as well as other macroeconomic and political factors. Other factors which typically impact vehicle sales levels and thus production volumes include: vehicle affordability; interest rates and/or availability of credit; fuel and energy prices; relative currency values; regulatory restrictions on use of vehicles in certain megacities; government subsidies to consumers for the purchase of low- and zero-emission vehicles; and other factors.
While the foregoing economic, political, and other factors are part of the general context in which the global automotive industry operates, there were a number of significant industry trends that impacted us during 2023, including:
| • | elevated inflation in all markets in which we operate; |
| • | price increases and surcharges from sub-suppliers impacted by inflationary pressures; |
| • | targeted labour strikes by UAW members against certain Ford, General Motors and Stellantis facilities in the U.S.; |
| • | supply chain disruptions, including continued impact from the global shortage of semiconductor chips that has materially affected global automotive production volumes since 2020; and |
| • | operational inefficiencies as a result of our production lines being stopped/restarted unexpectedly. |
We continue to implement a business strategy which is rooted in our best assessment as to the rate and direction of change in the automotive industry, including with respect to trends related to vehicle electrification and advanced driver assistance systems, as well as future mobility business models. Our short and medium-term operational success, as well as our ability to create long-term value through our business strategy, are subject to a number of risks and uncertainties which are discussed later in this MD&A.
Magna International Inc. Annual Report 2023 3
USE OF NON-GAAP FINANCIAL MEASURES
In addition to results presented in accordance with accounting principles generally accepted in the United States of America [“U.S. GAAP”], this report includes the use of Adjusted earnings before interest and taxes [“Adjusted EBIT”], Adjusted EBIT as a percentage of sales, Adjusted diluted earnings per share, and Adjusted Return on Invested Capital [collectively, the “Non-GAAP Measures”]. We believe these Non-GAAP financial measures provide additional information that is useful to investors in understanding our underlying performance and trends through the same financial measures employed by our management. Readers should be aware that Non-GAAP Measures have no standardized meaning under U.S. GAAP and accordingly may not be comparable to the calculation of similar measures by other companies. We believe that Adjusted EBIT, Adjusted EBIT as a percentage of sales, Adjusted diluted earnings per share and Adjusted Return on Invested Capital provide useful information to our investors for measuring our operational performance as they exclude certain items that are not reflective of ongoing operating profit and facilitate a comparison with prior periods. The presentation of any Non-GAAP Measures should not be considered in isolation or as a substitute for our related financial results prepared in accordance with U.S. GAAP. Non-GAAP financial measures are presented together with the most directly comparable U.S. GAAP financial measure, and a reconciliation to the most directly comparable U.S. GAAP financial measure, can be found in the “Non-GAAP Financial Measures Reconciliation” section of this MD&A.
During 2023, we revised our calculations of Adjusted EBIT, Adjusted diluted earnings per share and Adjusted Return on Invested Capital to exclude the amortization of acquired intangible assets. The historical presentation of these Non-GAAP measures within this MD&A has also been updated to reflect the revised calculations. Refer to the “Non-GAAP Financial Measures Reconciliation” section of this MD&A for further information.
RESULTS OF OPERATIONS
AVERAGE FOREIGN EXCHANGE
| 2023 | 2022 | Change | ||||||||||
| 1 Canadian dollar equals U.S. dollars |
0.742 | 0.769 | -4 | % | ||||||||
| 1 euro equals U.S. dollars |
1.082 | 1.053 | +3 | % | ||||||||
| 1 Chinese renminbi equals U.S. dollars |
0.141 | 0.149 | -5 | % | ||||||||
The preceding table reflects the average foreign exchange rates between the most common currencies in which we conduct business and our U.S. dollar reporting currency.
The results of operations for which the functional currency is not the U.S. dollar are translated into U.S. dollars using the average exchange rates for the relevant period. Throughout this MD&A, reference is made to the impact of translation of foreign operations on reported U.S. dollar amounts where relevant.
Our results can also be affected by the impact of movements in exchange rates on foreign currency transactions (such as raw material purchases or sales denominated in foreign currencies). However, as a result of hedging programs employed by us, foreign currency transactions in the current period have not been fully impacted by movements in exchange rates. We record foreign currency transactions at the hedged rate where applicable.
Finally, foreign exchange gains and losses on revaluation and/or settlement of monetary items denominated in a currency other than an operation’s functional currency impact reported results. These gains and losses are recorded in selling, general and administrative expense.
LIGHT VEHICLE PRODUCTION VOLUMES
Our operating results are mostly dependent on light vehicle production in the regions reflected in the table below:
Light Vehicle Production Volumes (thousands of units)
| 2023 | 2022 | Change | ||||||||||
| North America |
15,589 | 14,280 | +9 | % | ||||||||
| Europe |
17,481 | 15,802 | +11 | % | ||||||||
| China |
28,581 | 26,363 | +8 | % | ||||||||
| Other |
27,577 | 26,107 | +6 | % | ||||||||
|
|
|
|
|
|
|
|||||||
| Global |
89,228 | 82,552 | +8 | % | ||||||||
|
|
|
|
|
|
|
|||||||
Global light vehicle production increased 8% in 2023, largely reflecting the rebalancing of supply chains in 2023 compared to the significant industry production disruptions during 2022 caused by global semiconductor chip shortages.
4 Magna International Inc. Annual Report 2023
RESULTS OF OPERATIONS – FOR THE YEAR ENDED DECEMBER 31, 2023
SALES
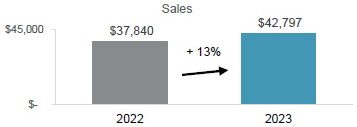
Sales increased 13% or $4.96 billion to $42.80 billion for 2023 compared to $37.84 billion for 2022 primarily due to:
| • | the launch of new programs during or subsequent to 2022; |
| • | higher global light vehicle production; |
| • | acquisitions, net of divestitures, subsequent to 2022, which increased sales by $814 million; and |
| • | customer price increases to recover certain higher production input costs. |
These factors were partially offset by:
| • | the negative impact of lost vehicle production as a result of the UAW labour strikes at certain customers during 2023, which decreased sales by approximately $325 million; |
| • | the net weakening of foreign currencies against the U.S. dollar, which decreased reported U.S. dollar sales by $91 million; and |
| • | net customer price concessions subsequent to 2022. |
COST OF GOODS SOLD
| 2023 | 2022 | Change | ||||||||||
| Material |
$ | 26,309 | $ | 23,388 | $ | 2,921 | ||||||
| Direct labour |
3,164 | 2,791 | 373 | |||||||||
| Overhead |
7,712 | 7,009 | 703 | |||||||||
|
|
|
|
|
|
|
|||||||
| Cost of goods sold |
$ | 37,185 | $ | 33,188 | $ | 3,997 | ||||||
|
|
|
|
|
|
|
|||||||
Cost of goods sold increased $4.00 billion to $37.19 billion for 2023 compared to $33.19 billion for 2022, primarily due to:
| • | higher material, direct labour and overhead associated with higher sales; |
| • | acquisitions, net of divestitures, subsequent to 2022; |
| • | higher launch, engineering and other costs associated with new assembly business; |
| • | commercial items in 2023 and 2022, which had a net unfavourable impact on a year over year basis; |
| • | higher pre-operating costs incurred at new facilities; and |
| • | higher net production input costs, including for labour, partially offset by lower prices for energy, certain commodities and freight. |
These factors were partially offset by:
| • | productivity and efficiency improvements, including lower costs at certain previously underperforming facilities; |
| • | the net weakening of foreign currencies against the U.S. dollar, which decreased reported U.S. dollar costs of goods sold by $44 million; and |
| • | the impact of operational excellence and cost initiatives. |
DEPRECIATION
Depreciation increased $63 million to $1.44 billion for 2023 compared to $1.37 billion for 2022 primarily due to increased capital deployed at new and existing facilities to support the launch of programs, and acquisitions, net of divestitures, subsequent to 2022, partially offset by the end of production of certain programs.
AMORTIZATION OF ACQUIRED INTANGIBLE ASSETS
Amortization of acquired intangible assets increased $42 million to $88 million for 2023 compared to $46 million for 2022 primarily due to the acquisition of Veoneer AS during the second quarter of 2023.
Magna International Inc. Annual Report 2023 5
SELLING, GENERAL AND ADMINISTRATIVE [“SG&A”]
SG&A expense increased $390 million to $2.05 billion for 2023 compared to $1.66 billion for 2022, primarily as a result of:
| • | higher labour and benefit costs; |
| • | commercial items in 2023 and 2022, which had a net unfavourable impact on a year over year basis; |
| • | acquisitions, net of divestitures, subsequent to 2022; |
| • | higher incentive compensation; |
| • | higher investments in research, development and new mobility; |
| • | higher restructuring costs; |
| • | higher costs to accelerate our operational excellence initiatives; and |
| • | higher pre-operating costs incurred at new facilities. |
These factors were partially offset by lower provisions against certain accounts receivable and other balances.
INTEREST EXPENSE, NET
During 2023, we recorded net interest expense of $156 million compared to $81 million for 2022. The $75 million increase was primarily a result of interest expense on the $1.6 billion of Senior Notes issued during the first quarter of 2023, interest expense on the Term Loan entered into during the first quarter of 2023, interest expense on higher short-term borrowings and higher interest rates. These factors were partially offset by higher interest income earned on cash and investments due to higher interest rates.
EQUITY INCOME
Equity income increased $23 million to $112 million for 2023 compared to $89 million for 2022, primarily as a result of earnings on higher sales at certain equity-accounted entities, and acquisitions subsequent to 2022, partially offset by higher launch costs, and higher production input costs, net of customer recoveries.
OTHER EXPENSE, NET
| 2023 | 2022 | |||||||
| Investments (1) |
$ | 201 | $ | 221 | ||||
| Restructuring (2) |
148 | 22 | ||||||
| Veoneer AS transaction costs (3) |
23 | — | ||||||
| Impairments and loss on sale of operations in Russia (4) |
16 | 376 | ||||||
| Loss on sale of business (5) |
— | 58 | ||||||
| Impairments (6) |
— | 26 | ||||||
|
|
|
|
|
|||||
| Other expense, net |
$ | 388 | $ | 703 | ||||
|
|
|
|
|
|||||
| (1) | Investments |
| 2023 | 2022 | |||||||
| Revaluation of public company warrants |
$ | 110 | $ | 173 | ||||
| Non-cash impairment charges (i) |
90 | — | ||||||
| Revaluation of public and private equity investments |
1 | 49 | ||||||
| Net gain on sale of public equity investments |
— | (1 | ) | |||||
|
|
|
|
|
|||||
| Other expense, net |
201 | 221 | ||||||
| Tax effect |
(28 | ) | (53 | ) | ||||
|
|
|
|
|
|||||
| Net loss attributable to Magna |
$ | 173 | $ | 168 | ||||
|
|
|
|
|
|||||
| (i) | The non-cash impairment charges relate to impairments of private equity investments and related long-term receivables within Other assets. |
| (2) | Restructuring |
During 2023, we recorded restructuring charges of $117 million [$97 million after tax] in our Power & Vision segment, and $31 million [$27 million after tax] in our Body Exteriors & Structures segment, respectively.
For the year ended December 31, 2022, we recorded restructuring charges of $22 million [$22 million after tax] in our Power & Vision segment.
6 Magna International Inc. Annual Report 2023
| (3) | Veoneer AS transaction costs |
During 2023, we incurred $23 million [$22 million after tax] of transaction costs relating to our acquisition of Veoneer AS. Refer to Note 7, “Business Combinations”, to the consolidated financial statements included in this Report.
| (4) | Impairments and loss on sale of operations in Russia |
During 2023, we completed the sale of all of our investments in Russia which resulted in a loss of $16 million [$16 million after tax] including a net cash outflow of $23 million.
During 2022, we recorded a $376 million [$361 million after tax] impairment charge related to our investment in Russia as a result of the expected lack of future cashflows and the uncertainties connected with the Russian economy. This included net asset impairments of $173 million and a $203 million reserve against the related foreign currency translation losses that were included in accumulated other comprehensive loss. The net asset impairments consisted of $163 million and $10 million in our Body Exteriors & Structures and Seating Systems segments, respectively.
| (5) | Loss on sale of business |
During 2022, we entered into an agreement to sell a European Power & Vision operation. Under the terms of the arrangement, we were contractually obligated to provide the buyer with up to $42 million of funding, resulting in a loss of $58 million [$57 million after tax]. During the first quarter of 2023, we completed the sales of this operation which resulted in a net cash outflow of $25 million.
| (6) | Impairments |
During 2022, we recorded impairment charges of $22 million [$21 million after tax] in our Body Exteriors & Structures segment and $4 million [$3 million after tax] in our Power & Vision segment, respectively.
INCOME FROM OPERATIONS BEFORE INCOME TAXES
Income from operations before income taxes was $1.61 billion for 2023 compared to $878 million for 2022. The $728 million increase was a result of the following changes, each as discussed above:
| 2023 | 2022 | Change | ||||||||||
| Sales |
$ | 42,797 | $ | 37,840 | $ | 4,957 | ||||||
|
|
|
|
|
|
|
|||||||
| Costs and expenses |
||||||||||||
| Cost of goods sold |
37,185 | 33,188 | 3,997 | |||||||||
| Depreciation |
1,436 | 1,373 | 63 | |||||||||
| Amortization of acquired intangible assets |
88 | 46 | 42 | |||||||||
| Selling, general & administrative |
2,050 | 1,660 | 390 | |||||||||
| Interest expense, net |
156 | 81 | 75 | |||||||||
| Equity income |
(112 | ) | (89 | ) | (23 | ) | ||||||
| Other expense, net |
388 | 703 | (315 | ) | ||||||||
|
|
|
|
|
|
|
|||||||
| Income from operations before income taxes |
$ | 1,606 | $ | 878 | $ | 728 | ||||||
|
|
|
|
|
|
|
|||||||
INCOME TAXES
| 2023 | 2022 | |||||||||||||||
| Income taxes as reported |
$ | 320 | 19.9 | % | $ | 237 | 27.0 | % | ||||||||
| Tax effect on Other expense, net and Amortization of acquired intangible assets |
70 | (1.2 | ) | 79 | (7.6 | ) | ||||||||||
| Adjustments to Deferred Tax Valuation Allowances |
47 | 2.3 | 29 | 1.8 | ||||||||||||
|
|
|
|
|
|
|
|
|
|||||||||
|
|
$ | 437 | 21.0 | % | $ | 345 | 21.2 | % | ||||||||
|
|
|
|
|
|
|
|
|
|||||||||
We released valuation allowances against certain deferred tax assets in South America and North America during 2023 and in Europe during 2022 [“Adjustments to Deferred Tax Valuation Allowances”].
Excluding the tax effect on Other expense, net and Amortization of acquired intangible assets, as well as the Adjustments to Deferred Tax Valuation Allowances our effective income tax rate decreased to 21.0% for 2023 compared to 21.2% for 2022 primarily due to lower losses not benefitted in Europe and higher non-taxable foreign exchange adjustments recognized for U.S. GAAP purposes. These factors were partially offset by lower favourable changes in our reserves for uncertain tax positions and a change in mix of earnings.
Magna International Inc. Annual Report 2023 7
INCOME ATTRIBUTABLE TO NON-CONTROLLING INTERESTS
Income attributable to non-controlling interests was $73 million for 2023 compared to $49 million for 2022. This $24 million increase was primarily due to higher net income at our non-wholly owned operations in China.
NET INCOME ATTRIBUTABLE TO MAGNA INTERNATIONAL INC.
Net income attributable to Magna International Inc. was $1.213 billion for 2023 compared to $592 million for 2022. This $621 million increase was as a result of an increase in income from operations before income taxes of $728 million partially offset by increases in income taxes and income attributable to non-controlling interests of $83 million and $24 million, respectively.
EARNINGS PER SHARE
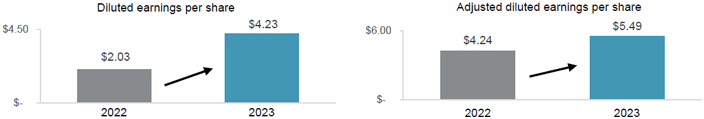
| 2023 | 2022 | % Change | ||||||||||
| Earnings per Common Share |
||||||||||||
| Basic |
$ | 4.24 | $ | 2.04 | + 108 | % | ||||||
| Diluted |
$ | 4.23 | $ | 2.03 | + 108 | % | ||||||
|
|
|
|
|
|
|
|||||||
| Weighted average number of Common Shares outstanding (millions) |
|
|||||||||||
| Basic |
286.2 | 290.4 | - 1 | % | ||||||||
| Diluted |
286.6 | 291.2 | - 2 | % | ||||||||
|
|
|
|
|
|
|
|||||||
| Adjusted diluted earnings per share |
$ | 5.49 | $ | 4.24 | + 29 | % | ||||||
|
|
|
|
|
|
|
|||||||
Diluted earnings per share was $4.23 for 2023 compared to $2.03 for 2022. The $2.20 increase was substantially a result of higher net income attributable to Magna International Inc., as discussed above, and a decrease in the weighted average number of diluted shares outstanding during 2023. The decrease in the weighted average number of diluted shares outstanding was primarily due to the purchase and cancellation of Common Shares, during or subsequent to 2022, pursuant to our normal course issuer bids.
Other expense, net, and the Amortization of acquired intangible assets, each after tax, and Adjustments to Deferred Tax Valuation Allowances negatively impacted diluted earnings per share by $1.26 in 2023 and $2.21 in 2022, respectively, as discussed. Adjusted diluted earnings per share, as reconciled in the “Non-GAAP Financial Measures Reconciliation” section, was $5.49 for 2023 compared to $4.24 for 2022, an increase of $1.25.
8 Magna International Inc. Annual Report 2023
NON-GAAP PERFORMANCE MEASURES - FOR THE YEAR ENDED DECEMBER 31, 2023
ADJUSTED EBIT AS A PERCENTAGE OF SALES
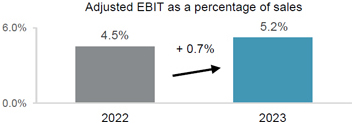
The table below shows the change in Magna’s Sales and Adjusted EBIT by segment and the impact each segment’s changes have on Magna’s Adjusted EBIT as a percentage of sales for 2023 compared to 2022:
| Sales | Adjusted EBIT |
Adjusted EBIT as a percentage of sales |
||||||||||
| 2022 |
$ | 37,840 | $ | 1,708 | 4.5 | % | ||||||
| Increase (decrease) related to: |
||||||||||||
| Body Exteriors & Structures |
1,507 | 452 | + 0.9 | % | ||||||||
| Power & Vision |
2,444 | 166 | + 0.1 | % | ||||||||
| Seating Systems |
778 | 114 | + 0.2 | % | ||||||||
| Complete Vehicles |
317 | (111 | ) | - 0.3 | % | |||||||
| Corporate and Other |
(89 | ) | (91 | ) | - 0.2 | % | ||||||
|
|
|
|
|
|
|
|||||||
| 2023 |
$ | 42,797 | $ | 2,238 | 5.2 | % | ||||||
|
|
|
|
|
|
|
|||||||
Adjusted EBIT as a percentage of sales increased to 5.2% for 2023 compared to 4.5% for 2022 primarily due to:
| • | earnings on higher sales including higher margins as a result of the impact of operational excellence and cost initiatives; |
| • | productivity and efficiency improvements, including lower costs at certain previously underperforming facilities; and |
| • | lower provisions against certain accounts receivable and other balances. |
These factors were partially offset by:
| • | higher launch, engineering and other costs associated with new assembly business; |
| • | acquisitions, net of divestitures, subsequent to 2022; |
| • | commercial items in 2023 and 2022, which had a net unfavourable impact on a year over year basis; |
| • | the negative impact of the UAW labour strikes during the third and fourth quarters of 2023; |
| • | higher launch costs associated with new manufacturing business; |
| • | lower amortization of the initial value of public company securities; |
| • | higher pre-operating costs incurred at new facilities; |
| • | lower scrap steel and aluminum recoveries; and |
| • | higher investments in research, development and new mobility. |
Magna International Inc. Annual Report 2023 9
ADJUSTED RETURN ON INVESTED CAPITAL
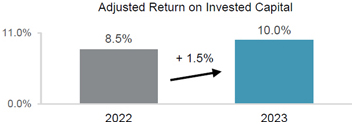
Adjusted Return on Invested Capital increased to 10.0% for 2023 compared to 8.5% for 2022 as a result of an increase in Adjusted After-tax operating profits partially offset by higher Average Invested Capital.
Average Invested Capital increased $1.85 billion to $17.77 billion for 2023 compared to $15.92 billion for 2022, primarily due to:
| • | the acquisition of Veoneer AS during 2023; |
| • | average investment in fixed assets in excess of our average depreciation expense on fixed assets; and |
| • | an increase in average operating assets and liabilities. |
These factors were partially offset by:
| • | the impairment of our Russian assets recorded during 2022; |
| • | lower net investments in public and private equity companies and public company warrants; and |
| • | the net weakening of foreign currencies against the U.S. dollar. |
10 Magna International Inc. Annual Report 2023
SEGMENT ANALYSIS
We are a global automotive supplier that has complete vehicle engineering and contract manufacturing expertise, as well as product capabilities which include body, chassis, exterior, seating, powertrain, active driver assistance, electronics, mechatronics, mirrors, lighting and roof systems. We also have electronic and software capabilities across many of these areas.
Our reporting segments are: Body Exteriors & Structures; Power & Vision; Seating Systems; and Complete Vehicles.
| Sales | Adjusted EBIT | |||||||||||||||||||||||
| 2023 | 2022 | Change | 2023 | 2022 | Change | |||||||||||||||||||
| Body Exteriors & Structures |
$ | 17,511 | $ | 16,004 | $ | 1,507 | $ | 1,304 | $ | 852 | $ | 452 | ||||||||||||
| Power & Vision |
14,305 | 11,861 | 2,444 | 668 | 502 | 166 | ||||||||||||||||||
| Seating Systems |
6,047 | 5,269 | 778 | 218 | 104 | 114 | ||||||||||||||||||
| Complete Vehicles |
5,538 | 5,221 | 317 | 124 | 235 | (111 | ) | |||||||||||||||||
| Corporate and Other |
(604 | ) | (515 | ) | (89 | ) | (76 | ) | 15 | (91 | ) | |||||||||||||
|
|
|
|
|
|
|
|
|
|
|
|
|
|||||||||||||
| Total reportable segments |
$ | 42,797 | $ | 37,840 | $ | 4,957 | $ | 2,238 | $ | 1,708 | $ | 530 | ||||||||||||
|
|
|
|
|
|
|
|
|
|
|
|
|
|||||||||||||
BODY EXTERIORS & STRUCTURES
| 2023 | 2022 | Change | ||||||||||||||
| Sales |
$ | 17,511 | $ | 16,004 | $ | 1,507 | +9 | % | ||||||||
|
|
|
|
|
|
|
|
|
|||||||||
| Adjusted EBIT |
$ | 1,304 | $ | 852 | $ | 452 | +53 | % | ||||||||
|
|
|
|
|
|
|
|
|
|||||||||
| Adjusted EBIT as a percentage of sales |
7.4 | % | 5.3 | % | +2.1 | % | ||||||||||
|
|
|
|
|
|
|
|
|
|||||||||
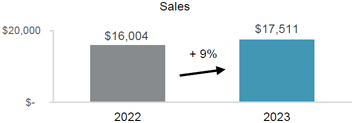
Sales – Body Exteriors & Structures
Sales increased 9% or $1.51 billion to $17.51 billion for 2023 compared to $16.00 billion for 2022, primarily due to:
| • | the launch of programs during or subsequent to 2022, including the: |
| • | Honda CR-V; |
| • | Ford F-Series Super Duty; |
| • | BMW X1 and |
| • | Rivian R1S & R1T; |
| • | higher global light vehicle production; and |
| • | customer price increases to recover certain higher production input costs. |
These factors were partially offset by:
| • | the negative impact of lost vehicle production as a result of the UAW labour strikes at certain customers during 2023, which decreased sales by approximately $200 million; |
| • | the net weakening of foreign currencies against the U.S. dollar, which decreased reported U.S. dollar sales by $99 million; |
| • | lower sales as a result of the substantial idling of our Russian facilities; and |
| • | net customer price concessions subsequent to 2022. |
Magna International Inc. Annual Report 2023 11
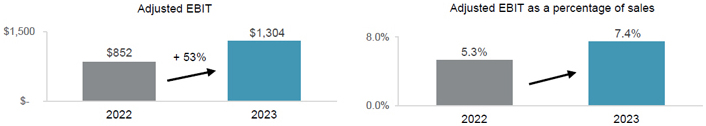
Adjusted EBIT and Adjusted EBIT as a percentage of sales – Body Exteriors & Structures
Adjusted EBIT increased $452 million to $1,304 million for 2023 compared to $852 million for 2022 and Adjusted EBIT as a percentage of sales increased to 7.4% from 5.3%. These increases were primarily due to:
| • | earnings on higher sales including higher margins due to the impact of operational excellence and cost initiatives; |
| • | productivity and efficiency improvements, including lower costs at certain previously underperforming facilities; |
| • | commercial items in 2023 and 2022, which had a net favourable impact on a year over year basis; and |
| • | lower provisions against certain accounts receivable and other balances. |
These factors were partially offset by:
| • | the negative impact of the UAW labour strikes during the third and fourth quarters of 2023; |
| • | higher restructuring costs; |
| • | higher launch costs; |
| • | higher pre-operating costs incurred at new facilities; |
| • | lower scrap steel and aluminum recoveries; and |
| • | the net weakening of foreign currencies against the U.S. dollar, which had a $19 million unfavourable impact on reported U.S. dollar Adjusted EBIT. |
POWER & VISION
| 2023 | 2022 | Change | ||||||||||||||
| Sales |
$ | 14,305 | $ | 11,861 | $ | 2,444 | + 21 | % | ||||||||
|
|
|
|
|
|
|
|
|
|||||||||
| Adjusted EBIT |
$ | 668 | $ | 502 | $ | 166 | + 33 | % | ||||||||
|
|
|
|
|
|
|
|
|
|||||||||
| Adjusted EBIT as a percentage of sales |
4.7 | % | 4.2 | % | + 0.5 | % | ||||||||||
|
|
|
|
|
|
|
|
|
|||||||||
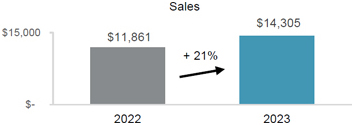
Sales – Power & Vision
Sales increased 21% or $2.44 billion to $14.31 billion for 2023 compared to $11.86 billion for 2022, primarily due to:
| • | the launch of programs during or subsequent to 2022, including the: |
| • | BMW X1 & iX1; |
| • | Chery Tiggo 9; |
| • | Chery Arrizo 8; and |
| • | Fisker Ocean; |
| • | acquisitions, net of divestitures, subsequent to 2022, which increased sales by $820 million; |
| • | higher global light vehicle production; and |
| • | customer price increases to recover certain higher production input costs. |
12 Magna International Inc. Annual Report 2023
These factors were partially offset by:
| • | the negative impact of lost vehicle production as a result of the UAW labour strikes at certain customers during 2023, which decreased sales by approximately $80 million; |
| • | the net weakening of foreign currencies against the U.S. dollar, which decreased reported U.S. dollar sales by $47 million; and |
| • | net customer price concessions subsequent to 2022. |
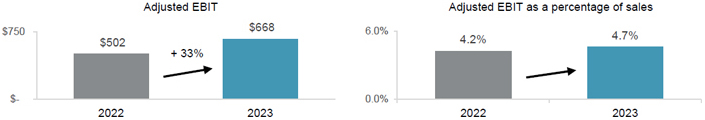
Adjusted EBIT and Adjusted EBIT as a percentage of sales – Power & Vision
Adjusted EBIT increased $166 million to $668 million for 2023 compared to $502 million for 2022 and Adjusted EBIT as a percentage of sales increased to 4.7% from 4.2%. These increases were primarily due to:
| • | earnings on higher sales including higher margins due to the impact of operational excellence and cost initiatives; |
| • | customer recoveries net of higher production input costs, including for certain commodities, energy, and freight, partially offset by higher prices for labour; |
| • | cost savings and efficiencies realized, including as a result of restructuring actions taken; |
| • | higher equity income; and |
| • | lower net warranty costs of $15 million. |
These factors were partially offset by:
| • | commercial items in 2023 and 2022, which had a net unfavourable impact on a year over year basis; |
| • | acquisitions, net of divestitures, subsequent to 2022; |
| • | the negative impact of the UAW labour strikes during the third and fourth quarters of 2023; and |
| • | the net weakening of foreign currencies against the U.S. dollar, which had a $20 million unfavourable impact on reported U.S. dollar Adjusted EBIT. |
SEATING SYSTEMS
| 2023 | 2022 | Change | ||||||||||||||
| Sales |
$ | 6,047 | $ | 5,269 | $ | 778 | + 15 | % | ||||||||
|
|
|
|
|
|
|
|
|
|||||||||
| Adjusted EBIT |
$ | 218 | $ | 104 | $ | 114 | + 110 | % | ||||||||
|
|
|
|
|
|
|
|
|
|||||||||
| Adjusted EBIT as a percentage of sales |
3.6 | % | 2.0 | % | + 1.6 | % | ||||||||||
|
|
|
|
|
|
|
|
|
|||||||||
Magna International Inc. Annual Report 2023 13
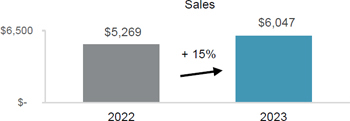
Sales – Seating Systems
Sales increased 15% or $778 million to $6.05 billion for 2023 compared to $5.27 billion for 2022, primarily due to:
| • | the launch of programs during or subsequent to 2022, including the: |
| • | Nissan Frontier; |
| • | Geely Boyue L; |
| • | Changan Oshan Z6; and |
| • | BMW XM; |
| • | higher global light vehicle production; and |
| • | customer price increases to recover certain higher production input costs. |
These factors were partially offset by:
| • | the net weakening of foreign currencies against the U.S. dollar, which decreased reported U.S. dollar sales by $50 million; |
| • | the negative impact of lost vehicle production as a result of the UAW labour strikes at certain customers during 2023, which decreased sales by approximately $45 million; and |
| • | net customer price concessions subsequent to 2022. |
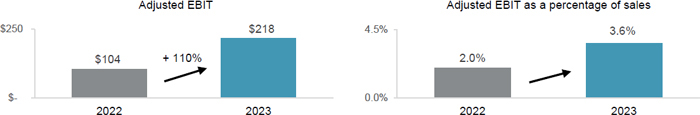
Adjusted EBIT and Adjusted EBIT as a percentage of sales – Seating Systems
Adjusted EBIT increased $114 million to $218 million for 2023 compared to $104 million for 2022 and Adjusted EBIT as a percentage of sales increased to 3.6% from 2.0%. These increases were primarily due to:
| • | earnings on higher sales including higher margins due to the impact of operational excellence and cost initiatives; |
| • | productivity and efficiency improvements, including lower costs at certain previously underperforming facilities; and |
| • | commercial items in 2023 and 2022, which had a net favourable impact on a year over year basis. |
These factors were partially offset by:
| • | higher production input costs net of customer recoveries, including for labour and certain commodities; |
| • | higher launch costs; |
| • | the negative impact of the UAW labour strikes during the third and fourth quarters of 2023; |
| • | higher net foreign exchange losses, primarily due to the weakening of the Argentine peso against the U.S. dollar; |
| • | lower equity income; and |
| • | the net weakening of foreign currencies against the U.S. dollar, which had a $5 million unfavourable impact on reported U.S. dollar Adjusted EBIT. |
14 Magna International Inc. Annual Report 2023
COMPLETE VEHICLES
| 2023 | 2022 | Change | ||||||||||||||
| Complete Vehicle Assembly Volumes (thousands of units)(i) |
105.1 | 112.2 | (7.1 | ) | - 6 | % | ||||||||||
|
|
|
|
|
|
|
|
|
|||||||||
| Sales |
$ | 5,538 | $ | 5,221 | $ | 317 | + 6 | % | ||||||||
|
|
|
|
|
|
|
|
|
|||||||||
| Adjusted EBIT |
$ | 124 | $ | 235 | $ | (111 | ) | - 47 | % | |||||||
|
|
|
|
|
|
|
|
|
|||||||||
| Adjusted EBIT as a percentage of sales |
2.2 | % | 4.5 | % | - 2.3 | % | ||||||||||
|
|
|
|
|
|
|
|
|
|||||||||
| (i) | Vehicles produced at our Complete Vehicle operations are included in Europe Light Vehicle Production volumes. |
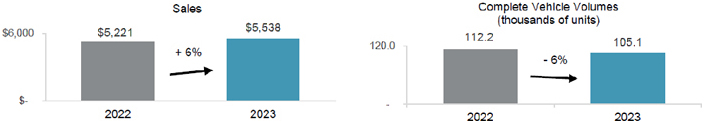
Sales – Complete Vehicles
Sales increased 6% or $317 million to $5.54 billion for 2023 compared to $5.22 billion for 2022. The increase in sales was primarily due to favourable program mix and a $109 million increase in reported U.S. dollar sales as a result of the strengthening of the euro against the U.S. dollar partially offset by lower assembly volumes, including the end of production of the BMW 5-Series.
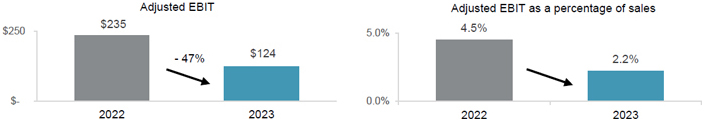
Adjusted EBIT and Adjusted EBIT as a percentage of sales – Complete Vehicles
Adjusted EBIT decreased $111 million to $124 million for 2023 compared to $235 million for 2022 and Adjusted EBIT as a percentage of sales decreased to 2.2% from 4.5%. These decreases were primarily due to:
| • | higher launch, engineering and other costs associated with new assembly business; |
| • | commercial items in 2023 and 2022, which had a net unfavourable impact on a year over year basis; and |
| • | lower earnings on lower assembly volumes, net of contractual fixed cost recoveries on certain programs. |
These factors were partially offset by higher earnings due to favourable program mix.
CORPORATE AND OTHER
Adjusted EBIT was a loss of $76 million for 2023 compared to income of $15 million for 2022. The $91 million decrease was primarily the result of:
| • | lower amortization of the initial value of public company securities; |
| • | higher incentive and stock-based compensation; |
| • | higher investments in research, development and new mobility; |
| • | higher labour and benefit costs; and |
| • | higher costs to accelerate our operational excellence initiatives. |
These factors were partially offset by an increase in fees received from our divisions and net transactional foreign exchange gains in 2023 compared to net transactional foreign exchange losses in 2022.
Magna International Inc. Annual Report 2023 15
FINANCIAL CONDITION, LIQUIDITY AND CAPITAL RESOURCES
OPERATING ACTIVITIES
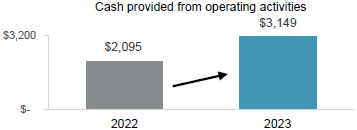
| 2023 | 2022 | Change | ||||||||||
| Net income |
$ | 1,286 | $ | 641 | ||||||||
| Items not involving current cash flows |
1,642 | 1,776 | ||||||||||
|
|
|
|
|
|
|
|||||||
| 2,928 | 2,417 | $ | 511 | |||||||||
| Changes in operating assets and liabilities |
221 | (322 | ) | 543 | ||||||||
|
|
|
|
|
|
|
|||||||
| Cash provided from operating activities |
$ | 3,149 | $ | 2,095 | $ | 1,054 | ||||||
|
|
|
|
|
|
|
|||||||
Cash provided from operating activities
Comparing 2023 to 2022, cash provided from operating activities increased $1.05 billion primarily as a result of:
| • | a $4.98 billion increase in cash received from customers; |
| • | higher dividends received from equity investments of $84 million; and |
| • | a $28 million decrease in cash taxes. |
These factors were partially offset by:
| • | a $2.84 billion increase in cash paid for materials and overhead; |
| • | a $1.08 billion increase in cash paid for labour; and |
| • | a $75 million increase in cash interest paid. |
Changes in operating assets and liabilities
During 2023, we generated $221 million from operating assets and liabilities primarily consisting of:
| • | a $637 million increase in other accrued liabilities; and |
| • | a $501 million increase in accounts payable. |
These factors were partially offset by:
| • | a $687 million increase in production and other receivables; and |
| • | a $246 million increase in tooling investment for current and upcoming program launches. |
16 Magna International Inc. Annual Report 2023
INVESTING ACTIVITIES
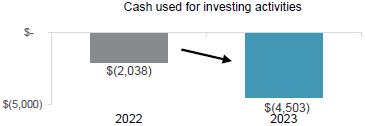
| 2023 | 2022 | Change | ||||||||||
| Fixed asset additions |
$ | (2,500 | ) | $ | (1,681 | ) | ||||||
| Increase in investments, other assets and intangible assets |
(562 | ) | (455 | ) | ||||||||
| Increase in public and private equity investments |
(11 | ) | (29 | ) | ||||||||
|
|
|
|
|
|
|
|||||||
| Fixed assets, investments, other assets and intangible assets additions |
(3,073 | ) | (2,165 | ) | ||||||||
| Proceeds from dispositions |
122 | 124 | ||||||||||
| Net cash (outflow) inflow from disposal of facilities |
(48 | ) | 6 | |||||||||
| Acquisitions |
(1,504 | ) | (3 | ) | ||||||||
|
|
|
|
|
|
|
|||||||
| Cash used for investing activities |
$ | (4,503 | ) | $ | (2,038 | ) | $ | (2,465 | ) | |||
|
|
|
|
|
|
|
|||||||
Cash used for investing activities in 2023 was $2.47 billion higher compared to 2022. The change between 2023 and 2022 was primarily due to the acquisition of Veoneer AS and a $908 million increase in cash used for fixed assets and other assets.
During the fourth quarter of 2022, we entered into an agreement to sell a European Power & Vision operation in early 2023. During the first quarter of 2023, we completed the sale of this operation which resulted in a net cash outflow of $25 million.
In addition, during the third quarter of 2023, we completed the sale of all of our investments in Russia resulting in a net cash outflow of $23 million.
FINANCING ACTIVITIES
| 2023 | 2022 | Change | ||||||||||
| Issues of debt |
$ | 2,083 | $ | 54 | ||||||||
| Increase in short-term borrowings |
487 | 11 | ||||||||||
| Issue of Common Shares on exercise of stock options |
20 | 8 | ||||||||||
| Contributions to subsidiaries by non-controlling interests |
11 | 5 | ||||||||||
| Tax withholdings on vesting of equity awards |
(11 | ) | (15 | ) | ||||||||
| Repurchase of Common Shares |
(13 | ) | (780 | ) | ||||||||
| Dividends paid to non-controlling interest |
(74 | ) | (46 | ) | ||||||||
| Dividends paid |
(522 | ) | (514 | ) | ||||||||
| Repayments of debt |
(644 | ) | (456 | ) | ||||||||
|
|
|
|
|
|
|
|||||||
| Cash provided from (used for) financing activities |
$ | 1,337 | $ | (1,733 | ) | $ | 3,070 | |||||
|
|
|
|
|
|
|
|||||||
During the first quarter of 2023, we issued the following Senior Notes [the “Senior Notes”]:
| Amount in USD at | ||||||||||||
| Issuance Date | Issuance Date | Maturity Date | ||||||||||
| Cdn$350 million Senior Notes at 4.950% |
March 10, 2023 | $ | 258 million | January 31, 2031 | ||||||||
| €550 million Senior Notes at 4.375% |
March 17, 2023 | $ | 591 million | March 17, 2032 | ||||||||
| $300 million Senior Notes at 5.980% |
March 21, 2023 | $ | 300 million | March 21, 2026 | ||||||||
| $500 million Senior Notes at 5.500% |
March 21, 2023 | $ | 500 million | March 21, 2033 | ||||||||
The total cash proceeds received from the Senior Note issuances was $1,637 million, which consisted of $1,649 million of Senior Notes less debt issuance costs of $12 million.
The Senior Notes are unsecured obligations and do not include any financial covenants. We may redeem the Senior Notes in whole or in part at any time, and from time to time, at specified redemption prices determined in accordance with the terms of the indenture governing the Senior Notes. Refer to Note 16, “Debt” of our audited consolidated financial statements for the year ended December 31, 2023.
Magna International Inc. Annual Report 2023 17
On March 6, 2023, we entered into a syndicated, unsecured, delayed draw term loan [the “Term Loan”] with a 3-year tranche of $800 million and 5-year tranche of $600 million. During the second quarter of 2023, we drew $100 million from the 3-year tranche and $300 million from the 5-year tranche of the Term Loan. The amounts are drawn in advances of 1,3 or 6-month loans and may be rolled over until the end of the 3- and 5-year terms. The remaining balance of the facility was subsequently cancelled.
Short-term borrowings increased $487 million in 2023 primarily due to the issuance of Commercial Paper.
Cash dividends paid per Common Share were $1.84 for 2023 compared to $1.80 for 2022.
FINANCING RESOURCES
| 2023 | 2022 | Change | ||||||||||
| Liabilities |
||||||||||||
| Short-term borrowings |
$ | 511 | $ | 8 | ||||||||
| Long-term debt due within one year |
819 | 654 | ||||||||||
| Current portion of operating lease liabilities |
399 | 276 | ||||||||||
| Long-term debt |
4,175 | 2,847 | ||||||||||
| Operating lease liabilities |
1,319 | 1,288 | ||||||||||
|
|
|
|
|
|
|
|||||||
|
|
$ | 7,223 | $ | 5,073 | $ | 2,150 | ||||||
|
|
|
|
|
|
|
|||||||
Financial liabilities increased $2.15 billion to $7.22 billion as at December 31, 2023 primarily as a result of the $1.64 billion issuance of Senior Notes during the first quarter of 2023, a $400 million increase in the Term Loan, and the issuance of $509 million of commercial paper in the fourth quarter of 2023. These increases were offset by a $569 million repayment of Senior Notes.
CASH RESOURCES
In 2023, our cash resources remain unchanged at $1.2 billion, primarily as a result of cash provided from operating and financing activities being offset by cash used for investing activities, as discussed above. In addition to our cash resources at December 31, 2023, we had term and operating lines of credit totaling $4.1 billion, of which $3.0 billion was unused and available.
On March 6, 2023, we entered into a Term Loan with a 3-year tranche of $800 million and a 5-year tranche of $600 million. During the second quarter of 2023, we drew $100 million from the 3-year tranche and $300 million from the 5-year tranche. The remaining balance of the facility was subsequently cancelled.
On April 27, 2023, we amended our $2.7 billion syndicated revolving credit facility, including to: (i) extend the maturity date from June 24, 2027 to June 24, 2028, and (ii) cancel the $150 million Asian tranche and allocate the equivalent amount to the Canadian tranche. As of December 31, 2023, we have had limited borrowing under this credit facility.
On May 26, 2023, we extended the maturity date of our $800 million 364-day syndicated revolving credit facility from June 24, 2023 to June 24, 2024. As of December 31, 2023, we have not borrowed any funds under this credit facility.
MAXIMUM NUMBER OF SHARES ISSUABLE
The following table presents the maximum number of shares that would be outstanding if all of the outstanding options at February 22, 2024 were exercised:
| Common Shares |
286,866,376 | |||
| Stock options (i) |
5,572,829 | |||
|
|
|
|||
| 292,439,205 | ||||
|
|
|
| (i) | Options to purchase Common Shares are exercisable by the holder in accordance with the vesting provisions and upon payment of the exercise price as may be determined from time to time pursuant to our stock option plans. |
18 Magna International Inc. Annual Report 2023
CONTRACTUAL OBLIGATIONS
A purchase obligation is defined as an agreement to purchase goods or services that is enforceable and legally binding on us and that specifies all significant terms, including: fixed or minimum quantities to be purchased; fixed, minimum or variable price provisions; and the approximate timing of the transaction. Consistent with our customer obligations, substantially all of our purchases are made under purchase orders with our suppliers which are requirements based and accordingly do not specify minimum quantities. Other long-term liabilities are defined as long-term liabilities that are recorded on our consolidated balance sheet. Based on this definition, the following table includes only those contracts which include fixed or minimum obligations.
At December 31, 2023, we had contractual obligations requiring annual payments as follows:
| 2024 | 2025- 2026 |
2027- 2028 |
Thereafter | Total | ||||||||||||||||
| Operating leases |
$ | 326 | $ | 535 | $ | 401 | $ | 779 | $ | 2,041 | ||||||||||
| Long-term debt |
819 | 1,101 | 967 | 2,125 | 5,012 | |||||||||||||||
| Unconditional purchase obligations: |
||||||||||||||||||||
| Materials and services |
5,151 | 576 | 424 | 45 | 6,196 | |||||||||||||||
| Capital |
1,011 | 199 | 63 | 12 | 1,285 | |||||||||||||||
|
|
|
|
|
|
|
|
|
|
|
|||||||||||
| Total contractual obligations |
$ | 7,307 | $ | 2,411 | $ | 1,855 | $ | 2,961 | $ | 14,534 | ||||||||||
|
|
|
|
|
|
|
|
|
|
|
|||||||||||
Our unfunded obligation with respect to employee future benefit plans, which have been actuarially determined, was $550 million at December 31, 2023. These obligations are as follows:
| Pension Liability |
Retirement Liability |
Termination and Long Service Arrangements |
Total | |||||||||||||
| Projected benefit obligation |
$ | 511 | $ | 21 | $ | 445 | $ | 977 | ||||||||
| Less plan assets |
(427 | ) | — | — | (427 | ) | ||||||||||
|
|
|
|
|
|
|
|
|
|||||||||
| Unfunded amount |
$ | 84 | $ | 21 | $ | 445 | $ | 550 | ||||||||
|
|
|
|
|
|
|
|
|
|||||||||
Foreign Currency Activities
Our North American operations negotiate sales contracts with OEMs for payment in U.S. dollars, Canadian dollars and Mexican pesos. Materials and equipment are purchased in various currencies depending upon competitive factors, including relative currency values. Our North American operations use labour and materials which are paid for in U.S. dollars, Canadian dollars and Mexican pesos. Our Mexican operations generally use the U.S. dollar as the functional currency.
Our European operations negotiate sales contracts with OEMs for payment principally in euros. Our European operations’ material, equipment and labour are paid for principally in euros and U.S. dollars.
Our Asian operations negotiate sales contracts with OEMs for payment principally in Chinese renminbi. Our Asian operations’ material, equipment and labour are paid for principally in Chinese renminbi.
We employ hedging programs, primarily through the use of foreign exchange forward contracts, in an effort to manage our foreign exchange exposure, which arises when manufacturing facilities have committed to the delivery of products for which the selling price or material purchases have been quoted in foreign currencies and for labour in countries where the local currency is not the divisions’ functional currency. These commitments represent our contractual obligations to deliver products over the duration of the product programs, which can last a number of years. The amount and timing of the forward contracts will be dependent upon a number of factors, including anticipated production delivery schedules and anticipated production costs, which may be paid in the foreign currency. Despite these measures, significant long-term fluctuations in relative currency values, in particular a significant change in the relative values of the U.S. dollar, Canadian dollar, euro, Chinese renminbi or Mexican peso, could have an adverse effect on our profitability and financial condition (as discussed throughout this MD&A).
Magna International Inc. Annual Report 2023 19
NON-GAAP FINANCIAL MEASURES RECONCILIATION
During 2023, we revised our calculations of Adjusted EBIT, Adjusted diluted earnings per share and Adjusted Return on Invested Capital to exclude the amortization of acquired intangible assets. Revenue generated from acquired intangible assets is included within revenue in determining net income attributable to Magna. We believe that excluding the amortization of acquired intangible assets from these Non-GAAP measures helps management and investors in understanding our underlying performance and improves comparability between our segmented results of operations and our peers.
The historical presentation of these Non-GAAP measures within this MD&A has also been updated to reflect the revised calculations.
The reconciliation of Non-GAAP financial measures is as follows:
ADJUSTED EBIT
| 2023 | 2022 | |||||||
| Net income |
$ | 1,286 | $ | 641 | ||||
| Add : |
||||||||
| Amortization of acquired intangible assets |
88 | 46 | ||||||
| Interest expense, net |
156 | 81 | ||||||
| Other expense, net |
388 | 703 | ||||||
| Income taxes |
320 | 237 | ||||||
|
|
|
|
|
|||||
| Adjusted EBIT |
$ | 2,238 | $ | 1,708 | ||||
|
|
|
|
|
|||||
ADJUSTED EBIT AS A PERCENTAGE OF SALES
| 2023 | 2022 | |||||||
| Sales |
$ | 42,797 | $ | 37,840 | ||||
|
|
|
|
|
|||||
| Adjusted EBIT |
$ | 2,238 | $ | 1,708 | ||||
|
|
|
|
|
|||||
| Adjusted EBIT as a percentage of sales |
5.2 | % | 4.5 | % | ||||
|
|
|
|
|
|||||
ADJUSTED DILUTED EARNINGS PER SHARE
| 2023 | 2022 | |||||||
| Net income attributable to Magna International Inc. |
$ | 1,213 | $ | 592 | ||||
| Add (deduct): |
||||||||
| Amortization of acquired intangible assets |
88 | 46 | ||||||
| Other expense, net |
388 | 703 | ||||||
| Tax effect on Amortization of acquired intangible assets and Other expense, net |
(70 | ) | (79 | ) | ||||
| Adjustments to Deferred Tax Valuation Allowances |
(47 | ) | (29 | ) | ||||
|
|
|
|
|
|||||
| Adjusted net income attributable to Magna International Inc. |
$ | 1,572 | $ | 1,233 | ||||
| Diluted weighted average number of Common Shares outstanding during the period (millions) |
286.6 | 291.2 | ||||||
|
|
|
|
|
|||||
| Adjusted diluted earnings per share |
$ | 5.49 | $ | 4.24 | ||||
|
|
|
|
|
|||||
20 Magna International Inc. Annual Report 2023
ADJUSTED RETURN ON INVESTED CAPITAL
Adjusted Return on Invested Capital is calculated as Adjusted After-tax operating profits divided by Average Invested Capital for the period. Average Invested Capital for the twelve month period is averaged on a five-fiscal quarter basis.
| 2023 | 2022 | |||||||
| Net Income |
$ | 1,286 | $ | 641 | ||||
| Add (deduct): |
||||||||
| Interest expense, net |
156 | 81 | ||||||
| Amortization of acquired intangible assets |
88 | 46 | ||||||
| Other expense, net |
388 | 703 | ||||||
| Tax effect on Interest expense, net, Amortization of acquired intangible assets and Other expense, net |
(102 | ) | (96 | ) | ||||
| Adjustments to Deferred Tax Valuation Allowances |
(47 | ) | (29 | ) | ||||
|
|
|
|
|
|||||
| Adjusted After-tax operating profits |
$ | 1,769 | $ | 1,346 | ||||
|
|
|
|
|
|||||
| 2023 | 2022 | |||||||
| Total Assets |
$ | 32,255 | $ | 27,789 | ||||
| Excluding: |
||||||||
| Cash and cash equivalents |
(1,198 | ) | (1,234 | ) | ||||
| Deferred tax assets |
(621 | ) | (491 | ) | ||||
| Less Current Liabilities |
(13,234 | ) | (10,998 | ) | ||||
| Excluding: |
||||||||
| Short-term borrowing |
511 | 8 | ||||||
| Long-term debt due within one year |
819 | 654 | ||||||
| Current portion of operating lease liabilities |
399 | 276 | ||||||
|
|
|
|
|
|||||
| Invested Capital |
$ | 18,931 | $ | 16,004 | ||||
|
|
|
|
|
|||||
| 2023 | 2022 | |||||||
| Adjusted After-tax operating profits |
$ | 1,769 | $ | 1,346 | ||||
|
|
|
|
|
|||||
| Average Invested Capital |
$ | 17,771 | $ | 15,924 | ||||
|
|
|
|
|
|||||
| Adjusted Return on Invested Capital |
10.0 | % | 8.5 | % | ||||
|
|
|
|
|
|||||
Magna International Inc. Annual Report 2023 21
SIGNIFICANT ACCOUNTING POLICIES AND CRITICAL ACCOUNTING ESTIMATES
Our significant accounting policies are more fully described in Note 2, “Significant Accounting Policies”, to the consolidated financial statements included in this Report. The preparation of the audited consolidated financial statements requires management to make estimates and assumptions that affect the reported amounts of assets, liabilities, revenues and expenses and the related disclosure of contingent assets and liabilities, as of the date of the consolidated financial statements. These estimates and assumptions are based on our historical experience, and various other assumptions we believe to be reasonable in the circumstances. Since these estimates and assumptions are subject to an inherent degree of uncertainty, actual results in these areas may differ significantly from our estimates.
We believe the following critical accounting policies and estimates affect the more subjective or complex judgements and estimates used in the preparation of our consolidated financial statements and accompanying notes. Management has discussed the development and selection of the following critical accounting policies with the Audit Committee of the Board of Directors, and the Audit Committee has reviewed our disclosure relating to critical accounting policies in this MD&A.
BUSINESS COMBINATIONS
We allocate the purchase price of an acquired business to its identifiable assets and liabilities based on estimated fair values at the date of the acquisition. The excess of the purchase price over the amount allocated to the assets and liabilities, if any, is recorded as goodwill.
Our purchase price allocation methodology contains uncertainties because it requires management to make assumptions and to apply judgement to estimate the fair value of assets acquired and liabilities assumed. When determining the fair values of assets acquired and liabilities assumed, management makes significant estimates and assumptions and engages outside appraisal firms to assist in the fair value determination of identifiable intangible assets and any other significant assets or liabilities. We adjust the preliminary purchase price allocation, as necessary, up to one year after acquisition closing date as we obtain more information regarding assets acquired and liabilities assumed.
Unanticipated events or circumstances may occur which could affect the accuracy of our fair value estimates, including assumptions regarding industry economic factors and business strategies. Accordingly, there can be no assurance that the estimates, assumptions, and values reflected in the valuations will be realized, and actual results could vary.
REVENUE RECOGNITION - COMPLETE VEHICLE ASSEMBLY ARRANGEMENTS
Our complete vehicle assembly contracts with customers are complex and often include promises to transfer multiple products and services, some of which may be implicitly contracted. Each good or service is evaluated to determine whether it represents a distinct performance obligation, and whether it should be characterized as revenue or as a reimbursement of costs incurred. The total transaction price is then allocated to the distinct performance obligations based on the expected cost plus a margin approach and recognized as revenue.
Significant interpretation and judgment is sometimes required to determine the appropriate accounting for these contracts including: (i) combining contracts that may impact the allocation of the transaction price between products and services; (ii) determining whether performance obligations are considered distinct and are required to be accounted for separately or combined; and (iii) the allocation of the transaction price to each distinct performance obligation and determining when to recognize revenue.
IMPAIRMENT ASSESSMENTS – GOODWILL, LONG-LIVED ASSETS, AND EQUITY METHOD INVESTMENTS
We review goodwill at the reporting unit level for impairment in the fourth quarter of each year or more frequently if events or changes in circumstances indicate that goodwill might be impaired. Goodwill impairment is assessed by comparing the fair value of a reporting unit to the underlying carrying value of the reporting unit’s net assets, including goodwill. If a reporting unit’s carrying amount exceeds its fair value, an impairment is recognized based on that difference. The fair value of a reporting unit is determined using the estimated discounted future cash flows of the reporting unit.
In addition to our review of goodwill, we evaluate fixed assets and other long-lived assets for impairment whenever indicators of impairment exist. Indicators of impairment include the bankruptcy of a significant customer or the early termination, loss, renegotiation of the terms of, significant volume decrease in, or delay in the implementation of, any significant production contract. If the sum of the future cash flows expected to result from the asset, undiscounted and without interest charges, is less than the carrying amount of the asset, an asset impairment may be recognized in the consolidated financial statements. The amount of impairment to be recognized is calculated by subtracting the fair value of the asset from the carrying amount of the asset.
22 Magna International Inc. Annual Report 2023
As of December 31, 2023, we had equity method investments of $987 million. We monitor our investments for indicators of other-than-temporary declines in value on an ongoing basis in accordance with U.S. GAAP. If we determine that an other-than-temporary decline in value has occurred, we recognize an impairment loss, which is measured as the difference between the book value and the fair value of the investment.
We believe that the impairment assessments for goodwill, long-lived assets, and equity method investments contain “critical accounting estimates” because: (i) they are subject to significant measurement uncertainty and are susceptible to change as management is required to make forward-looking assumptions regarding the impact of improvement plans on current operations, in-sourcing and other new business opportunities, program pricing and cost assumptions on current and future business, the timing of new program launches and future forecasted production volumes; and (ii) any resulting impairment loss could have a material impact on our consolidated net income and on the amount of assets reported in our consolidated balance sheet.
WARRANTY
We record product warranty costs, which include product liability and recall costs. Under most customer agreements, we only account for existing or probable claims on product default issues when amounts related to such issues are probable and reasonably estimable. Under certain complete vehicle assembly, powertrain systems, and electronics contracts, we record an estimate of future warranty-related costs based on the terms of the specific customer agreements and/or the Company’s warranty experience.
Product liability and recall provisions are established based on our best estimate of the amounts necessary to settle existing claims. These estimates typically require assumptions from management regarding: the number of units that may be returned; the cost of the product being replaced; labour to remove and replace the defective part; and the customer’s administrative costs relating to the recall. In making this estimate, judgement is also required as to the ultimate negotiated sharing of the cost between us, the customer and, in some cases a supplier. Where applicable, insurance recoveries related to such provisions are also recorded.
We monitor warranty activity on an ongoing basis and revise our best estimate as necessary. Due to the uncertainty and potential volatility of the factors contributing to developing estimates of the amounts necessary to settle existing claims, actual product liability costs could be materially different from our best estimate.
INCOME TAXES
The determination of our tax liabilities involves dealing with uncertainties in the application of complex tax laws. Significant judgement and estimates are required in determining our provision for income taxes, deferred tax assets and liabilities, and liabilities for unrecognized tax benefits. We recognize tax benefits from uncertain tax positions only if it is more likely than not that the tax position will be sustained on examination by the taxing authorities, based on the technical merits of the position. The tax benefits recognized in the financial statements from such positions are then measured based on the largest benefit that has a greater than 50% likelihood of being realized upon ultimate settlement.
At December 31, 2023, we had gross unrecognized tax benefits of $220 million excluding interest and penalties, of which $188 million, if recognized, would affect our effective tax rate. The gross unrecognized tax benefits differ from the amount that would affect our effective tax rate due primarily to the impact of the valuation allowances on deferred tax assets.
Deferred tax assets and liabilities are recognized for the estimated future tax effects attributable to temporary differences between financial statement carrying value of existing assets and liabilities and their respective tax bases and tax loss and credit carryforwards. Deferred tax assets and liabilities are measured using the enacted tax rates and laws that will be in effect when the differences are expected to reverse. Accounting standards require that we assess whether valuation allowances should be established or maintained against our deferred income tax assets, based on consideration of all available evidence, using a “more-likely-than-not” standard. The factors used to assess the likelihood of realization are: history of losses, forecasts of future pre-tax income and tax planning strategies that could be implemented to realize the deferred tax assets. On a quarterly basis, we evaluate the realizability of deferred tax assets by assessing our valuation allowances and by adjusting the amount of such allowances as necessary. We use tax planning strategies to realize deferred tax assets in order to avoid the potential loss of these tax benefits. Changes in our estimates, due to unforeseen events or otherwise, could have a material impact on our financial condition and results of operations. Refer to Note 12, “Income Taxes” of the notes to the consolidated financial statements for additional information.
EMPLOYEE FUTURE BENEFIT PLANS
The determination of the obligation and expense for defined benefit pension, termination and long service arrangements and other post-retirement benefits, such as retiree healthcare and medical benefits, is dependent on the selection of certain assumptions used by actuaries in calculating such amounts. Those assumptions include, among others, the discount rate, expected long-term rate of return on plan assets and rates of increase in compensation costs. Actual results that differ from the assumptions used are accumulated and amortized over future periods and therefore impact the recognized expense in future periods. Significant changes in assumptions or significant plan amendments could materially affect our future employee benefit obligations and future expense.
Magna International Inc. Annual Report 2023 23
At December 31, 2023, we had past service costs and actuarial experience losses of $116 million included in accumulated other comprehensive income that will be amortized to future employee benefit expense over the expected average remaining service life of employees or over the expected average life expectancy of retired employees, depending on the status of the plan.
COMMITMENTS AND CONTINGENCIES
From time to time, we may be contingently liable for litigation, legal and/or regulatory actions and proceedings and other claims. Refer to Note 23, “Contingencies” of our audited consolidated financial statements for the year ended December 31, 2023.
For a discussion of risk factors relating to legal and other claims/actions against us, refer to “Item 5. Risk Factors” in our Annual Information Form and Annual Report on Form 40-F, each in respect of the year ended December 31, 2023.
CONTROLS AND PROCEDURES
DISCLOSURE CONTROLS AND PROCEDURES
Disclosure controls and procedures (as defined in Rules 13a-15(e) and 15d-15(e) under the Securities Exchange Act of 1934, as amended [the “Exchange Act”]), are designed to ensure that material information required to be disclosed in reports filed or submitted under the Exchange Act is recorded, processed, summarized and reported on a timely basis, and that such information is accumulated and communicated to senior management, including the Company’s Chief Executive Officer and Chief Financial Officer, as appropriate, to enable them to make timely decisions regarding required disclosure of such information. We have conducted an evaluation of our disclosure controls and procedures as of December 31, 2023, under the supervision, and with the participation of our Chief Executive Officer and our Chief Financial Officer. Based on this evaluation, our Chief Executive Officer and our Chief Financial Officer have concluded that our disclosure controls and procedures (as this term is defined in the rules adopted by Canadian securities regulatory authorities and the United States Securities and Exchange Commission [“SEC”]) are effective as of December 31, 2023.
MANAGEMENT’S ANNUAL REPORT ON INTERNAL CONTROL OVER FINANCIAL REPORTING
Internal control over financial reporting is a process designed to provide reasonable, but not absolute, assurance regarding the reliability of financial reporting and preparation of financial statements for external purposes in accordance with U.S. GAAP. Our management is responsible for establishing and maintaining adequate internal control over financial reporting. Due to its inherent limitations, internal control over financial reporting may not prevent or detect misstatements on a timely basis. Additionally, projections of any evaluation of the effectiveness of internal control over financial reporting to future periods are subject to the risk that the controls may become inadequate because of changes in conditions, or that the degree of compliance with the policies or procedures may deteriorate. Our management used the Committee of Sponsoring Organizations of the Treadway Commission [“COSO”] Internal Control-Integrated Framework (2013) to evaluate the effectiveness of internal control over financial reporting.
On June 1, 2023, we completed the acquisition of 100% of the common shares of Veoneer AS. As permitted by securities rules and regulations, we have excluded Veoneer AS from our evaluation of internal controls over financial reporting as of December 31, 2023. The excluded Veoneer AS assets constituted 4% of our total assets as of December 31, 2023, and 2% of our sales for the year then ended.
Based on this evaluation, our Chief Executive Officer and our Chief Financial Officer have assessed the effectiveness of our internal control over financial reporting and concluded that, as at December 31, 2023, such internal control over financial reporting is effective. The Company’s internal control over financial reporting as of December 31, 2023, has been audited by Deloitte LLP, an Independent Registered Public Accounting Firm, who also audited the Company’s consolidated financial statements for the year ended December 31, 2023. Deloitte LLP expressed an unqualified opinion on the effectiveness of the Company’s internal control over financial reporting. This report precedes our audited consolidated financial statements for the year ended December 31, 2023.
CHANGES IN INTERNAL CONTROLS OVER FINANCIAL REPORTING
Other than the addition of Veoneer AS operations to our internal control over financial reporting, there have been no changes in our internal controls over financial reporting that occurred during 2023 that have materially affected or are reasonably likely to materially affect, our internal control over financial reporting. We are currently integrating Veoneer AS into our operations, compliance programs, and internal control process.
24 Magna International Inc. Annual Report 2023
RISK FACTORS
Our short and medium-term operational success, as well as our ability to create long-term value through our business strategy, are subject to risks and uncertainties. The following are the more significant risks:
MACROECONOMIC, GEOPOLITICAL AND OTHER RISKS
| • | Inflationary Pressures: We continue to experience elevated inflation in all markets in which we operate, with higher commodity, energy, labour, freight, and other production input pricing expected to persist in 2024. While many of these input price increases will moderate over time, the increases in wage levels we are currently experiencing are likely to have a longer-term effect on our cost structure. Additionally, we may continue to experience price increases or surcharges from sub-suppliers in connection with the inflationary pressures they face. The inability to offset inflationary price increases, including through recoveries from our customers, modifications to our products, continuous improvement actions or otherwise, could have a material adverse effect on our profitability. |
| • | Interest Rates: Increasing global inflation rates have spurred a cycle of monetary policy tightening, including through central bank increases to key short term lending rates. The availability and cost of credit are both factors affecting consumer confidence, which is a critical driver of vehicle sales and thus automotive production. A material, sustained decrease in consumer demand for vehicles could result in further reductions to vehicle production from levels assumed in our business plan, which could have a material adverse effect on our profitability and financial condition. Higher interest rates will have an adverse effect on our borrowing costs and, if prolonged, could have an adverse effect on our profitability. |
| • | Geopolitical Risks: The occurrence of geopolitical crises, including from the current military conflicts in Ukraine and Gaza, could create a number of risks, including: disruption of energy supplies (particularly natural gas and oil), shipping/transportation and logistics, vehicle production and/or supply chains; weakening economic growth and consumer confidence; increasing physical or cybersecurity threats; and/or worsening other risks described elsewhere in these Risk Factors, such as inflationary pressures, commodity prices, relative foreign exchange rates and risks of doing business in foreign markets. An expansion or worsening of existing geopolitical crises, or the occurrence of significant new geopolitical risks, could have a material adverse effect on our business and operations. |
RISKS RELATED TO THE AUTOMOTIVE INDUSTRY
| • | Economic Cyclicality: Ordinarily, the global automotive industry is cyclical, with potential for regional differences in the timing of expansion and contraction of economic cycles. In normal industry cycles, lower consumer confidence typically translates to lower vehicle sales and production volumes. Examples of factors which often reduce consumer confidence include: worsening economic, political, and other conditions; military conflict; increasing inflation (particularly fuel and energy prices); and rising interest rates. A significant decline in vehicle production volumes from levels assumed in our business plan could have a material adverse effect on our profitability and financial condition. |
| • | Regional Production Volume Declines: North America, Europe and China are key automotive producing regions for us, and our operating results are primarily dependent on car and light truck production by our customers in these regions. A significant or sustained decline in vehicle production volumes in any or all these geographic regions could have a material adverse effect on our operations, sales, and profitability. |
| • | Deteriorating Vehicle Affordability: Vehicle affordability to consumers is becoming more challenged due to a combination of factors, including: higher prices for electric vehicles; costs related to advanced electronic systems; increasing vehicle finance costs due to rising interest rates; inflationary cost increases impacting the entire bill of materials for a vehicle; and, in some cases, limited vehicle supply. A material, sustained decrease in consumer demand for vehicles due to deteriorating vehicle affordability could result in reductions to vehicle production from levels assumed in our business plan, which could have a material adverse effect on our profitability and financial condition. |
| • | Misalignment Between EV Production and Sales: The automotive industry is transitioning from vehicles powered by internal combustion engines (“ICE”) to electric vehicles (“EVs”), resulting in significant, industry-wide capital investment in EV-related production capacity. At the same time, there remains some uncertainty as to consumer acceptance of EVs due to issues such as: vehicle affordability; availability of government subsidies; concerns regarding evolving battery technologies; anxiety regarding driving range; adequacy of charging infrastructure; the proliferation of new, EV-focused OEMs and/or new EV models with little or no operating and warranty history; and other factors. Although the number of EVs sold globally is growing, the rate of growth has moderated in some markets, with a misalignment between EV production/supply and consumer demand for certain models. If planned production volumes for EV programs do not materialize, we may not be able to recover our capital investments related to such programs, or to recover such investments within the timeframes contemplated. |
Magna International Inc. Annual Report 2023 25
| • | Intense Competition: The automotive supply industry is highly competitive and becoming more so. Some of our competitors have higher or more rapidly growing market share than we do in certain product or geographic markets. Additionally, a number of established electronics, semiconductor chip and contract manufacturing companies have entered or expanded their presence in the automotive industry. At the same time, disruptive technology innovators have been introducing novel product and service solutions which traditional automotive suppliers may not be able to match. Failure to successfully compete with existing or new competitors, including failure to grow our electronics and/or EV content at or above the industry rates of growth for such products, could affect our ability to fully implement our corporate strategy. |
STRATEGIC RISKS
| • | Alignment With “Car of the Future”: The success of our corporate strategy is correlated in part to our ability to evolve our product mix based on alignment with the global megatrends defining the “Car of the Future.” Accordingly, we seek to grow our business and capabilities in areas which are positively impacted by megatrends related to vehicle electrification, autonomy, new mobility, and connectivity. Examples of such product areas include powertrain electrification, advanced driver assistance systems (ADAS) and battery enclosures. Some systems in our product portfolio are negatively impacted by the foregoing megatrends, including manual transmissions, mechanical all-wheel drive/four-wheel drive systems and fuel tank systems. The failure to grow our megatrend-aligned product areas at or above the industry rates of growth for such products could have a material adverse effect on our profitability and financial condition. |
| • | Evolving Business Risk Profile: The risk profile of our business continues to evolve with the increasing importance to us of product areas such as battery enclosures, electrified powertrains, ADAS and electronics, as well as new mobility business models. With this continuing evolution, we may face new or heightened risks, including: forecasting, planning and capital allocation risks due to uncertainties regarding the shift from ICE to EV production volumes, take-rates for ADAS systems and/or features offered to consumers as optional items; reduction in demand for certain products which are unique to ICE vehicles; challenges in quoting for profitable returns on products with leading-edge technologies and/or new service models for which we may not have significant quoting experience; rigorous testing and validation requirements from OEM customers for complex new products; increased warranty and recall risks on new products and leading-edge technologies; increased product liability risks; heightened risk of technological obsolescence of some of our products, processes and/or assets; and difficulties in attracting or retaining employees with critical skills in high-demand areas. Realization of one or more such risks could have a material adverse effect on our operations, profitability, or financial condition. |
| • | Technology and Innovation: While we continue to invest in technology and innovation which we believe will be critical to our long-term growth, the automotive industry is experiencing significant electrical, electronic, and software-driven change and disruption. Our ability to anticipate changes in technology and to successfully develop and introduce new and enhanced products and/or manufacturing processes on a timely basis will be significant factors in our ability to remain competitive. Additionally, our success is dependent on our ability to attract, develop and retain employees with the required technical and/or software skills. If we are unsuccessful or are less successful than our competitors in consistently developing innovative products and/or processes, we may be placed at a competitive disadvantage in bidding for new business and may not be able to recover some or all our engineering, research, and development costs, which could have a material adverse effect on our profitability and financial condition and ability to fully implement our corporate strategy. |
| • | Investments in Mobility and Technology Companies: In addition to our development activities, we have invested in various mobility and technology companies, as well as funds that invest in such companies. Such investments are an important element of our long-term strategy, and we may make further investments in such companies. However, investing in such companies involves a high degree of risk, including the potential loss of some or all our investment value. There is currently no public market for the shares or units of some of these investments and, as a result, we may be unable to monetize such investments in the future. In some cases, we have shares or share purchase warrants with technology-driven suppliers or OEMs with which we have commercial supply relations; while the value of such equity may be affected by the commercial prospects of such programs, our ability to exit our investments may be impaired by the existence of our commercial supply relationship. Investments in companies or funds which are currently or subsequently become publicly traded are “marked-to-market” quarterly, which may result in us recording unrealized gains or losses in any given quarter. The realization of any of the foregoing investment-related risks could have an adverse effect on our profitability and financial condition. |
CUSTOMER-RELATED RISKS
| • | Customer Concentration: Although we supply parts to all the leading OEMs, a significant majority of our sales are to six customers: General Motors, BMW, Stellantis, Daimler, Ford, and Volkswagen. In light of the amount of business we currently have with these six customers, our opportunities for incremental growth with them may be limited. Additionally, growth rates of OEMs differ by region and segment, with significant growth by some EV-focused OEMs in certain markets. Shifts in market share away from our top customers could have a material adverse effect on our profitability to the extent we are unable to offset such lost sales with sufficient sales growth with alternative OEMs. |
26 Magna International Inc. Annual Report 2023
| • | Growth of EV-Focused OEMs: A number of EV-focused OEMs, including Tesla, BYD, Changan, Fisker, Geely, Nio, Rivian, SAIC, and VinFast, have emerged in recent years. While BYD and Tesla have become established global OEMs, it remains too early to predict which of the other EV-focused OEMs will succeed globally. Some of the China-based, EV-focused OEMs, such as BYD and Geely, are entering the European market with vehicles exported from China, while VinFast has entered both the European and North American markets with vehicles exported from Vietnam. Vehicle electrification is an important component of our strategy, including through product areas such as electric drive systems and battery enclosures, as well as services such as complete vehicle engineering and contract vehicle manufacturing. While we are targeting growth with some of the newer EV-focused OEMs, we do not have relations with all, nor are such relationships as well established as those with our traditional customers. The failure to sufficiently grow our sales to those EV-focused OEMs which achieve significant commercial success could adversely impact our long-term strategy. At the same time, the failure of newer EV-focused OEMs to which we supply systems or vehicles to achieve their sales projections could adversely impact the success of our customer diversification and electrified product strategies, as well as create counterparty risks described below. |
| • | Risks of Conducting Business with Fisker and Other Newer EV-Focused OEMs: Conducting business with newer EV-focused OEMs, such as Fisker, continues to alter the risk profile of our business and poses incremental risks and challenges compared to our traditional customers, including as a result of: their relatively short operating histories; limited financial, liquidity/capital or other resources; less mature product development and validation processes; uncertain market acceptance of their products/services; and untested business models. These factors may elevate our counterparty risks in dealing with such OEMs, particularly with respect to recovery of: pre-production (including tooling, engineering, and launch) and production receivables; inventory; fixed assets and capitalized pre-production expenditures; as well as other third party obligations related to such items. As at December 31, 2023, our balance sheet exposure related to these factors was approximately $600 million, the majority of which related to Fisker. Additionally in the case of Fisker, we hold share purchase warrants which are “marked-to-market” quarterly, resulting in us recording unrealized gains or losses in any given quarter. The inability of Fisker or other newer EV-focused OEMs to achieve commercial success, or the bankruptcy or insolvency of Fisker or any such other OEM with which we conduct business, could have a material adverse effect on our profitability and financial condition. |
| • | Dependence on Outsourcing: We depend on outsourcing by OEMs, including the outsourcing of complete vehicle assembly to our contract vehicle manufacturing business. The extent of such outsourcing is dependent on a number of factors, including: the cost, quality, and timeliness of outsourced production relative to in-house production by an OEM; the degree of unutilized capacity at an OEM’s facilities; and collective bargaining agreements and labour relations between OEMs and labour unions. Currently, OEMs in Europe and China have excess vehicle assembly capacity. Additionally, since EVs have fewer components than vehicles with internal combustion engines, some OEMs may insource production of certain components or systems to maintain employment levels committed to in collective bargaining agreements and/or in connection with government incentives. A reduction in outsourcing by OEMs, or the loss of any material production or assembly programs combined with the failure to secure alternative programs with sufficient volumes and margins, could have a material adverse effect on our profitability. |
| • | Customer Cooperation and Consolidation: Competing OEMs have cooperated and collaborated in different ways to save costs, including through: joint purchasing activities; platform sharing; powertrain sharing; joint R&D; and regional joint ventures. Additionally, the automotive industry has experienced OEM consolidation, with the last material example being the merger of Fiat Chrysler Automobiles and PSA Group in 2021. While OEM cooperation and consolidation may present opportunities, they also present a risk that we could lose future business or experience even greater pricing pressure on certain production programs, either of which could have an adverse effect on our profitability. |
| • | Market Shifts: While we supply parts for a wide variety of vehicles produced globally, we do not supply parts for all vehicles produced, nor is the number or value of parts evenly distributed among the vehicles for which we do supply parts. Shifts in market shares away from vehicles on which we have significant content, as well as vehicle segments in which our sales may be more heavily concentrated, could have a material adverse effect on our profitability. |
| • | Consumer Take Rate Shifts: Shifts in consumer preferences may impact “take rates” for certain types of products we sell. Examples of such products include: all-wheel drive systems; power liftgates; active aerodynamics systems; ADAS; and complete vehicles with certain option packages or option choices. Where shifts in consumer preferences result in higher “take rates” for products that we do not sell or for products we sell at a lower margin, our profitability may be adversely affected. |
| • | Customer Purchase Orders: Contracts from our customers consist of blanket purchase orders which generally provide for the supply of a customer’s annual requirements rather than a specific quantity of products and can be terminated by a customer at any time. We may have various pre-production, tooling, engineering, and other costs which cannot be recovered from our customers if a purchase order is terminated and/or if forecast production volumes fail to materialize. The failure to recover such costs could have an adverse effect on our profitability. |
| • | Potential OEM Production-Related Disruptions: Any significant OEM production disruptions, including as a result of labour unrest at customer or sub-supplier facilities, would lead to disruptions to our production, which could have a material adverse effect on our sales, and profitability. |
Magna International Inc. Annual Report 2023 27
SUPPLY CHAIN RISKS
| • | Semiconductor Chip Supply Disruptions and Price Increases: A global shortage of semiconductor chips for use in automotive applications has had a material adverse effect on global automotive production volumes since 2020 and may continue having some impact in 2024. In response to semiconductor chip shortages, OEMs may continue to take actions such as: unplanned shutdowns of production lines and/or plants; reductions in their vehicle production plans; and changes to their product mix. Such OEM responses can result in a number of direct and indirect consequences for Tier 1 suppliers like Magna, including: lower sales; significant production inefficiencies resulting from our production lines being stopped/restarted unexpectedly when OEMs allocate scarce chips to specific production programs; higher inventory levels; premium freight costs to expedite shipments; other unrecoverable costs and charges, including from sub-suppliers which have been adversely affected by higher chip prices and/or production inefficiencies; and increased challenges in retaining employees through production disruptions. Although supplies of semiconductor chips are significantly better than in the last two years, it remains unclear when supply and demand for automotive semiconductor chips will fully rebalance. A worsening or prolongation of the semiconductor chip shortage could have a material adverse effect on our operations, sales, and profitability. |
| • | Supply Chain Disruptions: In addition to the global shortage of semiconductor chips for automotive applications, OEMs and Tier 1 automotive suppliers may also experience supply disruptions or constraints on other critical manufacturing inputs, for a number of different reasons, including: government regulation or intervention; geopolitical and/or military conflict; interruption of shipping or other transportation routes; natural catastrophes; labour disruptions; and pandemics. Supply chain disruptions which prevent us from timely supplying products to our customers could result in a range of potential adverse consequences, including: unrecoverable price increases; elevated, unrecoverable costs such as those for premium freight or re-sourcing of supply; penalties or business interruption claims by our customers; loss of future business; and reputational damage. The impacts of prolonged supply chain disruptions or constraints could have a material adverse effect on our operations and profitability. |
| • | Regional Energy Supply and Pricing: Regional energy supplies have from time to time been disrupted due to geopolitical and military conflict, supply/demand imbalances, government regulation, severe weather events, and challenges related to the transition to renewable energy generation. Unforeseen supply disruptions, demand spikes, prolonged energy disruptions and/or significant energy price increases could have a material adverse effect on our operations and profitability. |
| • | Supply Base Condition: We rely on a number of suppliers to supply us with a wide range of components required in connection with our business. The financial health of automotive suppliers is impacted by a number of factors, including economic conditions and production volumes. A significant worsening of economic conditions or reduction in production volumes could deteriorate the financial condition of our supply base, which could lead to, among other things: disruptions in the supply of critical components to us or our customers; and/or temporary shutdowns of one of our production lines or the production lines of one of our customers; all of which could have a material adverse effect on our profitability. |
MANUFACTURING / OPERATIONAL RISKS
| • | Product Launch: The launch of production is a complex process, the success of which depends on a wide range of factors, including: the timing and frequency of design changes by our customers relative to start of production; product maturity and complexity; production readiness of our own, as well as our customers’ and suppliers’ manufacturing facilities; robustness of manufacturing and validation processes; launch volumes; quality and production readiness of tooling and equipment; sufficiency of skilled employees; and initial product quality. Failure by us to successfully launch a new product or complete vehicle could result in commercial or litigation claims against us which could have a material adverse effect on our profitability. Additionally, a significant product or program launch failure could adversely affect our reputation and/or ability to execute our strategy. |
| • | Operational Underperformance: From time to time, we may have operating divisions which are not performing at expected levels of profitability. The size and complexity of automotive manufacturing operations often makes it difficult to achieve a quick turnaround of underperforming divisions. Significant underperformance in our operating divisions could have a material adverse effect on our profitability and operations. |
| • | Restructuring Costs: We may sell some product lines and/or downsize, close, or sell some of our operating divisions. By taking such actions, we may incur restructuring, downsizing and/or other significant non-recurring costs. These costs may be higher in some countries than others and could have a material adverse effect on our profitability. |
| • | Impairments: We have recorded significant impairment charges related to equity interests in joint ventures, goodwill, and long-lived assets in the past and may do so again in the future. The occurrence of any of a number of potential scenarios could result in indicators of impairment, including: the early termination, loss, renegotiation of the terms of, or delay in the implementation of, any significant production contract; the technological obsolescence of any of our products or production assets; production volumes that are lower than expected; and the insolvency of a customer. In conducting our impairment analysis, we make forward-looking assumptions regarding: the impact of turnaround plans on underperforming operations; new business opportunities; program price and cost assumptions on current and future business; the timing and success of new program launches; and forecast production volumes. To the extent such forward-looking assumptions are not met, any resulting impairment loss could have a material adverse effect on our profitability. |
28 Magna International Inc. Annual Report 2023
| • | Skilled Labour Attraction/Retention: Our business is based on successfully attracting, developing, and retaining employees at all levels of the company from “shopfloor” to Executive Management. The markets for highly skilled workers, as well as talented professionals and leaders in our industry are extremely competitive, particularly in the major global automotive and technology centres in which many of our operations are located. The inability to meet our needs for skilled workers and talented professionals and leaders, whether through recruitment or internal training and development activities could impact our ability to profitably conduct business and/or effectively implement our strategy. |
| • | Leadership Expertise and Succession: Effective succession planning programs and practices are a critical element of our overall talent management strategy. We experienced a significant number of planned retirements in the last few years and may experience similar waves in future years. As a result of such retirements, we have multiple senior leaders recently appointed to roles at a time of significant macroeconomic, geopolitical, industry and other disruptions discussed elsewhere in these Risk Factors. While we believe that our leadership development and succession program has been effective in facilitating leadership transitions to date, our ability to profitably conduct business and/or successfully implement our strategy could be impacted by the failure to: identify, train, develop and support high-performing leaders; ensure effective knowledge transfers from transitioning leaders to successors; and/or otherwise promote organizational robustness and resilience through leadership transitions in critical roles. |
PRICING RISKS
| • | Quote/Pricing Assumptions: The time between award of new production business and start of production typically ranges between two and four years. Since product pricing is typically determined at the time of award, we are subject to significant pricing risk due to changes in input costs and quote assumptions from the time of award through the start of production. This risk is elevated in a rising inflation environment, particularly with respect to wages, energy, and commodities. The inability to quote effectively, or the occurrence of a material change in input cost or other quote assumptions between program award and production, could have a material adverse effect on our profitability. |
| • | Customer Pricing Pressure/Contractual Arrangements: We face ongoing pricing pressure from OEMs, including through: quoting pre-requirements; long-term supply agreements with mutually agreed price reductions over the life of the agreement; non-contractual annual price concession demands; pressure to absorb costs related to product design, engineering and tooling, and/or amortize such costs through the piece price for the product; pressure to assume incremental warranty costs; and OEM refusal to fully offset inflationary price increases. OEMs possess significant leverage over their suppliers due to their purchasing power and the highly competitive nature of the automotive supply industry. As a result of the broad portfolio of parts we supply to our six largest OEM customers, such customers may be able to exert greater leverage over us as compared to our competitors. We attempt to offset price concessions and costs in a number of ways, including through commercial negotiations with our customers, improved operating efficiencies and cost reduction efforts. Our inability to fully offset price concessions, absorb design, engineering, and tooling costs, and/or fully recover such costs over the life of production, could have a material adverse effect on our profitability. Moreover, while we attempt to negotiate contractual terms with our suppliers that align with the contractual terms between us and our OEM customers, we may not always be successful in doing so. Any such gaps between our customer and supplier contract terms could, in certain circumstances, have an adverse effect on our profitability. |
| • | Commodity Price Volatility: Prices for certain key raw materials and commodities used in our parts, including steel, aluminum, and resin, can be volatile. In some cases, our risk is mitigated because we purchase steel or aluminum under customer resale programs. Where such commodity purchases are not made under customer resale programs, we seek to offset commodity price increases by: passing such increases to our customers; engineering products with reduced commodity content; implementing hedging strategies; or otherwise. To the extent we are unable to offset commodity price increases, such additional commodity costs could have an adverse effect on our profitability. |
| • | Scrap Steel/Aluminum Price Volatility: Some of our manufacturing facilities generate a significant amount of engineered scrap steel and/or aluminum in their manufacturing processes but recover some of the value through the sale of such scrap. Scrap steel and scrap aluminum prices can also be volatile and do not necessarily move in the same direction as steel or aluminum prices. Declines in scrap steel/aluminum prices from time to time could have an adverse effect on our profitability. |
WARRANTY / RECALL RISKS
| • | Repair/Replacement Costs: We are responsible for repair and replacement costs of defective products we supply to our customers. Certain of our products, such as transmissions and battery enclosures, typically have a higher unit and labour service cost in the event of replacement. Other products, such as cameras, radars and side door latches, are supplied in multiples of two or four for a single vehicle, which could result in significant cost in the event all need to be replaced. OEMs and/or government regulators can initiate recalls of safety or regulated products, which could place us at risk for the costs of the administrative costs of the recall in addition to the repair/replacement costs of defective products, even in situations where we dispute the need for a recall or the responsibility for any alleged defect. The obligation to repair or replace defective products could have a material adverse effect on our operations and profitability. To the extent such obligation arises as a result of a product recall, we may face reputational damage, and the combination of administrative and repair/replacement costs could have a material adverse effect on our profitability. |
Magna International Inc. Annual Report 2023 29
| • | Warranty Provisions: In certain circumstances, we are at risk for warranty, product liability and recall costs. We are currently experiencing increased customer pressure to assume greater warranty responsibility. Certain customers seek to impose partial responsibility for warranty costs where the underlying root cause of a product or system failure cannot be determined, or where the root cause is disputed, as in the case of a warranty claim disclosed in the Contingencies note of our consolidated financial statements. Warranty provisions for our products are based on our best estimate of the amounts necessary to settle existing or probable claims related to product defects. Warranty claims which exceed warranty provisions could have a material adverse effect on our profitability. In addition, warranty provisions for our powertrain systems, electronics and complete vehicle programs are also established based on our or our customers’ warranty experience with the applicable type of product and, in some cases, the terms in the applicable customer agreements. Actual warranty experience which results in costs that exceed our warranty provisions, could have a material adverse effect on our profitability. |
| • | Product Liability: We cannot guarantee that the design, engineering, testing, validation, and manufacturing measures we employ to ensure high-quality products will be completely effective, particularly as electronic content and product complexity increases and/or as we enter newer product areas such as e-Drives or ADAS. If our products fail to perform as expected or as required by governmental regulations, and/or to the extent any such failure results in, or is alleged to result in, bodily injury and/or property damage or other losses, our customers or government regulators may initiate a product recall of such products and/or third party product liability claims may be brought against us. The defense of product liability claims, particularly class action claims in North America, may be costly and judgements against us could impair our reputation and have a material adverse effect on our profitability. |
CLIMATE CHANGE RISKS
| • | Transition Risks and Physical Risks: Our Sustainability Report, which is appended to our current Annual Information Form / Annual Report on Form 40-F, contains a detailed discussion of transitional and physical climate change risks, along with our efforts to mitigate them. Readers are encouraged to review such climate risk disclosures. |
| • | Strategic and Other Risks: A number of the risk factors discussed above contain detailed discussion of strategic and other risks related to the evolution of the automotive industry and our business within the context of the transition to electromobility, including: Alignment with Car of the Future; Technology and Innovation; Evolving Business Risk Profile; Growth of EV-Focused OEMs; and Risks of Conducting Business with Fisker and Other Newer EV-Focused OEMs. Readers are encouraged to review this entire Risk Factors section in its entirety. |
IT SECURITY / CYBERSECURITY RISKS
| • | IT/Cybersecurity Breach: Although we have established and continue to enhance security controls intended to protect our IT systems and infrastructure, there is no guarantee that such security measures will be effective in preventing unauthorized physical access or cyber-attacks. A significant breach of our IT systems could: result in theft of funds; cause disruptions in our manufacturing operations; lead to the loss, destruction, or inappropriate use of sensitive data, including employees’ personal data; or result in theft of our, our customers’ or our suppliers’ intellectual property or confidential information. The occurrence of any of the foregoing could adversely affect our operations and/or reputation and could lead to claims against us that could have a material adverse effect on our profitability. |
| • | Product Cybersecurity: The risk of vehicle cyber-attacks has risen with the proliferation of technology designed to connect vehicles to external networks. Although vehicle and systems-level cybersecurity controls and protections are typically managed and/or specified by our OEM customers, we cannot provide assurance that such controls and protections will be effective in preventing cyber intrusion through one of our products. Furthermore, an OEM customer may still seek to hold us financially responsible, even where the OEM specified the cybersecurity controls and protections. Any such cyber intrusion could cause reputational damage and lead to claims against us that have an adverse effect on our profitability. |
ACQUISITION RISKS
| • | Inherent Merger and Acquisition Risks: Acquisitions are subject to a range of inherent risks, including the assumption of incremental regulatory/compliance, pricing, supply chain, commodities, labour relations, litigation, environmental, pensions, warranty, recall, IT, tax, or other risks. While due diligence on an acquisition target is intended to mitigate such risks, these efforts may not always prove to be sufficient in identifying all risks and liabilities related to the acquisition, including as a result of: limited access to information; time constraints for conducting due diligence; inability to access target company facilities and/or personnel; or other limitations in the due diligence process. Additionally, we may identify risks and liabilities that we are not able to sufficiently mitigate through appropriate contractual indemnities or other protections. The realization of any such risks could have a material adverse effect on our profitability. |
| • | Acquisition Integration and Synergies: We may not be able to successfully integrate or achieve anticipated synergies from our acquisitions and/or such acquisitions may be dilutive in the short to medium term. Either of these outcomes could have a material adverse effect on our profitability. |
30 Magna International Inc. Annual Report 2023
OTHER BUSINESS RISKS
| • | Joint Ventures: We conduct certain of our operations through joint ventures under contractual arrangements under which we share management responsibilities with our joint venture partners. Joint venture operations carry a range of risks, including those relating to: failure of our joint venture partner(s) to satisfy contractual obligations; potential conflicts between us and our joint venture partner(s); strategic objectives of joint venture partners that may differ from our own; potential delays in decision-making; a limited ability to implement some or all of our policies, practices and controls, or to control legal and regulatory compliance, within the joint venture(s); and other risks inherent to non-wholly-owned operations. The likelihood of such occurrences and their potential effect on us vary depending on the joint venture arrangement, however, the occurrence of any such risks could have an adverse effect on our operations, profitability, and reputation. |
| • | Intellectual Property: We own intellectual property that is important to our business and product portfolio. Our intellectual property is an important factor in protecting our innovation activities and maintaining our competitive advantage. From time to time, our intellectual property rights may be challenged, including through the assertion of intellectual property infringement claims which could result in us: being prevented from selling certain products; having to license the infringed product/technology; and/or incurring monetary damages. The foregoing consequences could have an adverse effect on our sales, profitability, and ability to fully implement our corporate strategy. |
| • | Risks of Doing Business in Foreign Markets: Conducting business in markets outside our traditional markets of North America and Europe carries a number of potential risks, including those relating to: political, civil and economic instability and uncertainty; military conflict; corruption risks; high inflation and our ability to recover inflation-related cost increases; trade, customs and tax risks; potential sanctions and export control risk; expropriation risks; currency exchange rates; currency controls; limitations on the repatriation of funds; insufficient infrastructure; competition to attract and retain qualified employees; and other risks associated with conducting business internationally. Expansion of our business in China is an element of our long-term strategy and, as a result, our exposure to the risks described above may be greater in the future. The likelihood of such occurrences and their potential effect on us vary from country to country and are unpredictable, however, the occurrence of any such risks could have an adverse effect on our operations, profitability, and financial condition. |
| • | Relative Foreign Exchange Rates: Our profitability is affected by movements of our U.S. dollar reporting currency against the Canadian dollar, the euro, the Chinese renminbi, and other currencies in which we generate revenues and incur expenses. Significant long-term fluctuations in relative currency values, in particular a significant change in the relative values of the U.S. dollar, Canadian dollar, euro, or Chinese renminbi, could have an adverse effect on our profitability and financial condition and any sustained change in such relative currency values could adversely impact our competitiveness in certain geographic regions. |
| • | Currency Devaluation in Argentina: Our sales in Argentina are generally paid to us in Argentine pesos. We import certain materials needed to generate these sales, and are contractually obligated to pay in U.S. dollars or other foreign currencies for such materials. The Argentine peso has experienced significant devaluation recently, including a loss of over 50% of its value relative to the U.S. dollar in December 2023 alone. Foreign exchange controls imposed by the Government of Argentina have restricted our ability to easily exchange Argentine pesos for U.S. dollars and other foreign currencies, increasing our exposure to foreign denominated payables. As a result, our profitability may be adversely affected by the impact of further devaluation of the Argentine peso relative to foreign currencies. |
| • | Returns on Capital Investments: In recent years, we have invested significant amounts of money in our business through capital expenditures to support new facilities, expansion of existing facilities, purchases of production equipment and acquisitions. We expect continued elevated capital expenditures in 2024 to support program awards and our continued growth, including in megatrend areas. Returns achieved on such investments in the past are not necessarily indicative of the returns we may achieve on future investments and our inability to achieve returns on future investments which equal or exceed returns on past investments could have a material adverse effect on our level of profitability. |
| • | Financial Flexibility: The occurrence of an economic shock not contemplated in our business plan, a rapid deterioration of conditions or a prolonged recession could result in the depletion of our cash resources, which could have a material adverse effect on our operations and financial condition. |
| • | Credit Ratings Changes: There is no assurance that any credit rating currently assigned to us will remain in effect for any period of time or that any rating will not be revised or withdrawn entirely by a rating agency in the future. A downgrade in the credit ratings assigned to us by one or more agencies could increase our cost of borrowing or impact our ability to negotiate loans, which could have an adverse effect on our profitability, financial condition, and the trading price of our Common Shares. |
| • | Stock Price Fluctuation: Trading prices of our Common Shares cannot be predicted and may fluctuate significantly due to a variety of factors, many of which are outside our control. |
Magna International Inc. Annual Report 2023 31
LEGAL, REGULATORY AND OTHER RISKS
| • | Legal and Regulatory Proceedings: From time to time, we may become involved in regulatory proceedings, or become liable for legal, contractual, and other claims by various parties, including customers, suppliers, former employees, class action plaintiffs and others. Depending on the nature or duration of any potential proceedings or claims, we may incur substantial costs and expenses, be required to devote significant management time and resources to the matters and suffer reputational damage as a result of regulatory proceedings. On an ongoing basis, we attempt to assess the likelihood of any adverse judgements or outcomes to these proceedings or claims, although it is difficult to predict final outcomes with any degree of certainty. Except as disclosed from time to time in our consolidated financial statements and/or our MD&A, we do not believe that any of the proceedings or claims to which we are currently a party will have a material adverse effect on our profitability; however, we cannot provide any assurance to this effect. |
| • | Changes in Laws: A significant change in the current regulatory environment in our principal markets, including changes in tax laws, laws related to vehicle emissions, and other laws which impose additional costs on automotive manufacturers or consumers, could have an adverse effect on our profitability. More than 135 jurisdictions have agreed to implement a new global minimum tax regime (“Pillar Two”) based on model rules published by the Organization for Economic Co-operation and Development. The proposed Pillar Two rules are intended to ensure that large multinational enterprises pay a minimum tax of 15% on the income arising in each jurisdiction in which they operate. Although the impact on Magna will depend on how each jurisdiction implements the model rules, as well as profitability and local tax liabilities of Magna’s operations in those jurisdictions, we do not believe that the proposed Pillar Two rules will have a material adverse effect; however, we cannot provide any assurance to this effect. |
| • | Trade Agreements: Historical global growth of the automotive industry has been aided by the free movement of goods, services, people, and capital through bilateral and regional trade agreements, particularly in North America and Europe. Introduction of measures which impede free trade could have a material adverse effect on our operations and profitability. |
| • | Trade Disputes/Tariffs: International trade disputes could, among other things, reduce demand for and production of vehicles, disrupt global supply chains, distort commodity pricing, impair the ability of automotive suppliers and vehicle manufacturers to make efficient long-term investment decisions, create volatility in relative foreign exchange rates, and contribute to stock market volatility. The imposition of sanctions, tariffs and/or escalation of trade disputes which interfere with automotive supply chains could have an adverse effect on our operations and profitability. |
32 Magna International Inc. Annual Report 2023
Exhibit 4
Consent of Independent Registered Public Accounting Firm
We consent to the incorporation by reference in Registration Statement Nos. 333-270086 and 333-277377 on Form F-10 and 333-271114, 333-210449 and 333-128257 on Form S-8 of our reports dated February 22, 2024, relating to the consolidated financial statements of Magna International Inc. (the “Company”), and the effectiveness of the Company’s internal control over financial reporting, appearing in this Current Report, dated March 28, 2024, on Form 40-F of the Company for the year ended December 31, 2023.
/s/ Deloitte LLP
Chartered Professional Accountants
Licensed Public Accountants
Toronto, Canada
March 28, 2024
Exhibit 97
MAGNA INTERNATIONAL INC.
POLICY ON RECOVERY OF ERRONEOUSLY AWARDED INCENTIVE-BASED COMPENSATION
| 1. | Purpose & Scope of Application |
| 1.1 | This Policy has been adopted by the Board in compliance with the rules of the SEC and listing standards of the NYSE implementing Section 954 of the Dodd-Frank Act, which provides for the Corporation’s recovery of erroneously awarded incentive-based compensation paid to Covered Executives. |
| 1.2 | This Policy applies in the event that the Corporation is required to prepare an accounting restatement due to material non-compliance with any financial reporting requirement under applicable securities laws during the Recovery Period. |
| 1.3 | This Policy applies to all Incentive-Based Compensation received by a person: |
| 1.3.1 | after beginning service as a Covered Executive; |
| 1.3.2 | who served as a Covered Executive at any time during the performance period for that Incentive-Based Compensation; |
| 1.3.3 | while the Corporation has securities listed on The New York Stock Exchange; |
| 1.3.4 | during the Recovery Period; and |
| 1.3.5 | on or after the Effective Date. |
| 2. | Definitions & Interpretation |
| 2.1 | For purposes of this Policy, the following terms shall have the meanings set forth below: |
| 2.1.1 | “award” means the award or payment of Incentive-Based Compensation. |
| 2.1.2 | “Board” means the Board of Directors of the Corporation. |
| 2.1.3 | “Clawback Policy” or “Policy” means this Policy on Recovery of Erroneously Awarded Incentive-Based Compensation. |
| 2.1.4 | “Corporation” means Magna International Inc. |
| 2.1.5 | “Covered Executives” shall mean any current or former “executive officer,” within the meaning of Rule 10D-1 under the Securities Exchange Act of 1934, as amended, of the Corporation or a subsidiary of the Corporation, including individuals who currently serve or formerly served as the Corporation’s: Chief Executive Officer; Chief Financial Officer; Chief Accounting Officer (or if there is no such accounting officer, the Controller); President; Chief Operating Officer; Chief Human Resources Officer; Chief Legal Officer; Chief Sales & Marketing Officer; Chief Technology Officer; any Executive Vice-President or Vice-President of the Corporation in charge of a principal business unit, division or function; any other officer or person who performs or formerly performed a similar policy making-function for the Corporation as any of the foregoing (including executive officers of the Corporation’s subsidiaries); and any other former or current employee designated from time to time as a “Covered Executive” for the purposes of this Policy; and “Covered Executive” refers to any one such individual. |
| 2.1.6 | “Dodd-Frank Act” means the Dodd-Frank Wall Street Reform and Consumer Protection Act of 2010; |
| 2.1.7 | “Effective Date” means October 2, 2023. |
| 2.1.8 | “Erroneously Awarded Incentive-Based Compensation” means the amount of Incentive-Based Compensation received by a Covered Executive during the Recovery Period that exceeds the amount of Incentive-Based Compensation that otherwise would have been received during the Recovery Period, had the latter amount been determined based on the restated amount(s), in the case of an accounting restatement. |
| 2.1.9 | “Financial Reporting Measure” means a measure that is determined and presented in accordance with the accounting principles used in preparing the Corporation’s financial statements, and any measure that is derived wholly or in part from such measure. For purposes of this Clawback Policy, each of stock price and total shareholder return is considered a Financial Reporting Measure. |
| 2.1.10 | “Incentive-Based Compensation” means any compensation that is granted, earned, or vested based wholly or in part upon the attainment of a Financial Reporting Measure. |
| 2.1.11 | “Materially Non-Compliant Financial Statements” means financial statements required to be restated due to material non-compliance with any financial reporting requirement under applicable securities laws, including any required accounting restatement to correct an error in previously issued financial statements that is material to the previously issued financial statements, or that would result in a material misstatement if the error were corrected in the current period or left uncorrected in the current period. |
| 2.1.12 | “NYSE” means The New York Stock Exchange. |
| 2.1.13 | “received” means, with respect to Incentive-Based Compensation, the deemed receipt in the issuer’s fiscal period during which the Financial Reporting Measure applicable to the Incentive-Based Compensation is attained or purportedly attained, even if the payment or grant of the Incentive-Based Compensation occurs after the end of that period. |
| 2.1.14 | “Recovery Period” shall mean the last three completed fiscal years immediately preceding the date that the Corporation is required to prepare an accounting restatement correcting the Materially Non-Compliant Financial Statements, as determined in accordance with Section 303A.14(c)(1)(ii) of the Listed Company Manual of NYSE; provided however, that if the Corporation changes its fiscal year-end during such last three completed fiscal years, the Recovery Period shall include any such transition period (as set forth in Section 303A.14(c)(1)(i)(D) of the Listed Company Manual of NYSE). |
| 2.1.15 | “SEC” means the U.S. Securities and Exchange Commission. |
| 2.1.16 | “TOCC” shall mean the Talent Oversight and Compensation Committee of the Board, including any successor committee or other committee of the Board to which the Board may delegate oversight authority of the Corporation’s executive compensation programs. |
| 2.2 | This Policy shall be effective with respect to compensation received on or after the Effective Date; provided however, that some or all of a Recovery Period may precede the Effective Date. |
2
| 3. | Recovery of Erroneously Awarded Incentive-Based Compensation |
| 3.1 | In the event Incentive-Based Compensation has been computed based on Materially Non-Compliant Financial Statements, the TOCC shall reasonably promptly recover Erroneously Awarded Incentive-Based Compensation in compliance with this Clawback Policy, except to the extent that any of the following conditions are met, and the TOCC has made a determination that recovery would be impracticable: |
| 3.1.1 | the direct expense paid to a third party to assist in enforcing the Policy would exceed the amount to be recovered; |
| 3.1.2 | recovery would violate Ontario law, where such law was adopted prior to November 28, 2022; or |
| 3.1.3 | recovery would likely cause an otherwise tax-qualified retirement plan, under which benefits are broadly available to employees of the Corporation, to fail to meet the requirements of 26 U.S.C. 401(a)(13) or 26 U.S.C. 411(a) and regulations thereunder. |
| 3.2 | For purposes of Section 3.1, before concluding that it would be impracticable to recover any amount of Erroneously Awarded Incentive-Based Compensation based on: |
| 3.2.1 | expense of enforcement, the Corporation shall make a reasonable attempt to recover such erroneously awarded compensation, document such reasonable attempt(s) to recover, and provide that documentation to NYSE; or |
| 3.2.2 | violation of Ontario law, the Corporation shall obtain and provide to NYSE an opinion of Ontario counsel acceptable to the NYSE that recovery would result in such a violation. |
| 3.3 | Subject to Section 3.2 of this Policy, in pursuing recovery of the Erroneously Awarded Incentive-Based Compensation, the TOCC shall have the discretion and authority regarding the means and amount of recovery, including but not limited to by collecting from the Covered Executive cash payments or shares of Corporation common stock from or by forfeiting any amounts that the Corporation owes to the Covered Executive. Covered Executives shall be solely responsible for any tax consequences to them that result from the recoupment or recovery of any amount pursuant to this Policy, and the Corporation shall have no obligation to administer the Policy in a manner that avoids or minimizes any such tax consequences. |
| 3.4 | Erroneously Awarded Incentive-Based Compensation is to be computed without regard to any taxes paid by or on behalf of the Covered Executive in respect of such compensation. |
| 3.5 | For Erroneously Awarded Incentive-Based Compensation based on stock price or total shareholder return, where the amount of such compensation is not subject to mathematical recalculation directly from the information in an accounting restatement: |
| 3.5.1 | the amount shall be based on a reasonable estimate of the effect of the accounting restatement on the stock price or total shareholder return upon which the Incentive-Based Compensation was received; and |
| 3.5.2 | the Corporation shall maintain documentation of the determination of such reasonable estimate and provide such documentation to NYSE. |
3
| 3.6 | The Corporation is prohibited from indemnifying any Covered Executive against the loss of Erroneously Awarded Incentive-Based Compensation, paying or reimbursing the premium for any insurance policy to cover any losses incurred by a Covered Executive under this Policy or any claims relating to the Corporation’s enforcement of rights under this Policy. |
| 3.7 | Recoupment under this Policy shall be required in the event that the Corporation is required to prepare an accounting restatement due to material non-compliance with any financial reporting requirement under applicable securities laws, regardless of whether the Covered Executive or any other person was at fault or responsible for accounting errors that contributed to the need for the accounting restatement. |
| 4. | Board Authority and Administration of this Policy |
| 4.1 | All determinations, decisions and interpretations to be made under this Clawback Policy shall be made by the TOCC on behalf of the Board, and shall be final, binding and conclusive on all parties. This Policy shall be interpreted to comply with the requirements of SEC rules and NYSE listing standards implementing Section 954 of the Dodd-Frank Act and, to the extent this Policy is in any manner deemed inconsistent with such rules, this Policy shall be treated as retroactively amended to be compliant with such rules. |
| 4.2 | Any applicable award agreement, form or other document setting forth the terms and conditions of any Incentive-Based Compensation covered by this Policy which is approved, granted, awarded or paid on or after the date on which this Policy is adopted by the Board shall be deemed to include the restrictions imposed herein and incorporate the Policy by reference and, in the event of any inconsistency, the terms of this Policy shall govern. |
| 4.3 | This Clawback Policy may be amended at any time by the Board in its discretion, including as it deems necessary to comply with changes to applicable laws and any rules, regulations, guidance or standards adopted by a securities regulatory authority or a stock exchange on which the Corporation’s securities are listed. |
| 5. | No Impairment of Other Remedies |
| 5.1 | The recovery of Incentive-Based Compensation under this Policy does not preclude the Corporation from taking any other action to enforce a Covered Executive’s obligations to the Corporation, whether arising under applicable law (including pursuant to Section 304 of the Sarbanes-Oxley Act of 2002), regulation or pursuant to the terms of any other policy of the Corporation, employment agreement, equity award, cash incentive award or other agreement applicable to a Covered Executive, including, without limitation: |
| 5.1.1 | terminating the employment of the Covered Executive; |
| 5.1.2 | adjusting the future compensation of the Covered Executive; or |
| 5.1.3 | authorizing legal action or taking such other action to enforce the Covered Executive’s obligations to the Corporation as it may deem appropriate in view of all of the facts and circumstances surrounding the particular case. |
Board Approval Date: November 2, 2023
4
Exhibit 99.1
CERTIFICATION
I, Seetarama (Swamy) Kotagiri, Chief Executive Officer, certify that:
| 1. | I have reviewed this annual report on Form 40-F of Magna International Inc. (the “issuer”); |
| 2. | Based on my knowledge, this report does not contain any untrue statement of a material fact or omit to state a material fact necessary to make the statements made, in light of the circumstances under which such statements were made, not misleading with respect to the period covered by this report; |
| 3. | Based on my knowledge, the financial statements, and other financial information included in this report, fairly present in all material respects the financial condition, results of operations and cash flows of the issuer as of, and for, the periods presented in this report; |
| 4. | The issuer’s other certifying officer(s) and I are responsible for establishing and maintaining disclosure controls and procedures (as defined in Exchange Act Rules 13a-15(e) and 15d-15(e)) and internal control over financial reporting (as defined in Exchange Act Rules 13a-15(f) and 15d-15(f)) for the issuer and have: |
| a) | Designed such disclosure controls and procedures, or caused such disclosure controls and procedures to be designed under our supervision, to ensure that material information relating to the issuer, including its consolidated subsidiaries, is made known to us by others within those entities, particularly during the period in which this report is being prepared; |
| b) | Designed such internal control over financial reporting, or caused such internal control over financial reporting to be designed under our supervision, to provide reasonable assurance regarding the reliability of financial reporting and the preparation of financial statements for external purposes in accordance with generally accepted accounting principles; |
| c) | Evaluated the effectiveness of the issuer’s disclosure controls and procedures and presented in this report our conclusions about the effectiveness of the disclosure controls and procedures, as of the end of the period covered by this report based on such evaluation; and |
| d) | Disclosed in this report any change in the issuer’s internal control over financial reporting that occurred during the period covered by the annual report that has materially affected, or is reasonably likely to materially affect, the issuer’s internal control over financial reporting; and |
| 5. | The issuer’s other certifying officer(s) and I have disclosed, based on our most recent evaluation of internal control over financial reporting, to the issuer’s auditors and the audit committee of the issuer’s board of directors (or persons performing the equivalent functions): |
| a) | All significant deficiencies and material weaknesses in the design or operation of internal controls over financial reporting which are reasonably likely to adversely affect the issuer’s ability to record, process, summarize and report financial information; and |
| b) | Any fraud, whether or not material, that involves management or other employees who have a significant role in the issuer’s internal control over financial reporting. |
Date as of the 28th day of March, 2024.
| /s/ “Swamy Kotagiri” |
| Seetarama (Swamy) Kotagiri |
| Chief Executive Officer |
Exhibit 99.2
CERTIFICATION
I, Patrick W.D. McCann, Executive Vice-President and Chief Financial Officer, certify that:
| 1. | I have reviewed this annual report on Form 40-F of Magna International Inc. (the “issuer”); |
| 2. | Based on my knowledge, this report does not contain any untrue statement of a material fact or omit to state a material fact necessary to make the statements made, in light of the circumstances under which such statements were made, not misleading with respect to the period covered by this report; |
| 3. | Based on my knowledge, the financial statements, and other financial information included in this report, fairly present in all material respects the financial condition, results of operations and cash flows of the issuer as of, and for, the periods presented in this report; |
| 4. | The issuer’s other certifying officer(s) and I are responsible for establishing and maintaining disclosure controls and procedures (as defined in Exchange Act Rules 13a-15(e) and 15d-15(e)) and internal control over financial reporting (as defined in Exchange Act Rules 13a-15(f) and 15d-15(f)) for the issuer and have: |
| a) | Designed such disclosure controls and procedures, or caused such disclosure controls and procedures to be designed under our supervision, to ensure that material information relating to the issuer, including its consolidated subsidiaries, is made known to us by others within those entities, particularly during the period in which this report is being prepared; |
| b) | Designed such internal control over financial reporting, or caused such internal control over financial reporting to be designed under our supervision, to provide reasonable assurance regarding the reliability of financial reporting and the preparation of financial statements for external purposes in accordance with generally accepted accounting principles; |
| c) | Evaluated the effectiveness of the issuer’s disclosure controls and procedures and presented in this report our conclusions about the effectiveness of the disclosure controls and procedures, as of the end of the period covered by this report based on such evaluation; and |
| d) | Disclosed in this report any change in the issuer’s internal control over financial reporting that occurred during the period covered by the annual report that has materially affected, or is reasonably likely to materially affect, the issuer’s internal control over financial reporting; and |
| 5. | The issuer’s other certifying officer(s) and I have disclosed, based on our most recent evaluation of internal control over financial reporting, to the issuer’s auditors and the audit committee of the issuer’s board of directors (or persons performing the equivalent functions): |
| a) | All significant deficiencies and material weaknesses in the design or operation of internal controls over financial reporting which are reasonably likely to adversely affect the issuer’s ability to record, process, summarize and report financial information; and |
| b) | Any fraud, whether or not material, that involves management or other employees who have a significant role in the issuer’s internal control over financial reporting. |
Date as of the 28th day of March, 2024.
| /s/ “Patrick McCann” |
| Patrick W.D. McCann |
| Executive Vice-President and |
| Chief Financial Officer |
Exhibit 99.3
CERTIFICATE OF PRINCIPAL EXECUTIVE OFFICER
PURSUANT TO
18 U.S.C. SECTION 1350
AS ADOPTED PURSUANT TO SECTION 906 OF
THE SARBANES-OXLEY ACT OF 2002
I, Seetarama (Swamy) Kotagiri, Chief Executive Officer of Magna International Inc. (the “Company”), certify that:
| 1. | the Annual Report on Form 40-F of the Company dated the 28th day of March, 2024 for the fiscal year ending December 31, 2023 (the “Report”) fully complies with the requirements of Sections 13(a) and 15(d) of the Securities Exchange Act of 1934; and |
| 2. | the information contained in the Report fairly presents, in all material respects, the financial condition and results of operations of the Company. |
Dated as of the 28th day of March, 2024.
| /s/ “Swamy Kotagiri” |
| Seetarama (Swamy) Kotagiri |
| Chief Executive Officer |
A signed original of this written statement required by Section 906 has been provided to the Company and will be retained by the Company and furnished to the Securities and Exchange Commission or its staff upon request.
Exhibit 99.4
CERTIFICATE OF PRINCIPAL FINANCIAL OFFICER
PURSUANT TO
18 U.S.C. SECTION 1350
AS ADOPTED PURSUANT TO SECTION 906 OF
THE SARBANES-OXLEY ACT OF 2002
I, Patrick W.D. McCann, the Executive Vice-President and Chief Financial Officer of Magna International Inc. (the “Company”), certify that:
| 1. | the Annual Report on Form 40-F of the Company dated the 28th day of March, 2024 for the fiscal year ending December 31, 2023 (the “Report”) fully complies with the requirements of Sections 13(a) and 15(d) of the Securities Exchange Act of 1934; and |
| 2. | the information contained in the Report fairly presents, in all material respects, the financial condition and results of operations of the Company. |
Dated as of the 28th day of March, 2024.
| /s/ “Patrick McCann” |
| Patrick W.D. McCann |
| Executive Vice-President and |
| Chief Financial Officer |
A signed original of this written statement required by Section 906 has been provided to the Company and will be retained by the Company and furnished to the Securities and Exchange Commission or its staff upon request.