| ☒ | ANNUAL REPORT PURSUANT TO SECTION 13 OR 15 (d) OF THE SECURITIES EXCHANGE ACT OF 1934 For the Fiscal Year Ended December 31, 2023 |
| ☐ | TRANSITION REPORT PURSUANT TO SECTION 13 OR 15(d) OF THE SECURITIES EXCHANGE ACT OF 1934 |
Pennsylvania |
88-4268702 |
|
|
(State or other Jurisdiction of Incorporation or Organization) |
(I.R.S. Employer Identification No.) |
183 Bayard Lane, Princeton,
|
08540 |
|
(Address of Principal Executive Offices) |
(Zip Code) |
Title of each class |
Trading Symbol(s) |
Name of each exchange on which registered |
||
| Common stock, no par value | BPRN | The Nasdaq Global Select Market |
| Large accelerated filer | ☐ | Accelerated filer | ☐ | |||
|
Non-accelerated filer |
☒ | Smaller reporting company | ☒ | |||
| Emerging growth company | ☐ | |||||
TABLE OF CONTENTS
3
Explanatory Note
On January 10, 2023 (the “Effective Date”), Princeton Bancorp, Inc., a Pennsylvania corporation (the “Company”) acquired all of the outstanding stock of The Bank of Princeton, a New Jersey state-chartered bank (the “Bank”), in a corporate reorganization (the “Reorganization”). Pursuant to the Reorganization, shares of the Bank’s common stock were exchanged for shares of the Company’s common stock on a one-for-one basis. As a result, the Bank became the sole direct subsidiary of the Company, the Company became the holding company for the Bank and the stockholders of the Bank became stockholders of the Company.
Before the Effective Date, the Bank’s common stock was registered under Section 12(b) of the Securities Exchange Act of 1934 (the “Exchange Act”), and the Bank was subject to the information requirements of the Exchange Act and filed quarterly reports, proxy statements and other information with the Federal Deposit Insurance Corporation (“FDIC”). As of the Effective Date, the Company is the successor registrant to the Bank, the Company’s common stock is deemed to be registered under Section 12(b) of the Exchange Act, and the Company has become subject to the information requirements of the Exchange Act and files reports, proxy statements and other information with the Securities and Exchange Commission (the “SEC”).
Prior to the Effective Date, the Company conducted no operations other than obtaining regulatory approval for the Reorganization. Accordingly, the consolidated financial statements as of and for the year ended December 31, 2022, discussions of those financial statements, and market data and all other information presented herein as of any dates prior to the Effective Date, are those of the Bank.
In this report, unless the context indicates otherwise, references to “we,” “us,” and “our” refer to the Company and the Bank. However, if the discussion relates to a period before the Effective Date, the terms refer only to the Bank.
Cautionary Note Regarding Forward-Looking Statements and Summary Risk Factors
The Company may from time to time make written or oral “forward-looking statements,” including statements contained in the Company’s filings with the SEC, in its reports to stockholders and in other communications by the Company (including this report), which are made in good faith by the Company pursuant to the “safe harbor” provisions of the Private Securities Litigation Reform Act of 1995 and Section 21E of the Exchange Act.
These forward-looking statements involve risks and uncertainties, such as statements of the Company’s plans, objectives, expectations, estimates and intentions that are subject to change based on various important factors (some of which are beyond the Company’s control). The following factors, among others, could cause the Company’s financial performance to differ materially from the plans, objectives, expectations, estimates and intentions expressed in such forward-looking statements: the extent of the adverse impact of any current or future pandemics or other natural disasters on our customers, prospects and business, including related supply chain shortage of goods; civil unrest, rioting, acts or threats of terrorism, or actions taken by the local, state and Federal governments in response to such events, which could impact business and economic conditions in our market area; the strength of the United States economy in general and the strength of the local economies in which the Company and the Bank conduct operations; the effects of, and changes in, trade, monetary and fiscal policies and laws, including interest rate policies of the Board of Governors of the Federal Reserve System; inflation, interest rate, market and monetary fluctuations; market volatility; the value of the Bank’s products and services as perceived by actual and prospective customers, including the features, pricing and quality compared to competitors’ products and services; the willingness of customers to substitute competitors’ products and services for the Bank’s products and services; credit risk associated with the Bank’s lending activities; risks relating to the real estate market and the Bank’s real estate collateral; the impact of changes in applicable laws and regulations and requirements arising out of our supervision by banking regulators; other regulatory requirements applicable to the Company and the Bank; the timing and nature of the regulatory response to any applications filed by the Company and the Bank; technological changes; acquisitions including the Company’s pending acquisition of Cornerstone Financial Corporation; ability to meet other closing conditions to that acquisition; delay in closing the acquisition; difficulties and delays in integrating the businesses of Cornerstone Financial Corporation and the Company or fully realizing cost savings and other benefits; changes in consumer spending and saving habits; those risks described in Item 1. “Business,” Item 1A. “Risk Factors” and Item 7. “Management’s Discussion and Analysis of Financial Condition and Results of Operations” of this report; and the success of the Company at managing the risks involved in the foregoing.
The Company cautions that the foregoing list of important factors is not exclusive. The Company does not undertake to update any forward-looking statement, whether written or oral, that may be made from time to time by or on behalf of the Company, except as required by applicable law or regulation.
4
PART I
Item 1. Business
General
The Bank of Princeton (the “Bank”) was incorporated on March 5, 2007 under the laws of the State of New Jersey and is a New Jersey state-chartered banking institution. The Bank was granted its bank charter on April 17, 2007, commenced operations on April 23, 2007 and is a full-service bank providing personal and business lending and deposit services. As a state-chartered bank, the Bank is subject to regulation by the New Jersey Department of Banking and Insurance and the FDIC. The area served by the Bank, through its 29 branches, is generally an area within an approximate 50-mile radius of Princeton, NJ, including parts of Burlington, Camden, Gloucester, Hunterdon, Mercer, Middlesex, Ocean, and Somerset Counties in New Jersey, and additional areas in portions of Philadelphia, Montgomery and Bucks Counties in Pennsylvania. The Bank also has two retail branches and conducts loan origination activities in select areas of the New York City metropolitan area.
The Bank offers traditional retail banking services, one-to-four-family residential mortgage loans, multi-family and commercial mortgage loans, construction loans, commercial business loans and consumer loans, including home equity loans and lines of credit.
On January 10, 2023, Princeton Bancorp, Inc., a Pennsylvania corporation formed by the Bank (the “Company”), acquired all the outstanding stock of the Bank in a corporate reorganization. As a result, the Bank became the sole direct subsidiary of the Company, the Company became the holding company for the Bank and the stockholders of the Bank became stockholders of the Company. As of December 31, 2023, the Company had 209 total employees and 206 full-time equivalent employees.
On May 19, 2023, the Company completed the acquisition of Noah Bank, a Pennsylvania chartered state bank headquartered in Elkins Park, Pennsylvania that primarily served the Philadelphia, North New Jersey and New York City markets. On that date the Company acquired 100% of the outstanding common stock, for cash, of Noah Bank and Noah Bank was merged with and into the Bank.
On January 18, 2024, the Company announced its plans to acquire Cornerstone Financial Corporation, a New Jersey based bank holding company headquartered in Mount Laurel, New Jersey and the holding company for Cornerstone Bank, a New Jersey state chartered commercial bank (collectively Cornerstone Financial Corporation and Cornerstone Bank are referred to in this Form 10-K as “Cornerstone”).
Our headquarters and one of our branches are located at 183 Bayard Lane, Princeton, New Jersey 08540. Our telephone number is (609) 921-1700 and our website address is www.thebankofprinceton.com.
The Company has elected to prepare this Annual Report on Form 10- K and other annual and periodic reports as a “smaller reporting company” consistent with the rules of the SEC.
Competition
We have substantial competition in originating commercial and consumer loans in our market area. This competition comes principally from other banks, savings institutions, mortgage banking companies and other lenders. Many of our competitors enjoy advantages over us, including greater financial resources and higher lending limits, more aggressive marketing campaigns, better brand recognition, a wider geographic presence, more accessible branch office locations, the ability to offer a wider array of services or more favorable pricing alternatives, as well as lower origination and operating costs. Among other things, this competition could reduce our interest income and net income by decreasing the number and size of loans that we originate and the interest rates we may charge on these loans.
In attracting business and consumer deposits, we face substantial competition from other insured depository institutions such as banks, savings institutions and credit unions, as well as institutions offering uninsured investment alternatives, including money market funds. These competitors may offer higher interest rates on deposits, which could decrease the deposits that we attract, or require us to increase the rates we pay to retain existing deposits or attract new deposits. Deposit competition could adversely affect our net interest income and net income, and our ability to generate the funds we require for our lending or other operations. As a result, we may need to seek other sources of funds that may be more expensive to obtain and could increase our cost of funds.
5
Lending Activities
Our loan portfolio consists of variable-rate and fixed-rate loans with a significant concentration in commercial real estate lending. While most loans and other credit facilities are appropriately collateralized, major emphasis is placed upon the financial condition of the borrower and the borrower’s cash flow versus debt service requirements.
Loan growth is driven by customer demand, which in turn is influenced by individual and business indebtedness and consumer demand for goods. Loaning money will always entail some risk. Without loaning money, however, a bank cannot generate enough net interest income to be profitable. The risk involved in each loan must be carefully evaluated before the loan is made. The interest rate at which the loan is made should always reflect the risk factors involved, including the term of the loan, the value of collateral, if any, the reliability of the projected source of repayment, and the amount of the loan requested. Credit quality and repayment capacity are generally the most important factors in evaluating loan applications.
The majority of our loans are to borrowers in our immediate markets. We believe that no single borrower or group of borrowers presents a credit concentration whereby the borrowers’ loan default would have a material adverse effect on our financial condition or results of operations.
Commercial Real Estate and Multi-family. At December 31, 2023, commercial real estate and multi-family loans amounted in the aggregate to $1.14 billion, or 73.8% of the total loans receivable. Our commercial real estate portfolio has increased $269.3 million or 30.8% since December 31, 2022, when commercial real estate and multi-family loans amounted to $873.6 million, or 63.7%, of our total portfolio.
The commercial real estate and multi-family loan portfolio consists primarily of loans secured by small office buildings, strip shopping centers, small apartment buildings and other properties used for commercial and multi-family purposes located in the Company’s market area. At December 31, 2023, the average commercial and multi-family real estate loan size was approximately $1.9 million.
Although terms for commercial real estate and multi-family loans vary, our underwriting standards generally allow for terms up to 7 years with loan-to-value ratios of not more than 75%. Most of the loans are structured with balloon payments of 5 years or less and amortization periods of up to 25 years. Interest rates are either fixed or adjustable, based upon designated market indices such as the Wall Street Journal prime rate plus a margin.
Commercial real estate and multi-family real estate lending involves different risks from single-family residential lending. These risks include larger loans to individual borrowers and loan payments that are dependent upon the successful operations of the project or the borrower’s business. These risks can be affected by supply and demand conditions in the project’s market area of rental housing units, office and retail space and other commercial space. We attempt to minimize these risks by limiting loans to proven businesses, only considering properties with existing operating performance which can be analyzed, using conservative debt coverage ratios in our underwriting, and periodically monitoring the operation of the business or project and the physical condition of the property.
Various aspects of commercial and multi-family loan transactions are evaluated in an effort to mitigate the additional risk in these types of loans. In our underwriting procedures, consideration is given to the stability of the property’s cash flow history, future operating projections, current and projected occupancy levels, location and physical condition. Generally, we impose a debt service ratio (the ratio of net cash flows from operations to debt service) of not less than 1.25 X. We also evaluate the credit and financial condition of the borrower, and if applicable, the guarantor. With respect to loan participation interests we purchase; we underwrite the loans as if we were the originating lender. Appraisal reports prepared by independent appraisers are reviewed by an outside third party prior to closing.
Set forth below is a brief description of our three largest commercial real estate or multi-family loans:
| - | The largest commercial real estate loan is a $31 million loan (split between two loans, $29 million and $2 million). This loan exceeds the Bank’s internal lending limit with approval of the Bank’s loan committee but still is below the regulatory lending limit of $38.0 million. The proceeds were used to refinance an existing loan, with cash out being escrowed and released in the future upon meeting certain requirements. The property is an eight-story mixed use property located in Brooklyn, NY with 69 residential units and one commercial unit with a loan-to-value of 70%. The borrower is paying in accordance with the loan terms as of December 31, 2023. |
| - | The second largest commercial real estate loan is a $23.3 million loan. The proceeds were used to refinance an existing loan with cash out for future real estate investments. The property is an industrial warehouse located in East Windsor, NJ with a loan-to-value of 59%. The borrower is paying in accordance with the loan terms as of December 31, 2023. |
6
| - | The third largest commercial real estate loan is a $20.7 million loan. The proceeds were used to refinance an existing loan. The property is an eight-story mixed use property located in Queens, NY with 49 residential units and two commercial units with a loan-to-value of 56%. The borrower is paying in accordance with the loan terms as of December 31, 2023. |
Commercial and Industrial Loans. At December 31, 2023, commercial and industrial loans amounted in the aggregate to $51.0 million, or 3.3%, of the total loan portfolio. Our commercial and industrial portfolio has increased $22.1 million, or 76.6%, since December 31, 2022, when commercial and industrial loans amounted to $31.3 million, or 2.3%, of our total loan portfolio.
Commercial business loans are made to small to mid-sized businesses in our market area primarily to provide working capital. Small business loans may have adjustable or fixed rates of interest and generally have terms of three years or less but may be as long as 15 years. Our commercial business loans have historically been underwritten based on the creditworthiness of the borrower and generally require a debt service coverage ratio of at least 1.20 X. In addition, we generally obtain personal guarantees from the principals of the borrower with respect to commercial business loans and frequently obtain real estate as additional collateral.
Set forth below is a brief description of our three largest commercial and industrial loans:
| - | The largest commercial and industrial loan is a $9.9 million loan. The proceeds were used for business purposes and completion of capital improvements. The collateral is a lien on all business assets. The borrower is paying in accordance with the loan terms as of December 31, 2023. |
| - | The second largest commercial and industrial loan is a $5.0 million loan. The proceeds were used as a fully drawn business line of credit for general purposes. The loan is secured by real estate and cash collateral. The borrower is paying in accordance with the loan terms as of December 31, 2023. |
| - | The third largest commercial and industrial loan is a $3.5 million loan. The proceeds were used for working capital for future business opportunities. The loan is unsecured. The borrower is paying in accordance with the loan terms as of December 31, 2023. |
Construction Loans. We originate various types of commercial loans, including construction loans, secured by collateral such as real estate, business assets and personal guarantees. The loans are solicited on a direct basis and through various professionals with whom we maintain contact and by referral from our directors, stockholders and customers. At December 31, 2023, our construction loans amounted to $310.2 million, or 20.0% of our total loans receivable. The average size of a construction loan was approximately $4.6 million at December 31, 2023. Our construction loans portfolio has decreased $107.4 million or 25.7% since December 31, 2022, when construction loans amounted to $417.5 million, or 30.5% of our total loans receivable. Construction lending represents a segment of our loan portfolio and is driven primarily by market conditions. Loans to finance construction of condominium projects or single-family homes and subdivisions are generally offered to experienced builders in our primary market area with whom we have an established relationship. The maximum loan-to-value limit applicable to these loans is 75% of the appraised post construction value and does not require amortization of the principal during the term of the loan. We often establish interest reserves and obtain personal and corporate guarantees as additional security on the construction loans. Interest reserves are used to pay monthly payments during the construction phases of the loan and are treated as an addition to the loan balance. Interest reserves pose an additional risk to the Bank if it does not become aware of deterioration in the borrower’s financial condition before the interest reserve is fully utilized. In order to mitigate risk, financial statements and tax returns are obtained from borrowers on an annual basis. Construction loan proceeds are disbursed periodically in increments as construction progresses and as inspection by approved appraisers or loan inspectors warrants. Construction loans are negotiated on an individual basis but typically have floating rates of interest based on a common index plus a stipulated margin. Additional fees may be charged as funds are disbursed. As units are completed and sold, we require that payments to reduce principal outstanding be made prior to them being released. We may permit a pre-determined limited number of model homes to be constructed on an unsold or “speculative” basis. Construction loans also include loans to acquire land and loans to develop the basic infrastructure, such as roads and sewers. The majority of the construction loans are secured by properties located in our primary areas.
Set forth below is a brief description of our three largest construction loans or loan relationships:
| - | The largest construction loan is a $32.5 million participation loan. The Bank’s share is 76.9% of the total loan amount. The proceeds are being used to construct a 9-story residential building consisting of 89 residential units in Brooklyn, NY. The project is approximately 14% complete. The borrower is paying in accordance with the loan terms as of December 31, 2023. |
| - | The second largest construction loan is a $28.1 million ($11.78 million non-revolver and $16.3 million revolver two phase loan.) The proceeds are being used to construct an eight-story building project consisting of 159 residential units in Monroe, NY. The project’s phase 1 is approximately 99% complete. The borrower is paying in accordance with the loan terms as of December 31, 2023. |
7
| - | The third largest construction loan is a $25.0 million loan to purchase land for future construction of a mixed-use property consisting of residential units and commercial/retail office space in Jersey City, NJ. The borrower is paying in accordance with the loan terms as of December 31, 2023. |
Residential First-Lien Mortgage Loans. We offer a narrow range of prime residential first-lien mortgage loans at competitive rates. Our customers, stockholders and local real estate brokers are a significant source of these loans. We strive to process, approve and fund loans in a timeframe that meets the needs of our borrowers. Generally, we originate and retain non-conforming residential first-lien mortgage loans and refer conforming residential first-lien mortgage loans to a third party, whereby we may earn a fee. At December 31, 2023, our residential first-lien loans amounted to $38.0 million, or 2.5%, of our total portfolio. Our residential first-lien loan portfolio has decreased $5.1 million, or 11.8%, since December 31, 2022, when residential first-lien loans amounted to $43.1 million, or 3.2%, of our total loan portfolio.
Home Equity Loans and Consumer Loans. We generate these loans and lines of credit primarily through direct marketing at our branch locations, referrals from local real estate brokers and, to a lesser extent, by targeted direct marketing programs such as mail and electronic mail. Consumer loans are solicited on a direct basis and upon referrals from our directors, stockholders and existing customers.
Loans Receivable, Net. Loans receivable, net increased from $1.37 billion at December 31, 2022, to $1.55 billion at December 31, 2023, an increase of $178.0 million, or 13.0%. The increase was attributable to an increase in commercial real estate loans of $269.3 million and an increase in commercial and industrial loans of $22.1 million, partially offset by a decrease of $107.4 million in construction loans.
The following table details our loan maturities by loan segment and interest rate type:
| December 31, 2023 | ||||||||||||||||||||
| Due in one year or less |
Due after one through five years |
Due after five years through fifteen years |
Due after fifteen years |
Total | ||||||||||||||||
| (Dollars in thousands) |
||||||||||||||||||||
| Commercial real estate |
$ | 58,707 | $ | 316,614 | $ | 382,800 | $ | 384,743 | $ | 1,142,864 | ||||||||||
| Commercial and industrial |
20,948 | 10,586 | 19,088 | 339 | 50,961 | |||||||||||||||
| Construction |
292,979 | 9,424 | — | 7,784 | 310,187 | |||||||||||||||
| Residential first-lien mortgage |
— | 60 | 5,347 | 32,633 | 38,040 | |||||||||||||||
| Home equity/consumer |
208 | 251 | 3,189 | 4,433 | 8,081 | |||||||||||||||
|
|
|
|
|
|
|
|
|
|
|
|||||||||||
| Total loans |
$ | 372,842 | $ | 336,935 | $ | 410,424 | $ | 429,932 | $ | 1,550,133 | ||||||||||
|
|
|
|
|
|
|
|
|
|
|
|||||||||||
| Amount due after one year | Fixed Rate | Variable Rate | ||||||
| (Dollars in thousands) |
||||||||
| Commercial real estate |
$ | 278,786 | $ | 805,371 | ||||
| Commercial and industrial |
15,985 | 14,028 | ||||||
| Construction |
280 | 16,928 | ||||||
| Residential first-lien mortgage |
32,967 | 5,073 | ||||||
| Home equity/consumer |
1,920 | 5,953 | ||||||
|
|
|
|
|
|||||
| Total loans |
$ | 329,938 | $ | 847,353 | ||||
|
|
|
|
|
|||||
The accrual of interest is discontinued when the contractual payment of principal or interest is 90 days past due or management has serious doubts about further collectability of the principal or interest, even if the loan is currently performing.
8
The following table sets forth certain information regarding our nonaccrual loans, troubled debt restructurings, accruing loans 90 days or more past-due, and other real estate owned.
| December 31, | ||||||||
| 2023 | 2022 | |||||||
| (Dollars in thousands) |
||||||||
| Commercial real estate |
$ | 4,485 | $ | — | ||||
| Commercial and industrial |
2,116 | — | ||||||
| Construction |
— | 148 | ||||||
| Residential first-lien mortgage |
107 | 118 | ||||||
| Home equity/consumer |
— | — | ||||||
|
|
|
|
|
|||||
| Total nonaccrual loans |
6,708 | 266 | ||||||
| Troubled debt restructurings (TDRs) - performing |
— | 5,882 | ||||||
| Accruing loans 90 days or more past due |
— | 184 | ||||||
|
|
|
|
|
|||||
| Total nonperforming loans and performing TDRs |
6,708 | 6,332 | ||||||
| Other real estate owned |
— | — | ||||||
|
|
|
|
|
|||||
| Total nonperforming assets and performing TDRs |
$ | 6,708 | $ | 6,332 | ||||
|
|
|
|
|
|||||
See Note 5 - “Loans Receivable” in the Notes to Consolidated Financial Statements within this Form 10-K for additional information regarding our loans not classified as nonperforming assets as of December 31, 2023 and for other information on our loan ratings of special mention, substandard and doubtful, all of which contain varying degrees of potential credit problems that could result in the loans being classified as nonaccrual, past-due 90 or more days or troubled debt restructurings in a future period.
Analysis of Allowance for Credit Losses. On January 1, 2023, the Company adopted ASU 2016-13 Financial Instruments – Credit Losses (Topic 326): Measurement of Credit Losses on Financial Instruments (“CECL” or “ASC 326”), which requires the recognition of the allowance for credit losses be estimated using the CECL methodology. The measurement of expected credit losses under CECL methodology is applicable to financial measured assets at amortized cost, including loan receivables. Available-for-sale (“AFS”) debt securities are included and require credit losses to be presented as an allowance rather than as a write-down. It also applies to off-balance sheet credit exposure, such as unfunded loan commitments, standby letters of credit and other similar instruments.
The Company adopted ASC 326 using the modified retrospective method for all financial assets measured at amortized cost and off-balance sheet credit exposures. Results for reporting periods beginning January 1, 2023 are presented under ASC 326 while prior periods continue to be reported in accordance with previous applicable GAAP. The Company recorded a net decrease of $284 thousand to retained earnings as of January 1, 2023 for the cumulative effect of adopting ASC 326, which included a net deferred asset of $110 thousand. The transition adjustment includes a $301 thousand decrease to the allowance for credit losses and the increase of $695 thousand in the allowance of credit losses on off-balance sheet credit-exposures.
The credit loss estimation process involves procedures to appropriately consider the unique characteristics of loan portfolio segments, which consist of commercial real estate loans, construction loans, commercial and industrial loans, residential loans and home equity line of credit (HELOC)/consumer loans. These segments are further disaggregated into loan classes, the level at which credit risk is monitored. For each of these segments, the Company generates cash flow projections at the instrument level wherein payment expectations are adjusted for estimated prepayment speed, curtailments, time to recovery, probability of default and loss given default. The modeling of expected prepayment speeds, curtailment rates, and time to recovery are based on historical data. The quantitative component of the ACL on loans is model-based and utilizes a forward-looking macroeconomic forecast. The Company uses a discounted cash flow method, incorporating probability of default and loss given default forecasted based on statistically derived economic variable loss drivers, to estimate expected credit losses. This process includes estimates which involve modeling loss projections attributed to existing loan balances, and considering historical experience, current conditions, and future expectations for segments of loans over a reasonable and supportable forecast period. The historical information used is that experienced by the Company or by a selection of peer banks, when appropriate.
Commercial real estate - Loans in this segment include owner-occupied commercial real estate, non-owner-occupied commercial real estate and multi-family dwellings within the Company’s market area. The underlying cash flows generated by the properties or operations can be adversely impacted by a downturn in the economy due to increased vacancy rates or diminished cash flows, which in turn, would have an effect on the credit quality in this segment. Management obtains financial information annually and monitors the cash flow of these loans.
Construction – Loans in this segment include primarily construction of condominium projects or single-family homes and subdivisions. Exposure to loans in this segment can come from construction delays, slow unit sales and insufficient interest reserves. The Company often requires personal and corporate guarantees as additional security on the loan. Management relies on progress reports and third-party experts prior to the release of additional funds.
Commercial and industrial loans - Loans in this segment are primarily for commercial business assets and/or purposes, which usually carry a personal guarantee from the business owners. Repayment is expected from the cash flow of the business. A weakened economy, and resultant decrease in consumer spending, will have an effect on quality in this segment.
Residential real estate loans – This portfolio segment consists of first lien secured by one-to-four family residential properties. The overall health of the economy, including unemployment rates and housing pricing, will have an effect on the credit quality in this segment.
Consumer/HELOC loans – Loans in this segment are secured and repayment is dependent on the credit quality of the individual borrower and include junior-lien mortgages.
Credits with Similar Risk Characteristics.
The Company is using Discounted Cash Flow Method (“DCF”) in estimating the component of the allowance for credit losses for loans that share similar risk characteristics with other loans, such loans are segregated into loan segments. The model calculates an expected loss percentage for each segment by considering the probability of default, using life-of-loan analysis periods for all segments, and the historical severity of loss, based on the aggregate net lifetime losses incurred per loan segment. The default and severity factors used to calculate the allowance for credit losses for loans that share similar risk characteristics with other loans are adjusted for differences between historical period used to calculate historical severity of loss, based on the aggregate net lifetime losses incurred per loan segment. The default and severity factors used calculate the allowance for credit losses for loans that share similar risk characteristics with other loans adjusted for differences between the historical loss and severity rates and expected conditions over the remaining lives of the loans in the portfolio related to: a) lending policy and procedures; b) economic conditions; c) volume of the loan portfolio; d) experience and depth of lending management; e) level of delinquencies; f) quality of our loan review system; g) the value of underlying collateral for collateralized loans and h) level of concentration of a particular segment.
Individually Evaluated Financial Assets.
For a loan that does not share risk characteristics with other loans, expected credit loss is measured based on net realizable value. For these loans, we recognize expected credit loss equal to the amount by which the net realizable value of the loan is less than the amortized cost basis of the loan, except when the loan is collateral dependent, that is, when the borrower is experiencing financial difficulty and repayment is expected to be provided substantially through the sale of the collateral. In these cases, expected credit loss is measured as the difference between amortized cost basis and the loan and the fair value of the collateral less disposal costs (such as sales costs, transfer taxes and unpaid real estate taxes).
Allowance for Credit Losses on Off-Balance Sheet Credit Exposures, Including Unfunded Loan Commitments.
The Company maintains a separate allowance for credit losses from off-balance-sheet credit exposures, including unfunded loan commitments, which are included in other liabilities on the consolidated statements of financial condition. Management estimates the amount of expected losses by calculating a commitment usage factor over the contractual period of exposure that are not unconditionally cancellable by the Company by applying the loss factors used in the ACL methodology to the result of the usage calculation to estimate the liability for credit losses related to unfunded commitments for each loan type. The allowance for credit losses on off-balance sheet credit exposures is adjusted as credit loss expense.
As of December 31, 2023, the allowance for credit losses on loans was $18.5 million as compared to $16.5 million as of December 31, 2022. The $2.0 million increase in the allowance for credit losses was attributed to a $1.8 million provision related to the Bank’s loan portfolio, $1.7 million for CECL day 1 provision and $601 thousand associated with purchased credit deteriorated loans, partially offset by $1.8 million of net-charge offs recorded during 2023 and $301 thousand related to the adoption of CECL effective January 1, 2023.
9
The following table presents a summary of our allowance for credit losses on loans and nonaccrual loans by total loans and a summary of net charge-offs by loan segments:
| As of and for Year Ended | ||||||||
| December 31, | ||||||||
| 2023 | 2022 | |||||||
| (Dollars in thousands) | ||||||||
| Allowance for credit losses to total loans outstanding: |
1.19 | % | 1.20 | % | ||||
| Allowance for credit losses on loans |
$ | 18,492 | $ | 16,461 | ||||
| Total loans outstanding |
$ | 1,550,133 | $ | 1,372,824 | ||||
| Nonaccrual loans |
$ | 6,708 | $ | 266 | ||||
| Allowance for credit losses to nonaccrual loans |
275.7 | % | 6188.3 | % | ||||
| Nonaccrual loans to total loans outstanding |
0.43 | % | 0.02 | % | ||||
| Net charge-offs (recoveries) during the period to average loans outstanding |
||||||||
| Commercial real estate |
0.17 | % | 0.05 | % | ||||
| Net charge-offs |
$ | 1,659 | $ | 459 | ||||
| Average amount outstanding |
$ | 986,974 | $ | 850,192 | ||||
| Commercial and industrial |
0.00 | % | 0.00 | % | ||||
| Net recoveries |
$ | (2 | ) | $ | — | |||
| Average amount outstanding |
$ | 42,850 | $ | 54,847 | ||||
| Construction |
0.04 | % | 0.02 | % | ||||
| Net charge-offs |
$ | 148 | $ | 100 | ||||
| Average amount outstanding |
$ | 371,037 | $ | 416,508 | ||||
| Residential first-lien |
0.00 | % | 0.00 | % | ||||
| Net charge-offs |
$ | 2 | $ | — | ||||
| Average amount outstanding |
$ | 40,831 | $ | 46,379 | ||||
| Home equity/consumer |
0.00 | % | 0.00 | % | ||||
| Net charge-offs |
$ | — | $ | — | ||||
| Average amount outstanding |
$ | 7,812 | $ | 7,575 | ||||
| Total loans |
0.12 | % | 0.04 | % | ||||
| Net charge-offs |
$ | 1,807 | $ | 559 | ||||
| Average amount outstanding |
$ | 1,449,504 | $ | 1,375,501 | ||||
10
The following table presents the allocation of the allowance for credit losses by portfolio segment for the years presented. The allocation of a portion of the allowance for credit losses to one category of loans does not preclude its availability to absorb losses in other categories.
| (Dollars in thousands) |
2023 | 2022 | ||||||||||||||
| Amount | Loan Balance as % of Total Loans |
Amount | Loan Balance as % of Total Loans |
|||||||||||||
| Commercial real estate |
$ | 16,047 | 73.7 | % | $ | 8,554 | 63.6 | % | ||||||||
| Commercial and industrial |
488 | 3.3 | % | 271 | 2.3 | % | ||||||||||
| Construction |
1,145 | 20.0 | % | 6,389 | 30.4 | % | ||||||||||
| Residential first-lien mortgage |
725 | 2.5 | % | 236 | 3.1 | % | ||||||||||
| Home equity/consumer |
87 | 0.5 | % | 45 | 0.6 | % | ||||||||||
| Unallocated |
— | 0.0 | % | 966 | 0.0 | % | ||||||||||
|
|
|
|
|
|
|
|
|
|||||||||
| Total loans |
$ | 18,492 | 100.0 | % | $ | 16,461 | 100.0 | % | ||||||||
|
|
|
|
|
|
|
|
|
|||||||||
See Note 5 – “Loans Receivable” in the Notes to Consolidated Financial Statements within this Form 10-K for additional information regarding our allowance for credit losses.
Investment Securities (available-for-sale and held-to-maturity)
We hold securities that are available to fund increased loan demand or deposit withdrawals and other liquidity needs, and which provide an additional source of interest income. Securities are classified as held-to-maturity (“HTM”) or available-for-sale (“AFS”) at the time of purchase. Securities are classified as HTM if we have the ability and intent to hold them until maturity. HTM securities are carried at cost, adjusted for unamortized purchase premiums and discounts. Securities that are classified as AFS are carried at fair value with unrealized gains and losses, net of income taxes, reported as a component of equity within accumulated other comprehensive income (loss).
Securities available-for-sale, which are carried at fair value, increased $8.0 million, or 9.5%, to $91.4 million at December 31, 2023 from $83.4 million at December 31, 2022. The increase was primarily due to $8.4 million in purchases of available-for-sale securities during 2023, the addition of $6.5 million from the Noah acquisition, and $1.1 million attributed to a reduction in the unrealized losses associated with the available-for-sale portfolio, partially offset by principal repayments of $4.9 million and $1.6 million of maturities or calls.
11
The following table summarizes the weighted-average yields based on maturity distribution schedule of the amortized cost of AFS debt securities at December 31, 2023. Interest income presented in this Form 10-K for tax-advantaged obligations of state and political subdivisions has not been adjusted to reflect fully taxable-equivalent interest income. Expected maturities may differ from contractual maturities because the securities may be called without any penalties.
| One year or less |
After one through five years |
After five through ten years |
After ten years |
Total | ||||||||||||||||
| (Dollars in thousands) |
||||||||||||||||||||
| Mortgage-backed securities - U.S. Government Sponsored Enterprises (GSEs) |
$ |
16 |
|
$ |
250 |
|
$ |
1,211 |
|
$ |
41,157 |
|
$ |
42,634 |
|
|||||
| U.S. government agencies |
— | 954 | 1,703 | 2,634 | 5,291 | |||||||||||||||
| Obligations of state and political subdivisions |
— | 4,855 | 27,943 | 8,011 | 40,809 | |||||||||||||||
| Small business association (SBA) securities |
— | 262 | 1,485 | 871 | 2,618 | |||||||||||||||
|
|
|
|
|
|
|
|
|
|
|
|||||||||||
| Total |
$ | 16 | $ | 6,321 | $ | 32,342 | $ | 52,673 | $ | 91,352 | ||||||||||
|
|
|
|
|
|
|
|
|
|
|
|||||||||||
| (Yield on securities) |
||||||||||||||||||||
| Mortgage-backed securities - U.S. Government Sponsored Enterprises (GSEs) |
2.96 | % | 3.06 | % | 2.50 | % | 3.26 | % | 3.24 | % | ||||||||||
| U.S. government agencies |
— | 2.84 | % | 2.00 | % | 2.33 | % | 2.32 | % | |||||||||||
| Obligations of state and political subdivisions |
— | 3.21 | % | 2.59 | % | 2.36 | % | 2.62 | % | |||||||||||
| Small business association (SBA) securities |
— | 7.16 | % | 6.74 | % | 5.38 | % | 6.33 | % | |||||||||||
|
|
|
|
|
|
|
|
|
|
|
|||||||||||
| Total |
2.96 | % | 3.31 | % | 2.75 | % | 3.11 | % | 3.00 | % | ||||||||||
|
|
|
|
|
|
|
|
|
|
|
|||||||||||
At December 31, 2023, there were no security holdings of any one issuer in an amount greater than 10.0% of our total stockholders’ equity. See Note 4 – “Investment Securities” in the Notes to Consolidated Financial Statements within this Form 10-K for additional information regarding debt securities.
Cash and Due from Banks and Interest-earning Bank Balances
Cash and due from banks and interest-earning bank balances increased from $25.3 million at December 31, 2022 to $34.5 million at December 31, 2023, an increase of $9.2 million, or 36.5%. The increase in cash and due from banks and interest-earning banks’ balances was primarily due to the Bank’s liquidity management.
Federal Funds Sold
Federal funds sold increased from $28.1 million at December 31, 2022 to $116.0 million at December 31, 2023, an increase of $88.0 million, or 313.6%. The increase in federal funds sold was primarily due to an increase in deposits partially offset by an increase in loans.
Premises and Equipment
Premises and equipment, net increased $2.7 million from December 31, 2022 to December 31, 2023 resulting from $2.5 million acquired in connection with the Noah acquisition, $1.7 million in a combination of purchases of new equipment and improvements, partially offset by $1.5 million in depreciation and disposals.
Goodwill and Core Deposit Intangible
At December 31, 2023, the Company had $8.9 million of goodwill and $1.4 million in core deposit intangible assets of which $1.3 million is remaining from the branch acquisition that occurred in May 2019 and $89,000 from the Noah acquisition.
Operating Lease Right-of-Use Asset
Operating lease right-of-use asset increased $7.4 million from $16.0 million at December 31, 2022 to $23.4 million at December 31, 2023 due to $10.5 million in leases acquired as part of the Noah acquisition partially offset by $2.4 million in amortization.
12
Equity Method Investments
The Company is a limited partner in a Small Business Investment Company (“SBIC”) and committed to contribute capital of $5.0 million to the partnership. At December 31, 2023, the SBIC had a book value of $2.4 million. The unfunded commitment to the partnership was $2.4 million at December 31, 2023.
The Company invested in a CRA eligible investment that acquires SBA loans within qualifying census tracts in which the Bank operates. The Company decides which loans are included in its investment. The Company has an outstanding commitment to fund up to $6.0 million and currently has $5.9 million funded. The unfunded commitment to the fund was $100,000 at December 31, 2023.
Accrued Interest Receivable and Other Assets
Accrued interest receivable increased $1.3 million from December 31, 2022 to December 31, 2023, primarily due to an increase in the outstanding principal balance of loans at December 31, 2023. Deferred taxes increased $3.9 million from December 31, 2022 to December 31, 2023, primarily due to the Noah acquisition. Bank owned life insurance increased $6.2 million from December 31, 2022 to December 31, 2023, primarily due to $5.0 million in purchases and a $1.3 million increase in cash surrender value resulting from the increase in interest rates. Other assets increased $4.5 million from December 31, 2022 to December 31, 2023, partially due to mortgage servicing rights of $1.6 million acquired in connection with the Noah acquisition.
Deposits
Our deposit services are generally comprised of a traditional range of deposit products, including checking accounts, savings accounts, attorney trust accounts, money market accounts, and certificates of deposit.
We offer our customers access to automated teller machines (“ATMs”) and other services which increase customer convenience and encourage continued and additional banking relationships.
We endeavor to maintain competitive rates on deposit accounts, and actual rates are established at the time that they are offered, and subsequently, based on contractual terms, taking into consideration competitor offerings. Although from time to time we advertise in local newspapers, our primary source of deposit relationships is satisfied customers. We offer a range of direct deposit products ranging from social security and disability payments to direct deposit of payroll checks.
During normal business practices the Bank will utilize deposits originated by brokers to support the Bank’s funding needs. At December 31, 2023 the balance of brokered deposits was $87.2 million, a decrease of $20.2 million from the $107.4 million outstanding at December 31, 2022.
At December 31, 2023, there were no customers whose deposit balances individually exceeded 5% of total deposits.
13
The following table presents the average balance of our deposit accounts and the average cost of funds for each category of our deposits, total uninsured deposits, and amount of uninsured portion of time deposits by maturity.
| 2023 | 2022 | |||||||||||||||
| Average Amount |
Average Rate Paid |
Average Amount |
Average Rate Paid |
|||||||||||||
| (Dollars in thousands) |
||||||||||||||||
| Non-interest-bearing checking |
$ | 248,233 | 0.00 | % | $ | 280,729 | 0.00 | % | ||||||||
| Demand interest-bearing |
250,312 | 1.46 | % | 261,951 | 0.31 | % | ||||||||||
| Money market |
311,478 | 3.07 | % | 353,224 | 0.44 | % | ||||||||||
| Savings deposits |
159,175 | 1.72 | % | 220,222 | 0.32 | % | ||||||||||
| Time deposits |
538,343 | 3.17 | % | 293,627 | 0.99 | % | ||||||||||
|
|
|
|
|
|
|
|
|
|||||||||
| $ | 1,507,541 | 2.19 | % | $ | 1,409,753 | 0.43 | % | |||||||||
|
|
|
|
|
|
|
|
|
|||||||||
| Amount | Amount | |||||||
| Uninsured deposits |
$ | 427,384 | $ | 456,729 | ||||
|
|
|
|
|
|||||
The following table represents the uninsured time deposits by maturity.
| As of December 31, | ||||||||
| 2023 | 2022 | |||||||
| Uninsured time deposits maturity | (Dollars in thousands) | |||||||
| Three months or less |
$ | 10,796 | $ | 1,822 | ||||
| Over three through six months |
22,609 | 6,060 | ||||||
| Over six through twelve months |
28,715 | 14,586 | ||||||
| Over twelve months |
6,678 | 19,942 | ||||||
|
|
|
|
|
|||||
| Total uninsured time deposits |
$ | 68,798 | $ | 42,410 | ||||
|
|
|
|
|
|||||
The uninsured portion of deposits is any balance that exceeds the FDIC insurance limit of $250,000.
See the liquidity discussion within Item 7 Management’s Discussion and Analysis of Financial Condition and Results of Operations within this Form 10-K for more information regarding our available funds.
Total deposits increased from $1.35 billion at December 31, 2022 to $1.64 billion at December 31, 2023, an increase of $288.0 million, or 21.4%, included in this increase was $192.7 million acquired from Noah Bank. Non-interest-bearing deposits decreased $15.8 million, or 6.0%, to $249.3 million at December 31, 2023. The Company acquired $55.2 million of non-interest-bearing deposits during 2023. Interest-bearing deposits increased $303.8 million, or 28.1%, included in this increase was $136.9 million of interest-bearing deposits acquired from Noah Bank, to $1.39 billion at December 31, 2023.
Borrowings
At December 31, 2023, the Company had no borrowings outstanding. At December 31, 2022, the Company had $10.0 million in overnight borrowings from the FHLB-NY.
14
Accrued Interest Payable, Lease Liabilities and Other Liabilities
Accrued interest payable increased $8.1 million from $1.0 million at December 31, 2022 to $9.2 million at December 31, 2023. The increase was primarily the result of the increase in interest rates offered on deposit accounts during 2023 as well as the increase in deposit balances due partially to the Noah acquisition. Lease liabilities increased $7.5 million due primarily to the Noah acquisition. Other liabilities increased $454,000.
Stockholders’ Equity
Total stockholders’ equity at December 31, 2023 increased $20.6 million or 9.4% when compared to the end of 2022. This increase was primarily due to the $25.8 million of earnings recorded during 2023, partially offset by $7.4 million of cash dividends paid during the period. Other increases in stockholders’ equity were $989,000, $807,000 and $779,000 due to stock options exercised, stock-based compensation and other comprehensive income, respectively. The ratio of equity to total assets at December 31, 2023 and December 31, 2022, was 12.5% and 13.7%, respectively.
Other Services
To further attract and retain customer relationships, we provide a standard array of additional community banking services, which include the following:
| Money orders |
Direct deposit | Automated teller machines | ||
| Cashier’s checks |
Safe deposit boxes | On-line banking | ||
| Wire transfers |
Night depository | Remote deposit capture | ||
| Debit cards |
Bank-by-mail | Automated telephone banking |
We also offer, on a limited basis, payroll-related services and credit card and merchant credit card processing through third parties whereby we do not undertake credit or fraud risk.
Internet Banking
We advertise but do not actively solicit new deposits or loans through our website. We utilize a qualified and experienced internet service provider to furnish the following types of customer account services:
| Full on-line statements |
Transaction histories | |
| On-line bill payment |
Transaction details | |
| Account inquiries |
Account-to-account transfers | |
| Mobile banking |
Fee Income
Fee income is a component of our non-interest income. By charging non-customers fees for using our ATMs and charging customers for banking services such as money orders, cashier’s checks, wire transfers and check orders, as well as other deposit and loan-related fees, we earn fee income. Prudent fee income opportunities are sought to supplement net interest income but may be limited by our efforts to remain competitive and by regulatory constraints.
Staffing
As of December 31, 2023, we had approximately 206 full-time equivalent employees.
Supervision and Regulation
General. We are extensively regulated under both federal and state law. These laws restrict permissible activities and investments and require compliance with various consumer protection provisions applicable to lending, deposit, brokerage and fiduciary activities. They also impose capital adequacy requirements and conditions to our ability to repurchase stock or to pay dividends. The Company is a registered bank holding company and, as such is subject to the provisions of the Bank Holding Company Act of 1956, as amended (the “BHCA”) and to supervision and examination by the Board of Governors of the Federal Reserve System (the “Federal Reserve”). The Bank is also subject to the supervision and examination by the FDIC, as their primary federal regulator and as the insurer of the Banks’ deposits. The Bank is also regulated and examined by the New Jersey Department of Banking and Insurance (the “Department”). These regulators have broad discretion to impose restrictions and limitations on our operations. This supervisory framework could materially impact the conduct and profitability of our activities.
15
To the extent that the following information describes statutory and regulatory provisions, it is qualified in its entirety by reference to the particular statutory and regulatory provisions. Proposals to change the laws and regulations governing the banking industry are frequently raised at both the state and federal levels. The likelihood and timing of any changes in these laws and regulations, and the impact such changes may have on us, is difficult to ascertain. Changes in applicable laws and regulations, or in the manner such laws or regulations are interpreted by regulatory agencies or courts, may have a material effect on our business, financial condition and results of operations.
We are subject to various requirements and restrictions under federal and state law, including requirements to maintain reserves against deposits, restrictions on the types, amount and terms and conditions of loans that may be originated, and limits on the type of other activities in which we may engage and the investments we may make. Banking regulations permit us to engage in certain additional activities, such as insurance sales and securities underwriting, through the formation of a “financial subsidiary.” In order to be eligible to establish or acquire a financial subsidiary, we must be “well capitalized” and “well managed” and may not have less than a “satisfactory” CRA rating. At this time, we do not engage in any activity which would require us to maintain a financial subsidiary. We are also subject to federal laws that limit the amount of transactions between us and any nonbank affiliates. Under these provisions, transactions, such as a loan or investment, by us with any nonbank affiliate are generally limited to 10% of our capital and surplus for all covered transactions with such affiliate or 20% percent of capital and surplus for all covered transactions with all affiliates. Any extensions of credit, with limited exceptions, must be secured by eligible collateral in specified amounts. We are also prohibited from purchasing any “low quality” assets from an affiliate. The Dodd-Frank Wall Street Reform and Consumer Protection Act (the “Dodd-Frank Act”) significantly expands the coverage and scope of the limitations on affiliate transactions within a banking organization.
Holding Company. The Federal Reserve has issued regulations under the BHCA that require a bank holding company to serve as a source of financial and managerial strength to its subsidiary banks. As a result, the Federal Reserve, pursuant to such regulations, may require the Company to stand ready to use its resources to provide adequate capital funds to the Bank during periods of financial stress or adversity. The BHCA requires the Company to secure the prior approval of the Federal Reserve before it can acquire all or substantially all of the assets of any bank or acquire ownership or control of 5% or more of any voting shares of any bank. Such a transaction would also require approval of the Department.
A bank holding company is prohibited under the BHCA from engaging in, or acquiring direct or indirect control of, more than 5% of the voting shares of any company engaged in non-banking activities unless the Federal Reserve, by order or regulation, has found such activities to be so closely related to banking or managing or controlling banks as to be a proper incident thereto. Under the BHCA, the Federal Reserve has the authority to require a bank holding company to terminate any activity or relinquish control of a non-bank subsidiary (other than a non-bank subsidiary of a bank) upon the Federal Reserve’s determination that such activity or control constitutes a serious risk to the financial soundness and stability of any bank subsidiary of the bank holding company.
As a public company with our securities listed for trading on the NASDAQ stock market, the Company is subject to the disclosure and regulatory requirements of the SEC, including under the Securities Act of 1933, as amended, and the Exchange Act, and the rules and listing standards of the NASDAQ stock market.
Monetary Policy. Our business, financial condition and results of operations are and will be affected by domestic economic conditions and the monetary and fiscal policies of the United States government and its agencies. The monetary policies of the Federal Reserve have a significant effect upon the operating results of commercial banks such as ours. The Federal Reserve has a major effect upon the levels of bank loans, investments and deposits through its open market operations in United States government securities transactions and through its regulation of, among other things, the discount rate on borrowings of member banks and the reserve requirements against member banks’ deposits. It is not possible to predict the nature and impact of future changes in monetary and fiscal policies.
Deposit Insurance. The Bank’s deposits are insured up to applicable limits by the Deposit Insurance Fund of the FDIC (“DIF”). No institution may pay a dividend if in default of the federal deposit insurance assessment.
The DIF has a designated reserve (target) ratio (“DRR”) of 2.00% of the estimated insured deposits. The FDIC has adopted a restoration plan to ensure that the DIF reserve ratio reaches 1.35 percent within 8 years of establishment, because the reserve ratio was 1.30 percent as of June 30, 2020. Increased loss provisions associated with the failures of Silicon Valley Bank, Signature Bank and First Republic Bank that reduced the DIF balance coupled with strong growth in uninsured deposits, resulted in the reserve ratio declining to 1.10 percent as of June 30, 2023. The Restoration Plan maintains the current schedule of assessment rates for all insured depository institutions. Dividends are required to be paid to the industry should the DRR exceed 1.50%, but grants the FDIC sole discretion in determining whether to suspend or limit the declaration or payment of dividends. The assessment base for insured depository institutions is the average consolidated total assets during an assessment period less average tangible equity capital during that assessment period.
16
The limit for federal deposit insurance is $250,000 and the cash limit of Securities Investor Protection Corporation protection is also $250,000.
The FDIC has authority to increase insurance assessments. A significant increase in insurance assessments would likely have an adverse effect on our operating expenses and results of operations. Management cannot predict what insurance assessment rates will be in the future.
Deposit insurance may be terminated by the FDIC upon a finding that the institution has engaged in unsafe or unsound practices, is in an unsafe or unsound condition to continue operations or has violated any applicable law, regulation, rule, order or condition imposed by the FDIC.
Dividend Restrictions. Under the New Jersey Banking Act of 1948, as amended (the “Banking Act”), a bank may declare and pay cash dividends only if, after payment of the dividend, the capital stock of the bank will be unimpaired and either the bank will have a surplus of not less than 50% of its capital stock or the payment of the dividend will not reduce the bank’s surplus. The FDIC prohibits payment of cash dividends if, as a result, the institution would be undercapitalized, or the institution is in default with respect to any assessment due to the FDIC.
Under Pennsylvania law, the Company may not pay a dividend, if, after giving effect thereto, it would be unable to pay its debts as they become due in the usual course of business and, after giving effect to the dividend, the total assets of the Company would be less than the sum of its total liabilities plus the amount that would be needed, if the Company were to be dissolved at the time of distribution, to satisfy the preferential rights upon dissolution of shareholders whose rights are superior to those receiving the dividend.
It is also the policy of the Federal Reserve that a bank holding company generally may only pay dividends on common stock out of net income available to common shareholders over the past twelve months and only if the prospective rate of earnings retention appears consistent with a bank holding company’s capital needs, asset quality, and overall financial condition. A bank holding company also should not maintain a dividend level that places undue pressure on the capital of such institution’s subsidiaries, or that may undermine the bank holding company’s ability to serve as a source of strength for such subsidiaries.
Regulatory Capital Requirements. Federally insured, state-chartered non-member banks are required to maintain minimum levels of regulatory capital. Current FDIC capital standards require these institutions to satisfy a common equity Tier 1 capital requirement, a leverage capital requirement and a risk-based capital requirement.
The common equity Tier 1 capital component generally consists of retained earnings and common stock instruments and must equal at least 4.5% of risk-weighted assets.
Leverage capital, also known as “core” capital, must equal at least 3.0% of adjusted total assets for the most highly rated state-chartered non-member banks. Core capital generally consists of common stockholders’ equity (including retained earnings). An additional cushion of at least 100 basis points is required for all other banking associations, which effectively increases their minimum Tier 1 leverage ratio to 4.0% or more. Under the FDIC’s regulations, the most highly-rated banks are those that the FDIC determines are strong banking organizations and are rated composite 1 under the Uniform Financial Institutions Rating System.
Under the risk-based capital requirements, “total” capital (a combination of core and “supplementary” capital) must equal at least 8.0% of “risk-weighted” assets. The FDIC also is authorized to impose capital requirements in excess of these standards on individual institutions on a case-by-case basis.
Capital rules require a common equity Tier 1 capital conservation buffer of 2.5% of risk-weighted assets, which is in addition to the other minimum risk-based capital standards described above. Institutions that do not maintain this required capital buffer become subject to progressively more stringent limitations on the percentage of earnings that can be paid out in dividends or used for stock repurchases and on the payment of discretionary bonuses to senior executive management. At December 31, 2023, the Bank met all capital adequacy requirements on a fully phased-in basis.
In determining compliance with the risk-based capital requirement, a banking organization is allowed to include both core capital and supplementary capital in its total capital, provided that the amount of supplementary capital included does not exceed the bank’s core capital. Supplementary capital generally consists of general allowances for loan losses up to a maximum of 1.25% of risk-weighted assets, together with certain other items. In determining the required amount of risk-based capital, total assets, including certain off-balance sheet items, are multiplied by a risk-weight based on the risks inherent in the type of assets. At December 31, 2023, the Bank exceeded all its regulatory capital requirements.
17
Any banking organization that fails any of the capital requirements is subject to possible enforcement action by the FDIC. Such action could include a capital directive, a cease-and-desist order, civil money penalties, the establishment of restrictions on the institution’s operations, termination of federal deposit insurance and the appointment of a conservator or receiver. The FDIC’s capital regulations provide that such actions, through enforcement proceedings or otherwise, could require one or more of a variety of corrective actions.
The Company qualifies as a “small bank holding company” with respect to the application of consolidated capital requirements because it has less than $3 billion of consolidated assets. “Small bank holding companies” are not subject to the consolidated capital requirements unless otherwise directed by the Federal Reserve.
Prompt Corrective Action. In addition to the required minimum capital levels described above, federal law establishes a system of “prompt corrective actions” that federal banking agencies are required to take, or have discretion to take, based upon the capital category into which a federally-regulated depository institution falls. Regulations set forth detailed procedures and criteria for implementing prompt corrective action in the case of any institution which is not adequately capitalized. The following table shows the amount of capital associated with the different capital categories set forth in the prompt corrective action regulations.
| Capital Category | Total Risk-Based Capital |
Tier 1 Risk-Based Capital |
Common Equity Tier 1 Capital |
Tier 1 Leverage Capital |
||||
| Well capitalized |
10% or more | 8% or more | 6.5% or more | 5% or more | ||||
| Adequately capitalized |
8% or more | 6% or more | 4.5% or more | 4% or more | ||||
| Undercapitalized |
Less than 8% | Less than 6% | Less than 4.5% | Less than 4% | ||||
| Significantly undercapitalized |
Less than 6% | Less than 4% | Less than 3% | Less than 3% |
In addition, a banking organization is “critically undercapitalized” if it has a ratio of tangible equity to total assets that is equal to or less than 2.0%. Under specified circumstances, a federal banking agency may reclassify a well-capitalized institution as adequately capitalized and may require an adequately capitalized institution or an undercapitalized institution to comply with supervisory actions as if it were in the next lower category (except that the FDIC may not reclassify a significantly undercapitalized institution as critically undercapitalized).
A banking organization generally must file a written capital restoration plan which meets specified requirements within 45 days of the date that the institution receives notice or is deemed to have notice that it is undercapitalized, significantly undercapitalized or critically undercapitalized. A federal banking agency must provide the institution with written notice of approval or disapproval within 60 days after receiving a capital restoration plan, subject to extensions by the agency. A banking organization which is required to submit a capital restoration plan must concurrently submit a performance guaranty by each company that controls the institution. In addition, undercapitalized organizations are subject to various regulatory restrictions, and the appropriate federal banking agency also may take any number of discretionary supervisory actions. At December 31, 2023, the Bank was not subject to any of the above mentioned restrictions.
Community Reinvestment Act. The Community Reinvestment Act (“CRA”) requires that banks meet the credit needs of all of their assessment area, as established for these purposes in accordance with applicable regulations based principally on the location of branch offices, including those of low-income areas and borrowers. The CRA also requires that the FDIC assess all financial institutions that it regulates to determine whether these institutions are meeting the credit needs of the community they serve. Under the CRA, institutions are assigned a rating of “outstanding,” “satisfactory,” “needs to improve” or “unsatisfactory.” Our record in meeting the requirements of the CRA is made publicly available and is taken into consideration in connection with any applications with federal regulators to engage in certain activities, including approval of a branch or other deposit facility, mergers and acquisitions, office relocations, or expansions into non-banking activities. As of December 31, 2023, we maintained a “satisfactory” CRA rating. On October 24, 2023, the FDIC, the Federal Reserve, and the Office of the Comptroller of the Currency issued a final rule to strengthen and modernize the CRA regulations. Under the final rule, banks with assets of at least $600 million as of December 31 in both of the prior two calendar years and less than $2 billion as of December 31 in either of the prior two calendar years will be an “intermediate bank.” The agencies will evaluate intermediate banks under the Retail Lending Test and either the current community development test, referred to in the final rule as the Intermediate Bank Community Development Test, or, at the bank’s option, the Community Development Financing Test. The applicability date for the majority of the provisions in the CRA regulations is January 1, 2026, and additional requirements will be applicable on January 1, 2027.
18
Dodd-Frank Act. The Dodd-Frank Act became law on July 21, 2010. The Dodd-Frank Act implemented far-reaching changes across the financial regulatory landscape. Among other things, the Dodd-Frank Act created the Consumer Financial Protection Bureau (the “CFPB”), which is an independent bureau within the Federal Reserve System with broad authority to regulate the consumer finance industry, including regulated financial institutions such as us, as well as non-banks and others who are involved in the consumer finance industry. The CFPB has exclusive authority through formal rulemaking, as well as through the issuance of orders, policy statements, guidance and enforcement actions to administer and enforce federal consumer financial protection laws, to oversee non-federally regulated entities, to prevent practices that the CFPB deems unfair, deceptive or abusive. While the CFPB has these extensive powers to interpret, administer and enforce federal consumer financial protection laws, the Dodd-Frank Act provides that the FDIC continues to have examination and enforcement powers over us on matters otherwise falling within the CFPB’s jurisdiction because we have less than $10 billion in assets. The Dodd-Frank Act also gives state attorneys general the ability to enforce federal consumer protection laws.
Federal Home Loan Bank (“FHLB”) Membership. We are a member of the FHLB-NY. Each member of the FHLB-NY is required to maintain a minimum investment in capital stock of the FHLB-NY. The Board of Directors of the FHLB-NY can increase the minimum investment requirements in the event it has concluded that additional capital is required to allow it to meet its own regulatory capital requirements. Any increase in the minimum investment requirements outside of specified ranges requires the approval of the Federal Housing Finance Agency. Because the extent of any obligation to increase our investment in the FHLB-NY depends entirely upon the occurrence of a future event, potential payments to the FHLB-NY are not determinable.
Additionally, in the event that we fail, the right of the FHLB-NY to seek repayment of funds loaned to us will take priority over certain other creditors.
The Sarbanes-Oxley Act. As a public company, the Bank is subject to the Sarbanes-Oxley Act of 2002 which addresses, among other issues, corporate governance, auditing and accounting, executive compensation, and enhanced and timely disclosure of corporate information. As directed by the Sarbanes-Oxley Act, our principal executive officer and principal financial officer are required to certify that our quarterly and annual reports do not contain any untrue statement of a material fact. The rules adopted by the SEC under the Sarbanes-Oxley Act require these officers to certify that they are responsible for establishing, maintaining and regularly evaluating the effectiveness of our internal control over financial reporting; they have made certain disclosures to our auditors and the audit committee of the Board of Directors about our internal control over financial reporting; and they have included information in our quarterly and annual reports about their evaluation and whether there have been changes in our internal control over financial reporting or in other factors that could materially affect internal control over financial reporting.
Loans to One Borrower. New Jersey banking law limits the total loans and extensions of credit by a bank to one borrower at one time to 15% of the capital funds of the bank, or up to 25% of the capital funds of the bank if the additional 10% is fully secured by collateral having a market value (as determined by reliable and continuously available price quotations) at least equal to the amount of the loans and extensions of credit over the 15% limit. At December 31, 2023, the Bank’s lending limit to one borrower under regulatory guidelines was $38.1 million, but our Board of Directors has set an internal lending limit of approximately 75.0% of the legal lending limit or $28.6 million.
Concentration and Risk Guidance. The federal banking regulatory agencies promulgated joint interagency guidance regarding material direct and indirect asset and funding concentrations. The guidance defines a concentration as any of the following: (i) asset concentrations of 25% or more of Total Capital (loan related) or Tier 1 Capital (non-loan related) by individual borrower, small interrelated group of individuals, single repayment source or individual project; (ii) asset concentrations of 100% or more of Total Capital (loan related) or Tier 1 Capital (non-loan related) by industry, product line, type of collateral, or short-term obligations of one financial institution or affiliated group; (iii) funding concentrations from a single source representing 10% or more of Total Assets; or (iv) potentially volatile funding sources that when combined represent 25% or more of Total Assets (these sources may include brokered, large, high-rate, uninsured, internet-listing-service deposits, Federal funds purchased or other potentially volatile deposits or borrowings). If a concentration is present, management must employ heightened risk management practices including board and management oversight and strategic planning, development of underwriting standards, risk assessment and monitoring through market analysis and stress testing, third party review and increasing capital requirements. The Bank adheres to the practices recommended in this guidance.
Restrictions on Transactions with Affiliates, Directors, and Officers. Under the Federal Reserve Act, the Bank may not lend funds or otherwise extend credit to its parent holding company or any other affiliate, except on specified types and amounts of collateral generally upon market terms and conditions. The Federal Reserve also has authority to define and limit the transactions between banks and their affiliates. The Federal Reserve’s Regulation W and relevant federal statutes and regulations, among other authorities, impose significant limitations on transactions in which the Bank may engage with us or with other affiliates, including per-affiliate and aggregate limits on affiliate transactions.
19
Federal Reserve Regulation O restricts loans to the Bank and its parent holding company’s insiders, which includes directors, certain officers, and principal shareholders and their respective related interests. All extensions of credit to the insiders and their related interests must be on the same terms as, and subject to the same loan underwriting requirements as, loans to persons who are not insiders. In addition, Regulation O imposes lending limits on loans to insiders and their related interests and imposes, in certain circumstances, requirements for prior approval of the loans by the Bank board of directors.
Changes in New Jersey Tax Laws. On September 29, 2020, New Jersey Governor Phil Murphy signed into law A.4721, extending through December 31, 2023, the 2.5% surtax currently imposed on Corporation Business Tax (CBT) filers with allocated taxable net income over $1 million. As originally enacted, the surtax rate was scheduled to decrease from 2.5% to 1.5% for privilege periods beginning on or after January 1, 2020 through December 31, 2021 and expire for privilege periods beginning on or after January 1, 2022. The change made by A.4721 took effect immediately and applied retroactively to privilege periods beginning on or after January 1, 2020.
Cyber-security. Federal regulators have issued two related statements regarding cyber-security. One statement indicates that financial institutions should design multiple layers of security controls to establish lines of defense and ensure their risk management processes also address the risk posed by compromised client credentials, including security measures to reliably authenticate clients accessing internet-based services of the financial institution. The other statement indicates that a financial institution’s management is expected to maintain sufficient business continuity planning processes to ensure the rapid recovery, resumption, and maintenance of the institution’s operations after a cyber-attack involving destructive malware. A financial institution is also expected to develop appropriate processes to enable recovery of data and business operations and address rebuilding network capabilities and restoring data if the institution or its critical service providers fall victim to this type of cyber-attack. If we fail to observe the regulatory guidance, we could be subject to various regulatory sanctions, including financial penalties.
In the ordinary course of business, we rely on electronic communications and information systems to conduct our operations and to store sensitive data. We employ a variety of preventative and detective controls and tools to monitor, block, and provide alerts regarding suspicious activity and to report on any suspected advanced persistent threats. We also offset cyber risk through internal training, testing of our employees, and we procure insurance to provide assistance on significant incidents and to offset potential liability.
We have not experienced a significant compromise, significant data loss, or any material financial losses related to cyber-security attacks. Risks and exposures related to cyber-security attacks are expected to remain high for the foreseeable future due to the rapidly evolving nature and sophistication of these threats, as well as due to the expanding use of third-party service providers, internet banking, mobile banking, and other technology-based products and services by us and our clients.
Other Laws and Regulations. We are subject to a variety of laws and regulations which are not limited to banking organizations. For example, in lending to commercial and consumer borrowers, and in owning and operating our own property, we are subject to regulations and potential liabilities under state and federal environmental laws.
We are heavily regulated by regulatory agencies at the federal and state levels. As a result of events in the financial markets and the economy in recent years, we, like most of our competitors, have faced and expect to continue to face increased regulation and regulatory and political scrutiny, which creates significant uncertainty for us and the financial services industry in general.
Future Legislation and Regulation. Regulators have increased their focus on the regulation of the financial services industry in recent years. Proposals that could substantially intensify the regulation of the financial services industry have been and are expected to continue to be introduced in the U.S. Congress, in state legislatures and by applicable regulatory authorities. These proposals may change banking statutes and regulation and our operating environment in substantial and unpredictable ways. If enacted, these proposals could increase or decrease the cost of doing business, limit or expand permissible activities or affect the competitive balance among banks, savings associations, credit unions, and other financial institutions. We cannot predict whether any of these proposals will be enacted and, if enacted, the effects that such laws or any implementing regulations would have on our business, financial condition and results of operations.
Item 1A. Risk Factors
Our business and results of operations are subject to numerous risks and uncertainties, many of which are beyond our control. The material risks and uncertainties that management believes affect the Company are described below. Additional risks and uncertainties that management is not aware of or that management currently deems immaterial may also impair the Bank’s business operations. This report is qualified in its entirety by these risk factors. If any of the following risks actually occur, our business, financial condition, and results of operations could be materially and adversely affected.
20
Our risk factors can be broadly summarized by the following categories:
• Risks Related to the Pending Acquisition of Cornerstone
• Credit and Interest Rate Risks
• Risks Related to the Bank’s Common Stock
• Economic Risks
• Operational Risks
• Strategic Risks
• Risks Related to the Regulation of our Industry
RISKS RELATED TO THE COMPANY’S PENDING ACQUISITION OF CORNERSTONE
Regulatory approvals may not be received, may take longer than expected or may impose conditions that are not presently anticipated or that could have an adverse effect on the Company following the transaction.
In connection with the Company’s pending acquisition of Cornerstone (See Item 1. Business – General), before the acquisition can be completed, the Company and the Bank must obtain approval of the acquisition from the FDIC, the New Jersey Department of Banking and Insurance and the Federal Reserve. In determining whether to grant these approvals, the regulators consider a variety of factors, including the regulatory standing of the Company, the Bank and Cornerstone, and other factors. An adverse development in either party’s regulatory standing or these factors could result in an inability to obtain approval or a delay in their receipt. These regulators may impose conditions on the completion of the acquisition or require changes to the terms of the Merger Agreement. Such conditions or changes could have the effect of delaying or preventing completion of the acquisition or imposing additional costs on or limiting the revenues of the Company following the completion of the acquisition, any of which might have an adverse effect on the Company following the acquisition.
The acquisition may be more difficult, costly or time-consuming than expected and the anticipated benefits of the transaction may not be realized.
The success of the acquisition, including anticipated benefits, will depend, in part, on the Company’s ability to successfully combine and integrate Cornerstone into the Company in a manner that permits growth opportunities and does not materially disrupt the existing customer relations nor result in decreased revenues due to loss of customers. It is possible that the integration process could result in the loss of key employees, the disruption of the Bank’s ongoing business or inconsistencies in standards, controls, procedures and policies that adversely affect the Bank’s ability to maintain relationships with clients, customers, depositors, employees and other constituents or to achieve the anticipated benefits of the transaction. The loss of key employees could adversely affect the Bank’s ability to successfully conduct its business, which could have an adverse effect on the Company’s financial results and the value of its common stock. If the Bank experiences difficulties with the integration process, the anticipated benefits of the acquisition may not be realized fully or at all or may take longer to realize than expected. As with any acquisition, there also may be business disruptions that cause the Bank to lose customers or cause customers to remove their accounts from the Bank and move their business to competing financial institutions. Integration efforts by the Bank will also divert management’s attention and resources. These integration matters could have an adverse effect on the Bank during the transition period and for an undetermined period after completion of the acquisition.
The Merger Agreement may be terminated in accordance with its terms, and the acquisition may not be completed.
The Merger Agreement is subject to a number of customary closing conditions that must be satisfied or waived in order to complete the acquisition, including the receipt of the requisite regulatory approvals. These conditions to the closing of the acquisition may not be satisfied or waived in a timely manner or at all, and, accordingly, the acquisition may be delayed or may not be completed. In addition, Cornerstone or the Company may elect to terminate the Merger Agreement in certain other circumstances.
Termination of the Merger Agreement could negatively impact the Company.
If the Merger Agreement is terminated, there may be various consequences. For example, the Bank’s business may have been impacted adversely by the failure to pursue other opportunities due to management’s focus on the acquisition, without realizing any of the anticipated benefits of completing the acquisition. Additionally, if the Merger Agreement is terminated, the market price of the Company’s common stock could decline to the extent that the current market prices reflect a market assumption that the Cornerstone acquisition will be completed.
21
Furthermore, the Company has incurred and will incur substantial expenses in connection with the completion of the transactions contemplated by the Merger Agreement. If the acquisition is not completed, the Company would have to recognize these expenses without realizing the expected benefits of the acquisition.
CREDIT AND INTEREST RATE RISKS
Our loan portfolio has a significant concentration in commercial real estate and commercial construction loans.
Our loan portfolio is made up largely of commercial real estate loans and commercial construction loans. At December 31, 2023, we had approximately $1.14 billion of commercial real estate loans, which represented 73.8% of our total loan portfolio. Our commercial real estate loans include loans secured by owner-occupied and non-owner-occupied tenanted properties for commercial uses and multi-family loans. The portfolio also consists of construction loans of approximately $310.2 million, or 20.0%, of our total loan portfolio as of December 31, 2023. In addition, we make both secured and unsecured commercial and industrial loans. At December 31, 2023, we had $51.0 million of commercial and industrial loans, which represented 3.3% of our total loan portfolio.
Commercial real estate loans generally expose a lender to a higher degree of credit risk of nonpayment and loss than other loans because of several factors, including dependence on the successful operation of a business or a project for repayment, the collateral securing these loans may not be sold as easily as for other loans, and loan terms may include a balloon payment rather than full amortization over the loan term. In addition, commercial real estate loans typically involve larger loan balances to single borrowers or groups of related borrowers. Underwriting and portfolio management activities cannot completely eliminate all risks related to these loans. Any significant failure to pay on time by our customers or a significant default by our customers could materially and adversely affect us.
Loans secured by owner-occupied real estate are reliant on the underlying operating businesses to provide cash flow to meet debt service obligations, and as a result they are more susceptible to the general impact on the economic environment affecting those operating companies as well as the real estate market. In general, construction and land lending involve additional risks because of the inherent difficulty in estimating a property’s value both before and at completion of the project as well as the estimated cost of the project and the time needed to sell the property at completion. Construction costs may exceed original estimates as a result of increased materials, labor or other costs. Because of the uncertainties inherent in estimating construction costs, as well as the market value of the completed project and the effects of governmental regulation on real property, it is relatively difficult to evaluate accurately the total funds required to complete a project and the related loan-to-value ratio. Changes in the demand, such as for new housing and higher than anticipated building costs may cause actual results to vary significantly from those estimated. For these reasons, this type of lending also typically involves higher loan principal amounts and is often concentrated with a small number of builders. A downturn in housing, or the real estate market, could increase loan delinquencies, defaults and foreclosures, and significantly impair the value of our collateral and our ability to sell the collateral upon foreclosure. Some of our builders have more than one loan outstanding with us and also have residential mortgage loans for rental properties with us. Consequently, an adverse development with respect to one loan or one credit relationship can expose us to a significantly greater risk of loss.
In addition, no payment from the borrower is required during the term of most of our construction loans since the accumulated interest is added to the principal of the loan through an interest reserve. As a result, construction loans often involve the disbursement of substantial funds with repayment dependent on the success of the ultimate project and the ability of the borrower to sell or lease the property or refinance the indebtedness, rather than the ability of the borrower or guarantor to repay principal and interest. If the appraisal of the value of the completed project proves to be overstated, we may have inadequate security for the repayment of the loan upon completion of construction of the project and may incur a loss. Because construction loans require active monitoring of the building process, including cost comparisons and on-site inspections, these loans are more difficult and costlier to monitor. Increases in market rates of interest may have a more pronounced effect on construction loans by rapidly increasing the end-purchasers’ borrowing costs, thereby reducing the overall demand for the project. Properties under construction are often difficult to sell and typically must be completed in order to be successfully sold which also complicates the process of working out problem construction loans. This may require us to advance additional funds and/or contract with another builder to complete construction. Further, in the case of speculative construction loans, there is added risk associated with identifying an end-purchaser for the finished project which poses a greater potential risk to us than construction loans to individuals on their personal residences. Loans on land under development or held for future construction as well as lot loans made to individuals for the future construction of a residence also pose additional risk because of the lack of income being produced by the property and the potential illiquid nature of the collateral. These risks can also be significantly impacted by supply and demand conditions.
Any recession in our local economy and commercial real estate market may make it more difficult for commercial real estate borrowers to repay their loans in a timely manner as commercial real estate borrowers’ ability to repay their loans frequently depends on the successful development of their properties. The deterioration of one or a few of our commercial real estate loans could cause a material increase in our level of nonperforming loans, which would result in a loss of revenue from these loans and could result in an increase in the provision for loan losses and/or an increase in charge offs, all of which could have a material adverse impact on our net income. We also may incur losses on commercial real estate loans due to declines in occupancy rates and rental rates, which could occur as a result of less need for office space due to more people working from home or other factors. This would decrease property values and may decrease the likelihood that a borrower may find permanent financing alternatives. Any weakening in the commercial real estate market will increase the likelihood of default on these loans, which could negatively impact our loan portfolio’s performance and asset quality. If we are required to liquidate the collateral securing a loan to satisfy the debt during a period of reduced real estate values, we could incur material losses. Any of these events could increase our costs, require management time and attention, and materially and adversely affect us.
22
Federal banking agencies have issued guidance regarding high concentrations of commercial real estate loans within bank loan portfolios. The guidance requires financial institutions that exceed certain levels of commercial real estate lending compared with their total capital to maintain heightened risk management practices that address the following key elements: board and management oversight and strategic planning, portfolio management, development of underwriting standards, risk assessment and monitoring through market analysis and stress testing, and maintenance of increased capital levels as needed to support the level of commercial real estate lending. If there is any deterioration in our commercial real estate portfolio or if our regulators conclude that we have not implemented appropriate risk management practices, it could adversely affect our business, and could result in the requirement to maintain increased capital levels or restrict our ability to originate new loans secured by commercial real estate. We can provide no assurance that capital would be available at that time.
The nature of our construction loan portfolio may expose us to increased lending risks.
Given the recent growth in our loan portfolio, a portion of our construction loans are unseasoned, meaning that they were originated relatively recently. Our limited time with these loans does not provide us with a significant payment history pattern with which to judge future collectability. As a result, it may be difficult to predict the future performance of our loan portfolio. These loans may have delinquency or charge off levels above our expectations, which could negatively affect our performance.
The small to mid-sized businesses that we lend to may have fewer resources to weather a downturn in the economy, which may impair a borrower’s ability to repay a loan to us that could materially harm our operating results.
We target our business development and marketing strategy primarily to serve the banking and financial services needs of small to mid-sized businesses. These small to mid-sized businesses frequently have smaller market share than their competition, may be more vulnerable to economic downturns, often need substantial additional capital to expand or compete and may experience significant volatility in operating results. In addition, the success of a small to mid-sized business often depends on the management talents and efforts of one or two persons or a small group of persons, and the death, disability or resignation of one or more of these persons could have a material adverse impact on the business and its ability to repay a loan. Any economic downturns and other events that negatively impact our market areas could cause us to incur substantial credit losses that could negatively affect our results of operations and financial condition.
Our allowance for credit losses may not be adequate to cover actual losses.
Like all financial institutions, we maintain an allowance for credit losses to provide for loan defaults and nonperformance. The process for determining the amount of the allowance is critical to our financial results and condition. It requires difficult, subjective and complex judgments about external factors, including the impact of national and regional economic conditions on the ability of our borrowers to repay their loans. If our judgment proves to be incorrect, our allowance for credit losses may not be sufficient to cover losses inherent in our loan portfolio. Further, state and federal regulatory agencies, as an integral part of their examination process, review our loans and allowance for credit losses and may require an increase in our allowance for credit losses. Although we believe that our allowance for credit losses at December 31, 2023 is adequate to cover known and probable incurred losses included in the portfolio, we cannot provide assurances that we will not further increase the allowance for credit losses or that our regulators will not require us to increase this allowance. Either of these occurrences could adversely affect our earnings.
Increased interest rates have decreased the value of a portion of the Company’s securities portfolio, and the Company would realize losses if it were required to sell such securities to meet liquidity needs.
As a result of inflationary pressures and the resulting rapid increases in interest rates over the last two years, the fair value of our securities classified as available for sale has declined. These securities make up a majority of the securities portfolio of the Company, resulting in unrealized losses embedded in other comprehensive income as a part of shareholders’ equity. If the Company were required to sell such securities to meet liquidity needs, including in the event of deposit outflows or slower deposit growth, it may incur losses, which could impair the Company’s capital, financial condition, and results of operations and require the Company to raise additional capital on unfavorable terms, thereby negatively impacting its profitability. While the Company has taken actions to maximize its funding sources, there is no guarantee that such actions will be successful or sufficient in the event of sudden liquidity needs.
23
The financial services industry is undergoing a period of great volatility and disruption.
Changes in interest rates, in the shape of the yield curve, or in valuations in the debt or equity markets or disruptions in the liquidity or other functioning of financial markets, most of which have occurred, could directly impact us in one or more of the following ways:
| • | Net interest income, the difference between interest earned on interest-earning assets and interest paid on interest-bearing liabilities, represents a significant portion of our earnings. Both increases and decreases in the interest rate environment may reduce our profits. We expect that we will continue to realize income from the spread between the interest we earn on loans, securities and other interest earning assets, and the interest we pay on deposits, and borrowings (when applicable). The net interest spread is affected by the differences between the maturity and repricing characteristics of our interest earning assets and interest-bearing liabilities. Our interest-earning assets may not reprice as slowly or rapidly as our interest-bearing liabilities. |
| • | The market value of our securities portfolio may decline and result in other than temporary impairment charges. The value of the securities in our portfolio is affected by factors that impact the U.S. securities markets in general as well as specific financial sector factors and entities. Uncertainty in the market regarding the financial sector has at times negatively impacted the value of securities within our portfolio. Further declines in these sectors may in future result in other than temporary impairment charges. |
| • | Asset quality may deteriorate as borrowers become unable to repay their loans. |
Changes in interest rates may adversely affect our earnings and financial condition.
Our net income depends primarily upon our net interest income. The level of net interest income is primarily a function of the average balance of our interest-earning assets, the average balance of our interest-bearing liabilities, and the spread between the yield on such assets and the cost of such liabilities. These factors are influenced by both the pricing and mix of our interest earning assets and our interest-bearing liabilities which, in turn, are impacted by such external factors as the local economy, competition for loans and deposits, the monetary policy of the Federal Open Market Committee of the Federal Reserve, and market interest rates.
A sustained increase in market interest rates could adversely affect our earnings if our cost of funds increases more rapidly than our yield on our interest earning assets and compresses our net interest margin. In addition, the economic value of equity could decline if interest rates increase. Different types of assets and liabilities may react differently, and at different times, to changes in market interest rates. We expect that we will periodically experience gaps in the interest rate sensitivities of our assets and liabilities. That means either our interest-bearing liabilities will be more sensitive to changes in market interest rates than our interest-earning assets, or vice versa. When interest-bearing liabilities mature or re-price more quickly than interest earning assets, an increase in market rates of interest could reduce our net interest income.
Likewise, when interest earning assets mature or re-price more quickly than interest bearing liabilities, falling interest rates could reduce our net interest income. We are unable to predict changes in market interest rates, which are affected by many factors beyond our control, including inflation, deflation, recession, unemployment, money supply, domestic and international events and changes in the United States and other financial markets.
We also attempt to manage risk from changes in market interest rates, in part, by controlling the mix of interest rate sensitive assets and liabilities. However, interest rate risk management techniques are not exact. A rapid increase or decrease in interest rates could adversely affect our results of operations and financial performance.
RISKS RELATED TO THE BANK’S COMMON STOCK
The Holding Company’s ability to pay dividends depends primarily on receiving dividends from the Bank, which is subject to regulatory limits and the Bank’s performance.
The Company is a bank holding company and banking operations are conducted by its subsidiary, the Bank. The Company’s ability to pay dividends depends on its receipt of dividends from the Bank. Dividend payments from the Bank are subject to legal and regulatory limitations, generally based on net profits and retained earnings, imposed by the various banking regulatory agencies. The ability of the Bank to pay dividends is also subject to its profitability, financial condition, capital expenditures, other cash flow requirements, and other factors deemed relevant by its Board of Directors. There is no assurance that the Bank will be able to pay dividends in the future, and if able, that the dividends will be at the same rate as 2023, or that the Company will generate adequate cash flow from the Bank to pay dividends in the future. The Company’s failure to pay dividends on its common stock could have a material adverse effect on the market price of its common stock.
24
Our stock price may reflect securities market conditions.
The effectiveness of governmental, fiscal and monetary policies, and regulatory responses to the market conditions affect the financial markets and the market prices for securities generally, and the market prices for bank stocks, including our common stock. The stock market’s gains due to a concentration of high growth companies has been adversely affected by inflation and higher interest rates and other national and international events.
ECONOMIC RISKS
Inflation can have an adverse impact on the Company’s business and its customers.
Inflation risk is the risk that the value of assets or income from investments will be worth less in the future as inflation decreases the value of money. Over the past year, in response to a pronounced rise in inflation, the Federal Reserve has raised certain benchmark interest rates to combat inflation. As discussed above under CREDIT AND INTEREST RATE RISKS— Changes in interest rates may adversely affect our earnings and financial condition, as inflation increases and market interest rates rise, the value of the Company’s investment securities, particularly those with longer maturities, would decrease, although this effect can be less pronounced for floating rate instruments. In addition, inflation generally increases the cost of goods and services the Company uses in its business operations, such as electricity and other utilities, and also generally increases employee wages, any of which can increase the Company’s non-interest expenses. Furthermore, the Company’s customers are also affected by inflation and the rising costs of goods and services used in their households and businesses, which could have a negative impact on their ability to repay their loans with the Company. Sustained higher interest rates by the Federal Reserve to tame persistent inflationary price pressures could also push down asset prices and weaken economic activity. A deterioration in economic conditions in the United States and the Company’s markets could result in an increase in loan delinquencies and non-performing assets, decreases in loan collateral values and a decrease in demand for the Company’s products and services, all of which, in turn, would adversely affect the Company’s business, financial condition and results of operations.
We face risks related to health epidemics and other outbreaks, severe weather, power or telecommunications loss, and terrorism which could significantly disrupt our operations.
Business disruptions can occur due to forces beyond the Bank’s control such as severe weather, power or telecommunications loss, accidents, flooding, terrorism, health emergencies, the spread of infectious diseases or pandemics. Our business could be adversely impacted by the effects of any of these events to the extent that they harm the local or national economy. Any of these events may also impact our branches, our operations, our customers and / or our vendors, which may materially and adversely affect our business, financial condition and results of operations. These business disruptions may include temporary closure of our branches and/or the facilities of our customers or vendors and suspension of services, which may materially and adversely affect our business, financial condition and results of operations.
Market conditions and economic cyclicality may adversely affect our industry.
Market developments, including unemployment, price levels, stock and bond market volatility, and changes, including those resulting from world events, affect consumer confidence levels, economic activity and inflation. Changes in payment behaviors and payment rates may increase delinquencies and default rates, which could affect our earnings and credit quality.
OPERATIONAL RISKS
Further negative developments in the banking industry could adversely affect our business operations and our financial condition and results of operations.
The large bank failures during the first half of 2023 and related negative media attention generated significant market trading volatility among publicly traded bank holding companies and, in particular, regional, as well as community banks like the Company. Similar developments in the future could negatively impact customer confidence in regional and community banks, which could prompt customers to move their deposits to larger financial institutions. Further, competition for deposits has increased in recent periods, and the cost of funding has similarly increased, putting pressure on our net interest margin. If we were required to sell a portion of our securities portfolio to address liquidity needs, we may incur losses, including as a result of the negative impact of rising interest rates on the value of our securities portfolio, which could negatively affect our earnings and our capital. If we were required to raise additional capital in the current environment, any such capital raise may be on unfavorable terms, thereby negatively impacting book value and profitability. While we have taken actions to improve our funding, there is no guarantee that such actions will be successful or sufficient in the event of sudden liquidity needs.
25
There has also been increased regulatory scrutiny – in the course of routine examinations and otherwise – and new regulations directed towards banks of similar size to the Company, designed to address the negative developments in the banking industry in 2023, all of which may increase our costs of doing business and reduce our profitability. Among other things, there may be an increased focus by both regulators and investors on deposit composition, the level of uninsured deposits, losses embedded in the held-to-maturity portion of our securities portfolio, contingent liquidity, CRE composition and concentration, capital position and our general oversight and internal control structures regarding the foregoing. As a result, the Company could face increased scrutiny or be viewed as higher risk by regulators and the investor community.
Competition from other financial institutions in originating loans and attracting deposits may adversely affect our profitability.
We face substantial competition in originating loans. This competition comes principally from other banks, savings institutions, mortgage banking companies, credit unions and other lenders in our market area, which is generally an area within an approximate 100-mile radius of Princeton and dominated by large statewide, regional and interstate banking institutions. Many of our competitors enjoy advantages, such as greater financial resources and higher lending limits, a wider geographic presence, more accessible branch office locations, the ability to offer a wider array of services or more favorable pricing alternatives, as well as lower origination and operating costs. This competition could reduce our net income by decreasing the number and size of loans that we originate and the interest rates we may charge on these loans.
These competitors may offer higher interest rates on deposits than we do, which could decrease the deposits that we attract or require us to increase our interest rates on deposit accounts to retain existing deposits or attract new deposits. Increased deposit competition could adversely affect our ability to generate the funds necessary for lending operations and may increase our cost of funds. Additionally, these competitors may offer lower interest rates on loans than we do, which could decrease the amount of loans that we attract or require us to decrease our interest rates on loans to attract new loans. Increased loan competition could adversely affect our net interest margin.
We also compete with non-bank providers of financial services, such as brokerage firms, consumer finance companies, insurance companies and governmental organizations which may offer more favorable terms. Some of our non-bank competitors are not subject to the same extensive regulations that govern our operations. As a result, such non-bank competitors may have advantages over us in providing certain products and services. This competition may reduce or limit our margins on banking services, reduce our market share and adversely affect our results of operations and financial condition.
If deposit levels are not sufficient, it may be more expensive to fund loan originations.
Our deposits have been our primary funding source. In current market conditions, depositors may choose to redeploy their funds into higher yielding investments, the stock market or other investment alternatives, regardless of our effort to retain such depositors. If this occurs, it will hamper our ability to grow deposits and could result in a net outflow of deposits. Our average total deposits for the year ended December 31, 2023 of $1.51 billion were $100.1 million higher than the $1.41 billion for the year ended December 31, 2022. We will continue to focus on deposit growth, which we use to fund loan originations. However, if we are unable to sufficiently increase our deposit balances, we will be required to increase our use of alternative sources of funding, including FHLB advances, or to increase our deposit rates in order to attract additional deposits, each of which would increase our cost of funds.
We must maintain and follow high underwriting standards to grow safely.
Our ability to grow our assets safely depends on maintaining disciplined and prudent underwriting standards and ensuring that our relationship managers and lending personnel follow those standards. The weakening of these standards for any reason, such as to seek higher yielding loans, or a lack of discipline or diligence by our employees in underwriting and monitoring loans, may result in loan defaults, foreclosures and additional charge offs and may necessitate that we significantly increase our allowance for credit losses. As a result, our business, results of operations, financial condition or prospects could be adversely affected.
We are a community bank and our ability to maintain our reputation is critical to the success of our business and the failure to do so may materially adversely affect our performance.
We are a community bank, and our reputation is one of the most valuable components of our business. As such, we strive to conduct our business in a manner that enhances our reputation. This is done, in part, by recruiting, hiring and retaining employees who share our core values of being an integral part of the communities we serve, delivering superior service to our customers and caring about our customers and associates. If our reputation is negatively affected by the actions of our employees or otherwise, our business and, therefore, our operating results may be materially adversely affected. Additionally, damage to our reputation could undermine the confidence of our current and potential clients in our ability to provide financial services. Such damage could also impair the confidence of our counterparties and business partners, and ultimately affect our ability to effect transactions. Maintenance of our reputation depends not only on our success in maintaining our service-focused culture and controlling and mitigating the various risks described herein, but also on our success in identifying and appropriately addressing issues that may arise in areas such as potential conflicts of interest, anti-money laundering, client personal information and privacy issues, record-keeping, regulatory investigations and any litigation that may arise from the failure or perceived failure of us to comply with legal and regulatory requirements. Maintaining our reputation also depends on our ability to successfully prevent third parties from infringing on the “The Bank of Princeton” brand and associated trademarks. Defense of our reputation, including through litigation, could result in costs adversely affecting our business, results of operations, financial condition or prospects.
26
Our internal control systems could fail to detect certain events.
We are subject to certain operational risks, including but not limited to data processing system failures and errors and customer or employee fraud. We maintain a system of internal controls to mitigate such occurrences which system recently had to be modified to cover the additional risks caused by the increase in the amount of time our employees are working remotely. We also maintain insurance coverage for such risks. However, should such an event occur that is not prevented or detected by our internal controls, is uninsured or in excess of applicable insurance limits, it could have a significant adverse effect on our business, results of operations, financial condition or prospects.
If we cannot favorably assess the effectiveness of our internal controls over financial reporting, we may be subject to additional regulatory scrutiny.
Like other banks of our size, our management is required to prepare a report that contains an assessment by management of the effectiveness of our internal control structure and procedures for financial reporting (including the Call Report that is submitted to the FDIC) as of the end of each fiscal year. The rules that must be met for management to assess our internal controls over financial reporting are complex and require significant documentation and testing and possible remediation of internal control weaknesses. The effort to comply with regulatory requirements relating to internal controls will likely cause us to incur increased expenses and will cause a diversion of management’s time and other internal resources. We also may encounter problems or delays in completing the implementation of any changes necessary to make a favorable assessment of our internal control over financial reporting. If we cannot favorably assess the effectiveness of our internal control over financial reporting, investor confidence and the price of our common stock could be adversely affected, and we may be subject to additional regulatory scrutiny.
We rely on third parties to provide key components of our business infrastructure, and the failure of these parties to fulfil their obligations to us could disrupt our operations.
Third parties provide key components of our business infrastructure such as data processing, internet connections, network access, core application processing, statement production and account analysis. Our business depends on the successful and uninterrupted functioning of our information technology and telecommunications systems and third- party servicers. The failure of these systems, or the termination of a third-party software license or service agreement on which any of these systems is based, could interrupt our operations. Because our information technology and telecommunications systems interface with and depend on third-party systems, we could experience service denials if demand for such services exceeds capacity, or such third-party systems fail or experience interruptions. Replacing vendors or addressing other issues with our third-party service providers could entail significant delay and expense. If we are unable to efficiently replace ineffective service providers, or if we experience a significant, sustained or repeated, system failure or service denial, it could compromise our ability to operate effectively, damage our reputation, result in a loss of customer business, and subject us to additional regulatory scrutiny and possible financial liability, any of which could have a material adverse effect on our business, financial condition, results of operations and future prospects.
We cannot predict how changes in technology will impact our business; increased use of technology may expose us to service interruptions.
The financial services market, including banking services, is increasingly affected by advances in technology, including developments in:
| • | telecommunications; |
| • | data processing; |
| • | automation; |
| • | Internet banking, including mobile banking; |
| • | social media; |
| • | debit cards and so-called “smart cards”; and |
| • | remote deposit capture. |
27
Our ability to compete successfully in the future will depend, to a certain extent, on whether we can anticipate and respond to technological changes. We offer electronic banking services for our consumer and business customers including Internet banking, mobile banking and electronic bill payment, as well as banking by phone. We also offer ATM and debit cards, wire transfers, and ACH transfers. The successful operation and further development of these and other new technologies will likely require additional capital investment in the future. In addition, increased use of electronic banking creates opportunities for interruptions in service which could expose us to claims by customers or other third parties. We can provide no assurance that we will have sufficient resources or access to the necessary technology to remain competitive in the future.
We may be vulnerable to cyberattacks or other security breaches affecting our electronic data and product delivery systems.
The financial services industry has experienced an increase in both the number and severity of reported cyberattacks aimed at gaining unauthorized systems access as a way to misappropriate assets and sensitive information, corrupt and destroy data, or cause operational disruptions. Cybercrime risks have increased as electronic and mobile banking activities have increased. We are increasingly dependent on technology systems to run our core operations and to be a delivery channel to provide products and services to our customers. We also rely on the integrity and security of a variety of third-party processors, payment, clearing and settlement systems, as well as the various participants involved in these systems, many of which have no direct relationship with us. Failure by these participants or their systems to protect our customers’ transaction data may put us at risk for possible losses due to fraud or operational disruption. In many cases, in order for these systems to function, they must be connected to the internet, directly or indirectly. These connections open our systems to potential attacks by third parties seeking to steal our data, our customers’ information or to disable our systems. A successful attack on our systems could adversely affect our results of operations by, among other things, harming our reputation among current and potential customers if their information is stolen, disrupting our operations if our systems are impaired, the loss of assets which could be stolen in an attack and the costs of remediating our systems after an attack. Although we have security safeguards and take numerous steps to protect our systems from a potential attack, we can provide no assurance that these measures will be successful in preventing intrusions into our systems. A portion of our workforce (which changes based on management’s discretion) are working a portion of their work hours remotely which has only increased our risk in this area. Therefore, the Bank’s information technology department has instituted additional security measures with the use of laptop computers at home, such as specially loaded software providing more accessibility, increased monitoring of access logs, and the requirement for employees to bring their laptop computer into the office when working there. In addition, files and documents are only allowed to be transferred via the issued laptop computer; no personal emails can be used. The occurrence of a breach of security involving our customers could damage our reputation and result in a loss of customers and business, subject us to additional regulatory scrutiny and could expose us to litigation and possible financial liability. Any of these events could have a material adverse effect on our financial condition and results of operations.
The increasing use of social media platforms presents new risks and challenges and the inability or failure to recognize, respond to, and effectively manage the accelerated impact of social media could materially adversely impact the Bank’s business.
There has been a marked increase in the use of social media platforms, including weblogs (blogs), social media websites, and other forms of internet-based communications which allow individuals’ access to a broad audience of consumers and other interested persons. Social media practices in the banking industry are evolving, which creates uncertainty and risk of noncompliance with regulations applicable to the Bank’s business. Consumers value readily available information concerning businesses and their goods and services and often act on such information without further investigation and without regard to its accuracy. Many social media platforms immediately publish the content their subscribers and participants’ post, often without filters or checks on accuracy of the content posted. Information posted on such platforms at any time may be adverse to the Bank’s interests and/or may be inaccurate. The dissemination of information online could harm the Bank’s business, prospects, financial condition, and results of operations, regardless of the information’s accuracy. The harm may be immediate without affording the Bank an opportunity for redress or correction.
Other risks associated with the use of social media include improper disclosure of proprietary information, negative comments about the Bank’s business, exposure of personally identifiable information, fraud, out-of-date information, and improper use by employees, directors and customers. The inappropriate use of social media by the Bank’s customers, directors or employees could result in negative consequences such as remediation costs, remedial training for employees, additional regulatory scrutiny and possible regulatory penalties, litigation, or negative publicity that could damage the Bank’s reputation adversely affecting customer or investor confidence.
STRATEGIC RISKS
Our growth has substantially increased our expenses and impacted our results of operations.
Although we believe that our growth-oriented business strategy will support our long-term profitability and franchise value, the expense associated with our growth, including compensation expense for the employees needed to support this growth and leasehold and other expenses associated with our locations, has and may continue to negatively affect our results. In addition, in order for our existing branches to contribute to our long-term profitability, we will need to be successful in attracting and maintaining cost-efficient deposits at these locations. In order to successfully manage our growth, we need to effectively execute policies, procedures and controls to maintain our credit quality and oversee our operations. We can provide no assurance that we will be successful in this strategy.
28
Our growth-oriented business strategy could be adversely affected if we are not able to attract and retain skilled employees.
We may not be able to successfully manage our business as a result of the strain on our management and operations that may result from growth. Our ability to manage growth will depend upon our ability to continue to attract, hire and retain skilled employees, and we may need to adopt additional equity plans in order to do so. Our success will also depend on the ability of our officers and key employees to continue to implement and improve our operational and other systems, to manage multiple, concurrent customer relationships and to hire, train and manage our employees.
RISKS RELATED TO THE REGULATION OF OUR INDUSTRY
We are subject to significant government regulation, which could affect our business, financial condition and results of operations.
We are subject to extensive governmental supervision, regulation and control. The Company is subject to regulation and supervision by the Federal Reserve, and the Bank is subject to regulation and supervision by the FDIC and the New Jersey Department of Banking and Insurance. These laws and regulations are subject to change and may require substantial modifications to our operations or may cause us to incur substantial additional compliance costs. In addition, future legislation and government policy could adversely affect the commercial banking industry and our operations. Such governing laws can be anticipated to continue to be the subject of future modification. Our management cannot predict what effect any such future modifications will have on our operations.
Changes to laws and regulation applicable to the financial industry, may impact the profitability of our business activities and may change certain of our business practices, including the ability to offer new products, obtain financing, attract deposits, make loans, and achieve satisfactory interest spreads, and could expose us to additional costs, including increased compliance costs. These changes also may require us to invest significant management attention and resources to make any necessary changes to operations in order to comply and could therefore also materially and adversely affect our business, financial condition and results of operations.
The federal and state laws and regulations applicable to our operations give regulatory authorities extensive discretion in connection with their supervisory and enforcement responsibilities, and generally have been promulgated to protect depositors and the Deposit Insurance Fund and not for the purpose of protecting stockholders. Laws and regulations now affecting us may be changed at any time, and the interpretation of such laws and regulations by bank regulatory authorities is also subject to change.
The USA PATRIOT and Bank Secrecy Acts require financial institutions to develop programs to prevent financial institutions from being used for money laundering and terrorist activities. If such activities are detected, financial institutions are obligated to file suspicious activity reports with the U.S. Treasury’s Office of Financial Crimes Enforcement Network. These rules require financial institutions to establish procedures for identifying and verifying the identity of customers seeking to open new financial accounts. Failure to comply with these regulations could result in fines or sanctions, including restrictions on conducting acquisitions or establishing new branches. During the last year, several banking institutions have received large fines for non-compliance with these laws and regulations. While we have developed policies and procedures designed to assist in compliance with these laws and regulations, these policies and procedures may not be effective in preventing violations of these laws and regulations.
We can give no assurance that future changes in laws and regulations or changes in their interpretation will not adversely affect our business. Legislative and regulatory changes may increase our cost of doing business or otherwise adversely affect us and create competitive advantage for non-bank competitors.
Our lending limit may restrict our growth.
We are limited in the amount we can loan to a single borrower by the amount of our capital. Generally, under current law, we may lend up to 15% of our unimpaired capital and surplus, including capital notes, to any one borrower. Based upon our current capital levels, the amount we may lend is less than that of many of our larger competitors and may discourage potential borrowers who have credit needs in excess of our lending limit from doing business with us. We may accommodate larger loans by selling participations in those loans to other financial institutions, but this ability may not always be available.
29
The Federal Reserve may require the Company to commit capital resources to support the Bank.
Federal law requires that a holding company act as a source of financial and managerial strength to its subsidiary bank and to commit resources to support such subsidiary bank. Under the “source of strength” doctrine, the Federal Reserve may require a holding company to make capital injections into a troubled subsidiary bank and may charge the holding company with engaging in unsafe and unsound practices for failure to commit resources to a subsidiary bank. A capital injection may be required at times when the holding company may not have the resources to provide it and therefore may require the holding company to borrow the funds or raise capital. Thus, any borrowing or capital raised to make a capital injection becomes more difficult and expensive and could have an adverse effect on the Company’s business, financial condition, and results of operations.
We are subject to the Community Reinvestment Act and fair lending laws, and failure to comply with these laws could lead to material penalties.
The CRA, the Equal Credit Opportunity Act, the Fair Housing Act and other fair lending laws and regulations impose nondiscriminatory lending requirements on financial institutions. A successful regulatory challenge to an institution’s performance under the CRA or fair lending laws and regulations could result in a wide variety of sanctions, including the required payment of damages and civil money penalties, injunctive relief, imposition of restrictions on mergers and acquisitions activity and restrictions on expansion. Private parties may also have the ability to challenge an institution’s performance under fair lending laws in private class action litigation. Such actions could have a material adverse effect on our business, financial condition and results of operations.
Item 1B. Unresolved Staff Comments
Not applicable.
Item 1C. Cybersecurity
We rely extensively on various information systems and other electronic resources to operate our business. In addition, nearly all our customers, service providers and other business partners on whom we depend, including the providers of our online banking, mobile banking, and accounting systems, use their own information systems and electronic resources. Any of these systems can be compromised, including through the employees, customers, and other individuals who are authorized to use them, and bad actors who use a sophisticated and constantly evolving set of software, tools, and strategies to do so. Moreover, the nature of our business as a financial services provider, and our relative size, make us and our business partners high-value targets for these bad actors to pursue. For additional information see “Item 1A. Risk Factors—Operational Risks.”
Accordingly, we have long devoted significant resources to assessing, identifying, and managing risks associated with cybersecurity threats, including:
| • | an in-house team dedicated to information and cybersecurity, responsible for conducting regular evaluations of our information systems, existing controls, vulnerabilities, and potential enhancements; |
| • | tools for continuous monitoring capable of detecting and aiding in the response to cybersecurity threats in real-time; |
| • | conducting thorough due diligence on our third-party service providers, evaluating their cybersecurity practices, and requiring contractual commitments from them to implement specific cybersecurity measures; |
| • | collaboration with third-party cybersecurity experts who perform periodic penetration testing, vulnerability assessments, and other procedures to pinpoint potential weaknesses in our systems and processes; and |
| • | regular cybersecurity training sessions for our staff. |
This information security program is a key part of our overall risk management system, which is administered by our Information Security Officer. The program includes administrative, technical and physical safeguards to help ensure the security and confidentiality of customer records and information. These security and privacy policies and procedures are in effect across all of our businesses and geographic locations.
We face a number of cybersecurity risks in connection with our business. From time-to-time, we have identified cybersecurity threats and cybersecurity incidents that require us to make changes to our processes and to implement additional safeguards. While none of these identified threats or incidents have materially affected us, it is possible that threats and incidents we identify in the future could have a material adverse effect on our business strategy, results of operations, and financial condition.
Our management team is responsible for the day-to-day management of risks we face, including our Chief Information Officer (“CIO”). Our CIO has been in the role since May 2021, and has 30 years of experience in technology risk management and cybersecurity, primarily within the financial services sector.
30
In addition, our board of directors is responsible for the oversight of risk management. In that role, our board of directors, with support from our cybersecurity advisors, are responsible for ensuring that the risk management processes designed and implemented by management are adequate and functioning as designed. To carry out those duties, our board of directors receives quarterly reports from our management team regarding cybersecurity risks, and our efforts to prevent, detect, mitigate, and remediate any cybersecurity incidents.
Item 2. Properties
We conduct our operations from our headquarters and branch located at 183 Bayard Lane, Princeton, New Jersey, an operations center at 403 Wall Street, Princeton, New Jersey, and from 28 other branch locations in New Jersey, Pennsylvania and New York. The following table sets forth certain information regarding the Bank’s properties as of December 31, 2023:
| Location |
Leased or Owned |
Date of Lease Expiration1 |
||
| Corporate Headquarters and Branch 183 Bayard Lane Princeton, NJ |
Leased | October 31, 2028 | ||
| Operations Center 403 Wall Street Princeton, NJ |
Leased | February 28, 2026 | ||
| Hamilton Branch 339 Route 33 Hamilton, NJ |
Leased | October 30, 2025 | ||
| Pennington Branch 2 Route 31 Pennington, NJ |
Leased | April 30, 2027 | ||
| Montgomery Branch 1185 Route 206 North Princeton, NJ |
Leased | April 30, 2025 | ||
| Monroe Branch 1 Rossmoor Drive Monroe Township, NJ |
Leased | July 31, 2030 | ||
| Lambertville Branch 10-12 Bridge Street Lambertville, NJ |
Owned | N/A | ||
| Lawrenceville Branch 2999 Princeton Pike Lawrenceville, NJ |
Leased | October 30, 2025 | ||
| Nassau Street Branch 194 Nassau Street Princeton, NJ |
Leased | November 30, 2026 | ||
| New Brunswick Branch 1 Spring Street, Suite 102 New Brunswick, NJ |
Leased | March 31, 2027 | ||
| Cream Ridge Branch 403 Rt 539 Cream Ridge, NJ |
Leased | November 30, 2028 | ||
31
| Chesterfield Branch 305 Bordentown-Chesterfield Road Chesterfield, NJ |
Owned | N/A | ||
| Bordentown Branch 335 Farnsworth Avenue Bordentown, NJ |
Owned | N/A | ||
| Browns Mills Branch 101 Pemberton Browns Mills Road Browns Mills, NJ |
Owned | N/A | ||
| Deptford Branch 1893 Hurffville Road Deptford, NJ |
Owned | N/A | ||
| Sicklerville Branch 483 Cross Key Road Sicklerville, NJ |
Leased | February 1, 2026 | ||
| Princeton Junction Branch 11 Cranbury Road Princeton Junction, NJ |
Leased | October 10, 2024 | ||
| Quakerbridge Branch 3745 Quakerbridge Road Hamilton, NJ |
Leased | April 1, 2024 | ||
| Lakewood Branch 12 American Avenue, 7B Lakewood, NJ |
Leased | August 20, 2025 | ||
| Piscataway Branch 1642 Stelton Road, Suite 410 Piscataway, NJ |
Leased | March 31, 2027 | ||
| North Wales Branch 1222 Welsh Road North Wales, PA |
Leased | September 30, 2026 | ||
| Cheltenham Branch 470 West Cheltenham Avenue Philadelphia, PA |
Leased | January 25, 2026 | ||
| Chinatown Branch 921 Arch Street Philadelphia, PA |
Leased | September 30, 2027 | ||
| Chestnut Street Branch 1839 Chestnut Street Philadelphia, PA |
Leased | February 28, 2027 | ||
| Kingston Branch 4442 Route 27 Kingston, NJ |
Leased | March 31, 2028 | ||
| Fort Lee Branch 2337 Lemoine Ave Fort Lee, NJ |
Leased | November 30, 2027 | ||
32
| Palisades Park Branch 449 Broad Ave Palisades Park, NJ |
Leased | December 31, 2025 | ||
| Flushing Branch 15404 Northern Blvd Flushing, NY |
Leased |
January 31, 2029 |
||
| Jericho Branch 350 N Broadway #352 Jericho, NY |
Leased |
November 30, 2028 |
||
| Elkins Park Branch 7301 Old York Rd Elkins Park, PA |
Leased |
May 31, 2041 |
||
| 1 | The expiration date is based on the next upcoming maturity date and does not take into consideration any renewal/extensions dates. |
Item 3. Legal Proceedings
From time to time the Company is a defendant in various legal proceedings arising in the ordinary course of our business. However, in the opinion of management of the Company, there are no proceedings pending to which the Company is a party or to which its property is subject, which, if determined adversely to the Company, would be material in relation to the Company’s profits or financial condition, nor are there any proceedings pending other than ordinary routine litigation incident to the business of the Company. In addition, no material proceedings are pending or are known to be threatened or contemplated against the Company by government authorities or others.
Item 4. Mine Safety Disclosures
Not applicable.
33
PART II
Item 5. Market for the Registrant’s Common Equity, Related Stockholder Matters and Issuer Purchases of Equity Securities
Market Information
The Company’s common stock trades on the “NASDAQ Global Select Market” under the ticker symbol “BPRN.” As of March 4, 2024, there were approximately 2,415 holders of our common stock.
Recent Sales of Unregistered Securities
None.
Dividends
The Company declared and paid cash dividends of $0.30 per share in each quarter for the year ended December 31, 2023. The payment of dividends to shareholders of the Company is dependent on the Bank paying dividends to the Company. The Bank may pay dividends as declared from time to time by the Board of Directors out of funds legally available, subject to certain restrictions. Under the New Jersey Banking Act of 1948, as amended, the Bank may not pay a cash dividend unless, following the payment, the Bank’s capital stock will be unimpaired and the Bank will have a surplus of no less than 50.0 percent of the Bank’s capital stock or, if not, the payment of the dividend will not reduce the surplus. In addition, the Bank cannot pay dividends in amounts that would reduce the Bank’s capital below regulatory imposed minimums.
Under Pennsylvania law, the Company may not pay a dividend, if, after giving effect thereto, it would be unable to pay its debts as they become due in the usual course of business and, after giving effect to the dividend, the total assets of the Company would be less than the sum of its total liabilities plus the amount that would be needed, if the Company were to be dissolved at the time of distribution, to satisfy the preferential rights upon dissolution of shareholders whose rights are superior to those receiving the dividend.
It is also the policy of the Federal Reserve that a bank holding company generally may only pay dividends on common stock out of net income available to common shareholders over the past twelve months and only if the prospective rate of earnings retention appears consistent with a bank holding company’s capital needs, asset quality, and overall financial condition. A bank holding company also should not maintain a dividend level that places undue pressure on the capital of such institution’s subsidiaries, or that may undermine the bank holding company’s ability to serve as a source of strength for such subsidiaries.
34
Performance Graph
The following graph demonstrates comparison of the cumulative total returns for the common stock of the Company, NASDAQ Composite Index, SNL Mid-Atlantic Bank Index, and Peer Group made up of banks and thrifts with total assets between $1.00 billion and $3.00 billion for the periods indicated. The graph below represents $100 invested in our Bank’s common stock at its closing price on December 31, 2018.
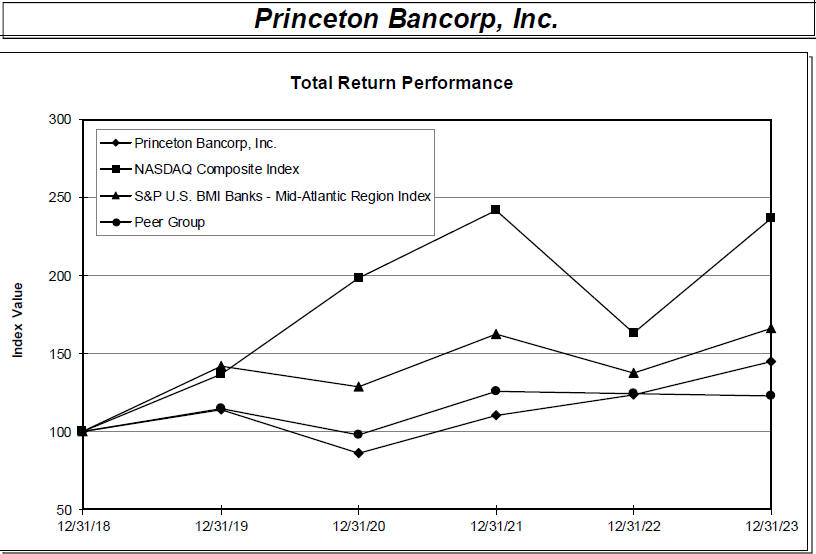
| Period Ending | ||||||||||||||||||||||||
| Index |
12/31/18 | 12/31/19 | 12/31/20 | 12/31/21 | 12/31/22 | 12/31/23 | ||||||||||||||||||
| Princeton Bancorp, Inc. |
100.00 | 113.60 | 85.98 | 110.18 | 123.16 | 144.98 | ||||||||||||||||||
| NASDAQ Composite Index |
100.00 | 136.69 | 198.10 | 242.03 | 163.28 | 236.17 | ||||||||||||||||||
| S&P U.S. BMI Banks - Mid-Atlantic Region Index |
100.00 | 142.19 | 128.53 | 162.33 | 137.10 | 166.23 | ||||||||||||||||||
| Peer Group |
100.00 | 114.61 | 97.79 | 125.48 | 124.42 | 123.09 | ||||||||||||||||||
Peer group includes Banks and Thrifts with total assets between $1B – $3B
Source: S&P Global Market Intelligence
© 2024
35
Securities Authorized for Issuance under Equity Compensation Plans
The following table summarizes our equity compensation plan information as of December 31, 2023. See Note 15 “Stock-Based Compensation” in the Notes to Consolidated Financial Statements included in this Annual Report on Form 10-K for a description of the material features of each plan.
| Plan Category |
Number of shares of common stock to be issued upon exercise of outstanding options |
Weighted- average exercise price of outstanding options |
Number of shares of common stock remaining available for future issuance under compensation plans |
|||||||||
| Equity Compensation Plans approved by security holders |
328,637 | $ | 19.44 | 246,883 | ||||||||
| Equity Compensation Plans not approved by security holders |
— | — | — | |||||||||
|
|
|
|
|
|
|
|||||||
| Total |
328,637 | $ | 19.44 | 246,883 | ||||||||
|
|
|
|
|
|
|
|||||||
Item 6. [Reserved]
None.
36
Item 7. Management’s Discussion and Analysis of Financial Condition and Results of Operations
Our Management’s Discussion and Analysis of Financial Condition and Results of Operations is presented in sections as follows:
| • | Overview and Strategy |
| • | Comparison of Financial Condition at December 31, 2023 and December 31, 2022 |
| • | Comparison of Operating Results for the Years Ended December 31, 2023 and 2022 |
| • | Rate/Volume Analysis |
| • | Liquidity, Commitments and Capital Resources |
| • | Off-Balance Sheet Arrangements |
| • | Impact of Inflation |
| • | Exposure to Changes in Interest Rates |
| • | Critical Accounting Policies and Estimates |
| • | Recently Issued Accounting Standards |
Overview and Strategy
We remain focused on establishing and retaining customer relationships by offering a broad range of traditional financial services and products, competitively priced and delivered in a responsive manner to small businesses, to professionals and individuals in our market area. As a community bank, we seek to provide superior customer service that is highly personalized, efficient and responsive to local needs. To better serve our customers, we endeavor to provide state-of-the-art delivery systems with ATMs, current operating software, timely reporting, online bill pay and other similar up-to-date products and services. We seek to deliver these products and services with the care and professionalism expected of a community bank and with a special dedication to personalized customer service.
Our primary business objectives are:
| • | to provide local businesses, professionals and individuals with banking services responsive to and determined by their needs and local market conditions; |
| • | to attract deposits and loans through competitive pricing, responsiveness and service; and |
| • | to provide a reasonable return to stockholders on capital invested. |
We also intend to continue pursuing a strategy that includes acquisitions. An acquisition strategy involves significant risks, including the following: finding suitable candidates for acquisition; attracting funding to support additional growth within acceptable risk tolerances; maintaining asset quality; retaining the target’s customers and key personnel; obtaining necessary regulatory approvals; conducting adequate due diligence and managing known and unknown risks and uncertainties; integrating acquired businesses; and maintaining adequate regulatory capital. The market for acquisition targets is highly competitive, which may adversely affect our ability to find acquisition candidates that fit our strategy and standards.
We strive to serve the financial needs of our customers while providing an appropriate return to our stockholders, consistent with safe and sound banking practices. We expect that a financial strategy that utilizes variable rates and matching assets and liabilities will enable us to increase our net interest margin, while managing interest rate risk. We also seek to generate fee income from various sources, subject to our desire to maintain competitive pricing within our market area.
Our recognition of, and commitment to, the needs of the local community, combined with highly personalized and responsive customer service, differentiates us from our competition. We continue to capitalize upon the personal contacts and relationships of our organizers, directors, stockholders and officers to establish and grow our customer base.
Comparison of Financial Condition at December 31, 2023 and December 31, 2022
General. Total assets were $1.92 billion at December 31, 2023, an increase of $314.7 million, or 19.7% when compared to $1.60 billion at the end of 2022 due primarily to the Noah acquisition. The primary components of the increase in total assets were an increase in loans of approximately $178.0 million and an increase in cash and cash equivalents of approximately $97.2 million. The increase in loans receivable primarily consisted of a $269.3 million increase in commercial real estate loans and a $19.6 million increase in commercial and industrial loans, partially offset by a $107.4 million decrease in construction loans during the twelve-month period covered.
37
Total liabilities increased by $294.1 million to $1.68 billion at December 31, 2023 from $1.38 billion at December 31, 2022. Total deposits at December 31, 2023 increased by $288.0 million, or 21.4%, when compared to December 31, 2022, primarily due to increases of $299.5 million in time deposits and $70.4 million in money market deposits partially offset by decreases in savings of $44.2 million, $21.8 million in interest checking, and $15.8 million in non-interest checking. The Bank had no outstanding borrowings at December 31, 2023 and $10 million in borrowings at December 31, 2022.
Total stockholders’ equity at December 31, 2023 increased $20.6 million or 9.4% when compared to the end of 2022. The increase was primarily due to the $17.9 million increase in retained earnings, consisting of $25.8 million in net income, the issuance of 50,900 shares resulting from the exercise of stock options and $807,000 of compensation expense related to restricted stock units, partially offset by $7.4 million of cash dividends recorded during the period. The ratio of equity to total assets at December 31, 2023 and at December 31, 2022, was 12.5% and 13.7%, respectively. The current period ratio decrease was primarily due to the Noah Bank acquisition.
We manage our balance sheet based on a number of interrelated criteria, such as changes in interest rates, fluctuations in certain asset and liability categories whose changes are not totally controlled by us, swings in deposit account balances driven by depositors’ needs, prepayments and issuer call options exercised on securities available for sale, early payoffs on loans, investment opportunities presented by market conditions, lending originations, capital provided by earnings, and active management of our overall liquidity positions. The management of these dynamic and interrelated elements of our balance sheet results in fluctuations in balance sheet items throughout the year.
Comparison of Operating Results for the Years Ended December 31, 2023 and 2022
General.
For the year ended December 31, 2023, the Company recorded net income of $25.8 million, or $4.03 per diluted common share, compared to $26.5 million, or $4.11 per diluted common share, for the same period in 2022. The decrease was due to an increase of $10.2 million in non-interest expenses, a decrease in net interest income of $3.1 million, and an increase in provision for credit losses of $2.7 million, partially offset by an increase of $12.3 million in non-interest income and a decrease in income tax expense of $3.0 million attributable in part to the $9.7 million bargain purchase gain from its Noah Bank acquisition in May of 2023 that is not taxable. The results for 2023 were significantly impacted by purchase accounting adjustments resulting from the Noah Bank acquisition.
Net interest income.
Net interest income for the twelve-month period ended December 31, 2023 was $65.0 million, a decrease of $3.1 million, or 4.5%, from 2022. The decrease from the previous year was the result of an increase in interest expense of $27.2 million, or 452.7%, partially offset by an increase in interest income of $24.1 million, or 32.5%, both as a result of the 525 basis-point increase in federal funds interest rates since March 2022 and management’s strategic initiative to maintain high levels of primary liquidity in this uncertain rate environment.
Total interest and dividend income.
Total interest and dividend income increased $24.1 million, or 32.5%, to $98.2 million for the year ended December 31, 2023, compared to $74.1 million for the prior year. The improvement in interest income resulted from an increase in the yield on earning assets of 114 basis points to 5.94% for the twelve-month period ended December 31, 2023.
Interest income and fees on loans increased $18.3 million, or 25.8%, to $89.3 million for the year ended December 31, 2023, compared to $71.0 million for the prior year. The increase was attributable to both a $74.0 million increase in the average balance and a 100 basis point increase in the year-over-year average yield on loans to 6.16%, due to rising interest rates over the period.
Interest income on securities increased approximately $323,000, or 14.9%, for the year ended December 31, 2023 compared to the prior year. This increase was attributable to a 59 basis point increase in the yield earned on the securities portfolio, partially offset by a $7.2 million decrease in average balances.
Other interest and dividends increased $5.5 million, or 595.0%, to $6.4 million for the year ended December 31, 2023, compared to $923,000 for the prior year due to an increase in federal funds sold. This increase was due to a 415 basis point increase in the yield and a $43.1 million increase in average balances of federal funds sold.
38
Interest expense.
Total interest expense increased $27.2 million, or 452.7%, for the year ended December 31, 2023 compared to the prior year. This increase was the result of a 210 basis point increase in the cost of interest-bearing liabilities and an increase of $132.5 million in average interest-bearing liabilities.
Interest expense on borrowings was not significant for either period presented.
Provision for credit losses.
The provision for credit losses for the twelve months ended December 31, 2023 was $3.1 million compared with a provision of $400,000 for the 2022 period. The $3.1 million provision for 2023 consists of a $3.4 million provision associated with the company’s loan portfolio, offset by a credit to the provision of $430,000 associated with unfunded commitments. The provision for credit losses on loans includes $1.7 million related to non-purchased-credit-deteriorated loans acquired in the Noah acquisition and was also a result of loan net charge offs of $1.8 million. See the section above titled “Analysis of Allowance for Credit Losses” for a discussion of our allowance for credit losses methodology, including additional information regarding the determination of the provision for credit losses.
Non-interest income.
Total non-interest income for the year ended December 31, 2023 increased $12.3 million, or 252.1%, primarily due to the $9.7 million bargain purchase gain and an increase in loan fees of $1.7 million over the same period in 2022.
Non-interest expense.
For the year ended December 31, 2023, non-interest expense was $48.7 million, compared to $38.5 million for the same period in 2022. The increase was primarily due to merger-related expenses of $5.6 million during 2023 as well as increases in salaries and employee benefits of $2.9 million, occupancy and equipment of $1.2 million and data processing and communications of $538 thousand over the same period in 2022.
Income tax expense.
For the year ended December 31, 2023, income tax expense was $4.6 million resulting in an effective tax rate of 15.1% compared to income tax expense of $7.6 million and an effective tax rate of 22.2% for the year ended December 31, 2022. This decrease was due to the $9.7 million non-taxable bargain purchase gain from the Noah Bank acquisition, partially offset by $274 thousand of merger-related expenses that were not tax-deductible.
39
Average Balance Sheets. The following table sets forth average balance sheets, yields and costs, and certain other information for the years indicated. The average yields and costs of funds shown are derived by dividing income or expense by the daily average balance of assets or liabilities, respectively, for the periods presented. Net loan fees of $2.8 million and $5.0 million were recorded for the twelve months ended December 31, 2023 and 2022, respectively. Nonaccrual loans are included in the average balance of loans receivable, net for all periods presented. No tax-equivalent adjustments have been made.
| 2023 | 2022 | Change 2023 vs 2022 | ||||||||||||||||||||||||||||||
| Average | Income/ | Yield | Average | Income/ | Yield | Average | Yield | |||||||||||||||||||||||||
| Balances | Expense | Rates | Balances | Expense | Rates | Balances | Rates | |||||||||||||||||||||||||
| (Dollars in thousands) |
||||||||||||||||||||||||||||||||
| Interest-earning assets: |
||||||||||||||||||||||||||||||||
| Loans receivable |
$ | 1,449,504 | $ | 89,278 | 6.16 | % | $ | 1,375,501 | $ | 70,996 | 5.16 | % | $ | 74,003 | 1.00 | % | ||||||||||||||||
| Securities |
||||||||||||||||||||||||||||||||
| Taxable available-for-sale |
43,476 | 1,339 | 3.08 | % | 47,358 | 986 | 2.08 | % | (3,882 | ) | 1.00 | % | ||||||||||||||||||||
| Tax exempt available-for-sale |
40,264 | 1,138 | 2.83 | % | 43,549 | 1,167 | 2.68 | % | (3,285 | ) | 0.15 | % | ||||||||||||||||||||
| Held-to-maturity |
197 | 10 | 5.28 | % | 204 | 11 | 5.39 | % | (7 | ) | -0.11 | % | ||||||||||||||||||||
| Federal funds sold |
109,441 | 5,858 | 5.35 | % | 66,292 | 797 | 1.20 | % | 43,149 | 4.15 | % | |||||||||||||||||||||
| Other interest earning-assets |
10,064 | 557 | 5.53 | % | 10,612 | 126 | 1.19 | % | (548 | ) | 4.35 | % | ||||||||||||||||||||
|
|
|
|
|
|
|
|
|
|
|
|||||||||||||||||||||||
| Total interest-earning assets |
1,652,946 | $ | 98,180 | 5.94 | % | 1,543,516 | $ | 74,083 | 4.80 | % | 109,430 | 1.14 | % | |||||||||||||||||||
|
|
|
|
|
|||||||||||||||||||||||||||||
| Other non-earnings assets |
122,321 | 101,940 | 20,381 | |||||||||||||||||||||||||||||
|
|
|
|
|
|
|
|||||||||||||||||||||||||||
| Total assets |
$ | 1,775,267 | $ | 1,645,456 | $ | 129,811 | ||||||||||||||||||||||||||
|
|
|
|
|
|
|
|||||||||||||||||||||||||||
| Interest-bearing liabilities |
||||||||||||||||||||||||||||||||
| Demand |
$ | 250,312 | $ | 3,654 | 1.46 | % | $ | 261,951 | $ | 823 | 0.31 | % | $ | (11,639) | 1.15 | % | ||||||||||||||||
| Savings |
159,175 | 2,742 | 1.72 | % | 220,222 | 714 | 0.32 | % | (61,047 | ) | 1.40 | % | ||||||||||||||||||||
| Money markets |
311,478 | 9,565 | 3.07 | % | 353,224 | 1,565 | 0.44 | % | (41,746 | ) | 2.63 | % | ||||||||||||||||||||
| Certificates of deposit |
538,343 | 17,085 | 3.17 | % | 293,627 | 2,893 | 0.99 | % | 244,716 | 2.19 | % | |||||||||||||||||||||
|
|
|
|
|
|
|
|
|
|
|
|||||||||||||||||||||||
| Total deposit |
1,259,308 | 33,046 | 2.62 | % | 1,129,024 | 5,995 | 0.42 | % | 130,284 | 2.20 | % | |||||||||||||||||||||
| Borrowings |
2,343 | 118 | 5.01 | % | 153 | 5 | 3.37 | % | 2,190 | 1.65 | % | |||||||||||||||||||||
|
|
|
|
|
|
|
|
|
|
|
|||||||||||||||||||||||
| Total interest-bearing liabilities |
1,261,651 | $ | 33,164 | 2.63 | % | 1,129,177 | $ | 6,000 | 0.53 | % | 132,474 | 2.10 | % | |||||||||||||||||||
|
|
|
|
|
|||||||||||||||||||||||||||||
| Non-interest-bearing deposits |
248,233 | 280,729 | (32,496 | ) | ||||||||||||||||||||||||||||
| Other liabilities |
36,856 | 20,755 | 16,101 | |||||||||||||||||||||||||||||
|
|
|
|
|
|
|
|||||||||||||||||||||||||||
| Total liabilities |
1,546,740 | 1,430,661 | 116,079 | |||||||||||||||||||||||||||||
| Stockholders’ equity |
228,527 | 214,795 | 13,732 | |||||||||||||||||||||||||||||
|
|
|
|
|
|
|
|||||||||||||||||||||||||||
| Total liabilities and stockholder’s equity |
$ | 1,775,267 | $ | 1,645,456 | $ | 129,811 | ||||||||||||||||||||||||||
|
|
|
|
|
|
|
|||||||||||||||||||||||||||
| Net interest-earnings assets |
$ | 391,295 | $ | 414,339 | $ | (23,044) | ||||||||||||||||||||||||||
| Net interest income; interest rate spread |
3.31 | % | 4.27 | % | -0.96 | % | ||||||||||||||||||||||||||
|
|
|
|
|
|
|
|||||||||||||||||||||||||||
| Net interest margin |
$ | 65,016 | 3.93 | % | $ | 68,083 | 4.41 | % | $ | (3,067) | -0.48 | % | ||||||||||||||||||||
|
|
|
|
|
|
|
|||||||||||||||||||||||||||
| Net interest margin FTE1 |
3.99 | % | 4.47 | % | -0.48 | % | ||||||||||||||||||||||||||
| 1 | Includes federal and state tax effect of tax exempt securities and loans. |
40
Rate/Volume Analysis
The following table reflects the sensitivity of our interest income and interest expense to changes in volume and in yields on interest-earning assets and costs of interest-bearing liabilities during the periods indicated.
| Twelve Months Ended December 31, 2023 vs . 2022 Increase (Decrease) Due to |
||||||||||||
| Rate | Volume | Net | ||||||||||
| (In thousands) |
||||||||||||
| Interest and dividend income: |
||||||||||||
| Loans receivable, including fees |
$ | 14,307 | $ | 3,975 | $ | 18,282 | ||||||
| Securities available-for-sale |
||||||||||||
| Taxable |
440 | (87 | ) | 353 | ||||||||
| Tax-exempt |
62 | (91 | ) | (29 | ) | |||||||
| Securities held-to-maturity |
— | (1 | ) | (1 | ) | |||||||
| Federal funds sold |
4,260 | 801 | 5,061 | |||||||||
| Other interest and dividend income |
438 | (7 | ) | 431 | ||||||||
|
|
|
|
|
|
|
|||||||
| Total interest and dividend income |
$ | 19,507 | $ | 4,590 | $ | 24,097 | ||||||
|
|
|
|
|
|
|
|||||||
| Interest expense: |
||||||||||||
| Demand |
$ | 2,869 | $ | (38 | ) | $ | 2,831 | |||||
| Savings |
2,274 | (246 | ) | 2,028 | ||||||||
| Money market |
8,206 | (206 | ) | 8,000 | ||||||||
| Certificates of deposit |
10,300 | 3,892 | 14,192 | |||||||||
| Borrowings |
4 | 109 | 113 | |||||||||
|
|
|
|
|
|
|
|||||||
| Total interest expense |
$ | 23,653 | $ | 3,511 | $ | 27,164 | ||||||
|
|
|
|
|
|
|
|||||||
|
|
|
|
|
|
|
|||||||
| Change in net interest income |
$ | (4,147 | ) | $ | 1,080 | $ | (3,067 | ) | ||||
|
|
|
|
|
|
|
|||||||
Liquidity, Commitments and Capital Resources
Liquidity. Our liquidity, represented by cash and due from banks, is a product of our operating, investing and financing activities. Our primary sources of funds are deposits, principal repayments of securities and outstanding loans, and funds provided from operations. In addition, we invest excess funds in short-term interest-earnings assets such as overnight deposits or U.S. agency securities, which provide liquidity to meet lending requirements. While scheduled payments from the amortization of loans and securities and short-term investments are relatively predictable sources of funds, general interest rates, economic conditions and competition greatly influence deposit flows and repayments on loans and mortgage-backed securities.
We strive to maintain sufficient liquidity to fund operations, loan demand and to satisfy fluctuations in deposit levels. We are required to have enough investments that qualify as liquid assets in order to maintain sufficient liquidity to ensure safe and sound banking operations. Liquidity may increase or decrease depending upon the availability of funds and comparative yields on investments in relation to the return on loans. We attempt to maintain adequate but not excessive liquidity, and liquidity management is both a daily and long-term function of our business management. We manage our liquidity in accordance with a board of directors-approved asset-liability policy, which is administered by our asset-liability committee (“ALCO”). ALCO reports interest rate sensitivity, liquidity, capital and investment-related matters on a quarterly basis to our board of directors.
We review cash flow projections regularly and update them in order to maintain liquid assets at levels believed to meet the requirements of normal operations, including loan commitments and potential deposit outflows from maturing certificates of deposit and savings withdrawals.
41
While deposits are our primary source of funds, when needed we are also able to generate cash through borrowings from the FHLB-NY. At December 31, 2023, we had remaining available capacity with FHLB-NY, subject to certain collateral restrictions, of $139.4 million.
Additionally, we are a shareholder of Atlantic Community Bancshares, Inc., and as such, as of December 31, 2023, we had available capacity with its subsidiary, Atlantic Community Bankers Bank of $10.0 million to provide short-term liquidity generally for a period of not more than fourteen days.
Contractual Obligations. We have non-cancelable operating leases for branch offices and our operations center. The following table is a schedule of future payments under operating leases with initial terms longer than 12 months at December 31, 2023:
| Amount | ||||
| Years ended December 31, | (In thousands) | |||
| 2024 |
$ | 3,162 | ||
| 2025 |
3,101 | |||
| 2026 |
2,914 | |||
| 2027 |
2,627 | |||
| 2028 |
2,487 | |||
| Thereafter |
16,312 | |||
|
|
|
|||
| Total |
$ | 30,603 | ||
|
|
|
|||
The following table summarizes our contractual cash obligations relating to certificates of deposits:
| Amount | ||||
| Years ended December 31, | (In thousands) | |||
| 2024 |
$ | 519,151 | ||
| 2025 |
92,413 | |||
| 2026 |
22,410 | |||
| 2027 |
2,583 | |||
| Thereafter |
1,474 | |||
|
|
|
|||
| Total |
$ | 638,031 | ||
|
|
|
|||
Capital Resources. Consistent with our goals to operate as a sound and profitable financial institution, we actively seek to maintain our status as a well-capitalized institution in accordance with regulatory standards. As of December 31, 2023, we met the capital requirements to be considered “well capitalized.” See Note 17 – “Regulatory Matters” in the Notes to Consolidated Financial Statements included within this Form 10-K for more information regarding our capital resources.
Off-Balance Sheet Arrangements
We are a party to financial instruments with off-balance sheet risk in the normal course of our business of investing in loans and securities as well as in the normal course of maintaining and improving our facilities. These financial instruments include significant purchase commitments, such as commitments related to capital expenditure plans and commitments to purchase investment securities or mortgage-backed securities, and commitments to extend credit to meet the financial needs of our customers.
Commitments to extend credit are agreements to lend to a customer as long as there is no violation of any condition established in the loan contract. Commitments generally have fixed expiration dates or other termination clauses and may require payment of a fee by our customers. Our exposure to credit loss in the event of non-performance by the counterparty to the financial instrument for commitments to extend credit is represented by the contractual notional amount of those instruments. We use the same credit policies in making commitments and conditional obligations as we do for on-balance-sheet instruments. Since many of the commitments are expected to expire without being drawn upon, the total commitment amounts do not necessarily represent future cash requirements.
42
We had the following off-balance sheet financial instruments whose contract amounts represent credit risk at December 31:
| 2023 | 2022 | |||||||
| (In thousands) | ||||||||
| Performance and standby letters of credit |
$ | 1,010 | $ | 1,420 | ||||
| Undisbursed construction loans-in-process |
89,258 | 140,538 | ||||||
| Commitments to fund loans |
38,863 | 41,753 | ||||||
| Unfunded commitments under lines of credit |
4,697 | 5,800 | ||||||
|
|
|
|
|
|||||
| Total |
$ | 133,828 | $ | 189,511 | ||||
|
|
|
|
|
|||||
For additional information regarding our outstanding lending commitments at December 31, 2023, see Note 9 – “Commitments and Contingencies” in the Notes to Consolidated Financial Statements contained in this Form 10-K.
Impact of Inflation
The financial statements included in this Form 10-K have been prepared in accordance with accounting principles generally accepted in the United States of America. These principles require the measurement of financial position and results of operations in terms of historical dollars, without considering changes in the relative purchasing power of money, over time, due to inflation. Our primary assets and liabilities are monetary in nature. As a result, interest rates have a more significant impact on our performance than the effects of general levels of inflation. Interest rates, however, do not necessarily move in the same direction or with the same magnitude as the price of goods and services, since such prices are affected by inflation.
Exposure to Changes in Interest Rates
Gap Analysis. The matching of assets and liabilities may be analyzed by examining the extent to which such assets and liabilities are “interest rate sensitive” and by monitoring the Bank’s interest rate sensitivity “gap.” An asset or liability is said to be interest rate sensitive within a specific time period if it will mature or reprice within that time period. The interest rate sensitivity gap is defined as the difference between the amount of interest-earning assets maturing or repricing within a specific time period and the amount of interest-bearing liabilities maturing or repricing within that same time period. A gap is considered positive when the amount of interest rate sensitive assets exceeds the amount of interest rate-sensitive liabilities. A gap is considered negative when the amount of interest rate sensitive liabilities exceeds the amount of interest rate sensitive assets. During a period of rising interest rates, a negative gap would tend to affect adversely net interest income while a positive gap would tend to result in an increase in net interest income. Conversely, during a period of falling interest rates, a negative gap would tend to result in an increase in net interest income while a positive gap would tend to affect adversely net interest income.
The table on the next page sets forth the amounts of our interest-earning assets and interest-bearing liabilities outstanding at December 31, 2023, which we expect, based upon certain assumptions, to reprice or mature in each of the future time periods shown (the “GAP Table”). Except as stated below, the amounts of assets and liabilities shown which reprice or mature during a particular period were determined in accordance with the earlier of term to repricing or the contractual maturity of the asset or liability. The table sets forth an approximation of the projected repricing of assets and liabilities at December 31, 2023, on the basis of contractual maturities, anticipated prepayments, and scheduled rate adjustments period and subsequent selected time intervals. The loan amounts in the table reflect principal balances expected to be redeployed and/or repriced as a result of contractual amortization and anticipated prepayments of adjustable-rate loans and fixed-rate loans, and as a result of contractual rate adjustments on adjustable-rate loans.
43
| 3 Months or Less |
More than 3 Months to 1 Year |
More than 1 Year to 3 Years |
More than 3 Years to 5 Years |
More than 5 Years |
Non-Rate Sensitive |
Total Amount | ||||||||||||||||||||||
| (Dollars in thousands) | ||||||||||||||||||||||||||||
| Interest-earning assets: (1) |
||||||||||||||||||||||||||||
| Investment securities |
$ | 12,953 | $ | 7,633 | $ | 11,048 | $ | 11,502 | $ | 58,822 | $ | (10,413 | ) | $ | 91,545 | |||||||||||||
| Loans receivable |
458,104 | 239,716 | 376,200 | 405,918 | 61,229 | (11,324 | ) | 1,529,843 | ||||||||||||||||||||
| Other interest-earnings assets (2) |
133,401 | — | — | — | — | 17,156 | 150,557 | |||||||||||||||||||||
| Non-interest-earning assets |
— | — | — | — | — | 144,552 | 144,552 | |||||||||||||||||||||
|
|
|
|
|
|
|
|
|
|
|
|
|
|
|
|||||||||||||||
| Total assets |
$ | 604,458 | $ | 247,349 | $ | 387,248 | $ | 417,420 | $ | 120,051 | $ | (4,581 | ) | $ | 1,916,497 | |||||||||||||
|
|
|
|
|
|
|
|
|
|
|
|
|
|
|
|||||||||||||||
| Interest-bearing liabilities: |
||||||||||||||||||||||||||||
| Checking and savings accounts |
$ | 394,423 | $ | — | $ | — | $ | — | $ | — | $ | — | $ | 394,423 | ||||||||||||||
| Money market accounts |
354,005 | — | — | — | — | — | 354,005 | |||||||||||||||||||||
| Certificate accounts |
94,627 | 429,863 | 112,106 | 1,435 | — | — | 638,031 | |||||||||||||||||||||
| Borrowings |
— | — | — | — | — | — | — | |||||||||||||||||||||
|
|
|
|
|
|
|
|
|
|
|
|
|
|
|
|||||||||||||||
| Total interest-bearing liabilities |
$ | 843,055 | $ | 429,863 | $ | 112,106 | $ | 1,435 | $ | — | $ | — | $ | 1,386,459 | ||||||||||||||
|
|
|
|
|
|
|
|
|
|
|
|
|
|
|
|||||||||||||||
| Interest-earning assets less interest-bearing liabilities |
$ | (238,597 | ) | $ | (182,514 | ) | $ | 275,142 | $ | 415,985 | $ | 120,051 | $ | (4,581 | ) | $ | 530,038 | |||||||||||
|
|
|
|
|
|
|
|
|
|
|
|
|
|
|
|||||||||||||||
| Cumulative interest-rate sensitivity gap (3) |
$ | (238,597 | ) | $ | (421,111 | ) | $ | (145,969 | ) | $ | 270,016 | $ | 390,067 | |||||||||||||||
|
|
|
|
|
|
|
|
|
|
|
|||||||||||||||||||
| Cumulative interest-rate gap as a percentage of total assets at December 31, 2023 |
-12.45 | % | -21.97 | % | -7.62 | % | 14.09 | % | 20.35 | % | ||||||||||||||||||
|
|
|
|
|
|
|
|
|
|
|
|||||||||||||||||||
| Cumulative interest-earning assets as a percentage of cumulative interest-bearing liabilities at December 31, 2023 |
71.70 | % | 66.92 | % | 89.46 | % | 119.48 | % | 128.13 | % | ||||||||||||||||||
|
|
|
|
|
|
|
|
|
|
|
|||||||||||||||||||
| (1) | Interest-earnings assets are included in the period in which the balances are expected to be redeployed and/or repriced as a result of anticipated prepayments, scheduled rate adjustments and contractual maturities. |
| (2) | Includes interest-bearing bank balances, FHLB stock and federal funds sold |
| (3) | Interest-rate sensitivity gap represents the difference between total interest-earning assets and total interest-bearing liabilities. |
Certain shortcomings are inherent in the method of analysis presented in the foregoing table. For example, although certain assets and liabilities may have similar maturities or periods to repricing, they may react in different degrees to changes in market interest rates. Also, the interest rates on certain types of assets and liabilities may fluctuate in advance of changes in market interest rates, while interest rates on other types may lag behind changes in market rates. Additionally, certain assets, such as adjustable-rate loans, have features which restrict changes in interest rates both on a short-term basis and over the life of the asset. Further, in the event of a change in interest rates, prepayment and early withdrawal levels would likely deviate significantly from those assumed in calculating the table. Finally, the ability of many borrowers to service their adjustable-rate loans may decrease in the event of an interest rate increase.
44
Net Portfolio Value Analysis. Our interest rate sensitivity also is monitored by management through the use of a model which generates estimates of the changes in our net portfolio value (“NPV”) over a range of interest rate scenarios. NPV is the present value of expected cash flows from assets, liabilities and off-balance sheet contracts. The NPV ratio, under any interest rate scenario, is defined as the NPV in that scenario divided by the market value of assets in the same scenario. The following table sets forth our NPV as of December 31, 2023 and reflects the changes to NPV as a result of immediate and sustained changes in interest rates as indicated.
| Change in Interest Rates |
Net Portfolio Value | NPV as % of Portfolio |
||||||||||||||||
| In Basis Points (Rate Shock) |
Amounts | $Change | % Change | NPV Ratio |
Change | |||||||||||||
| (Dollars in thousands) | ||||||||||||||||||
| 300 |
$ | 188,005 | $ | 1,581 | 0.85 | % | -10.79% | -4.74 | % | |||||||||
| 200 |
$ | 194,762 | $ | 8,338 | 4.47 | % | -9.01% | -2.97 | % | |||||||||
| 100 |
$ | 193,426 | $ | 7,002 | 3.76 | % | -7.48% | -1.43 | % | |||||||||
| Static |
$ | 186,424 | $ | — | -6.05% | |||||||||||||
| (100) |
$ | 198,504 | $ | 12,080 | 6.48 | % | -4.11% | 1.94 | % | |||||||||
| (200) |
$ | 215,642 | $ | 29,218 | 15.67 | % | -2.17% | 3.88 | % | |||||||||
| (300) |
$ | 216,134 | $ | 29,710 | 15.94 | % | -0.34% | 5.71 | % | |||||||||
As is the case with the GAP Table, certain shortcomings are inherent in the methodology used in the above interest rate risk measurements. Modeling changes in NPV require the making of certain assumptions which may or may not reflect the manner in which actual yields and costs respond to changes in market interest rates. In this regard, the models presented assume that the composition of our interest sensitive assets and liabilities existing at the beginning of a period remains constant over the period being measured and also assumes that a particular change in interest rates is reflected uniformly across the yield curve regardless of the duration to maturity or repricing of specific assets and liabilities. Accordingly, although the NPV model provides an indication of interest rate risk exposure at a particular point in time, such model is not intended to and does not provide a precise forecast of the effect of changes in market interest rates on net interest income and will differ from actual results.
Critical Accounting Policies and Estimates
In the preparation of our financial statements, we have adopted various accounting policies that govern the application of accounting principles generally accepted in the United States and in accordance with general practices within the banking industry. Our significant accounting policies are described in our financial statements under Note 1- “Summary of Significant Accounting Policies.” While all these policies are important to understanding the financial statements, certain accounting policies described below involve significant judgment and assumptions by management that have a material impact on the carrying value of certain assets and liabilities. We consider these accounting estimates to be critical accounting policies. The judgments and assumptions we use are based on historical experience and other factors, which we believe to be reasonable under the circumstances. Because of the nature of the judgments and assumptions we make, actual results could differ from these judgments and assumptions that could have a material impact on the carrying values of our assets and liabilities and our results of operations.
Allowance for Credit Losses. The allowance for credit losses consists of the allowance for loan losses and the reserve for unfunded lending commitments. The allowance for loan losses represents our estimate of losses expected in the loan portfolio as of the balance sheet date and is recorded as a reduction to loans. The reserve for unfunded lending commitments represents our estimate of losses expected in our unfunded loan commitments and is recorded in other liabilities on the balance sheet. The allowance for credit losses is increased by the provision for credit losses and recoveries and decreased by charge-offs. Generally, loans deemed to be uncollectible are charged-off against the allowance for credit losses, and subsequent recoveries, if any, are credited to the allowance for loan losses. All, or part, of the principal balance of loans receivable are charged off to the allowance for credit losses when it is determined that the repayment of all, or part, of the principal balance is highly unlikely.
45
Goodwill and Core Deposit Intangible. For mergers and acquisitions, we are required to record the assets acquired, including identified intangible assets such as core deposit intangibles, and the liabilities assumed at their fair value. The difference between consideration and the net fair value of assets acquired is recorded as goodwill or a bargain purchase gain if the acquired net fair value of assets acquired exceeds the consideration. Management uses significant estimates and assumptions to value such items, including projected cash flows, repayment rates, default rates and losses assuming default, discount rates and realizable collateral values. The allowance for credit losses for PCD loans is recognized within acquisition accounting. The allowance for credit losses for non-PCD assets is recognized as provision for credit losses in the same reporting period as the merger or acquisition. Fair value adjustments are amortized or accreted into the income statement over the estimated life of the acquired assets or assumed liabilities. The purchase date valuations and any subsequent adjustments determine the amount of goodwill recognized in connection with the merger or acquisition. The use of different assumptions could produce significantly different valuation results, which could have material positive or negative effects on our results of operations. Both goodwill and the core deposit intangible asset are reviewed for impairment annually or when events and circumstances indicate that an impairment may have occurred. Applicable accounting guidance requires an annual review of the fair value of a Reporting Unit that has goodwill in order to determine if it is more likely than not (that is, a likelihood of more than 50%) that the fair value of a Reporting Unit is less than its carrying amount, including goodwill. A qualitative factor test can be performed to determine whether it is necessary to perform a quantitative goodwill impairment test. If this qualitative test determines it is not more likely than not (less than 50% probability) that the fair value of the Reporting Unit is less than the Carrying Value, then the Company does not have to perform a quantitative test and goodwill can be considered not impaired. The Company performed its annual review at May 31, 2023 and determined that it was more than 50% probable the fair value of the Reporting Unit exceeds the then Carrying Value, therefore a quantitative test was not required as of May 31, 2023.
Recently Issued Accounting Standards
See Note 1- “Summary of Significant Accounting Policies” in the Notes to the Consolidated Financial Statements contained in this Annual Report on Form 10-K for a discussion of recently issued accounting standards.
Item 7A. Quantitative and Qualitative Disclosures about Market Risk
Not applicable.
Item 8. Financial Statements and Supplementary Data
46
THE BANK OF PRINCETON
INDEX TO
CONSOLIDATED FINANCIAL STATEMENTS
FOR THE YEARS ENDED DECEMBER 31, 2023 AND 2022
| Page | ||||
| Report of Independent Registered Public Accounting Firm for December 31, 2023 (PCAOB ID: 392) |
48 | |||
| 50 | ||||
| 51 | ||||
| 52 | ||||
| 53 | ||||
| 54 | ||||
| 56 | ||||
47

Report of Independent Registered Public Accounting Firm
To the Stockholders and the Board of Directors
Princeton Bancorp, Inc.
Opinion on the Financial Statements
We have audited the accompanying consolidated statements of financial condition of Princeton Bancorp, Inc. and subsidiaries (the Company) as of December 31, 2023 and 2022, the related consolidated statements of income, comprehensive income, changes in stockholders’ equity and cash flows for each of the years then ended, and the related notes to the consolidated financial statements (collectively, the financial statements). In our opinion, the financial statements present fairly, in all material respects, the financial position of the Company as of December 31, 2023 and 2022, and the results of its operations and its cash flows for each of the years then ended, in conformity with accounting principles generally accepted in the United States of America.
Change in Accounting Principle
As discussed in Note 1 to the financial statements, the Company has changed its method of accounting for the recognition and measurement of credit losses as of January 1, 2023 upon the adoption of Accounting Standards Codification Topic 326, Financial Instruments – Credit Losses (ASC 326).
Basis for Opinion
These financial statements are the responsibility of the Company’s management. Our responsibility is to express an opinion on the Company’s financial statements based on our audits. We are a public accounting firm registered with the Public Company Accounting Oversight Board (United States) (PCAOB) and are required to be independent with respect to the Company in accordance with U.S. federal securities laws and the applicable rules and regulations of the Securities and Exchange Commission and the PCAOB.
We conducted our audits in accordance with the standards of the PCAOB. Those standards require that we plan and perform the audit to obtain reasonable assurance about whether the financial statements are free of material misstatement, whether due to error or fraud. The Company is not required to have, nor were we engaged to perform, an audit of its internal control over financial reporting. As part of our audit, we are required to obtain an understanding of internal control over financial reporting but not for the purpose of expressing an opinion on the effectiveness of the Company’s internal control over financial reporting. Accordingly, we express no such opinion.
Our audits included performing procedures to assess the risks of material misstatement of the financial statements, whether due to error or fraud, and performing procedures that respond to those risks. Such procedures included examining, on a test basis, evidence regarding the amounts and disclosures in the financial statements. Our audits also included evaluating the accounting principles used and significant estimates made by management, as well as evaluating the overall presentation of the financial statements. We believe that our audits provides a reasonable basis for our opinion.
Critical Audit Matters
The critical audit matters communicated below are matters arising from the current period audit of the financial statements that was communicated or required to be communicated to the audit committee and that: (1) relates to accounts or disclosures that are material to the financial statements and (2) involved our especially challenging, subjective, or complex judgments. The communication of critical audit matters does not alter in any way our opinion on the financial statements, taken as a whole, and we are not, by communicating the critical audit matters below, providing separate opinions on the critical audit matters or on the accounts or disclosures to which they relate.
48
Allowance for Credit Losses – Loans Evaluated on a Pooled Basis
Critical Audit Matter Description
As described in Notes 1 and 5 to the financial statements, the Company has recorded an allowance for credit losses (ACL) for its loan portfolio in the amount of $18.5 million as of December 31, 2023, representing management’s estimate of credit losses over the remaining expected life of the Company’s loan portfolio as of that date. Upon adoption of ASC 326 on January 1, 2023, the Company recorded a cumulative effect adjustment to opening retained earnings which increased the ACL for loans and the reserve for off-balance sheet credit exposures recorded in other liabilities. Management determined the amounts, and corresponding provision for credit loss expense for the year, pursuant to the application of Accounting Standards Codification Topic 326, Financial Instruments – Credit Losses.
The Company’s methodology to determine its allowance for credit losses incorporates quantitative and qualitative assessments of its historical losses, current loan portfolio and economic conditions, the application of forecasted economic conditions, and related modeling. Management incorporates the use of third-party software to arrive at an expected life-of-loan loss amount based on discounted cash flow estimate at the loan level. The amount and timing of cash flows is determined using assumptions for probability of default and loss given default (PD/LGD); expected term; and forecasted economic factors. The results of these calculations are then qualitatively adjusted by management based on pool-specific attributes. We determined that performing procedures relating to these components of the Company’s methodology is a critical audit matter.
The principal considerations for our determination are (i) the application of significant judgment and estimation on the part of management, which in turn led to a high degree of auditor judgment and subjectivity in performing procedures and evaluating audit evidence obtained, and (ii) significant audit effort was necessary in evaluating management’s methodology, significant assumptions and calculations.
How the Critical Audit Matter Was Addressed in the Audit
Addressing the above matters involved performing procedures and evaluating audit evidence in connection with forming our overall opinion on the consolidated financial statements. These procedures included, among others, the following:
| • | Reviewing the Company’s procedures to validate the model and ensure that the model was conceptually sound. |
| • | Evaluating the segmentation of loans into pools with similar risk characteristics. |
| • | Testing assumptions used in the calculation of discounted cash flows, including prepayment speeds and expected loan terms. |
| • | Testing management’s process for determining the qualitative reserve components. |
| • | Testing the completeness and accuracy of data used in the model. |
Acquisition Method of Accounting – Valuation of Acquired Loan Portfolio
Critical Audit Matter Description
As described in Note 2 to the financial statements, on May 19, 2023, the Company completed its acquisition of Noah Bank for total consideration of $25.4 million. The fair value of total assets acquired as a result of the merger totaled $239.5 million, with loans totaling $185.9 million. Acquired loans were initially recorded at their acquisition-date fair value with the assistance of a management-engaged specialist. Fair values were based on a discounted cash flow methodology that involved assumptions and judgments regarding credit risk, market interest rates, collateral values, discount rates, prepayments assumptions and other market factors. In addition, a provision for credit loss of $1.7 million was recorded in the current period for acquired loans pursuant to applicable accounting guidance. We determined that performing procedures relating to these components of the Company’s methodology is a critical audit matter.
The principal considerations for our determination are (i) the application of significant judgment and estimation on the part of management, which in turn led to a high degree of auditor judgment and subjectivity in performing procedures and evaluating audit evidence obtained, and (ii) significant audit effort was necessary in evaluating management’s methodology and significant assumptions.
How the Critical Audit Matter Was Addressed in the Audit
To test management’s estimate of the fair value of the acquired loan portfolio, we performed audit procedures that included, among others, assessing the competence and objectivity of the management-engaged specialist, testing the completeness and accuracy of the loan data, assessing the reasonableness of the valuation methodology, and testing the significant assumptions and the underlying data used by the Company in its market interest rate and credit analysis. We compared the significant assumptions used by management to current industry data and supporting credit documentation.
We have served as the Company’s auditor since 2021.
/s/ Wolf & Company, P.C.
Boston, Massachusetts
March 25, 2024
49
December 31, 2023 |
December 31, 2022 |
|||||||
ASSETS |
||||||||
Cash and due from banks |
$ | 17,156 | $ | 12,161 | ||||
Interest-earning bank balances |
17,376 | 13,140 | ||||||
Federal funds sold |
116,025 | 28,050 | ||||||
Total cash and cash equivalents |
150,557 | 53,351 | ||||||
Securities available-for-sale, |
91,352 | 81,341 | ||||||
Securities held-to-maturity |
193 | 201 | ||||||
Loans receivable, net of deferred fees and costs |
1,548,335 | 1,370,368 | ||||||
Less: allowance for credit losses |
(18,492 | ) | (16,461 | ) | ||||
Loan receivable, net |
1,529,843 | 1,353,907 | ||||||
Bank-owned life insurance |
58,860 | 52,617 | ||||||
Premises and equipment, net |
14,453 | 11,722 | ||||||
Accrued interest receivable |
6,089 | 4,756 | ||||||
Restricted investment in bank stock |
1,410 | 1,742 | ||||||
Deferred taxes, net |
11,512 | 7,599 | ||||||
Goodwill |
8,853 | 8,853 | ||||||
Core deposit intangible |
1,422 | 1,825 | ||||||
Operating lease right-of-use |
23,398 | 16,026 | ||||||
Equity method investments |
8,296 | 2,061 | ||||||
Other assets |
10,259 | 5,778 | ||||||
TOTAL ASSETS |
$ | 1,916,497 | $ | 1,601,779 | ||||
LIABILITIES AND STOCKHOLDERS’ EQUITY |
||||||||
LIABILITIES |
||||||||
Deposits: |
||||||||
Non-interest-bearing |
$ | 249,282 | $ | 265,078 | ||||
Interest-bearing |
1,386,459 | 1,082,652 | ||||||
Total deposits |
1,635,741 | 1,347,730 | ||||||
Borrowings |
— | 10,000 | ||||||
Accrued interest payable |
9,162 | 1,027 | ||||||
Operating lease liability |
24,280 | 16,772 | ||||||
Other liabilities |
7,103 | 6,649 | ||||||
TOTAL LIABILITIES |
1,676,286 | 1,382,178 | ||||||
STOCKHOLDERS’ EQUITY: |
||||||||
Common stock, no par value; 15,000,000 shares authorized, 6,299,331 shares issued and outstanding at December 31, 2023; at December 31, 2022, par value $5.00 per share, 6,909,402 shares issued and 6,245,597 shares outstanding |
— | 34,547 | ||||||
Paid-in capital |
98,291 | 81,291 | ||||||
Treasury stock, at cost 663,805 shares at December 31, 2022 |
— | (19,452 | ) | |||||
Retained earnings |
149,414 | 131,488 | ||||||
Accumulated other comprehensive loss |
(7,494 | ) | (8,273 | ) | ||||
TOTAL STOCKHOLDERS’ EQUITY |
240,211 | 219,601 | ||||||
TOTAL LIABILITIES AND STOCKHOLDERS’ EQUITY |
$ | 1,916,497 | $ | 1,601,779 | ||||
Year Ended December 31, |
||||||||
2023 |
2022 |
|||||||
| INTEREST AND DIVIDEND INCOME |
||||||||
| Loans receivable, including fees |
$ | 89,278 | $ | 70,996 | ||||
| Securities available-for-sale: |
||||||||
| Taxable |
1,339 | 986 | ||||||
| Tax-exempt |
1,138 | 1,167 | ||||||
| Securities held-to-maturity |
10 | 11 | ||||||
| Other interest and dividend income |
6,415 | 923 | ||||||
| |
|
|
|
|||||
| TOTAL INTEREST AND DIVIDEND INCOME |
98,180 | 74,083 | ||||||
| |
|
|
|
|||||
| INTEREST EXPENSE |
||||||||
| Deposits |
33,046 | 5,995 | ||||||
| Borrowings |
118 | 5 | ||||||
| |
|
|
|
|||||
| TOTAL INTEREST EXPENSE |
33,164 | 6,000 | ||||||
| |
|
|
|
|||||
| NET INTEREST INCOME |
65,016 | 68,083 | ||||||
| Provision for credit losses |
3,108 | 400 | ||||||
| |
|
|
|
|||||
| NET INTEREST INCOME AFTER PROVISION FOR CREDIT LOSSES |
61,908 | 67,683 | ||||||
| |
|
|
|
|||||
| NON-INTEREST INCOME |
||||||||
| Gain on call/sale of securities available-for-sale |
39 | 2 | ||||||
| Income from bank-owned life insurance |
1,293 | 1,138 | ||||||
| Fees and service charges |
1,853 | 1,852 | ||||||
| Loan fees, including preypayment penalties |
3,221 | 1,484 | ||||||
| Gain on bargain purchase |
9,696 | — | ||||||
| Gain on sale of other real estate owned |
203 | — | ||||||
| Other |
816 | 386 | ||||||
| |
|
|
|
|||||
| TOTAL NON-INTEREST INCOME |
17,121 | 4,862 | ||||||
| |
|
|
|
|||||
| NON-INTEREST EXPENSE |
||||||||
| Salaries and employee benefits |
23,386 | 20,455 | ||||||
| Occupancy and equipment |
7,037 | 5,859 | ||||||
| Professional fees |
2,060 | 2,470 | ||||||
| Data processing and communications |
5,026 | 4,488 | ||||||
| Federal deposit insurance |
891 | 1,010 | ||||||
| Advertising and promotion |
504 | 484 | ||||||
| Office expense |
508 | 239 | ||||||
| Other real estate expenses |
1 | 106 | ||||||
| Core deposit intangible |
502 | 569 | ||||||
| Acquisition-related expenses |
5,635 | — | ||||||
| Other |
3,144 | 2,812 | ||||||
| |
|
|
|
|||||
| TOTAL NON-INTEREST EXPENSE |
48,694 | 38,492 | ||||||
| |
|
|
|
|||||
| INCOME BEFORE INCOME TAX EXPENSE |
30,335 | 34,053 | ||||||
| INCOME TAX EXPENSE |
4,570 | 7,559 | ||||||
| |
|
|
|
|||||
| NET INCOME |
$ | 25,765 | $ | 26,494 | ||||
| |
|
|
|
|||||
| Earnings per common share-basic |
$ | 4.10 | $ | 4.19 | ||||
| Earnings per common share-diluted |
$ | 4.03 | $ | 4.11 | ||||
Year Ended December 31, |
||||||||
2023 |
2022 |
|||||||
| NET INCOME |
$ | 25,765 | $ | 26,494 | ||||
| Other comprehensive income (loss) |
||||||||
| Unrealized gains (losses) arising during period on securities available-for-sale |
1,651 | (12,723 | ) | |||||
| Reclassification adjustment for losses (gains) realized in income 1
|
(39 | ) | (2 | ) | ||||
| |
|
|
|
|||||
| Net unrealized gain (loss) |
1,612 | (12,725 | ) | |||||
| Tax effect |
(833 | ) | 3,613 | |||||
| |
|
|
|
|||||
| Total other comprehensive income (loss) |
779 | (9,112 | ) | |||||
| |
|
|
|
|||||
| COMPREHENSIVE INCOME |
$ | 26,544 | $ | 17,382 | ||||
| |
|
|
|
|||||
|
1 |
Amounts are included in gain on call/sale of securities available-for-sale non-interest income. An income tax expense of approximately $13,000 was realized during 2023. There was no income tax expense or benefit during 2022. |
Years Ended December 31, 2023 and 2022 |
Common stock |
Paid-in Capital |
Treasury Stock |
Retained Earnings |
Accumulated Other Comprehensive (Loss) Income |
Total |
||||||||||||||||||
Balance, January 1, 2022 |
$ | 34,100 | $ | 80,220 | $ | (10,032 | ) | $ | 111,451 | $ | 839 | $ | 216,578 | |||||||||||
Net income |
— | — | — | 26,494 | — | 26,494 | ||||||||||||||||||
Other comprehensive loss |
— | — | — | — | (9,112 | ) | (9,112 | ) | ||||||||||||||||
Stock options exercised (76,900 shares) |
386 | 785 | — | — | — | 1,171 | ||||||||||||||||||
Restricted stock (8,741 shares) |
44 | 165 | — | — | — | 209 | ||||||||||||||||||
Dividends declared $1.00 per share |
— | — | — | (6,363 | ) | — | (6,363 | ) | ||||||||||||||||
Purchase of treasury stock (324,017 shares) |
— | — | (9,420 | ) | — | — | (9,420 | ) | ||||||||||||||||
Dividend reinvestment plan (3,343 shares) |
17 | 77 | — | (94 | ) | — | — | |||||||||||||||||
Stock-based compensation expense |
— | 44 | — | — | — | 44 | ||||||||||||||||||
Balance, December 31, 2022 |
$ | 34,547 | $ | 81,291 | $ | (19,452 | ) | $ | 131,488 | $ | (8,273 | ) | $ | 219,601 | ||||||||||
Balance, January 1, 2023 |
$ | 34,547 | $ | 81,291 | $ | (19,452 | ) | $ | 131,488 | $ | (8,273 | ) | $ | 219,601 | ||||||||||
Net income |
— | — | — | 25,765 | — | 25,765 | ||||||||||||||||||
Other comprehensive income |
— | — | — | — | 779 | 779 | ||||||||||||||||||
Change in accounting principle |
— | — | — | (284 | ) | — | (284 | ) | ||||||||||||||||
Formation of Princeton Bancorp, Inc. |
(34,547 | ) | 15,095 | 19,452 | — | — | — | |||||||||||||||||
Stock options exercised (50,900 shares) |
— | 989 | — | — | — | 989 | ||||||||||||||||||
Dividends declared $1.20 per share |
— | — | — | (7,446 | ) | — | (7,446 | ) | ||||||||||||||||
Dividend reinvestment plan (3,933 shares) |
— | 109 | — | (109 | ) | — | — | |||||||||||||||||
Stock-based compensation expense |
— | 807 | — | — | — | 807 | ||||||||||||||||||
Balance, December 31, 2023 |
$ | — | $ | 98,291 | $ | — | $ | 149,414 | $ | (7,494 | ) | $ | 240,211 | |||||||||||
Year Ended December 31, |
||||||||
2023 |
2022 |
|||||||
| CASH FLOWS FROM OPERATING ACTIVITIES |
||||||||
| Net income |
$ | 25,765 | $ | 26,494 | ||||
| Adjustments to reconcile net income to net cash provided by operating activities: |
||||||||
| Provision for credit losses |
3,108 | 400 | ||||||
| Depreciation and amortization |
1,476 | 1,483 | ||||||
| Stock-based compensation expense |
807 | 44 | ||||||
| Amortization of premiums and accretion of discount on securities |
26 | 49 | ||||||
| Accretion of net deferred loan fees and costs |
(2,814 | ) | (5,094 | ) | ||||
| Gain on call/sale of securities available-for-sale |
(39 | ) | (2 | ) | ||||
| Increase in cash surrender value of bank-owned life insurance |
(1,293 | ) | (1,138 | ) | ||||
| Deferred income tax |
200 | 527 | ||||||
| Amortization of core deposit intangible |
502 | 568 | ||||||
| Bargain purchase gain |
(9,696 | ) | — | |||||
| (Gain) loss on sale of other real estate owned |
(203 | ) | 125 | |||||
| Write down on other real estate owned |
— | 101 | ||||||
| Decrease in accrued interest receivable and other assets |
1,817 | 943 | ||||||
| Increase (decrease) in accrued interest payable and other liabilities |
3,456 | (513 | ) | |||||
| |
|
|
|
|||||
| NET CASH PROVIDED BY OPERATING ACTIVITIES |
23,112 | 23,987 | ||||||
| |
|
|
|
|||||
| CASH FLOWS FROM INVESTING ACTIVITIES |
||||||||
| Purchases of available-for-sale |
(8,439 | ) | (5,377 | ) | ||||
| Principal repayments of securities available-for-sale |
4,901 | 6,701 | ||||||
| Maturities and calls of securities available-for-sale |
1,604 | 3,659 | ||||||
| Maturities, calls and principal repayments of securities held-to-maturity |
8 | 8 | ||||||
| Net decrease (increase) in loans |
10,738 | (30,444 | ) | |||||
| Cash paid for acquisition |
(25,414 | ) | — | |||||
| Cash received from acquisition |
23,181 | — | ||||||
| Purchases of premises and equipment |
(1,712 | ) | (607 | ) | ||||
| Purchases of bank-owned life insurance |
(4,950 | ) | — | |||||
| Purchases of equity method investments |
(6,245 | ) | — | |||||
| Redemption (purchase) of restricted bank stock |
332 | (397 | ) | |||||
| Proceeds from other real estate owned |
236 | — | ||||||
| |
|
|
|
|||||
| NET CASH USED IN INVESTMENT ACTIVITIES |
(5,760 | ) | (26,457 | ) | ||||
| |
|
|
|
|||||
| CASH FLOWS FROM FINANCING ACTIVITIES |
||||||||
| Net increase (decrease) in deposits |
96,311 | (98,413 | ) | |||||
| (Repayment of) proceeds from overnight borrowings |
(10,000 | ) | 10,000 | |||||
| Cash dividends |
(7,555 | ) | (6,457 | ) | ||||
| Dividend reinvestment program |
109 | 94 | ||||||
| Purchase of treasury stock |
— | (9,420 | ) | |||||
| Proceeds from exercise of stock options |
989 | 1,092 | ||||||
| Release of restricted stock units |
— | 209 | ||||||
| |
|
|
|
|||||
| NET CASH PROVIDED BY (USED IN) FINANCING ACTIVITIES |
79,854 | (102,895 | ) | |||||
| |
|
|
|
|||||
| NET INCREASE (DECREASE) IN CASH AND CASH EQUIVALENTS |
97,206 | (105,365 | ) | |||||
| CASH AND CASH EQUIVALENTS, BEGINNING OF PERIOD |
53,351 | 158,716 | ||||||
| |
|
|
|
|||||
| CASH AND CASH EQUIVALENTS, END OF PERIOD |
$ | 150,557 | $ | 53,351 | ||||
| |
|
|
|
|||||
Year Ended December 31, |
||||||||
2023 |
2022 |
|||||||
| SUPPLEMENTARY CASH FLOWS INFORMATION: |
||||||||
| Interest paid |
$ | 25,029 | $ | 6,017 | ||||
| Income taxes paid |
$ | 5,883 | $ | 6,985 | ||||
| Net assets acquired from Noah Bank 1
|
$ | 239,451 | $ | — | ||||
| Net liabilities assumed from Noah Bank 1
|
$ | 204,341 | $ | — | ||||
|
1 |
For details of assets acquired and liabilities assumed - See Note 2. |
Fair Value |
||||
| (Dollars in thousands except per share data) Purchase Price Consideration in Cash for Noah Bank’s Outstanding Shares |
||||
| Noah Bank number of common shares outstanding |
4,235,666 | |||
| Purchase price per share assigned to cash consideration |
$ | 6.00 | ||
| |
|
|||
| Cash consideration |
$ | 25,414 | ||
| |
|
|||
| Assets Acquired: |
||||
| Cash and cash equivalents |
$ | 23,181 | ||
| Securities available-for-sale |
6,454 | |||
| Loans receivable, net of allowance |
185,891 | |||
| Core deposit intangible |
99 | |||
| Premises and equipment |
2,495 | |||
| Operating leases right-of-use |
10,523 | |||
| Deferred tax assets |
4,308 | |||
| Other assets |
6,500 | |||
| |
|
|||
| Fair value of assets acquired |
239,451 | |||
| |
|
|||
| Liabilities Assumed: |
||||
| Deposits |
191,700 | |||
| Operating lease liability |
10,523 | |||
| Other liabilities assumed |
2,118 | |||
| |
|
|||
| Fair value of liabilities assumed |
204,341 | |||
| |
|
|||
| Total identifiable net assets |
35,110 | |||
| |
|
|||
| Bargain purchase gain |
$ | (9,696 | ) | |
| |
|
|||
Year ended December 31, |
||||||||
2023 |
2022 |
|||||||
(In thousands, expect per share data) |
||||||||
| Net income applicable to common stock |
$ | 25,765 | $ | 26,494 | ||||
| Weighted average number of common shares outstanding |
6,281 | 6,320 | ||||||
| |
|
|
|
|||||
| Basic earnings per share |
$ | 4.10 | $ | 4.19 | ||||
| |
|
|
|
|||||
| Net income applicable to common stock |
$ | 25,765 | $ | 26,494 | ||||
| Weighted average number of common shares outstanding |
6,281 | 6,320 | ||||||
| Dilutive effect on common shares outstanding |
108 | 129 | ||||||
| |
|
|
|
|||||
| Weighted average number of diluted common shares outstanding |
$ | 6,389 | $ | 6,449 | ||||
| |
|
|
|
|||||
| Diluted earnings per share |
$ | 4.03 | $ | 4.11 | ||||
| |
|
|
|
|||||
December 31, 2023 |
||||||||||||||||
| |
|
|||||||||||||||
|
Amortized Cost |
Gross Unrealized Gains |
Gross Unrealized Losses |
Fair Value |
|||||||||||||
Available-for-sale |
(In thousands) | |||||||||||||||
| Mortgage-backed securities - U.S. government sponsored enterprises (GSEs) |
$ | 48,399 | $ | 219 | $ | (5,984 | ) | $ | 42,634 | |||||||
| U.S. government agency securities |
6,260 | — | (969 | ) | 5,291 | |||||||||||
| Obligations of state and political subdivisions |
44,059 | 12 | (3,262 | ) | 40,809 | |||||||||||
| Small business association (SBA) securities |
2,617 | 2 | (1 | ) | 2,618 | |||||||||||
| |
|
|
|
|
|
|
|
|||||||||
| Total |
$ | 101,335 | $ | 233 | $ | (10,216 | ) | $ | 91,352 | |||||||
| |
|
|
|
|
|
|
|
|||||||||
December 31, 2022 |
||||||||||||||||
| |
|
|||||||||||||||
|
Amortized Cost |
Gross Unrealized Gains |
Gross Unrealized Losses |
Fair Value |
|||||||||||||
Available-for-sale |
(In thousands) | |||||||||||||||
| Mortgage-backed securities - U.S. government sponsored enterprises (GSEs) |
$ | 41,515 | $ | 2 | $ | (6,602 | ) | $ | 34,915 | |||||||
| U.S. government agency securities |
6260 | — | (1,175 | ) | 5,085 | |||||||||||
| Obligations of state and political subdivisions |
45,161 | 8 | (3,828 | ) | 41,341 | |||||||||||
| |
|
|
|
|
|
|
|
|||||||||
| Total |
$ | 92,936 | $ | 10 | $ | (11,605 | ) | $ | 81,341 | |||||||
| |
|
|
|
|
|
|
|
|||||||||
Less than 12 Months |
More than 12 Months |
Total |
||||||||||||||||||||||
Fair Value |
Unrealized Losses |
Fair Value |
Unrealized Losses |
Fair Value |
Unrealized Losses |
|||||||||||||||||||
December 31, 2023 |
(In thousands) |
|||||||||||||||||||||||
| Mortgage-backed securities - U.S. government sponsored enterprises (GSEs) |
$ | 2,858 | $ | (14 | ) | $ | 31,398 | $ | (5,970 | ) | $ | 34,256 | $ | (5,984 | ) | |||||||||
| U.S. government agency securities |
— | — | 5,291 | (969 | ) | 5,291 | (969 | ) | ||||||||||||||||
| Obligations of state and political subdivisions |
5,117 | (102 | ) | 30,646 | (3,160 | ) | 35,763 | (3,262 | ) | |||||||||||||||
| Small business association (SBA) securities |
723 | (1 | ) | — | — | 723 | (1 | ) | ||||||||||||||||
| |
|
|
|
|
|
|
|
|
|
|
|
|||||||||||||
| Total |
$ | 8,698 | $ | (117 | ) | $ | 67,335 | $ | (10,099 | ) | $ | 76,033 | $ | (10,216 | ) | |||||||||
| |
|
|
|
|
|
|
|
|
|
|
|
|||||||||||||
Less than 12 Months |
More than 12 Months |
Total |
||||||||||||||||||||||
Fair Value |
Unrealized Losses |
Fair Value |
Unrealized Losses |
Fair Value |
Unrealized Losses |
|||||||||||||||||||
December 31, 2022 |
(In thousands) |
|||||||||||||||||||||||
| Mortgage-backed securities - U.S. government sponsored enterprises (GSEs) |
$ | 15,605 | $ | (1,778 | ) | $ | 19,137 | $ | (4,824 | ) | $ | 34,742 | $ | (6,602 | ) | |||||||||
| U.S. government agency securities |
— | — | 5,085 | (1,175 | ) | 5,085 | (1,175 | ) | ||||||||||||||||
| Obligations of state and political subdivisions |
36,421 | (3,457 | ) | 1,352 | (371 | ) | 37,773 | (3,828 | ) | |||||||||||||||
| |
|
|
|
|
|
|
|
|
|
|
|
|||||||||||||
| Total |
$ | 52,026 | $ | (5,235 | ) | $ | 25,574 | $ | (6,370 | ) | $ | 77,600 | $ | (11,605 | ) | |||||||||
| |
|
|
|
|
|
|
|
|
|
|
|
|||||||||||||
Amortized Cost |
Fair Value |
|||||||
| (In thousands) | ||||||||
Due in one year or less |
$ | — | $ | — | ||||
Due after one year through five years |
8,538 | 8,415 | ||||||
Due after five years through ten years |
29,382 | 27,040 | ||||||
Due after ten years |
12,399 | 10,645 | ||||||
Mortgage-backed securities (GSEs) |
48,399 | 42,634 | ||||||
Small business association (SBA) securities |
2,617 | 2,618 | ||||||
| $ | 101,335 | $ | 91,352 | |||||
December 31, 2023 |
December 31, 2022 |
|||||||
| (In thousands) | ||||||||
Commercial real estate |
$ | 1,142,864 | $ | 873,573 | ||||
Commercial and industrial |
50,961 | 31,328 | ||||||
Construction |
310,187 | 417,538 | ||||||
Residential first-lien mortgage |
38,040 | 43,125 | ||||||
Home equity/consumer |
8,081 | 7,260 | ||||||
Total loans |
1,550,133 | 1,372,824 | ||||||
Deferred fees and costs |
(1,798 | ) | (2,456 | ) | ||||
Loans, net |
$ | 1,548,335 | $ | 1,370,368 | ||||
December 31, 2023 |
December 31, 2022 |
|||||||
| (In thousands) | ||||||||
Allowance for credit losses - loans |
$ | (18,492 | ) | $ | (16,461 | ) | ||
Allowance for credit losses - off balance sheet |
(589 | ) | (332 | ) | ||||
| $ | (19,081 | ) | $ | (16,793 | ) | |||
PCD Accruing May 19, 2023 |
PCD Non- Accruing May 19, 2023 |
Total PCD Loans May 19, 2023 |
||||||||||
(In thousands) |
||||||||||||
Purchase price PCD Loans |
$ |
34,574 |
$ |
2,155 |
$ |
36,729 |
||||||
Allowance for credit losses at acquisition |
550 |
51 |
601 |
|||||||||
Non-Credit discount (premium) at acquisitions |
(665 |
) |
(537 |
) |
(1,202 |
) |
||||||
Par value of acquired PCD Loans |
$ |
34,689 |
$ |
2,641 |
$ |
37,330 |
||||||
December 31, 2023 |
December 31, 2022 |
|||||||||||||||
With a Related Allowance |
Without a Related Allowance |
With a Related Allowance |
Without a Related Allowance |
|||||||||||||
| (In thousands) | ||||||||||||||||
Commercial real estate |
$ | — | $ | 4,485 | $ | — | $ | — | ||||||||
Commercial and industrial |
— | 2,116 | — | — | ||||||||||||
Construction |
— | — | 148 | — | ||||||||||||
Residential first-lien mortgage |
— | 107 | — | 118 | ||||||||||||
Total nonaccrual loans |
$ | — | $ | 6,708 | $ | 148 | $ | 118 | ||||||||
30-59
Days Past Due |
60-89
Days Past Due |
>90 Days Past Due |
Total Past Due |
Current |
Total Loans Receivable |
Loans Receivable >90 Days and Accruing |
||||||||||||||||||||||
| (In thousands) | ||||||||||||||||||||||||||||
Commercial real estate |
$ | 159 | $ | — | $ | 4,485 | $ | 4,644 | $ | 1,138,220 | $ | 1,142,864 | $ | — | ||||||||||||||
Commercial and industrial |
303 | — | 2,116 | 2,419 | 48,542 | 50,961 | — | |||||||||||||||||||||
Construction |
— | — | — | — | 310,187 | 310,187 | — | |||||||||||||||||||||
Residential first-lien mortgage |
— | — | 107 | 107 | 37,933 | 38,040 | — | |||||||||||||||||||||
Home equity/consumer |
29 | — | — | 29 | 8,052 | 8,081 | — | |||||||||||||||||||||
Total |
$ | 491 | $ | — | $ | 6,708 | $ | 7,199 | $ | 1,542,934 | $ | 1,550,133 | $ | — | ||||||||||||||
|
30-59 Days Past Due |
60-89 Days Past Due |
Greater than 90 days |
Total Past Due |
Current |
Total Loans Receivable |
Receivable >90 Days and Accruing |
||||||||||||||||||||||
(In thousands) |
||||||||||||||||||||||||||||
Commercial real estate |
$ | — | $ | 6,193 | $ | — | $ | 6,193 | $ | 867,380 | $ | 873,573 | $ | — | ||||||||||||||
Commercial and industrial |
255 | — | 184 | 439 | 30,889 | 31,328 | 184 | |||||||||||||||||||||
Construction |
— | — | 148 | 148 | 417,390 | 417,538 | — | |||||||||||||||||||||
Residential first-lien mortgage |
1,292 | — | 118 | 1,410 | 41,715 | 43,125 | — | |||||||||||||||||||||
Home equity/consumer |
— | 7,260 | 7,260 | |||||||||||||||||||||||||
Total |
$ | 1,547 | $ | 6,193 | $ | 450 | $ | 8,190 | $ | 1,364,634 | $ | 1,372,824 | $ | 184 | ||||||||||||||
| 2023 | 2022 | 2021 | 2020 | 2019 | Prior | Revolving Loans |
Total | |||||||||||||||||||||||||
| (Dollars in thousands) | ||||||||||||||||||||||||||||||||
Commercial real estate |
||||||||||||||||||||||||||||||||
Pass |
$ | 132,834 | $ | 233,436 | $ | 116,836 | $ | 53,574 | $ | 175,991 | $ | 417,417 | $ | 5,551 | $ | 1,135,639 | ||||||||||||||||
Special mention |
— | — | — | — | — | 2,740 | — | 2,740 | ||||||||||||||||||||||||
Substandard |
— | — | — | — | — | 4,485 | — | 4,485 | ||||||||||||||||||||||||
Total commercial real estate |
132,834 | 233,436 | 116,836 | 53,574 | 175,991 | 424,642 | 5,551 | 1,142,864 | ||||||||||||||||||||||||
Current period gross charge-offs |
1,718 |
1,718 |
||||||||||||||||||||||||||||||
Commercial and industrial |
||||||||||||||||||||||||||||||||
Pass |
2,098 | 2,304 | 11,925 | 1,962 | 1,133 | 13,954 | 15,045 | 48,421 | ||||||||||||||||||||||||
Special mention |
— | — | — | — | — | 500 | — | 500 | ||||||||||||||||||||||||
Substandard |
— | — | — | — | — | 2,040 | — | 2,040 | ||||||||||||||||||||||||
Total commercial and industrial |
2,098 | 2,304 | 11,925 | 1,962 | 1,133 | 16,494 | 15,045 | 50,961 | ||||||||||||||||||||||||
Current period gross charge-offs |
55 |
55 |
||||||||||||||||||||||||||||||
Construction |
||||||||||||||||||||||||||||||||
Pass |
5,832 | 18,379 | 91,774 | 19,216 | — | 8,484 | 166,502 | 310,187 | ||||||||||||||||||||||||
Special mention |
— | — | — | — | — | — | — | — | ||||||||||||||||||||||||
Substandard |
— | — | — | — | — | — | — | — | ||||||||||||||||||||||||
Total construction |
5,832 | 18,379 | 91,774 | 19,216 | — | 8,484 | 166,502 | 310,187 | ||||||||||||||||||||||||
Current period gross charge-offs |
148 |
148 |
||||||||||||||||||||||||||||||
Residential first-lien mortgage |
||||||||||||||||||||||||||||||||
Performing |
— | 979 | 4,792 | 2,839 | 1,545 | 27,778 | — | 37,933 | ||||||||||||||||||||||||
Nonperforming |
— | — | — | — | — | 107 | — | 107 | ||||||||||||||||||||||||
Total residential first-lien mortgage |
— | 979 | 4,792 | 2,839 | 1,545 | 27,885 | — | 38,040 | ||||||||||||||||||||||||
Current period gross charge-offs |
2 |
2 |
||||||||||||||||||||||||||||||
Home equity/consumer |
||||||||||||||||||||||||||||||||
Performing |
1,153 | 1,016 | 1,172 | — | — | 1,606 | 3,134 | 8,081 | ||||||||||||||||||||||||
Nonperforming |
— | — | — | — | — | — | — | — | ||||||||||||||||||||||||
Total home equity/consumer |
1,153 | 1,016 | 1,172 | — | — | 1,606 | 3,134 | 8,081 | ||||||||||||||||||||||||
Total |
||||||||||||||||||||||||||||||||
Pass/performing |
141,917 | 256,114 | 226,499 | 77,591 | 178,669 | 469,239 | 190,232 | 1,540,261 | ||||||||||||||||||||||||
Special mention |
— | — | — | — | — | 3,240 | — | 3,240 | ||||||||||||||||||||||||
Substandard /nonperforming |
— | — | — | — | — | 6,632 | — | 6,632 | ||||||||||||||||||||||||
Total loans |
$ | 141,917 | $ | 256,114 | $ | 226,499 | $ | 77,591 | $ | 178,669 | $ | 479,111 | $ | 190,232 | $ | 1,550,133 | ||||||||||||||||
Pass |
Special Mention |
Substandard |
Doubtful |
Total |
||||||||||||||||
| (In thousands) | ||||||||||||||||||||
Commercial real estate |
$ | 864,497 | $ | 2,883 | $ | 6,193 | $ | — | $ | 873,573 | ||||||||||
Commercial and industrial |
30,819 | 509 | — | — | 31,328 | |||||||||||||||
Construction |
417,390 | — | 148 | — | 417,538 | |||||||||||||||
Residential first-lien mortgage |
43,007 | — | 118 | — | 43,125 | |||||||||||||||
Home equity/consumer |
7,260 | — | — | — | 7,260 | |||||||||||||||
Total with no related allowance |
$ | 1,362,973 | $ | 3,392 | $ | 6,459 | $ | — | $ | 1,372,824 | ||||||||||
Commercial real estate |
Commercial and industrial |
Construction |
Residential first-lien mortgage |
Home equity/ consumer |
Unallocated |
Total |
||||||||||||||||||||||
| (In thousands) | ||||||||||||||||||||||||||||
Allowance for credit losses: |
||||||||||||||||||||||||||||
Beginning balance |
$ | 8,654 | $ | 271 | $ | 6,289 | $ | 236 | $ | 45 | $ | 966 | $ | 16,461 | ||||||||||||||
CECL adoption |
1,384 | (73 | ) | (1,269 | ) | 428 | 195 | (966 | ) | (301 | ) | |||||||||||||||||
Provision for acquired loans |
1,586 | 105 | — | 16 | — | — | 1,707 | |||||||||||||||||||||
Purchased credit deteriorated loans |
499 | 102 | — | — | — | 601 | ||||||||||||||||||||||
Provision 1
|
5,583 | 81 | (3,727 | ) | 47 | (153 | ) | — | 1,831 | |||||||||||||||||||
Charge-offs |
(1,718 | ) | (55 | ) | (148 | ) | (2 | ) | — | — | (1,923 | ) | ||||||||||||||||
Recoveries |
59 | 57 | — | — | — | — | 116 | |||||||||||||||||||||
Total |
$ | 16,047 | $ | 488 | $ | 1,145 | $ | 725 | $ | 87 | $ | — | $ | 18,492 | ||||||||||||||
Ending Balance: |
||||||||||||||||||||||||||||
Individually evaluated |
$ | — | $ | — | $ | — | $ | — | $ | — | $ | — | $ | — | ||||||||||||||
Collectively evaluated |
16,047 | 488 | 1,145 | 725 | 87 | — | 18,492 | |||||||||||||||||||||
| $ | 16,047 | $ | 488 | $ | 1,145 | $ | 725 | $ | 87 | $ | — | $ | 18,492 | |||||||||||||||
|
1 |
The credit provision for credit losses on the Consolidated Statement of Income is a $3.1 million comprising $1.7 million related to non-PCD loans acquired, a $1.8 million record provision related to the Bank’s outstanding loan balance and net-chargeoffs, partially reduced by $430,000 related to the reserve for unfunded liabilities. |
|
Commercial real estate |
Commercial and industrial |
Construction |
Residential first-lien mortgage |
Home equity/ consumer |
Unallocated |
Total |
||||||||||||||||||||||
(In thousands) |
||||||||||||||||||||||||||||
Allowance for loan losses: |
||||||||||||||||||||||||||||
Beginning balance |
$ | 7,458 | $ | 713 | $ | 7,228 | $ | 267 | $ | 48 | $ | 906 | $ | 16,620 | ||||||||||||||
Provision |
1,655 | (442 | ) | (839 | ) | (31 | ) | (3 | ) | 60 | 400 | |||||||||||||||||
Charge-offs |
(757 | ) | — | (100 | ) | — | — | — | (857 | ) | ||||||||||||||||||
Recoveries |
298 | — | — | — | — | — | 298 | |||||||||||||||||||||
Total |
$ | 8,654 | $ | 271 | $ | 6,289 | $ | 236 | $ | 45 | $ | 966 | $ | 16,461 | ||||||||||||||
Commercial real estate |
Commercial and industrial |
Construction |
Residential first-lien mortgage |
Home equity/ consumer |
Unallocated |
Total |
||||||||||||||||||||||
(In thousands) |
||||||||||||||||||||||||||||
Loans: |
||||||||||||||||||||||||||||
Ending Balance: |
||||||||||||||||||||||||||||
Individually evaluated for impairment |
$ | 12,030 | $ | 10 | $ | 148 | $ | 118 | $ | 71 | $ | — | $ | 12,377 | ||||||||||||||
Collectively evaluated for impairment |
861,543 | 31,318 | 417,390 | 43,007 | 7,189 | — | 1,360,447 | |||||||||||||||||||||
Ending balance |
$ | 873,573 | $ | 31,328 | $ | 417,538 | $ | 43,125 | $ | 7,260 | $ | — | $ | 1,372,824 | ||||||||||||||
Allowance for loan losses: |
||||||||||||||||||||||||||||
Ending Balance: |
||||||||||||||||||||||||||||
Individually evaluated for impairment |
$ | — | $ | — | $ | 118 | $ | — | $ | — | $ | — | $ | 118 | ||||||||||||||
Collectively evaluated for impairment |
8,654 | 271 | 6,171 | 236 | 45 | 966 | 16,343 | |||||||||||||||||||||
| $ | 8,654 | $ | 271 | $ | 6,289 | $ | 236 | $ | 45 | $ | 966 | $ | 16,461 | |||||||||||||||
2023 |
2022 |
|||||||
| (In thousands) | ||||||||
| Outstanding related party loans at January 1 |
$ | 4,861 | $ | 5,639 | ||||
| New loans |
— | — | ||||||
| Repayments |
(260 | ) | (778 | ) | ||||
| |
|
|
|
|||||
| Outstanding related party loans at December 31 |
$ | 4,601 | $ | 4,861 | ||||
| |
|
|
|
|||||
Unpaid Principal Balance |
Recorded Investment |
Related Allowance |
Average Recorded Investment |
Interest Income Recognized |
||||||||||||||||
| (In thousands) |
||||||||||||||||||||
| With no related allowance recorded: |
||||||||||||||||||||
| Commercial real estate |
$ |
16,017 |
$ |
13,155 |
$ |
— |
$ |
9,667 |
$ |
656 |
||||||||||
| Commercial and industrial |
1,138 |
15 |
— |
526 |
16 |
|||||||||||||||
| Construction |
— |
— |
— |
243 |
— |
|||||||||||||||
| Residential first-lien mortgage |
144 |
131 |
— |
138 |
6 |
|||||||||||||||
| Home equity/Consumer |
106 |
108 |
— |
124 |
8 |
|||||||||||||||
| |
|
|
|
|
|
|
|
|
|
|||||||||||
| Total with no related allowance |
$ |
17,405 |
$ |
13,409 |
$ |
— |
$ |
10,698 |
$ |
686 |
||||||||||
| |
|
|
|
|
|
|
|
|
|
|||||||||||
| With an allowance recorded: |
||||||||||||||||||||
| Commercial real estate |
$ |
— |
$ |
— |
$ |
— |
$ |
— |
$ |
— |
||||||||||
| Commercial and industrial |
— |
— |
— |
— |
— |
|||||||||||||||
| Construction |
278 |
278 |
196 |
359 |
— |
|||||||||||||||
| Residential first-lien mortgage |
— |
— |
— |
— |
— |
|||||||||||||||
| Home equity/Consumer |
— |
— |
— |
— |
— |
|||||||||||||||
| |
|
|
|
|
|
|
|
|
|
|||||||||||
| Total with an allowance |
$ |
278 |
$ |
278 |
$ |
196 |
$ |
359 |
$ |
— |
||||||||||
| |
|
|
|
|
|
|
|
|
|
|||||||||||
| Total: |
||||||||||||||||||||
| Commercial real estate |
$ |
16,017 |
$ |
13,155 |
$ |
— |
$ |
9,667 |
$ |
656 |
||||||||||
| Commercial and industrial |
1,138 |
15 |
— |
526 |
16 |
|||||||||||||||
| Construction |
278 |
278 |
196 |
602 |
— |
|||||||||||||||
| Residential first-lien mortgage |
144 |
131 |
— |
138 |
6 |
|||||||||||||||
| Home equity/Consumer |
106 |
108 |
— |
124 |
8 |
|||||||||||||||
| |
|
|
|
|
|
|
|
|
|
|||||||||||
| Total |
$ |
17,683 |
$ |
13,687 |
$ |
196 |
$ |
11,057 |
$ |
686 |
||||||||||
| |
|
|
|
|
|
|
|
|
|
|||||||||||
| Estimated useful lives |
2023 |
2022 |
||||||||
| (In thousands) | ||||||||||
| Land |
N/A | $ | 1,468 | $ | 1,468 | |||||
| Buildings |
40 Years | 4,161 | 3,946 | |||||||
| Leashold improvements |
11,338 | 8,347 | ||||||||
| Furniture, fixtures and equipment |
3-8 Years |
4,270 | 3,311 | |||||||
| Construction in progress |
150 | 107 | ||||||||
| |
|
|
|
|||||||
| Total before accumulated depreciation and amortization |
21,387 | 17,179 | ||||||||
| Accumulated depreciation and amortization |
(6,934 | ) | (5,457 | ) | ||||||
| |
|
|
|
|||||||
| Total |
$ | 14,453 | $ | 11,722 | ||||||
| |
|
|
|
|||||||
|
December 31, 2023 |
December 31, 2022 |
|||||||||||||||
| (Dollars in thousands) | ||||||||||||||||
| Demand, non-interest-bearing checking |
$ | 249,282 | 15.24 | % | $ | 265,078 | 19.67 | % | ||||||||
| Demand, interest-bearing checking |
247,939 | 15.16 | % | 269,737 | 20.01 | % | ||||||||||
| Savings |
146,484 | 8.96 | % | 190,686 | 14.15 | % | ||||||||||
| Money market |
354,005 | 21.64 | % | 283,652 | 21.05 | % | ||||||||||
| Time deposits, $250,000 and over |
173,614 | 10.61 | % | 83,410 | 6.19 | % | ||||||||||
| Time deposits, other |
464,417 | 28.39 | % | 255,167 | 18.93 | % | ||||||||||
| |
|
|
|
|
|
|
|
|||||||||
| $ | 1,635,741 | 100.00 | % | $ | 1,347,730 | 100.00 | % | |||||||||
| |
|
|
|
|
|
|
|
|||||||||
Amount |
||||
Years ended December 31, |
(In thousands) | |||
| 2024 |
$ | 519,151 | ||
| 2025 |
92,413 | |||
| 2026 |
22,410 | |||
| 2027 |
2,583 | |||
| 2028 and thereafter |
1,474 | |||
| |
|
|||
| Total |
$ | 638,031 | ||
| |
|
|||
2023 |
2022 |
|||||||
| (In thousands) | ||||||||
Performance and standby letters of credit |
$ | 1,010 | $ | 1,420 | ||||
Undisbursed construction loans-in-process |
89,258 | 140,538 | ||||||
Commitments to fund loans |
38,863 | 41,753 | ||||||
Unfunded commitments under lines of credit |
4,697 | 5,800 | ||||||
Total |
$ | 133,828 | $ | 189,511 | ||||
2023 |
2022 |
|||||||
| (In thousands) | ||||||||
Current tax expense: |
||||||||
Federal |
$ | 2,943 | $ | 4,621 | ||||
State |
1,427 | 2,411 | ||||||
Total current |
4,370 | 7,032 | ||||||
Deferred income tax benefit: |
||||||||
Federal |
341 | 876 | ||||||
State |
(141 | ) | (349 | ) | ||||
Total deferred |
200 | 527 | ||||||
| $ | 4,570 | $ | 7,559 | |||||
2023 |
2022 |
|||||||
| (In thousands) | ||||||||
| Deferred tax assets: |
||||||||
| Allowance for credit losses |
$ | 5,252 | $ | 4,638 | ||||
| Net operating loss carry-forward |
2,406 | 374 | ||||||
| Branch acquisition |
— | 26 | ||||||
| Other |
1,383 | 681 | ||||||
| Core deposit intangible |
460 | 397 | ||||||
| Acquisition accounting adjustments |
1,966 | — | ||||||
| Deferred PPP loans |
— | 28 | ||||||
| Lease liability |
6,895 | 4,726 | ||||||
| SERP liabiltiy |
307 | 202 | ||||||
| Unrealized loss on securities |
3,007 | 3,322 | ||||||
| |
|
|
|
|||||
| Total deferred tax assets |
21,676 | 14,394 | ||||||
| Deferred tax liabilities: |
||||||||
| Depreciation |
(1,455 | ) | (1,341 | ) | ||||
| Deferred loan costs |
(853 | ) | (335 | ) | ||||
| ROU |
(6,645 | ) | (4,515 | ) | ||||
| Acquisition accounting adjustments |
— | (8 | ) | |||||
| Goodwill amortization |
(768 | ) | (596 | ) | ||||
| Other |
(443 | ) | — | |||||
| Total deferred tax liabilities |
(10,164 | ) | (6,795 | ) | ||||
| |
|
|
|
|||||
| Net deferred tax asset |
$ | 11,512 | $ | 7,599 | ||||
| |
|
|
|
|||||
2023 |
2022 |
|||||||||||||||
| Amount | Rate | Amount | Rate | |||||||||||||
| (Dollars in thousands) | ||||||||||||||||
| Federal income tax expense at statutory rate |
$ | 6,370 | 21.0 | % | $ | 7,151 | 21.0 | % | ||||||||
| Increase (reduction) in taxes resulting from: |
||||||||||||||||
| State income taxes, net of federal benefit |
1,016 | 3.4 | % | 1,629 | 4.8 | % | ||||||||||
| Tax-exempt income, net |
(413 | ) | -1.4 | % | (772 | ) | -2.3 | % | ||||||||
| Income from bank-owned life insurance |
(272 | ) | -0.9 | % | — | 0.0 | % | |||||||||
| Incentive and non-qualified stock options and RSU’s |
— | 0.0 | % | (146 | ) | -0.4 | % | |||||||||
| Non-deductible expenses |
107 | 0.4 | % | 17 | 0.1 | % | ||||||||||
| IRS refund |
— | 0.0 | % | (516 | ) | -1.5 | % | |||||||||
| Bargain purchase gain |
(2,036 | ) | -6.7 | % | — | 0.0 | % | |||||||||
| Other |
(202 | ) | -0.7 | % | 196 | 0.5 | % | |||||||||
| |
|
|
|
|
|
|
|
|||||||||
| Total income taxes applicable to pre-tax income |
$ | 4,570 | 15.1 | % | $ | 7,559 | 22.2 | % | ||||||||
| |
|
|
|
|
|
|
|
|||||||||
|
Statement of Financial Condition Location |
December 31, 2023 |
December 31, 2022 |
||||||||||
| (In thousands) | ||||||||||||
| Operating Lease Right of Use Asset: |
||||||||||||
| Gross carrying amount |
$ | 16,026 | $ |
17,919 |
| |||||||
| Increased asset from new leases |
$ | 9,799 | |
— |
| |||||||
| Accumulated amortization |
(2,427 | ) | |
(1,893 |
) | |||||||
| |
|
|
|
|||||||||
| Net book value |
Operating lease right-of-use asset |
$ | 23,398 | $ | 16,026 | |||||||
| |
|
|
|
|||||||||
| Operating Lease Liability: |
||||||||||||
| |
|
|
|
|||||||||
| Lease liability |
Operating lease liability | $ |
24,280 |
|
$ |
16,772 |
| |||||
| |
|
|
|
|||||||||
| Twelve Months Ended December 31, |
||||||||
2023 |
2022 |
|||||||
| (In thousands) | ||||||||
| Lease cost: |
||||||||
| Operating lease |
$ | 3,772 | $ | 2,700 | ||||
| Short-term lease cost |
105 | 94 | ||||||
| |
|
|
|
|||||
| Total lease cost |
$ | 3,877 | $ | 2,794 | ||||
| |
|
|
|
|||||
| Other information: |
||||||||
| |
|
|
|
|||||
| Cash paid for amounts included in the measurement of lease liabilities |
$ | 3,074 | $ | 2,309 | ||||
| |
|
|
|
|||||
Amount |
||||
| Twelve months ended December 31, |
(In thousands | ) | ||
| 2024 |
$ | 3,162 | ||
| 2025 |
3,101 | |||
| 2026 |
2,914 | |||
| 2027 |
2,627 | |||
| 2028 |
2,487 | |||
| Thereafter |
16,312 | |||
| |
|
|||
| Total future operating lease payment |
30,603 | |||
| Amounts representing interest |
(6,323 | ) | ||
| |
|
|||
| Present value of net future lease payments |
$ | 24,280 | ||
| |
|
|||
Goodwill |
Core Deposit Intangible |
|||||||
| (In thousands) | ||||||||
Balance at December 31, 2022 |
$ | 8,853 | $ | 1,825 | ||||
Acquisition of Noah Bank |
— | 99 | ||||||
Amortization expense |
— | (502 | ) | |||||
Balance at December 31, 2023 |
$ | 8,853 | $ | 1,422 | ||||
Goodwill |
Core Deposit Intangible |
|||||||
Balance at December 31, 2021 |
$ | 8,853 | $ | 2,393 | ||||
Amortization expense |
— | (568 | ) | |||||
Balance at December 31, 2022 |
$ | 8,853 | $ | 1,825 | ||||
Amount |
||||
| (In thousands) | ||||
2024 |
$ | 432 | ||
2025 |
353 | |||
2026 |
274 | |||
2027 |
195 | |||
2028 |
116 | |||
Thereafter |
52 | |||
Total |
$ | 1,422 | ||
Description |
(Level 1) Quoted Price in Active Markets for Identical Assets |
(Level 2) Significant Other Observable Inputs |
(Level 3) Significant Unobservable Inputs |
Total Fair Value December 31, 2023 |
||||||||||||
| (In thousands) | ||||||||||||||||
Mortgage-backed securities -U.S. government sponsored enterprise (GSEs) |
$ | — | $ | 42,634 | $ | — | $ | 42,634 | ||||||||
U.S. government agency securities |
— | 5,291 | — | 5,291 | ||||||||||||
Obligations of state and political subdivisions |
— | 40,809 | — | 40,809 | ||||||||||||
Small Business Association (SBA) securities |
— | 2,618 | — | 2,618 | ||||||||||||
Securities available-for-sale |
$ | — | $ | 91,352 | $ | — | $ | 91,352 | ||||||||
Description |
(Level 1) Quoted Price in Active Markets for Identical Assets |
(Level 2) Significant Other Observable Inputs |
(Level 3) Significant Unobservable Inputs |
Total Fair Value December 31, 2022 |
||||||||||||
| (In thousands) | ||||||||||||||||
Mortgage-backed securities -U.S. government sponsored enterprise (GSEs) |
$ | — | $ | 34,915 | $ | — | $ | 34,915 | ||||||||
U.S. government agency securities |
5,085 | — | 5,085 | |||||||||||||
Obligations of state and political subdivisions |
— | 41,341 | — | 41,341 | ||||||||||||
Securities available-for-sale |
$ | — | $ | 81,341 | $ | — | $ | 81,341 | ||||||||
Description |
(Level 1) Quoted Price in Active Markets for Identical Assets |
(Level 2) Significant Other Observable Inputs |
(Level 3) Significant Unobservable Inputs |
Total Fair Value December 31, 2023 |
||||||||||||
| (In thousands) | ||||||||||||||||
Collateral dependent loan |
$ | — | $ | — | $ | 4,485 | $ | 4,485 | ||||||||
| $ | — | $ | — | $ | 4,485 | $ | 4,485 | |||||||||
Description |
(Level 1) Quoted Price in Active Markets for Identical Assets |
(Level 2) Significant Other Observable Inputs |
(Level 3) Significant Unobservable Inputs |
Total Fair Value December 31, 2022 |
||||||||||||
| (In thousands) | ||||||||||||||||
Impaired loans |
$ | — | $ | — | $ | 30 | $ | 30 | ||||||||
| $ | — | $ | — | $ | 30 | $ | 30 | |||||||||
Description |
December 31, 2023 |
Valuation Technique |
Unobservable Input |
Range (Weighted Average) |
||||||||||
| (Dollars in thousands) | ||||||||||||||
| Discount | 0.0 | % | ||||||||||||
Collateral dependent loan |
$ | 4,485 | Collateral |
1 |
adjustment | (0.0 | %) | |||||||
|
1 |
Value based on third party offer to purchase note from the Bank |
Description |
Fair Value December 31, 2022 |
Valuation Technique |
Unobservable Input |
Range (Weighted Average) |
||||||||||
| (In thousands) | ||||||||||||||
| Discount | 6.0 | % | ||||||||||||
Impaired loans |
$ | 30 | Collateral |
1 |
adjustment | (6.0 | %) | |||||||
|
1 |
Fair value is generally determined through independent appraisal of the underlying collateral, primarily using comparable sales. |
December 31, 2023 |
||||||||||||||||||||
|
Carrying Amount |
Estimated Fair Value |
Level 1 |
Level 2 |
Level 3 |
||||||||||||||||
Financial assets: |
(In thousands) | |||||||||||||||||||
Cash and cash equivalents |
$ | 150,557 | $ | 150,557 | $ | 150,557 | $ | — | $ | — | ||||||||||
Securities available-for-sale |
91,352 | 91,352 | — | 91,352 | — | |||||||||||||||
Securities held-to-maturity |
193 | 192 | — | 192 | — | |||||||||||||||
Loans receivable, net |
1,529,843 | 1,425,814 | — | — | 1,425,814 | |||||||||||||||
Restricted investments in bank stock |
1,410 | 1,410 | — | 1,410 | — | |||||||||||||||
Accrued interest receivable |
6,089 | 6,089 | — | 6,089 | — | |||||||||||||||
Equity method investments |
8,296 | 8,296 | — | 5,900 | 2,396 | |||||||||||||||
Mortgage servicing rights |
1,562 | 1,562 | — | 1,562 | — | |||||||||||||||
Financial liabilities: |
||||||||||||||||||||
Deposits |
$ | 1,635,741 | $ | 1,581,762 | $ | — | $ | 1,581,762 | $ | — | ||||||||||
Accrued interest payable |
9,162 | 9,162 | — | 9,162 | — | |||||||||||||||
December 31, 2022 |
||||||||||||||||||||
|
Carrying Amount |
Estimated Fair Value |
Level 1 |
Level 2 |
Level 3 |
||||||||||||||||
Financial assets: |
(In thousands) | |||||||||||||||||||
Cash and cash equivalents |
$ | 53,351 | $ | 53,351 | $ | 53,351 | $ | — | $ | — | ||||||||||
Securities available-for-sale |
81,341 | 81,341 | — | 81,341 | — | |||||||||||||||
Securities held-to-maturity |
201 | 200 | — | 200 | — | |||||||||||||||
Loans receivable, net |
1,353,907 | 1,347,137 | — | — | 1,347,137 | |||||||||||||||
Restricted investments in bank stock |
1,742 | 1,742 | — | 1,742 | — | |||||||||||||||
Accrued interest receivable |
4,756 | 4,756 | — | 4,756 | — | |||||||||||||||
Equity method investments |
2,061 | 2,061 | — | — | 2,061 | |||||||||||||||
Financial liabilities: |
||||||||||||||||||||
Deposits |
$ | 1,347,730 | $ | 1,225,087 | $ | — | $ | 1,225,087 | $ | — | ||||||||||
Borrowings |
10,000 | 10,000 | — | 10,000 | — | |||||||||||||||
Accrued interest payable |
1,027 | 1,027 | — | 1,027 | — | |||||||||||||||
|
Number of Stock Options |
Weighted Average Exercise Price |
Weighted Avg. Remaining Contractual Life |
Average Intrinsic Value |
|||||||||||||
Balance at January 1, 2023 |
330,650 | $ | 21.45 | |||||||||||||
Granted |
— | — | ||||||||||||||
Exercised |
(50,900 | ) | 13.87 | |||||||||||||
Forfeited |
— | — | ||||||||||||||
Expired |
— | — | ||||||||||||||
Balance at December 31, 2023 |
279,750 | $ | 22.83 | 2.25 Years | $ | 3,654,453 | ||||||||||
Exercisable at December 31, 2023 |
279,750 | $ | 22.83 | 2.25 Years | $ | 3,654,453 | ||||||||||
Number of Stock Options |
Weighted Average Exercise Price |
Weighted Avg. Remaining Contractual Life |
Average Intrinsic Value |
|||||||||||||
Balance at January 1, 2022 |
407,650 | $ | 20.08 | |||||||||||||
Granted |
— | — | ||||||||||||||
Exercised |
(76,900 | ) | 14.18 | |||||||||||||
Forfeited |
— | — | ||||||||||||||
Expired |
(100 | ) | 13.75 | |||||||||||||
Balance at December 31, 2022 |
330,650 | $ | 21.45 | 2.87 Years | $ | 3,463.695 | ||||||||||
Exercisable at December 31, 2022 |
330,650 | $ | 21.45 | 2.87 Years | $ | 3,463,695 | ||||||||||
Actual |
For capital conservation buffer requirement |
To be well capitalized under prompt corrective action provision |
||||||||||||||||||||||
Amount |
Ratio |
Amount |
Ratio |
Amount |
Ratio |
|||||||||||||||||||
| (Dollars in thousands) | ||||||||||||||||||||||||
December 31, 2023: |
||||||||||||||||||||||||
Total capital (to risk-weighted assets) |
$ | 254,030 | 14.677 | % | $ | 181,740 | 10.500 | % | $ | 173,086 | 10.000 | % | ||||||||||||
Tier 1 capital (to risk-weighted assets) |
$ | 235,538 | 13.608 | % | $ | 147,123 | 8.500 | % | $ | 138,469 | 8.000 | % | ||||||||||||
Common equity tier 1 capital (to-risk weighted assets |
$ | 235,538 | 13.608 | % | $ | 121,160 | 7.000 | % | $ | 112,506 | 6.500 | % | ||||||||||||
Tier 1 leverage capital (to average assets) |
$ | 235,538 | 12.289 | % | $ | 124,583 | 6.500 | % | $ | 95,833 | 5.000 | % | ||||||||||||
December 31, 2022: |
||||||||||||||||||||||||
Total capital (to risk-weighted assets) |
$ | 233,657 | 15.309 | % | $ | 160,256 | 10.500 | % | $ | 152,625 | 10.000 | % | ||||||||||||
Tier 1 capital (to risk-weighted assets) |
$ | 217,196 | 14.231 | % | $ | 129,731 | 8.500 | % | $ | 122,100 | 8.000 | % | ||||||||||||
Common equity tier 1 capital (to-risk weighted assets |
$ | 217,196 | 14.231 | % | $ | 106,838 | 7.000 | % | $ | 99,206 | 6.500 | % | ||||||||||||
Tier 1 leverage capital (to average assets) |
$ | 217,196 | 13.474 | % | $ | 104,775 | 6.500 | % | $ | 80,596 | 5.000 | % | ||||||||||||
PART IV
Item 15. Exhibits, Financial Statement Schedules
| (a) | The following portions of the Bank’s consolidated financial statements are set forth in Item 8 - “Financial Statements of Supplementary Data” of this Annual Report: |
| i. | Consolidated Statements of Financial Condition as of December 31, 2023 and 2022 |
| ii. | Consolidated Statements of Income for the years ended December 31, 2023 and 2022 |
| iii. | Consolidated Statements of Comprehensive Income for the years ended December 31, 2023 and 2022 |
| iv. | Consolidated Statements of Changes in Stockholders’ Equity for the years ended December 31, 2023 and 2022 |
| v. | Consolidated Statements of Cash Flows for the years ended December 31, 2023 and 2022 |
| vi. | Notes to Consolidated Financial Statements |
| (b) | Financial Statement Schedules |
All financial statement schedules are omitted as the information, if applicable, is presented in the consolidated financial statements or notes thereto.
| (c) | Exhibits |
93
| * | Management contract or compensatory plan, contract or arrangement. |
Management contract or compensatory plan, contract or arrangement.
| (A) | Incorporated by reference to Exhibit 2.1 to registrant’s Current Report on Form 8-K, filed with the SEC on January 18, 2024 |
| (B) | Incorporated by reference to Exhibit 3.1 to registrant’s Current Report on Form 8-K, filed with the SEC on September 2, 2022 |
| (C) | Incorporated by reference to Exhibit 3.1(ii) to registrant’s Registration Statement No. 333-263313 of Form S-4EF filed with the SEC on March 4, 2022. |
| (D) | Incorporated by reference to Exhibit 4.1 to registrant’s Registration Statement No. 333-263313 of Form S-4EF filed with the SEC on March 4, 2022 (D) Incorporated by reference to Exhibit 4.1 to registrant’s Current Report on Form 8-K12B, filed with the SEC on January 10, 2023. |
| (E) | Incorporated by reference to Exhibit 10.1 to registrant’s Registration Statement No. 333-263313 of Form S-4EF filed with the SEC on March 4, 2022. |
| (F) | Incorporated by reference to Exhibit 10.2 to registrant’s Registration Statement No. 333-263313 of Form S-4EF filed with the SEC on March 4, 2022. |
| (G) | Incorporated by reference to Exhibit 10.3 to registrant’s Registration Statement No. 333-263313 of Form S-4EF filed with the SEC on March 4, 2022. |
| (H) | Incorporated by reference to Exhibit 10.4 to registrant’s Registration Statement No. 333-263313 of Form S-4EF filed with the SEC on March 4, 2022. |
| (I) | Incorporated by reference to Exhibit 10.5 to registrant’s Registration Statement No. 333-263313 of Form S-4EF filed with the SEC on March 4, 2022. |
| (J) | Incorporated by reference to Exhibit 10.1 to registrant’s Quarterly Report on Form 10-Q, filed with the SEC on August 14, 2023. |
| (K) | Incorporated by reference to Exhibit 10.2 to registrant’s Quarterly Report on Form 10-Q, filed with the SEC on August 14, 2023. |
| (L) | Incorporated by reference to Exhibit 10.3 to registrant’s Quarterly Report on Form 10-Q, filed with the SEC on August 14, 2023. |
| (M) | Incorporated by reference to Exhibit 10.10 to registrant’s Registration Statement No. 333-263313 of Form S-4EF filed with the SEC on March 4, 2022. |
94
| (N) | Incorporated by reference to Exhibit 10.11 to registrant’s Registration Statement No. 333-263313 of Form S-4EF filed with the SEC on March 4, 2022. |
| (O) | Incorporated by reference to Exhibit 10.12 to registrant’s Registration Statement No. 333-263313 of Form S-4EF filed with the SEC on March 4, 2022. |
| (P) | Incorporated by reference to Exhibit 10.13 to registrant’s Registration Statement No. 333-263313 of Form S-4EF filed with the SEC on March 4, 2022. |
| (Q) | Incorporated by reference to Exhibit 10.14 to registrant’s Registration Statement No. 333-263313 of Form S-4EF filed with the SEC on March 4, 2022. |
| (R) | Incorporated by reference to Exhibit 10.15 to registrant’s Registration Statement No. 333-263313 of Form S-4EF filed with the SEC on March 4, 2022 |
| (S) | Incorporated by reference to Exhibit 10.1 to registrant’s Quarterly Report on Form 10-Q, filed with the SEC on May 11, 2023 |
| (T) | Incorporated by reference to Exhibit 10.4 to registrant’s Quarterly Report on Form 10-Q, filed with the SEC on August 14, 2023 |
Item 16. Form 10-K Summary
None.
95
SIGNATURES
Pursuant to the requirements of Section 13 or 15(d) of the Securities Exchange Act of 1934, the Registrant has duly caused this Report to be signed on its behalf by the undersigned, thereunto duly authorized as of March 25, 2024.
| Princeton Bancorp, Inc. | ||
| /s/ Edward Dietzler |
||
| By: |
Edward Dietzler President and Chief Executive Officer (Principal Executive Officer) |
|
96
Pursuant to the requirements of the Securities Exchange Act of 1934, this report has been signed below by the following persons on behalf of the registrant and in the capacities and on the dates indicated.
| Signature |
Capacity |
Date |
||
| /s/ Richard Gillespie Richard Gillespie |
Chairman of the Board |
March 25, 2024 | ||
| /s/ Stephen Distler Stephen Distler |
Vice Chairman of the Board |
March 25, 2024 | ||
| /s/ Stephen Shueh Stephen Shueh |
Director |
March 25, 2024 | ||
| /s/ Robert N. Ridolfi Robert N. Ridolfi, Esq |
Director |
March 25, 2024 | ||
| /s/ Judith A. Giacin Judith A. Giacin |
Director |
March 25, 2024 | ||
| /s/ Martin Tuchman Martin Tuchman |
Director |
March 25, 2024 | ||
| /s/ Ross Wishnick Ross Wishnick |
Director, Vice Chairman |
March 25, 2024 | ||
| /s/ Edward Dietzler Edward Dietzler |
President, Chief Executive Officer, Director (Principal Executive Officer) | March 25, 2024 | ||
| /s/ George S. Rapp George S. Rapp |
Executive Vice President, Chief Financial Officer (Principal Financial Officer) | March 25, 2024 | ||
| /s/ Jeffrey T. Hanuscin Jeffrey T. Hanuscin |
Senior Vice President, Treasurer and Chief Accounting Officer (Principal Accounting Officer) | March 25, 2024 | ||
97
Exhibit 21.1
SUBSIDIARIES OF REGISTRANT
| Name of Subsidiary |
Jurisdiction of Incorporation or Formation |
|
| The Bank of Princeton |
NJ |
|
| Bayard Lane, LLC |
NJ | |
| 112 Fifth Avenue, LLC |
NJ | |
| Bayard Properties, LLC |
NJ | |
| TBOP REIT, Inc. |
NJ | |
| TBOP Delaware Investment Company |
DE |
Exhibit 23.1
Consent of Independent Registered Public Accounting Firm
We consent to the incorporation by reference in Registration Statement (No.333-263313) on Form S-4EF, as amended on Form S-4/A, on Post-Effective Amendment No. 1 on Form S-8, and on Post-Effective Amendment No. 2 on Form S-3 of Princeton Bancorp, Inc. of our report dated March 25, 2024, relating to the consolidated financial statements of Princeton Bancorp, Inc. appearing in this Annual Report on Form 10-K of the Company for the year ended December 31, 2023.
/s/ Wolf & Company, P.C.
Boston, Massachusetts
March 25, 2024
Exhibit 31.1
RULE 13A-14(A)/15D-14(A) CERTIFICATIONS OF THE
CHIEF EXECUTIVE OFFICER
I, Edward Dietzler, certify that:
| 1. | I have reviewed this annual report on Form 10-K of Princeton Bancorp, Inc.: |
| 2. | Based on my knowledge, this report does not contain any untrue statement of a material fact or omit to state a material fact necessary to make the statements made, in light of circumstances under which such statements were made, not misleading with respect to the period covered by this report. |
| 3. | Based on my knowledge, the financial statements, and other financial information included in this report, fairly present in all material respects the financial condition, results of operations and cash flows of the registrant as of, and for, the periods presented in this report. |
| 4. | The registrant’s other certifying officer and I are responsible for establishing and maintaining disclosure controls and procedures (as defined in Exchange Act Rules 13a-15(e) and 15d-15(e)) and internal control over financial reporting (as defined in Exchange Act Rules 13a-15(f) and 15d-15(f)) for the registrant and have: |
| a) | Designed such disclosure controls and procedures, or caused such disclosure controls and procedures to be designed under our supervision, to ensure that material information relating to the registrant, including its consolidated subsidiaries, is made known to us by others within those entities, particularly during the period in which this report is being prepared; |
| b) | Designed such internal control over financial reporting, or caused such internal control over financial reporting to be designed under our supervision, to provide reasonable assurance regarding the reliability of financial reporting and the preparation of financial statements for external purposes in accordance with generally accepted accounting principles; |
| c) | Evaluated the effectiveness of the registrant’s disclosure controls and procedures and presented in this report our conclusions about the effectiveness of the disclosure controls and procedures, as of the end of the period covered by this report based on such evaluation; and |
| d) | Disclosed in this report any change in the registrant’s internal control over financial reporting that occurred during the registrant’s most recent fiscal quarter (the registrant’s fourth fiscal quarter in the case of an annual report) that has materially affected, or is reasonably likely to materially affect, the registrant’s internal control over financial reporting; and |
| 5. | The registrant’s other certifying officer and I have disclosed, based on our most recent evaluation of internal control over financial reporting, to the registrant’s auditors and the audit committee of the registrant’s board of directors (or persons performing the equivalent functions): |
| a) | all significant deficiencies and material weaknesses in the design or operation of internal control over financial reporting which are reasonably likely to adversely affect the registrant’s ability to record, process, summarize and report financial information; and |
| b) | any fraud, whether or not material, that involves management or other employees who have a significant role in the registrant’s internal control over financial reporting |
| Date: | March 25, 2024 | /s/ Edward Dietzler |
||||
| Edward Dietzler | ||||||
| President and Chief Executive Officer (Principal Executive Officer) |
Exhibit 31.2
RULE 13A-14(A)/15D-14(A) CERTIFICATIONS OF THE
CHIEF FINANCIAL OFFICER
I, George S. Rapp, certify that:
| 1. | I have reviewed this annual report on Form 10-K of Princeton Bancorp, Inc.: |
| 2. | Based on my knowledge, this report does not contain any untrue statement of a material fact or omit to state a material fact necessary to make the statements made, in light of circumstances under which such statements were made, not misleading with respect to the period covered by this report. |
| 3. | Based on my knowledge, the financial statements, and other financial information included in this report, fairly present in all material respects the financial condition, results of operations and cash flows of the registrant as of, and for, the periods presented in this report. |
| 4. | The registrant’s other certifying officer and I are responsible for establishing and maintaining disclosure controls and procedures (as defined in Exchange Act Rules 13a-15(e) and 15d-15(e)) and internal control over financial reporting (as defined in Exchange Act Rules 13a-15(f) and 15d-15(f)) for the registrant and have: |
| a) | Designed such disclosure controls and procedures, or caused such disclosure controls and procedures to be designed under our supervision, to ensure that material information relating to the registrant, including its consolidated subsidiaries, is made known to us by others within those entities, particularly during the period in which this report is being prepared; |
| b) | Designed such internal control over financial reporting, or caused such internal control over financial reporting to be designed under our supervision, to provide reasonable assurance regarding the reliability of financial reporting and the preparation of financial statements for external purposes in accordance with generally accepted accounting principles; |
| c) | Evaluated the effectiveness of the registrant’s disclosure controls and procedures and presented in this report our conclusions about the effectiveness of the disclosure controls and procedures, as of the end of the period covered by this report based on such evaluation; and |
| d) | Disclosed in this report any change in the registrant’s internal control over financial reporting that occurred during the registrant’s most recent fiscal quarter (the registrant’s fourth fiscal quarter in the case of an annual report) that has materially affected, or is reasonably likely to materially affect, the registrant’s internal control over financial reporting; and |
| 5. | The registrant’s other certifying officer and I have disclosed, based on our most recent evaluation of internal control over financial reporting, to the registrant’s auditors and the audit committee of the registrant’s board of directors (or persons performing the equivalent functions): |
| a) | all significant deficiencies and material weaknesses in the design or operation of internal control over financial reporting which are reasonably likely to adversely affect the registrant’s ability to record, process, summarize and report financial information; and |
| b) | any fraud, whether or not material, that involves management or other employees who have a significant role in the registrant’s internal control over financial reporting |
| Date: |
March 25, 2024 | /s/ George S. Rapp |
||||
| George S. Rapp | ||||||
| Executive Vice President and Chief Financial Officer (Principal Financial Officer) |
Exhibit 32.1
SECTION 1350 CERTIFICATIONS
In connection with the Annual Report of Princeton Bancorp, Inc (the “Company”) on Form 10-K for the period ended December 31, 2023 as filed with the United States Securities and Exchange Commission on the date hereof (the “Report”), the undersigned certify, pursuant to 18 U.S.C. 1350, as adopted pursuant to Section 906 of the Sarbanes-Oxley Act of 2002, that:
1. The Report fully complies with the requirements of section 13(a) or 15(d) of the Securities and Exchange Act of 1934; and
2. The information contained in the Report fairly presents, in all material respects, the financial condition and results of operations of the Company.
| /s/ Edward Dietzler |
| Edward Dietzler |
| President and Chief Executive Officer |
| (Principal Executive Officer) |
| /s/ George S. Rapp |
| George S. Rapp |
| Executive Vice President and Chief Financial Officer |
| (Principal Financial Officer) |
March 25, 2024
Exhibit 97.1
EXECUTIVE COMPENSATION CLAWBACK POLICY 2023
Restatement; Formation of Committee
In the event of a restatement of the Bank’s financial results (other than a restatement caused by a change in applicable accounting rules or interpretations), the result of which is that any performance-based compensation paid would have been a lower amount had it been calculated based on such restated results, a committee consisting of the non-management members of the
Board of Directors (the “Independent Director Committee”) shall review such performance-based compensation.
Committee Determination; Compensation Subject to Recovery
If the Independent Director Committee determines that
| • | the amount of any such performance-based compensation actually paid or awarded to an executive officer (the “Awarded Compensation”) would have been a lower amount had it been calculated based on such restated financial statements (the “Actual Compensation”), |
and
| • | such executive officer engaged in fraud or intentional illegal conduct which materially contributed to the need for such restatement, |
then the Independent Director Committee shall, except as provided below, seek to recover for the benefit of the Bank the after-tax portion of the difference between the Awarded Compensation and the Actual Compensation (such difference, the “Excess Compensation”).
In determining the after-tax portion of the Excess Compensation, the Independent Director Committee shall take into account its good faith estimate of the value of any tax deduction available to the executive officer in respect of such repayment.
Exceptions
The Independent Director Committee shall not seek recovery to the extent it determines (i) that to do so would be unreasonable or (ii) that it would be better for the Bank not to do so. In making such determination, the Independent Director Committee shall take into account such considerations as it deems appropriate, including, without limitation, (A) the likelihood of success under governing law versus the cost and effort involved, (B) whether the assertion of a claim may prejudice the interests of the Bank, including in any related proceeding or investigation, (C) the passage of time since the occurrence of the act in respect of the applicable fraud or intentional illegal conduct and (D) any pending legal proceeding relating to the applicable fraud or intentional illegal conduct.
1
Due Process Rights
Before the Independent Director Committee determines to seek recovery pursuant to this policy, it shall provide to the applicable executive officer written notice and the opportunity to be heard, at a meeting of the Independent Director Committee (which may be in-person or telephonic, as determined by the Independent Director Committee).
Manner of Repayment
If the Independent Director Committee determines to seek a recovery pursuant to this policy, it shall make a written demand for repayment from the executive officer and, if the executive officer does not within a reasonable period tender repayment in response to such demand, and the Independent Director Committee determines that he or she is unlikely to do so, the Independent Director Committee may seek a court order against the executive officer for such repayment.
Definitions
For the purposes of this policy, (i) the term “executive officer” has the meaning given to that term in the Securities Exchange Act of 1934, as amended, and (ii) the term “performance-based compensation” means all bonuses and other incentive and equity compensation awarded to each of the Bank’s executive officers, the amount, payment and/or vesting of which was calculated based wholly or in part on the application of objective performance criteria measured during any part of the period covered by the restatement.
2